An experimental study of radiative and total heat transfer ...
182
AN ABSTRACT OF THE THESIS OF David Hsien-Yu Lei for the degree of Doctor of Philosophy in Mechanical Engineering presented on _January 8, 1988 Title: An Experimental Study of Radiative and Total Heat Transfer Between a High Temperature Fluidized Bed and an Array of /mmersed T4e# Abstract approved: Redacted for privacy James R. Welty Experimental data are reported for the time-averaged local radiative and total heat transfer coefficients for both an array of horizontal tubes as well as a single horizontal tube immersed in a large-particle fluidized bed at elevated temperatures. Spatial-averaged heat transfer coefficients computed from the local values, using a simple trapezoidal rule integration, are reported. An instrumented tube was used to measure both the radiative and total heat transfer rates simultaneously. Three different window materials, silicon, sapphire, and quartz, have been tested in order to examine some key design decisions made in the development of the radiation detector. It is concluded that the radiation detector employing silicon as the window material is most suitable to achieve accurate measurements of the radiative heat transfer between a fluidized bed and immersed surfaces. Experiments were conducted at the Oregon State University high temperature fluidized bed facility employing
-
Upload
khangminh22 -
Category
Documents
-
view
1 -
download
0
Transcript of An experimental study of radiative and total heat transfer ...

AN ABSTRACT OF THE THESIS OF
David Hsien-Yu Lei for the degree of Doctor of Philosophy in
Mechanical Engineering presented on _January 8, 1988
Title: An Experimental Study of Radiative and Total Heat
Transfer Between a High Temperature Fluidized Bed
and an Array of /mmersed T4e#
Abstract approved: Redacted for privacyJames R. Welty
Experimental data are reported for the time-averaged
local radiative and total heat transfer coefficients for
both an array of horizontal tubes as well as a single
horizontal tube immersed in a large-particle fluidized bed
at elevated temperatures. Spatial-averaged heat transfer
coefficients computed from the local values, using a simple
trapezoidal rule integration, are reported.
An instrumented tube was used to measure both the
radiative and total heat transfer rates simultaneously.
Three different window materials, silicon, sapphire, and
quartz, have been tested in order to examine some key design
decisions made in the development of the radiation detector.
It is concluded that the radiation detector employing
silicon as the window material is most suitable to achieve
accurate measurements of the radiative heat transfer between
a fluidized bed and immersed surfaces.
Experiments were conducted at the Oregon State
University high temperature fluidized bed facility employing

Tone grain as the bed material. Measurements were made for
two particle sizes (2.14 mm and 3.23 mm) and at three
different bed temperatures (812 K, 925 K, and 1000 K).
The radiative heat transfer results for tube arrays are
believed to be the first of their kind. In comparing these
results with those for a single tube, it was found that the
radiative heat transfer coefficient decreases with increases
in both bed temperature and particle size due to the
presence of neighboring "cool" tubes in a hot bed and the
greater "see through" effect of the larger particles.
Radiation contributions for a bubbling bed were calculated
for various test conditions.
The effects of superficial velocity, bed temperature,
particle size, and adjacent "cool" tubes on both the
radiative and total heat transfer performance are described
with comparisons made between the results of this study and
available literature data or correlations.

An Experimental Study of Radiative and Total HeatTransfer Between a High Temperature Fluidized
Bed and an Array of Immersed Tubes
by
David Hsien-Yu Lei
A THESIS
submitted to
Oregon State University
in partial fulfillment ofthe requirements for the
Degree of
Doctor of Philosophy
Completed January 8,1988
Commencement June 1988

APPROVED:
Redacted for privacyProfessor of M chanical Engineering Charge of Major
Redacted for privacyHead of Departient of Mechanical Engineering
Redacted for privacyrYDean of Gradu School (:
Date thesis is presented January 8 1988
Typed by David Hsien-Yu Lei

ACKNOWLEDGMENTS
I would like to express my grateful appreciation to Dr.
James R. Welty, my major professor, who provided direction
for my research and financial support during the course of
my graduate studies at Oregon Stat University. His ingenuity
was essential for the sucess of whole fluidized bed project,
and this thesis as well. Working with him has been a
pleasant and unforgettable experience.
My thanks also go to Dr. Adams for his valuable advise
and suggestions on this project. It was a good feeling to
know that there was someone who know answers to all your
confusions. Dr. Sollitt, Dr. Guenther, and Dr. Davis, are
appreciated for their reading and commenting on my thesis.
Many thanks are due to Dr. Nasser Alavizadeh and Ali
Goshayeshi for their assistance and helpful hands in many
occasions. I wish to express my thanks to Bea Bjornstad who
was always there to help me in so many ways.
Finally, I come to my family. My greatest appreciation
goes to my wife Vera for her patience, encouragement, and
consideration. She has done such a good job to our precious
little Oliver to whom I owe so much for not being a devoted
father in the first few months of his life. This thesis is
dedicated to my parents for their love and support. They
have done more than their share. I love you, Mom and Dad.

TABLE OP CONTENTS
ghgPtILIKPage
I INTRODUCTION. eeeeee
1.1 Background......................... ...... 1
1.2 Fluidization Phenomena........................ 41.3 Heat Transfer Mechanisms..... ..... ............ 9
1,3.1 Theoretical Models.............. ..... ...101.3.2 Predictive Correlations.................17
1.4 Experimental Studies..........................201.4.1 Total Heat Transfer......... ......... ...211.4.2 Radiative Heat Transfer.................22
1.5 Present
II. RADIATION DETECTOR................................29
2.1 Comments on Previous Investigations...........292.2 Design
2.2.1 Window Materials................... ..... 342.2.2 Heat Flux Sensor........ ...... ..........362.2.3 Theoretical Analysis....................39
2.3 Assembly......................... ..... . ..... ..412.4 Calibration................. ............. .....452.5 Experimental Verification.....................49
III. APPARATUS AND EXPERIMENTS........ ..... ..... ......61
3.1 Instrumented ..... .................613.1.1 Total Heat Flux Gauge........... ..... ...613.1.2 Calibration of Radiation Detector.......63
3.2 Tube Arrays3.3 Data Acquisition System............. ...... ....653.4 Fluidized Bed Facility......... ............... 67
3.4.1 Air and ...... ....693.4.2 Test Section............................693.4.3 Temperature Control 70
3.5 Bed Particle.............. ....... ....... 71
3.6 Experiments................ ...... ..... 713.6.1 Test Conditions and Procedure.. .... 713.6.2 Data Collection............ ..... 73
3.6.3 Data Reduction................... ...... 74
IV. RESULTS AND DISCUSSION...... ...... ......... .78
4.1 Spatial Average Heat Transfer-- ....... ....804.1.1 Radiative Heat Transfer...... ...... .....804.1.2 Total Heat Transfer.......... ......... ..98

Chapter Pace
4.2 Time Average Local Heat Transfer 1074.2.1 Radiative Heat Transfer 1084.2.2 Total Heat Transfer 117
V. CONCLUSIONS AND RECOMMENDATIONS 125
5.1 Conclusions 1255.2 Recommendations 128
BIBLIOGRAPHY 132
APPENDICES 146
A. Temperature and Heat Flux Conversion 146B. Error Estimation 149C. Tabulated Data 154

LIST OF FIGURES
Figure Page
1.1 Fluidization phenomena and regimes inlarge particle bed 5
1.2 Particle packing around an immersed horizontaltube 7
1.3 Pattern of particle circulation inthe defluidized cap 8
1.4 Different heat transfer mechanisms betweena fluidized bed and a immersed tube 8
1.5 Contribution of different heat transfermechanisms to the maximum time-averagedheat transfer coefficient in a cold bed 11
2.1 Basic design concept of radiation detector 35
2.2 Transmission characteristics of silicon,sapphire, and fused quartz 37
2.3 Geometry of the selected heat flux sensor 38
2.4 Assembly of radiation detectors inthe instrumentation tube 43
2.5 Calibration results for differentwindow materials 48
2.6 hrb vs. U0 at stagnation point forTf = 900 K, Dp = 3.23 mm 51
2.7 hrb vs. U0 at 90 degrees from stagnationpoint for Tf = 900 K, Dp = 3.23 mm 52
2.8 hrb vs. U0 at stagnation point forTf = 1080 K, Dp = 3.23 mm 53
2.9 hrb vs. U0 at 90 degrees from stagnationpoint for Tf = 1080K, Dp = 3.23 mm 54
2.10 hrb vs. U0 at stagnation point forTi = 900 K, Dp = 2.14 mm 55
2.11 hrb vs. U0 at 90 degrees from stagnationpoint for Tf = 900 K, Dp = 2.14 mm 56
2.12 hrb vs. U0 at stagnation point forTf = 1080 K, Dp = 2.14 mm 57

Figure Page
2.13 hrb vs. Uo at 90 degrees from stagnationpoint for Tf = 1080 K, Dp = 2.14 mm.... ... .. . 580..00
3.1 Total heat transfer gauges ..... . ........ 0000.00.0 62
3.2 Arrangements of tube array design. .. . .... ......... 62
3.3 Tube array geometry..... ..... ........ ..... ........ 66
3.4 Data acquisition system-- ..... . ...... eMVe00.0 68
3.5 Oregon State University high temperaturefluidized bed facility..... 0900. 09.00.000.0 63
4.1 hrb and h t vs. Uo forf Dp mm= 2.14 (Tube Array)... 81
4.2 rb and ht vs. U0 for Dp = 2.14 mm (Single Tube).. 82
4.3 Erb and ht vs. U0 for DP= 3.23 mm (Tube Array)... 83
4.4 Erb and Kt vs. U0 for DP= 3.23 mm (Single Tube).. 84
4.5 Erb vs. Uo for DP
= 2.14 Min**0.0000.040o .......... 85
4.6 Erb vs. U0 for DP
= 3.23 mm....... .......... . ..... 86
4.7 Erb and ht vs. Uo for DP= 2.14 mm, Tf = 812 K.... 90
4.8 hrb and ht vs. U0 for DP= 2.14 mm, Tf = 925 K.... 91
4.9 hrb and Et vs. U0 for Dp = 2.14 mm, Tf = 1000 K... 92
4.10 ii,..b and ht vs. U0 for DP
= 3.23 mm, Tf = 812 K.... 93
4.11 Erb and ht vs. U0 for DP
3.23 mm, Tf = 925 K.... 94
4.12 Radiative heat transfer coefficientsobtained in different studies... ....... ........... 97
4.13 ht vs. Uo for D = 2.14 mm 99
4.14 Kt vs. U0 for D = 3.23 mm 100
4.15 Dependence of the maximum heat transfercoefficient on mean particle diameter ..... 103
4.16 Maximum Nusselt number vs. Archimedesnumber in different studies............ ....... 106

LIST OF TABLES
Table
Measurements of radiation contribution
Page
1.1in different studies 24
2.1 Methods and possible sources of erroramong different studies 33
2.2 Window materials with results oftheoretical analysis 42
3.1 Size distribution, chemical compositions,and thermal properties of ione grain 72
4.1 Test conditions and results at optimumsuperficial velocity 79
4.2 Overall radiation contribution and heat transfercoefficient reduction in the bubbly-bed state.... 79
A.1 Sensitivity constant of heat flux sensor 148
C.1 Test results for D 2.14 mm and T f = 812 K(Tube Array) 155
C.2 Test results for D = 2.14 mm and T f = 925 K(Tube Array) 156
C.3 Test results for Dp = 2.14 mm and Tf = 1000 K(Tube Array) 157
C.4 Test results for D 3.23 mm and Tf = 812 K(Tube Array) 158
C.5 Test results for D = 3.23 mm and Tf = 925 K(Tube Array) 159
C.6 Test results for D = 2.14 mm and T f = 812 K(Single Tube) 160
C.7 Test results for D = 2.14 mm and Tf = 925 K(Single Tube) p 161
C.8 Test results for D = 2.14 mm and Tf = 1000 K(Single Tube) 162
C.9 Test results for D 3.23 mm and Tf = 812 K(Single Tube) p 163

Table Page
C.10 Test results for D = 3.23 mm and Tf = 925 K(Single Tube) 164
C.11 Local radiative heat transfer coefficient(hrb) for DP = 2.14 mm (Single Tube) 165
C.12 Local radiative heat transfer coefficient(hrb) for DP = 3.23 mm (Single Tube) 166

NOTATION
Symbol Description
r gDp3(pp-pf)pf 1
Units
Ar Archimedes number2
Pf
Cc Calibration constant of heat w/m2.pv
flux sensor [= F(Ts)/Cs]
Cs Heat flux sensor sensitivity AV.m2/Wconstant [Eqn. (A.2)]
cpf Gas specific heat at constant pressure kJ/kg.K
cps Particle specific heat at constant kJ/kg.Kpressure [Table 3.1]
Do Tube outside diameter mm
DP
Mean particle diameter mm
Dpj Mean diameter in particle size mminterval j [Eqn. (3.4)]
emf Heat flux sensor output voltage AV
F(Ts) Heat flux sensor multiplicationfactor [Eqn. (A.2)]
f Radiation contribution [= Qrb/Qt] %
Pave Average radiation contributionat bubbly bed stage
%
fo Bubble contact fraction
1-fc Emulsion contact fraction
g Gravity acceleration m/s2
Gr Grashof number [= gH3/3ATpf2/pf2]
H Cavity height
h Heat transfer coefficient W/m2.K
hb Gas convective heat transfer W/m2.Kcoefficient in bubble phase
hgc Gas convective heat transfer W/m2.Kcoefficient in emulsion phase

Symbol Description
hmf Gas convective heat transfercoefficient at minimum fluidization
hmax
hpc Particle convective heat transfercoefficient in emulsion phase
hr Radiative heat transfer coefficient W/m2.Kin emulsion and bubble phases
hrb Black tube local radiative heat W/m2.Ktransfer coefficient
Maximum heat transfer coefficient
Units
W/m2.K
W/m2oK
W /m2.K
ht Local total heat transfer W/m2.Kcoefficient
hamax Maximum local total heat transfer w/m2.K
coefficient
h Spatial-averaged heat transfer W/m2.Kcoefficient
hrb Spatial-averaged black tube radiative W/m2.Kheat transfer coefficient
ht Spatial-averaged total heat W/m2.Ktransfer coefficient
-max Spatial-averaged maximum total W/m2.Kheat transfer coefficient
k Thermal conductivity W/m.K
kf Gas thermal conductivity W/m.K
kp Particle thermal conductivity W/m.K
M Number of particle size intervals
MF Magnification factor of lens
N Number of data recorded
Nu Particle Nusselt number [= hDp/kf]
Particle Nusselt number at minimumNuPfluf fluidization [= hmfDp/kf]
Nut,b Nusselt number in bubble phase basedon tube diameter [= hDc/kf]

Symbol Description Units
Numax Spatial-averaged maximumparticle Nusselt number [= hmaxDp/kf]
Pr Prandtl number [= Afcpf/kf]
Q Heat flux W /m2
Qd Detected heat flux w/m2
Qrb Black tube radiative heat flux w/m2
Qrb,si Black tube radiative heat flux W /m2
employing silicon window
Qrb,sa Black tube radiative heat flux w/m2
employing sapphire window
Qrb,qz Black tube radiative heat flux w/m2
employing quartz window
Qt Total heat flux W /m2
sQrb Spatial-averaged black tube w/m2
radiative heat flux
5t Spatial-averaged total heat flux w/m2
Rep
Retmf
Particle Reynolds number [= pfUopp/Af]
Reynolds number based on tub diameterand minimum fluidization [= pfUmfDo/Af]
Tf Bed temperature
Tfi Film temperature [= (TeTwi)/2] K
Ts Heat flux sensor temperature K
Tw Tube wall temperature K
Twi Average window temperature K
Umf Minimum fluidization velocity m/s
U0 Gas superficial velocity m/s
Uop Optimum superficial velocity m/s
Vd Detected thermopile voltage AV
Vref Thermopile reference voltage V

Symbol Description Units
Vt Thermocouple voltage V
Y Horizontal tube spacing cm
Z Vertical tube spacing cm
Greek Description Units
a Angle measured from lower Degreesstagnation point
fl Coefficient of thermal expansion 1/K
6 Bubble phase volume fraction
1-6 Emulsion phase volume fraction
6ef Effective bed emissivity
ep Particle emissivity
ew Tube wall emissivity
Pf Gas viscosity kg/m.s
a Stefan-Boltzmann constant W /m2
Pf Gas density kg/m3
pp Particle density kg/m3
A Maximum value of uncertainty [Eqn. (B.2)]
Subscripts
i Heat flux and temperature index [Eqn. (3.5)]
j Particle size interval index [Eqn. (3.4)]
1,2,3 Radiative detector index number
4,5,6 Total heat flux gauge index number
sa Sapphire
si Silicon
qz Quartz

AN EXPERIMENTAL STUDY OF RADIATIVE AND TOTAL HEATTRANSFER BETWEEN A HIGH TEMPERATURE FLUIDIZED
BED AND AN ARRAY OF IMMERSED TUBES
I. INTRODUCTION
1.1 Background
Gas-solid fluidized bed technology has been used in
various industrial processes since the first major large-
scale commercial application in catalytic cracking process
in 1942 (99,30). Most applications of this technique take
advantage of its unusual characteristics, which include ease
of handling of fluid-like solids, extremely large areas of
contact between solid and fluid, nearly isothermal
conditions throughout the bed, and high rates of heat
transfer between the bed and immersed surfaces. In the
latter case, there is considerable interest in fluidized bed
combustion of high sulfur coal, wood chips, biomass, or
industrial waste in the field of energy utilization. Other
applications of fluidized bed heat transfer include heating
of process fluids such as crude oil (49), combustion of
radiative waste (145), metallurgical heat treatment, and
hydrocarbon processing (30).
The most effective application of coal, which comprises
over 80% of the earth's energy resource, is direct burning
(124). Unfortunately, coal usually contains substantial
amounts of sulfur and nitrogen compounds which are released
in the exhaust gas as SOx and NOx during the course of
combustion. Thus, the development of coal combustion

2
techniques should be concerned with minimizing these air
pollution problems. A principal motivation for the interest
in fluidized bed combustion is thus associated with the
concept that the combustion of coal in fluidized beds will
allow the adsorption of SOX.
The advantages of fluidized bed combustors over
conventional boilers are three-fold. First, the SO2 produced
during the combustion process is retained in the furnace by
using bed materials such as limestone or dolomite. Thus,
high sulfur coal can be utilized and the corrosion of the
boiler system is also minimized (122). Secondly, the lower
operating temperatures (Tf = 800-1000 °C) in a fluidized bed
boiler, comparing with conventional ones (Tf > 1400 °C),
reduce the emissions of NOs so that low rank fuel such as
oil shale or high ash coal can be used (95,100,124).
Thirdly, and probably more important as far as design and
thermal efficiencies are concerned, heat transfer rates
between a gas-solid fluidized bed and immersed surfaces can
be up to 20 times higher than with single phase flow (108).
This suggests that fluidized bed combustion has particular
appeal with its combined advantages of pollution control,
fuel flexibility, and excellent heat transfer
characteristics. It provides not only an optimum economic
combustor system, but also essential features which are
required for emission control (122).
The design aspects of different commercial or pilot-
scale fluidized bed combustion systems can be found in Basu

3
(21,22), Howard (88), Goblirsch, et al. (73), and Leon, et
al. (101). For a typical fluidized bed combustor, coal,
which comprises about 1% to 2% of the bed material, is
burned in the bed (40,116). The heat is transferred to in-
bed tube arrays, and steam generated in the tubes then is
sent to drive gas turbines for electricity generation or
other uses. It has also been suggested that the hot gases be
used along with steam to drive a combined cycle of both
steam and gas turbines (30).
In order to make such concepts practical realities, a
fundamental understanding of the hydrodynamics and heat
transfer between a fluidized bed and immersed surfaces is of
critical importance, particularly for large particles beds
(Dp > 1 mm) at elevated temperatures (Tf > 800 K) because
fluidized bed combustor design involves operation at such
conditions. However, these phenomena are complicated due to
the large number of bed parameters involved, which include
particle size, shape, and physical properties; type of
distributor; and the configuration of the immersed surfaces
such as size, shape, spacing, and pitch (122,145).
The following two sections give a review of the
fluidization phenomena and heat transfer mechanisms in a
gas-solid fluidized bed with emphasis on large particle beds
with immersed horizontal tubes. More general discussion can
be found in the books by Botterill (30), Davidson and
Harrison (51), Kunii and Levenspiel (99), and Zabrodsky
(145).
4
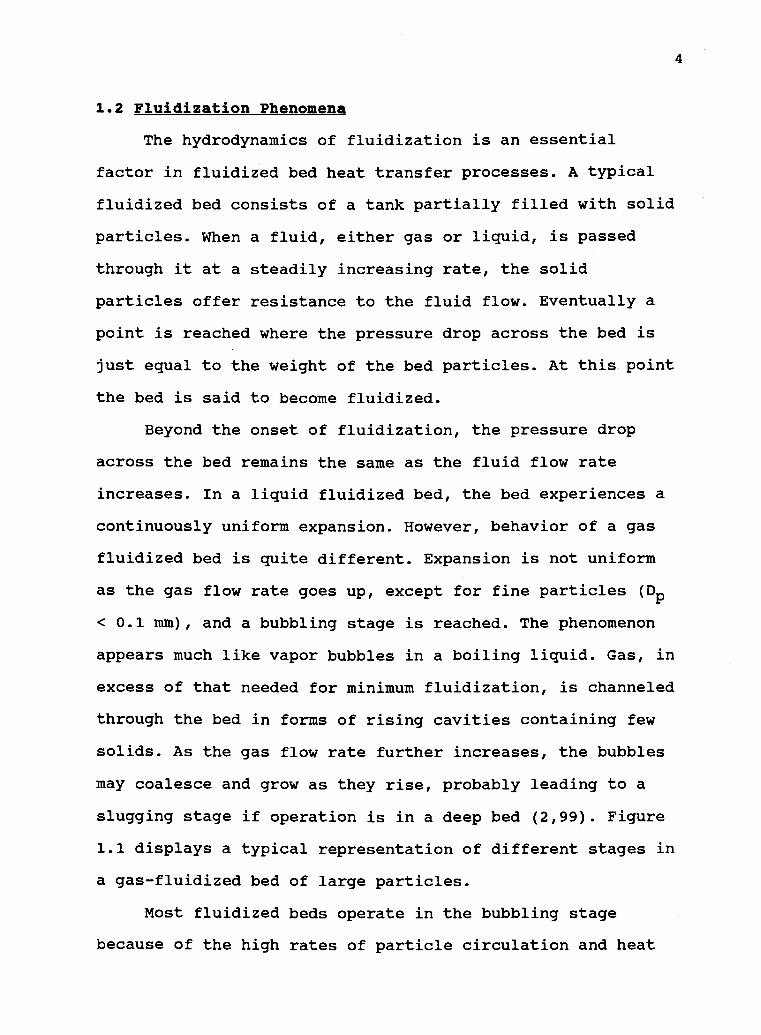
1.2 Fluidization Phenomena
The hydrodynamics of fluidization is an essential
factor in fluidized bed heat transfer processes. A typical
fluidized bed consists of a tank partially filled with solid
particles. When a fluid, either gas or liquid, is passed
through it at a steadily increasing rate, the solid
particles offer resistance to the fluid flow. Eventually a
point is reached where the pressure drop across the bed is
just equal to the weight of the bed particles. At this point
the bed is said to become fluidized.
Beyond the onset of fluidization, the pressure drop
across the bed remains the same as the fluid flow rate
increases. In a liquid fluidized bed, the bed experiences a
continuously uniform expansion. However, behavior of a gas
fluidized bed is quite different. Expansion is not uniform
as the gas flow rate goes up, except for fine particles (Dp
< 0.1 mm), and a bubbling stage is reached. The phenomenon
appears much like vapor bubbles in a boiling liquid. Gas, in
excess of that needed for minimum fluidization, is channeled
through the bed in forms of rising cavities containing few
solids. As the gas flow rate further increases, the bubbles
may coalesce and grow as they rise, probably leading to a
slugging stage if operation is in a deep bed (2,99). Figure
1.1 displays a typical representation of different stages in
a gas-fluidized bed of large particles.
Most fluidized beds operate in the bubbling stage
because of the high rates of particle circulation and heat

wall solidsslugs slugs
MINIMUM SLOW BUBBLE RAPIDLY GROWING SLUGGING REGIME TURBULENTFLUIDIZATION REGIME BUBBLE REGIME (deeper beds REGIME
uo/Umf
TURBULENT REGIME
FASTBUBBLES RAPIDLY GROWING BUBBLES
(OR SLUGS)
SLOWBUBBLES
-large particles
PARTICLE DIAMETER, Dp
Figure 1.1 Fluidization phenomena and regimes in large particle bed.[Adapted from Catipovic, N. M. (40)]

6
transfer. The bubble behavior, such as rising velocity,
size, and frequency, has been studied extensively in the
world of fluidization. It was noted that the behavior varies
for large and small particles (42,91,92). Catipovic, et al.
(42) developed a slow-fast bubble criterion for fluidization
of large particles, as shown in Figure 1.1. The conventional
fluidized bed boilers (AFB) are operated in the slow bubble
regime and circulating fluidized bed boilers (CFB) are
operated at a higher gas velocity, which generally falls in
the slugging or turbulent regime (107).
The bubble behavior and the bubble-induced particle
circulation around immersed horizontal tubes is of major
importance regarding bed-to-tube heat transfer study. Figure
1.2 shows a typical distribution of bubbles and particles
around a horizontal tube in a bubbling bed. Jovanovic (91)
indicated that bubble behavior for beds with immersed tubes
exhibits smoother characteristics than for empty beds. There
is a defluidized cap called a "lee stack" formed on top of
the tube at velocities near Umf. As the gas velocity
increases, particles in the defluidized cap will eventually
be swept back into the emulsion phase as a result of bulk
circulation (69). Hager and Schrag (84) described this
movement as in Figure 1.3. The rate of particle replacement
increases dramatically as excess gas velocity goes up.
Gelperin, et al. (65) observed that the cap of
defluidized particles tends to be less stable on tubes in an
array than single tube due to the higher local gas velocity

7
Gas flow
Figure 1.2 Particle packing around an immersed horizontaltube. [Adapted from Adams, R. L. (1)]

Figure 1.3 Pattern of particle circulation in thedefluidized cap.
TUBE
hgc
gas filmave. thickness
hpc
EMULSION
( Tw)
hr
hb
BUBBLE
Figure 1.4 Different heat transfer mechanisms betweena fluidized bed and a immersed tube.

9
between tubes. It has been noted that the lower portion of
the tube is generally shrouded by gas bubbles, as shown in
Figure 1.2 (85,120). However, for the case of an array of
tubes, Keairns (94) found that there is an alternating
character to bubble flow around a tube which results in a
constant replacement of particles in the lower portion.
1.3 Heat Transfer Mechanisms
The analytical approach and derivation of predictive
correlations for the heat transfer between a fluidized bed
and immersed surfaces has been a fertile field, as
summarized by Botterill (30), Saxena, et al. (122),
Zabrodsky (145), and others (51,79,100). A qualitative
description of the heat transfer between a bubbly bed and
immersed surfaces follows. As bubbles contact a surface, an
ongoing exchange of particles occurs. Fresh particles from
the bulk of the bed come into contact with the surface,
giving up heat, and remain for a finite time until they are
displaced by the next coming bubble. Heat transfer is
described by equation (1.1), proposed by Gelperin and
Einshtein (63,64).
ht = (1-fo) hpo + (1-fo) hgc + fo hb (1.1)
Where particle convective component in emulsion phase
hgc = gas convective component in emulsion phase
hb gas convective component in bubble phase

10
hr = radiative component in both phase
= bubble contact fraction
The four components occur in a parallel manner, as
shown in Figure 1.4. The dominance of each component depends
on the variation of system parameters, such as particle
size, superficial velocity, and bed temperature. Generally
speaking, the particle convective component becomes dominant
when the particle Reynolds number (Rep) is low, as for the
case of small particles or at low temperatures (30,63). The
gas convective components become important when Rep is high,
as for the case in which large particles or high pressures
are encountered (42,63). Figure 1.5 shows the experimental
results along with model predictions for the maximum heat
transfer coefficients obtained by Catipovic (40) for a
fluidized bed at ambient temperatures. It clearly displays
the shift of dominance from one of particle convection to
gas convection as the particle diameter increases. The
radiation component also has a significant contribution at
high temperatures.
1.3.1 Theoretical Models
Theoretical approaches differ in the way in which
fluidized particles are treated and in the role each
component plays in the heat transfer process. Most existing
models incorporate the heat transfer behavior described

11
100
90
80
70
60
50
40
30
BubbleContribution
20
10(1- fo)hpc/h
I
Particle ConvectiveContribution
I I I I
1 2 3 4 5 6 7
PARTICLE DIAMETER, op(mm)
Figure 1.5 Contribution of different heat transfermechanisms to the maximum time-averagedheat transfer coefficient in a cold bed.[Adapted from Catipovic, N. M. (40)]

12
above by considering emulsion residence time and bubble
contact fraction into their analyses (9).
Fluid Film Model
Levenspiel and Walton (102) proposed a "fluid film"
model as in a general convective heat transfer process. Bed
particles were treated as obstacles to reduce fluid film
resistance by the scouring action of particles in motion,
and their thermal properties were assumed not to effect the
heat transfer, which is not supported by experimental
results of various investigators (132,149,150). However,
this model was successful in some earlier studies
(56,102,136).
Packet Model
The "packet" model, first proposed by Mickley and
Fairbanks (111), considers that packets of particles are in
contact with immersed surfaces, transferring energy by
conduction during their residence times until they are swept
away by the gas flow. The heat transfer rate is dependent
upon the voidage and effective thermal properties of the bed
materials. Packet models work reasonably well in dense beds
in which packet residence time is long and/or bed particle
diameter is small. Experimental evidence (60,86) indicates
that they may overpredict heat transfer rates for short
residence times since they predict rates which are inversely
proportional to the square root of the residence time, which

13
is not physically reasonable. Schlunder (123) suggested a
physically limiting value for the heat transfer coefficient
for beds with short residence times. Several modifications
were made by adding a contact resistance
(18,79,98,116,143,144) attributed to various effects at the
bed-surface interface. Kubie and Broughton (98) took into
account the effect of immersed surfaces and bubbles on the
thermal properties of the bed. More recently, Chandran and
Chen (43) proposed a mechanistic model for local heat
transfer coefficients with horizontal tubes immersed in
small particle beds. This model was based on their previous
information of bed-surface contact dynamics and transient
conduction into the "packet" (45). Chen and Chen (48)
obtained a numerical solution to the energy equation
coupling the conduction terms and a two-flux radiation term.
Pillai (119) added the radiative component to the "packet"
model of Kubie and Broughton with an effective bed
emissivity and an effective radiating cavity-type voidage,
which are determined empirically. Vedamurthy and Sastri
(134) obtained the radiation contributions from both
emulsion and bubble phases. Yoshida, et al. (144) also
considered the radiation contribution in their emulsion
layer model. All "packet" models are restricted in
application to particle sizes less than 0.5 mm.

14
Chain-of-Particle Model
This model is based on unsteady conduction to chains of
particles and heat is transferred from distinct particles
rather than packets of particles. Gabor (60) simplified this
model into a series of alternating gas or solid slabs.
Botterill and Denloye (32), considered a boundary layer
across a few rows of particles at the heat transfer surface
and developed a model including the gas convective component
for both packed and fluidized beds. Kolar, et al. (96) and
Fatani (58) added a radiative component to the alternating
slab model. It was noted (79) that chain-of-particles model
yields a good approximation in the intermediate range (DP -
1 mm) and coincides with the Mickley-Fairbanks model for
long particle residence times.
Single-Particle Model
In the fluidized bed combustion of coal, operations
involve large particles at elevated temperatures. In such
cases, all components in equation (1.1) are expected to
affect on the total heat transfer when operating in the
bubbling regime. Hence, recent analytical developments have
been directed toward large particle beds in the bubbly
regime --- a single-particle approach.
These types of models are based on the assumption that
transient conduction is confined to the first row of
particles. Botterill and Williams (34) obtained a heat
transfer solution and temperature distribution for a single

15
particle contacting immersed surfaces. Ziegler, et al. (149)
and Chung, et al. (50) developed a penetration type model
using a statistical distribution of particle residence time
and assuming particles receive heat by gas convection. Based
on the results of Ziegler, et al. (149), Basu (20) provided
a theoretical prediction to examine the effect of coal
combustion on the heat transfer rate to an immersed surface.
Decker and Glicksman (53), applied a steady state particle-
to-surface conductive heat transfer solution obtained in
their earlier work (40), and proposed an over-all heat
transfer equation valid for particles with thermal contact
times much larger than particle residence times. Ganzha, et
al. (62) and Staub (126) developed mechanistic theories to
predict heat transfer at very high gas velocities (rapidly
growing bubbles or the turbulent regime, Figure 1.1).
Szekely and Fisher (128), using the single-particle model of
Botterill and Williams (34), obtained a simple expression
for the radiation contribution for small particles with long
residence times. Brewster (35) and Brewster and Tien (36)
proposed purely analytical models for radiative heat
transfer in a fluidized bed by treating the particles as
independent media for thermal radiation. Borodulya and
Kovensky (28) and Borodulya, et al. (29), taking into
account the effects of multiple particle reflections and the
bed structure, developed a radiative heat transfer model for
a surface immersed in fluidized beds; the emissivity of a
bubbly bed was calculated using their model.

16
For heat transfer to horizontal tubes immersed in
large particle fluidized beds, particularly the local heat
transfer around tubes, none of the models mentioned is
considered adequate since they do not include the effect of
particle packing, as shown in Figure 1.2. Adams and Welty
(2), analyzing gas flow between particles, developed a
steady gas convection model including the influence of
bubbles, particle packing, and adjacent horizontal tubes.
This was the first effort to provide a detailed physical
description of heat transfer between a large particle
fluidized bed and an immersed horizontal tube. Adams
(3,4,5,7), further suggested simplified formulae and
extended them to packed and bubbly fluidized beds. A coupled
gas-convection and transient conduction model including
numerical solutions of the particle convective component was
also developed by Adams (6). Experimental data (39,40,138)
show that the Adams-Welty model works well for particle
sizes larger than 2 mm in the slow bubble regime. Based on
the Adams-Welty model (2,6), Mahbod (104) and Mahbod, et al.
(105,106) developed a radiative heat transfer model by the
net radiation method applied to an enclosure formed by
spherical particles and a gray cylinder. Bakke (15) proposed
a simplified version of the particle convective component of
the Adams-Welty model by assuming one dimensional heat
conduction with linearized particle surface boundary
conditions.

17
Each of the approaches described above has been
successful in modeling heat transfer mechanisms for certain
ranges of operation conditions in fluidized beds. A
universal and easy-to-apply model has yet to be developed.
Such a model requires a thorough understanding of bed
hydrodynamics, particle residence time, and the effects of
particle configuration and thermal properties.
1.3.2 Predictive Correlations
A complete analytical model for predicting heat
transfer between a fluidized bed and immersed surfaces seems
unrealistic in view of the complexity of the heat transfer
mechanisms. Thus, most design work relies on empirical
correlations. A great number of empirical correlations have
been proposed (30,79,122,145). These correlations are
generally restricted to specific test conditions because
they were developed on the basis of observed data in
laboratory-scale fluidized beds with limited variation in
parameters (122). Interested readers may refer to Grewal
(79) and Saxena, et al. (122) for more detailed discussions.
Several correlations, regarding total heat transfer to
immersed horizontal tubes in large particle fluidized beds
at low temperatures, have been presented. Catipovic (40)
first suggested a semi-empirical correlation based on bubble
contact fraction (f0). In terms of particle and tube Nusselt
numbers (Nun and Nut), his correlation is

where
f DoNu = 6(1-fo ) + (1-fo)Nup,m
pf + ( )Nut,b
Dt
0.0175 Ar("46 Pr("33Nup,mf =
Nut b = (0.88 Retmf0"5 + 0.0042 Retmf) r0.33
(1.2)
(1.3)
(1.4)
On the right-hand-side of equation (1.2), the first
term represents particle convection, the second term is gas
convection in the emulsion phase, and the last term is gas
convection in the bubble phase. All properties involved are
evaluated at the bed temperature and the values of 1-f0 are
calculated using the following equations:
for a single tube
1-fo = 0.48 +
for a tube array
1-f = 0.45 +
0.065
(U0 - Umf) + 0.125
0.061
(U0 - Umf) + 0.125
(1.5)
(1.6)
Glicksman and Decker (71) proposed a correlation based
on bubble volume fraction (6) and, in terms of particle
Nusselt number, their expression is
Nu = (1-6) (9.42 + 0.042 Re Pr) (1.7)
18

The values of 1-6 can be obtained from the following
correlation proposed by Babu, et al. (14)
1 - 6 = 1 +10.978 (Uo-Umf) 0.783 p
0.376p
0.937 0.126 1 006Um pf0 D(1.8)
All properties in equations (1.7) and (1.8) are to be
evaluated at the film temperature [Tfi = (Tf +Tw) /2]. More
recently, Glicksman (70) has suggested more sophisticated
correlations by treating the emulsion and bubble phases
separately.
Zabrodsky, et al. (148) developed a semi-empirical
correlation by using a theoretical model (145) combined with
a modified gas convection term. Other correlations, Staub
(126), Ganzha, et al (62), and Martin (108) are available.
Grewal (79) found that the correlations by Catipovic,
Glicksman and Decker, and Zabrodsky, et al., are in good
agreement with most existing experimental data
(25,26,38,39,40,46,75,80,81).
Glicksman and Decker (72) discussed the role of
radiation and later, Glicksman (70) suggested the following
well-known equation to estimate the upper limit of the
radiative component in the emulsion phase for fluidized beds
with large particles.
hr(Tf4 - Tw4)
[ (1/eef ) + ( 1/ew) - 1](1.9)
19

20
Based on the experimental data of Pikashov, et al.
(117), Grewal (79) suggested the following equation to
evaluate eef
eef = (1 + ep)/2 (1.10)
The effective bed emissivity (Eef) is higher than the
particle emissivity (CO due to the re-entrant geometry
characteristic of particles in the emulsion phase (70).
Borodulya and Kovensky (28) also proposed a theoretical
model to calculate the value of eef used in equation (1.9).
1.4 Experimental Studies
A large number of experimental studies have been
reported which deal with the effect of various bed
parameters on the heat transfer to immersed surfaces in
fluidized beds (2.3). Most of these studies were conducted
in small-particle beds and at low temperatures. Some
efforts, however, have been directed toward the combustion
application of fluidized bed --- large particle beds at high
temperatures. Section 1.4.1 provides a brief review of heat
transfer measurements with horizontal tubes immersed in
large-particle beds. Previous radiative heat transfer
studies in high-temperature beds are reviewed in section
1.4.2.

21
1.4.1 Total Heat Transfer
Most spatial-averaged total heat transfer studies have
involved measuring inlet and outlet coolant temperatures and
estimating tube surface temperatures (9). Wright, et al.
(141,142) was the first to obtain spatial-averaged total
heat transfer data for a horizontal tube array immersed in a
large particle bed. Several more recent studies involving
similar measurements were performed by Grewal and Goblirsch
(80), Golan, et al. (75), Leon, et al.(101), and several
others (25,27,74,81,129,148). Ku, et al. (97) obtained data
at very high superficial velocities, the turbulent regime
(Figure 1.1), which are of value in the design of
circulating fluidized beds (22). Experimental data in large
particle beds show similar trends as for small particles
beds. Heat transfer rates increase sharply as a result of
the transformation from packed to fluidized bed conditions
with a maximum value occurring at a certain optimum
superficial velocity (U0p), followed by a slight decrease
with a further increase in superficial velocity. It has been
observed that the heat transfer rate for large particles is
much lower than for small particles.
A number of different techniques have been applied in
obtaining local heat transfer measurements. Berg and
Baskakov (23) measured the surface temperature difference
across a heated tube immersed in a small particle bed. Local
data were obtained by solving a one-dimensional heat
conduction equation across the tube wall. Similar

22
experiments were performed by Samson (121) and Gelperin, et
al. (8). Heating elements attached to the tube surface were
employed in some later studies, as performed by Cherrington,
et al.(49) and Chandran, et al.(46) in beds of intermediate-
sized particles. Applying a similar technique but with fast-
response measuring elements made of platinum, Catipovic (40)
obtained instantaneous and local heat transfer data for a
wide range of particle sizes (.37 mm < Dp < 6.6 mm) in a
cold bed. George (94) first obtained local heat transfer
data for a single tube, and Goshayeshi, et al. (78) for an
array of tubes, in a large-particle bed at elevated
temperatures. Thermopile heat flux sensors, covered with a
thin foil for protection against bed abrasion, were used in
their experiments.
1.4.2 Radiative Heat Transfer
An understanding of radiative heat transfer to immersed
tubes is of interest in the design of fluidized bed
combustors. It is generally accepted that this component
increases with bed temperature, particle size, and particle
or tube surface emissivity. A number of models, as described
in section 1.3, have been developed to evaluate the
radiation contribution for both small- (20,96,128,134,144)
and large- (70,104) particle fluidized beds. The
quantitative influence of these parameters, however, is hard
to ascertain and a consensus has not been obtained. The wide
variation between different models has been discussed by

23
Zabrodsky (146), Saxena, et al. (122), and Basu (20). Grewal
(79) also indicated that most models are difficult to apply
since they require the knowledge of particle/packet
residence times and/or bubble contact fraction which are
generally not provided. Furthermore, the predictive
correlation proposed by Glicksman (70), equation (1.9), only
gives an upper limit for the radiative component in the
emulsion phase (fixed bed condition). Thus, design
information remains reliant on experimental data.
There are relatively few experimental studies of
radiative heat transfer. The data reported in different
studies are summarized in Table 1.1, which also lists the
test conditions and the radiation contribution (fave) A
description of the conclusions of the various studies is
presented. The methods employed and possible errors in
different investigations will be discussed in section 2.1.
Kharchenko and Makhorin (95) investigated total heat
transfer to a spherical alpha-calorimeter immersed in a bed.
They concluded that radiant heat transfer is insignificant
for bed temperatures up to 1273 K, a conclusion supported by
Gelperin and Einshtein (79) and Dunsky and Tamarin (57).
Yoshida, et al. (144) and Szekely and Fisher (128), based on
their experimentally tested models, reached the same
conclusion for small particles or long-particle residence
times. Experiments made by Yoshida, et al. also showed the
effect of tube surface emissivity on radiative heat flux.
Results of Ilchenko, et al. (90) showed that the radiation

DP
Tf fave
Investigator(s) (mm) (K) (%)
Kharchenko & 0.34-1.66 433-1273 negligibleMakhorin (95)
Szekely & 0.1-0.15 600-650 negligibleFisher (128)
Yoshida, et al. 0.18 823-1273 negligible(144)
Ilchenko, et al. 0.57-1.75 703-1703 18-50(90) 0.57 1223 20
1.75 1223 24
Botterill & 0.2-3.0 773-1673 5-60Sealy (33)
Wright, et al 0.5-6.4 1123-1173 30-50(142)
Baskakov, et al. 0.35-1.25 1123 6-32(18) 0.35 1123 9
1.25 1123 32
Vedamurthy & <3.15 1173 20-40Sastri (135) <6.3 1173 50-60
Basu (20) 0.325-0.5 1073-1173 5-10
Ozkaynak, et al. 1.03 523-1033 7-35(114)
Vadivel & 0-6 1023 35Vedamurthy (131)
Alavizadeh, et al. 0.52 812 6
(11,12) 1.00 812 82.14 812,1050 12,203.23 812,1050 14,22
Table 1.1 Measurements of radiation contribution indifferent studies.
24

25
contribution was about 20% for zirconium oxide particles (Dp
= 0.57 mm) and 24% for corundum particles (Dp = 1.75 mm) at
Tf = 1223 K. Botterill and Sealey (33) analyzed the data of
Pikashov, et al. (118) and found that the radiation
contribution varied from 5% to 10% at Tf = 773 K and 50% to
60% at Tf = 1673 K for Dp = .2-3 mm.
Wright, et al. (142) calculated the radiation to be
between 30% and 50% for mixed particle sizes and Tf = 1123-
1173 K. Calculations were based on the assumption that
thermal radiation to surfaces immersed in a well-agitated
bed can be treated as if it were black. Baskakov, et al.
(18) measured the radiative heat transfer to surfaces at
various temperatures and immersed in a bed consisting of
chamotte particles. An increase of the radiation
contribution with surface temperature was observed.
Calculations from Bhattacharya and Harrison (24) show a
similar dependence for an air-sand system with Dp = .35
Vedamurthy and Sastri (135) first measured spatial-
averaged radiative heat transfer to a horizontal tube
immersed in a large particle bed at Tf = 1023-1323 K. Their
data indicated that the radiation contribution at Tf = 1173
K for different superficial velocities (U0 = .25-.45 m/s)
varied between 20% and 40% for D < 3.15 mm, and between 50%
and 60% for D < 6.3 mm. From both their experimental
investigations (135) and analytical studies (134), they
found the radiation contribution to be 20% to 40% for Tf =
1073-1273 K.

26
Basu (20) has also observed the role of radiation in
fluidized bed combustors. Results of his studies indicate
the radiation contribution to be about 5% to 10% of the
total heat transfer for sand particles. More recent
measurements by Ozkaynak, et al. (114) have shown the
fraction of the radiative component to increase from
approximately 7% at Tf = 523K to almost 35% at Tf = 1033 K.
Silica sand was used as a bed material and the superficial
velocity was varied from 1.5 to 4.83 m/s in this work.
Vadivel and Vedamurthy (131) pioneered the
investigation of local radiative heat transfer to a
horizontal tube immersed in a fluidized-bed coal combustor.
Tests were conducted at a bed temperature of 1023 K and
different superficial velocities (U0 = 0.87-1.7 m/s) for Dp
= 0-4 mm and 0-6 mm. A radiation contribution of about 35%
was found for D = 0-6 mm. The variation of local radiative
and total heat transfer coefficient with superficial
velocity and particle size was examined.
Alavizadeh (9) and Alavizadeh, et al. (11,12) measured
local radiative heat transfer for a horizontal tube immersed
in small and large particle beds with superficial velocities
up to 3.3 Umf. The radiative heat transfer was determined
using a specially designed instrumented tube which will be
discussed in detail in chapter II. The relative contribution
due to radiation for a black tube was found to increase from
6% to 14% with Dp from 0.52 mm to 3.23 mm at Tf = 812 K, and

27
to increase from 14% to 22% with Tf from 812 K to 1050 K for
D = 3.23 mm.
1.5 Present Work
The majority of both analytical and empirical efforts
have been directed toward heat transfer studies of small
particles (Dp < 1 mm) and/or low temperatures (Tf < 800 K)
where unsteady particle conduction is to be considered. Some
experimental studies have been reported which involve total
heat transfer measurements in large-particle beds. Only
limited attempts have been made to measure the radiative
component separately and published data show considerable
variation in the role of radiation as shown in Table 1.1. No
published data have been found dealing with radiative heat
transfer measurements to in-bed tube arrays.
The objective of the present study was to measure the
local bed-to-tube radiative and total heat transfer rates
for a horizontal tube array immersed in a large-particle,
high-temperature fluidized bed. A well designed instrumented
tube, developed by Alavizadeh, et al. (11) and proved in
this study, was employed to evaluate the effects of
different bed parameters. The results are also of use in
estimating the radiation contributions for tubes with
different emissivities.
Chapter II provides a description of the design,
assembly, calibration, and experimental verification of the
radiation detectors employed in this study, as a supplement

28
to the analysis done by Alavizadeh, et al. (11). Three
different window materials, silicon, sapphire, and fused
quartz, were employed and their performance was tested. This
experimental program yielded properly-designed, well-
calibrated, and direct-measuring devices capable of
measuring local bed-to-tube radiative heat transfer.
Chapter III is devoted to describing the apparatus and
experimental set-up, including a description of the
instrumented tube, tube-array design, the data acquisition
system, and the high-temperature fluidized bed test
facility. Also described are the test conditions and
procedures, data collection, and the methods of conversion
of voltage signals to heat flux and heat transfer
coefficients.
Chapter IV is a presentation of experimental results
and discussion. Spatial-averaged and time-averaged local
heat transfer coefficients with respect to superficial
velocity are shown for two particle sizes (Dp = 2.14 mm and
3.23 mm) and three different bed temperatures (Tf = 812 K,
925 K, and 1000 K). The effect of superficial velocity, bed
temperature, particle size and, most importantly,
neighboring "cool" tubes in a hot bed, are discussed.
Comparisons are made between the results of this present
study and others.
Chapter V gives conclusions of present study and
recommendations are made for possible future work.

29
II. RADIATION DETECTOR
Accurate and reliable instruments are essential for
measuring the radiative heat transfer rates to surfaces
immersed in a hot fluidized bed. The radiation detectors,
originally developed by Alavizadeh, et al. (11) were used in
this work. This chapter includes the experimental
verification of some key design decisions made by
Alavizadeh, et al. in the development of the radiation
detector. Some modifications were made in the configuration
and calibration procedure to improve the detector operation.
2.1 Comments on Previous Investigations
Methods employed and possible sources of error in some
radiative heat transfer observations in a fluidized bed have
been discussed by Saxena, et al. (122), Basu (20), Ozkaynak,
et al. (114), and Alavizadeh, et al. (9,11).
Kharchenko and Makhorin (95) based their conclusion of
an insignificant radiation contribution on an observed
linear relationship between the total heat transfer
coefficient and bed temperature. Basu (20), and Saxena, et
al. (122) indicated that this is somewhat questionable
because the variation of the conductive and radiative
components with bed temperature are both nonlinear. These
nonlinearities were thought to compensate and result in a
linear relationship when the two are added together; this
being caused by the change of particle density and residence

30
time with bed temperature. Experiments of Szekely and Fisher
(128) were carried out by transmitting heat from a source
through a transparent wall. No data at bed temperatures
higher than 650 K were obtained due to the limitations of
power input and cooling air capacity.
In investigations by Yoshida, et al. (144) and
Baskakov, et al. (18), radiative heat transfer was measured
indirectly by specially designed calorimetric metal probes
with different surface emissivities. Yoshida, et al.
compared the total heat transfer between an oxidized pipe
and a polished stainless steel pipe immersed in a bed. Total
heat flux was obtained by measuring the temperature change
of the coolant. Surface emissivities of the pipe surfaces
were calculated using the net radiation method. Baskakov, et
al. recorded the transient temperatures of two low Biot
number spheres immersed in a bed, one with an oxidized
surface NI = 0.8) and the other with a silver-plated
surface (ew = 0.1). Ozkaynak, et al. (114) indicated that
uncertainties in surface emissivity values and the effects
of varying surface temperatures could lead to
underestimating radiative heat flux. The higher figure
recorded by Baskakov, et al., as shown in Table 1.1, can be
explained by neglecting the cooling of particles on the heat
transfer wall (18,20). The same explanation is applied to
the overprediction by Wright, et al. (142).
Basu (20) used two identical copper tubes of 6.5 mm
outside diameter. One of the tubes was covered with a

31
coaxial transparent silica tube to reduce thermal conduction
to the copper tube and a correction was made for its
conduction error. Heat transfer rates were calculated by
measuring the inlet and outlet coolant temperatures. The
radiative component was obtained by comparing the heat
transfer rates between these two tubes.
Quartz glass has been widely employed as the
transparent window material in direct measurement of
radiative heat transfer to surfaces immersed in fluidized
beds, as performed by Ilchenko, et al. (90), Botterill and
Sealey (33), Vedamurthy and Sastri (135), and Vadivel and
Vedamurthy (131). The function of the transparent quartz
window, which was mounted on the top of a cavity within the
probe, was to eliminate incident convection and transmit
radiant energy. Transmitted radiant energy was detected by a
thermoelectric device mounted on the bottom of the cavity.
Calibration of the probes, employing a hohlraum as the
standard source of heat, was made in the studies of
Vedamurthy and Sastri and Vadivel and Vedamurthy. All data
obtained in the above studies are comparatively high
relative to the others, as shown in Table 1.1. This is
because the bed particle/gas convective heat transfer
produces near bed temperature on quartz window due to its
low thermal conductivity (k = 1.7 W/m.K), which results in a
conduction error through the gas gap in the cavity (11,114).
Ozkaynak, et al. (114) utilized a two-layer flat window
of zinc selenide mounted on the flat end of a 60 mm

32
cylindrical brass body covered with a copper plate. Zinc
selenide has a relatively high thermal conductivity (k = 13
W/m.K) and an effective transmittance band of 0.5 Am to 20
Am. Cooling air was circulated through the gap between
windows to eliminate the conduction error. The radiometer
probe was calibrated using a black body source.
Table 2.1 summarizes the methods employed and possible
sources of error among different studies. The radiative heat
transfer rates were obtained either indirectly by using a
transparent wall (20,128), emissivity differences (18,144),
and simplified calculations (113,142), or directly by a
specially-designed radiative probe using quartz
(33,90,131,135) or zinc selenide (114) as transmitting media
to detect radiation. In the latter case, a high conduction
error was introduced when using quartz as explained earlier.
Quartz is opaque to incident radiation with wavelength
longer than 4.8 Am (83,139), as shown in Figure 2.2 (8),
while the actual radiation from a high temperature fluidized
bed could involve wavelengths from 2.7 Am to 8.7 pm (125).
Calibration of the radiation instrument was not addressed in
most of these investigations. The emissivity of the heat
transfer surface, a decisive factor in determining the
actual radiative heat transfer, was also not reported in all
of the reports cited.

33
Investigator(s) Method Source of error
Kharchenko &Makhorin (95)
Szekely &Fisher (128)
Yoshida, et al.(144)
Baskakov, et al.(18)
Wright, et al.(142)
Basu (20)
Sphericalcalorimeter
Transparentbed wall
Emissivitydifference
Emissivitydifference
Black bodycalculations
Transparentheater wall
Ilchenko, et al. Radiative(90) probe
Botterill &Sealey (33)
Vedamurthy &Sastri (135)
Vadivel &Vedamurthy (131)
Radiativeprobe
Radiativeprobe
Radiativeprobe
Ozkaynak, et al. Radiometer(114) probe
Based on ht cc Tf
insufficientdata
Experimentaluncertainties
Experimentaluncertainties
Wrong assumption
Conduction throughgas gap
Conduction throughgas gap
Conduction throughgas gap
Conduction throughgas gap
Table 2.1 Methods and possible sources of error amongdifferent studies.

34
2.2 Design Analysis
The basic design concept of the radiative detector
employed in this study is illustrated in Figure 2.1. It is
similar to that of Ilchenko, et al. (90) and Vedamurthy and
Sastri (135). Thermal radiation from the bed is transmitted
through a transparent window mounted on the top of a cavity
within the instrumented tube, and is detected by a heat flow
sensor bonded to the base of the cavity.
2.2.1 Window Materials
The choice of window materials plays a dominant role
regarding the accuracy of direct measurements of radiative
heat transfer in fluidized beds (9,11,139). Generally
speaking, windows with the following properties are
preferred:
a) Windows should have high thermal conductivity in
order to minimize conduction through the window into
the cavity.
b) Windows should transmit over the widest possible
range of wavelengths.
c) Window materials should be as hard as possible to
withstand the abrasion of particle motion in the bed
environment.
Alavizadeh, et al. (11) analyzed four different window
materials, silicon, sapphire, crystal quartz, and fused
quartz, as potential candidates for transmitting medium. A
summary of his analysis is described in section 2.2.3.

35
TOTALBEDFLUID
CONVECTION RADIATION
00?)z7
G5 4a, i a
nc3 Q
0 o 1°6 cD eD 0 0 5 °c)WINDOW
-4,
1Ake.o..-41-
TUBE
11401`11--_*-
HEAT FLOW DETECTOR
CAVITY
Figure 2.1 Basic design concept of radiation detector.

36
Silicon was found to be the superior choice and was selected
as the window material in their study. Three different
window materials, silicon, sapphire, and fused quartz, were
employed in the experimental verification of the analysis
done by Alavizadeh, et al. The transmission characteristics
of the three windows are shown in Figure 2.2 (8).
2.2.2 Heat Flux Sensor
The first layer of particles contacting the window
surface has a nonuniform temperature distribution due to the
cooling effect of the tube, which results in a nonuniform
heat flux. This suggests the application of an averaging
device such as a thermopile-type heat flux sensor in the
design of radiative detectors. Hager (83) first used a thin
foil heat meter, formed by a thin, low thermal conductivity
film with a thermopile on each side, in heat transfer
measurements of fluidized beds. Similar devices have been
discussed by Brown, et al. (37).
Figure 2.3 illustrates the geometry of the selected
heat flux sensor (No. 20455-1, RdF Inc., Hudson, NH) with
dimensions of 0.76 mm x 12.7 mm x 28.5 mm and a maximum
service temperature up to 523 K. A type T thermocouple is
utilized in the sensor to monitor its surface temperature.
The small fraction of the sensing area is an advantage of
this type of sensor over others used for local heat transfer
measurement.

37
A. SILICON
B. SAPPHIRE
25T
Wavelength (microns)
00
BO
60
40
20
,o::
-,----
.
0.25 0.50 0.15
100
1C. FUSED QUARTZ
E 60
I :
0
0 2.0 3.0 4 0
Wavelength (u m)
2 2.5 3 3.5 4 4.5 5 5.5
Wavelength (microns)
Figure 2.2 Transmission characteristics of silicon,sapphire, and fused quartz.

I
N
3 14
]5rTHERMOCOUPLEJUNCTIONS
SURFACE TEMPERATURETHERMOCOUPLEJUNCTION 4. LEAD
WIRES
SENSING AREA THICKNESS= 0.076 mm
28.5
ALL DIMENSIONS IN MILLIMETERS
Figure 2.3 Geometry of the selected heat flux sensor.

39
A description of the principle and function of this
type of heat flux sensor is the following. As heat conducts
through the low conductivity thin film of the sensor, a
temperature difference is established across it. The heat
transfer rate is then calculated from the calibration data,
and the output voltage signal (emf). The calibration data
were provided by RdF Inc. as a function of sensor surface
temperature. The emf is actually a reading of temperature
difference across the sensor and it is independent of the
type of the heat flux source. It can thus be applied in
complicated measurements involving combined heat transfer
modes. The same heat flux sensors were employed in the total
heat transfer gauges without any correction. Information and
heat flux conversions for these sensors can be found in
Appendix A.
2.2.3 Theoretical Analysis
Alavizadeh, et al. (11) studied the effect of different
design parameters and the performance of different window
materials. This section summarizes the methods, results and
conclusions of their investigation.
A three-dimensional steady-state conduction analysis
was conducted to investigate the effect of nonuniform heat
flux on the heat flux sensor performance. Two cases were
compared, one with a uniform heat flux over the entire area
of the sensors, and the very unlikely case of a uniform heat
flux over the sensing area and zero over the rest of sensor

40
area. Using the calibration data provided by RdF Inc., it
was found that the heat flux would be about 2.5% lower for
the second case. The manufacture's calibrations are, thus,
applicable to the nonuniform heat flux measurements involved
in this study.
A two-dimensional heat conduction analysis was
performed to assess the magnitude of the conduction error
produced by the gas and the particle-convective heat
transfer. The outside surface of the window was exposed to
bed convection and the inside surface transferred heat, via
one-dimensional heat conduction across the air-filled
cavity, to the sensor. The magnitude of the conduction from
the window to the sensing area was then calculated by
averaging the heat conduction to it. The radiative heat
transfer to the sensing area was estimated by the net
radiation method for an enclosure including the window, heat
flux sensor, and cavity walls. The relative conduction error
was obtained from these two heat fluxes. An estimate of the
average window temperature (Twi) was calculated from the
solutions for a two-dimensional heat conduction for
different windows. It was used to examine the error in using
Twi as an approximation of Tw in the calculation of the
radiative heat transfer coefficient, hr = Q/(Tf-Twi).
The outside window surface should conform to the tube
contour to avoid any disturbance of the bed. This results in
a plano-convex cylindrical lens and magnifies the
transmitted radiant energy. A magnification factor, MF, was

41
calculated as "area of the window facing the bed/area of the
focal plane on the sensor". The Grashof number (Gr) based
on Twi, Tw, and cavity height, was also calculated to
investigate the effect of natural convection in the cavity.
Results of this analysis associated with the properties
of the four potential candidates as window material are
shown in Table 2.2. Two sets of data corresponding to the
local maximum heat transfer rates at Tf = 812 K and 1050 K
were considered with the larger error listed in Table 2.2.
The table shows that silicon produces the smallest relative
error in conduction (1%) and in the hr calculation (2%). The
larger MF of silicon (2.0) will further reduce its
conduction error. It was found that the average window
temperature, Twi, is the largest for quartz, due to its low
conductivity, and hence results in a further increase in the
error in hr, from 28% to 53%. The Grashof number is
sufficiently small (Gr A 1700) to allow natural convection
in the cavity to be neglected for all the window materials
considered. Based on the wide transmission band, high
thermal conductivity and hardness, negligible conduction
error, and no loss of accuracy using Twi as an approximation
for Twf silicon was selected as the window material in their
study.
2.3 Assembly
A schematic illustration of the radiative detectors is
shown in Figure 2.4. Each detector was mounted within the

Thermal ConductionWindow Transmission Conductivity Hardness Error
Materials (Wave Band, pm) at Twi
(W/mK) (Knoop) MF (%)
hrbError(%)
Silicon(Si)
Sapphire(A1203)
Quartz,Crystal(Si02)
Quartz,Fused(Si02)
0.50 117.0 1150 2.0 1 91 354 2
(1.3-7.0)0.35
(7.0-12.0)
0.84 35.0 1370 1.2 3 213 374 5
(0.30-5.0)
0.92 6.7 741 1.2 23 555 446 17
(0.30-2.2)0.50
(2.2-3.6)
0.91 1.7 461 1.1 28 961 589 53(0.30-3.4)
0.40(3.4-4.7)
Table 2.2 Window materials with results of theoretical analysis.[Adapted from Alavizadeh, N. (9)]

BRASSSTRIP
STAINLESS STEEL SHIM
HEAT FLOW DETECTOR
Figure 2.4 Assembly of radiation detectors in the instrumentation tube.

44
walls of the cavity in the instrumented tube. It has been
modified to produce a wider view angle between the bed and
the heat flux sensor by wrapping two stainless steel strips
(0.127 mm in thickness), overlapping the window, to hold the
window in position. A 17.5 mm x 30 mm window area is then
exposed to the bed, instead of the original 14 mm x 30 mm
area. Three instrumented ports were machined, each 90
degrees apart, to the size of the heat flux sensor (12.7 mm
x 28.5 mm) with a depth of 4.8 mm. The larger upper portion
was milled to house the window (17.5 mm x 41.4 mm) with a
maximum depth of 3.2 mm. The three windows, made of silicon,
sapphire, and fused quartz respectively were mounted on the
ports by applying a high thermal conductivity paste
(Omegatherm 201, k = 2.3 W/m.K and stable up to 478 K, Omega
Engineering, Inc., Connecticut) to reduce thermal contact
resistance. The silicon and sapphire windows were machined
to have the same curvature as the outside of the tube (Do =
51 mm). The quartz window was machined to have a flat
surface (1.6 mm in thickness) in order to study the effects
of the disturbance of gas-solid flow around the tube due to
the flat section of its surface.
Three new microfoil thermo-pile type heat flux sensors
were replaced and bonded to the bottom of the cavity by
applying a high thermal conductivity epoxy adhesive
(Omegabond 200, k = 1.4 W/m.K and stable up to 533 K). The
sensors were coated with a new type of high absorptivity
paint (3M ECP-2200, absorptivity = 0.96), instead of the

45
original 3M Nextle paint, to increase the absorption of
transmitted radiation and thus reduce the uncertainties in
the radiative heat flux measurement. The 3.2 mm hole
connecting the cavity and wire channel was sealed with Omega
CC cement and the channel was filled with Omegatherm 201.
All cavities were connected to the atmosphere by 2.4 mm-
diameter stainless steel tubes running through the wire
channel for ventilation, which further reduced the window
temperature, conduction error, and natural convection.
Damage to the original heat flux sensors in the radiative
detectors was probably due to the relatively poor
ventilation of the original 1.6 mm tubing (9) or the
operation in small particle beds which have much higher heat
transfer rates.
2.4 Calibration
Calibration of the heat flux sensor was done prior to
delivery by the manufacture, RdF Inc. The purpose of
additional calibration was to relate the heat flux detected
by the sensor to the actual radiation absorbed by the tube
wall. Calibration was carried out locally using a narrow-
angle black body source, Barnes 11-210 Radiation Reference
Source (16). Details of the calibration techniques and
procedures can be found in references (11) and (9). Some
changes were made in order to enlarge the viewing angle of
the heat flux sensor by moving the black body source to

46
about 1 mm (instead of the original 3 mm) away from the
instrumented tube.
The total heat transfer gauges were painted with high
emissivity lampblack (89), with a spectral emissivity of
0.96 from 0.2 pm to 20 Am wavelength, in order to generalize
the results of the experiments as the radiation absorbed by
a black tube. The incident radiation (Orb) absorbed by the
black total gauges were used for reference, where Orb was
taken as the average of the measurements on two total
gauges. The correlation between the detected heat flux (Qd)
from the radiation detector, and 0rb represents the-
calibration for the device. A well-designed alignment device
(11) was employed to align the black body source and
radiation detector to make the results (Qd vs. Orb)
comparable. No significant change in the calibration data
was found due to the change of tube wall temperature and the
effect of natural convection in the laboratory environment
(9,11). Calibration could then be conducted at room
temperature without a loss of accuracy.
Data were recorded employing a high precision data
logger (HP-3497A) with a maximum sensitivity of 0.001
microvolt. The black body source temperature was controlled
in the range from 400 °C to 1000 °C. The methods used in the
conversion of recorded data from voltage to heat flux are
discussed in Appendix A. Calibrations were made before and
after each exposure to the bed in order to examine the
possible changes of window transmissivity caused by particle

abrasion. No significant change in Qd was noted following
the first exposure to the bed, for all three window
materials. The silicon window used by Alavizadeh, et al.
(9,11,12) experienced approximately 20% drop in Qd after its
first exposure to the bed; no changes were observed
thereafter (9,11).
Results of the calibration for these windows are shown
in Figure 2.5. Data for the silicon window show a linear
relationship due to the wide wavelength of transmission.
This is an essential feature for accurate measurements of
radiation heat transfer. The calibration relationship was
determined by linear regression (112) to be
Qrb,si = 1.72 Qd (2.1)
The maximum deviation for this expression is 6% at low
heat fluxes (400-600 °C) and 1.5% in the high heat flux
region (600-1000 °C) where the actual application is made.
The relationship between Qd and Qrb was nonlinear for both
the sapphire and quartz windows. Third and fourth order
polynomial regression fits were performed for sapphire and
quartz respectively. Results of these regressions are
Qrbsa = 0.035 + 2.74 Qd - 0.08 Qd2 + 0.0018 Q 3
Qrbfqz 0.658 + 4.48 Qd - 0.305 Qd2 + 0.0162 Qd 3
- 0.00033 Qd4
(2.2)
(2.3)
47

N'
a
a
30
28
26
24
22
20
18
16
14
12
10
8
4
2
0
BLACK BODY SOURCE TEMPERATURE :
0 10 20 30
BLACK TUBE HEAT FLUX Qth001//m2)
Figure 2.5 Calibration results for different window materials.

49
Errors of the polynomial regression expression for
sapphire is within 1%, and within 2% for quartz. The
nonlinear behavior of the calibration curve for quartz is
more obvious than for sapphire. This can be explained by
their different transmission characteristics with respect to
wavelength, as shown in Figure 2.2. Note that the range of
wavelengths at which the maximum emissive power occurs is
from 2.3 Am to 9.5 Am for the calibration (83). The more
concave downward tendency of the quartz curve is due to its
lower and varied transmittance with respect to wavelength.
The emissivity of the stainless steel shim covering the
total gauge was found to be 0.37. This is the ratio of the
heat flux absorbed by a bare tube with that of a black tube.
2.5 Experimental Verification
The experimental apparatus is described in chapter III.
Tests were conducted at bed temperatures of 900 K and 1080 K
employing ione grain as bed particles with nominal diameters
of 2.14 mm and 3.23 mm (9,99). The instrumented tube was
placed horizontally 30 cm above the distributor plate and
the packed bed height was 45 cm. Measurements were made at 0
and 90 degrees from the lower stagnation point on the tube
with superficial velocities (U0) ranging from well below Umf
to about twice this value. A total of 12 channels, 6 for
radiative and total heat fluxes and 6 for surface
temperatures, were employed for data collection. A total of
50 scans of all channels was made for each run. Values of

50
the total heat flux measured during this test had no
significant use other than to aid in identifying whether the
bed was packed or fluidized. At each superficial velocity,
time-averaged radiative heat transfer coefficients for a
black tube (hrb) were computed from the average of 50
readings of both heat flux and tube temperature over a
period of 95 seconds. Detailed procedures for data and heat
flux conversions are discussed in section 3.6.3 and Appendix
A.
Tabulated results of the experiments are listed in
Table C.11 and C.12. The local radiative heat transfer
coefficient is calculated as hrb = Qrb / (Tf Tw). Figures
2.6 through 2.13 display the values of hrb associated with a
range of superficial velocities for two bed temperatures and
two particles sizes. The local radiative data measured with
the radiative detector, employing a silicon window, and the
total heat transfer data are found to compare well the
results of Alavizadeh (9).
Different results for each window material are evident.
Values of hrb for sapphire are 1.056 times the average,
ranging from 0.96 to 1.16 of that for silicon, while the
quartz data show values 1.93 times the average, ranging from
a minimum factor of 1.33 to a maximum of 5.08. The slightly
higher values of the sapphire data compared with those of
silicon are believed to be due to its slightly higher
conduction error as described in section 2.2.3 and listed in

60
Csi 50 -E
40 -
z
30410
b. 20vaz
10
0
o QUARTZ
+ SAPPHIRE
SILICON
Tf = 900 K Dp = 3.23 MM
08 1.2 1.6 2 2.4
SUPERFICIAL VELOCITY Uo(m/sea)
2.8
Figure 2.6 hrb vs. U0 at stagnation point for Tf = 900 K, Dp = 3.23 mm.

60
50 -E
40
zu
30
0
li. 20z
6 10
0.6 1.2 1.6 2 2.4
SUPERFICIAL. VELOCITY Uo(m/ses)
2.6
Figure 2.7 hrb vs. Uo at 90 degrees from stagnation point forTf = 900 R, Dp = 3.23 mm.

1 1.4 LS 2.2 2.6
SUPERFICIAL VELOCITY Uo(m/sea)
3 3.4
Figure 2.8 hrb vs. U0 at stagnation point for Tf = 1080 K, Dp = 3.23 mm.

BO
70
E
60
50
00mix 30
N
20
I 10
0
- If = 1080 K Dp = 3.23 mm
O QUARTZ
+ SAPPHIRE
O SIUCON
1 1.4 1.8 2.2 2.6
SUPERFICIAL VELOCITY Uo(m/sea)
3 3.4
Figure 2.9 hrb vs. U0 at 90 degrees from stagnation point forTf = 10808, Dp = 3.23 mm.

08 1.2 1.6 2 2.4
SUPERFICIAL VELOCITY Uo(m/s.0)
2.8
Figure 2.10 hrb vs. U0 at stagnation point for Tf = 900 K, Dp = 2.14 mm.

60
50
z
40
0
w30
0C)
20
10
0
08 1.2 1.6 2 2.4
SUPERFICIAL VELOCITY Uo(m/sec)
2.8
Figure 2.11 hrb vs. U0 at 90 degrees from stagnation point forTf = 900 R, Dp = 2.14 mm.

1.4 1.8 2.2 2.6
SUPERFICIAL VELOCITY Uo(m/sect)
3 3.4
Figure 2.12 hrb vs. U0 at stagnation point for Tf = 1080 K, Dp = 2.14 mm.

80
CNI
E
.0
50 -Z
040
0
30 -to
20
610
0
1
SUPERFICIAL VELOCITY Uo(m/s.0)
Figure 2.13 hrb vs. U0 at 90 degrees from stagnation point forTf = 1Q80 K, Dp = 2.14 mm.

59
Table 2.2. The extraordinarily high values for quartz are
caused by its much higher conduction error, higher window
temperature, and flat configuration. The flat configuration
resulted in a reduced window thickness of 1/3 and hence, a
higher view factor.
For a fused quartz window, the much higher conduction
error of these experiments (93%), compared with that
obtained by Alavizadeh (28%, Table 2.2), is primarily a
result of the assumption of negligible contact resistance
between the window and the bronze tube wall in Alavizadeh's
analysis. The actual quartz window temperature should be
higher than his prediction (9,11); this would, in turn,
result in an increase in the conduction error and in the
sensor surface temperature. The use of the higher sensor
surface temperature, as an approximation of wall
temperature, further increases the values of hrb [= Qrb/(Tf-
Tw)]. The same explanation applies for the small differences
(5.6.% to 3%) in the conduction error of sapphire. However,
for the window materials with high thermal conductivity,
such as silicon (k = 117 W/m.K), the assumption of
negligible thermal resistance between the window and tube
wall is reasonably valid.
The data for sapphire and quartz also show a
fluctuating behavior, as shown in Figures 2.6 to 2.13. These
fluctuations are due in part to their nonlinear calibration
relationship. The larger fluctuation exhibited by quartz can
be explained by its varied and lower transmittance.

60
It is concluded that the use of silicon as the
transmitting medium in the radiative detector
instrumentation will lead to accurate and reliable
measurements of local radiative heat transfer in high
temperature fluidized beds. The small conduction and hrb
errors of silicon analyzed by Alavizadeh (9) is confirmed by
comparing the silicon data with those of sapphire and
quartz.

61
III. APPARATUS AND EXPERIMENTS
3.1 Instrumented Tube
The instrumented tube, with outside and inside
diameters of 51 mm and 32 mm, was made of bronze and
equipped with three total and three radiative heat transfer
measurement devices. They were mounted side-by-side, each 90
degrees apart, along the axis of the tube. Figure 3.1 shows
a schematic illustration of the instrumented tube. The
radiation detector, employing silicon as the window
material, has been discussed in chapter II. A discussion of
the total heat flux gauge and calibration of the radiation
detector is presented in this chapter.
3.1.1 Total Heat Flux Gauge
The same type of heat flux sensors as used in the
radiation detector were employed and bonded to the tube
surface with a Omegabond 200 epoxy. They were then covered
by a 0.127 mm thick stainless steel shim to protect them
from bed abrasion due to particle motion. The shim was
pulled tightly over the sensors and connected to the tube by
a clamp, as shown in Figure 3.1. A thin film of Omegatherm
201 was deposited between the sensors and the shim to reduce
thermal contact resistance. Similar total gauges were
earlier employed by George (66) and Goshayeshi (78).
George (66) analyzed the following effects on the total
gauge performance: (a) heat conduction along the shim

BRASS BAR
51 mm COOLANT
SECTION A-A
WI RE CHANNEL
62
RADIATION PROBE
THIN -FILM DETECTOR
IINUMMWMMMa
re MNn%. VUMNAMTHIS PORTION IS I
I COVERED WITH I
14-- 0.I 27mm THICK -I. I1 STAINLESS STEELI SHIM (NOT SHOWN) I
I I
11\veNin
STAINLESS STEEL CLAMP
Figure 3.1 Total heat transfer gauges.
-1 h- Do -.0 0 0O 0 0 0 OTO 0 0 0 0O P /OPP
O 0 0 61O 0 0-60-1O 0 0 0 0O 000010101010
GAS
IN LINE ARRANGEMENT STAGGERED ARRANGEMENT
Figure 3.2 Arrangements of tube array design.

63
surface, (b) disturbance of the thermal boundary layer in
the bubble contact region due to nonuniform surface
temperature. The reduction in total heat flux measurement
was found to be 2% due to the presence of the stainless
steel shim, and 4% due to the nonuniform surface
temperature. Interested readers may consults George (66) and
Appendix B.1 for a detailed discussion. Instantaneous
measurement of the total heat flux are not possible due to
the gauge's large response time, 0.24 second (66).
3.1.2 Calibration of Radiation Detector
The calibration procedure and setup were described in
section 2.4. Calibrations were carried out before and after
each exposure to the bed. No significant changes were
observed between these times or from the results associated
with the first exposure, as reported by Alavizadeh (9). The
constants in the linear relationship (Qd vs. Qrb) are,
however, different due to the change of coating material (3M
ECP-2200) on the heat flux sensors. Calibration results for
the three radiative detectors are:
Qrbl = 2.22 Qd (3.1)
Qrb2 = 1.80 Qd (3.2)
Qrb3 = 1.94 Qd (3.3)
The quantity, Qd, was taken as the average of the
measurements on all three total gauges. The maximum
deviation was 3% at low temperatures (400-600 °C) and within

64
1.2% in high temperatures (600-1000 °C) where the actual
interest lies.
3.2 Tube Array Design
In the horizontal tube array design, the tube bundles
are generally arranged in either in-line or staggered
arrays, as shown in Figure 3.2. Extensive studies have been
made regarding the influence of tube spacing on the heat
transfer in fluidized beds, as reviewed by Saxena, et al.
(122). A P/Do (pitch/tube diameter) ratio is used in the
evaluation of tube spacing. For tube arrays with the in-line
arrangement, P is taken equal to the horizontal pitch (Y).
For staggered arrays, P is taken as the minimum distance
between centers of the adjacent tubes.
The following considerations were made in the tube
array design: (a) comparisons of performance of in-line and
staggered arrays, (b) influence of P/Do ratio, and (c)
minimum height required between the bottom of tube array and
the distributor plate. Theoretically, adjacent tubes were
found to increase the heat transfer due to increases in the
local interstitial gas velocity. Welty (138) investigated
the effect of tube spacing on the heat transfer performance
of the Adams-Welty model in large particle (Dp = 4 mm)
fluidized beds. A horizontal spacing of 1.5 diameter and a
vertical spacing of 3 diameters were determined to provide
the most effective heat transfer characteristics. Peeler and
Whitehead (115) studied the solids motion around horizontal

65
tubes immersed in large particle fluidized beds. A P/Do
ratio of larger than 2 is recommended. Borodulya and Ganzha
(25) suggested staggered arrays on the basis of their
experimental results.
A staggered, equilateral triangular tube array
arrangement was selected due to its superior fluidization
and heat transfer characteristics (64,127,138). A P/Do ratio
of 3 was chosen in order to allow sufficient particle motion
and avoid the decrease in heat transfer performance for
cases with P/Do much lower than 2 (8,25,82,110). The
distance from the distributor plate to the bottom of tube
array was chosen as 30 cm for the purpose of preventing
irregular fluidization at the bottom row (110,127,141).
An array of 9 tubes, made of bronze each with a
diameter of 51 mm, arranged in three horizontal rows, was
used. This arrangement, as shown in Figure 3.3, is the most
common in-bed tube design in industrial fluidized bed
combustors (78). Studies (17,38,110) have shown that the
heat transfer coefficient to individual tubes inside such an
array does not vary significantly with their position. The
instrumented tube was, thus, placed in the center of the 9
tubes, to present a typical tube in an actual, large-bed
array.
3.3 Data Acquisition System
A high precision digital data acquisition system (HP-
3497A) with a maximum sensitivity of 0.001 microvolt was

66
7 cm
60.96 cmSLUMPED EIGHT
5.08 cm
0SINGLE TUBE
LOCATION
30cm
I-GAS FLOW
DISTRIBUTOR PLATE
Figure 3.3 Tube array geometry.

67
used to measure the signals from the heat flux sensors. By
using an HP-85 microcomputer connected with an HP-IB
interface card and a dual disk drive (HP-83901M) as the
control unit, the raw data in microvolts were taken with an
HP-3497A data logger and transferred to diskettes by
commands resulting from locally-developed software. Figure
3.4 is a schematic diagram of the data acquisition system
used in this study. A quick user's manual for the
application of the data logger employed in the present study
is provided by Alavizadeh (10). A total of 12 channels, 6
for local radiative and total heat flux, and 6 for surface
temperature, were employed during the experiments. The
software allows for the scan time of all 12 channels to be a
minimum of 1.2 seconds.
The time-averaged local surface temperatures and heat
transfer coefficients were computed from the raw data.
Several programs, written in BASIC language, were developed
and employed in data collection, data reduction, and
computation of the superficial velocity.
3.4 Fluidized Bed Facility
All experiments were conducted in the Oregon State
University high-temperature fluidized bed facility. A
detailed design, construction, and operation information of
the facility is covered by Junge (93) and Welty (137). A
discussion of different components and operating procedure
is provided by Alavizadeh (9), George (66,67), and Gosmeyer

68
TESTSECTION
INSTRUMENTED TUBE
H P -82901 M
DISK DRIVE
HP-85CONTROLLER
Figure 3.4 Data acquisition system.
BYPASS 0
i
i j
. rr-L. 1 i
IPRO PA N
O !
AIR -- -
C)C)C)(g)(:)®0- VALVES0-AIR BLOWER®-H EAT EXCHANGER
0-DISTRIBUTOR PLATE(3-BUCKET
0- VENTURI METER CI- ROTAM E TER
®- BURNER CAN 0- WATER PUMP
0- I N STR U M EN TED TUBE 0-ROTARY UNION
0-TEST SECTION 6- CYCLONE
Figure 3.5 Oregon State University high temperaturefluidized bed facility.

69
(76). A schematic of this facility is included as Figure
3.5. The following discussion gives a brief description of
the principal components and their functions. The numbers in
the brackets stand for the components shown in Figure 3.5.
3.4.1 Air and Fuel
Combustion air was compressed and introduced into the
system using an air blower [5] driven by a 30 Hp electric
motor. The flow rate and pressure of the inlet air were
controlled by an air inlet valve [3] and a by-pass valve
[1]. The venturi meter [2] was used to measure the flow rate
of inlet air. Calibration of the venturi meter was provided
by Gosmeyer (76). Propane was fed into the burner [6] by the
main fuel valve [9] and burned in the refractory-lined
combustion chamber. The products of combustion were then
directed to the bed test section through the inconel gas
distributor [15]. No combustion occurred in the bed itself.
3.4.2 Test Section
The test section [16], as previously described by
Goshayeshi, et al. (78), has a 30 cm x 60 cm interior with
15.2-cm-thick refractory-lined walls. A total of 15 mounting
ports were built in the test section (3 columns x 5 rows) to
accommodate both tube arrays and a single tube. This
arrangement also provided the ability to investigate the
effect of bed height on the heat transfer performance. The
gas distributor consisted of 2 inconel 601 plates with a

70
stainless steel (ASTM 316) 16-mesh screen in between. The
upper plate contains 171 (19 x 9) holes, with a diameter of
6.35 mm, in an in-line array pattern (57.15 mm x 25.4 mm in
area). The lower plate is identical to the upper one except
it has 9.53-mm-diameter holes. A rotary union [17] was used
to adjust the instrumented tube [14] to a desired angular
position for data collection. Particles were prevented from
leaving the bed through the disengaging zone and the cyclone
[18]. A view port located on top of the disengaging zone was
used to monitor the bed's operation condition.
3.4.3 Temperature Control
Bed temperature was monitored and automatically
controlled to the set temperature by two type K (chromel-
alumel) thermocouples and an electronic fuel flow rate
controller. A manual by-pass fuel valve and a fuel flow
rotameter [4] were provided to assist in establishing the
desired bed temperature at higher superficial velocities.
All tubes were cooled and maintained at the desired
temperature by adjusting the flow rate of water, circulating
through the tubes in a closed loop by a 2.2 kW centrifugal
pump [7]. The instrumented tube temperature, which was
monitored by the data acquisition system with software
control, was held below 450 K to prevent damage to the heat
flux sensors. The temperature of the circulating water was
adjusted either by the water flow valve [7] or by the shell

71
and tube heat exchanger [8] with city water as a secondary
coolant.
3.5 Bed Particles
The range of nominal particle diameters for fluidized
bed combustors is generally between 0.37 mm and 4.1 mm (40).
A commercialized granular refractory material, ione grain,
with mean diameters of 2.14 mm and 3.23 mm, was used as the
bed material. The mean particle diameter was calculated by
Alavizadeh (9) from the equation suggested by Kunii and
Levenspiel (99).
D = 1 / .E1 J v.)(x/D,) (3.4)
In this expression, xj is the mass fraction of ione
grain particles in size interval j, as shown in Table 3.1.
Also shown is the particle material chemical composition
given by the supplier (Intepace Corp., Portland, OR) and its
thermal properties measured by Ghafourian (68). The size
distribution of bed particles remained stable after many
hours of operation (9).
3.6 Experiments
3.6.1 Test conditions and Procedure
For 2.14mm particles, experiments were conducted at bed
temperatures of 812 K, 925 K, and 1000 K, also at 812 K and
925 K for 3.23 mm particles. Both tube arrays and the single

72
ScreenNumber
OpeningDiameter
(mm)
Mass Fraction .(x11
D = 2.14 mmP
(%)
D = 3.23 mmP
(%)
4 4.76 0.165 4.00 0.28 8.86 3.36 0.61 36.88 2.38 36.5 54.4
10 2.00 36.92 MID
12 1.68 19.3316 1.19 4.66
pan 0.00 1.54 IM
pp (Particle Density) 2700 kg/m3
Chemical Composition : 53.5% silica43.8% alumina2.3% titania0.4% other
Thermal Properties :
Cps= .853 - .982 kJ/kg.K (for 470 - 900 K)
kp = 1.1 - 1.41 W/m.K (for 494 - 833 K)
Cps = .855 - .874 (for 279 - 452 K)
Table 3.1 Size distribution, chemical compositions, andthermal properties of ione grain.

73
tube cases were included with exception of the single tube
case at 812 K, which had been performed by Alavizadeh (9).
The single tube results represent a reference to investigate
the effects of adjacent "cool" tubes on the heat transfer
performance of the tube arrays case. A summary of the test
conditions is shown in first two columns of Table 4.1.
An array of 9 tubes with the instrumented tube in the
middle was placed at the lowest position in the test
section. The bottom row of the tube array was located 30 cm
above the distributor plate and the slumped (packed) bed
height was 71 cm, as shown in Figure 3.2. Also shown is the
single (instrumented) tube location.
The start up sequence of the fluidized bed facility and
test procedures were previously described by Junge (93) and
Alavizadeh (9) respectively. The minimum fluidization
condition was estimated by visual observation of the bed and
verified by later analysis of total heat transfer data.
3.6.2 Data Collection
Data were collected first at the maximum possible
superficial velocity, then at other different velocities in
a descending sequence. The bed temperature was controlled
within ±12 K of the set temperature by adjusting the fuel
by-pass valve during each data collection period.
Data were taken at 0°, 45°, 90°, 135°, and 180° from
the lower stagnation point on the tube with superficial
velocities ranging from below Umf to approximately twice

74
this value; thus, most of the data were in the bubbly-bed
regime. Twelve pieces of data, 3 for radiation, 3 for total
heat flux, and 6 for tube surface temperatures, were
collected in each scan. The minimum scanning time of 1.2
seconds was employed and a total of 150 scans with
approximate total time of 180 seconds were made for each
superficial velocity. This made full use of the computer-
controlled data acquisition system.
Recorded data also included particle diameter, air
inlet pressure and temperature, pressure drop across the
venturi meter, and bed temperature for the purpose of
computing gas flow rate as shown by Gosmeyer (76) and
Alavizadeh (9). The gas superficial velocity is equal to the
gas flow rate divided by the cross section area of the test
section.
3.6.3 Data Reduction
Heat Flux
Conversion of raw data to time-averaged local radiative
flux and total heat flux was carried out first by converting
raw signals in microvolts to sensor surface temperatures
using equation (A.1). The detected heat flux was then
computed using equation (A.2). A detailed discussion of the
conversion procedure is presented in Appendix A.
The time-averaged local heat transfer rates (Orb and
Qt) and tube temperature (T/4) were obtained according to:

75
1Q (or Tw) =
N . 1E
N1
Qi [or (Tw)i]=
(3.5)
Where N = 50 for the experiments in chapter 2.
N = 150 for the experiments in chapter 4.
i = refer to each reading.
The spatial-averaged heat transfer rates 65rb and &0
were calculated using the trapezoidal rule in the form
1
Q = [Q (a =00) + 2Q (a =450) + 2Q(a=90°)8
+ 2 Q(a=135°) + Q(a=180°)] (3.6)
The black tube radiative heat flux (Qrb) was obtained
from the detected heat flux employing the calibration data,
equations (3.1) to (3.3). The actual radiative heat transfer
rate, Qr, could then be evaluated from the measured tube
wall emissivity with the grey body assumption
Qr ETil Qrb (3.7)
Heat Transfer Coefficient
Local heat transfer coefficients (hrb and ht) were
computed by
Qh (3.8)
Tf-Tw
The temperatures obtained from the total heat flux
gauges and radiation detectors were used as approximations

76
for tube wall temperature (Tw) in equation (3.8). George
(66) computed the temperature drop across the stainless
steel shim on the total gauge to be less than 1.8 K, which
represented 0.3% of the bed-to-tube surface temperature
difference. Also from the conduction analysis and
experiments of Alavizadeh (9), it was determined that these
approximations introduce negligible error.
The spatial-averaged heat transfer coefficients (,11rb
and ht) were calculated from local values as
1E = [h (a =00) + 2h(a=45°) + 2h (a =900)
8+2h(a=135) +h(a=180°)] (3.9)
Radiation Contribution
The black tube radiation contribution (f) to total heat
transfer is determined by;
f (%)5rb
(3.10)
(1-Ew) 6-rb
Where (1-600-rb compensates for the spatial averaged
total heat flux (Qt) which was obtained on the nonblack tube
with an emissivity of TheThe value of was found to be
0.37 for the stainless steel shim which covered the total
heat flux gauge, and a value of 0.64 was used by Alavizadeh
(9). The reason for this difference is that the stainless
steel shims were polished by sand paper in the present
study, reducing its emissivity (125,140). This change will

77
have no effect on the calculation of black tube radiative
heat transfer.
Errors
A RSS (Root-Sum-Square) random error of ±8%, due to
calibration of the heat flux sensor and experimental data
acquisition, was calculated for the local total heat flux
(Qt) measurements. The error in local radiative heat flux
(Orb) measurements was ±9%. The larger error for the
radiation measurements was a result of the additional local
calibration procedure with the radiation detector.
The overall errors estimated in the local total and
radiative heat transfer coefficients (hrb and ht) reported
in this study were found to be +8%, -14% and +12.5%, -11.5%
respectively. Detailed calculations and a discussion of the
error estimation can be found in Appendix B. Note that both
actual RSS random and overall errors are always below the
estimated values which are obtained by the maximum values of
all possible variations combined.

78
IV RESULTS AND DISCUSSION
Experimental results for all test conditions are
tabulated in Appendix C (Table C.1 through C.10). The
radiative heat transfer results (hrb and hrb) for tube
arrays immersed in a large-particle bed are believed to be
the first of their kind. Note that all radiative heat
transfer coefficients and radiation contribution in
percentage (f) reported in this study were calculated for a
black tube wall (ew = 1.0). The actual radiative values can
be obtained from equation (3.7).
Table 4.1 summarizes the test conditions and highlights
some of the findings of the present work. The minimum
fluidization velocity (Umf) corresponds to the
transformation of a packed to a bubbly bed. The optimum
superficial velocity (U0p) is the fluidizing velocity at
which the total heat transfer coefficient approaches a
maximum (Emax) This is of great importance in designing
fluidized bed combustors since they are expected to have a
maximum heat transfer rate under normal operation condition.
Also shown in Table 4.1 are the corresponding radiative
values, hrb and f at Emax, where f is the radiation
contribution, in percentage, calculated from equation
(3.10) .

79
At limax
DP Tf Umf Uop hmax hr") f(44=1)
(mm) (K) (m/s) (m/s) (W /m2.K) (W /m2.K) (%)
812SA*
1.60 2.09 181 21 11.8812-r(St) 1.62 1.85 189 21.9 12.3
2.14 925(A) 1.64 2.15 193 27.5 13.5925(S) 1.65 2.15 205 32.1 15.5
1000(A) 1.73 2.17 200 28.4 14.31000(S) 1.71 2.02 217 37.3 17.2
3.23
812(A) 2.30 2.68 178 20.7 11.9812-r(S) 2.31 2.62 184 24.0 13.8
925(A) 2.32 2.68 183 24.6 13.5925(S) 2.33 2.61 196 31.5 16.4
* Stands for tube array+ Data from Alavizadeh (9)
# Stands for single tube
Table 4.1 Test conditions and results at optimumsuperficial velocity.
Test Conditions Reductions a) ----lave ALDp (mm) Tf (K) ht hrb Array Single
2.14
812
925
1000
6
7
8
9
14
22
12.2
14.1
14.8
13.1 *
16.1
18.0
3.23812
925
6
6
15
21
12.0
13.8
13.5*
16.9
* Data from Alavizadeh (9)
Table 4.2 Overall radiation contribution and heat transfercoefficient reduction in the bubbly-bed state.
80
4.1 Spatial Average Heat Transfer
Results of the spatial-averaged radiative and total
heat transfer coefficients with respect to superficial
velocity are presented for both tube arrays and a single
tube case. The discussion will include the effects of
superficial velocity, bed temperature, particle size, and
adjacent "cool" tubes on both the radiative and total heat
transfer performance. Also discussed in section 4.1.1 are
the radiation contributions under different test conditions.
Comparisons are made between the results of the present
study and those reported in the literature.
4.1.1 Radiative Heat Transfer
The variations in the spatial-averaged radiative heat
transfer coefficient (hrb) as a function of superficial
velocity (U0) are shown in Figures 4.1 and 4.2, for both the
tube array and the single tube cases respectively, with a
particle diameter of 2.14 mm, at three different bed
temperatures (812 K, 925 K, and 1000 K). Results for the
3.23 mm particle at two different bed temperatures (812 K
and 925 K) are shown in Figures 4.3 and 4.4. Comparisons of
the radiative values between the tube arrays and the single
tube at different bed temperatures are illustrated in
Figures 4.5 and 4.6, for 2.14 mm and 3.23 mm particles
respectively.

220
200
180
160it
140
5 120
O 1000re
80ILta
60
40
20
0
V TOTAL(1000K)X TOTAL(925K)
A TOTAL(812K)
O RADIATION(1000K)
RADIATION(925K)
O RADIATION(812K)
TOTAL AND RADIATION HEAT TRANSFER FOR
Dp = 2.14 mm (TUBE ARRAY)
1.4I I I I I I I I 1 I I I I I I I I I I
1.6 1.8 2 2.2 2.4 2.6 2.8
SUPERFICIAL. VELOCITY U0 (m/soc)
3
Figure 4.1 Erb and Et vs. U0 for Dp = 2.14 mm (Tube Array).
34

240
220
200
3 180
1606-
w 140
120
00 100
tri 80
60
40X
20
0
-
-
--
V TOTAL(t 000K)
X TOTAL(925K)
A TOTAL(812K)
A From AlavIzacloh
0 From AlavIzadoh
TOTAL AND RADIATION HEAT TRANSFER FOR
DP = 2.14 mm (SINGLE TUBE)O RADIATION(1000K)+ RADIATION(925K)
RADIATION(812K)
14IIII1
1.6 1.8IIIIIIIII12 2.2 2.4 2.6 2.8
SUPERFICIAL VELOCITY U0 (m/soo)
I I
3 3.2 3.4
Figure 4.2 hrb and ht vs. U0 for Dp = 2.14 mm (Single Tube).

200
190
180
170
160
150
140
130
120
110
100
90
80
70
60
50
40
30
20
10
0
TOTAL(812K)A TOTAL(925K)
O RADIATION(812K)O RADIATION(925K)
TOTAL AND RADIATION HEAT TRANSFER FOR
DP = 3.23 mm (TUBE ARRAY)
2 1 2.3 2.5 2.7 2.9
SUPERFICIAL VELOCITY Up (MA*C)
3.1
Figure 4.3 Erb and Et vs. U0 for Dp = 3.23 min (Tube Array).
33

NE
5
Ir
zw
w00
z
210200190
180
170
160
150
140
130
120
110
100
90
807060
50
4030
2010
0
A TOTAL(925K)
TOTAL(812K)
O RADIATION(925K)
RADIATION(812K)
+ From AlavIzacloh
O From AlovIzadoh
TOTAL AND RADIATION HEAT TRANSFER FOR
Dp 3.23 mm (SINGLE TUBE)
21 1 1 1 1 1 1 1 1 1 1
2.2 2.4 2.6 2.8 3
SUPERFICIAL VELOCITY U0 (m/soo)
3.2
Figure 4.4 Erb and ht vs. U0 for Dp = 3.23 mm (Single Tube).
3.4

45
Y 40 -N.E
35 -
IP30 -
h i
W.u . 2500
20la.0
15
10
5
14 1.6
O SINGLE(812K)A ARRAY(812K)
1.8 2 2.2 2.4 2.6 2.8 3 3.2
SUPERFICIAL VELOCITY U0 (m/sect)+ SINGLE(925K) O SINGLE(1000K)X ARRAY(925K) V ARRAY(t000K)
Figure 4.5 Erb vs. U0 for Dp = 2.14 mm.
34

40
Qs 35 -CV.
E
30IF
254
00 20cr
4 15rc
10
5
2I I I I I I
2.2 2.4 2.6 2.8 3
O SINGLE(812K)O ARRAY(812K)
SUPERFICIAL VELOCITY U 0 (m/sec)+ SINGLE(925K)A ARRAY(925K)
Figure 4.6 Erb vs. U0 for Dp = 3.23 mm.
3.2 34

87
Effect of Superficial Velocity
A sharp increase in hrb under all test conditions is
noted as Uo reaches Umf. The same behavior was observed by
Alavizadeh (9) and Alavizadeh, et al. (12) for a single
tube. This behavior is primary due to the bubble-induced
particle motion which replaces the cold particles near the
tube wall, particularly in the "lee stack" region on the
upper half of the tube, as shown in Figure 1.3. A detailed
discussion of this influence is presented in section 4.2.1.
As U0 is increased well beyond Umf, Erb increases very
slowly eventually approaching an asymptotic value, which
implies that radiation transfer is relatively insensitive to
the changes of bed density. The higher bubble contact
fraction, fo, at higher U0 results in larger radiation
contributions in the bubble phase, which also compensates
for the loss of radiation in the emulsion phase. Data of
Alavizadeh (9), Alavizadeh, et al. (12), and Vadivel and
Vedamurthy (131) shows similar trends except that Vadivel
and Vedamurthy observed a slight decrease in hrb past a
maximum in their experiments for Dp = 0-6 mm, Tf = 1023 K.
Effect of Bed Temperature
Bed temperature has a pronounced effect on hrb for all
test conditions as shown in Figures 4.5 and 4.6.
Specifically hrb increased approximately 70% for the single
tube case with Dp = 2.14 mm when the bed temperature was
increased from 812 K to 1000 K, and it is approximately 55%

88
for the tube array case with Dp = 2.14 mm. It was found that
Erb increased more sharply at higher Tf as U0 approached
Umf. This behavior is directly attributable to the fourth-
power temperature dependence in the Stefan-Boltzmann law of
thermal radiation.
Effect of Particle Size
The effect of particle size was not found to be
significant for the two particle sizes chosen (2.14 mm and
3.23 mm) in this study, except that the radiative heat
transfer rate for the smaller particles was more sensitive
to a change in U0 as U0 approached Umf. It was noted,
however, that large particles in a bubbly bed experienced a
smaller temperature drop, and thus, had a higher average
temperature as they came into contact with immersed
surfaces. Accordingly, there is a higher radiation
contribution than with small particles at the same bed
temperature. Investigations of Alavizadeh, et al. (12) for
Dp = 0.5 mm - 3.23 mm, Vedamurthy and Sastri (135) for Dp =
3.15 mm and 6.3 mm, and Vadivel and Vedamurthy (131) for Dp
= 0-6 mm clearly demonstrated these effects. Results of
Alavizadeh, et al. suggested that, from the standpoint of
radiation contribution, particles with a mean diameter in
the range of 1 mm to 2 mm could be classified as
"intermediate" rather than "large" in high temperature
fluidized bed applications.

89
Effect of Adjacent Cool Tubes
The data obtained with a single tube provide a basis
for studying the effects of neighboring "cool" tubes on
radiative heat transfer performance. Values for the
radiative heat transfer coefficients as a function of
superficial velocity for both tube arrays and a single tube
are shown in Figures 4.7 through 4.11.
Radiative heat transfer coefficients for tube arrays
are lower than for a single tube under all test conditions,
as indicated in Figures 4.7 and 4.11, as well as in Figures
4.5 and 4.6. The average reductions in hrb under bubbly bed
conditions were calculated by comparing these two cases.
Values for the percent decrease under different test
conditions are tabulated in Table 4.2. It was found that the
decrease in hrb is greater for larger particles and at
higher temperatures. This is due to the effect of the
presence of neighboring "cool" tubes in the hot bed which
absorb heat from the particles and reduce the effective bulk
bed temperature.
A calculation, using an effective bed emissivity, cef =
Qrb/aTf4, indicates the effective bed temperatures for tube
arrays to be 804 K, 890 K, and 934 K for 2.14 mm particles
at bed temperatures of 812 K, 925 K, and 1000 K,
respectively. The corresponding effective temperatures are
783 K and 870 K for 3.23 mm particles at bed temperatures of
812 K and 925 K.

200
190
180
170
160
150
140
130
120
110
100
90
80
70
60
50
40
30
20
10
0
.01
TOTAL(SINGLE)a TOTAL(ARRAY)
O RADIATION(SINGLE)* RADIATION(ARRAY)
+ From Nov Izocloh
From AlavIzadoh
TOTAL AND RADIATION HEAT TRANSFER FOR
Dp = 2.14 mm Tf = 812 K
I I I I I 1 I I 1 I i 1 1 1
1 4 1.6 1.8 2 2.2 2.4
SUPERFICIAL VELOCITY U0 (m/seo)
2.6 2.8
Figure 4.7 Erb and Et vs. U0 for DP = 2.14 mm, Tf = 812 K.

220
200 -
"E180
160
Itz
140
IT
0 1000
-
120 -
z
80-
60 _
40
20
TOTAL(SINGLE)A TOTAL(ARRAY)
O RADIAT1OKSINGLE)
O RADIATION(ARRAY)
TOTAL AND RADIATION HEAT TRANSFER FOR
D = 2.14 mm Tf = 925 K
0
1.4 1.6 1.8
11111111111112 2.2 2.4 2.6
SUPERFICIAL VELOCITY U0 (m/so)
2.8 3 3.2
Figure 4.8 Erb and ht vs. U0 for Dp = 2.14 mm, Tf = 925 K.

240
220 -
200
180
160 -
140 -
120 -
100 -
80 -
60 7
40 -
20 -
0
TOTAL(SINGLE)A TOTAL(ARRAY)
O RADIATION(SINGLE)
O RADIATION(ARRAY)
TOTAL AND RADIATION HEAT TRANSFER FOR
D P = 2.14 mm Tf = 1000 K
1.5 1.7 1.9 2.1 2.3 2.5 2.7
SUPERFICIAL VELOCITY U0 (m/sect)
2.9 3.1 3.3
Figure 4.9 Erb and Et vs. U0 for Dp = 2.14 mm, Tf = 1000 K.

200
190
180
170cve
160
150
Ix 140
130
120O 110
II' 100O 90
80
b. 70v)
60
50t-o- 40 --
30I20
10
0
TOTAL(SINGLE)TOTAL(ARRAY)
O RADIATION(SINGLE)
RADIRADIATION(ARRAY)
+ From AlovIzacloh
o From AlovIzadoh
TOTAL AND RADIATION HEAT TRANSFER FOR
DP
= 3.23 mm Tf = 812 K
21 2.3 2.5
SUPERFICIAL VELOCITY U0 (Wows)
2.7
Figure 4.10 Erb and Et vs. U0 for Dp = 3.23 mm, Tf = 812 K.
2.9

1?
220
200 -
180
160
IrI 140
rJ17.h.
120
Lal
0 1000
80Inz4 80
40
20
0
TOTAL(SINGLE)A TOTAL(ARRAY)
RADIATION(SINGLE)
o RADIATION(ARRAY)
TOTAL AND RADIATION HEAT TRANSFER FOR
DP = 3.23 in rti Tf = 925 K
4 +.
2 1 2.3 2.5 2.7 2.9
SUPERFICIAL VELOCITY Up (M/DC)
3.1 3.3
Figure 4.11 Erb and ht vs. U0 for Dp = 3.23 mm, Tf = 925 K.

95
The number of particles between adjacent tubes is about
30 for 3.23 mm particles and about 45 for 2.14 mm particles.
At the same bed temperatures, values listed in Table 4.2 for
an array, show the decrease in radiative heat transfer
coefficient to be higher for larger particles than for small
particles, when compared with a single tube. It is clear
that the effective bed temperature is lower for the case of
larger particles. Two effects contribute to this situation.
On the one hand, bubbles sweep the cooler particles from the
bottom row of the array upward. This bubble-induced particle
motion decreases the surrounding temperature at upper levels
in the tube arrays, and thus, will decrease the thermal
radiation exchange. Also, larger particles offer greater
"see through" effects from the neighboring "cool" tubes in a
bubbly bed which further results in a lower surrounding
temperature. The reduction will be even higher if bed
operation is in the slugging or turbulent regimes.
Radiation Contribution
The radiation contributions (f) to total heat transfer
rate, under different test conditions, are listed in Tables
C.1 through C.10. The overall radiation contributions(fave)
were computed as the average of f in the bubbly-bed state
(U0 > Umf). Values of fave for each test condition are
listed in the last two rows of Table 4.2, also in Table C.1
through C.10.

96
Comparisons
The correlation proposed by Glicksman (70), equation
(1.9), provides an upper limit for the radiation
contribution in the emulsion phase. It was found that all
values of the radiative heat transfer coefficient obtained
in this work are within the limits predicted by equation
(1.9).
No experimental data are available in the literature
comparing radiation results for tube arrays. Results of the
single tube case are in excellent agreement with those
obtained by Alavizadeh (9). In light of the dependence of
the radiation contribution on different test conditions,
such as particle size, bed temperature, and particle and
surface radiative properties, no further comparisons with
other experimental investigations can be made for the single
tube.
Alavizadeh (9) assumed the radiation in fluidized beds
to be proportional to the fourth power of the bed
temperature and compared his results with some other studies
(16,22,37,89,112,114) by plotting Erb vs. Tf3, as shown in
Figure 4.12. This might be useful since the single tube
results of the present study are in good agreement with his.
A number of analytical models have been developed for
radiation heat transfer in a fluidized bed, as described in
section 1.3.1. No comparisons of the present study results
can be made with existing models since they require special
input parameters such as bubble contact fraction, bubble

NE
It
100
80
60
40
20
0
Imo
0
0
0
V
A I
Study
O Boskakov, et oL
Basu
A Ilchenko, et al.
Vedamurthy and
Sastri
o Vadjvel and
Vedomudhy
O Ozkaynak, et al.
AWVIzadsh
I .
jj (K)
(18) 1123
(20) 1123
(90) 1223
1173(135)
1023(131)
(114) 1033
(9) 1050
1.0 1.5
(T1 x 10-3) 3 Tf [K]
2.0 2.5
Figure 4.12 Radiative heat transfer coefficients obtained in differentstudies.

98
frequency, emulsion residence time, particle spacing, and
transmission characteristics, which were not measured in
this study.
4.1.2 Total Heat Transfer
Figures 4.1 through 4.4 show the spatial-averaged total
heat transfer coefficient (4) as a function of superficial
velocity (U0) under different test conditions. A close look
at the total data is provided in Figures 4.13 and 4.14.
Effect of Superficial Velocity
When Uo approaches the minimum fluidizing velocity
(Umf), ht increases sharply due to the gas-particle
agitation as was explained in section 4.1.1. This sharp
increase is followed by a short period of a more gradual
increase, Fit reaching a maximum value for U0 somewhat
greater than Umf, and then shows a slow decrease. This
behavior was noted by many other investigators for a wide
range in particle sizes and bed temperatures. The slow
decrease can be attributed to the decrease in bed density
and also greater bubble contact fraction (f0) at higher
values of Uo.
Effect of Bed Temperature
The effect of bed temperature was not evaluated in most
of the total heat transfer studied since they were conducted
at low or ambient temperatures. Increases in Et (Figures

230
220
4. 210
\ 200
I x+' 190
Z 180
170
0 160
wix 150
z 140
130
120I
110
100 111 I 1 1 I I I I I I I I I 1 1 I I
1 4 1.6 1.8 2 2.2 2.4 2.6 2.8 3 3.2
O SINGLE(812K)A ARRAY(812K)
SUPERFICIAL VELOCITY U 0 (m/sec)+ SINGLE(925K) O SINGLE(1000K)X ARRAY(925K) V ARRAY(1000K)
Figure 4.13 Fit vs. U0 for Dp = 2.14 mm.
34

210
"E190
180
I Es
zW
170
u.160
0 150
so.U)
z
140
< 130
120
100
2IIIIIIIIIIIII
2.2 2.4 2.6 2.8 3
SUPERFICIAL VELOCITY U 0 (rn /sic)SINGLE(812K) + SINGLE(925K)
o ARRAY(812K) n ARRAY(925K)
Figure 4.14 Et vs. yo for Dp = 3.23 mm.
3.2 3.4
101
4.13 and 4.14) and hmax (Table 4.1) for all test conditions
were found as the bed temperature was increased, e.g. for
the single tube case with 2.14 mm particles shown in Table
4.1, there was an increase, in hmax, of 28 W/m2.K (15%) when
the bed temperature was elevated from 812 K to 1000 K, and
the increase was 19 W/m2.K (11%) for the tube arrays.
Comparing the increase in hrb under identical conditions (15
W/m2.K and 7 W/m2.K), the change in hmax (or ht) cannot be
explained solely by the additional radiative contribution,
as suggested by some investigators (90,113,128).
Observed variations of hmax and ht with Tf should not
be quantitatively generalized here due to scattering in the
radiation data. Reasons for the higher total heat transfer
at elevated temperatures can be physically explained by both
the greater radiation contribution and larger gas-solid
convection, resulting from the increased gas thermal
conductivity. Similar conclusions have been reached by other
researchers (9,75,144). Alavizadeh (9) suggested this
behavior to be due to the variation in thermophysical
properties of the gas with bed temperature, i.e. a greater
thermal conductivity at higher bed temperatures results in
increased particle convection. Golan, et al. (75) concluded
that gas and solid thermal properties play a role in the
variation of total heat transfer with bed temperature.
Yoshida, et al. (144) suggested that it is affected by the
increase in both the thermal conductivity in the emulsion
phase and the bubble frequency, rather than radiation.

102
Effect of Particle Size
Total heat transfer in beds over a wide range in
particle sizes has been reported (18,95,109,113,133) and
discussed (30,79,102,145) by various investigators. Results
of such findings are illustrated in Figure 4.15, in which
the maximum heat transfer coefficient is plotted against
particle diameter. The decrease of Emax with D in the fine
particle range (Dp < 0.02 mm) is due to poor fluidization
characteristics (agglomeration and channeling) of such fine
powder. In the small particle range (0.02 mm < Dp < 1 mm)
where the particle convective component (hpc) dominates,
171max decreases with increase in Dp caused by a greater
thermal resistance between particles and heat transfer
surfaces, a smaller particle surface area per unit volume of
the bed, and a higher bubble contact fraction for larger
particles. Further increases in D eventually result in a
transition (1 mm < D < 2 mm) from small-particle to large-
particle effects (D > 2 mm) in which the gas convective
component (hgc ) becomes dominant. In this position of the
size spectrum, Emax increases with Dp due to higher
fluidization velocities and a corresponding increase in
particle Reynolds number (Rep).
In the present study small decreases (1% - 5%), in Emax
with an increase in particle size from 2.14 mm to 3.23 mm,
were noted for both tube arrays and a single tube at the
same bed temperature, as shown in Table 4.1 and Tables C.1
through C.10. Decreases for tube arrays are relatively less

103
cv 800
ro
1.=
E: 600zI-4
I-1
gx3
O400
1:4
z
E-4 200
zz
r.a
0.01 0.1 1.0AVERAGE PARTICLE DIAMETER, D mm
10
Figure 4.15 Dependence of the maximum heat transfercoefficient on mean particle diameter.[Adapted from Zabrodsky, S. S. (145)]

104
than for a single tube. Similar trends were found by
Alavizadeh (9) and Goshayeshi (77) while the results of
George (66) showed no significant difference for these two
particle sizes. This is because the particle sizes employed
fall into the transition region, as shown in Figure 4.15,
with a corresponding small difference in magnitude for hmax
Effect of Adjacent Cool Tubes
The effect of adjacent-tube-spacing on total heat
transfer was studied extensively for small particle beds at
low temperatures, as summarized by Botterill (30), Grewal
(79), and Saxena, et al. (122). The tube array arrangement
was designed according to the studies by Welty (138),
Catipovic (40), and others (25,64,127), as already discussed
in section 3.2.
The relative decrease in ht for the tube array relative
to a single tube remained almost unchanged (6% - 8%) as the
bed temperature was increased for both particle sizes, as
shown in the third column of Table 4.2. The data obtained by
Goshayeshi (77) under almost identical test condition showed
about the same magnitude for the decrease in ht. Similar
trends were also found in the experiments conducted by
Catipovic (40) for a wide range of particle sizes (0.37 mm <
D < 6.6 mm) at ambient temperature. His suggested
correlations, equations (1.2) through (1.6), also suggest
such an invariance for low-temperature beds. When comparing
the decrease in hrb, the indication is that the relative

105
decrease in Fit is less sensitive to the change in bed
temperature than is firb.
Comparison
Figure 4.16 shows the maximum Nusselt number (Numax) as
a function of Archimedes number (Ar) for the present tube-
array case and for some other studies conducted by
Alavizadeh, et al. (12), Goshayeshi (77), and Catipovic
(40). The properties of air, evaluated at the bed
temperature, were used in the calculations of Numax and Ar.
Also shown are the correlations proposed by Maskaev and
Baskakov (109) and Zabrodsky, et al. (147). For larger
particles, Maskaev and Baskakov suggested the formula
Numax = 0.21 Ar0*32 1.4 x 10⁵ < Ar < 3 x 10⁸ (4.1)
Zabrodsky, et al. (100) expressed their correlation as
Numax = 0.88 Ar°'213 80 < Ar < 106 (4.2)
It is observed that equation (4.1) fits the tube array
data of the present study at higher temperatures (925 K and
1000 K) quite well; it fits single tube data even better.
As described in section 1.3.2, different correlations
have been proposed recently to estimate the total heat
transfer for horizontal tubes immersed in large particle
beds and their predictions agree reasonably well with most

1000
100
10
I I 1 1111 1 -r I I III-111 1 I 111111i I I I I !III' I I I I IIII.PRESENT DATA, IONE, 8I2K (Tube Array)
A PRESENT DATA, IONE, 925K, 1000K (Tube Array)
ALAVIZADEH, IONE, 812K (Single Tube)
I ALAVIZADEH, IONE, 1030,1050K (Single Tube)
7.-
o GOSHAYESHI, IONE, 810K (Tube Array)
o GOSHAYESHI, IONE, 922K (Tube Array)-1.0°'
...0.
.0o CATIPOVIC, SAND, LOW TEMPERATURE (Single Tube)
.. ..."".....
... .e CATIPOVIC, DOLOMITE, LOW TEMPERATURE (Single Tube) 4.0'
Eqn. (4.1)
Eqn. (4.2)
A
111110, 4110 ONO MASKAEVS CORRELATION
ZABRODSKYS CORRELATION
O3I0 104 105Ar
106 167
Figure 4.16 Maximum Nusselt number vs. Archimedes number in differentstudies. [Adapted from Alavizadeh, N. (9)]
108

107
of the existing data for low temperature beds. If the
radiation contribution is neglected, however, these
correlations tend to underestimate the convective heat
transfer coefficients obtained in this work as well as those
of Alavizadeh (9) obtained in a high-temperature bed.
Specifically, the correlations suggested by Catipovic (40),
equations (1.2) through (1.6), underestimate our results by
approximately 15% at Tf = 812 K and 20% at Tf = 1000 K. This
difference indicates that equation (1.3) underestimates the
gas convective component at high temperature bubbly-bed
conditions since it was obtained based on the minimum
fluidization condition in a cold bed (19).
4.2 Local Heat Transfer
Tables C.1 through C.10, in Appendix C, list the
complete results of the time-averaged local heat transfer
measurements for both tube arrays and a single tube.
Graphical results showing local heat transfer coefficients
(hrb and ht) for the tube arrays are presented for a range
of superficial velocities under each test condition. The
effect of superficial velocity on local heat transfer
performance will now be considered. Also to be considered is
the effect of adjacent "cool" tubes by comparing the results
of these two cases.
The distribution of local heat transfer coefficients
(hrb and ht) for both cases was found to be invariant with a
change in bed temperature for the particle sizes employed in

108
this study, although they do affect the magnitude of these
local values, and thus special-averaged heat transfer
performance, as discussed in section 4.1. Similar trends
were shown in the experimental studies of Alavizadeh (9),
Goshayeshi, et al. (78), and George (66). No further
attempts will be made to discuss these effects.
4.2.1 Local Radiative Heat Transfer
Values for the local radiative heat transfer
coefficient (hrb) around the instrumented tube for tubes
arrays are displayed in Figures 4.17 through 4.21. Each
figure shows the results with a given particle size and bed
temperature for six superficial velocities (U0). Two values
of velocity are below Umf; the others are greater.
Effect of Superficial Velocity
Values of hrb are relatively low at packed bed
conditions (U0 < Umf), particularly on the down stream side
of the tube (a > 90°). As U0 reaches a value slightly higher
than Umf, a large increase in hrb with U0 was observed over
the upper half of the tube (a =135° and 180°). A more
uniform distribution of hrb was established as higher values
of U0 were reached. Values of hrb on the lower half of the
tube, however, were always higher for all tests conducted.
Results of Alavizadeh (9) and Alavizadeh, et al. (12)
displayed the same behavior for Dp = 0.5-3.23 mm.

30
28
26
24
22
20
18
16
14
12
10
8
6
4
2
0
0 20 40 60 80 100
O 1.43m/seoA 1.93m/sos
a (DEGREES)+ 1.54m/seaX 2.51m/sec
120 140
0 1.64m/seoV 2.84m/sea
160 180
Figure. 4.17 Local radiative heat transfer coefficient distribution forD = 2.14 mm, Tf = 812 K (Tube Array).

35
LOCAL RADIATION (TUBE ARRAY)i? 30
NE
25
6 20 -E.
0O 15 -I
Wtr.to
1 0 -
5
0
0p =2.14mm
Tf =925K
Drnt=1.64m/seo
0 20 40 60
1.50m/sec2.15m/sea
1 I I I --t
80 100 120 140 160 180
a (DEGREES)+ 1.58m/ssoX 2.49m/sea
O 1.66m/sso3.26m/sa
Figure 4.18 Local radiative heat transfer coefficient distribution forD = 2.14 mm, Tf = 925 K (Tube Array).

40
35
"E30
25W
W 2000
15u.
10
5
LOCAL RADIATION (TUBE ARRAY)
0
0
D1, .112.14mm
Tf =1000K
U mf =1.73m/sec
I I
20
CI 1.59 m/ssa
A 2.17m/sec
40
rirm60 80 100
1
120 140
0 1.75m/sea1.66m/aa(DocEGREES)
X 2.81m/soo V 3.32m/see
I
160 180
Figure 4.19 Local radiative heat transfer coefficient distribution forD = 2.14 mm, Tf = 1000 K (Tube Array).
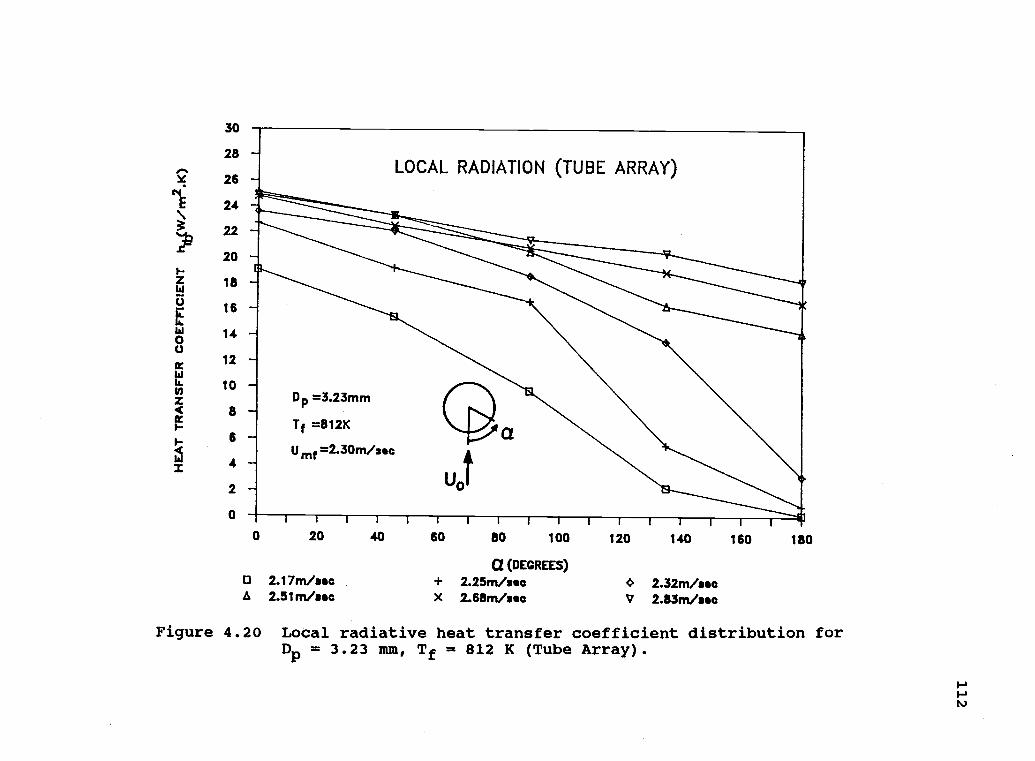
1?
t22
30
28
26
24
20
18
16
14
12
10
6
4
2
0
0A
0 20 60
2.17m/sea +2.51m/sea X
80 100
a (DEGREES)
2.25m/sea2.68m/soa
120 140
0 2.32m/seaV 2.83m/sea
160 180
Figure 4.20 Local radiative heat transfer coefficient distribution forDp = 3.23 mm, Tf = 812 K (Tube Array).

35
30
25
z20
V
k.
t5
10
5
O1 I I I I I I I I I I I I I I I I
0 20
L 2.20m/sec2.59m/sea
40 60 80 100
a (DEGREES)+ 2.27m/seaX 2.88m/soo
120 140
O 2.35m/soc3.26m/soo
160 180
Figure 4.21 Local radiative heat transfer coefficient distribution forD = 3.23 mm, Tf = 925 K (Tube Array).

114
The relatively low radiation heat transfer values on
the upper half of the tube at low U0 are caused by the
"cool" stagnant defluidized particle "cap" formed on the top
of the tube. The hydrodynamics of the so called "lee stack"
region have been studied by various investigators
(65,84,85), as described in section 2.1. As U0 is increased
significantly above Umf, the "cap" collapses due to the
influence of rising bubbles, and the "long-staying and
cooled" particles are replaced by fresh hot ones. Thus, the
local radiation heat transfer is significantly increased. An
increased particle mobility also produces a more uniform
distribution of hrb around the tube.
As noted earlier, values of hrb on the lower half of
the tube are insensitive to changes in U0 and remain higher
than those for the upper half even for the bubbly-bed regime
in which the lower portions of the tubes are generally
shrouded by gas bubbles (85,120). This implies that, for the
entire range of Uo, the radiation contribution due to the
bubble phase compensates for the reduction in the emulsion
phase which is caused by the low particle density adjacent
to the lower half of the tube. In contrast, data, obtained
by Vadivel and Vedamurthy (131) for a single horizontal tube
with Dp = 0-6 mm and Tf = 1023 K, displayed an increase in
hr with U0 followed by a decrease as Uo approached 2Umf. The
maximum local radiative heat transfer coefficient was
observed to shift to the lateral position (a = 90°). This
behavior is likely due to the inability of the bubble-phase
115
radiation to match the losses in the emulsion phase at very
high superficial velocities. No other experimental data are
available for analysis.
Effect of Adjacent Cool Tubes
Data for tube arrays show lower values at lateral
positions, i.e. a = 450, 90°, and 135°, compared with a
single tube, due to the effect of adjacent "cool" tubes in a
hot bed. These decreases are more pronounced at higher bed
temperatures and for larger particles due to the sensitivity
of the radiation to the drop in average bed temperature and
the larger "see through" effect with larger particles,
respectively. Further comparisons of hrb with those in ht
show greater relative decreases in the local radiative heat
transfer coefficient. This implies that the radiation
contribution is more sensitive to bed temperature than is
the total heat transfer. It further explains why the
reduction in spatial-averaged radiative heat transfer
coefficient (Hrb) is larger than that of total value (Et),
as discussed in section 4.1.
The maximum local radiative heat transfer coefficient
with tube arrays always occurred at, the stagnation point (a
= 0) for all test conditions. This was caused by the effect
of adjacent "cool" tubes. An additional effect is the
constant interchange of bubbles and particles at the
stagnation point, as discussed by Keairns (94). For a single

116
tube, however, the maximum value still remained at the lower
position of the tube (a = 00, 45°, and 90°). This is because
the regular replacement of cold particles by bubble action
induced fresh hot ones in this region. This is consistent
with observations by Peeler and Whitehead (115), Loew, et
al. (103), and other (9,15,40).
Comparison
To our knowledge, the only other local radiative heat
transfer measurements reported are those of Alavizadeh (9),
Alavizadeh, et al. (12), and Vadivel and Vedamurthy (131).
Local radiation values and their behavior in the present
study, for a single tube, show excellent agreement with the
results of Alavizadeh and fair agreement with those obtained
by Vadivel and Vedamurthy. Results with tube array cases are
the first of their kind.
Mahbod (104) developed a theoretical model for the
radiative heat transfer to an immersed horizontal tube. He
found the local radiative data of Alavizadeh to agree
reasonably well with his analytical predictions. The
information regarding emulsion residence time and bubble
contact fraction were interpolated from measurements of
Catipovic (40) for 1.3 mm and 4.0 mm particles in a two-
dimensional cold bed.

117
4.2.2 Local Total Heat Transfer
Graphical results are included in Figures 4.22 through
4.26. Tabulated data for the single-tube case are listed in
Tables C.6 through C.10.
Effect of Superficial Velocity
The effect of superficial velocity has been discussed
by Goshayeshi, et al. (78), Alavizadeh (9), and George (66).
The most obvious trend is a sharp increase in ht at the
downstream side of the tube as U0 approaches Umf. This is
known to be caused by the removal of the defluidized "cap"
of particles, as described in section 4.2.1. The same
behavior has been observed in previous local heat transfer
studies in both high-(9,66,74,78) and low-(22,40,49)
temperature beds.
The distribution of ht around the surface of the tube
tends to be more uniform as U0 is further increased. This
distribution has been found (40) to be more uniform for
large particles than for small particles (Dp < 1 mm) with
the same value of Uo/Umf. Thus, if there is concern for
thermal stress in the tubes, operation with large particles
at higher superficial velocities will provide less stressful
conditions. Values of ht display a small variation with U0
in an irregular manner at the lower stagnation point, as
shown in the figures. Similar trends were observed by
Goshayeshi, et al. (12), Alavizadeh (9), and Chandran, et
al. (46).

5,evi
160.c+j
ZI- 140
120u.
O 100
80
60
I 40
220
200
180
LOCAL TOTAL HEAT TRANSFER (TUBE ARRAY)
20
0
D P =2 14rnm
Tf =612K
Umf =1.6M/MIC
11111111111111 I I
O 20 40
0 1.43m/seaA 1.93m/sea
60
+X
80 100
a (DEGREES)1.54m/sec2.51rn/sea
120
0V
140
1.64m/sea2.84m/sea
160 180
Figure 4.22 Local total heat transfer coefficient distribution forD = 2.14 mm, Tf = 812 K (Tube Array).

240
220 -
200 -N'
3 180 -r 160 -ta .140 -
120 -O0
100
80 -1
60
40X
LOCAL TOTAL HEAT TRANSFER
(TUBE ARRAY)
20 -
0
Dp =2.14mm
T =925K
Umf =1.64m/sea
20 40 60
D 1.50m/seaA 2.15m/sea
80 100 120 140
a (DEGREES)+ 1.58m/seaX 2.49m/sea
O 1.66m/sea3.26m/sea
160 180
Figure 4.23 Local total heat transfer coefficient distribution forD = 2.14 mm, Tf = 925 K (Tube Array).

240
220
200E
180
160
1400
1200
100
tfi 80
60
40
LOCAL TOTAL HEAT TRANSFER(TUBE ARRAY)
20
0
D p =2.14mm
Tf =1000K
U mf =1.73m/asa
O 20 40
1.59m/secA 2.17m/soa
60 80 100
a (DEGREES)+ 1.66m/seaX 2.81m/sea
120 140
O 1.75m/soa3.32m/soo
160 180
Figure 4.24 Local total heat transfer coefficient distribution forD = 2.14 mm, Tf = 1000 K (Tube Array).

220
200
180
160
140 *
120
100
80
60
40 *
20
0
0
LOCAL TOTAL HEAT TRANSFER
(TUBE ARRAY)
Dp =3.23mm
If =812K
Unit =2.30m/sec
1111111111111111120 40 60 80 100
2.17m/ssaA 2.51m/sea
a (DEGREES)+ 2.25m/secX 2.68m/ssa
120 140 160
0 2.32m/seeV 2.83m/sea
180
Figure 4.25 Local total heat transfer coefficient distribution forD = 3.23 mm, Tf = 812 K (Tube Array).
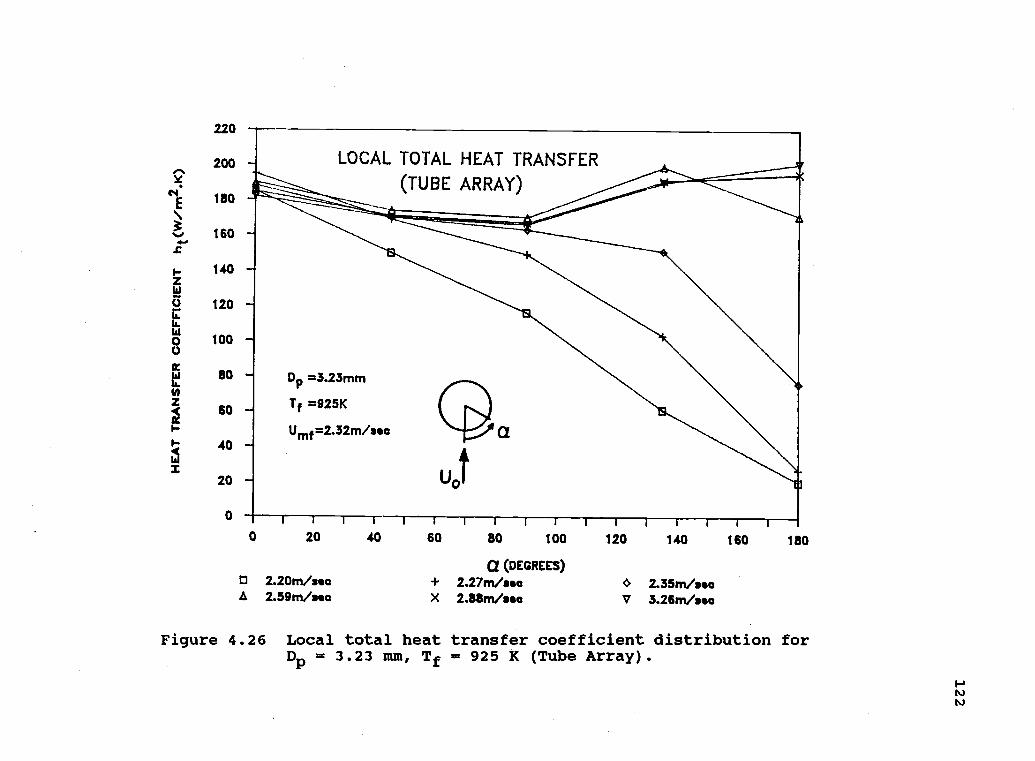
220
200 -
180
t 160
140
ES 120 -r.
O 1000
80 -1
60
40 -X
LOCAL TOTAL HEAT TRANSFER
(TUBE ARRAY)
20
0
D1, =3.23mm
Tf =925K
Umf =2.32m/ses
I 1 1 1 I II I II III I
0 20
CI 2.20m/secA 2.59m/sea
40 60
X
80 100
2.27nva (DEGREES)
2.88m/sea
120
0V
140
2.35m/sea3.26m/sea
160 180
Figure 4.26 Local total heat transfer coefficient distribution forD = 3.23 mm, Tf = 925 K (Tube Array).

123
In the bubbly-bed regime (U0 > Umf), the maximum local
heat transfer coefficient (hamax) always occurred on the
upper half of the tube, shifting from the equatorial lateral
zone toward the downstream side of the tube at higher Uo.
This observation is consistent with the results of many
other investigations (9,23,46,49,66,74,78) under a variety
of test conditions. As U0 reaches Umf, the high rate of
interaction of particles and bubbles at the lateral zone
results in maximum local heat transfer (47,120). Bed
porosity in this zone and the particle replacement rate in
the high bed density region on the top of the tube increase
significantly as U0 is raised. This behavior is responsible
for the shift of hamax
Effect of Adjacent Cool Tubes
Values of ht for tube arrays are generally lower than
for a single tube as expected although some discrepancies in
the distribution of ht were observed, which are discussed
below.
The shift of hamax is more pronounced for tube array
due to the higher gas velocity between tubes in an array
compared with a single tube at the same ratio of Uo/Umf
Gelperin, et al. (65) noted that the "cap" of defluidized
particles on top of the tubes in an array tend to become
less stable, which results in hamax being displaced more
rapidly near the upper stagnation point.

124
Values of ht at the lateral position for tube arrays
apparently experience larger reductions due to the presence
of adjacent "cool" tubes and increased bed porosity due to a
higher local gas velocity in this region. The reductions are
greater for smaller particles and higher temperatures.
It was also found that the distribution of ht is more
uniform for tube arrays than for a single tube, which
suggests that tube arrays will provide lower thermal stress
levels.
Comparison
Goshayeshi, et al. (78) conducted experiments to
measure local total heat transfer coefficients (ht) for tube
arrays under the same test conditions as this study, Dp =
2.14 mm and 3.23 mm and Tf = 812 K, 922 K, and 1005 K.
Experiments performed by Alavizadeh (9) and George (66) for
a single tube also involved local total heat transfer
measurements for Dp = 2.14 mm and 3.23 mm and Tf = 812 K and
1050 K. The range and behavior of the local total data of
the present study for both the tube array and a single tube
agree well with those obtained by Goshayeshi, et al. (78)
and Alavizadeh (9), respectively. Similar behavior has been
reported for large-particle low-temperature beds
(40,46,49,66,74). For identical particle sizes, values
obtained in a low-temperature bed are always lower.

125
V. CONCLUSIONS AND RECOMMENDATIONS
5.1 Conclusions
The time-averaged local radiative and total heat
transfer coefficients have been obtained for an array of
tubes as well as a single tube immersed in high-temperature
large-particle beds. Experimental evidence shows that the
radiative heat transfer detector employing a silicon window
as a protective and transmitting medium will lead to
accurate and reliable measurements of radiative heat
transfer in fluidized bed.
The experimental results have been presented and
discussed. It was found that the radiation heat transfer to
a single tube case does not represent the results for tube
arrays due to the presence of the adjacent "cool" tubes and
the greater "see through" effect associated with large
particles. However, the total heat transfer coefficient for
tube arrays, compared with the single tube case, did
decrease in the same relative amount (6% - 8%) for all the
test conditions involved.
Superficial velocity had a significant effect on heat
transfer coefficients measured or calculated for all cases
included in this study. It was observed that the spatial-
averaged heat transfer coefficients experienced a sharp
increase when superficial velocity (U0) was increased above
the minimum fluidization velocity (Umf) as a result of
bubble-induced particle motion. The spatial-averaged total
126
heat transfer coefficient approached a maximum at U0
slightly above Umf, and then experienced a slow decay with
further increase in U0 while the spatial-averaged radiative
heat transfer coefficient tended to reach an asymptotic
value.
The local radiative and total heat transfer
coefficients displayed more uniform distribution along the
circumference of the tube at higher values of Uo. Both the
radiative and total heat transfer rates at the upper half of
the tube increased sharply as U0 approached Umf while those
at the lower stagnation point on the tube were observed to
be relatively insensitive to Uo. The location of the maximum
local total heat transfer coefficient shifted from the
lateral zone to the downstream side as U0 was further
increased. This behavior is more pronounced for tube arrays
due to the higher local superficial velocity between tubes
in an array.
At higher bed temperatures, the radiative heat transfer
coefficient for tube arrays experienced a larger decrease
than did the total heat transfer coefficient. This implies
that the radiative component is more sensitive to a change
in bed temperature. All heat transfer results obtained
showed only minor variation with the particle sizes used in
this study.
The conduction error inherent in different radiative
heat transfer studies was quantified using results for local
radiative heat transfer measurements employing quartz and

127
sapphire as window materials. Other conclusions obtained in
present work are in the following:
1) The reduction in the radiation contribution with
tube arrays relative to a single tube is more
pronounced for larger particles and higher bed
temperatures due to the greater "see through" effect
of larger particles and the presence of neighboring
"cool" tubes in a hot bed.
2) Local radiative heat transfer coefficients at
lateral tube positions experienced a greater
decrease than at other positions for tubes in an
array.
3) The local radiative heat transfer coefficient was
always a maximum at the lower stagnation point while
values over the top half of the tube increased
steadily as U0 was increased.
4) The increase in the total heat transfer coefficient
with bed temperature, in large-particle beds, is due
both to a greater radiation contribution and
increased gas-solid convective heat transfer.
5) The distribution of local radiative and total heat
transfer coefficients was insensitive to particle
size, for the two sizes used in this study.
6) The shift of maximum local total heat transfer
coefficient (hamax) toward the downstream side of
the tube was more pronounced for tube arrays and for
smaller particles.

128
7) Correlations based on the studies in large particle
cold beds tend to underestimate the total heat
transfer performance of high-temperature beds.
8) Tube emissivity plays an important role in
determining the actual radiative heat transfer rate
to tubes immersed in beds.
5.2 Recommendations
1) The present work could be extended to cover a wider
range of particle sizes and bed temperatures, other
bed materials, and different tube spacings.
2) Radiative heat transfer studies for turbulent bed
conditions and/or in the free-board section are
highly recommended for future work due to their
practical importance in the area of circulating-
fluidized-bed (CFB) combustion.
3) The effect of bed temperature on total heat transfer
coefficients in large particle beds needs to be
further investigated. This requires more theoretical
information and experimental work about the
different heat transfer mechanisms and bed
hydrodynamics at elevated temperatures.
4) It is desirable to develop predictive correlations
for the heat transfer to horizontal tubes immersed
in large-particle high-temperature fluidized beds.
However, there are many experimental studies of the
effects such as tube spacing, tube size, particle

5
6
7
8
residence time, bubble contact fraction, and bubble
frequency, remained to be performed in order to
provide necessary information in the derivation of
such correlations.
A radiative heat transfer study for an array of
tubes immersed in small to intermediate-size
particle beds (.1 mm < Dp < 2 mm ) could be
conducted as a continuation of the present work
without difficulty. However, The fluidized bed
facility used in this work precludes extension to
larger particles (Dp > 4 mm) due to a limitation on
the air blower capacity.
Some efforts should be directed toward a better
understanding of radiation contributions in the
bubble phase. This requires information on the
radiative properties of the enclosure of a bubble
and the bubble contact region.
It is suggested that the effect of tube spacing on
local radiative heat transfer performance should be
further investigated for a wider range of particle
sizes and bed temperatures. Detailed physical
insight of the bed hydrodynamics with immersed tubes
are needed so that this effect can be theoretically
and quantitatively determined.
The radiative detector used in this work offers the
capability for fast sampling of radiation data due
to its short response time (120 msec). Instantaneous
129
130
radiative heat transfer data can thus be obtained.
Such information would likely provide some
hydrodynamic information, such as particle residence
time, bubble frequency, and bubble contact fraction,
in high-temperature fluidized beds, which are needed
for modeling the heat transfer mechanisms between a
high-temperature fluidized bed and immersed
surfaces.
9) Computers with larger memory, particular ROM space,
are needed to handle the large amount of fast
sampling data acquired in instantaneous
measurements.
10) The effect of coolant flow rate in tubes on the
total heat transfer coefficient is probably worth
examining.
11) Calibration of the radiation detector should be done
under a simulated bed condition to evaluate the
possible errors associated with the procedure
employed in this study.
12) Experimental results showed that a radiation
detector employing a sapphire windows would also
provide good measurements for the radiative heat
flux. The use of sapphire as a window material is a
possible alternative because it offers better
mechanical properties than silicon. Extreme care
must be used to minimize the thermal contact

131
resistance between this window and the tube wall due
to its lower thermal conductivity (Table 2.2).
13) Some modifications of the fluidized bed facility are
probably necessary so that its functions could be
expanded. This includes increasing the air blower
capacity, improving particle handling procedures,
and an improved distributor plate design. The use of
a ceramic distributor plate instead of inconel would
likely solve the warping and leaking problems which
occurred during this and previous studies.

132
BIBLIOGRAPHY
1. Adams, R. L., "An Analytical Model of Heat Transfer to aHorizontal Cylinder Immersed in a Gas Fluidized Bed,"PhD Thesis, Dept. of Mech. Eng., Oregon StateUniversity, June 1977.
2. Adams, R. L., "A Gas Convection Model of Heat Transferin Large Particle Fluidized Beds," AIChe J., Vol. 25,No. 3, May 1979, pp.395-405.
3. Adams, R. L., "An Approximate Formula for Gas ConvectionDominant Heat Transfer in Large Particles FluidizedBeds," J. of Heat Transfer, Vol. 101, May 1981, pp.395-397.
4. Adams, R. L., "Extension of the Adams-Welty Fluid BedHeat Transfer Model to the Packed Bed Case," J. of HeatTransfer, Vol. 103, Aug. 1981, pp.602-604.
5. Adams, R. L., "An Approximate Model of Bubble PhaseConvective Heat Transfer to a Horizontal Tube in a LargeParticles Fluidized Bed," J. of Heat Transfer, Vol. 104,Aug. 1982, pp.565-67.
6. Adams, R. L., "Coupled Gas Convection and UnsteadyConduction Effects in Fluid Bed Heat Transfer Based on aSingle Particle Model," Int. J. of Heat and MassTransfer, Vol 25, No. 12, 1982, pp.1819-28.
7. Adams, R. L., "Heat Transfer in Large Particle BubblingFluidized Beds," J. of Heat Transfer, Vol 106, Feb.1984, pp.85-90.
8. Adolf Meller Company Catalog, Providence, RI, USA, 1984.
9. Alavizadeh, N., "An Experimental Investigation ofRadiative and Total Heat Transfer Around a HorizontalTube," Ph.D. Thesis, Dept. of Mech. Eng., Oregon StateUniversity, Aug. 1985.
10. Alavizadeh, N., "A Quick Reference User's Manual Guidefor HP-3497A Data Logger and HP-85 Microcomputer," Dept.of Mech. Eng., Oregon State University, Corvallis, OR,97331, 1985.
11. Alavizadeh, N., Adams, R. L., Welty, J. R. andGoshayeshi, A., "An Instrument for Local Radiative HeatTransfer Measurement in a Gas-Fluidized Bed at ElevatedTemperatures," New Experimental Techniques in HeatTransfer, The 22nd National Heat Transfer Conf. andExhibition, Niagara Falls, NY, Aug. 1984, pp.1-8.

133
12. Alavizadeh, N., Fu, Z., Adams, R. L., Welty J. R., andGoshayeshi, A., "Radiative Heat Transfer Measurement fora Horizontal Tube Immersed in Small and Large ParticleFluidized Beds," The 5th Int. Heat Transfer Svm.,Beijing, China, Oct. 1985.
13. Analog Devices, Inc., Macsym ADIO Library, STB02Termination Panel, Norwood, MI, 1980.
14. Babu, S. P., Shah, B.Correlations for CoalFluidization VelocityRelation," AIChe Sym.pp.176-86.
and Talwalker, A., "FluidizationGasification Materials--Minimumand Fluidized Bed ExpansionSer., Vol. 74, No. 176, 1978,
15. Bakke, P. A., "A Simplified Model of Heat TransferBetween Large-Particles Gas-Fluidized Beds and ImmersedSurfaces," MS Thesis, Dept. of Mech. Eng., Oregon StateUniversity, April, 1986.
16. Barnes Engineering Company, "Infrared RadiationReference Source Model 11-210," Instruction Manual,Stamford, Connecticut.
17. Bartel, W. J. and Genetti, W. E., "Heat Transfer from aHorizontal Bundle of Bare and Finned Tubes in an AirFluidized Bed," AIChe Sym. Ser., Vol. 69, No. 128, 1973,p.85.
18. Baskakov, A. P., Berg, B. V., Vitt, 0. K., Filippovsky,N. F., Kirakosyan, V, A., Goldobin, J. M. and Maskaev,V. K., "Heat Transfer to Objects Immersed in FluidizedBeds," Powder Tech., Vol. 8, 1973, pp.273-82.
19. Baskakov, A. P. and Suprun, V. M., "Determination of theConvective Component of the Heat Transfer Coefficient toa Gas in a Fluidized Bed," Int. Chem. Eng., Vol. 12,1972, p.324.
20. Basu, P., "Bed to Wall Heat Transfer in a Fluidized BedCoal Combustor," AIChe Sym. Ser., Vol. 74, No. 176,1978, pp.187-93.
21. Basu, P., Fluidized Bed Boilers: Design and Application,Pergamon Press, Canada Ltd., 1984.
22. Basu, P., "Circulating Fluidized Bed Technology," Proce.of First Int. Conf. on Circulating Fluidized Beds,Halifax, Nova Scotia, Canada, Nov., 1985, Pergamon PressCanada Ltd., 1986.

134
23. Berg, B. V. and Baskakov, A. P., "Investigation of LocalHeat Transfer Between a Fixed Horizontal Cylinder and aFluidized Bed," Int. Chem. Eng., Vol. 14, No.3, July1974, pp.440-43.
24. Bhattacharya, S. C. and Harrison, D., "Heat Transfer inHigh Temperature Fluidized Beds," European Congress onParticle Technology, Nuremberg, 1977.
25. Borodulya, V. A., Ganzha, V. L., "Heat Transfer from In-Land and Staggered Horizontal Smooth Tube BundlesImmersed in a Fluidized Bed of Large Particles," Int. J.of Heat and Mass Transfer, Vol 23, 1980, pp.1602-04.
26. Borodulya, V. A., Ganzha, V. L. and Podberersky, A. I.,"High Pressure Heat Transfer Investigations forFluidized Beds of Large Particles and Immersed VerticalTube Bundles," Int. J. of Heat and Mass Transfer., Vol.26, No. 11, 1983, pp.1577-84.
27. Borodulya, V. A., Ganzha, V. L.,Upadhyay, S. N., and Saxena, S.between Fluidized Beds of LargeTube Bundles at High Pressure,"Transfer, Vol. 27, No. 8, 1984,
Podberersky, A. I.,C., "Heat TransferParticles and HorizontalInt. J. of Heat and Masspp.1219-25.
28. Borodulya, V. A. and Kovensky, V. I., "Radiative HeatTransfer Between a Fluidized Bed and a Surface," Int.J. of Heat and Mass Transfer, Vol 26, No. 2, 1983,pp.277-87.
29. Borodulya, V. A., Kovensky, V. I., and Makhorin, K.,"Fluidized Bed Radiative Heat Transfer," Proc. of the4th Int. Conf. on Fluidization, Japan, June, 1983,pp.379-88.
30. Botterill, J. S. M., Fluidized-Bed Heat Transfer,Academic Press, NY, 1975.
31. Botterill, J. S. M., and Denloye, A. 0. 0., "ATheoretical Model of Heat Transfer to a Packed orQuiescent Fluidized Bed," Chem. Eng. Sci., Vol.33, 1978,pp.509-15.
32. Botterill, J. S. M., and Denloye, A. 0. 0., "GasConvective Heat Transfer to Packed and Fluidized Beds,"AIChe Sym. Ser., Vol. 74, No. 176, 1978, pp.194-202.
33. Botterill, J. S. M. and Sealey, C. J., "Radiative HeatTransfer Between a Gas Fluidized Bed and an ExchangeSurface," British Chem. Eng., Vol. 15, No. 2, 1970,pp.1167-68.

34. Botterill, J. S. M. and Williams, J. R., "The Mechanismof Heat Transfer to Gas Fluidized Bed," Trans. Inst.Chem. Engrs., Vol. 41, 1963, pp.217-30.
35. Brewster, M. Q., "Radiative Heat Transfer in Fluidized-Bed Combustors," ASME paper No. 83-WA/HT-82, 1982.
36. Brewster, M. Q. and Tien, C. L., "Radiative Transfer inPacked Fluidized Bed: Dependent Versus IndependentScattering," J. of Heat Transfer, Vol. 104, Nov. 1982,pp.573-79.
37. Brown, E. A., Charlson, R. J. and Johnson, D. L.,"Steady-State Heat Flux Gauge," The Review of ScientificInstruments, Vol. 32, 1961, pp.984-85.
38. Canada, G. S. and Mclaughtin, M. H., "Large ParticleFluidization and Heat Transfer at High Pressures," AICheSvm. Ser., Vol. 74, No. 176, 1978, pp.27-37.
39. Catipovic, N. M., "A Study of Heat Transfer to ImmersedTubes in Fluidized Beds," AIChe 71st Annual Meeting,Miami FL, Nov. 1978, 34p.
40. Catipovic, N. M., "Heat Transfer to Horizontal Tubes inFluidized Beds," PhD. Thesis, Dept. of Chem. Eng.,Oregon State University, March 1979.
41. Catipovic, N. M., Fitzgerald, T. J., George, A. H. andWelty, J. R., "Experimental Validation of the Adams-Welty Model for Heat Transfer in Large-ParticleFluidized Beds," AIChe J., Vol. 28, No. 5, 1982, pp.714-20.
42. Catipovic, N.J., "RegimesJ., Vol. 24,
43. Chandran, R.Dynamics forJ., Vol. 28,
135
M., Jovanovic, G. N., and Fitzgerald, T.of Fluidization for Large Particles," AICheNo. 3, May 1978, pp.543-47.
and Chen, J. C., "Bed-Surface ContactHorizontal Tubes in Fluidized Beds," AICheNo. 6, 1982 pp.907-12.
44. Chandran, R. and Chen, J. C., "A Heat Transfer Model forTubes Immersed in Gas Fluidized Beds," AIChe J., Vol.31, No. 2, 1985, p.244.
45. Chandran, R. and Chen, J. C., "Influence of the Wall onTransient Conduction into Packed Media," AIChe J., Vol.31, No. 1, 1985, p.168.
46. Chandran, R., Chen, J. C. and Staub, F. W., "Local HeatTransfer Coefficient Around Horizontal Tubes inFluidized Beds", J. of Heat Transfer, Vol. 102, Feb.1980, pp.152-57.

136
47. Chen, J. C., "Heat Transfer to Tubes in Fluidized Beds,"ASME National Heat Transfer Conf., Paper No. 76-HT-75,1975.
48. Chen, J. C. and Chen, K. L., "Analysis of SimultaneousRadiative and Conductive Heat Transfer in FluidizedBeds," Chem. Eng. Commun., Vol. 9, No.1, 1981, pp.255-71.
49. Cherrington, D. C., Golan, L. P. and Hammitt, F. G.,"Industrial Application of Fluidized Bed Combustion--Single Tube Heat Transfer Study,". Proc. of the 5th Int.Conf. on Fluidized Bed Combustion, Vol 3, Dec. 1977,pp.184-209
50. Chung, B. T. F., Fan, L. T. and Hwang, C. L., "A Modelof Heat Transfer in Fluidized Beds," J. of HeatTransfer, Feb. 1972, pp.105-10.
51. Davidson, J. F. and Harrison, D., Fluidization, AcademicPress, London, pp.517-540, 1971.
52. Decker, N. A. and Glicksman, L. R., "Conduction HeatTransfer at the Surface of Bodies Immersed in GasFluidized Beds of Spherical Particles,". AIChe Sym.Ser., Vol. 77, No. 208, 1981, pp.341-49.
53. Decker, N. A. and Glicksman, L. R., "Heat Transfer inLarge Particle Fluidized Beds," Int. J. of Heat and MassTransfer, Vol. 26, No. 9, 1983, pp.1307-20.
54. Denloye, A. 0. O. and Botterill, J. S. M., "Bed toSurface Heat Transfer in a Fluidized Bed of LargeParticle," Powder Tech., Vol. 19, 1978, pp.197-203.
55. Doebelin, E. O., Measurement systems Application andDesign, Revised Edition, Mcgraw-Hill, NY, 1975.
56. Dow, W. M. and Jakob, M., "Heat Transfer Between anVertical Tube and a Fluidized Air-Solid Mixture," Chem.Eng. Prog., Vol. 47, No. 12, 1951, p.637.
57. Dunsky, V. D. and Tamarin, A. I., "Heat and MassTransfer in Disperse Systems," Nauka i Tekh., Minsk,1965.
58. Fatani, A. A., "An Analytical Model of Radiative andConvective Heat Transfer in Small and Large Particle GasFluidized Beds," PhD Thesis, Dept. of Mech. Eng., OregonState University, Oct. 1983.

137
59. Figliola, R. S. D., Beasley, D. E. and Subramaniam, C.,"Instantaneous Heat Transfer Between an ImmersedHorizontal Tube and a Gas fluidized Bed," ASME/AICheHeat Transfer Conf., Paper No. 84-HT-111. Niagara Fall,NY, 1984.
60. Gabor, J. D., "Wall to Bed Heat Transfer in FluidizedBed and Packed Bed," Chem. Eng. Prog. Sym. Ser., Vol.66, No. 105, pp.76-86.
61. Galloway, T. R. and Sage, B. H., "A Model of theMechanism of Transport in Packed Distended and FluidizedBed," Chem Eng. Sci., Vol. 25, pp.495-516.
62. Ganzha, V. L., L'hpadhyay, S. N. and Saxena, S. C., "AMechanistic Theory for Heat Transfer Between FluidizedBeds of Large Particles and Immersed Surfaces," Int. J.of Heat and Mass Transfer, Vol. 15, 1982, pp.1531-40.
63. Gelperin, N. I., Einshtein, V. G., "Heat Transfer inFluidized Bed," in Fluidization, Editors, Davidson, J.F. and Harrison, D., Academic Press, London, 1971.pp.517-40.
64. Gelperin, N. I., Einshtein, V. G., andA., "Heat Transfer Between a FluidizedBundles with Various Tube Arrangements,Vses. Khim. Obshchest., Vol. 14, No. 1,
Korotyanskaya, L.Bed and Tube" in Russian, Zh.1969, p.120.
65. Gelperin, N. I., Einshtein, V. G., and Zaikovskii, A.Characteristics of a
Fluidized Bed with a Horizontal Tube Bundle," J. of Eng.
66. George, A. H., "An Experimental Study of Heat Transferto a Horizontal Tube in a Large Particle Fluidized Bedat Elevated Temperature," PhD Thesis, Dept. of Mech.Eng., Oregon State University, June 1981.
67. George, A. H., "Documentation for the OSU HighTemperature Fluidized Bed Facility," Dept of Mech. Eng.,Oregon State University, Aug. 1981.
68. Ghafourian, M. R., "Determination of ThermalConductivity, Specific Heat, and Emissivity of IoneGrain," MS Project, Dept. of Mech. Eng., Oregon StateUniversity, June 1984.
69. Glass, D. H. and Harrison, D., "Flow Patterns Near aSolid Obstacle in a Fluidized Bed," Chem. Eng. Sci.,Vol. 19, 1964, pp.1001-02.

138
70. Glicksman, L. R., "Heat Transfer in Fluidized BedCombustors," in Fluidized Bed Boilers: Design andApplication, Editor, Basu, P., Pergamon Press, 1984,pp.63-100.
71. Glicksman, L. R. and Decker, N., "Design Relationshipsfor Predicting Heat Transfer to Tube Bundles inFluidized Bed Combustors," Proc. 6th Int. Conf. onFluidized Bed Combustion, Atlanta, GA, April, 1980, Vol.3, pp.1152-57.
72. Glicksman, L. R. and Decker, N. A., "Heat Transfer froman Immersed Surface to Adjacent Particles in a FluidizedBed; the Role of Radiation and Particle Packing," Proc.of 7th Int. Heat Transfer Conf., Munich, Vol. 6, 1982,pp.45-50.
73. Goblirsch, G. and Vander, R. H., "Atmospheric FluidizedBed Combustion Testing of North Dakota Lingnite," The6th Int. Fluidized Bed Conf., Atlanta GE, April 1980,13p.
74. Golan, L. P. and Cherrington, D, C., "Heat Transfer andUnit Response of a Large Fluidized Bed Combustor,"AIChe Svm. Ser., Vol. 77, No. 208, 1981, pp.374-83.
75. Golan, L. P., Lalonde, G. V. and Weiner, S. C., "HighTemperature Heat Transfer Studies in a Tube Filled Bed,"Proc. 6th Int. Conf. on Fluidized Bed Combustion,Atlanta, GA, Vol. 3, April, 1980, pp.1173-85.
76. Gosmeyer, C. D., "An Experimental Study of Heat Transferin a Large Particle Heated fluidized Bed," MS Thesis,Dept. of Chem. Eng., Oregon State University, Sept.1979.
77. Goshayeshi, A., "An Experimental Study of Heat Transferwith an Array of Horizontal Tube Immersed in a HighTemperature Fluidized Bed at Elevated Temperatures," PhDThesis, (to be published), Dept. of Mech. Eng., OregonState University, 1987.
78. Goshayeshi, A., Welty, J. R., Adams, R. L., Alavizadeh,N., "Local Heat Transfer Coefficients for HorizontalTube Arrays in High Temperature Large Particle FluidizedBed - An Experimental Study," 23rd ASME/AIChe NationalHeat Transfer Conference, Denver, CO. Aug. 1985.
79. Grewal, N. S., "Heat Transfer Between Tubes and Gas-Solid Fluid Beds," Dept. of Mech. Eng., University ofNorth Dakota 58202, 1984.

139
80. Grewal, N. S. and Goblirsch, G., "Heat Transfer toHorizontal Tubes in a Pilot-Scale Fluidized-BedCombustor Burning Low Rank Coals," ASME/AIChe NationalHeat Transfer Conf., Paper No. 83-HT-91, Dec. 1983.
81. Grewal, N. S. and Hajicek, D, R., "Experimental Studiesof Heat Transfer from an Atmospheric-Fluidized BedCombustor to an Immersed Array of Horizontal Tubes," The7th Int. Heat Transfer Conf., Paper No. HX23, 1983,Munchen, Germany, pp. 295-300.
82. Grewal, N. S. and Saxena, S. C., "Experimental Studiesof Heat Transfer between a Bundle of Horizontal Tubesand a Gas-Solid Fluidized Bed of Small Particles," Ind.Eng. Chem. Proc. Design and Development, Dec. 1983, Vol.22, pp.367-76.
83. Hager, N. E., "Thin Foil Heat Meter," The Review ofScientific Instruments, Vol. 36, No. 11, Nov. 1965, pp.1564-70.
84. Hager, W. R. and Schrag, S. D., "Particle CirculationDownstream from a Tube Immersed in a Fluidized Bed,"Chem. Eng. Sci., Vol. 31, 1976, pp.657-59.
85. Hager, W. R. and Thomson, W. J., "Bubble Behavior AroundImmersed Tubes in a Fluidized Bed," AIChe Sym. Ser.,Vol. 69, No. 128, 1973, pp.68-77.
86. Harakas, N. K. and Beatty, Jr., K. 0., "Moving Bed HeatTransfer : Effect of Interstitial Gas with FineParticles," Chem. Eng. Prog. Sym. Ser., Vol. 59, No. 41,1963, pp.122-28.
87. Hewlett Packard Co., Practical Temperature Measurement,Application Note 290, Aug. 1980.
88. Howard, J. R., Fluidized Bed: Combustion andApplication, Applied Science Publishers Ltd., London,1983.
89. Hy-Cal Engineering Co., Catalog No. CF-991.3, SantafaSpring, CA, 1981.
90. Ilchenko, A. I., Pikashov, V. S. and Makhorin, K. E.,"Study of Radiative Heat Transfer in Fluidized Beds," J.of Eng. Physics, Vol. 14, 1968, pp.321-24.
91. Jovanovic, G. N., "Gas Flow in Fluidized Beds of LargeParticles: Experiment and Theory," PhD Thesis, Dept. ofChem. Eng., Oregon State University, March 1979.

140
92. Jovanovic, G. N. and Catipovic, N. M., "A New Approachin Classifying Solids in Bubbling Gas-Fluidized Beds,"in Fluidization, editor, Kunii, D. and Toei R., Proc.of the 4th Int. Conf. on Fluidization, United Eng.Trustees, Inc., 1984.
93. Junge, D. C., "Design and Operation of OSU HighTemperature Fluidized Bed Facility," Dept. of Mech.Eng., Oregon State University, Aug. 1978.
94. Keairns, D. L., unpublished paper, WestinghouseResearch Laboratory, Pittsburgh, Penn. USA, 1970.
95. Kharchenko, N. V. and Makhorin, K. E., "The Rate ofHeat Transfer Between a Fluidized Bed and an ImmersedBody at High Temperatures," Int. Chem. Eng., Vol. 4,No. 4, Oct. 1964, pp.650-54.
96. Kolar, A. K., Grewal, N. S. and Saxena, S, C.,"Investigation of Radiative Contribution in a HighTemperature Fluidized Bed Using the Alternate-Slab-Model," Int. J. Heat and Mass Transfer, Vol. 22, 1979,pp. 1695-1703.
97. Ku, A. C., Kuwata, M. and Staub, F. W., "Heat Transferto Horizontal Tube Banks in a Turbulent Fluidized bedof Large Particles," AIChe Sym. Ser., Vol. 77, No. 208,1981, pp.359-73.
98. Kubie, J. and Broughton, J., "A Model of Heat Transferin Gas Fluidized Beds," Int. J. of Heat and MassTransfer, Vol. 18, 1975, pp.289-99.
99. Kunii, D. and Levenspiel, O., Fluidization Engineering,John Wiley & Sons, 1969
100. Kunii, D. and Toei, R., Editors, Fluidization: Proc. ofthe 4th Int. Conf. on Fluidization, May 1983, Japan,Engineering Foundation, United Eng. Trustees, Inc.,1984.
101. Leon, A. M., Choksey, P. J. and Bunk, S. A., "Design,Construction, Operation, and Evaluation of a PrototypeCulm Combustion Boiler/Heater Unit," Report FE 3269-9A,Dorr-Oliver, Inc., Stamford, Connecticut.
102. Levenspiel, O. and Walton, J. S., "Bed-Wall HeatTransfer in Fluidized Systems," Chem. Eng. Prog. Sym.,Vol. 50, No. 9, pp.1-13.
103. Loew, O., Shmutter, B. and Resnick, W., "Particle andBubble Behavior and Velocities in a Large-ParticlesFluidized Bed with Immersed Obstacles," Powder Tech.,Vol. 22, 1979, pp.45-57.

141
104. Mahbod, B., "A Theoretical Study of the RadiativeContribution to Heat Transfer Between a HighTemperature, Large Particle Gas Fluidized Bed and anImmersed Tube", PhD Thesis, Dept. of Mech. Eng., OregonState University, April 1984.
105. Mahbod, B. and Adams, R. L., "A Model of RadiativeContribution to Heat Transfer in a High-Temperature,Large-Particle Gas Fluidized Bed," ASME/AIChe NationalHeat Transfer Conf., Aug. 1984.
106. Mahbod, B., Tabesh, T. and Goshayeshi, A., "AnAnalytical Model for Prediction of Radiative HeatTransfer in Large-Particle Gas Fluidized Beds with anEmbedded Horizontal Tube," AIChe Sym. Ser., Vol. 81,No. 245, 1985, p.26.
107. Makansi, J., Schwieger, R., "Fluidized Bed Boiler,"Power, Vol. 131, No. 5, May 1987, pp.1-15.
108. Martin, H., "Heat & Mass Transfer in Fluidized Beds,"Int. Chem. Eng., Vol. 22, No. 1, pp.30-43, 1982.
109. Maskaev, V. K. and Baskakov, A. P., "Features ofExternal Heat Transfer in a Fluidized Bed of CoarseParticles," Int. Chem. Eng., Vol. 14, No. 1, Jan. 1974,pp.80-83.
110. McLaren, J. and Williams, D. F., "CombustionEfficiency, Sulphur Retention and Heat Transfer inPilot-Plant Fluidized-Bed Combustors," J. of theInstitute of Fuel, Vol. 42, 1969, pp.303-08.
111. Mickley, H. S. and Fairbanks, D. F., "Mechanism of HeatTransfer to Fluidized Beds," AIChe J., Vol. 1, Sept.1955, pp.374-84.
112. Neter, J., Wasserman, W., and Kutner, M. H., AppliedLinear Regression Models, Richard D. Irwin, Inc.,Homewood, IL, 1983.
113. Newby, R. A., Keairns, D. L. and Ahmed, M. M., "TheSelection of Design and Operations for Industrial AFBCto Meet Environmental Constraints," Proc. of DOE/WYUConf. on Fluidized Bed Combustion System Design andOperation, 1980, pp.59-133.
114. Ozkaynak, T. F., "An Experimental Investigation ofRadiation Heat Transfer in a High Temperature FluidizedBed," Proce. of 4th Int. Conf. on fluidization, Japan,May 1983, pp.371-78.

142
115. Peeler, J. P. K. and Whitehead, A. B., "Solids Motionat Horizontal Tube Surfaces in a Large Gas-SolidFluidized Bed," Chem. Eng. Sci., Vol. 17, No. 1, 1982,pp.77-82.
116. Petrie, J. C., Freeby, W. A. and Buckham, J. A., "InBed Heat Exchangers," Chem. Eng. Proq, Vol. 64, No. 7.July 1968, pp.45-51.
117. Pikashov, V. S., Zabrodsky, S. S., Makhorin, K. E., andIlchenko, A. I., "On the Experimental Study of theFluidized Bed Effective Emissivity," Heat and MassTransfer, Vol. 5, Nauka i Teckhn. Minsk. 1968.
118. Pikashov, V. S., Zabrodsky, S. S., Makhorin, K. E., andIlchenko, A. I., Bulletin of BSSR., Academy of Science,Physical Energetics, Series 100, No. 2, 1969, p.100.
119. Pillai, K. K., "A Radiative Packet Model for HeatTransfer in Fluidized Beds," The 6th Int. Conf. onFluidized Bed Combustion, Vol. 3, April, 1980, pp.1081-91.
120. Rowe, P. N., "Prediction of Bubble Size in a GasFluidized Bed," Chem. Eng. Sci., Vol. 31, 1976, pp.285-288.
121. Samson, T., "Heat Transfer to Objects in FluidizedBeds," Congress International Fluidization and ItsApplication, Vol. 1, Toulouse, France, Oct. 1973.
122. Saxena, S. C., Grewal, N. S. and Gabor, J. D., "HeatTransfer Between a Gas Fluidized Bed and ImmersedTubes," Advances in Heat Transfer, Vol. 14, 1978,Academic Press, pp.149-247.
123. Schlunder, E. V., "Heat Transfer to Moving SphericalPackings at Short Contact Times," Int. Chem. Eng., Vol.20, No. 4, 1980, p.550.
124. Schwieger, R. G., Editor, "Fluidized Bed Combustion andApplied Technology," First Int. Fluidization Svm.,Beijing, China, Aug. 1983, Mcgraw Hill, NY, 1984.
125. Siegel, R. and Howell, J. R., Thermal Radiation HeatTransfer, 2nd Edition, Hemisphere, NY,1981.
126. Staub, F. W., "Solids Circulation in TurbulentFluidized Beds and Heat Transfer to Immersed TubeBanks," ASME J. of Heat Transfer, Vol. 101, 1979,pp.391-96.

143
127. Strom, S. S., Dowdy, T. E., Lapple, W. C., Kitto J. B.,Stanoch, T. P., Boll, R. H., and Sage, W. L.,"Preliminary Evaluation of Atmospheric PressureFluidized Bed Combustion Applied to Electric UtilityLarge Steam Generators," EPRI Report No. RP 412-1,Electric Power Research Institute, Palo Alto, CA, Feb.1977.
128. Szekely, J. and Fisher, R. J., "Bed to Wall RadiationHeat Transfer in a Gas-Solid Fluidized Bed," Chem. Eng.Sci., Vol. 24, 1969, pp.833-49.
129. Tang, J. T. and Howe, W., "Heat Transfer Analysis forthe 6'x6' Atmospheric Fluidized Bed DevelopmentFacility," ASME/AIChe National Heat Transfer Conf.,Paper No. 80-HT-128, Orlando, Florida, July, 1980.
130. Temperature Measurement Handbook 1985, OmegaEngineering, Stamford, Connecticut, 1985.
131. Vadivel, R. and Vedamurthy, V. N., "An Investigation ofthe Influence of Bed Parameters on the Variation of theLocal Radiative and Total Heat Transfer Around anEmbedded Horizontal Tube in a Fluidized Bed Combustor,"Proc. of 6th Int. Conf. on Fluidized Bed Combustion,Vol. 3, Atlanta GA, USA, April 1980.
132. Van Heerden, C., Nobel, P. and Van Krevelen, D. W.,"Mechanism of Heat Transfer in Fluidized Beds," Ind.Eng. Chem., Vol. 45, 1953, pp.1237-42.
133. Varygin, N. N. and Martyushin, I. G., "A Calculation ofHeat Transfer Surface Area in Fluidized Bed Equipment,"Khim, Mashinostinostroenie, No. 5, 1959, pp.6-9.
134. Vedamurthy, V. N. and Sastri, V. M. K., "An Analysis ofthe Conductive and Radiative Heat Transfer to the Wallsof Fluidized Bed Combustors," Int. J. of Heat and MassTransfer, Vol. 17, No. 1, 1974, pp.1-9.
135. Vedamurthy, V. N. and Sastri, V. M. K., "AnExperimental Study of the Influence of Bed Parameterson Heat Transfer in a Fluidized Bed Combustor,"Fluidized Bed Library, New York University, pp.589-97.
136. Wen, C. Y. and Leva, M., "Fluidized Bed Heat Transfer:A Generalized Dense-Phase Correlation," AIChe. J., Vol.2, No. 4, Dec. 1956.
137. Welty, J. R., "Heat Transfer in High TemperatureFluidized Beds with Immersed Tubes of Coal CombustionService," Annual Report to US Dept. of Energy, No. FE-2714-5, 1978.
144
138. Welty, J. R., "Heat Transfer in Large ParticleFluidized Beds," US/CHINA Binational Heat TransferWorkshop, Editors, Wu, Z., Wand, B., Tien, C. L., andYang, K. T., Oct., 1983. pp.148-62.
139. Welty, J. R., Adams, R. L., Lei, D. H. S. and Bakke, P.A., "A Study of the Radiative Contribution to HeatTransfer Between a High-Temperature Fluidized Bed andan Array of Immersed Tube," Final Report to NSF, Dept.of Mech. Eng., Oregon State University, July 1986.
140. Welty, J. R., Wicks, C. E., and Wilson, R. E.,Fundamental of Momentum, Heat , and Mass Transfer, 3rdEdition, John Wiley & Sons, Inc., 1984.
141. Wright, S. J., Hickman, R. and Ketley, H. C., "HeatTransfer in Fluidized Beds of Wide Size Spectrum atElevated Temperatures," British Chem. Eng., Vol. 15,No. 12, 1970, pp.1551-54.
142. Wright, S. J., Ketley, H. C. and Hickman, R. G., "TheCombustion of Coal in Fluidized Beds for Firing ShellBoiler," J. of the Institute of Fuel, June 1969,pp.235-40.
143. Yoshida, K., Kunii, D. and Levenspiel, O., "HeatTransfer Mechanisms Between Wall Surface and FluidizedBed," Int. J. of Heat and Mass Transfer, Vol. 12, 1969,pp.529-31.
144. Yoshida, K., Ueno, T. and Kunii, D., "Mechanism of Bed-Wall Heat Transfer in a Fluidized Bed at HighTemperatures," Chem. Eng. Sci., Vol. 29, 1974, pp.77-82.
145. Zabrodsky, S. S., Hydrodynamics and Heat Transfer inFluidized Beds, Translation Editor, Zenz, F. A., TheMIT Press, MA, USA. 1966.
146. Zabrodsky, S. S., "Compound Heat Exchange Between aHigh Temperature Gas-Fluidized Bed and a SolidSurface," Int. J. of Heat and Mass Transfer, Vol. 16,1973, pp.241-48.
147. Zabrodsky, S. S., Antonishin, N. V., Vasiliev, G. M.,and Paranas, A. L., "The Choice of Design Correlationfor the Estimation of the High-Temperature FluidizedBed-to-Immersed Body Heat Transfer Coefficient," Vestn.Akad. Nank. USSR, Ser. Fiz-Energ. Nauk No. 4, 1974,pp.103-07.

145
148. Zabrodsky, S. S., Epanov, Y. G. and Galershtein, D. M.,"Heat Transfer in a Large Particle Fluidized Bed withImmersed In-Line and Staggered Bundles of HorizontalSmooth Tubes," Int. J. of Heat and Mass Transfer, Vol.24, No. 4, Nov. 1981, pp.571-79.
149. Ziegler, E. N. and Brazelton, W. T., "Mechanism of HeatTransfer to Fixed Surfaces in Fluidized Beds," Ind.Engr. Chem. Fundamentals, Vol. 3, 1964, pp.94-98.
150. Ziegler, E. N., Koppel, L. B. and Brazelton, W. T.,"Effects of Solid Thermal Properties on Heat Transferto Gas Fluidized Beds," Ind. Engr. Chem. Fundamentals,Vol. 3, No.4, Nov. 1964, pp.324-28.

APPENDICES

146
APPENDICES
Appendix A. Temperature and Heat Flux Conversion
The heat flux sensors (No. 204551-1, RdF, Inc.)
employed in this study are self-generating transducers,
requiring no reference junction, signal conditioning, or
special wiring. The use of a HP-3497A high precision data
logger also aided in obtaining maximum resolution. Each heat
flux sensor was furnished with a ANSI type T (copper-
constantan) thermocouple and two multi-junction thermopiles.
A discussion of the conversion of voltage reading to
temperature and heat flux follows.
A.1 Sensor Surface Temperature
A software compensation (87) was used in the sensor
surface temperature (Ts) measurements. The temperature-
voltage relationship of any type of thermocouple is
nonlinear. Better conversion accuracy can be obtained by
storing the thermocouple table provided by National Bureau
of Standards (130) in the computer (87). A more viable
approach is to approximate the table values using a power
series polynomial. The voltage readings were converted to
temperature employing a polynomial fit for the type T
thermocouple in the heat flux sensor (9). In equation (A.1),
Vt is the thermocouple voltage reading, and Vref is the
reference voltage obtained by converting reference
temperature to equivalent thermocouple voltage (82).

Ts ( °C) = CIE + C2E2 + C3E 3 + C4E4
Where C1 = 2.56613 x 10⁻²
C2 = -6.19549 x 10⁻⁷
C3 = 2.21816 x 10⁻¹¹
C4 = -3.55009 x 10⁻¹⁶
E = (Vt + Vref) x 10 6 (E in AV)
(A.1)
This polynomial fit has an accuracy of ±0.5 °C for
temperatures between 0 °C and 200 °C, which is within the
range of the sensor surface temperatures encountered in this
study.
A.2 Heat Flux
The heat transfer rate detected by the heat flux
sensor, Qd, is calculated from the following voltage-to-heat
flux conversion equation:
Qd-F(T ) x Vd
Cs
Where Qd : Detected heat flux (W/m2)
Fs : Multiplication factor
Vd : Detected thermopile voltage (DV)
Cs : Sensitivity constant (AV.m2/W)
(A.2)
147

148
The multiplication factor, F(Ts), is a compensation for
the change of thermopile conductivity with heat flux sensor
surface temperature (Ts). It is supplied by the manufacture
in a plot of F vs. Ts. A second-order polynomial fit was
performed to approximate F(Ts) between 50 °C and 180 °C. The
result is
F(Ts) = E0 + E1T5 (A.3)
Where Eo = 1.062806
E1 = -2.794375 x 10⁻³
E2 = 5.144126 x 10⁻⁶
The constant of sensitivity (Cs) is a calibration
constant given by the manufacturer at 21 °C (70 °F). The
value of Cs for each heat flux sensor is listed in Table
A.1.
Table A.1 Heat flux sensor sensitivity constant
Probe No. #1 #2 #3
Radiation 0.17 0.20 0.18
Total 0.198 0.206 0.207

149
Appendix B Error Estimation
B.1 Total Heat Flux Gauge
Three sources of error, as previously identified by
George (66), were presented in the total heat flux
measurements
(a) error due to heat conduction along the stainless steel
shim surface.
(b) error caused by nonuniform surface temperature in the
bubble contact region.
(c) calibration and data collection RSS (Root-Sum-Square)
error.
The first two are inherent errors of the gauges. George
(66) analyzed these two errors. The temperature drop across
the high thermal conductivity thin shim was found to be less
than 1.8 K at Tw = 478 K. By neglecting the temperature
difference, a two-dimensional steady state heat conduction
analysis was performed to assess the ratio of heat flux
transmitted to the sensor to that absorbed at the upper
surface of the shim. It was found that about 2% of the heat
flux absorbed at the shim's upper surface was not conducted
to the sensor's active area.
A laminar thermal boundary layer analysis was conducted
to investigate the effect of (b) on the performance of the
total heat flux gauge. Note that this analysis applies only
when the gauge is covered by gas bubbles, i.e. heat is
transferred by pure gas convection. A reduction of about 4%

150
in the total heat flux measurement was found using the data
of bubble contact fraction suggested by Catipovic (5,104),
equation (1.5).
RSS Random Error
The errors in (c), which are of primary concern in
terms of error estimation, are caused by operations in
calibration and in data collection. The local total heat
transfer coefficient (ht) is calculated from
htQt
Tf Tw
Cc Vd
Tf - Tw(B.1)
where
Cc = heat flux sensor calibration constant [= F(Ts)/Cs]
Vd = detected thermopile voltage
The Root-Sum-Square (RSS) random error for calibration
and data collection is given by Doebelin (55) as:
Aht r ACc _Vd (ATf)2+(ATw)211 2(---)ran = ± I( ----)2 + (----)` + (B.2)ht L
c Vd (Tf-Tw)2
RSS random error is then calculated using the
uncertainty in each quantity based on the manufacturer's
specifications and the author's operating experience. The
maximum possible random error for the experiments was found
to be

151
)Aht,
(12)2 (4)2 -11/2
t1(0.05)2 + (0.05)2 +---ran =
ht (812 - 420)2
= ± [(0.05)2 + (0.05)2 + (0.041)2 ]
cm. ± 0.08
1/2
Overall Error
The inherent errors in (a) and (b) are next added to
the random error to obtain the overall error
Aht()overall
= (+0.08, -0.08) + (0, -0.02) + (0, -0.04)"t
(+0.08, -0.14)
It is concluded that the values of local total heat
transfer coefficients reported in this study are within the
range of (+0.08, -0.14) of actual values.
B.2 Radiation Detector
There are two inherent errors in the radiation detector
itself, as described in section 2.2.3. The worst, ± 2.5%
variation in radiation heat transfer measurements, was
estimated due to the possibility of a nonuniform heat flux.
An overestimation of 1% was found due to conduction error
associated with the silicon window.

152
RSS Random Error
The black-tube local radiative heat transfer
coefficient (hrb) is calculated from
where
Qrb Cd Qd Cd Cc Vdhrb (B.3)
Tf Tw Tf Tw Tf - Tw
Cd = radiation detector calibration constant
Cc = heat flux sensor calibration constant
Vd = detected thermopile voltage
Note that an extra calibration constant (Cd), which is
caused by the locally conducted calibration for the
radiative detector, is involved in the calculation of the
RSS random errors. The RSS random error becomes
Ahrb F ACd AC,- 2
AVANA,
ATf2 + ATw211/2(----) ra.n± (----) (----)
2(
hrb L Cd Cc Vd (Tf - Tw)2) 1-1
(B.2)
Again, the maximum possible random error is calculated
employing the uncertainties in each term.
Ahrb (12)2 + (2)21 1/2(----) = ± 1(0.05)2 + (0.05)2 + (0.05)2 +h ran L
(812 - 368) 21rb
..1/2= ± [(0.05)2 + (0.05)2 + (0.05)2 + (0.033)2)
= ± 0.09

153
Overall Error
The estimation of overall error in local radiative heat
transfer coefficient values reported in this study is
obtained by adding all of these errors together
Ahrb(7)overali (+0.09, -0.09) + (+0.025, -0.025) + (+0.01, 0)-rb
= (+0.125, -0.115)

154
Appendix C. Tabulated Data
Experimental results for all test conditions are
presented in Tables C.1 through C.10, which list the time-
averaged local radiative (hrb) and total (ht) heat transfer
coefficients at different locations (a = 00, 450, 90 0
135°,and 180° measured from the lower stagnation point of
the tube) and superficial velocities (U0). Also listed are
the spatial-averaged radiative values (hrb), total values
(ht), and radiation contribution (f). Note that the data in
Table C.6 and C.9 are adapted from Alavizadeh (9).
Data for the experimental verification conducted for
the three window materials are listed in Tables C.11 and
C.12 in the form of local radiative heat transfer
coefficients (hrb) at two locations (a = 0° and 90°) for two
particle sizes (2.14 mm and 3.23 mm) and bed temperatures
(900 K and 1080 K).

155
Table C.1
Results for Dp = 2.14 mm and Tf = 812 K (Tube Array)
U0
a = 0 hrbht
a = 45 hrbht
a = 90 hrbht
a = 135 hrbht
a = 180 hrbht
SpatialAverage hrb
ht
f
Uo
a = 0 hrbht
a = 45 hrbht
a = 90 hrbht
a = 135 hrbht
a = 180 hrbht
SpatialAverage hrb
Fit
f
2.84 2.73 2.63 2.51 2.38 2.24 2.09
26.5 26.3 25.8 25.7 25.2 24.9 24.7178 177 179 178 181 180 189
25.3 25.1 25.2 25.0 25.2 24.9 24.7165 168 167 170 168 173 176
23.4 23.2 22.8 22.5 22.1 21.9 21.4175 177 173 174 173 171 178
20.7 20.4 19.9 19.6 18.7 18.4 18.0182 188 188 190 185 188 186
19.5 18.2 17.5 16.5 16.2 15.7 14.8203 199 196 194 189 180 180
23.1 22.8 22.4 22.0 21.7 21.4 21.0
177 180 179 180 178 178 181
13.2 12.8 12.7 12.5 12.4 12.3 11.8
1.93 1.84 1.74 1.64 1.54 1.43
24.6 24.7 24.3 23.9 22.1 19.5186 182 183 186 181 168
24.3 24.2 23.8 23.2 20.8 16.8176 178 181 177 173 143
21.1 21.0 20.8 20.3 18.8 13.4172 173 170 168 141 123
17.4 16.6 16.2 12.1 6.0 2.1178 173 162 149 113 53
13.6 11.6 9.4 3.5 .2 .0168 156 133 101 33 15
20.5 20.0 19.1 17.4 14.2 10.5
176 173 168 159 132 103
11.8 11.8 11.6 11.2 11.0 10.5
Umf = 1.60 m/sec Pave = 12.2

156
Table C.2
Results for Dp = 2.14 mm and Tf = 925 K (Tube Array)
a = 0
a = 45
a = 90
a = 135
a = 180
SpatialAverage
a = 0
a = 45
a = 90
a = 135
a = 180
SpatialAverage
Uo 3.26 3.02 2.74 2.49 2.31 2.15
hrb 32.4 32.1 32.5 32.2 32.4 32.8ht 186 191 189 187 191 193
hrb 31.0 30.8 30.2 30.5 30.4 30.6ht 175 176 180 184 181 184
hrb 28.7 28.1 28.3 27.8 27.7 27.1ht 172 173 180 178 179 180
hrb 26.9 26.5 26.0 25.7 25.0 24.8ht 188 189 195 204 214 216
hrb 25.6 25.0 24.9 24.0 23.2 22.1ht 218 212 206 199 196 190
Fir 28.9 28.5 28.3 28.0 27.7 27.5
11t 184 185 188 190 192 193
f 14.9 14.8 14.5 14.4 14.2 13.5
Uo 1.99 1.87 1.74 1.66 1.58 1.50
hrb 33.0 32.5 31.7 31.0 29.5 25.1ht 192 186 188 185 186 174
hrb 30.1 29.8 29.3 27.7 26.0 19.9ht 182 188 191 185 175 153
hrb 27.0 26.7 25.4 23.7 20.0 14.5ht 177 175 172 169 156 136
hrb 24.3 24.1 22.5 17.2 9.6 3.2ht 208 190 172 154 121 60
hrb 20.0 17.4 13.3 7.7 3.1 .5ht 188 172 150 117 50 27
27.0 26.4 25.1 22.6 18.0 12.6
ht 189 183 176 165 143 112
f 13.7 13.8 13.8 13.0 12.1 10.9
Umf = 1.64 m/sec fave = 14.1

Table C.3
Results for Dp = 2.14 mm and Tf = 1000 K (Tube Array)
a = 0
a = 45
a = 90
a = 135
a = 180
SpatialAverage
a = 0
a = 45
a = 90
a = 135
a = 180
SpatialAverage
Uo 3.32 3.16 2.99 2.81 2.62 2.41
hrb 35.8 35.6 35.9 35.1 36.2 35.3ht 190 191 193 193 196 198
hrb 34.1 33.3 33.5 33.2 33.5 32.5ht 176 177 182 181 184 186
hrb 31.5 31.3 30.9 29.5 28.3 28.0ht 171 167 175 181 183 189
hrb 29.1 28.8 28.0 26.9 26.7 26.2ht 192 194 199 202 208 218
hrb 27.6 26.8 26.4 25.1 24.6 24.1ht 223 215 213 207 205 201
Firb 31.6 31.1 30.9 29.8 29.7 29.1
ht 186 185 190 191 194 198
f 16.4 16.1 15.7 15.1 14.8 14.4
Uo 2.17 2.04 1.89 1.75 1.66 1.59
hrb 35.0 34.5 34.8 34.7 33.1 28.3ht 201 199 193 191 194 187
hrb 31.6 30.8 29.7 29.2 27.1 20.8ht 193 192 195 185 181 162
hrb 27.8 27.9 27.1 25.3 21.6 16.1ht 171 167 175 181 183 189
hrb 25.5 25.4 25.0 21.1 14.5 4.1ht 221 219 195 175 149 73
hrb 22.6 22.1 18.9 13.3 8.5 1.1ht 196 189 179 155 81 42
Rrb 28.4 28.1 27.2 24.9 21.0 13.9
ht 200 196 189 178 159 122
f 14.3 13.9 13.7 13.4 13.0 11.4
..6
.11
Umf = 1.73 m/sec Pave = 14.8
157

158
Table C.4
Results for Dp = 3.23 mm and Tf = 812 K (Tube Array)
a = 0
a = 45
a = 90
a = 135
a = 180
SpatialAverage
a = 0
a = 45
a = 90
a = 135
a = 180
SpatialAverage
Uo 2.83 2.78 2.74 2.68 2.63 2.57
hrb 24.9 24.4 24.5 24.8 24.5 24.4ht 169 173 175 178 178 184
hrb 23.3 23.2 23.1 22.5 23.2 22.1ht 164 169 169 170 166 167
hrb 21.4 21.5 21.6 20.8 21.1 20.9ht 164 166 165 166 163 163
hrb 20.4 19.5 19.3 18.9 18.1 17.6ht 183 189 192 195 188 181
hrb 18.2 18.0 17.3 16.5 15.9 15.1ht 193 190 186 185 179 171
hrb 21.7 21.4 21.2 20.7 20.6 20.1
Kt 174 176 177 178 174 172
f 12.7 12.4 12.2 11.9 12.0 12.0
Uo 2.51 2.45 2.39 2.32 2.25 2.17
hrb 25.1 24.3 24.5 23.6 22.7 19.1ht 185 184 185 184 191 182
hrb 23.3 22.9 22.8 22.1 19.2 15.4ht 168 174 175 169 164 140
hrb 20.5 20.0 19.4 18.6 16.6 9.7ht 167 168 169 161 137 116
hrb 16.3 15.7 15.0 13.5 5.5 2.2ht 173 165 150 140 104 60
hrb 14.2 13.9 9.1 3.1 .8 .1
ut 163 148 102 56 18 14
Krb 19.9 19.4 18.5 16.9 13.4 9.4
Kt 171 167 159 148 128 104
f 11.9 11.9 11.9 11.7 10.8 9.4
Umf = 2.30 m/sec Pave = 12.0

Table C.5
Results for Dp = 3.23 mm and Tf = 925 K (Tube Array)
a = 0
a = 45
a = 90
= 135
a = 180
SpatialAverage
a = 0
a = 45
a = 90
a = 135
a = 180
SpatialAverage
U0 3.26 3.15 3.02 2.88 2.78 2.68
hrb 28.8 28.5 29.1 29.0 29.6 29.1ht 182 178 180 185 186 189
hrb 28.1 27.8 27.8 28.9 28.3 27.9ht 170 171 174 171 172 174
hrb 26.9 26.7 26.3 26.5 26.4 25.7ht 166 169 166 167 170 168
hrb 25.0 24.5 24.1 23.1 21.9 21.4ht 190 193 188 191 198 204
hrb 23.8 23.1 22.3 21.7 19.5 17.9ht 201 196 189 195 192 183
Hrb 26.6 26.2 26.0 26.1 25.3 24.6
ht 179 180 178 180 182 183
f 14.5 14.3 14.4 14.1 13.6 13.5
U0 2.59 2.51 2.43 2.35 2.27 2.20
hrb 28.8 29.0 28.7 28.3 27.5 21.6ht 190 187 184 188 195 185
hrb 28.0 28.2 27.8 26.8 23.4 17.1ht 174 175 178 170 169 150
hrb 25.9 25.3 24.6 23.1 19.7 12.1ht 170 173 171 163 149 116
hrb 20.9 20.7 19.1 15.6 9.4 4.1ht 199 187 170 151 103 61
hrb 17.6 14.3 11.3 6.0 .6 .5ht 171 152 121 76 27 20
Flrb 24.5 24.0 22.9 20.7 16.2 11.3
Fit 181 176 168 154 133 107
f 13.3 13.5 13.6 13.2 12.0 10.6
Umf = 2.32 m/sec Pave = 13.8
159

160
Table C.6
Results for Dp = 2.14 mm and Tf = 812 K (Single Tube)
a = 0
a = 45
a = 90
a = 135
a = 180
SpatialAverage
a = 0
a = 45
a = 90
a = 135
a = 180
SpatialAverage
U0 2.77 2.68 2.58 2.46 2.35 2.19 2.07
hrb 27.5 26.8 26.6 26.3 26.0 25.9 25.4ht 169 166 175 174 174 177 175
hrb 27.2 26.9 26.9 26.1 26.0 25.5 25.8ht 176 182 185 190 189 186 190
hrb 24.8 24.7 24.4 24.2 24.1 24.1 23.7ht 188 179 189 193 182 188 183
hrb 23.6 23.3 22.9 22.9 23.0 22.3 21.2ht 186 183 190 177 177 182 190
hrb 21.4 20.1 20.3 19.8 19.3 18.1 18.4ht 201 204 205 204 205 206 207
hrb 25.0 24.6 24.4 24.1 23.9 23.5 23.1
ht 184 182 189 187 184 187 189
f 14.2 14.2 13.5 13.5 13.6 13.3 12.8
Uo 1.96 1.85 1.75 1.67 1.57 1.47
hrb 25.6 25.1 25.0 25.3 25.4 21.8ht 173 173 173 174 177 173
hrb 25.3 25.2 25.4 25.5 26.5 18.6ht 185 187 191 178 178 143
hrb 24.1 23.4 23.5 24.1 24.4 18.5ht 184 194 194 184 173 144
hrb 19.9 19.9 19.5 16.4 9.8 3.3ht 194 197 196 182 135 69
hrb 16.4 13.2 8.9 5.0 .7 0ht 207 186 156 122 76 19
hrb 22.6 21.9 21.3 20.3 18.4 12.8
ht 188 189 186 173 153 113
f 12.7 12.3 11.9 12.2 12.4 11.5
Umf = 1.62 m/sec rave = 13.1

Table C.7
Results for Dp = 2.14 mm and Tf = 925 K (Single Tube)
a = 0
a = 45
a = 90
a = 135
a = 180
SpatialAverage
a = 0
a = 45
a = 90
a = 135
a = 180
SpatialAverage
U0 3.25 3.01 2.73 2.48 2.30 2.15
hrb 35.1 35.3 35.8 35.5 35.3 36.0ht 179 183 185 191 183 185
hrb 35.5 35.0 35.7 36.4 35.4 36.4ht 183 192 191 197 201 198
hrb 34.3 34.2 33.8 34.7 34.1 33.6ht 194 203 209 211 215 219
hrb 32.6 31.9 31.4 31.2 30.8 29.9ht 202 200 201 209 213 215
hrb 28.3 27.9 26.5 25.0 23.8 21.3ht 193 189 185 191 193 189
Flrb 33.5 33.2 33.0 33.0 32.5 32.1
13t 191 195 197 202 204 205
f 17.1 16.6 16.3 16.0 15.8 15.5
Uo 2.01 1.88 1.77 1.68 1.59 1.51
hrb 36.3 35.8 34.7 35.1 33.4 31.9ht 180 183 181 177 175 173
hrb 36.6 36.2 35.5 35.9 33.5 29.2ht 194 189 187 185 179 165
hrb 33.4 33.0 32.9 32.1 28.1 22.0ht 216 214 209 201 188 157
hrb 29.5 29.3 28.5 24.3 17.5 5.4ht 210 205 195 184 141 77
hrb 19.8 18.6 16.4 13.1 8.6 3.1ht 187 184 171 141 79 37
hrb 31.9 31.5 30.6 29.1 25.0 18.5
171t201 198 192 182 159 126
f 15.7 15.8 16.0 16.1 15.7 14.7
Umf = 1.65 m/sec 1rave 16.1
161

Table C.8
Results for Dp = 2.14 mm and Tf = 1000 K (Single Tube)
a = 0
a = 45
a = 90
a = 135
a = 180
SpatialAverage
a = 0
a = 45
a = 90
a = 135
a = 180
SpatialAverage
Uo 3.30 3.15 2.98 2.79 2.60 2.38
hrb 41.3 40.9 41.9 42.1 41.8 41.5ht 185 183 180 185 189 188
hrb 41.7 41.6 42.1 42.0 42.3 41.6ht 182 189 185 194 198 197
hrb 40.5 39.2 40.6 40.0 40.4 40.1ht 196 202 209 210 216 218
hrb 38.8 38.0 37.8 37.7 37.1 36.4ht 204 212 216 217 222 230
hrb 34.4 33.6 31.4 29.9 28.9 28.6ht 200 198 208 213 212 211
Erb 39.7 39.0 39.3 38.9 38.8 38.3
Et 194 198 201 205 209 211
f 19.2 18.8 18.6 18.3 18.0 17.6
U0 2.18 2.02 1.87 1.74 1.65 1.57
hrb 41.9 40.8 41.2 40.3 39.5 38.1ht 195 192 188 183 184 179
hrb 41.1 41.3 41.5 41.2 40.1 33.2ht 197 195 194 192 185 173
hrb 39.9 39.4 38.3 37.9 32.5 26.3ht 224 221 218 212 203 165
hrb 35.6 35.1 33.9 31.1 22.9 7.7ht 240 256 233 201 176 104
hrb 27.4 26.1 23.5 19.2 12.5 4.5ht 205 201 193 159 104 62
Erb 37.8 37.3 36.6 35.0 30.4 22.1
Et 215 217 209 194 177 141
f 17.4 17.2 17.3 17.4 16.5 15.1
Umf = 1.71 m/sec Pave = 18.0
162

Table C.9
Results for Dp = 3.23 mm and Tf = 812 K (Single Tube)
a = 0
a = 45
a = 90
a = 135
a = 180
SpatialAverage
L
a = 0
a = 45
a = 90
a = 135
a = 180
SpatialAverage
Uo 2.62 2.52 2.45 2.38 2.33
hrb 25.0 24.8 25.2 25.2 25.1ht 168 172 171 174 179
hrb 25.6 25.2 25.9 25.3 25.8ht 182 179 176 175 175
hrb 24.7 24.3 24.5 24.4 24.5ht 196 196 195 195 192
hrb 22.9 22.1 21.9 21.3 20.7ht 193 198 196 196 190
hrb 21.1 17.6 16.2 13.8 8.3ht 160 148 134 119 78
Rrb 24.0 23.2 23.2 22.6 21.9
ht 184 183 180 178 171
f 13.8 13.4 13.5 13.4 13.5
U0 2.28 2.20 2.16 2.11
hrb 22.9 23.6 23.2 23.3ht 191 222 228 235
hrb 25.5 23.8 24.0 23.6ht 163 150 145 150
hrb 23.7 19.3 19.6 18.2ht 160 149 148 137
hrb 13.5 9.6 8.6 8.2ht 145 133 126 111
hrb .3 .0 .3 .1ht 23 20 19 19
Rrb 18.6 16.1 16.0 15.4
ht 144 138 136 131
f 13.2 12.1 12.1 12.1
Umf = 2.31 m/sec rave = 13.5
163

164
Table C.10
Results for Dp = 3.23 mm and Tf = 925 K (Single Tube)
a = 0
a = 45
a = 90
a = 135
a = 180
SpatialAverage
a = 0
a = 45
a = 90
a = 135
a = 180
SpatialAverage
Uo 3.28 3.17 3.05 2.92 2.80 2.70
hrb 34.2 34.0 34.1 34.0 34.3 34.5ht 174 172 175 180 181 180
hrb 34.3 34.1 33.8 33.6 34.3 34.1ht 188 191 195 198 196 199
hrb 34.1 33.5 33.0 32.7 32.4 32.7ht 195 200 205 208 204 210
hrb 32.4 31.9 31.7 31.3 30.6 30.2ht 191 195 199 201 195 197
hrb 29.9 29.1 28.4 27.7 26.9 25.8ht 178 174 169 164 166 167
Firb 33.1 32.8 32.4 32.0 32.0 31.8
Ht 188 190 193 195 192 195
f 17.6 17.3 17.2 16.9 17.1 16.9
Uo 2.61 2.53 2.45 2.37 2.29 2.21
hhrb 34.3 34.4 33.8 33.1 32.9 31.7ht 183 181 183 184 182 177
hrb 34.3 34.6 34.7 34.5 33.5 30.4ht 200 195 191 189 184 171
hrb 32.4 32.9 32.5 31.4 28.4 21.1ht 209 210 205 191 181 131
hrb 30.0 29.3 27.9 24.2 17.1 8.0ht 203 200 197 181 121 75
hrb 24.1 22.3 19.3 13.5 1.3 .8ht 159 151 137 97 31 23
hrb 31.5 31.3 30.4 28.4 24.0 19.1
ht 196 193 189 174 148 119
f 16.4 16.7 16.5 16.6 16.5 16.3
.16
Umf = 2.33 m/sec fave = 16.9

165
Table C.11
Local radiative heat transfer coefficient (hrb)for D = 2.14 mm (Single Tube)
Tf = 900 K Umf = 1.67 m/sec
U0 .96 1.17 1.34 1.49 1.63 1.75 1.86
a = 0 Si* 20.6 21.9 23.0 23.8 25.9 26.4 26.8Saw 21.7 22.3 24.6 24.4 28.3 27.8 28.1Qz+ 44.2 48.1 45.9 47.8 51.3 47.2 46.5
a = 90 Si 7.9 12.1 16.2 18.9 20.7 24.9 26.0Sa 8.5 13.4 15.9 19.5 21.5 26.2 27.8Qz 20.8 27.6 29.2 39.1 49.8 45.8 47.4
Uo 1.97 2.06 2.24 2.41 2.55 2.68 2.80
a = 0 Si 27.6 28.9 29.8 30.6 30.9 31.1 31.2Sa 29.2 29.8 32.7 31.6 33.1 34.5 33.8Qz 51.8 52.3 50.6 53.1 52.5 50.7 52.6
a = 90 Si 26.6 26.8 26.6 27.0 27.2 27.5 27.6Sa 28.8 27.6 29.4 28.2 29.5 28.9 29.9Qz 46.3 45.9 47.8 46.9 50.5 47.2 50.2
Tf = 1080 K Umf = 1.67 m/sec
Uo 1.15 1.40 1.61 1.80 1.95 2.10 2.24
a = 0 Si 31.2 36.8 40.9 44.7 47.1 47.8 48.1Sa 32.5 38.9 44.1 46.2 49.8 51.1 50.4Qz 59.4 68.5 65.6 75.1 70.1 73.1 65.2
a = 90 Si 11.4 18.6 25.7 37.8 45.1 45.9 46.3Sa 12.1 18.9 27.4 41.2 45.9 48.4 49.8Qz 24.5 36.7 55.6 69.4 65.3 71.5 67.5
Uo 2.37 2.48 2.70 2.89 3.07 3.22 3.36
a = 0 Si 48.3 48.5 48.2 48.7 47.7 47.1 47.0Sa 50.8 51.4 49.9 50.6 52.1 48.8 50.0Qz 68.3 68.5 72.4 69.0 64.0 62.8 69.5
a = 90 Si 46.7 46.9 47.6 47.3 47.4 46.8 46.2Sa 50.3 47.9 50.8 50.6 51.3 49.4 50.1Qz 69.0 68.2 71.3 74.1 72.5 69.4 68.6
* Stands for silicon# Stands for sapphire+ Stands for quartz

166
Table C.12
Local radiative heat transfer coefficient (hrb)for D = 3.23 mm (Single Tube)
Tf = 900 K Umf = 2.48 m/sec
U0 1.20 1.38 1.53 1.67 1.80 1.92 2.03
a = 0 Si*14 18.1 18.8 19.9 20.3 20.8 21.4 21.9Sat 19.3 18.1 20.5 22.7 21.3 22.6 24.3Qz+ 41.2 40.7 43.2 42.8 45.3 46.9 45.4
a = 90 Si 6.5 7.5 10.4 11.2 12.8 14.1 15.9Sa 6.9 8.6 9.8 11.6 13.5 14.3 16.9Qz 22.3 26.4 25.2 29.7 32.6 37.4 39.8
U0 2.11 2.29 2.45 2.59 2.66 2.73 2.85
a = 0 Si 22.2 22.8 23.5 23.8 24.7 25.7 27.0Sa 23.2 24.6 25.2 25.4 25.6 26.3 27.4Qz 48.8 44.8 44.4 47.1 48.6 48.3 50.2
-
a = 90 Si 18.2 32.7 22.1 22.9 23.0 24.2 25.3Sa 18.7 23.0 23.4 22.9 24.2 25.1 26.6Qz 41.5 39.9 45.7 44.4 47.5 46.9 48.7
Tf = 1080 K Umf = 2.25 m/sec
Uo 1.19 1.45 1.67 1.86 2.03 2.19 2.32
a = 0 Si 27.2 29.6 31.8 33.0 35.1 38.9 42.5Sa 29.8 33.6 33.7 34.6 37.6 40.2 44.3Qz 51.1 49.3 60.2 64.4 65.5 71.2 69.4
a = 90 Si 7.3 7.9 10.8 13.2 19.7 24.8 32.8Sa 8.2 8.1 10.5 13.9 18.8 25.6 32.7Qz 20.7 29.6 28.1 36.7 47.3 59.8 57.1
U0 2.57 2.79 2.99 3.17 3.33 3.48
a = 0 Si 46.2 47.0 49.3 50.4 49.7 49.1Sa 46.9 48.4 50.6 53.0 52.5 51.8Qz 67.9 68.6 69.8 73.4 71.2 71.0
a = 90 Si 44.3 45.0 45.9 46.5 45.8 45.2Sa 46.0 49.0 48.1 49.3 48.6 48.1Qz 62.4 69.5 67.4 70.2 72.2 70.1
* Stands for silicon# Stands for sapphire+ Stands for quartz