Hydrogeochemistry and greenhouse gases of the Pearl River, its estuary and beyond
12
Quaternary International 186 (2008) 79–90 Hydrogeochemistry and greenhouse gases of the Pearl River, its estuary and beyond Chen-Tung Arthur Chen a, , Shu-Lun Wang b , Xi-Xi Lu c , Shu-Rong Zhang c , Hon-Kit Lui a , Hsiao-Chun Tseng a , Bin-Jye Wang a , Hsiu-I Huang a a Institute of Marine Geology and Chemistry, National Sun Yat-Sen University, Kaohsiung 804, Taiwan b Department of Marine Environment Engineering, National Kaohsiung Marine University, Kaohsiung 811, Taiwan c Department of Geography, National University of Singapore, Singapore 117570, Singapore Available online 2 September 2007 Abstract The Pearl River (Zhujiang) ranks as the 13th or the 14th largest river in the world and is the 2nd largest in China in terms of annual water discharge. It is also the second largest river entering into the South China Sea. The three major tributaries, namely, the Xijiang (West River), the Beijiang (North River) and the Dongjiang (East River) are highly eutrophicated in the region of the Pearl River Delta because of the high nutrient and sediment loading. At places, the dissolved oxygen saturation level becomes as low as 2%. Naturally, CH 4 ,N 2 O, and CO 2 are highly supersaturated. Once the river water discharges into the main estuary, the Lingdingyang, it tends to flow out on the western side while open ocean waters with lower nutrient contents and pCO 2 but higher salinity and pH values enter on the eastern side. Largely as a result of mixing with the open ocean water but partly because of biological consumption, pCO 2 quickly reduces to near saturation only tens of kilometers off the mouth of the estuary. The % saturation of CH 4 and N 2 O is also greatly reduced but the continental shelf remains as a source of these greenhouse gases to the atmosphere. r 2007 Elsevier Ltd and INQUA. All rights reserved. 1. Introduction Since the beginning of the industrial period, humans have substantially increased loading of chemicals, such as carbon, nitrogen, and phosphorus on land, in the atmo- sphere and also in the oceans. Rivers act as carriers transporting these elements to the coastal oceans. Even though they have no significant impact on the open oceans, these carbon and excess nutrients can have important effects on the coastal oceans (Chen and Tsunogai, 1998). These anthropogenic loadings are now strongly interfering with the global biogeochemical cycles of such elements in the marginal seas, especially in the estuaries and the coastal areas. As a result of anthropogenic eutrophication of rivers and the coastal areas, carbon fixation has been enhanced resulting in richer organic carbon storage in the coastal sediments. Thus, more and more of the greenhouse gases such as CO 2 ,N 2 O, and CH 4 will be released by the increase of microbial respiration in the low oxygen content water column (Turner and Rabalais, 1994; Justic et al., 1995; Chen et al., 2003). In addition, hypoxia, or even anoxia may occur. Further, changes in the proportions of dissolved Si, N, and P in the riverine loads may shift phytoplankton communities from diatoms (siliceous) to coccolithophores and flagellates (non-siliceous) (Justic et al., 1994, 1995; Humborg et al., 1997). The Pearl River basin, especially the Pearl River Delta, is developing rapidly since the adoption of economic reform and open-door policy of China in 1978. Without having a good urban planning management and policy, environ- mental problems followed by the urbanization and industrialization have become more and more serious (Yeh and Li, 1999; Ouyang et al., 2006). As of 1990, there were 174 million people, or 15.4% of the population of China, living in the Pearl River basin. This translates to 177 people per km 2 , compared to the national average of 118 people per km 2 . The high population density and rapid ARTICLE IN PRESS 1040-6182/$ - see front matter r 2007 Elsevier Ltd and INQUA. All rights reserved. doi:10.1016/j.quaint.2007.08.024 Corresponding author. Tel.: +886 7 525 5146; fax: +886 7 525 5346. E-mail address: [email protected] (C.-T.A. Chen).
Transcript of Hydrogeochemistry and greenhouse gases of the Pearl River, its estuary and beyond
ARTICLE IN PRESS
1040-6182/$ - se
doi:10.1016/j.qu
�CorrespondE-mail addr
Quaternary International 186 (2008) 79–90
Hydrogeochemistry and greenhouse gases of the Pearl River,its estuary and beyond
Chen-Tung Arthur Chena,�, Shu-Lun Wangb, Xi-Xi Luc, Shu-Rong Zhangc, Hon-Kit Luia,Hsiao-Chun Tsenga, Bin-Jye Wanga, Hsiu-I Huanga
aInstitute of Marine Geology and Chemistry, National Sun Yat-Sen University, Kaohsiung 804, TaiwanbDepartment of Marine Environment Engineering, National Kaohsiung Marine University, Kaohsiung 811, Taiwan
cDepartment of Geography, National University of Singapore, Singapore 117570, Singapore
Available online 2 September 2007
Abstract
The Pearl River (Zhujiang) ranks as the 13th or the 14th largest river in the world and is the 2nd largest in China in terms of annual
water discharge. It is also the second largest river entering into the South China Sea. The three major tributaries, namely, the Xijiang
(West River), the Beijiang (North River) and the Dongjiang (East River) are highly eutrophicated in the region of the Pearl River Delta
because of the high nutrient and sediment loading. At places, the dissolved oxygen saturation level becomes as low as 2%. Naturally,
CH4, N2O, and CO2 are highly supersaturated.
Once the river water discharges into the main estuary, the Lingdingyang, it tends to flow out on the western side while open ocean
waters with lower nutrient contents and pCO2 but higher salinity and pH values enter on the eastern side. Largely as a result of mixing
with the open ocean water but partly because of biological consumption, pCO2 quickly reduces to near saturation only tens of kilometers
off the mouth of the estuary. The % saturation of CH4 and N2O is also greatly reduced but the continental shelf remains as a source of
these greenhouse gases to the atmosphere.
r 2007 Elsevier Ltd and INQUA. All rights reserved.
1. Introduction
Since the beginning of the industrial period, humanshave substantially increased loading of chemicals, such ascarbon, nitrogen, and phosphorus on land, in the atmo-sphere and also in the oceans. Rivers act as carrierstransporting these elements to the coastal oceans. Eventhough they have no significant impact on the open oceans,these carbon and excess nutrients can have importanteffects on the coastal oceans (Chen and Tsunogai, 1998).These anthropogenic loadings are now strongly interferingwith the global biogeochemical cycles of such elements inthe marginal seas, especially in the estuaries and the coastalareas. As a result of anthropogenic eutrophication of riversand the coastal areas, carbon fixation has been enhancedresulting in richer organic carbon storage in the coastalsediments. Thus, more and more of the greenhouse gases
e front matter r 2007 Elsevier Ltd and INQUA. All rights re
aint.2007.08.024
ing author. Tel.: +886 7 525 5146; fax: +886 7 525 5346.
ess: [email protected] (C.-T.A. Chen).
such as CO2, N2O, and CH4 will be released by the increaseof microbial respiration in the low oxygen content watercolumn (Turner and Rabalais, 1994; Justic et al., 1995;Chen et al., 2003). In addition, hypoxia, or even anoxiamay occur. Further, changes in the proportions ofdissolved Si, N, and P in the riverine loads may shiftphytoplankton communities from diatoms (siliceous) tococcolithophores and flagellates (non-siliceous) (Justicet al., 1994, 1995; Humborg et al., 1997).The Pearl River basin, especially the Pearl River Delta, is
developing rapidly since the adoption of economic reformand open-door policy of China in 1978. Without having agood urban planning management and policy, environ-mental problems followed by the urbanization andindustrialization have become more and more serious(Yeh and Li, 1999; Ouyang et al., 2006). As of 1990, therewere 174 million people, or 15.4% of the population ofChina, living in the Pearl River basin. This translates to 177people per km2, compared to the national average of 118people per km2. The high population density and rapid
served.
ARTICLE IN PRESSC.-T.A. Chen et al. / Quaternary International 186 (2008) 79–9080
industrialization have resulted in severe stress to theaquatic environment. As of 1985 the daily discharge ofwaste water reached 10.62� 106m3 resulting in eutrophica-tion and red tides (Seto, 2002).
Perhaps the most serious and widely discussed localeffects of eutrophication are hypoxia (Richardson andJorgensen, 1996). In extreme cases, the hypoxia is so severethat anoxia occurs. Hypoxia is defined as less than 2mgdissolved oxygen (DO) per liter and is considered stressfulfor all organisms. In fact, DO concentrations below4mg l�1 are already stressful for fish. Anoxia is not onlydeadly for biota, it also causes microbial and geochemicalreactions which are often detrimental to the environment.Notable examples are the release of toxic H2S and the non-toxic phosphorus which may produce favorable conditions
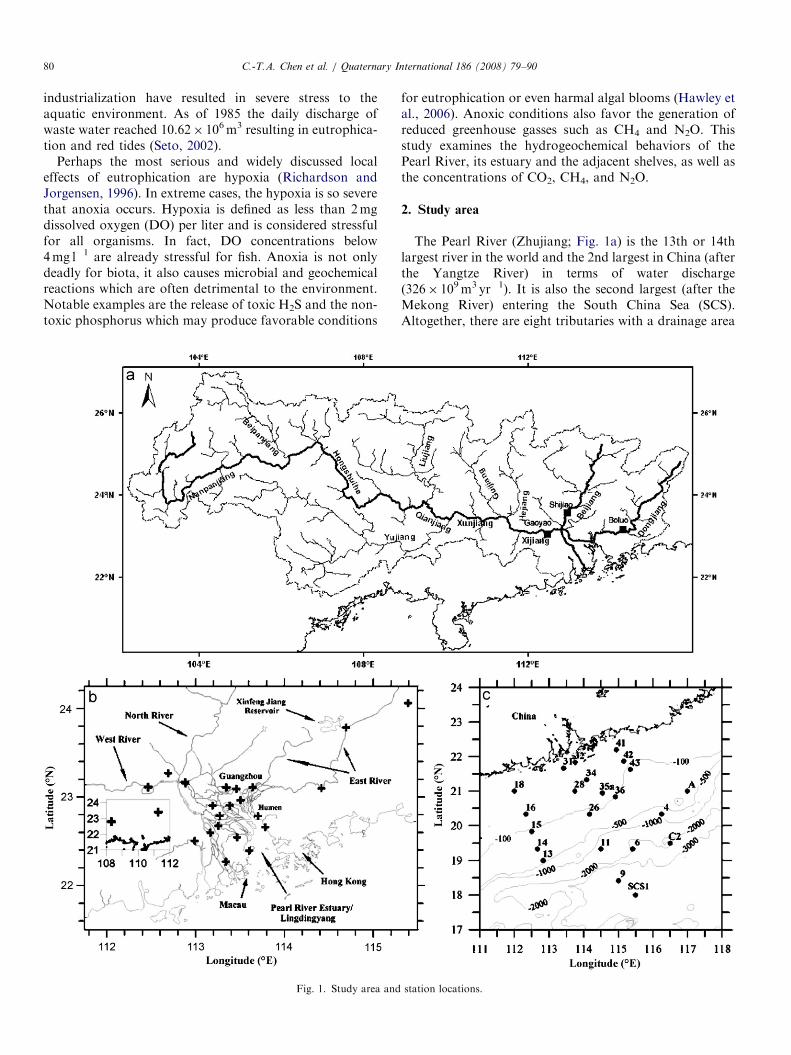
Fig. 1. Study area and
for eutrophication or even harmal algal blooms (Hawley etal., 2006). Anoxic conditions also favor the generation ofreduced greenhouse gasses such as CH4 and N2O. Thisstudy examines the hydrogeochemical behaviors of thePearl River, its estuary and the adjacent shelves, as well asthe concentrations of CO2, CH4, and N2O.
2. Study area
The Pearl River (Zhujiang; Fig. 1a) is the 13th or 14thlargest river in the world and the 2nd largest in China (afterthe Yangtze River) in terms of water discharge(326� 109m3 yr�1). It is also the second largest (after theMekong River) entering the South China Sea (SCS).Altogether, there are eight tributaries with a drainage area
station locations.

ARTICLE IN PRESS
Gaoyao
0
10
20
30
40
1 4 5 6 7 9 10 11 12
Wate
r d
isch
arg
e (
10
9 m
3)
0
2
4
6
8
Wate
r d
isch
arg
e (
10
9 m
3)
0
1
2
3
4
Wate
r d
isch
arg
e
(10
9 m
3)
Month
82 3
1 4 5 6 7 9 10 11 12
Month
82 3
1 4 5 6 7 9 10 11 12
Month
82 3
Shijiao
Boluo
Fig. 2. Monthly water discharge for the Xijiang (at Gaoyao), Beijiang
(at Shijiao) and Dongjiang (at Boluo).
C.-T.A. Chen et al. / Quaternary International 186 (2008) 79–90 81
larger than 10,000 km2 and 49 tributaries with a drainagearea larger than 1000 km2. The total drainage area is453,700 km2 with 442,100 km2 inside China, or 4.6% of thetotal area of China. The remaining 11,600 km2 is inVietnam. The total length of these tributaries reaches36,000 km with 14,000 km navigatable, or 1/8 of the totalnavigable water in China (Seto, 2002). There are threemajor tributaries, namely, the Xijiang (West River),Beijiang (North River), and the Dongjiang (East River).
The drainage area covers the provinces of Yunnan,Guizhou, Hunan, Jiangxi, Guangxi, and Guandong as wellas Hong Kong and Macau. The Xijiang is similar to othermajor rivers in China, e.g., the Yellow, Huai and YangtzeRivers, as it mainly flows from west to the east. At2200 km, it is the longest of the three major tributaries andis also the largest, contributing 70% of the total runoff
(Fig. 2). The Beijiang, however, basically flows from the northto the south whereas the Dongjiang flows from the northeastto the southwest. The runoff from the tributaries dischargeinto the northern SCS via eight major outlets: Humen,Jiaomen, Hongqimen, Hengmen, Modaomen, Jitimen, Hu-tiaomen, and Yamen. As the Tropic of Cancer crosses thePearl River Watershed, the entire river basin is warm andhumid. On the Yun-Gui Plateau where the Xijiang originatesthe annual rainfall is generally above 1000mm whereas therainfall increases to about 2000mm in the downstreamGuangxi and Guangdong provinces (Seto, 2002).
3. Methods
Two expeditions took place in September 2003 near theend of the flood season (Fig. 2) for the Xijiang andBeijiang. As for the Dongjiang, the monthly flow isrelatively even due to regulation by reservoirs. Surfacesamples were taken from the tributaries of the Pearl Riverand its estuary as shown in Fig. 1b between 13 and 20September. Samples beyond the estuary were taken duringthe Ocean Researcher I cruise OR-I 695 (21–30 Septem-ber), as shown in Fig. 1c. Saturated HgCl2 was added to allsamples except for the determinations of salinity (S).In the first expedition S, pH, and dissolved oxygen (DO)
were measured on site. pH was measured by the Hanna HI9025 microcomputer pH meter. Two standard buffersolutions with pH 4.00 and pH 7.00 were used to calibratethe electrode. The precision was better than70.02 pH unit.DO was measured with the YSI-52 DO meter with aprecision of better than 72%. In the cruise beyond theestuary, discrete seawater samples and temperatures werecollected by a CTD/Rosette sampler manufactured by Sea-Bird, fitted with 5-L Niskin bottles.Preserved samples from both expeditions were brought
back and measured in the laboratory. Major ions forfreshwater were measured by Dionex DX-120 ion chroma-tography after filtration by 0.45 mm filter. The precisionwas better than 75%. The total dissolved solids value(TDS) is the sum of all ions including nutrients. Forbrackish and seawater the TDS was calculated by salinity.Salinity in the discrete samples was determined bymeasuring conductivity with an AUTOSAL salinometer,which was calibrated with IAPSO standard seawater (batchno. P141). The precision of the measurements was 70.003salinity unit. Chlorophyll a was determined by the acetoneextraction method (Strickland and Parsons, 1972) by usinga fluorometer (Varian Eclipse), with a precision of 75%.DO for seawater was measured by direct spectrophoto-metry (Pai et al., 1993), with a precision of about 70.32%at the 190 mmol l�1 level. The apparent oxygen utilization(AOU) was calculated based on the oxygen solubilityequation of Chen (1981). pH was measured at 2570.05 1Cby a Radiometer-85 pH meter using a Phc-2401-7 combi-nation electrode. TRIS seawater buffer was used tocalibrate the electrode. The precision was better than70.003 pH unit.

ARTICLE IN PRESSC.-T.A. Chen et al. / Quaternary International 186 (2008) 79–9082
Total alkalinity (TA) was determined by the massbalance method of Bulter (1992) with 0.1MHCl, with aprecision better than 70.1%. The coulometric method wasemployed to measure total carbon dioxide (TCO2) ornamely dissolved inorganic carbon (DIC) with a precisionof 70.05%. A single operator multi-parameter metabolicanalyzer (SOMMA) system was used to extract CO2 gasfrom acidified seawater; then the CO2 gas was measuredwith a UIC, Coulometrics, Inc. model 5011 coulometricdetector (Diskson and Goyet, 1994). Reference materialprovided by A. Dickson was used for TA and TCO2
calibration. The pCO2 was calculated based on TA,salinity, and pH. Nitrate plus nitrite was measured bymeans of the pink azo dye method (Strickland and Parsons,1972) using a flow injection analyzer with an on-line Cd-coil. The precision of this method was about 71% at35 mmol l�1, and 73% at 1 mmol l�1. Nitrite was alsodetermined by the pink azo dye method (Strickland andParsons, 1972; Pai et al., 1990a) using a flow injectionanalyzer for a precision of 70.02 mmol l�1. Phosphate wasstudied by the molybdenum blue method (Murphy andRiley, 1962; Pai et al., 1990b) using a flow injectionanalyzer. The precision of the measurements was about70.5% at 2.8 mmol l�1 and 73% at 0.1 mmol l�1. Silicatewas measured with the silicomolybdenum blue method(Fanning and Pilson, 1973) using a flow injection analyzer.The precision was about 0.6% at 150 mmol l�1 and 2% at5 mmol l�1. The water samples for CH4 and N2O werecollected in 180-ml dark glass bottles with 10ml of airspace left. Dissolved CH4 and N2O were measured with aGC-FID (HP 5890 Series II) and a GC-ECD (Varian 3600and 3800, respectively). The NIST 1 mmol/mol CH4
standard and the Scott Specialty Gases (1 ppmv N2O)were used for calibration, for a precision of better than75%.
4. Results
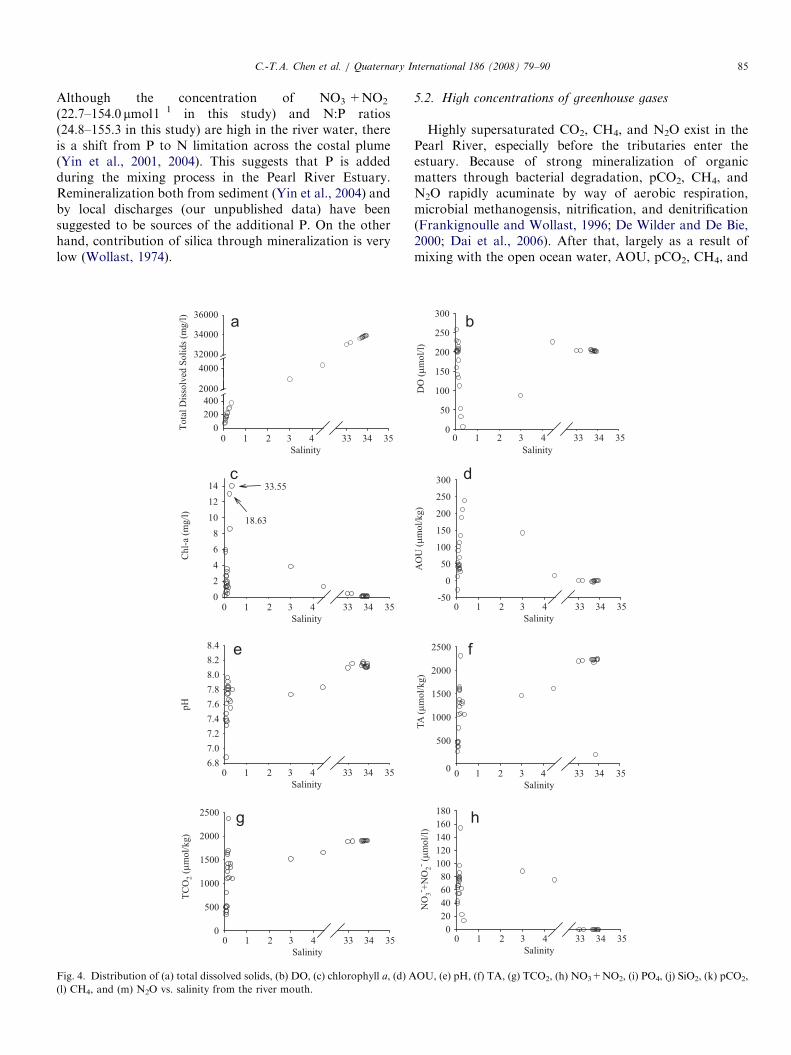
Both the hydrogeochemical parameters against thedistance from the river mouths or the salinity are shownin Figs. 3 and 4, respectively, while Fig. 5 shows thehorizontal distribution of these properties off the PearlRiver estuary. Total dissolved solids, TA, and TCO2
increase rapidly when the river water starts to encounterseawater near the river mouth and remain high outside ofthe estuary (Figs. 3a, f, g and 4a, f, g). The river waterbecomes suboxic within 100 km of the river month atsalinity between 0.2 and 0.3 but the DO concentrations arehigh away from the river mouth (Figs. 3b and 4b). Note theDO of the river water is not yet depleted in the Pearl RiverDelta under even serious eutrophication. However, inurbanized areas with high population density such asGuangzho and Humen, the DO of river water is nearlydepleted with low values of 1.02 and 0.16mg l�1, respec-tively. The chl-a is generally low except in the stretch200 km upstream of the river mouth and immediately afterthe rivers enter the estuary, at a salinity between 0.1 and 0.2
(Figs. 3c and 4c). The distribution of AOU generallymirrors the distribution of DO but the river waters haveslightly higher AOU than seawater (Figs. 3d and 4d).The pH of the river water generally varies between 7.4
and 8.0 except for a low value of below 6.9 near the rivermouth before seawater is encountered. For seawater, thepH is around 8.1 (Figs. 3e and 4e). The high TA and TCO2
of the river water come from the Xijiang and the Beijiang,compared with lower values found in the Dongjiang.NO3�+NO2
�, PO43� and SiO2, values are much higher for
river water than for seawater. A few high values stand outfor NO3
�+NO2� and PO4
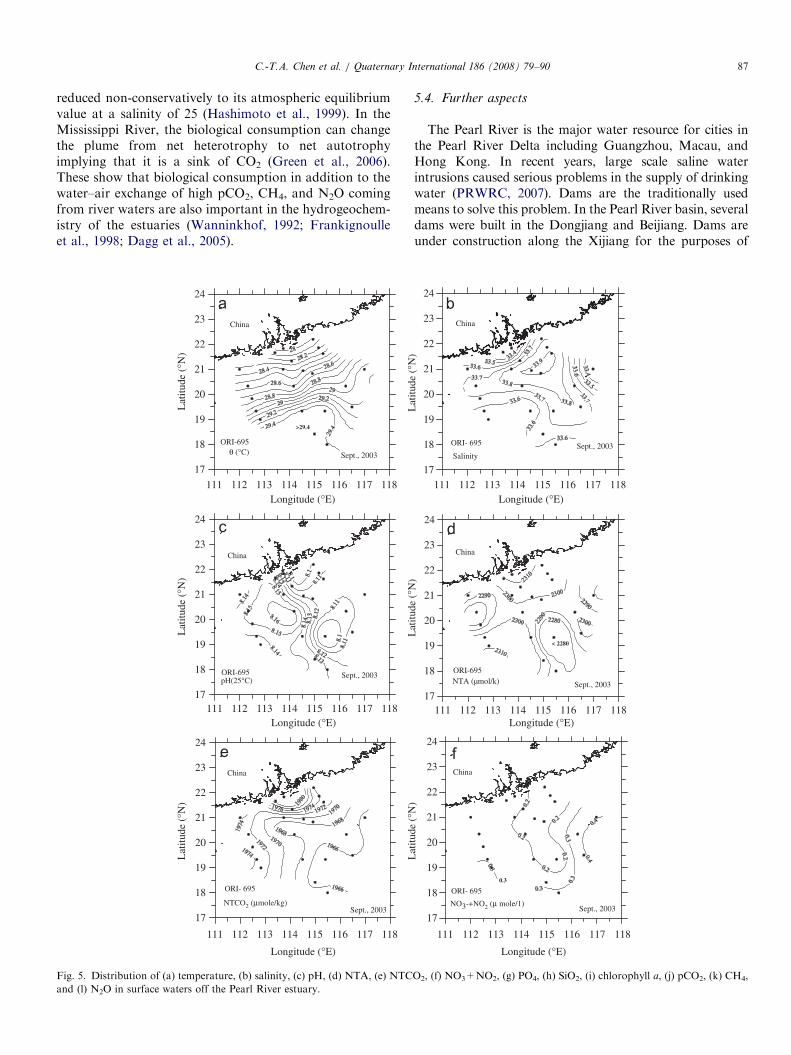
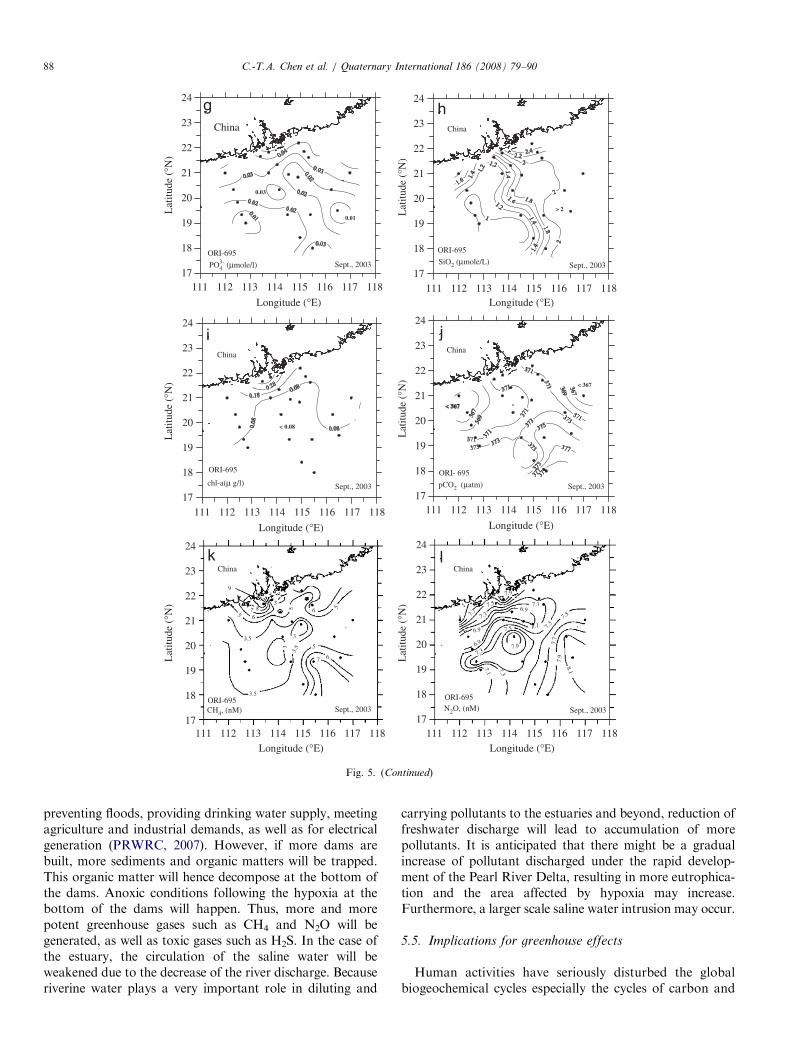
3� just before the rivers enter theestuary. In the case of the trace gases, pCO2, CH4, andN2O are all highly supersaturated in the rivers and theestuary ranging from 690 to 2680 matm, 23.26 to 2984 nMand 20.43 to 48.57 nM, respectively (Fig. 3k–m). Especiallyfor CH4, it is nearly 2–3 orders higher than the atmosphericequilibrium value. Landward of the estuary, pCO2, CH4,and N2O are less supersaturated. For instance, 865 kmfrom the estuary, pCO2, CH4 and N2O are 2254 matm, 117and 22.2 nM, respectively. Closer to the estuary concentra-tions of these gases gradually increase, and reach theirmaxima just before entering the estuary. It may be seen inFig. 4k, pCO2 increases significantly from 1105 matm at asalinity of 0.05 to 2680 matm when the salinity increases to0.26. AOU has nearly the same pattern (Fig. 4d) andrapidly increases from �27.6 mmol kg�1, at a salinity of0.04, to 239 mmol kg�1 at a salinity of 0.35. Similar patternshave been observed in the case of CH4 and N2O (Fig. 4land m). Tens of kilometers off the mouth of the estuary,pCO2 and N2O are rapidly reduced to just abovesaturation. CH4 is also quickly reduced offshore, but isstill much higher than the atmospheric equilibrium value,showing its characteristics that riverine waters, estuariesand the oceans are all sources of atmospheric CH4.Fig. 5a shows the distribution of temperature of surface
waters beyond the estuary. Water temperature generallyincreases with decreasing latitude. Because of the watercirculations in the region, however, the temperaturecontours are not parallel latitudinally. Instead, they inclineslightly from north-east to south-west (Chen, 2001), whichis almost parallel to the coast. Salinity distribution is morecomplicated (Fig. 5b). Because of the Coriolis force theriver plume tends to flow to the south-west after exiting thePRE. Modeled calculations and Landsat images alsoshowed that the suspended solids are transported towardthe southwest in the estuary (Chen et al., 2005). Under theinfluence of the south-west monsoon the plume may turnaround. It starts to flow to the north-east away from thecoast circumventing a body of slightly higher salinity water(Chen and Heinke, 2001; Dong et al., 2004; Su, 2004). Inthe high water discharge period, the plume may reach1181E with the front about 450 km away from the estuary(Su, 2004).Distributions of the pH, NTA, NTCO2, SiO2, and chl-a
are all consistent with the existence of the plume (Fig. 5c–e,h, i). Once the brackish water with relatively high nutrients

ARTICLE IN PRESSC.-T.A. Chen et al. / Quaternary International 186 (2008) 79–90 83
but low pH, TA, and TCO2 mixes with the open oceanwaters pH, TA, and TCO2 gradually increase in theseaward direction. At the same time, nutrients, chl-a, NTA,and NTCO2 gradually decrease. In the case of chl-a,generally, the nutrient-rich riverine water enhances primaryproduction which decreases seawardly due to mixing withnutrient-poor seawater. Riverine waters (near zero salinity)contain non-zero TA (262–1639 mmol kg�1) and TCO2
(341–1694 mmol kg�1), both of which will gradually in-crease in concentration after mixing with the open ocean
Distance from the river mouth (km)
Chl
-a (µ
g/l)
02468
101214
-865km
rivers estuaries shelves
19.63 33.55
Tota
l dis
solv
ed so
lids (
mg/
l)
0200400
2000
400032000
34000
36000 rivers estuaries shelves
Distance from the river mouth (km)
-865km
rivers estuaries shelves
Distance from the river mouth (km)-400 -200 0 200 400
-400 -200 0 200 400
pH
6.87.07.27.47.67.88.08.28.4
-400 -200 0 200 400
Distance from the river mouth (km)-400 -200 0 200 400
TCO
2 (µm
ol/k
g)
0
500
1000
1500
2000
2500
-865km
rivers estuaries shelves
-865km
a
c
e
g
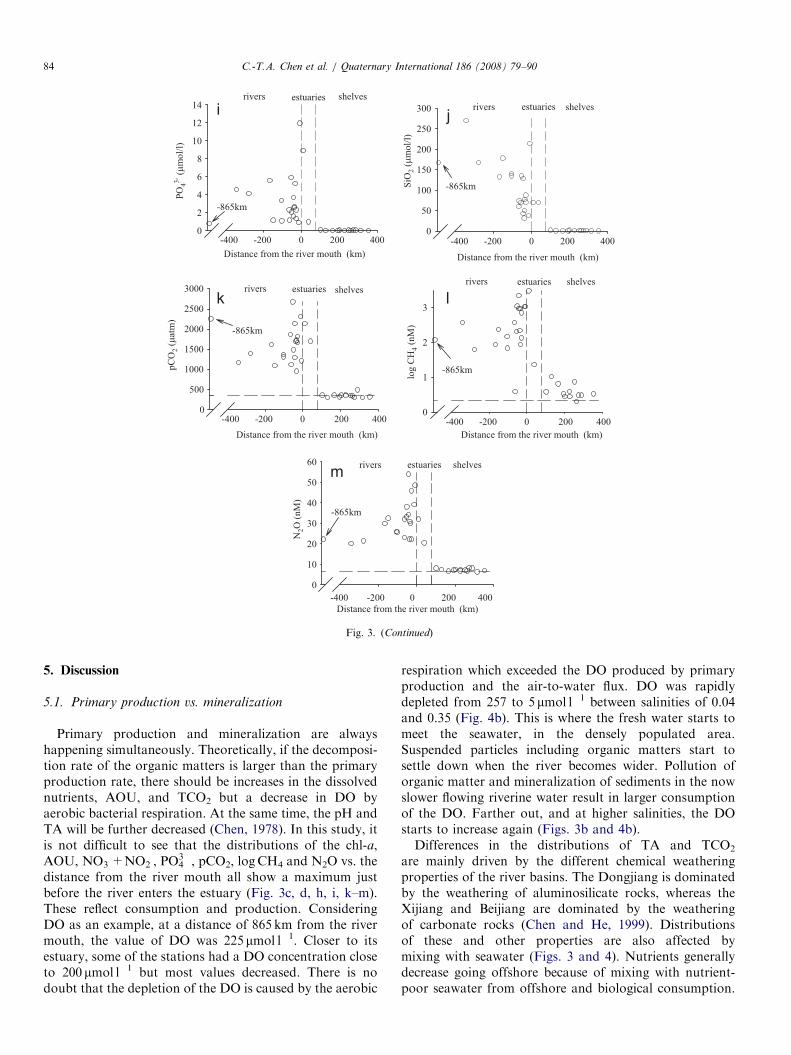
Fig. 3. Distribution of (a) total dissolved solids, (b) DO, (c) chlorophyll a, (d) A
(l) CH4, and (m) N2O vs. distance from the river mouth.
waters containing relative high TA and TCO2. However,both TA and TCO2 of river waters increase after normal-ization. It means that the higher the portion of riverinewater is, the higher is the NTA and NTCO2. Thedistributions of NO3
�+NO2� and PO4
3� off the estuaryare only marginally influenced by the river plume, and theyare nearly depleted in the surface water (Fig. 5f and g). Thisis because NO3
�+NO2� and PO4
3� are almost depleted inthe inner shelf by biological consumption (Yin et al., 2000,2004).
Distance from the river mouth (km)
DO
(µm
ol/l)
0
50
100
150
200
250
300
-865km
rivers estuaries shelves
Distance from the river mouth (km)
AO
U (µ
mol
/kg)
0
100
200
300
-865km
rivers estuaries shelves
-865km
rivers estuaries shelves
Distance from the river mouth (km)-400 -200 0 200 400
-400 -200 0 200 400
-400 -200 0 200 400
TA (µ
mol
/kg)
0
500
1000
1500
2000
2500
Distance from the river mouth (km)-400 -200 0 200 400
NO
3- +NO
2- (µm
ol/l)
020406080
100120140160180
-865km
rivers estuaries shelves
b
d
f
h
OU, (e) pH, (f) TA, (g) TCO2, (h) NO3+NO2, (i) PO4, (j) SiO2, (k) pCO2,
ARTICLE IN PRESS
Distance from the river mouth (km)-400 -200 0 200 400
N2O
(nM
)
0
10
20
30
40
50
60
log
CH
4 (nM
)0
1
2
3
Distance from the river mouth (km)
pCO
2 (µa
tm)
0
500
1000
1500
2000
2500
3000
Distance from the river mouth (km)
SiO
2 (µm
ol/l)
0
50
100
150
200
250
300
Distance from the river mouth (km)-400 -200 0 200 400
Distance from the river mouth (km)-400 -200 0 200 400-400 -200 0 200 400
-400 -200 0 200 400
PO43-
(µm
ol/l)
0
2
4
6
8
10
12
14
-865km
rivers estuaries shelves
-865km
rivers estuaries shelves
-865km
rivers estuaries shelvesestuaries shelvesrivers
-865km
-865km
rivers estuaries shelves
i j
k l
m
Fig. 3. (Continued)
C.-T.A. Chen et al. / Quaternary International 186 (2008) 79–9084
5. Discussion
5.1. Primary production vs. mineralization
Primary production and mineralization are alwayshappening simultaneously. Theoretically, if the decomposi-tion rate of the organic matters is larger than the primaryproduction rate, there should be increases in the dissolvednutrients, AOU, and TCO2 but a decrease in DO byaerobic bacterial respiration. At the same time, the pH andTA will be further decreased (Chen, 1978). In this study, itis not difficult to see that the distributions of the chl-a,AOU, NO3
�+NO2�, PO4
3�, pCO2, logCH4 and N2O vs. thedistance from the river mouth all show a maximum justbefore the river enters the estuary (Fig. 3c, d, h, i, k–m).These reflect consumption and production. ConsideringDO as an example, at a distance of 865 km from the rivermouth, the value of DO was 225 mmol l�1. Closer to itsestuary, some of the stations had a DO concentration closeto 200 mmol l�1 but most values decreased. There is nodoubt that the depletion of the DO is caused by the aerobic
respiration which exceeded the DO produced by primaryproduction and the air-to-water flux. DO was rapidlydepleted from 257 to 5 mmol l�1 between salinities of 0.04and 0.35 (Fig. 4b). This is where the fresh water starts tomeet the seawater, in the densely populated area.Suspended particles including organic matters start tosettle down when the river becomes wider. Pollution oforganic matter and mineralization of sediments in the nowslower flowing riverine water result in larger consumptionof the DO. Farther out, and at higher salinities, the DOstarts to increase again (Figs. 3b and 4b).Differences in the distributions of TA and TCO2
are mainly driven by the different chemical weatheringproperties of the river basins. The Dongjiang is dominatedby the weathering of aluminosilicate rocks, whereas theXijiang and Beijiang are dominated by the weatheringof carbonate rocks (Chen and He, 1999). Distributionsof these and other properties are also affected bymixing with seawater (Figs. 3 and 4). Nutrients generallydecrease going offshore because of mixing with nutrient-poor seawater from offshore and biological consumption.
ARTICLE IN PRESSC.-T.A. Chen et al. / Quaternary International 186 (2008) 79–90 85
Although the concentration of NO3�+NO2
�
(22.7–154.0 mmol l�1 in this study) and N:P ratios(24.8–155.3 in this study) are high in the river water, thereis a shift from P to N limitation across the costal plume(Yin et al., 2001, 2004). This suggests that P is addedduring the mixing process in the Pearl River Estuary.Remineralization both from sediment (Yin et al., 2004) andby local discharges (our unpublished data) have beensuggested to be sources of the additional P. On the otherhand, contribution of silica through mineralization is verylow (Wollast, 1974).
Chl
-a (m
g/l)
02468
101214
18.63
33.55
Tota
l Dis
solv
ed S
olid
s (m
g/l)
00 1 2 3 4 33 34 35
200400
2000
400032000
34000
36000
Salinity
TCO
2 (µm
ol/k
g)
0
500
1000
1500
2000
2500
pH
6.87.07.27.47.67.88.08.28.4
0 1 2 3 4 33 34 35Salinity
0 1 2 3 4 33 34 35Salinity
0 1 2 3 4 33 34 35Salinity
a
c
e
g
Fig. 4. Distribution of (a) total dissolved solids, (b) DO, (c) chlorophyll a, (d) A
(l) CH4, and (m) N2O vs. salinity from the river mouth.
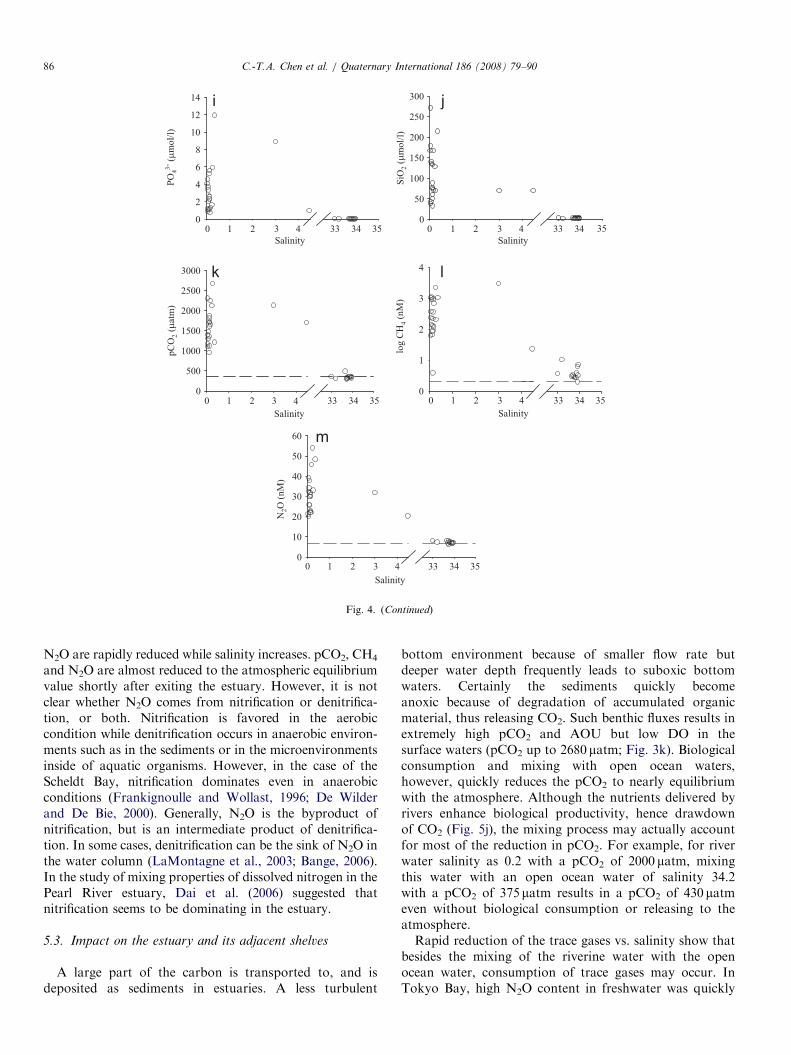
5.2. High concentrations of greenhouse gases
Highly supersaturated CO2, CH4, and N2O exist in thePearl River, especially before the tributaries enter theestuary. Because of strong mineralization of organicmatters through bacterial degradation, pCO2, CH4, andN2O rapidly acuminate by way of aerobic respiration,microbial methanogensis, nitrification, and denitrification(Frankignoulle and Wollast, 1996; De Wilder and De Bie,2000; Dai et al., 2006). After that, largely as a result ofmixing with the open ocean water, AOU, pCO2, CH4, and
AO
U (µ
mol
/kg)
-50
0
50
100
150
200
250
300
DO
(µm
ol/l)
0
50
100
150
200
250
300
NO
3- +NO
2- (µm
ol/l)
020406080
100120140160180
0
500
1000
1500
2000
2500
TA (µ
mol
/kg)
0 1 2 3 4 33 34 35Salinity
0 1 2 3 4 33 34 35Salinity
0 1 2 3 4 33 34 35Salinity
0 1 2 3 4 33 34 35Salinity
b
f
h
d
OU, (e) pH, (f) TA, (g) TCO2, (h) NO3+NO2, (i) PO4, (j) SiO2, (k) pCO2,
ARTICLE IN PRESS
N2O
(nM
)
0
10
20
30
40
50
60
log
CH
4 (nM
)0
1
2
3
4
pCO
2 (µa
tm)
0
500
1000
1500
2000
2500
3000
SiO
2 (µm
ol/l)
0
50
100
150
200
250
300
PO43-
(µm
ol/l)
0
2
4
6
8
10
12
14
0 1 2 3 4 33 34 35Salinity
0 1 2 3 4 33 34 35Salinity
0 1 2 3 4 33 34 35Salinity
0 1 2 3 4 33 34 35Salinity
0 1 2 3 4 33 34 35Salinity
i j
k l
m
Fig. 4. (Continued)
C.-T.A. Chen et al. / Quaternary International 186 (2008) 79–9086
N2O are rapidly reduced while salinity increases. pCO2, CH4
and N2O are almost reduced to the atmospheric equilibriumvalue shortly after exiting the estuary. However, it is notclear whether N2O comes from nitrification or denitrifica-tion, or both. Nitrification is favored in the aerobiccondition while denitrification occurs in anaerobic environ-ments such as in the sediments or in the microenvironmentsinside of aquatic organisms. However, in the case of theScheldt Bay, nitrification dominates even in anaerobicconditions (Frankignoulle and Wollast, 1996; De Wilderand De Bie, 2000). Generally, N2O is the byproduct ofnitrification, but is an intermediate product of denitrifica-tion. In some cases, denitrification can be the sink of N2O inthe water column (LaMontagne et al., 2003; Bange, 2006).In the study of mixing properties of dissolved nitrogen in thePearl River estuary, Dai et al. (2006) suggested thatnitrification seems to be dominating in the estuary.
5.3. Impact on the estuary and its adjacent shelves
A large part of the carbon is transported to, and isdeposited as sediments in estuaries. A less turbulent
bottom environment because of smaller flow rate butdeeper water depth frequently leads to suboxic bottomwaters. Certainly the sediments quickly becomeanoxic because of degradation of accumulated organicmaterial, thus releasing CO2. Such benthic fluxes results inextremely high pCO2 and AOU but low DO in thesurface waters (pCO2 up to 2680 matm; Fig. 3k). Biologicalconsumption and mixing with open ocean waters,however, quickly reduces the pCO2 to nearly equilibriumwith the atmosphere. Although the nutrients delivered byrivers enhance biological productivity, hence drawdownof CO2 (Fig. 5j), the mixing process may actually accountfor most of the reduction in pCO2. For example, for riverwater salinity as 0.2 with a pCO2 of 2000 matm, mixingthis water with an open ocean water of salinity 34.2with a pCO2 of 375 matm results in a pCO2 of 430 matmeven without biological consumption or releasing to theatmosphere.Rapid reduction of the trace gases vs. salinity show that
besides the mixing of the riverine water with the openocean water, consumption of trace gases may occur. InTokyo Bay, high N2O content in freshwater was quickly
ARTICLE IN PRESSC.-T.A. Chen et al. / Quaternary International 186 (2008) 79–90 87
reduced non-conservatively to its atmospheric equilibriumvalue at a salinity of 25 (Hashimoto et al., 1999). In theMississippi River, the biological consumption can changethe plume from net heterotrophy to net autotrophyimplying that it is a sink of CO2 (Green et al., 2006).These show that biological consumption in addition to thewater–air exchange of high pCO2, CH4, and N2O comingfrom river waters are also important in the hydrogeochem-istry of the estuaries (Wanninkhof, 1992; Frankignoulleet al., 1998; Dagg et al., 2005).
111 112 113 114 115 116 117 11817
18
19
20
21
22
23
24
Lat
itude
(°N
)
ORI-695
China
111 112 113 114 115 116 117 118
17
18
19
20
21
22
23
24
Lat
itude
(°N
)
China
111 112 113 114 115 116 117 118
17
18
19
20
21
22
23
24
Lat
itude
(°N
)
China
Longitude (°E)
Sept., 2003
ORI-695θ (°C)
pH(25°C)Sept., 2003
Longitude (°E)
ORI- 695
NTCO2 (μmole/kg)Sept., 2003
Longitude (°E)
Fig. 5. Distribution of (a) temperature, (b) salinity, (c) pH, (d) NTA, (e) NTC
and (l) N2O in surface waters off the Pearl River estuary.
5.4. Further aspects
The Pearl River is the major water resource for cities inthe Pearl River Delta including Guangzhou, Macau, andHong Kong. In recent years, large scale saline waterintrusions caused serious problems in the supply of drinkingwater (PRWRC, 2007). Dams are the traditionally usedmeans to solve this problem. In the Pearl River basin, severaldams were built in the Dongjiang and Beijiang. Dams areunder construction along the Xijiang for the purposes of
111 112 113 114 115 116 117 11817
18
19
20
21
22
23
24
Lat
itude
(°N
)
China
111 112 113 114 115 116 117 118
17
18
19
20
21
22
23
24
Lat
itude
(°N
)
China
111 112 113 114 115 116 117 11817
18
19
20
21
22
23
24
Lat
itude
(°N
)
ORI- 695
China
SalinitySept., 2003
Longitude (°E)
NTA (µmol/k)ORI-695
Longitude (°E)
ORI- 695
NO3-+NO2 (μ mole/1)
Longitude (°E)
Sept., 2003
Sept., 2003
O2, (f) NO3+NO2, (g) PO4, (h) SiO2, (i) chlorophyll a, (j) pCO2, (k) CH4,
ARTICLE IN PRESS
111 112 113 114 115 116 117 11817
18
19
20
21
22
23
24
Lat
itude
(°N
)
Lat
itude
(°N
)
ORI-695
PO4 (μmole/l)
China
0.03
17
18
19
20
21
22
23
24
China
17
18
19
20
21
22
23
24
Lat
itude
(°N
)
Lat
itude
(°N
)
17
18
19
20
21
22
23
24
Lat
itude
(°N
)
17
18
19
20
21
22
23
24
Lat
itude
(°N
)
China
17
18
19
20
21
22
23
24
ORI- 695
China
111 112 113 114 115 116 117 118Longitude (°E)
111 112 113 114 115 116 117 118Longitude (°E)
China China
ORI-695CH4, (nM)
ORI-695N2O, (nM)Sept., 2003 Sept., 2003
3- Sept., 2003
Longitude (°E)
111 112 113 114 115 116 117 118
Longitude (°E)
111 112 113 114 115 116 117 118
Longitude (°E)
111 112 113 114 115 116 117 118Longitude (°E)
chl-a(μ g/l)
ORI-695
Sept., 2003 Sept., 2003pCO2 (μatm)
ORI-695
SiO2 (μmole/L) Sept., 2003
Fig. 5. (Continued)
C.-T.A. Chen et al. / Quaternary International 186 (2008) 79–9088
preventing floods, providing drinking water supply, meetingagriculture and industrial demands, as well as for electricalgeneration (PRWRC, 2007). However, if more dams arebuilt, more sediments and organic matters will be trapped.This organic matter will hence decompose at the bottom ofthe dams. Anoxic conditions following the hypoxia at thebottom of the dams will happen. Thus, more and morepotent greenhouse gases such as CH4 and N2O will begenerated, as well as toxic gases such as H2S. In the case ofthe estuary, the circulation of the saline water will beweakened due to the decrease of the river discharge. Becauseriverine water plays a very important role in diluting and
carrying pollutants to the estuaries and beyond, reduction offreshwater discharge will lead to accumulation of morepollutants. It is anticipated that there might be a gradualincrease of pollutant discharged under the rapid develop-ment of the Pearl River Delta, resulting in more eutrophica-tion and the area affected by hypoxia may increase.Furthermore, a larger scale saline water intrusion may occur.
5.5. Implications for greenhouse effects
Human activities have seriously disturbed the globalbiogeochemical cycles especially the cycles of carbon and
ARTICLE IN PRESSC.-T.A. Chen et al. / Quaternary International 186 (2008) 79–90 89
nitrogen (IPCC, 2001). These activities, particularly thoserelated to cultivation and deforestation, have increased therate of denudation, hence riverine transport of carbon.Chemical erosion of rocks, facilitated by reaction with theatmospheric CO2 (weathering) and the subsequent exportof inorganic carbon from soils to rivers account forsignificant amounts of terrestrially sequestered atmosphericCO2 (Raymond and Cole, 2003). Part of the carbon in therivers further degrades, hence increasing the pCO2 toseveral times the atmospheric value. The bacterial respira-tion accompanies generation of CH4 and N2O in thewaters. If carbon dioxide fertilization is seen as a negativemechanism of global warming, then the release of thegreenhouse gases, CO2, CH4, and N2O from the rivers arepositive mechanisms. Under strong denudation, part ofburied organic matters in the past would be transporteddownstream by rivers. Part may be transported to thefarther places such as the oceans. However, some will betrapped in the anoxic environment beyond the dams. Themore critical issue is that they will start to decompose andhence become the more potent greenhouse gases.
6. Conclusions
The Pearl River is supersaturated with respect to pCO2,CH4, and N2O. When the riverine waters flow closer to theestuary, their flow rates decrease because the rivers becomewider. A longer residence time accompanied by strongermineralization may well result in the release of moregreenhouse gases produced through bacterial respiration.Even for such a large river, however, the area outside of theestuary directly influenced by the river is small. Concentra-tions of the greenhouse gases and nutrients quicklydecrease offshore mainly because of mixing with salinewater, but partly caused by biological consumption andsea-to-air fluxes. Saline water intrusion, eutrophication andthe release of greenhouse gases may be enhanced in theestuary if the river discharge is decreased.
Dams trap the suspended sediments as well as organicmatter, which decomposes behind the dams. More CO2,CH4, and N2O will be released to the atmosphere that mayworsen the greenhouse effect.
Acknowledgments
We wish to thank the captain and crew of OR-I forassistance at sea. An anonymous reviewer providedvaluable comments. The National Science Council ofTaiwan and the Ministry of Education supported thisresearch (NSC 95-2621-Z-110-005, 95-2611-M-110-001 andAim for the Top University Plan 950312).
References
Bange, H.W., 2006. Nitrous oxide and methane in European coastal
waters. Estuarine, Coastal and Shelf Science 70, 361–374.
Bulter, J.N., 1992. Alkalinity titration in seawater: how accurately can the
data be fit by an equilibrium model. Marine Chemistry 38, 251–282.
Chen, C.T.A., 1978. Decomposition of calcium carbonate and organic
carbon in the deep oceans. Science 201 (25), 735–736.
Chen, C.T., 1981. Oxygen solubility in seawater. In: Battino, R. (Ed.),
Solubility Data Series, vol. 7. Pergamon Press, Oxford, New York,
Toronto, Sydney, Paris, Frankfurt, pp. 41–55.
Chen, C.T.A., 2001. Oceanography of the South China Sea. Culture
Publishing Co. of Bohai Tang, Taiwan, p. 506.
Chen, J., He, D., 1999. Chemical characteristics and genesis of major ions
in the Pearl River Basin. Acta Scientiarum Naturalium Universitatis
Pekinensis 35 (6), 786–793.
Chen, J.C., Heinke, G.W., 2001. Pearl River Pollution Project, Summer
Report. Hong Kong University of Science and Technology, Hong
Kong, China, p. 122.
Chen, C.T.A., Tsunogai, S., 1998. Carbon and nutrients in the ocean. In:
Galloway, J.N. (Ed.), Asian Change in the Context of Global Climate
Change. Cambridge University Press, Cambridge, UK, pp. 271–307.
Chen, C.T.A., Liu, K.K., MacDonald, R., 2003. Continental margin
exchanges. In: Fasham, M.J.R. (Ed.), Ocean Biogeochemistry: A
JGOFS Synthesis. Spring, Berlin, pp. 53–97.
Chen, X.H., Chen, Y.Q., Lai, G.Y., 2005. Modeling transportation of
suspended solids in Zhujiang River estuary, South China. Chinese
Journal of Oceanology and Limnology 23 (1), 1–10.
Dagg, M.J., Bianchi, T.S., Breed, G.A., Cai, W.-J., Duan, S., Liu, H.,
McKee, B.A., Powell, R.T., Stewart, C.M., 2005. Biogeochemical
characteristics of the lower Mississippi River, USA, during June 2003.
Estuaries 28 (5), 664–674.
Dai, M., Guo, X., Zhai, W., Yuan, L., Wang, B., Wang, L., Cai, P., Tang,
T., Cai, W.-J., 2006. Oxygen depletion in the upper reach of the Pearl
River estuary during a winter drought. Marine Chemistry 102,
159–169.
De Wilder, H.P.J., De Bie, M.J.M., 2000. Nitrous oxide in the Schelde
estuary: production by nitrification and emission to the atmosphere.
Marine Chemistry 69, 203–216.
Diskson, A.G., Goyet, C., 1994. DOE Handbook of the Method for the
Determination of Total Dissolved Inorganic Carbon in Sea Water. US
Department of Energy, Washington, DC, p. 186.
Dong, L., Su, J., Wong, L.A., Cao, Z., Chen, J.-C., 2004. Seasonal
variation and dynamics of the Pearl River plume. Continental Shelf
Research (24), 1761–1777.
Fanning, K.A., Pilson, M.E.Q., 1973. On the spectrophotometric
determination of dissolved silica in natural waters. Analytical
Chemistry 45, 136–141.
Frankignoulle, M., Wollast, R., 1996. Atmospheric CO2 fluxes in a highly
polluted estuary (the Scheldt). Limnology and Oceanography 41 (2),
365–369.
Frankignoulle, M., Abril, G., Borges, A., Bourge, I., Canon, C., Delille,
B., Libert, E., Theate, J.-M., 1998. Carbon dioxide emission from
European estuaries. Science 282, 434–436.
Green, R.E., Bianchi, T.S., Dagg, M.J., Walker, N.D., Breed, G.A., 2006.
An organic carbon budget for the Mississippi River turbidity plume
and plume contributions to air–sea CO2 fluxes and bottom water
hypoxia. Estuaries and Coasts 29 (4), 579–597.
Hashimoto, S., Hikota, G.S., Hikota, N.S., Sendai, N., Otsuki, A., 1999.
Nitrous oxide emissions from coastal waters in Tokyo Bay. Marine
Environmental Research 47, 213–223.
Hawley, N., Johengen, T.H., Rao, Y.R., Ruberg, S.A., Beletsky, D.,
Ludsin, S.A., Eadie, B.J., Schwab, D.J., Croley, T.E., Brandt, S.B.,
2006. Lake Erie hypoxia prompts Canada–US Study. EOS 87 (32),
313–319.
Humborg, C., Ittekkot, V., Cociasu, A., Bodungen, B.V., 1997. Effect of
Danube River dam on Black Sea biogeochemistry and ecosystem
structure. Nature 386, 385–388.
IPCC, 2001. Atmospheric chemistry and greenhouse gases. In: Houghton,
J.T., Ding, Y., Griggs, D.J., Noguer, M., van der Linden, P.J., Dai, X.,
Maskell, K., Johnson, C.A. (Eds.), Climate Change 2001: The
Scientific Basis. Contribution of Working Group I to the Third
ARTICLE IN PRESSC.-T.A. Chen et al. / Quaternary International 186 (2008) 79–9090
Assessment Report of the Intergovernmental Panel on Climate
Change. Cambridge University Press, Cambridge, UK, pp. 239–237.
Justic, D., Rabalais, N.N., Turner, R.E., Dortch, Q., 1994. Changes in
nutrient structure of river-dominated coastal waters: stoichiometric
nutrient balance and its consequences. Estuarine, Coastal and Shelf
Science 40, 339–356.
Justic, D., Rabalais, N.N., Turner, R.E., 1995. Stoichiometric nutrient
balance and origin of coastal eutrophication. Marine Pollution
Bulletin 30 (1), 41–46.
LaMontagne, M.G., Duran, R., Valiela, I., 2003. Nitrous oxide sources
and sinks in coastal aquifers and coupled estuarine receiving waters.
The Science of the Total Environment 309, 139–149.
Murphy, J., Riley, J.P., 1962. A modified single solution method for the
determination of phosphate in natural waters. Analytica Chimica Acta
27, 31–36.
Ouyang, T., Zhu, Z., Kuang, Y., 2006. Assessing impact of urbanization
on river water quality in the Pearl River Delta economic zone, China.
Environmental Monitoring and Assessment 120, 313–325.
Pai, S.-C., Yang, C.-C., Riley, J.P., 1990a. Formation kinetics of the pink
azo dye in the determination of nitrate in natural waters. Analytica
Chimica Acta 232, 345–349.
Pai, S.-C., Yang, C.-C., Riley, J.P., 1990b. Effects of acidity and
molybdate concentration on the kinetics of the formation of the
phosphoantimonylmolybdenum blue complex. Analytica Chimica
Acta 229, 115–120.
Pai, S.-C., Gong, G.-C., Liu, K.-K., 1993. Determination of dissolved
oxygen in seawater by direct spectrophotometry of total iodine.
Marine Chemistry 41, 343–351.
PRWRC, 2007. Pearl River Water Resources Commission of the Ministry of
Water Resources, People of Republic of China./http://www.pearlwater.
gov.cnS.Raymond, P.A., Cole, J.J., 2003. Increase in the export of alkalinity from
North America’s largest river. Science 301, 88–91.
Richardson, K., Jorgensen, B.B., 1996. Eutrophication: definition, history
and effects. In: Jorgensen, B.B., Richardson, K. (Eds.), Eutrophication
in Coastal Marine Ecosystems. Coastal and Estuarine Studies 52,
AGU, Washington, DC, pp. 1–19.
Seto, S.J., 2002. The River Story: Zhujiang. Hong Wen Goan Pub. Inc.,
Kaohsiung, Taiwan, p. 567 (in Chinese).
Strickland, J.D.H., Parsons, T.R., 1972. A Practical Handbook of Seawater
Analysis. Fisheries Research Board of Canada, Ottawa, Canada, p. 310.
Su, J., 2004. Overview of the South China Sea circulation and its influence
on the coastal physical oceanography outside the Pearl River Estuary.
Continental Shelf Research 24, 1745–1760.
Turner, R.E., Rabalais, N.N., 1994. Coastal eutrophication near the
Mississippi river delta. Nature 368, 619–621.
Wanninkhof, R., 1992. Relationship between wind speed and gas
exchange over the ocean. Journal of Geophysical Research 97 (c5),
7373–7382.
Wollast, R., 1974. The silica problem. In: Goldberg, E.D. (Ed.), The Sea,
vol. 5: Marine Chemistry. Wiley-Interscience, New York, pp. 359–392.
Yeh, A.G.O., Li, X., 1999. Economic development and agricultural land
loss in the Pearl River Delta, China. Habitat International 23 (3),
373–390.
Yin, K., Qian, P.Y., Chen, J.C., Hsieh, D.P.H., Harrison, P.J., 2000.
Dynamics of nutrients and phytoplankton biomass in the Pearl River
estuary and adjacent waters of Hong Kong during summer:
preliminary evidence for phosphorus and silicon limitation. Marine
Ecology Progress Series 194, 295–305.
Yin, K., Qian, P.Y., Wu, M.C.S., Chen, J.C., Huang, L., Song, X., Jian,
W., 2001. Shift from P to N limitation of phytoplankton growth across
the Pearl River estuaries plume during summer. Marine Ecology
Progress Series 221, 17–28.
Yin, K., Song, X., Sun, J., Wu, M.C.S., 2004. Potential P limitation leads
to excess N in the pearl river estuarine coastal plume. Continental
Shelf Research 24, 1895–1907.