Copyright Statement - pearl - University of Plymouth
165
University of Plymouth PEARL https://pearl.plymouth.ac.uk 04 University of Plymouth Research Theses 01 Research Theses Main Collection 2019 THE SOURCES AND FATE OF PLASTIC ENTERING THE MARINE ENVIRONMENT Napper, Imogen Ellen http://hdl.handle.net/10026.1/14729 University of Plymouth All content in PEARL is protected by copyright law. Author manuscripts are made available in accordance with publisher policies. Please cite only the published version using the details provided on the item record or document. In the absence of an open licence (e.g. Creative Commons), permissions for further reuse of content should be sought from the publisher or author.
-
Upload
khangminh22 -
Category
Documents
-
view
3 -
download
0
Transcript of Copyright Statement - pearl - University of Plymouth

University of Plymouth
PEARL https://pearl.plymouth.ac.uk
04 University of Plymouth Research Theses 01 Research Theses Main Collection
2019
THE SOURCES AND FATE OF
PLASTIC ENTERING THE MARINE
ENVIRONMENT
Napper, Imogen Ellen
http://hdl.handle.net/10026.1/14729
University of Plymouth
All content in PEARL is protected by copyright law. Author manuscripts are made available in accordance with
publisher policies. Please cite only the published version using the details provided on the item record or
document. In the absence of an open licence (e.g. Creative Commons), permissions for further reuse of content
should be sought from the publisher or author.

Copyright Statement
This copy of the thesis has been supplied on condition that anyone who consults it is
understood to recognise that its copyright rests with its author and that no quotation from
the thesis and no information derived from it may be published without the author's prior
consent.


THE SOURCES AND FATE OF PLASTIC ENTERING
THE MARINE ENVIRONMENT
by
IMOGEN ELLEN NAPPER
A thesis submitted to the University of Plymouth
in partial fulfilment for the degree of
DOCTOR OF PHILOSOPHY
School of Biological and Marine Sciences
March 2019


i
Acknowledgements
After saying ‘I have nearly finished my PhD’ for about 2 years, I have a lot of people to
thank. Firstly, I must thank Richard Thompson, director of studies for my PhD. Thank you
for giving me the freedom to research a topic I am so passionate about and supporting me
with all the opportunities that arose from it. I’m looking forward to continuing working
together in the future.
For all 6th floor technicians (Marie, Ann, Roger, Tricky and Martin), I really appreciate all
your advice and help with my (sometimes bizarre) requests. The 6th floor would not be able
to function without you all! Additionally, I owe another big thank you to Glenn and the
rest of the SEM team (particularly enjoy our coffee catch ups), Andrew Tonkin, Richard
Hartley and everyone else that has helped me with experimental set up.
Where to begin with MBERC 6th Floor and Marine Building friends? A special mention to
Kirsty (buzzy bee!), Chloe, Amelia, Leah, Adam, Jake & Molly. Thank you for all your
support and happiness. Then of course cubicle 614; Nils, Poppy and Mike, you have been
my cubicle family and provided many hours of laughter and odd conversation. I’ve also
met a lot of incredible people in the last few years that have moved on from Plymouth for
new ventures. A special mention to the WOOOs (Bonny, Alex and baby Josie), Bekah and
Jake. Last but certainly not least, Anaelle and Holly; I could always trust you both to have
had me crying in laughter. For everyone just mentioned, you are stuck with me for life
now! I really have appreciated and value all of your friendship.
For my family (Dad, Mum and Alex), thank you for always believing and supporting me. I
have constantly remembered you telling me ‘always do what you are passionate about’ and
‘aim for the stars’. I’ve been following your advice, so I hope I have made you proud. A
huge thank you to my Nana and Grandad for supporting me too. Of course, I would also
like to thank my dog Rhubarb for just being Rhubarb.
Finally, I would like to thank my partner in crime, Phil. You have been wearing many hats
which include proof reader, chef, agony aunt, tech wizard, comedian and work-nudger.
Words cannot describe how thankful I am for all the support you have given me. It can be
pretty tough living in opposite parts of the country, but you honestly make me feel like
happiest and luckiest person. I’m so proud of everything you have achieved and I’m excited

ii
about the rest of our adventures together (mainly our dream farm with Warty and Hoggy
the warthogs).
Overall, this PhD has been a whirlwind of adventures, but I would not change one thing.
I’m extremely grateful for all the opportunities that have arisen and now looking forward to
the future.

iii
AUTHOR'S DECLARATION
At no time during the registration for the degree of Doctor of Philosophy has the author
been registered for any other University award without prior agreement of the Doctoral
College Quality Sub-Committee.
Work submitted for this research degree at the University of Plymouth has not formed part
of any other degree either at the University of Plymouth or at another establishment.
This study was self-funded, and relevant scientific conferences attended funded by The
Marine Biological Association of the U.K., the Plymouth Marine Science Education
Foundation, Plymouth University Doctoral Training Centre, Estuarine Coastal Sciences
Association (Charles Boyden Fund) and the Society of Environmental Toxicology and
Chemistry.

iv
List of accepted publications:
Napper, I.E., Pahl, S., Thompson, R.C., 2019. Marine Litter: are there solutions to this global environmental problem? Plastic Legacies (in press). Napper, I.E., Thompson, R.C., 2019. Marine Plastic Pollution: Other than micro-plastic, WASTE, A Handbook for Management, second edition (in press). Napper, I.E., Thompson, R.C., 2019. Micro- and Macroplastics in aquatic ecosystems. Encyclopaedia of Ecology, second edition (in press). Thompson, R.C., Napper, I.E., 2018, ‘Microplastics in the Environment. Plastics and the Environment’, in Hester, R. E. and Harrison, R.M., Issues in Environmental Science and Technology, London (U.K), Royal Society of Chemistry: 60-81 Napper, I.E., Thompson R.C. Release of synthetic microplastic plastic fibres from domestic washing machines: Effects of fabric type and washing conditions. Mar Pollut Bull 2016;112:39–45. Napper I.E., Bakir A., Rowland S.J., Thompson R.C. Characterisation, quantity and sorptive properties of microplastics extracted from cosmetics. Mar Pollut Bull 2015;99:178–85.

v
List of conferences, seminars and workshops attended:
MICRO 2018, Arrecife (Lanzarote, Spain), November 2018 - Oral presentation Royal Geographical Society Annual Explore Weekend, Royal Geographical Society (London, U.K.), November 2018 - Oral presentation Influence Nation Summit, National Geographic HQ, (Washington D.C., U.S.A.), September 2018 - Oral presentation National Geographic Explorers Festival, National Geographic HQ, (Washington D.C., U.S.A.), June 2018 - Oral presentation University of Portsmouth ‘See Bin, Sea Change’, University of Portsmouth (Portsmouth, U.K.), December 2017 - Oral presentation Exeter Science Park Seminar Series, Exeter Science Park (Exeter, U.K.), November 2017 - Oral presentation PlyMSEF ‘Making Waves’ 2017 Post-graduate Conference, Plymouth Marine Laboratory (Plymouth, U.K.), February 2017 - Oral presentation European Conference on Plastics, RDM Rotterdam (Rotterdam, Netherlands), December 2016 – Attendance SETAC Europe 26th Annual Meeting, La Cite Nantes Congress Center (Nantes, France), May 2016 - Oral presentation MICRO 2016, Arrecife (Lanzarote, Spain), May 2016 - Oral presentation University of Plymouth Post-graduate Conference, University of Plymouth (Plymouth, U.K.), July 2015 - Oral presentation Word count of main body of thesis: 31,804
Signed:
Date:

vi

vii
Table of Contents
Acknowledgements..............................................................................................................................i
Author’s Declaration.........................................................................................................................iii
List of Accepted Publications..........................................................................................................iv
List of Conferences, Seminars and Workshops Attended...........................................................v
Table of Contents.............................................................................................................................vii
Abstract................................................................................................................................................x
List of Figures....................................................................................................................................xii
List of Tables...................................................................................................................................xvii
1.0 General Introduction; Micro- and macroplastics in aquatic environments.....1
1.1 Introduction...........................................................................................................................3
1.2 Definitions of Plastic Litter.................................................................................................4
1.2.1 Macro & Mesoplastic...............................................................................................5
1.2.2 Microplastic..............................................................................................................5
1.2.3 Primary Microplastic...............................................................................................6
1.2.4 Secondary Microplastic...........................................................................................6
1.3 Sources....................................................................................................................................7
1.3.1 Sources of Macroplastic.........................................................................................8
1.3.2 Sources of Microplastic..........................................................................................9
1.3.3 Waste Water Treatment Plants............................................................................10
1.3.4 Source Trends........................................................................................................10
1.4 Distribution..........................................................................................................................11
1.4.1 Floating and Suspended Plastic Debris..............................................................12
1.4.2 Plastic Debris on the Seafloor.............................................................................14
1.4.3 Plastic Debris on Beaches....................................................................................14
1.5 Impacts.................................................................................................................................16
1.5.1 Impacts on Marine Organisms............................................................................16
1.5.2 Impacts on Maritime Industries, Tourism and Human Health.....................18
1.6 Conclusion.................................................................. .........................................................20
1.7 Aim of the Thesis................................................................................................................21
1.8 Thesis overview...................................................................................................................21

viii
2.0 Characterisation, Quantity and Sorptive Properties of Microplastics
Extracted From Cosmetics...........................................................................................23
2.1 Introduction.........................................................................................................................25
2.2 Method.................................................................................................................................27
2.2.1 Sample preparation...............................................................................................27
2.2.2 Visualisation and identification...........................................................................28
2.2.3 Sorption of pollutants to plastics........................................................................29
2.2.4 Statistical analysis...................................................................................................30
2.3 Results...................................................................................................................................30
2.3.1 Extraction and Identification...............................................................................30
2.3.2 Size-Frequency Distributions..............................................................................31
2.3.3 Sorption of persistent organic pollutants...........................................................34
2.4 Discussion............................................................................................................................36
2.5 Conclusion...........................................................................................................................40
3.0 Release of Synthetic Microplastic Fibres from Domestic Washing Machines
- Effects of Fabric Type and Washing Conditions.................................................41
3.1 Introduction.........................................................................................................................43
3.2 Methods................................................................................................................................45
3.3 Results...................................................................................................................................48
3.4 Discussion............................................................................................................................52
3.5 Conclusion ..........................................................................................................................56
4.0 The Properties and Degradability of Single-Use Disposable Wipes (Baby-
Wipes)................................................................................................................ ..................57
4.1 Introduction.........................................................................................................................59
4.2 Methods................................................................................................................................62
4.2.1 Environmental Setup............................................................................................63
4.2.2 Laboratory Setup...................................................................................................64
4.3 Results...................................................................................................................................65
4.3.1 Laboratory Results.................................................................................................68
4.3.2 Environmental Results.........................................................................................70
4.4 Discussion............................................................................................................................71
4.5 Conclusion...........................................................................................................................74

ix
5.0 Degradation of Biodegradable, Degradable and Conventional Plastic Carrier
Bags in the Environment Over a Three-Year Period............................................75
5.1 Introduction.........................................................................................................................77
5.2 Methods................................................................................................................................82
5.2.1 Sample Preparation...............................................................................................82
5.2.2 Visual Inspection...................................................................................................85
5.2.3 Tensile Stress Testing............................................................................................85
5.2.4 Molecular Composition Analysis (FTIR) and Image Analysis.......................86
5.3 Results...................................................................................................................................87
5.4 Discussion............................................................................................................................94
5.5 Conclusion...........................................................................................................................99
6.0 General Discussion; are there solutions to this global environmental
problem?................................................................................................................ ...........101
6.1 Introduction.......................................................................................................................103
6.2 Waste Management...........................................................................................................104
6.3 Education and Behaviour Change..................................................................................105
6.4 Industry and the Circular Economy................................................................................107
6.5 Policy Measures.................................................................................................................108
6.6 Future work........................................................................................................................109
6.7 Conclusions........................................................................................................................110
7.0 References........................................................................................................................113
Publications.....................................................................................................................................143

x
Abstract
THE SOURCES AND FATE OF PLASTIC ENTERING THE
MARINE ENVIRONMENT
Imogen Ellen Napper
Plastics can come in many forms and bring a wide range of societal benefits in healthcare,
agriculture, transport, construction and packaging. However, plastic is a large proportion of
marine litter and an internationally recognised pollutant. Marine litter results from the
indiscriminate disposal of waste items that are either directly or indirectly transferred into
aquatic environments. This debris can cause harmful effects for wildlife, commercial
fisheries, maritime industries, tourism and human well-being (Chapter 1).
Over the past decade, increased scientific interest has produced an expanding knowledge
base for plastic contamination in the environment. However, fundamental questions and
issues remain unresolved. This thesis addresses several prominent sources of plastic litter
and discusses the routes by which the plastic can enter the environment; these include
facial scrubs, laundering clothes, wet wipes and carrier bags. Whilst the emphasis of this
thesis is on microplastics (both primary and secondary source), the indiscriminate disposal
of macroplastics are also considered, as, with time, they have the potential to degrade into
secondary microplastics.
Cosmetic products, such as facial scrubs, were identified as a potentially important primary
sources of microplastics to the marine environment. Up to 94500 microplastics were found
to release in a single use (Chapter 2). The laundering clothes was also found to be an
important source of primary microplastic where over 700,000 fibres were estimated to be
released from an average 6 kg wash load (Chapter 3). Wet wipes degradability was tested
for both flushable and non-flushable alternatives. There are currently no standardised
criteria to measure whether a product can be flushed, and the degradability of these
products still remains unclear (Chapter 4). Furthermore, different formulations of carrier
bags that stated that they were biodegradable and oxo-biodegradable, were still present in
the soil and marine environment after 3 years. This suggests that they have no meaningful
advantage over conventional bags in terms of consequences of persistence. (Chapter 5).

xi
The versatility, low cost and often single use application of plastic mean that the material is
utilised for a wide variety of products. Therefore, one of the major challenges in addressing
the issues surrounding marine plastic debris is the diverse nature of plastic products and
the many routes by which they can enter the environment. To help manage and reduce
emissions it is essential to better understand the relative importance of these sources, assess
regional variation and target specific solution options (Chapter 6).

xii
List of Figures
Figure 1.1 Pictures showing typical microplastic samples: a) Polyethylene
particles extracted from a cosmetic product. Source: Napper &
Thompson, Plymouth University Electron Microscopy Suite. b)
Fragments of microplastic collected from a shoreline near to
Plymouth, UK. Source: Thompson, Plymouth University. Note:
Scale bar applies to both pictures.
Figure 1.2 The estimated mass of mismanaged plastic waste (millions of
metric tons) input into the ocean by populations living within 50
km of a coast in 192 countries, plotted as a cumulative sum from
2010 to 2025 (Jambeck et al., 2015)
Figure 1.3 Plastic contamination in the oceans. A model result for a global
count density in four size classes of plastic. The combined data
from 24 sampling missions with oceanographic computer
modelling, the global distribution of plastic particles was predicted
in specific size classes. Macroplastic is considered >5 mm, so is
displayed by the bottom two tiles. Credit; Eriksen & Lebreton
(Eriksen et al., 2014).
Figure 1.4 A beach clean organised by the Marine Conservation Society, UK
(Source: Marine Conservation Society)
Figure 1.5 Impacts of beach and marine litter on socio-economic activities;
Adapted from Reinhard et al. 2012 (Reinhard et al., 2012).
Figure 1.6 Potential impacts of marine litter on fisheries; Adapted from Mouat
et al. (2010) (Mouat et al., 2010).
Figure 2.1 Total mass of plastic microbeads extracted from six facial scrubs
(A-F) per 100 mL. Diamond symbol indicates x̅ (n=4). The tails
show both the maximum and minimum mass obtained, and the box
represents the upper and lower quartiles. There were significant
differences between the amount of microplastic in each of the
products (p < 0.05).
Figure 2.2
Particle size distribution of PE microbead particles extracted from
six facial scrubs (A-F). Determined using a Malvern Mastersizer
2000, laser particle sizer.

xiii
Figure 2.3
Estimates for the number of PE microbead particles in six brands
of facial scrubs per 1ml. Calculated using data from the volume
weighted mean (n = 3, ±SD; correlating to the spread of the
different amounts of particles calculated for high, medium and low
density PE).
Figure 2.4 A- Scanning Electron Microscopy (SEM) image of a typical rough
facial scrub plastic microbead particle (9000X magnification). B-
SEM image of surface microbead topography (16000X
magnification). C- SEM image of a broken smooth spherical plastic
microbead from ‘product F’ (900X magnification).
Figure 2.5 Single point distribution coefficients (Kd) for the sorption of a
mixture of phenanthrene (Phe) and DDT onto PE particles and
rough and smooth PE-microbeads extracted from cosmetic
products (n=3, ± SD). For each contaminant, treatments with the
same letters (A-C for Phe and a-d for DDT) were not significantly
different (p < 0.05).
Figure 3.1 Experimental design showing Factors used for each fabric type
(acrylic, polyester, polyester-cotton blend).
Figure 3.2 Fibre loss from three fabrics (acrylic, polyester & polyester-cotton
blend), over the first 5 washes. Data from the 5th wash was used in
the analysis (n = 4, ±SD).
Figure 3.3
Images to show the original garments (each representing a different
fabric), and a scanning electron microscopy image (SEM) of a
typical
fibre from each fabric (the scale bar is consistent for all images -
2500X magnification). Key details are included below about the
mean dimensions of fibres released during laundering, and
estimated quantity released from the fabric during each wash
(assuming a typical washing load of 6kg).
Figure 4.1
Left – Whole baby-wipes which have been sewn into mesh pouches
and placed in an orange high-density polyethylene bag before
deployment into the marine environment (Queen Anne’s Battery
Marina; Plymouth). Right – Extracted baby-wipes after 1 week
exposure in the marine environment. The brand names on the petri
dishes have been removed.

xiv
Figure 4.2 The Forest Stewardship Council (FSC) symbol is displayed on a
wood or wood based product for assurance that the product is
made with, or contains, wood that comes from FSC certified forests
or from post-consumer waste (FSC, 2017). The ‘Do Not Flush’
(bottom left) and ‘Tidy Man’ (bottom right) symbols to be used on
the packaging of products not designed to be flushed (INDA and
EDANA, 2013).
Figure 4.3 The weight in grams of single baby wipes extracted from four
different brands; 1F-3F (flushable) and 4NF (non-flushable). The y
axis begins at 0.8 g. The thick black line is the median for each
product and the diamond symbol indicates x̅ (n=4). The tails show
both the maximum and minimum mass obtained, and the box
represents the upper and lower quartiles. There were significant
differences between the amount of microplastic in each of the
products (p < .05).
Figure 4.4 Baby wipe samples embedded in resin and the cross sections then
stained with methylene blue to identify if they were made of
cellulosic material. The samples were visualised under a LEICA
M205C light microscope at a magnification of X100 A-D and X400
E. Cellulosic material was found in all fibres from all four products,
identified by the blue staining (shown as black in the diagram): the
flushable baby-wipes (A – 1F, B -2F, C - 3F), and the non-flushable
wipe (D & E - 4NF). The non-flushable wet-wipe (4NF) had
substantially less staining and therefore less cellulose in its material.
E shows how the fibre cross sections are interspersed with small
segments that have been dyed.
Figure 4.5 Scanning Electron Microscopy (SEM) showing the topography and
fibre composition of baby-wipes before experimentation (time 0).
Products (labelled in left hand corner of each row) 1-3F are
marketed as flushable/biodegradable baby-wipes. 4NF is marketed
as not flushable. Photos taken at X100 (1-3F) & X350
magnification (4NF).
Figure 4.6 Scanning Electron Microscopy (SEM) of disposable baby-wipes
after a 5 week exposure to different media; ASW (Autoclaved
Seawater), SW (Seawater) & SW+A (Seawater + Additional

xv
Nutrients). Products (labelled in left hand corner of each row) 1-3F
are marketed as flushable/biodegradable baby-wipes. 4NF is
marketed as not flushable. Photos taken at X350 magnification.
Figure 4.7 Scanning Electron Microscopy (SEM) of baby-wipes after 10 weeks
of exposure to seawater in a laboratory environment. Products
(labelled in left hand corner of each picture) 1-3F are marketed as
flushable/biodegradable baby-wipes. 4NF is marketed as not
flushable. These pictures are representative for each media type.
Photos taken at X350 magnification.
Figure 4.8 A non-flushable wetwipe (baby wipe) after 15 week exposure in the
marine environment at Queen Anne’s Battery Marina
(50°36'48.4"N, -4°12'96.5"W). Minimal degradation was shown.
Figure 5.1 Setup for the degradation experiment testing different types of
plastic used for carrier bags. The bags were marketed as being
either: oxo-biodegradable, biodegradable or compostable. A bag
made from conventional polyethylene was also tested.
Figure 5.2 Scanning Electron Microscopy (SEM) imagery showing the typical
topography of conventional plastic carrier bag (1a) and a
compostable carrier bag material (2a) before testing and then after
27-month exposure outside (1b & 2b, respectively) (2000X
magnification) (Images taken at Plymouth Electron Microscopy
Centre).
Figure 5.3
Figure 5.4
Oxo-biodegradable bags (oxobio2) which had either been
submerged in the marine environment (left) or buried in soil (right)
for over three years. Each bag is holding 2.25 kg of typical
groceries.
Mean of maximum tensile stress of plastic carrier bag samples,
shown as maximum stress before breakage displayed (mean + SE)
over a 27-month exposure period in 4 different environments
(control, marine, soil, open-air). Open-air is labelled as air in this
graph. If bag type is not shown in relation to an environment, it
denotes complete disintegration/fragmentation and hence samples
were not testable.

xvi
List of Tables
Table 2.1 Colour of microplastics found within six facial scrub
products.
Table 2.2 Recovery (%) of phenanthrene (Phe) and DDT following
sorption experiments onto PVC and PE (average values
displayed, n = 3).
Table 3.1 Analysis of variance (ANOVA) for factors affecting release
of fibres as a consequence of various laundering treatments
(n=4; bold = p = <0.05). Key: Temp (temperature), Deter
(detergent), Cond (conditioner).
Table 3.2 Outcomes of SNK tests for specific combinations of the
factors: a) fabric, b) detergent, c) temperature, d) conditioner.
For each combination the relative number of fibres released
is indicated by the sequence shown with permutation leading
to the greatest release of fibres being shown to the right.
Specific variables tested against three different fabric types
(acrylic, polyester & polyester-cotton blend), and the
subsequent fibre extract from laundering (n=4; * = p
(<0.05)). Key: PE (polyester), Blend (polyester-cotton blend),
Acr (acrylic), A (conditioner/detergent absent), C
(conditioner present), NB (non-bio detergent), bio (bio
detergent).
Table 5.1 Information on the tested carrier bags and the properties as
stated on the manufacture’s website. All bags were opaque
and obtained based on their prevalence in retail stores in and
around Plymouth, U.K.
Table 5.2 Mean of maximum tensile stress (MPa), standard deviation
(SD) and mean thickness of plastic bags before being
exposed in different environments (n=4). All bag types had
relatively consistent thickness.
Table 5.3 Outcomes of 1-way ANOVA test with post-hoc Tukey's
HSD tests showing the mean +/- S.D. and any significant

xvii
differences in maximum tensile stress of 5 different carrier
bag materials (n=4, >* signifies a significant difference at P
0.05, = denotes no significant difference)
Table 5.4 3-Way ANOVA to comparing changes in tensile strength of
5 bag types over 27 months. This focussed on the influence
of three independent variables (bag type, environment, time)
on the percentage change of maximum tensile stress of 150 x
25mm strips at 0-9 and 9-27 months. Bag type included 4
levels (4 bag types; Oxobio1, Oxobio2, Biodegradable and
Conventional), environment consisted of 4 levels (control,
open-air, marine, soil). Analysis of 9 - 27 months does not
include open-air samples due as they were too brittle to test.
The compostable bag was not included in the analysis due to
its rapid loss of marine samples.
Table 5.5 Outcomes of post-hoc Tukey's HSD tests showing the mean
+/- S.D. and any significant differences in maximum tensile
stress of 5 different carrier bag materials, in four different
environments over a period of 27 months. Separate analysis
was required for the compostable bag type as all its samples
had completely deteriorated within the marine environment
in 3 months. (n=4, >* signifies a significant difference at P
0.05, / signifies no available sample for testing and = denotes
no significant difference)
Table 5.6 The percentage (%) loss change in tensile stress (MPa) of 5
bag types over 27 months from 4 different environment
types. ⏦ denotes that the samples were too brittle to be
tested (after 9 months). ⏦⏦ denotes that samples were no
longer visible and therefore could not be tested.

xviii

GENERAL INTRODUCTION
1
Chapter 1
General Introduction; Micro- and
Macroplastics in Aquatic Environments

CHAPTER 1
2
Abstract
Marine litter is a growing environmental problem which can pose threats to the
environment, the economy and human wellbeing on a global scale. Over 300 million tons
of plastic is produced annually and around 75% of all marine litter is plastic. Plastic litter is
widespread in aquatic ecosystems and comes from a variety of sources. Once in the
environment, plastic can fragment due to exposure to UV light, heat and abrasion; this can
lead to the formation of microplastic (<5mm). Plastic debris can be harmful to wildlife as a
consequence of ingestion and entanglement. There are also concerns about the transfer of
chemicals by plastic to organisms upon ingestion, but there is currently little evidence to
indicate that plastics provide a major vector for chemical transfer in the environment.
Plastic debris also has a range of negative effects for commercial fisheries, maritime
industries and tourism. There is also emerging evidence of negative consequences for
human well-being. This general introduction provides a summary for the current
knowledge of plastic as a component of marine litter. It focusses on the different size
classes, potential impacts and then links to the different sources the plastic debris could
originate from. In the final section it also outlines the objectives of this thesis and indicates
the specific aims of each chapter.

GENERAL INTRODUCTION
3
1.0 General Introduction; Micro- and macroplastics in
aquatic environments
1.1 Introduction
The human race generates a considerable amount of solid waste on a daily basis. Quantities
of this waste are increasing, although amounts vary between countries. Plastics are nearly
always a major component of this waste, as well as being the dominant category of litter
reported in the marine environment (Thompson et al 2004; Jambeck et al., 2015). There
has been growing evidence about the effects plastic contamination can have in the
environments . Plastic litter now contaminates marine habitats from shallow water to the
deep sea (Bergmann and Klages, 2012; Woodall et al., 2014) and has been identified as a
major global issue by the United Nations Environment Assembly and in the G7 Leader´s
declaration 2015 (GESAMP, 2016; UNEP, 2017; Werner et al., 2016).
Plastics are synthetic or semi-synthetic organic polymers. They are typically lightweight,
strong, inexpensive, durable and corrosion-resistant (Derraik, 2002; Thompson et al.,
2009b). Most plastic items are composed of hydrocarbons derived from fossil oil or gas
feedstocks (Am. Chem. Counc., 2015). During the conversion from resin to product, a
wide variety of additives (such as fillers, plasticizers, flame retardants, thermal stabilizers,
antimicrobial agents and colouring agents) may be added to enhance performance and
appearance of plastic items (Andrady and Neal, 2009). As a consequence, plastic materials
can take many forms including rigid items together with more flexible films, adhesives,
foams and fibres.
The most commonly used polymers are high-density polyethylene (HDPE), low-density
polyethylene (LDPE), polyvinyl chloride (PVC), polystyrene (PS), polypropylene (PP) and
polyethylene terephthalate (PET), which cumulatively account for approximately 90% of
total plastic production. These plastics bring a wide range of societal benefits in healthcare,
agriculture, transport, construction and packaging (PlasticsEurope, 2016). The versatility of
plastic materials has resulted in a substantial increase in their use from 5 million tons
globally in the 1950s to over 335 million tons today (Andrady and Neal, 2009;
PlasticsEurope, 2018).

CHAPTER 1
4
Despite the durability of plastics, the main uses are in relatively short-lived applications,
such as packaging, which accounts for around 40% of all production. While packaging can
help protect food, drink and other items (thus reducing damage and wastage of products),
it also results in rapid accumulation of persistent plastic waste. This has led to one of the
most ubiquitous and long-lasting recent changes to the surface of our planet; the
accumulation and fragmentation of plastic debris (Barnes et al., 2009). Plastics represent a
substantial fraction of the municipal waste stream and a large proportion of marine litter is
plastic (Jambeck et al., 2015). This debris is widely reported in the environment where it
has accumulated at the sea surface (Law et al., 2010) , on shorelines of even the most
remote islands (Barnes, 2005), in the deep sea (Bergmann and Klages, 2012; Woodall et al.,
2014) and in arctic sea ice (Obbard et al., 2014). There is also increasing awareness of the
accumulation of plastic litter on land as well as in freshwater habitats (Eerkes-Medrano et
al., 2015).
Once in the environment, exposure to ultra-violet radiation, heat and oxygen can cause
plastics to become brittle and physical action can then cause them to break down into
smaller pieces, including microplastics. The timescale for degradation of discarded plastics
is not known with certainty and will depend on the chemical nature of the material, the
characteristics of the environment in which they persist and the manner in which
degradation is measured (Andrady and Neal, 2009). However, some polymer chemists
suggest that all of the conventional plastic that has ever been produced, with the exception
of any material that has been incinerated, still persists in the environment in a form too
large to be biodegraded (Thompson et al., 2005).
1.2 Definitions of Plastic Litter
Plastic debris can be defined and described in a variety of ways including by shape, colour,
polymer type, origin and original usage (e.g. packaging). Plastics enter the aquatic
environment in a wide range of sizes (Cole et al., 2011; Hidalgo-Ruz et al., 2012) and have
been reported hundreds of meters in length to microns in diameter. There are three
categories that are typically used to describe the size of plastic contamination; macroplastic
(>20 mm diameter), mesoplastic (5–20 mm) and microplastic (<5 mm) (Barnes et al.,
2009; Thompson et al., 2009a). Although there is uncertainty about absolute quantities of
plastic in the environment, or the ultimate sinks for this debris, there is evidence of
increasing quantities over time (Jambeck et al., 2015; Thompson et al., 2004).

GENERAL INTRODUCTION
5
1.2.1 Macro & Mesoplastic
Macroplastic refers to plastic items larger than 20 mm. Due to its high visibility,
contamination of the environment by macroplastic may be perceived as one of the most
concerning forms of plastic pollution. The accumulation of macroplastic has been reported
in a wide range of habitats (Browne, 2015; Ryan et al., 2009). Clean-up campaigns typically
focus on these larger items and there is wide geographical variability in abundance, which
increases the difficulty of analysing potential trends. However, due to the size of this
debris, it is often possible to categorize items according to their original usage; for example,
packaging, fishing or sewage related debris. Plastic debris that is larger than 5 mm but
smaller than 20 mm is termed mesoplastic.
1.2.2 Microplastic
Microplastic is used as a collective term to describe a heterogeneous range of small plastic
particles and fibres. In 2008, the National Oceanographic and Atmospheric Agency
(NOAA) of the U.S. hosted the first International Microplastics Workshop and as part of
this meeting formulated a working definition to include all plastic particles less than 5 mm
in diameter (Arthur et al., 2009). The lower size limit is typically set by the capacity of
capture methodology or analytical identification equipment and is currently around 20
microns. However, it is widely believed that plastic debris is present in the environment in
the nano-size range (Mattsson et al., 2015). As with macroplastics, microplastics can differ
in specific density, chemical composition, and shape (Fig. 1.1b) (Duis and Coors, 2016;
Law and Thompson, 2014). Microplastic can then be further divided into categories based
on their origin; primary and secondary microplastics.
Figure 1.1 Pictures showing typical microplastic samples: a) Polyethylene particles extracted from a cosmetic product. Source:
Napper & Thompson, Plymouth University Electron Microscopy Suite. b) Fragments of microplastic collected from a shoreline
near to Plymouth, UK. Source: Thompson, Plymouth University. Note: Scale bar applies to both pictures.

CHAPTER 1
6
1.2.3 Primary Microplastic
Particles that directly enter the environment in the microplastic size (<5mm in diameter)
are described as primary microplastics. Primary microplastics are produced through
extrusion or grinding, either as a feed stock for manufacture of products (Turner and
Holmes, 2015) or for direct use (Browne, 2015); for example in cleaning products (Cole et
al., 2011; Derraik, 2002), cosmetics (Fig. 1.1a) (Napper et al., 2015; Zitko and Hanlon,
1991) and as air-blasting media (Gregory, 1996).
1.2.4 Secondary Microplastic
Secondary microplastics are those formed in the environment from the fragmentation of
larger items of plastic debris (Cole et al., 2011; Law and Thompson, 2014). This
degradation occurs as a consequence of ultra-violet (UV) radiation and oxidation, which
overtime can reduce the structural integrity of the plastic, resulting in fragmentation. This
process is called photo-oxidation and is a result of the absorbance of high-energy
wavelengths of the ultraviolet (UV) spectrum by the polymers (Singh and Sharma, 2008).
Once degradation is initiated, it can proceed through temperature-dependent thermo-
oxidative reactions without further exposure to UV radiation, as long as oxygen is available
(Andrady, 2011). This ultimately causes plastics to become brittle and fragment. This can
be facilitated by physical forces from abrasion, wave-action and turbulence (Barnes et al.,
2009; Browne et al., 2007). The process is ongoing, with fragments becoming smaller and
smaller over time (Cole et al., 2011; Galgani et al., 2010).
Even if emissions of larger items of plastic to the environment were to cease with
immediate effect, it is likely that there would still be an increase in the quantity of
microplastic as a consequence of the fragmentation of larger items that are already in the
environment. Secondary microplastic can also be generated as a consequence of wear
during the use of a product. For example, fibres generated from the laundering of clothes
or from the wear of tyres.
The timescale for degradation of discarded plastics is not known with certainty and will
depend on the chemical nature of the material, the characteristics of the environment in
which they persist and the manner in which degradation is measured (Andrady and Neal,
2009). A rage of factors influence rates of degradation in the environment; hydrolysis and
biodegradation, occur at rates several orders of magnitude slower than the oxidative

GENERAL INTRODUCTION
7
mechanisms (Andrady, 2011). Plastics typically take much longer to degrade in water than
they do on land, mainly owing to the reduced UV exposure and lower temperatures found
in aquatic habitats (Gregory and Andrady, 2003). It has been suggested that all of the
conventional plastic that has ever been produced, with the exception of any material that
has been incinerated, still persists in the environment in a form too large to be biodegraded
(Thompson et al., 2005).
1.3 Sources
The majority of plastic in the sea originates from inland sources and is emitted to the
oceans from coastlines or by rivers (Jambeck et al., 2015). In addition, quantities are
released from ocean-based sources such as shipping and aquaculture (Andrady, 2011;
GESAMP, 2015). Smaller particles may also be carried in the air and deposited at sea (Dris
et al., 2015). It has been estimated that on a global scale, the input of plastic into the oceans
is 4.8 to 12.7 million metric tons per annum (based on 2010 data) (Jambeck et al., 2015).
Furthermore, assuming there are no improvements in waste management infrastructure,
the cumulative quantity of plastic waste available to enter the marine environment from
land could increase by approximately three times over the next decade (Fig. 1.2) (Jambeck
et al., 2015). However, a more precise estimate will require direct measurement of the input
rates of plastic waste by wind, tidal and ocean wave transport. It will also require a
methodical measurement of waste generation, collection rates, classification and waste
disposal methods for rural areas and urban centres in countries around the world (Law,
2017). Microplastics have been detected at very high levels globally in rivers and lakes
which could further add to this estimation (Auta et al., 2017; Free et al., 2014; McCormick
et al., 2016).

CHAPTER 1
8
Figure 1.2. The estimated mass of mismanaged plastic waste (millions of metric tons) input into the ocean by populations living
within 50 km of a coast in 192 countries, plotted as a cumulative sum from 2010 to 2025 (Jambeck et al., 2015).
1.3.1 Sources of Macroplastic
Much of the litter in aquatic environments enters as macroplastic from land-based actions
such as general littering, dumping of waste and loss during waste collection as well as that
from inappropriately managed landfill sites (Jambeck et al., 2015; Mehlhart and Blepp,
2012). Plastic waste is collected, and then contained in a waste management framework
which is designed to help minimize loss to the environment. From these land-based
sources, plastic litter then has the potential to end up in municipal wastewater and
freshwater systems (Cole et al., 2011; Leslie et al., 2013). This can result from windblown
litter escaping into the wider environment (Barnes et al., 2009; Mehlhart and Blepp, 2012;
Pruter, 1987). In industrialized countries, waste that is deposited in landfills is usually
covered regularly with soil or a synthetic material, and the landfill is cordoned by a fence to
prevent any debris accidentally leaving. However, in developing regions this is often not the
case (Barnes et al., 2009; Jambeck et al., 2015). The residues from plastic recycling could
also unintentionally escape into the environment (Moore, 2008).
Items released at sea are also an important component; analysis of floating macro-debris
revealed that 20% by number and 70% by weight was fishing–related, principally floats and
buoys (Eriksen et al., 2014). This was based on 4291 visual observations from 891 sampling
locations in the North and South Pacific, North and South Atlantic, Indian Ocean, Bay of
Bengal, Mediterranean Sea and coastal waters of Australia. Additionally, in 2010, the
amount of fishing gear lost to the environment was estimated at around 640,000 tonnes per

GENERAL INTRODUCTION
9
year (Good et al., 2010). Studies have indicated a significant relationship between the
number of ocean-based plastic items found on beaches and the level of commercial fishing
activity (Cunningham and Wilson, 2003; Ribic et al., 2010). Furthermore, unintentional loss
of in-service macroplastic products can occur when catastrophic events, such as tsunamis,
hurricanes, or floods, carry large amounts of material of all kinds into the marine
environment (Law, 2017).
Studies have indicated a significant relationship between the number of ocean-based plastic
items found on beaches and the level of commercial fishing activity (Cunningham and
Wilson, 2003; Ribic et al., 2010). In 2010, the amount of fishing gear lost to the
environment was estimated at around 640 000 t yr-1 (Good et al., 2010). Discarded fishing
items, which include monofilament lines and nylon netting, can float at a variety of depths
and result in ‘ghost fishing’ and entanglement of aquatic organisms; this will be discussed in
the ‘impact’ section (Good et al., 2010).
1.3.2 Sources of Microplastic
Primary microplastic can result from spillage/mishandling of industrial pre-production
plastics or from the use of cosmetics (Duis and Coors, 2016; Law, 2017; Napper et al.,
2015). Plastic microbeads from facial scrubs are an example of a cosmetic use source. After
their intended use, these microbeads are likely to enter household wastewater and some will
escape the waste water treatment system into the environment (Murphy et al., 2016). It has
been estimated that 94,500 microbeads could be released from an exfoliant in a single use,
accumulating to the UK alone to be emitting 16–86 tonnes yr−1 (Napper and Thompson,
2016). Other potentially important sources of microplastics are from microplastic used in
medicines, drilling fluids for oil/gas exploration and in industrial abrasives (i.e. for air-
blasting to remove paint from metal surfaces) (Derraik, 2002; Duis and Coors, 2016;
Gregory, 1996; Mintenig et al., 2014; Sundt et al., 2014).
Further sources of microplastic to the marine environment occur as a consequence of the
breakdown of larger plastic debris (secondary microplastic). These can then enter the
marine environment through two different pathways; a ‘direct’ (sewage or storm water) or
an ‘indirect’ (fragmentation of existing plastic debris) source. Washing of clothes made
from synthetic materials is an example of a direct secondary microplastic source. Again,
this microplastic can enter the environment via wastewater after the release of fibres from a

CHAPTER 1
10
washed garment. Some fabrics release fibres more readily than others; research by Napper
and Thompson (2016) reported that a wash load of 6 kg of acrylic clothing could release
over 700,000 fibres.
For primary and secondary microplastic pieces larger than around 20µm, it is possible to
identify what type of plastic polymer a particular piece of marine debris is made out of
(Thompson et al., 2004). However, it is extremely difficult to trace back the debris to its
origin.
1.3.3 Waste Water Treatment Plants
For any plastic that enters waste water treatment plants, the efficiency of capture (i.e.,
before the effluent is discharged into the environment) depends on the particular treatment
process. However, there is limited information on the efficiency of waste water treatment
plants to capture plastic; particularly microplastic. Some studies indicate extremely high
capture rates (>95%) of plastic particles (Carr et al., 2016; Murphy et al., 2016). Given the
large volume of influent daily, even low loss rates could result in detectable concentrations
of these plastic particles in the environment (Browne et al., 2011; Eriksen et al., 2013).
Murphy et al. (2016) predicted that waste water treatment plants could release 65 million
microplastics every day (Murphy et al., 2016). Wastewater and any plastic debris therein can
also bypass treatment as a consequence of sewage overflows. Even if microplastic is
intercepted during wastewater treatment, the resultant sewage sludge is often returned to
the land as a fertilizer, hence plastic is still released to the environment (Kirchmann et al.,
2017).
1.3.4 Source Trends
The sources of marine plastic litter are mostly well known, but there is still a considerable
lack of knowledge concerning the relative importance of the different sources and their
original usage (Nilsen et al., 2014). Some items can be attributed with a high level of
confidence to their origin; such as fishing gear and sewage-related debris (Galgani et al.,
2015). However, some types of plastic debris are much harder to trace back; such as
microplastic fragments.
Given the large amount of macroplastics entering the environment, it is generally assumed
that there will be a rise in microplastics from the fragmentation of larger items (Andrady,

GENERAL INTRODUCTION
11
2011). However, the fragmentation rates of macroplastics are largely unknown, and as a
result little quantitative information is available on the relative contribution from the
fragmentation of larger items to the abundance of microplastics (Koelmans et al., 2014;
Law and Thompson, 2014; Sundt et al., 2014).Therefore, it is important to understand
sources, pathways and quantities of larger items to the environment as they are the most
likely source of microplastic in our oceans (Andrady, 2011; Browne et al., 2007; Hidalgo-
Ruz et al., 2012).
In terms of abundance, there are no definitive estimates of the total quantity of plastic in
the environment overall. Estimates based on counts at sea suggest between 7000 or >250
000 t of plastic are now present in the open-ocean surface (Cózar et al., 2014; Eriksen et al.,
2014). However, estimations can often depend on what size fractions are being referred to.
The trends of production, consumer-use and demographics all point to a further increase
of plastic use in the future (Auta et al., 2017; Sutherland et al., 2014). Hence there are
considerable concerns that the problems of plastic pollution will escalate unless disposal
practices change.
1.4 Distribution
Once released into the marine environment, and due to their durability, plastic debris has
the potential to become widely dispersed (Fig. 1.3). The plastic debris can be transported
by wind and currents (Faure et al., 2015; Ryan et al., 2009). Plastic has been found to
accumulate in the oceans (Thompson et al., 2004), estuaries (Browne et al., 2010) and even
in remote habitats such as in arctic ice (Obbard et al., 2014). Within these environments,
plastic debris of all sizes, has been reported at the sea surface (Cózar et al., 2014),
suspended in the water column (Lattin et al., 2004), sediments (including those in the deep
sea) (Fischer et al., 2015; Van Cauwenberghe et al., 2013; Woodall et al., 2014) and beaches
(Nelms et al., 2016).
Macroplastic has spread to unhabituated areas, such as Antarctica, where research by
Barnes et al (2010) found a plastic cup and two fishing buoys in the Durmont D’Urville
and Davis seas, as well as two pieces of plastic packaging and a fishing buoy in the
Amundsen Sea (Barnes et al., 2010). Plastic debris has also been found in freshwater
environments showing that this issue is not limited to the marine environment (Ivleva et
al., 2017; Mani et al., 2016; Wagner et al., 2014).

CHAPTER 1
12
Figure 1.3. Plastic contamination in the oceans. A model result for a global count density in four size classes of plastic. The
combined data from 24 sampling missions with oceanographic computer modelling, the global distribution of plastic particles was
predicted in specific size classes. Macroplastic is considered >5 mm, so is displayed by the bottom two tiles. Credit; Eriksen &
Lebreton (Eriksen et al., 2014).
1.4.1 Floating and Suspended Plastic Debris
Rivers can transport considerable quantities of plastic (micro - macro size) to the oceans
and some of this debris can travel from locations far inland. In rivers, microplastic
concentrations have been found to vary along and across the river, reflecting various
sources such as waste water treatment plants, tributaries and weirs (Claessens et al., 2011;
Klein et al., 2015; Mani et al., 2016). Once released into the environment, and due to their
durability, plastic debris has the potential to become widely dispersed via wind and currents
(Faure et al., 2015; Lambert et al., 2014; Ryan et al., 2009).
At the water surface, smaller pieces of plastic present lower rise velocities and are more
susceptible to vertical transport (Reisser et al., 2015; Song et al., 2014). Some polymers such
as polyvinyl chloride (PVC), and polyethylene terephthalate (PET) are denser than water
and are more likely to sink, while polyethylene (PE), polypropylene (PP) and polystyrene
(PS) are more likely to float. However, microplastics typically accumulate fouling from
micro-organisms as well as sediment particles on their surface. Over time this increases
their apparent density causing even some of the less dense polymers to sink (Zettler et al.,
2013). Hence, the sea bed could be the most likely long-term place for the accumulation of
plastic debris.

GENERAL INTRODUCTION
13
Floating debris can be transported by wind and currents at the sea surface but may
eventually sink to the seafloor, be deposited on the shore or degrade over time (Andrady,
2015). Hence, the sources of floating marine debris in the oceans can be difficult to
identify, given the persistence and potential for long-range transport of lightweight
buoyant materials (Ryan et al., 2009).
Floating macrolitter, which includes plastics, is typically monitored by visual observation
from ships. Visual sightings of macroplastics from ship-based observers have been
reported since the 1970s (Venrick et al., 1973), and have proved to provide useful
information about litter densities and how these compare between regions and over time.
An example being in 2009; research from Titmus and Hyrenbach (2011) observed the
surface water from the American west coast to the North Pacific subtropical gyre and back
to the coast (Titmus and Hyrenbach, 2011). This provided data during 74 hours of
observation corresponding to a transect length of 1 343 km. A single observer at 10 m
above sea level recorded a total of 3868 pieces, of which 90 % were fragments and 96 % of
these were plastic. Eighty-one percent of the items had a size of 2–10 cm, 14 % of 10–
30 cm and 5 % of >30 cm. Their research found that the abundance of debris increased
towards the centre of the gyre.
Visual observations from vessels are constrained by an inability to detect smaller fragments
(<20 mm) and to retrieve the observed items for further analysis (Titmus and Hyrenbach,
2011). There has been an effort to standardise the observational methods used in order to
reduce potential bias in the data. Factors such as sea state, elevation of the observation
position and ship speed can all contribute to variations in the number of items measured
(UNEP, 2016). A simple methodology has been proposed that should greatly improve the
robustness of observations, allowing a more coherent picture for the distribution of
floating plastic objects (Ryan, 2013). This takes into account the minimum size of items
counted, the distance of items from the ship, the height of the observer above sea level and
the position of the observer relative to the ship’s bow wave. This proposed method would
be effective as long as there was adequate training for such a method.
Aircraft and satellite observations may also prove useful; for example, in the aftermath of
natural disasters, such as the 2011 Tōhoku earthquake tsunami in the North Pacific
(NASA, 2012). Looking to the future, automatized approaches using digital imaging and
image recognition techniques for the autonomous large-scale monitoring of plastic litter are
being researched (Hanke and Piha, 2011).

CHAPTER 1
14
1.4.2 Plastic Debris on the Seafloor
Plastic items that are a range of sizes are commonly observed, or collected, from the
seafloor (Pham et al., 2014). Their ability to sink through the water column to the sea
floor is determined by the plastics composition and environmental conditions (Galgani et
al., 2015). Polymers denser than seawater (e.g. PVC) will sink, while those with lower
density (e.g. PE and PP) will tend to float in water column. Biofouling of organisms on the
plastic surface increases the weight of plastic objects, thus increasing the potential for them
to sink (Lobelle and Cunliffe, 2011; Ye and Andrady, 1991). Degradation, fragmentation
and the leaching of additives can also influence the density of objects and hence their
distribution in the water column (Avio et al., 2017). As a result, plastic can dominate
macro-debris on the sea floor.
Sea bed surveys of macro-debris, have been conducted with divers (Donohue et al., 2001;
Nagelkerken et al., 2001), trawl surveys (Galgani et al., 2000; Moore and Allen, 2000;
Tekman et al., 2017) and submersibles/remote-operated vehicles (Loakeimidis et al., 2015).
The accumulation of large plastic items has also been found on the sea floor in the deep
sea, where research by Galgani et al. (1996) found that plastic bags accounted for more
than 70% of total debris off the French Mediterranean coast (Galgani et al., 1996). The
amount of plastic litter is so great in some areas that initiatives have been started to clean
the seabed with trawls, despite concerns about the ecological impacts of trawling (OSPAR
Commission, 2007).
The geographic distribution of debris on the ocean floor is strongly influenced by
hydrodynamics, geomorphology and human factors (Galgani et al., 1996; Pham et al.,
2014). Moreover, there are notable temporal variations, particularly seasonal, with
tendencies for accumulation and concentration of marine litter in particular geographic
areas (Galgani et al., 1995). The fragmentation and degradation of plastics at depth is
unknown, but accumulation of debris on the seafloor certainly began before scientific
investigations started in the 1990s (Galgani et al., 2015).
1.4.3 Plastic Debris on Beaches
The majority of studies on marine plastic debris have focused on its occurrence in coastal
waters and open ocean areas. However, plastic debris is now evident on beaches globally
(Fig. 1.4). Researching macro-debris on beaches uses different approaches that sometimes

GENERAL INTRODUCTION
15
lack detail (Hidalgo-Ruz and Thiel, 2015). These studies typically range from a local (Lee et
al., 2013) to a regional scale (Bravo et al., 2009) and cover a broad temporal range.
Information on sources, composition, amounts, usages, baseline data and environmental
significance are often also gathered (Cordeiro and Costa, 2010; Debrot et al., 2013; Nelms
et al., 2016).
Figure 1.4. A beach clean organised by the Marine Conservation Society, UK (Source: Marine Conservation Society)
The majority of studies investigating the abundance and distribution of plastic debris on
beaches have used citizen science-based data (Eastman et al., 2014; Hoellein et al., 2014).
An example being research from Nelms et al (2016); this research collected data over a
decade (2005–2014 inclusive) using results from Marine Conservation Society (MCS)
volunteers during beach litter surveys in the UK. Their results found that plastic was the
main constituent of anthropogenic litter and the majority of traceable items originated from
land-based sources. However, over the 10 year time there was no statistically significant
change in the total quantity of litter detected (Nelms et al., 2016).
Factors influencing the accumulation of this debris in coastal areas include the shape of the
beach, location and the nature of debris (Turra et al., 2015). Additionally, the abundance of
stranded and drifting plastic debris (both macro and micro particles) along beaches and
coastal areas is expected to increase with projected increases in sea level, wind speed, wave
height, and altered rainfall conditions (Browne et al., 2015).

CHAPTER 1
16
1.5 Impacts
There is a reasonably extensive evidence base relating to the harm caused by marine litter.
This can have a range of negative impacts on commercial fisheries, maritime industries and
infrastructure. It has also been found to affect a wide range of marine organisms; as a
consequence of entanglement and ingestion (Gall and Thompson, 2015; Sutherland et al.,
2010; Wang et al., 2016).
1.5.1 Impacts on Marine Organisms
Over 700 species of marine organisms have been reported to encounter plastic debris,
which can result in severe physical harm and death, or more subtle effects on behaviour
and ecological interactions (e.g. the ability to escape from predators or migrate) (Gall and
Thompson, 2015). It is likely that there are also a range of sub-lethal effects that have not
yet been recognized.
Impacts of plastic vary according to the type and size of the debris, and can occur at
different levels of biological organization in a wide range of habitats (Browne, 2015).
Encounters between plastic litter and organisms can negatively affect individuals and a
substantial proportion of some populations can be contaminated with plastics. For
example, over 40% of sperm whales beached on North Sea coasts had marine litter
including, ropes, foils and packaging material found in their gastro-intestinal tract (Unger et
al., 2016). Also, over 95% of the population of norther fulmars (Fulmar glacialis) may
contain plastic litter in some European waters (Van Franeker et al., 2011).
Over 330 species (50 marine mammals) have been found to become entangled or ingested
plastic debris (Kühn et al., 2015). However, evidence of harm from entanglement is easier
to observe and report than ingestion. This is because ingestion typically only becomes
apparent when the carcass of an animal opens; either as a result of dissection or
decomposition. It has been reported from UK surveys that there is an incidence rate of
entanglement between 2-9% for some populations of seabirds and marine mammals
(Werner et al., 2016).
The ingestion of meso- or macroplastic litter has been reviewed for numerous marine
species; particularly mammals, birds and turtles (Derraik, 2002; Gall and Thompson, 2015;
Gregory, 2009; Kühn et al., 2015; Laist, 1997). Studies have also shown that both

GENERAL INTRODUCTION
17
freshwater invertebrates and fish ingest microplastic (Imhof et al., 2013; Phillips and
Bonner, 2015). The potential for ingestion is greater with pieces in the microplastic size
range since their small size makes them readily accessible for ingestion by a wide range of
organisms (Davison and Asch, 2011) including whales, fishes, mussels, oysters, shrimps,
copepods and lugworms, (Cole et al., 2013; Ferreira et al., 2016; Lusher et al., 2015a,
2015b).
However, ingestion also depends on properties other than size including shape, density and
colour. For instance, low-density (i.e. buoyant) microplastics are potentially more likely to
be ingested by pelagic feeders and high-density microplastics by benthic feeders (Scherer et
al., 2017; Wright et al., 2013). With very small particles, including those in the nano size
range, there is also the potential for uptake across cell membranes, but little is known about
any associated impacts (Koelmans et al. 2014). Organisms at lower trophic levels can ingest
and accumulate microplastic particles, and it has been shown that microplastics can transfer
between trophic levels in the food-web (Watts et al., 2014). Ingestion has shown to lead to
physical effects that include physiological stress responses and even signs of tumour
formation (Rochman et al., 2013).
There are also concerns about the potential for ingestion to facilitate the transfer of
chemicals to marine life (Bakir et al., 2014). Hydrophobic organic pollutants readily sorb
onto plastics, and can accumulate at concentrations several orders of magnitude higher
than in seawater (Mato et al., 2001). These chemicals can then be released to organisms
upon ingestion. However, modelling estimates indicate the amount of chemical transfer
from water to organisms via plastic is probably not a major pathway leading to harm (Bakir
et al., 2016).
Additive chemicals incorporated into plastic products at the time of manufacture may also
transfer to marine organisms upon ingestion (Tanaka et al., 2013). These chemicals are
intentionally added during the manufacture or processing; for example to enhance the
plastics durability and corrosion resistance (Andrady, 2016) or act as stabilizers, plasticizers
or flame retardants. Some additives, such as plasticizers, are used at high concentrations
(10–50%) to ensure the functionality of the product. Degradation of plastic containing
these additives may result in the additives leaching out and becoming bioavailable to
organisms (Oehlmann et al., 2009; Talsness et al., 2009). Although, there is currently little
evidence of harmful effects associated with the release of additives from plastic litter in the
environment.

CHAPTER 1
18
A further source of concern is colonization of organisms on plastic debris; species found
on plastic debris can differ from the free-floating microbial communities in the
oceans (Zettler et al., 2013). For example, microplastics collected in the surface waters of
the North Atlantic were colonized by a variety of organisms including bacteria,
cyanobacteria, diatoms, ciliates and radiolaria (Zettler et al., 2013). As plastics have been
reported to travel over long distances, they may contribute to the dispersal of alien or
invasive species (Barnes, 2002).
1.5.2 Impacts on Maritime Industries, Tourism and Human Health
The presence of litter in the marine environment presents an aesthetic issue with economic
repercussions for the tourist industry, a hazard for numerous marine-industries (e.g.
shipping, fishing, energy production, aquaculture) and entanglement/damage of maritime
equipment (e.g. propellers on vessels) (Barnes et al., 2009a; Derraik, 2002). It is also
considered that litter within the marine environment is unsightly and detracts from the
inherent value of the world's coastlines, which can further impact human well-being and
socio-economic activities (Fig. 1.5) (Axelsson and van Sebille, 2017). As discussed, plastic is
the main constituent of marine anthropogenic litter, due to its high persistence within the
marine environment (Andrady, 2015; Barnes et al., 2009a; Jambeck et al., 2015; Poeta et al.,
2014; Thompson et al., 2009a).
Figure 1.5. Impacts of beach and marine litter on socio-economic activities; Adapted from Reinhard et al. 2012 (Reinhard et
al., 2012).

GENERAL INTRODUCTION
19
It has been reported that beach choice is more strongly determined by clean, litter-free
sand and seawater than by safety (Tudor and Williams, 2006). For example, 85% of 1000
residents and tourists said they would not visit a beach with an excess of two litter items
per metre (Ballance et al., 2000; Hastings and Potts, 2013). A study in Cape Town
estimated that a loss in the standards of cleanliness on the beaches would result in a 97%
loss in the value of those beaches (Ballance et al., 2000). It was also found that in Geoje
Island, Korea, marine debris cost the island US $29-37×106 in tourism losses following an
extreme rainfall event in 2011 (Jang et al., 2014).
There is also emerging evidence that even small quantities of litter on beaches can have a
negative effect on human well-being (Wyles et al., 2016). Wyles et al. (2015) found that the
restorative psychological benefits ordinarily experienced by people visiting the coast were
undermined by the presence of relatively small quantities of litter (Wyles et al., 2015).
Cleanup programs for anthropogenic litter can be ineffective and expensive. The total cost
of removing litter of all types from 34 UK harbors was estimated at approximately £236
000. Based on this, it was estimated that marine litter costs the ports and harbour industry
in the UK approximately £2.1×10⁶ each year (Mouat et al., 2010). Very limited research has
therefore been conducted into the costs of marine litter removal and estimates tend to be
based mostly on anecdotal evidence. Research in 2000 found that 56 UK local authorities
spent a total of £2 197 138 a year on beach cleansing, taking into account the cost of
collection, transport, disposal charges, workforce, equipment and administration (Hall and
KIMO (Organization), 2000).
Fishing can also be impacted by macroplastic debris (Fig. 1.6). Any subsequent decreases in
the abundance of stocks would directly affect the fisheries economy (Axelsson and van
Sebille, 2017). However, the most important impact of macroplastic debris on fisheries is
from ghost fishing from Abandoned, Lost or Otherwise Discarded Fishing Gear
(ALDFG). Ghost fishing occurs when passive gears such as gillnets, trammel nets, wreck
nets, pots and traps are lost or discarded. These then continue to catch commercially
important species of fish and crustaceans as well as non-commercial species of fish and
crustaceans, birds, marine mammals and turtles (Brown and Macfadyen, 2007). It has been
estimated that there is an annual loss of 208 t of Antarctic toothfish (Dissostichus mawsoni)
due to lost longlines (Webber and Parker, 2012). Another study in Australia found that

CHAPTER 1
20
collapsible trawl mesh pots could unintendedly catch 670 866 Blue swimmer crabs (Portunus
pelagicus) per year.
Figure 1.6. Potential impacts of marine litter on fisheries; Adapted from Mouat et al. (2010) (Mouat et al., 2010).
Additionally, plastic litter can damage vessels or present navigational hazards. It can lead to
injury or death following loss of power, due to entangled propellers or blocked water
intakes and collision with floating or semi-submerged objects, including (plastic) insulated
shipping containers (Frey and DeVogelaere, 2013). For example, in 2005, the USA
coastguard reported that collisions with submerged objects caused 269 boating incidents,
resulting in 15 deaths and 116 injuries (U.S. Coast Guard, 2006). The seriousness of the
potential consequences was highlighted by the sinking of the Ferry M/V Soe-Hae in 1993
which was, in part, caused by rope around the propellers, and resulted in 292 deaths (Cho,
2005). Clearly, the frequency of these negative impacts will increase in relation to increasing
levels of contamination. Furthermore, there is potential of harm to due to entanglement
when swimming and diving.
1.6 Conclusion
Once in the ocean, plastic debris has the potential to travel considerable distances from its
original location. The debris is persistent, accumulating and can potentially impact marine
organisms, maritime industries, tourism and human health. One of the major challenges in
addressing the issues surrounding marine plastic debris is the diverse nature of plastic
products and the many routes by which they can enter the environment. To help manage
and reduce emissions it is essential to better understand the relative importance of these
sources and to assess regional variation. We should focus on minimising direct inputs of
microplastic and reduce the quantity of larger items of litter entering the environment since
they will ultimately fragment into microplastics.

GENERAL INTRODUCTION
21
Therefore, understanding the different sources of plastic into the marine environment is
critical as human population and usage of plastic continues to rise. The following thesis
analyses four common plastic containing products (facial scrubs, clothes, wet wipes and
carrier bags) to identify their potential input and risk to the aquatic environment.
1.7 Aim of the Thesis
The overall aim of this thesis was to identify and analyse different sources of plastic
entering the marine environment.
The specific objectives were to:
1. Review the current knowledge of plastic marine debris
2. Research four different sources of plastic marine debris and their characteristics
3. Discuss the potential impact that each source could cause
4. Analyse degradation properties
1.8 Thesis overview
This thesis comprises six chapters. Each chapter investigates different plastic products and
identifies how they could be an important source of microplastics to aquatic habitats.
A description of each is given below.
Chapter 2 characterises, quantifies and then investigates the sorptive properties of plastic
microbeads that are used as exfoliants in cosmetics.
Chapter 3 examined the release of fibres from polyester, polyester-cotton blend and acrylic
fabrics when being laundered under various conditions of temperature, detergent and
conditioner.
Chapter 4 analyses four different baby-wipe brands labelled as flushable and one baby-wipe
labelled as non-flushable. This was to further understand their relative rates of degradation
in the marine environment.

CHAPTER 1
22
Chapter 5 tests the breakdown of carrier bags made out of oxo-/biodegradable,
compostable and conventional plastic formulations over three years in three different
environments (marine, soil and open-air).
Chapter 6 discusses the solutions to marine litter and the broader implications.
Accumulatively, these chapters develop our understanding of how plastic can enter our
marine environment, and in substantial quantities, from sources not often considered.

MICROPLASTIC IN COSMETICS
23
Chapter 2
Characterisation, Quantity and Sorptive
Properties of Microplastics Extracted from
Cosmetics
A version of this chapter is available online as:
Napper I.E., Bakir A., Rowland S.J., Thompson R.C. Characterisation,
quantity and sorptive properties of microplastics extracted from cosmetics.
Mar Pollut Bull 2015;99:178–85.
The Sorptive Properties research was conducted by Bakir, A.

CHAPTER 2
24
Abstract
Cosmetic products, such as facial scrubs, have been identified as potentially important
primary sources of microplastics to the marine environment. This study characterises,
quantifies and then investigates the sorptive properties of plastic microbeads that are used
as exfoliants in cosmetics. Polyethylene microbeads were extracted from several products,
and shown to have a wide size range (mean diameters between 164 to 327 μm). We
estimated that between 4594 – 94500 microbeads could be released in a single use. To
understand how microbeads could also accumulate and transport chemicals, they were
exposed to a binary mixture of 3H-phenanthrene and 14C-DDT in seawater. The potential
for transport of sorbed chemicals by microbeads was broadly similar to that of polythene
(PE) particles used in previous sorption studies. In conclusion, cosmetic exfoliants are a
potentially important, yet preventable source of microplastic contamination in the marine
environment.

MICROPLASTIC IN COSMETICS
25
2.0 Characterisation, Quantity and Sorptive Properties
of Microplastics Extracted From Cosmetics
2.1 Introduction
Plastics provide a diverse range of inexpensive, lightweight, strong, durable and corrosion-
resistant products (Thompson et al., 2009b). The success of plastics as materials has been
substantial and they are used in a wide range of applications. This versatility, together with
their low cost, has resulted in the annual worldwide production of around 300 million
tonnes (Plastics Europe. 2014). Approximately 50% of production is used to make
packaging, much of which is used in disposable applications. This creates a major waste
management problem, with plastics accounting for approximately 8-10% of all the waste
generated in the UK (Barnes et al., 2009; Hopewell et al., 2009).
Around 700 species of marine organism have been reported to encounter marine debris in
the natural environment, with plastic debris accounting for over 90% of these encounters
(Gall and Thompson, 2015). Large plastic items, such as discarded fishing rope and nets,
can cause entanglement of invertebrates, birds, mammals, and turtles (Carr, 1987; Eerkes-
Medrano et al., 2015; Fowler, 1987; Laist, 1997) but the marine environment is also
contaminated with much smaller microplastics particles (defined by NOAA as <5mm).
These have been reported at the sea surface (Law and Thompson 2014), on shorelines
(Claessens et al., 2011), and on the sea bed (Van Cauwenberghe et al., 2013). The sources
of microplastics include fragmentation of larger items (secondary sources), and direct
inputs of microplastic sized particles, such as microbeads used in cosmetics and pre-
production pellets (primary sources). It is important to understand the relative importance
of these sources as well as the size and abundance of microplastic particles released, since
this will influence encounter rate and availability to biota (Teuten et al., 2007; Thompson et
al., 2009a).
There is growing evidence that the amount of microplastics in marine waters is increasing,
with unknown ecotoxicological consequences (Goldstein et al., 2012). Fendall and Sewell
(2009) reported on microbeads used as “scrubbers” in cosmetics products, which they
described as being up to 500 µm in diameter, being released into the natural environment
and potentially available to organisms. Ingestion of microplastics, has been reported for a

CHAPTER 2
26
wide range of marine organisms including deposit and suspension feeders (Browne et al.,
2008; Graham and Thompson, 2009), crustaceans (Murray and Cowie, 2011), fish (Boerger
et al., 2010), marine mammals (Denuncio et al., 2011), and seabirds (Avery-Gomm et al.,
2012; Van Franeker et al., 2011). However, the extent, if any, to which chemicals sorbed
onto, or incorporated into plastics can desorb from plastic particles, and transfer to the
tissues of marine organisms is less clear. Recent experimental trials provide evidence for
the role of plastics in the transfer of chemicals with subsequent adverse physiological
effects (Besseling et al., 2013; Rochman et al., 2013), but studies based on bioaccumulation
models concluded that the transfer of contaminants from plastics to marine organisms
upon ingestion is of limited importance compared to other pathways (Gouin et al., 2011;
Koelmans et al., 2013).
Microplastics have been used to replace natural exfoliating materials (for example, pumice,
oatmeal, apricot or walnut husks) in cosmetics and have been reported in a variety of
products such as hand-cleansers, soaps, toothpaste, shaving foam, bubble bath, sunscreen,
shampoo and facial scrubs (Fendall and Sewell, 2009; Gregory, 1996; Zitko and Hanlon,
1991; UNEP, 2015).
Industry uses the terms ‘microbeads’ to describe microplastic particles present as
ingredients in personal care and cosmetic products; they may also be called microspheres,
nanospheres, plastic particulates (UNEP, 2015). Around 93% of the ‘microbeads’ used in
cosmetics are polyethylene (PE), but they can also be made of polypropylene (PP), PE
terephthalate (PET), polymethyl methacrylate (PMMA) and nylon (Gouin et al., 2015;
Eriksen et al., 2013; UNEP, 2015). Microbeads are likely to be transported to wastewater
treatment plants, where some will be captured in oxidation ponds or sewage sludge.
However, due to their small size, it is anticipated that a substantial proportion will pass
through filtration systems and enter aquatic environments (Fendall and Sewell, 2009).
Leslie et al. (2013), examined wastewater treatment plants that discharge into the North
Sea, the Oude Maas River or the North Sea Canal and reported that the treated effluent
contained on average 52 pieces of microplastics/L. Eriksen et al. (2013) also reported
substantial amounts of multi-coloured microplastic spheres in surface waters of the
Laurentian Great Lakes of the United States which were suspected to originate from
consumer products. This provides evidence that microplastics are not all captured in
sewage sludge of wastewater treatment plants and is of broad concern, since treated

MICROPLASTIC IN COSMETICS
27
effluent from sewage disposal sites is discharged into a range of water bodies, including
into inland waters, estuaries and the sea (DEFRA, 2002).
Gouin et al. (2011) estimated that the per capita consumption of microplastic used in
personal care products for the U.S. population, based on the usage of PE microplastic
beads used in personal care products, was approximately 2.4 mg per person per day,
indicating that the U.S. population may be emitting an estimated 263 tonnes per yr of PE
microplastic (Gouin et al., 2011). To set this into perspective, in terms of its contribution to
marine litter, this annual quantity is approximately equivalent to 25% of the total mass of
plastic that is estimated to have accumulated in the North Atlantic Subtropical Gyre (Law
et al., 2010; Gouin et al., 2011).
Facial scrubs are one type of cosmetic which contains microplastics as exfoliating agents.
Due to this, such products could contribute microplastics contamination to the marine
environment. Despite concerns about the potential for products containing microbeads to
represent a major source of microplastics to the environment, only one study has
measured microplastics in facial scrubs (Fendall and Sewell, 2009), and there are no peer
reviewed publications confirming the type or quantity of microplastic polymers used in
facial scrubs. Here we examined six brands of facial scrubs manufactured by three
companies and describe the microplastics (plastic microbeads) present, in terms of polymer
type, colour, size, weight and abundance. We also investigated the sorptive properties of
the microplastics in relation to the potential for transport of the POPs phenanthrene (Phe)
and dichlorodiphenyltrichloroethane (DDT) and compared them with commercially
available PE particles previously used in adsorption/desorption studies of persistent
organic pollutants (POPs) (Bakir et al., 2012, 2014a, b; Teuten et al., 2007).
2.2 Methods
2.2.1 Sample preparation
Six major brands of facial scrubs were chosen, based on their prevalence in major
supermarkets close to Plymouth UK. All of the products listed in their ingredients that they
contained PE. Four replicates of each product were purchased, with each replicate sourced
from a different supermarket to provide a representative sample.
Since the specific brand names of the products are not of particular relevance, they were
labelled A-F.

CHAPTER 2
28
Each facial scrub was a viscous liquid (A to D contained 150mL of product, E contained
125mL). The contents were subjected to vacuum filtration to obtain the plastic particles.
The procedure required mixing each product in approximately 1L of boiling water,
followed by vacuum filtration over Whatman Nº4 filter paper, then drying at 30°C to
constant weight. Once dry, the particles were weighed by Precisa 2200C weighing scales
and the residues were transferred into separate glass vials. A Kruskal-Wallis test was
performed on the data, using R studio, to test whether the amount of microplastics per unit
volume extracted differed between products (p < 0.05). This was followed by a post-hoc
Nemenyi-Test to find which specific products significantly differed.
2.2.2 Visualisation and identification
Microplastics from each product were identified using Fourier transform infra-red
spectroscopy (FTIR), using a Hyperion 1000 microscope (Bruker) coupled to an IFS 66
spectrometer (Bruker). The spectra obtained were compared to a spectral database of
synthetic polymers (Bruker I26933 Synthetic fibres ATRlibrary).
Some non-plastic residues were extracted and separated from the plastic particles using
Endecotts woven wire sieves of varying mesh size. The mass of plastic particles was
recorded.
A Malvern Mastersizer 2000 laser particle sizer (MM2) was used to measure the size-
frequency distributions (SFDs) of the extracted plastic into sixty-eight different sized bands
with logarithmic spacing (range 0.015 μm, to 2000 μm; Woolfe and Michibayashi, 1995).
The resultant particle size distributions were expressed as a volume weighted mean from an
average of twenty five measurements per product. The mean for each product was then
calculated.
The number of plastic particles in each product, N, was estimated, assuming the particles
were of spherical shape, using the following equations:
i) 𝑉𝑡 =𝑀𝑡
𝐷 ii) 𝑉(𝑎𝑣𝑔 𝑝𝑎𝑟𝑡𝑖𝑐𝑙𝑒) =
4
3𝜋𝑟3 iii) 𝑁 =
𝑉𝑡
𝑉(𝑎𝑣𝑔 𝑝𝑎𝑟𝑡𝑖𝑐𝑙𝑒)
where Vt is the total volume of plastic extracted, Mt is the total mass of plastic extracted, D
is the density, V(avg.p) is the mean volume of one particle, N is number of particles, and r is
the radius.
For each product: equation i) allowed calculation of the total volume of microplastic
extracted; equation ii) allowed calculation of the average volume of a microplastic particle

MICROPLASTIC IN COSMETICS
29
from each product; by dividing the total volume of microplastic by the average volume of a
microplastic particle, equation iii) allowed calculation of the approximate number of
particles in each product. Particles were then visualised by scanning electron microscopy
(JEOL, 7001F), imaging to describe both whole particles and their topography.
2.2.3 Sorption of pollutants to plastics
As part of a separate, but related study, microbead exfoliants were extracted from shower
gel and used to examine the adsorption of POPs by microbeads. The microbeads from the
shower gel products were extracted and identified by FTIR following the same methods in
sections 2.1 and 2.2. As these microbeads were extracted from different brands of exfoliant
products, they are labelled X, Y & Z. These microbeads were exposed to Phe and DTT;
the results were then compared with sorption to ultra-high-molecular-weight (UHMW) PE
particles used in a previous sorption study (Bakir et al., 2014a, 2014b, 2012).
Adsorption experiments were conducted in an ISO9001 accredited radioisotope facility at
Plymouth University. 3H-Phe and 14C-DDT were selected as contaminants in this study to
allow simultaneous quantification and to compare with past studies (Bakir et al., 2012). 10
mg of either UHMW PE or the extracted microbeads were placed into three glass
centrifuge tubes (50 mL) and 5 µL of 14C-DDT and 16 µL of 3H-Phe were added to the
walls of the tubes. The solvent was allowed to evaporate and 25 mL of seawater (35 psu,
59.3 ± 0.26 mS) was added and the tubes were equilibrated for 48 hours (Bakir et al.,
2014a) in the dark at 18 ºC under continuous horizontal, rotary agitation at 220 rpm. All
experiments were carried out in triplicate. The concentration of contaminant was
determined in the aqueous and solid phase by counting the β decay from the 14C-
contaminant by liquid scintillation counting (LSC) as outlined in Bakir et al. (2012). The
amount of contaminant in each phase was quantified using a calibration curve prepared by
counting known amounts of the contaminant.
The single point distribution coefficient, single point Kd, was calculated using the equation:
(iv).]/[][ aqesolide CqKd =
where qe is the amount of contaminant adsorbed onto plastic (µg kg-1) at equilibrium and Ce
is the contaminant concentration in the aqueous phase at equilibrium (µg L-1).

CHAPTER 2
30
2.2.4 Statistical analysis
A two-factor ANOVA, with contaminants and the microbead type considered as fixed
factors, was used to characterise any significant differences (p < 0.05) between the
distribution coefficients calculated from the sorption of Phe and DDT onto microbeads.
Cochran’s test was used to ensure that the data fulfilled the pre-requisites for parametric
analysis and the appropriate data were ln(x+1) transformed. Student-Newman-Keuls
(SNK) tests were then used to identify any significant terms. The tests were carried out
using GMAV5 software (Underwood et al., 2002).
2.3 Results
2.3.1 Extraction and Identification
All of the products contained microplastic particles of PE, which was in agreement with
their stated ingredients. Product C also contained green and yellow particles that were
slightly larger than the PE microbeads. These could not be identified by FTIR using the
Bruker spectral database and were removed from the samples via sieving and are not
included in any of the calculations. The collected solids from product C also contained
micro-‘glitter’. These ‘glitter’ particles were small and could not be removed from the filter
paper for further analysis. However, ‘glitter’ is commonly manufactured from plastic, such
as PE.
The weight of microplastic extracted varied significantly between products (Kruskal-Wallis
test, p = 0.0012, Fig 2.1); the products which were significantly different from each other
were C and E (p = 0.0009); D and E (p = 0.0463) (post hoc Nemenyi-Test).

MICROPLASTIC IN COSMETICS
31
Figure 2.1. Total mass of plastic microbeads extracted from six facial scrubs (A-F) per 100 mL. Diamond symbol indicates
x̅ (n=4). The tails show both the maximum and minimum mass obtained, and the box represents the upper and lower quartiles.
There were significant differences between the amount of microplastic in each of the products (p < 0.05).
2.3.2 Size-Frequency Distributions
Microplastics from the facial scrubs showed polydispersed size ranges, each with
logarithmic bimodal distributions (Fig 2.2). Product B had the largest size range (10μm to
>2000 μm), whereas product A was the most homogenous, ranging from 8μm to 56μm,
with the largest proportion of smaller particles. Size frequency by volume distributions
were used to calculate the mean diameters for each product. Products D-F had similar
volume-weighted mean diameters, which were 288.80 μm, 289.63 μm and 293.48 μm
respectively. The particles in product B and C were larger, with mean diameters of 326.83
μm and 317.91 μm, while product A was much smaller with a mean diameter of 163.82
μm. The volume-weighted mean diameters were used to estimate the number of particles
in each product. Since the absolute density of the extracted plastics was not known, we
calculated estimates using a range of standard densities. For PE these were, high (0.959
g/cm3), medium (0.940 g/cm3) and low density (0.910 g/cm3).

CHAPTER 2
32
Figure 2.2. Particle size distribution of PE microbead particles extracted from six facial scrubs (A-F). Determined using a
Malvern Mastersizer 2000, laser particle sizer.
Particle diameter, rather than the average weight in each product, was found to have the
greatest effect on abundance estimates. Product E had on average 11.47 g of PE in each
bottle, with a mean particle size of 289.63 μm, resulting in an estimated 6423 particles per
mL. Whereas product A had less PE by weight with, on average, 6.11g in each bottle, but
resulted in an estimate of 18906 particles per mL because the mean size was smaller
(163.82 μm); being the highest quantity in any of the products. Product C had the second
largest PE particles (317.91 μm), but the lowest particle abundance, with only 919 particles
per mL. This data implies that the products tested could each contain between 137,000 and
2,800,000 microparticles (Fig. 2.3). The quantity of particles was calculated using data for
the volume mean diameter, however the size particle distribution had a tail of smaller
particles, hence the particle abundances calculated are likely to be underestimates.

MICROPLASTIC IN COSMETICS
33
Figure 2.3. Estimates for the number of PE microbead particles in six brands of facial scrubs per 1ml. Calculated using data
from the volume weighted mean (n = 3, ±SD; correlating to the spread of the different amounts of particles calculated for high,
medium and low density PE).
The shape and surface topography of the extracted microplastic particles was visualised by
scanning electron microscopy. For all the brands, the extracted microplastics had a variety
of shapes, including ellipses, ribbons, and threads, as well as irregular fragments (Fig.
2.4). An exception was product F, which in addition to irregular shaped pieces, also
contained smooth, blue, PE spheres that were substantially larger than the rest of the
particles, but represented a small proportion of the total amount of plastics present. Some
of these spheres were fragmenting (Fig. 4).

CHAPTER 2
34
Figure 2.4. A-Scanning Electron Microscopy (SEM) image of a typical rough facial scrub plastic microbead particle (9000X
magnification). B- SEM image of surface microbead topography (16000X magnification). C- SEM image of a broken smooth
spherical plastic microbead from ‘product F’ (900X magnification).
The colour of microplastics used in the different products also varied (Table 2.1). All
products contained white microplastics, but products A, D, E and F also contained
coloured particles. The coloured microplastics in products D-F were larger than the white
plastics, but were less abundant. The white and pink microplastics in product A were of
similar size to each other.
Table 2.1. Colour of microplastics found within six facial scrub products.
2.3.3 Sorption of persistent organic pollutants
Visualisation of microbeads extracted from products X, Y, and Z showed they could be
differentiated between “smooth” and “rough” forms. This particle shape differentiation
was also observed in products A-F, where A-E contained "smooth" particles and product F
contained both "smooth" and "rough" forms (Fig. 2.4). Therefore, we considered sorption
onto both morphologies. Results showed that microbeads extracted from the cosmetic
products were able to sorb Phe and DDT from seawater (Fig. 2.5). Sorption capacity for all
plastics was significantly higher for DDT compared to Phe (p < 0.05, Table 2.2).
Product Colour of Microplastic Present
A White and Pink
B White
C White
D White and Light Blue
E White and Dark Blue
F White and Dark Blue

MICROPLASTIC IN COSMETICS
35
Particle
type POP
Aqueous
phase
Glass
wall
Solid
phase
Total
recovery
Product X
beads
DDT 12 8 59 78
Phe 43 1 24 68
Product Y
particles
DDT 7 8 91 106
Phe 13 3 65 81
Product Z
beads
DDT 20 26 33 79
Phe 64 2 6 73
Product Z
particles
DDT 3 8 90 101
Phe 11 5 60 75
UHMW PE DDT 2 6 87 94
Phe 7 2 80 89
Table 2.2. Recovery (%) of phenanthrene (Phe) and DDT following sorption experiments onto PVC and PE (average values
displayed, n = 3)
The “rough” microbeads were more efficient at adsorbing POPs from seawater than
“smooth” ones, probably due to increased surface area. The “rough” microbeads were also
more similar in shape, surface texture and sorptive property for POPs to PE particles used
in previous experiments (e.g. Bakir et al., 2012, 2014a, b; Teuten et al., 2007). There were
some significant differences between adsorption by microbeads and adsorption by PE
particles and the direction of these effects was that microbeads from cosmetics tended to
adsorb lower concentrations of POPs then PE particles. However, broadly speaking, it
would appear that results from previous studies on transport of chemicals by sorption on
to plastic are comparable with the transport potential on microbeads.
Figure 2.5. Single point distribution coefficients (Kd) for the sorption of a mixture of phenanthrene (Phe) and DDT onto PE
particles and rough and smooth PE-microbeads extracted from cosmetic products (n=3, ± SD). For each contaminant,
treatments with the same letters (A-C for Phe and a-d for DDT) were not significantly different (p < 0.05).

CHAPTER 2
36
2.4 Discussion
Microplastics found within cosmetics such as facial scrubs, will routinely be washed into
sewers as a direct consequence of consumer use. Due to their size, a considerable
proportion is likely to pass through preliminary sewage treatment screens (typically coarse,
>6 mm, and fine screens, 1.5–6 mm) (Water Environment Federation, 2003). Effulent
containing the microplastics would then be discharged into inland waters, estuaries and the
oceans. A recent study reported that treated effluent from three sample sites in the
Netherlands contained on average 52 microplastic particles/L (Leslie et al., 2013).
Microbeads used as exfoliants in facial scrubs are likely to be an important primary source
of microplastics contamination, due to the quantity of plastic used in each product.
When considering the potential consequences of the release of microbeads to the
environment, if any, it is important to consider both the mass of plastic, and the number
and size of the particles; the latter will have direct influence on the probability of
encounters with wildlife.
The common application of facial scrub exfoliants is once per day, and it has been
estimated that they are used by around 1.1 million women in the UK (Statista, 2013). This
figure is likely to be higher if male useage was also taken into account. Focussing on the
products used in this study (A-F), and assuming that the typical daily amount used is 5mL,
between 4594 – 94500 microplastic particles would have the potential to pass into the
sewage system per use.
In terms of the mass of plastic entering the marine environment, previous work by Gouin
et al (2011) estimated that users in the U.S emit 2.4 mg of PE person -1.d -1, amounting to
an emission of 263 tonnes yr-1. This estimate is calculated from data on liquid soap
consumption, and assumes that only 15% of the market is shared by companies that use
microplastic beads in their liquid soaps. However, many brands do use exfoliating
microbeads. Assuming that three out of four body exfoliants contain microplastics (Marine
Conservation Society, 2012), and that an estimate that 25% of the microplastic is caught by
the sewage system, the UK population could emit to the natural environment 40.5 – 215
mg of PE person -1.d -1, or between 16 and 86 tonnes yr-1 (population of the UK in 2013:
64.1 million, (The World Bank, 2013) just from facial exfoliants. In order to set these
quantities into context, by way of comparison, between 2009 and 2014 inclusive, in its

MICROPLASTIC IN COSMETICS
37
annual weekend beach clean, MCS typically collect around 9 tonnes of litter per year (over
an average length of 115km of UK shoreline).
The presence of microplastics in sewage sludge has been reported previously by Browne et
al. (2011), who found that former sewage disposal-sites on the seabed in UK waters
contained more microplastics than non-disposal reference sites, highlighting the potential
for microplastics to accumulate in aquatic habitats. The occurrence of microplastics within
the marine environment is now well documented in the water column, at the sea surface
and sediments (Law and Thompson 2014). Microplastics also account for around 10% of
all reports of ingestion of marine debris, highlighting their importance as a component of
marine debris (Gall and Thompson, 2015). Their size makes them accessible to organisms
with a range of feeding methods, including: filter feeders (mussels, barnacles), deposit
feeders (lugworms) and detritivores (amphipods, sea cucumbers) and zooplankton (Wright
et al., 2013a; Graham and Thompson, 2009; Thompson et al., 2009; Browne et al., 2008).
However, studies that quantify the abundance of microplastic predominately report
elongated fibres. This may in part be due to the relative ease of detection of pieces with
these shapes, since they differ from many natural particles found in sediments. Hence, the
prevalence of microplastics with non-fibrous shapes (Fig. 4), for example microbeads from
facial scrubs, may be under-reported in environmental sampling (Desforges et al., 2014;
Lusher et al., 2014; Gallagher et al., 2015).
There is no way of effectively removing microplastic contamination once it is in the
environment. The materials are too dispersed, the scale is too vast, ecological damage
would be caused by any remediation (tiny organisms would likely be removed along with
the microplastics), and the costs would be extremely high (UNEP, 2015). Since plastic is
highly resistant to degradation, the abundance of microplastics in the ocean is assumed to
be increasing, thus increasing the probability of ingestion by biota (Law and Thompson,
2014). The majority of microplastics extracted from the facial products herein were white
or blue. It has been suggested by Wright, et al. (2013b) that these colours are similar to
various types of plankton, a primary food source for surface feeding fish, which are visual
predators.
A further potential problem associated with microplastics contamination is the possibility
of transport of hydrophobic contaminants by microplastics: such contaminants have been
found to sorb onto their surface of plastics and may transfer to biota upon ingestion (Avio

CHAPTER 2
38
et al., 2015; Bakir et al., 2014b; Teuten et al., 2007). Previous studies have shown that PE
particles have the potential to sorb and concentrate a range of hydrophobic contaminants.
This is of interest because these contaminants can be released in conditions resembling
those in the gut of an organism (Bakir et al., 2014b) . However, at present, the
environmental importance of plastics as a vector in the transport of contaminants is not
known. Here we show that microbeads were able to adsorb greater amounts of DDT than
Phe when both chemicals were present in a mixture. This was in agreement with previous
work indicating that plastic showed a preferential affinity for DDT when present with Phe
in a binary mixture (Bakir et al., 2012). The size and shape of microbeads was also found to
be an important factor in their sorptive property for POPs and smooth microbeads were
found to adsorb lower concentrations of POPs than rough ones. Rough microbeads were
found to be most similar in their sorptive properties for POPs to commercially available
PE used in chemical transport studies (e.g. Bakir, et al., 2012, 2014b; a; Teuten, et al., 2007).
However, both types of microbeads were broadly similar in their sportive properties to the
microplastics used in previous studies. Hence, on the basis of the experimental work here,
it seems likely that conclusions regarding the potential role of microplastics as possible
vectors in the transport of POPs in the environment could also be applied to transport by
microbeads from cosmetics.
Rochman et al. (2013) investigated the transfer of hydrophobic organic compounds (PAHs,
PCBs and PBDEs) from PE to the fish, Japanese medaka (Oryzias latipes) and the subsequent
health effects. Plastic particles were exposed to natural marine conditions, as opposed to
laboratory exposures used in most previous studies. Environmental exposure will be highly
dependent on the sites selected, which can be prone to variation. Results suggested the
ingestion of virgin PE particles caused physiological stresses. However, the ingestion of
contaminated PE particles led to the transfer of adsorbed contaminants, causing liver toxicity
and pathology (Rochman et al., 2013). Laboratory studies using microplastic particles of
polystyrene (Besseling et al., 2013) and PVC (Browne et al., 2013) have also indicated the
potential for transfer of harmful chemicals with subsequent effects on biota. The present
study showed that plastic particles present in cosmetics can be of varying size and shape and
have differential affinities for sorption of POPs. Further work would be needed investigate
the presence of chemicals such as pigments and dyes in microbeads, and their potential, if
any, for migration from the polymer in either water or gut conditions.

MICROPLASTIC IN COSMETICS
39
The uneven topography of microplastics used in cosmetics could also provide habitats for
diverse communities of microorganisms. A study by Zettler et al. (2013) described the
presence of a rich eukaryotic and bacterial microbiota living on PE microplastic samples
collected from the North Atlantic subtropical Gyre. Scanning electron microscope (SEM)
images showed microbial cells embedded in pits on the plastic surface, and suggested that
some members of this community could be accelerating the physical degradation of plastic;
however this remains to be confirmed. The communities found on the plastic particles
were distinct from surrounding surface water, indicating that plastic provides a novel
habitat. Other studies have highlighted the potential for microplastic to act as vectors for
microbial pathogens (Harrison et al., 2014).
Currently, there are reported to be eighty facial scrubs in the UK market, which according
to their product labelling, contain plastic material amongst their ingredients (Beat the
Microbead, 2015). However, some companies have indicated that they will voluntarily
phase out microplastics from their products. This could possibly be due to research
indicating the negative consequences of microplastics within the environment; Fendall and
Sewell (2009) stated that the presence of microplastics in facial cleansers, and their
potential use by millions of consumers world-wide, should be of increasing concern, whilst
Andrady (2011) also reported that there is an urgent need to assess the future impact of
increasing microplastics levels on the world’s oceans. There have also been associated
public awareness campaigns (eg. Beat the Microbead and Scrub it Out), urging consumers
to boycott such products.
However, for the global market, usage statements vary within and between companies, with
some stating they will remove all microplastics from all their products, while others say
only PE will be removed. In some regions, legislation has been introduced; for example,
Illinois and California (U.S.A) have banned the manufacture and sale of cosmetics that
contain plastic microbeads, with similar legislation being proposed for New York,
Michigan, and Ohio (but not yet adopted) (Driedger et al., 2015).

CHAPTER 2
40
2.5 Conclusion
In conclusion, the present work characterised the microplastics in facial scrubs by
describing the polymer type, colour, size, weight and abundance. This allowed for
estimation that between 4594 and 94500 particles could be released into the environment
per use. We also estimate that the UK population is emitting 40.5 – 215 mg of PE person -
1.d -1, resulting in a total of 16-86 tonnes yr-1. Particle size, rather than the average weight in
each product, was found to be important as it had the greatest effect on abundance
estimates. Their small size also renders microbeads accessible to a wide range of organisms
and may facilitate the transfer of waterborne contaminants or pathogens. There are
alternatives to the use of plastics as exfoliating particles (UNEP 2015); hence these
emissions of microplastic are avoidable. Given the quantities of plastic particles reported
here, and current concerns about the accumulation of microplastics in the ocean, it is
important to monitor the extent to which manufactuers do voluntarily opt to remove
microplastics from their products. Such monitoring will help to establish whether there is a
need for further legislation.

MICROPLASTIC FIBRES FROM CLOTHES WASHING
41
Chapter 3
Release of Synthetic Microplastic Fibres from
Domestic Washing Machines - Effects of
Fabric Type and Washing Conditions
A version of this chapter is available online as:
Napper I.E., Thompson R.C. Release of synthetic microplastic plastic fibres
from domestic washing machines: Effects of fabric type and washing
conditions. Mar Pollut Bull 2016;112:39–45.

CHAPTER 3
42
Abstract
Washing clothes made from synthetic materials have been identified as a potentially
important source of microscopic fibres to the environment. This study examined the
release of fibres from polyester, polyester-cotton blend and acrylic fabrics. These fabrics
were laundered under various conditions of temperature, detergent and conditioner. Fibres
from waste effluent were examined and the mass, abundance and fibre size compared
between treatments. Average fibre size ranged between 11.9–17.7 μm in diameter, and 5.0–
7.8 mm in length. Polyester-cotton fabric consistently shed significantly fewer fibres than
either polyester or acrylic. However, fibre release varied according to wash treatment with
various complex interactions. We estimate over 700,000 fibres could be released from an
average 6kg wash load of acrylic fabric. As fibres have been reported in effluent from
sewage treatment plants, our data indicates fibres released by washing of clothing could be
an important source of microplastics to aquatic habitats.

MICROPLASTIC FIBRES FROM CLOTHES WASHING
43
3.0 Release of Synthetic Microplastic Fibres from
Domestic Washing Machines - Effects of Fabric Type
and Washing Conditions
3.1 Introduction
Microplastics have accumulated in marine and freshwater environments, and in some
locations outnumber larger items of debris (Browne et al., 2011; Thompson et al., 2004;
Wagner et al., 2014). The sources of microplastic include the fragmentation of larger plastic
items once they have entered the environment (secondary sources), and also the direct
input of microplastic sized particles, such as microbeads used in cosmetics and pre-
production pellets (Napper et al., 2015), or particles and fibres resulting from the wear of
products while in use (primary sources). Microplastics can be ingested by a wide range of
species both in marine (Anastasopoulou et al., 2013; Gall and Thompson, 2015; Lusher et
al., 2013) and freshwater environments (Eerkes-Medrano et al., 2015; Sanchez et al., 2014).
Laboratory studies indicate the potential for physical harm to biota from the result of
ingestion (Wright et al., 2013b). Ingestion could also facilitate the transfer of chemicals to
organisms, however the relative importance of plastic debris as a vector in the transport for
chemicals is not certain (Besseling et al., 2013b; Koelmans et al., 2014, 2013; Rochman et
al., 2013). Encounter rate, as well as polymer type and any associated chemicals (sorbed or
additives), will influence the potential for effects in the environment (Bakir et al., 2014a,
2012; Koelmans et al., 2013; Teuten et al., 2007), therefore it is important to understand the
relative abundance, as well as the sources of various types of microplastic.
Microplastic has been reported in a wide range of aquatic habitats, including beaches,
surface waters, the water column and subtidal sediments (Lattin et al., 2004; Thompson et
al., 2004), and there is evidence that the abundance is increasing (Thompson et al., 2004).
They are also reported in some of the most remote environments, including the deep sea
and the arctic (Obbard et al., 2014; Woodall et al., 2014). This indicates plastics ubiquity
and the need for further understanding about the potential environmental consequences
Release of microplastic sized fibres as a result of washing of textiles has been widely
reported as a potential source of microplastic (Browne et al., 2011; Dris et al., 2015; Essel
et al., 2015; GESAMP, 2015; Wentworth and Stafford, 2016), however there has been little

CHAPTER 3
44
quantitative research on the relative importance of this source or on the factors that might
influence such discharges. This is the focus of the research described here. In this context
we consider microplastics as particles of plastic <5 mm in their smallest dimension. While
some fibres may be longer than 5 mm they will usually have a diameter considerably less
than 5 mm. There is a lack of clarity on the formal definition for the lower size limit of
microplastic and in environmental studies this has tended to relate more to the method of
capture; e.g. mesh size of plankton nets used to sample water, or the method of
identification such as spectroscopy. At present the smallest particles identified form the
environment are around 20 µm in their smallest dimension.
Textiles have the potential to release fibres into the environment, and one pathway is via
laundering in washing machines. A range of fibres are used in the production of textiles;
these include natural fibres (such as cotton and wool), synthetic fibres (such as nylon) and
some are blends of natural and synthetic (such as polyester-cotton). Synthetic fibres have
been used to supplement cotton, wool and linen in textiles for more than 50 years, and
fabrics such as polyester and acrylic are now widely used in clothing, carpets, upholstery
and other such materials. Washing of clothing has been suggested as a potentially
important source of microplastic fibres (Browne et al., 2011).
Synthetic microplastic fibres are frequently reported in samples from sediments, the water
column and biota (Browne et al., 2011). Waste effluent from washing machines, containing
released fibres, will then travel via wastewater to sewage treatment plants (Dris et al., 2015;
Leslie et al., 2013). Due to the small size of the fibres, a considerable proportion could then
pass through preliminary sewage treatment screens (typically coarse, >6 mm, and fine
screens, 1.5–6 mm) (Water Environment Federation, 2003), and be released into aquatic
environments. As synthetic fibres are not readily decomposed by aerobic or anaerobic
bacteria, any that are intercepted in the sewage treatment plant will accumulate in sewage
sludge, and may subsequently be released back to the environment; for example if the
sludge is returned to the land or dumped at sea (Habib et al., 1998). Hence, there is a
considerable potential for fibres from synthetic textiles to accumulate in the environment;
Gallagher et al (2016) found predominately fibres when surveying the Solent estuarine
complex (U.K.) for microplastic. Similarly Dris et al (2015), found considerable quantities
of fibres in the River Seine. There is evidence that some of this material can be transported
as airborne particulates (Dris et al., 2015); however it would appear that considerable
quantities enter directly from sewage treatment (Browne et al., 2011). To date, there has

MICROPLASTIC FIBRES FROM CLOTHES WASHING
45
been limited research to establish the importance of clothing as a source of microplastic
contamination to the environment.
A study by Browne et al (2011), sampled wastewater from domestic washing machines and
suggested that a single garment could produce >1900 fibres per wash (Browne et al.,
2011). To examine the role of the sewage system as a pathway to the environment, Browne
extracted microplastic from effluent discharged by treatment plants, and also examined the
accumulation of microplastic in sediments from sewage sludge disposal sites. On average,
the effluents contained one particle of microplastic per litre, including polyester (67%) and
acrylic (17%) and polyamide (16%); these proportions were similar to the relative
proportions found on shorelines and disposal-sites (Browne et al., 2011). Similarly, a high
number of plastic fibres were observed in the sediments near to a sewage outfall in
Amsterdam (Leslie et al., 2013), and have been reported even 15 years after application in
terrestrial soils that have received sewage sludge (Zubris and Richards, 2005). Unless the
release of microplastics to waste water or sewage treatment practices change, the release of
microplastic to the environment via sewage is likely to increase, as the human population
grows. It is anticipated, for example, that reductions in emissions of microbeads via sewage
will be reduced as a consequence of legislation to prohibit their use in cosmetics (Napper et
al., 2015).
However, there are currently no peer reviewed publications that compare the quantity of
fibres released from common fabrics due to laundering. In addition, the potentially
important influence of washing practices including temperature, the use of detergent and
fabric conditioners have not been examined. Here we tested three different fabrics that are
commonly used to make clothes; polyester, polyester-cotton blend, and acrylic. These
fabrics were then laundered at two temperatures (30°C and 40°C), using various
combinations of detergent and fabric conditioner. The fibres extracted from the waste
effluent were examined to determine the typical size, and to establish any differences in the
mass / abundance of fibres among treatments.
3.2 Methods
Three synthetic fabric types were selected based on their prevalence in high-street retail
stores close to Plymouth, UK. The chosen fabric types were all from jumpers (Fig. 3.3),
with each being a different colour so they could be readily distinguished after
fragmentation; 100% polyester (black), 100% acrylic (green) and 65% polyester / 35%

CHAPTER 3
46
cotton blend (blue). Four replicates of each garment were purchased, with each replicate
sourced from a different retail outlet to provide a representative sample. The identity of
each fabric type was confirmed by Fourier transform infra-red spectroscopy (FTIR), using
a Hyperion 1000 microscope (Bruker) coupled to an IFS 66 spectrometer (Bruker). The
spectra obtained were compared to a spectral database of synthetic polymers (Bruker
I26933 Synthetic fibres ATRlibrary). As each garment varied in overall size, 20cm X 20cm
squares were cut from the back panel of the garments and the edges hemmed by 0.5 cm
using black and white cotton thread to deter the excess loss of fibres.
A Whirlpool WWDC6400 washing machine was used to launder the garment samples.
While it would be valuable to compare a range of washing machines, this was beyond the
budget of the current research. This machine was selected as it is a popular brand used for
domestic laundry. The number of fibres released from the wastewater outlet, as a result of
laundering, was recorded. To achieve this, a nylon CellMicroSieve™ (Fisher Scientific),
with 25 μm pores, was attached to the end of the drain hose. Once a cycle was complete,
the CellMicroSieve™ was removed and the fibres collected. Due to the potential build-up
of detergent or conditioner on the collected fibres, they were washed using 2L of water and
filtered again over Whatman Nº4 filter papers, and then dried at 30°C to constant weight.
Once dry, the fibres were weighed by a Cubis® precision balance (Sartorius). The weight of
fibres were compared across four factors: Factor one, (fabric type, fixed factor, 3 levels:
100% polyester, 100% acrylic, and 65% polyester / 35% cotton blend); Factor two wash
temperature (fixed factor, 2 levels; 30°C and 40°C); Factor three, detergent (3 levels;
detergent absent, 20ml bio-detergent present (contains enzymes), 20ml non-bio detergent
present); Factor four, conditioner (2 levels; 20ml conditioner absent or present). Factors
gave a total of 36 treatments (Fig. 3.1).
Figure 3.1. Experimental design showing Factors used for each fabric type (acrylic, polyester, polyester-cotton blend).

MICROPLASTIC FIBRES FROM CLOTHES WASHING
47
In this study the main factors of interest were: fabric type, temperature, presence of
detergent and / or conditioner. The duration of each wash and the rotations per minute are
also factors of potential relevance, but were beyond the scope of this study. Therefore, in
order not to confound the experimental design they were kept constant (Duration, 1 hour
15 minutes and 1400 rotations per minute (R.P.M)). Each treatment had four replicates.
Cross-contamination was minimized to <8 fibres per wash between washes, by running the
washing-machine at 30 °C, 1400 R.P.M for 45 minutes between washes with no fabric
present. Any initial spike in fibre loss from new clothes was reduced by washing each fabric
four times before recording any data. Care was taken to ensure any potential sources of
airborne contamination were minimised during the analysis (Woodall et al., 2015). The
number of fibres released in the effluent from each wash, N, was then estimated from the
weight of captured fibres using the following equations and assuming the fibres were of
cylindrical shape:
i) 𝑉𝑡 =𝑀𝑡
𝐷 ii) 𝑉(𝑎𝑣𝑔. 𝑓𝑖𝑏𝑟𝑒) = 𝜋𝑟2𝑙 iii) 𝑁 =
𝑉𝑡
𝑉(𝑎𝑣𝑔.𝑓𝑖𝑏𝑟𝑒)
where Vt is the total volume of fibres collected, Mt is the total mass of fibres collected, D
is the density, V(avg.fibre) is the mean volume of one fibre, N is number of fibres, l is the
averge length of a fibre and r is the average radius of a fibre.
For each product: equation i) allowed calculation of the total volume of fibres collected;
equation ii) allowed calculation of the average volume of a fibre from each garment; by
dividing the total volume of fibres by the average volume of a single fibre, equation iii)
allowed estimation of the approximate number of fibres released in the effluent from each
wash.
Fibres were visualised by scanning electron microscopy (JEOL, 7001F); images taken were
used to measure the width of the fibres, and also to analyse their topography. Images of the
fibres were also taken by using LEICA M205C light microscope and analysed by Image J to
measure their length (Rasband, 2015). For each fabric type, a mean size was calculated for
length and width based on data from 10 individual fibres.
Using GMav for windows, 4-Way Analysis of Variance (ANOVA) was used to establish
any significant effects (p < 0.05) between treatments. Post-hoc SNK tests were then used
to identify the location of any significant effects.

CHAPTER 3
48
3.3 Results
Substantial numbers of microplastic fibres (smallest dimension, <5 mm) were collected
from jumpers made out of all three of the common man-made fabrics (polyester, acrylic
and polyester-cotton blend) examined (Fig. 3.3). These were discharged into wastewater
from a generic cycle of a domestic washing machine. The fibres were confirmed to be the
material type stated on the garment by Fourier transform infra-red spectroscopy. Loss of
fibres during the first 4 washes were recorded (Fig. 3.2), but not included in the data
analysis. Polyester showed a steady decrease in fibre loss overall: 1st wash (2.79 mg) to 5th
(1.63 mg). Acrylic followed a similar pattern, but the fibre loss decreased more rapidly: 1st
wash (2.63 mg) to 4th (0.99 mg). Polyester-cotton blend had the least variation and showed
little decrease between subsequent washes: 1st wash (0.45 mg) to 4th (0.30 mg). Since there
was little change in fibre release between the 4th and 5th wash data, data from the 5th wash
was used for formal analysis.
Figure 3.2 Fibre loss from three fabrics (acrylic, polyester & polyester-cotton blend), over the first 5 washes. Data from the 5th
wash was used in the analysis (n = 4, ±SD).
While there was a consistent trend between fabric types, ANOVA revealed significant
complex interactions between the 4 Factors (Table 3.1). Focussing on the type of fabric,
polyester-cotton blend was consistently found to shed fewer fibres than both the other
fabric types, regardless of the differing treatments. This trend was consistent for all 12
relevant interactive effects, and was found to be significant for 9 out of these 12
interactions (Table 3.2). However, the significance of this effect varied according to the
treatment used, creating different interactions. There were some effects of temperature; for

MICROPLASTIC FIBRES FROM CLOTHES WASHING
49
example, polyester was often found to release more fibres than acrylic at 40°C, when
compared against 30°C (Table 3.2).
Table 3.1. Analysis of variance (ANOVA) for factors affecting release of fibres as a consequence of various laundering
treatments (n=4; bold = p = <0.05). Key: Temp (temperature), Deter (detergent), Cond (conditioner).
SOURCE Df MS F P
Fabric 2 5.36 83.18 0.00
Temp 1 0.10 1.54 0.22
Cond 1 0.37 5.67 0.02
Deter 2 0.52 8.07 0.00
FabricXTemp 2 0.02 0.33 0.72
FabricXCond 2 0.12 1.88 0.16
FabricXDeter 4 0.20 3.13 0.02
TempXCond 1 0.15 2.28 0.13
TempXDeter 2 0.13 2.09 0.13
CondXDeter 2 0.58 9.00 0.00
FabricXTempXCond 2 0.06 0.86 0.43
FabricXTempXDeter 4 0.06 1.00 0.41
FabricXCondXDeter 4 0.33 5.05 0.00
TempXCondXDeter 2 0.64 9.91 0.00
FabricXTempXCondXDeter 4 0.38 5.95 0.00
Residual 108 0.06
Total 143

CHAPTER 3
50
Table 3.2. Outcomes of SNK tests for specific combinations of the factors: a) fabric, b) detergent, c) temperature, d) conditioner.
For each combination the relative number of fibres released is indicated by the sequence shown with permutation leading to the
greatest release of fibres being shown to the right. Specific variables tested against three different fabric types (acrylic, polyester &
polyester-cotton blend), and the subsequent fibre extract from laundering (n=4; * = p (<0.05)). Key: PE (polyester), Blend
(polyester-cotton blend), Acr (acrylic), A (conditioner/detergent absent), C (conditioner present), NB (non-bio detergent), bio (bio
detergent).
There were also some significant effects of conditioner usage, where polyester-cotton blend
consistently shed more fibres when conditioner was used. It was also shown that more
fibres tended to be released with the addition of bio-detergent and conditioner. Detergent
showed the least clear pattern; however, in some treatment combinations, having no
detergent or using bio-detergent resulted in lower quantities of fibres being released.
Polyester-cotton blend was also found to shed the least fibres when detergent was absent,
and the most when non-bio detergent was used. Hence while there was a clear and fairly
a) FABRIC b) DETERGENT
Factors Order Factors Order
30 C- No Powder Blend<*Acr<*PE Acr 30 C- bio-NB-A
30 C- Bio Blend<*Acr-PE Acr 30 C+ A-NB-bio
30 C- Non Bio Blend-PE-Acr Acr 40 C- A-NB-bio
30 C+ No Powder Blend<*PE-Acr Acr 40 C+ bio-NB<*A
30 C+ Bio Blend<*PE-Acr Blend 30 C- bio-A-NB
30 C+ Non Bio Blend<*Acr-PE Blend 30 C+ A-bio-NB
40 C- No Powder Blend<*Acr<*PE Blend 40 C- A-bio<*NB
40 C- Bio Blend<*PE<*Acr Blend 40 C+ A-NB-bio
40 C- Non Bio Blend-Acr<*PE PE 30 C- bio-NB<*A
40 C+ No Powder Blend<*PE<*Acr PE 30 C+ A-bio-NB
40 C+ Bio Blend-Acr<*PE PE 40 C- bio<*A<*NB
40 C+ Non Bio Blend<*Acr-PE PE 40 C+ A-NB-bio
c) TEMPERATURE d) CONDITIONER
Factors Order Factors Order
Acr C- No Powder 40-30 Acr 30 No Powder C-A
Acr C- Bio 30<*40 Acr 30 Bio A<*C
Acr C- Non Bio 30-40 Acr 30 Non Bio A-C
Acr C+ No Powder 30-40 Acr 40 No Powder A<*C
Acr C+ Bio 40<*30 Acr 40 Bio C-A
Acr C+ Non Bio 40-30 Acr 40 Non Bio C-A
Blend C- No Powder 40-30 Blend 30 No Powder A-C
Blend C- Bio 40-30 Blend 30 Bio A-C
Blend C- Non Bio 30<*40 Blend 30 Non Bio A-C
Blend C+ No Powder 30-40 Blend 40 No Powder A-C
Blend C+ Bio 30-40 Blend 40 Bio A<*C
Blend C+ Non Bio 30-40 Blend 40 Non Bio C<*A
PE C- No Powder 40-30 PE 30 No Powder C<*A
PE C- Bio 40-30 PE 30 Bio A-C
PE C- Non Bio 30<*40 PE 30 Non Bio A<C
PE C+ No Powder 40-30 PE 40 No Powder C-A
PE C+ Bio 40-30 PE 40 Bio A<*C
PE C+ Non Bio 40-30 PE 40 Non Bio C<*A
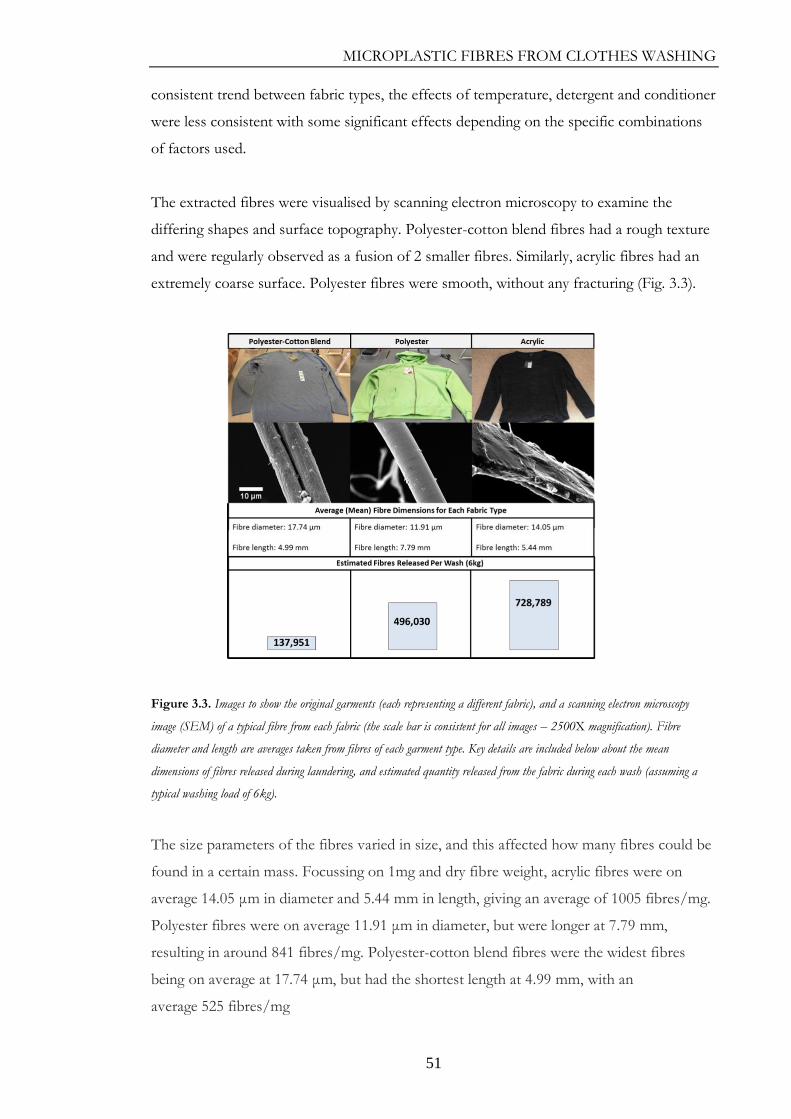
MICROPLASTIC FIBRES FROM CLOTHES WASHING
51
consistent trend between fabric types, the effects of temperature, detergent and conditioner
were less consistent with some significant effects depending on the specific combinations
of factors used.
The extracted fibres were visualised by scanning electron microscopy to examine the
differing shapes and surface topography. Polyester-cotton blend fibres had a rough texture
and were regularly observed as a fusion of 2 smaller fibres. Similarly, acrylic fibres had an
extremely coarse surface. Polyester fibres were smooth, without any fracturing (Fig. 3.3).
Figure 3.3. Images to show the original garments (each representing a different fabric), and a scanning electron microscopy
image (SEM) of a typical fibre from each fabric (the scale bar is consistent for all images – 2500X magnification). Fibre
diameter and length are averages taken from fibres of each garment type. Key details are included below about the mean
dimensions of fibres released during laundering, and estimated quantity released from the fabric during each wash (assuming a
typical washing load of 6kg).
The size parameters of the fibres varied in size, and this affected how many fibres could be
found in a certain mass. Focussing on 1mg and dry fibre weight, acrylic fibres were on
average 14.05 μm in diameter and 5.44 mm in length, giving an average of 1005 fibres/mg.
Polyester fibres were on average 11.91 μm in diameter, but were longer at 7.79 mm,
resulting in around 841 fibres/mg. Polyester-cotton blend fibres were the widest fibres
being on average at 17.74 μm, but had the shortest length at 4.99 mm, with an
average 525 fibres/mg

CHAPTER 3
52
3.4 Discussion
The environmental consequences of microplastic contamination are not fully understood.
The quantity of microplastic in the environment is expected to increase over the next few
decades; even if new emissions of plastic debris halted the fragmentation of legacy items
that are already in the environment, it would be expected to lead to an increase in
abundance (Law and Thompson, 2014). There are concerns about the potential for
microplastics to have harmful effects if ingested and some evidence of particle and
chemical toxicity have come from relatively high dose laboratory studies. Due to the
persistent nature of plastic contamination, there is growing awareness of the need to reduce
inputs at source; this includes the direct release of microplastic sized particles including
microbeads from cosmetics, and fibres form textiles.
Fibres from fabrics are known to be lost due to pilling. Pilling is defined as the entangling
of the fabric surface during wearing or washing, resulting in formation of fibre balls (or
pills) that stand proud on the surface of the fabric (Hussain et al., 2008). This occurs as a
consequence of two processes: (i) fuzzing; the protrusion of fibres from the fabric surface,
and (ii) pill formation; the persistence of formed neps (entangled masses of fibres) at the
fabric surface (Naik and Lopez-Amo, 1982). The pill may be worn or pulled away from the
fabric, as a consequence of mechanical action during either laundering or wear (Yates,
2002).
Most fabrics pill to some extent and this has always been a concern in the industry as it
spoils surface appearance and comfort, reduces the fabric’s strength and diminishes its
serviceability (Chiweshe and Crews, 2000; Hussain et al., 2008). This problem has become
more prominent with the widespread use of synthetic fibres, such as polyester and acrylic,
due to their higher tensile strength (Cooke, 1985). These synthetic fibres are widely used
because of their low cost and versatile use. Laundry methods have been recognised as
being important to minimise the pilling tendency (Cooke, 1985).
The rate or extent to which the pilling stages occur is determined by the physical properties
of the fibres which comprise the fabric (Gintis and Mead, 1959). From the fabrics tested
here, polyester-cotton blend consistently shed significantly fewer fibres than either of the
other fabric types which were entirely synthetic. Polyester is often added to cotton fabric to
reduce cost, whilst also increasing tenacity and resilience. This is because cotton fibres have
a lower tenacity, and as the pills are formed, the anchor fibres are easily broken; if the

MICROPLASTIC FIBRES FROM CLOTHES WASHING
53
tenacity of the fabric is increased with added polyester, the pill break-off rate is lower,
resulting in less fibres being released (Mccloskey and Jump, 2005).
Polyester fibres have many desirable properties, including good resistance to strain and
deformation (Pastore and Kiekens, 2000). 100% polyester fabrics are renowned for pilling,
but because of their high tenacity, the anchor fibres rarely break releasing the pills (Nunn,
1979). Previous research has even reported that as the polyester fibre content in a
polyester-cotton blend fabric increases, the pilling gets worse (Gintis and Mead, 1959;
Ruppenicker and Kullman, 1981). On the contrary, our research found that polyester
fabrics yielded significantly more fibres than polyester-cotton blend. It has previously been
suggested that pilling of polyester can be controlled by the modification of the polyester
properties, where a greater fibre release can improve polyester fabrics surface appearance
(Doustaneh et al., 2013). Weakening the fibres (reduced ultimate bending stiffness), leads
to more rapid break-off of pills due to fibre fatigue, leading to greater fibre release while at
the same time improving the fabrics topography and surface appearance (Doustaneh et al.,
2013). Hence from an aesthetic perspective, there may be benefits to the release of pills
from garments during washing. However, this can also create a trade-off between garment
appearance, and fibre release. More research would be needed to establish how release rates
vary over the lifetime of a garment in service in order to fully establish the temporal
dynamics of fibre emissions.
During the laundering of clothes, detergent and fabric conditioner are often used in
combination. Synthetic detergents remove the oils and waxes that serve as lubricants in
natural fibres, making a garment clean but harsh, scratchy, and uncomfortable to wear
(Egan, 1978). Fabric softeners are used to counteract these effects. In addition, the use of
fabric conditioners can reduce the build-up of static electricity, which can make the fabric
objectionable to the wearer. Fabric softeners act as antistatic agents by enabling synthetic
fibres to retain sufficient moisture to dissipate static charges (Ward, 1957).
Fabric conditioners may also increase pilling, and this is especially the case for synthetic
fibres (Smith and Block, 1982). Work by Chiweshe and Crews (2000), showed that use of
fabric conditioner on all cotton-containing fabrics resulted in increased pilling and/or an
increase in the size of pills, as well as increased breaking strength losses in polyester woven
fabric. Hence, it might be expected that the presence of conditioner could increse the

CHAPTER 3
54
release of fibres. This was observed in some of the treatment combinations here, but there
was no clear trend relating to the presence of conditioner.
Detergent use presented the least clear pattern for fibre release when compared against the
other factors. However, it was found that having no detergent or bio-detergent in a wash
cycle occasionally resulted in the fewer fibres being released. Previous research has also
shown that when polyester-cotton blend fabric has been laundered with a bio-detergent, it
exhibited less piling than when laundered using a non-bio (Chiweshe and Crews, 2000).
Our research produced some similar results, where polyester-cotton blend was also found
to shed fewer fibres when detergent was absent, and the most when non-bio detergent was
used.
Using the results from this experiment, the number of fibres potentially released into
washing machine waste water per wash was estimated. This was achieved by examining the
average fibre size, the various Factors tested and assuming a typical washing load of 6 kg.
Based on this, a washing load (6 kg) of polyester-cotton blend was estimated to release
137,951 fibres, polyester to potentially release 496,030 and Acrylic 728,789. The large
number of fibres released when clothing is laundered is therefore likely to represent a
substantial contributor to microplastic contamination in the environment. Our estimates
are similar to research by (Browne et al., 2011) where it was suggested that a single garment
could produce >1900 fibres per wash (Browne et al., 2011).
Wastewater Treatment Plants (WWTPs) play a critical role in the fate and transport of
microfibres into the environment. In countries with sewage infrastructure, the effluent
from washing machines is discharged into the local sewer system. This is then treated by a
WWTP and discharged as treated effluent, which is released into the aquatic environments.
Effluent discharge often contains suspended solids, such as microfibres, which are not
removed during the treatment processes. In Amsterdam, Leslie et al. (2013) found
concentrations from WWTP effluent ranged from 9 particles/L (min.) to 91 particles/L
(max.) with a mean and median of 52 particles/L. A study by Murphy et al. (2016),
compared the influent and effluent from a WWTP. The influent contained on average
15.70 (±5.23) microplastic/L, and was found to be reduced to 0.25 (±0.04) microplastic/L
in the final effluent, a decrease of 98.41%. However, emissions of microplastics may still be
substantial. For example, Mintenig et al. (2014) calculate between 8.2 and 93 billion
microplastics and synthetic fibres being discharged from wastewater treatment plants in
Germany (Essel et al., 2015). Even a small amount of microplastic being released per litre

MICROPLASTIC FIBRES FROM CLOTHES WASHING
55
can result in substantial amounts of microplastics entering the environment due to the large
volumes being treated. It has been predicted that a WWTP in the United Kingdom could
release up to 65 million microplastics into the receiving water every day (Murphy et al.,
2016).
Even if WWTPs are completely effective in the removal of microfibres, the extracted
plastic particles may still enter the environment if the resultant sewage sludge, a by-product
of the wastewater treatment process, is returned to the land; for example as a fertilizer
(Habib et al., 1998a; Zubris and Richards, 2005). Microfibres in sewage sludge may
subsequently persist in the terrestrial environment, or be transported to aquatic
environments via runoff. The potential for sewage sludge to transfer microplastic into the
marine environment was shown in a preliminary study by Habib et al. (1998), where
sediments were collected from a bay downstream of a sewage treatment plant. It was found
that the sediment contained numerous synthetic fibres, and as distance from the sewage
treatment plant increased, the size and number of fibres decreased. This effect was also
observed by McCormick et al (2014), where a higher concentration of microplastic (17.93
m3) was recorded downstream of a WWTP, compared to upstream (1.91 m3 ) (McCormick
et al., 2014).
Clothing design, including the type of fabric used, clearly has considerable potential to
influence fibre release; for example, our research found that a fabric made from a synthetic-
natural combination released around 80% fewer fibres than acrylic. Further work to better
understand how fabric design and textile choice influence fibre release should therefore be
undertaken. Important directions for future research include comparing release between
different types of washing machine, and using a variety of wash durations and spin speeds
together with an assessment of the temporal dynamics of fibre release throughout a
products life time. The Plastic Soup Foundation and MERMAIDS Life+ project are
currently promoting development of innovative solutions to minimise the release of plastic
fibres from garments. Filters for washing machines are also being developed (Mermaids
Organisation, 2015). These can be made of a stainless steel mesh, with various hole
diameters, which collect fibres but allow water to pass through (Environmental
Enhancements, 2016). For this measure to be successful, it will be essential to ensure the
filters are not subsequently disposed of via household liquid waste. Currently, the most
common method of removal of fibres collected through these filters will be via household
waste. However, from a material usage and efficacy perspective, minimising fibre release at

CHAPTER 3
56
the design stage should be regarded as the most effective priority in a management
hierarchy.
From the perspective of sustainability and environmental contamination, criteria that
synthetic garment manufactures should consider might therefore include: 1) performance
in service, giving a long lasting product that remains attractive during usage; 2) minimal
release of non-degradable synthetic fibres and 3) a product that is compatible with end of
life recycling. Such factors need to be taken into account throughout the design and
manufacturing stages; for example, including consideration of fibre properties
(composition, length), spinning method and the weaving/knitting process. Inadequate
consideration of potential environmental impacts at the product design stage has recently
led to considerable negative publicity and restrictive legislation relating to emissions of
plastic microbeads from cosmetics (Napper et al., 2015); clearly illustrating the benefit of a
precautionary approach. With microbeads in cosmetics, one of the considerations guiding
policy intervention was the lack of clear societal benefit from incorporating microplastic
particles into the cosmetics, coupled with concerns about environmental impacts. The
societal benefits of textiles are without question, and so any voluntary or policy
intervention should be directed toward reducing emissions either via changes in textile
design or filtration of effluent, or both. As well as considering direct environmental
impacts of manufacture, product use and disposal, there is a growing realisation of the need
for a more circular approach to material usage in order to maximise long term resource
sustainability and waste minimisation via a circular economy (European Commission, 2012;
World Economic Forum, 2016)
3.5 Conclusion
In conclusion, this work examined the release of textile fibres from three fabrics that are
commonly used to make clothing (polyester, polyester-cotton blend and acrylic). The
results show that laundering 6 kg of synthetic materials could release between 137,951–
728,789 fibres per wash. Our results indicate significant effects of wash conditions, but no
clear picture based on the two detergents and one conditioner used. Hence, further work to
examine in more detail differing washing machines and wash treatments, involving wash
duration and spin speed as well as temperature, detergent and conditioner may be
worthwhile. This could help establish whether specific wash conditions could be used to
help minimise fibre release. Temporal dynamics of release over the life time of a product
should also be examined, as this could help extend garment life while at the same time
reducing fibre emissions.

Degradability of Disposable Wipes
57
Chapter 4
The Properties and Degradability of Single-
Use Disposable Wipes (Baby-Wipes)

CHAPTER 4
58
Abstract
Disposable wipes (wet-wipes) are frequently flushed down the toilet in error often due to
unclear labels on packaging and a misconception that they are flushable like toilet paper.
Additionally, flushable wipes may still also cause blockages. Subsequently, they enter the
sewage system and could potentially enter the marine environment, adding to the
accumulation of marine litter.
There are currently no standardised criteria to measure whether a product can be flushed,
and the degradability of these products is still unclear. We analysed four different
disposable wipe brands labelled as flushable and one labelled as non-flushable. The results
help to identify: 1) indicate relative rates of disintegration in the marine environment; 2)
how the products disintegrate; 3) how environmental conditions influence their
breakdown.
Wipes were tested in both laboratory and environmental conditions over a period of 15
weeks. The flushable wipes were found to contain 2 different fibre structures, and both
remained throughout the disintegration process. Over a period of 15 weeks, for samples
exposed in lab conditions, the addition of nutrients appeared to accelerate fragmentation
for flushable wipes. However, the main wipe structure remained for those exposed to
seawater or autoclaved seawater. Within environmental conditions, non-flushable wipes
were found to persist in the marine environment after 15 weeks, but flushable wipes were
found to disintegrate within 3 weeks, but the degradability of the resultant fragments was
not assessed. As a pilot study, our results suggest that wet wipe structure stays intact longer
than anticipated.

Degradability of Disposable Wipes
59
4.0 The Properties and Degradability of Single-Use
Disposable Wipes (Baby-Wipes)
4.1 Introduction There are numerous innovative brands of toilet paper, biodegradable sanitary protection,
disposable nappies and disposable wipes. Some of these have been designed to be disposed
of via the toilet to the sewage system, providing a discrete and convenient waste option.
The disposal of these domestic items using the toilet as a ‘rubbish bin’ is habitual in many
countries, including the U.K. and U.S.A. (Einsohn, 2000). This stems from the historical
link associating health and hygiene risks with human waste. However, there is currently
little knowledge of the behaviour of these products after they are flushed.
Disposable wipes’ function is typically for cleaning purposes only and they are subjected to
light rubbing or friction, in order to remove dirt or liquid from a surface. Consumers want
these wipes to absorb, retain or release dust or liquid on demand in order to complete this
function. The vast global use of these disposable wipes is due to the many benefits they
provide. A disposable wipe is quicker and easier to use than the alternative of dispersing a
liquid and then using another cloth/paper towel to clean or remove the liquid. They are
also clean, reduce cross contamination and can be pre-cut to convenient sizes and shapes.
Pre-cut disposable wipes provide higher levels of convenience and mobility (Rengasamy,
2014; Sahu, 2012).
Disposable wipes are popular and cheap consumer items, which are ready for disposal after
a single use,. They can then be further classified into dry wipes and wet wipes (Rengasamy,
2014). These products make a broad market in three main categories: personal care wipes,
household cleaning wipes & industrial cleaning wipes (Sahu, 2012). The main category
from the above list is personal care wipes which are now widely used in a variety of
applications; such as for face and eye cleansing, make-up removal, treatment of oily skin,
self-tanning lotions and baby-wipes.
Consumers are likely to consider the following when purchasing disposable wipes: cost,
convenience, hygiene, performance, ease of use, time savings, safety/regulation and
consumer perceived aesthetics (for example, softness or bulkiness in baby wipes).
However, disposability is arguably one of the main factors. Therefore, many brands are

CHAPTER 4
60
now promoting that their wipes are flushable. Disposable flushable wipes have grown in
popularity over the last decade and there is currently no legislation enforcing which
products can and cannot be labelled as ‘flushable’ or as a ‘tissue’ (Wessex Water, 2016).
The word ‘tissue’ and ‘flushable’ leads the consumer to assume that the product is of
natural material and can disintegrate rapidly; therefore, promoting an expectation that the
product behaves like toilet paper when flushed. Disposable wipes can be made of different
materials such as paper, tissue or nonwoven alternatives, with many wet wipes containing
man-made plastic constituent parts (Rengasamy, 2014; Wessex Water, 2016). As consumers
are using both flushable and non-flushable wet wipes, there are significant issues with: 1)
users disposing non-flushable wipes incorrectly (Kim and Hergeth, 2012) and 2) the lack of
clarity on the fate of flushable wipes in waste water treatment and the environment.
Disposable personal wipes, such as baby-wipes, are typically made from material that is
nonwoven (Rengasamy, 2014). Nonwoven material is a manufactured structure of
directionally or randomly oriented fibres, bonded by friction, and/or cohesion and/or
adhesion (ISO 9092, 2011). Formation of a non-woven fabric is produced by suspending
fibres in water to disperse them evenly. The suspension is poured onto a moving screen
allowing the water to pass through and this leaves a fibre web, which is then dried to form
the fabric (Rengasamy, 2014).
All kinds of fibres can be used to produce nonwoven fabrics (Kalabek et al., 2016). The
selection of fibres is based on the following features: cost-effectiveness, the ease of
manufacture and the desired end-use properties of the webs (Turbak, 1993). The
commonly used fibres in non-woven products (such as disposable wipes) include natural
fibres (cotton, jute, flax, wool), synthetic fibres (polyester (PE), polypropylene (PP),
polyamide, rayon) and special fibres (glass, carbon, nano‐fibres, bi-component,
superabsorbent fibres) (Hongu et al., 2005; Kalabek et al., 2016; Turbak, 1993).
Two or more types of fibres are typically utilised. The fibres are usually blended or mixed
in order to improve performance properties of nonwovens, such as strength. The fibre
blend or mix can be natural/natural, synthetic/synthetic, or natural/synthetic (Kalabek et
al., 2016; Purdy, 1983). Man-made fibres are the most widely used in the nonwoven
industry. Owing to impurities and higher costs, natural fibres are of minor importance for
the production of nonwovens (Kalabek et al., 2016).

Degradability of Disposable Wipes
61
This means that even when disposable wipes that are flushed eventually break up, the
nonwoven fabric that makes the wipe has the potential to end up passing synthetic material
(such as plastic) into the environment (Wessex Water, 2016). This can be either onto
farmland via removal in sewage sludge or into the water environment via sewage effluent
(Murphy et al., 2016).
The time-frame for disposable flushable wipes to breakdown is still not known. The wipes
undergo various degradation processes such as physical disintegration by turbulent forces,
hydrolysis of soluble material, and biodegradation of dissolved materials. Physical
disintegration also depends on solid characteristics such as size, mechanical strength, and
density of the solids (Karadagli et al., 2012).
Their presence in the environment has been increasing. During the Marine Conservation
Society (MCS) 2016 Great British Beach clean, an average of 14.1 wipes for every 100m of
our coastline was found. MCS has reported a 700% increase of disposable wipes found on
U.K. beaches over the last decade (MCS, 2016). Furthermore, regardless of whether the
wipes are labelled as ‘flushable’ or not, it is predicated that the majority of wipes on the
market do not disintegrate quickly enough to avoid clogging the sewage pipes and pumps.
This not only reduces the operational safety and stability of the wastewater system, but also
puts additional financial cost on the operator (Mitchell et al., 2017; Wessex Water, 2016).
A major UK water company (Wessex Water) cleared more than 13,000 blockages from the
public sewer network and a further 5,000 blockages on customers’ privately-owned drains
(pipes just serving one property) in 2015. They estimated that within their operating area
more than 30,000 blockages are cleared each year. Analysis of the data shows that 80% of
all sewer blockages are as a result of customers disposing of inappropriate items down the
toilet or sink; often referred to as sewer misuse. Of these blockages, 70% are the result of
wet wipes (Wessex Water, 2016). Non-flushable wet wipes may also be mistakenly disposed
down the toilet.
For all wipe types, the share of personal care, household and industrial wipe products are
about 62%, 23% and 15% respectively. Baby wipes accounted for 63% of personal care
wipes in 2010 (Bell, 2011; Rengasamy, 2014). Therefore, our research focusses specifically
on baby wipes as they are the most used wipe on the market. Baby wipes are used to
cleanse and clean the sensitive skin of infants and adults. These are saturated with solutions
ranging form gentle cleansing ingredients to alcohol-based ‘cleaners’. Baby wipes are

CHAPTER 4
62
typically sold in plastic tubs that keep the cloths moist and allow for easy dispensing (Sahu,
2012).
There is currently no peer reviewed research that analyses the breakdown of disposable
wipes. Our research analysed the composition of both flushable and non-flushable baby
wipes and tested them in environmental and laboratory settings. We investigated the time
frame and the process of any disintegration. We also examined different factors which
could affect this. From the results, we further discuss the impact disposable wipes have
within the marine environment and we also discuss what the current legal and regulatory
situation is relating to these products.
4.2 Methods Four major brands of moistened disposable baby-wipes were chosen based on whether
they were stated to be flushable. Three brands were marketed as flushable, and one brand
stated to be non-flushable (which was chosen as a comparison). These baby wipes had a
high prevalence in major supermarkets in and around Plymouth UK. Four replicates of
each product were purchased, with each replicate sourced from a different supermarket to
provide a representative sample. Since the specific brand names of the products are not of
particular relevance, the flushable baby-wipes were labelled 1F-3F, and the non-flushable
wipe 4NF. None of the baby-wipes stated that they were of plastic material from their
ingredients list (including the non-flushable wipe).
10 wipes from each brand were dried at 30°C to a constant weight. Once dry, each wipe
was weighed by Precisa 2200C weighing scales and the mean dry weight of a wipe recorded
for each brand. This data was used for statistical testing and normal distribution was
confirmed by using QQ plots. A one-way analysis of variance (ANOVA) was used to
compare the dry weight of a wipe for each product type. Post-hoc Tukey tests were used to
identify the specific significant effects. All statistical tests were performed in R ver. 3.4.1 (R
Core Team 2017).
Fibres taken from each baby-wipe brand had their composition analysed by Fourier
Transform Infra-red Spectroscopy (FTIR), using a Hyperion 1000 microscope (Bruker)
coupled to an IFS 66 spectrometer (Bruker). The spectra obtained were compared to a
spectral database of synthetic polymers (Bruker I26933 Synthetic fibres ATR library).

Degradability of Disposable Wipes
63
Samples were also taken from each brand, embedded in resin and stained with methylene
blue to identify if they contained cellulosic material. Cross sections of the fibres in the resin
were then cut off using a microtome. The sections were then exposed to 0.1% aqueous
methylene blue for 15-20 minutes and then replaced with deionised water. The samples
were then visualised under a LEICA M205C light microscope.
The disintegration of the baby-wipes was then tested in both laboratory and environmental
conditions.
4.2.1 Environmental Setup
A whole wipe from each brand was then inputted into a hand-sewn pouch structure made
of green high-density polyethylene (HDPE) mesh and nylon fishing wire; both materials
were confirmed by FTIR. Each pouch included two HDPE sheets (30cmx30cm) sewn
together. The HDPE mesh allowed exposure to external environments due to the
continual holes (1 mm X 1 mm) provided by the material. Each compartment was slack to
provide any movement from external factors. Pouches were placed in orange HDPE mesh
bags that were then sealed (Fig. 4.1). The bags were monitored daily for 10 weeks.
Figure 4.1. Left – Whole baby-wipes which have been sewn into mesh pouches and placed in an orange high-density
polyethylene bag before deployment into the marine environment (Queen Anne’s Battery Marina; Plymouth). Right –
Extracted baby-wipes after 1 week exposure in the marine environment. The brand names on the petri dishes have been removed.
Samples were submerged at Queen Anne’s Battery Marina (50°36'48.4"N, -4°12'96.5"W).
The samples, connected to permanent panels, were attached to a plastic beam and
submerged to a depth of 1m. 3kg weights were connected on each side of the beam to
provide stability and assurance of depth.

CHAPTER 4
64
For each disposable baby-wipe brand, there were 10 planned sample dates (1 every week in
a 10-week period) and 4 replicates for each sample date. They were deployed on the 12th
June 2017. Collected samples were then dried at 30°C to a constant weight. These samples
were taken and visualised by scanning electron microscopy (JEOL, 7001F); images taken
were used to visually assess the breakdown of the material by analysing its topography for
any cracks or fragmentation.
4.2.2 Laboratory Setup
The laboratory conditions included 3 different variations of media that single wipes would
be exposed to; autoclaved seawater, seawater and seawater plus additional nutrients.
Seawater was collected from Queen Anne’s Battery Marina (50°36'48.4"N, -4°12'96.5"W).
The additional nutrients added were an inoculation of nitrogen, phosphorous and
potassium at a ratio of 10.6:4.4:1.7 respectively. This ratio was selected to aid microbial
growth. 1L of each media type was put into a tank that also had aeration tubes (seawater
plus additional nutrients had 1ml of nutrients substituted into media). The aeration tubes in
each tank helped to circulate the water (providing movement) and gave a constant oxygen
supply.
To stop foreign contaminants entering into the tanks and loss from condensation, they
were enclosed with a covering which was further held down with large Pyrex sheeting.
These tanks were kept in a 30°C controlled temperature room, which had 12 hours of light
per day. The controlled temperature room was cleaned on a daily basis and had limited
access to others to avoid potential foreign contamination within the tanks. The pH of the
media was analysed using a SevenExcellence pH Meter (METTLER TOLEDO). The
salinity measured by a Digital Refractometer for Seawater Analysis (HANNA Instruments).
4 replicates from each baby-wipe brand were tested in the 3 different media types.
Additionally, toilet paper and the baby-wipes exposed for a week in the marine
environment were tested under the same parameters (seawater media only). Toilet paper
and baby-wipes were exposed for one week in the marine environment to assess whether
microbial communities within this natural setting aided the disintegration rate.
As a comparison to disposable wipes, 1.25 g of toilet paper was also used. This weight was
chosen as it was equal to the mean dry-weight of the disposable baby-wipe brands.

Degradability of Disposable Wipes
65
Disposable baby-wipes that had a week exposure in the marine environment prior to lab
analysis were also deployed at Queen Anne’s Battery Marina. They had the identical set-up
as the environmental section of this experiment. Fresh seawater was collected as the media
for the exposed baby-wipes at the same time as retrieving them from the marine
environment.
The samples were deployed on the 12th June 2017. Their disintegration was monitored, and
samples were extracted at 5 and 10 weeks for closer examination. At 5 weeks, a 9 cm2
sample was taken from the main panel of each wipe. At 10 weeks, 10ml samples were taken
from the media itself to collect any released fibres. The media was then filtered, and the
fibres collected from a nylon CellMicroSieve™ (Fisher Scientific), with 25 μm pores. Any
collected fibres were then dried at 30°C to a constant weight. Similarly, to the
environmental deployed baby-wipes, these samples were analysed by scanning electron
microscopy (JEOL, 7001F). The wipes were also examined on a daily basis over 15 weeks
visually for signs of degradation and any changes recorded. These changes were recorded
based on 1) visual deterioration of the wipe (e.g. any holes), 2) reduction in size and 3) the
number of fibres clouding the water which had broken off of the main panel of the wipes.
4.3 Results All of the disposable baby-wipe products provided minimal technical information or
production details, but they all promoted that they were hypoallergenic and
dermatologically tested. Products 1-3F all stated that they were biodegradable and
flushable, and included this function in writing on the main marketing section of the
packaging. Product 4NF stated that the product was not to be disposed of by flushing by
displaying two small logos; ‘do not flush’ and ‘tidy man’ (Fig. 4.2). Products 2F and 3F also
displayed Forest Stewardship Council (FSC) ‘tick tree’ logo, both stating they contained
recycled wood. This logo is displayed on a wood or wood-based product for assurance that
the product is made with, or contains, wood that comes from FSC certified forests or from
post-consumer waste. There are three types of FSC label: 100%, FSC Mix or FSC Recycled
(FSC, 2017).

CHAPTER 4
66
Figure 4.2. The Forest Stewardship Council (FSC) symbol is displayed on a wood or wood based product for assurance that
the product is made with, or contains, wood that comes from FSC certified forests or from post-consumer waste (FSC, 2017).
The ‘Do Not Flush’ (bottom left) and ‘Tidy Man’ (bottom right) symbols to be used on the packaging of products not designed to
be flushed (INDA and EDANA, 2013).
When comparing the different brands, the mean dry wipe weight was similar for each
product type: 1F 0.99g; 2F 1.17g; 3F 1.20g (Fig.4.3). Product 1F had a weight outlier at
0.91g. The non-flushable wipe product, 4NF, was heavier in mean dry weight at 1.66g. It
also showed the most variation in weight. The weight of wipes varied significantly between
products (one-way ANOVA, p = .000). Post-hoc Tukey tests identified that all product
combinations were significantly different from each other (p = <.000), apart from 3F-2F (p
= .682).
Figure 4.3. The weight in grams of single baby wipes extracted from four different brands; 1F-3F (flushable) and 4NF (non-
flushable). The y axis begins at 0.8 g. The thick black line is the median for each product and the diamond symbol indicates x̅
(n=4). The tails show both the maximum and minimum mass obtained, and the box represents the upper and lower quartiles.
There were significant differences between the amount of microplastic in each of the products (p < .05).

Degradability of Disposable Wipes
67
The methylene blue staining on the baby wipe samples identified all of the products to
contain cellulosic material (Fig.4.4). The flushable wipes (1F-3F) were heavily dispersed
with cellulose. However, the non-flushable wet-wipe (4NF) had substantially less staining
and therefore less cellulose overall. On closer inspection, the fibre cross sections from 4NF
presented cellulose in interspersed small areas, surrounded by undyed non-cellulosic
alternatives. This is similar to what the FTIR results reported for product 4NF.
Figure 4.4 Baby wipe samples embedded in resin and the cross sections then stained with methylene blue to identify if they were
made of cellulosic material. The samples were visualised under a LEICA M205C light microscope at a magnification of X100
A-D and X400 E. Cellulosic material was found in all fibres from all four products, identified by the blue staining (shown as
black in the diagram): the flushable baby-wipes (A – 1F, B -2F, C - 3F), and the non-flushable wipe (D & E - 4NF). The
non-flushable wet-wipe (4NF) had substantially less staining and therefore less cellulose in its material. E shows how the fibre
cross sections are interspersed with small segments that have been dyed.
A spectrum of each of the products was obtained from FTIR. 1F-4NF spectra were
compared against library samples; 1-3F matched rayon (a manufactured fibre made from
regenerated cellulose) or cellulosic samples and 4NF for polypropylene. Other added
ingredients, such as preservatives and antibacterial compounds, were also found to be
present on the spectra and were difficult to remove from the wipe itself.
The surface topography and fibre structure of the baby-wipes was visualised by scanning
electron microscopy. For brands 2F-3F, 2 different fibre types were apparent; natural and
manufactured looking fibres (Fig. 4.5). The manufactured looking fibres looked processed.
They were uniformly long and thin with no cracks. In contrast, the cellulosic fibres looked
similar to strips of paper. Their shape was erratic and made out of joined segments. Many
of these fibres were splitting. 1F was on average 100% manufactured appearing fibres,

CHAPTER 4
68
while 2-3F was on average 40%. Product 4NF, also only appeared to contain manufactured
looking fibres (Fig 4.5).
Figure 4.5. Scanning Electron Microscopy (SEM) showing the topography and fibre composition of baby-wipes before
experimentation (time 0). Products (labelled in left hand corner of each row) 1-3F are marketed as flushable/biodegradable
baby-wipes. 4NF is marketed as not flushable. Photos taken at X100 (1-3F) & X350 magnification (4NF).
4.3.1 Laboratory Results
Toilet paper was chosen to be a comparison against disposable wipes in the laboratory
testing. This was to compare typical disintegration rates. The toilet paper samples in
seawater were the first to show disintegration, which could be visually seen after 24 hours.
However, they maintained their core structure for 5 weeks. Fibres from the paper were
released making the surrounding saltwater appear hazy.
Focussing on the disposable baby-wipes, 2F-3F showed very similar disintegration rates for
all replicate wipes for both seawater and seawater plus additional nutrients within the first 5
weeks. The main structure of the wipe remained, and fibres appeared to break off from the
edge. Similarly, to toilet paper, fibre release was apparent after 24 hours. The longer the
exposure in the tank, the more cloudy/hazy the surrounding media would become from
the released fibres, suggesting disintegration. The disintegration rate was slower for 1F
wipes and for wipes exposed in autoclaved seawater.
SEM images after a 5-week exposure in different media types showed any structural
changes (Fig. 4.6). Products 1F and 4NF remained unchanged after exposure for all media
types. Products 2-3F showed visible deterioration for natural/cellulosic appearing fibres.
They were fragmented, with segments breaking off. This was particularly noticeable for 3F
wipes in seawater plus additional nutrients (SW + A). The wipe’s structure looked pulped,
with the manufactured fibres remaining unchanged in the matrix. All samples gained salt
deposits on both types of fibre.

Degradability of Disposable Wipes
69
Figure 4.6. Scanning Electron Microscopy (SEM) of disposable baby-wipes after a 5 week exposure to different media; ASW
(Autoclaved Seawater), SW (Seawater) & SW+A (Seawater + Additional Nutrients). Products (labelled in left hand corner
of each row) 1-3F are marketed as flushable/biodegradable baby-wipes. 4NF is marketed as not flushable. Photos taken at
X350 magnification.
Excluding the disposable wipes in autoclaved seawater, microbial growth was noticeable
after 3 weeks for all flushable wipes. This was particularly prevalent for wipes that had been
exposed for a week in the marine environment and in seawater with additional nutrients
(SW + A), where the growth covered typically a quarter of each wipe.
For all treatment types, all variants of baby wipes started out being buoyant, allowing a
portion of the wipe to be exposed to the surface. The wipe’s buoyancy decreased
consistently, until it reached stability in the midmost section of the tank. The 4NF wipes
remained buoyant throughout the whole exposure period. For all wipe types, the released
fibres included a mixture of different buoyancies.
After 10 weeks, samples were taken again. This time, samples were taken from the
surrounding media to see what fibres had been released and persisted. SEM images showed
that all fibre types were found in the media that corresponded to the main body mesh of
the subsequent baby-wipe (Fig. 4.7). This was the same for all treatment types. Fibres from

CHAPTER 4
70
1F and 4NF replicates showed minimal signs of degradation. 2F-3F looked visibly more
aged.
Figure 4.7. Scanning Electron Microscopy (SEM) of baby-wipes after 10 weeks of exposure to seawater in a laboratory
environment. Products (labelled in left hand corner of each picture) 1-3F are marketed as flushable/biodegradable baby-wipes.
4NF is marketed as not flushable. These pictures are representative for each media type. Photos taken at X350 magnification.
For samples in seawater with additional nutrients (SW + A), visual disintegration after 15
weeks showed that the wipes from products 2-3F had completely broken down, and there
was no visible structure of any replicate left in their respective tank. 1F wipes were heavily
disintegrated, with approximately 20% of each wipe structure left in each tank. They also
were covered in microbial growth. 4NF was also covered in microbial growth but there was
no apparent degradation from the non-flushable wipe 4NF.
For the flushable wipes tested in ASW (autoclaved seawater) and SW (Seawater) the main
structure of the wipes still remained after 15 weeks. However, they were very sensitive to
movement and would subsequently fragment. 4NF had no apparent signs of degradation.
4.3.2 Environmental Results
The flushable wipes deployed in the environment broke down quicker than their
counterparts in laboratory conditions. The main structure of the wipes became increasingly
smaller throughout the 3-week period. Each flushable wipe appeared to lose mass from the
edges, consistently making the surface area smaller until no wipe remained. The last visible
sample was taken at 3 weeks; this was recorded for wipes 1-3F.
Analysis of their breakdown every week via SEM produced very similar results to flushable
wipes exposed in seawater with additional nutrients (SW + A), in the laboratory experiment
at 5 & 10 weeks.

Degradability of Disposable Wipes
71
For the non-flushable wipe comparison, 4NF, showed very little signs of disintegration.
Similarly, to the laboratory experiment, these wipes were still in full structure after a 15-
week period (Fig. 4.8).
Figure 4.8. A non-flushable wetwipe (baby wipe) after 15 week exposure in the marine environment at Queen Anne’s Battery
Marina (50°36'48.4"N, -4°12'96.5"W). Minimal degradation was shown.
4.4 Discussion The majority of disposable wipe products are made from blends of rayon fibres/wood pulp
and plastic fibres (such as polypropylene) (Das and Pourdeyhimi, 2014). For example; baby
wipes are typically produced with either 70:30 viscose rayon to polyester, or 50:50 rayon to
wood pulp with a basis weight 55 g per m2 (Das and Pourdeyhimi, 2014).
Similar results were found in this research. FTIR analysis identified the non-flushable wipe
(4NF) to be made purely of synthetic material; polypropylene. The material for the
flushable wipes (1-3F) showed that the main material was either rayon or cellulosic, with
the strongest similarity being rayon. When visualised by SEM, products 2F and 3F also
displayed two different types of fibre; manufactured and natural (cellulosic) appearing. The
product packaging also contained labelling stating that the wipes contained recycled wood
and cellulosic material was confirmed in the samples by a methylene blue test. Therefore, it
is expected that these disposable baby wipes are composed of both rayon and wood pulp.

CHAPTER 4
72
Product 1F is expected to be 100% rayon as only manufactured fibres were shown.
In Europe, fibres and fabrics produced from regenerated cellulose became known as
viscose, whereas in the U.S. they are termed rayon (Comnea-Stancu et al., 2017).
Viscose/rayon is one of the oldest manufactured fibres. It is a regenerated cellulose fibre
with a wide spectrum of properties and commonly used in textiles (Kalabek et al., 2016).
The important considerations for rayon are that the essential raw material for its
production, namely cellulose, is abundantly available and a renewable source (Kalabek et
al., 2016; Sengupta, 1997). Rayon fibres can be produced with a wide range of properties,
particularly mechanical properties, making it very desirable (Kalabek et al., 2016; Sengupta,
1997). Due to this, it is common fibre for wipes, especially for baby wipes. (Sahu, 2012).
However, it can be argued that rayon fibres behave like a synthetic fibre as rayon is widely
reported in the marine environment (Comnea-Stancu et al., 2017). Interestingly, already in
2013, Lusher et al. reported the identification of rayon / viscose fibres in the
gastrointestinal tract of fish, and in 2014, Woodall et al. came to the conclusion that rayon
fibres are a major source of microplastic debris even in the deep sea. (Comnea-Stancu et al.,
2017; Lusher et al., 2013; Woodall et al., 2014).
Both the synthetic and cellulosic fibre types undergo the same manufacturing processes to
be made into baby wipes (predominately non-woven material). This typically includes
making a pulp which is airlaid (produces a randomly orientated fibrous web structure),
hydroentangled (bonding process) and then the surface apertured (creates narrow
holes/gaps). The aperturing destabilizes and weakens the structure, especially the thinner
fabrics. Additionally, if the hydroentangling is done at low pressures (below 80 bar), then
the structure is given either chemical or thermal bonding to stabilize and improve the
strength of wipes. The binders usually increase the stiffness of wipes (Das and
Pourdeyhimi, 2014).
It has been reported that the bonding process when manufacturing a wipe will determine if
a wipe is flushable (Mango, 2008). A flushable wipe is made from a pulp that is bonded by
ion sensitive cationic polymer binders or by light hydroentanglement. The process in which
it is made means that when the wipe is immersed in water, it should become weak enough
to become flushable (Mango, 2008). However, it is also reported that flushable wipes
undergo various degradation processes such as physical disintegration caused by turbulent
forces, hydrolysis of soluble material, and biodegradation of dissolved materials. Physical

Degradability of Disposable Wipes
73
disintegration depends on turbulence and solid characteristics such as size, mechanical
strength, and density of solids (Karadagli et al., 2012).
Therefore, it is important to understand the definition of a flushable product. The
Association of the Nonwoven Fabric Industry collaboratively worked with the Wastewater
Industry across the United States and in Europe. This organisation states that for a
nonwoven product (such as babywipes) to be deemed flushable there must be evidence
indicating that it clears toilets and properly maintained drainage pipe systems when the
suppliers recommended usage instructions are correctly followed. It must also pass through
wastewater conveyance systems, be compatible with wastewater treatment, reuse and
disposal systems without causing system blockage or other operational problems.
Additionally, it should also be unrecognisable in effluent leaving onsite and municipal
wastewater treatment systems and in digested sludge from wastewater treatment plants that
are applied to soil (INDA and EDANA, 2013).
Currently within the UK, there is no way of assessing whether a product can be considered
to be suitable for disposal via the sewerage system (Drinkwater and Galletti, 2008). The
legal context for the disposal of anything other than faeces, toilet paper and consented
trade effluent is not clear. The law anticipates that domestic sewage contains waste from
toilets, and water that has been used for cooking and washing, but the relevant law for
domestic waste varies between regions of the British Isles. These requirements are
ambiguous as there are no compulsory tests that require a product to be tested that could
provide evidence. It is also particularly difficult to monitor products, such as baby wipes,
which can be made from different materials; often making them non-flushable.
As shown from our research, the quickest possible breakdown for the wipes was 3 weeks
when exposed in the marine environment. This is still a slow time frame and will
potentially still create blockages within sewage systems. The non-flushable wipe showed no
signs of degradation in 15 weeks, and due to its unclear labelling may often still end up in
the waste water system.
It has been reported that the most sustainable route for disposal of sanitary products, such
as disposable wipes, is via the solid waste disposal route. However, pressure on landfill sites
and from local authorities means that many consumers are seeking ways to reduce their
solid waste disposal (Ashley et al. 2005). Additionally, customers are wanting their products
to be convenient in use and disposal (Sahu, 2012). Flushable products fit these criteria.

CHAPTER 4
74
Therefore, manufacturers are now making it easier for customers to incorporate these
products into their normal bathroom use. Baby-wipes are particularly prevalent due to their
frequent and wide variety of uses.
The disintegration of disposable flushable wipes was shown in this study, where it appears
that the main structure of flushable wipes is breaking down. Subsequently, this releases
fibres which are no longer secured by the structural mesh. The degradability of these fibres
is still unknown. However, in laboratory conditions, when analysing the surrounding media
for released fibres, all fibre types observed were found even after a 10-week exposure. This
could potentially show that the fibres from the wipes are not biodegrading, but the
structure is breaking down. To the eye, this can make it appear that the wet wipes are
disintegrating as stated on the packaging, but the fibre release may still have a large impact
on the environment.
Developing truly disposable flushable wipes that are functional and affordable will
undoubtedly pose tremendous challenges to wipe manufacturers in future. Additionally,
alongside many disposable wipes there are also a number of other items which are
commonly flushed that are not intended by the manufacturer to be introduced into the
sewer system. These can include cotton-buds, tampons and disposable razors (Drinkwater
and Galletti, 2008). As the number of flushable products increase and consumers become
more convinced of their convenience (flushability), the numbers of blockages will increase
(Wessex Water, 2016). Water companies are now even urging the disposable wipes industry
to stop ‘misleading’ labelling on disposable wet wipes that are marketed as flushable.
4.5 Conclusion
Our research highlights the persistence of disposable wet wipes and potentially their fibres
once released into the marine environment. Our recommendation would be to remove
flushable labels from packaging and make it clear the impact that flushing these wipes have
on the sewer system and the environment. Furthermore, studies should look into the
potential of the persistence of rayon fibres compared to that of synthetic fibres in the
marine environment. Although from a natural source, there is potential that these fibres
could persist within the marine environment for a prolonged period.

CHAPTER 5
75
Chapter 5
Environmental Degradation of
Biodegradable, Degradable and Conventional
Plastic Carrier Bags in the Sea, Soil and
Open-Air Over a Three-Year Period
A version of this chapter is currently under review for Environmental Science
and Technology
Napper I.E., Thompson R.C., Degradation of Biodegradable, Degradable
and Conventional Plastic Carrier Bags in the Environment Over a Three-Year
Period.

DEGRADATION OF CARRIER BAGS
76
Abstract
Plastic carrier bags are ubiquitous in modern society but are often single use, disposable
items. The majority of bags are made from conventional polyethylene and there is clear
evidence of the accumulation of discarded bags in the environment. Partly in response to
this environmental concern, various plastic formulations have been developed which state
they disintegrate faster and/or have fewer impacts on the environment because their
persistence is shorter. This study examined the degradation of five plastic bag materials
over a three-year period. These were obtained from U.K. high-street retailers and were
either labelled as biodegradable, oxo-biodegradable, compostable or high-density
polyethylene (i.e. a conventional plastic carrier bag). These materials were exposed in three
natural environments which they could potentially encounter if discarded; open-air, buried
in soil and submersed in seawater as well as in controlled conditions in the laboratory. In
the marine environment, the compostable bag completely disappeared from the
experimental test rig within 3-months. However, the compostable bag type was present in
the soil environment after 27 months but was unable to hold any weight without tearing.
After 9 months exposure in the open-air, all bag materials had disintegrated into fragments.
Our results showed that biodegradable, oxo-biodegradable and conventional plastic
formulations persisted and remained functional as carrier bags after being in the soil or the
marine environment for over 3 years. Considering the highly variable receiving
environments in which plastic litter can accumulate, it is not clear that the oxo-
biodegradable or biodegradable formulations tested could be relied upon to offer a
sufficiently advanced rate of degradation, compared to conventional bags. Especially if they
are to be considered advantageous in reducing the impacts of plastic litter. Plastic films are
challenging to recycle even if disposed of properly, but there are additional concerns about
the compatibility of modified plastic formulations with available recycling and organic
waste streams.

CHAPTER 5
77
5.0 Environmental Degradation of Biodegradable,
Degradable and Conventional Plastic Carrier Bags in
the Sea, Soil and Open-Air Over a Three-Year Period
5.1. Introduction
Plastics are lightweight, strong, durable and corrosion-resistant materials which have
become an integral part of daily life worldwide (Thompson et al., 2009b). The versatility of
plastic, together with its low cost, has resulted in annual worldwide production exceeding
335 million tonnes (PlasticsEurope, 2018).
Approximately 50% of plastics are discarded after a single-use (Hopewell et al., 2009;
UNEP, 2018). Therefore, a large quantity of plastic items enter municipal waste streams at
the end of their service life. This creates a major waste management problem, with plastics
accounting for approximately 8–10% of all the waste generated in the U.K. (Barnes et al.,
2009; Hopewell et al., 2009). Considerable quantities of end of life plastics also escape to
the environment as litter, and single use items constitute a large proportion of the litter
found in marine and terrestrial environments.
Plastics are the dominant category of litter reported in the marine environment and can
account for up to 75% of all litter found on shorelines. Plastic debris has also accumulated
on the sea bed in shallow water and the deep sea (Bergmann and Klages, 2012; Debrot et
al., 2013; Woodall et al., 2014). Plastic litter can harm marine organisms via ingestion or
entanglement, and may favour the dispersal of invasive species (Gall and Thompson, 2015;
Gregory, 2009; Kühn et al., 2015). Additionally, there are concerns about the release of
chemicals from plastic, including additives (components of plastic) and the accumulation of
hydrophobic contaminants (adsorbed onto plastic from surrounding sea water) (Teuten et
al., 2009), but there is currently little evidence to suggest that plastics will transfer chemicals
in sufficient quantities to present toxicological harm in environmentally relevant scenarios
(Bakir et al., 2016; Koelmans et al., 2013).
In addition to the negative effects on marine life, there is evidence that plastic debris can
harm maritime industries, tourism and human wellbeing (Thompson, 2017; Thompson et

DEGRADATION OF CARRIER BAGS
78
al., 2009a; Wyles et al., 2015). In the marine environment the accumulation of plastic debris
has been identified as a major global issue by the United Nations Environment Assembly
and in the G7 Leader´s declaration 2015 (GESAMP, 2016; UNEP, 2017; Werner et al.,
2016).
Plastic debris is also widespread in terrestrial and freshwater environments. However,
much of the existing information about the presence of plastics in these environments is
focused on sources and transportation pathways to the oceans. Given that the majority of
all plastics will be used and disposed of on land, terrestrial environments will themselves be
subject to extensive pollution by plastics of all sizes, based on large amounts of
anthropogenic litter from both point (e.g. landfill, wastewater treatment discharge, sewage
sludge application) and diffuse (e.g. general littering) sources. As such it is highly likely that
soils may also act as long-term sinks for plastic debris (Rillig, 2012; Zubris and Richards,
2005).
Since their introduction in the 1970s, plastic carrier bags have become widespread in daily
life worldwide (Williams, 2004). They are typically considered as single-use items and are
commonly made from polyethylene (European Parliament and Council of the European
Union, 1994). These bags can be regarded as an iconic symbol of our ‘throw-away’ society
and their waste is often viewed as a very visible nuisance. In 2010, it was estimated that
98.6 billion plastic carrier bags were placed on the European Union (EU) market and about
100 billion plastic bags have been placed additionally every year since (European
Commission, 2013).
Plastic carrier bags are often supplied free or for a low charge and used in high volumes.
Consumption figures vary greatly between countries, with annual use per capita exceeding
450 bags in some EU countries (European Commission, 2013). Interventions to reduce the
use of plastic bags have been varied in range and scope. Governments in many nations
have strategies to either ban the sale of lightweight bags, charge customers for their use
and/or generate taxes from stores who sell them (Xanthos and Walker, 2017). Several
countries have already included bans or taxes, which have resulted in substantial reductions
in use (Convery et al., 2007). However, there is no consistency of taxes or regulations
between countries.

CHAPTER 5
79
There are growing concerns that the littering of plastic carrier bags presents a substantial
source of contamination in the oceans. They have been found to be one of the most
common items in the intertidal (Thiel et al., 2003; Willoughby et al., 1997) and subtidal
benthos (Galgani et al., 2000). Even if properly discarded, lightweight bags can
unintentionally be transferred away from landfill sites or other areas by wind or heavy rain
(Barnes et al., 2009).
The presence of carrier bags in the marine environment can have a number of effects.
Research by Bugoni et al. (2001), found that out of 50 dead stranded sea turtles, plastic
carrier bags were the main debris ingested. Green et al. (2015), found that within 9 weeks in
the marine environment, plastic carrier bags can create anoxic conditions within the
sediment, and that their presence can significantly lower abundances of infaunal
invertebrates. This indicates carrier bags can rapidly alter marine assemblages and the
ecosystem services they provide (Green et al., 2015). Additionally, Hodgson et al. (2018)
did laboratory experiments on carrier bags and showed that amphipods can shred plastic
carrier bags, generating numerous microplastic fragments (average diameter 488.59 μm).
This study was to investigate the shredding and subsequent potential ingestion of plastic by
amphipods.
Despite their durability once in the environment, plastics can become oxidized when
exposed to ultraviolet B (UVB) radiation from sunlight and the oxidative and hydrolytic
properties of the atmosphere and seawater. This can form hydroperoxides which lead to
polymer chain scission and fragmentation (Billingham et al., 2000). However, this is a very
lengthy process and it is likely that considerable further degradation would be required
before the plastic could reach a size sufficiently small that it might biodegrade. The
hydrophobicity and long carbon chain molecular structure of polyethylene, which is widely
used for plastic bags, makes it resistant to biodegradation under normal conditions and the
timeframe for the complete mineralisation is unknown. Therefore, with the large quantities
of carrier bags used this presents a major waste management issue.
Awareness of the accumulation of end of life plastic and its impact on the environment
has, in part led, to interest in the development of degradable polymers. Biodegradable, oxo-
biodegradable and compostable plastics are widely regarded as potential solutions to the
accumulation of plastic litter and waste. Some of these products are accompanied by
statements indicating they will break down ‘typically within 24 months’ and ‘quicker than

DEGRADATION OF CARRIER BAGS
80
conventional petroleum-based plastic’. These materials are widely used for the production
of carrier bags and some are also being used to make a variety of other items, including
single-use cutlery, water bottles and straws.
Biodegradation takes place through the action of enzymes and/or chemical deterioration
associated with living organisms, bacteria, fungi and algae. This occurs in two steps; the
first is the fragmentation of the polymers into sections of lower molecular mass by means
of either abiotic reactions (i.e. oxidation, photodegradation, hydrolysis), or biotic reactions
(i.e. degradation by microorganisms). This is followed by bioassimilation of the polymer
fragments by microorganisms and its mineralisation (Lucas et al., 2008). A material may be
labelled as ‘biodegradable’ if it conforms to certain national or regional standards that apply
to industrial composters, not to domestic compost heaps or the natural environment
(Kershaw, 2015).
Such standards could include: ISO, European Norm – EN and American Society for
Testing and Materials (ASTM) International. These standards are appropriate for
conditions that occur in an industrial composter, in which temperature are expected to
reach 70 °C. For example, the EN standard requires that at least 90% of the organic matter
is converted into CO2 within 6 months, and that no more than 30% of the residue is
retained by a 2 mm mesh sieve after 3 months composting (EN 13432:2000, 2000).
Oxo-biodegradable plastics (oxo-plastics) are reported to contain an additive (pro-oxidant)
which is intended to break the molecular chain within the polymer which will then lead to
its biodegradation (Koutny et al., 2006; Ojeda et al., 2009). However, there is typically no
clearly defined timeframe given for the breakdown of oxo-/biodegradable plastics
(Association for Organics Recycling, 2011).
'Composting' is enhanced biodegradation under managed conditions, predominantly
characterised by forced aeration and natural heat production resulting from the biological
activity taking place inside the material. The resulting output material, compost, contains
valuable nutrients and may act as a soil improver (European Commission, 2018).
Therefore, compostable plastics should biodegrade in a managed composting process
through the action of naturally occurring micro-organisms and typically do so in relation to
a specified timeframe (Association for Organics Recycling, 2011).

CHAPTER 5
81
There is a lack of clear evidence that biodegradable, oxo-biodegradable and compostable
materials offer an environmental advantage over conventional plastics, and the potential
for fragmentation into microplastics causes additional concern (Kershaw, 2015; O’Brine
and Thompson, 2010). To date, studies focusing on the breakdown of different types of
degradable plastics in the environment give varying results and are shorter in timeframe.
For example, O’Brine and Thompson (2010) tested biodegradable plastic within a 40-week
timeframe in the marine environment and found that the majority of plastic still remained.
The degree to which synthetic polymers degrade depends on both the properties of the
polymer and the environment to which it is exposed (Mohee and Unmar, 2007). Due to
lack of consistent evidence about rates of degradation in the environment, the overall
environmental benefits, allegedly misleading claims to consumers and risks that labelling
products as biodegradable may inadvertently promote littering behaviour, a process is being
proposed to restrict the use of oxo-plastics in the EU (European Commission, 2018).
The present study examined the degradation of bags which are stated to have
biodegradable, oxo-biodegradable or compostable properties. A conventional polyethylene
plastic carrier bag was also examined for comparison. All bags were available at the point of
sale in U.K. high-street retailers. These materials were exposed in various environments
that discarded carrier bags could encounter; in open-air, buried in soil and submersed in the
marine environment. This is the first research where plastic degradation has been examined
simultaneously across these three natural environments, together with controlled
conditions in the laboratory. Five different plastic carrier bag formulations were
considered, and their degradation was evaluated over a 3-year period. Deterioration was
considered in terms of visible loss in surface area and disintegration as well as approaches
to detect more subtle changes in tensile strength, surface texture and chemical structure.

DEGRADATION OF CARRIER BAGS
82
5.2 Methods
5.2.1 Sample Preparation
Five different types of plastic carrier bags were compared (Table 1): these included two
types of oxo-biodegradable bag (labelled here as Oxobio1 and Oxiobio2), one
biodegradable bag, one compostable bag, and high-density polyethylene (HDPE) carrier
(labelled in this research as a conventional carrier bag), which was not stated to have any
particular degradation/compostable properties.
The bags were chosen as they were all opaque and were obtained based on their prevalence
in retail stores in and around Plymouth (U.K.). Sixteen samples of each bag were obtained.
In order to ensure the samples were as independent from each other as possible, a
maximum of two bags were sourced from any one store on any single occasion. Where
repeat visits to the same store were necessary to obtain sufficient independent samples,
these visits were separated by at least 2 weeks. Hence our experiment was designed to
contain a range of products and production batches so as to be as representative as
possible. Since the specific retail stores from which the carrier bags were obtained is not of
particular relevance, bags will only be described based on their formulation (Table 1).

CHAPTER 5
83
Table 5.1. Information on the tested carrier bags and the properties as stated on the manufacture’s website. All bags were
opaque and obtained based on their prevalence in retail stores in and around Plymouth, U.K.

DEGRADATION OF CARRIER BAGS
84
Each carrier bag type was cut into strips; 15 x 25 mm. The strip samples were taken from
the main body of the carrier bag (not the handles or the sides), to provide areas of similar
structure. A strip of each plastic carrier bag type was then placed into a pouch made of
high-density polyethylene (HDPE) mesh and sewn secure using nylon fishing twine. Each
pouch structure (150 x 200 mm) was sewn together to provide 5 equally spaced separated
compartments. These compartments were then used to house an individual strip of each
bag type (Fig.1). The HDPE mesh (1 mm x 1 mm) allowed exposure to external
environments and each compartment was sewn so as to allow the bag samples to move
relatively freely. Each pouch structure was attached to a permanent panel to aid removal.
These permanent panels were placed in one of four different conditions; buried in soil,
exposed outdoors in the air, submerged in the marine environment and placed in a
blacked-out box in the laboratory as a control. The buried samples were situated at the
University of Plymouth’s Skardon Garden (50°22'38.4"N, -4°08'11.9"W) and were buried
to a depth of approximately 0.25 m (Fig.1a). The samples that were exposed in open-air
were also situated in Skardon Garden and were placed on a South facing wall (Fig.1b).
Samples placed in the marine environment were submerged on a beam at Queen Anne’s
Battery Marina (50°36'48.4"N, -4°12'96.5"W) at a depth of approximately 1 m (Fig.1c). 3 kg
weights were connected on each side of the beam to maintain depth. Control samples were
placed in a blacked-out box (kept at room temperature) in a laboratory at the University of
Plymouth.
Figure 5.1. Setup for the degradation experiment testing different types of plastic used for carrier bags. The bags were marketed
as being either: oxo-biodegradable, biodegradable or compostable. A bag made from conventional polyethylene was also tested.
The samples were cut into standardised strips and placed in 4 different environments: A –
buried in soil in (Skardon Garden, Plymouth University); B- Strips hung on a south-facing
wall, exposed to the outside environment (Skardon Garden, University of Plymouth; C –
Strips submerged in a salt-water marine environment (Queen Anne’s Battery Marina; arrow
denotes where). Control samples (not illustrated) were stored in a blacked-out container at
University of Plymouth.

CHAPTER 5
85
The sea temperature in Plymouth (England) ranges from 8.8 – 18.8 °C (United Kingdom
Sea Temperatures, 2018). The air temperature typically ranges between 1 - 21.5 °C,
depending on the season (Met Office, 2016).
All samples were deployed on the 10th July 2015. There were 3 subsequent sampling dates;
6th April 2016 (9 months), 6th Jan 2017 (18 months), 6th October 2017 (27 months).
Additionally, whole bags of each material were also deployed in polypropylene mesh in
each environment at the same time and used for visual inspection over the 3-year period
(23rd August 2018).
Before deployment, 4 subsample strips from each carrier bag type were tested to provide a
comparison starting point. After deployment, four replicate samples of strips from differing
bag replicates were collected from each environment on each sampling date. Samples were
removed from the mesh structure, gently cleaned using distilled water, air dried (30°) and
tested (see below) within 48 hours.
5.2.2 Visual Inspection
The first step on each sampling date was to visually inspect the samples to check for
surface area loss, holes or disintegration. Random samples of each carrier bag type were
then also visualised by scanning electron microscopy (JEOL, 7001F) prior to deployment,
and then from each environment at 27 months. The images were used to visually assess the
deterioration of the material by analysing its surface for cracks or fragmentation.
Measurements of tensile stress and molecular structure using Fourier transform infra-red
spectroscopy (FTIR) were made in order to detect any more subtle changes.
5.2.3 Tensile Stress Testing
The thickness of each strip was measured using an electronic micrometer (Sealey;
AK9635D). Each strip was measured at 10,50,100 and 140 mm from a central point. This
produced 4 reference points for each sample and the mean was then calculated. The
maximum load (N) for each strip was then measured using a tensile testing machine at a
rate of 100 mm min−1 (Instron, system ID 3345 k1669 - USA, force transducer model

DEGRADATION OF CARRIER BAGS
86
2519-104, capacity 500 N). Then, the maximum tensile stress of each strip was calculated
using the following equations:
i) 𝐴 = 𝑏ℎ ii) σ = 𝐹
𝐴
where b is the width (25 mm), h is the height (mean thickness) and F (maximum load, N) is
the force for each extracted strip. For each strip Eq. (i) allowed calculation of the cross-
sectional area (A) and Eq. (ii) allowed calculation of the tensile stress (σ, MPa). The
maximum tensile stress of a material is also termed as its ultimate strength (and referred to
as the rate of disintegration within this research).
Normality of the data was confirmed by using QQ plots to examine distribution. One-way
analysis of variance (ANOVA) was used to compare the maximum tensile stress difference
between the different bag types before being exposed in any environment. The effects of
bag type, environment and time on the maximum tensile stress was then examined. This
was compared using the percentage change of tensile stress from 0 to 9 months and 9 to 27
months using a three-way ANOVA. Post-hoc Tukey tests were then used to identify the
significant effects. Any samples which were too brittle to test or were no longer visible
were omitted from the analysis. All statistical tests were performed in R ver. 3.4.1 (R Core
Team 2017).
5.2.4 Molecular Composition Analysis (FTIR) and Image Analysis
In order to assess any subtle deterioration effects on the molecular composition of the
materials, Fourier transform infra-red spectroscopy (FTIR) was conducted (Hyperion 1000
microscope coupled to an IFS 66 spectrometer; Bruker). Prior to FTIR, samples were
cleaned with absolute ethanol to remove any residues. The spectra obtained were compared
against a spectral database of synthetic polymers (Bruker I26933; Synthetic fibres
ATRlibrary).

CHAPTER 5
87
5.3 Results
Prior to exposure in different environments, maximum tensile stress and thickness of the
bags was measured. Oxobio2 had the highest tensile stress and thickness (28.82 MPa and
0.04 mm), the compostable bag had the lowest tensile stress (10.47 MPa) and the
biodegradable, conventional and Oxobio1 bag had the lowest thickness (0.02 mm) (Table
2).
Bag Type Tensile Stress (MPa) Thickness (mm)
Compostable 10.47 ± 1.23 0.03
Biodegradable 21.36 ± 1.90 0.02
Oxobio1 25.98 ± 8.05 0.02
Oxobio2 28.82 ± 1.55 0.04
Conventional 20.61 ± 1.87 0.02
Table 5.2. Mean of maximum tensile stress (MPa), standard deviation (SD) and mean thickness of plastic bags before being
exposed in different environments (n=4). All bag types had relatively consistent thickness.
Before commencing the experiment there were significant differences in mean maximum
tensile stress [F (4, 15) = 12.94, p = <0.01)] between the carrier bag materials (Table 3). Post-
hoc Tukey's HSD tests showed that the compostable bag had a significantly lower
maximum tensile stress when compared against all other bag types. All other comparisons
were not significant.

DEGRADATION OF CARRIER BAGS
88
Table 5.3. Outcomes of 1-way ANOVA test with post-hoc Tukey's HSD tests showing the mean +/- S.D. and any
significant differences in maximum tensile stress of 5 different carrier bag materials (n=5, >* signifies a significant difference at
P 0.05, = denotes no significant difference)
After the various exposure periods, all pouch structures were successfully recovered from
all environments. The strips and whole bags were then analysed visually.
For plastic bag strips in both the control and soil environment, no surface area loss was
measurable over the period of 27 months. Within the marine environment, a microbial
biofilm was visible on the surface of all bags after 1-month. However, the compostable bag
samples (including whole bags) were no longer visible by the 1st sampling date of 9 months.
After 9 months, in the open-air environment all bag types (including conventional
polyethylene) were too brittle to test and had or were disintegrating into pieces. Most of the
pieces were in the microplastic size range (<5 mm); therefore, they could not be examined
for tensile stress. The whole bags were also found to have disintegrated into microplastic
pieces. Substantial quantities of the fragments that formed were visible to the naked eye on
the ground beneath the test rig and in the pouches. While disintegration into microplastic
was apparent it was not clear whether this fragmentation could have altered the potential
for the plastic to biodegrade and more work would be needed to establish this together
with the associated timescale.
Scanning electron microscope images were obtained before environmental exposure and
then again after 27 months. For each material, the topography and roughness were
assessed. The main noticeable changes were found with the open-air sample fragments
for both conventional and compostable bag types. Cracks and holes were present in the
conventional bag material suggesting deterioration (Fig. 5.2.1b). For the compostable
1-way ANOVA
Df Sum Sq Mean
Sq F value P-value
Bag Type 4 784.5 196.13 12.94 <0.01
Residuals 15 227.4 15.16 Outcome of post-hoc Tukey’s HSD tests
Oxobio2 (28.82 MPa ± 1.55) = Oxobio1 (25.98 MPa ± 8.05) =
Biodegradable (21.36 MPa ± 1.90) =
Conventional (20.61 MPa ± 1.87) >* Compostable (10.47 MPa ± 1.23)

CHAPTER 5
89
material, solid deposits that looked like filamentous bacteria were visible on the surface;
however, no cracks or holes were present nearby (Fig. 5.2.2b).
Figure 5.2. Scanning Electron Microscopy (SEM) imagery showing the typical topography of conventional plastic carrier bag
(1a) and a compostable carrier bag material (2a) before testing and then after 27-month exposure outside (1b & 2b, respectively)
(2000X magnification) (Images taken at Plymouth Electron Microscopy Centre).
After 3 years, photographs were taken of the whole bags from both the soil and marine
environment (Fig. 3). As a qualitative assessment of functionality these bags were loaded
with typical groceries from a local supermarket (weight 2.25 kg). Oxobio1, Oxobio2,
biodegradable and conventional were still functional and retained the items with no
breakages. However, the compostable bag type (which was only present in the soil
environment after 27 months) was unable to hold any weight without tearing.
Figure 5.3. Oxo-biodegradable bags (oxobio2) which had either been submerged in the marine environment (left) or buried in
soil (right) for over three years. Each bag is holding 2.25 kg of typical groceries.
The maximum tensile stress of all plastic types decreased in all environments over time, but at different rates
(Fig. 5.4). A three-way ANOVA was conducted to examine the effect of three factors (Bag type,
Environment, Time) on the percentage change in maximum tensile stress of 150 x 25mm strips. The factor
Time had two levels (0-9 and 9-27 months); Bag type had 5 levels (Oxobio1, Oxobio2, biodegradable,

DEGRADATION OF CARRIER BAGS
90
compostable and conventional) and environment consisted of 4 levels (control, open-air, marine, soil).
Overall, this involved destructive sampling of 262 samples, with each measurement taken from a previously
untested strip.
Figure 5.4. Mean of maximum tensile stress of plastic carrier bag samples, shown as maximum stress before breakage
displayed (mean + SE) over a 27-month exposure period in 4 different environments (control, marine, soil, open-air). Open-air
is labelled as air in this graph. If bag type is not shown in relation to an environment, it denotes complete
disintegration/fragmentation and hence samples were not testable.
As the compostable bag samples had completely disappeared from the mesh in the marine
environment this gave an unbalanced data set, and so this bag type was examined using a
separate analysis just considering the remaining environments and sampling dates.
Additionally, all bag types after 9 months in the open-air environment could not be tested
due to being too brittle; these were subsequently omitted from statistical testing from 9-27
months.
From the perspective of litter and potential interactions with biota most of the bag samples
remained intact. However, subtle changes in tensile stress were apparent in all the bag
materials indicating some degree of deterioration and the factors Time, Bag type and
Environment showed significant differences between 0 - 9 months exposure (Table 4).

CHAPTER 5
91
Post hoc comparisons found that Oxobio1 lost strength at a significantly faster rate than
the other bags between 0 - 9 months (p = <0.01). There were also differences between the
two Oxo-biodegradable samples; Oxobio1 lost strength significantly faster than Oxobio2 (p
= 0.01). Additionally, bags exposed in the open-air environment lost strength more rapidly
when compared to the other environments: control (p = <0.01), marine (p = <0.01) and
soil (p = <0.01).
A second ANOVA was conducted which included the compostable bag type. This bag type
needed a separate analysis as all its samples had completely disappeared within the marine
environment after 3 months. This ANOVA showed that the compostable bag material had
a significant difference in tensile stress to Oxobio1 (p = <0.01). The compostable bag
material exposed in the open-air environment also lost its strength more rapidly when
compared to bags exposed to both control (p = <0.01) and soil (p = <0.01) environments.

DEGRADATION OF CARRIER BAGS
92
Table 5.4. 3-Way ANOVA to comparing changes in tensile strength of 5 bag types over 27 months. This focussed on the
influence of three independent variables (bag type, environment, time) on the percentage change of maximum tensile stress of 150
x 25mm strips at 0-9 and 9-27 months. Bag type included 4 levels (4 bag types; Oxobio1, Oxobio2, Biodegradable and
Conventional), environment consisted of 4 levels (control, open-air, marine, soil). Analysis of 9 - 27 months does not include
open-air samples due as they were too brittle to test. The compostable bag was not included in the analysis due to its rapid loss of
marine samples.
Exposure from 9 - 27 months produced similar relative changes in tensile strength patterns
as 0 – 9 months (Table 4). However, Oxobio1 and the Conventional bag type were also
found to differ in tensile stress (p = <0.01). As samples in the open-air were too brittle to
test after 9 months, the only significant difference between environments was between soil
and control (p = <0.01). Furthermore, the specific order of tensile stress between the bags
was largely unchanged throughout 27 months, whereas environment type seemed to have a
greater effect (Table 5).
Time: 0 - 9 Months
Variable DF MS F P-
value
Time 1 10381 37.16 <0.01
Bag 3 1788 6.40 <0.01
Environment 3 2244 8.03 <0.01
Time:Bag 3 1788 6.40 <0.01
Time:Environment 3 2244 8.03 <0.01
Bag:Environment 9 69 0.25 0.99
Time:Bag:Environment 9 69 0.25 0.99
Residuals 96 279
Time: 9 - 27 Months
Variable DF MS F
P-
value
Time 1 12259 43.69 <0.01
Bag 3 4792 17.08 <0.01
Environment 2 1722 6.14 <0.01
Time:Bag 3 203 0.72 0.54
Time:Environment 2 1476 5.26 0.01
Bag:Environment 6 341 1.22 0.31
Time:Bag:Environment 6 325 1.16 0.34
Residuals 72 281

CHAPTER 5
93
Table 5.5. Outcomes of post-hoc Tukey's HSD tests showing the mean +/- S.D. and any significant differences in maximum
tensile stress of 5 different carrier bag materials, in four different environments over a period of 27 months. Separate analysis was
required for the compostable bag type as all its samples had completely deteriorated within the marine environment in 3 months.
(n=4, >* signifies a significant difference at P 0.05, / signifies no available sample for testing and = denotes no significant
difference)
There were also changes in tensile stress between 0 – 27 months; samples exposed in the
open-air were found to alter the most and those in the control environment the least (Table
5.6). When comparing bag types (and ignoring any samples that had deteriorated to such an
extent tensile strength could not be tested), Oxobio1 had the greatest loss in tensile stress
over 27 months for all environments; soil (75% loss), marine (60% loss) and control (29%
loss). Conventional plastic had the least reduction in tensile stress for both soil (34% loss)
and the marine environment (14% loss). Compostable plastic had the lowest change in
tensile stress within the control environment (11% loss), but samples within open-air and
marine environment showed total disintegration (Table 5.6).
Environment Type Sample Extraction Timeframe
0 Months
Control Oxobio2 (28.82 MPa ± 1.55) = Oxobio1 (25.98 MPa ± 8.05) = Biodegradable (21.36 MPa ± 1.90) = Conventional (20.61 MPa ± 1.87) >* Compostable (10.47 MPa ± 1.23)
Soil - - - - -
Open-air - - - - -
Marine - - - - -
0-9 Months
Control Oxobio2 (28.31 Mpa ± 5.12) = Biodegradable (22.02 Mpa ± 4.07) = Conventional (19.66 Mpa ± 2.86) = Oxobio1 (19.07 Mpa ± 0.77) = Compostable (9.35 Mpa ± 2.81)
Soil Oxobio2 (29.29 Mpa ± 3.39) = Biodegradable (21.76 Mpa ± 8.76) = Conventional (18.67 Mpa ± 3.11) = Oxobio1 (17.49 Mpa ± 5.24) = Compostable (10.35 Mpa ± 3.48)
Open- air Oxobio2 (19.74 Mpa ± 3.64) = Conventional (14.29 Mpa ± 1.93) = Biodegradable (13.71 Mpa ± 1.60) = Compostable (9.77 Mpa ± 0.77) >* Oxobio1 (6.77 Mpa ± 4.76)
Marine Oxobio2 (27.09 Mpa ± 2.36) = Conventional (20.04 Mpa ± 1.00) = Biodegradable (19.05 Mpa ± 2.72) = Oxobio1 (18.61 Mpa ± 2.74) (/) Compostable
9-27 Months
Control Oxobio2 (23.32 Mpa ± 1.64) = Oxobio1 (18.42 Mpa ± 2.05) = Biodegradable (17.46 Mpa ± 1.11) = Conventional (17.15 Mpa ± 1.00) = Compostable (9.26 Mpa ± 1.16)
Soil Biodegradable (16.01 Mpa ± 7.97) = Conventional (13.68 Mpa ± 3.11) = Oxobio2 (12.34 Mpa ± 4.49) = Oxobio1 (6.38 Mpa ± 2.44) = Compostable (3.26 Mpa ± 0.99)
Open- air / / / / /
Marine Oxobio2 (24.05 Mpa ± 2.86) = Conventional (17.82 Mpa ± 2.88) = Biodegradable (16.43 ± 5.05) = Oxobio1 (10.43 ± 2.41) (/) Compostable

DEGRADATION OF CARRIER BAGS
94
Table 5.6. The percentage (%) loss change in tensile stress (MPa) of 5 bag types over 27 months from 4 different environment
types. ⏦ denotes that the samples were too brittle to be tested (after 9 months). ⏦⏦ denotes that samples were no longer visible
and therefore could not be tested.
Subtle changes in chemical composition were indicated by FTIR analysis. Some samples
developed a small poorly defined carbonyl stretch at a wave number of approximately 1715
cm-1; this is indicative of oxidation which is a sign of deterioration and was more evident
for samples exposed in the open-air. However, this varied between materials and
environments, with no clear pattern being evident.
5.4 Discussion
Discarded plastics, including carrier bags, are likely to fragment over time in the
environment leading to formation of microplastics (Andrady, 2011). Therefore, it is
important to understand plastic litter fragmentation processes and mechanisms. However,
the degradability of plastics depends on the polymer composition and the environment in
which the product is exposed (Rujnić-Sokele and Pilipović, 2017).
Here we report the degradation of several plastic carrier bag materials after exposure in the
marine, soil, open-air and control environment over a period of 3 years. All bags were
obtained from mainstream retail shops and four of the materials were promoted as having
some level of enhanced degradability or composability presumably in relation to
conventional polyethylene. Apart from the compostable bag material deployed in the
marine environment, fragments or whole samples of each bag material type were present in
% Change in Tensile Stress (MPa)
Bag Type Open-
Air Soil Marine Control
Compostable ⏦
68.86 ⏦⏦ 11.48
Biodegradable ⏦
25.03 23.10 18.26
Oxobio1 ⏦ 75.46 59.85 29.09
Oxobio2 ⏦ 57.19 16.52 19.07
Conventional ⏦ 33.60 13.53 16.78

CHAPTER 5
95
all environments after 27 months and some of the whole bag samples were still functional
as plastic bags after 3 years in the natural environment.
More subtle, but statistically testable and significant, changes in tensile strength were
apparent overtime, but the extent of these changes varied among materials and
environments. The rates of degradation of plastics in different environments will strongly
depend on the local conditions to which they are exposed (Andrady, 2015). Physical and
chemical changes in polymers can be caused by environmental factors including light
(photo-oxidation), heat (photo-thermal oxidation), mechanical abrasion, moisture, chemical
conditions or biological activity (fungi, bacteria, yeasts, algae, and their enzymes) (Charles
and Carraher, 2013; Hodgson et al., 2018; Yousif and Haddad, 2013). For example, for the
compostable bag samples in the open-air environment, solid deposits that looked like
filamentous bacteria were visible on the surface of the material (Fig. 5.2 (2b)).
The tensile strength of bags exposed to sunlight outdoors (labelled as open-air) decreased
faster than in the other environments. Between 9 -18 months all of the samples exposed in
the open air had fragmented and could no longer hold their original shape because they
were too brittle. The faster rate of fragmentation in air may be due to greater levels of
ultraviolet (UV) radiation and oxygen, in combination with higher temperatures than in the
other environments (Andrady, 2011; Andrady et al., 1993). Ultraviolet (UV) radiation can
induce oxidation, which makes plastics brittle and easy to break up due to their decreasing
elasticity. This exposure may cause degradation by breaking the polymer chains, producing
radicals and reducing the molecular weight, causing deterioration of mechanical properties.
This can happen in an unpredictable time frame (Yousif and Haddad, 2013). The amount
of exposure to UV would be decreased if plastics are buried in soil, landfill, or if they are
submerged in the marine environment and this may explain the slower rates of
deterioration observed in these conditions during our study.
Samples buried in soil were found to lose tensile stress significantly faster than samples in
the control environment possibly because of increased moisture content in the soil.
Understanding the degradation of different plastic types in terrestrial environments is
important as substantial quantities of plastic will end up in landfills (Song et al., 2009).
Further, in the absence of a specific waste management pathway, for example to a
commercial composter, all of these materials will, unless littered be sent as residual waste to
landfill or incineration. When plastic accumulates within the soil, it becomes part of a

DEGRADATION OF CARRIER BAGS
96
complex mixture of organic matter and mineral substituents. It has been suggested that
within this environment microplastics could negatively impact organisms including
earthworms (Cao et al., 2017; Huerta Lwanga et al., 2016).
Polyethylene samples in soils have been predicted to take more than 300 years to entirely
degrade (Yoshito et al., 1998). However, research by Accinelli et al., (2012) showed that
deterioration of bioplastic carrier bags proceeded relatively rapidly in soil incubated under
constant moisture and air temperature with a 76% reduction in tensile strength after 3
months.
Our research showed that all carrier bag materials tested appeared intact after they were
buried in soil conditions after 27 months. However, more subtle changes were detectable
with a 25 – 69% reduction in tensile strength between the different bag types. These results
are perhaps more realistic than the previous studies due to being exposed for a longer time
period and being exposed to naturally fluctuating soil moisture or air temperature (O’Brine
and Thompson, 2010).
Samples exposed in soil and open-air were, overall, found to lose tensile stress significantly
quicker than in the marine environment. However, there were no significant differences
between the marine environment and control samples (Fig. 5.4), suggesting that
degradation in the marine environment was slow. Reduced degradation in seawater has
been observed previously. Rutkowska et al., (2002) exposed polyethylene (PE) for
20 months in 2 m water depth in the Baltic sea and reported that there was no
biodegradation. Pegram and Andrady (1989) studied the weathering of several plastics
typically found in beach debris using floating marine exposure tests over a 6-month period.
They measured the rate of deterioration from the changes in tensile elongation at break
(and, in some instances, by the force to rupture) and found it to be much slower (2%) for
samples exposed in the sea compared to samples exposed in open-air (95%). In the current
experiment, after 9 months, conventional polyethylene was found to lose 31% in tensile
strength in open-air, but only 2% in the marine environment.
In the marine environment, colonisation by micro- and macro-marine organisms (a process
described as fouling), may affect plastic in a variety of ways (Lobelle and Cunliffe, 2011).
Firstly, the biofilm may ‘shield’ the plastic from UV light (O’Brine and Thompson, 2010)
thus reducing the rate of photo-degradation. Fouling can also make plastics negatively
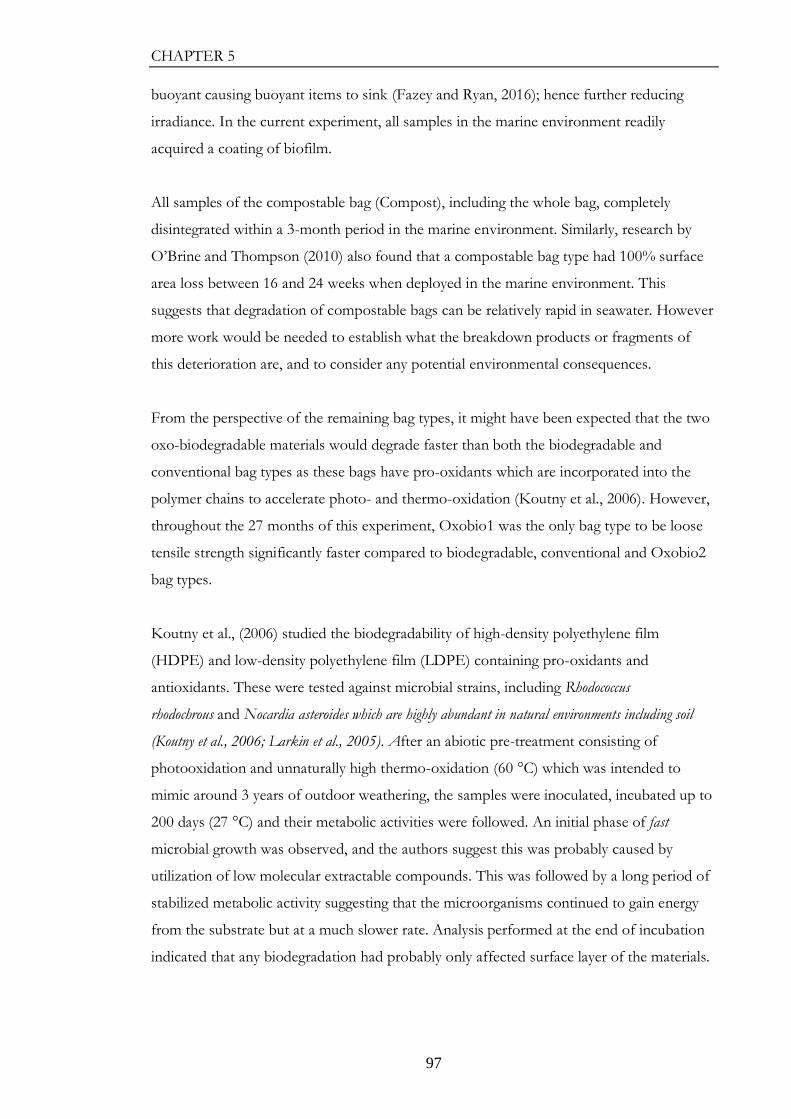
CHAPTER 5
97
buoyant causing buoyant items to sink (Fazey and Ryan, 2016); hence further reducing
irradiance. In the current experiment, all samples in the marine environment readily
acquired a coating of biofilm.
All samples of the compostable bag (Compost), including the whole bag, completely
disintegrated within a 3-month period in the marine environment. Similarly, research by
O’Brine and Thompson (2010) also found that a compostable bag type had 100% surface
area loss between 16 and 24 weeks when deployed in the marine environment. This
suggests that degradation of compostable bags can be relatively rapid in seawater. However
more work would be needed to establish what the breakdown products or fragments of
this deterioration are, and to consider any potential environmental consequences.
From the perspective of the remaining bag types, it might have been expected that the two
oxo-biodegradable materials would degrade faster than both the biodegradable and
conventional bag types as these bags have pro-oxidants which are incorporated into the
polymer chains to accelerate photo- and thermo-oxidation (Koutny et al., 2006). However,
throughout the 27 months of this experiment, Oxobio1 was the only bag type to be loose
tensile strength significantly faster compared to biodegradable, conventional and Oxobio2
bag types.
Koutny et al., (2006) studied the biodegradability of high-density polyethylene film
(HDPE) and low-density polyethylene film (LDPE) containing pro-oxidants and
antioxidants. These were tested against microbial strains, including Rhodococcus
rhodochrous and Nocardia asteroides which are highly abundant in natural environments including soil
(Koutny et al., 2006; Larkin et al., 2005). After an abiotic pre-treatment consisting of
photooxidation and unnaturally high thermo-oxidation (60 °C) which was intended to
mimic around 3 years of outdoor weathering, the samples were inoculated, incubated up to
200 days (27 °C) and their metabolic activities were followed. An initial phase of fast
microbial growth was observed, and the authors suggest this was probably caused by
utilization of low molecular extractable compounds. This was followed by a long period of
stabilized metabolic activity suggesting that the microorganisms continued to gain energy
from the substrate but at a much slower rate. Analysis performed at the end of incubation
indicated that any biodegradation had probably only affected surface layer of the materials.

DEGRADATION OF CARRIER BAGS
98
Over a 27-month period in the current experiment, little change in the chemical
structure of any of the samples was revealed. This outcome is similar to that obtained by
Ioakeimidis et al., (2016) who found that according to ATR-FTIR analysis, polyethylene
terephthalate (PET) bottles remained robust for at least fifteen years in the marine
environment.
The current study showed that, oxo-biodegradable, degradable and conventional carrier bag
materials did not degrade quickly in any of the natural environments examined and in some
cases, formulations merely disintegrated into small pieces (such as those in the open-air
environment). There are considerable concerns about the accumulation of microplastics in
the environment and it remains to be established whether fragmentation into microplastics
presents greater environmental risks than the original intact items of litter. From the
perspective of cleansing, fragments are certainly considerably harder, if not infeasible, to
remove from the environment compared to intact items.
It is of importance to understand the actual environmental degradability performance of
materials which are claimed to have enhanced degradation properties as these could make
consumers more relaxed about discarding, or even littering them, rather than reusing and
recycling. Due to the growing interest in products which indicate enhanced environmental
outcomes, we should be careful that such products do not inadvertently encourage littering
or compromise alternative approaches to waste reduction such as recycling.
Designing products specifically to degrade in the environment is very challenging because
of the natural variability between environment types, as illustrated by the present study. In
addition, formulations that are designed to be less durable may compromise recyclability
since they decrease the durability of the recyclate. It is also important to set the benefits of
the various formulations into a wider context since reducing the diversity of polymers that
are widely used is likely to facilitate greater recycling. To gain the maximum benefit from
materials with enhanced rates of degradability, it is essential to have clear definitions and
product labelling to indicate appropriate usage and disposal (Thompson et al., 2009a).
Clearly there may be drivers for the design of products with modified degradability other
than deterioration in the natural environment, but in order for any these potential benefits
to be realised it is essential that such products have a high probability of actually reaching
the appropriate waste stream. This will require availability of a dedicated waste stream, the

CHAPTER 5
99
appropriate infrastructure such as an industrial composting facility and sufficient
understanding amongst consumers to correctly separate their waste accordingly. Some
nations actively promote the use of carrier bags with biodegradable, degradable or
compostable formulations, for example using fiscal measures or other legislation. This
includes some nations with relatively poor waste management infrastructure where the
likelihood of these products reaching an appropriate waste stream seems low. Given the
findings of this study, the benefits of such policy measures are unclear.
5.5 Conclusion
In conclusion, the current experiment has shown that biodegradable, oxo-biodegradable
and conventional plastic formulations persist and remain functional in the soil and the
marine environment for over 3 years. The compostable bag was the only material that
completely disappeared from the experimental test rig within the marine environment and
did this within a 3-month period. Hence the current study indicated that over a 3-year
period, none of the materials examined could be relied upon to degrade (e.g. reduced
effects on aesthetics or biota) in all three environments. Moreover, it was not clear that the
materials which claimed to have enhanced degradation consistently degraded faster than
conventional polyethylene. Deterioration was influenced by the receiving environment, but
this was not consistent among material types. Hence, we suggest that statements about the
degradation of products should be made in conjunction with statements on the receiving
environment (air, soil, water) and timescale to which the claims relate. Since degradable and
compostable materials are not compatible with available recycling, it is also important that
the users are informed of the appropriate disposal route which in most circumstances will
be disposal to the residual waste stream. It is only by providing accurate, unambiguous and
complete guidance to the user regarding disposal that the potential benefits of novel
materials can be realised without the negative consequences that could result in
inappropriate disposal as well as unintended environmental consequences.

DEGRADATION OF CARRIER BAGS
100

CHAPTER 6
101
Chapter 6
General Discussion; Solutions and Future
work
Napper, I.E., Pahl, S., Thompson, R.C., 2018. Marine Litter: are there
solutions to this global environmental problem? Plastic Legacies (in press).

SOLUTIONS & FUTURE WORK
102
Abstract
Marine litter is a growing environmental problem which can pose threats to the
environment, the economy and human wellbeing on a global scale. Over 300 million tons
of plastic is produced annually and around 75% of all marine litter is plastic. Plastic litter is
widespread in aquatic ecosystems and comes from a variety of sources. Therefore, there are
abundant solutions to deter and reduce it from entering different environments. The
improvement of waste management frameworks internationally is a critical element in
preventing loss into the environment. Education is also crucial for promoting change in
reducing waste, limiting indiscriminate disposal and increasing awareness of marine litter.
This is particularly effective with citizen focused activities such as beach cleaning. Industry
has a key role in helping reduce the potential for end of life plastic to become waste and
litter, where appropriate decisions should be meet at the design stage of a product
considering the circular economy. Solutions linking to management strategies and policies
are also already in place to reduce marine litter. However, further measures and actions are
required globally. Additionally, the thesis’ contribution to both the issues and solutions to
marine debris are discussed, and the limitations and future research directions analysed.

CHAPTER 6
103
6.0 General Discussion; Solutions and Future work
6.1 Introduction
Modern lifestyles generate considerable quantities of waste on a daily basis. Marine litter
(also called marine debris) is solid waste that has been discharged into the marine
environment resulting from activities on land or at sea. Plastics represent a substantial
fraction of the municipal waste stream as well as marine litter. As a consequence of the
durability of plastics, they also have considerable persistence within the environment and
landfill. This is a growing issue; just a few decades ago much of our waste was composed of
organic, degradable materials yet in the last seven years we have produced more plastic
items than in the entire century that preceded (PlasticsEurope, 2016).
There is increasing awareness around the accumulation of litter in marine, freshwater and
terrestrial environments, which results from a variety of different sources (Eerkes-Medrano
et al., 2015). The importance of various sources varies considerably geographically, but on a
global scale it is widely recognised that most litter in the marine environment comes from
land-based actions such as general littering, dumping of waste and loss during waste
collection as well as from inappropriately managed landfill sites. Litter from shipping and
other maritime activities contributes a much smaller proportion (Jambeck et al., 2015;
Mehlhart and Blepp, 2012).
It has been suggested that the accumulation of marine litter and its fragmentation has led to
one of the most ubiquitous and long-lasting recent changes to the surface of our planet
(Barnes et al., 2009). This debris is widely reported in the environment where it has
accumulated at the sea surface (Law et al., 2010), on shorelines of even the most remote
islands (Barnes, 2005), in the deep sea (Bergmann and Klages, 2012; Woodall et al., 2014)
and in arctic sea ice (Obbard et al., 2014).
Globally around 75% of all marine litter is plastic, with other materials such as glass, metal
and paper contributing in much smaller relative proportions. Even though the large
majority of marine litter is plastic, the timescales for degradation of plastic items is not
known with certainty and will depend on the chemical nature of the material, the
characteristics of the environment in which they persist and the manner in which

SOLUTIONS & FUTURE WORK
104
degradation is measured (Andrady and Neal, 2009). However, it is clear that from the
substantial quantities of marine litter that are entering aquatic habitats daily, this litter
presents a range of negative economic and environmental consequences (Jambeck et al.,
2015; Werner et al., 2016).
Its accumulation has been identified as a major global conservation issue and a key priority
for research (Sutherland et al., 2010). It has also been identified as a major issue by the
United Nations Environment Assembly and in the G7 Leader´s declaration 2015
(GESAMP, 2016; UNEP, 2017; Werner et al., 2016). There is broad recognition that
marine litter presents a substantial problem therefore the key action must be to reduce the
quantity entering the oceans from the land. In addition, we need to further define the scale
of the problem in terms of quantities of litter and the types of impact, but in our view,
there is sufficient consensus that there is already enough evidence for us to take action to
stem the flow of plastics to the environment. This chapter considers the problem and some
of the solutions that are currently being implemented or considered.
6.2 Waste Management The accumulation of plastic litter in the oceans is actually a symptom of a wider, more
systemic problem of the linear use of plastic materials and the rapid accumulation of waste.
Litter can be defined as something of little or no value and hence the problem may be
exacerbated because plastics are inexpensive, which facilitates short-lived applications. The
vast variety of different plastic types presents a complication for the viability of recycling
and the quantity and diversity of single-use products is putting increasing pressure on waste
management infrastructures. Studies have shown that unless waste management improves
profoundly in the coming years, by 2025 the amount of plastic waste entering the ocean
from land will be three times greater than it was a decade previously (Jambeck et al., 2015).
Consequently, effective waste management and recycling is a critical element in preventing
loss into the environment.
Waste management frameworks are typically designed to help minimize loss to the
environment, but management practices can differ considerably between nations.
Incorrectly managed landfills or waste management systems may cause waste to escape into
the environment. In industrialized countries, waste that is deposited in landfills is usually
covered regularly with soil or a synthetic material, and the landfill is cordoned by a fence to
prevent any debris accidentally leaving. However, in developing regions this is often not the
case (Barnes et al., 2009; Jambeck et al., 2015). There are also circumstances in which waste

CHAPTER 6
105
management will not suffice in stopping plastic leaking into the ocean. For example, in the
immediate aftermath of a tropical storm, resource management is understandably focused
on human health, toxic spills and air quality as opposed to waste management (Institute of
Medicine, 2007).
There are solid waste management strategies that are used as alternatives of landfill, for
example, recycling (Singh et al., 2017), reuse or upcycling (recycling to improve a materials
value) (Braungart, 2013). However, the applicability of different approaches depends on the
quality of the waste, and a common issue is that the end of life disposal pathway has not
been appropriately considered at the design stage. If the quality is insufficient, energy
recovery via incineration is also an option. Even in developed countries with robust waste
management infrastructure, there are obstacles to recycling, including the lack of availability
of collection points, contamination of recycling feedstock, and the limited marketability of
some recycled material (Andrady, 2005; Law, 2017). Residues from plastic recycling can
also unintentionally escape into the environment (Moore, 2008).
Focusing on the 35 top-ranked countries for mass of mismanaged plastic waste, Jambeck et
al. (2015) suggest that to achieve a 75% reduction in the mass of this waste, waste
management would have to be improved by 85%. This strategy would require time and
substantial infrastructure investment primarily in low- and middle-income countries (Löhr
et al., 2017). Within these countries, the main focus is now on improving solid waste
collection and management, and some outstanding efforts are being made. Indonesia, for
example, set targets at the 2017 World Ocean Summit to reduce plastic waste in 25 coastal
cities and reduce marine litter by 70% by 2025 (UN Environment, 2017).
6.3 Education and Behaviour Change
Education is crucial for promoting change in reducing waste, limiting indiscriminate
disposal and increasing awareness of marine litter, especially if they include behaviour
change principles and go beyond merely teaching facts. Programs to help encourage this
are being considered and could be very successful in reducing litter and waste. For
example, a study by Hartley et al. (2015) found that school children in the UK significantly
improved their understanding of the causes and negative impacts of marine litter, as well as
their self-reported behaviour, after an education intervention related to plastic marine
debris. Education and behavioural change of children is crucial as they have an important
influence on their peers, parents and community (Hartley et al., 2015). Hartley et al., (2018)

SOLUTIONS & FUTURE WORK
106
demonstrated similar results following a European video contest for schools and training
specifically tailored to educators. Therefore, making resources available to incorporate
marine litter awareness into the school curriculum could prove to be a very successful tool
for collective understanding and spreading knowledge of the issues.
Citizen focused activities such as beach cleaning are also well recognized for their
educational value as well as in terms of the litter removed (Nelms et al., 2016) and may
even have benefits for human wellbeing (Wyles et al., 2016). These can be combined with
monitoring exercises and the involvement of local communities. Annual clean-up
operations are now organized internationally (Barnes et al., 2009) and are often run by
voluntary organizations. Volunteer involvement in two of the largest clean up schemes in
the UK (Marine Conservation Society Beach Watch and Keep Scotland Beautiful National
Spring Clean) has been estimated to provide a value of approximately £118,500 annually in
term of cleaning, which suggests that the total cost of voluntary action to remove marine
litter is considerable (Mouat et al., 2010).
Additionally, we need to consider the role of society and the processes of social perception
and influence amongst a range of actors (Hartley et al., 2018b). This is critical because
unless the efficacy of solutions is properly evidenced and understood there is a significant
risk that interventions taken in haste will not be socially acceptable and/or may lead to
unintended negative consequences.
In simple terms, it is important to raise awareness about the need to dispose of end of life
items properly and not to litter, in addition to raising awareness about often unnecessary
plastics use – such as single use carrier bags, cutlery, plates, drinking straws. However,
educating the public about the damage alone is unlikely to achieve the substantial change
required; we need to harness powerful motivators for managing waste differently, such as
the great affinity many children (and adults) feel with the ocean (Pahl et al., 2017).
Moreover, systemic change is necessary beyond raising public awareness to reduce the
substantial accumulation of end of life plastic waste. This systemic change will require
transition within the industry, right from the product design stage in order to ensure
maximum value can be recovered at end of life. In the absence of such changes, educating
the public alone is to some extent merely educating about a system that is currently broken.

CHAPTER 6
107
6.4 Industry and the Circular Economy
Industry has a key role in helping reduce the potential for end of life plastic to become
waste and litter. Current use of plastic materials is predominantly linear, and this is leading
to a rapid accumulation of persistent waste. Long-term sustainable solutions lie in moving
from a linear economy towards a more circular economy (Ellen MacArthur Foundation,
2016; European Commission, 2012). This approach involves utilising more sustainable
production and consumption patterns, and the circular use of materials that will ultimately
lead to waste reduction, for example, designing products for reuse/recycling and also
avoiding unnecessary plastics use. Most plastics are inherently recyclable, yet many single-
use items are not designed to be widely compatible with recycling. A key challenge
therefore is to ensure end-of-life disposal via recycling is appropriately considered at the
design stage. For these interventions to be successful, a tax may be required on non-
recyclable products or an incentive may motivate the use of recycled content in new
products so as to encourage reuse and or design for recyclability.
In addition, we need greater awareness about the applicability of alternative approaches,
which from a narrow perspective, may appear to present environmentally friendly
alternatives. These need to be considered in terms of the overall environmental footprint
and how they interact with existing collection schemes to ensure there are not unintended
negative consequences; for example, plastic products that are designed to have greater
degradability or are made from renewable rather than fossil carbon sources.
Materials with enhanced degradability may reduce the amount of highly visible macroplastic
waste. However, it is challenging to deliver products which are durable while in service, yet
can degrade in a meaningful timescale if they become litter in the environment. Some
formulations merely fragment compromising the potential for product re-use and
accelerating the production of microplastic fragments (Thompson et al., 2009). Even when
disposed properly, most degradable formulations are not compatible with recycling and can
only be disposed of as residual waste to landfill or incineration. These plastics do have a
role but may only present solutions in specific settings where the associated waste
collection is specifically managed, provides conditions suitable for degradation and
products are labelled accordingly to facilitate appropriate disposal. Similarly, altering the
carbon source for plastic by utilizing plant based carbon, rather than fossil carbon from oil
and gas, is to some extent a distraction. While this utilizes a renewable and hence a more

SOLUTIONS & FUTURE WORK
108
sustainable carbon source, it will not, per se, reduce the generation of waste nor the
accumulation of litter and may conflict with other uses of the resource.
In summary, industry has a key role in helping maximise the benefits that plastics products
can bring to society, while at the same time helping to minimise emissions of plastic during
life in service and at end of life. This requires greater recognition for unintended
consequences, via extended producer responsibility. Had this approach been in place when
the patent on use of microbeads in cosmetic products was first filed some 50 years ago,
much unnecessary contamination and the eventual need for costly legislative measures
could have been avoided. Similarly, it is now clear that some types of garment construction
release fibres more quickly than others (Napper and Thompson, 2016). This is not in the
interest of the consumers, because it means clothing wears out more quickly and it results
in more rapid release of fibres to the environment. The key step is to consider this at the
design stage to minimise the avoidable emission for synthetic textile fibres. In addition,
development of washing machine filters to capture any released synthetic fibres in the
washing cycle may be advantageous. The introduction of appropriate labelling on products
to indicate the environmental footprint in terms of recycled content, material use and
recyclability could be instrumental in guiding product choice along the supply chain. Such
information is just as important to major retailers as it is to the consumer since it paves the
way to helping ensure sustainability and ethical choices have been made upstream - taking
the burden off of the consumer.
6.5 Policy Measures
The United Nations Development Goals request nations to “prevent and significantly
reduce marine pollution” by 2025 (United Nations General Assembly, 2015). This may be
facilitated by policy measures to help reduce unnecessary plastics usage. However, there are
numerous applications where plastic is clearly the best material for a particular task and
here policy measures my help nudge behaviours toward more circular material use, for
example deposit return schemes. Ultimately these measures need to help us move to more
resource efficient circular material use (Lieder and Rashid, 2016). The European Union has
set this in motion in their “Action plan for the Circular Economy” implementing a waste
hierarchy in which prevention, reuse, recycling and energy recovery are favoured over
landfill in this respective order (European Commission, 2015).

CHAPTER 6
109
Solutions linking to management strategies and policies are also already in place to reduce
marine litter (GESAMP, 2015). This can include the use of targets, taxes, education and
bans. Banning microbeads in cosmetics is an example of such legislation. However, based
on the levels of concern and the scale of the marine litter problem in general it would
appear that the current measures used are insufficient. In some cases, there are difficulties
associated with enforcement; for example, the regulation of dumping at sea (MARPOL) is
extremely difficult to monitor.
Taxes introduced on plastic items have already shown to be instrumental in changing
consumer behaviour towards plastic. A fifteen euro cent tax on plastic bags in Ireland led
to a 90% reduction of plastic bag usage in the early 2000s (Convery et al., 2007). The tax
has successfully removed the widespread use of plastic bags throughout Ireland and has led
to similar taxes globally. In San Francisco, a ban on conventional plastic bags has been
introduced forcing the use of alternative bags; for example cotton tote bags (Romer, 2010).
Unfortunately, these taxes do not always work effectively. South Africa has struggled to
achieve similar reduction rates in plastic bag usage through taxes (Dikgang et al., 2012).
Plastic debris does not recognise international boundaries and enforcement of regulations
needs to be applied at an international scale. Global commitment and goals provide a good
basis for this, but measures and the actions then need to be translated to regional and
national levels. There are substantive regional differences in the causes of plastic pollution,
both on land and at sea, and solutions will therefore only be effective if they also take into
consideration local conditions; for example in terms of waste management infrastructure
(Jambeck et al., 2015; Van Franeker and Law, 2015). Hence, design and implementation of
effective, efficient and legitimate actions needs to be based on a thorough understanding of
the issue as well as the local context.
6.6 Future work It is important to recognise that the accumulation of plastics in the ocean is largely
avoidable. By comparison with many other current environmental challenges, the benefits
resulting from the use of plastics are not directly linked to the emission of plastic debris to
the environment or to degradation of the environment. Consequently, in theory at least, it
is possible for society to retain the benefits of plastic products and at the same time reduce
the quantity of plastic litter entering the environment (Thompson, 2015). However, to
further quantify and understand the specific impact different sources of plastic debris can

SOLUTIONS & FUTURE WORK
110
have within the environment, each source needs to be analysed. Emphasis should be on
further understanding the routes different sources have into various environments. This
will then provide guidance to different entities (such as industry or government) to make
decision towards sustainable management and reduction. Additionally, the wider
implications of its accumulation should continue to be analysed, particularly in terms of
human health.
6.7 Conclusion
While the suite of potential solutions is well recognised, there is no one size fits all solution.
In the current thirst for action, a major challenge is matching the most appropriate
solutions to particular aspects of the problem. To address this type of challenge we think
an inter-disciplinary, inter-sector approach will be necessary to reconfigure how modern
societies engage with plastics. Profiting from the current groundswell of public opinion,
transformative change could be achieved by harnessing the potential of the social and
behavioural sciences to understand and influence the decisions and behaviour underlying
the plastics challenge. In addition, arts and humanities can be helping to inspire creative
change yet be firmly integrated with the natural sciences’ evidence base.
Beyond integrating different academic perspectives, such an effort should work with
stakeholders, practitioners, policy makers and industry. This approach would be able to
capture how plastics are currently viewed and managed in society, truly representing the
user perspective. It would also identify and respond to both intrinsic and extrinsic
motivations plus constraints along the supply chain. More importantly, the approach can
demonstrate how the current situation may change by facilitating evidence-based dialogue
with design and waste management, economic and legal studies, arts and other creative
disciplines. Looking at the system in such an integrated way has the potential to trigger an
irreversible course towards more sustainable design, use and disposal of plastics and could
be adapted to other societal challenges.
This thesis addresses different sources to marine litter and shows that they are a symptom
of a more systemic issue originating on land that relates to the design, the use and the
disposal of waste (particularly single-use plastic items). Solutions to the marine litter
problem require coordinated action amongst industry, policy and the general public, on a
local to global level. This will involve the interaction of consumers, producers, policy
makers, managers, local residents, tourists, industries, and many other factors. Unity,

CHAPTER 6
111
collaboration and ownership of solutions between these groups will provide the greatest
potential for success. Currently the scope, timeframe and dynamics of all these initiatives
are distinctly different and orchestration at all levels in close collaboration with each other
is lacking.

SOLUTIONS & FUTURE WORK
112

CHAPTER 7
113
7.0 References
Albertsson, A.-C., Karlsson, S., 1988. The three stages in degradation of polymers—
polyethylene as a model substance. J. Appl. Polym. Sci. 35, 1289–1302.
doi:10.1002/app.1988.070350515
Am. Chem. Counc., 2015. Resin Review. Am. Chem. Counc., Washington, USA.
Anastasopoulou, A., Mytilineou, C., Smith, C.J., Papadopoulou, K.N., 2013. Plastic debris
ingested by deep-water fish of the Ionian Sea (Eastern Mediterranean). Deep. Res.
Part I Oceanogr. Res. Pap. 74, 11–13. doi:10.1016/j.dsr.2012.12.008
Andrady, A.., 2015. Persistence of plastic litter in the oceans, in: Marine Anthropogenic
Litter. pp. 29–56. doi:10.1007/978-3-319-16510-3_3
Andrady, A., 2011. Microplastics in the marine environment. Mar. Pollut. Bull. 62, 1596–
1605. doi:10.1016/j.marpolbul.2011.05.030
Andrady, A.L., 2016. Environmental Sustainability of Plastics. John Wiley, Chichester, UK.
Andrady, A.L., 2005. Plastics in marine environment; A technical perspective, in:
Proceedings of the Plastic Debris Rivers to Sea Conference. Algalita Marine Research
Foundation, California, USA.
Andrady, A.L., Neal, M.A., 2009. Applications and societal benefits of plastics. Philos.
Trans. R. Soc. Lond. B. Biol. Sci. 364, 1977–1984. doi:10.1098/rstb.2008.0304
Andrady, A.L., Pegram, J.E., Song, Y., 1993. Studies on enhanced degradable plastics. II.
Weathering of enhanced photodegradable polyethylenes under marine and freshwater
floating exposure. J. Environ. Polym. Degrad. 1, 117–126. doi:10.1007/BF01418205
Arthur, C., Baker, J., Bamford, H., 2009. Proceedings of the international research
workshop on the occurrence, effects and fate of microplastic marine debris. Sept 9–
11, 2008. NOAA Tech. Memo. NOS-OR&R30.
Ashley, R., Blackwood, D., Souter, N., Hendry, S., Moir, J., Dunkerley, J., Davies, J., Butler,
D., Cook, A., Conlin, J., Squibbs, M., Britton, A., Goldie, P., 2005. Sustainable
Disposal of Domestic Sanitary Waste. J. Environ. Eng. 131, 206–215.
doi:10.1061/(ASCE)0733-9372(2005)131:2(206)

REFERENCES
114
Association for Organics Recycling, 2011. Concise guide to Compostable Products and
Packaging [WWW Document]. UK Local Auth. Guid. URLhttp://www.organics-
recycling.org.uk/uploads/article1983/EN 13432 Compostable Products and
Packaging.pdf (accessed 4.29.18).
Auta, H.S., Emenike, C.., Fauziah, S.., 2017. Distribution and importance of microplastics
in the marine environment: A review of the sources, fate, effects, and potential
solutions. Environ. Int. 102, 165–176. doi:10.1016/j.envint.2017.02.013
Avery-Gomm, S., O’Hara, P.D., Kleine, L., Bowes, V., Wilson, L.K., Barry, K.L., 2012.
Northern fulmars as biological monitors of trends of plastic pollution in the eastern
North Pacific. Mar. Pollut. Bull. 64, 1776–1781. doi:10.1016/j.marpolbul.2012.04.017
Avio, C.G., Gorbi, S., Milan, M., Benedetti, M., Fattorini, D., D’Errico, G., Pauletto, M.,
Bargelloni, L., Regoli, F., 2015. Pollutants bioavailability and toxicological risk from
microplastics to marine mussels. Environ. Pollut. 198, 211–222.
doi:10.1016/j.envpol.2014.12.021
Avio, C.G., Gorbi, S., Regoli, F., 2017. Plastics and microplastics in the oceans: From
emerging pollutants to emerged threat. Mar. Environ. Res. 128, 2–11.
doi:10.1016/j.marenvres.2016.05.012
Axelsson, C., van Sebille, E., 2017. Prevention through policy: Urban macroplastic leakages
to the marine environment during extreme rainfall events. Mar. Pollut. Bull. 124, 211–
227. doi:10.1016/J.MARPOLBUL.2017.07.024
Bakir, A., O’Connor, I.A., Rowland, S.J., Hendriks, A.J., Thompson, R.C., 2016. Relative
importance of microplastics as a pathway for the transfer of hydrophobic organic
chemicals to marine life. Environ. Pollut. 219, 56–65.
doi:10.1016/j.envpol.2016.09.046
Bakir, A., Rowland, S.J., Thompson, R.C., 2014a. Enhanced desorption of persistent
organic pollutants from microplastics under simulated physiological conditions.
Environ. Pollut. 185, 16–23. doi:10.1016/j.envpol.2013.10.007
Bakir, A., Rowland, S.J., Thompson, R.C., 2014b. Transport of persistent organic
pollutants by microplastics in estuarine conditions. Estuar. Coast. Shelf Sci. 140, 14–
21. doi:10.1016/j.ecss.2014.01.004

CHAPTER 7
115
Bakir, A., Rowland, S.J., Thompson, R.C., 2014c. Enhanced desorption of persistent
organic pollutants from microplastics under simulated physiological conditions.
Environ. Pollut. 185, 16–23. doi:10.1016/j.envpol.2013.10.007
Bakir, A., Rowland, S.J., Thompson, R.C., 2012. Competitive sorption of persistent organic
pollutants onto microplastics in the marine environment. Mar. Pollut. Bull. 64, 2782–
2789. doi:10.1016/j.marpolbul.2012.09.010
Ballance, A., Ryan, P.., Turpie, J., 2000. How much is a clean beach worth? The impact of
litter on beach users in the Cape Peninsula, South Africa. S. Afr. J. Sci. 96, 210–213.
Barnes, D., 2005. Remote Islands Reveal Rapid Rise of Southern Hemisphere Sea Debris.
Sci. World J. 5, 915–921. doi:10.1100/tsw.2005.120
Barnes, D., 2002. Invasions by marine life on plastic debris. Nature 416, 808–809.
doi:10.1038/416808a
Barnes, D., Galgani, F., Thompson, R.C., Barlaz, M., 2009. Accumulation and
fragmentation of plastic debris in global environments. Philos. Trans. R. Soc. B Biol.
Sci. 364, 1985–1998. doi:10.1098/rstb.2008.0205
Barnes, D.K.A., Walters, A., Gonçalves, L., 2010. Macroplastics at sea around Antarctica.
Mar. Environ. Res. 70, 250–252. doi:10.1016/j.marenvres.2010.05.006
Beat the Microbead, 2015. Products that Contain Microplastic (UK) [WWW Document].
Bell, I., 2011. Nonwovens industry, Nonwovens Ind. [Rodman Publications].
Bergmann, M., Klages, M., 2012. Increase of litter at the Arctic deep-sea observatory
HAUSGARTEN. Mar. Pollut. Bull. 64, 2734–2741.
doi:10.1016/j.marpolbul.2012.09.018
Besseling, E., Wegner, A., Foekema, E.M., Van Den Heuvel-Greve, M.J., Koelmans, A.A.,
2013. Effects of microplastic on fitness and PCB bioaccumulation by the lugworm
Arenicola marina (L.). Environ. Sci. Technol. 47, 593–600. doi:10.1021/es302763x
Billingham, N.C., Wiles, D.M., Cermak, B.E., Gho, J.G., Hare, C.W.J., Tung, J.F., 2000.
Controlled-lifetime environmentally degradable plastics based on conventional
polymers. Basel, Switzerland.

REFERENCES
116
Boerger, C.M., Lattin, G.L., Moore, S.L., Moore, C.J., 2010. Plastic ingestion by
planktivorous fishes in the North Pacific Central Gyre. Mar. Pollut. Bull. 60, 2275–
2278. doi:10.1016/j.marpolbul.2010.08.007
Braungart, M., 2013. Upcycle to eliminate waste: the chemist recasts materials in an endless
loo. Nature 494.
Bravo, M., de los Ángeles Gallardo, M., Luna-Jorquera, G., Núñez, P., Vásquez, N., Thiel,
M., 2009. Anthropogenic debris on beaches in the SE Pacific (Chile): Results from a
national survey supported by volunteers. Mar. Pollut. Bull. 58, 1718–1726.
doi:10.1016/j.marpolbul.2009.06.017
Brown, J., Macfadyen, G., 2007. Ghost fishing in European waters: Impacts and
management responses. Mar. Policy 31, 488–504. doi:10.1016/j.marpol.2006.10.007
Browne, M.A., 2015. Sources and Pathways of Microplastics to Habitats, in: Marine
Anthropogenic Litter. Springer International Publishing, Cham, pp. 229–244.
doi:10.1007/978-3-319-16510-3_9
Browne, M.A., Chapman, M.G., Thompson, R.C., Amaral Zettler, L.A., Jambeck, J.,
Mallos, N.J., 2015. Spatial and Temporal Patterns of Stranded Intertidal Marine
Debris: Is There a Picture of Global Change? Environ. Sci. Technol.
doi:10.1021/es5060572
Browne, M.A., Crump, P., Niven, S.J., Teuten, E., Tonkin, A., Galloway, T., Thompson,
R., 2011. Accumulation of microplastic on shorelines woldwide: Sources and sinks.
Environ. Sci. Technol. 45, 9175–9179. doi:10.1021/es201811s
Browne, M.A., Dissanakyake, A., Galloway, T.S., Lowe, D.., Thompson, R.., 2008. Ingested
microscopic plastic translocates to the circulatory system of the mussel, Mytilus edulis
(L). Environ. Sci. Technol. 42, 5026–5031.
Browne, M.A., Galloway, T., Thompson, R., 2007. Microplastic-an emerging contaminant
of potential concern? Integr. Environ. Assess. Manag. 3, 559–561.
doi:10.1002/ieam.5630030412
Browne, M.A., Galloway, T.S., Thompson, R.C., 2010. Spatial patterns of plastic debris
along estuarine shorelines. Environ. Sci. Technol. 44, 3404–3409.
doi:10.1021/es903784e

CHAPTER 7
117
Browne, M.A., Niven, S.J., Galloway, T.S., Rowland, S.J., Thompson, R.C., 2013.
Microplastic moves pollutants and additives to worms, reducing functions linked to
health and biodiversity. Curr. Biol. 23, 2388–2392. doi:10.1016/j.cub.2013.10.012
Bugoni, L., Krause, L., Petry, M. V., 2001. Marine debris and human impacts on sea turtles
in Southern Brazil. Mar. Pollut. Bull. doi:10.1016/S0025-326X(01)00147-3
Cao, D., Wang, X., Luo, X., Liu, G., Zheng, H., 2017. Effects of polystyrene microplastics
on the fitness of earthworms in an agricultural soil, in: IOP Conference Series: Earth
and Environmental Science. doi:10.1088/1755-1315/61/1/012148
Carr, A., 1987. Impact of nondegradable marine debris on the ecology and survival outlook
of sea turtles. Mar. Pollut. Bull. 18, 352–356. doi:10.1016/S0025-326X(87)80025-5
Carr, S.A., Liu, J., Tesoro, A.G., 2016. Transport and fate of microplastic particles in
wastewater treatment plants. Water Res. 91, 174–182.
doi:10.1016/j.watres.2016.01.002
Charles, E., Carraher, J.I., 2013. Introduction to Polymer Chemistry. CRC Press: Taylor &
Francis Group, Florida, United States.
Chiweshe, A., Crews, P., 2000. Influence of household pabric softeners and laundry
enzymes on pilling ratings and breaking strength. Text. Chem. Color. Am. Dye. Rep.
32, 41–47.
Cho, D.O., 2005. Challenges to marine debris management in Korea. Coast. Manag. 33,
389–409. doi:10.1080/08920750500217559
Claessens, M., Meester, S. De, Landuyt, L. Van, Clerck, K. De, Janssen, C.R.C.R., 2011.
Occurrence and distribution of microplastics in marine sediments along the Belgian
coast. Mar. Poll. Bull. 1, 2199–2204. doi:10.1016/j.marpolbul.2011.06.030
Cole, M., Lindeque, P., Fileman, E., Halsband, C., Goodhead, R., Moger, J., Galloway, T.S.,
2013. Microplastic ingestion by zooplankton. Environ. Sci. Technol. 47, 6646–6655.
doi:10.1021/es400663f
Cole, M., Lindeque, P., Halsband, C., Galloway, T.S., 2011. Microplastics as contaminants
in the marine environment: A review, Marine Pollution Bulletin.
doi:10.1016/j.marpolbul.2011.09.025

REFERENCES
118
Comnea-Stancu, I.R., Wieland, K., Ramer, G., Schwaighofer, A., Lendl, B., 2017. On the
Identification of Rayon/Viscose as a Major Fraction of Microplastics in the Marine
Environment: Discrimination between Natural and Manmade Cellulosic Fibers Using
Fourier Transform Infrared Spectroscopy. Appl. Spectrosc. 71, 939–950.
doi:10.1177/0003702816660725
Convery, F., McDonnell, S., Ferreira, S., 2007. The most popular tax in Europe? Lessons
from the Irish plastic bags levy. Environ. Resour. Econ. 38, 1–11.
doi:10.1007/s10640-006-9059-2
Cooke, W.D., 1985. Pilling Attrition and Fatigue. Text. Res. J. 55, 409–414.
doi:10.1177/004051758505500705
Cordeiro, C.A., Costa, T.M., 2010. Evaluation of solid residues removed from a mangrove
swamp in the São Vicente Estuary, SP, Brazil. Mar. Pollut. Bull. 60, 1762–1767.
doi:10.1016/j.marpolbul.2010.06.010
Cózar, A., Echevarría, F., González-Gordillo, J.I., Irigoien, X., Ubeda, B., Hernández-
León, S., Palma, A.T., Navarro, S., García-de-Lomas, J., Ruiz, A., Fernández-de-
Puelles, M.L., Duarte, C.M., Echevarria, F., Gonzalez-Gordillo, J.I., Irigoien, X.,
Ubeda, B., Hernandez-Leon, S., Palma, A.T., Navarro, S., Garcia-de-Lomas, J., Ruiz,
A., Fernandez-de-Puelles, M.L., Duarte, C.M., 2014. Plastic debris in the open ocean.
Proc. Natl. Acad. Sci. U. S. A. 111, 10239–10244. doi:10.1073/pnas.1314705111
Cunningham, D.J., Wilson, S.P., 2003. Marine Debris on Beaches of the Greater Sydney
Region. J. Coast. Res. doi:10.2307/4299182
Das, D., Pourdeyhimi, B., 2014. Composite nonwoven materials : structure, properties and
applications. Elsevier Science.
Davison, P., Asch, R.G., 2011. Plastic ingestion by mesopelagic fishes in the North Pacific
Subtropical Gyre. Mar. Ecol. Prog. Ser. 432, 173–180. doi:10.3354/meps09142
Debrot, A.O., Meesters, H.W.G., Bron, P.S., de León, R., 2013. Marine debris in
mangroves and on the seabed: Largely-neglected litter problems. Mar. Pollut. Bull. 72,
1. doi:10.1016/j.marpolbul.2013.03.023
DEFRA, 2002. Sewage Treatment in the UK; UK Implementation of the EC Urban Waste
Water Treatment Directive. London.

CHAPTER 7
119
Denuncio, P., Bastida, R., Dassis, M., Giardino, G., Gerpe, M., Rodríguez, D., 2011. Plastic
ingestion in Franciscana dolphins, Pontoporia blainvillei (Gervais and d’Orbigny,
1844), from Argentina. Mar. Pollut. Bull. 62, 1836–1841.
doi:10.1016/j.marpolbul.2011.05.003
Derraik, J.G.B., 2002. The pollution of the marine environment by plastic debris: A review.
Mar. Pollut. Bull. 44, 842–852. doi:10.1016/S0025-326X(02)00220-5
Desforges, J.P.W., Galbraith, M., Dangerfield, N., Ross, P.S., 2014. Widespread
distribution of microplastics in subsurface seawater in the NE Pacific Ocean. Mar.
Pollut. Bull. 79, 94–99. doi:10.1016/j.marpolbul.2013.12.035
Dikgang, J., Leiman, A., Visser, M., 2012. Analysis of the plastic-bag levy in South Africa.
Resour. Conserv. Recycl. 66, 59–65. doi:10.1016/j.resconrec.2012.06.009
Donohue, M.J., Boland, R.C., Sramek, C.M., Antonelis, G.A., 2001. Derelict fishing gear in
the Northwestern Hawaiian Islands: Diving surveys and debris removal in 1999
confirm threat to Coral Reef ecosystems. Mar. Pollut. Bull. 42, 1301–1312.
doi:10.1016/S0025-326X(01)00139-4
Doustaneh, A.H., Mahmoudian, S., Mohammadian, M., Jahangir, A., 2013. The effects of
weave structure and yarn fiber specification on pilling of woven fabrics. World Appl.
Sci. J. 1, 503–506.
Driedger, A.G.J.J., Dürr, H.H., Mitchell, K., Van Cappellen, P., 2015. Plastic debris in the
Laurentian Great Lakes: A review, Journal of Great Lakes Research.
doi:10.1016/j.jglr.2014.12.020
Drinkwater, A., Galletti, S., 2008. TEST PROTOCOL TO DETERMINE THE
FLUSHABILITY OF DISPOSABLE PRODUCTS. Wiltshire, UK.
Dris, R., Gasperi, J., Rocher, V., Saad, M., Renault, N., Tassin, B., 2015. Microplastic
contamination in an urban area: A case study in Greater Paris. Environ. Chem. 12,
592–599. doi:10.1071/EN14167
Duis, K., Coors, A., 2016. Microplastics in the aquatic and terrestrial environment: sources
(with a specific focus on personal care products), fate and effects. Environ. Sci. Eur.
28, 2. doi:10.1186/s12302-015-0069-y

REFERENCES
120
Eastman, L., Hidalgo-Ruz, V., Macaya, V., Nuñez, P., Thiel, M., 2014. The potential for
young citizen scientist projects: a case study of Chilean schoolchildren collecting data
on marine litter. Rev. Gestão Costeira Integr. 14, 569–579. doi:10.5894/rgci507
Eerkes-Medrano, D., Thompson, R.C., Aldridge, D.C., 2015. Microplastics in freshwater
systems: A review of the emerging threats, identification of knowledge gaps and
prioritisation of research needs. Water Res. doi:10.1016/j.watres.2015.02.012
Egan, R.R., 1978. Cationic surface active agents as fabric softeners. J. Am. Oil Chem. Soc.
55, 118–121. doi:10.1007/BF02673399
Einsohn, H., 2000. Local to global: New Yorkers need to think before flushing, Scottish
Environmental Protection Agency. SEPA View, Stirling, U.K.
Ellen MacArthur Foundation, 2016. The New Plastics Economy: Rethinking the future of
plastics. Ellen MacArthur Found. doi:10.1103/Physrevb.74.035409
EN 13432:2000, 2000. Packaging. Requir. Packag. Recover. through Compost. Biodegrad.
Test scheme Eval. criteria Final Accept. Packag.
Environmental Enhancements, 2016. About the Lint LUV-R Filter [WWW Document].
URL http://www.environmentalenhancements.com/Lint-LUV-R-about-luv-r.html
Eriksen, M., Lebreton, L.C.M.M., Carson, H.S., Thiel, M., Moore, C.J., Borerro, J.C.,
Galgani, F., Ryan, P.G., Reisser, J., 2014. Plastic Pollution in the World’s Oceans:
More than 5 Trillion Plastic Pieces Weighing over 250,000 Tons Afloat at Sea. PLoS
One 9, e111913. doi:10.1371/journal.pone.0111913
Eriksen, M., Mason, S., Wilson, S., Box, C., Zellers, A., Edwards, W., Farley, H., Amato, S.,
2013. Microplastic pollution in the surface waters of the Laurentian Great Lakes. Mar.
Pollut. Bull. 77, 177–182. doi:10.1016/j.marpolbul.2013.10.007
Essel, R., Engel, L., Carus, M., Ahrens, R.H., 2015. Sources of Microplastics Relevant to
Marine Protection in Germany. Fed. Environ. Agency 48.
European Commission, 2018. REPORT FROM THE COMMISSION TO THE
EUROPEAN PARLIAMENT AND THE COUNCIL: on the impact of the use of
oxo-degradable plastic, including oxo-degradable plastic carrier bags, on the
environment. Brussels.

CHAPTER 7
121
European Commission, 2015. COMMUNICATION FROM THE COMMISSION TO
THE EUROPEAN PARLIAMENT, THE COUNCIL, THE EUROPEAN
ECONOMIC AND SOCIAL COMMITTEE AND THE COMMITTEE OF THE
REGIONS [WWW Document]. COM/2015/0614 Final. URLhttps://eur-
lex.europa.eu/legal-content/EN/TXT/?uri=CELEX%3A52015DC0614
European Commission, 2013. Media release: Commission Proposes to Reduce the Use of
Plastic Bags; 4th November 2013 [WWW Document].
URLhttp://europa.eu/rapid/press-release_IP-13-1017_en.htm (accessed 9.14.17).
European Commission, 2012a. European Commission Manifesto for a resource-efficient
Europe. Brussels.
European Commission, 2012b. Manifesto for a resource-efficient Europe. Gov. Doc. Rec.
Number; 3491 Brussels, 2.
European Parliament and Council of the European Union, 1994. European Parliament and
Council Directive 94/62/EC of 20 December 1994 on packaging and packaging
waste. Off. J. Eur. Communities No L 365/10.
Faure, F., Saini, C., Potter, G., Galgani, F., de Alencastro, L.F., Hagmann, P., 2015. An
evaluation of surface micro- and mesoplastic pollution in pelagic ecosystems of the
Western Mediterranean Sea. Environ. Sci. Pollut. Res. 22. doi:10.1007/s11356-015-
4453-3
Fazey, F.M.C., Ryan, P.G., 2016. Biofouling on buoyant marine plastics: An experimental
study into the effect of size on surface longevity. Environ. Pollut. 210, 354–360.
doi:10.1016/j.envpol.2016.01.026
Fendall, L.S., Sewell, M.A., 2009. Contributing to marine pollution by washing your face:
Microplastics in facial cleansers. Mar. Pollut. Bull. 58, 1225–1228.
doi:10.1016/j.marpolbul.2009.04.025
Ferreira, P., Fonte, E., Soares, M.E., Carvalho, F., Guilhermino, L., 2016. Effects of multi-
stressors on juveniles of the marine fish Pomatoschistus microps: Gold nanoparticles,
microplastics and temperature. Aquat. Toxicol. 170.
doi:10.1016/j.aquatox.2015.11.011
Fischer, V., Elsner, N.O., Brenke, N., Schwabe, E., Brandt, A., 2015. Plastic pollution of
the kuril-kamchatka trench area (NW pacific). Deep. Res. Part II Top. Stud.
Oceanogr. 111, 399–405. doi:10.1016/j.dsr2.2014.08.012

REFERENCES
122
Fowler, C.W., 1987. Marine debris and northern fur seals: A case study. Mar. Pollut. Bull.
18, 326–335. doi:10.1016/S0025-326X(87)80020-6
Free, C.M., Jensen, O.P., Mason, S.A., Eriksen, M., Williamson, N.J., Boldgiv, B., 2014.
High-levels of microplastic pollution in a large, remote, mountain lake. Mar. Pollut.
Bull. 85, 156–163. doi:10.1016/j.marpolbul.2014.06.001
Frey, O., DeVogelaere, A.., 2013. The Containerized Shipping Industry and the
Phenomenon of Containers Lost at Sea. Office of National Marine Sanctuaries, Silver
Spring, Maryland, USA.
FSC, 2017. FREQUENTLY ASKED QUESTIONS [WWW Document]. For. Steward.
Counc. URL http://www.fsc-uk.org/en-uk/about-fsc/what-is-fsc/frequently-asked-
questions (accessed 11.7.17).
Fuller, S., Gautam, A., 2016. A Procedure for Measuring Microplastics using Pressurized
Fluid Extraction. Environ. Sci. Technol. 50, 5774–5780. doi:10.1021/acs.est.6b00816
Galgani, F., Burgeot, T., Bocquéné, G., Vincent, F., Leauté, J.., Labastie, J., 1995.
Distribution and abundance of debris on the continental shelf of the Bay of Biscay
and in Seine Bay. Mar. Pollut. Bull. 30, 58–62. doi:10.1016/0025-326X(94)00101-E
Galgani, F., Fleet, D., Franeker, J. Van, Katsanevakis, S., Maes, T., Mouat, J., Oosterbaan,
L., Poitou, I., Hanke, G., Thompson, R., Amato, E., Birkun, A., Janssen, C., 2010.
International Council for the Exploration of the Sea for Exploitation of the Sea
Conseil International pour l’Exploration de la Mer.
Galgani, F., Hanke, G., Maes, T., 2015. Global Distribution, Composition and Abundance
of Marine Litter, in: Marine Anthropogenic Litter. Springer International Publishing,
Cham, pp. 29–56. doi:10.1007/978-3-319-16510-3_2
Galgani, F., Leaute, J.P., Moguedet, P., Souplet, A., Verin, Y., Carpentier, A., Goraguer, H.,
Latrouite, D., Andral, B., Cadiou, Y., Mahe, J.C., Poulard, J.C., Nerisson, P., 2000.
Litter on the sea floor along European coasts. Mar. Pollut. Bull. 40, 516–527.
doi:10.1016/S0025-326X(99)00234-9
Galgani, F., Souplet, A., Cadiou, Y., 1996. Accumulation of debris on the deep sea floor off
the French Mediterranean coast. Mar. Ecol. Ser. 142, 225–234.
doi:10.3354/meps142225

CHAPTER 7
123
Gall, S.C., Thompson, R.C., 2015. The impact of debris on marine life. Mar. Pollut. Bull.
92, 170–179. doi:10.1016/j.marpolbul.2014.12.041
Gallagher, A., Rees, A., Rowe, R., Stevens, J., Wright, P., 2016. Microplastics in the Solent
estuarine complex, UK: An initial assessment. Mar. Pollut. Bull. 102, 243–249.
doi:10.1016/j.marpolbul.2015.04.002
GESAMP, 2016. Sources, Fate and Effects of Microplastics in the Marine Environment –
Part Two of a Global Assessment.
IMO/FAO/UNESCOIOC/UNIDO/WO/IAEA/UN/UNEP/UNDP Jt. Gr.
Expert. Sci. Asp. Mar. Environ. Prot. (ed. P. J. Kershaw C. M. Rochman) 220.
GESAMP, 2015. Sources, fate and effects of microplastics in the marine environment: a
global assessment GESAMP No. 90, in: Kershaw, P.J. (Ed.), (IMO/FAO/UNESCO-
IOC/UNIDO/WMO/IAEA/UN/UNEP/UNDP Joint Group of Experts on the
Scientific Aspects of Marine Environmental Protection). p. 96.
Gintis, D., Mead, E.J., 1959. The Mechanism of Pilling. Text. Res. J. 29, 578–585.
doi:10.1177/004051755902900709
Goldstein, M.C., Rosenberg, M., Cheng, L., 2012. Increased oceanic microplastic debris
enhances oviposition in an endemic pelagic insect. Biol. Lett. 8, 817–820.
doi:10.1098/rsbl.2012.0298
Good, T.P., June, J.A., Etnier, M.A., Broadhurst, G., 2010. Derelict fishing nets in Puget
Sound and the Northwest Straits: Patterns and threats to marine fauna. Mar. Pollut.
Bull. 60, 39–50. doi:10.1016/j.marpolbul.2009.09.005
Gouin, T., Roche, N., Lohmann, R., Hodges, G., 2011. A thermodynamic approach for
assessing the environmental exposure of chemicals absorbed to microplastic. Environ.
Sci. Technol. 45, 1466–72. doi:10.1021/es1032025
Graham, E.R., Thompson, J.T., 2009. Deposit- and suspension-feeding sea cucumbers
(Echinodermata) ingest plastic fragments. J. Exp. Mar. Bio. Ecol. 368, 22–29.
doi:10.1016/j.jembe.2008.09.007
Green, D.S., Boots, B., Blockley, D.J., Rocha, C., Thompson, R., 2015. Impacts of
discarded plastic bags on marine assemblages and ecosystem functioning. Environ.
Sci. Technol. 49, 5380–5389. doi:10.1021/acs.est.5b00277

REFERENCES
124
Gregory, M.R., 2009. Environmental implications of plastic debris in marine settings;
entanglement, ingestion, smothering, hangers-on, hitch-hiking and alien invasions.
Philos. Trans. R. Soc. B Biol. Sci. 364, 2013–2025. doi:10.1098/rstb.2008.0265
Gregory, M.R., 1996. Plastic scrubbers’ in hand cleansers: A further (and minor) source for
marine pollution identified. Mar. Pollut. Bull. 32, 867–871. doi:10.1016/S0025-
326X(96)00047-1
Gregory, M.R., Andrady, A.L., 2003. Plastics in the marine environment, in: Andrady, A.L.
(Ed.), Plastics and the Environment. John Wiley and Sons, New Jersey, USA.
Habib, D., Locke, D.C., Cannone, L.J., 1998. Synthetic fibers as indicators of municipal
sewage sludge, sludge products, and sewage treatment plant effluents. Water. Air. Soil
Pollut. 103, 1–8. doi:10.1023/A:1004908110793
Hall, K., KIMO (Organization), 2000. Impacts of marine debris and oil : economic and
social costs to coastal communities. Kommunenes Internasjonale Miljøorganisasjon,
Lerwick.
Hanke, G., Piha, H., 2011. Large scale monitoring of surface floating marine litter by high
resolution imagery, in: Presentation and Extended Abstract, Fifth International
Marine Debris Conference, 20–25 March 2011. Honolulu, Hawaii.
Harrison, J.P., Schratzberger, M., Sapp, M., Osborn, A.M., 2014. Rapid bacterial
colonization of low-density polyethylene microplastics in coastal sediment
microcosms. BMC Microbiol. 14, 232. doi:10.1186/s12866-014-0232-4
Hartley, B.L., Pahl, S., Holland, M., Alampei, I., Veiga, J.M., Thompson, R.C., 2018a.
Turning the tide on trash: Empowering European educators and school students to
tackle marine litter. Mar. Policy. doi:10.1016/J.MARPOL.2018.02.002
Hartley, B.L., Pahl, S., Veiga, J., Vlachogianni, T., Vasconcelos, L., Maes, T., Doyle, T.,
d’Arcy Metcalfe, R., Öztürk, A.A., Di Berardo, M., Thompson, R.C., 2018b.
Exploring public views on marine litter in Europe: Perceived causes, consequences
and pathways to change. Mar. Pollut. Bull. 133, 945–955.
doi:10.1016/J.MARPOLBUL.2018.05.061

CHAPTER 7
125
Hartley, B.L., Thompson, R.C., Pahl, S., 2015. Marine litter education boosts children’s
understanding and self-reported actions. Mar. Pollut. Bull. 90, 209–217.
doi:10.1016/j.marpolbul.2014.10.049
Hastings, E., Potts, T., 2013. Marine litter: Progress in developing an integrated policy
approach in Scotland. Mar. Policy 42, 49–55. doi:10.1016/j.marpol.2013.01.024
Hidalgo-Ruz, V., Gutow, L., Thompson, R.C., Thiel, M., 2012. Microplastics in the marine
environment: A review of the methods used for identification and quantification. Sci.
Technol. 46, 3060–75. doi:10.1021/es2031505
Hidalgo-Ruz, V., Thiel, M., 2015. The Contribution of Citizen Scientists to the Monitoring
of Marine Litter, in: Marine Anthropogenic Litter. pp. 429–447. doi:10.1007/978-3-
319-16510-3
Hodgson, D.J., Bréchon, A.L., Thompson, R.C., 2018. Ingestion and fragmentation of
plastic carrier bags by the amphipod Orchestia gammarellus: Effects of plastic type
and fouling load. Mar. Pollut. Bull. 127, 154–159.
doi:10.1016/J.MARPOLBUL.2017.11.057
Hoellein, T., Rojas, M., Pink, A., Gasior, J., Kelly, J., 2014. Anthropogenic litter in urban
freshwater ecosystems: Distribution and microbial interactions. PLoS One 9.
doi:10.1371/journal.pone.0098485
Hongu, T., Takigami, M., Phillips, G.O., 2005. New Millennium Fibers. Elsevier Science.
Hopewell, J., Dvorak, R., Kosior, E., 2009. Plastics recycling: challenges and opportunities.
Philos. Trans. R. Soc. Lond. B. Biol. Sci. 364, 2115–2126. doi:10.1098/rstb.2008.0311
Huerta Lwanga, E., Gertsen, H., Gooren, H., Peters, P., Salánki, T., Van Der Ploeg, M.,
Besseling, E., Koelmans, A.A., Geissen, V., 2016. Microplastics in the Terrestrial
Ecosystem: Implications for Lumbricus terrestris (Oligochaeta, Lumbricidae).
Environ. Sci. Technol. 50, 2685–2691. doi:10.1021/acs.est.5b05478
Hussain, T., Ahmed, S., Qayum, A., 2008. Effect of different softeners and sanforising
treatment on pilling performance of polyester/viscose blended fabrics. Color.
Technol. 124, 375–378. doi:10.1111/j.1478-4408.2008.00166.x

REFERENCES
126
Imhof, H.K., Ivleva, N.P., Schmid, J., Niessner, R., Laforsch, C., 2013. Contamination of
beach sediments of a subalpine lake with microplastic particles. Curr. Biol. 23.
doi:10.1016/j.cub.2013.09.001
INDA and EDANA, 2013. Guidelines for Assessing the Flushability of Disposable
Nonwoven Products; A Process for Assessing the Compatibility of Disposable
Nonwoven Products with Plumbing and Wastewater Infrastructure (Third Edition).
North Carolina, USA.
Institute of Medicine, 2007. Environmental Public Health Impacts of Disasters: Hurricane
Katrina: Workshop Summary. Washington, USA.
Ioakeimidis, C., Fotopoulou, K.N., Karapanagioti, H.K., Geraga, M., Zeri, C.,
Papathanassiou, E., Galgani, F., Papatheodorou, G., 2016. The degradation potential
of PET bottles in the marine environment: An ATR-FTIR based approach. Sci. Rep.
6, 23501. doi:10.1038/srep23501
ISO 9092, 2011. ISO 9092:2011 establishes a definition for the term nonwovens [WWW
Document]. ISO/TC 38 Text.
URL https://www.iso.org/standard/50397.html (accessed 10.26.17).
Ivleva, N.P., Wiesheu, A.C., Niessner, R., 2017. Microplastic in Aquatic Ecosystems.
Angew. Chemie - Int. Ed. doi:10.1002/anie.201606957
Jambeck, J.R., Geyer, R., Wilcox, C., Siegler, T.R., Perryman, M., Andrady, A., Narayan, R.,
Law, K.L., 2015. Plastic waste inputs from land into the ocean. Science (80-. ). 347,
768–771. doi:10.1126/science.1260352
Jang, Y.C., Hong, S., Lee, J., Lee, M.J., Shim, W.J., 2014. Estimation of lost tourism
revenue in Geoje Island from the 2011 marine debris pollution event in South Korea.
Mar. Pollut. Bull. 81, 49–54. doi:10.1016/j.marpolbul.2014.02.021
Kalabek, N.A., Babaarslan, O., Kalebek, N.A., Babaarslan, O., 2016. Fiber Selection for the
Production of Nonwovens. InTech. doi:10.5772/61977
Karadagli, F., Rittmann, B.E., McAvoy, D.C., Richardson, J.E., 2012. Effect of turbulence
on the disintegration rate of flushable consumer products. Water Environ. Res. 84,
424–33. doi:10.2175/106143012X13354606450960

CHAPTER 7
127
Kershaw, P.., 2015. Biodegradable plastics and marine litter: misconceptions, concerns and
impacts on marine environments. Nairobi .
Kim, M.J., Hergeth, H.H., 2012. Technology roadmap for flushable nonwoven wipes. J.
Text. Inst. 103, 200–209. doi:10.1080/00405000.2011.564800
Kirchmann, H., Börjesson, G., Kätterer, T., Cohen, Y., 2017. From agricultural use of
sewage sludge to nutrient extraction: A soil science outlook. Ambio 46, 143–154.
doi:10.1007/s13280-016-0816-3
Klein, S., Worch, E., Knepper, T.P., 2015. Occurrence and Spatial Distribution of
Microplastics in River Shore Sediments of the Rhine-Main Area in Germany. Environ.
Sci. Technol. 49, 6070–6076. doi:10.1021/acs.est.5b00492
Koelmans, A., Gouin, T., Thompson, R., Wallace, N., Arthur, C., 2014. Plastics in the
marine environment. Environ. Toxicol. Chem. 33, 5–10. doi:10.1002/etc.2426
Koelmans, A.A., Besseling, E., Wegner, A., Foekema, E.M., 2013. Plastic as a carrier of
POPs to aquatic organisms: A model analysis. Environ. Sci. Technol. 47, 7812–7820.
doi:10.1021/es401169n
Koutny, M., Sancelme, M., Dabin, C., Pichon, N., Delort, A.M., Lemaire, J., 2006.
Acquired biodegradability of polyethylenes containing pro-oxidant additives. Polym.
Degrad. Stab. 91, 1495–1503. doi:10.1016/j.polymdegradstab.2005.10.007
Kühn, S., Bravo Rebolledo, E.L., Van Franeker, J.A., 2015. Deleterious Effects of Litter on
Marine Life, in: Marine Anthropogenic Litter. p. 75=116. doi:10.1007/978-3-319-
16510-3_4
Laist, D.W., 1997. Impacts of marine debris: entanglement of marine life in marine debris
including a comprehensive list of species with entanglement and ingestion records
Marine Debris, in: Coe, J.M., Rogers, D.B. (Eds.), Marine Debris - Sources, Impacts,
and Solutions. Springer, New York, USA, pp. 99–135.
Lambert, S., Sinclair, C., Boxall, A., 2014. Occurrence, degradation, and effect of polymer-
based materials in the environment. Rev. Environ. Contam. Toxicol. 227, 1–53.
doi:10.1007/978-3-319-01327-5_1

REFERENCES
128
Larkin, M.J., Kulakov, L.A., Allen, C.C., 2005. Biodegradation and Rhodococcus – masters
of catabolic versatility. Curr. Opin. Biotechnol. 16, 282–290.
doi:10.1016/j.copbio.2005.04.007
Lattin, G.L., Moore, C.J., Zellers, A.F., Moore, S.L., Weisberg, S.B., 2004. A comparison of
neustonic plastic and zooplankton at different depths near the southern California
shore. Mar. Pollut. Bull. 49, 291–294. doi:10.1016/j.marpolbul.2004.01.020
Law, K.L., 2017. Plastics in the Marine Environment. Ann. Rev. Mar. Sci. 9, 205–229.
doi:10.1146/annurev-marine-010816-060409
Law, K.L., Morét-Ferguson, S., Maximenko, N.A., Proskurowski, G., Peacock, E.E.,
Hafner, J., Reddy, C.M., 2010a. Plastic accumulation in the North Atlantic subtropical
gyre. Science 329, 1185–1188. doi:10.1126/science.1192321
Law, K.L., Moret-Ferguson, S., Maximenko, N.A., Proskurowski, G., Peacock, E.E.,
Hafner, J., Reddy, C.M., Morét-Ferguson, S., Maximenko, N.A., Proskurowski, G.,
Peacock, E.E., Hafner, J., Reddy, C.M., 2010b. Plastic Accumulation in the North
Atlantic Subtropical Gyre. Science (80-. ). 329, 1185–1188.
doi:10.1126/science.1192321
Law, K.L., Thompson, R.C., 2014. Microplastics in the seas. Science (80-. ). 345, 144–145.
doi:10.1126/science.1254065
Lee, J., Hong, S., Song, Y.K., Hong, S.H., Jang, Y.C., Jang, M., Heo, N.W., Han, G.M., Lee,
M.J., Kang, D., Shim, W.J., 2013. Relationships among the abundances of plastic
debris in different size classes on beaches in South Korea. Mar. Pollut. Bull. 77, 349–
354. doi:10.1016/j.marpolbul.2013.08.013
Leslie, H.A., Van Velzen, M.J.M., Vethaak, A.D., 2013. Microplastic Survey of the Dutch
Environment Novel Data Set of Microplastics in North Sea Sediments, Treated
Wastewater Effluents and Marine Biota, IVM Institute for Environmental Studies.
Lieder, M., Rashid, A., 2016. Towards circular economy implementation: a comprehensive
review in context of manufacturing industry. J. Clean. Prod. 115, 36–51.
doi:10.1016/J.JCLEPRO.2015.12.042
Loakeimidis, C., Papatheodorou, G., Fermeli, G., Streftaris, N., Papathanassiou, E., 2015.
Use of ROV for assessing marine litter on the seafloor of Saronikos Gulf (Greece): a

CHAPTER 7
129
way to fill data gaps and deliver environmental education. Springerplus 4, 463.
doi:10.1186/s40064-015-1248-4
Lobelle, D., Cunliffe, M., 2011a. Early microbial biofilm formation on marine plastic
debris. Mar. Pollut. Bull. 62, 197–200. doi:10.1016/j.marpolbul.2010.10.013
Lobelle, D., Cunliffe, M., 2011b. Early microbial biofilm formation on marine plastic
debris. Mar. Pollut. Bull. 62, 197–200. doi:10.1016/j.marpolbul.2010.10.013
Löhr, A., Savelli, H., Beunen, R., Kalz, M., Ragas, A., Van Belleghem, F., 2017. Solutions
for global marine litter pollution. Curr. Opin. Environ. Sustain.
doi:10.1016/j.cosust.2017.08.009
Lucas, N., Bienaime, C., Belloy, C., Queneudec, M., Silvestre, F., Nava-Saucedo, J.-E.,
2008. Polymer biodegradation: Mechanisms and estimation techniques – A review.
Chemosphere 73, 429–442. doi:10.1016/J.CHEMOSPHERE.2008.06.064
Lusher, A.L., Burke, A., O’Connor, I., Officer, R., 2014. Microplastic pollution in the
Northeast Atlantic Ocean: Validated and opportunistic sampling. Mar. Pollut. Bull. 88,
325–333. doi:10.1016/j.marpolbul.2014.08.023
Lusher, A.L., Hernandez-Milian, G., O’Brien, J., Berrow, S., O’Connor, I., Officer, R.,
2015a. Microplastic and macroplastic ingestion by a deep diving, oceanic cetacean:
The True’s beaked whale Mesoplodon mirus. Environ. Pollut. 199, 185–191.
doi:10.1016/j.envpol.2015.01.023
Lusher, A.L., Tirelli, V., O’Connor, I., Officer, R., Halsband, C., Galloway, T.S., 2015b.
Microplastics in Arctic polar waters: the first reported values of particles in surface
and sub-surface samples. Sci. Rep. 5, 14947. doi:10.1038/srep14947
Lusher, A.L.L., McHugh, M., Thompson, R.C.C., 2013. Occurrence of microplastics in the
gastrointestinal tract of pelagic and demersal fish from the English Channel. Mar.
Pollut. Bull. 67, 94–99. doi:10.1016/j.marpolbul.2012.11.028
Mango, P., 2008. Flushable wipes – past; present; and future, in: International Conference
Insight 2008. Missouri, U.S.A, pp. 64–71.
Mani, T., Hauk, A., Walter, U., Burkhardt-Holm, P., 2016. Microplastics profile along the
Rhine River. Sci. Rep. 5, 17988. doi:10.1038/srep17988

REFERENCES
130
Marine Conservation Society, 2012. Micro plastics in personal care products [WWW
Document].
Mato, Y., Isobe, T., Takada, H., Kanehiro, H., Ohtake, C., Kaminuma, T., 2001. Plastic
resin pellets as a transport medium for toxic chemicals in the marine environment.
Environ. Sci. Technol. 35, 318–324. doi:10.1021/es0010498
Mattsson, K., Hansson, L.-A., Cedervall, T., 2015. Nano-plastics in the aquatic
environment. Environ. Sci. Process. Impacts 17, 1712–1721.
doi:10.1039/C5EM00227C
Mccloskey, S.G.G., Jump, J.M., 2005. Bio-polishing of polyester and polyester/cotton
fabric. Text. Res. J. 1, 480–484. doi:10.1177/0040517505053846
McCormick, A., Hoellein, T.J., Mason, S.A., Schluep, J., Kelly, J.J., 2014. Microplastic is an
Abundant and Distinct Microbial Habitat in an Urban River. Environ. Sci. Technol.
48, 11863–11871. doi:10.1021/es503610r
McCormick, A.R., Hoellein, T.J., London, M.G., Hittie, J., Scott, J.W., Kelly, J.J., 2016.
Microplastic in surface waters of urban rivers: Concentration, sources, and associated
bacterial assemblages. Ecosphere 7. doi:10.1002/ecs2.1556
MCS, 2016. Frequently Asked Questions; Wetwipes [WWW Document]. Mar. Conserv.
Soc. URL https://www.mcsuk.org/forms/wetwipes_faqs.php(accessed 10.18.17).
Mehlhart, G., Blepp, M., 2012. Study on land-sourced litter (LSL) in the marine
environment: review of sources and literature in the context of the initiative of the
Declaration of the Global. Öko-Institut eV, Darmstadt/freibg. Google Sch.
Mermaids Organisation, 2015. Newsletter 2 Life+ project Mermaids [WWW Document].
Met Office, 2016. South West England: climate [WWW Document]. Reg. Clim. .
URL https://www.metoffice.gov.uk/climate/uk/regional-climates/sw(accessed
11.22.18).
Mintenig, S., Int-Veen, I., M. Löder, G., 2014. Gerdts Mikroplastik in ausgewählten
Kläranlagen des Oldenburgisch- Ostfriesischen Wasserverbandes (OOWV) in
Niedersachsen Abschlussbericht des Alfred-Wegener-Instituts (AWI) im Auftrag des
Oldenburgisch-Ostfriesischen Wasserverbandes (OOWV) und des Nieder.
Landesbetriebs für Wasserwirtschaft, Naturschutz (NLWKN), Küsten- und.

CHAPTER 7
131
Mitchell, R.-L., Thamsen, P.U., Gunkel, M., Waschnewski, J., 2017. Investigations into
wastewater composition focusing on nonwoven wet wipes. Czas. Tech. 1, 125–135.
doi:10.4467/2353737XCT.17.010.6107
Mohee, R., Unmar, G., 2007. Determining biodegradability of plastic materials under
controlled and natural composting environments. Waste Manag. 27, 1486–1493.
doi:10.1016/J.WASMAN.2006.07.023
Moore, C.J., 2008. Synthetic polymers in the marine environment: A rapidly increasing,
long-term threat. Environ. Res. 108, 131–139. doi:10.1016/j.envres.2008.07.025
Moore, S.L., Allen, M.J., 2000. Distribution of anthropogenic and natural debris on the
mainland shelf of the Southern California Bight. Mar. Pollut. Bull. 40, 83–88.
doi:10.1016/S0025-326X(99)00175-7
Mouat, J., Lopez Lozano, R., Bateson, H., 2010. Economic impacts of marine litter. UK:
Kommunenes Internasjonale Miljoorganisasjon (KIMO International) [WWW
Document]. URL eeloket.nl/images/Economic impacts of marine litter_1290.pdf
(accessed 8.1.17).
Murphy, F., Ewins, C., Carbonnier, F., Quinn, B., 2016. Wastewater Treatment Works
(WwTW) as a Source of Microplastics in the Aquatic Environment. Environ. Sci.
Technol. 50, 5800–5808. doi:10.1021/acs.est.5b05416
Murray, F., Cowie, P.R., 2011. Plastic contamination in the decapod crustacean Nephrops
norvegicus (Linnaeus, 1758). Mar. Pollut. Bull. 62, 1207–1217.
doi:10.1016/j.marpolbul.2011.03.032
Nagelkerken, I., Wiltjer, G.A.M.T., Debrot, A.O., Pors, L.P.J.J., 2001. Baseline study of
submerged marine debris at beaches in Curaçao, West Indies. Mar. Pollut. Bull. 42,
786–789. doi:10.1016/S0025-326X(01)00091-1
Naik, A., Lopez-Amo, F., 1982. Pilling Propensity of Blended Textiles. Melliand
Textilbericht 6.
Napper, I.E., Bakir, A., Rowland, S.J., Thompson, R.C., 2015. Characterisation, quantity
and sorptive properties of microplastics extracted from cosmetics. Mar. Pollut. Bull.
99, 178–185. doi:10.1016/j.marpolbul.2015.07.029

REFERENCES
132
Napper, I.I., Thompson, R.C., 2016. Release of synthetic microplastic plastic fibres from
domestic washing machines: Effects of fabric type and washing conditions. Mar.
Pollut. Bull. 112, 39–45. doi:10.1016/j.marpolbul.2016.09.025
NASA, 2012. Tracking Debris from the Tohoku Tsunami : Image of the Day.
Nelms, S., Coombes, C., Foster, L., Galloway, T., Godley, B., Lindeque, P., Witt, M., 2016.
Marine anthropogenic litter on British beaches: A 10-year nationwide assessment
using citizen science data. Sci. Total Environ. doi:10.1016/j.scitotenv.2016.11.137
Nilsen, F., David Hyrenbach, K., Fang, J., Jensen, B., 2014. Use of indicator chemicals to
characterize the plastic fragments ingested by Laysan albatross. Mar. Pollut. Bull. 87,
230–236. doi:10.1016/j.marpolbul.2014.07.055
Nunn, D.M., 1979. The Dyeing of Synthetic Polymer and Acetate Fibres. The Dyers
Company Publications Trust, West Yorkshire, UK.
O’Brine, T., Thompson, R.C., 2010. Degradation of plastic carrier bags in the marine
environment. Mar. Pollut. Bull. 60, 2279–2283. doi:10.1016/j.marpolbul.2010.08.005
Obbard, R.W., Sadri, S., Wong, Y.Q., Khitun, A.A., Baker, I., Thompson, R.C., 2014.
Global warming releases microplastic legacy frozen in Arctic Sea ice. Earth’s Futur. 2,
315–320. doi:10.1002/2014EF000240.Abstract
Oehlmann, J., Schulte-Oehlmann, U., Kloas, W., Jagnytsch, O., Lutz, I., Kusk, K.O.,
Wollenberger, L., Santos, E.M., Paull, G.C., Van Look, K.J.W., Tyler, C.R., 2009. A
critical analysis of the biological impacts of plasticizers on wildlife. Philos. Trans. R.
Soc. London B Biol. Sci. 364.
Ojeda, T.F.M., Dalmolin, E., Forte, M.M.C., Jacques, R.J.S., Bento, F.M., Camargo, F.A.O.,
2009. Abiotic and biotic degradation of oxo-biodegradable polyethylenes. Polym.
Degrad. Stab. 94, 965–970. doi:10.1016/j.polymdegradstab.2009.03.011
OSPAR Commission, 2007. Background report on fishing-for-litter activities in the
OSPAR region. London, U.K.
Pahl, S., Wyles, K.J., Thompson, R.C., 2017. Channelling passion for the ocean towards
plastic pollution. Nat. Hum. Behav. 1, 697–699. doi:10.1038/s41562-017-0204-4
Pastore, C., Kiekens, P., 2000. Surface Characteristics of Fibers and Textiles [WWW
Document]. CRC Press.

CHAPTER 7
133
URL https://books.google.com/books?id=L84IjpMAxmEC&pgis=1 (accessed
5.19.16).
Pegram, J.E., Andrady, A.L., 1989. Outdoor weathering of selected polymeric materials
under marine exposure conditions. Polym. Degrad. Stab. 26, 333–345.
doi:10.1016/0141-3910(89)90112-2
Pham, C.K., Ramirez-Llodra, E., Alt, C.H.S.S., Amaro, T., Bergmann, M., Canals, M.,
Company, J.B., Davies, J., Duineveld, G., Galgani, F., Howell, K.L., Huvenne,
V.A.I.I., Isidro, E., Jones, D.O.B.B., Lastras, G., Morato, T., Gomes-Pereira, J.N.,
Purser, A., Stewart, H., Tojeira, I., Tubau, X., Van Rooij, D., Tyler, P.A., 2014. Marine
litter distribution and density in European seas, from the shelves to deep basins. PLoS
One 9, e95839. doi:10.1371/journal.pone.0095839
Phillips, M.B., Bonner, T.H., 2015. Occurrence and amount of microplastic ingested by
fishes in watersheds of the Gulf of Mexico. Mar. Pollut. Bull. 100, 264–269.
doi:10.1016/j.marpolbul.2015.08.041
Plastics Europe, 2014. The Facts 2014. An Analysis of European Plastics Production,
Demand and Waste Data [WWW Document].
URLhttp://www.plasticseurope.org (accessed 4.15.15).
PlasticsEurope, 2018. Plastics – the Facts 2017. Brussels, Belgium.
PlasticsEurope, 2016. Plastics – the Facts 2016 [WWW Document]. Plast. Shape Futur.
URL http://www.plasticseurope.org/Document/plastics---the-facts-2016-
15787.aspx?Page=DOCUMENT&FolID=2 (accessed 11.4.16).
PlasticsEurope, 2015. Plastics - the Facts 2015 [WWW Document]. PlasticsEurope.
URL http://www.plasticseurope.org/Document/plastics---the-facts-
2015.aspx (accessed 6.30.17).
Poeta, G., Battisti, C., Acosta, A.T.R., 2014. Marine litter in Mediterranean sandy littorals:
Spatial distribution patterns along central Italy coastal dunes. Mar. Pollut. Bull. 89,
168–173. doi:10.1016/j.marpolbul.2014.10.011
Pruter, A.T., 1987. Sources, quantities and distribution of persistent plastics in the marine
environment. Mar. Pollut. Bull. 18, 305–310. doi:10.1016/S0025-326X(87)80016-4

REFERENCES
134
Purdy, A.., 1983. Development of Nonwovens. Text. Inst. 12.
Rasband, W., 2015. ImageJ. U. S. Natl. Institutes Heal. Bethesda, Maryland, USA
//imagej.nih.gov/ij/.
Reinhard, S., de Blaeij, A., Bogaardt, M.J., Gaaff, A., M., Mardik, L., Scholl, M., Slijkerman,
D., Strietman, W.J., van der Wielen, P., 2012. Cost-Effectiveness and Cost-Benefit
Analysis for the MSFD Framework for the Netherlands. In LEI report 2011-036,.
Hague LEI, part Wageningen UR 145.
Reisser, J., Slat, B., Noble, K., Du Plessis, K., Epp, M., Proietti, M., De Sonneville, J.,
Becker, T., Pattiaratchi, C., 2015. The vertical distribution of buoyant plastics at sea:
An observational study in the North Atlantic Gyre. Biogeosciences 12, 1249–1256.
doi:10.5194/bg-12-1249-2015
Rengasamy, R.., 2014. Composite Nonwoven in Wipes, in: Das, D., Pourdeyhimi, B. (Eds.),
Composite Nonwoven Materials: Structure, Properties and Applications. Elsevier,
Cambridge, UK, pp. 89–118.
Ribic, C.A., Sheavly, S.B., Rugg, D.J., Erdmann, E.S., 2010. Trends and drivers of marine
debris on the Atlantic coast of the United States 1997–2007. Mar. Pollut. Bull. 60,
1231–1242. doi:10.1016/j.marpolbul.2010.03.021
Rillig, M.C., 2012. Microplastic in terrestrial ecosystems and the soil?, Environmental
Science and Technology. American Chemical Society. doi:10.1021/es302011r
Rochman, C.M., Hoh, E., Kurobe, T., Teh, S.J., 2013. Ingested plastic transfers hazardous
chemicals to fish and induces hepatic stress. Sci. Rep. 3, 3263. doi:10.1038/srep03263
Romer, J.., 2010. The evolution of San Francisco’s plastic-bag ban. Golden Gate Univ.
Environ. Law J. 1, 439–465.
Rujnić-Sokele, M., Pilipović, A., 2017. Challenges and opportunities of biodegradable
plastics: A mini review. Waste Manag. Res. 35, 132–140.
doi:10.1177/0734242X16683272
Ruppenicker, G.F., Kullman, R.M.H., 1981. Properties of Yarns and Fabrics Produced
from High-Cotton-Content Blends with Polyester Fibers. Text. Res. J. 51, 590–596.
doi:10.1177/004051758105100906

CHAPTER 7
135
Rutkowska, M., Heimowska, A., Krasowska, K., Janik, H., 2002. Biodegradability of
Polyethylene Starch Blends in Sea Water. Polish J. Environ. Stud. 11, 267–274.
Ryan, P.G., 2013. A simple technique for counting marine debris at sea reveals steep litter
gradients between the Straits of Malacca and the Bay of Bengal. Mar. Pollut. Bull. 69,
128–136. doi:10.1016/j.marpolbul.2013.01.016
Ryan, P.G., Moore, C.J., van Franeker, J.A., Moloney, C.L., 2009. Monitoring the
abundance of plastic debris in the marine environment. Philos. Trans. R. Soc. Lond.
B. Biol. Sci. 364, 1999–2012. doi:10.1098/rstb.2008.0207
Sahu, P.B., 2012. Wipes: What, Where, Why ; How? - Nonwovens Industry Magazine -
News, Markets; Analysis for the Nonwovens Industry [WWW Document].
NONWOVENS Ind. URL http://www.nonwovens-industry.com/issues/2012-
01/view_features/wipes-what-where-why-how (accessed 8.24.17).
Sanchez, W., Bender, C., Porcher, J.M.J.-M., 2014. Wild gudgeons (Gobio gobio) from
French rivers are contaminated by microplastics: Preliminary study and first evidence.
Environ. Res. 128, 98–100. doi:10.1016/j.envres.2013.11.004
Scherer, C., Brennholt, N., Reifferscheid, G., Wagner, M., 2017. Feeding type and
development drive the ingestion of microplastics by freshwater invertebrates. Sci. Rep.
7, 17006. doi:10.1038/s41598-017-17191-7
Sengupta, A.K., 1997. Rayon Fibres, in: Gupta, V.B., Kothari, V.K. (Eds.), Manufactured
Fibre Technology. Chapman & Hall, London, U.K., pp. 480–513.
Singh, B., Sharma, N., 2008. Mechanistic implications of plastic degradation. Polym.
Degrad. Stab. doi:10.1016/j.polymdegradstab.2007.11.008
Singh, N., Hui, D., Singh, R., Ahuja, I.P.S., Feo, L., Fraternali, F., 2017. Recycling of plastic
solid waste: A state of art review and future applications. Compos. Part B Eng.
doi:10.1016/j.compositesb.2016.09.013
Smith, B.., Block, I., 1982. Textiles in Perspective. Prentice Hall, New Jersey, U.S.A.
Song, J.H., Murphy, R.J., Narayan, R., Davies, G.B.H., 2009. Biodegradable and
compostable alternatives to conventional plastics. Philos. Trans. R. Soc. B Biol. Sci.
364, 2127–2139. doi:10.1098/rstb.2008.0289

REFERENCES
136
Song, Y.K., Hong, S.H., Jang, M., Kang, J.-H., Kwon, O.Y., Han, G.M., Shim, W.J., 2014.
Large Accumulation of Micro-sized Synthetic Polymer Particles in the Sea Surface
Microlayer. Environ. Sci. Technol. 48, 9014–9021. doi:10.1021/es501757s
Statista, 2013. Number of women using facial scrubs and masks in the United Kingdom
(UK) in 2013, by frequency of use (in 1,000) [WWW Document].
Sundt, P., Schultze, P.-E., Syversen, F., 2014. Sources of microplastic- pollution to the
marine environment. Mepex, Nor. Environ. Agency 1–108. doi:M-321|2015
Sutherland, W.J., Aveling, R., Brooks, T.M., Clout, M., Dicks, L. V., Fellman, L.,
Fleishman, E., Gibbons, D.W., Keim, B., Lickorish, F., Monk, K.A., Mortimer, D.,
Peck, L.S., Pretty, J., Rockstrom, J., Rodriguez, J.P., Smith, R.K., Spalding, M.D.,
Tonneijck, F.H., Watkinson, A.R., 2014. A horizon scan of global conservation issues
for 2014. Trends Ecol. Evol. doi:10.1016/j.tree.2013.11.004
Sutherland, W.J., Clout, M., Côté, I.M.I.M., Daszak, P., Depledge, M.H.M.H., Fellman, L.,
Fleishman, E., Garthwaite, R., Gibbons, D.W.D.W., De Lurio, J., Impey, A.J.A.J.,
Lickorish, F., Lindenmayer, D., Madgwick, J., Margerison, C., Maynard, T., Peck,
L.S.L.S., Pretty, J., Prior, S., Redford, K.H.K.H., Scharlemann, J.P.W.J.P.W., Spalding,
M., Watkinson, A.R.A.R., 2010. A horizon scan of global conservation issues for
2010. Trends Ecol. Evol. 25, 1–7. doi:10.1016/j.tree.2009.10.003
Talsness, C.E., Andrade, A.J.M., Kuriyama, S.N., Taylor, J.A., vom Saal, F.S., 2009.
Components of plastic: experimental studies in animals and relevance for human
health. Philos. Trans. R. Soc. London B Biol. Sci. 364.
Tanaka, K., Takada, H., Yamashita, R., Mizukawa, K., Fukuwaka, M. aki, Watanuki, Y.,
2013. Accumulation of plastic-derived chemicals in tissues of seabirds ingesting
marine plastics. Mar. Pollut. Bull. 69, 219–222. doi:10.1016/j.marpolbul.2012.12.010
Tekman, M.B., Krumpen, T., Bergmann, M., 2017. Marine litter on deep Arctic seafloor
continues to increase and spreads to the North at the HAUSGARTEN observatory.
Deep. Res. Part I Oceanogr. Res. Pap. 120, 88–99. doi:10.1016/j.dsr.2016.12.011
Teuten, E.L., Rowland, S.J., Galloway, T.S., Thompson, R.C., 2007. Potential for plastics to

CHAPTER 7
137
transport hydrophobic contaminants. Environ. Sci. Technol. 41, 7759–7764.
doi:10.1021/es071737s
Teuten, E.L., Saquing, J.M., Knappe, D.R.U., Barlaz, M.A., Jonsson, S., Björn, A.,
Rowland, S.J., Thompson, R.C., Galloway, T.S., Yamashita, R., Ochi, D., Watanuki,
Y., Moore, C., Viet, P.H., Tana, T.S., Prudente, M., Boonyatumanond, R., Zakaria,
M.P., Akkhavong, K., Ogata, Y., Hirai, H., Iwasa, S., Mizukawa, K., Hagino, Y.,
Imamura, A., Saha, M., Takada, H., 2009. Transport and release of chemicals from
plastics to the environment and to wildlife. Philos. Trans. R. Soc. Lond. B. Biol. Sci.
364, 2027–45. doi:10.1098/rstb.2008.0284
Thiel, M., Hinojosa, I., Vásquez, N., Macaya, E., 2003. Floating marine debris in coastal
waters of the SE-Pacific (Chile). Mar. Pollut. Bull. 46, 224–231. doi:10.1016/S0025-
326X(02)00365-X
Thompson, R., Moore, C., Andrady, A., Gregory, M., Takada, H., Weisberg, S., 2005. New
Directions in Plastic Debris. Science (80-. ). 310.
Thompson, R.C., 2017. Future of the Sea: Plastic Pollution [WWW Document]. Gov. Off.
Sci. URL
https://www.gov.uk/government/uploads/system/uploads/attachment_data/file/63
4433/Future_of_the_sea_-_plastic_pollution_final.pdf (accessed 8.18.17).
Thompson, R.C., 2015. Microplastics in the marine environment: Sources, consequences
and solutions, in: Bergmann, M., Gutow, L., Klages, M. (Eds.), Marine Anthropogenic
Litter. Springer Open, New York, USA, pp. 185–200. doi:10.1007/978-3-319-16510-
3_7
Thompson, R.C., Moore, C.J., vom Saal, F.S., Swan, S.H., 2009a. Plastics, the environment
and human health: current consensus and future trends. Philos. Trans. R. Soc. Lond.
B. Biol. Sci. 364, 2153–2166. doi:10.1098/rstb.2009.0053
Thompson, R.C., Olsen, Y., Mitchell, R.P., Davis, A., Rowland, S.J., John, A.W.G.,
McGonigle, D., Russell, A.E., 2004. Lost at sea: where is all the plastic? Science 304,
838. doi:10.1126/science.1094559

REFERENCES
138
Thompson, R.C., Swan, S.H., Moore, C.J., vom Saal, F.S., 2009b. Our plastic age. Philos.
Trans. R. Soc. Lond. B. Biol. Sci. 364, 1973–1976. doi:10.1098/rstb.2009.0054
Titmus, A.J., Hyrenbach, D.K., 2011. Habitat associations of floating debris and marine
birds in the North East Pacific Ocean at coarse and meso spatial scales. Mar. Pollut.
Bull. 62, 2496–2506. doi:10.1016/j.marpolbul.2011.08.007
Tudor, D.T., Williams, A.T., 2006. A rationale for beach selection by the public on the
coast of Wales, UK. Area 38, 153–164. doi:10.1111/j.1475-4762.2006.00684.x
Turbak, A.F., 1993. Nonwovens : theory, process, performance, and testing. Technical
Association of the Pulp and Paper Industry, Georgia, U.S.A.
Turner, A., Holmes, L.A., 2015. Adsorption of trace metals by microplastic pellets in fresh
water. Environ. Chem. 12, 600–610. doi:10.1071/EN14143
Turra, A., Manzano, A.B., Dias, R.J.S., Mahiques, M.M., Barbosa, L., Balthazar-Silva, D.,
Moreira, F.T., 2015. Three-dimensional distribution of plastic pellets in sandy beaches:
shifting paradigms. Sci. Rep. 4, 4435. doi:10.1038/srep04435
U.S. Coast Guard, 2006. Boating Statistics 2005 [WWW Document]. U.S. Dep. Homel.
Secur. URL https://www.uscgboating.org/library/accident-
statistics/USCGBoatingStatistics2005.pdf (accessed 11.30.17).
UN Environment, 2017. Indonesia joins UN in a bid to eradicate ocean plastic | UN
Environment [WWW Document]. United Nations Environ. Program. URL
https://www.unenvironment.org/news-and-stories/story/indonesia-joins-un-bid-
eradicate-ocean-plastic (accessed 6.1.18).
UNEP, 2018. SINGLE-USE PLASTICS A Roadmap for Sustainability. United Nations
Environment Programme.
UNEP, 2017. UN Declares War on Ocean Plastic [WWW Document]. Press Release. URL
http://web.unep.org/newscentre/un-declares-war-ocean-plastic (accessed 12.18.17).

CHAPTER 7
139
UNEP, 2016. Marine plastic debris and microplastics – Global lessons and research to
inspire action and guide policy change. Nairobi, Kenya.
Unger, B., Rebolledo, E.L.B., Deaville, R., Gröne, A., IJsseldijk, L.L., Leopold, M.F.,
Siebert, U., Spitz, J., Wohlsein, P., Herr, H., 2016. Large amounts of marine debris
found in sperm whales stranded along the North Sea coast in early 2016. Mar. Pollut.
Bull. 112, 134–141. doi:10.1016/j.marpolbul.2016.08.027
United Kingdom Sea Temperatures, 2018. Plymouth Sea Temperature [WWW Document].
URL https://www.seatemperature.org/europe/united-kingdom/plymouth.htm
(accessed 11.22.18).
United Nations General Assembly, 2015. Resolution 70/1. Transforming Our World: The
2030 Agenda for Sustainable Development. October 21. A/RES/70/1.
Van Cauwenberghe, L., Vanreusel, A., Mees, J., Janssen, C.R., 2013. Microplastic pollution
in deep-sea sediments. Environ. Pollut. doi:10.1016/j.envpol.2013.08.013
Van Franeker, J.A., Blaize, C., Danielsen, J., Fairclough, K., Gollan, J., Guse, N., Hansen,
P.L., Heubeck, M., Jensen, J.K., Le Guillou, G., Olsen, B., Olsen, K.O., Pedersen, J.,
Stienen, E.W.M., Turner, D.M., 2011. Monitoring plastic ingestion by the northern
fulmar Fulmarus glacialis in the North Sea. Environ. Pollut. 159, 2609–2615.
doi:10.1016/j.envpol.2011.06.008
Van Franeker, J.A., Law, K.L., 2015. Seabirds, gyres and global trends in plastic pollution.
Environ. Pollut. 203, 89–96. doi:10.1016/j.envpol.2015.02.034
Venrick, E.L., McGowan, J.A., Mantyla, A.W., 1973. Deep Maxima of Photosynthetic
Chlorophyll in the Pacific Ocean. Fish. Bull. 71, 41–52.
Wagner, M., Scherer, C., Alvarez-Munoz, D., Brennholt, N., Bourrain, X., Buchinger, S.,
Fries, E., Grosbois, C., Klasmeier, J., Marti, T., Rodriguez-Mozaz, S., Urbatzka, R.,
Vethaak, A., Winther-Nielsen, M., Reifferscheid, G., 2014. Microplastics in freshwater
ecosystems: what we know and what we need to know. Environ. Sci. Eur. 26, 12.
doi:10.1186/s12302-014-0012-7

REFERENCES
140
Ward, H.., 1957. Textile Softners for Home Laundering. J. Home Econ. 49.
Water Environment Federation, 2003. Wastewater Treatment Plant Design, 1st ed. ed.
IWA Publishing, Virgina, USA.
Watts, A.J.R., Lewis, C., Goodhead, R.M., Beckett, S.J., Moger, J., Tyler, C.R., Galloway,
T.S., 2014. Uptake and Retention of Microplastics by the Shore Crab Carcinus
maenas. Environ. Sci. Technol. 48, 8823–8830. doi:10.1021/es501090e
Webber, D.N., Parker, S.J., 2012. Estimating unaccounted fishing mortality in the ross sea
region and amundsen sea (CCAMLR subareas 88.1 and 88.2) bottom longline
fisheries targeting Antarctic toothfish. CCAMLR Sci. 19, 17–30.
Wentworth, J., Stafford, C., 2016. Marine Microplastic Pollution POSTNOTE (528)
[WWW Document]. Houses Parliam. UK. URL
http://researchbriefings.parliament.uk/ResearchBriefing/Summary/POST-PN-
0528?utm_source=website&utm_medium=website&utm_campaign=PN528
Werner, S., Budziak, A., Van Franeker, J.A., Galgani, F., Hanke, G., Maes, T., Matiddi, M.,
Nilsson, P., Oosterbaan, L., Priestland, E., Thompson, R., Veiga Joana, M.,
Vlachogianni, T., 2016. Harm caused by Marine Litter - European Commission, JRC
Technical Report. doi:10.2788/690366
Wessex Water, 2016. ‘Flushable’ wet wipes: An evidence report documenting the
consequences of misleading product advertising and labelling. Bath, UK.
Williams, C., 2004. Battle of the bag. New Sci. 183, 30–33.
Willoughby, N.G., Sangkoyo, H., Lakaseru, B.O., 1997. Beach litter: An increasing and
changing problem for Indonesia. Mar. Pollut. Bull. 34, 469–478. doi:10.1016/S0025-
326X(96)00141-5
Woodall, L.C., Gwinnett, C., Packer, M., Thompson, R.C., Robinson, L.F., Paterson,
G.L.J., 2015. Using a forensic science approach to minimize environmental
contamination and to identify microfibres in marine sediments. Mar. Pollut. Bull. 95,

CHAPTER 7
141
40–46. doi:10.1016/j.marpolbul.2015.04.044
Woodall, L.C., Sanchez-Vidal, A., Canals, M., Paterson, G.L.J., Coppock, R., Sleight, V.,
Calafat, A., Rogers, A.D., Narayanaswamy, B.E., Thompson, R.C., 2014. The deep sea
is a major sink for microplastic debris. R. Soc. Open Sci. 1, 140317–140317.
doi:10.1098/rsos.140317
Woodall, L.C., Sanchez-Vidal, A., Canals, M., Paterson, G.L.J., Coppock, R., Sleight, V.,
Calafat, A., Rogers, A.D., Narayanaswamy, B.E., Thompson, R.C., 2014. The deep sea
is a major sink for microplastic debris. R. Soc. Open Sci. 1, 140317–140317.
doi:10.1098/rsos.140317
World Economic Forum, 2016. World Economic Forum Ellen MacArthur Foundation and
McKinsey & Company The New Plastics Economy — Rethinking the future of
plastics [WWW Document]. URL
http://www.ellenmacarthurfoundation.org/publications
Wright, S.L., Thompson, R.C., Galloway, T.S., 2013. The physical impacts of microplastics
on marine organisms: A review. Environ. Pollut. 178, 483–492.
doi:10.1016/j.envpol.2013.02.031
Wyles, K.J., Pahl, S., Thomas, K., Thompson, R.C., 2016. Factors That Can Undermine the
Psychological Benefits of Coastal Environments. Environ. Behav. 48, 1095–1126.
doi:10.1177/0013916515592177
Wyles, K.J., Pahl, S., Thomas, K., Thompson, R.C., 2015. Factors that can undermine the
psychological benefits of coastal environments: exploring the effect of tidal State,
presence, and type of litter. Environ. Behav. 0013916515592177-.
doi:10.1177/0013916515592177
Xanthos, D., Walker, T.R., 2017. International policies to reduce plastic marine pollution
from single-use plastics (plastic bags and microbeads): A review. Mar. Pollut. Bull.
118, 17–26. doi:10.1016/J.MARPOLBUL.2017.02.048
Yates, M., 2002. Fabrics: A Guide for Interior Designers and Architects. W.W. Norton,

REFERENCES
142
New York.
Ye, S., Andrady, A.L., 1991. Fouling of floating plastic debris under Biscayne Bay exposure
conditions. Mar. Pollut. Bull. 22, 608–613. doi:10.1016/0025-326X(91)90249-R
Yoshito, O., Tomoko, K., Hitoshi, A., Nobunao, M., 1998. Studies on biodegradation of
LDPE — observation of LDPE films scattered in agricultural fields or in garden soil.
Polym. Degrad. Stab. 60, 79–84. doi:10.1016/S0141-3910(97)00032-3
Yousif, E., Haddad, R., 2013. Photodegradation and photostabilization of polymers,
especially polystyrene: review. Springerplus 2, 398. doi:10.1186/2193-1801-2-398
Zettler, E.R., Mincer, T.J., Amaral-Zettler, L.A., 2013. Life in the “plastisphere”: microbial
communities on plastic marine debris. Environ. Sci. Technol. 1, 7137–7146.
Zitko, V., Hanlon, M., 1991. Another source of pollution by plastics - skin cleaners with
plastic scrubbers. Mar. Poll. Bull 1, 41–42.
Zubris, K.A. V, Richards, B.K., 2005. Synthetic fibers as an indicator of land application of
sludge. Environ. Pollut. 138, 201–211. doi:10.1016/j.envpol.2005.04.013