
Plymouth County Retirement Association
197
BOSTON CHICAGO LONDON MIAMI NEW YORK PORTLAND SAN DIEGO MEKETA.COM Meeting Materials Plymouth County Retirement Association November 30, 2021
-
Upload
khangminh22 -
Category
Documents
-
view
1 -
download
0
Transcript of Plymouth County Retirement Association

BOSTON CHICAGO LONDON MIAMI NEW YORK PORTLAND SAN DIEGO MEKETA.COM
Meeting Materials
Plymouth County Retirement Association
November 30, 2021

Plymouth County Retirement Association
Agenda
Agenda
1. Estimated Retirement Association Performance As of October 31, 2021
2. Performance Update As of September 30, 2021
• Private Markets Second Quarter 2021
3. Current Issues
• Small Cap Value Equity RFP Respondent Review
• Emerging Markets Debt RFP Respondent Review
4. Appendices
• Investment Manager Status Report
• Disclaimer, Glossary, and Notes
2 of 197
Estimated Retirement Association Performance
As of October 31, 2021
3 of 197

Plymouth County Retirement Association
Estimated Retirement Association Performance
Estimated Aggregate Performance1
October2
(%)
YTD
(%)
1 YR
(%)
3 YR
(%)
5 YR
(%)
10 YR
(%)
Total Retirement Association 1.9 13.7 28.5 13.3 10.9 9.0
Benchmark Returns
October
(%)
YTD
(%)
1 YR
(%)
3 YR
(%)
5 YR
(%)
10 YR
(%)
Russell 3000 6.8 22.8 42.0 22.6 18.9 15.8
MSCI EAFE 2.5 11.0 33.5 12.3 9.8 7.0
MSCI Emerging Markets 1.0 -0.3 15.2 13.1 9.4 4.7
Barclays Aggregate 0.0 -1.6 -0.6 5.5 3.1 3.0
Barclays TIPS 1.1 4.7 6.9 8.2 4.7 3.1
Barclays High Yield -0.2 4.4 10.5 7.4 6.3 6.8
JPM GBI-EM Global Diversified (Hard Currency) 0.0 -1.3 4.2 6.3 A4.1 5.3
S&P Global Natural Resources 4.8 22.3 54.7 10.6 10.5 3.3
Estimated Total Assets
Estimate
Total Retirement Association $1,405,306,972
1 The October performance estimates are calculated using index returns as of October 31, 2021 for each asset class. No performance estimate was included for private equity, real estate, infrastructure,
and private natural resources asset classes. 2 As of October 31, 2021.
4 of 197

Performance Update
As of September 30, 2021
5 of 197

Allocation vs. Target
CurrentBalance
CurrentAllocation
Policy Policy RangeWithin IPS
Range?_
Domestic Equity $363,753,323 26% 26% 21% - 36% Yes
International Developed Market Equity $45,379,588 3% 6% 1% - 16% Yes
International Emerging Market Equity $128,014,622 9% 10% 5% - 20% Yes
Global Equity $150,073,498 11% 10% 5% - 20% Yes
Core Bonds $108,964,827 8% 9% 4% - 14% Yes
Value-Added Fixed Income $124,055,705 9% 6% 2% - 12% Yes
Private Equity $152,486,273 11% 13% 4% - 18% Yes
Real Estate $124,652,087 9% 10% 5% - 15% Yes
Real Assets $77,331,287 6% 6% 2% - 10% Yes
Hedge Fund of Funds $91,139,844 7% 4% 2% - 8% Yes
Cash $12,921,128 1% 0% 0% - 3% Yes
Total $1,378,772,181 100% 100%XXXXX
CurrentBalance
CurrentAllocation
Policy Policy RangeWithin IPS
Range?_
Total Equity $918,647,588 67% 69% 60% - 80% Yes
Total Fixed Income $233,020,532 17% 15% 5% - 25% Yes
Total Real Assets and Real Estate $214,182,934 16% 16% 13% - 19% Yes
Cash $12,921,128 1% 0% 0% - 3% YesXXXXX
Plymouth County Retirement Association
Total Retirement Association | As of September 30, 2021
6 of 197

Plymouth County Retirement Association
Total Retirement Association | As of September 30, 2021
7 of 197

Asset Class Net Performance Summary
Market Value($)
% ofPortfolio
1 Mo(%)
QTD(%)
YTD(%)
1 Yr(%)
3 Yrs(%)
5 Yrs(%)
10 Yrs(%)
Inception(%)
InceptionDate
_
Total Retirement Association 1,378,772,181 100.0 0.5 1.4 11.5 25.9 10.5 10.1 9.5 8.2 Nov-89
Policy Benchmark (Net) (1) -0.3 1.2 12.8 24.5 11.2 10.8 9.9 -- Nov-89
Actual Allocation (Net) -0.8 0.7 11.0 22.0 9.7 9.5 -- -- Nov-89
Domestic Equity Assets 363,753,323 26.4 -3.5 -1.2 13.2 38.6 15.7 17.3 -- 16.6 Jan-16
Russell 3000 -4.5 -0.1 15.0 31.9 16.0 16.9 16.6 16.1 Jan-16
International Developed Market Equity Assets 45,379,588 3.3 -2.9 0.7 4.3 20.2 3.6 6.0 -- 5.7 Jan-16
MSCI EAFE -2.9 -0.4 8.3 25.7 7.6 8.8 8.1 7.9 Jan-16
International Emerging Market Equity Assets 128,014,622 9.3 -3.4 -5.8 2.7 23.6 9.7 9.6 -- 10.6 Jan-16
MSCI Emerging Markets -4.0 -8.1 -1.2 18.2 8.6 9.2 6.1 10.8 Jan-16
Global Equity Assets 150,073,498 10.9 -2.1 -1.2 11.7 27.1 11.9 -- -- 8.9 Feb-18
MSCI ACWI -4.1 -1.1 11.1 27.4 12.6 13.2 11.9 9.7 Feb-18
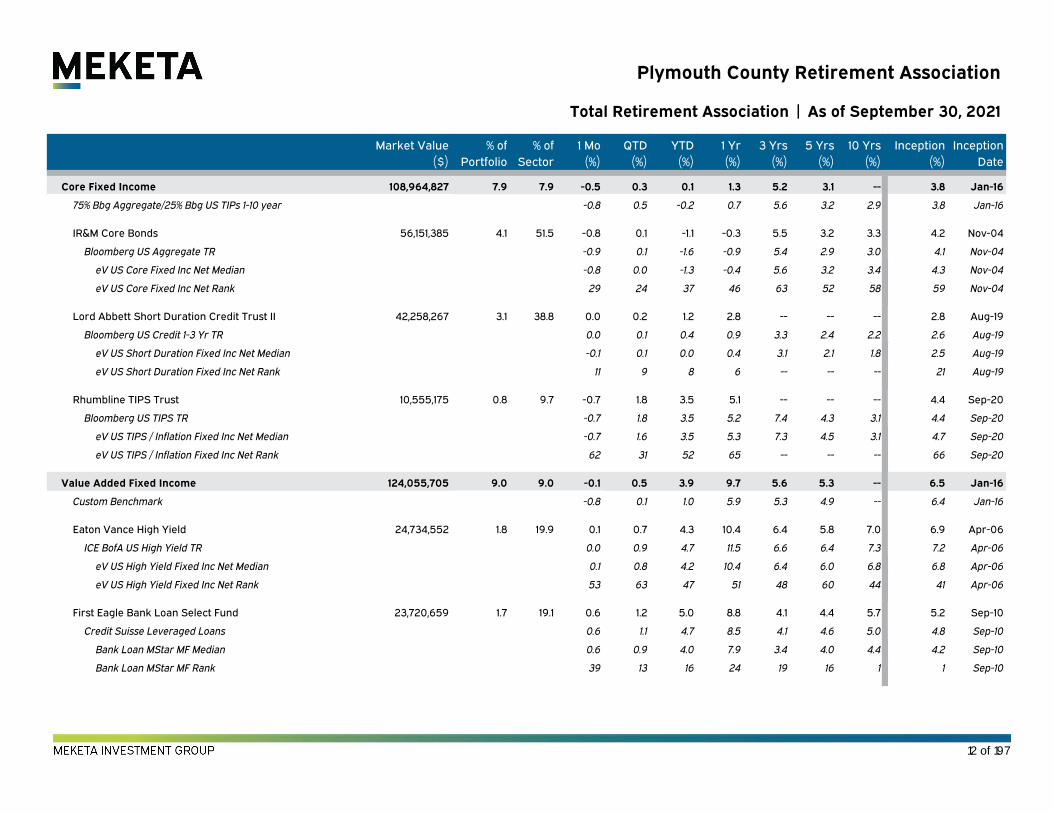
Core Fixed Income 108,964,827 7.9 -0.5 0.3 0.1 1.3 5.2 3.1 -- 3.8 Jan-16
75% Bbg Aggregate/25% Bbg US TIPs 1-10 year -0.8 0.5 -0.2 0.7 5.6 3.2 2.9 3.8 Jan-16
Value Added Fixed Income 124,055,705 9.0 -0.1 0.5 3.9 9.7 5.6 5.3 -- 6.5 Jan-16
Custom Benchmark (2) -0.8 0.1 1.0 5.9 5.3 4.9 -- 6.4 Jan-16
Hedge Funds (3) 91,139,844 6.6 -0.2 0.4 6.2 24.2 5.6 6.6 5.8 5.2 Feb-10
Custom Benchmark 0.4 0.8 5.7 14.0 6.5 5.8 4.5 3.9 Feb-10
Real Estate (4) 124,652,087 9.0 8.1 8.9 15.8 23.0 11.3 8.4 -- 8.0 Jan-16
80% NCREIF ODCE / 20% Wilshire REIT 4.1 5.6 15.0 18.5 7.3 6.9 -- 7.2 Jan-16
Private Equity (5) 152,486,273 11.1 12.0 12.0 37.9 47.8 19.2 15.7 -- 12.4 Jan-16
Cambridge Associates FoF Composite 1Q Lagged 11.6 11.6 47.5 61.0 23.3 19.5 14.4 17.2 Jan-16
Real Assets (6) 77,331,287 5.6 6.0 5.9 13.8 18.2 7.2 4.4 -- 2.3 Jan-16
CPI + 3% 0.6 1.9 7.0 8.4 5.9 5.6 4.9 5.5 Jan-16
Cash and Cash Equivalent 12,921,128 0.9 XXXXX
(1) The custom benchmark is comprised of 26% Russell 3000/ 6% MSCI EAFE/ 10% MSCI Emerging Markets/ 13% Cambridge Associates FOF 1Q Lag/ 10% MSCI ACWI/ 4% Hedge Funds Custom Benchmark/ 9% (75/25 Barclays Aggregate andBarclays Tips 1-10yr)/ 6% Value Added FI Custom Benchmark/ 10% (80/20 NCREIF ODCE and Wilshire REIT)/ 6% CPI+3%
(2) The custom benchmark is comprised of 25% BBgBarc US High Yield/ 25% Credit Suisse Leveraged Loans/ 25% JP Morgan EMBI Global diversified/ 25% BBgBarc Multiverse TR
(3) The data for Entrust Special Opportunities Fund III, Ltd and EntrustPermal Special Opportunities Evergreen Fund, Ltd is based on December 31, 2020 fair market value, adjusted for subsequent cash flows.
(4) The market value and performance is one quarter lagged.
(5) The market value and performance is one quarter lagged.
(6) The market value and performance is one quarter lagged.
Plymouth County Retirement Association
Total Retirement Association | As of September 30, 2021
8 of 197

Trailing Net Performance
Market Value($)
% ofPortfolio
% ofSector
1 Mo(%)
QTD(%)
YTD(%)
1 Yr(%)
3 Yrs(%)
5 Yrs(%)
10 Yrs(%)
Inception(%)
InceptionDate
_
Total Retirement Association 1,378,772,181 100.0 -- 0.5 1.4 11.5 25.9 10.5 10.1 9.5 8.2 Nov-89
Policy Benchmark (Net) -0.3 1.2 12.8 24.5 11.2 10.8 9.9 -- Nov-89
Actual Allocation (Net) -0.8 0.7 11.0 22.0 9.7 9.5 -- -- Nov-89
InvMetrics Public DB > $1B Net Median -1.8 0.2 9.6 21.2 10.1 9.9 9.6 8.2 Nov-89
InvMetrics Public DB > $1B Net Rank 1 20 29 5 39 44 51 51 Nov-89
Domestic Equity Assets 363,753,323 26.4 26.4 -3.5 -1.2 13.2 38.6 15.7 17.3 -- 16.6 Jan-16
Russell 3000 -4.5 -0.1 15.0 31.9 16.0 16.9 16.6 16.1 Jan-16
Rhumbline Russell 1000 Value 69,323,971 5.0 19.1 -3.5 -0.8 16.1 34.9 10.1 10.9 -- 10.5 Apr-13
Russell 1000 Value -3.5 -0.8 16.1 35.0 10.1 10.9 13.5 10.7 Apr-13
eV US Large Cap Value Equity Net Median -3.6 -0.8 17.1 35.4 10.1 11.7 13.5 11.0 Apr-13
eV US Large Cap Value Equity Net Rank 44 51 60 53 51 67 -- 63 Apr-13
Rhumbline Russell 1000 Growth 70,114,267 5.1 19.3 -5.6 1.2 14.3 27.3 22.0 22.8 19.6 17.9 Jul-09
Russell 1000 Growth -5.6 1.2 14.3 27.3 22.0 22.8 19.7 18.0 Jul-09
eV US Large Cap Growth Equity Net Median -5.5 0.5 13.6 26.4 20.5 21.1 18.3 16.6 Jul-09
eV US Large Cap Growth Equity Net Rank 56 32 41 41 32 30 20 14 Jul-09
Fisher Midcap Value 71,200,032 5.2 19.6 -4.9 -0.2 19.2 45.8 17.3 18.0 16.1 10.1 Apr-07
Russell MidCap Value -3.7 -1.0 18.2 42.4 10.3 10.6 13.9 7.9 Apr-07
Russell MidCap -4.1 -0.9 15.2 38.1 14.2 14.4 15.5 9.6 Apr-07
eV US Mid Cap Value Equity Net Median -3.0 -0.9 18.3 45.4 9.7 10.9 13.7 8.3 Apr-07
eV US Mid Cap Value Equity Net Rank 96 19 41 49 1 1 2 7 Apr-07
Mellon Small Cap Growth 74,904,714 5.4 20.6 -3.0 -5.1 -2.0 26.0 21.3 23.7 19.9 17.7 Aug-09
Russell 2000 Growth -3.8 -5.7 2.8 33.3 11.7 15.3 15.7 14.7 Aug-09
eV US Small Cap Growth Equity Net Median -3.4 -1.9 9.6 38.8 17.1 19.8 17.7 16.5 Aug-09
eV US Small Cap Growth Equity Net Rank 37 90 97 93 25 25 16 34 Aug-09
Plymouth County Retirement Association
Total Retirement Association | As of September 30, 2021
9 of 197

Market Value($)
% ofPortfolio
% ofSector
1 Mo(%)
QTD(%)
YTD(%)
1 Yr(%)
3 Yrs(%)
5 Yrs(%)
10 Yrs(%)
Inception(%)
InceptionDate
_
LMCG Small Cap Value 78,210,339 5.7 21.5 -0.7 -0.3 21.7 57.4 8.7 10.2 12.8 9.3 Mar-11
Russell 2000 Value -2.0 -3.0 22.9 63.9 8.6 11.0 13.2 9.7 Mar-11
eV US Small Cap Value Equity Net Median -1.9 -2.0 22.0 58.0 8.6 10.9 13.2 10.0 Mar-11
eV US Small Cap Value Equity Net Rank 19 19 52 53 47 60 66 68 Mar-11
International Developed Market Equity Assets 45,379,588 3.3 3.3 -2.9 0.7 4.3 20.2 3.6 6.0 -- 5.7 Jan-16
MSCI EAFE -2.9 -0.4 8.3 25.7 7.6 8.8 8.1 7.9 Jan-16
Aristotle International Equity 23,881,714 1.7 52.6 -1.1 0.7 -- -- -- -- -- 10.4 Mar-21
MSCI EAFE -2.9 -0.4 8.3 25.7 7.6 8.8 8.1 7.1 Mar-21
eV EAFE Core Equity Net Median -3.6 -0.6 9.6 25.2 8.0 9.1 9.2 8.1 Mar-21
eV EAFE Core Equity Net Rank 1 17 -- -- -- -- -- 23 Mar-21
Walter Scott International Equity 21,497,874 1.6 47.4 -4.8 0.6 -- -- -- -- -- 10.0 Mar-21
MSCI EAFE -2.9 -0.4 8.3 25.7 7.6 8.8 8.1 7.1 Mar-21
eV EAFE Core Equity Net Median -3.6 -0.6 9.6 25.2 8.0 9.1 9.2 8.1 Mar-21
eV EAFE Core Equity Net Rank 91 20 -- -- -- -- -- 26 Mar-21
International Emerging Market Equity Assets 128,014,622 9.3 9.3 -3.4 -5.8 2.7 23.6 9.7 9.6 -- 10.6 Jan-16
MSCI Emerging Markets -4.0 -8.1 -1.2 18.2 8.6 9.2 6.1 10.8 Jan-16
ABS Emerging Markets 68,577,165 5.0 53.6 -2.2 -4.9 5.8 26.3 -- -- -- 17.2 Dec-18
MSCI Emerging Markets -4.0 -8.1 -1.2 18.2 8.6 9.2 6.1 11.1 Dec-18
eV Emg Mkts Equity Net Median -4.0 -6.8 1.4 21.4 9.7 9.5 6.7 12.4 Dec-18
eV Emg Mkts Equity Net Rank 15 30 31 34 -- -- -- 22 Dec-18
Driehaus Emerging Markets Growth 59,437,458 4.3 46.4 -4.7 -6.7 -0.4 18.0 -- -- -- 15.8 Mar-19
MSCI Emerging Markets -4.0 -8.1 -1.2 18.2 8.6 9.2 6.1 9.7 Mar-19
eV Emg Mkts Equity Net Median -4.0 -6.8 1.4 21.4 9.7 9.5 6.7 11.1 Mar-19
eV Emg Mkts Equity Net Rank 74 48 61 67 -- -- -- 24 Mar-19
Plymouth County Retirement Association
Total Retirement Association | As of September 30, 2021
10 of 197

Market Value($)
% ofPortfolio
% ofSector
1 Mo(%)
QTD(%)
YTD(%)
1 Yr(%)
3 Yrs(%)
5 Yrs(%)
10 Yrs(%)
Inception(%)
InceptionDate
_
Global Equity Assets 150,073,498 10.9 10.9 -2.1 -1.2 11.7 27.1 11.9 -- -- 8.9 Feb-18
MSCI ACWI -4.1 -1.1 11.1 27.4 12.6 13.2 11.9 9.7 Feb-18
First Eagle Global Value Fund 24,682,559 1.8 16.4 -2.8 -1.8 8.5 20.3 8.6 -- -- 5.9 Feb-18
MSCI ACWI Value NR USD -3.0 -1.4 12.6 31.3 6.5 8.4 8.9 3.9 Feb-18
eV Global Value Equity Net Median -3.0 -1.4 14.2 37.7 8.3 9.7 9.9 5.4 Feb-18
eV Global Value Equity Net Rank 43 60 91 98 47 -- -- 46 Feb-18
Kopernik Global All Cap Fund 37,557,368 2.7 25.0 2.6 -0.6 19.0 38.7 20.5 -- -- 12.4 Feb-18
MSCI ACWI Value NR USD -3.0 -1.4 12.6 31.3 6.5 8.4 8.9 3.9 Feb-18
eV Global All Cap Value Eq Net Median -2.6 -1.6 14.4 39.3 8.5 9.5 9.4 5.9 Feb-18
eV Global All Cap Value Eq Net Rank 2 17 7 52 3 -- -- 8 Feb-18
Lee Munder Global Multi-Cap Strategy 44,187,796 3.2 29.4 -4.1 -1.7 12.4 28.8 9.8 -- -- 9.0 Mar-18
MSCI ACWI -4.1 -1.1 11.1 27.4 12.6 13.2 11.9 11.2 Mar-18
eV All Global Equity Net Median -4.4 -0.6 11.8 28.3 12.6 13.0 12.0 11.6 Mar-18
eV All Global Equity Net Rank 41 73 45 48 71 -- -- 69 Mar-18
Wellington Durable Enterprises, L.P. 43,645,775 3.2 29.1 -3.5 -1.0 7.2 21.1 10.4 -- -- 11.0 Mar-18
MSCI ACWI -4.1 -1.1 11.1 27.4 12.6 13.2 11.9 11.2 Mar-18
eV All Global Equity Net Median -4.4 -0.6 11.8 28.3 12.6 13.0 12.0 11.6 Mar-18
eV All Global Equity Net Rank 24 60 86 84 65 -- -- 55 Mar-18
Plymouth County Retirement Association
Total Retirement Association | As of September 30, 2021
11 of 197
Market Value($)
% ofPortfolio
% ofSector
1 Mo(%)
QTD(%)
YTD(%)
1 Yr(%)
3 Yrs(%)
5 Yrs(%)
10 Yrs(%)
Inception(%)
InceptionDate
_
Core Fixed Income 108,964,827 7.9 7.9 -0.5 0.3 0.1 1.3 5.2 3.1 -- 3.8 Jan-16
75% Bbg Aggregate/25% Bbg US TIPs 1-10 year -0.8 0.5 -0.2 0.7 5.6 3.2 2.9 3.8 Jan-16
IR&M Core Bonds 56,151,385 4.1 51.5 -0.8 0.1 -1.1 -0.3 5.5 3.2 3.3 4.2 Nov-04
Bloomberg US Aggregate TR -0.9 0.1 -1.6 -0.9 5.4 2.9 3.0 4.1 Nov-04
eV US Core Fixed Inc Net Median -0.8 0.0 -1.3 -0.4 5.6 3.2 3.4 4.3 Nov-04
eV US Core Fixed Inc Net Rank 29 24 37 46 63 52 58 59 Nov-04
Lord Abbett Short Duration Credit Trust II 42,258,267 3.1 38.8 0.0 0.2 1.2 2.8 -- -- -- 2.8 Aug-19
Bloomberg US Credit 1-3 Yr TR 0.0 0.1 0.4 0.9 3.3 2.4 2.2 2.6 Aug-19
eV US Short Duration Fixed Inc Net Median -0.1 0.1 0.0 0.4 3.1 2.1 1.8 2.5 Aug-19
eV US Short Duration Fixed Inc Net Rank 11 9 8 6 -- -- -- 21 Aug-19
Rhumbline TIPS Trust 10,555,175 0.8 9.7 -0.7 1.8 3.5 5.1 -- -- -- 4.4 Sep-20
Bloomberg US TIPS TR -0.7 1.8 3.5 5.2 7.4 4.3 3.1 4.4 Sep-20
eV US TIPS / Inflation Fixed Inc Net Median -0.7 1.6 3.5 5.3 7.3 4.5 3.1 4.7 Sep-20
eV US TIPS / Inflation Fixed Inc Net Rank 62 31 52 65 -- -- -- 66 Sep-20
Value Added Fixed Income 124,055,705 9.0 9.0 -0.1 0.5 3.9 9.7 5.6 5.3 -- 6.5 Jan-16
Custom Benchmark -0.8 0.1 1.0 5.9 5.3 4.9 -- 6.4 Jan-16
Eaton Vance High Yield 24,734,552 1.8 19.9 0.1 0.7 4.3 10.4 6.4 5.8 7.0 6.9 Apr-06
ICE BofA US High Yield TR 0.0 0.9 4.7 11.5 6.6 6.4 7.3 7.2 Apr-06
eV US High Yield Fixed Inc Net Median 0.1 0.8 4.2 10.4 6.4 6.0 6.8 6.8 Apr-06
eV US High Yield Fixed Inc Net Rank 53 63 47 51 48 60 44 41 Apr-06
First Eagle Bank Loan Select Fund 23,720,659 1.7 19.1 0.6 1.2 5.0 8.8 4.1 4.4 5.7 5.2 Sep-10
Credit Suisse Leveraged Loans 0.6 1.1 4.7 8.5 4.1 4.6 5.0 4.8 Sep-10
Bank Loan MStar MF Median 0.6 0.9 4.0 7.9 3.4 4.0 4.4 4.2 Sep-10
Bank Loan MStar MF Rank 39 13 16 24 19 16 1 1 Sep-10
Plymouth County Retirement Association
Total Retirement Association | As of September 30, 2021
12 of 197

Plymouth County Retirement Association
Total Retirement Association | As of September 30, 2021
Market Value($)
% ofPortfolio
% ofSector
1 Mo(%)
QTD(%)
YTD(%)
1 Yr(%)
3 Yrs(%)
5 Yrs(%)
10 Yrs(%)
Inception(%)
InceptionDate
_
Manulife Strategic Fixed Income 35,643,350 2.6 28.7 -0.8 -0.4 0.9 5.3 -- -- -- 5.1 Jul-19
Bloomberg Multiverse TR -1.8 -0.9 -3.8 -0.4 4.3 2.2 2.1 2.7 Jul-19
Multisector Bond MStar MF Median -0.3 0.4 2.6 6.9 5.7 4.7 5.2 4.8 Jul-19
Multisector Bond MStar MF Rank 91 99 87 81 -- -- -- 43 Jul-19
Mesirow High Yield 17,658,038 1.3 14.2 0.4 1.1 10.3 21.2 -- -- -- 11.3 Aug-19
Bloomberg US Corporate High Yield TR 0.0 0.9 4.5 11.3 6.9 6.5 7.4 7.0 Aug-19
eV US High Yield Fixed Inc Net Median 0.1 0.8 4.2 10.4 6.4 6.0 6.8 6.5 Aug-19
eV US High Yield Fixed Inc Net Rank 13 9 3 2 -- -- -- 1 Aug-19
Eaton Vance EMD Opportunities Fund 22,299,105 1.6 18.0 -0.3 0.5 3.5 10.7 -- -- -- 9.8 Aug-20
JP Morgan EMBI Global Diversified -2.1 -0.7 -1.4 4.4 5.7 3.9 5.8 2.5 Aug-20
eV Emg Mkts Fixed Inc - Blended Currency Net Median -2.4 -1.4 -2.5 5.6 5.3 3.6 4.4 3.6 Aug-20
eV Emg Mkts Fixed Inc - Blended Currency Net Rank 1 6 6 10 -- -- -- 9 Aug-20
Hedge Funds 91,139,844 6.6 6.6 -0.2 0.4 6.2 24.2 5.6 6.6 5.8 5.2 Feb-10
Custom Benchmark 0.4 0.8 5.7 14.0 6.5 5.8 4.5 3.9 Feb-10
ABS Offshore SPC - Global Segregated Portfolio 37,919,117 2.8 41.6 -1.1 0.0 2.7 16.4 7.6 7.5 6.6 6.2 Aug-10
HFRI Fund of Funds Composite Index 0.1 0.8 5.8 14.3 6.5 5.8 4.5 4.1 Aug-10
Entrust Special Opportunities Fund III, Ltd. 20,908,855 1.5 22.9 -1.2 -1.2 8.3 34.9 3.7 9.5 -- 9.5 Oct-16
HFRI Fund of Funds Composite Index (QTR) 0.7 0.7 5.5 13.5 6.2 5.6 4.4 5.6 Oct-16
Old Farm Partners Master Fund, L.P. 11,613,154 0.8 12.7 1.2 2.0 7.3 23.9 9.2 -- -- 9.2 Oct-18
HFRI Fund of Funds Composite Index 0.1 0.8 5.8 14.3 6.5 5.8 4.5 6.5 Oct-18
EnTrustPermal Special Opportunities Evergreen Fund,Ltd.
20,698,718 1.5 22.7 1.8 1.8 9.2 26.4 -- -- -- 11.4 Jan-19
HFRI Fund of Funds Composite Index (QTR) 0.7 0.7 5.5 13.5 6.2 5.6 4.4 8.8 Jan-19
Note: The data for Entrust Special Opportunities Fund III, Ltd and Entrust Permal Special Opportunities Evergreen Fund, Ltd is based on preliminary fair marketvalue.
13 of 197

Prepared by Meketa Investment Group
Plymouth County Retirement Association
Total Retirement Association | As of September 30, 2021
Market Value($)
% ofPortfolio
% ofSector
1 Mo(%)
QTD(%)
YTD(%)
1 Yr(%)
3 Yrs(%)
5 Yrs(%)
10 Yrs(%)
Inception(%)
InceptionDate
_
Real Estate 124,652,087 9.0 9.0 8.1 8.9 15.8 23.0 11.3 8.4 -- 8.0 Jan-16
80% NCREIF ODCE / 20% Wilshire REIT 4.1 5.6 15.0 18.5 7.3 6.9 -- 7.2 Jan-16
Core Real Estate 78,730,599 5.7 63.2 7.7 9.1 16.0 19.2 10.0 8.4 -- 8.7 Jan-16
NCREIF-ODCE 6.6 6.6 13.1 14.6 7.1 7.5 9.9 7.7 Jan-16
TA Realty Core Property Fund, L.P. 47,524,726 3.4 60.4 11.0 11.0 19.5 23.8 13.1 -- -- 12.5 Apr-18
NCREIF ODCE 6.6 6.6 13.2 14.6 7.1 7.5 9.9 7.3 Apr-18
JPMorgan Strategic Property 31,205,873 2.3 39.6 3.1 6.4 11.0 12.9 -- -- -- 5.6 Apr-19
NCREIF-ODCE 6.6 6.6 13.1 14.6 7.1 7.5 9.9 7.2 Apr-19
Non-Core Real Estate 45,921,488 3.3 36.8 8.6 8.6 15.5 28.9 13.6 7.2 -- 4.6 Jan-16
Private Equity 152,486,273 11.1 11.1 12.0 12.0 37.9 47.8 19.2 15.7 -- 12.4 Jan-16
Cambridge Associates FoF Composite 1Q Lagged 11.6 11.6 47.5 61.0 23.3 19.5 14.4 17.2 Jan-16
Private Equity 140,570,718 10.2 92.2 12.6 12.5 36.9 47.5 19.9 15.2 -- 11.8 Jan-16
Venture Capital 11,915,555 0.9 7.8 6.3 6.3 50.2 53.0 13.4 14.1 -- 12.4 Jan-16
Real Assets 77,331,287 5.6 5.6 6.0 5.9 13.8 18.2 7.2 4.4 -- 2.3 Jan-16
CPI + 3% 0.6 1.9 7.0 8.4 5.9 5.6 4.9 5.5 Jan-16
IFM Global Infrastructure 42,729,584 3.1 55.3 5.1 4.9 13.1 17.9 11.8 -- -- 11.8 Oct-18
CPI+5% 0.8 2.4 8.5 10.4 7.9 7.6 6.9 7.9 Oct-18
Cash and Cash Equivalent 12,921,128 0.9 0.9
Cash 12,921,128 0.9 100.0 XXXXX
Note: The data for Real Estate, Private Equity, and Real Assets is based on June 30,2021 fair market value, adjusted for subsequent cash flows.Note: The data for TA Realty Core Property Fund,. JPMorgan Strategic Property , and IFM Global Infrastructure is as of September 30, 2021.
14 of 197

Plymouth County Retirement Association
Total Retirement Association | As of September 30, 2021
Attribution Summary
1 Year Ending September 30, 2021
Wtd. ActualReturn
Wtd. IndexReturn
ExcessReturn
SelectionEffect
AllocationEffect
InteractionEffects
TotalEffects
Domestic Equity Assets 38.6% 30.9% 7.6% 1.9% 0.0% 0.0% 2.0%
International Equity 22.6% 25.2% -2.6% -0.5% -0.1% 0.1% -0.4%
Global Equity Assets 27.1% 26.5% 0.6% 0.1% 0.0% 0.0% 0.0%
Fixed Income Assets 5.5% 0.2% 5.3% 1.0% -0.9% 0.2% 0.3%
Hedge Funds 24.2% 13.2% 11.1% 0.5% -0.3% 0.2% 0.5%
Real Estate 23.0% 17.6% 5.4% 0.6% 0.0% -0.1% 0.5%
Private Equity 47.8% 59.9% -12.0% -1.4% -1.4% 0.5% -2.3%
Real Assets 18.2% 7.7% 10.5% 0.7% 0.0% 0.0% 0.7%
Cash and Cash Equivalent 0.0% 0.0% 0.0% 0.0% -0.2% 0.0% -0.2%
Total 25.9% 24.9% 1.0% 2.8% -2.8% 1.0% 1.0%
15 of 197

Statistics Summary
5 Years Ending September 30, 2021
Anlzd ReturnAnlzd Standard
DeviationInformation Ratio Beta Sharpe Ratio Tracking Error
_
Total Retirement Association 10.1% 9.5% -0.3 1.1 1.0 2.0%
Policy Benchmark (Net) 10.8% 8.6% -- 1.0 1.1 0.0%
Domestic Equity Assets 17.3% 18.2% 0.1 1.1 0.9 4.4%
Russell 3000 16.9% 15.8% -- 1.0 1.0 0.0%
Rhumbline Russell 1000 Value 10.9% 16.3% -0.8 1.0 0.6 0.1%
Russell 1000 Value 10.9% 16.3% -- 1.0 0.6 0.0%
Rhumbline Russell 1000 Growth 22.8% 16.4% -0.8 1.0 1.3 0.1%
Russell 1000 Growth 22.8% 16.4% -- 1.0 1.3 0.0%
Fisher Midcap Value 18.0% 19.6% 1.7 1.0 0.9 4.5%
Russell MidCap Value 10.6% 18.7% -- 1.0 0.5 0.0%
Mellon Small Cap Growth 23.7% 22.2% 1.1 1.0 1.0 7.4%
Russell 2000 Growth 15.3% 21.0% -- 1.0 0.7 0.0%
LMCG Small Cap Value 10.2% 21.1% -0.2 0.9 0.4 4.6%
Russell 2000 Value 11.0% 22.4% -- 1.0 0.4 0.0%
International Equity 8.1% 15.5% -0.3 1.0 0.5 4.4%
International Equity Custom Benchmark 9.3% 15.2% -- 1.0 0.5 0.0%
International Developed Market Equity Assets 6.0% 16.3% -0.7 1.1 0.3 4.2%
MSCI EAFE 8.8% 14.6% -- 1.0 0.5 0.0%
Aristotle International Equity -- -- -- -- -- --
MSCI EAFE 8.8% 14.6% -- 1.0 0.5 0.0%
Walter Scott International Equity -- -- -- -- -- --
MSCI EAFE 8.8% 14.6% -- 1.0 0.5 0.0%
Plymouth County Retirement Association
Total Retirement Association | As of September 30, 2021
16 of 197

Anlzd ReturnAnlzd Standard
DeviationInformation Ratio Beta Sharpe Ratio Tracking Error
_
International Emerging Market Equity Assets 9.6% 16.4% 0.2 1.0 0.5 2.3%
MSCI Emerging Markets 9.2% 16.7% -- 1.0 0.5 0.0%
ABS Emerging Markets -- -- -- -- -- --
MSCI Emerging Markets 9.2% 16.7% -- 1.0 0.5 0.0%
Driehaus Emerging Markets Growth -- -- -- -- -- --
MSCI Emerging Markets 9.2% 16.7% -- 1.0 0.5 0.0%
Global Equity Assets -- -- -- -- -- --
MSCI ACWI 13.2% 14.7% -- 1.0 0.8 0.0%
First Eagle Global Value Fund -- -- -- -- -- --
MSCI ACWI Value NR USD 8.4% 15.5% -- 1.0 0.5 0.0%
Kopernik Global All Cap Fund -- -- -- -- -- --
MSCI ACWI Value NR USD 8.4% 15.5% -- 1.0 0.5 0.0%
Lee Munder Global Multi-Cap Strategy -- -- -- -- -- --
MSCI ACWI 13.2% 14.7% -- 1.0 0.8 0.0%
Wellington Durable Enterprises, L.P. -- -- -- -- -- --
MSCI ACWI 13.2% 14.7% -- 1.0 0.8 0.0%
Fixed Income Assets 4.1% 4.6% 0.2 0.9 0.6 3.5%
Bloomberg US Universal TR 3.3% 3.3% -- 1.0 0.7 0.0%
Core Fixed Income 3.1% 3.3% -0.1 1.0 0.6 1.6%
75% Bbg Aggregate/25% Bbg US TIPs 1-10 year 3.2% 3.0% -- 1.0 0.7 0.0%
IR&M Core Bonds 3.2% 3.2% 0.3 0.9 0.7 1.0%
Bloomberg US Aggregate TR 2.9% 3.3% -- 1.0 0.6 0.0%
Lord Abbett Short Duration Credit Trust II -- -- -- -- -- --
Plymouth County Retirement Association
Total Retirement Association | As of September 30, 2021
17 of 197

Anlzd ReturnAnlzd Standard
DeviationInformation Ratio Beta Sharpe Ratio Tracking Error
_
Bloomberg US Credit 1-3 Yr TR 2.4% 1.5% -- 1.0 0.9 0.0%
Rhumbline TIPS Trust -- -- -- -- -- --
Bloomberg US TIPS TR 4.3% 3.7% -- 1.0 0.9 0.0%
Value Added Fixed Income 5.3% 6.3% 0.3 1.0 0.7 1.4%
Custom Benchmark 4.9% 6.3% -- 1.0 0.6 0.0%
Eaton Vance High Yield 5.8% 6.7% -0.6 0.9 0.7 1.0%
ICE BofA US High Yield TR 6.4% 7.4% -- 1.0 0.7 0.0%
First Eagle Bank Loan Select Fund 4.4% 6.5% -0.4 1.0 0.5 0.6%
Credit Suisse Leveraged Loans 4.6% 6.8% -- 1.0 0.5 0.0%
Manulife Strategic Fixed Income -- -- -- -- -- --
Bloomberg Multiverse TR 2.2% 4.7% -- 1.0 0.2 0.0%
Mesirow High Yield -- -- -- -- -- --
Bloomberg US Corporate High Yield TR 6.5% 7.3% -- 1.0 0.7 0.0%
Eaton Vance EMD Opportunities Fund -- -- -- -- -- --
JP Morgan EMBI Global Diversified 3.9% 9.0% -- 1.0 0.3 0.0%
Hedge Funds 6.6% 12.4% 0.1 1.9 0.4 7.1%
Custom Benchmark 5.8% 6.0% -- 1.0 0.8 0.0%
ABS Offshore SPC - Global Segregated Portfolio 7.5% 8.1% 0.5 1.3 0.8 3.5%
HFRI Fund of Funds Composite Index 5.8% 5.8% -- 1.0 0.8 0.0%
Entrust Special Opportunities Fund III, Ltd. 9.5% 22.6% 0.2 2.5 0.4 16.6%
HFRI Fund of Funds Composite Index (QTR) 5.6% 7.6% -- 1.0 0.6 0.0%
Old Farm Partners Master Fund, L.P. -- -- -- -- -- --
HFRI Fund of Funds Composite Index 5.8% 5.8% -- 1.0 0.8 0.0%
EnTrustPermal Special Opportunities EvergreenFund, Ltd.
-- -- -- -- -- --
Plymouth County Retirement Association
Total Retirement Association | As of September 30, 2021
18 of 197

Anlzd ReturnAnlzd Standard
DeviationInformation Ratio Beta Sharpe Ratio Tracking Error
_
HFRI Fund of Funds Composite Index (QTR) 5.6% 7.6% -- 1.0 0.6 0.0%
Real Estate 8.4% 5.7% 0.3 0.8 1.3 4.5%
80% NCREIF ODCE / 20% Wilshire REIT 6.9% 4.3% -- 1.0 1.3 0.0%
Core Real Estate 8.4% 4.9% 0.3 1.0 1.5 2.8%
NCREIF-ODCE 7.5% 4.2% -- 1.0 1.5 0.0%
TA Realty Core Property Fund, L.P. -- -- -- -- -- --
NCREIF ODCE 7.5% 4.2% -- 1.0 1.5 0.0%
JPMorgan Strategic Property -- -- -- -- -- --
NCREIF-ODCE 7.5% 4.2% -- 1.0 1.5 0.0%
Private Equity 15.7% 11.2% -0.6 0.8 1.3 6.4%
Cambridge Associates FoF Composite 1QLagged
19.5% 12.6% -- 1.0 1.5 0.0%
Real Assets 4.4% 5.2% -0.3 1.4 0.6 5.1%
CPI + 3% 5.6% 0.9% -- 1.0 5.1 0.0%
IFM Global Infrastructure -- -- -- -- -- --
CPI+5% 7.6% 0.9% -- 1.0 7.5 0.0%XXXXX
Plymouth County Retirement Association
Total Retirement Association | As of September 30, 2021
19 of 197

Asset Allocation on September 30, 2021Actual Actual
_
Fisher Midcap Value $71,200,032 19.6%
LMCG Small Cap Value $78,210,339 21.5%
Mellon Small Cap Growth $74,904,714 20.6%
Rhumbline Russell 1000 Growth $70,114,267 19.3%
Rhumbline Russell 1000 Value $69,323,971 19.1%
Total $363,753,323 100.0%_
Plymouth County Retirement Association
As of September 30, 2021
Plymouth County Retirement Association
Domestic Equity Assets | As of September 30, 2021
20 of 197
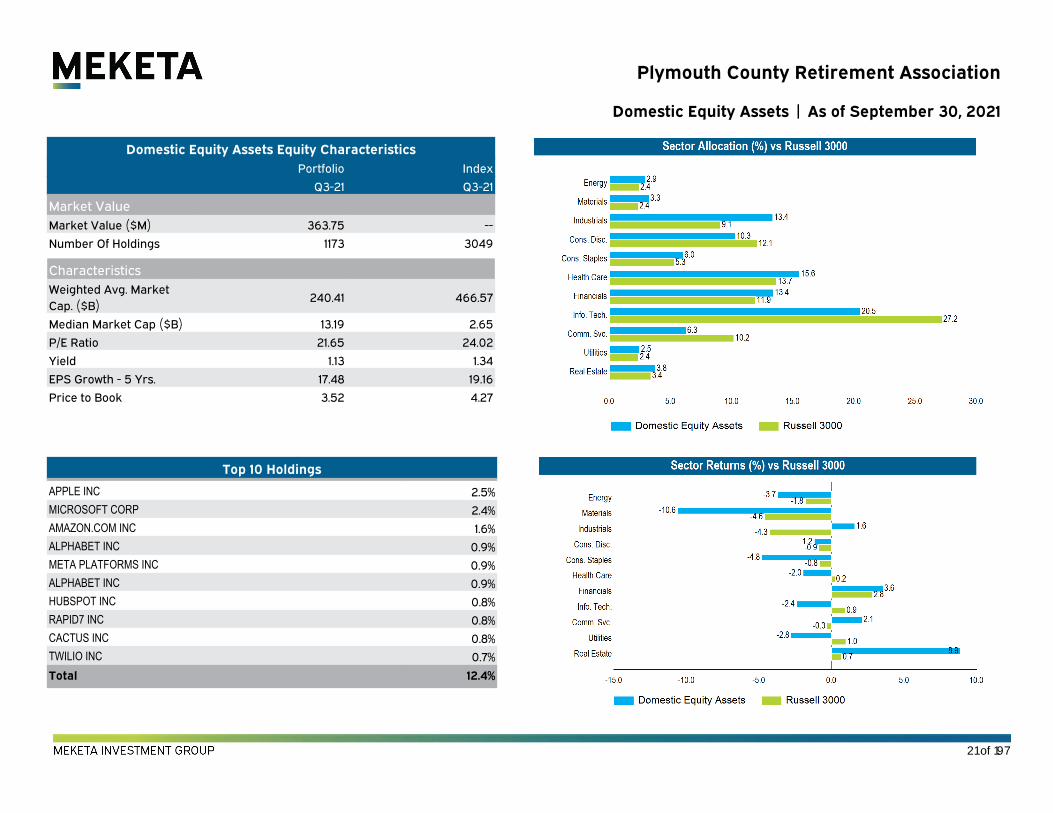
Top 10 Holdings_
APPLE INC 2.5%MICROSOFT CORP 2.4%AMAZON.COM INC 1.6%ALPHABET INC 0.9%META PLATFORMS INC 0.9%ALPHABET INC 0.9%HUBSPOT INC 0.8%RAPID7 INC 0.8%CACTUS INC 0.8%TWILIO INC 0.7%
Total 12.4%_
Domestic Equity Assets Equity CharacteristicsPortfolio Index
Q3-21 Q3-21
Market ValueMarket Value ($M) 363.75 --
Number Of Holdings 1173 3049
CharacteristicsWeighted Avg. MarketCap. ($B)
240.41 466.57
Median Market Cap ($B) 13.19 2.65
P/E Ratio 21.65 24.02
Yield 1.13 1.34
EPS Growth - 5 Yrs. 17.48 19.16
Price to Book 3.52 4.27
Plymouth County Retirement Association
Domestic Equity Assets | As of September 30, 2021
21 of 197

Asset Allocation on September 30, 2021Actual Actual
_
ABS Emerging Markets $68,577,165 39.5%
Aristotle International Equity $23,881,714 13.8%
Driehaus Emerging Markets Growth $59,437,458 34.3%
Walter Scott International Equity $21,497,874 12.4%
Total $173,394,210 100.0%_
Plymouth County Retirement Association
International Equity | As of September 30, 2021
22 of 197

Top 10 Holdings_
TAIWAN SEMICONDUCTOR MANUFACTURING CO LTD 4.2%TENCENT HOLDINGS LTD 3.1%SAMSUNG ELECTRONICS CO LTD 2.9%ICICI BANK LTD 1.5%VISA INC 1.3%RELIANCE INDUSTRIES LTD 1.3%SBERBANK OF RUSSIA OJSC 1.2%APPLE INC 1.2%MICROSOFT CORP 1.2%ISHARES CORE MSCI EMERGING MARKETS ETF 1.2%
Total 19.0%_
International Equity Equity CharacteristicsPortfolio Index
Q3-21 Q3-21
Market ValueMarket Value ($M) 173.39 --
Number Of Holdings 214 2348
CharacteristicsWeighted Avg. MarketCap. ($B)
231.70 94.55
Median Market Cap ($B) 43.38 10.26
P/E Ratio 26.67 15.76
Yield 1.46 2.64
EPS Growth - 5 Yrs. 16.27 11.88
Price to Book 3.98 2.70
Plymouth County Retirement Association
International Equity | As of September 30, 2021
23 of 197

Asset Allocation on September 30, 2021Actual Actual
_
First Eagle Global Value Fund $24,682,559 16.4%
Kopernik Global All Cap Fund $37,557,368 25.0%
Lee Munder Global Multi-Cap Strategy $44,187,796 29.4%
Wellington Durable Enterprises, L.P. $43,645,775 29.1%
Total $150,073,498 100.0%_
Plymouth County Retirement Association
Global Equity Assets | As of September 30, 2021
24 of 197

Top 10 Holdings_
MICROSOFT CORP 2.5%ALPHABET INC 2.3%APPLE INC 2.2%ISHARES CORE MSCI EMERGING MARKETS ETF 2.2%AMAZON.COM INC 2.1%GAZPROM 1.6%META PLATFORMS INC 1.5%KT CORP 1.4%COMCAST CORP 1.4%CAMECO CORP 1.4%
Total 18.7%_
Global Equity Assets Equity CharacteristicsPortfolio Index
Q3-21 Q3-21
Market ValueMarket Value ($M) 150.07 --
Number Of Holdings 310 2973
CharacteristicsWeighted Avg. MarketCap. ($B)
273.27 353.48
Median Market Cap ($B) 17.53 13.68
P/E Ratio 14.36 20.42
Yield 2.16 1.88
EPS Growth - 5 Yrs. 15.95 16.51
Price to Book 2.92 3.66
Plymouth County Retirement Association
Global Equity Assets | As of September 30, 2021
25 of 197

Asset Allocation on September 30, 2021Actual Actual
_
Eaton Vance EMD Opportunities Fund $22,299,105 9.6%
Eaton Vance High Yield $24,734,552 10.6%
First Eagle Bank Loan Select Fund $23,720,659 10.2%
IR&M Core Bonds $56,151,385 24.1%
Lord Abbett Short Duration Credit Trust II $42,258,267 18.1%
Manulife Strategic Fixed Income $35,643,350 15.3%
Mesirow High Yield $17,658,038 7.6%
Rhumbline TIPS Trust $10,555,175 4.5%
Total $233,020,532 100.0%_
Fixed Income Assets Characteristics
vs. Bloomberg US Universal TR
Portfolio Index Portfolio
Q3-21 Q3-21 Q2-21
Fixed Income Characteristics
Yield to Maturity 3.9 1.9 3.7
Average Duration 4.1 6.6 3.9
Average Quality BBB AA BBB
Weighted Average Maturity 6.6 12.8 6.6XXXXX
Plymouth County Retirement Association
Fixed Income Assets | As of September 30, 2021
26 of 197

Top 10 Holdings_
BERKSHIRE HATHAWAY INC 2.6%JPMORGAN CHASE & CO 2.4%JOHNSON & JOHNSON 2.1%UNITEDHEALTH GROUP INC 1.9%BANK OF AMERICA CORP 1.7%PROCTER & GAMBLE CO (THE) 1.7%WALT DISNEY CO (THE) 1.4%EXXON MOBIL CORP 1.3%PFIZER INC 1.2%CISCO SYSTEMS INC 1.1%
Total 17.4%_
Portfolio Performance Summary
QTD(%)
1 Yr(%)
3 Yrs(%)
5 Yrs(%)
10 Yrs(%)
Inception(%)
InceptionDate
_
Rhumbline Russell 1000 Value -0.8 34.9 10.1 10.9 -- 10.5 Apr-13
Russell 1000 Value -0.8 35.0 10.1 10.9 13.5 10.7 Apr-13
eV US Large Cap Value Equity NetMedian
-0.8 35.4 10.1 11.7 13.5 11.0 Apr-13
eV US Large Cap Value Equity NetRank
51 53 51 67 -- 63 Apr-13XXXXX
Account InformationAccount Name Rhumbline Russell 1000 Value
Account Structure Commingled Fund
Investment Style Passive
Inception Date 4/30/13
Account Type US Equity
Benchmark Russell 1000 Value
Universe eV US Large Cap Value Equity Net
Rhumbline Russell 1000 Value CharacteristicsPortfolio Index Portfolio
Q3-21 Q3-21 Q2-21
Market ValueMarket Value ($M) 69.3 -- 54.9
Number Of Holdings 844 848 844
CharacteristicsWeighted Avg. MarketCap. ($B)
156.9 156.3 151.8
Median Market Cap($B)
13.8 13.8 14.0
P/E Ratio 18.7 18.7 20.7
Yield 2.0 2.0 1.9
EPS Growth - 5 Yrs. 12.1 11.9 11.0
Price to Book 2.6 2.6 2.7
Sector DistributionEnergy 5.3 4.5 5.2
Materials 3.7 3.7 3.8
Industrials 11.7 11.7 12.0
ConsumerDiscretionary
5.6 5.3 5.7
Consumer Staples 7.0 7.2 7.2
Health Care 17.3 17.5 17.3
Financials 22.0 21.7 20.9
Information Technology 9.8 10.3 10.2
CommunicationServices
7.8 8.4 8.5
Utilities 4.9 4.9 4.8
Real Estate 4.8 4.8 4.5
Plymouth County Retirement Association
Rhumbline Russell 1000 Value | As of September 30, 2021
27 of 197

Top 10 Holdings_
APPLE INC 10.4%MICROSOFT CORP 10.0%AMAZON.COM INC 6.7%META PLATFORMS INC 3.8%ALPHABET INC 3.2%ALPHABET INC 3.0%TESLA INC 2.9%NVIDIA CORPORATION 2.3%VISA INC 1.8%HOME DEPOT INC. (THE) 1.6%
Total 45.7%_
Rhumbline Russell 1000 Growth CharacteristicsPortfolio Index Portfolio
Q3-21 Q3-21 Q2-21
Market ValueMarket Value ($M) 70.1 -- 59.5
Number Of Holdings 496 500 501
CharacteristicsWeighted Avg. MarketCap. ($B)
814.8 815.3 778.5
Median Market Cap($B)
19.7 19.5 18.9
P/E Ratio 34.6 34.6 38.4
Yield 0.7 0.7 0.7
EPS Growth - 5 Yrs. 26.3 26.3 26.4
Price to Book 12.8 12.8 13.5
Sector DistributionEnergy 0.3 0.2 0.3
Materials 1.0 1.0 1.0
Industrials 5.9 5.9 6.3
ConsumerDiscretionary
18.4 18.4 18.4
Consumer Staples 3.8 3.8 3.8
Health Care 9.2 9.2 9.0
Financials 2.4 2.5 2.3
Information Technology 44.2 44.5 43.5
CommunicationServices
12.7 12.7 12.5
Utilities 0.0 0.0 0.0
Real Estate 1.7 1.7 1.7
Account InformationAccount Name Rhumbline Russell 1000 Growth
Account Structure Commingled Fund
Investment Style Passive
Inception Date 7/31/09
Account Type US Equity
Benchmark Russell 1000 Growth
Universe eV US Large Cap Growth Equity Net
Portfolio Performance Summary
QTD(%)
1 Yr(%)
3 Yrs(%)
5 Yrs(%)
10 Yrs(%)
Inception(%)
InceptionDate
_
Rhumbline Russell 1000 Growth 1.2 27.3 22.0 22.8 19.6 17.9 Jul-09
Russell 1000 Growth 1.2 27.3 22.0 22.8 19.7 18.0 Jul-09
eV US Large Cap Growth Equity NetMedian
0.5 26.4 20.5 21.1 18.3 16.6 Jul-09
eV US Large Cap Growth Equity NetRank
32 41 32 30 20 14 Jul-09XXXXX
Plymouth County Retirement Association
Rhumbline Russell 1000 Growth | As of September 30, 2021
28 of 197

Top 10 Holdings_
CHARLES RIVER LABORATORIES INTERNATIONAL INC 5.1%SVB FINANCIAL GROUP 3.9%FREEPORT-MCMORAN INC 3.3%PERKINELMER INC. 3.2%SYNOPSYS INC 3.1%UNITED RENTALS INC. 3.0%RAYMOND JAMES FINANCIAL INC. 2.5%COOPER COS INC (THE) 2.5%PROLOGIS INC 2.5%TERADYNE INC. 2.4%
Total 31.5%_
Account InformationAccount Name Fisher Midcap Value
Account Structure Separate Account
Investment Style Active
Inception Date 4/30/07
Account Type US Equity
Benchmark Russell MidCap Value
Universe eV US Mid Cap Value Equity Net
Portfolio Performance Summary
QTD(%)
1 Yr(%)
3 Yrs(%)
5 Yrs(%)
10 Yrs(%)
Inception(%)
InceptionDate
_
Fisher Midcap Value -0.2 45.8 17.3 18.0 16.1 10.1 Apr-07
Russell MidCap Value -1.0 42.4 10.3 10.6 13.9 7.9 Apr-07
Russell MidCap -0.9 38.1 14.2 14.4 15.5 9.6 Apr-07
eV US Mid Cap Value Equity NetMedian
-0.9 45.4 9.7 10.9 13.7 8.3 Apr-07
eV US Mid Cap Value Equity NetRank
19 49 1 1 2 7 Apr-07
Fisher Midcap Value CharacteristicsPortfolio Index Portfolio
Q3-21 Q3-21 Q2-21
Market ValueMarket Value ($M) 71.2 -- 71.2
Number Of Holdings 73 700 73
CharacteristicsWeighted Avg. MarketCap. ($B)
24.3 20.9 24.2
Median Market Cap($B)
17.1 10.9 17.0
P/E Ratio 19.2 18.2 22.7
Yield 0.8 1.7 0.8
EPS Growth - 5 Yrs. 21.0 13.7 19.0
Price to Book 3.5 2.5 3.7
Sector DistributionEnergy 3.4 4.6 3.6
Materials 8.8 7.3 9.4
Industrials 16.9 15.7 18.1
ConsumerDiscretionary
5.4 10.7 5.7
Consumer Staples 0.8 4.2 0.9
Health Care 21.4 8.4 20.1
Financials 17.6 16.9 16.5
Information Technology 20.4 9.9 20.6
CommunicationServices
0.4 4.0 0.5
Utilities 0.0 7.0 0.0
Real Estate 4.9 11.1 4.6
Plymouth County Retirement Association
Fisher Midcap Value | As of September 30, 2021
29 of 197

Top 10 Holdings_
HUBSPOT INC 3.2%RAPID7 INC 3.1%TWILIO INC 2.7%PLANET FITNESS INC 2.6%BIOHAVEN PHARMACEUTICAL HOLDING CO LTD 2.2%KORNIT DIGITAL LTD 2.1%ENERGY RECOVERY INC 2.0%CONSTRUCTION PARTNERS INC 1.9%FRESHPET INC 1.9%REDFIN CORP 1.8%
Total 23.6%_
Account InformationAccount Name Mellon Small Cap Growth
Account Structure Separate Account
Investment Style Active
Inception Date 8/31/09
Account Type US Equity
Benchmark Russell 2000 Growth
Universe eV US Small Cap Growth Equity Net
Boston Company Small Cap Growth Characteristics
Portfolio Index Portfolio
Q3-21 Q3-21 Q2-21
Market Value
Market Value ($M) 74.9 -- 79.7
Number Of Holdings 109 1224 101
Characteristics
Weighted Avg. MarketCap. ($B)
6.9 3.8 7.6
Median Market Cap ($B) 3.5 1.4 4.0
P/E Ratio 29.4 26.1 37.0
Yield 0.1 0.4 0.1
EPS Growth - 5 Yrs. 27.7 18.7 21.9
Price to Book 5.1 5.1 5.7
Sector Distribution
Energy 2.8 2.1 1.0
Materials 1.5 2.9 1.4
Industrials 15.0 14.0 13.1
Consumer Discretionary 9.2 14.9 8.6
Consumer Staples 4.9 3.7 5.9
Health Care 31.2 29.0 31.5
Financials 3.0 5.1 1.6
Information Technology 21.8 22.6 20.6
Communication Services 3.5 2.7 2.5
Utilities 0.0 0.3 0.0
Real Estate 2.9 2.8 2.1
Portfolio Performance Summary
QTD(%)
1 Yr(%)
3 Yrs(%)
5 Yrs(%)
10 Yrs(%)
Inception(%)
InceptionDate
_
Mellon Small Cap Growth -5.1 26.0 21.3 23.7 19.9 17.7 Aug-09
Russell 2000 Growth -5.7 33.3 11.7 15.3 15.7 14.7 Aug-09
eV US Small Cap Growth Equity Net Median -1.9 38.8 17.1 19.8 17.7 16.5 Aug-09
eV US Small Cap Growth Equity Net Rank 90 93 25 25 16 34 Aug-09XXXXX
Plymouth County Retirement Association
Mellon Small Cap Growth | As of September 30, 2021
30 of 197

Portfolio Performance Summary
QTD(%)
1 Yr(%)
3 Yrs(%)
5 Yrs(%)
10 Yrs(%)
Inception(%)
InceptionDate
_
LMCG Small Cap Value -0.3 57.4 8.7 10.2 12.8 9.3 Mar-11
Russell 2000 Value -3.0 63.9 8.6 11.0 13.2 9.7 Mar-11
eV US Small Cap Value Equity NetMedian
-2.0 58.0 8.6 10.9 13.2 10.0 Mar-11
eV US Small Cap Value Equity NetRank
19 53 47 60 66 68 Mar-11XXXXX
Account InformationAccount Name LMCG Small Cap Value
Account Structure Separate Account
Investment Style Active
Inception Date 3/31/11
Account Type US Equity
Benchmark Russell 2000 Value
Universe eV US Small Cap Value Equity Net
Top 10 Holdings_
PINNACLE FINANCIAL PARTNERS INC 2.8%WESTERN ALLIANCE BANCORPORATION 2.6%STERLING BANCORP 2.4%HOSTESS BRANDS INC 2.3%NEWMARK GROUP INC 2.3%PORTLAND GENERAL ELECTRIC CO 2.2%BANKUNITED INC 2.2%MURPHY USA INC 2.1%MGIC INVESTMENT CORP 2.0%UMPQUA HOLDINGS CORP 2.0%
Total 22.9%_
LMCG Small Cap Value Characteristics
Portfolio Index Portfolio
Q3-21 Q3-21 Q2-21
Market Value
Market Value ($M) 78.2 -- 78.3
Number Of Holdings 89 1426 92
Characteristics
Weighted Avg. MarketCap. ($B)
4.1 2.9 4.1
Median Market Cap ($B) 3.7 1.1 3.8
P/E Ratio 15.8 13.8 19.2
Yield 1.6 1.7 1.6
EPS Growth - 5 Yrs. 12.3 12.8 7.9
Price to Book 2.1 1.8 2.2
Sector Distribution
Energy 3.2 7.1 3.6
Materials 6.6 4.6 7.5
Industrials 20.0 14.7 21.8
Consumer Discretionary 8.3 8.0 8.8
Consumer Staples 8.4 2.8 8.2
Health Care 4.7 11.3 4.8
Financials 25.8 26.3 24.3
Information Technology 7.6 5.4 8.0
Communication Services 2.0 4.2 2.1
Utilities 5.0 4.6 4.9
Real Estate 5.6 11.1 4.7
Plymouth County Retirement Association
LMCG Small Cap Value | As of September 30, 2021
31 of 197

Aristotle International Equity Characteristics
Portfolio Index
Q3-21 Q3-21
Market Value
Market Value ($M) 23.9 --
Number Of Holdings 75 842
Characteristics
Weighted Avg. Market Cap.($B)
510.1 79.8
Median Market Cap ($B) 85.4 14.4
P/E Ratio 23.3 17.8
Yield 1.3 2.7
EPS Growth - 5 Yrs. 20.6 9.9
Price to Book 3.9 2.8
Sector Distribution
Energy 1.9 3.5
Materials 2.0 7.3
Industrials 6.4 15.8
Consumer Discretionary 13.1 12.8
Consumer Staples 5.0 10.2
Health Care 11.0 12.7
Financials 13.3 17.2
Information Technology 22.9 9.6
Communication Services 10.6 4.8
Utilities 1.3 3.3
Real Estate 0.9 2.9
Top 10 Holdings_
APPLE INC 5.0%MICROSOFT CORP 5.0%ISHARES CORE MSCI EMERGING MARKETS ETF 5.0%ALPHABET INC 4.9%AMAZON.COM INC 4.7%ISHARE INC - ISHARES MSCI TAIWAN ETF 2.5%META PLATFORMS INC 2.4%ISHARES MSCI SOUTH KOREA ETF 2.3%CAPITAL ONE FINANCIAL CORP. 2.1%TARGET CORP 1.9%
Total 35.8%_
Portfolio Performance Summary
QTD(%)
1 Yr(%)
3 Yrs(%)
5 Yrs(%)
10 Yrs(%)
Inception(%)
InceptionDate
_
Aristotle International Equity 0.7 -- -- -- -- 10.4 Mar-21
MSCI EAFE -0.4 25.7 7.6 8.8 8.1 7.1 Mar-21
eV EAFE Core Equity Net Median -0.6 25.2 8.0 9.1 9.2 8.1 Mar-21
eV EAFE Core Equity Net Rank 17 -- -- -- -- 23 Mar-21XXXXX
Account InformationAccount Name Aristotle International Equity
Account Structure Commingled Fund
Investment Style Active
Inception Date 3/01/21
Account Type Non-US Stock Developed
Benchmark MSCI EAFE
Universe eV EAFE Core Equity Net
Plymouth County Retirement Association
Aristotle International Equity | As of September 30, 2021
32 of 197
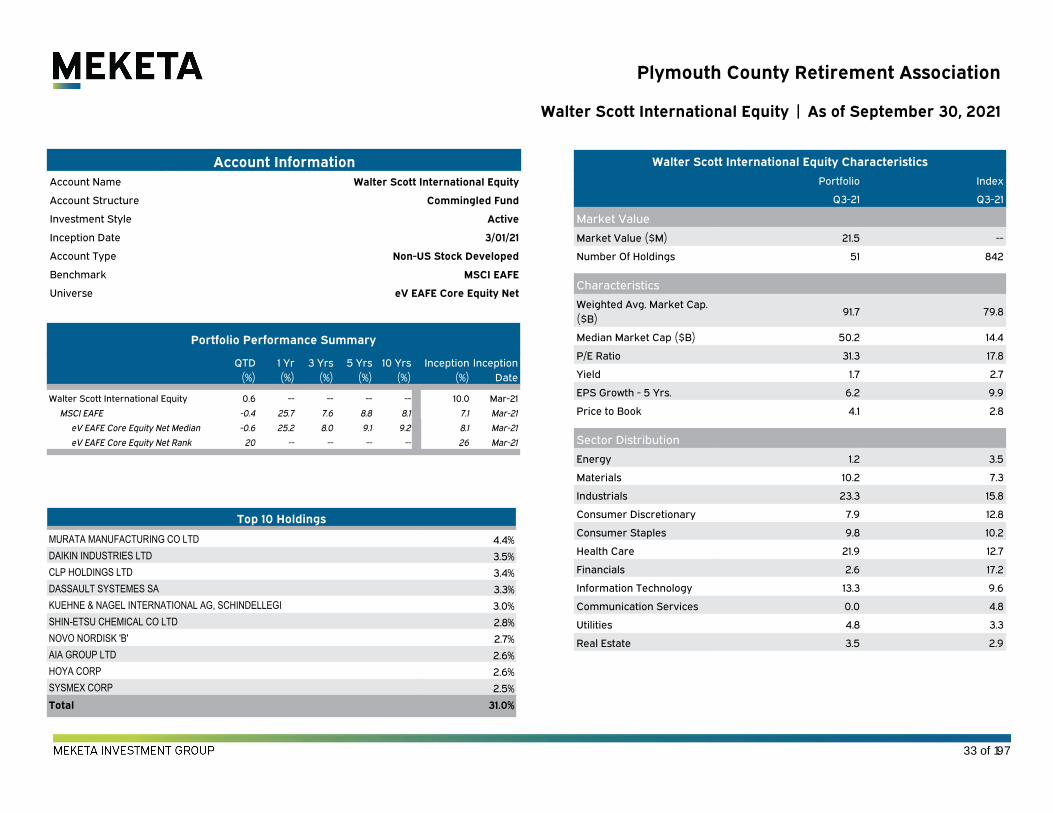
Walter Scott International Equity Characteristics
Portfolio Index
Q3-21 Q3-21
Market Value
Market Value ($M) 21.5 --
Number Of Holdings 51 842
Characteristics
Weighted Avg. Market Cap.($B)
91.7 79.8
Median Market Cap ($B) 50.2 14.4
P/E Ratio 31.3 17.8
Yield 1.7 2.7
EPS Growth - 5 Yrs. 6.2 9.9
Price to Book 4.1 2.8
Sector Distribution
Energy 1.2 3.5
Materials 10.2 7.3
Industrials 23.3 15.8
Consumer Discretionary 7.9 12.8
Consumer Staples 9.8 10.2
Health Care 21.9 12.7
Financials 2.6 17.2
Information Technology 13.3 9.6
Communication Services 0.0 4.8
Utilities 4.8 3.3
Real Estate 3.5 2.9
Top 10 Holdings_
MURATA MANUFACTURING CO LTD 4.4%DAIKIN INDUSTRIES LTD 3.5%CLP HOLDINGS LTD 3.4%DASSAULT SYSTEMES SA 3.3%KUEHNE & NAGEL INTERNATIONAL AG, SCHINDELLEGI 3.0%SHIN-ETSU CHEMICAL CO LTD 2.8%NOVO NORDISK 'B' 2.7%AIA GROUP LTD 2.6%HOYA CORP 2.6%SYSMEX CORP 2.5%
Total 31.0%_
Account InformationAccount Name Walter Scott International Equity
Account Structure Commingled Fund
Investment Style Active
Inception Date 3/01/21
Account Type Non-US Stock Developed
Benchmark MSCI EAFE
Universe eV EAFE Core Equity Net
Plymouth County Retirement Association
Walter Scott International Equity | As of September 30, 2021
Portfolio Performance Summary
QTD(%)
1 Yr(%)
3 Yrs(%)
5 Yrs(%)
10 Yrs(%)
Inception(%)
InceptionDate
_
Walter Scott International Equity 0.6 -- -- -- -- 10.0 Mar-21
MSCI EAFE -0.4 25.7 7.6 8.8 8.1 7.1 Mar-21
eV EAFE Core Equity Net Median -0.6 25.2 8.0 9.1 9.2 8.1 Mar-21
eV EAFE Core Equity Net Rank 20 -- -- -- -- 26 Mar-21XXXXX
33 of 197

Account InformationAccount Name Driehaus Emerging Markets Growth
Account Structure Commingled Fund
Investment Style Active
Inception Date 3/01/19
Account Type Non-US Stock Emerging
Benchmark MSCI Emerging Markets
Universe eV Emg Mkts Equity Net
Top 10 Holdings_
TAIWAN SEMICONDUCTOR MANUFACTURING CO LTD 6.9%TENCENT HOLDINGS LTD 5.6%SAMSUNG ELECTRONICS CO LTD 5.3%ICICI BANK LTD 2.7%RELIANCE INDUSTRIES LTD 2.3%SBERBANK OF RUSSIA OJSC 2.1%OIL CO LUKOIL PJSC 2.0%JD.COM INC 2.0%TATA CONSULTANCY SERVICES LTD 1.9%GPO FINANCE BANORTE 1.8%
Total 32.6%_
Driehaus Emerging Markets Growth Characteristics
Portfolio Index Portfolio
Q3-21 Q3-21 Q2-21
Market Value
Market Value ($M) 59.4 -- 63.6
Number Of Holdings 94 1415 91
Characteristics
Weighted Avg. MarketCap. ($B)
167.9 136.2 201.8
Median Market Cap ($B) 29.1 7.1 31.7
P/E Ratio 26.7 13.3 27.7
Yield 1.4 2.5 1.2
EPS Growth - 5 Yrs. 18.5 15.1 16.4
Price to Book 4.0 2.8 4.3
Sector Distribution
Energy 4.8 5.9 3.2
Materials 7.1 8.7 6.9
Industrials 6.8 4.9 6.9
Consumer Discretionary 10.1 14.7 13.0
Consumer Staples 4.8 5.9 4.2
Health Care 4.1 5.0 4.5
Financials 21.2 19.6 18.0
Information Technology 25.8 20.9 28.0
Communication Services 11.1 10.1 11.3
Utilities 1.3 2.3 1.0
Real Estate 0.0 2.1 0.0
Portfolio Performance Summary
QTD(%)
1 Yr(%)
3 Yrs(%)
5 Yrs(%)
10 Yrs(%)
Inception(%)
InceptionDate
_
Driehaus Emerging Markets Growth -6.7 18.0 -- -- -- 15.8 Mar-19
MSCI Emerging Markets -8.1 18.2 8.6 9.2 6.1 9.7 Mar-19
eV Emg Mkts Equity Net Median -6.8 21.4 9.7 9.5 6.7 11.1 Mar-19
eV Emg Mkts Equity Net Rank 48 67 -- -- -- 24 Mar-19XXXXX
Plymouth County Retirement Association
Driehaus Emerging Markets Growth | As of September 30, 2021
34 of 197

Top 10 Holdings_
ORACLE CORP 4.1%COMCAST CORP 3.0%EXXON MOBIL CORP 2.6%PHILIP MORRIS INTERNATIONAL INC 2.1%META PLATFORMS INC 2.1%GROUPE BRUXELLES LAMBERT SA 1.9%DANONE 1.8%C.H. ROBINSON WORLDWIDE INC. 1.7%BRITISH AMERICAN TOBACCO PLC 1.7%BANK OF NEW YORK MELLON CORP (THE) 1.6%
Total 22.5%_
First Eagle Global Value Fund Characteristics
Portfolio Index Portfolio
Q3-21 Q3-21 Q2-21
Market Value
Market Value ($M) 24.7 -- 25.1
Number Of Holdings 141 2973 138
Characteristics
Weighted Avg. MarketCap. ($B)
171.0 353.5 168.1
Median Market Cap ($B) 30.1 13.7 29.7
P/E Ratio 19.2 20.4 22.0
Yield 2.3 1.9 2.2
EPS Growth - 5 Yrs. 11.2 16.5 10.0
Price to Book 2.5 3.7 2.6
Sector Distribution
Energy 4.6 3.5 5.1
Materials 5.3 4.7 6.1
Industrials 10.3 9.7 11.0
Consumer Discretionary 5.5 12.4 5.6
Consumer Staples 11.5 6.8 12.1
Health Care 5.4 11.7 5.2
Financials 14.8 14.4 14.3
Information Technology 11.1 22.3 10.7
Communication Services 5.8 9.2 6.0
Utilities 0.5 2.6 0.6
Real Estate 3.9 2.6 4.0
Account InformationAccount Name First Eagle Global Value Fund
Account Structure Commingled Fund
Investment Style Active
Inception Date 2/01/18
Account Type Equity
Benchmark MSCI ACWI Value NR USD
Universe eV Global Value Equity Net
Portfolio Performance Summary
QTD(%)
1 Yr(%)
3 Yrs(%)
5 Yrs(%)
10 Yrs(%)
Inception(%)
InceptionDate
_
First Eagle Global Value Fund -1.8 20.3 8.6 -- -- 5.9 Feb-18
MSCI ACWI Value NR USD -1.4 31.3 6.5 8.4 8.9 3.9 Feb-18
eV Global Value Equity Net Median -1.4 37.7 8.3 9.7 9.9 5.4 Feb-18
eV Global Value Equity Net Rank 60 98 47 -- -- 46 Feb-18XXXXX
Plymouth County Retirement Association
First Eagle Global Value Fund | As of September 30, 2021
35 of 197
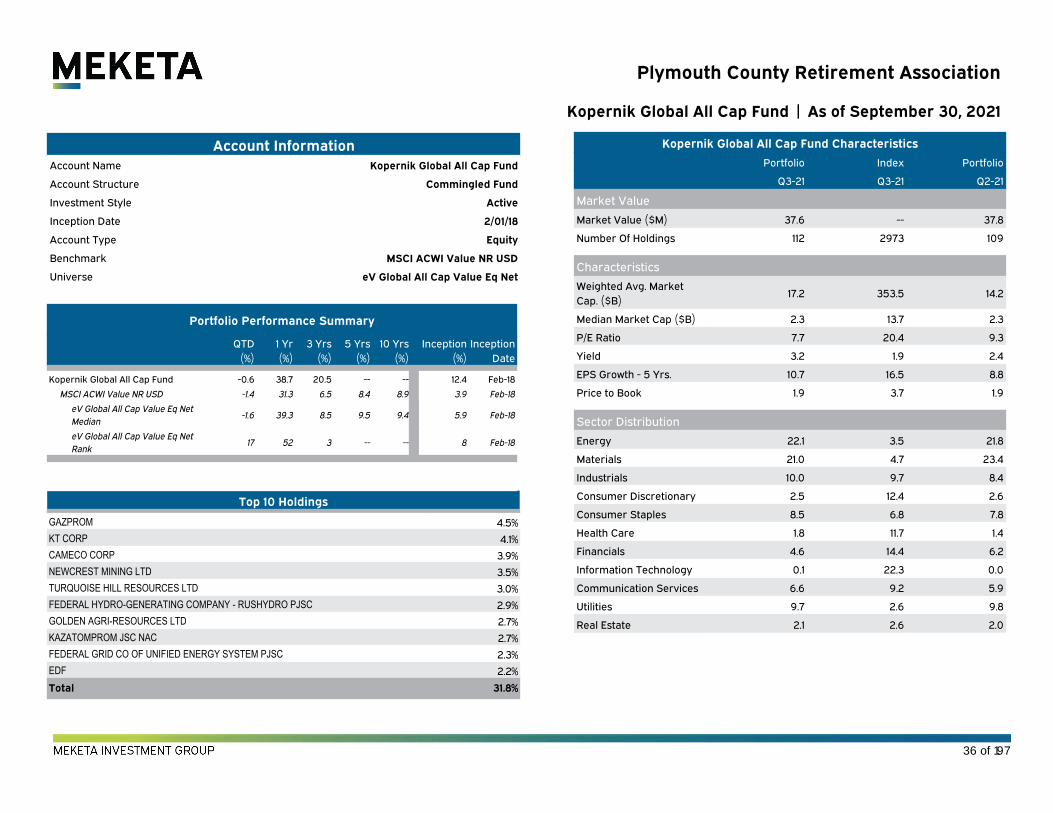
Account InformationAccount Name Kopernik Global All Cap Fund
Account Structure Commingled Fund
Investment Style Active
Inception Date 2/01/18
Account Type Equity
Benchmark MSCI ACWI Value NR USD
Universe eV Global All Cap Value Eq Net
Kopernik Global All Cap Fund Characteristics
Portfolio Index Portfolio
Q3-21 Q3-21 Q2-21
Market Value
Market Value ($M) 37.6 -- 37.8
Number Of Holdings 112 2973 109
Characteristics
Weighted Avg. MarketCap. ($B)
17.2 353.5 14.2
Median Market Cap ($B) 2.3 13.7 2.3
P/E Ratio 7.7 20.4 9.3
Yield 3.2 1.9 2.4
EPS Growth - 5 Yrs. 10.7 16.5 8.8
Price to Book 1.9 3.7 1.9
Sector Distribution
Energy 22.1 3.5 21.8
Materials 21.0 4.7 23.4
Industrials 10.0 9.7 8.4
Consumer Discretionary 2.5 12.4 2.6
Consumer Staples 8.5 6.8 7.8
Health Care 1.8 11.7 1.4
Financials 4.6 14.4 6.2
Information Technology 0.1 22.3 0.0
Communication Services 6.6 9.2 5.9
Utilities 9.7 2.6 9.8
Real Estate 2.1 2.6 2.0
Top 10 Holdings_
GAZPROM 4.5%KT CORP 4.1%CAMECO CORP 3.9%NEWCREST MINING LTD 3.5%TURQUOISE HILL RESOURCES LTD 3.0%FEDERAL HYDRO-GENERATING COMPANY - RUSHYDRO PJSC 2.9%GOLDEN AGRI-RESOURCES LTD 2.7%KAZATOMPROM JSC NAC 2.7%FEDERAL GRID CO OF UNIFIED ENERGY SYSTEM PJSC 2.3%EDF 2.2%
Total 31.8%_
Portfolio Performance Summary
QTD(%)
1 Yr(%)
3 Yrs(%)
5 Yrs(%)
10 Yrs(%)
Inception(%)
InceptionDate
_
Kopernik Global All Cap Fund -0.6 38.7 20.5 -- -- 12.4 Feb-18
MSCI ACWI Value NR USD -1.4 31.3 6.5 8.4 8.9 3.9 Feb-18
eV Global All Cap Value Eq NetMedian
-1.6 39.3 8.5 9.5 9.4 5.9 Feb-18
eV Global All Cap Value Eq NetRank
17 52 3 -- -- 8 Feb-18XXXXX
Plymouth County Retirement Association
Kopernik Global All Cap Fund | As of September 30, 2021
36 of 197

Top 10 Holdings_
APPLE INC 5.0%MICROSOFT CORP 5.0%ISHARES CORE MSCI EMERGING MARKETS ETF 5.0%ALPHABET INC 4.9%AMAZON.COM INC 4.7%ISHARE INC - ISHARES MSCI TAIWAN ETF 2.5%META PLATFORMS INC 2.4%ISHARES MSCI SOUTH KOREA ETF 2.3%CAPITAL ONE FINANCIAL CORP. 2.1%TARGET CORP 1.9%
Total 35.8%_
Lee Munder Global Multi-Cap Strategy Characteristics
Portfolio Index Portfolio
Q3-21 Q3-21 Q2-21
Market Value
Market Value ($M) 44.2 -- 39.9
Number Of Holdings 75 2973 106
Characteristics
Weighted Avg. MarketCap. ($B)
510.1 353.5 271.3
Median Market Cap ($B) 85.4 13.7 50.6
P/E Ratio 23.3 20.4 20.7
Yield 1.3 1.9 1.8
EPS Growth - 5 Yrs. 20.6 16.5 13.0
Price to Book 3.9 3.7 3.0
Sector Distribution
Energy 1.9 3.5 4.5
Materials 2.0 4.7 3.1
Industrials 6.4 9.7 7.9
Consumer Discretionary 13.1 12.4 8.9
Consumer Staples 5.0 6.8 7.6
Health Care 11.0 11.7 12.6
Financials 13.3 14.4 15.5
Information Technology 22.9 22.3 16.1
Communication Services 10.6 9.2 7.0
Utilities 1.3 2.6 1.7
Real Estate 0.9 2.6 1.8
Account InformationAccount Name Lee Munder Global Multi-Cap Strategy
Account Structure Separate Account
Investment Style Active
Inception Date 3/01/18
Account Type Equity
Benchmark MSCI ACWI
Universe eV All Global Equity Net
Portfolio Performance Summary
QTD(%)
1 Yr(%)
3 Yrs(%)
5 Yrs(%)
10 Yrs(%)
Inception(%)
InceptionDate
_
Lee Munder Global Multi-Cap Strategy -1.7 28.8 9.8 -- -- 9.0 Mar-18
MSCI ACWI -1.1 27.4 12.6 13.2 11.9 11.2 Mar-18
eV All Global Equity Net Median -0.6 28.3 12.6 13.0 12.0 11.6 Mar-18
eV All Global Equity Net Rank 73 48 71 -- -- 69 Mar-18XXXXX
Plymouth County Retirement Association
Lee Munder Global Multi-Cap Strategy | As of September 30, 2021
37 of 197

Portfolio Performance Summary
QTD(%)
1 Yr(%)
3 Yrs(%)
5 Yrs(%)
10 Yrs(%)
Inception(%)
InceptionDate
_
IR&M Core Bonds 0.1 -0.3 5.5 3.2 3.3 4.2 Nov-04
Bloomberg US Aggregate TR 0.1 -0.9 5.4 2.9 3.0 4.1 Nov-04
eV US Core Fixed Inc Net Median 0.0 -0.4 5.6 3.2 3.4 4.3 Nov-04
eV US Core Fixed Inc Net Rank 24 46 63 52 58 59 Nov-04XXXXX
Account InformationAccount Name IR&M Core Bonds
Account Structure Separate Account
Investment Style Active
Inception Date 11/30/04
Account Type US Fixed Income Investment Grade
Benchmark Bloomberg US Aggregate TR
Universe eV US Core Fixed Inc Net
IR&M Core Bonds Characteristics
vs. Bloomberg US Aggregate TR
Portfolio Index Portfolio
Q3-21 Q3-21 Q2-21
Fixed Income Characteristics
Yield to Maturity 1.7 1.5 1.7
Average Duration 6.5 6.8 6.4
Average Quality AA AA AA
Weighted Average Maturity 7.8 8.3 7.8XXXXX
Plymouth County Retirement Association
IR&M Core Bonds | As of September 30, 2021
38 of 197
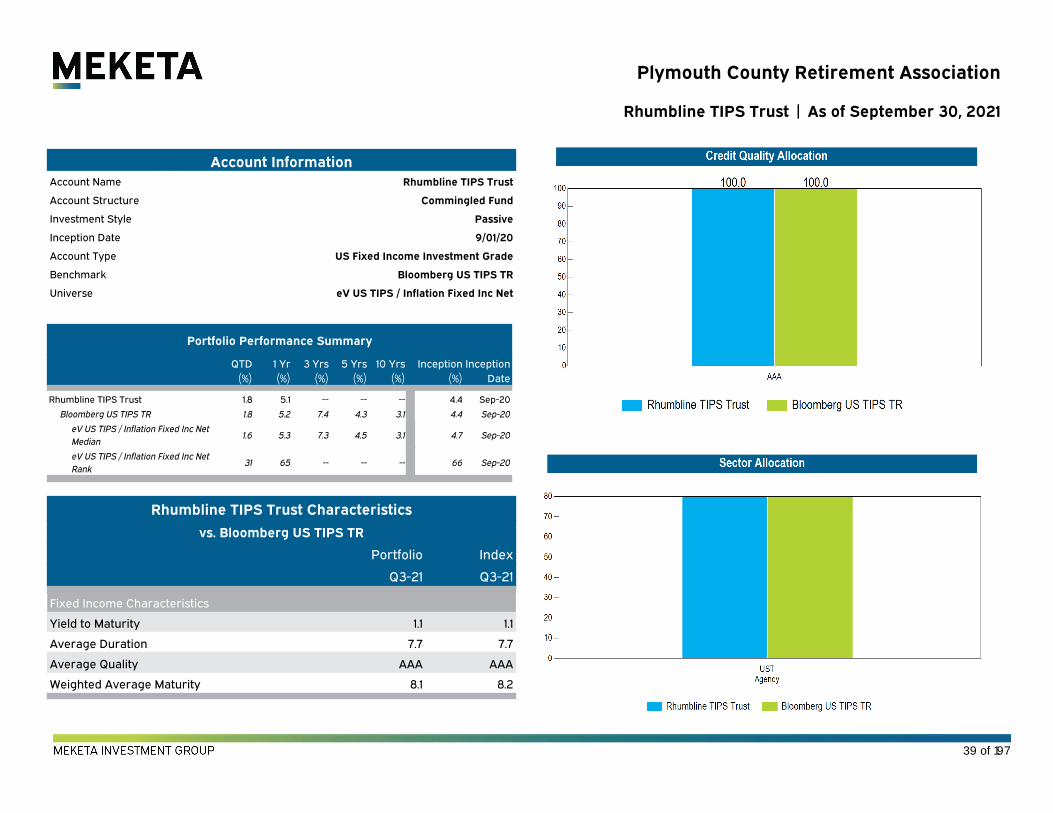
Account InformationAccount Name Rhumbline TIPS Trust
Account Structure Commingled Fund
Investment Style Passive
Inception Date 9/01/20
Account Type US Fixed Income Investment Grade
Benchmark Bloomberg US TIPS TR
Universe eV US TIPS / Inflation Fixed Inc Net
Portfolio Performance Summary
QTD(%)
1 Yr(%)
3 Yrs(%)
5 Yrs(%)
10 Yrs(%)
Inception(%)
InceptionDate
_
Rhumbline TIPS Trust 1.8 5.1 -- -- -- 4.4 Sep-20
Bloomberg US TIPS TR 1.8 5.2 7.4 4.3 3.1 4.4 Sep-20
eV US TIPS / Inflation Fixed Inc NetMedian
1.6 5.3 7.3 4.5 3.1 4.7 Sep-20
eV US TIPS / Inflation Fixed Inc NetRank
31 65 -- -- -- 66 Sep-20XXXXX
Rhumbline TIPS Trust Characteristics
vs. Bloomberg US TIPS TR
Portfolio Index
Q3-21 Q3-21
Fixed Income Characteristics
Yield to Maturity 1.1 1.1
Average Duration 7.7 7.7
Average Quality AAA AAA
Weighted Average Maturity 8.1 8.2XXXXX
Plymouth County Retirement Association
Rhumbline TIPS Trust | As of September 30, 2021
39 of 197

Eaton Vance High Yield Characteristics
vs. ICE BofA US High Yield TR
Portfolio Index Portfolio
Q3-21 Q3-21 Q2-21
Fixed Income Characteristics
Yield to Maturity 4.6 4.6 4.5
Average Duration 3.3 5.3 3.2
Average Quality B B B
Weighted Average Maturity 6.6 6.7 6.6XXXXX
Portfolio Performance Summary
QTD(%)
1 Yr(%)
3 Yrs(%)
5 Yrs(%)
10 Yrs(%)
Inception(%)
InceptionDate
_
Eaton Vance High Yield 0.7 10.4 6.4 5.8 7.0 6.9 Apr-06
ICE BofA US High Yield TR 0.9 11.5 6.6 6.4 7.3 7.2 Apr-06
eV US High Yield Fixed Inc NetMedian
0.8 10.4 6.4 6.0 6.8 6.8 Apr-06
eV US High Yield Fixed Inc NetRank
63 51 48 60 44 41 Apr-06XXXXX
Account InformationAccount Name Eaton Vance High Yield
Account Structure Commingled Fund
Investment Style Active
Inception Date 4/30/06
Account Type US Fixed Income High Yield
Benchmark ICE BofA US High Yield TR
Universe eV US High Yield Fixed Inc Net
Plymouth County Retirement Association
Eaton Vance High Yield | As of September 30, 2021
40 of 197

Account InformationAccount Name Eaton Vance EMD Opportunities Fund
Account Structure Commingled Fund
Investment Style Passive
Inception Date 8/01/20
Account Type Non-US Fixed Income
Benchmark JP Morgan EMBI Global Diversified
Universe eV Emg Mkts Fixed Inc - Blended Currency Net
Portfolio Performance Summary
QTD(%)
1 Yr(%)
3 Yrs(%)
5 Yrs(%)
10 Yrs(%)
Inception(%)
InceptionDate
_
Eaton Vance EMD Opportunities Fund 0.5 10.7 -- -- -- 9.8 Aug-20
JP Morgan EMBI Global Diversified -0.7 4.4 5.7 3.9 5.8 2.5 Aug-20
eV Emg Mkts Fixed Inc - BlendedCurrency Net Median
-1.4 5.6 5.3 3.6 4.4 3.6 Aug-20
eV Emg Mkts Fixed Inc - BlendedCurrency Net Rank
6 10 -- -- -- 9 Aug-20XXXXX
Eaton Vance EMD Opportunities Fund Characteristics
vs. JP Morgan EMBI Global Diversified
Portfolio Index Portfolio
Q3-21 Q3-21 Q2-21
Fixed Income Characteristics
Yield to Maturity 8.2 4.4 7.7
Average Duration 2.6 7.9 2.1
Average Quality BB BB BB
Weighted Average Maturity 7.7 12.4 9.1XXXXX
Plymouth County Retirement Association
Eaton Vance EMD Opportunities Fund | As of September 30, 2021
41 of 197

THL Bank Loan Select Fund Characteristics
Portfolio Portfolio
Q3-21 Q2-21
Fixed Income Characteristics
Yield to Maturity 5.4 5.1
Average Duration 0.2 0.2
Average Quality B B
Weighted Average Maturity 4.8 4.6XXXXX
Account InformationAccount Name First Eagle Bank Loan Select Fund
Account Structure Commingled Fund
Investment Style Active
Inception Date 9/30/10
Account Type US Fixed Income High Yield
Benchmark Credit Suisse Leveraged Loans
Universe Bank Loan MStar MF
Portfolio Performance Summary
QTD(%)
1 Yr(%)
3 Yrs(%)
5 Yrs(%)
10 Yrs(%)
Inception(%)
InceptionDate
_
First Eagle Bank Loan Select Fund 1.2 8.8 4.1 4.4 5.7 5.2 Sep-10
Credit Suisse Leveraged Loans 1.1 8.5 4.1 4.6 5.0 4.8 Sep-10
Bank Loan MStar MF Median 0.9 7.9 3.4 4.0 4.4 4.2 Sep-10
Bank Loan MStar MF Rank 13 24 19 16 1 1 Sep-10XXXXX
Plymouth County Retirement Association
First Eagle Bank Loan Select Fund | As of September 30, 2021
42 of 197

Account InformationAccount Name Manulife Strategic Fixed Income
Account Structure Commingled Fund
Investment Style Active
Inception Date 7/17/19
Account Type US Fixed Income High Yield
Benchmark Bloomberg Multiverse TR
Universe Multisector Bond MStar MF
Manulife Strategic Fixed Income Characteristics
vs. Bloomberg Multiverse TR
Portfolio Index Portfolio
Q3-21 Q3-21 Q2-21
Fixed Income Characteristics
Yield to Maturity 2.6 1.3 2.3
Average Duration 3.8 7.4 3.1
Average Quality BBB AA BBB
Weighted Average Maturity 5.3 10.9 4.5XXXXX
Portfolio Performance Summary
QTD(%)
1 Yr(%)
3 Yrs(%)
5 Yrs(%)
10 Yrs(%)
Inception(%)
InceptionDate
_
Manulife Strategic Fixed Income -0.4 5.3 -- -- -- 5.1 Jul-19
Bloomberg Multiverse TR -0.9 -0.4 4.3 2.2 2.1 2.7 Jul-19
Multisector Bond MStar MF Median 0.4 6.9 5.7 4.7 5.2 4.8 Jul-19
Multisector Bond MStar MF Rank 99 81 -- -- -- 43 Jul-19XXXXX
Plymouth County Retirement Association
Manulife Strategic Fixed Income | As of September 30, 2021
43 of 197

Account InformationAccount Name Mesirow High Yield
Account Structure Commingled Fund
Investment Style Active
Inception Date 8/01/19
Account Type US Fixed Income High Yield
Benchmark Bloomberg US Corporate High Yield TR
Universe eV US High Yield Fixed Inc Net
Portfolio Performance Summary
QTD(%)
1 Yr(%)
3 Yrs(%)
5 Yrs(%)
10 Yrs(%)
Inception(%)
InceptionDate
_
Mesirow High Yield 1.1 21.2 -- -- -- 11.3 Aug-19
Bloomberg US Corporate High Yield TR 0.9 11.3 6.9 6.5 7.4 7.0 Aug-19
eV US High Yield Fixed Inc NetMedian
0.8 10.4 6.4 6.0 6.8 6.5 Aug-19
eV US High Yield Fixed Inc Net Rank 9 2 -- -- -- 1 Aug-19XXXXX
Mesirow High Yield Characteristics
vs. Bloomberg US Corporate High Yield TR
Portfolio Index Portfolio
Q3-21 Q3-21 Q2-21
Fixed Income Characteristics
Yield to Maturity 7.2 4.6 7.1
Average Duration 3.3 5.2 3.0
Average Quality B B B
Weighted Average Maturity 5.4 6.6 5.1XXXXX
Plymouth County Retirement Association
Mesirow High Yield | As of September 30, 2021
44 of 197

Plymouth County Retirement Association
ABS Emerging Markets |September 30, 2021
Account Information
Mandate: Hedge Fund, Fund of
Funds Market Value: $68.6 M Portfolio Manager: Team Location: Greenwich, CT
Inception Date: 12/1/2018 Account Type: Limited Partnership # of Investments: 18 Fee Schedule: 0.35% management fee,
10% performance fee
Liquidity Constraints: Quarterly with 45 days
notice
Instrument Allocation
Portfolio Performance Summary
3Q21
(%) 1 YR
(%) 3 YR
(%) 5 YR
(%)
Since
12/2018
(%)
ABS Emerging Markets -2.2 26.3 NA NA 17.2 MSCI Emerging Markets -4.0 18.2 8.6 9.2 11.1
Top 5 Funds (%)
Sinovision SMA Ltd 14
Ivyrock lo SMA Ltd 9
Anda SMA Ltd 9
Houshan SMA Ltd 8
WhiteOak SMA 6
Historical Strategy Allocations
Geographic Exposure Allocation (%) 9/30/2021 6/30/2021 3/31/2021 12/31/2020 Emerging Markets 96 97 97 97 Developed Asia 2 3 2 2 Developed Europe 1 0 1 1 North America 0 0 0 0
Exposure Report (%) 9/30/2021 6/30/2021 3/31/2021 12/31/2020 Total Gross Exposure 97 96 96 96 Gross Long Exposure 97 96 96 96 Gross Short Exposure 0 0 0 0 Net Exposure 97 96 96 96
Return Distribution
Equity100%
0%
20%
40%
60%
80%
100%
4Q20 1Q21 2Q21 3Q21
Cash Long/Short Equity
0
5
10
45 of 197

Plymouth County Retirement Association
EnTrustPermal Special Opportunities Evergreen Fund, Ltd. | As of June 30, 2020
Account Information
Mandate: Hedge Fund, Fund of Funds Market Value: $20.7 M Portfolio
Manager: Team
Location: New York, NY
Inception Date: 1/1/2019
Account Type: Limited Partnership # of Investments: 24 Fee Schedule: 1.25% management fee;
10% performance fee
Liquidity
Constraints: Distributions from monetized
investments will be recycled into the
Fund, unless otherwise noted by the
investor. Investors who opt out of the
Fund (in part or in whole) following
expiration of the 3 year Commitment
Period, and any applicable
successive renewals, will receive
their pro rata distributions of
underlying investments in the Fund,
net of fees and expenses, as they are
realized by the Investment Manager
Instrument Allocation
Portfolio Performance Summary
3Q21
(%) 1 YR
(%) 3 YR
(%) 5 YR
(%)
Since
1/2019
(%)
EnTrustPermal Special Opportunities Evergreen Fund, Ltd. 1.8 26.4 NA NA 11.4 HFRI FOF Composite 0.7 13.5 6.2 5.6 8.8
Top 5 Funds (%)
Hill Path – Seaworld II 10 Stubhub - Declaration 8 Tosca – IWG 8 Voce – Argp 7 Engaged – Hain 7
Historical Strategy Allocations
Geographic Exposure Allocation (%) 9/30/2021 6/30/2021 3/31/2021 12/31/2020 North America 59 62 67 65 Developed Europe 35 28 31 33 Developed Asia 6 10 2 2 Emerging Markets 0 1 0 0
Exposure Report (%) 9/30/2021 6/30/2021 3/31/2021 12/31/2020 Total Gross Exposure 88 89 95 106 Gross Long Exposure 86 88 87 93 Gross Short Exposure 2 1 8 13 Net Exposure 86 87 79 80
Return Distribution
Equity90%
Fixed Income
10%
0%
20%
40%
60%
80%
100%
4Q20 1Q21 2Q21 3Q21
Event Driven Fixed Income
0
5
10
15
46 of 197

Plymouth County Retirement Association
Old Farm Partners Master Fund, L.P. | As of June 30, 2020
Account Information
Mandate: Hedge Fund, Fund of Funds Market Value: $11.6 M Portfolio Manager: Team Location: New York, NY
Inception Date: 10/1/2018 Account Type: Limited Partnership # of Investments: 16 Fee Schedule: 0.5% management fee;
5% performance fee
Liquidity Constraints: Quarterly with 65 days'
notice
Instrument Allocation
Portfolio Performance Summary
3Q21
(%) 1 YR
(%) 3 YR
(%) 5 YR
(%)
Since
10/2018
(%)
Old Farm Partners Master Fund, L.P. 2.0 23.9 9.2 NA 9.2 HFRI Fund of Funds Composite Index 0.8 14.3 6.5 5.8 6.5
Top 5 Funds (%)
Crake 8
Divisar 6
Plustick 6
Prospect 5
SIO 5
Historical Strategy Allocations
Geographic Exposure Allocation (%) 9/30/2021 6/30/2021 3/31/2021 12/31/2020 North America 72 70 69 68 Developed Europe 22 22 22 23 Emerging Markets 4 4 5 5 Developed Asia 2 4 4 4
Exposure Report (%) 9/30/2021 6/30/2021 3/31/2021 12/31/2020 Total Gross Exposure 136 155 159 157 Gross Long Exposure 93 109 109 111 Gross Short Exposure 43 46 50 46 Net Exposure 50 62 59 65
Return Distribution
Equity95%
Derivative1%
Fixed Income
4%
0%
20%
40%
60%
80%
100%
4Q20 1Q21 2Q21 3Q21
Arbitrage Cash Event Driven Fixed Income Global Macro Long/Short Equity Other Private
0
5
10
47 of 197

Plymouth County Retirement Associationmouth County Retirement Association
ABS Offshore SPC - Global Segregated Portfolio | September 30th, 2021 As of June 30, 2020
Account Information
Mandate: Hedge Fund, Fund of
Funds Market Value: $37.9 M Portfolio Manager: Team Location: Greenwich, CT Inception Date: 8/31/2010 Account Type: Limited Partnership # of Investments: 29 Fee Schedule: 1.00% management fee;
5.0% performance fee Liquidity Constraints: Quarterly with 45 days'
notice
Instrument Allocation
Portfolio Performance Summary
3Q21
(%) 1 YR
(%) 3 YR
(%) 5 YR
(%)
Since
8/2010
(%)
ABS Offshore SPC - Global Segregated Portfolio 0.0 16.4 7.6 7.5 6.2 HFRI Fund of Funds Composite Index 0.8 14.3 6.5 6.8 4.1
Top 5 Funds (%)
Antero Peak Long/Short Offshore Fund 6
TPG Public Equity Partners 5
One01 Capital 5
IvyRock China Fund 5
Lansdowne Energy 5
Historical Strategy Allocations
Geographic Exposure Allocation (%) 9/30/2021 6/30/2021 3/31/2021 12/31/2020 North America 68 65 65 63
Developed Europe 13 14 14 16
Emerging Markets 12 14 14 14
Developed Asia 7 7 7 8
Exposure Report (%) 9/30/2021 6/30/2021 3/31/2021 12/31/2020 Total Gross Exposure 147 153 150 157
Gross Long Exposure 99 103 102 106
Gross Short Exposure 48 50 48 51
Net Exposure 51 53 55 55
Return Distribution
Equity83%
Fixed Income
2%
Derivative15%
0%
20%
40%
60%
80%
100%
4Q20 1Q21 2Q21 3Q21
Cash Long/Short Equity
0
5
10
15
20
25
48 of 197

Plymouth County Retirement Association
EnTrust Special Opportunities Fund III, Ltd. | As of June 30, 2020
Account Information
Mandate: Hedge Fund, Fund of
Funds Market Value: $20.1 M Portfolio Manager: Team Location: New York, NY Inception Date: 10/1/2016 Account Type: Limited Partnership # of Investments: 24 Fee Schedule: 1.25% management fee;
10% performance fee; 7.5%
hurdle Liquidity Constraints: 3 Year Lockup (4 years
max) then quarterly with
95 days' notice
Instrument Allocation
Portfolio Performance Summary
3Q21
(%) 1 YR
(%) 3 YR
(%) 5 YR
(%)
Since
10/2016
(%)
EnTrust Special Opportunities Fund III, Ltd. -1.2 34.9 3.7 9.5 9.5 HFRI FOF Composite (1-qtr lagged) 0.7 13.5 6.2 5.6 5.6
Top 5 Funds (%)
Hill Path 13
Standard General 12
Tosca 9
Hudson Executive 8
Entrust Global 7
Historical Strategy Allocations
Geographic Exposure Allocation (%) 9/30/2021 6/30/2021 3/31/2021 12/31/2020 North America 60 61 61 59
Developed Europe 33 31 30 32
Developed Asia 2 3 4 4
Emerging Markets 5 5 5 4
Exposure Report (%) 9/30/2021 6/30/2021 3/31/2021 12/31/2020 Total Gross Exposure 98 101 97 96 Gross Long Exposure 98 101 97 96 Gross Short Exposure 0 0 0 0 Net Exposure 98 101 97 96
Return Distribution
Equity92%
Fixed Income
8%
80%
85%
90%
95%
100%
4Q20 1Q21 2Q21 3Q21
Event Driven Fixed Income
0
5
10
15
20
25
30
35
49 of 197

Annual Investment Expense AnalysisAs Of September 30, 2021
Name Fee Schedule Market Value Estimated Fee Value Estimated Fee
Domestic Equity Assets $363,753,323
Rhumbline Russell 1000 Value0.05% of First 25.0 Mil,0.04% of Next 25.0 Mil,0.03% Thereafter
$69,323,971 $28,297 0.04%
Rhumbline Russell 1000 Growth0.05% of First 25.0 Mil,0.04% of Next 25.0 Mil,0.03% Thereafter
$70,114,267 $28,534 0.04%
Fisher Midcap Value 0.65% of Assets $71,200,032 $462,800 0.65%
Mellon Small Cap Growth 0.45% of Assets $74,904,714 $337,071 0.45%
LMCG Small Cap Value 0.90% of Assets $78,210,339 $703,893 0.90%
International Developed Market Equity Assets $45,379,588
Aristotle International Equity 0.49% of Assets $23,881,714 $117,020 0.49%
Walter Scott International Equity 0.85% of Assets $21,497,874 $182,732 0.85%
International Emerging Market Equity Assets $128,014,622
ABS Emerging Markets Performance-based 0.35 and 0.10 $68,577,165 $240,020 0.35%
Driehaus Emerging Markets Growth 0.55% of Assets $59,437,458 $326,906 0.55%
Global Equity Assets $150,073,498
First Eagle Global Value Fund 0.75% of Assets $24,682,559 $185,119 0.75%
Kopernik Global All Cap Fund
0.80% of First 50.0 Mil,0.75% of Next 150.0 Mil,0.70% of Next 250.0 Mil,0.65% of Next 350.0 Mil
$37,557,368 $300,459 0.80%
Lee Munder Global Multi-Cap Strategy 0.45% of Assets $44,187,796 $198,845 0.45%
Wellington Durable Enterprises, L.P. 0.60% of Assets $43,645,775 $261,875 0.60%
Core Fixed Income $108,964,827
Plymouth County Retirement Association
Total Retirement Association | As of September 30, 2021
50 of 197

Name Fee Schedule Market Value Estimated Fee Value Estimated Fee
IR&M Core Bonds0.25% of First 50.0 Mil,0.20% of Next 50.0 Mil,0.15% Thereafter
$56,151,385 $137,303 0.24%
Lord Abbett Short Duration Credit Trust II 0.17% of Assets $42,258,267 $71,839 0.17%
Rhumbline TIPS Trust0.04% of First 5.0 Mil,0.03% Thereafter
$10,555,175 $3,667 0.03%
Value Added Fixed Income $124,055,705
Eaton Vance High Yield 0.42% of Assets $24,734,552 $103,885 0.42%
First Eagle Bank Loan Select Fund 0.40% of Assets $23,720,659 $94,883 0.40%
Manulife Strategic Fixed Income 0.35% of Assets $35,643,350 $124,752 0.35%
Mesirow High Yield 0.40% of Assets $17,658,038 $70,632 0.40%
Eaton Vance EMD Opportunities Fund 0.30% of Assets $22,299,105 $66,897 0.30%XXXXX
Plymouth County Retirement Association
Total Retirement Association | As of September 30, 2021
51 of 197

Note: The value is based on June 30, 2021 FMV.
Plymouth County Retirement Association
Total Retirement Association | As of September 30, 2021
52 of 197

Note: The data for IFM Global Infrastructure, TA Reallty Core Property Fund, and JPMorgan Strategic Property is as of September 30, 2021.
Plymouth County Retirement Association
Total Retirement Association | As of September 30, 2021Note: The value is based on June 30, 2021 FMV.
53 of 197
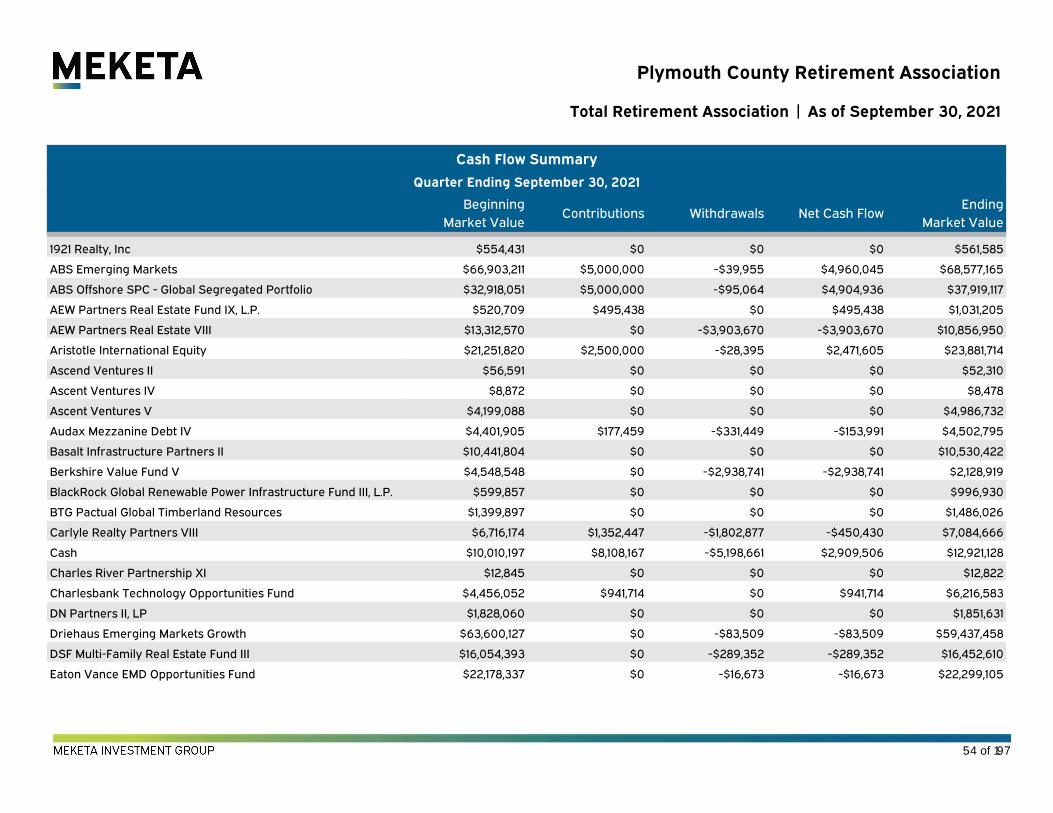
Cash Flow Summary
Quarter Ending September 30, 2021
BeginningMarket Value
Contributions Withdrawals Net Cash FlowEnding
Market Value_
1921 Realty, Inc $554,431 $0 $0 $0 $561,585
ABS Emerging Markets $66,903,211 $5,000,000 -$39,955 $4,960,045 $68,577,165
ABS Offshore SPC - Global Segregated Portfolio $32,918,051 $5,000,000 -$95,064 $4,904,936 $37,919,117
AEW Partners Real Estate Fund IX, L.P. $520,709 $495,438 $0 $495,438 $1,031,205
AEW Partners Real Estate VIII $13,312,570 $0 -$3,903,670 -$3,903,670 $10,856,950
Aristotle International Equity $21,251,820 $2,500,000 -$28,395 $2,471,605 $23,881,714
Ascend Ventures II $56,591 $0 $0 $0 $52,310
Ascent Ventures IV $8,872 $0 $0 $0 $8,478
Ascent Ventures V $4,199,088 $0 $0 $0 $4,986,732
Audax Mezzanine Debt IV $4,401,905 $177,459 -$331,449 -$153,991 $4,502,795
Basalt Infrastructure Partners II $10,441,804 $0 $0 $0 $10,530,422
Berkshire Value Fund V $4,548,548 $0 -$2,938,741 -$2,938,741 $2,128,919
BlackRock Global Renewable Power Infrastructure Fund III, L.P. $599,857 $0 $0 $0 $996,930
BTG Pactual Global Timberland Resources $1,399,897 $0 $0 $0 $1,486,026
Carlyle Realty Partners VIII $6,716,174 $1,352,447 -$1,802,877 -$450,430 $7,084,666
Cash $10,010,197 $8,108,167 -$5,198,661 $2,909,506 $12,921,128
Charles River Partnership XI $12,845 $0 $0 $0 $12,822
Charlesbank Technology Opportunities Fund $4,456,052 $941,714 $0 $941,714 $6,216,583
DN Partners II, LP $1,828,060 $0 $0 $0 $1,851,631
Driehaus Emerging Markets Growth $63,600,127 $0 -$83,509 -$83,509 $59,437,458
DSF Multi-Family Real Estate Fund III $16,054,393 $0 -$289,352 -$289,352 $16,452,610
Eaton Vance EMD Opportunities Fund $22,178,337 $0 -$16,673 -$16,673 $22,299,105
Plymouth County Retirement Association
Total Retirement Association | As of September 30, 2021
54 of 197

BeginningMarket Value
Contributions Withdrawals Net Cash FlowEnding
Market Value_
Eaton Vance High Yield $24,566,418 $0 -$25,926 -$25,926 $24,734,552
Entrust Special Opportunities Fund III, Ltd. $21,615,340 $0 -$457,317 -$457,317 $20,908,855
EnTrustPermal Special Opportunities Evergreen Fund, Ltd. $20,328,735 $0 $0 $0 $20,698,718
Euro Choice V Programme $4,202,603 $0 -$312,480 -$312,480 $4,871,650
First Eagle Bank Loan Select Fund $23,438,009 $0 -$23,585 -$23,585 $23,720,659
First Eagle Global Value Fund $25,124,712 $0 -$47,072 -$47,072 $24,682,559
Fisher Midcap Value $71,206,369 $0 -$118,988 -$118,988 $71,200,032
FS Equity Partners VIII, L.P. $5,062,437 $1,148,389 $0 $1,148,389 $6,838,118
Global Infrastructure Partners III $8,958,939 $91,703 -$270,978 -$179,275 $9,017,798
Global Infrastructure Partners IV, L.P. $1,091,204 $721,331 $0 $721,331 $1,764,261
Globespan Capital V $5,118,518 $0 -$260,326 -$260,326 $4,522,339
HarbourVest Partners Co-Investment V $13,881,966 $900,000 $0 $900,000 $15,669,509
IFM Global Infrastructure $42,487,564 $0 -$1,749,889 -$1,749,889 $42,729,584
IR&M Core Bonds $56,053,816 $0 -$34,491 -$34,491 $56,151,385
Ironsides Direct Investment Fund V, L.P. $17,562,706 $0 $0 $0 $19,041,321
JP Morgan Global Maritime Investment $5,640,557 $0 -$512,605 -$512,605 $6,630,191
JPMorgan Strategic Property $29,311,819 -$69,839 -$76,026 -$145,865 $31,205,873
Kohlberg Investors IX $894,306 $1,193,120 $0 $1,193,120 $2,345,695
Kopernik Global All Cap Fund $37,785,404 $0 -$74,138 -$74,138 $37,557,368
Landmark Equity Partners XIV $955,431 $0 -$78,280 -$78,280 $795,003
Lee Munder Global Multi-Cap Strategy $39,902,071 $5,000,000 -$50,783 $4,949,217 $44,187,796
Leeds Equity Partners IV $13,187 $0 $0 $0 $13,189
Leeds Equity Partners V $1,139,385 $8,274 -$680,349 -$672,075 --
Lexington Capital Partners VII $1,958,184 $0 -$204,948 -$204,948 $1,926,464
Plymouth County Retirement Association
Total Retirement Association | As of September 30, 2021
55 of 197

BeginningMarket Value
Contributions Withdrawals Net Cash FlowEnding
Market Value_
LLR Equity Partners V, LP. $10,895,219 $0 $0 $0 $12,108,880
LMCG Small Cap Value $78,271,247 $0 -$175,640 -$175,640 $78,210,339
Lord Abbett Short Duration Credit Trust II $37,145,729 $5,000,000 -$17,954 $4,982,046 $42,258,267
Manulife Strategic Fixed Income $30,762,249 $5,000,000 -$31,326 $4,968,674 $35,643,350
Mellon Small Cap Growth $79,672,302 $0 -$86,133 -$86,133 $74,904,714
Mesirow Financial Capital Partners IX, LP $73,162 $0 $0 $0 $74,400
Mesirow Financial International Real Estate Fund I $1,260,872 $0 $0 $0 $1,228,923
Mesirow High Yield $12,460,000 $5,000,000 -$17,569 $4,982,431 $17,658,038
Old Farm Partners Master Fund, L.P. $6,379,953 $5,000,000 $0 $5,000,000 $11,613,154
Rhumbline Russell 1000 Growth $59,537,981 $9,998,598 -$7,275 $9,991,323 $70,114,267
Rhumbline Russell 1000 Value $54,891,393 $14,994,708 -$7,164 $14,987,543 $69,323,971
Rhumbline TIPS Trust $10,371,013 $0 -$921 -$921 $10,555,175
Ridgemont Equity Partners III, L.P. $8,266,231 $0 $0 $0 $9,929,332
RIMCO Royalty Partners, LP $1 $0 $0 $0 $1
Rockpoint Real Estate Fund VI, L.P. $1,710,806 $958,936 $0 $958,936 $3,101,521
Searchlight Capital III, L.P. $5,377,147 $976,972 -$996,503 -$19,531 $5,982,977
Siguler Guff Distressed Opportunities Fund III, LP $1,076,478 $0 -$51,476 -$51,476 $1,060,074
Summit Partners Growth Equity Fund IX $17,959,214 $0 -$3,233,978 -$3,233,978 $18,646,415
Summit Partners Venture Capital Fund V $531,919 $1,462,600 $0 $1,462,600 $1,994,519
TA Realty Core Property Fund, L.P. $43,251,622 $75,690 -$508,207 -$432,516 $47,524,726
TerraCap Partners V, L.P $3,446,707 $0 $0 $0 $3,475,109
Timbervest Partners III, LP $4,407,578 $0 -$305,500 -$305,500 $4,176,075
TRG Growth Partnership II $1,106,860 $0 $0 $0 $1,252,180
Trilantic Capital Partners VI, L.P. $4,235,952 $2,109,786 -$150,513 $1,959,273 $6,829,773
Plymouth County Retirement Association
Total Retirement Association | As of September 30, 2021
56 of 197

Plymouth County Retirement Association
Total Retirement Association | As of September 30, 2021
BeginningMarket Value
Contributions Withdrawals Net Cash FlowEnding
Market Value_
Walter Scott International Equity $21,369,463 $0 -$85,981 -$85,981 $21,497,874
Waud Capital Partners V $6,408,831 $1,499,898 $0 $1,499,898 $8,623,026
Wellington Durable Enterprises, L.P. $44,066,874 $0 -$66,986 -$66,986 $43,645,775
Wellspring Capital Partners VI $9,855,206 $1,423,329 $0 $1,423,329 $12,330,056
Total $1,299,065,229 $86,068,719 -$25,449,652 $60,619,067 $1,378,772,181XXXXX
57 of 197

Plymouth County Retirement Association Private Markets Program
Private Markets Program
58 of 197
Plymouth County Retirement Association Private Markets Program
Table of Contents
Table of Contents
1. Private Equity Program
2. Private Debt Program
3. Real Assets Program
59 of 197

Plymouth County Retirement Association Private Markets Program
Introduction | As of June 30, 2021
The purpose of this document is to offer a review of the Retirement Association’s aggregate private market
investments.
As of June 30, 2021 the Retirement Association had committed $613.1 million to 63 partnerships. The reported fair
market value of the program, in aggregate, was $348.1 million at the end of the quarter.
Private Equity Program Real Assets Program Real Estate Program
No. of Funds 33 No of Funds 9 No of Funds 21
Committed $245.1 million Committed $105.0 million Committed $263.0 million
Contributed $173.5 million Contributed $76.2 million Contributed $219.7 million
Distributed $108.7 million Distributed $9.2 million Distributed $177.8 million
Fair Market Value $146.3 million Fair Market Value $77.2 million Fair Market Value $124.6 million
TVPI 1.47x TVPI 1.13x TVPI 1.37x
Since Inception IRR 8.4% Since Inception IRR 3.6% Since Inception IRR 5.7%
1-Quarter IRR 11.8% 1-Quarter IRR 6.4% 1-Quarter IRR 5.7%
1-Year IRR 51.8% 1-Year IRR 16.4% 1-Year IRR 12.8%
60 of 197

Plymouth County Retirement Association Private Equity Program
Private Equity Program
61 of 197

Plymouth County Retirement Association Private Equity Program
Overview | As of June 30, 2021
Introduction
As of June 30, 2021, the Retirement Association had committed $245.1 million to 33 partnerships. The Retirement
Association maintains a 13% allocation target to private equity. No new commitments were made during the
second quarter of 2021. The fair market value of the private equity program was $146.3 million, representing 11.3%
of the Retirement Association’s total assets.
Program Status Performance Since Inception
Program Peer Universe
No. of Investments 33 DPI 0.63x 1.05x
Committed ($ MM) 245.1 TVPI 1.47x 1.80x
Contributed ($ MM) 173.4 IRR 8.4% 12.7%
Distributed ($ MM) 108.6
Fair Market Value ($ MM) 146.3
5.9% 5.9%4.5% 4.4% 3.4% 3.4%
5.0%6.4%
9.4%11.3%
0%
4%
8%
12%
16%
20%
0
10
20
30
40
50
60
70
Pro
gra
m F
MV
% T
ota
l A
sse
ts
Co
mm
itm
en
ts (
$ M
M)
Commitments by Vintage Year Fair Market Value % of Total Assets
62 of 197

Plymouth County Retirement Association Private Equity Program
Recent Activity | As of June 30, 2021
Commitments
Recent Quarterly Commitments
Commitments This Quarter
Fund Strategy Region Amount (MM)
No new commitments made during the quarter
0.0
5.0
10.0
15.0
20.0
25.0
30.0
Co
mm
itm
en
t ($
MM
)
63 of 197

Plymouth County Retirement Association Private Equity Program
Recent Activity | As of June 30, 2021
Cash Flows
Recent Quarterly Cash Flows
Largest Contributions This Quarter Largest Distributions This Quarter
Fund Vintage Strategy Region
Amount
($MM)
Fund Vintage Strategy Region
Amount
($MM)
Waud V 2019 Buyout North America 2.15 Summit
Growth IX
2016 Growth Equity North America 1.24
Trilantic VI 2018 Buyout North America 1.16 Charlesbank
Tech
2019 Buyout Global: All 1.06
Charlesbank
Tech
2019 Buyout Global: All 0.82 Leeds V 2010 Buyout North America 0.81
-3.6 -4.2-7.4 -6.2
-4.3 -5.1 -4.7
-18.3
-4.6-7.1
1.4 1.7 2.5 3.1 4.00.8 0.3
1.8 2.05.5
-20.0
-15.0
-10.0
-5.0
0.0
5.0
10.0A
mo
un
t ($
MM
)
Contributions Distributions
64 of 197
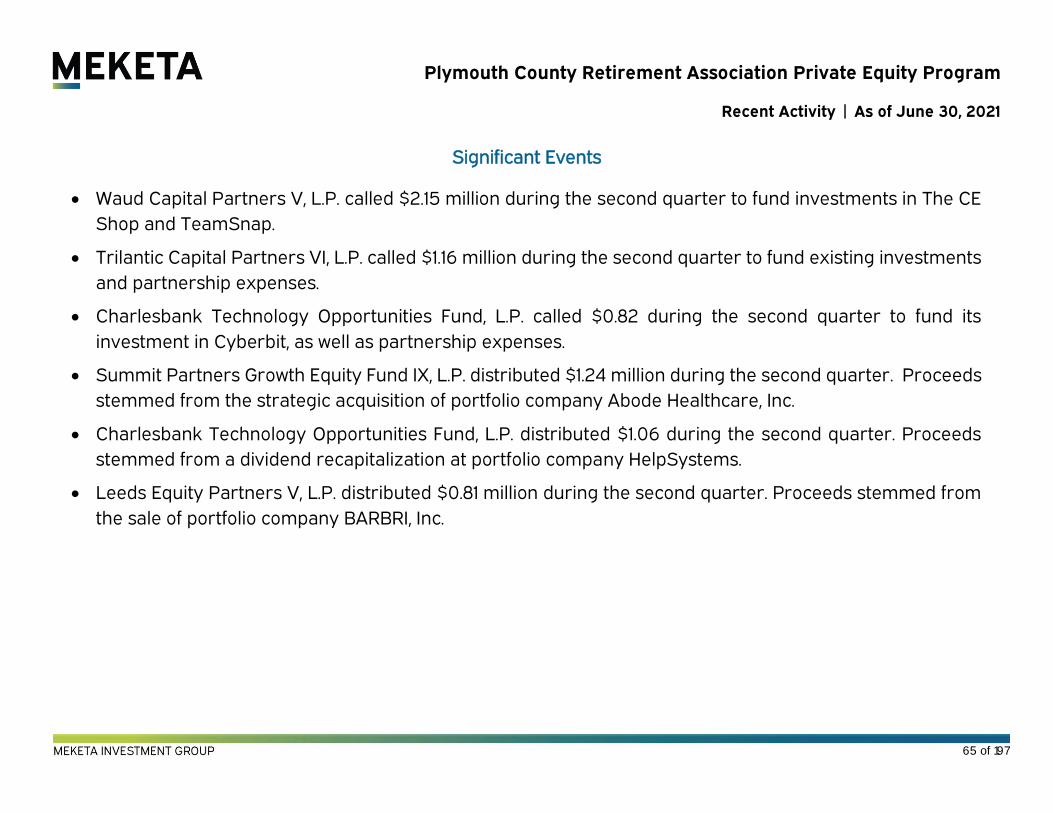
Plymouth County Retirement Association Private Equity Program
Recent Activity | As of June 30, 2021
Significant Events
• Waud Capital Partners V, L.P. called $2.15 million during the second quarter to fund investments in The CE
Shop and TeamSnap.
• Trilantic Capital Partners VI, L.P. called $1.16 million during the second quarter to fund existing investments
and partnership expenses.
• Charlesbank Technology Opportunities Fund, L.P. called $0.82 during the second quarter to fund its
investment in Cyberbit, as well as partnership expenses.
• Summit Partners Growth Equity Fund IX, L.P. distributed $1.24 million during the second quarter. Proceeds
stemmed from the strategic acquisition of portfolio company Abode Healthcare, Inc.
• Charlesbank Technology Opportunities Fund, L.P. distributed $1.06 during the second quarter. Proceeds
stemmed from a dividend recapitalization at portfolio company HelpSystems.
• Leeds Equity Partners V, L.P. distributed $0.81 million during the second quarter. Proceeds stemmed from
the sale of portfolio company BARBRI, Inc.
65 of 197

Plymouth County Retirement Association Private Equity Program
Performance Analysis | As of June 30, 2021
By Strategy
Group Number
Committed
($ MM)
Contributed
($ MM)
Unfunded
($ MM)
Distributed
($ MM)
Fair
Market
Value
($ MM)
Exposure
($ MM)
DPI
(X)
TVPI
(X)
IRR
(%)
Buyout 17 149.1 88.2 65.8 29.4 99.3 165.1 0.33 1.46 10.0
Fund of Funds 3 17.6 17.3 2.1 20.3 6.3 8.4 1.17 1.54 8.8
Growth Equity 2 17.5 19.0 3.3 12.3 23.1 26.4 0.65 1.87 13.5
Private Debt 1 10.0 7.9 3.5 4.5 4.7 8.2 0.57 1.15 9.8
Secondary 2 16.0 14.8 1.3 19.2 3.1 4.4 1.30 1.51 12.6
Special Situations 1 3.0 4.9 0.0 5.1 0.0 0.0 1.04 1.04 1.3
Venture Capital 7 31.8 21.5 10.5 17.9 9.8 20.4 0.83 1.29 3.3
Total 33 245.1 173.4 86.6 108.6 146.3 232.8 0.63 1.47 8.4
66 of 197

Plymouth County Retirement Association Private Equity Program
Performance Analysis | As of June 30, 2021
By Vintage
Group Number
Committed
($ MM)
Contributed
($ MM)
Unfunded
($ MM)
Distributed
($ MM)
Fair
Market
Value
($ MM)
Exposure
($ MM)
DPI
(X)
TVPI
(X)
IRR
(%)
1998 1 2.6 2.7 0.0 0.1 0.0 0.0 0.04 0.04 -25.5
1999 1 5.0 4.4 0.6 2.2 0.0 0.6 0.49 0.49 -14.9
2000 1 1.8 1.8 0.0 2.5 0.0 0.0 1.39 1.40 5.6
2001 1 2.0 2.0 0.0 7.7 0.0 0.0 3.83 3.83 29.1
2004 3 13.0 13.1 0.5 18.2 0.0 0.5 1.39 1.39 4.8
2005 3 9.5 11.0 0.3 8.0 0.1 0.5 0.73 0.74 -5.3
2006 1 5.0 4.9 0.1 8.6 4.8 4.9 1.78 2.77 14.3
2007 2 12.5 9.7 2.8 7.6 3.1 5.9 0.78 1.10 1.6
2008 2 12.0 11.7 0.3 15.4 2.0 2.4 1.32 1.50 10.4
2009 1 10.0 8.9 1.2 12.3 2.1 3.3 1.38 1.62 14.0
2010 1 2.5 3.5 0.0 4.8 0.5 0.5 1.36 1.49 10.6
2011 1 5.0 5.0 0.2 3.2 5.0 5.1 0.64 1.63 8.3
2012 1 6.1 5.9 1.5 3.7 5.2 6.7 0.62 1.50 9.2
2016 2 20.0 19.5 6.7 9.2 26.5 33.2 0.47 1.83 34.8
2017 2 24.0 18.9 6.6 2.4 23.0 29.6 0.12 1.34 19.8
2018 3 36.0 22.9 13.5 0.8 38.7 52.2 0.04 1.72 32.4
2019 5 58.0 25.8 33.6 1.7 34.0 67.6 0.07 1.39 NM
2020 2 20.0 1.5 18.7 0.2 1.2 19.8 0.11 0.88 NM
Total 33 245.1 173.4 86.6 108.6 146.3 232.8 0.63 1.47 8.4
67 of 197

Plymouth County Retirement Association Private Equity Program
Performance Analysis | As of June 30, 2021
Since Inception Performance Over Time
Horizon IRRs
1 Year
(%)
3 Year
(%)
5 Year
(%)
10 Year
(%)
Since Inception
(%)
Aggregate Portfolio 51.8 26.5 22.1 11.9 8.4
Public Market Equivalent 37.2 17.7 16.7 11.4 8.4
0%
4%
8%
12%
16%
20%
0.00
0.20
0.40
0.60
0.80
1.00
1.20
1.40
1.60
IRR
TV
PI
TVPI IRR
68 of 197

Plymouth County Retirement Association Private Equity Program
Performance Analysis | As of June 30, 2021
Periodic NCV 1 Quarter Drivers Of NCV
15.3 45.6 57.9
11.8%
51.8%
24.6%
0%
10%
20%
30%
40%
50%
60%
$0.0
$10.0
$20.0
$30.0
$40.0
$50.0
$60.0
$70.0
Pe
rce
nt
NC
V A
mo
un
t ($
MM
)
NCV Amount NCV Percent
-$4.0-$2.0$0.0$2.0$4.0$6.0$8.0
$10.0$12.0$14.0$16.0$18.0
NC
V A
mo
un
t ($
MM
)
69 of 197
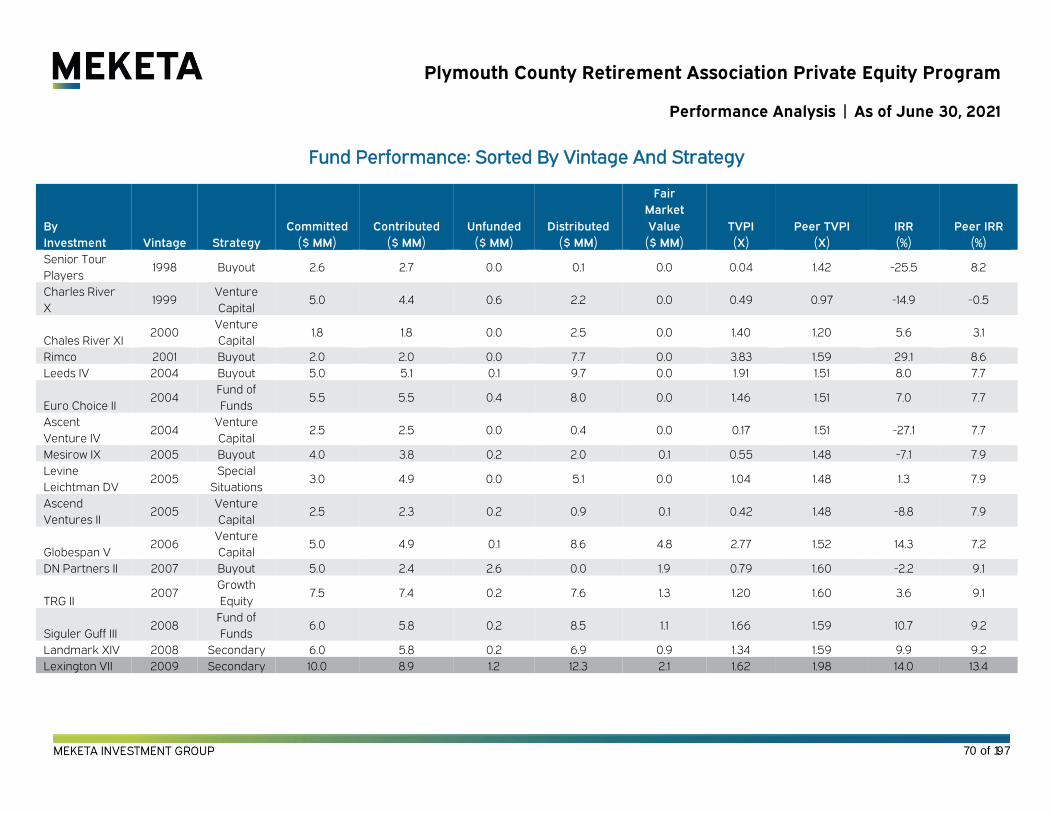
Plymouth County Retirement Association Private Equity Program
Performance Analysis | As of June 30, 2021
Fund Performance: Sorted By Vintage And Strategy
By
Investment Vintage Strategy
Committed
($ MM)
Contributed
($ MM)
Unfunded
($ MM)
Distributed
($ MM)
Fair
Market
Value
($ MM)
TVPI
(X)
Peer TVPI
(X)
IRR
(%)
Peer IRR
(%)
Senior Tour
Players 1998 Buyout 2.6 2.7 0.0 0.1 0.0 0.04 1.42 -25.5 8.2
Charles River
X 1999
Venture
Capital 5.0 4.4 0.6 2.2 0.0 0.49 0.97 -14.9 -0.5
Chales River XI 2000
Venture
Capital 1.8 1.8 0.0 2.5 0.0 1.40 1.20 5.6 3.1
Rimco 2001 Buyout 2.0 2.0 0.0 7.7 0.0 3.83 1.59 29.1 8.6
Leeds IV 2004 Buyout 5.0 5.1 0.1 9.7 0.0 1.91 1.51 8.0 7.7
Euro Choice II 2004
Fund of
Funds 5.5 5.5 0.4 8.0 0.0 1.46 1.51 7.0 7.7
Ascent
Venture IV 2004
Venture
Capital 2.5 2.5 0.0 0.4 0.0 0.17 1.51 -27.1 7.7
Mesirow IX 2005 Buyout 4.0 3.8 0.2 2.0 0.1 0.55 1.48 -7.1 7.9
Levine
Leichtman DV 2005
Special
Situations 3.0 4.9 0.0 5.1 0.0 1.04 1.48 1.3 7.9
Ascend
Ventures II 2005
Venture
Capital 2.5 2.3 0.2 0.9 0.1 0.42 1.48 -8.8 7.9
Globespan V 2006
Venture
Capital 5.0 4.9 0.1 8.6 4.8 2.77 1.52 14.3 7.2
DN Partners II 2007 Buyout 5.0 2.4 2.6 0.0 1.9 0.79 1.60 -2.2 9.1
TRG II 2007
Growth
Equity 7.5 7.4 0.2 7.6 1.3 1.20 1.60 3.6 9.1
Siguler Guff III 2008
Fund of
Funds 6.0 5.8 0.2 8.5 1.1 1.66 1.59 10.7 9.2
Landmark XIV 2008 Secondary 6.0 5.8 0.2 6.9 0.9 1.34 1.59 9.9 9.2
Lexington VII 2009 Secondary 10.0 8.9 1.2 12.3 2.1 1.62 1.98 14.0 13.4
70 of 197

Plymouth County Retirement Association Private Equity Program
Performance Analysis | As of June 30, 2021
Fund Performance: Sorted By Vintage and Strategy (con’t)
By
Investment Vintage Strategy
Committed
($ MM)
Contributed
($ MM)
Unfunded
($ MM)
Distributed
($ MM)
Fair
Market
Value
($ MM)
TVPI
(X)
Peer TVPI
(X)
IRR
(%)
Peer IRR
(%)
Leeds V 2010 Buyout 2.5 3.5 0.0 4.8 0.5 1.49 1.95 10.6 13.0
Ascent
Venture V 2011
Venture
Capital 5.0 5.0 0.2 3.2 5.0 1.63 2.11 8.3 16.2
Euro Choice V 2012
Fund of
Funds 6.1 5.9 1.5 3.7 5.2 1.50 2.01 9.2 15.8
Summit
Growth IX 2016
Growth
Equity 10.0 11.6 3.1 4.7 21.9 2.30 1.84 45.7 23.0
Audax Mezz IV 2016
Private
Debt 10.0 7.9 3.5 4.5 4.7 1.15 1.84 9.8 23.0
LLR V 2017 Buyout 12.0 11.0 2.5 2.4 12.1 1.31 1.80 16.8 29.5
Wellspring VI 2017 Buyout 12.0 7.9 4.1 0.0 10.9 1.39 1.80 25.2 29.5
HV Co-Invest V 2018 Buyout 12.0 8.4 3.6 0.0 14.8 1.76 1.56 62.1 29.7
Ironsides
Direct V 2018 Buyout 12.0 10.2 2.2 0.8 19.0 1.94 1.56 31.5 29.7
Trilantic VI 2018 Buyout 12.0 4.3 7.7 0.0 4.9 1.14 1.56 7.0 29.7
Charlesbank
Tech 2019 Buyout 12.0 3.5 9.2 1.1 5.3 1.84 1.38 NM NM
FS Equity VIII 2019 Buyout 12.0 3.9 8.1 0.0 5.7 1.45 1.38 NM NM
Ridgemont III 2019 Buyout 12.0 7.9 4.8 0.7 9.9 1.34 1.38 NM NM
Searchlight III 2019 Buyout 12.0 4.4 7.6 0.0 6.0 1.35 1.38 NM NM
Waud V 2019 Buyout 10.0 6.1 3.9 0.0 7.1 1.17 1.38 NM NM
Kohlberg IX 2020 Buyout 10.0 1.0 9.2 0.2 1.2 1.37 1.14 NM NM
Summit
Venture V 2020
Venture
Capital 10.0 0.5 9.5 0.0 0.01 NM NM NM NM
Total 245.1 173.4 86.6 108.6 146.3 1.47 1.80 8.4 12.7
1 Summit Venture Capital Fund V, L.P. did not produce a Q2 2021 capital account statement, despite $0.5 million having been called from the Retirement Association as of June 30, 2021.
71 of 197

Plymouth County Retirement Association Private Equity Program
Fund Diversification | As of June 30, 2021
By Strategy
Percent of FMV Percent of Exposure
68%
16%
7%
4%3%
2%
Buyout
Growth Equity
Venture Capital
Fund of Funds
Private Debt
Secondary
Special Situations
71%
11%
9%
4%3%
2%
Buyout
Growth Equity
Venture Capital
Private Debt
Fund of Funds
Secondary
Special Situations
72 of 197

Plymouth County Retirement Association Private Equity Program
Fund Diversification | As of June 30, 2021
By Vintage1
Percent of FMV Percent of Exposure
1 “Other” includes funds from vintage years 2005, 2008, 2010, 2020.
26%
23%18%
16%
4%
3%3%
2%1% 3%
2018
2019
2016
2017
2012
2011
2006
2007
2009
Other
29%
22%14%
13%
9%
3%
3%
2%2%
3%2019
2018
2016
2017
2020
2012
2007
2011
2006
Other
73 of 197

Plymouth County Retirement Association Private Equity Program
Disclaimer | As of June 30, 2021
By Geographic Focus
Percent of FMV Percent of Exposure
85%
9%
6%
North America
Global: All
Global: Developed
82%
11%
7%
North America
Global: All
Global: Developed
74 of 197

Plymouth County Retirement Association Real Assets Program
Real Assets Program
75 of 197

Plymouth County Retirement Association Real Assets Program
Overview | As of June 30, 2021
Introduction
As of June 30, 2021, the Retirement Association had committed $105.0 million to nine partnerships. No new
commitments were made during the second quarter of 2021. The fair market value of the Retirement
Association’s Real Assets program was $77.2 million, representing the program’s target 6.0% of total assets.
Program Status Performance Since Inception
Program Peer Universe
No. of Investments 9 DPI 0.12x 0.40x
Committed ($ MM) 105.0 TVPI 1.13x 1.23x
Contributed ($ MM) 76.2 IRR 3.6% 6.2%
Distributed ($ MM) 9.2
Fair Market Value ($ MM) 77.2
0.8% 1.4% 1.7% 1.8% 1.8% 1.8%
4.9% 5.0%5.9% 6.0%
0%
3%
6%
9%
12%
0
2
4
6
8
10
12
Pro
gra
m F
MV
% T
ota
l A
sse
ts
Co
mm
itm
en
ts (
$ M
M)
Commitments by Vintage Year Fair Market Value % of Total Assets
76 of 197

Plymouth County Retirement Association Real Assets Program
Recent Activity | As of June 30, 2021
Commitments
Recent Quarterly Commitments
Commitments This Quarter
Fund Strategy Region Amount (MM)
No new commitments made during the Quarter.
0.0
5.0
10.0
15.0
20.0
25.0
Co
mm
itm
en
t ($
MM
)
77 of 197

Plymouth County Retirement Association Real Assets Program
Recent Activity | As of June 30, 2021
Cash Flows
Recent Quarterly Cash Flows
Largest Contributions This Quarter1 Largest Distributions This Quarter
Fund Vintage Strategy Region Amount($MM) Fund Vintage Strategy Region Amount ($MM)
BlackRock
GRPIF III
2020 Value-Added Global: All 0.43 BTG Global
Timber
2011 Natural
Resources
Global: All 0.70
GIP IV 2019 Value-Added Global: Developed 0.42 Timbervest
III
2010 Natural
Resources
North America 0.21
GIP III 2016 Value-Added Global: Developed 0.05 GIP III 2016 Value-Added Global: Developed 0.07
1 Total contributions for the quarter reflect an amount lower than the total of largest contributions for the quarter due to two return of excess contributions, resulting in $0.6 million of capital contributed
to BlackRock Global Renewable Power Infrastructure Fund III, L.P. being returned to the Retirement Association.
-0.5-2.9
-1.2 -1.4-0.1
-15.1
-0.5-3.0
-1.0 -0.3
0.5 0.2 0.4 0.7 0.0 0.6 0.32.1
1.1 1.0
-20.0
-15.0
-10.0
-5.0
0.0
5.0
Am
ou
nt
($ M
M)
Contributions Distributions
78 of 197

Plymouth County Retirement Association Real Assets Program
Recent Activity | As of June 30, 2021
Significant Events
• BlackRock Global Renewable Power Infrastructure Fund III, L.P. called $0.43 million during the
second quarter to fund existing investments in Phoenix & Lotus, Genesis, and Hayabusa. The total
contribution was offset by a return of excess contributed capital of $0.6 million.
• Global Infrastructure Partners IV, L.P. called $0.42 million during the second quarter to fund existing
investments and partnership expenses.
• Global Infrastructure Partners III, L.P. called $0.05 million during the second quarter to fund management
fees and partnership expenses for the quarter.
• BTG Pactual Global Timberland Resources Fund, LLC distributed $0.70 million during the second quarter
as proceeds from the sale of Underberg as well as timber sale revenue from its operations in Brazil.
• Domain Timbervest Partners III, L.P. distributed $0.21 million during the second quarter as proceeds from
timber and land sales throughout the quarter.
• Global Infrastructure Partners III, L.P. distributed $0.07 million during the second quarter as proceeds from
its existing investments in ADNOC Gas Pipeline Assets LLC and Clearway Energy Group.
79 of 197
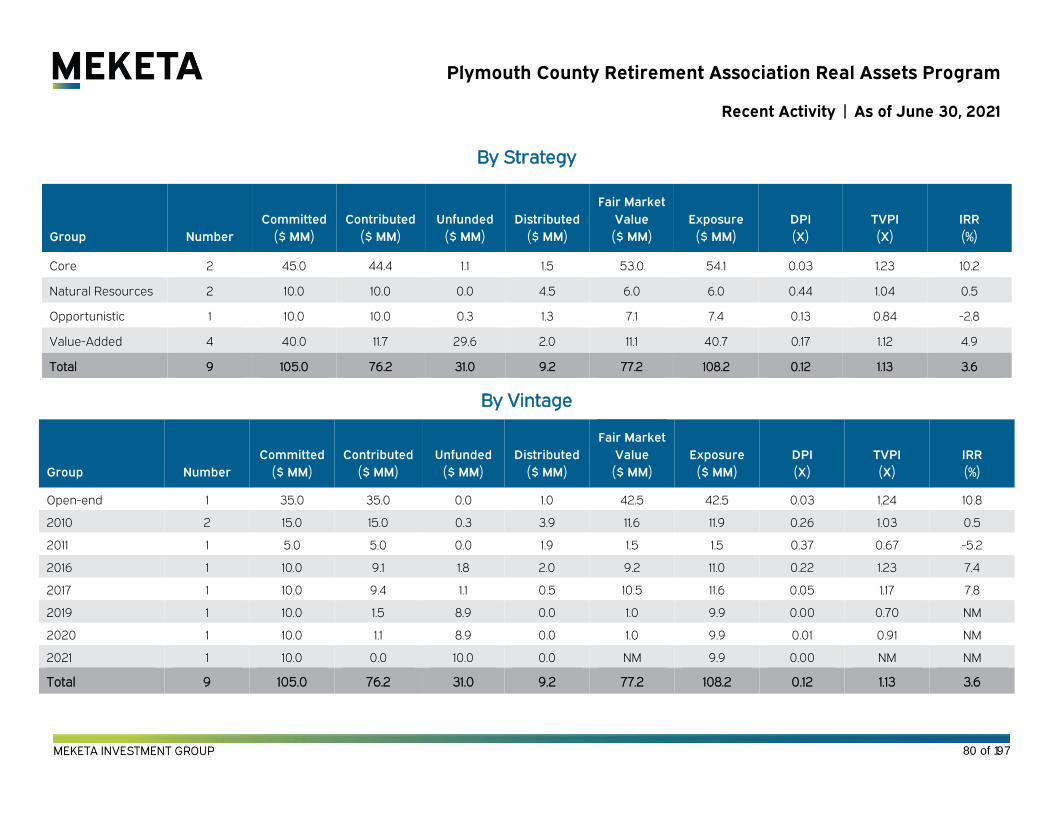
Plymouth County Retirement Association Real Assets Program
Recent Activity | As of June 30, 2021
By Strategy
Group Number
Committed
($ MM)
Contributed
($ MM)
Unfunded
($ MM)
Distributed
($ MM)
Fair Market
Value
($ MM)
Exposure
($ MM)
DPI
(X)
TVPI
(X)
IRR
(%)
Core 2 45.0 44.4 1.1 1.5 53.0 54.1 0.03 1.23 10.2
Natural Resources 2 10.0 10.0 0.0 4.5 6.0 6.0 0.44 1.04 0.5
Opportunistic 1 10.0 10.0 0.3 1.3 7.1 7.4 0.13 0.84 -2.8
Value-Added 4 40.0 11.7 29.6 2.0 11.1 40.7 0.17 1.12 4.9
Total 9 105.0 76.2 31.0 9.2 77.2 108.2 0.12 1.13 3.6
By Vintage
Group Number
Committed
($ MM)
Contributed
($ MM)
Unfunded
($ MM)
Distributed
($ MM)
Fair Market
Value
($ MM)
Exposure
($ MM)
DPI
(X)
TVPI
(X)
IRR
(%)
Open-end 1 35.0 35.0 0.0 1.0 42.5 42.5 0.03 1.24 10.8
2010 2 15.0 15.0 0.3 3.9 11.6 11.9 0.26 1.03 0.5
2011 1 5.0 5.0 0.0 1.9 1.5 1.5 0.37 0.67 -5.2
2016 1 10.0 9.1 1.8 2.0 9.2 11.0 0.22 1.23 7.4
2017 1 10.0 9.4 1.1 0.5 10.5 11.6 0.05 1.17 7.8
2019 1 10.0 1.5 8.9 0.0 1.0 9.9 0.00 0.70 NM
2020 1 10.0 1.1 8.9 0.0 1.0 9.9 0.01 0.91 NM
2021 1 10.0 0.0 10.0 0.0 NM 9.9 0.00 NM NM
Total 9 105.0 76.2 31.0 9.2 77.2 108.2 0.12 1.13 3.6
80 of 197

Plymouth County Retirement Association Real Assets Program
Performance Analysis | As of June 30, 2021
Since Inception Performance Over Time
Horizon IRRs
1 Year
(%)
3 Year
(%)
5 Year
(%)
10 Year
(%)
Since Inception
(%)
Aggregate Portfolio 16.4 7.9 6.3 3.6 3.6
Public Market Equivalent 32.0 11.2 11.0 8.6 8.7
-8%
-6%
-4%
-2%
0%
2%
4%
6%
0.00
0.20
0.40
0.60
0.80
1.00
1.20
IRR
TV
PI
TVPI IRR
81 of 197
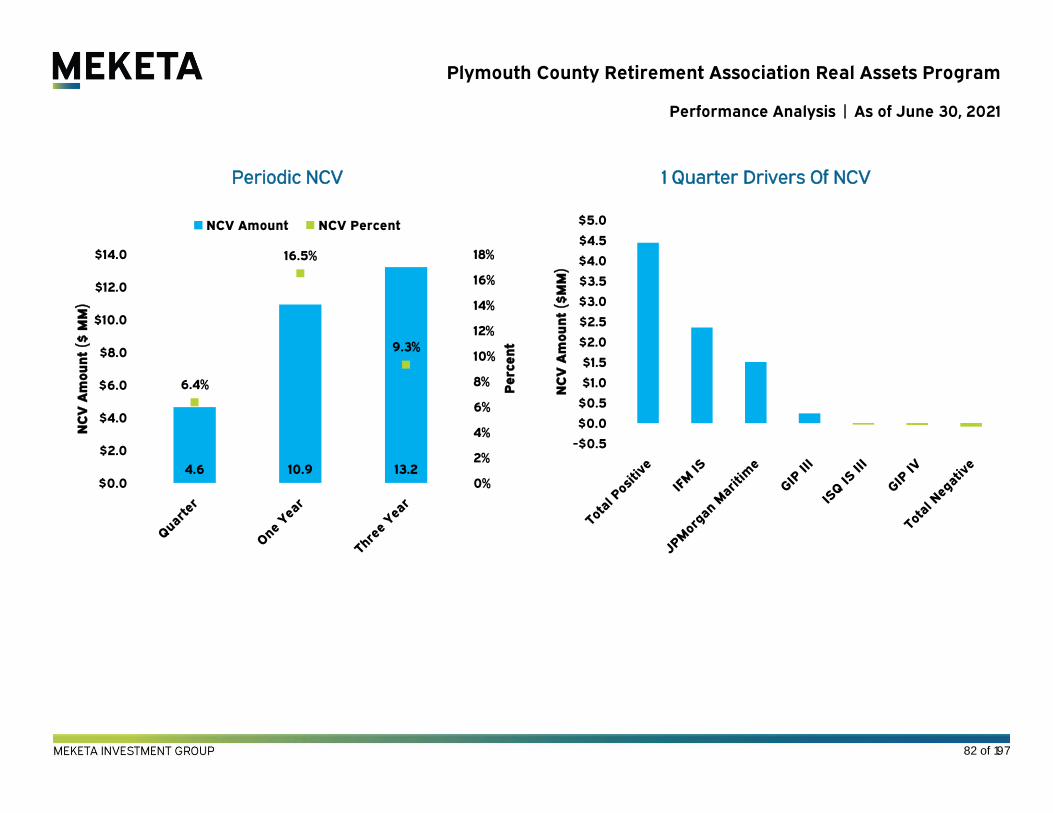
Plymouth County Retirement Association Real Assets Program
Performance Analysis | As of June 30, 2021
Periodic NCV 1 Quarter Drivers Of NCV
4.6 10.9 13.2
6.4%
16.5%
9.3%
0%
2%
4%
6%
8%
10%
12%
14%
16%
18%
$0.0
$2.0
$4.0
$6.0
$8.0
$10.0
$12.0
$14.0
Pe
rce
nt
NC
V A
mo
un
t ($
MM
)
NCV Amount NCV Percent
-$0.5
$0.0
$0.5
$1.0
$1.5
$2.0
$2.5
$3.0
$3.5
$4.0
$4.5
$5.0
NC
V A
mo
un
t ($
MM
)
82 of 197

Plymouth County Retirement Association Real Assets Program
Time Weighted Performance | As of June 30, 2021
2Q21
(%)
1 YR
(%)
3 YR
(%)
5 YR
(%)
10 YR
(%)
Since Inception
(%)
Inception
Date
IFM Global Infrastructure 5.9 14.5 NA NA NA 10.4 10/01/2018
CPI+5% 3.5 10.4 NA NA NA 7.7
83 of 197

Plymouth County Retirement Association Real Assets Program
Performance Analysis | As of June 30, 2021
Fund Performance: Sorted By Vintage And Strategy
By Investment Vintage Strategy
Committed
($ MM)
Contributed
($ MM)
Unfunded
($ MM)
Distributed
($ MM)
Fair
Market
Value
($ MM)
TVPI
(X)
Peer
TVPI
(X)
IRR
(%)
Peer
IRR
(%)
IFM IS Open
end
Core 35.0 35.0 0.0 1.0 42.5 1.24 NM 10.8 NM
Timbervest III 2010
Natural
Resources 5.0 5.0 0.0 2.6 4.5 1.41 1.20 4.5 2.6
JPMorgan Maritime 2010 Opportunistic 10.0 10.0 0.3 1.3 7.1 0.84 1.20 -2.8 2.6
BTG Global Timber 2011
Natural
Resources 5.0 5.0 0.0 1.9 1.5 0.67 1.01 -5.2 0.3
GIP III 2016 Value-Added 10.0 9.1 1.8 2.0 9.2 1.23 1.22 7.4 8.4
Basalt IS II 2017 Core 10.0 9.4 1.1 0.5 10.5 1.17 1.21 7.8 8.6
GIP IV 2019 Value-Added 10.0 1.5 8.9 0.0 1.0 0.70 NM NM NM
BlackRock GRPIF III 2020 Value-Added 10.0 1.1 8.9 0.0 1.0 0.91 NM NM NM
ISQ IS III 2021 Value-Added 10.0 0.0 10.0 0.0 NM2 NM NM NM NM
Total 105.0 76.2 31.0 9.2 77.2 1.13 1.23 3.6 6.2
2 The fair market value as of June 30, 2021 is ($132,526) due to syndication costs, placement fees, and other expenses incurred by ISQ Global Infrastructure Fund III, L.P. since inception, without calling
capital for investment.
84 of 197

Plymouth County Retirement Association Real Assets Program
Fund Diversification | As of June 30, 2021
By Strategy
Percent of FMV Percent of Exposure
69%
14%
9%
8%
Core
Value-Added
Opportunistic
Natural Resources
50%
38%
7%6%
Core
Value-Added
Opportunistic
Natural Resources
85 of 197

Plymouth County Retirement Association Real Assets Program
Fund Diversification | As of June 30, 2021
By Vintage
Percent of FMV Percent of Exposure
55%
15%
14%
12%
2%1% 1% <1%
Open-end
2010
2017
2016
2011
2019
2020
2021
39%
11%11%
10%
9%
9%
9%1%
Open-end
2010
2017
2016
2019
2020
2021
2011
86 of 197
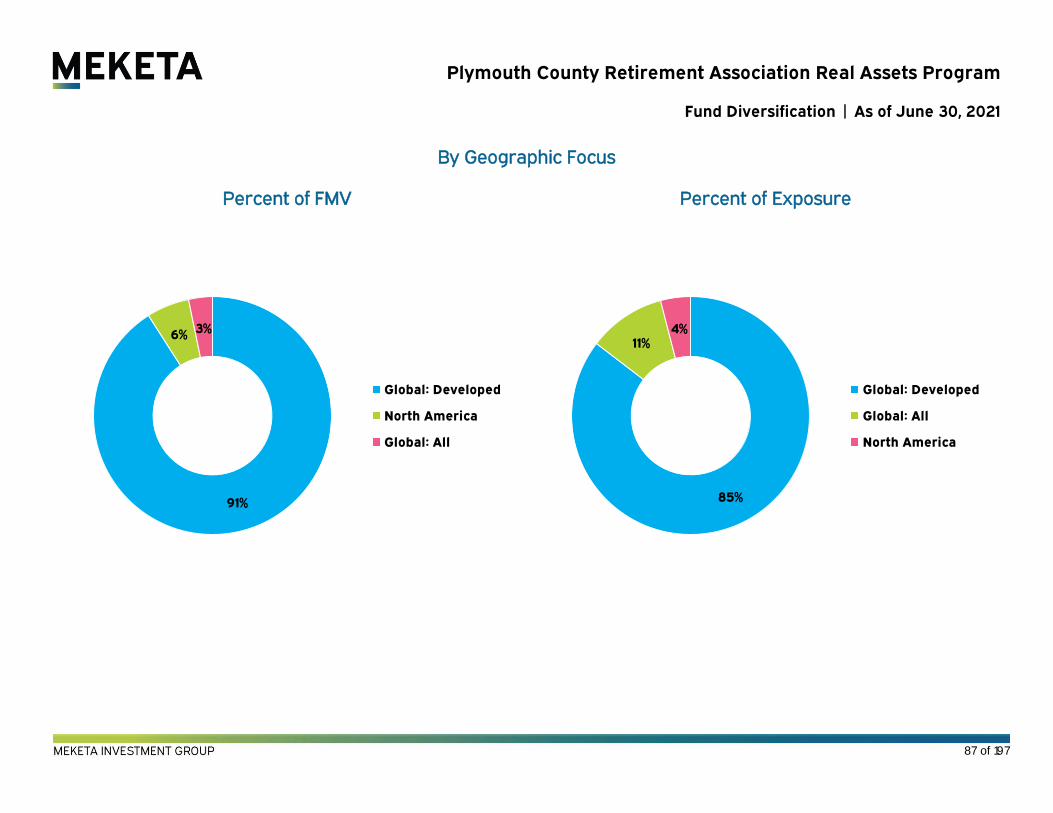
Plymouth County Retirement Association Real Assets Program
Fund Diversification | As of June 30, 2021
By Geographic Focus
Percent of FMV Percent of Exposure
91%
6% 3%
Global: Developed
North America
Global: All
85%
11%4%
Global: Developed
Global: All
North America
87 of 197

Plymouth County Retirement Association Real Estate Program
Real Estate Program
88 of 197

Plymouth County Retirement Association Real Estate Program
Overview | As of June 30, 2021
Introduction
As of June 30, 2021, the Retirement Association had committed $263.0 million to 21 partnerships. As of quarter
end, the fair market value of the real estate portfolio, in aggregate, was $124.6 million. The Retirement
Association’s Real Estate program asset value represents 9.6% of total assets, slightly below its 10% target.
Program Status Performance Since Inception
Program Peer Universe
No. of Investments 21 DPI 0.81x 0.93x
Committed ($ MM) 263.0 TVPI 1.37x 1.33x
Contributed ($ MM) 219.7 IRR 5.7% 7.3%
Distributed ($ MM) 177.8
Fair Market Value ($ MM) 124.6
13.9%12.7% 13.6% 12.9%
11.6% 10.7% 11.2%8.7% 9.5% 9.6%
0%
5%
10%
15%
20%
0
10
20
30
40
50
Pro
gra
m F
MV
% T
ota
l A
sse
ts
Co
mm
itm
en
ts (
$ M
M)
Commitments by Vintage Year Fair Market Value % of Total Assets
89 of 197

Plymouth County Retirement Association Real Estate Program
Recent Activity | As of June 30, 2021
Commitments
Recent Quarterly Commitments
Commitments This Quarter
Fund Strategy Region Amount (MM)
No new commitments made during the quarter
0.0
5.0
10.0
15.0
20.0
25.0
30.0
Co
mm
itm
en
t ($
MM
)
90 of 197

Plymouth County Retirement Association Real Estate Program
Recent Activity | As of June 30, 2021
Cash Flows
Recent Quarterly Cash Flows
Largest Contributions This Quarter Largest Distributions This Quarter
Fund Vintage Strategy Region
Amount
($MM)
Fund Vintage Strategy Region
Amount
($MM)
Carlyle Realty VIII 2017 Opportunistic North America 1.61 AEW Partners VIII 2017 Opportunistic North America 2.85
TerraCap V 2020 Value-Added North America 0.68 Carlyle Realty VIII 2017 Opportunistic North America 1.92
Berkshire Value V 2019 Value-Added North America 0.38 DSF III 2016 Value-Added North America 1.64
-7.7
-34.6
-2.3 -2.7
-17.3
-1.9 -4.4 -3.9 -2.0 -3.0
0.1
52.5
3.0 2.9 3.5 0.3 0.74.6 0.7
6.9
-40.0
-20.0
0.0
20.0
40.0
60.0
Am
ou
nt
($ M
M)
Contributions Distributions
91 of 197

Plymouth County Retirement Association Real Estate Program
Recent Activity | As of June 30, 2021
Significant Events
• Carlyle Realty Partners VIII, L.P. called $1.61 million during the second quarter to fund existing investments
and partnership expenses.
• TerraCap Partners V, L.P. called $0.68 million during the second quarter. Contributions were used to fund
the acquisition of assets and pay expenses.
• Berkshire Value Fund V, L.P. called $0.38 million during the quarter to fund the Graham Mezzanine Loan
acquisition.
• AEW Partners Real Estate Fund VIII, L.P. distributed $2.85 million during the quarter. Proceeds stemmed
from a preferred equity investment and the sale of several portfolio investments.
• Carlyle Realty Partners VIII, L.P. distributed $1.92 million. Proceeds stemmed from several portfolio
investments during the quarter.
• DSF Multi-Family Real Estate Fund III, L.P. distributed $1.64 million. Proceeds stemmed from the sale of a
portfolio investment during the quarter.
92 of 197
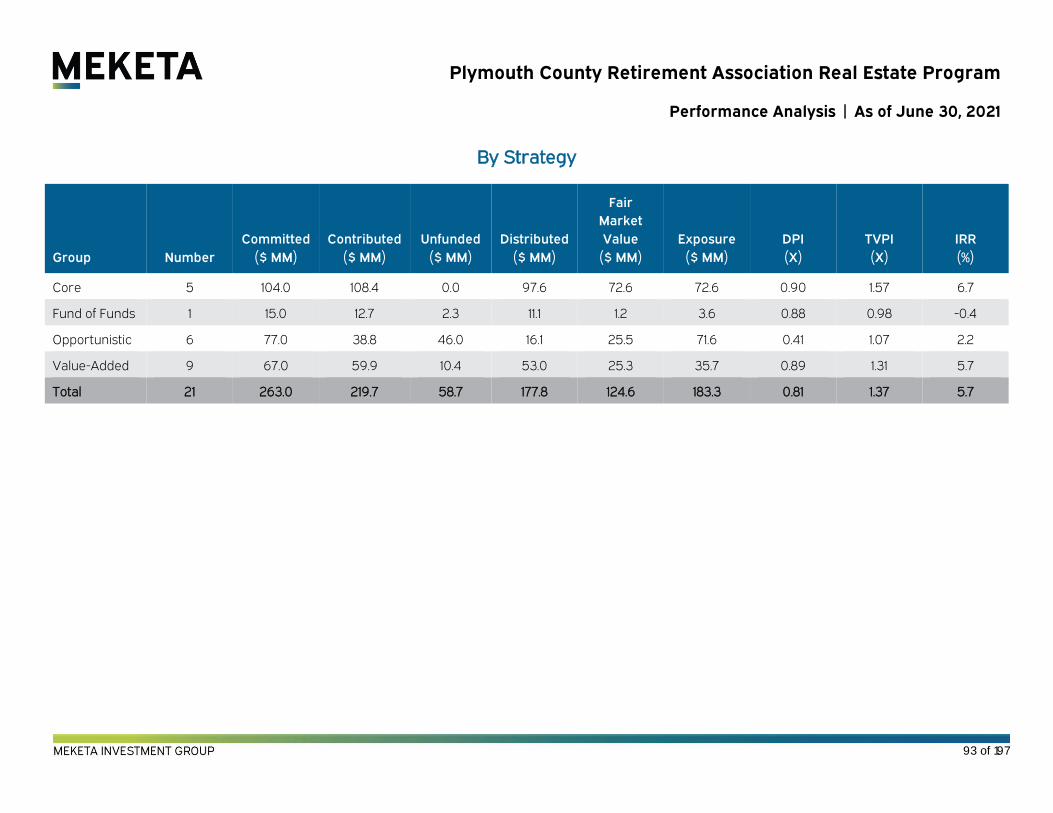
Plymouth County Retirement Association Real Estate Program
Performance Analysis | As of June 30, 2021
By Strategy
Group Number
Committed
($ MM)
Contributed
($ MM)
Unfunded
($ MM)
Distributed
($ MM)
Fair
Market
Value
($ MM)
Exposure
($ MM)
DPI
(X)
TVPI
(X)
IRR
(%)
Core 5 104.0 108.4 0.0 97.6 72.6 72.6 0.90 1.57 6.7
Fund of Funds 1 15.0 12.7 2.3 11.1 1.2 3.6 0.88 0.98 -0.4
Opportunistic 6 77.0 38.8 46.0 16.1 25.5 71.6 0.41 1.07 2.2
Value-Added 9 67.0 59.9 10.4 53.0 25.3 35.7 0.89 1.31 5.7
Total 21 263.0 219.7 58.7 177.8 124.6 183.3 0.81 1.37 5.7
93 of 197

Plymouth County Retirement Association Real Estate Program
Performance Analysis | As of June 30, 2021
By Vinatge
Group Number
Committed
($ MM)
Contributed
($ MM)
Unfunded
($ MM)
Distributed
($ MM)
Fair Market
Value
($ MM)
Exposure
($ MM)
DPI
(X)
TVPI
(X)
IRR
(%)
Open-end 5 104.0 108.4 0.0 97.6 72.6 72.6 0.90 1.57 6.7
2001 1 4.0 4.6 0.0 5.7 0.0 0.0 1.23 1.23 2.4
2003 1 10.0 9.0 1.9 11.7 0.0 1.9 1.31 1.31 5.1
2004 1 4.0 4.6 0.0 2.4 0.0 0.0 0.54 0.54 -8.0
2007 3 30.0 26.9 4.3 33.1 1.2 5.5 1.23 1.27 4.9
2008 1 5.0 5.4 0.0 0.0 0.6 0.6 0.00 0.10 -15.9
2011 1 5.0 5.0 0.0 7.4 0.0 0.0 1.48 1.48 11.6
2016 1 15.0 15.1 0.0 3.8 16.7 16.7 0.25 1.36 10.2
2017 2 43.0 31.2 19.3 16.0 22.3 41.6 0.51 1.23 14.0
2019 2 18.0 5.6 12.3 0.1 7.2 19.5 0.02 1.31 NM
2020 2 15.0 4.1 10.9 0.0 4.0 14.9 0.01 0.99 NM
2021 1 10.0 0.0 10.0 0.0 0.0 10.0 0.00 NM NM
Total 21 263.0 219.7 58.7 177.8 124.6 183.3 0.81 1.37 5.7
94 of 197

Plymouth County Retirement Association Real Estate Program
Performance Analysis | As of June 30, 2021
Since Inception Performance Over Time
Horizon IRRs
1 Year
(%)
3 Year
(%)
5 Year
(%)
10 Year
(%)
Since Inception
(%)
Aggregate Portfolio 12.8 6.4 5.4 7.5 5.7
Public Market Equivalent 33.8 7.0 4.2 8.3 7.4
0%
2%
4%
6%
8%
10%
1.20
1.25
1.30
1.35
1.40
1.45
1.50
1.55
1.60
IRR
TV
PI
TVPI IRR
95 of 197

Plymouth County Retirement Association Real Estate Program
Performance Analysis | As of June 30, 2021
Periodic NCV 1 Quarter Drivers Of NCV
6.8 14.4 20.8
5.7%
13.1%
6.7%
0%
2%
4%
6%
8%
10%
12%
14%
$0.0
$5.0
$10.0
$15.0
$20.0
$25.0
Pe
rce
nt
NC
V A
mo
un
t ($
MM
)
NCV Amount NCV Percent
-$1.0
$0.0
$1.0
$2.0
$3.0
$4.0
$5.0
$6.0
$7.0
$8.0
NC
V A
mo
un
t ($
MM
)
96 of 197

Plymouth County Retirement Association Real Estate Program
Time Weighted Performance | As of June 30, 2021
2Q21
(%)
1 YR
(%)
3 YR
(%)
5 YR
(%)
10 YR
(%)
Since
Inception
(%)
Inception
Date
JPMorgan Strategic Property 2.7 5.8 NA NA NA 3.7 4/01/2019
NCREIF ODCE Equal Weighted (Net) 4.2 8.0 NA NA NA 4.8
TA Realty Core Property Fund, L.P. 5.3 12.4 8.8 NA NA 10.5 3/21/2018
NCREIF ODCE Equal Weighted (Net) 4.2 8.0 5.2 NA NA 5.9
97 of 197

Plymouth County Retirement Association Real Estate Program
Performance Analysis | As of June 30, 2021
Fund Performance: Sorted By Vintage And Strategy
By Investment Vintage Strategy
Committed
($ MM)
Contributed
($ MM)
Unfunded
($ MM)
Distributed
($ MM)
Fair
Market
Value
($ MM)
TVPI
(X)
Peer
TVPI
(X)
IRR
(%)
Peer
IRR
(%)
Invesco RE Open-end Core 22.0 23.9 0.0 44.8 0.0 1.87 NM 8.3 NM
JPMorgan
Strategic Open-end Core 27.0 27.0 0.0 0.0 29.3 1.09 NM 3.7 NM
MEPT Open-end Core 5.0 5.0 0.0 15.9 0.0 3.18 NM 6.5 NM
PRISA I Open-end Core 15.0 17.2 0.0 35.5 0.0 2.06 NM 5.3 NM
TA Realty Core Open-end Core 35.0 35.2 0.0 1.4 43.3 1.27 NM 9.8 NM
Intercontinental
III 2001 Value-Added 4.0 4.6 0.0 5.7 0.0 1.23 1.65 2.4 18.8
Hunt
Redevelopment 2003 Value-Added 10.0 9.0 1.9 11.7 0.0 1.31 1.40 5.1 12.1
Intercontinental
IV 2004 Value-Added 4.0 4.6 0.0 2.4 0.0 0.54 1.29 -8.0 8.0
Mesirow RE Intl 2007 Fund of Funds 15.0 12.7 2.3 11.1 1.2 0.98 1.18 -0.4 3.2
Berkshire Multi
II 2007 Value-Added 10.0 11.3 0.0 17.9 0.0 1.59 1.18 11.0 3.2
New Boston VII 2007 Value-Added 5.0 3.0 2.0 4.0 0.0 1.33 1.18 5.6 3.2
1921 Realty 2008 Opportunistic 5.0 5.4 0.0 0.0 0.6 0.10 1.30 -15.9 5.2
98 of 197

Plymouth County Retirement Association Real Estate Program
Performance Analysis | As of June 30, 2021
Fund Performance: Sorted By Vintage And Strategy (con’t)
By Investment Vintage Strategy
Committed
($ MM)
Contributed
($ MM)
Unfunded
($ MM)
Distributed
($ MM)
Fair
Market
Value
($ MM)
TVPI
(X)
Peer
TVPI
(X)
IRR
(%)
Peer
IRR
(%)
DSF IV 2011 Value-Added 5.0 5.0 0.0 7.4 0.0 1.48 1.48 11.6 11.9
DSF III 2016 Value-Added 15.0 15.1 0.0 3.8 16.7 1.36 1.37 10.2 11.9
AEW Partners
VIII 2017 Opportunistic 25.0 21.5 6.9 12.1 14.8 1.24 1.26 13.8 11.8
Carlyle Realty
VIII 2017 Opportunistic 18.0 9.6 12.4 3.9 7.5 1.19 1.26 14.7 11.8
Rockpoint VI 2019 Opportunistic 9.0 1.7 7.3 0.1 2.1 1.35 1.09 NM NM
Berkshire Value
V 2019 Value-Added 9.0 3.9 5.0 0.0 5.1 1.29 1.09 NM NM
AEW Partners
IX 2020 Opportunistic 10.0 0.6 9.4 0.0 0.5 0.87 1.05 NM NM
TerraCap V 2020 Value-Added 5.0 3.5 1.5 0.0 3.5 1.01 1.05 NM NM
PCCP Equity IX 2021 Opportunistic 10.0 0.0 10.0 0.0 0.0 NM NM NM NM
Total 263.0 219.7 58.7 177.8 124.6 1.37 1.33 5.7 7.3
99 of 197

Plymouth County Retirement Association Real Estate Program
Performance Analysis | As of June 30, 2021
By Strategy
Percent of FMV Percent of Exposure
58%20%
20%
1%
Core
Opportunistic
Value-Added
Fund of Funds
40%
39%
19%
2%
Core
Opportunistic
Value-Added
Fund of Funds
100 of 197

Plymouth County Retirement Association Real Estate Program
Performance Analysis | As of June 30, 2021
By Vintage
Percent of FMV Percent of Exposure
58%
18%
13%
6%3%
1%0%
0%0%
Open-end
2017
2016
2019
2020
2007
2008
2011
2003
40%
23%
11%
9%
8%
5%3%
1%
Open-end
2017
2019
2016
2020
2021
2007
2003
2008
101 of 197

Plymouth County Retirement Association Real Estate Program
Performance Analysis | As of June 30, 2021
By Geographic Focus
Percent of FMV Percent of Exposure
100%
North America
100%
North America
102 of 197

Plymouth County Retirement Association Private Markets Program
Market & Industry Analysis
As of June 30, 2021
103 of 197

Plymouth County Retirement Association Private Markets Program
Market & Industry Analysis | As of June 30, 2021
Private Equity
Global Fundraising1
Fundraising activity for private equity funds in the second quarter of 2021 increased compared to the previous quarter, with $241.5 billion raised,
marking the highest fundraising total for a second quarter over the last five years. Fundraising in the second quarter increased 74% from the same
period in 2020 and 11% from Q1 2021. The number of fund closings also increased 35%, to 510 funds, relative to Q2 2020, but decreased by 14% relative to
the previous quarter. The short-term market disruption from the COVID-19 pandemic continues to subside and fundraising has largely recovered in the
past three quarters. That said, the annual growth rate of private equity fundraising has been declining since 2017, and a longer-term slowdown could be
the prevailing trend. Fundraising continued to demonstrate signs of further capital consolidation with larger, more established managers increasing
their market share. The average size of funds still in the market has been declining, indicating that smaller funds have been hardest hit by the
challenging conditions and have had the most difficulty establishing new LP relationships.
1 Preqin
$0
$50
$100
$150
$200
$250
$300
Q1 Q2 Q3 Q4 Q1 Q2 Q3 Q4 Q1 Q2 Q3 Q4 Q1 Q2 Q3 Q4 Q1 Q2 Q3 Q4 Q1 Q2
2016 2017 2018 2019 2020 2021
Ca
pit
al
Ra
ise
d (
$B
)
104 of 197

Plymouth County Retirement Association Private Markets Program
Market & Industry Analysis | As of June 30, 2021
Purchase Price Breakdown, All LBOs1
Dry Powder by Fund Type2
Relative to 2020, private equity purchase price multiples in the first half of 2021 slightly decreased to 11.1x EBITDA. Equity
contribution (relative to total purchase price) also decreased slightly to 48%, resulting in total purchase prices comprising
slightly more debt than equity during the period. However, during the three months ended June 30, 2021, purchase price
multiples increased to 11.5x EBITDA, supported by a continued record level of dry powder, which still surpasses the year-
end level in 2020. Dry powder levels will remain high as long as more capital is being raised than is being deployed, and
investors may expect to continue to see high purchase prices as a result of the high levels of capital competing for deals.
1 S&P 2 Preqin
6.1x5.0x
3.8x4.6x4.9x5.1x5.3x5.7x5.6x5.4x5.7x5.8x5.8x5.7x5.8x
3.6x4.2x
3.9x3.9x3.9x3.6x3.5x
3.9x4.7x4.6x4.9x4.8x
5.7x5.7x5.3x
0.0x
2.0x
4.0x
6.0x
8.0x
10.0x
12.0x
14.0x Debt/ EBITDA Equity/ EBITDA
0
200
400
600
800
1,000
1,200
1,400
1,600
1,800 Venture Capital Buyout Growth Other Private Equity
105 of 197

Plymouth County Retirement Association Private Markets Program
Market & Industry Analysis | As of June 30, 2021
Purchase Price Breakdown, All LBOs1
Dry Powder by Fund Type2
Relative to 2020, private equity purchase price multiples in the first half of 2021 slightly decreased to 11.1x EBITDA. Equity
contribution (relative to total purchase price) also decreased slightly to 48%, resulting in total purchase prices comprising
slightly more debt than equity during the period. However, during the three months ended June 30, 2021, purchase price
multiples increased to 11.5x EBITDA, supported by a continued record level of dry powder, which still surpasses the year-
end level in 2020. Dry powder levels will remain high as long as more capital is being raised than is being deployed, and
investors may expect to continue to see high purchase prices as a result of the high levels of capital competing for deals.
1 S&P 2 Preqin
6.1x5.0x
3.8x4.6x4.9x5.1x5.3x5.7x5.6x5.4x5.7x5.8x5.8x5.7x5.8x
3.6x4.2x
3.9x3.9x3.9x3.6x3.5x
3.9x4.7x4.6x4.9x4.8x
5.7x5.7x5.3x
0.0x
2.0x
4.0x
6.0x
8.0x
10.0x
12.0x
14.0x Debt/ EBITDA Equity/ EBITDA
0
200
400
600
800
1,000
1,200
1,400
1,600
1,800 Venture Capital Buyout Growth Other Private Equity
106 of 197

Plymouth County Retirement Association Private Markets Program
Market & Industry Analysis | As of June 30, 2021
Capital Raised by Strategy1 Capital Raised by Geography2
Buyout funds continued to be the most popular private equity sub-strategy and increased from 37% of all private equity capital raised in the first quarter
of 2021 to 52% in the second quarter of 2021. Alternatively, Venture Capital and Growth Equity strategies, as a percentage of total capital raised,
decreased from Q1 2021, falling from 24% and 13%, respectively, to 17% and 7%. Secondaries strategies also experienced a decrease in capital raised from
8% in the first quarter of 2021 to 4% in the second quarter. Fund of Funds and Other Private Equity, which includes co-investment and hybrid vehicles,
stayed relatively consistent through the second quarter compared the previous quarter.
North America-focused vehicles continued to represent the majority of funds raised during the second quarter, representing 55% of total capital. This is
a slight decrease from 60% in the prior quarter with private equity investors starting to re-emphasize commitments to Asia, which increased from 13% to
21% of capital raised during the second quarter of 2021. Europe-focused funds remained at 22% of capital raised. Overall, private equity investors
continued to favor commitments to North America-focused funds, but investor appetite for Asia. Asia-focused funds raised $51.8 billion in Q2 2021, only
slightly less than the traditionally larger European market, which raised $52.9 billion. Preqin data shows that newer-vintage funds are increasingly
looking to invest in Asia. Funds currently in market with Asia as their primary geographic focus account for 27% of targeted capital, compared with 15% of
all funds in market.
1 Preqin 2 Preqin
52%
7%
17%
10%
4%9%
Buyout
Growth Equity
Venture Capital
Fund of Funds
Secondaries
Other Private Equity
55%
22%
21%
2%North America
Europe
Asia
Rest of World
107 of 197

Plymouth County Retirement Association Private Markets Program
Market & Industry Analysis | As of June 30, 2021
Private Equity Performance by Horizon1 Private Equity Performance by Vintage Year2
Horizon
Private
Equity Buyout
Venture
Capital
Growth
Equity
1 Year to 6/2021 61.3% 51.7% 82.2% 64.0%
3 Years to 6/2021 25.9 21.2 35.0 28.6
5 Years to 6/2021 22.3 19.9 26.3 24.3
10 Years to 6/2021 15.6 14.1 19.4 16.9
Recent private equity returns have been very strong, with all Private Equity generating a 61.3% IRR over the past year following the
outbreak of the COVID-19 pandemic in Q1 2020 and write-downs across most portfolios at that time related to the associated
uncertainty. One-year performance of Venture Capital was particularly impressive, generating an 82.2% IRR. In general, performance
has been strong in each vintage year since the Global Financial Crisis. Buyout and Venture Capital funds have generally both
performed well over the various horizons on an absolute basis, with Venture funds significantly outperforming Buyout funds over
multiple time horizons. The spread between first and third quartile performance in private equity has grown consistently since the
Global Financial Crisis; 2007 vintage funds reported a 12.6% spread while 2019 vintage funds reported a 43.1% spread.
1 Cambridge Associates Published Global Pooled Returns as of 6/30/2021. 2 Cambridge Associates Published Global Quartile Returns as of 6/30/2021.
0%
10%
20%
30%
40%
50%
60%
70%
Top Quartile Net IRR Boundary Median Net IRR
Bottom Quartile Net IRR Boundary
108 of 197

Plymouth County Retirement Association Private Markets Program
Market & Industry Analysis
As of June 30, 2021
109 of 197

Plymouth County Retirement Association Private Markets Program
Market & Industry Analysis | As of June 30, 2021
Global Quarterly Unlisted Natural Resource Fundraising1
After a full year following the declaration of the global pandemic, fundraising continued to improve. During the quarter,
approximately $29.9 billion was raised across 40 funds with the average fund size raised averaging approximately $0.8 billion of
commitments. As of June 30, 2021, Preqin reported a total of 411 unlisted natural resources funds with a combined fundraising target
of approximately $215 billion. The majority of natural resources managers fundraising during the second quarter were focused on
North America, accounting for half of cumulative targeted capitalization in the market.
1 Source: Preqin Private Capital Fundraising Update, Q2 2021.
110 of 197

Plymouth County Retirement Association Private Markets Program
Market & Industry Analysis | As of June 30, 2021
Extracted Resources
Oil Price vs. Active US Rigs1
Oil prices ended the quarter at $71 per barrel representing a 15% increase from the prior quarter and an 86% increase from one year prior.
Global demand continues to modestly increase while increases in production from the US and OPEC+ have been muted. Also during the
quarter, the Colonial Pipeline, a pipeline system that transports gasoline and other fuels, suffered a cyberattack that led to shortages
across the Southeast. During the quarter, the active US oil rig count increased by 52 to 367. International oil, as represented by Brent
prices, increased by 12% to $73 per barrel. US gasoline prices for regular blend increased to $3.28 per gallon representing a 9% quarterly
increase and 45% yearly increase.
1 Source: EIA and Baker Hughes.
111 of 197
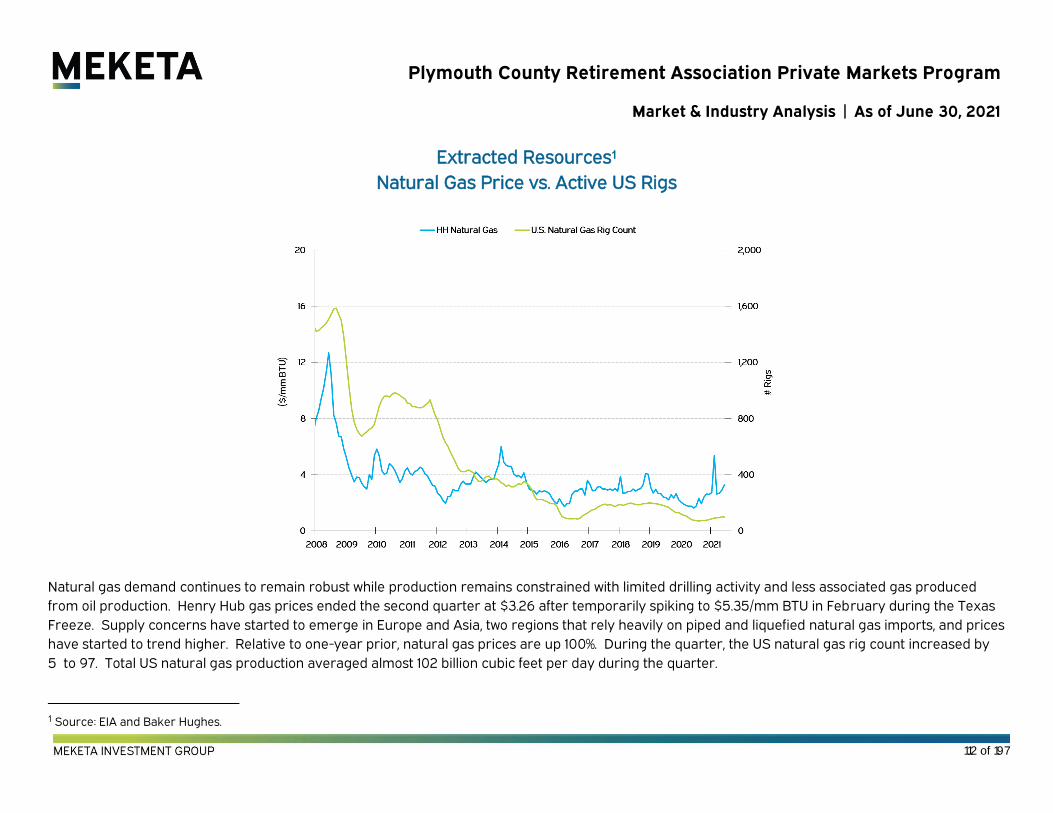
Plymouth County Retirement Association Private Markets Program
Market & Industry Analysis | As of June 30, 2021
Extracted Resources1
Natural Gas Price vs. Active US Rigs
Natural gas demand continues to remain robust while production remains constrained with limited drilling activity and less associated gas produced
from oil production. Henry Hub gas prices ended the second quarter at $3.26 after temporarily spiking to $5.35/mm BTU in February during the Texas
Freeze. Supply concerns have started to emerge in Europe and Asia, two regions that rely heavily on piped and liquefied natural gas imports, and prices
have started to trend higher. Relative to one-year prior, natural gas prices are up 100%. During the quarter, the US natural gas rig count increased by
5 to 97. Total US natural gas production averaged almost 102 billion cubic feet per day during the quarter.
1 Source: EIA and Baker Hughes.
112 of 197

Plymouth County Retirement Association Private Markets Program
Market & Industry Analysis | As of June 30, 2021
Extracted Resources
Metals Prices1
Generally, many metals increased in price during the quarter on strong demand from a variety of sectors including manufacturing, electrical vehicles,
and renewable energy projects. Gold prices ended the quarter at approximately $1,835 per ounce representing a quarterly increase of 7% and a 6%
increase from one year prior. Copper prices ended the quarter at $4.37 per pound representing a 7% increase for the quarter and a 67% increase from
one year prior.
1 Source: World Bank
113 of 197

Plymouth County Retirement Association Private Markets Program
Market & Industry Analysis | As of June 30, 2021
Harvested Resources
Wheat, Corn, & Soybean1
After several years of low crop prices, contributed to by bumper harvests around the world and decreased exports to
China, grain prices began strengthening over the past year. During the quarter, wheat, corn, and soybean prices
experienced a -3%, 19%, and 5% change, respectively. Relative to one year prior, the grains were up by 31%, 98%, and 66%,
respectively. The NCREIF Farmland index increased by 1.5% during the quarter driven by income returns of 0.6% and
appreciation of 0.9%.
1 Source: World Bank
114 of 197

Plymouth County Retirement Association Private Markets Program
Market & Industry Analysis | As of June 30, 2021
Harvested Resources
US South Timber Prices1
Significant increases in demand from new home construction and remodeling activity helped boost prices for cut wood products such
as lumber and panels. However, limited mill capacity and an oversupply of logs in the US South continue to limit the price increases
for sawlogs. US South average timber prices for sawtimber and chip-n-saw have remained fairly consistent over the past several
years, while pulpwood experienced more volatility. Hardwood pulpwood experienced a quarterly decrease of 3.9% and was down 0.2%
for the trailing one-year period. Pine pulpwood decreased 3.1% during the first quarter but was up 4.7% over the past year. Pine
sawtimber prices were relatively stable increasing by 3.0% and 11.7% during the quarter and one year period, respectively. The
quarterly NCREIF Timberland index increase of 1.7% was driven by income returns of 0.8% and appreciation of 0.9%.
1 Source: Bloomberg and TimberMart South
115 of 197

Plymouth County Retirement Association Private Markets Program
Market & Industry Analysis
As of June 30, 2021
116 of 197

Plymouth County Retirement Association Private Markets Program
Market & Industry Analysis | As of June 30, 2021
Global Quarterly Unlisted Infrastructure Fundraising1
Capital raised in the second quarter of 2021 was more than the first quarter of 2021 and more than the capital
raised in the second quarter of 2020. The average fund raised so far in 2021 is $1.1 billion, which is greater than
the 2020 average of $786 million. As of June 30, 2021, a total of 328 unlisted infrastructure funds were in market,
according to Preqin, with a combined fundraising target of approximately $238 billion.
1 Source: Preqin 2Q 2021 Global Infrastructure Report.
117 of 197

Plymouth County Retirement Association Private Markets Program
Market & Industry Analysis | As of June 30, 2021
Moving 12-month Total on All US Roads1
The second quarter was the highest distance traveled on US roads since before the global pandemic, with a total
of approximately 813 billion miles. This represented an increase of 13% over the same period in 2020. The travel
data is trending back to higher values, indicating a natural return to travel as COVID-19 restrictions continue to
loosen. Up to this point in 2021, the average US price of a gallon of gas went down to a monthly average of $2.85
per gallon, with a peak of $3.16. This compares to $2.26 and $2.64 seen in 2020, respectively.
1 Source: US Department of Transportation, Federal Highway Administration: Office of Highway Policy Information.
118 of 197

Plymouth County Retirement Association Private Markets Program
Market & Industry Analysis | As of June 30, 2021
US Port Activity – Container Trade in TEUs1
The chart presents the top three US ports by container volume, as measured by twenty-foot equivalent units
(TEU). Activity at the three ports provides a high-level representation of the volume at US ports more broadly.
During the second quarter of 2021, volumes at the three ports increased by 1.9 million units relative to the same
period in 2020. On a year-over-year basis, the combined port volumes increased by 5.2 million TEU, or 24.7%,
over the prior 12-month period. The Port of Long Beach recorded an increase of 27.8% (2.1 million TEU), the Port of
NY/NJ reported an increase of 16.0% (0.8 million TEU) and the Port of Los Angeles recorded an increase of 27.1%
(2.3 million TEU) over the prior 12 months.
1 Source: www.polb.com, www.panynj.gov, and www.portoflosangeles.org.
119 of 197

Plymouth County Retirement Association Private Markets Program
Market & Industry Analysis | As of June 30, 2021
Total US Domestic and International Flights1
The chart above presents all US domestic and international flights, excluding foreign point-to-point flights by
month. Historically, air traffic is cyclical with peaks in the summer months and troughs in the winter months.
There were 1.2 million more flights during the second quarter of 2021, representing a 159.8% increase compared to
the same period in 2020. Air traffic activity decreased by 27% over the 12-month period ending June 30, 2021
over the previous 12 months. In addition to the number of flights during the second quarter decreasing year-over-
year, the total number of passengers travelling on US and international airlines decreased by 42% from 2020 to
2021 with the lowest level of international travelers since 2003.
1 Source: Bureau of Transportation Statistics: Flights, All US, and Foreign Carriers.
120 of 197

Plymouth County Retirement Association Private Markets Program
Market & Industry Analysis | As of June 30, 2021
Total US Power Generation1
The graph above presents the total net generation for the past 12 months compared to the 10-year average for
each month. Over the past year, power generation was below the 10-year average in seven out of 12 months. Net
energy generation in the US increased by 5.7% during the second quarter, compared to the same period in 2020.
For the 12-month period ending June 30, 2021, net energy generation increased by 1.0% over the previous 12
months.
1 Source: US Energy Information Administration: Electric Power Monthly, June 2021.
225,000
250,000
275,000
300,000
325,000
350,000
375,000
400,000
425,000
Am
ou
nt
of
Po
we
r G
en
era
ted
(T
ho
usa
nd
Me
ga
wa
tt H
ou
rs)
Power Generated by Month
Last Twelve Months 10-Year Monthly Average
121 of 197

Plymouth County Retirement Association Private Markets Program
Market & Industry Analysis | As of June 30, 2021
US Power Generation by Source1
Three power generation sources in the US—coal, wind, natural gas, and solar—increased 35%, 10%, 1% and 30%, respectively,
in the second quarter of 2021 (versus the same period in the previous year). Generation from nuclear and hydroelectric
conventional dropped by 3% and 14%, respectively, during the same period. Wind and utility-scale solar continue to make
up a small portion of total net energy generation in the US, accounting for only 10% and 7% of energy generation in the
second quarter, respectively, while coal, natural gas, and nuclear accounted for 21%, 38%, and 19%, respectively. However,
the growth of wind and solar as sources of energy generation continues to increase at a faster rate than coal and natural
gas, especially over the last couple of years.
1 Source: US Energy Information Administration: Electric Power Monthly, June 2021.
122 of 197

Plymouth County Retirement Association Private Markets Program
Market & Industry Analysis
As of June 30, 2021
123 of 197

Plymouth County Retirement Association Private Markets Program
Market & Industry Analysis | As of June 30, 2021
Real Estate Fundamentals
Vacancy by Property Type1
In the second quarter of 2021, vacancy rates decreased for all property types except office. Multifamily vacancies decreased by 143
basis points in the second quarter after reaching 8.0% in the fourth quarter of 2020. Industrial vacancies appeared to have bottomed
in 2018 just above 3.0% and is currently tracking at 3.1%. Office and retail have seen sharp increases in vacancy due to the COVID-19
pandemic. Office and retail saw increases in vacancy over the trailing twelve months, while industrial and retail have seen decreases
over the same period. Compared to one year ago, vacancy rates in multifamily decreased 167 basis points, office increased 251 basis
points, industrial decreased 28 basis points, and retail increased 180 basis points. Overall, the vacancy rate across all properties
increased 1 basis point from Q2 2020.
1 Source: NCREIF
124 of 197

Plymouth County Retirement Association Private Markets Program
Market & Industry Analysis | As of June 30, 2021
NOI Growth1
The trailing twelve-month rate of NOI growth increased sharply in Q2 2021 to 5.3%. The ongoing COVID-19 pandemic has negatively
impacted commercial property operations as revenue declines outpaced declines in operating expenses, particularly for retail and
urban multifamily properties. Industrial NOI growth has increased, now trending above 10.0% for the trailing year ending Q2 2021.
Office NOI growth trended down slightly to 2.5% year-over-year, and Apartment NOI (a sector with “gross” rents, compared to “net”
rents in other property types) experienced negative NOI growth at 5.3% year-over-year, as occupancy in many core CBD locations
declined, and delinquencies increased in Q2 and Q3 2020. Retail NOI growth has improved significantly from the previous four
quarters, now at 21.1% year-over-year.
1 Source: NCREIF
125 of 197

Plymouth County Retirement Association Private Markets Program
Market & Industry Analysis | As of June 30, 2021
Transaction Volume ($bn)1
Private real estate transaction volume for properties valued over $2.5 million for Q2 2021 was up significantly from Q2 2020 to $156.3
billion. Compared to a year ago, all property types saw major increases in transaction volume: office (+135%), industrial (+165%), retail
(202%), multifamily (286%), hotel (1,788%) and land (73%). Multifamily and industrial properties made up the largest percentages of
total transaction volume during the quarter, at 38% and 21%, respectively.
1 Source: PREA
126 of 197

Plymouth County Retirement Association Private Markets Program
Market & Industry Analysis | As of June 30, 2021
Real Estate Capital Markets
Cap Rates vs. 10-Year Treasury1
The NPI Value Weighted Cap Rate decreased 3 basis points in Q2 2021 to 4.1%. The 10-year Treasury yield
decreased by 29 basis points in Q2 2021 from the previous quarter, and is still well below historical yields. The
spread between cap rates and treasury yields (261 basis points) is back above the long-term average spread of
252 basis points.
1 Source: NCREIF and US Department of the Treasury
127 of 197

Plymouth County Retirement Association Private Markets Program
Market & Industry Analysis | As of June 30, 2021
Trailing Period Returns1
As of June 30, 2021 1 Year 3 Years 5 Years 10 Years
NFI-ODCE (EW, net) 8.0% 5.2% 6.1% 8.9%
NFI-ODCE (VW, net) 7.1 4.6 5.6 8.7
NCREIF Property Index 8.0 5.2 6.1 8.8
NAREIT Equity REIT Index 32.8 11.8 8.0 10.3
Private real estate indices were positive in Q2 2021 and continue to be positive over the 1-year, 3-year, 5-year, and
10-year time horizons. Public real estate performance in 2020 and into 2021 has been volatile, returning 12.0% in
Q2 2021, after posting a negative return (-5.1%) over the course of 2020.
1 Source: NCREIF
128 of 197

Plymouth County Retirement Association Private Markets Program
Market & Industry Analysis | As of June 30, 2021
ODCE Return Components 1
(Equal Weight, Net)
The NFI-ODCE Equal Weight return for Q2 2021 was positive at 4.2%, posting the highest quarterly return since Q2
2011. The income component of the quarterly return was consistent at 0.9%, and appreciation for the quarter was
very strong at 3.4%.
1 Source: NCREIF
129 of 197

Current Issues
130 of 197

Plymouth County Retirement Association
Small Cap Value Equity
RFP Respondent Review
131 of 197

Plymouth County Retirement Association
Small Cap Value Equity RFP Respondent Review
Background
• The Association currently employs LMCG to manage its domestic small cap value allocation, which
represents roughly 6% of the total portfolio, or $78.2 million as of September 30, 2021.
• In August, Meketa Investment Group issued an RFP on behalf of the Association to evaluate the
US small cap value universe.
− Twenty-three managers submitted responses to the RFP.
• Based upon our review and evaluation of each respondent, Meketa Investment Group has five managers
ranked as “Highly Advantageous”, 17 ranked as “Advantageous”, and one manager ranked as
“Not Advantageous”.
• The following pages review the twenty-three manager respondents.
132 of 197

Plymouth County Retirement Association
Small Cap Value Equity RFP Respondent Review
RFP Respondents
Manager Headquarters Strategy Overall Rating
AllianceBernstein Nashville, TN US Small Cap Value Equity Highly Advantageous
Brown Advisory Baltimore, MD Small Cap Fundamental Value Highly Advantageous
Systematic Financial Management Teaneck, NJ Small Cap Value Free Cash Flow Highly Advantageous
Vaughan Nelson Houston, TX Small Cap Value Highly Advantageous
Vulcan Value Partners Birmingham, AL Small Cap Highly Advantageous
Barrow Hanley Dallas, TX Small Cap Value Equity Advantageous
Boston Partners New York, NY Small Cap Value Equity Advantageous
Boston Partners New York, NY Small Cap Value Equity II Advantageous
Brandywine Global Philadelphia, PA Institutional Small Cap Value Equity Advantageous
Channing Capital Management Chicago, IL Small Cap Value Advantageous
CRM LLC (OG) Greenwich, CT Small Cap Value Advantageous
DRZ Winter Park, FL Small Cap Value Advantageous
Fiduciary Management Milwaukee, WI Small Cap Equity Advantageous
Fisher Investments Camas, WA Small Cap Value Advantageous
Frontier Capital Management (OG) Boston, MA Small Cap Value Advantageous
Kayne Anderson Rudnick Los Angeles, CA Small Cap Quality Value Advantageous
LMCG Boston, MA Small Cap Value Advantageous
LSV Asset Management Chicago, IL Small Cap Value Equity (U.S) Advantageous
Mesirow Chicago, IL Small Cap Value Equity Advantageous
Peregrine Capital Management Minneapolis, MN Small Cap Value Advantageous
Shapiro Capital Management Atlanta, GA Small Cap Value Advantageous
T. Rowe Price Baltimore, MD US Small Cap Value Equity Advantageous
HGK Asset Management Jersey City. NJ Small Cap Value Not Advantageous
133 of 197

Plymouth County Retirement Association
Small Cap Value Equity RFP Respondent Review
AllianceBernstein
Rating Criteria Rating Rationale
Overall Highly Advantageous
Organization Advantageous • AllianceBernstein (AB) is a large New York City based asset manager and was founded in 1971. AXA Financial is AllianceBernstein’s
majority shareholder with 65.3% of the equity. AB employees, directors, and officers own 13.4% of the company, and the remainder
is publicly traded.
• As of September 2021, AllianceBernstein had $742.2 billion in assets under management, including $3.6 billion in the Small Cap
Value strategy, incepted 1/91. The small cap value team also manages a SMID Cap Value strategy with $7.1 billion in assets.
Team Highly Advantageous • CIO James MacGregor leads the small/mid cap value team. He started his investment career in 1991 and joined AB in 1998. He
started at the firm as a senior research analyst. At the beginning of 2009, he was appointed the CIO and PM of the team.
• Mr. MacGregor is supported by co-portfolio manager Erik Turenchalk. Mr. Turenchalk started his investment career in 1999 at AB
and has been with the firm since. In 2012, he joined the small/mid cap value team.
• The team has four dedicated analysts. Mr. MacGregor also has access to AB’s central research department consisting of 39
fundamental analysts and 10 quantitative analysts. About 70% of the small cap value portfolio is researched by the small/mid cap
value team.
Investment Philosophy Highly Advantageous • Mr. MacGregor believes that the value of a stock is determined by its normalized cash earnings and that unless a company has
been impacted by secular changes, cash earnings will revert to their mean over time once the company’s problems have been
corrected.
• He also believes that many small cap stocks overreact to negative short-term problems and that investors often overestimate the
long-term impact of these issues. Mr. MacGregor and his analysts try to understand the nature of the controversy, assess the path
to recovery, and determine the company’s potential earnings power if the problems facing the company are resolved. Mr.
MacGregor requires all stocks in the portfolio to have catalysts at the time of purchase.
Investment Process Highly Advantageous • Investment ideas are generated from a universe of 2,500 stocks. Most ideas come from a proprietary quantitative scoring model
that is used as a screen, but analysts may also generate ideas based on their industry coverage. The scoring model incorporates
quality, valuation and momentum characteristics. Due diligence includes analyzing the company’s financial statements,
management strategy, and competitive position. Industry analysis, incorporating supply/demand and structural changes, is also
included in the review.
• The analyst builds an earnings model on each company. The team discusses the idea, and Messrs. MacGregor and Turenchalk
decide whether to add the stock to the portfolio.
• The portfolio is diversified and typically consists of 60 to 125 securities. Portfolio turnover is typically 30% to 60%.
Performance Highly Advantageous • AB’s excess returns have ranked in the top quintile over 7 years and top decile over 10 years (applicable for PM tenure). Tracking
error tends to rank in the bottom quartile, while beta is consistently above 1.00.
Fees Not Advantageous • Separate account estimated fee: 0.88%. Ranked 21 out of 23 responding managers (lower rank = less expensive). Approximate
Peer Ranking: 68th percentile
134 of 197

Plymouth County Retirement Association
Small Cap Value Equity RFP Respondent Review
Brown Advisory
Rating Criteria Rating Rationale
Overall Highly Advantageous
Organization Highly Advantageous • Brown Advisory was founded in January 1993. Brown Advisory is majority employee-owned. Current employees hold 70% of
the company’s equity.
• As of September 2021, Brown managed $64.2 billion in AUM across eight equity and one fixed income product. The Small
Cap Value strategy, incepted in January 2009, had $2.1 billion in AUM.
Team Advantageous • David Schuster has been the portfolio manager of the Small Cap Fundamental Value portfolio since the strategy’s inception.
Prior to joining Brown, Mr. Schuster was a managing director for the Financial Institutions Merger & Acquisition/Advisory
Group of Citigroup and a managing director in the M&A practice of Lazard Freres. Michael Poggi, CFA, is the strategy’s
associate portfolio manager and an equity analyst. Mr. Poggi joined Brown Advisory in 2003.
• Brown Advisory has 27 sector-focused analysts organized in a central research structure. The analysts support all the
portfolio managers. Each strategy also has an informal “working group” that consists of a sub-set of analysts from the
central research. Small Cap Fundamental Value’s working groups consists of five analysts who started in the investment
industry between 2001 and 2011.
Investment
Philosophy
Highly Advantageous • The believe that investing in companies with sustainable free cash flow and management teams that effectively allocate
capital will lead to strong risk-adjusted returns.
• Mr. Schuster views growth in a company’s cash flow as an important part of the potential total return. The team looks for
companies in which the reported GAAP net income differs materially from free cash flow.
• Brown’s investment team evaluates businesses the same way as a potential acquirer. They are long-term oriented with a 3-
5 year investment horizon.
Investment Process Highly Advantageous • Investment ideas come from quantitative screens, investment conferences, company visits, and the industry specific
knowledge of the analysts. The primary purpose of the team’s research is to understand the key attributes of each business.
Due diligence includes analyzing and modeling financial statements, on-site visits, and reviewing market research. The team
also leverages the firm’s extensive network of venture capital and private equity relationships, clients, directors and outside
shareholders. Multiple analysts often perform research on any given company.
• Mr. Schuster makes investment decisions. He holds post-mortem meetings to learn from names that went wrong/right.
• The portfolio holds 50-70 holdings. Name turnover is usually about 25%, while total portfolio turnover is normally 30% to 40%.
Performance Not Advantageous • Performance ranks below the peer group median. However, there is a lot of end-point bias given an especially poor 2020.
The portfolio has outperformed the index in eight of the last 10 calendar years with a beta ranging from ~0.8-0.9.
Fees Not Advantageous • Separate account estimated fee: 0.89%. Ranked 22 out of 23 responding managers (lower rank = less expensive).
Approximate Peer Ranking: 71st percentile
135 of 197

Plymouth County Retirement Association
Small Cap Value Equity RFP Respondent Review
Systematic Financial
Rating Criteria Rating Rationale
Overall Highly
Advantageous
Organization Advantageous • Systematic Financial Management (“Systematic”) was founded in December 1982 in Teaneck, NJ. Systematic is a wholly-owned affiliate
of Affiliated Managers Group (“AMG”). AMG owns stakes in 35 affiliate investment boutiques with aggregate assets under management
of $756 billion as of 6/30/2021
• As of September 2021, Systematic manages $3.6 billion in assets including $3.4 billion in Small Cap Value Free Cash Flow. The firm also
manages a SMID Cap Value Free Cash Flow portfolio that follows the same investment approach as Small Cap Value Free Cash Flow.
Team Highly
Advantageous
• Portfolio manager Kenneth Burgess leads the investment team. Mr. Burgess has spent his entire investment career at Systematic,
which he joined in 1993. He has managed the Small Cap Value Free Cash Flow strategy since 1996, and he became a partner of the firm
in 1997. Mr. Burgess also manages the SMID Cap Value Free Cash Flow strategy with the same investment team.
• Mr. Burgess is supported by a team of five analysts who joined the firm between 2004 and 2008. These individuals each cover multiple
sectors.
Investment
Philosophy
Highly
Advantageous
• Mr. Burgess believes that the value of a company is determined by the stream of cash flows that it will generate, and that the
company’s value will eventually be recognized by the market. He focuses the team on companies with sustainable and predictable cash
flows.
• The team emphasizes companies with strong balance sheets, including low leverage, low capital intensity, and strong cash flow debt
coverage. The investment team holds businesses for the long-term to let the cash flows compound. The portfolio has an average
holding period of five plus years and average annual turnover of ~20%.
Investment Process Highly
Advantageous
• The investment process begins with a quantitative screen of the Russell 2000 index. The screen’s metrics are largely cash flow and
balance sheet based including price/operating cash flow, price/free cash flow, enterprise value/free cash flow, total debt to capitalization,
and debt coverage.
• Analysts then fundamentally analyze the target companies. They begin by reviewing the business model. They attempt to identify and
understand the key business attributes in order to assess the sustainability of the business model. They also review and analyze
company management and its strategy for executing the business model. Meeting with company management is a key element of the
due diligence process. Mr. Burgess makes final investment decisions.
• The final portfolio will hold 100 to 150 stocks. Position sizes are limited to 5% of the total portfolio.
Performance Highly
Advantageous
• Performance ranks in top quintile over 7 and 10-year periods, top quartile over five years, and top decile since inception. Tracking error
is consistently in the bottom third of the universe, while beta is below 1.00.
Fees Highly
Advantageous
• Separate account estimated fee: 0.76%. Ranked 12 out of 23 responding managers (lower rank = less expensive). Approximate Peer
Ranking: 29th percentile
136 of 197

Plymouth County Retirement Association
Small Cap Value Equity RFP Respondent Review
Vaughan Nelson Investment Management
Rating Criteria Rating Rationale
Overall Highly
Advantageous
Organization Advantageous • Vaughan Nelson was founded in 1970 in Houston, TX. Vaughan Nelson has been wholly owned by Natixis Asset Management since 1996.
Natixis owns 10 investment managers throughout the world.
• As of September 2021, the firm managed $15.2 billion in assets across three domestic equity strategies, three non-US equity strategies,
and two fixed income portfolios. Small Cap Value, which was incepted in April 1997, had $3.6 billion in assets.
Team Highly
Advantageous
• CIO and Lead PM Chris Wallis leads the Small Cap Value investment team. Mr. Wallis performs company level research, provides
macroeconomic insights, and is the final decision maker for the Small Cap Value portfolio. He joined Vaughan Nelson in 1999 and started
in the investment industry in 1991.
• Stephen Davis was formally named Mr. Wallis’s co-PM on Small Cap Value on January 1, 2019. Mr. Davis has been in the investment
industry since 2005 and joined VN in 2010. Prior to VN, he was an analyst at Goldman Sachs for 4.5 years. Currently, he serves as a
sounding board for Mr. Wallis.
• Messrs. Wallis and Davis are supported by a team of five fundamental equity analysts who joined VN between 2005 and 2020. The
analysts are generalists, covering companies across sectors, though some have expertise in certain sectors. These individuals support
VN’s three US equity strategies.
Investment
Philosophy
Highly
Advantageous
• Vaughan Nelson believes that stocks can experience short-term declines in price and trade below their long- term intrinsic value as a
result of information and liquidity inefficiencies. Mr. Wallis views the change in Return on Invested Capital (ROIC) as the key driver of stock
price appreciation.
• Mr. Wallis is a flexible value manager. He looks for companies with undervalued earnings growth, companies that trade a discount to their
asset value, and companies with an attractive dividend yield. Mr. Wallis believes that investing in these three categories enhances
performance across different markets.
Investment Process Highly
Advantageous
• The process is largely bottom-up, though the team has an understanding of macroeconomic variables. The investable universe
comprises companies in the Russell 2000 Value Index. Due diligence includes financial statement analysis, meeting with management,
evaluation of the company’s strategy, assessment of cyclical and secular trends, and discussions with customers, suppliers, competitors,
and other industry participants.
• Once presented with the research, Messrs. Wallis and Davis decide whether the stock should be included in the portfolio. They are
absolute return oriented, and stocks need to have at least 50% appreciation potential over their three-year investment horizon. The
portfolio typically holds 55-85 stocks. Annual portfolio turnover approximates 60-80%, with name turnover of about 30%.
Performance Advantageous • Above median performance over 7 and 10-years and top quintile since inception. Bottom quintile beta of 0.85.
Fees Highly
Advantageous
• Separate account estimated fee: 0.79%. Ranked 14 out of 23 responding managers (lower rank = less expensive). Approximate Peer
Ranking: 39th percentile
137 of 197

Plymouth County Retirement Association
Small Cap Value Equity RFP Respondent Review
Vulcan
Rating Criteria Rating Rationale
Overall Highly
Advantageous
Organization Highly
Advantageous
• Founded in 2007 by C.T. Fitzpatrick, Vulcan Value Partners is a Birmingham, Alabama based boutique investment firm focused
on U.S. value equity strategies. The firm is majority employee-owned (83%) and 17% owned by a group of outside investors well
known to Vulcan employees. The outside investors are passive owners, and the largest individual non-employee owner owns no
more than 2% of the outstanding shares
• As of September 2021, Vulcan had $20.4 billion in AUM, including $1.9 billion in Small Cap Value.
Team Highly
Advantageous
• The investment team consists of seven individuals, led by CIO and Founder C.T. Fitzpatrick. Mr. Fitzpatrick started Vulcan in 2007
to employ the same rigor and discipline he learned at Southeastern, but to focus on higher quality businesses.
• A team of six generalists supports Mr. Fitzpatrick. These individuals joined the investment industry between 1989 (two
individuals) and 2017. On average, the team started in the industry in 2004. Some individuals bear the title of Portfolio Manager
and others Analyst. While the decision-making is highly collaborative and open, Mr. Fitzpatrick retain final decision-making
authority in the event of disagreements, which are rare.
Investment
Philosophy
Highly
Advantageous
• Mr. Fitzpatrick believes that by investing in high quality companies with stable or growing free cash flow at a discount to intrinsic
value, an investor will be in a good position to minimize risk and earn strong absolute returns. Rather than look for stocks that
are cheap first, Vulcan will look for good companies, then invest once valuation becomes attractive.
• Vulcan approaches investing with a private equity mindset as if it were going to own the entire business enterprise for the long-
term, so the team has a five-plus year investment horizon. Given the absolute return focus, the portfolio is benchmark agnostic.
Mr. Fitzpatrick also believes in managing concentrated portfolios to give the best ideas an opportunity to make a meaningful
impact.
Investment
Process
Highly
Advantageous
• The first step in the process is for the analysts to identify good businesses. A good business has stable FCF, high returns on
invested capital, sustainable competitive advantages, and experienced management teams that have a good track record of
allocating capital. The investment team will speak with management teams, and visit plants and company headquarters. They will
also speak with customers, suppliers, and competitors.
• Positions are sized linearly by their level of discount, in 10% discount increments. An individual position is limited to 10%. The
portfolio will typically hold 25-30 stocks. Expected annual turnover is below 50%, and lower name turnover.
Performance Highly
Advantageous
• Top quintile 5, 7, 10-year, SI performance. However, top decile tracking error, so must be comfortable w/ active risk.
Fees Not Advantageous • Separate account estimated fee: 0.83%. Ranked 17 out of 23 responding managers (lower rank = less expensive). Approximate
Peer Ranking: 54th percentile
138 of 197

Plymouth County Retirement Association
Small Cap Value Equity RFP Respondent Review
Barrow Hanley
Rating Criteria Rating Rationale
Overall Advantageous
Organization Not
Advantageous
• Barrow Hanley (BH) is a Dallas based asset manager founded in 1979 focused on value equity and fixed income strategies globally. In late
2020, Brightsphere Investment Group (NYSE: BSIG) sold its 75.1% stake in Barrow Hanley to Perpetual Limited, an Australian financial services
company traded on the Australian Securities Exchange. The remaining 24.9% is held by employees.
• As of September 30, 2021 BH had $49.6 billion in assets under management, including $2.3 billion in Small Cap Value.
Team Not
Advantageous
• Jim McClure and Coleman Hubbard are the portfolio managers for both Small Cap Value and Diversified Small Cap Value. Diversified Small
Cap Value is a more diversified portfolio of 150-200 stocks that follows a quantitative approach.
• Mr. McClure has managed the strategy since its 1996 inception along with John Harloe, who retired at the end of 2020. He is still the key
investor on the team and is later in his career. Mr. Hubbard joined BH in 2012 as an analyst after spending three years as an analyst at Bank
of America and Edgeview Partners.
• DJ Taylor, an analyst, supports Messrs. McClure and Hubbard. He joined the team in 2016 and spent the previous three years as an analyst at
Value Management Group, a healthcare valuation / transaction advisory firm.
Investment
Philosophy
Advantageous • BH looks for situations where companies are under-earning normalized levels, expectations are low, and valuations are attractive. The team
is contrarian, looking for stocks that are moving down and are out of favor. They focus on turnarounds. However, the company must display
some sign that fundamentals can be repaired and that earnings/cash flows can improve.
Investment
Process
Advantageous • The process is bottom-up. The investment universe comprises companies with market caps between $500 million and $4 billion. The team
culls this universe of about 2,000 companies down to those with attractive valuations, a high probability of rising return on capital, strong
normalized free cash flow, and shareholder-oriented management.
• The resulting ~150 companies that pass these criteria are subject to fundamental due diligence, which includes meeting with management
teams and channel checks with customers, suppliers, and competitors. The team constructs a three-year forward earnings model and a cash
flow yield model for each company to calculate the valuation gap. They strive to understand the company’s normalized earnings power as
part of the valuation work.
• BH does not look for specific catalysts and is willing to be early to invest in depressed stocks to take advantage of the inflection. Stocks may
stay depressed for some time after BH has established a position. Position sizing is a function of upside potential and liquidity. Positions are
rarely established at less than 2%, while average weightings are 3-5%.
• The result is a portfolio of 30 to 40 stocks. The team is benchmark agnostic, so the only sector guardrail is an absolute limit of 35% in any one
given sector. Portfolio turnover is typically 25% to 30%.
Performance Advantageous • Annual performance, especially in 2020 and 2021, has been volatile. Annualized excess returns have been above average over the trailing 5,
7, and 10-year periods ranking in or near the top quintile of the peer group. Portfolio beta is high.
Fees Highly
Advantageous
• Separate account estimated fee: 0.68%. Ranked 7 out of 23 responding managers (lower rank = less expensive). Approximate Peer Ranking:
14th percentile
139 of 197

Plymouth County Retirement Association
Small Cap Value Equity RFP Respondent Review
Boston Partners Small Cap Value
Rating Criteria Rating Rationale
Overall Advantageous
Organization Advantageous • Boston Partners (BP) is an established asset management firm based in Boston, MA. Boston Partners is a wholly owned subsidiary of
Orix Corp. (TYO: 8591), a publicly traded financial services company based in Japan.
• As of September 30, 2021 Boston Partners managed $93 billion in long only and long/short domestic and global equity products. The
Small Cap Value strategy was incepted in July 1995 and has $2.6 billion in assets.
Team Advantageous • The strategy is managed by David Dabora, senior portfolio manager, and George Gumpert, CFA, Portfolio Manager. They are
responsible for final decisions for the portfolio. Mr. Dabora has managed the strategy beginning in 2001. Mr. Gumpert, joined the team
in 2000 as a dedicated Small and Small/Mid Cap Value analyst and was promoted to assistant portfolio manager in 2005 and
portfolio manager in 2010. These individuals also manage the SMID Value and Small Cap Value II strategies.
• A team of 28 Global Research Analysts organized around industry specialties supports all of Boston Partners’ value equity strategies
globally. Quantitative researchers primarily focus on building multi-factor investment and risk models. Each group works
contemporaneously.
• Additionally, Messrs. Dabora and Gumpert have a dedicated research analyst, David Hinton, who focuses solely on small cap.
Investment
Philosophy
Advantageous • Boston Partners believes there are a few fundamental truths to investing that have been empirically proven to produce superior
returns over full market cycles. Specifically, Boston Partners believes that low valuation stocks outperform high valuation stocks,
companies with strong fundamentals outperform companies with weak fundamentals, and stocks with positive business momentum
outperform those with poor momentum.
Investment
Process
Highly
Advantageous
• The investable universe comprises companies with markets caps in the range of the Russell 2000 Index (about 3,800 businesses).
The investment process starts with quantitative scoring and screening, resulting in a composite score for each stock in the
investment universe based on 1) relative valuation, 2) momentum, and 3) fundamentals. From there, the team examines the model’s
output for data validation.
• Attractive investment candidates are then analyzed by the fundamental equity research team. The team focuses on identifying a
stock’s potential catalyst. Research includes discussions with management, suppliers, and competitors and a review of public filings.
The most attractive candidates are rated and presented to all of the firm’s PMs and analysts. Messrs. Dabora and Gumpert make final
investment decisions for Small Cap Value.
• The end result is a diversified portfolio of about 150 stocks. Portfolio turnover can range from 20-70% per annum.
Performance Not
Advantageous
• 5, 7, and 10-year performance ranks around the median of the peer group with only a modest amount of value added on a gross of
fees basis (no value add on a net of fees basis). Tracking error ranks near the bottom quartile of the peer set.
Fees Not
Advantageous
• Separate account estimated fee: 0.86%. Ranked 19 out of 23 responding managers (lower rank = less expensive). Approximate Peer
Ranking: 64th percentile
140 of 197

Plymouth County Retirement Association
Small Cap Value Equity RFP Respondent Review
Boston Partners Small Cap Value II
Rating Criteria Rating Rationale
Overall Advantageous
Organization Advantageous • Boston Partners (BP) is an established asset management firm based in Boston, MA. Boston Partners is a wholly owned subsidiary of Orix
Corp. (TYO: 8591), a publicly traded financial services company based in Japan.
• As of September 30, 2021 Boston Partners managed $93 billion in long only and long/short domestic and global equity products. The Small
Cap Value II strategy was incepted in July 1998 and has $1.0 billion in assets.
Team Advantageous • The strategy is managed by David Dabora, senior portfolio manager, and George Gumpert, CFA, Portfolio Manager. They are responsible for
final decisions for the portfolio. Mr. Dabora has managed the strategy beginning in 2001. Mr. Gumpert, joined the team in 2000 as a
dedicated Small and Small/Mid Cap Value analyst and was promoted to assistant portfolio manager in 2005 and portfolio manager in
2010. These individuals also manage the SMID Value and Small Cap Value II strategies.
• A team of 28 Global Research Analysts organized around industry specialties supports all of Boston Partners’ value equity strategies
globally. Quantitative researchers primarily focus on building multi-factor investment and risk models. Each group works
contemporaneously.
• Additionally, Messrs. Dabora and Gumpert have a dedicated research analyst, David Hinton, who focuses solely on small cap.
Investment
Philosophy
Advantageous • Boston Partners believes there are a few fundamental truths to investing that have been empirically proven to produce superior returns
over full market cycles. Specifically, Boston Partners believes that low valuation stocks outperform high valuation stocks, companies with
strong fundamentals outperform companies with weak fundamentals, and stocks with positive business momentum outperform those with
poor momentum.
Investment
Process
Highly
Advantageous
• The investable universe comprises companies with markets caps in the range of the Russell 2000 Index (about 3,800 businesses). The
investment process starts with quantitative scoring and screening, resulting in a composite score for each stock in the investment universe
based on 1) relative valuation, 2) momentum, and 3) fundamentals. From there, the team examines the model’s output for data validation.
• Attractive investment candidates are then analyzed by the fundamental equity research team. The team focuses on identifying a stock’s
potential catalyst. Research includes discussions with management, suppliers, and competitors and a review of public filings. The most
attractive candidates are rated and presented to all of the firm’s PMs and analysts. Messrs. Dabora and Gumpert make final investment
decisions for Small Cap Value.
• The end result is a diversified portfolio of about 150 stocks. Portfolio turnover can range from 20-70% per annum.
• Note that this portfolio is broadly similar to Small Cap Value, except that BP identifies additional attractive micro-cap names to add to this
strategy and reduces exposure slightly to larger small cap names in Small Cap Value.
Performance Not Advantageous • 7-year performance ranks around the median, while 10-year performance ranks in the 39th percentile of the peer group. However, the
strategy has not added value on a net of fees basis. Tracking error ranks in the bottom quintile of peers.
Fees Not Advantageous • Separate account estimated fee: 0.86%. Ranked 20 out of 23 responding managers (lower rank = less expensive). Approximate Peer
Ranking: 64th percentile
141 of 197

Plymouth County Retirement Association
Small Cap Value Equity RFP Respondent Review
Brandywine Global
Rating Criteria Rating Rationale
Overall Advantageous
Organization Not
Advantageous
• Brandywine Global (BG) is a Philadelphia based asset manager founded in 1986 offering a range of global equity, fixed income and multi-
asset strategies. BG operates as an indirect wholly-owned subsidiary of Franklin Resources, Inc. Brandywine has a revenue share with
Franklin Templeton.
• As of September 30, 2021 BH had $69.4 billion in AUM, including $118 million in Institutional Small Cap Value.
Team Not
Advantageous
• Edward Trumbour and Rastislav Berlansky previously co-managed this strategy from 2005-2015, while Mr. Trumbour was the sole PM on the
portfolio from its inception from 1996-2005. Mr. Trumbour left after some restructuring that affected the team. Mr. Berlansky left several
months later. Both reunited to start their own firm in 2015.
• Gregory Manley and Justin Bennitt were appointed co-lead PMs on the strategy in 2015, along with the Micro and SMID Value strategies. Mr.
Bennitt rejoined the firm in 2013 as an analyst on the Fundamental Equity Team. Before rejoining, he was a managing member of Clarke
Bennitt from 2005-2011. He previously held several roles with Brandywine from 2001-2005 including Mid Cap Value Equity PM from 2004-
2005. Mr. Manley has spent most of his career at BG, joining the firm in 2000 and has held several roles including fundamental and
quantitative analyst as well as lead trader for the Diversified Value Equity portfolios. Previously, he was a trader with Trinity Investment
Management from 1996-2000.
• The Co-PMs are supported by other members of the Fundamental Equity Team, including eight research analysts. There has been a fair
amount of turnover in this team over the last five years.
Investment
Philosophy
Advantageous • The team believes that the value of a stock is determined by the future value of long-term cash flows to investors or the value of the assets
that could generate that cash flow. The team seeks to invest in securities that are mispriced due to the market’s focus on consensus in the
short-term, but that have long-term earnings power and cash flow potential.
Investment
Process
Advantageous • The investable universe comprises all US stocks with market caps from $100 million to $5 billion. New ideas are sourced from multiple
sources, including screens, company visits, a proprietary company database, other investors, or corporate/regulatory events.
• Due diligence includes reviewing filings and press releases, earnings call transcripts, and investors. The team will sometimes meet with
management or conduct telephone interviews. They sometimes review sell side research to gain information or to ascertain the consensus
case. The analyst calculates a three-year IRR for the stock based on the estimated intrinsic value and presents the idea to the broader team.
Another team members takes the short side of the argument to vet the idea. The Co-PMs have investment decision-making authority.
• The result is a portfolio of 50 to 75 stocks. Annual portfolio turnover over the last five years has averaged 75%.
Performance Advantageous • Since the current co-PMs took over in mid-2015, the strategy has outperformed the index by 236 basis points annualized gross of fees.
Tracking error for the strategy is high as is beta, which has trended higher over time.
Fees Advantageous • Separate account estimated fee: 0.80%. Ranked 15 out of 23 responding managers (lower rank = less expensive). Approximate Peer Ranking:
43rd percentile
142 of 197

Plymouth County Retirement Association
Small Cap Value Equity RFP Respondent Review
Channing Capital
Rating Criteria Rating Rationale
Overall Advantageous
Organization Highly
Advantageous
• Based in Chicago, Wendell Mackey, Rodney Herenton and Eric McKissack founded Channing Capital in 2003. Mr. McKissack retired
from the firm in December 2018.
• The firm is 100% employee-owned. Messrs. Mackey and Herenton own 47.5% each, and the investment team holds the remaining 5%.
Channing is also majority minority-owned.
• As of 6/30/21, the firm had total AUM of $3.1 billion. Incepted on 6/30/06, Channing Small Cap Value strategy is the firm’s most
important product with assets of $2.2 billion. $560 million is in a SMID Value product.
Team Highly
Advantageous
• CIO Wendell Mackey is the lead portfolio manager for the small and SMID cap value strategies. Mr. Mackey has managed the small
cap product since its inception on 6/30/06. . He has more than 25 years of investment experience
• A 5-person investment team supports Mr. Mackey. The analysts are all sector-focused. The investment team has an average of 20
years of investment experience. One analyst was added to the team in both 2017 and 2018. There have been no departures during
the last five years.
Investment
Philosophy
Advantageous • Channing’s philosophy is based on the principles of high quality, intrinsic value (IV) investing. The investment team employs a
fundamental, concentrated, bottom-up value approach that focuses on undervalued and neglected small capitalization companies.
Channing looks for companies that are trading at least a 30% IV discount, which offers a “margin of safety”.
Investment
Process
Advantageous • Channing looks for companies with strong management teams, a solid ROE and business model, an attractive price, recent
underperformance and a discount relative to intrinsic value. Quantitative screens are used initially to narrow down the universe.
• The companies Channing invests in must also demonstrate an ability to compound earning growth. Over the long-term, the firm
believes that earnings drives stock prices. Stocks are held for an average of 2 to 3 years.
• The investment team conducts fundamental analysis after identifying promising new ideas with Mr. Mackey making all final
decisions. The portfolio consists of 35 to 50 stocks. Annual turnover approximates 40% to 50%.
Performance Advantageous • Annual performance, especially in 2020 and 2021, has been volatile. Annualized excess returns have been above average over the
trailing 3, 5 and 7-year periods and nearly in the top third of the peer group over the 10-year period. Portfolio beta has been slightly
higher than the index during the last 10 years, while tracking error has been relatively high, between 5.5% and 7.5%.
Fees Highly
Advantageous
• Separate account estimated fee: 0.66%. Ranked 6 out of 23 responding managers (lower rank = less expensive). Approximate Peer
Ranking: 12th percentile
143 of 197
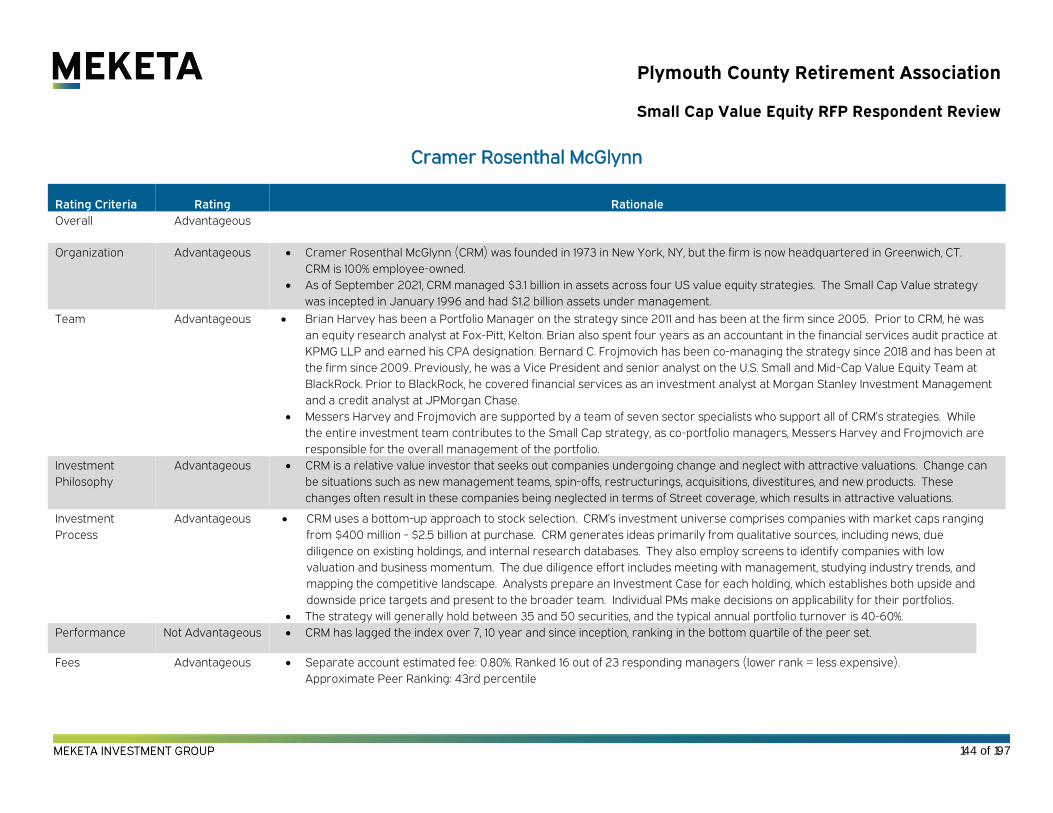
Plymouth County Retirement Association
Small Cap Value Equity RFP Respondent Review
Cramer Rosenthal McGlynn
Rating Criteria Rating Rationale
Overall Advantageous
Organization Advantageous • Cramer Rosenthal McGlynn (CRM) was founded in 1973 in New York, NY, but the firm is now headquartered in Greenwich, CT.
CRM is 100% employee-owned.
• As of September 2021, CRM managed $3.1 billion in assets across four US value equity strategies. The Small Cap Value strategy
was incepted in January 1996 and had $1.2 billion assets under management.
Team Advantageous • Brian Harvey has been a Portfolio Manager on the strategy since 2011 and has been at the firm since 2005. Prior to CRM, he was
an equity research analyst at Fox-Pitt, Kelton. Brian also spent four years as an accountant in the financial services audit practice at
KPMG LLP and earned his CPA designation. Bernard C. Frojmovich has been co-managing the strategy since 2018 and has been at
the firm since 2009. Previously, he was a Vice President and senior analyst on the U.S. Small and Mid-Cap Value Equity Team at
BlackRock. Prior to BlackRock, he covered financial services as an investment analyst at Morgan Stanley Investment Management
and a credit analyst at JPMorgan Chase.
• Messers Harvey and Frojmovich are supported by a team of seven sector specialists who support all of CRM’s strategies. While
the entire investment team contributes to the Small Cap strategy, as co-portfolio managers, Messers Harvey and Frojmovich are
responsible for the overall management of the portfolio.
Investment
Philosophy
Advantageous • CRM is a relative value investor that seeks out companies undergoing change and neglect with attractive valuations. Change can
be situations such as new management teams, spin-offs, restructurings, acquisitions, divestitures, and new products. These
changes often result in these companies being neglected in terms of Street coverage, which results in attractive valuations.
Investment
Process
Advantageous • CRM uses a bottom-up approach to stock selection. CRM’s investment universe comprises companies with market caps ranging
from $400 million - $2.5 billion at purchase. CRM generates ideas primarily from qualitative sources, including news, due
diligence on existing holdings, and internal research databases. They also employ screens to identify companies with low
valuation and business momentum. The due diligence effort includes meeting with management, studying industry trends, and
mapping the competitive landscape. Analysts prepare an Investment Case for each holding, which establishes both upside and
downside price targets and present to the broader team. Individual PMs make decisions on applicability for their portfolios.
• The strategy will generally hold between 35 and 50 securities, and the typical annual portfolio turnover is 40-60%.
Performance Not Advantageous • CRM has lagged the index over 7, 10 year and since inception, ranking in the bottom quartile of the peer set.
Fees Advantageous • Separate account estimated fee: 0.80%. Ranked 16 out of 23 responding managers (lower rank = less expensive).
Approximate Peer Ranking: 43rd percentile
144 of 197

Plymouth County Retirement Association
Small Cap Value Equity RFP Respondent Review
DePrince, Race & Zollo (DRZ)
Rating Criteria Rating Rationale
Overall Advantageous
Organization Advantageous • Based in Winter Park, FL, Greg DePrince, John Race and Victor Zollo founded the firm in April 1995. .DRZ is 100% employee-owned.
• As of September 2021, the firm had total AUM of $4.1 billion. This amount is down significantly from peak assets of $8.5 billion at the end of
2013. Incepted on June 1995, DRZ Small Cap Value had AUM of $1.1 billion at the end of September 2021.
Team Advantageous • PMs Greg Ramsby and Randy Renfrow co-manage the Small Cap Value strategy. Mr. Ramsby has worked on the product since 1996 and
started in the industry in 1990. Mr. Renfrow started in the industry in 1999 and has been involved with the strategy since 2008.
• A team of four analysts, all of whom are generalists, support the PMs. The analysts started in the investment industry between 1997 and
2009. One analyst was added to the team at the end of 2019.
Investment
Philosophy
Advantageous • DRZ is a relative value manager. The firm looks at the value of a stock relative to its historical range and compared to the overall small cap
market.
• The investment team believes in mean reversion and likes to invest in businesses that grow.
• All stocks in the portfolio have a minimum dividend yield of 1%, giving the strategy a “quality” bias.
Investment
Process
Advantageous • The process begins with a screen for yield, market cap and stocks trading in the lower third of their historic relative valuation range.
• The investment team performs financial analysis and due diligence in order to determine why the stock is relatively inexpensive. Potential
catalysts are identified to close the valuation gap between the stock’s current share price and what the investment team believes the
company is worth.
• DRZ seeks out companies with strong management teams that have a history of execution and operating in the interests of shareholders.
• Messrs. Ramsby and Renfrow make the final investment decision. They construct a portfolio of 55 to 70 stocks. The portfolio is bottom-up
driven with an economic overlay. Annual turnover during the last five years has been between 60% and 140%.
Performance Highly
Advantageous
• Annualized excess returns have been in, or close to, the top quartile of the peer group during the trailing 3, 5, 7 and 10-year periods.
Portfolio beta has approximated the index during the last 10 years, while tracking error has been moderate, between 5% and 6%.
Fees Highly
Advantageous
• Separate account estimated fee: 0.68%. Ranked 8 out of 23 responding managers (lower rank = less expensive). Approximate Peer
Ranking: 14th percentile
145 of 197

Plymouth County Retirement Association
Small Cap Value Equity RFP Respondent Review
Fiduciary Management, Inc.
Rating Criteria Rating Rationale
Overall Advantageous
Organization Advantageous • Fiduciary was founded in 1980 by Ted Kellner and is based in Milwaukee, Wisconsin .The firm is 53% employee-owned. Nineteen of the firm’s 28
employees are equity owners. Retired firm founder Ted Kellner owns the remaining equity with the exception of less than 1% held by a former
employee.
• As of September 2021, the firm had total AUM of $16.3 billion. The Fiduciary Small Cap Equity strategy, which launched at firm inception in
January 1980, had assets of $2.1 billion.
Team Advantageous • Led by CIO and CEO Patrick English, the investment team is responsible for managing all four of Fiduciary’s domestic and international
investment strategies. Mr. English has been at Fiduciary Management since 1986.
• Mr. English is supported by Director of Research, Jonathan Bloom, seven analysts, and two traders. Each analyst is responsible for covering 10-
15 stocks across the opportunity set.
Investment
Philosophy
Advantageous • Fiduciary believes that investing in durable business franchises trading at a discount to intrinsic value should result in superior risk-adjusted
returns over a full market cycle. The investment team seeks to purchase companies with attractive returns on invested capital during a period
when a controversy that surrounds the business results in a significant discount to the team’s assessment of intrinsic value. Fiduciary
endeavors to invest like a business owner by thoroughly investigating the economics of every candidate company.
Investment
Process
Advantageous • The first step in the FMI process is to screen the investable universe based on market capitalization ($400 million to $4 billion) and valuation.
The valuation metrics include price-to-earnings, price-to-cash-flow, and price-to-sales. In addition, they screen for companies with a debt to
equity ratio under 40%. They also screen for stocks that have experienced a price decline of 40% or greater and 3-year average ROIC of at least
8%.
• The upfront quantitative screen results in approximately 80-100 companies. Ideas also come from company visits, conferences, and trade
shows. The team performs fundamental research on each company. Due diligence is thorough. All members of the investment team contribute
to the research process. Business model evaluation, financial analysis and company management assessment are the primary areas of
evaluation.
• The strategy typically holds 40-50 stocks diversified across sectors. Portfolio turnover averages 30% per year.
Performance Advantageous • Fiduciary Small Cap Equity outperformed the Russell 2000 Value index in 6 of the last 10 full calendar years by an average of 563 basis points
(bps). The strategy lagged the index by over 1,000 bps in 2016 and by 673 bps in 2012. The strategy’s excess returns of 46 bps and 92 bps over
the trailing 5 and 10-year periods, respectively, rank in the top half of the small cap value peer group. The strategy’s bottom decile beta over the
trailing 10-year period has to top decile Jensen’s alpha. Fiduciary’s performance should be considered in light of the strategy’s core tilt.
Fees Highly
Advantageous
• Separate account estimated fee: 0.78%. Ranked 13 out of 23 responding managers (lower rank = less expensive). Approximate Peer Ranking:
34th percentile
146 of 197
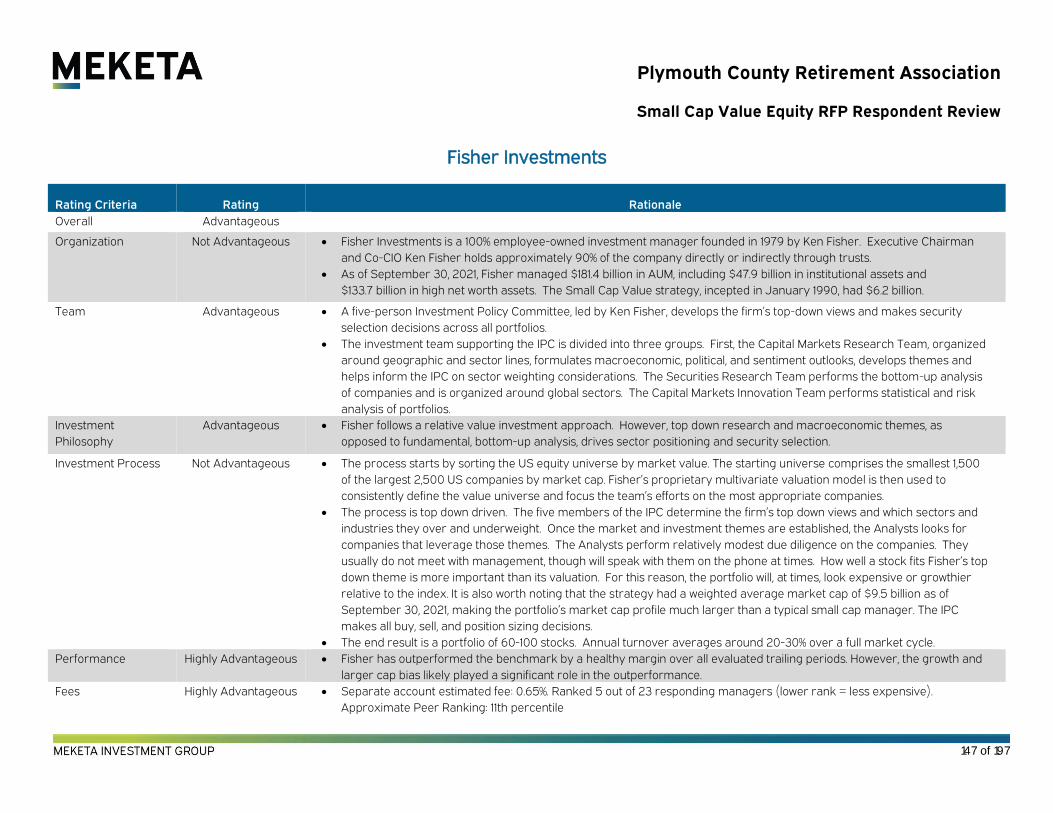
Plymouth County Retirement Association
Small Cap Value Equity RFP Respondent Review
Fisher Investments
Rating Criteria Rating Rationale
Overall Advantageous
Organization Not Advantageous • Fisher Investments is a 100% employee-owned investment manager founded in 1979 by Ken Fisher. Executive Chairman
and Co-CIO Ken Fisher holds approximately 90% of the company directly or indirectly through trusts.
• As of September 30, 2021, Fisher managed $181.4 billion in AUM, including $47.9 billion in institutional assets and
$133.7 billion in high net worth assets. The Small Cap Value strategy, incepted in January 1990, had $6.2 billion.
Team Advantageous • A five-person Investment Policy Committee, led by Ken Fisher, develops the firm’s top-down views and makes security
selection decisions across all portfolios.
• The investment team supporting the IPC is divided into three groups. First, the Capital Markets Research Team, organized
around geographic and sector lines, formulates macroeconomic, political, and sentiment outlooks, develops themes and
helps inform the IPC on sector weighting considerations. The Securities Research Team performs the bottom-up analysis
of companies and is organized around global sectors. The Capital Markets Innovation Team performs statistical and risk
analysis of portfolios.
Investment
Philosophy
Advantageous • Fisher follows a relative value investment approach. However, top down research and macroeconomic themes, as
opposed to fundamental, bottom-up analysis, drives sector positioning and security selection.
Investment Process Not Advantageous • The process starts by sorting the US equity universe by market value. The starting universe comprises the smallest 1,500
of the largest 2,500 US companies by market cap. Fisher’s proprietary multivariate valuation model is then used to
consistently define the value universe and focus the team’s efforts on the most appropriate companies.
• The process is top down driven. The five members of the IPC determine the firm’s top down views and which sectors and
industries they over and underweight. Once the market and investment themes are established, the Analysts looks for
companies that leverage those themes. The Analysts perform relatively modest due diligence on the companies. They
usually do not meet with management, though will speak with them on the phone at times. How well a stock fits Fisher’s top
down theme is more important than its valuation. For this reason, the portfolio will, at times, look expensive or growthier
relative to the index. It is also worth noting that the strategy had a weighted average market cap of $9.5 billion as of
September 30, 2021, making the portfolio’s market cap profile much larger than a typical small cap manager. The IPC
makes all buy, sell, and position sizing decisions.
• The end result is a portfolio of 60-100 stocks. Annual turnover averages around 20-30% over a full market cycle.
Performance Highly Advantageous • Fisher has outperformed the benchmark by a healthy margin over all evaluated trailing periods. However, the growth and
larger cap bias likely played a significant role in the outperformance.
Fees Highly Advantageous • Separate account estimated fee: 0.65%. Ranked 5 out of 23 responding managers (lower rank = less expensive).
Approximate Peer Ranking: 11th percentile
147 of 197

Plymouth County Retirement Association
Small Cap Value Equity RFP Respondent Review
Frontier Capital Management
Rating Criteria Rating Rationale
Overall Advantageous
Organization Advantageous • Frontier Capital Management is a Boston based firm founded in 1980. The firm is 81% owned by Affiliated Managers Group, while the
remaining 19% is owned by 15 employees. FCM had approximately $12.9 billion in assets under management across five US Equity
products as of September 2021, including $2.2 billion in the Small Cap Value Equity strategy, which was incepted in January 1999.
Team Highly
Advantageous
• Co-PM William Teichner joined Frontier in 1992 as a research analyst. In 1999, Mr. Teichner began co-managing Frontier's Small Cap
Value product. He has managed this product since inception. Prior to Frontier, Mr. Teichner worked at the White House and Shearson
Lehman Brothers.
• Frontier appointed Greg Jiang as co-PM of SCV in July 2018 in anticipation of Co-PM Thomas Duncan’s departure. Mr. Jiang started in
the investment industry in 2002 and has been with Frontier since 2005. His work experience includes Goldman Sachs and the India
Capital Fund.
• The entire investment team consists of 17 individuals, including 8 PMs and 9 analysts, though everyone has coverage. This team
supports the entire Frontier suite of products.
Investment
Philosophy
Advantageous • The Frontier Small Cap Value strategy pursues long-term capital appreciation by employing a Relative Value approach to identify U.S.
small-capitalization equity companies.
• The team believes that both the level of normalized earnings and the trajectory of those earnings determine a stock’s value over time.
In many cases, Frontier’s investments are under-earning their long-term potential at the outset (though they avoid companies with
negative earnings).
Investment Process Highly
Advantageous
• The Frontier Small Cap Value strategy uses the companies in the Russell 2000 Value Index as the primary universe for purchase
candidates. New ideas are identified through management meetings, field research, and industry conferences.
• Due diligence includes calls or meetings with management teams to assess the company’s long-term earnings potential and
constructing earnings models to assess earnings potential validity relative to current price. The team leverages some external
research for industry insights and to gain an idea around what the consensus is. The analyst then constructs a research reports that is
presented to the broader team. The PMs execute investment decisions.
• Frontier Small Cap Value portfolios generally hold 70-100 stocks, constructed on a bottom-up basis. Total annual turnover has
averaged 28%, while name turnover has averaged 19%.
Performance Highly
Advantageous
• 7 year returns rank in the top third of the peer set, 10 years in top quintile and since inception in top 2%. Tracking error has been below
peer median on a consistent basis, and the strategy has outperformed
Fees Not Advantageous • Separate account estimated fee: 0.85%. Ranked 18 out of 23 responding managers (lower rank = less expensive). Approximate Peer
Ranking: 60th percentile
148 of 197

Plymouth County Retirement Association
Small Cap Value Equity RFP Respondent Review
Kayne Anderson Rudnick
Rating Criteria Rating Rationale
Overall Advantageous
Organization Advantageous • Kayne Anderson Rudnick (KAR) was founded in 1984 by Richard Kayne and John Anderson in order to manage the funds of its principals and
clients. The firm is headquartered in Los Angeles, California, and is wholly owned by Virtus Investment Partners, Inc. (NASDAQ: VRTS).
• As of September 2021, the firm had total AUM of $62 billion. Incepted in June 1998, the Small Cap Quality Value strategy had AUM of $7.1
billion.
Team Advantageous • Julie Kutasov and Craig Stone are co-portfolio managers for the KAR Small Cap Quality Value portfolio. Ms. Kutasov joined KAR in 2001 and
has spent her career at the firm. Mr. Stone joined KAR in 2000 and started in the investment industry in 1989.
• Ms. Kutasov and Mr. Stone are supported by a team of six analysts, some of whom have portfolio management responsibilities on other
strategies. The analysts started in the investment industry between 1995 and 2015.
Investment
Philosophy
Advantageous • Kayne Anderson believes that high quality companies will outperform over time. The team defines high quality as companies with strong
competitive advantages, management teams that prudently allocate capital and businesses that can grow throughout a market cycle.
• Kayne Anderson believes in managing concentrated portfolios. They seek to get an edge by knowing the companies in their portfolio better
than peers and allow their best ideas to drive performance.
Investment
Process
Highly
Advantageous
• New ideas primarily come from screens, but other sources include industry research, company meetings, investment conferences, etc. The
team looks for quantitative financial indicators of a competitive advantage, including a high return on capital, a history of resilient earning
power, or ample free cash flow generation.
• If an idea appears promising, the analyst will review the last five years of financial statements, read industry research, and construct an
earnings model. The PMs will then set up a conference call with the management team. The formal opinion is documented in the firm’s Quality
Report, Progress Report, and Position Review Report.
• The investment team utilizes proprietary valuation models for each company under base, best, and worst-case scenarios. The portfolio will
hold 20 to 35 stocks. Portfolio turnover is typically 25% to 35%.
Performance Highly
Advantageous
• Annual performance has been volatile. The strategy’s excess returns have exceeded +/-500 basis points in 7 of the past 10 calendar years.
Performance has been strong over the long term. Excess returns rank in the 14th and 8th percentiles of the peer group over the trailing 5
and 10-year periods, respectively. On a risk-adjusted basis, the strategy’s bottom decile beta has resulted in a top decile Jensen’s alpha over
those periods. Despite a top quintile tracking error over those periods, the strategy’s information ratio ranks in the top quartile.
Fees Highly
Advantageous
• Separate account estimated fee: 0.68%. Ranked 9 out of 23 responding managers (lower rank = less expensive). Approximate Peer Ranking:
14th percentile
149 of 197

Plymouth County Retirement Association
Small Cap Value Equity RFP Respondent Review
LMCG
Rating Criteria Rating Rationale
Overall Advantageous
Organization Not Advantageous • LMCG is an equity manager founded in 2000 and based in Boston, MA. While the firm is currently 87% owned by Royal Bank of
Canada and 13% employee-owned, the firm announced on November 2, 2021 that the Value team has entered into an agreement with
RBC to spin out into a newly-formed, SEC registered entity called Leeward Investments. The transaction is expected to close in Q1
2022, at which point Leeward would be wholly-owned by Leeward employees.
• As of September 30, 2021, LMCG managed $7.2 billion in AUM, including $2.1 billion in Small Cap Value.
Team Advantageous • The strategy is managed by a team led by portfolio manager Todd Vingers. Mr. Vingers joined LMCG in 2002 and he has managed
Small Cap Value since its 2002 inception. Prior to joining LMCG, he was senior PM for American Century Investments from 1994-
2002.
• The broader Value team comprises 5 investors. While team members are technically generalists, they gravitate towards sectors. The
team started in the industry between 1996 and 2003.
Investment
Philosophy
Advantageous • The team seeks to invest in high quality, though temporarily out of favor, small cap stocks. They focus on companies with higher
returns on capital, free cash flow, and strong balance sheets. LMCG seeks out companies with an intellectual property and/or cost
edge that operate in industries with high barriers to entry. They also look for market leaders, which is how they define “quality”. Mr.
Vingers’s investment horizon is 12-18 months.
Investment
Process
Highly Advantageous • The universe comprises companies within the Russell 2000 Value market cap range that meet valuation criteria, notably being in the
cheaper one-third of at least two of five valuation metrics. Ideas can also come from various sources including previously owned
companies, companies the team monitors that face temporary setbacks, and companies recently downgraded by the sell side. They
seek out companies with a 3:1 upside/downside profile.
• Due diligence includes studying a company’s valuation history relative to peers and the market using normalized earnings. The goal
is to determine if the issues affecting the company are transitory or secular. The team then assigns a quality score, which
incorporates margins, earnings, balance sheet strength and sentiment. The team then engages in fundamental underwriting of the
business, including a review of the competitive positioning and financial history. They meet with management at this stage. Potential
investments are vetted by the broader team. Mr. Vingers makes final investment decisions.
• The portfolio is diversified in order to control risk. The portfolio will own 80 - 115 securities. Position sizes are limited to a maximum of
3%.
Performance Not Advantageous • 10-year excess returns rank in the 62nd percentile of the peer group, and the strategy has not added value net of fees over 5, 7, or 10
years. Most of the outperformance came in the strategy’s earlier years. Tracking error ranks in the bottom quintile given the
diversified approach.
Fees Highly Advantageous • Separate account estimated fee: 0.72%. Ranked 11 out of 23 responding managers (lower rank = less expensive). Approximate Peer
Ranking: 20th percentile
150 of 197

Plymouth County Retirement Association
Small Cap Value Equity RFP Respondent Review
LSV Asset Management
Rating Criteria Rating Rationale
Overall Advantageous
Organization Advantageous • LSV was founded in 1994 as a quantitative equity investment firm. The firm is 61% owned by its employees. The remaining 39% is
owned by SEI. SEI also provides human resources and back office support to LSV. Firm founder, Josef Lakonishok, the firm’s
CEO and CIO, has a 25% stake in the firm.
• LSV had approximately $107.2 billion in assets under management as of September 2021, including $4.3 billion in the Small Cap
Value Equity strategy, which was incepted in February 1997.
Team Highly
Advantageous
• CIO, Josef Lakonishok, leads the investment team. He is supported by a team of twelve other investors, some of whom are
supporting Portfolio Managers, some of whom are Quantitative Analysts. This team manages all of LSV’s strategies and
averages over 20 years of experience. There have been no departures from the team in the last 10+ years.
Investment
Philosophy
Advantageous • The fundamental premise on which LSV's investment philosophy is based is that superior long-term results can be achieved by
systematically exploiting the judgmental biases and behavioral weaknesses that influence the decisions of many investors.
Investment
Process
Highly
Advantageous
• The firm follows a quantitative investment process. There are three main components of the LSV model: Value Factors (cheap
valuation), Long-Term Performance (contrarian, negative performance over the past five years), and Momentum Factors (signs
of recent improvement). The goal is to find companies that are statistically cheap (value factors), with poor long-term
performance (contrarian), but also that exhibit recent signs of improvement (momentum).
• The team begins with a screen of approximately 9,000 equity securities for market capitalization $100 million and $4 billion and
reasonable liquidity, which results in an investable universe of roughly 1,700 names. After this list is ranked on an expected
return basis by the team’s model using the factors listed above, the team focuses on the top 15% ranked companies, resulting in
about 250 securities. These stocks are optimized for risk control purposes; the optimization is constrained relative to the
benchmark by industry, capitalization, and company to enforce diversification.
• The portfolio typically holds 175-200 securities. Turnover typically averages 25% annually.
Performance Not Advantageous • While performance has ranked slightly above median over 10 years and in the 44th percentile since inception, it has deteriorated
to bottom third over 7 years and bottom quintile over five years. However, the deep value bias has hurt the strategy. Long-term
beta is around 1.1 (top decile).
Fees Highly
Advantageous
• Separate account estimated fee: 0.64%. Ranked 3 out of 23 responding managers (lower rank = less expensive). Approximate
Peer Ranking: 9th percentile:
151 of 197

Plymouth County Retirement Association
Small Cap Value Equity RFP Respondent Review
Mesirow Equity Management
Rating Criteria Rating Rationale
Overall Advantageous
Organization Advantageous
• Norman Mesirow founded the firm in 1937. Mesirow provides global investment management (FI, RE, currency and equity), capital
markets and investment banking, and advisory services.
• As of Sept. 2021, 244 employees owned 94% of Mesirow’s stock. Non-employee individuals held the remaining 4%.
• Mesirow’s Equity Management (MEM), which consists of four small and SMID cap value products, had AUM of $816 million as of
September 2021. Small Cap Value strategy assets were $617 million at 6/30/21, down from a peak of $1.7 billion at the end of 2015
right before the acquisition. Small Cap Value was incepted in July 1994.
Team Advantageous • Mesirow entered the equity business by acquiring Fiduciary Management Associates (FMA), a value manager, in April of 2016. The
purchase price and terms of the deal were not disclosed. FMA was majority owned by Kathryn Vorisek. Other FMA employees
owned the rest of the firm.
• Ms. Vorisek and Leo Harmon are the co-CIOs and PMs on the Mesirow Small Cap Value strategy. Both are also analysts. Five
sector analysts who started in the industry between 1989 and 2002 support the PMs.
Investment
Philosophy Advantageous
• MEM characterizes their investment style as relative value. The investment team believes that earnings and cash flow growth are
the main drivers of value creation for companies over time. MEM also believes the key to generating consistent investment
returns is the selection of investment opportunities that have attractive valuations and identifiable catalysts that are expected to
generate accelerating earnings and cash flow growth.
Investment
Process
Advantageous • The investment process seeks to identify companies with attractive valuations and catalysts that will drive an inflection in earnings
and cash flow growth over an 18 to 24 month timeframe. MEM prefers higher quality companies that have healthy balance sheets,
sound business models, and management teams that have demonstrated an ability to add value.
• The analysts in each sector use screens to generate new ideas. They perform fundamental due diligence on these companies.
This work is combined with a macroeconomic evaluation that identifies broad themes that are incorporated into security selection.
The PMs make the final investment decisions. The portfolio consists of 70 to 90 stocks. Turnover approximates 75% to 125%.
Performance Advantageous
• Performance has been average to above average vs. peers during the 3, 5, and 7-year trailing periods and below average over 10
years. Mesirow has underperformed, or been about in-line with the index, after fees for the 5, 7 and 10-year trailing periods.
Portfolio beta has been ~10% below the index, while tracking error has approximated 5%.
Fees Highly
Advantageous
• Separate account estimated fee: 0.56%. Ranked 2 out of 23 responding managers (lower rank = less expensive). Approximate
Peer Ranking: 5th percentile
152 of 197

Plymouth County Retirement Association
Small Cap Value Equity RFP Respondent Review
Peregrine
Rating Criteria Rating Rationale
Overall Advantageous
Organization Highly
Advantageous
• Peregrine is a 100% employee-owned public equity investment boutique founded in 1984 and based in Minneapolis.
• The firm focuses on domestic equity, offering both value and growth strategies across the capitalization spectrum. As of
September 30, 2021, Peregrine managed $6.3 billion in assets. The Small Cap Value strategy, incepted in January 1996, had $1.4
billion in AUM.
Team Highly
Advantageous
• Jason Ballsrud, Tasso Coin, and Doug Pugh are PM/analysts and solely responsible for the Small Cap Value strategy. This team
has been in place since 1997. Each team member focuses on specific sectors.
• Mr. Ballsrud has spent his entire career at Peregrine, while Messrs. Coin and Pugh have spent the lion’s share of their careers at
the firm.
Investment
Philosophy
Advantageous • The team believes that assets, earnings, and cash flow drive a company’s valuation over the long-term. They strive to purchase
inexpensive stocks with improving fundamentals that the market is underestimating.
• The team follows a sector relative value approach, focusing on the least expensive 10-15% of valued names in each sector.
• The team looks for one or more of its proprietary Value Buy criteria: resolvable short-term problem, catalyst for change,
unrecognized assets, fundamental undervaluation, and takeover potential.
Investment
Process
Highly
Advantageous
• The process starts with a custom universe of 1,900 domestic stocks with market capitalizations between $200 million and $4
billion. The team employs a proprietary valuation tool using a combination of 60 different fundamental and operational factors
dating back to 1970 to screen out the least expensive stocks in each sector. This process results in a candidate list of roughly 175
names.
• Meeting with management is the cornerstone of the due diligence process. The team conducts 200-300 meetings with senior
management teams annually. These meetings include customers, competitors and suppliers of existing holdings.
• The portfolio is diversified across 90-100 stocks with a single position maximum of 3.5%. Typical annual turnover is 50-80%. The
team uses FactSet to monitor positions, liquidity, and attribution in real-time. They also employ Bloomberg Risk Analytics to
understand exposures.
Performance Not Advantageous • Performance over 5, 7, and 10-year has been right around the median of the peer set. Performance is in the bottom quintile
since the strategy’s inception. Tracking error is in the bottom third of peers given the diversified approach. Beta is high and has
consistently been between 1.07-1.09
Fees Highly
Advantageous
• CIT fee: 0.70%. Ranked 10 out of 23 responding managers (lower rank = less expensive). Approximate Peer Ranking: 17th
percentile
153 of 197

Plymouth County Retirement Association
Small Cap Value Equity RFP Respondent Review
Shapiro Capital Management
Rating Criteria Rating Rationale
Overall Advantageous
Organization Advantageous • Shapiro Capital Management is an investment boutique focused on US value equity strategies. The firm was founded in 1990 and is
based in Atlanta, GA. Shapiro was 100% employee-owned until 2017, when Resolute Investment Managers purchased a 60% interest in
Shapiro in order to provide liquidity to founder Sam Shapiro.
• As of September 30, 2021, Shapiro managed $5.5 billion, including $922 million in Small Cap Value, which was incepted in 1990.
Team Advantageous • The portfolio is team-managed by all four principals – Mike McCarthy, Sam Shapiro, Louis Shapiro, and Harry Shapiro. Sam Shapiro and
Mike McCarthy have managed the strategy since its inception. Louis Shapiro has managed the strategy for 29 years, while Harry
Shapiro has managed the strategy for 16 years.
• Mr. McCarthy is the Director of Research, facilitating the investment process. All four principals contribute to the research process, and
the team follows a generalist structure. The team averages 36 years of investment experience.
Investment
Philosophy
Advantageous • Shapiro follows a high active share, concentrated, benchmark-agnostic investment approach. The team favors companies that have
greater nuance and complexity. Shapiro believes that this complexity results in their trafficking in less crowded areas of the small cap
market, creating greater pricing inefficiencies and more opportunities. The team tries to identify company-specific catalysts (e.g. spin-
offs, post-bankruptcy) that should catalyze value. They are not afraid to be contrarian.
Investment Process Advantageous • The investment universe comprises those companies in the Russell 2000 Index. The team derives most of its holdings from the upper
two-thirds market cap of the index. They believe that this cohort of stocks is populated with names that benefit from inefficiencies, but
also have less risk than the bottom one-third market cap of the index. Within this universe, the team seeks out contrarian sectors,
restructurings and other areas known for inefficiency. Sources of ideas include 52-week low lists and subscription services that identify
restructuring candidates.
• Due diligence encompasses an analysis of publicly available financial data. The team regenerates financial statements to better
understand a company’s true cash flow potential. The team also studies management’s historical behavior, including compensation
packages. They generally meet with management, often onsite at the company’s offices. They will also contact industry experts to gain a
more complete picture of the competitive landscape.
• The portfolio is concentrated with 20-30 companies, with total annualized turnover of 40-55% (lower on a name turnover basis).
Performance Highly
Advantageous
• Performance over 5, 7, 10-year and since inception has ranked in or near the top quartile of the peer universe. The portfolio does take
on significant active risk, as evidenced by top quintile tracking error over 5, 7, and 10 years. Beta has also been above one. However,
investors have been compensated for this risk in the form of excess returns over the index.
Fees Not Advantageous • Separate account estimated fee: 0.90%. Ranked 23 out of 23 responding managers (lower rank = less expensive). Approximate Peer
Ranking: 75th percentile
154 of 197

Plymouth County Retirement Association
Small Cap Value Equity RFP Respondent Review
T. Rowe Price
Rating Criteria Rating Rationale
Overall Advantageous
Organization Advantageous • T. Rowe Price is a publicly-traded large asset management firm founded in 1937 and based in Baltimore, MD. Employees own
approximately 8% of the outstanding shares. The firm offers an array of primarily active strategies across equity, fixed income, and
multi-asset offerings.
• As of September 30, 2021, T. Rowe Price managed $1.6 trillion in assets. The Small Cap Value strategy, incepted in July 1993, had
$1.8 billion in AUM.
Team Highly
Advantageous
• Lead portfolio manager David Wagner has managed this strategy since 2014. Mr. Wagner started in the investment industry in
1999. After spending at year as an analyst at National Economics Research Associates, he joined T. Rowe Price in 2000 and has
been at the firm since then.
• While Mr. Wagner has final decision-making authority, he leverages T. Rowe’s Price’s 203 equity research professionals worldwide
for ideas to populate the portfolio. Most of the analysts specialize by geography or industry.
Investment
Philosophy
Advantageous • Mr. Wagner seeks to invest in undervalued companies that have a catalyst for value realization. He is long-term oriented, with a
three to five year hold period. He believes that long-term earnings growth drives stock prices over full market cycles.
Investment
Process
Advantageous • The investment universe comprises company with market caps ranging from $150 million to $5 billion. Ideas are drawn from
personal experience, industry contacts, niche brokerage firms, conferences, and trade publications.
• Due diligence for value stocks at T. Rowe Price often focuses on whether issues facing the company, such as a poorly integrated
acquisition or a downturn in a major end market, can be resolved in a reasonable amount of time. Research includes assessments
of the company’s market position, business model, management team, and industry structure. The analysts also conduct financial
statement analysis, including an evaluation of the company’s ability to generate free cash flow, debt levels, and access to capital.
Valuation is determined through a combination of metrics and is compared against the company’s own history, peers, and the
market as a whole.
• The portfolio is diversified with 140-200 companies. Position sizes typically range from 0.25% to 2.50%. Turnover typically ranges
from 15-25% annually.
Performance Highly
Advantageous
• Performance over 10 years and since 1993 inception ranks in the 38th percentile of the small cap value universe. Over five years,
performance ranks in the top quintile. The diversified approach has meant that tracking error is in the bottom quartile of the peer
set over longer trailing periods. Beta is also low having averaged 0.87-0.90
Fees Highly
Advantageous
• Separate account estimated fee: 0.64%. Ranked 4 out of 23 responding managers (lower rank = less expensive). Approximate Peer
Ranking: 9th percentile
155 of 197

Plymouth County Retirement Association
Small Cap Value Equity RFP Respondent Review
HGK Asset Management
Rating Criteria Rating Rationale
Overall Not
Advantageous
Organization Advantageous • Jeffrey Harris, Warren Greenhouse and Joseph Kutzel founded HGK in 1983. Based in Jersey City, N.J., the firm manages domestic
value and fixed income strategies..
• HGK is 100% owned by employees and former employees. An employee stock ownership plan (ESOP) in which 17 employees
participate, holds 65% of the firm’s equity. Founder and Chairman Emeritus Jeff Harris owns 23% of HGK’s equity. He has been selling
his stock back to the firm.
• As of 6/30/21, HGK had total AUM of $2.7 billion. Incepted on 6/30/07, HGK’s Small Cap Value product had AUM of only $67 million.
Team Not
Advantageous
• Former PM Eric Fuhrman and DOR Andrew Rothstein managed HGK’s Small Cap Value strategy from inception until they left the firm
on 2/28/19 to join a San Diego-based investment manager.
• Three analysts on HGK’s Large Cap Value strategy, David Ayres, Geoffrey Hauck and Helena Scholz, assumed management of the
product when Messrs. Fuhrman and Rothstein departed. They are all generalists and have been analysts at HGK for between five and
eight years.
Investment
Philosophy
Advantageous • HGK is a traditional value investor with a relative value influence. The PMs tend to own “high quality” companies, which they define as
companies that are able to generate strong, consistent and sustainable returns on their invested cash flows. In the long-term, they
believe that a company’s ability to deliver cash flow returns continually above their cost of capital will drive the stock price.
Investment
Process
Not
Advantageous
• HGK views the investable universe as all companies with market caps between $500 million and $6 billion that have adequate liquidity.
New ideas are generated using a quantitative screening process. The screen is designed to identify companies with financial strength.
• The PMs perform fundamental research on this sub-set of companies in order to identify those with defensible business models and
superior management teams. Stocks are added to the portfolio if the price is discounted enough to offer material upside with an
adequate margin of safety. All three PMs must agree. Their investment horizon is generally two to three years.
• The portfolio consists of 50 to 70 stocks. Annual turnover approximates 35% to 40%.
Performance Not
Advantageous
• The three PMs assumed management of the portfolio in the first quarter of 2019. Since taking over, the strategy has underperformed
by a wide margin. Over the trailing 3-year periods, most of which is the current PMs,’ performance has been below average vs. peers.
Portfolio beta has been ~10% below the index while tracking error has approximated 6% during the trailing 3-year period.
Fees Highly
Advantageous
• Separate account estimated fee: 0.50%. Ranked 1 out of 23 responding managers (lower rank = less expensive). Approximate Peer
Ranking: 3rd percentile
156 of 197
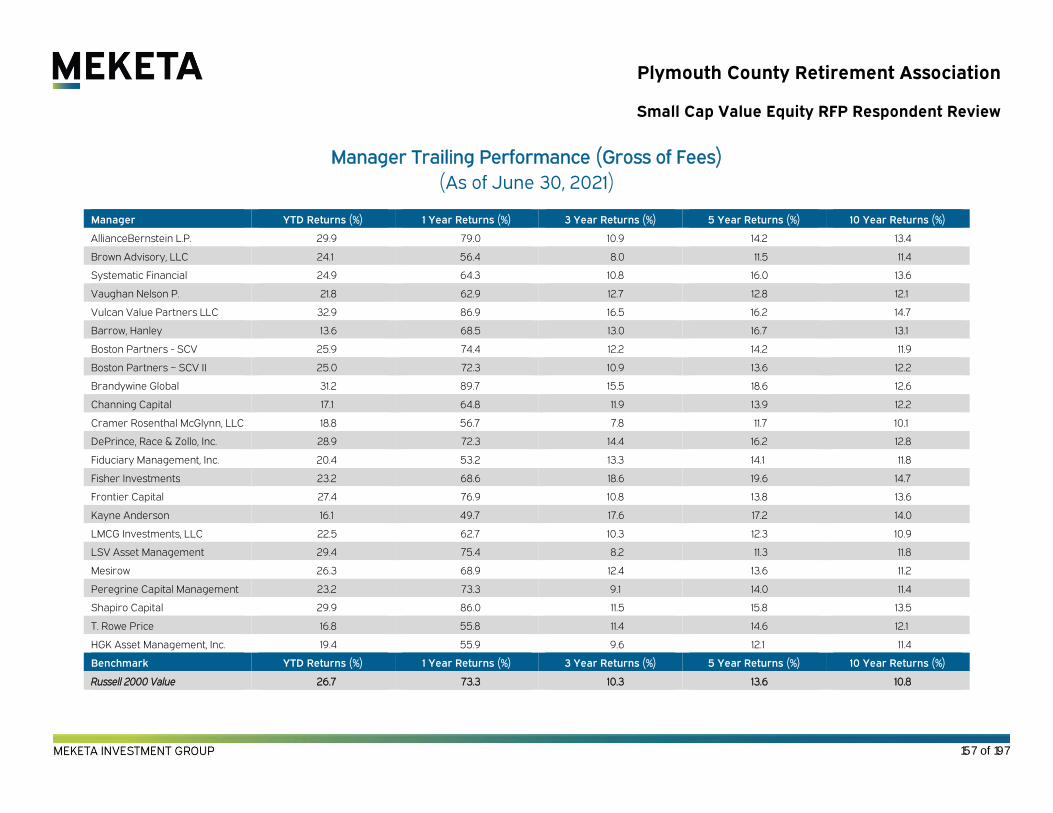
Plymouth County Retirement Association
Small Cap Value Equity RFP Respondent Review
Manager Trailing Performance (Gross of Fees)
(As of June 30, 2021)
Manager YTD Returns (%) 1 Year Returns (%) 3 Year Returns (%) 5 Year Returns (%) 10 Year Returns (%)
AllianceBernstein L.P. 29.9 79.0 10.9 14.2 13.4
Brown Advisory, LLC 24.1 56.4 8.0 11.5 11.4
Systematic Financial 24.9 64.3 10.8 16.0 13.6
Vaughan Nelson P. 21.8 62.9 12.7 12.8 12.1
Vulcan Value Partners LLC 32.9 86.9 16.5 16.2 14.7
Barrow, Hanley 13.6 68.5 13.0 16.7 13.1
Boston Partners - SCV 25.9 74.4 12.2 14.2 11.9
Boston Partners – SCV II 25.0 72.3 10.9 13.6 12.2
Brandywine Global 31.2 89.7 15.5 18.6 12.6
Channing Capital 17.1 64.8 11.9 13.9 12.2
Cramer Rosenthal McGlynn, LLC 18.8 56.7 7.8 11.7 10.1
DePrince, Race & Zollo, Inc. 28.9 72.3 14.4 16.2 12.8
Fiduciary Management, Inc. 20.4 53.2 13.3 14.1 11.8
Fisher Investments 23.2 68.6 18.6 19.6 14.7
Frontier Capital 27.4 76.9 10.8 13.8 13.6
Kayne Anderson 16.1 49.7 17.6 17.2 14.0
LMCG Investments, LLC 22.5 62.7 10.3 12.3 10.9
LSV Asset Management 29.4 75.4 8.2 11.3 11.8
Mesirow 26.3 68.9 12.4 13.6 11.2
Peregrine Capital Management 23.2 73.3 9.1 14.0 11.4
Shapiro Capital 29.9 86.0 11.5 15.8 13.5
T. Rowe Price 16.8 55.8 11.4 14.6 12.1
HGK Asset Management, Inc. 19.4 55.9 9.6 12.1 11.4
Benchmark YTD Returns (%) 1 Year Returns (%) 3 Year Returns (%) 5 Year Returns (%) 10 Year Returns (%)
Russell 2000 Value 26.7 73.3 10.3 13.6 10.8
157 of 197

Plymouth County Retirement Association
Small Cap Value Equity RFP Respondent Review
Proposed Fees
Manager Investment Vehicle Type Estimated Effective Fee (%)
AllianceBernstein L.P. Separate Account 0.88
Brown Advisory, LLC Separate Account 0.89
Systematic Financial Separate Account 0.76
Vaughan Nelson P. Separate Account 0.79
Vulcan Value Partners LLC Separate Account 0.83
Barrow, Hanley Separate Account 0.68
Boston Partners - SCV Separate Account 0.86
Boston Partners – SCV II Separate Account 0.86
Brandywine Global Separate Account 0.80
Channing Capital Separate Account 0.66
Cramer Rosenthal McGlynn, LLC Separate Account 0.80
DePrince, Race & Zollo, Inc. Separate Account 0.68
Fiduciary Management, Inc. Separate Account 0.81
Fisher Investments Separate Account 0.65
Frontier Capital Separate Account 0.85
Kayne Anderson Separate Account 0.68
LMCG Investments, LLC Separate Account 0.72
LSV Asset Management Separate Account 0.64
Mesirow Separate Account 0.56
Peregrine Capital Management Separate Account 0.80
Shapiro Capital Separate Account 0.90
T. Rowe Price Separate Account 0.64
HGK Asset Management, Inc. Separate Account 0.50
158 of 197

Plymouth County Retirement Association
Small Cap Value Equity RFP Respondent Review
Summary
A total of 23 managers submitted responses to this search. Based upon our review and evaluation of each
respondent, Meketa Investment Group has five managers ranked as “Highly Advantageous”, 17 ranked as
“Advantageous”, and one manager ranked as “Not Advantageous”.
159 of 197

Plymouth County Retirement Association
Emerging Markets Debt
RFP Respondent Review
160 of 197

Plymouth County Retirement Association
RFP Respondent Review
Background
• The Association currently employs Eaton Vance to manage its Emerging Markets Debt allocation, which
represents roughly 2% of the total portfolio, or $22.3 million as of September 30, 2021.
• Meketa Investment Group issued an RFP for Emerging Market Debt managers on September 23, 2021, with
responses due on October 8, 2021.
− Seventeen managers response submitted responses to the RFP.
• Based upon our review and evaluation of each respondent, Meketa Investment Group has one manager
ranked as “Highly Advantageous, 11 managers were ranked as “Advantageous,” and five were ranked as
“Not Advantageous.”
− Eaton Vance, hired by the Association in 2020, we also included for reference, although they did
not respond to the RFP.
• The following pages review the manager options.
161 of 197

Plymouth County Retirement Association
RFP Respondent Review
RFP Respondents
Manager Headquarters Strategy Overall Rating
Eaton Vance Management Boston, Massachusetts Emerging Markets Debt Opportunities Highly Advantageous
Wellington Boston, Massachusetts Blended Opportunistic Emerging
Markets Debt
Highly Advantageous
Neuberger Berman New York, New York Emerging Markets Debt Blend Advantageous
TCW Los Angeles, California Emerging Markets Fixed Income Total
Return
Advantageous
Barings Charlotte, North Carolina Emerging Markets Debt Blended Total
Return
Advantageous
Pacific Investment management Company (PIMCO) Newport Beach, California Emerging Markets Full Spectrum Bond Advantageous
Ashmore Investment Management London, United Kingdom EM Blended Debt Total Return Advantageous
Lazard Asset Management LLC New York, New York Lazard’s Emerging Markets Debt –
Blend
Advantageous
Federated Hermes Pittsburgh, Pennsylvania Emerging Markets Debt Fund Advantageous
Finisterre Capital Des Moines, Iowa EMD Total Return Fund Advantageous
Manulife Investment Management Boston, Massachusetts Emerging Markets Debt Advantageous
Nuveen New York, New York Emerging Markets Debt Fund Advantageous
Stone Harbor Investment Partners LP New York, New York EMD Global Allocation 50-50 Core Advantageous
FIM Partners Dubai, UAE Emerging Market Debt Not Advantageous
Loomis Boston, Massachusetts Emerging Markets Debt Blended Total
Return
Not Advantageous
Macquarie Philadelphia, Pennsylvania Emerging Markets Debt Select
Opportunities
Not Advantageous
Man Group London, United Kingdom Global Emerging Markets Debt Total
Return
Not Advantageous
DuPont Wilmington, Delaware Emerging Markets Debt Not Advantageous
162 of 197

Plymouth County Retirement Association
RFP Respondent Review
Eaton Vance Management
Rating Criteria Rating Rationale
Overall Highly
Advantageous
Organization Advantageous • Eaton Eaton Vance was formed in 1979 by the merger of Eaton & Howard and Vance, Sanders, and Company. The firm is currently
headed by Thomas E. Faust Jr., who has been Chairman of the Board and CEO since 2007, and was previously the Chief Investment
Officer from 2001 to 2007. The firm is a wholly-owned subsidiary of Eaton Vance Corporation, which announced a definitive agreement
to be acquired by Morgan Stanley in October 2020 which closed in March 2021.
• EV traces its beginning to 1924 and has $180.9 billion in assets under management as of March 2021. The Emerging Markets Debt
Opportunities was launched in 2013 and has $1.5 billion in assets. The Global Income Team has been managing EMD assets since 1996
and manages $11 billion in total across various EMD strategies.
Team Advantageous • In September of 2021, lead portfolio manager Michael Cirami, Head trader Mike O’Brien and named portfolio manager Sarah Orvin
departed Eaton Vance. The new Co-Directors of the EMD Team are John Baur and Marshall Stocker, both have a long track record
with the EMD Team. The investment team changes are significant but there are also some adjustments they have made as a result of
the departures that seem reasonable and likely to succeed, in our opinion
• Analysts are country specialists, and there are more than one team member covering each country.
Investment
Philosophy
Advantageous • The team relies on, short term factors, intermediate-term fundamentals and long-term structural trends to form views about specific
countries. They see themselves as “country pickers” and believe that countries that have improving economic freedom are some of
the best places to invest.
• Benchmark agnostic, benchmark weights do not play a role in determining position sizing or portfolio construction. It is usually more
concentrated than the benchmark and comprises only the best ideas.
Investment Process Highly
Advantageous
• Country analysis and access to markets are the first steps in the investment process. Eaton Vance has worked over the years to build
traditional and non-traditional liquidity sources to properly access markets. When conducting country analysis, the team’s primary
goal is to determine a country’s direction of change over the intermediate to long term (1-5 years). Once the team has conducted the
fundamental work on each country, they evaluate securities through a risk and return framework. Then the team submits investment
positions for potential inclusion in the portfolio.
• When constructing the portfolio, the team uses a tier system that allows countries with strong or improving country fundamentals, high
return potential and ample liquidity to have a higher weight within the portfolio. Michael Cirami is the coordinating portfolio for the
strategy and has final decision-making authority.
Performance Highly
Advantageous
• Eaton Vance outperformed the 50% JPM EMBI Global Diversified / 50% JPM GBI-EM Global Diversified index over the one-, three-, and
five-year trailing periods, with excess returns of 5.8%, 3.7% and 4.3% respectively.
Fees Highly
Advantageous
• Commingled Fund: Stated fee of 0.30% with other operating expenses capped at 0.15%
163 of 197

Plymouth County Retirement Association
RFP Respondent Review
Wellington Trust Company
Rating Criteria Rating Rationale
Overall Highly
Advantageous
Organization Advantageous • Wellington Trust Company was established in 1928 and headquarters are located in Boston, Massachusetts.
Wellington Management Group LLP, is owned by 165 partners, all active in the business of the firm.
• As of December 2020, total firm asset were $1.3 trillion, of which $7.9 billion are in the Blended Opportunistic Emerging
Markets Debt strategy, incepted in 2009.
• Wellington has a long track record of investing in emerging markets debt (EMD) since 1990 within multiple strategies and
began managing dedicated EMD portfolios on an advisory basis in 1998.
Team Highly
Advantageous • Lead Portfolio Manager Jim Valone has been managing the approach since the inception. Kevin Murphy, as backup Portfolio
Manager, works with Jim Valone on macro country/sector decisions while Evan Ouellette, as the second backup
Portfolio Manager, focuses primarily on portfolio construction and security selection. Jim Valone, team leader and portfolio
manager on the Emerging Markets Debt Team, will retire and withdraw from Wellington Management’s partnership on
31 December 2021. Kevin Murphy will assume leadership of the product and the long-only Emerging Markets Debt platform.
• The team has 5 additional portfolio managers who support actively in broad strategy discussions and are supported by a
team of 27 dedicated Emerging Markets professionals in addition to over 100 other shared firm investment professionals.
Investment
Philosophy Highly
Advantageous • The team believes that emerging markets must be approached from a global perspective, recognizing that global market
conditions will impact the attractiveness of emerging markets. They take both a quantitative and fundamental approach to
assessing rates and currencies in a large universe of emerging markets countries.
Investment Process Highly
Advantageous • The investment process begins with an assessment of global economic, liquidity, and market conditions. The portfolio
managers have final responsibility for setting the total portfolio risk level. Country research assesses both the ability and
willingness of emerging countries to service their external debt, and summarizes this in a country score to quantify the
team’s sovereign credit outlook and rank countries according to credit strength from high to low.
• Portfolios are constructed with the goal of generating attractive total returns while minimizing systemic risk. Mr. Valone has
final decision making power and all decisions are made under his guidance and approval.
Performance Advantageous • Wellington outperformed the 50% JPM EMBI Global Diversified / 50% JPM GBI-EM Global Diversified index over the one-,
three-, five-, and ten-year trailing periods, with excess returns of 1.6%, 1.4%, 1.8% and 1.6% respectively.
Fees Advantageous • Commingled Fund: Effective fee of 0.55% with other operating expenses capped at 0.20% (currently ~0.045%)
• Separate Account effective fee of 0.75%
164 of 197

Plymouth County Retirement Association
RFP Respondent Review
Neuberger Berman
Rating Criteria Rating Rationale
Overall Advantageous
Organization Advantageous • Neuberger Berman was founded in 1939 and is a large, New York-based investment management firm. The firm went
through several organizational changes, including an IPO, a merger, and multiple acquisitions, before becoming 100%
employee-owned in 2018. Neuberger Berman has a total of $405.4 billion under management as of December 31, 2020. The
team manages $29 billion in Emerging Markets Debt strategies overall and $7.7 billion in the Emerging Markets Debt Blend
strategy.
Team Highly
Advantageous
• Neuberger Berman’s emerging market debt platform is headed by Rob Drijkoningen in The Hague and Gorky Urquieta in the
firm’s Atlanta, GA office. Messrs. Drijkoningen and Urquieta have 31 and 27 years of experience, respectively.
• The co-heads are supported by thirteen portfolio managers, twelve research analysts, four economists/strategists, two
portfolio specialists, 1 quantitative analyst, and three traders. Sector specialist portfolio managers manage the three
segments of the Blend strategy: EM hard currency, local currency, and corporate debt.
Investment
Philosophy Advantageous • The EMD team believes EM debt is a generally improving asset class that is less efficient than developed debt markets. As
such, they believe active management is the best way for investors to access the full potential of the asset class, as
fundamental managers can generate alpha by exploiting mispricing. The team believes in investing with a medium-term
investment horizon and relatively low turnover.
Investment Process Highly
Advantageous
• The team’s investment process combines a bottom-up focus on fundamental value in relatively concentrated exposures in
the country, FX, rates, and corporates, with a top-down driven tactical asset allocation among the various risk categories, as
well as cash.
• The first step of the process is a top-down review of the EMD investment universe to create top-down scores for each of the
blended strategy’s sub-strategies. The second step of the process involves bottom-up country and corporate issuer,
currency, rates or local duration, and instrument level selection.
• As compared to peers we would view this as strategy as one of the more “true” 50/50 blend strategies. The Blend strategy
tends to be more benchmark relative than other blend strategies in terms of over/underweights to local/hard currency in the
EMD Blend universe which has resulted in a much low tracking error compared to peers.
Performance Advantageous • Neuberger outperformed the 50% JPM EMBI Global Diversified / 50% JPM GBI-EM Global Diversified index over the one-,
three- and five-year trailing periods, with excess returns of 2.2%, 0.2% and 0.5% respectively.
Fees Advantageous • Collective Investment Trust (Class I) effective fee of 0.69%
• Mutual Fund (Institutional Class) effective fee of 0.79%
165 of 197
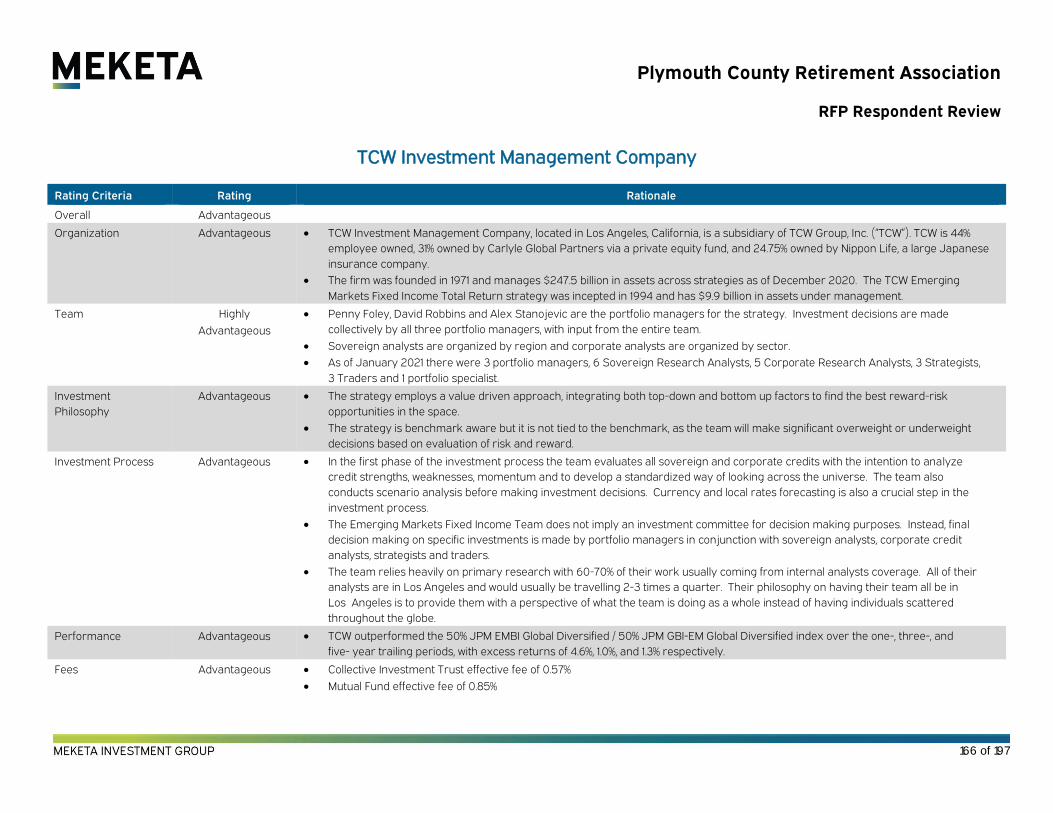
Plymouth County Retirement Association
RFP Respondent Review
TCW Investment Management Company
Rating Criteria Rating Rationale
Overall Advantageous
Organization Advantageous • TCW Investment Management Company, located in Los Angeles, California, is a subsidiary of TCW Group, Inc. (“TCW”). TCW is 44%
employee owned, 31% owned by Carlyle Global Partners via a private equity fund, and 24.75% owned by Nippon Life, a large Japanese
insurance company.
• The firm was founded in 1971 and manages $247.5 billion in assets across strategies as of December 2020. The TCW Emerging
Markets Fixed Income Total Return strategy was incepted in 1994 and has $9.9 billion in assets under management.
Team Highly
Advantageous
• Penny Foley, David Robbins and Alex Stanojevic are the portfolio managers for the strategy. Investment decisions are made
collectively by all three portfolio managers, with input from the entire team.
• Sovereign analysts are organized by region and corporate analysts are organized by sector.
• As of January 2021 there were 3 portfolio managers, 6 Sovereign Research Analysts, 5 Corporate Research Analysts, 3 Strategists,
3 Traders and 1 portfolio specialist.
Investment
Philosophy
Advantageous • The strategy employs a value driven approach, integrating both top-down and bottom up factors to find the best reward-risk
opportunities in the space.
• The strategy is benchmark aware but it is not tied to the benchmark, as the team will make significant overweight or underweight
decisions based on evaluation of risk and reward.
Investment Process Advantageous • In the first phase of the investment process the team evaluates all sovereign and corporate credits with the intention to analyze
credit strengths, weaknesses, momentum and to develop a standardized way of looking across the universe. The team also
conducts scenario analysis before making investment decisions. Currency and local rates forecasting is also a crucial step in the
investment process.
• The Emerging Markets Fixed Income Team does not imply an investment committee for decision making purposes. Instead, final
decision making on specific investments is made by portfolio managers in conjunction with sovereign analysts, corporate credit
analysts, strategists and traders.
• The team relies heavily on primary research with 60-70% of their work usually coming from internal analysts coverage. All of their
analysts are in Los Angeles and would usually be travelling 2-3 times a quarter. Their philosophy on having their team all be in
Los Angeles is to provide them with a perspective of what the team is doing as a whole instead of having individuals scattered
throughout the globe.
Performance Advantageous • TCW outperformed the 50% JPM EMBI Global Diversified / 50% JPM GBI-EM Global Diversified index over the one-, three-, and
five- year trailing periods, with excess returns of 4.6%, 1.0%, and 1.3% respectively.
Fees Advantageous • Collective Investment Trust effective fee of 0.57%
• Mutual Fund effective fee of 0.85%
166 of 197

Plymouth County Retirement Association
RFP Respondent Review
Barings
Rating Criteria Rating Rationale
Overall Advantageous
Organization Advantageous • Barings is a wholly owned subsidiary of Mass Mutual based out of Charlotte, NC. As of December 2020, the firm had over
$345 billion in assets under management across a global client base. They manage over $14.4 billion within their Emerging
Markets Debt platform and $2.1 billion in their Blended Total Return strategy.
Team Highly
Advantageous
• The Emerging Markets Debt Platform is led by Martin Horne, Head of Global Fixed Income and Head of European High Yield..
• The Emerging Markets Blended Total Return Fund is co-managed by Ricardo Adrogué, Ph.D., Cem Karacadag, and Natalia Krol.
The EM Sovereign Debt Team and the EM Corporate Debt Team support them. In total there are 8 portfolio managers,
12 analysts, and 4 dedicated traders.
Investment
Philosophy
Advantageous • The Blended Total Return strategy sources ideas from a disciplined, bottom-up, team-based credit underwriting process.
They seek dynamic instrument selection and rotation among sub-strategies.
• The Blended Total Return portfolio is a higher risk/opportunistic portfolio with relatively concentrated positioning and at times
large allocations to EM currency risk.
Investment Process Highly
Advantageous
• The team has an investment committee structure in place where all portfolio managers and analysts are invited to
contribute. They take consensus during their meetings to make their decisions on sector rotation between hard, local and
sovereign debt. The team utilizes both interest rate swaps and cash bonds for exposures.
• The EM Corporate Investment process starts with bottom-up analysis analyzing fundamentals, ESG, sovereign and relative
value. There outputs are utilized in the investment committee to arrive at approved issuers and for continued monitoring,
portfolio managers can only invest in credits that are approved to be on the Buy list. The portfolio construction is then based on
corporate analysts' top picks with weighting concentrations based on Issuer, Country and Sector.
• The EM Local Currency investment process analyzing interest rates utilizes disciplined rates modeling (DSGE) to study how
the economy evolved over time and how the economy reacts to exogenous shocks. These models are updated and tested
monthly and they perform fundamental country by county analysts to check or supersede DSGE output. For currency
analysis the team quantitatively ranks 111 currencies and their competitiveness. The currency models are updated bi-monthly.
As with the interest rate analysis, fundamental analysis is used to check or supersede model outputs and for sizing of positions.
Performance Highly
Advantageous
• Barings outperformed the 50% JPM EMBI Global Diversified / 50% JPM GBI-EM Global Diversified index over the one-, three-,
and five-year trailing periods, with excess returns of 6.5%, 6.7% and 5.3% respectively.
Fees Advantageous • Private Placement Fund stated fee of 0.475% and other operating expenses capped at 0.20%. Current “early-bird” pricing has
operating expenses capped at 0.075% to make an all-in fee of 0.55%.
167 of 197

Plymouth County Retirement Association
RFP Respondent Review
Pacific Investment Management Company (PIMCO)
Rating Criteria Rating Rationale
Overall Advantageous
Organization Advantageous • PIMCO is located in Newport Beach and is a majority owned subsidiary of AAM, a subsidiary of Allianz SE, a
financial services company based in Germany.
• The firm was founded in 1971 and as of December 2020 totals $1.6 trillion in assets under management across
strategies. The PIMCO Emerging Markets Full Spectrum Bond Fund was incepted in 2013 and has close to $36.9
billion in assets.
Team Highly
Advantageous
• The strategy is managed in a team based approach by the Emerging Markets Portfolio Committee (EMPC).
Pramol Dhawan, Head of the Emerging Markets, is the chair of the EMPC and has final decision making authority.
The EM Portfolio Management Team now totals close to 30 members.
Investment
Philosophy
Advantageous • PIMCO seeks to generate strong risk adjusted returns independently of the market cycle. Their approach is
based on three principles to bring discipline and consistency into their process. The first principle involves
analyzing from every angle as they believe that no single approach holds the key to unlocking alpha. Secondly,
they strive to avoid concentrations in order protect against low probability/ high impact events. Lastly the
emerging markets team looks for ways to be different than the crowd.
Investment
Process
Advantageous • The investment process centers on the Emerging Markets Portfolio Committee (EMPC), comprised of nine
senior members with Pramol Dhawan as chair. The EMPC meets several times per week and are in charge of
building a model portfolio for all emerging markets strategies. PIMCO employs internal ratings that take into
account country fundamentals, political landscape, reserve levels, debt profile and contingency measures. The
EMPC then blends PIMCO’s top-down views, which are developed through various forums, into the emerging
markets process.
• The investment process is a collaborative effort of the entire team, decisions tend to be made on a consensus
basis. However, if no consensus can be reached Pramol Dhawan has final decision making authority.
Performance Advantageous • PIMCO outperformed the 50% JPM EMBI Global Diversified / 50% JPM GBI-EM Global Diversified index over the
one-, three- and five-year trailing periods, with excess returns of 1.3%, 0.2% and 0.5% respectively.
Fees Not Advantageous • Mutual Fund (PFSIX): Effective fee of 1.12%
168 of 197

Plymouth County Retirement Association
RFP Respondent Review
Ashmore Investment Advisors Limited
Rating Criteria Rating Rationale
Overall Advantageous
Organization Advantageous • Ashmore Investment Advisors Limited is a London-based firm owned by Ashmore Group plc, a public company listed in the
London Stock exchange.
• Ashmore was founded in 1992 and manages roughly $93 billion in assets across all strategies as of 12/31/2020. There is
approximately $12.2 billion in the Ashmore Emerging Markets Blended Debt strategy, whose track record dates back to 2003.
Team Highly
Advantageous
• Ashmore has a team driven approach when managing emerging markets debt portfolios. Investment decisions need to go
through the Investment Committee, which includes Mark Coombs, Ricardo Xavier, Jan Dehn, Herbert Saller, Robin Forrest
and Fernando Assad. Jan Dehn is expected to retire at the end of 2021.
• Portfolio managers are responsible for conducting research, portfolio monitoring and trade execution. Most of their time is
spent on research, as they have primary and secondary product and geographical responsibilities.
Investment
Philosophy
Advantageous • Ashmore thinks about emerging markets through a macroeconomic top-down lens. They place strong emphasis on a value
driven approach to find diverging market prices and credit risk. Liquidity management also plays a central role as it is
embedded into the security selection and portfolio construction methodologies.
Investment Process Advantageous • The Investment process begins with the weekly Investment Committee meeting, where members discuss the
macroeconomic environment and review individual countries. These meetings determine the theme allocations across all
emerging markets fixed income funds in addition to the broader macroeconomic positioning. Then the Investment
Committee breaks down into sub-Investment Committees where investment professionals discuss/act on trade ideas for
their respective areas of expertise.
• The investment Committee is the ultimate decision making body, however the Heads of External, Corporate and Local
Currency teams are given a limited amount of autonomy to make trading decisions, which need to be ratified at the following
Investment Committee meeting.
Performance Not
Advantageous
• Ashmore outperformed the 50% JPM EMBI Global Diversified / 50% JPM GBI-EM Global Diversified index over the one-, five-,
and ten-year trailing periods, with excess returns of 5.9%, 1.0% and 0.7% respectively. However, they outperformed over the
three-year trailing period by -0.5%.
Fees Advantageous • Collective Investment Trust: stated fee of 0.70% with an estimated 0.15% other operating costs
• UCITS SIVAC stated fee of 0.70% with an estimated 0.12% other operating costs
• Limited Partnership stated fee of 0.70% with an estimated 0.08% other operating costs
169 of 197

Plymouth County Retirement Association
RFP Respondent Review
Lazard Asset Management
Rating Criteria Rating Rationale
Overall Advantageous
Organization Advantageous • Lazard Asset Management is located in New York, New York and is a wholly-owned subsidiary of Lazard Freres & Co. LLC, a
limited liability company with one member, Lazard Group LLC. Interest of Lazard Group LLC are held by Lazard Ltd, a publicly
traded company on the New York Stock Exchange.
• Lazard traces its history back to the 1840’s as a dry goods merchant. Asset management capabilities began in 1953 out of London
and totals $222.9 billion in assets under management across strategies as of December 2020. The Lazard EMD Blend strategy
was incepted in 2011 and has close to $4.6 billion in assets.
Team Advantageous • The Emerging Markets Debt team is led by Denise Simon and Arif Joshi. They are supported by three sector-specific portfolio
managers/analysts including Sergio Valderrama for Sovereign Credit , Felipe Pianetti for local currency debt and Adam Borneleit
for corporate debt.
• Additionally the team is supported by a team of research analysts, who cover countries from an asset class perspective.
Investment
Philosophy Advantageous • The investment philosophy is based on the belief that there are broad structural inefficiencies in emerging markets that create
attractive opportunities. Lazard focuses on fundamental global trends follows a flexible management approach, fostering the
ability to adapt to changing market environments.
• The strategy is benchmark aware but it is able to invest in out of benchmark securities.
Investment
Process Advantageous • The Emerging Markets Debt Investment Process begins by developing global macroeconomic themes. Asset allocation is then
determined based on expected returns for each asset class and forward volatility expectations. Then the team conducts issuer
analysis taking into consideration country-specific economic data, political trends, country visits and ESG factors among many
others. Once the team has determined issuer weightings they move into instrument selection and portfolio construction.
• Denise Simon and Arif Joshi decide on asset class allocation, overall risk framework and macroeconomic themes. In addition,
Mr. Simon makes final security selection decisions for local currency debt, while Mr. Joshi makes final security selection decisions
for sovereign hard currency debt. Mr. Borneleit makes final security selection decisions on corporate securities.
Performance Advantageous • Lazard outperformed the 50% JPM EMBI Global Diversified / 50% JPM GBI-EM Global Diversified index over the one-, three- and
five-year trailing periods by 2.6%, 0.7% and 0.3% respectively.
Fees Advantageous • Commingled Fund: Stated fee of 0.55% with other operating expenses capped at 0.23% (currently running at 0.10%)
• Mutual Fund (R6): Effective fee of 0.81%
• Separate Account: Effective fee of 0.80%
170 of 197
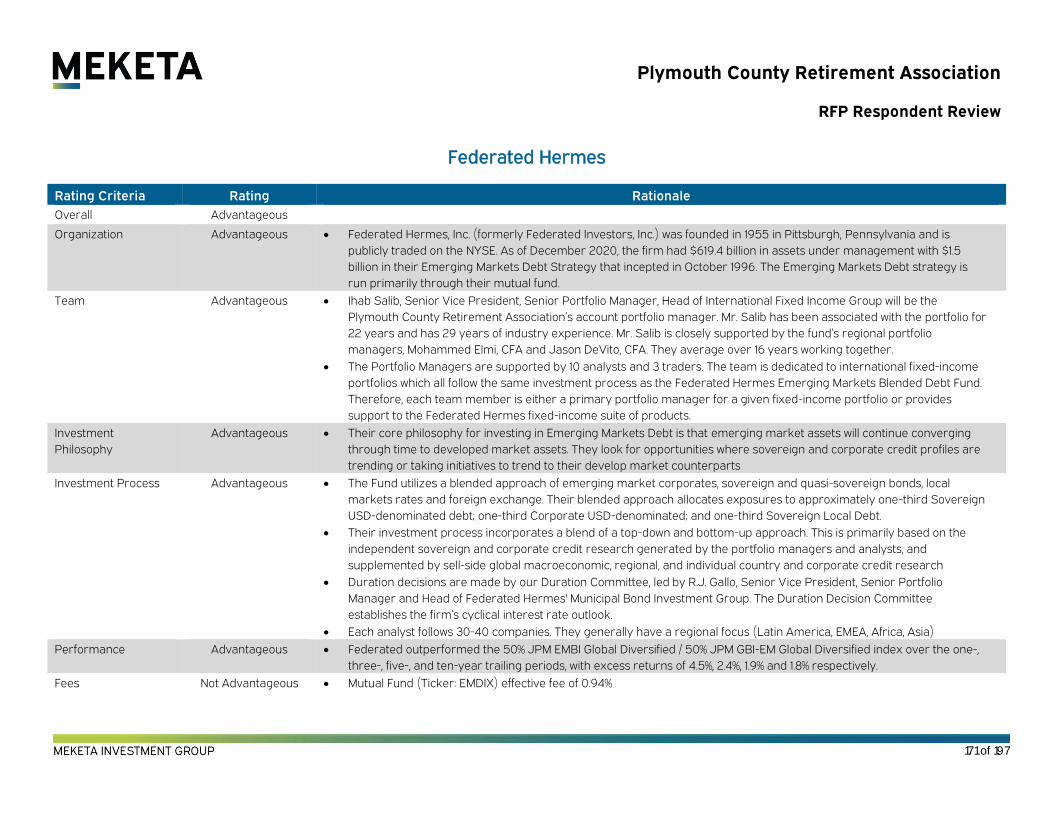
Plymouth County Retirement Association
RFP Respondent Review
Federated Hermes
Rating Criteria Rating Rationale
Overall Advantageous
Organization Advantageous • Federated Hermes, Inc. (formerly Federated Investors, Inc.) was founded in 1955 in Pittsburgh, Pennsylvania and is
publicly traded on the NYSE. As of December 2020, the firm had $619.4 billion in assets under management with $1.5
billion in their Emerging Markets Debt Strategy that incepted in October 1996. The Emerging Markets Debt strategy is
run primarily through their mutual fund.
Team Advantageous • Ihab Salib, Senior Vice President, Senior Portfolio Manager, Head of International Fixed Income Group will be the
Plymouth County Retirement Association’s account portfolio manager. Mr. Salib has been associated with the portfolio for
22 years and has 29 years of industry experience. Mr. Salib is closely supported by the fund’s regional portfolio
managers, Mohammed Elmi, CFA and Jason DeVito, CFA. They average over 16 years working together.
• The Portfolio Managers are supported by 10 analysts and 3 traders. The team is dedicated to international fixed-income
portfolios which all follow the same investment process as the Federated Hermes Emerging Markets Blended Debt Fund.
Therefore, each team member is either a primary portfolio manager for a given fixed-income portfolio or provides
support to the Federated Hermes fixed-income suite of products.
Investment
Philosophy Advantageous • Their core philosophy for investing in Emerging Markets Debt is that emerging market assets will continue converging
through time to developed market assets. They look for opportunities where sovereign and corporate credit profiles are
trending or taking initiatives to trend to their develop market counterparts
Investment Process Advantageous • The Fund utilizes a blended approach of emerging market corporates, sovereign and quasi-sovereign bonds, local
markets rates and foreign exchange. Their blended approach allocates exposures to approximately one-third Sovereign
USD-denominated debt; one-third Corporate USD-denominated; and one-third Sovereign Local Debt.
• Their investment process incorporates a blend of a top-down and bottom-up approach. This is primarily based on the
independent sovereign and corporate credit research generated by the portfolio managers and analysts, and
supplemented by sell-side global macroeconomic, regional, and individual country and corporate credit research
• Duration decisions are made by our Duration Committee, led by R.J. Gallo, Senior Vice President, Senior Portfolio
Manager and Head of Federated Hermes' Municipal Bond Investment Group. The Duration Decision Committee
establishes the firm’s cyclical interest rate outlook.
• Each analyst follows 30-40 companies. They generally have a regional focus (Latin America, EMEA, Africa, Asia)
Performance Advantageous • Federated outperformed the 50% JPM EMBI Global Diversified / 50% JPM GBI-EM Global Diversified index over the one-,
three-, five-, and ten-year trailing periods, with excess returns of 4.5%, 2.4%, 1.9% and 1.8% respectively.
Fees Not Advantageous • Mutual Fund (Ticker: EMDIX) effective fee of 0.94%
171 of 197

Plymouth County Retirement Association
RFP Respondent Review
Finisterre Capital
Rating Criteria Rating Rationale
Overall Advantageous
Organization Advantageous • Finisterre Capital was founded in London in 2002 as a specialist Emerging Markets Debt investment manager. Effective Oct 2019,
Principal Global, the investment arm of the publicly traded Principal Financing Group acquired the remaining ownership interest in
Finisterre after being the majority owner since 2011. Post-acquisition, Finisterre and Principal’s investment teams merged to create a
single Emerging Markets Fixed Income platform.
• As of December 2020, Finisterre manages a total of $2.6 billion in assets. The Total Return strategy, launched in June 2013, has $2.3
billion assets under management.
Team Advantageous • The strategy is led by Damien Buchet and Christopher Watson. Damien focuses on portfolio strategy, construction and risk
budgeting with a bias towards the local currency and sovereign debt strategies. Christopher has a bottom-up credit and special
situations analysis background and focuses on the Emerging Markets corporate and frontier sovereign strategies. The two are the
key decision makers on the Total Return strategy. The team is fully embedded in the Finisterre Emerging Markets Portfolio
Management platform consisting of 5 portfolio managers and 7 research analysts.
Investment
Philosophy
Advantageous • The firm’s investment philosophy combines top-down analysis of global macro trends and conditions with rigorous single name work
on individual countries and companies. For Finisterre, the management of risk is critical, with diligent country research, corporate
credit analysis, and consistent risk monitoring playing a central role in their investment process.
Investment Process Not
Advantageous
• The team follows a holistic, benchmark-agnostic, top-down approach for the Total Return Strategy. Being totally unconstrained in
their focus and priorities, both investment teams and research teams are free to focus on certain names, sectors which have been
identified as worth focusing on, either from a flow angle, following specific market/sovereign/sectoral events, or as a result of a
valuation screening by PMs or analysts.
• The Macro process involves weekly meetings examining the most relevant issues for EMD such as outlook for the US, EU, China, Oil
and commodities, as well as global risk appetite and liquidity conditions. Subsequently the analysis drills down to the country level
with decisions to focus on certain countries made through consensus by portfolio managers and economists. The meetings are
supplemented with daily interactions, as the Macro Research team sits next to the portfolio managers.
• The EM Total Return team has developed its own monitoring tools such as the “EM Country Map” that sources data from the IMS and
World Bank macro databases.
• Specific to this mandate, we would prefer to see a more benchmark aware strategy.
Performance Advantageous • Finisterre outperformed the 50% JPM EMBI Global Diversified / 50% JPM GBI-EM Global Diversified index over the one-, three- and
five-year trailing periods by 2.1%, 2.8%, and 3.8% respectively.
Fees Advantageous • Limited Partnership stated fee of 0.60%
• Mutual Fund Effective fee of 0.86%
172 of 197

Plymouth County Retirement Association
RFP Respondent Review
Manulife Investment Management
Rating Criteria Rating Rationale
Overall Advantageous
Organization Advantageous • Manulife Investment Management, located in Boston, is the global asset management arm of Manulife, a publicly-held
corporation trading under the symbol ‘MFC’ on the NYSE, TSX and PSE, and under ‘945’ on the SEHK.
• Manulife IM was founded in 2002 and merged with John Hancock 2014. As of December 2020, Manulife has $456 billion in
assets under management. The Emerging Market Debt strategy, incepted in 2007, has $1.1 billion in assets.
Team Advantageous • Lead portfolio managers Roberto Sanchez-Dahl, CFA and Paolo H. Valle, responsible for the Emerging Markets Debt Strategy were
solely responsible for the strategy at another firm since 2007 and joined Manulife in 2013.
• The team is supported by 16 credit research analysts, 4 traders, 3 macroeconomic advisers and an Asia Team in 10 markets.
Investment
Philosophy
Advantageous • The team invests in Emerging Market economies with a long-term horizon and seek countries with improving sovereign credit
stories and great companies.
• The team believes a successful investment strategy should incorporate a flexible approach with strategic allocation to hard
currency sovereign and corporate debt, and tactical allocation to local currency debt.
Investment Process Advantageous • The investment process begins with a top-down macro-economic assessment in which the investment team analyzes fiscal
and monetary policy, global liquidity, market risk appetite and volatility, geopolitical and regulatory environment, interest rate,
yield curve and currency trends. This macroeconomic analysis drives global and local investment themes on a secular
(long-term) and cyclical (short-term) basis which focus the entire investment process, from country and security selection to
currency and duration
• The top-down analysis drives the process and the credit research provides the opportunity set to gain that exposure in the
specific countries. If the team does not view the country positively, they will not invest there.
• As a general rule, the portfolio maintains a duration +/-20% of benchmark and does not employ aggressive interest rate timing
in managing the strategy.
Performance Advantageous • Manulife outperformed the 50% JPM EMBI Global Diversified / 50% JPM GBI-EM Global Diversified index over the one-, three-, five-,
and ten-year trailing period, with excess returns of 3.6%, 1.9%, 2.0%, and 2.9% respectively.
Fees Highly
Advantageous
• Commingled Fund effective fee of 0.49%
• Mutual Fund effective fee of 0.77%
• Separate Account: Effective fee of 0.60%
173 of 197

Plymouth County Retirement Association
RFP Respondent Review
Nuveen
Rating Criteria Rating Rationale
Overall Advantageous
Organization Advantageous • Nuveen is headquartered in New York and is a wholly owned subsidiary of stock life insurance company TIAA, Teachers
Insurance and Annuity Association of America.
• The firm was founded in 1898, acquired by TIAA in 2014 and as of December 2020 totals $1.2 trillion in assets under
management across strategies. The Emerging markets Blend composite was launched in 2004 and has close to $15.8 billion
in assets under management.
Team Advantageous • The emerging markets debt team was formed in 1997 to manage over $1 billion in assets for the TIAA General Account.
Katherine Renfrew joined the emerging markets debt team in 1998 and was named the lead portfolio manager of the blend
strategy at inception in 2004. Anupam Damani joined the team in 2005 and was named portfolio manager for the blend
strategy in 2014.
• Katherine is ultimately accountable for asset allocation across sovereign, corporate, and local currency as well as risk
budgeting, regional allocations, country exposure and duration/yield curve positioning.
• The portfolio managers are supported by research analysts segmented by region and across sovereign and corporate debt
Investment
Philosophy Advantageous • Nuveen’s philosophy centers around protecting on downside risk. The team seeks to generate consistent, incremental alpha
over long-term returns without taking concentrated bets in any one region, country, issuer or issue. They believe EM
provides greater opportunity given less market coverage and protect the portfolios from lower recovery rates by creating
barbells with higher-quality corporates with lower-quality sovereigns.
Investment Process Advantageous • The team’s investment process begins with an assessment of global markets and this macro assessment at each individual
sovereign level drives duration and rate biases of the portfolio.
• Duration is typically maintained within +/-30% of the benchmark. Duration is monitored at portfolio level and is determined by
the lead portfolio manager. Alpha sourced from duration is primarily at individual country or company level. The majority of
alpha is sourced from country and security selection.
• The lead portfolio manager is tasked with allocating across sovereigns, corporates, and local currency.
Performance Advantageous • Nuveen outperformed the 50% JPM EMBI Global Diversified / 50% JPM GBI-EM Global Diversified index over the one-, three-,
five-, and ten-year trailing period, with excess returns of 6.0%, 3.1%, 3.1% and 3.7% respectively.
Fees Highly
Advantageous
• Commingled fund effective fee of 0.45%
• Mutual Fund effective fee of 0.62%
174 of 197

Plymouth County Retirement Association
RFP Respondent Review
Stone Harbor Investment Partners LP
Rating Criteria Rating Rationale
Overall Advantageous
Organization Advantageous • Stone Harbor is located in New York, New York and is 100% employee owned, with ownership broadly dispersed among firm’s
employees.
• The firm was founded in 2005 and has $16.7 billion assets under management. The team’s track records trace back to the
early 1990s when they were established at Salomon Brothers, almost all of the original investment team continues to work at
Stone Harbor. The Emerging Markets Debt (EMD) Global Allocation Core strategy, launched in 2007, has ~$1.8 billion assets
under management.
• Assets have declined from $30.4 billion to $11.4 billion in their emerging markets debt strategies since the end 2015.
Team Advantageous • James Craige, Co-Chief Investment Officer and Head of Emerging Markets is the lead portfolio manager for the strategy. He
joined the industry in 1988 and has been with Stone Harbor since it was first founded. A senior portfolio manager covering
local currency bonds, Pablo Cisilino, was replaced in 2019.
• All members of the Emerging Markets team are located in the New York and London offices and most have a long tenure at
the firm. The team is 23 members total with 7 industry credit analysts, 1 quant researcher and 1 global corporate trader.
Investment
Philosophy Advantageous • Stone Harbor’s philosophy rests on three pillars, investing on improving emerging market debt instruments will result in
favorable performance, combining fundamental and political analysis provides the foundation for portfolio construction and
the team’s long-term experience is a competitive advantage. The team believes that the key to generating excess returns is
through a disciplined process of rigorous credit analysis combined with investment people and technology
Investment Process Advantageous • The investment process begins with idea generation derived from internal research, almost all ideas are generated this way
but the firm also takes into consideration external research from Teneo Intelligence and Global Source Partners. Then the
team conducts deeper analysis on the best ideas including sector and security analysis. Country visits are also part of the
due diligence process, and they serve as a way to confirm or disprove the team’s assumptions on local investors positioning
and sentiment.
• The team collaborates together to make investment decisions.
Performance Advantageous • Stone Harbor underperformed the 50% JPM EMBI Global Diversified / 50% JPM GBI-EM Global Diversified index over the one-
, three-, and five-year trailing periods by 2.4%, 0.1% and 0.0% respectively.
Fees Highly
Advantageous
• Collective Investment Trust stated fee of 0.35% with other expenses of 0.10%
• Mutual Fund (SHADX): Effective fee of 0.85%
175 of 197

Plymouth County Retirement Association
RFP Respondent Review
FIM Partners
Rating Criteria Rating Rationale
Overall Not Advantageous
Organization Advantageous • Dubai-based FIM Partners was established in 2008 as a boutique, institutional asset manager in the emerging and frontier
market space. The firm is co-owned equally by its founder, Hedi Ben Mlouka and EFG-Hermes UAE Limited, a subsidiary of EFG-
Hermes Holding SAE. An additional 10% of phantom shares is owned by the senior employees of FIM. EFG-Hermes is a financial
services firm with presence in emerging and frontier markets.
• As of December 2020, FIM had $2.1 billion assets under management with $310 million in their Emerging Markets Debt strategy
that incepted in December 2019
Team Not
Advantageous
• The lean, five-person EMD debt team averages 25 years’ experience from international financial institutions, multi-lateral
development banks (World Bank, IMF), investment banks and large asset managers. Francesc Balcells leads the team and is CIO
of Global Emerging Markets Debt for FIM.
• The team leans heavily on its EM equity analysts for research on countries and industries which it views as a competitive
advantage, particularly in frontier markets where they are already invested in equity.
• Although the team is experienced, we would rather see a larger more dedicated EM Fixed Income team.
Investment
Philosophy
Advantageous • The Global Emerging Markets (GEM) fund uses a highly concentrated unconstrained approach to seek the most attractive
opportunities across global EM debt and frontier markets. The portfolio is anchored to hard currency debt but can dynamically
allocate to corporates, local currency sovereigns and EM FX, finding the best “expression” of risk given the team’s fundamental
views.
Investment Process Advantageous • FIM manages a high conviction EMD strategy with a highly concentrated portfolio of 30-50 positions across approximately 10
countries with a higher allocation to frontier markets than most peers (~30%). They hold approximately 5% cash for liquidity and
derivatives and they hold some shorter duration higher liquidity issues to meet obligations. There are several positions greater
than 10%. Duration can be within three years of the blended index (75% JPM EMBI GD/25% GBI EM GD.)
• There is an issuer limit of 10% and country limit of 15%. They can use derivatives up to 25% (net basis) of the portfolio. Credit
quality can be up to three notches +/- the benchmark average. The strategy is typically underweight duration and overweight
carry (carries a higher yield) than the blended benchmark.
• Filtering the EM universe through a proprietary research framework, they concentrate investment efforts on a narrower set of
opportunities. The investment style is unconstrained and fundamentally based with high tracking error. The strategy is
benchmark aware through management of risk factor exposures; not by name replication.
Performance Advantageous • FIM outperformed the 50% JPM EMBI Global Diversified / 50% JPM GBI-EM Global Diversified index over the one-, three-, and
five-year trailing periods, with excess returns of 4.8%, 2.8% and 1.8% respectively.
Fees Not Advantageous • Separate account stated fee of 0.85%
176 of 197

Plymouth County Retirement Association
RFP Respondent Review
Loomis
Rating Criteria Rating Rationale
Overall Not
Advantageous
Organization Advantageous • Loomis Sayles is structured as a limited partnership. It is a wholly-owned subsidiary of Natixis Investment Managers, the US-based
subsidiary of Natixis which is based in Paris, France. Natixis Investment Managers is headquartered in Boston, Massachusetts.
• Loomis Sayles has been providing investment management services since 1926, when it was established by founders Robert H. Loomis
and Ralph T. Sayles. As of December 2020, the firm managed $347.8 billion with $297 million in Emerging Markets Debt. The Blended
Total Return strategy incepted in March 2017 and the proposed NHIT vehicle incepted in January 2021.
Team Not
Advantageous
• The investment team is part of the broader Alpha Strategies team, which started at Loomis in 2009. Andrea DiCenso, one of the EMD
Blend portfolio managers, was a strategist (with an EM focus) on the multi asset credit team and was later promoted to portfolio manager.
Peter Yanulis was an analyst in the central macro research team before moving to Alpha Strategies to be a strategist (again, with an EM
focus). Peter and Andrea, in conjunction with others on the Alpha Strategies team, developed the EM Blend process over a number of
years.
• We would prefer to see more support and resources dedicated specifically to this strategy as opposed to a carve out of a larger team.
Investment
Philosophy
Advantageous • The Emerging Market Blend (EMD) team’s philosophy is that emerging markets are driven by economic cycles over the medium-to-long
term and by regimes in the short-to-medium term. The team believes that correct identification of these cycles and regimes should allow
investors to capture a significant portion of the EMD return distribution, avoid tail risks and generate outperformance.
Investment
Process
Not
Advantageous
• The Emerging Markets Debt Blended Total Return strategy is a carve out from a broader multi asset credit strategy called the World
Credit Asset Fund.
• The team uses a proprietary machine learning algorithm to guide top-down positioning. They then work with the firm’s macro and credit
researchers and traders to build the portfolio. Proprietary tools help ensure risk is constantly monitored from multiple dimensions.
• The process is structured to infer credit cycles from market data, seeking to capture risk premiums by identifying and positioning for
risk-on and risk-off regimes
Performance Advantageous • Loomis outperformed the 50% JPM EMBI Global Diversified / 50% JPM GBI-EM Global Diversified index over the one and three-year
trailing periods by 4.6% and 4.4% respectively.
Fees Advantageous • Commingled Fund: Stated fee of 0.65%
• Separate Account: Effective fee of 0.40%
177 of 197

Plymouth County Retirement Association
RFP Respondent Review
Macquarie
Rating Criteria Rating Rationale
Overall Not Advantageous
Organization Advantageous • The Macquarie Group developed Macquarie investment Management (MIM) in 1985. MIM is headquartered in Philadelphia in the US with a
presence in Macquarie Group’s headquarters in Sydney, Australia. Macquarie Group is publicly traded in Australia and holds a 95%
ownership interest with the remaining 5% owned by employees.
• As of December 2020, the firm had $268 billion in assets under management with $259 million in the Emerging Markets Debt Select
Opportunities Strategy that incepted in September 2019. The firm manages over $2 billion in emerging markets debt assets. The EMD
Select Opportunities strategy has just been made available as an investment vehicle in the US last quarter.
Team Not
Advantageous
• The Emerging Markets Debt team is led Alex Kozhemiakin and supported by Mansur Rasul and Gyula Toth on the portfolio management
team. The portfolio managers are supported by 3 sovereign analysts, 2 credit research analysts, 2 global credit research analysts and 1
dedicated trader and FX strategist. The EMD Corporate analysis is conducted by dedicated EM corporate research analysts made up of 16
industry specialists.
• While the team has relative industry experience, all but two of the team members have been with MIM for less than 4 years. The team was
created in 2019 following the hire of Mr. Kozhemiakin in December 2018.
Investment
Philosophy
Advantageous • EMD is a heterogeneous, semi-efficient market with multiple sources of mispricing. The strategy aims to generate attractive returns over
cash through the cycle by identifying the best risk-adjusted opportunities from the full spectrum of EMD – sovereign, corporate and local
– modulating the portfolio exposure to the macro environment.
Investment
Process
Advantageous • Their investment process starts with the assessment of the global macro environment. They believe that EMD is “not an island.” As such,
they start with an analysis of the global macro environment, specifically the future direction of developed market credit spreads, US
dollar, and US Treasury yields. Next, they determine the likely evolution of differentials between the EM and DM macro-economic cycles.
This helps them anticipate any changes in the differentials between EM and DM spreads for similar credit quality. They then do we
proceed to the sovereign analysis and individual corporate assessment.
• For corporate analysis, the team methodically conducts fundamental analysis with multiple filters, reducing the 600+ universe issuers
down to ~80-100 issuers. The analysis considers the company’s business model, financials, ESG factors, and capital structure.
• ESG factors are an integral component of the sovereign and corporate research process. The ESG scores are based on two dozen
variables from 9 different public sources. In the US vehicle the team excludes the bottom quartile of sovereigns in the ESG ranking.
Performance Not Advantageous • Macquarie underperformed the 50% JPM EMBI Global Diversified / 50% JPM GBI-EM Global Diversified index over the one-year trailing
period by -1.0%.
Fees Highly
Advantageous
• Commingled Fund fee of 0.30% (discounted from 0.75% stated fee). New vehicle launched in the US in 2021.
• Separate Account: Effective fee of 0.30%
178 of 197

Plymouth County Retirement Association
RFP Respondent Review
Man Group
Rating Criteria Rating Rationale
Overall Not
Advantageous
Organization Advantageous • Man GLG is an investment division of Man Group. Man GLG was founded in 1995 as a division of Lehman Brother International. In 2007
GLG became a NYSE listed company which acquired Société Générale Asset Management UK in April 2009. In October 2010 GLG
Partners was acquired by Man Group and delisted from the NYSE. Today, Man GLG is a wholly owned subsidiary of Man Group that is
listed on the London Stock Exchange.
• Man GLG’s head office is based in London with main offices in New York for their US business. As of December 2020 the firm had $30.5
billion in assets under management with $1.9 billion in the Global EM Debt Total Return strategy that incepted in May 2016.
Team Advantageous • The investment team is led by Guillermo Ossés, Head of Emerging Markets Debt, with 29 years of experience. He joined Man GLG, from
HSBC where he Headed Emerging Market Debt strategies for five years. Mr. Ossés is supported by Phil Yuhn who co-manages the Fund
and has 16 years of experience. The Fund also benefits from the expertise of Jose Wynne, a co-Portfolio Manager/Economist in the Local
Currency Strategy who has over 17 years of professional experience, Lisa Chua, the Co-Portfolio Manager for the Hard Currency
benchmark strategy with 18 years of professional experience and Ehsan Bashi, co-Portfolio Manager of the Local Currency strategy with
12 years of industry experience.
Investment
Philosophy
Not
Advantageous
• The team follows an unconstrained, or benchmark agnostic, approach to obtain structural long exposure to emerging markets debt. This
leads to key differences in portfolio construction versus traditional investing and includes the: initially considered investment opportunity
set, method for determining the size of each investment, measures of access and approach to risk management.
• For this mandate we would like to see a benchmark aware strategy to follow the clients investment guidelines.
Investment
Process
Not
Advantageous
• They aim to build a portfolio that will maximize the upside capture and minimize the downside capture to achieve a return over a cycle
that should, at least, match that of the Blend (comprised of 50% JP Morgan EMBIG, 50% JP Morgan GBI-EM< GD), but with lower volatility
(50-75% volatility of that of the Blend) and drawdowns.
• The team covers the sovereign and quasi-sovereign issuers of the JP Morgan EMBIG and JP Morgan GBI-EM GD and the 10-15 largest EM
corporate companies. The initial screening is heavily quantitative and followed by a deep research analyses on the potential investment
candidates in the hard currency and local currency side of the universe that emerged from the initial screening
• Historically, the duration of the strategy has ranged between 0 years to 4 years. Even when duration is close to this historical range
ceiling it is typically meaningfully lower than the duration of the JPM EMBIG and JPM GBI-EM GD.
Performance Not Advantageous • Man GLG underperformed the 50% JPM EMBI Global Diversified / 50% JPM GBI-EM Global Diversified index over the one-, three- and five-
year trailing periods by -11.3%, -5.0%, and -1.7% respectively.
Fees Advantageous • Commingled Fund: Stated fee of 0.50% with a performance fee of 0.20%.
179 of 197

Plymouth County Retirement Association
RFP Respondent Review
DuPont Capital
Rating Criteria Rating Rationale
Overall Not Advantageous
Organization Advantageous • DuPont Capital was established in 1993 and is based out of Wilmington, Delaware. DuPont Capital is a wholly owned subsidiary of
Corteva, Inc. a publicly traded company. Their history of institutional asset management is rooted back to 1942 when their former
parent company, DuPont, established a pension plan for its employees. Corteva Inc. succeeded DuPont as sponsor of the DuPont
Pension Plan in 2019. DuPont Capital is a wholly owned subsidiary of Corteva and continues to manage the legacy DuPont Pension
Plan
• DuPont has $27.4 billion assets under management with $466 million in the Emerging Markets Debt strategy that incepted in 1995.
Peak assets were reached in the second quarter of 2014 at $37.6 billion. Strategy specific assets have declined from $590 million in
2017.
Team Advantageous • The emerging markets debt portfolio team is led by Kris Kowal, PhD Material Science, Yong Zhu, PhD Theoretical Physics, and Ted Hu,
PhD Biophysics. These three individuals have worked together since 1999 and have a unique approach to investing given their
backgrounds
Investment
Philosophy
Not
Advantageous
• The EMD team at DuPont tend to run concentrated portfolios focusing on hard currency sovereign bonds. They believe their strength
is picking countries, and they usually have 5 to 10 high conviction ideas in the portfolio, which can go as high as 10% above the
benchmark.
Investment Process Advantageous • The team has an academically driven research process, they mention that the way they conduct research is very similar to what
they did in their respective programs. They conduct a variety of historical studies and rely on various proprietary models. The 7-
facctor country model takes into consideration four quantitative factors and three qualitative factors to come up with a normalized
credit score for each country. The primary goal of the model is to group countries together with similar risk profiles, which then
allows each risk category (mature, stable, risky and distressed) to be evaluated and determine valuations. Valuation ranges (under-
valued, fairly-valued and over-valued) are determined by looking back at history. This initial analysis is ran on a daily basis in order
to identify undervalued securities across the entire risk spectrum.
• After the focus group is identified, the team spends the majority of their time understanding why a country looks cheap and if there
are any factors that would drive long-term improvements. They also seek to add alpha through a process called Global Edge in which
they assess the relative strengths and footprint in global trade of each country in the focus group.
• The portfolio is usually constructed to have 50% of assets in fairly-valued countries and the other 50% consists of 5 to 10 country
overweights. There are typically 50-75 issuers in total.
Performance Not
Advantageous
• DuPont outperformed the 50% JPM EMBI Global Diversified / 50% JPM GBI-EM Global Diversified index over one-year trailing period
with an excess returns of 1.9%. However, they underperformed the three- and five-year trailing period by -0.8% and -0.2% respectively.
Fees Advantageous • Separate Account effective fee of 0.60%
180 of 197

Plymouth County Retirement Association
RFP Respondent Review
Manager Trailing Performance (Gross of Fees)
As of June 30, 2021
Manager
Inception
Date1
1 Year
(%)
3 Year
(%)
5 Year
(%)
10 Year
(%)
Eaton Vance Management Apr-13 12.8 9.2 8.4 ---
Wellington Mar-09 8.7 6.8 5.9 4.7
Neuberger Berman Oct-13 9.2 5.7 4.6
TCW Apr-12 11.7 6.4 5.4 ---
Barings Jan-15 13.6 12.1 9.4 ---
Pacific Investment management Company (PIMCO) Mar-13 8.3 5.7 4.6 ---
Ashmore Investment Management Jun-03 12.9 5.0 5.1 3.8
Lazard Asset Management LLC Oct-11 9.7 6.2 4.4 ---
Federated Hermes Oct-96 11.6 7.9 6.0 4.9
Finisterre Capital Jun-13 9.1 8.2 7.9 ---
Manulife Investment Management Mar-07 10.7 7.3 6.1 6.0
Nuveen Sep-04 13.1 8.6 7.2 6.8
Stone Harbor Investment Partners LP Mar-16 9.4 5.5 4.1 ---
FIM Partners Apr-15 11.9 8.3 5.9 ---
Loomis Mar-17 11.6 9.8 --- ---
Macquarie Oct-19 6.1 --- --- ---
Man Group Jun-16 -4.2 0.5 2.4 ---
DuPont Jan-95 9.0 4.7 3.9 5.0
50% JP Morgan EMBI GD / 50% JPM GBI-EM GD 7.1 5.5 4.1 3.1
1 Inception date noted is the inception date of the product/composite provided by the managers. The inception date of the strategies may be different.
181 of 197

Plymouth County Retirement Association
RFP Respondent Review
Proposed Fees
Manager Proposed Vehicle Stated Fee (%)1 Other Expenses Minimum Investment
Eaton Vance
Management
Commingled Fund 0.30 0.15% $5 million
Wellington Trust
Company
Commingled Fund
Separate Account
0.55
0.75
0.045% capped at 0.20%
-
$1 million
$200 million
Neuberger Berman
CIT (Class I)
Separate Account
Mutual Fund (Inst Class)
UCITS
Private Fund
0.69
0.65
0.79
0.70
0.65
-
-
-
0.20%
-
$10 million
$150 million
$1 million
$2.5 million
$10 million
TCW Commingled Fund
Mutual Fund
0.57
0.85
-
-
$5 million
$2,000
Barings Private Placement Fund
(3c7)
0.475 0.20% $1 million
Pacific Investment
Management
Company (PIMCO)
Mutual Fund (PFSIX) 1.12 - $1 million
Ashmore Investment
Advisors Limited
CIT (Class A)
UCITS SICAV
Limited Partnership
0.70
0.70
0.70
NA
0.12%
0.08%
$10 million
$1 million
$10 million
Lazard Asset
Management
Commingled Fund
Mutual Fund
Separate Account
0.55
0.81
0.80
0.10% capped at 0.23%
-
-
$1 million
$1 million
$50 million
1 Assumes a mandate size of $15 million. In certain cases operating expenses for commingled fund/collective investment trust vehicles were included in the stated fee. Otherwise the other operating
expenses are listed separately and not included in the “Stated Fee”
182 of 197

Plymouth County Retirement Association
RFP Respondent Review
Proposed Fees (con’t)
Manager Proposed Vehicle Stated Fee (%)1 Other Expenses Minimum Investment
Federated Hermes Mutual Fund 0.94 - $1 million
Finisterre Capital Mutual Fund (PFUMX)
Limited Partnership
0.86
0.60
-
-
NA
NA
Manulife Investment
Management
Commingled Fund
Mutual fund (JHEMX)
Separate Account
0.49
0.77
0.60
-
-
-
$20 million
$1 million
$25 million
Nuveen2 Mutual Fund
Commingled Fund
0.62
0.45
-
-
$2 million
NA
Stone Harbor
Investment Partners3
Mutual Fund (SHADX)
Commingled Fund
0.85
0.35
-
0.10%
$1 million
$15 million
FIM Partners Commingled Fund
Separate Account
1.25
0.85
-
-
$0.1 million
$5 million
Loomis Separate Account
Commingled Fund
0.40
0.65
-
-
$15 million
$5 million
Macquarie Separate Account
Commingled Fund
0.30
0.30
-
-
$15 million
$1 million
Man Group Commingled Fund 0.50 0.20% performance fee $1 million
DuPont4 Separate Account 0.60 - $25 million*
1 Assumes a mandate size of $15 million. In certain cases operating expenses for commingled fund/collective investment trust vehicles were included in the stated fee. Otherwise the other operating
expenses are listed separately and not included in the “Stated Fee” 2 Nuveen is in the process of launching a CIT for which they are seeing investors who are eligible for founders pricing and are willing to discuss in more detail through the search process 3 Separate account minimum listed for Stone Harbor is the standard amount that they are offering to be lowered to $15 million for the PCRA account. 4 Separate account minimum listed for DuPont is the standard amount that they are willing to negotiate for the PCRA account.
183 of 197

Plymouth County Retirement Association
RFP Respondent Review
Summary
• A total of 17 managers submitted responses to this search. Based upon our review and evaluation of each
respondent, Meketa Investment Group has rated 1 as “Highly Advantageous, 11 were ranked as
“Advantageous,” and 5 was ranked as “Not Advantageous.”
− Eaton Vance, the Association’s current manager, is also considered “Highly Advantageous” despite
the recent turnover on the investment team.
184 of 197

Appendices
185 of 197

Plymouth County Retirement Association
Investment Manager Status Report
186 of 197

Plymouth County Retirement Association
Investment Manager Status Report
Overview of Watch List Policies
• The Board is responsible for selecting and monitoring investment managers on the Association’s roster
and recognizes the importance of diligent manager oversight.
• The Board must be informed of changes in strategy, personnel, and organizational structure, to effectively
evaluate the Association’s managers.
• However, overly aggressive “management” of managers (i.e., rapid hiring and firing of managers) can be
counterproductive.
− Achieving superior returns requires patience. Frequent changes in managers usually results in
poor performance, since each change can incur substantial transaction costs, as an entire portfolio
of securities is restructured.
• Watch List Policies represent an intermediate state of heightened oversight, triggered by any change that
could jeopardize an Investment Manager’s ability to successfully fulfill their role for the Association.
• This document presents an overview of the Association’s current Watch List Policy and our
recommendations.
187 of 197
Plymouth County Retirement Association
Investment Manager Status Report
Watch List and Probation Policy
In-Compliance
• The investment manager is acting in accordance with its investment guidelines.
Watch List
• An elevated state of review. There is a problem with performance, an unusual change in characteristics,
an alternation in management style or key investment personnel, and/or any irregularities that diminish
the Board’s confidence in the manager.
Probation
• An elevated state of Watch List status. Based on continued concern with one or more of the alert issues,
failure for a manager to improve upon stated issues within a time period justifies termination.
Termination
• The Board has voted to terminate the manager.
188 of 197

Plymouth County Retirement Association
Investment Manager Status Report
PCRA Investment Policy Statement Language: Portfolio Monitoring Procedures
• The Trustees will meet with the Consultant no less frequently than quarterly to review portfolio performance, review
portfolio weights relative to target weights and managers’ performance. Further, the Board will endeavor to meet with
each of its investment managers in accordance with PERAC requirements.
• The investment managers managing separate accounts on behalf of the System will be issued investment manager
guidelines and they will be monitored at two levels of contract review: Watchlist and Probation, the latter being a more
heightened level of review.
• The Consultant will recommend to the Board when a manager should be placed on or removed from Watchlist or
Probation. When an investment manager is placed on the Watchlist/Probation, it is effective immediately. There is no
minimum time requirement on the Watchlist/Probation before a termination may be made. An investment manager’s
contract may be terminated for any reason at any time, whether on Watchlist/Probation or not.
• A representative listing of potential reasons an investment manager may be added to Watchlist/Probation is detailed
on the next page. During an investment manager’s tenure on the Watchlist/Probation, the investment consultant will
provide the Board with regular reports, including background information and support, about the progress the
investment manager is or is not making. An investment manager may be removed from heightened alert if the Board
believes the issues that placed the firm on the Watchlist/Probation are resolved.
• Should the manager’s performance not improve over a reasonable time period, the Consultant will recommend further
action and possible termination after a careful review of the manager’s performance, portfolio structure and the market
environment. Before a manager is officially dismissed, the Consultant will recommend to the Board a plan of action for
managing (internally, externally, or in combination) or liquidating the assets.
• Circumstances may warrant that the Trustees take immediate action to terminate a manager. Therefore, the Trustees
reserve the right to bypass the course outlined above and remove a manager immediately if deemed prudent and in
the best interests of the Association participants.
189 of 197

Plymouth County Retirement Association
Investment Manager Status Report
PCRA Investment Policy Statement Language: Watch List and Probation Policy
Organizational Issues
• Change in ownership or control of the company
• Significant change in team composition or responsibilities
• Material change in the business organization of the investment manager
• Departure of significant personnel
Performance
• 1, 3 and 5-year performance net of fees below benchmark
• 1, 3 and 5-year performance net of fees below peers (below median of relevant peer universe)
• Performance inconsistent with the investment manager’s style and risk controls
Investment Process
• Deviation from investment style
• Deviation from risk controls
Other
• Material guideline violation not brought to our attention by the investment manager
• Material guideline violation not sufficiently explained by the investment manager
• Failure to comply with terms of contract
• Any extraordinary regulatory action or other proceeding affecting the investment
• Failure to abide by Massachusetts law and investment restrictions
• Unsatisfactory client service
190 of 197

Plymouth County Retirement Association
Investment Manager Status Report
Active Manager Roster1
Investment Manager Recommendation As of 9/30/21
Fisher Midcap Value In-Compliance
Mellon Small Cap Growth In-Compliance
LMCG Small Cap Value Watch List - Performance 2,3
Aristotle International Equity In-Compliance
Walter Scott International Equity In-Compliance
ABS Emerging Markets In-Compliance
Driehaus Emerging Markets Growth In-Compliance
First Eagle Global Value In-Compliance
Kopernik Global All Cap In-Compliance
Lee Munder Global Multi-cap In-Compliance
Wellington Durable Enterprises In-Compliance
1 Excluding illiquid asset classes of private equity and non-core real estate. 2 1, 3 and 5-year performance net of fees below benchmark. 3 1, 3 and 5-year performance net of fees below peers (below median of relevant peer universe).
191 of 197

Plymouth County Retirement Association
Investment Manager Status Report
Active Manager Roster1 (con’t)
Investment Manager Recommendation as of 9/30/21
IR&M Core Bonds In-Compliance
Rhumbline TIPS In-Compliance
Lord Abbett Short Duration In-Compliance
Eaton Vance High Yield In-Compliance
First Eagle Bank Loan Select (Formerly THL Bank Loan Select) In-Compliance
Manulife Strategic Fixed Income In-Compliance
Mesirow High Yield In-Compliance
Eaton Vance Emerging Market Debt Watch List - Organizational
ABS Offshore SPC - Global Segregated In-Compliance
Entrust Special Opportunities Fund III, In-Compliance
Old Farm Partners Master Fund In-Compliance
EnTrustPermal Special Opportunities Evergreen Fund In-Compliance
TA Realty Core Property Fund In-Compliance
JPMorgan Strategic Property In-Compliance
IFM Global Infrastructure In-Compliance
1 Excluding illiquid asset classes of private equity and non-core real estate.
192 of 197

Disclaimer, Glossary, and Notes
Disclaimer, Glossary, and Notes
193 of 197

Disclaimer, Glossary, and Notes
WE HAVE PREPARED THIS REPORT (THIS “REPORT”) FOR THE SOLE BENEFIT OF THE INTENDED RECIPIENT (THE “RECIPIENT”).
SIGNIFICANT EVENTS MAY OCCUR (OR HAVE OCCURRED) AFTER THE DATE OF THIS REPORT AND THAT IT IS NOT OUR FUNCTION OR
RESPONSIBILITY TO UPDATE THIS REPORT. ANY OPINIONS OR RECOMMENDATIONS PRESENTED HEREIN REPRESENT OUR GOOD FAITH VIEWS
AS OF THE DATE OF THIS REPORT AND ARE SUBJECT TO CHANGE AT ANY TIME. ALL INVESTMENTS INVOLVE RISK. THERE CAN BE NO
GUARANTEE THAT THE STRATEGIES, TACTICS, AND METHODS DISCUSSED HERE WILL BE SUCCESSFUL.
INFORMATION USED TO PREPARE THIS REPORT WAS OBTAINED FROM INVESTMENT MANAGERS, CUSTODIANS, AND OTHER EXTERNAL
SOURCES. WHILE WE HAVE EXERCISED REASONABLE CARE IN PREPARING THIS REPORT, WE CANNOT GUARANTEE THE ACCURACY OF ALL
SOURCE INFORMATION CONTAINED HEREIN.
CERTAIN INFORMATION CONTAINED IN THIS REPORT MAY CONSTITUTE “FORWARD - LOOKING STATEMENTS,” WHICH CAN BE IDENTIFIED BY THE
USE OF TERMINOLOGY SUCH AS “MAY,” “WILL,” “SHOULD,” “EXPECT,” “AIM”, “ANTICIPATE,” “TARGET,” “PROJECT,” “ESTIMATE,” “INTEND,”
“CONTINUE” OR “BELIEVE,” OR THE NEGATIVES THEREOF OR OTHER VARIATIONS THEREON OR COMPARABLE TERMINOLOGY. ANY
FORWARD-LOOKING STATEMENTS, FORECASTS, PROJECTIONS, VALUATIONS, OR RESULTS IN THIS PRESENTATION ARE BASED UPON CURRENT
ASSUMPTIONS. CHANGES TO ANY ASSUMPTIONS MAY HAVE A MATERIAL IMPACT ON FORWARD - LOOKING STATEMENTS, FORECASTS,
PROJECTIONS, VALUATIONS, OR RESULTS. ACTUAL RESULTS MAY THEREFORE BE MATERIALLY DIFFERENT FROM ANY FORECASTS,
PROJECTIONS, VALUATIONS, OR RESULTS IN THIS PRESENTATION.
PERFORMANCE DATA CONTAINED HEREIN REPRESENT PAST PERFORMANCE. PAST PERFORMANCE IS NO GUARANTEE OF FUTURE RESULTS.
194 of 197

Disclaimer, Glossary, and Notes
Credit Risk: Refers to the risk that the issuer of a fixed income security may default (i.e., the issuer will be unable to make timely principal and/or interest payments on the security.)
Duration: Measure of the sensitivity of the price of a bond to a change in its yield to maturity. Duration summarizes, in a single number, the characteristics that cause bond prices to
change in response to a change in interest rates. For example, the price of a bond with a duration of three years will rise by approximately 3% for each 1% decrease in its yield to maturity.
Conversely, the price will decrease 3% for each 1% increase in the bond’s yield. Price changes for two different bonds can be compared using duration. A bond with a duration of six years
will exhibit twice the percentage price change of a bond with a three-year duration. The actual calculation of a bond’s duration is somewhat complicated, but the idea behind the calculation
is straightforward. The first step is to measure the time interval until receipt for each cash flow (coupon and principal payments) from a bond. The second step is to compute a weighted
average of these time intervals. Each time interval is measured by the present value of that cash flow. This weighted average is the duration of the bond measured in years.
Information Ratio: This statistic is a measure of the consistency of a portfolio’s performance relative to a benchmark. It is calculated by subtracting the benchmark return from the
portfolio return (excess return), and dividing the resulting excess return by the standard deviation (volatility) of this excess return. A positive information ratio indicates outperformance
versus the benchmark, and the higher the information ratio, the more consistent the outperformance.
Jensen’s Alpha: A measure of the average return of a portfolio or investment in excess of what is predicted by its beta or “market” risk. Portfolio Return- [Risk Free Rate+Beta*(market
return-Risk Free Rate)].
Market Capitalization: For a firm, market capitalization is the total market value of outstanding common stock. For a portfolio, market capitalization is the sum of the capitalization of
each company weighted by the ratio of holdings in that company to total portfolio holdings; thus it is a weighted-average capitalization. Meketa Investment Group considers the largest
65% of the broad domestic equity market as large capitalization, the next 25% of the market as medium capitalization, and the smallest 10% of stocks as small capitalization.
Market Weighted: Stocks in many indices are weighted based on the total market capitalization of the issue. Thus, the individual returns of higher market-capitalization issues will more
heavily influence an index’s return than the returns of the smaller market-capitalization issues in the index.
Maturity: The date on which a loan, bond, mortgage, or other debt/security becomes due and is to be paid off.
Prepayment Risk: The risk that prepayments will increase (homeowners will prepay all or part of their mortgage) when mortgage interest rates decline; hence, investors’ monies will be
returned to them in a lower interest rate environment. Also, the risk that prepayments will slow down when mortgage interest rates rise; hence, investors will not have as much money as
previously anticipated in a higher interest rate environment. A prepayment is any payment in excess of the scheduled mortgage payment.
Price-Book Value (P/B) Ratio: The current market price of a stock divided by its book value per share. Meketa Investment Group calculates P/B as the current price divided by Compustat's
quarterly common equity. Common equity includes common stock, capital surplus, retained earnings, and treasury stock adjusted for both common and nonredeemable preferred stock.
Similar to high P/E stocks, stocks with high P/B’s tend to be riskier investments.
195 of 197

Disclaimer, Glossary, and Notes
Price-Earnings (P/E) Ratio: A stock’s market price divided by its current or estimated future earnings. Lower P/E ratios often characterize stocks in low growth or mature industries,
stocks in groups that have fallen out of favor, or stocks of established blue chip companies with long records of stable earnings and regular dividends. Sometimes a company that has
good fundamentals may be viewed unfavorably by the market if it is an industry that is temporarily out of favor. Or a business may have experienced financial problems causing investors
to be skeptical about is future. Either of these situations would result in lower relative P/E ratios. Some stocks exhibit above-average sales and earnings growth or expectations for above
average growth. Consequently, investors are willing to pay more for these companies’ earnings, which results in elevated P/E ratios. In other words, investors will pay more for shares of
companies whose profits, in their opinion, are expected to increase faster than average. Because future events are in no way assured, high P/E stocks tend to be riskier and more volatile
investments. Meketa Investment Group calculates P/E as the current price divided by the I/B/E/S consensus of twelve-month forecast earnings per share.
Quality Rating: The rank assigned a security by such rating services as Fitch, Moody’s, and Standard & Poor’s. The rating may be determined by such factors as (1) the likelihood of
fulfillment of dividend, income, and principal payment of obligations; (2) the nature and provisions of the issue; and (3) the security’s relative position in the event of liquidation of the
company. Bonds assigned the top four grades (AAA, AA, A, BBB) are considered investment grade because they are eligible bank investments as determined by the controller of the
currency.
Sharpe Ratio: A commonly used measure of risk-adjusted return. It is calculated by subtracting the risk-free return (usually three-month Treasury bill) from the portfolio return and
dividing the resulting excess return by the portfolio’s total risk level (standard deviation). The result is a measure of return per unit of total risk taken. The higher the Sharpe ratio, the
better the fund’s historical risk adjusted performance.
SI: Since Inception
STIF Account: Short-term investment fund at a custodian bank that invests in cash-equivalent instruments. It is generally used to safely invest the excess cash held by portfolio managers.
Standard Deviation: A measure of the total risk of an asset or a portfolio. Standard deviation measures the dispersion of a set of numbers around a central point (e.g., the average return).
If the standard deviation is small, the distribution is concentrated within a narrow range of values. For a normal distribution, about two thirds of the observations will fall within one standard
deviation of the mean, and 95% of the observations will fall within two standard deviations of the mean.
Style: The description of the type of approach and strategy utilized by an investment manager to manage funds. For example, the style for equities is determined by portfolio
characteristics such as price-to-book value, price-to-earnings ratio, and dividend yield. Equity styles include growth, value, and core.
Tracking Error: A divergence between the price behavior of a position or a portfolio and the price behavior of a benchmark, as defined by the difference in standard deviation.
196 of 197

Disclaimer, Glossary, and Notes
Yield to Maturity: The yield, or return, provided by a bond to its maturity date; determined by a mathematical process, usually requiring the use of a “basis book.” For example, a 5% bond
pays $5 a year interest on each $100 par value. To figure its current yield, divide $5 by $95—the market price of the bond—and you get 5.26%. Assume that the same bond is due to
mature in five years. On the maturity date, the issuer is pledged to pay $100 for the bond that can be bought now for $95. In other words, the bond is selling at a discount of 5% below par
value. To figure yield to maturity, a simple and approximate method is to divide 5% by the five years to maturity, which equals 1% pro rata yearly. Add that 1% to the 5.26% current yield,
and the yield to maturity is roughly 6.26%.
5% (discount) =
1% pro rata, plus
5.26% (current yield) = 6.26% (yield to maturity)
5 (yrs. to maturity)
Yield to Worst: The lowest potential yield that can be received on a bond without the issuer actually defaulting. The yield to worst is calculated by making worst-case scenario assumptions
on the issue by calculating the returns that would be received if provisions, including prepayment, call, or sinking fund, are used by the issuer.
NCREIF Property Index (NPI): Measures unleveraged investment performance of a very large pool of individual commercial real estate properties acquired in the private market by
tax-exempt institutional investors for investment purposes only. The NPI index is capitalization-weighted for a quarterly time series composite total rate of return.
NCREIF Fund Index - Open End Diversified Core Equity (NFI-ODCE): Measures the investment performance of 28 open-end commingled funds pursuing a core investment strategy that
reflects funds' leverage and cash positions. The NFI-ODCE index is equal-weighted and is reported gross and net of fees for a quarterly time series composite total rate of return.
Sources: Investment Terminology, International Foundation of Employee Benefit Plans, 1999.
The Handbook of Fixed Income Securities, Fabozzi, Frank J., 1991
The Russell Indices®, TM, SM are trademarks/service marks of the Frank Russell Company.
Throughout this report, numbers may not sum due to rounding.
Returns for periods greater than one year are annualized throughout this report.
Values shown are in millions of dollars, unless noted otherwise.
197 of 197