2021_iri_fact_book_final.pdf - Insured Retirement Institute
222
A Guide to Concepts, Solutions, Trends, and Data in the Retirement Income Industry IRI FACT BOOK FACT BOOK . . 2020 2020 RETIREMENT RETIREMENT Insured Retirement Institute
-
Upload
khangminh22 -
Category
Documents
-
view
0 -
download
0
Transcript of 2021_iri_fact_book_final.pdf - Insured Retirement Institute

A Guide to
Concepts,
Solutions,
Trends, and
Data in the
Retirement
Income
Industry
IRIFACT BOOKFACT BOOK .. 2020 2020RETIREMENTRETIREMENT
Insured Retirement Institute

Premier Alliance Partners
Platinum
Gold
Silver

About IRI iii
About the Insured Retirement InstituteThe Insured Retirement Institute (IRI) is the leading association for the retirement income industry. IRI proudly leads a national consumer coalition of more than 30 organizations, and is the only association that represents the entire supply chain of insured retirement strategies. IRI members include the major insurers, asset managers, broker-dealers/distributors, and 150,000 financial professionals. As a not-for-profit organization, IRI provides an objective forum for communication and education, and advocates for the sustainable retirement solutions Americans need to help achieve a secure and dignified retirement. Learn more at www.IRIonline.org.
About the IRI Retirement Fact Book:Marking its 19th year in publication, the IRI Fact Book continues to be a reliable, trusted source for information regarding the insured retirement industry. Building on the redesign and renaming that commenced with the tenth edition in 2011, we strive to improve content each year, while keeping the focus on practical information that can help financial professionals better understand and serve their clients, including through the exploration and analysis of retirement topics beyond annuities. Readers will find practice management tips and information, the latest consumer and advisor research regarding retirement planning, current retirement market statistics, and much more. As IRI continues to grow to serve the diverse needs of the people and organizations that we are proud to represent, this publication will also evolve as a resource for the entire insured retirement industry and the consumers that invest in our strategies.
Nineteenth Edition©2020 Insured Retirement Institute
All rights reserved. No part of this book may be reprinted or reproduced in any form or used for any purpose
other than educational without the express written consent of IRI.
Insured Retirement Institute

iv IRI Retirement Fact Book 2020, 19th Edition

Table of Contents v
Table of ContentsAbout The Insured Retirement Institute ..............................................iii
About The IRI Retirement Fact Book ....................................................iii
Chapter 1: Insured Retirement .............................................................. 1The Retirement Landscape ............................................................................................. 1What Is Insured Retirement? .......................................................................................... 2The Outdated “4%” Rule? ................................................................................................ 3An Aging Problem ............................................................................................................ 4Two Financial Sides of Retirement .................................................................................. 5Is Retirement Getting More Expensive? ........................................................................ 6Retirement Income Sources ............................................................................................ 9Pension Plans .................................................................................................................. 9Social Security ............................................................................................................... 10Insured Retirement ........................................................................................................ 11
Chapter 2: Social Security .................................................................. 13Introduction ................................................................................................................... 13The Basics of Social Security ....................................................................................... 13Qualifying for Benefits ................................................................................................... 14How to Determine Benefits............................................................................................ 15Filing Rules and Strategies............................................................................................ 15Life Expectancy ............................................................................................................. 17Optimizing Benefits ........................................................................................................ 17Social Security and Medicare ........................................................................................ 18Social Security and Medicare Means Testing ............................................................... 18Cost-of-Living Adjustments ........................................................................................... 18Social Security’s Role in Retirement Planning .............................................................. 19Conclusion ..................................................................................................................... 19
Chapter 3: Health Care in Retirement ................................................. 21Health Care is a Primary Retirement Concern ............................................................. 21Transitioning from Employer-sponsored Plans to Medicare .......................................... 21Parts of Medicare .......................................................................................................... 22Health Care Inflation ...................................................................................................... 23Long-Term Care ............................................................................................................. 23Long-Term Care Funding Options ................................................................................. 24State-to-State Variance.................................................................................................. 25Women and Long-Term Care ........................................................................................ 25Medicare Means Testing ................................................................................................ 25Reducing MAGI through Investment Products .............................................................. 26Income Replacement Ratios and Health Care.............................................................. 26Conclusion ..................................................................................................................... 27

vi IRI Retirement Fact Book 2020, 19th Edition
Chapter 4: Annuities 101 ..................................................................... 29What is an Annuity? ....................................................................................................... 29What Role Can Annuities Play in a Comprehensive Retirement Plan? ........................ 30Who Are the Parties to an Annuity Contract? ............................................................... 30What Types of Annuities are Available? ........................................................................ 31What Are the Differences Between Deferred and Immediate Annuities ....................... 33What Are the Differences Between Fixed and Variable Annuities? .............................. 34What Are the Differences Between Qualified and Non-Qualified Annuities? .............. 35Are Annuities Sold Outside of the Retail Market? ........................................................ 37What Fees and Expenses Are Associated With Annuities?.......................................... 38How Are Variable Annuity Sales Charges Structured? ................................................. 39What Are Guaranteed Minimum Death Benefits? ........................................................ 41What Are the Different Types of Guaranteed Minimum Living Benefits? ...................... 42How Is the Value of a Deferred Annuity Determined? ................................................... 44How Is the Value of a Variable Annuity Measured? ...................................................... 45How Is the Value of a Fixed Annuity Measured? ........................................................... 46What Happens to the Annuity Value if the Contract Is Surrendered? ........................... 47How Are Annuities Used to Generate Retirement Income? ......................................... 47What Are the Various Options for Receiving Retirement Income? ............................... 48What Are the Benefits of Annuitization? ........................................................................ 50What Types of Annuity Payout Options Are Typically Available at Annuitization? ......... 50How Are Variable Annuity Payment Amounts Determined? ......................................... 51How Are Annuity Payments Taxed? .............................................................................. 52How Are Annuities Used in Estate Planning? ............................................................... 53How Are Annuity Products Developed and Sold? ......................................................... 54Who Can Sell Annuities? ............................................................................................... 55Where Can Annuities Be Purchased?........................................................................... 55How Are Variable Annuity Commissions Determined? ................................................. 55
Chapter 5: State of the Industry .........................................................57Overview ........................................................................................................................ 57Growing Need for Insured Retirement Solutions........................................................... 57Developments in 2019 ................................................................................................... 59Looking Into 2020 .......................................................................................................... 59Annuity Market Review .................................................................................................. 60Distribution Channel Disruption and Evolution .............................................................. 64Interest Rates ................................................................................................................ 65Managing Risk and Capacity......................................................................................... 65Financial Resilience and Company Strength ................................................................ 66Advisors Make the Connection ...................................................................................... 67Product Development .................................................................................................... 68Summary ....................................................................................................................... 69
Chapter 6: Recent Annuity Innovations .............................................. 71Fixed Indexed Annuities ................................................................................................ 72Necessity: The Mother of Invention ............................................................................... 72Structured Annuities ...................................................................................................... 73Volatility Controlled Indices for Fixed and Variable Annuities ........................................ 74Investment Oriented Variable Annuities ........................................................................ 75Fee-Based Annuities ..................................................................................................... 76Deferred Income Annuities ............................................................................................ 76

Table of Contents vii
Chapter 7: Generating (Almost) Immediate Income .......................... 79Growth Trends ................................................................................................................ 79Product Details .............................................................................................................. 80Generating Income Now ................................................................................................ 81Advantages and Disadvantages .................................................................................... 82
Chapter 8: Planning for Future Income .............................................. 85Fixed Annuities with GLWB or GMIB ............................................................................. 85Fixed Indexed Annuities with GLWB ............................................................................. 86Variable Annuities with GLWB or GMIB ........................................................................ 86First Thing First – How do GLWB and GMBI Provide Guaranteed Income .................. 87The Mechanics of GLWB ............................................................................................... 88Step-Up Features .......................................................................................................... 88Deferral Bonus ............................................................................................................... 88Combination of Step-Up and Deferral Bonus ................................................................ 89The Mechanics of GMIB ................................................................................................ 90GLWB/GMIB Considerations ......................................................................................... 91Deferred Income Annuities (DIAs) ................................................................................. 94
Chapter 9: Focus on Accumulation with Income Flexibility ............... 95Building Investable Assets and Generating Lifetime Income ........................................ 95Tax Deferral and Income Potential ................................................................................ 96
Chapter 10: U.S. Households’ Retirement Income Planning .............. 99Research Background: The Cerulli Report.................................................................... 99Households’ Financial Goals ......................................................................................... 99Retirement Income Planning ....................................................................................... 101Generating Retirement Income and the Role of Annuities ......................................... 103
Chapter 11: Distribution Trends in the Year of COVID-19 ................... 107A Look Back and a Look Forward ............................................................................... 107Concluding Thoughts ................................................................................................... 113
Chapter 12: Tax-Qualified Retirement Plans ...................................... 115Personal Retirement Savings Plans ............................................................................ 115Defined Benefit Plans .................................................................................................. 116Defined Contribution Plans .......................................................................................... 117Shift in Retirement Plan Assets ................................................................................... 118The Use of Annuities in Qualified Plans ...................................................................... 120In-Plan Guaranteed Lifetime Income Options ............................................................. 120
Chapter 13: Other Sources of Insured Retirement Income ............... 123Employer-Sponsored: Defined Benefit Plans .............................................................. 123Government Programs ................................................................................................ 125Individually Purchased Vehicles .................................................................................. 125Other Income-Generating Products ............................................................................ 127
Chapter 14: Regulation and Taxation Of Annuities ............................ 129Regulation Under State Insurance Laws ..................................................................... 129Regulation Under Federal Securities Laws ................................................................. 130Standard of Conduct for Financial Professionals ........................................................ 133

viii IRI Retirement Fact Book 2020, 19th Edition
Other Annuity Sales Practices Rules .......................................................................... 143Dodd-Frank Act Reforms ............................................................................................. 145Recent Developments ................................................................................................. 148Taxation of Annuities ................................................................................................... 149
Chapter 15: Data Section ................................................................... 155Total Annuity Market .................................................................................................... 155Variable Annuity Market ............................................................................................... 160Fixed Annuity Market ................................................................................................... 170
Glossary of Annuity Product Terms ................................................... 177
The Evolution of Annuities ................................................................ 193
Index ................................................................................................. 197
Special Thanks to Data Providers ....................................................208
Special Thanks to Content Contributors .........................................209

List of Figures ix
List of FiguresChapter 1: Insured Retirement
1-1 Retirement Expenses Increasing While Traditional Income Sources Diminish ..... 11-2 Sustainable Spending Rates from an Investment Portfolio ................................... 31-3 Age 65+ United States Population Growth ............................................................ 41-4 Boomers’ Anticipated Age of Retirement .............................................................. 5 1-5 Life Expectancy at Age 65: 1950 - 2017................................................................ 61-6 Healthcare Costs as a Percentage of U.S. GDP ................................................... 71-7 Average OOP Medical Expenses (Female Age 65) .............................................. 81-8 Income Sources as a Percentage of Total Household Income ............................. 91-9 Retirement Savings Allocation by Plan Type ....................................................... 101-10 Full Retirement Age and Reduction for Benefits Starting at Age 62 ................... 11
Chapter 2: Social Security2-1 Full Retirement Age ............................................................................................. 142-2 Social Security Income Projections ..................................................................... 16
Chapter 3: Retirement Health Care3-1 Medicare MAGI Income Brackets ........................................................................ 26
Chapter 4: Annuities 1014-1 Types of Annuities ................................................................................................ 324-2 Qualified and Non-Qualified Annuities ................................................................ 364-3 Retirement Savings Plan Contribution Limits – 2020 .......................................... 37
Chapter 5: State of the Industry5-1a Historic Annuity Sales by Variable versus Fixed ................................................. 605-1b Data Table: Historic Annuity Sales in $Millions .................................................... 615-2a Historic Market Share by Product Type ............................................................... 615-2b Data Table: Historic Annuity Market Share .......................................................... 615-3a Historic Annuity Sales by Product Type ............................................................... 625-3b Data Table: Historic Annuity Sales by Sub-Type in $Millions .............................. 625-4a Historic Market Share by Product Sub-Type ....................................................... 635-4b Data Table: Historic Annuity Market Share .......................................................... 635-5 Evolution of Annuity Product Mix by Channel 2010 vs. 2019 .............................. 645-6 10-Year Constant Maturity Treasury Rate: 2009 to 2019 .................................... 655-7 Expected Hedge Cost for Hypothetical GLWB .................................................... 665-8a New Annuity Issuance 2012 - 2019 ..................................................................... 685-8b Data Table: New Annuity Issuance 2012 - 2019 .................................................. 69
Chapter 6: Recent Annuity Innovations6-1 Return Potential versus Downside Risk .............................................................. 75
Chapter 7: Generating (Almost) Immediate Income Chapter 8: Planning for Future Income
8-1 Difference Between Lifetime Income Benefit Types ............................................ 878-2 GLWB with Step-up ............................................................................................. 88

x IRI Retirement Fact Book 2020, 19th Edition
8-3 GLWB with Deferral Bonus .................................................................................. 898-4 GLWB with Step-Up and Stackable Deferral Bonus ........................................... 908-5 GMIB Annuitized at Year 10 ................................................................................. 918-6 Impact of Benefit Base Reduction Method on Guaranteed Withdrawal Amounts . 928-7 Impact of Step-Up on Fees Associated with a Benefit Guarantee Rider ............ 92
Chapter 9: Focus on Accumulation with Income Flexibility9-1 Comparison of Investment Growth in Variable Annuity Versus Mutual Fund Portfolio ........................................................................................... 969-2 Comparison of Income Generated by a Variable Annuity Versus Mutual Fund Portfolio ........................................................................................... 97
Chapter 10: U.S. Households’ Retirement Income Planning 10-1 Households’ Most Important Financial Goals by Age Range, 2019 ................. 10010-2 Households’ Most Important Financial Goals by Investable Assets, 2019 ....... 10110-3 Households That Have a Formal Retirement Income Plan by Age Range, 2019 .......................................................................................... 10110-4 Households That Have a Formal Retirement Income Plan by Advice Orientation, 2019 ............................................................................................... 10210-5 Willingness to Pay for Advice by Age and Investable Assets, 2019 .................. 10310-6 Retirement Households’ Income Sources by Investable Assets, 2019 ............. 10410-7 Retirement Households’ Income Sources by Age Range, 2019 ....................... 10410-8 Households’ Primary Reason for Variable Annuity Purchase, 2019 ................. 10510-9 Households’ Primary Reason for Fixed Annuity Purchase, 2019 ..................... 106
Chapter 11: Distribution Trends in the Year of COVID-1911-1 Insurance Product Sales Volumes - Past 12 Months ........................................ 10811-2 Short Term (3-6 Month) Outlook for the Impact of COVID-19 ........................... 10811-3 Impact of Remote Work Posture on Sales Effectiveness .................................. 10911-4 Advisor Perception of How Disruptive Various Aspects of COVID-19 Have Been ....................................................................................... 11011-5 Challenges of Social Distancing ........................................................................ 11011-6 Advisors’ Perception of Support ........................................................................ 11111-7 Value of Different Aspects of Support ............................................................... 11111-8 Top Client Concerns .......................................................................................... 11211-9 Sales Activity by Client Type .............................................................................. 113
Chapter 12: Tax-Qualified Retirement Plans
12-1 Total U.S. Retirement Market Assets – 2000 ..................................................... 11912-2 Total U.S. Retirement Market Assets – 2019 ..................................................... 119
Chapter 13: Other Sources of Insured Retirement Income13-1 Other Sources of Insured Retirement Income .................................................. 12313-2 Costs of Long-Term Care and Related Services .............................................. 127
Chapter 14: Regulation and Taxation of Annuities
Chapter 15: Data SectionTotal Annuity Market
15-1 Annuity Industry Net Assets .............................................................................. 15515-2 Annuity Industry Total Sales .............................................................................. 15515-3 Annuity Industry Sales by Quarter .................................................................... 156

List of Figures xi
15-4 Annuity Industry Net Assets – Qualified vs. Non-Qualified ............................... 15715-5 Annuity Total Sales – Qualified vs. Non-Qualified ............................................. 15815-6 Annuity Industry Total Sales – Deferred vs. Immediate ..................................... 15815-7 Annuity Total Sales Percentages by Distribution Channel ................................ 15915-8 2019 Total Annuity Sales by Top 25 Issuers ...................................................... 159
Variable Annuity Market15-9 Annual VA Net Flow, Total Sales and Net Assets .............................................. 16015-10 Quarterly VA Net Flow, Total Sales and Net Assets .......................................... 16015-11 Variable Annuity Net Assets – Qualified vs. Non-Qualified ............................... 16215-12 Variable Annuity Total Sales – Qualified vs. Non-Qualified ............................... 16215-13 Variable Annuity Total Sales – Deferred vs. Immediate ..................................... 16315-14 Variable Annuity Total Sales by Distribution Channel ........................................ 16315-15 Variable Annuity Total Sales by Distribution Channel by Quarter ..................... 16415-16 Variable Annuity Contracts ................................................................................ 16515-17 Variable Annuity Net Assets by Asset Class ..................................................... 16615-18 Variable Annuity Net Assets by Subaccount Investment Category .................. 167 15-19 Variable Annuity Sales by State, 2018 .............................................................. 16815-20 2019 Total Variable Annuity Sales by Top 25 Issuers ........................................ 169
Fixed Annuity Market15-21 Fixed Annuity Sales and Net Assets ................................................................. 17015-22 Fixed Annuity Sales by Quarter Assets ............................................................. 17115-23 Fixed Annuity Assets – Qualified vs. Non-Qualified Assets .............................. 17215-24 Fixed Annuity Sales – Qualified vs. Non-Qualified ............................................ 17215-25 Fixed Annuity Sales – Product Type .................................................................. 17315-26 Fixed Annuity Sales – Deferred vs. Immediate ................................................. 17315-27 Fixed Annuity Sales Percentages by Distribution Channel ............................... 17415-28 Fixed Indexed Annuities ..................................................................................... 17415-29 2019 Total Fixed Annuity Sales by Top 25 Issuers ............................................ 175

xii IRI Retirement Fact Book 2020, 19th Edition

Chapter 1: Insured Retirement 1
Insured RetirementThe Retirement LandscapeRetirement for most American workers today bears little resemblance to the retirement of their parents and grandparents. Fifty years ago, a typical working life trajectory consisted of being employed by the same company for 30 or 40 years, fully retiring at age 65 with confidence that Social Security and a defined benefit pension plan would provide adequate income for as long as one might live — and perhaps with a gold watch to mark the time.
Retirement and pre-retirement have changed dramatically. The responsibility of providing for adequate income during retirement has shifted away from employers (traditional defined benefit pension plans) to individuals (defined contribution plans such as 401(k) plans). For more workers today, income beyond that provided by Social Security will have to come from savings or continuing to work well past age 65.
There are about 76 million baby boomers in the United States, approximately 50 million of whom are already age 65 or older. The United States is steadily moving into a period of potential crisis as the number of retirees increases significantly over the coming decades: 10,000 Americans will reach retirement age every day through at least 2030, when almost 73 million individuals, or 20 percent of the U.S. population, will be age 65 or older. At the same time, traditional retirement income sources have diminished, retirement is becoming more expensive, and many retirees and near-retirees are unprepared. And the United States is hardly alone; other developed countries are facing the same issues.
Figure 1-1 Retirement Expenses Increasing While Traditional Income Sources Diminish
However, these challenges are also opportunities. Financial services companies and insurers who offer solutions to help Americans save more for retirement, and create sustainable lifetime
Traditional retirement income sourcesPension plans and retiree health insurance: fewer Americans are covered
Social Security: age to receive full benefits has increased
Retirement expenses increasingLongevity: people are living longer, requiring more years of retirement income
Healthcare costs: continue to increase
1CH

2 IRI Retirement Fact Book 2020, 19th Edition
income from their savings, are critical to helping Americans manage their needs and risks. Insured retirement solutions can help Americans prepare for retirement by providing for additional tax-advantaged savings opportunities, protection from market and other risks, and guaranteed income during retirement.
What Is Insured Retirement?Retirement consists of many unknowns: How long will one live? How long will one’s spouse live? Will he or she require expensive health care or long-term care? How will changes in equity markets and interest rates affect one’s financial well-being? Will inflation be mild or significant?
Americans underestimate their life expectancy. The average life expectancy for a U.S. male is 76, and for a U.S. female it is 81 (World Health Organization, 2016), but that is life expectancy from birth. Among those who live to age 65 in excellent health, a male has a 63 percent chance of living to age 85, a 43 percent chance of making it to age 90, and more than one in five can expect to live to age 95. A female has a 72 percent chance of surviving to age 85, a 53 percent chance of reaching 90, and almost one in three will attain age 95. For a male/female couple age 65, there is an 89 percent chance one will make it to age 85, a 73 percent chance one will reach age 90, and in almost one-half of couples one person will survive to at least age 95 (Society of Actuaries Longevity Illustrator). In most cases the surviving spouse will be female; there are more than three widows in the United States for every widower, and after the age of 80 the ratio of widows to widowers is 5 to 1 (US Census Bureau). The unfortunate reality is that women are especially vulnerable during retirement as they will likely live longer and may live as widows for years or even decades. Compounding the problem, due to a variety of factors such as lower earned income and time spent out of the workforce caring for children or other family members, they may also have saved less for retirement.
American workers, on average, plan to retire at age 66, but the average reported retirement age for Americans who are currently retired is 61 (Gallup, 2018) and 56 percent of Americans retired earlier than they expected (2018 Transamerica Survey of Retirees). Americans should expect, and plan for, a retirement lasting as long as their working years. Unfortunately, most do not plan for this possibility, and do not have a plan to ensure their retirement savings can generate sustainable lifetime income. Americans simply must have a plan that contemplates a longer retirement than they might have envisioned, because the longer a person lives the more all the other risks one may experience during retirement, such as an unfavorable sequence of returns, above average inflation, health care, and long-term care are magnified.
There are many financial products and approaches that can provide retirement income. However, most of these products do not guarantee income for life, leading to the potential of one “running out” of money, possibly at an advanced age when options like returning to the workforce are not possible. The financial events in 2008 and 2009, the ongoing low interest rate environment, and the economic uncertainty and market volatility resulting from COVID-19 in 2020 illustrate the perils of relying on non-guaranteed income during retirement.
For example, assume a 65-year-old retired in 2008 with a $1 million nest egg. The retiree was planning to withdraw $50,000 a year (5% of the nest egg) to supplement his or her Social Security and pension plan. However, assume the nest egg dropped in value to $600,000 because of withdrawals and weak equity markets in 2008 and 2009. If the retiree withdrew another $50,000, he or she would now be withdrawing 8.3 percent of the account value, a level that may not be sustainable. The retiree now has two choices: 1) continue to take out $50,000 and face a greater

Chapter 1: Insured Retirement 3
probability of depleting the account value, or 2) scale back the amount of the annual withdrawals (and still face the risk of running out of money). True, returns on equities have been robust over the past decade plus, and particularly in the time period following the 2016 presidential election, but did retirees who lost a significant portion of their nest eggs during the financial crisis participate in those gains? There is strong evidence to suggest they did not, and that retirement savers don’t truly understand diversification: the 2019 BlackRock Global Investor Pulse survey found that 57 percent of investors do not hold any stocks or bonds.
The Outdated “4%” RuleThe 4% rule, proposed by William Bengen in the 1994 paper “Determining Withdrawal Rates Using Historical Data,” was a guideline for determining a withdrawal rate that would theoretically provide sustainable income without depleting assets entirely over a 30-year retirement. Over the years, many have suggested using 4% as the amount that retirees can withdraw from their assets on an annual basis, adjusted for inflation, with a reasonable expectation that their assets will last for the rest of their life. However, an underlying assumption of the rule is an at least 50 percent allocation to stocks, and preferably 75 percent, with 25 to 50 percent allocated to bonds. With interest rates at historic lows and equity markets at still at near historic highs as of this writing, despite COVID-19, expected returns may well be much lower in the future. Withdrawal rates can vary widely based on the portfolio assumption used and the desired probability of success. Wade Pfau, Ph.D., CFA, a professor at the American College in Bryn Mawr, Pa, recently calculated “safe” withdrawal rates from volatile investment portfolios under a variety of spending and asset allocation scenarios. Figure 1-2 presents several spending strategies, and withdrawal percentages are based on varying levels of stock allocation, remaining wealth, and probability horizon (confidence that x% of wealth remains after y years).
Figure 1-2 Sustainable Spending Rates from an Investment Portfolio (March 11, 2020)
Portfolio Allocation
Spending StrategyConservative (25% Stocks)
Moderate (50% Stocks)
Aggressive (75% Stocks)
Fixed Spending (No Growth) 2.77% 3.73% 4.88%
Spending with 2% Cost of Living Adjustment (COLA) 2.04% 2.88% 3.97%
Inflation (CPI-U) Adjusted Spending (the “4% rule”) 1.48% 2.40% 3.54%
Spending with 2% COLA and 5 Years of Buffer Asset 2.40% 3.56% 5.25%
CPI-U Adjusted Spending and 5 Years of Buffer Asset 1.69% 2.91% 4.60%
Guyton & Klinger Decision Rules (Variable Spending) 2.65% 4.03% 5.13%
Notes: The conservative couple uses a 25 percent stock allocation and seeks a 95 percent chance that real wealth will not fall below 20 percent of its initial level by year 35 of retirement. The moderate couple uses a 50 percent stock allocation and seeks a 90 percent chance that real wealth will not fall below 15 percent of its initial level by year 30 of retirement. The aggressive couple uses a 75 percent stock allocation and seeks and 80 percent chance that real wealth will not fall below 10 percent of its initial level by year 25 of retirement. Analysis assumes that withdrawals are made at the start of each year, retirees earn the underlying indexed market returns, and market return simulations are based on capital market assumptions starting from today’s level of interest rates. Source: Retirement Researcher (www.retirementresearcher.com).
Systematic withdrawal strategies, whether a simple “x%” rule or based on a more sophisticated stochastic analysis of the probability that assets will not be depleted at various withdrawal rates, have two significant drawbacks: first, they are based on historic asset class returns, which may

4 IRI Retirement Fact Book 2020, 19th Edition
not repeat in the same sequence in the future, and secondly, they assume that the investor acts rationally, maintaining the asset allocation assumed in the models even during periods of significant negative returns, when in practice many consumers may weight more heavily toward cash and cash equivalents after a period of negative returns, and miss out on subsequent positive returns. Insured retirement refers to products and solutions that guarantee income and/or protection against principal loss and other risks regardless of market conditions. For example, annuities and pensions can guarantee lifetime income while long-term care insurance provides financial protection against long-term care costs.
An Aging ProblemIn 2018 there were an estimated 53 million individuals age 65 or older in the United States, representing 16.7 percent of the total population (U.S. Census Bureau, “Annual Estimates of the Resident Population for Selected Age Groups by Sex, Single Year of Age, Race Alone or in Combination, and Hispanic Origin for the United States: April 1, 2010 to July 1, 2018), as compared to 51 million and 15.2 percent of the population in 2017. These numbers are projected to increase steadily over the coming decade, with 73 million individuals age 65 or older by 2030, or 21 percent of the projected population. (U.S. Census Bureau 2017 National Population Projections Tables, Projections of the Population by Sex and Age for the United States: 2017 to 2060)
The increase in the number of retirees over the coming decades is expected to strain governmental retirement programs such as Social Security and Medicare, as there will be fewer workers supporting more retirees.
Figure 1-3 Age 65+ United States Population Growth
Source: U.S. Census Bureau
0102030405060708090
100
2060205520502045204020352030202520202016
Percentage of the Total US Population Millions of People Age 65 and Over
0%
5%
10%
15%
20%
25%

Chapter 1: Insured Retirement 5
Two Financial Sides of RetirementFor all age groups, there are two sides to an individual’s finances: expenses and income. However, there are significant differences between retirees and non-retirees. One major difference is that it is difficult for many retirees to increase their annual income amount if needed as they may lack adequate savings to do so, or be unable to re-enter the workforce due to their own health issues, or due to the health of a spouse or other family member.
While some people have a retirement date in mind, many Americans, particularly those in the boomer generation, do not know when they will retire and among those that do many are planning to retire later. An annual series of IRI studies on baby boomers shows that in 2011 only 17 percent of boomers planned to retire at age 70 or older, never, or simply don’t know when they might retire; this rose to 27 percent in 2019. Figure 1-4 reflects the findings of the 2019 boomer survey, which shows most boomers planning to work past age 65. However, recall that the Transamerica survey found most workers will retire earlier than they expect.
Figure 1-4 Boomers’ Anticipated Age of Retirement
Source: “Boomer Expectations for Retirement 2019,” IRI 2019
People retiring today face three fundamental problems: Retirement has become more expensive due to longevity and health care costs, the age to receive maximum Social Security benefits has increased, and fewer Americans are covered by traditional pension plans and retiree health insurance.
24%
26%
29%
8%
13%
Age 65-69
Age 70+
Never
Don't know
Prior to age 65

6 IRI Retirement Fact Book 2020, 19th Edition
Is Retirement Getting More Expensive?Life expectancyLife expectancy has increased dramatically over the past century, with a person born in 2017 expected to live to age 78.6 (76.1 years for males, 81.1 years for females), thirty-two years longer than the age 47 life expectancy of a person born in 1900 (CDC/NCHS, National Vital Statistics System, Mortality Data, Key Mortality Statistics).
However, for the purposes of retirement planning, the more relevant statistic is not one’s life expectancy at birth, which a century ago was heavily impacted by much higher rates of infant mortality, but one’s life expectancy during retirement. The life expectancy of a 65-year-old has also increased significantly over the past generation. In 1980, the average life expectancy for a 65-year-old male was 79.1 years. By 2017, this number had increased by almost four years, to age 83 (NCHS, National Vital Statistics System, Mortality).
Figure 1-5 Life Expectancy at Age 65: 1950 - 2017
Source: U.S. Centers for Disease Control and Prevention
While an increase of four years may not seem dramatic over one’s lifetime, it can have a significant impact on one’s retirement security. Say a person has annual expenses of $50,000 in retirement (ignore inflation for now). Expenses for a 65-year-old living 14 years in retirement would total $700,000. Now, assume that a 65-year-old lives 18 years in retirement. Those additional four years increase expenses by $200,000 for a total of $900,000, an increase of 29 percent.
Let’s now factor in inflation, assuming an annual rate of 3 percent. Under this scenario, a 65-year-old living 14 years to age 79 would need $854,000 in income to meet his or her expenses. And by living an additional four years to age 83, he or she would have total retirement expenses of $1,170,000, 37 percent higher.
Another note on life expectancy: it is an average of all demographic and geographical groups in the United States. Differences exist across different ethnic groups, states, and of course gender. As an example, the life expectancy of a white female at age 65 was 85.5 years in 2015 (the
MaleFemale
77
78
79
80
81
82
83
84
85
86
20172016200019901980197019601950
Both
85.6
84.4
83

Chapter 1: Insured Retirement 7
most recent year data based on ethnicity is available), more than four years longer than the life expectancy of a black male (“Health, United States Life Tables, 2016,” U.S. Department of Health and Human Services).
Health care costsHealth care costs account for about 18 percent of the Gross Domestic Product (GDP), as shown in Figure 1-6. While health care costs as a percentage of GDP remained steady from 2009 through 2013, they rose to 17.7 percent by 2018 and are expected to reach 18 percent in 2020. This growth is expected to continue over the next decade as national health spending increases; in 2018 national health spending grew 4.6 percent to $3.6 trillion, or $11,172 per person, and is projected to grow by 5.4 percent annually beginning in 2019 and to reach $6.2 trillion by 2028 (Centers for Medicare & Medicaid Services, National Health Expenditures and Selected Economic Indicators).
Figure 1-6 Healthcare Costs as a Percentage of U.S. GDP
Source: U.S. Centers for Medicare and Medicaid Services*Projected
While Medicare provides medical insurance to most over age 65, it does not provide complete coverage. Retirees covered by Medicare will still have out-of-pocket (OOP) medical expenses, which include insurance premiums (for Medicare Advantage or supplemental plans), co-pays, and expenditures not covered by Medicare, such as dental care, eyeglasses, and hearing aids. OOP expenses may be highly variable depending on risk, i.e. the type and amount of medical care needed, as shown in Figure 1-7.
0%
5%
10%
15%
20%
25%
2020*2019*201820172010200520001990198019701960
5.0%6.9%
8.9%
12.1%13.3%
15.5%17.3% 17.9% 17.7%
% of GDP
17.8% 18.0%

8 IRI Retirement Fact Book 2020, 19th Edition
Figure 1-7 Average OOP Medical Expenses (Female Age 65)
Source: Mercer-Vanguard health care cost model, 2018
What does this total throughout one’s lifetime? Based on life expectancy, a 65-year-old couple can expect to incur approximately $280,000 in health care costs (in today’s dollars) during retirement, not including costs for long-term care (Fidelity).
Long-term care is another significant component of health care costs in retirement, one which many mistakenly assume is always covered by Medicare — in fact, in IRI’s 2019 Boomer study 50 percent of respondents believed long-term care would be covered by Medicare. People also tend to miscalculate their need for long-term care. Long-term care is a range of services and support to help people meet their personal care needs. Most long-term care is not medical care, but rather assistance with the basic tasks of everyday life, sometimes called Activities of Daily Living, or ADLs. The ADLs include bathing, dressing, eating, using the toilet, transference (as from bed to chair), and caring for incontinence. Seventy percent of people turning age 65 can expect to use some form of long-term care to help with these ADLs during their lives (U.S. Department of Health and Human Services). Long-term care services may be provided in a nursing home or through home health care. Medicare only pays for skilled services or rehabilitative care, not for non-skilled ADL assistance, which makes up most long-term care services. Non-skilled nursing home assistance with the ADLs may be paid by Medicaid, but generally only after an individual spends down his or her assets (within limits, and different limits apply for married couples).
The cost of nursing home care is expensive. Nationally, average rates in 2019 for a private room were $280 per day or $102,200 annually, and for a semi-private room were $90,155 (Genworth Cost of Care Survey 2019). See Chapter 3 for more detailed information regarding health care costs and planning for retiree health care.
$0
$4,000
$8,000
$12,000
$16,000
$20,000
Worst CaseHigh RiskMedium Risk
$3,800
$20,000
$7,200

Chapter 1: Insured Retirement 9
Retirement Income SourcesMany are familiar with the traditional three-legged stool of retirement income:
1. Employer-sponsored pension plans2. Governmental plans, such as Social Security3. Income from personal savings
Today, however, fewer Americans are covered by traditional pension plans, and the age to receive full Social Security benefits has increased. This requires Americans to take a more active role in preparing for their retirement.
Figure 1-8 shows income sources for Americans retired between five and 15 years, who retired with at least $100,000 in investable assets. Social Security accounts for 50 percent of income, or more, for only 16 percent of these retirees, while pensions account for 50 percent or more of income for 40 percent. Employment and systematic withdrawals from savings are less significant than either (“Retirement, Income, and Risk,” IRI 2018).
Figure 1-8 Income Sources as a Percentage of Total Household Income
Source: “Retirement, Income, and Risk,” IRI 2018
Pension PlansThe number of traditional pension plans has decreased significantly over the past several decades. In 1985, there were over 114,000 private pension plans insured by the Pension Benefit Guaranty Corporation. Today that number has dropped to less than 24,000, covering 40 million people (Pension Benefit Guaranty Corporation, 2019).
While the number of private pension plans has decreased, many government employees are still covered by a traditional pension plan.
Figure 1-9 shows the decline of private pension plans since 1985 as a percentage of all retirement
0%
10%
20%
30%
40%
50%
60%
70%
80%
75% or more50% to 74%25% to 49%1% to 24%None
6%
19%
61%
73%
39%
17%
28%
18%
39%
24%
6% 5%
13%
25%
3% 3% 3%
15%
2% 1%
Social Security Pension SWiP Employment

10 IRI Retirement Fact Book 2020, 19th Edition
savings. In 1985, the split between individual retirement savings and private pension plans was nearly 50/50. However, the percentage allocated to individual plans (including annuities, IRAs, and employer-sponsored defined contribution plans such as 401(k), 403(b), and 457 plans) versus private pensions has increased steadily, reaching 87 percent in 2019 (Investment Company Institute, Q4 2019).
Figure 1-9 Retirement Savings Allocation by Plan Type
Source: Investment Company Institute
Social SecurityHistorically, the age to receive full retirement benefits from Social Security was 65. However, due to concerns about the financial solvency of the Social Security system full retirement age has increased, varying by year of birth. For example, individuals born in 1955 can begin receiving full retirement benefits when they reach age 66 and 2 months, while those born in 1960 or later must wait until age 67 to receive their full retirement benefit. Individuals can still begin Social Security retirement benefits at age 62, but the annual amount they will receive will be reduced.
What is the impact on a retiree? Consider someone who was able to retire with full benefits at age 65 compared with someone born in 1960, who must wait until age 67 to begin receiving full Social Security retirement benefits. Assume that both individuals live to age 82, retiring at age 67 instead of age 65 means the retiree will receive 15 years of Social Security benefits as compared to 17 years.
Persons born in 1960 or later can receive 70% of the maximum benefit if they retire at age 62. If they begin receiving benefits after age 62, the percentage is increased every month until age 67. For example, those born in 1960 can receive 86.7% of the full benefit if they retire in the month they reach age 65.
Private Pension PlansIndividual Retirement Savings
0%
10%
20%
30%
40%
50%
60%
70%
80%
90%
1985
1986
1987
1988
1989
1990
1991
1992
1993
1994
1995
1996
1997
1998
1999
2000
2001
2002
2003
2004
2005
2006
2007
2008
2009
2010
2011
2012
2013
2014
2015
2016
2017
2018
2019

Chapter 1: Insured Retirement 11
Figure 1-10 Full Retirement Age and Reduction for Benefits Starting at Age 62
Birth year Full retirement age Amount benefit is reduced if retirement begins at age 62
1937 or earlier 65 20.00%
1938 65 and 2 months 20.83%
1939 65 and 4 months 21.67%
1940 65 and 6 months 22.50%
1941 65 and 8 months 23.33%
1942 65 and 10 months 24.17%
1943-1954 66 25.00%
1955 66 and 2 months 25.83%
1956 66 and 4 months 26.67%
1957 66 and 6 months 27.50%
1958 66 and 8 months 28.33%
1959 66 and 10 months 29.17%
1960 and later 67 30.00%
Source: Social Security Administration
Insured RetirementThe need for insured retirement products and solutions is arguably greater than ever as:
• Americans are living longer and health care costs continue to increase, and • Fewer Americans are covered by traditional pension plans and the age to receive full
Social Security benefits has increased.
There are many sources of retirement income, but the key question is if the source is guaranteed. For example, one can take systematic withdrawals from a mutual fund or stock portfolio, but the income cannot be guaranteed to last a lifetime. One can plan on returning to the workforce to earn additional income to mitigate the risk of running out of money, but health concerns may prohibit this.
There are a number of insured retirement products and solutions such as annuities, long-term care insurance, life insurance, and reverse mortgages. These products and solutions can help provide Americans with protection during their retirement and ensure guaranteed lifetime income.

12 IRI Retirement Fact Book 2020, 19th Edition

Chapter 2: Social Security 13
Social SecurityIntroductionThe original intent of the creators of Social Security in post-Depression America was to provide a basic income stream that would offer some level of economic stability for those who were no longer able to work. As America prospered, Social Security became a welcome supplement to pensions and savings; however, since employers have steadily eliminated pensions over the past two decades, Social Security has become the greatest source of income for many retirees.
As of 2020, approximately 48 million American workers and survivors of deceased workers aged 65 or older receive Social Security benefits, and approximately 10 million disabled workers (including 1.5 million spouses and children of disabled workers) also collect benefits. According to the Social Security Administration, the number of Americans over age 65 will swell to 79 million by 2035, which is expected to put enormous strain on the Social Security Trust Fund.
Those who believe Social Security will provide a sustainable living income may be greatly disappointed, as Medicare premiums and reduced cost-of-living adjustments (COLAs) slowly erode monthly disbursements.
The Basics of Social SecuritySocial Security benefits are based on a beneficiary’s Primary Insurance Amount (PIA). During employment years, workers contribute 6.2 percent of earnings into Social Security (up to $132,900 per year), and employers match this amount. These funds are not held in personal accounts that individuals can access upon retirement; rather, the system pays it forward, with current contributions distributed to eligible beneficiaries. Any collected money that is not paid out in benefits goes into the Social Security Trust Fund.
2CH

14 IRI Retirement Fact Book 2020, 19th Edition
Qualifying for BenefitsAs more people work into their sixties and seventies, what will be the definition of “retired”? The government’s definition of “full retirement age” (FRA) — or when a citizen can collect their full retirement benefits — varies by year of birth:
Figure 2-1 Full Retirement Age
Year of Birth Full Retirement Age
1937 or earlier 65
1938 65 and 2 months
1939 65 and 4 months
1940 65 and 6 months
1941 65 and 8 months
1942 65 and 10 months
1943-1954 66
1955 66 and 2 months
1956 66 and 4 months
1957 66 and 6 months
1958 66 and 8 months
1959 66 and 10 months
1960 and later 67
Source: Social Security Administration
For most soon-to-be retirees, FRA is between age 66 and 67, as 2017 marked the first year in which someone eligible to collect on their own Social Security benefit had an FRA greater than age 66. For those born after 1960, FRA is age 67. While one can begin drawing on Social Security at 62, the system is set up to encourage deferment, and penalties are levied against those who collect early.
Eligible beneficiaries who start collecting at age 62 will receive the minimum benefit. Waiting to start at FRA will return at least 33 percent more annually and waiting to claim until age 70 will yield 75 percent more income than at age 62. After age 70, no further age-based benefit increases are applied.
Using an example of someone who could earn $1,000/month at age 62 (with an FRA of 66):
Collecting age 62 66 70
Monthly Benefit $1,000 $1,333 $1,760
Yearly Benefit $12,000 $15,996 $21,120
For those who have no income and/or can no longer work, claiming at a younger age may be the only option, but that is likely to result in a lower standard of living. Those who have more financial flexibility may be wise to wait.

Chapter 2: Social Security 15
How to Determine BenefitsBecause few give much thought to Social Security until it is time to collect, the general assumptions are that Social Security income automatically begins at retirement or when it is time to sign up for Medicare. According to a survey conducted by KRC Research (on behalf of MassMutual), more than seven in 10 Americans incorrectly believe that full Social Security retirement age is 65, when the age actually varies depending on birth year.
Retirement benefits are NOT automatic. Everyone must choose when to claim, and that choice affects the amount received.
The key factors in determining benefits are:
• Age in relation to FRA• The age that retiree (and spouse, if applicable) plan to claim• Whether payments are based on an individual’s or spouse’s recorded earnings• Change in marital status• Wages earned after filing for benefits (if applicable)• Life expectancy
Social Security was never meant to be an individual’s only source of retirement income, as it only replaces about 40 percent of the average earner’s wages. Also, Medicare Part B premiums are directly deducted from Social Security benefits; therefore, as premiums rise and COLAs shrink (the Social Security COLA was 0% in 2015, 0.3% in 2016, 2.0% in 2017, 2.8% in 2018 and 1.6% in 2019, as compared to a historical average of around 3%), more retirees can expect to see a reduction in their monthly checks.
Filing Rules and StrategiesSocial Security is structured to motivate people to defer claiming, and those who do will reap significantly higher monthly benefits during their retirement. The earliest an individual may choose (or due to health or other personal circumstances, have no choice but) to claim Social Security benefits is age 62. However, someone claiming at FRA (in this case, 66) would gain 33.3 percent more. If that same person delayed claiming until 70 years old, he/she would earn 76 percent more than when filing at 62.
IndividualsFor Americans who have never been married, deciding when to claim is generally straightforward, but a couple of determining variables should be weighed: retirement income (including potential wages from a job), budgetary needs, and life expectancy.
As far as Social Security is concerned, there are three types of claimers: early, at FRA, and deferred. Here is a basic chart that compares how much an average 62-year-old would receive based on the filing date with the payments that individual would receive by waiting until FRA or age 70, assuming the current average monthly benefit of $1,503 and an annual COLA of 2.5 percent beginning in 2021.

16 IRI Retirement Fact Book 2020, 19th Edition
Figure 2-2 Social Security Income Projections
Lifetime Social Security Income Depends On Claiming Date and Life Expectancy
Start Social Security At 62 (Earliest) 66 (FRA) 70 (Latest)
Initial Annual Income $12,625 $20,406 $27,682
Live to 70, Total Lifetime Income $125,678 $107,261 $27,682
Live to 80, Total Lifetime Income $302,323 $365,920 $345,571
Live to 90, Total Lifetime Income $528,444 $697,026 $752,496
Married CouplesFor years, couples were able to increase their retirement income by taking advantage of several claiming strategies, which provided retirees with some control over when to file and how much they could receive. Unfortunately, recent legislative changes “simplified” the filing process by adjusting two income-generating strategies known as “File and Suspend” and “File Restricted.”
Here are the three remaining available spousal claiming strategies combinations:
1. Husband files for his own benefit, Wife files for her own benefit2. Husband files restricted application*, Wife files for her own benefit3. Husband files for his own benefit, Wife files restricted application*
*Restricted Application: Spouse A files for benefits at FRA based on Spouse B’s record, then Spouse A receives own benefits at FRA, plus accrued delayed credits. This strategy can only be utilized by individuals who achieved age 62 by January 1st, 2016.
Ex-Spousal BenefitsDivorcees who were married for longer than 10 years can receive benefits from an ex-spouse’s record (even if the ex-spouse has remarried) if
• the claimer is unmarried (unless remarriage took place at age 60 or later)• the claimer is aged 62 or older• the ex-spouse is entitled to Social Security retirement benefits; and,• benefits based on claimer’s employment history are less than ex-spouse’s benefits.
Note: The claimer’s benefit as a divorced spouse is equal to one-half of an ex-spouse’s full retirement amount if the claimer files at FRA. Even if the ex-spouse has not applied for retirement benefits, but can qualify for them, the claimer can receive benefits on the ex-spouse’s record if they are divorced for more than two years.
Claiming EarlyAt first glance, it certainly seems much more cost effective to resist signing up for as long as possible. However, several personal factors can influence a decision, including
• having no other source of income• experiencing an earnings reduction that renders current income insufficient• becoming a widow or widower (survivor benefits can start any time between age 60 and
full retirement age)• learning of limited life expectancy (say from a diagnosed medical condition).

Chapter 2: Social Security 17
Life ExpectancyLet’s examine life expectancy a little more closely. If everyone lived to 100, the obvious answer would be to wait as long as possible to file, because claimers would have time to recoup lost benefits. This is of course unrealistic (and such certainty around mortality would drastically change the benefit calculus in any case), so attempting to determine life expectancy becomes one of the most important variables in the decision-making process.
If life expectancy is in question, or there isn’t an immediate need for retirement benefits before FRA, the choice of when to claim may hinge on what age will generate the largest lifetime income; therefore, it is important to try to calculate a break-even point, or the age when the total Social Security income from two claiming options becomes equivalent.
Here is a simple illustration of a hypothetical Social Security claimant:
Based on Mary’s last 35 years of work, she is eligible to collect $1,400 per month in Social Security after her FRA, which is age 66. Mary wants to know her break-even point if she chooses to file at age 62. For simplicity, COLA is ignored.
Earnings at FRA
Penalty for Taking
EarlyAdvantage
Total Benefits between 62 + 66
Divide Benefits
by Monthly Penalty
Divide by 12 (Months
in Year)
Add to FRA
Break-Even Point
$1400/ month
-25% or$350/month
+ 48 months of collecting
$50,400 $50,400/350=144 144/12=12 66+12 78
If Mary claims at 62 and dies before age 78, she will have maximized her possible Social Security income.
As indicated, life expectancy may be the greatest single variable in determining how much an individual will receive in total lifetime Social Security benefits.
It is also extremely important to consider surviving spouses when weighing claiming options. If a husband (with a higher PIA) who suffers from a heart condition has a life expectancy of 73, and his surviving spouse has a life expectancy of 89, it may make sense to delay filing so that the wife can earn more for a longer period of time.
Optimizing BenefitsGoing forward, does it make sense for people to try to optimize Social Security benefits? Perhaps now more than ever.
With more retirees facing a reduction in lifetime benefits, individuals and couples need to analyze alternative income streams based on various filing dates and actuarially calculated life expectancy, and personalized longevity projections become even more critical in determining a break-even point and/or optimized claiming strategy. Income benefits earmarked for dependents may also play an important role in determining the right time to claim.
Additionally, retirees need to be aware of their net income after Medicare premiums and

18 IRI Retirement Fact Book 2020, 19th Edition
surcharges are deducted from monthly Social Security checks and, if applicable, available survivor benefits. It is important to note that survivor benefits may have a significant impact on the quality of life of the surviving spouse, as this income stream can be used to pay for rising health care costs or long-term care services.
Finally, when developing a successful investment strategy to fund retirement, income sources such as Social Security and pensions must be incorporated when determining how much savings will be required in a 401(k), IRA, Roth, and various insured retirement products.
Social Security and MedicareThe Medicare Modernization Act of 2003 initiated a policy change that ensured Medicare premiums would be deducted from Social Security disbursements. Unfortunately, this will ultimately result in health care expenses slowly eroding Social Security benefits and dramatically reducing future retirement income.
Affluent Americans are certainly not exempt from high health care costs. Although they may receive more in Social Security benefits, Medicare outlays will increase because of means tested surcharges. An affluent couple retiring today will likely see over half of their Social Security benefits consumed by medical expenses.
Social Security and Medicare Means TestingMeans testing for Medicare Parts B and D was officially introduced in 2007. This basically translates into “The more you make, the more you pay.” Retirees who cross income thresholds can see their Medicare Part B Premiums rise from 40 percent to over 200 percent.
Social Security is included in the calculation of total annual income, which can push retirees to draw income from other sources — and depending on what those sources are, past means-testing thresholds. This means that even more will be deducted from Social Security to pay for Part B premiums.
Means testing is discussed in greater detail in Chapter 3, Retirement Health Care.
Cost-of-Living Adjustments Social Security cost-of-living adjustments (COLAs) were implemented in 1973 to ensure that benefits would keep pace with inflation. The annual calculations are based on the percentage increase in the Consumer Price Index for All Urban Consumers, or CPI-U.
Future Social Security COLAs are expected to average 2.5 percent annually. This will fall short of the pace of rising health care inflation, which is expected to increase by over 6 percent for the foreseeable future. With health care inflation projected to outpace anticipated Social Security COLAs by more than a two to one margin — and more retirees slated to face means testing in the future — it is likely that a large percentage of retirees will eventually see their Social Security income completely consumed by health care costs.

Chapter 2: Social Security 19
Social Security’s Role in Retirement PlanningTo be blunt, Social Security will simply not provide enough income for most Americans to survive in retirement. The program has evolved into a budgetary supplement that can potentially offset some retirement expenses, including a percentage of health care. As of 2020, the maximum Social Security PIA is $3,790 per month, or $45,480 per year. Using the example of a 65-year-old female in Chapter 1 (Figure 1-7), annual health care costs could range from 8 percent to 44 percent of that amount (not including potential income-based surcharges). After other household expenditures, such as housing, food, and transportation, little if any of that monthly check will be left over.
ConclusionDeciding when to claim Social Security is personal and must be made in conjunction with other retirement planning strategies. A 62-year-old suffering from a chronic condition who can no longer work may be forced to file, while a healthy and financially stable 66-year-old may choose to wait.
Social Security’s most valuable feature is that lifetime monthly income is guaranteed — it can certainly be the cornerstone of a person’s retirement income portfolio. Combining Social Security benefits with stable investment products such as annuities and growth-oriented investments, such as mutual funds and stocks, can provide retirees with a measure of long-term financial stability as well as the potential to keep up with inflation.
Ultimately, in contrast to its often-perceived role in retirement budgets, Social Security must be viewed in the future as a complementary, not primary, source of retirement income that can help alleviate the growing burden of health care costs and supplement basic household needs.

20 IRI Retirement Fact Book 2020, 19th Edition

Chapter 3: Retirement Health Care 21
Retirement Health CareBecause millions are entering the Medicare system every year, health and wealth in retirement are now inexorably linked. Americans will pay more for fewer benefits and will need to purchase supplemental coverage to fill in the gaps. Financial and health-related stability in retirement, a luxury enjoyed by most Americans since the passing of Medicare in 1965, will be replaced by the need for all consumers to place health care costs at the forefront of their retirement planning.
Health Care is a Significant Retirement ConcernMany people have little understanding of the long-term financial impact of health care costs. IRI’s 2019 study on the Baby Boomer Generation found that while 70 percent of boomers who work with financial advisors have calculated a retirement savings goal, only half have considered health care expenses in those calculations. More than half also erroneously believe Medicare covers long-term care expenses. In the future, increasing premiums, expanded means testing, and Social Security Cost of Living Adjustments (COLAs) that may keep pace with general inflation, but not the accelerated inflation of health care, will exacerbate the problem.
There are four hard realities making rising health care costs the single greatest issue facing retirees:
1. Medicare is not free. Premiums, coverage gaps, co-pays, long-term care, and a host of other variables chip away at household budgets.
2. The double-edged sword of longevity means that Americans are living longer, but consequently are also more likely to outlive their retirement savings.
3. Health care inflation is increasing at more than twice the rate of Social Security COLAs.4. The Affordable Care Act, through means testing (and other variables) had a significant
long-term impact on Medicare costs.
Transitioning from Employer-sponsored Plans to MedicareResearch conducted by the California Health Care Foundation revealed that 56 percent of respondents were not aware of basic Medicare coverage options, and many Americans believe that Medicare will cover all or most of health care costs in retirement. In fact, original Medicare (Parts A and B) will only cover approximately 20 percent of total costs and retirees are responsible for 100 percent of costs for health coverage (Medicare Parts B, D and supplemental insurance) comparable to what many enjoyed under employer-sponsored plans (but were only responsible for 25 percent of premiums).
3CH

22 IRI Retirement Fact Book 2020, 19th Edition
Parts of MedicareA full analysis of the intricacies of Medicare is beyond the scope of this book, but it is useful to include a simple outline of its basic benefits.
The Difference Between Medicare and Medicaid Medicare is an entitlement that everyone receives. To be eligible for Medicare a subscriber must be 65 years or older, a citizen for five years, or suffer from a qualified disability. Medicaid recipients must qualify based on their level of income, as Medicaid benefits are intended for those who cannot afford health care.
Medicare Components • Medicare Part A—Free for most. Some may be required to pay premiums if neither they nor
their spouses worked for 40 quarters. Medicare A is not all-inclusive; it covers most hospital care (but not all) and one wellness physical per year with no vitals or blood work.
• Covered Services• Inpatient care• Skilled nursing facilities• Hospice care
• Must enroll between October 15 and December 7 • If eligible at age 65, subscriber has a seven-month period that begins three months
before, includes the month of, and extends three months after 65th birthday • Medicare Part B—Supplementary, but everyone enrolled must pay based on income.
• Covered Services• Most other necessary medical services, such as doctor visits, physical therapy,
medical equipment, etc. • Costs
• 20 percent copay• In 2020, first-time Medicare recipients are charged a monthly premium of
$144.60• A small number of current enrollees pay slightly less “hold harmless” provision
that aligns premiums with the Social Security COLA• Premiums are deducted from Social Security• Individuals who make more than $87,000, or a couple earning over $174,000, may
be subject to Part B surcharges• Additional penalties can be incurred for signing up late
• Medicare Part C—Formerly known as Medicare Plus Choice, now known as Medicare Advantage Plan.
• Similar to HMO plans• Provides almost the same coverage as A and B at a lower cost, but some services
require referrals and “in-network” restrictions can apply• Subscribers are responsible for 100 percent of the cost for out-of-network doctor
visits• Medicare Part D—Prescription drug coverage.
• Covers most or all of six main prescription drug categories, but specific drug coverage and cost can vary and be quite complex
• Premiums are based on terms and conditions set by private insurance companies• Everyone is eligible, but the open enrollment period lasts from November 15 to
December 31. This is the only time when plans may be changed• Premiums can be impacted by income and state of residency• Part D coverage gap (the “Donut Hole”)

Chapter 3: Retirement Health Care 23
• Occurs when a person’s drug costs reach a set amount ($4,020 in 2019)• The Donut Hole closed in for all drugs in 2020, so a subscriber entering the
coverage gap is responsible for 25 percent of the cost of covered drugs.• When out-of-pocket costs for covered drugs reach $6,350 in 2020, subscribers
leave the donut hole and enter “catastrophic coverage,” with significantly lower copays or coinsurance for the remainder of the year.
• Supplemental Insurance• Policies are purchased from private insurance companies• Covers copays, deductibles, and out-of-pocket expenses• Costs vary depending on the plan offered in each state
Prescription drug and supplemental insurance policies are regulated by the state, which approves carriers, policies that can be sold within its borders, and associated pricing. Therefore, retirees may discover significant price disparities for similar policies depending on where they choose to live.
State differences in retirement health care expenses highlight the problem of utilizing national averages when budgeting for future medical expenses. Instead, estimates of supplemental-plan costs should be based on a retiree’s planned state of residence.
Health Care Inflation Estimates in the year-end summary from the Centers for Medicare and Medicaid (CMS) project that retirees will endure multiple years of health care inflation between 5 percent and 7 percent. Data from the Kaiser Family Foundation indicates the percentages of retiree household budgets spent on health care expenses is nearly three times higher than for working families (14 percent versus 5 percent), therefore inflation in health care costs will have a much greater impact on retirees than those still in the work force.
Long-Term CareMedical advances in the latter half of the twentieth century have buoyed American life expectancy, but there is another downside to living longer, and that comes in the form of the potential need for long-term care (LTC). According to a 2018 report from the Kaiser Family Foundation, there were 16,100 nursing homes in the US, with just over 1.66 million beds available, and by 2020 between 12 and 14 million people would need some form of long-term care. In 2020 long-term care facilities have also been stressed by COVID-19, with social distancing and additional cleaning and care protocols likely to have a material impact on capacity.
Types of Long-Term CareNursing Home Care is medically necessary and usually requires a residential stay. It is important to understand that Medicare covers required services such as physical therapy or post-surgery nursing, but it does not pay for custodial care, which provides help with the daily activities mentioned above. Medicare Part A may cover some costs in a sanctioned rehabilitation facility — under strict parameters and time constraints. Assisted Living may or may not require inpatient treatment, but some care is necessary, such as redressing bandages. These are largely state-regulated, and are sometimes referred to as

24 IRI Retirement Fact Book 2020, 19th Edition
residential care, adult congregate care, or domiciliary care. According to the National Caregivers Library, nearly 1.2 million individuals live in the nearly 30,000 assisted living facilities in the United States. That number is expected to rise significantly as millions of boomers receive assisted living care over the next 25 years. While private insurance may cover some of the cost, Medicare does not. Home Health Care provides several medical-related services that can be administered in the home, such as injections, nutrition therapy, and wound care. Eligible patients must be under a doctor’s supervision and require intermittent skilled nursing care, physical therapy, speech-language pathology services, or occupational therapy. The motivations behind acquiring care at home are lower costs, patient comfort, and maintaining independence.
According to the National Care Planning Council, the average stay in a nursing home is 835 days, and the average stay for those who have been discharged is 270 days. The 2019 Genworth Cost of Care Survey puts the daily cost of a semi-private room in a skilled nursing facility at $247, or a total cost of $66,690 to $206,245 based on the average stay data. This is, of course, quite daunting as it is in addition to the cost for health care, which as noted above will likely be substantial for most retirees.
Long-Term Care Funding OptionsInsuranceLong-term care insurance covers personal and custodial care in various settings, such as facilities, community organizations, or homes. The policies compensate recipients with a daily amount for services to assist with the Activities of Daily Living, which include eating, bathing, dressing, toileting, transferring (moving unassisted from bed to bath, for example), and continence. The cost of the policy depends on the age when policy is purchased, the maximum daily amount the policy will pay, the maximum number of times the policy will pay, the lifetime maximum amount the policy will pay, and any optional benefits chosen.
While long-term care insurance provides some relief for custodial care, policy and premium coverage will vary so it is important to consult a financial professional for assistance in choosing the best option.
AnnuityAnnuities are also a viable funding option for LTC. There are a host of flexible annuities that can be used to either create a single-purpose plan targeting long-term care expenses, or a multi-purpose plan in which LTC is one expense among others. From an advisor perspective, a narrow focus is often more appealing to clients, but of course deciding which annuity suits a consumer is an exercise in balancing needs and resources holistically.

Chapter 3: Retirement Health Care 25
State-to-State VarianceThe cost of long-term care varies greatly depending on state of residency. Prices fluctuate based on the availability and quality of care, economic factors, and population distribution. The cost of long-term care varies so greatly that choosing where to reside can have a tremendous financial impact on a fixed retirement budget. For example, in the Genworth study the median annual cost for a semi-private room in a nursing facility in Massachusetts is $149,672, while in Missouri the cost is $60,736.
Women and Long-Term Care Women are especially vulnerable financially because they have longer life expectancies than men and are often left without enough savings after their spouses pass on. According to a “Women & Long-Term Care” fact sheet published by AARP:
• Over 70 percent of nursing home residents are women• 70 percent of women 75 or older are widowed, divorced, or never married• Women are around twice as likely as men to be living alone in their advanced years
A healthy 58-year-old woman living in Boston will have a life expectancy of 89 years and will have a 60% chance of requiring long-term care services at some point in her life.
• Average length of a future stay in a nursing home for this woman will be just over two years
• Average annual cost of nursing home care in the Boston area today is nearly $152,000 • Estimated annual cost 30 years from now will be just over $480,000
If this 58-year-old woman is married to her 60-year-old husband, it is anticipated that she will live four years beyond her husband’s passing.
• His life expectancy will be approximately 87 years• Average length of a future stay in a nursing home for a healthy 60-year-old male will be
around 1.5 years• Estimated annual cost 26 years from now will be over $410,000
Medicare Means TestingSince the passing of the Affordable Care and Medicare Modernization Acts, Parts B and D are now means tested. For subscribers, this means that higher incomes equal higher premiums. Medicare assesses surcharges by measuring Modified Adjusted Gross Income (MAGI), which includes almost every potential source of income — including working in retirement, Social Security, pensions, required minimum distributions, earned interest, and capital gains.
When MAGI surpasses $87,000 for a single person and $174,000 for a couple, surcharges are levied. There is also a two-year look-back period, which means that any income earned at age 63 can be counted when the subscriber signs up at 65. This rule can also become especially troublesome at age 72, when required minimum distributions (RMDs) must be taken, or when a spouse passes away, which may leave an income stream that could vault the lone survivor into a higher income bracket.

26 IRI Retirement Fact Book 2020, 19th Edition
Crossing the first surcharge threshold increases Medicare Parts B and D by 35 percent and surpassing the highest thresholds will inflate costs by more than 200 percent. The thresholds are not indexed to inflation and have been in place for seven years.
The following is a breakdown of the current Medicare MAGI income brackets.
Figure 3-1 Medicare MAGI Income Brackets
Income Level (Individuals) Income Level(Married, Filing Jointly) Total % Increase
$87,000 or less Under $174,000 0%
$87,001 - $109,000 $174,001 - $218,000 40%
$109,001 - $136,000 $218,001 - $272,000 100%
$136,001 - $163,000 $272,001 - $326,000 160%
$163,001 - $499,999 $326,001 - $749,999 220%
$500,000 or more $750,000 or more 240%
Source: Medicare.gov
Lowering the income brackets appears to be an effort to extend the life of the Medicare trust fund, therefore it is unlikely that the trend of expanding means testing to include more middle class and affluent Medicare beneficiaries will end anytime soon.
Reducing MAGI through Investment ProductsIt is critical for future retirees to diversify their investments to include products that do not fall under MAGI; portfolio management can be especially important at age 72, when required RMDs must be taken, or when a spouse passes away, which may leave an income stream that could place the lone survivor into a higher income bracket.
Products including life insurance, non-qualified annuities, Roth IRAs and Roth 401(k)s, Health Savings Accounts (HSAs), longevity insurance, and even reverse mortgages can decrease MAGI and reduce Medicare Part B and D surcharges.
Income Replacement Ratios and Health CareAn income replacement ratio (IRR) is the percentage of pre-retirement income used to estimate how much investors will need to maintain their desired lifestyles throughout retirement. Income replacement ratios provide advisors with a streamlined, top-down approach to help assess retirement savings and income goals without having to calculate and project individual line-item expenses.
A basic assumption underpinning the use of IRRs is that evaluating pre-retirement income provides a solid foundation for calculating income needs during retirement since, for the most part, basic household expenses (housing, food, utilities) will continue after one stops working. The goal is for long-term IRR-based investments to produce sufficient income to last through retirement. While this may be effective to some degree, the truth is that retirees will have a significantly higher health care cost burden in retirement than when they were working — one that is not typically accounted for in IRR calculations.

Chapter 3: Retirement Health Care 27
A second assumption of IRRs is that overall expenses in retirement can be projected forward using an average inflation rate. While inflation rates of 2.5 percent to 3 percent are generally used in IRR calculations, health care costs are expected to rise at approximately 5 to 6 percent a year for the foreseeable future. This can create a sizeable planning gap between calculated needed retirement savings and the impact health care costs will have on those savings in retirement. While IRRs can be an efficient strategy in the planning process, when applied to one of the most significant expenses in retirement — health care costs – the calculation may come up short.
While the gap may appear substantial, it is nonetheless manageable and can be closed through the implementation of slightly higher replacement ratios. This modification can motivate clients to make modest additional contributions to 401(k) plans, HSAs, Roth IRAs, annuities, or other products such as life insurance. With as little as $100 in additional contributions per month (or even less), Americans can greatly strengthen their retirement savings and offset the potential gap from failing to factor health care into IRRs.
ConclusionWith medical care becoming more expensive and health care inflation expected to remain significantly above annual Social Security COLAs, health care will be among the most significant expenses for Americans in retirement.
To be prepared, retirees must understand the complexities of future health care expenses, develop strategies that can reduce the burden of these costs, and begin planning early. At a time when too few pre-retirees are saving at sufficient levels to achieve retirement security (even before health care is factored in), those who take action now, employ a knowledgeable advisor, and create a long-term plan to save for, manage, and reduce costs will be able to enjoy greater long-term financial security.

28 IRI Retirement Fact Book 2020, 19th Edition

Chapter 4: Annuities 101 29
Annuities 101What Is an Annuity? Annuities have been around for centuries. In early Roman times, citizens would make a one-time payment to a contract known as an annua in exchange for income payments received once a year for the rest of their lives. Today an annuity is an insurance agreement that comes in a number of different forms and can (1) help individuals accumulate money for retirement through tax-deferred savings, (2) provide them with monthly income that can be guaranteed to last for as long as they live, or (3) do both.
An annuity can be viewed as life insurance in reverse. Whereas life insurance protects a family’s financial situation against the premature death of a breadwinner, an annuity protects an individual or a couple from running out of money at an advanced age. As with life insurance, annuity contracts are based on the principle of risk pooling; that is, the pooled funds of a large group are used to pay benefits to a relative few in any given year. The burden of not knowing how long one will live is shifted from the individual to the insurance company, which spreads the longevity risk among all annuitants, some of whom will die sooner than expected while others will live longer than expected. A good analogy is homeowner’s insurance: the risk of fire is common to all homeowners, but in any given time period only a relative few houses will burn down. For most people such an event would be financially devastating, so the risk is pooled using insurance.
Annuities can play a vital role in helping investors save for retirement and receive guaranteed lifetime income during retirement — effectively giving them the ability to create their own pensions. Unlike other investments, annuities provide a wide variety of benefit options that can protect against untimely death, provide principal guarantees, assure a specified amount of income when the contract is annuitized, guarantee withdrawals for life, or a combination of all of these.
4CH

30 IRI Retirement Fact Book 2020, 19th Edition
What Role Can Annuities Play in a Comprehensive Retirement Plan? Annuities are the only financial instruments available today, other than Social Security and employer-provided pensions, that can guarantee a lifetime stream of income during retirement. Along with giving retirees the peace of mind that comes from knowing they will not outlive their assets; annuities provide another important benefit — a way to increase current income.
Many of today’s retirees are faced with the challenge of how to withdraw enough money from their portfolios to live comfortably during retirement without depleting their funds if they live a long life. Withdrawing money from an investment portfolio may not present a problem in the early years, but as retirees age, the risk of running out of money can increase dramatically. Allocating a portion of the portfolio to one or more annuities reduces this risk.
Annuity payments form an essential part of a comprehensive retirement plan along with Social Security and pension income. The amount of each annuity payment reflects the fact that some annuitants will not live as long as others. This “risk pooling” allows insurance companies to make annuity payments that are larger than would be possible through a systematic withdrawal plan, where an individual retiree periodically withdraws funds in amounts that give reasonable assurance that he or she will not run out of money. Thus, annuities can serve to both reduce the risk of running out of money in retirement and increase the amount of each income payment received.
Who Are the Parties to an Annuity Contract? Most annuity contracts — and all commercial annuity contracts — are issued by life insurance companies. When the purchaser completes the application to buy an annuity, the contract owner, annuitant, and beneficiary are designated and identified as such in the contract.
Contract Owner The owner of an annuity contract pays the premiums. He or she has certain rights under the contract, such as the right to make contributions, withdraw all or a portion of the contract value, or change the parties to the contract. The owner is usually an individual or couple but can also be a non-natural person such as a trust or a partnership. Special tax rules apply to annuities owned by non-natural persons.
Annuitant The annuitant is the person upon whose life annuity payments are based. Often, the annuitant is also the contract owner, so payments continue as long as the owner/annuitant is alive. It is also possible for two people, such as an owner and spouse, to be designated as joint annuitants so that income can continue throughout either of their lives. This type of annuity is called a “joint and survivor annuity.” While in most cases payments are made to the contract owner or annuitant, funds also can be paid to a third party referred to as a “payee.”

Chapter 4: Annuities 101 31
Beneficiary The beneficiary is the person designated under the contract to receive any payments that may be due upon the death of the contract owner or annuitant. Contingent beneficiaries, to whom payments are made in the event the primary beneficiary predeceases the owner or annuitant, may also be named in the contract.
Respective Rights of the Parties Because annuity contracts can offer a great deal of flexibility in setting up income payments, the respective rights of the contract owner, annuitant, and beneficiary can vary. For example, under one insurer’s contract, the owner may be entitled to receive annuity payments. Under another insurer’s contract, the annuitant may be the party entitled to receive annuity payments.
What Types of Annuities Are Available? A wide variety of annuities are available today, many designed to meet specific needs and help consumers achieve their retirement goals. With a deferred annuity, assets accumulate on a tax-deferred basis until distributions are made, usually during retirement; with an immediate annuity, the contract owner converts assets into income and starts receiving payments right away. Fixed annuities accumulate savings or distribute income at guaranteed rates and in guaranteed amounts; variable annuities accumulate savings or distribute income based on the performance of the underlying investment options chosen by the contract owner. Annuities can be part of an IRA, a qualified retirement plan such as a 401(k) or 403(b) (a “qualified” annuity) or may be purchased with after-tax dollars (a “non-qualified” annuity). The following is a more detailed look at various types of annuities.

32 IRI Retirement Fact Book 2020, 19th Edition
Figure 4-1 Types of Annuities
Deferred Immediate
Variable (VA)
• Purchased either with a single premium or with periodic payments to help save for retirement; the contract owner determines the point at which accumulated principal and earnings are converted into a stream of income.
• The contract value or income payments vary based on the investment performance of underlying subaccounts or a stated rate, if provided by the issuer.
• Total sales of deferred VAs in 2019 were $98.2 billion.
• Purchased with a single lump sum; income payments begin within a short period — less than 13 months.
• The income payments vary based on the investment performance of underlying subaccounts or a stated rate, if provided by the issuer.
• Total sales of immediate VAs in 2019 were about $0.1 billion.
Structured
• Structured annuities, also called Registered Index Linked Annuities (RILAs) use options on market indexes to provide purchases with upside potential and downside protection
• RILAs carry investment risk, and are therefore a form of variable annuity
• Total RILA sales in 2019 were $17.5 billion (included in deferred VA total sales above)
• There are no immediate versions of RILAs, but as a variable annuity they may be annuitized to create a fixed lifetime income stream
Fixed
• Purchased either with a single premium or with periodic payments to help save for retirement; the contract owner determines the point at which accumulated principal and earnings are converted into a stream of income.
• Guarantees that the contract owner will earn a stated rate of interest during the accumulation phase of a deferred annuity and receive a defined amount of income on a regular schedule when the contract is annuitized.
• Total sales of deferred fixed annuities in 2019 were $117.6 billion.
• Total sales of deferred income annuities in 2019 were $1.7 billion.
• Purchased with a single lump sum; income payments begin within a short period — less than 13 months.
• The income payments are a pre-determined amount on a regular schedule.
• Total sales of immediate fixed annuities in 2019 were $10.2 billion.
Source: Morningstar, Inc.; Beacon Research

Chapter 4: Annuities 101 33
What Are the Differences Between Deferred and Immediate Annuities? Deferred Annuities: A Way to Save Money for Retirement Many people buy annuities because they want their money to grow tax deferred while they are saving for retirement, and they want a guaranteed income stream once they retire. This type of annuity is called a deferred annuity. A deferred annuity contract has two phases — an accumulation or savings phase, and a payout or retirement income phase.
In the accumulation phase, the owner pays premiums (also referred to as purchase payments) into the contract to accumulate assets. Some contracts are purchased with a single payment and are called single premium contracts. Other contracts allow payments to be made at any time and are called flexible premium contracts. During the accumulation phase, the owner can surrender the contract or take one or more partial withdrawals.
In the payout phase, the owner (or other designated payee) receives income. When he or she wants payments to begin, the insurance company starts sending checks on a regular basis, typically monthly. The effective date of payments is called the annuity start date or the annuity commencement date. In certain circumstances, the insurance company will allow annuity payments to be commuted for a lump sum equal to their present value.
Immediate Annuities: When You Want to Receive Money Right Away An immediate annuity (commonly known by the acronym SPIA, which stands for Single Premium Immediate Annuity, and may also be called a “payout” or “income” annuity) is purchased with a single premium and annuity payments begin right away (there is no accumulation period). If the owner chooses to receive monthly payments, payments usually begin at the end of the first month but may be scheduled to start any time within one year after purchase. An immediate annuity can be purchased using retirement savings, for example, from a 401(k) plan and/or personal savings, as a way to create guaranteed income payments during retirement. It can also be purchased using money from other sources, such as an inheritance or the sale of a business.
Annuity payments can be made over the lives of one or more individuals or for a specified number of years, e.g., for 10 or 15 years. Life annuity payments typically end when the annuitant dies, but various types of guarantees are widely available. For example, you can purchase a life annuity with 10 years of payments guaranteed. Under such an annuity, the payments will continue for the longer of 10 years or the annuitant’s life. In addition, insurers offer annuity payments that provide that if the annuitant dies before annuity payments equal to the premiums paid for the contract have been paid, the contract beneficiary will receive a lump sum equal to the difference between the sum of the annuity payments and the premiums paid (“cash refund”). As there are many payout options offered by issuing insurers, the owner should work with his or her financial advisor to assure that the payment feature meets his or her financial needs.
Data from the CANNEX annuity quoting platform shows about one-third of quote requests, a good proxy for sales, are for SPIA with cash refund, about 20 percent are for life-only payments, and the remaining approximately one-half are for life with periods certain of various durations, 10 years being the most common. More than 85 percent are for monthly payments.
Inflation-Protected Annuities An inflation-protected annuity (IPA) is similar to an immediate annuity but payments are indexed to the rate of inflation. Initial payments will usually be smaller than they would be without the

34 IRI Retirement Fact Book 2020, 19th Edition
inflation protection. Even at a moderate rate of 4 percent, inflation reduces the purchasing power of one dollar to fifty cents in approximately 15 years. IPAs guarantee a real rate of return at or above inflation. Very few life insurance companies offer true IPAs for sale in the United States (largely due to the difficulty of hedging the inflation risk). However, consumers can buy immediate annuity contracts available that provide pre-determined annual increases in the amount of annuity payments, e.g., 3 percent each year for the life of the contract. CANNEX data indicates more than 90 percent of quotes include no payment adjustment feature, i.e. no provision for increasing the monthly payment over time.
Structured Settlement AnnuitiesStructured settlement annuities are used to provide periodic payments to satisfy legal judgments.
What Are the Differences Between Fixed and Variable Annuities? Fixed Annuities: Guaranteed Investment Performance With a fixed annuity, the owner is guaranteed at least a minimum rate of investment return. The insurer declares a specific credited rate of return based on the investment performance of its general account assets. In the case of a deferred fixed annuity, the insurance company guarantees a minimum interest rate (also known as a minimum credited interest rate) on payments made by the owner during the accumulation phase. In many cases, an insurer will credit interest at a higher rate than the minimum for varying periods. This type of interest is often referred to as “excess interest.” The owner’s purchase payments are invested in the insurance company’s general account. When the annuity reaches the payout phase, the dollar amount of the annuity income payments is determined based on payment rates guaranteed at the time the deferred annuity was issued (or the insurer’s current payment rates, if higher) and are guaranteed for the selected payout duration, e.g., the owner’s life or a specified period of years.
Generally, fixed annuities involve less investment risk than variable annuities because they offer a guaranteed minimum rate of interest. The minimum rate is not affected by fluctuations in market interest rates or the company’s yearly profits. Some people like the security of knowing that their annuity payments will never vary or that they will receive at least a minimum amount of credited interest. Although they are less risky, fixed annuities generally offer less investment flexibility and less opportunity for growth than variable annuities.
Fixed Index Annuities: Market-Linked Interest Potential and Guaranteed Minimum Interest A Fixed Index Annuity is a fixed annuity that typically provides the contract owner with an investment return that is a function of the change in the level of an index, such as the S&P 500, while guaranteeing no less than a stated fixed return on the investment. These products are designed for investors who want to partake in the benefits of a market-linked vehicle with a protected investment floor if there is a downturn in the benchmark index. Some indexed annuities also offer riders that guarantee income for life, even if the annuity value declines to zero.
Variable Annuities: Investment Performance Based on Portfolios Chosen by the Owner With a variable annuity, contract owners are able to choose from a wide range of investment options called subaccounts, each of which generally invests in shares of a single underlying mutual fund or, in some cases, in a “fund of funds (FOF),” which is a mutual fund that invests in

Chapter 4: Annuities 101 35
several other mutual funds or in exchange-traded funds (ETFs). Variable annuity contract owners are able to direct the allocation of their contract value among subaccounts that correspond to a wide range of underlying mutual funds, such as equity funds, bond funds, funds that combine equities and bonds, actively managed funds, index funds, domestic funds, and international funds. Unlike mutual funds sold to the public, the mutual funds that underlie subaccounts are available only to investors in variable annuities, variable life insurance contracts, and in some cases, 401(k) plans, IRAs, and certain other investments permitted by applicable tax laws and regulations. Assets in a variable annuity can be transferred between subaccounts tax free. As a result, investment decisions can be made based on an investor’s needs and strategy without worrying about the tax implications.
As with mutual funds, the investment return of variable annuities fluctuates. During the accumulation phase, the contract value varies based on the performance of the underlying subaccounts chosen. During the payout phase of a deferred variable annuity (and throughout the entire life of an immediate variable annuity), the dollar amount of the annuity payments may fluctuate, again based on how the portfolio performs.
Unlike mutual funds, annuities offer a wide variety of guarantees to protect a contract owner’s investment. Death benefits provide principal protection in the event a contract owner dies during a market downturn. Living benefit features protect against investment and/or longevity risk by providing guarantees that cover income, accumulation, and withdrawals for either a fixed number of years or for life.
In addition to variable investment options or subaccounts, many variable annuities offer a fixed account or fixed investment option. This means that during the accumulation phase of a deferred variable annuity, the owner can allocate payments not only to one or more variable investment options, but to a fixed interest option as well. The money allocated to the fixed option goes into the insurance company’s general account. A minimum rate of interest is typically guaranteed for a period of one or more years.
Structured annuities, also called Registered Index Linked Annuities (RILAs) are a relatively recent innovation. RILAs generally do not offer subaccounts (although some include a money market subaccount); rather, purchase payments are invested in the insurer’s general account and a portion is used to purchase options on one or more market indexes selected by the purchaser. The use of options provides some upside potential to contract owners in years when the index(es) perform well, and limit downside risk during years when returns are negative.
During the payout phase of some contracts, only fixed annuity income payments are offered. Other contracts provide fixed and/or variable payouts. Providing both types of payouts allows contract owners to take on the added risk associated with variable investment options while accumulating assets, and to manage their level of risk during retirement by choosing to have the rate of return guaranteed for at least some portion of their income payments.
What Are the Differences Between Qualified and Non-Qualified Annuities? Qualified Plans versus Non-Qualified Plans Annuities can be used in tax-qualified retirement plans, such as IRAs, pension or profit sharing plans, 401(k) plans, 403(b) plans, and certain governmental plans. These annuities are called

36 IRI Retirement Fact Book 2020, 19th Edition
qualified annuities and are typically funded with pretax dollars. Some qualified annuities are purchased with after-tax dollars for use with Roth accounts, under which the annuity payments and other withdrawals are tax free if certain tax rules are satisfied. Annuities that are not used in qualified plans are called non-qualified annuities and are purchased by members of the general public with after-tax dollars.
The first variable annuity in America was designed and developed for a qualified retirement program offered by TIAA-CREF (now called TIAA) in 1952. As such, the variable annuity was available only as an investment within a tax-qualified plan until 1960 when the first publicly available variable annuity outside a qualified plan was developed and brought to market by the Variable Annuity Life Insurance Company (VALIC).
An annuity used in a qualified plan can provide contract owners with the same insurance benefits offered by non-qualified annuities, such as guaranteed death benefits, guaranteed living benefits, and guaranteed income payments for life. It does not, however, provide any additional tax-deferred treatment of earnings — tax deferral is provided by the qualified plan itself. Other tax aspects of qualified and non-qualified annuities are discussed in Chapter 14: Regulation and Taxation of Annuities.
Figure 4-2 Qualified and Non-Qualified Annuities
Qualified Non-Qualified
Variable
• Purchased through retirement plans or IRAs using pre-tax dollars, up to specified limits.
• The contract value or income payments vary based on the investment performance of underlying subaccounts.
• Total sales of qualified variable annuities in 2019 were $62.8 billion.
• Purchased by members of the general public using after-tax dollars.
• The contract value or income payments vary based on the investment performance of underlying subaccounts.
• Total sales of non-qualified variable annuities in 2019 were $35.5 billion.
Fixed
• Purchased through retirement plans or IRAs using pre-tax dollars, up to specified limits.
• Guarantees that the contract owner will earn a stated rate of interest during the accumulation phase of a deferred annuity, and receive a defined amount of income on a regular schedule when the contract is annuitized.
• Total sales of qualified fixed annuities in 2019 were $75.7 billion.
• Purchased by members of the general public using after-tax dollars.
• Guarantees that the contract owner will earn a stated rate of interest during the accumulation phase of a deferred annuity, and receive a defined amount of income on a regular schedule when the contract is annuitized.
• Total sales of non-qualified fixed annuities in 2019 were $53.8 billion.
Total• Total sales of qualified
annuities in 2019 were $138.5 billion.
• Total sales of non-qualified annuities in 2019 were $89.3 billion.
Source: Morningstar, Inc.; Beacon Research

Chapter 4: Annuities 101 37
Annuities used within qualified plans are subject to annual contribution limits. The government does not, however, limit the total annual amount of premium payments to non-qualified annuities. Insurance companies may impose maximum premium limits that are typically very high and do not affect most contract owners. Because of this feature, many people view non-qualified annuities as valuable personal retirement accounts to which they can contribute as much as they need for retirement.
Figure 4-3 Retirement Savings Plan Contribution Limits – 2020
Source: Internal Revenue Service – Publication 590, Individual Retirement Arrangements
Are Annuities Sold Outside of the Retail Market? In addition to the annuities described above that are sold through the retail market, several annuities are sold through institutional or private markets. This includes group annuities as well as lesser-utilized annuity products such as private annuities, private placement annuities, and charitable gift annuities. While most of the remainder of the IRI Retirement Fact Book concentrates on individually sold annuities, a brief mention of these additional types of annuities is included for informational purposes.
Group AnnuitiesGroup annuities are typically used as a retirement income plan for employees. Unlike annuities sold in the retail market, group annuity contracts are generally owned by the employer, and employees are participants. Certain individual annuities used in 403(b) plans may also be referred to as “group annuities,” but these are actually individually owned contracts purchased in a group setting and contributed to via payroll deduction, for example in the case of a retirement plan for employees of a university or hospital. Group annuities are covered in more detail in Chapter 12: Tax-Qualified Retirement Plans.
Private Annuities In the United States, all commercial annuities are issued exclusively by insurance companies. A “private” annuity is not issued by an insurance company. Rather, it involves the transfer of
$0
$50,000
$100,000
$150,000
$200,000
$250,000
Non-Qualified Annuity
401(k) Plus Catch-UP
401(k)IRA Plus Catch-Up
IRA
$6,000 $7,000$19,500 $26,000
$1 Million+(Varies by Insurer)

38 IRI Retirement Fact Book 2020, 19th Edition
property (such as real estate) from an individual or a revocable living trust in exchange for an unsecured promise by the transferee (an individual or a non-insurance entity, such as a trust) to make a periodic stream of fixed payments. The tax treatment of private annuities is complex and differs from the tax treatment of commercial annuities.
Private Placement Annuities Private placement annuities are variable annuity contracts that are not registered under federal or state securities laws. They are available exclusively to investors who meet certain minimum net worth and income levels under such laws. The types of investment options available under private placement annuity contracts often include hedge funds, commodities, managed accounts, and other kinds of private equity offerings.
Charitable Gift Annuities With a charitable gift annuity, a donor transfers cash or property (including appreciated property) to a charitable organization in exchange for income payments for life or joint lives, with no guarantee period. The federal tax law imposes specific requirements on the relationship of the amount donated and the value of the promised annuity stream. The charity can fund its payment obligations using its own assets, or it can fund them by purchasing a commercial annuity.
What Fees and Expenses Are Associated With Annuities? What Fees and Expenses Are Associated with Fixed Annuities?A fixed annuity typically does not impose direct expense charges on the contract owner, other than surrender charges (charges for cancellation of the contract during its early years) for deferred fixed annuities. The spread, or difference between what the issuing company expects to earn and what it commits to pay out is intended to cover the insurer’s expenses.
What Fees and Expenses Are Associated with Variable Annuities?A variable annuity, on the other hand, involves direct expenses in the form of insurance charges and indirect expenses in the form of management and other fees and expenses associated with the underlying mutual funds in which the variable annuity subaccounts invest.
Insurance, Administrative, and Distribution Charges The fees and charges commonly associated with variable annuities include mortality and expense risk charges (M&E fees), administrative charges, and distribution charges.
In most contracts, the M&E fee pays for three important insurance guarantees: • The ability to choose a payout option that provides an income that cannot be outlived at
rates set forth in the contract at the time of purchase • When available, a death benefit to protect beneficiaries • The promise that the annual insurance charges will not increase
The administrative and distribution charges pay for all of the services involved in the maintenance of variable annuity contracts, such as the preparation of contract statements and mailings and other customer services. Some variable annuities also impose an annual contract fee that is similar to the annual account maintenance fee imposed by many IRAs. This fee generally ranges between $30 and $40 per year. Most insurers waive this fee for contracts with an accumulation or contract value of at least a certain amount, e.g. $25,000.

Chapter 4: Annuities 101 39
Mutual Fund Fees and Expenses Underlying mutual funds incur investment management fees and operating expenses, and in many cases, distribution charges known as “12b-1 fees,” which are named after the SEC rule that governs them. Investment management fees for the mutual funds that underlie the subaccount investment options in variable annuities are, on average, lower than those charged for publicly offered mutual funds. These lower fees have the effect of offsetting, to some extent, the insurance charges. See Chapter 9: Focus on Accumulation with Income Flexibility, for illustrations show how projected accumulation values can vary between variable annuity and mutual fund portfolios.
Surrender Fees If a contract owner decides to cancel a deferred annuity during the early years of the contract, surrender charges may apply. These charges, if applicable, generally begin in a range from 5 percent to 7 percent of the amount invested and decline to zero over a period of time, such as five to seven years. Surrender charges are structured differently for different annuity products. (See the following section, How Are Variable Annuity Sales Charges Structured?)
Unbundled Fees Some variable annuity contracts permit purchasers to select from a menu of optional product features, each of which usually has an associated charge. This unbundling approach gives customers the ability to select and pay for only those features they want. Optional features, referred to as riders, include, for example, enhanced guaranteed death benefits and guaranteed minimum living benefits. These riders typically have a separate, additional fee. See Chapter 8: Planning for Future Income, for data on these optional contract rider fees.
Premium Tax States may impose premium taxes on variable annuity purchases. Currently California, Maine, Nevada, South Dakota, West Virginia, and Wyoming tax life insurance and annuity premiums, and only California and West Virginia tax qualified purchases. Tax rates range from 0.5 percent (California on qualified monies) to 3.5 percent (Nevada on non-qualified). Florida assesses a 1 percent tax on both qualified and non-qualified monies, but it is typically absorbed by the issuing insurance company.
How Are Variable Annuity Sales Charges Structured? B-Share Variable Annuities Most variable annuity contracts are B-share products. They are offered with no initial sales charge, but cancellation of the contract during its early years may trigger a withdrawal charge known as a surrender charge. These charges typically range from 5 percent to 7 percent of premium in the first policy year, and subsequently decline to zero, generally after five to seven years (known as the surrender charge period). Some annuity contracts impose surrender charges only during the initial surrender charge period that begins after the contract is purchased, while others associate a new surrender charge period with each subsequent premium payment.
Surrender charges underscore the long-term nature of the annuity product. As long as contract owners remain committed to accumulating money for retirement through their variable annuity, they generally will not incur these charges. In addition to surrender charges, B-share contracts have annual M&E and administration fees. B-shares accounted for more than 84 percent of variable annuity sales in 2019.
A number of insurers have begun to offer other types of charge structures to meet different

40 IRI Retirement Fact Book 2020, 19th Edition
investor needs. The following are the most common. A-Share Variable Annuities Like A-share mutual funds, A-share variable annuities have up-front sales charges instead of surrender charges. Sales charges are calculated as a percentage of each premium payment.
A-share variable annuities offer breakpoint pricing, which means up-front sales charges decrease depending on the cumulative amount of purchase payments that have been made. In addition, assets that a contract owner has in other products in the company’s product line may be recognized in the cumulative payment amount used to determine the breakpoint pricing. A-share contracts often have lower ongoing M&E annual fees than annuities with surrender charges. A-shares accounted for 0.8 percent of total VA sales in 2019.
C-Share or No-Surrender-Charge Variable Annuities C-share, or no-surrender-charge variable annuities, offer full liquidity to owners at any time, without any up-front or surrender charges (although tax penalties may apply to withdrawals before age 59½). There are, however, ongoing M&E and administrative fees. C-shares made up 1.6 percent of total VA sales in 2019.
I-share or Fee-Based Variable AnnuitiesI-share, or fee-based variable annuities, are intended for investors who favor paying one fee to have their investment portfolio managed by a registered investment advisor or fee-only advisor, (for example, a wrap-fee advisory program). Typically, the sale of an I-share does not result in a sales commission for an advisor from the issuing insurance company. However, the advisor assesses fees for the services, including the I-share contract, which is agreed upon by the client. Consequently, M&E annual fees are generally less than other share-classes due to the absence of commissions. I-shares have no surrender charges and may provide optional living benefit guarantees for an additional fee. I-share sales are a larger percentage of the VA market than they were several years ago; sales of I-shares have grown as overall VA sales have dropped, so I-shares are about 7 percent of the VA market today versus 3 percent 10 years ago. As a percentage of overall annuity sales, however, fee-based annuities (including a very few fee-based fixed annuities) are still about 3 percent of total annuity sales.
L-Share Variable Annuities L-share variable annuities have no up-front sales charges. They typically have relatively short surrender charge periods, such as three or four years, but may have higher ongoing M&E and administrative charges than other share classes. It is becoming more common for L-shares to be structured as a B-share with an optional “buy down,” which reduces the duration of surrender charges for an additional fee. This “liquidity rider” expires when the shortened surrender charge period is over, as does its fee. L-shares once accounted for almost one-third of the market but have almost disappeared from the VA landscape due to suitability concerns and represented less than 1 percent of total VA sales in 2019, with most of this likely coming from additional purchase payments to existing contracts rather than new sales.
O-share Variable Annuities O-shares are intended to merge the M&E and surrender charges of A-share and B-share variable annuities, respectively. Unlike A-shares, O-shares do not impose up-front sales charges, while, typically, possessing surrender charge periods akin to B-shares. Instead, M&E charges are assessed against both the account value and the premium, with the premium-based charges progressively declining throughout the surrender period, and ending after the surrender period. These features result in expenses similar to an A-share once the contract is free of surrender charges. The design of O-shares encourages investors to think of variable annuities as a long-

Chapter 4: Annuities 101 41
term investment by rewarding longer holding periods with lower fees. O-shares were 3.2 percent of sales in 2019.
X-Share (Bonus) Variable Annuities X-Share variable annuity contracts credit an additional amount or bonus to the contract value, which is calculated as a percentage of purchase payments added to the contract at or subsequent to contract issue. Bonus amounts generally range from 1 percent to 6 percent. For example, with a 3 percent bonus feature, a contract owner paying $10,000 in premiums would have $300 credited immediately to the balance. This category does not include contracts that credit additional amounts to the contract value after a designated period, sometimes referred to as “persistency bonuses.” Variable annuities with bonus credits may have higher ongoing expense charges and longer surrender periods than variable annuities without bonus credits. Some contracts allow the insurer to re-capture all or part of the bonus if the contract is surrendered within the first few years. Bonus contracts are difficult for companies to offer in a low interest rate environment, and there are far fewer available than there once were. There are only a few X-shares available for new purchase, and the class accounted for 1.9 percent of total sales in 2019.
What Are Guaranteed Minimum Death Benefits? If a contract owner dies in the accumulation phase, a deferred annuity contract will, at a minimum, pay the accumulation value to a named beneficiary. Sometimes the contract may be continued by the beneficiary, with the beneficiary as the new owner. The contractual payout of this benefit varies by policy and can be payable as a lump-sum payment or as periodic annuity payments. Fees associated with death benefits are discussed in Chapter 8: Planning for Future Income. The tax treatment of death benefits is discussed in Chapter 14: Regulation and Taxation of Annuities.
Most, but not all, variable annuity contracts provide a standard Guaranteed Minimum Death Benefit (GMDB) during the accumulation period equal to the greater of (a) the contract value at death or (b) premium payments minus any prior withdrawals. The “return of premium” (ROP) GMDB gives contract owners the confidence to invest in the stock market, important in keeping up with market inflation, as well as the security of knowing their families will be protected against financial loss in the event death occurs as a time when the account value has incurred losses due to negative market returns.
The value and importance of the death benefit is periodically highlighted during major market corrections, most recently as the market dropped precipitously in the first quarter of 2020, and also during the financial crisis in 2008 and the technology led selloff in 2003. While markets inevitably recover and historically go on to reach new highs, the beneficiaries of variable annuity contracts owned by those who die during or immediately after a huge selloff are protected. During past major market corrections, variable annuity beneficiaries received death benefits worth billions more than the value of the annuities, helping to make up for those short-term market losses. For a VA contract owner dying in a “trough” of financial market returns, the preservation of assets for heirs afforded by a GMDB, even a standard ROP, can be quite significant: estimates of unhedged GMDB exposure at the height of the 2008-2009 financial crisis were as high as $15 billion, meaning $15 billion of death benefit liability in excess of variable annuity account value. Beyond ROP there are also several types of enhanced GMDBs that provide additional growth and/or protection of account value. The different types of enhanced GMDBs are described below, some of which have additional associated charges.

42 IRI Retirement Fact Book 2020, 19th Edition
Contract Anniversary Value or Ratchet Some life insurance companies offer death benefits that step up or increase based on pre-determined criteria. Called contract anniversary value or ratchet, these enhanced GMDBs are equal to the greater of (a) the contract value at death, (b) premium payments minus prior withdrawals, or (c) the contract value on a specified prior date. The specified date could be a prior contract anniversary date, such as the date at the end of every seven-year period, every anniversary date, or even more often. A ratchet GMDB locks in the contract’s gains on each of the dates specified.
Initial Purchase Payment With Interest or Rising Floor Some insurers offer a rising floor GMDB that is equal to the greater of (a) the contract value at death or (b) premium payments minus prior withdrawals, increased annually at a specified rate of interest. In some cases, a ratchet and a rising floor may be available within the same contract. Some contracts offer a choice of a ratchet or a rising floor. Though they have become less common and more expensive in recent years due to low interest rates, they are still available.
Enhanced Earnings Benefits Not all variable annuity death benefits are associated with protection against falling markets. Many variable annuity contracts offer enhanced earnings benefits (EEB) that provide a separate death benefit to help offset federal and state income taxes payable upon death on any gains in the contract. With this feature, beneficiaries receive not only the base death benefit amount, but also an additional amount that is usually equal to a percentage of the contract’s earnings at death, e.g., 40 percent.
What Are the Different Types of Guaranteed Minimum Living Benefits? Prior to 1997, principal protection under variable annuity contracts was offered only in the case of death. In 1997 the first Guaranteed Minimum Income benefit was issued by Equitable, which offered contract holders the opportunity to generate annuity income from the greater of the account value or a guaranteed minimum amount based on the premium, after a multi-year waiting period. In subsequent years insurers developed other “living protection” against investment and/or longevity risk in variable annuity contracts by guaranteeing minimum accumulation values or withdrawal amounts. Some type of living benefit rider is offered on about 60 percent of “open” (i.e. available for new purchases) variable annuity contracts.
Various types of guaranteed minimum living benefit (GMLB) riders are described below. Besides offering these in new contracts, some companies allow them to be added to existing contracts. Guaranteed living benefits are usually offered as riders to variable annuity contracts for an optional charge. Fees associated with guaranteed living benefits are discussed in Chapter 8: Planning for Future Income.
Guaranteed Minimum Income Benefit A guaranteed minimum income benefit (GMIB) rider is designed to provide the investor with a base amount of lifetime income when they retire regardless of how the investments have performed. It guarantees that if the owner decides to annuitize the contract (for life, life plus a certain period, or the lives of two people), payments are based on the greater of the contract value, or the amount invested credited with simple or compound “interest” at a rate of 1 percent to 4 percent. The “interest” creates a notional balance upon which annuity payments can be

Chapter 4: Annuities 101 43
calculated; it does not represent account or cash value. An investor must annuitize to receive this benefit and there is typically a 10-year holding period before it can be exercised. Age limits may also apply.
Guaranteed Minimum Accumulation Benefit A guaranteed minimum accumulation benefit (GMAB) rider guarantees that an owner’s contract value will be at least equal to a certain minimum percentage (usually 100 percent) of the amount invested after a specified number of years (typically 10 years), regardless of actual investment performance.
Guaranteed Minimum Withdrawal Benefit First introduced in 2002 by The Hartford, a guaranteed minimum withdrawal benefit (GMWB) rider guarantees that a certain percentage (usually 4 percent to 6 percent) of the amount invested can be withdrawn annually until the entire amount is recovered, regardless of market performance. Reducing withdrawals in one year generally does not allow for increased withdrawals in subsequent years. However, if a contract owner defers withdrawals and the account value grows and is “locked in” at certain points as the new “benefit base,” the amount of subsequent withdrawals allowed may be larger.
If the underlying investments perform well, there will be an excess amount in the policy at the end of the withdrawal period. If they perform poorly and the account value is depleted before the end of the withdrawal period, the investor can still continue to make withdrawals until the full amount of the original investment is recovered.
If the investor decides to terminate the contract before the end of the withdrawal period, he or she will receive the cash surrender value of the contract.
Guaranteed Lifetime Withdrawal Benefit Another type of GMWB rider that guarantees withdrawals for life was introduced in 2004. The guaranteed lifetime withdrawal benefit (GLWB) guarantees that a certain percentage (typically 3 percent to 5 percent, often based on age) of the amount invested can be withdrawn each year for as long as the contract holder lives. This percentage may vary depending on the person’s age when withdrawals begin, whether the payment is guaranteed to continue for the life of one (single life) or two (joint life) individuals, and in some of the newest structures based on the level of an external benchmark such as the 10-year Treasury Constant Maturity Rate. More recently issued benefits may also include other levers that help the insurance company manage the risk of guaranteeing lifetime income on a variable annuity, such as a reduction in the withdrawal percentage rate if the account value is exhausted while income payments are still being made.
In many GLWBs, “step-up” features periodically, e.g., annually or every five years, lock in higher guaranteed withdrawals if investments do well. “Roll-up” features, conversely, increase the amount that may be withdrawn (by increasing the “benefit base” used to calculate withdrawals) during the deferral period, i.e., prior to the commencement of withdrawals. Allocation to a balanced or volatility managed fund, adherence to an asset allocation program, or a minimum allocation to a fixed or fixed income subaccount is often required when electing a GLWB. The liability risk to the insurer may also be managed through dynamic rebalancing, which shifts allocation toward more conservative investment options when equity returns are negative and/or market volatility increases.

44 IRI Retirement Fact Book 2020, 19th Edition
Standalone Lifetime Income Benefit The standalone lifetime income benefit (SALB) was introduced in 2008. The SALB provides protection similar to that provided by the GLWB, while adding flexibility with the various types of assets that can be protected. It is designed to be attached to a balanced fund by endorsement, primarily for use as an option in an employer sponsored retirement plan. Development of the market for these products has been almost non-existent, primarily due to ambiguity around the fiduciary responsibilities of the plan sponsor in selecting an insurance carrier and issues around portability that make it difficult for the plan participant to move the benefit when changing employers.
Long-Term Care Protection Some annuity contracts have features designed to address aging Americans’ concerns about long-term care (LTC). Many contracts permit owners to withdraw money from their contracts for long-term care needs without incurring surrender charges. Surrender charges may be waived if, for example, a contract owner has been confined to a nursing home for a minimum period or has suffered a critical illness. Some variable annuity contracts provide GLWB features that double the income payment during a qualified long-term care event, for example admission to a long-term care facility or the inability to perform the Activities of Daily Living (ADLs). Additional benefits may also be offered, such as eldercare resources, referral and consultation services, and discounted long-term care services from a specified group of providers. Hybrid annuity/long-term care products can provide valuable protection against the impact of long-term costs to consumers for whom traditional long-term care may be unaffordable, or unobtainable due to pre-existing conditions.
With the enactment of the Pension Protection Act of 2006, new hybrid products that combine annuities with LTC were introduced. Beginning in 2010, tax-free distribution status was given to both annuity assets and LTC rider benefits used for a qualified LTC purpose. Under prior law, withdrawals taken from the annuity to pay the LTC premiums were taxable and subject to a 10 percent penalty prior to age 59½.
How Is the Value of a Deferred Annuity Determined?The accumulation period begins when the initial purchase (or premium) payment is made by the contract owner and the contract is issued by the life insurance company. Gifts, an inheritance, or any other source of income can be used to initiate or add to a contract. Typically, insurance companies have minimum requirements for initial and additional premium amounts. However, sometimes a life insurance company will permit a smaller minimum initial payment, for example, $1,000, if the purchaser agrees to pay premiums on a regular basis, e.g., through automatic payroll deduction. Insurers may also have lower minimum premium requirements for annuities in qualified retirement plans such as 403(b) or 401(k) plans. As is true for all qualified plans, contributions to annuities used to fund qualified plans must come from earned income.

Chapter 4: Annuities 101 45
How Is the Value of a Variable Annuity Measured?The value of a contract owner’s variable annuity is equal to the sum of the contract owner’s account values in all of the variable investment options or subaccounts plus the value of any amounts allocated to available fixed account options, if any.
Unit ValuesEach subaccount has a unit value, which is similar to the net asset value (NAV) of a mutual fund. The unit value measures the numerical worth of the assets in a subaccount, per unit of the subaccount owned. The unit value increases or decreases, respectively, with the positive or negative investment performance of the underlying mutual fund in which the subaccount invests, and is reduced by insurance charges and the fees and expenses of the underlying mutual fund. Unit values vary among the subaccount options inside a variable annuity. A contract owner’s account value allocated to a particular subaccount is equal to the number of units of the subaccount owned multiplied by the current unit value.
Unit values apply to variable annuities in both the accumulation phase and the payout phase. Although the specific unit values differ between the accumulation and payout phases, the concept is the same. During the payout phase, contract owners are entitled to receive a determined number of units of benefit, which translate into an income payment amount based on the unit value at the time of payment. The unit value and resultant income payment may increase or decrease due to investment performance.
Variable Investment Options Variable annuities offer investment choices called subaccounts, a selection of funds similar to publicly sold mutual funds, often managed by the same fund managers (most variable annuities also offer a fixed account, effectively an embedded fixed annuity, within the variable contract). The value of the subaccounts will fluctuate over time, and the variable annuity’s return will be based on the investment performance of those subaccounts.
A variable annuity contract will generally permit the owner to choose from a range of subaccounts with different asset classes and strategies. The choices may include equity funds, bond funds, balanced funds, money market funds, and specialty funds such as international and sector funds.
The subaccounts are often managed by a variety of investment advisors, who may or may not be affiliated with the insurance company. In fact, a number of well-known mutual fund companies offer subaccounts that serve as investment options or provide professional fund management services for variable annuities.
Variable Annuity Portfolio AllocationVariable annuities offer investors a wide variety of funds to choose from to match their risk tolerance and views of the market. There are different types of asset allocation programs available to help variable annuity purchasers analyze their risk tolerance and decide on a specific mix of funds. Choosing the right mix can be a complex process.
Portfolio Rebalancing Once a contract owner has decided on the investment mix best suited for his or her needs, premium payments are allocated in accordance with those percentages. However, as time goes by, market performance may alter the percentage of the variable annuity’s contract value held in certain subaccounts (e.g., equity exposure may be significantly higher after a period of strong stock market returns). Many variable annuity issuers offer programs that automatically maintain

46 IRI Retirement Fact Book 2020, 19th Edition
a pre-determined investment diversification based on the specific needs of each investor. These programs, referred to as portfolio rebalancing programs, periodically reallocate variable annuity contract assets among fixed and variable investment options to reflect the proportions originally selected.
Dollar Cost Averaging Contract owners who are wary of investing when the market is at a peak can take advantage of dollar cost averaging programs offered under many variable annuity contracts. An owner may choose to allocate a substantial portion of his or her premium payments to a particular stock fund. If the allocation is made all at once, it is possible that a single purchase price could be locked in when asset values of the stock fund are relatively high. With dollar cost averaging, the premium is systematically transferred (typically from the variable annuity’s fixed account option or a money market option) to one or more stock, bond, or balanced funds over a specified period of time, with the goal of investing at lower, as well as higher, prices. While dollar cost averaging does not ensure a profit or protect against a loss, it can be an effective investment technique.
Importance of Tax Deferral to Portfolio Allocation The benefits of tax deferral are vital to rebalancing programs and dollar cost averaging. In a taxable account, such as a stand-alone mutual fund, each time an investor sells a stock, mutual fund, or other investment, and replaces it with another in order to reallocate assets, the investor can be required to pay short- or long-term capital gains tax on any investment growth. With a variable annuity, an owner can rebalance between funds as desired without being taxed, thereby maximizing investment potential.
Transfers While variable annuity contract owners may transfer money, tax free, from one investment option to another during the accumulation period, certain restrictions typically apply. Owners may be restricted to the number and amount of transfer payments allowed in any given year from a fixed account contained inside a variable annuity contract. Another restriction may also limit the number of transfers made among the variable investment options within a specified period of time. Transfers in excess of such limits may be subject to nominal administration charges or alternative transfer request methods, such as a requirement to send such requests via U.S. Mail versus online or telephonic instruction.
How Is the Value of a Fixed Annuity Measured?Fixed annuities offer a rate of return that is determined by the insurance company for a set period of time, subject to a specified minimum. When the applicable period is over, the company may offer a new rate for the next period, which can be for a different length of time. Fixed annuities generally specify a minimum credited interest rate for the lifetime of the contract.
There are several types of deferred fixed annuities available, each with its own method of crediting interest.
• Book value deferred products earn a fixed rate for a guaranteed period. The surrender value is based on the annuity’s purchase value plus credited interest, net of any charges.
• Market value adjusted (MVA) annuities are similar to book value deferred annuities, but the surrender value is subject to a market value adjustment based on interest rate changes.
• Fixed indexed annuities (FIA) guarantee that a certain rate of interest will be credited to

Chapter 4: Annuities 101 47
premiums paid but also provide additional credited amounts based on the performance of a specified market index (such as the S&P 500).
Individual fixed indexed annuity contracts have additional interest crediting provisions. These include:
• Crediting method — the method used to measure the change in the underlying index, e.g., point-to-point or annual reset.
• Participation rate — the percentage of the calculated index gain credited to the contract owner as interest. This can be guaranteed or eligible for reset.
• Spread/Margin — the percentage by which the gross index gain is reduced before being credited to the contract owner as interest.
• Cap — the maximum index-based interest credited to the contract owner. This can be guaranteed or eligible for reset.
• Volatility Controlled Indexes — custom indexes intended to mute the effect of ups and downs in the markets they track; may be used instead of, or in conjunction with, participation rates, caps, and spreads.
What Happens to the Annuity Value if the Contract is Surrendered?Deferred annuity contracts permit the contract owner to surrender the annuity contract during the accumulation period and receive a cash payment from the insurance company. This amount is called the cash value or cash surrender value of the contract. It equals the sum of premiums paid plus any earnings, minus prior withdrawals and charges deducted. The owner may take partial withdrawals or fully surrender the contract during the accumulation phase. Penalties for early withdrawal may be incurred and federal income taxes will apply to any gain in the contract value. The amount paid to the contract owner on surrender may be subject to surrender charges, which generally range from 5 percent to 7 percent. Some deferred annuity contracts impose surrender charges only for an initial period after the contract is purchased; others start a new surrender charge period for each individual premium paid. Surrender charges usually decline to zero over a period of time, such as five or seven years.
A partial surrender is the withdrawal of an amount less than the entire cash surrender value of the contract. Partial surrenders can also be taken as a pre-scheduled series of payments under a systematic withdrawal plan. Many contracts permit annual withdrawals of an amount, such as 10 percent of the contract value, free of a surrender charge. Tax penalties may apply, however, in the event such withdrawals occur prior to the contract owner reaching age 59½.
How Are Annuities Used to Generate Retirement Income?While much of the focus on annuities in recent years has been on their value as a savings vehicle for retirement, their value as a source of lifetime income during retirement is equally important. Traditional sources of guaranteed retirement income are diminishing at the same time retirees are living longer, more active lives. This places the burden on individuals to both carefully save for retirement and wisely manage their investments during retirement, so their money lasts as long as they live. How retirees decide to receive income from their annuities once they retire can play

48 IRI Retirement Fact Book 2020, 19th Edition
an important role in achieving this outcome.
What Are the Various Options for Receiving Retirement Income?Once a person is ready to retire, annuities offer a number of retirement income options. The contract owner can choose to receive all the assets from the annuity at once, opt for a series of withdrawals of his or her choosing until all the assets are exhausted, or decide to exercise the annuitization features of the contract.
The following information pertains to non-qualified annuities that are purchased with after-tax dollars. While the payout options available are the same for annuities purchased as part of qualified retirement plans, as discussed in the last section of this chapter the tax consequences are different.
Lump-Sum Option When a contract owner elects a lump-sum distribution, the annuity is surrendered and all assets are withdrawn from the contract. Taxes will be due on earnings in the year the money is received and tax penalties may apply to withdrawals before age 59½. With this option, individuals are still faced with the need to generate a guaranteed stream of income.
Systematic Withdrawal Plan With a systematic withdrawal plan, the assets are left in the annuity and the contract owner receives distributions at regular intervals until the assets have been exhausted or the contract owner elects to suspend the operation of the plan. All earnings on the investment are considered to be distributed before any return of principal and are taxable at ordinary income tax rates. Assets remaining in the annuity continue to grow tax deferred until withdrawn.
The principal advantages of a systematic withdrawal plan are the flexibility provided to the contract owner and the ability to maintain full ownership of the assets. The principal disadvantage is that the contract owner retains the risks associated with both uncertain longevity and investment fluctuations, particularly the exposure to adverse market performance during the early stages of retirement.
If a specified dollar amount is withdrawn each period, whether adjusted for inflation or not, the contract owner assumes the full risk of market cycles. The very principles that recommend dollar cost averaging as a successful strategy for entering the market work against the contract owner in a liquidation strategy. Withdrawal of a fixed dollar amount means that a higher percentage of assets will be liquidated in a down market than in an up market. This can be a very dangerous strategy, even if long-term investment performance meets anticipated targets, since the withdrawal of assets in earlier years can prevent the overall portfolio from achieving the projected return.
The withdrawal of a specified percentage of assets rather than a specified dollar amount may help reduce this risk. Many people plan their retirement income based on an average rate of return on their investments (such as 8 percent). If they happen to retire during a time of far lower (or even negative) returns, however, the specified percentage of assets they withdraw may not provide sufficient income to maintain their desired lifestyle. To help reduce the impact of market fluctuations on retirement income, it is important for retirees to have a variety of diversified

Chapter 4: Annuities 101 49
investments in their portfolios, including annuities, which can help create a guaranteed source of income that will last as long as they live.
Guaranteed Withdrawals Contract owners electing a guaranteed minimum withdrawal benefit (GMWB) rider can choose to receive the value of their investment through annual withdrawals (up to a set percentage) at least until the entire amount invested is completely recovered. Contract owners electing a guaranteed lifetime withdrawal benefit (GLWB) can choose to withdraw a percentage of their contract value each year for as long as they live, even if the account value is exhausted. All earnings on the investment are considered to be distributed before any return of principal and are taxable at ordinary income tax rates, as are any payments made by the insurance company should the account value be reduced to zero.
Contract owners electing these benefits have greater control over their assets but may receive less on a monthly basis than if they annuitized. While some GLWBs are beginning to tailor the percentage withdrawal to the age of the contract owner, it is only through annuitization that an investor can truly take advantage of the increased income that comes with risk pooling.
Annuitization Annuitization involves turning the contract owner’s accumulated assets into a stream of income based on the amount of the contract, the annuitant’s age, payout choices, etc. The insurance company guarantees that it will provide payments for the life of the annuitant(s). With a deferred annuity, money is saved and invested during the accumulation period, and then annuity payments are received during the income period (e.g., during retirement). With an immediate annuity, payments begin immediately or within one year after the annuity is purchased. Payments can be either fixed or variable and guaranteed for one person’s life, for the lives of two people, and/or for a specified period of time. Payments can also be structured with a cash refund feature, which provides for a payment to beneficiaries of an amount equal to the difference between the annuitized amount and the total payments made prior to the annuitant’s death, should death occur before payments at least equal the amount annuitized.
Deferred Income Annuities With a deferred income annuity (sometimes called longevity insurance), a retiree can purchase a contract at one point in time, for example, at age 65, but defer payments until a later time, for example, at age 85. Individuals not living until the commencement age will not receive benefits; and individuals who do live to the required age and beyond, will receive income payments. Because these products usually have no death or living benefits, and not all contract owners will live long enough to collect income, insurance companies can maximize insurance leveraging (risk pooling) and thus make larger income payments to retirees still living. Recent innovations include optional death benefit and joint and survivor payments, but the trade-off is a higher premium or smaller monthly payments. The issuance of new regulations from the U.S. Treasury in June 2014, the “Qualified Longevity Insurance Contract” rules, provided clarity around the use of these products in qualified plans by establishing a deferred income annuity purchase amount limit of the greater of 25 percent of account value or $125,000 ($135,000 in 2020, up from $130,000 in 2019) and created provisions for the addition of a death benefit and the ability to reverse an excess purchase payment in order to avoid tax penalties.

50 IRI Retirement Fact Book 2020, 19th Edition
What Are the Benefits of Annuitization?By exercising the annuitization option of a deferred annuity (or by purchasing an immediate annuity), the contract owner can transfer the longevity risk to the insurance company and, if a fixed annuity is chosen, the investment risk as well.
As mentioned earlier, annuities are the only financial instruments available today, other than Social Security and pensions, that can guarantee a lifetime stream of income during retirement. Annuitizing a portion of retirement savings provides retirees with an effective hedge against outliving their assets. And because annuity owners are part of a mortality pool, the annuity payments received are larger than they could generate by saving on their own and systematically withdrawing funds in amounts that give them a reasonable assurance of not running out of money.
As part of a comprehensive retirement portfolio, annuities both reduce the risk of running out of money if a person lives a long life and increase the amount of each income payment received.
What Types of Annuity Payout Options Are Typically Available at Annuitization? One of the first choices contract owners may have to make once they decide to annuitize is whether to receive fixed or variable payments. Owners of deferred fixed annuities can elect only a fixed payout option. Owners of deferred variable annuities, however, can sometimes choose either fixed or variable payouts. Once a selection is made, it is usually irreversible. With fixed payments, the insurance company sets a given amount it will pay (typically monthly) for the term of the contract. With variable payments, the amount of each payment is not guaranteed but changes with the performance of the underlying portfolio selected by the contract owner. Fluctuations in these payments can sometimes be reduced by opting for level payments (which hold payments level for a certain period of time) or stabilization guarantees (which provide a floor below which payments will not fall).
Life Annuities A life annuity provides an income stream guaranteed to last as long as the annuitant lives. Under a straight or pure life annuity, annuity payments stop when the annuitant dies. A joint and survivor annuity (often selected by spouses) provides income for as long as either of the two annuitants is alive, although the amount of each payment will be less than if the payment were based on a single life. Payments can stay the same or decrease after the death of the first annuitant. Under a joint and two-thirds annuity, each payment made after the death of the first annuitant is two-thirds of the amount paid while both annuitants were alive. This can be an effective strategy, as it results in a higher payment when both annuitants are alive and expenses will likely be lower for one person than for two.
As discussed previously, a valuable feature of an annuity is the fact that it can generate higher income payments than an individual systematic withdrawal plan and continue payments for as long as a person lives. But what about the investor who does not live long enough to receive many payments? There are a number of options for mitigating this risk. Each, however, results in a lower basic periodic payment.

Chapter 4: Annuities 101 51
Period Certain Annuities With a period certain annuity, payments are guaranteed to continue for a specified time, for example, 10 years, no matter how long the annuitant lives. If the annuitant dies before the period has expired, payments continue to the designated beneficiaries for the remainder of the period. Period certain annuity payments typically are available for periods from five to 30 years. This option, however, offers no protection against longevity risk as payments are only made for the fixed period selected.
Life Annuities With a Period Certain Life annuities with a period certain option guarantee payments for the life of the annuitant, but also guarantee that these payments will continue for a set period of time if the annuitant dies before the period has expired. Payments continue to the designated beneficiaries until the guarantee period has ended.
Cash Refund Annuities With a pure life annuity, payments stop when the annuitant dies. In the most extreme case, an annuitant could die after one payment is made. Some annuitants prefer to hedge against this possibility by setting up a life annuity with some form of refund feature. As indicated earlier, adding such provisions results in a lower payment than would otherwise be the case.
There are two types of refund annuities now being offered that pay a refund to the beneficiary if the annuitant dies before the total of the annuity payments received equals the premiums paid for the annuity.
• A cash refund annuity provides for a lump sum refund of the premium minus the annuity payments already made at the time of the annuitant’s death.
• An installment refund annuity provides that payments will continue in installments until the amount received is equal to the premiums paid.
Risk Tolerance vs. Longevity In deciding what type of annuity payment option to choose and how much to commit to it, individuals must determine their risk tolerance with respect to their possible longevity, as well as the relative importance to them of receiving lifetime income versus leaving money to their heirs. All else equal, individuals who live beyond average life expectancy will generally realize higher income but lower estate values when using annuities versus other approaches.
How Are Variable Annuity Payment Amounts Determined?The amount of each payment received from a fixed annuity is calculated at the time of annuitization and does not change during the life of the contract. The amount of each variable payment, on the other hand, fluctuates based on the investments chosen. Since the investment return of the portfolio cannot be determined in advance, some assumptions must be made in order to calculate the amount of the initial payment under the contract. This is accomplished by selecting an assumed interest rate, or AIR. After the initial payment, each subsequent payment is determined by adjusting the previous payment up or down based on the actual performance of the underlying portfolio for the period of time in question. If the portfolio earns more than the AIR, the subsequent payment will increase. If the portfolio earns less, the payment will decrease. If it earns the same amount, the payment will stay the same.

52 IRI Retirement Fact Book 2020, 19th Edition
Some contracts set the AIR, but most allow the contract owner to choose from a range (usually 3 percent to 6 percent), the outside limits of which are set by state regulations. Selecting a low AIR will cause payments to increase faster with higher positive returns, or decline more slowly with low or negative returns, than if a higher AIR were selected. However, the initial income payment will be less than if the higher AIR were selected.
Level Annuity Payments Some variable annuity contracts provide payment streams that can be adjusted at periodic intervals of up to 12 months, rather than on a monthly basis, in order to provide the annuitant with an element of certainty. This allows the annuitant to plan on a given level of payments for the period in question. When the periodic adjustments are made, however, they are likely to be more substantial than if the adjustments had been calculated more frequently.
Payment Stabilization Guarantees Other variable annuity contracts offer payments supported by “floors.” These floors guarantee that subsequent payments will never be less than a given percentage of the original payment e.g., 85 percent or 100 percent, regardless of the performance of the underlying portfolio. Some provisions, limit the investment choices underlying the annuity, providing the insurance company with the opportunity to hedge its guarantee with derivative instruments. These floors provide contract owners with a safety net that may make them more comfortable with having their annuity payments subject to the variability of stock market performance. If a contract owner chooses this feature, however, payment amounts will be lower than if no floor were elected.
Liquidity Options Historically, once an annuity contract was annuitized the stream of payments could not be altered. Some insurance companies now offer life annuities that allow annuitants who have also selected a period certain option to receive an advance of a given percentage of income payments, subject to certain restrictions that vary by company. These partial commutations, as they are called, reduce the remaining annuity payments. Some companies also allow the liquidation of the entire annuity, converting the value of the future stream of income into a lump-sum payment. If this option is exercised, all future payments cease.
How Are Annuity Payments Taxed? If an annuity (fixed or variable) was purchased with non-qualified or after-tax dollars, a portion of each payment is considered to be a tax-free return of principal. The remainder of the payment is subject to taxation to the extent it represents earnings. Current federal income tax law specifies that the taxable portion of annuitized payments is taxable at ordinary income tax rates.
To determine the amount of each fixed annuity payment that qualifies as a tax-free return of principal, the insurance company makes an underlying calculation based on a formula known as the “exclusion ratio.” For variable annuities, since the amount of each future payment is unknown, a different calculation is performed to determine the exclusion amount.
If an annuity was purchased with qualified or pre-tax dollars using funds from a 403(b), a 401(k), or an IRA (other than a Roth or an after-tax IRA), the full amount of each distribution is taxable at ordinary income tax rates, even the amount attributable to principal.
Qualified assets, once they have been annuitized, are not subject to the required minimum distribution rules of the Internal Revenue Code since the insurance company is deemed to have

Chapter 4: Annuities 101 53
already made the appropriate calculation for a lifetime distribution of the underlying assets. (See Chapter 14: Regulation and Taxation of Annuities, for more details on taxation.)
How Are Annuities Used in Estate Planning? A variable annuity, while not designed as an estate planning tool, does offer some benefits in this area. An annuity avoids probate, provides flexibility when passing on assets to heirs, and can potentially increase the likelihood of leaving a larger estate in some circumstances.
Variable Annuities Avoid Probate — A variable annuity is a contract between an owner and an insurance company. The contract requires that a beneficiary be named. When a contract owner dies, there is a payout directly to the beneficiary. As a result, the annuity assets do not go through the probate process.
Probate, or the distribution of a deceased’s assets via the court system, can be costly and time consuming. There are attorney fees, court costs, and administrative expenses, and the process slows the distribution of proceeds. Plus, probate proceedings are a matter of public record. Assets held in a variable annuity bypass this process and go directly to the beneficiary.
Variable annuity proceeds will be subject to probate only if the estate is named as beneficiary, when no beneficiary is named, or when a death benefit is disclaimed by the beneficiary and no contingent beneficiary is named.
The Restricted Beneficiary Option Offers Advantages — Naming a restricted beneficiary is a unique option available to an annuity owner. This enables the owner to direct the amount, frequency, and timing of the distributions. Choosing the restricted beneficiary option provides the added benefit of continued tax-deferral over the life expectancy of the beneficiary. The individuals named as beneficiaries get payouts over a period of time, during which the proceeds grow tax deferred and compound over time, potentially providing many times more from the investment than a lump-sum payout. An individual must be directly named as beneficiary to take advantage of this treatment. It is necessary to complete paperwork instructing the insurer how to distribute the death benefit proceeds.
A Single Premium Immediate Annuity as an Estate-Building Tool — Here is an example of an annuity product that can, under some circumstances, increase the value of an estate. A single premium immediate annuity (SPIA) is usually not considered to be a vehicle that can help preserve or increase the size of an estate. Indeed, many people have the false belief that a SPIA always reduces the size of the estate. However, for those retirees who need to make regular withdrawals from their assets, a portfolio that uses a SPIA is more likely to leave a larger estate than a portfolio without it. Consider an example. Most retirees, especially as they age, place at least half of their money in fixed investments, usually bonds or certificates of deposit. Regular income is often taken from these fixed investments. As of April 1, 2020, the average 10-year High Quality Market (HQM) Corporate Bond Spot Rate was 2.77 percent. For a retiree to withdraw $1,000 a month ($12,000 per year) from high quality corporate bonds, that person would have to invest approximately $434,000. In 10 years the retiree would get back the original $434,000.
At the same time, a 70-year-old male could elect to receive the same $1,000 monthly income from a SPIA with a 10-year certain period for a premium of about $180,000. Imagine a 70-year-old retiree who has $434,000 in retirement savings and decides to use $175,000 for a SPIA while investing the remaining $259,000 in a side fund for long-term growth. After 10 years,

54 IRI Retirement Fact Book 2020, 19th Edition
assuming an annual return from a balanced portfolio of approximately 5.4 percent per year, the side fund would grow to the same $434,000. The side fund would also be significantly larger if the returns were higher, as would certainly be possible based on the long-term average return of a diversified investment portfolios. According to Vanguard the historic average annual return of a 40 percent stocks, 40 percent bonds portfolio from 1926-2018 was 7.7 percent, which would grow the hypothetical side fund in this example to over $547,000. In addition, the retiree continues receiving the $1,000 monthly payment from the annuity for life, while the bond holder would get no further income after the bonds mature and may have to reinvest the proceeds at a lower interest rate (though the value of the bonds would likely have risen in this scenario, providing a partial offset). A 70-year-old male has an 80 percent chance of living 10 years, a 63 percent chance of living 15 years, and four in 10 70-year-olds can expect to reach at least age 90, which means that most people who buy a SPIA at age 70 will be alive at age 80 and are likely to have more money and more income with a SPIA and a side fund than if they relied solely on bonds for income.
A Variable Annuity Offers a Death Benefit — Most variable annuities offer a death benefit, which guarantees that if the annuity owner dies at a time when the market value is less than the money they put into it because of market declines, the beneficiaries will get the original purchase amount, minus any withdrawals that may have made. In some cases, the beneficiaries can receive more than was invested via an enhanced death benefit, which steps up the death benefit payout based on positive performance of the investments, or a fixed percentage increase annually in the promised death benefit payout. A beneficiary must often recognize income and pay taxes on the earnings portion of the death benefit payout. The earnings enhancement death benefit can help offset a higher tax bill. Overall, annuities are not designed as estate-planning tools. But these products do help a person protect his or her financial security and can often lead to a larger estate if an annuity is invested in a retirement portfolio.
How Are Annuity Products Developed and Sold? In the United States, commercial annuities are issued by insurance companies. When new fixed and variable products are developed, they must be filed with the state’s insurance department. Before these products can be sold, each state where they will be available must provide written approval.
Because variable annuities are considered securities as well as insurance products, when a new variable annuity is developed, a registration statement must be filed with the Securities and Exchange Commission (SEC). This statement includes a prospectus that discloses, among other things, the fees and charges associated with the annuity contract; a description of the various benefits, rights, and privileges afforded under the contract; any changes that can be made to the contract; and the risks and tax consequences associated with investing in the contract. The prospectus, which is updated annually, is a vital source of information for all contract holders and should be read thoroughly.
Insurance Company Ratings Annuity guarantees are subject to the claims-paying ability of the issuing insurance company. It is therefore important to consider the financial soundness of a company before making a purchase. Companies are rated by one or more of the following independent industry analysts: AM Best Company, Standard & Poor’s, Fitch Ratings, and Moody’s Investors Services. The ratings do

Chapter 4: Annuities 101 55
not apply to the underlying mutual funds, which are subject to market risk and will fluctuate with changes in market conditions. Ratings can differ somewhat among the analysts, so it is useful to check the ratings from at least two analysts.
Who Can Sell Annuities? People who sell variable annuities need training in both securities and insurance. This training can be obtained from many sources. Some distributors provide in-house training to their registered representatives; others utilize training provided by insurance company wholesalers and independent third-party educators.
Fixed annuity sellers receive much of the same instruction as those selling variable annuities but do not need the securities training.
In order to sell annuities, individuals must first obtain a state insurance license from the state in which their office is located. A non-resident license must be obtained for all states in which out-of-state clients reside.
Since variable annuities are considered securities under federal securities laws, individuals who wish to sell them must, in addition to having an insurance license, be associated with a broker-dealer, be federally registered as a representative, and pass a Series 6 exam, or the more comprehensive Series 7 exam. In some jurisdictions, a state securities license is also required.
Where Can Annuities Be Purchased? Some insurance companies sell their products only through a dedicated sales force (captive agents); others use agents who represent many companies and have no primary relationship (independent agents). But annuities can also be purchased from a variety of different sources, some of which may sell both fixed and variable annuities while others may market only one type.
Variable annuities can be purchased through a number of different distribution channels, such as independent FINRA firms, wirehouses, regional investment firms, captive agents, and banks. Fixed annuities are sold through these same distribution channels, yet sales are dominated by independent agents and banks. The difference in the percent of sales by distribution channel for fixed and variable annuities may be explained, at least in part, by the fact that purchasers of fixed annuities tend to be more conservative with their investments than those who buy variable annuities.
How Are Variable Annuity Commissions Determined? Broker-dealer firms may be paid a commission by insurance companies when they sell variable annuity contracts. The amount of compensation depends upon the issuing insurer, the relationship the broker-dealer has with the insurer, the types of annuities sold, the amount of money invested in the annuity, and the manner in which commissions are paid. Commissions can be paid in full at the time the annuity is sold, as a level commission over the life of the contract or some other period, or as a smaller amount at the time of the sale with a trail commission

56 IRI Retirement Fact Book 2020, 19th Edition
paid each year thereafter for a period. Both fixed and variable annuities may also be sold within managed, fee-based accounts, where the account is charged an ongoing annual fee and there is no commission paid on the sale of the annuity.
Registered sales representatives are, in turn, paid a commission when they sell an annuity contract. Commissions paid to representatives are generally less than the full amount paid to the broker-dealer and may or may not be on the same basis. Also, certain management personnel, such as branch managers, may be paid for sales made by representatives over whom they have supervisory responsibility.
In addition to commissions, the broker-dealer may receive other forms of compensation from insurance companies, such as lodging, travel, and meals at insurance company-sponsored meetings. Some broker-dealers also receive monetary and other support to conduct client and educational seminars.
Insurance companies recoup the commissions and other compensation they pay through the various fees, charges, and deductions within the annuity contract, including any sales load that may be imposed, but no one charge is specifically earmarked to pay commissions.

Chapter 5: State of the Industry 57
State of the IndustryOverviewAt the mid-point of 2020, COVID-19 and civil unrest are weighing heavily on the economy, and interest rates persist at ultra-low levels. Equities markets have recovered to start-of-the-year levels, with the NASDAQ up over 10 percent, but the effect of re-opening the economy is not yet understood in terms of what it means for the impact of the virus. With this as a backdrop, consumers are likely even more concerned about retirement risks and the possibility of outliving savings. Already uncertain how to use retirement account balances to create sustainable lifetime income and worried about potential Social Security insolvency and rising medical costs, they are now forced to consider a level of market volatility even worse than what they saw during the financial crisis more than a decade ago. These factors should be putting insured retirement solutions squarely on the radar of retirement savers and financial advisors, both for guaranteed income and protection against market loss. Today, too few Americans are using, or are even aware of, annuities, and too few are consulting with financial professionals regarding their retirement needs, wants, and aspirations. Evidence abounds that annuities and advisors improve outcomes. The insured retirement industry is focused on improving technologies that enable seamless inclusion of annuities in retirement portfolios. It is focused on promoting legislation that encourages and empowers Americans to save for retirement. And it is focused on getting the message to consumers that guaranteed income and protection from market downturns are valuable aspects of annuities that can help them live their best lives in retirement.
This chapter looks at the developments that were significant for the insured retirement income industry in the past year, and which will work to shape the future in 2020 and beyond.
Growing Need for Insured Retirement Solutions• Americans’ wealth continues to grow. Fidelity Investments reported the average 401(k)
balance was $105,200 in the third quarter of 2019, down slightly from an average of $106,500 in the third quarter of 2018. For long-term savers (those in their plans for 10 or more years) the average balance reached a record $306,500 in Q3 2019, versus the previous high of $306,000 in Q3 2018.
• Americans are also growing more dependent on their assets to generate sufficient retirement income. IRI research on Americans retired for between five and 15 years finds that 79 percent of retirees with at least $100,000 in retirement savings receive pension payments, with 64 percent citing a pension as providing at least 25 percent of their income from a pension.1 Meanwhile, only 28 percent of Baby Boomers receive or expect a pension.2
• Demographic shifts are under way that have far reaching implications for the marketing
5CH
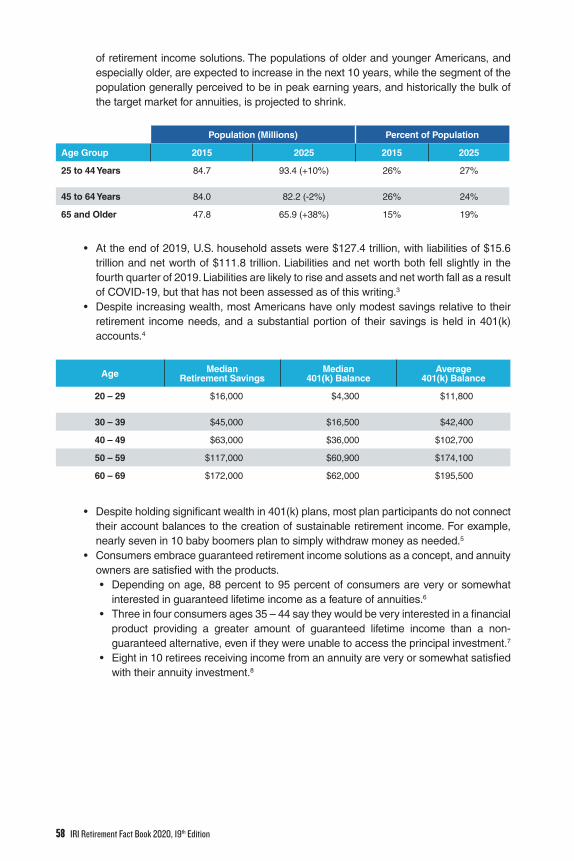
58 IRI Retirement Fact Book 2020, 19th Edition
of retirement income solutions. The populations of older and younger Americans, and especially older, are expected to increase in the next 10 years, while the segment of the population generally perceived to be in peak earning years, and historically the bulk of the target market for annuities, is projected to shrink.
Population (Millions) Percent of Population
Age Group 2015 2025 2015 2025
25 to 44 Years 84.7 93.4 (+10%) 26% 27%
45 to 64 Years 84.0 82.2 (-2%) 26% 24%
65 and Older 47.8 65.9 (+38%) 15% 19%
• At the end of 2019, U.S. household assets were $127.4 trillion, with liabilities of $15.6 trillion and net worth of $111.8 trillion. Liabilities and net worth both fell slightly in the fourth quarter of 2019. Liabilities are likely to rise and assets and net worth fall as a result of COVID-19, but that has not been assessed as of this writing.3
• Despite increasing wealth, most Americans have only modest savings relative to their retirement income needs, and a substantial portion of their savings is held in 401(k) accounts.4
Age MedianRetirement Savings
Median401(k) Balance
Average401(k) Balance
20 – 29 $16,000 $4,300 $11,800
30 – 39 $45,000 $16,500 $42,400
40 – 49 $63,000 $36,000 $102,700
50 – 59 $117,000 $60,900 $174,100
60 – 69 $172,000 $62,000 $195,500
• Despite holding significant wealth in 401(k) plans, most plan participants do not connect their account balances to the creation of sustainable retirement income. For example, nearly seven in 10 baby boomers plan to simply withdraw money as needed.5
• Consumers embrace guaranteed retirement income solutions as a concept, and annuity owners are satisfied with the products.• Depending on age, 88 percent to 95 percent of consumers are very or somewhat
interested in guaranteed lifetime income as a feature of annuities.6
• Three in four consumers ages 35 – 44 say they would be very interested in a financial product providing a greater amount of guaranteed lifetime income than a non-guaranteed alternative, even if they were unable to access the principal investment.7
• Eight in 10 retirees receiving income from an annuity are very or somewhat satisfied with their annuity investment.8

Chapter 5: State of the Industry 59
Developments in 2019• Fixed indexed annuities (FIAs) continued to capture more sales than any other annuity
product type. While off recent highs, FIAs currently account for almost one-third of total annuity sales, having surpassed variable annuities with lifetime income benefits (VAGLIB) in 2018.
• Fee-based variable annuity product issuance slowed, with existing fee-based annuities closing to new investors at approximately the same amount
• Fee-based annuity sales continue to grow as a percentage of variable annuity sales, but have consistently represented about 3 percent of total annuity sales for the past decade.
• Fee-based fixed indexed annuities are just beginning to reach the market, with little sales activity to date. However, this trend foretells more versatility for fee-based advisors in terms of the types of annuity products that can be seamlessly used in wrap accounts.
• Insurers including Nationwide, Lincoln National, Pacific Life, and Great American received private letter rulings (PLR) from the Internal Revenue Service (IRS) asserting that the payment of an advisory fee from a variable, fixed indexed, or hybrid non-qualified annuity can be structured so as to not give rise to a taxable distribution.
• The SECURE Act passed, which will create more opportunity for Americans to save for retirement and access lifetime income products.
Looking Into 2020• At the start of the year, IRI was optimistic there would be a moderate rise in sales
in 2020, driven by demographic trends, improvements in technology and processes, and the desire among investors to lock gains and establish a loss floor after more than a decade of overwhelmingly positive market performance. COVID-19, and resulting constriction in the ability of advisors to work with clients, will almost certainly have an impact on sales this year.
• Other headwinds in 2020 include persistently low interest rates, ongoing efforts by the states to enact fiduciary regulations, and friction in the transaction process acting as a barrier to entry for new and fee-based advisors.
• Potential emerging opportunities: renewed interest in stand-alone living benefits as options within managed account platforms, annuity options in defined contribution plans under the recently passed SECURE Act, continued growth and design evolution in structured annuities, and continued advances in enabling the integration of annuities into portfolios in planning software.
• A positive side-effect of the COVID-19 shutdown will be the acceleration of digital efforts, bringing annuity transaction processing much closer to the experience advisors are accustomed to when transacting in mutual funds and other securities. This has the potential to significantly increase annuity sales in years to come by providing greater efficiency for the advisor and a better experience for the consumer.

60 IRI Retirement Fact Book 2020, 19th Edition
Annuity Market ReviewIn 2016, fixed annuities surpassed variable annuities in market share for the first time, capturing 51% of annuity sales that year, led primarily by large annual increases in fixed indexed annuity sales throughout the decade. As of the end of 2019, fixed products account for about 57% of total annuity sales, with fixed indexed annuities surpassing $70 billion in annual sales for the first time. Variable annuities with embedded or optional guaranteed lifetime withdrawal benefits have lost more than half of their market share, falling from 59 percent of total sales in 2011 to 26 percent in 2019. This can be attributed in part to a falloff in 1035 exchanges – when guaranteed lifetime income benefits were first introduced, it was advantageous for investors to exchange from older variable annuities lacking such benefits to the newer products. Post-financial crisis and the de-risking of these benefits due to the persistent low interest rate environment, the reverse is true – investors are more likely to find it economically advantageous to remain in an older product with a richer guarantee.
A bright spot in the variable landscape are structured annuities, also referred to as Registered Index Linked Annuities, or RILAs. Structured annuities are index option-based products that provide a capped upside and limited (the insurance company will absorb market loss greater than x%) or buffered (the insurance company will absorb the first x% of market loss) downside protection. These products appeal to investors who are willing to take some risk of investment loss in exchange for greater participation in market index gains than offered by a fixed indexed annuity, which guarantees against any loss of principal due to market downturns. Sales of structured annuities are still small in dollar terms when compared to variable annuities with guaranteed income benefits or fixed indexed annuities, but they have grown considerable in market share in the past few years.
Figures 1 through 4 and the accompanying data tables show the evolution of annuity sales and market share over the past decade, on both a broad product type (fixed versus variable) basis and through the more detailed lens of product sub-type.
Figure 5-1a Historic Annuity Sales by Variable versus Fixed
Sources: Morningstar, Inc. and Beacon Annuity Solutions
0
50,000
100,000
150,000
200,000
250,000
2019201820172016201520142013201220112010
Group VA Individual VA Individual Fixed Individual Income
Tota
l Sal
es in
$M
illio
ns

Chapter 5: State of the Industry 61
Figure 5-1b Data Table: Historic Annuity Sales in $Millions
Broad Type 2010 2011 2012 2013 2014 2015 2016 2017 2018 2019
Group VA 14,401 13,949 14,669 14,543 13,264 13,508 13,769 13,068 11,443 11,013
Individual VA 122,538 140,633 129,250 127,523 124,522 117,548 90,810 83,113 87,707 87,247
Individual Fixed 68,445 67,092 57,788 67,053 78,509 85,867 95,695 87,386 113,611 117,564
Individual Income 7,958 8,481 9,197 11,030 13,021 12,523 12,317 10,459 11,412 11,916
Annual Totals 213,342 230,154 210,905 220,149 229,315 229,446 212,592 194,026 224,173 227,806
Figure 5-2a Historic Market Share by Product Type
Sources: Morningstar, Inc. and Beacon Annuity Solutions
Figure 5-2b Data Table: Historic Annuity Market Share
Product Type 2010 2011 2012 2013 2014 2015 2016 2017 2018 2019
Group VA 7% 6% 7% 7% 6% 6% 6% 7% 5% 5%
Individual VA 57% 61% 61% 58% 54% 51% 43% 43% 39% 38%
Individual Fixed 32% 29% 27% 30% 34% 37% 45% 45% 51% 52%
Individual Income 4% 4% 4% 5% 6% 5% 6% 5% 5% 5%
0%
20%
40%
60%
80%
100%
2019201820172016201520142013201220112010
Group VA Individual VA Individual Fixed Individual Income

62 IRI Retirement Fact Book 2020, 19th Edition
Figure 5-3a Historic Annuity Sales by Product Sub-Type
Sources: Morningstar, Inc. and Beacon Annuity Solutions
Figure 5-3b Data Table: Historic Annuity Sales by Sub-Type in $Millions
Product Type 2010 2011 2012 2013 2014 2015 2016 2017 2018 2019
Group VA 14,401 13,949 14,669 14,543 13,264 13,508 13,769 13,068 11,443 11,079
VA-GLWB 118,727 135,952 121,762 115,869 111,702 102,976 75,388 64,662 65,668 62,281
Fee-Based 3,700 4,200 4,700 5,800 5,900 6,000 5,300 6,800 8,800 5,875
Structured 70 457 1,413 1,783 1,776 3,746 7,314 9,085 11,074 17,248
IOVA 42 24 1,375 4,072 5,144 4,826 2,808 2,566 2,165 1,842
Fixed Indexed 33,080 32,978 34,198 38,710 47,958 54,603 58,756 54,276 69,882 72,466
Fixed- MVA 6,348 5,996 4,751 6,716 9,778 11,058 16,025 12,371 15,838 19,859
Fixed- Book Value
29,017 28,117 18,840 21,627 20,772 20,206 20,914 20,739 27,890 25,289
Income 7,958 8,481 9,197 11,030 13,021 12,523 12,317 10,459 11,412 11,916
Annual Totals 213,342 230,154 210,905 220,149 229,315 229,446 212,592 194,026 224,173 227,807
0
50,000
100,000
150,000
200,000
250,000
2019201820172016201520142013201220112010
Group VA VA-GLWB Fee-Based Structured IOVA
Fixed Indexed Fixed - MVA Fixed - Book Value Income
Tota
l Sal
es in
$M
illio
ns

Chapter 5: State of the Industry 63
Figure 5-4a Historic Market Share by Product Type
Sources: Morningstar, Inc. and Beacon Annuity Solutions
Figure 5-4b Data Table: Historic Annuity Market Share
Product Type 2010 2011 2012 2013 2014 2015 2016 2017 2018 2019
Group VA 7% 6% 7% 7% 6% 6% 6% 7% 5% 5%
VA-GLWB 56% 59% 58% 53% 49% 45% 35% 33% 29% 27%
Fee-Based 2% 2% 2% 3% 3% 3% 2% 4% 4% 3%
Structured 0% 0% 1% 1% 1% 2% 3% 5% 5% 8%
IOVA 0% 0% 1% 2% 2% 2% 1% 1% 1% 1%
Fixed Indexed 16% 14% 16% 18% 21% 24% 28% 28% 31% 32%
Fixed- MVA 3% 3% 2% 3% 4% 5% 8% 6% 7% 9%
Fixed- Book Value
14% 12% 9% 10% 9% 9% 10% 11% 12% 11%
Income 4% 4% 4% 5% 6% 5% 6% 5% 5% 5%
0%
20%
40%
60%
80%
100%
2019201820172016201520142013201220112010
Group VA VA-GLWB Fee-Based Structured IOVA
Fixed Indexed Fixed - MVA Fixed - Book Value Income
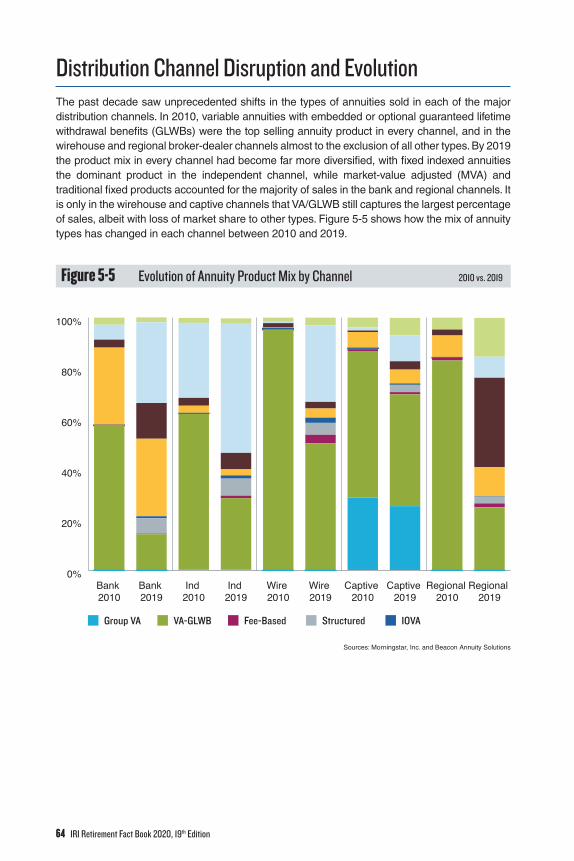
64 IRI Retirement Fact Book 2020, 19th Edition
Distribution Channel Disruption and EvolutionThe past decade saw unprecedented shifts in the types of annuities sold in each of the major distribution channels. In 2010, variable annuities with embedded or optional guaranteed lifetime withdrawal benefits (GLWBs) were the top selling annuity product in every channel, and in the wirehouse and regional broker-dealer channels almost to the exclusion of all other types. By 2019 the product mix in every channel had become far more diversified, with fixed indexed annuities the dominant product in the independent channel, while market-value adjusted (MVA) and traditional fixed products accounted for the majority of sales in the bank and regional channels. It is only in the wirehouse and captive channels that VA/GLWB still captures the largest percentage of sales, albeit with loss of market share to other types. Figure 5-5 shows how the mix of annuity types has changed in each channel between 2010 and 2019.
Figure 5-5 Evolution of Annuity Product Mix by Channel 2010 vs. 2019
Sources: Morningstar, Inc. and Beacon Annuity Solutions
0%
20%
40%
60%
80%
100%
Regional 2019
Regional 2010
Captive 2019
Captive 2010
Wire 2019
Wire 2010
Ind 2019
Ind 2010
Bank 2019
Bank 2010
Group VA VA-GLWB Fee-Based Structured IOVA
Fixed (Non-MVA) Fixed - MVA Indexed Fixed Income (SPIA)

Chapter 5: State of the Industry 65
Interest RatesLong-term interest rates fell steadily throughout 2019 and ended the year at 1.92%. With rates more than 100 basis points below 3%, capacity, withdrawal rates on GLWBs, and participation rates on fixed indexed products are constrained. While ending the year higher than a September low of 1.47%, rates need to move solidly higher for a sustained period in order to produce meaningful changes in annuity products. As of this writing the 10-Year Treasury rate is below 1%; though off a low of 54 basis points in early March, rates are far lower than historic norms and continue to have a negative impact on the industry.
Figure 5-6 10-Year Constant Maturity Treasury Rate: 2009 to 2019
Source: Federal Reserve Bank of St. Louis
Managing Risk and CapacityThe Milliman Hedge Cost IndexTM (MHCI) provides the estimated hedging cost for a hypothetical Lifetime Guaranteed Withdrawal Benefit block of business. Hedging cost fell in the fall of 2019 after rising steadily throughout the year, but moved to at least a seven-year high by May 2020 as long-term interest rates plummeted and volatility spiked. A complete description of the Milliman methodology can be found at http://www.milliman.com/mhci-methodology/.
0%
1%
2%
3%
4%
20192018201720162015201420132012201120102009

66 IRI Retirement Fact Book 2020, 19th Edition
Figure 5-7 Expected Hedge Cost for Hypothetical GLWB
Source: Milliman Hedge Cost IndexTM
Financial Resilience and Company StrengthWhile product focus has shifted away from variable annuities and the industry has further consolidated over the past few years as some carriers refocused their business lines, the industry remains fundamentally strong.
Positive Developments and Outlooks in 2019• The top 15 annuity carriers, which represent approximately two-thirds of total annuity
sales, all had at least an “A” rating from AM Best at the end of 2019. Since COVID-19, and as of this writing, none of the top carriers have been downgraded.
Number of Carriers AM Best Rating Market Share
6 A 25%
6 A+ 30%
3 A++ 13%
• Improvement in the transaction process and the advisor/customer experience continue to improve the environment for, and perception of, annuities. Carriers are focused on distributing/supporting products on advisory platforms such as Envestnet/FIDx and Simon. There is greater focus on using digital products and industry analytics for cost reduction, efficiency and customer experience. Newer technologies such as chatbots and artificial intelligence are beginning to be leveraged more effectively and workforces are being retrained to work differently.
• The industry continues to collaborate on changing the consumer perception of annuities through the Alliance for Lifetime Income’s “Retire Your Risk” campaign and other initiatives.
40
90
140
190
240
290D
ec-1
3M
ar-1
4Ju
n-14
Sep-
14D
ec-1
4M
ar-1
5Ju
n-15
Sep-
15D
ec-1
5M
ar-1
6Ju
n-16
Sep-
16D
ec-1
6M
ar-1
7Ju
n-17
Sep-
17D
ec-1
7M
ar-1
8Ju
n-18
Sep-
18D
ec-1
8M
ar-1
9Ju
n-19
Sep-
19D
ec-1
9M
ar-2
0

Chapter 5: State of the Industry 67
• Regulation Best Interest provided a workable standard to protect investors while also preserving access to investment and insurance products, and choice.
• The passage of the SECURE Act paves the way for increased retirement savings and broader use of annuities in defined contribution plans.
• While COVID-19 disrupted the longest bull market in history, the major indexes had recovered a significant portion of first quarter losses as of this writing, with the NASDAQ actually up over 10 percent for the year. Of course both the economy and securities markets are still quite uncertain during a period of both pandemic and civil unrest, but this should represent a tremendous opportunity for variable annuities with income guarantees, fixed indexed annuities, and structured annuities – products that can help investors lock gains and create floors against potential losses while continuing to participate in further market gains if the U.S. experiences a sharp recovery.
Headwinds• The uncertainty, unease and economic impact of COVID-19, the potential for ongoing
civil unrest, and a contentious presidential election year• Ongoing efforts by some states to enact their own fiduciary standards, with the potential
to ultimately create a patchwork of differing standards with which companies may find it difficult and costly to comply.
• As noted earlier, persistent low interest rates and market volatility and the resulting impact on product development and sales.
Advisors Make the Connection Automated investment advice (robo-advice) continues to develop and expand in terms of capabilities. However, such solutions remain primarily automated asset allocation tools with limited, or no, ability to help consumers make decisions about, and manage, products designed to help them generate sustainable income from their portfolios. The financial advisor is currently, and for the foreseeable future will be, the gateway through which consumers will find annuities. IRI continues to work with member companies to study advisor product knowledge, attitudes and how advisors view their roles, their practices, and their responsibilities to their clients. Some of the findings from those groups bear repeating and reinforcing this year:
• Advisors who successfully use annuities tend to perform complete financial reviews, identifying both financial goals and financial habits.
• Successful advisors do not shy away from characterizing annuities as insurance. They compare annuities to other solutions, such as managed accounts, and explain to the client that the annuity costs more because it insures against a negative outcome, such as market loss or loss of income.
• Advisors perceive that robo platforms are good for small portfolios, beginning investors, and the few true do-it-yourselfers, but ultimately consumers want advice from someone they trust. This also reflected in IRI consumer research, which consistently shows that investors, including millennials who generally prefer automated solutions in other aspects of their lives, prefer working with a human advisor when dealing with the complexity of planning for retirement.
• Advisors believe do-it-yourself does not work for most people due to paralysis of choice – there are simply too many options.
• Advisors continue to make significant investments in technology in order to maintain or increase efficiency.

68 IRI Retirement Fact Book 2020, 19th Edition
• Advisors are increasingly helping their clients manage all their retirement income sources, risks and insurance needs – Social Security, Medicare, Health Savings Accounts and health care in general, and long-term care – either within their own practices by hiring specialists, or through strategic partnerships.
• Managing family dynamics is often a large part of the value advisors deliver. Whether helping clients see the impact of overspending or showing them how their retirement will be affected if they continue to support adult children, financial advisors can help consumers avert a slow-motion disaster before it occurs – another function a robo-advisor simply cannot perform.
A decade ago IRI created the IRI Advisor Council, a diverse group of 30+ accomplished financial professionals who help inform and guide IRI’s research and outreach efforts. Annually during National Retirement Planning Week, these individuals gather in Washington, D.C. and conduct a Financial Fitness Fair for Senate and Congressional staff, helping to promote a deeper understanding of the importance and complexity of retirement planning, and the critical role financial advisors play. Twelve Advisor Council members provided financial counseling to 130 staffers during the April 2019 event, a new record for attendance. Unfortunately this event had to be cancelled in 2020 due to concerns about COVID-19, but IRI looks forward to resuming such events in the future.
Product Development Product development in 2019 was led by fixed and fixed indexed annuities; 23 new fixed indexed annuities were introduced, and 12 fixed products. The new fixed annuities consisted of four market-value adjusted (MVA) products and eight non-MVA products. On the variable side, 12 commissionable variable annuities with optional lifetime income benefits were launched, as well as nine fee-based VAs and five structured products (also referred to as “register index-linked annuities”, or RILAs).
Figure 5-8a New Annuity Issuance 2012 - 2019
Sources: Morningstar, Inc. and Beacon Annuity Solutions
0
20
40
60
80
100
120
140
20192018201720162015201420132012Group VA GIB VA IOVA Fee-Based VA
Structured Fixed Indexed

Chapter 5: State of the Industry 69
Figure 5-8b Data Table: New Annuity Issuance 2012 - 2019
Product Type 2012 2013 2014 2015 2016 2017 2018 2019
Group VA 2 4 0 2 0 8 0 0
GIB VA 57 58 20 29 22 9 9 12
IOVA 5 4 8 4 0 5 0 0
Fee-Based VA 12 5 10 1 7 17 3 9
Structured 1 1 1 0 2 0 1 5
Fixed 17 12 11 3 6 22 25 12
Indexed 22 38 37 61 28 23 46 23
Summary The industry will continue to evolve “to address” regulatory and economic challenges in order to meet increasing demand for annuity products by American workers planning and saving for retirement, and those in retirement who seek solutions to ensure their savings provide income for as long as they might live. The remaining chapters of this book delve deeper into product design, use, and market perception. Chapter 6: Annuity Innovations to Meet Today’s Challenges; Chapter 7: Generating (Almost) Immediate Income; Chapter 8: Planning for Future Income; and Chapter 9: Focus on Accumulation with Income Flexibility, provide detailed information about the various types of annuities available to consumers to help them plan for, and be successful in, retirement, and on the evolution of product development to meet the retirement income needs of consumers. Chapter 10: Consumer Use and Attitudes Towards Annuities and Chapter 11: Distribution Trends in the Year of COVID-19 provide research and insights on how different consumer demographic groups view annuities and retirement, and how financial advisor practices are evolving during an unprecedented period of upheaval and change.
References1 “Retirement, Income, and Risk – 2nd Biennial Study on the American Retirement Experience” (IRI, 2018)
2 “Boomer Expectations for Retirement 2019 – Ninth Annual Update on the Retirement Preparedness of the Boomer Generation” (IRI, 2019)
3 FRED Economic Research, Federal Reserve Bank of St. Louis
4 United States Census Bureau
5 “Boomer Expectations for Retirement 2019 – Ninth Annual Update on the Retirement Preparedness of the Boomer Generation” (IRI, 2019)
6 “The Language of Retirement 2017 – Advisor and Consumer Attitudes Toward Securing Income in Retirement” (IRI-Jackson 2017)
7 Ibid
8 “Retirement, Income, and Risk – 2nd Biennial Study on the American Retirement Experience” (IRI, 2018)

70 IRI Retirement Fact Book 2020, 19th Edition

Chapter 6: Recent Annuity Innovations 71
Recent Annuity InnovationsEquity markets performed exceptionally well in 2019 and into 2020, unemployment hit historic lows, and economic growth appeared solid. Interest rates, while briefly approaching three percent territory in the early months of 2019, fell throughout the year to end 2019 below two percent. Enter 2020 and COVID-19. Equities have been roiled, and the 10-year Treasury approached 50 basis points before recovering, but to a level still below one percent at the midpoint of 2020. Low rates translate into anemic returns in low risk, fixed-income financial products designed for conservative savers. The financial services industry, with so many product offerings dependent upon a reasonable degree of interest rate spread, faces challenges keeping its consumer offerings attractive when rates drop to such low levels. Conservatively positioned products that guarantee return of principal, from certificates of deposit to high grade government and corporate bonds, to fixed annuities and fixed indexed annuities, continue to offer historically low crediting rates. Further complicating the investing environment for bond holders, especially in longer maturities, is the risk of substantial loss of principal should rates begin to rise rapidly.
Annuity products, whether fixed or variable, face several challenges in an extremely low interest rate environment:
1. Low crediting rates on deferred fixed annuities constrain income potential.2. Participation rates, caps, and spreads fall on fixed indexed annuities.3. Payouts are lower on single premium immediate annuities and deferred income
annuities; or put another way, a higher purchase payment is required to get the same payout as when rates are higher.
4. Withdrawal percentages, roll-up rates, and the percent of the portfolio allocated to equities (i.e., the growth potential) of variable annuities with guaranteed income benefits are all reduced.
However, this industry is adapting to this condition, with two bright spots being the continued development and growth of fixed indexed annuities and structured annuities. In fact, variable annuity sales growth in 2019 was entirely attributable to structured annuities, without which VA sales would have dropped from 2018 levels, and fixed indexed annuities continued to gain market share in the overall annuity landscape. With principal guarantees and limits on upside potential through participation rates, caps, and spreads, the fixed indexed annuity has much more in common with fixed income products than with equity products, and in fact should be viewed as a component of the fixed income portion of an investment portfolio. Importantly, however, especially in a historically low rate environment, it does not carry interest rate risk — the risk of principal loss due to rising rates. The value of a corporate bond, for example, drops when interest rates rise; if interest rates rise suddenly and significantly, depending on the duration of a bond portfolio the effect on market value can be devastating. But, absent a market value adjustment feature, the value of a fixed indexed annuity does not change when interest rates rise; in fact, rising rates tend to increase participation rates, caps, and spreads, thereby increasing the
6CH

72 IRI Retirement Fact Book 2020, 19th Edition
potential for excess interest to be credited based on indexed returns. Structured products can play a similar role for investors, albeit with some risk of principal loss in exchange for a greater degree of upside potential.
Fixed Indexed Annuities Fixed indexed annuity (FIA) sales rose in 2019 for the third year in a row, reaching a record high of $72.5 billion, a 3.7 percent increase over 2018 sales of $69.9 billion. As a brief primer, FIAs are designed to guarantee that principal is returned at the end of the surrender charge period while crediting a guaranteed rate of interest (around 1 percent in the current environment) and potentially additional interest based on the change in the price of one or more broad market indexes such as the S&P 500. In order to secure that guarantee and provide the opportunity for index-based gains, the insurance company issuing the product allocates a portion of the premium to bonds and a portion to the purchase of options on the index(es). The lower prevailing interest rates, the greater the percentage of premium that must go to the bond piece that secures the principal. This leaves less for the “options budget,” or that piece of the premium that can be used to obtain the market exposure from which the interest crediting is derived. This is the upside potential of fixed indexed annuities and is often expressed in terms of the interest rate cap or spread, which define the potential share of the index return the product will credit. In a year like 2008, a typical fixed indexed annuity may have returned 1 percent versus the -38 percent return of the S&P 500; conversely, in a year like 2019, when the change in the S&P 500 index was 28.9 percent, the return on a fixed indexed product would be greater than the 1 percent guaranteed rate but would be much lower due to the cap and/or participation rate. Many newer products are “uncapped” in the sense that there is no explicit cap or spread on the return of the index; however, “uncapped” products either use custom indices that blend an index with a volatility control component (e.g. cash) to mute the gains and losses of the index, or there is a requirement to allocate a percentage of premium to a fixed account.
Prior to the financial crisis, in a more normalized interest rate environment, the interest rate caps on fixed indexed products were significantly more attractive (for example, six or seven percent per year), while today those same caps have cut that return potential in half, or more. The upside potential of fixed indexed annuities today — while still greater than traditional fixed rate annuity products — is significantly lower than it was several years ago, but an investor can still expect fixed indexed annuities to outperform other fixed income investments, such as Certificates of Deposit, by about 1 percent per year when held for longer terms.
Necessity: The Mother of InventionThe persistent low-rate environment has prodded many firms to take a closer look at the existing product categories for deferred annuities — fixed, fixed indexed, and variable — and come up with some new product ideas that are creating new sub-categories of annuities.

Chapter 6: Recent Annuity Innovations 73
Structured AnnuitiesStructured annuities are registered products — some are filed as all other registered variable annuities using SEC Form N-4, while others are filed using SEC Form S-1 or S-3 (simplified SEC registration forms used to make an offering of securities). In either case, structured annuities are considered securities as there is a risk of loss of principal, but they resemble both variable and fixed indexed annuities in their characteristics. Recently introduced legislation, the Registered Index Linked Annuities (RILA) Act, which IRI strongly supports, would require the SEC to modernize its filing requirements to allow structured annuities to be filed without the need for extraneous and unnecessary information required on forms that were not specifically designed for them. Sales of structured annuities grew 55.7 percent in 2019, recording $17.5 billion in sales versus $11.1 billion in 2018. While still dwarfed by $62.3 billion in sales of variable annuities with lifetime income benefits, they are growing rapidly in market share. The impetus for the development of structured annuities is the recognition that, in a persistent low interest rate environment, it is exceedingly difficult to both guarantee principal and offer attractive upside potential. The premise behind structured annuities is shared risk. Whereas a fixed indexed annuity guarantees full return of principal and a variable annuity (absent a death or living benefit) provides no guarantee of principal, the structured annuity provides a defined level of protection against investment loss. In exchange for giving up complete protection of principal, the contract holder is afforded greater upside potential than that provided by fixed indexed annuities, though typically less than the potential upside of a variable annuity.
There are two concepts insurance companies employ to share risk in structured annuities, the “buffer” approach and the “loss limit” approach, and issuing companies may offer one or the other, or both.
The buffer approach is one in which the issuing company agrees to absorb losses up to a certain limit — (for example the first 10 percent or 20 percent) over a specified time period for a given investment option. In exchange for this buffer, the investor enjoys a higher cap than in a fixed indexed annuity. However, beyond the “buffer” the contract owner is theoretically exposed to unlimited downside risk. The loss limit approach takes the buffer concept and turns it upside down. With the loss limit, the contract owner absorbs losses up to a defined point (for example the first 10 percent or 20 percent) and the issuing company protects the contract owner from losses beyond the limit. Essentially, the contract owner decides between protecting against market volatility versus protecting against major market corrections.
In either the buffer or loss limit approach, the basic point is the same: these constructs are designed for a more nuanced world of annuity value propositions. Yesterday’s investors generally fell into one of two camps: those willing to exchange safety of principal for modest returns, and those able to tolerate the higher risk of being invested in securities in exchange for greater upside potential. The introduction of products like structured annuities recognizes the developing market for hybrid products that allow investors some ability to customize a level of risk with which they are comfortable. Structured annuities meet the needs of the in-between investor who wants some degree of certainty but also desires some upside potential. Or perhaps more to the point, the investor who is hard pressed to find an adequate safe return amid persistent low interest rates.

74 IRI Retirement Fact Book 2020, 19th Edition
Volatility Controlled Indexes for Fixed and Variable Annuities“Volatility overlays,” or the use of options to mitigate market risk, are increasingly used in the asset allocation funds often required when electing lifetime income benefits in variable annuities. Similarly, volatility managed indexes, synthetic indexes which embed options strategies in order to dampen volatility, are increasingly used as the benchmark index in fixed indexed annuities, particularly “uncapped” fixed indexed annuities.
These synthetic indexes are generally created and managed by mixing a base index — such as the S&P 500 — with a cash component. Given that cash has little or no volatility, it offsets the volatility inherent in securities markets. Functionally it is not much different from allocating a portion of premium to cash and a portion to the index crediting “bucket.” The resulting synthetic index is less expensive to hedge, and fewer options purchases are necessary to achieve the target level of exposure. Low rates dramatically increase the proportion of fixed indexed annuity premium that must be allocated to securing the principal guarantees, leaving less for the upside potential offered by the options purchased on the index(es). The result is a very small options budget that then must be stretched for maximum opportunity. Applying that budget to a relatively stable volatility-controlled index means fewer options need to be purchased (as there is inherently less risk), and in some cases upside potential can be uncapped (though a margin, spread, or participation rate may still apply). However, while the index-based return may be uncapped, it is important to bear in mind that the synthetic index has a lower potential return than the “base” index due to the cash component. A risk/reward chart for annuities, where “risk” is defined as the opportunity cost of the tradeoff between guaranteed, but generally lower, investment return and safety of principal, and “reward” is the higher potential returns of the equities markets, would look something like Figure 6-1. On this type of chart, fixed indexed annuities (volatility managed or not) appear northeast of products like CDs and fixed annuities due to the tradeoff between guaranteed and potential return, and structured annuities and variable annuities without guarantees are even further northeast due to their potential for at least some degree of principal loss but also higher potential returns.

Chapter 6: Recent Annuity Innovations 75
Figure 6-1 Return Potential versus Downside Risk
Given the black box nature of many of these synthetic risk-controlled indices, they are less actively managed as they are programmed to meet given volatility targets. This programming is the result of a target volatility that is identified in the index objective, and the resulting algorithm that is built to “manage” to that level of target volatility.
Within variable annuity contracts, the volatility control is embedded in the allocation funds used in conjunction with lifetime income benefits. A typical overlay will have anywhere from 5 percent to 30 percent of the fund’s assets allocated to the buying and selling of options on major market indexes. The options are intended to offset losses in the remainder of the portfolio, smoothing out returns. Because volatility is dampened, it is less expensive to hedge the risk that income benefit liabilities will become greater than the assets supporting them. The use of volatility managed funds shifts some of the investment risk back to the contract owner.
“Investment Oriented” Variable AnnuitiesVariable annuity companies grappling with managing the risk of guarantees have in recent years begun developing and marketing variable annuities with no guarantees, known as “investment oriented” variable annuities, or IOVAs. As the name suggests, these products are focused on the investment options and strategies offered through the product. Alternatives-based and
Fixed Annuities
Fixed Indexed Annuities
StructuredAnnuities
VariableAnnuities
Downside Risk
Retu
rn P
oten
tial

76 IRI Retirement Fact Book 2020, 19th Edition
outcome-oriented strategies provide advisor and investor with pre-cooked portfolio approaches designed to achieve certain goals, such as diversification through the use of non-correlated asset classes (i.e., an alternatives based strategy), or perhaps strategies designed to defend against inflation or rising interest rates. Combined with tax deferral, which complements strategies that may involve the use of tax inefficient funds and/or frequent portfolio rebalancing, these products can complement an overall accumulation strategy. IOVA sales are difficult to track as it is not defined as a specific product type in databases that track sales by product; e.g., an IOVA may offer a death or living benefit, but if most sales do not include those benefits this is opaque in the data, as sales are not broken out by benefit elections. Annual sales of “pure” IOVA products (commission-based products offering goals-based portfolios with no death or living benefits) have fallen below $2 billion from a peak of $5.1 billion in 2014.
Fee-Based AnnuitiesFee-based annuities are less an innovation than a proliferation; in the wake of the efforts by the Department of Labor to enact the ultimately vacated fiduciary rule, annuity issuers brought a flood of new fee-based variable annuities to market. Fee-based variable annuities carry low fees and no surrender charges, and do not pay compensation to the selling advisor or agent. These products were intended for use in so-called “wrap fee” programs, where the investor pays an annualized percentage of assets for the management of the entire portfolio. As the sales and management of annuities generally require the advisor to expend considerably more time and effort than is the case when working with mutual funds, including maintaining additional licensing and continuing education and satisfying more regulatory requirements through additional state forms, many advisors seek to use other financial products and approaches (discussed in more detail in Chapter 9: Advisor Practices in Managing Retirement Income Portfolios and Use of Guaranteed Solutions/Annuities) such as bond ladders when they cannot receive higher compensation through commissions. This has constrained growth in annuity sales, especially in third party channels. Annuity commissions are often, and unfairly, the target of criticism in the annuity space, when in fact they are generally only modestly higher than the compensation paid on actively managed mutual funds. Sales of fee-based annuities may grow significantly in the future as a result of accelerated transaction modernization efforts driven by the exigencies of COVID-19, such as the drive toward universal adoption of e-signature and e-delivery.
Deferred Income AnnuitiesDeferred Income Annuities (DIAs) trace their roots to longevity insurance, a product that first appeared in the market in the early 2000s. Longevity insurance was a restrictive product that was designed to start making payments five, 10, or even 20+ years after purchase, provided the annuitant was still alive at that point. So, a 65-year-old would purchase the product and payments would commence at age 80 or 85. Because payments would not begin for 20 or 25 years, and then only if the annuitant was alive to receive them, the product was relatively low cost for the amount of payment guaranteed. However, limited or no recourse in the event the financial needs of the purchaser changed meant the product did not resonate with consumers. The DIA is similar in structure to longevity insurance, i.e., lifetime annuity payments commence only if the annuitant reaches an advanced age, but it may offer a death benefit option and/or liquidity provisions such as the flexibility to change the income start date or a one-time cash withdrawal feature. DIAs can work well in a holistic financial plan as they create a finite time period over which other income sources are tapped. Some of the newest DIA products are even participating, that is

Chapter 6: Recent Annuity Innovations 77
they can receive dividends from the issuing company, further enhancing their payout potential. In June of 2014 the Department of the Treasury issued a rule for Qualified Longevity Annuity Contracts (QLACs). The rule allowed the greater of 25 percent or $125,000 of qualified assets (IRA, 401(k), etc.) to be allocated to the purchase of a QLAC and excluded from calculations of Required Minimum Distribution (RMD) amounts; for 2019 the limit was increased to $135,000, from $130,000 in 2018. Additionally, the rule permits the reversal of QLAC purchases that inadvertently exceed the investment limit, and the inclusion of a death benefit feature. While the QLAC rule has not led to explosive growth in DIA sales, it has sparked development of products designed to work with the rule. Sales of DIA products have been relatively flat for the past few years after a peak of $2.6 billion in 2016, to $1.7 billion in 2017, $1.4 billion in 2018, and $1.7 billion in 2019.

78 IRI Retirement Fact Book 2020, 19th Edition

Chapter 7: Generating (Almost) Immediate Income 79
Generating (Almost) Immediate IncomeAnnuities offer several options for providing immediate (or almost immediate) income when retirement begins or afterward. Fixed immediate income annuities are most frequently utilized for this purpose. These products generate payments of a guaranteed amount on a regular schedule. Variable immediate income annuities also pay out on a regular schedule, but the amounts fluctuate based on the investment performance of underlying subaccounts. Immediate annuity payments may last for a lifetime or a specified duration. Several deferred fixed indexed annuities offer guaranteed lifetime withdrawal benefits (GLWBs) that can be utilized after a brief waiting period. These contracts generally are purchased with a single contribution (not a series), using before- or after-tax funds. Owners of non-qualified deferred annuities also can roll their contracts into an immediate or indexed annuity as a tax-free exchange. Or they may choose to annuitize their contracts, turning the accumulated assets into a stream of income. If purchased some time ago when interest rates were higher, these contracts may offer guaranteed payouts higher than those attainable with new money. All these options can provide lifetime income for one or two people, thereby transferring longevity risk to the insurance company. The company manages this risk by pooling longevity over many individuals. Premiums paid by those who die earlier than expected represent gains for the remaining individuals in the pool and provide a higher yield or credit to survivors than could be achieved through individual investments outside of the pool. Annuities are akin to Social Security in this regard, albeit on a much smaller scale. This survivor or mortality credit increases significantly with age/shorter life expectancy.
Growth TrendsSales of fixed and variable immediate income annuities and deferred income annuities have more than doubled since 2003. They experienced double-digit percentage growth in 2013 and 2014 but declined moderately 2015 and 2016 and more precipitously in 2017. In 2018 sales of income annuities reversed their declines, rising 8 percent to $11.4 billion from 2017 sales of $10.5 billion, and rising again in 2019 to $11.9 billion (see Chapter 15: Data Section for historic deferred and immediate annuity sales data).
Future growth is expected for several reasons in addition to demographic trends. Lifetime payouts are relatively attractive in the current low interest rate environment due to survivorship credits and will be considerably more attractive when interest rates rise. Income annuities have been endorsed by the U.S. Government General Accountability Office, the federal government has
7CH

80 IRI Retirement Fact Book 2020, 19th Edition
been encouraging employer sponsors of defined contribution retirement savings plans (such as 401(k)s) to offer them as options for retiring employees, and the U.S. Treasury issued rules specific to the use of Qualified Longevity Annuity Contracts (QLACs) in qualified plans in June 2014. The maximum investment, initially set at the greater of 25 percent of the qualified plan (IRA or 401(k)) balance or $125,000, was raised to $130,000 in 2018 and maintained at $130,000 for 2019. Sales of QLACs have been anemic, but their popularity may rise as the public becomes more familiar with them and more workers enter retirement with substantial qualified plan balances.
Finally, carriers are adding liquidity and inflation-protection features to existing products — or introducing new ones with these features — to overcome the objections many advisors and consumers have had to fixed immediate lifetime income annuities in the past. “Participating contracts,” which hold the potential for income to increase through dividend payments from the issuing company, are also relatively new to the market and may help make the product more palatable. In contrast, term-certain (non-lifetime) payments have been declining in popularity. This is probably due to increasing demand for guaranteed lifetime income as well as the low interest rate environment — because the payments are not life-contingent, there are no survivorship credits to boost payouts. Variable immediate income annuity sales are quite small relative to sales of deferred variable annuities, generally accounting for less than 2 percent of sales in a given period. Variable and indexed annuity GLWBs are rarely utilized for immediate income and this is not expected to change much in the future, mainly because relatively few products offer this option and payments are generally smaller than they would be after a longer waiting period.
Though partial annuitization recently became possible, it is still the case that deferred annuities are rarely annuitized. A recent development is the traditional fixed annuity with GLWB, which has seen very little proliferation to date, but which may grow with rising rates. Little in the way of sales or product data is available yet, but this is a product that may do quite well since it is a simpler and more conservative, yet flexible, alternative to variable and fixed indexed annuities with GLWB.
Product Details Single Premium Immediate Annuities (SPIAs): These immediate income annuity products are purchased with a single premium. Regularly scheduled payments (usually monthly) of a guaranteed amount begin within 12 months. Term-certain or period-certain annuities provide a stream of payments for a specified time (generally five to 30 years). The amount of these payments is a function of the premium size, the specified period and prevailing interest rates. Lifetime income payment size is a function of all these factors plus the life expectancy of the covered individual (the annuitant). The shorter the life expectancy, the larger the payment. Medically underwritten income annuities take health status as well as age into account in calculating the payout amount.
For any given age, the largest lifetime payouts generally are made by a straight or pure life annuity. These payments stop when the individual annuitant dies, and this enables the maximum survivorship credit.
A joint and survivor annuity (often chosen by couples) provides income if either of the two annuitants is living. The payment is usually less than it would be if based on a single life because joint life expectancy is longer. Depending on expected income needs, payments can stay the

Chapter 7: Generating (Almost) Immediate Income 81
same or decrease after the first death.
Many are uncomfortable with the possibility that they may not recover some of their premium if they do not live as long as they expect. This is not a concern with term-certain products because payments are not based on the annuitant’s lifetime. There are two basic options to address this issue; both ensure full recovery of premiums but will result in smaller payments. Life annuities with a period certain will provide guaranteed payments for the life of the annuitant or a specified period, whichever is longer. Refund annuities provide a lump sum equal to the premium minus payments already received (cash refund) or continue making payments until the total amount received equals the premium (installment refund). In all these cases, payments are made to designated beneficiaries after the annuitant’s death.
It was once the case that fixed immediate income annuity payments provided an irrevocable stream of equal payments for the specified period or the annuitant’s lifetime. Insurance companies have responded to market preferences for more flexibility in several ways. Liquidity options include an advance of a given percentage or number of payments, which may be very helpful when there are unexpected or one-time expenses. Some carriers will liquidate (commute) the entire annuity, converting the present value of the future stream of payments into a lump sum. Some lifetime income annuities can be structured to provide larger payments early and smaller payments later (perhaps to pay for travel early in retirement), or to provide smaller payments early and larger payments later (to cover increased medical or assisted living costs).
Those concerned that inflation may erode the value of their income annuity payments can find contracts that provide pre-determined annual increases in the payment amount. A few carriers offer true inflation protection, but this is rare because inflation is difficult to hedge. When an increasing payment option is elected, payments in the early years will be smaller than they would be with level payments.
Immediate Variable Annuities (IVAs): Immediate Variable Annuities are fundamentally the same as their fixed cousins in terms of payment options, liquidity features, etc. However, unlike fixed immediate annuities the payment amount can fluctuate based on the value of the investments to which the investment in the contract is allocated. Payments are initially determined using an “assumed interest rate,” or AIR. A higher AIR means a higher initial payment, but also a higher probability that future adjustments will reduce the payment amount. For example, if an AIR of 3 percent is selected and the return on the underlying investments (net of fees) is greater than 3 percent, the payment will rise, but if less than 3 percent the payment will fall. All else equal, a higher AIR means a higher initial payment, but also a greater probability that future adjustments will reduce the payment amount. The payment may adjust every month or may lock in for periods of a year. In any event, when the payment is eligible for adjustment the return of the portfolio of investments is compared to the AIR — if lower, the payment is reduced; if equal, the payment remains the same; and if higher, the payment increases. There are other variations — the payment amount may lock for longer periods and/or there may be liquidity provisions that allow for periodic windows during which additional income may be taken, but in general the greater the liquidity the smaller the initial payment and subsequent adjustments.
Generating Income NowFixed or variable immediate income annuities and some indexed annuity GLWBs can be used to provide income that’s needed now. GLWBs on variable annuities may also be purchased to provide income that begins immediately, but as these are more typically used for accumulation

82 IRI Retirement Fact Book 2020, 19th Edition
followed by future income, they are covered in detail in Chapter 8: Planning for Future Income. Any of these options can be effective for providing enough guaranteed income to cover basic living expenses in combination with other sources of guaranteed lifetime income such as pensions and Social Security; the choice as to which is optimal is an individual one and depends on each consumer’s goals, risk tolerance, bequeathing motivations, health status, and other factors. Term-certain fixed immediate annuities can be used to bridge the gap between actual retirement age and age 70, when Social Security payments are considerably larger. They also can be used as part of a laddering strategy, providing income while other assets grow, or until interest rates are higher.
When a retiree is trying to live on interest from certificates of deposit or bonds, a fixed immediate annuity or indexed annuity GLWB can provide considerably more income and free up assets to be invested more aggressively. Having some assets in higher risk investments generally will help reduce inflation risk.
Qualified retirement savings are subject to the Required Minimum Distribution (RMD) rule at age 72. But many retirees want to spend more money when they are younger and still be able to travel or be active in other ways. If some of these funds are used to purchase a SPIA, or a variable or indexed annuity with GLWB, income well in excess of RMDs can be generated when it will contribute most to quality of life. Unneeded income can be invested or can fund life or long-term care insurance.
Advantages and DisadvantagesSingle Premium Immediate Annuities: These products generally generate the largest guaranteed payments of the three kinds of annuities providing immediate income. They are relatively simple and easy to understand. The cost of liquidity and other options is reflected in quoted payouts, so it is easier to see the tradeoffs and make informed decisions. If purchased with after-tax funds, payouts also receive favorable tax treatment. But there is no possibility of asset growth, as well as less control, flexibility, and liquidity.
Immediate Variable Annuities: Immediate variable annuities offer the potential for income payments to grow as a result of positive market returns, as opposed to fixed immediate annuities where the payment remains the same and its real value is eroded by inflation over time. Due to the natural rate of inflation it is almost a certainty that, over time and barring the onset of a deflationary environment, the purchasing power of payments from a fixed immediate annuity will drop as the real value of the payments becomes lower than the nominal value. Unfortunately it is also far from a certainty that payments from an IVA will increase over time; adverse return sequencing (where negative performance is experienced in early years and positive performance later on) can cause payments to remain flat or drop below the initial level, especially when a high AIR is used to calculate the initial payment (because a higher AIR results in a higher payment, fewer invested dollars are left to grow if returns are negative in early years).
Fixed Indexed Annuity Guaranteed Lifetime Withdrawal Benefits (FIA GLWBs): Owners maintain control of the annuity’s cash value, which can be partly or fully liquidated at any time. However, withdrawals will reduce the account value and those larger than the guaranteed amount will reduce the benefit base as well. Surrender charges also may apply. Account value growth is possible, especially during periods of strong returns on the underlying market index(es). GLWB payments may be stopped (e.g., if unneeded and/or to allow the account value to grow) and

Chapter 7: Generating (Almost) Immediate Income 83
restarted at the owner’s option. On the other hand, guaranteed income payments usually will be smaller, and they will be taxed as ordinary income to the extent they exceed the cost basis of the contract or represent settlement payments made if the account value goes to zero. Fixed indexed annuity crediting methods and GLWBs can also be complex and difficult to explain or understand.

84 IRI Retirement Fact Book 2020, 19th Edition

Chapter 8: Planning for Future Income 85
Planning for Future IncomeThere are several insurance-based products that are structured to provide for a period of accumulation, during which the total amount invested may grow due to investment earnings and additional contributions, followed by a period during which amounts are distributed from the product to provide income. Broadly speaking, these products fall into one of the following four categories:
1. Fixed Annuities with guaranteed lifetime withdrawal benefits (GLWBs) or guaranteed minimum income benefits (GMIBs)
2. Fixed Indexed Annuities with GLWB or GMIB3. Variable Annuities with GLWB or GMIB4. Deferred Income Annuities (DIA)
Investors planning for retirement use these products to help create predictable future income, i.e. income that will be at least some minimum level when they reach their planned retirement age. While some of the products covered in this chapter may also be employed to generate immediate income, this chapter will focus on product aspects that are geared toward growth over a fixed time period followed by lifetime guaranteed income.
Fixed Annuities with GLWB or GMIBAny deferred annuity product can be annuitized, but it is also true that a deferred annuity can be exchanged for an immediate annuity when income is desired, allowing the contract owner to shop for the best payout. Therefore, this chapter focuses on generating income from deferred annuities using GLWB features.
Traditional Fixed Annuities with an add-on GLWB currently make up a relatively small percentage of total annuity sales. It may seem surprising that an insurance product with a guaranteed minimum rate of return would also offer an income guarantee, but such a guarantee can be an important part of managing longevity risk in an overall income strategy.
8CH

86 IRI Retirement Fact Book 2020, 19th Edition
Fixed Indexed Annuities with GLWBFixed indexed annuity (FIA) GLWBs provide lifetime guaranteed withdrawals, limited to a maximum annual amount to enable the payment of ongoing income. Withdrawal amounts are calculated as a stated percentage (generally 2 percent to 6 percent, though rates above 5 percent are typically available only if withdrawals begin at age 70 or later) of a shadow account, known variously as the benefit base, income base, or income account. Often confused with the accumulated/cash value of the fixed indexed annuity, it exists for no other purpose than to provide the basis for guaranteed withdrawals. Initially equal to the amount invested in the contract, the benefit base for most GLWBs grows by a guaranteed annual percentage — often called the rollup rate — during a period of years that ends when guaranteed lifetime withdrawals begin. Of course, there isn’t time for the benefit base to grow in this way when lifetime withdrawals are taken soon after the contract is purchased. For this reason, GLWBs designed for almost immediate withdrawals usually offer a larger benefit base bonus and a lower rollup rate. But as mentioned, these very early guaranteed payments are almost always significantly smaller than those available after five or 10 years. In the years since the financial crisis of 2008, it has become more common to see features embedded in lifetime withdrawal benefits that serve to help the issuer manage the risk of guaranteeing payments for the contract owner’s lifetime, such as:
• Withdrawal percentages pegged to an external benchmark, such as the 10 Year Constant Maturity Treasury (CMT) Rate.
• Withdrawal percentages based on the age at which withdrawals begin, with percentages significantly lower when payments start at younger ages.
• Withdrawal percentages that are reduced if the account value is completely exhausted and the contract moves into a “settlement phase,” where payments continue to be made while the contract owner(s) are still living but the account value is zero.
Guaranteed payments covering two lifetimes are generally lower than those which only cover a single lifetime but can incorporate any of these risk management features as well. Some GLWBs will also increase payments by a guaranteed percentage if the owner is unable to perform two or more activities of daily living as a form of long-term care insurance. This may be particularly valuable for those who are unable to obtain affordable underwritten long-term care insurance.
Most GLWBs are available as optional riders for an annual fee. Fees range from 0.35 percent to 1.60 percent, the wide range a function of varying withdrawal percentages, step-up features, and asset allocation restrictions. In most cases, the annuity’s cash value will be reduced in years when the credited interest is less than the fee, but a few contracts guarantee that rider charges will never exceed credited interest. There are some no-fee GLWBs, but credited interest may well be lower (e.g., smaller cap/participation rates) to cover the cost of providing the GLWB.
Variable Annuities with GLWB or GMIBIn the past decade variable annuities have increasingly been purchased for their guaranteed income features, an evolution from the historic sales drivers of tax deferral and death benefits. Additional fees for GLWB features average 1.23 percent, and GMIB fees average 0.90 percent (2019 Morningstar, Inc.). Not that these latter elements are irrelevant, but with the top selling products consistently offering, and being sold with, either GLWB or GMIB benefits and roughly 70 percent of sales reported in qualified plans (i.e., sales where the tax deferral is a function of the plan, not the product), death benefits and tax deferral have become secondary considerations
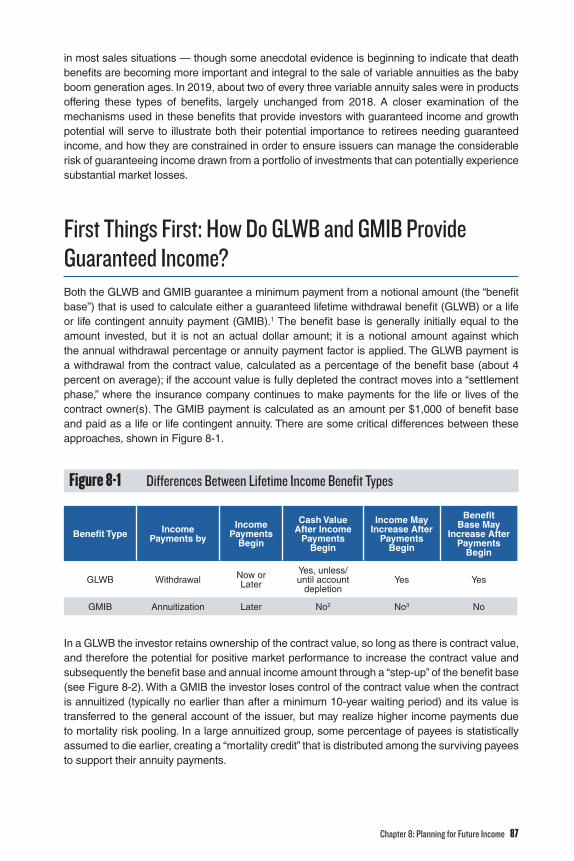
Chapter 8: Planning for Future Income 87
in most sales situations — though some anecdotal evidence is beginning to indicate that death benefits are becoming more important and integral to the sale of variable annuities as the baby boom generation ages. In 2019, about two of every three variable annuity sales were in products offering these types of benefits, largely unchanged from 2018. A closer examination of the mechanisms used in these benefits that provide investors with guaranteed income and growth potential will serve to illustrate both their potential importance to retirees needing guaranteed income, and how they are constrained in order to ensure issuers can manage the considerable risk of guaranteeing income drawn from a portfolio of investments that can potentially experience substantial market losses.
First Things First: How Do GLWB and GMIB Provide Guaranteed Income?Both the GLWB and GMIB guarantee a minimum payment from a notional amount (the “benefit base”) that is used to calculate either a guaranteed lifetime withdrawal benefit (GLWB) or a life or life contingent annuity payment (GMIB).1 The benefit base is generally initially equal to the amount invested, but it is not an actual dollar amount; it is a notional amount against which the annual withdrawal percentage or annuity payment factor is applied. The GLWB payment is a withdrawal from the contract value, calculated as a percentage of the benefit base (about 4 percent on average); if the account value is fully depleted the contract moves into a “settlement phase,” where the insurance company continues to make payments for the life or lives of the contract owner(s). The GMIB payment is calculated as an amount per $1,000 of benefit base and paid as a life or life contingent annuity. There are some critical differences between these approaches, shown in Figure 8-1.
Figure 8-1 Differences Between Lifetime Income Benefit Types
Benefit Type Income Payments by
Income Payments
Begin
Cash Value After Income
Payments Begin
Income May Increase After
Payments Begin
Benefit Base May
Increase After Payments
Begin
GLWB Withdrawal Now or Later
Yes, unless/until account
depletionYes Yes
GMIB Annuitization Later No2 No3 No
In a GLWB the investor retains ownership of the contract value, so long as there is contract value, and therefore the potential for positive market performance to increase the contract value and subsequently the benefit base and annual income amount through a “step-up” of the benefit base (see Figure 8-2). With a GMIB the investor loses control of the contract value when the contract is annuitized (typically no earlier than after a minimum 10-year waiting period) and its value is transferred to the general account of the issuer, but may realize higher income payments due to mortality risk pooling. In a large annuitized group, some percentage of payees is statistically assumed to die earlier, creating a “mortality credit” that is distributed among the surviving payees to support their annuity payments.

88 IRI Retirement Fact Book 2020, 19th Edition
The Mechanics of GLWBAs noted above, the benefit base is generally initially equal to the amount invested, and this is true in both GLWB and GMIB benefits. However, the benefit base may increase before income payments begin in both GLWB and GMIB structures, and after income payments begin with GLWB. Broadly speaking, there are three ways the benefit base may increase after the initial investment: through a step-up feature (also called maximum anniversary value); a deferral bonus (also known as a rising floor); or a combination of the two.
Step-Up FeaturesSo named because it “steps up” the benefit base to a higher value, this feature increases the benefit base to equal the current account value. Put another way, it is an increase in the notional value against which the withdrawal percentage is applied. Such adjustments are usually done annually, but may be more frequent, and most compare the contract anniversary account value to the current benefit base and increase the benefit base if the current account value is higher. Some benefits may use the highest quarterly, monthly, or even daily value reached during the preceding contract year, which affords more opportunity to capture market upturns. Figure 8-2 illustrates a step-up feature, assuming withdrawals begin in the fifth contract year.
Figure 8-2 GLWB with Step-Up
Source: IRI
Deferral BonusA deferral bonus rewards the contract owner for delaying withdrawals. The basic structure is fairly simple: the notional benefit base increases by a fixed percentage (generally 3 percent to 5 percent in the current market, but has been as high as 7 percent during periods when long-term interest rates are higher) as long as there are no withdrawals from the contract. The details can get a bit intricate, however; below are some of the ways in which deferral bonus features may differ from product to product:
$0
$20,000
$40,000
$60,000
$80,000
$100,000
$120,000
$140,000
Yr10Yr9Yr8Yr7Yr6Yr5Yr4Yr3Yr2Yr1$0
$1,000
$2,000
$3,000
$4,000
$5,000
$6,000
$7,000
Benefit BaseAccount Value Withdrawal
Acco
unt V
alue
Annu
al W
ithdr
awal
Am
ount
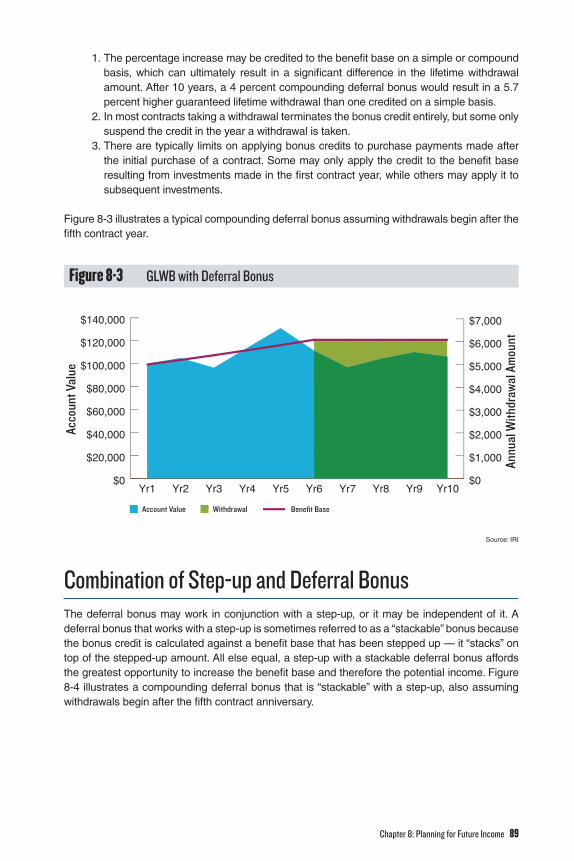
Chapter 8: Planning for Future Income 89
1. The percentage increase may be credited to the benefit base on a simple or compound basis, which can ultimately result in a significant difference in the lifetime withdrawal amount. After 10 years, a 4 percent compounding deferral bonus would result in a 5.7 percent higher guaranteed lifetime withdrawal than one credited on a simple basis.
2. In most contracts taking a withdrawal terminates the bonus credit entirely, but some only suspend the credit in the year a withdrawal is taken.
3. There are typically limits on applying bonus credits to purchase payments made after the initial purchase of a contract. Some may only apply the credit to the benefit base resulting from investments made in the first contract year, while others may apply it to subsequent investments.
Figure 8-3 illustrates a typical compounding deferral bonus assuming withdrawals begin after the fifth contract year.
Figure 8-3 GLWB with Deferral Bonus
Source: IRI
Combination of Step-up and Deferral BonusThe deferral bonus may work in conjunction with a step-up, or it may be independent of it. A deferral bonus that works with a step-up is sometimes referred to as a “stackable” bonus because the bonus credit is calculated against a benefit base that has been stepped up — it “stacks” on top of the stepped-up amount. All else equal, a step-up with a stackable deferral bonus affords the greatest opportunity to increase the benefit base and therefore the potential income. Figure 8-4 illustrates a compounding deferral bonus that is “stackable” with a step-up, also assuming withdrawals begin after the fifth contract anniversary.
$0
$20,000
$40,000
$60,000
$80,000
$100,000
$120,000
$140,000
Yr10Yr9Yr8Yr7Yr6Yr5Yr4Yr3Yr2Yr1$0
$1,000
$2,000
$3,000
$4,000
$5,000
$6,000
$7,000
Benefit BaseAccount Value Withdrawal
Acco
unt V
alue
Annu
al W
ithdr
awal
Am
ount

90 IRI Retirement Fact Book 2020, 19th Edition
Figure 8-4 GLWB with Step-Up and Stackable Deferral Bonus
Source: IRI
A deferral bonus is “non-stackable” when there is a step-up that is independent of the bonus, i.e. the deferral bonus is not credited to the stepped-up benefit base and the withdrawal amount, when set, is calculated against the greater of the benefit base as increased by step-up(s) or the benefit base as increased by the deferral bonus. In other words, the greater of the income amounts shown in Figures 8-2 and 8-3. The combination concept may also include a separate provision that guarantees a benefit base of at least 200 percent of the initial investment after a defined time period. This provision ensures that if the deferral bonus and/or step-up provisions do not result in a benefit base that is at least double the amount invested by the end of the specified contract year, the benefit base will be increased to equal that amount.
The Mechanics of GMIBIn the accumulation phase GLWB and GMIB can be quite similar; both employ the concept of a notional benefit base, the only purpose of which is to calculate an income amount, and both commonly offer opportunities to increase the benefit base through step-ups, deferral bonuses, and features that double the benefit base. It is in the generating of income payments that the two are very different. Whereas income payments from a GLWB are withdrawals from account value and only become payable directly by the insurance company in the event the account value is fully liquidated, income payments under a GMIB require the transfer of the full account value to the insurance company in exchange for life or life contingent annuity payments paid by the insurance company to the annuitant. Figure 8-5 illustrates the production of income under a GMIB from the investor’s point of view.
$0
$20,000
$40,000
$60,000
$80,000
$100,000
$120,000
$140,000
Yr10Yr9Yr8Yr7Yr6Yr5Yr4Yr3Yr2Yr1$0
$1,000
$2,000
$3,000
$4,000
$5,000
$6,000
$7,000
Benefit BaseAccount Value Withdrawal
Acco
unt V
alue
Annu
al W
ithdr
awal
Am
ount

Chapter 8: Planning for Future Income 91
Figure 8-5 GMIB Annuitized at Year 10
Source: IRI
When income begins under a GMIB the investor has no further rights to any account or cash value, only to periodic life or life contingent payments. The advantage, or tradeoff, relative to a GLWB is higher income: due to the effect of mortality pooling,4 the guaranteed income amount from an annuitized account balance is likely to be significantly higher than the amount guaranteed by a GLWB with a 4 percent withdrawal rate.
GLWB/GMIB ConsiderationsBoth GLWB and GMIB features carry risk for the insurer. The basic concept of insurance is that of pooling risk: a large group of individuals pay an insurer to protect against an event that, while certain (death), rare (tornado damage), or even relatively common (structural damage, such as that caused by storms or fire), will statistically only affect a small number of a very large insured group in any given span of time. In the case of living benefit guarantees such as GLWB and GMIB the relationship is flipped: the insurer protects against a relatively rare event (catastrophic market correction) that impacts an entire large insured group (variable annuity contract owners with GLWB or GMIB) at the same time, while also protecting against longevity risk. Offsetting these risks is complex and involves the use of financial hedging instruments like options and futures to offset losses on the total portfolio of protected assets, as well as pricing structure, risk mitigating benefit features, and hedging instruments built directly into the funds invested in under the guarantees. These can be difficult to understand in terms of their application and impact. Here are a few of the mechanisms and strategies that mitigate the insurer’s risk of offering these benefits; the list is by no means exhaustive, but rather is meant to provide an overview of the moving parts of GLWB and GMIB features.
• If a withdrawal is taken that is greater than the benefit base times the applicable withdrawal percentage, the benefit base and future guaranteed income is typically reduced. If the contract value is lower than the benefit base the impact can be significant and will vary based on the adjustment method, where the benefit base is either reduced in proportion to the reduction in contract value or simply reset to equal the contract value immediately after the withdrawal. Figure 8-6 shows how each adjustment method impacts the benefit base and guaranteed withdrawal amount.
$0
$20,000
$40,000
$60,000
$80,000
$100,000
$120,000
$140,000
$160,000
Yr10Yr9Yr8Yr7Yr6Yr5Yr4Yr3Yr2Yr1$0$1,000$2,000$3,000$4,000$5,000$6,000$7,000$8,000$9,000
Benefit BaseAccount Value Withdrawal
Acco
unt V
alue
Annu
al W
ithdr
awal
Am
ount

92 IRI Retirement Fact Book 2020, 19th Edition
Figure 8-6 Impact of Benefit Base Reduction Method on Guaranteed Withdrawal Amounts
Benefit Base Reduction Method
Value Pro-Rata Reset
Pre-Withdrawal Benefit Base $100,000 $100,000
Pre-Withdrawal Contract Value $80,000 $80,000
Guaranteed Withdrawal $5,000 $5,000
Actual Withdrawal $6,000 $6,000
Post-Withdrawal Contract Value $74,000 $74,000
Post-Withdrawal Benefit Base $92,500 $74,000
New Guaranteed Withdrawal $4,625 $3,700
Reduction in Guaranteed Withdrawal $(375) $(1,300)
Source: IRI
In some contracts an excess withdrawal can also terminate the life payout component of the GLWB, meaning that after the excess withdrawal the benefit will only make income payments until the benefit base is exhausted. A GLWB investor with a cash need should carefully consider whether withdrawing excess dollars from a GLWB is the best option for meeting that need.
• The fees for most GLWB and GMIB features are assessed against the benefit base rather than the account value, so an increase in the benefit base (e.g., due to a step-up) may increase the fee deducted from the account value. Investors must weigh the increase in the withdrawal amount due to the higher benefit base against the fee, which may be a higher percentage of invested assets if the account value has dropped. For example, if a benefit base is locked at $100,000 and the account value falls to $80,000, a 1 percent annual fee assessed against the benefit base would reduce the account value by 1.25 percent (ignoring other fees and market performance).
• If the fee for the benefit has increased since the annuity was purchased, the increase is generally not applicable to the contract owner until there is a step-up. Here the investor must weigh whether the step-up is “worth it,” i.e. will the increase in the benefit base produce enough additional income to more than offset the annual increase in the benefit fee? Below is an example where it might not be to the contract owner’s advantage to accept a step-up.
Figure 8-7 Impact of Step-Up on Fees Associated with a Benefit Guarantee Rider
Contract Aspect Before After
Contract Value $100,000 $110,000
Benefit Base $100,000 $110,000
Annual Income (@4% of Benefit Base) $4,000 $4,400
Income Increase N/A $400
Fee % 1.00% 1.50%
Annual Fee Amount $1,000 $1,650
Fee Increase N/A $650
Source: IRI

Chapter 8: Planning for Future Income 93
• In benefits where the step-up is automatic the benefit base will generally not increase automatically if the fee has increased since contract issue or since the last step-up, to afford the investor an opportunity to determine whether the step-up is large enough to offset the fee increase.
• The allocation of the investment to subaccounts in the contract may be limited when a GLWB or GMIB is elected. The investor may be required to invest in a specific fund or among a small group of funds, for example asset allocations funds that limit equity exposure to 60 percent or 70 percent. Or the investor may be required to allocate a minimum of 30 percent of the investment to lower risk funds, limit the allocation to higher risk funds to a maximum of 10 percent, and may freely invest the remaining 60 percent among the remaining funds. In both models periodic rebalancing (to ensure the portfolio has not skewed toward too much risk) is generally required. Volatility managed funds have also become a common requirement; “vol funds” typically allocate 5 percent to 30 percent of the fund, depending on market conditions, to index options purchases intended to offset the performance of the securities in the rest of the portfolio and reduce the volatility of returns. The theoretical result is returns that are neither as positive nor as negative as they would have been otherwise, reducing the insurers cost to hedge the risk of providing guaranteed lifetime withdrawals from the portfolio held in the VA. In contracts with no investment restrictions or rebalancing requirements the portfolio may be subject to “dynamic rebalancing,” which is complex in terms of calculation but relatively simple in concept: when the contract value drops due to negative market performance, the portfolio is reallocated to more conservative investment options to preserve capital and help limit the issuer’s risk. Failure to adhere to portfolio allocation requirements can cause the benefit to terminate. The investor must weigh flexibility in managing the portfolio and the amount of risk exposure available in the contract against the features and cost of the guarantee.
• Income payments under a GMIB merit special mention. Annuity payments are higher than interest payments due to the recovery of principal as part of each payment and the mortality component (those dying early fund larger payments for those living longer). Payments under a GMIB are subject to age setbacks (e.g., payments calculated based on age 55 for a 65-year-old), adjusted mortality tables (more conservative assumptions regarding the number of deaths per year), and lower interest rate assumptions. These adjustments result in a lower payment to the annuitant than an amount equal to the benefit base would produce if invested in a single premium immediate annuity (SPIA). Lower payments help protect the insurer against the risk that the actual account value, which may be much lower than the benefit base at the point the contract is annuitized, is not sufficient to produce the income guaranteed by the GMIB. Annuitizing the GMIB may still be advantageous if the contract value is significantly lower than the benefit base, but it is important to understand that in general the benefit base of a GMIB produces a lower annuity payment than an equivalent cash amount invested in a SPIA.
GLWB and GMIB features offered in variable annuities are complex, but so are the risks they protect against. Whether one of these products is appropriate for a given investor is a function of many variables, such as the investor’s retirement income needs and goals, risk tolerance, health status, and bequeathing motives. Understanding the moving parts of an income guarantee, adhering to the requirements for maintaining it, and following a plan for how it will be employed as part of an overall retirement plan are the keys to using it successfully.

94 IRI Retirement Fact Book 2020, 19th Edition
Deferred Income Annuities (DIAs)A DIA is, in theory, an ideal retirement income product; purchased at a deep discount due to the time between purchase and payout, it is a pure risk management product, paying only if one lives to an advanced age. However, this waiting period is also the primary drawback, and difficult selling point, for DIAs because it leads to the notion that one might be “paying for nothing.” However, this is no more accurate than asserting that one “pays for nothing” when purchasing homeowner’s insurance without ever experiencing a fire or natural disaster. The reason homeowner’s insurance is purchased is because most people cannot self-insure the risk of losing a home in a fire or natural disaster — knowing this, banks generally make housing loans contingent upon proof of insurance coverage. Similarly, most individuals cannot self-insure the risk of living to an advanced age (Bill Gates, Jeff Bezos, etc. being notable exceptions), therefore the reason for purchasing a DIA is to help ensure quality of life and dignity in one’s later years, not necessarily to maximize return on investment. However, the reality of the marketplace is that some form of liquidity is generally needed to help consumers become comfortable with the purchase, so recent innovations include the addition of a death benefit to many DIA products. In fact, the Qualifying Longevity Annuity Contract, or QLAC for short, rules enacted by the U.S. Treasury Department specifically address the permissibility of return of premium death benefits in QLACs, which should help drive higher sales of these products.
A DIA is, effectively, a SPIA with an extended waiting period between purchase and the start of income payments. Conceptually, the DIA allows planning to occur over a finite time horizon, providing a backstop in the event one lives to an advanced age. For example, an individual might use a portion of investable assets to purchase a DIA at age 65, schedule payments to begin at age 85, and use systematic withdrawals, interest, dividends, etc., from the remainder of the portfolio to provide income for the 20 years from age 65 to age 85. If the individual dies prior to age 85 the DIA may pay nothing to heirs, or it may pay a death benefit. Contracts that pay nothing to heirs provide a higher payment, or put another way require less premium to purchase the same payment as one that does provide a death benefit. The QLAC ruling permits the greater of 25 percent of assets, or $125,000 (increased to $135,000 in 2019 from $130,000 in 2018), to be used for a DIA purchase in a qualified plan. In addition to providing lifetime income in the future, the amount used to purchase the DIA is also removed from Required Minimum Distribution (RMD) calculations, providing a modicum of tax relief.
Endnotes1 In its purest form, an annuity payment is a set dollar amount paid at regular intervals (e.g., monthly) for the life of one individual, called the “annuitant.” A life contingent annuity incorporates a minimum number of payments or minimum total cash payout in addition to the guarantee of lifetime payments, for example a “life annuity with 10 year certain” makes payments for a minimum 10 years even if the annuitant dies before that time expires, or continues to make payments for life if the annuitant survives beyond the 10 year certain period. All else equal, life contingent annuity payments are lower than pure life payments due to the guarantee of a minimum number of payments.
2 While not properly referred to as “cash value,” some contracts may offer commutation features that permit the present value of some or all future payments to be received in a lump sum. Such features may be needs based, for example requiring a qualifying medical expense or long-term care event and exercising these options will reduce or eliminate future payments.
3 CPI-based increases to payments may be available but reduce the amount of the initial payment; market performance-based increases are generally not available.
4 Mortality pooling refers to the excess income generated in an annuity as a result of the distribution of deaths in a large group. A simple example illustrates this concept quite clearly: imagine four individuals, age 90, decide to each put $10,000 into a joint account, with 5 percent of the account to be withdrawn each year and shared equally among the survivors. For simplicity assume no taxes and the account earns a net 5 percent each year, which results in each member of the group receiving $500 at the end of each of the first five years ($40,000 x 5%/4=$500). In the sixth year one member of the group dies, and each of the remaining three receives a $667 payment ($40,000 x5%/3 = $667). With no increase in principal the survivors each received a 33 percent “raise” due to mortality pooling. That, in principle, is how annuitization results in a higher payment than systematic withdrawals.

Chapter 9: Focus on Accumulation with Income Flexibility 95
Focus on Accumulation with Income FlexibilityBuilding Investable Assets and Generating Lifetime IncomeGiven the intense focus on guaranteed income, fueled by the demographics of ten thousand Baby Boomers retiring every day, it is easy to overlook one of the core advantages of a variable annuity: the ability to accumulate a nest egg on a tax deferred basis without being subject to the IRS investment limitations applicable to qualified plan savings. Particularly where expenses are relatively low, the ability to defer taxes can contribute meaningfully to growth, and in a properly managed annuity contract the tax advantages of annuitized income can help achieve income results equal or superior to a similar portfolio of mutual funds. Many fee-based annuities focus on delivering a well-diversified lineup of investment options, including exposure to alternative asset classes such as commodities, and most offer either no insurance benefits or make such benefits optional, resulting in lower expense ratios. In 2019 fee-based products represented approximately 3 percent of individual variable annuity sales.
Provided the underlying portfolios are adequately diversified and the investment is made with post-tax dollars, variable annuities are not subject to current income, dividend, or capital gains taxes. If the contract value exceeds the total initial and subsequent contributions when a withdrawal is taken, or the contract is surrendered, the withdrawal is deemed taken as “earnings first” and the earnings portion is subject to ordinary income tax rates. If the contract is non-qualified and annuitized an Exclusion Ratio applies, meaning that a portion of every annuity payment is considered return of principal and not taxed. The principal portion of each payment is calculated based on the life expectancy of the annuitant; this is hypothetically shown in Figure 9-2.
The efficacy of tax deferral in variable annuities centers on the value of deferring taxation relative to the expense of the higher fees one might incur in a variable annuity versus a similar portfolio of mutual funds. Another issue is the more favorable tax treatment of dividends and capital gains in the mutual fund portfolio as compared to the taxation of earnings in a variable annuity, which are always taxed at higher ordinary income rates. A full discussion of the tax implications of variable annuities versus mutual funds is beyond the scope of this book, but two simple “back of the envelope” illustrations, based on reasonable and data-based assumptions, will help clarify the concept.
9CH

96 IRI Retirement Fact Book 2020, 19th Edition
Tax Deferral and Income PotentialFigures 9-1 and 9-2 compare the hypothetical growth of a mutual fund portfolio to that of a variable annuity, and the potential income that can be generated from each, using the following assumptions:
• The initial after-tax investment is $100,000 and there are no subsequent investments.• The contract owner’s taxable income is between $85,526 and $163,300 (single) or
$171,051 and $326,600 (married filing jointly) per year.• The ordinary income tax rate is 24 percent.• Long term capital gains and qualified dividend income are taxed at 15 percent (rate
applicable to single income of $40,001 to $441,450 or married filing jointly income of $80,001 to $496,600 per year).
• Gains in the mutual fund portfolio are taxed as 58 percent ordinary income and 42 percent dividend/long-term capital gains based on the weighted average turnover ratio of 24,294 mutual fund share classes in the Morningstar database that meet the criteria of having reported assets under management and being available for new investment.
• The gross annual return for both the variable annuity and the mutual fund portfolio is 8 percent during the accumulation period. When distributions begin the mutual fund portfolio gross return is reduced to 3.5 percent based on the assumption that the portfolio would be more heavily weighted toward conservative investments with lower expected returns. In fact, it would not be unfair to assume an even lower return in the mutual fund portfolio both prior to and after the start of income; according to 2019 research by DALBAR, Inc., the average subaccount investor outperformed the average mutual fund investor by 75 basis points or more in each of the prior five years, and outperformed investors overall in each of the past 10 years. However, in order to illustrate using a conservative view this is not factored into the analysis.
• Total annual expenses for the variable annuity are 1.13 percent. This is the weighted average of the contract and underlying fund expenses (total expenses net of contractual waivers and reimbursements) for contracts that do not offer death or living benefits, which creates an “apples-to-apples” comparison as there are no expenses for lifetime income or death benefits, the values of which are not reflected in the analysis.
• Total annual expenses for the mutual fund portfolio are 0.54 percent, calculated as the weighted average of total fund expenses, less contractual waivers and reimbursements.
Figure 9-1 Comparison of Investment Growth in Variable Annuity Versus Mutual Fund Portfolio
Accumulated Value Liquidated Value
Year Variable Annuity Mutual Funds Variable Annuity Mutual Funds
1 $106,865 $105,954 $105,218 $105,954
5 $139,376 $133,530 $129,926 $133,530
10 $194,256 $178,302 $171,635 $178,302
15 $270,746 $238,087 $229,767 $238,087
20 $377,355 $317,918 $310,790 $317,918
25 $525,941 $424,515 $423,715 $424,515

Chapter 9: Focus on Accumulation with Income Flexibility 97
So, viewed strictly through an accumulation and liquidation lens as in Figure 9-1, the additional fees incurred in the average variable annuity result in a fully liquidated portfolio that is worth about the same as the mutual fund portfolio after 25 years, but a bit less in earlier years. Of course, the lower the fees in the variable annuity the more likely it is that the tax deferred earnings would accumulate to a point where the after-tax value would exceed that of the fund portfolio much earlier, but the differences in the tax treatment of earnings would likely still result in a break-even point several years after the initial investment. And of course, at the highest income and capital gains tax brackets the variable annuity would be farther ahead of the mutual fund portfolio. This analysis also overlooks many factors that could influence individual results, such as the actual turnover ratio of the mutual fund portfolio, which could result in a larger proportion of earnings being taxed as ordinary income, and the extent to which the portfolio is adjusted or rebalanced; buying and selling activity does not, in and of itself, impact the variable annuity but may have adverse tax consequences in the mutual fund portfolio. These details aside, these are representations of retirement income portfolios so it is also important to compare them with a view toward the amount of income that would theoretically be produced, and how long (i.e., to what age) that income would be expected to last. Figure 9-2 compares the two portfolios based on drawing annual income in an amount equal to the annuitized income a 65-year-old male would receive from the VA.
Figure 9-2 Comparison of Income Generated by a Variable Annuity Versus Mutual Fund Portfolio
VA Annuity Income Mutual Fund Portfolio Withdrawals
Annuitization of Mutual Fund Portfolio
YearVariable Annuity Value
After-Tax Annual Annuity Income
Portfolio Value
After-Tax Annual
Withdrawals
Portfolio Value
After-Tax Annual Annuity Income
1 $106,865 $105,954 $105,954
10 (Age 65) $194,256 $178,302 $178,302
11 $0 $9,955 $172,326 $9,955 $0 $9,235
15 $0 $9,955 $146,973 $9,955 $0 $9,235
20 $0 $9,955 $111,762 $9,955 $0 $9,235
25 $0 $9,955 $72,189 $9,955 $0 $9,235
30 $0 $9,955 $27,714 $9,955 $0 $9,235
31 $0 $8,755 $18,179 $9,955 $0 $8,035
When the variable annuity contract is annuitized, the exclusion ratio lowers the tax liability on each annuity payment. The exclusion ratio is calculated as the initial investment divided by the total expected payments over the life expectancy of the annuitant. In this example, with annuity payments beginning at age 65, the exclusion ratio is based on a pre-tax payment of $11,520 per year for 20 years, totaling $230,400. The exclusion ratio is therefore $100,000/$230,400, or 43.4 percent excluded from taxation. In the 21st year of income, when the initial investment is recovered, the full amount is taxed, and the after-tax payment drops to $8,755. The pre-tax annual payment of $11,520 is approximately 5.9 percent of the ending contract value, and the after-tax payment of $9,955 is about 5.1 percent of that value. There is no contract value remaining, only the right to receive future payments until death. At this level of withdrawal, the mutual fund portfolio can sustain payments for 20 years, or to age 85, but with only a little over $18,000 remaining; maintaining the same level of income, the mutual portfolio would be fully

98 IRI Retirement Fact Book 2020, 19th Edition
depleted in less than two years.
One might assume that the fund portfolio continues to achieve an 8 percent annual rate of return, in which case the hypothetical fund portfolio could sustain withdrawals at the level of annuity income until age 100 or longer. However, this is unlikely to be the case in reality; either immediately upon beginning to use the portfolio for income or as its value dwindles the portfolio is likely to be re-allocated toward more conservative investments with lower risk and lower expected returns, especially as the portfolio value moves closer to zero — at some point it might logically be assumed that the remaining balance would be completely allocated to cash, generating little or no return, in a bid to preserve the remaining principal. The last part of the example in Figure 9-2 assumes the fund portfolio is annuitized by liquidating the portfolio and using the proceeds to purchase an immediate annuity, either fixed or variable. However, the after-tax annuity payment is 7.2 percent lower with the same loss of liquidity as when generating annuity income from the variable annuity, and in the event the individual lives past age 85, when the exclusion ratio is no longer available, the after-tax annuity payment would be 8.2 percent lower in the annuitized mutual fund scenario than in the annuitized deferred VA approach. There are many variables in this analysis that would differ, perhaps substantially, in the “real world,” so these examples are not intended to state definitively that one approach is more favorable than the other for a unique individual. Rather, it is designed to reveal that when assessing whether tax deferral in a variable annuity delivers value to a specific investor it is critical to think about the investor’s need to utilize savings to maximize retirement income versus other goals. Is the end goal to achieve the largest lump sum possible, to structure a personal pension that maximizes income that cannot be outlived, to bequeath a large percentage of wealth to heirs, or a combination of all of these? Accurately assessing the expected, and desired, disposition of investable assets is critical in determining the optimal mix of investment and insurance products for each unique individual.

Chapter 10: U.S. Households’ Retirement Income Planning 99
U.S. Households’ Retirement Income PlanningResearch Background: The Cerulli ReportThe Cerulli Report — U.S. Annuity Markets 2019: Adapting to Financial Advisory Trends is the thirteenth iteration of an annual series. The study is an outcome of ongoing research and analysis of the retail annuity marketplaces by Cerulli. The report focuses on three key areas — distribution, product development, and asset management opportunities. This report leverages Cerulli’s continuous analysis of variable and fixed annuities, including fixed-indexed, fee-based, and structured annuities (i.e., index-linked annuities), as well as the insurance subadvisory marketplace. The report is designed as a business planning tool, and additional support leveraging this data is available.
Proprietary surveys of insurance company executives conducted in 3Q 2019 serve as the foundation of the report. Cerulli partnered with the Insured Retirement Institute (IRI) to distribute annual surveys, effective with the 2010 edition. Also included are the results of Cerulli’s ongoing surveys of financial advisors and U.S. households, as well as insurance companies’ sales managers, heads of strategy, and product development as they pertain to annuities and retirement income, conducted throughout 2019. Financial advisor surveys were conducted in partnership with WealthManagement.com, Investments & Wealth Institute (IWI), and the Financial Planning Association® (FPA®).
Data is also included from Cerulli’s partnership with Phoenix Marketing International, whose PMI Global Wealth Monitor is the largest affluence study in the United States, with online surveys of nearly 10,000 households throughout the year. Phoenix also fields the Retirement Services Study, which addresses the target market of retirement providers.
Households’ Financial Goals Cerulli’s ongoing research finds that wealth accumulation and protection, along with healthcare concerns, continue to dominate the concerns of affluent U.S. investors. While macroeconomic factors, such as the overall trend of equity markets or interest rates, affect the overall financial landscape, investors express much higher interest in progressing toward their own personal goals. Unfortunately, facing a firehose of information available to them through digital media and their own recency and availability biases, investors can become easily distracted by factors outside their control.
10CH

100 IRI Retirement Fact Book 2020, 19th Edition
To overcome this, the financial services industry should continue to seek opportunities to incorporate suggestions for incremental steps clients can take to improve their progress, without meddling with their strategic portfolios. For example, investors tend to deemphasize their concerns regarding important elements in financial wellness, such as mortgage rates or saving for emergencies. There are large opportunities to educate these households on how these elements play directly into their ability to achieve their more important concerns, including retirement planning, protecting accumulated wealth, and being well positioned to help care for loved ones’ health.
With regard to most important specific financial goals, a comfortable retirement (47%) and wealth protection (20%) combine to cover two-thirds of all survey respondents. Improving cash flow is the only other response to garner a double-digit response rate (11%), largely attributable to younger, less wealthy respondents.
Figure 10-1 Households’ Most Important Financial Goals by Age Range, 2019
Head of Household Age
Most Important Goal <30 30-39 40-49 50-59 60-69 ≥70 All Households
Assure comfortable standard of living in retirement 19% 26% 38% 58% 59% 42% 47%
Protect current level of wealth 13% 10% 11% 15% 24% 36% 20%
Improve household cash flow 24% 27% 18% 7% 5% 4% 11%
Aggressively grow wealth 24% 17% 11% 8% 3% 2% 8%
College education financing 5% 8% 12% 4% 1% 1% 5%
Leave an estate for heirs 3% 2% 2% 3% 4% 9% 4%
Better manage market risk 4% 5% 5% 3% 2% 2% 3%
Minimize income and capital gains taxes 6% 2% 3% 2% 2% 3% 3%
Charitable giving 3% 2% 1% 1% 0% 1% 1%
Sources: Phoenix Marketing International, Cerulli Associates
As investors grow older and accumulate assets, their goals turn from asset growth to protection. Investors under the age of 40 indicate high interest in improving their cash flow to aid in aggressively growing their wealth, but, interestingly, fewer than one in 10 self-identify as having an aggressive risk tolerance (data not shown here). Understandably, the majority of the industry’s focus has been on older investors’ retirement needs; however, there are clear opportunities to help address this gap among younger investors. Providers must consider opportunities to provide an “on-ramp” to aggressive investing ideas for investors with extended investment horizons. By helping investors use mental accounting to separate their assets into short- and long-term buckets, providers can better align preferences with goals.

Chapter 10: U.S. Households’ Retirement Income Planning 101
Figure 10-2 Households’ Most Important Financial Goals by Investable Assets, 2019
Household Investable Assets
Most Important Goal $100K-$250K
$250K-$500K
$500K-$1m
$1m-$2m
$2m-$5m >$5m All
Households
Assure comfortable standard of living in retirement 30% 51% 52% 49% 42% 35% 47%
Protect current level of wealth 9% 17% 21% 26% 24% 32% 20%
Improve household cash flow 31% 11% 7% 6% 6% 2% 11%
Aggressively grow wealth 14% 8% 7% 5% 7% 5% 8%
College education financing 9% 4% 4% 3% 3% 3% 5%
Leave an estate for heirs 1% 4% 4% 4% 6% 8% 4%
Better manage market risk 3% 3% 2% 3% 5% 3% 3%
Minimize income and capital gains taxes 2% 2% 2% 3% 4% 7% 3%
Charitable giving 1% 1% 1% 1% 3% 4% 1%
Sources: Phoenix Marketing International, Cerulli Associates
Viewing households’ financial goals by investable assets, rather than by age, reveals the fact that all investors, regardless of net worth, share two common aspirations — comfortable standards of living and wealth preservation. However, naturally, the specific details of how to achieve these goals is correlated to wealth. For example, investors with less than $250,000 are focused on improving cashflow and reducing debt, while the wealthier tend to take less aggressive risks to expand wealth and are more likely to concentrate on minimizing tax implications and focusing on estate planning and charitable causes.
Retirement Income Planning
Figure 10-3 Households That Have a Formal Retirement Income Plan by Age Range, 2019
Sources: Phoenix Marketing International, Cerulli Associates. Analyst Note: Respondents are households that are not retired.
0%
20%
40%
60%
80%
100%
All Households
>7060-6950-5940-4930-39<30
Have a formal retirement income plan Do not have a formal plan
43%58%
44%56%
47%53%
43%57%
37%63%
41%59%
43%58%

102 IRI Retirement Fact Book 2020, 19th Edition
More than half (58%) of all non-retired households report having a formal retirement plan, which Cerulli views as a very positive sign. The households that report the lowest percentage of preparedness are those led by individuals ages 40-49, most likely because they are still focused on their careers and prime accumulation years. This does not imply that these investors are not thinking about retirement income sources, just that they haven’t begun establishing formal plans yet. Given their longer time horizon, all investors under age 60 who haven’t formally planned could glean important lessons from older investors who tend to heavily rely on Social Security for retirement income and may or may not benefit from subsidizing this stream with an annuity.
Cerulli’s Advice by Orientation outlined in Figure 10-4 should be viewed as a spectrum of investors engaging with advisors. On the far left are “self-directed” investors, defined by Cerulli as those who execute their own trades and planning via a direct-to-consumer brokerage account without formal advisor relationships. Comparatively, “advisor-directed” households are those investors who are fully engaged and take direction from financial advisors, which often includes advisors retaining full investment discretion.
Figure 10-4 Households That Have a Formal Retirement Income Plan by Advice Orientation, 2019
Sources: Phoenix Marketing International, Cerulli Associates. Analyst Note: Respondents were asked if they had a specific plan for their income stream in retirement, not just saving money toward retirement while they are or were working. Respondents are households who are not retired.
The key takeaway here is that the odds of a household having established a retirement income plan are considerably higher among those working with an advisor. This is understandable as broker/dealers (B/Ds) and registered investment advisors (RIAs) — and their advisors — continue to enhance their module and comprehensive planning capabilities and tools in order to better meet client needs, deepen relationships, and increase their value proposition.
Equally encouraging is that greater than half (52%) of all households indicate a willingness to pay for these advice services. Moreover, there are no major outliers in the willingness to pay for advice across age cohorts and/or investable asset ranges. This is mutually beneficial for firms that offer these solutions and client outcomes.
0%
20%
40%
60%
80%
100%
All Households
Advisor-Directed
Advisor-Assisted
Advice for Special Events
Self-Directed
Have a formal retirement income plan Do not have a formal retirement income plan
52%48%
40%60%
31%69%
37%63%
43%58%

Chapter 10: U.S. Households’ Retirement Income Planning 103
Figure 10-5 Willingness to Pay for Advice by Age and Investable Assets, 2019
Head of Household Age
I Am Willing to Pay for Advice <30 30-39 40-49 50-59 60-69 ≥70 All
Households
Strongly agree 20% 19% 18% 13% 14% 14% 15%
Agree 36% 36% 37% 37% 37% 36% 37%
Neither disagree nor agree 27% 27% 27% 26% 28% 24% 27%
Disagree 12% 13% 12% 16% 14% 15% 14%
Strongly disagree 6% 5% 6% 8% 8% 11% 8%
Household Investable Assets
I Am Willing to Pay for Advice
$100K-$250K
$250K-$500K
$500K-$1m
$1m-$2m
$2m-$5m >$5m All
Households
Strongly agree 11% 12% 16% 22% 23% 19% 15%
Agree 36% 36% 40% 39% 34% 29% 37%
Neither disagree nor agree 32% 30% 26% 18% 21% 29% 27%
Disagree 17% 15% 12% 13% 14% 11% 14%
Strongly disagree 5% 8% 7% 9% 9% 12% 8%
Sources: Phoenix Marketing International, Cerulli Associates
Generating Retirement Income and the Role of Annuities Creating a sustainable retirement income stream may be a surprisingly challenging endeavor even for investors with more than $1 million in investable assets. Current financial planning best practices recommend withdrawal rates of approximately 5% annually to ensure that distributions can continue over a household’s combined life expectancies. However, an income of $50,000 is likely to fall below expectations for a household that has amassed $1 million of dedicated retirement assets.
Providers that can differentiate themselves with expertise in leveraging a variety of potential income sources, including Social Security, insured products, and illiquid holdings, have the potential to noticeably increase their marketshare by becoming the recognized leader in the space. Obtaining this position will require the development of technology tools for use by client-facing specialists to develop personalized income plans within a flexible overall methodology. This is particular important if an advisor or firm is trying to entice self-directed investors.
In terms of current income sources, affluent retirees report an average of 27% of their retirement income is attributable to Social Security distributions, from a high of 36% among those with $250,000 to $500,000 in investable assets, to just 9% among those in the highest wealth tier.

104 IRI Retirement Fact Book 2020, 19th Edition
Figure 10-6 Retirement Households’ Income Sources by Investable Assets, 2019
Household Investable Assets
Source of Income $250K- $500K
$500K- $1m $1m-$2m $2m-$5m >$5m All Retired
Households
Social Security 36% 26% 23% 16% 9% 27%
401(k), pension, etc. 20% 25% 23% 20% 11% 21%
IRAs 13% 14% 18% 16% 11% 14%
Other 14% 15% 12% 13% 9% 13%
Dividends from stocks and bonds 4% 8% 10% 23% 48% 11%
Annuity income 8% 7% 7% 4% 2% 7%
Full- or part-time employment 2% 3% 3% 3% 0.4% 2%
Real estate investments 2% 2% 1% 2% 7% 2%
Personal trust accounts 0.5% 1% 1% 2% 2% 1%
Family business 0.4% 0.5% 1% 1% 1% 0.5%
Sources: Phoenix Marketing International, Cerulli Associates. Analyst Note: Retired households were asked how much of their retirement income came from the listed sources. “Other” includes income
from spouse or children and any miscellaneous source of retirement income. Totals may not add to 100% due to rounding.
Optimizing a retiree’s Social Security distribution strategy remains one of the most vexing challenges facing platform providers. With factors such as the life expectancy of two household members and taxation status, even a well-designed algorithm offers limited scaling options as the “best” decision and is based fundamentally on clients’ preferences rather than a precise calculation. To maximize client satisfaction, providers will need to not only develop tools to address this topic but offer qualified representatives to help near-retirees understand the full implications of each decision in this process.
Figure 10-7 Retirement Households’ Income Sources by Age Range, 2019
Head of Household Age
Source of Income 50-59 60-69 ≥70 All Retired Households
Social Security 10% 25% 30% 27%
401(k), pension, etc. 29% 22% 20% 21%
IRAs 11% 13% 16% 14%
Other 25% 14% 12% 13%
Dividends from stocks and bonds 9% 11% 11% 11%
Annuity income 5% 8% 6% 7%
Full- or part-time employment 6% 2% 2% 2%
Real estate investments 2% 3% 1% 2%
Personal trust accounts 3% 1% 1% 1%
Family business 1% 1% 0.4% 0.5%
Sources: Phoenix Marketing International, Cerulli Associates. Analyst Note: Retired households were asked how much of their retirement income came from the listed sources. Based on changes in the sample
methodology, investors with less than $250,000 in investable assets will be no older than 45 years old. Based on this change, retired investors with less than $250,000 in investable assets have been omitted from the survey. “Other” includes income from spouse or children and any miscellaneous source of
retirement income. Totals may not add to 100% due to rounding.

Chapter 10: U.S. Households’ Retirement Income Planning 105
Retirees under age 50 report 25% of their income as attributable to “other” sources, nearly twice as high as respondents in older cohorts. With limited access to distributions from other retirement-specific resources and a longer expected distribution phase, early retirees need to cobble together a variety of income sources. Advisors who can provide expert assistance in this area have the opportunity to gather significant additional clients from this niche community. As noted in the previous exhibits, annuities are just one of many income sources; however, annuities can improve portfolios and planning by providing guaranteed and predictable income flooring. Cerulli continues to be encouraged by the many surveyed households that cite the income stream as the main reason for their buying a variable annuity. That means these clients show a willingness to use the annuity for the purpose for which it was intended, not just for asset growth. The popularity of guaranteed lifetime withdrawal benefits (GLWBs) as an alternative to annuitization has also helped clients appreciate the income story.
Figure 10-8 Households’ Primary Reason for Variable Annuity Purchase, 2019
Sources: Phoenix Marketing International, Cerulli Associates. Analyst Note: Respondents who had only purchased a variable annuity policy were asked, “Which of the following is the most important reason you purchased your annuity?” Respondents had to select only one choice.
Feedback from households that purchased fixed annuities is mixed. While 21% of these households attributed “asset protection” as their primary reason, a greater number (38%) indicated electing the products to “provide a retirement income stream.” This can be a bit concerning if these investors purchased “traditional” fixed annuities because the primary benefit is typically protecting assets through a guaranteed rate of return. Moreover, advisors do not generally recommend annuitizing these products for lifetime income. Unfortunately, other owners may not understand why they own the product, which could be due to the complexity of products or, hopefully in fewer cases, less transparent original product recommendations. That said, with the growing popularity of fixed-indexed annuities offering living benefits, it could be that gradually clients are becoming more aware of the income-taking advantages among an increasing supply of fixed annuity solutions. Either way, insurers should help this educational process along so that more clients grasp just how helpful annuities can be in managing their retirement savings and why they would elect one solution over another.
0% 10% 20% 30% 40% 50% 60%
To provide income stream during retirementAsset protection
As a savings vehicle
To provide account growth
Tax benefits associated with policy
To diversify assets
Other
Investment performance
Maxed out on other retirement vehicles 0%
1%
2%
5%
5%
6%
19%
22%
39%

106 IRI Retirement Fact Book 2020, 19th Edition
Figure 10-9 Households’ Primary Reason for Fixed Annuity Purchase, 2019
Sources: Phoenix Marketing International, Cerulli Associates. Analyst Note: Respondents who had only purchased a fixed annuity policy were asked, “Which of the following is the most important reason you purchased your annuity?” Respondents had to select only one choice.
0% 10% 20% 30% 40% 50% 60%
To provide income stream during retirementAsset protection
Tax benefits associated with policy
As a savings vehicle
To diversify assets
To provide account growth
Other
Investment performance
Maxed out on other retirement vehicles 0%
3%
4%
5%
9%
9%
11%
21%
38%

Chapter 11: Distribution Trends in the Year of COVID-19 107
Distribution Trends in the Year of COVID-19COVID-19 has had a tremendous impact on the economy and financial markets, but also on business practices across all industries as companies work to re-align production and distribution with social distancing and remote work postures. Financial practitioners working with annuities and insurance are especially challenged as these products typically involve a high degree of personal interaction with the client during the sales process, and there are operational aspects such as multiple signed forms and policy delivery for which virtual process such as e-signature and e-delivery are not always available. This chapter will look at how distribution trends are evolving during this difficult and rapidly evolving period, drawing from a survey of 408 financial advisors conducted by IRI, LIMRA, Oliver Wyman and NAIFA between May 5, 2020 and June 1, 2020.
A Look Back and a Look ForwardMost of the advisors surveyed for the study make at least some use of insurance products in their practices. At least one annuity was sold in the past 12 months by 75 percent of respondents, with more than half selling six annuities or more. Similar usage is observed across different types of life products, and about six in 10 sold at least one long-term care policy. Figure 11-1 breaks down sales across multiple insurance product types.
11CH

108 IRI Retirement Fact Book 2020, 19th Edition
Figure 11-1 Insurance Product Sales Volumes – Past 12 Months
n = 408
Despite the challenges involved in navigating a difficult and unprecedented environment, there is considerable optimism among advisors, at least at this moment. Of note are the positive responses around retaining and attracting clients, with over 60 percent of advisors having a positive outlook around their ability to prospect for and onboard new clients, and over 80 percent feeling positive about retaining their existing clients. Which is not to say advisors are not feeling pressures – significant numbers have concerns around revenue and staffing, particularly the prospect of hiring new staff. Figure 11-2 examines advisors’ outlooks on a variety of business metrics.
Figure 11-2 Short Term (3-6 Month) Outlook for the Impact of COVID-19
n = 408
0%
20%
40%
60%
80%
100%
LTC or Disability
Final Expense / Pre-need
Term Life
Indexed Universal
Life
Universal Life
Whole LifeAnnuities
None 1 - 5 6 - 10 10+ Not applicable
20%35%
35%
54%
6%
56%
32%
33%
35%
37%
20%
27%
18%
38%
18%13%
10% 6%
16%
5% 11%
24% 23%11%
7%
47%
5%11%
5% 4% 7%13%
4%16%
8%
9% 21% 22% 39% 8%8%
0% 20% 40% 60% 80% 100%
Very positive Somewhat positive Neutral
Somewhat negative Very negative
Investing in new or upgraded technologyRetaining existing staff
Hiring new staff
Retaining existing clientsTaking on new clients
Prospecting for new clients
Remaining in operationProfitability of your practice
Funding/salary/ stipend/advancing business incomeTotal revenue 9% 21% 22% 39% 8%
7% 16% 25% 29% 18%5%12% 25% 26% 31% 5%
55% 20% 16% 5%
23% 37% 20% 7%11%28% 38% 18% 13%
51% 30% 12% 5%
5% 11% 32% 12% 25%15%34% 18% 17% 23%6%
16% 26% 34% 6%9% 9%
Not applicable
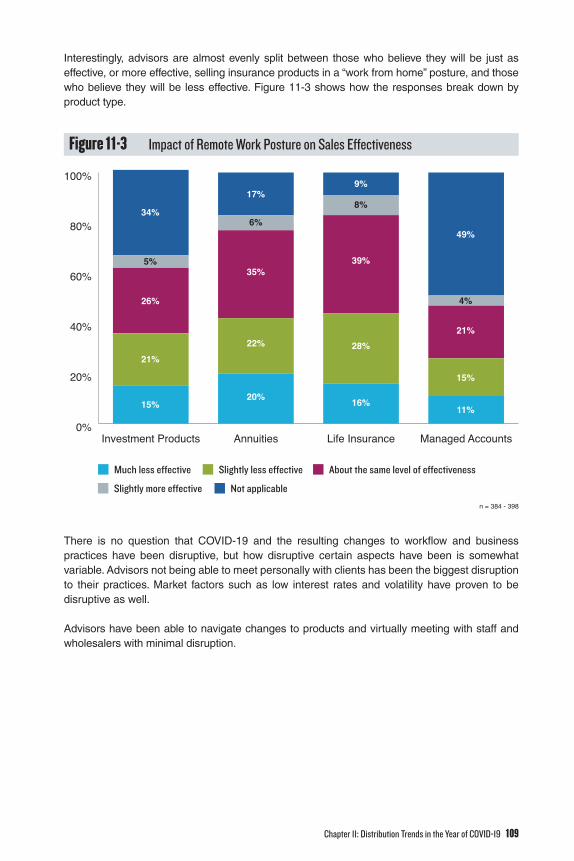
Chapter 11: Distribution Trends in the Year of COVID-19 109
Interestingly, advisors are almost evenly split between those who believe they will be just as effective, or more effective, selling insurance products in a “work from home” posture, and those who believe they will be less effective. Figure 11-3 shows how the responses break down by product type.
Figure 11-3 Impact of Remote Work Posture on Sales Effectiveness
n = 384 - 398
There is no question that COVID-19 and the resulting changes to workflow and business practices have been disruptive, but how disruptive certain aspects have been is somewhat variable. Advisors not being able to meet personally with clients has been the biggest disruption to their practices. Market factors such as low interest rates and volatility have proven to be disruptive as well.
Advisors have been able to navigate changes to products and virtually meeting with staff and wholesalers with minimal disruption.
0%
20%
40%
60%
80%
100%
Managed AccountsLife InsuranceAnnuitiesInvestment Products
Much less effective Slightly less effective About the same level of effectiveness
Slightly more effective Not applicable
11%
15%
21%
4%
49%
16%
28%
39%
8%
9%
20%
22%
35%
6%
17%
15%
21%
26%
5%
34%

110 IRI Retirement Fact Book 2020, 19th Edition
Figure 11-4 Advisor Perception of How Disruptive Various Aspects of COVID-19 Have Been
n = 408
Annuities and whole/universal life insurance are “high touch” products, requiring advisors to engage in extensive discussion with clients as to the role they play in their overall financial picture. Social distancing, a key element of the efforts to control the spread of COVID-19, was a worrisome development – how would it impact the marketing and servicing of life insurance and annuities? At least at the time of this survey, on average social distancing has caused a moderate degree of challenge across the new business sales process and closing and paperwork of new business has only caused a low degree of challenge. Trends are generally consistent across channels. Wirehouse advisors are least challenged by social distancing while RIAs are the most challenged.
Figure 11-5 Challenges of Social Distancing
n = 408
0% 10% 20% 30% 40% 50% 60% 70% 80% 90% 100%
Low interest rates
Market volatility
Changes to insurance products or their availability
Changes to investment products or their availability
Less or no ability to work in usual space
Less or no ability to personally meet with wholesalers and/or other vendors
Less or no ability to personally meet with staff
Less or no ability to personally meet with clients
Not at all Somewhat Very
14%
46%
48%
49%
72%
57%
26%
33%
37%
36%
31%
38%
21%
33%
43%
45%
49%
18%
22%
14%
7%
10%
32%
22%
0% 10% 20% 30% 40% 50% 60% 70% 80% 90% 100%
Closing and paperwork of new business
Medical underwriting
Product sales conversations with new clients
Prospecting new clients
Initial/planning conversations with new clients 31%
35%
26%
19%
16%
32%
34%
35%
29%
29%
20%
14%
22%
24%
29%
10%
10%
11%
13%
18%
5%
4%
4%
6%
6%
3%
9%
4%
3%
2%
High degree of challenge Moderate degree of challenge Low degree of challenge
No different than pre COVID-19 Better than pre COVID-19 Not applicable

Chapter 11: Distribution Trends in the Year of COVID-19 111
Maintaining the ability to do business is critical in this environment, and most advisors feel like they are well supported by their broker-dealers or agencies, and insurance companies.
Figure 11-6 Advisors’ Perception of Support
n = 408
Some kinds of support are more valuable than others; topping the list for advisors are changes to, or reductions in, compliance requirements and moving to digital fulfilment of transactions. E-Signature, e-Delivery, and process changes such as resolving not-in-good-order (NIGO) issues by phone or e-mail rather than requiring forms to be re-signed have gone a long way toward helping advisors work with their clients while unable to meet with them in person.
Figure 11-7 Value of Different Aspects of Support
n = 408
In terms of what is keeping clients awake at night, market volatility is by far their largest concern. The stock market has recovered much of the ground lost in March as of this writing, and it will be interesting to observe whether that market shock will result in greater consumer interest
0% 10% 20% 30% 40% 50% 60% 70% 80% 90% 100%
Webinars on business management/continuity
Webinars on working with clients
Webinars on investment and insurance concepts
Interactive video conferences/training
Wholesaler support
White papers
COVID-19 marketing/sales articles/tip sheets
COVID-19 business practice articles/tip sheetsProduct manufacturers creating new products
aimed at clients’ COVID-19 concernsProduct manufacturers better communicating
changes to crediting rates/caps/pricingSwitch from paper to digital fulfillment
Change/reduce compliance requirements
Have Don’t have
93%
97%
90%
93%
84%
92%
88%
89%
94%
92%
95%
94%
7%
3%
10%
7%
16%
8%
13%
11%
6%
8%
5%
6%
0% 10% 20% 30% 40% 50% 60% 70% 80% 90% 100%
Webinars on business management/continuity
Webinars on working with clients
Webinars on investment and insurance concepts
Interactive video conferences/training
Wholesaler support
White papers
COVID-19 marketing/sales articles/tip sheets
COVID-19 business practice articles/tip sheetsProduct manufacturers creating new products
aimed at clients’ COVID-19 concernsProduct manufacturers better communicating
changes to crediting rates/caps/pricingSwitch from paper to digital fulfillment
Change/reduce compliance requirements 34%
41%
15%
17%
12%
15%
9%
17%
26%
19%
23%
26%
3%
5%
4%
6%
5%
6%
7%
4%
4%
30%
32%
31%
41%
34%
37%
28%
33%
43%
40%
43%
43%
30%
20%
42%
29%
37%
34%
47%
36%
23%
30%
25%
22%
4%
7%
8%
10%
10%
9%
8%
5%
7%
6%
5%
3%
3%
4%
3%
Very valuable Somewhat valuable Neutral
Not very valuable Not at all valuable

112 IRI Retirement Fact Book 2020, 19th Edition
in protection-oriented products such as structured and fixed indexed annuities, and variable annuities with living benefits.
Figure 11-8 Top Client Concerns
n = 408
As might be expected, during the time the survey was conducted advisors were far more focused on working with existing clients than with new clients; many areas of the country were under “shelter in place” orders, and consumers were focused on more immediate concerns than their portfolios.
0%
20%
40%
60%
80%
100%
120%
Emergency need for insurance
Questions about policy
coverage with respect to the virus
Low interest rates
Stock market volatility
Top Concern - 1 2 3 4 Least Concerned - 5
6%
19%
26%
40%
20%
20%
19%
31%
22%
23%
9%
36%
25%
25%
16%
53%
21%
11%
11%
13%

Chapter 11: Distribution Trends in the Year of COVID-19 113
Figure 11-9 Sales Activity by Client Type
n = 408
Concluding ThoughtsThe year 2020 visited challenges to the retirement industry that were both severe and unanticipated. No one wants a crisis such as COVID-19 to occur, but often in times of crisis innovation efforts are galvanized because there is no choice but to innovate. Digital processing of annuity transactions has seen more advancement and broader adoption due to the necessity of a paperless process, and this has delivered a better experience for the advisor and the consumers. The challenge now is to make these innovations permanent and build on them to bring the annuity sales and transaction process as close as possible to the experience of purchasing mutual funds.
17%
54%
24%
Higher proportion of sales to existingclients compared to business as usual
Higher proportion of sales to new clientscompared to business as usual
All sales have been to existing clients
5%
All sales have been to new clients

114 IRI Retirement Fact Book 2020, 19th Edition

Chapter 12: Tax-Qualified Retirement Plans 115
Tax-Qualified Retirement PlansThe role of Social Security and employer-provided defined benefit pension plans in providing a secure retirement income is diminishing for many Americans. The importance of self-directed plans such as 401(k)s and 403(b)s is increasing. Yet despite the significance of this shift, many people still do not understand the types of retirement plans available to them and the options they have. This understanding is essential if individuals are going to be able to effectively plan for their own retirement and make appropriate decisions about managing their income once they retire.
In recognition of the need to encourage individuals to save for retirement, the U.S. Government has codified preferential tax treatment for assets held in several types of retirement plans. These “tax-qualified” plans must meet the specific requirements of the Internal Revenue Code, as well as the requirements of various other laws that have been enacted over the years, such as the Employee Retirement Income Security Act of 1974 (ERISA).
Some of the most common types of tax-qualified retirement plans are described below.
Personal Retirement Savings Plans Individual Retirement Arrangements (IRAs) An individual retirement arrangement (also known as an individual retirement account or individual retirement annuity) is a tax-deferred retirement plan, typically set up through a bank, mutual fund company, or brokerage firm (in the case of an account), or a life insurance company (in the case of an annuity). An individual can contribute money earned each year to an IRA, subject to certain limits. In 2020, individuals younger than age 50 generally can contribute up to $6,000, while individuals age 50 and older generally can contribute up to $7,000. Earnings on contributions (investments) grow tax deferred. Amounts withdrawn before age 59½ generally incur a 10 percent tax penalty, subject to certain exceptions.
Amounts generally can be transferred or “rolled over” between IRAs tax-free, subject to certain rules and restrictions. Likewise, amounts in other types of qualified retirement plans (such as 401(k) plans and defined benefit plans) generally can be rolled over tax-free to an IRA. In that regard, it is quite common for employees to roll over their retirement plan assets to an IRA when they switch jobs or retire.
12CH

116 IRI Retirement Fact Book 2020, 19th Edition
The most common types of IRAs are Traditional IRAs and Roth IRAs, both of which are discussed in this chapter. Other types include SEPs (simplified retirement plans for self-employed individuals or small business owners) and SIMPLEs (flexible, easy-to-administer retirement plans for businesses with 100 or fewer employees).
• Traditional IRA: Anyone with earned income can make contributions to a Traditional IRA. However, only those who do not participate in an employer-sponsored retirement plan, or who participate in such a plan but meet certain income limits, can make tax-deductible contributions. Distributions of tax-deductible contributions and all earnings or interest from a Traditional IRA are taxed as ordinary income in the year received. As noted above, amounts withdrawn before age 59½ generally incur a 10 percent early-withdrawal tax penalty. Minimum distributions from a Traditional IRA generally must begin by April 1 following the year the owner turns 72 (70½ if the owner reached that age before January 1, 2020).
• Roth IRA: A Roth IRA is like a Traditional IRA, but with several important differences. Similarities include the application of the same contribution limits (which apply on an aggregated basis to Traditional and Roth IRAs), the same earned income requirement, and the same penalty tax for distributions made before age 59½.
The key differences between Traditional and Roth IRAs are that (1) contributions to a Roth IRA are never tax deductible; (2) anyone with earned income can make contributions to a Roth IRA regardless of age; and (3) distributions from a Roth IRA are tax free if made on or after the taxpayer turns 59½ and at least five years after the year in which the taxpayer made his or her first contribution to any Roth IRA. Distributions also are tax free if made after death, upon disability, or for the first-time purchase of a primary residence. Traditional IRAs are subject to income limits, with the deductibility of contributions in 2020 disallowed above adjusted gross income of $75,000 for single filers and above $124,000 for married filing jointly. If your income in 2020 was between $65,000 and $75,000 for individuals and between $104,000 and $124,000 for married couples filing a joint return, you may take a partial deduction for amounts contributed to the Traditional IRA. Unlike Traditional IRAs, Roth IRAs are not subject to minimum distribution requirements during the owner’s lifetime. In 2020, individuals with annual incomes above $139,000 for single filers and $206,000 for married filing jointly cannot contribute to a Roth IRA. If your income in 2020 was between $124,000 and $139,000 for single filers and $196,000 and $206,000 for married couples filing a joint return, you may contribute a modified amount to a Roth IRA. An individual can convert a Traditional IRA to a Roth IRA without regard to the annual income limits that otherwise would apply to Roth IRA contributions. Such a conversion will trigger tax on the fair market value of the amount converted.
Defined Benefit Plans With a traditional defined benefit plan (pension plan), upon commencement of retirement a retiree receives a specific monthly payment (the defined benefit) from his or her employer based on salary history, years of service, and age. These payments are typically guaranteed by the employer no matter how the underlying investments perform or how long the retiree lives. If returns are less than expected, or employees live longer than expected, the employer may have to increase contributions to the plan — thus bearing both the investment and longevity risks. Employees rarely contribute any of their own money to private sector defined benefit plans. Many public sector defined benefit plans, such as the California Public Employees’ Retirement System (CalPERS), require employees to contribute. Pension payments generally begin at retirement and are taxable as ordinary income when received.

Chapter 12: Tax-Qualified Retirement Plans 117
Defined Contribution Plans A defined contribution plan is a plan in which an employee’s benefits during retirement primarily depend on the contributions made to his or her account by the employee and/or the employer as well as the investment performance of the assets in his or her account, rather than on the employee’s years of service or earnings history. Unlike a defined benefit plan, in a defined contribution plan the exact benefit to be received at and during retirement is not known. Instead, the final amount available in a defined contribution plan for retirement income is the total account balance for the employee at the time the benefit commences. This is comprised of the value of the total of employee and employer contributions and the investment earnings (or losses) on the account, less investment and administrative fees. The amount contributed to the plan and decisions about how those assets are invested among the investment vehicles included in the plan are typically made by the employee, who bears the entire investment risk in addition to the longevity risk. Some of the most common types of defined contribution plans are discussed below.
401(k) A 401(k) is an employer-sponsored retirement plan that allows employees to specify the amount of income to be deducted from their paychecks and placed in the plan. Contributions are made on a pre-tax basis and all contributions and earnings remain untaxed until withdrawn. In 2020, individuals younger than age 50 can contribute up to $19,500 to their 401(k)s, while individuals age 50 and older can contribute up to $26,000. In many plans, a portion of the employee’s contribution is matched by the employer based on a set formula (e.g., 50 percent of the employee’s contribution up to a maximum of 6 percent of employee compensation). Employers can also make other types of contributions. Employee and employer contributions combined generally can total up to $57,000 in 2020 ($63,500 if age 50 or older).
In-service distributions from a 401(k) plan generally are subject to restrictions. In addition, if a distribution is made, it generally will be subject to a 10 percent tax penalty unless the participant is at least age 59½ or another specified exception applies (e.g., disability, death). Minimum distributions must begin by April 1 following the calendar year in which the employee turns 72 (70½ for participants who reach that age before January 1, 2020) or, if later (and depending on the plan’s provisions), the calendar year in which the employee retires.
Roth 401(k) 401(k) plans are now permitted to offer designated Roth accounts. A designated Roth account under a 401(k) plan is like a Roth IRA in that contributions are made with after-tax dollars (i.e., contributions are included in the participant’s gross income when made) and distributions are tax free if certain conditions are met. However, designated Roth accounts under a 401(k) plan differ in certain ways from a Roth IRA. For example, lifetime minimum distribution requirements apply beginning at age 72 (70½ for participants who reach that age before January 1, 2020) or retirement, and in-service distributions are restricted, whereas such rules do not apply to Roth IRAs. In addition, the same limits that apply to non-Roth employee contributions to a 401(k) plan apply to employee contributions to a designated Roth account under the plan ($19,500 in 2020). Non-Roth amounts within a 401(k) plan may be converted to a designated Roth account within the same plan if certain conditions are met. A 401(k) plan now may permit rollovers from non-Roth to Roth accounts for amounts that would not otherwise be eligible for distribution at the time of rollover. (A similar expansion applies to 403(b) plans and governmental 457(b) plans.)

118 IRI Retirement Fact Book 2020, 19th Edition
403(b) A 403(b) plan is also like a 401(k) plan, but is offered to the employees of educational, religious, and charitable organizations. Although several types of contribution limits apply to 403(b) plans, employee elective contribution limits through salary deduction are generally the same as for 401(k)s. Also, like 401(k)s, in-service withdrawals generally are restricted, and a 10 percent tax penalty applies to permissible withdrawals made before age 59½ (subject to certain exceptions). Earnings grow tax deferred until they are withdrawn, at which point they are taxed as ordinary income. Minimum distributions must begin by April 1 following the calendar year in which the employee turns 72 (70½ for participants reaching that age before January 1, 2020) or, if later (and depending on the plan’s terms), the calendar year in which the employee retires. A 403(b) plan can only invest in annuities or mutual funds, and most are invested in annuities.
Roth 403(b) 403(b) plans are now permitted to begin offering designated Roth accounts. Designated Roth accounts under a 403(b) plan are like such accounts under a 401(k) plan. Thus, as described above, contributions are made with after-tax dollars and distributions are tax free if certain conditions are met. Like their 401(k) counterparts, designated Roth accounts under a 403(b) plan also are subject to in-service withdrawal restrictions and minimum distribution requirements beginning at age 72 (70½ for participants who reached that age prior to January 1, 2020) or retirement. Rollovers from non-Roth to Roth 403(b) plans are subject to rules like those for 401(k) plans.
457(b) A 457(b) plan is a deferred compensation plan that is available only to employees of state and federal governments and tax-exempt organizations. Contribution limits for governmental 457(b) plans generally resemble 401(k) plans. Special catch up contribution rules allow participants to increase their catch-up contribution three years prior to the normal retirement date specified in the plan. One notable exception is that the aggregate employer and employee contributions to a governmental 457(b) plan are limited to $19,500 (or $26,000 for participants age 50 or older) in 2020, rather than the $57,000 aggregate limit that generally applies to 401(k) plans. Non-governmental 457(b) plans are subject to the somewhat less favorable rules governing nonqualified deferred compensation, and increased contributions are not allowed for participants age 50 or older.
Governmental Roth 457(b)Governmental 457(b) plans are now permitted to begin offering designated Roth accounts. Designated Roth accounts under a governmental 457(b) plan are like such accounts under a 401(k) or 403(b) plan. Rollovers from non-Roth to governmental Roth 457(b) plans are subject to rules similar to those for 401(k) and 403(b) plans. Designated Roth accounts are not allowed under non-governmental 457(b) plans.
Shift in Retirement Plan Assets The percentage of assets held in various types of retirement plans has changed significantly over the last few decades, reflecting a shift from employer-sponsored defined benefit plans to employee-funded defined contribution plans, such as 401(k) plans.
At the end of 2019, assets held in IRAs and Keoghs (tax-deferred retirement savings plans for self-employed individuals or small business owners) accounted for the largest segment of the retirement plan market with $11 trillion, or 34 percent of total assets, as compared to 23 percent

Chapter 12: Tax-Qualified Retirement Plans 119
in 2000. Assets in defined contribution plans were $9 trillion, or 28 percent of total assets in 2019, compared to 26 percent in 2000. In contrast, assets held in employer-sponsored defined benefit plans decreased from 17 percent to only 11 percent of total retirement plan assets between 2000 and 2019.
Figure 12-1 Total U.S. Retirement Market Assets – 2000 (100% = $11.6 trillion)
Source: Investment Company Institute
Figure 12-2 Total U.S. Retirement Market Assets – 2019 (100% = $32.6 trillion)
Source: Investment Company Institute
6% 23%
26%
20%
8%
Private Defined Contribution
Private Defined Benefit
State & Local Government
Federal Government
IRAs
Annuities
17%
6%
34%
28%
15%
7%
Private Defined Contribution
Private Defined Benefit
State & Local Government
Federal Government
IRAs
Annuities11%

120 IRI Retirement Fact Book 2020, 19th Edition
The Use of Annuities in Qualified Plans The use of annuities in funding a qualified retirement plan is both longstanding and widespread.
As more and more Americans face retirement without the safety net of a traditional defined benefit pension plan that provides retirement income for life, new sources of guaranteed income will need to be identified. Annuities are uniquely suited to fill this need.
In 1952, the Teachers Insurance and Annuity Association - College Retirement Equities Fund (TIAA-CREF, now known as simply TIAA) developed the first variable annuity for use in college and university retirement plans. Due to the structure of regulations in this area, group and individual annuity contracts came to dominate the retirement plan arena for the non-profit sector. As time went on annuities also evolved into funding vehicles for other tax-qualified arrangements such as IRAs and 401(k)s. Annuities that are specifically created and designed for the qualified (i.e., retirement plan) market are subject to a variety of rules that are different from annuities in the non-qualified market. For example, the required minimum distribution requirements applicable to qualified plans include specific rules for the use of variable annuities in satisfying those requirements.
At the end of 2019, variable annuity assets invested in qualified retirement plans totaled $1.3 trillion, or 64.8 percent of total variable annuity assets. The legitimacy of using a variable annuity to fund a qualified retirement plan is sometimes questioned because the annuity does not provide any additional tax-deferred treatment of earnings beyond that already provided by the plan itself. However, annuities also offer many benefits that can make them suitable for use in qualified plans, such as lifetime income, principal protection, death benefits, and fee guarantees.
The financial crisis and the associated reduction of many workers’ retirement savings in qualified retirement plans has prompted a fresh look at annuities. While not using the word “annuity,” in 2010 the Obama administration’s Middle Class Task Force advocated “promoting the availability of guaranteed lifetime income products” as a means to reduce “the risks that retirees will outlive their savings or that their living standards will be eroded by investment losses or inflation.” And in 2014, the U.S. Treasury issued rules specifically addressing the use of Qualified Longevity Annuity Contracts (QLACs) in qualified plans, including setting purchase limits at the greater of 25 percent of qualified plan assets or $125,000 (raised to $130,000 in 2018 and to $135,000 in 2020). Annuities are designed to help consumers reach their retirement goals by providing for the accumulation of assets during the owner’s income-producing years, and guaranteeing payments in retirement that last a lifetime — a benefit that defined contribution plans not funded using annuities, or not offering annuity options such as QLACs, do not otherwise provide participants.
In-Plan Guaranteed Lifetime Income Options Fixed immediate annuities were endorsed by the Government Accountability Office (GAO) and the federal government has been encouraging employer sponsors of defined contribution plans, such as 401(k)s, to offer them as options for retiring employees. See Chapter 7: Generating (Almost) Immediate Income, to learn more about these types of annuities. On December 20, 2019, the Setting Every Community Up for Retirement Enhancement (SECURE) Act was signed into law as part of the Further Consolidated Appropriations Act, 2020. The SECURE Act contains several provisions designed to encourage the use of in-plan guaranteed lifetime income options. Further discussion of the SECURE Act follows below.

Chapter 12: Tax-Qualified Retirement Plans 121
Advantages of In-Plan Guaranteed Lifetime Income OptionsIt is important to remember that the primary goal of a retirement plan is not to obtain tax deferral, but rather to provide retirement income that will last for the life of the retiree. In recognition of this there is a relatively new twist on the use of annuities within 401(k) plans — allowing employees to invest a percentage of ongoing contributions in an “in-plan” investment option that will build up a stream of “guaranteed income” for life that is not subject to the same market volatility of a typical equity or bond investment option in a 401(k) plan. These in-plan guaranteed income options typically provide downside income protection through insurance guarantees, upside income potential through participation in financial markets, and guaranteed income for life.
There is a widespread need for education on understanding and creating income in retirement, and employers can be a trusted source for that education. Employers and service providers often provide financial education on the topic of saving for retirement. Adding education on managing those assets in retirement is a logical next step. Employees will benefit from ongoing education on the value of guaranteed income options. Specifically, within an employer plan, participant education materials should clearly and concisely explain the benefits of guaranteed lifetime income products and how they compare to other options that are offered by their plan. This would include information such as the historic return patterns of each of the options, the specific risk ratios associated with each of the plan choices, the expense ratios or fees associated with each option, and an explanation of differences between and among different options. Similar educational information is already provided in the accumulation stage under the plans.
For employers, in-plan guaranteed options present advantages through enhanced value of the defined contribution plan as a labor force management tool. According to 2017 research by Prudential, 67 percent of defined contribution plan participants said investing in an in-plan guaranteed retirement income option made them more confident in general about their retirement security. In addition to the enhanced security of the participant, such options can help ensure employees retire on time — delayed retirements can limit companies’ abilities to hire new staff and provide advancement opportunities for existing talent and may represent a significant cost. In another 2017 study, Prudential found that employers incur an incremental cost of over $50,000 for each employee whose retirement is delayed by one year. For an employer with 3,000 employees and workforce costs of $200 million, a one-year delay in retirement age may cost $2-$3 million. The SECURE ActThe SECURE Act addresses many of the challenges that had previously been associated with the use of lifetime income products in defined contribution plans.
• Fiduciary safe harbor for evaluating annuity issuers: The choice of an annuity as an investment or distribution option in a defined contribution plan subject to ERISA is a fiduciary decision, and the Department of Labor previously issued guidance that plan fiduciaries can use to demonstrate prudence in selecting an annuity for a defined contribution plan under certain circumstances. One of factors that a fiduciary must consider when making these decisions is the financial capability of the insurance company issuing the annuity. Evaluating the financial strength of an insurance company is a task that few plan sponsors feel qualified to do, and many plan sponsors have cited fiduciary concerns as a significant reason for not including annuity options in defined contribution plans. To address this concern, the SECURE Act introduces a new safe harbor that a plan fiduciary may use to demonstrate that it acted prudently in determining the financial capability of an insurer backing a guaranteed retirement income contract. Under the safe harbor, a plan sponsor generally can rely on representations of the insurance company

122 IRI Retirement Fact Book 2020, 19th Edition
with respect to its financial capabilities in purchasing an annuity. As explained in the legislative history to the SECURE Act, the safe harbor would be an optional means of establishing prudence, and not the exclusive means.
• Portability of lifetime income products: Plan sponsors of defined contribution plans had been concerned that participants could lose some or all of the lifetime guarantee that they had accumulated, should a lifetime income product be discontinued as an investment option. Income guarantees are product specific and usually cannot be transferred between insurance companies. Participants who are not distribution eligible (e.g., for a 401(k) plan or 403(b) plan, active employees under the age 59½) were unable to rollover the guarantee to an IRA offered by the same annuity issuer. The SECURE Act adds new provisions to the tax code that permit a defined contribution plan to transfer or distribute a lifetime income investment under certain circumstances, even if the participant is not otherwise eligible to take a distribution. Under the new provisions, if a lifetime income investment that meets certain requirements is no longer authorized to be held as an investment option under a tax-qualified defined contribution plan (including a section 401(k) plan, section 403(b) plan, or governmental section 457(b) plan), the plan will generally be able to allow (1) a distribution of the investment in a trustee-to-trustee transfer to another employer-sponsored retirement plan or IRA, or (2) a distribution of the investment in the form of annuity contract purchased for the participant, even if the participant is actively employed and not yet age 59½. The distribution must be made within 90 days of the date when the lifetime income product is no longer authorized to be held as an investment option under the plan.
• Lifetime income disclosure: Defined contribution plans subject to ERISA are generally required to provide a benefits statement to each plan participant once every 12 months, identifying the participant’s accrued benefit and vested benefit. The SECURE Act requires defined contributions plans to include a lifetime income disclosure in the annual benefits statement. The lifetime income disclosure is an estimate of the monthly payments that that the participant would receive if his or her account balance were converted to a lifetime income stream under a single life annuity or a qualified joint and survivor annuity with the participant’s spouse, based on assumptions to be specified by the Department of Labor. The legislation directs the Department of Labor to issue a model lifetime income disclosure within one year of enactment. The legislation provides that no plan fiduciary, plan sponsor or other person will have any liability under ERISA solely by reason of providing a lifetime income disclosure statement in accordance with the rules established by the Department of Labor.

Chapter 13: Other Sources of Insured Retirement Income 123
Other Sources of Insured Retirement IncomeIn addition to annuities, there are other retirement income instruments insured to last one’s lifetime.
The following table provides an overview of these other insured lifetime income vehicles, who provides the funding, and who provides the insurance that income will last one’s lifetime.
Figure 13-1 Other Sources of Insured Retirement Income
Instrument Who Provides Funding Who Provides Insurance for Lifetime Income
Defined benefit plansEmployers (public and private)
Private plans: Pension Benefit Guaranty CorporationPublic plans: federal and state governments
Social Security and Medicare
Payroll taxes into trust funds
Social Security Administration and the federal government
Life insurance Individual Life insurance companies
Long-term care insurance Individual Life insurance companies
Reverse mortgages Individual Federal Housing Administration
Fixed-income vehicles Individual Varies
Employer-Sponsored: Defined Benefit Plans As with owners of annuities that include a guaranteed source of retirement income, individuals fortunate enough to be covered by a defined benefit program through their employer can look to a steady, guaranteed income source in retirement.
Defined benefit programs, also known as pensions, used to be the standard retirement benefit offered to employees. Over the years, this standard has given way to defined contribution plans such as 401(k) plans, in which the employee assumes a much greater responsibility for his or her retirement savings and guarantees are no longer provided.
13CH

124 IRI Retirement Fact Book 2020, 19th Edition
How a Defined Benefit Plan WorksA defined benefit plan guarantees an employee a certain benefit upon retirement. That amount generally depends on factors such as salary, age, and years of service with the company. For 2020, the maximum retirement benefit permitted under a defined benefit plan is $230,000 (increased from $225,000 in 2019).
Each year, pension actuaries calculate the future benefits that are projected to be paid from the plan and ultimately determine what amount, if any, needs to be contributed to fund that projected benefit payout. Employers are normally the only contributors to the plan. Defined benefit plans can require that employees contribute to the plan also, but it is uncommon. The employer is also responsible for making the decisions about how to invest the contributions.
Employees are always entitled to the vested accrued benefit earned to date. If an employee leaves the company before retirement, the benefits earned up to that point are frozen and held in a trust for the employee until he or she reaches retirement age. The defined benefit plan must allow its vested employees to receive their benefits no later than the 60th day after the end of the plan year in which the latest of the following occurs:
• They reach age 65 or the normal retirement age specified in their plan. Starting in 2002, the maximum benefit was reduced for retirement prior to age 62, and increased for retirement after age 65
• They have been in the plan for 10 years• They leave their employer
The plan cannot force employees to receive benefits before normal retirement age unless they have less than $5,000 vested in the plan. However, employees must begin to receive their benefits no later than April 1 following the last year of employment or age 70½, whichever is later.
Defined benefit plans distribute their benefits through life annuities. In a life annuity, employees receive equal periodic benefit payments (monthly, quarterly, etc.) for the rest of their lives. If married, and the employee has chosen the joint and survivor option, upon his or her death the surviving spouse can continue to receive distributions of at least 50 percent of the employee’s periodic payment amount. Some plans may also allow employees to receive their entire benefit in one lump sum at retirement.
While still popular with government and public employees, according to the Department of Labor the number of private pension plans in the U.S. fell from a peak of 175,143 single- and multi-employer plans in 1983 to 46,698 plans in 2017, the most recent year for which data is available. As of 2020, the Pension Benefit Guaranty Corporation (PBGC) insures about 24,000 defined benefit plans, down from a high of about 114,000 in 1985. PBGC states that this decline was due primarily to the elimination of plans with 100 or fewer participants. One possible reason is the complexity and cost required to administer pension plans.
The Pension Benefit Guaranty Corporation, a federal agency, provides protection against a private pension not being able to meet its obligations. Pension plans for public employees are guaranteed by the federal and various state governments.
Analysis by Willis Towers Watson shows global pension assets at the end of 2019 at USD 46.7 trillion, a 16 percent increase over assets of USD 40.2 trillion at the end of 2018. United States pension fund assets represented 63 percent of the global total at the end of 2019, or USD 29.2 trillion, an increase of 17 percent. The average global asset allocation of the seven largest pension markets was 45 percent equities, 29 percent bonds, 23 percent other assets, and 3

Chapter 13: Other Sources of Insured Retirement Income 125
percent cash. This allocation pattern has changed markedly since 1999, as allocations to other assets increased while allocations to equities decreased over the same period; in 1999 61 percent of assets were allocated to equities.
Government ProgramsThe most widely used source of insured retirement income in the United States is Social Security. Social Security provides insured retirement income for most non-governmental employees, assuming they have earned a minimum number of credits; generally, one must have worked 10 years to be eligible for benefits.
Many government employees are not covered by Social Security. They are commonly covered by other retirement pension programs, or by a combination of Social Security and other programs.
While Medicare technically does not provide insured income, it does provide health insurance for those age 65 and older (as well as for some under age 65 with disabilities). Like Social Security, Medicare is operated by trusts set up by the federal government and is funded primarily via payroll taxes.
Individually Purchased VehiclesThe previous two sections — Employer-Sponsored Defined Benefit Plans and Government Programs — focused on insured retirement income that is not directly funded by an individual. This section focuses on sources for insured retirement income plans that individuals can purchase directly.
Life Insurance as a Source of Income in RetirementThe cash value available in a whole life insurance policy can be used to supplement retirement income. Whole life insurance includes any life insurance with a cash value, including universal life, variable life, and variable universal life. The advantage to this funding source is the flexibility in terms of when, how, and how much an individual can leverage.
Even for individuals who have done a good job saving for retirement — funding their IRAs, 401(k)s, and taxable retirement accounts — the market may not be “right” when it comes time to start drawing down their assets. While individuals may think they have accumulated enough savings to supply from 70 percent to 80 percent of their working income in retirement, a sustained market downturn can negatively impact their savings. In turn, this can increase the risk they will outlive their assets. A whole life insurance policy can be used to soften the effects of a down market by allowing investors to either withdraw cash or take a loan from the life policy and avoid drawing down their other retirement savings at the least opportune time.
There are other incentives to incorporating life insurance into a retirement portfolio. While some retirement plans can grow on a tax-deferred basis (called qualified retirement plans), whole life insurance makes cash available tax free. Plus, life insurance provides a tax-free insurance benefit to beneficiaries when the policyholder passes away.
In addition, while 401(k)s, IRAs, and other qualified savings plans are important, there are restrictions — such as the 10 percent tax penalty imposed on money withdrawn before age 59½.

126 IRI Retirement Fact Book 2020, 19th Edition
One of the benefits of using life insurance as a part of retirement planning is that it allows one to access cash value. Highly rated life insurance companies invest primarily in highly rated bonds. That means one is participating in an insurance company’s bond portfolio without the downside risk of the bond market, because most whole life insurance policies provided a guaranteed interest rate and cash value.
While using whole life insurance to help save for retirement can be beneficial, there are also pitfalls that could result in adverse tax consequences. Investors need to pay careful attention to the basis of their contract, which is usually the premium that has been paid, as well as the gain earned on the policy.
For example, take someone who has a contract with $200,000 in basis and $50,000 in gain. If $210,000 is withdrawn, $200,000 would be tax free and $10,000 would be taxable.
To avoid current tax liability for amounts above cost basis (the amount invested), the consumer should consider a loan. Loans against a life insurance policy are not taxable, but if they are not repaid, they will reduce the death benefit and could cause the policy to lapse. Outstanding loans also reduce the interest or investment gains that accrue, so it is also important to ensure that the life insurance policy remains in force and matures as a death claim, as any gains, including gains on amounts taken as loans, are taxable in the year the policy lapses. For beneficiaries who are no longer relying on the investor for financial support, the life insurance policy can become an additional retirement fund to the extent the death benefit proceeds net of loan repayment are paid out.
Long-term Care InsuranceLong-term care (LTC) is the name given to the spectrum of daily living and health services provided to individuals who can no longer function independently due to a physical or cognitive impairment and/or aging. Services may be provided on an inpatient, outpatient, or at-home basis. Long-term care insurance (LTCI) is insurance that is purchased to cover an individual’s ongoing need for long-term care services.
Many people don’t anticipate they will need LTC or mistakenly think LTC will be covered by Medicare, but statistics show that at least 70 percent of people turning 65 today will need long-term care services at some point in their lives (U.S. Department of Health and Human Services).
LTC, especially if confined to a nursing home, is extremely expensive and only the very financially well-off can typically pay for extended LTC on an out-of-pocket basis. Figure 13-2 provides an overview of different types of services and care levels available and their 2019 costs.

Chapter 13: Other Sources of Insured Retirement Income 127
Figure 13-2 Costs of Long-Term Care and Related Services
Type of Service Services Provided 2019 Median Cost
Median Annual Cost
5-Year Annual
Cost Growth
Licensed Homemaker Services
Hands-off care such as helping with cooking and cleaning and running errands
$22.50/hour $51,480 3.08%
Licensed Home Health Aide Services
Hands-on personal care such as help in bathing, dressing, and transferring
$23/hour $52,624 2.50%
Adult Day Health CareSocial and other related support services in a community-based setting for part of the day
$75/day $19,500 2.79%
Assisted Living Facility (One Bedroom)
Hands-on personal care as well as medical care for those unable to live by themselves
$4,051/month $48,612 2.59%
Nursing Home (Semi-Private Room)
24-hour skilled nursing care $247/day $90,155 3.28%
Nursing Home (Private Room) 24-hour skilled nursing care $280/day $102,200 3.76%
Source: Genworth Cost of Care Survey 2019
LTCI can be purchased individually or at the workplace as part of a group employee benefit, with most sales occurring in the individual market. Approximately eight million Americans have LTCI; even if every policy owner is at least age 65, only about 17 percent of the 48 million Americans who are 65 or older would be covered by LTCI (American Association for Long-Term Care Insurance; United States Census Bureau).
Over the past several years, many insurance companies have struggled to make long-term care insurance a profitable product line. LTC services are wide-ranging, expensive, and difficult to predict. With annuities, the amount and timing of payments is known but the duration is not; with life insurance, the timing of payment is unknown, but the amount is, and the payment is typically a one-time event. With LTCI, the amount, timing, and duration of payments are all unknown, and small pools of insureds make it difficult to price the product at a point where it will be both affordable for the consumer and profitable for the insurer. However, LTC and an aging population that will consume ever more of these services is not an issue that will disappear. Government and the private sector must work together to resolve the LTC crisis.
Other Income-Generating ProductsReverse MortgagesReverse mortgages provide lifetime retirement income and are insured by the Federal Housing Administration.
A reverse mortgage is a loan that enables older homeowners, 62 or older, to convert part of the equity in their homes into tax-free cash without having to sell the home, give up title, or take on a new monthly mortgage payment. Seniors with an outstanding first mortgage or other debt on their home may also qualify for a reverse mortgage. The proceeds of the reverse mortgage, however, must first be used to pay off such debts.

128 IRI Retirement Fact Book 2020, 19th Edition
To qualify for a reverse mortgage, a person must:
• Be at least 62 years old. In the case of a couple or co-owners, both must be 62 if their names appear on the title to the home
• Own as primary residence a single-family home, qualified condominium, townhouse, manufactured home, or one- to four-family owner-occupied property
The payment options available under a reverse mortgage include:
• An up-front lump-sum payment• Line of credit• Fixed monthly payments for as long as you remain in your home (or a predetermined,
shorter period) • A combination of monthly income and line of credit1
In the 2019 fiscal year, there were 31,274 Home Equity Conversion Mortgages (HECMs) completed in the United States, down 35 percent from 48,359 in fiscal year 2018 and 73 percent below the all-time high of 114,692 in 2009.
The bipartisan Reverse Mortgage Stabilization Act was signed into law in 2013. “The new law gives FHA the authority to make administrative decisions on an expedited basis in order to manage the HECM program more responsively based on lessons learned along the way and ever-changing economic conditions” (Reverse Mortgage Magazine, November-December 2013; National Reverse Mortgage Lenders Association).
Fixed-income VehiclesIt is possible to withdraw interest from fixed-income vehicles while maintaining the principal. If the underlying principal is guaranteed, the individual is guaranteed income for life. However, it is important to note that the level of income is not guaranteed.
We will use a certificate of deposit (CD) as an example. Assume someone puts $100,000 into a one-year CD crediting 1 percent interest (a good approximation of the market rate in 2020). The owner can withdraw $1,000 at the end of the year while maintaining the principal. And since the CD is guaranteed by the FDIC (up to certain limits), the person is guaranteed income for his or her lifetime.
However, the person is not guaranteed $1,000 a year in this example. The guaranteed income amount will vary in future years based on the future interest rates. For the 12 months ended April 2020 the annual inflation rate in the United States was 0.3%, implying a 0.7% real rate of return in this example.
1 National Reverse Mortgage Lenders Association

Chapter 14: Regulation and Taxation of Annuities 129
Regulation and Taxation of Annuities Annuities are insurance contracts regulated under state insurance laws. Variable annuities and certain other types of annuities are also regulated as securities under federal and state securities laws.
Regulation Under State Insurance LawsAll fixed and variable annuities are governed by a comprehensive state regulatory framework. State laws govern the organization and licensing of insurance companies, and state insurance departments oversee insurance company operations. Generally, annuity contracts and amendments must be filed with, and approved by, the state in which contracts are sold or by the Interstate Insurance Product Regulation Commission (IIPRC) (often referred to as the “Interstate Compact”), an important modernization initiative that benefits state insurance regulators, consumers, and the insurance industry. Insurance salespersons (often referred to as “producers”) need to be licensed in each state in which they operate. Only licensed producers may sell annuity contracts.
The National Association of Insurance Commissioners (NAIC) is a voluntary organization of the chief insurance regulatory officials of the 50 states, the District of Columbia, and five U.S. territories. The NAIC promotes best practices and uniformity in state insurance laws through the development of “model laws” and “model regulations” that are designed to protect consumers and maintain the financial stability of the insurance marketplace. Each state can decide whether to adopt these model laws and model regulations and are free to modify them as they deem appropriate.
Insurance Company Licensing In order to offer annuity products in a state, an insurance company must be licensed in that state. A company needs to be licensed regardless of whether it is a “domestic” insurance company (i.e., organized in the state) or a “foreign” insurance company (i.e., organized in another state). To be licensed, an insurance company must be organized according to specific state laws. Before it is granted a license, an insurance company must demonstrate compliance with strict capital, surplus, and financial requirements. In addition, the state scrutinizes the experience and
14CH

130 IRI Retirement Fact Book 2020, 19th Edition
character of the company’s management.
Producer Licensing and AppointmentInsurance producers must be licensed by state insurance departments. Applicants must submit a form to the state providing information about their experience, character, and financial responsibility. They also must pass an examination. Insurance producers also must be appointed by an insurance company before the producer may sell the company’s products.
Contract Requirements and Prior Regulatory Approval Annuity contracts and related forms generally must be filed and approved in every state where they will be sold. An alternative, more streamlined method of obtaining state approval is to file through the Interstate Insurance Product Regulation Commission (IIPRC), of which 46 states and territories are currently members. While there is no standard required form for annuity contracts, states and the IIPRC set forth standards that are applicable for contracts filed with the IIPRC.
Generally, contracts need to be readable and set forth the contract’s benefit terms and conditions before the state or the IIPRC will approve the annuity for sale. Amendments to contracts also must be filed and approved. If the amendment could adversely affect existing contract owners’ rights, prior approval from the contract owners may be required.
Protection Against Insurance Company InsolvencyState Guaranty Funds All states, the District of Columbia, and Puerto Rico have guaranty funds to protect contract owners against insurance company insolvency. Insurers doing business in a state must contribute to that state’s guaranty fund. The actual coverage provided for annuity contracts varies from state to state, but cash values and annuity benefits generally are protected for at least $100,000. Coverage generally is not provided for variable annuity contracts other than those portions that are guaranteed by the insurance company, e.g., fixed accounts.
Insulation from Insurance Company’s CreditorsVariable annuity contracts are issued through life insurance company separate accounts. When a contract owner allocates purchase payments to a variable investment option under a variable annuity contract, those assets are held in the separate account. The assets in the separate account are insulated against the creditors of the insurance company in the event of the company’s insolvency (in some states, annuity assets are also shielded from the contract owner’s creditors).
Regulation Under Federal Securities LawsBesides being governed by the state regulatory framework, absent an exemption, variable annuities are regulated as securities under the Federal Securities laws. The primary Federal

Chapter 14: Regulation and Taxation of Annuities 131
Securities laws that regulate variable annuities and the separate accounts through which they are issued are the Securities Act of 1933 (1933 Act), the Securities Exchange Act of 1934 (1934 Act), and the Investment Company Act of 1940 (1940 Act). The SEC administers these acts. Fixed annuities, with which the insurance company guarantees a specific rate of return to the contract owner, generally are not subject to these laws. In addition, the Dodd-Frank Act (which is discussed below) effectively exempts fixed indexed annuities from the 1933 Act, subject to compliance with certain conditions.
In summary, the Federal Securities laws require certain disclosure documents, including a prospectus and certain periodic reports, to be filed with the SEC and given to investors. In addition, written marketing materials such as advertisements are subject to regulation under SEC and FINRA rules. These requirements are discussed in more detail on the following pages.
Securities Act of 1933 Registration Because variable annuities are securities, they generally must be registered with the SEC under the 1933 Act before they can be offered to the public (with two exceptions noted below). The SEC staff reviews and comments on registration statements, which usually must be amended in response to staff comments before they will be declared effective. (The SEC does not, however, approve or disapprove of any securities, including variable annuities, and does not pass on the accuracy or adequacy of any prospectus.) A “post-effective” amendment updating the variable annuities registration statement generally must be filed at least annually. The first registration exception is for variable annuity contracts issued in connection with certain qualified plans, such as 401(k) plans. The second exception is for private placement variable annuities, which are contracts that, among other things, are offered only to sophisticated investors who meet certain requirements under the Federal Securities laws (and not to members of the general public). Even with these exceptions, however, issuers and others involved in marketing non-registered variable annuities remain subject to the anti-fraud provisions of the Federal Securities laws.
Prospectus Delivery When someone purchases a registered variable annuity, he or she receives a prospectus. Prospectuses are updated regularly. Separate prospectuses describe underlying investment options — the funds to which the purchaser may allocate his or her investments (underlying funds). This can result in a purchaser receiving numerous prospectuses. However, in 2009, the SEC adopted a rule permitting the delivery of “summary prospectuses” for mutual funds, which are shorter and intended to be more “user-friendly” than full fund prospectuses. As discussed below, the SEC recently adopted a rule that permits the use of summary prospectuses for variable annuities as well as variable life insurance policies.
Disclosure of Fees and Expenses Variable annuity prospectuses contain fee tables that disclose the maximum guaranteed charge for all contract transaction expenses and recurring charges. These amounts are expressed in dollars or percentages of the contract value so purchasers will know what they will pay if they buy the contract. The fee tables also list the range of total operating expenses for the underlying funds offered by the contract. In addition, variable annuity prospectuses contain numerical examples showing in dollars per $10,000 what a hypothetical contract owner would pay for the contract and the maximum fees and expenses charged by any of the funds over one-, three-, five-, and 10-

132 IRI Retirement Fact Book 2020, 19th Edition
year periods. These examples assume a 5 percent return and that the contract is surrendered at the end of the relevant period. Additional examples are required that assume the investor does not surrender the contract if a sales load or other fee is charged upon surrender. This format shows the effect of any surrender charge.
Securities Exchange Act of 1934 The 1934 Act regulates the distribution of variable annuities through registered broker-dealer firms and their registered representatives. Broker-dealers and their representatives are subject to extensive operational and financial rules that cover minimum net capital requirements, reporting, recordkeeping, supervision, advertising, and sales activities.
In addition to the broker-dealer regulatory framework established by the 1934 Act, registered broker-dealer firms that sell variable annuities also must be members of FINRA, which is a self-regulatory organization overseen by the SEC. It has an extensive body of rules with which broker-dealers must comply. For example, examinations are required; fingerprints must be provided; and numerous supervisory, suitability, advertising, recordkeeping, and reporting rules apply. A 1934 Act rule requires broker-dealers to send confirmation statements to contract owners to reflect purchase and sale transactions involving a variable annuity contract. In addition, insurance companies send contract owners periodic account statements showing a beginning balance, transactions during the period, and an ending balance so that the owner will have a record of all activity in his or her contract.
Investment Company Act of 1940 The 1940 Act imposes an extensive federal regulatory structure on investment companies, including variable annuity separate accounts and underlying funds. (Some separate accounts and funds, however, such as those used in connection with tax-qualified retirement plans, are excluded from 1940 Act regulation.) For example, the 1940 Act governs how variable annuities and shares of underlying funds are issued and redeemed. There are also corporate governance requirements and prohibitions against self-dealing. Each separate account regulated under the 1940 Act must file a report on its operations annually with the SEC. In addition, annual and semi-annual reports containing information about the underlying mutual funds that serve as investment options for variable annuities must be sent to contract owners. In some cases, these reports also contain information on the variable annuities themselves. The SEC follows a risk-based approach in inspecting variable annuity separate account operations. The SEC and FINRA also inspect various locations, such as broker-dealer branch offices, from which variable annuities are sold. Examination recommendations are made, and any deficiencies are noted. If the situation is serious enough, it may lead to regulatory enforcement.

Chapter 14: Regulation and Taxation of Annuities 133
Regulation of Fees and Charges Currently, the SEC does not regulate individual variable annuity fees and charges. However, the 1940 Act makes it unlawful for any registered separate account funding variable annuity contracts, or for the sponsoring insurance company, to sell any such contract unless the fees and charges deducted under the contract are, in the aggregate, reasonable in relation to the services rendered, the expenses expected to be incurred, and the risks assumed by the insurance company. The insurer must represent in the annuity contract’s registration statement that the fees and charges are reasonable.
Standard of Conduct for Financial ProfessionalsFor nearly a decade, Congress and regulators at the federal and state levels have been working to formulate appropriate standards of conduct for financial professionals who provide personalized advice about investments and/or insurance to retail consumers. IRI and its members have long supported the principle that financial professionals should be required to act in their clients’ best interest, and IRI has been among the leaders of the financial services industry’s efforts to advocate for adoption of a clear, consistent, and workable best interest standard that will provide meaningful and effective consumer protections without depriving Americans of access to valuable financial products and services.
SEC Regulation Best Interest and Form CRS The Dodd-Frank Wall Street Reform and Consumer Protection Act, enacted in 2010 (the “Dodd-Frank Act”) directed the SEC to study the effectiveness of the current standard of care for broker-dealers and investment advisors in providing personalized investment advice and recommendations about securities to retail customers. It also empowered (but did not require) the SEC to subject broker-dealers to the same standard as investment advisors when providing such personalized investment advice to retail customers. To harmonize enforcement, the Dodd-Frank Act directed the SEC to prosecute and sanction violators of the standard, whether broker-dealers or investment advisors, to the same extent. In January 2011, the SEC staff issued a study in which it recommended that the SEC exercise its rulemaking authority to implement a uniform fiduciary standard of conduct for broker-dealers and investment advisors when providing personalized investment advice about securities to retail customers. The uniform fiduciary standard would require broker-dealers and investment advisors to act in the best interest of the customer without regard to the financial or other interest of the broker-dealer or investment advisor providing the advice. On March 1, 2013, the SEC issued a request for data and other information relating to the costs and benefits of a uniform fiduciary standard of conduct, as well as other standards of conduct, for broker-dealers and investment advisors when providing personalized investment advice about securities to retail customers. In November 2013, the SEC’s Investor Advisory Committee voted unanimously to recommend that the SEC conduct rulemaking to impose a fiduciary duty on broker-dealers when they provide personalized investment advice to retail investors. Meanwhile, on September 26, 2017, in testimony before the Senate Committee on Banking, Housing, and Urban Affairs, SEC Chairman Jay Clayton stated in response to questions

134 IRI Retirement Fact Book 2020, 19th Edition
regarding coordination with the DOL that the SEC had issued a request for updated views from investors and industry participants on the effects of the DOL fiduciary rule and what the SEC should do in terms of the standard of conduct, that the SEC was reviewing the information received, and that based on what he knows to date he wanted any joint rulemaking with the DOL and state regulators to reflect the following: 1) choice – that investors understand they have a choice and are not pushed into any narrow set of circumstances as a result of rulemaking; 2) clarity – that investors know the type of person they are dealing with and the obligations owed to them; 3) consistency – that there is consistency across retirement and non-retirement accounts; and 4) coordination – that the SEC, DOL, and state regulators are coordinated in how they approach the issue. Regarding how state regulators will be involved with fixed income annuities, Chairman Clayton confirmed that the SEC “has been in dialogue with state regulators and will be part of this effort.” Chairman Clayton also confirmed that the SEC was working with the DOL on a harmonized fiduciary rule. While he did not provide a date for when such a rule would be completed, Chairman Clayton stated that the rule was not merely a priority but “at the top of my list in that area of the Commission.”
On April 18, 2018, a divided SEC voted to propose a rulemaking “package” consisting of: (1) new SEC “Regulation Best Interest,” which would establish a best interest standard of conduct for broker-dealers (BDs) and their associated persons when making a recommendation of any securities transaction or investment strategy involving securities to a retail customer; (2) disclosure changes, including a new Form CRS Relationship Summary, required disclosures in retail communications, and limitations on the use of the title “adviser” and similar words; and (3) a proposed interpretation of the standard of conduct for investment advisers (IAs). According to SEC Chairman Clayton, the objectives of the proposals were to: (1) “enhance retail investor protection and decision making by [r]aising the standard of conduct for broker-dealers when they provide recommendations to retail investors, and [re]affirming and in some instances clarifying the terms of the relationships that retail investors have with their investment professionals;” (2) “preserve retail investor access (in terms of choice and cost) to a variety of investment services and products,” and (3) “raise retail investor awareness of whether they are transacting with registered financial professionals.”
The three motivating reasons for the proposals, according to SEC Chairman Clayton, included: (1) “investor confusion” regarding the “important differences between BDs and IAs — from differences in the variety of services they offer and how investors pay for those services, to the regulatory frameworks that govern their relationship,” (2) the “need” to hold investment professionals to standards of conduct that meet reasonable investor expectations and that adequately address conflicts of interest, and (3) “regulatory complexity” resulting from the DOL fiduciary rule and more generally from regulatory, inspection, and enforcement inconsistencies that apply to the provision of financial advice. As proposed, Regulation Best Interest would impose a best interest obligation on a BD and its individual associated persons by requiring them to act in the best interest of a “retail customer” when recommending a securities transaction or investment strategy involving securities, without placing their financial or other interests ahead of the interest of the retail customer. As written, the proposal essentially would provide a safe harbor by deeming the best interest obligation satisfied if the BD or its individual associated persons meet three obligations: a disclosure obligation, a care obligation, and conflict of interest obligations. The disclosure obligation under Proposed Regulation Best Interest would require that, at or prior to the time of making a recommendation, the BD or individual associated person of the BD “reasonably discloses to the retail customer, in writing, the material facts relating to the scope

Chapter 14: Regulation and Taxation of Annuities 135
and terms of the relationship with the retail customer, including all material conflicts of interest that are associated with the recommendation.”
The care obligation under Proposed Regulation Best Interest would require the BD or individual associated person of the BD in making a recommendation to exercise “reasonable diligence, care, skill, and prudence to: (1) [u]nderstand the potential risks and rewards associated with the recommendation and have a reasonable basis to believe that the recommendation could be in the best interest of at least some retail customers; (2) [h]ave a reasonable basis to believe that the recommendation is in the best interest of a particular retail customer based on that retail customer’s investment profile and the potential risks and rewards associated with the recommendation; and (3) [h]ave a reasonable basis to believe that a series of recommended transactions, even if in the retail customer’s best interest when viewed in isolation, is not excessive and is in the retail customer’s best interest when taken together in light of the retail customer’s investment profile.”
The conflict of interest obligations under Proposed Regulation Best Interest would require the BD to establish, maintain, and enforce written policies and procedures reasonably designed to: (1) “identify and at a minimum disclose, or eliminate, all material conflicts of interest that are associated with such recommendations;” and (2) “identify and disclose and mitigate, or eliminate, material conflicts of interest arising from financial incentives associated with such recommendations.”
Proposed Regulation Best Interest drew sharp criticism from various SEC Commissioners, including then SEC Commissioner Kara Stein, the lone dissenter, who criticized the proposal for, among other things, not defining the term “best interest,” not requiring full and fair disclosure of any conflicts of interests, not requiring financial professionals making investment recommendations to retail customers to be fiduciaries, and not requiring financial professionals to provide the “best available options” to retail customers.
New Form CRS would require BDs and IAs to provide retail investors with eight items of disclosure concerning: (1) introductory information about the firm, (2) relationships and services, such as brokerage or advisory account services, services provided by affiliates, and fee information, (3) the applicable standard of conduct, (4) fees and costs, (5) comparisons by standalone BDs and IAs of features of typical brokerage and advisory accounts, respectively, (6) conflicts of interest, (7) legal, disciplinary, and other information, and (8) key questions to ask. Commissioner Stein expressed concern that Form CRS called for information that was “too generic and too legalistic such that retail investors won’t bother to read it.” She took particular issue with the fact that the Form placed the burden on the retail investor to take the initiative to raise questions with his or her financial professional on matters about which the investor may be confused. In addition, according to Commissioner Stein, the Form CRS fell short by permitting but not requiring the use of “visually dynamic” techniques to convey information to retail investors.
The proposals also would prohibit BDs and individual associated persons of a BD from using the term “adviser” or “advisor” in communicating with a retail investor unless the BD is registered as an investment advisor either with the SEC or with a state, the individual associated person is a supervised person of the registered advisor, and such associated person provides investment advice on behalf of the registered advisor. The last requirement would prevent individual associated persons who do not provide investment advice as an investment advisor from using the term “adviser” or “advisor” merely because they are associated with a BD that is dually registered as an investment advisor.
The prohibition would apply to names such as “financial advisor,” “wealth adviser,” “trusted advisor,”

136 IRI Retirement Fact Book 2020, 19th Edition
and “advisory.” The prohibition would not apply to communications with institutional clients. The prohibition also would not apply when acting on behalf of a bank or insurance company, or when acting on behalf of a municipal advisor or commodity trading advisor.
The SEC’s proposed interpretation of the federal fiduciary standard under the Advisers Act seeks in a single release to “reaffirm — and in some cases clarify — certain aspects of the fiduciary duty that an investment advisor owes to its clients under Section 206 of the Advisers Act.” The proposed interpretation states that an IA’s fiduciary duty “is similar to, but not the same as, the proposed obligations of BDs under Regulation Best Interest.” The proposed interpretation, however, does not expressly elaborate on the distinction. Also, like Regulation Best Interest, the proposed interpretation does not define what it means to act in the “best interest” of an advisory client. In addition to describing other duties of an IA, the proposed interpretation seeks comment on three potential “enhancements” to the obligations of IAs that borrow from investor protections provided by the BD regulatory framework. These “enhancements” include (1) federal licensing and continuing education requirements for personnel of SEC-registered IAs, (2) the delivery of periodic account statements either directly or through the client’s custodian regardless of whether the advisor is deemed to have custody under the Advisers Act, and (3) financial responsibility requirements similar to those that apply to BDs, e.g., net capital requirements and fidelity bonds.
On June 5, 2019, the SEC adopted the Regulation Best Interest regulatory package largely within the proposed framework, but with some important differences. According to the SEC, it received comments that touched on “almost every aspect of the proposal.” Key changes identified by the SEC include: the definition of “retail customer” to include “any natural person who receives a recommendation from the broker-dealer for the natural person’s own account (but not an account for a business that he or she works for), including individual plan participants;” implicit hold recommendations where the broker-dealer agrees to undertake certain monitoring obligations; the express application of Regulation Best Interest to account recommendations such as recommendations to roll over or transfer assets in a workplace retirement plan account to an IRA, recommendations to open a particular securities account (such as brokerage or advisory), and recommendations to take a plan distribution for the purpose of opening a securities account; and guidance for dual-registrants in complying with Regulation Best Interest. The SEC also noted that it was clarifying the relationship between a broker-dealer’s general obligation to act in the best interest of its retail customers and the component obligations of Regulation Best Interest. As adopted, Regulation Best Interest added a fourth component obligation requiring broker-dealers to establish, maintain, and enforce policies and procedures reasonably designed to achieve compliance with Regulation Best Interest. Other changes from the proposal included, among other things, the removal of “prudence” from the care obligation on grounds that its inclusion created “legal uncertainty and confusion” and that it was redundant of the broker-dealers obligation to exercise “diligence, care, and skill;” clarifications and refinements to each of the proposed disclosure, care, and conflict obligations; and the issuance of a separate interpretive release on the meaning of the “solely incidental” prong of the broker-dealer exclusion under the Advisers Act.
The SEC did not adopt the proposed rule that would have prohibited the use by broker-dealers and their associated persons of the words “adviser” or “advisor” as part of a name or title when communicating with retail investors. Instead, the SEC expressed the view that such use by a broker-dealer that is not also registered as an investment adviser or by an associated person that is not also a supervised person of an investment adviser, would be presumed to be a violation of the capacity disclosure requirement under the disclosure obligation of Regulation Best Interest.
In adopting Regulation Best Interest, the SEC affirmatively stated that it does “not believe

Chapter 14: Regulation and Taxation of Annuities 137
Regulation Best Interest creates any new private right of action or right of rescission, nor do we intend such a result.”
The SEC also adopted several key changes to proposed Form CRS, including, among other things, the use of a standardized question and answer format instead of declarative headings, and less prescribed wording; instructions that encourage the use of charts, graphs, tables, and other graphics to explain or compare different aspects of a firm’s offerings; the use of online tools and layered disclosures; a more streamlined introductory paragraph with a link to the SEC’s investor education website; a combined section on fees, costs, conflicts, and standards of conduct; a separate disciplinary history section; the use of conversation starters; the elimination of a proposed section showing how the services of advisers and broker-dealers are different from the firm’s services; and a change to when a broker-dealer must deliver the Form CRS to retail investors.
Regulation Best Interest and Form CRS became effective as of June 30, 2020.
FINRA Suitability Rule for Deferred Variable Annuities — Rule 2330 FINRA Rule 2330 imposes a wide range of requirements tailored specifically to deferred variable annuity transactions, including suitability, principal review, supervision, and training. This Rule provides that, in recommending a deferred variable annuity, a registered representative must have a reasonable basis to believe that (1) the customer has been informed in general terms of various features of a deferred variable annuity; (2) the customer would benefit from certain features of deferred variable annuities, such as tax-deferred growth, annuitization, or a death or living benefit; and (3) the particular deferred variable annuity as a whole, the underlying subaccounts to which funds are allocated at the time of purchase or exchange of the deferred variable annuity, and riders and product enhancements, if any, are suitable for the particular customer based on required customer information. These specific requirements are in addition to the requirements of FINRA Rule 2111 governing suitability generally. As discussed above, the NAIC Suitability Model is patterned after FINRA’s suitability standards. FINRA has published substantive guidance, in question and answer format, on the suitability obligations of member firms and registered representatives under FINRA Rule 2111, including with respect to hold recommendations, implicit recommendations, investment strategies, non-securities products, and recordkeeping, among other things.
On March 19, 2020, FINRA filed a proposed rule change with the SEC to provide clarity and remove certain inconsistencies with SEC Regulation Best Interest. Among other things, the proposed rule change would amend FINRA Rule 2111 to state that it does not apply to recommendations that are subject to SEC Regulation Best Interest. The underlying rationale is that compliance with SEC Regulation Best Interest would necessarily result in compliance with FINRA’s suitability standard. FINRA did not propose eliminating Rule 2111 altogether, because it applies to all recommendations to customers whereas SEC Regulation Best Interest applies only to recommendations to “retail customers,” i.e., a natural person or the natural person’s legal representative who receives a recommendation of a securities transaction (or an investment strategy involving securities) and who uses the recommendation primarily for personal, family, or household purposes. FINRA Rule 2111 would have continuing application to recommendations to entities and institutions such as pension funds, as well as natural persons who use the recommendations other than primarily for personal, family, or household purposes. Examples

138 IRI Retirement Fact Book 2020, 19th Edition
provided in the proposed rule change include small business owners and charitable trusts. The proposed rule change also would amend Rule 2111 to eliminate the “control” element in the quantitative suitability obligation that currently must be proved to demonstrate a violation. This change is intended to conform to the care obligation of SEC Regulation Best Interest, which does not have a control element. In addition, the proposed rule change would amend various FINRA rules, including Rules 2320 and 2341 governing cash and non-cash compensation arrangements for variable insurance products and investment company securities, respectively. The proposed rule change would require any non-cash compensation arrangement permitted by those FINRA rules to be consistent with SEC Regulation Best Interest, which does not permit sales contests based on sales of specific securities or specific types of securities within a limited period of time. The concern is that FINRA rules permit internal sales contests based on sales of specific types of securities, such as mutual funds and variable annuities, which may conflict with SEC Regulation Best Interest. In addition, the proposed rule change would eliminate provisions in Rules 2320 and 2341 that require internal non-cash compensation arrangements to be based on total production and equal weighting of securities sales. This change would prohibit member firms from permitting or sponsoring “internal sales contests based on sales of securities within a product category within a limited time, even if they are based on total production and equal weighting.” The proposed rule change would apply to non-cash compensation rules governing gifts, business entertainment, and education or training meetings.
On June 18, 2020, the SEC adopted the proposed rule change, as modified by FINRA in response to comments, to restore the language in FINRA Rules 2320 and 2341 that requires non-cash compensation arrangements for the sale of variable insurance products of investment company securities, respectively, to be based on total production and equal weighing of sales of variable insurance products or investment company securities. In making this modification, FINRA noted that its intent was not to “propose changes to its non-cash compensation rules that would prohibit sales contests, sales quotas, bonuses, or non-cash compensation that are permissible under [SEC Regulation Best Interest].” Additionally, FINRA has taken a number of steps to assist member firms in complying with SEC Regulation Best Interest, such as providing a checklist for that explains key differences between FINRA’s rule and the SEC rule and related disclosure requirements under SEC Form CRS, and posting podcasts and virtual conferences on topics such as SEC Regulation Best Interest implementation and regulatory compliance inspections and examinations.
DOL Fiduciary Investment Advice Rule On April 14, 2015, the DOL issued a proposed regulation that would re-define the circumstances under which firms and individuals who provide “investment advice” to employee benefit plans or individual retirement accounts would be considered fiduciaries. On April 6, 2016, the DOL issued a final version of its fiduciary rule, and related prohibited transaction exemptions, which drastically expanded the universe of financial professionals who would be deemed to be “fiduciaries” under the law. Shortly thereafter, several industry trade associations, including IRI, filed lawsuits seeking to overturn the rule on a variety of grounds. On February 3, 2017, the White House released a memorandum that ordered the DOL to review the fiduciary rule “to determine whether it may adversely affect the ability of Americans to gain access to retirement information and financial advice.” As part of that examination, the White

Chapter 14: Regulation and Taxation of Annuities 139
House ordered the DOL to prepare an updated economic and legal analysis concerning the likely impact of the fiduciary rule, in which analysis must consider, among other things, (1) potential harm “to investors due to a reduction of access to retirement savings offerings, retirement product structures, retirement savings information, or related financial advice;” (2) whether the rule “has resulted in dislocations or disruptions within the retirement services industry that may adversely affect investors or retirees;” and (3) whether the rule “is likely to cause an increase in litigation, and an increase in the prices that investors and retirees must pay to gain access to retirement services.” Further to the White House memorandum, on April 4, 2017, the DOL announced a 60-day extension of the applicability dates of the fiduciary rule and related exemptions. According to the DOL, “advisers to retirement investors will be treated as fiduciaries and have an obligation to give advice that adheres to ‘impartial conduct standards’ of the fiduciary rule beginning on June 9 rather than on April 10, 2017, as originally scheduled.” The impartial conduct standards require advisors to adhere to a “best interest” standard when making investment recommendations, charge no more than “reasonable compensation” for their services, and refrain from making misleading statements. The DOL stated that it intended to complete its review as required by the White House memorandum by January 1, 2018, when the full requirements of the fiduciary rule and related exemptions become applicable. On July 6, 2017, the DOL published a request for information seeking public input that could form the basis of new exemptions or changes to the fiduciary rule and related exemptions, as well as public input on the advisability of extending the January 1, 2018 applicability date of provisions in certain exemptions. The DOL received approximately 60,000 letters and petitions in response expressing a wide range of views. On August 31, 2017, the DOL published a proposal to extend the transition period for certain exemptions to July 1, 2019. On November 27, 2017, the DOL adopted a final rule extending the transition period to July 1, 2019. On March 15, 2018, the U.S. Court of Appeals for the Fifth Circuit invalidated the DOL Fiduciary Rule in a case involving a challenge by the U.S. Chamber of Commerce and other plaintiffs including IRI. Among other things, the Fifth Circuit found that the DOL Fiduciary Rule conflicted with the language of ERISA. On June 21, 2018, the Fifth Circuit issued a formal mandate vacating the DOL Fiduciary Rule. On June 29, 2020, the DOL formally restored the original investment advice regulation and its five-part test for defining an investment advice fiduciary, while also restoring DOL Interpretive Bulletin 96-1 regarding participant investment education and the prohibited transaction exemptions that were amended in 2016 to their pre-amendment forms. In addition, the DOL proposed to create a new prohibited transaction class exemption that would be available for investment-advice fiduciaries in lieu of the prohibited transaction exemptions issued by the DOL in 2016. The proposed prohibited transaction exemption would be available to financial institutions such as registered investment advisers, broker-dealers, banks, insurance companies and their employees, representatives, and agents. Under the proposed prohibited transaction exemption, financial institutions and investment professionals, and their affiliates and related entities, would be able to receive reasonable compensation as a result of providing fiduciary investment advice, including commissions, 12b-1 fees, trial commissioners, loads, markups and mark-downs, and revenue sharing from third parties. The proposed prohibited transaction exemption also would cover compensation received as a result of investment advice to roll over assets from a plan to an IRA, and would provide relief for a financial institution to engage in the purchase or sale of an asset in a riskless principal transaction or a covered principal transaction, and receive a mark-up, mark-down, or

140 IRI Retirement Fact Book 2020, 19th Edition
other payment for rollovers and allow principal transactions between financial institutions, plans, and IRAs. To rely on the proposed prohibited transaction exemption, the financial institution and investment professional would be required to act in accordance with impartial conduct standards. The impartial conduct standards have three components, including a best interest standard, a reasonable compensation standard, and a requirement to make no misleading statements about investment transactions and other relevant matters. The DOL noted, among other things, that the proposed best interest standard is to be interpreted and applied in a manner consistent with the best interest standard set forth in the SEC’s Regulation Best Interest. Under the proposed prohibited transaction exemption, financial institutions would be required to acknowledge in writing their fiduciary status, as well as that of their investment professionals, with respect to any fiduciary investment advice provided by the financial institution or investment professional to the retirement investor. In addition, financial institutions would be required to provide reasonable oversight of their investment professionals, adopt a “culture of compliance,” and engage in an annual retrospective review of compliance with the impartial conduct standards. The 30-day comment period expired on August 6, 2020.
NAIC Suitability in Annuity Transactions Model Regulation The NAIC adopted its Suitability in Annuity Transactions Model Regulation (#275) (the “Suitability Model”) to set standards to ensure the suitability of an annuity recommendation. The Suitability Model also requires insurers to establish a system to supervise annuity recommendations. The Suitability Model was originally adopted in 2003 and has since been revised on multiple occasions (2006, 2010, 2015, 2020). As of this writing, the current version has been adopted and will take effect at the beginning of 2021 in two states (Arizona and Iowa), while prior versions are in place in 46 states and the District of Columbia. New York adopted its own enhanced annuity sales practice rules prior to the adoption of the revised Suitability Model. The First Amendment to Insurance Regulation 187 (Regulation 187) became effective in August 2019 with respect to annuities and in February 2020 with respect to life insurance. Lawsuits in New York challenging the legality of Regulation 187 were filed in 2018. The consolidated lawsuits alleged, among other things, that Regulation 187 imposes a vague standard and fails to instruct agents/brokers whose best interest they must consider, e.g., the policyholder, beneficiary, or owner of a policy. The consolidated lawsuits were dismissed in August 2019. In February 2020, NAIC members approved revisions to the Suitability Model that require producers to act in the “best interest of the consumer when making a recommendation of an annuity.” As before, the revised Suitability Model requires insurers to establish and maintain a system to supervise annuity recommendations, but with the goal of “effectively” and not merely “appropriately” addressing the insurance needs and financial objectives of consumers at the time of the transaction. The new best interest obligation explicitly prohibits the producer from putting the financial interests of the producer or the insurer ahead of the consumer’s interest. At the same time, the revised Suitability Model provides, among other things, that the Model does not subject the producer to civil liability under the best interest standard of care or under standards applicable to fiduciaries. The revised Suitability Model provides that a producer will have acted in the best interest of the consumer if the producer satisfies certain prescribed obligations regarding care, disclosure,

Chapter 14: Regulation and Taxation of Annuities 141
conflict of interest, and documentation. Notably, these obligations correspond to the four component obligations under the SEC’s new Regulation Best Interest, discussed below under “SEC Regulation Best Interest.” In an effort to harmonize its requirements with those of SEC Regulation Best Interest, the revised Suitability Model includes a safe harbor provision that treats recommendations and sales of annuities that are made in compliance with “comparable standards” as satisfying the requirements of the Model. Under the revised Suitability Model, the best interest obligation applies to “every producer who has exercised material control or influence in the making of a recommendation and has received direct compensation as a result of the recommendation or sale” regardless of whether the producer had direct contact with the consumer. The best interest obligation does not apply to activities such as providing product wholesaling and other back office support, providing or delivering marketing or educational materials, or providing general supervision of a producer, that do not themselves constitute material control or influence. Until the revised Suitability Model is adopted in a state, the requirements of the existing Suitability Model, as approved in that state, will continue to apply. The requirements of the existing Suitability Model are discussed below along with some differences with the revised Suitability Model. The Suitability Model is similar to Financial Industry Regulatory Authority (FINRA) requirements governing the suitability of variable annuity transactions, which are described below. The pre-2020 versions of the Suitability Model provided a safe harbor under which compliance with FINRA requirements on suitable recommendations and supervision of producers is deemed to satisfy the similar requirements of the Suitability Model. As noted above, the revised Suitability Model expanded this safe harbor to a broader range of comparable standards. Among other things, the pre-2020 versions of the Suitability Model required an insurance producer, when making a recommendation to a consumer to purchase or exchange an annuity, to make reasonable efforts to obtain “suitability information,” such as the consumer’s age, annual income, financial objectives, and risk tolerance, that is “reasonably appropriate” to determine the suitability of the recommendation. The revised Suitability Model requires the producer to “exercise reasonable diligence, care and skill” to “know the consumer’s financial situation, insurance needs and financial objectives” and to make reasonable efforts to obtain “consumer profile information” before making an annuity recommendation. The consumer profile information is a prescribed list of at least 14 factors, including many factors in the existing Suitability Model. The revised Suitability Model also requires the producer to understand make a reasonable inquiry into available recommendation options and to understand them, but does not require the producer to consider products outside the scope of the producer’s license or to consider other possible alternative products or strategies available in the market at the time of the recommendation. The pre-2020 versions of the Suitability Model also required the insurance producer to have “reasonable grounds” for believing that the recommendation is suitable for the consumer based on the suitability information and other facts provided by the consumer. In addition, the insurance producer must have a “reasonable basis” for believing: that the consumer has been “reasonably informed” of the annuity’s features; that the consumer would benefit from certain of those features; that the annuity as a whole, the underlying investment options selected by the consumer, and any riders or similar product enhancements are suitable for the consumer; and in the case of an exchange or replacement of an annuity, the exchange or replacement is suitable. If no insurance producer is involved, these requirements apply to the insurer. The revised Suitability Model requires the producer to have a reasonable basis to believe that a recommended product “effectively addresses the consumer’s financial situation, insurance needs and financial objectives over the life of the product” in light of the consumer’s profile information.

142 IRI Retirement Fact Book 2020, 19th Edition
The revised Suitability Model also requires the producer to disclose certain information to the consumer prior to the recommendation or sale of an annuity, including a description of the scope and terms of the producer’s relationship with the consumer, the producer’s role in the transaction, and the manner in which the producer is compensated, among other things. Similar to the existing Suitability Model, under the revised Suitability Model the producer must have a reasonable basis for believing that the consumer has been “informed” (rather than “reasonably informed”) of various features of the annuity, and that the consumer “would benefit from certain features of the annuity, such as annuitization, death or living benefits or other insurance-related features.” The revised Suitability Model does not require the recommendation of the annuity “with the lowest one-time or multiple occurrence compensation structure” nor does it impose an ongoing monitoring obligation on the producer. The revised Suitability Model requires the producer to document in writing any recommendation covered by the Model and the basis for the recommendation, and, if the consumer refuses to provide consumer profile information or wishes to proceed with a non-recommended annuity transaction, to obtain the consumer’s signed statement to that effect. The revised Suitability Model requires a 60-month rather than a 36-month look-back on whether the consumer has had an annuity exchange or replacement. The pre-2020 versions of the Suitability Model also required insurers to establish a supervisory system that is “reasonably designed” to achieve compliance with its requirements, including procedures for reviewing recommendations before issuing an annuity to ensure there is a “reasonable basis” to determine that the recommended annuity, as well as “reasonable procedures” for detecting recommendations that are not suitable. The revised Suitability Model prohibits an insurer from issuing an annuity that has been recommended to a consumer absent a “reasonable basis to believe the annuity would effectively address the particular consumer’s financial situation, insurance needs and financial objectives based on the consumer’s consumer profile information.” In addition, the revised Suitability Model requires the insurer to establish and maintain reasonable procedures to “assess” whether the producer has provided information required by the Model to the consumer, to identify and address “suspicious consumer refusals to provide consumer profile information,” and to identify and eliminate “sales contests, sales quotas, bonuses, and non-cash compensation that are based on sales of specific annuities within a limited period of time.” The revised Suitability Model provides that the last requirement is “not intended to prohibit the receipt of health insurance, office rent, office support, retirement benefits or other employee benefits by employees as long as those benefits are not based upon the volume of sales of a specific annuity within a limited period of time.” The Suitability Model also imposes training requirements for producers. Specifically, it provides that producers may not solicit annuity sales unless they have adequate knowledge to recommend the product and comply with the insurer’s product-specific training standards. Insurers are required to provide producers with product-specific training and materials that explain all material features of its annuity products. Producers can rely on insurer-provided training and materials to meet this requirement. In addition, producers must complete a one-time, four-credit Continuing Education (CE) training course that is approved by the department of insurance and provided by a department of insurance-approved training provider. New producers cannot sell annuities until they complete this course. Existing producers must complete the training within six months. The revised Suitability Model imposes additional training obligations, including training on the appropriate standard of conduct and appropriate sales practices, and replacement and disclosure requirements under the revised Suitability Model.

Chapter 14: Regulation and Taxation of Annuities 143
State Fiduciary Regulations Unlike investment advisers who owe a fiduciary duty to their clients, broker-dealers who sell annuities have historically been subject to a suitability standard under federal and state securities laws. Following the vacatur of the DOL Fiduciary Rule by the U.S. Court of Appeals for the Fifth Circuit in 2018, several states have pushed forward with their own regulations that impose, or would impose, a fiduciary duty on broker-dealers. As of this writing, Massachusetts, Nevada, and New Jersey, each have proceeded with their own regulations to varying degrees. Massachusetts proposed amendments to its securities regulations on December 13, 2019 to apply a fiduciary conduct standard to broker-dealers when making recommendations and providing investment advice to customers. On February 21, 2020, Massachusetts adopted the amendments, which deem the failure to adhere to a fiduciary standard to be a dishonest or unethical practice. The Massachusetts fiduciary standard became effective on March 6, 2020, and enforcement is set to begin on September 1, 2020. Following the enactment of a fiduciary statute in 2017, Nevada issued a proposed fiduciary regulation and solicited comments on January 18, 2019 but has not yet adopted a final regulation. New Jersey released a proposed fiduciary regulation on April 15, 2019 but has not yet adopted a final rule. On April 14, 2020, the rulemaking process in New Jersey was temporarily paused under an executive order issued by Governor Phil Murphy due to the public health emergency resulting from COVID-19. The foregoing regulations, however, have faced challenges. The Nevada and New Jersey proposals have received criticism from the industry for being overly broad in scope. In Maryland, a bill was introduced in the state senate on February 4, 2019 that would impose a fiduciary duty on broker-dealers and empower the Maryland commissioner of financial regulation to adopt fiduciary duty regulations. The Maryland Senate Finance Committee overwhelmingly voted to reject the fiduciary bill on April 4, 2019.
Other Annuity Sales Practices RulesAdvertisingAll states prohibit advertising that is misleading, deceptive, or confusing, based on the overall impression that the advertisement may reasonably be expected to create upon a person of average intelligence within the segment of the public to which the advertisement is directed. In addition, states have adopted rules governing the general content of advertising and rules regarding specific types of advertising materials, such as illustrations. SEC rules govern variable annuity advertising. Among other things, if past performance of a fund or variable annuity is presented, performance must be calculated according to standardized formulas. “Non-standardized” performance may also be shown but must be presented along with standardized performance. In addition, performance advertisements should include a toll-free (or collect) telephone number or a website where an investor may obtain total returns current to the most recent month end, unless the advertisement includes total returns current to the most recent month ended seven business days prior to date of the advertisement’s use. FINRA rules govern broker-dealer communications with the public about variable annuities. These rules impose principal approval, filing, and recordkeeping requirements on broker-dealer

144 IRI Retirement Fact Book 2020, 19th Edition
firms that disseminate retail communications about variable annuities.
Social MediaBoth the SEC and FINRA, as well as state insurance regulators, have taken a keen interest in the use of social media by financial services firms, including insurance companies and insurance producers. The SEC has issued guidance urging investors to use caution in using social media when considering an investment or establishing an account on a social media website, such as Facebook or Twitter, and identifying steps investors can take to protect themselves when using social media. The SEC also has issued guidance to financial services firms regarding their social media and social networking practices and has taken enforcement actions against firms that use social media in connection with violations of the Federal Securities laws.
Similarly, FINRA has issued regulatory notices that provide guidance to member firms and registered representatives on the application of FINRA rules governing communications with the public to the use of social media sites, including blogs and social networking sites. Among other things, these notices address responsibilities with respect to recordkeeping; suitability; third party posts, links, and content; interactive electronic forums; supervision; and personal communications and other devices. In addition, FINRA’s Advertising Regulation Department has conducted a “spot check” of social media communications to determine how firms and their associated persons were using social media in the conduct of their businesses. Among other things, the spot check included reviewing written supervisory procedures regarding the production, approval, and distribution of social media communications, and steps firms were taking to monitor compliance with the firms’ social media policies.
FINRA also has published guidance in the form of questions and answers on how its rules apply to various uses of social media in public communications, such as text messaging; hyperlinks and sharing; so-called “native advertising” in which the advertisement’s content bears a similarity to the news, product reviews, and other material that surrounds it; and testimonials and endorsements. FINRA also has taken disciplinary action against member firms, principals, and representatives involving the use of websites and social media in the conduct of their businesses. These disciplinary actions involve allegations that cover several areas, including failure to supervise; failure to comply with advertising requirements; false, misleading, or inadequate disclosures; and failure to safeguard customer information.
Unfair Trade PracticesAll states have adopted unfair trade practices acts with provisions that apply to an insurer’s activities. These laws define and prohibit unfair methods of competition and unfair or deceptive business practices, including those involved with the issuance, sale, and administration of annuity contracts.
Annuity DisclosuresThe NAIC Annuity Disclosure Model Regulation (#245) (the “Disclosure Model”) requires that consumers be provided an Annuity Buyer’s Guide and a disclosure document.

Chapter 14: Regulation and Taxation of Annuities 145
The current version of the Disclosure Model, which has been periodically revised, applies to fixed, fixed indexed, and variable annuities (except for non-registered variable annuities issued exclusively to accredited investors or qualified purchasers), while the previous version applied only to fixed and fixed indexed annuities. The current version of the Disclosure Model also includes standards for fixed and fixed indexed annuity illustrations that require, among other things: a narrative summary (unless the information is provided at the same time in a disclosure document); a numeric summary; for annuities with market value adjustment (MVA) features, a narrative explanation of the MVA, a demonstration of the MVA under at least one positive and one negative scenario, and actual MVA floors and ceilings; and for fixed indexed annuity illustrations, specific requirements on illustrating non-guaranteed values. While the Disclosure Model establishes these standards for the use of illustrations, it does not require that illustrations be provided. These illustration standards do not apply to variable annuity illustrations.
As of this writing, the NAIC’s Annuity Disclosure Working Group has proposed revisions to the Disclosure Model that would prohibit illustrating the performance of any index used in determining an account value that has been in existence for at least 15 years, unless: (1) the index is a combination of indices each of which has been in existence for at least 15 years; (2) the method of combination allows for the construction of a “unique” 15-year history of the index; (3) any algorithm or other method of combining the indices is fixed from the creation of the index except for changes made pursuant to the index provider’s established governance rules and procedures; (4) any algorithm or other method that supports the index and that is included in the illustration is available for inspection upon request by the insurance commissioner; and (5) indexed returns based on historical performance prior to the existence of the index are visually differentiated from those that are based on historical performance after the creation of the index.
The NAIC adopted a new Buyer’s Guide in 2013. The new Buyer’s Guide is available in three alternate versions — one for fixed and fixed indexed annuities, one for variable annuities, and one for all deferred annuities — and can be delivered in print or electronically.
Dodd-Frank Act Reforms The Dodd-Frank Act included comprehensive and far-reaching reforms in the regulation of the financial services industry, including insurance companies that issue annuities and the financial intermediaries that sell them. Reforms relevant to the insurance industry are described below.
Federal Insurance Office The Dodd-Frank Act created a Federal Insurance Office (FIO) within the Treasury Department to monitor all aspects of the insurance industry and to identify issues or gaps in insurance regulation that could contribute to a systemic crisis in the insurance industry or the U.S. financial system. The Dodd-Frank Act required the FIO to report to Congress on how to improve and modernize the system of insurance regulation in the United States by January 21, 2012. The FIO issued its first report almost two years later in December 2013. Among other things, the report recommended the adoption by every state of the NAIC’s Suitability in Annuity Transactions Model Regulation.

146 IRI Retirement Fact Book 2020, 19th Edition
The Dodd-Frank Act also requires the FIO to report annually to the President and to certain Congressional committees on the insurance industry. In its 2014 annual report (“2014 Report”), the FIO indicated that U.S. insurers continue to show “resilience” following the financial crisis. Among other things, the Report noted that life and health insurers as well as property casualty insurers achieved record net income levels in 2013. The 2014 Report also noted that several states have increased regulatory scrutiny of transactions involving the acquisition by private equity firms of life insurance companies that issue annuities. According to the 2014 Report, several states have increased regulatory scrutiny of these transactions, reflecting concerns that private equity firms may have relatively short investment horizons that are not fully consistent with the long-term nature of the annuity business. In its 2015 annual report (“2015 Report”), the FIO noted that, in 2014, the U.S. insurance industry “continued to report consecutive years of good financial performance and, in the aggregate, remained in sound financial condition.” The FIO also noted that, in the absence of “more uniform adoption and implementation of the Model Suitability Regulation, federal authorities should consider appropriate action.” In its 2016 annual report (“2016 Report”), the FIO described 2015 as “another year in a run of solid financial performance,” noting that the U.S. insurance industry in the aggregate “remained in sound financial condition.” Among other things, the 2016 Report examined the effects of the continuing low interest rate environment on insurers, particularly life insurers, as well as state insurance regulatory developments, such as the adoption of Principles Based Reserving (PBR). The Report cautioned that “PBR presents certain concerns and may not eliminate the use of captive reinsurers.” In its 2017 annual report (“2017 Report”), the FIO described 2016 as a year of “mixed financial performance” for the U.S. insurance industry but one in which the industry “in the aggregate remained in sound financial condition.” The 2017 Report, among other things, also discussed the growth of the innovative use of technology in insurance or “Insurtech,” including blockchain technology, automated underwriting, artificial intelligence, big data, and telematics. The 2017 Report provided some brief background on the DOL Fiduciary Rule but provided no substantive observations or analysis. In addition, the 2017 Report discussed state regulatory developments including capital, principles-based reserving rules, unclaimed death benefits, and an update on the activities of the NAIC.
The 2018 annual report (“2018 Report”) focused on the role of the FIO and its activities since the October 2017 issuance by the Treasury Department of its report entitled “A Financial System That Creates Economic Opportunities: Asset Management and Insurance” (the EO Report). The EO Report endorsed the state-based regulatory model for the U.S. insurance industry and described how, in executing its statutory mission, FIO should be guided by five “pillars,” namely: (1) promote the U.S. state-based insurance regulatory system and advocate for the U.S. insurance sector in international forums and negotiations, and in foreign markets; (2) provide insurance policy expertise and advice to the federal government, state insurance regulators, and industry through the publication of comprehensive research and analysis, consultation on emerging issues, and evaluation of federal insurance programs; (3) provide coordinated and collaborative leadership on insurance issues that engage the federal government and state insurance regulators, including through enhanced coordination between the federal government and state insurance regulators; (4) protect the U.S. financial system and economy by advising the Secretary and the Council on insurance-related matters that may pose a threat to U.S. financial stability; and (5) protect America’s financial security by promoting access to insurance products and administering the Terrorism Risk Insurance Program.
The 2018 Report reviewed various FIO activities since those described in the 2017 Report, including its activities representing the United States in the International Association of Insurance Supervisors (IAIS) and elsewhere on prudential international insurance measures. The 2018 Report also reviewed the domestic insurance market outlook for 2018, noting that based on the financial results reported in the first half of 2018, the outlook for the U.S. insurance industry

Chapter 14: Regulation and Taxation of Annuities 147
appeared to be a continuation of the “healthy trends observed in 2017.” In describing its activities since the 2018 Report, the FIO organized its 2019 annual report (“2019 Report”) around four key themes from the 2017 report by the Treasury Department entitled “A Financial System That Creates Economic Opportunities: Asset Management and Insurance” (“Insurance EO Report”). The themes include: (1) the proper evaluation of systemic risk; (2) ensuring effective regulation and government processes; (3) rationalizing international engagement; and (4) promoting economic growth and informed choices. Notably, with respect to efficient regulation and government processes, the 2019 Report noted that the Treasury Department in the Insurance EO Report had “recommended that the SEC prioritize annuity-related disclosure reform by adopting a rule permitting a variable annuity summary prospectus and a streamlined prospectus update, while continuing to provide appropriate disclosure to investors.” The FIO commended the SEC for its 2018 proposal of a modernized disclosure framework for both variable annuity contracts and variable life insurance policies that would permit the use of summary prospectuses. Also, with respect to economic growth and informed choices, the 2019 Report reviewed the SEC’s 2018 package of rulemaking regarding standards of conduct applicable to broker-dealers and investment advisers that provide retail investment advice, including SEC Regulation Best Interest, the Form CRS client relationship summary, and interpretive guidance on an investment adviser’s fiduciary obligations and the investment adviser registration exclusion for broker-dealers that provide investment advice that is “solely incidental” to their traditional transaction execution services. The 2019 Report also reviewed state efforts to establish standards of conduct. In addition, with respect to economic growth and informed choices, the 2019 Report described FIO’s outreach efforts and related work during 2019 regarding InsurTech, including “insurers, reinsurers, InsurTech startups, tech companies, accelerators/incubators, trade associations, academics, consumer groups, consultants, and lawyers.” The discussion included a market overview; innovations in the area of digital distribution and marketing; potential applications of “big data;” developments in the area of artificial intelligence, machine learning, and deep learning as well as predictive analytics; telematics and Internet of Things sensors; and emerging technologies. The 2019 Report identified as an area for report anti-rebating laws, the use of paper and proof of delivery, and rate and form requirements, among other things. The 2019 Report also identified regulatory “sandboxes” (meaning a construct that allows companies to test new products or technologies without meeting all regulatory requirements) as an important issue, along with data privacy and “RegTech” (technology innovations to improve the effectiveness and efficiency of insurance regulation) as ongoing concerns.
Swaps and Other Derivatives The Dodd-Frank Act established a new comprehensive framework for the regulation of swaps and other derivatives, with potential implications for financial companies, such as insurers, that use derivatives for hedging or other investment purposes. The SEC and the Commodity Futures Trading Commission (CFTC) are responsible under the Dodd-Frank Act for promulgating regulations to implement the new framework. Under the Dodd-Frank Act, the SEC has regulatory authority over “security-based swaps,” which are swaps that are based on a single security or loan or a narrow-based group or index of securities, or based on events relating to a single issuer or issuer of securities in a narrow-based security index. The CFTC has primary regulatory authority over all other swaps. The SEC and CFTC share authority over “mixed swaps,” which are security-based swaps with a commodity component. The SEC also has anti-fraud enforcement authority over security-based swap agreements. In July 2012, the SEC and CFTC jointly adopted regulations and interpretations that provide a non-exclusive safe harbor that excludes variable

148 IRI Retirement Fact Book 2020, 19th Edition
life insurance and annuity products from the definition of “swap” and “security-based swap.”
Recent DevelopmentsSEC and FINRA Examination PrioritiesOn January 7, 2020, the SEC’s Office of Compliance Inspections and Examinations (OCIE) published its examination priorities for 2020. As in prior years, the 2020 priorities reflect a continuing focus by OCIE on key areas of risk affecting retail investors, particularly seniors, as well as the intermediaries that interact with retail investors, the products marketed to retail investors, and the disclosures provided about fees and expenses as well as conflicts of interest. The 2020 priorities also include a focus on registered investment advisers, such as new and never-before examined advisers, private fund advisers, and advisers that are also dually-registered as broker-dealers, as well as their examination programs and their fulfillment of their fiduciary duties to provide advice that is in the best interest of their clients. In addition, the 2020 priorities include a focus on broker-dealers and their preparation and implementation of changes in response to the SEC’s rulemaking package that includes Regulation Best Interest, new SEC Form CRS, and the SEC’s two interpretative releases on adviser fiduciary duty and the broker-dealer exclusion under the Advisers Act. Other priorities, among others, include information security; financial technology (FinTech) and innovation, including digital assets, alternative data, and electronic or “robo” advice; anti-money laundering programs; and continued oversight of FINRA and the Municipal Securities Rulemaking Board (MSRB).
On January 9, 2020, FINRA released its “2020 Risk Monitoring and Examination Priorities Letter” (“2020 Letter”), which identifies areas of focus for FINRA’s 2020 risk monitoring, surveillance and examination programs. The 2020 Letter also includes a list of practical considerations and questions that member firms may use in evaluating their compliance, supervisory, and risk programs these programs, as well as a new appendix with links to additional FINRA and other resources for each risk monitoring and examination priority. The 2020 Letter includes a single reference to variable annuities in the context of FINRA’s ongoing focus on sales practices and supervision in the area of complex products. The 2020 Letter states that FINRA will review member firms’ compliance with SEC Regulation Best Interest, Form CRS, and related SEC guidance. In evaluating compliance with Regulation Best Interest, FINRA indicated that it would consider factors such as whether firms have policies and procedures to assess whether recommendations use the best interest standard, whether firms and associated persons apply a best interest standard to account recommendations, whether reasonably available alternatives are considered, and whether firms have policies and procedures to identify and address conflicts of interest. Other FINRA priorities discussed in the 2020 Letter include, among other things, member firms’ compliance programs relating to rules pertaining to customer protection and net capital, as well as overall financial risk financial management programs, including with respect to “digital asset” activities.

Chapter 14: Regulation and Taxation of Annuities 149
Summary Prospectus for Variable Insurance ProductsOn March 11, 2020, the SEC voted to adopt regulatory changes to modernize disclosures provided to investors about variable annuities and variable life insurance policies (“variable insurance products” or “contracts”). The purpose of these changes is to help investors make informed decisions about variable insurance products through the use of summary prospectuses and a layered disclosure approach “designed to provide investors with key information relating to the contract’s terms, benefits, and risks in a concise and more reader-friendly presentation, with website addresses or hyperlinks to more detailed information posted online and delivered electronically or in paper format on request.”
Key aspects of the changes include the optional use of an initial summary prospectus containing key disclosures for variable insurance products currently offered to new investors, the optional use of an updating summary prospectus for existing investors, and online delivery of underlying fund prospectuses and other documents. In addition, the regulatory changes (with some modifications) grandfather the industry’s longstanding practice of relying on the so-called “Great-West” line of no-action letters, which conditionally permits the delivery of alternative disclosures in lieu of updating the registration statements and delivering current prospectuses for certain variable insurance products. The regulatory changes also include an optional “modernized” alternative disclosure approach that conditionally permits the online delivery of fund documents and insurance company and separate account financial statements. One condition under the modernized alternative disclosure is the delivery of a “notice” document containing essentially the same information that would be included in an updating summary prospectus. Moreover, the regulatory changes require variable insurance product registrants to submit Interactive Data Files containing data about their products using the Inline XBRL format. The purpose of this requirement is to allow investors, investment professionals, and others to analyze and compare available information about variable insurance products.
Taxation of Annuities This section explains the federal income taxation of annuities. The focus is on annuities that are not part of a qualified plan, although the basic differences between qualified and non-qualified annuities are discussed. State taxes and federal estate and gift taxes are not discussed; however, these taxes may also affect annuity owners.
Premiums If an annuity contract is part of an employer-sponsored retirement plan, such as a 401(k), premiums are plan contributions and generally not includible in the employee’s income when paid. However, if an annuity is used in a “Roth” type of arrangement, such as a Roth 403(b) annuity, the premiums are includible in income. Premiums paid for an IRA annuity may be deductible in whole or in part. For a non-qualified annuity, premiums are paid with after-tax monies and are not tax deductible.

150 IRI Retirement Fact Book 2020, 19th Edition
Tax Deferral Dividends, interest, and capital gains credited to an annuity are not taxed until they are withdrawn. In other words, earnings are tax deferred and reinvested to help accumulate assets for retirement. As a result, money may be transferred from one investment option to another inside a variable annuity without incurring a tax liability. This is not true for taxable investments, in which transferring amounts from one investment to another, such as from one mutual fund to another, will be treated as a sale and any gains will be taxable. If a deferred annuity contract is not owned by an individual, but rather by an entity such as a corporation, the contract is not eligible for tax deferral in most cases. Rather, the entity is taxed each year on the increase in the net surrender value of the contract, minus premiums paid during the year. (Special rules allow trusts and other entities to own an annuity and still be eligible for tax deferral in certain circumstances.) Congress enacted this requirement to ensure that the tax deferral granted by annuities is used primarily as a vehicle for individuals’ retirement savings.
Withdrawals When a contract owner begins to receive money from an annuity, distributions taken in excess of the amount invested are subject to taxation at the owner’s ordinary income tax rate. Just as with IRAs, 401(k) plans, and other tax-qualified plans, when money is withdrawn, it does not receive favorable capital gains treatment. As discussed below, however, annuity income payments receive more favorable tax treatment than lump sum payments or withdrawals. Also, unlike qualified plans, income payments under a non-qualified annuity can be deferred past age 70½ and taken when the need arises. Because Congress set the rules on tax deferral to encourage long-term retirement savings, withdrawals made before age 59½ may be subject to a 10 percent federal tax penalty on the taxable amount of earnings withdrawn, in addition to any income taxes due on that amount. (There are exceptions to the 10 percent penalty.) This is similar to the 10 percent penalty tax on premature distributions from IRAs and underscores the fact that annuities are designed to be long-term retirement vehicles. (There also may be surrender charges, as discussed in Chapter 4: Annuities 101, if the withdrawal exceeds any annual free-withdrawal amount or the surrender charge period has not run out. Surrender charges are imposed by the terms of the contract and should not be confused with the 10 percent federal tax penalty.) For non-qualified annuity contracts, the tax rule on withdrawals is “interest and earnings first.” Under this rule, interest and earnings are considered withdrawn first for federal income tax purposes. For example, if someone invested $25,000 in a fixed or variable annuity and the contract is now worth $45,000, the first $20,000 withdrawn is taxable. The remaining $25,000 is not taxed because it is considered a return of principal. Withdrawals are taxed until all interest and earnings are withdrawn; the principal then can be withdrawn without tax. The “interest and earnings first” rule is intended to encourage the use of annuities for long-term savings and retirement. Congress decided that the advantage of tax deferral should not be accompanied by the ability to withdraw principal first, with no tax payable until all principal is withdrawn. Different rules apply to tax-qualified annuities (such as IRAs), under which withdrawals are taxed on a pro rata basis to the extent there were any after-tax contributions made to the contract.

Chapter 14: Regulation and Taxation of Annuities 151
Complete Surrenders When an owner surrenders an annuity contract, the excess of the amount received over the owner’s investment in the contract is taxable. Generally, the investment in the contract is the amount of premiums paid (less any principal that has been previously returned to the contract owner without tax) at the time of distribution.
Gifts and Assignments of Annuity Contracts If a contract owner gives an annuity contract as a gift, the contract owner may have to pay income tax at the time of the transfer. The contract owner must include in income the difference between the cash surrender value of the contract and the owner’s investment in the contract at the time of the transfer. This rule does not apply if the transfer is made between spouses or former spouses as part of a divorce. (Gift taxes also may apply.)
In addition, any assignment or pledge of (or agreement to assign or pledge) any portion of an annuity contract’s cash surrender value is treated as a withdrawal of such amount from the contract. Hence, the tax treatment that normally applies to withdrawals also applies to assignments or pledges of annuity contracts.
Premature Distributions For non-qualified annuities, a 10 percent federal tax penalty may apply to the taxable portion of an amount received before age 59½. There are exceptions to the 10 percent penalty, for example, if the payment is made upon the owner’s death or disability. As noted earlier, this penalty is intended to encourage the use of annuities for retirement savings purposes. For that reason, similar penalties generally apply to withdrawals from IRAs and qualified plans, which also are intended for retirement savings.
Taxation of Annuity Payouts Annuity owners can elect several payout options, as discussed in Chapter 4: Annuities 101. The basic rule for annuity payouts (as distinguished from withdrawals or other non-periodic payments) is that the money a contract owner invests in the contract is returned in equal tax-free installments over the payment period. The remainder of the amount received each year is treated as the earnings on the owner’s premiums and is included in income. The income portion is taxed at ordinary income tax rates, not capital gains rates. The total amount that is received tax-free can never exceed the premiums the owner paid for the contract.
The taxable portion of each payment is equal to the excess of the payment over the “exclusion amount.” With a fixed annuity, the exclusion amount generally is computed by (1) dividing the premiums paid for the annuity by the total expected return from all scheduled annuity payments, and (2) multiplying each payment by this “exclusion ratio.” With a variable annuity, because the expected return cannot be predicted, the exclusion amount is generally computed by dividing the premiums paid for the contract by the number of years that payments are expected to be made.

152 IRI Retirement Fact Book 2020, 19th Edition
For a lifetime annuity, the expected return is always computed by reference to the annuitant’s life expectancy as determined using IRS tables. To illustrate, assume that a male age 65 elects a lifetime annuity and his investment in the contract is $100,000. Assume further that he has elected to receive annual variable annuity payments and the payment for the first year is $8,000. Since the payments are variable, they will vary each year thereafter. (For simplicity, this illustration assumes annual annuity payments, although monthly or quarterly payments are more common.) Applicable IRS tables indicate that such a person is expected to live 20 years. The portion of each annuity payment excluded from income is $5,000, which is $100,000 divided by 20. During the first year, $5,000 of the $8,000 will be excluded from income and $3,000 will be included and taxable. The $5,000 is excluded each year until the total investment in the contract has been received.
Partial AnnuitizationsIn some cases, the owner of a deferred annuity contract may wish to apply only a portion of the contract’s cash value (rather than the entire cash value) to produce a series of annuity payments under the contract, while leaving the contract’s remaining cash value in the deferral or accumulation stage. For example, the owner’s current financial need may be for annuity payments that are less than the payments the contract’s full cash value would produce, or the owner may wish to “ladder” or “stagger” annuity payments to take advantage of future changes in annuity purchase rates. Prior to 2011, there was no specific rule in the tax code regarding such “partial annuitizations.” Starting in 2011, however, the tax code provides that partial annuitizations of non-qualified annuities are treated the same as other annuitizations, as long as the resulting annuity payments are made for a period of at least 10 years or over the life or lives of one or more individuals. In such cases, the annuitized and non-annuitized portions of the contract are treated as separate contracts and the after-tax investment in the contract is allocated pro rata between them for purposes of applying the rules governing the taxation of distributions.
Death of an Owner When an owner of an annuity dies, the general rule is that certain distributions must be made. (Similar rules apply to qualified plans.) The tax policy behind this rule is to prevent the prolonged deferral of income tax on the gains in an annuity contract that would occur if ownership could be passed from person to person without taxation occurring. If an owner dies on or after the annuity commencement date, but before the entire interest in the contract has been distributed (e.g., if the owner dies five years into a 10-year guaranteed payout term), the remaining portion must be distributed at least as rapidly as under the method of distribution in effect at the time of death.
If an owner dies before the annuity commencement date, the general rule is that the entire interest in the contract must be distributed within five years after the date of the owner’s death. Under this rule, a beneficiary has the following choices:
• Take the amount due under the contract and pay taxes at that time. • Make withdrawals over the course of the next five years and pay taxes on each
withdrawal, with the remainder of the contract value growing tax deferred.

Chapter 14: Regulation and Taxation of Annuities 153
• Wait up to five years with the contract value growing tax deferred, then take the entire amount due and pay taxes.
An exception to the five-year rule described above is available for cases in which payments are made to a beneficiary over life or life expectancy. Specifically, within 12 months of the owner’s death, a beneficiary can (1) annuitize the remaining interest over his or her life or life expectancy and receive the favorable tax treatment accompanying annuity payments, or (2) begin withdrawals over a period not exceeding the beneficiary’s life expectancy, calculated in a manner specified in IRS rules, and pay taxes on each withdrawal on an income-first basis. For purposes of the foregoing after-death distribution rules, if an individual is the owner under a contract and the spouse is the beneficiary, then following the owner’s death the surviving spouse is treated as the “owner” of the contract. In such case, the after-death distribution rules take effect upon the surviving spouse’s death, rather than upon the original owner’s death. In the case of a non-natural owner (such as a corporation), the foregoing after-death distribution rules apply on the death of the primary annuitant.
Replacement Contracts/1035 Exchanges When a contract owner purchases a new annuity contract to replace an existing one, the new contract is referred to as a replacement contract. Replacement contracts usually occur in connection with a tax-free exchange of non-qualified contracts under Section 1035 of the Internal Revenue Code, or because of a rollover or direct transfer of a qualified plan contract (e.g., an individual retirement annuity) from one life insurance company to another. Annuity owners generally can exchange their annuity contracts for new ones, tax free. In both qualified plans and non-qualified annuities, depending upon the terms of the contract, it also may be possible to transfer, tax-free, a portion of the contract to a new contract issued by the same or a different carrier, while continuing the remaining portion of the contract from which the partial transfer was taken. Special rules must be followed to assure that either a complete or a partial exchange or transfer qualifies for tax-free treatment.
The reasons for an exchange of annuity contracts can include:
• The owner has a fixed annuity with a substantially lower interest rate than other contracts currently available.
• The company that issued the current contract is not as financially strong as it was in the past.
• The new contract may have better features, such as an enhanced death benefit, guaranteed minimum income benefit, portfolio rebalancing, or dollar cost averaging.
• The new contract may have more or better-performing investment options. • The new contract may have lower fees and charges.
Many states have passed regulations requiring certain procedures be followed before an annuity contract is replaced. The contract purchaser and the agent must sign a statement as to whether the contract being purchased will replace an existing one. If so, the new insurance company must promptly notify the old insurance company. The new insurance company must provide the purchaser with a prescribed statement about important factors to consider before buying the replacement contract. In some cases, a surrender charge may be incurred by exchanging the old contract and a new surrender charge period may start on the new contract. For this reason,

154 IRI Retirement Fact Book 2020, 19th Edition
an individual and his or her financial advisor should carefully evaluate a proposed exchange to ensure that it is in the contract owner’s best interest. States have adopted replacement regulations ensuring full disclosure in these situations and affording other protections. States also may provide longer free-look periods for replacement contracts than for other annuity contracts.
Medicare Tax on Investment IncomeSince 2013, distributions from non-qualified annuity contracts, to the extent not excludible from income, have generally been subject to the 3.8 percent Medicare tax on investment income for taxpayers with adjusted gross income (with certain modifications) over $250,000 in the case of married couples filing jointly and qualifying widow(er)s with dependent children, $125,000 in the case of married taxpayers filing separately, or $200,000 in the case of other taxpayers.

Chapter 15: Data Section 155
Figure 15-1 Annuity Industry Net Assets (dollars in billions)
Year Variable Fixed Total2002 777.4 421.0 1,198.42003 972.6 490.0 1,462.62004 1,165.9 510.0 1,675.92005 1,187.3 534.0 1,721.32006 1,386.6 519.0 1,905.62007 1,499.3 511.0 2,010.32008 1,129.4 556.0 1,685.42009 1,354.5 620.2 1,974.72010 1,504.4 658.6 2,163.02011 1,502.3 676.0 2,178.32012 1,639.9 691.6 2,331.52013 1,868.5 721.2 2,589.72014 1,920.4 747.1 2,667.52015 1,871.6 782.0 2,653.62016 1,896.7 827.5 2,847.22017 1,985.7 861.5 2,847.22018 1,814.3 902.3 2,716.62019 2,018.0 946.6 2,964.6
Sources: Morningstar, Inc.; LIMRA Secure Retirement Institute
Data SectionTotal Annuity Market
Figure 15-2 Annuity Industry Total Sales (dollars in billions)
Year Variable Fixed Total2002 114.8 103.3 218.12003 126.1 84.1 210.22004 129.9 86.7 216.62005 133.4 76.5 209.92006 157.6 74.0 231.62007 183.4 66.6 250.02008 154.8 106.7 261.52009 125.6 104.2 229.82010 136.8 76.4 213.22011 154.6 75.6 230.22012 143.9 67.0 210.92013 142.1 78.1 220.22014 137.8 91.5 229.32015 131.1 98.4 229.52016 104.6 108.0 212.62017 96.2 97.8 194.02018 99.2 125.0 224.22019 98.3 129.5 227.8
Sources: Beacon Research; Morningstar, Inc.
15CH

156 IRI Retirement Fact Book 2020, 19th Edition
Figure 15-3 Annuity Industry Sales by Quarter (dollars in billions)
Year Variable Fixed TotalQ1 2005 31.7 18.8 50.5Q2 2005 33.5 21.9 55.4Q3 2005 33.8 18.4 52.2Q4 2005 34.4 17.4 51.8
Total 2005 133.4 76.5 209.9Q1 2006 38.3 17.4 55.7Q2 2006 41.8 18.8 60.6Q3 2006 37.1 20.5 57.6Q4 2006 40.4 17.3 57.7
Total 2006 157.6 74.0 231.6Q1 2007 41.3 14.1 55.4Q2 2007 47.5 16.4 63.9Q3 2007 46.5 18.1 64.6Q4 2007 48.1 18.0 66.1
Total 2007 183.4 66.6 250.0Q1 2008 41.7 19.6 61.3Q2 2008 42.0 25.3 67.3Q3 2008 37.8 27.7 65.5Q4 2008 33.3 34.1 67.4
Total 2008 154.8 106.7 261.5Q1 2009 30.5 34.8 65.3Q2 2009 31.9 27.8 59.7Q3 2009 31.1 22.1 53.2Q4 2009 32.1 19.5 51.6
Total 2009 125.6 104.2 229.8Q1 2010 31.5 17.9 49.3Q2 2010 34.2 20.4 54.6Q3 2010 33.9 20.5 54.4Q4 2010 37.2 17.6 54.8
Total 2010 136.8 76.4 213.2Q1 2011 39.0 18.6 57.6Q2 2011 39.8 20.7 60.4Q3 2011 38.9 19.0 57.9Q4 2011 37.0 17.3 54.3
Total 2011 154.6 75.6 230.2Q1 2012 35.9 16.9 52.8Q2 2012 37.9 17.2 55.1Q3 2012 36.0 16.6 52.6Q4 2012 34.1 16.2 50.3
Total 2012 143.9 67.0 210.9Q1 2013 34.4 15.0 49.4Q2 2013 37.1 17.1 54.2Q3 2013 34.9 22.5 57.4Q4 2013 35.6 23.5 59.1
Total 2013 142.1 78.1 220.2Q1 2014 33.5 22.5 56.0Q2 2014 35.6 24.3 59.9Q3 2014 35.2 21.7 56.9Q4 2014 33.6 23.0 56.6
Total 2014 137.8 91.5 229.3Q1 2015 32.1 20.9 53.0Q2 2015 35.8 22.8 58.6Q3 2015 32.2 26.5 58.7Q4 2015 31.1 28.2 59.3
Total 2015 131.1 98.4 229.5Q1 2016 26.5 29.6 56.2Q2 2016 27.0 29.1 56.2Q3 2016 26.0 25.7 51.7Q4 2016 25.0 23.5 48.5
Total 2016 104.6 108.0 212.6

Chapter 15: Data Section 157
Figure 15-4 Annuity Industry Net Assets – Qualified vs. Non-Qualified (dollars in billions)
Qualified Non-Qualified
Year Variable Fixed Total Variable Fixed Total Total
2002 445.6 167.0 612.6 331.8 254.0 585.8 1,198.4
2003 569.2 201.0 770.2 403.4 289.0 692.4 1,462.6
2004 705.5 208.0 913.5 460.4 302.0 762.4 1,675.9
2005 736.1 214.0 950.1 451.2 320.0 771.2 1,721.3
2006 847.3 225.0 1,072.3 539.3 312.0 851.3 1,923.6
2007 925.4 211.0 1,136.4 573.9 300.0 873.9 2,010.3
2008 739.1 242.0 981.1 390.3 314.0 704.3 1,685.4
2009 969.5 272.0 1,241.5 385.0 348.0 733.0 1,974.5
2010 1,036.7 297.0 1,333.7 467.7 362.0 829.7 2,163.4
2011 1,012.5 315.0 1,327.5 489.8 360.0 849.8 2,177.3
2012 1,099.3 325.0 1,424.3 540.6 367.0 907.6 2,331.9
2013 1,220.8 346.0 1,566.8 647.7 376.0 1,023.7 2,590.5
2014 1,253.3 363.6 1,616.9 667.1 395.0 1,062.1 2,679.0
2015 1,235.8 385.1 1,620.9 635.8 418.8 1,054.6 2,675.5
2016 1,311.5 409.2 1,720.7 585.2 445.0 1,030.2 2,750.9
2017 1,373.1 433.3 1,806.4 612.6 471.1 1,083.7 2,890.1
2018 1,175.7 484.9 1,660.6 638.6 417.4 1056.0 2,716.6
2019 1,307.7 530.1 1,837.8 710.3 416.5 1,126.8 2,964.6
Sources: Morningstar, Inc. (Variable); LIMRA Secure Retirement Institute (Fixed)
Year Variable Fixed TotalQ1 2017 24.4 25.2 49.6Q2 2017 24.8 26.1 50.9Q3 2017 21.9 22.6 44.5Q4 2017 25.0 23.9 48.9
Total 2017 96.2 97.8 194.0Q1 2018 24.5 25.5 50.0Q2 2018 25.7 31.8 57.5Q3 2018 24.6 31.9 56.4Q4 2018 24.5 35.9 60.3
Total 2018 99.2 125.0 224.2Q1 2019 21.9 35.9 57.8Q2 2019 24.9 35.8 60.7Q3 2019 25.6 30.1 55.7Q4 2019 25.9 27.7 53.6
Total 2019 98.3 129.5 227.8
Sources: Beacon Research; Morningstar, Inc.

158 IRI Retirement Fact Book 2020, 19th Edition
Figure 15-5 Annuity Total Sales – Qualified vs. Non-Qualified (dollars in billions)
Qualified Non-Qualified
Year Variable Fixed Total Variable Fixed Total Total
2003 73.8 30.0 103.8 52.3 54.2 106.5 210.3
2004 78.6 31.1 109.7 51.3 55.6 106.9 216.6
2005 82.7 28.6 111.3 50.7 47.9 98.6 209.9
2006 96.3 27.6 123.9 61.3 46.4 107.7 231.6
2007 113.2 22.0 135.2 70.2 44.6 114.8 250.0
2008 101.3 41.6 142.9 53.5 65.1 118.6 261.5
2009 89.9 43.7 133.6 35.7 60.5 96.2 229.8
2010 94.2 34.1 128.3 42.7 42.2 84.9 213.2
2011 104.1 33.6 137.7 50.5 42.0 92.5 230.2
2012 96.1 34.8 130.9 47.8 32.2 80.0 210.9
2013 92.8 39.2 132.0 49.3 38.9 88.2 220.2
2014 89.9 50.9 140.8 47.9 40.6 88.5 229.3
2015 86.7 56.7 143.3 44.4 41.7 86.2 229.5
2016 72.9 61.9 134.9 31.7 46.1 77.7 212.6
2017 63.4 53.9 117.3 32.8 43.9 76.7 194.0
2018 66.1 69.7 135.7 33.1 55.3 88.5 224.2
2019 62.8 75.7 138.5 35.5 53.8 89.3 227.8
Sources: Beacon Research and Morningstar, Inc.
Figure 15-6 Annuity Industry Total Sales – Deferred vs. Immediate (dollars in billions)
Year Deferred Immediate Total
2003 205.2 5.2 210.3
2004 210.1 6.5 216.6
2005 203.0 6.9 209.9
2006 224.5 7.1 231.6
2007 243.1 7.0 250.0
2008 252.4 9.0 261.5
2009 221.8 7.9 229.8
2010 205.1 8.1 213.2
2011 221.7 8.5 230.2
2012 201.7 9.2 210.9
2013 209.2 11.0 220.2
2014 216.2 13.1 229.3
2015 216.9 12.6 229.5
2016 200.1 12.5 212.6
2017 183.4 10.6 194.0
2018 212.7 11.5 224.2
2019 215.9 11.9 227.8
Sources: Beacon Research; Morningstar, Inc.

Chapter 15: Data Section 159
Figure 15-7 Annuity Total Sales Percentages by Distribution Channel
Year Banks Career Agents
Direct Response
Independent Broker Dealers
Independent Agents
Full Service Nat’l BDs
Regional Broker/Dealers
2003 25.7% 24.4% 1.5% 18.8% 13.7% 8.1% 7.8%
2004 23.7% 24.7% 1.5% 19.8% 15.9% 6.9% 7.6%
2005 19.9% 27.0% 1.7% 20.3% 16.8% 7.1% 7.3%
2006 18.3% 25.8% 2.0% 24.3% 14.8% 8.1% 6.6%
2007 16.9% 24.6% 2.2% 27.2% 13.3% 9.0% 6.9%
2008 20.5% 23.9% 2.6% 23.0% 15.5% 7.9% 6.6%
2009 19.9% 25.1% 2.2% 22.0% 16.6% 7.0% 7.1%
2010 15.8% 25.5% 2.5% 23.1% 18.2% 6.8% 8.2%
2011 16.5% 24.7% 2.1% 24.1% 15.5% 7.7% 9.5%
2012 14.4% 26.2% 2.7% 24.1% 16.8% 7.6% 8.2%
2013 16.3% 25.4% 2.9% 23.5% 16.8% 7.1% 8.1%
2014 16.8% 23.6% 2.6% 25.1% 16.9% 6.9% 8.0%
2015 17.8% 24.8% 2.2% 23.6% 17.3% 5.8% 8.5%
2016 18.1% 24.6% 2.2% 22.0% 19.8% 4.9% 8.3%
2017 18.2% 23.0% 2.5% 23.5% 19.2% 4.9% 8.7%
2018 18.9% 20.6% 2.8% 23.9% 20.2% 4.6% 9.0%
2019 18.1% 20.4% 2.9% 24.4% 20.3% 4.7% 9.2%
Sources: Beacon Research; Morningstar, Inc.
Figure 15-8 2019 Total Annuity Sales by Top 25 Issuers
Company Total Flow ($MM) Rank % Share Cumulative% Share
Jackson National 19,626.7 1 8.6% 8.6%AIG Companies 17,970.1 2 7.9% 16.5%Lincoln National 14,837.8 3 6.5% 23.0%New York Life 12,640.1 4 5.5% 28.6%Allianz 12,503.7 5 5.5% 34.1%Nationwide 11,026.7 6 4.8% 38.9%Equitable Financial 10,872.8 7 4.8% 43.7%Prudential 9,698.0 8 4.3% 47.9%TIAA 9,574.4 9 4.2% 52.1%Global Atlantic 8,370.7 10 3.7% 55.8%Pacific Life 8,202.2 11 3.6% 59.4%Athene USA 6,782.2 12 3.0% 62.4%Brighthouse Financial 6,223.4 13 2.7% 65.1%Massachusetts Mutual 5,601.0 14 2.5% 67.6%American Equity 4,963.2 15 2.2% 69.7%Great American 4,645.0 16 2.0% 71.8%AEGON USA 4,317.1 17 1.9% 73.7%Ameriprise Financial 4,100.7 18 1.8% 75.5%F & G Life 3,595.1 19 1.6% 77.1%Symetra Financial 3,594.0 20 1.6% 78.6%Thrivent 2,998.9 21 1.3% 80.0%Principal Financial 2,890.4 22 1.3% 81.2%Security Benefit 2,676.9 23 1.2% 82.4%Midland National 2,568.3 24 1.1% 83.5%Delaware Life 2,423.7 25 1.1% 84.6%
Source: Beacon Research; Morningstar, Inc.

160 IRI Retirement Fact Book 2020, 19th Edition
Figure 15-9 Annual VA Net Flow, Total Sales and Net Assets (dollars in billions)
Year Net Flow Total Sales Net Assets
2002 30.7 114.8 777.4
2003 46.0 126.1 972.6
2004 40.2 129.9 1,165.9
2005 20.4 133.4 1,187.3
2006 29.7 157.6 1,386.6
2007 33.4 183.4 1,499.3
2008 23.8 154.8 1,129.4
2009 17.0 125.6 1,354.5
2010 21.6 136.8 1,504.4
2011 27.7 154.6 1,502.3
2012 14.7 143.9 1,639.9
2013 1.3 142.1 1,868.5
2014 -5.4 137.8 1,920.4
2015 -12.9 131.1 1,871.6
2016 -32.0 104.6 1,896.7
2017 -66.7 96.2 1,985.7
2018 -79.2 99.2 1,814.3
2019 -90.3 98.3 2,018.0
Source: Morningstar, Inc.
Variable Annuity Market
Figure 15-10 Quarterly VA Net Flow, Total Sales and Net Assets (dollars in billions)
Year Net Sales Total Sales Net AssetsQ1 2005 4.8 31.7 1,108.5 Q2 2005 5.2 33.5 1,138.7 Q3 2005 4.6 33.8 1,191.4 Q4 2005 5.8 34.4 1,187.3
Total 2005 20.4 133.4 Q1 2006 7.0 38.3 1,300.5 Q2 2006 8.2 41.8 1,271.9 Q3 2006 9.3 37.1 1,309.4 Q4 2006 5.2 40.4 1,386.6
Total 2006 29.7 157.6 Q1 2007 6.4 41.3 1,409.8 Q2 2007 8.7 47.5 1,476.6 Q3 2007 9.4 46.5 1,515.2 Q4 2007 8.9 48.1 1,499.3
Total 2007 33.4 183.4 Q1 2008 7.2 41.7 1,413.6 Q2 2008 7.5 42.0 1,425.1 Q3 2008 4.9 37.8 1,303.1 Q4 2008 4.2 33.3 1,129.4
Total 2008 23.8 154.8 Q1 2009 5.2 30.5 1,067.9 Q2 2009 6.1 31.9 1,185.6 Q3 2009 2.8 31.1 1,311.2 Q4 2009 2.9 32.1 1,354.5
Total 2009 17 125.6 Q1 2010 3.6 31.5 1,397.8 Q2 2010 6.2 34.2 1,319.6 Q3 2010 6.4 33.9 1,418.0 Q4 2010 5.4 37.2 1,504.4
Total 2010 21.6 136.8

Chapter 15: Data Section 161
Year Net Sales Total Sales Net AssetsQ1 2011 5.8 39.0 1,558.0 Q2 2011 5.8 39.8 1,567.3 Q3 2011 8.9 38.9 1,421.7 Q4 2011 7.2 37.0 1,502.3
Total 2011 27.7 154.6 Q1 2012 3.8 35.9 1,610.9Q2 2012 4.9 37.9 1,559.3Q3 2012 5.8 36.0 1,621.9Q4 2012 0.1 34.1 1,639.9
Total 2012 14.7 143.9 Q1 2013 0.9 34.4 1,715.9Q2 2013 1.6 37.1 1,716.4Q3 2013 1.6 34.9 1,787.0Q4 2013 -2.8 35.6 1,868.5
Total 2013 1.3 142.1 Q1 2014 -1.2 33.5 1,882.1Q2 2014 1.6 35.6 1,934.8Q3 2014 -2.5 35.2 1,903.3Q4 2014 -3.3 33.6 1,920.4
Total 2014 -5.4 137.8 Q1 2015 -3.5 32.1 1,947.2Q2 2015 2.9 35.8 1,982.5Q3 2015 -7.1 32.2 1,841.0Q4 2015 -5.2 31.1 1,871.6
Total 2015 -12.9 131.1Q1 2016 -9.8 26.5 1,874.7Q2 2016 -5.6 27.0 1,880.2Q3 2016 -10.8 26.0 1,921.0Q4 2016 -5.8 25.0 1,896.7
Total 2016 -32.0 104.6Q1 2017 -17.8 24.4 1,941.2Q2 2017 -14.8 24.8 1,985.2Q3 2017 -15.9 21.9 1,958.0Q4 2017 -18.2 25.0 1,985.7
Total 2017 -66.7 96.2Q1 2018 -18.4 24.4 1,953.2Q2 2018 -21.1 25.7 1,967.2Q3 2018 -19.4 24.5 2,004.4Q4 2018 -20.3 24.4 1,814.3
Total 2018 -79.2 99.1Q1 2019 -24.8 21.9 1,932.4Q2 2019 -20.4 24.9 1,960.9Q3 2019 -21.5 25.6 1,946.5Q4 2019 -23.6 25.9 2,018.0
Total 2019 -90.3 98.3
Source: Morningstar, Inc.

162 IRI Retirement Fact Book 2020, 19th Edition
Figure 15-11 Variable Annuity Net Assets – Qualified vs. Non-Qualified (dollars in billions)
Year Qualified Non-Qualified Total
2002 445.6 331.8 777.4
2003 569.2 403.4 972.6
2004 705.5 460.4 1,165.9
2005 736.1 451.2 1,187.3
2006 847.3 539.3 1,386.6
2007 925.4 573.9 1,499.3
2008 739.1 390.3 1,129.4
2009 969.5 385.0 1,354.5
2010 1,036.7 467.7 1,504.4
2011 1,012.5 489.8 1,502.3
2012 1,099.3 540.6 1,639.9
2013 1,220.8 647.7 1,868.5
2014 1,253.3 667.1 1,920.4
2015 1,235.8 635.8 1,871.6
2016 1,311.5 585.2 1,896.7
2017 1,373.1 612.6 1,985.7
2018 1,175.7 638.6 1,814.3
2019 1,307.7 710.3 2,018.0
Source: Morningstar, Inc.
Figure 15-12 Variable Annuity Total Sales – Qualified vs. Non-Qualified (dollars in billions)
Year Qualified Non-Qualified Total
2002 65.8 49.0 114.8
2003 73.8 52.3 126.1
2004 78.6 51.3 129.9
2005 82.7 50.7 133.4
2006 96.3 61.3 157.6
2007 113.2 70.2 183.4
2008 101.3 53.5 154.8
2009 89.9 35.7 125.6
2010 94.2 42.7 136.9
2011 104.1 50.5 154.6
2012 96.1 47.8 143.9
2013 92.8 49.3 142.1
2014 89.9 47.9 137.8
2015 86.7 44.4 131.1
2016 72.9 31.7 104.6
2017 63.4 32.8 96.2
2018 66.1 33.1 99.2
2019 62.8 35.5 98.3
Source: Morningstar, Inc.

Chapter 15: Data Section 163
Figure 15-13 Variable Annuity Total Sales – Deferred vs. Immediate (dollars in billions)
Year Deferred Immediate Total
2002 114.3 0.5 114.8
2003 125.9 0.5 126.4
2004 129.5 0.4 129.9
2005 132.8 0.6 133.4
2006 156.8 0.8 157.6
2007 183.1 0.3 183.4
2008 154.4 0.4 154.8
2009 125.5 0.1 125.6
2010 136.8 0.1 136.9
2011 154.6 0.0 154.6
2012 143.9 0.0 143.9
2013 142.1 0.0 142.1
2014 137.7 0.1 137.8
2015 131.0 0.1 131.1
2016 104.5 0.1 104.6
2017 96.1 0.1 96.2
2018 99.1 0.1 99.2
2019 98.2 0.1 98.3
Source: Morningstar, Inc.
Figure 15-14 Variable Annuity Total Sales by Distribution Channel (dollars in billions)
Year Captive Agents
Independent NASD
Banks/Credit Unions
WirehousesRegional
Investment Firms
Direct Response Total
2002 40.7 29.9 12.7 15.0 15.1 1.4 114.8
2003 41.6 37.3 17.2 15.7 13.2 1.1 126.1
2004 43.1 41.1 17.4 13.9 13.4 1.0 129.9
2005 47.0 40.9 17.3 13.9 13.0 1.3 133.4
2006 49.8 53.9 20.9 17.0 13.1 2.9 157.6
2007 53.5 65.6 24.1 21.0 15.4 3.8 183.4
2008 47.9 54.6 18.5 18.0 12.6 3.2 154.8
2009 41.8 44.8 12.6 14.0 10.2 2.2 125.6
2010 44.5 46.5 15.5 13.7 14.1 2.6 136.9
2011 48.1 51.9 17.8 16.4 17.8 2.6 154.6
2012 46.9 47.8 17.2 15.1 14.0 2.9 143.9
2013 45.9 48.4 17.7 14.7 12.1 3.3 142.1
2014 43.3 48.8 16.4 14.7 11.5 3.2 137.8
2015 44.1 44.3 16.5 11.7 11.1 3.4 131.1
2016 40.9 34.5 11.5 8.3 6.6 2.9 104.6
2017 36.3 35.0 9.1 7.1 5.4 3.2 96.2
2018 35.9 38.2 8.8 6.9 6.1 3.3 99.2
2019 34.5 39.2 9.2 6.6 6.0 2.8 98.3
Source: Morningstar, Inc.

164 IRI Retirement Fact Book 2020, 19th Edition
Figure 15-15 Variable Annuity Total Sales by Distribution Channel by Quarter (dollars in billions)
Year Captive Agents Ind. NASD
Banks/ Credit Unions
New York Wirehouses
Regional Investment
Firms
Direct Response Total
Q1 2005 11.4 9.6 4.2 3.1 3.2 0.3 31.8
Q2 2005 12.1 10.1 4.3 3.5 3.3 0.2 33.5Q3 2005 11.5 10.6 4.4 3.6 3.3 0.3 33.7Q4 2005 12.0 10.6 4.4 3.7 3.2 0.5 34.4
Total 2005 47.0 40.9 17.3 13.9 13.0 1.3 133.4Q1 2006 12.3 12.5 5.1 4.6 3.2 0.6 38.3
Q2 2006 13.1 14.3 5.7 4.4 3.5 0.8 41.8
Q3 2006 11.9 13.1 4.8 3.6 3.0 0.7 37.1Q4 2006 12.5 14.0 5.3 4.4 3.4 0.8 40.4
Total 2006 49.8 53.9 20.9 17.0 13.1 2.9 157.6Q1 2007 12.8 14.6 5.5 4.1 3.4 0.9 41.3Q2 2007 13.9 17.0 6.5 5.2 3.9 1.0 47.5Q3 2007 12.9 17.3 6.0 5.3 4.1 0.9 46.5Q4 2007 13.9 16.7 6.1 6.4 4.0 1.0 48.1
Total 2007 53.5 65.6 24.1 21.0 15.4 3.8 183.4Q1 2008 12.2 14.8 5.4 4.9 3.3 1.1 41.7Q2 2008 12.8 14.7 5.3 4.9 3.5 0.8 42.0Q3 2008 11.7 13.2 4.4 4.6 3.2 0.7 37.8Q4 2008 11.2 11.9 3.4 3.6 2.6 0.6 33.3
Total 2008 47.9 54.6 18.5 18.0 12.6 3.2 154.8Q1 2009 10.3 10.9 2.7 3.6 2.4 0.6 30.5Q2 2009 10.7 11.6 3.3 3.5 2.4 0.4 31.9Q3 2009 10.0 11.2 3.3 3.6 2.5 0.5 31.1Q4 2009 10.8 11.1 3.3 3.3 2.9 0.7 32.1
Total 2009 41.8 44.8 12.6 14.0 10.2 2.2 125.6Q1 2010 10.4 10.9 3.5 3.2 3.1 0.6 31.6Q2 2010 11.0 11.7 4.0 3.4 3.6 0.6 34.2Q3 2010 11.3 11.4 3.9 3.3 3.5 0.6 33.9Q4 2010 11.9 12.6 4.3 3.9 4.0 0.8 37.3
Total 2010 44.5 46.5 15.5 13.7 14.1 2.6 136.9Q1 2011 11.8 13.7 4.3 4.2 4.2 0.7 38.9Q2 2011 12.1 13.4 4.8 4.1 4.6 0.8 39.8Q3 2011 12.1 12.7 4.7 4.1 4.7 0.7 39.0Q4 2011 12.0 12.0 4.1 4.1 4.4 0.4 37.0
Total 2011 48.1 51.9 17.8 16.4 17.8 2.6 154.6Q1 2012 12.0 11.8 4.2 3.8 3.5 0.7 35.9Q2 2012 12.3 12.6 4.6 4.0 3.7 0.7 37.8Q3 2012 11.1 12.7 4.3 3.8 3.5 0.7 36.0Q4 2012 11.5 10.7 4.2 3.6 3.4 0.8 34.1
Total 2012 46.9 47.8 17.2 15.1 14.0 2.9 143.9Q1 2013 11.0 11.7 4.4 3.4 3.0 0.9 34.4Q2 2013 11.6 12.7 4.9 3.8 3.2 0.9 37.1Q3 2013 11.1 11.9 4.4 3.7 3.1 0.7 34.9Q4 2013 12.0 11.9 4.1 3.9 2.9 0.8 35.6
Total 2013 45.9 48.4 17.7 14.7 12.1 3.3 142.1Q1 2014 10.8 11.7 3.9 3.6 2.7 0.8 33.5Q2 2014 11.2 12.7 4.3 3.8 2.8 0.8 35.6Q3 2014 10.6 12.7 4.3 3.7 3.1 0.8 35.2Q4 2014 10.7 11.7 3.9 3.6 2.9 0.8 33.6
Total 2014 43.3 48.8 16.4 14.7 11.5 3.2 137.8Q1 2015 10.5 11.1 4.2 2.9 2.7 0.9 32.3Q2 2015 11.5 12.1 4.6 3.2 3.0 1.0 35.4Q3 2015 11.0 11.0 4.0 2.8 2.8 0.7 32.3Q4 2015 11.3 10.3 3.6 2.7 2.5 0.8 31.2
Total 2015 44.1 44.3 16.5 11.7 11.1 3.4 131.1

Chapter 15: Data Section 165
Year Captive Agents Ind. NASD
Banks/ Credit Unions
New York Wirehouses
Regional Investment
Firms
Direct Response Total
Q1 2016 10.2 8.8 2.9 2.0 1.9 0.6 26.5Q2 2016 10.8 8.7 3.1 2.2 1.6 0.7 27.0Q3 2016 9.9 8.6 3.0 2.2 1.6 0.7 26.0Q4 2016 9.9 8.4 2.6 1.9 1.3 0.8 25.0
Total 2016 40.9 34.5 11.5 8.3 6.6 2.9 104.6Q1 2017 9.5 8.6 2.4 1.6 1.5 0.8 24.4Q2 2017 9.4 8.9 2.5 1.9 1.3 0.8 24.8Q3 2017 8.1 8.2 2.0 1.7 1.3 0.7 21.9Q4 2017 9.2 9.3 2.2 2.0 1.5 0.8 25.0
Total 2017 36.3 35.0 9.1 7.1 5.4 3.2 96.2Q1 2018 8.9 9.3 2.1 1.8 1.5 0.9 24.5Q2 2018 9.7 9.6 2.2 1.8 1.5 0.9 25.7Q3 2018 8.5 9.6 2.2 1.7 1.6 0.9 24.6Q4 2018 8.8 9.7 2.1 1.6 1.5 0.7 24.5
Total 2018 35.9 38.2 8.8 6.9 6.1 3.3 99.2Q1 2019 8.1 8.5 1.9 1.4 1.3 0.7 21.9Q2 2019 8.7 9.8 2.4 1.7 1.5 0.8 24.9Q3 2019 8.7 10.5 2.4 1.7 1.7 0.6 25.6Q4 2019 9.0 10.4 2.5 1.8 1.5 0.7 25.9
Total 2019 34.5 39.2 9.2 6.6 6.0 2.8 98.3
Source: Morningstar, Inc.
Figure 15-16 Variable Annuity Contracts
Year# Unique
Products Offered
# Cos. Selling Variable
Annuities
# Contracts in Force (millions)
Average Individual
Contract Value
Average # Funds Per Registered
Contract
2002 667 55 27.7 $29,376 342003 818 50 28.0 $35,860 382004 941 48 21.5 $52,200 392005 1,008 45 21.8 $55,800 442006 1,150 42 22.5 $61,400 442007 1,376 40 22.8 $66,500 522008 1,491 40 22.7 $49,200 512009 1,591 40 24.2 $56,087 492010 1,694 40 24.3 $61,973 502011 1,951 41 24.0 $62,619 622012 2,051 37 23.3 $70,382 632013 2,136 37 22.5 $83,229 672014 2,181 35 20.0 $93,988 692015 2,233 35 19.6 $94,229 562016 2,297 34 19.1 $94,711 572017 2,327 33 18.4 $106,187 592018 2,343 33 17.9 $113,053 602019 2,396 33 * * 60
Sources: Morningstar, Inc.; LIMRA Secure Retirement Institute *Data not available at time of publication

166 IRI Retirement Fact Book 2020, 19th Edition
Figure 15-17 Variable Annuity Net Assets by Asset Class (dollars in billions)
Year Equity Fixed Accounts Balanced Bonds Money Market Total
2002 371.8 237.1 57.6 73.0 37.9 777.42003 524.5 264.1 74.4 83.0 26.6 972.62004 669.0 272.0 100.4 99.3 25.2 1,165.92005 691.0 270.7 104.5 96.2 24.9 1,187.32006 834.9 256.9 152.9 109.4 32.5 1,386.62007 887.9 255.6 189.1 125.7 41.0 1,499.32008 491.7 301.6 146.8 127.4 61.9 1,129.42009 642.5 294.3 216.8 158.0 42.9 1,354.52010 697.0 298.1 307.5 166.9 34.9 1,504.42011 616.5 324.7 348.1 177.9 35.1 1,502.32012 620.3 315.1 484.6 188.2 31.7 1,639.92013 769.6 321.8 576.5 171.6 29.0 1,868.52014 734.8 334.6 651.1 172.3 27.6 1,920.42015 677.4 344.6 652.9 166.8 29.9 1,871.62016 739.0 344.2 613.6 174.6 25.3 1,896.72017 676.0 341.6 775.1 171.2 21.8 1,985.72018 590.6 346.7 676.8 173.2 27.0 1,814.32019 635.3 352.7 827.8 178.7 23.5 2,018.0
Source: Morningstar, Inc.

Chapter 15: Data Section 167
Figure 15-18 Variable Annuity Net Assets by Subaccount Investment Category (dollars in billions)
Subaccounts 2010 2011 2012 2013 2014 2015 2016 2017 2018 2019
BALANCED/HYBRID:
Aggressive Allocation - - 74.1 94.2 106.0 110.1 105.2 241.5 206.3 237.1
Conservative Allocation 86.8 100.7 132.7 138.4 167.0 144.5 113.2 116.2 96.7 104.2
Moderate Allocation 217.7 244.2 273.6 338.2 290.0 300.2 357.1 389.6 345.4 374.7
Tactical Allocation N/A N/A N/A N/A N/A 24.0 30.0 22.1 18.5 20.1
World Allocation 19.6 33.2 42.3 66.9 81.3 66.1 70.3 64.8 57.4 78.5
Target Date 2.9 3.1 4.2 5.7 6.8 7.2 8.0 9.7 10.0 13.1
CORE BOND:
Long-Term Corporate 2.9 4.8 5.0 3.1 4.6 2.7 13.3 14.1 15.6 19.5
Long-Term Government 0.7 0.7 0.7 0.5 1.9 0.5 0.5 0.4 0.4 0.4
Intermediate-Term Corporate 90.9 100.5 100.7 89.8 92.4 95.9 88.6 86.4 88.2 84.8
Intermediate-Term Government 9.6 10.3 10.5 8.0 4.4 5.3 7.0 6.2 5.5 5.9
Short-Term Corporate 9.4 8.5 8.6 9.2 10.4 11.2 12.6 10.4 11.0 10.6
Short-Term Government 0.3 0.3 0.4 1.2 0.5 0.4 0.4 0.4 0.3 0.3
Inflation-Protected 18.8 19.0 21.4 17.6 17.2 15.3 15.2 14.6 13.5 13.8
FIXED:
Fixed 298.2 324.7 315.1 321.8 334.6 344.6 344.2 346.8 346.7 352.7
DOMESTIC STOCK:
Bear Market 0.2 0.2 0.2 0.1 0.1 0.1 0.1 0.1 0.1 0.0
Large Cap 439.4 384.5 367.3 449.0 478.0 434.3 422.5 329.9 296.9 358.2
Mid Cap 55.6 46.2 48.8 61.3 63.2 57.1 58.8 61.2 51.2 62.5
Small Cap 33.6 28.2 28.9 38.8 36.7 33.7 38.0 38.3 33.7 39.7
Natural Resources 6.4 6.0 3.9 2.9 2.4 1.3 2.8 2.5 1.7 1.8
Real Estate 6.6 6.1 4.6 3.7 4.5 4.2 4.3 4.1 3.4 8.1
Specialty 19.3 19.8 25.3 32.8 39.1 42.9 45.6 50.6 49.7 57.2
Utility 2.7 2.9 2.7 3.2 3.2 2.5 2.6 2.8 2.5 2.9
HIGH YIELD/SPECIALTY BOND:
Bank Loan 1.8 1.1 1.5 3.2 3.6 3.5 3.8 4.0 3.5 3.1
High Yield 17.0 16.0 19.0 19.1 17.8 15.6 16.4 15.9 13.1 16.1
Multi-Sector Bond 8.8 9.0 10.7 9.7 9.9 8.8 8.3 11.2 10.5 9.9
Ultra-Short Bond - - - - - - - 2.1 3.0 3.0
INTERNATIONAL STOCK:
Developed Markets Stock 99.9 79.9 86.1 100.9 97.4 100.1 93.8 107.4 93.8 95.0
Emerging Markets Stock 12.4 8.6 9.9 10.0 9.6 0.6 0.5 0.6 0.4 11.0
Japan - - - - - - - - - -
Pacific 0.7 0.5 0.6 0.5 0.6 0.1 - - - 0.2
INTERNATIONAL BOND:
Developed Markets Bond 6.5 7.3 8.4 8.9 8.8 8.1 7.8 8.3 7.7 9.1
Emerging Markets Bond 0.9 0.9 1.0 0.8 0.8 0.7 0.5 0.6 0.6 0.7
MONEY MARKET:
Money Market 34.9 35.1 31.7 29.0 27.6 29.9 25.3 22.9 27.0 23.6
TOTAL: 1,504.4 1,502.3 1,639.9 1,868.5 1,920.4 1,871.6 1,896.7 1,985.7 1,814.3 2,018.0
Source: Morningstar, Inc.

168 IRI Retirement Fact Book 2020, 19th Edition
Figure 15-19 Variable Annuity Sales by State – 2018 (dollars in millions)*
Rank State $ Total % of Total Rank State $ Total % of
Total
1 California 7,657.7 8.6% 28 New Mexico 1,171.3 1.3%
2 New York 5,350.6 6.0% 29 Louisiana 1,159.2 1.3%
3 North Carolina 3,909.3 4.4% 30 North Dakota 1,099.8 1.2%
4 Ohio 3,892.0 4.4% 31 Kansas 1,069.9 1.2%
5 Texas 3,790.0 4.3% 32 South Dakota 1,063.0 1.2%
6 Florida 3,785.6 4.2% 33 Hawaii 1,057.3 1.2%
7 Minnesota 3,219.8 3.6% 34 Kentucky 999.0 1.1%
8 Georgia 3,146.2 3.5% 35 Mississippi 951.0 1.1%
9 Pennsylvania 3,032.8 3.4% 36 West Virginia 887.9 1.0%
10 New Jersey 2,817.4 3.2% 37 Nevada 861.4 1.0%
11 Michigan 2,473.2 2.8% 38 Tennessee 838.8 0.9%
12 Massachussets 2,378.7 2.7% 39 South Carolina 832.0 0.9%
13 Rhode Island 2,125.0 2.4% 40 Vermont 676.3 0.8%
14 Illinois 2,107.1 2.4% 41 Arkansas 659.1 0.7%
15 Virginia 2,002.2 2.2% 42 Nebraska 619.8 0.7%
16 Wisconsin 1,816.5 2.0% 43 Alabama 615.9 0.7%
17 Connecticut 1,763.1 2.0% 44 Montana 595.9 0.7%
18 Indiana 1,751.0 2.0% 45 Maine 560.7 0.6%
19 Utah 1,747.6 2.0% 46 Wyoming 476.3 0.5%
20 Oklahoma 1,678.9 1.9% 47 New Hampshire 424.1 0.5%
21 Colorado 1,664.1 1.9% 48 Alaska 377.8 0.4%
22 Iowa 1,598.8 1.8% 49 Idaho 335.7 0.4%
23 Maryland 1,585.8 1.8% 50 District of Columbia 323.9 0.4%
24 Missouri 1,480.6 1.7% 51 Delaware 280.7 0.3%
25 Oregon 1,439.7 1.6% 52 Puerto Rico 178.2 0.2%
26 Washington 1,396.4 1.6% 53 U.S. Virgin Islands 2.1 0.0%
27 Arizona 1,293.8 1.5% 54 Other 115.0 0.1%
Total 89,136.0 100%
Source: Morningstar, Inc. *$89.1 billion total sales by state represents 89.8% of 2018 total variable annuity sales of $99.2 billion.

Chapter 15: Data Section 169
Figure 15-20 2019 Total Variable Annuity Sales by Top 25 Issuers
Company Total Flow ($MM) Rank % Share Cumulative
% Share
Jackson National 14,693.8 1 14.9% 14.9%
Equitable Financial 10,872.8 2 11.1% 26.0%
Lincoln National 9,753.0 3 9.9% 35.9%
TIAA 9,574.4 4 9.7% 45.7%
Prudential 8,523.8 5 8.7% 54.3%
AIG Companies 6,125.4 6 6.2% 60.6%
Brighthouse Financial 5,857.4 7 6.0% 66.5%
Nationwide 4,911.8 8 5.0% 71.5%
Ameriprise Financial 4,100.7 9 4.2% 75.7%
Allianz 4,005.6 10 4.1% 79.8%
AEGON USA 3,817.8 11 3.9% 83.6%
New York Life 3,376.4 12 3.4% 87.1%
Pacific Life 3,316.7 13 3.4% 90.4%
Thrivent 2,365.9 14 2.4% 92.9%
Fidelity Investments Life 1,545.7 15 1.6% 94.4%
CMFG Life Insurance Company 1,215.7 16 1.2% 95.7%
Northwestern Mutual 1,140.7 17 1.2% 96.8%
Massachusetts Mutual 471.4 18 0.5% 97.3%
Mutual Of America 469.5 19 0.5% 97.8%
Securian Financial 376.4 20 0.4% 98.2%
Midland National 314.5 21 0.3% 98.5%
Great-West 279.8 22 0.3% 98.8%
Horace Mann Life 259.2 23 0.3% 99.0%
Protective Life 246.5 24 0.3% 99.3%
Ameritas 159.5 25 0.2% 99.4%
Source: Morningstar, Inc.

170 IRI Retirement Fact Book 2020, 19th Edition
Figure 15-21 Fixed Annuity Sales and Net Assets (dollars in billions)
Year Sales Net Assets
2002 103.3 421.0
2003 84.1 490.0
2004 86.7 510.0
2005 76.5 534.0
2006 74.0 519.0
2007 66.6 511.0
2008 106.7 556.0
2009 104.2 620.2
2010 76.4 658.6
2011 75.6 676.0
2012 67.0 691.6
2013 78.1 721.2
2014 91.5 747.1
2015 98.4 782.0
2016 108.0 827.5
2017 97.8 861.5
2018 125.0 902.3
2019 129.5 946.6
Sources: Beacon Research and LIMRA Secure Retirement Institute
Fixed Annuity Market (Excludes Structured Settlements)

Chapter 15: Data Section 171
Figure 15-22 Fixed Annuity Sales by Quarter Assets (dollars in billions)
Year SalesQ1 2006 17.4Q2 2006 18.8Q3 2006 20.54 2006 17.3
Total 2006 74.0Q1 2007 14.1Q2 2007 16.4Q3 2007 18.1Q4 2007 18.0
Total 2007 66.6Q1 2008 19.6Q2 2008 25.3Q3 2008 27.7Q4 2008 34.1
Total 2008 106.7Q1 2009 34.8Q2 2009 27.8Q3 2009 22.1Q4 2009 19.5
Total 2009 104.2Q1 2010 17.9Q2 2010 20.4Q3 2010 20.5Q4 2010 17.6
Total 2010 76.4Q1 2011 18.6Q2 2011 20.7Q3 2011 19.0Q4 2011 17.3
Total 2011 75.6Q1 2012 17.0 Q2 2012 17.2 Q3 2012 16.6 Q4 2012 16.2
Total 2012 67.0 Q1 2013 15.0 Q2 2013 17.1 Q3 2013 22.5 Q4 2013 23.5
Total 2013 78.1 Q1 2014 22.5 Q2 2014 24.3 Q3 2014 21.7 Q4 2014 23.0
Total 2014 91.5 Q1 2015 20.9 Q2 2015 22.8 Q3 2015 26.5 Q4 2015 28.2
Total 2015 98.4 Q1 2016 29.6 Q2 2016 29.1 Q3 2016 25.8 Q4 2016 23.5
Total 2016 108.0 Q1 2017 25.2 Q2 2017 26.1 Q3 2017 22.6 Q4 2017 23.9
Total 2017 97.8 Q1 2018 25.5 Q2 2018 31.8 Q3 2018 31.9 Q4 2018 35.8
Total 2018 125.0 Q1 2019 35.9 Q2 2019 35.8 Q3 2019 30.1 Q4 2019 27.7
Total 2019 129.5 Source: Beacon Research

172 IRI Retirement Fact Book 2020, 19th Edition
Figure 15-23 Fixed Annuity Assets – Qualified vs. Non-Qualified Assets (dollars in billions)
Year Qualified Non-Qualified Total
2002 167.0 254.0 421.0
2003 201.0 289.0 490.0
2004 208.0 302.0 510.0
2005 214.0 320.0 534.0
2006 207.0 312.0 519.0
2007 211.0 300.0 511.0
2008 242.0 314.0 556.0
2009 272.2 348.0 620.2
2010 300.6 358.0 658.6
2011 313.0 363.0 676.0
2012 324.6 367.0 691.6
2013 344.2 377.0 721.2
2014 365.1 382.0 747.1
2015 388.0 394.0 782.0
2016 428.5 399.0 827.5
2017 453.5 408.0 861.5
2018 484.9 417.4 902.3
2019 530.1 416.5 946.6
Source: LIMRA Secure Retirement Institute
Figure 15-24 Fixed Annuity Sales – Qualified vs. Non-Qualified (dollars in billions)
Year Qualified Non-Qualified Total
2003 29.9 54.2 84.1
2004 31.1 55.6 86.7
2005 28.6 47.9 76.5
2006 27.6 46.4 74.0
2007 22.0 44.6 66.6
2008 41.6 65.1 106.7
2009 43.7 60.5 104.2
2010 34.1 42.2 76.3
2011 33.6 42.0 75.6
2012 34.8 32.2 67.0
2013 39.2 38.9 78.1
2014 50.9 40.6 91.5
2015 56.7 41.7 98.4
2016 61.9 46.1 108.0
2017 53.9 43.9 97.8
2018 69.7 55.3 125.0
2019 75.7 53.8 129.5
Source: Beacon Research

Chapter 15: Data Section 173
Figure 15-25 Fixed Annuity Sales – Product Type (dollars in billions)
Year Book Value Market Value Indexed Income Annuities Total
2003 59.0 9.0 11.0 5.0 84.0
2004 51.0 9.0 21.0 6.0 87.0
2005 38.0 6.0 27.0 6.0 77.0
2006 33.0 10.0 25.0 6.0 74.0
2007 27.0 8.0 25.0 7.0 67.0
2008 54.0 18.0 27.0 9.0 108.0
2009 52.0 15.0 30.0 8.0 105.0
2010 29.0 6.3 33.1 8.0 76.4
2011 28.1 6.0 33.0 8.5 75.6
2012 18.8 4.8 34.2 9.2 67.0
2013 21.7 6.7 38.7 11.0 78.1
2014 20.8 9.8 47.9 13.0 91.5
2015 20.2 11.1 54.6 12.5 98.4
2016 20.9 16.0 58.8 12.3 108.0
2017 20.6 12.4 54.3 10.5 97.8
2018 27.9 15.9 69.8 11.4 125.0
2019 25.2 19.9 72.5 11.9 129.5
Source: Beacon Research
Figure 15-26 Fixed Annuity Sales – Deferred vs. Immediate (dollars in billions)
Year Deferred Immediate Deferred Income Total
2003 79.4 4.8 - 84.1
2004 80.6 6.1 - 86.6
2005 70.2 6.3 - 76.5
2006 67.7 6.3 - 74.0
2007 60.0 6.7 - 66.6
2008 98.0 8.6 - 106.7
2009 96.3 7.8 - 104.1
2010 68.4 8.0 - 76.4
2011 67.1 8.5 - 75.6
2012 58.0 8.0 1.0 67.0
2013 67.0 8.9 2.2 78.1
2014 78.5 10.4 2.6 91.5
2015 85.9 9.9 2.6 98.4
2016 95.6 9.8 2.6 108.0
2017 87.3 8.8 1.7 97.8
2018 113.6 10.0 1.4 125.0
2019 117.6 10.2 1.7 129.5
Source: Beacon Research (Prior to 2012, Deferred Income Annuities were included in Immediate)

174 IRI Retirement Fact Book 2020, 19th Edition
Figure 15-28 Fixed Indexed Annuities (dollars in billions)
Year Total Fixed Indexed Assets
Total Fixed Indexed Sales
Sales as a % of Total FIA Sales
2002 35.0 11.8 11%
2003 47.0 11.3 13%
2004 71.0 21.1 24%
2005 93.0 26.8 35%
2006 103.0 25.0 34%
2007 125.0 25.1 38%
2008 137.0 26.7 25%
2009 157.0 29.5 28%
2010 185.1 33.1 43%
2011 205.0 33.0 44%
2012 224.6 34.2 51%
2013 256.7 38.7 50%
2014 295.1 47.9 52%
2015 334.2 54.6 55%
2016 374.3 58.8 54%
2017 407.8 54.3 56%
2018 453.6 69.8 56%
2019 495.4 72.5 56%
Sources: Beacon Research; LIMRA Secure Retirement Institute
Figure 15-27 Fixed Annuity Sales Percentages by Distribution Channel (dollars in billions)
YearCaptive Agents
Independent Producers
WirehousesLarge/
regional B-Ds
Independent B-Ds
Banks & S&Ls
Direct/Third Party
Total Sales
2003 11.6% 34.2% 1.7% 3.7% 2.6% 43.8% 2.4% 84.1
2004 12.0% 39.7% 1.3% 3.5% 2.0% 39.1% 2.5% 86.7
2005 12.6% 46.1% 1.4% 3.0% 2.2% 31.9% 2.9% 76.5
2006 13.5% 46.3% 2.4% 3.0% 3.3% 29.2% 2.4% 74.0
2007 11.9% 49.8% 2.2% 2.7% 3.6% 27.2% 2.6% 66.6
2008 13.7% 38.0% 2.5% 4.3% 5.2% 32.9% 3.4% 106.7
2009 15.3% 36.6% 2.0% 5.9% 5.5% 31.9% 2.8% 104.2
2010 12.7% 51.1% 1.2% 4.4% 3.3% 23.9% 3.5% 76.4
2011 11.5% 47.4% 1.6% 5.2% 4.6% 26.7% 2.9% 75.6
2012 12.4% 53.3% 1.3% 4.9% 4.2% 19.7% 4.2% 66.8
2013 12.7% 47.4% 1.1% 7.3% 4.1% 23.4% 4.0% 78.1
2014 11.9% 42.4% 1.4% 7.5% 9.5% 24.3% 3.1% 91.5
2015 12.9% 40.2% 1.8% 8.6% 10.2% 24.7% 1.7% 98.4
2016 11.0% 38.3% 2.2% 10.2% 11.8% 24.8% 1.7% 109.3
2017 9.5% 36.9% 2.6% 11.5% 11.6% 26.2% 1.7% 100.4
2018 9.5% 34.8% 2.9% 11.0% 13.1% 26.3% 2.4% 128.3
2019 9.3% 35.6% 3.2% 11.5% 12.9% 24.7% 2.8% 129.5
Source: Beacon Research

Chapter 15: Data Section 175
Figure 15-29 2019 Total Fixed Annuity Sales by Top 25 Issuers
Company Total Flow ($MM) Rank % Share Cumulative % Share
AIG Companies 11,844.6 1 9.1% 9.1%
New York Life 9,263.7 2 7.2% 16.3%
Allianz 8,498.0 3 6.6% 22.9%
Global Atlantic 8,314.5 4 6.4% 29.3%
Athene USA 6,766.9 5 5.2% 34.5%
Nationwide 6,114.9 6 4.7% 39.2%
Massachusetts Mutual 5,129.5 7 4.0% 43.2%
Lincoln National 5,084.8 8 3.9% 47.1%
American Equity 4,963.2 9 3.8% 51.0%
Jackson National 4,933.0 10 3.8% 54.8%
Pacific Life 4,885.6 11 3.8% 58.5%
Great American 4,545.6 12 3.5% 62.1%
F & G Life 3,595.1 13 2.8% 64.8%
Symetra Financial 3,497.6 14 2.7% 67.5%
Principal Financial 2,890.4 15 2.2% 69.8%
Security Benefit 2,539.9 16 2.0% 71.7%
Delaware Life 2,423.7 17 1.9% 73.6%
Midland National 2,253.8 18 1.7% 75.3%
North American 2,216.5 19 1.7% 77.0%
Western Southern 2,055.7 20 1.6% 78.6%
EquiTrust Life 1,825.4 21 1.4% 80.0%
Protective Life 1,781.9 22 1.4% 81.4%
Reliance Standard Life 1,412.3 23 1.1% 82.5%
American National Insurance Company 1,398.6 24 1.1% 83.6%
Bankers Life 1,286.9 25 1.0% 84.6%
Source: Beacon Research

176 IRI Retirement Fact Book 2020, 19th Edition

Glossary of Annuity Product Terms 177
Glossary of Annuity Product Terms AA-SHARE VARIABLE ANNUITIES Annuity contracts in which sales charges are incurred at time of investment or premium payment. A-share contracts typically have no surrender charges.
ACCUMULATION PHASE The period in an annuity contract prior to annuitization when annuity owners can add money and accumulate tax-deferred assets.
ACCUMULATION UNIT VALUE (AUV) A variable annuity subaccount price per share during the accumulation phase. An AUV is the net asset value after income and capital gains have been included and subaccount management expenses have been subtracted.
ANNUAL CONTRACT FEE An annual fee paid to the insurance company for administering the contract. The fee is often waived for contracts with high account values.
ANNUITANT The person, frequently the contract owner, to whom an annuity is payable and whose life expectancy is used to calculate the income payment.
ANNUITIZATION The conversion of the annuity accumulation value to a fixed or variable income stream for the life of the annuitant(s) or for a specified period.
ANNUITY A periodic income payable for the lifetime of one or more persons, or for a specified period. A contract in which an insurance company agrees to pay an income for life or for a specified number of years.
ANNUITY COMMENCEMENT DATE The date income payments begin, also known as the annuity start date.
ANNUITY CONTRACT A legal agreement between the contract owner and the insurance company.
ANNUITY OWNER The person or entity that has the rights to the contract, including withdrawals, surrender, change of beneficiary, or other specified terms.
ANNUITY INCOME PAYMENTS or PAYOUTS A series of payments made over a specific period of time with the duration guaranteed by the life insurance company at the beginning of the period.
ANNUITY START DATE The beginning date of the series of annuity payments.
ANNUITY PURCHASE RATE The cost of an annuity based on insurance company tables, which take into account various factors such as age and gender.

178 IRI Retirement Fact Book 2020, 19th Edition
ANNUITY UNIT Annuity units (variable) are the units in the separate account after the maturity date that is used to determine the amount of the annuity payment. The amount of the payment is the number of annuity units times the annuity unit value.
ANNUITY UNIT VALUE The number of annuity units in an account remains constant during the annuitant’s lifetime. Each annuity unit value changes each payment period based on the following factors:
• The investment performance of the account • The assumed investment returns (AIR) • Contract expenses during the period
APPLICATION A form supplied by a life insurance company on the basis of information received from the applicant. The form is signed by the applicant and is part of the insurance or annuity contract.
ASSET ALLOCATION In a variable annuity, distribution of assets across multiple classes, e.g., stocks, bonds, and cash, in order to meet an individual’s financial goals. The objective of asset allocation is to reduce investment risk.
ASSET ALLOCATION PROGRAMS A system of assigning variable annuity purchase payments to subaccounts based on a contract owner’s financial goals and risk tolerance. Portfolio rebalancing programs redistribute the amount of money allocated to each subaccount when the target percentages move out of alignment over time as the value of some subaccounts changes faster than others.
ASSET-BASED EXPENSES Variable annuity expenses, such as investment management fees and annual insurance charges, that are based on the value of the assets held in the insurance company’s separate account.
ASSUMED INVESTMENT RETURN (AIR) Variable annuity payments increase or decrease based on the net performance (returns after fees and expenses) of the underlying investments in relation to a benchmark assumed investment return. If the total investment return minus expenses exceeds the AIR, the payment increases. If the return minus expenses is less than the AIR, the payment decreases. If the return minus expenses equals the AIR, payments remain the same.
BB-SHARE VARIABLE ANNUITIES Variable annuity contracts characterized by deferred sales charges, which typically range from 5% to 7% in the first year, and subsequently decline to zero after five to seven years. B-shares are the most common form of annuity contracts sold.
BAILOUT PROVISION If a fixed annuity’s interest rate falls below a rate specified in the annuity contract, this feature assures the free withdrawal of all funds from an annuity account.
BENEFICIARY A person, persons, or trust designated under the contract to receive any payments due in the event of the death of the owner or the annuitant.
BONUS RATE Extra interest accumulated in the first year of a deferred annuity that is added to the sum upon which interest is calculated in later years, also called a first-year bonus rate.

Glossary of Annuity Product Terms 179
BONUS SHARE (X-SHARE) VARIABLE ANNUITIES A bonus amount, typically defined in the prospectus as a percentage of purchase payments, is allocated to the annuity accumulation value early in the contract period. This type of annuity typically has higher expenses to pay for the cost of the bonus.
BREAKPOINT PRICING A system whereby the cost of up-front sales charges decreases depending on the cumulative amount of purchase payments made.
CC-SHARE VARIABLE ANNUITIES Variable annuity contracts with no up-front or contingent deferred sales charges, which offer full liquidity to contract holders at any time
CASH REFUND ANNUITY An annuity settlement payment, which provides that upon the death of the annuitant before payments totaling the purchase price have been made, the excess will be paid in one sum to designated beneficiaries.
CASH SURRENDER VALUE The amount that can be withdrawn from the contract after the deduction of any surrender charge. It is equal to the contract value (the sum of premiums and earnings minus contract charges and withdrawals) minus the surrender charge.
CASH VALUE (SURRENDER VALUE) The amount available to the owner when a policy is surrendered. During the early policy years, in some contracts, the cash value equals the account value less a “surrender charge.”
CHARITABLE ANNUITY (GIFT ANNUITY) A charitable gift annuity is a contract between a donor and a foundation, under which the foundation guarantees payment of an annuity.
COMMUTATION A process provided under some annuities that allows annuity payments to be terminated and the remaining value to be withdrawn from the contract.
CONTINGENT ANNUITANT In the case of the death of an annuitant prior to the beginning of annuity payments, the person who is designated to receive the payments in the original annuitant’s stead.
CONTINGENT BENEFICIARY A person or persons named to receive contract benefits if the primary beneficiary is deceased.
CONTINGENT DEFERRED ANNUITY A retirement product option in an employer sponsored plan, typically composed of a balanced mutual fund coupled with a lifetime income feature that, subject to certain conditions, continues to make payments to an insured in the event systematic withdrawals from the fund reduce its value to zero.
CONTINGENT DEFERRED SALES CHARGE Costs imposed on the withdrawal of proceeds or liquidation of a variable annuity, which typically range from 5% to 7% in the first year, and subsequently decline to zero.
CONTRACT DATE The date an annuity contract becomes effective.

180 IRI Retirement Fact Book 2020, 19th Edition
CONTRACT OWNER The purchaser of an annuity contract, and holder of all rights pertaining to the contract.
COST BASIS The initial payment/premium(s) paid to a non-qualified annuity is known as the cost basis in the contract. Since it was previously taxed, cost basis is not taxed upon withdrawal.
DDEATH BENEFITS The payment the investor’s estate or beneficiaries receive if the contract holder dies prior to the annuity starting date. Types of death benefits: Greater of account value or premiums less withdrawals; rising floor, in which the insurance company guarantees a minimum return on premium deposits; ratchet, a benefit equal to the greater of (a) the contract value, (b) premiums less withdrawals, or (c) the contract value on a specified prior date.
DEFERRED ANNUITY The annuity contract during the time period prior to annuitization. The contract owner determines the point at which accumulated principal and earnings are converted into a stream of income.
DEFERRED INCOME ANNUITY An annuity product designed to make lifetime payments to an insured beginning 5 to 40 years in the future.
DEFINED BENEFIT PLAN An employer-administered pension plan that qualifies for special tax treatment under the Internal Revenue Code. With a deferred benefit plan, the retired employee receives lifetime payments based on salary, years of service, and age at retirement. The employer bears the investment risk. The plan provides lifetime income through a group or individual annuity contract.
DEFINED CONTRIBUTION PLAN An employer-administered retirement plan in which the contribution, rather than the benefit, is defined. Under a 401(k) type of defined contribution plan, the employee is allowed to channel part of his/her income into the plan on a pre-tax basis. A percentage of employee contributions may be matched by the employer but the employee bears the investment risk. The final benefit consists solely of assets (including investment returns) that have accumulated in these individual accounts. Depending on the type of defined contribution plan, contributions may be made either by the company, the participant, or both. In some DC plans, distribution options in the form of life annuities are available.
DISTRIBUTION A payout made from a retirement plan or annuity contract. See also Lump-Sum Distribution and Annuity.
DOLLAR COST AVERAGING A program for investing a fixed amount of money at set intervals with the goal of purchasing more shares at low values and fewer shares at high values. Variable annuity dollar cost averaging programs involve allocating a certain amount to one investment subaccount, such as a money market fund, and then having portions of that payment periodically transferred to other subaccounts. Dollar cost averaging does not guarantee a profit or prevent a loss in declining markets.

Glossary of Annuity Product Terms 181
EEARLY WITHDRAWAL PENALTY A 10% penalty tax for withdrawal of assets from a qualified retirement plan prior to age 59½. This 10% penalty tax is in addition to regular federal and (if applicable) state tax. Exceptions to the penalty, such as death and disability, may apply.
EFFECTIVE ANNUAL YIELD In a fixed deferred annuity, the annualized return based on the daily compounding and crediting of the annuity’s interest.
EFFECTIVE INTEREST RATE The actual annual interest rate that accrues, including the effects of compounding.
ENHANCED DEATH BENEFIT A death benefit that goes beyond the guaranteed minimum death benefit by periodically locking in investment gains or paying a minimum stated interest rate on purchase payments.
ENHANCED EARNINGS BENEFIT A feature of some variable annuity contracts that provides beneficiaries with an additional death benefit amount, usually equal to a percentage of earnings.
ERISA A federal law requiring plan sponsors to design and administer their plans in accordance with the Employee Retirement Income Security Act of 1974 (ERISA). Among its statutes, ERISA calls for proper plan reporting and disclosure to participants. Non-qualified annuities are not covered by ERISA.
EXCESS INTEREST Interest credited to a fixed annuity contract beyond the minimum guaranteed by the insurance company.
EXCHANGE TRADED FUNDS (ETFS) An investment fund traded on stock exchanges, much like stocks. An ETF holds assets such as stocks, commodities, or bonds, and trades close to its net asset value over the course of the trading day.
EXCLUSION RATIO The formula that determines which portion of an annuity payment is considered taxable and which is a tax-free return of principal. For variable annuities, this formula is similar, however, due to the fluctuating nature of variable payouts, this is recalculated annually and is reported as an exclusion amount.
EXPENSE RATIO The percentage of a fund’s assets used to pay its annual expenses.
FFIDUCIARY A person who has undertaken to act for and on behalf of another in a relationship of trust and confidence. Fiduciaries are required under ERISA to make decisions based solely on the best interests of plan participants.
FIXED ACCOUNT An investment option in the issuing insurance company’s general account that is offered in some variable annuity contracts. A minimum rate of interest is guaranteed, usually for a period of one year.

182 IRI Retirement Fact Book 2020, 19th Edition
FIXED ANNUITIZATION A series of guaranteed income payments of a specified amount payable for the life of the annuitant(s) or a specified number of years.
FIXED ANNUITY A contract providing a specified rate of interest paid on the amount invested during the accumulation phase and a specified payment amount during the annuitization phase. The issuing company assumes the investment risk.
FIXED INDEXED ANNUITY An annuity on which credited interest is based upon the performance of an equity market index, such as the S&P 500. The principal investment is protected from losses in the equity market, while gains add to the annuity’s returns.
FIXED PERIOD ANNUITY Payout option for a specified number of years instead of for a lifetime.
FLEXIBLE PREMIUM ANNUITY Contracts purchased with a series of payments over a period of time. The owner is usually allowed to change the amount or frequency of payments, subject to minimum annual amounts.
FREE-LOOK PERIOD A specified number of days (e.g., 10 days) during which an annuity contract owner may revoke the purchase of the contract.
FRONT-END LOAD A percent of premium fee insurance companies charge at contract inception and each subsequent premium payment to cover the costs of establishing new accounts. Referred to as A- share pricing.
GGENERAL ACCOUNT The assets and liabilities of the insurance company not allocated to separate accounts.
GUARANTEE PERIOD The period during which the level of interest credited under a fixed annuity is guaranteed.
GUARANTEED INTEREST RATE The minimum rate of interest the insurance company agrees to pay each year on a fixed annuity.
GUARANTEED INVESTMENT CONTRACTS (GICS) Group contracts with an insurance company at a fixed rate of interest.
GUARANTEED LIFETIME WITHDRAWAL BENEFIT (GLWB) An annuity option that provides a specified percentage of a guaranteed benefit base that can be withdrawn each year for the life of the contract holder, regardless of market performance or the actual account balance.
GUARANTEED MINIMUM ACCUMULATION BENEFIT (GMAB) A guarantee that ensures that the contract value of a variable annuity will be, at least, equal to a stated minimum amount after a specified number of years.
GUARANTEED MINIMUM DEATH BENEFIT (GMDB) The basic death benefit offered under variable annuity contracts, which specifies that if the owner, or in some contracts the annuitant, dies before annuity income payments begin, the beneficiary will receive a payment equal to (a) the greater of the contract value or (b) purchase payments less withdrawals.

Glossary of Annuity Product Terms 183
GUARANTEED MINIMUM INCOME BENEFIT (GMIB) An annuity option guaranteeing that the owner may annuitize the contract at a stated future date, based on the greater of (a) the actual account value or (b) an amount equal to premiums credited with a defined interest rate or the maximum anniversary value of the account prior to annuitization.
GUARANTEED MINIMUM LIVING BENEFIT (GMLB) A benefit that protects against investment risks by guaranteeing the level of account values or annuity payments. There are three types — guaranteed minimum income benefits, guaranteed minimum accumulation benefits, and guaranteed minimum withdrawal benefits.
GUARANTEED MINIMUM WITHDRAWAL BENEFIT (GMWB) A guarantee that promises a certain percentage (usually 5% to 7%) of a guaranteed benefit base (often paid premiums) can be withdrawn annually until the base is completely recovered, regardless of market performance or the actual account balance.
II-SHARE VARIABLE ANNUITY Also known as fee-based variable annuities in which an investor pays one fee to have the portfolio managed by an investment advisor. I-shares do not offer a sales commission to the advisor. However, the advisor assesses fees for the services, including the I-share contract, which is agreed upon by the client.
IMMEDIATE ANNUITY An annuity purchased with a single premium on which income payments begin within one year of the contract date. With fixed immediate annuities, the payment is based on a specified interest rate. With variable immediate annuities, payments are based on the value of the underlying investments. Payments are made for the life of the annuitant(s), for a specified period, or both (e.g., 10 years certain and life).
INCOME FLOOR GUARANTEE Annuity feature that guarantees payments will never be less than a given percentage of the original payment, such as 80%, regardless of the performance of the underlying investments.
INCOME OR PAYOUT OPTIONS Methods by which a contract owner can receive income from an annuity. These include a lump-sum payment, systematic withdrawals, living benefits, and annuitization.
INDEXED ANNUITY (See Fixed Indexed Annuity.)
INDIVIDUAL RETIREMENT ACCOUNT (IRA) IRC Sec 408(a) defines an IRA as an Individual Retirement Account. Sec 408(b) defines an IRA as an Individual Retirement Annuity. With either definition, an IRA is a tax-advantaged personal savings plan that allows an individual to set aside money for retirement. All or part of the participant’s contributions may be tax deductible, depending on the type of IRA chosen and the investor’s personal financial circumstances. Distributions from most employer-sponsored retirement plans may be eligible to be rolled into an IRA to continue tax-deferred growth until the funds are needed. Generally, distributions are required to begin at age 70½.
INITIAL INTEREST RATE The rate of interest set by the insurance company each policy year based on the prevailing market rates.

184 IRI Retirement Fact Book 2020, 19th Edition
INSURANCE CHARGES Costs which cover administrative expenses and the mortality and expense (M&E) risk.
INVESTMENT MANAGEMENT FEE The fee paid in connection with the professional management of the assets of the investment funds underlying variable annuities.
INVESTMENT ONLY VARIABLE ANNUITY A variable annuity that does not offer any death or living benefits, or offers them only for an additional fee. Such product typically offer a wide range of subaccount investment options and/or pre-designed, outcome oriented investment strategies (e.g. inflation protection).
ISSUER The insurance company that issues the annuity contract.
JJOINT AND SURVIVOR ANNUITY A life annuity in which there are two annuitants, usually spouses, known as joint annuitants Annuity payments continue as long as either annuitant is alive.
LL-SHARE VARIABLE ANNUITIES Variable annuity contracts that typically have shorter surrender periods, such as three or four years. L-share variable annuities typically have higher mortality and expense (M&E) charges than B-share annuities.
LEVELIZED ANNUITY PAYMENTS Payments under a variable annuity contract that remain the same for a period of time, such as 12 months, and then change to reflect investment performance. Once changed, the payments remain the same for the next 12 months.
LIFE ANNUITY Annuity payments that are guaranteed to continue for the life of the annuitant.
LIFE EXPECTANCY The average duration of the life remaining to a number of persons of a given age (cohort), according to a selected mortality table.
LIFETIME INCOME Income payments that continue throughout a person’s life, irrespective of the duration.
LIVING BENEFITS The term applied to a series of annuity options that protect against investment risk by guaranteeing either withdrawal payments, account values, or annuity payments. There are three primary types—guaranteed minimum income benefits, guaranteed minimum accumulation benefits, and guaranteed minimum withdrawal benefits.
LONGEVITY RISK The risk of outliving one’s assets.
LUMP-SUM DISTRIBUTION The distribution at retirement of a participant’s entire account balance within one calendar year due to retirement, death, or disability.

Glossary of Annuity Product Terms 185
LUMP-SUM OPTION A withdrawal option in which the annuity is surrendered and all assets are withdrawn in a single payment.
MMARKET RISK The risk of losing portfolio value due to the volatility of the stock market.
MARKET VALUE ADJUSTMENT (MVA) A feature included in some annuity contracts which imposes an adjustment or fee upon the surrender of a fixed annuity or the fixed account of a variable annuity. The adjustment is based on the relationship of market interest rates at the time of surrender and the interest rate guaranteed in the annuity.
MINIMUM CREDITED INTEREST RATE The minimum rate of interest that is guaranteed on a fixed annuity.
MONEY MARKET FUND A mutual fund seeking to generate income for participants through investments in short-term fixed income securities.
MONEY-PURCHASE PLAN A type of defined contribution plan in which the employer’s contributions are determined by a specific formula, usually as a percentage of pay. Contributions are not dependent on company profits.
MONTE CARLO SIMULATION A computerized analytical model that considers thousands of scenarios, using multiple data points such as inflation, interest rates, and market returns, and presents a range of probabilities that various outcomes might actually occur.
MORTALITY AND EXPENSE RISK CHARGE (M&E) A fee charged in variable annuities for insurance guarantees, including the death benefit, the guaranteed lifetime income options, and the guarantee that contract charges will not increase.
MORTALITY TABLE A table showing the incidence of death at specified ages that is used to determine average life expectancy.
NNET ASSET VALUE (NAV) The market value of all securities owned by a mutual fund, minus its total liabilities, divided by the number of shares issued.
NET SALES OR NET FLOWS Total variable annuity sales minus surrenders, withdrawals, inter- and intra-company exchanges, and benefit payments.
NON-QUALIFIED ANNUITY An annuity in which purchase payments are made with after-tax dollars. Earnings accumulate on a tax-deferred basis until withdrawn.

186 IRI Retirement Fact Book 2020, 19th Edition
OO-SHARE VARIABLE ANNUITIES Annuity contracts which do not impose up-front sales charges, while, typically, possessing surrender charge periods similar to B-shares. Mortality and expense charges are assessed, and progressively decline throughout the surrender period.
PPARTIAL WITHDRAWAL The withdrawal of an amount less than the total contract value of an annuity. Many contracts permit annual withdrawals of a certain amount free of a surrender charge.
PARTY-AT-INTEREST An individual or group having direct interest in a contract, including the issuer, the contract owner, and the annuitant.
PAYOUT PHASE or PAYOUT PERIOD The period during which the money accumulated in an annuity is paid out as regular income payments.
PENSION ANNUITIES An annuity incorporated in a pension or other qualified retirement plan set up by a corporation, labor union, government, or other organization for its employees, including profit-sharing plans, stock bonus and employee stock ownership plans, thrift plans, target benefit plans, money purchase plans, and defined benefit plans.
PENSION BENEFIT GUARANTY CORPORATION (PBGC) A federal agency established by Title IV of ERISA for the insurance of defined benefit pension plans. The PBGC provides payment of limited pension benefits if a plan terminates and is unable to cover all required benefits.
PERIOD CERTAIN A type of refund annuity guaranteeing that if the annuitant dies before payments have been made for a minimum number of years, payments to the beneficiary will continue until the end of the stated period.
PERSISTENCY BONUS An enhancement to the policy’s benefits, usually in the form of additional interest credits and/or reduced charges, for policies that remain in force for a certain period. The bonus may or may not be guaranteed in the contract.
PORTFOLIO REBALANCING A type of asset allocation program that periodically reallocates contract assets among investment options within a variable annuity contract.
PREMATURE DISTRIBUTION or WITHDRAWAL (PREMATURE DISTRIBUTION PENALTY) Withdrawals made from deferred annuities and certain other tax-favored plans may be subject to an additional 10% federal income tax if the withdrawal is made before the contract owner reaches age 59½. Certain exemptions apply. The contract owner should seek legal and tax advice before making withdrawals prior to age 59½.
PREMIUM BONUS A premium bonus is an additional amount credited to the accumulation account of an annuity policy under certain conditions.
PREMIUMS The amounts of money paid into an annuity contract. Also known as purchase payments.

Glossary of Annuity Product Terms 187
PREMIUM TAXES Some states charge a tax on the contributions made to an annuity, typically upon annuitization. The issuing company generally charges the annuity contract for any premium tax and other taxes based on premium it pays to the state.
PRIMARY BENEFICIARY The person or entity named as first in line to receive proceeds or benefits from a contract following the death of the contract holder or, in some contracts, the death of the annuitant.
PRIVATE ANNUITY A private annuity is an arrangement in which the client transfers property to an individual or entity in return for a promise of fixed periodic payments for the rest of the client’s life. In private annuities, the person or entity assuming the payment obligation is not in the business of selling annuities.
PROCEEDS The net amount of money payable by the company at the death of the insured or at the maturity of a contract.
QQUALIFIED ANNUITIES Qualified annuities are annuities purchased for funding an IRA, 403(b) tax-deferred annuity, or other type of tax-benefited retirement arrangements. An IRA or qualified retirement plan provides tax deferral. An annuity contract should be used to fund an IRA or qualified retirement plan to benefit from annuity features including lifetime income, living benefits, and the guaranteed minimum death benefit.
QUALIFYING LONGEVITY ANNUITY CONTRACT (QLAC) A deferred income annuity intended for purchase within a qualified plan (e.g. 401(k) or IRA) that meets IRS requirements that it a) provide distributions that begin at an advanced age, but not later than age 85; b) not be a variable contract under section 817, or an equity-indexed contract; and c) may include a return of premium death benefit, but may not include commutation rights, cash surrender value, or other similar feature.
RRATCHET GUARANTEED MINIMUM DEATH BENEFIT A type of enhanced death benefit that is equal to the greater of (a) the contract value, (b) premium payments less prior withdrawals, or (c) the contract value on a specified prior date.
REFUND ANNUITY A contract that provides a lump sum at the death of the annuitant, which when added to total annuity payments equals the purchase price.
RENEWAL RATE INTEREST Rate at time of annuity contract anniversary set at the end of each policy year.
RESERVE Actuarially determined amounts held by insurance companies, which are required to meet future contract obligations.

188 IRI Retirement Fact Book 2020, 19th Edition
RETIREMENT INCOME PERIOD or PHASE The period during which the money accumulated in a deferred annuity contract, or the purchase payment for an immediate annuity, is paid out as income payments.
REVERSE ANNUITY MORTGAGE A reverse annuity mortgage is an arrangement in which a homeowner borrows against home equity and receives lifetime monthly payments from the lender.
RISING FLOOR GUARANTEED MINIMUM DEATH BENEFIT A type of enhanced death benefit that is equal to the greater of (1) the contract value or (2) premium payments less prior withdrawals increased annually at a specified rate of interest.
RISK POOLING The spreading (in the case of annuities) of longevity risk among a large group of individuals, some of whom die sooner than expected, some of whom will live longer than expected.
ROLLOVER The action of moving plan assets from one qualified plan to another or to an IRA within sixty days of distributions, while retaining the tax benefits of a qualified plan.
SSAVINGS PERIOD OR PHASE The period in which the owner of a deferred annuity makes payments and accumulates assets.
SECTION 1035 EXCHANGE or 1035 EXCHANGE A tax-free exchange of:
• An existing life insurance policy for a new life insurance policy, or • An existing life insurance policy for a new annuity policy, or • An existing annuity policy for a new annuity policy.
A requirement in a 1035 exchange is that the owner is not in constructive receipt of the surrendered contract value. In cases in which the old and new carriers are different companies, this is accomplished by the owner assigning the contract to the new carrier, which takes delivery of the surrender proceeds, which are then applied to the new contract.
SEPARATE ACCOUNT The insurance company’s investment portfolio that supports variable life and annuity contracts. It is an element of added protection to the investor that variable annuity assets are held in a separate account protected from the claims of insurance company creditors.
SERVICE PROVIDER A company that provides any type of service to the plan, including managing assets, recordkeeping, providing plan education, and plan administration.
SIMPLIFIED EMPLOYEE-PENSION PLAN (SEP) A defined contribution plan in which employers make contributions to individual employee accounts (similar to IRAs).
SINGLE PREMIUM ANNUITY An annuity contract that is purchased with a single payment. All immediate annuities and some deferred non-qualified annuities are in this category.

Glossary of Annuity Product Terms 189
SPLIT ANNUITIES A split annuity is the combination of a single premium deferred annuity and a single premium immediate annuity. The immediate annuity pays a sum each month over a specified period. The deferred annuity accumulates on a fixed interest basis. The objective is that when the immediate annuity is depleted, the deferred annuity has reestablished the starting principal.
STANDALONE LIFETIME BENEFIT (SALB) A living benefit product that provides protection similar to that provided by the GLWB, while adding flexibility with the various types of assets that can be protected.
STEPPED-UP DEATH BENEFIT A death benefit that is increased periodically to protect investment gains.
STRAIGHT LIFE ANNUITY An annuity income option that pays during the lifetime of the annuitant(s) and ceases at the death of the last surviving annuitant.
STRUCTURED ANNUITY A structured annuity, also called a Registered Index-Linked Annuity (RILA), is a variable annuity that credits interest based on the change in price of one or more market indexes. Call options are used to provide the investor with some upside potential and some downside protection. Generally, these products use a “buffer” strategy, where the investor is protected against the first x% of loss, or a “floor” strategy, where the investor is protected from losses after the first x%. Gains are capped based on the level of protection selected by the contract owner; the higher the level of protection, the lower the cap.
SUBACCOUNT The investment funds offered in variable annuity contracts are often called subaccounts. The term refers to their position as accounts held within the separate account of the insurance company offering the variable annuity.
SUBACCOUNT INVESTMENT OBJECTIVE The category of securities representing the principal investment in a given subaccount, for example, aggressive growth, international, money market, or corporate bond.
SURRENDER CHARGE The cost to a contract owner for withdrawals from the contract before the end of the surrender charge period. The surrender charge period typically is five to seven years.
SURRENDER VALUE The surrender value is the amount that is available for withdrawals or contract liquidation.
SYSTEMATIC WITHDRAWAL PLAN A distribution method that allows a variable annuity contract owner to periodically receive a specified amount as a partial withdrawal from the annuity contract value prior to the annuity starting date. Unlike lifetime annuity payments, systematic withdrawals continue until the contract value is exhausted. Systematic withdrawals are taxable to the extent they represent investment gain in the contract.

190 IRI Retirement Fact Book 2020, 19th Edition
TTAX-QUALIFIED RETIREMENT PLAN A retirement plan, such as an IRA, 401(k), or 403(b), that meets specific requirements of the Internal Revenue Code as well as stipulations in various laws, such as the Employee Retirement Income Security Act of 1974 (ERISA), the Economic Growth and Tax Relief Reconciliation Act of 2001 (EGTRRA), and the Pension Protection Act of 2006 (PPA). In some cases, funding of such plans is through fixed or variable annuities.
TAX-SHELTERED ANNUITIES A type of retirement plan for employees of tax-exempt organizations or schools, which are covered under Section 403(b) of the IRC. Tax-sheltered annuities are funded by pre-tax contributions made through salary reduction agreements. Employers may also make direct contributions on behalf of employees.
TERM CERTAIN ANNUITY An annuity that provides income payments for a specified number of years.
TOTAL SALES OR TOTAL PREMIUM FLOWS The sum of new sales (all first-time buyers of a contract, including inter- and intra-company exchanges) and additional premiums from existing contract owners.
TRANSFER The movement of assets from one subaccount to another.
TRANSFER FEE The charge for transferring assets from one subaccount to another.
TRUSTEE The individual, group of individuals, bank, or trust company having fiduciary responsibility for holding plan assets.
U UNBUNDLED CONTRACTS Annuity contracts that permit purchasers to choose and pay for certain optional features they want in their contracts.
UNIT VALUE A measurement of the performance of the underlying funds in a variable annuity, similar to the share value of a stock. Each investment subaccount has a separate unit value. The unit value increases with positive investment performance in the subaccount and decreases with negative investment performance and with asset management and insurance charges.

Glossary of Annuity Product Terms 191
VVARIABLE ANNUITIZATION A stream of income payments that vary based on the investment performance of underlying subaccounts.
VARIABLE ANNUITY An insurance company contract into which the buyer makes a lump-sum payment or series of payments. In return, the insurer agrees to make periodic payments beginning immediately or at some future date. Purchase payments are directed to a range of investment options, which may be mutual funds, or directly into the separate account of the insurance company that manages the portfolios. The value of the account during accumulation, and the income payments after annuitization vary, depending on the performance of the investment options chosen.
VARIABLE ANNUITY PAYMENT FLOOR A guaranteed minimum amount for each annuity payment.
VARIABLE ANNUITY UNIT VALUE A measurement of the performance of the underlying funds in a variable annuity, similar to the share value of a stock. Each investment subaccount has a separate unit value. The unit value increases with positive investment performance in the subaccount, and decreases with negative investment performance and with asset management and insurance charges.
VARIABLE INVESTMENT OPTIONS The investment choices available to a variable annuity contract owner. These choices typically include stock, bond, and money market funds.
W WITHDRAWAL FEE An administrative fee charged on withdrawals.
WRAP-FEE A comprehensive charge levied by an investment manager or investment advisor to a client for providing a bundle of services, such as investment advice, investment research and brokerage services. Wrap fees allow an investment advisor to charge one straightforward fee to their clients, simplifying the process for both the advisor and the customer.
XX-SHARE (BONUS) VARIABLE ANNUITIES X-share variable annuity contracts credit an additional amount or bonus to the contract value, which is calculated as a percentage of purchase payments added to the contract at, or subsequent to, contract issue. Contract charges may be higher in X-share products.

192 IRI Retirement Fact Book 2020, 19th Edition

The Evolution of Annuities 193
The Evolution of Annuities 225 Roman jurist Gnaeus Domitius Annius Ulpianis produces the first known mortality table
for an “annua,” which provided lifetime stipends made once per year in exchange for a lump-sum payment.
1600s Tontines become popular with European governments to pay for wars and public works projects. A tontine gave each participant income for life, with the payments to the survivors increasing as the other participants passed away. Payments ceased upon the death of all the participants.
1700s The British Parliament authorizes annuity sales. Annuities became popular among European “high society” as a form of prevention from a fall from grace, unavailable in other more risky investments.
1759 Pennsylvania charters the Corporation for the Relief of Poor and Distressed Presbyterian Ministers and Distressed Widows and Children of Ministers.
1776 The National Pension Program for Soldiers was passed in America prior to the signing of the Declaration of Independence. It provided annuity payments to soldiers and their families.
1812 The Pennsylvania Company for Insurance on Lives and Granting Annuities is the first American company to offer annuities to the general public.
1905 Andrew Carnegie establishes the Teacher’s Pension Fund. This eventually became the Teacher’s Insurance and Annuity Association (TIAA) in 1918 to provide annuities to educators.
1930s Annuities become popular, as concerns about the overall health of the financial markets prompt many to purchase products from insurance companies, which are seen as stable institutions.
1930s New Deal programs encourage individuals to save for their own retirement. The group annuity market for corporate pension plans begins to develop.
1952 The first variable annuity is issued by TIAA-CREF for use in college- and university-qualified retirement plans.
1959 In SEC v. Variable Annuity Life Insurance Company, the Supreme Court holds that variable annuities are subject to federal securities regulation.
1960 The first non-qualified variable annuity policy becomes available through the Variable Annuity Life Insurance Company (VALIC).
1977 Revenue Ruling 77-85 is issued stating that individual investments in an annuity cannot be directed by the owner.

194 IRI Retirement Fact Book 2020, 19th Edition
1979 Revenue Ruling 79-335 is issued eliminating the tax-free step-up in basis at death for variable annuity contracts.
1980 Revenue Ruling 80-274 is issued ruling that bank CDs cannot be wrapped in an annuity.
1980 The guaranteed minimum death benefit (GMDB) is introduced.
1981 Revenue Ruling 81-225 is issued stating that publicly traded mutual funds cannot be the underlying investments in a non-qualified annuity.
1982 The Tax Equity and Fiscal Responsibility Act of 1982 allows annuities to keep their valuable tax-deferred status, retains the exclusion ratio, which treats annuitization payments as part return of principal and part return of taxable earnings, and changes the taxation of withdrawals from principal first to income first.
1984 The Tax Reform Act of 1984 eliminates the double taxation of realized capital gains of separate accounts at the insurance company level.
1986 The Tax Reform Act of 1986 disallows non-natural owners of annuities unless they are held by a trust acting as agent for an individual. The capital gain preference tax is eliminated and tax shelter investments are greatly curtailed.
1991 The National Association for Variable Annuities (NAVA) is formed.
1995 Indexed annuities and the maximum anniversary value (ratchet) death benefit are introduced.
1995 Annuity industry sales top $100 billion.
1996 The guaranteed minimum income benefit (GMIB) is introduced.
1997 Total annuity assets top $1 trillion.
1998 Bonus variable annuities are introduced.
1999 Variable annuity sales top $100 billion a year for the first time.
2000 Variable annuity assets top $1 trillion.
2000 Enhanced earnings benefits (EEBs) and L-share variable annuities are introduced.
2002 The guaranteed minimum withdrawal benefit (GMWB) is introduced.
2002 The guaranteed minimum accumulation benefit (GMAB) is introduced.
2002 The variable annuity industry standardizes net flows (net sales) reporting.
2002 Fixed annuity sales top $100 billion a year for the first time.
2004 The guaranteed lifetime withdrawal benefit (GLWB) is introduced.
2005 Indexed annuity sales top $25 billion for the year.

The Evolution of Annuities 195
2006 The Pension Protection Act of 2006 overhauls the federal pension plan and tax laws, which, among other provisions, allows annuities to include long-term care riders and makes it easier for traditional defined contribution plans to offer annuities to workers by clarifying the “safest available annuity” standard under ERISA.
2008 The standalone lifetime benefit (SALB) is introduced.
2009 NAVA becomes the Insured Retirement Institute (IRI).
2010 IRI membership tops 30,000 financial professionals
IRI launches first-ever, industry-wide data reporting – uniting Morningstar variable annuity data and Beacon Research fixed annuity data.
Total annuity assets top $2 trillion.
2011 Variable Annuity assets reach all-time high of $1.6 trillion.
IRI research shows that 92% of annuity owners feel well prepared for retirement.
IRI celebrates its 20th anniversary.
2012 Fixed Indexed Annuity sales surpass traditional Fixed Annuity sales for the first time.
With roughly $1 billion in sales, 2012 marks the first year of significant sales for Deferred Income Annuities.
The NAIC endorses the National Association of Registered Agents and Brokers Reform Act of 2012 (NARAB II).
The NAIC determines that contingent deferred annuities (CDAs) are best written by life insurance companies and subject to existing state laws and regulations applicable to annuities.
2013 Deferred Income Annuity sales more than double, reaching $2.2 billion.
Total annuity assets top $2.5 trillion. Fixed Indexed Annuities become available through Wirehouses, top $38 billion in sales.
2014 Record Fixed Indexed Annuity sales of $48 billion propel the industry to growth.
Deferred Income Annuity sales grow 18% to $2.6 billion.
Total annuity assets reach a new all-time high of $2.7 trillion.
The U.S. Treasury issues final rules regarding Qualifying Longevity Annuity Contracts (QLACS).
2015 Fixed indexed annuity sales reach 60 percent of fixed annuity sales, and 24 percent of overall annuity sales.

196 IRI Retirement Fact Book 2020, 19th Edition
The Department of Labor publishes its final Conflict of Interest Rule – Retirement Investment Advice, defining the term “Fiduciary” under the Employment Retirement Income Security Act of 1974 (ERISA). The rule is effective June 7, 2016 with an applicability date of April 10, 2017.
2016 Fixed annuity sales surpass variable annuity sales for the first time, accounting for 51.7 percent of total annuity sales in 2016.
Fee-based variable annuities are developed at a brisk pace in an effort to provide guaranteed income solutions workable within the DOL fiduciary rule framework.
The Department of Labor Rule faces an uncertain future as President Donald Trump’s
administration compels Federal agencies to review regulations, with an eye toward eliminating regulations that are unnecessarily burdensome.
2017 Fixed and variable annuities see sales drop due to uncertainty created by the DOL fiduciary rule.
The industry awaited a decision by the United States Court of Appeals for the Fifth Circuit on the decision by the United States District Court for the Northern District of Texas to uphold the rule. Fifth Circuit Court vacated the rule on March 15, 2018.
2018 The United State Court of Appeals for the Fifth Circuit vacates the DOL Fiduciary Rule.
Annuity sales rise, led by fixed indexed products, as business processes normalize in the wake of the DOL vacatur.
Structured annuities begin to stake out a larger market presence, with sales increasing 22 percent in 2018, to $11.1 billion from 2017 sales of $9.1 billion.
2019 The SECURE Act becomes law in December 2019, paving the way for broader inclusion of annuities and guaranteed lifetime income benefits in employer-sponsored defined contribution plans.
Low interest rates create a difficult environment for annuity product development, capacity and profitability, but this also spurs innovation. Structured annuities continue gaining market share, closing the year with $17.2 billion in sales, a 56 percent gain over 2018.
Index 197
IndexSymbols
401(k) ............................................. 1, 10, 18, 27, 31, 33, 35, 44, 52, 57, 58, 77, 80, 104, .................................115, 117, 118, 121, 122, 123, 131, 149, 150, 180, 187, 190
403(b) ............................................. 10, 31, 35, 37, 44, 52, 117, 118, 122, 149, 187, 190457(b) ..........................................................................................................117, 118, 122
Aaccumulation period ..................................................................33, 41, 44, 46, 47, 49, 96accumulation phase ...................................... 32, 33, 34, 35, 36, 41, 45, 47, 90, 177, 182administrative charges/fees ..................................................................................... 38, 40advertising rules ..........................................................................................132, 143, 144
advertising and unfair trade practices rules ...................................................... 143Financial Industry Regulatory Authority ........................................................... 141FINRA ................................................ 55, 131, 132, 137, 138, 141, 143, 144, 148SEC ............................................... 39, 54, 73, 131, 132, 133, 134, 135, 136, 137,
......................................... 138, 140, 141, 143, 144, 147, 148, 149, 193Securities and Exchange Commission ............................................................... 54
affluent .......................................................................................................18, 26, 99, 103agent licensing ...............................................................................................76, 129, 136AIR .......................................................................................................51, 52, 81, 82, 178annual contract fee ...................................................................................................... 177annuitant .................................................... 30, 31, 33, 49, 50, 51, 52, 76, 80, 81, 90, 93,
.......................94, 95, 97, 152, 153, 177, 178, 179, 182, 183, 184, 186, 187, 189annuities, types of ...................... 4, 10, 11, 19, 24, 26, 27, 29, 30, 31, 32, 33, 34, 35, 36,
..............37, 38, 39, 40, 41, 44, 45, 46, 47, 48, 49, 50, 51, 52, 54, 55, 56, 57, 58, ................................ 59, 60, 64, 66, 67, 68, 69, 71, 72, 73, 74, 75, 76, 79, 80, 81, .............................................. 82, 85, 86, 87, 93, 95, 99, 105, 107, 110, 112, 118, ........................................................ 120, 121, 123, 124, 127, 129, 130, 131, 132, ................................................ 134, 137, 138, 140, 141, 142, 143, 144, 145, 146, ........................................................ 148, 149, 150, 151, 152, 153, 179, 180, 181, .........................................183, 184, 185, 186, 187, 188, 190, 193, 194, 195, 196charitable gift .........................................................................................37, 38, 179deferred ........................................................15, 29, 31, 32, 33, 34, 35, 36, 38, 39,
.................................. 41, 46, 47, 48, 49, 50, 53, 71, 72, 79, 80, 85, 95, ....................97, 98, 115, 118, 120, 125, 137, 145, 150, 152, 153, 177, .................178, 179, 180, 181, 183, 185, 186, 187, 188, 189, 194, 195
Deferred Income .......................................................49, 76, 85, 94, 173, 180, 195fixed ....................................................... 25, 32, 34, 35, 36, 38, 40, 43, 45, 46, 47,
.............................................. 48, 49, 50, 51, 52, 53, 54, 55, 56, 59, 60, ........................................ 64, 65, 67, 68, 71, 72, 73, 74, 79, 80, 81, 82, .......................... 85, 86, 88, 98, 99, 105, 106, 112, 128, 129, 130, 131, ................................ 134, 145, 150, 151, 153, 177, 178, 180, 181, 182, ......................................................... 183, 185, 187, 189, 190, 195, 196
Fixed immediate .......................................................................................... 79, 120fixed rate ...............................................................................................46, 72, 182

198 IRI Retirement Fact Book 2020, 19th Edition
Immediate ........................ 32, 33, 53, 69, 79, 80, 81, 82, 120, 158, 163, 173, 183income ........................................ 1, 2, 3, 4, 5, 6, 9, 11, 13, 14, 15, 16, 17, 18, 19,
.................................. 22, 25, 26, 29, 30, 31, 32, 33, 34, 35, 36, 37, 38, ........................................ 42, 43, 44, 45, 47, 48, 49, 50, 51, 52, 53, 54, .................................. 57, 58, 59, 60, 67, 68, 69, 71, 72, 73, 74, 75, 76, ........................................ 79, 80, 81, 82, 83, 85, 86, 87, 88, 89, 90, 91, ................................ 92, 93, 94, 95, 96, 97, 98, 99, 100, 101, 102, 103, ................................ 104, 105, 115, 116, 117, 118, 120, 121, 122, 123, ........................125, 127, 128, 134, 141, 146, 149, 150, 151, 152, 153, ................................ 154, 177, 179, 180, 182, 183, 184, 185, 186, 187, ......................................................... 188, 189, 190, 191, 193, 194, 196
non-qualified ....................................... 26, 31, 36, 37, 39, 48, 52, 59, 79, 95, 120, ................................. 149, 150, 151, 152, 153, 154, 180, 188, 193, 194
ownership of .................................................................................................. 48, 87private placement .................................................................................37, 38, 131qualified ......................... 22, 26, 31, 35, 36, 37, 39, 44, 48, 49, 52, 59, 77, 79, 80,
................................ 86, 94, 95, 96, 104, 115, 120, 121, 122, 125, 128, ........................................ 131, 132, 145, 149, 150, 151, 152, 153, 154, ......................................................... 180, 181, 186, 187, 188, 193, 194
single premium immediate ..............................................................53, 71, 93, 189variable .............................................. 7, 17, 31, 32, 34, 35, 36, 38, 39, 40, 41, 42,
.................................. 43, 44, 45, 46, 49, 50, 51, 52, 53, 54, 55, 56, 59, ........................................ 60, 64, 66, 67, 68, 71, 72, 73, 74, 75, 76, 79, .............................................. 80, 81, 82, 86, 87, 91, 93, 95, 96, 97, 98, .................................. 99, 105, 109, 112, 120, 125, 129, 130, 131, 132, ........................133, 137, 138, 141, 143, 144, 145, 147, 148, 149, 150, ........................................ 151, 152, 168, 177, 178, 179, 181, 182, 183, .................184, 185, 186, 187, 188, 189, 190, 191, 193, 194, 195, 196
variable immediate ................................................................................79, 81, 183annuitization ....48, 49, 50, 51, 80, 94, 105, 137, 142, 177, 180, 182, 183, 187, 191, 194annuity assets ..................................................................44, 53, 120, 130, 188, 194, 195annuity contract ................... 30, 33, 35, 41, 45, 46, 47, 52, 54, 56, 91, 95, 97, 122, 130,
................................................ 132, 133, 149, 150, 151, 152, 153, 177, 178, 179, ......................................................... 180, 181, 182, 184, 186, 187, 188, 189, 191
annuity payments ............... 30, 31, 33, 34, 35, 36, 41, 42, 49, 50, 51, 52, 76, 79, 81, 87, .......................90, 94, 97, 151, 152, 153, 177, 178, 179, 183, 184, 187, 189, 193Joint and Survivor Annuity ................................................................................ 184joint and two-thirds annuity ................................................................................. 50Level Annuity Payments ...................................................................................... 52life annuity .................................................... 30, 33, 50, 51, 80, 94, 122, 124, 184Payment Stabilization Guarantees ..................................................................... 52period certain annuity ......................................................................................... 51pure life annuity .......................................................................................50, 51, 80refund annuity ............................................................................................. 51, 186Straight Life Annuity .......................................................................................... 189
annuity purchase method of ........................................................................105, 106, 177annuity sales .............................................. 39, 40, 59, 60, 66, 71, 76, 79, 80, 85, 87, 95,
......................................................... 113, 140, 142, 168, 185, 193, 194, 195, 196A-Share Variable Annuities .................................................................................... 40, 177asset allocation ..................................................... 3, 4, 43, 45, 67, 74, 86, 124, 178, 186assets under management ............................................................................................ 96assumed interest rate .............................................................................................. 51, 81

Index 199
BBaby Boomers ......................................................................................................... 57, 95beneficiary .......................................................................................31, 53, 178, 179, 187Best Interest .................................. 67, 133, 134, 135, 136, 137, 138, 140, 141, 147, 148bonus .................................................................... 41, 86, 88, 89, 90, 178, 179, 186, 191bonuses ...................................................................................................41, 90, 138, 142Boomers .............................................................................................................. 5, 57, 95breakpoint pricing .......................................................................................................... 40B-Share Variable Annuities .................................................................................... 39, 178
Ccash surrender value ...............................................................................43, 47, 151, 187charitable gift annuity ............................................................................................. 38, 179clients, retirement income ................................ 1, 2, 9, 11, 15, 16, 18, 19, 26, 33, 37, 47,
.................................................... 48, 57, 58, 68, 69, 93, 94, 97, 98, 99, 102, 103, ......................................................... 104, 105, 115, 117, 120, 121, 123, 125, 127
commissions ........................................................................................40, 55, 56, 76, 139commutation .......................................................................................................... 94, 187complete surrender ...................................................................................................... 151contract anniversary value ............................................................................................. 42contract owner .............30, 31, 32, 34, 35, 36, 38, 39, 40, 41, 43, 44, 45, 47, 48, 49, 50,
............................................ 52, 53, 73, 75, 85, 86, 87, 88, 92, 96, 130, 131, 150, .........................................151, 153, 154, 177, 178, 180, 182, 183, 186, 189, 191
contract requirements .................................................................................................. 130cost-of-living ............................................................................................................. 13, 18credited interest rate ................................................................................................ 34, 46C-share variable annuity ........................................................................................ 40, 179
Ddeferred annuity ............................................... 31, 32, 33, 34, 36, 39, 41, 47, 49, 50, 85,
......................................................................... 150, 152, 178, 181, 187, 188, 189deferred income annuity ........................................................................................ 49, 187defined benefit plans ...........................................................115, 116, 118, 119, 124, 186defined contribution plans ....1, 10, 59, 67, 117, 118, 119, 120, 121, 122, 123, 195, 196demographics ................................................................................................................ 95
age .................. 1, 2, 4, 5, 6, 7, 8, 9, 10, 11, 13, 14, 15, 16, 17, 22, 24, 25, 26, 29, ........................................ 30, 40, 43, 44, 47, 48, 49, 53, 54, 58, 76, 79, ........................ 80, 82, 85, 86, 93, 94, 97, 98, 100, 101, 102, 105, 115, ........................................ 116, 117, 118, 121, 122, 124, 125, 127, 141, ................................. 150, 151, 152, 177, 180, 181, 183, 184, 186, 187
employment ..................................................................................13, 16, 104, 124gender ........................................................................................................... 6, 177household income ................................................................................................. 9
Department of Labor .....................................................................76, 121, 122, 124, 196distribution .........25, 38, 39, 44, 48, 52, 53, 55, 59, 64, 94, 99, 104, 105, 107, 116, 117,
.........118, 120, 121, 122, 132, 136, 144, 147, 151, 152, 153, 178, 180, 184, 189

200 IRI Retirement Fact Book 2020, 19th Edition
distribution channel ........................................................................................................ 55Dodd-Frank Act ............................................................................131, 133, 145, 146, 147DOL ............................................................................ 134, 138, 139, 140, 143, 146, 196DOL fiduciary rule ................................................................................................134, 196dollar cost averaging ................................................................................46, 48, 153, 180
Eenhanced death benefit .........................................................................54, 153, 187, 188enhanced earnings benefit ............................................................................42, 181, 194estate planning ...................................................................................................... 53, 101exchanges .............................................................................................60, 181, 185, 190exclusion ratio ....................................................................................52, 97, 98, 151, 194
Ffederal securities law .............................................................................55, 130, 131, 144fee-based variable annuity............................................................................................. 59fees and expenses ...........................................................................38, 45, 131, 148, 178
administrative charges .................................................................................. 38, 40annual contract fee ............................................................................................. 38disclosure of ...................................................................................................... 135insurance charges ..........................................................38, 39, 45, 178, 190, 191investment management fees ..................................................................... 39, 178M&E fee .............................................................................................................. 38mortality and expense fees ......................................................................... 38, 184premium tax ................................................................................................ 39, 187surrender charge ............................. 39, 40, 47, 72, 132, 150, 153, 179, 186, 189surrender fee ....................................................................................................... 39unbundled fees ................................................................................................... 39up-front sales charge ..........................................................................40, 179, 186
Fiduciary .................................................... 44, 59, 67, 76, 121, 122, 133, 134, 136, 138, ......................................................................... 139, 140, 143, 147, 148, 190, 196
financial advisor .................................................................................33, 67, 69, 135, 154Financial Industry Regulatory Authority (FINRA) .................................55, 131, 132, 137,
..........................................................................................138, 141, 143, 144, 148financial professional .......................................................57, 68, 133, 134, 135, 138, 195FINRA ........................................................... 55, 131, 132, 137, 138, 141, 143, 144, 148fixed account ................................................................................35, 45, 46, 72, 181, 185fixed annuity 34, 35, 38, 45, 50, 51, 52, 80, 105, 106, 151, 153, 178, 181, 182, 185, 195fixed immediate ..........................................................................................80, 81, 82, 183fixed index ....................................................... 62, 63, 72, 82, 85, 86, 174, 182, 183, 195fixed rate ..........................................................................................................46, 72, 182fixed payout .................................................................................................................... 50flexible premium contracts ............................................................................................. 33FRA ..............................................................................................................14, 15, 16, 17full retirement age ..............................................................................................10, 14, 16

Index 201
Gratchet guaranteed minimum death benefit................................................................. 187rising floor guaranteed minimum death benefit ........................................................... 188general account .........................................................................................34, 35, 87, 181GLWB ............................................ 43, 44, 49, 62, 63, 64, 66, 80, 82, 85, 86, 87, 88, 89,
..................................................................................90, 91, 92, 93, 182, 189, 194GMAB ............................................................................................................43, 182, 194GMIB ............................................................. 42, 85, 86, 87, 88, 90, 91, 92, 93, 183, 194GMWB .....................................................................................................43, 49, 183, 194guaranteed income payments ...................................................................33, 36, 83, 182guaranteed income stream ............................................................................................ 33guaranteed lifetime withdrawal benefit ......................................................43, 49, 87, 194guaranteed minimum accumulation benefit .......................................................... 43, 194guaranteed minimum death benefit .......................................................41, 182, 187, 188guaranteed minimum income benefit ............................................................42, 153, 194guaranteed minimum rate of interest............................................................................. 34guaranteed minimum withdrawal benefit .........................................................43, 49, 194guarantees .......29, 33, 34, 35, 38, 40, 42, 43, 49, 50, 54, 60, 67, 71, 73, 74, 75, 90, 91,
................................................. 120, 121, 122, 123, 124, 131, 179, 180, 183, 185annuitization ........................................ 48, 49, 50, 51, 80, 94, 105, 137, 142, 177,
..................................................................180, 182, 183, 187, 191, 194death benefit ..................................... 38, 41, 42, 49, 53, 54, 76, 77, 94, 126, 153,
......................................................... 181, 182, 185, 187, 188, 189, 194deferral bonus .........................................................................................88, 89, 90deferred fixed annuities ...............................................................32, 38, 46, 50, 71deferred variable annuities ....................................................................50, 80, 137immediate annuities ........................................................71, 81, 82, 120, 183, 188interest rate ............................................. 2, 34, 41, 46, 51, 54, 60, 71, 72, 73, 79,
....................................... 80, 81, 93, 126, 146, 153, 178, 181, 183, 185living benefits ................. 36, 39, 42, 49, 59, 76, 96, 105, 112, 142, 183, 184, 187payment stabilization .......................................................................................... 52step-up features .................................................................................................. 86
Hhealth care .............................................. 2, 5, 7, 8, 11, 18, 19, 21, 22, 23, 24, 26, 27, 68health care risk ....................................... 2, 5, 7, 8, 11, 18, 19, 21, 22, 23, 24, 26, 27, 68household ............................................. 19, 21, 23, 26, 58, 100, 101, 102, 103, 104, 137household income ........................................................................................................... 9
Iimmediate annuity ............................ 31, 33, 34, 49, 50, 53, 79, 82, 85, 93, 98, 188, 189income annuity...........................................................................................49, 80, 81, 187income replacement ...................................................................................................... 26income solutions .................................................................................................... 58, 196independent agent ................................................................................................. 55, 159indexed annuity ........................... 47, 60, 71, 72, 73, 74, 79, 80, 81, 82, 83, 86, 145, 195

202 IRI Retirement Fact Book 2020, 19th Edition
individual retirement account (IRA) ............................................................................. 183Roth IRA .......................................................................................26, 27, 116, 117Traditional IRA ................................................................................................... 116
inflation-protected annuities........................................................................................... 33inflation risk .............................................................................................................. 34, 82in-plan guaranteed lifetime income options ................................................................. 120insurance company licensing ...................................................................................... 129insurance company ratings............................................................................................ 54insured retirement ......................................................................................11, 18, 57, 125interest and earnings first rule ..................................................................................... 150Investment Company Act of 1940 .......................................................................131, 132
regulation of fees and charges ......................................................................... 133separate account .............130, 131, 132, 133, 149, 178, 182, 188, 189, 191, 194
Investment management fees ....................................................................................... 39investment options ........................................... 31, 34, 35, 38, 39, 43, 45, 46, 75, 93, 95,
......................................................................... 131, 132, 141, 153, 184, 186, 191fixed investment option ....................................................................................... 35variable investment option ......................................................................35, 45, 46
I-share variable annuity ............................................................................................... 183
Jjoint and survivor annuity ...........................................................................30, 50, 80, 122
Llevel annuity payments .................................................................................................. 52life annuity ............................................................... 30, 33, 50, 51, 80, 94, 122, 124, 184life expectancy ..........................................................2, 6, 7, 8, 15, 16, 17, 23, 25, 51, 53,
................................................................. 79, 80, 95, 97, 104, 152, 153, 177, 185liquidity ...............................................................................40, 76, 80, 81, 82, 94, 98, 179living benefits ............................ 36, 39, 42, 49, 59, 76, 96, 105, 112, 142, 183, 184, 187longevity insurance ............................................................................................26, 49, 76longevity risk ....................................................... 29, 35, 42, 50, 51, 79, 85, 91, 117, 188long-term care protection .............................................................................................. 44L-share variable annuity ........................................................................................ 40, 184lump sum payment ...................................................................................................... 150
Mmarket risk ...............................................................................................55, 74, 100, 101market value adjustment .................................................................................46, 71, 145means testing ....................................................................................................18, 21, 26Medicare ...............4, 7, 8, 13, 15, 17, 18, 21, 22, 23, 24, 25, 26, 68, 123, 125, 126, 154Medicare Part A ....................................................................................................... 22, 23Medicare Part B ...........................................................................................15, 18, 22, 26Medicare Part C ............................................................................................................. 22Medicare Part D ............................................................................................................. 22Millennial ........................................................................................................................ 67

Index 203
minimum credited interest rate ................................................................................ 34, 46mortality .......................................................... 6, 17, 38, 50, 79, 87, 91, 93, 94, 184, 193
NNAIC Annuity Disclosure Model .................................................................................. 144National Association of Insurance Commissioners ..................................................... 129non-qualified annuities ........................................ 26, 36, 37, 48, 149, 151, 152, 153, 188non-qualified plan .......................................................................................................... 35
OO-share variable annuity .................................................................................40, 41, 186owner ............................................. 30, 31, 32, 33, 34, 35, 36, 38, 39, 40, 41, 42, 43, 44,
............45, 46, 47, 48, 49, 50, 52, 53, 54, 73, 75, 83, 85, 86, 87, 88, 92, 96, 116, ........................................120, 127, 128, 130, 131, 132, 140, 150, 151, 152, 153, .................................154, 177, 178, 179, 180, 182, 183, 186, 188, 189, 191, 193
Ppartial annuitization ........................................................................................................ 80partial surrender ............................................................................................................ 47partial withdrawal .............................................................................................33, 47, 186parties to an annuity contract ........................................................................................ 30payment stabilization guarantees .................................................................................. 52payout phase ...............................................................................................33, 34, 35, 45pensions ............................................................. 4, 9, 10, 13, 18, 25, 29, 30, 50, 82, 123period certain annuities ................................................................................................. 51personal retirement savings plans ............................................................................... 115portfolio rebalancing ........................................................................................46, 76, 153premature distributions ........................................................................................150, 151premiums/purchase payments .............................. 33, 34, 35, 40, 41, 89, 130, 178, 179,
..........................................................................................181, 182, 185, 186, 191annual contribution limits .................................................................................... 37automatic payroll deduction ................................................................................ 44earned income ........................................................................................2, 44, 116flexible premium annuity ................................................................................... 182initial purchase payment ..................................................................................... 42
premium tax ........................................................................................................... 39, 187private annuities ...............................................................................................37, 38, 187Prohibited Transaction .................................................................................138, 139, 140Prohibited Transaction Exemption .......................................................................139, 140prospectus .....................................................................................54, 131, 147, 149, 179pure life annuity..................................................................................................50, 51, 80

204 IRI Retirement Fact Book 2020, 19th Edition
QQLAC ...............................................................................................................77, 94, 187qualified annuities ............................... 26, 36, 37, 48, 149, 150, 151, 152, 153, 181, 188qualified joint and survivor annuity .............................................................................. 122qualified plans ................................. 36, 37, 44, 49, 80, 86, 120, 131, 150, 151, 152, 153qualified retirement plans ......................................... 35, 44, 48, 115, 120, 125, 132, 193Qualifying Longevity Annuity Contract .................................................................. 94, 187
Rrefund annuity ........................................................................................................ 51, 186Registered Index-Linked Annuity................................................................................. 189regulation ............................................................ 131, 132, 138, 139, 143, 145, 147, 193Regulation Best Interest ............... 67, 133, 134, 135, 136, 137, 138, 140, 141, 147, 148replacement contracts .........................................................................................153, 154required minimum distribution rules .............................................................................. 52retirees ............................................... 1, 3, 4, 5, 9, 13, 14, 15, 16, 17, 18, 19, 21, 23, 24,
.................26, 27, 30, 47, 48, 49, 50, 53, 57, 58, 82, 87, 103, 104, 105, 120, 139retirement income assets ............................................................................................ 103retirement income options ............................................................................................. 48retirement income phase ............................................................................................... 33RILA .................................................................................................................32, 73, 189risk pooling ...........................................................................................29, 30, 49, 87, 188RMD .......................................................................................................25, 26, 77, 82, 94Roth 401(k) .................................................................................................................. 117Roth 403(b) ..........................................................................................................118, 149Roth 457(b) .................................................................................................................. 118
Ssavings phase ................................................................................................................ 33Section 1035 of the Internal Revenue Code .......................................................153, 188SECURE Act ...........................................................................59, 67, 120, 121, 122, 196Securities Act of 1933.................................................................................................. 131
contract registration .......................................................................................... 131disclosure of fees and expenses ...................................................................... 131prospectus delivery ........................................................................................... 131
Securities and Exchange Commission ......................................................................... 54Securities Exchange Act of 1934 ........................................................................131, 132sequence of returns ......................................................................................................... 2share class ............................................................................................................... 40, 96single premium contract ................................................................................................ 33Single Premium Immediate Annuities ..................................................................... 80, 82social media, regulation of ........................................................................................... 144Social Security ............................. 1, 2, 4, 5, 9, 10, 11, 13, 14, 15, 16, 17, 18, 19, 21, 22,
.................................25, 27, 30, 50, 57, 68, 79, 82, 102, 103, 104, 115, 123, 125SPIA .................................................................................................33, 53, 54, 82, 93, 94spousal benefits ............................................................................................................. 16

Index 205
spouse .............................................. 2, 5, 15, 16, 17, 18, 25, 26, 30, 104, 122, 124, 153state guaranty funds .................................................................................................... 130structured annuity .................................................................................................. 73, 189subaccounts................................ 32, 34, 35, 36, 38, 45, 79, 93, 137, 178, 180, 189, 191surrender charge ........................................ 39, 40, 47, 72, 132, 150, 153, 179, 186, 189surrender charge period ......................................................39, 40, 47, 72, 150, 153, 189surrender fee ................................................................................................................. 39surrenders ......................................................................................................47, 151, 185
complete surrender ........................................................................................... 151partial surrender .................................................................................................. 47partial withdrawal .......................................................................................... 33, 47
systematic withdrawal ..................................................................................30, 47, 48, 50
Ttaxation of annuities ..................................................................................................... 149
annuity payouts ................................................................................................. 151complete surrenders ......................................................................................... 151death of an owner ............................................................................................. 152exclusion amount ................................................................................52, 151, 181exclusion ratio .........................................................................52, 97, 98, 151, 194gifts .................................................................................................................... 138interest and earnings first ................................................................................. 150Replacement contracts ..................................................................................... 153
tax deferral .............................................................. 36, 46, 76, 86, 95, 98, 121, 150, 187tax penalty .................................................................. 115, 116, 117, 118, 125, 150, 151transfers ...........................................................................................................38, 46, 187
Uunbundled fees .............................................................................................................. 39unit value ................................................................................................45, 178, 190, 191
Vvariable annuity .............................. 32, 34, 35, 36, 38, 39, 41, 42, 43, 44, 45, 46, 52, 53,
........54, 55, 59, 71, 73, 75, 87, 91, 95, 96, 97, 98, 105, 120, 130, 131, 132, 133, ........................137, 141, 143, 145, 147, 150, 151, 152, 168, 177, 178, 179, 181, .................................182, 184, 185, 186, 188, 189, 190, 191, 193, 194, 195, 196
variable investment option .................................................................................35, 45, 46variable payouts ...............................................................................................35, 50, 181
Wwealth................................................................ 3, 21, 57, 58, 98, 99, 100, 101, 103, 135withdrawals .............................. 2, 3, 9, 11, 29, 33, 35, 36, 40, 41, 42, 43, 44, 47, 48, 49, ............................................... 53, 54, 82, 86, 88, 89, 90, 93, 94, 98, 118, 150, 151, 152, ....................................153, 177, 179, 180, 182, 183, 185, 186, 187, 188, 189, 191, 194

206 IRI Retirement Fact Book 2020, 19th Edition
women ....................................................................................................................... 2, 25workers ..............................................................................1, 2, 4, 5, 13, 69, 80, 120, 195workforce .................................................................................................2, 5, 11, 66, 121
XX-share variable annuities 41, 179, 191

Index 207

208 IRI Retirement Fact Book 2020, 19th Edition
Special Thanks to —Data Providers:

Special Thanks 209
Special Thanks to the Following People for Their Contributions to the IRI Retirement Fact Book 2020:MICHAEL RAYMOND, Chair IRI Research Committee, Lincoln Financial; CHRISTINE TUCKER, Chair IRI Research Committee, Pacific Life; JEREMY ALEXANDER, Beacon Research; DIANA SWEENEY, Morningstar, Inc.; TODD GIESING, LIMRA Secure Retirement Institute; TAMIKO TOLAND, Cannex Financial Exchanges; RICHARD CHOI, Carlton Fields, P.A.; STEPHEN CHOI, Carlton Fields, P.A.; DONNIE ETHIER, Cerulli Associates; CAROL MCCLARNON, Eversheds Sutherland; MARK SMITH, Eversheds Sutherland. IRI Staff Liaisons: JASON BERKOWITZ, Chief Legal & Regulatory Affairs Officer; FRANK O’CONNOR, Vice President, Research and Outreach; PAUL RICHMAN, Chief Government & Political Affairs Officer.
IRI would also like to thank all members of the IRI Research Committee for their contributions to the IRI Retirement Fact Book, and for their ongoing enthusiasm and support.

Insured Retirement Institute1100 Vermont Avenue, NW, 10th FloorWashington, D.C. 20005P 202-469-3000 • F 202-469-3030www.IRIonline.org
Insured Retirement Institute