Working for a Good Retirement
38
Working Paper No. 463 Working for a Good Retirement by Barbara A. Butrica Karen E. Smith C. Eugene Steuerle The Urban Institute 2100 M Street, NW Washington, DC 20037 July 2006 The research reported herein was performed pursuant to a grant from the U.S. Social Security Administration (SSA) to the Center for Retirement Research at Boston College (CRR). The opinions and conclusions are solely those of the authors and should not be construed as representing the opinions or policy of SSA or any agency of the Federal Government or of the CRR, or the Urban Institute, its board, or its sponsors. The authors thank Richard Johnson for his advice on this and related projects. The Levy Economics Institute Working Paper Collection presents research in progress by Levy Institute scholars and conference participants. The purpose of the series is to disseminate ideas to and elicit comments from academics and professionals. The Levy Economics Institute of Bard College, founded in 1986, is a nonprofit, nonpartisan, independently funded research organization devoted to public service. Through scholarship and economic research it generates viable, effective public policy responses to important economic problems that profoundly affect the quality of life in the United States and abroad. The Levy Economics Institute P.O. Box 5000 Annandale-on-Hudson, NY 12504-5000 http://www.levy.org Copyright © The Levy Economics Institute 2006 All rights reserved.
Transcript of Working for a Good Retirement

Working Paper No. 463
Working for a Good Retirement
by
Barbara A. Butrica Karen E. Smith
C. Eugene Steuerle
The Urban Institute 2100 M Street, NW
Washington, DC 20037
July 2006
The research reported herein was performed pursuant to a grant from the U.S. Social Security Administration (SSA) to the Center for Retirement Research at Boston College (CRR). The opinions and conclusions are solely those of the authors and should not be construed as representing the opinions or policy of SSA or any agency of the Federal Government or of the CRR, or the Urban Institute, its board, or its sponsors. The authors thank Richard Johnson for his advice on this and related projects.
The Levy Economics Institute Working Paper Collection presents research in progress by
Levy Institute scholars and conference participants. The purpose of the series is to disseminate ideas to and elicit comments from academics and professionals.
The Levy Economics Institute of Bard College, founded in 1986, is a nonprofit, nonpartisan, independently funded research organization devoted to public service. Through scholarship and economic research it generates viable, effective public policy responses to important economic problems that profoundly affect the quality of life in the United States and abroad.
The Levy Economics Institute
P.O. Box 5000 Annandale-on-Hudson, NY 12504-5000
http://www.levy.org
Copyright © The Levy Economics Institute 2006 All rights reserved.

ABSTRACT
The choice of retirement age is the most important portfolio choice most workers will make.
Drawing on the Urban Institute’s Dynamic Simulation of Income model (DYNASIM3), this
report examines how delaying retirement for nondisabled workers would affect individual retiree
benefits, the solvency of the Social Security trust fund, and general revenues. The results suggest
that delaying retirement by itself does not generate enough additional revenue to make Social
Security solvent by 2045. Benefit cuts or supplementary funding sources will be necessary to
achieve solvency. However, the size of the benefit cuts or tax increases could be minimized if
individuals worked longer. This additional work also substantially increases worker’s retirement
well-being. Lower-income workers, to the extent they can work longer, have the most to gain
from their additional labor. Policy changes that encourage work at older ages will substantially
improve both economic and personal well-being in the future.
JEL Classifications: J26, H6, I3 Keywords: Retirement, Social Security, taxes, federal deficit, retirement well-being

1
INTRODUCTION
One way of relieving the economic pressures created by an aging population is to
encourage workers to delay retirement. When people leave the workforce, they forgo
earnings. To replace these earnings, many retirees begin collecting pensions and/or
drawing down their assets. Most retirees also begin collecting Social Security benefits. At
the same time, retirees pay fewer taxes—not just payroll taxes that support Social
Security, but also federal, state, and local income taxes that support other government
programs. Thus, the retirement of the boomer generation, some 76 million people, is
expected to have a large impact on individuals, the retirement system, and the economy.
The oldest boomers will turn age 62—the age of first eligibility for Social
Security benefits and the age at which the majority of retired workers elect to receive
benefits—beginning in 2008. Because people are living much longer than before, even
substantial increases in work duration would leave future generations with more years of
retirement on average than almost all generations living in the past. When Social Security
benefits first became payable in 1940, the average worker retired at 68. To retire for an
equivalent number of years in 2005 would mean retiring at 74; by 2050, that equivalent
age would increase to 78. However, in 2005, workers on average retired about age 63
(Steuerle 2005).
When people work longer, they earn more income, usually save some of that
income, allow existing assets to grow, increase their lifetime Social Security benefits, and
increase their annual Social Security benefit even more when their lifetime benefits are
withdrawn over a shorter period of time. Butrica et al. (2004) estimate that people could
increase their annual consumption at older ages by more than 25 percent by simply
retiring at age 67 instead of age 62.
An aging population and the approaching retirement of the largest birth cohort in United
States history could mean an insufficient income stream to pay promised Social Security
benefits in 2017. Delaying retirement could ease this logjam. In 2004, the Social Security
Old-Age and Survivors Insurance and Disability Insurance (OASDI) Trust Funds paid
about $493 billion in Social Security benefits and received about $658 billion in revenue.

2
About 84 percent of this revenue came from payroll taxes paid by employees, employers,
and the self-employed. Another 2 percent came from income taxes paid on Social
Security benefits, and 14 percent came from interest income on OASDI Trust Funds
(Board of Trustees 2005).
The Office of the Chief Actuary (OCACT) projects that OASDI revenues (payroll
taxes, interest on the OASDI trust funds, and income taxes on Social Security benefits)
will be more than enough to pay promised benefits through 2016. After that, boomers
retiring in hoards would require trustees to begin redeeming the bonds held by the
OASDI Trust Funds. According to current projections, all assets in the trust funds will be
depleted by 2041. Without reform, benefits received after 2041 will have to be paid
solely out of payroll tax and the proceeds from income tax on benefits, which will fall
short of benefits promised under current law (Board of Trustees 2005). So working
longer would inject the trust funds with much-needed cash, especially from the additional
payroll taxes.
What’s more, workers who delay retirement produce additional goods and
services for the economy and pay additional income taxes that increase general revenues
used to support other government programs (or, for that matter, used to cover some of
Social Security reform). At the same time, these additional revenues from a larger
national income reduce tax pressures on younger workers or, alternatively, allow
government to spend more on programs other than for the elderly.
This report is the first comprehensive look at how changes in retirement behavior
and reforms that encourage workers to delay retirement could impact individual retiree
benefits, the solvency of the Social Security Trust Funds, and general revenues. The
specific ripple effect of delayed retirement is gauged using projections of retirement age,
Social Security take-up age, pensions, Social Security benefits, taxes, and other important
sources of income in retirement from the Urban Institute’s Dynamic Simulation of
Income Model (DYNASIM3).1 We increase the retirement and Social Security take-up
age of nondisabled workers and estimate their Social Security benefits, payroll taxes, and
federal and state income taxes. While the report shows the extraordinary possibilities
1. DYNASIM uses OCACT 2005 economic and demographic assumptions including labor force participation rates, average earnings, and mortality.

3
additional work generates, it is not a behavioral study of exactly how people respond to
existing incentives. Instead, it measures the economic consequences of delaying
retirement under a range of specified behavioral responses. Additional work requires
individuals to give up leisure time, but for many individuals, work also comes with
improved physical and mental well-being (Calvo 2006).
Findings show that the Social Security earnings generated from just one
additional year of work are almost equal to the entire 2045 Social Security shortfall (of
benefits from taxes) projected under the baseline scenario. A share of those earnings is
paid to the government in the form of taxes, including Social Security taxes. The
additional Social Security taxes generated by five years of work alone offset more than
half of the Social Security shortfall in 2045. Further, if one takes into account the
additional income tax revenues, the government’s gain to its unified account is far greater
than the size of the Social Security deficit. While it is harder to depend upon additional
work only to close the gap between projected Social Security income and outlays, various
combinations of benefit cuts and additional work can still leave the average retiree with
significantly higher average retirement income than he or she otherwise might have. The
increase in personal wealth from added work more than offsets any decrease in personal
wealth due to simulated Social Security benefit cuts. Under all of the simulated reform
options, added work leads to a more solvent and more financially secure retirement.
LITERATURE REVIEW
Although numerous studies have examined how our tax and benefit systems affect work
incentives, previous research has not measured the combined impact of Social Security,
taxes, and employee benefits on the returns to work at older ages. Gokhale, Kotlikoff, and
Sluchynsky (2002), for example, compare lifetime earnings for a representative two-
earner couple to lifetime taxes and the lifetime value of transfer payments they lose
because of work, and conclude that workers give up nearly 50 cents in tax payments and
foregone transfers for every dollar they earn. The authors do not, however, examine
returns to work at older ages or how returns vary with age. A number of studies have

4
investigated the impact of financial incentives on retirement behavior, especially the role
of Social Security and employer-sponsored pension and health plans (Coile and Gruber
2004; Johnson, Davidoff, and Perese 2003; Lumsdaine, Stock, and Wise 1992, 1994;
Samwick 1998; Stock and Wise 1990), but they have not focused on how total returns to
work change as adults age. Finally, Diamond and Gruber (1999) compute implicit tax
rates and replacement rates for prototypical workers, but they ignore the role of federal
income taxes and employer-sponsored pension and health insurance plans, which have
important effects on work incentives.
Research by Butrica et al. (2004) attempts to fill the gap in this literature by
describing the combined impact of Social Security, typical employee benefits, and the tax
system on the tax rates, replacement rates, and retirement wealth of representative
workers. The authors find that the implicit tax rate on work increases rapidly at older
ages, and by age 65, people can typically receive nearly as much in retirement as they can
by working (see figure 1). However, the authors also find that older individuals could
substantially increase their financial resources in retirement by working longer.2 For
example, the representative worker could nearly double his real annual income at age 75,
net of health insurance premiums and federal taxes, by stopping work at age 65 instead of
age 55. By waiting until age 68 to retire, he would accumulate enough wealth (from
pensions, Social Security, and saved earnings) to finance an annual consumption stream
at older ages of $60,000 per year, nearly three times as much as he could finance if he
retired at age 55.
This report builds on the research of Butrica et al. (2004) in two primary ways.
First, the results in this report are based on a nationally representative sample of the
United States population, rather than on prototypical individuals. Second, this report
examines the consequences of delaying retirement both at the macro and individual level,
rather than just the individual level. Specifically, this report considers how additional
work influences the Social Security deficit and the taxes that would go to support all
government programs within a unified budget, in addition to the lifetime and annual
benefit payments in Social Security. 2. Some of the implicit taxes are returned to workers in the form of higher Social Security benefits and pension income in retirement. Saved earnings from additional employment will increase consumption without increasing taxable income.

5
INTERACTION OF SOCIAL SECURITY, PENSIONS, EARNINGS, AND TAXES
This report accounts for the complex interaction between Social Security benefits,
pensions, earnings, and taxes to assess how working longer influences individual retiree
benefits, the solvency of the Social Security Trust Funds, and general revenues. This
section briefly describes how working longer might influence each income source, as
well as taxes. Butrica et al. (2004) provides more detail about the provisions of Social
Security, tax law, and employer benefit policies as they pertain to the decision to work at
older ages.
Working an additional year will generally increase future Social Security benefits,
for example, but the relationship between work history and Social Security is complex.
Social Security reduces payments for those who collect benefits before the normal
retirement age (NRA) and increases benefits for those who delay collecting until after the
NRA.3 But delaying take-up also reduces the number of payments they receive. The
optimal age of take-up depends in part on mortality expectations: those who survive until
very advanced ages will gain more from claiming later than those who do not live as
long. In addition, beneficiaries who continue to work are subject to the retirement
earnings test. For those below the NRA, Social Security withholds $1 in benefits for
every $2 of earnings in excess of the exempt amount—$12,480 in 2006. The reduction in
benefits is partly offset by higher future benefits.
Traditional defined benefit plans often introduce strong disincentives to work at
older ages. Workers with defined contribution pension plans can build up the assets in
these accounts through their own, and possibly their employers’, contributions. With
defined benefit pension plans, however, additional work does not necessarily translate
into higher benefits. For instance, many traditional defined benefit plans penalize those
who continue on the job after they qualify for full retirement benefits, reducing the
lifetime benefits they receive from the plan. Some plans also cap the number of service 3. Social Security reduces benefits by 5/9 of 1 percent for each month that benefits are received before the NRA, up to 36 months. The benefit is further reduced by 5/12 of 1 percent for every month before the NRA in excess of 36. Benefits are increased by 3/4 of 1 percent for each month that initial take-up exceeds the NRA, up to age 70. No credit is given for delaying initial take-up beyond age 70.

6
years that workers can credit toward their pensions, and others cap the share of pre-
retirement earnings that the plan will replace in retirement. In addition, for every year that
workers remain on the job past the plan’s retirement age, they forgo a year of retirement
benefits. Pension wealth declines when the increase in annual benefits from an additional
year of work is insufficient to offset the loss due to a reduction in the number of pension
installments.
Delaying retirement increases lifetime earnings and the ability to support, and
possibly increase, current and future consumption. Yet, the individual returns to work are
somewhat reduced because workers must pay both payroll and income taxes on most of
their earnings. For society as a whole, however, those additional taxes now become
available for other purposes, such as covering the cost of Social Security and Medicare.
METHODOLOGY
The Urban Institute’s Dynamic Simulation of Income Model (DYNASIM3) is used to
determine the individual and budgetary consequences of working longer. In DYNASIM,
retirement is defined as substantial, but not necessarily complete, withdrawal from the
labor force. Specifically, DYNASIM’s retirement age represents the age at which a
worker experiences at least a 50 percent drop in earnings compared with average earnings
earned between age 45 and 50. (The drop in earnings must last for at least two years.)
Defining the retirement age this way allows DYNASIM to simulate more gradual
transitions to full retirement. A separate DYNASIM module projects Social Security
take-up age using discrete-time hazard models based on age, expected benefit amount,
spousal characteristics, and Social Security policy parameters. (See Favreault and Smith
[2004] for more detailed information.)
The DYNASIM retirement and Social Security take-up age is increased by one or
five years to simulate delayed retirement. We do this for those who: (1) are not disabled,
(2) did not die before the model predicted their retirement or Social Security take-up, (3)
retired or took up Social Security benefits before age 70 or the end of the projection
period, and (4) are still in the labor force and not collecting Social Security benefits in

7
1993, the first year of DYNASIM projections. For example, in the “work one more year”
scenario, if DYNASIM projects a worker to retire at age 60 and to begin receiving Social
Security benefits at age 62, we force the worker to retire at age 61 and to take up Social
Security benefits at age 63. In the “work five more years” scenario, we force the worker
to retire at age 65 and to take up Social Security benefits at age 67. We then insert the
worker’s pre-retirement earnings, indexed by wage growth, in each simulated extra year
of work. We also shift the worker’s original post-retirement earnings to reflect his or her
additional work effort. After adjusting the earnings and benefit take-up age, we let the
model re-estimate pensions, Social Security benefits, and federal and state income taxes.
Working longer by itself may not close the gap between projected Social Security
income and outlays, and Social Security benefit changes may induce additional work.
Experimenting with alternative Social Security benefit structures, we conduct five policy
simulations that differ from Social Security current law (summarized in table 1):
• Pure Work Effect: All nondisabled individuals delay retirement and benefit take-
up and work one (or five) additional year(s). In this simulation, retirees receive
Social Security benefits, which may stay constant or increase because of a
delayed retirement credit or adjustment in the retirement earnings test, over a
shorter period of time.
• Pure Benefit Cut: An across-the-board benefit cut that is unaccompanied by any
change in work effort. This is represented by an increase in the Social Security
NRA, which forces an actuarial reduction in the benefit at every age of
retirement.4 While this simulation does not generate income for the Social
Security Trust Funds, it does decrease costs substantially.
• Partial Work, No Benefit Cut: An increase in the Social Security early entitlement
age (EEA) accompanied by an increase in the work effort of individuals who
4. Increasing the NRA as a way of cutting benefits is not unprecedented. The 1983 Social Security Amendments raised the NRA from age 65 to 67 over a 22-year period beginning in 2000. This provision was designed to increase the benefit reduction at age 62 from 20 percent in 1999 to 30 percent in 2022, and to institute a reduction in benefits at age 65 by as much as 13.4 percent in 2022. In our simulation, 62-year-old claimants in 2022 would face a 35 percent benefit reduction if the NRA were increased by one additional year, and a 45 percent benefit reduction if it were increased by five additional years.

8
originally retired before the new EEA.5 If the EEA increases by five years, then
workers who used to retire at or before age 62 would retire five years later, those
who used to retire between ages 63 and 66 would retire at age 67, and those who
used to retire at age 67 or later would not change their retirement age. This
simulation raises income slightly because workers who delay retirement continue
to pay taxes. But it also raises costs slightly because no one receives a benefit cut,
they just delay their Social Security take-up and benefits are reduced less for early
retirement.
• Partial Work with Benefit Cut: An increase in the EEA and the NRA,
accompanied by an increase in the work effort of individuals who originally
retired before the EEA. This is similar to the previous simulation except that it
decreases costs because the increase in the NRA is essentially a benefit cut.
• Full Work with Benefit Cut: Finally, an increase in the EEA and NRA,
accompanied by an increase of similar magnitude in the work effort of all
individuals. For example, if the EEA and NRA increase by one year, the work
effort of all individuals, excluding the disabled, increases by one year. This
simulation is identical to the previous one, but with a much larger impact since
everyone increases work effort in addition to the EEA and NRA changes.
For each of these simulations, we examine how individual retirement annuity income and
wealth, Social Security income and costs, and general revenues change compared to the
baseline (no reform).6 Because we are interested in highlighting how an individual’s work decision can
impact his or her retirement income, each of these sources of wealth reflects only the
wealth created by the individual. That is, we only include retired-worker benefits in the
Social Security wealth calculation (i.e., we exclude Social Security auxiliary benefits), 5. The early entitlement age, currently age 62, is the earliest age that individuals may take up Social Security benefits. However, annual benefits are then reduced to adjust for the fact that early retirees receive benefits over a longer period.
6. In order to analyze the change in net wealth and annual future consumption made possible by additional work, we first define total retirement wealth (TW) as the sum of Social Security wealth (SW), defined benefit pension wealth (DBPW), defined contribution account balances (DCPW), and earnings wealth (EW), less federal and state income taxes (IT) and payroll taxes (PT): TW = SW + DBPW + DCPW + EW – IT – PT

9
and pension wealth excludes survivors’ benefits, inheritances, and benefits obtained
through divorce. Each component of total retirement wealth is measured as the present
discounted value (PDV) of the expected future stream of benefits or payments from age
50 until death, and then put into constant 2006 dollars. The computations assume a real
interest rate of 2 percent. The measure shows net resources (from earnings, pensions, and
Social Security) available to finance consumption after age 49, evaluated in the year
2006.
We also annuitize the value of retirement wealth to show how real annual
consumption changes with additional work. We take the level of retirement wealth that
accumulates over the individual’s lifetime and divide it by the real annuity factor at age
50. The resulting value of the annuity shows how much could be consumed every year
from age 50 until death, if the retiree chose to equalize real annual consumption after age
49.7 If retirees saved their additional wealth from working longer and annuitized the
additional amount at retirement, their annual annuity payments would be much higher.
To show this, we compute a second annuity, which is the sum of two different
annuities—a baseline annuity purchased at age 50 and another purchased at the later of
retirement age or Social Security take-up age. To compute the second annuity, we
calculate the change in total net wealth between the baseline and alternative scenario,
grow it from age 50 until the later of retirement or Social Security take-up age by a real
interest rate of 2 percent, divide it by the real annuity factor that corresponds to that age,
and add it to the baseline annuity.
At the macro level, we calculate the change in the Social Security deficit and in
general revenue due to additional work. To do this, we aggregate Social Security benefits
and revenues over all individuals in the population and compare the projected total
number of OASDI beneficiaries, the total benefits that will be paid to them, the total
number of covered workers, and the total general revenue (payroll and income taxes)
generated by their work under the baseline and alternative scenarios. For these analyses,
we include both the individual’s Social Security retired-worker and auxiliary benefits to
represent more accurately the total costs to the system. We calculate the change in
7. The annuity is price-indexed (inflation protected) and based on the average mortality by age, cohort, sex, race, and education. The real rate of return is 2 percent.

10
Medicare Hospital Insurance (HI) tax from additional work, but we exclude these funds
in our Social Security deficit reduction calculations.
DESCRIPTION OF DYNASIM
DYNASIM is a useful tool for gaining insights into the future retiree population and their
retirement incomes.8 The model starts with a self-weighting sample of about 100,000
individuals from the 1990 to 1993 Survey of Income and Program Participation.
DYNASIM ages this starting sample in yearly increments to 2050, using parameters
estimated from longitudinal data sources. The model integrates many important trends
and differentials in life course processes, including birth, death, schooling, leaving home,
first marriage, remarriage, divorce, disability, work, and earnings. Important for this
study, DYNASIM projects retirement age and Social Security take-up age. DYNASIM
also simulates the major sources of retirement income—specifically Social Security
benefits, pension income, income from assets, earnings, Supplemental Security Income
(SSI), imputed rental income, and income from nonspouse co-resident family members.
Finally, the most recent version of DYNASIM also includes federal and state income
taxes, which are calculated using the income tax calculator developed by Jon Bakija
(2005). This calculator accurately models current law taxes including the Economic
Growth and Tax Relief Reconciliation Act (EGTRRA), the Jobs and Growth Tax Relief
Reconciliation Act (JGTRRA), the AMT, and the taxation of Social Security benefits and
pension income. (See the appendix for more detail on DYNASIM).
8. DYNASIM has been used to simulate how potential changes to Social Security will affect the future retirement benefits of at-risk populations (Favreault and Sammartino 2002; Favreault, Sammartino, and Steuerle 2002), how annuitization affects outcomes under a Social Security system with personal accounts (Uccello et al. 2003), the potential retirement consequences of rapid work effort growth among low-wage, single mothers in the late 1990s (Johnson, Favreault, and Goldwyn 2003), the implications of recent earnings inequality patterns for future retirement income (Smith 2002), and patterns of wealth accumulation and retirement preparedness (Butrica and Uccello 2004).

11
INCREASE IN INCOME AND WEALTH FOR INDIVIDUALS
Table 2 shows net retirement wealth and its components in our DYNASIM baseline. It
also describes the change in wealth due to working both one and five years longer. In our
baseline scenario, retirees who survive to 2049 and are receiving Social Security benefits
accumulate an average net retirement wealth of $625,976 (2006 dollars). This is the sum
of $199,378 in Social Security wealth, $39,576 in defined benefit pension wealth,
$54,633 in retirement account balances (defined contribution pensions), and $477,862 in
earnings wealth, less $110,982 in lifetime federal and state income taxes and $34,491 in
OASDI and HI payroll taxes. This retirement wealth could support an annual
consumption stream of $26,570 per year from age 50 onward.9
If everyone delayed their retirement by just one year (Pure Work Effect), the
average net retirement wealth would increase by $31,897 and the average annuity at age
50 would increase by $1,317 per year (5 percent). If retirees saved their additional wealth
from working another year and annuitized it at retirement (e.g., 401[k] balances were left
untouched until retirement), their annual annuity would increase by $2,402 per year (9
percent) compared to the baseline. When workers work an additional five years, average
net wealth increases $160,992 (26 percent) compared to the baseline. Annuitized at
retirement, this extra wealth would increase annual retirement income by $14,888 per
year—a 56 percent increase in retirement income compared to the baseline. While
average Social Security wealth and retirement account balances increase with extra work,
the big gains in net wealth for the individual come from his or her additional earnings.
This additional wealth also generates additional taxes that can then be used to support
more government spending for the retired population or for the population as a whole.
The pure addition of extra work has a large positive impact on retirement income, at least
as measured by potential consumption.
Table 3 shows the change in net wealth and the annual annuity under our five
reform scenarios working an additional one year and five years compared to the
9. Reported numbers include Social Security beneficiaries in 2049 age 60 and older. We also ran these analyses for the cohorts born between 1964 and 1966 and found very similar results. For this reason, we present only the results of the larger sample.

12
baseline.10 The baseline and “Pure Work Effect” columns show the same results as in
table 2.
Increasing the NRA without changing work behavior (Pure Benefit Cut) has a
large negative impact on retirement wealth because it is essentially a benefit cut. With a
one-year increase in the NRA and no work response, average net wealth would decline
by $12,169. The average annual annuity at age 50 would fall by $515 (2 percent), and the
average annual annuity at retirement would fall by $936 (4 percent) compared to the
baseline. With a five-year increase in the NRA, average net wealth would decrease by
over $60,000 and the average annuity at retirement would fall by 17 percent.
Next, consider a delay in retirement, but only by workers who originally retired
before the new EEA. If the EEA were increased one year in this “Part Work No Benefit
Cut” scenario, average net wealth would increase by $21,685 and pay out an annual
annuity that is $882 higher or even $1,497 higher (if the additional annuity did not begin
until retirement) than the baseline. If the EEA were increased five years and early retirees
worked five more years, average net wealth would increase by $132,716 and the annual
annuity at retirement would increase by $11,264 (42 percent). Note that what goes on
here is that lifetime Social Security benefits go up (the actuarial adjustment is more than
fair) slightly, some workers labor for an additional year and get more earnings, there are
additional savings in defined contribution plans, and there are more taxes paid on the
work.
In contrast to pure benefit cuts that decrease average net wealth, benefit cuts that
are accompanied by additional work actually increase average net wealth. If only early
retirees worked one more year but we increased the NRA one year (Part Work and
Benefit Cut), net wealth would increase $9,661. This would increase the average annuity
at retirement by 2 percent. If every eligible worker changed his work behavior on top of a
benefit cut (Full Work and Benefit Cut), net wealth would increase $20,016 and the
annuity at retirement would increase 5 percent. Under these scenarios, workers get the
wealth benefit from the extra work, but the gain is partly offset by a reduction in Social
10. Appendix A2 provides more details on how the sources of net wealth change with both one year and five years of additional work.

13
Security benefits due to the benefit cut. The more workers who work longer, the larger
the net gain.
If we focus just on the change in annuity income at retirement under our alternate
reform scenarios, bigger increases in work effort yield bigger gains in retirement income.
Reductions in Social Security benefits reduce retirement income, but benefit cuts in
conjunction with additional work will ultimately lessen the size of any benefit cut needed
to achieve solvency.
Lower-income workers get larger gains from additional work than do higher-
income workers (see figure 2). Partly because of the progressive Social Security and
income tax systems, lower-income workers keep a greater share of additional earnings
because of lower tax rates compared with higher-income workers. Of course, since lower-
income workers also tend to have somewhat higher mortality rates than higher-income
workers, their additional earnings are spread over fewer years of remaining life. This
mortality differential is captured in our calculated annuity income through education.
While DYNASIM projects that the average annuity at retirement from one year of work,
given no changes in Social Security policy, would increase 9 percent, workers in the
bottom fifth of lifetime earnings distribution would get an average increase of 16 percent
in their annuity at retirement from one year more work and a 98 percent increase from
five more years of work. Benefits from work are still large for the top lifetime earners,
but only about half as large as for the lowest earners.
Not all low-income workers can achieve this gain, of course. This paper does not
examine all the policy options that one may also want to enact in conjunction with efforts
to increase working years. But note that the relative gains increase well up the income
scale, so that even the second richest quintile has a larger percentage increase in annual
income than does the richest. Still, the gains are sizable in every quintile.
Most individuals are healthy and able to work at older ages. Only about 20
percent of recent early Social Security claimants report having a health condition that
limits the amount or type of work they can do (Panis et al. 2002).11 Most of these
individuals would be eligible for Social Security disability insurance and are not included
11. Panis et al. (2002) is based on the first five waves (1992, 1994, 1996, 1998, and 2000) of the Health and Retirement Study among individuals born between 1931 and 1941.

14
in our simulations. Panis et al. (2002) find that only about 5 percent of early claimants
would be disadvantaged by an increase in the EEA due to poor health, lack of pension,
and physically demanding jobs. This leaves a large share of healthy workers who are
potentially able to increase their work effort.
Substantial increases in work at older ages may be dependent on some amount of
policy reform. Changing the symbolism of defining 62 as old age may itself have long-
term effects if people begin to realize at that age they often have one-third of their adult
lives on average remaining before them. Policy reform—whether it changes symbols or
incentives or both—is likely to change work behavior (although we do not examine how
much in this paper). As a bottom line, however, neither the “Pure Work Effect” nor the
“Pure Benefit Cut” scenarios is realistic. Rather, reforms that include both work increases
and benefit cuts are a more likely outcome.
Our examination of the potential change in retirement age brings to mind two
very important problems that should be addressed. First, an increase in the retirement age
for some individuals means an actual loss in defined benefits under current private plan
practices. These net losses for individuals in some cases are offset by an equal and
opposite net gain to employers. If one believes that employees could capture these gains,
then the table understates the net gains to employees; either way it understates the net
gains to the economy. Second, the actuarial adjustments in Social Security are quite
generous as one moves into the future—in fact, they are more than actuarially fair from a
benefit standpoint.12 Adjustments in retirement age need to be done in a way that avoids
large unintended losses by relying on old formulas for what makes actuarial sense. For
example, the “Pure Work Effect” scenario not only increases taxes paid by workers, it
also bumps up their average lifetime benefits.
12. Given expected increases in life expectancy of future retirees, the actuary reduction for early benefits does not reduce benefits enough to compensate for the additional years of expected benefits. The reduction factors are based on life expectancy of earlier cohorts.

15
EFFECTS OF ADDITIONAL WORK ON SOCIAL SECURITY
This section examines the extent to which working longer can help make Social Security
solvent. To do this, we aggregate Social Security benefits and revenues over all
individuals in the population and compare the projected total number of OASDI
beneficiaries, the total benefits that will be paid to them, the total number of covered
workers, and the total payroll taxes generated by their work under the baseline and
alternative scenarios.
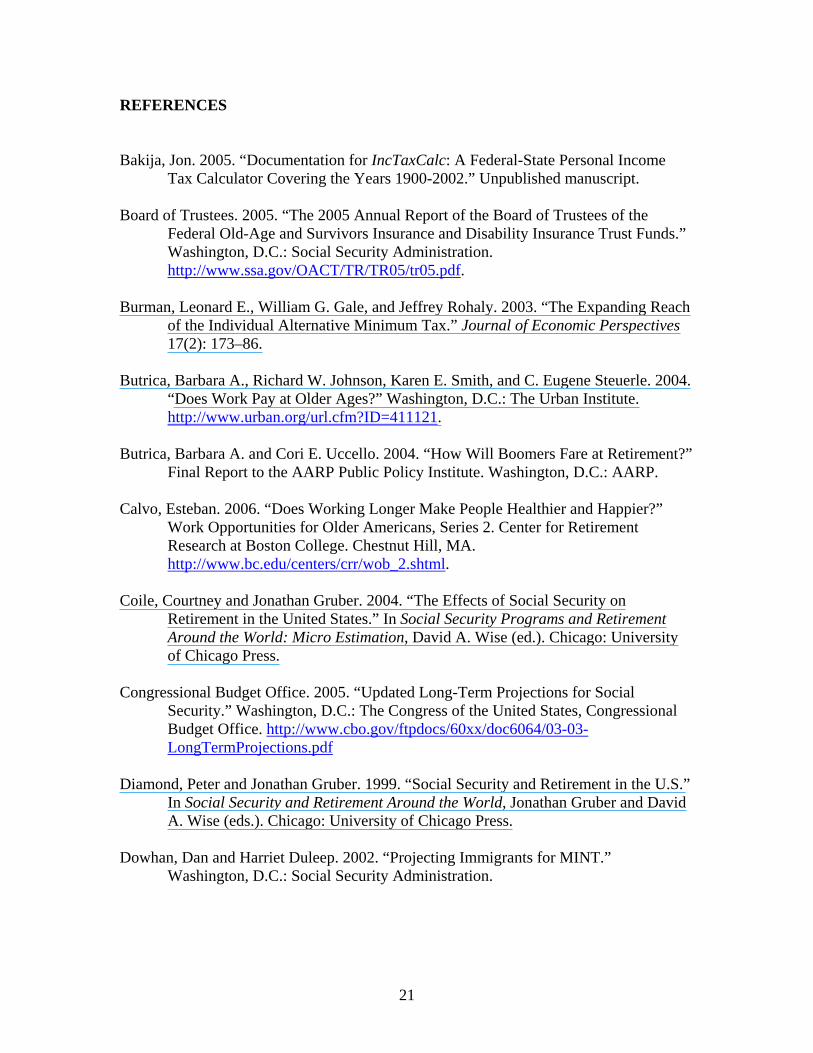
Under the DYNASIM baseline, Social Security expenditures on benefit payments
will exceed income from OASDI payroll taxes beginning in 2023 (see figure 3).13 By
2045, DYNASIM projects Social Security income to be $3,791 billion and costs to be
$4,430 billion—a deficit of $638 billion. If everyone worked one more year (Pure Work
Effect), this would reduce the deficit by 2 percent (see table 4). However, working five
more years (Pure Work Effect) would reduce the deficit by 29 percent, still leaving a
Social Security deficit of $450 billion. Unfortunately, working longer by itself does not
close the gap between projected Social Security income and outlays.14
Combining additional work with changes in Social Security policy has a much
larger impact on the Social Security deficit than just working longer by itself. For
example, if everyone delayed retirement by five years and, at the same time, both the
EEA and NRA were increased by five years (Full Work and Benefit Cut), Social Security
could remain solvent beyond 2049 (the last year in the projection period). The deficit in
2045 would be reduced by 159 percent to become a surplus of $377 billion. Even under
the “Part Work and Benefit Cut” scenario, where not everyone delays retirement, the
deficit in 2045 would be reduced by 147 percent to become a surplus of $299 billion.
13. OCACT projects that Social Security outlays will first exceed revenues in 2017 (Board of Trustees 2005). The Congressional Budget Office projects this year to be 2020 (Congressional Budget Office 2005). Our estimates will differ from either of these sources because (1) DYNASIM does not project children’s Social Security benefits, (2) our measure of Social Security revenue includes only payroll taxes and excludes interest and taxes on benefits, and (3) there are small differences in lifetime earnings of workers and their spouses.
14. Of course, increasing work beyond five years may be enough to close the gap, but this policy seems unrealistic.

16
Increasing the NRA five years alone (Pure Benefit Cut) would achieve solvency,
reducing the deficit by 138 percent to become a surplus of $243 billion in 2045.
Even though delaying retirement by itself (Pure Work Effect) does not close the
deficit, it does reduce it by 2 percent for one more year of work and by 29 percent for five
more years of work. Thus, more work allows a much higher benefit level to be sustained
(at any tax rate). The Social Security earnings from one additional year of work ($568
billion) in 2045 are almost equal to the entire 2045 Social Security deficit projected under
the baseline scenario. Also, the additional Social Security taxes generated by five years of
work ($360 billion) is more than half of the Social Security shortfall in 2045.
Figure 4 shows aggregate income and costs to the Social Security system under
the baseline and alternate scenarios assuming workers delay retirement by 5 years. As the
cost to income ratio illustrates, under the baseline, the year of insolvency is 2023. It
moves to 2027 under the “Pure Work Effect” scenario, to 2025 under “Part Work Effect
No Benefit Cut” scenario, and beyond 2049 under all other scenarios.
EFFECTS OF ADDITIONAL WORK ON GENERAL REVENUES
Additional work also increases general revenues through federal and state income taxes.
While this extra revenue is not earmarked for Social Security, it does represent additional
resources available to cover other government spending or to help avoid higher taxes. We
add this additional revenue to our measure of deficit reduction to calculate the change in
the unified deficit. If all eligible workers worked one more year (Pure Work Effect),
general revenues would increase $170 billion (see table 5).15 The extra general tax
revenue combined with the $10 billion Social Security deficit reduction (from table 4)
would generate $180 billion additional revenue—that is a 28 percent reduction in the
baseline Social Security deficit, compared with only a 2 percent reduction when the extra
general tax revenue is excluded. A benefit cut without any additional work (Pure Benefit
15. Additional work also increases hospital insurance (HI) taxes. We do not include the additional HI revenue in our measure of revenue gains from work.

17
Cut) also lowers the Social Security deficit, but because it produces less income tax
revenue, it reduces the total reform savings.
The impact of increased general revenues would be substantially greater if
everyone delayed retirement by five years. For example, under the “Pure Work Effect”
scenario, the Social Security deficit would decline by 29 percent, but the unified deficit
would decline by 159 percent—more than enough to pay promised Social Security
benefits in 2045. In fact, accounting for the increase in general revenues, all of the five-
year scenarios modeled would be solvent throughout the projection period (see figure 5).
While none of our one-year scenarios generate enough additional revenue to close
the long-term Social Security deficit, all of the five-year scenarios are more than
sufficient. The more we can encourage workers to delay retirement, the less we will have
to reduce promised benefits to achieve solvency. (The net fiscal cost will depend on the
net cost of the reform option used to induce the retirement change.) More work also
increases retirement income through increased personal savings and a shorter spend-
down period. The less we need to cut benefits to close the spending gap, the more we can
promise in Social Security. Since Social Security is still the most important asset for most
retired households, additional work goes a long way toward ensuring retirees a
comfortable retirement in the decades to come.
Looking narrowly at the Social Security system and ignoring the individual’s
additional earnings, at any given tax rate, additional work allows Social Security on
average to pay a higher level of lifetime benefits (because there are more taxes to be
shared). If people also stop increasing their number of years of benefits as their lifespans
increase, their annual benefits in retirement can be maintained at a higher rate. As a
corollary, for any Social Security system with any (reformed or unreformed) tax rate, a
higher average retirement age (however induced) means higher lifetime benefits and
much higher annual benefits than in a system with a lower retirement age.

18
DISCUSSION
A number of policy changes have already occurred to encourage more work at older ages.
These include the increase in the Social Security normal retirement age, the shift from
defined benefit to defined contribution pensions, and the scaling back of retiree health
insurance. However, these changes alone will probably not be enough. The revenue
impact of additional work can significantly lessen the amount of benefit cuts necessary to
make Social Security solvent. Any reform that increases work effort allows substantially
higher levels of consumption for the population and higher Social Security benefits for
retirees.16
Some options to consider that would encourage work at older ages include the
following:
• Change the Social Security actuarial adjustments to boost the rewards for working
longer and the penalties for retiring younger—even if actuarially neutral. For
instance, one could consider decreasing early Social Security benefits and
increasing delayed Social Security benefits. Note that distributional issues can be
met several ways, such as providing a minimum benefit, or applying this type of
actuarial adjustment only for marginal benefits above some minimum (so that
only retirees with higher lifetime earnings were affected).
• Increases in the benefit entitlement age for both Social Security and Medicare.
Indexing the NRA and the EEA to changes in life expectancy by itself would help
reverse past trends where, because people were receiving benefits earlier and
earlier relative to expected death, smaller and smaller shares of total benefits were
being paid to the truly old (e.g., those in the last ten years of their lives).
• Many incentives for early retirement are outside of the Social Security system.
Regulatory barriers (e.g., from the tax code, the Employee Retirement Income
Security Act of 1974 [ERISA], and the Age Discrimination in Employment Act
[ADEA]) discourage the offering of phased retirement. For instance, some 16. Although some reform options would require additional government spending, they would improve work incentives at older ages.

19
regulations prevent workers from collecting their defined benefit pensions while
continuing to work for the plan sponsor, forcing workers to either retire or lose
substantial pension wealth (Penner, Perun, and Steuerle 2002).
• The elimination of the requirement that Medicare serve as the secondary payer for
workers with employer-sponsored coverage. The high cost of medical insurance
for older workers discourages employers from retaining or hiring workers over
age 65. Allowing Medicare (whatever the initial age of eligibility) to be the
primary payer would lower employment costs and reduce the implicit tax rate
faced by older workers, increasing work incentives at older ages.
CONCLUSION
Previous work has shown that the economic pressures of an aging population can be
relieved considerably for particular hypothetical workers if they can be encouraged to
delay retirement. The choice of retirement age is the most important portfolio choice
most workers will make—far exceeding in importance such issues as whether to invest
their 401(k)s in stocks or bonds. Working longer increases the net output and productivity
of the economy, generates additional payroll and income tax revenue, and reduces the
average number of years in which people receive retirement benefits. This report extends
that previous research by demonstrating for the population as a whole just how much of a
difference additional years of work can make for retirement income, for closing the gap
in the Social Security deficit, and for producing other taxes that can be used to support
the government as a whole.
We find that people could increase their annual consumption at older ages by 5
percent if they worked one more year and by 25 percent if they worked five more years—
assuming an annuity purchased at age 50. The gains from working longer would be even
greater if retirees saved their additional wealth and annuitized it at retirement—a 9
percent increase in consumption from one more year of work and a 56 percent increase
from five more years of work. Lower-income workers gain more from additional work
than higher-income workers, but all workers gain.

20
The Social Security earnings generated from one additional year of work are
almost equal to the entire 2045 Social Security shortfall (of benefits from taxes) projected
under the baseline scenario. Also, the additional Social Security taxes generated by five
years of work offset more than half of the Social Security shortfall in 2045. While
working an additional five years reduces the Social Security deficit, it is not enough to
completely erase it. However, combining additional work with a corresponding change in
the NRA means that Social Security could remain solvent beyond 2049 (the last year in
the projection period). Accounting for the federal and state income taxes generated from
additional work, no other changes in Social Security policy would be needed for the
system to remain solvent throughout the projection period. Interpolating between the one
year and five year projections suggests that if workers would increase their work over the
next 45 years roughly in proportion to their increase in life expectancy, they would likely
increase payroll and income taxes by enough to wipe out almost any deficit in old age
insurance payments between benefit payments and Social Security taxes currently
collected.17 In this last case, we are not arguing that all those tax dollars should be
devoted to Social Security, only how powerful the effect of additional work can be.
17. According to OCACT, the life expectancy in 2004 was 74.6 years for men and 79.6 years for women (Board of Trustees 2005). Under their intermediate assumptions, life expectancies in 2050 will increase by 4.8 years for men and 3.6 years for women.
21
REFERENCES
Bakija, Jon. 2005. “Documentation for IncTaxCalc: A Federal-State Personal Income Tax Calculator Covering the Years 1900-2002.” Unpublished manuscript.
Board of Trustees. 2005. “The 2005 Annual Report of the Board of Trustees of the
Federal Old-Age and Survivors Insurance and Disability Insurance Trust Funds.” Washington, D.C.: Social Security Administration. http://www.ssa.gov/OACT/TR/TR05/tr05.pdf.
Burman, Leonard E., William G. Gale, and Jeffrey Rohaly. 2003. “The Expanding Reach
of the Individual Alternative Minimum Tax.” Journal of Economic Perspectives 17(2): 173–86.
Butrica, Barbara A., Richard W. Johnson, Karen E. Smith, and C. Eugene Steuerle. 2004.
“Does Work Pay at Older Ages?” Washington, D.C.: The Urban Institute. http://www.urban.org/url.cfm?ID=411121.
Butrica, Barbara A. and Cori E. Uccello. 2004. “How Will Boomers Fare at Retirement?”
Final Report to the AARP Public Policy Institute. Washington, D.C.: AARP. Calvo, Esteban. 2006. “Does Working Longer Make People Healthier and Happier?”
Work Opportunities for Older Americans, Series 2. Center for Retirement Research at Boston College. Chestnut Hill, MA. http://www.bc.edu/centers/crr/wob_2.shtml.
Coile, Courtney and Jonathan Gruber. 2004. “The Effects of Social Security on
Retirement in the United States.” In Social Security Programs and Retirement Around the World: Micro Estimation, David A. Wise (ed.). Chicago: University of Chicago Press.
Congressional Budget Office. 2005. “Updated Long-Term Projections for Social
Security.” Washington, D.C.: The Congress of the United States, Congressional Budget Office. http://www.cbo.gov/ftpdocs/60xx/doc6064/03-03-LongTermProjections.pdf
Diamond, Peter and Jonathan Gruber. 1999. “Social Security and Retirement in the U.S.”
In Social Security and Retirement Around the World, Jonathan Gruber and David A. Wise (eds.). Chicago: University of Chicago Press.
Dowhan, Dan and Harriet Duleep. 2002. “Projecting Immigrants for MINT.”
Washington, D.C.: Social Security Administration.

22
Favreault, Melissa M. and Frank J. Sammartino. 2002. “Impact of Social Security Reform on Low-Income and Older Women.” Final Report to the AARP Public Policy Institute. Washington, D.C.: AARP.
Favreault, Melissa M., Frank J. Sammartino, and C. Eugene Steuerle (eds.). 2002. Social
Security and the Family Addressing Unmet Needs in an Underfunded System. Washington, D.C.: Urban Institute Press.
Favreault, Melissa M. and Karen E. Smith. 2004. “A Primer on the Dynamic Simulation
of Income Model (DYNASIM3).” Discussion Paper, The Retirement Project. Washington, D.C.: The Urban Institute.
Gokhale, Jagadeesh, Laurence J. Kotlikoff, and Alexi Sluchynsky. 2002. “Does It Pay to
Work?” NBER Working Paper No. 9096. Cambridge, MA: National Bureau of Economic Research.
Holmer, Martin, Asa Janney, and Bob Cohen. 2006. “Overview of PENSIM.” Report for
the U.S. Department of Labor, Employee Benefits Security Administration. http://www.polsim.com/overview.pdf.
Johnson, Richard W., Amy J. Davidoff, and Kevin Perese. 2003. “Health Insurance Costs
and Early Retirement Decisions.” Industrial and Labor Relations Review 56(4): 716–29.
Johnson, Richard W., Melissa M. Favreault, and Joshua H. Goldwyn. 2003.
“Employment, Social Security, and Future Retirement Outcomes for Single Mothers.” CRR Working Paper No. 2003-14. Chestnut Hill, MA: Center for Retirement Research at Boston College. http://www.bc.edu/centers/crr/wp_2003-14.shtml.
Lumsdaine, Robin, James H. Stock, and David A. Wise. 1992. “Three Models of
Retirement: Computational Complexity Versus Predictive Validity.” In Topics in the Economics of Aging, David A. Wise (ed.). Chicago: University of Chicago Press.
———. 1994. “Pension Plan Provisions and Retirement: Men and Women, Medicare and
Models.” In Studies in the Economics of Aging, David A. Wise (ed.). Chicago: University of Chicago Press.
Panis, Constantijn, Michael Hurd, David Loughran, Julie Zissimopoulos, Steven Haider,
and Patricia St.Clair. 2002. “The Effects of Changing Social Security Administration's Early Entitlement Age and the Normal Retirement Age.” Report for the Social Security Administration. Santa Monica, CA: RAND.

23
Penner, Rudolph G., Pamela Perun, and Eugene Steuerle. 2002. “Legal and Institutional Impediments to Partial Retirement and Part-Time Work by Older Workers.” Washington, D.C.: The Urban Institute. http://www.urban.org/url.cfm?ID=410587.
Samwick, Andrew A. 1998. “New Evidence on Pensions, Social Security, and the Timing
of Retirement.” Journal of Public Economics 70(2): 207–36. Smith, Karen E. 2002. “How Will Recent Patterns of Earnings Inequality Affect Future
Retirement Incomes?” Final Report for AARP. Washington, D.C.: The Urban Institute.
Smith, Karen E., Fritz Scheuren, and Jillian Berk. 2001. “Adding Historical Earnings to
the Survey of Income and Program Participation (SIPP).” In 2001 Proceedings, Statistical Computing Section. [CD-ROM]. American Statistical Association.
Steuerle, C. Eugene. 2005. “Alternatives to Strengthen Social Security.” Testimony
before the U.S. Committee on Ways and Means of the U.S. House of Representatives, May 12.
Stock, James H. and David A. Wise. 1990. “Pensions, the Option Value of Work, and
Retirement.” Econometrica 58(5): 1151–80. Uccello, Cori E., Melissa M. Favreault, Karen E. Smith, and Larry H. Thompson. 2003.
“Simulating the Distributional Consequences of Personal Accounts: Sensitivity to Annuitization Options.” Washington, D.C.: The Urban Institute. http://www.urban.org/url.cfm?ID=410960.
VanDerhei, Jack, Russell Galer, Carol Quick, and John Rea. 1999. “401(k) Plan Asset
Allocation, Account Balances, and Loan Activity.” EBRI Issue Brief No. 205. Washington, D.C.: Employee Benefit Research Institute.

24
Option Work AdjustmentChange in
EEAChange in
NRABaseline - - -Pure Work Effect Work+N - -Pure Benefit Reduction - - ↑
Part Work No Benefit Cut Work+N before EEA ↑ -Part Work with Benefit Cut Work+N before EEA ↑ ↑
Full Work with Benefit Cut Work+N ↑ ↑
Table 1. Summary of Policy Simulations
Notes: N equals one for the one-year scenarios and five for the five-year scenarios. Dash indicates no change compared to the baseline scenario. Arrow indicates an increase compared to the baseline scenario.
BaselineWork One More Year
Work Five More Years
Social Security $199,378 $5,937 $28,864DB Pensions 39,576 -421 -2,517DC Pensions 54,633 2,028 10,859Earnings 477,862 35,579 180,658Federal/State Income Taxes 110,982 8,736 44,157Payroll Taxes 34,491 2,489 12,715
Total Net Wealth 625,976 31,897 160,992Annual Annuity at Age 50 26,570 1,317 6,688Annual Annuity at Retirement 2,402 14,888
%Change Total Net Wealth 5% 26%%Change Annual Annuity at Age 50 5% 25%%Change Annual Annuity at Retirement 9% 56%
Source: The Urban Institute tabulations of DYNASIM3.
2. Annuity at retirement is the change in total net wealth between the baseline and alternative scenario, grown from age 50 until the later of retirement or Social Security take-up age by a real interest rate of 2 percent, divided it by the real annuity factor that corresponds to that age, and added to the baseline annuity.
Table 2. Mean Baseline Respondent Wealth and Change from Additional Work ($2006)
Change from Baseline
Notes: Based on 17,547 unweighted observations of persons who are alive in 2049 and retired and receiving Social Security benefits.1. Annuity at age 50 is total net wealth divided by the real annuity factor at age 50.

25
BaselinePure Work
EffectPure Benefit
Cut
Part Work No Benefit
Cut
Part Work and Benefit
Cut
Full Work and Benefit
CutWork One More Year
Net Wealth $625,976 $31,897 -$12,169 $21,685 $9,661 $20,016Annuity at Age 50 26,570 1,317 -515 882 374 816Annuity at Retirement 2,402 -936 1,497 554 1,449% Change Annuity at Age 50 5% -2% 3% 1% 3%% Change Annuity at Retirement 9% -4% 6% 2% 5%
Work Five More YearsNet Wealth 625,976 160,992 -60,256 132,716 73,331 100,344Annuity at Age 50 26,570 6,688 -2,549 5,482 2,968 4,127Annuity at Retirement 14,888 -4,617 11,264 5,948 8,993% Change Annuity at Age 50 25% -10% 21% 11% 16%% Change Annuity at Retirement 56% -17% 42% 22% 34%
Source: The Urban Institute tabulations of DYNASIM3.
Table 3. Mean Respondent Wealth and Annuity Income in 2049 Under Current Law and Estimated Change Under Alternate Reform Scenarios ($2006)
Notes: Based on 17,547 unweighted observations of persons who are alive in 2049 and retired and receiving Social Security benefits.1. Annuity at age 50 is total net wealth divided by the real annuity factor at age 50.2. Annuity at retirement is the change in total net wealth between the baseline and alternative scenario, grown from age 50 until the later of retirement or Social Security take-up age by a real interest rate of 2 percent, divided it by the real annuity factor that corresponds to that age, and added to the baseline annuity.
Change Due to the Reform Compared to Baseline
Baseline
Pure Work Effect
Pure Benefit
Cut
Part Work No Benefit
Cut
Part Work and
Benefit Cut
Full Work and
Benefit Cut
Work One More YearSocial Security Earnings $30,575 $31,161 $30,575 $30,944 $30,944 $31,161Social Security Income 3,791 3,864 3,791 3,837 3,837 3,864Social Security Cost 4,430 4,492 4,250 4,511 4,309 4,317Social Security Deficit (OASDI) 638 628 459 674 472 453Percent Change in Deficit -2% -28% 6% -26% -29%
Work Five More YearsSocial Security Earnings $30,575 $33,481 $30,575 $32,873 $32,873 $33,481Social Security Income 3,791 4,152 3,791 4,076 4,076 4,152Social Security Cost 4,430 4,602 3,548 4,652 3,777 3,775Social Security Deficit 638 450 -243 576 -299 -377Percent Change in Deficit -29% -138% -10% -147% -159%
Source: The Urban Institute tabulations of DYNASIM3.
Table 4. Total Social Security Income, Cost, Social Security Deficit in 2045 by Reform Scenario (dollars in billions)
Notes: Includes all surviving U.S. residents in 2045 (146,555 unweighted observations). Social Security Earnings includes only covered earnings below the taxable maximum. Social Security income includes OASI and DI taxes. Social Security cost includes OASI and DI adult benefits.

26
Pure Work Effect
Pure Benefit Cut
Part Work No Benefit
Cut
Part Work and Benefit
Cut
Full Work and Benefit
CutWork One More Year
Increase in Income Tax 170 -23 97 69 139Reduction in Social Security Deficit 10 180 -36 167 185Reduction in Unified Deficit 180 157 62 236 324Percent Change in Social Security Deficit -2% -28% 6% -26% -29%Change in Unified Deficit as a Percent of the Social Security Deficit -28% -25% -10% -37% -51%
Work Five More YearsIncrease in Income Tax 824 -110 610 473 684Reduction in Social Security Deficit 188 882 63 938 1,015Reduction in Unified Deficit 1,012 772 672 1,411 1,700Percent Change in Social Security Deficit -29% -138% -10% -147% -159%Change in Unified Deficit as a Percent of the Social Security Deficit -159% -121% -105% -221% -266%
Includes all surviving U.S. residents in 2045 (146,555 unweighted observations).Income tax includes both federal and state income tax. Source: The Urban Institute tabulations of DYNASIM3.
Table 5. Total Change in Income Tax, Social Security Deficit and Unified Deficit in 2045 by Reform Scenario (dollars in billions)
Notes: Percent change based on projected baseline Social Security deficit of $638 billion in 2045.

27
Figure 1. Net Income of a Hypothetical Worker by Age and Employment Status
$0
$5,000
$10,000
$15,000
$20,000
$25,000
$30,000
$35,000
$40,000
$45,000
55 56 57 58 59 60 61 62 63 64 65 66 67 68 69
Age
Net
Inco
me
($20
04)
Retired
Working
Source: Urban Institute tabulations of DYNASIM3.
Figure 2. Percent Change from Baseline in Average Annuity Income at Retirement by Lifetime Earnings Quintile and Additional Work
Effort
9%16%
12% 10% 8% 7%
56%
98%
71%61%
52%42%
0%
20%
40%
60%
80%
100%
120%
All BottomQuintile
2ndQuintile
3rdQuintile
4thQuintile
TopQuintile
Lifetime Earnings Quintile
Perc
ent C
hang
e in
Ann
uity
Inco
me
at
Ret
irem
ent
Work One More YearWork Five More Years
Source: Urban Institute tabulations of DYNASIM3.
28
Figure 3. Aggregate Income and Costs to the Social Security System, Under the Baseline, 2000 to 2050
0
1000
2000
3000
4000
5000
6000
2000 2005 2010 2015 2020 2025 2030 2035 2040 2045 2050Year
Am
ount
(Bill
ions
)
Cost
Income
Cost begins to exceed income in 2023
Source: Urban Institute tabulations of DYNASIM3.
Figure 4. Social Security Cost to Income Ratio Under Various Working Five More Years Reform Scenarios, 2000 to 2049
0.4
0.5
0.6
0.7
0.8
0.9
1.0
1.1
1.2
2000 2005 2010 2015 2020 2025 2030 2035 2040 2045Year
Cos
t to
Inco
me
Rat
io
Baseline
Part Work No Benefit Cut
Pure Work Effect
Pure Benefit Cut
Part Work and Benefit Cut
Full Work and Benefit Cut
Source: Urban Institute tabulations of DYNASIM3.

29
Figure 5. Social Security Cost to Income Ratio Under Various Working Five More Years Reform Scenarios
Including Additional Income Tax, 2000 to 2049
0.4
0.5
0.6
0.7
0.8
0.9
1.0
1.1
1.2
2000 2005 2010 2015 2020 2025 2030 2035 2040 2045Year
Cos
t to
Inco
me
Rat
io
BaselinePart Work No Benefit CutPure Benefit CutPure Work EffectPart Work and Benefit CutFull Work and Benefit Cut
Source: Urban Institute tabulations of DYNASIM3.

30
APPENDIX
Appendix table 1 summarizes the basic processes modeled in DYNASIM, along with the
data on which the module’s parameters are estimated. Favreault and Smith (2004)
provide a fuller description of each of the modules used in DYNASIM. More details on
the modules directly related to this report are provided below.
Sample
DYNASIM begins with a self-weighting sample of 103,072 individuals from the 1990–
1993 Survey of Income and Program Participation (SIPP) data. The SIPP data provide
starting values for age, sex, race, education, marital status, immigrant status, earnings,
pension characteristics, financial asset, home equity, earnings, Social Security, and SSI.
Earnings
Projections of pension and Social Security wealth depend on earnings. DYNASIM has
historic individual earnings from 1951 to 1992 and projected earnings from 1993 to 2050.
These historical data are based on earnings records that are statistically matched from
longitudinal earnings histories taken from the 1968–1994 PSID and the 1973 March
Current Population Survey (CPS) matched to the Social Security Administration
Summary Earnings Record.18 Projected labor supply and earnings are based on a complex
set of regressions from the PSID and the National Longitudinal Survey of Youth (NLSY)
and calibrated to 2005 Social Security Office of the Chief Actuary (OCACT)
assumptions about future labor force participation and wage growth.
Taxes
DYNASIM has the capacity to estimate payroll taxes, as well as state and federal income
taxes. The DYNASIM tax calculator accurately models current law taxes including
EGTRRA, JGTRRA, the AMT, and the taxation of Social Security benefits and pension
18 Smith, Scheuren, and Berk (2001) show that these earnings histories match up quite well with actual earnings histories that are available on a confidential basis at the Social Security Administration.

31
income. The tax calculator also simulates future tax law. For short-term projections
(through about 2010), it holds constant the current law tax rates and adjusts the brackets
as appropriate for expected inflation. It holds the Social Security taxation thresholds at
their current law values, since these are not indexed for inflation. The calculator also
price indexes the provisions of the alternative minimum tax (AMT) beyond the current
period, even though these provisions are not currently indexed. Without this adjustment,
many middle-class taxpayers would end up paying the AMT (Burman, Gale, and Rohaly
2003). Since wages are expected to increase faster than prices, the tax calculator indexes
the brackets and provisions of the AMT to wages instead of prices for the long-term
projections. Doing this will avoid real-bracket creep and prevent the ratio of taxes to
gross domestic product (GDP) from rising steadily over time. It also continues to hold the
Social Security taxation thresholds at their current law values.
Pensions
DYNASIM projects pension amounts in defined benefit (DB) plans and defined
contribution (DC) plans, as well as from IRA and Keogh plans. Pensions are based on an
individual’s entire work history (real and simulated) up to the projected retirement date.
Baseline information regarding pension coverage on current and past jobs is based on
SIPP self-reports. To impute future job changes and pension coverage on future jobs,
DYNASIM incorporates data on synthetic work histories from the Policy Simulation
Group’s PENSIM model, developed for the Department of Labor, Pension and Welfare
Benefits Administration.19
DYNASIM next projects pension benefits from past, current, and future jobs. In
general, DB plan benefits are projected using pension plan formulas from the Pension
Benefit Guarantee Corporation (PBGC)’s Pension Insurance Modeling System (PIMS).
DC account balances are projected using self-reported information on the SIPP regarding
account balances and contribution rates, as well as asset allocations and future
contribution rates that vary by age according to EBRI/ICI data on 401(k) asset allocations
(VanDerhei et al. 1999). The proportion of initial contributions and balances allocated to
equities varies by age category. Then, every five years, the model rebalances the
19 See Holmer, Janney, and Cohen (2006) for more detail on the PENSIM model.

32
portfolios according to the allocation strategy for the individual’s attained age category.
Subsequent contributions are allocated to match the allocation strategy of the attained
age, if different. DYNASIM accumulates DC account balances assuming a Consumer Price Index
(CPI) growth rate of 3.00 percent (the growth rate assumed by OCACT), a real rate of
return for stocks of 6.50 percent, and a real rate of return for bonds of 3.30 percent. One
percent is subtracted from each of the stock and bond real rates of return to reflect
administrative costs. Investment experience varies by individual and by year by setting
the rates stochastically (assuming a standard deviation of 17.28 percent for stocks and
2.14 percent for bonds).
The SIPP also includes information regarding IRA/Keogh account balances and
contributions. Similar to DC plans, IRA/Keogh account balances are accumulated to the
retirement date, along with any new contributions and interest earnings. IRA/Keogh
contribution rates are allowed to vary over time by age and earnings, using the same
method used for DC plans. IRA/Keogh contributions are capped according to the legal
limits that vary by year. IRA/Keogh assets are allocated the same way as DC assets and
rates of return are set stochastically using the same method as that used for DC plans.
Only those with IRA/Keogh coverage at the time of the SIPP interview have
IRAs/Keoghs. No new IRA/Keogh participation is simulated in DYNASIM.
Social Security Benefits
DYNASIM also includes a detailed Social Security benefit calculator that uses earnings
and marital histories to estimate Social Security benefits—either retired-worker, spouse,
or survivor benefits. The current benefit calculator is based on the 2005 OCACT
assumptions about future price and wage growth. In each year, from the projected year of
first benefit receipt until the projected year of death, DYNASIM computes a respondent’s
Social Security benefit that reflects his or her earnings and marital history at that point in
time. The calculator first establishes benefit eligibility based on personal characteristics
such as age, number of covered quarters, disability status, marital status, and length of
marriage. For those who qualify, the model computes Social Security benefits—either
retired worker, spouse, divorced spouse, or survivor benefits. The calculator then checks

33
an individual’s take-up age against his or her NRA, reducing benefits for those who retire
before their NRA and increasing benefits for those who retire later. Social Security
estimates are based on the assumption that current-law benefits will be payable
throughout the projection period. However, the Social Security OASDI Trust Funds are
projected to be exhausted by 2041 and OCACT estimates that benefits would need to be
reduced by 12.8 percent starting in 2005 in order for the trust funds to remain solvent
(Board of Trustees 2005). If the benefit cuts are delayed, the average percentage
reduction would need to be larger. Our Social Security wealth estimates are based on the
assumption that future retirees will receive the current law benefits they were promised,
not the benefits that current trust fund receipts will finance in the long run. But the model
is capable of simulating the effects of alternative benefit levels.

34
Appendix Table 1. Summary of Core Processes Modeled in DYNASIM
(continued)
Process Data Form and predictors
Birth Estimation: NLSY (1979–94); VS; Target: OCACT
7-equation parity progression model; varies on the basis of marital status; predictors include age, marriage duration, time since last birth; uses vital rates after age 39; sex of newborn assigned by race; probability of multiple birth assigned by age and race
Death
Estimation: NLMS (1979–81); VS (1982–97); Target: OCACT
3 equations; time trend from Vital Statistics 1982–1997; includes socioeconomic differentials; separate process for the disabled based on age, sex, age of disability onset, and disability duration derived from Zayatz (1999)
Schooling NLSY (1979–94), CPS (Oct. 1995) 10 cross-tabulations based on age, race, sex, and parent’s education
Leaving Home NLSY (1979–94) 3 equations; family size, parental resources, and school and work status are important predictors
First Marriage NLSY (1979–93) 8 equations; depends on age, education, race, earnings, presence of children (for females); uses vital rates at older ages
Spouse SelectionClosed marriage market (spouse must be selected from among unmarried, opposite-sex persons in the population); match likelihood depends on age, race, education
Remarriage VS (1990) Table lookups, separate by sex for widowed and divorced
Divorce PSID (1985–93) Couple-level outcome; depends on marriage duration, age and presence of children, earnings of both spouses
Labor Supply and Earnings
Estimation: PSID (1980–93); NLSY (1979–89); Target: OCACT (LFP, wage/price growth)
Separate participation, hours decisions, wage rates for 16 age-race-sex groups; all equations have permanent and transitory error components; some wage equations correct for selection bias; key predictors include age splines, marital status, number and ages of children, job tenure, education level, region of residence, disability status, schooling status, unemployment level, and age spline–education-level interactions
Disability SIPP (1990) Separate entry (by sex)/exit (pooled) equations; include socio-economic differences (education, marital status, earnings history)
DI Take-up SIPP (1990–93)
2 separate equations (by sex) predict take-up of those eligible for disabled worker benefits (ages 19 though the normal retirement age); key predictors include age, disability status, education, marital status, recent earnings

35
Appendix Table 1. Summary of Core Processes Modeled in DYNASIM (cont.)
BLS = Bureau of Labor Statistics; CPS = Current Population Survey; EBRI = Employee Benefits Research Institute; DB = defined benefit; DC = defined contribution; DI = Disability Insurance; ICI = Investment Company Institute; INS = U.S. Immigration and Naturalization Service; LFP = labor force participation; NLMS = National Longitudinal Mortality Study; NLSY = National Longitudinal Survey of Youth; OASDI = Old-Age, Survivors, and Disability Insurance; OCACT = Office of the Chief Actuary intermediate assumptions; PBGC = Pension Benefit Guarantee Corporation; PIMS = Pension Insurance.
Process Data Form and predictors
Pensions (DB, DC, IRAs, Keoghs)
BLS (1999–2000); EBRI/ICI; SIPP (1990–93); PENSIM (PSG) and PIMS models (PBGC)
Uses SIPP self-reports on past and current pension coverage with job changes and future coverage simulated using PENSIM; uses PIMS for DB formulas (with separate procedure for DBs from government jobs); DC balances projected using SIPP self-reports of account balances and contribution rates and EBRI/ICI data asset allocations and contribution rates for new participants
Wealth PSID (1984–94); SIPP (1990–93)
4 random-effects models for ownership/value given ownership separately for housing and non-housing wealth; additional models for spend-down after first OASDI receipt; key predictors include age, race, marital status, family size, birth cohort, dual-earner status, pension coverage, recent earnings
OASI Take-up SIPP (1990–93)
Eligibility is deterministic; 3 separate equations (separate for workers by lagged earnings, and auxiliary beneficiaries) predict take-up of those eligible for retired worker benefits (ages 62 and older); key predictors include age, disability status, education, marital status, recent earnings, pensions, lifetime earnings, and spouse characteristics; take-up of survivor benefits at 60 and 61 is deterministic (i.e., mandatory if earnings are below the exempt amount)
OASDI Benefits Rule-basedSophisticated calculator incorporates entire work and marriage histories, auxiliary benefits for spouses/survivors and former spouses, and the retirement earnings test.
SSI Benefits SIPP (1990–93) Eligibility is deterministic; 2 equations predict take-up of the aged; key predictors include demographics, state supplement, resources
Living Arrangements of the Aged
SIPP (1990–93)
Logistic regression that considers health, resources, and kin availability (number of children ever born); resources of co-residing family members are imputed using donor families sampled from current co-residing aged individuals in SIPP.
ImmigrationPUMS 1980, 1990, 2000; INS yearbook 2001
Adds target number of immigrants based on sex, country of origin, and age at immigration derived from Dowhan and Duleep (2002)

36
BaselinePure Work
EffectPure Benefit
Cut
Part Work No Benefit
Cut
Part Work and Benefit
Cut
Full Work and Benefit
CutWork One More Year
Social Security 199,378 205,315 185,796 203,055 189,563 191,804DB Pensions 39,576 39,155 39,576 39,550 39,550 39,155DC Pensions 54,633 56,661 54,633 55,760 55,760 56,661Earnings 477,862 513,441 477,862 501,860 501,860 513,441Federal/State Income Taxes 110,982 119,718 109,569 116,438 114,970 118,089Payroll Taxes 34,491 36,981 34,491 36,126 36,126 36,981Total Net Wealth 625,976 657,873 613,807 647,661 635,637 645,991Annual Annuity at Age 50 26,570 27,887 26,056 27,452 26,944 27,386Annual Annuity at Retirement 28,972 25,635 28,067 27,124 28,020
Percent Change in Net Wealth 5.1% -1.9% 3.5% 1.5% 3.2%Change Total Net Wealth 31,897 -12,169 21,685 9,661 20,016Change Annual Annuity at Age 50 1,317 -515 882 374 816Change Annual Annuity at Retirement 2,402 -936 1,497 554 1,449
Work Five More YearsSocial Security 199,378 228,242 132,816 222,480 154,651 158,694DB Pensions 39,576 37,060 39,576 40,610 40,610 37,060DC Pensions 54,633 65,492 54,633 62,095 62,095 65,492Earnings 477,862 658,520 477,862 623,259 623,259 658,520Federal/State Income Taxes 110,982 155,139 104,676 145,156 136,712 146,239Payroll Taxes 34,491 47,207 34,491 44,596 44,596 47,207Total Net Wealth 625,976 786,968 565,720 758,692 699,307 726,320Annual Annuity at Age 50 26,570 33,258 24,021 32,052 29,538 30,698Annual Annuity at Retirement 41,458 21,953 37,834 32,518 35,563
Percent Change in Net Wealth 26% -10% 21% 12% 16%Change Total Net Wealth 160,992 -60,256 132,716 73,331 100,344Change Annual Annuity at age 50 6,688 -2,549 5,482 2,968 4,127Change Annual Annuity at Retirement 14,888 -4,617 11,264 5,948 8,993
Notes: Based on 17,547 unweighted observations of persons who are alive in 2049 and retired and receiving Social Security benefits.1. Annuity at age 50 is total net wealth divided by the real annuity factor at age 50.
Source: The Urban Institute tabulations of DYNASIM3.
Table A2. Mean Respondent Wealth and Annuity Income in 2049 Under Current Law and Estimated Change Under Alternate Reform Scenarios ($2006)
2. Annuity at retirement is the change in total net wealth between the baseline and alternative scenario, grown from age 50 until the later of retirement or Social Security take-up age by a real interest rate of 2 percent, divided it by the real annuity factor that corresponds to that age, and added to the baseline annuity.