Financial Literacy, Retirement Planning and Household Wealth
51
1 Financial Literacy, Retirement Planning, and Household Wealth Maarten van Rooij (DNB and Netspar) Annamaria Lusardi (Dartmouth College and NBER) Rob Alessie (University of Groningen, Netspar and Tinbergen Institute)* August 2008 Abstract There is ample empirical evidence documenting widespread financial illiteracy and limited pension knowledge. At the same time, the net worth distribution is heavily dispersed and many workers arrive on the verge of retirement with little or no personal wealth. This paper is the first to investigate the relation between financial sophistication and household net worth relying on specific measures of financial knowledge and skills rather than crude proxies. For this purpose, we have designed a new module for the Dutch DNB Household Survey. Our findings provide evidence of a statistically and economically significant positive effect of financial sophistication on net worth. Moreover, we highlight and document empirical evidence of two channels by which financial sophistication facilitates wealth accumulation. First, financial skills increase the likelihood to invest in the stock market thereby opening the possibility to benefit form the equity premium and improving the opportunities for risk diversification. Second, financial sophistication boosts retirement planning behavior by households, thereby providing an important channel for the development of savings plans and creating instruments for self-control. In addition, our results suggest that respondents who are relatively confident on their own financial skills have a higher propensity to plan. To take into account that wealth, portfolio management and planning activities might exert an independent effect on financial literacy, we employ instrumental variable regression techniques using information on economics education. Key words: Financial Education, Savings and Wealth Accumulation, Retirement Planning, Knowledge of Finance and Economics, Overconfidence, Stock Market Participation JEL codes: D91, D12, J26 * Maarten C.J. van Rooij, Economics & Research Division, De Nederlandsche Bank, P.O. Box 98, 1000 AB, Amsterdam ([email protected] ), Annamaria Lusardi, Department of Economics, Dartmouth College, Hanover, NH 03755 ([email protected] ), and Rob J.M. Alessie, University of Groningen ([email protected] ). We gratefully acknowledge valuable comments and suggestions by Johannes Binswanger, Lex Hoogduin, Peter Schotman, Federica Teppa, Peter van Els, and participants in the Netspar pension conference (The Hague, June 2008). We thank the staff of CentERdata and, in particular, Corrie Vis for their assistance in setting up the survey and the field work. The views expressed in this paper are those of the authors and do not necessarily reflect the views of De Nederlandsche Bank.
-
Upload
khangminh22 -
Category
Documents
-
view
0 -
download
0
Transcript of Financial Literacy, Retirement Planning and Household Wealth

1
Financial Literacy, Retirement Planning, and Household Wealth
Maarten van Rooij (DNB and Netspar) Annamaria Lusardi (Dartmouth College and NBER)
Rob Alessie (University of Groningen, Netspar and Tinbergen Institute)*
August 2008
Abstract
There is ample empirical evidence documenting widespread financial illiteracy and limited pension knowledge. At the same time, the net worth distribution is heavily dispersed and many workers arrive on the verge of retirement with little or no personal wealth. This paper is the first to investigate the relation between financial sophistication and household net worth relying on specific measures of financial knowledge and skills rather than crude proxies. For this purpose, we have designed a new module for the Dutch DNB Household Survey. Our findings provide evidence of a statistically and economically significant positive effect of financial sophistication on net worth. Moreover, we highlight and document empirical evidence of two channels by which financial sophistication facilitates wealth accumulation. First, financial skills increase the likelihood to invest in the stock market thereby opening the possibility to benefit form the equity premium and improving the opportunities for risk diversification. Second, financial sophistication boosts retirement planning behavior by households, thereby providing an important channel for the development of savings plans and creating instruments for self-control. In addition, our results suggest that respondents who are relatively confident on their own financial skills have a higher propensity to plan. To take into account that wealth, portfolio management and planning activities might exert an independent effect on financial literacy, we employ instrumental variable regression techniques using information on economics education. Key words: Financial Education, Savings and Wealth Accumulation, Retirement Planning, Knowledge of Finance and Economics, Overconfidence, Stock Market Participation JEL codes: D91, D12, J26 ∗ Maarten C.J. van Rooij, Economics & Research Division, De Nederlandsche Bank, P.O. Box 98, 1000 AB, Amsterdam ([email protected]), Annamaria Lusardi, Department of Economics, Dartmouth College, Hanover, NH 03755 ([email protected]), and Rob J.M. Alessie, University of Groningen ([email protected]). We gratefully acknowledge valuable comments and suggestions by Johannes Binswanger, Lex Hoogduin, Peter Schotman, Federica Teppa, Peter van Els, and participants in the Netspar pension conference (The Hague, June 2008). We thank the staff of CentERdata and, in particular, Corrie Vis for their assistance in setting up the survey and the field work. The views expressed in this paper are those of the authors and do not necessarily reflect the views of De Nederlandsche Bank.

2
1. Introduction
Households hold very different amounts of savings. Heterogeneity in lifetime earnings,
the willingness to leave bequests, motives for precautionary or other savings, and cross sectional
variability in time preferences, expectations, health, longevity, inheritances and other income
shocks contribute to the dispersion in wealth holdings and have been researched extensively.1
The relation between wealth accumulation and financial capabilities has received much less
attention, mainly because information on the level of financial sophistication is usually
unavailable. Recently, however, there has been a boost in research on the measurement of
financial literacy and its effects on household behavior (e.g. Van Rooij, Lusardi and Alessie,
2007; Lusardi and Mitchell, 2007a, 2007b, 2008; Agnew, Szykman, Utkus and Young, 2007;
Kimball and Shumway, 2006). This paper reports the results of a newly designed survey with an
extensive set of questions to measure basic and more advanced financial skills and to the best of
our knowledge it contains the first study of its impact on net worth.
The relation between financial sophistication and savings behavior is important as
individuals are increasingly asked to take private responsibility for their financial well-being.
Given the evidence on widespread financial illiteracy and limited pension knowledge, there is an
obvious policy interest in the question whether financial education affects savings behavior and
what type of education programs is most effective. The empirical evidence on the effect of
financial education and the provision of information on savings behavior is mixed (Lusardi,
2004). Moreover, even if studies find a significant impact of financial education on savings, the
outcomes generally do not provide much information on the channel underlying this effect.
Studies on the impact of retirement seminars on savings for example are typically not able to
disentangle the effect of an increase in financial skills, if any, from behavioral effects due to the
provision of information, retirement seminars being an integral part of a more comprehensive
initiative to increase financial awareness, or the importance of peer and community effects in
raising savings (Duflo and Saez, 2003). We investigate whether household financial
sophistication by itself has an impact on wealth accumulation and ask ourselves what underlying
channels could be at work here.
The main contributions of this paper are the following. We provide evidence of an
independent and positive effect of financial sophistication on wealth accumulation over and
1 See the references in the next section.

3
above the effect of other determinants such as income, age, education, family composition, risk
tolerance, patience, the attitude towards saving, and basic cognitive ability. We identify and
highlight two channels by which financial literacy facilitates wealth accumulation. First, a high
level of financial skills lowers economic and psychological barriers to invest in the stock market
(Bertaut and Haliassos, 1995; Vissing-Jorgenson, 2004). We show that financial sophistication
indeed fosters stock market participation and thereby provides households with the opportunity
to benefit from the equity premium on stock investments. Second, we find that financial
sophistication boosts retirement planning behavior by households, thereby providing an
important mechanism for wealth accumulation (Ameriks, Caplin, and Leahy, 2003; Mitchell and
Lusardi, 2007b). In addition, our empirical results suggest that respondents who are relatively
confident about their own financial skills have a higher propensity to plan. The intuition behind
the retirement planning channel is that a high level of financial knowledge and skills reduces
planning costs, i.e. the economic and psychological barriers to acquire information, do the
calculations and develop a plan. Our data show that once households start doing calculations on
their savings needs for retirement, they often follow through setting up a retirement plan and are
in general also successful in sticking to their plan.
Our findings have important policy implications. We show that financial illiteracy is
widespread and that the lack of financial sophistication has important consequences for wealth
holdings. This suggests that the skills to take financial decisions often fall short of what is
necessary for the kind of choices that many individuals nowadays are expected to make in a
world with a vast and growing supply of complicated financial products which have become
accessible to a large public by now. The implication is that there is an important role for financial
education as by effectively boosting financial sophistication households become better equipped
to manage their own savings. One reason why this is important is that many households enter
retirement with very little wealth (Venti and Wise, 1998, 2000; Lusardi, 1999, 2003). This has
profound implications not only for personal welfare but also for public policy, as low savings
households lack a buffer to deal with negative shocks and are more likely to become dependent
on state benefits. In addition, financial education initiatives might help reducing the dispersion in
wealth; a dispersion that is much higher than the often debated inequality in income (Cagetti and
De Nardi, 2006) and which seems to be growing along with the de facto opening of the stock
markets to a wider audience (Bilias, Georgarakos and Haliassos, 2007).

4
This paper is organized as follows. In Section 2 we review the current literature on wealth
accumulation in relation to financial sophistication. In Section 3 we present data and descriptive
statistics, and explain how the measures of financial ability and sophistication are constructed. In
Section 4, we report the results of wealth regressions including measures of financial ability and
sophistication. In Section 5, we present several extensions and discuss the robustness of the
results. In section 6, we consider two channels by which financial skills exert an effect on wealth
accumulation: stock market participation and retirement planning activities. In addition, we
examine the economic relevance of being financially sophisticated. In Section 7, we conclude
with some remarks on implications for policy and areas for future research.
2. Literature
The simplest version of the life cycle consumption model without bequests and
uncertainty predicts that households accumulate savings during their working career to finance
retirement and decumulate their wealth thereafter (Modigliani and Miller, 1954). This type of
savings behavior enables households to smooth their marginal utility of consumption over the
life cycle. However, there are many reasons why household consumption and wealth follow
different patterns and the standard model can quite easily be adjusted to cope with many of them
(Browning and Lusardi, 1996; Cagetti and De Nardi, 2006).
A large variety of empirical research sheds light on the observed patterns in wealth
dispersion and portfolio choice. Studies have highlighted among others the role of precautionary
saving motives (Hubbard, Skinner and Zeldes, 1995), longevity and bequests (Hurd, 1989),
different economic opportunities across cohorts (Kapteyn, Alessie and Lusardi, 2005), self-
control (Laibson, 1997; Benartzi and Thaler, 2004; Ameriks, Caplin, Leahy and Tyler, 2007),
correlations across generations (Charles and Hurst, 2003), unexpected events (Venti and Wise,
2000; Lusardi, 2003), background income risk (Heaton and Lucas, 2000; Guiso, Jappelli,
Terlizzese, 1996), and health (Rosen and Wu, 2004). To the best of our knowledge, none of these
studies focus on the role of financial capabilities in accumulating savings, while more financially
sophisticated individuals are likely to perceive lower barriers for gathering and processing
information and are thus better equipped to manage their savings portfolio. Somewhat related is
the work by Chan and Stevens (2008) who show that many households base their pension and

5
retirement savings decisions upon the limited and sometimes incorrect pension knowledge they
have.2
Bernheim (1995, 1998) was among the first to stress that policymakers and researchers
might have overlooked the importance of financial literacy for personal savings. Since then many
studies emphasize the role of financial sophistication but, in absence of specific literacy
measures, resort to crude proxies for financial skills, such as income, wealth or education
(Calvet, Campbell and Sodini, 2007; Vissing-Jorgenson, 2004). The disadvantage of these
proxies is that there is no way to disentangle the effect of financial ability from the effect of the
proxy variable. By using education as a measure of financial sophistication one is not able to
separate the independent effect of financial skills from the impact of the education level as such,
which in addition in many regression specifications also serves as a proxy for lifetime income.
More recently, researchers have increased effort in developing specific measures of
financial ability and knowledge (Hilgert and Hogarth, 2003; Lusardi and Mitchell, 2006) and
have started investigating its relation to economic decisions and portfolio choice. Hilgert,
Hogarth, and Beverly (2003) explore the relation between literacy and money management,
while Lusardi and Mitchell (2006) consider the associations with retirement planning. More
recently Van Rooij, Lusardi and Alessie (2007) and Christelis, Jappelli and Padula (2007) have
studied the link between the decision to invest in stocks and specific measures of financial
sophistication and basic cognitive abilities.
Several authors have stressed that the welfare costs of financial mistakes are not
negligible (Campbell, 2006; Calvet, Campbell and Sodini, 2007; Cocco, Gomes and Maenhout,
2005). Nevertheless, an increasing amount of studies documents the prevalence of financial
mistakes. Agarwal, Driscoll, Gabaix and Laibson (2007)) provide evidence on financial mistakes
in the loan market with many households paying too much in terms of fees or interest rates on
credit card debt, home equity loans and mortgages. Calvet, Campbell and Sodini (2007) show
that in Sweden – a country that is claimed to have efficient investors – many households hold
underdiversified portfolios or do not participate in financial markets at all.
The amount of financial mistakes might not come as a surprise given the body of
evidence on limited financial literacy among households. This evidence is robust in different
2 Many authors have documented that households are rather ill-informed about their Social Security benefits and company pensions. See Gustman and Steinmeier (2004) and Van Els, Van den End and Van Rooij (2004) for evidence for the US and the Netherlands, respectively.

6
settings and across different countries of which many have reacted by setting up financial
education programs (OECD, 2005). While the large variation in the initiatives to enhance
awareness and financial sophistication creates many possibilities to learn in the near future about
how to effectively design and implement education programs, these evaluations have been
limited so far (Smith and Stewart, 2008).
The impact of financial education on savings behavior has been investigated almost
exclusively in the context of retirement seminars offered by US firms. An important exception is
the work by Bernheim, Garrett, and Maki (2001) who document positive effects of financial
education during high school on long term savings employing the variability in state mandates on
the teaching of topics related to household financial decisions. Bernheim and Garrett (2003),
Lusardi (2004) and Clark, D’Ambrosio, McDermed and Sawant (2006) have documented
positive effects of retirement seminars in the workplace, especially when it regards the intentions
to change savings behavior. Overall, however, the evidence is mixed as other studies were not
able to come up with significant, lasting effects (Duflo and Saez, 2003, 2004).
Moreover, as the attendance in retirement seminar is voluntary it is not to be excluded
that participants form a selected group that is already more intrinsically motivated to remedy
insufficient pension savings. In addition, any beneficial effect of retirement seminars could also
be the direct result of the provision of information on the need for retirement savings, rather than
of an increase in financial sophistication. This is especially likely as retirement seminars
typically take one or at most a few hours. Interestingly, Mandell (2008) does not find a literacy
enhancing effect of more intensive courses at high school devoted to teaching personal finance
and money management on test scores for financial literacy. This suggests that the effect of
financial education on savings could also work via other channels than raising financial
knowledge and ability. The impact of financial education on savings in these studies might for
example work more indirectly through an effect on individual characteristics and the appetite for
saving. In this paper, we do not evaluate financial education programs but focus directly on the
role of actual financial knowledge and capabilities in wealth accumulation and disentangle its
effects from other personal traits including risk tolerance, patience, and other preferences related
to tastes for saving.

7
3. Data
We have devised a special module for the annual DNB Household Survey (DHS)
including an elaborate set of questions on financial ability and knowledge as well as a section on
retirement planning activities. The questions have been answered by the household panel run by
CentERdata; a survey agency at Tilburg University specialized in internet surveys and
experiments on response behavior in a web-based environment.3 It is important to note that -
even though the Netherlands has an internet penetration of about 80% - the selection of panel
members is not dependent on the use and availability of internet. Households without a computer
or an internet connection are provided with the necessary equipment (e.g. a set-top box to
participate through their television connection). Attrition is dealt with by biannual refreshment
samples that are drawn in view of keeping the panel representative of the Dutch population of 16
years and older (persons staying in hospitals, specialized care institutions or prisons are not
included).4
The questionnaire was held among those persons within the household who are in charge
of household finances. It was fielded in 2005 from September 23 until September 27 and
repeated a week thereafter for those households that had not responded yet. The response rate
equaled 74.4% (1508 out of 2028 households). The DHS contains an extensive set of information
on income and work, health, household debt and assets, and an extensive set of psychological
questions on attitudes with respect to saving and portfolio investments. We merge our module on
financial literacy with the data in DHS 2005 on net worth for those households for which we
have information on all of their assets and debts. Because wealth regressions might be sensitive
to outliers we trim the net worth variable by excluding the top and bottom 1% of observations
which are most suspicious to measurement error.
After these steps, our reduced sample consists of 1091 households. The average age of
the respondents equals 50.8 (ranging from 22 to 90 years); 53.1% of the respondents are male;
56.7% are married or living together with a partner, about one third have children living at home
and 20.4% of the respondents is retired. Comparison of these characteristics with the full sample
shows that especially elderly respondents report their asset and debt position more frequently,
but overall the composition of the sample remains fairly unchanged. The upper part of Table 1
3 For more information, we refer to http://www.uvt.nl/centerdata/en. 4 In addition, we will use household weights to calculate descriptive statistics to ensure representativeness of the population.

8
reports the median, mean and standard deviation of household net worth. Household wealth
includes all kind of savings and investments accounts, housing wealth, other real estate, and
durable goods, net of mortgages and other financial debt. It is clear that its distribution is skewed
and that there is a lot of dispersion in net worth also after the substantial reduction due to the
trimming process.
3.1. The measurement of literacy5
The module that we have inserted in the DNB Household Survey contains two sets of
questions to assess financial literacy. These questions were designed using similar modules in the
US Health and Retirement Survey (HRS) and a variety of other surveys on financial literacy.
However, a few questions are unique to our module on literacy.6 Households are instructed to
answer the questions without consulting additional information or using a calculator.7
The first set of questions relates to basic financial literacy. Box 1 reports the exact
wording of these questions, that measure the ability to perform simple calculations (the first
question), the understanding of how compound interest works (second question), and the effect
of inflation (third question). We also designed questions to assess the knowledge of time
discounting (fourth question) and whether respondents suffer from money illusion (fifth
question). These concepts lie at the basis of basic financial transactions, financial planning, and
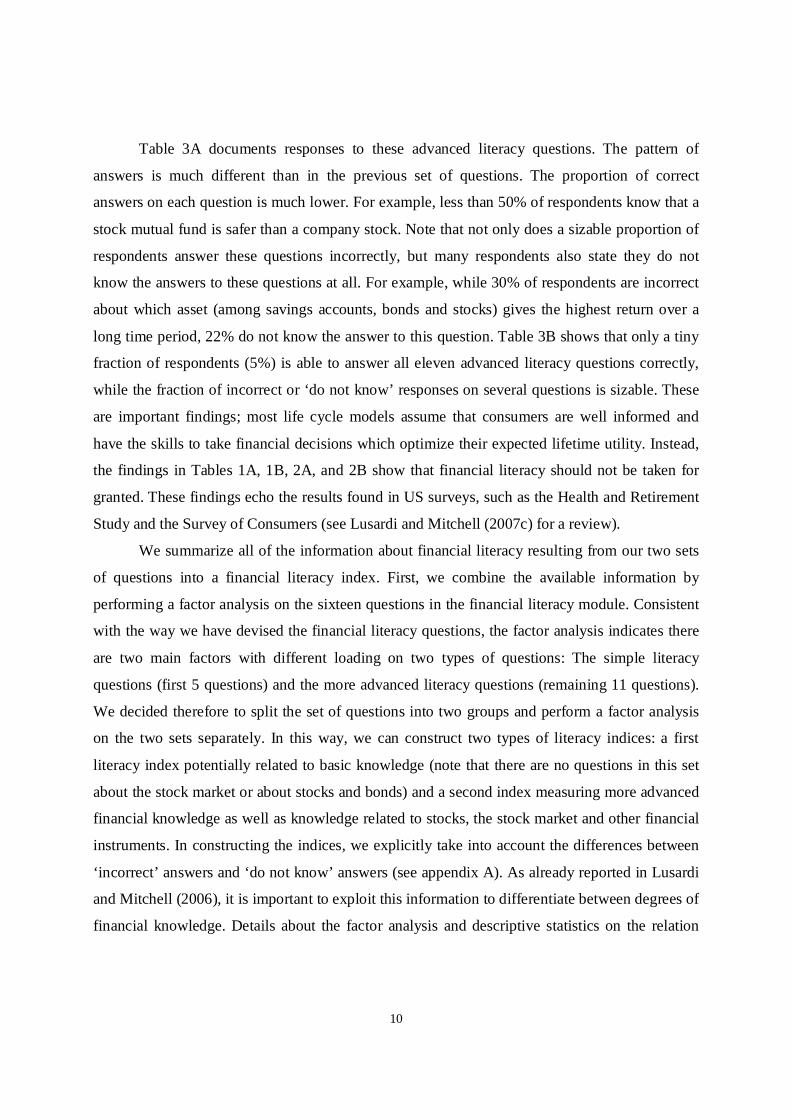
day-to-day financial decision-making. Responses to these questions are reported in Table 2A.
Note that, while many respondents answer each individual question correctly, the proportion of
respondents who answered all five questions correctly is only 40.2% (Table 2B). Thus, while
many respondents display knowledge of a few financial concepts, basic financial literacy is not
widespread.
The second set of questions is directed at the measurement of more advanced financial
knowledge to be able to classify respondents according to different levels of sophistication. Box
2 reports the exact wording.8 Clearly, these are much more complex questions than the ones in
5 See Van Rooij, Lusardi and Alessie (2007) for an elaborate description of the measurement of financial literacy and its relation to demographics. 6 For an analysis of the module on financial literacy in the 2004 HRS, see Lusardi and Mitchell (2006). For a review of financial literacy surveys across countries, see Lusardi and Mitchell (2007c). 7 This facilitates the comparison with other surveys, which are normally done via telephone. Moreover, this procedure better enables researchers to assess what respondents know. 8 Because we could not perform a pilot study to assess how respondents perform on these questions and how well they understood them, we use the wording of questions from other existing surveys (with some modifications to

9
the previous set. The purpose of these questions is to measure financial skills related to
investment and portfolio choice. Specifically, these questions were devised to assess knowledge
of financial assets, such as stocks, bonds and mutual funds as well as the trade-off between risk
and return. Moreover, we attempt to measure whether respondents understand the concept of risk
diversification, the function of the stock market, and the relationship between bond prices and
interest rates.
Box 1. Basic Literacy Questions 1) Numeracy Suppose you had €100 in a savings account and the interest rate was 2% per year. After 5 years, how much do you think you would have in the account if you left the money to grow? (i) More than €102; (ii) Exactly €102; (iii) Less than €102; (iv) Do not know; (v) Refusal. 2) Interest compounding Suppose you had €100 in a savings account and the interest rate is 20% per year and you never withdraw money or interest payments. After 5 years, how much would you have on this account in total? (i) More than €200; (ii) Exactly €200; (iii) Less than €200; (iv) Do not know; (v) Refusal. 3) Inflation Imagine that the interest rate on your savings account was 1% per year and inflation was 2% per year. After 1 year, how much would you be able to buy with the money in this account? (i) More than today; (ii) Exactly the same; (iii) Less than today; (iv) Do not know; (v) Refusal. 4) Time value of money Assume a friend inherits €10,000 today and his sibling inherits €10,000 3 years from now. Who is richer because of the inheritance? (i) My friend; (ii) His sibling; (iii) They are equally rich; (iv) Do not know; (v) Refusal. 5) Money illusion Suppose that in the year 2010, your income has doubled and prices of all goods have doubled too. In 2010, how much will you be able to buy with your income? (i) More than today; (ii) The same; (iii) Less than today; (iv) Do not know; (v) Refusal.
reflect the characteristics of the Dutch financial system and the behavior of Dutch financial markets). Specifically, we took question 6 from the National Council of Economic Education Survey, questions 7 and 9 from the NASD Investor Knowledge Quiz, question 15 from the 2004 Health and Retirement Study module on financial literacy, questions 8, 10, 11, 12, 13, 14 and 16 from the Survey of Financial Literacy in Washington State, the Survey of Consumers, and the John Hancock Financial Services Defined Contribution Plan Survey. We took the questions that best reflect financial sophistication related to financial instruments and the working of the stock market.
10
Table 3A documents responses to these advanced literacy questions. The pattern of
answers is much different than in the previous set of questions. The proportion of correct
answers on each question is much lower. For example, less than 50% of respondents know that a
stock mutual fund is safer than a company stock. Note that not only does a sizable proportion of
respondents answer these questions incorrectly, but many respondents also state they do not
know the answers to these questions at all. For example, while 30% of respondents are incorrect
about which asset (among savings accounts, bonds and stocks) gives the highest return over a
long time period, 22% do not know the answer to this question. Table 3B shows that only a tiny
fraction of respondents (5%) is able to answer all eleven advanced literacy questions correctly,
while the fraction of incorrect or ‘do not know’ responses on several questions is sizable. These
are important findings; most life cycle models assume that consumers are well informed and
have the skills to take financial decisions which optimize their expected lifetime utility. Instead,
the findings in Tables 1A, 1B, 2A, and 2B show that financial literacy should not be taken for
granted. These findings echo the results found in US surveys, such as the Health and Retirement
Study and the Survey of Consumers (see Lusardi and Mitchell (2007c) for a review).
We summarize all of the information about financial literacy resulting from our two sets
of questions into a financial literacy index. First, we combine the available information by
performing a factor analysis on the sixteen questions in the financial literacy module. Consistent
with the way we have devised the financial literacy questions, the factor analysis indicates there
are two main factors with different loading on two types of questions: The simple literacy
questions (first 5 questions) and the more advanced literacy questions (remaining 11 questions).
We decided therefore to split the set of questions into two groups and perform a factor analysis
on the two sets separately. In this way, we can construct two types of literacy indices: a first
literacy index potentially related to basic knowledge (note that there are no questions in this set
about the stock market or about stocks and bonds) and a second index measuring more advanced
financial knowledge as well as knowledge related to stocks, the stock market and other financial
instruments. In constructing the indices, we explicitly take into account the differences between
‘incorrect’ answers and ‘do not know’ answers (see appendix A). As already reported in Lusardi
and Mitchell (2006), it is important to exploit this information to differentiate between degrees of
financial knowledge. Details about the factor analysis and descriptive statistics on the relation

11
between literacy and age, gender and education are provided by Van Rooij, Lusardi and Alessie
(2007).
Box 2. Advanced Literacy Questions 6) Which of the following statements describes the main function of the stock market? (i) The stock market helps to predict stock earnings; (ii) The stock market results in an increase in the price of stocks; (iii)The stock market brings people who want to buy stocks together with those who want to sell stocks; (iv) None of the above; (v) Do not know; (vi) Refusal. 7) Which of the following statements is correct? If somebody buys the stock of firm B in the stock market: (i) He owns a part of firm B; (ii) He has lent money to firm B; (iii) He is liable for firm B’s debts; (iv) None of the above; (v) Do not know; (vi) Refusal. 8) Which of the following statements is correct? (i) Once one invests in a mutual fund, one cannot withdraw the money in the first year; (ii) Mutual funds can invest in several assets, for example invest in both stocks and bonds; (iii) Mutual funds pay a guaranteed rate of return which depends on their past performance; (iv) None of the above; (v) Do not know; (vi) Refusal. 9) Which of the following statements is correct? If somebody buys a bond of firm B: (i) He owns a part of firm B; (ii) He has lent money to firm B; (iii) He is liable for firm B’s debts; (iv) None of the above; (v) Do not know; (vi) Refusal. 10) Considering a long time period (for example 10 or 20 years), which asset normally gives the highest return? (i) Savings accounts; (ii) Bonds; (iii) Stocks; (iv) Do not know; (vi) Refusal. 11) Normally, which asset displays the highest fluctuations over time? (i) Savings accounts; (ii) Bonds; (iii) Stocks; (iv) Do not know; (v) Refusal. 12) When an investor spreads his money among different assets, does the risk of losing money: (i) Increase; (ii) Decrease; (iii) Stay the same; (iv) Do not know; (v) Refusal. 13) If you buy a 10-year bond, it means you cannot sell it after 5 years without incurring a major penalty. True or false? (i) True; (ii) False); (iii) Do not know; (iv) Refusal. (14) Stocks are normally riskier than bonds. True or false? (i) True; (ii) False; (iii) Do not know; (iv) Refusal. (15) Buying a company stock usually provides a safer return than a stock mutual fund. True or false? (i) True; (ii) False; (iii) Do not know; (iv) Refusal. (16) If the interest rate falls, what should happen to bond prices? (i) Rise; (ii) Fall; (iii) Stay the same; (iv) None of the above; (v) Do not know; (vi) Refusal.

12
3.2 Wealth and literacy
This paper aims at exploring a new potential explanation contributing to the
heterogeneity in wealth holdings, i.e. the role of the apparent widespread differences in financial
literacy. First, we look at the bivariate relationship. The middle and bottom part of Table 1
documents a strong increase in median net worth with basic and advanced literacy. The median
net worth position of the top quartile of financially sophisticated individuals amounts to €185900
which is the quadruple of the median net worth position in the bottom advanced literacy quartile
(€46700). Also the differences in wealth position across basic literacy quartiles are large -
although somewhat smaller than for advanced literacy. These simple correlations suggest a
strong, non-linear gradient between literacy and net worth.
Table 4 shows a similar pattern for several asset categories. Home ownership and
investments in stocks, mutual funds and bonds are much more common among those who score
high on the literacy scales. Nevertheless there are obvious differences between asset classes.
While home ownership is also not uncommon among the most illiterate households, investments
in individual stocks or bonds are almost absent within this subgroup. This evidence suggests that
more literate households have more diversified portfolios or at least spread their wealth over a
richer class of assets.
4. Wealth regressions
To further investigate the relation between wealth accumulation and financial
sophistication, we start with a basic multivariate regression for total net worth and extend this
specification by successively including additional information. Table 5 reports the results. First,
we run an OLS regression of total net worth on our measure for basic financial skills and
cognitive abilities. Other control variables include gender, age and education level of the
respondent, household composition (marital status and the number of children within the
household), household net disposable income, and a dummy for whether the respondent is
retired. We have also included a dummy for being self-employed as entrepreneurs differ in many
aspects from others and might behave accordingly (Hurst and Lusardi, 2004).
Age and income appear to be strongly significant (Table 5, column 1). Total net worth is
increasing in age, especially for those respondents who are in the middle of their working career,

13
but also at the older ages.9 Of course, based on a cross-section, we cannot disentangle age and
cohort effects. Nevertheless, while it may be surprising that households hardly decumulate
wealth after retirement this finding is conform earlier evidence based on panel data for the
Netherlands (Kapteyn, Alessie and Lusardi, 2005; Alessie, Lusardi and Kapteyn, 1999). To
capture complex, possibly non-linear effects of income on wealth accumulation, we have
included a polynomial for the natural logarithm of net disposable household income with a
linear, quadratic and cubic term. A one percent increase in household income – measured at
mean levels of the control variables – is associated with an increase in total net worth by
somewhat more than €1400.
Most interesting is the positive and significant effect of basic cognitive financial ability
on total net worth. A unit increase in basic literacy goes together with about €12000 more wealth
(the basic literacy measure itself has a zero mean and a standard deviation of one). Individuals
with better cognitive abilities seem to be more likely to accumulate savings. Nevertheless, it is
not immediately clear whether this is the result of better financial decisions because of the ability
to collect and process information at low cost and effort or runs through its association to
personal characteristics like risk aversion, time preference or overconfidence (see for example
Christelis, Jappelli and Padula, 2007, for a discussion).
First, we examine the role of confidence in financial skills in relation to actual financial
knowledge. In addition to financial ability, self-knowledge or misperceptions of one’s own
ability might assert an independent effect on financial outcomes. Persons who are overly modest
about their financial skills might refrain from financial innovations and forego potential financial
benefits. Insofar high confidence in one’s personal skills leads to less conservative portfolio
management it could have a positive impact on net worth. On the other hand, these people might
get involved into complex products that they do not fully understand and could end up making
financial mistakes with serious money at stake. In the literature of overconfidence, it is argued
that individuals with too much trust in their own skills could be inclined to interpret and filter
information in accordance with their own beliefs and might trade excessively (ending up with
high trading costs and lower net investment returns). Barber and Odean (2000, 2001) for instance
9 The increase in the 70 plus age group could also be partly related to different mortality rates depending upon the wealth position (Hurd, 1990).

14
provide evidence of overconfident investors trading excessively and ending up with lower
returns.
At the start of our survey, we ask respondents ‘How would you assess your
understanding of economics (on a 7-points scale; 1 means very low and 7 means very high)?’
Based upon this self-assessment of economic literacy, we construct a relative measure of
overconfidence. The self-reported literacy question and our basic ability index are not directly
comparable due to the use of different scales, but do provide information on the relative position
of respondents within the distribution of actual basic literacy and self-assessed literacy,
respectively. We start with grouping both variables into four categories and rank the respondents
accordingly from the top category to the lowest group. Thereafter, we create a dummy for
overconfidence that equals unity if the respondents’ self-assessed literacy ranking is higher than
his classification for basic financial skills. In addition, we construct a dummy for relatively low
confidence or underconfidence measuring whether the ranking on self-assessed literacy is more
modest than warranted. Thereafter, we rerun the first wealth regression now including both
dummies (the reference group being the respondents with a proper assessment of their skills).
The construction of the confidence measures is explained in more detail in appendix A. Our main
interest is whether the effect of basic financial ability on wealth accumulation is affected by the
inclusion of the information on over- and underconfidence. The coefficient of basic financial
capabilities remains significant and increases somewhat (Table 5, column 2).10 The coefficient of
overconfidence is negative albeit insignificant. Underconfidence however has a significant
negative impact on net worth. Compared to persons with proper knowledge of their financial
skills, these people do not seem to take full advantage of their capabilities.
Experimental evidence reveals that individuals with lower cognitive abilities are likely to
be less risk tolerant and more impatient (Benjamin, Brown and Shapiro, 2006; Dohmen, Falk,
Huffman and Sunde, 2007). To test whether the effect of cognitive ability runs through an
association with risk attitude, we include a measure of risk aversion. In the annual DHS
respondents are asked to indicate to what extent they agree with the following statement
‘Investing in stocks is something I don’t do, since it is too risky’. The response scale runs from 1
to 7, where 1 corresponds to complete disagreement and 7 to complete agreement. Kapteyn and
10 The number of observations has now decreased from 1091 to 1060 as, in constructing the measures for under and overconfidence, we ignore respondents answering ‘do not know’ when asked to assess their financial skills.

15
Teppa (2002) use this measure and show that it has more explanatory power in models of
portfolio choice than measures of risk tolerance based on a series of hypothetical choices
between uncertain streams of lifetime income as introduced by Barsky, Juster, Kimball, and
Shapiro (1997). The regression results in Table 5 (column 3)11 show that there is indeed an
important role for risk aversion in explaining wealth heterogeneity, but the coefficient of basic
financial skills is virtually unaffected.12
We subsequently test whether financial ability serves as a proxy for patience. We do not
have direct information on time preferences, but we include information on smoking and
drinking behavior as a proxy for myopic behavior as it is done in many other studies since the
work by Fuchs (1980) on the relation between different types of health decisions and patience.
We use information on whether people smoke and how often, and on whether they are heavy
drinkers (more than four alcoholic drinks on average per day). We do not find any relation
between net worth and these proxies for time preference and the coefficient of the basic financial
literacy index remains virtually unaffected (Table 5, column 4)
In the next step, we investigate whether basic financial abilities could be a proxy for more
advanced financial skills (as suggested by the results in Van Rooij, Lusardi and Alessie, 2007)
and include a more advanced measure of financial sophistication. Indeed the effect of advanced
literacy is strongly significant, reduces the coefficient on basic financial capacity and wipes out
its significance (Table 5, column 5). The coefficient of advanced literacy is higher than the
original effect of the basic capacity index and a unit increase in financial sophistication raises the
household net worth position by €24000 on average. However, we need to be cautious with the
interpretation of the OLS coefficient for financial sophistication. Where the financial ability
index touches upon very basic cognitive skills that people more or less need on a daily basis
(including questions on numeracy and a basic understanding of inflation and interest rates), the
advanced literacy index includes questions on the working of stocks, bonds and mutual funds
and thus addresses skills which for most people are not a necessity in daily transactions. It is
conceivable that wealth management fosters the collection of a larger financial knowledge and
11 The information on risk aversion and time preferences is available in the DHS modules on saving attitudes, income and health. Due to the merging process the total number of observations in our regression is reduced by 57 (even though we were able to retain some households by using information on time preferences and risk tolerance from adjacent years).

16
thus the coefficient could be biased upwards (simultaneity bias). On the other hand the
measurement of advanced financial knowledge could be surrounded with substantial error and
the coefficient on financial sophistication could also be biased to zero (attenuation bias). Indeed
Van Rooij, Lusardi and Alessie (2007) provide evidence of the importance of slight variations in
the wording of questions for responses patterns, which suggests that there is some guessing
going on for questions that are apparently hard to grasp.
Therefore, we perform an IV regression including economics education as an instrument.
This variable measures the exposure to education before entering the job market, It is based upon
the answers to the question ‘How much of your education was devoted to economics?’, where
response categories include the options ‘a lot’, ‘some’, ‘little’ and ‘hardly at all’.13 This
information is unrelated to wealth, but has strong predictive power for financial literacy as
shown by the test on instrument relevance in the first stage regression (Table 5, column 6). The
F-value equals 13, clearly above 10 the value that is often recommended as a rule of thumb to be
sure that problems due to weak instruments are avoided (Staiger and Stock, 1997). The
estimation results show that the IV coefficient remains significant at the 5% level and increases
substantially to €67000 suggesting that financial literacy is indeed measured with imprecision.
The Hansen J-test on the validity of the overidentifying restrictions is not rejected. Overall, our
estimates are in line with the hypothesis that financial sophistication is an important determinant
for wealth accumulation also after accounting for information on attitudes and preferences which
might be associated with the level of financial sophistication.
5. Extensions
One potential concern with our instrument is that accumulating wealth, and becoming
literate or being exposed to economics education are choice variables depending on a common
unobserved factor or another omitted variable. One possible candidate for a variable that drives
literacy, education and wealth but is usually not available in wealth regressions is ability as some
people are intrinsically more gifted by nature with talent and basic cognitive skills then others.
For this reason, we maintain the basic literacy variable in the wealth regressions to control for
12 As a robustness check we have included the Barsky et al. (1997) measure of risk tolerance as it has proved to be a valuable measure in other papers (e.g. Van Rooij, Prast and Kool, 2007), but it turned out to be insignificant confirming the results of Kapteyn and Teppa (2002). 13 See appendix B for the precise wording.

17
cognitive ability. Carefulness is an example of an important common factor that is perhaps not
sufficiently taken into account yet. Careful persons taking many precautions to prevent bad thing
happening to them could be more likely to hold additional savings buffers and to invest in
financial education as well to lower the probability to enter a debt situation or end up with
financial problems. To explore this possibility we run two additional specifications including
information from two separate questions on whether respondents consider themselves as a
‘careful person’, and whether they ‘take many precautions’. The response scale runs from 1
(completely disagree) to 7 (completely agree). Appendix B reports the precise wording of these
questions, which are available in a separate DHS module. By merging this information with our
dataset we lose close to 300 observations. Due to the lower number of observations, the F-value
of the joint significance of economics education in the first stage regression decreases to 6, but
remains strongly significant. More importantly, Table 6A shows that the inclusion of the
information on how careful the respondents are does not take anything away from the effect of
financial sophistication on net worth. The coefficient remains significant at the 5% confidence
level and even increases in value.
Another potential concern with respect to our result that financial sophistication leads to
higher net wealth holdings is that net worth is a very heterogeneous concept. Although we have
included controls for the impact of demographics, risk aversion, time preferences and confidence
measures many other potential drivers of wealth heterogeneity could be related to financial
sophistication - possibly in an unexpected way - and might influence the relation between
financial literacy and the accumulation of savings. In this section we further exploit the richness
of the DHS dataset to investigate whether the importance of the effect of financial sophistication
is taken away once we control for alternative explanations of wealth dispersion.
One potential explanation for wealth heterogeneity is different appetites for saving. Venti
and Wise (1998, 2000) eliminate successively lifetime earnings, chance events and investment
choices as sufficient explanations for wealth inequality and conclude that a major driving factor
must be unobserved heterogeneity in the taste for savings. Our dataset contains a direct proxy for
the appetite for saving; we include the responses to the question on what respondents ‘do with
money that is left over after having paid for food, rent, and other necessities’. The response scale
runs from 1 to 7, where 1 means ‘I like to spend all my money immediately’ and 7 means ‘I want
to save as much as possible’. Exact wording and responses are reported in appendix B. Table 6B

18
(columns 1 and 2) indeed shows that across the board a higher taste for saving translates into
higher accumulated savings. Being a crude proxy that perhaps could also serve as a measure of
patience, the most important result from the table is that the magnitude and significance of the
coefficient of financial sophistication is unaffected.
Another alternative measure for time preference can be obtained from the question
whether people use a short or a long forward looking horizon in their spending decisions. Being
a direct measure of patience and saving compared to the commonly used smoking and drinking
proxies for time preference, the disadvantage is that responses to this question could already be
conditioned on a number of other personal characteristics and background information. That said
the estimates show that the responses have clear predictive value for wealth accumulation (Table
6B, columns 3 and 4). Nevertheless, the inclusion of this measure does not take away the effect
of financial sophistication on net worth.
Self-control is indisputably an important factor in saving outcomes. No matter how much
importance people attach to savings, if they have difficulties to withstand the short term
temptations of consumption and cannot find ways to constrain their consumption behavior, they
will hold accumulated savings below their target level. The question to respondents whether they
find it difficult to control their expenditures (on a scale from 1 to 7 where 1 means ‘very easy’
and 7 means ‘very difficult’) appeals directly to problems of self-control. As expected self-
control is a major determinant for wealth accumulation (Table 6C, columns 1 and 2). The
difference in net worth between those who have little or no problems in controlling their
expenses and those who recognize that this is a major challenge is as much as nearly €90000.
The inclusion of self-control, however, does not fundamentally affect the relation between
financial literacy and wealth accumulation.
The same is true if we take into account that bequest motives might be associated with
vast differences in wealth accumulations. Although there is no a priori reason to believe that
financial sophistication is related to the intention to leave bequests, the bequest motive might be
an omitted variable explaining a large part of the variation in wealth accumulation. Indeed the
empirical results suggest that some households apparently hold substantial amounts of their
wealth for intentional bequests (Table 6C, columns 3 and 4). The positive impact of financial
sophistication on net worth survives upon inclusion of the bequest motive: its magnitude and
significance even increase somewhat.

19
In addition to these extensions we have incorporated a large number of variables which
based upon the theoretical and empirical literature could principally account for part of the
variation in net worth among households. To this end, we have utilized the rich dataset we have
available by merging our dataset with information from other modules which sometimes
inevitably leads to a loss of observations. At the same time the variables employed are
sometimes simple, crude proxies but may serve at least as a first test for the underlying
hypotheses. We have included several alternative health measures, the self-assessed probability
of the respondent for survival until certain age levels to account for heterogeneity with respect to
perceived longevity, income uncertainty, expectations regarding house price developments, the
perceived likelihood of a future reduction in the generosity of the state pension, and the expected
replacement rate (based upon state pension eligibility and mandatory employer company
savings). The latter variable proxies annuitized pension wealth which is not part of the household
net worth position. All these variables appear insignificant and do take away the effect of
financial sophistication. Finally, we have tested the robustness of our results to other
specifications of the wealth regression. Using net worth over permanent income as a dependent
variable, where the latter variable follows from an auxiliary regression of income on a number of
demographics, we find a positive and significant impact of financial sophistication on wealth.
6. Discussion
6.1 Financial sophistication and stock market participation
Given that financial sophistication increases household wealth holdings, it might be
attractive from a public policy point of view to invest in financial education initiatives. To learn
about what type of education programs might be most effective it is important to understand the
mechanisms at work behind the relation between financial sophistication and net worth. We will
explore two possible explanations related to the well documented limited stock market
participation puzzle and to another puzzling fact in household finance, i.e. the lack of retirement
planning.
Economic theory dictates that possibly except for a small proportion of households it is
optimal to hold at least part of their wealth in the form of stocks (Haliassos and Bertaut, 1995).
Investments in the stock market provide the opportunity to exploit the equity premium and to

20
benefit from risk diversification. International evidence on the composition of household
portfolios shows that many households have no stocks at all in their wealth portfolio (Guiso,
Haliassos and Jappelli, 2002). In our sample about a quarter of the households invest in stocks
either direct or indirect via mutual funds. The limited participation in stock markets is mostly
explained by transaction costs and the costs of processing information which create a threshold
for entering the stock markets (Haliassos and Bertaut, 1995; Vissing-Jorgenson, 2004). In
addition, it has been argued that households are either simply unaware of the opportunities to
invest in stock markets or refrain from doing so due to a lack of trust (Guiso and Jappelli, 2005;
Guiso, Sapienza and Zingales, 2008).
An increase in financial sophistication lowers information costs as well as impediments
to participating due to a lack of knowledge or trust in the working of financial markets. Indeed,
the regression results reported in Table 7 (columns 1 and 2) show that the probability to own
stocks increases by 8 percentage points upon a one-standard deviation increase in the level of
financial sophistication, and about 14 percentage points when we employ the IV approach
correcting for measurement error in the index for financial sophistication as well as taking into
account that one might improve financial knowledge in the process of investing in stocks. The
regression results reported here include the same controls as the wealth regressions. They remain
unaffected in other specifications and when we employ a variety of robustness checks (Van
Rooij, Alessie and Lusardi, 2007).
The fact that financial knowledge boosts stock ownership provides an opportunity to
exploit the risk premium on equity investments and might contribute to the positive effect of
financial literacy on net worth. This is true regardless of the fact that some households may in
fact be better off by not investing in the stock market due to excessive trading or a bad timing of
transactions as the evidence in the finance literature shows that the vast majority of households
investing in the stock market follow very passive investment strategies (see e.g. Ameriks and
Zeldes, 2004).
6.2 Financial sophistication and retirement planning
A second potentially important channel for wealth accumulation is that financial
sophistication is related to planning behavior. As an example, the model by Reis (2006)
distinguishes inattentive consumers who do not plan and do not accumulate wealth from those

21
who do plan and thereby accumulate savings. Empirical evidence supports the assertion that
planning affects wealth accumulation (Ameriks, Caplin and Leahy, 2003; Lusardi and Mitchell,
2007a). Planning is an inherently complex task requiring advanced cognitive skills and financial
understanding. One needs to collect and process information from different sources on current
and future income and expenditures and calculate savings needs based upon alternative
scenarios. Thus, it is obvious that the effect of financial literacy on total net worth might be
related to planning capabilities.14 Indeed, Lusardi and Mitchell (2007b) report convincing
evidence of financial sophistication fostering thinking about retirement. Lusardi and Mitchell
(2008) document a positive relation between simple measures of financial knowledge and more
specific measures of retirement planning related to the calculation of saving needs. In the
following, we will take these two approaches a step further by relating the latter more concrete
definition of retirement planning to well-developed measures of financial sophistication.
Our survey includes a series of questions on retirement planning developed by Lusardi
and Mitchell (2006) and inserted in the 2004 wave of HRS. The precise wording and variation
therein depending on marital status and employment status are reported in appendix B. The first
question relates to the very first step in setting up a retirement plan: ‘Have you ever tried to
figure out how much your household would need to save for retirement?’. Out of 1508
respondents 564 answered affirmatively and are labeled as ‘simple’ planners. The proportion of
simple planners is comparable to the one found for US households in HRS 2004, although the
latter figure is based on a sample of older households. Those respondents who answered ‘yes’,
were given the next follow-up question ‘Have you developed a plan for retirement saving? The
majority seems to have developed some sort of a retirement savings plan as 161 plus 299
respondents answered ‘yes’ or ‘more or less’, respectively. Out of this group of ‘serious’
planners, the large majority claims to have been successful in the sense that 169 plus 250
respond ‘always’ or ‘mostly’ to the third question ‘How often have you been able to stick to this
plan’. The proportion of simple, serious and successful planners is roughly comparable to, albeit
14 Even if people outsource much of the work to financial planners, they have to come up with a lot of information some of which is complex to retrieve and communicate (e.g. subjective information on their preferences and the uncertainty around the main scenario they foresee) and have to be financially smart enough to understand the implications of proposals by intermediaries to judge whether these plans indeed fit their needs best. Interestingly, multivariate regressions reveal that financial sophistication does not exert an independent effect on the probability of consulting a financial intermediary. Illiterate households do however rely significantly more often on the advice of friends and acquaintances when making important financial decisions (the results are not reported but available upon request)

22
somewhat higher than, the findings for US households in HRS 2004, although the latter is based
on a sample of elderly households (Lusardi and Mitchell, 2006). The weighted percentage of
simple, serious and successful planners in our sample equals 34.6, 27.6, and 25.1 respectively.
Descriptive statistics on retirement planning and demographics are reported in Tables 8
and 9. As expected, there is a strong correlation with age. The closer people get to retirement the
more likely they are to start rethinking their retirement needs. No differences in planning
activities between men and women come forward, while couples are more likely to be successful
in executing their plans. While there is not much evidence that planning is related to education or
basic literacy, there is a strong correlation with advanced financial literacy. The proportion of
planners in the most literate group is almost double the number for households with the lowest
level of financial understanding.
The relation between financial sophistication and simple retirement planning is confirmed
in a multivariate regression analysis including the same explanatory variables as before (Table 7,
columns 3 and 4). We report the outcomes of OLS and IV regressions, as we are cautious of
possible simultaneity bias because one could become more financially educated in the process of
calculating saving needs, and developing and executing a retirement plan. The IV-coefficients
however suggest that the downward bias in the OLS coefficient due to imprecise measurement of
financial sophistication is more important than the effect of planning on financial sophistication.
A one standard deviation increase in financial sophistication increases the probability to plan for
retirement with more than 20 percentage points. Another interesting result is the role of
confidence. Those people who are very confident in their financial capabilities are more likely to
start making calculations on how much they need to save for retirement purposes. This suggests
that worries about their own financial skills and capacity to handle complex retirement savings
decisions withhold people from attempting to calculate retirement savings needs and setting up
plans.
Critics might argue that, in particular in the Netherlands, it is not clear that sophisticated
persons decide to save more for retirement when they compare the expected retirement income
with spending needs.15 Informed people could as well come to the conclusion that they are
currently holding more wealth than necessary and adjust their savings downward, since the
15 Also for the US the conclusion - drawn in many studies - that retirement savings are insufficient is not undisputed (Scholz, Seshadri, and Khitatrakun, 2006).

23
Dutch pension system is known to be relatively generous and the vast majority of employees
save via mandatory defined benefit retirement plans with mandatory pension contributions (Van
Rooij, Kool and Prast, 2007). Nevertheless, research findings show that the replacement rates
provided in Dutch mandatory pension system are in many cases below the expectations by
households and insufficient to provide in the desired old age standard of living (Van Duijn,
Lindeboom, Lundborg, and Mastrogiacomo, 2008; Binswanger and Schunk, 2008). This
suggests that also in the Dutch system doing retirement calculations, and subsequently
developing targets for spending and saving might help people overcoming problems of self-
control and improving their wealth position.
6.3 Cost of ignorance
A question of major relevance for public policy decisions is whether the impact of
financial sophistication on net wealth positions is not only statistically significant but also
quantitatively meaningful, in other words. whether financial literacy really matters in economic
terms. From the household’s point of view it is important as well to know whether it is
worthwhile to invest time, effort and financial resources in building up a high level of financial
sophistication. The regression results that document a positive and statistically significant effect
of financial literacy on wealth accumulation provide also a basis for some simple calculations on
the difference in net worth associated with different levels of financial sophistication.
Table 10 reports the difference in net worth for individuals with lower and higher levels
of financial sophistication based upon our estimate for the advanced literacy coefficient.16 The
table shows that a small increase in financial sophistication from just below the level of an
average consumer to somewhat above the average, i.e. from the 45th to the 55th percentile of its
distribution, increases net worth in expected terms by €11500. This certainly constitutes a non-
negligible number as about 20 percent of the households in our sample have lower levels of total
net worth. Wealth effects for larger improvements along the literacy distribution are even more
substantial: the net worth difference associated with the 75th percentile of the financial literacy
distribution up from the 25th percentile equals over €81000. Comparison with the median net
worth level of about €120000 and the mean household net worth of less than two hundred
16 In the calculations we use the coefficient and confidence interval for the effect of financial sophistication on wealth from the preferred specification among the regression in Table 5 (see column 6).

24
thousand euro makes clear that this type of wealth differences are associated with big jumps in
the relative wealth position. The 95%-confidence interval surrounding this estimate ranges from
€11500 to €150600 reflecting that the estimate of the coefficient of financial literacy is
surrounded by substantial uncertainty. The net worth difference associated with an increase from
the bottom to the top tail of the financial literacy distribution is estimated at over €200000. Note
that these calculations do not take into account possible wealth effects of changes in risk attitude
or other personal characteristics associated with higher levels of financial literacy.
Summarizing even though we have to recognize that our calculations provide crude
approximations, it is clear that from a public policy point of view the wealth effects of financial
sophistication are likely to be substantial. Also for households it seems attractive in terms of
wealth holdings to invest in financial education insofar as these efforts boost financial skills. For
the ultimate impact on personal welfare though it makes a difference whether the higher wealth
holdings come from improved wealth management leading to the avoidance of financial mistakes
and to higher portfolio returns or are the result of households being in a better position to control
their expenses. The two channels described above suggest that both mechanisms are at work
here. That said it is important to realize that any effect of financial education on household
wealth is not instantaneous but needs time to materialize.
7. Concluding remarks
Household financial skills, their effect on decisions and the prevalence of financial
mistakes have become an important topic in policy debates. It obvious that the management of a
wealth portfolio nowadays requires more sophisticated knowledge and skills than say two or
three decades ago. Not only have households become more and more responsible for their
individual welfare, but at the same time the landscape of financial markets and products has
dramatically changed; changes that have been characterized by a vast increase in complexity and
possibilities. To the best of our knowledge, this is the first study on the relation between financial
sophistication and wealth accumulation. Using explicit measures for the level of basic cognitive
financial ability and more advanced measures of financial sophistication, we have documented
empirical evidence of an independent positive effect from financial sophistication on wealth
accumulation. This effect of financial sophistication on accumulated savings is robust across
specifications and continuous to hold if we control for many other determinants of dispersion in

25
wealth holdings.
We have highlighted and documented evidence of two important channels that could
drive this relation which is the fact that financially literate persons are more likely to invest in
stocks and have a higher propensity to plan for retirement. We argue that this is the result of
financial sophistication lowering the costs of collecting and processing information, and reducing
planning costs. Thereby it facilitates the execution of financial decisions and brings down
economic and psychological thresholds for participating in the stock market or calculating
retirement savings needs and subsequently developing retirement plans. In addition, we have
illustrated that the economic effects of changes in financial sophistication are likely to be
substantial. Our estimates suggest that even small difference in financial sophistication are likely
to be responsible for substantial differences in wealth holdings, but this figure easily extends to
over €80000 for larger differences in financial sophistication (e.g. comparing the expected net
worth difference associated with the 75th and 25th percentile for financial literacy).
Our study is complementary to the studies by Bernheim, Garret and Maki (2001), and
Bernheim and Garrett (2003) who have shown that financial education in the US (either at high
school or via seminars at the work place) exerted a positive impact on savings, but could not
identify whether this effect runs via its influence on tastes for saving, via the provision of
information and the supply of commitment devices, through a broad improvement in financial
literacy and reduction in financial mistakes or worked mainly via peer effects. The latter might
be the case if at least some students are stimulated to further enhance their financial education
and neighbors, relatives, colleagues or others benefit via word-of-mouth information or
community effects. Our work shows that financial sophistication does directly boost wealth
accumulation, but this does not imply that the effect of financial education programs in indeed
runs through an increase in financial literacy.17 For this we need to separate the impact of several
financial educating programs on financial ability and knowledge from other channels.
An alternative to financial education could be to consider and stimulate initiatives
aiming to simplify complex decisions or to increase the transparency of markets and products.
Ironically, firms have less of an incentive to come up with more transparent and simple products
the larger the part of the population with low financial sophistication (Gabaix and Laibson,
17 Interestingly, a further analysis shows that peer effects might indeed play an important role in financial behavior especially for those with less financial sophistication as they are more likely to consult friends and relatives as their most important source of information for advice on financial decisions.

26
2006). The idea is that these firms employ strategies to profit from less sophisticated individuals
even if this means that part of these gains are used to subsidize financial sophisticated
individuals who make optimal use of selling strategies to attract less sophisticated, more
inattentive consumers.
From a policy perspective, the benefits of higher financial sophistication are clear. Our
results show that financial sophistication leads to higher net worth levels, boosts the participation
in the stock market and increases the propensity to plan for retirement. These effects are very
much welcome as they all contribute to consumers being well equipped to take individual
responsibility for their financial well being over the life cycle. An important issue that is beyond
the scope of this paper but certainly warrants more study is how and to what extent financial
sophistication can be stimulated and enhanced effectively.

27
References Agarwal, S., J. Driscoll, X. Gabaix, and D. Laibson, 2007, The age of reason: Financial decisions over the lifecycle, NBER Working Paper, 13191. Agnew, J., L. Szykman, S. Utkus, and J. Young, 2007, Literacy, trust and 401(k) savings behavior, Center for Retirement Research Working Paper, 2007-10, Boston. Alessie, R., A. Lusardi, and A. Kapteyn, 1995, Saving and wealth holding of the elderly, Research in Economics, 49, 293-315. Alessie, R., A. Lusardi, and A. Kapteyn, 1999, Saving after retirement: Evidence from three different surveys, Labour Economics, 6, 277-310. Ameriks, J., A. Caplin, and J. Leahy, 2003, Wealth accumulation and the propensity to plan, Quarterly Journal of Economics, 118, 1007-1047. Ameriks, J., A. Caplin, J. Leahy, and. T. Tyler, 2007, Measuring self-control problems, American Economic Review, 97, 966-972. Ameriks, J., and S. Zeldes, 2004, How do household portfolio shares vary with age?, mimeo, Columbia Graduate School of Business. Barber, B., and T. Odean, 2000, Trading is hazardous to your wealth: The common stock investment performance of individual investors, Journal of Finance, 55, 773-806. Barber, B., and T. Odean, 2001, Boys will be boys: Gender, overconfidence, and common stock investment, Quarterly Journal of Economics, 116, 261-292. Barsky, R., F. Juster, M. Kimball, and M. Shapiro, 1997, Preference parameters and behavioral heterogeneity: An experimental approach in the Health and Retirement Study, Quarterly Journal of Economics, 112, 537-579. Benartzi, S., and R. Thaler, 2004, Save more tomorrow. Using behavioral economics to increase employee saving, Journal of Political Economy, 112, 164-187. Benjamin D., S. Brown, and J. Shapiro, 2006, Who is ‘behavioral’?: Cognitive ability and anomalous preferences, mimeo, Harvard University. Bernheim, D., D. Garrett, and D. Maki, 2001, Education and saving: The long-term effects of high school financial curriculum mandates, Journal of Public Economics, 85, 435-565. Bernheim, D., and D. Garrett, 2003, The effects of financial education in the workplace: Evidence from a survey of households, Journal of Public Economics, 87, 1487-1519. Bilias, Y., D. Georgarakos, and M. Haliassos, 2007, Equity culture and the distribution of

28
wealth, mimeo. Binswanger, J. and D. Schunk, 2008, What is an adequate standard of living during retirement?, mimeo, Netspar, Tilburg University. Browning, M. and A. Lusardi, 1996, Household saving: Micro theories and micro facts, Journal of Economic Literature, 34, 1797-1855. Calvet, L., J. Campbell, and P. Sodini, 2007, Down or out: Assessing the welfare costs of household investment mistakes, Journal of Political Economy, 115, 707-747. Cagetti, M., and M. De Nardi, Wealth inequality: Data and models, NBER Working Paper, 12550. Campbell, J., 2006, Household finance, Journal of Finance, 61, 1553-1604. Chan, S., and A. Stevens, 2008, What you don’t know cannot help you: Pension knowledge and retirement decision-making, Review of Economics and Statistics, 90, 253-266. Charles, K., and E. Hurst, 2003, The correlation of wealth across generations, Journal of Political Economy, 111, 1155-1182. Christelis, D., T. Jappelli, and M. Padula, 2007, Cognitive abilities and portfolio choice, mimeo, University of Salerno. Cocco, J., F. Gomes, and P. Maenhout, 2005, Consumption and portfolio choice over the life-cycle, Review of Financial Studies, 18, 490-533. Das, M., and B. Donkers, 1999, How certain are Dutch households about future income? An empirical analysis, Review of Income and Wealth, 45, 325-338. Duflo, E., and E. Saez, 2003, The role of information and social interactions in retirement plan decisions: Evidence from a randomized experiment, Quarterly Journal of Economics, 118, 815-842. Duflo, E., and E. Saez, 2004, Implications of pension plan features, information, and social interactions for retirement saving decisions. In: O. Mitchell and S. Utkus (eds.), Pension Design and Structure: New Lessons from Behavioral Finance, Oxford, Oxford University Press, 137-153. Dohmen, T., A. Falk, D. Huffman, and U. Sunde, 2007, Are risk aversion and impatience related to cognitive ability?, IZA Discussion Paper, 2735. Fuchs, V., 1980, Time preference and health: An explorative study, NBER Working Paper, 539.

29
Gabaix, X., and D. Laibson, 2006, Shrouded attributes, consumer myopia, and information suppression in competitive markets, Quarterly Journal of Economics, 121, 505-540. Guiso, L., and T. Jappelli, 2005, Awareness and stock market participation, Review of Finance, 9, 537-567. Guiso, L., M. Haliassos, and T. Jappelli, 2002, Household portfolios, MIT Press, Cambridge. Guiso, L., T. Jappelli, and D. Terlizzese, 1996, Income risk, borrowing constraints, and portfolio choice, American Economic Review, 86, 158-172. Guiso, L., P. Sapienza, and L. Zingales, 2008, Trusting the stock market, Journal of Finance, forthcoming. Gustman, A., and T. Steinmeier, 2004, What People Don’t Know about their Pensions and Social Security, in W. Gale, J. Shoven, and M. Warshawsky, eds., Private Pensions and Public Policies, Washington, D.C.: Brookings Institution, 57-125. Haliassos, M., and C. Bertaut, 1995, Why do so few hold stocks?, Economic Journal, 105, 1110-1129. Heaton, J. and D. Lucas, 2000, Portfolio choice and asset prices: The importance of entrepreneurial risk, Journal of Finance, 55, 1163-1198. Hilgert, M., and J. Hogarth, 2002, Financial knowledge, experience and learning preferences: Preliminary results from a new survey on financial literacy, Consumer Interest Annual, 48. Hilgert, M., J. Hogarth, and S. Beverly, 2003, Household financial management: The connection between knowledge and behavior, Federal Reserve Bulletin, 309-322. Hubbard, R., J. Skinner, and S. Zeldes, 1995, Precautionary savings and social insurance, Journal of Political Economy, 103, 360-399. Hurd, M., 1989, Mortality risk and bequests, Econometrica, 57, 779-813. Hurd, M., 1990, Research on the elderly: Economic status, retirement and consumption and saving, Journal of Economic Literature, 28, 565-637. Hurst, E., and A. Lusardi, 2004, Liquidity constraints, household wealth and entrepreneurship. Journal of Political Economy, 112, 319–347. Hurst, E., and A. Lusardi, 2008, Liquidity constraints and entrepreneurship. Household wealth, parental wealth, and the transition in and out of entrepreneurship, forthcoming in Overcoming Barriers to Entrepreneurship, Rowman and Littlefield.

30
Kapteyn, A., R. Alessie, and A. Lusardi, 2005, Explaining the wealth holdings of different cohorts: Productivity growth and social security, European Economic Review, 49, 1361-1391. Kapteyn, A., and F. Teppa, 2002, Subjective measures of risk aversion and portfolio choice, mimeo, Rand. Kimball, M., and T. Shumway, 2006, Investor sophistication, and the participation, home bias, diversification, and employer stock puzzles, mimeo, University of Michigan. Laibson, D., 1997, Golden eggs and hyperbolic discounting, Quarterly Journal of Economics, 112, 443-477. Lusardi, A., 1999, Information, expectations, and savings for retirement. In: H. Aaron (ed.), Behavioral Dimensions of Retirement Economics, Washington, D.C.: Brookings Institution Press and Russell Sage Foundation, 81-115 Lusardi, A., 2003, Planning and Saving for Retirement, Working Paper, Dartmouth College. Lusardi, A., 2004, Saving and the effectiveness of financial education. In: O. Mitchell and S. Utkus (eds.), Pension Design and Structure: New Lessons from Behavioral Finance, Oxford University Press, 157-184. Lusardi, A., and O. Mitchell, 2006, Financial literacy and planning: Implications for retirement wellbeing, Pension Research Council Working Paper 1, The Wharton School. Lusardi, A., and O. Mitchell, 2007a, Baby boomers retirement security: The role of planning, financial literacy and housing wealth, Journal of Monetary Economics, 54, 205-224. Lusardi, A., and O. Mitchell, 2007b, Financial literacy and retirement planning: New evidence from the American Life Panel?, Working Paper, Dartmouth College. Lusardi, A., and O. Mitchell, 2007c, Financial literacy and retirement preparedness: Evidence and implications for financial education, Business Economics, 35-44. Lusardi, A., and O. Mitchell, 2008, Planning and financial literacy: How do women fare? American Economic Review, 98, 413-417. Modigliani, F., and R. Brumberg, 1954, Utility analysis and the consumption function: An interpretation of cross-section data. In: K. Kurihara (ed.), Post-Keynesian Economics, New Brunswick, New Jersey, Rutgers University Press, 388-436. Mandell, L., 2008, Financial education in high School. In: A. Lusardi (ed.), Overcoming the Saving Slump: How to Increase the Effectiveness of Financial Education and Saving Programs, University of Chicago Press, forthcoming.

31
Moore, D., 2003, Survey of financial literacy in Washington State: Knowledge, behavior, attitudes and experiences, Technical report 03-39, Social and Economic Sciences Research Center, Washington State University. Organization for Economics Co-Operation and Development, 2005, Improving financial literacy: Analysis of issues and policies, Paris, France. Reis, R., 2006, Inattentive Consumers, Journal of Monetary Economics, 53, 1761-1800. Rosen, H., and S. Wu, 2004, Portfolio choice and health status, Journal of Financial Economics, 72, 457-484. Scholz, J., A. Seshadri, and S. Khitatrakun, 2006, Are Americans saving “optimally” for retirement?, Journal of Political Economy, 114, 607-643. Smith, B., and F. Stewart, 2008, Learning from the experience of OECD countries: Lessons for policy, programs, and evaluations. In: A. Lusardi (ed.), Overcoming the Saving Slump: How to Increase the Effectiveness of Financial Education and Saving Programs, University of Chicago Press, forthcoming. Staiger, D., and J. Stock, 1997, Instrumental variables regression with weak instruments, Econometrica, 65, 557-586. Van Duijn, M., M. Lindeboom, P. Lundborg, and M. Mastrogiacomo, 2008, Pension plans and pension outcomes, who gets it right? An investigation on the congruence of expected retirement replacement rates, mimeo, Netspar, Free University of Amsterdam. Van Els, P., W. van den End, and M. van Rooij, 2004, Pensions and public opinion: A survey among Dutch households, De Economist, 152, 101-116. Van Rooij, M., A. Lusardi, and R. Alessie, 2007, Financial literacy and stock market participation, NBER Working Paper, 13565. Van Rooij, M., C. Kool, and H. Prast, 2007, Risk-return preferences in the pension domain: Are people able to choose?, Journal of Public Economics, 91, 701-722. Venti, S. and D. Wise, 1998, The cause of wealth dispersion at retirement: Choice or chance?, American Economic Review, 88, 185-191. Venti, S. and D. Wise, 2000, Choice, chance, and wealth dispersion, NBER Working Paper, 7521. Vissing-Jorgensen, A., 2004, Perspectives on behavioral finance: Does “irrationality” disappear with wealth? Evidence from expectations and actions. In: M. Gertler and K. Rogoff (eds.), NBER Macroeconomics Annual 2003, Cambridge, MIT Press.

32
Appendix A. Measuring literacy and confidence
Basic and advanced financial literacy
The construction of the basic and advanced literacy index is explained in detail in a previous paper (Van
Rooij, Lusardi and Alessie, 2007). In short, the basic literacy index follows from a factor analysis based
on five simple questions. For each question, we create a binary dummy equal to unity if the respondent
provides the correct answer. The five questions measure numeracy and the understanding of economic
concepts (related to the working of inflation and interest rates) that are more or less necessary in day--to-
day transactions. The index of advanced literacy is based on eleven questions about more advanced
concept like the understanding of stocks and bonds, the relation between risk and return and the benefits
of diversification. To do justice to the important role of do-not-know answers, we have created two binary
dummies for each question, measuring whether the question is answered correctly, respectively whether
the respondent indicated that he did not know the answer. The factor analysis on these 22 dummies
clearly points to one factor that adequately describes the variation in responses. The procedure takes into
account the fact that we have used minor variations in wording for three out of eleven questions to test the
sensitivity of responses to these variations.
Overconfidence and underconfidence
At the beginning of our survey, we ask respondents to assess their own literacy. Table A.1 reports the
exact wording of the question and the distribution of the responses. We have grouped the bottom three
categories and the top two categories from the 7-points response scale to retrieve four categories with
about equal size. We also divide the basic literacy index based on simple economic questions over four
different groups and thereby try to mimic the size of the groups of the self-reported literacy groups.
Thereby, we obtain a relative ranking of self-reported literacy and one for measured basic literacy. Those
respondents that rank themselves higher than the rank we find for the basic literacy score are labeled
overconfident and those who are modest about their financial skills compared to the actual measure of
basic literacy are labeled underconfident. Both variables are binary dummies taking the value unity if the
respondent is overconfident or underconfident, respectively, and zero otherwise. This way, we end up
with 404 overconfident respondents, 599 underconfident respondents, 464 respondents with an equal
ranking for actual and self-reported literacy, and 41 respondents with missing information because they
did not answer the self-assessed literacy question. The fact that we obtain more relatively underconfident
than overconfident persons is related to the fact that we are not able to match the group sizes exactly,
since the top category for basic literacy is relatively large, containing the 677 respondents (out of 1508)
who answer all five questions correctly.

33
Table A.1 Self-assessed literacy Number and percentage of respondents ____________________________________________________ How would you assess your understanding of economics (on a 7-points scale; 1 means very low and 7 means very high)? ____________________________________________________ N % _____________ _____________ 1 (very low) 9 0.60 2 56 3.71 3 137 9.08 4 366 24.27 5 499 33.09 6 355 23.54 7 (very high) 45 2.98 Do not know 31 2.06 Refusal 10 0.66 _____________ _____________ Total 1508 100.00 ____________________________________________________

34
Appendix B. Wording of questions and construction of variables used in empirical work This appendix provides information on important variables used in the regression analysis. The squared brackets in the retirement planning questions indicate the different wording used depending on the marital status of the respondent and depending on whether the respondent is retired or not. Risk aversion To what extent do you agree or disagree with the statement ‘Investing in stocks is something I don’t do, since it is too risky’ (on a scale from 1 to 7, where 1 means ‘completely disagree’ and 7 means ‘completely agree’)?
Completely disagree Completely agree [ ] 1 [ ] 2 [ ] 3 [ ] 4 [ ] 5 [ ] 6 [ ] 7 This provides us with a measure of risk aversion. The reference group in the empirical work consists of those respondents who disagree completely (category 1). Economics education How much of your education was devoted to economics? [ ] A lot [ ] Some [ ] Little [ ] Hardly at all [ ] Do not know [ ] Refusal The instrument variable economics education in the past is used in the regression analysis by including four dummy variables for the response categories ‘some’, ‘little’, ‘hardly at all,’ and ‘do not know/refusal’ respectively. The reference group consists of those respondents whose education was devoted ‘a lot’ to economics. Taste for saving Some people spend all their income immediately. Others save some money in order to have something to fall back on. Please indicate what you do with money that is left over after having paid for food, rent, and other necessities (on a scale from 1 to 7, where 1 means ‘I like to spend all my money immediately’ and 7 means ‘I want to save as much as possible’)?
I like to spend all my money immediately I want to save as much as possible [ ] 1 [ ] 2 [ ] 3 [ ] 4 [ ] 5 [ ] 6 [ ] 7 The measure of taste for saving used in the regression analysis is constructed by grouping together the two lowest categories (very few respondents have chosen the lowest level), recoding the remaining six levels of taste for saving from 1 (quite low) to 6 (very high). The reference group in the empirical work consists of those respondents who like to spend all their money immediately (category 1).

35
Time preference People use different time horizons when they decide about what part of the income to spend, and what part to save. Which of the time horizons mentioned below is in your household MOST important with regard to planning expenditures and savings? [ ] The next couple of months [ ] The next year [ ] The next couple of years [ ] The next 5 to 10 years [ ] More than 10 years from now The reference group in the empirical work consists of those respondents who state that the most important time horizon is shortest, i.e. the next couple of months (category 1). Self-control Do you find it difficult to control your expenditures? Please indicate how difficult you find this (on a scale from 1 to 7, where 1 means ‘very easy’ and 7 means ‘very difficult’)?
Very easy Very difficult [ ] 1 [ ] 2 [ ] 3 [ ] 4 [ ] 5 [ ] 6 [ ] 7 The measure of self-control used in the regression analysis is constructed by grouping together the two highest categories (very few respondents have chosen the highest level), recoding the remaining six levels of self-control from 1 (very easy) to 6 (quite difficult). The reference group in the empirical work consists of those respondents who find it very easy to control their expenditures (category 1). Bequest motive Please indicate which of the following four statements about parents leaving a bequest to their children would be closest to your own opinion about this? [ ] If our children would take good care of us when we get old, we would like to leave them a considerable bequest [ ] We would like to leave our children a considerable bequest, irrespective of the way they will take care of us when we are old [ ] We have no preconceived plans about leaving a bequest to our children [ ] We don’t intend to leave a bequest to our children [ ] None of the above-mentioned statements

36
Carefulness To what extent do you agree or disagree with the statement ‘I would describe myself as a careful person’ (on a scale from 1 to 7, where 1 means ‘completely disagree’ and 7 means ‘completely agree’)?
Completely disagree Completely agree [ ] 1 [ ] 2 [ ] 3 [ ] 4 [ ] 5 [ ] 6 [ ] 7
[ ] Do not know [ ] Refusal
The measure of carefulness used in the regression analysis is constructed by grouping together the two lowest categories (very few respondents have chosen the lowest category), recoding the remaining six levels of carefulness from 1 (quite low) to 6 (very high). The few respondents that have chosen ‘do not know’ are added to the last category. The reference group in the empirical work consists of those respondents who strongly disagree with the statement that they are careful person (category 1). Precaution To what extent do you agree or disagree with the statement ‘When there is possible danger, I take many precautions’ (on a scale from 1 to 7, where 1 means ‘completely disagree’ and 7 means ‘completely agree’)?
Completely disagree Completely agree [ ] 1 [ ] 2 [ ] 3 [ ] 4 [ ] 5 [ ] 6 [ ] 7
[ ] Do not know [ ] Refusal
The measure of precaution used in the regression analysis is constructed by grouping together the two lowest categories (very few respondents have chosen the lowest category), recoding the remaining six levels of precaution from 1 (quite low) to 6 (very high). The few respondents that have chosen ‘do not know’ are added to the last category. The reference group in the empirical work consists of those respondents who strongly disagree with the statement that they take many precautions (category 1). Thinking about retirement How much have you thought about retirement? [ ] A lot [ ] Some [ ] Little [ ] Hardly at all [ ] Do not know [ ] Refusal In the regression analysis, we use a dummy which takes the value 1 if respondents have thought ‘a lot‘ or ‘some’ about retirement, and 0 otherwise.

37
Simple planning [Have you [or your husband/wife/partner] ever tried\Did you [or your husband/wife/partner] try] to figure out how much your household would need to save yourself for [retirement?/ before you retired?] [ ] Yes [ ] No [ ] Do not know [ ] Refusal In the regression analysis, we use a dummy which takes the value 1 if respondents answered affirmatively and 0 otherwise. Serious planning [Have you\Did you] [or your husband/wife/partner] develop(ed) a plan for retirement saving? [ ] Yes [ ] More or Less [ ] No [ ] Do not know [ ] Refusal In the regression analysis, we use a dummy which takes the value 1 if respondents answered affirmatively and 0 otherwise. Successful planning How often [have you [and your husband/wife/partner] been\were you [and your husband/wife/partner]] able to stick to this plan: would you say always, mostly, rarely, or never? [ ] Always [ ] Mostly [ ] Rarely [ ] Never [ ] Do not know [ ] Refusal In the regression analysis, we use a dummy which takes the value 1 if respondents answered affirmatively and 0 otherwise Self-assessed literacy How would you assess your understanding of economics (on a 7-points scale; 1 means very low and 7 means very high)?
Very low Very high [ ] 1 [ ] 2 [ ] 3 [ ] 4 [ ] 5 [ ] 6 [ ] 7
[ ] Do not know [ ] Refusal
The index of self-assessed literacy used in the regression analysis is constructed by grouping together the two lowest categories (very few respondents have chosen the lowest level), recoding the remaining six levels of self-assessed literacy from 1 to 6 and excluding ‘do not know’ answers and ‘refusals.’

38
Table 1. Total net worth versus basic and advanced literacy Thousands of euro (N=1091) ________________________________________________________________ Total net worth ______________________________________ Total net worth Median Mean Standard deviation _______________________ _________ _________ _______________ before trimming (N=1116) 119.7 184.3 279.3 after trimming 119.7 167.1 189.0 Total net worth ______________________________________ Basic literacy quartiles Median Mean Standard deviation _______________________ _________ _________ _______________ 1 (low) 43.9 117.2 162.3 2 98.8 150.2 164.7 3 111.2 156.5 173.6 4 (high) 142.8 195.7 209.3 Total net worth ______________________________________ Advanced literacy quartiles Median Mean Standard deviation _______________________ _________ _________ _______________ 1 (low) 46.7 100.1 121.2 2 82.0 129.3 151.0 3 112.4 167.5 181.4 4 (high) 185.9 236.3 228.4 ________________________________________________________________
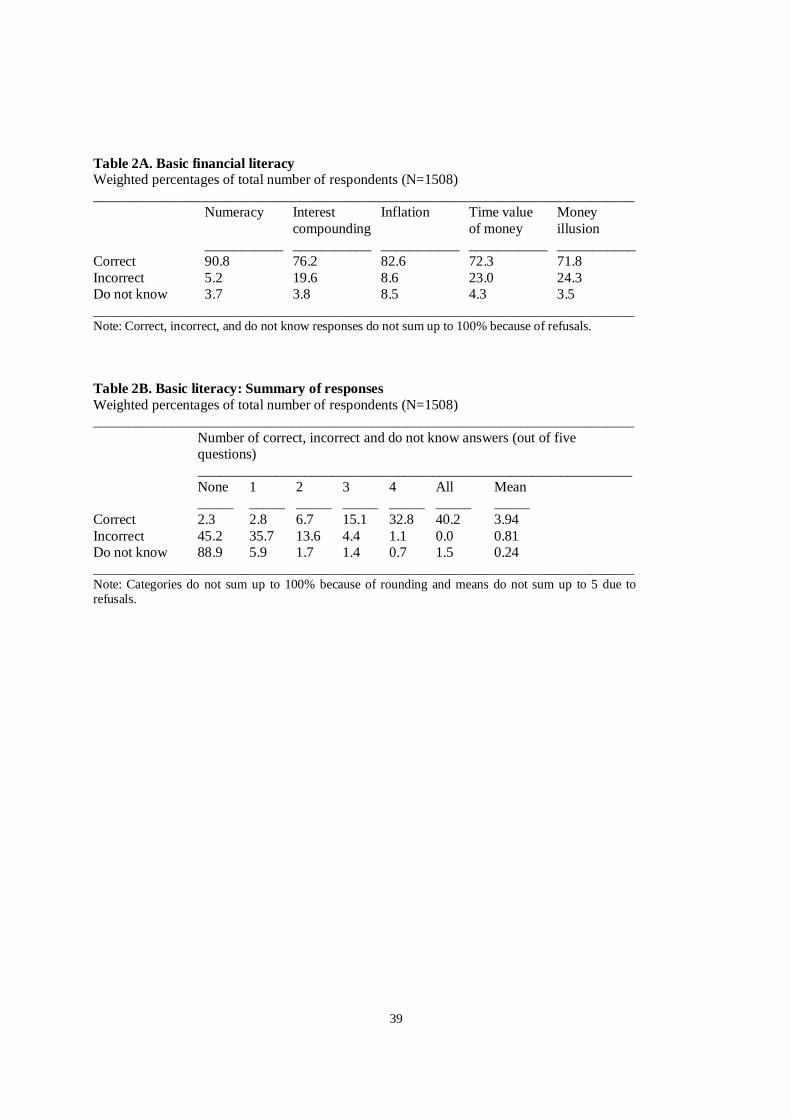
39
Table 2A. Basic financial literacy Weighted percentages of total number of respondents (N=1508) ____________________________________________________________________________ Numeracy Interest
compounding Inflation Time value
of money Money illusion
___________ ___________ ___________ ___________ ___________ Correct 90.8 76.2 82.6 72.3 71.8 Incorrect 5.2 19.6 8.6 23.0 24.3 Do not know 3.7 3.8 8.5 4.3 3.5 ____________________________________________________________________________ Note: Correct, incorrect, and do not know responses do not sum up to 100% because of refusals.
Table 2B. Basic literacy: Summary of responses Weighted percentages of total number of respondents (N=1508) ____________________________________________________________________________ Number of correct, incorrect and do not know answers (out of five
questions) _____________________________________________________________ None 1 2 3 4 All Mean _____ _____ _____ _____ _____ _____ _____ Correct 2.3 2.8 6.7 15.1 32.8 40.2 3.94 Incorrect 45.2 35.7 13.6 4.4 1.1 0.0 0.81 Do not know 88.9 5.9 1.7 1.4 0.7 1.5 0.24 ____________________________________________________________________________ Note: Categories do not sum up to 100% because of rounding and means do not sum up to 5 due to refusals.

40
Table 3A. Advanced financial literacy Weighted percentages of total number of respondents (N=1508) _______________________________________________________________________________________ Correct Incorrect Do not
know ______ _______ ______ Which statement describes the main function of the stock market? 1)
67.0 12.9 19.7
What happens if somebody buys the stock of firm B in the stock market? 1)
62.2 25.7 11.0
Which statement about mutual funds is correct? 1)
66.7 11.1 21.7
What happens if somebody buys a bond of firm B? 1)
55.6 17.8 26.4
Considering a long time period (for example 10 or 20 years), which asset normally gives the highest return: savings accounts, bonds or stocks?
47.2 30.1 22.3
Normally, which asset displays the highest fluctuations over time: savings accounts, bonds, stocks?
68.5 12.7 18.4
When an investor spreads his money among different assets, does the risk of losing money increase, decrease or stay the same?
63.3 17.4 19.0
If you buy a 10-year bond, it means you cannot sell it after 5 years without incurring a major penalty. True or false?
30.0 28.3 37.9
Stocks are normally riskier than bonds. True or false? 2)
60.2 15.1 24.3
Buying a company fund usually provides a safer return than a stock mutual fund. True or false? 2)
48.2 24.8 26.6
If the interest rate falls, what should happen to bond prices: rise/fall/stay the same/none of the above? 2)
24.6 37.1 37.5
_______________________________________________________________________________________ 1) See exact wording in the text; 2) This question has been phrased in two different ways. Note: Correct, incorrect and do not know responses do not sum up to 100% because of refusals.

41
Table 3B. Advanced literacy: Summary of responses Weighted percentages of total number of respondents (N=1508) ________________________________________________________________________________________ Number of correct, incorrect and do not know answers (out of eleven questions) ____________________________________________________________________________ None 1 2 3 4 5 6 7 8 9 10 All Mean ____ ____ ____ ____ ____ ____ ____ ____ ____ ____ ____ ____ _____ Correct 7.6 5.1 5.2 6.4 7.3 10.0 11.1 11.3 10.8 10.6 9.8 5.0 5.93 Incorrect 18.7 20.2 19.8 16.8 10.4 7.1 4.7 1.6 0.6 0.1 0.0 0.0 2.33 Do not know 44.2 11.4 8.0 6.1 5.1 3.7 4.1 4.2 2.8 3.2 3.5 3.6 2.65 ________________________________________________________________________________________ Note: Categories do not sum up to 100% because of rounding and means do not sum up to 11 due to refusals.
Table 4. Asset ownership versus basic and advanced literacy Weighted percentages (N=1116) ____________________________________________________________________________ % of households owning __________________________________________________ Basic literacy quartiles Stocks Mutual funds Bonds Home _______________________ ___________ ___________ ___________ ___________ 1 (low) 2.4 5.6 1.9 40.5 2 9.7 17.6 3.8 53.4 3 10.2 16.5 3.0 54.4 4 (high) 18.1 23.9 6.1 60.8 % of households owning __________________________________________________ Advanced literacy quartiles Stocks Mutual funds Bonds Home _______________________ ___________ ___________ ___________ ___________ 1 (low) 2.0 6.5 1.4 44.6 2 5.0 11.8 1.2 44.8 3 14.2 18.5 5.0 56.0 4 (high) 25.2 33.1 8.8 70.9 ____________________________________________________________________________ Note: Percentages may not sum up to 100 due to rounding.

42
Table 5. Total net worth versus financial ability and financial literacy: multivariate regressions ____________________________________________________________________________________________
(1) (2) (3) (4) (5) (6) OLS OLS OLS OLS OLS IV _________ _________ _________ _________ _________ _________ Advanced financial literacy index 23514*** 67122** (4.86) (2.28) Basic financial literacy index 12328*** 15804*** 15712*** 16694*** 9050 -5129 (3.42) (3.37) (3.08) (3.17) (1.64) (-0.45) Age dummy (30<age<=40) 26904** 24581** 22398* 20743 24756* 32198** (2.25) (2.02) (1.69) (1.55) (1.81) (2.12) Age dummy (40<age<=50) 72269*** 72359*** 74986*** 76027*** 77806*** 81106*** (5.42) (5.34) (5.20) (5.24) (5.31) (5.24) Age dummy (50<age<=60) 131181*** 130456*** 136511*** 136072*** 134470*** 131499*** (8.71) (8.49) (8.33) (8.17) (8.05) (7.49) Age dummy (60<age<=70) 143929*** 144246*** 152902*** 151976*** 150595*** 148034*** (7.01) (6.94) (7.25) (7.18) (7.11) (6.71) Age dummy (age>70) 166320*** 161898*** 168605*** 169144*** 169701*** 170733*** (6.31) (5.88) (6.15) (6.16) (6.17) (6.08) Intermediate vocational 18230 12666 12961 16282 12459 5368 (1.37) (0.93) (0.92) (1.14) (0.87) (0.35) Secondary pre-university 10709 2851 4714 5994 -1197 -14533 (0.65) (0.18) (0.28) (0.35) (-0.070) (-0.76) Higher vocational 25853* 22434 18835 17733 11324 -563 (1.85) (1.59) (1.30) (1.21) (0.77) (-0.034) University 37059** 35853* 26112 25821 16848 208 (1.98) (1.88) (1.32) (1.30) (0.84) (0.0094) Male -7952 -10204 -20710** -19907* -26884** -39823*** (-0.81) (-1.02) (-1.97) (-1.84) (-2.49) (-3.01) Married 30905*** 26639** 24494** 22754* 24778** 28533** (2.72) (2.29) (2.08) (1.89) (2.07) (2.28) Number of children 10285* 11166* 10199 10687* 11424* 12790** (1.70) (1.80) (1.59) (1.66) (1.79) (1.99) Retired 45437** 45454** 42855** 43503** 41651** 38215* (2.16) (2.11) (2.03) (2.06) (1.98) (1.78) Self-employed 26205 25016 25300 26025 24797 22520 (1.17) (1.12) (1.04) (1.07) (1.03) (0.93) Ln(household income) -3277982*** -3261105*** -3062710*** -3066220*** -3011077*** -2908803*** (-3.76) (-3.72) (-3.69) (-3.68) (-3.57) (-3.28) Ln(household income)2 315864*** 314721*** 297871*** 299340*** 293782*** 283474*** (3.71) (3.67) (3.67) (3.66) (3.57) (3.30) Ln(household income)3 -9676*** -9648*** -9179*** -9261*** -9084*** -8754 *** (-3.51) (-3.45) (-3.48) (-3.48) (-3.40) (-3.17) High confidence -10738 -9253 -8685 -9829 -11951 (-0.79) (-0.66) (-0.61) (-0.70) (-0.84) Low confidence -26368** -21614* -23286* -19605 -12778 (-2.15) (-1.70) (-1.83) (-1.55) (-0.94) Risk aversion dummy 2 (low) -1181 -3888 -8001 -15629 (-0.043) (-0.14) (-0.29) (-0.57) Risk aversion dummy 3 -16204 -21340 -23968 -28841 (-0.65) (-0.86) (-0.97) (-1.17) Risk aversion dummy 4 -30789 -35329 -33869 -31162 (-1.24) (-1.41) (-1.36) (-1.23) Risk aversion dummy 5 -13917 -16025 -19345 -25502 (-0.53) (-0.60) (-0.74) (-0.99)
43
Risk aversion dummy 6 -55402** -57751** -54037** -47149** (-2.41) (-2.51) (-2.37) (-1.98) Risk aversion dummy: very high -64013*** -66105*** -60545*** -50234** (-2.85) (-2.93) (-2.71) (-2.07) Smoking: every now and then -20230 -18589 -15544 (-1.22) (-1.15) (-0.95) Smoking: daily (< 20 cigarettes) -6861 -5978 -4339 (-0.39) (-0.34) (-0.25) Smoking: daily (>= 20 cigarettes) -20227 -21097 -22711 (-0.73) (-0.76) (-0.82) Drinking: daily (> 4 drinks) -966 -1802 -3353 (-0.040) (-0.076) (-0.15) Constant 10880396*** 10818615*** 10088240*** 10066777*** 9897789*** 9584366*** (3.67) (3.65) (3.58) (3.56) (3.45) (3.15) Observations 1091 1060 1013 1003 1003 1003 R-squared 0.32 0.32 0.34 0.34 0.35 0.32 p-value test age=0 0.00 0.00 0.00 0.00 0.00 0.00 p-value test education=0 0.26 0.27 0.61 0.64 0.81 0.84 p-value test income=0 0.00 0.00 0.00 0.00 0.00 0.00 p-value test confidence=0 0.10 0.24 0.18 0.30 0.56 p-value test risk aversion=0 0.00 0.00 0.01 0.48 p-value test smoking, drinking=0 0.74 0.77 0.83 p-value Hansen J test 0.30 F-statistic first stage regression 13.0 p-value exogeneity test 0.18 ____________________________________________________________________________________________
Note: Robust standard errors in parentheses; *** p<0.01, ** p<0.05, * p<0.1. The dependent variable is net worth. The most risk tolerant, none smoking and moderately drinking (4 alcoholic drinks or less a day) respondents are in the reference group. The advanced literacy index has been instrumented using dummy variables indicating how much the respondent’s education was devoted to economics. The reference group consists of those respondents whose education was devoted a lot to economics.

44
Table 6A. Total net worth regressions: including carefulness and precaution _____________________________________________________________________________
(1) (2) (3) (4) OLS IV OLS IV __________ __________ __________ _________ Advanced financial literacy index 24139*** 92061** 25390*** 96858** (4.03) (2.19) (4.26) (2.33) Basic financial literacy index 10023 -12794 10813* -13227 (1.60) (-0.82) (1.68) (-0.85) Carefulness dummy 2 (low) -43822 -40941 (-1.18) (-1.13) Carefulness dummy 3 -50935 -33725 (-1.48) (-0.97) Carefulness dummy 4 -10235 3741 (-0.30) (0.11) Carefulness dummy 5 6059 10025 (0.17) (0.29) Carefulness dummy 6 (very high) -6969 -8211 (-0.19) (-0.23) Precaution dummy 2 (low) 24382 1035 (0.64) (0.024) Precaution dummy 3 7903 5677 (0.24) (0.16) Precaution dummy 4 25802 16869 (0.80) (0.48) Precaution dummy 5 19022 5463 (0.59) (0.15) Precaution dummy 6 (very high) 29969 29647 (0.88) (0.82) Demographics (see table 5) yes yes yes yes Observations 721 721 721 721 R-squared 0.38 0.31 0.37 0.29 p-value test carefulness=0 0.00 0.03 p-value test precaution=0 0.80 0.78 p-value Hansen J test 0.14 0.15 F-statistic first stage regression 6.24 6.12 p-value exogeneity test 0.12 0.10 ______________________________________________________________________________ Note: Robust standard errors in parentheses; *** p<0.01, ** p<0.05, * p<0.1. The dependent variable is net worth. The reference group in the first two columns contains those respondents who strongly disagree with the statement that they consider themselves as a careful person. The reference group in the last two columns contains those respondents who strongly disagree with the statement that they take many precautions. The advanced literacy index has been instrumented using dummy variables indicating how much the respondent’s education was devoted to economics. The reference group consists of those respondents whose education was devoted a lot to economics.

45
Table 6B. Total net worth: including taste for saving and alternative time preferences
_____________________________________________________________________________ (1) (2) (3) (4) OLS IV OLS IV __________ __________ __________ __________ Advanced financial literacy index 20951*** 63127** 23189*** 64954** (4.40) (2.15) (4.85) (2.21) Basic financial literacy index 6763 -6445 10022* -3589 (1.21) (-0.58) (1.81) (-0.31) Taste for saving dummy 2 (low) 41138** 31847 (2.20) (1.61) Taste for saving dummy 3 52947*** 47649*** (3.18) (2.76) Taste for saving dummy 4 68209*** 61623*** (4.37) (3.79) Taste for saving dummy 5 100078*** 86603*** (5.94) (4.53) Taste for saving dummy 6 (very high) 68491*** 57392*** (3.42) (2.62) Time preference: horizon 3-12 months 663 -939 (0.053) (-0.074) Time preference: horizon 1-5 years 32813** 33408*** (2.56) (2.59) Time preference: horizon 5-10 years 55025*** 52812*** (2.67) (2.59) Time preference: horizon > 10 years 60375** 55111** (2.32) (2.08) Demographics (see table 5) yes yes yes yes Observations 1003 1003 1003 1003 R-squared 0.37 0.34 0.37 0.34 p-value taste for saving=0 0.00 0.00 p-value test time preference=0 0.00 0.00 p-value Hansen J test 0.33 0.26 F-statistic first stage regression 12.6 13.0 p-value exogeneity test 0.20 0.22
______________________________________________________________________________ Note: Robust standard errors in parentheses; *** p<0.01, ** p<0.05, * p<0.1. The dependent variable is net worth. The reference group in the first two columns contains those respondents with a very low taste for saving. The reference group in the last two columns contains those respondents with a very sort time horizon (a couple of months). The advanced literacy index has been instrumented using dummy variables indicating how much the respondent’s education was devoted to economics. The reference group consists of those respondents whose education was devoted a lot to economics.

46
Table 6C. Total net worth regressions: including self-control and bequest motives
_____________________________________________________________________________ (1) (2) (3) (4) OLS IV OLS IV __________ __________ __________ __________ Advanced financial literacy index 21539*** 63363** 18918*** 71014** (4.47) (2.18) (4.04) (2.45) Basic financial literacy index 5950 -7420 8797 -7154 (1.06) (-0.66) (1.63) (-0.66) Self-control dummy 2 (quite easy) -13081 -9695 (-0.79) (-0.58) Self-control dummy 3 -43830** -35643* (-2.45) (-1.84) Self-control dummy 4 -47582** -39237* (-2.46) (-1.95) Self-control dummy 5 -68355*** -58363*** (-3.86) (-2.99) Self-control dummy 6 (quite difficult) -88070*** -86862*** (-4.48) (-4.41) Dummy bequest motive: yes 106732*** 103244*** (4.81) (4.66) Dummy bequest motive: no -12838 -10935 (-0.88) (-0.73) Dummy bequest motive: other -57490*** -32600 (-2.87) (-1.26) Demographics (see table 5) yes yes yes yes Observations 1003 1003 1003 1003 R-squared 0.37 0.34 0.40 0.36 p-value taste self-control=0 0.00 0.00 p-value test bequest motive=0 0.00 0.00 p-value Hansen J test 0.21 0.29 F-statistic first stage regression 13.4 12.8 p-value exogeneity test 0.23 0.08
______________________________________________________________________________ Note: Robust standard errors in parentheses; *** p<0.01, ** p<0.05, * p<0.1. The dependent variable is net worth. The reference group in the first two columns contains those respondents who find it very easy to control their expenditures. The reference group in the last two columns contains those respondents who do not have children. The advanced literacy index has been instrumented using dummy variables indicating how much the respondent’s education was devoted to economics. The reference group consists of those respondents whose education was devoted a lot to economics.

47
Table 7. Stock market participation and retirement planning versus financial ability and financial literacy
_________________________________________________________________________________________________ Stock ownership Simple retirement planning _______________________________ ______________________________ (1) (2) (3) (4) OLS IV OLS IV _______________ ______________ _______________ ______________ Advanced financial literacy index 0.080*** 0.14** 0.072*** 0.25*** (6.54) (1.98) (4.13) (2.66) Basic financial literacy index 0.034** 0.015 0.031* -0.026 (2.40) (0.54) (1.79) (-0.71) Dummy (30<age<=40) 0.026 0.036 0.026 0.056 (0.54) (0.73) (0.43) (0.89) Dummy (40<age<=50) 0.11** 0.11** 0.084 0.097 (2.27) (2.36) (1.39) (1.62) Dummy (50<age<=60) 0.090* 0.086* 0.18*** 0.17*** (1.89) (1.79) (2.99) (2.77) Dummy (60<age<=70) 0.18*** 0.17*** 0.16** 0.15** (3.02) (3.01) (2.16) (2.04) Dummy (age>70) 0.27*** 0.27*** 0.052 0.056 (3.95) (4.03) (0.62) (0.69) Intermediate vocational -0.0033 -0.013 0.0029 -0.026 (-0.091) (-0.34) (0.062) (-0.49) Secondary pre-university -0.018 -0.036 -0.0081 -0.062 (-0.43) (-0.77) (-0.15) (-1.02) Higher vocational 0.026 0.0099 -0.033 -0.080 (0.73) (0.25) (-0.74) (-1.57) University 0.022 -0.00065 0.073 0.0064 (0.48) (-0.012) (1.31) (0.095) Male -0.034 -0.052 -0.061* -0.11** (-1.24) (-1.54) (-1.79) (-2.55) Married -0.033 -0.028 -0.032 -0.017 (-1.10) (-0.93) (-0.87) (-0.44) Number of children 0.011 0.013 0.017 0.022 (0.74) (0.86) (0.92) (1.20) Retired -0.027 -0.031 0.034 0.020 (-0.54) (-0.65) (0.54) (0.32) Self-employed -0.022 -0.025 0.0090 -0.000095 (-0.34) (-0.39) (0.13) (-0.0012) Ln(household income) -1.46 -1.32 -0.13 0.28 (-0.92) (-0.84) (-0.050) (0.092) Ln(household income)2 0.14 0.13 0.029 -0.012 (0.96) (0.87) (0.12) (-0.043) Ln(household income)3 -0.0044 -0.0039 -0.0013 0.0000036 (-0.94) (-0.84) (-0.16) (0.00039) High confidence 0.013 0.0097 0.14*** 0.13*** (0.35) (0.27) (3.35) (2.98) Low confidence -0.036 -0.027 -0.048 -0.021 (-1.17) (-0.83) (-1.30) (-0.51) Risk aversion dummy 2 (low) 0.12** 0.11* 0.0085 -0.022 (2.06) (1.93) (0.13) (-0.32) Risk aversion dummy 3 -0.040 -0.046 0.023 0.0034 (-0.61) (-0.73) (0.34) (0.050) Risk aversion dummy 4 -0.17*** -0.16*** 0.017 0.028 (-2.80) (-2.79) (0.27) (0.43)
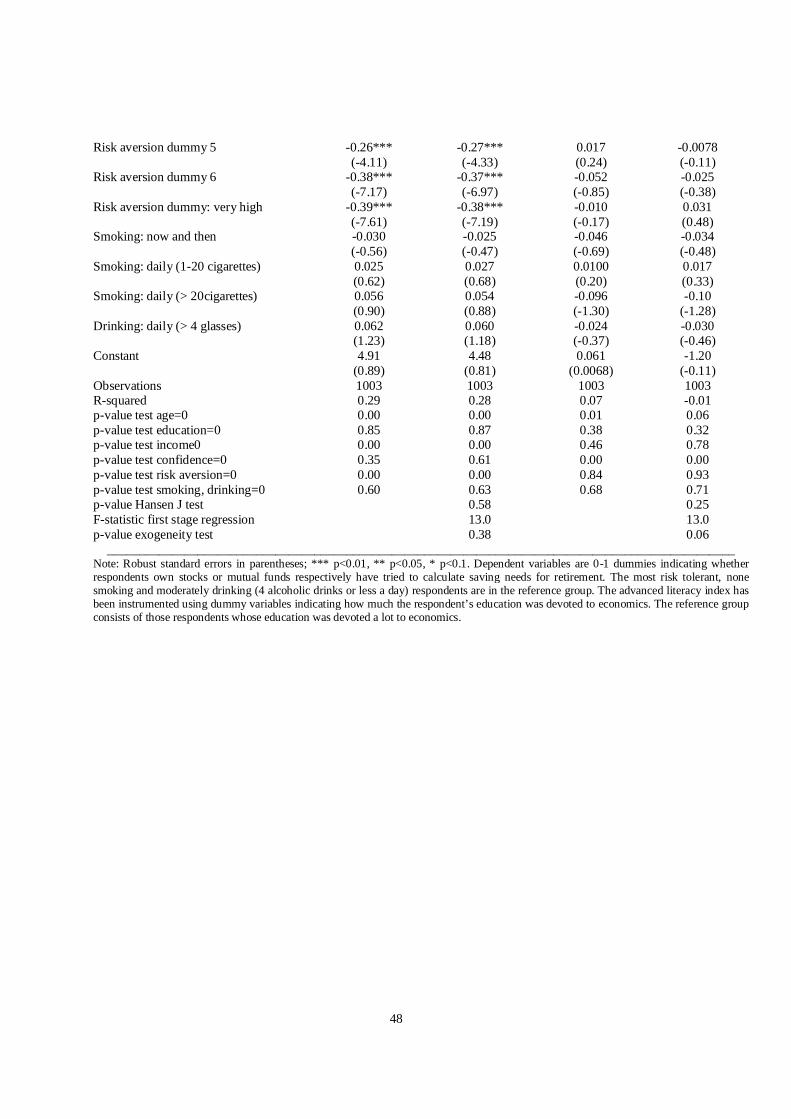
48
Risk aversion dummy 5 -0.26*** -0.27*** 0.017 -0.0078 (-4.11) (-4.33) (0.24) (-0.11) Risk aversion dummy 6 -0.38*** -0.37*** -0.052 -0.025 (-7.17) (-6.97) (-0.85) (-0.38) Risk aversion dummy: very high -0.39*** -0.38*** -0.010 0.031 (-7.61) (-7.19) (-0.17) (0.48) Smoking: now and then -0.030 -0.025 -0.046 -0.034 (-0.56) (-0.47) (-0.69) (-0.48) Smoking: daily (1-20 cigarettes) 0.025 0.027 0.0100 0.017 (0.62) (0.68) (0.20) (0.33) Smoking: daily (> 20cigarettes) 0.056 0.054 -0.096 -0.10 (0.90) (0.88) (-1.30) (-1.28) Drinking: daily (> 4 glasses) 0.062 0.060 -0.024 -0.030 (1.23) (1.18) (-0.37) (-0.46) Constant 4.91 4.48 0.061 -1.20 (0.89) (0.81) (0.0068) (-0.11) Observations 1003 1003 1003 1003 R-squared 0.29 0.28 0.07 -0.01 p-value test age=0 0.00 0.00 0.01 0.06 p-value test education=0 0.85 0.87 0.38 0.32 p-value test income0 0.00 0.00 0.46 0.78 p-value test confidence=0 0.35 0.61 0.00 0.00 p-value test risk aversion=0 0.00 0.00 0.84 0.93 p-value test smoking, drinking=0 0.60 0.63 0.68 0.71 p-value Hansen J test 0.58 0.25 F-statistic first stage regression 13.0 13.0 p-value exogeneity test 0.38 0.06
_________________________________________________________________________________________________ Note: Robust standard errors in parentheses; *** p<0.01, ** p<0.05, * p<0.1. Dependent variables are 0-1 dummies indicating whether respondents own stocks or mutual funds respectively have tried to calculate saving needs for retirement. The most risk tolerant, none smoking and moderately drinking (4 alcoholic drinks or less a day) respondents are in the reference group. The advanced literacy index has been instrumented using dummy variables indicating how much the respondent’s education was devoted to economics. The reference group consists of those respondents whose education was devoted a lot to economics.

49
Table 8. Retirement planning across demographics Weighted household percentages __________________________________________________________________ Percentage of planners ______________________________ Education Simple Serious Successful N ________________________ ________ ________ ________ ____ Primary 20.6 16.9 15.9 67 Preparatory intermediate voc. 37.3 27.6 25.1 345 Intermediate vocational 33.0 26.2 22.7 295 Secondary pre-university 33.1 26.6 23.1 207 Higher vocational 35.5 30.8 29.1 397 University 39.8 29.9 28.9 197 Pearson chi2(5) 9.50 3.37 4.75 p-value 0.09 0.64 0.45 __________________________________________________________________ Age Simple Serious Successful N ________________________ ________ ________ ________ ____ 21-30 years 24.8 18.5 14.9 179 31-40 years 30.0 23.0 21.8 306 41-50 years 34.6 27.1 24.8 333 51-60 years 45.4 36.7 34.0 311 61-70 years 34.8 28.4 25.3 217 71 years and older 34.4 28.9 27.0 162 Pearson chi2(5) 23.4 19.7 19.8 p-value 0.00 0.00 0.00 __________________________________________________________________ Gender Simple Serious Successful N ________________________ ________ ________ ________ ____ Female 32.6 26.5 24.4 674 Male 36.6 28.4 25.7 834 Pearson chi2(1) 0.42 0.03 0.02 p-value 0.52 0.86 0.88 __________________________________________________________________ Marital status Simple Serious Successful N ________________________ ________ ________ ________ ____ Single/divorced/widow 0.323 0.237 0.213 Married/living together 0.364 0.304 0.279 476 1032 Pearson chi2(1) 1.59 3.35 4.04 p-value 0.21 0.07 0.04 __________________________________________________________________ Note: Percentages may not sum up to 100 due to rounding.

50
Table 9. Retirement planning versus literacy Weighted household percentages __________________________________________________________________ Percentage of planners ______________________________ Basic literacy Simple Serious Successful N ________________________ ________ ________ ________ ____ 1 (low) 31.9 23.8 21.7 217 2 33.7 27.9 22.9 284 3 31.4 26.4 24.0 350 4 (high) 38.1 29.5 28.2 657 Pearson chi2(3) 1.95 0.94 3.62 p-value 0.58 0.82 0.31 __________________________________________________________________ Advanced literacy Simple Serious Successful N ________________________ ________ ________ ________ ____ 1 (low) 24.5 19.9 18.6 330 2 31.8 22.9 20.9 354 3 38.2 31.7 28.3 371 4 (high) 44.1 35.5 32.5 453 Pearson chi2(3) 32.6 22.9 20.6 p-value 0.00 0.00 0.00 __________________________________________________________________ Self-assessed literacy Simple Serious Successful N ________________________ ________ ________ ________ ____ 1 (very low) 53.4 44.1 44.1 9 2 33.3 17.8 15.0 56 3 21.2 17.3 16.2 137 4 26.7 20.3 16.1 366 5 37.0 30.7 28.2 499 6 45.7 37.7 36.1 355 7 (very high) 51.4 42.7 41.5 45 Do not know 17.6 10.2 10.2 31 Refusal 27.2 13.9 13.9 10 Pearson chi2(8) 48.6 43.6 49.9 p-value 0.00 0.00 0.00 __________________________________________________________________ Note: Percentages may not sum up to 100 due to rounding.

51
Table 10. Net worth differences associated with different levels of financial sophistication ______________________________________________________________________________ Improvement within financial literacy distribution (percentiles)
Simulated net worth difference (thousands of euro)
____________________________ ______________________________________ From To Expected 95%-confidence interval _____ _____ __________ ___________________ 45 55 11,5 (1,6 -21,4) 40 60 24,1 (3,4 -44,8) 25 75 81,1 (11,5-150,6) 10 90 181,6 (25,8-337,5) 5 95 220,9 (31,3-410,5) 1 99 251,1 (35,6-466,5) ______________________________________________________________________________ Note: the expected net worth difference and its 95%-interval are derived from the estimate and its 95%-confidence interval for the coefficient on advanced financial literacy in the IV specification from Table 5, keeping the values of all other variables unchanged.