retirement plan for chicago
50
RETIREMENT PLAN FOR CHICAGO TRANSIT AUTHORITY EMPLOYEES Financial Statements and Supplementary Information For the Years Ended December 31, 2017 and 2016 With Independent Auditor’s Report
-
Upload
khangminh22 -
Category
Documents
-
view
3 -
download
0
Transcript of retirement plan for chicago

RETIREMENT PLAN FOR CHICAGO TRANSIT AUTHORITY EMPLOYEES Financial Statements and Supplementary Information For the Years Ended December 31, 2017 and 2016 With Independent Auditor’s Report

RETIREMENT PLAN FOR CHICAGO TRANSIT AUTHORITY EMPLOYEES For the Years Ended December 31, 2017 and 2016
TABLE OF CONTENTS Page(s) INDEPENDENT AUDITOR’S REPORT 1–2 Management’s Discussion and Analysis 3–10 BASIC FINANCIAL STATEMENTS Statements of Fiduciary Net Position 11 Statements of Changes in Fiduciary Net Position 12 Notes to Financial Statements 13–40 REQUIRED SUPPLEMENTARY INFORMATION Schedule of Changes in Employer’s Net Pension Liability and Related Ratios 41 Schedule of Employer Contributions 42 Schedule of Investment Returns 43 Notes to Required Supplementary Information 44 OTHER INFORMATION Schedule of Investment and Administrative Expenses 45

333 West Wacker Drive Chicago, IL 60606
T +1 312 332 4964 F +1 312 332 0181
1 mitchelltitus.com
INDEPENDENT AUDITOR’S REPORT The Board of Trustees Retirement Plan for Chicago Transit Authority Employees Report on the Financial Statements We have audited the accompanying financial statements of the Retirement Plan for Chicago Transit Authority Employees (the Plan), which comprise the statements of fiduciary net position as of December 31, 2017 and 2016, the related statements of changes in fiduciary net position for the years then ended, and the related notes to the financial statements. Management’s Responsibility for the Financial Statements The Plan’s management is responsible for the preparation and fair presentation of these financial statements in accordance with accounting principles generally accepted in the United States of America; this includes the design, implementation, and maintenance of internal control relevant to the preparation and fair presentation of financial statements that are free from material misstatement, whether due to fraud or error. Auditor’s Responsibility Our responsibility is to express an opinion on these financial statements based on our audits. We conducted our audits in accordance with auditing standards generally accepted in the United States of America. Those standards require that we plan and perform the audit to obtain reasonable assurance about whether the financial statements are free from material misstatement. An audit involves performing procedures to obtain audit evidence about the amounts and disclosures in the financial statements. The procedures selected depend on the auditor’s judgment, including the assessment of the risks of material misstatement of the financial statements, whether due to fraud or error. In making those risk assessments, the auditor considers internal control relevant to the entity’s preparation and fair presentation of the financial statements in order to design audit procedures that are appropriate in the circumstances, but not for the purpose of expressing an opinion on the effectiveness of the entity’s internal control. Accordingly, we express no such opinion. An audit also includes evaluating the appropriateness of accounting policies used and the reasonableness of significant accounting estimates made by management, as well as evaluating the overall presentation of the financial statements. We believe that the audit evidence we have obtained is sufficient and appropriate to provide a basis for our audit opinion.

2
Opinion
In our opinion, the financial statements referred to above present fairly, in all material respects, the financial position of the Plan as of December 31, 2017 and 2016, and the changes in its financial position for the years then ended, in accordance with accounting principles generally accepted in the United States of America.
Other Matters
Required Supplementary Information
Accounting principles generally accepted in the United States of America require that the Management’s Discussion and Analysis and the required supplementary information listed in the table of contents be presented to supplement the basic financial statements. Such information, although not a part of the basic financial statements, is required by the Governmental Accounting Standards Board which considers it to be an essential part of financial reporting for placing the basic financial statements in an appropriate operational, economic, or historical context. We have applied certain limited procedures to the required supplementary information in accordance with auditing standards generally accepted in the United States of America, which consisted of inquiries of management about the methods of preparing the information and comparing the information for consistency with management’s responses to our inquiries, the basic financial statements, and other knowledge we obtained during our audits of the basic financial statements. We do not express an opinion or provide any assurance on the information because the limited procedures do not provide us with sufficient evidence to express an opinion or provide any assurance.
Other Information
Our audits were conducted for the purpose of forming an opinion on the basic financial statements as a whole. The accompanying schedule of investment and administrative expenses is presented for purposes of additional analysis and is not a required part of the basic financial statements.
Such information is the responsibility of management and was derived from and relates directly to the underlying accounting and other records used to prepare the basic financial statements. Such information has been subjected to the auditing procedures applied in the audits of the basic financial statements and certain additional procedures, including comparing and reconciling such information directly to the underlying accounting and other records used to prepare the basic financial statements or to the basic financial statements themselves, and other additional procedures in accordance with auditing standards generally accepted in the United States of America. In our opinion, the information is fairly stated, in all material respects, in relation to the basic financial statements as a whole.
September 28, 2018

MANAGEMENT’S DISCUSSION AND ANALYSIS (Unaudited)
3
Management’s Discussion and Analysis of the Retirement Plan for Chicago Transit Authority Employees (the Plan) provides an overview and analysis of the financial statements of the Plan, including highlights and comparisons for the years ended December 31, 2017 and 2016. For more detailed information regarding the Plan’s financial activities, review the Plan’s financial statements, including the notes and supplementary schedules.
Overview of the Financial Statements
The financial statements are prepared on the accrual basis of accounting in accordance with accounting principles generally accepted in the United States (U.S. GAAP) as established by the Governmental Accounting Standards Board (GASB) and are described below:
The Statements of Fiduciary Net Position presents the Plan’s assets and liabilities and theresultant net position held in trust for plan benefits at the end of the year. The statementreflects the Plan’s investments at fair value as well as receivables and liabilities.
The Statements of Changes in Fiduciary Net Position presents the additions and deductionsto the Plan during the current year. It reflects the investment income and net realized andunrealized gains or losses during the year, along with members’ contributions andemployer’s contributions; and then benefit payments, refunds, and administrative expenses.
The Notes to Financial Statements provide additional information for a better understandingof the data provided in the financial statements. They explain the purpose of the Plan,significant accounting policies, investment details and related risks, and other relevantinformation.
The required supplementary information consists of a schedule of changes in the employer’s net pension liability and related ratios, a schedule of employer contributions and a schedule of investment returns as well as the related notes to required supplementary information to discuss actuarial assumptions and methods. Such schedules provide information to aid in the analysis of the Plan’s funded status and the internal rate of return on pension plan investments.
The Schedule of Changes in the Employer’s Net Pension Liability and Related Ratios showsthe liability of the employer to plan members and retirees for benefits provided through thepension plan and the changes thereof during the year.
The Schedule of Employer Contributions contains historical trend information of employercontributions. It shows the amounts of required employer contributions and the relatedamounts the employer has contributed to meet its requirement.
The Schedule of Investment Returns shows the period-by-period returns on pension planinvestments that adjust for the changing amounts actually invested. It represents an internalrate of return on pension plan investments, net of pension plan investment expenses.
The Notes to the Required Supplementary Information describes the actuarial method andassumptions used to aid in the understanding of the required supplementary schedules.
The additional schedule provided is the Schedule of Investment and Administrative Expenses, which reflects the costs to manage the defined benefit pension plan.

MANAGEMENT’S DISCUSSION AND ANALYSIS (Unaudited)
4
Financial Highlights
The fiduciary net position held in trust for Plan benefits totaled approximately $1.86 billion atDecember 31, 2017, compared to $1.73 billion at December 31, 2016 and $1.74 billion atDecember 31, 2015. The fiduciary net position is available for payment of members’pensions.
For the 2017 Plan year, the addition to fiduciary net position was $408.5 million, andconsisted of contribution revenue of $174.8 million, increased by a net investment gain of$233.7 million. The addition to fiduciary net position for the 2016 Plan year was $262.0million, which consisted of contribution revenue of $143.4 million, increased by a netinvestment gain of $118.6 million.
Benefit payments to retirees increased by $7.4 million in 2017, $7.9 million in 2016, and$7.8 million in 2015. Refunds of member contributions increased by $2.5 million in 2017,decreased by $1.5 million in 2016, and decreased by $0.9 million in 2015.
The funded ratio of the Plan for pension benefits was 52.6% at December 31, 2017, 52.5%at December 31, 2016, compared to 53.3% at December 31, 2015. The increase in thefunded ratio at December 31, 2017 compared to December 31, 2016 was mainly due tomarket value return of 13.9% compared to 8.25% assumed. The decrease in the fundedratio at December 31, 2016 compared to December 31, 2015 resulted from market valuereturns of 6.8% compared to 8.25% assumed, payroll and salaries increased less thanexpected and demographic experience.

MANAGEMENT’S DISCUSSION AND ANALYSIS (Unaudited)
5
Fiduciary Net Position
A condensed schedule of the Plan’s fiduciary net position is presented below:
Fiduciary Net Position (in millions) As of December 31, 2017, 2016 and 2015
2017-2016 Change
2017 2016 2015 $ %
Receivables $ 16.7 $ 27.8 $ 17.2 $ (11.1) (39.9)% Brokers–unsettled trades 8.4 18.2 4.7 (9.8) (53.8) Investments, at fair value 1,849.2 1,725.1 1,728.7 124.1 7.2 Invested securities lending collateral 123.0 126.0 192.4 (3.0) (2.4)
Total assets 1,997.3 1,897.1 1,943.0 100.2
Brokers–unsettled trades 5.0 31.2 3.7 (26.2) (84.0) Securities lending payable 123.0 126.0 192.4 (3.0) (2.4) Accounts payable and accrued expenses 3.4 3.5 3.7 (0.1) (2.9)
Total liabilities 131.4 160.7 199.8 (29.3)
Fiduciary net position $ 1,865.9 $ 1,736.4 $ 1,743.2 $ 129.5 7.5%
Fiduciary net position increased by $129.5 million, or 7.5%, at December 31, 2017 from $1,736.4 million at December 31, 2016. It decreased by $6.8 million, or 0.4%, at December 31, 2016 from $1,743.2 million at December 31, 2015.
The increase in fiduciary net position at December 31, 2017 was primarily due to favorable market conditions, which increased investments at year end by $124.1 million. Receivables decreased by $11.1 million at December 31, 2017 compared to the prior year because of the timing of deposit of contributions. In 2016, receivables included November and December contributions compared to 2017, in which only December contributions was included.
The decrease in fiduciary net position at December 31, 2016 was primarily due to member and employer contributions and investment returns less than benefit payments and other deductions. In 2016, total additions were enough to cover benefit payments. The overall reduction of fiduciary net position in 2016 was impacted by the liquidation of marketable securities to meet monthly benefit obligations.

MANAGEMENT’S DISCUSSION AND ANALYSIS (Unaudited)
6
Changes in Fiduciary Net Position The following schedule presents a condensed comparison of various changes in the Plan’s fiduciary net position: Changes in Fiduciary Net Position (in millions) Years Ended December 31, 2017, 2016 and 2015 2017-2016 Change 2017 2016 2015 $ % Additions Member contributions $ 70.3 $ 59.6 $ 59.0 $ 10.7 18.0% Employer contributions 104.5 83.8 82.8 20.7 24.7 Net investment gains and investment income 233.7 118.6 8.2 115.1 97.0
Total additions 408.5 262.0 150.0 146.5 Deductions Annuity and disability benefits 268.8 261.4 253.5 7.4 2.8 Refunds of contributions 7.3 4.8 6.3 2.5 52.1 Administrative expenses 2.9 2.6 2.9 0.3 11.5
Total deductions 279.0 268.8 262.7 10.2 Net increase (decrease) $ 129.5 $ (6.8) $ (112.7) $ 136.3 2,004.0% Additions to the Plan’s fiduciary net position are derived from member contributions, employer contributions and investment income. Total additions were $408.5 million in 2017, $262.0 million in 2016 and $150.0 million in 2015. Total additions of $408.5 million in 2017 were higher than the amounts in 2016, primarily due to a net investment gain of $233.7 million in 2017 compared to a net investment gain of $118.6 million in 2016. This represents an increase of $115.1 million, or 97.0%, in 2017 compared to 2016. In 2017, member contributions increased slightly by $10.7 million, or 18.0%, and employer contributions increased by $20.7 million, or 24.7%, compared to 2016 due to an increase in employee and employer contribution rates. Total additions of $262.0 million in 2016 were higher than the amounts in 2015, primarily due to a net investment gain of $118.6 million in 2016 compared to a net investment gain of $8.2 million in 2015. This represents an increase of $110.4 million, or 1,346.3%, in 2016 compared to 2015. In 2016, member contributions increased slightly by $0.6 million, or 1.0%, and employer contributions increased by $1.0 million, or 1.2%, compared to 2015 due to negotiated wage increases. Deductions increased by $10.2 million in 2017, $6.1 million in 2016, and $6.4 million in 2015. The increases in 2017, 2016 and 2015 were mainly due to increases in annuity and disability benefits. Administrative expenses increased by $0.3 million in 2017, or 11.5%, mainly due to an increase in legal and professional services during the year. Administrative expenses decreased by $0.3 million in 2016, or 10.3%, mainly due to a decrease in legal and professional services during the year.

MANAGEMENT’S DISCUSSION AND ANALYSIS (Unaudited)
7
Plan Membership
The following table presents the changes in Plan membership as of December 31, 2017, 2016 and 2015:
2017 2016 2015 Change % .
Retirees and beneficiaries receiving benefits 10,387 10,150 10,028 237 2.3 %Active employees 8,192 8,129 8,204 63 0.8 %Terminated (inactive members)
employees entitled to benefits or refunds of contributions 106 105 98 1 1.0 %
Total 18,685 18,384 18,330 301 1.6 %
2017-2016
Funding Status
The Plan’s funding status for pension benefits is as follows:
Funding Status for Pension Benefits At December 31, 2017, 2016 and 2015 (in millions)
2017 2016 2015
GASB Statement No. 67 Employer’s net pension liability $1,657 $1,721 $1,609 Plan fiduciary net position as a percentage of the total pension liability 52.97% 50.23% 52.00%
Current funding policy under 40 ILCS 5/22-101(e) Unfunded actuarial accrued liability $1,621 $1,586 $1,524 Funded ratio 52.65% 52.49% 53.36%
Actuarial assumption changes: There were no assumptions changes during valuation for year ended December 31, 2017. For statutory funding purposes, during 2016, the asset valuation method was changed from the market value of assets to a five-year smoothed actuarial value of assets.
The Plan adopted GASB Statement No. 67, Financial Reporting for Pension Plans, during the year ended December 31, 2014. See Note 7 in the financial statements for further information.
The table above presents funding information for pension benefits reflecting the requirements under GASB Statement No. 67 and the current funding policy under 40 Illinois Compiled Status 5 Section 22-101(e).

MANAGEMENT’S DISCUSSION AND ANALYSIS (Unaudited)
8
Effects of Economic Factors
Funding
The Plan’s funding objective is to meet long-term benefit obligations by accumulating sufficient assets through contributions and investment income. The Plan is well funded when it has sufficient assets to meet all expected future obligations to participants.
The funded ratio, under 40 ILCS 5/22-101(e) of the Plan was 52.6% at December 31, 2017, 52.5% at December 31, 2016 and 53.4% at December 31, 2015. The increase in the funded ratio in 2017 compared to 2016 was mainly due to market value returns of 13.9% compared to 8.25% assumed. The decrease in the funded ratio in 2016 compared to 2015 was mainly due to losses from a combination of two principal factors: demographic experience and investment performance.
Effective January 1, 2007, the retiree healthcare assets included in the Retirement Plan were marked to the fair market value of the retiree healthcare account and allocated in proportion to the actuarial accrued liabilities. During 2009, the retiree healthcare liability was transferred from the Retirement Plan to the Retiree Health Care Plan.
Public Act 095-0708 changed the structure and funding of the Retirement Plan significantly. The Act requires that the funding and liability for retiree healthcare be removed from the Retirement Plan. The Act also changed the eligibility for retirement benefits for Chicago Transit Authority (CTA) employees hired after January 17, 2008 and created a separate Retiree Healthcare Trust to administer the benefits for retirees. Further, the Act gave the CTA the authority to issue debt in order to fund the Retirement Plan and the Retiree Healthcare Trust, which was created in May 2008.
Changes to the Plan from Public Act 095-0708 effectively removed the liability for retiree healthcare benefits from the Retirement Plan, effective January 1, 2009. There were no Plan assets available for retiree healthcare benefits in the Retirement Plan since December 31, 2009, as the retiree healthcare liability was transferred to the CTA Retiree Health Care Plan in 2009. There were no legislative or administrative changes that affected the Plan’s funding during the years ended December 31, 2017, 2016 and 2015.
Investment Activities
The Plan’s fiduciary net position held for investment was $1.86 billion at year-end 2017, an increase of $129.5 million over 2016, with a total Plan rate of return of 14.9%. Domestic equity investment managers returned a positive 18.6%, while non-U.S. equity investment managers returned a positive 31.2%, and total fixed income returned a positive 4.9% for the year ended December 31, 2017. The Plan’s fiduciary net position held for investment was $1.7 billion at year-end 2016, a decrease of $6.8 million over 2015, with a total Plan rate of return of 7.2%. Domestic equity investment managers returned a positive 14.1%, while non-U.S. equity investment managers returned a positive 3.9%, and total fixed income returned a positive 4.9% for the year ended December 31, 2016.

MANAGEMENT’S DISCUSSION AND ANALYSIS (Unaudited)
9
During 2014, new investment asset allocation was approved by the Board of Trustees as recommended by our Investment Consultants; therefore, the Retirement Plan began to move assets in-line with the newly adopted policy target. Investment asset allocation for 2017 and 2016 was 28% of assets invested in domestic equity, 21% in international equity, 17% in real estate (including 5% in infrastructure), 10% in private equity, 7% in hedge funds, and 17% in fixed income. During 2017 and 2016, the Plan’s investment asset allocation stayed within its target asset allocation ranges.
Investment Returns (Calendar Year Gross of Fees Performance Basis) Years Ended December 31, 2017, 2016 and 2015
2017 2016 2015
Total Plan 14.9% 7.2% 0.2% Benchmark portfolio 14.1 6.4 0.7
Domestic equities 18.6% 14.1% (3.4)% Benchmark (Russell 3000) 21.1 12.7 0.5
International equities 31.2% 3.9% (3.9)% Benchmark (MSCI EAFE) 27.2 4.5 (5.7)
Fixed income 4.9% 4.9% (0.4)% Benchmark (Barclays Aggregate) 3.5 2.6 0.6
Real estate 7.6% 8.3% 15.6% Benchmark (CPI +5.5% over rolling five-year periods) 7.2 7.2 5.8
Private equity 14.8% 3.0% 11.0% Benchmark (Cambridge Associates All PE) 18.7 9.7 7.3
Hedge fund 5.3% 0.6% 1.4% Benchmark (HFRI FOF Conservative Index) 4.1 1.9 0.4
Subsequent Events
Starting January 1, 2018, covered employees are required to contribute 12.010% of their salary to the Plan and the employer is required to contribute 18.019%, which is net of a credit for debt service on pension obligation bonds.

MANAGEMENT’S DISCUSSION AND ANALYSIS (Unaudited)
10
Contact Information
This financial report is designed to provide the employer, plan participants, and others with a general overview of the Plan’s finances and to show accountability for the monies received. Questions concerning any of the information provided in this report or requests for additional financial information should be addressed to:
Mr. John V. Kallianis Executive Director Retirement Plan for Chicago Transit Authority Employees 55 West Monroe Street, Suite 1950 Chicago, Illinois 60603

The accompanying notes are an integral part of these financial statements.
11
RETIREMENT PLAN FOR CHICAGO TRANSIT AUTHORITY EMPLOYEES Statements of Fiduciary Net Position December 31, 2017 and 2016 (Amounts in thousands)
2017 2016
ASSETSDeposits 101$ 101$ Securities lending cash collateral 122,896 125,958
Total cash 122,997 126,059
ReceivablesEmployer contributions 8,349 14,318 Employee contributions 5,645 10,198 Securities sold, but not received 8,400 18,241 Accrued interest and dividends 1,977 1,912 Other 758 1,248
Total receivables 25,129 45,917
Prepaid expense 14 12
InvestmentsFixed income 330,794 347,101 Domestic equities 515,057 528,524 International equities 386,923 317,115 Venture capital and partnerships 145,789 66,585 Real estate 248,134 228,205 Hedge funds 114,687 193,714 Infrastructure 54,106 - Short-term investments 53,673 43,875
Total investments 1,849,163 1,725,119
Total assets 1,997,303 1,897,107
LIABILITIESPayables
Collateral payable for securities lending 122,896 125,958 Accounts payable 1,953 2,046 Other payables 1,538 1,559 Securities purchased, but not paid 5,015 31,175
Total liabilities 131,402 160,738
Net position restricted for pensions 1,865,901$ 1,736,369$
The accompanying notes are an integral part of these financial statements.
12
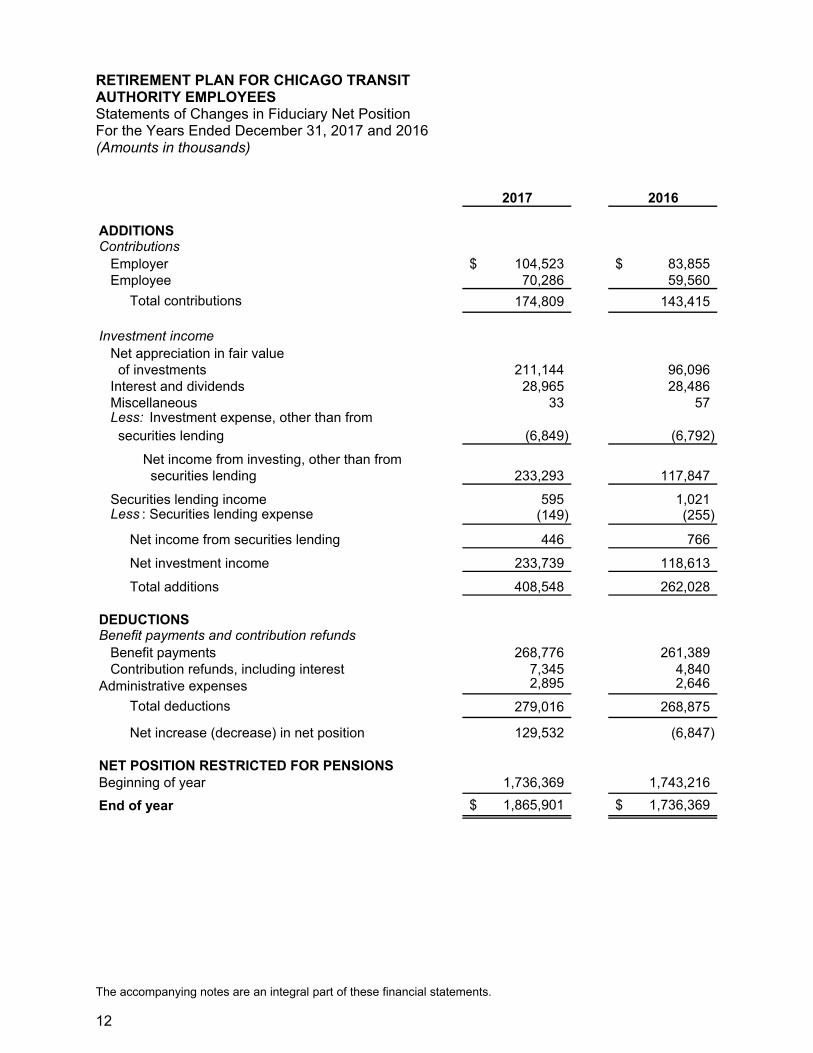
RETIREMENT PLAN FOR CHICAGO TRANSIT AUTHORITY EMPLOYEES Statements of Changes in Fiduciary Net Position For the Years Ended December 31, 2017 and 2016 (Amounts in thousands)
2017 2016
ADDITIONSContributions
Employer 104,523$ 83,855$ Employee 70,286 59,560
Total contributions 174,809 143,415
Investment incomeNet appreciation in fair value of investments 211,144 96,096Interest and dividends 28,965 28,486Miscellaneous 33 57Less: Investment expense, other than from securities lending (6,849) (6,792)
Net income from investing, other than from securities lending 233,293 117,847
Securities lending income 595 1,021 Less : Securities lending expense (149) (255)
Net income from securities lending 446 766
Net investment income 233,739 118,613
Total additions 408,548 262,028
DEDUCTIONSBenefit payments and contribution refunds Benefit payments 268,776 261,389 Contribution refunds, including interest 7,345 4,840Administrative expenses 2,895 2,646
Total deductions 279,016 268,875
Net increase (decrease) in net position 129,532 (6,847)
NET POSITION RESTRICTED FOR PENSIONSBeginning of year 1,736,369 1,743,216
End of year 1,865,901$ 1,736,369$

RETIREMENT PLAN FOR CHICAGO TRANSIT AUTHORITY EMPLOYEES Notes to Financial Statements December 31, 2017 and 2016
13
NOTE 1 SUMMARY OF SIGNIFICANT ACCOUNTING POLICIES Reporting Entity Accounting principles generally accepted in the United States of America (U.S. GAAP), as established by the Governmental Accounting Standards Board (GASB), define a financial reporting entity as consisting of the primary government and its component units for which the primary government is financially accountable. Financial accountability includes appointing a voting majority of a component unit’s governing board, the ability of the primary government to impose its will on the component unit, or the potential for the component unit to provide specific financial benefits to or to impose specific financial burdens on the primary government. A primary government may also be financially accountable for its component units that are fiscally dependent on it. Based on the above criteria, the Retirement Plan for Chicago Transit Authority Employees (the Plan) has no component units and is not a component unit of any other entity. Basis of Accounting The Plan’s financial statements are prepared on the accrual basis of accounting. Employee and employer contributions are recognized as additions in the period in which employee services are performed. Benefits and refunds are recognized when due and payable in accordance with the terms of the Plan; expenses are recorded when the corresponding liabilities are incurred, regardless of when payment is made. Use of Estimates The preparation of financial statements in conformity with U.S. GAAP requires management to make estimates and assumptions that affect the reported amounts of fiduciary net position at the date of the financial statements and the actuarial information included in the required supplementary information as of the benefit information date, the changes in fiduciary net position during the reporting period and disclosures of contingent assets and liabilities at the date of the financial statements. Accordingly, actual results may differ from those estimates. Deposit and Investments The Plan is authorized to invest in bonds, notes, and other direct obligations of the U.S. Government and U.S. Government agencies; corporate bonds, debentures, and notes; certain notes secured by mortgages (including pass-through securities); common and preferred stocks; and certain real estate funds, private equity funds, hedge funds, and stable value funds.

RETIREMENT PLAN FOR CHICAGO TRANSIT AUTHORITY EMPLOYEES Notes to Financial Statements December 31, 2017 and 2016
14
NOTE 1 SUMMARY OF SIGNIFICANT ACCOUNTING POLICIES (continued)
Deposit and Investments (continued) The Plan does not have a formal deposit and investment risk policy. Investment risk management is a function of the Plan’s asset allocation process. Plan assets are diversified over a broad range of asset classes, utilizing multiple investment strategies to limit concentration risk. Method Used to Value Investments To the extent available, investments are recorded at fair value based on quoted market prices in active markets on a trade-date basis. Additional information regarding the fair value measurement of investments is disclosed in Note 6. Because of the inherent uncertainty in the use of estimates, values that are based on estimates may differ from the values that would have been used had a ready market existed for the investments. The net increase (decrease) in the fair value of investments is recognized as a component of investment income. Deposit and short-term investments are reported at amortized cost, which approximates fair value. Securities traded on a national or international exchange are valued at the last reported sales price at current exchange rates. Fixed-income securities are valued principally using quoted market prices provided by independent pricing services. For collective investments, the net asset value (NAV) is determined and certified by the investment managers as of the reporting date. Guaranteed investment contracts are carried at contract value, which is principal plus accumulated interest less any withdrawals. The real estate-open end investment funds are reported at NAV of shares held by the Plan at year end based on independent appraisals of underlying properties. Hedge funds do not have established market prices and are reported at NAV of shares held by the Plan at year end as estimated by money managers. The fair value of investments in certain private equity funds and real estate closed-end funds have been determined using recent observable transaction information for similar investments and non-binding bids received from potential buyers of the investments. Security Transactions Purchases and sales of securities are accounted for on the trade dates. For purposes of determining the realized gain or loss on the disposal of investments, the average cost of investments sold is used. Unrealized gains or losses on investments held during the year, as well as realized gains or losses on securities sold are included in the statement of changes in fiduciary net position in the year in which they occur. Investment Income Dividend income is recorded on the ex-dividend date. Income from other investments is recorded when earned.

RETIREMENT PLAN FOR CHICAGO TRANSIT AUTHORITY EMPLOYEES Notes to Financial Statements December 31, 2017 and 2016
15
NOTE 1 SUMMARY OF SIGNIFICANT ACCOUNTING POLICIES (continued)
Furniture and Office Equipment Furniture and office equipment are not capitalized, as they are immaterial and are charged to expenses in the year of purchase.
Administrative Expenses Administrative expenses are recorded as incurred and budgeted and approved by the Plan’s Board of Trustees. Administrative expenses are paid from Plan assets and investment earnings. Certain administrative expenses are allocated between the Plan and the Retiree Health Care Plan based on periodic time and expense studies. The Retiree Health Care Plan provides and administers health care benefits to CTA’s retirees and their dependents and survivors. Securities Lending Transactions Cash received as collateral on securities lending transactions and investments made with that cash are reported as assets in the statement of fiduciary net position at fair value. Securities received as collateral are reported as assets only if the Plan has the ability to pledge or sell them without a borrower default. Liabilities resulting from these transactions are reported in the statement of fiduciary net position. Interest on Refunds of Participant Contributions Interest on refunds of participant contributions is expensed when the refunds are recorded. Interest on accumulated contributions from continuing participants is reflected in each participant’s account annually. Recently Issued/Adopted Accounting Pronouncements In March 2016, the GASB issued Statement No. 82, Pension Issues—an Amendment of GASB Statements No. 67, No. 68, and No. 73. This Statement addresses certain issues raised by GASB Statement No. 67, No. 68 and No. 73 regarding the presentation of payroll-related measures in required supplementary information, the selection of assumptions and the treatment of deviations from the guidance in an Actuarial Standard of Practice for financial reporting purposes, and the classification of payments made by employers to satisfy employee (plan member) contribution requirements. The requirements of this Statement are effective for reporting periods beginning after June 15, 2016. The Plan adopted this Statement in its year ended December 31, 2017. Adoption of this Statement did not have a significant impact on the financial statements.

RETIREMENT PLAN FOR CHICAGO TRANSIT AUTHORITY EMPLOYEES Notes to Financial Statements December 31, 2017 and 2016
16
NOTE 1 SUMMARY OF SIGNIFICANT ACCOUNTING POLICIES (continued)
Recently Issued/Adopted Accounting Pronouncements (continued) During 2017, the GASB issued Statement No. 87, Leases (GASB 87). The objective of this Statement is to better meet the information needs of financial statement users by improving accounting and financial reporting for leases by governments. This Statement increases the usefulness of governments' financial statements by requiring recognition of certain lease assets and liabilities for leases that previously were classified as operating leases and recognized as inflows of resources or outflows of resources based on the payment provisions of the contract. It establishes a single model for lease accounting based on the foundational principle that leases are financings of the right to use an underlying asset. Under this Statement, a lessee is required to recognize a lease liability and an intangible right-to-use lease asset, and a lessor is required to recognize a lease receivable and a deferred inflow of resources, thereby enhancing the relevance and consistency of information about governments' leasing activities. The requirements of this Statement are effective for reporting periods beginning after December 15, 2019 and earlier application is encouraged. Management is evaluating the impact of this Statement on the financial statements and does not anticipate significant impact on the Plan’s financial statements.
NOTE 2 PLAN DESCRIPTION
Plan Administration: The following brief description of the Plan is provided for general information purposes only. Arbitration awards are periodically handed down and negotiated changes occur. Certain aspects of the Plan are now governed by Illinois state statute (40 ILCS 5/22-101). These changes can revise certain provisions of the Plan regarding the Chicago Transit Authority (CTA), employee contributions, and employee death benefits. Those changes that have affected the Plan are summarized in the following notes. Participants should refer to the Plan document, as amended, for complete information.
The Plan is a single-employer, contributory defined-benefit public pension plan, covering all full-time CTA permanent employees. The Plan is administered by an 11-member Board of Trustees composed of members appointed by the CTA, the Amalgamated Transit Union (ATU), the Regional Transportation Authority and a member appointed to represent the employees not represented by the ATU. The Board of Trustees has the authority to establish or amend the contribution and benefit provisions under the Plan. The Plan is classified as a “governmental plan” and is, therefore, exempt from certain provisions of the Employee Retirement Income Security Act of 1974. The Plan was amended, effective January 31, 2012, to comply with applicable laws. Employees who have completed one year of continuous service are eligible for participation.

RETIREMENT PLAN FOR CHICAGO TRANSIT AUTHORITY EMPLOYEES Notes to Financial Statements December 31, 2017 and 2016
17
NOTE 2 PLAN DESCRIPTION (continued) Plan Membership: At December 31, 2017 and 2016, pension plan membership consisted of the following: 2017 2016 Retirees, disabled participants, and beneficiaries of deceased retirees currently receiving benefits 10,387 10,150 Terminated employees entitled to benefits but not yet receiving benefits 106 105 Active 8,192 8,129
18,685 18,384 Benefits Provided: Employees are entitled to annual pension benefits upon normal retirement at age 65, in an amount generally based on a percentage of their average annual compensation in the highest four of the 10 preceding years, multiplied by the number of years of continuous participating service. For employees retiring before December 1, 1987, the percentage was 1.65%. The agreement between the CTA and its unions, signed September 1987, raised the percentage to 1.70% and 1.75% for retirements on or after December 1, 1987 and 1989, respectively. The agreement between the CTA and its unions, signed August 1993, raised the percentage to 1.80% and 1.85% for retirements on or after January 1, 1993 and January 1, 1995, respectively. The Arbitration Award of November 12, 2003, increased the benefit multiplier for service after June 1, 1949 to 2.00% from 1.85% for employees retiring from January 1, 2000 to December 31, 2000, and to 2.15% for employees retiring on and after January 1, 2001. The multiplier for employees retiring before January 1, 2000 remained at 1.85%. During 1995, a Voluntary Early Retirement Incentive Program was offered, which provided a percentage of 2.05% for employees retiring after January 1, 1994. Employees who met the requirements for early retirement had to respond by February 28, 1995. During 1997, the Plan offered a Voluntary Early Retirement Program to eligible employees who had 25 years of continuous service on or before December 31, 1999, and had not retired prior to January 1, 1997, in the form of a retirement allowance of 2.40% for each year of continuous service, with a maximum retirement allowance of 70% of the employee’s annual compensation. All eligible employees who elected to participate were allowed to retire as soon as possible, but no later than December 31, 1999.

RETIREMENT PLAN FOR CHICAGO TRANSIT AUTHORITY EMPLOYEES Notes to Financial Statements December 31, 2017 and 2016
18
NOTE 2 PLAN DESCRIPTION (continued) The Plan permits early retirement at age 55, generally with reduced benefits. However, in the event of early retirement by an employee who has 25 years or more of continuous service, regardless of their age, benefits will not be reduced. In accordance with Public Act 095-0708, for all employees hired after January 17, 2008, eligibility for an unreduced pension benefit has changed to age 64 with 25 years of service. All retirees receive a monthly pension benefit. Married employees can elect to receive their pension benefits in the form of a joint and survivor option. Death Benefits: Lump-sum death benefits based on age and years of service, ranging from $2,000 to $8,000, are paid to the designated beneficiaries. Also, the excess, if any, of employee contributions plus interest on such contributions over pension benefits previously paid to the retiree, and spouse in the case of a survivorship option, is paid to the designated beneficiary. Disability Allowance: An employee is eligible for a disability allowance if he or she becomes disabled after completing 10 years of continuous service or, if the disability is covered under the Illinois Workers Compensation Act, after completing five years of continuous service. The disability allowance is based on compensation and service to date of the disability, with a minimum benefit of $400 per month. Refund of Contributions: A participant’s accumulated contributions plus interest (currently 3% annually) are refunded when the participant is separated from service and has less than 10 years of continuous participation, or when a participant with more than 10 years of service is separated and elects to receive a refund of his or her contributions. Deferred, Vested Retirement: A participant who is separated from service after completing 10 or more years of continuous service who is not eligible for a retirement or disability allowance at separation, and who elects not to receive a refund of his contributions, is entitled to receive, at normal retirement age, a deferred vested pension based on length of service and compensation to date of the separation. Contributions and Vesting: Contributions from the CTA and employees are based on a percentage of compensation pursuant to various agreements between the CTA and the unions. For years beginning January 1, 2009 through 2040, the amount of contributions to be paid by the CTA, with respect to debt service on bonds issued for contribution to the Plan, is treated as a credit against the amount of required contribution, up to an amount not to exceed 6% of compensation. Starting January 1, 2018, covered employees are required to contribute 12.010% of their salary to the Plan and the employer is required to contribute 18.019%, which is net of a credit for debt service on pension obligation bonds.

RETIREMENT PLAN FOR CHICAGO TRANSIT AUTHORITY EMPLOYEES Notes to Financial Statements December 31, 2017 and 2016
19
NOTE 2 PLAN DESCRIPTION (continued) During 2017, covered employees were required to contribute 11.962% of their salary to the Plan and the employer was required to contribute 17.925%, which is net of credit for debt service on pension obligations bonds. Starting January 1, 2016, covered employees were required to contribute 11.962% of their salary to the Plan and the employer was required to contribute 23.925% of compensation, less a credit for debt service of 6%, with a total net employer contribution of 17.925%. During 2013, covered employees were required to contribute 10.125% of their salary to the Plan and the employer is required to contribute 20.25% of compensation, less a credit for debt service of 6%, with a total net employer contribution of 14.250%. During 2012, covered employees were required to contribute 8.65% of their salary to the Plan and the employer was required to contribute 17.30% of compensation, less a credit for debt service of 6%, with a total net employer contribution of 11.30%. During 2011, the employee contribution rate was 8.345% of their salary to the Plan and the employer was required to contribute 16.69% of compensation, less a credit for debt service of 6%, with a total net employer contribution of 10.69%. During 2010, the employee contribution rate was 8.35% of their salary and the required employer contribution rate was 16.69% of compensation, less debt service paid of 6%, with a net employer contribution of 10.69% of compensation. For Plan year 2009, the employee contribution rate was 6% of their salary and the employer contribution rate was 12% of compensation, less debt service paid, with a total net employer contribution of 6% after the credit. From January 18, 2008 through December 31, 2008, covered employees were required to contribute 6% of their salary to the Plan and the employer was required to contribute 12% of compensation. Prior to January 18, 2008, the CTA’s contribution was 6% of total compensation and the employee contribution rate was 3% of total compensation. From January 1997 to June 1997, there were no employer or employee contributions to the pension fund because of a union contract agreement, which enforced a pension holiday. Contributions resumed in July 1997. In accordance with Public Act 095-0708 (effective January 18, 2008), the CTA issued bonds and notes in the aggregate amount of $1,348,550,000, of which net proceeds of $1,110,500,000 were deposited into the Plan during the year ended December 31, 2008. No bond proceeds were received in 2017 and 2016.
Funding Ratio: According to Public Act 095-0708, beginning in 2009 and ending on December 31, 2039, if the funding ratio is projected to decline below 60% in any year before 2040, the Board of Trustees will determine the increased contribution required each year as a level percentage of payroll over the years remaining until 2040, using the projected-unit credit actuarial cost method, so that the funded ratio does not decline below 60%.

RETIREMENT PLAN FOR CHICAGO TRANSIT AUTHORITY EMPLOYEES Notes to Financial Statements December 31, 2017 and 2016
20
NOTE 3 INVESTMENTS
Investment Policy: The pension plan’s policy regarding the allocation of invested assets is established and may be amended by the Board of Trustees. The primary objective of the Plan’s investment policy is to provide a structured approach in implementing the Plan’s investment strategies to achieve above-average returns consistent with prudent risk and investment volatility. To minimize the impact of large losses and to reduce annual variability of returns, the Plan’s assets are allocated across major asset classes and diversified broadly within each asset class. The following was the Board of Trustees’ adopted asset allocation policy as of December 31, 2017 and 2016: Target Allocation At December 31 2017 2016 Asset Class Fixed income 17% 17% Domestic equities 28 28 International equities 21 21 Venture capital and partnerships 10 10 Real estate 12 12 Hedge funds 7 7 Infrastructure 5 5 There were no changes to the target asset allocation between December 31, 2017 and 2016. Rate of Return: For the years ended December 31, 2017 and 2016, the annual money-weighted rate of return on pension plan investments, net of pension plan investment expense, was 13.61% and 6.54%, respectively. The money-weighted rate of return expresses investment performance, net of investment expense, adjusted for the changing amounts actually invested.

RETIREMENT PLAN FOR CHICAGO TRANSIT AUTHORITY EMPLOYEES Notes to Financial Statements December 31, 2017 and 2016
21
NOTE 4 INVESTMENT SUMMARY
The Plan’s investments were held by The Northern Trust Company (TNT) as Trustee under a 1996 trust agreement. TNT is also the custodian for the Plan. The following table summarizes the Plan’s investments by type at December 31, 2017 and 2016 (amounts in thousands):
2017 2016 Asset-backed securities $ 14,606 $ 14,497 Bank loans 37,587 36,328 Commercial mortgage-backed securities 2,827 4,168 Corporate bonds 47,810 43,517 Emerging market 55,145 50,476 Global aggregate 52,600 53,611 Government agency securities 5,700 4,299 Government bonds 49,933 44,225 Government mortgage-backed securities 38,499 38,882 Government-issued commercial mortgage-backed securities 2,482 1,502 Index-linked government bonds 488 1,564 Municipal/provincial bonds 1,895 1,440 Non-government-backed CMOs 1,640 1,893 Guaranteed investment contracts 19,582 50,699 U.S. equities 515,057 528,524 Foreign equities 386,923 317,115 Venture capital and partnerships 145,789 66,585 Real estate—pooled funds 248,134 228,205 Hedge funds 114,687 193,714 Infrastructure 54,106 - Short-term investments and currency positions 53,673 43,875
Total investments, at fair value $ 1,849,163 $ 1,725,119 NOTE 5 DEPOSIT AND INVESTMENT RISK
The Plan’s deposit and investments are subject to risks, including credit risk, custodial credit risk, concentration of credit risk, interest rate risk and foreign currency risk. The following describes those risks:
Credit Risk: Credit risk is the risk that the issuer or other counterparty to an investment will not fulfill its obligations to pay interest or principal in a timely manner, or that a negative perception of the issuer’s ability to make payments will cause a decline in the security’s price. One measure of credit risk is the quality ratings issued by national credit rating agencies, such as Moody’s Investors Service and Standard & Poor’s Financial Services (S&P). The Plan does not have a formal policy regarding aggregate credit quality of fixed-income holdings.

RETIREMENT PLAN FOR CHICAGO TRANSIT AUTHORITY EMPLOYEES Notes to Financial Statements December 31, 2017 and 2016
22
NOTE 5 DEPOSIT AND INVESTMENT RISK (continued) The Plan utilizes external investment management firms to invest in fixed-income securities and credit quality is addressed within the guidelines of the mandate to the investment managers. Unless allowed by the mutually agreed-upon guidelines of the mandate, all securities invested in are investment grade. If a holding falls below investment grade, the manager will immediately notify the Trustees in writing of the event and describe the portfolio manager’s plans for dealing with the security. The following tables provide information on the credit ratings associated with the Plan’s investments in debt securities. Ratings were obtained from Standard & Poor’s (amounts in thousands):

RETIREMENT PLAN FOR CHICAGO TRANSIT AUTHORITY EMPLOYEES Notes to Financial Statements December 31, 2017 and 2016
23
NOTE 5 DEPOSIT AND INVESTMENT RISK (continued)
December 31, 2017
Investment Type Total AAA AA A BBB BB B CCC CC D Not RatedU.S. Gov't. Agencies
Asset-backed securities 14,606$ 5,233$ 438$ -$ -$ 11$ 58$ -$ -$ -$ 8,866$ -$ Bank loans 37,587 - - - - - - - - - 37,587 - Commercial mortgage-backed securities 2,827 595 - - - - - - - - 2,232 - Corporate bonds 47,810 375 2,439 14,078 29,524 658 259 - - - 477 - Emerging market 55,145 - - - - - - - - - 55,145 - Global aggregate 52,600 - - - - - - - - - 52,600 - Government agency securities 5,700 1,955 3,593 - 152 - - - - - - - Government bonds 49,933 - 431 203 431 - - - - - - 48,868 Government mortgage-backed securities 38,499 - - - - - - - - - 2,222 36,277 Government-issued commercial - - - mortgage-backed securities 2,482 210 - - - - - - - - - 2,272 Index-linked government bonds 488 - - - - - - - - - - 488 Municipal/provincial bonds 1,895 248 753 154 158 - - - - - 582 - Non-government-backed CMOs 1,640 195 258 252 - 96 - 62 - 55 722 - Guaranteed investment contracts 19,582 - - - - - - - - - 19,582 -
Total 330,794$ 8,811$ 7,912$ 14,687$ 30,265$ 765$ 317$ 62$ -$ 55$ 180,015$ 87,905$
December 31, 2016
Investment Type Total AAA AA A BBB BB B CCC CC D Not RatedU.S. Gov't. Agencies
Asset-backed securities 14,497$ 5,818$ 292$ 89$ -$ 20$ 151$ -$ -$ -$ 8,127$ -$ Bank loans 36,328 - - - - - - - - - 36,328 - Commercial mortgage-backed securities 4,168 1,223 - - 835 - - - - - 2,110 - Corporate bonds 43,517 344 2,276 14,571 24,646 1,058 251 - - 122 249 - Emerging market 50,476 - - - - - - - - - 50,476 - Global aggregate 53,611 - - - - - - - - - 53,611 - Government agency securities 4,299 - 4,278 - 21 - - - - - - - Government bonds 44,225 - 197 - 639 198 - - - - - 43,191 Government mortgage-backed securities 38,882 - - - - - - - - - 2,493 36,389 Government-issued commercial mortgage-backed securities 1,502 - - - - - - - - - - 1,502 Index-linked government bonds 1,564 - - - - - - - - - - 1,564 Municipal/provincial bonds 1,440 - 718 144 - - - - - - 578 - Non-government-backed CMOs 1,893 - 358 123 - 284 - 94 - 92 942 - Guaranteed investment contracts 50,699 - - - - - - - - - 50,699 -
Total 347,101$ 7,385$ 8,119$ 14,927$ 26,141$ 1,560$ 402$ 94$ -$ 214$ 205,613$ 82,646$

RETIREMENT PLAN FOR CHICAGO TRANSIT AUTHORITY EMPLOYEES Notes to Financial Statements December 31, 2017 and 2016
24
NOTE 5 DEPOSIT AND INVESTMENT RISK (continued) Custodial Credit Risk: The custodial credit risk for deposits is the risk that, in the event of the failure of a depository financial institution, the Plan will not be able to recover its deposits or collateral securities that are in the possession of an outside party. The custodial credit risk for investments is the risk that, in the event of the failure of the counterparty to a transaction, the Plan will not be able to recover the value of its investments or collateral securities that are in the possession of an outside party. Deposits consist of a certificate of deposit held in the Plan’s name by TNT Company; such certificate of deposit is insured by the Federal Deposit Insurance Corporation. Deposits balance at December 31, 2017 and 2016 was $101,006 and $100,759, respectively. Investment securities are exposed to custodial credit risk if the securities are uninsured, are not registered in the name of the Plan, and are held by either the counterparty or the counterparty’s trust department or agent but not in the Plan’s name. The Plan’s master custodian holds all investments of the Plan in the Plan’s name. As of December 31, 2017 and 2016, deposits of $1,758,290 and $944,640, respectively, were exposed to custodial credit risk as uninsured and uncollateralized. These amounts are included within short-term investments on the statements of fiduciary net position. Concentration of Credit Risk: Concentration of credit risk is the risk of loss attributed to the magnitude of the Plan’s investment in a single issuer. According to the Plan’s investment policy, no purchase shall be made which would cause the holding of any one issuer to exceed 10% of the investment manager’s portfolio value at market. The Plan does not have a formal policy in regards to aggregate concentration of credit risk. The following investments represent 5% or more of the Plan’s fiduciary net position at December 31, 2017 and 2016 (amount in thousands): 2017 2016 . Northern Trust Collective S&P 500 Index Fund $139,718 $110,942 Northern Trust Collective MSCI Emerging Markets Fund $107,037 $ 41,994 Interest Rate Risk: The risk that the fair value of debt securities will decrease due to increases in the prevailing market interest rate. Generally, the longer the maturity of an investment, the greater the sensitivity of its fair value to changes in market interest rates. The Plan manages its exposure to interest rate risk by purchasing a combination of short- and long-term investments and by timing cash flow from maturity evenly over time, as necessary, to provide cash flow and liquidity needed for operations. The following tables show the segmented time distribution of the Plan’s investment maturities based on the investments’ cash flows.

RETIREMENT PLAN FOR CHICAGO TRANSIT AUTHORITY EMPLOYEES Notes to Financial Statements December 31, 2017 and 2016
25
NOTE 5 DEPOSIT AND INVESTMENT RISK (continued)
At December 31, 2017 and 2016, the Plan had the following investments and maturities related to certain fixed-income securities (amounts in thousands):
2017
Fair Less Than 1+ to 6 6+ to 10 More Than Not Investment Type Value 1 Year Years Years 10 Years Determined
Asset-backed securities 14,606$ 4$ 2,726$ 3,959$ 7,917$ -$ Bank loans 37,587 - - - - 37,587 Commercial mortgage-backed securities 2,827 - - - 2,827 - Corporate bonds 47,810 2,578 23,808 11,069 10,355 - Emerging market 55,145 - - - - 55,145 Global aggregate 52,600 - - - - 52,600 Government agency securities 5,700 - 4,333 1,313 54 - Government bonds 49,933 - 15,965 18,759 15,209 - Government mortgage-backed securities 38,499 281 614 788 36,816 - Government-issued commercial mortgage-backed securities 2,482 - 1,603 879 - - Index-linked government bonds 488 - - 402 86 - Municipal/provincial bonds 1,895 - - 582 1,313 - Non-government-backed CMOs 1,640 - 785 - 855 - Guaranteed investment contracts 19,582 4,173 14,074 - - 1,335
Total 330,794$ 7,036$ 63,908$ 37,751$ 75,432$ 146,667$
Investment Maturities
2016
Fair Less Than 1+ to 6 6+ to 10 More Than Not Investment Type Value 1 Year Years Years 10 Years Determined
Asset-backed securities 14,497$ -$ 3,519$ 3,710$ 7,268$ -$ Bank loans 36,328 - - - - 36,328 Commercial mortgage-backed securities 4,168 - - - 4,168 - Corporate bonds 43,517 2,326 23,920 9,046 8,225 - Emerging market 50,476 - - - - 50,476 Global aggregate 53,611 - - - - 53,611 Government agency securities 4,299 - 2,027 2,261 11 - Government bonds 44,225 - 17,641 13,829 12,755 - Government mortgage-backed securities 38,882 - 947 580 37,355 - Government-issued commercial mortgage-backed securities 1,502 - 1,502 - - - Index-linked government bonds 1,564 - 702 617 245 - Municipal/provincial bonds 1,440 - - - 1,440 - Non-government-backed CMOs 1,893 - 1,074 - 819 - Guaranteed investment contracts 50,699 2,475 36,967 - - 11,257
Total 347,101$ 4,801$ 88,299$ 30,043$ 72,286$ 151,672$
Investment Maturities

RETIREMENT PLAN FOR CHICAGO TRANSIT AUTHORITY EMPLOYEES Notes to Financial Statements December 31, 2017 and 2016
26
NOTE 5 DEPOSIT AND INVESTMENT RISK (continued)
Foreign Currency Risk: Foreign currency risk is the risk that changes in exchange rates will adversely affect the fair value of an investment or a deposit. International equity securities purchased by the Plan meet exchange listing requirements; all foreign equities held by the Plan are denominated in U.S. dollars. The Plan has no formal foreign currency risk policy. The Plan’s exposure to foreign currency risk is as follows (amounts in thousands): (US$) (US$) Type of Investment 2017 2016 Short-term investments and currency position
Australian dollar $ - $ 69 British pound sterling 19 20 Canadian dollar 1 57 European euro 67 120 Hong Kong dollar - 197 Japanese yen 208 - New Israeli shekel 2 155 New Zealand dollar - 17 Norwegian krone - 165 Singapore dollar 39 1 South Korean won 137 59 Swedish krona 99 87
$ 572 $ 947

RETIREMENT PLAN FOR CHICAGO TRANSIT AUTHORITY EMPLOYEES Notes to Financial Statements December 31, 2017 and 2016
27
NOTE 5 DEPOSIT AND INVESTMENT RISK (continued) (US$) (US$) Type of Investment 2017 2016 Equities
Australian dollar $ 4,406 $ 3,080 British pound sterling 25,779 23,235 Canadian dollar 7,376 7,532 Danish krone 4,207 2,295 European euro 38,956 34,407 Hong Kong dollar 4,130 3,585 Japanese yen 24,400 20,770 Mexican peso 2,265 1,632 New Israeli shekel 515 564 New Zealand dollar 520 560 Norwegian krone 713 276 Singapore dollar 931 310 South Korean won 3,092 2,379 Swedish krona 1,585 1,310 Swiss franc 15,247 13,460
$ 134,122 $ 115,395 Investment Management Fees Investment management fees from equity and fixed-income managers, including most of the collective funds, are included in the investment management fees on the statements of changes in fiduciary net position. Investment management fees from funds of short-term investments, hedge, real estate, venture capital and private equity are reflected in the net investment income from such investment products. Such investment management fees are not significant to the Plan.
NOTE 6 FAIR VALUE OF INVESTMENTS
GASB Statement No. 72 (GASB 72), Fair Value Measurements and Application, clarifies the definition of fair value for financial reporting, establishes a framework for measuring fair value, and requires additional disclosures about the use of fair value measurements. GASB 72 established a three-level valuation hierarchy for disclosure of fair value measurements. The valuation hierarchy is based upon the transparency of inputs to the valuation of an asset or liabilities as of the measurement date. The three levels are defined as follows:

RETIREMENT PLAN FOR CHICAGO TRANSIT AUTHORITY EMPLOYEES Notes to Financial Statements December 31, 2017 and 2016
28
NOTE 6 FAIR VALUE OF INVESTMENTS (continued)
Level 1: Observable market inputs that are unadjusted quoted prices for identical assets or liabilities in active markets that a government can access at the measurement date.
Level 2: Inputs other that quoted prices included within Level 1 – that are
observable for the asset or liability, either directly or indirectly.
Level 3: Inputs to the valuation methodology are unobservable and significant to the fair value measurement.
The Plan categorized its fair value measurements within the fair value hierarchy established by U.S. GAAP. The Plan has the following recurring fair value measurements as of December 31, 2017 and 2016 (amounts in thousands):
QuotedPrices in
Active SignificantMarkets for Other SignificantIdentical Observable UnobservableAssets Inputs Inputs
12/31/2017 (Level 1) (Level 2) (Level 3)
Investments by fair value levelFixed-income investments
Asset-backed securities 14,606$ -$ 9,735$ 4,871$ Limited partnership - Bank loans 37,587 - - 37,587 Commercial mortgage- backed securities 2,827 - 2,827 - Corporate bonds 47,810 - 47,810 - Government agency securities 5,700 - 5,700 - Government bonds 50,421 - 50,421 - Government mortgage- backed securities 38,499 - 38,499 - Government-issued commercial mortgage-backed securities 2,482 - 2,482 - Municipal/provincial bonds 1,895 - 1,895 - Non-government-backed CMOs 1,640 - 990 650
Total fixed-income investments 203,467 - 160,359 43,108
Equity investmentsCorporate stocks 519,969 519,969 - - Common and collective trusts 355,748 54,106 301,642 -
Total equity investments 875,717 574,075 301,642 -
Private equity fundsPrivate equity - non-real estate focused 145,789 - - 145,789 Real estate - closed-end funds 50,308 - - 50,308
Total private equity 196,097 - - 196,097
Total investments by fair value level 1,275,281$ 574,075$ 462,001$ 239,205$
Fair Value Measurements Using

RETIREMENT PLAN FOR CHICAGO TRANSIT AUTHORITY EMPLOYEES Notes to Financial Statements December 31, 2017 and 2016
29
NOTE 6 FAIR VALUE OF INVESTMENTS (continued)
QuotedPrices in
Active SignificantMarkets for Other SignificantIdentical Observable UnobservableAssets Inputs Inputs
12/31/2016 (Level 1) (Level 2) (Level 3)
Investments by fair value levelFixed income investments
Asset-backed securities 14,497$ -$ 9,637$ 4,860$ Limited partnership - Bank loans 36,328 - - 36,328 Commercial mortgage- backed securities 4,168 - 4,168 - Corporate bonds 43,517 - 43,517 - Government agency securities 4,299 - 4,299 - Government bonds 45,789 - 45,789 - Government mortgage- backed securities 38,882 - 38,882 - Government-issued commercial mortgage-backed securities 1,502 - 1,502 - Municipal/provincial bonds 1,440 - 1,440 - Non-government-backed CMOs 1,893 - 1,543 350
Total fixed income investments 192,315 - 150,777 41,538
Equity investmentsCorporate stocks 545,731 545,731 - - Common and collective trusts 201,710 - 201,710 -
Total equity investments 747,441 545,731 201,710 -
Private equity fundsPrivate equity - non-real estate focused 66,585 - - 66,585 Real estate - closed-end funds 54,180 - - 54,180
Total private equity 120,765 - - 120,765
Total investments by fair value level 1,060,521$ 545,731$ 352,487$ 162,303$
Fair Value Measurements Using

RETIREMENT PLAN FOR CHICAGO TRANSIT AUTHORITY EMPLOYEES Notes to Financial Statements December 31, 2017 and 2016
30
NOTE 6 FAIR VALUE OF INVESTMENTS (continued)
2017 2016
Investments measured at net asset value (NAV)Emerging market debt collective trust 55,145$ 50,476$ Global plus trust fund 52,600 53,611 Emerging markets fund 25,000 52,980 Emerging markets small-cap 55,369 45,218 Real estate funds - open-end funds 197,826 174,025 Hedge funds 114,687 193,714
Total investments measured at NAV 500,627 570,024
Total investments by fair value level 1,775,908$ 1,630,545$
Investments not subject to fair value levelingGuaranteed investment contracts 19,582$ 50,699$ Short-term investments and currency positions 53,673 43,875
Total investments not subject to fair value leveling 73,255$ 94,574$
December 31,
Equity securities classified in Level 1 of the fair value hierarchy are valued using prices quoted in active markets for those securities. Equity funds and fixed-income securities classified in Level 2 of the fair market hierarchy are valued using either a bid evaluation or a matrix pricing technique maintained by various pricing vendors. Bid evaluations may include market quotations, yields, maturities, call features and ratings. Matrix pricing is used to value securities based on the securities’ relationship to benchmark quoted prices. Fixed-income investments and private equity funds classified in Level 3 of the fair value hierarchy are securities whose stated market price is unobservable by the market place. Many of these securities are priced by the issuers of industry groups. These prices are obtained from various pricing sources by the Fund’s custodian bank.

RETIREMENT PLAN FOR CHICAGO TRANSIT AUTHORITY EMPLOYEES Notes to Financial Statements December 31, 2017 and 2016
31
NOTE 6 FAIR VALUE OF INVESTMENTS (continued) The valuation method for investments measured at NAV per share (or its equivalent) is presented on the following tables (amounts in thousands):
Investments measured at NAV Redemption RedemptionFair Unfunded Frequency (if Notice
Value Commitments Currently Eligible) Period
Emerging market debt collective trust 55,145$ -$ Daily 1 to 5 daysGlobal plus trust fund 52,600 - Daily 1 dayEmerging markets fund 25,000 - Daily 1 to 7 daysEmerging markets small-cap fund 55,369 - Daily 10 daysReal estate open-end funds 197,826 - Quarterly 90 daysHedge funds 114,687 - Quarterly 90 days
Total investments measured at NAV 500,627$
Private equity - non-real estate 145,789$ 166,517$ NA NAReal estate - closed-end funds 50,308$ 12,751$ NA NA
2017
Investments measured at NAV Redemption RedemptionFair Unfunded Frequency (if Notice
Value Commitments Currently Eligible) Period
Emerging market debt collective trust 50,476$ -$ Daily 1 to 5 daysGlobal plus trust fund 53,611 - Daily 1 dayEmerging markets fund 52,980 - Daily 1 to 7 daysEmerging markets small-cap fund 45,218 - Daily 10 daysReal estate open-end funds 174,025 17,071 Quarterly 90 daysHedge funds 193,714 - Quarterly 90 days
Total investments measured at NAV 570,024$
Private equity - non-real estate 66,585$ 123,692$ NA NAReal estate - closed-end funds 54,180$ 24,539$ NA NA
2016
Emerging market debt collective trust fund. This type includes investments in one fund that invests in a diversified portfolio of debt securities and other permitted investments. The fair value in this type of investment has been determined using the NAV per unit of the fund and is calculated on each business day by dividing the total value of assets, less liabilities, by the number of units outstanding. Global plus trust fund. This fund will invest in a portfolio of fixed-and floating-rate debt securities and debt obligations of governments or government-related issuers worldwide as well as derivatives. Units of the fund are issued and redeemed at NAV per unit as determined on the valuation date.

RETIREMENT PLAN FOR CHICAGO TRANSIT AUTHORITY EMPLOYEES Notes to Financial Statements December 31, 2017 and 2016
32
NOTE 6 FAIR VALUE OF INVESTMENTS (continued) Emerging markets fund. This fund invests in equity securities of issuers in emerging markets. The fair value in this type of investment has been determined using the NAV per unit of the Fund and is calculated on each business day by dividing the total value of assets, less liabilities, by the number of units outstanding.
Emerging markets small-cap fund. This fund invests primarily in equity securities of small to mid-capitalization companies. The fair value in this type of investment has been determined using the NAV per unit of the fund and is calculated on each business day by dividing the total value of assets, less liabilities, by the number of units outstanding.
Real estate funds. This type of fund consists of 15 core, value-add, and opportunistic real estate funds. Six funds are open-end private and provide liquidity to investors quarterly, subject to each fund’s ability to honor investment and redemption requests. The remaining closed-end private real estate funds includes finite-life pooled private market investment vehicles that are typically structured as limited partnerships, where the investors are limited partners (LPs) and the fund sponsor/manager is the general partner (GP). The LPs have limited control and limited liability. The fair value of the investments in these types have been determined using the NAV per share (or its equivalent) of the investments.
Hedge funds. This type of fund consists of eight equity long/short, event-driven, multi-strategy, distressed debt and hedged equity fund of funds. The fair value of the investments in these types has been determined using the NAV per share (or its equivalent) of the investments.
Private equity. These investments can never be redeemed with the funds. Instead, the nature of the investments in this type is that distributions are received through the liquidation of the underlying assets of the fund. The fair value of investments in certain private equity funds has been determined using recent observable transaction information for similar investments and non-binding bids received from potential buyers of the investments.
NOTE 7 NET PENSION LIABILITY OF THE EMPLOYER (CTA)
The components of the net pension liability of the CTA at December 2017 and 2016 were as follows (amounts in thousands):
2017 2016 Total pension liability $ 3,522,803 $ 3,456,992 Plan fiduciary net position (1,865,901) (1,736,369)
CTA’s net pension liability $ 1,656,902 $ 1,720,623
Plan fiduciary net position as a percentage of the total pension liability 52.97% 50.23%

RETIREMENT PLAN FOR CHICAGO TRANSIT AUTHORITY EMPLOYEES Notes to Financial Statements December 31, 2017 and 2016
33
NOTE 7 NET PENSION LIABILITY OF THE EMPLOYER (CTA) (continued) Actuarial Assumptions: The total pension liability was determined by an actuarial valuation as of December 31, 2017 and 2016, using the following actuarial assumptions, applied to all periods included in the measurement:
2017 2016 Inflation 3.25% 3.25% Salary increases Years of service 1 9% 9% 2 11% 11% 3 16% 16% 4 5% 5% Equal to or more than 5 4% 4% Investment rate of return (net of pension plan investment expense, including inflation) 8.25% 8.25% For 2017 and 2016, the mortality rates for active members and retirees and survivors were based on the RP-2000 Blue Collar Table, base year 2000 fully generational based on Scale BB. Mortality rates for Disabled Employees were based on the RP-2000 Disabled Table, base year 2000 fully generational based on Scale BB. The actuarial assumptions used in the December 31, 2017 and 2016 valuation were based on the results of an actuarial experience study covering plan years from January 1, 2008 through December 31, 2012. The long-term expected rate of return on pension plan investments was determined using a building-block method in which best-estimate ranges of expected future real rates of return (expected returns, net of pension plan investment expense and inflation) are developed for each major asset class. These ranges are combined to produce the long-term expected rate of return by weighting the expected future real rates of return by the target asset allocation percentage and by adding expected inflation. Best estimates of arithmetic real rates of return for each major asset class included in the pension plan’s target asset allocation as of December 31, 2017 and 2016 are summarized in the following table:

RETIREMENT PLAN FOR CHICAGO TRANSIT AUTHORITY EMPLOYEES Notes to Financial Statements December 31, 2017 and 2016
34
NOTE 7 NET PENSION LIABILITY OF THE EMPLOYER (CTA) (continued) Long-Term Expected Real Rate of Return Asset Class 2017 2016 Fixed income 1.31% 1.39% Domestic equities 9.41 9.38 International equities 8.37 8.31 Venture capital and partnerships 12.54 12.52 Real estate 6.91 6.82 Hedge funds 4.66 4.66 Infrastructure 6.72 6.73 Discount Rate: The discount rate used to measure the total pension liability was 8.25%. The projection of cash flows used to determine the discount rate assumed that Plan members and employer contributions will continue to follow the current funding policy. Based on those assumptions, the Plan’s fiduciary net position was projected to be available to make all projected future benefit payments of current plan members. Therefore, the long-term expected rate of return on pension plan investments was applied to all periods of projected benefit payments to determine the total pension liability.
Sensitivity of the Net Pension Liability to Changes in the Discount Rate: The following presents the net pension liability of the CTA, calculated using the discount rate of 8.25%, as well as what the CTA’s net pension liability would be if it were calculated using a discount rate that is 1 percentage point lower (7.25%) or 1 percentage point higher (9.25%) than the current rate (amounts in thousands): 1% Current 1% Decrease Discount Increase Net Pension Liability (7.25%) Rate (8.25%) (9.25%) December 31, 2017 $1,997,031 $1,656,902 $1,365,529
NOTE 8 DERIVATIVES
The Plan’s investment managers may enter into derivative transactions as permitted by their guidelines for hedging or risk reduction, but not for speculative purposes. A derivative financial instrument’s payoff depends on the value of an underlying security, such as bond or stock prices, a market index, or commodity prices. Derivative financial instruments involve credit risk and market risk in varying degrees. The Plan did not invest in derivative instruments during 2017 and 2016.
RETIREMENT PLAN FOR CHICAGO TRANSIT AUTHORITY EMPLOYEES Notes to Financial Statements December 31, 2017 and 2016
35
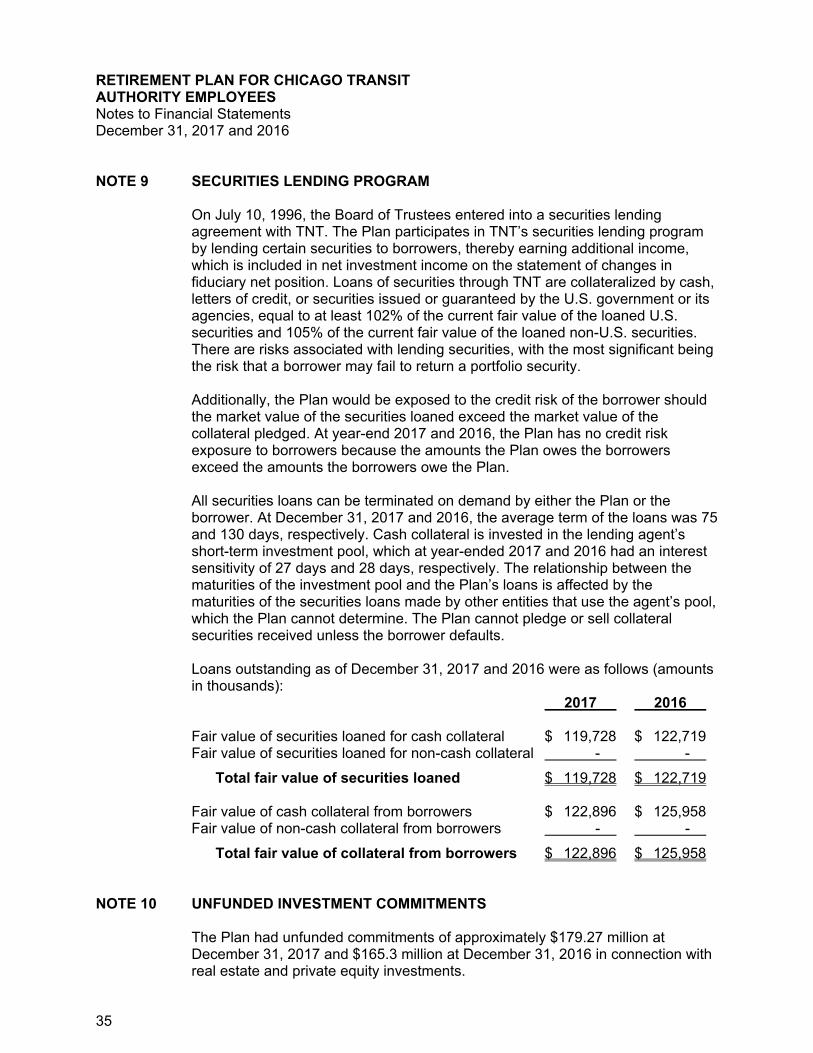
NOTE 9 SECURITIES LENDING PROGRAM
On July 10, 1996, the Board of Trustees entered into a securities lending agreement with TNT. The Plan participates in TNT’s securities lending program by lending certain securities to borrowers, thereby earning additional income, which is included in net investment income on the statement of changes in fiduciary net position. Loans of securities through TNT are collateralized by cash, letters of credit, or securities issued or guaranteed by the U.S. government or its agencies, equal to at least 102% of the current fair value of the loaned U.S. securities and 105% of the current fair value of the loaned non-U.S. securities. There are risks associated with lending securities, with the most significant being the risk that a borrower may fail to return a portfolio security.
Additionally, the Plan would be exposed to the credit risk of the borrower should the market value of the securities loaned exceed the market value of the collateral pledged. At year-end 2017 and 2016, the Plan has no credit risk exposure to borrowers because the amounts the Plan owes the borrowers exceed the amounts the borrowers owe the Plan. All securities loans can be terminated on demand by either the Plan or the borrower. At December 31, 2017 and 2016, the average term of the loans was 75 and 130 days, respectively. Cash collateral is invested in the lending agent’s short-term investment pool, which at year-ended 2017 and 2016 had an interest sensitivity of 27 days and 28 days, respectively. The relationship between the maturities of the investment pool and the Plan’s loans is affected by the maturities of the securities loans made by other entities that use the agent’s pool, which the Plan cannot determine. The Plan cannot pledge or sell collateral securities received unless the borrower defaults. Loans outstanding as of December 31, 2017 and 2016 were as follows (amounts in thousands): 2017 2016 Fair value of securities loaned for cash collateral $ 119,728 $ 122,719 Fair value of securities loaned for non-cash collateral - -
Total fair value of securities loaned $ 119,728 $ 122,719 Fair value of cash collateral from borrowers $ 122,896 $ 125,958 Fair value of non-cash collateral from borrowers - -
Total fair value of collateral from borrowers $ 122,896 $ 125,958
NOTE 10 UNFUNDED INVESTMENT COMMITMENTS
The Plan had unfunded commitments of approximately $179.27 million at December 31, 2017 and $165.3 million at December 31, 2016 in connection with real estate and private equity investments.

RETIREMENT PLAN FOR CHICAGO TRANSIT AUTHORITY EMPLOYEES Notes to Financial Statements December 31, 2017 and 2016
36
NOTE 11 RISKS AND UNCERTAINTIES
The Plan invests in investment securities that are exposed to various risks, such as interest rate, market volatility, and credit risks. Due to the level of risk associated with certain investment securities, it is at least reasonably possible that changes in the values of investment securities will occur in the near term. The changes could materially affect the amounts reported in the statement of fiduciary net position.
Contributions to the Plan and the actuarial information included in the required supplementary information are reported based on certain assumptions pertaining to interest rates, inflation rates, and employee compensation and demographics. Due to the changing nature of these assumptions, it is reasonably possible that changes in these assumptions may occur in the near term and, due to the uncertainties inherent in setting assumptions, that the effect of such changes could be material to the financial statements. The actuarial valuations involve estimates of the value of reported amounts and assumptions about the probability of events far into the future. Because actuarial calculations reflect a long-term perspective, actuarially determined amounts are subject to continual revision, as results are compared to past expectations and new estimates made about the future. Examples include assumptions about mortality, investment returns, and future employment.
The Plan is subject to various claims and legal proceedings arising in the ordinary course of business which, in management’s opinion, will be resolved without any material adverse effect on the Plan’s financial position or changes in its financial position.
NOTE 12 LEGAL PROCEEDINGS
Matthews v. Chicago Transit Authority, et al., No. 11 CH 15446 (Circuit Court of Cook County, Illinois). On April 26, 2011, Plaintiffs Jerry Matthews, Jerry Williams, Tommy Sams, Cynthia Boyne and Charles Brown, all employees and retirees of the Chicago Transit Authority, filed suit against the Chicago Transit Authority (CTA) and against the Retirement Plan for Chicago Transit Authority Employees, the Board of Trustees of the Retirement Plan for Chicago Transit Authority Employees, the Retiree Health Care Trust, and the Board of Trustees of the Retiree Health Care Trust (collectively, the “Plan and Trust Defendants”). The claims were brought on behalf of two purported classes. Class I, consisted of CTA employees who retired before January 1, 2007; Class II consists of CTA employees who were currently employed by the CTA or those who retired after January 1, 2007.

RETIREMENT PLAN FOR CHICAGO TRANSIT AUTHORITY EMPLOYEES Notes to Financial Statements December 31, 2017 and 2016
37
NOTE 12 LEGAL PROCEEDINGS (continued)
Generally, the plaintiffs challenged the reduction of healthcare benefits for retirees in the 2007 Collective Bargaining Agreement (CBA) governing CTA employees, and the related provisions of 40 ILCS 5/22-101B, which require retirees to pay up to 45% of the cost of their healthcare benefits. On May 5, 2016, the Illinois Supreme Court affirmed the appellate court's judgment in part and reversed in part. 2016 IL 117638. The Supreme Court determined that the Class II plaintiffs, the current employees and those who retired after January 1, 2007, lacked standing to challenge the 2007 CBA and affirmed the dismissal of all of their claims. The Supreme Court found that the Class I plaintiff, Jerry Williams, who retired prior to the expiration of the 2004 CBA had standing to challenge the modification to healthcare benefits pursuant to the 2007 CBA. The Supreme Court also found that the Class I plaintiff sufficiently stated a cause of action against the Plan and Trust Defendants for breach of contract, for declaratory judgment, and for violation of the pension protection clause because the 2004 CBA constituted an enforceable, vested right as to those who retired before the expiration of that agreement. Finally, the Supreme Court held that the retired employees were not entitled to pursue their claim of promissory estoppel against the CTA because they sought to enforce an obligation that went beyond the terms of the 2004 CBA. The Supreme Court remanded the case to the Circuit Court for further proceedings.
The case is now back in the Circuit Court. On May 31, 2017, Plaintiffs were granted leave to file a First Amended Complaint, which removed named plaintiffs whose claims were dismissed, removed CTA as a defendant, and largely removed dismissed claims. The First Amended Complaint lists Jerry Williams as the first named plaintiff, and adds two retiree named plaintiffs, Stewart Cooke and Larry Whitehead. The case is now captioned Williams et al. v. Retirement Plan for Chicago Transit Authority Employees, et al.
The Retirement Plan for Chicago Transit Authority Employees and the Board of Trustees of the Retirement Plan for Chicago Transit Authority Employees (“Retirement Plan Defendants”) filed a motion to dismiss a portion of the First Amended Complaint, specifically the allegations challenging the composition of the Retirement Plan Board, and answered the remaining counts. In response to the Retirement Plan Defendants’ motion, Plaintiffs moved to voluntary dismiss their claims and allegations challenging the composition of the Retirement Plan Board and the Retiree Health Care Trust Board from the First Amended Complaint.

RETIREMENT PLAN FOR CHICAGO TRANSIT AUTHORITY EMPLOYEES Notes to Financial Statements December 31, 2017 and 2016
38
NOTE 12 LEGAL PROCEEDINGS (continued)
The Retiree Health Care Trust and the Board of Trustees of the Retiree Health Care Trust Defendants (“Health Care Trust Defendants”) also filed a motion to dismiss all counts of the First Amended Complaint for failure to state a claim. On November 20, 2017, the Court granted the Health Care Trust Defendants motion to dismiss the breach of contract claim, and gave Plaintiffs leave to replead. On December 22, 2017, Plaintiffs filed a Second Amended Complaint. The Health Care Trust Defendants again filed a motion to dismiss the breach of contract Claim of the Second Amended Complaint. On July 12, 2018, the Court granted the motion, and again gave Plaintiffs leave to replead. On August 3, 2018, Plaintiffs filed their Third Amended Complaint. On September 7, 2018, the Health Care Trust Defendants filed a motion to dismiss the breach of contract claim of the Third Amended Complaint. That motion is being briefed; no hearing date has been set.
On September 7, 2018, Retirement Plan Defendants filed an Answer and Affirmative Defenses to the Third Amended Complaint, the Counterclaims against the Plaintiffs and Health Care Trust Defendants.
The parties are engaged in discovery and motions related to discovery disputes. After discovery, we anticipate the Plaintiffs will file a motion for class certification for the claims asserted in the Third Amended Complaint. The Retirement Plan is vigorously defending the matter. At this time, we are unable to determine the amount or range of any potential loss in the event of an unfavorable outcome.
NOTE 13 PRIORITIES AT PLAN TERMINATION
While the CTA intends to maintain the Plan permanently, should the Plan terminate, the Plan’s fiduciary net position held in trust for pension benefits would be allocated and used generally to provide the following, in the order indicated:
a. Refunds of participant contributions plus interest, less benefits paid.
b. Retirement and disability benefits to participants who have retired or reachedage 65 on the date of termination.
c. In the event a balance remains, it will be used to provide for reducedretirement and disability benefits for all other participants.

RETIREMENT PLAN FOR CHICAGO TRANSIT AUTHORITY EMPLOYEES Notes to Financial Statements December 31, 2017 and 2016
39
NOTE 14 TAX STATUS
The IRS issued a letter of determination dated March 8, 2017, stating that the Plan meets the requirements of a governmental plan under Section 414(d) of the Internal Revenue Code (the Code). Such determination was made on the condition that the Plan adopt two proposed amendments. The first proposed amendment is to add a new subparagraph to the first paragraph of Rule No. 14, in order to update the Plan’s definition of compensation to include differential wage payments to comply with the HEART Act. The second proposed amendment is to revise the second sentence of the last paragraph of Rule No. 30, in order to explicitly provide that all distributions from the Plan will be made in accordance with Income Tax Regulations Sections 1.401(a)(9)-2 through 1.401(a)(9)-9. Both amendments were approved by the Board at the monthly meeting on May 25, 2017.
The Plan is required to operate in conformity with the Code to maintain this qualification. The Plan’s management is not aware of any course of action or series of events that have occurred, which may adversely affect the Plan’s tax status.
NOTE 15 OPERATING LEASE
During 2013, the Plan entered into a new lease agreement for office space, which expires on December 31, 2028. Concurrently with the execution of the lease, the Plan has deposited $100,000 in the form of an irrevocable letter of credit. At December 31, 2017, the remaining future rental lease payments are as follows (amounts in thousands):
Year Amount
2018 $ 832019 852020 872021 892022 91Thereafter 546
$ 981
Rent and utilities paid by the Plan were $112,000 in 2017 and $107,000 in 2016. The amount of rent paid for 2017 and 2016 represents 75% of the total amount paid by the Plan. The other 25% is reimbursed by the CTA Retiree Health Care Plan based on management’s expense allocation for the shared office space.

RETIREMENT PLAN FOR CHICAGO TRANSIT AUTHORITY EMPLOYEES Notes to Financial Statements December 31, 2017 and 2016
40
NOTE 16 SUBSEQUENT EVENTS
Starting January 1, 2019, covered employees are required to contribute 12.010% of their salary to the Plan and the employer is required to contribute 18.019%, which is net of a credit for debt service on pension obligation bonds.

REQUIRED SUPPLEMENTARY INFORMATION

See accompanying Independent Auditor’s Report.
41
RETIREMENT PLAN FOR CHICAGO TRANSIT AUTHORITY EMPLOYEES Schedule of Changes in the Employer’s Net Pension Liability and Related Ratios (Unaudited)
2017 2016 2015 2014
Total pension liabilityService cost 50,432,791$ 50,111,555$ 51,357,649$ 49,066,078$ Interest 278,183,536 269,898,773 264,578,983 259,592,822 Difference between expected and actual experience 13,679,323 51,517,655 13,082,408 - Benefit payments, including refunds of member contributions (276,485,263) (266,566,974) (260,141,627) (246,037,562)
Net change in total pension liability 65,810,387 104,961,009 68,877,413 62,621,338
Total pension liability - beginning 3,456,992,119 3,352,031,110 3,283,153,697 3,220,532,359
Total pension liability - ending 3,522,802,506$ 3,456,992,119$ 3,352,031,110$ 3,283,153,697$
Plan's fiduciary net position
Contributions - employer 104,523,053$ 83,855,066$ 82,799,918$ 82,268,465$ Contributions - member 70,285,731 59,560,473 58,993,284 58,566,279 Net investment income 233,739,435 118,613,412 8,230,003 71,524,132 Benefit payments, including refunds of member contributions (276,485,263) (266,566,974) (260,141,627) (246,037,562) Administrative expense (2,531,493) (2,309,231) (2,577,197) (3,123,365)
Net change in plan fiduciary net position 129,531,463 (6,847,254) (112,695,619) (36,802,051)
Plan's fiduciary net position - beginning 1,736,369,178 1,743,216,432 1,855,912,051 1,892,714,102
Plan's fiduciary net position - ending 1,865,900,641$ 1,736,369,178$ 1,743,216,432$ 1,855,912,051$
Net pension liability - ending 1,656,901,865$ 1,720,622,941$ 1,608,814,678$ 1,427,241,646$
Plan's fiduciary net position as a percentage of the totalpension liability 52.97% 50.23% 52.00% 56.53%
Covered-employee payroll 595,046,668$ 575,443,885$ 573,548,196$ 564,827,965$
Employer's net pension liability as a percentage of covered-employee payroll 278.45% 299.01% 280.50% 252.69%
The above information is required beginning in 2014. Information for the next six years will be presented in future years.

See accompanying Independent Auditor’s Report.
42
RETIREMENT PLAN FOR CHICAGO TRANSIT AUTHORITY EMPLOYEES Schedule of Employer Contributions (Amounts in thousands) (Unaudited)
2017 2016 2015 2014 2013 2012 2011 2010 2009 2008
Employer portion of required contribution
contribution on a statutory basis* 106,662$ 82,001$ 81,731$ 80,488$ 102,800$ 61,982$ 55,976$ 56,474$ 34,030$ 53,473$
Actual employer contributions 104,523 83,855 82,800 82,268 79,518 62,788 60,318 56,216 41,448 1,165,947
Contribution deficiency (excess) 2,139$ (1,854)$ (1,069)$ (1,780)$ 23,282$ (806)$ (4,342)$ 258$ (7,418)$ (1,112,474)$
Covered-employee payroll 595,047$ 575,444$ 573,548$ 564,827$ 550,616$ 548,515$ 541,354$ 528,288$ 567,173$ 594,139$
Contributions as a percentage of covered-
employee payroll 17.92% 14.25% 14.25% 14.25% 18.67% 11.30% 10.34% 10.69% 6.00% 9.00%
*Actuarially determined contributions.

See accompanying Independent Auditor’s Report.
43
RETIREMENT PLAN FOR CHICAGO TRANSIT AUTHORITY EMPLOYEES Schedule of Investment Returns (Unaudited)
2017 2016 2015 2014
Annual money-weighted rate of return, net of investment expense 13.61% 6.54% (0.27)% 4.70%
The above information is required beginning in 2014. Information for the next six years will be presented in future years.

See accompanying Independent Auditor’s Report.
44
RETIREMENT PLAN FOR CHICAGO TRANSIT AUTHORITY EMPLOYEES Notes to Required Supplementary Information (Unaudited)
Actuarial Methods and Assumptions
The total pension liability as of December 31, 2017 was determined by rolling forward the total pension liability as of January 1, 2016 to December 31, 2017 using the following actuarial methods and assumptions that were applied to all periods included in the measurement.
Valuation date: January 1, 2017
Actuarial cost method: Entry Age Normal – Level Percentage of Pay
Amortization method: For pension expense, the difference between expected and actual liability experience and changes of assumptions are amortized over the average of the expected remaining service lives of all members. The difference between projected and actual earnings is amortized over a closed period of five years.
Inflation rate: 3.25%
Projected salary increases: 9% for 1 year of service, 11% for 2 years of service, 16% for 3 years of service, 5% for 4 years of service, and 4% thereafter.
Investment rate of return: 8.25%
Retirement age: Normal retirement age is 65
Mortality: Active – RP2000 Blue Collar Table, base year 2000 fully generational based on Scale BB.
Retirees & Survivors – RP2000 Blue Collar Table, base year 2000 fully generational based on Scale BB.
Experience study: The actuarial assumptions used were based on the results of an actuarial experience study covering plan years from January 1, 2008 through December 31, 2012.

OTHER INFORMATION

See accompanying Independent Auditor’s Report.
45
RETIREMENT PLAN FOR CHICAGO TRANSIT AUTHORITY EMPLOYEES Schedule of Investment and Administrative Expenses For the Years Ended December 31, 2017 and 2016 (Amounts in thousands)
2017 2016 INVESTMENT EXPENSES Investment management fees $ 6,188 $ 6,117 Investment consultant 325 325 Trustee fees 329 322 Reporting and monitoring 7 28
Total investment expenses $ 6,849 $ 6,792
ADMINISTRATIVE EXPENSES Personal services
Staff salaries and fringe benefits $ 1,023 $ 1,060
Professional services Actuarial 59 69 Auditing 85 90 Data processing 115 108 Legal 669 420 Benefit payments administration 262 259 Disability administration 365 338
1,555 1,284 Communication
Stationery and printing 9 15 Telephone 5 6Postage and messenger 12 15
26 36 Office and equipment
Office space 108 104 Utilities 3 3Equipment 9 6 Equipment rental 11 11
131 124 Insurance
Fiduciary and other insurance 81 78
Miscellaneous Seminars and travel 33 21 Supplies 11 15 Court reporting 16 12 Seminars for retirees 14 6 Other 5 10
79 64
Total administrative expenses $ 2,895 $ 2,646