TEACHER RETIREMENT PATTERN 2017-2027 - Amazon S3
72
Education Sector Analytical and Capacity Development Partnership TEACHER RETIREMENT PATTERN 2017-2027: AN OPPORTUNITY TO IMPROVE TEACHER MANAGEMENT Working Paper June 2017 Photo : BKLM MoEC
-
Upload
khangminh22 -
Category
Documents
-
view
0 -
download
0
Transcript of TEACHER RETIREMENT PATTERN 2017-2027 - Amazon S3
1
Education Sector Analytical and Capacity Development Partnership
TEACHER RETIREMENT PATTERN 2017-2027:AN OPPORTUNITY TO IMPROVE TEACHER MANAGEMENT
Working PaperJune 2017
Photo : BKLM MoEC
2
Education Sector Analytical and Capacity Development Partnership
Photo : BKLM MoEC
EXECUTIVE SUMMARY
The PNS teacher retirement wave is a one-time phenomenon that creates a unique opportunity to improve teacher management without the widespread resistance encountered in the past.
Between 2017 and 2027 approximately 749,300 (48.5%) of all Ministry of Education and Culture (MOEC) civil service (PNS) teachers will reach the mandatory retirement age of 60. For the Ministry of Religious Affairs (MORA), the pattern is somewhat different, only 24,169 (19%) of their PNS teacher allotment will reach retirement age during that period.
The retirement pattern can address three challenges: equitable distribution of teacher resources, escalating teacher wage bill, and low value derived from high cost of teachers. This paper offers findings, insights, and options to consider considerations
More equitable distribution of PNS teachers. The distribution of PNS teachers is highly uneven between schools, districts, and provinces, but redistribution of serving teachers has been nearly impossible to achieve. However, transferring positions vacated by retired teachers may encounter less resistance. Mapping PNS teacher locations reveals a higher than average concentration of teachers over 50 years of age in cities and in more desirable locations. This concentration can be attributed to a seniority-based teacher management system typical of a civil service model.
ABSTRACT:
This working paper views the teacher retirement pattern as an opportunity to improve the teacher management system and: address inequities in teacher distribution, gradually curb the burgeoning teacher wage bill, and move incrementally towards a sustainable teacher management system. Approximately 48% of civil service (PNS) teachers will reach the mandatory retirement age of 60 between 2017 and 2027, according to the MOEC and MORA administrative databases from January 2017. The wave of PNS teacher retirement is a onetime phenomenon that offers opportunities to reform teacher management without encountering the widespread resistance met by past attempts. In particular, the retirement pattern can help: (i) improve equity of teacher distribution by transferring the vacant positions of retired PNS teachers to less advantaged schools or areas; (ii) reduce the teacher wage bill by not filling all PNS teacher vacancies; and/or (iii) transition to a sustainable teacher management model.
Redistributing PNS teacher positions left vacant by retired teachers opens options for improving the equity of teacher distribution. Four redistribution options for consideration are: (i) from Western to Eastern Indonesia, (ii) within provinces for positions at the senior secondary level, (iii) within districts or cities for positions at the primary and junior secondary levels, and (iv) between schools in the same kecamatan or city ward. At present, there is a moratorium on hiring new PNS teachers, and it is not clear whether this hiring freeze applies to vacancies opened by retiring teachers.
Curtailing the growth in the teacher wage bill. Over the next 10 years the accumulated savings for retiring MOEC and MORA PNS teachers is calculated at just over USD 5 billion. In 2017, the APBN needed to provide approximately USD 12 billion to pay the estimated wage and allowance bill for MOEC and MORA teachers. Since 2005, teacher numbers and remuneration norms have been set without sufficient attention to public financing or classroom performance.
The pace of growth for the teacher wage and allowance bill can be slowed by retiring the PNS position along with the incumbent, gradually, to a set target. Reducing the number of teachers is possible as Indonesia has a very low student to teacher ratio overall, 15:1 for all teachers and 33:1 for PNS teachers only. The very low STR is a result of many factors including an excessive number of small schools, resistance to multi-grade teaching, and staffing standards that load the

3
Education Sector Analytical and Capacity Development Partnership
Photo : BKLM MoEC
labor market model, new teachers and current non-PNS teachers are hired nationally, compete for school vacancies, and given 5-year renewable contracts with the school as government employees. One further step in the direction of a labor market is to set base wages nationally, wages that are linked to performance as well as seniority. Teacher benefits could be set by labor market dynamics and reflect the “market price” needed to attract the type of teachers required in specific or undesirable locations.
Enabling a sustainable model for financing the teacher cadre. Rather than deploying teachers on an individual basis, the central government could resource a complement of teacher positions per school based on service standards. Under the current teacher management and financing model teacher positions are assigned, in theory, on the basis of service standards; in practice, some schools are resourced in excess of those standards while others are under-resourced. Over resourcing is not a problem for the school, because teachers arrive fully funded from the national budget as individuals.
The teachers’ remuneration pattern could be restructured to be comprised of two parts: an individual part consisting of her or his salary and a school-based part. The school based part is divided equally among the teachers and is increased incrementally until the number of teachers reaches the national standard. Should the number of teachers exceed the national standard, the portion received by any individual teacher would be reduced. This combination of individual and school-based financing for teachers would act as a disincentive for over-hiring teacher by school management.
education system with under-employed teachers.
Enabling a Sustainable Teacher Management Model. Concerns are growing about Indonesia’s persistently weak performance on all international tests of learning proficiencies in spite of generous public financing (20% of the public budget is allocated to education). The Minister of Finance raised the question about value for expenditure in February 2017 when she voiced questions in a public forum about teacher allowances asking, “are these really improving the quality of teaching?” 1
Over the past 10 years, the student performance improvement rate has been virtually flat; simultaneously the growth in the number and remuneration of teachers has been steep. This disconnection is partially attributable to a teacher management model with roots in the colonial period and to a school financing model with perverse incentives. Indonesian PNS teachers are accustomed to the security of civil service status and its high stability—tenure, predictable emoluments, seniority system—and low accountability. Non-PNS teachers aspire to civil service status and view their low salaries, temporary status, and lack of pensions and other benefits as only a stage in their journey to PNS positions. Therefore, as the institutional culture, tradition, and special interests that characterize the civil servant model for teacher management system are deeply entrenched, any change needs to be both incremental and non-threatening to incumbents
At the very least, the attrition of retiring teachers opens the opportunity to modify the teacher promotion system. Simply adding more stringent filters to the current promotion system and salary structure can improve the quality of teaching. Moving from a strictly seniority system to one based on performance according to some proxies for quality may ultimately lead to improvements in the quality of teaching and learning.
A more fundamental change would be to shift from a civil service to a market-based model. The 2014 Civil Service Reform Act introduced a new type of public employee, namely a “contract-based national government employee.” 2 The teacher retirement pattern can enable a gradual change in the composition of the teaching cadre. Under a
1 Finance Detik. 2017. Begitu juga dengan tunjangan guru yang nilainya mencapai kisaran Rp 25 triliun setiap tahunnya. Akan tetapi, kualitas guru masih dipertanyakan. “Kenaikan tunjangan guru, are these really improving the quality of teaching?,” https://finance.detik.com/berita-ekonomi-bisnis/3430353/sedihnya-sri-mulyani-menatap-hasil-apbn-ribuan-triliun
2 Law No. 5/2014 on the Indonesian civil service

4
Education Sector Analytical and Capacity Development Partnership
TABLE OF CONTENT
Abstract 2
Executive Summary 2
A. Introduction and Background 5
B. The Retirement Wave 9
C. Insights and Opportunities 10
1.Reducing Inequitable distribution: 10
2. Reducing the PNS and non-PNS teacher wage bill 12
3. Enabling a Sustainable Teacher Management Model 14
ANNEXES 15
Annex 1. Teacher Data Management 15
Annex 2.Teacher Wage Calculation Parameters 18
APPENDICES 24
Appendix 1. MOEC and MORA Teachers by Employment Status 25
Appendix 2. MOEC and MORA Teacher Salary Calculations 2017 – 2027 28
Appendix 3. STR of MOEC PNS Teachers by Province and District– MOEC 30
Appendix 4. STR by Province all levels– MORA 46
Appendix 6. PNS Techer Retirement Pattern MORA 65
Appendix 7. Indicative PNS Teacher Retirement Pattern by Level and Subject MOEC and MORA 2017-2027 in Total 66

5
Education Sector Analytical and Capacity Development Partnership
Table 1. Teachers by Ministry and Status as of January 2017
PNS non-PNS TOTAL
MOEC 1,601,271 1,266,708 2,867,979
MORA 124,045 527,216 651,261
Combined 1,725,316 1,793,924 3,519,240
Source: MOEC Dapodik Semester 1, 2016/2017 (accessed 24 May 2017) and MORA EMIS Semester 1. 2016/2017 (accessed 4 April 2017)
Teacher categorization by employment status: The teacher management model categorizes teachers by employment status--PNS or non-PNS--and uses a different management model for each category.
PNS teachers. In January 2017, there were 1,725,316 PNS teachers according to the two discrete MOEC and MORA administrative databases. PNS teacher management follows a national civil service model established more than 70 years ago, which traces its roots back to the colonial period. The number of new PNS teacher positions is set annually by the central government, taking national standards and financing into consideration. School placement for PNS teachers under MOEC is managed by local governments while those under MORA are managed by local branches of the MORA bureaucracy.
The overwhelming majority of PNS teachers (93%) are under the much larger MOEC system. For MOEC PNS teachers, salaries and allowances are financed out of the national budget through direct transfer and transfers to local governments using block and earmarked grants. MORA PNS teacher salaries and allowances are managed by the local MORA office. PNS teachers hold tenured, permanent positions and receive good salaries and benefits in comparison to non-PNS teachers. Career paths for PNS teachers can lead from classroom teacher to school principal, supervisor, and ultimately to a position in the education bureaucracy.
Although they hold national civil service status, many MOEC PNS teachers are closely connected to local government and local elites to whom they owe their school placements, and PNS teachers play an active role in local elections often at the expense of their classroom duties. Teacher management
A. INTRODUCTION AND BACKGROUND
Purpose and Perspective: The purpose of this working paper is to provide central level planners with insights on how the civil service (PNS) teacher retirement pattern can contribute to resolving longstanding problems in teacher management, namely: (i) the inequitable distribution of PNS teachers; (ii) the burgeoning PNS teacher salary and wage bill; and (iii) the low value-added and the high cost of the current model for teacher management.
Methodology and Limitations: Data underpinning the insights and options presented below derives from the administrative databases maintained by MOEC and MORA and are current as of January 2017 for MOEC and March 2017 for MORA. The data is based on school self-reporting and while over 96% of schools report their data, it is not independently verified and may be subject to error. Annex 1 describes how the data was obtained, cleaned, managed and analyzed.
The overall pattern of retirement by level, subject specialization, and location described in this report is valid, but the accuracy of specific numbers of teachers retiring each year will increasingly deviate from forecasts over time due to the overall flow of teachers. Each year teachers leave the profession for reasons other than retirement while others enter or attain PNS status. For example, the MOEC administrative data from January 2017 did not include 260,277 teachers who appeared in the 2016 data and included 196,759 new teachers. Without further verification, it is not possible to determine whether these fluctuations are due to reporting errors, normal teacher flow, or both. Therefore, to increase accuracy in the future, the study should be repeated every 3-4 years using the most up-to-date data. Finally, this strictly quantitative analysis does not address issues pertaining to the quality of teaching, teachers’ aspirations, teacher education and training, or international models for teacher management.
Background: Approximately 3.5 million Indonesians teach grades 1-12 in public and private general schools and madrasah (table 1). Appendix 1 reports a detailed breakdown for MORA and MOEC teachers. The Ministry of Education and Culture (MOEC) is responsible for the general education system while the Ministry of Religious Affairs (MORA) for madrasah and teachers of religion in general schools.
6
Education Sector Analytical and Capacity Development Partnership
reforms that seek to curb PNS teacher numbers, curtail the burgeoning teacher wage bill, or relocate serving teachers are vehemently resisted through unions, public demonstrations, mass media campaigns, and other legitimate means typical of a healthy democracy.
Non-PNS teachers. As of January 2017, there were approximately 1,793,924 non-PNS teachers in MOEC and MORA schools and madrasah. These teachers are casually employed on short term contracts; most are engaged directly by schools or madrasah using School Operational Assistance (BOS) funds or through contributions from parents, religious organizations, or community members; but some are employed by local governments using their own funds. Non-PNS teachers typically lack job security, have lower salaries, fewer allowances, and lower pension benefits than PNS teachers serving in the same school. They have no career path, but most aspire to become PNS teachers.
As most non-PNS teachers are hired by schools, they have a different relationship with local politics than PNS teachers. From the perspective of local government, non-PNS teachers represent a means for staffing schools that has little impact on fiscal space at local levels. On the other hand, non-PNS teachers advocate collectively for teacher management reforms that would facilitate their transition to PNS status or provide equal salary and benefits. The sheer number of non-PNS teachers creates unwelcome pressure on local and national governments to accommodate their demands.
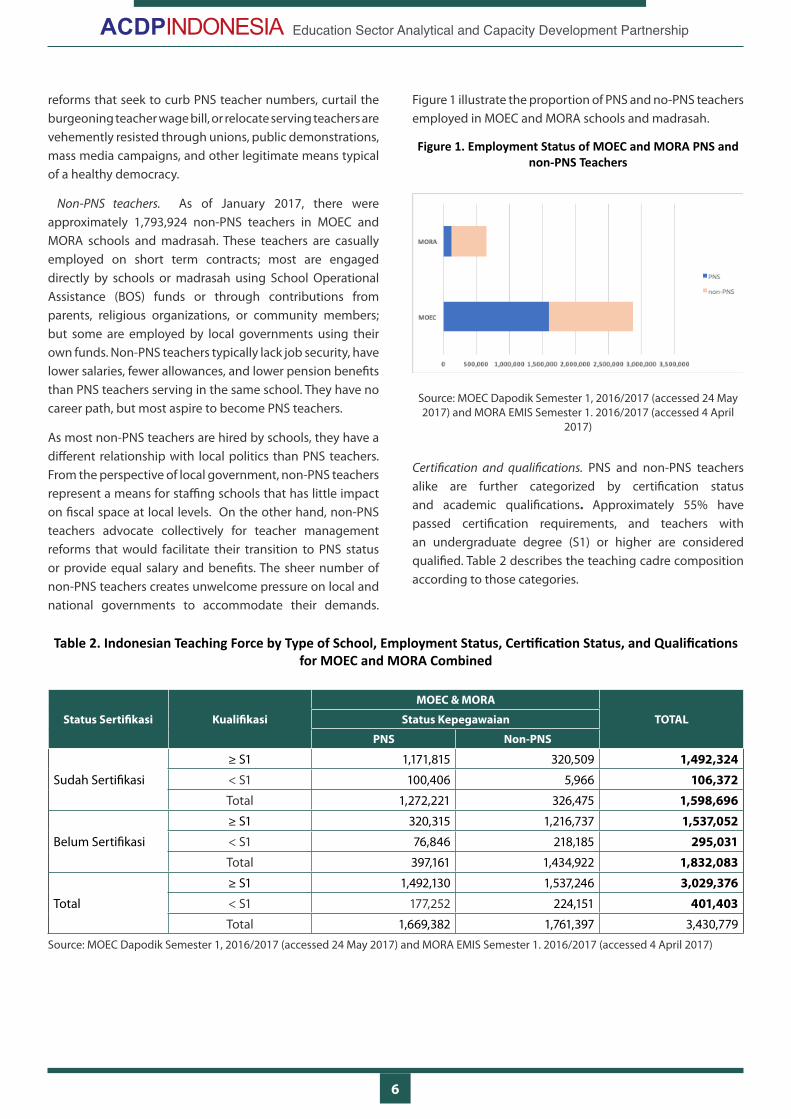
Figure 1 illustrate the proportion of PNS and no-PNS teachers employed in MOEC and MORA schools and madrasah.
Figure 1. Employment Status of MOEC and MORA PNS and non-PNS Teachers
Source: MOEC Dapodik Semester 1, 2016/2017 (accessed 24 May 2017) and MORA EMIS Semester 1. 2016/2017 (accessed 4 April
2017)
Certification and qualifications. PNS and non-PNS teachers alike are further categorized by certification status and academic qualifications. Approximately 55% have passed certification requirements, and teachers with an undergraduate degree (S1) or higher are considered qualified. Table 2 describes the teaching cadre composition according to those categories.
Table 2. Indonesian Teaching Force by Type of School, Employment Status, Certification Status, and Qualifications for MOEC and MORA Combined
Status Sertifikasi Kualifikasi
MOEC & MORA
TOTALStatus Kepegawaian
PNS Non-PNS
Sudah Sertifikasi≥ S1 1,171,815 320,509 1,492,324< S1 100,406 5,966 106,372Total 1,272,221 326,475 1,598,696
Belum Sertifikasi≥ S1 320,315 1,216,737 1,537,052< S1 76,846 218,185 295,031Total 397,161 1,434,922 1,832,083
Total≥ S1 1,492,130 1,537,246 3,029,376< S1 177,252 224,151 401,403Total 1,669,382 1,761,397 3,430,779
Source: MOEC Dapodik Semester 1, 2016/2017 (accessed 24 May 2017) and MORA EMIS Semester 1. 2016/2017 (accessed 4 April 2017)
7
Education Sector Analytical and Capacity Development Partnership
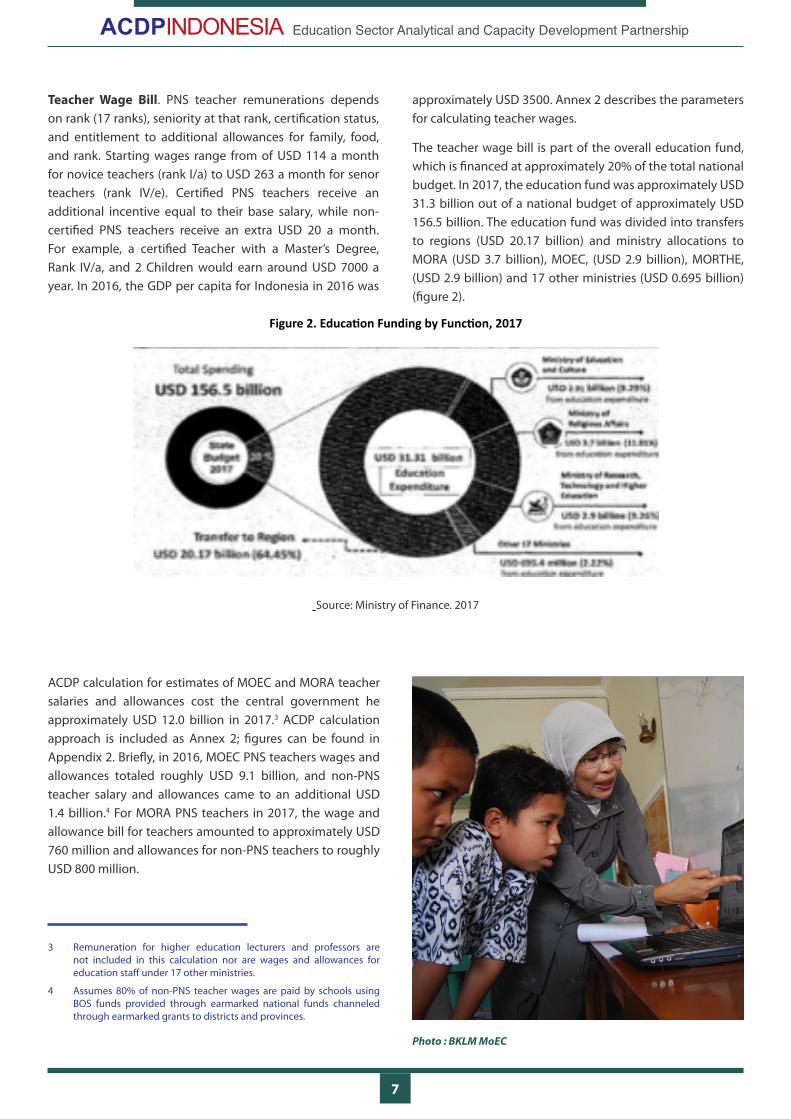
Figure 2. Education Funding by Function, 2017
Source: Ministry of Finance. 2017
Teacher Wage Bill. PNS teacher remunerations depends on rank (17 ranks), seniority at that rank, certification status, and entitlement to additional allowances for family, food, and rank. Starting wages range from of USD 114 a month for novice teachers (rank I/a) to USD 263 a month for senor teachers (rank IV/e). Certified PNS teachers receive an additional incentive equal to their base salary, while non-certified PNS teachers receive an extra USD 20 a month. For example, a certified Teacher with a Master’s Degree, Rank IV/a, and 2 Children would earn around USD 7000 a year. In 2016, the GDP per capita for Indonesia in 2016 was
approximately USD 3500. Annex 2 describes the parameters for calculating teacher wages.
The teacher wage bill is part of the overall education fund, which is financed at approximately 20% of the total national budget. In 2017, the education fund was approximately USD 31.3 billion out of a national budget of approximately USD 156.5 billion. The education fund was divided into transfers to regions (USD 20.17 billion) and ministry allocations to MORA (USD 3.7 billion), MOEC, (USD 2.9 billion), MORTHE, (USD 2.9 billion) and 17 other ministries (USD 0.695 billion) (figure 2).
ACDP calculation for estimates of MOEC and MORA teacher salaries and allowances cost the central government he approximately USD 12.0 billion in 2017.3 ACDP calculation approach is included as Annex 2; figures can be found in Appendix 2. Briefly, in 2016, MOEC PNS teachers wages and allowances totaled roughly USD 9.1 billion, and non-PNS teacher salary and allowances came to an additional USD 1.4 billion.4 For MORA PNS teachers in 2017, the wage and allowance bill for teachers amounted to approximately USD 760 million and allowances for non-PNS teachers to roughly USD 800 million.
3 Remuneration for higher education lecturers and professors are not included in this calculation nor are wages and allowances for education staff under 17 other ministries.
4 Assumes 80% of non-PNS teacher wages are paid by schools using BOS funds provided through earmarked national funds channeled through earmarked grants to districts and provinces.
Photo : BKLM MoEC

8
Education Sector Analytical and Capacity Development Partnership
Student Teacher Ratios (STR): While the STR for all teachers in grades 1-12 is 15:1 for MOEC and MORA schools combined. The STR figures change dramatically when counting only PNS teachers. The aggregate STR for MOEC PNS teachers assigned to grades 1-12 increases to 32:1 overall ranging from a low of 17:1 in Aceh, Central Kalimantan and Maluku
Table 3a. STR for PNS Teachers for Grades 1-12 for MOEC
Level Students All Teachers PNS Teachers STR All Teachers STR PNS Teachers
SD 25,618,078 1,586,084 940,476 16 27SMP 10,145,405 622,592 345,597 16 29SMA 4,657,786 294,743 163,581 16 28SMK 4,682,913 276,099 95,683 17 49
Total 45,104,182 2,779,518 1,545,337 16 29
Source: MOEC Dapodik Semester 1, 2016/2017 (accessed 24 May 2017)
Table 3b. STR for PNS Teachers for Grades 1-12 for MORA
Level Students All Teachers PNS Teachers STR All Teachers STR PNS Teachers
MI 3,671,108 266,868 49,846 14 74MTS 3,189,990 260,616 48,870 12 65MA 1,383,614 123,777 25,329 11 55
Total 8,244,712 651,261 124,045 13 66
Source: MORA EMIS Semester 1, 2016/2017 (accessed 4 April 2017)
Table 3c. STR for PNS Teachers for Grades 1-12 for MOEC and MORA Combined
Level Students All Teachers PNS Teachers STR All Teachers STR PNS Teachers
SD/MI 29,289,186 1,852,952 990,322 16 30SMP/MTS 13,335,395 883,208 394,467 15 34SMA/MA 6,041,400 418,520 188,910 14 32SMK 4,682,913 276,099 95,683 17 49
Total 53,348,894 3,430,779 1,669,382 16 32
Source: MOEC Dapodik Semester 1, 2016/2017 (accessed 24 May 2017) and MORA EMIS Semester 1. 2016/2017 (accessed 4 April 2017)
to a high of 51:1 in DKI Jakarta. For MORA, the PNS teacher to student ratio overall is 66:1, ranging from 35:1 in South Kalimantan to 104:1 in West Java. Table 3 includes the overall STR for PNS teachers by level of education for MOEC and MORA combined. Details at the provincial level can be found in Appendices 3 and 4 respectively.
9
Education Sector Analytical and Capacity Development Partnership
B. THE RETIREMENT WAVE
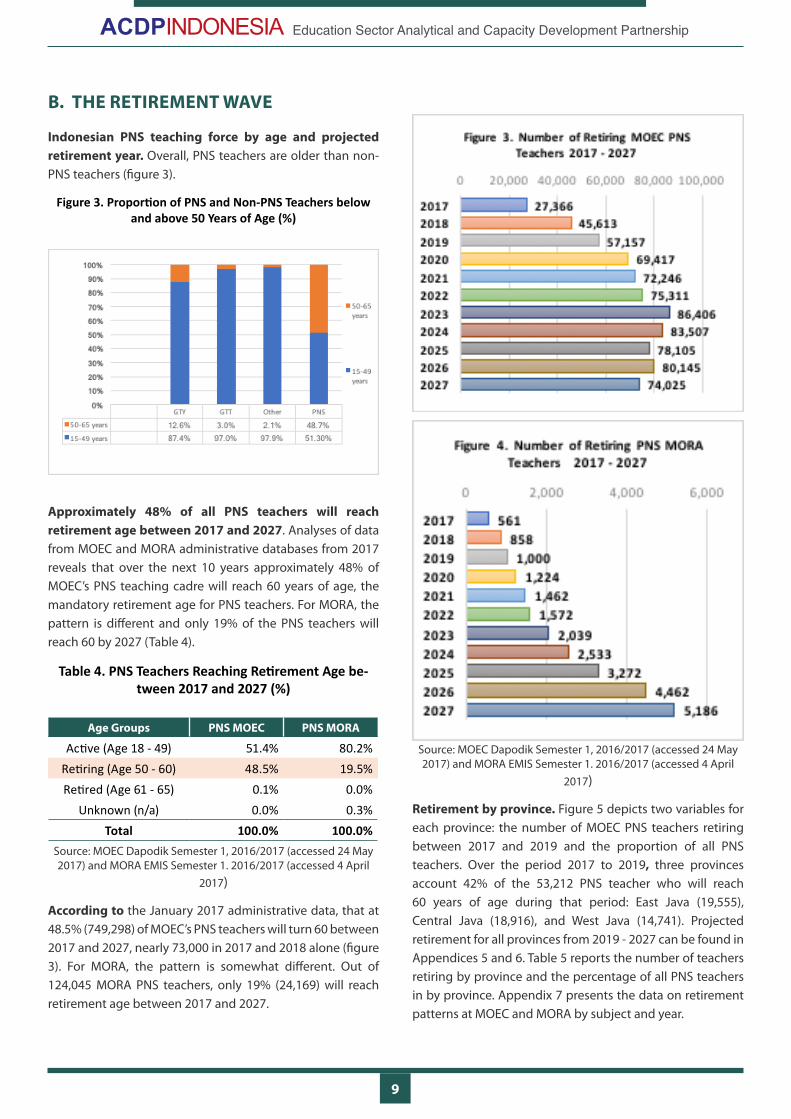
Indonesian PNS teaching force by age and projected retirement year. Overall, PNS teachers are older than non-PNS teachers (figure 3).
Figure 3. Proportion of PNS and Non-PNS Teachers below and above 50 Years of Age (%)
Approximately 48% of all PNS teachers will reach retirement age between 2017 and 2027. Analyses of data from MOEC and MORA administrative databases from 2017 reveals that over the next 10 years approximately 48% of MOEC’s PNS teaching cadre will reach 60 years of age, the mandatory retirement age for PNS teachers. For MORA, the pattern is different and only 19% of the PNS teachers will reach 60 by 2027 (Table 4).
Table 4. PNS Teachers Reaching Retirement Age be-tween 2017 and 2027 (%)
Age Groups PNS MOEC PNS MORA
Active (Age 18 - 49) 51.4% 80.2%Retiring (Age 50 - 60) 48.5% 19.5%Retired (Age 61 - 65) 0.1% 0.0%
Unknown (n/a) 0.0% 0.3%Total 100.0% 100.0%
Source: MOEC Dapodik Semester 1, 2016/2017 (accessed 24 May 2017) and MORA EMIS Semester 1. 2016/2017 (accessed 4 April
2017)
According to the January 2017 administrative data, that at 48.5% (749,298) of MOEC’s PNS teachers will turn 60 between 2017 and 2027, nearly 73,000 in 2017 and 2018 alone (figure 3). For MORA, the pattern is somewhat different. Out of 124,045 MORA PNS teachers, only 19% (24,169) will reach retirement age between 2017 and 2027.
Source: MOEC Dapodik Semester 1, 2016/2017 (accessed 24 May 2017) and MORA EMIS Semester 1. 2016/2017 (accessed 4 April
2017)
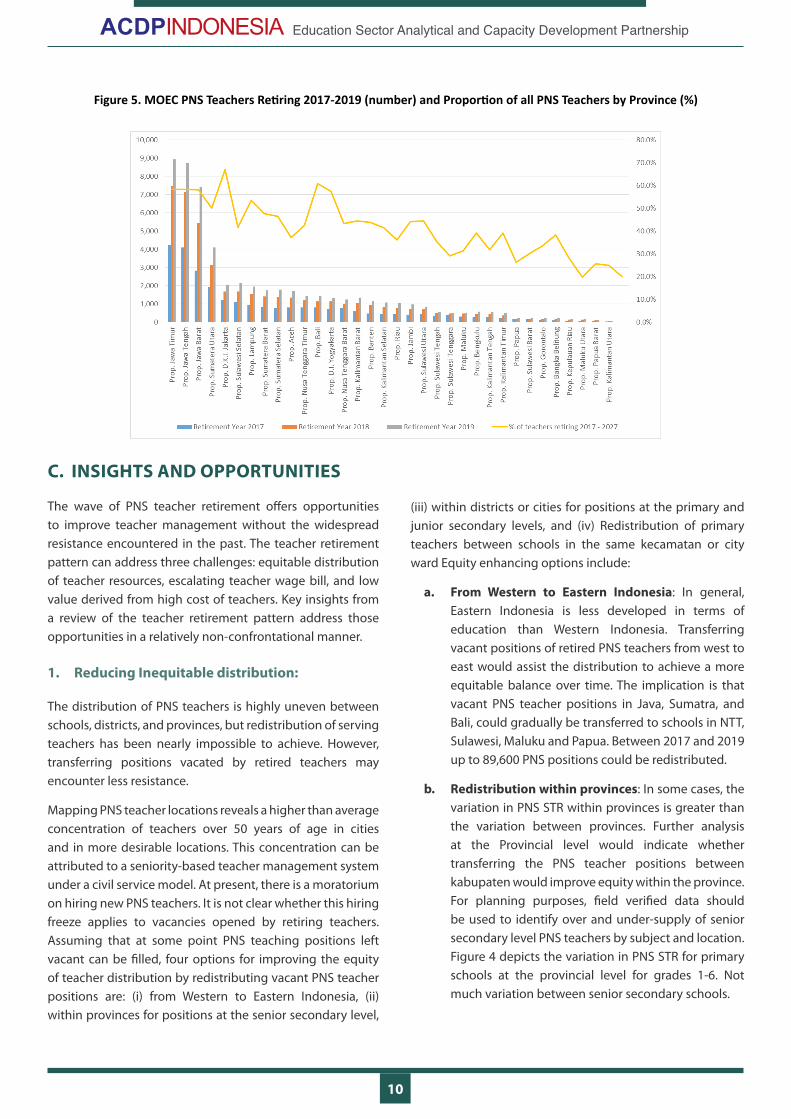
Retirement by province. Figure 5 depicts two variables for each province: the number of MOEC PNS teachers retiring between 2017 and 2019 and the proportion of all PNS teachers. Over the period 2017 to 2019, three provinces account 42% of the 53,212 PNS teacher who will reach 60 years of age during that period: East Java (19,555), Central Java (18,916), and West Java (14,741). Projected retirement for all provinces from 2019 - 2027 can be found in Appendices 5 and 6. Table 5 reports the number of teachers retiring by province and the percentage of all PNS teachers in by province. Appendix 7 presents the data on retirement patterns at MOEC and MORA by subject and year.
10
Education Sector Analytical and Capacity Development Partnership
Figure 5. MOEC PNS Teachers Retiring 2017-2019 (number) and Proportion of all PNS Teachers by Province (%)
C. INSIGHTS AND OPPORTUNITIES
The wave of PNS teacher retirement offers opportunities to improve teacher management without the widespread resistance encountered in the past. The teacher retirement pattern can address three challenges: equitable distribution of teacher resources, escalating teacher wage bill, and low value derived from high cost of teachers. Key insights from a review of the teacher retirement pattern address those opportunities in a relatively non-confrontational manner.
1. Reducing Inequitable distribution:
The distribution of PNS teachers is highly uneven between schools, districts, and provinces, but redistribution of serving teachers has been nearly impossible to achieve. However, transferring positions vacated by retired teachers may encounter less resistance.
Mapping PNS teacher locations reveals a higher than average concentration of teachers over 50 years of age in cities and in more desirable locations. This concentration can be attributed to a seniority-based teacher management system under a civil service model. At present, there is a moratorium on hiring new PNS teachers. It is not clear whether this hiring freeze applies to vacancies opened by retiring teachers. Assuming that at some point PNS teaching positions left vacant can be filled, four options for improving the equity of teacher distribution by redistributing vacant PNS teacher positions are: (i) from Western to Eastern Indonesia, (ii) within provinces for positions at the senior secondary level,
(iii) within districts or cities for positions at the primary and junior secondary levels, and (iv) Redistribution of primary teachers between schools in the same kecamatan or city ward Equity enhancing options include:
a. From Western to Eastern Indonesia: In general, Eastern Indonesia is less developed in terms of education than Western Indonesia. Transferring vacant positions of retired PNS teachers from west to east would assist the distribution to achieve a more equitable balance over time. The implication is that vacant PNS teacher positions in Java, Sumatra, and Bali, could gradually be transferred to schools in NTT, Sulawesi, Maluku and Papua. Between 2017 and 2019 up to 89,600 PNS positions could be redistributed.
b. Redistribution within provinces: In some cases, the variation in PNS STR within provinces is greater than the variation between provinces. Further analysis at the Provincial level would indicate whether transferring the PNS teacher positions between kabupaten would improve equity within the province. For planning purposes, field verified data should be used to identify over and under-supply of senior secondary level PNS teachers by subject and location. Figure 4 depicts the variation in PNS STR for primary schools at the provincial level for grades 1-6. Not much variation between senior secondary schools.

11
Education Sector Analytical and Capacity Development Partnership
Figure 4. Indicative Distribution of MOEC PNS Teachers for SD within 34 Provinces by STR as of January 2017 (Range Median and Quartile)
Source: MOEC Dapodik Semester 1, 2016/2017 (accessed 24 May 2017)
c. Redistribution within districts: In some cases, the variation in PNS STR at the classroom level within kabupaten or cities appears to be wider than the
variation between provinces. Figure 5 depicts the variation of PNS teachers’ STR within East Java as compared to the median.
Figure 5: East Java MOEC PNS Teacher STR by District and City in January 2017 as of January 2017 (Range, Median and Quartile for all schools)
Source: MOEC Dapodik Semester 1, 2016/2017 (accessed 24 May 2017)
12
Education Sector Analytical and Capacity Development Partnership
d. Redistribution between schools in the same kecamatan or city ward. As senior PNS teachers tend to be concentrated in cities and surrounding areas, equity goals can be supported by redistribution of retired PNS positions within city and around cities. Again, field verification would identify the best locations for the intra-sub-district and option. In this case equity targets are based on proportion of PNS teachers in each school.
For example, in the Duren Sawit kecamatan in East Jakarta there are a total of 104 primary schools and 1749 primary teachers of whom 743 (42%) are PNS teacher. However, 530 of all the PNS teachers in 70 schools are age 50 and over (71%). This creates an opportunity for re-distribution of PNS teacher positions between schools in the same kecamatan based either on Minimum Service Standards (MSS)5 or on STR.
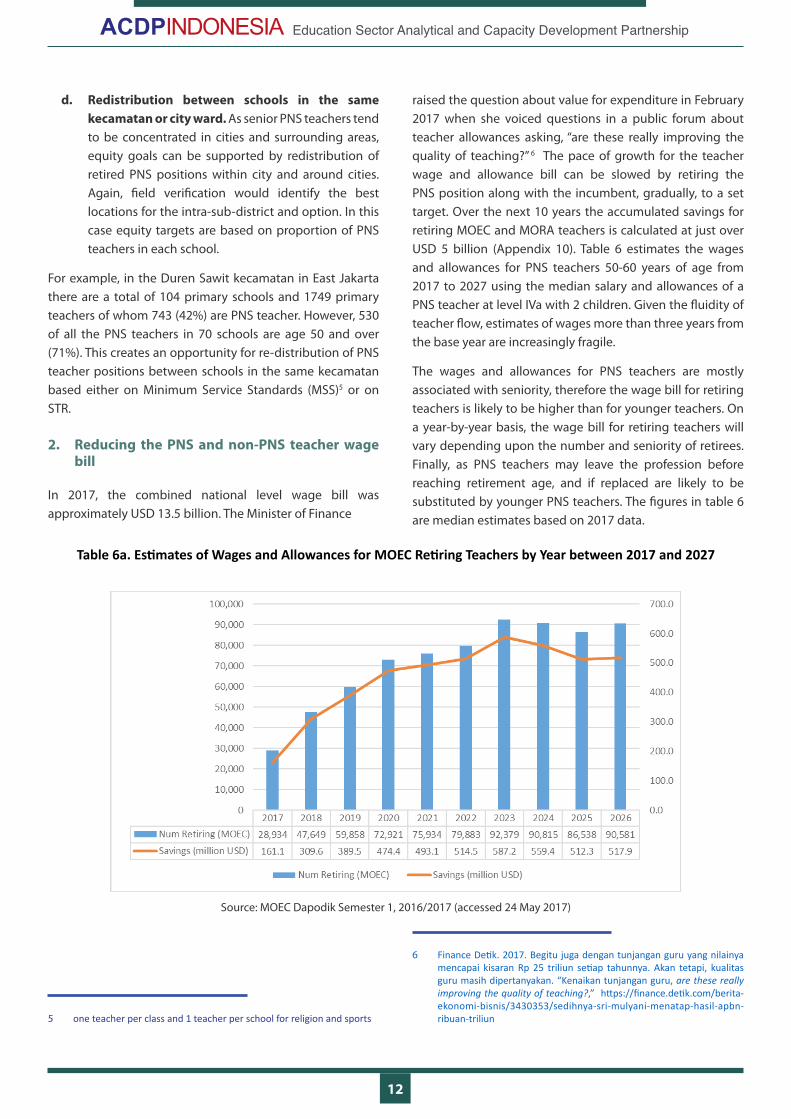
2. Reducing the PNS and non-PNS teacher wage bill
In 2017, the combined national level wage bill was approximately USD 13.5 billion. The Minister of Finance
5 one teacher per class and 1 teacher per school for religion and sports
raised the question about value for expenditure in February 2017 when she voiced questions in a public forum about teacher allowances asking, “are these really improving the quality of teaching?” 6 The pace of growth for the teacher wage and allowance bill can be slowed by retiring the PNS position along with the incumbent, gradually, to a set target. Over the next 10 years the accumulated savings for retiring MOEC and MORA teachers is calculated at just over USD 5 billion (Appendix 10). Table 6 estimates the wages and allowances for PNS teachers 50-60 years of age from 2017 to 2027 using the median salary and allowances of a PNS teacher at level IVa with 2 children. Given the fluidity of teacher flow, estimates of wages more than three years from the base year are increasingly fragile.
The wages and allowances for PNS teachers are mostly associated with seniority, therefore the wage bill for retiring teachers is likely to be higher than for younger teachers. On a year-by-year basis, the wage bill for retiring teachers will vary depending upon the number and seniority of retirees. Finally, as PNS teachers may leave the profession before reaching retirement age, and if replaced are likely to be substituted by younger PNS teachers. The figures in table 6 are median estimates based on 2017 data.
6 Finance Detik. 2017. Begitu juga dengan tunjangan guru yang nilainya mencapai kisaran Rp 25 triliun setiap tahunnya. Akan tetapi, kualitas guru masih dipertanyakan. “Kenaikan tunjangan guru, are these really improving the quality of teaching?,” https://finance.detik.com/berita-ekonomi-bisnis/3430353/sedihnya-sri-mulyani-menatap-hasil-apbn-ribuan-triliun
Table 6a. Estimates of Wages and Allowances for MOEC Retiring Teachers by Year between 2017 and 2027
Source: MOEC Dapodik Semester 1, 2016/2017 (accessed 24 May 2017)
13
Education Sector Analytical and Capacity Development Partnership
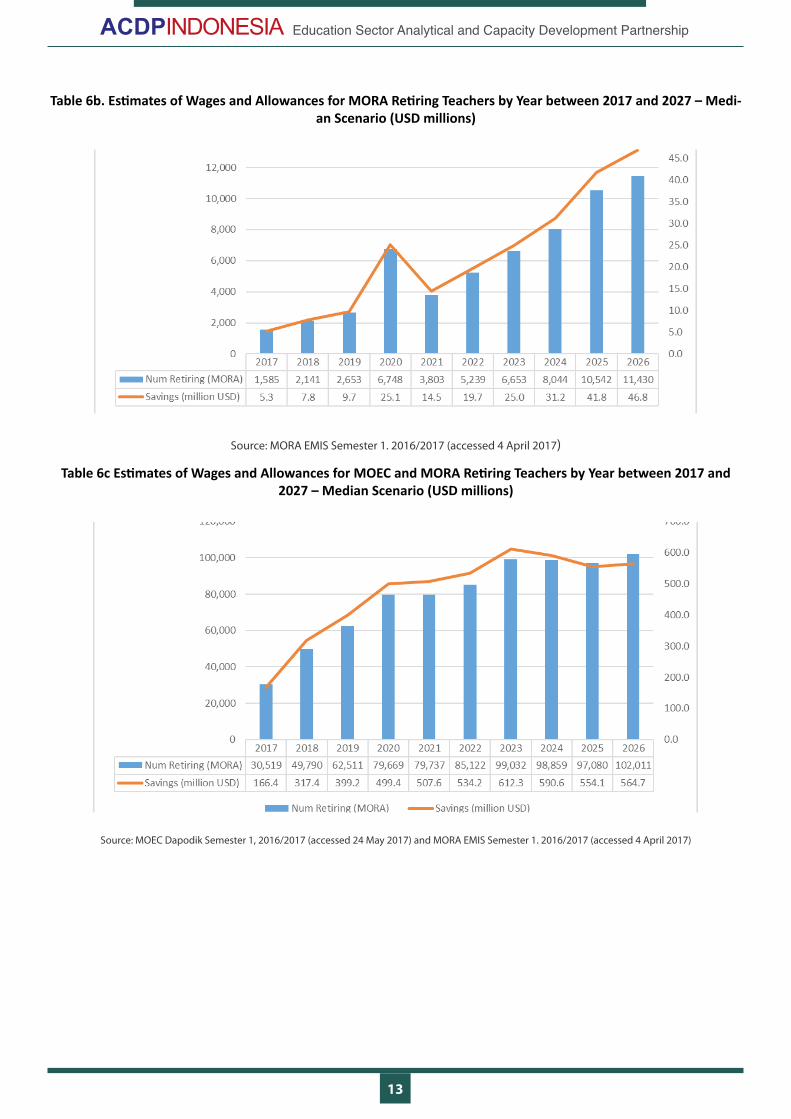
Table 6b. Estimates of Wages and Allowances for MORA Retiring Teachers by Year between 2017 and 2027 – Medi-an Scenario (USD millions)
Source: MORA EMIS Semester 1. 2016/2017 (accessed 4 April 2017)
Table 6c Estimates of Wages and Allowances for MOEC and MORA Retiring Teachers by Year between 2017 and 2027 – Median Scenario (USD millions)
Source: MOEC Dapodik Semester 1, 2016/2017 (accessed 24 May 2017) and MORA EMIS Semester 1. 2016/2017 (accessed 4 April 2017)
14
Education Sector Analytical and Capacity Development Partnership
3. Enabling a Sustainable Teacher Management Model
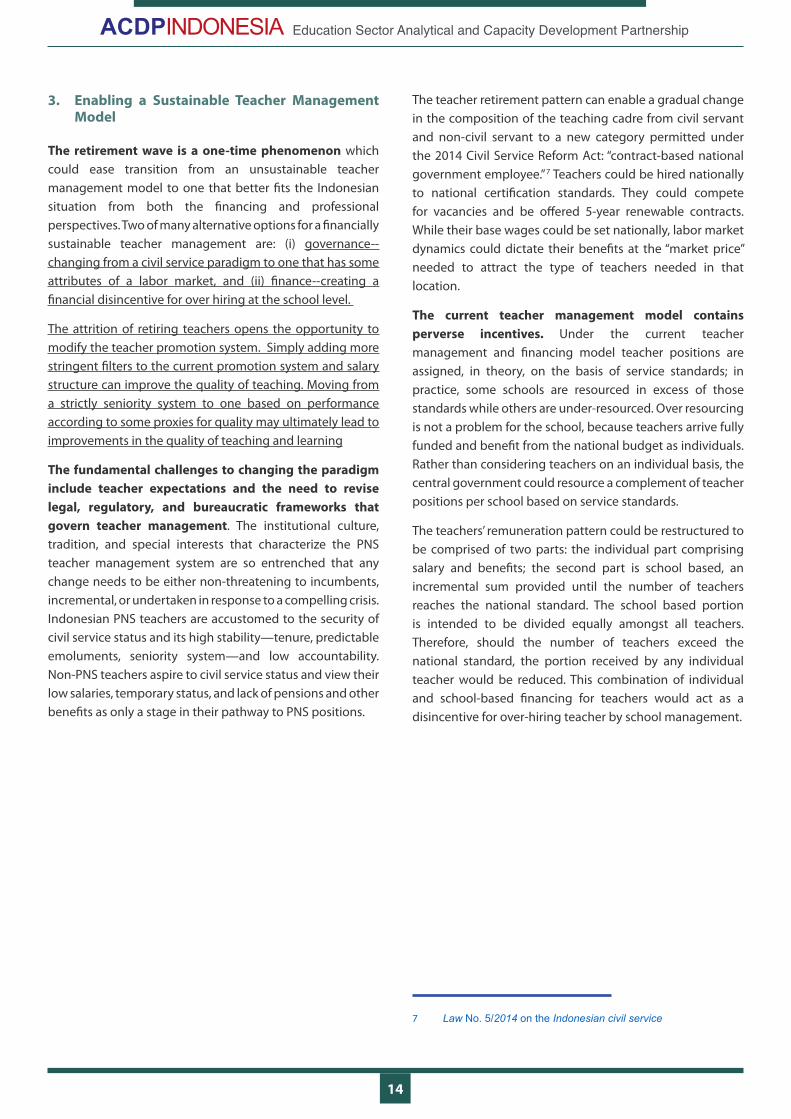
The retirement wave is a one-time phenomenon which could ease transition from an unsustainable teacher management model to one that better fits the Indonesian situation from both the financing and professional perspectives. Two of many alternative options for a financially sustainable teacher management are: (i) governance--changing from a civil service paradigm to one that has some attributes of a labor market, and (ii) finance--creating a financial disincentive for over hiring at the school level.
The attrition of retiring teachers opens the opportunity to modify the teacher promotion system. Simply adding more stringent filters to the current promotion system and salary structure can improve the quality of teaching. Moving from a strictly seniority system to one based on performance according to some proxies for quality may ultimately lead to improvements in the quality of teaching and learning
The fundamental challenges to changing the paradigm include teacher expectations and the need to revise legal, regulatory, and bureaucratic frameworks that govern teacher management. The institutional culture, tradition, and special interests that characterize the PNS teacher management system are so entrenched that any change needs to be either non-threatening to incumbents, incremental, or undertaken in response to a compelling crisis. Indonesian PNS teachers are accustomed to the security of civil service status and its high stability—tenure, predictable emoluments, seniority system—and low accountability. Non-PNS teachers aspire to civil service status and view their low salaries, temporary status, and lack of pensions and other benefits as only a stage in their pathway to PNS positions.
The teacher retirement pattern can enable a gradual change in the composition of the teaching cadre from civil servant and non-civil servant to a new category permitted under the 2014 Civil Service Reform Act: “contract-based national government employee.” 7 Teachers could be hired nationally to national certification standards. They could compete for vacancies and be offered 5-year renewable contracts. While their base wages could be set nationally, labor market dynamics could dictate their benefits at the “market price” needed to attract the type of teachers needed in that location.
The current teacher management model contains perverse incentives. Under the current teacher management and financing model teacher positions are assigned, in theory, on the basis of service standards; in practice, some schools are resourced in excess of those standards while others are under-resourced. Over resourcing is not a problem for the school, because teachers arrive fully funded and benefit from the national budget as individuals. Rather than considering teachers on an individual basis, the central government could resource a complement of teacher positions per school based on service standards.
The teachers’ remuneration pattern could be restructured to be comprised of two parts: the individual part comprising salary and benefits; the second part is school based, an incremental sum provided until the number of teachers reaches the national standard. The school based portion is intended to be divided equally amongst all teachers. Therefore, should the number of teachers exceed the national standard, the portion received by any individual teacher would be reduced. This combination of individual and school-based financing for teachers would act as a disincentive for over-hiring teacher by school management.
7 Law No. 5/2014 on the Indonesian civil service

15
Education Sector Analytical and Capacity Development Partnership
ANNEXES
1. Teacher Data Management
2. Teacher Wage Calculation Parameters
Annex 1. Teacher Data Management
Data Collection’
The data was obtained from two sources:
1. Data Pokok Pendidikan (DAPODIK) from Pusat Data Statistik Pendidikan (PDSP) of the Ministry of Education and Culture (MOEC).
a. Period 1: Semester 1 Academic Year 2015/2016
b. Period 2: Semester 1 Academic Year 2016/2017
Data comparison:
PNS Non-PNS Total PNS Non-PNS Total
Received Date
Data Format
Total Data Received 1,601,494 1,266,718 2,868,212 1,545,375 1,234,504 2,779,879
Duplicate Data(Teachers' ID)
223 10 233 37 195 232
Total Data Used 1,601,271 1,266,708 2,867,979 1,545,338 1,234,309 2,779,647
Total Data Match(Between Data Sources)
1,489,621 1,118,081 2,607,702 1,545,338 1,234,309 2,779,647
Total Data Mismatch(Drop/New)
111,650 148,627 260,277 0 0 0
The Number of Variables of Teachers Profile
10 variables + 9 supplement files (linkable) 26 variables
December 2016 January 2017 & May 2017
Comparison
Data Source
DAPODIK Semester 1 2016/2017DAPODIK Semester 1 2015/2016
Database backup file (.bak) Microsoft Access (.accdb)

16
Education Sector Analytical and Capacity Development Partnership
2. Education Management Information System (EMIS) from the Ministry of Religious Affairs (MORA). Data peri-od was Semester 1 Academic Year 2016/2017 (received date: 29 March 2017).
Data Processing
Data initially obtained must be processed or organised for analysis. Stages of data processing:
1. Converting data from database format (e.g: .bak; .accdb; .mdb) into statistical software/SPSS format (.sav)
2. Checking data requirement for the data analysis, including variable identification
3. Cleaning data from duplication, incomplete and unrealistic data.
4. Merging between data file (teachers data file with school data file)
5. Grouping data into new data group needed by analysis.
Variables Original Data Recode DataTeachers Qualification Belum S1 < S1
D4
≥ S1S1S2S3
Employment Status CPNS
PNSPNSPNS DepagPNS DiperbantukanGTY/PTY
Non PNS
Honor Daerah TK.I ProvinsiHonor Daerah TK.II Kab/KotaTenaga Honor SekolahGuru Bantu PusatGuru Honor SekolahKontrak Kerja WNALainnya
Certification Status Sertifikat Pendidik (PSPL)
Sudah Sertifikasi
Sertifikat InduksiPendidikan dan Pel Prof (PLPG)Pelatihan Profesi Guru (PPG)Portofolio (PF)LainnyaLainnya Kepala SekolahLainnya GuruLainnya Laboranbelum Belum Sertifikasi
Data Cleaning

17
Education Sector Analytical and Capacity Development Partnership
Once processed and organized, the data may be incomplete/missing, contain duplicates, or unsual amounts. Stage of data cleaning:
1. Remove duplicate value
The duplicate teachers’ data was identified by teachers’ ID (ptk_id), while the duplicate school data was iden-tified by school ID (sekolah id).
2. Estimate the missing data
The missing data were estimated using the other existing variable.
3. Recode the unusual amounts
The unusual amount (e.g: age below 18 or above 65) were recoded into “n/a”.
18
Education Sector Analytical and Capacity Development Partnership
Annex 2.Teacher Wage Calculation Parameters
Salary Calculation and Assumption:
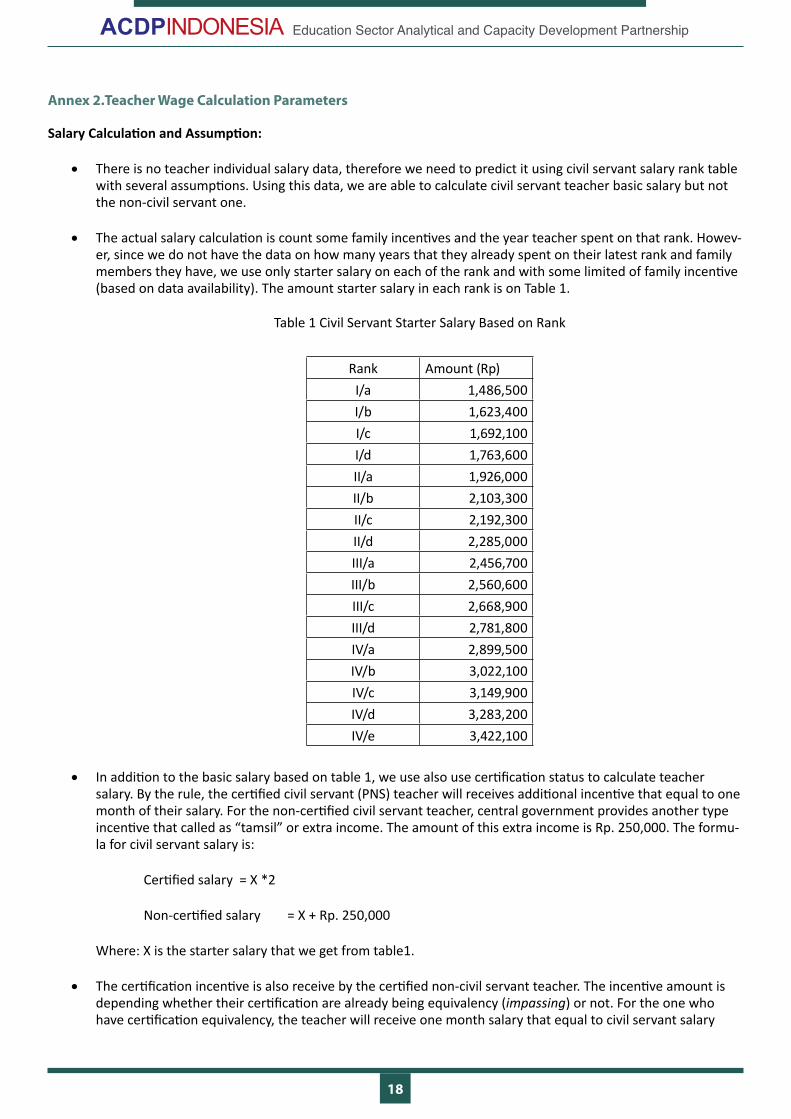
• There is no teacher individual salary data, therefore we need to predict it using civil servant salary rank table with several assumptions. Using this data, we are able to calculate civil servant teacher basic salary but not the non-civil servant one.
• The actual salary calculation is count some family incentives and the year teacher spent on that rank. Howev-er, since we do not have the data on how many years that they already spent on their latest rank and family members they have, we use only starter salary on each of the rank and with some limited of family incentive (based on data availability). The amount starter salary in each rank is on Table 1.
Table 1 Civil Servant Starter Salary Based on Rank
Rank Amount (Rp)I/a 1,486,500I/b 1,623,400I/c 1,692,100I/d 1,763,600II/a 1,926,000II/b 2,103,300II/c 2,192,300II/d 2,285,000III/a 2,456,700III/b 2,560,600III/c 2,668,900III/d 2,781,800IV/a 2,899,500IV/b 3,022,100IV/c 3,149,900IV/d 3,283,200IV/e 3,422,100
• In addition to the basic salary based on table 1, we use also use certification status to calculate teacher salary. By the rule, the certified civil servant (PNS) teacher will receives additional incentive that equal to one month of their salary. For the non-certified civil servant teacher, central government provides another type incentive that called as “tamsil” or extra income. The amount of this extra income is Rp. 250,000. The formu-la for civil servant salary is:
Certified salary = X *2
Non-certified salary = X + Rp. 250,000
Where: X is the starter salary that we get from table1.
• The certification incentive is also receive by the certified non-civil servant teacher. The incentive amount is depending whether their certification are already being equivalency (impassing) or not. For the one who have certification equivalency, the teacher will receive one month salary that equal to civil servant salary
19
Education Sector Analytical and Capacity Development Partnership
with the same year experience and educational background, whereas the one without equivalency will re-ceive fix amount Rp.1,500,000. Based on the salary rank and certification status, we only able to predict the salary of civil servant (both certified and not) and the certified non-civil servant teacher. Salary formula for certified non-civil servant teacher that we use:
X if they have already impassing their certification and Rp. 1,500,000 if not.
X is also from table 1.
• Another type of teacher that is the civil servant candidate (CPNS), they are the new teacher or just convert-ed their status from non-civil servant to civil servant. This status is a kind of probation status, where teacher spent a year before they have to join 3 week of civic training and become civil servant. During this period they are only receive 80% of their salary and they are also receive 80% of certification allowance if they are already certified. Salary formula for civil servant teacher candidate that we use:
Certified civil servant teacher candidate salary =X * 0.8 * 2
Non-certified civil servant teacher candidate salary =X * 0.8
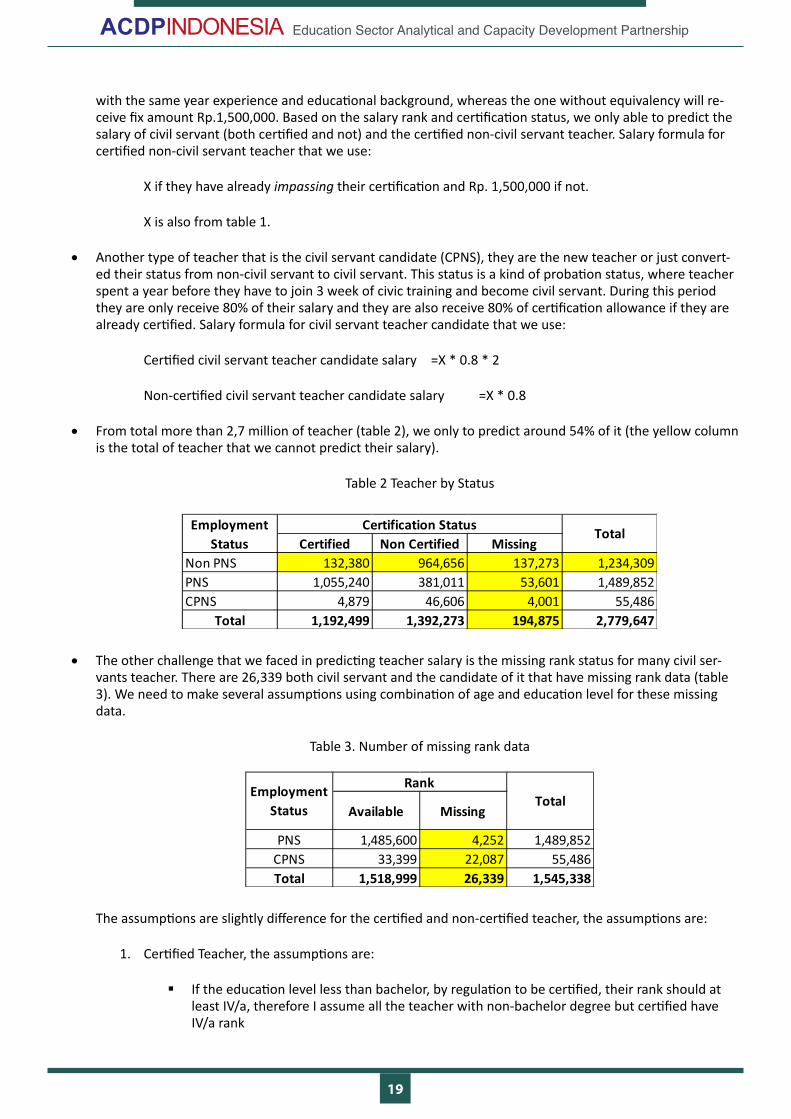
• From total more than 2,7 million of teacher (table 2), we only to predict around 54% of it (the yellow column is the total of teacher that we cannot predict their salary).
Table 2 Teacher by Status
Certified Non Certified MissingNon PNS 132,380 964,656 137,273 1,234,309PNS 1,055,240 381,011 53,601 1,489,852CPNS 4,879 46,606 4,001 55,486
Total 1,192,499 1,392,273 194,875 2,779,647
Certification StatusEmployment Status
Total
• The other challenge that we faced in predicting teacher salary is the missing rank status for many civil ser-vants teacher. There are 26,339 both civil servant and the candidate of it that have missing rank data (table 3). We need to make several assumptions using combination of age and education level for these missing data.
Table 3. Number of missing rank data
Available Missing
PNS 1,485,600 4,252 1,489,852CPNS 33,399 22,087 55,486Total 1,518,999 26,339 1,545,338
RankEmployment Status
Total
The assumptions are slightly difference for the certified and non-certified teacher, the assumptions are:
1. Certified Teacher, the assumptions are:
§ If the education level less than bachelor, by regulation to be certified, their rank should at least IV/a, therefore I assume all the teacher with non-bachelor degree but certified have IV/a rank
20
Education Sector Analytical and Capacity Development Partnership
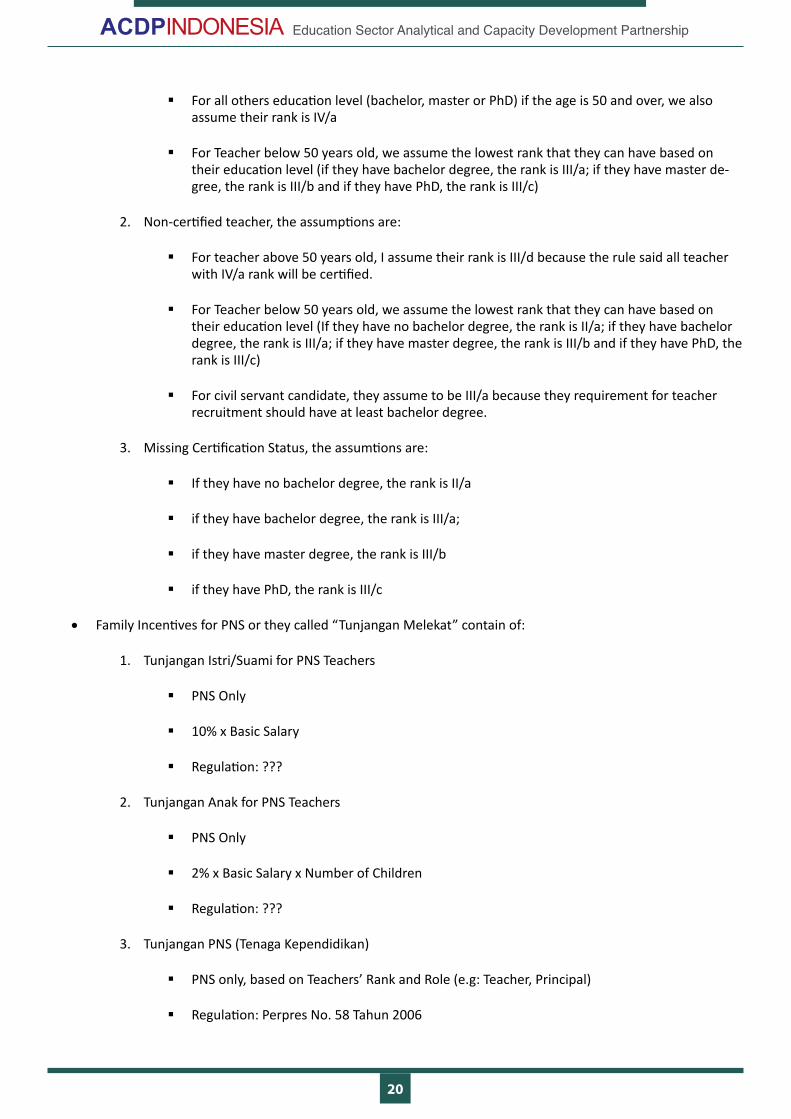
§ For all others education level (bachelor, master or PhD) if the age is 50 and over, we also assume their rank is IV/a
§ For Teacher below 50 years old, we assume the lowest rank that they can have based on their education level (if they have bachelor degree, the rank is III/a; if they have master de-gree, the rank is III/b and if they have PhD, the rank is III/c)
2. Non-certified teacher, the assumptions are:
§ For teacher above 50 years old, I assume their rank is III/d because the rule said all teacher with IV/a rank will be certified.
§ For Teacher below 50 years old, we assume the lowest rank that they can have based on their education level (If they have no bachelor degree, the rank is II/a; if they have bachelor degree, the rank is III/a; if they have master degree, the rank is III/b and if they have PhD, the rank is III/c)
§ For civil servant candidate, they assume to be III/a because they requirement for teacher recruitment should have at least bachelor degree.
3. Missing Certification Status, the assumtions are:
§ If they have no bachelor degree, the rank is II/a
§ if they have bachelor degree, the rank is III/a;
§ if they have master degree, the rank is III/b
§ if they have PhD, the rank is III/c
• Family Incentives for PNS or they called “Tunjangan Melekat” contain of:
1. Tunjangan Istri/Suami for PNS Teachers
§ PNS Only
§ 10% x Basic Salary
§ Regulation: ???
2. Tunjangan Anak for PNS Teachers
§ PNS Only
§ 2% x Basic Salary x Number of Children
§ Regulation: ???
3. Tunjangan PNS (Tenaga Kependidikan)
§ PNS only, based on Teachers’ Rank and Role (e.g: Teacher, Principal)
§ Regulation: Perpres No. 58 Tahun 2006

21
Education Sector Analytical and Capacity Development Partnership
4. Tunjangan Umum for CPNS (PNS candidate)
§ CPNS only, based on Teachers’ Rank
§ Regulation: Perpres No. 12 Tahun 2006
5. Tunjangan Beras for PNS Teacher
§ PNS Only
§ 10 kg x Number of Family Member x Rp. 7,242
§ Regulation: Peraturan Dir. Perbendaharaan No. PER-3/PB/2015
6. Others (based on their role/function/placement):
a. Tunjangan Struktural
b. Tunjangan Fungsional
c. Tunjangan Daerah
d. Tunjangan Terpencil
e. Tunjangan Lain
f. Tunjangan Kompen
g. Pembulatan
h. Tunjangan PPh
• Based on the last database from PDSP (Semester 1 Academic Year 2016/2017), we do not have the data for counting all family incentive. Therefore, we used some assumtion to create the data/variable based on data availability. The assumptions are:
1. Mariage Status
§ Age < 30 : Not Married
§ Age ≥ 30 : Married
2. Number of Children
§ Age < 30 : no child
§ 30 ≤ Age ≤ 35 : 1 child
§ Age > 35 : 2 child
22
Education Sector Analytical and Capacity Development Partnership
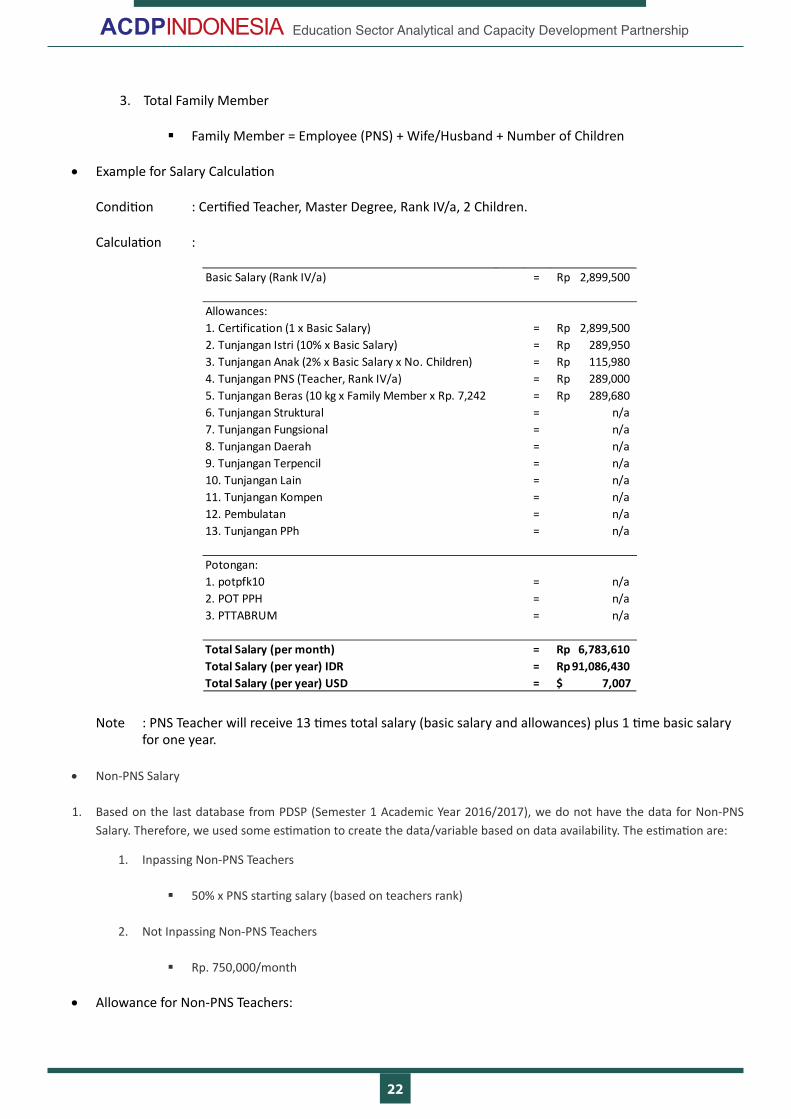
3. Total Family Member
§ Family Member = Employee (PNS) + Wife/Husband + Number of Children
• Example for Salary Calculation
Condition : Certified Teacher, Master Degree, Rank IV/a, 2 Children.
Calculation :
Basic Salary (Rank IV/a) = 2,899,500Rp
Allowances:1. Certification (1 x Basic Salary) = 2,899,500Rp 2. Tunjangan Istri (10% x Basic Salary) = 289,950Rp 3. Tunjangan Anak (2% x Basic Salary x No. Children) = 115,980Rp 4. Tunjangan PNS (Teacher, Rank IV/a) = 289,000Rp 5. Tunjangan Beras (10 kg x Family Member x Rp. 7,242 = 289,680Rp 6. Tunjangan Struktural = n/a7. Tunjangan Fungsional = n/a8. Tunjangan Daerah = n/a9. Tunjangan Terpencil = n/a10. Tunjangan Lain = n/a11. Tunjangan Kompen = n/a12. Pembulatan = n/a13. Tunjangan PPh = n/a
Potongan:1. potpfk10 = n/a2. POT PPH = n/a3. PTTABRUM = n/a
Total Salary (per month) = 6,783,610Rp Total Salary (per year) IDR = 91,086,430Rp Total Salary (per year) USD = 7,007$
Note : PNS Teacher will receive 13 times total salary (basic salary and allowances) plus 1 time basic salary for one year.
• Non-PNS Salary
1. Based on the last database from PDSP (Semester 1 Academic Year 2016/2017), we do not have the data for Non-PNS Salary. Therefore, we used some estimation to create the data/variable based on data availability. The estimation are:
1. Inpassing Non-PNS Teachers
§ 50% x PNS starting salary (based on teachers rank)
2. Not Inpassing Non-PNS Teachers
§ Rp. 750,000/month
• Allowance for Non-PNS Teachers:
23
Education Sector Analytical and Capacity Development Partnership
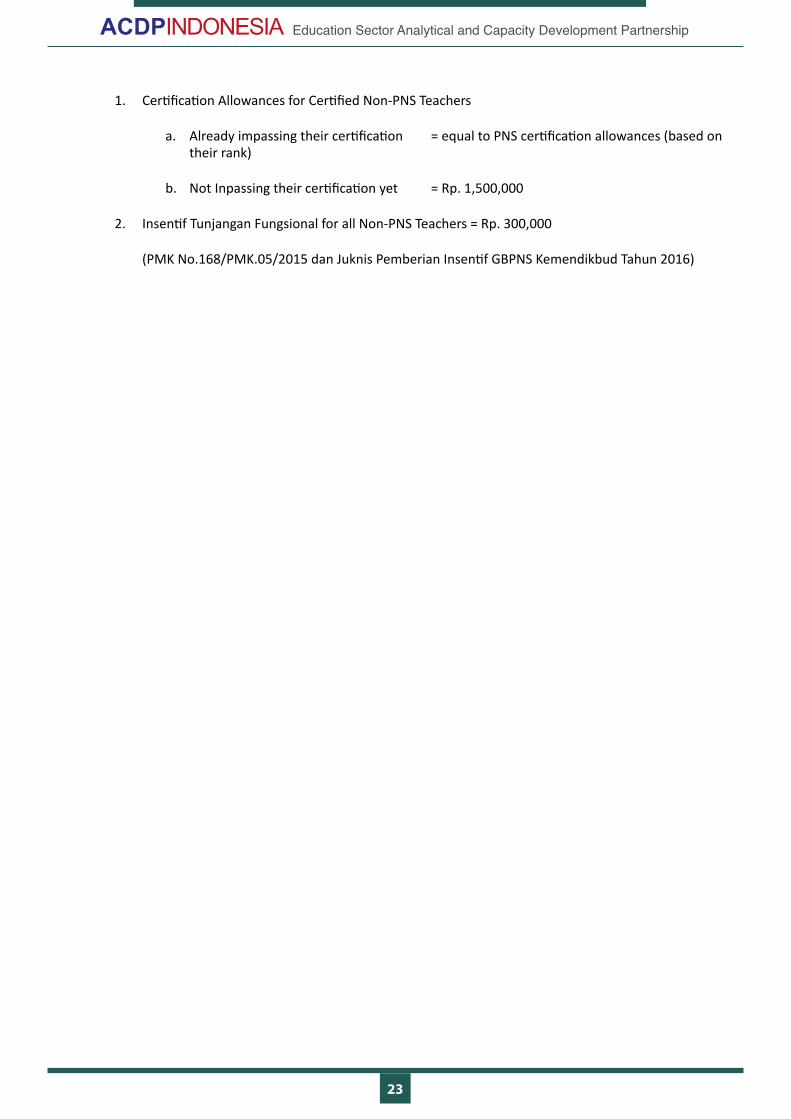
1. Certification Allowances for Certified Non-PNS Teachers
a. Already impassing their certification = equal to PNS certification allowances (based on their rank)
b. Not Inpassing their certification yet = Rp. 1,500,000
2. Insentif Tunjangan Fungsional for all Non-PNS Teachers = Rp. 300,000
(PMK No.168/PMK.05/2015 dan Juknis Pemberian Insentif GBPNS Kemendikbud Tahun 2016)
24
Education Sector Analytical and Capacity Development Partnership
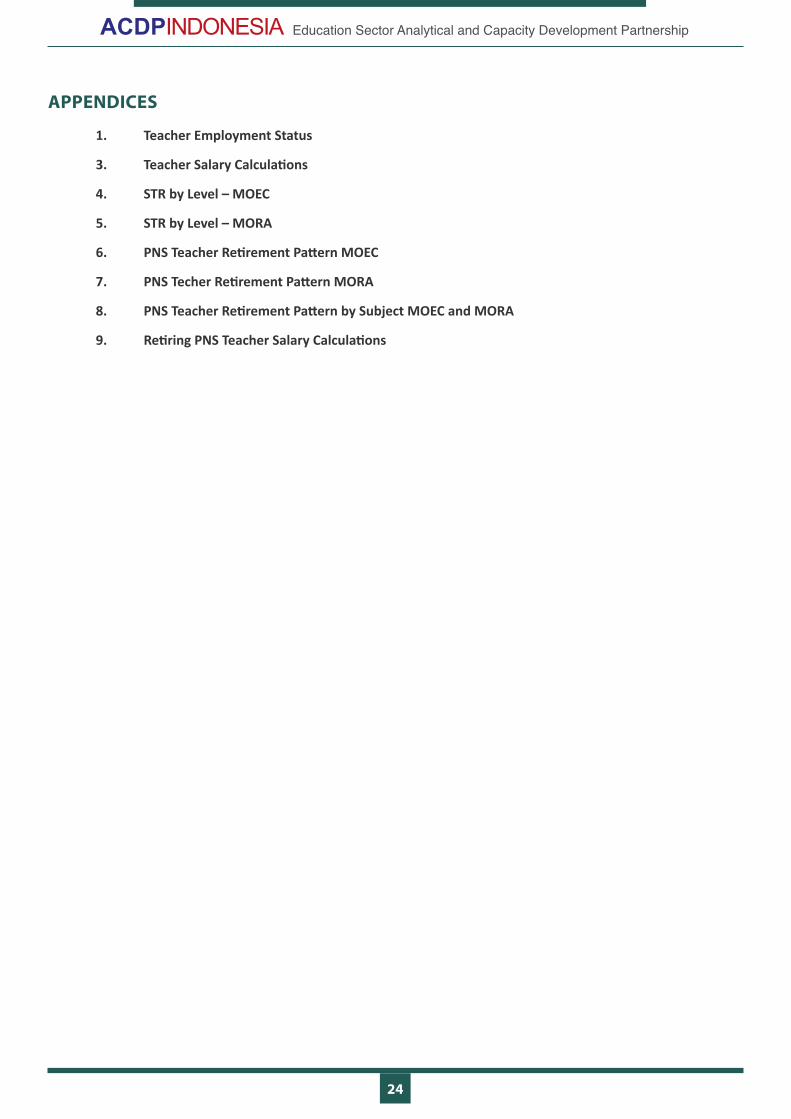
APPENDICES
1. Teacher Employment Status
3. Teacher Salary Calculations
4. STR by Level – MOEC
5. STR by Level – MORA
6. PNS Teacher Retirement Pattern MOEC
7. PNS Techer Retirement Pattern MORA
8. PNS Teacher Retirement Pattern by Subject MOEC and MORA
9. Retiring PNS Teacher Salary Calculations
25
Education Sector Analytical and Capacity Development Partnership
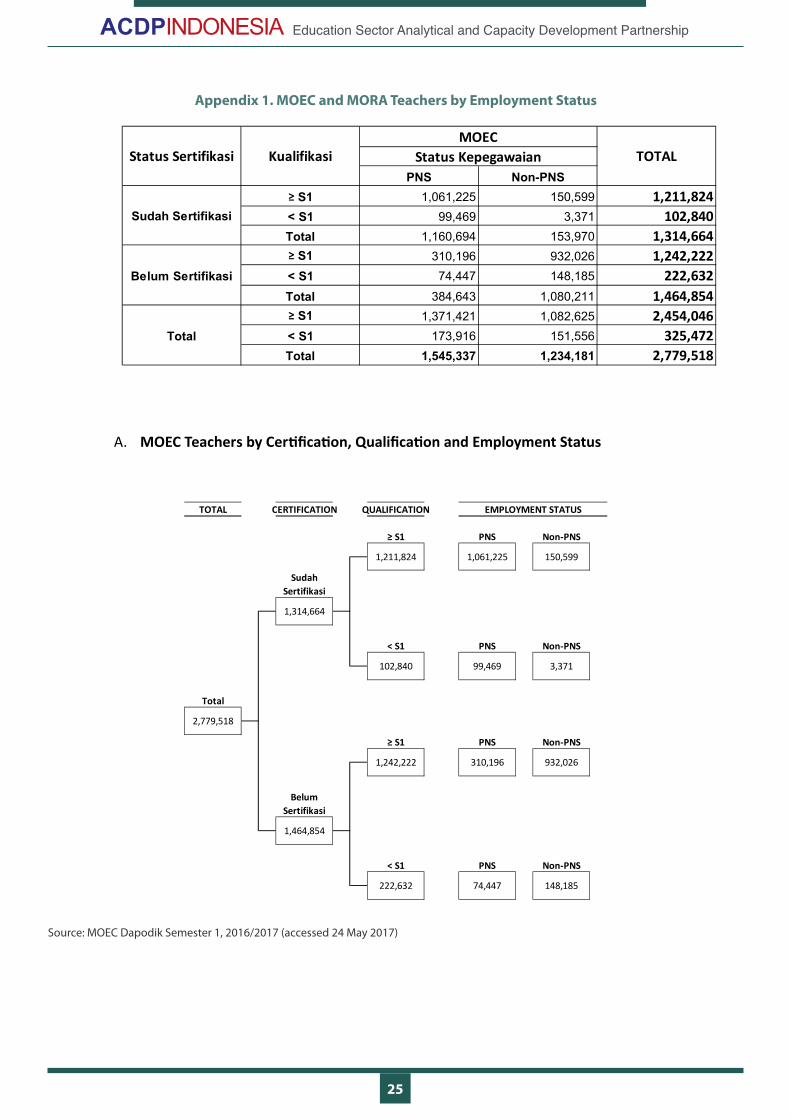
Appendix 1. MOEC and MORA Teachers by Employment Status
PNS Non-PNS
S1 1,061,225 150,599 1,211,824< S1 99,469 3,371 102,840Total 1,160,694 153,970 1,314,664
S1 310,196 932,026 1,242,222< S1 74,447 148,185 222,632Total 384,643 1,080,211 1,464,854
S1 1,371,421 1,082,625 2,454,046< S1 173,916 151,556 325,472Total 1,545,337 1,234,181 2,779,518
Sudah Sertifikasi
Belum Sertifikasi
Total
Status Sertifikasi KualifikasiMOEC
TOTALStatus Kepegawaian
A. MOEC Teachers by Certification, Qualification and Employment Status
TOTAL CERTIFICATION QUALIFICATION
S1 PNS Non-PNS
< S1 PNS Non-PNS
Total
S1 PNS Non-PNS
Belum Sertifikasi
< S1 PNS Non-PNS
1,464,854
222,632 74,447 148,185
102,840 99,469 3,371
2,779,518
1,242,222 310,196 932,026
EMPLOYMENT STATUS
1,211,824 1,061,225 150,599
1,314,664
Sudah Sertifikasi
Source: MOEC Dapodik Semester 1, 2016/2017 (accessed 24 May 2017)
26
Education Sector Analytical and Capacity Development Partnership
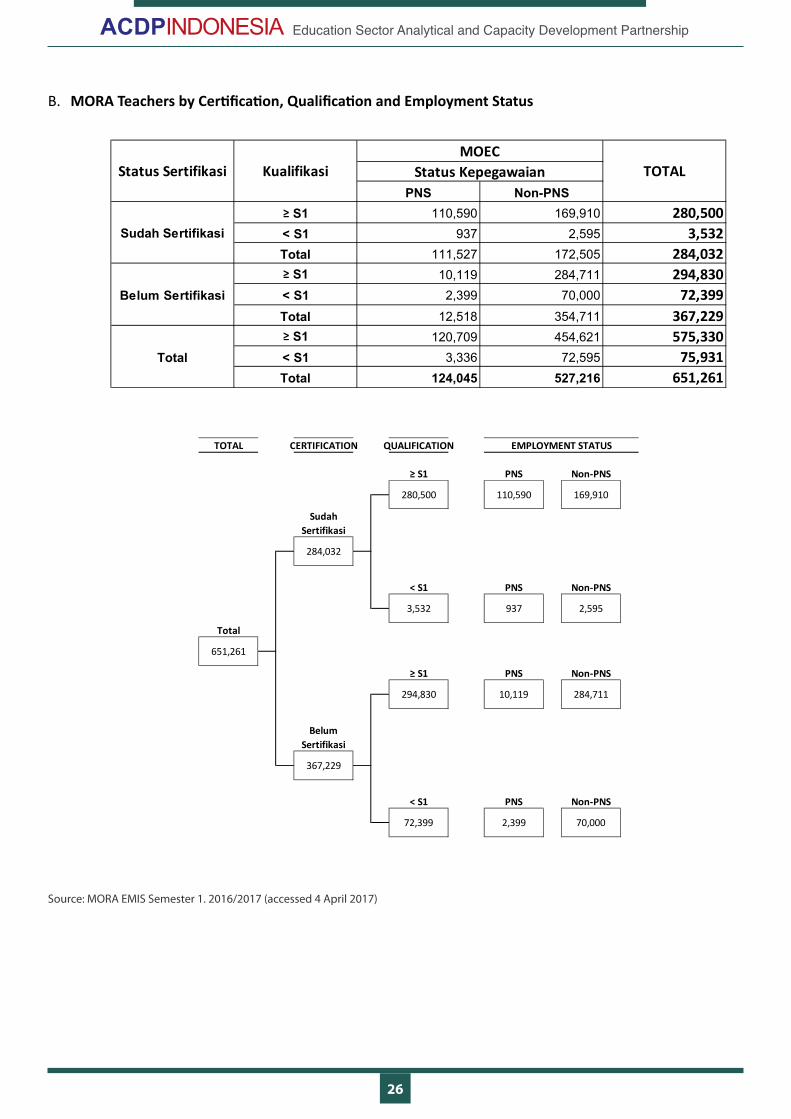
B. MORA Teachers by Certification, Qualification and Employment Status
PNS Non-PNS
S1 110,590 169,910 280,500< S1 937 2,595 3,532Total 111,527 172,505 284,032
S1 10,119 284,711 294,830< S1 2,399 70,000 72,399Total 12,518 354,711 367,229
S1 120,709 454,621 575,330< S1 3,336 72,595 75,931Total 124,045 527,216 651,261
Status Sertifikasi KualifikasiMOEC
TOTALStatus Kepegawaian
Sudah Sertifikasi
Belum Sertifikasi
Total
TOTAL CERTIFICATION QUALIFICATION
S1 PNS Non-PNS
< S1 PNS Non-PNS
Total
S1 PNS Non-PNS
Belum Sertifikasi
< S1 PNS Non-PNS
EMPLOYMENT STATUS
280,500 110,590 169,910
Sudah Sertifikasi
284,032
367,229
72,399 2,399 70,000
3,532 937 2,595
651,261
294,830 10,119 284,711
Source: MORA EMIS Semester 1. 2016/2017 (accessed 4 April 2017)
27
Education Sector Analytical and Capacity Development Partnership
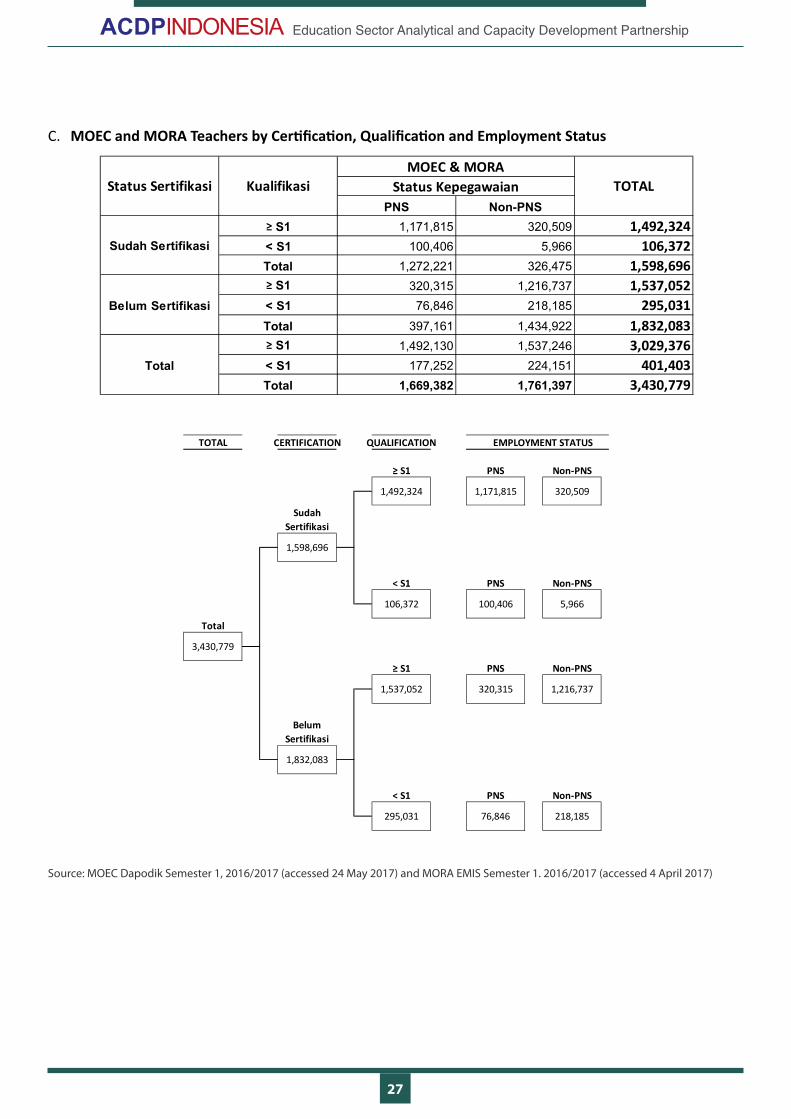
C. MOEC and MORA Teachers by Certification, Qualification and Employment Status
PNS Non-PNS
S1 1,171,815 320,509 1,492,324< S1 100,406 5,966 106,372Total 1,272,221 326,475 1,598,696
S1 320,315 1,216,737 1,537,052< S1 76,846 218,185 295,031Total 397,161 1,434,922 1,832,083
S1 1,492,130 1,537,246 3,029,376< S1 177,252 224,151 401,403Total 1,669,382 1,761,397 3,430,779
Status Sertifikasi KualifikasiMOEC & MORA
TOTALStatus Kepegawaian
Sudah Sertifikasi
Belum Sertifikasi
Total
TOTAL CERTIFICATION QUALIFICATION
S1 PNS Non-PNS
< S1 PNS Non-PNS
Total
S1 PNS Non-PNS
Belum Sertifikasi
< S1 PNS Non-PNS
EMPLOYMENT STATUS
1,492,324 1,171,815 320,509
Sudah Sertifikasi
1,598,696
1,832,083
295,031 76,846 218,185
106,372 100,406 5,966
3,430,779
1,537,052 320,315 1,216,737
Source: MOEC Dapodik Semester 1, 2016/2017 (accessed 24 May 2017) and MORA EMIS Semester 1. 2016/2017 (accessed 4 April 2017)
28
Education Sector Analytical and Capacity Development Partnership
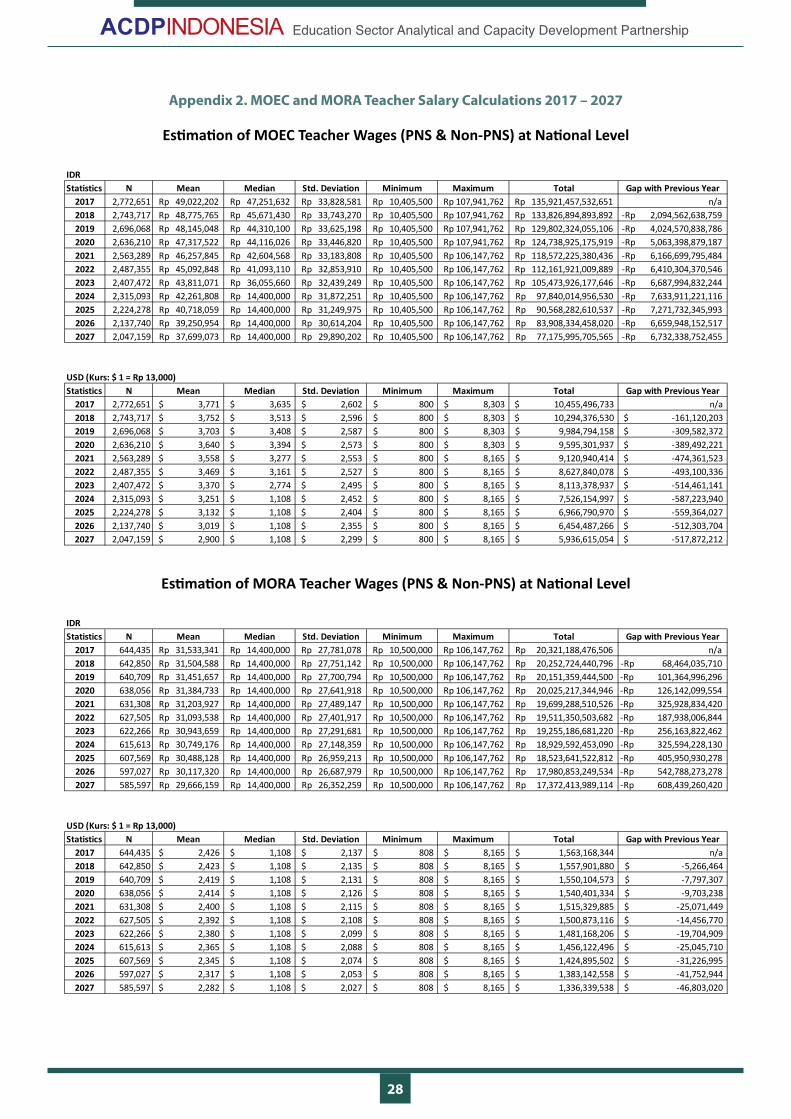
Appendix 2. MOEC and MORA Teacher Salary Calculations 2017 – 2027
Estimation of MOEC Teacher Wages (PNS & Non-PNS) at National Level
IDRStatistics N Mean Median Std. Deviation Minimum Maximum Total Gap with Previous Year
2017 2,772,651 49,022,202Rp 47,251,632Rp 33,828,581Rp 10,405,500Rp 107,941,762Rp 135,921,457,532,651Rp n/a2018 2,743,717 48,775,765Rp 45,671,430Rp 33,743,270Rp 10,405,500Rp 107,941,762Rp 133,826,894,893,892Rp 2,094,562,638,759-Rp 2019 2,696,068 48,145,048Rp 44,310,100Rp 33,625,198Rp 10,405,500Rp 107,941,762Rp 129,802,324,055,106Rp 4,024,570,838,786-Rp 2020 2,636,210 47,317,522Rp 44,116,026Rp 33,446,820Rp 10,405,500Rp 107,941,762Rp 124,738,925,175,919Rp 5,063,398,879,187-Rp 2021 2,563,289 46,257,845Rp 42,604,568Rp 33,183,808Rp 10,405,500Rp 106,147,762Rp 118,572,225,380,436Rp 6,166,699,795,484-Rp 2022 2,487,355 45,092,848Rp 41,093,110Rp 32,853,910Rp 10,405,500Rp 106,147,762Rp 112,161,921,009,889Rp 6,410,304,370,546-Rp 2023 2,407,472 43,811,071Rp 36,055,660Rp 32,439,249Rp 10,405,500Rp 106,147,762Rp 105,473,926,177,646Rp 6,687,994,832,244-Rp 2024 2,315,093 42,261,808Rp 14,400,000Rp 31,872,251Rp 10,405,500Rp 106,147,762Rp 97,840,014,956,530Rp 7,633,911,221,116-Rp 2025 2,224,278 40,718,059Rp 14,400,000Rp 31,249,975Rp 10,405,500Rp 106,147,762Rp 90,568,282,610,537Rp 7,271,732,345,993-Rp 2026 2,137,740 39,250,954Rp 14,400,000Rp 30,614,204Rp 10,405,500Rp 106,147,762Rp 83,908,334,458,020Rp 6,659,948,152,517-Rp 2027 2,047,159 37,699,073Rp 14,400,000Rp 29,890,202Rp 10,405,500Rp 106,147,762Rp 77,175,995,705,565Rp 6,732,338,752,455-Rp
USD (Kurs: $ 1 = Rp 13,000)Statistics N Mean Median Std. Deviation Minimum Maximum Total Gap with Previous Year
2017 2,772,651 3,771$ 3,635$ 2,602$ 800$ 8,303$ 10,455,496,733$ n/a2018 2,743,717 3,752$ 3,513$ 2,596$ 800$ 8,303$ 10,294,376,530$ -161,120,203 $ 2019 2,696,068 3,703$ 3,408$ 2,587$ 800$ 8,303$ 9,984,794,158$ -309,582,372 $ 2020 2,636,210 3,640$ 3,394$ 2,573$ 800$ 8,303$ 9,595,301,937$ -389,492,221 $ 2021 2,563,289 3,558$ 3,277$ 2,553$ 800$ 8,165$ 9,120,940,414$ -474,361,523 $ 2022 2,487,355 3,469$ 3,161$ 2,527$ 800$ 8,165$ 8,627,840,078$ -493,100,336 $ 2023 2,407,472 3,370$ 2,774$ 2,495$ 800$ 8,165$ 8,113,378,937$ -514,461,141 $ 2024 2,315,093 3,251$ 1,108$ 2,452$ 800$ 8,165$ 7,526,154,997$ -587,223,940 $ 2025 2,224,278 3,132$ 1,108$ 2,404$ 800$ 8,165$ 6,966,790,970$ -559,364,027 $ 2026 2,137,740 3,019$ 1,108$ 2,355$ 800$ 8,165$ 6,454,487,266$ -512,303,704 $ 2027 2,047,159 2,900$ 1,108$ 2,299$ 800$ 8,165$ 5,936,615,054$ -517,872,212 $
Estimation of MORA Teacher Wages (PNS & Non-PNS) at National Level
IDRStatistics N Mean Median Std. Deviation Minimum Maximum Total Gap with Previous Year
2017 644,435 31,533,341Rp 14,400,000Rp 27,781,078Rp 10,500,000Rp 106,147,762Rp 20,321,188,476,506Rp n/a2018 642,850 31,504,588Rp 14,400,000Rp 27,751,142Rp 10,500,000Rp 106,147,762Rp 20,252,724,440,796Rp 68,464,035,710-Rp 2019 640,709 31,451,657Rp 14,400,000Rp 27,700,794Rp 10,500,000Rp 106,147,762Rp 20,151,359,444,500Rp 101,364,996,296-Rp 2020 638,056 31,384,733Rp 14,400,000Rp 27,641,918Rp 10,500,000Rp 106,147,762Rp 20,025,217,344,946Rp 126,142,099,554-Rp 2021 631,308 31,203,927Rp 14,400,000Rp 27,489,147Rp 10,500,000Rp 106,147,762Rp 19,699,288,510,526Rp 325,928,834,420-Rp 2022 627,505 31,093,538Rp 14,400,000Rp 27,401,917Rp 10,500,000Rp 106,147,762Rp 19,511,350,503,682Rp 187,938,006,844-Rp 2023 622,266 30,943,659Rp 14,400,000Rp 27,291,681Rp 10,500,000Rp 106,147,762Rp 19,255,186,681,220Rp 256,163,822,462-Rp 2024 615,613 30,749,176Rp 14,400,000Rp 27,148,359Rp 10,500,000Rp 106,147,762Rp 18,929,592,453,090Rp 325,594,228,130-Rp 2025 607,569 30,488,128Rp 14,400,000Rp 26,959,213Rp 10,500,000Rp 106,147,762Rp 18,523,641,522,812Rp 405,950,930,278-Rp 2026 597,027 30,117,320Rp 14,400,000Rp 26,687,979Rp 10,500,000Rp 106,147,762Rp 17,980,853,249,534Rp 542,788,273,278-Rp 2027 585,597 29,666,159Rp 14,400,000Rp 26,352,259Rp 10,500,000Rp 106,147,762Rp 17,372,413,989,114Rp 608,439,260,420-Rp
USD (Kurs: $ 1 = Rp 13,000)Statistics N Mean Median Std. Deviation Minimum Maximum Total Gap with Previous Year
2017 644,435 2,426$ 1,108$ 2,137$ 808$ 8,165$ 1,563,168,344$ n/a2018 642,850 2,423$ 1,108$ 2,135$ 808$ 8,165$ 1,557,901,880$ -5,266,464 $ 2019 640,709 2,419$ 1,108$ 2,131$ 808$ 8,165$ 1,550,104,573$ -7,797,307 $ 2020 638,056 2,414$ 1,108$ 2,126$ 808$ 8,165$ 1,540,401,334$ -9,703,238 $ 2021 631,308 2,400$ 1,108$ 2,115$ 808$ 8,165$ 1,515,329,885$ -25,071,449 $ 2022 627,505 2,392$ 1,108$ 2,108$ 808$ 8,165$ 1,500,873,116$ -14,456,770 $ 2023 622,266 2,380$ 1,108$ 2,099$ 808$ 8,165$ 1,481,168,206$ -19,704,909 $ 2024 615,613 2,365$ 1,108$ 2,088$ 808$ 8,165$ 1,456,122,496$ -25,045,710 $ 2025 607,569 2,345$ 1,108$ 2,074$ 808$ 8,165$ 1,424,895,502$ -31,226,995 $ 2026 597,027 2,317$ 1,108$ 2,053$ 808$ 8,165$ 1,383,142,558$ -41,752,944 $ 2027 585,597 2,282$ 1,108$ 2,027$ 808$ 8,165$ 1,336,339,538$ -46,803,020 $

29
Education Sector Analytical and Capacity Development Partnership
Estimation of MOEC & MORA Teacher Wages (PNS & Non-PNS) at National Level
IDRStatistics N Minimum Maximum Total Gap with Previous Year
2017 3,417,086 10,405,500Rp 107,941,762Rp 156,242,646,009,157Rp n/a2018 3,386,567 10,405,500Rp 107,941,762Rp 154,079,619,334,688Rp 2,163,026,674,469-Rp 2019 3,336,777 10,405,500Rp 107,941,762Rp 149,953,683,499,606Rp 4,125,935,835,082-Rp 2020 3,274,266 10,405,500Rp 107,941,762Rp 144,764,142,520,865Rp 5,189,540,978,741-Rp 2021 3,194,597 10,405,500Rp 106,147,762Rp 138,271,513,890,962Rp 6,492,628,629,904-Rp 2022 3,114,860 10,405,500Rp 106,147,762Rp 131,673,271,513,571Rp 6,598,242,377,390-Rp 2023 3,029,738 10,405,500Rp 106,147,762Rp 124,729,112,858,866Rp 6,944,158,654,706-Rp 2024 2,930,706 10,405,500Rp 106,147,762Rp 116,769,607,409,620Rp 7,959,505,449,246-Rp 2025 2,831,847 10,405,500Rp 106,147,762Rp 109,091,924,133,349Rp 7,677,683,276,271-Rp 2026 2,734,767 10,405,500Rp 106,147,762Rp 101,889,187,707,554Rp 7,202,736,425,795-Rp 2027 2,632,756 10,405,500Rp 106,147,762Rp 94,548,409,694,679Rp 7,340,778,012,875-Rp
USD (Kurs: $ 1 = Rp 13,000)Statistics N Minimum Maximum Total Gap with Previous Year
2017 3,417,086 800$ 8,303$ 12,018,665,078$ n/a2018 3,386,567 800$ 8,303$ 11,852,278,410$ -166,386,667 $ 2019 3,336,777 800$ 8,303$ 11,534,898,731$ -317,379,680 $ 2020 3,274,266 800$ 8,303$ 11,135,703,271$ -399,195,460 $ 2021 3,194,597 800$ 8,165$ 10,636,270,299$ -499,432,972 $ 2022 3,114,860 800$ 8,165$ 10,128,713,193$ -507,557,106 $ 2023 3,029,738 800$ 8,165$ 9,594,547,143$ -534,166,050 $ 2024 2,930,706 800$ 8,165$ 8,982,277,493$ -612,269,650 $ 2025 2,831,847 800$ 8,165$ 8,391,686,472$ -590,591,021 $ 2026 2,734,767 800$ 8,165$ 7,837,629,824$ -554,056,648 $ 2027 2,632,756 800$ 8,165$ 7,272,954,592$ -564,675,232 $
30
Education Sector Analytical and Capacity Development Partnership
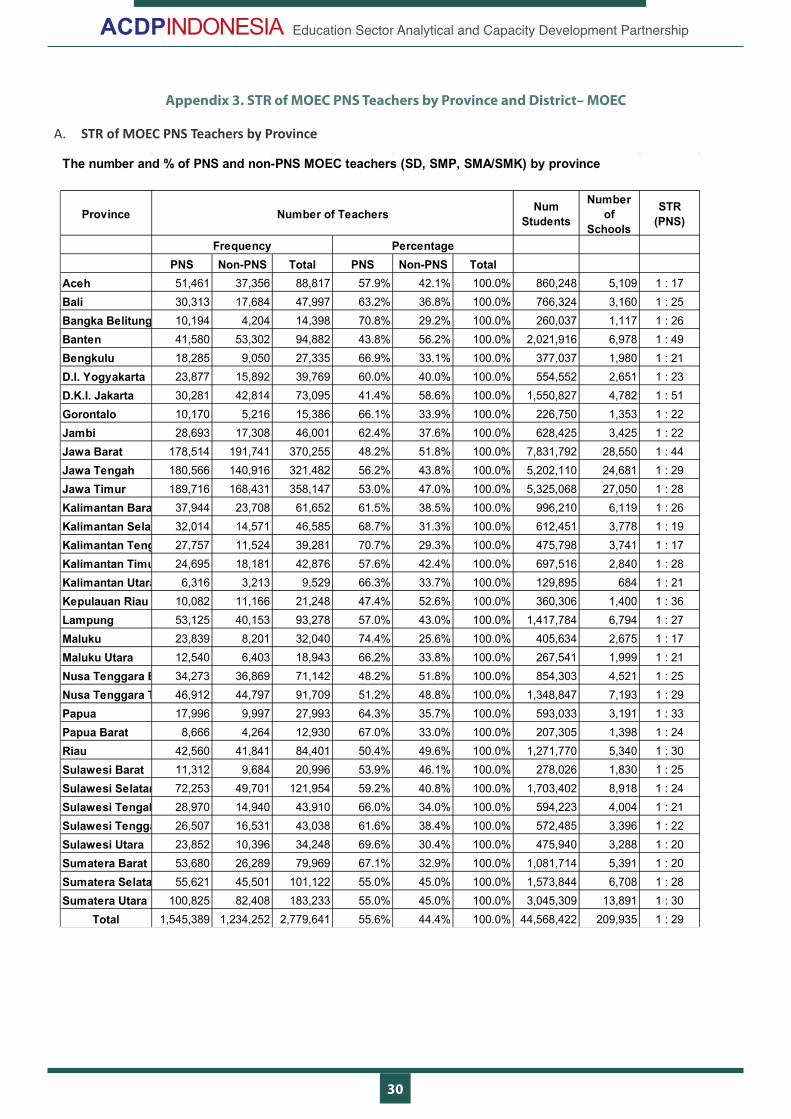
Appendix 3. STR of MOEC PNS Teachers by Province and District– MOEC
A. STR of MOEC PNS Teachers by Province
The number and % of PNS and non-PNS MOEC teachers (SD, SMP, SMA/SMK) by province
Province Number of TeachersNum
Students
Number
of
Schools
STR
(PNS)
Frequency Percentage
PNS Non-PNS Total PNS Non-PNS Total
Aceh 51,461 37,356 88,817 57.9% 42.1% 100.0% 860,248 5,109 1 : 17Bali 30,313 17,684 47,997 63.2% 36.8% 100.0% 766,324 3,160 1 : 25Bangka Belitung 10,194 4,204 14,398 70.8% 29.2% 100.0% 260,037 1,117 1 : 26Banten 41,580 53,302 94,882 43.8% 56.2% 100.0% 2,021,916 6,978 1 : 49Bengkulu 18,285 9,050 27,335 66.9% 33.1% 100.0% 377,037 1,980 1 : 21D.I. Yogyakarta 23,877 15,892 39,769 60.0% 40.0% 100.0% 554,552 2,651 1 : 23D.K.I. Jakarta 30,281 42,814 73,095 41.4% 58.6% 100.0% 1,550,827 4,782 1 : 51Gorontalo 10,170 5,216 15,386 66.1% 33.9% 100.0% 226,750 1,353 1 : 22Jambi 28,693 17,308 46,001 62.4% 37.6% 100.0% 628,425 3,425 1 : 22Jawa Barat 178,514 191,741 370,255 48.2% 51.8% 100.0% 7,831,792 28,550 1 : 44Jawa Tengah 180,566 140,916 321,482 56.2% 43.8% 100.0% 5,202,110 24,681 1 : 29Jawa Timur 189,716 168,431 358,147 53.0% 47.0% 100.0% 5,325,068 27,050 1 : 28Kalimantan Barat 37,944 23,708 61,652 61.5% 38.5% 100.0% 996,210 6,119 1 : 26Kalimantan Selatan 32,014 14,571 46,585 68.7% 31.3% 100.0% 612,451 3,778 1 : 19Kalimantan Tengah 27,757 11,524 39,281 70.7% 29.3% 100.0% 475,798 3,741 1 : 17Kalimantan Timur 24,695 18,181 42,876 57.6% 42.4% 100.0% 697,516 2,840 1 : 28Kalimantan Utara 6,316 3,213 9,529 66.3% 33.7% 100.0% 129,895 684 1 : 21Kepulauan Riau 10,082 11,166 21,248 47.4% 52.6% 100.0% 360,306 1,400 1 : 36Lampung 53,125 40,153 93,278 57.0% 43.0% 100.0% 1,417,784 6,794 1 : 27Maluku 23,839 8,201 32,040 74.4% 25.6% 100.0% 405,634 2,675 1 : 17Maluku Utara 12,540 6,403 18,943 66.2% 33.8% 100.0% 267,541 1,999 1 : 21Nusa Tenggara Barat34,273 36,869 71,142 48.2% 51.8% 100.0% 854,303 4,521 1 : 25Nusa Tenggara Timur46,912 44,797 91,709 51.2% 48.8% 100.0% 1,348,847 7,193 1 : 29Papua 17,996 9,997 27,993 64.3% 35.7% 100.0% 593,033 3,191 1 : 33Papua Barat 8,666 4,264 12,930 67.0% 33.0% 100.0% 207,305 1,398 1 : 24Riau 42,560 41,841 84,401 50.4% 49.6% 100.0% 1,271,770 5,340 1 : 30Sulawesi Barat 11,312 9,684 20,996 53.9% 46.1% 100.0% 278,026 1,830 1 : 25Sulawesi Selatan 72,253 49,701 121,954 59.2% 40.8% 100.0% 1,703,402 8,918 1 : 24Sulawesi Tengah 28,970 14,940 43,910 66.0% 34.0% 100.0% 594,223 4,004 1 : 21Sulawesi Tenggara 26,507 16,531 43,038 61.6% 38.4% 100.0% 572,485 3,396 1 : 22Sulawesi Utara 23,852 10,396 34,248 69.6% 30.4% 100.0% 475,940 3,288 1 : 20Sumatera Barat 53,680 26,289 79,969 67.1% 32.9% 100.0% 1,081,714 5,391 1 : 20Sumatera Selatan 55,621 45,501 101,122 55.0% 45.0% 100.0% 1,573,844 6,708 1 : 28Sumatera Utara 100,825 82,408 183,233 55.0% 45.0% 100.0% 3,045,309 13,891 1 : 30
Total 1,545,389 1,234,252 2,779,641 55.6% 44.4% 100.0% 44,568,422 209,935 1 : 29

31
Education Sector Analytical and Capacity Development Partnership
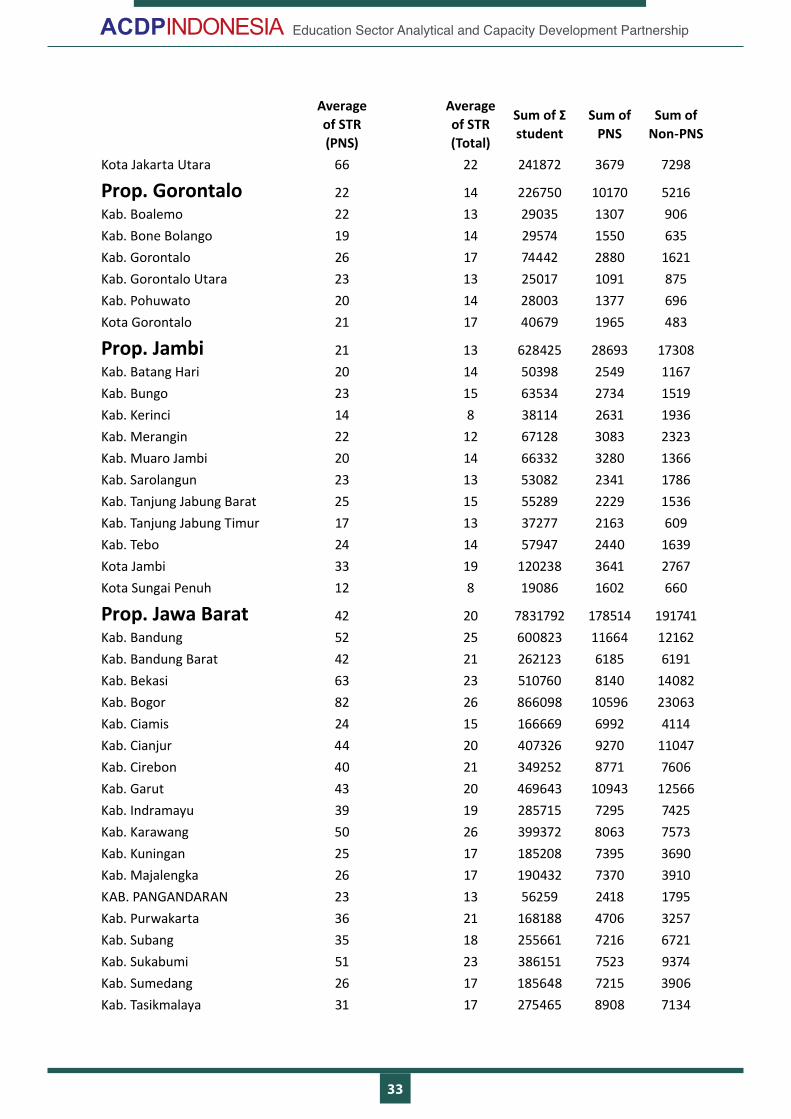
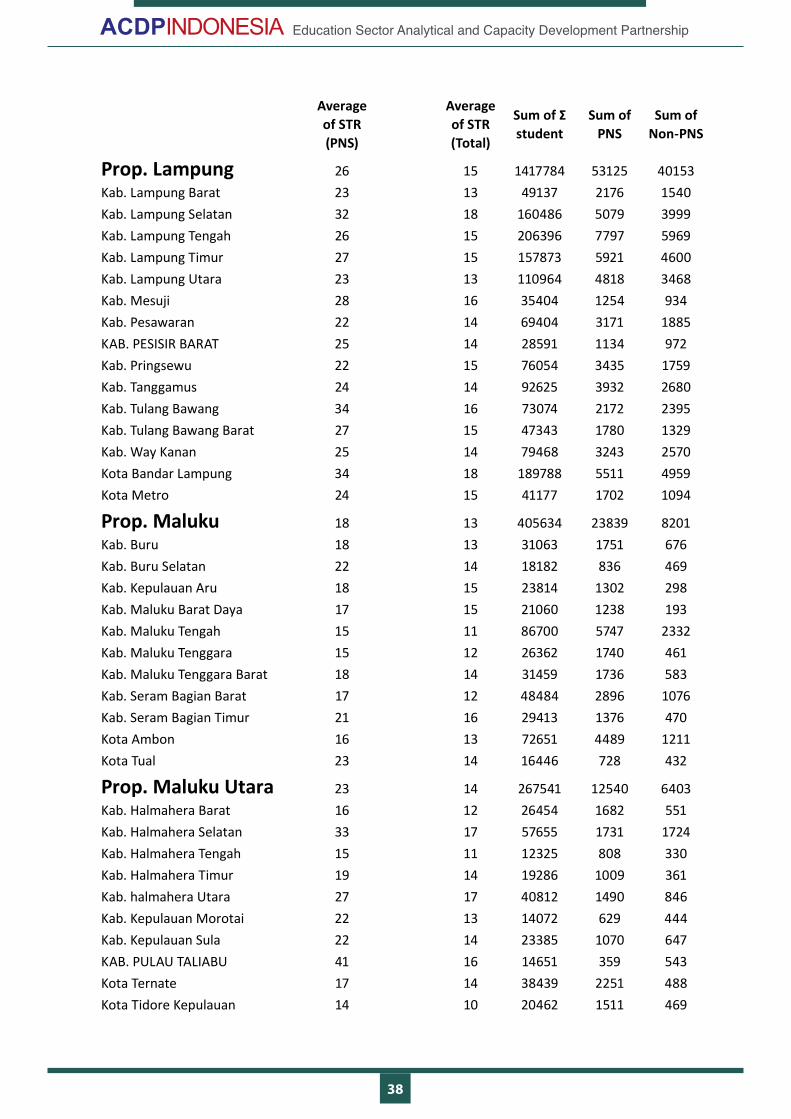
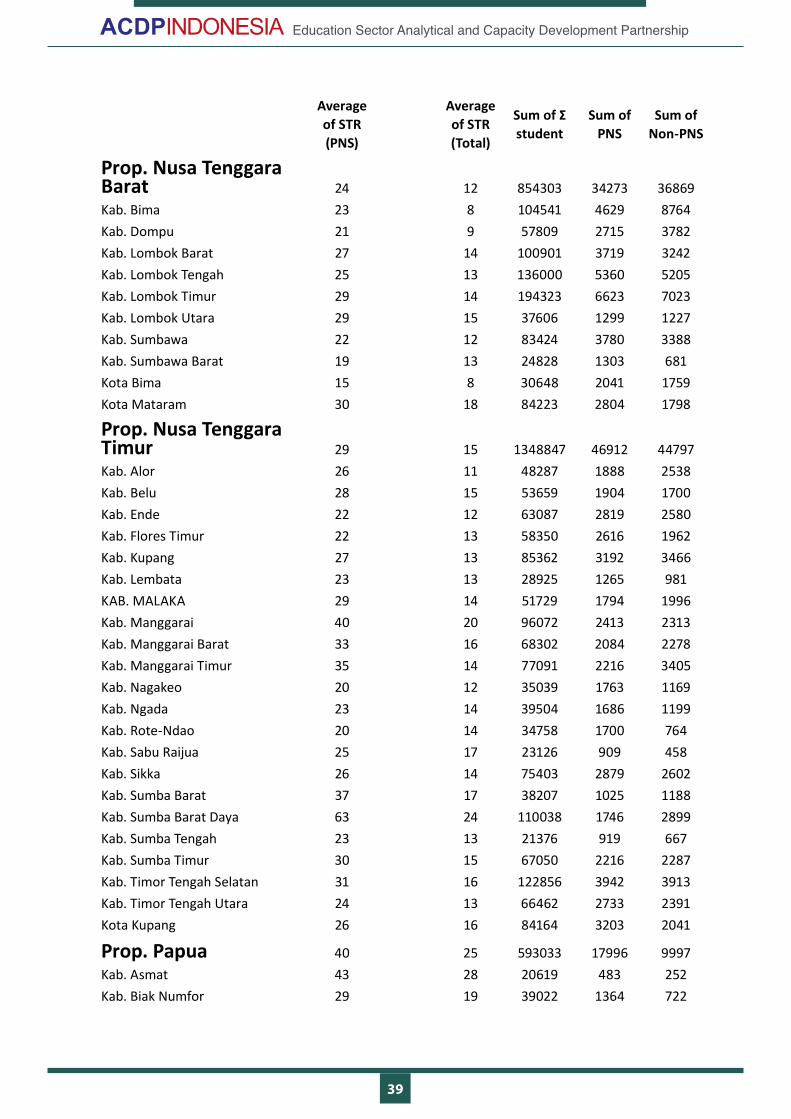
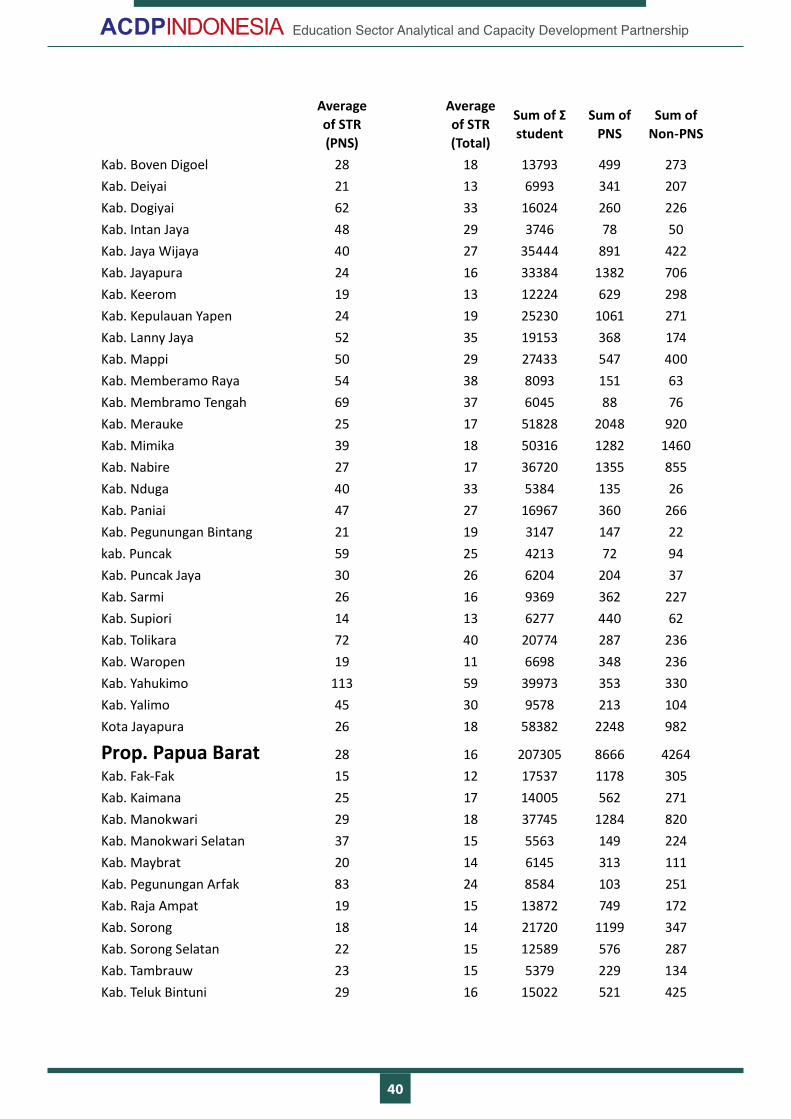
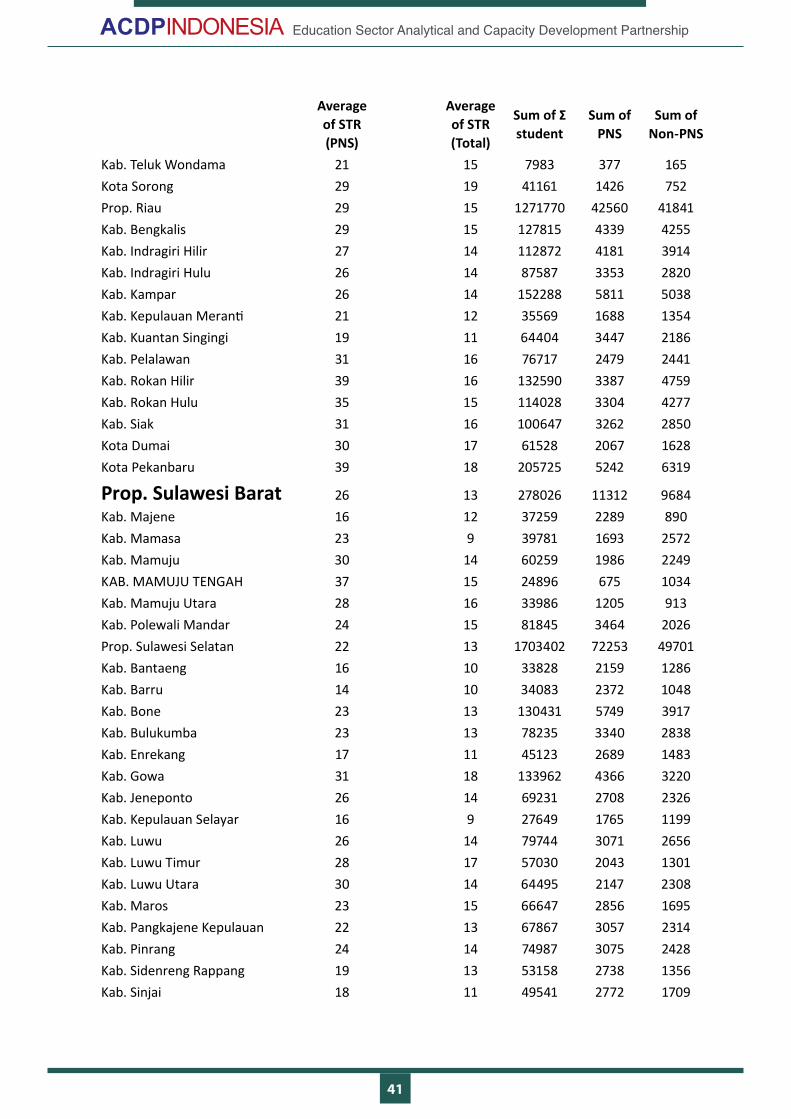
B. STR of MOEC PNS Teachers by District
Average of STR (PNS)
Average of STR (Total)
Sum of Σ student
Sum of PNS
Sum of Non-PNS
Prop. Aceh 16 10 860248 51461 37356Kab. Aceh Barat 13 8 29638 2328 1401Kab. Aceh Barat Daya 15 9 24211 1589 1192Kab. Aceh Besar 15 9 49513 3380 1944Kab. Aceh Jaya 12 9 14153 1152 437Kab. Aceh Selatan 14 8 38927 2766 1816Kab. Aceh Singkil 23 13 27986 1215 864Kab. Aceh Tamiang 22 14 53914 2419 1505Kab. Aceh Tengah 13 8 32629 2424 1433Kab. Aceh Tenggara 21 13 43136 2086 1179Kab. Aceh Timur 21 11 70087 3365 2911Kab. Aceh Utara 20 10 104971 5364 5671Kab. Bener Meriah 15 8 24403 1662 1415Kab. Bireuen 15 8 63806 4187 3867Kab. Gayo Lues 16 12 17695 1098 430Kab. Nagan Raya 15 10 26708 1819 914Kab. Pidie 15 8 64077 4174 3556Kab. Pidie Jaya 12 6 21167 1709 1783Kab. Simeulue 15 8 19630 1292 1298Kota Banda Aceh 17 13 43198 2517 757Kota Langsa 18 12 28991 1610 803Kota Lhokseumawe 20 12 34882 1743 1275Kota Sabang 10 7 6432 632 247Kota Subulussalam 22 13 20094 930 658
Prop. Bali 25 16 766324 30313 17684Kab. Badung 33 18 113500 3411 2907Kab. Bangli 20 13 40998 2078 1121Kab. Buleleng 23 16 127789 5582 2524Kab. Gianyar 26 16 92811 3554 2364Kab. Jembrana 26 17 47267 1810 945Kab. Karang Asem 18 14 78478 4389 1284Kab. Klungkung 17 13 35844 2152 626Kab. Tabanan 17 11 69238 4062 2041Kota Denpasar 49 22 160399 3275 3872Prop. Bangka Belitung 25 18 260037 10194 4204Kab. Bangka 30 19 57912 1946 1146

32
Education Sector Analytical and Capacity Development Partnership
Average of STR (PNS)
Average of STR (Total)
Sum of Σ student
Sum of PNS
Sum of Non-PNS
Kab. Bangka Barat 27 18 37431 1403 723Kab. Bangka Selatan 28 18 36269 1296 701Kab. Bangka Tengah 25 20 33497 1362 298Kab. Belitung 22 17 32895 1505 391Kab. Belitung Timur 16 14 21922 1370 233Kota Pangkalpinang 31 20 40111 1312 712
Prop. Banten 49 21 2021916 41580 53302Kab. Lebak 33 19 229286 6972 4955Kab. Pandeglang 30 17 225208 7426 6195Kab. Serang 42 21 261162 6156 6366Kab. Tangerang 78 25 532027 6855 14174Kota Cilegon 33 18 77949 2394 2006Kota Serang 43 23 133945 3140 2774Kota Tangerang 60 22 323221 5375 9164Kota tangerang Selatan 73 22 239118 3262 7668
Prop. Bengkulu 20 13 377037 18285 9050Kab. Bengkulu Selatan 16 13 33974 2099 507Kab. Bengkulu Tengah 13 11 20683 1541 385Kab. Bengkulu Utara 24 13 56199 2327 2061Kab. Kaur 21 13 25078 1189 741Kab. Kepahiang 18 13 24381 1324 496Kab. Lebong 17 13 20287 1219 344Kab. Muko-muko 23 13 35379 1561 1148Kab. Rejang Lebong 24 16 53506 2260 1140Kab. Seluma 20 14 36193 1785 828Kota Bengkulu 24 16 71357 2980 1400
Prop. D.I. Yogyakarta 23 14 554552 23877 15892Kab. Bantul 24 15 134113 5697 3471Kab. Gunung Kidul 19 12 98638 5266 2659Kab. Kulon Progo 16 11 64848 3976 1721Kab. Sleman 27 15 157729 5798 4834Kota Yogyakarta 32 16 99224 3140 3207
Prop. D.K.I. Jakarta 48 20 1550827 30281 42814Kab. Kepulauan Seribu 22 13 4314 198 131Kota Jakarta Barat 60 21 328918 5500 9875Kota Jakarta Pusat 48 21 162446 3394 4467Kota Jakarta Selatan 48 21 339971 7090 9434Kota Jakarta Timur 45 21 473306 10420 11609
33
Education Sector Analytical and Capacity Development Partnership
Average of STR (PNS)
Average of STR (Total)
Sum of Σ student
Sum of PNS
Sum of Non-PNS
Kota Jakarta Utara 66 22 241872 3679 7298
Prop. Gorontalo 22 14 226750 10170 5216Kab. Boalemo 22 13 29035 1307 906Kab. Bone Bolango 19 14 29574 1550 635Kab. Gorontalo 26 17 74442 2880 1621Kab. Gorontalo Utara 23 13 25017 1091 875Kab. Pohuwato 20 14 28003 1377 696Kota Gorontalo 21 17 40679 1965 483
Prop. Jambi 21 13 628425 28693 17308Kab. Batang Hari 20 14 50398 2549 1167Kab. Bungo 23 15 63534 2734 1519Kab. Kerinci 14 8 38114 2631 1936Kab. Merangin 22 12 67128 3083 2323Kab. Muaro Jambi 20 14 66332 3280 1366Kab. Sarolangun 23 13 53082 2341 1786Kab. Tanjung Jabung Barat 25 15 55289 2229 1536Kab. Tanjung Jabung Timur 17 13 37277 2163 609Kab. Tebo 24 14 57947 2440 1639Kota Jambi 33 19 120238 3641 2767Kota Sungai Penuh 12 8 19086 1602 660
Prop. Jawa Barat 42 20 7831792 178514 191741Kab. Bandung 52 25 600823 11664 12162Kab. Bandung Barat 42 21 262123 6185 6191Kab. Bekasi 63 23 510760 8140 14082Kab. Bogor 82 26 866098 10596 23063Kab. Ciamis 24 15 166669 6992 4114Kab. Cianjur 44 20 407326 9270 11047Kab. Cirebon 40 21 349252 8771 7606Kab. Garut 43 20 469643 10943 12566Kab. Indramayu 39 19 285715 7295 7425Kab. Karawang 50 26 399372 8063 7573Kab. Kuningan 25 17 185208 7395 3690Kab. Majalengka 26 17 190432 7370 3910KAB. PANGANDARAN 23 13 56259 2418 1795Kab. Purwakarta 36 21 168188 4706 3257Kab. Subang 35 18 255661 7216 6721Kab. Sukabumi 51 23 386151 7523 9374Kab. Sumedang 26 17 185648 7215 3906Kab. Tasikmalaya 31 17 275465 8908 7134
34
Education Sector Analytical and Capacity Development Partnership
Average of STR (PNS)
Average of STR (Total)
Sum of Σ student
Sum of PNS
Sum of Non-PNS
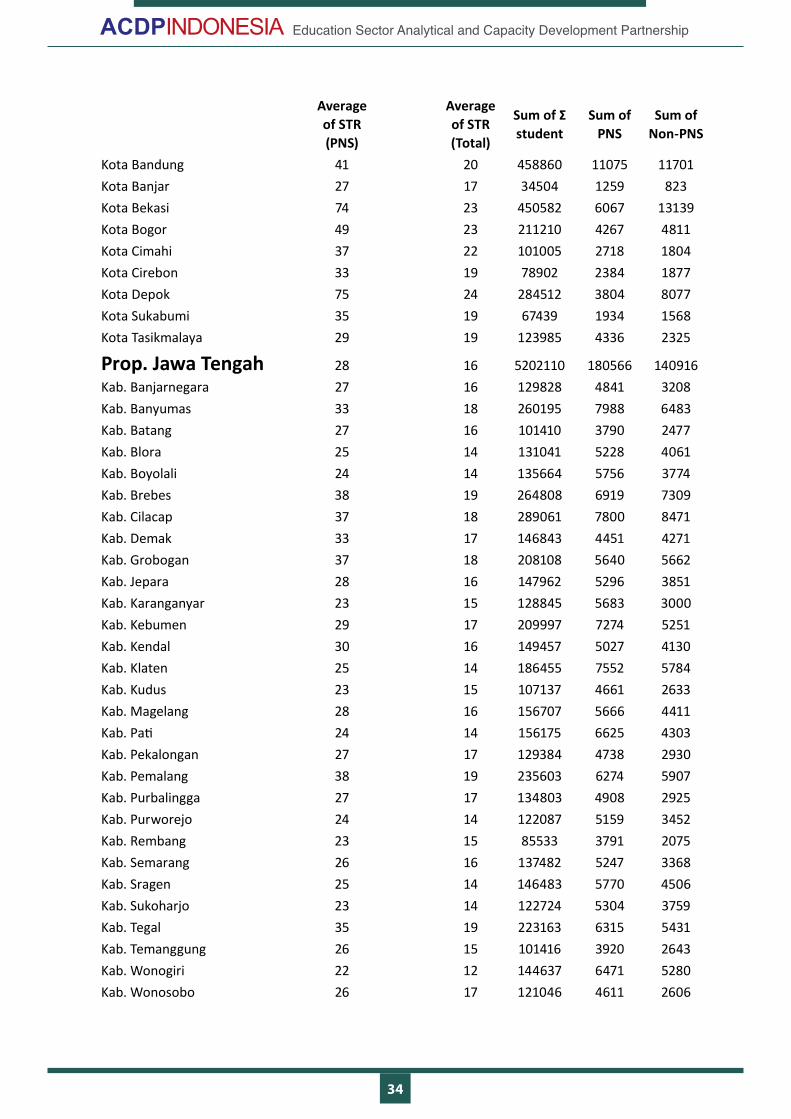
Kota Bandung 41 20 458860 11075 11701Kota Banjar 27 17 34504 1259 823Kota Bekasi 74 23 450582 6067 13139Kota Bogor 49 23 211210 4267 4811Kota Cimahi 37 22 101005 2718 1804Kota Cirebon 33 19 78902 2384 1877Kota Depok 75 24 284512 3804 8077Kota Sukabumi 35 19 67439 1934 1568Kota Tasikmalaya 29 19 123985 4336 2325
Prop. Jawa Tengah 28 16 5202110 180566 140916Kab. Banjarnegara 27 16 129828 4841 3208Kab. Banyumas 33 18 260195 7988 6483Kab. Batang 27 16 101410 3790 2477Kab. Blora 25 14 131041 5228 4061Kab. Boyolali 24 14 135664 5756 3774Kab. Brebes 38 19 264808 6919 7309Kab. Cilacap 37 18 289061 7800 8471Kab. Demak 33 17 146843 4451 4271Kab. Grobogan 37 18 208108 5640 5662Kab. Jepara 28 16 147962 5296 3851Kab. Karanganyar 23 15 128845 5683 3000Kab. Kebumen 29 17 209997 7274 5251Kab. Kendal 30 16 149457 5027 4130Kab. Klaten 25 14 186455 7552 5784Kab. Kudus 23 15 107137 4661 2633Kab. Magelang 28 16 156707 5666 4411Kab. Pati 24 14 156175 6625 4303Kab. Pekalongan 27 17 129384 4738 2930Kab. Pemalang 38 19 235603 6274 5907Kab. Purbalingga 27 17 134803 4908 2925Kab. Purworejo 24 14 122087 5159 3452Kab. Rembang 23 15 85533 3791 2075Kab. Semarang 26 16 137482 5247 3368Kab. Sragen 25 14 146483 5770 4506Kab. Sukoharjo 23 14 122724 5304 3759Kab. Tegal 35 19 223163 6315 5431Kab. Temanggung 26 15 101416 3920 2643Kab. Wonogiri 22 12 144637 6471 5280Kab. Wonosobo 26 17 121046 4611 2606
35
Education Sector Analytical and Capacity Development Partnership
Average of STR (PNS)
Average of STR (Total)
Sum of Σ student
Sum of PNS
Sum of Non-PNS
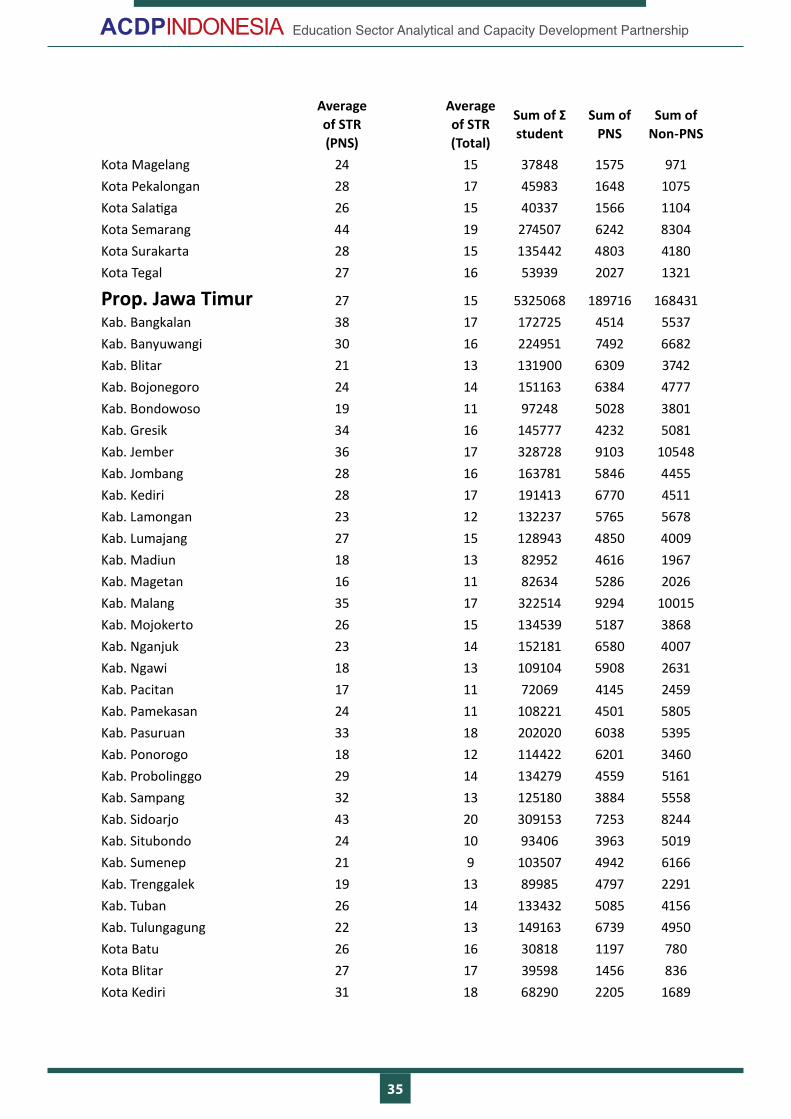
Kota Magelang 24 15 37848 1575 971Kota Pekalongan 28 17 45983 1648 1075Kota Salatiga 26 15 40337 1566 1104Kota Semarang 44 19 274507 6242 8304Kota Surakarta 28 15 135442 4803 4180Kota Tegal 27 16 53939 2027 1321
Prop. Jawa Timur 27 15 5325068 189716 168431Kab. Bangkalan 38 17 172725 4514 5537Kab. Banyuwangi 30 16 224951 7492 6682Kab. Blitar 21 13 131900 6309 3742Kab. Bojonegoro 24 14 151163 6384 4777Kab. Bondowoso 19 11 97248 5028 3801Kab. Gresik 34 16 145777 4232 5081Kab. Jember 36 17 328728 9103 10548Kab. Jombang 28 16 163781 5846 4455Kab. Kediri 28 17 191413 6770 4511Kab. Lamongan 23 12 132237 5765 5678Kab. Lumajang 27 15 128943 4850 4009Kab. Madiun 18 13 82952 4616 1967Kab. Magetan 16 11 82634 5286 2026Kab. Malang 35 17 322514 9294 10015Kab. Mojokerto 26 15 134539 5187 3868Kab. Nganjuk 23 14 152181 6580 4007Kab. Ngawi 18 13 109104 5908 2631Kab. Pacitan 17 11 72069 4145 2459Kab. Pamekasan 24 11 108221 4501 5805Kab. Pasuruan 33 18 202020 6038 5395Kab. Ponorogo 18 12 114422 6201 3460Kab. Probolinggo 29 14 134279 4559 5161Kab. Sampang 32 13 125180 3884 5558Kab. Sidoarjo 43 20 309153 7253 8244Kab. Situbondo 24 10 93406 3963 5019Kab. Sumenep 21 9 103507 4942 6166Kab. Trenggalek 19 13 89985 4797 2291Kab. Tuban 26 14 133432 5085 4156Kab. Tulungagung 22 13 149163 6739 4950Kota Batu 26 16 30818 1197 780Kota Blitar 27 17 39598 1456 836Kota Kediri 31 18 68290 2205 1689
36
Education Sector Analytical and Capacity Development Partnership
Average of STR (PNS)
Average of STR (Total)
Sum of Σ student
Sum of PNS
Sum of Non-PNS
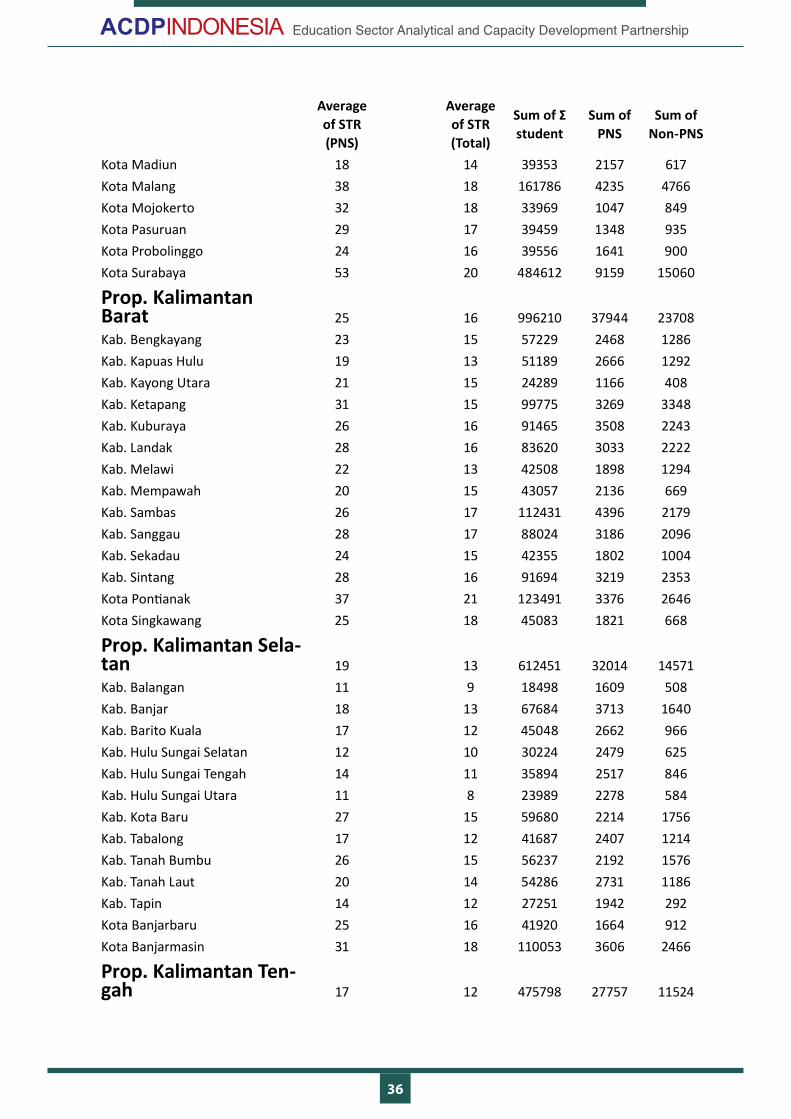
Kota Madiun 18 14 39353 2157 617Kota Malang 38 18 161786 4235 4766Kota Mojokerto 32 18 33969 1047 849Kota Pasuruan 29 17 39459 1348 935Kota Probolinggo 24 16 39556 1641 900Kota Surabaya 53 20 484612 9159 15060
Prop. Kalimantan Barat 25 16 996210 37944 23708Kab. Bengkayang 23 15 57229 2468 1286Kab. Kapuas Hulu 19 13 51189 2666 1292Kab. Kayong Utara 21 15 24289 1166 408Kab. Ketapang 31 15 99775 3269 3348Kab. Kuburaya 26 16 91465 3508 2243Kab. Landak 28 16 83620 3033 2222Kab. Melawi 22 13 42508 1898 1294Kab. Mempawah 20 15 43057 2136 669Kab. Sambas 26 17 112431 4396 2179Kab. Sanggau 28 17 88024 3186 2096Kab. Sekadau 24 15 42355 1802 1004Kab. Sintang 28 16 91694 3219 2353Kota Pontianak 37 21 123491 3376 2646Kota Singkawang 25 18 45083 1821 668
Prop. Kalimantan Sela-tan 19 13 612451 32014 14571Kab. Balangan 11 9 18498 1609 508Kab. Banjar 18 13 67684 3713 1640Kab. Barito Kuala 17 12 45048 2662 966Kab. Hulu Sungai Selatan 12 10 30224 2479 625Kab. Hulu Sungai Tengah 14 11 35894 2517 846Kab. Hulu Sungai Utara 11 8 23989 2278 584Kab. Kota Baru 27 15 59680 2214 1756Kab. Tabalong 17 12 41687 2407 1214Kab. Tanah Bumbu 26 15 56237 2192 1576Kab. Tanah Laut 20 14 54286 2731 1186Kab. Tapin 14 12 27251 1942 292Kota Banjarbaru 25 16 41920 1664 912Kota Banjarmasin 31 18 110053 3606 2466
Prop. Kalimantan Ten-gah 17 12 475798 27757 11524

37
Education Sector Analytical and Capacity Development Partnership
Average of STR (PNS)
Average of STR (Total)
Sum of Σ student
Sum of PNS
Sum of Non-PNS
Kab. Barito Selatan 14 9 25159 1850 901Kab. Barito Timur 11 8 19642 1817 656Kab. Barito Utara 14 10 28187 2042 731Kab. Gunung Mas 14 11 25016 1779 502Kab. Kapuas 16 11 56584 3485 1553Kab. Katingan 16 13 34260 2106 503Kab. Kotawaringin Barat 25 17 49978 2013 995Kab. Kotawaringin Timur 30 16 86535 2872 2423Kab. Lamandau 13 11 15817 1234 220Kab. Murung Raya 16 11 24879 1511 671Kab. Pulang Pisau 11 9 22633 1990 511Kab. Seruyan 25 13 30762 1245 1075Kab. Sukamara 13 11 10322 775 148Kota Palangka Raya 15 13 46024 3038 635Prop. Kalimantan Timur 28 15 697516 24695 18181Kab. Berau 24 14 46764 1973 1342Kab. Kutai Barat 22 10 35469 1629 1947Kab. Kutai Kartanegara 22 15 142752 6555 3102Kab. Kutai Timur 30 16 69426 2284 2030KAB. MAHAKAM ULU 27 10 6811 255 429Kab. Paser 25 14 51513 2095 1466Kab. Penajam Paser Utara 22 16 33846 1565 605Kota Balikpapan 42 21 120504 2903 2724Kota Bontang 35 17 34983 1004 1099Kota Samarinda 35 20 155448 4432 3437
Prop. Kalimantan Utara 19 13 129895 6316 3213Kab. Bulungan 17 12 28681 1658 749Kab. Malinau 15 10 16651 1141 605Kab. Nunukan 24 14 37422 1590 1010Kab. Tana Tidung 9 7 4461 520 86Kota Tarakan 30 20 42680 1407 763Prop. Kepulauan Riau 29 14 360306 10082 11166Kab. Bintan 21 14 29917 1429 642Kab. Karimun 28 14 47646 1711 1576Kab. Kepulauan Anambas 19 10 9657 515 451Kab. Lingga 12 9 17598 1486 566Kab. Natuna 15 10 15719 1032 602Kota Batam 78 22 196633 2533 6442Kota Tanjungpinang 31 19 43136 1376 887
38
Education Sector Analytical and Capacity Development Partnership
Average of STR (PNS)
Average of STR (Total)
Sum of Σ student
Sum of PNS
Sum of Non-PNS
Prop. Lampung 26 15 1417784 53125 40153Kab. Lampung Barat 23 13 49137 2176 1540Kab. Lampung Selatan 32 18 160486 5079 3999Kab. Lampung Tengah 26 15 206396 7797 5969Kab. Lampung Timur 27 15 157873 5921 4600Kab. Lampung Utara 23 13 110964 4818 3468Kab. Mesuji 28 16 35404 1254 934Kab. Pesawaran 22 14 69404 3171 1885KAB. PESISIR BARAT 25 14 28591 1134 972Kab. Pringsewu 22 15 76054 3435 1759Kab. Tanggamus 24 14 92625 3932 2680Kab. Tulang Bawang 34 16 73074 2172 2395Kab. Tulang Bawang Barat 27 15 47343 1780 1329Kab. Way Kanan 25 14 79468 3243 2570Kota Bandar Lampung 34 18 189788 5511 4959Kota Metro 24 15 41177 1702 1094
Prop. Maluku 18 13 405634 23839 8201Kab. Buru 18 13 31063 1751 676Kab. Buru Selatan 22 14 18182 836 469Kab. Kepulauan Aru 18 15 23814 1302 298Kab. Maluku Barat Daya 17 15 21060 1238 193Kab. Maluku Tengah 15 11 86700 5747 2332Kab. Maluku Tenggara 15 12 26362 1740 461Kab. Maluku Tenggara Barat 18 14 31459 1736 583Kab. Seram Bagian Barat 17 12 48484 2896 1076Kab. Seram Bagian Timur 21 16 29413 1376 470Kota Ambon 16 13 72651 4489 1211Kota Tual 23 14 16446 728 432
Prop. Maluku Utara 23 14 267541 12540 6403Kab. Halmahera Barat 16 12 26454 1682 551Kab. Halmahera Selatan 33 17 57655 1731 1724Kab. Halmahera Tengah 15 11 12325 808 330Kab. Halmahera Timur 19 14 19286 1009 361Kab. halmahera Utara 27 17 40812 1490 846Kab. Kepulauan Morotai 22 13 14072 629 444Kab. Kepulauan Sula 22 14 23385 1070 647KAB. PULAU TALIABU 41 16 14651 359 543Kota Ternate 17 14 38439 2251 488Kota Tidore Kepulauan 14 10 20462 1511 469
39
Education Sector Analytical and Capacity Development Partnership
Average of STR (PNS)
Average of STR (Total)
Sum of Σ student
Sum of PNS
Sum of Non-PNS
Prop. Nusa Tenggara Barat 24 12 854303 34273 36869Kab. Bima 23 8 104541 4629 8764Kab. Dompu 21 9 57809 2715 3782Kab. Lombok Barat 27 14 100901 3719 3242Kab. Lombok Tengah 25 13 136000 5360 5205Kab. Lombok Timur 29 14 194323 6623 7023Kab. Lombok Utara 29 15 37606 1299 1227Kab. Sumbawa 22 12 83424 3780 3388Kab. Sumbawa Barat 19 13 24828 1303 681Kota Bima 15 8 30648 2041 1759Kota Mataram 30 18 84223 2804 1798
Prop. Nusa Tenggara Timur 29 15 1348847 46912 44797Kab. Alor 26 11 48287 1888 2538Kab. Belu 28 15 53659 1904 1700Kab. Ende 22 12 63087 2819 2580Kab. Flores Timur 22 13 58350 2616 1962Kab. Kupang 27 13 85362 3192 3466Kab. Lembata 23 13 28925 1265 981KAB. MALAKA 29 14 51729 1794 1996Kab. Manggarai 40 20 96072 2413 2313Kab. Manggarai Barat 33 16 68302 2084 2278Kab. Manggarai Timur 35 14 77091 2216 3405Kab. Nagakeo 20 12 35039 1763 1169Kab. Ngada 23 14 39504 1686 1199Kab. Rote-Ndao 20 14 34758 1700 764Kab. Sabu Raijua 25 17 23126 909 458Kab. Sikka 26 14 75403 2879 2602Kab. Sumba Barat 37 17 38207 1025 1188Kab. Sumba Barat Daya 63 24 110038 1746 2899Kab. Sumba Tengah 23 13 21376 919 667Kab. Sumba Timur 30 15 67050 2216 2287Kab. Timor Tengah Selatan 31 16 122856 3942 3913Kab. Timor Tengah Utara 24 13 66462 2733 2391Kota Kupang 26 16 84164 3203 2041
Prop. Papua 40 25 593033 17996 9997Kab. Asmat 43 28 20619 483 252Kab. Biak Numfor 29 19 39022 1364 722
40
Education Sector Analytical and Capacity Development Partnership
Average of STR (PNS)
Average of STR (Total)
Sum of Σ student
Sum of PNS
Sum of Non-PNS
Kab. Boven Digoel 28 18 13793 499 273Kab. Deiyai 21 13 6993 341 207Kab. Dogiyai 62 33 16024 260 226Kab. Intan Jaya 48 29 3746 78 50Kab. Jaya Wijaya 40 27 35444 891 422Kab. Jayapura 24 16 33384 1382 706Kab. Keerom 19 13 12224 629 298Kab. Kepulauan Yapen 24 19 25230 1061 271Kab. Lanny Jaya 52 35 19153 368 174Kab. Mappi 50 29 27433 547 400Kab. Memberamo Raya 54 38 8093 151 63Kab. Membramo Tengah 69 37 6045 88 76Kab. Merauke 25 17 51828 2048 920Kab. Mimika 39 18 50316 1282 1460Kab. Nabire 27 17 36720 1355 855Kab. Nduga 40 33 5384 135 26Kab. Paniai 47 27 16967 360 266Kab. Pegunungan Bintang 21 19 3147 147 22kab. Puncak 59 25 4213 72 94Kab. Puncak Jaya 30 26 6204 204 37Kab. Sarmi 26 16 9369 362 227Kab. Supiori 14 13 6277 440 62Kab. Tolikara 72 40 20774 287 236Kab. Waropen 19 11 6698 348 236Kab. Yahukimo 113 59 39973 353 330Kab. Yalimo 45 30 9578 213 104Kota Jayapura 26 18 58382 2248 982
Prop. Papua Barat 28 16 207305 8666 4264Kab. Fak-Fak 15 12 17537 1178 305Kab. Kaimana 25 17 14005 562 271Kab. Manokwari 29 18 37745 1284 820Kab. Manokwari Selatan 37 15 5563 149 224Kab. Maybrat 20 14 6145 313 111Kab. Pegunungan Arfak 83 24 8584 103 251Kab. Raja Ampat 19 15 13872 749 172Kab. Sorong 18 14 21720 1199 347Kab. Sorong Selatan 22 15 12589 576 287Kab. Tambrauw 23 15 5379 229 134Kab. Teluk Bintuni 29 16 15022 521 425
41
Education Sector Analytical and Capacity Development Partnership
Average of STR (PNS)
Average of STR (Total)
Sum of Σ student
Sum of PNS
Sum of Non-PNS
Kab. Teluk Wondama 21 15 7983 377 165Kota Sorong 29 19 41161 1426 752Prop. Riau 29 15 1271770 42560 41841Kab. Bengkalis 29 15 127815 4339 4255Kab. Indragiri Hilir 27 14 112872 4181 3914Kab. Indragiri Hulu 26 14 87587 3353 2820Kab. Kampar 26 14 152288 5811 5038Kab. Kepulauan Meranti 21 12 35569 1688 1354Kab. Kuantan Singingi 19 11 64404 3447 2186Kab. Pelalawan 31 16 76717 2479 2441Kab. Rokan Hilir 39 16 132590 3387 4759Kab. Rokan Hulu 35 15 114028 3304 4277Kab. Siak 31 16 100647 3262 2850Kota Dumai 30 17 61528 2067 1628Kota Pekanbaru 39 18 205725 5242 6319
Prop. Sulawesi Barat 26 13 278026 11312 9684Kab. Majene 16 12 37259 2289 890Kab. Mamasa 23 9 39781 1693 2572Kab. Mamuju 30 14 60259 1986 2249KAB. MAMUJU TENGAH 37 15 24896 675 1034Kab. Mamuju Utara 28 16 33986 1205 913Kab. Polewali Mandar 24 15 81845 3464 2026Prop. Sulawesi Selatan 22 13 1703402 72253 49701Kab. Bantaeng 16 10 33828 2159 1286Kab. Barru 14 10 34083 2372 1048Kab. Bone 23 13 130431 5749 3917Kab. Bulukumba 23 13 78235 3340 2838Kab. Enrekang 17 11 45123 2689 1483Kab. Gowa 31 18 133962 4366 3220Kab. Jeneponto 26 14 69231 2708 2326Kab. Kepulauan Selayar 16 9 27649 1765 1199Kab. Luwu 26 14 79744 3071 2656Kab. Luwu Timur 28 17 57030 2043 1301Kab. Luwu Utara 30 14 64495 2147 2308Kab. Maros 23 15 66647 2856 1695Kab. Pangkajene Kepulauan 22 13 67867 3057 2314Kab. Pinrang 24 14 74987 3075 2428Kab. Sidenreng Rappang 19 13 53158 2738 1356Kab. Sinjai 18 11 49541 2772 1709
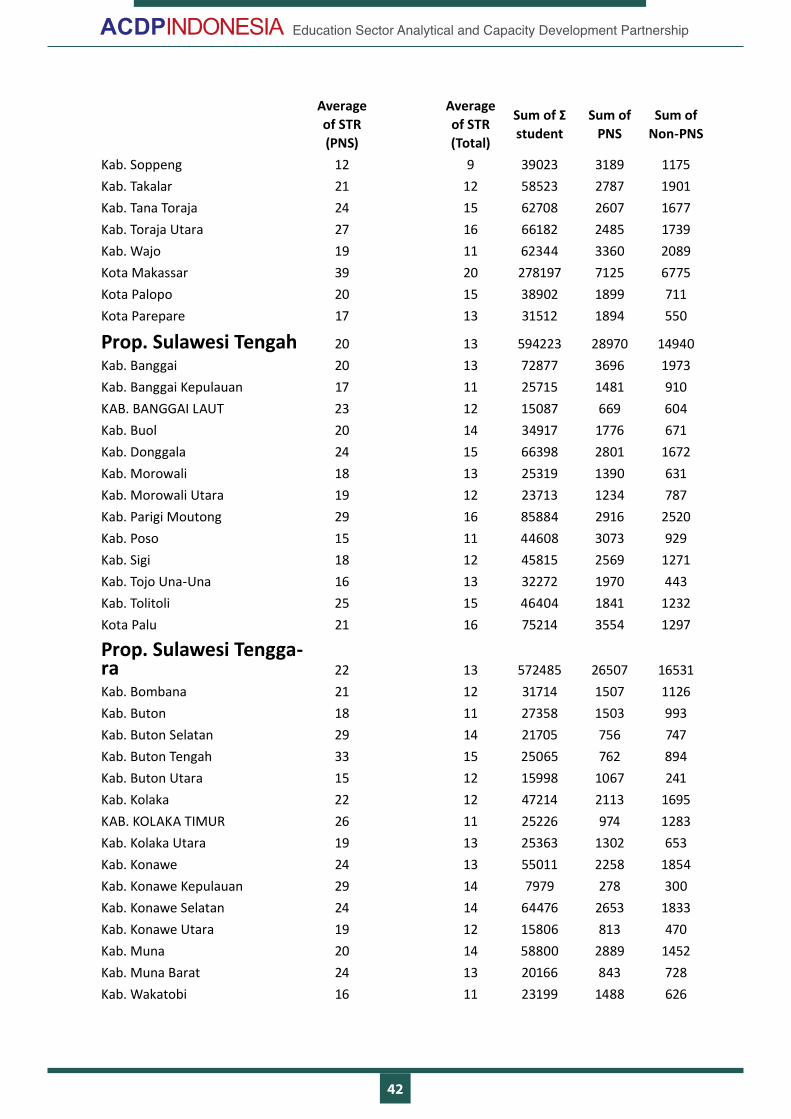
42
Education Sector Analytical and Capacity Development Partnership
Average of STR (PNS)
Average of STR (Total)
Sum of Σ student
Sum of PNS
Sum of Non-PNS
Kab. Soppeng 12 9 39023 3189 1175Kab. Takalar 21 12 58523 2787 1901Kab. Tana Toraja 24 15 62708 2607 1677Kab. Toraja Utara 27 16 66182 2485 1739Kab. Wajo 19 11 62344 3360 2089Kota Makassar 39 20 278197 7125 6775Kota Palopo 20 15 38902 1899 711Kota Parepare 17 13 31512 1894 550
Prop. Sulawesi Tengah 20 13 594223 28970 14940Kab. Banggai 20 13 72877 3696 1973Kab. Banggai Kepulauan 17 11 25715 1481 910KAB. BANGGAI LAUT 23 12 15087 669 604Kab. Buol 20 14 34917 1776 671Kab. Donggala 24 15 66398 2801 1672Kab. Morowali 18 13 25319 1390 631Kab. Morowali Utara 19 12 23713 1234 787Kab. Parigi Moutong 29 16 85884 2916 2520Kab. Poso 15 11 44608 3073 929Kab. Sigi 18 12 45815 2569 1271Kab. Tojo Una-Una 16 13 32272 1970 443Kab. Tolitoli 25 15 46404 1841 1232Kota Palu 21 16 75214 3554 1297
Prop. Sulawesi Tengga-ra 22 13 572485 26507 16531Kab. Bombana 21 12 31714 1507 1126Kab. Buton 18 11 27358 1503 993Kab. Buton Selatan 29 14 21705 756 747Kab. Buton Tengah 33 15 25065 762 894Kab. Buton Utara 15 12 15998 1067 241Kab. Kolaka 22 12 47214 2113 1695KAB. KOLAKA TIMUR 26 11 25226 974 1283Kab. Kolaka Utara 19 13 25363 1302 653Kab. Konawe 24 13 55011 2258 1854Kab. Konawe Kepulauan 29 14 7979 278 300Kab. Konawe Selatan 24 14 64476 2653 1833Kab. Konawe Utara 19 12 15806 813 470Kab. Muna 20 14 58800 2889 1452Kab. Muna Barat 24 13 20166 843 728Kab. Wakatobi 16 11 23199 1488 626
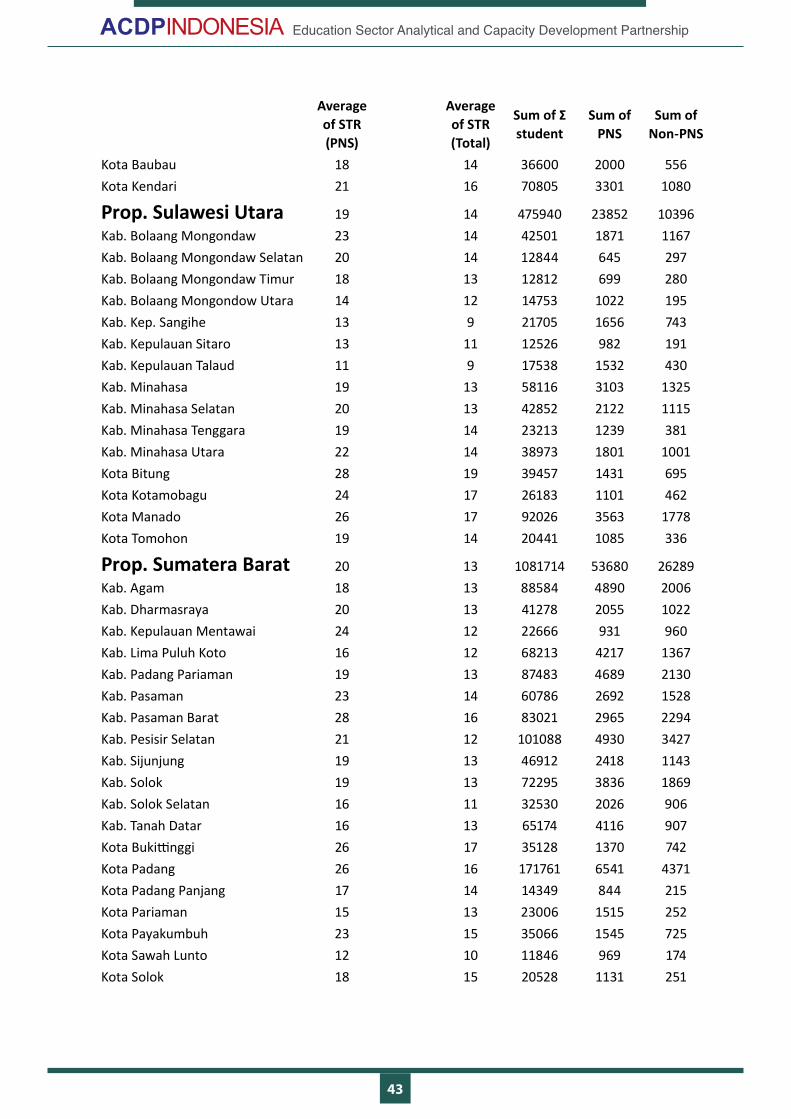
43
Education Sector Analytical and Capacity Development Partnership
Average of STR (PNS)
Average of STR (Total)
Sum of Σ student
Sum of PNS
Sum of Non-PNS
Kota Baubau 18 14 36600 2000 556Kota Kendari 21 16 70805 3301 1080
Prop. Sulawesi Utara 19 14 475940 23852 10396Kab. Bolaang Mongondaw 23 14 42501 1871 1167Kab. Bolaang Mongondaw Selatan 20 14 12844 645 297Kab. Bolaang Mongondaw Timur 18 13 12812 699 280Kab. Bolaang Mongondow Utara 14 12 14753 1022 195Kab. Kep. Sangihe 13 9 21705 1656 743Kab. Kepulauan Sitaro 13 11 12526 982 191Kab. Kepulauan Talaud 11 9 17538 1532 430Kab. Minahasa 19 13 58116 3103 1325Kab. Minahasa Selatan 20 13 42852 2122 1115Kab. Minahasa Tenggara 19 14 23213 1239 381Kab. Minahasa Utara 22 14 38973 1801 1001Kota Bitung 28 19 39457 1431 695Kota Kotamobagu 24 17 26183 1101 462Kota Manado 26 17 92026 3563 1778Kota Tomohon 19 14 20441 1085 336
Prop. Sumatera Barat 20 13 1081714 53680 26289Kab. Agam 18 13 88584 4890 2006Kab. Dharmasraya 20 13 41278 2055 1022Kab. Kepulauan Mentawai 24 12 22666 931 960Kab. Lima Puluh Koto 16 12 68213 4217 1367Kab. Padang Pariaman 19 13 87483 4689 2130Kab. Pasaman 23 14 60786 2692 1528Kab. Pasaman Barat 28 16 83021 2965 2294Kab. Pesisir Selatan 21 12 101088 4930 3427Kab. Sijunjung 19 13 46912 2418 1143Kab. Solok 19 13 72295 3836 1869Kab. Solok Selatan 16 11 32530 2026 906Kab. Tanah Datar 16 13 65174 4116 907Kota Bukittinggi 26 17 35128 1370 742Kota Padang 26 16 171761 6541 4371Kota Padang Panjang 17 14 14349 844 215Kota Pariaman 15 13 23006 1515 252Kota Payakumbuh 23 15 35066 1545 725Kota Sawah Lunto 12 10 11846 969 174Kota Solok 18 15 20528 1131 251

44
Education Sector Analytical and Capacity Development Partnership
Average of STR (PNS)
Average of STR (Total)
Sum of Σ student
Sum of PNS
Sum of Non-PNS
Prop. Sumatera Sela-tan 29 15 1573844 55621 45501Kab. Banyuasin 29 16 142478 4865 3849Kab. Empat Lawang 28 14 49844 1762 1888Kab. Lahat 22 11 82136 3660 3810Kab. Muara Enim 28 16 117522 4176 3142Kab. Musi Banyuasin 33 16 132394 4011 4036Kab. Musi Rawas 24 15 73111 3010 1927Kab. Musi Rawas Utara 42 17 35364 841 1295Kab. Ogan Ilir 20 13 74779 3753 1961Kab. Ogan Komering Ilir 28 15 141984 5063 4255Kab. Ogan Komering Ulu 24 14 73352 3000 2162Kab. Ogan Komering Ulu Selatan 25 13 65025 2559 2386Kab. Ogan Komering Ulu Timur 24 15 109646 4632 2882Kab. Penukal Abab Lematang Ilir 56 19 41535 741 1477Kota Lubuk Linggau 27 16 49875 1870 1164Kota Pagar Alam 19 12 27387 1419 820Kota Palembang 37 20 316872 8591 7257Kota Prabumulih 24 14 40540 1668 1190
Prop. Sumatera Utara 28 16 3045309 100825 82408Kab. Asahan 31 18 133971 4280 3318Kab. Batubara 30 18 80690 2679 1841Kab. Dairi 26 17 79417 3078 1610Kab. Deli Serdang 38 19 340939 9075 8693Kab. Humbang Hasudutan 20 15 56620 2828 837Kab. Karo 21 15 83439 3931 1572Kab. Labuhan Batu 33 19 94002 2814 2253Kab. Labuhan Batu Selatan 36 18 57930 1625 1558Kab. Labuhan Batu Utara 30 16 73038 2423 2134Kab. Langkat 27 16 184473 6859 4458Kab. Mandailing Natal 23 13 95857 4163 3463Kab. Nias 35 16 42752 1227 1523Kab. Nias Barat 25 12 26525 1082 1046Kab. Nias Selatan 49 16 98092 1991 4316Kab. Nias Utara 28 12 39781 1402 1960Kab. Padang Lawas 26 16 49724 1877 1282Kab. Padang Lawas utara 25 15 50323 1978 1391Kab. Pakpak Bharat 15 11 11722 792 322Kab. Samosir 18 13 36256 1985 844Kab. Serdang Bedagai 30 17 123277 4055 3150Kab. Simalungun 24 15 171311 7157 4148Kab. Tapanuli Selatan 22 14 61300 2768 1590

45
Education Sector Analytical and Capacity Development Partnership
Aver
age
of S
TR
(PN
S)
Aver
age
of S
TR
(Tot
al)
Sum
of Σ
st
uden
tSu
m o
f PN
SSu
m o
f N
on-P
NS
Kab.
Tap
anul
i Ten
gah
2414
7429
130
4223
28Ka
b. T
apan
uli U
tara
2314
8436
437
1021
76Ka
b. T
oba
Sam
osir
2014
5214
326
5210
63Ko
ta B
inja
i25
1664
968
2600
1584
Kota
Gun
ungs
itoli
2214
3689
316
4910
35Ko
ta M
edan
6021
5060
9384
8515
882
Kota
Pad
ang
Sidi
mpu
an23
1651
018
2260
1031
Kota
Pem
atan
gsia
ntar
3117
7730
724
8320
40Ko
ta S
ibol
ga26
1829
910
1139
512
Kota
Tan
jung
Bal
ai28
2035
777
1265
535
Kota
Teb
ing
Ting
gi28
1741
106
1471
913
Gran
d To
tal
2715
4456
8422
1545
389
1234
252
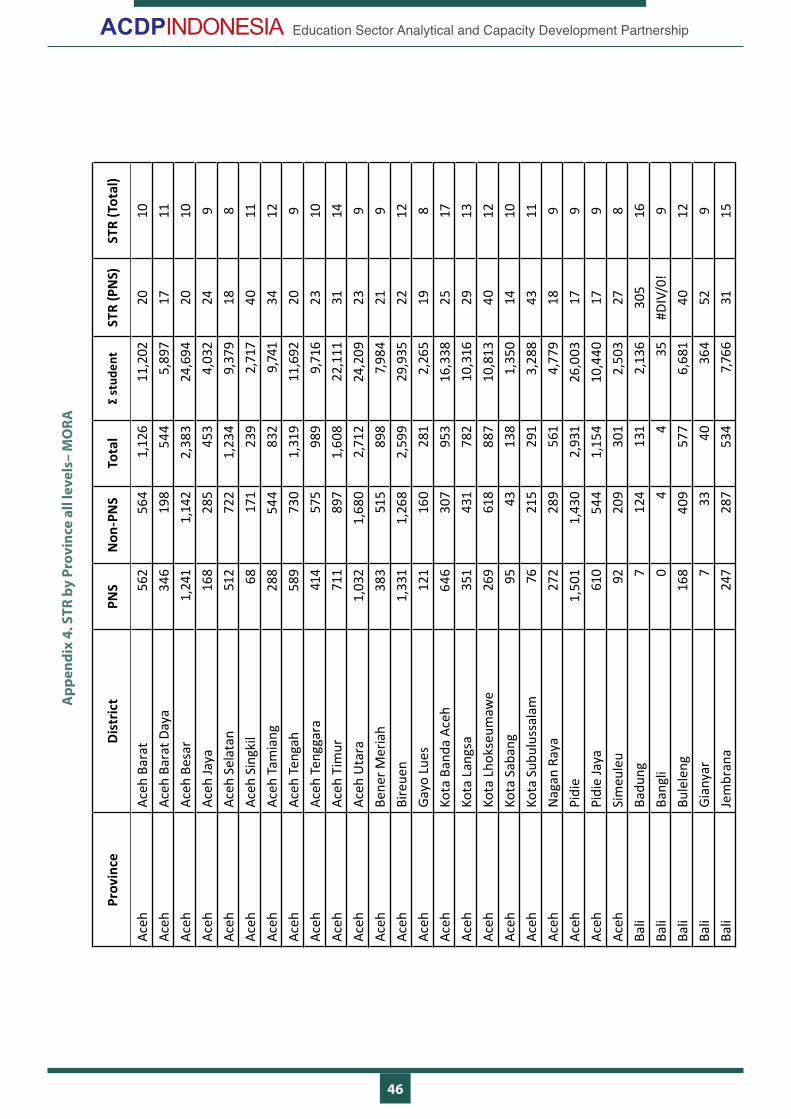
46
Education Sector Analytical and Capacity Development Partnership
Appe
ndix
4. S
TR b
y Pr
ovin
ce a
ll le
vels
– M
ORA
Prov
ince
Dist
rict
PNS
Non
-PN
STo
tal
Σ st
uden
tST
R (P
NS)
STR
(Tot
al)
Aceh
Aceh
Bar
at56
256
41,
126
11,2
0220
10Ac
ehAc
eh B
arat
Day
a34
619
854
45,
897
1711
Aceh
Aceh
Bes
ar1,
241
1,14
22,
383
24,6
9420
10Ac
ehAc
eh Ja
ya16
828
545
34,
032
249
Aceh
Aceh
Sel
atan
512
722
1,23
49,
379
188
Aceh
Aceh
Sin
gkil
6817
123
92,
717
4011
Aceh
Aceh
Tam
iang
288
544
832
9,74
134
12Ac
ehAc
eh T
enga
h58
973
01,
319
11,6
9220
9Ac
ehAc
eh T
engg
ara
414
575
989
9,71
623
10Ac
ehAc
eh T
imur
711
897
1,60
822
,111
3114
Aceh
Aceh
Uta
ra1,
032
1,68
02,
712
24,2
0923
9Ac
ehBe
ner M
eria
h38
351
589
87,
984
219
Aceh
Bire
uen
1,33
11,
268
2,59
929
,935
2212
Aceh
Gayo
Lue
s12
116
028
12,
265
198
Aceh
Kota
Ban
da A
ceh
646
307
953
16,3
3825
17Ac
ehKo
ta L
angs
a35
143
178
210
,316
2913
Aceh
Kota
Lho
kseu
maw
e26
961
888
710
,813
4012
Aceh
Kota
Sab
ang
9543
138
1,35
014
10Ac
ehKo
ta S
ubul
ussa
lam
7621
529
13,
288
4311
Aceh
Nag
an R
aya
272
289
561
4,77
918
9Ac
ehPi
die
1,50
11,
430
2,93
126
,003
179
Aceh
Pidi
e Ja
ya61
054
41,
154
10,4
4017
9Ac
ehSi
meu
leu
9220
930
12,
503
278
Bali
Badu
ng7
124
131
2,13
630
516
Bali
Bang
li0
44
35#D
IV/0
!9
Bali
Bule
leng
168
409
577
6,68
140
12Ba
liGi
anya
r7
3340
364
529
Bali
Jem
bran
a24
728
753
47,7
6631
15
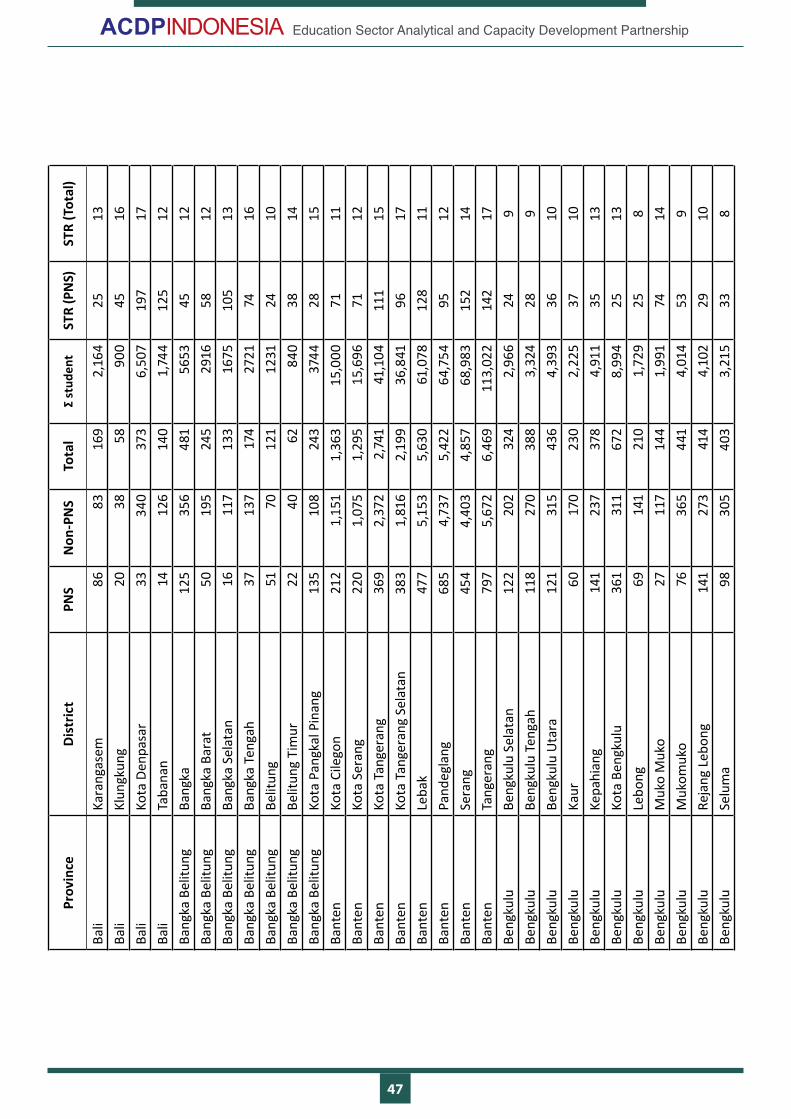
47
Education Sector Analytical and Capacity Development Partnership
Prov
ince
Dist
rict
PNS
Non
-PN
STo
tal
Σ st
uden
tST
R (P
NS)
STR
(Tot
al)
Bali
Kara
ngas
em86
8316
92,
164
2513
Bali
Klun
gkun
g20
3858
900
4516
Bali
Kota
Den
pasa
r33
340
373
6,50
719
717
Bali
Taba
nan
1412
614
01,
744
125
12Ba
ngka
Bel
itung
Bang
ka12
535
648
156
5345
12Ba
ngka
Bel
itung
Bang
ka B
arat
5019
524
529
1658
12Ba
ngka
Bel
itung
Bang
ka S
elat
an16
117
133
1675
105
13Ba
ngka
Bel
itung
Bang
ka T
enga
h37
137
174
2721
7416
Bang
ka B
elitu
ngBe
litun
g51
7012
112
3124
10Ba
ngka
Bel
itung
Belit
ung
Tim
ur22
4062
840
3814
Bang
ka B
elitu
ngKo
ta P
angk
al P
inan
g13
510
824
337
4428
15Ba
nten
Kota
Cile
gon
212
1,15
11,
363
15,0
0071
11Ba
nten
Kota
Ser
ang
220
1,07
51,
295
15,6
9671
12Ba
nten
Kota
Tan
gera
ng36
92,
372
2,74
141
,104
111
15Ba
nten
Kota
Tan
gera
ng S
elat
an38
31,
816
2,19
936
,841
9617
Bant
enLe
bak
477
5,15
35,
630
61,0
7812
811
Bant
enPa
ndeg
lang
685
4,73
75,
422
64,7
5495
12Ba
nten
Sera
ng45
44,
403
4,85
768
,983
152
14Ba
nten
Tang
eran
g79
75,
672
6,46
911
3,02
214
217
Beng
kulu
Beng
kulu
Sel
atan
122
202
324
2,96
624
9Be
ngku
luBe
ngku
lu T
enga
h11
827
038
83,
324
289
Beng
kulu
Beng
kulu
Uta
ra12
131
543
64,
393
3610
Beng
kulu
Kaur
6017
023
02,
225
3710
Beng
kulu
Kepa
hian
g14
123
737
84,
911
3513
Beng
kulu
Kota
Ben
gkul
u36
131
167
28,
994
2513
Beng
kulu
Lebo
ng69
141
210
1,72
925
8Be
ngku
luM
uko
Muk
o27
117
144
1,99
174
14Be
ngku
luM
ukom
uko
7636
544
14,
014
539
Beng
kulu
Reja
ng L
ebon
g14
127
341
44,
102
2910
Beng
kulu
Selu
ma
9830
540
33,
215
338
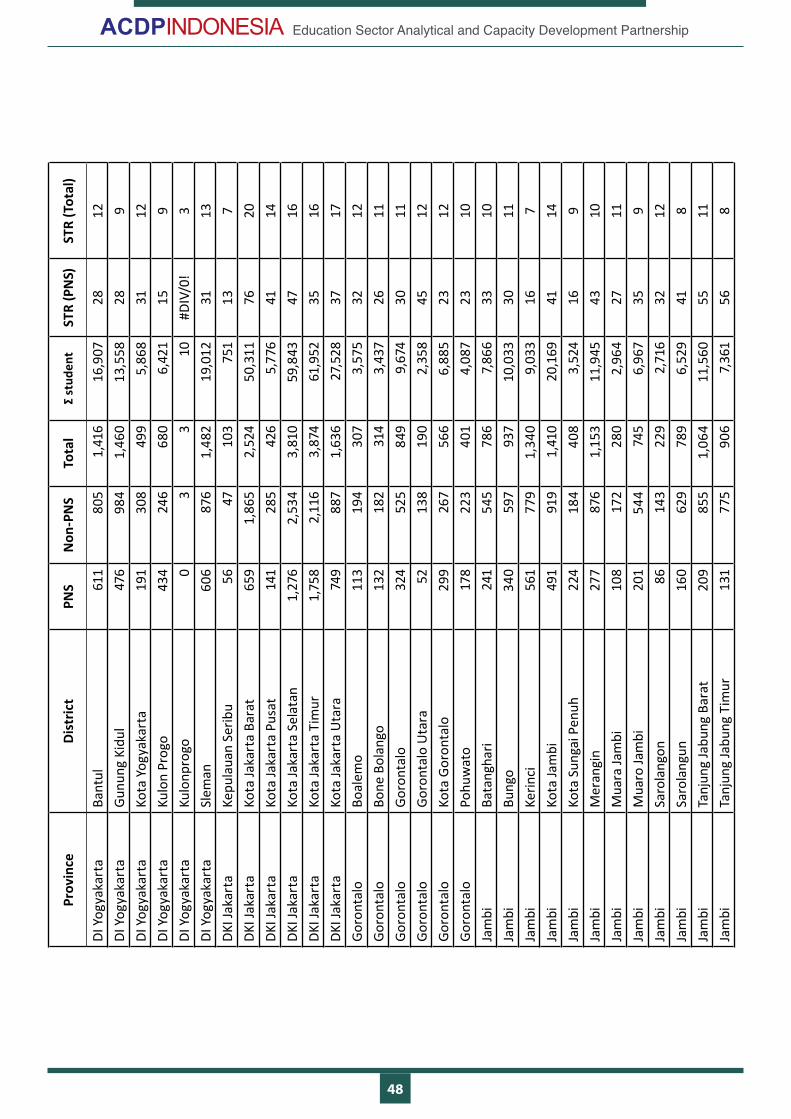
48
Education Sector Analytical and Capacity Development Partnership
Prov
ince
Dist
rict
PNS
Non
-PN
STo
tal
Σ st
uden
tST
R (P
NS)
STR
(Tot
al)
DI Y
ogya
kart
aBa
ntul
611
805
1,41
616
,907
2812
DI Y
ogya
kart
aGu
nung
Kid
ul47
698
41,
460
13,5
5828
9DI
Yog
yaka
rta
Kota
Yog
yaka
rta
191
308
499
5,86
831
12DI
Yog
yaka
rta
Kulo
n Pr
ogo
434
246
680
6,42
115
9DI
Yog
yaka
rta
Kulo
npro
go0
33
10#D
IV/0
!3
DI Y
ogya
kart
aSl
eman
606
876
1,48
219
,012
3113
DKI J
akar
taKe
pula
uan
Serib
u56
4710
375
113
7DK
I Jak
arta
Kota
Jaka
rta
Bara
t65
91,
865
2,52
450
,311
7620
DKI J
akar
taKo
ta Ja
kart
a Pu
sat
141
285
426
5,77
641
14DK
I Jak
arta
Kota
Jaka
rta
Sela
tan
1,27
62,
534
3,81
059
,843
4716
DKI J
akar
taKo
ta Ja
kart
a Ti
mur
1,75
82,
116
3,87
461
,952
3516
DKI J
akar
taKo
ta Ja
kart
a U
tara
749
887
1,63
627
,528
3717
Goro
ntal
oBo
alem
o11
319
430
73,
575
3212
Goro
ntal
oBo
ne B
olan
go13
218
231
43,
437
2611
Goro
ntal
oGo
ront
alo
324
525
849
9,67
430
11Go
ront
alo
Goro
ntal
o U
tara
5213
819
02,
358
4512
Goro
ntal
oKo
ta G
oron
talo
299
267
566
6,88
523
12Go
ront
alo
Pohu
wat
o17
822
340
14,
087
2310
Jam
biBa
tang
hari
241
545
786
7,86
633
10Ja
mbi
Bung
o34
059
793
710
,033
3011
Jam
biKe
rinci
561
779
1,34
09,
033
167
Jam
biKo
ta Ja
mbi
491
919
1,41
020
,169
4114
Jam
biKo
ta S
unga
i Pen
uh22
418
440
83,
524
169
Jam
biM
eran
gin
277
876
1,15
311
,945
4310
Jam
biM
uara
Jam
bi10
817
228
02,
964
2711
Jam
biM
uaro
Jam
bi20
154
474
56,
967
359
Jam
biSa
rola
ngon
8614
322
92,
716
3212
Jam
biSa
rola
ngun
160
629
789
6,52
941
8Ja
mbi
Tanj
ung
Jabu
ng B
arat
209
855
1,06
411
,560
5511
Jam
biTa
njun
g Ja
bung
Tim
ur13
177
590
67,
361
568
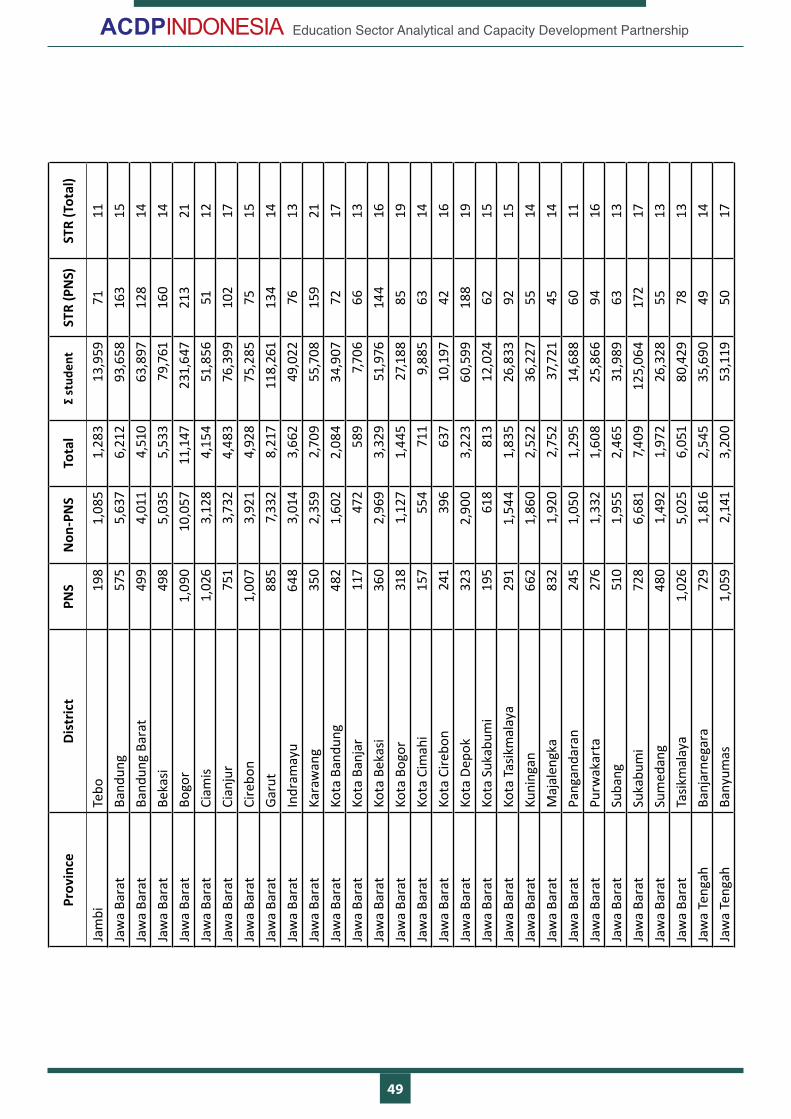
49
Education Sector Analytical and Capacity Development Partnership
Prov
ince
Dist
rict
PNS
Non
-PN
STo
tal
Σ st
uden
tST
R (P
NS)
STR
(Tot
al)
Jam
biTe
bo19
81,
085
1,28
313
,959
7111
Jaw
a Ba
rat
Band
ung
575
5,63
76,
212
93,6
5816
315
Jaw
a Ba
rat
Band
ung
Bara
t49
94,
011
4,51
063
,897
128
14Ja
wa
Bara
tBe
kasi
498
5,03
55,
533
79,7
6116
014
Jaw
a Ba
rat
Bogo
r1,
090
10,0
5711
,147
231,
647
213
21Ja
wa
Bara
tCi
amis
1,02
63,
128
4,15
451
,856
5112
Jaw
a Ba
rat
Cian
jur
751
3,73
24,
483
76,3
9910
217
Jaw
a Ba
rat
Cire
bon
1,00
73,
921
4,92
875
,285
7515
Jaw
a Ba
rat
Garu
t88
57,
332
8,21
711
8,26
113
414
Jaw
a Ba
rat
Indr
amay
u64
83,
014
3,66
249
,022
7613
Jaw
a Ba
rat
Kara
wan
g35
02,
359
2,70
955
,708
159
21Ja
wa
Bara
tKo
ta B
andu
ng48
21,
602
2,08
434
,907
7217
Jaw
a Ba
rat
Kota
Ban
jar
117
472
589
7,706
6613
Jaw
a Ba
rat
Kota
Bek
asi
360
2,96
93,
329
51,9
7614
416
Jaw
a Ba
rat
Kota
Bog
or31
81,
127
1,44
527
,188
8519
Jaw
a Ba
rat
Kota
Cim
ahi
157
554
711
9,88
563
14Ja
wa
Bara
tKo
ta C
irebo
n24
139
663
710
,197
4216
Jaw
a Ba
rat
Kota
Dep
ok32
32,
900
3,22
360
,599
188
19Ja
wa
Bara
tKo
ta S
ukab
umi
195
618
813
12,0
2462
15Ja
wa
Bara
tKo
ta T
asik
mal
aya
291
1,54
41,
835
26,8
3392
15Ja
wa
Bara
tKu
ning
an66
21,
860
2,52
236
,227
5514
Jaw
a Ba
rat
Maj
alen
gka
832
1,92
02,
752
37,7
2145
14Ja
wa
Bara
tPa
ngan
dara
n24
51,
050
1,29
514
,688
6011
Jaw
a Ba
rat
Purw
akar
ta27
61,
332
1,60
825
,866
9416
Jaw
a Ba
rat
Suba
ng51
01,
955
2,46
531
,989
6313
Jaw
a Ba
rat
Suka
bum
i72
86,
681
7,40
912
5,06
417
217
Jaw
a Ba
rat
Sum
edan
g48
01,
492
1,97
226
,328
5513
Jaw
a Ba
rat
Tasik
mal
aya
1,02
65,
025
6,05
180
,429
7813
Jaw
a Te
ngah
Banj
arne
gara
729
1,81
62,
545
35,6
9049
14Ja
wa
Teng
ahBa
nyum
as1,
059
2,14
13,
200
53,1
1950
17

50
Education Sector Analytical and Capacity Development Partnership
Prov
ince
Dist
rict
PNS
Non
-PN
STo
tal
Σ st
uden
tST
R (P
NS)
STR
(Tot
al)
Jaw
a Te
ngah
Bata
ng59
71,
225
1,82
227
,732
4615
Jaw
a Te
ngah
Blor
a18
71,
504
1,69
121
,887
117
13Ja
wa
Teng
ahBo
yola
li92
12,
124
3,04
541
,037
4513
Jaw
a Te
ngah
Breb
es64
73,
724
4,37
175
,725
117
17Ja
wa
Teng
ahCi
laca
p81
62,
402
3,21
853
,854
6617
Jaw
a Te
ngah
Dem
ak97
54,
005
4,98
070
,032
7214
Jaw
a Te
ngah
Grob
ogan
446
2,36
12,
807
42,4
2395
15Ja
wa
Teng
ahJe
para
387
4,50
64,
893
74,6
4219
315
Jaw
a Te
ngah
Kara
ngan
yar
469
934
1,40
319
,917
4214
Jaw
a Te
ngah
Kebu
men
760
2,23
82,
998
39,2
9252
13Ja
wa
Teng
ahKe
ndal
326
1,62
81,
954
31,6
7597
16Ja
wa
Teng
ahKl
aten
627
1,02
41,
651
23,1
7737
14Ja
wa
Teng
ahKo
ta M
agel
ang
114
8620
03,
158
2816
Jaw
a Te
ngah
Kota
Pek
alon
gan
293
692
985
16,6
7157
17Ja
wa
Teng
ahKo
ta S
alati
ga16
917
033
95,
563
3316
Jaw
a Te
ngah
Kota
Sem
aran
g36
51,
521
1,88
628
,750
7915
Jaw
a Te
ngah
Kota
Sur
akar
ta26
132
959
07,
824
3013
Jaw
a Te
ngah
Kota
Teg
al11
027
838
86,
825
6218
Jaw
a Te
ngah
Kudu
s44
23,
342
3,78
458
,317
132
15Ja
wa
Teng
ahM
agel
ang
571
3,17
53,
746
52,9
2693
14Ja
wa
Teng
ahPa
ti43
94,
831
5,27
067
,158
153
13Ja
wa
Teng
ahPe
kalo
ngan
631
1,50
52,
136
37,1
5059
17Ja
wa
Teng
ahPe
mal
ang
573
1,35
91,
932
31,5
7155
16Ja
wa
Teng
ahPu
rbal
ingg
a84
71,
604
2,45
138
,975
4616
Jaw
a Te
ngah
Purw
orej
o30
771
01,
017
14,7
4648
14Ja
wa
Teng
ahRe
mba
ng34
61,
389
1,73
523
,270
6713
Jaw
a Te
ngah
Sem
aran
g28
81,
882
2,17
032
,237
112
15Ja
wa
Teng
ahSr
agen
683
1,02
61,
709
23,6
4535
14Ja
wa
Teng
ahSu
koha
rjo53
71,
280
1,81
726
,846
5015
Jaw
a Te
ngah
Tega
l49
12,
914
3,40
557
,838
118
17
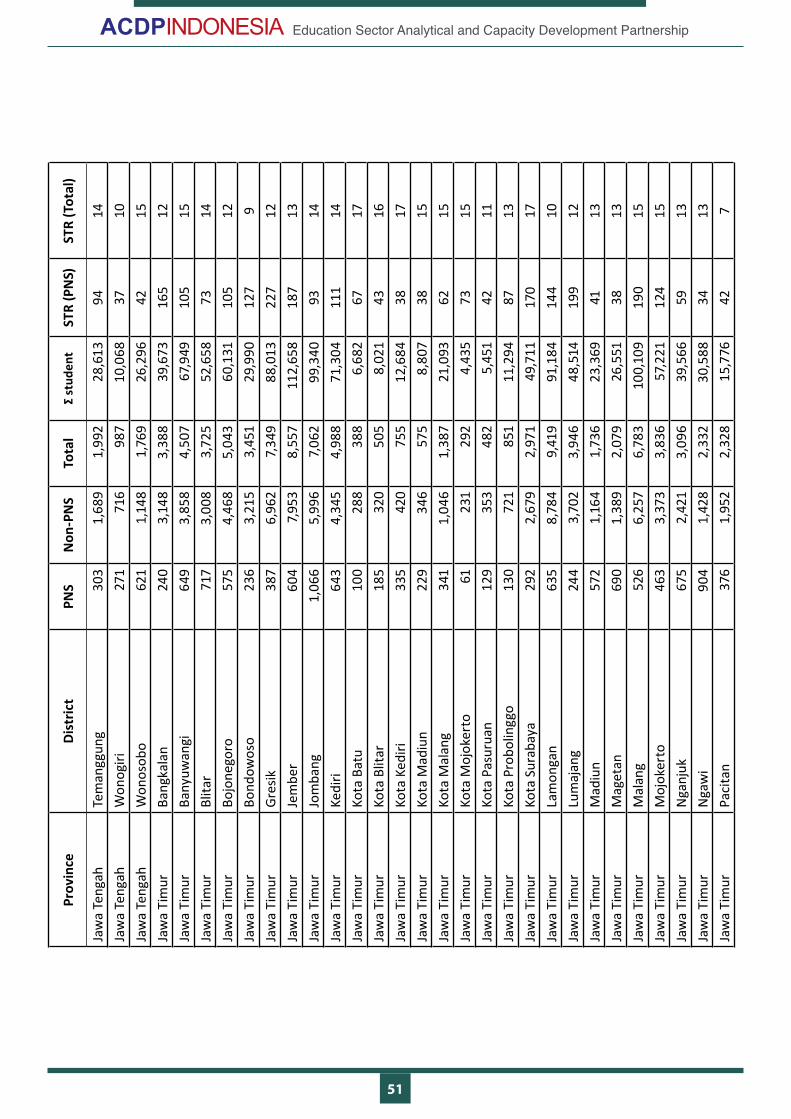
51
Education Sector Analytical and Capacity Development Partnership
Prov
ince
Dist
rict
PNS
Non
-PN
STo
tal
Σ st
uden
tST
R (P
NS)
STR
(Tot
al)
Jaw
a Te
ngah
Tem
angg
ung
303
1,68
91,
992
28,6
1394
14Ja
wa
Teng
ahW
onog
iri27
171
698
710
,068
3710
Jaw
a Te
ngah
Won
osob
o62
11,
148
1,76
926
,296
4215
Jaw
a Ti
mur
Bang
kala
n24
03,
148
3,38
839
,673
165
12Ja
wa
Tim
urBa
nyuw
angi
649
3,85
84,
507
67,9
4910
515
Jaw
a Ti
mur
Blita
r71
73,
008
3,72
552
,658
7314
Jaw
a Ti
mur
Bojo
nego
ro57
54,
468
5,04
360
,131
105
12Ja
wa
Tim
urBo
ndow
oso
236
3,21
53,
451
29,9
9012
79
Jaw
a Ti
mur
Gres
ik38
76,
962
7,34
988
,013
227
12Ja
wa
Tim
urJe
mbe
r60
47,
953
8,55
711
2,65
818
713
Jaw
a Ti
mur
Jom
bang
1,06
65,
996
7,06
299
,340
9314
Jaw
a Ti
mur
Kedi
ri64
34,
345
4,98
871
,304
111
14Ja
wa
Tim
urKo
ta B
atu
100
288
388
6,68
267
17Ja
wa
Tim
urKo
ta B
litar
185
320
505
8,02
143
16Ja
wa
Tim
urKo
ta K
ediri
335
420
755
12,6
8438
17Ja
wa
Tim
urKo
ta M
adiu
n22
934
657
58,
807
3815
Jaw
a Ti
mur
Kota
Mal
ang
341
1,04
61,
387
21,0
9362
15Ja
wa
Tim
urKo
ta M
ojok
erto
6123
129
24,
435
7315
Jaw
a Ti
mur
Kota
Pas
urua
n12
935
348
25,
451
4211
Jaw
a Ti
mur
Kota
Pro
bolin
ggo
130
721
851
11,2
9487
13Ja
wa
Tim
urKo
ta S
urab
aya
292
2,67
92,
971
49,7
1117
017
Jaw
a Ti
mur
Lam
onga
n63
58,
784
9,41
991
,184
144
10Ja
wa
Tim
urLu
maj
ang
244
3,70
23,
946
48,5
1419
912
Jaw
a Ti
mur
Mad
iun
572
1,16
41,
736
23,3
6941
13Ja
wa
Tim
urM
aget
an69
01,
389
2,07
926
,551
3813
Jaw
a Ti
mur
Mal
ang
526
6,25
76,
783
100,
109
190
15Ja
wa
Tim
urM
ojok
erto
463
3,37
33,
836
57,2
2112
415
Jaw
a Ti
mur
Nga
njuk
675
2,42
13,
096
39,5
6659
13Ja
wa
Tim
urN
gaw
i90
41,
428
2,33
230
,588
3413
Jaw
a Ti
mur
Paci
tan
376
1,95
22,
328
15,7
7642
7
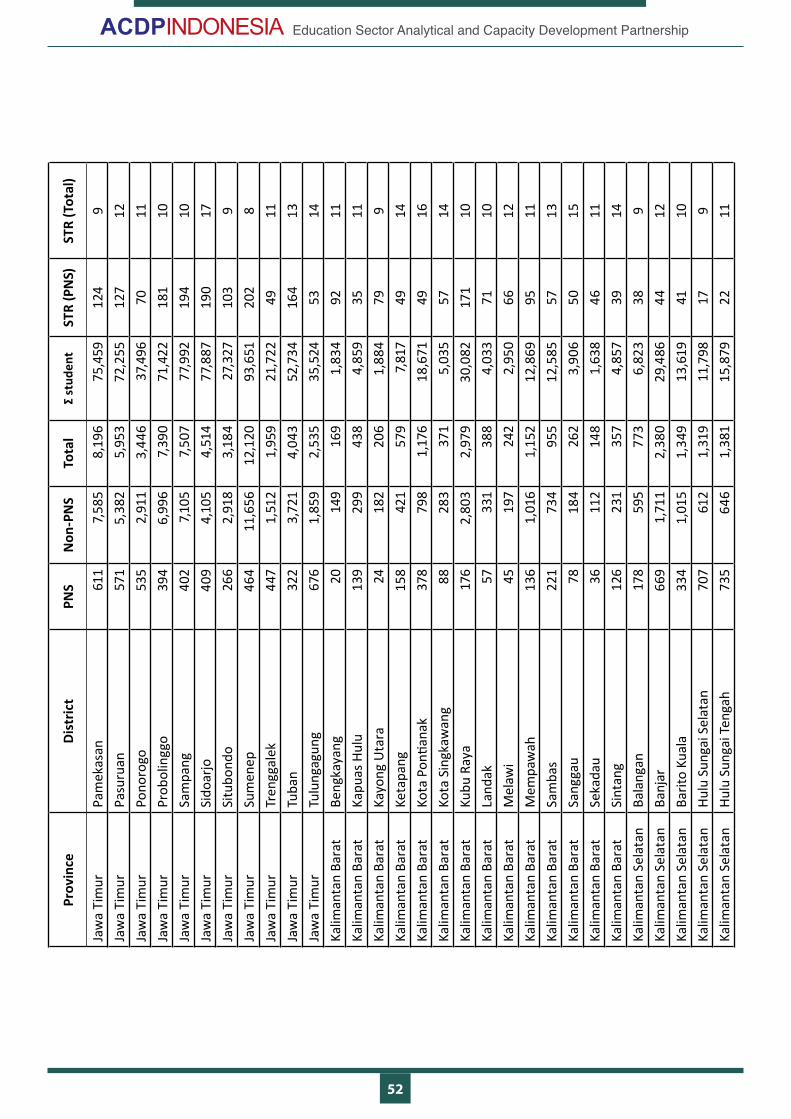
52
Education Sector Analytical and Capacity Development Partnership
Prov
ince
Dist
rict
PNS
Non
-PN
STo
tal
Σ st
uden
tST
R (P
NS)
STR
(Tot
al)
Jaw
a Ti
mur
Pam
ekas
an61
17,
585
8,19
675
,459
124
9Ja
wa
Tim
urPa
suru
an57
15,
382
5,95
372
,255
127
12Ja
wa
Tim
urPo
noro
go53
52,
911
3,44
637
,496
7011
Jaw
a Ti
mur
Prob
olin
ggo
394
6,99
67,
390
71,4
2218
110
Jaw
a Ti
mur
Sam
pang
402
7,10
57,
507
77,9
9219
410
Jaw
a Ti
mur
Sido
arjo
409
4,10
54,
514
77,8
8719
017
Jaw
a Ti
mur
Situ
bond
o26
62,
918
3,18
427
,327
103
9Ja
wa
Tim
urSu
men
ep46
411
,656
12,1
2093
,651
202
8Ja
wa
Tim
urTr
engg
alek
447
1,51
21,
959
21,7
2249
11Ja
wa
Tim
urTu
ban
322
3,72
14,
043
52,7
3416
413
Jaw
a Ti
mur
Tulu
ngag
ung
676
1,85
92,
535
35,5
2453
14Ka
liman
tan
Bara
tBe
ngka
yang
2014
916
91,
834
9211
Kalim
anta
n Ba
rat
Kapu
as H
ulu
139
299
438
4,85
935
11Ka
liman
tan
Bara
tKa
yong
Uta
ra24
182
206
1,88
479
9Ka
liman
tan
Bara
tKe
tapa
ng15
842
157
97,
817
4914
Kalim
anta
n Ba
rat
Kota
Pon
tiana
k37
879
81,
176
18,6
7149
16Ka
liman
tan
Bara
tKo
ta S
ingk
awan
g88
283
371
5,03
557
14Ka
liman
tan
Bara
tKu
bu R
aya
176
2,80
32,
979
30,0
8217
110
Kalim
anta
n Ba
rat
Land
ak57
331
388
4,03
371
10Ka
liman
tan
Bara
tM
elaw
i45
197
242
2,95
066
12Ka
liman
tan
Bara
tM
empa
wah
136
1,01
61,
152
12,8
6995
11Ka
liman
tan
Bara
tSa
mba
s22
173
495
512
,585
5713
Kalim
anta
n Ba
rat
Sang
gau
7818
426
23,
906
5015
Kalim
anta
n Ba
rat
Seka
dau
3611
214
81,
638
4611
Kalim
anta
n Ba
rat
Sint
ang
126
231
357
4,85
739
14Ka
liman
tan
Sela
tan
Bala
ngan
178
595
773
6,82
338
9Ka
liman
tan
Sela
tan
Banj
ar66
91,
711
2,38
029
,486
4412
Kalim
anta
n Se
lata
nBa
rito
Kual
a33
41,
015
1,34
913
,619
4110
Kalim
anta
n Se
lata
nHu
lu S
unga
i Sel
atan
707
612
1,31
911
,798
179
Kalim
anta
n Se
lata
nHu
lu S
unga
i Ten
gah
735
646
1,38
115
,879
2211
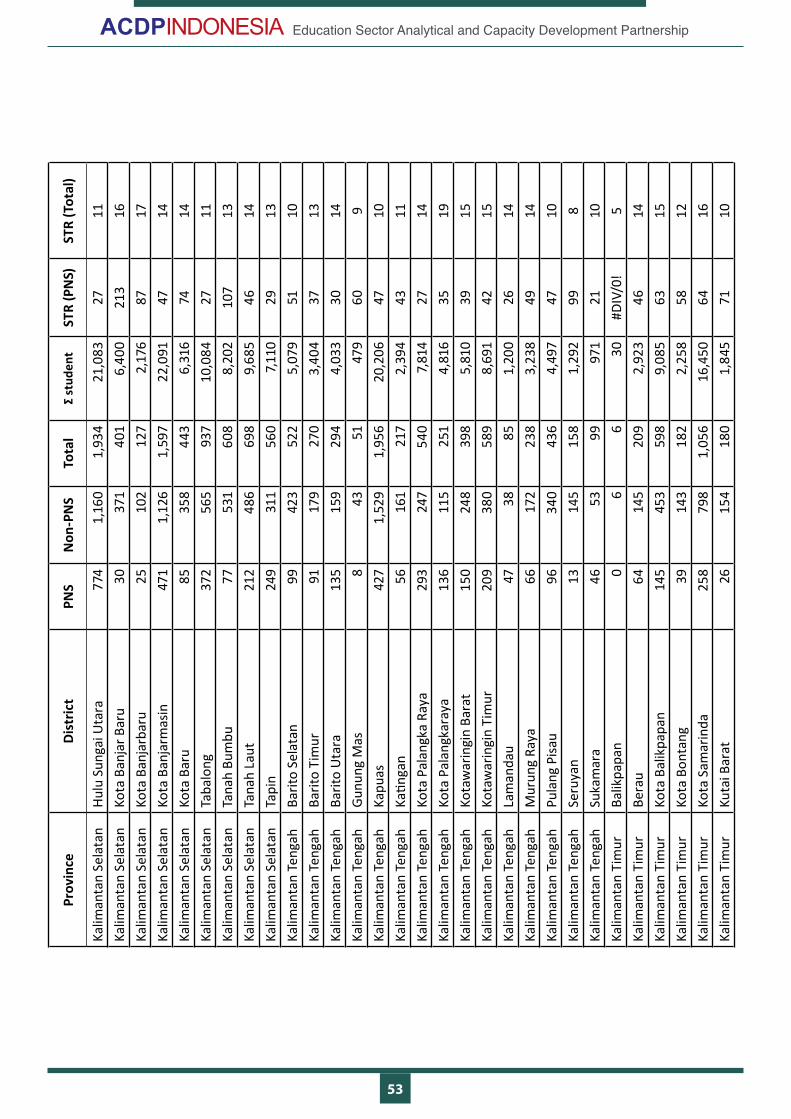
53
Education Sector Analytical and Capacity Development Partnership
Prov
ince
Dist
rict
PNS
Non
-PN
STo
tal
Σ st
uden
tST
R (P
NS)
STR
(Tot
al)
Kalim
anta
n Se
lata
nHu
lu S
unga
i Uta
ra77
41,
160
1,93
421
,083
2711
Kalim
anta
n Se
lata
nKo
ta B
anja
r Bar
u30
371
401
6,40
021
316
Kalim
anta
n Se
lata
nKo
ta B
anja
rbar
u25
102
127
2,17
687
17Ka
liman
tan
Sela
tan
Kota
Ban
jarm
asin
471
1,12
61,
597
22,0
9147
14Ka
liman
tan
Sela
tan
Kota
Bar
u85
358
443
6,31
674
14Ka
liman
tan
Sela
tan
Taba
long
372
565
937
10,0
8427
11Ka
liman
tan
Sela
tan
Tana
h Bu
mbu
7753
160
88,
202
107
13Ka
liman
tan
Sela
tan
Tana
h La
ut21
248
669
89,
685
4614
Kalim
anta
n Se
lata
nTa
pin
249
311
560
7,11
029
13Ka
liman
tan
Teng
ahBa
rito
Sela
tan
9942
352
25,
079
5110
Kalim
anta
n Te
ngah
Barit
o Ti
mur
9117
927
03,
404
3713
Kalim
anta
n Te
ngah
Barit
o U
tara
135
159
294
4,03
330
14Ka
liman
tan
Teng
ahGu
nung
Mas
843
5147
960
9Ka
liman
tan
Teng
ahKa
puas
427
1,52
91,
956
20,2
0647
10Ka
liman
tan
Teng
ahKa
tinga
n56
161
217
2,39
443
11Ka
liman
tan
Teng
ahKo
ta P
alan
gka
Raya
293
247
540
7,81
427
14Ka
liman
tan
Teng
ahKo
ta P
alan
gkar
aya
136
115
251
4,81
635
19Ka
liman
tan
Teng
ahKo
taw
arin
gin
Bara
t15
024
839
85,
810
3915
Kalim
anta
n Te
ngah
Kota
war
ingi
n Ti
mur
209
380
589
8,69
142
15Ka
liman
tan
Teng
ahLa
man
dau
4738
851,
200
2614
Kalim
anta
n Te
ngah
Mur
ung
Raya
6617
223
83,
238
4914
Kalim
anta
n Te
ngah
Pula
ng P
isau
9634
043
64,
497
4710
Kalim
anta
n Te
ngah
Seru
yan
1314
515
81,
292
998
Kalim
anta
n Te
ngah
Suka
mar
a46
5399
971
2110
Kalim
anta
n Ti
mur
Balik
papa
n0
66
30#D
IV/0
!5
Kalim
anta
n Ti
mur
Bera
u64
145
209
2,92
346
14Ka
liman
tan
Tim
urKo
ta B
alik
papa
n14
545
359
89,
085
6315
Kalim
anta
n Ti
mur
Kota
Bon
tang
3914
318
22,
258
5812
Kalim
anta
n Ti
mur
Kota
Sam
arin
da25
879
81,
056
16,4
5064
16Ka
liman
tan
Tim
urKu
tai B
arat
2615
418
01,
845
7110
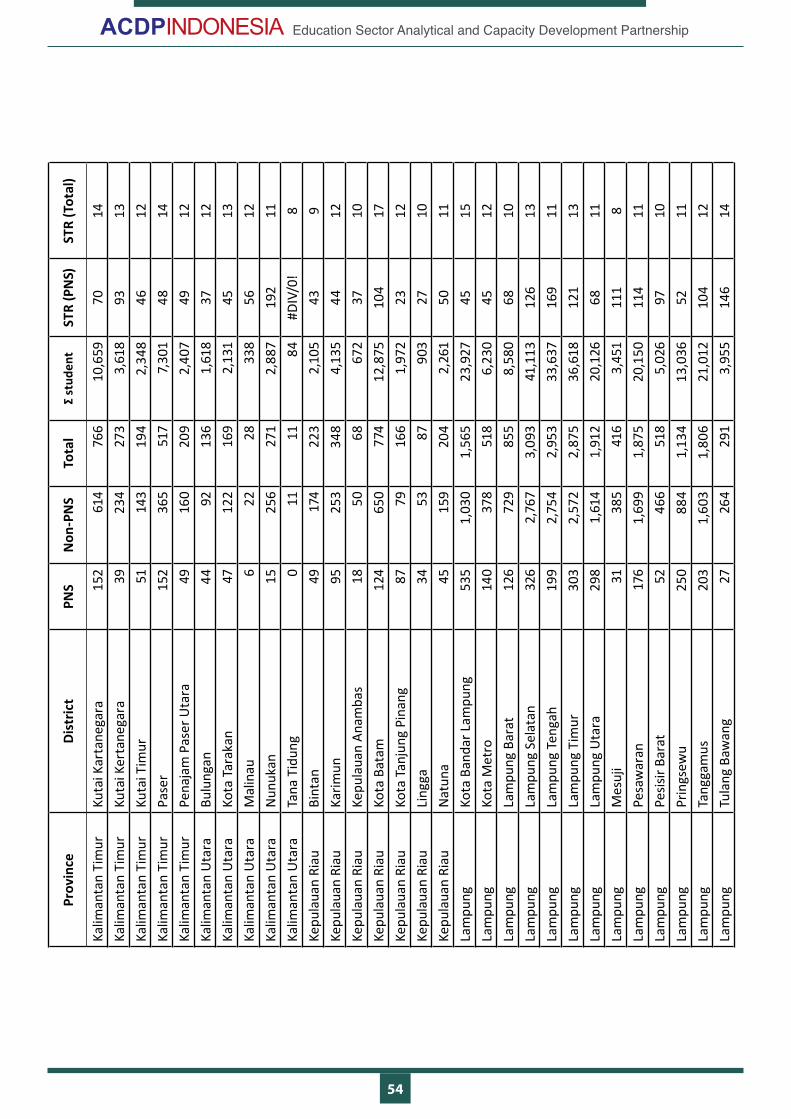
54
Education Sector Analytical and Capacity Development Partnership
Prov
ince
Dist
rict
PNS
Non
-PN
STo
tal
Σ st
uden
tST
R (P
NS)
STR
(Tot
al)
Kalim
anta
n Ti
mur
Kuta
i Kar
tane
gara
152
614
766
10,6
5970
14Ka
liman
tan
Tim
urKu
tai K
erta
nega
ra39
234
273
3,61
893
13Ka
liman
tan
Tim
urKu
tai T
imur
5114
319
42,
348
4612
Kalim
anta
n Ti
mur
Pase
r15
236
551
77,
301
4814
Kalim
anta
n Ti
mur
Pena
jam
Pas
er U
tara
4916
020
92,
407
4912
Kalim
anta
n U
tara
Bulu
ngan
4492
136
1,61
837
12Ka
liman
tan
Uta
raKo
ta T
arak
an47
122
169
2,13
145
13Ka
liman
tan
Uta
raM
alin
au6
2228
338
5612
Kalim
anta
n U
tara
Nun
ukan
1525
627
12,
887
192
11Ka
liman
tan
Uta
raTa
na T
idun
g0
1111
84#D
IV/0
!8
Kepu
laua
n Ri
auBi
ntan
4917
422
32,
105
439
Kepu
laua
n Ri
auKa
rimun
9525
334
84,
135
4412
Kepu
laua
n Ri
auKe
pula
uan
Anam
bas
1850
6867
237
10Ke
pula
uan
Riau
Kota
Bat
am12
465
077
412
,875
104
17Ke
pula
uan
Riau
Kota
Tan
jung
Pin
ang
8779
166
1,97
223
12Ke
pula
uan
Riau
Ling
ga34
5387
903
2710
Kepu
laua
n Ri
auN
atun
a45
159
204
2,26
150
11La
mpu
ngKo
ta B
anda
r Lam
pung
535
1,03
01,
565
23,9
2745
15La
mpu
ngKo
ta M
etro
140
378
518
6,23
045
12La
mpu
ngLa
mpu
ng B
arat
126
729
855
8,58
068
10La
mpu
ngLa
mpu
ng S
elat
an32
62,
767
3,09
341
,113
126
13La
mpu
ngLa
mpu
ng T
enga
h19
92,
754
2,95
333
,637
169
11La
mpu
ngLa
mpu
ng T
imur
303
2,57
22,
875
36,6
1812
113
Lam
pung
Lam
pung
Uta
ra29
81,
614
1,91
220
,126
6811
Lam
pung
Mes
uji
3138
541
63,
451
111
8La
mpu
ngPe
saw
aran
176
1,69
91,
875
20,1
5011
411
Lam
pung
Pesis
ir Ba
rat
5246
651
85,
026
9710
Lam
pung
Prin
gsew
u25
088
41,
134
13,0
3652
11La
mpu
ngTa
ngga
mus
203
1,60
31,
806
21,0
1210
412
Lam
pung
Tula
ng B
awan
g27
264
291
3,95
514
614

55
Education Sector Analytical and Capacity Development Partnership
Prov
ince
Dist
rict
PNS
Non
-PN
STo
tal
Σ st
uden
tST
R (P
NS)
STR
(Tot
al)
Lam
pung
Tula
ng B
awan
g Ba
rat
6151
657
75,
375
889
Lam
pung
Tula
ngba
wan
g27
490
517
4,41
516
49
Lam
pung
Way
Kan
an93
1,05
11,
144
11,1
3312
010
Mal
uku
Buru
120
193
313
2,36
720
8M
aluk
uBu
ru S
elat
an27
5380
707
269
Mal
uku
Kepu
laua
n Ar
u70
8915
91,
855
2712
Mal
uku
Kota
Am
bon
225
224
449
5,64
125
13M
aluk
uKo
ta T
ual
7525
332
82,
599
358
Mal
uku
Mal
uku
Teng
ah42
589
01,
315
11,8
8328
9M
aluk
uM
aluk
u Te
ngga
ra10
328
739
03,
074
308
Mal
uku
Sera
m B
agia
n Ba
rat
164
520
684
5,91
236
9M
aluk
uSe
ram
Bag
ian
Tim
ur12
432
745
15,
164
4211
Mal
uku
Uta
raHa
lmah
era
Bara
t13
211
624
81,
606
126
Mal
uku
Uta
raHa
lmah
era
Sela
tan
354
504
858
8,83
325
10M
aluk
u U
tara
Halm
aher
a Te
ngah
6610
617
21,
425
228
Mal
uku
Uta
raHa
lmah
era
Tim
ur59
9615
51,
508
2610
Mal
uku
Uta
raHa
lmah
era
Uta
ra20
048
668
66,
464
329
Mal
uku
Uta
raKe
pula
uan
Sula
145
292
437
4,65
732
11M
aluk
u U
tara
Kota
Ter
nate
262
124
386
4,67
218
12M
aluk
u U
tara
Kota
Tid
ore
Kepu
laua
n35
817
553
34,
370
128
Mal
uku
Uta
raPu
lau
Mor
otai
110
230
340
3,77
134
11M
aluk
u U
tara
Pula
u Ta
liabu
2915
318
21,
488
518
Nus
a Te
ngga
ra B
arat
Bim
a34
52,
838
3,18
319
,814
576
Nus
a Te
ngga
ra B
arat
Dom
pu15
81,
507
1,66
512
,212
777
Nus
a Te
ngga
ra B
arat
Kota
Bim
a22
459
982
37,
519
349
Nus
a Te
ngga
ra B
arat
Kota
Mat
aram
277
754
1,03
111
,908
4312
Nus
a Te
ngga
ra B
arat
Lom
bok
Bara
t27
44,
028
4,30
240
,607
148
9N
usa
Teng
gara
Bar
atLo
mbo
k Te
ngah
489
9,41
39,
902
72,7
8214
97
Nus
a Te
ngga
ra B
arat
Lom
bok
Tim
ur53
59,
025
9,56
084
,130
157
9N
usa
Teng
gara
Bar
atLo
mbo
k U
tara
231,
155
1,17
89,
224
401
8
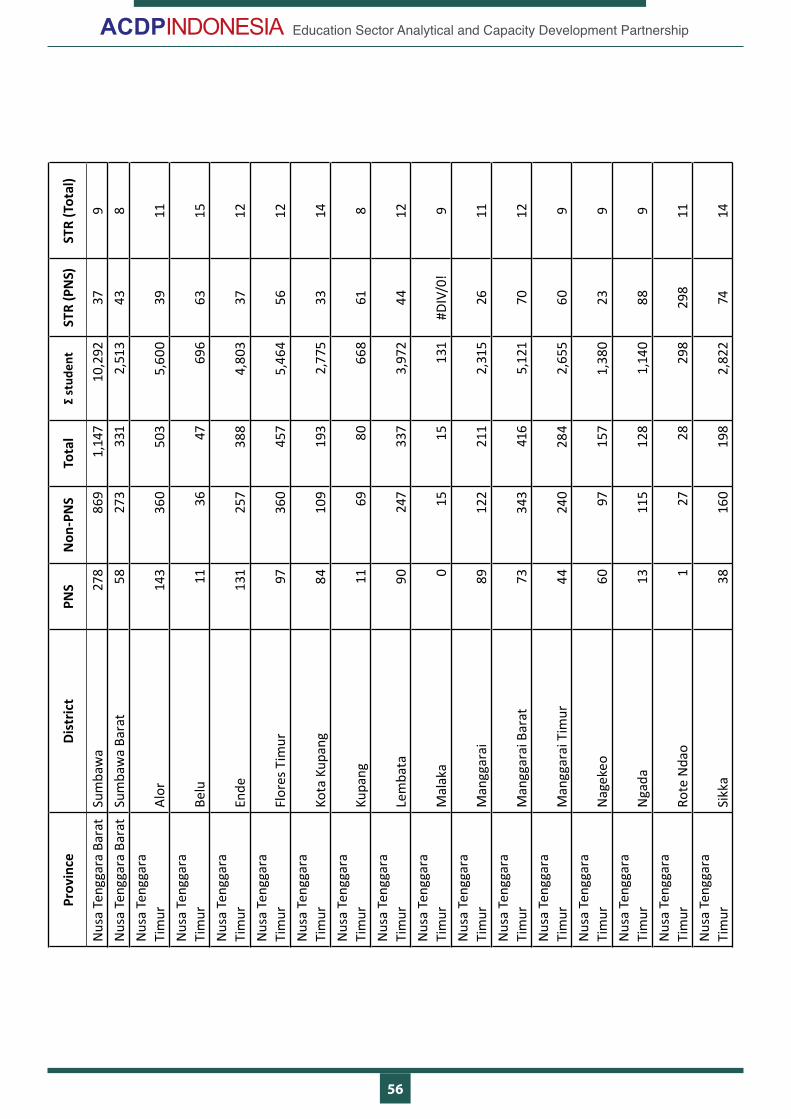
56
Education Sector Analytical and Capacity Development Partnership
Prov
ince
Dist
rict
PNS
Non
-PN
STo
tal
Σ st
uden
tST
R (P
NS)
STR
(Tot
al)
Nus
a Te
ngga
ra B
arat
Sum
baw
a27
886
91,
147
10,2
9237
9N
usa
Teng
gara
Bar
atSu
mba
wa
Bara
t58
273
331
2,51
343
8N
usa
Teng
gara
Ti
mur
Alor
143
360
503
5,60
039
11N
usa
Teng
gara
Ti
mur
Belu
1136
4769
663
15N
usa
Teng
gara
Ti
mur
Ende
131
257
388
4,80
337
12N
usa
Teng
gara
Ti
mur
Flor
es T
imur
9736
045
75,
464
5612
Nus
a Te
ngga
ra
Tim
urKo
ta K
upan
g84
109
193
2,77
533
14N
usa
Teng
gara
Ti
mur
Kupa
ng11
6980
668
618
Nus
a Te
ngga
ra
Tim
urLe
mba
ta90
247
337
3,97
244
12N
usa
Teng
gara
Ti
mur
Mal
aka
015
1513
1#D
IV/0
!9
Nus
a Te
ngga
ra
Tim
urM
angg
arai
8912
221
12,
315
2611
Nus
a Te
ngga
ra
Tim
urM
angg
arai
Bar
at73
343
416
5,12
170
12N
usa
Teng
gara
Ti
mur
Man
ggar
ai T
imur
4424
028
42,
655
609
Nus
a Te
ngga
ra
Tim
urN
agek
eo60
9715
71,
380
239
Nus
a Te
ngga
ra
Tim
urN
gada
1311
512
81,
140
889
Nus
a Te
ngga
ra
Tim
urRo
te N
dao
127
2829
829
811
Nus
a Te
ngga
ra
Tim
urSi
kka
3816
019
82,
822
7414
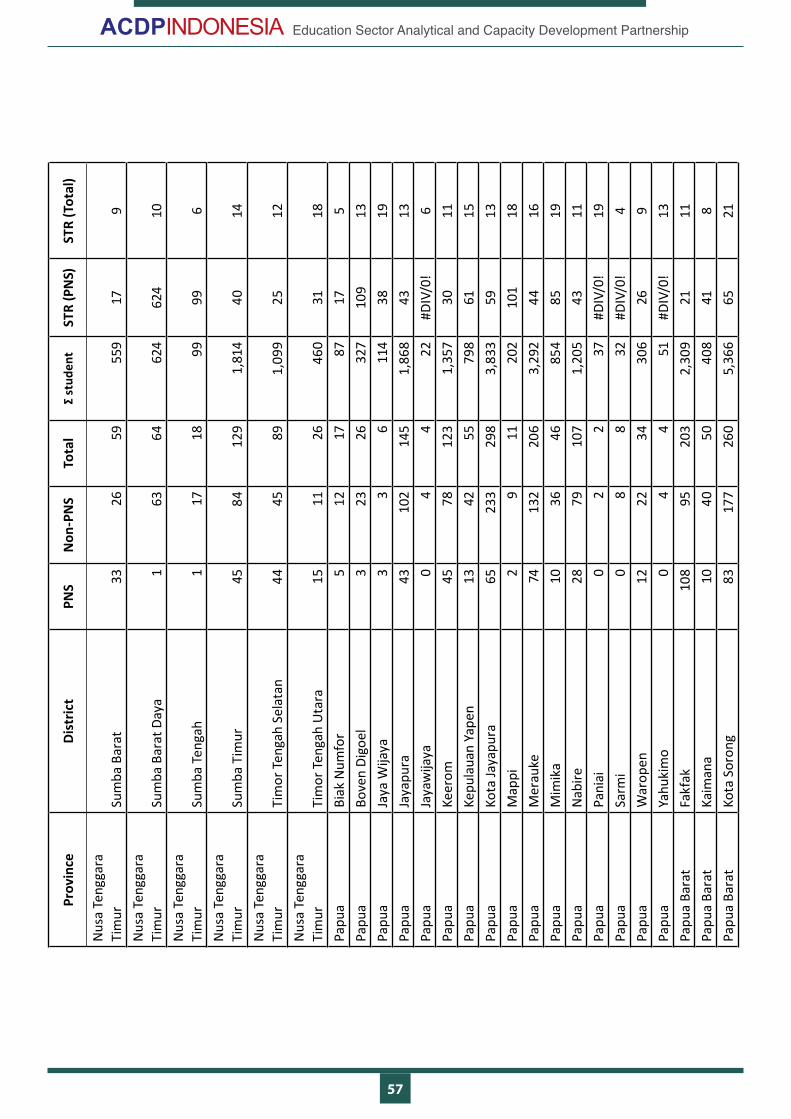
57
Education Sector Analytical and Capacity Development Partnership
Prov
ince
Dist
rict
PNS
Non
-PN
STo
tal
Σ st
uden
tST
R (P
NS)
STR
(Tot
al)
Nus
a Te
ngga
ra
Tim
urSu
mba
Bar
at33
2659
559
179
Nus
a Te
ngga
ra
Tim
urSu
mba
Bar
at D
aya
163
6462
462
410
Nus
a Te
ngga
ra
Tim
urSu
mba
Ten
gah
117
1899
996
Nus
a Te
ngga
ra
Tim
urSu
mba
Tim
ur45
8412
91,
814
4014
Nus
a Te
ngga
ra
Tim
urTi
mor
Ten
gah
Sela
tan
4445
891,
099
2512
Nus
a Te
ngga
ra
Tim
urTi
mor
Ten
gah
Uta
ra15
1126
460
3118
Papu
aBi
ak N
umfo
r5
1217
8717
5Pa
pua
Bove
n Di
goel
323
2632
710
913
Papu
aJa
ya W
ijaya
33
611
438
19Pa
pua
Jaya
pura
4310
214
51,
868
4313
Papu
aJa
yaw
ijaya
04
422
#DIV
/0!
6Pa
pua
Keer
om45
7812
31,
357
3011
Papu
aKe
pula
uan
Yape
n13
4255
798
6115
Papu
aKo
ta Ja
yapu
ra65
233
298
3,83
359
13Pa
pua
Map
pi2
911
202
101
18Pa
pua
Mer
auke
7413
220
63,
292
4416
Papu
aM
imik
a10
3646
854
8519
Papu
aN
abire
2879
107
1,20
543
11Pa
pua
Pani
ai0
22
37#D
IV/0
!19
Papu
aSa
rmi
08
832
#DIV
/0!
4Pa
pua
War
open
1222
3430
626
9Pa
pua
Yahu
kim
o0
44
51#D
IV/0
!13
Papu
a Ba
rat
Fakf
ak10
895
203
2,30
921
11Pa
pua
Bara
tKa
iman
a10
4050
408
418
Papu
a Ba
rat
Kota
Sor
ong
8317
726
05,
366
6521
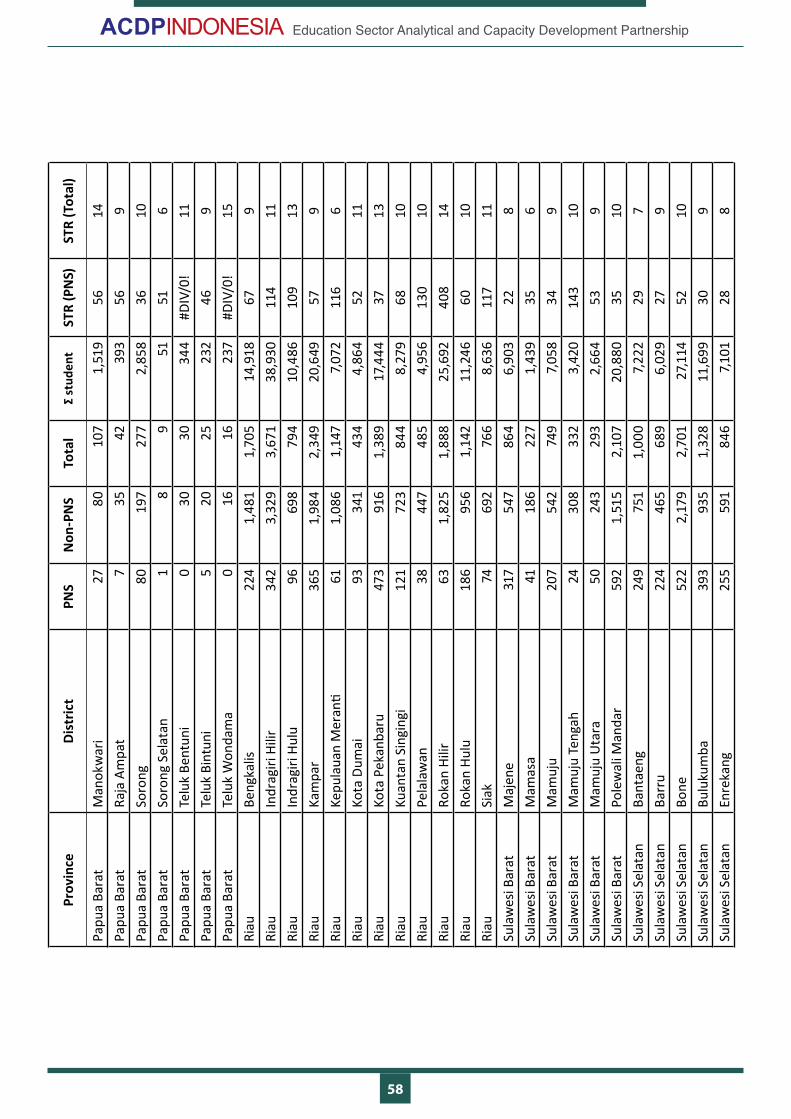
58
Education Sector Analytical and Capacity Development Partnership
Prov
ince
Dist
rict
PNS
Non
-PN
STo
tal
Σ st
uden
tST
R (P
NS)
STR
(Tot
al)
Papu
a Ba
rat
Man
okw
ari
2780
107
1,51
956
14Pa
pua
Bara
tRa
ja A
mpa
t7
3542
393
569
Papu
a Ba
rat
Soro
ng80
197
277
2,85
836
10Pa
pua
Bara
tSo
rong
Sel
atan
18
951
516
Papu
a Ba
rat
Telu
k Be
ntun
i0
3030
344
#DIV
/0!
11Pa
pua
Bara
tTe
luk
Bint
uni
520
2523
246
9Pa
pua
Bara
tTe
luk
Won
dam
a0
1616
237
#DIV
/0!
15Ri
auBe
ngka
lis22
41,
481
1,70
514
,918
679
Riau
Indr
agiri
Hili
r34
23,
329
3,67
138
,930
114
11Ri
auIn
drag
iri H
ulu
9669
879
410
,486
109
13Ri
auKa
mpa
r36
51,
984
2,34
920
,649
579
Riau
Kepu
laua
n M
eran
ti61
1,08
61,
147
7,07
211
66
Riau
Kota
Dum
ai93
341
434
4,86
452
11Ri
auKo
ta P
ekan
baru
473
916
1,38
917
,444
3713
Riau
Kuan
tan
Sing
ingi
121
723
844
8,27
968
10Ri
auPe
lala
wan
3844
748
54,
956
130
10Ri
auRo
kan
Hilir
631,
825
1,88
825
,692
408
14Ri
auRo
kan
Hulu
186
956
1,14
211
,246
6010
Riau
Siak
7469
276
68,
636
117
11Su
law
esi B
arat
Maj
ene
317
547
864
6,90
322
8Su
law
esi B
arat
Mam
asa
4118
622
71,
439
356
Sula
wes
i Bar
atM
amuj
u20
754
274
97,
058
349
Sula
wes
i Bar
atM
amuj
u Te
ngah
2430
833
23,
420
143
10Su
law
esi B
arat
Mam
uju
Uta
ra50
243
293
2,66
453
9Su
law
esi B
arat
Pole
wal
i Man
dar
592
1,51
52,
107
20,8
8035
10Su
law
esi S
elat
anBa
ntae
ng24
975
11,
000
7,22
229
7Su
law
esi S
elat
anBa
rru
224
465
689
6,02
927
9Su
law
esi S
elat
anBo
ne52
22,
179
2,70
127
,114
5210
Sula
wes
i Sel
atan
Bulu
kum
ba39
393
51,
328
11,6
9930
9Su
law
esi S
elat
anEn
reka
ng25
559
184
67,
101
288
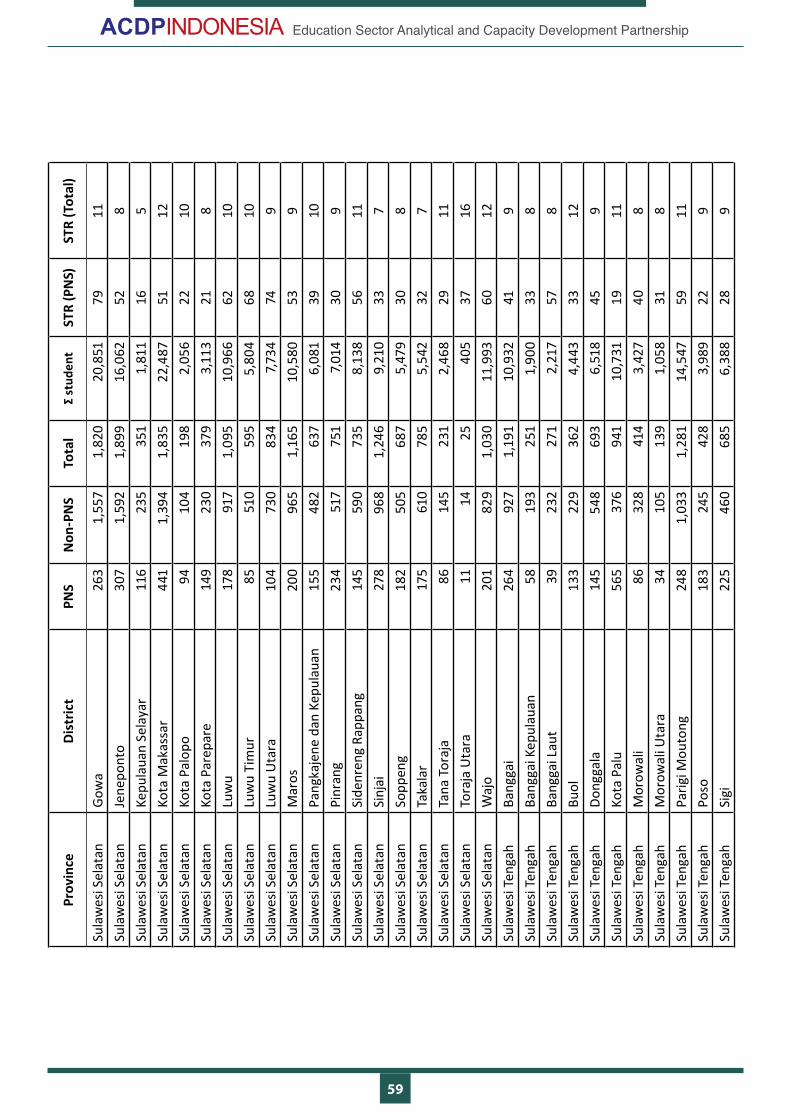
59
Education Sector Analytical and Capacity Development Partnership
Prov
ince
Dist
rict
PNS
Non
-PN
STo
tal
Σ st
uden
tST
R (P
NS)
STR
(Tot
al)
Sula
wes
i Sel
atan
Gow
a26
31,
557
1,82
020
,851
7911
Sula
wes
i Sel
atan
Jene
pont
o30
71,
592
1,89
916
,062
528
Sula
wes
i Sel
atan
Kepu
laua
n Se
laya
r11
623
535
11,
811
165
Sula
wes
i Sel
atan
Kota
Mak
assa
r44
11,
394
1,83
522
,487
5112
Sula
wes
i Sel
atan
Kota
Pal
opo
9410
419
82,
056
2210
Sula
wes
i Sel
atan
Kota
Par
epar
e14
923
037
93,
113
218
Sula
wes
i Sel
atan
Luw
u17
891
71,
095
10,9
6662
10Su
law
esi S
elat
anLu
wu
Tim
ur85
510
595
5,80
468
10Su
law
esi S
elat
anLu
wu
Uta
ra10
473
083
47,7
3474
9Su
law
esi S
elat
anM
aros
200
965
1,16
510
,580
539
Sula
wes
i Sel
atan
Pang
kaje
ne d
an K
epul
auan
155
482
637
6,08
139
10Su
law
esi S
elat
anPi
nran
g23
451
775
17,
014
309
Sula
wes
i Sel
atan
Side
nren
g Ra
ppan
g14
559
073
58,
138
5611
Sula
wes
i Sel
atan
Sinj
ai27
896
81,
246
9,21
033
7Su
law
esi S
elat
anSo
ppen
g18
250
568
75,
479
308
Sula
wes
i Sel
atan
Taka
lar
175
610
785
5,54
232
7Su
law
esi S
elat
anTa
na T
oraj
a86
145
231
2,46
829
11Su
law
esi S
elat
anTo
raja
Uta
ra11
1425
405
3716
Sula
wes
i Sel
atan
Waj
o20
182
91,
030
11,9
9360
12Su
law
esi T
enga
hBa
ngga
i26
492
71,
191
10,9
3241
9Su
law
esi T
enga
hBa
ngga
i Kep
ulau
an58
193
251
1,90
033
8Su
law
esi T
enga
hBa
ngga
i Lau
t39
232
271
2,21
757
8Su
law
esi T
enga
hBu
ol13
322
936
24,
443
3312
Sula
wes
i Ten
gah
Dong
gala
145
548
693
6,51
845
9Su
law
esi T
enga
hKo
ta P
alu
565
376
941
10,7
3119
11Su
law
esi T
enga
hM
orow
ali
8632
841
43,
427
408
Sula
wes
i Ten
gah
Mor
owal
i Uta
ra34
105
139
1,05
831
8Su
law
esi T
enga
hPa
rigi M
outo
ng24
81,
033
1,28
114
,547
5911
Sula
wes
i Ten
gah
Poso
183
245
428
3,98
922
9Su
law
esi T
enga
hSi
gi22
546
068
56,
388
289
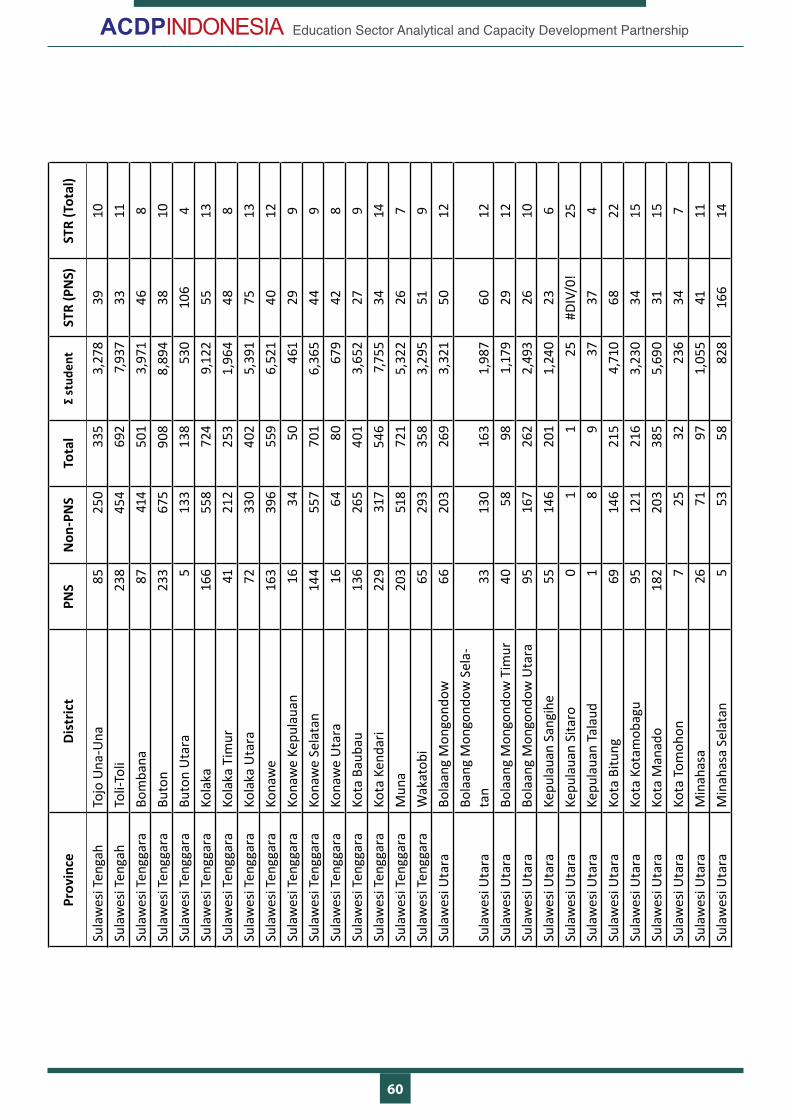
60
Education Sector Analytical and Capacity Development Partnership
Prov
ince
Dist
rict
PNS
Non
-PN
STo
tal
Σ st
uden
tST
R (P
NS)
STR
(Tot
al)
Sula
wes
i Ten
gah
Tojo
Una
-Una
8525
033
53,
278
3910
Sula
wes
i Ten
gah
Toli-
Toli
238
454
692
7,93
733
11Su
law
esi T
engg
ara
Bom
bana
8741
450
13,
971
468
Sula
wes
i Ten
ggar
aBu
ton
233
675
908
8,89
438
10Su
law
esi T
engg
ara
Buto
n U
tara
513
313
853
010
64
Sula
wes
i Ten
ggar
aKo
laka
166
558
724
9,12
255
13Su
law
esi T
engg
ara
Kola
ka T
imur
4121
225
31,
964
488
Sula
wes
i Ten
ggar
aKo
laka
Uta
ra72
330
402
5,39
175
13Su
law
esi T
engg
ara
Kona
we
163
396
559
6,52
140
12Su
law
esi T
engg
ara
Kona
we
Kepu
laua
n16
3450
461
299
Sula
wes
i Ten
ggar
aKo
naw
e Se
lata
n14
455
770
16,
365
449
Sula
wes
i Ten
ggar
aKo
naw
e U
tara
1664
8067
942
8Su
law
esi T
engg
ara
Kota
Bau
bau
136
265
401
3,65
227
9Su
law
esi T
engg
ara
Kota
Ken
dari
229
317
546
7,755
3414
Sula
wes
i Ten
ggar
aM
una
203
518
721
5,32
226
7Su
law
esi T
engg
ara
Wak
atob
i65
293
358
3,29
551
9Su
law
esi U
tara
Bola
ang
Mon
gond
ow66
203
269
3,32
150
12
Sula
wes
i Uta
raBo
laan
g M
ongo
ndow
Sel
a-ta
n33
130
163
1,98
760
12Su
law
esi U
tara
Bola
ang
Mon
gond
ow T
imur
4058
981,
179
2912
Sula
wes
i Uta
raBo
laan
g M
ongo
ndow
Uta
ra95
167
262
2,49
326
10Su
law
esi U
tara
Kepu
laua
n Sa
ngih
e55
146
201
1,24
023
6Su
law
esi U
tara
Kepu
laua
n Si
taro
01
125
#DIV
/0!
25Su
law
esi U
tara
Kepu
laua
n Ta
laud
18
937
374
Sula
wes
i Uta
raKo
ta B
itung
6914
621
54,
710
6822
Sula
wes
i Uta
raKo
ta K
otam
obag
u95
121
216
3,23
034
15Su
law
esi U
tara
Kota
Man
ado
182
203
385
5,69
031
15Su
law
esi U
tara
Kota
Tom
ohon
725
3223
634
7Su
law
esi U
tara
Min
ahas
a26
7197
1,05
541
11Su
law
esi U
tara
Min
ahas
a Se
lata
n5
5358
828
166
14
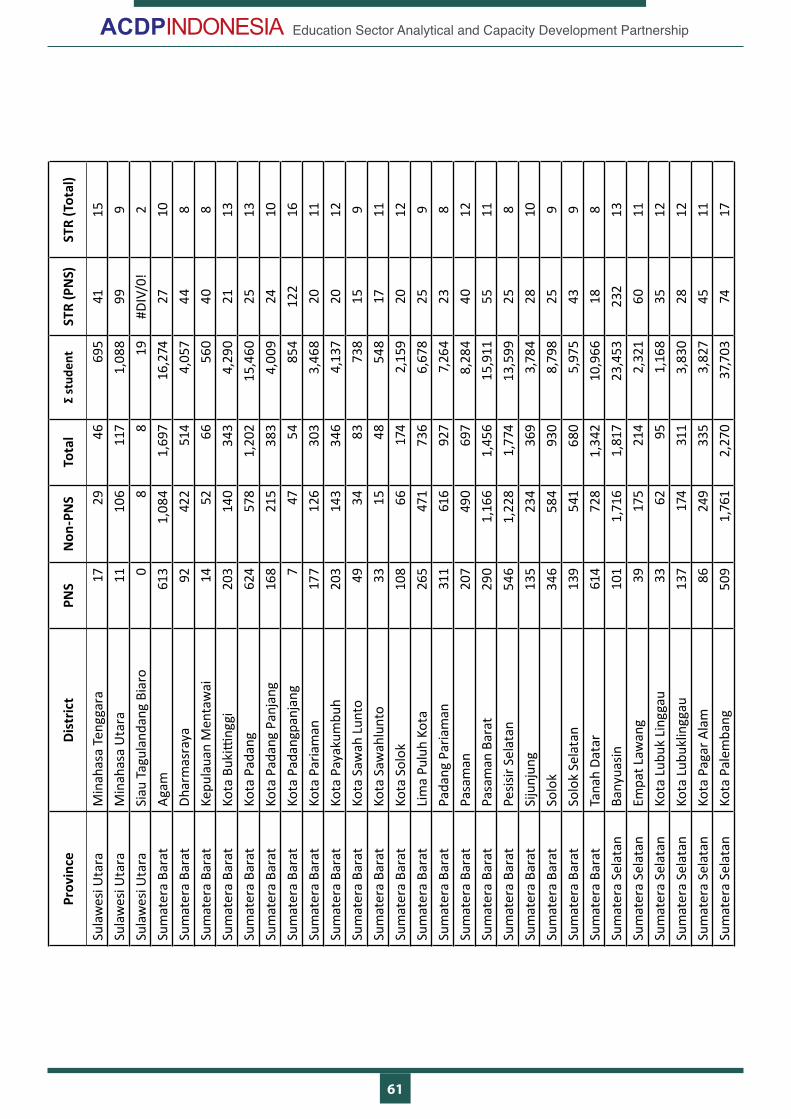
61
Education Sector Analytical and Capacity Development Partnership
Prov
ince
Dist
rict
PNS
Non
-PN
STo
tal
Σ st
uden
tST
R (P
NS)
STR
(Tot
al)
Sula
wes
i Uta
raM
inah
asa
Teng
gara
1729
4669
541
15Su
law
esi U
tara
Min
ahas
a U
tara
1110
611
71,
088
999
Sula
wes
i Uta
raSi
au T
agul
anda
ng B
iaro
08
819
#DIV
/0!
2Su
mat
era
Bara
tAg
am61
31,
084
1,69
716
,274
2710
Sum
ater
a Ba
rat
Dhar
mas
raya
9242
251
44,
057
448
Sum
ater
a Ba
rat
Kepu
laua
n M
enta
wai
1452
6656
040
8Su
mat
era
Bara
tKo
ta B
ukitti
nggi
203
140
343
4,29
021
13Su
mat
era
Bara
tKo
ta P
adan
g62
457
81,
202
15,4
6025
13Su
mat
era
Bara
tKo
ta P
adan
g Pa
njan
g16
821
538
34,
009
2410
Sum
ater
a Ba
rat
Kota
Pad
angp
anja
ng7
4754
854
122
16Su
mat
era
Bara
tKo
ta P
aria
man
177
126
303
3,46
820
11Su
mat
era
Bara
tKo
ta P
ayak
umbu
h20
314
334
64,
137
2012
Sum
ater
a Ba
rat
Kota
Saw
ah L
unto
4934
8373
815
9Su
mat
era
Bara
tKo
ta S
awah
lunt
o33
1548
548
1711
Sum
ater
a Ba
rat
Kota
Sol
ok10
866
174
2,15
920
12Su
mat
era
Bara
tLi
ma
Pulu
h Ko
ta26
547
173
66,
678
259
Sum
ater
a Ba
rat
Pada
ng P
aria
man
311
616
927
7,26
423
8Su
mat
era
Bara
tPa
sam
an20
749
069
78,
284
4012
Sum
ater
a Ba
rat
Pasa
man
Bar
at29
01,
166
1,45
615
,911
5511
Sum
ater
a Ba
rat
Pesis
ir Se
lata
n54
61,
228
1,77
413
,599
258
Sum
ater
a Ba
rat
Siju
njun
g13
523
436
93,
784
2810
Sum
ater
a Ba
rat
Solo
k34
658
493
08,
798
259
Sum
ater
a Ba
rat
Solo
k Se
lata
n13
954
168
05,
975
439
Sum
ater
a Ba
rat
Tana
h Da
tar
614
728
1,34
210
,966
188
Sum
ater
a Se
lata
nBa
nyua
sin10
11,
716
1,81
723
,453
232
13Su
mat
era
Sela
tan
Empa
t Law
ang
3917
521
42,
321
6011
Sum
ater
a Se
lata
nKo
ta L
ubuk
Lin
ggau
3362
951,
168
3512
Sum
ater
a Se
lata
nKo
ta L
ubuk
lingg
au13
717
431
13,
830
2812
Sum
ater
a Se
lata
nKo
ta P
agar
Ala
m86
249
335
3,82
745
11Su
mat
era
Sela
tan
Kota
Pal
emba
ng50
91,
761
2,27
037
,703
7417
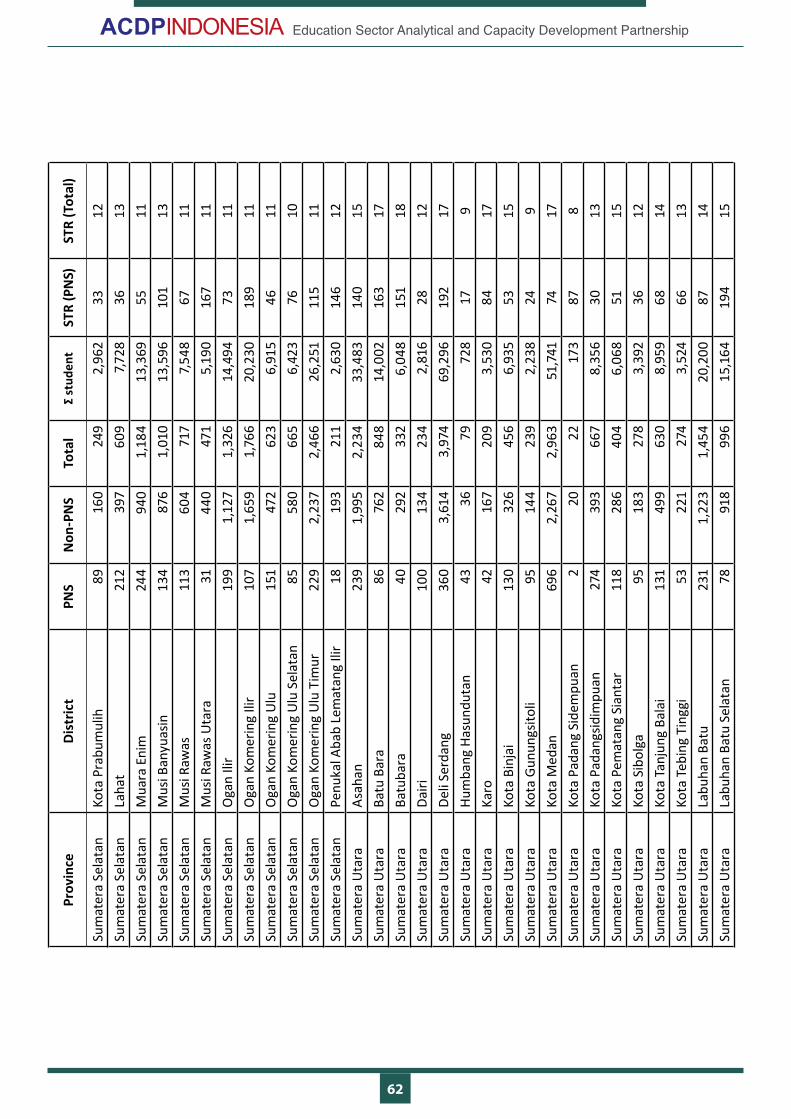
62
Education Sector Analytical and Capacity Development Partnership
Prov
ince
Dist
rict
PNS
Non
-PN
STo
tal
Σ st
uden
tST
R (P
NS)
STR
(Tot
al)
Sum
ater
a Se
lata
nKo
ta P
rabu
mul
ih89
160
249
2,96
233
12Su
mat
era
Sela
tan
Laha
t21
239
760
97,7
2836
13Su
mat
era
Sela
tan
Mua
ra E
nim
244
940
1,18
413
,369
5511
Sum
ater
a Se
lata
nM
usi B
anyu
asin
134
876
1,01
013
,596
101
13Su
mat
era
Sela
tan
Mus
i Raw
as11
360
471
77,
548
6711
Sum
ater
a Se
lata
nM
usi R
awas
Uta
ra31
440
471
5,19
016
711
Sum
ater
a Se
lata
nO
gan
Ilir
199
1,12
71,
326
14,4
9473
11Su
mat
era
Sela
tan
Oga
n Ko
mer
ing
Ilir
107
1,65
91,
766
20,2
3018
911
Sum
ater
a Se
lata
nO
gan
Kom
erin
g Ul
u15
147
262
36,
915
4611
Sum
ater
a Se
lata
nO
gan
Kom
erin
g Ul
u Se
lata
n85
580
665
6,42
376
10Su
mat
era
Sela
tan
Oga
n Ko
mer
ing
Ulu
Tim
ur22
92,
237
2,46
626
,251
115
11Su
mat
era
Sela
tan
Penu
kal A
bab
Lem
atan
g Ili
r18
193
211
2,63
014
612
Sum
ater
a U
tara
Asah
an23
91,
995
2,23
433
,483
140
15Su
mat
era
Uta
raBa
tu B
ara
8676
284
814
,002
163
17Su
mat
era
Uta
raBa
tuba
ra40
292
332
6,04
815
118
Sum
ater
a U
tara
Dairi
100
134
234
2,81
628
12Su
mat
era
Uta
raDe
li Se
rdan
g36
03,
614
3,97
469
,296
192
17Su
mat
era
Uta
raHu
mba
ng H
asun
duta
n43
3679
728
179
Sum
ater
a U
tara
Karo
4216
720
93,
530
8417
Sum
ater
a U
tara
Kota
Bin
jai
130
326
456
6,93
553
15Su
mat
era
Uta
raKo
ta G
unun
gsito
li95
144
239
2,23
824
9Su
mat
era
Uta
raKo
ta M
edan
696
2,26
72,
963
51,7
4174
17Su
mat
era
Uta
raKo
ta P
adan
g Si
dem
puan
220
2217
387
8Su
mat
era
Uta
raKo
ta P
adan
gsid
impu
an27
439
366
78,
356
3013
Sum
ater
a U
tara
Kota
Pem
atan
g Si
anta
r11
828
640
46,
068
5115
Sum
ater
a U
tara
Kota
Sib
olga
9518
327
83,
392
3612
Sum
ater
a U
tara
Kota
Tan
jung
Bal
ai13
149
963
08,
959
6814
Sum
ater
a U
tara
Kota
Teb
ing
Ting
gi53
221
274
3,52
466
13Su
mat
era
Uta
raLa
buha
n Ba
tu23
11,
223
1,45
420
,200
8714
Sum
ater
a U
tara
Labu
han
Batu
Sel
atan
7891
899
615
,164
194
15
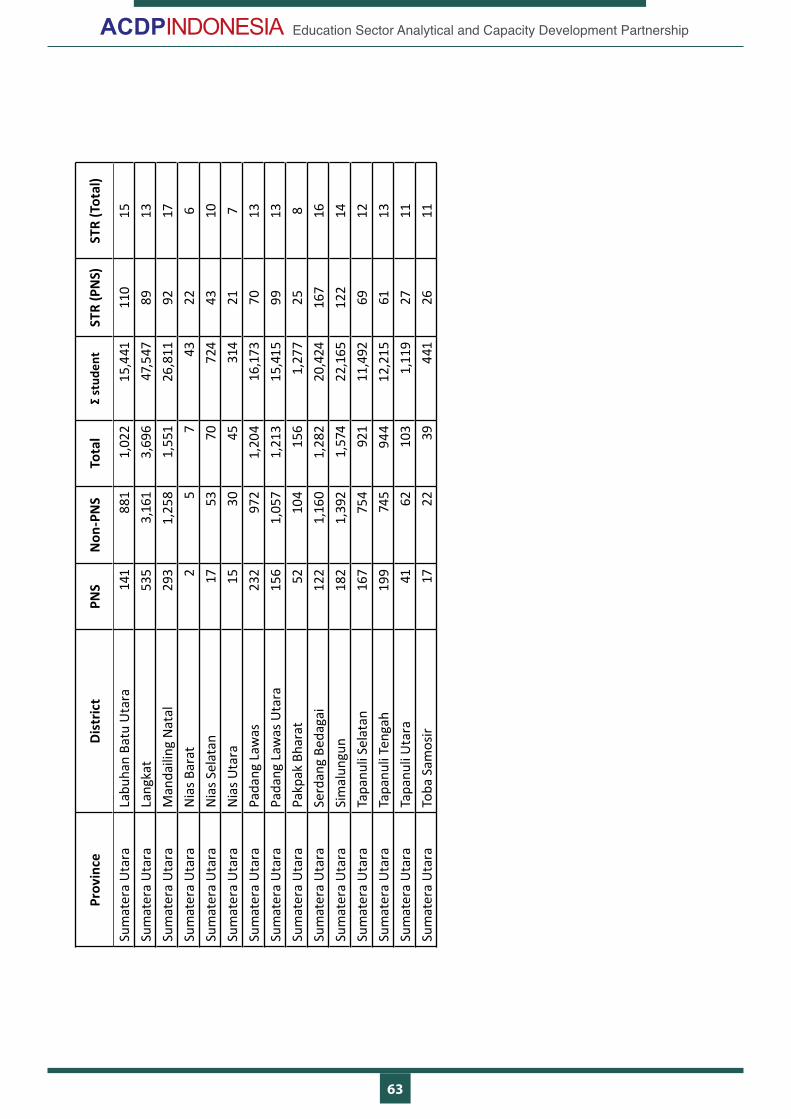
63
Education Sector Analytical and Capacity Development Partnership
Prov
ince
Dist
rict
PNS
Non
-PN
STo
tal
Σ st
uden
tST
R (P
NS)
STR
(Tot
al)
Sum
ater
a U
tara
Labu
han
Batu
Uta
ra14
188
11,
022
15,4
4111
015
Sum
ater
a U
tara
Lang
kat
535
3,16
13,
696
47,5
4789
13Su
mat
era
Uta
raM
anda
iling
Nat
al29
31,
258
1,55
126
,811
9217
Sum
ater
a U
tara
Nia
s Bar
at2
57
4322
6Su
mat
era
Uta
raN
ias S
elat
an17
5370
724
4310
Sum
ater
a U
tara
Nia
s Uta
ra15
3045
314
217
Sum
ater
a U
tara
Pada
ng L
awas
232
972
1,20
416
,173
7013
Sum
ater
a U
tara
Pada
ng L
awas
Uta
ra15
61,
057
1,21
315
,415
9913
Sum
ater
a U
tara
Pakp
ak B
hara
t52
104
156
1,27
725
8Su
mat
era
Uta
raSe
rdan
g Be
daga
i12
21,
160
1,28
220
,424
167
16Su
mat
era
Uta
raSi
mal
ungu
n18
21,
392
1,57
422
,165
122
14Su
mat
era
Uta
raTa
panu
li Se
lata
n16
775
492
111
,492
6912
Sum
ater
a U
tara
Tapa
nuli
Teng
ah19
974
594
412
,215
6113
Sum
ater
a U
tara
Tapa
nuli
Uta
ra41
6210
31,
119
2711
Sum
ater
a U
tara
Toba
Sam
osir
1722
3944
126
11
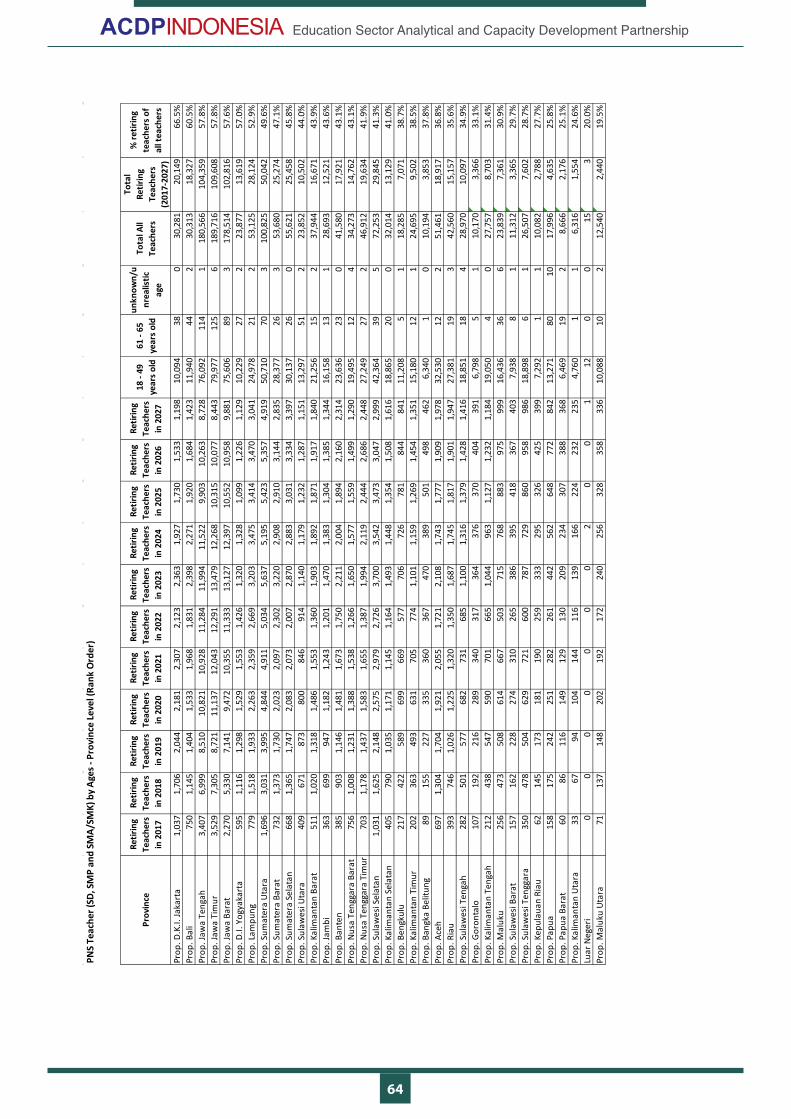
64
Education Sector Analytical and Capacity Development Partnership
Appe
ndix
5. P
NS
Teac
her R
etire
men
t Patt
ern
MO
ECPN
S Te
ache
r (SD
, SM
P an
d SM
A/SM
K) b
y Ag
es -
Prov
ince
Leve
l (Ra
nk O
rder
)
Prov
ince
Retir
ing
Teac
hers
in
201
7
Retir
ing
Teac
hers
in
201
8
Retir
ing
Teac
hers
in
201
9
Retir
ing
Teac
hers
in
202
0
Retir
ing
Teac
hers
in
202
1
Retir
ing
Teac
hers
in
202
2
Retir
ing
Teac
hers
in
202
3
Retir
ing
Teac
hers
in
202
4
Retir
ing
Teac
hers
in
202
5
Retir
ing
Teac
hers
in
202
6
Retir
ing
Teac
hers
in
202
7
18 -
49
year
s old
61 -
65
year
s old
unkn
own/
unr
ealis
tic
age
Tota
l All
Teac
hers
Tota
l Re
tirin
g Te
ache
rs
(201
7-20
27)
% re
tirin
g te
ache
rs o
f al
l tea
cher
s
Prop
. D.K
.I. Ja
kart
a1,
037
1,70
62,
044
2,18
12,
307
2,12
32,
363
1,92
71,
730
1,53
31,
198
10,0
9438
030
,281
20,1
4966
.5%
Prop
. Bal
i75
01,
145
1,40
41,
533
1,96
81,
831
2,39
82,
271
1,92
01,
684
1,42
311
,940
442
30,3
1318
,327
60.5
%Pr
op. J
awa
Teng
ah3,
407
6,99
98,
510
10,8
2110
,928
11,2
8411
,994
11,5
229,
903
10,2
638,
728
76,0
9211
41
180,
566
104,
359
57.8
%Pr
op. J
awa
Tim
ur3,
529
7,30
58,
721
11,1
3712
,043
12,2
9113
,479
12,2
6810
,315
10,0
778,
443
79,9
7712
56
189,
716
109,
608
57.8
%Pr
op. J
awa
Bara
t2,
270
5,33
07,
141
9,47
210
,355
11,3
3313
,127
12,3
9710
,552
10,9
589,
881
75,6
0689
317
8,51
410
2,81
657
.6%
Prop
. D.I.
Yog
yaka
rta
595
1,11
61,
298
1,52
91,
553
1,42
61,
320
1,32
81,
099
1,22
61,
129
10,2
2927
223
,877
13,6
1957
.0%
Prop
. Lam
pung
779
1,51
81,
933
2,26
32,
359
2,66
93,
203
3,47
53,
414
3,47
03,
041
24,9
7821
253
,125
28,1
2452
.9%
Prop
. Sum
ater
a U
tara
1,69
63,
031
3,99
54,
844
4,91
15,
034
5,63
75,
195
5,42
35,
357
4,91
950
,710
703
100,
825
50,0
4249
.6%
Prop
. Sum
ater
a Ba
rat
732
1,37
31,
730
2,02
32,
097
2,30
23,
220
2,90
82,
910
3,14
42,
835
28,3
7726
353
,680
25,2
7447
.1%
Prop
. Sum
ater
a Se
lata
n66
81,
365
1,74
72,
083
2,07
32,
007
2,87
02,
883
3,03
13,
334
3,39
730
,137
260
55,6
2125
,458
45.8
%Pr
op. S
ulaw
esi U
tara
409
671
873
800
846
914
1,14
01,
179
1,23
21,
287
1,15
113
,297
512
23,8
5210
,502
44.0
%Pr
op. K
alim
anta
n Ba
rat
511
1,02
01,
318
1,48
61,
553
1,36
01,
903
1,89
21,
871
1,91
71,
840
21,2
5615
237
,944
16,6
7143
.9%
Prop
. Jam
bi36
369
994
71,
182
1,24
31,
201
1,47
01,
383
1,30
41,
385
1,34
416
,158
131
28,6
9312
,521
43.6
%Pr
op. B
ante
n38
590
31,
146
1,48
11,
673
1,75
02,
211
2,00
41,
894
2,16
02,
314
23,6
3623
041
,580
17,9
2143
.1%
Prop
. Nus
a Te
ngga
ra B
arat
756
1,00
81,
231
1,38
81,
538
1,26
61,
650
1,57
71,
559
1,49
91,
290
19,4
9512
434
,273
14,7
6243
.1%
Prop
. Nus
a Te
ngga
ra T
imur
703
1,17
81,
437
1,58
31,
655
1,38
71,
994
2,11
92,
444
2,68
62,
448
27,2
4927
246
,912
19,6
3441
.9%
Prop
. Sul
awes
i Sel
atan
1,03
11,
625
2,14
82,
575
2,97
92,
726
3,70
03,
542
3,47
33,
047
2,99
942
,364
395
72,2
5329
,845
41.3
%Pr
op. K
alim
anta
n Se
lata
n40
579
01,
035
1,17
11,
145
1,16
41,
493
1,44
81,
354
1,50
81,
616
18,8
6520
032
,014
13,1
2941
.0%
Prop
. Ben
gkul
u21
742
258
969
966
957
770
672
678
184
484
111
,208
51
18,2
857,
071
38.7
%Pr
op. K
alim
anta
n Ti
mur
202
363
493
631
705
774
1,10
11,
159
1,26
91,
454
1,35
115
,180
121
24,6
959,
502
38.5
%Pr
op. B
angk
a Be
litun
g89
155
227
335
360
367
470
389
501
498
462
6,34
01
010
,194
3,85
337
.8%
Prop
. Ace
h69
71,
304
1,70
41,
921
2,05
51,
721
2,10
81,
743
1,77
71,
909
1,97
832
,530
122
51,4
6118
,917
36.8
%Pr
op. R
iau
393
746
1,02
61,
225
1,32
01,
350
1,68
71,
745
1,81
71,
901
1,94
727
,381
193
42,5
6015
,157
35.6
%Pr
op. S
ulaw
esi T
enga
h28
250
157
768
273
168
51,
100
1,31
61,
379
1,42
81,
416
18,8
5118
428
,970
10,0
9734
.9%
Prop
. Gor
onta
lo10
719
221
628
934
031
736
437
637
040
439
16,
798
51
10,1
703,
366
33.1
%Pr
op. K
alim
anta
n Te
ngah
212
438
547
590
701
665
1,04
496
31,
127
1,23
21,
184
19,0
504
027
,757
8,70
331
.4%
Prop
. Mal
uku
256
473
508
614
667
503
715
768
883
975
999
16,4
3636
623
,839
7,36
130
.9%
Prop
. Sul
awes
i Bar
at15
716
222
827
431
026
538
639
541
836
740
37,
938
81
11,3
123,
365
29.7
%Pr
op. S
ulaw
esi T
engg
ara
350
478
504
629
721
600
787
729
860
958
986
18,8
986
126
,507
7,60
228
.7%
Prop
. Kep
ulau
an R
iau
6214
517
318
119
025
933
329
532
642
539
97,
292
11
10,0
822,
788
27.7
%Pr
op. P
apua
158
175
242
251
282
261
442
562
648
772
842
13,2
7180
1017
,996
4,63
525
.8%
Prop
. Pap
ua B
arat
6086
116
149
129
130
209
234
307
388
368
6,46
919
28,
666
2,17
625
.1%
Prop
. Kal
iman
tan
Uta
ra33
6794
104
144
116
139
166
224
232
235
4,76
01
16,
316
1,55
424
.6%
Luar
Neg
eri
00
00
00
02
00
112
00
153
20.0
%Pr
op. M
aluk
u U
tara
7113
714
820
219
217
224
025
632
835
833
610
,088
102
12,5
402,
440
19.5
%
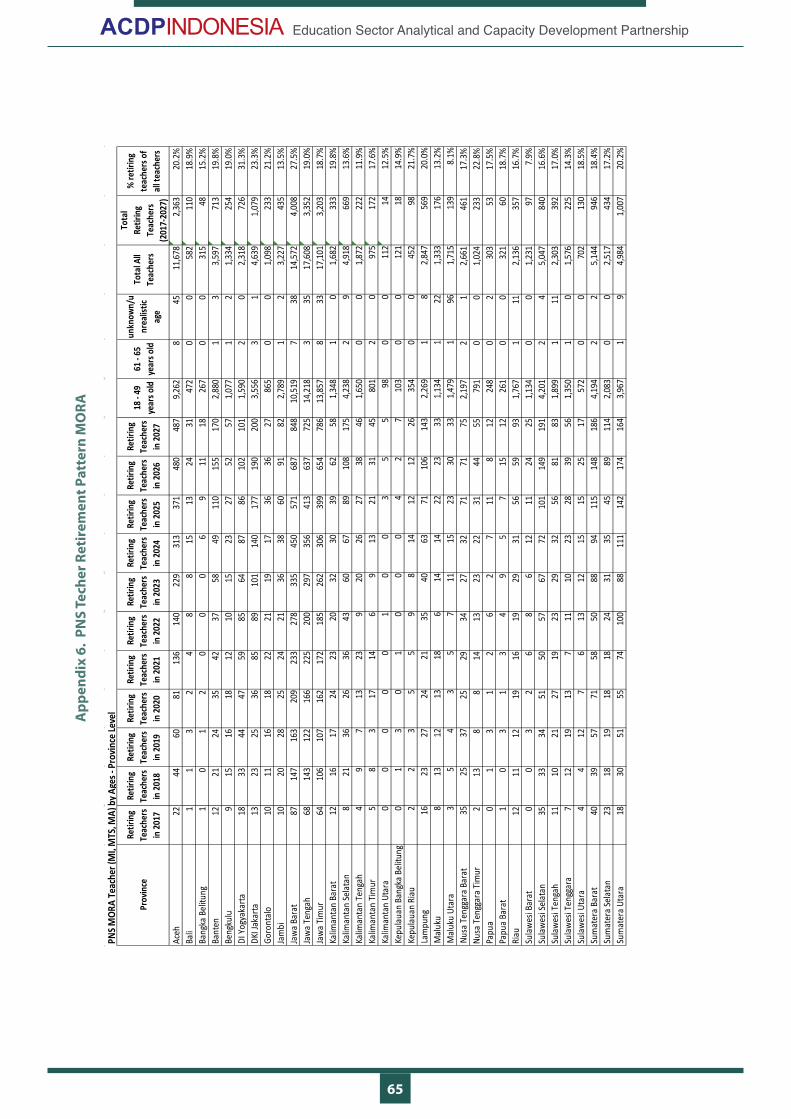
65
Education Sector Analytical and Capacity Development Partnership
Appe
ndix
6.
PNS
Tech
er R
etire
men
t Pat
tern
MO
RA
PNS M
ORA
Teac
her (
MI, M
TS, M
A) b
y Age
s - P
rovin
ce Le
vel
Prov
ince
Retir
ing
Teac
hers
in
201
7
Retir
ing
Teac
hers
in
201
8
Retir
ing
Teac
hers
in
201
9
Retir
ing
Teac
hers
in
202
0
Retir
ing
Teac
hers
in
202
1
Retir
ing
Teac
hers
in
202
2
Retir
ing
Teac
hers
in
202
3
Retir
ing
Teac
hers
in
202
4
Retir
ing
Teac
hers
in
202
5
Retir
ing
Teac
hers
in
202
6
Retir
ing
Teac
hers
in
202
7
18 -
49
year
s old
61 -
65
year
s old
unkn
own/
unr
ealis
tic
age
Tota
l All
Teac
hers
Tota
l Re
tirin
g Te
ache
rs
(201
7-20
27)
% re
tirin
g te
ache
rs o
f al
l tea
cher
s
Aceh
2244
6081
136
140
229
313
371
480
487
9,26
28
4511
,678
2,36
320
.2%
Bali
11
32
48
815
1324
3147
20
058
211
018
.9%
Bang
ka B
elitu
ng1
01
20
00
69
1118
267
00
315
4815
.2%
Bant
en12
2124
3542
3758
4911
015
517
02,
880
13
3,59
771
319
.8%
Beng
kulu
915
1618
1210
1523
2752
571,
077
12
1,33
425
419
.0%
DI Y
ogya
karta
1833
4447
5985
6487
8610
210
11,
590
20
2,31
872
631
.3%
DKI J
akar
ta13
2325
3685
8910
114
017
719
020
03,
556
31
4,63
91,
079
23.3
%Go
ront
alo
1011
1618
2221
1917
3636
2786
50
01,
098
233
21.2
%Ja
mbi
1020
2825
2421
3638
6091
822,
789
12
3,22
743
513
.5%
Jaw
a Ba
rat
8714
716
320
923
327
833
545
057
168
784
810
,519
738
14,5
724,
008
27.5
%Ja
wa
Teng
ah68
143
122
166
225
200
297
356
413
637
725
14,2
183
3517
,608
3,35
219
.0%
Jaw
a Ti
mur
6410
610
716
217
218
526
230
639
965
478
613
,857
833
17,1
013,
203
18.7
%Ka
liman
tan
Bara
t12
1617
2423
2032
3039
6258
1,34
81
01,
682
333
19.8
%Ka
liman
tan
Sela
tan
821
3626
3643
6067
8910
817
54,
238
29
4,91
866
913
.6%
Kalim
anta
n Te
ngah
49
713
239
2026
2738
461,
650
00
1,87
222
211
.9%
Kalim
anta
n Ti
mur
58
317
146
913
2131
4580
12
097
517
217
.6%
Kalim
anta
n Ut
ara
00
00
01
00
35
598
00
112
1412
.5%
Kepu
laua
n Ba
ngka
Bel
itung
01
30
10
00
42
710
30
012
118
14.9
%Ke
pula
uan
Riau
22
35
59
814
1212
2635
40
045
298
21.7
%La
mpu
ng16
2327
2421
3540
6371
106
143
2,26
91
82,
847
569
20.0
%M
aluk
u8
1312
1318
614
1422
2333
1,13
41
221,
333
176
13.2
%M
aluk
u Ut
ara
35
43
57
1115
2330
331,
479
196
1,71
513
98.
1%Nu
sa T
engg
ara
Bara
t35
2537
2529
3427
3271
7175
2,19
72
12,
661
461
17.3
%Nu
sa T
engg
ara
Tim
ur2
138
814
1323
2231
4455
791
00
1,02
423
322
.8%
Papu
a0
13
12
62
711
812
248
02
303
5317
.5%
Papu
a Ba
rat
10
31
34
95
715
1226
10
032
160
18.7
%Ri
au12
1112
1916
1929
3156
5993
1,76
71
112,
136
357
16.7
%Su
law
esi B
arat
00
32
68
612
1124
251,
134
00
1,23
197
7.9%
Sula
wes
i Sel
atan
3533
3451
5057
6772
101
149
191
4,20
12
45,
047
840
16.6
%Su
law
esi T
enga
h11
1021
2719
2329
3256
8183
1,89
91
112,
303
392
17.0
%Su
law
esi T
engg
ara
712
1913
711
1023
2839
561,
350
10
1,57
622
514
.3%
Sula
wes
i Uta
ra4
412
76
1312
1515
2517
572
00
702
130
18.5
%Su
mat
era
Bara
t40
3957
7158
5088
9411
514
818
64,
194
22
5,14
494
618
.4%
Sum
ater
a Se
lata
n23
1819
1818
2431
3545
8911
42,
083
00
2,51
743
417
.2%
Sum
ater
a Ut
ara
1830
5155
7410
088
111
142
174
164
3,96
71
94,
984
1,00
720
.2%

66
Education Sector Analytical and Capacity Development Partnership
Appe
ndix
7. I
ndic
ativ
e PN
S Te
ache
r Ret
irem
ent P
atte
rn b
y Le
vel a
nd S
ubje
ct M
OEC
and
MO
RA 2
017-
2027
in To
tal
A.
Indi
cativ
e M
OEC
SM
P In
dica
tive
PNS
Teac
her R
etire
men
t Patt
ern
by S
ubje
ct 2
017-
2027
in To
tal
Ag
am
aA
ntr
op
olo
gi
Ba
ha
sa
Asi
ng
La
in
Ba
ha
sa
Ind
on
esi
aB
ah
asa
In
gg
ris
Ba
ha
sa
Sa
stra
In
do
ne
sia
Bio
log
iB
KE
ko
no
mi
Fisi
ka
Ge
og
rafi
Gu
ru
Ke
las
Gu
ru
SLB
IPA
IPS
Ke
tra
mp
ilan
Lain
ny
aM
ate
ma
tik
aM
ulo
kP
JOK
PP
Kn
Se
jara
hS
en
iS
osi
olo
gi
TIK
Un
kn
ow
nG
ran
d
To
tal
Ace
h3
90
07
44
37
49
60
60
76
90
11
70
50
31
20
26
34
60
01
58
24
33
14
87
7
Ba
li3
86
70
72
76
30
30
49
65
74
48
59
61
37
22
03
21
29
21
98
74
46
2
Ba
ngk
a B
elit
un
g2
87
42
41
06
06
88
56
22
33
50
25
71
14
31
Ba
nte
n1
24
14
86
20
61
05
23
18
36
05
41
34
53
71
49
20
61
05
14
36
25
49
Be
ngk
ulu
57
18
41
03
38
01
56
18
69
01
77
25
63
14
74
54
60
12
54
D.I
. Y
ogy
aka
rta
20
14
77
27
63
34
40
04
97
20
24
95
12
81
87
28
02
26
52
14
63
90
1
D.K
.I.
Jaka
rta
21
10
69
64
51
36
81
57
47
26
23
31
60
48
23
52
28
32
26
67
33
13
52
36
Go
ron
talo
33
17
48
46
80
09
71
60
26
11
26
19
57
86
51
42
51
01
1
Ja
mb
i1
41
13
88
16
89
10
02
49
28
53
30
35
85
11
30
18
99
92
58
72
29
5
Ja
wa
Ba
rat
98
00
27
62
11
00
71
70
11
67
72
31
33
64
32
10
47
06
12
25
11
63
18
79
11
86
36
61
65
48
Ja
wa
Te
nga
h1
00
80
29
88
17
41
21
49
12
27
82
86
16
62
02
58
69
12
13
60
17
72
12
82
27
72
38
22
11
5
Ja
wa
Tim
ur
96
32
32
72
15
29
17
46
01
23
36
34
09
57
84
31
53
61
91
13
62
19
09
45
22
32
50
22
35
6
Ka
lima
nta
n B
ara
t1
51
32
02
25
29
00
28
23
30
28
36
12
21
44
24
77
91
13
62
26
5
Ka
lima
nta
n S
ela
tan
12
71
38
51
74
11
00
28
83
17
41
23
59
60
13
92
03
70
16
38
23
30
Ka
lima
nta
n T
en
gah
10
91
48
81
72
73
30
17
17
55
23
71
56
42
43
61
29
3
Ka
lima
nta
n T
imu
r9
81
25
11
88
51
00
21
23
15
45
29
52
91
50
18
61
24
10
53
20
08
Ka
lima
nta
n U
tara
15
28
20
31
84
65
28
72
32
21
12
62
34
Ke
pu
lau
an
Ria
u3
89
66
21
13
58
88
19
06
31
23
24
82
55
85
68
La
mp
un
g2
18
87
13
21
32
20
57
37
02
82
06
44
15
02
89
30
12
92
12
16
44
94
1
Ma
luku
88
03
15
11
02
32
53
28
67
00
21
54
41
44
19
61
20
71
35
20
06
Ma
luku
Uta
ra5
20
70
21
21
13
65
79
05
51
04
85
22
31
28
46
6
Nu
sa T
en
gga
ra B
ara
t1
32
03
88
18
62
49
00
33
72
53
40
13
02
15
12
12
32
87
86
62
41
7
Nu
sa T
en
gga
ra T
imu
r2
52
47
33
14
18
30
43
05
71
75
03
95
57
17
02
46
95
07
17
03
43
8
Pa
pu
a6
90
12
15
52
50
17
21
40
14
01
01
13
40
12
12
46
58
86
0
Pa
pu
a B
ara
t3
45
62
91
10
52
80
22
59
13
34
50
15
02
34
78
Ria
u1
79
50
32
84
18
80
32
74
38
72
04
39
65
18
62
55
16
51
87
63
19
5
Su
law
esi
Ba
rat
48
78
34
25
06
76
62
50
68
10
41
82
52
32
56
24
Su
law
esi
Se
lata
n4
07
09
27
52
42
54
01
87
28
97
25
54
78
51
52
53
87
07
43
48
21
79
70
18
Su
law
esi
Te
nga
h9
70
43
81
85
54
02
79
26
31
80
24
21
86
62
44
59
10
86
20
59
Su
law
esi
Te
ngg
ara
11
81
77
13
59
20
20
72
61
10
12
24
31
70
19
55
18
57
16
37
Su
law
esi
Uta
ra9
84
41
19
85
70
36
75
21
77
13
50
10
22
02
22
92
12
19
74
29
48
Su
ma
tera
Ba
rat
33
60
98
64
88
17
31
07
83
91
92
20
38
32
20
94
51
51
55
49
41
27
46
78
0
Su
ma
tera
Se
lata
n2
05
16
77
28
20
27
31
05
45
55
67
20
61
26
22
37
20
12
22
20
94
40
60
Su
ma
tera
Uta
ra7
35
16
02
82
46
29
19
36
12
14
23
13
13
49
19
25
15
83
35
76
67
25
99
96
68
12
81
62
23
03
11
07
21
08
86
31
20
73
16
31
52
07
50
37
71
25
19
05
64
16
38
84
21
24
53
37
70
01
12
65
38
95
14
86
26
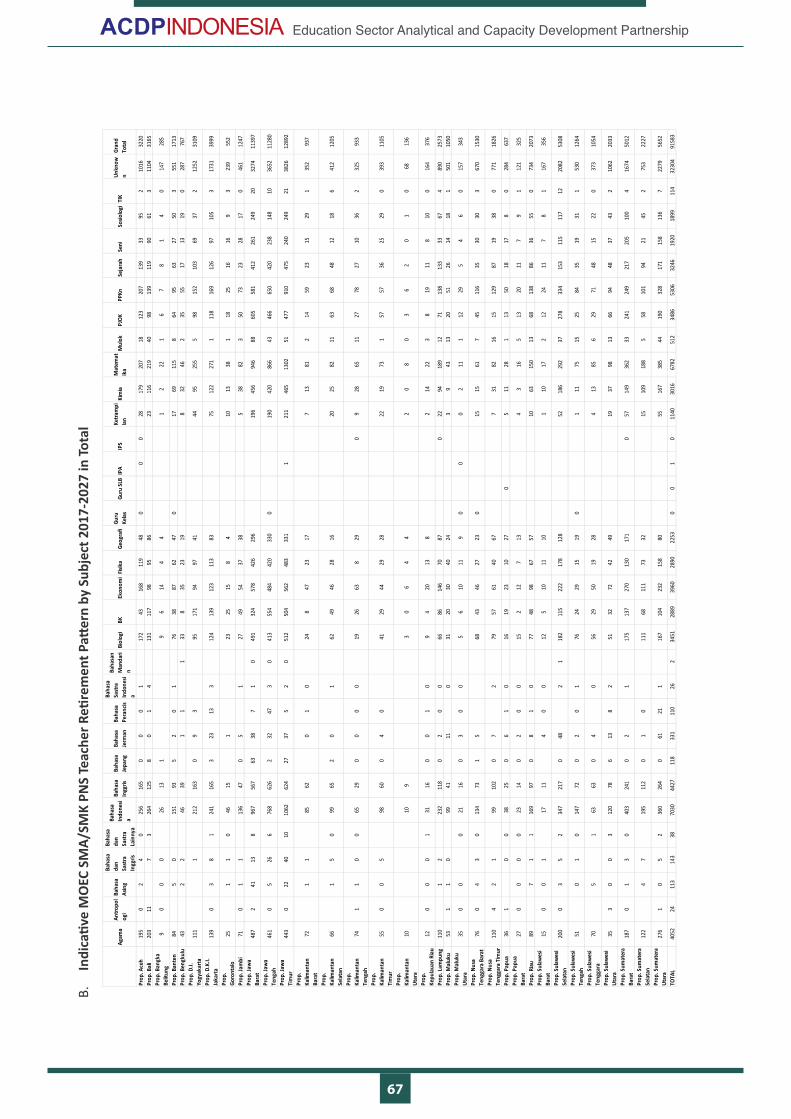
67
Education Sector Analytical and Capacity Development Partnership
B.
Indi
cativ
e M
OEC
SM
A/SM
K PN
S Te
ache
r Reti
rem
ent P
atter
n by
Sub
ject
201
7-20
27 in
Tota
l
Agam
aAn
tropo
log
iBa
hasa
As
ing
Baha
sa
dan
Sast
ra
Ingg
ris
Baha
sa
dan
Sast
ra
Lain
nya
Baha
sa
Indo
nesi
a
Baha
sa
Ingg
risBa
hasa
Je
pang
Baha
sa
Jerm
anBa
hasa
Pe
ranc
is
Baha
sa
Sast
ra
Indo
nesi
a
Baha
san
Man
dari
nBi
olog
iBK
Ekon
omi
Fisik
aGe
ogra
fiGu
ru
Kela
sGu
ru S
LBIP
AIP
SKe
tram
pila
nKi
mia
Mat
emat
ika
Mul
okPJ
OKPP
KnSe
jara
hSe
niSo
siolo
giTI
KUn
know
nGr
and
Tota
l
Prop
. Ace
h19
50
24
025
616
50
00
117
243
168
119
480
00
2817
920
718
123
207
139
3395
210
1632
20Pr
op. B
ali
203
117
326
412
58
01
413
111
798
9586
2311
621
940
9813
911
990
613
1104
3165
Prop
. Ban
gka
Belit
ung
90
00
2613
19
614
44
12
221
67
81
40
147
285
Prop
. Ban
ten
845
015
193
52
01
7638
8762
470
1769
115
864
9563
2750
355
117
13Pr
op. B
engk
ulu
432
246
391
11
338
3523
198
3246
235
5517
1319
028
776
7Pr
op. D
.I.
Yogy
akar
ta11
11
212
163
09
395
171
9497
4144
9525
55
9815
210
369
372
1252
3109
Prop
. D.K
.I.
Jaka
rta13
90
38
124
116
53
2313
312
413
912
311
383
7512
227
11
118
169
126
9710
53
1731
3999
Prop
. Go
ront
alo
251
10
4615
123
2515
84
1013
381
1825
1616
93
239
552
Prop
. Jam
bi71
01
113
647
05
127
4954
3738
538
823
5073
2328
170
461
1247
Prop
. Jaw
a Ba
rat
487
241
138
967
567
6338
71
049
132
457
842
629
619
645
694
688
605
581
412
261
249
2032
7411
397
Prop
. Jaw
a Te
ngah
461
05
266
768
626
232
473
041
355
448
442
033
00
190
420
866
4346
665
042
023
814
810
3652
1128
0
Prop
. Jaw
a Ti
mur
443
022
4010
1062
624
2737
52
051
250
456
248
333
11
211
465
1302
5147
791
047
524
024
921
3826
1289
2
Prop
. Ka
liman
tan
Bara
t72
11
8562
01
024
847
2317
713
812
1459
2315
291
352
937
Prop
. Ka
liman
tan
Sela
tan
661
50
9965
20
162
4946
2816
2025
8211
6368
4812
186
412
1205
Prop
. Ka
liman
tan
Teng
ah74
11
00
6529
00
00
1926
638
290
928
6511
2778
2710
362
325
933
Prop
. Ka
liman
tan
Tim
ur55
00
598
600
40
4129
4429
2822
1973
157
5736
2529
039
311
05
Prop
. Ka
liman
tan
Utar
a10
109
30
64
42
08
03
62
01
068
136
Prop
. Ke
pula
uan
Riau
120
00
131
160
01
09
420
138
214
223
819
118
100
164
376
Prop
. Lam
pung
110
12
232
118
02
00
6686
146
7087
022
9418
912
7113
813
333
674
890
2573
Prop
. Mal
uku
531
10
9941
110
3120
3040
243
943
1320
5126
1418
150
110
50Pr
op. M
aluk
u Ut
ara
350
00
2116
03
00
56
1011
90
00
211
112
295
46
015
734
3
Prop
. Nus
a Te
ngga
ra B
arat
760
43
013
473
15
6843
4627
230
1515
617
4511
635
3030
367
015
30
Prop
. Nus
a Te
ngga
ra T
imur
110
42
199
102
07
279
5761
4067
731
8216
1512
987
1938
077
118
26
Prop
. Pap
ua36
10
038
250
61
016
1923
1027
05
1128
113
5018
178
028
463
7Pr
op. P
apua
Ba
rat
270
00
023
140
20
015
212
713
43
165
1320
117
91
121
325
Prop
. Ria
u89
71
116
997
08
10
7748
9867
5710
6315
013
6813
886
3655
073
420
73Pr
op. S
ulaw
esi
Bara
t15
00
117
114
00
125
1011
101
1017
212
2411
78
116
735
6
Prop
. Sul
awes
i Se
lata
n20
00
35
234
721
70
482
118
211
522
217
812
852
186
292
3727
833
415
311
511
712
2082
5308
Prop
. Sul
awes
i Te
ngah
510
10
147
720
20
176
2429
1519
01
1175
1525
8435
1931
153
012
64
Prop
. Sul
awes
i Te
ngga
ra70
51
6363
04
056
2950
1928
413
856
2971
4815
220
373
1054
Prop
. Sul
awes
i Ut
ara
353
00
312
078
613
82
5132
7242
4919
3798
1366
9448
3743
210
6220
33
Prop
. Sum
ater
a Ba
rat
187
01
30
403
241
02
117
513
727
013
017
10
5714
936
233
241
249
217
205
100
416
7450
12
Prop
. Sum
ater
a Se
lata
n12
24
719
511
20
10
111
6811
173
3215
109
188
558
101
9421
452
753
2227
Prop
. Sum
ater
a Ut
ara
276
10
52
360
264
061
211
167
104
232
158
8055
167
385
4419
032
817
115
813
67
2279
5652
TOTA
L40
5224
113
143
3870
3044
2711
833
111
026
234
5128
8939
6028
9022
530
01
011
4030
1667
8251
234
8653
0632
4619
2018
9911
432
304
9158
3
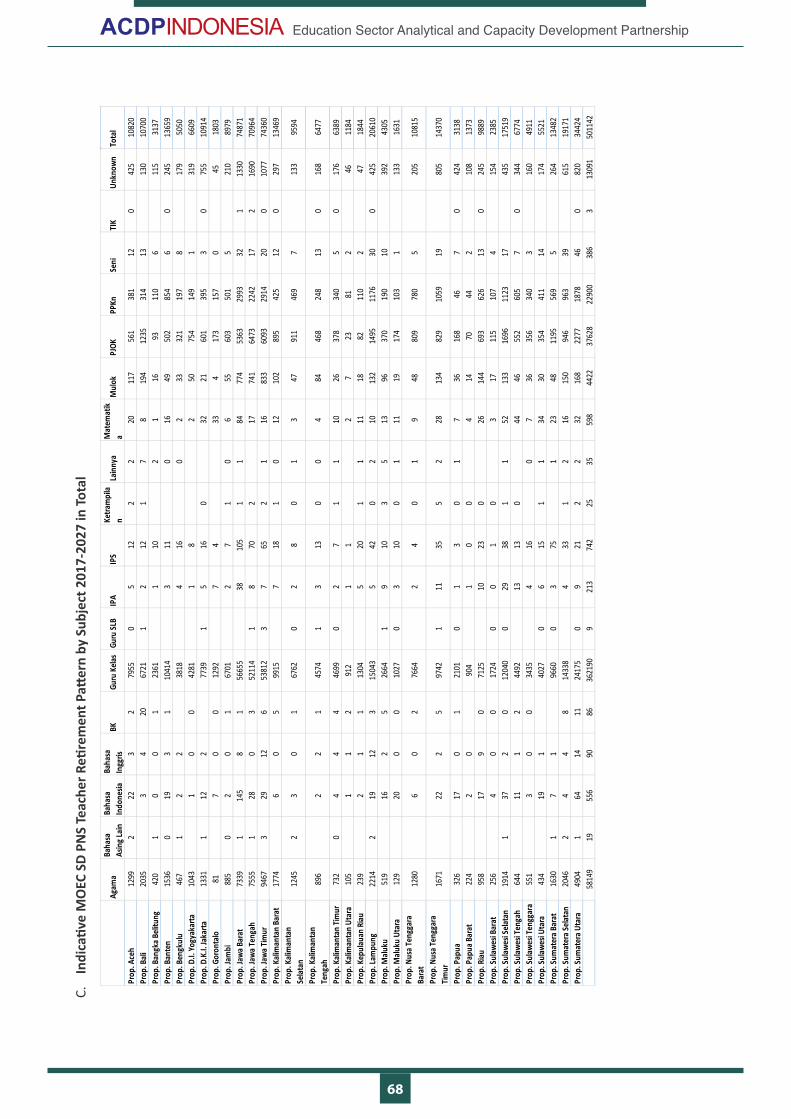
68
Education Sector Analytical and Capacity Development Partnership
C.
Indi
cativ
e M
OEC
SD
PNS
Teac
her R
etire
men
t Patt
ern
by S
ubje
ct 2
017-
2027
in To
tal
Agam
aBa
hasa
As
ing L
ainBa
hasa
In
done
siaBa
hasa
In
ggris
BKGu
ru K
elas
Guru
SLB
IPA
IPS
Ketra
mpi
lan
Lain
nya
Mat
emat
ika
Mul
okPJ
OKPP
KnSe
niTI
KUn
know
nTo
tal
Prop
. Ace
h12
992
223
279
550
512
22
2011
756
138
112
042
510
820
Prop
. Bali
2035
34
2067
211
212
17
819
412
3531
413
130
1070
0Pr
op. B
angk
a Beli
tung
420
10
01
2361
110
21
1693
110
611
531
37Pr
op. B
ante
n15
360
193
110
414
311
016
4950
285
46
024
513
659
Prop
. Ben
gkul
u46
71
22
3818
416
02
3332
119
78
179
5050
Prop
. D.I.
Yogy
akar
ta10
431
00
4281
18
250
754
149
131
966
09Pr
op. D
.K.I.
Jaka
rta13
311
122
7739
15
160
3221
601
395
30
755
1091
4Pr
op. G
oron
talo
817
00
1292
74
334
173
157
045
1803
Prop
. Jam
bi88
50
20
167
012
71
06
5560
350
15
210
8979
Prop
. Jaw
a Bar
at73
391
145
81
5665
538
105
11
8477
453
6329
9332
113
3074
871
Prop
. Jaw
a Ten
gah
7555
128
03
5211
41
870
217
741
6473
2242
172
1690
7096
4Pr
op. J
awa T
imur
9467
329
126
5381
23
765
21
1683
360
9329
1420
010
7774
360
Prop
. Kali
man
tan
Bara
t17
746
05
9915
718
10
1210
289
542
512
029
713
469
Prop
. Kali
man
tan
Selat
an12
452
30
167
620
28
01
347
911
469
713
395
94
Prop
. Kali
man
tan
Teng
ah89
62
21
4574
13
130
04
8446
824
813
016
864
77
Prop
. Kali
man
tan
Timur
732
04
44
4699
02
71
110
2637
834
05
017
663
89Pr
op. K
alim
anta
n Ut
ara
105
11
291
21
12
723
812
4611
84Pr
op. K
epul
auan
Riau
239
21
113
045
201
111
1882
110
247
1844
Prop
. Lam
pung
2214
219
123
1504
35
420
210
132
1495
1176
300
425
2061
0Pr
op. M
aluku
519
162
526
641
910
35
1396
370
190
1039
243
05Pr
op. M
aluku
Uta
ra12
920
00
1027
03
100
111
1917
410
31
133
1631
Prop
. Nus
a Ten
ggar
a Ba
rat
1280
60
276
642
40
19
4880
978
05
205
1081
5
Prop
. Nus
a Ten
ggar
a Tim
ur16
7122
25
9742
111
355
228
134
829
1059
1980
514
370
Prop
. Pap
ua32
617
01
2101
01
30
17
3616
846
70
424
3138
Prop
. Pap
ua B
arat
224
20
904
10
04
1470
442
108
1373
Prop
. Riau
958
179
071
2510
230
2614
469
362
613
024
598
89Pr
op. S
ulaw
esi B
arat
256
40
017
240
01
03
1711
510
74
154
2385
Prop
. Sul
awes
i Sela
tan
1914
137
20
1204
00
2938
11
5213
316
9611
2317
435
1751
9Pr
op. S
ulaw
esi T
enga
h64
411
12
4492
1313
044
4655
260
57
034
467
74Pr
op. S
ulaw
esi T
engg
ara
551
30
034
354
160
736
356
340
316
049
11Pr
op. S
ulaw
esi U
tara
434
191
4027
06
151
134
3035
441
114
174
5521
Prop
. Sum
ater
a Bar
at16
301
71
9660
03
751
2348
1195
569
526
413
482
Prop
. Sum
ater
a Sela
tan
2046
24
48
1433
84
331
216
150
946
963
3961
519
171
Prop
. Sum
ater
a Uta
ra49
041
6414
1124
175
09
212
232
168
2277
1878
460
820
3442
458
149
1955
690
8636
2190
921
374
225
3559
844
2237
628
2290
038
63
1309
150
1142
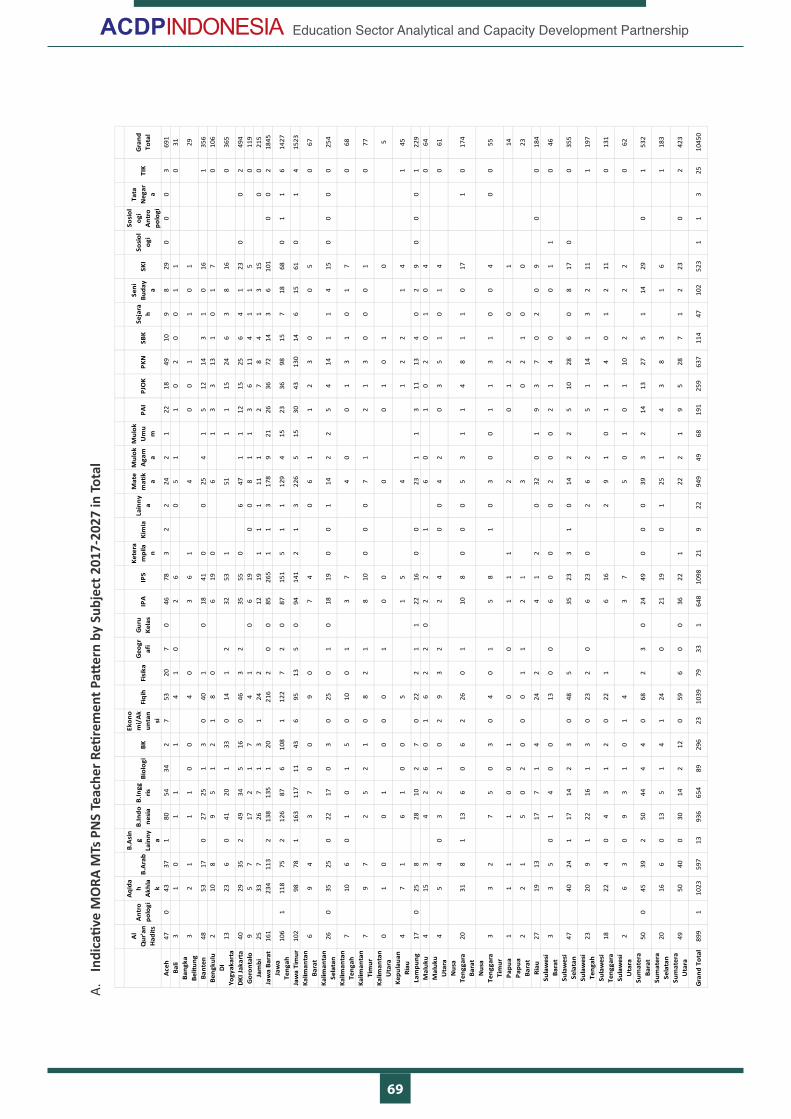
69
Education Sector Analytical and Capacity Development Partnership
A.
Indi
cativ
e M
ORA
MTs
PN
S Te
ache
r Reti
rem
ent P
atter
n by
Sub
ject
201
7-20
27 in
Tota
l
Al
Qur
'an
Had
its
Ant
ropo
logi
Aqi
da h A
khla
k
B.A
rab
B.A
sin
g La
inny a
B.In
done
sia
B.In
ggris
Biol
ogi
BK
Ekon
om
i/A
kun
tan
si
Fiqi
hFi
sika
Geo
graf
iG
uru
Kela
sIP
AIP
SKe
tera
mpi
lan
Kim
iaLa
inny a
Mat
em
atik
a
Mul
ok
Aga
ma
Mul
ok
Um
um
PAI
PJO
KPK
NSB
KSe
jara
h
Seni
Bu
day
aSK
ISo
siol
ogi
Sosi
olog
i A
ntro
polo
gi
Tata
N
egar
aTI
KG
rand
To
tal
Ace
h47
043
371
8054
342
753
207
046
783
22
242
122
1849
109
829
00
03
691
Bali
31
01
11
41
02
60
51
10
20
01
10
31Ba
ngka
Be
litun
g3
21
11
00
40
36
14
00
11
01
29
Bant
en48
5317
027
251
30
401
018
410
025
41
512
143
10
161
356
Beng
kulu
210
89
51
21
80
619
06
13
313
10
17
010
6D
I Yo
gyak
arta
1323
60
4120
133
014
12
3253
151
11
1524
63
816
036
5
DKI
Jaka
rta
4029
352
4934
516
046
32
3555
06
471
112
1525
64
123
00
249
4G
oron
talo
95
717
21
74
10
619
00
81
13
611
41
15
011
9Ja
mbi
2533
726
71
31
242
1219
11
111
12
78
41
315
00
215
Jaw
a Ba
rat
161
234
113
213
813
51
2021
62
00
8526
51
13
178
921
2636
7214
36
101
00
218
45Ja
wa
Teng
ah10
61
118
752
126
876
108
112
27
20
8715
15
11
129
415
2336
9815
718
680
11
614
27
Jaw
a Ti
mur
102
9878
116
311
711
436
9513
50
9414
12
13
226
515
3043
130
146
1561
01
415
23Ka
liman
tan
Bara
t6
94
37
00
90
74
06
11
23
00
50
67
Kalim
anta
n Se
lata
n26
035
250
2217
03
025
01
018
190
01
142
25
414
11
415
00
00
254
Kalim
anta
n Te
ngah
710
60
10
15
010
01
37
40
01
31
01
70
68
Kalim
anta
n Ti
mur
79
72
52
10
82
18
100
00
71
21
30
00
10
77
Kalim
anta
n U
tara
01
00
10
00
10
00
01
01
05
Kepu
laua
n Ri
au4
71
61
00
51
54
12
21
41
45
Lam
pung
170
258
2810
27
022
21
122
160
023
11
311
134
02
90
00
122
9M
aluk
u4
153
42
60
16
22
02
21
60
10
20
10
40
64M
aluk
u U
tara
45
40
32
10
29
32
24
00
42
03
51
01
40
61
Nus
a Te
ngga
ra
Bara
t20
318
113
60
62
260
110
80
00
53
11
48
11
017
10
174
Nus
a Te
ngga
ra
Tim
ur3
32
75
03
04
01
58
10
30
01
13
10
04
00
55
Papu
a1
11
10
01
00
11
12
01
20
114
Papu
a Ba
rat
22
15
02
00
01
12
13
02
10
023
Riau
2719
1317
71
424
24
12
032
01
93
70
20
90
018
4Su
law
esi
Bara
t3
35
01
40
013
00
60
00
20
02
14
00
11
046
Sula
wes
i Se
lata
n47
4024
117
142
30
485
3523
31
014
22
510
286
08
170
035
5
Sula
wes
i Te
ngah
2320
91
2216
13
023
20
623
02
62
51
141
32
111
197
Sula
wes
i Te
ngga
ra18
224
04
31
20
221
616
29
10
11
40
12
110
131
Sula
wes
i U
tara
26
30
93
10
14
37
50
10
110
22
20
62
Sum
ater
a Ba
rat
500
4539
250
444
40
682
30
2449
00
039
32
1413
275
114
290
153
2
Sum
ater
a Se
lata
n20
166
013
51
41
240
2119
01
251
43
83
16
118
3
Sum
ater
a U
tara
4950
400
3014
212
059
60
036
221
222
19
528
71
223
02
423
Gra
nd T
otal
899
110
2359
713
936
654
8929
623
1039
7933
164
810
9821
922
949
4968
191
259
637
114
4710
252
31
13
2510
450
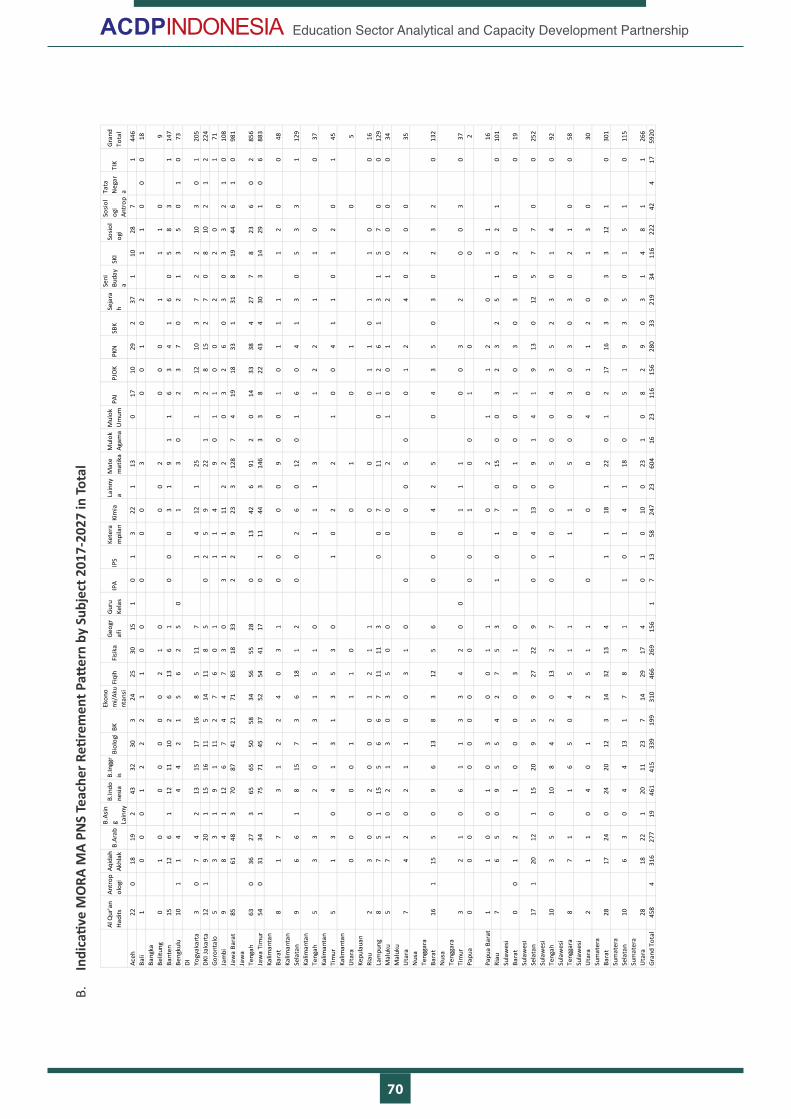
70
Education Sector Analytical and Capacity Development Partnership
B.
Indi
cativ
e M
ORA
MA
PNS
Teac
her R
etire
men
t Patt
ern
by S
ubje
ct 2
017-
2027
in To
tal
Al Q
ur'a
n H
adits
Antr
opol
ogi
Aqid
ah
Akhl
akB.
Arab
B.As
ing La
inny
B.In
done
sia
B.In
ggr
isBi
olog
iBK
Ekon
om
i/Ak
unt
ansi
Fiqi
hFi
sika
Geo
graf
iG
uru
Kela
sIP
AIP
SKe
tera
mpi
lan
Kim
iaLa
inny
aM
ate
mat
ika
Mul
ok
Agam
aM
ulok
U
mum
PAI
PJO
KPK
NSB
KSe
jara
h
Seni
Bu
day
aSK
ISo
siol
ogi
Sosi
olog
i An
trop
Tata
N
egar
aTI
KG
rand
To
tal
Aceh
220
1819
243
3230
324
2530
151
01
322
113
017
1029
237
110
287
144
6Ba
li1
00
01
22
21
10
00
00
30
01
02
11
00
018
Bang
ka
Belit
ung
01
00
00
00
21
00
02
00
01
11
09
Bant
en15
126
112
1110
26
136
10
00
31
91
16
34
16
05
83
114
7Be
ngku
lu10
11
44
42
15
62
50
13
02
37
02
13
50
10
73D
I Yo
gyak
arta
30
74
213
1517
168
511
71
412
125
13
1210
37
22
103
01
205
DKI
Jaka
rta
121
920
115
1611
514
118
50
25
922
12
815
27
08
102
12
224
Gor
onta
lo5
33
19
111
27
60
11
14
90
11
00
22
01
71Ja
mbi
98
41
126
74
47
30
31
111
22
03
26
03
03
32
10
108
Jaw
a Ba
rat
8561
483
7087
4121
7185
1833
22
923
312
87
419
1833
131
819
446
10
981
Jaw
a Te
ngah
630
3627
365
6550
5834
5655
280
1342
691
20
1433
384
277
823
60
285
6Ja
wa
Tim
ur54
031
341
7571
4537
5254
4117
01
1144
314
63
38
2243
430
314
291
06
883
Kalim
anta
n Ba
rat
81
73
12
24
03
10
00
09
00
10
11
11
20
048
Kalim
anta
n Se
lata
n9
66
18
157
36
181
20
02
60
120
16
04
13
05
33
112
9Ka
liman
tan
Teng
ah5
33
20
13
15
10
11
13
12
21
10
037
Kalim
anta
n Ti
mur
51
30
41
31
35
30
10
22
10
04
11
01
20
145
Kalim
anta
n U
tara
00
00
11
10
01
01
05
Kepu
laua
n Ri
au2
30
02
00
01
21
10
00
11
01
10
016
Lam
pung
87
51
155
66
711
113
00
711
01
26
13
15
70
012
9M
aluk
u5
71
02
13
03
50
00
02
10
01
21
00
00
34M
aluk
u U
tara
74
20
21
10
03
10
00
05
00
12
40
20
035
Nus
a Te
ngga
ra
Bara
t16
115
50
96
138
312
56
00
04
25
04
35
03
02
32
013
2N
usa
Teng
gara
Ti
mur
32
10
61
13
34
20
00
11
10
03
20
03
037
Papu
a0
00
00
00
00
01
00
10
02
Papu
a Ba
rat
11
00
10
30
01
10
21
12
01
116
Riau
76
50
95
54
27
53
10
17
015
00
32
32
51
02
10
101
Sula
wes
i Ba
rat
00
12
10
00
03
10
01
01
00
10
30
30
20
019
Sula
wes
i Se
lata
n17
120
121
1520
95
927
229
00
413
09
14
19
130
125
77
00
252
Sula
wes
i Te
ngah
103
50
108
42
013
27
01
00
05
00
43
52
30
14
092
Sula
wes
i Te
ngga
ra8
71
16
50
45
11
11
50
03
03
03
02
10
058
Sula
wes
i U
tara
21
10
40
12
51
10
00
40
11
20
13
030
Sum
ater
a Ba
rat
2817
240
2420
123
1432
134
11
181
220
12
1716
39
33
121
030
1Su
mat
era
Sela
tan
106
30
44
131
78
31
10
14
118
05
19
35
01
51
011
5Su
mat
era
Uta
ra28
1822
120
1123
714
2917
40
10
100
231
08
29
03
14
81
126
6G
rand
Tot
al45
84
316
277
1946
141
533
919
931
046
626
915
61
713
5824
723
604
1623
116
156
280
3321
934
116
222
424
1759
20
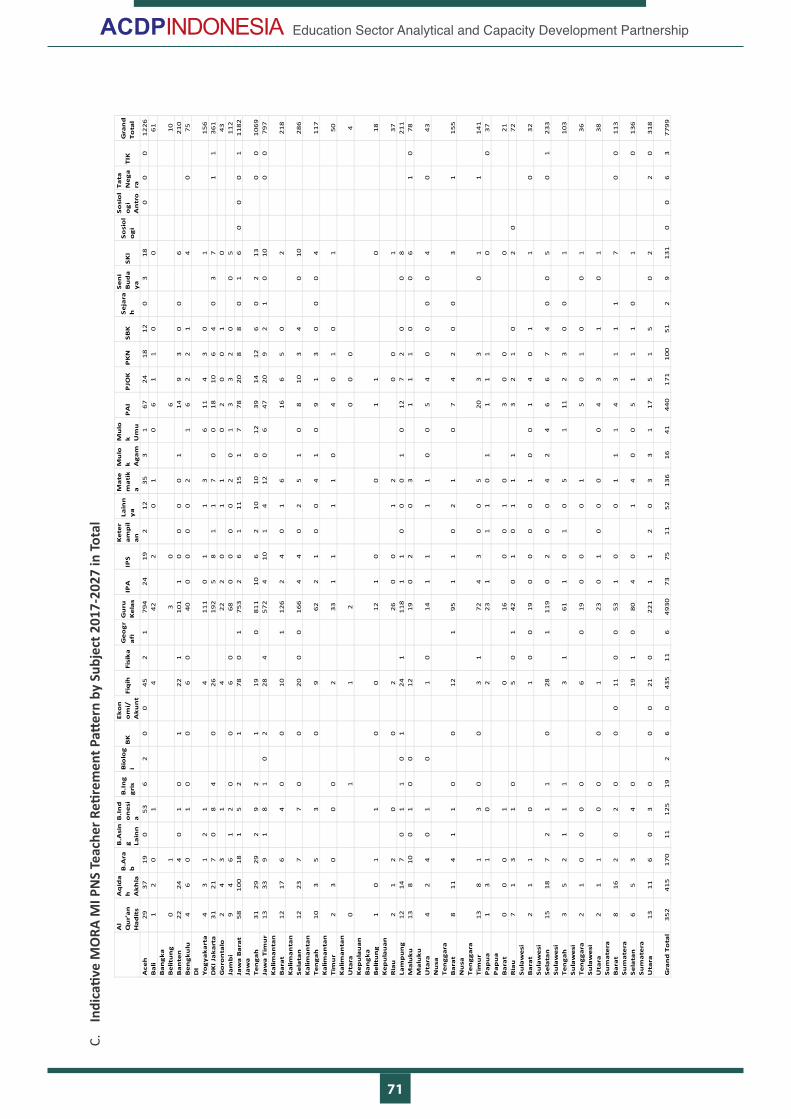
71
Education Sector Analytical and Capacity Development Partnership
C.
Indi
cativ
e M
ORA
MI P
NS
Teac
her R
etire
men
t Patt
ern
by S
ubje
ct 2
017-
2027
in To
tal
Al
Qu
r'a
n
Ha
dit
s
Aq
ida
h
Ak
hla
B.A
rab
B.A
sin
g
Lain
n
B.I
nd
on
esi
a
B.I
ng
gri
sB
iolo
gi
BK
Ek
on
om
i/A
ku
nt
Fiq
ihFi
sik
aG
eo
gr
afi
Gu
ru
Ke
las
IPA
IPS
Ke
ter
am
pil
an
Lain
ny
a
Ma
tem
ati
ka
Mu
lok
A
ga
m
Mu
lok
U
mu
PA
IP
JOK
PK
NS
BK
Se
jara
h
Se
ni
Bu
da
ya
SK
IS
osi
ol
og
i
So
sio
lo
gi
An
tro
Ta
ta
Ne
ga
raT
IKG
ran
d
To
tal
Ace
h2
93
71
90
53
62
00
45
21
79
42
41
92
12
35
31
67
24
18
12
03
18
00
01
22
6B
ali
12
01
44
22
01
06
11
00
61
Ba
ng
ka
B
elit
un
g0
13
06
10
Ba
nte
n2
22
44
01
01
22
11
01
10
00
01
14
93
00
62
10
Be
ng
ku
lu4
60
10
06
04
00
00
02
16
22
14
07
5D
I Y
og
ya
ka
rta
43
12
14
11
10
11
36
11
43
01
15
6D
KI
Jak
art
a3
12
17
08
40
26
19
25
81
17
00
18
10
64
03
71
13
61
Go
ron
talo
24
31
42
22
01
10
20
01
04
3Ja
mb
i9
46
12
00
60
68
00
00
20
13
32
00
51
12
Jaw
a B
ara
t5
81
00
18
15
21
78
01
75
32
61
11
15
17
78
20
88
01
60
00
11
18
2Ja
wa
T
en
ga
h3
12
92
92
92
11
90
81
11
06
21
01
00
12
39
14
12
60
21
30
01
06
9Ja
wa
Tim
ur
13
33
91
81
02
28
45
72
41
01
41
20
64
72
09
21
01
00
07
97
Ka
lima
nta
n
Ba
rat
12
17
64
00
10
11
26
24
01
61
66
50
22
18
Ka
lima
nta
n
Se
lata
n1
22
37
70
02
00
01
66
44
02
51
08
10
34
01
02
86
Ka
lima
nta
n
Te
ng
ah
10
35
30
96
22
10
04
10
91
30
00
41
17
Ka
lima
nta
n
Tim
ur
23
00
02
33
11
11
04
01
01
50
Ka
lima
nta
n
Uta
ra0
11
20
00
4K
ep
ula
ua
n
Ba
ng
ka
B
elit
un
g1
01
10
01
21
00
11
01
8K
ep
ula
ua
n
Ria
u2
12
00
22
60
01
20
01
37
Lam
pu
ng
12
14
70
11
01
24
11
18
11
00
01
01
27
20
08
21
1M
alu
ku
13
81
00
10
01
21
90
20
31
11
00
61
07
8M
alu
ku
U
tara
42
40
10
10
14
11
11
00
54
00
00
40
43
Nu
sa
Te
ng
ga
ra
Ba
rat
81
14
11
00
12
19
51
10
21
07
42
00
31
15
5N
usa
T
en
gg
ara
T
imu
r1
38
13
00
31
72
43
00
52
03
30
11
14
1P
ap
ua
13
10
22
31
11
01
11
10
03
7P
ap
ua
B
ara
t0
00
10
16
00
10
30
00
21
Ria
u7
13
10
50
14
20
10
11
13
21
02
07
2S
ula
we
si
Ba
rat
21
10
10
01
90
00
01
00
14
01
10
32
Su
law
esi
S
ela
tan
15
18
72
11
02
81
11
90
20
04
24
66
74
00
50
12
33
Su
law
esi
T
en
ga
h3
52
11
13
16
11
01
05
11
12
30
01
10
3S
ula
we
si
Te
ng
ga
ra2
10
00
06
01
90
00
15
01
00
13
6S
ula
we
si
Uta
ra2
11
00
01
23
01
00
00
43
10
13
8S
um
ate
ra
Ba
rat
81
62
02
00
01
10
05
31
00
11
14
31
11
70
01
13
Su
ma
tera
S
ela
tan
65
34
01
91
08
04
01
40
05
11
10
10
13
6S
um
ate
ra
Uta
ra1
31
16
03
00
02
10
22
11
12
03
31
17
51
50
22
03
18
Gra
nd
To
tal
35
24
15
17
01
11
25
19
26
04
35
11
64
93
07
37
51
15
21
36
16
41
44
01
71
10
05
12
91
31
00
63
77
99

72
Education Sector Analytical and Capacity Development Partnership
ACDP
ACDP SecretariatMinistry of Education and CultureNational Office for Research and Development (BALITBANG)E Building, 19th FloorJl. Jend. Sudirman Senayan, Jakarta 10270Phone : (021) 578-51100, Fax: (021) 578-51101 Email : [email protected] Website : www.acdp-indonesia.org
The Government of Indonesia (represented by the Ministry of Education and Culture, the Ministry of Religious Affairs, and the Ministry of National Development Planning / BAPPENAS), the Government of Australia, through Australian Aid, the European Union (EU) and the Asian Development Bank (ADB) have established the Education Sector Analytical and Capacity Development Partnership (ACDP). ACDP is a facility to promote policy dialogue and facilitate institutional and organisational reform to underpin policy implementation and to help reduce disparities in education performance. The facility is an integral part of the Education Sector Support Program (ESSP). EU’s support to the ESSP also includes a sector budget support along with a Basic Education Minimum Service Standards capacity development program. Australia’s support is through Australia’s Education Partnership with Indonesia. This policy issue has been prepared with grant support provided by the Government of Australia and the European Union, through ACDP.
Photo : BKLM MoEC