2017campbell274059phd_full.pdf - University of Plymouth ...
436
University of Plymouth PEARL https://pearl.plymouth.ac.uk 04 University of Plymouth Research Theses 01 Research Theses Main Collection 2017 Fisheries, Marine Conservation, Marine Renewable Energy and Displacement: A Fresh Approach Campbell, Maria Shauna http://hdl.handle.net/10026.1/8336 University of Plymouth All content in PEARL is protected by copyright law. Author manuscripts are made available in accordance with publisher policies. Please cite only the published version using the details provided on the item record or document. In the absence of an open licence (e.g. Creative Commons), permissions for further reuse of content should be sought from the publisher or author.
-
Upload
khangminh22 -
Category
Documents
-
view
0 -
download
0
Transcript of 2017campbell274059phd_full.pdf - University of Plymouth ...
University of Plymouth
PEARL https://pearl.plymouth.ac.uk
04 University of Plymouth Research Theses 01 Research Theses Main Collection
2017
Fisheries, Marine Conservation, Marine
Renewable Energy and Displacement: A
Fresh Approach
Campbell, Maria Shauna
http://hdl.handle.net/10026.1/8336
University of Plymouth
All content in PEARL is protected by copyright law. Author manuscripts are made available in accordance with
publisher policies. Please cite only the published version using the details provided on the item record or
document. In the absence of an open licence (e.g. Creative Commons), permissions for further reuse of content
should be sought from the publisher or author.

This copy of the thesis has been supplied on condition that anyone who consults it is
understood to recognise that its copyright rests with its author and that no quotation
from the thesis and no information derived from it may be published without the
author’s prior consent.

Fisheries, Marine Conservation, Marine Renewable Energy and
Displacement: A Fresh Approach
by
Maria Shauna Campbell, B.Sc. (Hons.), M.Sc.
A thesis submitted to Plymouth University in partial fulfilment for the
degree of Doctor of Philosophy
School of Marine Science and Engineering
May 2015

Acknowledgements
I want to thank an incredible amount of people who helped me through one of the
most intense journeys of my life. Thank you supervisors, especially Vic and Martin, I
pushed you to the limits. I would also like to thank from the depths of my being, the
motley crew; Maxwell House, Cathy, Mc Fisty, Dr de la Haye, Vale, Jaime, Jess,
Claire Mc S, Miss DeAmicis, Manuel de la Fuego, Mazmo, Astrid, Dr J for always
accepting me in whatever state I was in at the end of the day.
To Phil and the Nowhere raggedy crew, being so close to the best pint of cider and
craic was my saviour on more occasions than I care to imagine.
Lucy Davies, I will be ever so grateful, to the end! To the end! I may be batwick, but I
will love you forever.
Finally, my mum and my little brother who always believed in me, all these years and
were always there with a Gday, or some high glucose treat of some kind. We are the
three amigos! Unstoppable! Unshakeable! Solid!
To Dan, my hero, without you I would not know what to do!
And finally, to my Papa Bear, Rambo, Uncle Andy, for always making me get really
defensive about my choice of career “why can’t you get a normal job?” The hardest
thing was not having you here at the end, thank you for a life less ordinary. This
thesis is dedicated to you!

Author’s declaration
At no time during the registration for the degree of Doctor of Philosophy has the
author been registered for any other University award without prior agreement of the
graduate committee.
This study was financed by an initial studentship from the Esmée Fairbairn
Foundation for the first two years, however the remainder was primarily self-funded.
Additional funding, mainly for conference and workshop attendance was attained
from; Challenger Society for Marine Science, American Geophysical Union, NERC
Knowledge Exchange Programme, National Federation of Fishermen’s Organisation
(NFFO), Seafish, International Council for Exploration of the Sea (ICES) and
Plymouth Marine Science Partnership. Also, a highly competitive final year
scholarship was awarded by the Funds for Women Graduates (FfWG), an
educational charity for the advancement and promotion of higher education of
women graduates. The work was carried out in collaboration with the Partnership for
Research in Marine Renewable Energy (PRIMaRE), the Marine Biology and Ecology
Research Group and the Centre of Marine and Coastal Policy Research, all residing
within Plymouth University.
Relevant conferences were regularly attended at which work was presented, and
several Chapters have been published or are currently in preparation with co-authors.
Due to the part-time nature of my PhD, I have a number of other publications related
to collaboration with my workplace as a plankton taxonomist with the Sir Alister

Hardy Foundation for Ocean Science (SAHFOS) and Plymouth University
colleagues.
A record of my individual contribution to this collaborative research specifically
relating to my PhD is provided as part of this thesis.
Refereed journal publications:
Campbell, M. S, Stehfest, K. M., Votier, S. C., Hall-Spencer, J. M. (2014) Mapping
fisheries for marine spatial planning: gear-specific vessel monitoring system
(VMS), marine conservation and offshore renewable energy. Marine Policy,
45: 293-300.
de Groot, J., Campbell, M., Ashley, M. & Rodwell, L. (2014) Investigating the co-
existence of fisheries and offshore renewable energy in the UK: Identification
of a mitigation agenda for fishing effort displacement. Ocean and Coastal
Management, 102, 7-18
Rodwell, L., Fletcher, S., Glegg, G. A., Campbell, M., Rees, S. A., Ashley, M., Linley,
E. A., Frost, M., Earll, B., Wynn, R. B., Almada-Villela, P., Lear, D., Stanger,
P., Colenutt, A., Davenport, F., Barker-Bradshaw, N. J. & Covey, R. (2014)
Marine and coastal policy in the UK: Challenges and opportunities in a new
era, Marine Policy, 45, 251-258.
Bicknell, A.W.J., Knight, M.E., Bilton, D.T., Campbell, M., Reid, J.B., Newton, J. &
Votier, S.C. (2013) Intercolony movement of pre-breeding seabirds over

oceanic scales: implications of cryptic age classes for conservation and
metapopulation dynamics. Diversity & Distributions, 20(2), 160-168.
Bicknell, Campbell, M.S., Knight, M.E., Bilton, D.T., Newton, and J. & Votier, S.C.
(2011) Effects of formalin preservation on stable carbon and nitrogen
signatures in calanoid copepods: implications for the use of the CPR Survey
samples in stable isotope analyses. Rapid Communications in Mass
Spectrometry, 25(15), 1794-1800.
Rees, S., Fletcher, S., Glegg, G., Marshall, C., Rodwell, L., Jefferson, R., Campbell,
M., Langmead, O., Ashley, M., Bloomfield, H., Brutto, D., Colenutt, A.,
Conversi, A., Earll, B., Abdel Hamid, I., Hattam, C., Ingram, S., McKinley, E.,
Mee, L., Oats, J., Peckett, F., Portus, J., Reed, M., Rogers, S., Saunders, J.,
Scales, K. & Wynn, R. (2013) Priority questions to shape the marine and
coastal policy research agenda in the United Kingdom. Marine Policy, 38,
531-537.
Hall-Spencer, J. M., Tasker, M., Soffker, M., Christiansen, S., Rogers, S., Campbell,
M. & Hoydal, K. et al. (2009) The design of Marine Protected Areas on High
Seas and Territorial waters of Rockall. Marine Ecology Progress Series, 397:
305-308.
Publications currently in preparation:
Campbell, M., Ashley, M., de Groot, J., Hall-Spencer, J., Attrill, M., Abbott, V.,
Rodmell, D. & Rodwell, L. (In Prep) The assessment of fishing effort
displacement: a review of methodologies, Fish & Fisheries.

Campbell, M., Attrill, M., Abbott, V. & Hall-Spencer, J. (In Prep) The ‘natural’
variability of trends in fishing effort in the South West of the UK: Defining a
baseline for detecting displacement, ICES Journal of Marine Science.
Campbell, M., Hartwell, L. & Hind, E. (In Prep) How simple technological advances
in data sharing can increase fishermens’ participation in fisheries
management, Fish & Fisheries (Ghoti).
Campbell, M., Hind, E., de Groot, J., Ashley, M., Hartwell, L., Rodmell, D. Hall-
Spencer, H., Attrill, M., Abbott, V. & Rodwell, L. (In Prep) Lost at sea:
Assessment of fishing effort displacement without inclusion of Fishers’
Knowledge (FK), ICES Journal of Marine Science.
de Groot, J., Campbell, M., Ashley, M. & Rodwell, L. (In Prep) Marine renewable
energy, conservation and fishing effort displacement: A policy review, Marine
Policy.
Reports:
Campbell, M., Ashley, M., de Groot, J. & Rodwell, L. (In Review) Assessing
fisheries displacement as a result of developing a UK networ of MPAs and
offshore energy development. A report jointly funded by NFFO and Seafish,
110 pp.
Rodwell, L. D., de Groot, J. R., Ashley, M., Campbell, M., Linley, A. (2013) Fisheries
and marine renewable energy interactions: assessment and mitigation: a final
report on the expert workshop for the Marine Renewable Energy Knowledge
Exchange Programme (MREKEP), York, April 17-18, 33 pp.

Rodwell, L.D., Campbell, M., de Groot, J.R., Ashley, M. (2012) Fisheries and marine
renewable energy interactions: a summary report on a scoping workshop for
the Marine Renewable Energy Knowledge Exchange Programme (MREKEP),
held at Environmental Interactions of Marine Renewable Energy Technologies
(EIMR) Conference, Orkney, May 3-6, 20 pp.
Seeley, B., Higgs, S., Lear, D., Neilly, M., Wilkes, P., Campbell, M., Evans, J. &
Adams, L. (2010) Accessing and developing the required biophysical datasets
and data layers for Marine Protected Areas network planning and wider
marine spatial planning purposes. Report No. 16: Task 2C. Mapping of
Protected Habitats. Report to Defra. Contract No. MB0102,146 pp.
Wilding, C., Jackson, E., Langmead, O., Hiscock, K., Evans, J., Sewell, J., Oakley, J.
& Tyler-Walters, H. (2009) Marine Health Check Update. Flagship species
revisited. Marine Life and Information Network (MarLIN) report in conjunction
with WWF, Goldaming Surrey, 67 pp. (One of the deep-sea coral data
provider)
Conference Presentations:
2014. International Conference on Ocean Energy (ICOE), Halifax, Nova Scotia,
Canada. Poster entitled ‘The Fisheries and Marine Renewable Energy Working
Group: An agenda for improved co-existence’.
2014. Marine and Coastal Policy Forum, Plymouth University, Plymouth, UK. Talk
entitled ‘Fisheries and marine renewable energy: Creating a mitigation agenda for
improved co-existence’.

2013. South West Marine Ecosystems, Marine Biological Association of the UK,
Plymouth, UK. Talk entitled ‘MRE and fishing effort displacement in the South West
UK’.
2012. Invited Keynote Heligoland Celebratory Roads Symposium, Heligoland,
Germany. Talk entitled ‘The global significance of the CPR Survey’.
2012. 6th World Fisheries Congress, Edinburgh, UK. Talk entitled ‘Minimising
fisheries displacement in offshore MPA design’.
2012. South West Marine Ecosystems, Marine Biological Association of the UK,
Plymouth, UK. Talk entitled ‘Vessel monitoring system (VMS) data and fishing effort
assessment’.
2011. ICES Annual Science Conference, Gdansk, Poland. Talk entitled ‘Mapping
fisheries for marine spatial planning using VMS data’.
2011. Marine and Coastal Policy Forum, Plymouth University, Plymouth, UK. Talk
entitled ‘Mapping fisheries for marine spatial planning using VMS data’.
2010. Deep-sea Biology Symposium, Reykjavik, Iceland. Talk entitled ‘Deep-sea
corals of the UK and Ireland’.
2009. Plymouth Marine Sciences Partnership, Plymouth, UK. Talk entitled ‘The
protection of deep-sea corals within the continental shelf limits of the UK and Ireland’.
2008. Porcupine Marine Natural History Society Annual Conference, Bangor, Wales,
UK. Talk entitled ‘Marine protected area monitoring tools’.
2008. 4th Deep-sea Coral Symposium, Wellington, New Zealand. Talk entitled ‘The
protection of deep-sea corals within the continental shelf limits of the UK and Ireland’.

2008. International Network on Offshore Renewable Energy (INORE), Brest, France.
Talk entitled ‘Conflict between fisheries and marine renewable energy’.
Word count of main body of thesis: 54802
Signed…………………………………………
Date……………………………………………

Abstract
Fishers are among the biggest commercial resource users in the marine
environment. In order to meet international, national and local policies, the UK has
to designate a suite of marine protected areas (MPAs) and reach marine renewable
energy (MRE) targets. Inevitably, there will be conflict between these two industries
and marine conservation. This study uses a multi-disciplinary approach to examine
evaluate the suitability of various sources of data, which could be used to detect,
assess, and ultimately predict, fishing effort displacement within the different sectors
of the > 15 m fleet in the South West of the UK. Gear-specific Vessel Monitoring
System (VMS) data from 2005-2008 was used to assess potential effort
displacement due to Haig Fras, a proposed MPA and Wave Hub, a marine
renewable energy installation (MREI). The spatial distribution of fishing activity was
highly heterogeneous and distinct areas of intense fishing could be identified for all
gear-types. A closure of Haig Fras would have the greatest impact on gillnetters.
Scallop dredgers also occasionally use the area. The current closure at Wave Hub
has the greatest impact on potters and whelkers whose geographic specialisation is
most pronounced and who use the area extensively. Longliners also use the area
disproportionately would be affected. A simple index of variability was developed in
order to determine baselines and two other sources of data were used. High
resolution seabed data and low resolution catch data. A semi structured interview
was conducted with forty fishers to elicit further information on the challenges,
barriers to progress and priority issues in relation to MRE those fishers face. The
theme of discontent with the consultation process scored highly throughout. Fishers’
Knowledge (FK) another source of data also scored highly, although further work
must be carried out to identify what aspects of this data are useful in assessment of
fishing effort displacement.

Chapter 1 Table of Contents Abstract................................................................................................................................. xi
Chapter 1 Thesis overview .................................................................................................... 1
1.1 Thesis aim ................................................................................................................... 1
1.2 Rationale for the case study site and survey ................................................................ 6
1.2.1 MREI developments in the South West ................................................................. 6
1.3 Thesis outline ............................................................................................................ 15
Chapter 2 Literature Review and Conceptual Framework ................................................... 18
2.1 Introduction ................................................................................................................ 19
2.1.1: Understanding effort distribution in fisheries ....................................................... 26
2.1.1.1: Vessel Monitoring System (VMS) data ......................................................... 26
2.1.1.2 Analysing Fishing activity without access to VMS ......................................... 32
2.1.1.3 Murawski et al. (2005): All year round and seasonally closed areas NE USA 33
2.2 The use of Fishers’ Knowledge (FK) .......................................................................... 35
2.2.1 Fishers: the last of the hunter gatherers or the new scientists ............................. 36
2.2.2 Factors affecting fishers’ behaviour: Fuel price ................................................... 37
2.2.3 The consequences of ignoring FK ....................................................................... 39
2.3 Predicting fishing effort displacement ........................................................................ 40
Chapter 3 Spatial and Temporal Distribution of Fisheries in the South West of the UK, with
reference to the Case Studies of Haig Fras and Wave Hub. ............................................... 43
3.1 Introduction ................................................................................................................ 44
3.1.1 ICES divisions VII e-h, and case studies Haig Fras and Wave Hub..................... 48
3.1.2 Primary objectives ............................................................................................... 50
3.2 Methodology .............................................................................................................. 50
3.2.1 VMS Data............................................................................................................ 50
3.2.1.1 Access to raw VMS data post-2008 .............................................................. 52
3.2.2 Fishing activity analyses ...................................................................................... 53
3.2.2.1 VMS ............................................................................................................. 53
3.2.2.2 Differences in spatial patterns of fishing activity ............................................ 56
3.2.2.3 EU defined fleet effort analysis ..................................................................... 58
3.3 Results ...................................................................................................................... 60
3.3.1 Spatial and temporal analyses ............................................................................ 60
3.3.2 Effects of spatial and temporal resolution ............................................................ 79
3.4.1 Winners and losers in terms of fishing effort displacement: initial insights ........... 84
3.4.2 Potential wider ecological impacts ....................................................................... 87
3.4.2.1 Apex predators ............................................................................................. 87

3.4.2.2 Seabed features ........................................................................................... 87
3.4.3 VMS under the microscope ................................................................................. 89
3.4.3.1 Investigation of other technologies: Automatic Identification System (AIS)
technology in lieu of VMS? ....................................................................................... 92
3.5 Summary ................................................................................................................... 94
Chapter 4 Determining Variability in Fishing Effort Trends in the South West of the UK:
Defining a Baseline for Detecting Displacement. ................................................................. 98
4.1 Introduction ................................................................................................................ 99
4.1.1 Detecting baselines ................................................................................................ 99
4.1.1 Primary Objectives ............................................................................................ 101
4.2 Methodology ............................................................................................................ 104
4.2.1 VMS data and analysis...................................................................................... 104
4.2.2 Fishing activity and marine substrate .................................................................... 104
4.2.3 Statistical Analyses ........................................................................................... 105
4.2.4 Fishing effort variability index ............................................................................ 106
4.3 Results .................................................................................................................... 107
4.3.1 Substrate .......................................................................................................... 107
4.3.3 Variability in Fishing Effort ................................................................................. 124
4.3.3 Relationship between Catch and Variability in Fishing Effort ............................. 133
4.4 Discussion ............................................................................................................... 142
4.5 Summary ................................................................................................................. 144
Chapter 5 Assessing the possibility of co-existence between fisheries and marine renewable
energy: The results of a national fisher survey helping to put the spotlight on fishers and
fishers’ knowledge (FK) ..................................................................................................... 149
5.1 Introduction .............................................................................................................. 149
5.1.1 Primary objectives ............................................................................................. 150
5.2 Methodology ............................................................................................................ 150
5.2.1 National survey of fishers and marine renewable energy .................................. 150
5.3 Results .................................................................................................................... 153
5.3.1 National survey of fishers and marine renewable energy interactions: Fishers
identifying issues, challenges, priorities and helping evaluate agendas ..................... 153
5.3.1.1 Description of respondents ......................................................................... 153
5.3.1.2 Priority issues and barriers to progress ....................................................... 154
5.3.1.3 Consultation process .................................................................................. 155
5.3.1.4 Research agenda ....................................................................................... 157
5.4 Discussion ............................................................................................................... 162
5.4.1 Data needs ........................................................................................................ 162

5.4.3 The need for further investigation ...................................................................... 165
5.4.3.1 Where to next for NERC MREKE Programme Marine Renewable Energy and
Fisheries Displacement Working Group? ................................................................ 165
5.4.3.2 An extension to the national fishers’ survey ................................................ 166
5.6 Summary ................................................................................................................. 172
Chapter 6 Conclusion........................................................................................................ 174
6.1 Introduction .............................................................................................................. 175
6.2 Chapter 2................................................................................................................. 178
6.3 Chapter 3................................................................................................................. 179
6.4 Chapter 4................................................................................................................. 183
6.5 Chapter 5................................................................................................................. 188
6.6 The potential of the ‘mixed method approach’ ......................................................... 191
6.7 Further work and high level recommendations on assessment of fishing effort
displacement ................................................................................................................. 193
References ....................................................................................................................... 198
Appendix 1: Questionnaire ................................................................................................ 229
Appendix 2: Statement of contribution to co-authored papers ........................................... 234
Appendix 3: Published papers and presentations .............................................................. 242

List of Illustrations
Figure 1.1: Schematic of research pathway .......................................................................... 5
Figure 1.2 Active and proposed UK Marine Renewable Energy Installations (MREI). ........... 7
Figure 1.3 Total quantity (in tonnes) liveweight of fish landed by all vessels with mobile gear
types. .................................................................................................................................. 10
Figure 1.4 Total quantity (in tonnes) liveweight of fish landed by all vessels with static gear
types. .................................................................................................................................. 11
Figure 1.5 Total value (GBP) of landed fish by all vessels with mobile gears. ..................... 12
Figure 1.6 Total value (GBP) of landed fish by all vessels with static gears. ....................... 13
Figure 1.7 Landings in the 21 major ports in England from demersal, pelagic and shellfish
fisheries, expressed as a percentage of the total in that respective group. .......................... 14
Figure 3.1: Study area showing ICES divisions, Haig Fras Natura 2000 site and Wave Hub
........................................................................................................................................... 49
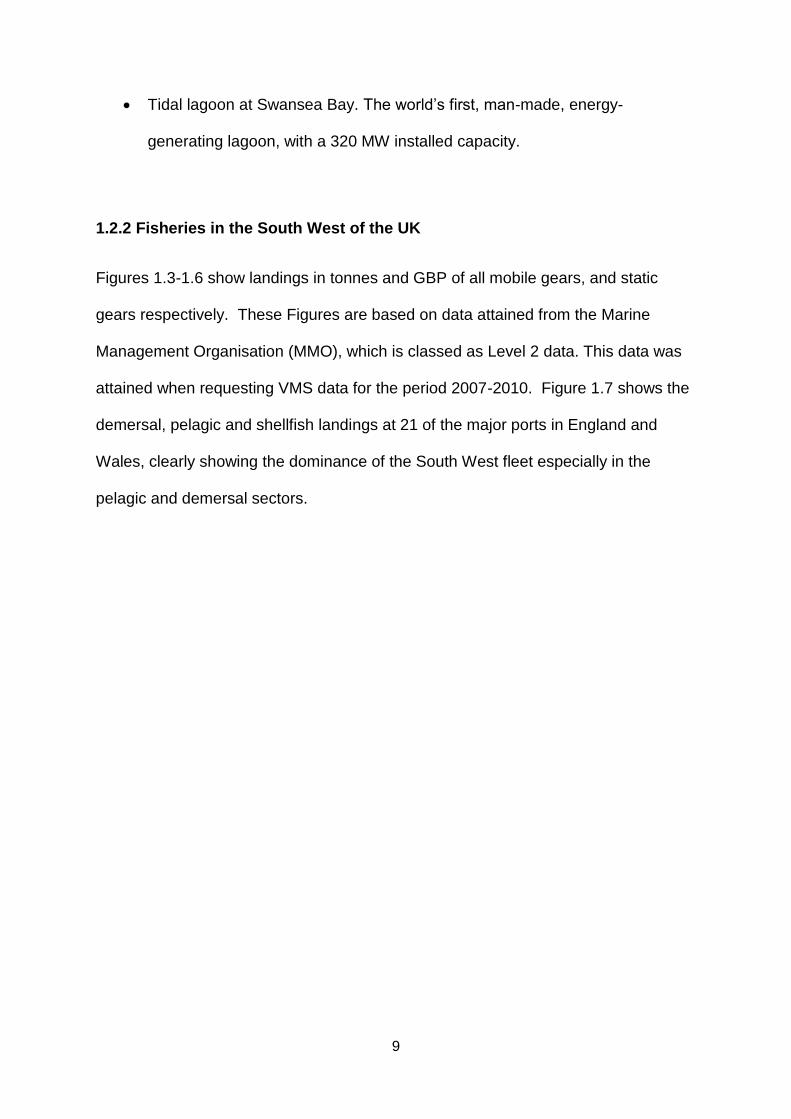
Figure 3.2 2-D MDS ordination of fishing activity of scallop dredgers, longliners, beam
trawlers, otter trawlers, potter/whelkers and gillnetters between gears and between years. 62
Figure 3.3 The Euclidean distance matrix between all gears and all years. ......................... 64
Figure 3.4 Fishing activity for beam trawlers ....................................................................... 70
Figure 3.5 Fishing Activity for demersal otter trawlers ......................................................... 71
Figure 3.6 Fishing activity for gillnetters .............................................................................. 72
Figure 3.7 Fishing activity for longliners .............................................................................. 73
Figure 3.8 Fishing activity for scallop dredgers .................................................................... 74
Figure 3.9 Fishing activity for potters and whelkers ............................................................. 75
Figure 3.10 Global Moran’s I ............................................................................................... 76
Figure 3.11 Getis-Ord Gi Statistic for all gear-types between 2005-2008. ........................... 78
Figure 3.12 Percentage absolute change in index of relative difference in pattern of fishing
activity for different grid sizes .............................................................................................. 80
Figure 3.13 Average number of days at sea by UK vessels >15 m in length and average per
calendar month in total per ICES divisions VII e-h ............................................................... 82
Figure 3.14 2-D MDS ordination of number of days at sea, for each gear-type with all years
and ICES VII e-h aggregated. ............................................................................................. 83
Figure 4.1: Kinetic energy at the seabed in the South West UK waters ............................. 102
Figure 4.2: Bathymetry of the South-west UK waters ........................................................ 103
Figure 4.3: Five substrate types derived from UK Seamap data ........................................ 108
Figure 4.4: The location of proposed/active MREIs in the South West UK ........................ 109
Figure 4.5: Substrate map overlain with the spatial distribution of beam trawl effort .......... 110
Figure 4.6: Substrate map overlain with the spatial distribution of demersal otter trawl effort
......................................................................................................................................... 111
Figure 4.7: Substrate map overlain with the spatial distribution of scallop dredge effort .... 112
Figure 4.8: Substrate map overlain with the spatial distribution of gillnetter effort .............. 113
Figure 4.9: Substrate map overlain with the spatial distribution of longliner effort .............. 114
Figure 4.10: Substrate map overlain with the spatial distribution of potter/whelker effort ... 115
Figure 4.11 Distribution of per-grid, number of hours fished, aggregated over regions and
years. ................................................................................................................................ 118
Figure 4.12 Quantile-Quantile plot of the residuals in the model ....................................... 119
Figure 4.13 Coeffficient of variation (CV) of beam trawl fishing effort per grid cell, over 2005-
2008 .................................................................................................................................. 125

Figure 4.14 Coefficient of variation (CV) of otter trawl fishing effort per grid cell, over 2005-
2008. ................................................................................................................................. 126
Figure 4.15 Coefficient of variation (CV) of scallop dredge fishing effort per grid cell ........ 127
Figure 4.16 Coefficient of Variation (CV) of longliner fishing effort per grid cell ................. 129
Figure 4.17 Coefficient of Variation (CV) of gillnetter fishing effort per grid cell, ................ 130
Figure 4.18 Coefficient of variation (CV) of potter/whelker fishing effort per grid cell ......... 132
Figure 4.19 Coefficient of variation (CV) of fishing effort by all the mobile gear types per grid
cell .................................................................................................................................... 135
Figure 4.20 Coefficient of variation of fishing effort by all the static gear types per grid cell136
Figure 4.21 Colour-filled contour map of the coefficient of variation (CV) of fishing effort by all
the mobile gear types grid cell overlain with contours of gross tonnage of landed fish ...... 138
Figure 4.22 Colour-filled contour map of the coefficient of variation of fishing effort by all the
mobile gear types per grid cell overlain with contours of gross value of landed fish .......... 139
Figure 4.23 Colour-filled contour map of coefficient of variation of fishing effort by all the
static gear types per grid cell, over the 4-year period 2005-2008, overlain with contours of
gross tonnage of landed fish ............................................................................................. 141
Figure 4.24 Colour-filled contour map of the coefficient of variation of fishing effort by all the
static gear types per grid cell, overlain with contours of gross value of landed fish ............ 142
1
Chapter 1 Thesis overview
“Hark, now hear the sailors cry, smell the sea, and feel the sky let your soul & spirit
fly, into the mystic...”
Van Morrison, Into the mystic, Moondance, 1970.
1.1 Thesis aim
The aim of this thesis is to evaluate the suitability of various sources of data, which
could be used to detect, assess, and ultimately predict, fishing effort displacement
due to implementation of marine conservation objectives and the development of the
marine renewable energy (MRE) sector (Figure 1.1). This will be achieved by looking
at one area - the South West of the UK – at the highest possible detail. The principal
data sources that will be critically assessed come from the satellite Vessel
Monitoring System (VMS) and interviews and workshops with fishers themselves,
information on aspects of fishing behaviour and strategies that can be termed
Fishers’ Knowledge (FK).
The key objectives of this work are to:
Detect, identify and highlight ways in which the UK fishing fleet could be
affected by the development of marine conservation efforts and MRE
development, and how that might translate into the displacement of vessels
into new fishing grounds.

2
Carry out this work at varying resolutions, from the individual vessel, through
assemblages of vessels with the same gear types, to fishing fleets operating
out of individual ports, and finally to whole fleets operating wholesale out of all
ports in the South West of the UK;
Assess what data and analysis methods would be required to detect such a
displacement of fishing effort, and at what resolution and scale would such a
detection be possible; and
Assess the potential of these data and methodologies to predict which
fisheries in the > 15 m sector are at risk of fishing effort displacement.
During the course of this work, some important developments influenced the
direction the thesis research was to take. Firstly, deployment of Wave Hub, the first
of the marine renewable energy installations (MREIs) in the South West did not
occur until late 2010. Secondly, major data changes to access to VMS data for non-
fisheries institutes (including Plymouth University) within the EU occurred from 2009-
2011, meaning that restrictions are placed on the level of access for the whole data
set and non-access to individual vessel data. In consequence, the only data
available to me at sufficient resolution to carry out the above thesis objectives at the
finest possible detail are from 2005 to 2008 inclusive. Additional, lower resolution
data are available from 2009 and 2010. Only fisheries institutes can access this high
resolution VMS data thereafter. This meant that any changes to fishing effort during
installation, operation and post operation of this MREI could not be elucidated and
this is highly significant. The widespread implications of this policy in studying and
managing fisheries displacement are a major theme of this work and are discussed
at length during the course of this thesis. An additional important development
occurred in 2011, when a fisheries and MRE interactions workshop was held at the

3
UK’s first Marine & Coastal Policy Forum in Plymouth. This event spurred the
development of a Natural Environment Research Council MRE Knowledge
Exchange Programme (NERC MREKEP) (Rodwell et al., 2012, 2013), of which I
became a principal member, and which involved a questionnaire at the
Environmental Impacts of Marine Renewable Energy (EIMR) in Orkney in 2012, a
scoping and expert panel workshop which included fishers, fishing body
representatives, scientists, practitioners, policy makers and MRE industry
representatives from all over England, Wales, Northern Ireland and Scotland, and
which led to the design of a mitigation agenda and a set of actions to take forward
(de Groot et al., 2014). This mitigation agenda specifically refers to fishing effort
displacement due to MRE developments, and conflict between different sectors of
the UK fleet. Certain priority actions were taken forward: the development of efficient
and cost-effective methods for overcoming data issues for assessing fishing effort
displacement; the development of appropriate methods of assessment; and the
development of an acceptable consultation protocol between MRE and fishing
sectors agreed on by all stakeholders. A subsequent fisher survey was designed
and used primarily in the South West, however was extended to select fishers
around the remainder of the UK using various techniques; social media outlets
including Twitter, and Through the Gaps fisheries blog, meetings and fisher
orientated events such as industry expos and activities in the ports. In light of the
limitations made to VMS data and catch data access the activities and research that
was undertaken under the auspices of NERC MREKE Programme created an
opportunity to address three further objectives, specifically related to MRE, and
which were not originally planned:

4
To develop a list of data collection and activities that would enable
assessment of the degree and impact of fishing effort displacement;
To make recommendations to improve both the collection and use of FK for
the assessment of fishing effort displacement; and
To validate a mitigation agenda brought forward during MREKE Programme
workshops.
This thesis is presented as a compendium of research Chapters, each containing
more narrowly defined aims and objectives for the component of the study that the
Chapter seeks to address, a full review, description of methodologies used, a
discussion and summary conclusions. Most of the research was undertaken in a
case study area, i.e. the South West of the UK. However, Chapter 5 also includes
research which is national in scope. A significant part of Chapter 5 was the result of
a combined effort with others within our MREKE Programme team, which resulted in
the publication mentioned above (de Groot et al., 2014). A portion of material from
that publication pertaining to stakeholder views on data has been both reproduced
and expanded upon in Chapter 5.

5
Figure 1.1: Schematic of research pathway
Schematic of research pathway to investigate the research question ‘What various
sources of data could be used to detect, assess, and ultimately predict, fishing effort
Fisheries, Marine Conservation, Marine Renewable Energy and
Displacement: A Fresh Approach
Identify what fisheries data source has the highest temporal and
spatial resolution
Using SW case study use
primary data source to map
effort
Assessment of baselines to
detect effort displacement
Summarise the positive and negative aspects of data sources
used
Identification of research
priorities
Stakeholder led initiatves
Synthesise results in relation to MPA and MRE objectives
Establish a framework for collection and analysis of data fit for
assessment of fishing effort displacement

6
displacement due to implementation of marine conservation objectives and the
development of the marine renewable energy (MRE) sector?’
1.2 Rationale for the case study site and survey
1.2.1 MREI developments in the South West
The South West has great potential in relation to MRE resources (PMSS, 2010a).
Named the South West Marine Energy Park in 20121, continual investment will see
this region grow as a global industry leader. For example, recent funds obtained via
an EU Horizon 2020 bid, has secured the testing of a WEC developed by the Finnish
company Wello2. There is also a large offshore proposed Marine Protected Area
(MPA), thus providing fertile territory for analysis of the potential for fishing activity
displacement and the assessment of suitable baselines.
Shown below in Figure 1.2 are the most up to date active and proposed MRE sites in
the UK. This figure is provided in order to place the South West of the UK in context
with the rest of the country.
1 https://www.gov.uk/government/news/south-west-makes-splash-as-first-marine-energy-park 2 http://www.wavehub.co.uk/latest-news/eu-horizon-2020-programme-grants-eur17-million-for-wave-power-research-proj

7
Figure 1.2 Active and proposed UK Marine Renewable Energy Installations (MREI).
Data obtained from the UK Crown Estate (accessed January 2015 from
http://www.thecrownestate.co.uk/energy-and-infrastructure/downloads/maps-and-
gis-data/). Red polygons are wave energy sites, blue areas are tidal energy sites,
and green polygons are wind energy sites.

8
Shown below are the current Marine Renewable Energy (MRE) developments in the
South West3. These are also represented in Chapter 4, Figure 4.4:
Wave Hub, a MREI, a facility for testing prototype Wave Energy Converters
(WECs) located 10 NM from Hayle, North Cornwall. This closure will result in
an 8 km2 exclusion zone initially, but with visions for increasing berth numbers;
Pembrokeshire Wave Energy Test site is managed by Wave Hub Ltd with a
total area of 90 km2 and has a generating capacity of up to 30 MW when at
full array level and is located 7-12 NM offshore;
North Devon Tidal Zone, also managed by Wave Hub Ltd is located in the
Bristol Channel. Measuring a total area of 35 km2 it has a generating
capacity of up to 30 MW when at full array level and is located 2-5.5 NM
offshore;
North Cornwall Demonstration Zone, a new wave energy site has the
potential to produce 30 MW when at full array level and is located 2-6 NM
offshore of Hayle;
FaBTest is a 2.8 km2 nursery facility located in Falmouth Bay between 1-3
NM offshore; and
Tidal Energy Developments South Wales Ltd (TEDSWL) has two sites off the
Pembrokeshire coast. One, a preliminary site in Ramsay Sound, will
develop into a small array off the coast at St. David’s Head in 2017. Both
sites are approximately 1-5 NM offshore, and it is proposed the array when
fully functional has the potential to produce 10 MW.
3 https://www.regensw.co.uk/7283018298372873/wp-content/uploads/2015/05/South-West-MEP-Statement-of-Ambition.pdf
9
Tidal lagoon at Swansea Bay. The world’s first, man-made, energy-
generating lagoon, with a 320 MW installed capacity.
1.2.2 Fisheries in the South West of the UK
Figures 1.3-1.6 show landings in tonnes and GBP of all mobile gears, and static
gears respectively. These Figures are based on data attained from the Marine
Management Organisation (MMO), which is classed as Level 2 data. This data was
attained when requesting VMS data for the period 2007-2010. Figure 1.7 shows the
demersal, pelagic and shellfish landings at 21 of the major ports in England and
Wales, clearly showing the dominance of the South West fleet especially in the
pelagic and demersal sectors.

10
Figure 1.3 Total quantity (in tonnes) liveweight of fish landed by all vessels with mobile gear types.
Data have been gridded to a 0.1 degree regular grid (Data supplied by MMO, Level 2
data)

11
Figure 1.4 Total quantity (in tonnes) liveweight of fish landed by all vessels with static gear types.
Data have been gridded to a 0.1 degree regular grid (Data supplied by MMO, Level 2
data)

12
Figure 1.5 Total value (GBP) of landed fish by all vessels with mobile gears.
Data have been gridded to a 0.1 degree regular grid (Data supplied by MMO, Level 2
data)

13
Figure 1.6 Total value (GBP) of landed fish by all vessels with static gears.
Data have been gridded to a 0.1 degree regular grid (Data supplied by MMO, Level 2
data)

14
Figure 1.7 Landings in the 21 major ports in England from demersal, pelagic and shellfish fisheries, expressed as a percentage of the total in that respective group.
The category ‘other’ represents the rest of the ports in England. (Data provided by
MMO UK Sea Fisheries Statistics (2007-2010))

15
1.3 Thesis outline
Chapter 2 is a literature review and scene setting exercise. This Chapter outlines
the use of certain data sources in the assessment of fishing effort displacement
Chapter 3 chooses the most appropriate method for assessing effort displacement
using gear-specific VMS data for > 15m vessels and seeks to evaluate the potential
of effort displacement on different segments of the South West fleet due to a
proposed marine protected area (MPA), Haig Fras, and a marine renewable energy
installation (MREI) Wave Hub. Patterns in fishing effort are elucidated by the use of
statistical techniques, and visualised using multidimensional scaling and hotspot
analysis is included in order to ascertain high level activity for each gear type from
2005-2008.
Chapter 4 addresses the question: how might the background variability of fishing
effort is described, so that a displacement can be assessed? The approach is
twofold. First, fishing effort in South West UK waters is described and quantified
relative to arguably the most dominant physical control on the spatial distribution of
fishing: seabed substrate. Secondly, a generalised linear model (GLM) analysis was
performed, in order to model fishing effort as a linear combination of available
independent, or explanatory, variables: depth, wind strength, wave strength,
substrate type, and gear type, year and fish value. Thirdly, a simple technique,
based on the coefficient of variation is developed that can be used to describe and
quantify variability. This technique can be compared across any number of gear
types and across any number of years, and can be interpreted using standard

16
statistical methods. This Chapter also Investigates the relationship between fish
catch data (derived from low-resolution, less-access-restricted level 2 VMS data) and
the background variability of fishing effort, in order to explore the potential role of
broad scale catch data (weight and economic value of fish) as a simple proxy for
baseline fishing effort. Level 2 data are: available on a 4 year aggregated basis
contains fishing type split into simple static vs mobile. Landings values are not at the
individual vessel level but are at the level of an ICES square, any area containing
less than 10 vessels are removed from the dataset due to confidentiality issues and
there is no access to vessel logbook information. The Level 2 vs Level 3 data will
be discussed in more detail in Chapter 3.
Chapter 5 focuses on responses of fishers to the challenges of marine renewable
energy (MRE). This Chapter is the product of semi-structured interviews with forty
fishers around the UK. It is primarily South West based due to financial constraints.
In addition, sections of the UK in Scotland, Northern Ireland and Wales fleet were
successfully approached using various social media outlets including Twitter,
meetings and fisher orientated events such as industry expos and port-side activities.
Validation of a mitigation agenda for fishing effort displacement developed by de
Groot et al. (2014) is presented along with the establishment of a debate about the
application of Fishers’ Knowledge (FK) in the assessment of fishing effort
displacement. A set of recommendations are presented on how to incorporate FK in
a systematic way in order to assess fishing effort displacement and a debate is
initiated on how to innovate how we engage with fishers and improve the
consultation process.

17
Chapter 6 is a concluding Chapter which brings together the results from each
Chapter to provide an overview of the constraints and opportunities for the
development of this field of research. Data provision and access are two
fundamental themes running throughout the whole of this thesis; this Chapter
reviews current data policies within the UK and the EU and discusses future ideas on
how to improve data issues within the context of MRE and MPA objectives and data
policy climate. It is important to remember that this thesis is one of the first theses to
address fishing effort displacement in relation to MRE, and evaluate a potential
mitigation agenda designed during the period of study. Considering the data access
challenges presented, this Chapter attempts to make some high level
recommendations about the assessment of fishing effort displacement and initiates a
debate about the formation of an ICES Study Group on assessment of fishing effort
displacement.

18
Chapter 2 Literature Review and Conceptual Framework
Work presented in this Chapter will be incorporated into the following manuscript
which is currently in preparation:
Campbell, M., Ashley, M., De Groot, J., Hall-Spencer, J., Attrill, M., Abbott, V.,
Rodmell, D. & Rodwell, L. (In Prep) ‘The assessment of fishing effort displacement: a
review of methodologies’, Fish & Fisheries.

19
“Up jumps a herring, the king of the sea
He jumps up on deck saying "helms a-lee!"
Singing, blow the wind westerly, blow the wind
By a gentle nor-wester, how steady she goes”
‘Blow the wind westerly’, Newfoundland Sea Shanty
2.1 Introduction
Of all the extractive processes that occur in our marine realm, fisheries have one of
the greatest spatial footprints of all (Eastwood et al., 2007). Professor Ray Hilborn,
one of the leading marine scientists of the 21st Century, who has changed our
contemporary thinking on fisheries management, once stated “managing fisheries is
managing people” (Hilborn, 2007) and in a world with an increasing population and
competition for space in our coastal and offshore realms, the need for improved
analysis of fishers’ behaviour should be high on the agenda. Understanding what
drives fishing fleet dynamics (van Putten et al., 2012) and fine scale effort, in order to
delineate what influences the choices they make in response to closures, and in
particular the effects of displacement due to these closures, respective of region,
inshore vs. offshore and gear-type, is paramount.
The study area of fishers’ behaviour is not new to science, having been around since
at least the late 1970’s and the key to successful fisheries management is
knowledge of this area (Wilen, 1979; Hilborn & Walters, 1992). During this time,
major technological advances in vessel efficiency, fish capture and storage, leading
to greater diversification in gear types, fishing further offshore, introduction of new

20
and changing economic markets for different fish species has resulted in the
introduction of even greater layers of complexity in fisheries analysis. However, due
to concerns about global fish stock viability, sustainability and illegal unreported and
unregulated (IUU) fishing, new systems of monitoring, enforcement and enhanced
stock assessments have meant that data availability, quality and resolution have
improved dramatically. This has helped progress the development of scientific
methodologies and models to unravel these layers of complexity, to stimulate debate
about and contribute to better fisheries management.
One of these enforcement measures was the introduction of de jure Marine
Protected Areas (MPAs) as a means to not only mitigate for fisheries in peril, but
also to limit the degradation of the benthic environment, biodiversity loss and
therefore ecosystem function. A set of international commitments; Convention on
Biological Diversity (CBD), Oslo-Paris (OSPAR) Convention and the World Summit
for Sustainable Development (WSSD), calls for networks of MPAs, known as Marine
Conservation Zones (MCZs) to be introduced in 2012, 2010 and 2012 respectively.
Sites have been selected to protect areas that are important to conserve the diversity
of nationally rare, threatened and represented habitats and species and ecological
coherence or connectivity. They will exist alongside already established MPAs, i.e.
Special Areas of Conservation (SACs) and Special Protection Areas (SPAs)
protecting habitats and birds respectively. However, in the UK the process for
establishing a network of MCZs has been extended, in order to improve the
robustness and reliability of evidence provided to underpin site selection.
For the UK, the implementation of the Marine and Coastal Access Act in 2009, was
both a turning point for campaigners and a positive change leading to improved
management of the marine realm: the establishment of a new Marine Management

21
Organisation (MMO), a new system of marine spatial planning through the
development of the Marine Policy Statement, new mechanisms for MCZ designation,
and, streamlining and modernisation of licensing and enforcement powers. Another
change, is the replacement of Sea Fisheries Committees with 10 regional Inshore
Fisheries Conservation Authority (IFCA), a new type of regulator with extended
responsibilities; achieving sustainable fisheries objectives while at the same time
meeting conservation objectives.
The current MCZ process has caused much debate among the fishing communities
across the UK, and not all of it positive. The formation of an MPA Fishing Coalition
(MPAC) took place to deal with issues surrounding the designation of MCZs and the
stakeholder-led process in particular, and one of the main reasons for establishment
of the Coalition, was the issue of displacement of fishers from their customary fishing
grounds. It considered that inadequate attention was being given to the
consequences of displacement, for vessels directly affected and adjacent or distant
areas into which fishing effort is displaced. In the siting of MCZs, the National
Federation for Fishermen’s Organisations (NFFO) briefly outlined a list of the
unintended consequences that should, from a conservation perspective, be avoided
and offered some 1st stage strategies to mitigate against conflict. This is shown in
Table 2.1, below.
Table 2.1: NFFO list of consequences of displacement and strategies in selecting sites for
closure for conservation purposes4.
Consequences Strategies
Displacement to areas that have been subject to less pressure and are
Do not select sites upon prime fishing grounds located on relatively resilient
4 NFFO news item 22/03/13 Marine Conservation Zones and Fisheries displacement

22
therefore more likely to be in a pristine state, or to less resilient habitats from those areas where fisheries take place
habitats
Displacement to less productive fishing areas where a greater amount of fishing effort is required in order to catch equivalent quantities of fish
Avoid areas where the greatest catches are harvested
The locking up of significant productive resources that undermines the productivity of the remaining accessible resource and prevents maximum sustainable yields from being achieved
Aim to avoid prime fishing grounds, particularly for those fisheries that are limited in their distribution
Coupled with marine conservation is the need for renewable energy for a sustainable
future. Presently, the world’s oceans are increasingly being tapped as a source of
renewable wind, tidal and wave energy (Jones et al., 2008; Clément et al., 2002) to
address the decline in fossil fuel reserves and reduce the rates of environmental
changes, i.e. ocean acidification caused by anthropogenic carbon dioxide emissions
(Hall-Spencer et al., 2008; Shields et al., 2009). The UK as an island community
holds great potential as a source of marine renewable energy and as a result, the UK
Government has set a target for approximately one third of its electricity production
coming from marine renewable sources by 2020 (House of Lords, 2008).
Commercial offshore wind energy is already well established but the technology for
wave, tidal and deep-water offshore wind energy is still in its infancy (Witt et al.,
2012). Marine Renewable Energy Installations (MREIs) also have the capacity to
cause further displacement of fishers from traditional fishing grounds, from both
construction and operational phase perspective (Inger et al., 2009). However,
MREIs also have the potential to become de facto MPAs, because at present fishers
will not risk damage to fishing gear by fishing in these areas, thus the areas are free

23
of fishing activity. . But on the other hand, MREIs, in particular wind turbine arrays
have the potential to benefit fisheries, by enhancing shellfish and seaweed
aquaculture, and this idea of the potential for co-location of the above, and co-
location of MREIs and MCZs are the subjects of intense scrutiny right now (Yates et
al., 2015b). However, matters of health and safety and liability issues have
precedence here (de Groot et al., 2014) and the respective technology and the law
must keep up with the pace of both MREI developments and MCZ designations, but
what are important here are the issues of mitigation of displacement and co-location.
Mitigation and specifically the research and design required to provide mitigation for
the life cycle of marine renewable energy projects and MCZs is at the centre of
debate when it comes to fisheries displacement.
This increase of human activities in the marine environment calls for a more
integrated approach to management rather than a purely fragmented and sector
based one (Smith & Wilen, 2003; Crowder et al., 2006; Tyldesley, 2006; Douvere,
2008). Marine spatial planning (MSP) is a term which originated from the
Government’s overarching vision for the marine environment as set out in the first
Marine Stewardship Report (Defra, 2002). MSP involves delivering a more
ecosystem-based approach to managing and planning of marine activities. As
defined by Defra (2004) MSP is a ‘strategic, forward-looking planning for regulating,
managing and protecting the marine environment, including through allocation of
space, that addresses the multiple, cumulative, and potentially conflicting uses of the
sea’. In summary, MSP will provide a framework that will minimise losses for both
industry (i.e. energy and resource needs) and conservation, and should, in effect
address effort displacement and the context within which industry and conservation
rests.

24
Hence, the questions arise: how to effectively measure displacement? How to
separate it from change brought about by regulations and outside economic
considerations for example? Are there gear-specific differences and do these differ
from region to region? Are there differences within similar métiers? Do the decisions
fishers make operating inshore differ from larger offshore vessels? How do we
quantify these decisions and apply to displacement analysis among the fleets? Can
we predict where fishers will move if areas are closed? If so at what scales are we
assessing fishing activity, and what is the appropriate level of data resolution? What
are the ecological, social and economic consequences of closures, reallocation of
effort and competition between fishers? How do we deal with the paucity of data for
the inshore fleet? How do we separate short-term vs. long-term behaviour? Which
leads to: what data are currently available or could be made available?5
This might include data such as: vessel characteristics, i.e. age, length and engine
size (power and capacity), home port and registration port, main gear type, operation
of multiple gears, ownership/ management of vessel, crew size; Vessel Monitoring
System (VMS) data (> 15 m vessels); detailed logbook access; mobile VMS for < 15
m; catch/ landing data via ICES database; Joint Nature Conservation Committee
(JNCC) substrate layers/marine landscape types; MMO quota statistics for gears and
regions; qualitative methods via questionnaires on fishers’ life at sea, the fish they
catch, their strategies, their behaviour due to external economic changes, i.e. quota
changes, fuel costs.
What is key to all these questions is; the elucidation of normal practice for fishers,
defining of fishing activity baselines taking into account their short-term and long-
5 The use of some of the data requires the explicit permission of the fishers involved. Written agreement is
provided by the fisher, given to the MMO who then contact the fishers involved to verify and then requested
data will be released.

25
term behaviour, using both quantitative fishers capture information and both
quantitative and qualitative social science techniques to delineate factors which
underpin individual fishers’ strategies and thus fleet dynamics. The increased use of
Fishers’ Knowledge (FK) which is a combination of tacit knowledge, Fishers’
Ecological Knowledge (FEK), and Local Ecological Knowledge (LEK) or defined by
Hind (2015) as “the experiential knowledge that fish harvesters accumulate while
operating in their respective fisheries”. It is mainly qualitative in content and has
been absent from fisheries management for a long time, however it is becoming
integral to the reform of the CFP and will underpin management decisions for the
foreseeable future, if aspects of the reform are to be successfully introduced.
Careful consideration is of FK required here of the question is whether FK can be a
serious contender regarding the identification of mitigation strategies that deal with
fishing effort displacement? Hind (2012, 2015) believes this to be the case and
suggests using FK as one of the central information pillars to achieving ecosystem-
based management. A pilot project Annual Fisheries Reports using FK initiated by
the NFFO and the Cornish Fish Producers’ Organisation (CFPO) in 2010 has led the
way with other POs getting involved and has been viewed by many scientists as
where the future of the industry lies. This ‘mixed-method approach’ as discussed by
Urquhart et al. (2012) is an approach that combines both qualitative and quantitative
research in a single study, and if really encouraged across research areas, it has the
potential, illuminate and expand the field of fishing effort displacement.. What is
emerging from recent research also, e.g. Hind (2015) and Stephenson et al. (2016)
is that the use of FK coupled with the active participation of fishers in assessment
and management may help improve fisheries governance.

26
Never has there been a more genuine urgency to advocate unique and innovative
ways of quantifying and mitigation against, fisheries displacement and its
consequences for inshore and offshore fishers. Assessing VMS and catch data for
example is only the first step in investigating fishing effort, but fishing is a way of life,
processes are complex, what factors influence the decisions that fishers make are
multifarious, hence, the investigation of FK alongside all of the other data sources as
listed above, may be imperative to gaining any momentum in the resolution of
conflict in the multiple uses of marine space and one of our last ‘hunter-gatherer’
traditions, i.e. fishing.
2.1.1: Understanding effort distribution in fisheries
2.1.1.1: Vessel Monitoring System (VMS) data
The use of VMS as a valuable tool for assessing the distribution of fishing effort is
well established (e.g. Dinmore et al., 2003; Eastwood et al., 2007; Mills et al., 2007;
Stelzenmüller et al., 2008; Hall-Spencer et al., 2009; Lee et al., 2010; Gerritsen and
Lordan, 2011, and references therein) and its availability has revolutionised analyses
of the spatial and temporal distribution of fishing effort. However, owing to the array
of data collection and treatment (there is no agreed single method in assessing
fishing effort from VMS data) that previous researchers have employed globally to
ascertain fishing effort among different fleets using VMS, including, speed based
rules to identify actual fishing from non-fishing, grid cell sizes, VMS intervals
(minutes), conversion of points to a measure of activity, Lee et al. (2010) proposed a
method, based on known fishing activity that could be a step towards standardization
of methods. This is extremely useful as a means to improve data sharing between
different nations occupying shared fishing space, and the “audit trail” of various
stages from raw data format to the production of fine scale maps of fishing effort,

27
supports international collaboration (Lee et al., 2010). In Lee et al. (2010), the
analysis is supported by actual observer data from a discard monitoring program to
assess accuracy of speed values used to delineate fishing vs. non-fishing activity in
the VMS dataset. On this topic, observers recorded the timing, location of fishing
activity catch and discard rates. Lee et al. (2010) discuss how local or sectorial
differences in speed of vessels may be observed when fishing and the fact that only
0.5- 1% of fishing trips of English and Welsh vessels have observers on board
(Cotter et al., 2006) reinforces the idea that in order to assess risk better, more
detailed information of the dynamics of local fleet activities (Lee et al., 2010) could
be attained through increased use of observers? Murawski et al. (2005), in analyses
of effort distribution and catch patterns adjacent to MPAs, also used observer data,
and its inclusion meant that assessments of spatial allocation behaviour could be
captured at a much finer resolution.
In the analysis by Lee et al. (2010), their access to logbooks meant that any the gear
type of any vessel with VMS could be established by linking the national logbook
data to the unique vessel identifier and time. Using a speed, distance, time triangle,
and known speeds of vessels fishing, they used a point summation method by
applying a grid cell size of latitude 3- min/ 0.05° to all VMS point locations, thus
allowing the cells to be mapped directly to the scale of ICES rectangles and catch
based reporting in logbooks.
The authors also developed an index of difference in spatial pattern to assess the
difference in effort between years for the same gears and with different gears.
Activity vs. effort, especially in relation to static gears, i.e. VMS data can result in an
analysis of activity but information on the size, soak time of nets or traps and hauling
times is missing so in order to fully assess effort data these factors are needed. As

28
mentioned briefly above, a point summation method was employed and the
reasoning is in part due to the polling frequency of VMS, i.e. 2 hours. Track based
approaches may be more appropriate if the polling interval decreases, or if one is
researching a small area with fewer vessels, however work by Hinzten et al. (2010)
may be a step towards improvement in track reconstruction in order to capture the
true distribution of fishing activity. In the case of mobile fisheries, “e.g. Deng et al.
(2005) and Lambert et al. (2012)” suggested the use of polling intervals that vary
between different sectors of the fleet may be more prudent, , especially when
considering fishing impacts on seabed biota and habitats.
Another important caveat associated with VMS data, is the fact that the activity of
smaller vessels (< 15 m), which constitute a major part of the UK fishing fleet is not
captured. However, from 1st January 2012 vessels < 12 m had to install VMS and
there are discussions about extending the systems to towed gear vessels < 8 m in
length (EC, 2011b). This combined with the suggestions of reduction of polling
intervals, actual logging of fishing activity and non-fishing activity and access to VMS
data for international fleets operating in a shared space, may go some way further
increase the value of VMS as a source of high resolution fishing effort data (Lee et
al., 2010).
Jennings and Lee (2012) took this a step further and compared different methods to
define fishing grounds by assessing fleets at regional and national scales, with the
aim of assessing “how the choice of criteria for defining fishing grounds influences (i)
size, shape and location, (ii) overlap among fishing grounds, and (iii) the extent to
which annual and multiannual patterns of fishing activity describe ground used
seasonally or by individual fishers”. VMS analysis of this study by Jennings & Lee
(2012) followed that of Lee et al. (2010). Analysis was carried out in three sections:

29
Individual vessels of the South-west beam trawl fleet
o Spatial extent of fishing effort, contribution of fishing grounds to annual
fishing effort and landings
o Definition of boundaries encompassing 70, 80, 90 and 100 % of total
activity of each vessel and ranking of cells from low to high activity
o Cumulative activity and area calculations
o Assessment of consistency of extent of grounds used by fleet on an
annual basis with extent used on a monthly basis and by individual
vessels
Fleets at the regional scale, i.e. the scale of ICES VII
o Description of fishing grounds encompassing 70, 80, 90 and 100 % of
total activity of each fleet; beam and otter trawl, dredge, net, potting
o Definition of boundaries encompassing 70, 80, 90 % of total activity
o Cumulative activity and area calculations
o Landings weight and value of bottom fleets compared to landings
weight and value of all UK vessels
The main fleets in the Northwest Atlantic
o Description of fishing grounds encompassing 70, 80, 90 and 100 % of
total activity of each fleet; beam and otter trawl, dredge, net, potting
and seine
o Definition of boundaries encompassing 70, 80, 90 and 100 % of total
activity of each vessel and ranking of cells from low to high activity
Other methods were also employed:

30
A modified version of the index of difference in spatial pattern developed by
Lee et al. (2010) was employed to assess spatial patterns of different fleets
and overlap of fishing grounds
Proportional overlap of fishing grounds also calculated when grounds defined
as covering 70, 80, 90 and 100 % of total activity
Weight and value of landings reallocated from scale of reporting to scale of
the grid cell used for estimated fishing activity (if required)
From 2006-2009, the grounds fished by individual beam trawlers had extensively but
infrequently fished margins. For all fleets in the South West lightly fished areas
accounted for 10 % of activity and overlap of ground decreased when exclusion of
low activity areas occurred. Analysis of the relationship between cumulative area
and activity revealed that most fishing activity was recorded in relatively small
proportion of the total area fished. Overlaps between fishing grounds used by all UK
fleets decreased as threshold for defining grounds reduced.
This work highlights the importance of stimulating discussion about definition of
fishing grounds for all UK fleets and encourages the development of further studies.
For all gears across various scales used, fishing activity concentrated in core areas,
with the presence of extensive but infrequently fished margins. Therefore exclusion
of these margins when defining areas has wide implications, for example when trying
to inform the siting of activities in shared space and assessment of the impact of
various activities on seabed features (Jennings et al., 2012). This analysis gives an
insight into the possible trade-offs between different sea interests and a range of
approaches to fisher access to core areas. Since 2009 changes to access to VMS
data, and the level of data resolution allowed for researchers due to EU Council
regulation interpretation (EC 2009; ICES 2010) may prove severely disadvantageous

31
to accurate assessment of fishing fleet activity, the complexities of impact on the
seabed, and the consequences of displacement for these fleets, thus having the
potential for societal implications (Hinz et al., 2012). Outlined here in the
comprehensive review by Hinz et al. (2012) are the concerns raised by the research
team and the potential consequences of limited access to high resolution datasets:
Aggregated data at 3 NM scale may be to coarse,, to assess impacts on
marine habitats which are at best patchy, in particular in the assessment of
biogenic reefs or other features of concern. This scale is currently the adopted
scale used in MSP (Lee et al., 2010)
Issues arise with the proposed format of data and inability to link with
logbooks.
Aggregation of data on proposed scale may lead to consequences of under or
over estimation of fishing activity
o Lambert et al. (2012) assessed the scallop fishing effort using a 3 NM
1.5 NM scales, the latter requiring non-aggregated data. Using the
coarser resolution, impact was estimated to be 17 % greater.
o This has consequences for the accurate assessment of the impact on
fauna, especially in the context of displacement of effort.
o There is difficulty in separating impacts on each species in areas where
mixed fishing occurs
o Delineating habitat fishery interactions is also a problem when
designating areas suitable for each sector of fishing fleets.
Risk of increased uncertainty in management advice due to low resolution
data hampering assessment of ecosystem level effects of fishing

32
o Risk of development of suboptimal pressure indicators, indicators that
are requested within EU legislation
2.1.1.2 Analysing Fishing activity without access to VMS
The calls for a more comprehensive understanding of the spatial distribution and
economic importance of our fishing fleets, has stimulated the development of
innovative techniques in order to capture this information. Due to the paucity of data
and subsequent management and access decisions taken in response to that
paucity, a number of schemes have been and are in the process of being
implemented.
The integration of FK through mapping exercises including information elicited on
socio-economic and operational aspects of inshore fisheries, have added rich value
by helping to inform management and policy making. The pilot study carried out in
the Pentland Firth and Orkney waters (Marine Scotland, 2013) , where considerable
interest lies in terms of renewable energy developments (Crown Estate, 2013 is now
being rolled out to other areas in Scottish waters. Through the other regional MCZ
projects, Irish Sea Conservation Zones and the Welsh inshore waters MCZ Wales
Project, the overall approach is somewhat the same, i.e. to elicit information on
areas fished, seasonal usage, target species, methods employed, gear changes,
employment and exit/entry into each sector.
Following on from this, initiated in 2012, the Self-sampling of the Inshore Sector
(SESAMI) project, managed by Cefas has called for volunteers to take part in this 2
year project. The aims are to effectively collect evidence to support this sector in
management decisions and to monitor discards and develop strategies to reduce
them. The project will be conducted in two phases; the first phase will involve data

33
collection by skippers and crew, and validation of the data they collect by Cefas
observers who will board participating vessels at agreed times with vessel skippers
and the second phase, with participating vessels being involved in trials to develop
the most selective configurations and strategies for their gear. Also covered in part
2, section 3, are methods put forward by Witt et al. (2010), for assessing area
coverage by smaller vessels, being dependent on home port and vessel size. This is
a crude method, but combined with higher level data which has been obtained by the
initial MCZ projects, ScotMap (McLay et al., 2012) for example and the ambitious
future returns from SESAMI, there is a real chance at better elucidation of the
consequences of displacement on different segments of the inshore fleet at regional
scales.
In order to accurately assess fishing effort in the static gear fleets, further information
on the size, soak time of nets or traps, hauling times for example and also area of
seabed covered by gear is needed. Pioneering work in Orkney waters has been
underway since 2013 in order to sustain the commitment of the inshore creel
fisheries. It is the first UK based Fishery Improvement Project (FIP) and as well as
monitoring of practices and development of stock assessment, the project with the
aid of The Crown Estate, will allow the attachment of GPS on the gear in order to
provide mapping of the seabed, thus informing the siting of marine energy
developments. Tagging of crabs and juvenile lobsters will also take place, allowing
better information on spawning migrations (WWF, 2014).
2.1.1.3 Murawski et al. (2005): All year round and seasonally closed areas NE USA
This study evaluated the changes in effort distribution and concentration over time
due to year round and multiple adjacent seasonal closures of the NE USA. The
closed areas are large, more than 22000 km2 in the year round closures and much

34
greater in the seasonal closures. In particular several questions needed to be
answered:
Does effort become concentrated around the boundaries of the closed area?
What are the effects of seasonal closures on the concentration of fishing effort
and catch rates?
How do year round closures affect the spatial choice dynamics and other
aspects of fisher behaviour?
To address the questions, port sampler interviews were used, together with vessel
trip reports from logbooks, VMS data and fishery observer data, catch per unit effort
(CPUE), a measure of abundance for various species and the value in dollars per
unit effort ($PUE) were calculated as explanatory variables describing targeting of
fishing effort in relation to distance from the MPAs. Standardization of effort among
the three different vessel size classes occurred.
1. Year round closures
Effort displaced by these closures was 31 % of trawling effort mainly attributed to
those targeting groundfish stocks. Overall fishing effort reduced by 50 % of pre-1994
levels, hence there could not have been reabsorption of displaced effort into the
open areas. Changes in sampling and reporting procedures and the spatial scales
at which the data was aggregated confounded these latter results, i.e. effort
attraction to the boundaries occurs at local scales 0-5 km so that the 10-min grid size
used was too coarse. Altogether, 10 % of trawling effort occurred within 1 km of the
MPA boundaries, and approximately 25 % within 5 km and average catch value per
unit time trawled was twice as high within 4 km of the boundary. Analyses
suggested that “scouting behaviour” and “risk-taking” in their spatial decisions were

35
infrequent, due to a days-at-sea cap. Spatial choice was principally influenced by
catch histories and revenues.
2. Seasonal closures
Once the seasonal closures were reopened, an increase in effort was observed.
These closures operating out of phase displaced effort among the areas, and the
displaced effort is dependent upon the sequence of closure and reopening. What is
important to note here is that due to the proximity of multiple seasonal closures
operating at various times, any conservation benefit attained may be diluted by the
various patterns of effort once the closures are re-opened.
Further work has been highlighted by the authors: detailed bioeconomic modelling to
consider factors such as distance to port, effects of trip limits on the myriad of
species, catch rates within a single trip for example, more complex analyses of
trade-offs in fishing strategies near boundaries, more complex models of spatial
behaviour to discern what determines initial targeting choices and the development
of models to describe spatial location choice dynamics at scales appropriate to
management scenarios. Owing to the fine scale resolution of the use of observer
data, interpretation of location choice behaviour was more appropriate to temporal
and spatial resolution associated with MPAs and seasonal closures.
2.2 The use of Fishers’ Knowledge (FK)
FK the knowledge that fishers accumulate in their day to day operations (Neis, 1992),
including the change in techniques and the changing environment (Johannes &
Yeeting, 2001). Analysis of FK by Soto (2006) implied that FK is unreliable and
inferior to traditional fisheries science, most likely due to it being mainly qualitative in
nature. However, other scientists have realised the value of such ‘anecdotal’

36
information from fishers, and have used innovative ways of turning qualitative
information into a semi-quantitative output, e.g. turning FK into maps that show
seasonal migration patterns of cod unknown before the use of FK (Murray et al.,
2006), and the creation of rules to describe herring shoals based on FK and
interviews with fisheries managers (Mackinson, 2001). Dengbol et al. (2006) state
that fisheries science must prepare for new approaches and the careful integration of
FK with traditional science is a strong contender. Daw (2008), concluded from his
work on FK within tropical fishery case studies that fisheries management is more
effective if FK is translated into scientific output. Wilson et al. (2006) also highlight
the importance of the interaction of scientists with FK, that this knowledge is a
“product of the fishing community” thus requiring effective engagement techniques in
order to gather it.
2.2.1 Fishers: the last of the hunter gatherers or the new scientists
Research by Hind (2011, 2012, and 2015) focused on the fishery and on how FK is
collected, interpreted and organized in Galway Bay and the Aran Islands, Ireland.
The thesis was part of a much larger project, the Irish Fishers’ Knowledge Project
and the aim of this project to was to develop a methodology to engage fishers as
stakeholders and assess if FK could become part of the Marine Institute’s permanent
activities, due to scientific uncertainty of stocks in that area.
The work by Hind (2011, 2012, and 2015) showed:
There is a lack of systematic application of FK, it simply being seen as an
object for pilot studies for example.

37
Fisheries science could be improved by better combing the qualitative and
socio-economic information with standard quantitative information. This is
especially relevant in the context of displacement and closures.
That there is potential for FK becoming more precise, for example asking
fishers to use their boat based GPS to draw maps as opposed to drawing
them freehand, and this comes back to fishery and other industry
collaboration and a hint at a possible mitigation strategy.
Through the techniques developed to elicit FK, fine scale resolution of local
fishing areas of importance were quite precise.
FK highlighted concerns about top-down policies and price of catches that
gave some insight to current and future fishing behaviour and strategies.
Through the capture of FK, fishers presented ideas on how the fisheries could
be better managed.
That we need to be using the appropriate level of knowledge that matches the
scale of the study site, or the research question being asked.
And finally states that FK should be used across all fleets, both those
operating inshore and offshore.
2.2.2 Factors affecting fishers’ behaviour: Fuel price
Abernethy et al. (2010) undertook a study of the impact of an acute fuel price rise in
2008 on the behaviour of different sectors of the UK fishing fleet in the South-west of
the UK. All interviewees were skippers of vessels >10 m in size and a range of
vessel owners and company skippers were selected. A cross section of beam trawl,
otter trawl, gillnettter, scallop dredger and crab/lobster potters were interviewed. A
selection of quantitative information was acquired; namely, fish price change over
time, and vessel characteristics, i.e. size, age and power, and further semi

38
structured interviews were used to elicit additional information about vessel
characteristics, i.e. maintenance, fuel consumption, fuel cost per trip currently and
from 1 year previously and fuel costs were calculated for average trips from 2007-
2008. Skippers were then asked a series of open ended questions about the effects
of fuel price increase on the decisions they make, how their behaviour has changed
since the fuel price and what the future holds. Unstructured surveys were also
conducted with members of the wider fishing community, POs, Seafood Cornwall,
ex-skippers, market workers and fisheries scientists and observers.
Results showed: fishers towing mobile gears were more affected than static users
however fuel efficient static fishers also suffered negative effects on income; higher
fuel consumption by towed gears and larger vessels; vessels skippered by owners
used less fuel than company skippers; strong interaction between towed gear and
ownership, i.e. ownership of vessel makes a difference in fuel efficiency (vessels
skippered by owner had newer vessels, newer engines and more regular
maintenance). Across all gear types 34% of skippers experience difficulty in
recruiting (67% were company skippers). Skipper owners had fewer problems. In
effect, fuel price directly changed the way they fished (mainly to reduce fuel
consumption):
Fishing with flow of tide not against it
Steaming and fishing more slowly
Fishing in good weather only
Fishing closer to port
Less time spent in exploratory fishing
Reducing gear experimentation

39
The onshore market value of fish rises as other fishers (15%) take advantage of low
number of boats in poor weather, this equates to less fish in market meaning
seafood buyers bid higher and drive fish price up. Further work is needed here as
some of the behaviour changes discussed may be masked if using only certain types
of data, VMS for example. There is the potential to overestimate or underestimate
fishing activity, as described by the six main behaviour observations above and this
has consequences when assessing true effort displacement among different sectors
of the fleet.
2.2.3 The consequences of ignoring FK
A study by Suuronen et al. (2010) in the eastern Baltic cod fishery analysed the
views of Swedish, Danish and Polish fishers, mainly trawlers and gillnetters in
response to closures for marine conservation and MPAs. Closures had taken place
between 1997 and 2003, leading to a shift in effort and catch distribution. In 2004-
2005 further larger closures had taken place, effectively closing all three major cod
spawning areas. However, no positive impacts had been observed in the status of
the cod stock and negligible reduction of effort occurred (ICES, 2007). Scientists,
with the help of a spatially explicit fishery simulation model ISIS-Fish, suggested that
the networks of MPAs performed poorly (Kraus et al., 2009). ISIS-Fish, a three part
fishery model was designed to simulate and evaluate policies in multi-species multi-
fleet fisheries (Mahévas & Pelletier, 2004), taking into account spatial and
seasonality differences in both fish species and fishing activities. The Baltic cod
population is well known in both biological and ecological terms, and this study by
Kraus et al. (2009) where fleet models are parameterised based on catch data, was
able to show that the MPA design, i.e. the seasonal closures were totally inefficient
in reducing cod mortality.

40
Suuronen et al. (2010) explicitly gathered information on fishers’ perceptions and
attitudes on aspects on the MPAs and other management measures in the Baltic cod
fishery, in order to understand their responses to inform better management in the
future. Fishers had expressed concerns about rule compliance between different
nations and the MPAs and had detailed ideas on use of various other management
techniques, i.e. seasonal closures, days-at-sea cap. The main take home point here,
is that the study by Suuronen et al. (2010) was the first study to capture the views
and management suggestions (i.e. FK) of fishers, but they were not incorporated into
the MPA design thus ignoring FK, what is observed in this Baltic cod fishery are,
increased catch of juvenile cod, as fleets were displaced to areas where smaller fish
were more prevalent, and subsequent intensification of competition between fleets
and reallocation of fishing effort. All fishers, Danish, Polish and Swedish also
expressed worry over unrealistic short-term management decisions that were taken
without cooperation of the fishing industry completely jeopardising the long-term
vision for this well studied cod population. Thus, further illustrating that better
integration of stakeholder views i.e. FK into decision making processes is a
fundamental part of successful fisheries management, and in this case across
multiple gear-types and Member States.
2.3 Predicting fishing effort displacement
Economic modelling methods exist that provide tools with which to predict short-term
choice behaviour in a fishery facing area restrictions but these require input data
from consultation. Andersen and Christensen (2005) provide methods to inform
models of behaviour in a commercial fishery by including interview derived data on
the principal factors leading to the decision of where and how to fish. Economic
theories suggest that redistribution of fishing effort within remaining suitable fishing

41
grounds will be determined by the profit return each individual fisherman expects
(Gordon, 1954). Andersen and Christensen (2005) use detailed information from
interviews and questionnaires to identify important factors influencing the short term
decision making process. This knowledge is then utilised to inform the theoretical
background of a random utility model (RUM) which models behaviour based on
quantitative information from a commercial fishery (such as logbooks data, sale slips
and registered vessel data). The model presented by Andersen and Christensen
(2005) predicts effort redistribution effectively for a species specific fishery. However
for the real life example that was used to validate the model the fishermen actually
changed gears and targeted a different species, an outcome that was not available
within the model.
It is necessary to consider that behaviour is difficult to model due to the large amount
of variables possible. Although the model in this example provides a useful indicator,
understanding the options fishermen are likely to take can involve parameters
outside those in any given model. Therefore gaining feedback and engagement on
the outcomes of modelling exercises and understanding how changes in quota,
fishing restrictions and personal choice of fishermen can affect fishing activity
patterns is of direct benefit to having confidence in model outcomes.
In the most up to date review van Putten et al. (2012) present the main conceptual
models that aim to explain and predict the behaviour of fishing fleets. In this review,
the majority of studies, mainly in North America and Europe, focused on location
choice behaviour, demersal and pelagic species and mainly trawl based fishing
method (Rijnsdorp et al., 2000, 2001; Hiddink et al., 2006). And while a large
proportion of studies considered individual characteristics, i.e. vessel attributes and
descriptors of fishers and their motivations as key drivers of fishing choice, economic

42
factors dominated. Coupled social and economic behavioural models in explaining
observed fishing behaviour remain under developed (van Putten et al., (2012), but
the road ahead is one of optimism. Recently, Lade et al. (2015) carried out an
insightful study on how the interaction of social information and ecological processes
can be critical if we are to understand the dynamics of a fishery. . With enough
attention to issues examined in the above section, getting access to this data will
result in improvements in the actual analyses of displaced fishing effort, and of the
consequences of this displaced effort in terms of how the fishers are affected and the
impact on benthic communities.

43
Chapter 3 Spatial and Temporal Distribution of Fisheries in the
South West of the UK, with reference to the Case Studies of Haig
Fras and Wave Hub.
Part of this Chapter has been published in:
Campbell, M., Stehfest, K., Votier, S. & Hall-Spencer, H. (2014) ‘Mapping fisheries
for marine spatial planning: Gear-specific Vessel Monitoring System (VMS), marine
conservation and offshore renewable energy’, Marine Policy, 45: 293-300.
The above publication also includes some elements of Chapter 4, i.e. marine
substrate map and descriptors.

44
“The charm of fishing is that it is the pursuit of what is elusive but attainable, a
perpetual series of occasions for hope”
John Buchan, 1874-1940.
3.1 Introduction
Over the last 20 years, management approaches have shifted from the conservation
of individual species to the more holistic management of spaces to help reduce
damage to ecosystems and the goods and services they provide (Zacharias & Roff,
2000; Roberts et al., 2005; Apitz et al., 2006; Pedersen et al., 2009a). Marine
protected areas (MPAs) are emerging as a central tool for this approach, with the
World Summit for Sustainable Development calling for the establishment of a
representative and coherent network of MPAs by the year 2012 (United Nations,
2002; Spalding et al., 2008; Jones & Carpenter, 2009), however progress has been
slow and the year 2020 is a more realistic target. In addition, the world’s oceans are
increasingly being tapped as a source of renewable wind, tidal and wave energy
(Clement et al., 2002; Gray et al., 2005; Breton & Moe, 2009; Inger et al., 2009) to
make up for a potential shortfall in fossil fuel reserves, and to help reduce the rates
of environmental changes caused by anthropogenic carbon dioxide emissions (Hall-
Spencer et al., 2008; Shields et al., 2009). The UK, has set a target to produce 33
gigawatts from marine renewable sources by 2020, which would meet the EU target
of supplying 20 % of its gross consumption of energy from marine renewables by
2020 (United Kingdom House of Lords, 2008). The current political strategy is to
stimulate private large-scale, large capital investment in developing the technological

45
means necessary to make wave and tidal energy conversion an economically viable
enterprise by making available large offshore areas for marine renewable energy
installations (MREIs). However, large scale offshore (> 12 nm) MREIs have the
potential to exclude certain fishing gear types from large areas of the sea in both
construction and operational phases (Inger et al., 2009).
The development of offshore MREIs and designation of marine protected areas are
two rapidly emerging demands on marine space that may compete with or displace
fishing activities (Gray et al., 2005; Stewart & Possingham, 2005). For example, in
relation to MPAs, North Sea and Baltic beam trawl cod fisheries, could be forced to
concentrate activity onto smaller grounds, leading to increased competition,
reallocation of activity and lower catch (Rijnsdorp et al., 2000; Suuronen et al., 2010).
To resolve conflicts, marine policymaking has shifted away from sector-by-sector
management towards an integrated, multi-sector, ecosystem-based approach with a
transparent planning process, known as marine spatial planning (MSP) (Smith &
Wilen, 2003; Crowder et al., 2006; Tyldesly, 2006; Douvere, 2008; EC, 2008a;
Gilliland & Laffoley, 2008; Douvere & Ehler, 2009; Foley et al., 2010; Halpern et al.,
2012). This is intended to help managers optimize sustainable use of the sea, for
example by avoiding long-term damage to benthic habitats or the wasteful bycatch of
non-target species. Recently a group of international experts met to devise priority
needs for the successful practical implementation of MSP (Halpern et al., 2012).
Decision support, i.e. types of data, information and tools needed to facilitate
implementation and advancement of MSP, was identified as a priority need, and key
to this is spatially high-resolution and temporally accurate information on the various
activities taking place in the marine environment (Eastwood et al., 2007; Halpern et
al., 2012).

46
Until relatively recently, marine managers had to rely on surveillance data from
observer planes/vessels or logbook catch data to determine the spatial distribution of
fishing activity (Witt et al., 2007). These data lacked temporal and spatial coverage
and resolution, preventing full integration of fisheries data into marine spatial plans
(Pedersen et al., 2009a) at the level of detail recommended by Halpern et al. (2012).
Satellite vessel monitoring systems (VMS) are increasingly being used to overcome
these limitations. Introduced in the 1990s in various parts of the world (Marshall &
Robert, 1998), VMS were originally established to allow fisheries administrators to
control and monitor fishing activity (Davies et al., 2007; Witt et al., 2007). In
European Union waters, VMS were introduced in 2000 when all vessels >24 m in
length (and all vessels >15 m in length since 2005) were required to submit
information on their identity and position every two hours to a Fisheries Monitoring
Centre (EC, 2003). Vessel speed values have also been obligatory since 2005.
From 1st January 2012, there were plans for all vessels > 12 m to install VMS (EC,
2011a). These smaller vessels are mostly inshore. However, there have been major
delays, and full implementation of this system now called Inshore VMS or I-VMS,
may not occur until late 2015 after further trials have taken place (MMO, 2014a).
The system is being introduced through a collaborative effort between the MMO,
Cefas, IFCAs and Seafish, and is being designed to specifically deal with MPAs and
fisheries displacement in inshore areas (MMO, 2012). A number of developers are
also involved, including Selex® and Succorfish®, who are both leaders in vessel
tracking and satellite communications, thus fit for fishing industry purposes. The
main aim is to provide a system which is cost effective, gives fishers access to their
own data (stewardship issues), and which allows fishers to collect a greater variety
of physical and environmental data and through the use of sensors on gear records

47
when a vessel is fishing or not fishing. Trials in the Lyme Bay area have proven a
great success6. The MMO are also offering grant-in-aid of up to £2000 for
vessels >15 m to update or replace their current VMS terminals7. There are even
discussions about extending the systems to towed gear vessels > 8 m in length (EC,
2009a), however as described above until test windows have closed and lengthy
consultation with fishers has occurred, there will most likely be further delays. What
is clear is that VMS has become an established monitoring practice and its use and
perceived importance to fisheries studies is on the increase.
VMS data have proven valuable in spatial analyses of fishing activity (Deng et al.,
2005; Davies et al., 2007; Witt et al., 2007) to the extent that these data have even
been used as a proxy for the distribution of target fish stocks (Bertrand et al., 2008).
Such data can also be used to show how spatial closures can displace fisheries
activity (Murawski et al., 2005; Hiddink et al., 2006). VMS is now being used to
inform the design of MPAs to avoid displacement of destructive fishing activities onto
vulnerable marine ecosystems in the deep sea (Rogers et al., 2008; Hall-Spencer et
al., 2009). In addition, gear-specific VMS analyses have been carried out within the
German EEZ (Fock, 2008; Pedersen et al., 2009a), the Irish EEZ (Gerritsen &
Lordan, 2011), the UK EEZ (Stelzenmüller et al., 2008; Lee et al., 2010; Jennings &
Lee, 2012; Lambert et al., 2012) and for the Danish fleet (Bastardie et al., 2010)
which greatly improve the assessment of fisheries impacts in those areas. Such work
has considerable implications for management of local fishing grounds, as different
6 http://www.seafish.org.uk/about-seafish/news-and-events/news/seafish-invites-industry-to-demonstration-day-at-brixham-to-find-out-how-innovative-inshore-vessel-monitoring-system-technology-works 7 http://www.fishnewseu.com/index.php?option=com_content&view=article&id=13549:vms-grants-available&catid=44:uk

48
fishing sectors (defined by catch or gear type) have specific responses to different
management measures such as closures.
3.1.1 ICES divisions VII e-h, and case studies Haig Fras and Wave Hub
In this Chapter, VMS data are used to provide an overview of the distribution of
fishing activity by gear type in ICES divisions VII e-h (Figure 3.1), which borders the
coasts of Ireland, the UK and France. This area covers parts of the English Channel,
Celtic Sea and Atlantic Ocean and is one of the most highly used marine areas, in
terms of all marine activity, on the planet (Witt & Godley, 2007; Halpern et al., 2008).
This Chapter details a VMS data-driven analysis of how two fisheries closures, one a
MREI and the other a proposed MPA, may affect the distribution of both static and
mobile gear users. This is done by mapping fishing effort by all gear types onto a
regular grid within the entire area in order to look for spatial and temporal trends with
which to draw inference about the nature of fishing within and adjacent to the two
areas.
The first of the closures is Wave Hub, a MREI, a facility for testing prototype Wave
Energy Converters (WECs) located 10 NM from Hayle, North Cornwall within the
South West Marine Energy Park (MEP), and the first of its kind in the UK. This
closure will result in an 8 km2 exclusion zone. The project was due to be deployed in
2008, however lengthy delays meant that construction, installation and operations
did not commence until 2010. Coupled with this, due to the nature of the exclusion
zones associated with MRE developments, there is a great deal of interest in the
formation of de facto MPAs (Inger et al., 2009), so-called because the closure of the
MPA is due to development but might aid conservation efforts. And it is hoped that
efforts at Wave Hub will provide great insight into this phenomenon (Witt et al., 2012).

49
The other closure is a proposed MPA. Haig Fras, a 45 km long granite reef that is
the only substantial area of rocky reef in the Celtic Sea (Rees, 2000) was put forward
as a Natura 2000 conservation area in 2008 (JNCC, 2008). In 2009, the site was
approved by the EC as a Site of Community Importance (SCI), however due to the
fact that it is located beyond the UK’s 12 NM limit, any management decisions will
have to be taken under the EU CFP. Therefore, the site is now awaiting these
management measures to be put in place due to the reform of the CFP which began
in January 2014, and which is discussed in the previous Chapters.
Figure 3.1: Study area showing ICES divisions, Haig Fras Natura 2000 site and Wave Hub
Study area showing ICES divisions VII e-h boundaries, the location of the proposed Haig
Fras Natura 2000 site in ICES VIIg and the location of the Wave Hub deployment area in
ICES VIIf.

50
3.1.2 Primary objectives
The objectives of this Chapter are as follows:
To calculate and visualise the distribution of fishing effort by UK vessels > 15
m in ICES subarea VII which encompasses the offshore waters of the South
West UK, at the highest available resolution, for the years 2005 – 2008
inclusive;
To examine the applicability of methods proposed for the calculation of fishing
effort from VMS data;
To make a broad assessment of the patterns of fishing effort across gear
types and areas within ICES subarea VII, in particular divisions e-h by using a
variety methods;
To make a broad assessment of the scale of fishing effort, and its distribution
across gear types, in the Wave Hub, an MREI and Haig Fras proposed MPA;
To examine the added value of high resolution VMS data to assess questions
regarding fisheries displacement related to the spatial resolution of the data;
and
To examine the added value of high resolution VMS data to assess questions
regarding fisheries displacement related to the temporal resolution of the data.
3.2 Methodology
3.2.1 VMS Data
Raw, unfiltered VMS data for all UK registered vessels >15 m in length that were
active in ICES subarea VII, divisions e-h in 2005-2008 were obtained from the
Marine Management Organisation (MMO), formerly the UK Marine and Fisheries
Agency. As was explained in the introductory Chapter, such high resolution data is

51
currently only accessible to fisheries agencies. Access to post 2008 data was not
available in the same high-resolution format as earlier data. Access to gear type
information was not available for non-UK fishing vessels fishing in UK waters, thus
these vessels were excluded from analyses. The UK vessel VMS dataset contained
vessel records, each consisting of a randomly created vessel identification number
(to separate individual vessels while retaining their anonymity), speed, vessel
position in decimal degrees together with the date and time of transmission. Access
to individual logbook information was not permitted by the MMO for this study,
although gear type information was extracted from logbooks by the MMO and
submitted with the initial VMS dataset. The following fishing gear type classifications
were used: scallop dredge, longline, gillnetter, potter/whelker, beam trawl and
demersal otter trawl, all which conform as close as possible to European Union level
3 and 4 Data Collection Regulation (DCR) (EC, 2008b; EC, 2008c) considering the
level of data made available for this study (this ‘level of data’ is discussed in detail in
Chapter 1). For the purposes of this study, in order to meet the objectives outlined in
Chapter 1, the highest possible obtainable resolution is required to examine its
information content with respect to fisheries displacement, and to make an
assessment of what loss of information occurs when aggregation or averaging is
made over scales and gear types. When data aggregated to the extent to which it is
when served to the public and non-fisheries agencies, the sorts of questions that can
be answered using it changes compared to the higher resolution data. Only by
comparing the sorts of information relevant to assessing fisheries displacement
between high and low resolution data sets, is it possible to evaluate the added value
of the higher resolution data. This is essential to understand the potential utility of the
lower resolution data served to non-fisheries research institutes and the general

52
public, including the fishers themselves. The resolution of the data is a fundamental
control on what specific questions about fisheries displacement can be answered
using it.
3.2.1.1 Access to raw VMS data post-2008
This issue has been explained briefly in the preceding Chapters however, it is
important to explain here in depth the nature of the issues with data access.
Presently, EU VMS data for purposes other than those relating to the Common
Fisheries Policy (CFP) are “constrained by a combination of human rights law; data
protection law; the law of confidence and EU law, in particular the EU confidentiality
obligation under Article 113 of EC Regulation 1224/2009 (the ‘Control Regulation’)”
(ICES, 2010). VMS are considered to provide personal data obtained via
surveillance although if data analyses are for marine planning purposes, and if such
analyses are integral to the CFP, then anonymized, aggregated data may be
released (ICES, 2010).
When VMS data from 2009 onwards was requested from the MMO, access was
initially denied as they had been going through a major overhaul due to the change
in EU regulations concerning the data. Numerous repeat attempts resulted in an
initial dataset, 2007-2010 that was presented as an aggregated 4 year dataset,
vessel gear type separated into static and mobile with no classification provision, and
any areas with less than 10 vessels operating records were removed. This level of
data is known as ‘Level 2’ clearance. Subsequent attempts at explaining the nature
of the work being carried out and the need for higher resolution data in order to
assess displacement resulted in ‘Level 3’ clearance. This data set did contain areas
with less than 10 vessels operating, did split fishing activity by gear type and
included live weight landings from each gear classification; however data was

53
presented only on a yearly basis (i.e. aggregated or averaged over a period of 1
year). This is the highest level of data resolution currently authorised by the MMO
and is not sufficient for assessing fishing effort displacement, especially in a discrete
region, for example the study region: ICES subarea VII divisions e-h.
3.2.2 Fishing activity analyses
3.2.2.1 VMS
VMS data analysis followed the approach for estimating fishing activity established
by Lee et al. (2010). In summary, records without an associated gear type; within 3
NM of ports, and duplicates are all removed. To identify bona fide fishing activity, the
interval between each successive record was calculated and only those vessels
travelling at a speed less than 6 knots were deemed to be actively fishing. This
methodology was applied to all gear types. Summaries of totals per area at each
processing stage are provided in Table 3.1 a-h. Between approximately 15 and 60%
of raw records are removed depending on the ICES division and the year. The
number of duplicate records is very small compared to those records removed
because of speed or proximity to port.
A point summation method followed, using a grid cell size of 0.05° (or 3 arc minutes),
equating to 3 NM, the resolution of fishing data considered necessary to inform MSP
in the UK (Jennings & Lee, 2012). In summary, every 2 hours, a vessel with a
known unique identifier sends a ‘ping’ or a signal to the satellite, thus position in
latitude and longitude is known. Between successive positional information, the
distance that the vessel covers and the time that has passed is known, thus by using
a simple distance-speed- time relationship, the speed value of each successive
position can be calculated. By using speed values of known fishing, active fishing

54
and steaming can be separated. Thus, fishing activity (hours) in each grid cell can
be calculated by summing the single points that have been deemed to be actively
fishing. Fishing activity in each of the ICES division VII e-h was calculated
separately because vessels that move between ICES divisions are assigned new
unique identifiers, thus each division has to be taken as a separate study area. The
vessels are assigned these new unique identifiers as an extra means of ensuring
confidentiality.
Table 3.1 Data processing stages and summaries: a) number of raw records; b) number of
unique records; c) number of duplicate records; d) number of records near a port; e) the
number of records remaining after filtering for duplicates and proximity to port; f) number of
records removed based on high speed; g) number of records left after filtering for duplicates,
proximity to port, and speed; and h) % of raw records left after all filtering.
(a) Number of raw records/ ICES division
e f g h all areas
2005 194429 65876 25210 54862 340377
2006 182543 74347 28116 39975 324981
2007 193313 84485 20924 32900 331622
2008 185477 82644 22120 27347 317588
(b) Number of unique records/ ICES division
e f g h all areas
2005 194242 65681 25195 54831 339949
2006 182009 74074 28050 39897 324030
2007 192954 84378 20901 32872 331105
2008 182232 81073 21895 26980 312180
(c) Number of duplicates (removed)/ ICES division
e f g h all areas
2005 187 195 15 31 428
2006 534 273 66 78 951
2007 359 107 23 28 517
2008 3245 1571 225 367 5408

55
(d) Number of records near port (removed)/ ICES division
e f g h all areas
2005 56071 3388 4183 0 63642
2006 60120 3697 8129 0 71946
2007 69693 3457 3693 0 76843
2008 59871 3767 5865 0 69503
(e) Number records left after filtered for duplicates and near port/ ICES division
e f g h All
2005 138171 62293 21012 54831 276307
2006 121889 70377 19921 39897 252084
2007 123261 80921 17208 32872 254262
2008 122361 77306 16030 26980 242677
(f) Number records removed based on speed/ ICES division
e f g h All
2005 56261 11751 8954 14257 91223
2006 51245 11189 8601 11191 82226
2007 49493 12167 6977 7438 76075
2008 37408 7494 5185 5264 55351
(g) Number records left after filtered for duplicates, near port, and speed/ ICES division
e f g h All
2005 81910 50542 12058 40574 185084
2006 70644 59188 11320 28706 169858
2007 73768 68754 10231 25434 178187
2008 84953 69812 10845 21716 187326
(h) % records total raw records left after all filtering/ ICES division
e f g h All
2005 42.12 76.72 47.83 73.95 54.37
2006 38.69 79.61 40.26 71.80 52.26
2007 38.15 81.38 48.89 77.30 53.73
2008 45.80 84.47 49.02 79.40 58.98

56
3.2.2.2 Differences in spatial patterns of fishing activity
Maps of fishing effort were created by gridding data by linear interpolation at a
resolution of 3 square NM, and presented using a Mercator projection. The data
were gridded with the distortion in this projection accounted for, by using non equal
grid increments in latitude and longitude, in order to grid fishing effort onto a regular
square grid of 3NM. In each map (Figures 3.4 to 3.9 inclusive) the 6 NM and 12 NM
limits are shown, as well as the UK Exclusive Economic Zone (EEZ) limit.
Differences in spatial patterns of fishing activity were quantified 1) between pairs of
gear types and 2) within same gear types but between pairs of years. The index of
difference in spatial pattern developed by Lee et al. (2010) was used whereby, in
brief, “the absolute differences in proportion of fishing activity in each cell were
calculated, so that the total activity in ICES VII e-h was equal to 1.0. To compare
two maps, the per-cell absolute differences in the proportion of fishing activity were
calculated and summed for the entire ICES VII e-h then divided by 2 resulting in an
index of difference in spatial pattern varying from 0 to 1, i.e. 0 representing identical
spatial fishing patterns in the same cells and 1 representing no activity in the same
cells”. This metric can be thought of as an index of spatial coherency: 1 would
indicate no coherence in the spatial distribution between 2 data sets (for example,
comparing 2 years) and a value of 0 would indicate full coherence or identical spatial
distributions. Notice that this method of quantifying changing spatial distribution
would be highly dependent on the size of the cell and thus only meaningful
comparisons can be made between data sets with identical cell size (i.e. spatial
resolution) and is dealt with in Section 3.3.2.
3.2.2.2.1 Multidimensional Scaling (MDS)

57
In order to further display the overall compositional patterns in the high-dimensional
(space and time) data, i.e. between-year and between-gear differences (both indices)
in fishing effort, they are further analysed using two-dimensional non-metric
multidimensional scaling (MDS) which produces data ordinates that can be
visualised on a simple two-dimensional scatter plot (Kenkel & Orlóci, 1986). These
indices correspond perfectly to distances, and it would be possible to construct a
matrix of pair-wise comparisons between all combinations of gear and year, with an
MDS plot to illustrate the main patterns in a compact way. This is shown is Figure
3.2.
3.2.2.2.2 How concentrated is fishing effort across each gear type and ICES VIIe-h?
The use of Moran’s I and Getis-Ord Gi statistic
Clustering, or concentratedness, or fishing effort was examined at two scales; global
and local. A global analysis involves studying the entire map of fishing effort. In order
to assess the degree of effort concentration (visualised in Figures 3.4-3.9), a global
Moran’s I analysis (Moran, 1950) was carried out in order to compute autocorrelation
in the spatial distribution of the number of hours fished. This analysis was carried out
per-gear and per-year, with the fishing effort data kept in the same spatial resolution
of grid cell (3NM2). The metric has ranges in value from -1 (indicating a much
dispersed or totally random pattern) to +1 (indicating a much clustered pattern).
Once this ‘global’ pattern is the dataset was calculated, a local analysis explores
within the global pattern to identify clusters or so-called ‘hotspots’ that show localised
intense fishing effort. The ‘local’ Getis-Ord Gi statistic (Ord & Getis, 1995) was used
to determine which areas with the highest number of hours fished, or ‘hotspots’ on a
per-year, per-gear basis. The statistic was computed over a range of scales, on a
per-grid-cell basis. The calculations were carried out using the PySAL toolbox.

58
3.2.2.3 EU defined fleet effort analysis
Fishing effort of fleets is defined in the Basic Regulation of 2002 (Article 3(h)) (EC,
2002a) as the product of capacity and activity. Capacity of a vessel is measured in
terms of its gross tonnage (GT) or engine power (kW), and activity is commonly
measured as the period of time in which a vessel is active, i.e. days-at- sea. In this
study, capacity is presented as number of vessels, which is an accepted, albeit
approximate, method when GT or kW is not available. Each ICES division VII e-h
was analysed separately for the same reasons as outlined in section 3.2.2.1. All
analyses were performed using MATLAB (Matlab, 2007).
3.2.2.3.1 Two dimensional non-metric Multidimensional Scaling (MDS)
In order to further display the overall compositional patterns in the data, i.e. number
of days-at-sea, and especially as a simple means with which to identify any
seasonality in fishing trends, they are further visualised using two-dimensional non-
metric multidimensional scaling (MDS). This is shown is Figure 3.14, and was
performed in order to further visualise seasonality between gear-type and area by
showing the month-by-month pattern in fishing effort. These plots also show, at-a-
glance, which gear-types display a greater or lesser degree in seasonality than
others.
3.2.2.4 Effects of spatial and temporal resolution
VMS data needs to be interpolated onto a regular grid in order for comparative
analyses (between gears, over space, and in time). The spatial resolution at which
VMS data is analysed partially dictates the level of uncertainty that applies to any
inferences made using it. An advantage of having data at the highest possible
available resolution, such as here, is that it can be analysed at varying resolutions in

59
order to assess at what spatial resolution is appropriate, by examining how the value
of metrics change with different grid sizes (both up- and down-sampling).
In order to demonstrate this, the effect of spatial grid resolution on our ability to
interpret indices of relative difference in pattern of fishing activity was investigated.
Maps of this fishing effort (similar to Figures 3.4 – 3.9) were prepared for each gear
and for each of the following grid sizes: 1) 0.025 degrees (1.5 NM); 2) 0.05 degrees
(3 NM); 3) 0.1 degree (6 NM); 4) 0.2 degrees (12 NM); and 5) 0.4 degrees (24 NM).
This was carried out for data collected in 2005 to 2008 inclusive. As before, the
proportion of fishing effort in each cell was again calculated such that the sum over
the entire study area, ICES VII e-h was 1.0. For each gear type, and for each grid
size, the per-cell absolute differences in the proportion of effort in 2005 and 2008
were calculated, summed for the entire grid, and divided by 2. This produced an
index of difference in spatial pattern, varying from 0 to 1, over the period 2005 to
2008, for each gear types, and for varying spatial resolutions. To examine the effect
of spatial resolution, the percentage change in this index was calculated for 0.05, 0.1,
0.2, and 0.4 degrees, respectively, relative to 0.025 degrees.

60
3.3 Results
3.3.1 Spatial and temporal analyses
The spatial distribution of fishing activity was highly heterogeneous and distinct
areas of intense fishing could be identified for all gear types (Figures 3.4 – 3.9).
Spatial patterns were more consistent within gears between 2005 and 2008 for
mobile gears (scallop dredge, beam and otter trawls), with the index of difference in
spatial distribution ranging from 0.122 to 0.654 (Table 3.2) representing high to
intermediate spatial coherence (or low to intermediate change) in spatial pattern of
fishing effort. For the static fleet (longline, gillnetter and potters/whelkers), smaller
ranges were observed, ranging from 0.195 to 0.362. For static gear types, the
spatial patterns within gears between successive years tended to be more similar
than dissimilar (non-random spatial patterns, indicative of non-transient fishing).
However, for the scallop dredging fleet, spatial patterns from 2005-2008 ranged from
0.613 to 0.654, indicating a slight shift in spatial distribution from the previous year
and more transient fishing behaviour.
Table 3.2 Indices of relative difference in spatial pattern, calculated according to the method
of Lee et al. (2010), within gear between 2005 and 2008.
Year Scallop Dredge Longliner
Potter/ Whelker Gillnetter
Beam trawl
Otter trawl
2005 - 2006 0.613 0.211 0.195 0.320 0.129 0.407
2006 - 2007 0.654 0.276 0.215 0.274 0.122 0.434
2007 - 2008 0.654 0.214 0.233 0.362 0.141 0.501
0= total equality; 1= maximal difference
Patterns of fishing activity between pairs of gears ranged from 0.648 to 0.998,
indicating a high degree of dissimilarity in the spatial distributions of fishing effort by
vessels with different gear types (Table 3.3 a-d).

61
Table 3.3 Indices of relative difference in spatial pattern, calculated according to the method
of Lee et al. (2010), between gears between (a) 2005, (b) 2006, (c) 2007 and (d) 2008.
(a) 2005 Dredge Longliner P/W Gillnetter Beam Otter
Dredge x 0.958 0.986 0.823 0.914 0.955
Longliner x x 0.965 0.905 0.749 0.867
P/W x x x 0.964 0.898 0.937
Gillnetter x x x x 0.798 0.848
Beam x x x x x 0.861
Otter x x x x x x
(b) 2006 Dredge Longliner P/W Gillnetter Beam Otter
Dredge x 0.971 0.990 0.851 0.899 0.965
Longliner x x 0.945 0.907 0.648 0.848
P/W x x x 0.948 0.867 0.955
Gillnetter x x x x 0.827 0.875
Beam x x x x x 0.855
Otter x x x x x x
(c) 2007 Dredge Longliner P/W Gillnetter Beam Otter
Dredge x 0.960 0.992 0.954 0.923 0.985
Longline x x 0.954 0.936 0.669 0.897
P/W x x x 0.953 0.905 0.913
Gillnetter x x x x 0.803 0.922
Beam x x x x x 0.890
Otter x x x x x x
(d) 2008 Dredge Longline P/W Gillnetter Beam Otter
Dredge x 0.994 0.998 0.936 0.942 0.995
Longliner x x 0.933 0.947 0.596 0.92
P/W x x x 0.971 0.928 0.911
Gillnetter x x x x 0.843 0.962
Beam x x x x x 0.961
Otter x x x x x x
0= total equality; 1= maximal difference
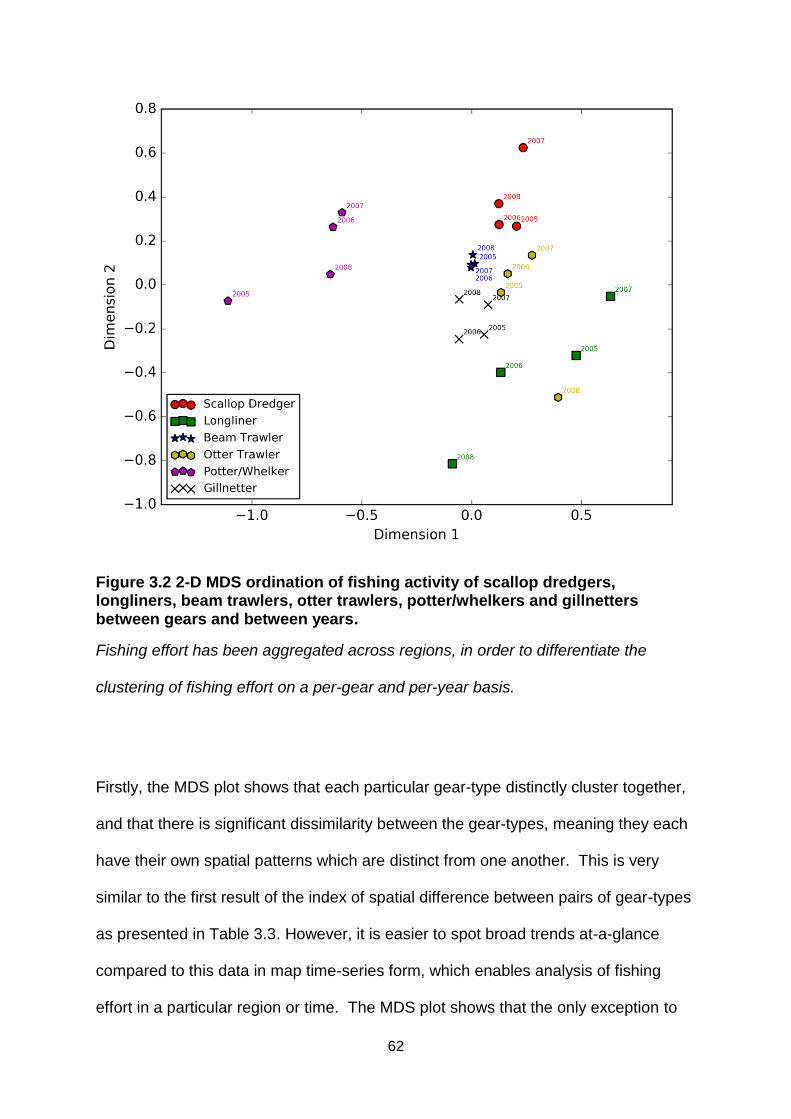
62
Figure 3.2 2-D MDS ordination of fishing activity of scallop dredgers, longliners, beam trawlers, otter trawlers, potter/whelkers and gillnetters between gears and between years.
Fishing effort has been aggregated across regions, in order to differentiate the
clustering of fishing effort on a per-gear and per-year basis.
Firstly, the MDS plot shows that each particular gear-type distinctly cluster together,
and that there is significant dissimilarity between the gear-types, meaning they each
have their own spatial patterns which are distinct from one another. This is very
similar to the first result of the index of spatial difference between pairs of gear-types
as presented in Table 3.3. However, it is easier to spot broad trends at-a-glance
compared to this data in map time-series form, which enables analysis of fishing
effort in a particular region or time. The MDS plot shows that the only exception to

63
the general trend of non-overlap between gear types is an overlap between otter
trawling in 2008, and the longlining fleet, which is also observed in the index of
spatial difference of otter trawling in 2008 (Table 3.2). Examination of the relevant
maps of fishing effort, the cause is apparent: namely, there was a major shift in otter
trawling in 2008, which is shown in Figure 3.3 as a Northwest extension to the fishing
grounds, east of the Bristol Channel which is not observed in any other year. The
highest clustering is observed within the beam trawl fleet, which suggests very little
change in fishing grounds from 2005-2008, this is also illustrated in Table 3.2. This
illustrates that the use of multiple visualisation tools is necessary to observe any
nuances between fishing activity between gear-type and year. The MDS plot is also
a useful way to see any outlier years with each fishing gear-type. This may have the
potential to be a really useful simple first-order tool in assessment of effort
displacement. It could be also be used to assess fishing activity by gear-type in any
given month, thus looking at seasonality differences. It should be noted however,
that the stress value, which is the measure of how the distances in the configuration
ordinally fit the data, was estimated at 2.4, much greater than the threshold of 0.2
which corresponds to ‘good data fit’ (Kruskal, 1964). This may also be due to the
high number of data points, and in a 24* 24 matrix of 6 gear-types over 4 years of
data, the number of data points is extremely high. Thus caution is needed in taking
the stress value at face value. In cases like these, advice states that we could
increase the dimensionality, of 3 or 4 for example but in doing so we increase the
level of complexity to beyond what the human mind can readily comprehend
(Wickelmaier, 2003).
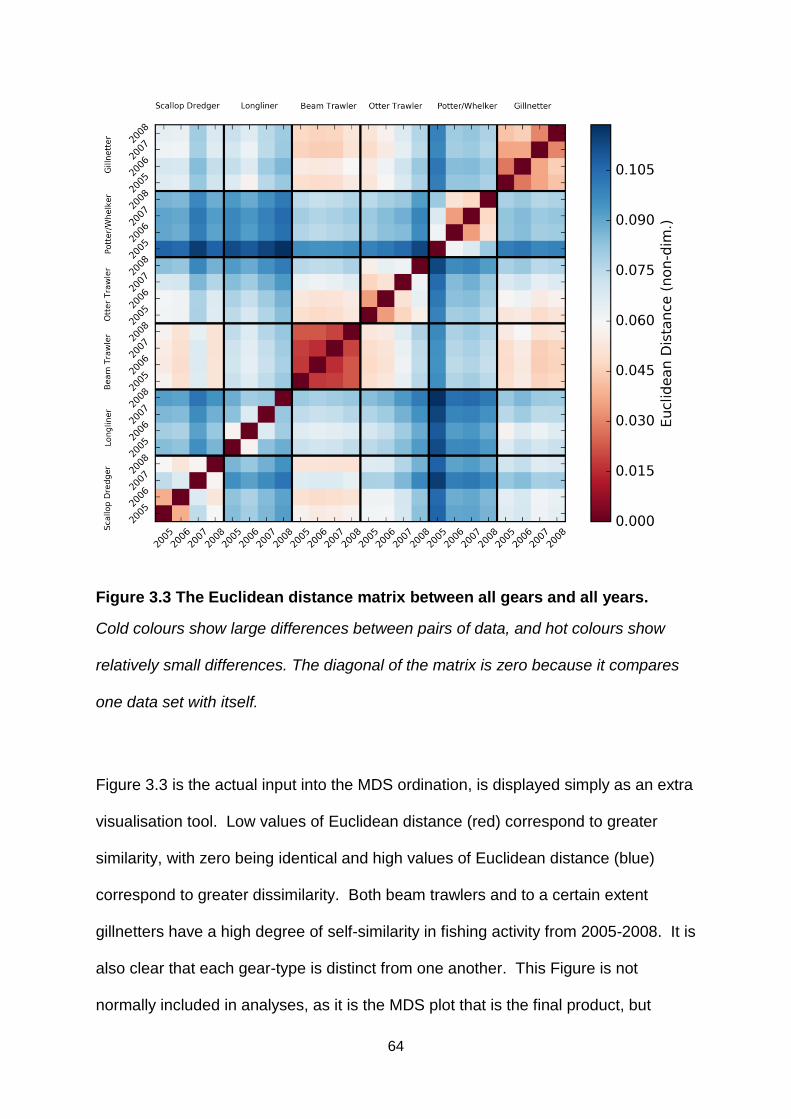
64
Figure 3.3 The Euclidean distance matrix between all gears and all years.
Cold colours show large differences between pairs of data, and hot colours show
relatively small differences. The diagonal of the matrix is zero because it compares
one data set with itself.
Figure 3.3 is the actual input into the MDS ordination, is displayed simply as an extra
visualisation tool. Low values of Euclidean distance (red) correspond to greater
similarity, with zero being identical and high values of Euclidean distance (blue)
correspond to greater dissimilarity. Both beam trawlers and to a certain extent
gillnetters have a high degree of self-similarity in fishing activity from 2005-2008. It is
also clear that each gear-type is distinct from one another. This Figure is not
normally included in analyses, as it is the MDS plot that is the final product, but

65
nonetheless, this is a good visual tool that serves as the link between the MDS plot,
which is an abstraction of the data in non-dimensional units, to the map forms of
fishing effort, which are more readily understood but are harder to summarise.
Fishing effort of the fleets as described by EC (2002) are presented in Table 3.4.
ICES VII f (which contains Wave Hub), represents an area with some of the highest
potting and whelking and gillnetting effort, in comparison to other ICES divisions,
although some heterogeneity was observed over the present study period 2005-
2008. Even for the gear-types that show least heterogeneity, the variations are such
that if a particular location is not necessarily well matched by the larger trends, and it
depends on location and gear-type. A detailed analysis of fishing effort within the
confines of the Wave Hub MREI (Figure 3.1), summarised in Tables 3.5 and 3.6,
revealed that beam trawling was most dominant in terms of vessel numbers and
fishing effort, but that of all static gear types, gillnetting was by far the dominant and
in fact was the dominant fishing activity when normalised by the number of vessels.
Potting and whelking was less prevalent relative to area VII f as a whole. A
comparison of effort between the Wave Hub MREI and area VII f as a whole reveals
that regional estimates only go so far in being able to accurately describe the
distribution of fishing effort among different gear types within Wave Hub, which
suggests that analysis at the scale of an entire ICES region is too coarse in scale to
indicate fishing effort within small MREIs or MPAs in that region.
According to Table 3.4, ICES VII e represented the highest scallop dredging effort.
ICES VII g, which contains the Haig Fras MPA site, also represented high fishing
effort values for gillnetting and scallop dredging, in comparison to other fishing gears

66
in the area. Again, a comparison between regional fishing efforts (Table 3.4) and
localised efforts within the Haig Fras area (Tables 3.5 and 3.6) is instructive.
Gillnetting within Haig Fras broadly reflects the trend for the region; however scallop
dredging only features in 2005 and 2006 within Haig Fras whereas the region as a
whole does not see the same trend. However, estimates in fishing activity within
Haig Fras are highly volatile owing to the very few numbers of UK vessels that
operate there. It is known in the industry that French demersal vessels use the area
heavily, however those non-UK vessel data are not available therefore not amenable
to the same analyses (Cornish Fish Producers Organisation (CFPO), pers. comm.,
August 2012). Beam trawling and otter trawling are widespread throughout the study
area with highest effort in ICES VII e and f, but almost absent from Haig Fras
(Figures 3.4, 3.3; Tables 3.5 and 3.6). Again, these results suggests that analysis at
the scale of an entire ICES region is too coarse in scale to be indicative of fishing
effort within small MREIs or MPAs in that region.
Table 3.4 Capacity (no. vessels) and activity (days at sea) of UK fleets in ICES VII e-h from
2005-2008. Wave Hub is within ICES VII f, and Haig Fras within ICES VII g and is
highlighted within the table.
Year/gear type e
f
g
h
2005
No. vessels
Days at sea
No. vessels
Days at sea
No. vessels
Days at sea
No. vessels
Days at sea
SD 17 207 14 33 6 0 12 59
Longliner 5 51 5 5 7 20 9 64
Gillnetter 22 62 23 154 24 58 26 58
P/W 10 62 7 80 5 26 0 0
Beam 58 210 48 153 43 33 45 106
Otter 18 114 15 98 41 32 16 29
2006 No. Days No. Days No. Days No. Days

67
vessels at sea vessels at sea vessels at sea vessels at sea
SD 29 125 23 26 23 23 20 31
Longliner 4 42 3 4 5 15 5 102
Gillnetter 22 66 21 186 19 78 24 46
P/W 11 186 7 99 3 0 0 0
Beam 60 210 49 141 36 38 44 94
Otter 17 113 13 79 30 41 15 35
2007 No.
vessels Days at sea
No. vessels
Days at sea
No. vessels
Days at sea
No. vessels
Days at sea
SD 27 134 18 18 16 35 17 12
Longliner 1 156 1 1 2 1 4 51
Gillnetter 16 72 14 261 13 106 13 76
P/W 14 147 9 133 3 2 0 0
Beam 53 203 47 135 29 42 38 103
Otter 8 154 9 111 25 34 8 71
2008 No.
vessels Days at sea
No. vessels
Days at sea
No. vessels
Days at sea
No. vessels
Days at sea
SD 19 86 16 17 19 23 9 12
Longliner 2 19 2 0 2 1 4 12
Gillnetter 13 50 13 184 10 85 12 57
P/W 13 149 6 160 3 85 0 0
Beam 48 159 34 116 23 10 39 55
Otter 7 84 5 122 24 48 8 21
Table 3.5. Fishing activity of UK fleets in (a) Wave Hub MREI and (b) Haig Fras from 2005
to 2008.
(a) WAVE HUB
Number of hrs fished 2005 2006 2007 2008
Otter trawl 103 71 36 82
Beam trawl 301 167 179 140
Gillnetter 137 173 146 104
Longline 64 36 70 25
Scallop dredge 9 7 1 0
Potter/Whelker 18 19 36 19
(b) HAIG FRAS

68
Number of hrs fished 2005 2006 2007 2008
Otter trawl 5 1 2 1
Beam trawl 3 1 1 1
Gillnetter 13 15 9 4
Longline 0 0 0 0
Scallop dredge 7 7 0 0
Potter/Whelker 0 0 0 0
Table 3.6. Number of unique UK fishing vessels in (a) Wave Hub MREI and (b) Haig Fras
from 2005 to 2008.
(a) WAVE HUB
Number of unique
vessels 2005 2006 2007 2008
Otter trawl 2 3 3 5
Beam trawl 21 28 25 13
Gillnetter 4 2 5 3
Longline 2 6 1 1
Scallop dredge 1 2 1 0
Potter/Whelker 3 3 4 4
(b) HAIG FRAS
Number of unique
vessels 2005 2006 2007 2008
Otter trawl 2 1 2 1
Beam trawl 1 1 1 1
Gillnetter 12 10 10 6
Longline 0 0 0 0
Scallop dredge 1 1 0 0

69
Potter/Whelker 0 0 0 0
Fishing with mobile gear was more widely distributed (Figures 3.4, 3.5 & 3.8): beam
trawling occurred over the largest part of the study area (Figure 3.4) closely followed
by otter trawling which was also widespread (Figure 3.5). The distribution of static
gear fishing was focused in fewer, smaller and more isolated areas (Figures 3.6, 3.7
& 3.9). These broad trends are a logical consequence of these broad gear
classifications; however the changing nature of these spatial patterns year-on-year,
as well as patterns within the various mobile and static gear types are a crucial form
of decision support, i.e. types of data, information which are classed as priority and
needed to facilitate implementation and advancement of MSP, as defined in section
3.1 (Halpern et al., 2012). In general, otter trawlers (Figure 3.5) tended to venture
further afield from port than beam trawlers (Figure 3.4) and occupied a greater
proportion of the Celtic sea than the western English Channel and Atlantic.
Gillnetters showed most geographic spread, occupying most areas more equally
except a few ‘hot spots’ of activity (such as Haig Fras). Longliners were confined
almost exclusively to the western English Channel whereas scallop dredgers
became increasingly concentrated in both the Channel and the Atlantic regions
during the study period, losing their presence in the Celtic Sea by 2008. Finally, the
distribution of potters and whelkers strongly reflected the relatively small number of
ports that they operated from, showing a high degree of geographic specialisation.
One dominant area for that gear type is within the boundaries of Wave Hub.

70
Figure 3.4 Fishing activity for beam trawlers
Fishing activity (number of hrs fished) distribution of UK vessels >15 m in length in
ICES divisions VII e-h from 2005-2008 for beam trawlers. Haig Fras and Wave Hub
MREI are identified.

71
Figure 3.5 Fishing Activity for demersal otter trawlers
Fishing activity (number of hrs fished) distribution of UK vessels >15 m in length in
ICES divisions VII e-h from 2005-2008 for demersal otter trawlers. Haig Fras and
Wave Hub are identified.

72
Figure 3.6 Fishing activity for gillnetters
Fishing activity (number of hrs fished) distribution of UK vessels >15 m in length in
ICES divisions VII e-h from 2005-2008 for gillnetters. Haig Fras and Wave Hub are
identified.

73
Figure 3.7 Fishing activity for longliners
Fishing activity (number of hrs fished) distribution of UK vessels >15 m in length in
ICES divisions VII e-h from 2005-2008 for longliners. Haig Fras and Wave Hub are
identified.

74
Figure 3.8 Fishing activity for scallop dredgers
Fishing activity (number of hrs fished) distribution of UK vessels >15 m in length in
ICES divisions VII e-h from 2005-2008 for scallop dredgers. Haig Fras and Wave
Hub are identified.

75
Figure 3.9 Fishing activity for potters and whelkers
Fishing activity (number of hrs fished) distribution of UK vessels >15 m in length in
ICES divisions VII e-h from 2005-2008 for potters and whelkers. Haig Fras and
Wave Hub are identified.

76
Figure 3.10 Global Moran’s I
Figure showing autocorrelation of fishing activity (number of hours) per gear-type
and year. Cold colours indicate a high degree of spatial clustering in fishing effort,
over all regions. Hot colours show a relatively dispersed pattern in fishing effort.
Results show that different gear-types have different degrees of spatial clustering,
but also that some variability in this clustering occurs in time. The Moran’s I analysis
(Figure 3.10) shows that the global pattern for beam trawling in particular, shows a
high degree of clustering. In contrast, the distribution of fishing effort by longliners is
much more dispersed. Other gear-types lie between these two end member cases.
While the analysis (Moran’s I, Figure 3.10) shows broadly the same patterns that you
can discern from the maps of fishing effort (Figures 3.4-3.9), the power of such an

77
analysis is that it provides an objective statistical means to compare gear-type and
analyse spatial distributions of fishing effort over time. For example, the variability in
Moran’s I between 2005 and 2008 was sensitive enough to pick up the same
changes in spatial distributions for longliners and scallop dredgers in particular, that
could be discerned by eye, but provides an objective means to evaluate subsequent
changes.
78
Figure 3.11 Getis-Ord Gi Statistic for all gear-types between 2005-2008.
Contours show the areas of very intense fishing effort, colour-coded by year. The
contours represent the areas with a standardised local Getis-Ord Gi statistic of
greater than 10. Contours that overlap indicate areas that are hotspots over multiple
years. Contours in isolation represent areas that are intensively fished in only some
years.
High values of the G statistic show very high localised autocorrelation in fishing effort,
which corresponds to a very spatially clustered pattern in fishing. To demonstrate
these fishing hotspots in map form, the areas within which the G statistic was greater
than 10 were contoured (Figure 3.11), for each fishing gear type. The value 10 was
chosen as an appropriately high value that demonstrated fishing hotspots across all
gear types. Similar statistical analyses were conducted by Jalali et al. (2015) to

79
demonstrate hotspots in fishing effort. These maps (Figure 3.11) show that fishers
tend to fish intensely at very specific sites year upon year, but that the distribution of
these localised areas varies considerably with gear type. There is almost no overlap
between the gear-specific hotspots. Such analyses could be extremely useful for
identifying areas that only occasionally intensely fish, areas that are overfished, or
areas most vulnerable to displacement.
3.3.2 Effects of spatial and temporal resolution
VMS data needs to be interpolated onto a regular grid in order for comparative
analyses (between gears, over space, and in time). The spatial resolution at which
VMS data are analysed partially dictates the level of uncertainty that applies to any
inferences made using it. An advantage of having data at the highest possible
available resolution, such as here, is that it can be analysed at varying resolutions in
order to assess what spatial resolution is appropriate, by examining how the value of
metrics change with different grid sizes.
The results (Figure 3.13) suggest in general that relatively small (<5 %) relative
changes are to be expected for grid sizes of less than 0.2 degrees, and that up to 20%
relative changes would be expected up to 0.4 degrees. It is recommended that a
spatial resolution of no more than 0.1 degree was appropriate. No evidence was
found that a resolution of less than 0.05 degrees (Lambert et al., 2012; Hinz et al.,
2013) was necessary in this case. This pattern varied per gear type: for example, the
spatial resolution made relatively little difference to data from scallop dredge vessels
and beam trawlers. Spatial resolution had much greater effects of the spatial pattern
indices of otter trawlers and potters/whelkers.

80
Figure 3.12 Percentage absolute change in index of relative difference in pattern of fishing activity for different grid sizes
Percentage absolute change in index of relative difference in pattern of fishing
activity for a grid size of 0.05 (cyan), 0.1 (red), 0.2 (yellow) and 0.4 (blue) degrees
respectively, relative to a grid of 0.025 degrees, over the period 2005 – 2008, for
each of the 6 gear types.

81
Table 3.4 summarises the number of days fished in total per year, per gear and per
ICES division. Having data at a high temporal resolution is beneficial for also looking
at seasonality in the fishing effort. Displacement of fishing effort need not only occur
in space: it might also have a temporal component if closures mean that fishing
intensifies in certain areas at certain times of the year. It is therefore important to
examine in trends in fishing effort by various fleets throughout the year, on a month-
by-month basis. Detecting the effects of fisheries displacement might be possible by
looking at how the seasonality of fishing effort changes in an area following a closure.
In order to detect a change, a baseline needs to be established. Here, this is done
using 2005 – 2008 as the pre-displacement baseline.
Figure 3.13 summarises fishing effort per calendar month, per ICES VII division, e-h,
for each of the gear types. The average number of days per vessel was calculated
as the total number of hours fished, divided by 24 hours, and divided by the number
of unique vessels with a certain gear type. Strong seasonality is in evidence in
longliners and potters/whelkers. Closures would presumably therefore
disproportionately affect these gear types during the summer months when relatively
more fishing is carried out. It might intensify summer fishing effort elsewhere. The
relative impacts on benthic ecosystems would vary seasonally from these fishing
types. In contrast, only weak seasonality is in evidence for scallop dredging,
gillnetting, beam and otter trawling. The pattern in seasonality between gears also
varies strongly across ICES VII e-h (Figure 3.14). The effects of closures on fishing
effort needs to take into account, at some level, whether or not fishing is physically,
biologically and economically viable throughout the year (like trawling), or only in
certain seasons. It is likely that longliner and potter/whelker fishers, without
adaptation, would be disproportionately affected by closures and displacement

82
because the fishing season is short. All this points to that, fishing is more
concentrated at particular times of the year, thus displacement potentially causes
more intense impacts than if it was distributed evenly through the year. It is important
to note that these conclusions could not be drawn using data at a coarser temporal
resolution.
Figure 3.13 Average number of days at sea by UK vessels >15 m in length and average per calendar month in total per ICES divisions VII e-h
Average number of days at sea by UK vessels >15 m in length 2005-2008 (coloured
lines) and on average (heavy black line) per calendar month, in total over ICES
divisions VII e-h.

83
Figure 3.14 2-D MDS ordination of number of days at sea, for each gear-type with all years and ICES VII e-h aggregated.
Each dot represents a different month of the year.
Figure 3.14 clearly shows seasonality in each fishery, because there is a regular
trend in the values of the ordinates month by month, which manifests as a circular
pattern. This seasonality is strongest for beam trawler, otter trawler, and
potter/whelker, and to a lesser extent with the others which show slight departures
from the circular pattern in the plot. This analysis has been conducted by
aggregating over years and regions but displays similar patterns for each region and
year (not shown)

84
3.4 Discussion
3.4.1 Winners and losers in terms of fishing effort displacement: initial insights
The presented analyses of Vessel Monitoring Scheme data from South West UK
reveal clear gear-specific differences in spatial and temporal patterns of fishing
activity and allow detailed analyses of the use of shared resources by UK fleets. As
expected, the VMS data show that intensely fished areas vary between gear types
with towed demersal gear users generally avoiding the rocky grounds that are
targeted by other static gear fleets, for example towed gears avoiding Haig Fras.
When gear type is not analysed then useful information (e.g. seasonal patterns in the
locations of areas that are intensely used by sectors of the fleet – Figures 3.9 and
3.10) is lost and the overall impression of fleet activity is dominated by the most
common fishing method (Witt et al., 2007). As such, detection of differences in other
than the most dominant fishing gear type would be difficult. Previously, VMS data
have been used to plan offshore marine protected areas, designed to minimize
displacement of activity and to identify areas that were most likely to have untrawled
biogenic habitats (Hall-Spencer et al., 2009). Gear-specific fishing activity was not
analysed for the design of these offshore MPAs because such data were not made
available by the authorities. Given the diversity of fishing gears used in inshore
waters (< 12 nm), a lack of gear-specific information could lead to poor marine
spatial management decisions. Results presented here illustrate that gear-based
VMS analyses can offer greater detail on fleet activities than traditional sources of
fisheries data, such as overflight data, and provides an opportunity to improve
marine spatial planning, but could be substantially improved if higher level data, i.e.
access to logbooks, and further years of data were available (for example, Lee et al.,
2010; Jennings & Lee, 2012). This is particularly important in the South West UK as

85
this area currently harbours most of the English and Welsh fishing fleets (Defra,
2007).
The effects of fishery closures (e.g. for nature conservation or offshore renewable
energy developments) will vary considerably between different sectors of the fishing
industry owing to the spatial heterogeneity in fishing effort. In the present study,
beam trawling was the most widespread type of fishing, closely followed by demersal
otter trawling. This sector of the fleet exploited such large areas that effects of two
small area closures (Haig Fras and Wave Hub) are unlikely to have detectable
environmental impacts outside the closures as mobile gears are rarely used within
the these closures. However, if more (or different) areas off South West UK were
closed, displacement of towed demersal gear activity might have the potential to
increase pressure on benthic habitats unless seldom fished parts of a region are
closed to towed demersal gear (Hall-Spencer et al., 2009) or in response to new
measures being discussed for deep-sea fisheries leading to “a displacement of a
fleet of large capacity demersal vessels into areas in Western Waters such as the
Celtic Sea where an ongoing recovery of demersal stocks would be jeopardized”
(National Federation for Fishermen’s Organisations (NFFO) pers. comm., July 2012).
It may seem that this fear is not proportional to the scale of likely closures, however
the risk of other vessels moving into other users territory is something that is
discussed by various fishers (Chapter 5) and it is why a potential risk analysis of
variability in fishing effort causing displacement is much needed (Chapter 4).
Conversely, closed areas can sometimes benefit mobile gear users through ‘spillover’
(Gell & Roberts, 2003) or enhanced recruitment through larval export (Beukers-
Stewart et al., 2005). In this study, VMS analyses showed that longlining activity,
and to a lesser extent gillnetting activity, were concentrated in much smaller areas

86
than mobile demersal gear types in South West UK. If the Haig Fras Natura 2000
site were to be closed to gillnetters, then their activity could likely be displaced onto
other areas, potentially increasing competition between fishers and pressure on
these habitats (for example, Rijnsdorp et al., 2000; Suuronen et al., 2010). Potters
and whelkers, who often compete for space with mobile gear users (Blyth et al.,
2002), may also be more affected by the small closures than mobile gear users. The
loss of even relatively small fishing grounds might incur economic costs for the
potting/whelking fleet that need to be weighed against any long-term benefits of
‘spillover’ during compensation claims if closures are related to commercial ventures
such as MRE developments (Gray et al., 2005; Berkenhagen et al., 2010). We can
use the outcomes of hotspot analysis in order to observe statistically derived
hotspots for each given gear-type in any given year (Figures 3.10, 3.11). In the case
of Wave Hub, initial impact assessments were deemed completely inappropriate and
fishing effort highly underestimated, leading to conflict at the beginning of an
important process. A solution was reached and fishermen were compensated,
however, in order to come to this point, 18 months of new stakeholder negotiations
had to take place and considerable damage had occurred between these two
industries (Wave Hub fisheries liaison officer, pers. comm., October, 2013). This
study has shown that, given the spatial and temporal heterogeneity of fishing effort in
South West UK waters, detecting and assessing fisheries displacement requires
high-resolution data and spatially distributed analyses, especially given the
complexity caused by the interaction of factors involved.

87
3.4.2 Potential wider ecological impacts
3.4.2.1 Apex predators
Given that different fisheries have different environmental impacts, spatial
management plans require high-resolution information on the distribution of different
types of fishing activity (Stelzenmüller et al., 2008). For example, apex marine
predators may benefit from feeding/scavenging on discards (Furness, 2003; Votier et
al., 2004; Bicknell et al., 2013) or be at risk from accidental bycatch in long-lines or
nets (Lewison et al., 2004) with discard rates and bycatch risk varying greatly as a
function of gear type (Lewison et al., 2004; Furness et al., 2007). The VMS dataset
used here indicates only modest longlining activity in the region, but high levels of
bottom trawling may generate large quantities of discards that may benefit certain
seabird populations in the region (Mitchell et al., 2004) given that individual seabirds
appear to adjust their foraging behaviour when overlapping with bottom trawling
VMS tracks in the Celtic Sea (Votier et al., 2010, 2013). A further study in the Celtic
Sea has pointed at the creation of de facto refugia for elasmobranchs due to the
spatial heterogeneity of fishing activity among the fleets (Shephard et al., 2012).
However, as described above, changes to fisheries management, in particular
fisheries area closures may negate this effect, if fishers’ behaviour is altered and
fishing activity displaced. There is scope for modelling this type of uncertainty based
on the types of datasets available (e.g. Stelzenmüeller et al. (2015), Zhang et al.
(2015))
3.4.2.2 Seabed features
When managing seabed habitats for biodiversity conservation, or for the commercial
protection of nursery areas and brood stock, gear specific VMS data will prove useful
in spatial planning since mobile demersal gear types have major impacts on certain

88
benthic communities (Kaiser et al., 2006; Pedersen et al., 2009b), with scallop
dredging known to cause more damage to seabed habitats than potting, for example
(Hall-Spencer & Moore, 2000; Tyler-Walters et al., 2009). A spatially explicit
analysis of which fishing gears are used is important, combined with evidence of the
spatial distribution of those susceptible benthic communities, to both assess the
cumulative likely impacts on these marine ecosystems but also in the context of
marine planning, given the potential of MPAs and marine renewables to displace
fishing effort into smaller areas, thereby potentially intensifying impacts elsewhere
(Halpern et al., 2008; Stelzenmüller et al., 2008; Hinz et al., 2009; Stelzenmüller et
al., 2010a, 2010b; Hiddink et al., 2011). Given the spatial and temporal variability in
fishing effort that we have demonstrated in this Chapter, it is important that the
spatial resolution of the VMS data be of equal or higher spatial resolution than
information on the spatial distribution of the seabed habitats of vulnerable benthic
communities. This is especially important if those habitats exist in relatively small or
isolated/fragmented pockets. In other words, if the threat to a given habitat is
evaluated using fishing data from VMS at a cell size greater than the habitat area (or
outside of the habitat’s spatial extent), then the uncertainty in assessing the potential
impacts of fishing in that area would be prohibitively large to draw meaningful
conclusions.
Marine reserve planners and renewable energy developers are increasingly using
multi criteria decision analysis tools such as Marxan to optimize site selection
(Baban & Parry, 2001; Villa et al., 2002; Bruce & Elliott, 2006; Prest et al., 2007), as
this allows consideration of a variety of different spatially explicit selection objectives.
While the main consideration is the distribution of the natural resource in question,
the inclusion of gear-specific high-resolution fisheries data can minimize

89
environmental costs of closures incurred by activity displacement (Dinmore et al.,
2003), minimize the effects of accidental bycatch, discarding and trawl damage and
increase the economic benefits of closures to fishers (Richardson et al., 2006), one
of the main stakeholders in the marine environment (Gray et al., 2005), thereby
making closures more politically feasible (Richardson et al., 2006).
3.4.3 VMS under the microscope
Although, in general, gear-type-specific VMS data analyses need to be carried out to
sensibly manage the marine environment, there are exceptions. The fact that only
vessels <15 m length are presently included in VMS means these data cannot be
used to predict effects of inshore marine renewable energy installations on the
distribution of inshore fishing activity. So this stresses the need for new approaches,
and one which has shown potential uses a behavioural rule approach at the level of
the home port of each vessel (Vanstaen et al., 2010). The rule follows that vessels
of a certain size will have a maximum limit of distance to where they can travel to
from their home port; hence we can obtain a broad scale picture of the extent of
inshore fisheries in a given area, by creating buffer layers on a map indicating
maximum extent of fishing area. However, in the case of assessment of fishing
effort displacement, as this study has demonstrated, a broad scale is not sufficient to
detect changes in fishing effort. More data on < 15 m behaviour could have been
obtained via one of the regional MCZ projects, Finding Sanctuary, however all
stakeholders had signed a confidentiality clause meaning any third party not involved
in the initial project would not get access to data. Successive attempts to access this
data throughout the study period met without success, until 2013 when large
aggregated polygons were made available through another research project.
However, no meaningful analyses in relation to fishing effort displacement could be

90
made with these aggregated 1 year datasets. This was a substantial amount of work
at a fine scale performed by the regional MCZ projects, and it could have been put to
better use once the projects were finished. VMS still provides the highest resolution
data if raw records can be obtained and, as described above, current updates to the
I-VMS project carried out by the MMO, Cefas, Seafish and the Inshore Fisheries and
Conservation Authorities (IFCAs) will lead the way for inshore fishing analysis in the
future.
Data on non-UK vessels was unavailable for this study; however even if it had been
available, concerns over data inaccuracies, in particular the lack of information on
gear type (Lee et al., 2010) would have precluded its use. As described above, the
fact that Haig Fras is an important site for French demersal vessels and some UK
vessels (Table 3.6 a & b) means that in relation to fishing effort displacement and
indeed the impacts of displacement, the discussion is limited in scope unless we
have a complete dataset that includes all fishing activity from all Member States
operating in the same region. Clearly, accurate assessment of the environmental
impacts of international fisheries activity requires knowledge of activity distribution of
all vessels, regardless of their length and nationality.
Other issues arise in the VMS analyses. The analyses are based on records that
are transmitted every 2 hours, and there are risks in production or propagation of
errors; misclassification of fishing vs. non-fishing; and interpreting fishing activity in
the smaller area of Wave Hub, this is an issue which needs to be explored further,
especially in the case of static gear use. In this analysis, a point summation method
is used but underestimations of activity are a risk (Jennings & Lee, 2012).
Reconstruction of tracks is an alternative option (Mills et al., 2007), but vessels rarely
travel in straight lines and again, it may not be appropriate for those using static gear.

91
Regardless of using point summation or tracks, the 2 hour polling frequency is an
issue (Jennings & Lee, 2012). In terms of track reconstruction, a nonlinear
interpolation technique like a spline (Hintzen et al., 2010; Russo et al., 2011) might
help reconstruct a more plausible track than linear interpolation would, but the
fundamental problem is that 2 hrs is too long between successive samples (Lambert
et al., 2012). In the case of reducing VMS polling frequency, seminal work by
Lambert et al. (2012) has suggested polling at intervals specific for each gear-type is
optimal, supporting more accurate assessments of fishing activity and resulting
impacts on the seabed. This work was carried out directly with the fishermen in the
Isle of Man scallop fishery, and this work must be encouraged further in other areas
and fisheries in order to ascertain if both mobile and static gears would need
different polling regimes, i.e. making sure the polling regime is fit for purpose for that
particular gear classification. This would require high effort on the part of the
scientific and fishing communities and the formation of strategic collaborations in
order to encourage any change to be initiated at the EU level, who oversees any
changes to VMS policies.
The quality of VMS data is generally good: the number of duplicate records is very
small compared to those records removed because of speed or proximity to port. Of
the data filtering methods employed, most uncertainty is assigned to the filtering of
records based on speed. This is in part due to a necessarily somewhat arbitrary
threshold (6 knots) beyond which a vessel is deemed to be fishing, but mostly due to
uncertainty surrounding the representativeness of recorded speed value in each 2-
hourly VMS record. In January 2005, transmission of speed data became
compulsory in EU VMS but a reliance on these data could underestimate fishing
activity if it falls between 2-hourly VMS records (Witt et al., 2007; Fock, 2008) A

92
simple speed filter such as used here allows the correct identification of a high
percentage of both steaming and fishing activity (Lee et al., 2010; Jennings & Lee,
2012). The speed filters used, although necessary to indicate fishing gear
deployment, could however potentially overestimate fishing activity in a situation
where vessels slow down, for example, due to bad weather or treacherous terrain, or
to reduce fuel costs (Abernethy et al., 2010). In addition, local or sectorial differences
in fishing speeds of individual vessels or at fleet level may occur (Lee et al., 2010)
which would call into question the 6 knot threshold for all gear types, areas, and
weather conditions. As was stated above, testing various polling intervals would
help identify an appropriate speed threshold for each fishing fleet type. Technological
aspects of VMS will continue to improve, but if marine spatial planning is to mature
as a discipline there is a compelling argument to be made to include fishers’
knowledge (FK) which includes the biological, sociological and psychological
influences on fishing fleet behaviour (for example, Murray et al., 2011; van Putten et
al., 2011; Rees et al., 2013) with VMS and logbook data in order to predict the
movement of vessels across metiérs and fleets, in both the short-term and long-term.
This topic is explored in detail in a later Chapter.
3.4.3.1 Investigation of other technologies: Automatic Identification System (AIS)
technology in lieu of VMS?
AIS, a self-reporting messaging system, was developed by the International Maritime
Organisation (IMO) to ensure safety and collision avoidance at sea and is mandatory
for all sea going vessels of 300 gross tonnage (GT) and upwards on international
voyages, and 500 GT and upwards for vessels not engaged in international voyages
and passenger ships (SOLAS, 2002). In addition, fishing vessels of 15 m length
and above within the water of EU Member States are required to have AIS (EC,

93
2011b). Unlike VMS, which is usually based on point-to-point satellite
communications between the ship and the ground centres, AIS messages are
broadcasted by the vessels omnidirectionally and can be received by other ships in
the neighbourhood, by ground based receivers and by satellites. The AIS system
provides the possibility for ships to exchange, in near-real-time, vector information on
its current state (position, speed, course, rate of turn etc.), static information about
the vessel (vessel identifiers, dimensions, ship-type etc.) and voyage related
information (destination, ETA, draught etc.) at variable refresh rates of seconds while
in motion to 2-5 minutes while at anchor (ITU-R, 2014). Over the past few years,
these data has been transmitted to various regional and national data centres with
varying levels of data stream success and changing levels of coverage over time and
space.
AIS might never be able to replace VMS but they could be used in tandem. Although
AIS has potential and is generating interest from the scientific community, robust
methods for data manipulation and analysis are still in their infancy (for example,
Pallotta et al., 2013; Mazzarella et al., 2014). AIS do not come under the same
control restrictions as that of VMS, and with all EU vessel uptake of the system,
there are no trans-boundary issues between Member States, therefore data should
be much widely available. For example, regarding availability, AIS recently made
headlines with an initiative between Skytruth, Oceana and Google, with ‘fishing vs
‘non-fishing’ behaviour explicitly presented that aims to tackle global overfishing by
simple vessel monitoring8. As described above the polling frequency of VMS is
something that needs to be explored, having a lower polling frequency than 2 hours
may be much more advantageous in the assessment of fishing effort and AIS
8 Global Fishing Watch http://www.globalfishingwatch.org

94
provides significantly lower polling frequencies. However it was not specifically
introduced with fisheries control in mind, and the technical aspects of the AIS signal,
i.e. intermittent communication represents limitations in ensuring a complete and
systematic coverage. Other aspects include, inclusion of only the >15 m fleet and
the difficulty of assessing vessels that engage in static fishing.
3.5 Summary
The spatial distribution of fishing activity was highly heterogeneous and
distinct areas of intense fishing could be identified for all gear types;
The methods of Lee et al. (2010) are the most appropriate, straight forward to
implement, and therefore most valuable for the calculation of fishing effort
from VMS data. These methods in summary: records without an associated
gear type, within 3 NM of ports and duplicates are all removed. To identify
bona fide fishing activity, the interval between each successive record was
calculated and only those vessels travelling at a speed less than 6 knots were
deemed to be actively fishing. This methodology was applied to all gear types.
A point summation method followed, using a grid cell size of 0.05° (or 3 arc
minutes), equating to 3 NM, the resolution of fishing data considered
necessary to inform MSP;
In lieu of data on vessel gross tonnage (GT) or engine power (kW), fishing
effort was defined in terms of number of vessels and number of hours fished.
Further work could be carried out to establish the importance, or otherwise, of
factoring in the vessel’s size and/or engine power in fishing capacity;
An index of spatial difference in spatial distributions revealed that scallop
dredgers were the most spatially variable fleet in South West UK waters, and

95
they were the only gear type whose shift in geographic spread was easily
noticeable by eye at a large scale, moving their efforts from the Celtic Sea
(including Haig Fras) further south into the western English Channel and
Atlantic during the study period;
Mobile gear types have a high to intermediate spatial coherence (or low to
intermediate change) in spatial pattern of fishing effort between years, despite
their mobility. This might be because they remain active almost year-round.
The claim that the VMS data and analysis methods employed were sufficient
to capture displacement is supported, for example, by this analysis capturing
the changing pattern of fishing effort by scallop dredgers which underwent
significant shifts in spatial distribution between years;
There was a high degree of dissimilarity between the spatial distributions of
fishing grounds by vessels with different gear types. The two gear types most
closely matched according to an index of spatial difference in spatial
distributions were longline and beam trawlers, but it is suggested that this is
only the case because of the wide geographic spread of beam trawlers and
the relative isolated patches of activity by longliners;
The index of spatial similarity is a robust method of quantifying changing
spatial distribution but is highly dependent on the size of the cell. Therefore,
care should be taken to report this cell size because meaningful comparisons
can only be made between data sets with identical cell size. If this method
proves popular in subsequent research, a standard cell size should be
adopted;
A closure of Haig Fras would have the greatest impact on gillnetters. Scallop
dredgers also occasionally use the area; however they exhibited much more

96
spatially variable behaviour during the study period so it is less clear whether
their occasional use of the area reflected long term usage trends. It is
important to note that this analysis is Uk vessel centric, and we know that a
large number of French vessels use this area, and we cannot say anything
about the likely impacts of these;
The G statistic maps show that fishers tend to fish intensely at very specific
sites year upon year ‘hotspots’, but that the distribution of these localised
areas varies considerably with gear type. There is almost no overlap between
the gear-specific hotspots. Such analyses could be extremely useful for
identifying areas that are only occasionally intensely fished, areas that are
overfished, or areas most vulnerable to displacement.
The current closure at Wave Hub has the greatest impact on potters and
whelkers whose geographic specialisation is most pronounced and who use
the area extensively. Longliners also use the area disproportionately and
would be affected. In contrast, the potential impacts of beam and otter
trawlers seem less clear given their much wider spatial distributions in fishing;
Relatively small (<5 %) relative changes in calculated statistics of fishing effort
are to be expected for grid sizes of less than 0.2 degrees, and that up to 20%
relative changes would be expected up to 0.4 degrees. It is recommended
that a spatial resolution of no more than 0.1 degree is appropriate. No
evidence was found that a grid resolution of less than 0.05 degrees was
necessary;
The spatial resolution made relatively little difference to data from scallop
dredge vessels and beam trawlers. Spatial resolution had much greater
effects of the spatial pattern indices of otter trawlers and potters/whelkers.

97
These two fishing types are very different, in general, in terms of spatial
coverage and clustering, so it is suggested that the grid resolution effects are
due to capturing, or otherwise, the nature of intense fishing in a relatively
small number of highly localised areas;
Longliners, potters and whelkers show the greatest seasonality in fishing
effort with disproportionately greater effort in summer months. Closures and
any expansion to those closures might therefore disproportionately affect
those gear types during the summer months when relatively more fishing is
carried out.

98
Chapter 4 Determining Variability in Fishing Effort Trends in the
South West of the UK: Defining a Baseline for Detecting
Displacement.
Work presented in this Chapter will be incorporated into the following manuscript
which is currently in preparation:
Campbell, M., Attrill, M., Abbott, V. & Hall-Spencer, J. (In Prep) ’The ‘background’
variability of trends in fishing effort in the South West of the UK: Defining a baseline
for detecting displacement’, ICES Journal of Marine Science.

99
“The fishermen know that the sea is dangerous and the storm terrible, but they have
never found these dangers sufficient for remaining ashore”
Vincent Van Gogh, 1853-1890.
4.1 Introduction
4.1.1 Detecting baselines
In order to detect and evaluate a change in fishing effort directly attributable to
Marine Renewable Energy (MRE) or Marine Protected Areas (MPAs) associated
closures, it is necessary to establish baselines by mapping fishing effort. For this,
there must be access to high-resolution temporally and spatially explicit data about
what the fisheries community are now calling the “anatomy” of fishing grounds
(Jennings & Lee, 2012) to assess fishery footprints (Jennings et al., 2012). Recent
work by de Groot et al. (2014), elements of which will be discussed in detail in the
next Chapter, highlighted the insufficiency of base line monitoring thus far in
assessing interactions between MREIs and fisheries. In particular there were
numerous examples of under estimations of fishing effort, hence inaccurate
baselines, and this is a concern when attempting to plan and predict any
displacement of effort, or mitigate against it. In addition, in relation to impacts of
Offshore Wind Farms (OWFs), Ashley (2014) found that in many cases only one
year sampling was conducted pre-closure, giving no indication of natural patterns of
variation, due to insufficient baselines and making any meaningful comparison for
impacts post-closure difficult.
It is imperative, therefore, that the background variability in fishing effort is
understood and quantified. Assessing fishing effort pre-displacement will allow a

100
change in fishing behaviour caused by displacement to be identified because it will
be a forced behaviour outside the background pattern. Long time series are also
important due to the fact that marine ecosystems go through cyclical patterns and
shifts that can extend over long periods. For the purposes of monitoring, this is
required to answer questions regarding how long after a displacement change might
be detectable. This is a fundamental prerequisite in any studies into the causes and
effects of fisheries displacement. This Chapter addresses the question: how might
the background variability of fishing effort be described, so that a displacement can
be assessed? The approach is twofold. First, fishing effort in South West UK waters
is described and quantified relative to arguably the most dominant physical control
on the spatial distribution of fishing: seabed substrate. Given the seabed substrate is
a straightforward quantity to measure and varies relatively slowly over long time
scales and large spatial scales – indeed, potentially much more slowly than
ecological and socio-economic factors and even changes in waves and tides - any
relationships that can be made between fishing trends and substrates is useful for
first-order description and prediction of fishing effort. Second, a simple technique is
developed that can be used to describe and quantify variability. This technique can
be compared across any number of gear types and across any number of years, and
can be interpreted using standard statistical methods. It is argued that compiling this
metric over sufficient time will provide a baseline against which the spatial
distribution in fishing effort in a given year can be compared and, by extension, the
potential effects of fisheries displacement detected. This variability index is
necessary in order to make associations between fishing effort and an explanatory
variable that would explain that variability when information sources and drivers in
fishing effort are not collected on a frequency comparable to VMS data (such as

101
policy changes, socio-economic study findings, substrate, specific benthic ecology
studies, etc.).
Seabed substrate type at a given location is controlled predominantly by broad-scale
supplies in sediment and energy at the seabed (Figure 4.1), which in turn is strongly
controlled by water depth (Figure 4.2). Some studies suggest that there can be
strong relationships between the spatial distributions of seabed substrates and fish
of individual species (Maravelias et al., 2000; van der Kooij et al., 2008; Chatfield et
al., 2010).
4.1.1 Primary Objectives
The objectives of this Chapter are as follows:
Assess the potential role of substrate in explaining the spatial distribution of
UK fishing effort in South West UK waters;
Determine the significance of a suite of explanatory variables: depth, wind
strength, substrate type, gear-type and fish value for fishing effort;
Determine the gear types with which fishing effort is significantly different;
Develop an objective means to assess the background variability of fishing
effort, as a baseline against which to assess displacement; and
Investigate the relationship between fish catch data (derived from low-
resolution, less-access-restricted level 2 VMS data) and the background
variability of fishing effort, in order to explore the potential role of broad scale
catch data (weight and economic value of fish) as a simple proxy for baseline
fishing effort.

102
Figure 4.1: Kinetic energy at the seabed in the South West UK waters
Kinetic energy at the seabed (Nm-2) in the South West UK waters. Major proposed MREIs
(wave developments in yellow, tidal developments in blue) and Haig Fras (red) are also
shown. (McBreen et al., 2011)

103
Figure 4.2: Bathymetry of the South-west UK waters
Bathymetry of the South-west UK waters. Coloured filled contours correspond to depth in
metres at 7 isobaths. Major proposed MPAs (red) and proposed/ active (wave developments
in yellow, tidal developments in blue) are also shown (source: ABPmer Atlas of MRE).

104
4.2 Methodology
4.2.1 VMS data and analysis
The methods for VMS data, access and analysis are outlined in section 3.2.1,
Chapter 3. As described in the previous Chapter, VMS confidentiality issues have
affected this study, and also others.
4.2.2 Fishing activity and marine substrate
Seafloor composition should, at some level, have some bearing on explaining the
distribution of fishing effort for certain gear-types, to the extent that Seafish used
seabed type as a proxy for fishing activity and intensity (Seafish representative, pers.,
comm, January 2015). Seafish are a levy body that represent the UK seafood
industry (www.seafish.org).
Here, the distribution of fishing activity was assessed with respect to five ‘marine
landscape’ types (following the EUNIS 2007-2011 classification scheme) derived
from UK SeaMap 2010 data, a predictive model based on inputs of observed
substrates, biological zone, energy, salinity and biogeographic region (McBreen et
al., 2011) with additional categories on deep-sea areas provided by Howell (2010).
Outputs are at a resolution of 0.0025 decimal degrees (about 300 m). The five
substrate categories used were: sand, mixed sediment, coarse sediment, mud and
rock (including rias, sealochs and mounts). Substrates are considered to be
invariant over the study period (2005 – 2008). To assess seabed type as a driver of
fishing activity, average number of fishing hours per 1 km2 of the different marine
landscape was calculated, following the methods described in section 3.2.2.1,
Chapter 3. The seabed map only covers the UK continental shelf Exclusive
Economic Zone (EEZ), whereas ICES divisions VII e-h have a greater geographic
area (Figure. 3.1., Chapter 3). Therefore the relationship between substrate and

105
fishing effort could only be assessed within the EEZ. Fortunately, however, division
VII f is entirely contained within the EEZ boundary, and at least half by area of each
of the remaining ICES VII divisions are within the EEZ. Given that most fishing effort
of beam trawlers (Figure 3.4., Chapter 3), otter trawlers (Figure 3.5., Chapter 3),
gillnetters (Figure 3.6., Chapter 3), longliners (Figure 3.7., Chapter 3), and
potters/whelkers (Figure 3.8., Chapter 3) are within the EEZ, it is argued that the
substrate analyses are unbiased. Only scallop dredgers (Figure 3.8., Chapter 3)
show significant fishing activity outside the EEZ; therefore conclusions drawn
regarding the relationship of scallop dredging and substrate are to be considered
tentative. It is also pertinent to point out that all UK MPAs and MREIs are within the
UK EEZ, so any fishing-substrate relationships outside the EEZ are of contextual
interest only.
4.2.3 Statistical Analyses
A generalised linear model (GLM) analysis was performed, in order to model fishing
effort as a linear combination of available independent, or explanatory, variables:
depth, wind strength, wave strength, substrate type, gear type, year and fish
monetary value. The response (dependent) variable was the aggregated fishing
effort data for all gear-types and all years. Since the numbers of hours fished is a
form of count data, being the number of fishing hours in a fixed spatial area, the
appropriate statistical model is a Poisson distribution, which is a very good fit to the
data (Figure 4.11). The GLM model was constructed using a log link function which
is standard practice for Poisson-based GLM analyses (Zeileis et al., 2008; O'Hara
and Kotze, 2010). The predictor matrix was composed of, each per grid cell, a) water
depth; b) annual mean wind speed; c) annual mean significant wave height; d)
substrate type (coded 1 to 5 inclusive for, respectively, sand, coarse, mixed, rock,

106
mud); e) gear type (coded 1 to 6 inclusive); f) year (coded 1 to 4 inclusive); and g)
total value of fish landed by all vessels (derived from the MMO level 2 data, 2007-
2010, described further in section 4.3.3). The rationale behind using fish value is that
fishers might be likely to return to known profitable grounds. The GLM was
constructed using the 'statsmodels' package
(http://statsmodels.sourceforge.net/devel/glm.html). The total number of
observations was derived from the fishing effort, substrate, wind, wave, bathymetry,
and fish value data sets gridded onto the same regular grid.
4.2.4 Fishing effort variability index
A simple metric was developed to characterise the background variability in fishing
effort. Given that fisheries displacement is inherently a spatial problem (that cannot
meaningful be summarised in space, only in time) and the spatial distributions of
fishing effort differ markedly between gear types (Chapter 3), it is important that
variability is spatially explicit (i.e. not averaged or aggregated over space). In
developing such a metric it is also important that it is 1) simple (therefore easy to
apply), 2) does not differ in its application as a function of the amount of data
available (so can be re-calculated as more data becomes available over time) and 3)
calculated in such a way that its statistical validity can be easily assessed.
One approach that satisfies the above criteria is as follows. For each gear type, the
per-cell coefficient of variation (CV) in fishing effort is computed across the 4 years
available (2005 – 2008 inclusive) as the ratio of the standard deviation and mean
effort (across years) per cell, expressed as a percentage. This coefficient of variation
is used as a simple measure of the variability in fishing effort which can be specified

107
on a per-grid-cell basis and assumes nothing about the distribution of the data.
Because it is calculated per gear and per location, calculated relative to, and
expressed as a percentage of, the mean fishing effort, valid comparisons can be
made between gear types, between locations, and over time. This quantity when
mapped gives an indication of the variability in fishing effort over space, with small
values of this index indicating small fluctuations in per-grid variability in fishing effort
relative to the mean fishing effort for the same grid cell, which is in turn indicative of
a region which is stable, or a ground fished with similar intensity year-to-year. High
values of this index indicate highly variable, sporadic fishing effort not indicative of a
stable, regularly fished area.
4.3 Results
4.3.1 Substrate
Figure 4.3. shows the seabed map derived for the ICES VII subarea for the UK EEZ.
The general pattern of clastic substrates (sand, mixed and coarse sediments) follows
the general distribution of depth (Figure 4.2.) and kinetic energy at the seabed
(Figure 4.1.): sandy in moderate energy locations, and coarse and mixed sediment in
higher energy regions. Locations of rock are generally more spatially isolated and
are controlled by bedrock geology rather than wave energy (Connor et al., 2006).
Haig Fras is predominantly rocky with some small patches of coarse and mixed
sediment. At this spatial resolution, the Wave Hub region is coarse sediment
exclusively (Figure 4.4.). There is a wide variety in substrate types for the proposed
MREI sites in the South West of the UK (Figure 4.4.).

108
Figure 4.3: Five substrate types derived from UK Seamap data
Five substrate types derived from UK Seamap data (McBreen et al., 2010; Howell, 2010)
within the UK continental shelf covering the ICES divisions VII e-h. The location of Haig Fras
is also noted.

109
Figure 4.4: The location of proposed/active MREIs in the South West UK
The location of proposed/active MREIs (wave energy developments are red, and tidal
energy developments are blue) in the South West UK, in relation to substrate types derived
from UK Seamap data.

110
Figure 4.5: Substrate map overlain with the spatial distribution of beam trawl effort
Substrate map overlain with the spatial distribution of beam trawl effort 2005-2008 (see
Figure 4.3 for key to substrates).

111
Figure 4.6: Substrate map overlain with the spatial distribution of demersal otter trawl effort
Substrate map overlain with the spatial distribution of demersal otter trawl effort 2005-2008
(see Figure 4.3 for key to substrates).

112
Figure 4.7: Substrate map overlain with the spatial distribution of scallop dredge effort
Substrate map overlain with the spatial distribution of scallop dredge effort 2005-2008 (see
Figure 4.3 for key to substrates).

113
Figure 4.8: Substrate map overlain with the spatial distribution of gillnetter effort
Substrate map overlain with the spatial distribution of gillnetter effort 2005-2008 (see Figure
4.3 for key to substrates).

114
Figure 4.9: Substrate map overlain with the spatial distribution of longliner effort
Substrate map overlain with the spatial distribution of longliner effort 2005-2008 (see Figure
4.3 for key to substrates).

115
Figure 4.10: Substrate map overlain with the spatial distribution of potter/whelker effort
Substrate map overlain with the spatial distribution of potter/whelker effort 2005-2008 (see
Figure 4.3 for key to substrates).

116
For static gears, in particular, the potting and whelking fleet but also to a certain
extent gillnetting, this broad qualitative pattern in spatial distribution of fishing effort is
clearly linked to the ability of the vessels to travel to areas of suitable marine
substrate type (Figure 4.10.) within the range capabilities of the craft, since fishing
activity is concentrated on rocky areas (Tables 4.1 and 4.2), which covered the
smallest percentage of the study area (Figure 4.3). Longlining activity per unit area
was highest over mud; however high values were also observed over mixed
sediment and rock. Mobile gear activity per unit area of marine landscape type
varied between all marine landscape types; scallop dredging occurring mixed
sediment or mud, and beam and otter trawling mainly in muddy areas with high
coverage per unit time in mixed and sand respectively. Some overlap with rocky
areas did occur with the mobile fleets (Tables 4.1 and 4.2).
In addition to substrate type, bathymetry also influences the distribution of intensely
fished areas for some gear types. For example the continental shelf break in the
southwestern corner of the study area was a hotspot for gillnetting and longlining.
Furthermore, Hurd’s Deep (49º 30’ N: 3º 34’ W), a narrow channel at which depths
drop below 100 m to the north of Jersey, is targeted by beam trawling.

117
Table 4.1. Activity (hrs/ km2 * 10-5) of all UK fleets respective of substrate type from 2005 to
2008.
Gear type/substrate Sand Coarse Mixed Rock Mud
Totals
Mobile Scallop dredge 11.026 9.555 38.196 26.158 40.09
125.025
Beam trawl 61.424 42.332 63.597 21.147 355.34
543.84
Otter trawl 8.315 2.654 4.179 21.183 246.671
283.002
Static Longline 1.174 1.58 4.281 1.727 11.162
19.924
Gillnetter 11.624 5.203 10.637 23.562 143.617
194.643
Potter/Whelker 2.441 5.837 4.967 15.623 7.332
36.2
Totals 96.004 67.161 125.857 109.4 804.212
Table 4.2. Percentage of activity (Table 4.1) per substrate type.
Gear type/substrate Sand Coarse Mixed Rock Mud
Mobile Scallop dredge 8.81 7.64 30.55 20.92 32.06
Beam trawl 11.29 7.78 11.69 3.88 65.33
Otter trawl 2.93 0.93 1.47 7.48 87.16
Static Longline 5.89 7.93 21.48 8.66 56.02
Gillnetter 5.97 2.67 5.46 12.10 73.78
Potter/Whelker 6.74 16.12 13.72 43.15 20.25
4.3.2 Generalized Linear Model Results
The GLM model was constructed to explore the multivariate response of fishing
effort to a suite of potentially explanatory, independent variables. It is able to
simultaneously account for the variance in spatially distributed fishing effort
explained by multiple independent variables and their interactions (covariances)
mapped onto the same spatial grid. The MDS analysis presented in Chapter 3 was
able to reveal that different fishing gear-types have distinct patterns, which serves as

118
justification for the GLM analysis which seeks to explain the underlying cause of
these spatial patterns, at the present spatial resolution and given the temporally
limited data set, given plausible explanatory variables. As mentioned above, the
data have a Poisson form (Figure 4.11). The results from the ‘global’ GLM analysis
on all fishing effort data (all gears, all years, and all regions) are summarized in
Table 4.3.
Figure 4.11 Distribution of per-grid, number of hours fished, aggregated over regions and years.
The frequencies have been normalized, and a Poisson distribution has been fitted to
the data using a least-squares method. The lambda parameter for this example is

119
0.123. All gear types, years and regions have a similar statistical distribution in
fishing effort, with similarly good Poisson model fits.
Figure 4.12 Quantile-Quantile plot of the residuals in the model
This shows that the model resultant from the GLM analysis had normally distributed
residuals.
Table 4.3 Generalized Linear Model Regression Results for aggregated fishing effort data.
Significant p-values (at the 95% level) are highlighted in bold
Variable Model coefficient
Standard error
z value P>|z| [95.0% Conf. Int.]
Depth 0.0025 0.004 0.687 0.492 -0.005 , 0.010

120
Wind Speed -9.575e-11 2.38e-11 -4.021 0.000 -1.42e-10, -4.91e-11
Wave Height -0.0106 0.004 -2.704 0.007 0.018 , -0.003
Substrate -0.0051 0.004 -1.391 0.164 -0.012 , 0.002
Gear Type -0.0057 0.001 -3.963 0.000 -0.009, -0.003
Year -0.0046 0.003 -1.738 0.082 -0.010, 0.001
Fish value -0.0194 0.001 -35.854 0.000 0.021, -0.018
The model residuals were normally distributed (Figure 4.12) which means the model
is amenable to a chi-square goodness-of-fit test, based on the residual deviance of
8530 and 7 degrees of freedom (6 model parameters plus a constant term). The test
suggested that the model did not fit the data well (p = 0.0, the null hypothesis that the
model is not a good fit to the data is accepted), despite the residuals between the
model and the data being normally distributed. Therefore, subsequent analyses
using the model to predict mean fishing effort based on individual explanatory
variables, and pairwise comparisons between gears and years, was not carried out.
However, the model has value in identifying the strength of the relationship between
the dependent variable (fishing effort) and the chosen explanatory variables. For
example, the model suggests that neither the depth, nor the substrate, nor the year
variable were significant at the 95% level (with p-values on Z scores of, respectively,
0.492, 0.164, and 0.082) whereas gear type, wind and wave energy, and total fish
value were all highly significant at the 95% confidence level. The results from simple
ANOVA tests (not shown) evaluating the variance in fishing effort explained the
same suite of explanatory variables showed very similar dependencies as the GLM
results presented here, which corroborates the choices behind the GLM construction.

121
Identical analyses were constructed for each of the 6 gear types (by aggregating
data over years and regions), with the same suite of explanatory variables except
gear type. The results of this analysis are summarised in Tables 4.4 to 4.9 inclusive,
and summarised in Table 4.10 which summarises the most important information in
Tables 4.4 to 4.9, which is what explanatory variables were statistically significant for
each gear type.
Table 4.4 Generalized Linear Model Regression Results for fishing effort by scallop dredgers
model coefficient std err z value P>|z| [95.0% Conf. Int.]
Depth 0.1249 0.034 3.686 0.000 0.058, 0.191
Wind -1.05e-07 1.87e-08 -5.610 0.000 -1.42e-07, -6.83e-08
Wave -0.0677 0.187 -0.361 0.718 -0.435,, 0.300
Substrate 0.1872 0.215 0.871 0.384 -0.234, 0.608
Year -0.2482 0.106 -2.348 0.019 -0.455, -0.041
Fish value
1.1495 0.103 11.213 0.000 0.949 , 1.350
Bold indicates significance at 0.05 level
Table 4.5 Generalized Linear Model Regression Results for fishing effort by longliners
Variable Coefficient Std. err. z value P>|z| [95.0% Conf. Int.]
Depth -0.0727 0.034 -2.147 0.032 -0.13, -0.006
Wind -4.267e-08 - 1.69e-08 -2.518 0.012 -7.59e-08, -9.46e-09
Wave 1.4884 0.234 6.367 0.000 1.030 , 1.947
Substrate 0.2481 0.184 1.350 0.177 -0.112, 0.608
Year -0.7888 0.125 6.310 0.000 -1.034, -0.544
Fish value
0.1078 0.065 1.654 0.098 -0.020 0.235
Bold indicates significance at 0.05 level

122
Table 4.6 Generalized Linear Model Regression Results for fishing effort by beam trawlers
Variable Coefficient Std. err z value P>|z| [95.0% Conf. Int.]
Depth 0.0346 0.015 2.241 0.025 0.004, 0.065
Wind -3.803e-08 8.45e-09 4.500 0.000 -5.46e-08, -2.15e-08
Wave 0.1396 0.085 1.652 0.099 -0.026, 0.305
Substrate -0.0973 0.099 -0.986 0.324 -0.291 , 0.096
Year -0.2575 0.051 -5.063 0.000 -0.357, -0.158
Fish value 0.9235 0.041 22.435 0.000 0.843 1.004
Bold indicates significance at 0.05 level
Table 4.7 Generalized Linear Model Regression Results for fishing effort by otter trawlers
Variable Coefficient Std. err z value P>|z| [95.0% Conf. Int.] Depth -0.0141 0.017 -0.833 0.405 -0.047, 0.019
Wind 4.043e-08 1.15e-08 3.504 0.000 1.78e-08, 6.3e-08
Wave 0.1490 0.114 1.307 0.191 -0.074 , 0.372
Substrate -0.3858 0.132 2.928 0.003 -0.644, -0.128
Year -0.2761 0.079 -3.508 0.000 -0.430 -0.122
Fish value 0.4834 0.049 9.800 0.000 0.387 0.580
Bold indicates significance at 0.05 level
Table 4.8 Generalized Linear Model Regression Results for fishing effort by potters/whelkers
Variable Coefficient Std. err z value P>|z| [95.0% Conf. Int.] Depth 0.0317 0.043 0.742 0.458 -0.052, 0.115
Wind 8.745e-09 1.85e-08 0.473 0.636 -2.75e-08, 4.5e-08
Wave -0.9679 0.222 -4.358 0.000 -1.403, -0.533

123
Substrate 0.7825 0.242 3.232 0.001 0.308 , 1.257
Year 0.0414 0.120 0.344 0.730 -0.194, 0.277
Fish value 0.5268 0.070 7.574 0.000 0.390, 0.663
Bold indicates significance at 0.05 level
Table 4.9 Generalized Linear Model Regression Results for fishing effort by gillnetters
Variable Coefficient Std. err z value P>|z| [95.0% Conf. Int.] Depth -0.1138 0.027 -4.225 0.000 -0.167, -0.061
Wind 3.329e-08 1.17e-08 2.842 0.004 1.03e-08, 5.63e-08
Wave 0.9687 0.150 6.458 0.000 0.675 , 1.263
Substrate 0.4301 0.136 3.159 0.002 0.163 , 0.697
Year -0.2010 0.083 -2.426 0.015 -0.363 , -0.039
Fish value 0.3926 0.052 7.533 0.000 0.290, 0.495
Bold indicates significance at 0.05 level
Table 4.10 Statistically significant explanatory variables (marked with an 'x'), collated from
GLM Regression results for fishing effort by each gear type. n/a means ‘not assessed’.
All gears Scallop Dredger
Longliner Beam Trawler
Otter trawler
Potter/ whelker
Gillnetter
Depth X X X x
Wind x X X X x x
Wave x X x x
Substrate x x x
Gear x n/a n/a n/a n/a n/a n/a
Year X X X x x
Fish value
x X X x x x

124
4.3.3 Variability in Fishing Effort
Figures 4.13 to 4.18 inclusive show the index of variability (coefficient of variation) in
fishing effort, as described in section 4.2.3 for respectively, beam trawl, otter trawl,
scallop dredge (collectively, the mobile gears), longline, gillnetter, and
potters/whelkers. Cold colours (blues) represent a large variability (less regularly
fished, or not regularly fished with the same annual intensity) in fishing effort and
warm colours (reds) represent small variability (more regularly fished, or regularly
fished with the same annual intensity).
The distribution of this index for beam trawl (Figure 4.13) strongly follows proximity to
port, with greater variability in effort the further out to sea being the general pattern.
Fishing grounds in VII e are the most stable (show the least variability) in general
and grounds in VII g and h show the greatest variability. Using this metric it is
possible to tell at-a-glance which areas are routinely fished (deep red colours) and
those areas that are rarely fished (deep blue colours). The areas coloured red are
most stable (similar intensity of fishing effort year on year) and, all other factors –
such as proximity to port - being equal, would be greatest affected by displacement.
Closure of Haig Fras would not affect beam trawling. Within Wave Hub, variability is
moderate.). Wave Hub area is a moderately important fishing ground for the fleet
within the region but not nearly as intensively or routinely fished with this gear as
other grounds nearby. Displacement of fishing effort in this area would cause greater
variability because areas once fished with moderate intensity and stability would no
longer be fished. Therefore incorporating data from subsequent years would turn
those areas more blue if displacement had occurred.

125
Figure 4.13 Coeffficient of variation (CV) of beam trawl fishing effort per grid cell, over 2005-2008
Coefficient of Variation of beam trawl fishing effort per grid cell, over 2005-2008. Haig Fras
(black polygon) and MREIs (red/blue polygons) are marked.

126
Figure 4.14 Coefficient of variation (CV) of otter trawl fishing effort per grid cell, over 2005-2008.
Coefficient of Variation of otter trawl fishing effort per grid cell, over 2005-2008. Haig
Fras (black polygon) and MREIs (red/blue polygons) are marked.
The spatial distribution of the variability index for demersal otter trawl (Figure 4.14) is
more complicated than for beam trawl, with ‘hotspots’ of stable fishing grounds at the
edges of VIIg and h, around Lands’ End and the Scilly Isles, South Wales and Lyme
Bay. The variation in intensity of effort in parts of Haig Fras and Wave Hub is very
high because of infrequent visits to those areas by this gear type. Proposed wave
energy developments at FaBTest (near Falmouth) and offshore of Pembrokeshire

127
would affect otter trawling to a greater degree, given the relative stability of fishing in
those areas by otter trawlers.
Figure 4.15 Coefficient of variation (CV) of scallop dredge fishing effort per grid cell
Coefficient of Variation of scallop dredge fishing effort per grid cell, over 2005-2008.
Haig Fras (black polygon) and MREIs (red/blue polygons) are marked.
The spatial distribution of the variability index for scallop dredging (Figure 4.15)
shows very high variability almost everywhere, which aligns with the results from

128
Chapter 3. Scallop dredging within Wave Hub is non-existent, and highly variable
within Haig Fras. Unlike with beam trawlers and otter trawlers whose preferred
grounds are identifiable from the hotspots of warm colours of their respective maps,
more years of data would be required to assess the preferred fishing grounds of
scallop dredgers. Alternatively, it could be concluded that the effects of displacement
would be more variable between years, thus more years are required to estimate the
average long-term consequences. The most stable areas are to the north of Brittany.

129
Figure 4.16 Coefficient of Variation (CV) of longliner fishing effort per grid cell
Coefficient of variation of longliner fishing effort expressed as a percentage of the
mean fishing effort per grid cell, over 2005-2008. Haig Fras (black polygon) and
MREIs (red/blue polygons) are marked.
The spatial distribution of the variability index for longliners (Figure 4.16) shows that
the most stable grounds are proximal to southern Cornwall and Devon ports. In
general, variability increases with greater distance to port. The exception is a small
stable area to the west of Brittany. Longliners are absent from Haig Fras, and their
fishing effort is highly variable within Wave Hub and Pembrokeshire MREIs.
Longliners would potentially be greatly affected by any South West extension to

130
FaBTtest which is an area of low variability in fishing effort, indicative of a preferred
ground.
Figure 4.17 Coefficient of Variation (CV) of gillnetter fishing effort per grid cell,
Coefficient of variation of gillnetter fishing effort per grid cell, over 2005-2008. Haig
Fras (black polygon) and MREIs (red/blue polygons) are marked.

131
Gillnetters show a wide variation in both areas fished, and the fishing effort variability
index (Figure. 4.17). The most stable areas are identified within a broad band that
stretches from the western tip of Britanny in the Atlantic to the southern coast of
Ireland in the Celtic Sea, with the most stable areas in the central Celtic Sea
between Haig Fras and Wave Hub. Haig Fras is a stable fishing ground for gillnetters
and therefore might be disproportionately affected by a closure. Gillnetting within
Wave Hub is much more variable. An interesting trend is how localised variability is:
small patches of intense and stable effort (reds) are found adjacent to less stable
areas (blues). The substrate type is uniformly coarse in this region (Figure 4.4). This
ubiquitous heterogeneity is not observed in the other gear types to the same degree,
perhaps because the other gears do not cover nearly the same spatial extent, or
perhaps this reflects the same spatial variability in target fish populations.

132
Figure 4.18 Coefficient of variation (CV) of potter/whelker fishing effort per grid cell
Coefficient of variation of potter/whelker fishing effort expressed as a percentage of
the mean fishing effort per grid cell, over 2005-2008. Haig Fras (black polygon) and
MREIs (red/blue polygons) are marked.
In contrast to the heterogeneous spatial pattern of fishing effort variability displayed
by gillnetters, potters and whelkers (Figure 4.18) show much more localised and
invariant fishing effort, especially adjacent to the major ports that these fleets operate

133
out of (especially Plymouth, Poole, Padstow and Newlyn). As with beam trawlers,
there is a clear general pattern of high variability in fishing effort (sporadic occasional
visits and effort rather than frequent and prolonged activity) with increasing distance
from port. There are stable grounds within the Wave Hub area but not within Haig
Fras.
4.3.3 Relationship between Catch and Variability in Fishing Effort
The final objective of this Chapter, as listed in section 4.1.1, is to investigate the
relationship between fish catch data (derived from low-resolution, less-access-
restricted level 2 VMS data) and the background variability of fishing effort. In
Chapter 1, maps (Figures 1.3 to1.6, where contours are in order of magnitude
increments) were presented showing UK fishing effort in terms of total quantity of
landed catches (in tonnes liveweight) and total economic value (in GB£), derived
from MMO level 2 VMS data aggregated over gears and over the years 2007 – 2010
inclusive. Here, the relationship between these bulk statistics on a broad scale and
the variability in fishing effort (derived from higher resolution VMS data) is explored.
This analysis is an attempt to utilise the catch statistics in order to further
characterise fishing effort, in order to explore the potential role of broad scale catch
data (weight and economic value of fish) as a simple proxy for baseline fishing effort.
This is important because of the access restrictions imposed on the level 3 VMS
data which have already been discussed at length.
Owing to the limitations imposed by the level 2 VMS data, the above is only possible
at a broad scale: from data aggregated across gears (but still separated into mobile
and static gear types) and across multiple years. Fishing variability index was

134
calculated for all mobile gears on aggregate and all static gears on aggregate, and
compared qualitatively to maps of economic value and gross weight of fish caught by
mobile and static gears, respectively, derived from the VMS level 2 data (presented
in Chapter 1). The comparison was of different, but overlapping, periods of time
(2005-2008 compared with 2007-2010), however the analysis was conducted over
the same spatial extent and at the same spatial grid resolution.
Level 2 VMS data are separated by mobile and static gears, so first, the variability in
fishing effort for mobile gears (scallop dredgers, beam trawlers and otter trawlers)
and static gears (potters/whelkers, longliners, and gillnetters) were computed by
summing fishing effort obtained using the high-resolution VMS data from 2005 –
2008 inclusive, and calculating the coefficient of variation using the same procedure
described in section 4.3.2. These results are presented as Figures 4.19 and 4.20 for
mobile and static gears, respectively. Note that Figure 4.19 is the aggregate of data
presented in Figures 4.13 to 4.15, and Figure 4.20 is the aggregate of data
presented in Figures 4.16 to 4.18.

135
Figure 4.19 Coefficient of variation (CV) of fishing effort by all the mobile gear types per grid cell
Coefficient of variation of fishing effort by all the mobile gear types per grid cell, over
2005-2008. Haig Fras (black polygon) and MREIs (red/blue polygons) are marked.

136
Figure 4.20 Coefficient of variation of fishing effort by all the static gear types per grid cell
Coefficient of variation of fishing effort by all the static gear types per grid cell, over
2005-2008. Haig Fras (black polygon) and MREIs (red/blue polygons) are marked.
The map of variability in fishing effort by mobile gears in South West UK was
overlain with contours of the data presented in Figures 1.3 (Chapter 1, total quantity
in tonnes of fish landed by mobile gear vessels) and Figure 1.5 (Chapter 1, total
value in GB£ of fish landed by mobile gear vessels) and these are presented as
Figures 4.21 and 4.22 respectively. Both datasets are per grid 0.05 degree square
cell. While the data represent different periods of time (catch data over the 4 year
period 2007-2010 and fishing effort data over the period 2005-2008), the two data

137
sets are comparable in that they are defined over the same spatial extend and at the
same resolution and aggregated to the same, albeit very broad, gear types. The 50%
overlap in time between the two periods was deemed to be sufficient for qualitative
comparative purposes.
As expected, those stable grounds that are fished frequently (with low variability
indices) also tend to yield higher catches, in terms of both liveweight tonnage and
economic value. Those grounds with less stable, perhaps less reliable, fishing (with
high variability indices) yielded less catch. There is a very close correspondence
between the 1 tonne liveweight contour (Figure 4.19), the 1000 GB£ contour (Figure
4.22), and the contour representing up to a CV of 240 % in fishing effort, in all areas.

138
Figure 4.21 Colour-filled contour map of the coefficient of variation (CV) of fishing effort by all the mobile gear types grid cell overlain with contours of
gross tonnage of landed fish
Colour-filled contour map of the CV of fishing effort by all the mobile gear types per
grid cell, over the 4-year period 2005-2008, overlain with contours of gross tonnage
of landed fish from the 4-year period 2007-2010. The contour lines shown are 1
tonne (black), 10 tonnes (red), 50 tonnes (yellow) and 100 tonnes or greater (blue).

139
Figure 4.22 Colour-filled contour map of the coefficient of variation of fishing effort by all the mobile gear types per grid cell overlain with contours of gross
value of landed fish
Colour-filled contour map of CV of fishing effort by all the mobile gear types over the
4-year period 2005-2008, overlain with contours of gross value of landed fish from
the 4-year period 2007-2010. The contour lines shown are GB£1 (black), GB£1000
(red), and GB£10,000 or greater (yellow).
The same analysis was carried out for static gear types. The map of variability in
fishing effort by mobile gears in South West UK was overlain with contours of the
data presented in Figure 1.4 (Chapter 1, total quantity in tonnes of fish landed by

140
static gear vessels) and Figure 1.6 (Chapter 1, total value in GB£ of fish landed by
static gear vessels) and these are presented as Figures 4.23 and 4.24 respectively.
As with mobile gear types, there is a close correspondence between the 1 tonne
liveweight contour (Figure 4.23), the GB£1000 contour (Figure 4.24), and the contour
representing up to 240% coefficient of variation, in all areas.
As a rule of thumb, it is therefore suggested that fish catches over 1 tonne and
greater than GBP£1000, are concentrated in areas where the variability in fishing
effort was less than 240% coefficient of variation fishing effort. This pattern is broadly
the same for both mobile and static fishing gears. It would be interesting to apply a
similar analysis to other regions and time periods to see how general, if at all, this
trend is. If a relationship such as this proves to be sufficiently general that specific
threshold values of either fish catch weight, or value, or both, could be used as
proxies to specific thresholds of fishing effort, then that would be enormously
beneficial as 1) contextual information for analyses of lower-resolution VMS data
(with which it is not possible to compute indices of fishing effort, or variability in
fishing effort); and 2) input variables in behavioural modelling of fishing and fisheries
displacement.
This analysis bolsters the plausibility of the fishing variability metric described in
section 4.2.3 and presented in section 4.3.3 insomuch that it captures the spatial
variability fishing effort that help explain trends revealed by an independent data and
set of metrics (fish catch weight and value).

141
Figure 4.23 Colour-filled contour map of coefficient of variation of fishing effort by all the static gear types per grid cell, over the 4-year period 2005-2008,
overlain with contours of gross tonnage of landed fish
Colour-filled contour map of the CV of fishing effort by all the static gear types per
grid cell, over the 4-year period 2005-2008, overlain with contours of gross tonnage
of landed fish from the 4-year period 2007-2010. The contour lines shown are 1
tonne (black), 10 tonnes (red), and 50 tonnes or greater (yellow).

142
Figure 4.24 Colour-filled contour map of the coefficient of variation of fishing effort by all the static gear types per grid cell, overlain with contours of gross
value of landed fish
Colour-filled contour map of the CV of fishing effort by all the static gear types per
grid cell, over the 4-year period 2005-2008, overlain with contours of gross value of
landed fish from the 4-year period 2007-2010. The contour lines shown are GB£1
(black), GB£1000 (red), and GB£10,000 or greater (yellow).
4.4 Discussion
The over-arching question of this part of the study was: do we expect average
intensity of fishing to vary between substrates more than between gears and over
time? Based on the evidence presented in Tables 4.4–4.10, the answer is,

143
statistically speaking, no. What all of this analysis points to is the fact that either
substrate only has a very subtle role in fishing effort when viewed at large scales
and/or aggregated over gear types, or that substrate plays a role at scales smaller
than the 3 NM scale at which fishing effort was calculated and assessed. This makes
sense given the fact that substrate is only one factor in the spatial distribution and
population dynamics of different fish. Substrate only plays a significant role
depending on specifics of place and gear type, and possibly time, other
investigations would have to include other environmental factors. Disentangling the
relative contributions of substrate and other factors in examining both the causes of
a particular fishing effort in a particular place requires modelling a whole suite of
substrate and other factors. What the analysis in this study shows is examining what
role of substrate plays is only meaningful at the smallest possible scale.
Thus, using this simple variability index provides a means to investigate the footprint
of vessels using a specific gear type, helping to define fishing grounds further giving
a map of low variability corresponding to stable grounds or ‘hot spots’, and high
variability grounds corresponding to infrequently fished margins. This variability
index acts much like a broad-scale risk analysis, and could be used by agencies
when dealing with issues of siting of MREIs and the formation of an MPA.
There are caveats associated with the substrate analysis which analysed fishing
effort per substrate type by aggregating data from all ICES divisions. There are no
doubts as to the value of the analysis at a broad scale, i.e. ICES divisions VII e-h as
a whole; however, a finer scale analysis would be needed to assess the seasonal
movements of the fleets. In addition, when we consider that we cannot take into
account vessels changing gear (at present is no access to logbook information), then
we reach a limit to the certainty with which VMS data can be used to explore fishing

144
effort per gear type, at least at this spatial resolution. Further analysis should include
defining fishing grounds to assess space allocation by various fleets (Jennings & Lee,
2012) and impacts of various fleet activities on the seabed (Jennings et al., 2012;
Gerritsen et al., 2013).
More recently attempts have been made to predict regional fishing grounds of
commercially important static fishery using remotely sensed LiDAR and catch data
(Ali Jalali et al., 2015). With the use of these techniques and their input into a
MaxENT model, accurate estimations of suitable fishing grounds based on habitat
complexity and bathymetry were achieved. However, they highlighted the need to
down scale regional analyses and the use of GPS located catch data to generate
habitat suitability models, especially where there are limitations with other spatially
important data. Having access to daily catch records from logbooks along with
associated gear-type VMS (e.g. Gerritsen & Lordan, 2011), both at a high resolution,
is what is needed if we are to truly assess predict and plan for effort displacement.
4.5 Summary
Qualitatively, for static gears the relationships with substrate are most obvious.
The gillnetting and potting and whelking fleet concentrated significantly on
rocky areas. Longlining activity per unit area was highest over mud, however
high values were also observed over mixed sediment and rock. For mobile
gears activity per unit area of substrate type varied considerably, to the point
that it was hard to discern any relationship; in general, it might be true that
scallop dredging occurring mixed sediment or mud, and beam and otter

145
trawling mainly in muddy areas with high coverage per unit time in mixed and
sand respectively, but there was large variability in these trends;
The potential role of substrate and a suite of other potentially explanatory
were assessed by statistically testing the relationship between fishing effort
and substrate in South West UK waters. This was achieved using a
Generalised Linear Model (GLM) approach that attempted to model the
spatial distribution in fishing effort as a function of physical variables (wind,
waves, depth, and substrate), gear type, year, and the monetary value of
fishing grounds. The approach was also used to construct models for each
individual gear-type. The results showed that substrate almost always was an
insignificant predictor of fishing effort. The relative importance of wind and
waves, depth and substrate, gear, year and fish value varied significantly
depending on gear type. This result reinforced the building line of evidence
presented in this thesis that when it comes to assessing fishing intensity, and
fisheries displacement, this must be done at the highest possible spatial and
temporal resolution, and most importantly, always carrying out the analyses
on a per-gear basis;
Within a given year, there was an unequal average fishing effort per substrate
type. This suggests that only data aggregated over very large scales (an
entire ICES subarea, e.g. VII) does it become evident that substrate plays a
non-gear-specific role in fishing effort;
In ICES divisions VIIe and VIIh, and as a whole, within a given year there was
an unequal average fishing effort per gear. This suggests that data
aggregated over smaller scales can be sufficient to demonstrate that gear

146
type can be a significant driver in fishing effort, and can be identified
irrespective of the substrate type;
Fishing effort with a given gear type is statistically more similar over time than
over different substrates, and fishing effort across all gear types does not
significantly change over time;
Fishing effort over mud is almost always significantly different than all other
substrate types. Fishing effort over rock is almost always significantly different
than other substrate types but only in ICES divisions VIIf, VIIg and VIIh.
Fishing effort over sand, coarse and mixed substrates tends not to differ
significantly;
Pairwise comparisons of fishing effort between different gears almost always
show significant difference, but the details depend on the specific ICES
divisions. The notable exception is otter trawlers who tend not to differ
significantly in fishing effort compared to other gear types except for in ICES
VIIe and h;
An objective means was developed to assess the background variability of
fishing effort, as a baseline against which to assess displacement. This index
is the coefficient of variation, which quantifies of intensity about the mean
fishing effort, expressed as a percentage of the mean fishing effort. Because it
is calculated per gear and per location, calculated relative to, and expressed
as a percentage of, the mean fishing effort, valid comparisons can be made
between gear types, between locations, and over time. Small values of this
index indicate small fluctuations about the mean, which is in turn indicative of
a regularly fished region, or a preferred fishing ground. High values of this

147
index indicate highly variable, sporadic fishing effort not indicative of a stable,
regularly fished area;
The distribution of this index for beam trawl strongly follows proximity to port,
with greater variability in effort the further out to sea being the general pattern.
In contrast, otter trawling occurs in more localised ‘hotspots’ of stable fishing
grounds. Scallop dredging shows very high variability almost everywhere.
Unlike with beam trawlers and otter trawlers whose preferred grounds are
identifiable from the hotspots of warm colours of their respective maps, further
years of data would be required to assess the preferred fishing grounds of
scallop dredgers;
For static gears, longliners had very stable grounds proximal to southern
Cornwall and Devon ports and in general, variability in fishing effort increases
with greater distance to port. Gillnetters show a wide variation in both areas
fished. Small patches of intense and stable effort (reds) are found adjacent to
areas (blues) but this ubiquitous heterogeneity is not observed in the other
gear types. Finally, there is much more localised and invariant fishing effort,
especially adjacent to the major ports that these fleets operate. As with
longliners, variation in fishing intensity increases strongly with distance from
port; and
Fishing variability index was calculated for all mobile gears on aggregate and
all static gears on aggregate, and compared qualitatively to maps of economic
value and gross weight of fish caught by mobile and static gears, respectively,
derived from the VMS level 2 data. Both data sets were aggregated over a 4
year period.

148
Overlying contours of fish catch weights or monetary value onto maps of
aggregated fishing effort variability index revealed coherent spatial patterns:
as expected, those stable grounds that are fished frequently (with low
variability indices) also tend to yield higher catches, in terms of both liveweight
tonnage and economic value. Those grounds with less stable, perhaps less
reliable, fishing (with high variability indices) yielded less catch. This analysis
bolsters the plausibility of the variability metric presented here, insomuch that
it captures fishing effort that help explain trends revealed by an independent
data and set of metrics (fish catch weight and value).
As a rule of thumb, it was revealed that catches over 1 tonne and greater than
1000 pounds sterling were concentrated in areas where the variability in
fishing effort has a coefficient of variation of less than 240%. This pattern was
broadly the same for both mobile and static fishing gears. Further analyses in
other areas and time periods might prove this relationship to be sufficiently
general that specific thresholds of fish catch statistics could be used as
proxies to specific thresholds of fishing effort (Figures 4.23, 4.24).

149
Chapter 5 Assessing the possibility of co-existence between
fisheries and marine renewable energy: The results of a national
fisher survey helping to put the spotlight on fishers and fishers’
knowledge (FK)
“You’ve got to want to do the job, it’s not a job you do for the money, you wouldn’t do it
in all honesty. You’ve got to love the job, want to do the job and then the money’s
secondary you know. That’s the way I see it. ... fishing is a way of life, a completely
different way of life”
Craig, fisherman, Cadgwith Cove.
5.1 Introduction
There is the overarching public opinion that global fisheries management has thus
far failed (Beddington et al., 2007; Worm et al., 2009). Urquhart et al. (2014)
discusses the need for application of the ‘mixed method’ approach i.e. that combines
both qualitative and quantitative research in a single study, in some way to help with
the fishing industries problems. Assessment of fishing effort displacement is one of
those major industry problems. Symes & Phillipson (2009) highlight the fact that the
social dimension in fisheries is lacking, and in ignoring this data, the complexity of
fishing industry is under-represented. In the case of this research thesis, this may
result in the potential under-estimation in the consequences of fishing effort
displacement on different sectors of the UK fleet, because we fail to shed light on
these complexities within fishing behaviour. Chapter 3 and 4 highlight how aspects
of spatially and temporally explicit data can inform certain aspects of resource use,
but in order to get a true representation of fisher behaviour, these semi structured
interviews have the potential to be a way of eliciting much more significant

150
information. Fishers’ Knowledge (FK), as outlined in Chapter 2 is a data source that
is both highly under-utilised, not greatly understood by the more traditional marine
science community, and it has certainly has not been considered when capturing
data in order to inform the fishing effort displacement and MRE debate, nor has it
been applied to any discussions on marine spatial planning. It is fisher specific, and
because fisheries are about managing fishers (Hilborn, 2007), this Chapter by using
the questionnaire enables some gaps to be filled in reference to fishers views on
current fisheries management fisher behaviour which is the fundamental basis of
understanding displacement and ensuring minimal socio-ecological impacts of MRE.
5.1.1 Primary objectives
The objectives of this Chapter are as follows:
To develop a list of data collection and activities that would enable
assessment of the degree and impact of fishing effort displacement;
To attempt to validate a mitigation agenda developed by stakeholders
involved in MREKE Programme; and
To make recommendations to improve both the collection and use of FK for
the assessment of fishing effort displacement.
5.2 Methodology
5.2.1 National survey of fishers and marine renewable energy
The questionnaire designed for fishers around the UK is shown in Appendix 1. Table
5.1 details the rationale for each question which followed the example of Rees et al.
(2013b). All fishers interviewed were skippers of a vessel, and operated a particular
gear type, shown in Tables 5.2-5.3. A semi-structured interview was used according

151
to Bernard (2006) and fishers were asked a series of closed questions to elicit
information about regional and local fishing activity and general vessel
characteristics etc., and open –ended questions to elicit more information about
fishing behaviour. Triangulation, i.e. comparing the points of view of three or more
independent sources to determine accuracy of information (Bruce et al., 2000) was
also employed in order to increase the accuracy of the responses provided. Informal,
unstructured surveys were also carried out with other members of the fishing
communities: crew, Producer Organisations (POs), fleet managers, fish merchants,
fisheries consultants, members of fishing communities. These were conducted in
order to gain a better understanding of the array of issues that are of relevance to
the wider fishing community.
Due to the nature of the case studies that are in Chapter 3 and 4, most face to face
interviews were conducted in the South West of the UK. Due to financial constraints,
in order to reach other fishers in other regions; England ((SW), (NE), (SE), (NW)),
Northern Ireland (NI), Scotland (Sc) and Wales (Wa), the survey was emailed to a
wide array of fishing associations and Producer Organisations (POs) along with the
outputs of the MREKE Programme. Social media was also used to establish contact
with the fishers and telephone interviews followed. The survey had a large
geographical scale and an attempt was made to include only those areas where
MREIs have been developed or have been proposed. However, given the nature of
social media, and the rapid uptake of information, other fishers interested in the
subject matter also requested to be interviewed, they may not be directly affected by
MREIs but had in-depth knowledge and opinions on the subject matter. A brief
overview of the aims and objectives of the survey was published in The Skipper, a
monthly publication produced by Mara Media, a publishing and event management

152
company in Ireland. Interviews were also conducted at a Mara Media Skipper Expo
International event in Bristol. Regular Defra and Cefas fisheries meetings held in
Newyln were also attended in order to understand fishing industry issues, and elicit
contacts for further interviews. One interview was conducted with a Dutch fisher and
fleet owner who fishes in the North Sea. Key responses from this fisher are included
as a separate section as this questionnaire was designed for UK fishers only in order
to assess gear-type and regional differences. However, this fisher who is both a
skipper and fleet owner had very valid suggestions that could illuminate the debate
about co-existence of MRE and fisheries and in particular FK.
Qualitative data were extracted and analysed using the text analysis software
NVivo8 (QSR International, 2010), which enables the analysis of open ended
questions and allows coding of themes and key quotes extracted. This package
allows the analysis of text-rich research such as interview outputs. Data from each
interview are organised in separate files, and then using ‘text search queries’, the
use, context and meaning of words can be explored. For example, some
expressions can be associated with particular demographics, or can be found
several times in each separate interview and this can be found using particular key
word searches, and they can be counted. If the text search query returns some
interesting content, this can be saved as a ‘node’, hence it is these nodes that
enable the organisation of content into broad themes that can be interrogated.
Table 5.1 Rationale behind the questions for the fisher survey on fishing activity and marine
renewable energy
Section/ Question no. Rationale
Section A Questions designed to define local/regional fishing activity of interviewees
1 Scoping question to identify priorities

153
2 Scoping question to determine experienced/perceived barriers to progress
3, 4 Visioning questions to aid management
5 Visioning question to aid research objectives
6 Visioning question to identify research priorities
7, 8, 9 Scoping questions to identify potential impacts
10 Scoping question to identify potential fisher adaptations/ to aid management
11 Scoping question to identify gaps/ aid management
5.3 Results
5.3.1 National survey of fishers and marine renewable energy interactions: Fishers
identifying issues, challenges, priorities and helping evaluate agendas
5.3.1.1 Description of respondents
Forty skippers were interviewed for the purpose of this study, which is a low
response rate, i.e. a low number of questionnaire returns. The age range
represented in this study is shown in Table 5.2. The average number of years each
fisher has spent in the fishing industry is 23 years (sd=+/- 10). The number of fishers
from each region and the type of fishing activity they are engaged in is shown in
Table 5.3.
Table 5.2 The age range of respondents
Age 18-30 31-40 41-50 51-60 Over 60
No. fishers 2 10 17 11 0
Time spent in the industry
(sum)
18 150 387 369 0
Table 5.3 The number of skippers interviewed and main type of fishing activity and area
fished (some fishermen in different seasons use a different gear-type and these are included
also)

154
Gear-type Scallop Beam trawl
Otter trawl
Longline Pots/whelkers Gillnetter
No. skippers
1 12 5 4 11 7
Fishing area
1 (Wa) 1 (S) 3 (SW) 5 (SE) 3 (NI)
2 (SW) 1 (SE) 2 (Sc)
3 (SW) 1 (SE)
6 (SW) 3 (SE) 1 (NE)
5 (SW) 2 (NE)
5.3.1.2 Priority issues and barriers to progress
A thematic analysis of fishers’ responses to questions on priority issues and barriers
to progress is presented below in Table 5.4. The results of these questions are
important as they underpin not just the consultation process but also any future
research agenda.
Key: England ((NW), (NE), (SW), (SE)); Scotland (Sc); Northern Ireland (NI); Wales (Wa)

155
Table 5.4 Thematic analysis of fishers’ response to priority issues and barriers to progress to
inform future management
Themes for barriers
to progress
No./ (%)fisher
response
Themes for priority
issues
No./ (%) fisher
response
1. Policy
11 (28)
1. Displacement/loss
of access
18 (45)
1. Consultation
11 (28)
2. Cable disturbance
11 (28)
2. Lack of Trust
9 (23)
3. Timing of
installation/ repairs
10 (25)
3. Lack of knowledge
7 (18)
4. Co-location
9 (23)
3. True
representation of all fishers
7 (18)
5. Inshore fishers-
limited range
8 (20)
4. Science and fisher
observation Mismatch
4 (10)
6. Effects on seabed
6 (15)
5. Timescales
3 (8)
6. Policy of OWF
siting
6 (15)
5.3.1.3 Consultation process
The question regarding the consultation elicited quite negative responses from the
fishers overall, however, one fisher expressed one positive opinion. The results of
dominant themes are shown in Table 5.5.

156
Table 5.5 Thematic analysis of fishers’ responses on the consultation process
Consultation theme No. /(%) of fisher responses
1. Not fit for purpose 14 (35)
2. Disconnect with management 10 (25)
3. The lack of the fishers voice 9 (23)
4. Lack of Trust 7 (18)
5. Lack of long-term vision 5(13)
6. Ineffective Communication 3 (8)
6. Legitimacy 3 (8)
7. Lack of knowledge sharing 2 (5)
8. Efficient on a local basis 1 (3)
In total, 35% of fishers agreed that in this current climate, the consultation process is
simply ‘not fit for purpose’. In relation to this theme, one fisher stated ‘we are
presented with fait accompli, we’re not involved in the planning stages, plans are
done, then we come in, what then? This didn’t happen with the oil industry, so why
with renewables?’ One fisher alluded to a completely closed consultation process, in
particular to an ongoing but opposed development off the North East coast. A group
of fishers using their years of knowledge, i.e. FK suggested alternative sites, but
were ignored by the OWF developer. This lack of confidence in a pivotal process
directly relates to how fishers can feel disconnected with management, and in this
case one quarter of fishers interviewed expressed this view. This is discussed in
detail in section 5.4.2. This loss of confidence in a process, feeds this disconnect
with those making decisions about marine plans, and may help to explain why 18%

157
of fishers have a lack of trust in not just the process of a consultation but also the
outcomes. Following on from this, 8% of fishers interviewed expressed views on the
actual legitimacy of the consultation process. FK scored highly here, with 23% of
fishers actively acknowledging the lack of inclusion of their knowledge. The one
fisher, who expressed positivity about the consultation process, was referring directly
to consultation processes at the smallest local level, and this is something to
highlight, can much smaller focus groups work better than large industry meetings?
5.3.1.4 Research agenda
Fishers were asked to give three examples of research areas that could aid in the
improved co-existence of fisheries and MRE. Table 5.6 shows the top three in rank
order.
Table 5.6 Fisher identified research priorities in rank order
Research Priority/ Rank
No./ (%) fisher
responses
1. Use of fishers’ knowledge 17 (43)
2. Siting of MREIs 7 (18)
3. Vulnerability of stocks 5 (13)
There were a low number of opinions on this subject. Some fishers had multiple
answers while others did not answer the question at all. Some fishers mainly in the
North Sea were concerned with stocks and climate change, and if more MREIs are
planned they felt that the area would become much more encroached. More than
one fisher expressed an interest in how the research community can try and predict

158
effects of different scenarios with one fisher asking ‘can the researchers inform areas
for siting and predict effects? One fisher stated that ‘now fishermen and scientists
have the same opinion on certain stocks and we are working better with ICES now’
but that ‘younger researchers are more open to new ideas but there is still a way to
go’. The same fisher also stated that “back in 1987, when I started I thought the sea
was mine, but now we all need each other’, referring to scientists. Fishers’
Knowledge (FK) was a theme that was recorded in every interview, and was stated
in many guises, e.g. ‘our knowledge’, ‘our opinions’, ‘all the years at sea’, ‘our voice’.
Therefore there needs to be a framework designed for the capture of this data
source, and designed in a systematic way with specifically fishing effort displacement
in mind.
One gillnetter in the NE stated that ‘our knowledge targets the aspirations of the
fisheries, of the fishermen for the long-term’, and in this case, this fisher is referring
to FK. One of the many negative aspects of the consultation process experienced by
fishers was the lack of long-term vision; hence FK integration may be a solution to
better reception of and participation in the consultation process. Siting of MREIs was
also one of the top research areas mainly because fishers felt ‘alternatives sites are
there, we just are not being listened to’. A query about fisher incentives was brought
up here ‘is there some way of trying to figure out with scientists how we could come
up with incentives for us at sea, like a rewards scheme?”. This subject of incentives
is not new (Hilborn et al., 2005) but it has been discussed by many fishers, and it
would form a good research project, especially considering the level of conflict being
experienced between both the MRE and fishing industry.5.3.1.5 Mitigation agenda
validation

159
A thematic analysis of fishers responses to the mitigation agenda are shown in Table
5.7.
Table 5.7 Fisher responses to aspects of the mitigation agenda developed by de Groot et al.
(2014) and number of fishers who provided responses
Mitigation agenda/ action points
No./ (%) fisher
responses
Top three emerging themes by
rank
Overcoming data issues for assessment of fishing effort displacement
Variety of data gathered using appropriate methodologies
Data to be made available and shared freely while respecting commercial sensitivity
Direct involvement of fishers
15 (38) 1. Trust issues between fishers and managers/scientists
2. Data management issues
3. Previous failures
The need for the development of assessment guidelines and methods
A variety of fishing effort analysis methods exist, but are not specifically designed for assessment of effort displacement
Distributed on a national basis
10 (25) 1. More Collaboration needed
2. Guidance from scientists
3. Timeframes differ between a fisher and managers/scientists
Analysis of case studies to inform behaviour rules of various gears, vessels and skippers
Further analysis of MRE case studies to identify successes and failures
23 (58) 1. Who will start process/how to initiate
2. Improved Communication
3. The need for the fisher’ voice

160
The urgent need for the sharing of best practice
The set-up of a Mitigation Toolkit, hosted on the NERC portal
Both industries to contribute and a facilitator required
14 (35) 1. Improved Communication
2. Trust issues between fishers and managers/scientists and
between two industries
3. The need for the fishers’ voice
Collaboration of fishers and MRE developers
Direct involvement of fishers in collaborative projects with developers and researchers to further technologies, methods and plans to maximise fishing opportunities within and around energy sites.
This requires improved coordination between fishers and science funders.
27 (68) 1. Lack of understanding between two industries
2. Process fatigue
3. Funding issues
Development of standards across UK and Member States
Reform the Marine Industry Liaison Group (MILG) to operate at a more strategic level, and ensure involvement of the fishing industry.
Research initiatives a priority across Europe
30 (75) 1. Existence of trans-boundary issues
2. Mistrust of other EU countries
3. Pessimism about timeframes
Development of a new consultation protocol between MRE and fishing sectors
New design of appropriate methods to engage fishers
Ensure consistency in procedures and be sensitive to differences in discourse between the two industries
Improve communication in consultation and engagement processes and develop
29 (73) 1. Timeframe 2. Political issues-MRE Policy
driving 3. Historic lack of fisher voice
inclusion

161
specific protocols for these
5.3.1.6 Dutch fisher responses
Although not taken into account in the analysis of fishers from the UK, as this last
Chapter was UK-centric, the decision to include the responses of this fisher as a
separate section, are based on the suggestions for the consultation process and the
use of FK, which very much aligned with what UK fishers were expressing. This is
very important, because it illustrates that across boundaries and Member States,
fishers are experiencing the same conflict between MRE and fisheries, and if so then,
sharing this knowledge might in some way help to tackle the issues highlighted in
fishers’ evaluation of the mitigation agenda developed by de Groot et al. (2014)
(Table 5.7).
This fisher has amassed 34 years’ experience in the fishing industry, and as
described above, is an active skipper and vessel owner, and his vessel is the largest
in the Dutch fleet. The MRE development most commented upon here was Dogger
Bank Offshore Wind Farm (OWF). One of the biggest issues this fisher commented
on most was the consultation process between fishers, fisheries managers and
scientists how it could be dramatically improved. This is in alignment with
approximately 73% of UK fishers who felt that as part of a mitigation agenda to work,
the consultation process needs to be improved. In addition to this, two key themes
that emerged from analysis shown in Table 5.5 that hindered a positive consultation
process; the lack of use of FK and MRE policy driving the process. This directly
matched the opinions of this fisher, ‘political decisions are taken before consultation
takes place’. He also included a lack of choice when it came to what was offered
when the consulting process was underway, and was directly referring again to the

162
MRE policy drivers not being considered alongside fisheries policy. The improved
use and application of FK, was also a strong theme. In particular, this fisher detailed
FK about; fish populations, currents and detailed observations on ecological and
environmental changes that need to acknowledged. He referred to the change of
currents and fish populations and in particular spawning patterns of commercially
valuable fish since OWFs have been built on Dogger Bank, and how this has
remained ignored for the most part. In addition, MRE repairs were taking place at
sensitive times for two major species here, Plaice and Sole. This kind of information
has to be a priority when conducting the consultations. This is also in line some of
UK fishers’ responses to FK, in that 23% feel that FK has to be considered in
consultations for them to be meaningful and aid in reducing conflict between the
industries. Regarding the top three research topics, the fisher, in order of
importance stated, ‘quota and stocks, FK and knowledge sharing’, key themes which
also emerged from discussions with UK fishers. In terms of aiding fisheries
management, which was one of the visioning questions (Q3, Appendix 1, Table 5.1),
this fisher focused on the ‘lack of long-term planning for MRE not taken into account
alongside the need for long-term survival of fish in the North Sea’, and in not aligning
both MRE and fisheries objectives in the long-term, effort displacement is an issue.
5.4 Discussion
5.4.1 Data needs
Through a collaborative process at the UK’s first Marine and Coastal Policy Forum,
Rees et al. (2013a) sought to identify priority questions that could shape the marine
and coastal policy agenda. In relation to data and MSP, the majority of questions

163
from participants related to how to use data effectively. This is in line with barriers to
progress from this survey; fishers have concern over what they are seeing in their
environment on a daily basis in comparison to what scientists are reporting and are
questioning if data are being used in the right way. What is surprising from the forum
participants is the lack of questions regarding what data are needed or how it can be
collected, which is a concern of fishers. This may be a reflection of the attendance
of different sectors, of which fishing industry representation was lacking. Fishers
identifying data needs and the priorities, barriers and challenges of collecting this
data for the purposes of assessing fishing effort displacement must not be a static
process. The scale and pace of change in the marine and coastal policy of the UK,
and overarching changes to the CFP mean that fishers must find ways to adapt at
the same rate of change, thus affecting resource use estimates on various temporal
and spatial scales. It must be an iterative process and at every stage, be
transparent and be subject to stakeholder consultation (Shucksmith & Kelly, 2014),
in this case with the fishing industry.5.4.2 Incentives and the consultation process
Fisher incentives were highlighted in these interviews, and it is significant.
Beddington et al. (2007) stated that for fisheries management to work, among other
practical solutions were incentives for fishermen, so clearly there needs to be a
discussion on how to make this work. A theme that emerged from the consultation
process with fishers was this ‘disconnect with management’, this was a strong theme
also in the research carried out by de Groot et al. (2014), termed the ‘fisheries
disconnect’. Another way to describe it was the lack of a fishers’ voice, a feeling
expressed by the fishing community (Gray et al., 2005). Within the fisher validation
of the mitigation agenda, the timeframe was the most important aspect. The
mitigation agenda developed by de Groot et al. (2014) identified MSP as a way to

164
tackle the conflict between both industries. Because fishers expressed the view that
there is a lack of long-term vision when considering fisheries objectives alongside
those of MRE, then MSP could provide a more integrated approach for mitigating
fishing effort displacement. Why? Because defining timeframes is an integral part of
the MSP process (Douvere, 2008), and considers short-term and long-term
components, i.e. a base year to assess ‘current conditions’ and target years that
defines the planning period and identification of future year scenarios. Timeframe
designation has to be a fundamental part of the consultation process. In the early
COWRIE reported by Blyth-Skyrme et al. (2010) early engagement with fishers at
the beginning of a planning process was explicitly explained as being of the highest
priority. , In conducting surveys with fishers across multiple MRE sites, Ashley (2014)
found that fishers felt they were not involved in the process from the beginning.
These surveys were carried out four years after the initial COWRIE work, thus
signifying there is something inherently wrong with the current consultation process.
This is further reinforced by the outcomes of this study. Clearly, there has to be a
paradigm shift in how we engage with fishers in the consultation process as it is the
basic building blocks of a successful MRE development and in designing a new
process fishers must be involved. Perhaps one way of mitigating against
displacement, for example, could be certain incentives put in place for fishers that do
not simply involve compensation.
Maxwell et al. (2015) in discussing a new way to manage our marine resources via
‘dynamic ocean management’ highlights the need for innovation. If the UK is to
reach its target to produce 33 gigawatts from marine renewable sources by 2020
(United Kingdom House of Lords, 2008), then some innovation is needed in how to

165
approach the consultation process. This paradigm shift in fisher engagement and the
need for innovation are considered in section 5.4.4.
5.4.3 The need for further investigation
5.4.3.1 Where to next for NERC MREKE Programme Marine Renewable Energy and
Fisheries Displacement Working Group?
Cvitanovic et al. (2015) identified that knowledge exchange must improve between
scientists and policy-makers, thus the research undertaken under the NERC MREKE
Programme (de Groot et al., 2014) which was one of the first of its kind for the UK, is
a step in the right direction. Harnessing the power of all actors from all regions,
including active fishers, fishing association representatives, MRE industry
representatives, scientists, practitioners and policy-makers, means that scientists
have greater opportunity to conduct policy focused and relevant science (Halpern et
al., 2012).
Fishers responded positively to the mitigation agenda that was developed by the
working group. Of particular interest was the development of a consultation protocol
actively involving fishers in its design. But progress has been slow to initiate action
plans and activities, hence there needs to be an analysis of the impact of the NERC
MREKE Programme on each stakeholder group and overall impact of the project
thus far. All of the research outputs generated through NERC MREKE Programme
migrate to the International Council for the Exploration of the Sea Working Group on
Marine Renewable Energy (ICES WGMRE). There may be potential to create an
ICES Study Group (SG) within ICES WGMRE specifically addressing fishing effort
displacement assessment and mitigation.

166
A significant section on the interrogation of data priorities which was outlined in
Chapter 1 requires further study, however discussions are currently underway in
order to attempt to continue the questionnaire across multiple regions of the UK
5.4.3.2 An extension to the national fishers’ survey
As explained in the results, there were not enough data to suggest gear-type or
regional differences, mainly due to financial constraints in gaining face to face
interviews, but there are plans to extend this questionnaire in conjunction with any
further work carried out under NERC MREKE Programme. To conduct a national
questionnaire of this size was rather ambitious. The idea could be to allocate each
region to an array of ex-fishermen, much like that used by Rees et al. (2013b), who
have experience of the industry, or endeavour to get the involvement of Seafish, or
active fishermen for that matter. Likert scale analysis could have been used to
investigate perception statements, like that used by Rodwell et al. (2014b) of
fishermen in different regions, because there may have been further information
about each fisher in that area that this survey did not elicit.
Another fisher survey was carried out by Rees et al. (2013b) in on the social impacts
of MCZs on the North Devon inshore fishing fleet. Given the fact that it also included
responses about an MREI, the Atlantic Array, and the proposed installation
subsequently being cancelled, it would be prudent to evaluate the responses in
greater detail in order to elicit any further information about fishers’ knowledge (FK).
And it would also be useful to set up a meeting with developers and fishers in order
to document why the Atlantic Array project failed, anecdotal evidence points to
fisheries conflicts, thus this is very important for both consultation process redesign
and application of FK. A fundamental part of the mitigation agenda (de Groot et al.,
2014) is to document successes and failures in MRE and fisheries and share best

167
practice, this is vital information for inclusion in the Mitigation Toolkit, and should be
a priority.
5.4.4 The consultation process: Paradigm shifts, innovation and incentives
The fact that 35% of fishers felt that the current consultation process for fisheries and
MRE is not fit for purpose signifies that there has to be a complete paradigm shift in
how it is designed. However, before discussions on reinventing the consultation
process can occur, the whole culture of how scientists, fisheries managers and MRE
developers engage with fishers has to change. There are two keys words that need
to be acknowledged, creativity and innovation. De Groot et al. (2010) show weak
valuation of ecosystem services, conservation fisheries and MRE, for example is a
major impediment to informing the decision- making process. Thus the key is
bringing fishers closer to the subject matter by way of training, education for example.
Cooke et al. (2013) provide some interesting ideas on ‘formal and non-formal
strategies’. One formal strategy proposed is the development of training manuals,
which would be fisher specific, and use of non-formal strategies such as social
media. What is illustrated here in this thesis is the value of social media as an
effective means of engagement with fishers. Social media works by generating
interest in a topic, more fishers are engaging in social media, mainly Twitter and
Facebook and there are research projects now being initiated e.g. ResponSEAble9
that aim to directly investigate social media as a tool for fisher engagement. A new
charity Fishing into the Future (FitF) are working with an industry led Steering Group
consisting of active fishers along with scientists, processing and retail and
government representatives ‘Focusing on sharing knowledge, key outcomes include
a comprehensive scheme for UK fishermen to contribute data into the science which
9 http://www.responseable.eu

168
underpins fisheries management; training and education initiatives ,including
broadening the scope of skippers' training to include fisheries biology, management
and marketing, and establishing regional knowledge exchange workshops for
fishermen and other seafood industry businesses’. These are really great strides
forward to achieving full representation of fishers in the consultation process. The
key word here is capacity building, and since consultations are a stakeholder led
process, providing this training etc. may in a way help fishers feel more inclusive.
One fisher in this study attributed consultation process success with the design being
of a local nature. There could be the formation of small focus groups from each
gear-type per region beginning the consultation process, and then representatives
from each gear-type per region could be paid to attend larger consultations. The key
is investment; much more funding should be invested in the consultation process.
During a number of informal discussions on the topic of innovation, one fisher
pointed to marine planning consultations with fishers in the Mull of Kintyre by
Alexander et al. (2012). Researchers used interactive pads with mapping software
and invited fishers for a series of sessions, conduced questionnaires and mapping
exercises. Fishers were very receptive to this and the use of such technology was
hailed as a success. Recent work by Mayer et al. (2013) involving simulation
gaming (SG), i.e. gaming software designed for marine spatial planning showed that
taking scientists, agencies and industry representatives out of the ‘normal’
consultation protocol led to a deeper understanding of the issues that each
representative faces in their work environment in the context of spatial planning. The
use of online streaming technology, i.e. Bambuser was piloted at the last meeting of
the Gap2 project, a consortium of researchers who focus on stakeholder
engagement. This software was used to stream a conference live, with fishers in the

169
UK logging on from their laptops, and a conference that was capped at 150
attendees reached almost 400. It has since been used to stream Marine Scotland
fisheries and CFP meetings (Katrina Borrow, Mindfully Wired Comms).10 This might
be termed revolutionary in terms of gaining greater fisher participation in
consultations, because fishers who rely on their commercial catch for their living can
participate remotely.
During the course of the interviews with fishers, this idea of Incentives was a popular
discussion element among fishers. This idea of incentives in fisheries is not new
(Hilborn et al., 2005), but the fact that fishers are interested and it is motivating them,
it should be considered. Fishers considered extra days-at-sea as a possible rewards
route for good environmental stewardship. Others considered the chance to work
with researchers and carry out research as an incentive providing capital could be
made available to update vessels etc. Interesting conversations with some fishers in
Newyln occurred regarding the ‘fisher as a consultant’, and incentives around these
possibilities. Clearly fishers are interested in working with the research community,
so there needs to be some planning as to how this could be as successful as the
fisher and science partnership in Lyme Bay.
5.5.5 Establishment of a framework for the collection and analysis of FK
In section 5.3.1.4, the improved inclusion of FK was identified as a priority in terms of
directing a research agenda. The first reform of the CFP in 2002 promised greater
inclusion of FK (EC, 2002), but what is being observed among the fishers
interviewed for this study and from other important studies (e.g. Griffin, 2009, Stöhr &
Chabay, 2010) is that more than a decade later, fishers still feel FK is not included in
10 http://www.mindfullywiredcomms.org/

170
decision-making and management. The most important aspect to be considered in
designing a framework for the collection and analysis of FK, is that it should be
systematic in its approach (Daw, 2008, Tesƒamichael et al, 2014). This was a
method which was employed in this study and showed as an example in
questionnaires conducted with the North Devon inshore fishers by Rees et al.
(2013b). In this study by Rees et al. (2013b) an ex-fisher who was employed in
order to conduct the surveys altered how the questions needed to be asked to
fishers, e.g. asking for exceptional experiences as opposed to general or vague
questions. This is also an important point linking why fishers could be employed to
lead consultation processes on a local level as described above in section 5.4.4.
Table 5.8 below illustrates a potential systematic approach for the collection and
analysis of FK in the assessment of fishing effort displacement. This has been
compiled using an array of published work and advice on the subject (Daw, 2008,
Tesƒamichael et al, 2014, Leopold et al., 2014, Hind, 2015)
Table 5.8 A potential systematic approach for the collection and analysis of FK in
assessment of fishing effort displacement
Step Methods Rationale
1. Formation of small local focus groups to discuss surveys. First step of engagement with the community is very important. Potential to employ a fisher/ scientist fisher combination to carry out surveys
From interviews with fishers, more success seems to stem form locally orientated groups who can feed into larger association, regional meetings See Rees et al. (2013b) ref above
2. Designing the survey:
Aim is to create experiential questions as well as
Fishers find it easier to answer these easier than general or vague questions. Semi-structured survey with

171
demographics and attitudes to and perceptions of subject matter
Semi-structured, open –ended questions
Use Likert Scale questions when dealing with attitudes or perceptions
open ended questions allow a better flow of conversation
3. Random and targeted sampling of fishers and triangulation with other members of the wider fishing community, e.g. processors, managers, PO’s
Most of the time surveys can be opportunistic. But sometimes, fishers can recommend someone who may know more on a subject or someone beneficial to talk to
4. Elicit information on FK of fishing areas and catch size through maps either digitally or on paper Info on: species, home port, distance, gear-type, month, year, seasonality, other factors that might affect fishing behaviour
The use of digital maps, or a computer is best with mapping software
5. Input data in a spatial database
Use of GIS
6. Mapping of catch, effort, CPUE Follow up with methodologies outlined in Chapters 3 and 4 of this thesis Analysis of Likert Scale analysis of perceptions/attitudes Textual language analysis (NVivo) to identify themes for management
Standard in any fisheries analysis

172
5.6 Summary
Barriers to progress, in order of the most important theme included: policy,
consultation, trust, lack of knowledge, true representation of all fishers,
science vs. fisher observation mismatches and time scales;
Priority issues identified in order of importance were: displacement or loss of
access, cable disturbance, timings of installation/repairs, effects on the
seabed and specifically offshore wind farm (OWF) siting;
The consultation process caused a lot of discontent among fishers across all
gears. The three top themes identified were: not fit for purpose, management
disconnect and the lack of the fishers voice;
Fishers identified incentives as an important part of mitigation strategies;
Initial validation of a mitigation agenda developed by de Groot et al. (2014)
highlighted themes of trust in relation to trans-boundary issues, data
management and the consultation process;
Lack of understanding, process fatigue and funding themes emerged when
validating a collaborative effort with MRE as part of the mitigation agenda;
In order of the most important: use of FK, siting of MREIs and vulnerability of
stocks were the three areas that scientists should focus their research upon;
The response rate of the importance of gathering FK was high, fishers felt this
data source was an important aspect of trying to assess impacts on the UK
fleet due to MRE;
A framework for the collection and application of FK is suggested, but more
development is needed;
Due to the small number of fishers interviewed, further study into regional and
gear-type differences of fishers responses needs to be conducted;

173
Due to the small number of fishers interviewed and the fact that more
research needs to be conducted, this means that results are indicative rather
than conclusive.

174
Chapter 6 Conclusion

175
“There is increasing recognition of the benefits of combining spatial analysis with
more qualitative research strategies to uncover the complexities of fisheries… Mixed
methods are likely to prove fruitful in exploring an integrated strategy which is both
iterative and reflexive…”
Urquhart et al. (2014) Fisheries Research, 108, 240-247.
6.1 Introduction
Balancing nature conservation objectives, reaching MRE targets and sustaining an
industry that provides livelihoods and social good is a complex and often conflicted
arena. The UK is to reach its target to produce 33 gigawatts from marine renewable
sources by 2020 (United Kingdom House of Lords, 2008), move towards the
establishment of a representative and coherent network of MPAs by the year 2012
(Jones & Carpenter, 2009), of which progress has been slow and the target is closer
to 2020. Alongside these objectives, there is fisheries policy, i.e. the CFP, the new
changes of which were initiated in 2014 with also a new vision for European fisheries
by 2020 (EC, 2009b). Displacement of fishing effort has implications for the
conservation of habitats, species population on remaining grounds (Dinmore et al.,
2003, Kaiser et al., 2006). In respect to the actual fishers involved, displacement
has caused fishing conflict between gear-types occupying shared space (Murawski
et al., 2005, Suuronen et al., 2010) and has perceived implications, costs, safety
risks due to more time at sea, poorer catches and increased impact on already
vulnerable areas (Mackinson, 2006). Finding the right balance that can address
fisheries policy and achieve sustainability, maintain conservation features in ‘a
176
favourable condition’ and bring about the ability to harness our own energy in order
to meet climate change targets is a difficult road to venture upon. Thus, this thesis
afforded the opportunity to truly interrogate available fisheries data, and add
research to a sparsely populated research area, fishing effort displacement. The key
points from each element of study reported in this thesis are discussed below and
are considered in relation to the overall aim of the thesis and recent developments in
this area of research into fishing effort displacement and fisheries and data policy
development within the EU.
The overall aim of the thesis was to evaluate the suitability of various sources of data,
which could be used to detect, assess, and ultimately predict, fishing effort
displacement due to implementation of marine conservation objectives and the
development of the marine renewable energy (MRE) sector. The key objectives of
this work were to:
Detect, identify and highlight ways in which the UK fishing fleet could be
affected by the development of marine conservation efforts and MRE
development, and how that might translate into the displacement of vessels
into new fishing grounds. Carry out this work at varying resolutions, from the
individual vessel, through assemblages of vessels with the same gear types,
to fishing fleets operating out of individual ports, and finally to whole fleets
operating wholesale out of all ports in the South West of the UK;
Assess what data and analysis methods would be required to detect such a
displacement of fishing effort, and at what resolution and scale would such a
detection be possible; and

177
Assess the potential of these data and methodologies to predict which
fisheries in the > 15 m sector are at risk of fishing effort displacement
And in light of major limitations made to data access, the activities and research that
were undertaken under the auspices of NERC MREKE Programme created an
opportunity to address three further objectives, specifically related to MRE, and
which were not originally planned:
To develop a list of data collection and activities that would enable
assessment of the degree and impact of fishing effort displacement;
To make recommendations to improve both the collection and use of FK for
the assessment of fishing effort displacement; and
To validate a mitigation agenda for fishing effort displacement brought forward
during MREKE Programme workshops.
6.1.1 Research in a changing policy and data climate
The initial literature review identified a range of research requirements to assess
fishing effort displacement (Chapter 2), however it was not until the MREKE
Programme opportunity arose, as described above, that made it apparent that an
interdisciplinary approach would be needed, and a new set of research objectives
created, and various sections added to Chapter 2.
This thesis was conducted in a changing policy and data climate. The data changes
to data access were discussed at length in Chapters 1 and 2. Policy wise, the
development of MSP to balance competing interests in the use of the marine
environment, i.e. fisheries management, biodiversity and MRE development (Qui &

178
Jones, 2013) occurred during the study period. Alongside this, the enactment of the
Marine and Coastal Access Act in November in 2009 required the newly formed
Marine Management Organisation (MMO) and the existing Welsh Government to
produce plans for their inshore and offshore waters. Within this, the overarching
Marine Policy Statement (MPS) which guide these marine plans had some
fundamental statements laid out, one of which states ‘…to reduce real and potential
conflict, maximise compatibility between marine activities and encourage co-
existence of multiple uses’. From the conclusions drawn from this thesis, we are still
a long way from reducing the conflict when it comes to MRE and conservation plans.
And, it is now ironic as the conclusions of this thesis are being drawn, that the EU is
set to change some Fisheries Control Regulations and fisheries data collection
methods from 2017-2020. The current Fisheries Control Regulation 1224/2009. (EC,
2009a), is now .under consultation and all stakeholders have the opportunity to
respond, of particular interest to this thesis concerns information on ‘new instruments
of the EC to ensure the implementation of the CFP by Member States’ (EC, 2016a).
This same Fisheries Control Regulation, which when amended in 2009, blocked
VMS data access, hence this is an important consultation. Thus the changes to
these policies will have a direct impact on the direction of research into fishing effort
displacement.
6.2 Chapter 2
This Chapter shows that there are currently no prescribed methodologies for the
assessment of fishing effort displacement. This Chapter presents the various
methods used to assess fishing activity and illustrates a number of important case
studies that deal with different data sources. Central to all these case studies is the
type of data needed. Currently, in the EU there is another stakeholder consultation
179
underway in trying to establish ‘where are we, and where are we going with our
fisheries’ (EC, 2016b). This Chapter set out the methods that would be appropriate
for the analysis of displacement, and the information contained and research
questions generated would feed directly into this consultation.
6.3 Chapter 3
The methods of Lee et al. (2010) were used to analyse 2-hourly, level 3 VMS data to
derive a number of important parameters to quantify fishing effort in the South West
UK (ICES areas VII e-h inclusive), the most important being fishing activity, defined
in terms of the number of hours fished. In summary, the methods by Lee et al.
(2010): records without an associated gear type, within 3 NM of ports and duplicates
are all removed, to identify bona fide fishing activity, the interval between each
successive record was calculated and only those vessels travelling at a speed less
than 6 knots were deemed to be actively fishing. This methodology was applied to all
gear types. A point summation method followed, using a grid cell size of 0.05° (or 3
arc minutes), equating to 3 NM, the resolution of fishing data considered necessary
to inform MSP. The spatial distribution of fishing activity in South West UK was not
only highly heterogeneous, with distinct areas of intense fishing that could be
identified for all gear types, but also varied significantly in time.
These maps were used to assess the variability of individual fleets. Variability was
here is defined in terms of the degree to which the spatial pattern of fishing effort for
a particular gear type changed over time, quantified by an index of spatial difference
in the distributions of fishing effort. This index revealed that scallop dredgers were
the most transient fleet in South West UK waters, and whose gear type whose shift
in geographic spread between years was easily noticeable by eye on large scale
maps, moving their efforts from the Celtic Sea (including Haig Fras, a Natura 2000

180
site) further south into the western English Channel and Atlantic during the period
2005 to 2008 inclusive. It was revealed that other mobile gear types (beam and otter
demersal trawlers) tend to have a high to intermediate spatial coherence (or low to
intermediate change) in spatial pattern of fishing effort between years, despite their
mobility. This might be because they remain active almost year-round and cover
large areas more uniformly than static gears for which the spatial distribution
conforms to ‘hotspots’ of more intensely fished areas. Variability may be an
important component in assessing economic impact, depending on what drives that
variability
Fishing effort was assessed with specific reference to two major case studies: one
proposed MPA (Haig Fras); and one MREI (Wave Hub). A closure of Haig Fras
would have the greatest impact on gillnetters. Scallop dredgers also occasionally use
the area; however they exhibited much more transient behaviour during the study
period so it is less clear whether their occasional use of the area reflected long term
usage trends. The current closure at Wave Hub has the greatest potential impact on
potters and whelkers whose geographic specialisation is most pronounced, i.e.
fishing small areas most intensely, and who use the area extensively. Longliners
also use the area disproportionately and would be affected. In contrast, the potential
impacts of beam and otter trawlers may be minimal given their much wider spatial
distributions in the nature of their fishing activity.
The index of spatial similarity is a robust method of quantifying changing spatial
distribution but is highly dependent on the size of the cell. Therefore, care should be
taken to report this cell size because meaningful comparisons can only be made
between data sets with identical cell size. If this method proves popular in
subsequent research, a standard cell size should be adopted when conducting

181
regional scale analyses. Much more research would need to be carried out on cell
size when trying to ascertain spatial similarities at much smaller local scales. In
order to promote such a move, the analyses were carried out at a number of different
spatial resolutions (grid sizes) in order to evaluate the effects of spatial resolution on
the computed fishing activity metric. The effect of spatial resolution on calculated
statistics on fishing effort varies markedly with gear type, which is suggested to be
due to capturing, or otherwise, the nature of intense fishing in a relatively small
number of highly localised areas. For example, the spatial resolution made relatively
little difference to data from scallop dredge vessels and beam trawlers, but had much
greater effects of the spatial pattern indices of otter trawlers and potters/whelkers.
Despite the variability between the gear-types, however, some general
recommendations can be drawn from the analysis. Relatively small (<5 %) relative
changes in calculated statistics of fishing effort are to be expected for grid sizes of
less than 0.2 degrees, and that up to 20% relative changes would be expected up to
0.4 degrees. It is recommended that a spatial resolution of no more than 0.2 degree
is appropriate, and that statistics should be computed at resolutions no coarser than
0.4 degrees. In this study, no evidence was found that a grid resolution of less than
0.05 degrees was necessary, which contradicts what was previously reported in the
literature (e.g. Lambert et al., (2013), Hinz et al. (2012)), however these studies
focused on single mobile fisheries in much smaller localised areas, so there is still
some debate on what grid size is appropriate when we conduct regional scale
analysis compared to local scale analysis. It also fuels the debate about assigning
different grid cell sizes for each specific gear-type.
The analyses suggest that high-resolution, 2-hourly VMS data, and the analysis
methods employed, would be sufficient to detect and quantify the changing nature of

182
fishing effort. In particular, due to the spatial extent of the study area, i.e. regional
ICES VII e-h, this 2-hour polling rate is satisfactory. For example, this analysis
captured the changing pattern of fishing effort by scallop dredgers which underwent
marked shifts in spatial distribution between years. However, in order to detect a
displacement in fishing effort caused by closures, appropriate baselines need to be
established which quantify the variability in fishing effort, as determined from VMS
data analysis methods, which would be expected to occur whether or not a closure
takes place. Given the spatial and temporal variability in fishing effort, and the
variability among fleets, establishing baseline conditions against which a change due
to displacement could be detected and evaluated, needs to be as spatially explicit as
possible, which requires high resolution data and appropriate statistics. Developing
protocols for establishing baseline fishing effort, and understanding this ‘natural’
variability, were the subjects of Chapter 4. An MDS analysis was fund to be a very
powerful means with which to visualise differences in fishing effort between different
gear types. A localised index of spatial autocorrelation, Getis-Ord G statistic, was a
very powerful way to capture intensity in fishing effort in a spatially distributed sense,
which should be explored by other researchers in future evaluation of fisheries
displacement in any context.
In a meeting with the ICES Working Group on Fisheries Spatial Data (WGSFD)
(ICES, 2015) participants agreed that the future direction of the WG should be the
‘streamlining of the analytical process and development of robust methodologies’ in
assessing the spatial effort of fishing activity. This also forms one of the high level
recommendations in assessment of fishing effort displacement in section 6.7 at the
end of this Chapter, thus illustrating how aligned this thesis is with the objectives of a
pan-European WG with key experts in this field. Another key component to data

183
analysis, being taken forward by this WG is the standardising of methodologies
across Member States, which is also a key finding of this thesis. The same issues
are still arising in data availability, security and coverage, which are discussed in
great length in Chapter 2 and 3, and the WG some good suggestions on assessment
of data quality, and development of data quality control standards, which this thesis
did consider as part of high level recommendations on assessment of fishing effort
displacement (section 6.7). What is interesting is that the WG submitted a
questionnaire to users of VMS data at the end of 2015 detailing the need for
knowledge on methods and software used and this would be a valuable component
to the Mitigation Toolkit idea described by de Groot et al. (2015) and in fact the first
ToR for a potential ICES Study Group on Fishing Effort Displacement (SGFED)
(Table 6.1, section 6.5.2).This Chapter and Chapter 4 focused on the types of data
which are fundamentally important in the assessment of fishing effort displacement,
as stated by the objectives outlined in Chapter 1. It is promising to observe that in
the EU Implementing Decision (EC, 2016c), through an evaluation of the framework
for the collection, management and use of data in the fisheries sector, a new
multiannual programme should focus on what data are required from Member States.
Regarding data value, there is also high priority on the collection of social and
economic data, which aligns with the findings of Chapter 5.
6.4 Chapter 4
In order to detect and evaluate a change in fishing effort directly attributable to MRE
or MPA associated closures, it is necessary to establish baselines by mapping
fishing effort. In order to detect, plan for and predict fishing effort displacement due
to spatial plans, it is imperative that we develop systematic, repeatable and

184
applicable methods for determining baselines at the smallest possible scale and
resolution that are adequate for each gear-type.
A simple, objective means was developed to assess the natural variability of fishing
effort, as a baseline against which to assess displacement. This index is the
confidence interval of the variation of intensity about the mean fishing effort.
Because it is calculated per gear and per location, calculated relative to, and
expressed as a percentage of, the mean fishing effort, valid comparisons can be
made between gear types, between locations, and over time. Being expressed as a
percentage of the mean allows valid comparisons to be made over time, even if the
absolute magnitude of fishing effort changes over time. Small values of this index
indicate small fluctuations about the mean fishing effort, which is in turn indicative of
a regularly fished region, or a preferred (or ‘stable’) fishing ground. High values of
this index indicate highly variable, sporadic fishing effort not indicative of a stable,
regularly fished area.
Maps of fishing variability index were prepared, for each gear type classification, for
the South West UK region using the same VMS level 3 data from 2005-2008 used in
Chapter 3. For each grid cell, the standard error on the mean fishing effort over the
period was computed and, assuming a normal distribution of fishing effort in that cell,
a coefficient of variation which was expressed as a percentage. It is argued that this
is an intuitive metric which is easy to understand, reproduce and extend to any other
area and time period where VMS level 3 data are available. Maps were created for
each mobile and static gear type, and for mobile and static gear types on aggregate.
The analysis could, and should, easily be extended to more years if the data are
available (which it was not in this instance).

185
The distribution of this index for beam trawl strongly follows proximity to port, with
greater variability in effort the further out to sea being the general pattern. In contrast,
otter trawling occurs in more localised ‘hotspots’ of stable fishing grounds. These
hotspots are not clearly visible when looking at the mean fishing maps. Scallop
dredging shows very high variability almost everywhere. Unlike with beam trawlers
and otter trawlers whose preferred grounds are identifiable from the hotspots of
activity of their respective maps, further years of data would be required to assess
the preferred fishing grounds of scallop dredgers.
For static gears, the spatial distributions of fishing effort variability were different than
mobile gears. Longliners had very stable grounds proximal to southern Cornwall and
Devon ports and in general, variability in fishing effort increases with greater distance
to port. Gillnetters show a wide variation in both areas fished. Small patches of
intense and stable effort are found adjacent to more variably used areas almost
everywhere, but this ubiquitous heterogeneity is not observed in the other gear types.
This implies that establishing baselines and therefore detecting displacement will not
be equally easy for all gear types: some gear types, such as gillnetters, show greater
spatial heterogeneity in fishing variability and therefore might need longer time
periods over which to evaluate statistics in order to establish both baseline and
significant change.
Fishing variability index was calculated for all mobile gears on aggregate and all
static gears on aggregate, and compared qualitatively to maps of economic value
and gross weight of fish caught by mobile and static gears, respectively, derived
from the VMS level 2 data (described in Chapters 1 and 3). The comparison was of
different, but overlapping, periods of time (2005-2008 compared with 2007-2010),
however the analysis was conducted over the same spatial extent and at the same

186
spatial grid resolution. Overlying contours of fish catch weights or monetary value
onto maps of aggregated fishing effort variability index revealed coherent spatial
patterns: as expected, those stable grounds that are fished frequently (with low
variability indices) also tend to yield higher catches, in terms of both liveweight
tonnage and economic value. Those ground with less stable, perhaps less reliable,
fishing (with high variability indices) yielded less catch. This analysis bolsters the
plausibility of the variability metric presented here, insomuch that it captures fishing
effort that helps explain trends revealed by an independent data and set of metrics
(fish catch weight and value). As a rule of thumb, it was revealed that catches over 1
tonne per unit time and greater than 1000 pounds sterling were concentrated in
areas where the variability in fishing effort had a coefficient of variation of less than
240%. This pattern was broadly the same for both mobile and static fishing gears.
Further analyses in other areas and time periods might prove this relationship to be
sufficiently general that specific thresholds of fish catch statistics could be used as
proxies for specific thresholds of fishing effort. It is suggested that proxies such as
this could be useful in situations where access to level 3 VMS data are restricted –
level 2 data in this case (aggregate catch data) can be used as a broad-scale proxy
for variability in fishing effort, which would otherwise only be gleaned using (access-
restricted) level 3 VMS data. Relationships such as these might also act as inputs to
predictive models of fisheries behaviour, to allow modelling of displacement using
simple data-driven scenario-based analysis. For these reasons, given the sensitive
nature of high-resolution VMS data and the limited utility of lower-resolution data in
assessing gear-specific, time-specific, trends in fishing effort, it is suggested that
future work should explore any further relationships between indices that can be
estimated using low-resolution level 2 VMS data (with less access restrictions) that

187
could be used as proxies for fishing effort otherwise only revealed by higher-
resolution data.
Another potential proxy for, or explanatory variable for, seabed substrate could be
fishing effort. The co-variation of substrate type and fishing effort per gear type was
investigated qualitatively, and quantitatively using a General Linear Model (GLM)
analysis. Qualitatively, for static gears, the relationships with substrate are most
obvious: the gillnetting and potting and whelking fleet concentrated significantly on
rocky areas. Longlining activity per unit area was highest over mud, however high
values were also observed on mixed sediment and rock. For mobile gears activity
per unit area of substrate type varied considerably; in general, scallop dredging
occurring on mixed sediment or mud, and beam and otter trawling mainly in muddy
areas with high coverage per unit time in mixed and sand respectively, but there was
large variability in these trends. The GLM revealed that substrate was generally a
poor explanatory variable for fishing effort. This might be due to the mismatch in
spatial resolutions between the substrate information (approximately every 300 m)
and the fishing effort (every 3 nautical miles).
As described in section 6.1.1, important changes to Fisheries Control Regulation
1224/2009 may potentially be underway after an extensive consultation period (EC,
2016a). This Chapter illustrated the need for appropriate baseline data, and the
outcomes of this analysis in this Chapter were akin to a type of ‘risk analysis
approach’ using different metrics to assess the variation in fishing effort per gear-
type over time. One potential area of assessment in this new consultation is the
identification of new instruments to ensure the implementation of the CFP. Within the
draft statements is ‘The first main thrust in this context is the introduction of a
systematic risk analysis approach and the introduction of a comprehensive

188
traceability system as the basis for fisheries control. The new approach aims at
making the best possible use of modern technologies. In particular data have been
automated as far as possible and are subject to comprehensive and systematic
cross-checks with a view to identifying areas where there is a particularly high risk of
irregularities’. This further reinforces the significance of the methods developed in
this Chapter, i.e. the risk of effort displacement due to different conservation or MRE
developments and their importance in informing this consultation.
6.5 Chapter 5
One of the first questions in the survey for fishers (Appendix 1, Q 2) was the
identification of the barriers to progress with regard to the co-existence of marine
renewables and fisheries. One of -the major themes emerging as a barrier to
progress was the displacement of fishing effort or loss of access. Priority issues
identified in order of importance were: displacement of fishing effort or loss of access,
cable disturbances to fishing grounds and fish populations, the timings of
installation/repairs, negative effects on the seabed and specifically OWF siting.
The consultation process caused a lot of discontent among fishers across all gear-
types and regions. The three top themes identified were: the process being
completely inadequate or not fit for purpose, a feeling of disconnection with
management and lack of inclusion in decision making and the lack of the inclusion of
FK in planning. Fishers identified incentives as an important part of mitigation
strategies. Initial validation of a mitigation agenda developed by de Groot et al.
(2014) highlighted themes of lack of trust in relation to trans-boundary issues and
Member States, data management and confidentiality issues and inherent problems

189
with the consultation process that fishers felt did not include them. A Lack of
understanding, process fatigue and uncertainty in funding themes emerged when
validating how an improved collaborative effort between fisheries and MRE would
work as part of the mitigation agenda.
In order of importance: the increased use of FK in planning and management, better
informed siting of MREIs and vulnerability of stocks were the three areas that fishers
felt scientists should focus their research upon. The response rate of the importance
of gathering FK was high and fishers felt this data source was an important element
of trying to assess impacts on the fleet due to MRE. An initial framework for the
collection and application of FK remains was developed.
6.5.1 Consultation process: A new dawn?
Considering the investment in marine renewable energy, it is somewhat disillusioning
to be gaining responses from fishers on how the consultation process is still
inadequate, six years after initial COWRIE work established that early and continued
engagement with the fishing community was essential in order to secure success for
the life cycle of MRE developments. Further work must be carried out in order to:
determine what aspects of this process do not work, examine success and failures
across MRE and conservation and examine best practice examples in order to
ascertain what can be changed. Chapter 5 has presented initial ideas on how the
consultation could be improved through innovation, incentives and working examples.
Investing in technology and engagement techniques for the consultation process has
been identified as the best way forward. The use innovative tools such as interactive
smart pads with mapping software e.g. Alexander et al. (2012) used in initial marine
spatial planning solutions in response to proposed MRE development in the Mull of
Kintyre is one of the best examples of innovative technology. Giving fishers the tools

190
with which to become more informed about the objectives of other ecosystem
services such as MRE and conservation has been identified as a priority, using
examples from freshwater conservation and engaging the public (Cooke et al., 2013),
such as formal teaching methods and development of training manuals that
scientists have a direct input in. The importance of charities like Fishing into the
Future (FiTF) collaborating with Seafish, scientists and fisheries managers which
have been discussed at length in Chapter 5, section 5.4.4 is also part of this
innovative engagement and consultation process. In summary11: FitF are working
with an industry led Steering Group consisting of active fishers along with scientists,
processing and retail and government representatives ‘Focusing on sharing
knowledge, key outcomes include a comprehensive scheme for UK fishermen to
contribute data into the science which underpins fisheries management; training and
education initiatives ,including broadening the scope of skippers' training to include
fisheries biology, management and marketing, and establishing regional knowledge
exchange workshops for fishermen and other seafood industry businesses’. These
are really great strides forward to achieving full representation of fishers in the
consultation process, which was highlighted in the mitigation agenda by de Groot et
al. (2014).
6.5.2 Establishment of an International Council for the Exploration of the Sea
Study Group (ICESSG) on fishing effort displacement: Suggested Terms of
Reference (ToR)
Finally, the study aims to stimulate debate on whether there should be an ICES SG
on fishing effort displacement (SGFED). This SG could be organised within the
Working Group on Marine Renewable Energy (WGMRE), or the Working Group on
Spatial Fisheries Data (WGSFD) alongside the Strategic Initiative on the Human
11 http://www.seafish.org/about-seafish/blog/2013/7/29/fishing-into-the-future

191
Dimension (SIHD). This thesis has shown that assessment of fishing effort
displacement is complex, and the variety of data sources required to quantify it and
the impacts of it, involves the human dimension and data sources such as FK, thus
the SG would have to be aligned between the WG’s shown above. Table 6.1 below
makes an attempt to generate ToRs for this potential SG.
Table 6.1 Table showing ToR Descriptors for the Study Group on Fishing effort
Displacement (SGFED)
ToR Description Background
a
Provide summaries of data sources to assess fishing effort displacement. ‘Horizon scanning’ to identify future data sources
1) Science requirements: The science community need to be updated on what sources of data are valuable 2) Advisory requirements: Advice to WGMRE and SIHD
b Report on methods and tools that are being developed by research teams across the EU/ globally considering cumulative impacts and application of risk-based approaches Horizon scanning to identify future methods
As above
c Identify cross-sectoral issues of MRE with MCZs, co-location
As above
d Foster strong collaborative working relationships with other ICES groups but also research groups across EU/Globally
As above
e Manage NERC Portal Mitigation Toolkit
As above
6.6 The potential of the ‘mixed method approach’
VMS data remains one of the most powerful information sources for analysis of
fishing activity; however, there is room for improvement, such as including smaller

192
vessels, of which is being progressed slowly through the I-VMS project (Chapter 2),
and facilitating easier access to the data for researchers and spatial planners across
EU Member States. Since 2009, changes to access to VMS, and the level of
resolution available due to EC Council regulations as described in detail in Chapters
2 and 3, changes which have affected this study, may prove severely
disadvantageous for accurate assessment of fishing fleet activity and the
consequences of displacement for these fleets, may have societal implications (Hinz
et al., 2012). However as described in the above sections in this Chapter:
consultations are underway in order to assess Fisheries Control Regulations (EC,
2016a) and proposed changes to data collection methods 2017-2020 are currently
being discussed in EU Parliament (EC, 2016c), the elements of which are the basis
of EC Regulation 199/2008 (EC, 2008c). This is promising in terms of pushing the
data needs agenda in relation to assessment of fishing effort displacement, because
as stated in the proposal ‘The new streamlined rules will pave the way for gathering more
and better data to help close persistent gaps in our knowledge. They will give scientists and
decision-makers a better idea of how fisheries are affecting marine and maritime
ecosystems’ (EC, 2016b).
As described in Chapter 1, the consultation of the second tranche of MCZs in the UK
has now closed. In comparison to the results on the first consultation and
designation of MCZs in 2013, the fishing industry has hailed this second tranche site
selection and consultation a success due to the fact that they believe this time it is a
process “based on building a solid knowledge base on which to make these
important decisions” (Barrie Deas, Chief Executive NFFO, pers. comm., January,
2015). This knowledge base equates to robust, high resolution data and the fishing
industry must become more involved in provision of its data, analysis and

193
interpretation given the fact that some MCZ proposals in the South West and Irish
Sea are still being deferred mainly due to issues of fishing effort displacement.
As detailed in Chapter 1, given the high level of potential resources for MRE in the
South West and forecasts showing that the MRE industry by 2030 will be 5 times the
size of the fishing industry (PMSS, 2010a, 2010b), and in an area of highly
productive commercially important seas, it is imperative that data access and sharing
becomes a much higher priority than it currently is, and it will take much better
communication and engagement between the actors involved than currently exists.
Another way of eliciting important data are the use of social science techniques, and
the design of semi-structured interviews to gather information on general aspects of
their trips at sea and their opinions and perceptions on priorities, challenges, barriers
and perception of impacts due to closures for, in this case marine renewable energy
(MRE) and producing semi-quantitative value maps, e.g. ScotMap (McLay et al.,
2012) which can be used to assess fine scale changes in fishing effort.
6.7 Further work and high level recommendations on assessment of
fishing effort displacement
Further clarification of any effects of gear-type and geographical location on fisher
response must be achieved. The small number of fishers interviewed and the fact
that more thematic analyses have to be performed means that results are indicative
rather than conclusive. A lack of access to high-resolution gear-specific fisheries
data raises scientific and socio-economic concerns about the underpinning of
ongoing marine spatial management decisions. Given the rapid current expansion in
European marine space leased to marine renewable energy, and plans for a network
of MPAs that restrict certain fishing gear types, it is imperative that gear-specific

194
VMS and other high resolution fisheries data are made available and used in
conjunction with each other to predict and plan for the likely effects of spatial
restrictions on fisheries.
One such company making waves in fisheries data capture and analysis are
Succorfish. Gaining access to trial data in Lyme Bay that is involved in I-VMS is a
priority. Individual fishers are trialling an app that has the capacity to store meta-
data about each trip as well as a larger suite of environmental data. The vessel also
operates a 2 minute ping rate, out-performing the standard 2 hour ping rate. This
has the potential to revolutionise assessing fisheries displacement, as it operates on
the smallest scale possible and can provide information on individual fisher
behaviour across a range of time scales, which then can be rescaled to sector level
and then fleet level to enable the input of more precise data in order to train current
models in use is the assessment of fisher behaviour. It would be prudent to elucidate
further responses from fishers, or an extension to the original questionnaire in this
study (Appendix 1) in order to further validate a mitigation agenda developed by de
Groot et al. (2014) and gain insight into the value and application of fishers’
knowledge (FK). Perhaps an even greater priority is to assess the actual impact of
the MREKE Programme outcomes and mitigation agenda on each of the actors
involved. There is also the idea to perform research on development of performance
monitoring and assessment of spatially and temporally explicit data. This thesis does
not deal with cumulative impacts of displacement, there must be research into the
development of a suite of tools that are fit for purpose, i.e. are designed with
fisheries displacement in mind but which is not currently in place;
One of the themes in both mitigation and research priorities is trans-boundary issues.
A funding call via INTERREG Europe 2014-2020 with the first round of proposals

195
mid-summer brings a chance for collaboration between Member States on the issue
of fishing effort displacement in a shared sea space.
As a final conclusion to this thesis, there needs to be some high level
recommendations about the assessment of fishing effort displacement. This subject
is complex and throughout the development of MRE, there has been conflict
between the fisheries industry and MRE, and considering the UK will have to reach
its target to produce 33 gigawatts from marine renewable sources by 2020 (United
Kingdom House of Lords, 2008). Due to the nature of MRE developments underway
and updates to rMCZ designations, the recommendations below in some way
contribute to the need for this joined up approach between stakeholders to provide a
cost-effective means of collecting more extensive baseline data (Chapter 4) (MMO,
2013).
Data access changes: Firstly, changes need to come from the top down, but
they need to be a discussion from the bottom up. Data access policy from the
EU has got to change. As discussed in section 6.2-6.3, there are underway a
suite of consultations on Fisheries Regulation and data collection in the EU,
but in order for actual changes a lot more collaboration is required between
scientists working with individual fishers, fishing associations or create new
focus groups within each region in order to provide evidence to the ICES
Groups, who in turn provide advice to OSPAR for example. The impetus is
there, this thesis has captured the attitudes, perceptions and suggestions
from fishers, and the fact that loss of grounds is a priority issue for most of the
fishers interviewed, means that meaningful spatial and temporal analyses
have to be performed. There also has to be some method of MRE developers

196
having to release their data, this was discussed during the MREKE
Programme, but no further action has been taken. The level of physical data
that MRE developers hold is immense, and the data collected is quite large,
why are we duplicating research effort and spending funds that could
otherwise be channelled somewhere else.
Funding: There has to be some investment in initiatives such Fishing into the
Future (FitF) which was discussed at length in Chapter 5,section 5.4.4, who
train fishermen and provide them with educational opportunities, and there
has to be investment in the design of a new consultation process. There may
be a way of MRE developers funding providing much needed investment here
considering the cost of projects, after all it is in their interest to work on the
ground with fishers due to the fact that displacement of fishing effort, or
underestimation of effort can impinge on a projects development. This
funding issue needs to have a long-term vision
NERC MREKE Programme, Fisheries and MRE Displacement Working Group
(WG): Firstly, there needs to be an evaluation of the impacts of this WG on
the 34 invited participants across both the fishing and MRE industry, fishing
associations, conservation practitioners and scientists in order to produce
outputs. This was the first and only of its kind in the UK. Due to funding,
there has not been any development. This WG had three workshops, a report
and publication, and much more engagement needs to occur. This WG has
the potential to contribute greatly to the suggested ICES WGFED detailed
section 6.5.2 and as the first organised WG of its kind, has also the potential
to need to continue to exist, facilitate, provide workshops and conduct
research for the life cycle of MRE developments.
197
Capacity building: There has to be a priority to equip fishers with the
knowledge of scientific methods and training in order to foster better
awareness of other ecosystem services. Assessment of fishing effort
displacement has to be a stakeholder led endeavour, due to the importance of
fisher sources of data, i.e. FK which is discussed at length in Chapter 5.
Fishing into the Future (FitF) as described in Chapter 5, section 5.4.4 are only
one charity who are doing just that, however the key word here is charity, and
that means needed investment. Under this term capacity building, there must
also be an attempt to provide enough training so that fishers can be employed
as consultants, liaison officers for example and work alongside managers and
scientists.
Methods: Lee et al. (2010) made the first attempt to standardise VMS analysis,
and others across Member States have conducted the same analysis, and
developed their own, have however not much development of methods
specifically for fishing effort displacement has occurred since. This needs to
change, and begin standardising other methods and steps are currently being
taken by the ICES Working Group on Fisheries Spatial Data (WGSFD) (ICES,
2015).
Collaboration: There has to be a drive for the fostering of more strategic
collaboration, between research groups across member states who are
involved in the analysis of fishing effort displacement. An idea would be to
hold a meeting, or conference as a potential Kick-off event, perhaps through
ICES channels.
NERC Mitigation Toolkit: It has been discussed throughout this thesis, but this
is very important. There is no one data, methods, best practice and advice

198
repository that includes submission of relevant items by both MRE and fishing
industries, conservation practitioners and scientists. Underpinning this is the
discussion on the development of data protocols and data quality controls as
we are still dealing with sensitive data, and this conversation has to occur now.
Discussed in section 6.2-6.4, a new Danish initiative DISPLACE model has
aspects of what this repository would look like, but overall it is a sharing
platform. Funding is needed in order to employ individuals to begin work on
this.
References
Abernethy, K. E., Trebilcock, P., Kebede, B., Allison, E. H. & Dulvy, N. K. (2010)
Fuelling the decline in UK fishing communities. ICES Journal of Marine
Science, 67, 1076-1085.
Alexander, K. A., Janssen, R., Arciniegas, G., O’Higgins, T. G., Eikelbloom, E. &
Wilding, T. A. (2012) Interactive Marine Spatial Planning: Siting tidal energy
Arrays around the Mull of Kintyre. PLoS ONE, 7(1), e30031.

199
Alexander, K. A., Potts, T. & Wilding, T. A. (2013) Marine renewable energy and
west coast fishers: exploring impacts, opportunities and potential mitigation.
Ocean and Coastal Management, 75, 1-10.
Alexander, K. A., Wilding, T. A. & Heymans, J. J. (2013) Attitudes of Scottish fishers
towards marine renewable energy. Marine Policy, 37, 239-244.
Ali Jalali, M., Lerodiaconou, D., Monk, M., Gorfine, H., Rattray, A. (2015) Predictive
mapping of abalone fishing grounds using LiDAR and commercial catch data.
Fisheries Research, 169, 26-36.
Andersen, B. S. & Christensen, A.S. (2005) Modelling short-term choice behaviour of
Danish fishermen in a mixed fishery. In, Proceedings of the 2005 North
American Association of Fisheries Economists Forum: Fisheries Centre
Research Reports 2006, p. 13-26.
Ashley, M. (2014) The implications of co-locating marine protected areas around
offshore windfarms. Ph.D. Thesis, Plymouth University, Plymouth, UK, 384
pp.
Ashley, M. C., Mangi S. C. & Rodwell L. D. (2013) The potential of offshore wind
farms to act as marine protected areas – a systematic review of current
evidence. Marine Policy, 45, 301-309.
Apitz, S. E., Elliott, M., Fountain, M. & Galloway, T. S. (2006) European
Environmental Management: Moving to an Ecosystem Approach. Integrated
Environmental Assessment and Management, 2(1), 80-85.
Baban, S. M. J. & Parry, T. (2001) Developing and applying a GIS-assisted
approach to locating wind farms in the UK. Renewable Energy, 24, 59-71.

200
Bastardie, F., Nielsen, J. R., Ulrich, C., Egekvist, J. & Degel, H. (2010) Detailed
mapping of fishing activity and landings by coupling fishing logbooks with
satellite-recorded vessel geo-location. Fisheries Research, 106, 41-53.
Beddington, J. R., Agnew, D. J. & Clark, G. D. (2007) Current problems in the
management of marine fisheries. Science, 316, 1713-1716.
Berkenhagen, J., Döring, R., Fock, H. O., Kloppmann, M. H. F., Pedersen, S. A. &
Schulze, T. (2010) Decision bias in marine spatial planning of offshore wind
farms: Problems of singular versus cumulative assessments of economic
impacts on fisheries. Marine Policy, 34(3), 733-736.
Bernard, H. R. (2006) Research methods in anthropology. Qualitative and
quantitative approaches. 4th Edition, Alta Mira Press, Oxford, 803 pp.
Bertrand, S., Diaz, E. & Lengaigne, M. (2008) Patterns in the spatial distribution of
Peruvian anchovy (Engraulis ringens) revealed by spatially explicit fishing
data. Progress in Oceanography, 79, 379-389.
Beukers-Stewart, B. D, Vause, B. J, Mosley, M. W. J., Rossetti, H. L. & Brand, A. R.
(2005) Benefits of closed area protection for a population of scallops. Marine
Ecology Progress Series, 298, 189–204.
Bicknell, A. W. J., Kees, D. O., Camphuysen, C. J. & Votier, S. C. (2013) Potential
consequences of discard reform for seabird communities. Journal of Applied
Ecology, 50(3), 649-658.
Blythe, R. E., Kaiser, M. J, Edwards-Jones, G. & Hart, P. J. B. (2002) Voluntary
management in an inshore fishery has conservation benefits. Environmental
Conservation, 29, 493-508.

201
Blyth-Skyrme, R.E. (2010) Options and opportunities for marine fisheries mitigation
associated with windfarms. Final report for Collaborative Offshore Wind
Research into the Environment contract FISHMITIG09. COWRIE Ltd, London.
125 pp.
Blyth-Skyrme, R.E. (2011) Benefits and disadvantages of Co-locating windfarms and
marine conservation zones; report to Collaborative Offshore Wind Research
Into the Environment Ltd., London, December 2010, 37 pp.
Branch, T. A., Hilborn, R., Haynie, A. C., Fay, G., Flynn, L., Griffiths, J., Marshall, K.
N., Randall, J. K., Scheuerell, J. M., Ward, E.J. & Young, M. (2006) Fleet
dynamics and fishermen behaviour: lessons for fisheries managers.
Canadian Journal of Fisheries and Aquatic Sciences, 63, 1647-1668.
Breton, S. P. & Moe, G. (2009) Status, plans and technologies for offshore wind
turbines in Europe and North America. Renewable Energy, 34, 646-654.
Bruce, L., Townsley, P., Pomeroy, R. & Polnac, P. (2000) Socioeconomic Manual for
Coral Reef Management. Austalian Institute of Marine Science, Townsville,
Australia, 264 pp.
Bruce, E. M. & Eliot, I. G. (2006) A spatial model for marine park zoning. Coastal
Management, 34, 17-38.
Campbell, M. S., Stehfest, K. M., Votier, S. C. & Hall-Spencer, J. M. (2014) Mapping
fisheries for marine spatial planning: gear-specific vessel monitoring system
(VMS), marine conservation and offshore renewable energy. Marine Policy,
45: 293-300.

202
Clement, A., McCullen, P., Falcão, A., Fiorentino, A., Gardner, F., Hammarlund, K.,
Lemonis, G., Lewis, T., Nielsen, K., Petroncini, S., Pontes, T., Schild, P.,
Sjöström, B., Sørensen, H. C. & Thorpe, T. (2002) Wave energy in Europe:
current status and perspectives. Renewable and Sustainable Energy
Reviews, 6, 405-431.
Chatfield, B.S., Van Niel, K., Kendrick, G.A., & Harvey, E.S. (2010) Combining
environmental gradients to explain and predict structure of demersal fish
distributions. Journal of Biogeography 37, 593 – 605.
Cooke, S.J., Lapointe, N.W.R., Martins, E.G., Thiem, J.D., Raby, G. D., Taylor, M.K.,
Beard Jnr, T.D. & Cowx, I.G. (2013) Failure to engage the public in issues
related to inland fish and fisheries: strategies for building public and political
will to promote meaningful conservation. Journal of Fish Biology, 83, 997-
1018.
Connor, D. W., Gilliland, P. M., Golding, N., Robinson, P., Todd, D. & Verling, E.
(2006) UK SeaMap: the mapping of seabed and water column features of UK
seas. Joint Nature Conservation Committee, Peterborough, 113 pp.
Crowder, L. B., Osherenko, G., Young, O. R., Airamé, S., Norse, E. A., Baron, N.,
Day, J. C., Douvere, F., Ehler, C. N., Halpern, B. S., Langdon, S. J., McLeod,
K. L., Ogden, J. C., Peach, R. E., Rosenberg, A. A. & Wilson, J. A. (2006)
Resolving mismatches in U.S. Ocean Governance. Science, 313, 617-618.
Cvitanovic, C., Hobday, A. J., van Kerkhoff, L., Wilson, S. K., Dobbs, K. & Marshall,
N. A. (2015) Improving knowledge exchange between scientists and decision-

203
makers to facilitate the adaptive governance of marine resources: A review of
knowledge and research needs. Ocean & Coastal Management, 112, 25-35.
Davies, A., Roberts, J. M. & Hall-Spencer, J.M. (2007) Preserving deep-sea natural
heritage: emerging issues in offshore conservation and management.
Biological Conservation, 298, 299-312.
Daw, T.M. (2008) Spatial distribution of effort by artisanal fishers: Exploring
economic factors affecting the lobster fisheries of the Corn Islands, Nicaragua.
Fisheries Research, 90: 17-25.
Defra (2002). Safeguarding our seas: A Strategy for the Conservation and
Sustainable Development of our Marine Environment, DEFRA, London.
Defra (2007) United Kingdom Sea Fisheries Statistics 2007. Department of
Environment, Food and Rural Affairs (Defra), London, pp. 104.
Degnbol, P., Gislason, H., Hanna, S., Jentoft, S., Raakjær, J., Sverdrup-Jensen, S. &
Wilson, D.C. (2006) Painting the floor with a hammer: technical fixes in
fisheries management. Marine Policy, 30: 534-43.
Deng, R., Dichmont, C., Milton, D., Haywood, M., Vance, D., Hall, N. & Die, D. (2005)
Can vessel monitoring system data also be used to study trawling intensity
and population depletion? The example of Australia's northern prawn fishery.
Canadian Journal of Fisheries and Aquatic Sciences, 62, 611-622.
De Groot, R. S., Alkemade, R., Brat, L., Hein, L. & Willemen, L. (2010) Challenges
in integrating the concept of ecosystem services and values in landscape

204
planning, management and decsion making. Ecological Complexity, 7, 260-
272.
de Groot, J., Campbell, M., Ashley, M. & Rodwell, L. (2014) Investigating the co-
existence of fisheries and offshore renewable energy in the UK: Identification
of a mitigation agenda for fishing effort displacement. Ocean and Coastal
Management, 102, 7-18.
Dinmore, T. A, Duplisea, D. E., Rackham, B. D., Maxwell, D. L. & Jennings, S. (2003)
Impact of a large-scale area closure on patterns of fishing disturbance and the
consequences for benthic communities. ICES Journal of Marine Science, 60,
371-380.
Douvere, F. (2008) The importance of marine spatial planning in advancing
ecosystem-based sea use management. Marine Policy, 32, 762-771.
Douvere, F. & Ehler, C. N. (2009) New perspectives on sea use management: initial
findngs from European experience with marine spatial planning. Journal of
Environmental Management, 90, 77-88.
Douvere, F. & Ehler, C. (2010) The importance of monitoring and evaluation in
adaptive maritime spatial planning. Journal of Coastal Conservation, 15(2),
305-311.
Eastwood, P. D., Mills, C. M., Aldridge, J. N, Houghton, C. A. & Rogers, S. I. (2007)
Human activities in UK offshore waters: an assessment of direct, physical
pressure on the seabed. ICES Journal of Marine Science, 64, 453-463.
European Commission (EC) (2002a) Commission Regulation (EC) No 2371/2002 of
20 December 2002 on the conservation sustainable exploitation of fisheries

205
resources under the Common Fisheries Policy. Official Journal of the
European Union, L358, 59-80.
European Commission (EC) (2002b) Opinion of the European Economic and Social
Committee on the ‘Commission Communication of the Reform of the Common
Fisheries Policy’ (“Roadmap”), 28th May 2002, COM(2002) 181final,
European Commission (EC) (2003) Commission Regulation No. 2244/2003 of 18
December 2003. Laying down detailed provisions regarding satellite-based
Vessel Monitoring Systems. Official Journal of the European Union, L 333,
17–27.
European Commission (EC) (2008a) Directive 2008/56/EC of the European
Parliament and of the Council of 17 June 2008 establishing a framework for
community action in the field of marine environmental policy (Marine Strategy
Framework Directive). Official Journal of the European Union, L 164/19.
European Commission (EC) (2008b) Commission Regulation (EC) No 665/2008 of
14 July 2008 laying down detailed rules for the application of Council
Regulation (EC) No 199/2008 concerning the establishment of a Community
Framework for the collection, management and use of data in the fisheries
sector and support for scientific advice regarding the Common Fisheries
Policy. Official Journal of the European Union, L186, 3-5.
European Commission (EC) (2008c) Commission Decision of 6 November 2008
adopting a multiannual Community programme pursuant to Council
Regulation (EC) No 199/2008 establishing a Community framework for the
collection, management and use of data in the fisheries sector and support for

206
scientific advice regarding the Common Fisheries Policy (2008/949/EC).
Official Journal of the European Union, L346, 37-88.
European Commission (EC) (2009a) Proposal for a Council Regulation 1224/2009.
Establishing a Community control system for ensuring compliance with the
rules of the Common Fisheries Policy DS 329/09 20 May 2009. CM 2229/09.
European Commission (EC) (2009b) Green Paper: Reform of the Common Fisheries
Policy, 22 April 2009. COM(2009)163 final, 27 pp.
European Commission (EC) (2011a) Commission Implementing Regulation (EU) No
404/2011 of 8th April 2011. Laying down detailed rules for the implementation
of Council Regulation EC No 1224/2009 establishing a Community control
system for ensuring compliance with the rules of the Common Fisheries
Policy. Official Journal of the European Union, L112/1.
European Commission (EC) (2011b) Commission Directive 2011/15/EU of 23
February 2011 amending Directive 2002/59/EC of the European Parliament
and of the Council establishing a Community vessel traffic monitoring and
information system. Official Journal of the European Union, L49/33.
European Commission (EC) (2012) Green Paper Marine Knowledge 2010: from
seabed mapping to ocean forecasting, COM (2012) 473 Final, 28 pp.
European Commission (EC) (2016a) Consultation Document: Evaluation of Fisheries
Regulation EC 1224/2009 on Fisheries Control, 11 pp.
European Commission (EC) (2016b) Communication from the Commission to the
European Parliament and the Council. Consultation on the fishing

207
opportunities for 2017 under the Common Fisheries Policy, 15 June 2016,
COM(2016) 396 final, 10 pp.
European Commission (EC) (2016c) Commission Implementing Decision EU
2016/1251. Adopting a multiannual Union Programme for the collection,
management and use of data in fisheries and aquaculture sectors for the
period 2017-2019. L207/113, 12pp.
Evariste, E., Claquin, P., Robin, J., Auber, A., Mc Quattors-Gallop, A., Fletcher, S.,
Glegg, G. & Dauvin, J. (2015) What did we learn from PEGASEAS Forum
“Science and governance of the Channel ecosystem?” Marine Pollution
Bulletin, 93, 1-4.
FLOWW (2008) Fishing Liaison with Offshore Wind and Wet Renewables Group
(FLOWW) Recommendations for Fisheries Liaison. Best practice guidance for
offshore renewables developers. Department for Business, Enterprise &
Regulatory Reform (BERR), May 2008, 34 pp.
Fock, H. O. (2008) Fisheries in the context of marine spatial planning: Defining
principal areas for fisheries in the German EEZ. Marine Policy, 32, 728-739.
Foley, M. M., Halpern, B. S., Micheli, F., Armsby, M. H., Caldwell, M. R., Crain, C. M.,
Rohr, N., Sivas, D., Beck, M. W., Carr, H., Crowder, L. B., Duffy, J. E., Hacker,
S. D., McLeod, K. L., Palumbi, S. R., Peterson, C. H., Regan, H. M.,
Ruckelshaus, M.H., Sandifer, P. A. & Steneck, R. S. (2010) Guiding principles
for marine spatial planning. Marine Policy, 34, 955-966.

208
Fulton, E. A., Smith, A. D. M., Smith, D. C. & van Putten, I. E. (2011) Human
behaviour: the key source of uncertainty in fisheries management. Fish &
Fisheries, 12, 2-17.
Furness, R. W. (2003) Impacts of fisheries on seabird communities. Scientia Marina,
67, 33-45.
Furness, R. W., Edwards, A. E. & Oro, D. (2007) Influence of management practices
and of scavenging seabirds on availability of fisheries discards to benthic
scavengers. Marine Ecology Progress Series, 350, 235-244.
Gell, F. R. & Roberts, C. M. (2003) Benefits beyond boundaries: the fishery effects
of marine reserves. Trends in Ecology and Evolution, 18, 448–455.
Gerritsen, H. & Lordan, C. (2011) Integrating vessel monitoring systems (VMS) data
with daily catch data from logbooks to explore the spatial distribution of catch
and activity at high resolution. ICES Journal of Marine Science, 68, 245-252.
Gerritsen, H. D, Minto, C. & Lordan, C. (2013) How much of the seabed is impacted
by mobile gear? Absolute estimates from Vessel Monitoring System (VMS)
point data. ICES Journal of Marine Science, 70(3), 523-531.
Gilliland, P. M. & Laffoley, D. (2008) Key elements and steps in the process of
developing ecosystem-based marine spatial planning. Marine Policy, 32, 787-
796.
Gray, T., Haggett, C. & Bell, D. (2005) Offshore wind farms and commercial fisheries
in the UK: a study in Stakeholder Consultation. Ethics, Place and Environment,
8, 127-140.

209
Griffin, L. (2009) Scales of knowledge: north Sea fisheries governance, the local
fisherman and the European scientist. Environmental Politics, 18, 557-575.
Hall-Spencer, J. M. & Moore, P.G. (2000) Scallop dredging has profound, long-term
impacts on maerl habitats. ICES Journal of Marine Science, 57, 1407–1415.
Hall-Spencer, J. M., Rodolfo-Metalpa, R., Martin, S., Ransome, E., Fine, M., Turner,
S. M., Rowley, S.J., Tedesco, D. & Buia, M-C. (2008) Volcanic carbon dioxide
vents reveal ecosystem effects of ocean acidification. Nature, 454, 96-99.
Hall-Spencer, J. M., Tasker, M., Soffker, M., Christiansen, S., Rogers, S., Campbell,
M. & Hoydal K. (2009) The design of Marine Protected Areas on High Seas
and territorial waters of Rockall. Marine Ecology Progress Series, 397, 305-
308.
Halpern, B. S., Gaines, S. D. & Warner, R. R. (2004) Confounding effects and the
displacement of fishing effort from marine reserves. Ecological Applications,
14(4), 1248-1256.
Halpern, B. S., Walbridge, S., Selkoe, K. A., Kappel, C. V., Micheli, F., D’Agrosa, C.,
Bruno, J. F., Casey, K. S., Ebert, C., Fox, H. E., Fujita, R., Heinemann, D.,
Lenihan, H. S., Madin, E. M. P., Perry, M.T., Selig, E. R., Spalding, M.,
Steneck, R. & Watson, R. (2008) A Global Map of Human Impact on Marine
Ecosystems. Science, 319, 948-952.
Halpern, B.S., Diamond, J., Gaines, S., Gelcich, S., Gleason, M., Jennings, S.,
Lester, S., Lace, A., McCook, L., McLoed, K. L., Napoli, N., Rawson, K,, Rice,
J., Rosenberg, A., Ruckleshaus, M., Saier, B., Sandifer, P., Scholz, A. &

210
Zivian, A. (2012) Near time priorities for the science, policy and practice of
Coastal and Marine Spatial planning (CMSP). Marine Policy, 36, 198-205.
Hiddink, J.G., Hutton, T., Jennings, S.& Kaiser, M. J. (2006) Predicting the effects of
area closures and fishing activity restrictions on the production, biomass, and
species richness of benthic invertebrate communities. ICES Journal of Marine
Science, 63, 822-830.
Hiddink J. G., Johnson A. F., Kingham, R. & Hinz, H. (2011) Could our fisheries be
more productive? Indirect negative effects of bottom trawl fisheries on fish
condition. Journal of Applied Ecology, 48(6), 1441-1449.
Hilborn, R. (2007) Managing fisheries is managing people: what has been learned?
Fish & Fisheries, 8, 285-296.
Hilborn, R. & Walters, C.J. (1992) Quantitative fisheries stock assessment: choice,
dynamics and uncertainty. Reviews ion Fish Biology and Fisheries, 2(2): 177-
178.
Hilborn, R., Orensanz, J.M. & Parma, A.M. (2005) Institutions, incentives, and the
future of fisheries. Philos. Trans. R. Soc. London. B Biol., 360(1453), 47-57.
Hind, E.J. (2011) The Socio-Economic Marine Research Unit (SEMRU) National
University of Galway; Working Paper 10-WP-SEMRU-11 Fishers: The
Forgotten Scientists.
Hind, E. (2012) Last of the hunter gatherers or the next scientists: Arguments for
and against fishers and their knowledge inclusion in mainstream fisheries
management. Ph.D. Thesis. National University of Galway, Ireland.

211
Hind,E. (2015) A review of the past, present and future use of fishers’ knowledge
research: A challenge to established fishery science. ICES Journal of Marine
Science, 72(2), 341-358.
Hinz, H., Prieto, V. & Kaiser, M. J. (2009) Trawl disturbance on benthic communities:
chronic effects and experimental predictions. Ecological Applications, 19(3),
761-773.
Hinz, H., Murray, L.G., Lambert, G. I., Hiddink, J. G. & Kaiser, M. J. (2013)
Confidentiality over fishing effort data threatens science and management
progress. Fish and Fisheries, 14(1), 110-117.
Hintzen, N. T., Piet, G. J. & Brunel, T. (2010) Improved estimation of trawling tracks
using cubic hermite spline interpolation of position registration data. Fisheries
Research, 101, 108-115.
Howell, K. (2010) A benthic classification system to aid in the implementation of
marine protected area networks in the deep/high seas of the NE Atlantic.
Biological Conservation, 143(5), 1041-1056.
ICES (2007) Report of the ICES Advisory Committee on Fishery Management,
Advisory Committee on Marine management and Advisory Committee on
Ecosystems. ICES Advice, Book 8, 150 pp.
ICES (2010) Report of the Study Group on VMS data, its storage, access and tools
for analysis (SGVMS), 8-9th September 2010, Hamburg, Germany. ICES
CM/2010/SSGSUE:12, 46 pp.

212
ICES (2015) Report of the Working Group on Fisheries Spatial data (WGSFD), 8-
12th June 2015, ICES Headquarters, Copenhagen, Denmark. ICES CM
2015/SSGEPI:18, 150 pp.
ITU-R (2014) International Telecommunication Union, Radio Communication.
Recommendation ITU-R, M.1371-3. Technical characteristics for an automatic
identification system using time division multiple access in the VHF maritime
mobile band. Geneva, 148 pp.
Inger, R., Attrill, M. J., Bearhop, S., Broderick, A. C., Grecian, W.J., Hodgson, D.J.,
Mills, C., Sheehan, E., Votier, S.C., Witt, M.J. & Godley, B. J. (2009) Marine
Renewable energy: potential benefits to biodiversity? An urgent call for
research. Journal of Applied Ecology, 46, 1145-1153.
Jalali, M. A., Lerodiaconou, D., Gorfine, H., Monk, J. & Rattray, A. (2015) Exploring
spatiotemporal trends in fishing effort of an abalone fishing zone: A GIS based
hotspot model. PLoS ONE, 10(5), e0122995.
Jennings, S. & Lee, J. (2012) Defining fishing grounds with vessel monitoring system
data. ICES Journal of Marine Science, 69(1), 51-63.
Jennings, S., Lee, J. & Hiddink, J. G. (2012) Assessing fishery footprints and the
trade-offs between landings value, habitat sensitivity and fishing impacts to
inform marine spatial planning and an ecosystem approach. ICES Journal of
Marine Science, 69(6), 1053-1063.
JNCC (2008) Offshore Special Area of Conservation: Haig Fras. SAC Selection site
Version 4.0, 14 pp. Available from

213
http://jncc.defra.gov.uk/PDF/haigFras_selectionAsseessment_4.0.pdf
[Accessed September 2010]
Johannes, R.E. & Yeeting, B. (2001) I-Kiribati knowledge and management of
Tarawa’s lagoon resources. Atoll Research Bulletin. 489. Available at:
http://hdl.handle.net/10088/4979 [Accessed 5 March 2012].
Jones, P. J. S. & Carpenter, A. (2009) Crossing the divide: The challenges of
designing an ecologically coherent and representative network of MPAs for
the UK. Marine Policy, 33, 737–743.
Kaiser, M. J., Clarke, K. R, Hinz, H., Austen, M. C. V., Somerfield, P. J. & Karakassis,
I. (2006) Global analysis and the prediction of the response of benthic biota to
fishing. Marine Ecology Progress Series, 311, 1-14.
Kaplan, I.M. & McCay, B.J. (2004) Cooperative research, co-management and the
social dimension of fisheries science and management. Marine Policy, 28,
257-258.
Kenkel, N. C. & Orlóci, L. (1986) Applying metric and nonmetric multidimensional
scaling to ecological studies: Some new results. Ecology, 67, 919-928.
Kraus, G., Pelletier, D., Debreuil, J., Möllmann, C., Hinrichsen, H-H., Bastardie, F. et
al. (2009) A model-based evaluation of marine protected areas: An example
of eastern Baltic cod (Gadhus morhua callarias L.). ICES Journal of Marine
Science, 66, 109-121.
Lade, S. J., Nirranen, S., Hentati-Sundberg, J., Bleckner, T., Boonstra, W. J., Orach,
K. et al. (2015) An empirical model of the Baltic Sea reveals the importance of
214
social dynamics for ecological regime shifts. Proceeddings of the National
Academy of Sciences, 112(35), 11120-11125.
Lambert, G., Jennings, S., Hiddink, J. G., Hinzten, N. T., Hinz, H., Kaiser, M. J. &
Murray, L. (2012) Implications of using alternative methods of vessel
monitoring system data analysis to describe fishing activities and impacts.
ICES Journal of Marine Science, 69, 682-693.
Lee, J., South, A. & Jennings S. (2010) Developing reliable, repeatable, and
accessible methods to provide high-resolution estimates of fishing-activity
distributions from vessel monitoring system (VMS) data. ICES Journal of
Marine Science, 67, 1260-1271.
Lewison, R. L, Crowder, L. B., Read, A. J. & Freeman, S. A. (2004) Understanding
impacts of fisheries bycatch on marine megafauna. Trends in Ecology &
Evolution, 19, 598-604.
Mackinson, S. (2001) Integrating local and scientific knowledge: an example in
fisheries science. Environmental Management, 27: 533-45.
Mackinson, S., Curtis, H., Brown, R., McTaggart, K., Taylor, N., Neville, S., Rogers,
S., 2006. A report on the perceptions of the fishing industry into the potential
socio-economic impacts of offshore wind energy developments on their work
patterns and income. CEFAS and Seafish document E1103, Science series
technical report E113, October 2006, 63 pp.
Mahévas, S. & Pelletier, D. (2004) ISIS-Fish, a generic and spatially explicit
simulation tool for evaluating the impact of management measures on
fisheries dynamics. Ecological Modelling, 171, 65-84.

215
Mangi, S.C., Rodwell, L.D. & Hattam, C. (2011) Assessing the Impacts of
Establishing MPAs on Fishermen and Fish Merchants: The Case of Lyme Bay,
UK. Ambio, 40, 457-468.
Maravelias, C. D., Reid, D.G., & Swartzman, G. (2000) Seabed substrate, water
depth and zooplankton as determinants of the prespawning spatial
aggregation of North Atlantic herring. Marine Ecology Progress Series, 195,
249-259.
Marine Scotland (2013) Draft Report on ScotMap. The Inshore Fishing Study Pilot in
Pentaldn Firth and Orkney Waters, 18 pp.
Marshall. P. & Robert, T. (1998) FAO Technical Guidelines for Responsible Fisheries,
No.1 Suppl.1. Food and Agriculture Organization of the United Nations 1998,
58 pp. Rome.
Maxwell, S. M., Hazen, E. L., Lewison, R. L., Dunn, D. C., Bailey, H., Bograd, S. J.,
Briscoe, D. K., Fosette, S., Hobday, A. J., Bennett, M., Benson, S., Caldwell,
M, R., Costa, D. P., Dewar, H., Eguchi, T., Hazen, L., Kohin, S., Sippel, T. &
Crowder, L. B. (2015) Dynamic ocean management: Defining and
conceptualizing real time management of the ocean. Marine Policy, 58, 42-50.
MATLAB (2007) The Mathworks, Inc. Natick, MA, USA.
Mazarella, F., Vespe, M., Damalas, D. & Osio, G. (2014) Discovering vessel activites
at sea using AIS data: Mapping of fishing footprints. In, The 17th International
Conference on Information Fusion (FUSION). Salamanca, 12-17th July 2014.

216
McBreen, F., Askew, N., Cameron, A., Connor, D., Ellwood, H. & Carter, A. (2011)
UK Seamap 2010. Predictive Mapping of UK seabed habitats in UK waters.
JNCC Report No. 446, October 2011, 109 pp.
McLay, A., Gubbins, M., Jones, G., Watret, R., Barreto, E. & Bruce, D. (2012)
Mapping inshore fishing activity to inform marine planning in Scotland: A pilot
project using stakeholder data in the Pentland Firth and Orkney waters. ICES
CM 2012/I:07.
Millenium Ecosystem Assessment (MEA) (2005)
Mills, C. M., Townsend, S. E., Jennings, S., Eastwood, P. D. & Houghton, C. A.
(2007) Estimating high resoltution fishing effort from satellite based vessel
monitoring system data. ICES Journal of Marine Science, 64, 248-255.
Mitchell, P. I, Newton, S. F, Ratcliffe, N. & Dun, T.E. (2004) Seabird Populations of
Britain and Ireland. A & C Black Publishers Ltd, London, 509 pp.
MMO (2012) Lyme Bay and Torbay cSAC. Vessel Monitoring trials- Joint final report
Marine Management Organisation (MMO) and Devon & Severn IFCA,
Southern IFCA, 35 pp. [Accessed July 2012]
MMO (2013) Evaluation on the current state of knowledge on potential cumulative
effects from Offshore Wind Farms (OWF) to inform marine planning and
licensing. Prepared by Cefas for the MMO, May 2013, MMO Project No:1009.
MMO (2014a) Inshore Vessel Monitoring System Project.
https://www.gov.uk/inshore-vessel-monitoring-system-project [Accessed
December 2014].

217
MMO (2014b) Scoping the opportunities and challenges of using a ‘core fishing
grounds’ approach to develop a marine spatial plan policy for fishing. A report
prepared for the Marine Management Organisation, MMO Project No. 1074,
September 2014, 85 pp.
Moran, P. A. P. (1950) Notes on continuous stochastic phenomena. Biometrika, 37:
17-23.
Murawski, S. A, Wigley, S. E, Fogarty, M. J., Rago, P. J. & Mountain, D. G. (2005)
Activity distribution and catch patterns adjacent to temperate MPAs. ICES
Journal of Marine Science, 62, 1150-1167.
Murray, G.D., Neis, B. & Johnsen, J. (2006) Lessons learned from reconstructing
interactions between local ecological knowledge, fisheries science, and
fisheries management in the commercial fisheries of Newfoundland and
Labrador Canada. Human Ecology, 34: 549-572.
Murray, L. G., Hinz, H. & Kaiser, M. J. (2011) Functional response of fishers in the
Isle of Man scallop fishery. Marine Ecology Progress Series, 430, 157-169.
Neis, B. (1992) Fishers’ ecological knowledge and stock assessment in
Newfoundland. Newfoundland and Labrador Studies, 8: 155-78.
O’Hara, R. B. & Kotze, D.J. (2010) Do not log-transform count data. Methods in
Ecology and Evolution, 1(2),118-122.
Ord, J.K. & Getis, A. (1995) Local spatial autocorrelation statistics: Distributional
issues and an application. Geographical Analysis, 27: 286-306.

218
Pallotta, G., Vespe, M. & Bryan, K. (2013) Vessel pattern knowledge discovery from
AIS data: A framework for anomaly detection and route prediction. Entropy,
15, 2218-2245.
Patrão Neves, M. (2013) Report on Marine Knowledge 2020: Seabed mapping for
promoting sustainable fisheries. Report submitted to Committee on Fisheries
for a plenary vote, (2013/2101(INI), 15 pp.
Pedersen, S. A., Fock, H. O. & Sell, A. F. (2009a) Mapping fisheries in the German
exclusive economic zone with special reference to offshore Natura 2000 sites.
Marine Policy, 33, 571–590.
Pedersen, S. A., Fock, H., Krause, J. K., Push, C., Sell, A. F., Böttcher, U., Rogers,
S. I, Sköld, M., Skov, H., Podolska, M., Piet, G. J. & Rice, J. C. (2009b)
Natura 2000 sites and fisheries in German offshore waters. ICES Journal of
Marine Science, 66, 155-169.
PMSS (2010a) Offshore Renewables Resource Assessment and Development
(ORRAD) Project - Technical Report. Report prepared for the South West
Regional Development Agency, October 2010, 62 pp. [Accessed June, 2011]
PMSS (2010b) Offshore Renewables Resource & Development (ORRAD)- South
West Ecomonic Impact Assessment. Report prepared for the South West
Regional Development Agency, November 2010, 65 pp. [Accessed June,
2011]
Prest, R., Daniell, T. & Ostendorf, B. (2007) Using GIS to evaluate the impact of
exclusion zones on the connection cost of wave energy to the electricity grid.
Energy Policy, 35, 4516-4528.

219
QSR International (2010) NVivo qualitative data analysis software. QSR
International Pty Ltd Version 10. Victoria, Australia.
Qui, W. & Jones, P. J. S. (2013) The emerging policy landscape for marine spatial
planning in Europe. Marine Policy, 39(1), 182-190.
Rees, E. I. S. (2000) Preliminary observations on benthic biotopes at Haig Fras: an
isolated submmerged rock in the Celtic Sea. Southampton:
OSPAR/ICES/EEA Second Workshop on habitat Classification, 18-22
Sepetmber, 9 pp.
Rees, S. E., Attrill, M. J., Austen, M. C., Mangi, S. C., Richards, J. P. & Rodwell, L. D.
(2010) Is there a win-win scenario for marine nature conservation? A case
study of Lyme Bay, England. Ocean & Coastal Management, 53, 135-145.
Rees, S., Fletcher, S., Glegg, G., Marshall, C., Rodwell, L., Jefferson, R., Campbell,
M., Langmead, O., Ashley, M., Bloomfield, H., Brutto, D., Colenutt, A.,
Conversi, A., Earll, B., Abdel Hamid, I., Hattam, C., Ingram, S., McKinley, E.,
Mee, L., Oats, J., Peckett, F., Portus, J., Reed, M., Rogers, S., Saunders, J.,
Scales, K. & Wynn, R. (2013a) Priority questions to shape the marine and
coastal policy research agenda in the United Kingdom. Marine Policy, 38,
531-537.
Rees, S. E., Rodwell, L., Searle, S. & Bell, A. (2013b) Identifying the issues and
options for managing the societal impacts of Marine Protected Areas on a
small fishing community. Fisheries Research, 146, 51-58.

220
Richardson, E. A., Kaiser, M. J., Edwards-Jones, G. & Possingham, H. (2006)
Sensitivity of marine-reserve design to the spatial resolution of socioeconomic
data. Conservation Biology, 20, 1191-1202.
Rijnsdorp, A. D., Mourik, B. PLv. & Visser, E. G. (2000) Competitive interactions
among beam trawlers exploiting local patches of flatfish in the North Sea.
ICES Journal of Marine Science, 57, 894-902.
Rijnsdorp, A., Dol, W., Hoyer, M. and Pastoors, M. (2000) Effects of fishing power
and competitive interactions among vessels on the effort allocation on the trip
level of the Dutch beam trawl fleet. ICES Journal of Marine Science, 57, 927.
Roberts, C. M., Hawkins, J. P. & Gell, F. R. (2005) The role of marine reserves in
achieving sustainable fisheries. Philosophical Transactions of the Royal
Society B: Biological Sciences, 360, 123-132.
Rodwell, L. D., Campbell, M., de Groot, J. R., Ashley, M. (2012) Fisheries and
marine renewable energy interactions: a summary report on a scoping
workshop for the Marine Renewable Energy Knowledge Exchange
Programme (MREKEP), held at Environmental Interactions of Marine
Renewable Energy Technologies (EIMR) Conference, Orkney, May 3-6, 20 pp.
Rodwell, L. D., de Groot, J. R., Ashley, M., Campbell, M., Linley, A. (2013) Fisheries
and marine renewable energy interactions: assessment and mitigation: a final
report on the expert workshop for the Marine Renewable Energy Knowledge
Exchange Programme (MREKEP), York, April 17-18, 33 pp.

221
Rodwell, L. D., Fletcher, S., Glegg, G. A., Campbell, M., Rees, S. A., Ashley, M.,
Linley, E. A., Frost, M., Earll, B., Wynn, R. B., Almada-Villela, P., Lear, D.,
Stanger, P., Colenutt, A., Davenport, F., Barker-Bradshaw, N. J. & Covey, R.
(2014a) Marine and coastal policy in the UK: Challenges and opportunities in
a new era, Marine Policy, 45, 251-258.
Rodwell, L. D., Lowther, J., Hunter, C. & Mangi, S. C. (2014b) Fisheries co-
management in a new era of marine policy in the UK; A preliminary
assessment of stakeholder perceptions. Marine Policy, 45, 279-286.
Rogers, A. D, Clark, M. R, Hall-Spencer, J. M. & Gjerde, K.M. (2008) A scientific
guide to the FAO draft international guidelines (December 2007) for the
management of deep-sea fisheries in the High Seas. IUCN, Switzerland, 48
pp.
Russo, T., Parisi, A. & Cataudella, S. (2011) New insights in interpolating fishing
tracks from VMS data for different métiers. Fisheries Research, 108, 184-194.
Sen, S. (2010) Developing a framework for displaced fishing effort programs in
marine protected areas. Marine Policy, 34(6), 1171-1177.
Shephard, S., Gerritsen, H., Kaiser, M. J. & Reid, D. G. (2012) Spatial heterogeneity
in fishing creates de facto refugia for endangered Celtic Sea elasmobranchs.
PLoS ONE, 7(11), e49307.
Shields, M. A, Dillon, L. J., Woolf, D. K. & Ford, A. T. (2009) Strategic priorities for
assessing ecological impacts of marine renewable energy devices in the
Pentland Firth (Scotland, UK). Marine Policy, 33, 635-642.

222
Shucksmith, R. J & Kelly, C. (2014) Data collection and mapping- principles,
processes and applications of marine spatial planning. Marine Policy, 50, 27-
33.
Smith, M. D. & Wilen, J. E. (2003) Economic Impacts of Marine Reserves: The
Importance of Spatial Behaviour. Journal of Environmental Economics and
Management, 46, 183-206.
SOLAS (2002) International Convention for the Safety of Life at Sea. Chapter V:
Safety of Navigation, Regulation 19, 13 December 2002.
Soto, C.G. (2006) Socio-cultural barriers to applying fishers’ knowledge in fisheries
management: an evaluation of literature cases. Ph.D Thesis. Simon Fraser
University, Burnaby, Canada.
Spalding, M. D., Fish, L. & Wood, L. J. (2008) Towards a representative protection
of the world’s coasts and oceans - progress, gaps, and opportunities.
Conservation Letters, 1, 217-226.
Stelzenmüller, V., Rogers, S. I. & Mills, C.M. (2008) Spatio-temporal patterns of
fishing pressure on UK marine landscapes, and their implications for spatial
planning and management. ICES Journal of Marine Science, 65, 1081-1091.
Stelzenmüller, V., Lee, J., Garnacho, E. & Rogers, S. I. (2010a) Assessment of a
Bayesian Belief Network-GIS framework as a practical tool to support marine
planning. Marine Pollution Bulletin, 60, 1743-1754.
Stelzenmüller, V., Lee, J., South, A. & Rogers, S. I. (2010b) Quantifying cumulative
impacts of human pressures on the marine environment: a geospatial
modelling framework. Marine Ecology Progress Series, 398, 19-32.

223
Stelzenmüller, V., Lee, J., South, A., Foden, J. & Rogers, S. I. (2013) Practical tools
for supporting marine spatial planning: A review and some prototype tools.
Marine Policy, 34, 214-227.
Stelzenmüller, V., Vega Fernández, T., Cronin, K., Röckmann, C., Pantazi, M.,
Vanaverbeke, J., Stamford, T. (2015) Assessing uncertainty associated with
the monitoring and evaluation of spatially managed areas. Marine Policy, 51,
151-162.
Stephenson, R. L., Stacey, P., Pastoors, M. A., Kraan, M., Holm, P., Wiber, M.,
Mackinson, S., Dankel, D. J., Brooks, K. & Benson, A. (2016) Integrating
fishers’ knowledge research into science and management. ICES Journal of
Marine Science, 73(6): 1459-1465.
Stewart, R. R. & Possingham, H. P. (2005) Efficiency, costs and trade-offs in marine
reserve system design. Environmental Modelling & Assessment, 10, 203-213.
Stöhr, C. & Chabay, I. (2010) Science and participation in governance of the Baltic
Sea fisheries. Environmental Policy and Governance, 20, 350-363.
Suuronen, P., Jounela, P. &Tschernij, V. (2010) Fishermen responses on marine
protected areas in the Baltic cod fishery. Marine Policy, 34, 237-243.
Symes, D. & Phillipson, J. (2009) Whatever became of social objectives in fisheries
policy? Fisheries Research, 95, 1-5.
Symes, D. & Hoefnagel, E. (2010) Fisheries policy, research and the social sciences
in Europe: Challenges for the 21st Century. Marine Policy, 33, 268-275.

224
Tesƒamichael, D., Pitcher, T. J. & Pauly, D. (2014) Assessing changes in fisheries
using fishers’ knowledge to generate long-time series of catch rates: A case
study of the Red Sea. Ecology and Society, 19(1),18.
The Crown Estate (2013) Wave and tidal energy in Pentland Firth and Orkney
waters: Delivering the first phase of projects. A report from The Crown Estate
with help from Industry, September 2013, 20 pp.
Tyldesley, D. (2006) A vision for marine spatial planning. Ecos, 27, 33–39.
Tyler-Walters, H., Rogers, S. I., Marshall, C.E. & Hiscock, K. (2009) A method to
assess the sensitivity of sedimentary communities to fishing communities.
Aquatic Conservation Marine and Freshwater Systems, 19, 285-300.
United Kingdom House of Lords (2008) 27th Report of Session 2007-08: The EU’s
target for Renewable Energy: 20 % by 2020 Volume I: Report. House of
Lords European Union Committee. 2008; 8th. Available
http://www.publications.parliament.uk/pa/ld200708/ldselect/ldeucom/175/175.
pdf [Accessed September 2011]
United Nations (2002) Report on the World Summit on Sustainable Development.
Johannesburg, South Africa., Para. 32(c), 173 pp. New York.
Valcic, B. (2009) Spatial policy and the behaviour of fishermen. Marine Policy, 33,
215-222.
van der Kooij, J., Scott, B.E., & Mackinson, S. (2008) The effects of environmental
factors on daytime sandeel distribution and abundance on the Dogger Bank.
Journal of Sea Research, 60, 201 – 209.

225
van Putten, I. E., Kulmala, S., Thébaud, O., Dowling, N., Hamon, K. G., Hutton, T. &
Pascoe, S. (2012) Theories and behavioural drivers underlying fleet dynamics
models. Fish and Fisheries, 13(2), 216-235.
Vanstaen, K., Clark, R., ware, S., Eggleton, J., James, J. C. W, Cotteril, C., Rance,
J., Manco, F. & Woolmer, A. (2010) Assessment of the distribution and
intensity of fishing activities in the vicinity of aggregate extraction sites.
MALSEF_MEPF Project08/P73, Cefas, Lowestoft, 116 pp.
Villa, F., Tunesi, L. & Agardy, T. (2002) Zoning marine protected areas through
spatial multiple-criteria analysis: the case of the Asinara Island National
Marine Reserve of Italy. Conservation Biology, 16, 515-526.
Votier, S. C, Furness, R. W, Bearhop, S., Crane, J. E, Caldow, R. W. G, Catry, P.,
Ensor, K., Hamer, K. C., Hudson, A. V., Kalmbach, E., Klomp, N. I, Pfeiffer S.,
Phillips, R. A., Prieto, I. & Thompson, D. R. (2004) Changes in fisheries
discard rates and seabird communities. Nature, 427, 727-730.
Votier, S. C, Bearhop S., Witt, M. J., Inger, R., Thompson, D. & Newton, J. (2010)
Individual responses of seabirds to commercial fisheries revealed using GPS
tracking, stable isotopes and vessel monitoring systems. Journal of Applied
Ecology, 47, 487-497.
Votier, S. C., Bicknell, A. W. J., Cox, S. L., Scales, K. L. & Patrick, S. (2013) A bird’s
eye view of discard reforms: bird-borne cameras reveal seabird/ fishery
interactions. PLoS ONE, 8, e57376.

226
Wicklemaier, F. (2003) An introduction to MDS. Sound Quality Research Unit,
Aalborg University, Denmark, 26 pp.
Wilen, J. E. (1979) Fisherman behaviour and the design of efficient fisheries
regulation programs. Journal of the Fisheries Research Board of Canada, 36:
855–858
Wilen, J. E. (2006) Why fisheries management fails: treating symptoms rather then
the cause. Bulletin of Marine Science, 78, 529-546.
Wilson, D. C., Raakjaer, J. & Degnbol, P. (2006) Local ecological knowledge and
practical fisheries management in the tropics: a policy brief. Marine Policy, 30,
794-801.
Witt, M. J. & Godley, B. J. (2007) A Step Towards Seascape Scale Conservation:
Using Vessel Monitoring Systems (VMS) to Map Fishing Activity. PLoS ONE,
2, e1111.
Witt, M. J, Sheehan, E. V, Bearhop, S., Broderick, A. C, Conley, D. C, Cotterell, S. P.,
Crow, E., Grecian, W. J., Halsband, C., Hodgson, D. J, Hosegood, P., Inger,
R., Miller, P. I, Sims, D. W, Thompson, R. C, Vanstaen, K., Votier, S. C, Attrill,
M. J. & Godley, B. J. (2012). Assessing wave energy effects on biodiversity:
the Wave Hub experience. Philosophical Transactions of the Royal Society of
London A: Mathematical, Physical & Engineering Sciences, 370(1759), 502-
529.
World Wildlife Fund (2014) Orkney Creel Fishery for Brown Crab, European Lobster
and Velvet Crab. Review of Fishery Improvement Project (FIP), 20th February
2014, 35 pp.
227
Worm, B., Hillborn, R., Baum, J. K., Branch, T. A., Collie, J. S., Costello, C., Fogarty,
M. J., Fulton, E. A., Hutchings, J. A., Jennings, S., Jensen, O. P., Lotze, H. K.,
Mace, P. M., McClanahan, T. R., Minto, C., Palumbi, S. R., Parma, A. M.,
Ricard, D., Rosenberg, A. A., Watson, R. & Zeller, D. (2009) Rebuilding global
fisheries. Science, 325, 578-585.
Yates, K. L. & Schoeman, D. S. (2013) Spatial Access Pritority Mapping (SAPM) with
fishers: A quantitative GIS method for participatory planning. PLoS ONE, 8(7),
e68424.
Yates, K. L., Payo Payo, A. & Schoeman, D. S. (2013) International, regional and
natinal commitments meet local implementation: A case stufy of marine
conservation in Northern Ireland. Marine Policy, 38, 140-150.
Yates, K. L. (2014) View from the wheelhouse: Perceptions on marine management
from the fishing community and suggestions for improvement. Marine Policy,
48, 39-50.
Yates, K. L. & Schoeman, D. S. (2015a) Incorporating the spatial access pritorites of
fishers into strategic conservation planning and marine protected area design:
reducing cost and increasing transparency. ICES Journal of Marine Science,
72(2): 587-594.
Yates, K.L., Schoeman, D.S. & Klein, C.J. (2015b) Ocean zoning for conservation,
fisheries and marine renewable energy: assessing trade-offs and co-location
opportunities. Journal of Environmental Management, 152:201-209.
Zacharias, M. A. & Roff, J. C. (2000) A hierarchical ecological approach to
conserving marine biodiversity. Conservation Biology, 14, 1327-1334.

228
Zeilis, A., Kleiber, C. & Jackman, S. (2008) Regression models for count data in R.
Journal of Statistical Software, 27(8), 1-25.
Zhang, C., Chen, Y. & Ren Y. (2015) Assessing uncertainty of a multispecies size
spectrum model resulting from process and observation errors. ICES Journal
of Marine Science, 72(8), 2223-2233.

229
Appendix 1: Questionnaire
230
Marine Renewable Energy Knowledge Exchange Programme (MREKEP)/ NFFO Fishing Energy Survey
I am working on a national project funded by the Natural Environment Research Council
(and SEAFISH / NFFO) to find out the main issues concerning how renewable energy
developments affect fishing and the best course of action to solve the problems that are
identified.
This short survey is being conducted with individual fishermen and fishing representatives
around the coast of the UK. We aim of collect views from each region to the central
questions that will be discussed and reported to government, industry (fishing and
renewables) and planners. I would like to develop this questionnaire once I have analysed
all the responses, I aim to conduct further research and would hope that I could contact you
again regarding this also.
We have already led a workshop in Orkney and an expert panel in York. One of the main
issues that had come up already is that fishermen do not have the time and support from a
large company or organisation to attend these national meetings. This leaves decisions
being made in isolation from the local fishermen who are affected most. Our aim is therefore
to record your views alongside other fishermen around the coast of the UK, in order to have
greater representation in this project.
The survey is being led by Plymouth University. As part of the ethical procedure followed by
the university the information you provide will be reported anonymously, each survey will be
allocated a number and date so it can be identified if you wish to withdraw the information
you provide at a later date.
Please contact me at [email protected] or phone 07814745926 if you have
any concerns or wish to withdraw the information you provide in the future. Once the survey
is completed and we have not heard from you by 31st September 2014 we will assume you
are happy to have your views included (anonymously aggregated with all other interviewees)
in the final report.

231
Respondent details How many years have you been fishing? Which areas do you fish the most (general locations such as Bristol Channel, within twenty miles of Hayle etc.): Where is your home port? What gears do you use and in which seasons? What species?
Spring Summer Autumn Winter
Gear
Species
Is your vessel over or under 10 m? How old is the vessel? Are you a vessel owner or company skipper? Gender: Male O Female O Age: 18-30 O 31-40 O 41-50 O 51-60 60+ O Fishing and Energy developments:
1. What are the priority issues to aid the co-existence of marine renewable and
fisheries? (i.e. What issues have you encountered related to the interaction of marine
renewables and fishing industries).
2. What are the barriers to progress with regard to the co-existence of marine
renewables and fisheries?
ID No:
Date:

232
3. How can we mitigate problems associated with marine renewables and
fisheries? What mitigation strategies would be best suited to aid local fisheries (i.e.
funding stock enhancement, better research of construction and operation effects, siting
developments more carefully in relation to fishing grounds)
4. What are your thoughts on the consultation process with regard to new marine
renewable developments?
Interaction of marine renewables and fishing industries
5. If you could choose three research topics or projects to aid fishing and
renewable energy development co-existence, what would they be? Why?
i. ……………………………………………………………………
ii. ……………………………………………………………………
iii. ……………………………………………………………………
6. Which one of these three would you consider to be the most important?
Effort Displacement: Displacement of fishing effort has been raised in the initial project meeting and also by SEAFISH and NFFO as a major issue (whether fishermen forced to lose existing

233
grounds or new additional effort appearing in remaining grounds). The following questions are intended to record your views on this subject.
7. How do you think you will personally be interacting with the marine renewables
industry?
8. Do you think your fishing activity will be affected by the marine energy
industry?
9. If yes, how do you think you will be affected? (e.g. either by losing ground or
new boats entering the grounds you currently fish)
10. What suggestions do you have to reduce the negative effects of displacement?
11. What are your thoughts on a mitigation agenda developed by NERC MREKE
Programme?
Thank you very much for your participation in this scoping survey. Are there any other issues that you would like to raise? Could you recommend anyone else that I could contact regarding this research?
Name……………………………………..
Telephone……………………………….
Email……………………………………..
Do you have any comments on the interview that you would like to add?
……………………………………………………………………………………………………………
……………………………………………………………………………………………………………

234
Appendix 2: Statement of contribution to co-authored papers
Mapping fisheries for marine spatial planning: gear-specific vessel monitoring system
(VMS), marine conservation and offshore renewable energy.
Maria S. Campbella,b, Kilian M. Stehfestc, Stephen C. Votierd and Jason M. Hall-
Spencera
a Marine Biology and Ecology Research Centre (MBERC), Plymouth University,
Plymouth, Drakes Circus, PL4 8AA, UK.
b The Centre for Marine and Coastal Policy Research (MarCoPol), Plymouth
University, Plymouth, Drakes Circus, PL4 8AA, UK.
c Institute for Marine and Antarctic Studies (IMAS), University of Tasmania, Taroona,
Tasmania, Australia.
d Environment and Sustainability Institute, Exeter University, Penryn campus, Penryn,
Cornwall, TR10 9FE, UK.
This paper was written by me, with written and GIS contributions by Kilian Stehfest
under the supervision of Professor Jason Hall-Spencer and Dr Stephen Votier. This
paper combines analyses from Chapters 3 and some elements of Chapter 4 of the
thesis, and provides not only one of the most comprehensive spatial and temporal
analyses of fishing effort in the South West of the UK using gear-specific Vessel
Monitoring System (VMS) data, but also one of the first detailed analysis of risk of
effort displacement due to marine conservation and marine energy. Dr Victor Abbott
from my supervisory team, an anonymous reviewer from one of my research groups,
the Centre for Marine and Coastal Policy Research (MarCoPol) and an additional

235
anonymous reviewer provided comments of drafts of this paper. This paper was
published in the journal Marine Policy in 2014.
Investigating the co-existence of fisheries and offshore renewable energy in the UK:
identification of a mitigation agenda for fishing effort displacement.
Jiska de Groota,b, Maria Campbella,c, Matthew Ashleya,d & Lynda Rodwella
a The Centre for Marine and Coastal Policy Research (MarCoPol), Plymouth
University, Drakes Circus, Plymouth, PL4 8AA, UK.
b Energy Research Centre (ERC), University of Cape Town, Rondebosch 7701,
Cape Town, South Africa.
c Marine Biology and Ecology Research Centre (MBERC), Plymouth University,
Drakes Circus, Plymouth, PL4 8AA, UK.
d Plymouth Marine Laboratory (PML), Prospect Place, The Hoe, Plymouth, PL1 3DH,
UK.
This paper was a concerted effort under the NERC funded MREKE Programme.
The paper is a synthesis of scoping workshop and questionnaire in Orkney, and an
expert panel held in York. It was written overall by Jiska de Groot but with equal
writing content by me as second author under the supervision of Dr Lynda Rodwell.
The publication identifies as three key priority areas for this agenda: developing
efficient and cost-effective mechanisms for overcoming data aresues for assessment
of fishing effort displacement; the development of appropriate methods of

236
assessment; and the development of an acceptable consultation protocol between
MRE and fishing sectors agreed on by all stakeholders. Two anonymous reviewers
commented on drafts of the paper. This paper was published in the journal Ocean
and Coastal management in 2014.
Marine and coastal policy in the UK: Challenges and opportunities in a new era
Lynda Rodwella, Steve Fletchera,b, Gillian Glegga, Maria Campbella,c, Siân Reesa,d,
Matthew Ashleya,e, Annie Linleyf, Matthew Frostg, Bob Earllh, Russell Wynni, Patricia
Almada-Villelaj, Dan Leark, Peter Stangerl, Andrew Colenuttm, Francesca Davenportn,
Natasha Barker-Bradshawo & Roger Coveyp.
a The Centre for Marine and Coastal Policy Research (MarCoPol), Plymouth
University, Drakes Circus, Plymouth, PL4 8AA, UK.
b United Nations Environment Programme (UNEP), Gigiri, Nairobi, Kenya
c Marine Biology and Ecology Research Centre (MBERC), Plymouth University,
Drakes Circus, Plymouth, PL4 8AA, UK.
d Marine Institute, Plymouth University, Drakes Circus, Plymouth, PL4 8AA, UK.
e Plymouth Marine Laboratory (PML), Prospect Place, The Hoe, Plymouth, PL1 3DH,
UK.
f NERC Marine Renewable Exchange Knowledge Exchange Programme (MREKEP),
National Oceanography Centre, Southampton University, European Way,
Southampton, S014 3HZ.

237
g The Laboratory, Marine Biological association of the UK, Citadel Hill, Plymouth,
PL1 2PB.
h Communications for Sustainability (CMS), Kempley, Gloucestershire, GL18 2BU
i National Oceanography Centre, Southampton University, European Way,
Southampton, S014 3HZ.
j Marine Management Organisation, Lancaster House, Hampshire Court, Newcastle
Business Park, Newcastle upon Tyne, NE4 7YH
k DaSSH, The Laboratory, Marine Biological association of the UK, Citadel Hill,
Plymouth, PL1 2PB.
l School of Earth and Ocean Sciences, Cardiff University, Cardiff CF10 3AT, United
Kingdom
m Channel Coastal Observatory, National Oceanography Centre, Southampton
University, European Way, Southampton, S014 3HZ.
n Science Communication Unit, Faculty of Health and Life Sciences, Frenchay
Campus, Coldharbour Lane, University of the West of England, Bristol BS16 1QY,
United Kingdom
o WWF-UK, Panda House, Godalming, Surrey GU7 1XR, United Kingdom
p Natural England, Pydar house, Pydar Street, Truro, Cornwall TR1 1XU, United
Kingdom
This paper was written by Dr Lynda Rodwell, and each co-author contributed a
section and summary highlight from their presentation. The paper was the product
of the UK’s first Marine and Coastal Policy Forum, and is the introductory paper in a

238
Special Issue from this forum. In this introductory paper the global context of marine
policy changes and the themes which emerged from the forum, forming the basis of
the articles in this special issue, are outlined. I was the coordinator of this forum and
assisted on all drafts. Two anonymous reviewers commented on drafts of the paper.
This paper was published in the journal Marine Policy in 2014.
Priority questions to shape the marine and coastal policy research agenda in the
United Kingdom.
Siân Reesa, Steve Fletchera,b, Gillian Glegga, Charlotte Marshallc, Lynda Rodwella,
Rebecca Jeffersond, Maria Campbella,e, Olivia Langmeada, Matthew Ashleya,f, ,
Helen Bloomfieldg, Daniel Bruttoh, Andrew Colenutti, Alexandra Conversia, Bob Earllj,
Imman Abdel Hamidk, Caroline Hattamf, Simon Ingrama, Emma McKinleyl, Laurence
Meem, Jenny Oatsn, Frances Pecketto, Jim Portusp, Martin Reeda, Stuart Rogersq,
Justine Saundersr, Kylie Scaless, & Russell Wynnt.
a The Centre for Marine and Coastal Policy Research (MarCoPol), Plymouth
University, Drakes Circus, Plymouth, PL4 8AA, UK.
b United Nations Environment Programme (UNEP), United Nations Avenue, Gigiri,
Nairobi, Kenya
c Natural England, Pydar House, Pydar Street, Truro TR1 1EA
d RSPB, Potton Rd, Sandy, Bedfordshire, SG19 2DL
e Marine Biology and Ecology Research Centre (MBERC), Plymouth University,
Drakes Circus, Plymouth, PL4 8AA, UK.

239
f Plymouth Marine Laboratory (PML), Prospect Place, The Hoe, Plymouth, PL1 3DH,
UK.
g School of Environmental Sciences, University of Liverpool, Liverpool L69 3BX, UK
h Marine Ecological Surveys Ltd., 3 Palace Yard Mews, Bath BA1 2NH, UK
i Channel Coastal Observatory, National Oceanography Centre, Southampton
University, European Way, Southampton, S014 3HZ.
j Communications for Sustainability (CMS), Kempley, Gloucestershire, GL18 2BU
k FSLtd, 7 Queens Gdns, Aberdeen, AB14 4YD
l University of Chichester, Upper Bognor Road, Bognor Regis, West Sussex PO21
1HR, UK
m Scottish Association for Marine Science, Scottish Marine Institute, Oban, Argyll
PA37 1QA, UK
n Joint Nature Conservation Committee, Monkstone House, City Road, Peterborough
PE1 1JY, UK
o JNCC, 30 City Road, Cambridgeshire, Peterborough, PE1 1JY
p South West Fish Producers Organisation Ltd, 49–50 Fore Street, Ivybridge, Devon
PL21 9AE, UK
q Centre for Environment, Fisheries & Aquaculture Science, Pakefield Road,
Lowestoft, Suffolk NR33 0HT, UK
r EMU Ltd, 1 Mill Court, The Sawmills, Durley, Southampton SO32 2 EJ, UK

240
s Plymouth Marine Laboratory (PML), Prospect Place, The Hoe, Plymouth, PL1 3DH,
UK.
t National Oceanography Centre, Southampton University, European Way,
Southampton, S014 3HZ.
This paper was written by Siân Rees and was the result of a workshop held at the
UK’s first Marine and Coastal Policy Forum in 2011. Thirty four priority research
questions within six broad themes were identified by delegates who attended the 1st
marine and coastal policy Forum, hosted by the Centre for Marine and Coastal
Policy Research at Plymouth University in June 2011. I and six members of the
research group analysed the responses to the workshop and synthesised them.
Two anonymous reviewers as well as myself and others in the research group
commented on drafts of the paper. This paper was published in journal Marine
Policy in 2013
The design of Marine Protected Areas on High Seas and Territorial waters of Rockall.
Jason Hall-Spencera, Mark Taskerb, Marta Soffkerc, Sabine Christiansend, Stuart
Rogerse, Maria Campbella,f, Kjartan Hoydalg,
a Marine Biology and Ecology Research Centre (MBERC), Plymouth University,
Plymouth, Drakes Circus, PL4 8AA, UK.
b JNCC, 30 City Road, Cambridgeshire, Peterborough, PE1 1JY
c UEA, School of Biological Sciences Norwich Research Park, Norwich, Norfolk NR4
7TJ

241
d WWF North-East Atlantic Programme, Magdeburger Str. 17, 20457 Hamburg,
Germany
e Centre for Environment, Fisheries & Aquaculture Science, Pakefield Road,
Lowestoft, Suffolk NR33 0HT, UK
f The Centre for Marine and Coastal Policy Research (MarCoPol), Plymouth
University, Plymouth, Drakes Circus, PL4 8AA, UK
g sp/f Skrivarastova Fish and Film, Government Consultancy
This paper was written by Professor Jason Hall-Spencer. Both Marta Soffker and I
performed all the analyses and I prepared all the figures. I also wrote a section
about the coral data used and commented on all reviews. Two anonymous
reviewers also commented on the manuscript. The paper summarise how
remote fisheries closures were designed to protect Lophelia pertusa habitat in a
region of the NE Atlantic that straddles the EU fishing zone and the high seas. This
paper was published in the journal Marine Ecology Progress Series in 2009.

242
Appendix 3: Published papers and presentations
Campbell, M. S., Stehfest, K. M., Votier, S. C. & Hall-Spencer, J. M. (2014) Mapping
fisheries for marine spatial planning: gear-specific vessel monitoring system (VMS),
marine conservation and offshore renewable energy. Marine Policy, 45: 293-300.
de Groot, J., Campbell, M., Ashley, M. & Rodwell, L. (2014) Investigating the co-
existence of fisheries and offshore renewable energy in the UK: Identification of a
mitigation agenda for fishing effort displacement. Ocean and Coastal Management,
102, 7-18.
Campbell, M., de Groot, J., Ashley, M. & Rodwell, L. (2014) The Fisheries and
Marine Renewable Energy Working group: Creating an agenda for improved co-
existence. In, 5th International Conference in Ocean energy (ICOE), Halifax, Nova
Scotia, Canada, 4-6th November 2014.
Rodwell, L., Fletcher, S., Glegg, G. A., Campbell, M., Rees, S. A., Ashley, M., Linley,
E. A., Frost, M., Earll, B., Wynn, R. B., Almada-Villela, P., Lear, D., Stanger, P.,
Colenutt, A., Davenport, F., Barker-Bradshaw, N. J. & Covey, R. (2014) Marine and
coastal policy in the UK: Challenges and opportunities in a new era, Marine Policy,
45, 251-258.

243
Rees, S., Fletcher, S., Glegg, G., Marshall, C., Rodwell, L., Jefferson, R., Campbell,
M., Langmead, O., Ashley, M., Bloomfield, H., Brutto, D., Colenutt, A., Conversi, A.,
Earll, B., Abdel Hamid, I., Hattam, C., Ingram, S., McKinley, E., Mee, L., Oats, J.,
Peckett, F., Portus, J., Reed, M., Rogers, S., Saunders, J., Scales, K. & Wynn, R.
(2013) Priority questions to shape the marine and coastal policy research agenda in
the United Kingdom. Marine Policy, 38, 531-537.
Hall-Spencer, J. M., Tasker, M., Soffker, M., Christiansen, S., Rogers, S., Campbell,
M. & Hoydal, K. et al. (2009) The design of Marine Protected Areas on High Seas
and Territorial waters of Rockall. Marine Ecology Progress Series, 397: 305-308.

244
Journal Publications
Mapping fisheries and assessing displacement due to closures for the
purposes of marine conservation and marine renewable energy using gear-
specific Vessel Monitoring System data in the South-west of the UK
Maria S. Campbella, Kilian M. Stehfestb, Stephen C. Votiera, Jason M. Hall-
Spencera*
a Marine Biology and Ecology Research Centre/ Marine Institute, Plymouth University,
Davy Building, Drake Circus, Plymouth, PL4 8 AA, United Kingdom
b CSIRO-UTAS Quantitative Marine Science Program, University of Tasmania,
Australia
*Corresponding author:
Jason M. Hall-Spencer
Marine Biology and Ecology Research Centre, Marine Institute, Plymouth University,
Portland Square A428, Drake Circus, Plymouth, PL4 8 AA, United Kingdom
Tel: 0044 7152 584629
Email: [email protected]
Abstract
Vessel Monitoring System (VMS) data from 2005-2008 in ICES areas VII e-h were
used to assess the distribution and intensity of fishing activity in and around the
western English Channel, one of the most intensively used marine areas, in terms of
all marine activity on the planet. We analyzed the distribution of the UK fleet of large

(>15 m length) fishing vessels and, as expected, found clear gear-specific temporal
and spatial differences in activity. Mobile demersal gears had the highest intensity
and widest distribution of activity in the study area, and so these gear types might be
expected to have the most widespread effects on ecosystems of this region. We
describe the potential effects of two proposed fisheries closures; a planned wave
energy testing facility (Wave Hub) and a candidate offshore Marine Protected Area
(Haig Fras). Our maps indicate that if the mobile demersal gear fleets were
excluded from these proposed closures they would be little affected but if the static
gear fleets were excluded this would likely result in displacement of certain vessels
and increase fishing pressure on other rocky grounds and other fishers who use
these areas. Predictions concerning the effects of fisheries displacement can be
improved through the use of high-resolution gear-specific activity data. Our study
shows that VMS can provide an invaluable source of such data, provided that gear
information is made available to fisheries managers and to scientists.
Keywords: Marine protected area, marine renewable energy, marine spatial
planning, gear type, displacement, vessel monitoring system.
1. Introduction
Over the last 20 years, management approaches have shifted from the conservation
of species to the more holistic management of spaces to help reduce damage to
ecosystems and the goods and services they provide [1,2,3,4]. Marine protected
areas (MPAs) are emerging as a central tool for this approach, with the World
Summit for Sustainable Development calling for the establishment of a
representative and coherent network of MPAs by the year 2012 [5,6,7], however

progress has been slow and we now look to the year 2020. In addition, the world’s
oceans are increasingly being tapped as a source of renewable wind, tidal and wave
energy [8,9,10,11] to address the decline in fossil fuel reserves and reduce the rates
of changes caused by anthropogenic carbon dioxide emissions [12,13]. The UK, has
set a target to produce 33 gigawatts from marine renewable sources by 2020,
meeting the EU target of supplying 20 % of its gross consumption of energy from
marine renewables by 2020 [14]. However, large scale offshore marine renewable
energy installations (MREIs) have the potential to exclude certain fishing gear types
from large areas of the sea from construction to operational phases [11].
The development of offshore marine renewable energy and designation of marine
protected areas are two rapidly emerging demands on marine space that compete
with use by certain types of fishing activities [9,15] and are likely to alter spatial
patterns of fishing activity. In examples from the North Sea and Baltic cod fishery,
beam trawling, could be forced to concentrate activity onto smaller grounds, leading
to increased competition, reallocation of activity and lower catch [16, 17]. To resolve
conflicts, marine policymaking has shifted away from sector-by-sector management
towards an integrated, multi-sector, ecosystem-based and transparent planning
process, known as marine spatial planning (MSP) [18-25]. This is intended to help
managers optimize sustainable use of the sea, for example by avoiding long-term
damage to benthic habitats or the wasteful bycatch of non-target species. Recently
a group of international experts met to devise priority needs for the successful
practical implementation of MSP [26]. Decision support, i.e. types of data,
information and tools needed to facilitate advancement of MSP was identified, and

key to this; high-resolution spatially and temporally accurate information on the
various activities taking place in the marine environment [26, 27].
Until recently, marine managers had to rely on surveillance data from observer
planes/vessels or logbook catch data to determine the spatial distribution of fishing
activity [28]. These data lacked temporal coverage and spatial resolution
respectively, preventing full integration of fisheries data into marine spatial plans [4].
Satellite vessel monitoring systems (VMS) are increasingly being used to overcome
these limitations. Introduced in the 1990s in various parts of the world [29], VMS
were originally established to allow fisheries administrators to control and monitor
fishing activity [28,30]. In European Union waters, VMS were introduced in 2000
when all vessels >24 m in length (and all vessels >15 m in length since 2005) were
required to submit information on their identity, position every two hours to a
Fisheries Monitoring Centre [31]. Vessel speed values were included from 2005.
From 1st January 2012 vessels > 12 m will have to install VMS [32] and there are
discussions about extending the systems to towed gear vessels > 8 m in length [33].
VMS data have proven valuable in spatial analyses of fishing activity [28,30,34] and
have been used as a proxy for the distribution of target fish stocks [35]. Such data
can also show how spatial closures can displace fisheries activity [36,37]. VMS is
now being used to inform the design of MPAs to avoid displacement of destructive
fishing activities onto vulnerable marine ecosystems in the deep sea [38,39]. In
addition, gear-specific VMS analyses have been carried out within the German EEZ
[4,40], the Irish EEZ [41], the UK EEZ [42-45] and for the Danish fleet [46] which
greatly improve the assessment of fisheries impacts. Such work has considerable

implications for management, as different fishing sectors have specific responses to
different management measures e.g. closures.
Here, VMS data are used to provide an overview of the distribution of fishing activity
by gear type in ICES areas VII e-h (Fig. 1a), which borders the coasts of Ireland, the
UK and France. This area covers parts of the English Channel, Celtic Sea and
Atlantic Ocean and is one of the most highly used marine areas in terms of all
marine activity on the planet [28,47]. Descriptions are provided of how two potential
fisheries closures may affect the distribution of activity of both static and mobile gear
users. Investigations are made of the potential effects of displacement and the
influence of bathymetry and seabed type on fisheries activity. One of the proposed
closures is for an MREI, a facility for testing prototype Wave Energy Converters
(WECs), Wave Hub, the UK’s first marine energy park, located 10 NM from Hayle,
North Cornwall resulting in an 8 km2 exclusion zone. Coupled with this, due to the
nature of the exclusion zones associated with offshore marine renewable energy
developments, there is a great deal of interest in the formation of de facto MPAs [11].
The other proposed closure is Haig Fras, a 45 km long granite reef that is the only
substantial area of rocky reef in the Celtic Sea [48] and was put forward as a Natura
2000 conservation area in 2008 [49].
2. Materials and Methods
2.1 VMS Data
VMS data for all UK registered vessels >15 m in length that were active in ICES
areas VII e-h in 2005-2008 were obtained from the Marine Management

Organisation (MMO), formerly the UK Marine and Fisheries Agency. Access to post
2008 data was not available in the same high-resolution format as earlier data.
Access to gear type information was not available for non-UK fishing vessels fishing
in UK waters, thus were excluded from analyses. The UK vessel VMS dataset
contained vessel records, each consisting of a randomly created vessel identification
number (to separate individual vessels while retaining their anonymity), speed,
vessel position in decimal degrees together with the date and time of transmission.
Access to logbook information was not permitted by the MMO for this study, although
gear type information was extracted from logbooks by the MMO and submitted with
the initial VMS dataset. The following fishing gear type classifications were used:
scallop dredge, longline, gillnet, potter/whelker, beam trawl and demersal otter trawl,
all which conform as close as possible to European Union level 3 and 4 Data
Collection Regulation (DCR) [EU 2008a, EU 2008b] [50,51] considering the level of
data made available for this study.
2.2 Fishing activity analyses
2.2.1 VMS
VMS data analysis followed the recently established approach for estimating fishing
activity by Lee et al. [43]. In summary; removal of records without an associated
gear type, within 3 nm of ports and duplicates occurred, the interval between each
successive record calculated and a speed based rule of 1-6 knots was applied to
identify actual fishing activity for all gear types. A point summation method followed,
using a grid cell size of 0.05° or 3 mins, the resolution to provide fishing data to

inform marine spatial planning in the UK [44]. Fishing activity in each of the ICES
areas VII e-h was calculated separately, the reasoning being that the dataset
provided meant that as each vessel moved between ICES areas the unique
identification number changed and without access to logbook information or other
higher level information, it would have been impossible to know which vessel this
was, causing potential over representation of activity. All analyses were performed
using Mathworks programming software, MATLAB 12.
To quantify the differences in spatial patterns of fishing activity between gear types
and within same gear types but between years, the index of difference in spatial
pattern developed by [43], was used. In brief, activity in each cell was calculated so
that the sum of all activity in ICES VII e-h was one. To compare, the absolute
differences in proportion of activity in each cell were calculated, summed for ICES
VII e-h then divided by 2, resulting in an index of difference in spatial pattern varying
from zero to one, i.e. zero representing identical spatial fishing patterns in the same
cells and one representing no activity in the same cells [43].
2.2.2 EU defined fleet effort analysis
Fishing effort of fleets is defined in the Basic Regulation of 2002 (Article 3(h)) [52] as
capacity * activity. Capacity is measured in terms of the size of vessels gross
tonnage (GT) or engine power (kW) and activity commonly measured as the period
of time in which a vessel is active, i.e. days at sea. In this study, we presented
capacity as number of vessels, which is an accepted, albeit rough method, GT or kW
was not made available for this study. Each ICES area VII e-h were analysed
separately.
2.2.3 Fishing activity and marine landscapes
The distribution of fishing activity with respect to 5 marine landscape types derived
from UK SeaMap data [53]. The 5 categories were; sand, mixed sediment, coarse
sediment, rock and mud. Fishing activity and not fishing impact on seabed was
assessed here, thus average number of fishing hours per 1 km2 of the different
marine landscape was calculated. The region, ICES VII e-h was analysed as a
whole.
3. Results
The spatial distribution of fishing activity was highly heterogeneous and distinct
areas of intense fishing could be identified for all gear types (Fig. 2). Spatial patterns
were more consistent within gears between 2005 and 2008 for mobile gears ranging
from 0.2698 to 0.5151 (Table 1). For the static fleet, similar consistencies were
observed for both potting and whelking and gillnetting from 2005-2008, ranging from
0.3837 to 0.5025 and in longlining from 2005-2006. However, for the longlining fleet,
spatial patterns from 2006-2008 ranged from 0.6629 to 0.721, indicating perhaps a
slight shift in spatial distribution from the previous year. Patterns of fishing activity

between pairs of gears ranged from 0.8472 to 0.9979, indicating the heterogeneity in
activity as discussed briefly above (Table 2), although some lower values were
observed between beam trawling and scallop dredging across all years ranging from
0.6089 to 0.6832, possibly indicating a slight overlap of fishing activity.
Fishing effort of the fleets as described by (Table.3), showed some very interesting
results with Wave Hub, ICES VII f, representing an area with some of the highest
potting and whelking effort, as well as gillnetting, although some heterogeneity
occurred from 2005-2008. Ices VII e represented the highest scallop dredging effort.
Haig Fras, ICES VII g also represented high fishing effort values for gillnetting and
longlining, in comparison to other fishing gears in the area. Beam trawling and otter
trawling are widespread throughout the study area with highest effort in ICES VII e
and f.
Fishing with mobile gear was more widely distributed (Fig. 2a, e, f) with beam
trawling occurring over the largest part of the study area (Fig. 2e) but also
widespread otter trawling (Fig. 2f), whereas static gear fishing was focused in fewer
areas (Fig. 2b, c, d). For static gear, in particular, the potting and whelking fleet, this
pattern is clearly linked to the availability of suitable marine landscape type (Fig. 3),
with fishing activity concentrated on rocky areas (Table 4), which covered the
smallest percentage of the study area (Fig. 3), but also to a certain extent gillnetting
(Table 4). Longlining activity per unit area, was highest over mud however, high
values were also observed over mixed sediment and rock. Mobile gear activity per
unit area of marine landscape type varied between all marine landscape types;
scallop dredging occurring mixed sediment or mud, and beam and otter trawling

mainly in muddy areas with high coverage per unit time in mixed and sand
respectively. Some overlap with rocky areas did occur with the mobile fleets (Table
4).
In addition to marine landscape type, bathymetry also influences the distribution of
intensely fished areas for some gear types. For example the continental shelf break
in the southwestern corner of the study area was a hotspot for gillnetting and
longlining. Furthermore, Hurd’s Deep (49º 30’ N: 3º 34’ W), a narrow channel at
which depths drop below 100 m to the North of Jersey is targeted by beam trawling.
4. Discussion
Vessel Monitoring Scheme data from South-west UK reveal clear gear-specific
differences in spatial patterns of fishing activity and allow analyses of the use of
shared resources by UK fleets. As expected, the VMS data show that intensely
fished areas vary between gear types with towed demersal gear users generally
avoiding the rocky grounds that are targeted by other static gear fleets. When gear
type is not analysed then useful information (e.g. seasonal patterns in the locations
of areas that are intensely used by sectors of the fleet) is lost and the overall
impression of fleet activity is dominated by the most common fishing method [28].
Previously, VMS data have been used to plan offshore marine protected areas,
designed to minimize displacement of activity and to identify areas that were most
likely to have untrawled biogenic habitats [39]. Gear-specific fishing activity was not
analysed for the design of these offshore MPAs as such data were not released by

the authorities. Given the diversity of fishing gears used in inshore waters, a lack of
gear specific information could lead to poor marine spatial management decisions.
Our results illustrate that gear-based VMS analyses can offer greater detail on fleet
activities than traditional sources of fisheries data, such as over flight data, and
provides an opportunity to improve marine spatial planning, but could be improved if
higher level data were available (for example, [43,44]. This is particularly important
in areas such as South-west UK as this area currently harbors most of the UK fishing
fleet [54].
The effects of fishery closures (e.g. for nature conservation or offshore renewable
energy developments) will vary considerably between different sectors of the fishing
industry. In the present study, beam trawling was the most widespread type of
fishing and to a certain extent demersal otter trawling. This sector of the fleet
exploited such large areas that effects of two small area closures (Haig Fras and
Wave Hub) are unlikely to have detectable environmental impacts outside the
closures as mobile gear is rarely used within the proposed closures. However, if
more areas off South-west UK were closed, displacement of towed demersal gear
activity has the potential to increase pressure on benthic habitats unless seldom
fished parts of a region are closed to towed demersal gear [39] or in response to new
measures being discussed for deep-sea fisheries leading to “a displacement of a
fleet of large capacity demersal vessels into areas in Western Waters such as the
Celtic Sea where an ongoing recovery of demersal stocks would be jeopardized”
(NFFO pers. comm., July 2012). On the other hand, closed areas can sometimes
benefit mobile gear users through ‘spillover’ [55] or enhanced recruitment through
larval export [56]. An example is the increase in scallop dredging activity on areas

surrounding large towed demersal gear closures in the NW Atlantic [36]. In our
study, VMS analyses showed that longlining activity, and to a lesser extent gillnetting
activity, was concentrated in much smaller areas than mobile demersal gear types in
South-west UK. If the Haig Fras Natura 2000 site were to be closed to longline and
gillnet fisheries then their activity would likely be displaced onto other areas,
potentially increasing competition between fishers and pressure on these habitats
(For example [16,17]). Potters and whelkers, who often compete for space with
mobile gear users [57], may also be more affected by the proposed small closures
than mobile gear users. The loss of even relatively small fishing grounds might incur
economic costs for the potting/whelking fleet that need to be weighed against any
long-term benefits of ‘spillover’ during compensation claims if closures are related to
commercial ventures such as marine renewable energy developments [9,58]. There
are caveats associated with the marine landscape analysis. There are no doubts as
to the value of the analysis as a broad brush approach, i.e. ICES areas VII e-h as a
whole, however, a finer scale analysis would be needed to assess the seasonal
movements of the fleets and as we cannot take into account vessels changing gear,
then these issues which do need to be addressed. Further analysis, by using the
methods of defining fishing grounds to assess, not only space allocation by various
fleets [44] and impacts of various fleet activities on the seabed [59,60] would improve
this current study and the questions it raises regarding consequences of fishing
activity displacement.
Given that different fisheries have different environmental impacts, spatial
management plans require high-resolution information on the distribution of different
types of fishing activity [42]. For example, apex marine predators may benefit from

feeding/scavenging on discards [61,62] or be at risk from accidental bycatch in long-
lines or nets [63] with discard rates and bycatch risk varying greatly as a function of
gear type [63,64]. Our VMS dataset indicates only modest longlining activity in the
region but high levels of bottom trawling with discards that likely benefit certain
seabird populations in the region [65] given that individual seabirds adjust their
foraging behavior when overlapping with bottom trawling VMS tracks in the Celtic
Sea [66,67]. A study in the Celtic Sea has pointed at the creation of de facto refugia
for elasmobranchs due to the spatial heterogeneity of fishing activity among the
fleets [68]. However, as described above, changes to fisheries management,
fisheries area closures may negate this effect, if fishers’ behavior is altered and
fishing activity displaced.
When managing seabed habitats for biodiversity conservation, or for the commercial
protection of nursery areas and brood stock, gear specific VMS data will prove useful
in spatial planning since mobile demersal gear types have major impacts on certain
benthic communities [70,71], with scallop dredging known to cause more damage to
seabed habitats than potting, for example [72,73]. An analysis of which fishing gears
are used where is important, both in assessing the cumulative impacts on marine
ecosystems but also in the context of marine planning, given the potential of MPAs
and marine renewables to concentrate impacts into smaller areas [42,47,74-77].
Marine reserve planners and renewable energy developers are increasingly using
multi criteria decision analysis tools such as Marxan to optimize site selection [78-
81], as this allows consideration of a variety of different spatially explicit selection
objectives. While the main consideration is the distribution of the natural resource in

question, the inclusion of gear-specific high-resolution fisheries data can minimize
environmental costs of closures incurred by activity displacement [82], minimize the
effects of accidental bycatch, discarding and trawl damage and increase the
economic benefits of closures to fishers [83], one of the main stakeholders in the
marine environment [9], thereby making closures more politically feasible [83].
Although gear-type specific VMS data analyses need to be carried out to sensibly
manage the marine environment, there are caveats. The fact that only vessels > 15
m length are presently included in VMS means these data cannot be used to predict
effects of inshore marine renewable energy installations on the distribution of inshore
fishing activity. However, mobile phone VMS for small inshore vessels are being
trialed throughout the EU, and fishing vessels of certain lengths tend to follow
predictable patterns of fishing activity [84]. Current work being carried out by the
Centre for Environment, Fisheries and Aquaculture Science (Cefas) in conjunction
with the Inshore Conservation Authorities (IFCAs) will lead the way for fine scale
inshore fishing analysis. Data on non-UK vessels was not made available for our
study, however concerns over inaccuracies in this data in particular the lack of gear
type provided [43], meant that it could not have been used. Clearly, accurate
assessment of the environmental impacts of international fisheries activity requires
knowledge of activity distribution of all vessels, regardless of their length and
nationality. Other, issues arise in the VMS analyses. The analyses are based on
records that are transmitted every 2 hours, and there are risks in production or errors
or misclassification of fishing vs. non-fishing and in when interpreting fishing activity
in the smaller area of Wave Hub, this is an issue which needs to be explored further,
especially in the case of static gear use. In this analysis a point summation method

is used as it is deemed more transparent but underestimations of activity are a risk
[44]. Reconstruction of tracks is an option [85], but vessels rarely travel in straight
lines and again, it may not be appropriate for those using static gear and the 2 hour
polling frequency is an issue [44]. In terms of track reconstruction, recent work has
helped improve VMS analysis using cubic Hermite splines for beam trawl [86] and
subsequently other gear types [87]. In the case of reducing VMS polling frequency,
seminal work by [45] has suggested polling at intervals of 30 min, supporting more
accurate assessments of fishing activity and resulting impacts on the seabed.
In January 2005, transmission of speed data became compulsory in EU VMS but a
reliance on these data could underestimate fishing activity if fishing activity falls
between VMS records, typically sent every 2 hours. A simple speed filter allows the
correct identification of a high percentage of both steaming and fishing activity
[43,44]. The speed filters used, although necessary to indicate fishing gear
deployment, could overestimate fishing activity as vessels might slow down due to
bad weather, treacherous terrain or to reduce fuel costs [88] or local or sectoral
differences in fishing speeds of individual vessels or at fleet level may occur [43]. As
marine spatial planning advances there is an opportunity to include fishers’
knowledge (FK) with VMS and logbook data as well as studies of the biological,
sociological and psychological influences on fishing fleet behaviour [89-91] in order
to predict the movement of vessels across fleets in both the short-term and long-
term.
There is room for improvement in the VMS, such as including smaller vessels and
facilitating easier access to the data for researchers and spatial planners across EU

Member States. Presently, EU VMS data for purposes other than those relating to
the Common Fisheries Policy (CFP) is “constrained by a combination of human
rights law; data protection law; the law of confidence and EU law, in particular the EU
confidentiality obligation under Article 113 of EC Regulation 1224/2009 (the ‘Control
Regulation’)” [92]. VMS are considered to provide personal data obtained via
surveillance although if data analyses are for marine planning purposes, and if such
analyses are integral to the CFP, then anonymized, aggregated data may be
released [92]. Since 2009, changes to access to VMS data, and the level of
resolution due to EU Council regulations, changes which have affected this study,
may prove severely disadvantageous to accurately assessing fishing fleet activity
and the consequences of displacement for these fleets, hence having societal
implications [93].
Conclusions
A lack of access to high-resolution gear-specific fisheries data for analyses raises
scientific and socio-economic concerns about the underpinning of ongoing marine
spatial management decisions. Given the rapid current expansion in European
marine space leased to marine renewable energy, and plans for a network of MPAs
that restrict certain fishing gear types, it is imperative that gear-specific VMS and
other high resolution fisheries data are used to predict and plan for the likely effects
of spatial restrictions on fisheries.
Acknowledgements

This project was funded by PRIMaRE, and the EU Charm III and KNOWSEAS
(Grant number 226675) Programmes. We thank the Marine Management
Organization (formerly the UK Marine and Fisheries Agency) for providing VMS data.
We gratefully acknowledge the critical comments of our anonymous reviewer and
those of Dr Victor Abbott, Plymouth University, which helped improve the present
manuscript. The authors would also like Dr Daniel Buscombe, GCMRC for his
assistance with MATLAB processing and analysis.
References
[1] Zacharias MA, Roff JC. A hierarchical ecological approach to conserving marine
biodiversity. Conservation Biology 2000, 14, 1327-1334.
[2] Roberts CM, Hawkins JP, Gell FR. The role of marine reserves in achieving
sustainable fisheries. Philosophical Transactions of the Royal Society B: Biological
Sciences 2005; 360: 123-132.
[3] Apitz SE, Elliott M, Fountain M, Galloway TS. European Environmental
Management: Moving to an Ecosystem Approach. Integrated Environmental
Assessment and Management 2006; 2(1): 80-85.

[4] Pedersen SA, Fock HO, Sell AF. Mapping fisheries in the German exclusive
economic zone with special reference to offshore Natura 2000 sites. Marine Policy
2009; 33: 571–590.
[5] United Nations (2002) Report of the world summit on sustainable development.
Para. 32(c), UN.
[6] Spalding MD, Fish L, Wood LJ. Toward representative protection of the world’s
coasts and oceans - progress, gaps, and opportunities. Conservation Letters 2008;
1: 217-226.
[7] Jones PJS, Carpenter A. Crossing the divide: The challenges of designing an
ecologically coherent and representative network of MPAs for the UK. Marine Policy
2009; 33: 737–743.
[8] Clement A, McCullen P, Falcão A, Fiorentino A, Gardner F, Hammarlund K,
Lemonis G, Lewis T, Nielsen K, Petroncini S, Pontes T, Schild P, Sjöström B,
Sørensen HC, Thorpe T. Wave energy in Europe: current status and perspectives.
Renewable and Sustainable Energy Reviews 2002; 6: 405-431.
[9] Gray T, Haggett C, Bell D. Offshore wind farms and commercial fisheries in the
UK: a study in Stakeholder Consultation. Ethics, Place and Environment 2005; 8:
127-140.

[10] Breton SP, Moe G. Status, plans and technologies for offshore wind turbines in
Europe and North America. Renewable Energy 2009; 34: 646-654.
[11] Inger R, Attrill MJ, Bearhop S, Broderick AC, Grecian WJ, Hodgson DJ, Mills C,
Sheehan E, Votier SC, Witt MJ, Godley BJ. Marine Renewable energy: potential
benefits to biodiversity? An urgent call for research. Journal of Applied Ecology
2009; 46: 1145-1153.
[12] Hall-Spencer JM, Rodolfo-Metalpa R, Martin S, Ransome E, Fine M, Turner SM,
Rowley SJ, Tedesco D, Buia M-C. Volcanic carbon dioxide vents reveal ecosystem
effects of ocean acidification. Nature 2008; 454: 96-99.
[13] Sheilds MA, Dillon LJ, Woolf DK, Ford AT. Strategic priorities for assessing
ecological impacts of marine renewable energy devices in the Pentland Firth
(Scotland, UK). Marine Policy 2009; 33: 635-642.
[14] United Kingdom House of Lords. 27th Report of Session 2007-08: The EU’s
target for Renewable Energy: 20 % by 2020 Volume I: Report. House of Lords
European Union Committee. 2008; 8th. Available
http://www.publications.parliament.uk/pa/ld200708/ldselect/ldeucom/175/175.pdf
[Accessed September 2010]
[15] Stewart RR, Possingham HP. Efficiency, costs and trade-offs in marine reserve
system design. Environmental Modeling & Assessment 2005; 10: 203-213.

[16] Rijnsdorp AD, Mourik BPLv, Visser EG. Competitive interactions among beam
trawlers exploiting local patches of flatfish in the North Sea. ICES Journal of Marine
Science 2000; 57: 894-902.
[17] Suuronen P, Jounela P, Tschernij V. Fishermen responses on marine protected
areas in the Baltic cod fishery. Marine Policy 2010; 34: 237-243.
[18] Smith MD, Wilen JE. Economic Impacts of Marine Reserves: The Importance of
Spatial Behavior. Journal of Environmental Economics and Management 2003; 46:
183-206.
[19] Crowder LB, Osherenko G, Young OR, Airamé S, Norse EA, Baron N, Day JC,
Douvere F, Ehler CN, Halpern BS, Langdon SJ, McLeod KL, Ogden JC, Peach RE,
Rosenberg AA, Wilson JA. Resolving Mismatches in U.S. Ocean Governance.
Science 2006; 313: 617-618.
[20] Tyldesley D. A vision for marine spatial planning. Ecos 2006; 27: 33–39.
[21] Douvere F. The importance of marine spatial planning in advancing ecosystem-
based sea use management. Marine Policy 2008; 32: 762-771.
[22] EC (European Commission) 2008. Directive 2008/56/EC of the European
Parliament and of the Council of 17 June 2008 establishing a framework for
community action in the field of marine environmental policy (Marine Strategy
Framework Directive).

[23] Gilliland PM, Laffoley D. Key elements and steps in the process of developing
ecosystem-based marine spatial planning. Marine Policy 2008; 32: 787-796.
[24] Douvere F, Ehler CN. New perspectives on sea use management: initial findngs
from European experience with marine spatial planning. Journal of Environmental
Management 2009; 90:77-88.
[25] Foley MM, Halpern BS, Micheli F, Armsby MH, Caldwell MR, Crain CM, Rohr N,
Sivas D, Beck MW, Carr H, Crowder LB, Duffy JE, Hacker SD, McLeod KL, Palumbi
SR, Peterson CH, Regan HM, Ruckelshaus MH, Sandifer PA, Steneck RS. Guiding
principles for marine spatial planning. Marine Policy 2010; 34: 955-966.
[26] Halpern BS, Diamond J, Gaines S, Gelcich S, Gleason M, Jennings S, Lester S,
Lace A, McCook L, McLoed, Napoli N, Rawson K, Rice J, Rosenberg A,
Ruckleshaus M, Saier B, Sandifer P, Scholz A, Zivian A. Near time priorities for the
science, policy and practice of Coastal and Marine Spatial planning (CMSP). Marine
Policy 2012; 36: 198-205.
[27] Eastwood PD, Mills CM, Aldridge JN, Houghton CA, Rogers SI. Human
activities in UK offshore waters: an assessment of direct, physical pressure on the
seabed. ICES Journal of Marine Science 2007; 64: 453-463.

[28] Witt MJ, Godley B J. A Step Towards Seascape Scale Conservation: Using
Vessel Monitoring Systems (VMS) to Map Fishing Activity. PLoS ONE 2007; 2:
e1111.
[29] Marshall P, Robert T. FAO Technical Guidelines for Responsible Fisheries, No.1
Suppl.1. Food and Agriculture Organization of the United Nations 1998, Rome.
[30] Davies A, Roberts JM, Hall-Spencer JM. Preserving deep-sea natural heritage:
emerging issues in offshore conservation and management. Biological Conservation
2007; 138: 299-312.
[31] EC. Commission Regulation No. 2244/2003 of 18 December 2003 Laying down
detailed provisions regarding satellite-based Vessel Monitoring Systems. Official
Journal of the European Union 2003 17–27 L 333.
[32] EC. Commission Implementing Regulation (EU) No 404/2011 of 8th April 2011.
Laying down detailed rules for the implementation of Council Regulation EC No
1224/2009 establishing a Community control system for ensuring compliance with
the rules of the Common Fisheries Policy. Official Journal of the European Union
2011 L112/1.
[33] EC. Proposal for a Council Regulation establishing a Community control system
for ensuring compliance with the rules of the Common Fisheries Policy DS 329/09 20
May 2009.

[34] Deng R, Dichmont C, Milton D, Haywood M, Vance D, Hall N, Die D. Can
vessel monitoring system data also be used to study trawling intensity and
population depletion? The example of Australia's northern prawn fishery. Canadian
Journal of Fisheries and Aquatic Sciences 2005; 62: 611-622.
[35] Bertrand S, Diaz E, Lengaigne M. Patterns in the spatial distribution of Peruvian
anchovy (Engraulis ringens) revealed by spatially explicit fishing data. Progress in
Oceanography 2008; 79: 379-389.
[36] Murawski SA, Wigley SE, Fogarty MJ, Rago PJ, Mountain DG. Activity
distribution and catch patterns adjacent to temperate MPAs. ICES Journal of Marine
Science 2005; 62: 1150-1167.
[37] Hiddink JG, Hutton T, Jennings S, Kaiser MJ. Predicting the effects of area
closures and fishing activity restrictions on the production, biomass, and species
richness of benthic invertebrate communities. ICES Journal of Marine Science 2006;
63: 822-830.
[38]Rogers AD, Clark MR, Hall-Spencer JM, Gjerde KM. A scientific guide to the
FAO draft international guidelines (December 2007) for the management of deep-
sea fisheries in the High Seas. IUCN 2008, Switzerland.
[39] Hall-Spencer JM, Tasker M, Soffker M, Christiansen S, Rogers S, Campbell M,
Hoydal K. The design of Marine Protected Areas on High Seas and territorial waters
of Rockall. Marine Ecology Progress Series 2009; 397: 305-308.

[40]Fock HO. Fisheries in the context of marine spatial planning: Defining principal
areas for fisheries in the German EEZ. Marine Policy 2008; 32: 728-739.
[41] Gerritsen H, Lordan C. Integrating vessel monitoring systems (VMS) data with
daily catch data from logbooks to explore the spatial distribution of catch and activity
at high resolution. ICES Journal of Marine Science; 68: 245-252.
[42] Stelzenmüller V, Rogers SI, Mills CM. Spatio-temporal patterns of fishing
pressure on UK marine landscapes, and their implications for spatial planning and
management. ICES Journal of Marine Science 2008; 65: 1081-1091.
[43] Lee J, South A, Jennings S. Developing reliable, repeatable, and accessible
methods to provide high-resolution estimates of fishing-activity distributions from
vessel monitoring system (VMS) data. ICES Journal of Marine Science 2010; 67:
1260-1271.
[44] Jennings S, Lee J. Defining fishing grounds with vessel monitoring system data.
ICES Journal of Marine Science 2012; 69(1): 51-63.
[45] Lambert G, Jennings S, Hiddink JG, Hinzten NT, Hinz H, Kaiser MJ, Murray L.
Implications of using alternative methods of vessel monitoring system data analysis
to describe fishing activities and impacts. ICES Journal of Marine Science 2012; 69:
682-693.

[46] Bastardie F, Nielsen JR, Ulrich C, Egekvist J, Degel H. Detailed mapping of
fishing activity and landings by coupling fishing logbooks with satellite-recorded
vessel geo-location. Fisheries Research 2010; 106: 41-53.
[47] Halpern BS, Walbridge S, Selkoe KA, Kappel CV, Micheli F, D’Agrosa C, Bruno
JF, Casey KS, Ebert C, Fox HE, Fujita R, Heinemann D, Lenihan HS, Madin EMP,
Perry MT, Selig ER, Spalding M, Steneck R, Watson R. A Global Map of Human
Impact on Marine Ecosystems. Science 2008; 319: 948-952.
[48] SWRDA. Wave Hub 2009. Available http://www.wavehub.co.uk/ [Accessed
September 2010] TAKE OUT
[49] Rees EIS. Preliminary observations on benthic biotopes at Haig Fras: an
isolated submmerged rock in the Celtic Sea. Southampton: OSPAR/ICES/EEA
Second Workshop on habitat Classification, 18-22 Sepetmber 2000.
[50] JNCC 2008. Offshore Special Area of Conservation: Haig Fras. SAC Selection
site Version 4.0. 14 pp. Available from
http://jncc.defra.gov.uk/PDF/haigFras_selectionAsseessment_4.0.pdf [Accessed
September 2010]
[51] European Commission. Commission Regulation (EC) No 665/2008 of 14 July
2008 laying down detailed rules for the application of Council Regulation (EC) No
199/2008 concerning the establishment of a Community framework for the collection,
management and use of data in the fisheries sector and support for scientific advice
regarding the Common Fisheries Policy. Official Journal of the European Union
2008; L186: 3-5.
[52] European Commission. Commission Decision of 6 November 2008 adopting a
multiannual Community programme pursuant to Council Regulation (EC) No
199/2008 establishing a Community framework for the collection, management and
use of data in the fisheries sector and support for scientific advice regarding the
Common Fisheries Policy (2008/949/EC). Official Journal of the European Union
2008; L346: 37-88.
[53] European Commission. Commission Regulation (EC) No 2371/2002 of 20
December 2002 on the conservation sustainable exploitation of fisheries resources
under the Common Fisheries Policy. Official Journal of the European Union 2002;
L358: 59-80.
[54] Rijnsdorp AD, Buys AM, Storbeck F, Visser EG. Micro-scale distribution of
beam trawl activity in the southern North Sea between 1993 and 1996 in relation to
the trawling frequency of the sea bed and the impact on benthic organisms. ICES
Journal of Marine Science 1998; 55: 403-419. OUT!
[55] Connor DW, Gilliland PM, Golding N, Robinson P, Todd D, Verling E. UK
SeaMap: the mapping of seabed and water column features of UK seas. Joint
Nature Conservation Committee 2006, Peterborough.

[56] Barratt C, Irwin C. United Kingdom Sea Fisheries Statistics 2007. Department
of Environment, Food and Rural Affairs (DEFRA), London.
[57] Gell FR, Roberts CM. Benefits beyond boundaries: the fishery effects of marine
reserves. Trends in Ecology and Evolution 2003; 18: 448–455.
[58] Beukers-Stewart BD, Vause BJ, Mosley MWJ, Rossetti HL, Brand AR. Benefits
of closed area protection for a population of scallops. Marine Ecology Progress
Series 2005; 298: 189–204.
[59] Blyth RE, Kaiser MJ, Edwards-Jones G, Hart PJB. Voluntary management in an
inshore fishery has conservation benefits. Environmental Conservation 2002; 29:
493-508.
[60]Berkenhagen J, Döring R, Fock HO, Kloppmann MHF, Pedersen SA, Schulze T.
Decision bias in marine spatial planning of offshore wind farms: Problems of singular
versus cumulative assessments of economic impacts on fisheries. Marine Policy
2010; 34: 733-736.
[61] Jennings S, Lee J, Hiddink JG. Assessing fishery footprints and the trade-offs
between landings value, habitat sensitivity and fihsing impacts to inform marine
spatial planning and an ecosystem approach. ICES Journal of Marine Science 2012;
69(6): 1053-1063.

[62] Gerritsen HD, Minto C, Lordan C. How much of the seabed is impacted by
mobile gear? Absolute estimates from Vessel Monitoring System (VMS) point data.
ICES Journal of Marine Science 2013; 69(6): doi/1093/icesjms/fst017.
[63] Furness RW. Impacts of fisheries on seabird communities. Scientia Marina
2003; 67: 33-45
[64] Votier SC, Furness RW, Bearhop S, Crane JE, Caldow RWG, Catry P, Ensor K,
Hamer KC, Hudson AV, Kalmbach E, Klomp NI, Pfeiffer S, Phillips RA, Prieto I,
Thompson DR. Changes in fisheries discard rates and seabird communities. Nature
2004; 427: 727-730.
[65] Lewison RL, Crowder LB, Read AJ, Freeman SA. Understanding impacts of
fisheries bycatch on marine megafauna. Trends in Ecology & Evolution 2004; 19:
598-604.
[66] Furness RW, Edwards AE, Oro D. Influence of management practices and of
scavenging seabirds on availability of fisheries discards to benthic scavengers.
Marine Ecology Progress Series 2007; 350: 235-244.
[67] Mitchell PI, Newton SF, Ratcliffe N, Dun TE. Seabird Populations of Britain and
Ireland. London. T & A D Poyser; 2004.
[68] Votier, SC, Bearhop S, Witt MJ, Inger R, Thompson D, Newton J. Individual
responses of seabirds to commercial fisheries revealed using GPS tracking, stable

isotopes and vessel monitoring systems. Journal of Applied Ecology 2010; 47: 487-
497.
[69] Kaiser MJ, Clarke KR, Hinz H, Austen MCV, Somerfield PJ, Karakassis I.
Global analysis and the prediction of the response of benthic biota to fishing. Marine
Ecology Progress Series 2006; 311: 1-14.
[70] Shephard S, Gerritsen H, Kaiser MJ, Reid DG. Spatial heterogeneity in fishing
creates de facto refugia for endangered Celtic Sea elasmobranchs. PLoS ONE
2012; 7(11): e49307. Doi:10.1371/journal.pone.0049307.
[71] Pedersen SA, Fock H, Krause JK, Push C, Sell AF, Böttcher U, Rogers SI,
Sköld M, Skov H, Podolska M, Piet GJ, Rice JC. Natura 2000 sites and fisheries in
German offshore waters. ICES Journal of Marine Science 2009; 66: 155-169.
[72] Hall-Spencer JM, Moore PG. Scallop dredging has profound, long-term impacts
on maerl habitats. ICES Journal of Marine Science 2000; 57: 1407–1415.
[73] Tyler-Walters H, Rogers SI, Marshall CE, Hiscock K. A method to assess the
sensitivity of sedimentary communities to fishing communities. Aquatic Conservation
Marine and Freshwater Systems 2009; 19: 285-300.
[74] Stelzenmüller V, Lee J, Garnacho E, Rogers SI. Assessment of a Bayesian
Belief Network-GIS framework as a practical tool to support marine planning. Marine
Pollution Bulletin 2010; 60: 1743-1754.

[75] Stelzenmüller V, Lee J, South A, Rogers SI. Quantifying cumulative impacts of
human pressures on the marine environment: a geospatial modelling framework.
Marine Ecology Progress Series 2010; 398: 19-32.
[76] Hinz H, Prieto V, Kaiser MJ. Trawl disturbance on benthic communities: chronic
effects and experimental predictions. Ecological Applications 2009; 19(3): 761-773.
[77] Hiddink JG, Johnson AF, Kingham R, Hinz H (In Press). Could our fisheries be
more productive? Indirect negative effects of bottom trawl fisheries on fish condition.
Journal of Applied Ecology 2011
[78] Baban SMJ, Parry T. Developing and applying a GIS-assisted approach to
locating wind farms in the UK. Renewable Energy 2001; 24: 59-71.
[79] Villa F, Tunesi L, Agardy T. Zoning marine protected areas through spatial
multiple-criteria analysis: the case of the Asinara Island National Marine Reserve of
Italy. Conservation Biology 2002; 16: 515-526.
[80] Bruce EM, Eliot IG. A spatial model for marine park zoning. Coastal
Management 2006; 34: 17-38.
[81] Prest R, Daniell T, Ostendorf B. Using GIS to evaluate the impact of exclusion
zones on the connection cost of wave energy to the electricity grid. Energy Policy
2007; 35: 4516-4528.
[82] Dinmore TA, Duplisea DE, Rackham BD, Maxwell DL, Jennings S. Impact of a
large-scale area closure on patterns of fishing disturbance and the consequences for
benthic communities. ICES Journal of Marine Science 2003; 60: 371-380.
[83] Richardson EA, Kaiser MJ, Edwards-Jones G, Possingham H. Sensitivity of
marine-reserve design to the spatial resolution of socioeconomic data. Conservation
Biology 2006; 20: 1191-1202.
[84] Witt MJ, Sheehan EV, Bearhop S, Broderick AC, Conley DC, Cotterell SP, Crow
E, Grecian WJ, Halsband C, Hodgson DJ, Hosegood P, Inger R, Miller PI, Sims DW,
Thompson RC, Vanstaen K, Votier SC, Attrill MJ, Godley BJ (2012). Assessing
wave energy effects on biodiversity: the Wave Hub experience. Philosophical
Transactions of the Royal Society of London A: Mathematical, Physical &
Engineering Sciences; doi:10.1098/rsta.2011.0265.
[85] Mill CM, Townsend SE, Jennings S, Eastwood PD, Houghton CA. Estimating
high resoltution fishing effort from satellite based vessel monitoring system data.
ICES Journal of Marine Science 2007; 64: 248-255.
[86] Hintzen NT, Piet GJ, Brunel T. Improved estimation of trawling tracks using
cubic Hermite spline interpolation of position registration data. Fisheries Research
2010; 101: 108-115.

[87] Russo T, Parisi A, Cataudella S. new insights in interpolating fishing tracks from
VMS data for different métiers. Fisheries Research 2011; 108: 184-194.
[88] Abernethy KE, Trebilcock P, Kebede B, Allison EH, Dulvy NK. Fuelling the
decline in UK fishing communities. ICES Journal of Marine Science 2010; 67: 1076-
1085.
[89] Murray LG, Hinz H, Kaiser MJ. Functional response of fishers in the Isle of Man
scallop fishery. Marine Ecology Progress Series 2011; 430: 157-169.
[90] Rees S, Fletcher S, Glegg G, Marshall C, Rodwell L, Jefferson R, Campbell M,
Langmead O, Ashley M, Bloomfield H, Brutto D, Colenutt A, Conversi A, Earll B,
Abdel Hamid I, Hattam C, Ingram S, McKinley E, Mee L, Oats J, Peckett F, Portus J,
Reed M, Rogers S, Saunders J, Scales K, Wynn R. Priority questions to shape the
marine and coastal policy research agenda in the United Kingdom. Marine Policy
2013; 38: 531-537. .
[91] van Putten IE, Kulmala S, Thébaud O, Dowling N, Hamon KG, Hutton T, Pascoe
S. Theories and behavioural drivers underlying fleet dynamics models. Fish and
Fisheries 2011; doi: 10.1111/j. 1467-2979.2011.00430.x
[92] ICES. Report of the Study Group on VMS data, its storage, access and tools for
analysis (SGVMS), 8-9th September 2010, Hamburg, Germany. ICES CM
2010/SSGSUE: 12, 2010. 46pp.

[93] Hinz H, Murray LG, Lambert GI, Hiddink JG, Kaiser MJ. Confidentiality over
fishing effort data threatens science and management progress. Fish and Fisheries
2012; 14: 110-117.
Tables
Table 1. Indices of relative difference in spatial pattern within gear between 2005
and 2008 Lee et al. 2010 [43].
Year Scallop dredge Longline Gillnet Potter/Whelker Beam trawl Otter trawl
2005-2006 0.4591 0.5199 0.3955 0.3837 0.2698 0.4311
2006-2007 0.5151 0.6629 0.4438 0.3096 0.2949 0.4568
2007-2008 0.4393 0.721 0.5025 0.3988 0.2913 0.5031
0= total equality; 1= maximal difference
Table 2. Indices of relative difference in spatial pattern between gear types for all
years Lee et al. 2010 [43].
2005 Dredge Longline P/W Gillnet Beam Otter
Dredge 0 0.9393 0.9319 0.9009 0.6832 0.8576
Longline 0 0 0.9717 0.7746 0.8956 0.9378
P/W 0 0 0 0.9733 0.8728 0.9179
Gillnet 0 0 0 0 0.8129 0.8472
Beam 0 0 0 0 0 0.8606
Otter 0 0 0 0 0 0

2006 Dredge Longline P/W Gillnet Beam Otter
Dredge 0 0.956 0.8966 0.9152 0.6261 0.852
Longline 0 0 0.9939 0.8698 0.8987 0.9659
P/W 0 0 0 0.9464 0.8467 0.9464
Gillnet 0 0 0 0 0.8438 0.8794
Beam 0 0 0 0 0 0.867
Otter 0 0 0 0 0 0
2007 Dredge Longline P/W Gillnet Beam Otter
Dredge 0 0.9583 0.8977 0.9492 0.6089 0.9013
Longline 0 0 0.9905 0.9581 0.932 0.9875
P/W 0 0 0 0.9554 0.8874 0.9141
Gillnet 0 0 0 0 0.8348 0.9308
Beam 0 0 0 0 0 0.8938
Otter 0 0 0 0 0 0
2008 Dredge Longline P/W Gillnet Beam Otter
Dredge 0 0.9927 0.9174 0.9489 0.6529 0.9331
Longline 0 0 0.9979 0.9371 0.9562 0.9903
P/W 0 0 0 0.9512 0.8919 0.9332
Gillnet 0 0 0 0 0.8681 0.9678
Beam 0 0 0 0 0 0.9632
Otter 0 0 0 0 0 0
0= total equality; 1= maximal difference

Table 3. Capacity (no. vessels) and activity (days at sea) of UK fleets in ICES VII e-
h from 2005 to 2008.
Year/gear type e f g
h
2005 No. vessels Days at sea No. vessels Days at sea No. vessels
Days at sea No. vessels Days at sea
SD 17 207 14 33 6 0
12 59
Longline 5 51 5 5 7 20
9 64
Gillnet 22 62 23 154 24 58
26 58
P/W 10 62 7 80 5 26
0 0
Beam 58 210 48 153 43 33
45 106
Otter 18 114 15 98 41 32
16 29
2006
SD 29 125 23 26 23 23
20 31
Longline 4 42 3 4 5 15
5 102

Gillnet 22 66 21 186 19 78
24 46
P/W 11 186 7 99 3 0
0 0
Beam 60 210 49 141 36 38
44 94
Otter 17 113 13 79 30 41
15 35
2007
SD 27 134 18 18 16 35
17 12
Longline 1 156 1 1 2 1
4 51
Gillnet 16 72 14 261 13 106
13 76
P/W 14 147 9 133 3 2
0 0
Beam 53 203 47 135 29 42
38 103
Otter 8 154 9 111 25 34
8 71
2008
SD 19 86 16 17 19 23
9 12
Longline 2 19 2 0 2 1
4 12

Gillnet 13 50 13 184 10 85
12 57
P/W 13 149 6 160 3 85
0 0
Beam 48 159 34 116 23 10
39 55
Otter 7 84 5 122 24 48
8 21

Table 4. Activity (hrs/ km2 * 10-5) of all UK fleets respective of marine landscape
type from 2005 to 2008.
Gear type/ Marine landscape Sand Coarse Mixed Rock Mud
Mobile
Scallop dredge 11.02615 9.555377 38.19663 26.15827 40.09043
Beam trawl 61.42465 42.33229 63.59778 21.14759 355.342
Otter trawl 8.3149726 2.6548399 4.179753 21.18380 246.67104
Static
Longline 1.1745026 1.5800855 4.2812401 1.7274331 11.162576
Gillnet 11.624799 5.2034432 10.637948 23.562868 143.6178
Potter/Whelker 2.441716 5.8374971 4.9672157 15.623484 7.332280

Figures
Fig. 1. Study area showing ICES areas VII e-h boundaries, the location of the
proposed Haig Fras Natura 2000 site and the location of the proposed Wave Hub
deployment area.
Fig. 2. Fishing activity distribution of UK vessels >15 m in length in ICES areas VII e-
h from 2005-2008 (a) scallop dredge (b) longline (c) gillnet (d) potters/whelkers (e)
beam trawl (f) otter trawl. Logarithmic scale bar (hrs) is shown.

(a)

(b)

(c)

(d)

(e)

(f)

(g)

Fig. 3. Five marine landscape types derived from UK Seamap data [48](Connor et
al., 2006) within the boundaries of ICES areas VII e-h.

Investigating the co-existence of fisheries and offshore renewable energy in
the UK: Identification of a mitigation agenda for fishing effort displacement
Jiska de Groota*, Maria Campbellb, Matthew Ashleyc, Lynda Rodwelld
a Plymouth University, School of Geography, Earth and Environmental Sciences,
Portland Square Building A503, Drake Circus, PL4 8AA, UK
b Plymouth University, School of Marine Science and Engineering, Room 614
Davy Building, Drake Circus, Plymouth PL4 8AA, UK
c Plymouth University, Marine Institute, Marine Building, Drake Circus, Plymouth PL4
8AA, UK
d Plymouth University, School of Marine Science and Engineering, Room 123
Reynolds Building, Drake Circus, Plymouth PL4 8AA, UK
*Corresponding author:
Jiska de Groot
School of Geography, Earth and Environmental Sciences, Portland Square
Building A503, Drake Circus, PL4 8AA, UK
Email: [email protected]
Abstract
The increased demand for sea space for marine renewable energy (MRE)
developments and marine conservation will have impacts on the fishing sector. As a
consequence, it is imperative to understand the ways in which fisheries and

renewable energy interact and explore the potential for co-existence. In this paper
we investigate the challenges of co-existence between the two sectors and explore a
mitigation agenda for fishing effort displacement in the UK. Data were collected
through stakeholder questionnaires and two stakeholder workshops. Thematic
analysis was carried out to identify the key challenges faced by stakeholder groups.
The research identifies, as main points of this agenda: developing mechanisms for
overcoming data issues for assessment of effort displacement; the development of
appropriate methods of assessment; and development of a consultation protocol
between MRE and fishing sectors.
Keywords: conflict management, stakeholder engagement, consultation, fisheries
management, marine renewable energy, ecological data, environmental monitoring,
fishing effort displacement.
1. Introduction
1.1. Increasing demand on sea space
Extensive fisheries management and policy has been developed responding to
growing concerns about depletion of commercial fish stock due to overfishing.
Management measures such as area closures and fishing quota, as a way to control
fishing effort, have been implemented, which as has resulted in displaced effort (for
example, Suuronen et al., 2010). In the UK, the Common Fisheries Policy (CFP) is
the main mechanism to deliver sustainable fisheries and economic strength to the
fishing sector. It consists of four interrelated policies addressing: markets, structures,

external fishery relations and conservation. Originally created in 1983, the CFP was
part of the Common Agricultural Policy (CAP) in the 1970s and used until the CFP
was formally created in 1983. However, when part of the CAP, the CFP was used
avoid conflict with other nations over competing claims on fish stocks (European
Commission, 2009). However, the CFP has failed to deliver on these objectives due
to lack of compliance; communication problems; lack of transparency; lack of
integration of scientific evidence into decision making as well as weak integration of
environmental concerns into the CFP (Khalilian et al., 2010; Osterblom et al., 2011;
Qui and Jones, 2013; Rodwell et al., 2013b). Several decades after the CFP was put
in place, the issue now is not so much nations competing for access to the sea but
competing activities and priorities such as conservation and renewable energy
generation. This is the result of the growing concern about fossil fuel depletion, its
supply and impacts on the environment, which has led governments around the
world to introduce measures to increase the proportion of energy produced from
renewable sources, and enter into agreements to deploy renewable energy
(Sustainable Development Commission, 2007).
1.2. Fisheries in the UK
Current fisheries statistics, provided by the Marine Management Organisation
(2013), place the over 10 m fleet vessel number at 1374, and the number of vessels
10 m and below active were 5 032. The composition of the approximately 12 450
vessels operating in the UK in 2012 consisted of: 5 950 in England; 4 700 in
Scotland; 800 Northern Ireland; and 1 000 Wales. In 2012, vessels landed
approximately 627, 000 tonnes of fish (including shellfish) into the UK and abroad

with a market value of £770 million. Pelagic and shellfish landings increased from
2011 to 2012, with shellfish constituting the majority of landings, however average
price of pelagic fish decreased from the previous year, hence the value landed is 7%
less than 2011. Most of the Scottish and Northern Irish fleet landings consist of
pelagic fish; Welsh catches consist of mainly shellfish; and the English fleet land
predominantly pelagic fish. In 2012, more than half of all landings made by the UK
fleet were caught in the Northern North Sea and West of Scotland. Falling catches of
cod and haddock have contributed to the fall in demersal catches since the mid
1990's, however mackerel and herring catches have continued to rise. Since 2008,
scallop landings have increased while both crab and Nephrops have shown some
decline. The UK has the 4th most powerful fleet in the EU (Marine Management
Organisation, 2013), which underlines the need for careful consideration of MRE
interaction with the fishing sector. The greatest share of larger vessels is based in
Scotland whereas the higher number of smaller vessels, i.e. below 10 m are based
in English waters. The reason for these differences; the Scottish fleet are responsible
for the targeted catches of herring and mackerel and fish mainly in the North Sea
and west of Scotland. The English fleet mainly target Channel fisheries for Sole and
Plaice, but with a higher proportion of smaller vessels, these also target inshore
areas.
1.3. Offshore renewable energy development and effort displacement
The UK has made commitments to ensure that an overall 15% of energy demand is
met from renewable sources by 2020 (DECC, 2011), with more ambitious targets set
by the devolved administrations. Since 1998, increased powers were given to the

governments in Northern Ireland, Scotland and Wales, within the UK as a whole. As
a result, many of the administrative, executive and legislative authorities operate only
within these administrations. There areas have their own ministers, priorities and
mandates to different degrees, resulting in a variety in policies and procedures in
each administration, for issues such as energy, fisheries, and marine planning.
Energy policy, for example, is fully devolved in Northern Ireland; in Scotland, it is
executively devolved, which provides Scottish Minsters with full control over major
consents and planning as well as operational control over market and support
systems; and Wales, which as the least devolved power, oversees planning and
consents for smaller renewable emerging facilities. Regarding renewable energy,
this has resulted in different targets: 100% of demand for electricity from renewable
energy by 2020 in Scotland (Scottish Government, 2011); 40% in Northern Ireland
(DECC, 2011); and 22.5 Gigawatts of installed capacity from different renewable
energy technologies in Wales by 2020E2025 (Welsh Assembly Government, 2010).
To achieve targets, the UK must strongly increase its renewable energy deployment
and comprehensive energy policies, and strategies were established to abate to
increase the use of energy from renewable sources. As a consequence, the marine
area around the British Isles increasingly functions as a location for energy
generation, because offshore there are better resources (Pelc and Fujita, 2002), the
possibility of larger scale developments, as well as perceived increased acceptance
and higher consenting rates (Haggett, 2008; Jay, 2010).
Large, high capacity wind farms are being planned, whilst other more nascent
technologies, such as wave and tidal technologies, are on the rise, increasing the

competition for ocean space. Since 2000, the owner of the seabed, the Crown
Estate, has leased large areas of the UK seabed for development with a generating
capacity of up to 40 GW (Crown Estate, 2013a). Six rounds have been announced
for offshore wind, increasing in scale and technical complexity as the industry
developed. In September 2008, the first leasing round took place in the Pentland
Firth in Scotland for wave and tidal energy, which resulted in six wave project
development sites and four tidal stream sites to be leased with a potential up to
several 100 MWs (Crown Estate, 2013b).
Marine renewable energy (MRE) development may lead to large impacts on the
fisheries sector. If the developments proposed around the country go ahead, it is
expected that exclusion zones will be established around the developments,
resulting in displaced effort of fishers (Alexander et al., 2013; Mackinson et al.,
2006), and together with the planned suite of marine conservation zones (MCZs), the
problem of displacement is compounded even further (Campbell et al., 2014).
Although area closures and controls of fishing effort have been widely used as
fisheries management tools, and it is known that they affect the distribution of fishing
effort (Hiddink et al., 2006), the scale and extent of the offshore renewables industry
as well as other area closures (e.g. as a result of marine protection) is
unprecedented. This increased pressure on the marine space is recognised in both
the UK and beyond, and in order to improve the stewardship of our seascapes and
reduce conflict, a forward-looking, ecosystem-based and transparent process known
as Marine Spatial Planning (MSP) is being promoted; frameworks being developed;
experiences documented; criteria tested; and future priorities envisioned (Douvere
and Ehler, 2009; Foley et al., 2010; Halpern et al., 2012; Stelzenmüller et al., 2013).
In the UK, the Marine and Coastal Access Act (MCAA) (hereafter the Marine Act), a
system for MSP gaining Royal Assent in 2009 and now enacted into law, was
established, which aims to rationalise the use of the marine area. However, little is
known about offshore renewable energy generation and its interaction with fishing
effort. Even less is known about the social, economic and environmental impacts of
effort displacement or the cumulative impacts that multiple area closures will have
(Hilborn et al., 2004; Mangi et al., 2011; Punt et al., 2009; Sale et al., 2005). As a
result of increased development in the sea space it is imperative to understand the
ways in which fisheries and renewable energy interact and explore potential for co-
existence.
In this research we investigate the challenges in resolving interactions between
fisheries and marine renewable energy. We focus on the improved co-existence
between the two sectors and developing a mitigation agenda for fishing effort
displacement in the UK. This research was carried out as part of the work of the
Fisheries and Marine Renewable Energy Working Group (FMREWG), and consists
of a scoping survey and two workshops, funded by the Marine Renewable Energy
Knowledge Exchange Programme (MREKEP), a Natural Environment Research
Council (NERC) project and coordinated by Plymouth University.
2. Methods
The primary focus of the research was the interaction of fisheries and the MRE
sector in the UK context. Focusing on the UK as a case study enabled an in-depth
investigation of the issues around fishing effort displacement and renewable

interactions in this specific area. Robson (2002) described this approach “as a
strategy of research which involves an empirical investigation of a contemporary
phenomenon in its real life context using multiple sources of evidence”. This focus
also allowed for the application of multiple methods, including a questionnaire survey
and two workshops based on the Delphi-method.
2.1. Data collection
2.1.1. Questionnaire survey
The first method applied consisted of a questionnaire survey, which was conducted
at the EIMR (Environmental Interactions of Marine Renewable energy) Conference
in Orkney in May 2012. Around 200 delegates participated in this event, including
representatives from business, policy and academia from a variety of backgrounds
including ecology, engineering, policy and fisheries. The survey was aimed as a
scoping exercise for exploring the range of knowledge exchange options between
the areas of marine energy development and fisheries, to identify priority research
issues, knowledge gaps and collaboration needs. Not all delegates had relevant
activities or knowledge areas for this topic, and therefore not all delegates felt like
they could not contribute to this debate.
2.1.2. Workshops
Workshops were used as the main technique to explore the range of issues
associated with effort displacement as a result of offshore renewable energy
deployment. The nature of the participants and the aim of the research to develop a
mitigation agenda lent itself to a Delphi-approach. This method generally consists of

various techniques, but typical features include: an expert panel, rounds with
questions through which information is collected from those in the panel, the
information is analysed and fed back, which provides participants with an opportunity
to revise their judgements (Okoli and Pawlowski, 2004; Mullen, 2003). The approach
aims to achieve consensus on a complex problem. Although modified to fit the aim
and circumstances of the research, the approach provided an opportunity for
knowledge exchange be-tween multiple stakeholders as well as consensus on a
mitigation agenda. To enable discussion and knowledge exchange to take place,
participants from different backgrounds and regions were divided into groups. Each
group thus consisted of a mix of people from different backgrounds and
administrations, and the results must be taken in the context of these groups working
together. To ensure confidentiality of the participants' comments to a wider audience,
no specific comments were allocated to persons.
2.1.2.1. Workshop 1- Scoping
The second part of the MREKEP activities concerned a scoping workshop which
aimed to identify key issues and research topics in the fields of fisheries and marine
renewable energy interactions (Rodwell et al., 2012). In May 2012, 29 delegates of
the EIMR Conference in Orkney attended the scoping workshop. The participants
included academics, regulators, and the offshore renewables and fisheries sectors.
The workshop took a focus group approach, a form of group interview which
employs the interaction between research participants to generate data. This method
is considered to be “particularly useful for exploring people's knowledge and
experience” (Kitzinger, 1995), and enables to explore participants to explore issues
of importance. Participants were divided into 4 groups of 7-8 people with a facilitator

attached to each group. The groups covered four questions each between 5 and 10
min, and were asked to brainstorm their ideas to create a mind map or produce list of
key ideas. The groups would rotate so they were able to read the previous' group
work and add to their ideas. The four questions were:
1. What are the priority issues to focus on with regard to the interaction of
marine renewable and fisheries?
2. What are the barriers to progress with regard to the interaction of marine
renewable and fisheries?
3. How can we mitigate problems associated with the interaction of marine
renewable and fisheries?
To provide the opportunity for reflection and achieving consensus, the facilitator of
each group would present the key ideas of each round. An open discussion followed
to ensure appropriate coverage of ideas. Furthermore, participants were asked to
use post-it notes to add anything that was not covered in this work-shop, but was
deemed important to include in the expert work-shop. Extensive notes were taken
during the discussion and mind maps, key ideas and post-it notes were collected, all
of which provided additional input for the analysis.
2.1.2.2. Workshop 2 -Expert Workshop
The final activity consisted of an expert workshop which brought together 33
representatives from all devolved administrations covering: academia, the offshore
renewable energy industry, regulators and delegates involved in marine conservation
and fisheries. The workshop took place over one and a half days. The aim of the

expert workshop was to examine the issues raised in the scoping workshop in more
detail or expand on them, as well as to contribute to secure positive future
interactions between fishing and offshore renewables industry, and so addressing
the issue of fishing effort displacement as a result of development of an offshore
energy industry. Table 1 provides a summary of the sectors represented at the
workshop.
The workshop was designed in four separate sessions, which aimed to move from
the present situation towards development of positive actions in the future. The
sessions covered:
1. A review of past research and work
2. Case study experience and practical implementation
3. Moving forward and recommendations for action
4. Achieving consensus on action
During both workshops, each group was moderated by a facilitator, and notes were
taken during the discussions. The second workshop was recorded.
2.2. Data analysis
2.2.1. Questionnaire survey
The returned questionnaires were entered into SPSS. Descriptive statistics were
used to summarize the sample and the number of respondents that identified
particular research gaps and priority issues. The number of completed
questionnaires collected, a total of 24, was too low to conduct in-depth statistical

analysis. Instead, to assess the most urgent needs for data and collaboration, survey
responses were assigned a score according to the respondent's indicated
appropriate level of data and collaboration needs. The data needs score was
developed based on the ranking of importance of issues. The scores were weighted
and high data needs were assigned a score of 3, medium of 2, and low of 1. For
example, the identified data needs score of 51 for ecological data (Fig. 1), is based
on 14 respondents indicating high data needs, 4 medium and 1 low. The calculated
data score therefore is: (14*3) + (4*2) + (1*1) = 51. A high data needs score means
that respondents thought that there is a data need and that this data need is urgent.
An indicated low data need means that in comparison to others the data are needed
but not most urgent. When a type of data was not marked, this indicated that the
respondent thought there were no data needs. Correspondingly, priorities for
research collaboration needs were assessed by assigning a score to the appropriate
level of collaboration needs, with high collaboration needs scored as 3, medium as 2
and low scoring 1. The collaboration needs score was calculated in the same way as
the data needs score.
Table 1. Affiliations of the delegates attending the MREKEP expert workshop in
York.
Sector Number of delegates
Offshore renewable energy sector (e.g. developers, utility company, non-profit renewable energy trade association)
5
Fishing sector (e.g. fishing organisations, industry groups, conservation authorities)
10

Planning and management (e.g. non-departmental , public bodies, government representatives, government advisory body)
10
Academia 8
2.2.2. Workshops
The data resulting each of the workshops were coded, which is the process of
categorising the data. Open coding, an inductive approach to coding that is not
based on pre-defined themes, was used to identify key themes. Thematic analysis
was applied to the codes from the scoping workshop which in qualitative research
involves identification of recurrent issues in the data (Joffe and Yardley, 2004;
Creswell, 1994). Themes are clusters of linked categories which convey similar
meanings, and allowed for the nuances of the themes to be explored in-depth.
Although software is available (such as NVivo), to aid the process of searching
through the data, the identification of themes remains dependent on human effort,
and was achieved through systematic reduction of the texts and notes into separate
units. Once reduced, data issues, assessment methods, and communication were
identified as the three overarching themes, each with a set of sub-themes, based on
population of the codes. The presentation of the key themes and their in-depth
exploration are discussed in the next section as the challenges for coexistence of
fisheries and offshore renewable energy.

Data analysis of the expert workshop focused on examining the issues and themes
raised in the scoping workshop, and to contribute to secure positive future
interactions between fishing and offshore renewables industry by achieving
consensus on actions. Because the themes for discussion were identified through
analysis of the first workshop, the data from the expert workshop were coded
through a process of deductive coding, which analyses the data based on existing
codes that can be based on previous research or a pre-existing theoretical
framework (Joffe and Yardley, 2004; Creswell, 1994). This provided further insight
into the existing codes and contributed to the practical components of the mitigation
agenda.
Fig. 1. Data needs identified by survey respondents
1411
2
74
7
47
9
10
12
12
1 2
7
22
1
Ecological data Environmentalmonitoring
Engineeringdata
Fishing activity Other resourceuser data
economic data
Data Needs high Data Needs medium Data Needs low
51 49 31 43 38 46
Data needs score

3. Results: identification of key challenges for coexistence of fisheries and
offshore renewable energy development
Inductive analysis of the coded data from both workshops found three key
overarching challenges that a mitigation agenda should address; Data issues,
assessment of fishing effort displacement, and issues around consultation and
communication. Early identification of these themes in the survey and scoping
workshop, enabled elaboration on the themes in more detail in the expert workshop.
Reoccurrence of the themes throughout the research activities confirmed their
importance. The key challenges and results presented below are the results from the
two workshops. Where indicated, the results discussed are specifically from the
survey. These key challenges will provide the basis for the mitigation agenda.
underlying themes identified in all activities are discussed below. The main results
presented below are the results from the two workshops. Where indicated, the
results discussed are specifically from the survey. These key challenges will provide
the basis for the mitigation agenda.
3.1. Challenge: data issues
A first challenge identified was issues surrounding data. The main issues discussed
included: different types of data needs, availability of data and data sharing.
3.1.1. Data needs
Participants indicated a large data gap for assessing effort displacement. This is
supported by evidence from the literature, where few studies have sought to balance
the benefits that may result from closed areas against the cost that results from the
displacement of fishing effort (Halpern et al., 2004; Hiddink et al., 2006; Kaiser,

2005). The data showed that once core fishing areas are accurately identified more
research and development should go into understanding the dynamics of these
areas in various research fields (for example, Jennings and Lee, 2012). Similar work
by Bastardie et al. (2010, 2014) has shown that access to single vessel data and
combining more than one data set, leads to more accurate predictions of fisher
behaviour, profits and stock abundance for example. Participants were cognisant of
the difficulties of obtaining funding for research and monitoring, and questions were
raised on who could provide this additional research funding.
The survey results showed the different areas in which respondents thought more
data were needed (Fig. 1). Survey respondents were asked to prioritise data needs
for research into MRE and fisheries interactions and indicate the appropriate priority
level assigned to the type of data. The final data needs score is given above each
data column (Fig. 1).
3.1.1.1. Ecological data and environmental monitoring
Despite well-developed methods for assessing the effects of management actions of
fish stocks (Quinn II and Deriso, 1999), assessment methods of the effects on other
components and attributes of the ecosystem is not as well developed (Hiddink et al.,
2006; Sainsbury et al., 2000). This also showed in the survey results. The need for
ecological data was considered highly important by survey respondents as well as
how fisheries and fishing impacts the existing resource and locations. Ecological
data was mentioned by 14 respondents as having a high need for data (Fig. 1). The
need for ecological data was also mentioned by workshop participants although to a
lesser degree. This difference is likely to be explained through the different balance
between the types of actors present at the workshop compared to the initial

conference. Environmental monitoring was also identified as having high data needs
with a data needs score of 49. Survey respondents were also invited to explain their
opinion, which resulted in identification of research gaps regarding: potential effects
of displaced fishing activity on ecology; opportunities for co-location; behavioural
case studies, long term impacts on marine organisms; changes in fish behaviour and
migration; and fish mortality.
3.1.1.2. Engineering data
Participants thought that design level mitigation by the developer and research on
engineering solutions is lacking. Although engineering data needs did not show in
the survey as critically lacking with a data needs score of 31, it was considered that
tackling design level mitigation by research on engineering solutions is a gigantic
leap forward for overcoming effort displacement.
Research should be conducted on construction techniques, such as scour protection
and armouring to aid discussions about mitigation and potential fishery benefits
following construction. For the successful development of a mitigation strategy,
fishers' representatives indicated that fishers should ideally be involved in the
research, because there may be displacement for some fisheries but potential
benefits to others. Examples included Holderness, Bangor and Lyme Bay, and
participants indicated that these benefits could be more widespread.
3.1.1.3. Fishing activity, cumulative impact and spatial scale
The results found a gap in data on fishing activity, cumulative impact and spatial
scale. This is consistent with the academic literature, which identified that the
aggregate environmental effects of closing large areas of the seabed to fishing have

rarely been investigated (Halpern et al., 2004; Hiddink et al., 2006; Murawski et al.,
2005; Steele and Beet, 2003). Data needs for fishing activity scored high in the
survey, with a data needs score of 43. The data gaps identified in the survey for
fishing activity include: the spatial distribution of commercial fisheries in scales
(temporal, spatial, and gear specific); spatial displacement; key areas for life stages
of commercial species; and cumulative and in combination effects of MRE and MCZs
on fishing opportunity.
A need for a greater understanding of spatial scale issues was indicated as well as
assessment of cumulative displacement. A further lack of guidance was identified on
how to assess cumulative displacement, which was recognised as something that
must be addressed with immediate effect. Assessment of cumulative effects was
deemed important, particularly in relation to the spatial scales regarding inshore and
offshore zones and the combination of activities. The need to understand the
cumulative effects on the multiple sectors operating in marine and coastal areas has
also been identified in the literature (Rodwell et al., 2012; Stellzenmüller et al., 2010).
The importance of clear identification of activities in the marine space also shows
from the survey where data needs regarding other resource users received a data
needs score of 38. It was agreed that spatial scale issues and cumulative impacts of
developments requires the best possible spatial data for both habitats and fishing
activity. However, constraints to access of this data were recognised as a barrier to
timely evidence gathering, and ways must be found to overcome this issue.
3.1.1.4. Socio-economic data
Economic data received a data needs score of 46, making it the third highest ranked
data needs priority. Research gaps indicated were: importance of each fishing

ground (economic and productive); actual economic impacts upon fishers in terms of
displacement/loss of access; potential employment for fishers from MRE; supply
chain issues; community benefits of MRE; and social impacts on fishers.
Discussions raised the importance of greater emphasis on socio-economic research
to build up a greater evidence base. There also are insufficient mitigation solutions
for developments in the consenting stage. There is a lack of information for fishing
communities on potential employment or spin-off effects of the renewable energy
sector, or on potential impacts. Because decisions on these issues (e.g. which port
to use) are rarely being made until after the consenting process, communities are
kept in the dark.
3.1.2. Availability of data
There was consensus among participants from all sectors that there is a large
amount of data in existence, from both industry and individual vessels and in
electronic format (e.g. VMS data) or paper format (e.g. catch and landing data).
Participants raised that there is a wealth of information that is not or not entirely
recorded on paper and consists of fishers' local knowledge (FK), which is
increasingly being recognised as important data (For examples in the literature see
Close and Brent Hall, 2006; Hind, 2012; Johannes et al., 2000). It was agreed that
these types of data can collectively be used to assess displacement.
However, participants pointed to the difficulties of accessing these data, and for
these data to be used, methods must be further developed to translate knowledge
into evidence. Development of best practice guidelines to achieve close collaboration
on research project between academics, professionals, fishers and the MRE in-

dustry during all phases of planning and development was suggested. The time
delay between the actual research and its translation into advice and policy was
considered too long, and ‘any measures that can speed up the process should
be considered’(Rodwell et al., 2012).
3.1.3. Data sharing
Participants were divided on the topic of data sharing, in particular if the data are
commercially sensitive. Some resistance from the fishing industry was considered
justifiable. Others emphasized the rationality of sharing the data because it will
improve the assessment of effort displacement and correspondingly the outcome of
the assessment. Nevertheless, there was general consensus that to overcome
issues related to inaccessibility of data, there needs to be appropriate sharing of this
data (Rodwell et al., 2012). Processes of data sharing should follow a strict protocol
in which the user guarantees its use for specific purposes, and safeguards
confidentiality. Furthermore, benefits of releasing the information should be
communicated clearly along with possible negative consequences of not providing
the data. Holderness was seen as an example of good practice in data sharing. It
was mutually agreed that trust and communication are key factors for data sharing to
take place.
Strong opinions were voiced on regulator responsibility: the power of the regulator
was considered underused. There was a call for a coordinated approach which
would include multiple bodies; Government, marine authorities, the fishing industry
and MRE industry. Regulators could impose more stringent conditions upon
industries and help to establish memorandum of understanding (MOU) between
industries. This underlined the need for general consensus on a UK wide approach

to data utilisation and establishment of a MOU between all relevant bodies, for
example the Triton Knoll project and the Statement of Common Ground (SoCG)
developed by both the fishing and MRE industries.
Participants identified an urgent need for careful development of access and consent
protocols. This was considered to be the result of dented trust in the appropriate use
of the data, which as caused by negative press surrounding the misuse of fisheries
data by NGOs which had resulted in the prosecution of fishers involved in voluntary
logbook schemes. This issue was also flagged in a fisheries and offshore wind
energy interactions report by Mackinson et al. (2006).
A data case study repository was suggested to enable quick access to data and
avoid repetition. Data should be easy to access and it should become a requirement
that all data are freely available. Suggestions included that data provision could be
part of the consents process for developers. It was considered an issue that the data
belong to a developer, who paid for this. If no consent is given, another can take the
data it needs. In some cases may be possible to sell on the data. It was considered
that the issue required further attention. A national database or repository, however,
was not seen as a replacement for dialogue.
3.2. Challenge: assessing fishing effort displacement
Another challenge identified relates to assessment of fishing effort displacement and
appropriate methods and tools. There was also considered to be a need to
understand the rationale for assessing fishing effort displacement, and to clearly
define what needs to be assessed and to what level. Before dealing with specific site
issues, the scientific questions that are sought to be answered should be clear, and

clarity is needed around the scientific aspects of issues such as monitoring before
starting a discussion on ‘higher level issues’. For example, there was a general
consensus that it must be clear whether the scientific aspect to be researched ad-
dresses monitoring or outstanding scientific knowledge. Once the rationale of the
research is clear, it is important to start the process of selecting what to monitor
immediately, as well as decisions upon targets. This baseline research and
monitoring is currently lacking for appropriate site selection.
3.2.1. Assessment methods
Irrespective of the state of development of the methods, there was general
agreement among participants that there needs to be a standard methodology for
assessing effort displacement across all UK administrations and Member States of
the European Union. Research should be directed towards investigating cross-
boundary issues, as both fishers and developers will be sharing cross boundary
space. With fisheries management largely regulated through policies at a European
level, there is merit in approaching effort displacement measurement through a
standard methodology that can be applied by all Member States. This is particularly
relevant because fishing effort displacement as a result of offshore renewables is
currently unassessed.
The data showed that comprehensive methods for assessing fishing effort
displacement are missing. Research is needed on specific gear interactions and the
dynamics of fishing areas. With reference to data gaps, it was felt that Plotter data
should be used first and foremost when assessing fishing effort, although VMS

remains the first port of call for many and must not be undervalued. Data restrictions
on VMS have reduced its resolution, but pressure must be increased from the
academic community and industry for better regulated access. This issue needs
immediate attention, as is supported by the academic literature in this field
(Campbell et al., 2014; Hinz et al., 2013, and references therein).
An important weakness identified by participants was that most methods are not
specifically developed to assess fishing effort displacement. Therefore, although
there are several methods in existence through which effort displacement could be
measured, when determining choice of method, it must be taken into account that
these methods are not developed specifically for this task. This is also discussed in
the literature where it is indicated that interpretation of such data only represents a
partial view of real activity as measuring activity is not the same as measuring effort
(Jennings and Lee, 2012; Lee et al., 2010). There are still unknowns in the
compatibility of fishers sharing the same area, and these are the complexities we
must research further. In addition to the development of models the suitability of a
variety of tools and technologies that are currently in use for various purposes were
discussed for assessing displacement.
3.2.1.1. ‘Traditional’ VMS (vessel monitoring system) and IVMS (inshore vessel
monitoring systems)
Vessel monitoring systems are used for monitoring of fishing vessels. All fishing
vessels in the UK over 15 m in length1 are required to have a VMS on board, which
transmits the geographical position every two hours. Although this data exists,
1 On January 1st 2012 vessels over 12 m in length were obliged to install VMS. There are also discussions on
towed vessels over 8 m in length installing VMS systems.

unprocessed VMS data are considered personal data under the Data Protection Act
and can therefore not be released by the management authorities; hence an
aggregated, anonymised format is released to non-fisheries agency personnel, and
this is a significant problem (Nolan, 2006). VMS data are considered valuable at the
first stage of assessing fishing activity in a general area, but care must be taken
when selecting a particular analytical method, e.g. grid cell resolution (for example,
Lambert et al., 2012). Potential overestimates or underestimates may occur, and the
grid cell resolution recommended and used to inform MSP may not be adequate.
However, further work by Kafas et al. (2012) and the Scottish case studies, are trying
to overcome traditional gridded analyses and use other forms of fishing density
analyses. The sys-tem also only polls every two hours. Research carried out
Lambert et al. (2012) suggest a polling of 30 min, hence further work with fishers is
needed in order to assess these suggestions among different mobile vessels with
different gear types. Furthermore, data inconsistencies exist with certain data
unavailable as a result of changes in certain EU legislations, i.e. UK researchers
needing EU (non-UK) data may find incomplete data sets, hence cannot use the
data to assess shared space use by Member States. Because only vessels over 15
m are currently assessed, there may be an under-estimation of fishing effort,
resulting in potential misinterpretation of data. However, developments are occurring,
the IVMS project (Marine Management Organisation, 2012), a low cost method using
mobile phone technology, which was trialed in 2011 and 2012 in Lyme Bay, was
considered to be a promising tool for assessing displacement, however
improvements must be made, including the range of service and compliance by
individuals.

3.2.1.2. Plotter data
Moving on from ‘traditional’ VMS methodologies towards improved methods to
monitor vessels, fisher plotter data were discussed. This included highly accurate
GPS chart plotting data and the Succorfish SC2 vessel monitoring system
technology (Succorfish, 2014), which could include the footprint of fishery, the time in
which fishing activities are carried out, key activity areas and seasonal variances.
The technologies, which are being tested in several places, including Shetland and
the South West of England, were considered to be very precise methods for
providing the data necessary to assess displacement. Although promising, it was
emphasized that these methods are still in development and current knowledge and
experience with their implementation was considered far from ideal
3.2.1.3. Mapping tools
Scotmap is a Marine Scotland project which provides information of fishing activity of
fishing vessels under 15 m of length. The data set is based on interviews with
fishermen to define their fishing areas, and is used to provide information on
monetary value, relative importance and space usage of the Scottish marine area
(Scottish Government, 2013). Scotmap was indicated as moving towards the ideal
standard methodology for assessing displacement. Finally, modelling was thought to
have great potential, but participants questioned the knowledge and multiple
variables that would have to feed into the model before it could assess fishing
location choice. Therefore, mapping exercises were considered a more fruitful
endeavour.
3.2.1.4. Marine Spatial Planning

Although not a direct tool or method for measuring assessment, a system of MSP,
introduces strategic approaches to account for marine uses, and enable a variety of
uses that are compatible with each other (Douvere, 2008; Jay, 2010). MSP
therefore, was regarded as a valuable integrated approach for mitigating
displacement. Survey respondents indicated that methods that should be developed
were habitat resilience and vulnerability tools, particularly at the start of the mapping
process that is currently taking place as part of MSP.
3.3. Challenge: communication, consultation and collaboration
It became evident during the discussions across all groups and areas of expertise
that it is important to have realistic expectations of what can be achieved through
engagement: there will always be some degree of displacement. However, there
must be a general acceptance net. This creates a clear imperative to provide
guidance on management of displacement and its impacts. There are clear
differences between fishers' perceptions and the perceptions of developers. This
section describes the challenges of interaction between fisheries and MRE, focused
around three main issues: legitimacy of consultation practices, communication
protocols and collaboration.
3.3.1. Legitimacy of consultation practices
The legitimacy of consultation practices was discussed on multiple occasions, in
particular issues around the moral responsibility of consulting versus consultation as
a legal requirement. Respondents indicated that ‘If you are conducting engagement,
you must be interested in the result’, and you ‘should not practice tokenism purely
because engagement is required by the regulator’ (Rodwell et al., 2013a). Fishers

explained that this recalls similar feelings of powerlessness they experienced with
the MCZ process and consultation regarding leasing rounds for energy
developments, which had taken place two years after 11 sites had been announced
(Rodwell et al., 2012).
A genuine belief that participation in the process will make a difference and can
contribute something to the process will increase willingness to participate from the
side of the fishers. Participants, and fishers' representatives in particular,
emphasized that the merit of the consultation should be clear, and those consulting
should be clear about the degree of influence that can be exercised. Fishers should
thus only be consulted if they have the power to influence the outcome, otherwise it
was considered disingenuous to ask for their participation. At a more practical level,
it was deemed important to realise that fishers give up their time when going to
consultations and research exercises. Participants should be allowed either
monetary compensation for lost days at sea or allowed some flexibility in allocation
of quotas (Rodwell et al., 2012).
There was general agreement that suitable methods for consultation with the fishing
sector must be better identified and used, and it was recognised that these methods
might be different for consultation on MSP and licensing of individual developments.
It is important to clearly communicate the difference between these two issues as
well as the different degrees of influence that can be exercised during these
processes. For example, during MSP processes, stakeholders have the opportunity
to be involved during the planning phase, which provides stakeholders with the
opportunity to provide input at strategic level, as is described by Pomeroy and
Douvere (2008). Participants felt that good engagement during this process could

potentially mitigate problems during the licensing stage. At this stage it is still
possible to emphasize the importance of particular fishing grounds and have these
incorporated in the MSP, as is the case in Shetland, where high and low constraint
sites are mapped for the renewables sector in relation to fishing grounds (Shetland
Islands Council and NAFC Marine Centre, 2013). Consultation at the licensing stage
was considered a different matter, as plans are further ahead and moved to a
concrete proposal. A need for guidance on improvement of selection process for
renewable development zones was identified, and concern was voiced about what
policies the MMO put in place if it is not possible to alter the spatial extent of a site.
Participants indicated that consultation with the fishing sector in the past had been
too ad hoc and not focused on the issues hand (Rodwell et al., 2012), and it was
proposed that consultation regarding effort displacement consultation should be
framed in terms of: identification of locations where the displaced fishers go;
assessment of new activity in the displacement area and; assessment of changes in
the pressure on fish stocks.
The issues described above relate to four elements in the literature that Portman
(Portman, 2009) describes that relate to communication in consultation practices:
process presentation, transparency, clarity of message and communicated at the
appropriate level to facilitate understanding of those that will have to read it, and
accessibility. The author further indicates that the second and third elements may be
particularly challenging for MRE projects, which employ nascent technologies.
A final issue participants identified under consultation was representation of fishers
in the decision making process, and a careful consideration of the initiation of
consultation. Consultation should be inclusive instead of inviting key figures or the

loudest members, because they do not necessarily represent the voice of the
majority and potentially polarize the consultation discussion. The use of local
representatives was considered important as they are regarded as having the
knowledge and trust within communities to foster effective consultation.
Correspondingly, the cost implications for conducting good and inclusive consultation
were recognised as a barrier for the renewables sector. Energy and resources
should be aimed at fostering meaningful consultation to mitigate or solve problems.
3.3.2. Communication protocols
Communication protocols should be a two-way stream of in-formation, in which
consultation on collaborative efforts are arranged in a reciprocal way and not
dictated by one party. This was perceived by members of the fishing sectors as
sending out the message that ‘if you want to have your say, you will have to give up
your time to suit our meeting’ (Rodwell et al., 2013a). The site designation for MCZs
was given as an example of a difficult communication process in which two-way
communication was not functioning well. Because of the perceived lack of influence
in the site designation, some fishers responded by refusing to participate. A positive
side effect of this negative experience was that it united the fishermen because they
felt they could not influence the process. This resulted in establishment of the MPA
Coalition, which aims to maximize the influence of the fishing industry in the
designation of MPAs and the management measures required within them (NFFO,
2010).
3.3.2.1. Representation of fishers during decision making processes

Fishers will get the most from engagement and negotiation opportunities if joined up
as a group from the start with central point of contact, and legal aid such as a
solicitor to negotiate and record business to business agreements. Participants
supported the use of a unified body to represent local fishers and speak for them in
MRE decisions and development. The establishment of Fisheries Groups for
different gear and vessel types was discussed. It was considered important that
fishers create groups that have: a clear point of contact; an agreed aim; and
objective and legal representation. In the Fisheries Groups, requirements of
individuals could be dis-cussed and agreed before entering into negotiations with the
developer.
Negotiations can be supported with documented case studies of existing successful
mitigation practices. These studies, based on UK, European and international
examples can provide reference, sup-port and guidance for site specific negotiations.
The power of communities and effective communication with communities was
highlighted with reference to Shetland. By using the Council as a mediator there was
successful resolution to the conflict and the first test of a wave development.
Requirements for sharing best practice could be built into the consent requirements,
along with data sharing, and again the idea of inputting this into the ‘toolboxes’ is a
positive step forward.
3.3.2.2. Inter-jurisdictional communication
Inter-jurisdictional communication was considered by participants as part of the
process of creating good communication protocols. The importance of
communicating across borders was emphasized because renewable energy siting
sometimes moves across jurisdictional boundaries, for example the proposed

Dogger Bank wind farm and the wind farms in the Irish Sea being fished by Belgian,
Irish, English and Welsh fishing vessels. In these cases, multiple administrative
boundaries need to be integrated. In the future, the boundaries of marine plan zones
will be added to these. Before consultation or engagement, it was deemed important
to determine who is operating in the particular area of a development. Furthermore,
there needs to be a greater awareness of what is going on in the various areas of the
UK among research organisations.
The fishing sector identified a need for a clear understanding of why and how their
input is being used. Central to efficient communication protocols, communication
between the MRE sector and the fishing sector, and those initiating the
communication should consider carefully what information is requested and the way
the information is requested (Rodwell et al., 2013b). Enhanced dialogue was
advocated particularly in the early part of consent process.
Particularly poignant here with multi-jurisdictional, cross-border, national and
international members is the need for the development of innovative techniques to
help engage stakeholders and practitioners, especially in the context of MSP, was
identified. Recent work involving simulation gaming (SG) between scientists, policy-
makers and MSP practitioners by Mayer et al. (2013) offered new possibilities for
management between sectors, was shown to improve understanding of issues and
foster stronger collaborations between individuals and agencies. Encouraging this
kind of approach using SG for use by the sectors discussed here both early in the
consenting process and for the life cycles of MRE projects may be a step in the right
direction, or at least stimulate ideas.
3.3.2.3. Consistency in procedures

The participants emphasized that trust needs to be built at the local level but is also
dependent on nationwide consistency in procedures and processes, for example the
provision of consistent points of contact in both industries to maximise the benefits
from communication. Further-more, in the exchange of information that is taking
place the consulting body must deliver on promised outputs from the consultation.
It was considered crucial that particularities of the fishing and renewables sectors
were taken into account when engaging. In particular, the differences in discourse
and practice between the two sectors were considered a potential barrier for
engaging with fishing communities. Information should be kept simple at all stages.
For example, participants from the fishing sector indicated that few fishers would be
likely to read a long and technical report, whereas a single page leaflet with a clear
and straightforward message would greatly benefit them. The outputs must be easily
available and understandable. Outputs solely produced in paper format were not
considered sufficient because of differences in the way individual's acquire and
process information.
3.3.3. Collaboration
An important difference was identified between consultation and collaboration.
Instead of only consultation, participants agreed that there should be collaboration
between the fishing and MRE sectors from the earliest possible opportunity. The
single most important message was that working together is crucial for over-coming
fisheries displacement issues. ‘Working together requires collaboration and
communication at different levels, and between stakeholders’, during which ‘the
marine renewable energy industry, the fishing sector and spatial planners must work

together based on trust and respect’ (Rodwell et al., 2012). This was acknowledged
by representatives of both sectors.
Survey respondents were asked to identify priorities for research collaborations into
MRE and fisheries interactions. The final collaboration needs score is given above
each data column (Fig. 2). The results demonstrate that the highest need for
research collaboration was considered for the fishing industry (with a score of 57)
and MRE industry (53), closely followed by the marine management organisation
(49) and local planning organisations (48).
Collaborations between energy companies and the fishing sector should be
promoted, and guidance could be beneficial for dealing with fishing effort
displacement (Rodwell et al., 2012). Furthermore, it was argued that some fishers
should be directly involved in collaborative projects with developers and researchers.
For example projects in which fishers work with developers and research to further
develop technologies, methods and plans to maximise fishing opportunities within
and around energy sites. For this to take place however, improved coordination is
required be-tween fishers and science funders. Development of fisheries led
initiatives involving developers and researchers was also seen as a way to open up
constructive communication whilst addressing trust and power balance issues, which
were identified as key barriers in fisheries and renewables interaction.
Several cases of collaboration are already taking place. An example of practical
collaboration taking place and being documented is the Fishermen and Scientists
Society in Halifax, Nova Scotia. This is a partnership based on effective
communication and common goals between fishermen, scientists and the general
public. The Society facilitates both collaborative research and the collection of

relevant information that promotes the conservation of North Atlantic fisheries stock.
It is aimed at establishing and maintaining a network of fishermen and scientific
personnel that are concerned with long-term sustainability of the marine fishing
industry in the Atlantic region (Fishermen & Scientists Research Society, 2012).
Through the society, fishers participate in research, communication and
establishment of a knowledge base which can be used to better manage and
conserve the resource.
Industry led projects also exist in the UK. For example, the European Marine Energy
Centre (EMEC) is working together with Herriot Watt University's International Centre
for Island Technologies, Seafood Scotland and industry input from the Orkney
Fishermen's Society and Orkney Fishermen's Association. In this project, fishers are
involved in monitoring activities around the Bilia Croo wave test site in Orkney
(EMEC, 2012). There is an opportunity for developers, fishers and the industry
authority, Seafish, to work together to survey and identify hazards. This collaboration
could obtain mutually beneficial information on hazards and gear obstructions
unknown to developers and fishers. Currently available chart updates accessible
through the seafood authority's website (Seafish, 2013) provide opportunities for
effective updates of new hazards and infrastructure. Identification of new seabed
hazards provides an opportunity to apply the communication protocols discussed
above utilising consistent group representatives and legal recording to agree
mitigation and safety considerations.
Fig. 2. Priorities for research collaborations identified by survey respondents

At a national level, the FLOWW (Fisheries Liaison with Offshore Wind and Wet
Renewables) group meets four times a year with the aim of advancing the
relationships between the fisheries and offshore renewable energy industries
through dialogue. FLOWW developed best practice guidance to aid offshore
renewable energy developers with fisheries liaison, such as establishing and man-
aging contacts, guard vessels, information for construction and maintenance
personnel, providing assistance to fishers, entangled fishing gear, and dealing with
claims for loss or damage of gear (FLOWW, 2014). To improve liaison between the
renewable energy and fisheries sectors, the initial FLOWW guidelines should be
disseminated as widely as pos guidelines available as a link on relevant sites (such
as on the Crown Estate website). This requires co-ordination on a national level.
Other suggestions included making FLOWW guidelines a legal requirement,

execution of these requirements would remain with the Crown Estate (Rodwell et al.,
2013a). Further solutions were suggested to reform the Marine Industry Liaison
Group (MILG) to operate at a more strategic level, and ensure involvement of the
fishing industry.
4. Towards a mitigation agenda for fishing effort displacement
The results from the workshops presented above bring about a set of activities and
action points to mitigate fishing effort displacement as a result of marine renewable
energy development. A workshop recommendation was that a Mitigation Toolkit
should be developed, to open up a way of sharing research and ideas and allowing
for more efficient targeting of research and reversing the current trend of holding
back mitigation solutions.
4.1. Overcoming data issues for assessing effort displacement
Better guidelines and procedures to quantify displacement are urgently needed. If
displacement is assessed at an early stage the developer can then shape the
development accordingly. This in turn leads to promotion and understanding the
need for fishers to share data, addresses specific protocols on how to respect
commercial sensitivity and can aid developers to inform decisions and activity. This
will require multiple partner support and should be initiated immediately. This would
require project funding and protocols developed in order to share the data, and
identification of the various bodies that could take on this responsibility (Rodwell et
al., 2013a).
For assessing fishing effort displacement there is a need for:

o A variety of accurate data gathered through appropriate assessment
methodologies
o Data to be made available and shared freely whilst respecting commercial
sensitivity
o Assessment guidelines to be developed and distributed at a national level.
o Case studies need to be analysed to inform behaviour rules of various gears,
vessels, and skippers.
o Best practice of displacement assessment to be shared.
o Direct involvement of fishers in collaborative projects with developers and
researchers to further technologies, methods and plans to maximise fishing
opportunities within and around energy sites. This requires improved
coordination between fishers and science funders.
4.2. Development of appropriate methods for assessing displacement
Although a variety of methods exists that have the potential to assess fishing effort
displacement, these methods are not specifically developed for this purpose.
Therefore it is important that:
o When determining choice of method, it must be taken into ac-count that they
are not specifically developed for this task.
o Comprehensive methods are developed for assessing effort displacement,
including tailoring of existent methods.
o Models for displacement should be developed as well as habitat resilience
and vulnerability tools, particularly at the start of the mapping process that is
currently taking place as part of MSP
o MSP could provide an integrated approach for mitigating displacement.

o A standard methodology is developed for assessing effort displacement
across all UK administrations and Member States of the European Union.
4.3. A consultation protocol between MRE and fishing sectors
Beginning engagement and negotiation for upcoming projects at the earliest possible
stage provides a significant opportunity for least impact on existing fishing activity.
This, however, requires collaboration and communication between all stakeholders.
This study has shown that it is necessary to formalise negotiation procedures, and
develop appropriate methods for approaching fishers. To mitigate effort
displacement as a result of marine renewable energy development it is necessary to:
o Clearly communicate the merit of the consultation and the de-gree of
influence that can be exercised.
o Ensure consultation is inclusive and all sectors are represented, and a
practical solution was suggested to reform the Marine Industry Liaison Group
(MILG) to operate at a more strategic level, and ensure involvement of the
fishing industry.
o Improve communication in consultation and engagement processes and
develop protocols; and ensure inter-jurisdictional communication. Develop the
current FLOWW guidelines into a legal requirement.
o Ensure consistency in procedures, and be sensitive to differences in
discourse and practice between the two sectors.
o Determine mitigation options on evidence of success and agreements with
stakeholders.

o Analyse case studies of marine renewable developments to identify
successes and failures of mitigation options, and learn from case studies on
conflict resolution.
5. Conclusion
In this paper we investigated the challenges for co-existence between the fisheries
and renewable energy sectors, and explored a mitigation agenda for fishing effort
displacement resulting from MRE development in the UK. The workshops, which
provided the primary input for this paper, brought together key experts (both
academic and practitioners) in the field of marine renewable energy and fisheries.
The research, which was the first of its kind to exist in the UK, demonstrated the
need for a collaborative effort to overcome the potential difficulties associated with
the co-existence of marine industries within limited marine space. There was an
overwhelming sense of genuine desire for the two industries to work together to find
solutions. The main points identified for a mitigation agenda consisted of: developing
efficient and cost-effective mechanisms for overcoming data issues for assessing
effort displacement; the development of appropriate methods of assessment; and
development of an acceptable consultation protocol between MRE and fishing
sectors agreed on by all stakeholders. It was considered that with appropriate
interaction, through effective communication and the use of transferable in-formation
such as the mitigation toolkit, data and case study repositories, real progress can be
made in mitigating conflict between the fisheries sector and the MRE industry.
Although this information will be largely applicable in a UK context, appropriate

methods of assessment, consultation protocols, and data issues, can be adapted to
the context of other countries facing similar challenges.
Acknowledgements
The authors acknowledge the financial support of the National Environment
Research Council's Marine Renewable Energy Knowledge Exchange Programme
(MREKEP) for the organisation of the research workshops in Orkney on May 1 2012
and 17E18 April 2013 in York. Thanks in particular to Dr Annie Linley who provided
us with useful advice and comments throughout the organisation of the workshops.
They also wish to thank the participants of the workshop for their valuable input.
References
Alexander, K.A., Potts, T., Wilding, T.A., 2013. Marine renewable energy and
Scottish west coast fishers: Exploring impacts, opportunities and potential mitigation.
Ocean & Coastal Management 75, 1-10.
Bastardie, F., Nielsen, J.R., Anderson, B.S., Eigaard, O.R., 2010. Effects of fishing
effort displacement scenarios on energy efficiency and profitability: an individual-
based model applied to Danish fisheries. Fisheries Research, 106, 501-516.
Bastardie, F., Nielsen, J.R. Miethe, T., 2014. DISPLACE: a dynamic, individual-
based model for spatial fishing planning and effort displacement-integrating

underlying fish population models. Canadian Journal of Fisheries and Aquatic
Sciences, 71(3), 366-386.
Campbell, M., Stehfest, K., Votier, S., Hall-Spencer, J., 2014. Mapping fisheries for
marine spatial planning: Gear-specific vessel monitoring system (VMS), marine
conservation and offshore renewable energy. Marine Policy 45, 293-300.
Close, C.H., Brent Hall, G., 2006. A GIS-based protocol for the collectio nand use of
local knowledge in fisheries management planning. Journal of Environmental
Management 78, 341-352.
European Commission, 2009.. The Common Fisheries Policy: a users guide,
Luxembourg: Office for Official Publications of the European Communities, 36 pp.
Available at:
http://ec.europa.eu/fisheries/documentation/publications/pcp2008_en.pdf
Creswell, J., 1994. Research design: Qualitative and Quantitative Approaches.
Thousand Oaks; London: Sage.
Crown Estate, 2013a. Leasing rounds and projects. Available at:
http://www.thecrownestate.co.uk/energy-infrastructure/wave-and-tidal/pentland-firth-
and-orkney-waters/leasing-round-and-projects/

Crown Estate, 2013b. Our portfolio. Available at:
http://www.thecrownestate.co.uk/energy-infrastructure/offshore-wind-energy/our-
portfolio/
DECC, 2011. UK Renewable Energy Roadmap. Department of Energy and Climate
Change, London, 107 pp. Available at:
https://www.gov.uk/government/uploads/system/uploads/attachment_data/file/48128/
2167-uk-renewable-energy-roadmap.pdf
Douvere, F., 2008. The importance of marine spatial planning in advancing
ecosystem-based sea use management. Marine Policy 32, 762-771.
Douvere, F., Ehler, C.N., 2009. New perspectives on sea use management: initial
findings from the European experience with marine spatial planning. Journal of
Environmental Management, 90, 77-88.
EMEC, 2012. Billia Croo fisheries project: final report to the Scottish Government.
EMEC, Orkney. Available at: http://www.emec.org.uk/?wpfb_dl=63
Fishermen & Scientists Research Society, 2012. Our focus. Available at:
http://www.fsrs.ns.ca/focus.html
FLOWW, 2014. FLOWW best practice guidance for offshore renewables
developments: recommendations for fisheries liaison. Available at:
http://www.sff.co.uk/sites/default/files/FLOWW%20Best%20Practice%20Guidance%
20for%20Offshore%20Renewables%20Developments%20Jan%202014.pdf
Foley, M.M., Halpern, B.S., Micheli, F., Armsby, M.H., Caldwell, M.R., Crain, C.M.,
Prahler, E., Rohr, N., Sivas, D., Beck, M.W., Carr, M.H., Crowder, L.B., Duffy, J.E.,
Hacker, S.D., McLoed, K.L., Palumbi, S.R., Peterson, C.H., Regan, H.M.,
Ruckleshaus, M.H., Sandifer, P.A., Stenech, P.A., 2010. Guiding ecological
priniciples for marine spatial planning. Marine Policy, 34, 955-966.
Haggett, C., 2008. Over the sea and far away? A consideration of planning, politics
and public perception of offshore wind farms. Journal of Environmental Policy and
Planning 10, 289-306.
Halpern, B.S., Gaines, S.D., Warner, R.R., 2004. Confounding effects of the export
of production and the displacement of fishing effort from marine reserves. Ecol. Appl.
14, 1248-1256.
Halpern, B.S., Diamond, J., Gaines, S., Gelcich, S., Gleason, M., Jennings, S.,
Lester, S., Mace, A., Cook, L., Mcleod, K., Napoli, N., Rawson, K., Rice, J.,
Rosenberg, A., Ruckleshaus, M., Saier, B., Sandifer, P., Scholz, A., Zivian, A.,
2012. Near-term priorities for the science, policy and practice of Coastal and Marine
Spatial Planning. Marine Policy, 36, 198-205.
Hiddink, J.G., Hutton, T., Jennings, S., Kaiser, M.J., 2006. Predicting the effects of
area closures and fishing effort restrictions on the production, biomass, and species

richness of benthic invertebrate communities. ICES Journal of Marine Science 63,
822-830.
Hilborn, R., Stokes, K., Maguire, J.-J., Smith, T., Botsford, L.W., Mangel, M.,
Orensanz, J., Parma, A., Rice, J., Bell, J., Cochrane, K.L., Garcia, S., Hall, S.J.,
Kirkwood, G.P., Sainsbury, K., Stefansson, G., Walters, C., 2004. When can marine
reserves improve fisheries management? Ocean & Coastal Management 47, 197-
205.
Hind, E.J., 2012. Last of the hunter gatherers or the next scientists: arguments for
and against fishers and their knowledge inclusion in mainstream fisheries
management. National University of Galway, Galway, Ireland. Ph.D Thesis.
Hinz, H., Murray, L.G., Lambert, G., Hiddink, J., Kaiser, M.J., 2013. Confidentiality
over fishing effort datya threatens science and management progress. Fish and
Fisheries 14(1), 110-117.
Jay, S., 2010. Planners to the rescue: Spatial planning facilitating the development of
offshore wind energy. Marine Pollution Bulletin 60, 493-499.
Jennings, S., Lee, J., 2012. Defining fishing grounds with vessel monitoring system
data. ICES Journal of Marine Science 69, 51-63.
Johannes, R.E., Freeman, M.M.R., Hamilton, R.J., 2000. Ignore fishers’ knowledge
and miss the boat. Fish and Fisheries 1, 257-271.

Joffe, H., Yardley, L., 2004. Content and thematic analysis. In D. F. Marks and L.
Yardley (Eds.), Research methods for clinical and health psychology, pp 56-68
London: Sage.
Kafas, A., Jones, G., Watret, R., Davies, I., Scott, B., In Press. Representation of the
use of marine space by commercial fishing by Marine Spatial Planning. ICES Journal
of Marine Science.
Kaiser, M.J., 2005. Are marine protected areas a red herring or fisheries panacea?
Canadian Journal of Fisheries and Aquatic Sciences 62, 1194-1199.
Khalilian, S., Froese, R., Proelss, A., Requate, T., 2010. Designed for failure: A
critique of the Common Fisheries Policy of the European Union. Marine Policy 34,
1178-1182.
Lambert, G.I., Jennings, S., Hiddink, J.G., Hintzen, N.T., Hinz, H., Kaiser, M.J.,
Murray, L.G., 2012. Implications of using alternative methods of vessel monitoring
system (VMS) data analysis to describe fishing activities and impacts. ICES Journal
of Marine Science 69, 682-693.
Lee, J., South, A.B., Jennings, S., 2010. Developing reliable, repeatable, and
accessible methods to provide high-resolution estimates of fishing-effort distributions
from vessel monitoring system (VMS) data. ICES Journal of Marine Science 67,
1260-1271.

Mackinson, S., Curtis, H., Brown, R., McTaggart, K., Taylor, N., Neville, S., Rogers,
S., 2006. A report on the perceptions of the fishing industry into the potential socio-
economic impacts of offshore wind energy developments on their work patterns and
income, Science Series Technical Report CEFAS, Lowestoft, 62 pp.
Mangi, S.C., Rodwell, L.D., Hattam, C., 2011. Assessing the impacts of establishing
MPAs on fishermen and fish merchants: the case of Lyme Bay, UK. Ambio 40, 457-
468.
Marine Management Organisation, 2013. UK Sea Fisheries Statistics 2012. 98 pp.
Marine Management Organisation, Devon and Severn IFCA & Southern IFCA, 2012.
Lyme Bay and Torbay candidate Special Area of Conservation Vessel Monitoring
System Trial. Joint final report,. 35 pp.
Mayer, I.S., Zhou, Q., Lo, J., Abspoel, L., Keijser, X., Olsen, E., Nixon, E., 2013.
Integrated, ecosystem-based Marine Spatial Planning: Design and results of a the
results of a game-based quasi experiment. Ocean & Coastal Management, 82, 7-26.
Mullen, P. M., 2003. Delphi: myths and reality. Journal of Health Organization and
Management 17(1), 37-52.
Murawski, S.A., Wigley, S.E., Fogarty, M.J., Rago, P.J., Mountain, D.G., 2005. Effort
distribution and catch patterns adjacent to temperate MPAs. ICES Journal of Marine
Science 62, 1150-1167.

NFFO, 2010. NFFO News - MPA Coalition builds strong support. Available at:
http://www.nffo.org.uk/pdf/newsletter2010/NFFO_May10.pdf
Nolan, F., 2006. Confidentiality of fisheries data in the context of enforcement
activities versus research. ICES Document CM 2006/ M: 05, p 11
Okoli, C. and S. D. Pawlowski 2004. The Delphi method as a research tool: an
example, design considerations and applications. Information & Management 42(1),
15-29.
Österblom, H., Sissenwine, M., Symes, D., Kadin, M., Daw, T., Folke, C., 2011.
Incentives, social–ecological feedbacks and European fisheries. Marine Policy 35,
568-574.
Pelc, R., Fujita, R.M., 2002. Renewable energy from the ocean. Marine Policy 26,
471-479.
Pomeroy, R., Douvere, F., 2008. The engagement of stakeholders in the marine
spatial planning process. Marine Policy 32, 816-822.
Portman, M., 2009. Involving the public in the impact assessment of offshore
renewable energy facilities. Marine Policy 33, 332-338.
Punt, M.J., Groeneveld, R.A., van Ierland, E.C., Stel, J.H., 2009. Spatial planning of
offshore wind farms: A windfall to marine environmental protection? Ecological
Economics 69, 93-103.

Qui, W., Jones, P.J.S., 2013. The emerging policy landscape for marine spatial
planning in Europe. Marine Policy, 39, 182-190.
Quinn II, T.J., Deriso, R.B., 1999. Quantitative fish dynamics. InGetz, W.M. (Ed.),
Biological Resource Management Series (pp. 542). New York, NY: Oxford University
Press ..
Robson, C., 2002. Real World Research: A Resource for Social Scientists and
Practitioner-Researchers. 2nd Ed. Oxford: Blackwell Publishing.
Rodwell, L.D., Campbell, M., De Groot, J.R., Ashley, M., 2012. Fisheries and marine
renewable energy interactions: a summary report on a scoping workshop for the
Marine Renewable Energy Knowledge Exchange Programme (MREKEP), held at
Environmental Interactions of Marine Renewable Energy Technologies (EIMR)
Conference, Orkney, May 3-6, 20 pp.
Rodwell, L.D., De Groot, J.R., Ashley, M., Campbell, M., Linley, A., 2013a. Fisheries
and marine renewable energy interactions: assessment and mitigation: a final report
on the expert workshop for the Marine Renewable Energy Knowledge Exchange
Programma (MREKEP), York, April 17-18, 33 pp.

Rodwell, L.D., Lowther, J., Hunter, C., Mangi, S.C., 2013b. Fisheries co-
management in a new era of marine policy in the UK: A preliminary assessment of
stakeholder perceptions. Marine Policy 45, 279-286.
Sainsbury, K.J., Punt, A.E., Smith, A.D.M., 2000. Design of operational management
strategies for achieving fishery ecosystem objectives. ICES Journal of Marine
Science 57, 731-741.
Sale, P.F., Cowen, R.K., Danilowicz, B.S., Jones, G.P., Kritzer, J.P., Lindeman, K.C.,
Planes, S., Polunin, N.V.C., Russ, G.R., Sadovy, Y.J., Steneck, R.S., 2005. Critical
science gaps impede use of no-take fishery reserves. Trends in Ecology & Evolution
20, 74-80.
Scottish Government, 2011. 2020 Routemap for Renewable Energy in Scotland, 121
pp. Available at: http://www.scotland.gov.uk/Resource/Doc/917/0118802.pdf
Scottish Government, 2013. Scotmap- Inshore fisheries mapping project in Scotland.
Available at:
http://www.scotland.gov.uk/Topics/marine/science/MSInteractive/Themes/ScotMap
Seafish, 2013. Kingfisher Information Services. Available at:
http://www.seafish.org/industry-support/kingfisher-information-services
Shetland Islands Council, NAFC Marine Centre, 2013. Supplementary guidance
Shetland Islands' Marine Spatial Plan. 4th Edition, 202 pp. Available at:

http://www.nafc.uhi.ac.uk/study-at-nafc/marine-science-and-
technology/strategy/SMSP%20Nov%202013.pdf
Steele, J.H., Beet, A.R., 2003. Marine protected areas in 'nonlinear' ecosystems.
Proceedings of the Royal Society of LondonB 270, S230-S233.
Stelzenmüller, V., Lee, J., South, A., Rogers, S.I., 2010. Quantifying cumulative
impacts of human pressures on the marine environment: a geospatial modelling
framework. Marine Ecology Progress Series 398, 19-32.
Stelzenmüller, V., Breen, P., Stamford, T., Thomsen, F., Badalamenti, F., Borja, A.,
Buhl-Mortensen, L., Carlstöm, J., D’Anna, G., DAnkers, N., Degraer, S., Dujun, M.,
Fiorentina, F., Galparsoro, L., Giakoumi, S., Gristina, M., Johnson, K., Jones, P.J.S.,
Katsanevakis, S., Knittweis, L., Kyriazi, Z., Pipitone, C., Piwowarczyk, J., Rabaut, M.,
Sørensen, T.K., van Dalfsen, J., Vassilopoulou, V., Vega Fernández, T., Vincx, M.,
2013. Monitoring and evaluation of spatially managed areas: a generic framework for
implementation of ecosystem-based marine management and its application. Marine
Policy, 37, 149-164.
Succorfish, 2014. How it works. Available at: http://www.succorfish.com/how-it-
works.html
Suuronen, P., Jounela, P., Tschernji, V., 2010. Fishermen responses on marine
protected areas in the Baltic cod fishery. Marine Policy, 34, 237-243.

Sustainable Development Commission, 2007. Turning the tide: tidal energy in the
UK, 156 pp. Available at: http://www.sd-
commission.org.uk/data/files/publications/Tidal_Power_in_the_UK_Oct07.pdf
United Kingdom House of Lords, 2008. The 27th report of session of 2007-8. The
EU’s renewable energy target of 20% by 2020. Volume I: report, 58 pp. Available at:
http://www.publications.parliament.uk/pa/ld200708/ldselect/ldeucom/175/175.pdf
Welsh Assembly Government, 2010. A low carbon revolution, the Welsh Assembly
Government’s Energy Policy Statement, 24 pp. Available at:
http://www.mng.org.uk/gh/resources/100315energystatementen.pdf

Marine and coastal policy in the UK: Challenges and opportunities in a new era
L.D. Rodwell a,n, S. Fletcher a, G.A. Glegg a, M. Campbell a, S.E Rees a, M. Ashley a,
E.A. Linley b, M. Frost c, B. Earll d, R.B. Wynn e, L. Mee f, P. Almada-Villela g, D. Lear
c, P. Stanger h, A. Colenutt i, F. Davenport j, N.J. Barker Bradshaw k, R. Covey l
a Centre for Marine and Coastal Policy Research, Marine Institute and School of
Marine Science and Engineering, Plymouth University, Drake Circus, Plymouth,
Devon PL4 8AA, United Kingdom
b NERC Marine Renewable Energy Knowledge Exchange Programme, The
Innovation Centre, Rennes Drive, University of Exeter, Exeter EX4 4RN,
United Kingdom
c The Marine Biological Association of the UK, The Laboratory, Citadel Hill PL1
2PB, United Kingdom
d Coastal Management for Sustainability (CMS), Candle Cottage, Kempley,
Gloucestershire GL18 2BU, United Kingdom
e National Oceanography Centre, European Way, Southampton SO14 3ZH, United
Kingdom
f Scottish Association for Marine Science, Oban, Argyll PA37 1QA, United Kingdom
g Marine Management Organisation, Lancaster House, Newcastle upon Tyne NE4
7YH, United Kingdom
h School of Earth and Ocean Sciences, Cardiff University, Cardiff CF10 3AT, United
Kingdom

i New Forest District Council, Town Hall, Avenue Road, Lymington, Hampshire SO14
9HZ, United Kingdom
j Science Communication Unit, Faculty of Health and Life Sciences, Frenchay
Campus, Coldharbour Lane, University of the West of England, Bristol BS16 1QY,
United Kingdom
k WWF-UK, Panda House, Godalming, Surrey GU7 1XR, United Kingdom
l Natural England, Pydar house, Pydar Street, Truro, Cornwall TR1 1XU, United
Kingdom
Corresponding author:
Tel: 01752584725
Email: [email protected]
Keywords: Legislation, Management, Marine conservation, Fisheries, Marine
planning, Renewable energy.
Abstract
Marine and coastal policy in the UK has faced a number of significant changes in
recent years, most notably the passing of the Marine and Coastal Access Act in
2009. These changes have brought significant challenges and opportunities for all

those involved in the management and use of the UK's marine and coastal
environment. This new era of marine policy inspired the UK's first Marine and
Coastal Policy forum held in June 2011. In this introductory paper the global context
of marine policy changes and the themes which emerged from the forum, forming
the basis of the articles in this special issue, are outlined. It is concluded that there is
a high level of engagement, capacity and willingness of key stakeholders to work
collaboratively to address the environmental, social and economic complexities of
managing the marine and coastal environment. It is both evident and encouraging
that progress is being made and the many challenges faced in this new era give rise
to a number of opportunities to develop new ideas and effective mechanisms for
finding solutions.
1. Introduction
In November 2009 the Marine and Coastal Access Act (MCAA) [1] was passed,
which marked the beginning of a new era in the management and protection of the
marine and coastal environment in the UK2. This ambitious and complex legislation
brings with it both opportunities and challenges for policy makers, coastal managers
and practitioners. It has eight main components which include: the establishment of
the Marine Management Organisation (MMO); a marine planning system; a reformed
marine licensing system; a new mechanism for marine nature conservation;
modernising of inshore fisheries management and marine enforcement; a new
2 The Marine and Coastal Access Act is focused on England and Wales. The Scottish
Government passed devolved legislation in the form of the Marine (Scotland) Act, 2010. Northern Ireland will have its own policy approach with supporting legal instruments.

authorisation scheme for migratory and freshwater fisheries; improvement in coastal
access; and a more ‘joined up’ approach to coastal and estuarine management. It is
the opportunities and challenges that this act brings with it which inspired the UK's
first Marine and Coastal Policy forum, 22–24th June 2011. The forum was hosted by
the Centre for Marine and Coastal Policy Research, based within the Marine
Institute, Plymouth University. It aimed to bring together marine experts to explore
the key influences, approaches and techniques within what is a changing policy
climate for the sustainable use of the marine and coastal environment.
The aim of this paper is to outline the main challenges and opportunities for marine
policy which were first highlighted at this forum and that have subsequently been
developed into research articles to form this special issue. In the following section,
the global context of policy surrounding the marine and coastal environment is
established. Then the four cross-cutting themes covered by the forum and related
research articles are presented and discussed in brief. These themes are:
management and planning of the marine environment e.g. [2–8]; science-policy
integration and communication e.g. [9,10]; social and economic issues e.g. [11–14]
and marine conservation and ecosystem services e.g. [15,16]. The key findings of
forum workshops directly linked to these themes are described in boxes. The
challenges and opportunities are then put in the context of sustainability and
solutions which can be generated by better communication are discussed. Finally a
number of overarching conclusions as to the future of marine policy in the UK are
drawn.
2. The global context
The global context and the key ideas that are driving work in the marine environment
from a global to a local scale were outlined in the keynote talks by Laurence Mee
(Scottish Associa-tion of Marine Science (SAMS) and Dan Laffoley (International
Union for Conservation of Nature (IUCN). In his talk entitled ‘Designer seas or
stewardship, a people's choice?’ Professor Mee, Director of SAMS discussed: the
changing use of the marine environment; the increasing demands for exclusive and
shared use of marine space which is triggering conflicts; and the designation of
access and property rights through marine spatial planning. Mee illustrated his point
with the example of the Dogger Bank in the North Sea where conservation and wind
farm interests are juxtaposed. Coupled with this problem, there is a change in human
perception about our seas, sometimes coloured by the phenomenon of slipping
ecological baselines where standards and expectations of natural environmental
quality gradually decline with each generation. A survey carried out in seven EU
countries as part of the EU funded Knowseas project demonstrated that popular
perceptions of the problems afflicting the marine environment do not always coincide
with those held by scientists [17]. In this example the foremost popular concern of
respondents was found to be industrial pollution even though the worst polluters are
regulated or have moved to Asia. Mee concluded that it is difficult to deal with or
communicate complexity and political systems tend to focus on the linear causality of
‘easy wins’ rather than the complex, ‘wicked’ problems related to trade-offs and
human values. Furthermore, there is no simple mechanism to balance the
prerogative to conserve natural capital whilst optimising economic return and
maintaining human well-being. Adaptive management, which offers one mechanism
to set environmental and social objectives and work towards them, is at the heart of
the EU Marine Strategy Framework Directive. This new strategy requires ‘buy in’

from the public but opinion surveys have shown low confidence in current institutions
and efforts to build public understanding have been minimal. There is no way to
return to pristine marine systems of the past and the mix of conservation and
‘designer seas’ projected for the future will require clear benchmarks, new human
values and a common understanding of stewardship.
Continued emphasis on the global scale of problems and potential solutions, was
given by Professor Dan Laffoley, Senior Advisor, Marine Science and Conservation
for the Global Marine and Polar Programme in the IUCN. Laffoley focused on the
use of new technologies in communicating key messages about how to achieve a
positive future for the marine environment. He showed how the IUCN is making great
strides in bringing information about the marine environment to the general public
and policy makers through media using tools such as Google and how in the future
‘apps’ for mobile handheld devices may be developed to make information more
accessible [9]. It was proposed that through better communication, people can
develop their knowledge and understanding, so that they could become more
involved in the decision making processes which should lead to better informed
decisions being made. He emphasised the need to inspire people to care enough so
that change, in the form of better protection of the marine environment, can become
a reality.
3. Management and planning of marine resources
With the variety of emerging legislation and policy such as the Marine and Coastal
Access Act 2009 and the EU Marine Strategy Framework Directive and the formation

of the MMO, there is now a stronger mandate than ever before for marine planning.
The UK Marine Policy Statement published in March 2011 [18] establishes the policy
framework for marine planning and decision making for the whole of the UK's marine
environment. Its aim is to help achieve the UK Government's vision for clean,
healthy, safe, productive and biologically diverse oceans and seas. The evolution of
the coastal and marine governance framework in recent years has been both
significant and pronounced. This is the focus of the paper by Fletcher et al. [2] which
highlights the main changes in how England's marine and coastal spaces are
governed. The evolving governance framework is a response to the multitude of
management challenges facing the marine environment in the coming years, such as
the management of historic marine sites in the face of increasing use of the marine
and coastal environment [3]. Marine management and planning requires a robust
under-standing of a variety of disciplines and their interactions with natural and
anthropogenic activities in a given area. Potential approaches to help find
sustainable solutions include the use of effective fisheries management tools, ocean
front modelling, Vehicle Monitoring Systems (VMS) tracking and mapping, innovative
technologies, predictive modelling, decision support tools and stakeholder
engagement. In all these approaches data access is deemed to be a common and
crucial issue (Box 1).
Using Cefas Observer Data, Harriet Condie and colleagues [4] have analysed the
potential impact of implementing a fisheries discard ban, in conjunction with effort
restrictions or catch quotas, on otter trawlers operating in the North Sea. They found
that a discard ban in isolation will not incentivise more selective fishing. However, if
suitable market size regulations are in place, a discard ban in conjunction with effort

restrictions can generate a small incentive to fish more selectively. Research
identified that whilst catch quotas can create strong incentives for fishers to operate
more selectively, they may not be suitable for all vessel segments due to
dramatically shortened fishing seasons that may render fishing unprofitable.
Gear-specific VMS data have been employed by Campbell and colleagues [5] to
map fishing effort in and around the Western English Channel from 2005 to 2008.
The resulting maps highlight potential effects of fisheries closures around a
renewable energy installation, Wave Hub in Cornwall, and at a candidate offshore
Marine Protected Area, Haig Fras, on the distribution of an international fishing fleet
of large (>15 m length) vessels and spatial differences in the intensity of fishing by
different gear types. Patterns in fishing effort reflect the suitability of different
substrata for each gear type and the availability of target species and the data clearly
show that intensely fished ‘hot-spots' varied between gear types. The key findings of
the study demonstrate the value of gear-specific VMS for spatial management
planning.
There is a growing demand for fit-for-purpose maps of the UK's offshore area, and in
the recent financial climate increased co-operation is crucial to delivering this. One
example is the UK Marine Environmental Mapping Programme (MAREMAP), a new
partnership of UK public sector organisations which is responsible for seafloor
geological and habitat mapping [20]. By sharing resources and best practice, the
MAREMAP partners are attempting to address the under-sampling of UK seas (only
about one-third of the UK offshore area is mapped with multibeam bathymetry). The
products generated through this multi-disciplinary programme such as high-
resolution seafloor habitat maps, are underpinning policy in several ways. For

example, the maps are influencing the location and size of potential Special Areas of
Conservation (SACs) in the UK offshore area and contributing to UK actions under
the EU Habitats Directive. The MAREMAP partners are also developing new
technologies and techniques to increase the spatio-temporal resolution and cost-
effectiveness of marine mapping and monitoring. A recent study commissioned by
Defra investigated the application of marine autonomous systems to mapping and
monitoring of the future UK MPA network [21].
Box. 1. Summary of the ‘Data Access’ workshop
Data access
Data access is recognised as an important issue that requires a concerted effort from the marine community to solve. Currently, there is no definitive route to accessing many datasets and participants were unsure of how to request some of the data. There are issues on location, access and licensing restrictions; lack of consistent standards and formats; incomplete or lacking metadata; quality of data and gaps in data availability. There are concerns that while it is necessary to request data from a wide variety of sources, more effort is needed to standardise or harmonise access to data within the UK and Europe. It was suggested that there is a need for high level support in resolving these issues and that the Marine Science and Coordinating Committee could provide such support. The activities of Marine Environmental Data and Information Network (MEDIN) were discussed with regard to data exchange formats and metadata standards, and the linkages to the UK Location Programme, which transposes the EU INSPIRE Directive [19] to improve the sharing and re-use of public sector location information. Important issues raised include enabling adequate data discovery and access and ensuring confidence in the data by utilising metadata including details such as how data were collated, by whom and for what original purpose. Only with this information was it felt that sufficient confidence could be ascribed to allow reuse. The MMO’s approach to ensuring the quality assurance processes of data providers to assign a level of confidence to data has been criticised as being too academic. However, a high priority must be given to building a robust evidence base for all to use. There is still a need to overcome barriers to data access. The UK government is working towards making public data available to all. However, there are still obstacles to achieving this such as licenses on some datasets, compliance to regulations on disclosure of personal data and commercially sensitive data. Despite a number of remaining challenges, significant progress has been made over a relatively short time. There is now a much greater emphasis placed on data standards, collection and management and there is recognition that data management beyond the life of specific, short-term projects is vital.

Further tools for the management and planning of marine resources include
predictive modelling and software tools such as Marxan. Marshall and colleagues
have applied species distribution models (SDMs) to marine conservation and
planning [6]. They offer practical considerations for discussion and propose recom-
mendations for best practice of application of SDMs to support marine conservation
planning, including combining model out-puts with other data layers, metadata
standards and model error. Tools, such as Marxan, have been developed to support
the identification of areas for conservation. However, it has been shown that the
successful selection of appropriate areas for conservation can depend upon the
availability of data. Using the case study of Lyme Bay in UK, Peckett and colleagues
assess the effectiveness of currently available substrate data to designate marine
reserves to meet conservation objectives [7].
Miller and colleagues have shown how the distribution of oceanic fronts observed by
satellite may be used as a proxy for enhanced pelagic biodiversity [8]. These maps
of ocean fronts can then be applied to assist in the designation of Marine Protected
Areas (MPAs), fisheries management and site selection for marine renewable
energy installations. Frequently fronts between different water masses are
associated with higher plankton abundance and diversity and with certain pelagic
fish and megafauna. A front climatology of the UK continental shelf was generated
showing the regions where strong fronts are most frequently observed during each
season. These results have already been used by the UK government to advise the
selection of potential MPAs.
The Crown Estate has extensive experience of managing activities within the marine
environment and of balancing economic activity with stewardship of natural

resources for future generations to use and enjoy. Olivia Burgess presented case
study examples of offshore wind, aggregates and coastal assets emphasising the
experience of the Crown Estate's in managing its business assets in the context of
emerging policy and legislation [22]. Given the Crown Estate's stewardship role in
the conservation of the marine environment, the need for well-balanced relation-
ships with key stakeholders and policy makers was noted. The development of
marine renewable energy creates numerous opportunities and challenges which
were further discussed (Box 2).
4. Science-policy integration and communication for coastal and marine
governance
The integration of scientific knowledge and understanding into policy making can
supports improved policy decisions on the management of the marine and coastal
environment. The key questions to shape policy for the future were investigated in
one of the forum workshops (Box 3, [10]). The challenges of bridging the gap
between policy and science were discussed in a parallel workshop (Box 4). Some of
the successes, failures and challenges in attempts at integration are detailed below.
Communicating science to stakeholders including the public was the focus of some
discussion at the forum. Piers Stanger discussed the overarching strategy for their
management through Shoreline Management Plans (SMPs) and discussed the
inclusion of climate change science [24]. One of his key findings was that much work
is needed to improve the effectiveness of science communication within this process.
Andrew Colenutt focused on the high quality of data provided by Channel Coastal
Observatory data management centre [25] and the role it plays in underpinning

policy. The national network of regional coastal monitoring programmes (funded by
Defra, and in partnership with maritime local authorities and Environment Agency
regional teams) provide high quality topographic, bathy-metric, hydrodynamic and
remote sensing data. These datasets were essential to the production of the North
Solent SMP [26], which used analytical and visualisation techniques to raise aware-
ness and understanding of the potential implications from present and future risks of
tidal flooding and coastal erosion, to vulnerable coastal communities. Such
techniques, he claimed, proved extremely effective consultation and communication
tools. Further to the national planning guidance relating to development and coastal
change, Colenutt suggested that Local Planning Authorities use the flood and
erosion risk assessments produced through the SMP process when designating
Coastal Change Management Areas.
Franca Davenport of the Science Communication Unit in University of West of
England highlighted the increasing reliance of EU policy makers on scientific
knowledge and opinion in order to produce evidence-based policy. The topics
covered by European-level marine and coastal policy covers a broad range of topics
which have widely differing time frames and research needs. In order to feed
effectively into European policy, research should aim to be either policy-framed with
direct connections to specific legislation or policy-relevant with findings that have
implications for current or future policy making and implementation. To have an
impact, Davenport argued, research needs to reach policy makers at an appropriate
time within the policy cycle which is often difficult to synchronise. Consultancies may
play an important role in collating scientific evidence and evaluating the
implementation of policy. By developing relationships with consultancies or taking on

the role of the consultant, researchers and academic centres can facilitate the
transfer of their research to the policy community. She identified multiple routes to
influencing policy, that range from personal contact to publication of consultancy
reports, and using several of these pathways could have the largest impact.
Natasha Barker of WWF-UK noted that SMPs are a leading example of how to apply
the ecosystem approach to policy. She also agreed with the need for better
communication between scientists, policy makers and stakeholders is becoming
more apparent identifying the range of emerging initiatives to support this such as
NERC Knowledge Exchange programme [27], DG Env Science for Environ-mental
Policy news and EC funded projects such as PISCES [28]. Whilst recognising
science-policy integration is a two-way process, she emphasised that since policy
makers have little available time to go looking for relevant science, the most pressing
need is for scientists to report their work in a way that clearly links it to the relevant
policy context.
There was mixed opinion concerning the success of SMPs in underpinning policy,
indicating that some coastal regions may still have a lot to learn from the good
practice of others. There was a clear message that the onus should be on scientists
to be pro-active in communicating their science effectively to policy makers.
Scientists need to communicate the constraints of marine and coastal research and
the answers that can be realistically provided to policy makers. Furthermore, they
should be aware of potential conflicts between policies and how to effectively
position their science so it can provide an objective view. Lastly, it was high-lighted
that communicating science is something that natural and social scientists often feel

uncomfortable or ill-equipped to do and as such, it presents a significant challenge
for scientific community in the future.

Box. 2. Summary of ‘Fisheries and Marine Renewable Energy Interactions
Workshop’
Fisheries and Marine Renewable Energy Interactions Conflict often arises during the development and operation of offshore marine renewable energy (MRE) projects. This workshop brought together a variety of interested stake-holders who, in a round table discussion, highlighted a number of key reasons and possible solutions. The lack of broad scale datasets on the displacement of species at MRE sites (including cabling areas) was discussed by Stuart Rogers from the Centre for Environment, Fisheries and Aquaculture Science (Cefas). He identified the need to introduce monitoring programmes to observe the impact and assess the likely consequences of developments and to determine how fisheries and MRE can best work together. The lessons learnt from the Wave Hub EIA process with regard to fisheries were outlined by Colin Cornish. During community consultation, it emerged that the financial impacts on the fishery had been grossly underestimated. Mitigation was found to be the preferred option for fisheries groups, rather than financial compensation. A Strategic Mitigation Fund was established which feeds into the community rather than individuals. This funds projects such as a local fuel supply. Local boats are now used for survey work. During consultations with fisheries during the environ-mental impact assessment process for Atlantic Array, Tim Golding found that relations were generally good with organisations and groups and these consultations provided a broad overview. Consultations were also undertaken with individuals to provide finer detail. It was highlighted that messages from groups to individuals differ, as often a few strongly opinionated people can dominate in a group. Therefore, it is essential to pursue individual engagement. As with the Wave Hub, mitigation was preferred to compensation as this invested in a long term future. Currently there is very little scientific fisheries evidence available for windfarm sites to allow constructive engagement and mitigation planning [16] although the effects on biodiversity of Wave Hub were investigated as part of the PriMARE project [23]. There is a need for better engagement with not only fisheries but also with coastal communities. Development of marine renewables needs to be seen as a positive opportunity. Better research methods, tools and application of new technologies are also required. However, much better base-line data are required across all species in order to inform better mitigation. Two specific problems identified were the electro-magnetic field effects on elasmobranchs and the noise effects on all species. Unknown shifts in ecosystems mean that further research in this area is also required. A fisheries mitigation working group is now being funded by a Natural Environment Research Council Knowledge Exchange Programme (MREKE) [27] as a direct result of this workshop.

Box 3. Summary of ‘Questions to shape Marine Policy’ (See [10] for full outputs of
this workshop)
Questions to shape marine policy (See Rees et al. [10] for full outputs of this workshop) UK and European policy is rapidly developing to meet international targets for the sustainable use and protection of the marine environment. To inform this process, research needs to keep pace with these changes and research questions must focus on providing robust scientific evidence. To this end, a collaborative methodology for identifying priority questions that are pertinent to recent changes in marine policy was developed by members of the Centre for Marine and Coastal Policy Research at Plymouth University, UK. One hundred and fifteen primary questions were generated by the forum delegates. Twenty three participants nominated themselves to take part in a facilitated workshop to sort and combine the primary questions into a set of 38 priority questions. These research questions were then subject to a process of review, validation and quality control by a working group from the Centre of Marine and Coastal Policy Research. The priority research questions identified at the forum are timely and closely linked to current policy processes in the UK such as the development of a UK network of Marine Protected Areas and the introduction of marine planning. The data requirements to support these processes were identified, including building capacity for a centralised data collection and monitoring framework. Discussions also identified a need to gain a greater understanding of the relationship between ecosystem function and the delivery of ecosystem services, particularly for use within a management context, and research to further understanding of the emerging concept of marine citizenship. Questions relating to governance are dominated by the need to review the current policy framework to streamline efforts, avoid duplication, and ensure that national policy is fit for purpose. The final priority questions provide a research focus to address the current challenges. They are interdisciplinary and will require cross sectoral partnerships. The results of this research are not restricted to a UK audience. Some of these questions are local in nature, for example those concerning a UK network of Marine Protected Areas, but some have a global element e.g. carbon sequestration as an ecosystem service. Individual countries or regions are progressing their own timelines towards international policy goals. There is much to be gained from international efforts to share experiences to inform progress.

Box 4. Summary of ‘Helping to Bridge the Gap between Marine Science and Policy’
workshop
5. Social and economic considerations in marine policy
Until relatively recently, marine scientists have tended to focus on marine
environmental issues when considering and engaging with marine policy, with
Helping to bridge the gap between marine science and policy In order to bridge the gap between marine science and policy is it important to first identify: what the gap or perceived gap between marine science and policy is; what obstacles are preventing us from bridging the gap; and what are possible solutions? The participants of this workshop, representing a diversity of backgrounds such as fishing, NGOs, scientific research, statutory organisations and local councils, identified a number of key gaps including: communication, collaboration, experienced manpower, funding, data accessibility and knowledge of the marine environment. They also identified some possible underlying reasons (and in some cases obstacles) such as a mismatch in agenda between science and social values, changing methodological standards, mismatch in spatial and temporal scales of science and policy, preconceived notions and inconvenient truths. It was generally agreed that in order to cross the existing gap a positive approach is needed—‘not just doom and gloom’. All stakeholders need to be prepared to suggest solutions and simplify language used thereby improving good science communication. Collaboration and integration are needed at an appropriate scale. A credible advocate is required along with good leadership and accountability and adaptive institutions. Research councils are now making it very clear that in all proposals for funding the social impact of any study should be demonstrated. This illustrates that some headway is being made in connecting science and policy. However, some participants felt that this requirement was just an addendum rather than integral to the rationale for carrying on the project. Likewise, the social impact is also becoming more prominent in Research Excellence Framework which demands that academics consider the implications of their research to society. Many academics feel lost as how to address this. There is clearly a need for training of specialists in the area of science communication. The general consensus was that, though gaps and obstacles do still exist, there is some success in starting to bridge them.

economists and social scientists working separately to the marine science
community. There are now, however, increased efforts to integrate natural, social
and economic considerations more in keeping with the ‘ecosystem approach’. For
example, the 2010 State of Seas Assessment, Charting Progress 2 [29] was the first
to include a full socio-economic analysis in the form of a ‘Productive Seas Evidence
Group (PSEG)’ chapter and the 2011 National Ecosystem Assessment includes
chapters on the socio-economic use and value of UK marine and coastal
ecosystems [30]. Some of the latest developments in estimating value for the marine
environment and looking at some specific applications of this type of thinking are
discussed below.
Stephen Hull from ABPMER outlined a framework for assessing the change in value
of the marine estate under different management options [11]. This framework has
used the Charting Progress 2 Productive Seas Evidence Group report [31] to
develop ‘static’ baseline values of ecosystem services as at 2008 and considers how
these baseline values might change up to 100 years into the future. Knowledge in
this area is developing rapidly as new information becomes available along with
more refined models.
An area-focused example of socio-economic impacts of environmental policy in the
form of the 2008 Lyme Bay closures to mobile fishing gear was presented by
Caroline Hattam of Ply-mouth Marine Laboratory. This case showed that there is a
wide range of opinion on whether this policy intervention had been beneficial or not
depending on the stakeholder group being asked. Mobile gear fishermen were
expectedly negative in their assessment, whereas static fishermen in the closure
area were more positive [12]. It could be many years before the full environmental

and socio-economic implications will be truly known. There were lessons learned on
displacement of activities and the communication processes used by managers,
which could be applied to the ongoing MCZ process in England and Wales.
Research identified that some stakeholders in Lyme Bay did not seem fully aware of
the reason for the closure. It was advocated that every effort should be made to
anticipate the likely results of area closures such as the pressure of relocation and
new areas of potential conflict.
Julie Urquhart, of the Society, Economy and Environment Research Group (SEERG)
at the University of Greenwich, considered the contribution of inshore fisheries to a
community's sense of place using Sussex and Cornwall as examples. This reflects
the fishing communities' long, often multi-generational, history of interacting with the
local sea area whereas environmentalism can be perceived as the relatively new
concept. The integration of marine conservation and fisheries objectives through the
establishment of Inshore Fisheries and Conservation Authorities (IFCAs) remains a
challenge though there is a general sense of optimism that they are an improvement
on their predecessors, the Sea Fisheries Committees, and they provide an
opportunity for better integration and communication between fisheries and
conservation sectors [13].
Michael Clark of the University of Central Lancashire high-lighted that tourism and
recreation, while undoubtedly important elements of the marine and coastal
economy with environmental implications, need to be managed in a positive way. A
case study example of economic and social impacts of establishing an artificial surf
reef at Boscombe to encourage surf tourism demonstrated that careful consideration
is needed of the promises made to local communities about the potential economic

and social benefits of the establishment of such constructions when there is little
evidence available [14]. Benefits to local communities may be achieved through
coastal regeneration schemes alone. However, the potential benefits of the
marketing provided to an area by such a novel scheme should not be overlooked.
There is clearly a challenge to both those responsible for setting policy for UK seas
and to marine scientists to have a comprehensive view of the range of interests and
activities in the marine environment. The traditional divide between those focused on
environmental aspects of UK seas and those with an economic interest needs to be
bridged to ensure sustainable use of UK seas for future generations. Furthermore,
potential policy success is highly dependent on the engagement of stakeholders.
The implications of marine related policy for society were the focus of one of the
forum workshops (Box 5).
6. Marine conservation and ecosystem based management
Having a strong evidence base for selection, designation and management of Marine
Protected Areas is fundamental in making decisions that all stakeholders can trust.
Incorporating ecosystem services into marine conservation planning can play an
important role in informing decision makers of the best sites for protection (Box 6).
Many new techniques and approaches are being developed and were discussed at
the forum, including methods for the identification of biodiversity hotspots to support
the MCZ selection process in England and the scope to apply this in data poor
offshore regions [32]. However there was a strong warning from Caroline Chambers
(from Marine Ecological Surveys Ltd) about the need to ensure that data quality is

known and made explicit, using confidence measure to explain the likely implications
of data presented. Research has found that the closure of the Lyme Bay reefs to
mobile fishing gear caused understandable concern within the mobile fishing sector,
who felt the closure was unwarranted and unjustified. Results of ongoing monitoring
presented by Tim Stevens may go some way to demo three showed clear recovery
trends, and these were difficult to link unequivocally to the closure. However, data
analysis over community information showed the new closure areas were developing
communities which were similar to the closed control areas over time. Further
monitoring of the closed area will be essential in determining whether exclusion of
demersal fishing gear is an appropriate management action to conserve marine
biodiversity. Of the 16 indicator species surveyed, only three showed clear recovery
trends, and these were difficult to link unequivocally to the closure. However, data
analysis over community information showed the new closure areas were developing
communities which were similar to the closed control areas over time. Further
monitoring of the closed area will be essential in determining whether exclusion of
demersal fishing gear is an appropriate management action to conserve marine
biodiversity.
Mobile marine species present special challenges to marine conservation, shifting
across borders and potentially needing a range of locations during various life
stages. There are clear difficulties in identifying geographic areas which are
consistently important for particular mobile species. Clare Embling presented
methods to determine habitat use by mobile species [33–35], and use habitat
modelling to identify critical areas which could be defined as Marine Protected Areas
[33]. In both case studies, clear environmental factors drove the distribution of the

mobile species which enabled geographic areas to be defined, and equally important
gave clear information on the environmental factors which need to be maintained to
conserve those mobile species [33–35]. Such an approach will be critical in defining
and managing MPAs where they are a suitable tool for mobile species conservation.
demonstrating the environmental benefits of the closure through recovery of benthic
fauna, but trends are variable [15].

Box 5. Summary of ‘Marine Policy and Society’ workshop
Marine policy and society The aim of this workshop was to investigate what current trends such as globalisation, demographic change, climate change and peak oil mean for planning and policy and what research needs exist in order for us to meet the challenges we currently face. For each of these trends, participants considered the questions: What are the impacts of this trend for the management of the marine and coastal domain? What does this mean for marine planning/policy? What research is needed to support policy making? In terms of marine planning and policy, participants identified that themes need to be translated into local actions. Sometimes the problem appears too large to be addressed but often there are things that can be done locally that can make a difference, for example, a change to consumption patterns. Trends are often case study dependent. This was particularly the case for demographic change where some areas are positively affected and others negatively. Each case must be considered in turn. It was also proposed that for effective policy making more appropriate training and a wider skillset are needed. Weaknesses in the skillset must be identified and training provided in order to successfully address key issues. Policy must be adaptive—one size does not fit all. Constantly changing problems mean that policy makers need to be able to adjust to changes in an appropriate and timely fashion. Often there is a mismatch between the scale of the problem and the policy ‘solution’. Awareness of appropriateness of scale is vital. Some problems need to be tackled at all scales; local, regional, national and global. The research needs identified were numerous and included some generic issues such as increasing funding, standardising data collection and monitoring, sharing data, international collaboration, improved communication and cultural understanding. More specific topics identified, which cut across all themes, included the transition to a green economy, sustainable lifestyles, social attitudes and valuing ecosystem services such as aesthetics.

Box 6. Summary of ‘Towards a Systematic Approach to Ecosystem Services in
Marine Conservation planning in the UK’ workshop
Towards a systematic approach to ecosystem services in marine conservation planning in the UK The aim of this workshop was to discuss how the ecosystem services approach could contribute systematically to marine conservation planning in the UK. It was highlighted that the key benefit of incorporating ecosystem services into marine conservation planning was its potential role as an integrative factor in decision and policy making. This would allow marine conservation planning to be undertaken within a single holistic decision making framework which transparently showed: causality relationships; trade-offs between different policy and planning choices; and identified the relationships between key variables in marine conservation planning. More broadly, workshop participants considered that using ecosystem services in marine conservation planning provided a clear link between societal well-being and the marine environment, and as such, provided a potentially powerful mechanism to improve public and policy-maker understanding of the marine environment. The two key challenges of using ecosystem services in marine conservation planning related first, to the methodology of identifying, classifying and valuing marine ecosystem services; and second, to the data gaps that currently exist in the evidence base to support ecosystem service assessment. Specific concerns focused upon the potential for over-simplification in current classifications, difficulties in measuring intangible ecosystem services, difficulties in linking monetary values to ecosystem services, and how to ensure that any assessment of ecosystem services met the needs of a range of policy-making processes. The lack of data concern-ing ecosystems and associated services was the second dominant theme. At present there is a considerable lack of evidence concerning the existence of ecosystem services. This makes an accurate assessment or valuation of them impossible. In order to improve incorporation of ecosystem services into marine conservation planning, a multi-disciplinary research agenda must be mapped and prioritised. This should include: a consistent ecosystem service classification suited to the marine environment; the identification and systematic filling of data gaps; learning from experience elsewhere and from other environments how to enhance the application of ecosystem services in the marine environment; and finding an effective way of measuring intangible benefits. More broadly, finding mechanisms to better engage relevant stakeholders and the public in debates about the social benefits of marine conservation was also highlighted as important. Overall, the workshop saw significant value in incorporating ecosystem service approaches into marine conservation planning, but felt that at present, this was difficult due to methodological concerns and a lack of evidence. However, with focused research, the benefits could be realised.

7. Sustainability- From ideas to practice
In the final keynote speech of the forum Bob Earll (Director of Communications and
Management for Sustainability) focused on two key themes, delivering sustainability
and the ways that conferences can promote and generate ideas. He proposed that
sustainability is the key idea that provides the focus for much of the policy and
technical world. The central idea of sustainability is simply stated but fundamental. It
involves a clear view of the future, a vision which includes social, environmental and
economic elements and people. The generation of new and realistic ideas is crucial
to the development and implementation of sustainability. A two-way discourse
between academics and practitioners is also essential to meet the very real
challenges we face including meeting environmental, economic and social
challenges.
Earll highlighted that the scale and complexity of the issues can be discouraging but
also demonstrate the need for action [36,37]. The need to present and communicate
complicated ideas like sustainability much more clearly, by using systems diagrams
such as the periodic table, was advocated [38]. Important ideas like ecosystem
services need to be operationalised, with the context of informing decision making;
there are scientific limits to this approach [39]. Fishing remains a major challenge not
least from its decline and failure to provide an important food source but also
because of the level of environmental damage that can be caused. Society needs to
normalise the way fishing operates, at present; its position relative to every other
sector is quite exceptional for reasons that are unclear and disproportionate to its
performance. Constructive opportunities such as scallop ranching need to be found,
however, their limits must be recognized.

Earll concluded that networking and the building of networks to help tackle critical
issues is very important and conferences, such as the Marine and Coastal Policy
forum, have an critical role to play in helping to generate and promote ideas which
are key to developing a more sustainable future.
8. Conclusions
In this special issue the key challenges and opportunities regarding marine policy in
the UK as identified by the expert participants of the UK's first Marine and Coastal
Policy Forum are highlighted. The forum demonstrated a high level of engagement,
capacity and willingness of the research, academic, professional and practitioner
communities to grapple with the environmental, social and economic complexities
associated with the very difficult realities of managing the marine and coastal
environment.
Several important and prominent issues stood out. Better socio-economic research
input is needed in the process of managing our marine environment to enable us to
evaluate the full extent of activities in the marine and coastal environment. The
ecosystem services approach can provide a useful framework for linking social and
ecological systems and bringing a fuller range of issues into the valuation process.
There is a clear need for effective mechanisms of societal engagement within the
decision making process and policy cycle. Furthermore, marine management tools
such as predictive modelling require further development and implementation to
assist effective decision making.

Effective management of commercial fishing is one of the biggest challenges of the
21st Century. Given the huge geographical range and scale of commercial fleets, an
increasing global population, conflict with other sectors and the decline of
ecosystems, urgent action needs to be taken. Conferences can provide information
about the problems caused but they must also galvanise fisheries managers and
governments to take robust, effective action to address the issues identified.
The introduction of the MCAA and the associated management bodies has provided
the UK with a real opportunity to implement a range of new tools and techniques to
enhance marine governance and learn from the outcomes. For example, the process
of MCZ establishment and the establishment of the new IFCAs provide us with clear
opportunities but also challenges in incorporating a diversity of stakeholder views
whilst still being successful in achieving conservation and fisheries objectives.
A clear issue which needs to be addressed is that of conflict management due to
multiple uses of the marine environment. One such example is the interactions
between marine renewable developments and fisheries. The first steps in this
process were achieved at this forum with the establishment of a marine renewables
and fishing working group (funded by NERC). In this special issue the key outputs
from the forum are synthesised. It is intended that these outputs will contribute to
developing UK-specific responses to both domestic and EU marine policies.
Acknowledgements
The Marine and Coastal Policy Forum 2011 was sponsored by the Science for
Environment Policy EU, The Marine Conservation Zone Project, the Institute of

Marine Engineering, Science and Technology, the Institute of Ecology and
Environmental Management and the Marine Institute, Plymouth University.
References
[1] Marine and Coastal Access Act. Available at:
⟨http://www.legislation.gov.uk/ukpga/2009/23/pdfs/ukpga_20090023_en.pdf⟩.
Last accessed May 10th; 2013.
[2] Fletcher S, Jefferson R, Glegg G, Rodwell LD, Dodds W. England's evolving
marine and coastal governance framework. Marine Policy 2013 (Special Issue).
[3] Pater C, Oxley I. Developing marine historic environment policy: the English
Heritage experience. Marine Policy 2013 (Special Issue).
[4] Condie HM, Catchpole TL, Grant A. Incentivising selective fishing under a
policy to ban discards; lessons from home and abroad. Marine Policy 2013
(Special Issue).
[5] Campbell M, Stehfest KM, Hall-Spencer JM, Votier SC. Mapping fisheries for
marine resource management using gear‐specific vessel monitoring system data.
Marine Policy 2013 (Special Issue).
[6] Peckett FJ, Glegg GA, Rodwell LD. Assessing the quality of data required to
identify effective marine protected areas. Marine Policy 2013 (Special Issue).

[7] Miller PI, Christodoulou S. Frequent locations of oceanic fronts as an indicator of
pelagic diversity: application to marine protected areas and renewables. Marine
Policy 2013 (Special Issue).
[8] Laffoley D. ‘Future Ocean’—communicating and conserving the blue heart of the
planet. Marine Policy 2013 (Special Issue).
[9] Rees SE, Fletcher S, Glegg G, Marshall C, Rodwell L, Jefferson R, et al. Priority
questions to shape the marine and coastal policy research agenda in the United
Kingdom. Marine Policy 2013; 38:531–7.
[10] Hull S, Saunders J, Dickie I. Issues and challenges in spatio-temporal applica-
tion of an ecosystem services framework to UK Seas. Marine Policy 2013 (Special
Issue).
[11] Hattam C, Mangi SC, Gall S, Rodwell LD. Impacts of a temperate fisheries
closure: understanding stakeholders’ views. Marine Policy 2013 (Special Issue).
[12] Rodwell LD, Lowther J, Hunter C, Mangi SC. Fisheries co-management in a
new era of marine policy in the UK: a preliminary assessment of stakeholder
perceptions. Marine Policy 2013 (Special Issue).
[13] Rendle E, Rodwell LD. Socio-economic impacts of an artificial surfing reef—
implications for coastal development and marine policy. Marine Policy 2013 (Special
Issue).
[14] Stevens T, Sheehan E, Gall S, Attrill M. Initial evaluation of the UK's first reserve
for marine biodiversity conservation: changes in the Lyme Bay reefs after the
exclusion of mobile bottom fishing. Marine Policy 2013 (Special Issue).

[15] Ashley M, Mangi SC, Rodwell LD. The potential of offshore wind farms to act as
marine conservation zones—a systematic review of current evidence. Marine Policy
2013 (Special Issue).
[16] Potts T, O'Higgins T, Mee L, Pita C., Public perceptions of Europe's Seas—A
Policy Brief; 2011. EU FP7 KNOWSEAS Project.
[17] Defra. The Marine Policy Statement. Department for Environment, Food and
Rural Affairs 2011. Available at: ⟨http://www.defra.gov.uk/publications/files/ pb3654-
marine-policy-statement-110316.pdf⟩. Last accessed March 10 2013.
[18] European Union. INSPIRE Directive. 2013. Available at: ⟨http://inspire.jrc.ec.
europa.eu/⟩ ast accessed May 10th 2013.
[19] MAREMAP. Marine Environmental Mapping Programme. 2013. Available at:
⟨http://www.maremap.ac.uk/index.html⟩. Last accessed May 10th 2013.
[20] Wynn RB, Bett BJ, Evans AJ, Griffiths G, Huvenne VAI, Jones AR, et al.
MAREMAP partners. Investigating the feasibility of utilizing AUV and Glider
technology for mapping and monitoring of the UK MPA network. Final report for
Defra project MB0118. Southampton: National Oceanography Centre; 244.
[21] Crown Estate. Offshore Wind Energy. 2013. Available at: ⟨http://www.thecrow
nestate.co.uk/energy-infrastructure/offshore-wind-energy/⟩. Last accessed May 10th
2013.
[22] Crown Estate. Offshore Wind Energy. 2013. Available at: ⟨http://www.thecrow
nestate.co.uk/energy-infrastructure/offshore-wind-energy/⟩. Last accessed May 10th
2013.

[23] Witt MJ, Sheehan EV, Bearhop S, Broderick AC, Conley DC, Cotterell SP, et
al. Assessing wave energy effects on biodiversity: the Wave Hub experience.
Philosophical Transactions of the Royal Society A: Mathematical, Physical and
Engineering Sciences 2012; 370(1959):502–29.
[24] Environment Agency. Shoreline management plans. 2013 Available at:
⟨http:// www.environment-agency.gov.uk/research/planning/104939.aspx⟩. Last
accessed May 10th 2013.
[25] Channel Coast Observatory. Strategic Regional Coastal Monitoring Pro-
grammes. 2013. Available at: ⟨www.channelcoast.org⟩. Last accessed May 10th
2013.
[26] The North Solent Shoreline Management Plan, November 2010. Available at:
⟨http://www2.westsussex.gov.uk/ds/mis/101110ee9.pdf⟩. Last accessed May 15th;
2013.
[27] NERC. Marine renewable energy knowledge exchange Programme, Natural
Environment Research Council. 2013. Available at: ⟨https://ke.services.nerc.ac.
uk/Marine/Pages/Home.aspx⟩. Last accessed May 10th 2013.
[28] PISCES (Partnerships Involving Stakeholders in the Celtic Sea Ecosystem);
2013. Available at: ⟨http://www.projectpisces.eu/⟩. Last accessed May 10th 2013.
[29] United Kingdom Marine Monitoring and Assessment Strategy (UKMMAS).
Charting progress 2. 2010. Available at: ⟨http://chartingprogress.defra.gov.uk/⟩. Last
accessed May 10th 2013.

[30] Austen MC, Malcolm SJ, Frost M, Hattam C, Mangi S, Stentiford G, et al.
Marine. The UK national ecosystem assessment technical report. UK National
Ecosys-tem Assessment, UNEP-WCMC, Cambridge; 2011. p. 40.
[31] United Kingdom Marine Monitoring and Assessment Strategy (UKMMAS).
Charting Progress 2 Feeder Report Productive Seas. Department for Environment
Food and Rural Affairs on behalf of UKMMAS (editors. Saunders, J. and McKie, J.);
2010. p. 472.
[32] Langmead O, Jackson EL, Griffiths C, Wilkes P, Neilly M, Lear D, et al.
Accessing and developing the required biophysical datasets and data layers for
Marine Protected Areas network planning and wider marine spatial planning pur-
poses Report no. 20, Task 2F. UK marine benthic diversity layer. Report to Defra
from Marine Biological Association of the UK; 2011.
[33] Embling CB, Gillibrand PA, Gordon J, Shrimpton J, Stevick PT, Hammond
PS. Using habitat models to identify suitable sites for marine protected areas for
harbour porpoises (Phocoena phocoena). Biological Conservation 2010;143: 267–
79.
[34] Embling CB, Illian J, Armstrong E, van der Kooij J, Sharples J, Camphuysen
KCJ, et al. Investigating fine-scale spatio-temporal predator-prey patterns in
dynamic marine ecosystems: a functional data analysis approach. Journal of
Applied Ecology 2012; 49:481–92.
[35] Embling CB, Sharples J, Armstrong E, Palmer MR, Scott BE. Fish behaviour
in response to tidal oceanography over a shelf sea bank. Progress in Oceano-
graphy, http://dx.doi.org/10.1016/j.pocean.2013.06.013, in press.

[36] Rogers AD, Laffoley, D. International Earth system expert workshop on
ocean stresses and impacts. Summary report IPSO Oxford; 2011. p. 18.
[37] Clarke S. Understanding pressures on fishery resources through trade statis-
tics: a pilot study of four products in the Chinese dried seafood market. Fish and
Fisheries 2004;5:53–74.
[38] Communication and Management for Sustainability (CMS) Delivering
sustain-ability. 2011. Available at: ⟨http://www.coastms.co.uk/pages/sustainability⟩.
Last accessed May 10th 2013.
[39] Stirling A. Deliberative futures: precaution and progress in social choice of
sustainable technology. Sustainable Development 2007; 15:286–95.

Priority questions to shape the marine and coastal policy research agenda in
the UK
Siȧn Rees a,n, Stephen Fletcher a, Gillian Glegg a, Charlotte Marshall a,b, Lynda
Rodwell a, Rebecca Jefferson a, Maria Campbell a, Olivia Langmead a,b, Matthew
Ashley a,c, Helen Bloomfield d, Daniel Brutto e, Andrew Colenutt f,g, Alessandra
Conversi a,h,i, Bob Earll j, Caroline Hattam c, Simon Ingram a, Emma McKinley k,
Laurence Mee l, Jenny Oates m, Francis Peckett a, Jim Portus n, Martin Reed a,
Stuart Rogers o, Justine Saunders p, Kylie Scales c, Russel Wynn q
a Centre for Marine and Coastal Policy Research, The Marine Institute, Portland
Square, Plymouth University, Plymouth PL4 8AA, UK b Marine Biological
Association, The Laboratory, Citadel Hill, Plymouth PL1 2PB, UK
c Plymouth Marine Laboratory, Prospect Place, The Hoe, Plymouth PL1 3DH, UK
d School of Environmental Sciences, University of Liverpool, Liverpool L69 3BX, UK e
Marine Ecological Surveys Ltd., 3 Palace Yard Mews, Bath BA1 2NH, UK
f New Forest District Council, Town Hall, Avenue Road, Lymington SO41 9ZG, UK
g Channel Coastal Observatory, National Oceanography Centre, European Way,
Southampton SO14 3ZH, UK
h ISMAR—Marine Sciences Institute in La Spezia, CNR—National Research
Council of Italy, Forte S. Teresa, Loc. Pozzuolo, 19032 Lerici (SP), Italy i Sir Alister
Hardy Foundation for Ocean Science, Citadel Hill, The Hoe, Plymouth PL1 2PB, UK

j Communication and Management for Sustainability, Candle Cottage, Kempley,
Gloucestershire GL18 2BU, UK k University of Chichester, Upper Bognor Road,
Bognor Regis, West Sussex PO21 1HR, UK
l Scottish Association for Marine Science, Scottish Marine Institute, Oban, Argyll
PA37 1QA, UK m Joint Nature Conservation Committee, Monkstone House, City
Road, Peterborough PE1 1JY, UK
n South West Fish Producers Organisation Ltd, 49–50 Fore Street, Ivybridge, Devon
PL21 9AE, UK
o Centre for Environment, Fisheries & Aquaculture Science, Pakefield Road,
Lowestoft, Suffolk NR33 0HT, UK p EMU Ltd, 1 Mill Court, The Sawmills, Durley,
Southampton SO32 2 EJ, UK
q MAREMAP, National Oceanography Centre, European Way, Southampton SO14
3 ZH, UK
Corresponding author:
Tel: +44752 584732
Email: [email protected]
Abstract
United Kingdom (UK) and European Union policy is rapidly developing to meet
international targets for the sustainable use and protection of the marine
environment. To inform this process, research needs to keep pace with these

changes and research questions must be focused on providing robust scientific
evidence. Thirty four priority research questions within six broad themes were
identified by delegates who attended the 1st marine and coastal policy Forum,
hosted by the Centre for Marine and Coastal Policy Research at Plymouth
University in June 2011. The priority questions formed through this research are
timely and reflect the pace and change of marine policy in the UK in response to
international, European and national policy drivers. Within the data theme, the
majority of questions seek to find improved procedures to manage and use data
effectively. Questions related to governance focus on how existing policies should
be implemented. The marine conservation questions focus entirely upon
implementation and monitoring of existing policy. Questions related to ecosystem
services focus on research to support the conceptual links between ecosystem
services, ecosystem function, and marine management. Questions relating to
marine citizenship are fundamental questions about the nature of societal
engagement with the sea. Finally, the marine planning questions focus upon
understanding the general approaches to be taken to marine planning rather than
its detailed implementation. The questions that have emerged from this process
vary in scale, approach and focus. They identify the interdisciplinary science that is
currently needed to enable the UK to work towards delivering its European and
international commitments to achieve the sustainable use and protection of the
marine environment.
Keywords: Marine Conservation, Marine Planning, Marine Citizenship, Ecosystem
Services, Data, Governance

1. Introduction
The need to identify research priorities is important because a robust evidence base
is critical to support informed policy change. However, it is a complex issue as
national policy for the marine. and coastal environment is not created in isolation
and is driven, at least in part, by the need to meet international commitments. These
include global treaties, such as the Ramsar Convention on Wetlands and the
Convention on Biological Diversity, and regional agreements, such as the OSPAR
Convention of the Protection of the North East Atlantic [1–3]. These policies provide
a frame-work for both UK and European Union (EU) marine policy through the
definition of important over-arching principles and criteria for species and habitat
protection. The EU translates many of these principles into more concrete
objectives through its directives and it is the responsibility of the member states to
ensure the requirements of these directives are met.
Central to the management of the European marine environment are the Habitats
Directive (92/43/EEC) and the Birds Directive (79/409/EEC) which together create a
network of protected areas for a number of listed species and habitats native to
member states in the terrestrial and marine environment. These directives require
the designation of European Marine Sites as either Special Areas of Conservation
(SACs) or Special Protection Areas (SPAs) and subsequently protection of these
sites from harmful development [4]. More recently the Marine Strategy Framework
Directive 2008/56/EC (MSFD) has been introduced to provide broader marine
environ-mental protection in European waters [5]. This Directive, which constitutes
the environmental component of the EU’s Integrated Maritime Policy (IMP), aims to
achieve good environmental status in all EU marine waters by 2020 while protecting

the resource base for economic and social activities. This brings the marine
environment in line with the EU’s Water Framework Directive’s (WFD) requirements
for inland and coastal waters. In addition, the IMP, which advocates an integrated
approach to governance of marine and coastal waters, has proposed the
introduction of marine or maritime plans, working in close association with
integrated coastal zone management.
To support the UK Government in meeting these international and European
commitments and to achieve the Government’s aim of ‘clean, healthy, safe,
productive and biologically diverse oceans and seas’ [6], the Marine and Coastal
Access Act 2009 (MCAA) [7], the Marine (Scotland) Act 2010 [8], and the
forthcoming Northern Ireland Marine Bill 2012 are providing the framework to
stream-line the way the marine environment is managed in the UK. Along with
developing legislation from the devolved administrations [9] these new provisions
include the legal frameworks to develop Marine Plans (guided at a national level by
the Marine Policy Statement [10]), provide powers to set licensing controls for
development proposals in the marine area, and enable the designation of a new
type of Marine Protected Area (MPA) called Marine Conservation Zones (MCZs).
The scale and pace of change in European and national policy presents challenges
in managing the marine environment for its sustainable use. These changes in the
governance of the marine environment place considerable demands on the marine
community to work together to provide the necessary information and understanding
to fulfill the set objectives. Decision makers need access to scientific evidence that is
targeted to their needs [11,12]. To this end, academic research in the science-policy
arena must be integrated and interdisciplinary. It must also be timely by framing

research activities within the context of the general trends in that field [13,14].
Collaborative exercises to identify priority areas for research and management have
demonstrated a metho-dology for identifying relevant areas of research to scientists,
policy makers and practitioners [15–22]. However, none has focused on the
interdisciplinary research requirements needed to achieve the sustainable use and
protection of marine environment in the UK. To fill this gap in knowledge the aim of
this study was to work with policy makers, practitioners and academics to identify
priority questions to shape the marine and coastal policy research agenda in the UK.
2. Methods
In his taxonomy of horizon-scanning methods, Sutherland [16] identifies the
methods used in this research as ‘expert workshops’ which ‘‘bring together experts
to suggest possible future issues based on their own experience and knowledge’’
(p. 524). Sutherland identifies the advantages of this approach as the credibility
provided by experts and that the iterative nature of the work-shops draws out key
issues and provides opportunities to refine the outcomes. The disadvantages are
that the findings are always constrained by who was (or was not) involved in the
workshops and by the precise process that was followed. The authors recognised
these qualities in this study and specifically sought to minimise the disadvantages
inherent to the method through the application of a rigorous research process
described below, yet inevitably some effect will remain. Any variation in the methods
used and in participation in the workshop would have resulted in a slightly different
list of research questions; however, this is the case for all such processes.

The development of this research involved four stages (Fig. 1). The central focus for
undertaking this research was the 1st marine and coastal policy Forum which was
hosted by the Centre for Marine and Coastal Policy Research (MarCoPol) at
Plymouth University, UK in June 2011.
Fig. 1. Process diagram that shows the stages undertaken for developing the
priority questions to shape the marine and coastal policy research agenda in the
UK. n= the number of questions at each stage of the process.
Table 1. Delegates to the Marine and Coastal Policy Forum shown by sector.
Sector Number of forum delegates
Consultant 12
Charity representative (e.g., National Trust, The Wildlife Trust)
12
Government advisory body (e.g., Joint Nature Conservation Committee)
6
Industry representative 3

Local government authority representative
3
Research institute member (e.g., University, Plymouth Marine Laboratory, Marine Biological Association)
52
Student (MSc & BSc) 6
2.1.Stage 1: Generating initial questions
Forum delegates were asked to identify the key questions that they felt were
needed to be addressed by the research community to fully meet the challenges
posed by recent policy developments to achieve the sustainable use and protection
of the UK coastal and marine environment. Delegates were invited to submit
questions by email prior to the Forum and during the first two days of the meeting.
One hundred and fifteen initial questions were generated in total. Table 1 provides a
summary of the sectors represented by Forum delegates. The majority of delegates
to the Forum were representatives of research institutions within the UK, many of
whom are experienced in providing research to support marine governance and
policy decisions. In addition, there was representation from all key stakeholder
sectors active in the UK’s marine and coastal governance framework.
2.2.Stage 2: Pre-sorting questions and workshop
In order to make the best use of time available during the Forum meeting, the
questions initially submitted were pre-sorted into thematic categories by a working
group from the Centre for Marine and Coastal Policy Research. The thematic

categories were: data, the ecosystem approach, human impacts, MPAs, marine
spatial planning, policy, and social issues.
2.3.Stage 3: Priority questions workshop
Twenty three delegates attended the Forum workshop, during which they were
asked to work in small groups to review the initial, themed, pre-sorted questions.
Delegates were asked to keep the following criteria in mind when writing, reviewing,
and combining research questions. The criteria, adapted from Sutherland et al. [16],
were that each question should:
a) be answerable through realistic research design;
b) be SMART (specific, measurable, attainable, realistic and timely);
c) allow a factual answer that does not depend on value judgements; and
d) be of relevance to the UK.
Each group was moderated by a facilitator who kept the group to task and recorded
the process through which decisions were made, primarily in order to maintain a
clear audit trail between the initial questions generated by the wider Forum
delegates and the refined questions identified by delegates at the workshop. The
outcome of the workshop was 38 priority questions to take forward to the next
stage.
2.4.Stage 4: Priority question review
A working group from the Centre for Marine and Coastal Policy Research undertook
a final review of the priority questions in order to remove duplication and validate

the audit trail between the initial questions and the final set of priority questions.
This process resulted in the removal of four duplicated questions. A final set of 34
priority questions was agreed.
3. Results
The research questions were grouped into the following six broad categories:
marine conservation, marine planning, marine citizenship, ecosystem services, data
and governance. The questions were divided into these categories in order to
provide a coherent structure for presentation. However, it should be recognised that
an individual question may have relevance under one or more categories. The final
34 questions are not ranked. The results are presented and discussed according to
their categories.
3.1.Data
1. What are the minimum data requirements (range of datasets and quality
thresholds) for effective marine planning?
2. What lessons have been learned from the recent Marine Conservation Zone
(MCZ) process to improve the incorporation of scientific and stakeholder data into
marine conservation planning?
3. What elements are required to coordinate a national data collection and
monitoring framework to support marine management?
4. How can confidence in stakeholder sourced data be assessed?

The need for a robust evidence base to inform marine decision making is apparent
in questions 1–4. All four questions are forward thinking and, ultimately, aim to
identify ways in which the collation and provision of data can be improved to support
marine environmental management. Questions 1 and 4 reflect upon the
development of the UK MPA network, in particular with regard to improving the
incorporation and quality of data into the decision making process (question 1).
Data initiatives such as the Ocean Biogeographic Information System (OBIS), and
the Marine Environmental Data and Information Network (MEDIN), have developed
in response to the fragmented nature of marine environmental data holdings in the
UK and have worked to increase the availability of marine environmental data to
end-users. Yet lack of data has been cited as a common impediment to progress in
conservation, especially in offshore environments [23]. The questions posed here
recognise the extent of data gathering (consolidation of ecological data and
gathering of social and economic data) required to determine the location of MCZs
(question 2) and support the development of marine plans (question 1). Question 3
also identified that the development of a central data body, monitoring framework
and a protocol for the assessment of stakeholder sourced data (question 4) could
serve to support robust policy delivery.
3.2.Ecosystem services
5. What are the links between marine ecosystem function and ecosystem services?
6. How can marine ecosystem services (e.g., climate regulation) be incorporated
into marine management?

7. What are the research priorities to improve our understanding of marine
ecosystem services?
Marine ecosystems provide a number of essential ecosystem services, such as the
provision of food and climate regulation, which are essential to maintain human
wellbeing [24–26]. The development of descriptors [24] to translate the complexity
of marine ecosystem functions into marine ecosystem services has broadened the
inclusion of marine ecosystem services into policy and planning [27,28]. As such,
the consideration of eco-nomic, social and ecological values in decision making (the
ecosystem approach) via defining ecosystem services has become integral to
marine conservation planning and policy in the UK [5,7,10,29]. The questions raised
under the category of ecosystem services (questions 5–7) demonstrate that greater
understanding is needed of the concept, particularly with regard to the links
between ecosystem functions and the delivery of ecosystem services (question 5),
in order for it to be used in a management context (question 6). As this is a broad
area of research it is suggested that setting research priorities within the subject
area may improve its practical application (question 7).
3.3.Governance
8. How can marine heritage priorities (e.g., wrecks) be integrated into coastal and
marine policy?
9. How can the current marine and coastal policy framework adapt to drivers of
change?
10. Can the current marine and coastal policy framework in the UK be streamlined
and duplication reduced?

11. How do sectoral interests (e.g., fisheries, conservation, energy) influence
marine and coastal policy at different scales?
12. How does the current marine and coastal policy framework enable the
sustainable management of the marine environment?
13. To what extent is the Marine Policy Statement effective and how can this be
assessed?
14. To what extent is the national capacity for marine and coastal governance
appropriate for the scale of the challenge(s)?
The UK marine and coastal governance framework mediates policy derived from a
number of scales into tangible actions, usually at the national, sub-national, or local
level. The priority research questions developed related to governance all address
specific issues related to the implementation of current policy, either as standalone
policy themes or through integration with other policy frameworks. The coastal and
marine governance framework has been the subject of on-going debate in the UK
for the last five years during the development of new marine legislation, therefore
many of the questions about what the legislation should contain have been
resolved. The emphasis in questions 8–14 reflects this evolution; they are directed
at assessing the suitability of the current policy framework to deliver overarching
policy objectives. Given that the questions refer to a system which has very recently
been developed and not yet fully implemented, this can be read as the participants’
observation that there is both an opportunity and need to build in mechanisms for
review and adaption of that system as the challenges of implementing the policy
become apparent. Questions are posed as to whether current policy is adaptive to

drivers of change (question 9), whether duplication can be reduced between
policies (question 10) and whether current policies incorporate all sectors fairly
(questions 8 and 11).
3.4. Marine citizenship
15. How are people’s perceptions of the marine environment influenced by media?
16. What are the barriers to engaging the public with the marine environment and
how can these be overcome?
17. What is the role of the ‘Big Society’ in the marine environment?
18. What public behaviours could be encouraged to change in order to improve the
health of marine ecosystems?
19. What role do retailers and consumers play in the use and management of marine
resources?
Questions 15–19 all relate to aspects of marine citizenship, the emerging paradigm
that encompasses an individual’s responsibility to make informed choices about their
impact on the marine environment [30]. In common with other citizenship principles,
marine citizenship recognises that individual members of society have a
responsibility to contribute to solving marine environ-mental problems through their
personal behaviour, particularly related to everyday consumer and lifestyle choices
[31–33]. Multiple factors, including knowledge, values and experience, can influence
public engagement with environmental issues [34] and the relationship between the
public and the marine environment is also likely to be influenced by similar factors

[35]. Better understanding of these factors, and the channels through which
information about the marine environment flows will support future action to increase
the level of marine citizenship in a target population (questions 15 and 16). Elements
of marine citizenship and the UK’s ‘Big Society’ (the current Government agenda of
greater individual involvement in civic activity in policy areas where Government has
reduced or retracted direct support) are potentially aligned, therefore question 17 is
significant, but potentially UK specific. At present, the desirable individual pro-
environmental behaviours that might be considered as expressions of marine
citizenship in order to reduce human pressures on marine environmental health are
uncertain, hence question 18. Finally, question 19 focuses on the role retailers can
play in influencing the choices of consumers and therefore indirectly contributing to
the governance of marine resources. These questions highlight the potential of
marine citizenship as an emergent policy channel in the UK, but also identify some of
the challenges which need to be overcome in order to support its realisation.
3.5. Marine conservation
20. What are the impacts (social, economic and ecological) and extent of
recreational fishing within UK seas?
21. How can ecological change in the UK MPA network be monitored from a
baseline to demonstrate performance against conservation objectives at varying
scales?

22. Can non-statutory management measures deliver the conservation objectives of
the UK MPA network?
23. To what extent do the conservation objectives of the UK MPA network help
achieve wider good environmental status for UK seas as defined in the EU MSFD?
24. What are the relationships between socio-economic and ecological change in the
MPA network?
25. What are the socio-economic impacts of the UK MPA network and how can they
be monitored?
26. What are the thresholds and criteria for implementing statutory management
measures in an MPA?
27. Does the size, shape and number of MPAs influence their social, ecological and
economic effectiveness?
28. What are the relative costs and benefits of statutory and non-statutory
management and enforcement measures for marine management?
29. How can the conservation needs of highly mobile marine species be addressed
within the current policy framework?
The UK administrations are tasked to substantially complete an ecologically coherent
network of MPAs by 2012 [10]. Recommendations for MCZs in English and offshore

Welsh waters were published in September 2011 [36–39]. These recommendations
have been reviewed by an independent scientific advisory panel and the statutory
nature conservation agencies. Final recommendations will be put forward to
Government in 2012. Questions 20 to 29 all relate to this policy development and
delivery. The questions identified under this category recognise that in order to
improve decision making a greater understanding is required of the human impacts
on marine resources e.g., does recreational angling have a significant impact on
marine resources (question 20). At present, the future management of activities
within the MPA network is under review, based on the statutory conservation
objectives for each site. As such, questions 22, 26 and 28 highlight the need to
assess the suitability of different management measures to deliver the conservation
gains for which the MCZ network was designed and to set thresholds for the
management of activities to be reviewed. In addition, the priority questions identify a
need to make provisions to monitor and manage the network of MPAs from a
baseline economic, social and ecological perspective (questions 21, 24, 25 and 27)
against which the success of the MPA in delivering conservation objectives both
locally, regionally and internationally can be reviewed. Question 29 specifically
addresses the provisions for the conservation needs of highly mobile marine species
within the current marine conservation policy framework.
3.6. Marine planning
30. How can the net environmental impact of marine planning be measured?

31. What are the mechanisms and criteria (ecological, economic and social) for
identifying and negotiating trade-offs between human activities in marine planning?
32. How can the representation of stakeholders be quality assured in participative
marine management?
33. How can marine planning integrate with the existing policy framework and
management processes at varying scales?
34. What are the implications of applying a precautionary approach to marine
planning?
Marine spatial planning is considered to be a critical step to implementing an
ecosystem based approach to managing the multiple uses of the marine
environment [40]. The EU IMP [41], the EU MSFD 2008/56/EC, the UK MCAA
(2009), the Marine (Scotland) Act (2010), and the UK Marine Policy Statement have
collectively set the course for delivering marine plans in the UK. This policy impetus
has shaped the development of the priority research questions 30–34. Question 30
identifies the need for developing methods to determine the net environmental
impact of marine planning and one reason for this could be to determine the impact
of the planning process itself on our use of the marine environment. It is possible that
the introduction of marine planning will increase human impacts on the marine
environment or facilitate better protection, and such a study would enable the
impacts to be assessed and compared with the goals of the Marine Policy
Statement. It is recognised that decision making within this ecosystem based context

of marine planning requires trade-offs to be made between multiple users [42,43].
Therefore, questions 30 and 31 require the identification of these activities, potential
trade-offs, and a mechanism to review the net environmental impact of the marine
plans to deliver broader marine resource use objectives.
The representation of stakeholders in the decision making process is addressed by
question 32. The task of ensuring that appropriate representation is maintained may
be more challenging for offshore areas, than for example for estuaries or terrestrial
environments where user groups are more easily defined, as there could be a lack of
democratic representation, given that it is remote to the general population.
Questions 33 and 34 require an overview of the policy and to identify whether the
objectives can be integrated with other concurrent polices and management
(question 33), including those existing at sea and those on land, and if the
application of the precautionary approach should be reasserted (question 34). A lack
of data is particularly acute in offshore areas [23] but there is a need to provide plans
in the immediate future. Where insufficient data exists to make informed choices the
precautionary principle requires that there is a presumption in favour of
environmental protection. This is relatively straightforward when considering new
activities but can be more challenging when reviewing and approving existing
activities which may be causing harm and determining their future maintenance or
growth. Hence, exploring the application of the precautionary principle to marine
planning offers many interesting research questions particularly with regard to
balancing social and economic factors within a precautionary approach.
4. Discussion

This research priority setting process was focused on the needs of marine and
coastal policymakers in the UK; therefore the questions form an explicitly applied
research agenda largely specific to the UK. It is anticipated that policymakers will
benefit from the development of a research agenda that supports their information
needs [22] and which therefore underpins the development of policy. The questions
that emerged from this process varied in scale, approach and focus, which
potentially reflected the interdisciplinary nature of marine and coastal research [44]
and the mix of participants in the process (e.g., the notable lack of questions relating
to coastal processes) [22]. The balance of questions between each category varied,
with an emphasis towards marine conservation, governance, and marine planning.
However, as topicality is an important influence in the selection of questions, this is
unsurprising, as the development of an MPA network within a marine planning
framework are the central developments in the UK’s current marine and coastal
governance framework.
The specific nature of the questions presented under each category broadly reflected
the stage of that theme or topic in the policy cycle (Table 2). The number and
composition of each stage in the cycle varies, but a typical policy cycle includes the
following stages: (1) identification of a policy challenge; (2) evidence collection to
understand the characteristics of the policy challenge; (3) analysis of the evidence in
order to understand the cause and effect relationships involved in the policy
challenge; (4) identification of potential policies to address the policy challenge; (5)
selection of favoured policies; (6) implementation of favoured policies; and (7)
monitoring of implemented policies to evaluate success and con-sider the need for

policy adaptation. Table 2 broadly summarises the approximate connection between
the question categories and stages of the policy cycle.
Within the data category, the majority of questions sought to find improved
procedures to manage and use data effectively rather than focus on what data is
needed or how it should be collected. These questions were concerned with the
implementation of data policy, which perhaps reflects data management as a long-
standing concern in the UK. Similarly, the questions related to governance reflected
the advanced stage of governance issues within the policy cycle, and focused on
how existing policies should be implemented. The marine conservation questions
demonstrated the furthest progression through the policy cycle as they were, in
general terms, focused entirely upon implementation and monitoring of existing
policy. These questions were also rather specific, targeting existing gaps in
knowledge that, if filled, would support the delivery of existing policy, rather than the
development of new policy. In contrast, the questions related to ecosystem services
were much more fundamental in nature, focused on conceptual links between
ecosystem services, ecosystem function, and marine management. The current
policy frame-work related to ecosystem services reflects the need to understand the
issues surrounding how ecosystem service ideas could be formulated and applied to
the marine environment and its management. The questions related to marine
citizenship illustrated a similarly early position in the policy cycle as they related, in
general terms, to fundamental questions about the nature of marine citizenship
rather than its implementation or monitoring. Finally, the marine planning questions
reflected a mid-stage in the policy cycle by focusing upon understanding the key

approaches to be taken to marine planning rather than focusing upon its detailed
implementation.
It was notable that although all questions were intended to be focused on the UK,
some of the questions, if successfully answered, would provide insight into issues at
other geographic scales. For example, answers to the question ‘What are the
mechanisms and criteria (ecological, economic, and social) for identifying and
negotiating trade-offs between human activities in marine planning?’ (question 31)
would also be of benefit at the European scale, to inform the implementation of the
European Roadmap for Maritime Spatial Planning [45–47] and in more general terms
as a contribution to the delivery of the European IMP [48]. In addition, recent studies
focused on the Mediterranean and the Black Sea highlight data needs for the
integration of science into policy [49]. The development of research related to those
questions derived under the marine conservation theme would benefit from
international collaborations with scientists in countries where networks of MPAs are
more advanced (e.g., [50–52]) or where studies on MPA impacts are already in
effect (e.g., [53,54]).
That the potential usefulness of the answers to some questions extends beyond the
UK highlights that some questions transcend national boundaries and are potentially
salient questions applicable to other countries, to regional seas, or globally. Given
the influence of the EU in particular on UK marine and coastal policy, the applicability
of certain questions at a variety of scales was perhaps to be expected. The observed
interdependence does highlight the potential for the development of a European or
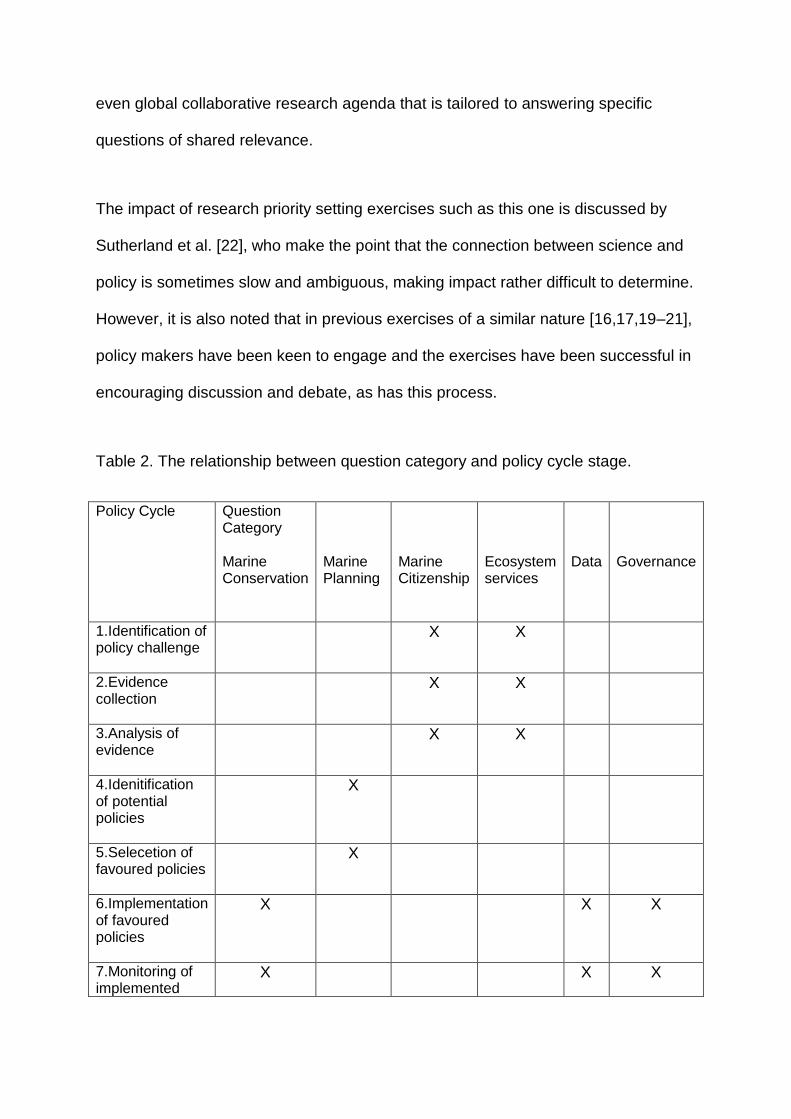
even global collaborative research agenda that is tailored to answering specific
questions of shared relevance.
The impact of research priority setting exercises such as this one is discussed by
Sutherland et al. [22], who make the point that the connection between science and
policy is sometimes slow and ambiguous, making impact rather difficult to determine.
However, it is also noted that in previous exercises of a similar nature [16,17,19–21],
policy makers have been keen to engage and the exercises have been successful in
encouraging discussion and debate, as has this process.
Table 2. The relationship between question category and policy cycle stage.
Policy Cycle
Question Category Marine Conservation
Marine Planning
Marine Citizenship
Ecosystem services
Data
Governance
1.Identification of policy challenge
X X
2.Evidence collection
X X
3.Analysis of evidence
X X
4.Idenitification of potential policies
X
5.Selecetion of favoured policies
X
6.Implementation of favoured policies
X X X
7.Monitoring of implemented
X X X

policies
5. Conclusion
The priority questions formed through this research reflect the pace and change of
marine and coastal policy in the UK in response to international, European and
national policy drivers. They also represent a ‘to date’ snapshot of issues pertinent to
the science-policy research community. By using a collaborative process to identify
priority questions the results will enable scientists to be more effective and efficient
at delivering policy focussed science [15]. The results will also encourage
collaborations between sectors and academic fields. The questions have identified
the science that is currently needed to inform policy that will enable the UK to deliver
its European and international commitments to achieve sustainable use and
protection of marine environment.
Identifying questions that are pertinent to the UK does not however exclude a wider
European and international audience from engaging with this research. Answers to
some of these questions are local in nature but others, including ecosystem service
questions, have global relevance (e.g., carbon sequestration), and research must be
focussed at an international scale. With a global trend towards integrated
approaches to managing ecosystems at appropriate scales [55], the sustainable
management of the oceans requires science to be integral to current policy
requirements. Developing priority questions to focus research is not a static process.
To maintain relevance within this fast-moving subject base, the science-policy

research community would benefit from regular revisions of this process and the
inclusion of a broader sample group. Developing priority questions is therefore an
iterative exercise and one which must (like policy) reflect the trends, values and
needs of society.
Acknowledgements
Members of the Centre for Marine and Coastal Policy Research would like to thank
all delegates who attended the 1st marine and coastal policy Forum at Plymouth
University. The authors would also like to thank the two anonymous reviewers who
suggested changes to improve the paper.
References
[1] Ramsar. Convention on Wetlands of international importance especially as
Waterfowl Habitat. As amended by the Paris Protocol, 3 December 1982, and
Regina Amendments, 28 May 1987. In: 14583 UTSN, editor. Ramsar (Iran) 1971.
[2] OSPAR Convention Convention for the protection of the marine environment of
the North-East Atlantic. In: Commission O, editor. 2002.
[3] United Nations. The Convention on Biological Diveristy. In: Nations U, editor.
1992. p. 30.

[4] European Community Council Directive. Conservation of habitats and wild fauna
and flora. In: communities TCoE, editor. EC 92/43/EEC 1992.
[5] European Parliament and Council. Directive 2008/56/EC of the European
Parliament and of the Council of 17 June 2008 establishing a framework for
community action in the field of marine environmental policy (Marine Strategy
Framework Directive) In: Parliment TE, editor. 2008. p. 22.
[6] Defra. Safeguarding our Seas—a strategy for the conservation and sustainable
development of our marine environment. London 2002.
[7] HM Government. Marine and Coastal Access Act. Crown copyright; 2009. p. 347.
[8] Marine (Scotland) Act Crown copyright 2010. p. 112.
[9] Department of the Environment. A Northern Ireland Marine Bill—policy proposals.
Planning and Natural Resources Department (Department of the Environment);
2010. p. 81.
[10] HM Government. UK Marine Policy Statement. London: Crown copyright; 2011.
p. 47.
[11] Sutherland WJ, Pullin AS, Dolman PM, Knight TM. The need for evidence-based
conservation. Trends Ecol Evol 2004;19:305–308.
[12] Pullin AS, Knight TM. Support for decision making in conservation practice: an
evidence-based approach. J Nat Conserv 2003;11:83–90.

[13] Leslie HM, McLeod KL. Confronting the challenges of implementing marine
ecosystem-based management. Front Ecol Environ 2007;5:540–548.
[14] Boesch DF. The role of science in ocean governance. Ecol Eng 1999;31: 189–
198.
[15] Halpern BS, Diamond J, Gaines S, Gelcich S, Gleason M, Jennings S, et al.
Near-term priorities for the science, policy and practice of Coastal and Marine Spatial
Planning (CMSP). Mar Policy 2011;36:198–205.
[16] Sutherland WJ, Adams WM, Aronson RB, Aveling R, Blackburn TM, Broad S, et
al. One hundred questions of importance to the Conservation of Global Biological
Diversity Cien Preguntas de Importancia para la Conservacio´n de la Diversidad
Biolo´gica Global. Conserv Biol 2009;23:557–567.
[17] Sutherland WJ, Armstrong-Brown S, Armsworth PR, Tom B, Brickland J,
Campbell CD, et al. The identification of 100 ecological questions of high policy
relevance in the UK. J Appl Ecol 2006;43:617–627.
[18] Rudd MA, Beazley KF, Cooke SJ, Fleishman E, Lane DE, Mascia MB, et al.
Generation of priority research questions to inform conservation policy and
management at a national level Generacio´n de Preguntas de Investigacio´n
Prioritarias para Informar a las Polı´ticas y Gestio´n de la Conservacio´n a Nivel
Nacional. Conserv Biol 2011;25:476–484.
[19] Pretty J, Sutherland WJ, Ashby J, Auburn J, Baulcombe D, Bell M. The top 100
questions for global agriculture and food. Int J Agric Sustainability 2010;8: 219–236.

[20] Sutherland WJ, Albon SD, Allison H, Armstrong-Brown S, Bailey MJ, Bereton T.
The identification of priority opportunities for UK nature conservation policy. J Appl
Ecol 2010;47:955–965.
[21] Sutherland WJ, Clout M, Cote IM, Daszak P, Depledge MH. A horizon scan of
global conservation issues for 2010. Trends Ecol Evol 2010;25:1–7.
[22] Sutherland WJ, Fleishman E, Mascia MB, Pretty J, Rudd MA. Methods for
collaboratively identifying research priorities and emerging issues in science and
policy. Methods Ecol Evol 2011;2:238–247.
[23] Marshall C, Howell K, Glegg G 2011 Species distribution modelling for offshore
marine planning: data issues challenges and recommendations. Plymouth University
PhD thesis 2011.
[24] Beaumont NJ, Austen MC, Atkins JP, Burdon D, Degraer S, Dentinho TP, et al.
Identification, definition and quantification of goods and services provided by marine
biodiversity: implications for the ecosystem approach. Mar Pollut Bull 2007;54:253–
265.
[25] Millennium Ecosystem Assessment. Ecosystems and human well-being:
synthesis. The millennium ecosystem assessment series. Washington, DC: World
Resources Institute; 2005. p. 155.
[26] Austen MC, Malcolm SJ, Frost M, Hattam C, Mangi S, Stentford G, et al. Marine
the UK national ecosystem assessment technical report: UNEP-WCMC; 2011

[27] Rees SE, Rodwell LD, Attrill MJ, Austen MC, Mangi SC. The value of marine
biodiversity to the leisure and recreation industry and its application to marine spatial
planning. Mar Policy 2010;34:868–875.
[28] Fletcher S, Saunders J, Herbert R Description of the ecosystem services
provided by broad-scale habitats and features of conservation importance that are
likely to be protected by marine protected areas in the Marine Conservation Zone
project area. Natural England research report RP03342011.
[29] OSPAR Commission. Guidance on developing an ecologically coherent net-
work of OSPAR marine protected areas (Reference number 2006-3). OSPAR
Convention for the protection of the marine environment of the North East Atlantic;
2006. p. 11.
[30] Fletcher S, Potts J. Ocean citizenship: an emergent geographical concept.
Coast Manage 2007;35:511–524.
[31] Matti S. The imagined environmental citizen: exploring the state–individual
relationship in Swedish environmental policy. Lulea University of Technol-ogy; 2006.
[32] Cruz JM. Dyanamics of supply chain networks with corporate social respon-
sibility through integrated environmental decision making. Eur J Oper Res
2008;184:1005–1031.
[33] Donert K Aspects of European citizenship and environmental education through
information and communications technology. First international conference on
environmental research and assessment. Bucharest, Romania 2003.

[34] Kollmuss A, Agyeman J. Mind the gap: why do people act environmentally and
what are the barriers to pro-environmental behavior? Environ Educ Res 2002;8:239–
260.
[35] Jefferson RL. Communicating marine environmental health: connecting science,
social and policy values. Plymouth: University of Plymouth PhD Thesis; 2010.
[36] Leiberknecht LM, Hooper TEJ, Mullier TM, Murphy A, Neilly M, Carr H, et al.
Finding sanctuary final report and recommendations. A report submitted by the
finding sanctuary stakeholder project to Defra, the Joint Nature Conservation
Committee and Natural England 2011:101.
[37] Irish Sea Conservation zones. Final recommendations for Marine Conservation
Zones in the Irish Sea. Warrington 2011. p. 53.
[38] Net Gain. Final recommendations. Submission to Natural England and JNCC.
Hull 2011. p. 880.
[39] Balanced Seas. Marine conservation zones project. Final recommendations.
2011. p. 78.
[40] Douvere F, Ehler CN. New perspectives on sea use management: initial findings
from European experience with marine spatial planning. J Environ Manage
2009;90:77–88.
[41] Commission of the European Communities. An Integrated Maritime Policy for
the European Union. Brussels: Communication from the Commission to the
European Parliament, the Council, the European Economic and Social Committee
and the Committee of the Regions.; 2007.

[42] Rees SE, Attrill MJ, Austen MC, Mangi SC, Richards JP, Rodwell LD. Is there a
win-win scenario for marine nature conservation? A case study of Lyme Bay,
England Ocean Coast Manage 2010;53:135–145.
[43] McShane TO, Hirsch PD, Trung TC, Songorwa AN, Kinzig A, Monteferri B, et al.
Hard choices: making trade-offs between biodiversity conservation and human well-
being. Biolog Conserv 2011;144:966–972.
[44] Christie P. Creating space for interdisciplinary Marine and Coastal Research:
five dilemmas and suggested resolutions. Environ Conserv 2011;38:172–186.
[45] Commission of the European Communities. Communication from the
Commission—Roadmap for Maritime Spatial Planning: achieving common principles
in the EU. COM (2008). Brussels. 2008. p. 791.
[46] Munda G, Nijkamp P, Rietveld P. Qualitative multicriteria evaluation for
environmental management. Ecol Econ 1994;10:97–112.
[47] Calado H, Ng K, Johnson D, Sousa L, Phillips M, Alves F. Marine spatial
planning: lessons learned from the Portuguese debate. Mar Policy 2010;34: 1341–
1349.
[48] European Commission. An integrated maritime strategy for the European Union.
Brussels: European Community; 2007. p. 575.
[49] House C, Phillips MR. Integrating the science education nexus into coastal
governance: a Mediterranean and Black Sea case study. Mar Policy 2012;36:495–
501.

[50] Le´de´e EJI, Sutton SG, Tobin RC, De Freitas DM. Responses and adaptation
strategies of commercial and charter fishers to zoning changes in the Great Barrier
Reef Marine Park. Mar Policy 2012;36:226–234.
[51] Banks SA, Skilleter GA. Implementing marine reserve networks: a compar-ison
of approaches in New South Wales (Australia) and New Zealand. Mar Policy
2010;34:197–207.
[52] Stamieszkin K, Wielgus J, Gerber LR. Management of a marine protected area
for sustainability and conflict resolution: lessons from Loreto Bay National Park (Baja
California Sur, Mexico). Ocean Coast Manage 2009;52:449–458.
[53] Christie P. Marine protected areas as biological successes and social failures in
South East Asia. Am Fish Soc Symp 2004;42:155–164.
[54] Mascia MB, Claus CA, Naidoo R. Impacts of marine protected areas on fishing
communities. Conserv Biol 2010;24:1424–1429.
[55] Ruckelshaus M, Klinger T, Knowlton N, DeMaster DP. Marine ecosystem-based
management in practice: scientific and governance challenges. BioScience
2008;58:53–63.

Design of Marine Protected Areas on high seas and territorial waters of
Rockall Bank
Jason M. Hall-Spencer1, 6,*, Mark Tasker2, 6, Marta Soffker1, Sabine Christiansen3, 6,
Stuart Rogers4, Maria Campbell1, Kjartan Hoydal5
1Marine Institute, Marine Biology and Ecology Research Centre, University of
Plymouth, Plymouth, PL4 8AA, UK
2Joint Nature Conservation Committee, Dunnet House, 7 Thistle Place, Aberdeen,
AB10 1UZ, UK
3WWF North-East Atlantic Programme, Magdeburger Str. 17, 20457 Hamburg,
Germany
4The Centre for Environment, Fisheries and Aquaculture Science, Pakefield Road,
Lowestoft, Suffolk, NR33 0HT, UK
5North East Atlantic Fisheries Commission, 22 Berners Street, London, W1T 3DY,
UK
6ICES Working Group on Deep-water Ecology
*Email: [email protected]
Abstract

Fisheries closures are rapidly being developed to protect vulnerable marine
ecosystems worldwide. Satellite monitoring of fishing vessel activity indicates that
these closures can work effectively with good compliance by international fleets even
in remote areas. Here we summarise how remote fisheries closures were designed
to protect Lophelia pertusa habitat in a region of the NE Atlantic that straddles the
EU fishing zone and the high seas. We show how scientific records, fishers’
knowledge and surveillance data on fishing activity can be combined to provide a
powerful tool for the design of Marine Protected Areas.
Keywords: Lophelia pertusa, MPA, Fisheries, Offshore Marine Protected Area, NE
Atlantic, Vessel monitoring system, VMS
Introduction
The past few years have seen rapid development in the use of fisheries closures to
protect deep-water coral habitats from destructive fishing practices throughout the
North Atlantic. The world’s first deep-water coral protected area came into effect in
1984, but did not prevent trawling damage to Oculina varicosa reefs off the Atlantic
coast of Florida due to lack of enforcement (Reed et al. 2005). Surveys in the late
1990s revealed that bottom trawling and long-lining was also causing widespread
and long-term damage to more northern coral communities on both sides of the
Atlantic (Jones & Willison 2001, Hall-Spencer et al. 2002). This met with rapid
responses by the authorities, with the establishment of cold-water coral protected
areas first in Scandanavia and Canada (Fosså et al. 2002, Mortensen et al. 2005)
followed by closures in EU waters, the USA and Iceland. The first areas in the

Atlantic high seas to be closed to protect deep-water habitats entered into force on 1
January 2005 and were recommended by the North East Atlantic Fisheries
Commission (NEAFC), followed by closures in the NW Atlantic by the Northwest
Atlantic Fisheries Organization (NAFO) from 1 January 2007 (Table 1). Satellite
monitoring of fishing vessel activity has indicated that these closures can work
effectively with good compliance by international fleets even in remote areas such as
the Darwin Mounds, a coral-rich area 180 km off the NW coast of Scotland (Davies
et al. 2007).
Here we summarise how deep-water Lophelia pertusa habitats were selected for
closure on Rockall Bank (see ICES 2002, 2006, 2007a). The Bank lies to the west of
Scotland in the NE Atlantic and straddles the boundary between the fishing zone
managed by the EU and the high seas, where fishing is managed by NEAFC. The
Bank supports important fisheries for haddock and other shallower water species on
the upper slopes and top of the bank, together with deeper-water species such as
monkfish and blue ling on the lower slopes.
Table 1. Areas closed to bottom trawl fishing in the North Atlantic to protect deep-
and/or cold-water habitats (adapted from ICES 2007a). Note Gilkinson & Edinger
(2009) provide an update on Canadian closures since 2007. NEAFC: North East
Atlantic Fisheries Commission; NAFO: Northwest

Closed area Region Year closed
Oculina Bank USA 1984 Sula Reef Norway 1999
Iverryggen Reef Norway 2000
Selligrunnen Reef Norway 2000
Sacken reef EU (Sweden) 2001
Spiran reef (degraded) EU (Sweden) 2001
Vadero reef (degraded) EU (Sweden) 2001
Northeast Channel Canada 2002
Tisler Reef Norway 2003
Fjellknausene Reef Norway 2003
Røst Reef Norway 2003
The Gully Canada 2004
Stone Fence Canada 2004
Darwin Mounds EU (UK) 2004
Azores, Madeira, EU (Spain/Portugal) 2004
Canary Islands
Reykjanes Ridge NEAFC 2005
(part of)
Hekate Seamounts NEAFC 2005
Faraday Seamounts NEAFC 2005
Altair Seamounts NEAFC 2005
Antialtair Seamounts NEAFC 2005
Oceanographer Canyon USA 2005 Lydonia Canyon USA 2005
Hornafjarardjúp Iceland 2006 Skaftárdjúp Iceland 2006
Reynisdjúp Iceland 2006
Orphan Knoll NAFO 2007
Newfoundland NAFO 2007
Seamounts
Corner Seamount NAFO 2007
New England NAFO 2007
Seamounts
Hatton Bank NEAFC 2007
NW Rockall Bank NEAFC/EU (UK) 2007
W Rockall Mounds NEAFC 2007
Logachev Mounds NEAFC/EU (Eire) 2007
NW Porcupine Bank EU (Eire) proposed
Hovland Mound EU (Eire) proposed
Province
SW Porcupine Bank EU (Eire) proposed
Belgica Mound EU (Eire) proposed
Province
Methods
Based on evidence presented by the World Wildlife Foundation, the Convention for
the Protection of the Marine Environment in the North Atlantic (OSPAR)
communicated to NEAFC its concern about the conservation of Lophelia pertusa
reefs on the Bank. NEAFC then requested the International Council for the
Exploration of the Sea (ICES) to indicate appropriate boundaries of any closure of

areas where cold-water corals are affected by fishing activities. Three sources of
information were used by the ICES Working Group on Deep Water Ecosystems
(WGDEC) to identify such boundaries. These were: (1) records in the scientific
literature and elsewhere of the occurrence of L. pertusa; (2) the knowledge of fishers
using the Bank on the distribution of Lophelia; and (3) records of fishing activity
derived from satellite-based vessel monitoring systems (VMS).
Each of these sources had their advantages and dis-advantages. Scientific records
may be very old, and historical records of coral occurrence may now be inaccurate,
as may be the geographical locations of records due to poor position fixing or if the
data are from long dredge hauls (Hall-Spencer et al. 2007). In contrast, fishers’
knowledge is recent and therefore may be more ‘believable’ to the fishing industry,
but may not be complete or fully accurate. VMS records showing the location of
trawling activity are generally comprehensive and unbiased, but there are several
reasons for an area of the seabed to remain unfished; notwithstanding the presence
of net-damaging corals, other seabed obstructions may exist or it may be too deep
for trawling to take place. These sources could not necessarily be relied upon
individually to identify suitable closure areas, but when used together provided a
powerful tool indicating where such closed areas should be established.
VMS positions were provided by NEAFC, the Irish Navy and the UK Department of
Environment, Food and Rural Affairs for 2005, the most recent year of
comprehensive available information on the distribution of fishing fleets in the area.
VMS data were filtered to remove non-trawling activity by only including vessels
travelling between 1.5 and 4.5 knots. Note that this filter did not remove all pelagic

trawling tracks from the plot and may include some vessels travelling slowly in the
area, but not fishing. These records were combined with data on coral distribution
provided by WGDEC reports, and new information on Lophelia distribution from
surveys carried out by the UK Government in 2005 and 2006 (Davies et al. 2006,
Howell et al. 2009), a Fisheries Research Services (FRS) monkfish survey in
November 2006 (FRS unpubl. data) and data from the EU HERMES programme
(van Duyl & Duineveld 2005). The final analysis (Fig. 1) combined information on the
spatial distribution of coral records and data describing fleet distribution to select
potential sites for closure where the conservation benefit of closures was maximal
and the displacement effect on fishing was minimal.
Fig. 1. North East Atlantic Fisheries Commission/EU closures (hatched) around
Rockall off Scotland and Ireland in 2007;(a) Deep-sea scleractinian areas noted by
fishers (black shading) and (b) scientific records with overlay of filtered vessel
monitoring system (VMS) tracks for 2005 showing the patchy distribution of fished
areas around Rockall Bank.


Results and Discussion
Following ICES advice, areas of Rockall Bank in NEAFC- and EU-controlled waters
were closed to fishing effective from March 2007 (ICES 2007a). Fig. 1 shows the
North West Rockall, Logachev Mounds and West Rockall Mounds areas that were
closed to protect coral habitat in 2007, in addition to an area that was closed to
protect haddock stocks in 2001 which has the additional benefit of helping protect
benthic habitats.
The process of designing and enforcing a network of offshore Marine Protected
Areas is ongoing and has made significant progress in recent years. A new tranche
of deep-water coral closures has been pro-posed within the Irish EEZ, also based on
a combination of scientific surveys, fishers’ knowledge and VMS (ICES 2007b).
Further challenges to designing an eco-logically robust network of closures remain,
such as the need for an increased understanding of cold-water coral food webs and
of larval transport to and from pro-posed closures, which could be tackled using
molecular approaches (Le Goff-Vitry et al. 2004, van Oevelen et al. 2009). Effective
surveillance and enforcement are critical to the protection of coral in these areas,
which will be helped by VMS records which include data on the gear in use and
vessel activity. Boundaries will also need to be designed to account for gears used
and the frequency of transit.
Acknowledgements
This work was funded by the Esmée Fairbairn Foundation DC-UK project
(www.deepseaconservation.org) and contributes to the EC-funded Framework 7

project Knowledge-based Sustainable Management for Europe’s Seas (KnowSeas-
226675.
Literature cited
Davies AJ, Narayanaswamy BE, Hughes DJ, Roberts JM (2006) An introduction to
the benthic ecology of the Rock-all-Hatton Area (SEA 7). Report for the Department
of Trade and Industry. Available at www.offshore-
sea.org.uk/consultations/SEA_7/SEA7_Benthos_SRSL.pdf
Davies AJ, Roberts JM, Hall-Spencer JM (2007) Preserving deep-sea natural
heritage: emerging issues in offshore conservation and management. Biol
Conserv 138:299–312
Fosså JH, Mortensen PB, Furevik DM (2002) The deep-water coral Lophelia pertusa
in Norwegian waters: distribution and fishery impacts. Hydrobiologia 471:1–12
Gilkinson KD, Edinger EN (eds) (2009) The ecology of deep-sea corals in
Newfoundland and Labrador waters: bio-geography, life history, biogeochemistry,
and role as critical habitat. Can Tech Rep Fish Aquat Sci 2830
Hall-Spencer JM, Allain V, Fosså JH (2002) Trawling damage to Northeast Atlantic
ancient coral reefs. Proc R Soc Lond B Biol Sci 269:507–511
Hall-Spencer JM, Rogers A, Davies J, Foggo A (2007) Historical deep-sea coral
distribution on seamount, oceanic island and continental shelf-slope habitats in the
NE Atlantic. In: George RY, Cairns SD (eds) Conservation and adaptive
management of seamount and deep-sea coral ecosystems. Rosenstiel School of
Marine and Atmospheric Science, University of Miami, Miami, p 135–146

Howell KL, Davies JS, Jacobs C, Narayanaswamy BE (2009) Broadscale survey of
the habitats of Rockall Bank, and mapping of Annex I ‘reef’ habitat. JNCC Report No.
422, Joint Nature Conservation Committee, Peterborough
ICES (2002) Study group on mapping the occurrence of cold water corals. ICES CM
2002/ACE:05, ICES, Copenhagen ICES (2006) Report of the working group on
deep-water ecology. ICES CM 2006/ACE:04, ICES, Copenhagen
ICES (2007a) Report of the working group on deep-water ecology. ICES CM
2007/ACE:01 Ref. LRC, ICES, Copenhagen
ICES (2007b) Report of the ad hoc group for western Irish Natura sites. ICES CM
2007/ACE:06, ICES, Copenhagen J
ones DP, Willison JHM (2001) The role of the Canadian Ocean Habitat Protection
Society in deep-sea coral education and conservation advocacy in Nova Scotia. In:
Willi-son JHM, Hall J, Gass SE, Kenchington ELR, Butler M, Doherty P (eds) Proc
First Int Symp Deep-Sea Corals. Ecol-ogy Action Centre and Nova Scotia Museum,
Halifax, p166–174
Le Goff-Vitry MC, Pybus OG, Rogers AD (2004) Genetic structure of the deep-sea
coral Lophelia pertusa in the North East Atlantic revealed by microsatellites and ITS
sequences. Mol Ecol 13:537–549
Mortensen PB, Buhl-Mortensen L, Gordon DC, Fader GBJ, McKeown DL, Fenton
DG (2005) Effects of fisheries on deep-water gorgonian corals in the Northeast
Channel, Nova Scotia (Canada). Am Fish Soc Symp 41:369–382

Reed JK, Shepard AN, Koenig C, Sanlon KN, Gilmore RG (2005) Mapping, habitat
characterization, and fish surveys of the deep-water Oculina coral reef Marine
Protected Area: a review of historical and current research. In: Frei-wald A, Roberts
M (eds) Cold-water corals and ecosys-tems. Springer, Berlin/Heidelberg, p 443–465
van Duyl FC, Duineveld GCA (2005) Biodiversity, ecosystem functioning and food
web complexity of deep water coral reefs in the NE Atlantic (Rockall Bank and
Porcupine Bank). BIOSYS-HERMES 2005 Cruise Report Cruise 64PE 238. Royal
Netherlands Institute for Sea Research, Texel
Van Oevelen D, Duineveld G, Lavaleye M, Mienis F, Soetaert K, Heip CHR (2009)
The cold-water coral community as a hot spot for carbon cycling on continental
margins: a food-web analysis from Rockall Bank (northeast Atlantic).

The Fisheries and Marine Renewable Energy Working Group: creating an agenda for improved co-existence
Maria Campbell, Jiska de Groot, Matthew Ashley, Lynda Rodwell
Centre for Marine & Coastal Policy Research, Plymouth University, UK
Introduction As an emerging industry, Marine Renewable Energy (MRE) is expected to play a major contributory role if the UK
is to successfully reach its desired target of renewable energy production by 2020 (DECC, 2011). However, due
to the competing objectives and priorities of MRE and other industries, for example fisheries, and in the delivering
of conservation measures, the demand for space within our marine landscape is increasing, and interactions are
inevitable. In this research we investigate the challenges in resolving interactions between fisheries and marine
renewable energy. We focus on the improved co-existence between the two sectors and developing a mitigation
agenda for fishing effort displacement in the UK. This research was carried out as part of the work of the
Fisheries and Marine Renewable Energy Working Group (FMREWG) and funded by the Marine Renewable
Energy Knowledge Exchange Programme (MREKEP), a Natural Environment Research Council (NERC) project
and co-ordinated by Plymouth University.
Methods The first method included a scoping survey questionnaire conducted at the Environmental Interactions of Marine
Renewable Energy (EIMR) in Orkney May 2012. Participants responses to questions were given a data needs
score based on their ranking of importance of certain issues presented, resulting in priority areas and research
gaps being identified. A Scoping workshop followed (Rodwell et al., 2012) and data was coded according to an
inductive process in order to identify key themes and challenges. Individuals were selected for the final expert
workshop, held in York in April 2013 (Rodwell et al., 2013). Data from this workshop was coded according to a
deductive process, as themes had already been identified from the initial workshop. This provided further insight
into the existing codes and contributed to the practical components of the mitigation agenda. Both workshops
were based on the Delphi- method and in order to enable discussion participants from different backgrounds and
regions were divided into groups.
Results
Discussion This research has enabled the authors and members of this Working Group to bring about a
set of activities and action points to mitigate fishing effort displacement as a result of MRE
development. One of the final recommendations was the development of a Mitigation toolkit,
in order to open up research channels and share ideas and case studies among various
practitioners, academics and industry representatives. Collaboration needs to be more
strategic and will require multiple partner support in order to target issues of communication,
full representation of the fishing industry and inherent problems in data availability and utility.
Conclusions This Working Group, the first of its kind in the UK, brings
together individuals from a nationally diverse group of
academics, regulators, policy makers and representatives
from fisheries, MRE sectors and conservation bodies. It has
the potential, for the first time, to develop effective guidelines
and protocols for both mitigation and assessment of
displacement of fishing effort, for the entire life cycle of MRE
projects, and has further potential to adapt to the needs other
countries facing similar challenges.
References Campbell, Stehfest et al. (2014) Marine Policy, 45: 293-300; De Groot, Campbell et al.
(2014) OCMA, 102: 7-18; DECC (2011) UK Renewable Energy Roadmap. Department of
Energy and Climate Change, London, 107 pp; Rodwell et al. (2012) MREKEP Results
from first scoping survey Orkney May 2012, 20 pp (avail. NERC); Rodwell et al. (2013)
Final Report on the Expert Workshop for the MREKEP, 33 pp. (avail. NERC).
Acknowledgements The authors would like to acknowledge the financial support of NERC MREKEP for the
organisation of both the scoping and expert workshops. Thanks in particular are also
due to Dr Annie Linley who provided advice and comments for the life cycle of the
project. We would also like to thank the workshop participants for their input and
continued support.
Scoping Workshop
1. What are the priority issues?
2. What are the barriers to progress?
3. How can we mitigate problems?
4. What are your thoughts on consultation
process?
Key
themes &
challenges identified
Assessment methods • Choice of appropriate method
(Plotter, VMS, Mapping tools)
• Marine Spatial Planning?
Data issues • Data needs
• Monitoring
• Fishing activity, spatial scale
&cumulative impact
• Socio-economic data
• Data sharing & availability
Communication, consultation &
collaboration • Legitimacy of consultation practice
• True representation of fishers
• Inter-jurisdictional communication
Mitigation Agenda
Expert workshop
1. Review of past research
2. Case study review
3. Recommendations for action
4. How to achieve consensus on action
Overcoming data issues
in assessment of
displacement
Development of
consultation protocol
between MRE and fishing
sectors
Development of methods
for assessing
displacement
Figure 1. Flow chart outlining the basic process of this project from survey to
the final workshop, and an overview of key themes, challenges and
recommendations for action
Questionnaire Survey
To explore the range of knowledge exchange
options between MRE & fishing sectors and
Identify research gaps/ priority areas
ACTION