
oluwafemi oyedele oyemomi - pearl
289
University of Plymouth PEARL https://pearl.plymouth.ac.uk 04 University of Plymouth Research Theses 01 Research Theses Main Collection 2017 The Impact Of Organisational Factors On Knowledge Sharing Performance Oyemomi, Oluwafemi Oyedele http://hdl.handle.net/10026.1/9844 University of Plymouth All content in PEARL is protected by copyright law. Author manuscripts are made available in accordance with publisher policies. Please cite only the published version using the details provided on the item record or document. In the absence of an open licence (e.g. Creative Commons), permissions for further reuse of content should be sought from the publisher or author.
-
Upload
khangminh22 -
Category
Documents
-
view
1 -
download
0
Transcript of oluwafemi oyedele oyemomi - pearl

University of Plymouth
PEARL https://pearl.plymouth.ac.uk
04 University of Plymouth Research Theses 01 Research Theses Main Collection
2017
The Impact Of Organisational Factors
On Knowledge Sharing Performance
Oyemomi, Oluwafemi Oyedele
http://hdl.handle.net/10026.1/9844
University of Plymouth
All content in PEARL is protected by copyright law. Author manuscripts are made available in accordance with
publisher policies. Please cite only the published version using the details provided on the item record or
document. In the absence of an open licence (e.g. Creative Commons), permissions for further reuse of content
should be sought from the publisher or author.

THE IMPACT OF ORGANISATIONAL
FACTORS ON KNOWLEDGE SHARING
PERFORMANCE
by
OLUWAFEMI OYEDELE OYEMOMI
A thesis submitted to Plymouth University
in partial fulfilment for the degree of
DOCTOR OF PHILOSOPHY
Social Science Doctoral Training Centre
November 2016

2
Copyright statement
This copy of the thesis has been supplied on condition that anyone who consults it is
understood to recognise that its copyright rests with its author and that no quotation from
the thesis and no information derived from it may be published without the author's prior
consent.

3
Acknowledgement
This thesis would not have been possible without the support of several people who
contributed with ideas, conversations, guidance and care. My special indebted is first to
my Director of studies Prof. Shaofeng Liu, Co-ordinator of School Postgraduate Research
(MPhil/PhD), who made available her support in a number of ways. She gave me the
opportunity to pursue my dissertation and continuously provided ideas and advice, at the
same time creating valuable opportunities for research and teaching. I would also like to
thank my second supervisor Dr. Irina Neaga for her dedicated support throughout my
study at Plymouth University. In addition, she gave me a lot of opportunities to teach both
postgraduate and undergraduate students as an associate lecturer.
With a big thank you to all of the academic and administrative staff in Plymouth Business
School for their kind advice and support. Especially, Dr. Lise Hunter and Dr. Festus
Oderanti who helped in mentoring me to becoming a good researcher and lecturer.
I would like to thank all survey participants for their valuable information, time and
patience during my research, without them this research would not have seen the light.
I wish appreciation the support of my family and friends for their endless supports and
encouragement. To the most important person in my life, the rock behind my successes
and the source of lasting joy Tracey Oyemomi, thank you for your patience and sacrifices
throughout this journey of my career.

4
Author’s declaration
At no time during the registration for the degree of Doctor of Philosophy has the author
been registered for any other University award without prior agreement of the Graduate
Sub-Committee.
Work submitted for this research degree at the Plymouth University has not formed part
of any other degree either at Plymouth University or at another establishment.
Papers have been published and presented by the author based on the PhD work, and the
full list of publications has been included in the next page.
Word count of main body of thesis: 63,984
Signed ………………………………… Date ……………………………………

5
Publications
Journal article
Oluwafemi Oyemomi, Shaofeng Liu, Irina Neaga and Ali Alkhuraiji (2016). “How
knowledge sharing and business process contribute to organisational performance:
using the fsQCA approach”. Journal of Business Research 69(11): 5222-5227. Doi:
10.1016/j.jbusres.2016.04.116.
Book chapter
Oluwafemi Oyemomi, Shaofeng Liu and Irina Neaga (2015). The Contribution of
Knowledge Sharing to Organizational Performance: An Integrative Knowledge
Sharing Performance Framework for Organizational Decision Making, In book:
Decision Support Systems IV – Information and Knowledge Management in Decision
Process, (Editors: I Linden, S Liu, F Dargam, JE Hernández), vol. 221, pp.1-12.
Publisher: Springer.
Conference papers
Oluwafemi Oyemomi, Shaofeng Liu and Irina Neaga (2016). Measuring knowledge
sharing performance with DEA efficiency scores: Efficiency model. In Proceedings
of the EWG-DSS 2016 International Conference on Decision Support System
Technology (ICDSST 2016): Decision Support Systems Addressing Sustainability
and Societal Challenges. ISBN: 978-18-4102-409-7. 23-25 May 2016, Plymouth, UK.
(Won the Best Paper Award)
Oluwafemi Oyemomi, Shaofeng Liu and Irina Neaga (2015). The contribution of
knowledge sharing to organizational performance and decision making. In
Proceedings of the EWG-DSS 2015 International Conference on Decision Support

6
System Technology (ICDSST 2015). ISBN: 978-86-7680-313-2. 27-29 May 2015,
Belgrade, Serbia.
Other conference/poster presentations
Oluwafemi Oyemomi, Shaofeng Liu and Irina Neaga, (2016). “How knowledge
sharing and business process contribute to organizational performance: using the
fsQCA approach”, Global Innovation and Knowledge Academy (GIKA)
Conference 2016, Valencia, Spain, 21-23 March 2016.
Oluwafemi Oyemomi, Shaofeng Liu and Irina Neaga, (2015). “Organizational
Knowledge Framework for Performance Decision Making”, Plymouth
International Postgraduate Symposium 2015, Plymouth, UK, 4-5 June.
Irina Neaga, Shaofeng Liu, Lai Xu and Oyemomi Oluwafemi, (2015). “Cloud
Enabled Big Data Business Platform for Logistics Services: A Research and
Development Agenda”, Euro Working Group on Decision Support Systems
(EWG-DSS) ICDSST 2015, Belgrade, Serbia, 27-29 May 2015.
Oluwafemi Oyemomi, Shaofeng Liu and Irina Neaga, (2014). “Effective
Knowledge Sharing for Intelligent Supply Chain Decision Support”, Euro
Working Group on Decision Support Systems (EWG-DSS) IFORS 2014,
Barcelona, Spain, 13-18 July 2014.

7
Abstract
Facing global challenges in the knowledge economy, the competitiveness of business
organisations has transformed dramatically in recent years. With the increase in the
significance of knowledge sharing to organisational growth, a lot of resources have been
invested to the management of knowledge via technological applications. In the same line
of argument, a wide range of literature has argued for the contribution of employees in
the sharing of knowledge. However, there are few literature that discussed the impact of
organisational factors on the integration of business processes and knowledge sharing.
Given the amount of research on the importance of knowledge management to improve
business processes and organisational knowledge, it becomes imperative to develop a
clear understanding of the impact of organisational factors on knowledge sharing
performance. Therefore, the primary aim of this research is develop and validate a
functional knowledge sharing model which can facilitate and enhance organisational
performance considering the impact of organisational factors for business-knowledge
implementation.
A conceptual framework is built based on thorough literature review of knowledge
management, organisational factors, performance and in-depth discussion with
knowledge experts. The proposed conceptual framework is empirically tested adopting a
quantitative method with survey data using over 300 responses from manufacturing and
service industries in seven countries across three continents for a comprehensive and
balanced view. The data from the survey are analysed by using integrated techniques of
both Fuzzy Set Qualitative Comparative Analysis (fsQCA) and Data Envelopment
Analysis (DEA).
The fsQCA phase of this study discussed the comparative impact of organisational factors
in the seven countries where survey data were collected and formulated the input and
output variables for the measurement of knowledge sharing performance using DEA.
With regard to the findings of the empirical research, three main constructs (knowledge
sharing, organisational factors and performance) were successfully validated as
dimensional constructs. The structural paths support conceptual framework that
knowledge sharing has a positive influence on organisational competitive advantage, and
organisational factors such as culture has a strong contribution to knowledge sharing
performance. However, the direct impact of knowledge sharing on organisational
performance is insignificant when key performance indicators are not identified.
Various manufacturing and service organisations will potentially benefit from applying
the results of this study to their knowledge sharing practices when seeking greater
integration of multi business processes with accrued knowledge. The theoretical
contribution of this study includes an integrated framework and model for knowledge
transformation processes, knowledge sharing processes and knowledge sharing decision
making for organisational performance.

8
List of contents
Copyright statement ........................................................................................................ 2
Acknowledgement........................................................................................................... 3
Author’s declaration ........................................................................................................ 4
Publications ..................................................................................................................... 5
Abstract ........................................................................................................................... 7
List of figures ................................................................................................................ 14
List of tables .................................................................................................................. 16
List of abbreviations ...................................................................................................... 19
Chapter one: Introduction ......................................................................... 21
1.1 Research context ..................................................................................................... 21
1.2 Research aim and objectives ................................................................................... 22
1.3 Research justification .............................................................................................. 23
1.4 Key contributions .................................................................................................... 24
1.5 Structure of the thesis .............................................................................................. 27
1.6 Summary ................................................................................................................. 28
Chapter two: Literature review ................................................................. 30

9
2.1 Introduction ............................................................................................................. 30
2.2 Knowledge sharing.................................................................................................. 30
2.2.1 Data, information and knowledge .................................................................... 32
2.2.2 Understanding knowledge sharing ................................................................... 36
2.2.3 Knowledge sharing environment ..................................................................... 41
2.3 Organisational factors ............................................................................................. 44
2.3.1 Culture .............................................................................................................. 44
2.3.2 Learning ........................................................................................................... 48
2.3.3 Leadership ........................................................................................................ 51
2.3.4 Structure ........................................................................................................... 55
2.4 Knowledge sharing performance ............................................................................ 57
2.4.1 Performance ..................................................................................................... 57
2.4.2 Performance measurement ............................................................................... 59
2.5 Research gaps .......................................................................................................... 65
2.6 Conceptual framework ............................................................................................ 69
2.6.1 Knowledge sharing modules ............................................................................ 71
2.6.2 Knowledge sharing performance ..................................................................... 72

10
2.6.3 Links between KS, OF and PERF .................................................................... 73
2.7 Summary ................................................................................................................. 74
Chapter three: Research methodology ..................................................... 76
3.1 Introduction ............................................................................................................. 76
3.2 Research philosophy ............................................................................................... 76
3.3 Research design ....................................................................................................... 80
3.4 Research methods.................................................................................................... 84
3.5 Data envelopment analysis (DEA) .......................................................................... 86
3.6 Fuzzy-set qualitative comparative analysis (fsQCA) .............................................. 91
3.7 Integrating DEA and fsQCA techniques ............................................................... 106
3.8 Research ethics ...................................................................................................... 109
3.9 Summary ............................................................................................................... 110
Chapter four: Data collection .................................................................. 111
4.1 Introduction ........................................................................................................... 111
4.2 Data collection protocol ........................................................................................ 111
4.3 Questionnaire design ............................................................................................. 114
4.4 Sampling strategy and pilot study ......................................................................... 116

11
4.4.1 Sampling procedure ....................................................................................... 118
4.4.2 Pilot test .......................................................................................................... 120
4.5 Validity .................................................................................................................. 120
4.5.1 Content validity .............................................................................................. 121
4.5.2 Convergent validity ........................................................................................ 122
4.5.3 Discriminant validity ...................................................................................... 122
4.6 Measurement approaches ...................................................................................... 123
4.7 Knowledge DEA efficiency .................................................................................. 127
4.8 Summary ............................................................................................................... 132
Chapter five: Data analysis and findings ................................................ 134
5.1 Introduction ........................................................................................................... 134
5.2 Selecting the variables........................................................................................... 135
5.3 Correlation analysis ............................................................................................... 136
5.4 Multivariate analysis ............................................................................................. 137
5.5 Cluster analysis ..................................................................................................... 140
5.6 Identifying the type of returns to scale .................................................................. 141
5.7 Measuring Germany KSP efficiency .................................................................... 142

12
5.8 Knowledge fsQCA comparability ......................................................................... 146
5.9 Analysis of necessary conditions .......................................................................... 197
5.10 Truth table analysis for sufficiency condition ..................................................... 200
5.11 Subset/superset analysis of association testing ................................................... 206
5.12 Summary ............................................................................................................. 210
Chapter six: Discussion ............................................................................ 211
6.1 Introduction ........................................................................................................... 211
6.2 KS for organisational performance ....................................................................... 214
6.3 Impact of OFs on knowledge processes ................................................................ 221
6.4 KSP model for organisations ................................................................................ 226
6.5 Integrating DEA and fsQCA ................................................................................. 231
6.6 Summary ............................................................................................................... 235
Chapter seven: Conclusions ..................................................................... 237
7.1 Introduction ........................................................................................................... 237
7.2 How the research questions were answered? ........................................................ 237
7.3 Key contributions .................................................................................................. 243
7.3.1 Theoretical contributions ............................................................................... 243

13
7.3.2 Managerial implications ................................................................................. 245
7.4 Limitations of the study ........................................................................................ 247
7.5 Future research ...................................................................................................... 248
References .................................................................................................. 250
Appendices ................................................................................................. 266
Appendix A: Cover letter ............................................................................................ 266
Appendix B: Questionnaire template .......................................................................... 268
Appendix C: Data collection report ............................................................................ 273

14
List of figures
Figure 1.1 Structure of the thesis ...................................................................................... 27
Figure 2.1 The SECI process ............................................................................................ 31
Figure 2.2 Understanding continuum of the knowledge pyramid .................................... 34
Figure 2.3 Difference between knowledge sharing and transfer ...................................... 37
Figure 2.4 The four types of Ba ........................................................................................ 42
Figure 2.5 Elements of culture .......................................................................................... 47
Figure 2.6 Experiential learning ...................................................................................... 50
Figure 2.7: Elements of leadership ................................................................................... 54
Figure 2.8 Diagrammatic view of measurement ............................................................... 61
Figure 2.9 KSP conceptual framework ............................................................................. 70
Figure 3.1 The research ‘onion’ path in this research ..................................................... 78
Figure 3.2 Research design .............................................................................................. 83
Figure 3.3 Histogram showing difference between high and low operations
capabilities ........................................................................................................................ 98
Figure 3.4 Flowchart of fsQCA procedures ................................................................... 106
Figure 4.1 Types of questionnaire .................................................................................. 112
Figure 4.2 Procedure for developing a questionnaire .................................................... 116
Figure 4.3 KSP implementation model ........................................................................... 127
15
Figure 4.4 Knowledge sharing efficiency 1 .................................................................... 131
Figure 4.5 knowledge sharing efficiency 2 ..................................................................... 132
Figure 5.1 Overview of data analysis and findings reporting ....................................... 134
Figure 5.2 Intersection area problem when comparing combined unique coverage across
different analyses ............................................................................................................ 176
Figure 5.3 xy plot for ~c with ie as part of the necessary condition analysis ................ 198
Figure 5.4 xy plots for ~c with ~ie as part of the necessary condition analysis ............. 200
Figure 5.5 xy plots for each intermediate solution and ie .............................................. 206
Figure 5.6 Flow chart of process tracing for association validity classification ........... 209
Figure 6.1 Holitic view of this study ............................................................................... 214
Figure 7.1 An overview and links across different stages of the research project ......... 238

16
List of tables
Table 2.1 Definitions of KS ............................................................................................... 38
Table 2.2 Examples of use of the term ‘performance’ in recent publications .................. 58
Table 2.3 Advice for effective performance measures based on the literature ................. 62
Table 3.1 Fundamental quantitative research strategy .................................................... 79
Table 3.2 Research methods ............................................................................................. 84
Table 3.3 Performance measure comparison table .......................................................... 89
Table 3.4 Crisp set versus fuzzy set ................................................................................... 96
Table 4.1 Illustrates a short introduction to various types of validity ............................ 121
Table 5.1 KSP efficiency data ......................................................................................... 135
Table 5.2 Results of correlation analysis ........................................................................ 136
Table 5.3 Efficiency changes due to omitting one variable ............................................ 137
Table 5.4 Efficiency changes due to omitting more than one variable ........................... 139
Table 5.5 Country data after cluster analysis ................................................................. 141
Table 5.6 The outcomes of CRS (CCR) and VRS (BCC) and their means ...................... 142
Table 5.7 The DEA CCR model outcome score .............................................................. 143
Table 5.8 Changes in efficiency after adding the P and Q vectors ................................. 144
Table 5.9 The new pay-off table ...................................................................................... 144

17
Table 5.10 Comparison between old and new trade-off values ...................................... 145
Table 5.11 Summary of target setting and resource allocation for the SWE .................. 146
Table 5.11 fsQCA findings for H1a: LCD-BCD-IE/IEF ................................................. 155
Table 5.12a fsQCA findings for H1b: BPD-OE1/OE1F ................................................. 157
Table 5.12b fsQCA findings for A1b: BPD-OE2/OE2F ................................................. 158
Table 5.13a fsQCA findings for A1c: S-EF1/EF1F ........................................................ 160
Table 5.13b fsQCA findings for A1c: S-EF2/EF12F ...................................................... 161
Table 5.14 fsQCA results for A1d: C-AD1/AD2 ............................................................. 163
Table 5.15 fsQCA findings for A2a: OP-IE/IEF ............................................................. 165
Table 5.16 fsQCA findings for A2b: OL-OE1/OE1F ...................................................... 167
Table 5.17 fsQCA findings for A2b: OL-OE1F .............................................................. 167
Table 5.18 fsQCA findings for A2b: OL-OE2/OE2F ...................................................... 168
Table 5.19 fsQCA findings for A2c: OS-EF1/EF1F ....................................................... 171
Table 5.20 fsQCA findings for A2c: OS-EF2/EF2F ....................................................... 173
Table 5.21 fsQCA findings for A2d: CT-AD1/AD2 ......................................................... 174
Table 5.22 Comparison of solution coverage of all sub-associations testing A1 and
A2 .................................................................................................................................... 177
Table 5.23 fsQCA findings for A3a: KAD-OP-IE/IEF ................................................... 181
Table 5.24 fsQCA findings for A3b: BPD-OL-OE1/OE1F ............................................. 183

18
Table 5.25 fsQCA findings for A3b: BPD-OL-OE2/OE2F ............................................. 183
Table 5.26 fsQCA findings for A3c: S-LP-OS-EF1/EF1F .............................................. 188
Table 5.27 fsQCA findings for A3c: S-LP-OS-EF2/EF2F .............................................. 188
Table 5.28 fsQCA findings for A3d: C-CT-AD1/AD2 ..................................................... 190
Table 5.29 Comparison of solution coverage for all sub-associations of A1, A2 and
A3 .................................................................................................................................... 192
Table 5.30 Summary test findings for A1, A2 and A3 ..................................................... 195
Table 5.31 The necessity test ........................................................................................... 198
Table 5.32 The necessity test ........................................................................................... 199
Table 5.33 The truth table ............................................................................................... 203

19
List of abbreviations
AD: Adaptability
AHP: Analytic Hierarchy Process
BCC: Banker, Chames and Cooper
CCR: Constant Returns to Scale
CT: Culture
D: Decision
DEA: Data Envelopment Analysis
DMU: Decision Making Unit
EF: Effectiveness
ELECTRE: ELimination Et Choix Traduisant la REalité
fsQCA: Fuzzy Set Qualitative Comparative Analysis
IE: Input Efficiency
INUS conditions: Cause and Effect
KA: Knowledge Asset
KAD: Knowledge Asset Decision
KM: Knowledge Management
KPI: Key Performance Indicator

20
KS: Knowledge Sharing
KSP: Knowledge Sharing Performance
LP: Leadership
OA: Overall Performance Proxy
OE: Output Efficiency
OF: Organisational Factors
OL: Organisational Learning
OP: Operation
OS: Organisational Structure
PERF: Performance
SCP: Structure Conduct Performance
SECI: Socialisation Externalisation Combination Internalisation
SFA: Stochastic Frontier Analysis
SWE: Sweden
SWOT: Strength Weakness Opportunities Threats
URL: Uniform Resource Locator
VRS: Variable Returns to Scale

21
Chapter one: Introduction
1.1 Research context
Business process in an organisation is constantly seeking to out-compete others by
developing its competitive advantage in order to achieve outstanding performance. There
are two methods relating to how to achieve this goal: integrating knowledge with the
business process to best match the objectives of the organisation and advance in the
competitive environment (Nonaka et al., 1996); or building knowledge capacity to
enhance the productivity of the firm’s resources in order to be more effective and efficient
than others (Polanyi, 1966).
Knowledge is one of the most valuable assets that organisations pursue to sustain a
competitive edge (Owrang and Grupe,1996). This is supported by the widespread
integration of numerous knowledge acquisition solutions. Whilst knowledge management
systems have been acquired in many organisations, some organisations struggle to exist
over organisational knowledge and organisational factors (OF) as a result of differing
performance results.
Research has shown that organisational factors have a profound impact on knowledge
sharing (KS) intentions (Constant, 1994; Jarvenpaa and Staples, 2001; Navon and
Ramsey, 1989; Saetang et al., 2010) and organisational performance (Furby, 1980). The
decisions and motivations lying behind knowledge sharing are based on social context of
interactions between employees and team members to build a sustainable knowledge-
business processes. Sustainable knowledge-business processes refers to business
processes within any organisation that considering the impact of organisational factors,
perceive that employees’ knowledge assets are the key to winning the competitive market
challenges. Therefore, sharing knowledge is the organisation’s asset and creating more

22
enablers to share knowledge that leads to benefits for the organisation (Dulipovici and
Baskerville, 2007).
While a debate and conflicts are still taking place over the difficulty to enforce the laws,
understanding ownership perception will help to reflect individual beliefs related to their
belongings (in this case, their knowledge) and their intentions to share. Hence, knowledge
ownership should be considered to advance researches in the area of knowledge
management.
The work of (Constant, 1994; Jarvenpaa and Staples, 2001; Navon and Ramsey, 1989;
Saetang et al., 2010) outlines the motivating factors (i.e competitive advantages and
profitability) that have focused on knowledge sharing, organisational factors and
performance. Hence, this study investigates current studies in knowledge sharing,
organisational factors and performance, and collects empirical data to measure knowledge
sharing efficiency by data envelopement analysis (DEA) and fuzzy set qualitative
comparative analysis (fsQCA). Knowledge sharing performance will contribute to
effective management of knowledge assets in an organisation, provided key
organisational factors are considered (Jayawickrama et al., 2013). The conditions of the
social context in which employees interact determine the level of the organisational
performance (Wiig et al., 1997).
1.2 Research aim and objectives
The aim of this study is to develop and validate a functional knowledge sharing model
which can facilitate and enhance organisational performance considering the impact of
organisational factors. Three research questions have been formulated:
[1] What are the key components of knowledge sharing in an organisation?

23
[2] What are the main organisational factors that potentially facilitate effective
knowledge sharing in an organisation?
[3] How can DEA and fsQCA be used to measure the impact of organisational factors
on organisational knowledge sharing efficiency?
In order to achieve the research aim, this study has detailed research objectives emerging
through innovative approaches in addressing the interdisciplinary research questions
across knowledge sharing (KS), organisation studies and performance management:
[1] To define key knowledge sharing components required to improve organisational
performance.
[2] To identify key organisational factors that impact on knowledge sharing
performance.
[3] To develop a knowledge sharing performance framework.
[4] To evaluate the extent to which a knowledge sharing performance model is of
operational value to organisations.
A comprehensive understanding of the relationships between KS and organisational
factors (OF) that can be measured by using DEA and fsQCA, this study will provide
answers to the research questions with guidance on what the benefits of KS practices are,
what the impact of OF on knowledge sharing, and how KS, OF and performance are
related to each other.
1.3 Research justification
The importance of this study lies in its contribution to theory and practice, and the
robustness of the data analysis, findings and discussion. The study examines the influence
of OFs on KS by measuring the components of their relationships with DEA and fsQCA,
24
and the differences knowledge efficiency across seven countries where data collection
was carried out. From a theoretical perspective, this study advances and provides insight
into the links between KS, OFs, and PERF. These relations have not, to date, been studied
in any organisation with DEA and fsQCA, particularly in understanding how to measure
the performance of the entities in this relationship.
Two aspects are important for sustaining competitive advantage and continuous increase
in performance: the first is the relationships between KS and OFs. OFs are known to
initiate and stimulate strong effects via a variety of organisational initiatives that
encourage employees to contribute to the organisation’s performance (Laudon and
Laudon, 2002). Such as leadership, which enables the creation of a suitable climate, sets
of values and, norms, and create a culture of change. Thus, it will be useful to provide a
better understanding of the linkages between KS, OFs, and PERF.
The second important aspect is the measurement of the contribution of KS in the
competitiveness of an organisation and innovation. KS is known to be a key issue in
enhancing innovation and performance (Hislop, 2013). Hence, this study contributes to
the KS, OFs, and PERF literature by utilising DEA and fsQCA as analysis techniques to
implement the practicality of the theoretical relationships.
1.4 Key contributions
This study examines the impact of KS on PERF through an integrating role of OFs, and
the differences between focused countries in this regard. From a theoretical perspective,
the study advances and provides insights into the links between KS, OFs, and PERF.
These relations have not, to date, been studied in an organisational perspective
environment.

25
Specifically, in terms of the theoretical issue, rather than arguing whether KS or
OFs better contributes to performance, this study proposes that neither is
universally better causal factor. Rather, both are essential and thus it is better to
consider them jointly because each offers a different perspective to explain
performance. KS (Drew, 1999; Heijst et al., 1997; Hendriks and Vriens, 1999)
draws on an external perspective (intellectual capital) while OFs (Despres and
Chauvel 1999; Johannessen, Olsen et al., 1999) take an internal perspective.
Therefore, this study proposes that there are associations or circumstances in which
“doing more of one thing increases the returns to doing more of another” (Liebowitz,
2001; Liebowitz and Wright, 1999; Nonaka et al., 1996) between KS and OFs and
anticipates that, as a result of a reciprocal and mutually reinforcing effect, consistency
between KS and OFs in terms of similar practices will provide a better explanation of
performance than the pursuit of incompatible alternatives. According to complementarity
theory, this situation called “supermodularity” stems from similarity or practices “of the
same kind” (Liao, 2002). For example, the performance of a business process aiming for
a low-cost strategy is expected to be better if it belongs to an organisation that has a strong
operations capability rather than a strong marketing capability. With the flexibility to
adapt to a new and more cost- efficient operations system, such a business process may
reduce its costs further and maintain its cost leadership status, which will be reflected in
better performance. On the other hand, strength in the marketing function will not help
reduce its costs; rather, it will actually require the business process to spend more on
marketing campaigns, which in turn will increase the overall cost and go against its
configurational objectives (although this may impact positively on differentiation). This
mismatch between KS and OFs will be reflected in unfavourable performance.

26
By using DEA and fsQCA, a combination of two research techniques based on
efficiency modelling and causal asymmetry assumption, both techniques aim at
improving organisational performance, this thesis could demonstrate the existence
of associations, which would help mitigate criticisms of the theoretical weakness
of integrating KS and OFs, research and support its progress by improving its
predictive ability and bridging the gap between these two well-established
research streams. It is also expected that improved performance exists in this
research context. When different KS or OFs or a combination of the two lead to
the same level of performance, and when different combinations of KS and OFs
as well as different performance dimensions lead to the same level of overall
performance proxy.
With regard to empirical concerns, this study builds on the ideas that performance
dimensions cannot all be achieved simultaneously because doing well on one
dimension usually entails trade-offs with performance on another (Donaldson,
1984) and that business processes should perform well on the performance
dimensions most relevant to the type of strategy they are implementing. This study
seeks to prove that the integration of KS and OFs configuration typologies have
different appropriate performance measurements. Thus, using DEA and fsQCA
will demonstrate the equivocal empirical performance dimensions to
organisational configurations.
In addition, by providing a better understanding of past management actions, this research
will enable managers to predict the likely consequences of decisions and competitive
actions. This research may also help develop a clearer understanding of the impact of
various KS and OFs on different performance dimensions. A better understanding of these
relationships will result in improved strategy formation and implementation of decisions,

27
especially in adjusting strategies and organisational resources to match changing
environments and achieve performance goals.
1.5 Structure of the thesis
This section briefly explains the structure of the thesis. The thesis comprises seven
chapters excluding references and appendices. Figure 1.1 illustrates the overall thesis
structure and key segments associated with each chapter.
Figure 1.1 Structure of the thesis
Chapter one presents the research context, aim and objectives, and research questions.
The structure of the thesis is introduced.

28
Chapter two outlines the extant literature in regard to knowledge sharing and its key
components, organisational factors and performance management in order to provide
detailed knowledge regarding knowledge sharing efficiency, impact of organisational
factors and performance measurement. It demonstrates a conceptual framework by
developing associations. In addition, the scales for each construct are conceptualised and
operationalised to underpin questionnaires deployed in this study.
Chapter three examines the research methodology used to answer the research questions
and to achieve the research objectives. The chapter discusses the details of methodology,
including the research design process.
Chapter four provides rthe details of data collection by discussing the data collection
protocol, questionnaire design, sampling strategy and pilot study.
Chapter five is dedicated to data analysis using DEA and fsQCA and reporting findings.
This chapter also discusses how the conceptual framework has been refined and improved
to develop the integrated knowledge sharing performance KSP model.
Chapter six discusses relevant issues in relation to the operationalisation of all research
constructs used to test the research model, describing the measurement approach, the unit
of analysis, and the calibration criteria required by DEA and fsQCA, which are the
techniques adopted in this research.
Chapter seven summarises this study by linking each research question to relevant
findings of each node of the model. Theoretical implications and managerial implications
of the findings are highlighted. It also identifies the limitations of the study and makes
suggestions for further research.
1.6 Summary

29
This chapter provided an overview of the content of this thesis. This chapter also included
research context, research aim and objectives, and the structure of the thesis. The next
chapter presents the literature review on knowledge sharing, organisational factors,
organisational performance and the conceptual framework developed based on the critical
analysis of the literature.
30
Chapter two: Literature review
2.1 Introduction
This chapter reviews relevant literature on knowledge sharing (concept of knowledge
sharing and knowledge sharing environment), organisational factors (culture, learning,
leadership and structure) and organisational performance, focusing on organisational
factors implication for knowledge sharing performance. This review will aim to show
that, while the conceptual framework is supported by some previous research studies, it
has been challenged by others; and that, despite adjustments in response to the challenges,
which to a certain extent prove that there is room to develop the level of performance
predictability because literature covers only a review of knowledge sharing and other
components. Subsequently, this chapter identifies research gaps in the literature of
knowledge sharing, organisational factors and performance management, exploring the
wide available resources on the measurement of knowledge sharing performance. Finally,
this chapter proposes a conceptual framework based on the relevant literature with
potential contribution to the field of research.
2.2 Knowledge sharing
Knowledge sharing can be achieved through people and technology, once created and
identified or captured the next stage is to circulate knowledge around the organisation
(Rubenstein-Montano et al., 2001; Wiig, 1997; Wiig et al., 1997; Wegen et al., 1997).
Kim et al. (2000) and Kalling and Styhre (2003, p. 57) highlight that it is perhaps the
single most important knowledge management practice because it embodies all of the
opportunities and challenges associated with managing intangible invisible assets. While
technology may help in the capture and mainly distribution of knowledge, emphasis
should be placed on the organisation. Liebowitz (1999) suggests that for an organisation

31
to succeed in knowledge management, it is imperative for it to have a supporting
corporate environment, which is given by Lemken et al (2000) as the norms and values
that bind an organisation together. With regards to knowledge, Oliver and Kandandi
(2006) propose that organisations create and share knowledge to remain competitive.
Meier (2011, p. 2) also comments on the challenges organisations face due to a rapidly
changing business environment, identifying knowledge assets as crucial for achieving
competitive advantage. However, Goodman (2006, p. 54-56) points out that promoting
and integrating knowledge sharing within an organisation can be a lengthy process. The
author recalls Ernst and Young’s introduction of a knowledge sharing concept in
(Johannessen et al., 1999); according to them whilst it made improvements, concluded
that knowledge management work is never done and setting the knowledge agenda is a
constant challenge (Liebowitz and Wright, 1999; Wilkins et al., 1997).
Figure 2.1 The SECI process
Source: (Nonaka et al., 2000, p. 12)

32
The preceding sections suggest that knowledge is an intangible resource with potential
which organisations need to manage effectively. Exploring the SECI model in Figure 2.1
from top left, knowledge creation begins in tacit form; in the head of an individual, and
is converted to either tacit or explicit knowledge by means of socialisation or
externalisation respectively. The SECI model depicts knowledge creation as a spiral, the
knowledge lifecycle, also a common framework, depicts knowledge creation as a
continuous cycle. Several other authors including (Fleurat-Lessard, 2002; Kang et al.,
1998; Kim et al., 2000; Knight and Ma, 1997; Liao, 2000, 2001; Lee and Lee, 1999)
present work associated with the knowledge lifecycle, although having varying
explanations, they all share a few similarities in what they highlight as the stages which
knowledge moves through in its lifecycle.
2.2.1 Data, information and knowledge
The real emphasis should be made on the difference between data, information and
knowledge, as the mistake of interchanging these terms has resulted in organisations
spending enormous amount of resources on technological, and other initiatives which did
not deliver what they thought they would be getting (Feelders et al., 2000; Bae et al.,
2002; Hui and Jha, 2000; Jiang et al, 1999). Cauvin (1996) and Kim et al. (2000) support
this, suggesting that if organisations do not develop a working definition of knowledge,
utilisation of knowledge resource will be difficult, and organisations will substitute terms
such as data warehousing plans or advanced IT programs for knowledge management
initiatives.
The implications for a researcher would therefore be one of making distinctions between
the definitions of data, information and knowledge; this ultimately clarifies the initiatives
which concern each individual term. Data therefore are “a set of discrete, objective facts
about events; in an organisational context data is most usefully described as structured

33
records of transactions” (Laudon and Laudon, 2002). “The amount of data stored in the
world’s databases doubles every 20 months” and McMeekin and Ross (2002) explain that
this volume makes it difficult to identify which single instance is most important within.
Data when processed within a given context however, helps to inform decisions.
According to Tian et al., (2002) data is the essential raw material for the creation of
information, but it has little meaning to an organisation on its own.
The terms information and knowledge have been used interchangeably which may result
in ineffective management initiatives. Information is data endowed with meaning,
reliance and purpose (Abidi, 2001; Cannataro et al., 2002). (Ha et al., 2002; Hui and Jha,
2000; Lin and McClean, 2001; Shaw et al., 2001) defines information, simply as data that
is put into context; both definitions highlight a movement in stages from one form to the
other suggested in Figures 2.2. The definitions given reflect understanding continuum in
Figure 2.2, as it presents information as a connection of parts that is “absorbed” and
needed for “doing” something. Ramesh and Tiwana (1999) and Caraynnnis (1999)
explain that information needs to be understood by the recipient for the transformation to
be valid. Ramesh and Tiwana (1999) and Robey et al. (2000) highlight that information
simply implies transfer (i.e. the process of informing), and Sokolov and Wulff (1999),
Huang et al. (2000), Wilkins and Barrett (2000), and Shafer and Agrawal (2000) argue
that the most current information in an organisation resides in the minds of trusted
colleagues; this definition however, clashes with the business processes being attempted
within the understanding continuum and the knowledge pyramid, but its logic is presented
to the reader in the section addressing the types of knowledge.
Knowledge has diverse definitions because of its interdisciplinary nature, but the scope
has been given to include information management, sense making, and tools and
techniques that facilitate socialisation and sharing of expertise, skills, or experiences.
34
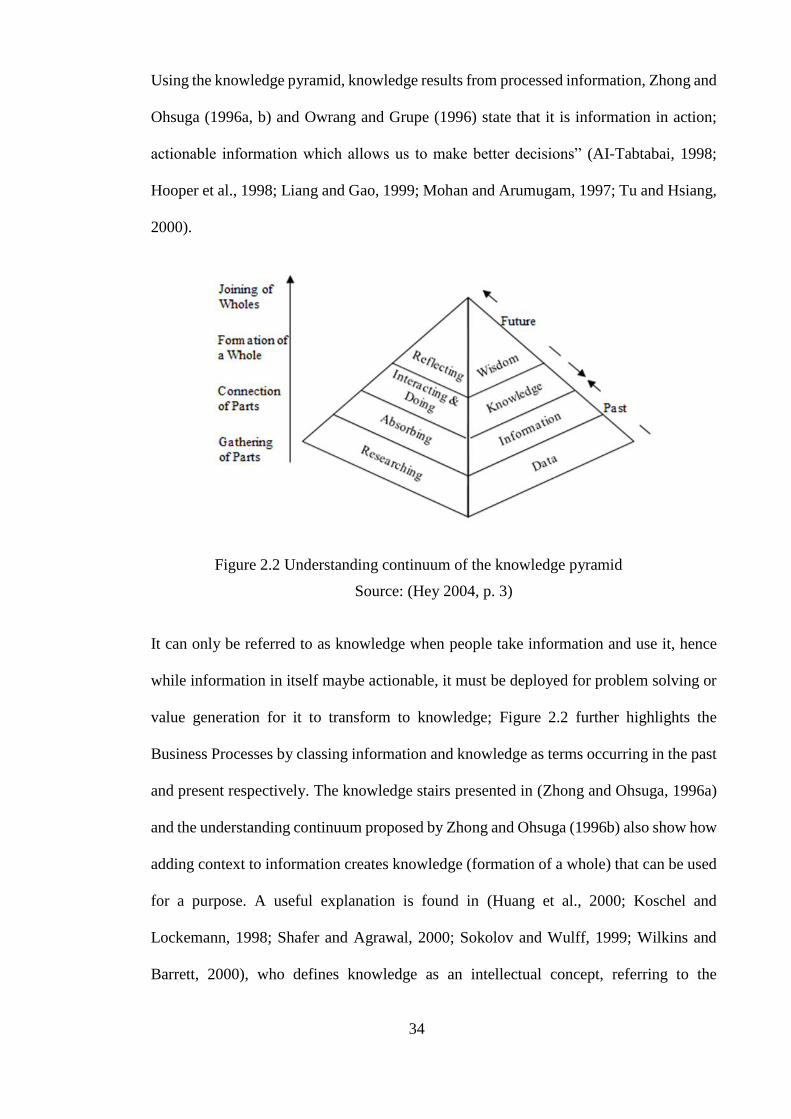
Using the knowledge pyramid, knowledge results from processed information, Zhong and
Ohsuga (1996a, b) and Owrang and Grupe (1996) state that it is information in action;
actionable information which allows us to make better decisions” (AI-Tabtabai, 1998;
Hooper et al., 1998; Liang and Gao, 1999; Mohan and Arumugam, 1997; Tu and Hsiang,
2000).
Figure 2.2 Understanding continuum of the knowledge pyramid
Source: (Hey 2004, p. 3)
It can only be referred to as knowledge when people take information and use it, hence
while information in itself maybe actionable, it must be deployed for problem solving or
value generation for it to transform to knowledge; Figure 2.2 further highlights the
Business Processes by classing information and knowledge as terms occurring in the past
and present respectively. The knowledge stairs presented in (Zhong and Ohsuga, 1996a)
and the understanding continuum proposed by Zhong and Ohsuga (1996b) also show how
adding context to information creates knowledge (formation of a whole) that can be used
for a purpose. A useful explanation is found in (Huang et al., 2000; Koschel and
Lockemann, 1998; Shafer and Agrawal, 2000; Sokolov and Wulff, 1999; Wilkins and
Barrett, 2000), who defines knowledge as an intellectual concept, referring to the

35
condition of knowing or understanding something. Knowledge management needs to be
concerned with creating an environment within an organisation that facilitates the
creation, transfer and sharing of knowledge (Caraynnnis, 1999; Chen et al., 2002; Harun,
2002; Hicks, Culley et al., 2002; McCown, 2002; Ramesh and Tiwana, 1999; Robey et
al., 2000; Yoo and Kim, 2002). This statement, while accurately presenting the scope of
knowledge, also highlights the concept of knowledge sharing which is an important
component of this research. In order to manage knowledge an understanding of the
different types of knowledge is required.
The types of knowledge that are most commonly used in the literature are tacit and
explicit knowledge, which are the focus of this study. These types of knowledge were
first used by Polanyi (1967) but have since been applied to the context of organisations
by Nonaka (1994). Tacit knowledge describes the personal, the subjective, and the
intangible (Nonaka, 1994, Nonaka, 1995, Hislop, 2009). It is embedded in the minds of
people, is accumulated through study, learning, and experiences, and developed through
conversations, workshops, job training, and social interaction (Nonaka and Takeuchi,
1995, Nonaka and Toyama, 2005, Polanyi, 1967, von Krogh et al., 2012). Nonaka et al.
(2006) explained that tacit knowledge consists of two elements: the technical and the
cognitive. The technical element refers to informal personal skills that apply to a specific
context, such as know-how and crafts, while the cognitive component includes beliefs,
paradigms, values and a person’s mental model. Tacit knowledge is difficult to
communicate, articulate and transmit (Hislop, 2005). It is argued that this type of
knowledge is less familiar and unconventional. This includes their problem-solving
ability, and their capability to conduct research. Tacit knowledge can be a source of
competitive advantage in an organisation (Bryant, 2003, Chen and Edginbton, 2005). It
is crucial to getting things done and is the key to organisational tasks, such as creating

36
new knowledge, generating new products, and improving procedures, that lead to
innovation.
In contrast to tacit knowledge, explicit knowledge denotes knowledge that is articulated,
objective, externalised and captured, and has a more tangible format (Yahya and Goh,
2002). This type of knowledge is saved in documents and found in books, databases,
models, procedures, rules, policies, and regulations, making it easily shared between
individuals and organisations. Therefore it is more common in the workplace (Nonaka,
2005, Ichijo and Nonaka, 2007, Uriarte, 2008, Birasnav et al., 2011, von Krogh et al.,
2012). Nonaka et al. (2006) argued that explicit knowledge includes object-based and
rule-based knowledge. Object-based knowledge refers to intangible knowledge such as
words, numbers, and, formulas, and tangible knowledge such as equipment, and
documents, while rule-based knowledge refers to knowledge that is translated into the
rules, routines, and procedures of the organisation. Therefore, it is referred to as know-
what. Kumar et al. (2013) explained that the advantage of this type of knowledge is that
it is easy to share and can be reused to solve similar problems.
2.2.2 Understanding knowledge sharing
The literature on KM has adopted various terms to describe KS, such as knowledge
exchange (Calantone et al, 2002; Hertzum, 2002; Kidwell et al, 1997; Lang et al, 2002;
Walsham, 2002), knowledge diffusion or dissemination (Huang et al., 2000; Koschel and
Lockemann, 1998; Shafer and Agrawal, 2000; Sokolov and Wulff, 1999; Wilkins and
Barrett, 2000), conversion (Dekker and Hoog, 2000; Hinton, 2002; Kitts, Edvinsson and
Beding, 2001; Maddouri et al., 1998; Muller and Wiederhold, 2002; Wirtz, 2001; Wong,
2001), knowledge sharing (Calantone et al., 2002; Hertzum, 2002; Kidwell et al., 1997;
Lang et al., 2002; Walsham, 2002), and knowledge flows (Allsopp et al., 2002;
Sugumaran and Storey, 2002). The term knowledge transfer has been used frequently in
37
the recent literature on KM to described KS (Huang et al., 2000; Koschel and Lockemann,
1998; Shafer and Agrawal, 2000; Sokolov and Wulff, 1999; Wilkins and Barrett, 2000).
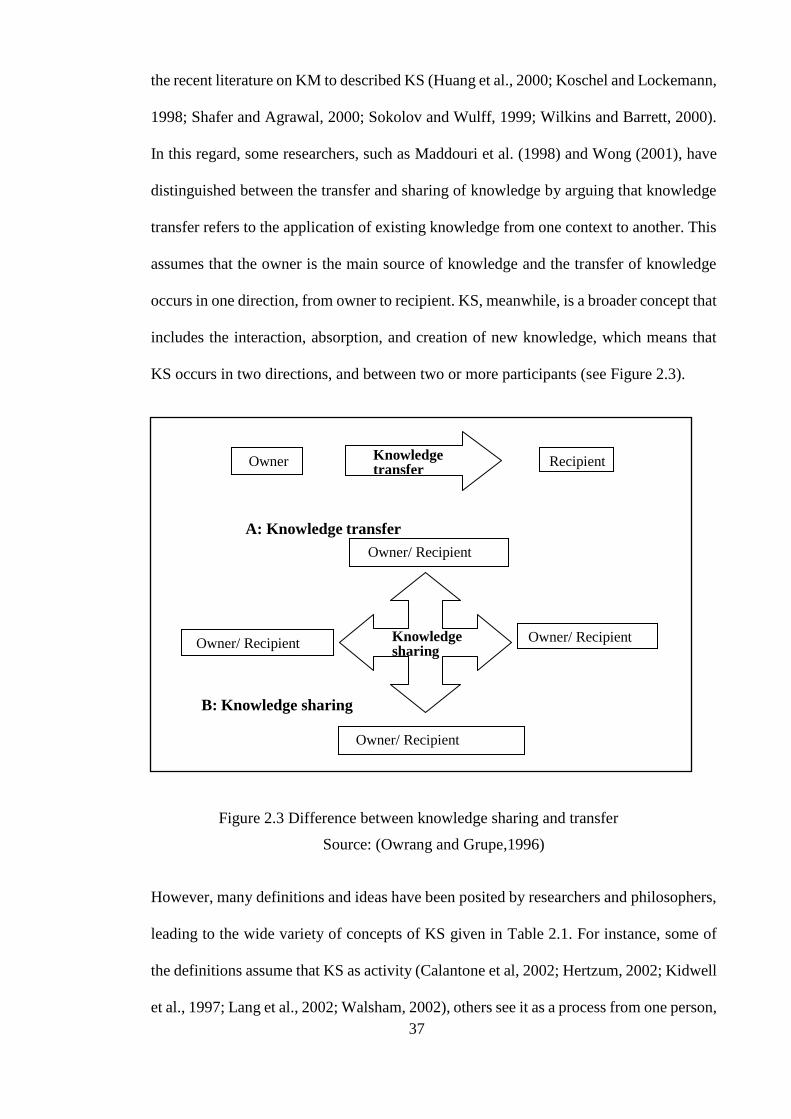
In this regard, some researchers, such as Maddouri et al. (1998) and Wong (2001), have
distinguished between the transfer and sharing of knowledge by arguing that knowledge
transfer refers to the application of existing knowledge from one context to another. This
assumes that the owner is the main source of knowledge and the transfer of knowledge
occurs in one direction, from owner to recipient. KS, meanwhile, is a broader concept that
includes the interaction, absorption, and creation of new knowledge, which means that
KS occurs in two directions, and between two or more participants (see Figure 2.3).
Figure 2.3 Difference between knowledge sharing and transfer
Source: (Owrang and Grupe,1996)
However, many definitions and ideas have been posited by researchers and philosophers,
leading to the wide variety of concepts of KS given in Table 2.1. For instance, some of
the definitions assume that KS as activity (Calantone et al, 2002; Hertzum, 2002; Kidwell
et al., 1997; Lang et al., 2002; Walsham, 2002), others see it as a process from one person,
Knowledge transfer
A: Knowledge transfer
Knowledge sharing
B: Knowledge sharing
Owner Recipient
Owner/ Recipient
Owner/ Recipient Owner/ Recipient
Owner/ Recipient

38
group or firm to another (McFadden et al, 2000), while others found KS is a culture or
behaviour may occur formally among colleagues in a workplace or informally among
friends and social networks (Lee and Lee, 1999; Liao, 2000).
Table 2.1 Definitions of KS
Author/s Definition
(Dyer and Nobeoka,
2000)
KS is the activity of working to exchange knowledge
among people and enable them to achieve their
individual aims.
(Darr and Kurtzbery,
2000)
KS is the process of helping people to acquire
knowledge by learning from others’ experiences.
(Bartol and
Srivastava, 2002)
KS is the activity of helping organisational members to
share their data, information, ideas, experiences, and
suggestions within the organisation.
(Argote et al., 2003) Is the process by which one unit is affected by the
experience of another.
(Ipe, 2003) KS is the process of converting knowledge from
individuals who possess it into individuals who accept
the knowledge and absorb it.
(Hooff and Ridder,
2004)
KS is the process by which knowledge is exchanged and
created at the same time.
(Bock et al., 2005) KS refers to the behaviour of individuals in sharing their
knowledge with each other within an organisation.
(Lin, 2007) KS is a culture of social interaction that includes the
exchange of knowledge, experiences, and skills among
employees.
(Xiong and Deng,
2008)
KS refers to the exchange and communication of
knowledge and information between members.
(Sohail and Daud,
2009)
KS represents the exchange and sharing of the events,
thoughts, and experiences of people.
(Islam et al., 2010) KS is the process of social exchange that occurs
between individuals, from individuals to organisations,
and from organisation to organisation.
(Lee et al., 2010) KS refers to the interaction of tacit and explicit
knowledge that is relevant to the task in hand.
(Masrek et al., 2011) KS is described as a process by which individuals
mutually exchange their tacit and explicit knowledge
and jointly generate new knowledge.
(Jahani et al., 2011) KS includes the activities by which knowledge is
transferred from one person, group, or organisation to
another.
(Hitam and
Mahamad, 2012)
KS is the exchange of knowledge, experiences, and
skills among members through various departments in
the organisation.

39
(Kim et al., 2013) KS is the activity by which information, skills, and
insights are exchanged among organisational members.
Prior literature has reported different types of KS processes. For instance, Hendriks
(1999) distinguished between the knowledge owners who have the knowledge and also
called externalisation, and the knowledge receivers who receive the knowledge. Ardichili
et al. (2003) proposed that KS includes a supply of new knowledge and a demand for new
knowledge. Lin (2007) discussed KS as involving the carrier and the requester of
knowledge.
From Kankanhalli et al., (2005) point of view, KS processes consist of knowledge seekers
and knowledge contributors. Weiss (1999) indicated that KS involves two processes:
knowledge collection, which includes the accumulation, storage and recording of
knowledge, and the connection of knowledge, which, consists of the knowledge seeker
accessing a knowledge source and identifying the needed knowledge.
Additionally, Wei et al. (2009) divided KS processes into knowledge seeking and
knowledge contribution. Similarly, Chen and Hung (2010) pointed out that KS consists
of knowledge contributing, collecting, and utilising. Others, such as Ipe (2003), found
that KS processes involve the transmission and absorption of knowledge. Kuo and Young
(2008) noted that the transmission of knowledge includes sending knowledge to the
recipients, while the absorption of knowledge reflects the effectiveness of knowledge use.
Davenport and Prusak (2000) and Hussain et al. (2004) differentiate between the
possession and acquisition of knowledge. Gupta and Govindarajan (2000) explained that
KS includes the sourcing of knowledge, its transmission, receiving knowledge, and
absorbing knowledge. Other researchers, such as Tong and Song (2011), have
distinguished between voluntary and solicited knowledge. In the case of voluntary

40
knowledge, individuals initiate the sharing (giving) of knowledge, while solicited KS
occurs when individuals are asked by others or by an organisation to share their
knowledge (receiving). Reid (2003), meanwhile, saw KS as encompassing a knowledge
seller and a knowledge buyer.
However, this study agrees with Hooff and Weenen (2004), who divided KS processes
into donating and collecting knowledge. These two processes have been studied by
several researchers and tested empirically in different environments (De Vries et al., 2006,
Lin, 2007, Kamasak and Bulutlar, 2010, Lin et al., 2009, Sandhu et al., 2011, Kim et al.,
2013, Alhady et al., 2011, Chen and Hung, 2010, Tong et al., 2013). The donating of
knowledge refers to the exchange process and communicating to others what one’s
personal intellectual capital is (Hooff and Ridder, 2004, De Vries et al., 2006). It
represents the willingness and eagerness of individuals in organisations to give and share
their knowledge with others (Kim et al., 2013). It is argued that without willingness it is
impossible for knowledge to be donated and transferred to others (Islam et al., 2010). This
refers to the capacity of individuals to share what they know and to use what they learn
(Lin, 2007).
Knowledge collecting, on the other hand, refers to the recipient of knowledge who must
consult colleagues through observation, listening or practising so as to encourage them to
share their intellectual capital (Hooff and Weenen 2004, De Vries et al., 2006). It reflects
the person’s willingness to ask for, accept, and adopt new intellectual capital and know-
how (Kim et al., 2013). Lin (2007) indicated that this process represents the acquisition
of information and knowledge from internal and external sources. Knowledge collecting
is a key aspect of organisations’ success because the organisation with proficiency in
gathering knowledge is more likely to be unique and rare (Lin, 2007). Knowledge
collecting occurs when organisational members are willing to learn from others (De Vries

41
et al., 2006). Senge (1998) stated that collecting knowledge means learning, absorbing,
and applying it.
These two processes of KS promote trust and mutual respect as well as facilitate the flow
of people’s knowledge assets to be capitalised for performance development (Kamasak
and Bulutlar, 2010). It is clear that the processes of knowledge donating and knowledge
collecting have drawn the attention of some researchers but perhaps not enough and not
in all contexts. Hence, for the purpose of this study and according to the objectives of the
research, this thesis defines KS as a two-dimensional process, as described by Hooff and
Weenen (2004) with members of staff sharing and exchanging their tacit and explicit
knowledge. Interaction creates new knowledge through the process of knowledge
exchange, donation, and collection.
2.2.3 Knowledge sharing environment
Nonaka’s concept of knowledge creation was re-conceptualised in 1996 through the idea
of ‘ba’. The organisational ‘ba’ or ‘shared space’ (i.e. physical, mental or virtual) provides
a basis for knowledge creation. The physical space (e.g. room, office or workplace),
mental space (e.g. idea, concept, or experience sharing) and virtual space (e.g. IT
platform, Internet or intranet) works as an incubator in which an individual and collective
knowledge creation transpires (Nonaka and Konno, 2005). For instance, Nonaka and
Konno (2005) noted that originating ‘ba’ plays its prime and incisive role in knowledge
creation by sharing tacit knowledge among individuals through the first SECI mode of
socialization as shown in Figure 2.4. The doctrine of originating ‘ba’ derived from
‘existentialism’ which asserts that shared space provides a basis for knowledge creation
through face to face interaction. It is related to human existence in which individuals are
overwhelmingly involved in interaction and their emotions, thoughts and experiences
(Nonaka et al., 2001). Therefore, the exchange of information, knowledge, ideas, data,

42
collaboration and mobilisation helps organisations to countenance requirements and
convey shared space (Choudhary et al., 2013). The interacting ‘ba’ created by the
reflection when ‘individual skills, knowledge and mental models are changed in general
terms and concepts’ (Nonaka et al., 2000). It is argued that during externalisation in which
tacit knowledge is converted into explicit knowledge, the primary role of interactive ‘ba’
is to facilitate dialogue within teams and groups in which they engage in a new idea
creation and value addition (Nonaka and Konno, 2005). The cyber (or systematising) ‘ba’
represents a combination mode in which virtual or non-physical elements (e.g. software,
database, repositories and online communication systems) are particularly involved in
converting one type of explicit knowledge to another explicit knowledge in order to create
a new explicit knowledge (Nonaka et al., 2006).
Figure 2.4 The four types of Ba
Source: (Nonaka et al., 1994)
According to Nonaka and Toyama (2005), the SECI combination mode is efficiently
operating in information technology supported by the environment because explicit
knowledge can only be articulated, codified, stored in databases and transferred, shared
and managed by knowledge sharing tools. However, the exercising ‘ba’ is purely personal
or subjective which relies on one's attitude or belief. Internalisation facilitates continuous

43
learning and self-improvement through workplace training, mentoring and individual
participation (Nonaka et al., 2006). Nonaka and Toyama (2005) reported that
internalisation can be helpful in converting explicit (e.g. codified) knowledge into tacit
(e.g. real life) knowledge and during this process exercising ‘ba’ play its role of mental
modelling and thought refinement.
More specifically, knowledge embedded in the ‘ba’ which is intangible can be acquired
through one’s own experience when organisational members share and exchange in this
‘shared space’. In a recent quantitative research project conducted in twenty-three high
tech international firms, Alvarenga Neto (2010, p. 209) found that “management of ‘ba’
and the enabling conditions rather than ‘management of knowledge’ supports ‘innovation,
sharing, learning, collaborative problem solving and tolerance to honest mistake”. In
other words, managing knowledge through ‘managing an enabling context’ in terms of
‘ba’ or ‘shared space’ supports knowledge sharing and use (Alvarenga Neto and Choo,
2011).
In spite of the evidence that knowledge sharing through managing the context or enabling
conditions, the striking challenge within knowledge management is cultural and
behavioural (Choo and Alvarenga Neto, 2010). For example, organisational culture
provides a specified state that the constructs bond between employees and configures
their attitudes and behaviours (Schein, 2006). Lundvall and Johnson (1994) also cited that
the culture and behaviour are dominant over the liveliness of the relationships and the
likelihood of knowledge creation, sharing and transfer. Nevertheless, an organisational
context in which people work is characterised by numerous artefacts (e.g. leadership,
communication, structure, technology, values, norms and stories) counted under the
general concept of organisational climate and culture (Schein, 2006). In addition to this,
it is argued that the cultural artefacts facilitate employees relationships through their

44
interaction and communication (Weick, 1995). However, ‘ba’ can only provide a ‘mental
or virtual space’ rather than a ‘cultural artefact of space’ that also contains objects and
physical environment (Lamproulis, 2007). Therefore, it is argued here that both ‘mental
or virtual space’ and ‘cultural artefact of space’ provide a basis for knowledge sharing
within the specified time and space (Nonaka et al., 2000).
2.3 Organisational factors
This section discusses the relevant literature in terms of organisational factors and their
influence on knowledge sharing performance in an organisation. There are numerous
factors to consider when implementing knowledge sharing within an organisation,
however, this section will consider four critical organisational factors to support research
findings in this study. According to (Oyemomi et al., 2015), culture, learning, leadership
and structure are core organisational factors to that impact knowledge sharing
performance.
2.3.1 Culture
An often mentioned vital element of the concept of knowledge sharing is culture.
Goodman (2007, p. 7) identifies culture as an element that enhance an organisation’s
knowledge sharing. The knowledge culture needs to be embedded within the daily
processes of the organisation, meaning that it has to be incorporated into every part of the
business. There are many proposed benefits to engendering a knowledge sharing culture;
the two common viewpoints presented in literature are focused on the tangible and
intangible elements associated with it. The benefits proposed by Huysman and Wit (2002)
include the value of saving time resources, contingency plans for crises and financial and
people-oriented rewards. According to Kelleher and Levene (2001) the benefits include
values obtained from enhancing the organisation’s knowledge searching activities, the
45
organisation’s ability to remain up-to-date with quick and constant environmental
changes, increasing effective integration, and the ability to simplify complex processes.
Bowman (2002, p. 32) adds that for organisations which are becoming more
geographically dispersed, knowledge sharing is of great importance to operate in a
dynamic business environment.
In the knowledge creation theory, organisational culture as an antecedent is not assumed,
although, it is generally claimed that culture (i.e. in a different context) is a function of
knowledge sharing (Haag et al., 2010). In order to make the assumption that culture can
be a primary antecedent of knowledge sharing; there is a need to look at the nature of both
culture and knowledge sharing process. Despite the recognition of the influence of culture
on effective knowledge management implementation (Janz and Prasarnphanich, 2003);
knowledge management practices (Alavi et al., 2006); and knowledge sharing,
management and transfer (Schumann and Tittmann, 2010), the relationship between
organisational culture and specific knowledge sharing processes is not investigated
(Mueller, 2012).
Nonaka and Takeuchi (1996) theorise that knowledge is created when both tacit and
explicit knowledge are complementing and interfacing each other through four switching
modes; socialisation, externalisation, combination, and internalisation. It is suggested that
the basic cognitive process of knowledge conversion between tacit and explicit
knowledge is a natural process that is highly dependent on culture and the supporting
environment. It can be argued that knowledge is intensely embedded in different
organisational routines and practices including organisational culture, values, practices,
policies, repositories, documents, systems, and memories. It resides in individual
assumptions and requires an appropriate state that provides inter-subjectivity in order to
be conclusive. Therefore, the importance of organisational culture in the knowledge

46
sharing processes is widely acknowledged. Ponis et al., (2010, p. 15) argued that culture
is made up of values, assumptions and beliefs of organisational members that strongly
influence how organisational strategies are implemented. It implies that values,
assumptions and beliefs facilitate organisational members to invent, discover, or develop
their external adaptation and internal integration so as to deal with the problems. For
scholars, it is always a primary concern to grasp specific ways (or cultural context) in
which creation has taken place. The cultural difference may have an influence on the
knowledge (or the way people perceive events and objects). It implies that the act of
perceiving any objects is subject to culture or cultural values and assumptions.
In an organisational context, cultural difference and similarities may prevent the act of
perceiving any objects on the one side and expedite the entire process on the other. For
instance, the social interaction may be the main source in deploying tacit knowledge
because the continuous process of sharing and observing life or work experiences through
social interaction and replicating these interactions with learning by doing so may be the
source of creating new knowledge (Nickols, 2000). Moreover, organisational culture
offers a mutual system of learning in which people can share and exchange life or work
experiences through social interaction. Kitayama et al. (1997, p. 1247) found that
people’s cognitive capacities can be changed if they are exposed to a new host culture. In
other words, culture either pacifies the environment in which knowledge sharing takes
place or it tends to regulate individual behaviour which is important for knowledge
sharing. Thus, organisations should provide an environment in which people utilise their
cognitive capacities during workplace socialisation for knowledge sharing and use.
The concept of knowledge creation also discussed in terms of individual behavior as
shown in Figure 2.5. For example, Delong and Fahey (2000) argued that knowledge
creation is a behavioural phenomenon as behaviours are playing a mediating role in the

47
knowledge creation process. According to Hagg et al. (2010), culture determines an
individual’s behaviour whereas behaviour is a result of different sociological forces which
has the capability to influence people. It implies that the culture regulates individual
behaviour and this regulated behaviour has a tendency to create new knowledge in terms
of new ideas, concept, and know-how (Ribiere and Sitar, 2003).
Figure 2.5 Elements of culture
Source: (Delong and Fahey, 2000)
More specifically, Delong and Fahey (2000) identified three primary elements of
organisational culture; namely, values, norms and practices that directly impact
behaviours which, in turn, keep influencing knowledge sharing and its utilization as
illustrated in Figure 2.5. It is argued that values, norms and practices are fundamentally
interconnected at multiple levels. Values are deeply rooted and may not be easily
expressed, but it would impact on knowledge creation capability because it manipulates
individual behaviour that could be the source of useful knowledge creation. Therefore, it
suggested that the interplay between norms and values support the desired behaviour
which is necessary to create and sustain knowledge creation and sharing capability. It
further indicated that, culture demonstrates a specific set of practices which are required
in daily routines. Thus, practices symbolically provide a direct lever for change that may
be needed to support knowledge creation, sharing, and use.

48
Moreover, it is strongly conceived that the knowledge creation process not only is
‘culturally situated’ but stems from a specific cultural context. Also, four SECI
knowledge creation modes (socialisation, externalisation, combination, and
internalisation) are robustly influenced and created by culture and cultural attributes
(Nisbett et al., 2001). Due to the scarcity of literature, an attempt has been made to link
up some elements of organisational culture and the four knowledge creation processes at
an organisational level for which it was originally intended.
2.3.2 Learning
Beyond the widely-accepted proposition that learning constitutes a pivotal aspect of the
competitive advantage of organisations (Argyris and Schön, 1996; Senge, 1990), learning
in general has received attention throughout the last century owing to its explicit
recognition as a necessity of human life (Dewey, 2014) and its ubiquitous presence
wherever activities occur (Lave, 2009; Wenger, 2009). It has however, passed through
many different phases, which may explain that it is nowadays frequently perceived as a
“vogue term” (Contu et al., 2003, p. 932) but also a generally “good thing” (Contu et al.,
2003, p. 932).
Organisational learning is generally attributed to changes in the behaviour of people,
leading to better results in comparison to a previous point in time (Spender, 2008). Within
traditional perspectives there also resides the claim that these changes are to occur in spite
of continuity of those stimuli that generate action; assuming the possibility that
environmental factors could remain static (Weick, 1991). However, learning may also
happen without any observable changes in conduct, when it only leads to a better
understanding of the respective phenomenon (Elkjaer, 2009). Organisational learning is
linked, and sometimes reduced to, learning curves, which provide evidence that
performance of mechanical activities improves by repeatedly executing them, which can

49
be called learning by doing (Argote et al., 1990; Darr et al., 1995; Epple et al., 1991;
Reagans et al., 2005).
Traditional learning theories are often based on behaviourism, focusing on stimulus-
response relations and selective reinforcement, minimising pain and maximising pleasure
(Piaget and Inhelder, 1969). This is argued to change behaviour or cognitive structure as
suggested within cognitive learning theories (Wenger, 2009). These treat environmental
factors as independent variables of learning (Kolb, 1984). Moving beyond the traditional
theories of learning, the American philosopher and psychologist John Dewey was among
the first who advanced a theory of learning based on experience, which is converted into
knowledge. In contrast to traditional theories of learning, author emphasised its process.
The understanding that learning is a process, generating knowledge has indeed found
broad acceptance among scholars and practitioners (Duncan and Weiss, 1979 as cited in
Weick, 1991).
It may be regarded as a widely accepted fact that experience plays a central role in the
learning process. According to Weick (1991, p. 121) experience is manifested through
perception and interpretation of events. Elkjaer (2009, p. 74) argues that “experience is
the relation between the individual and environments, ‘subject’ and ‘worlds’, which are
the terms I use to connote a socialised individual and the interpreted world”. The central
role of experience on learning is depicted by Kolb (1984), who defines learning as “the
process whereby knowledge is created through the transformation of experience”.
Kolb and Kolb (2005) point out the six propositions of their learning theory, which has
been very influential, and are based on experience:
[1] Learning should be understood as a process not as an outcome.
[2] Learning builds upon prior knowledge, termed relearning.

50
[3] Learning is about the resolution of dialectical conflicts of adaption to the
world.
[4] Learning is an holistic process of adaptation to the world.
[5] Learning involves the interaction between the person and the environment.
[6] Learning is about the creation of knowledge.
Within this theory as illustrated in Figure 2.6, the learning process is triggered by a
concrete experience, which initiates reflective observation, followed by an abstract
conceptualisation to then start an active experiment.
Figure 2.6 Experiential learning
Source: (Kolb and Kolb, 2005).
Whilst the model of experiential learning may be regarded as simplistic, as pointed out
by Mezirow (2009), it has had a big influence on contemporary learning theory,
highlighting the role of experience and connecting it with learning. It has been suggested
that some learners have different preferences in their learning and thus focus more on one
dimension or the other. However, the role of experience is pivotal either way, causing
reflection, rejection, emotional response of action as Mezirow (2009) points out.

51
However, experience may also lead to no learning at all as Elkjaer (2009, p. 81) argues:
Some experience never enters consciousness and communication, but remains emotional
and subconscious. Accordingly, and in line with Dewey (2014), Elkjaer (2009, p. 81)
highlights the role of discourse, which may be in the form of language or other forms of
communication, such as pictures, to elevate experience to consciousness.
Notwithstanding this, it may be argued that even emotional or subconscious experiences
lead to learning, even though the learner may not be explicitly aware of them. Still, in line
with Elkjaer (2009), this research will indeed emphasise the role of willingness to learn,
as it will become evident in this dissertation.
Teece et al (1997) differentiate between learning as a process in which recurring
execution and experimentation improve performance, and learning as the identification
of new opportunities. From an organisational perspective this may be described as either
exploitation, which is to be understood as improved performance and efficiency gains, or
exploration, the creation of something new (O'Reilly and Tushman, 2008). March (1991)
argues that the adequate balance between exploration and exploitation capabilities within
a firm represents a critical component for company survival and well-being (Gibson and
Birkinshaw, 2004; Lavie et al, 2010). Those organisations that are able to efficiently
manage this balance, by answering the dynamic business requirements of today, while
also assuring survival in the long term, can be coined ambidextrous (Levinthal and March,
1993). While there seems to be a general agreement that KS between exploitation and
exploration is important for organisations, the proposals on how to reach this balance are
different. Knowledge sharing has been associated with all of these learning outcomes.
2.3.3 Leadership
Leadership is one of the fields that is most discussed around the world. It has gained
importance in every walk of life, from business and education to social organisations.

52
Although administrative leadership has long been a subject of interest, the scientific
research on leadership began in the early 20th century. Researchers have found leadership
behaviours to be important determinants of organisational success (Bass, 1990, Saenz,
2011, DuBrin, 2012). Organisations today need people with leadership ability they are
believed to bring assets and success to their organisations (Northouse, 2007). Good
leadership has the ability to bring change in relation to environmental demands
(Schermerhorn, 2008). It is considered the solution to most organisational problems
(Yukl, 2013). Riaz and Haider (2010) noted that effective leaders have the ability to lead
organisations to success by paying more attention to expected future events and
environmental change.
Leadership plays a vital role in establishing high-performing teams and is one of the
critical elements in enhancing organisational performance (Northouse, 2007, Betroci,
2009, DuBrin, 2012). It has been identified as one of the key factors in promoting
innovation (Jung et al., 2003). According to Yukl (2010), there is no general agreement
on the definition of leadership. Some of the definitions that have appeared in the past
include the following:
[1] Leadership includes directing and coordinating the work of group
members (Fiedler, 1967).
[2] Leadership is exercised when a group of individuals mobilises political,
and other resources to arouse, engage and satisfy the motives of followers
(Burns, 1978, p. 18).
[3] Leadership comprises influential processes that affect the actions of
subordinates (Yukl, 1981).

53
[4] Leadership is the ability to motivate confidence, encouragement and
support among the organisational members who are required to reach the
goals of the organisation (House et al., 1991).
[5] Daft (1999) defined leadership as the influential relationship that occurs
between leader and followers who aim to make changes that reflect their
shared purposes.
[6] Leadership is described as a process that encourages others to work hard
to accomplish tasks (Schermerhorn, 2008).
[7] Leadership is a process that includes the effects of individuals and the
group towards the accomplishment of goals (Robbins and Coultar, 2005).
[8] Oke et al. (2010) found leadership to be a social process that takes place
in a group context in which the leaders influence their followers’
behaviours to achieve desired organisational goals.
[9] Leadership is a process in which an individual influences a group of
individuals to achieve certain goals (Northouse, 2007, 2012).
[10] Dubrin (2007, 2012) defined leadership as the ability of the leaders to
motivate confidence, encouragement, and support among their followers,
who are needed to achieve the goals of the organisation.
[11] Leadership is defined as a trait, behaviour, influence, or relation between
leader and followers, or the role relationships of an administrative position
(Yukl, 2006, 2010, 2013).

54
Although different definitions listed above, most cover the following: leadership is a
“process” by which a leader can affect and be affected by their subordinates. The leader’s
“influence” on the followers, is considered a necessary condition without which
leadership cannot exist. Leadership occurs in a “group” and influences the individuals in
that group to have the same goals as the leader. It involves the “accomplishment” of set
of goals through the direction of a group of people.
Others, such as Daft (1999), have added another element to the idea of leadership,
describing it as including the influence that occurs between leaders and their followers,
that produces the outcomes the leader wants, so that both leader and followers are actively
involved in the pursuit of a change aimed at reaching the required goals. Daft argued that
these elements are connected and cannot be separated from the success of the process of
leadership (see Figure 2.7)
Figure 2.7: Elements of leadership
Source: (Daft, 1999, p. 6)

55
It is clear that the people who can affect others are called leaders, while the people towards
whom the leadership is directed are called followers, and that both leaders and followers
are connected in the leadership process (Northouse, 2007).
There is a consensus among leadership researchers that leadership centres on the same
issues as management. Therefore, it is useful to differentiate it from this term. According
to Bennis and Nanus (1985), management means the achievement of activities, actions
and main routines, while leadership focuses on creating a vision for change and influence.
Kotter (1990) further clarified the distinction between management and leadership:
Management produces order and consistency through planning and budgeting, organising
and staffing, controlling and problem solving. Meanwhile, leadership produces change
and movement by establishing direction, aligning people, motivating and inspiring them.
Although management and leadership deal with different activities, it is argued that both
are essential to the success of organisations (Northouse, 2007). Thus, the two terms are
complementary and overlapping, while managers who are concerned with affecting a
group so as to achieve their goals, practice leadership, leaders who engage in planning,
organising, and controlling are involved in management. Several studies of leadership
have been produced over the years (Burns, 1978, Bass, 1985, Northouse, 2007, Yukl,
2010). As a result, different schools of thought have emerged regarding such aspects as
traits, styles, behaviour, situational, transactional and transformational leadership.
2.3.4 Structure
According to Huczynski and Buchanan (2010), the rationale for an organisational
structure itself is to divide and allocate the activities of organisations, then control and
co-ordinate these activities in pursuit of the organisational purpose. They highlight

56
specialisation, hierarchy, span-of-control, chain-of-command, departmentalisation,
formalisation, specialisation and centralisation as the building key variables of structure.
Hatch and Cunliffe (2006) identified the characteristics of five structural types:
functional, multidivisional, matrix, hybrid and network. A functional structure divides the
organisation by specialist departments such as culture, accounts and operations.
Responsibilities are clearly defined and within the functions there can be close
relationships. However, co-ordination between functional groupings can sometimes be
problematical, and Lam (1996) was in no doubt that a structure separated into different
functions inhibits knowledge sharing. Multidivisional structures consist of a collection of
separate functional structures. This is typical of larger organisations and groupings can
be created on the basis of products groups or geographical territories. Coordination
between groups is provided by the headquarters (Hatch and Cunliffe, 2006). Johnson et
al (2011) pointed out the dangers of fragmentation with this structure and again consider
that this impedes knowledge sharing.
In contrast the matrix structure is a combination of functional and divisional structures
and employees may report to two managers in different sections, typically a functional
manager and project manager. Although this can lead to conflict due to competing
demands (Hatch and Cunliffe, 2006) there is an increase in accessibility to different social
networks for employees and this will serve to improve horizontal knowledge sharing
(Cummings, 2004).
The network structure is relatively new and accentuates lateral rather than horizontal
communication. Groupings within the company are characterised by partnership and
collaboration and on the whole knowledge sharing and innovation are encouraged (Hatch
and Cunliffe, 2006). The dominant form of organisational form for the majority of the

57
twentieth century has been the bureaucracy. Bureaucracies typically exhibit functional
specialism, a hierarchy of authority and normally possess a formal set of rules that
employees are compelled to follow Morris and Farrell (2007).
Clearly, characteristics such as the focus on trust, the sharing of strategic information, the
network of relationships and open boundaries are favourable to knowledge sharing and
management in the post-bureaucratic model whereas the hoarding of information at the
apex of the organisation coupled with the consequence of trust can only be a disincentive
to sharing knowledge. In addition, the bureaucratic form was also no longer considered
to be fit for the purpose due to the development of fast-moving markets and an
intensification of competition due to its rigidity and lack of responsiveness (Morris and
Farrell, 2007). Post bureaucracies are also credited with the ability to engender high
performance flexible workforces able to adapt to change, and more importantly for
knowledge sharing establish lateral rather than top down communication (Applebaum et
al., 2000; Tucker, 1999).
2.4 Knowledge sharing performance
This section defines performance in general, discussing use of the term in the literature,
the growing body of research specifically on performance and research using similar
terms. In using words such as ‘fulfilment’ and ‘achievement’, the definition alludes to
some sort of attainment or reaching a standard in the output of a process. They suggest
that a wide range of things may perform, including processes, actors or products.
2.4.1 Performance
The term ‘performance’ is widely used across a range of bodies of knowledge in the
literature, including strategy, operations management and innovation. As Lebas, (1995)
argued, few people agree on what performance really means: it can mean anything from

58
efficiency, to robustness or resistance or return on investment, or plenty of other
definitions never fully specified.
Table 2.2 Examples of use of the term ‘performance’ in recent publications
Journal No. Publications
with Performance
in Title)
Examples of Publications and their Use of
‘Performance’
International
Journal of
Operations
and
Production
Management
106 Millington et al. (2006): Performance
of suppliers, in particular global
suppliers
Narasimhan et al. (2005):
Performance of
manufacturing plants
Kennerley and Neely (2003): Measuring
performance
Fynes and Voss (2002): Quality,
manufacturing and business
performance
Journal of
Operations
Management
78 Kaufmann and Carter (2006):
Supply management performance,
performance outcomes of sourcing
Melnyk et al. (2003): Corporate and
environmental performance
Hendricks and Singhal (2003): Financial
performance of the organisation
Journal of
Purchasing
and Supply
Management
11 Paulraj et al. (2006): Supply chain
performance
Day and Lichtenstein (2006):
Organisational performance
O’Toole and Donaldson
(2002): Relationship
performance dimensions
Harvard
Business Review
30 Kaplan and Norton (2005): Performance
measures
Kirby (2005): High performance
company
Augustine et al. (2001): Performance of
individuals Journal of
Product
Innovation
Management
41 Leenders et al. (2007): Performance of
new product teams
Frishammar and Sven (2005): Innovation
performance
Langerak et al. (2004): New product
performance, organisational
performance
Morgan and Vorhies (2001): Business
unit performance
Hultink and Atuahene-Gima
(2000): New product selling
performance
Cooper et al. (1999): New
product portfolio performance

59
Further, other existing research has studied performance in a less specific way. For
example, Carter and Ellram, (2003) reviewed the most common research topics in the
Journal of Supply Management. Papers on inventory and production management
including forecasting, purchasing organisation and contracting including contract
management and cost analysis all attempt to build theories about how organisations
manage their processes or other organisations towards improving or maintaining
performance in some form.
So far the literature suggests that performance is a commonly used term, indeed other
similar terms also appear such as ‘success’, ‘value’ and ‘effectiveness’. Ritter and
Gemunden, (2004) built a concept of product innovation success based upon measures
including an organisation having better market response to innovations compared with
others. ‘Success’ is thus used in a very similar conceptual sense to performance as
analyzed above, however Ritter and Gemunden, (ibid.) give a success scale that is reverse
scored: “Our competitors have more success with their product innovations”,
demonstrating that success is a positive concept that is either present or absent, whereas
performance may be positive or negative. Success has had limited use in the literature
whereas performance has been used extensively in the concepts of performance
measurement and performance management for example. In addition to success and the
opposite concept of failure, Cooper and Kleinschmidt, (1987) refer to new product
winners and losers in the same publication, again suggesting that terminology is relatively
common in the field.
2.4.2 Performance measurement
A performance measure is defined by Neely et al., (2005) as: “a metric used to
quantify the efficiency and/or effectiveness of an action”. Although this definition
was produced on the basis of a review of the performance measurement literature,

60
it is limited when viewed in the context of the broader performance literature
reviewed in this research. Efficiency and effectiveness are broad descriptions of
performance, but the literature also includes research on softer aspects of
performance such as quality of life (Skevington, 1999) and more qualitative aspects
of performance in general (Teece, 1992), that are not viewed from such a
mechanistic, operational viewpoint. The definition presents measures as objective,
though the human element involved in using a measure suggests that there is some
subjectivity involved (Johnson and Kaplan, 1987 pp. 253-262). The discussion of
quantification is not inclusive of softer, qualitative measures and the term ‘metric’
is a narrower term that is often used to replace ‘measure’, alluding to quantitative,
decimal scales. Expressing the concept of measurement, Farbey et al., (1993 pp. 75-
94) described how a measurement procedure maps and preserves the difference in
a set of symbols and the difference in attributes of a collection of entities. This
expresses the same basic phenomena as Neely et al., (ibid.), yet reflects the broader
concepts in the literature. It is shown in Figure 2.8.
Attribute Metric
Where L=Attribute
M = Metric

61
Figure 2.8 Diagrammatic view of measurement
Source: (Farbey et al., 1993)
As suggested by the Neely et al., (2005) definition and criticism of it, views of
measures and the process of measurement in the literature come from a variety of
philosophical viewpoints from natural science to social science. The different
perspectives of measures cover both objective natural science and subjective social
science measures and measurement processes. The latter tend to be more
qualitative, taking far more account of the role of humans in the measurement
process, than quantitative natural science views. Literature on the background to
performance measures also discusses issues of validity of measures and whether to
use nominal, ordinal, interval or ratio scales for example (Bryman 2004, pp. 65-75,
225-227).
Being a prominent part of the performance literature, discussion of performance
measurement reflects themes in the development of the performance literature as a
whole. For example, financial performance measures are often used in the
accounting based literature (Biddle et al., 1997, Ferguson and Leistikow, 1997), the
early literature (Ridgway, 1956) and often where a sole performance measure is
used (Hendricks and Singhal, 2003). However operational measures have received
increasing attention, as they lead or drive future financial performance, whereas
financial measures follow performance, showing the results of management action
already taken (Kaplan and Norton, 1992, Ittner and Larcker, 1998a). Also there is
an emphasis on using measures taking a view external to the organisation, focusing
on customer satisfaction. Johnson and Kaplan (1987 pp. 253-262) also promote a
broader description of organisational performance than the traditional financial
measures, which they describe as rooted in nineteenth century cost accounting and

62
inappropriate for the increased dynamism and competition in the contemporary
business setting as illustrated in Table 2.3.
The range of performance measures is not only becoming broader, but more diverse
and specialised. Further specialist types of performance measures include those of
innovation, discussed when defining performance of innovation (Tidd et al., 2005
pp. 561-569, Chiesa et al., 1996). However, Coombs and Bierly (2006) emphasise
that performance measures in the technology field usually have shortcomings. The
broad range of performance measures reflect the broad conceptualisations of
performance found in the literature. Having described a range of types of measures,
the literature also discusses their appropriate selection and implementation
(Hammer, 2007; Purbey et al., 2007; Ridgway, 1956), including a summary of
existing work in the area (Neely, 1997). Table 2.3 summarises the literature
concerned.
Table 2.3 Advice for effective performance measures based on the literature
Publication Recommendations for Effective
Performance Measures
Description of Research
Principles
Hammer
(2007)
Decide what to measure
Measure the right way
Use metrics systematically
Create a measurement
friendly culture
Guidance to avoid ‘the 7
deadly sins of performance
measurement’, enabling
performance improvement

63
Purbey et al.
(2007) Sensitivity to changes in
internal and external
environment of
organisation
Reviewing and
reprioritising internal
objectives when
environmental changes are
significant
Deploying changes to
internal objectives and
priorities to critical parts of
the organisation
Ensuring that gains
achieved through
improvement programs
are maintained
Guidance for characteristics
of a performance
measurement system for
healthcare processes
Robson
(2005)
Measurement system
must provide relevant
graphical information at
local level
Performance measurement
information must be in form
that assists people in
perceiving their control of
performance as part of their
job
Measurement system
designed from the outset
with psychological
consequences in mind
Examines how to
implement a performance
measurement system that
creates a high performance
culture
Bititci et al.
(1997) System deploys corporate
and stakeholder objectives
throughout organisation
System defines key
competitive factors,
position of business within
competitive environment
Focus on key business
processes to manage
performance
A measurement
methodology
differentiating
between actuality,
capability and
potentiality
Use of proactive rather
than reactive measures
Presents reference model
for a performance
measurement system, as a
critical system embedded
within performance
management as a key
business process

64
Kaplan and
Norton
(1992)
Use a broad based set of
measures
Measures should have an
associated goal
The opinions of a range of
stakeholders should be
taken into account
Develops a practical tool
consisting of a range of
measures intended to avoid
maximising performance in
one area at the expense of
another. Both financial and
operational measures
should be used, operational
measures are the drivers of
future financial
performance
Lea and
Parker
Simple to understand
Ensure visual impact
Improvement focused
rather than on variance
Japanese operations (1989) management based work
using lean principles.
Fortuin
(1988)
Enable fast feedback
Provide information
Be exact and precise about
what is being measured
Be objective not subjective
Development of effective
indicators, operations
research numerical,
objective bias.
Johnson and
Kaplan (1987
pp253-262)
Use broader range of
operational
performance
measures rather than
traditional accounting
measures
Describes the inadequacy
of traditional management
accounting system
measures, advocating a
broader, operations based
approach to measures.
Globerson
(1985)
Be aligned with strategy
Provide timely and accurate
feedback
Relate to specific,
stretching but
achievable goals
Based on quantities that can
be influenced or controlled
Clearly defined
Be part of a closed
management loop
Have an explicit purpose
Be based on an explicitly
defined formula and source
of data
Use ratios rather than
absolute numbers
Use data which are
automatically collected
as part of a process
where possible
Effective performance
measures must be
developed as a basis for
effective planning and
control performance
management.
Emphasis on operational
performance criteria.

65
Ridgway
(1956)
Both qualitative and
quantitative performance
measures must be used to
avoid dysfunctional
consequences
Performance measures must
be chosen to determine the
right behavioural
consequences
Describes and gives
suggestions for mitigating
the effects of dysfunctional
consequences of
performance measures.
2.5 Research gaps
The major challenge of measuring the benefits of knowledge sharing to organisational
performance is the process of selecting the most suitable approach, improve competitive
advantage for the organisation in the market which they operate, particularly when
confronted with issues of organisational factors (Yang et al., 2014). Another challenge
which focuses on knowledge activities within the organisation is how to retain and
retrieve knowledge within the organisation for the purpose of achieving organisational
goals (Yassin et al., 2013). These challenges have motivated developing a model for data
warehousing of individual and group experiences, providing a resourceful learning
organisation for sharing of knowledge, enhancing individual performance in the
organisation (Lahoz and Camarotto, 2012). There are existing studies that have provided
conceptual solutions to these problems rather than empirical, that organisational learning
is the foundation for effective knowledge sharing within the organisation shows that study
in this field is under-researched from an international context (Evans, 2010). The
development of an empirical knowledge sharing model creates an environment for an
organisation to motivate their staff in building an organisational knowledge bank and
examine the implemented knowledge processes, by empowering individual members
through the transfer of knowledge from the originator to develop positive reinforcement,
team building and organisational performance (Yassin et al., 2013).

66
Researchers have carried out a significant number of studies through which organisations
have implemented knowledge management systems to support activities and processes to
achieve improve performance. However, for an organisation to implement successful
knowledge management systems, an employee’s readiness to adjust or adopt to the KS
system must be considered and motivated, the extent to which employees hold positive
views to modifications within the organisation can also be influenced by the leadership
structure of the organisation (Özşahin et al., 2013). therefore, for employees to contribute
their know-how to the organisation, there must be an enabling environment for the
organisation and the employees, one of the ways to build an enabling environment for
employees is to have an organisational structure which provides a sense of ownership of
the organisation, hence, employees have the opportunities to invest their resources at the
same time, which gives them that feeling of ownership (Markham, 2012). This remains a
dearth of literature which shows support for the implementation of knowledge
management systems, to improve organisational performance. There are numerous
existing knowledge management studies (Al-Khawaldeh et al., 2013, Chang et al., 2009)
concerned with organisational factors and different organisation-wide changes in
achieving organisational goals.
There is a need to justify the contribution of knowledge sharing to the performance of an
organisation and to support organisation-wide goals. Hence, there is a need to measure
knowledge contribution as an asset and a process. Therefore, such measurement system
should consider OFs set or facilitators which are gaps for the implementation of the
knowledge sharing system (Lai et al., 2011). There is indication that such research draws
attention to organisational goals with an organisation’s adaptive strengths from
knowledge sharing system for the purpose of improving organisational performance.
67
However, there is no study where the performance of knowledge sharing has been
measured using specific analysis techniques to assess the impact of OFs.
The potential causal factor in order partially to adopt the suggestions of those who have
challenged the validity of organisational knowledge performance (Barney and Hoskisson,
1990) and focus on the performance implications of organisational-specific
characteristics without neglecting organisational factors completely. Rather, both
parameters will be taken into account simultaneously and it will be suggested that
complementarity between them provides a better explanation of performance than
considering only a single notion at a time because each provides different perspectives on
the source of competitive advantage, increasing the likelihood of complementarity rather
than substitution.
Knowledge power explanation, focuses on the impact of components of knowledge
sharing on an organisation’s ability to raise prices above a competitive level. This
explanation is rooted in the structure-conduct-performance (S-C-P) paradigm of industrial
organisation economics (Bain, 1956) in that, if the industry structure (e.g. number of
competitors, product heterogeneity, and entry and exit costs) and the particular firm’s
conduct or actions (e.g. price taking, product differentiation, tacit knowledge, and
exploiting market power) restrict the entry of newcomers into the industry by raising
various barriers, then that firm will achieve above normal performance, while firms that
cannot take advantage of knowledge power will achieve only normal or below normal
performance. This concept is built on a review of opportunities and threats in the
environment (external appraisal) under the SWOT analysis model. It is reflected in the
KS of this research in that its proponents, with an “outside-in” view, focus firstly on
analyzing the external or industry environment and then positioning business processes
by developing unique strategies as well as related surrounding contexts (combination of

68
technology, structure and process), collectively called configurations, to best match the
organisation.
Efficiency explanation, focuses on the impact of disparity between organisations’ ability
to respond to customer needs, as some firms are more effective and efficient than others
(Demsetz, 1973), resulting in superior performance (Rumelt, 1984). This explanation is
rooted in neoclassical price theory (Foss and Knudsen, 2003) in that it is costlier for less
efficient organisations to mimic more efficient firms, perpetuating differences in their
performance levels. Likewise, this notion is developed in a review of organisational
strengths and weaknesses (internal appraisal). This included an attempt to develop
typologies of these tangible and intangible assets in order to suggest that different types
of factors of production may have different effects for organisations (Barney and Clark,
2007). These assets were first called simply “resources” (Wernerfelt, 1984; Barney,
1991b) with no more detailed categories. When building on Selznick (1957), they
developed their core competencies concept of a diversified firm and added the term
“competence” to this research stream. Stalk, Evans and Shulman (1992), argue that
competencies and capabilities are different, then added the term “capabilities”. Moreover,
as resource-based theory continues to develop, other parallel research streams have
emerged to explain the same phenomenon from different perspectives. Although it is
helpful to understand the full range of an organisation’s factors, Barney and Clark (2007:
249) argue that “the essential predictions of resource-based theory did not change with
the introduction of these [resource] typologies”. In other words, whether the knowledge
is called resources, capabilities, competencies or whatever, the theoretical prediction will
be exactly the same in that these organisational factors are likely to be a source of
sustained competitive advantage only if they enable the organisation to implement a
strategy that increases customers’ willingness to pay and/or reduces its costs. At the same
69
time, such strategies must be path dependent, causally ambiguous or socially complex.
This research stream is at the root of OFs, another construct used in this research,
advocates of which, taking an “inside-out” view, primarily emphasise the characteristics
of internal resources and capabilities within organisations derived from collective and
learning processes. This, in turn, creates efficiency, resulting in above average
performance and sustainable competitive advantage.
2.6 Conceptual framework
As seen from the previous section, a large amount of existing research on KS, OF and
PERF has been published relating to the literature of this study. The main purpose of this
study is not just to explore past studies, but to provide an overall picture of the body of
knowledge, and more importantly to elicit KSP conceptual framework. Hence, it is
important to demonstrate the links between KS, OF and PERF as illustrated in Figure 2.9.
In addition, the KSP conceptual framework is developed in order to fill the research gaps
identified in the literature by contributing new knowledge to the field of this study.
Knowledge sharing is the platform where employees directly/indirectly mutually ex-
change individual ‘know-how’, ‘know-what’ and ‘know-why’ (Liu et al., 2012, 2014).
Based on (Abidi, 2001; Anand et al., 1996; Anand et al., 1998; Cannataro et al., 2002;
Nemati et al., 2002; Park et al., 2001; Sforna, 2000; Shaw et al., 2001), SECI model has
been developed. In categorising the SECI model, internalisation and socialisation as
knowledge sharing process converts organisational knowledge to individual knowledge,
while combination and externalisation as knowledge sharing process is the transfer of
individual knowledge to organisational knowledge (Bock et al., 2005, Cui et al., 2005,
Ling and Nasurdin, 2010, Andreeva and Kianto, 2011, Ferraresi et al., 2012).
Organisations position knowledge sharing activities as a means to tackle unresolved

70
problems, innovation and reduce cost. Furthermore, implementation of successful
knowledge sharing practices has benefits to organisation, such as improved performance
and decision making. Tacit and explicit knowledge are the foundations of socialisation
and combination respectively, while for externalisation and internalisation, it will be
classified as an equal share of contribution by Sokolov and Wulff (1999), Huang et al.
(2000), Wilkins and Barrett (2000), and Shafer and Agrawal (2000). The KSP conceptual
framework as shown in Figure 2.9 defines knowledge sharing modules, organisational
factors and knowledge sharing performance feature, as well as the links between them.
Figure 2.9 KSP conceptual framework
Source: (Oyemomi et al., 2015)
Knowledge transformation process has incorporated the significant of SECI model and
Japanese Ba theory to business activities. The advantages of knowledge sharing has
propelled an environment in the organisation for knowledge generation, also supporting
decision making, key knowledge indicators measure the performance of knowledge
sharing by comparing the outcome of the organisational process before the
implementation of knowledge sharing and after. Knowledge transformation process
combine organisational activities with knowledge to achieve optimal performance.

71
2.6.1 Knowledge sharing modules
It is important to consider main limitations to the integration of knowledge sharing
with organisational factors. The role of knowledge sharing for future research needs
to support decision making through its impact on organisational performance.
Therefore, the foundation of knowledge has to be embedded in the processes of the
organisation, starting with the types of knowledge; tacit knowledge as a type of
knowledge is context specific, therefore it is very difficult to document, codify and
communicate (Laudon and Laudon, 2002). However, tacit knowledge is understood
to be the hub where new knowledge is initiated. On the other hand, explicit
knowledge is knowledge which can be codify, documented and easily
communicated. Hence, the transfer of explicit knowledge is more easily carried out
through a channel while tacit knowledge requires enabling environment for transfer
(Oyemomi et al., 2015, 2016). The KSP conceptual framework presents the
combination of tacit knowledge from the SECI model and the social context for
interaction, the nature of tacit knowledge requires an organisational environment
where shared mental model exist. Although for knowledge sharing to be effectively
productive, the following organisation factors; culture, leadership, structure and
learning needs to be favorable for employees to actively share their experiences and
‘know-how’ (Liu et al., 2014; Oyemomi et al., 2016). In order to avoid the
complexity of knowledge sharing at group, sectorial and departmental level will
ensure documentation of specialised knowledge sharing, this procedure promotes
the association of knowledge sharing activities with processes within this domain.
Therefore, the summation of knowledge sharing activities in all departments forms
the organisational knowledge sharing process.
72
This feature sets out the knowledge domains which is in existence and focus on
sharing that knowledge from individuals to groups, from groups to departments and
from departments to the entire organisation as a whole. In terms of strategic decision
support, the contribution of knowledge sharing is an orientation towards attaining
efficiency in organisational processes as well as improving competitive advantage
(Lee and Lee, 1999; Liao, 2000). Knowledge sharing strategy ensures that
organisations are capable of developing organisational memory by integrating
existing knowledge from employees’ knowledge domains. Ultimately, considering
the fact that organisational memory is built on experiences of employees which are
gained over a period of time, therefore the interaction of employees with
organisational processes over time deposits new knowledge which improves
performance.
2.6.2 Knowledge sharing performance
Organisational performance is classified into three main levels; financial, non-financial,
and operational level (Kennerley and Neely, 2003, Kaplan and Norton, 2005). The
financial level of an organisational performance is the net profit derived after sales.
Almost all companies focus more on finance performance (Lindgreen and Wynstra, 2005,
Eriksson and Lofmarck-Vaghult, 2000). The non-financial level is considered as the
employees’ satisfaction, the outcome of finance performance most often dependent on
the non-financial performance, while operational level is the performance of the market
share, quality of products and services (Kaplan and Norton, 1992). However, financial
and operational performance is directly influence by the efficiency of non-financial
performance.
During the last two decades, there is a shift from measuring only financial performance
to financial and non-financial performance of assets and liabilities. The annual report of

73
the organisation reflects the relationship between financial and non-financial entities
(Johnson and Kaplan, 1987 pp. 253-262). Therefore, the contribution of either hampers
the performance of the other. Most financial performance measurements have national
and international report standards. There are guide-lines which are supervised by financial
governing institutions, hence, the measurement of financial performance of the
organisation is easy to quantify. On the other hand, there exist little or no non-financial
governing institutions to design a uniform measuring guide-line for the organisations
(Johnson and Kaplan, 1987 pp. 253-262). Therefore, the measurement of non-financial
performance activities such as knowledge sharing is developed within organisations.
Hence, this study is looking into the non-financial performance of the organisation,
specifically on the contribution of knowledge sharing. Performance measurement
provides a comprehensive view of the organisation’s achievement over a given period of
time, this achievement varies when comparing time periods, and performance is subjected
to factors such as; government policy, environmental conditions and other external
influences. Owing the limited research in this area of study, it is difficult to measure the
performance of knowledge sharing in the organisation, however, organisation relies on
internal planning and monitoring to evaluate key impacts of knowledge sharing activities
in the organisation. Internal planning and monitoring uses strategic performance
indicators such as; internal target setting and feedback to evaluate the knowledge non-
financial achievements.
2.6.3 Links between KS, OF and PERF
As identified in literature and research gaps, there is existing research on KS, OF and
PERF. However, the relationships between the components of KS and OF have not been
measured in the past. Therefore, the need to measure knowledge contribution against cost
investment encourages effective organisational decision making. Research on knowledge

74
performance has taken tremendous steps in finding how knowledge sharing contributes
to improve organisational performance for better decision making. Investment in
knowledge assets primarily shows knowledge output when decisions are based on
customers’ satisfaction from products and services of the organisation. Intra and inter
organisational knowledge activities improves the creation of new knowledge, during this
process, employees improve their knowledge base and this knowledge base enhances
employees’ performance (Teece, 1992). KPIs are set values or figures which are tools
used to measure against targets, goals, and objectives. KPIs provide the platform to
compare both internal and external targeted performance milestones. KPIs are
characterised by;
[1] The fewer the number of indicators, the better the performance.
[2] Knowledge impacted processes should be measured against real factors.
[3] Comparing of indicators should reflect past, present, and future.
[4] The interest of stakeholders should come first when designing indicators.
[5] To achieve a more comprehensive performance, complex indicators should be
simplified. KPIs represent organisational key success factors.
This concept of performance management as some sort of planning and controlling action
in addition to performance measurement is found widely.
2.7 Summary
This chapter discussed the relevant literature in the field of knowledge sharing,
organisational factors and performance context. This study is the first study that explores
the possibilities of measuring knowledge sharing performance by studying the impact of

75
organisational factors on knowledge sharing. Knowledge sharing performance is useful
to gain more understandings about key factors to influence knowledge sharing. Despite
the importance of the topic, there is a lack of knowledge and empirical work in the area
of knowledge sharing performance. Thus, this study explores the knowledge sharing
concepts and proposes a conceptual framework on knowledge sharing performance in
organisational context arguing that knowledge sharing is affected by organisational
factors. This research seeks to assess the contribution of knowledge sharing to
organisational performance and maintaining long-term performance.

76
Chapter three: Research methodology
3.1 Introduction
This chapter discusses the design of the research strategy and methodology. Since the aim of
this study is to measure the impact of organisational factors on knowledge sharing, the
methodology adopted in this study is primarily quantitative seen as a suitable methodology to
answer research questions and achieve research objectives. It outlines the research philosophy,
approach, design and methods chosen for this study along with the justifications behind
selecting them. Furthermore, it discusses research ethnics.
3.2 Research philosophy
The choice of methodology should be guided by fundamental principles. The term research
philosophy is concerned with the development and nature of knowledge (Saunders et al.,
2012). Research philosophy affects the quality of management research, so it is viewed as an
important notion in research design (Easterby-Smith et al., 2012). Moreover, the specific
research philosophy which a researcher adopts can be considered as his or her assumptions in
regards to the way in which he or she views the world, so this assumption will underpin the
research strategy and methods (Saunders et al., 2012). Easterby-Smith et al. (2012) argued that
this is why the research philosophy is useful because it leads researchers to clarify research
designs. Further, researchers can not only identify and create research designs beyond their
previous experience, but also can adapt designs in accordance with the constraints of different
knowledge structures. The belief that one research philosophy is superior to another may be
wrong as each philosophy suits different aims (Saunders et al., 2012).
A research design is a framework that guides how research should be conducted, based on
people’s philosophies and their assumptions about the world and the nature of knowledge
(Collis and Hussey, 2009, p. 55). The philosophical paradigms reflect specific ontologies and
77
epistemologies. Ontological assumptions concern the nature of reality whilst epistemology is
concerned with valid knowledge (Collis and Hussey, 2009). The ontological perspective looks
for not only objectivism, which contends that social phenomena have an existence that is a
reality external to social actors, but also constructionism (constructivism), which argues that
social phenomena are generated by social interaction in a constant state of revision (Bryman
and Bell, 2011). Bryman and Bell (2011) asserted that an epistemological issue is associated
with what should be considered as acceptable knowledge in disciplines, and in particular the
most central element of epistemology is whether a social world can be investigated in
accordance with the same procedures, ethos and principles as natural sciences.
In general, there are two main philosophical paradigms on epistemology: positivism and
interpretivism. Positivism supports the application of natural scientific methods to social
reality and beyond (Bryman and Bell, 2011). Easterby-Smith et al. (2012) contended that a
social world must be evaluated through objective ways rather than subjective methods such as
reflection or intuition because positivists assume that the social world exists externally.
According to Creswell (1994), positivists assume that investigation of social reality has no
impact on that reality since they tend to see reality as independent from them. Positivism is
concerned with quantitative research because it assumes that research can measure social
phenomena (Collis and Hussey, 2009). Positivists prefer researching causal relationships by
collecting observable data and developing associations and using existing theory (Saunders et
al., 2012). In addition, positivists are likely to adopt a highly structured methodology so as to
ease replication (Gill and Johnson, 2010)
Deductive approach refers to the research in which a theoretical structure is developed and
evaluated through empirical observations (Collis and Hussey, 2009), whilst an inductive
approach begins with data in hand and creates a theory from the ground up (Saunders et al.,
2012). The deductive approach is likely to be employed in positivism whilst the inductive

78
approach is dominant in interpretivism. As shown in Figure 3.1, this study assumes positivism
since the main constructs will be tested by a deductive approach based on extant theories.
Given this, the quantitative methodology is employed because it is concerned with a deductive
approach focusing on test my theory. Quantitative research is associated with survey research
(Saunders et al., 2012), and closed questions are typically employed in quantitative research
using large-scale surveys (Hair et al., 2007). Therefore, the survey method including closed
questions is selected as the major research strategy. In terms of choosing a time horizon, the
‘snapshot’ time horizon means cross-sectional whilst longitudinal represents ‘diary’
perspective (Saunders et al., 2012).
Figure 3.1 The research ‘onion’ path in this research
Source: (Saunders et al., 2012)
Dess et al (1993: 783) suggest that research on performance is primarily inductive in nature a
process of observation and description. Short et al (2008) also assert that the uniqueness of KS
research is in pursuing three goals describing organisations by identifying the similarity of

79
important dimensions; explaining organisational success and failure by arguing about fit
within any given circumstance; and predicting which sets of firms will be successful in a
particular context. In other words, organisational KS researchers believe that events are
determined by antecedents. These causal relationships can be understood from and verified by
the empirical evidence (empiricism). The knowledge from observation can then be generalised
to the world at large (generality). Clearly, with these scientific assumptions, this research
stream appears to be consistent with positivism.
In addition to recognising critical theory, critical realism and the social constructivism
concept, the awareness of Feyerabend’s (1975) criticism of Lakatos’s (1970) assumption that
all areas of study must share the basic characteristics of physics. Feyerabend (1975) argues
that methodologies and standards for judging physics may not be suitable in other areas.
Unlike physics, studies of people and societies cannot proceed by isolating an individual
mechanism without affecting the subject under investigation. In other words, a change in
theory may bring about a change in the system being studied. Nevertheless, this literature still
shows no good examples to support the argument regarding this criticism as illustrated in
Table 3.1. Although the “swings of the pendulum” of theory and research in strategic
management (Hoskisson et al., 1999) have two main implications for the theoretical focus of
source of performance and the dominant method for conducting strategic management
research, they have no effect on the organisational KS performance relationship, the
phenomenon being studied.
Table 3.1 Fundamental quantitative research strategy
Quantitative Research Principal orientation to the role of theory in
relation to research Deductive; testing of theory
Epistemological orientation Positivism
Ontological orientation Objectivism
Example of methods Survey, Laboratory experiments
Source: (Bryman and Bell, 2007, p. 28)

80
The positivist concept that best fits with this thesis appears to be that of Lakatos (1970)
because it conforms to the real situation in this research stream. His suggestion, regarding the
way to deflect away from the hard core (negative heuristic) towards model in the protective
belt (positive heuristic), has inspired me to propose integrating DEA and fsQCA to explain
knowledge sharing performance, the main argument of this dissertation, how to maintain the
knowledge sharing performance and reduce the impact of organisational factors by suggesting
a favourable conditions as another causal condition that will improve the organisation’
competitiveness. The core of the KS-performance, this study answers Dess et al (1993) call
for a research philosophy that permits a causality inference to be applied in this literature by
using DEA and fsQCA as the research methodology rather than continuing to use a rigid
approach like most previous research, which may help improve the match between the
research programme’s predictions and observation and experiment without relinquishing the
core of the KS- performance. A supporting reason for switching from a conventional
correlational approach to a set theoretic approach will be covered in detail in Section 3.4.
3.3 Research design
According to Bryman and Bell (2007), research design is a way to define the framework and
methods to collect and analyse data to support propositions or to answer research questions.
Five well-known research designs are suggested:
[1] Experimental design is a research design that researchers set, control and manipulate
independent variables to observe the outcomes from a dependent variable. This design
is strong for its internal validity; a way to ensure that there is a relationship between
the independent and dependent variable. However, this design is difficult to conduct
to study organisational behaviours because in a real situation for example in an
organisation, it is difficult to manipulate and control variables and environments.
81
[2] Cross-sectional design is a design that “entails the collection of data on more than one
case (usually quite a lot more than one) and at the single point in time in order to collect
a body of quantitative or quantifiable data in connection with two or more variables
(usually many more than two), which are then examined to detect patterns of
association” (Bryman and Bell, 2007). In this design, researchers cannot manipulate
and control any variables so causal relationship can hardly be claimed in the same
way as experiment design does.
[3] Longitudinal design is a design that entails time and context which the changes are
created. This design involves comprehensive level of analysis of phenomenon through
time. Hence, it is time and cost consuming and usually, it is an extension of social
survey research to observe phenomenon. Causal relationship can be inferred by this
design.
[4] Case study design is an intensive examination and analysis of a case study location
such as a workplace and an organisation. This design tends to favour qualitative
methods because details and explanations are generated from observation and
interviews.
[5] Comparative design is a research design involving comparing and contrasting the
identical or different cases or situations in order to gain more understanding.
Comparative design is an extension of cross-sectional design to involve two or more
cross-sectional studies. One example of comparative design is cross-cultural research
or cross-national research which is research conducted in two or more countries
(Bryman and Bell, 2007). The main purpose of cross cultural research is to explore
significance and meaning of differences and similarities of the chosen cultures.

82
As shown in Figure 3.2, the research design of this study is divided into four stages. The first
section focused on conceptual stage, the second one was created for data collection, the third
was designed to reveal the data analysis, findings and discussion, and the final one was
constructed to provide a more detailed account of this study’s research conclusion and key
contribution.
[1] The flow of activities in the first stage were carried out by designing research questions
and research objectives, literature review based on the application of the research
questions and research objective to focused organisations, developed a conceptual
framework from literature review and identifying possible research gaps.
[2] The second stage is the data collection phase of this study. This section consists of the
data collection approaches that were used by conducting a survey which followed the
following procedures:
Data collection protocol
Questionnaire design
Sampling strategy
Pilot study

83
Figure 3.2 Research design
[3] The third stage of the research design implemented the data that were collected at stage
two of this study by using DEA and fsQCA methods to analyses the data. The analysis
was carried out in two parts i.e the DEA analysis to find the knowledge sharing
effieciency and the fsQCA analysis for knowledge performance identifies the
relationships of components of KS and OFs. Thereafter, the findings of the analysis
were presented and discussed.

84
[4] The fourth stage explains the conclusions of all the chapters of this study by comparing
the existing research work to the concepts derived for KS and OFs relationships for
KSP. Furthermore, key contributions to theory and practice were discussed along with
future research.
3.4 Research methods
The qualitative method allows the research findings to emerge from significant themes
inherent in qualitative raw data and uses several methods to collect these data as illustrated in
Table 3.2. Researchers deal with a small sample of subjects and theory is developed as a result
of the data analysis. Hence, this approach is exploratory, unlike the explanatory nature of
quantitative research. It works well under the interpretivist paradigm (Creswell, 2009).
Creswell (2009) explains that this component represents the declaration of forms of data
collection, analysis, and interpretation, which the researcher intends to employ in the research.
Table 3.2 Research methods
Quantitative method Predetermined
Instrument based questions
Performance data
Attitude data
Observational data
Census data
Statistical analysis
Qualitative Method Emerging methods
Open-ended questions
Interview data
Observation data
Document data
Audio-visual data
Text and image analysis
85
Mixed Methods Both predetermined and emerging methods
Both open-ended and closed-ended questions
Multiple forms of data drawing all possibilities
Statistical and text analysis
Source: (Creswell, 2003, p. 17)
The decision over whether to use the deductive or the qualitative method is not an easy one,
but it is important to attach these methods to the philosophies of the research as this will help
the researcher to determine the types of strategies and methods to be used in the data collection
(Saunders et al., 2012). Since this study uses mono-paradigm, quantitative method was used;
the first stage is to explain the differences in knowledge sharing efficiency and their effects on
PERF and innovation across sectors, and in the second stage to test the association model.
The survey is a method associated with the deductive method. It helps the researcher to collect
a large amount of data from a sizeable population using a questionnaire (Saunders et al., 2012).
According to Bryman (2012), the data collected by using a survey strategy can provide several
possible explanations of the relationships between variables and posit models of these
relationships. Gray (2009) noted that there are two types of survey: descriptive and analytical.
A descriptive survey is designed to measure the characteristics of a particular population at
various times and enable the researcher to identify the variability in different phenomena. An
analytical survey, on the other hand, attempts to test a theory and to explore whether there is
a relationship between the independent variables (the causes of change) and the dependent
variables (the subject of change) (Gray, 2009).
Saunders et al. (2012) explained that the choice over which questionnaire to use will be
influenced by several factors related to the questions and objectives of the research, such as
the characteristics of the respondents, the size of sample required for the analysis, and the
types and number of questions needed to collect the data. Researchers have distinguished
between two further types of questionnaire: self-administered and interviewer-administered.

86
Self-administered surveys are usually completed by the respondents themselves: this type
encompasses three sub-types:
[1] the delivery-and-collection questionnaire, where the researcher delivers the
questionnaire by hand to each respondent and collects it later (Gray, 2009).
[2] the postal questionnaire, which is sent by post to selected respondents,
[3] internet surveys and email-based surveys administered either via a website or via a
word-processed document attached to an e-mail.
(Gray, 2009) stated that the main advantage of the third method is that it can be used to cover
a wide geographical area.
On the other hand, with interviewer-administered questionnaires, the respondents’ answers are
recorded by the interviewer. The researcher can collect the data either by one of two methods:
[1] In the telephone questionnaire, he/she telephones the respondents and completes the
questionnaire based on their answers. This method is the most widely used in survey
research, because of the high proportion of the population that has access to household
telephones.
[2] In the interview questionnaire, sometimes called interview schedules, the interviewers
meet the respondents face-to-face and ask them questions directly (Saunders et al.,
2012).
3.5 Data envelopment analysis (DEA)
Key performance indictors KPIs are essential to the day to day business operations as they can
easily reflect the different aspects of performance and be used as descriptive, diagnostic and
predictive measures. Whilst KPIs alone cannot indicate the possible magnitude of

87
improvements, they can be used in benchmarking studies so as to seek this externally oriented
information. However, the external information necessary to the interpretation of the measure
itself cannot generally be easily included in the KPI measure itself. For example, vehicle
weight cannot be easily incorporated in the miles per gallon measure despite the fact that
knowing the vehicle weight is essential to interpret miles per gallon. Furthermore, both
methods struggle to reflect all aspects of performance in a single measure. Instead several
KPIs have to be used to reflect all aspects of performance. Although weighted averages are
often used to address this issue, Laise (2004, p. 624) warns on the risk associated with using
simple weighted averages to find best in class performers. Similarly, Cooper et al (2007)
explain how problems can arise when arbitrarily choosing weights. This makes finding best in
class performers using KPIs or traditional benchmarking hard and potentially impractical task.
On the other hand, literature has shown that outranking methods are better suited to ranking
different entities. Analytic hierarchy process AHP, a method first introduced by Saaty (1980),
calculates each criterion’s weight through matrix calculations based on dominance values
given by managers generally on a 1-9 scale although some are known to use different scales.
This process has the advantages of appraising each criterion’s weight by translating human
opinions of dominance to actual weights (a more robust process than arbitrarily choosing the
weights). The process also checks on the consistency of the manager’s perception of criteria
dominance. Nevertheless, the ELimination Et Choix Traduisant la REalité ELECTRE methods
do not only weigh each criterion individually but works on a dominance basis instead
(although weights can be used to relax the notion of strict dominance) (Buchanan and
Vanderpooten, 2007). These two different methods address traditional benchmarking
limitations in regards to finding best in class performers for multi-criteria situations. They
could consequently both be used to find best performers in terms of multi-criteria
benchmarking. However, they do not offer a satisfactory method to include the factors that are
necessary to the interpretation of the knowledge measure and thus, do not answer all its

88
limitations. Consequently, similar conditions could be compared without bias using these
outranking methods (which in turn limits the usefulness of these methods).
In contrast, frontier methods provide suitable mechanisms to measure performance against
several different criteria. Moreover, these methods offer mechanisms to incorporate the
variables necessary to the interpretation of the knowledge measure which cannot be
satisfactorily included within traditional or outranking approaches. Stochastic frontier analysis
SFA, the production frontier method which looks at efficiency from a statistical perspective,
can incorporate these kinds of variables as exogenous variables (Kumbhakar and Knox Lovell,
2000, p. 261). Similarly, DEA offers adequate mechanisms to take into account in the
calculations exogenous or undesirable factors.
The literature on the inclusion of exogenous and undesirable factors seems more extensive in
DEA than in SFA. Additionally, because SFA relies on a statistical approach, the confidence
in the inferences drawn from datasets in which variables are only observed once (these datasets
are called single cross section) is severely limited (Kumbhakar and Knox Lovell, 2000, p. 95
and p. 166). Although DEA requires adequate and intelligent data cleansing to ensure that no
measurement error is assigned to a Decision Making Unit’s (DMU) efficiency, it performs
well with single observation datasets. Additionally, DEA provides very efficient and relatively
easy ways to analyse the factors affecting efficiency (Cooper et al., 2007), a feature which
importance was highlighted by Tingley et al (2005).
Due to its statistical approach, SFA is less robust than DEA at measuring performance when
dealing with datasets having a limited number of observations. DEA seems to be a more robust
choice in this respect. In light of the previous theory, DEA can also be used as descriptive,
diagnostic, and predictive performance measures. Effectively, DEA scores can be used to
quantify observed performance (descriptive), weights and slacks are a powerful tool to
understand the reasons behind performance (Cooper et al., 2007), and extensive research was

89
also conducted on measuring performance over time using DEA (Cooper et al., 2007).
Similarly, the knowledge sharing efficiency model can encompass all the relevant families of
measure (productivity/resource utilisation) into a single model and thus, into a single measure.
Finally, DEA has been widely applied in the banking sector (Cullinane et al., 2006, p. 356)
although the literature concentrates mainly on financial performance (Cullinane et al., 2006,
SangHyun, 2009), benchmarking (Yoshida and Fujimoto, 2004, Yu, 2004, Pestana Barros and
Dieke, 2007), or other important performance indictors rather than directly on knowledge.
There is no paper found dealing with the use of DEA to measure knowledge, and despite the
potential interest highlighted in the aforementioned literature on knowledge sharing. This lack
of research brings originality to this study.
For all the above reasons, this study will use DEA as a means of measuring knowledge sharing
efficiency.
Table 3.3 lists the performance measures introduced so far and compares their different
characteristics.
Table 3.3 Performance measure comparison table
PM KPI benchmark AHP ELECTRE SFA DEA
Measure can be used as a
descriptive measure
Measure can be used as a
diagnostic measure
Measure can be used as a
predictive measure
Can appropriately include
other factors in the measure
Benchmarking
Compare agaainst best
performance
Can easily draw inferences
from limited observations

90
Efficiency is commonly measured through the mean of a performance ratio which takes the
form illustrated in Formula 3.1 (Cooper et al., 2007):
Formula 3.1 Efficiency ratio
More generally, efficiency ratios can also be used to reflect productivity such as with the
number of jobs per day/vehicle (where the number of jobs is the output and day/vehicle the
input). These measures are called ‘partial productivity measures’ in an effort to differentiate
them from ‘total productivity measures’ (Hayes et al., 1988); the latter attempting to take into
account all outputs and all inputs under the same efficiency ratio (Cooper et al., 2007, p.1). A
total productivity efficiency ratio can be illustrated as in Formula 3.2.
Formula 3.2 Total factor productivity ratio
The choice of weights in DEA is not arbitrary but is rather the result of an optimisation process
completed for each entity. One interesting feature of total productivity measures is that they
reduce the risk and increase the chances of attributing gains to one factor which are in fact
caused by another factor (or other factors). For instance, if a supermarket’s sales increase
following an advertising campaign, the ratio ‘sales / labour’ would also be likely to improve.
However, labour’s performance could have potentially decreased during that same period and
this could go unnoticed (or worse, the sales increase could be attributed to labour). The total

91
productivity approach used by DEA avoids this problem by directly including all parameters
under the same ratio and simultaneously measure the impact of all factors.
3.6 Fuzzy-set qualitative comparative analysis (fsQCA)
In this section, this study will argue for the benefit of a set theoretic approach over a
conventional correlational approach in terms of its greater suitability to the objective of this
research. Both conceptual and brief analytical procedures regarding fsQCA, a proposed
analytical technique grounded in set theory, since this methodology is relatively new to the
knowledge management field. Casual condition and equifinality, the two main arguments of
this research, share the same underlying assumption as the set theoretic approach that patterns
of attributes will exhibit different features and lead to different outcomes depending on how
they are arranged (Fiss, 2007: 1181). In other words, contextuality, which is how attributes
within a case of concern are arranged (as present or absent conditions) and interacted, rather
than the net effect of all attributes (as isolated items), determines the outcome. Casual
condition exists when there is a match between causal factors, which leads to a higher level of
outcome. By the same token, equifinality takes place when there are at least two different paths
(combination of causal factors) that result in the same level of outcome. However, although
the discussion of organisational KS stresses causal asymmetry, synergistic effects and
equifinality, previous research studies have been conducted mainly using an econometric
method, which relies on causal symmetry, additive effects and an assumption of unifinality
(Fiss, 2007) because of the lack of the alternative technique supporting causal asymmetry,
synergistic effects and equifinality assumption.
This assumption mismatch resulting from methodological gap makes it impossible to capture,
not to mention test, combination and equifinality, potentially leading to equivocal results in
prior researches. For instance, regression analysis is based on the independent contribution of
a particular variable while everything else stays the same, usually called a ceteris paribus

92
condition (Kogut, 2010). By focusing on the net effect of a variable without taking into account
the meaning of the presence or absence of other variables, regression analysis cannot identify
in which situations a particular variable has more (or less) influence on the outcome. In other
words, correlation-based analysis cannot both detect Casual condition (Fiss, 2007) and
consider equifinality (Van de Ven and Drazin, 1985).
The interaction effect, and two and three-way interactions in particular, has been utilised in
organisational KS to circumvent the limitations of regression analysis (Baker and Cullen,
1993; Dess et al., 1997; Miller, 1988). Nonetheless, three-way interaction is by and large the
current boundary of interpretation (Van de Ven and Drazin, 1985; Dess et al., 1997; Ganzach,
1998). Furthermore, the assumption that its estimated nonlinear relationship applies to all
cases under examination stands in direct opposition to the equifinality assumption (Gresov
and Drazin, 1997; Fiss, 2007).
This method cannot explain how each of these variables are relevant to the outcome. In fact,
it cannot even demonstrated whether a particular variable shown in the identified group is
really a part of the cause. Therefore, one of the weaknesses of this technique is that it is
possible that cluster analysis may classify two cases with many similar variables in the same
group, whereas in fact these variables are irrelevant to the outcome (Fiss, 2007). In addition,
cluster analysis relies on the researcher’s judgment regarding the choice of sample and
variables, scaling of variables, stopping rule, similarity measure and clustering method (Ragin,
2000).
A deductive approach which has also been employed to study knowledge sharing
performance is deviation score (Drazin and Van de Ven, 1985; Delery and Doty, 1996). Again,
although this method is theoretically more convincing than cluster analysis because it allows
modelling regarding the relationship between the level of performance and the level of the
profile’s fit (deviation score), which is calculated from the difference between a theoretically-

93
defined ideal type and the empirical profile of the organisation in the dataset, deviation score
is still prone to the same criticism as cluster analysis, which is its inability to identify which
misfitting profile actually results in low performance (Fiss, 2007). In other words, although
deviation score is an improvement on cluster analysis, it still cannot distinguish the more
relevant causal factors from the less relevant ones. Thus, the “black box” concern remains
unsolved: only a limited peek into the box is achieved (Fiss, 2007). Furthermore, this approach
is also based on the researcher’s judgment regarding the ideal profile. Hence, the reliability of
deviation score is questionable owing to the debatable level of reliability of its original value
(Gupta and Govindarajan, 1993).
Key problem remains because the fundamental assumptions of these methodologies have not
yet taken the premise of causal complexity into consideration. With a completely symmetrical
view, they test equally for a connection between the absence of the cause and the absence of
the effect. In other words, they assume that the explanations for both negative and positive
outcomes are based on the same mechanisms and conditions, which is not true for the nature
of social science causal relationship. Obviously, the reasons causing low performance are not
necessarily the reverse of those causing high performance. Similarly, the explanations for
extremely high performance can be vastly different from those that result in moderately high
performance levels. Consequently, conventional quantitative analysis, especially correlation,
is blind to causal asymmetry assumption of set theoretic relationships (Ragin, 2008), resulting
in previous inconsistent findings.
Therefore, understanding of casual condition and equifinality cannot be developed further
without using a new empirical methodology that takes the concept of causal complexity (set
theoretic relationships) into account. This set-theoretic approach is uniquely suitable for
analysing the impact of organisational factor knowledge sharing, because it is based on the set
94
relationship understanding of how causes combine to bring about outcomes, and because it
can handle significant levels of causal complexity (Ragin, 2000, 2008; Fiss, 2007).
Furthermore, in contrast to regression analysis, nonparametric, set methods make sample
representativeness less of a concern because they do not assume that data are drawn from a
given probability distribution. In addition, as part of QCA procedure, which will be explained
later, the calibration of sets to measure research constructs reduces sample dependence. This
is because set membership is defined relative to substantive knowledge rather than the sample
mean, thereby further reducing the importance of sample representativeness (Fiss, 2007,
2011). In summary, these points suggest that a set-theoretic approach will allow for the
analysis of small to medium-sized situations, in which the number of cases is too large for
traditional quantitative analysis and too small for many conventional statistical analyses, for
example between 10 and 50 cases (Ragin, 1994, 2000; Lacey, 2001). However, it should be
noted that, although QCA was initially considered to be a small-N approach, more recent
works have extended QCA to large-N settings unproblematically (Greckhamer et al., 2008;
Ragin and Fiss, 2008).
In summary, one of the main reasons for the prior KS researches’ puzzle (equivocal results) is
the methodological gap, particularly the mismatch between the underlying assumption of
causal relationship of methodologies available for the previous studies and actual social
phenomena. Hence, this study proposes using a set-theoretic approach fuzzy set qualitative
comparative analysis, or fsQCA to test the model of this research. fsQCA (Ragin, 1987, 2000)
is a formal analysis of qualitative evidence to study causal complexity, focusing on what
conditions are necessary and/or sufficient for an outcome of interest using Boolean algebra (a
set-theoretic method). The fundamental idea of this method is that cases are best understood
as combinations of attributes resembling overall types and that a comparison of cases may
allow a researcher to strip away attributes that are unrelated to the outcome in question (Fiss,

95
2011). fsQCA’s logic is rooted in the “method of difference” and the “method of agreement”
(Mill, 2002), in which one compares instances of the cause and outcome to understand patterns
of causation. Unlike previous methods, fsQCA focuses on set-subset relationships to examine
causal patterns. For example, to understand which combination of OFs leads to high overall
performance, the fsQCA researcher first considers members of the set of “high-overall
performing” organisations and then distinguishes the combinations of attributes (OFs)
associated with the relevant outcome (high overall performance) using Boolean algebra that
allows logical reduction of various complex causal conditions into a reduced set of
combinations that lead to the outcome.
In order to gain a clear understanding of the mechanism of the set-theoretic approach, it is
better to compare it with the quantitative approach. Therefore, the basic steps of the
quantitative approach will be summarised for the purposes of comparison, then the main
differences between these approaches will be discussed. After that, the procedure for fsQCA
will be explained. The conventional template for the quantitative approach starts by
identifying the phenomenon under consideration (dependent variable) believed to vary across
cases and/or over time. Then, a literature review of relevant theories and studies must be
conducted to list the most important causes (independent variables). The quantitative
researcher should develop measurements for both the dependent variable and independent
variables and identify a given population that has variation in both variables. Depending on
the selected dataset, control variables may be required to include independent variables. After
specifying the associations and/or models, multivariate analysis is conducted on the selected
variables to estimate the “net effect” of each independent variable based on its intercorrelation
with other independent variables and its correlation with the dependent variable. In the final
stage, re- specification of the analysis, the most important independent variables are identified.
Some independent variables that have weak effects on the dependent variable or are weakly
justified by theory may be dropped. The researcher can then report a theory that explains the

96
greatest variation in the dependent variable (Ragin, 2008). The set-theoretic approach, on the
other hand, assumes that “relationships among different variables are often best understood in
terms of set membership” (Fiss, 2007: 1183). This fundamental notion has three implications
as follows.
First, it uses calibrated sets, instead of measured variables. Rather than using a variable that
captures a degree of variation across observations relative to each other based on indicators of
sample-specific statistics (e.g. company A has greater operations capability than company B
or than average), a set is employed to be more case-oriented because it requires membership
criteria based on external, substantive standards, and thus has classificatory consequences
(Ragin, 2008). A set is not just a nominal-scale variable with values of 0 (non- membership)
and 1 (full membership), also known as a crisp set. Cases may vary in the degree to which
they satisfy membership criteria, which is the primary idea of fuzzy sets (Ragin, 1987, 2000).
In fuzzy sets, between 0 (non-membership) and 1 (full membership) represent varying degrees
of membership in the set. In other words, a fuzzy set allows partial membership of the set. 0.5
is the crossover point between “more in” and “more out”. As mentioned previously, the
assignment of set membership scores (a process called “calibration” in fsQCA) follows
directly from the external standard definition of the set as shown in Table 3.4.
Table 3.4 Crisp set versus fuzzy set
Crisp set 0
fully out 1
fully in
Fuzzy set
(6 values)
0
fully out
0.2
mostly but not
fully out
0.4
more or less
out
0.6
more or
less in
0.8
mostly but
not fully in
1
fully in
Fuzzy set
(continuous)
0
fully out
0<Xi<0.5
more out than in
0.5 (crossover)
neither in nor out
0.5<Xi<1
more in than out
1
fully in
Source: (Ragin, 2008)
Accordingly, the processed data consist of set membership scores, which reflect membership
of cases in sets. For instance, in the previous example, rather than only measuring the score of

97
company A and comparing it with other companies’ scores or even a mean score, the
researcher must also specify the score according to external, agreed standards that would
qualify a company for full membership in the set of high operations capability (membership
score = 1) and specify the score that would completely exclude it from this set (membership
score = 0), meaning it is not in a set of high operations capability (OP).
It should also be noted that the set of firms that are out of a set of high OP is not the same as
a set of low OP. It is possible to be a company that is not in a set of high OP but still not in a
set of low OP. This is because the criteria for these two sets are not necessarily the reverse of
each other. In addition to the benefit of calibration to differentiate between “different kinds of
case” as mentioned earlier, the researcher can also calibrate a fuzzy set to “differentiate
between different kinds of causal connections” (Ragin, 2008). For example, is it a firm with
high OP that is linked to avoiding input inefficiency (formally: ⊂) or is it not a firm with low
OP (formally: ⊂ IE)? These two notions, again, are not mirror images, for there are plenty of
companies that are not high OP but still not in a group of firms that have input inefficiency.
Unlike the conventional research method with the assumption of symmetry, a fuzzy set can
easily address these kinds of competing arguments simply by assigning different calibration
schemes to the same indicator.
Obviously, a fuzzy set allows the researcher to achieve “fidelity to verbal formulations” by
calibrating a membership score that is directly commensurate with theoretical constructs
(Ragin, 2008), while variables in the traditional quantitative approach will be taken for granted
without calibration. Aiming to explain cross-case and/or variation over time in the dependent
variable, conventional quantitative researchers calculate total pools of variation in the
dependent variable by adding up the effects of all observed independent variables, but they
may still not know which cases (combinations of causal conditions) actually exhibit the
outcome that inspired them in the first place (Ragin, 2008).

98
Assuming that company A achieves the criterion for the set of high OP (let us say, 0.7, which
is a membership score greater than 0.5, the crossover point or the most ambiguous point), and
hence it is more “in” than “out” in this set, company A is then classified as a firm with high
OP. In formal mathematical terms, let A be a company A and OP a set of firms with high
operation capability. The previous statement can be restated as A is a member of set OP or A
is a subset of OP or formally: A⊂OP. Figure 4.4 shows an example histogram displaying the
difference between a set of high operations capability and a set of low operations capability,
as well as example company A.
Figure 3.3 Histogram showing difference between high and low operations capabilities
Source: (Ragin, 2008)
Secondly, relationships between social phenomena are perceived and can be modeled in terms
of set relations. This is best explained by example. Let OP be a set of firms with high
operations capability and OA be a set of firms with high overall performance. Thus, the
statement that firms with high operations capability exhibit high overall performance (all firms

99
with high operations capability are high overall performance firms) may be restated as that
such firms form a subset of high overall performance firms (formally: ⊂). This statement can
also be mathematically paraphrased as that a set of high overall performance firms is a superset
of high operations capability firms (formally: ⊃).
Thirdly, the result emphasises causal complexity. In social phenomena, the overlap between
two sets need not be absolute. For instance, from the previous example, consider CT, a set of
firms with high culture capability. This characteristic may also lead to high overall
performance, thus making firms that do exceptionally well in their culture activities another
subset of high overall performance firms (formally: ⊂). Yet there may, in fact, be little overlap
between the two subsets OP and CT; one can easily imagine a situation in which a cost
reduction-led production system and a high level of advertisement expense may inhibit or
preclude each other, thus making both OP and CT non-overlapping subsets of OA. This may
be expressed in the following logical statement:
[1] where “+” denotes the logical operator or, which represents the union of two sets,
while “” denotes the logical implication operator, as in “OP or CT implies OA”.
Both OP and CT therefore present two different but viable ways of achieving high
overall performance.
Consider a somewhat more contingent statement: firms that exhibit an efficient production
system will be high overall performing if they do not conduct much OL, i.e. if they are not in
a set of high product design and OL capability. In logical terms, this statement may be
expressed as follows:
[2] where “” denotes the logical operator and, which represents the intersection of two
sets, while “~” denotes the logical not, which represents non-membership of the
referred set (complement set).

100
In effect, statement 2 shows a contingency in set theory. To better understand the possible
complexity of the causal relationship in social phenomena, specifically a concept of
contextuality, which suggests that an outcome is determined by how attributes are arranged
(case-oriented), rather than the net effect of all attributes as isolated items (variable-oriented),
let us introduce another contingency statement: firms with high culture capability (CT) will be
high overall performing if they also exhibit a high level of product design and OL capability.
Combining this statement with statement 2 from above results in the following statement:
[3] The Boolean statement above thus summarises two contingency statements (causal
recipes) about the relationship between organisational factors OFs and a firm’s overall
performance.
The fact that all of the ingredients in one of these two causal recipes must be present for the
outcome to occur demonstrates that this view pays attention to how conditions combine in
each case, and thus is much more case-oriented than the net effects understanding of causation,
which is variable-oriented (Ragin, 2008). These social phenomena can be viewed in terms of
set-subset relationships, which are better interpreted in terms of necessity and sufficiency
(Ragin, 1987). These two notions allow researchers to generalise from a limited set of cases
to larger populations.
On the one hand, a necessary condition indicates that an outcome can be achieved only if the
attribute in question is present. It should be noted that the researcher need not consider the
attribute in question for cases in which the outcome has not been achieved, because whether
the attribute in question is present or absent in such cases does not violate the statement of
necessity. The implication for the set-theoretic approach regarding necessity is that
membership of cases in the causal attribute under consideration must be more than or equal to
the membership of cases in the outcome of interest. Essentially, a set of the causal conditions

101
must be a superset of the outcome. In other words, a set of the outcome must be a subset of
the causal conditions (Ragin, 1987, 2000).
On the other hand, a sufficient condition suggests that an outcome will always be obtained if
the attribute in question is present. It should be noted that the researcher need not consider
achievement of the outcome for cases in which the attribute in question is not present, because
whether the outcome of interest is present or absent in such cases does not violate the statement
of sufficiency. The implication for the set-theoretic approach regarding sufficiency is that
membership of cases in the outcome of interest must be more than or equal to the membership
of cases in the concerned causal attribute. Essentially, the set of the outcome must be a superset
of the causal conditions. In other words, the set of the causal conditions must be a subset of
the outcome (Ragin, 1987, 2000).
Necessary and sufficient conditions for fuzzy sets can be presented in visual format by plotting
the membership scores of cases in an XY matrix, which has a membership score of causal
conditions as the horizontal axis and a membership score of the outcome as the vertical axis.
(It may also be a combination of conditions depending on the researcher’s focus of concern.)
As mentioned above, cases are not allowed to show in the upper left area above the diagonal
line in order to achieve a necessary condition because this area represents cases for which the
causal attributes concerned are more than or equal to their membership in the outcome of
interest. Conversely, cases are not allowed to show in the lower right area below the diagonal
line in order to attain a sufficient condition as this area represents cases for which membership
in the outcome of interest concerned is more than or equal to their causal attributes.
Conventional steps in understanding a contexuality of solution paths of fsQCA results (Crilly,
2011; Fiss, 2011; Greckhamer, 2011) start with discarding unreliable solution paths using a
particular consistency threshold (e.g. 0.65 is used for “usually” sufficiency). Then the residual
solution paths will be grouped by their combination of core conditions. Those share the same

102
combination of core conditions (in term of their presence and absence) will be categorised into
the same group. The difference between these unique groups displays first-order equifinality
(different across-group) that equally achieve a particular outcome, while the difference within
a particular group (a deviation exists only in combination of peripheral conditions.) portrays
second-order equifinality (different within group) (Fiss, 2011).
By applying this notion into this research context, both types of equifinality provide evidences
supporting this research argument that the prior researches’ unifinality assumption in the
relationship between KS or OF or their combination and corresponding performance (i.e. one
best way) is wrong, rather there are many possible ways leading to the same level of outcome
depending on the contexuality or the arrangement of attributes of each case. In other words,
they prove causal complexity and causal asymmetry assumption in the concerned relationship,
which in turn resolving previous inconsistent findings, at different levels. The presence of
first-order equifinality suggests a trade-off (substitution) in a broader sense, which is across
different groups based on their unique combination of core conditions, to achieve a same level
of desired outcome while the presence of second-order equifinality suggests a trade-off
(substitution) in a narrow sense, which is between different combinations of peripheral
conditions within a group that shares the same combination of core conditions, to also achieve
a same level of desired outcome. Therefore, different constellations of peripheral conditions
surrounding core conditions in the same analysis provide a finer-grained understanding of
which conditions are substitutes for each other (other peripheral conditions) under second-
order (within-group) equifinality. Apart from finding potential substitution relationship
mentioned above, a careful consideration of a contexuality of solution paths of fsQCA results
may also suggest a potential “true” combination between two attributes present as core
conditions within the same solution path because both are required with the same level of
importance. Moreover, existence of an empirically dominant combination, which is a solution

103
path that has the highest unique coverage within a particular analysis, provide insights into
understanding which solution path is the most relevant to generate a concerned outcome.
Although fsQCA solves many previous limitations of conventional correlational approach, it
still has an unsolved limitation. Like regression and other standard statistical methods, fsQCA
identifies associations, not causality. In a typical analysis, fsQCA reveals combinations of
attributes associated with an outcome; it is up to the researcher, however, to model any
possible causal mechanisms. It is here that the justification for a set theoretical interpretation
of the model should be justified. The researcher can then array the possible causal conditions
in model chains and claim that it is necessary to conduct separate analysis for each
intermediate outcome. fsQCA can also be modified to include temporality in the analysis by
explicitly including attributes that include time patterns, such as “X preceded Y,” in the
analysis (Caren and Panofsky, 2005; Ragin and Strand, 2008).
With regard to a robustness test for fsQCA, Epstein et al. (2008) suggest replicating the
analysis with a reduced consistency threshold and comparing the new solution (parsimonious,
intermediate and conservative solutions) and its consistency and coverage (raw, unique and
solution coverage scores) with those of the previous analysis as illustrated in Figure 3.4. For
the robust solution, it is expected that the combinations will be similar among a variety of
consistency thresholds but the consistency and coverage may be reduced when applying a
lower consistency threshold (Schneider and Wagemann, 2012).
The conventional template for the quantitative approach starts by identifying the phenomenon
under consideration (dependent variable) believed to vary across cases and/or over time. Then,
a literature review of relevant theories and studies must be conducted to list the most important
causes (independent variables). The quantitative researcher should develop measurements for
both the dependent variable and independent variables and identify a given population that has
variation in both variables. Depending on the selected dataset, control variables may be

104
required to include independent variables. After specifying the hypotheses and/or models,
multivariate analysis is conducted on the selected variables to estimate the “net effect” of each
independent variable based on its intercorrelation with other independent variables and its
correlation with the dependent variable.21 In the final stage, re- specification of the analysis,
the most important independent variables are identified. Some independent variables that have
weak effects on the dependent variable or are weakly justified by theory may be dropped. The
researcher can then report a theory that explains the greatest variation in the dependent variable
(Ragin, 2008). The set-theoretic approach, on the other hand, assumes that “relationships
among different variables are often best understood in terms of set membership” (Fiss, 2007:
1183).
Complementarity and equifinality, the two main arguments of this research, share the same
underlying assumption as the set theoretic approach that “patterns of attributes will exhibit
different features and lead to different outcomes depending on how they are arranged” (Fiss,
2007: 1181). In other words, contextuality, which is how attributes within a case of concern
are arranged (as present or absent conditions) and interacted, rather than the net effect of all
attributes (as isolated items), determines the outcome. Complementarity exists when there is
a match between causal factors, which leads to a higher level of outcome. By the same token,
equifinality takes place when there are at least two different paths (combination of causal
factors) that result in the same level of outcome. However, although the discussion of
organizational configuration stresses causal asymmetry, synergistic effects and equifinality,
previous research studies have been conducted mainly using an econometric method, which
relies on causal symmetry, additive effects and an assumption of unifinality (Fiss, 2007)
because of the lack of the alternative technique supporting causal asymmetry, synergistic
effects and equifinality assumption.

105
This assumption mismatch resulting from methodological gap makes it impossible to capture,
not to mention test, complementarity and equifinality, potentially leading to equivocal results
in prior researches. For instance, regression analysis is based on the independent contribution
of a particular variable while everything else stays the same, usually called a ceteris paribus
assumption (Kogut, 2010). By focusing on the net effect of a variable without taking into
account the meaning of the presence or absence of other variables, regression analysis cannot
identify in which situations a particular variable has more (or less) influence on the outcome.
In other words, correlation-based analysis cannot both detect complementarity (Fiss, 2007)
and consider equifinality (Van de Ven & Drazin, 1985).

106
Figure 3.4 Flowchart of fsQCA procedures
Source: (Fiss, 2011)
3.7 Integrating DEA and fsQCA techniques
Integrating DEA and fsQCA is a circumstance in which doing more of one thing increases the
returns to doing more of another (Milgrom and Robert, 1995: 181). Setting the integration
notion in this research context, this study anticipates that consistency between KS (the
components of knowledge sharing) and OF (organisational factors) will result in better
performance than pursuing incompatible alternatives, a situation known as “supermodularity”
in fsQCA theory (Milgrom and Robert, 1995). The principal aim is not to try to resolve the
underlying theoretical tension between the two perspectives, since this study is conscious that
they are drawn from two different theoretical traditions. Rather, to improve the explanation of
knowledge sharing performance by simultaneously incorporating the impact of both industry
and firm-specific organisational factors on knowledge sharing performance, in order to
demonstrate whether consistency between them better predicts a higher performance outcome
than each individually. In effect, this study will attempt to extend the relevant empirical
literature (Schmalensee, 1985; Hansen and Wernerfelt, 1989; Rumelt, 1991; McGahan and
Porter, 1997; Mauri and Michaels, 1998; Spanos and Lioukas, 2001) by proposing a composite
model in which these two distinct but integrating perspectives explicitly modelled and
concurrently tested to find compatible combinations. Although there is no explicit theories
that integrate DEA and fsQCA stems from similarity, practices “of the any kind”, Milgrom
and Roberts (1995) considered the examples of combination of techniques by complementary.
Consequently, the dominant function of organisational performance in this field follows this
assumption that combining stems from similarity. For example, Williamson (2004) suggests
that the less varied the practices in a particular system, the better. Building on this notion, this

107
study aims to identify similarities between each integration of KS and each type of OF, which
in turn should lead to integration and generate higher levels of performance.
Although it appears that relationship between KS and OF in explaining KSP has only recently
been recognised (Conner, 1991; Mahoney and Pandian, 1992; Amit and Schoemaker, 1993;
Peteraf, 1993; Henderson and Cockburn, 1994), in fact Wernerfelt (1984) suggested that a
competitive advantage framework (the root of KS) and a resource- based view (the root of OF)
are two sides of the same coin. Likewise, Hamel and Prahalad (1986) have argued that to be
successful (to achieve sustained competitive advantage), a company must reconcile its
purpose, which is comparable with the ideal type of organisational performance, with its
means, which are comparable with the knowledge resources and OFs underlying its current
position, through strategic intent (a corporate challenge to achieve a desired future position).
Similarly, Cool and Schendel (1988: 209) have argued that if a firm’s current actions
[strategies] are incongruent with its accumulated ‘stock’ of knowledge assets [resources and
skills or competences], then it is likely to be less effective than other firms pursuing a similar
strategy but with a good ‘fit’ between current strategic investments and accumulated assets.
Barney (1992) and Barney and Griffin (1992) also argue that value is created not only through
internal fit between the resources and capabilities within a firm and its pursued strategy, but
also by external fit between the firm’s strategy and its competitive environment.
In addition, Barney and Zajac (1994) claim that, unless the content of the firm’s strategy and
competitive environment are taken into account, strategy implementation (resources and
capabilities) cannot be clearly understood. Similarly, Short et al. (2007) assert that to better
understand why some firms outperform others, strategic group level, which is an important
component of the organisational system, must be added to resource-based logic.

108
In the same manner, Sirmon et al (2007) propose that contingency theory (the root of KS)
should be integrated with resource-based theory (the root of OF) to explain resource
management processes, because value created by resource management is at least partly
contingent on a firm’s external environment. In other words, varying degrees of uncertainty
and favourability in the environment affect the potential value of a firm’s resources and
capabilities (Sirmon et al., 2007).
Perhaps the most logically convincing argument in this regard is that of Spanos and Lioukas
(2001), who argue for combination between these two theoretical models and for a composite
framework for three reasons. Firstly, by considering their difference in terms of the nature of
the organisational performance created by a firm, these two approaches are integrated in
providing multi-dimensional explanations for KSP because they offer a balanced view (both
internal and external antecedents) of sources of competitive advantage. In other words, it could
be argued that a KSP framework and a resource-based view jointly constitute the KSP model
(Spanos and Lioukas, 2001). While the focus of the KSP framework on industry analysis to
understand the industry’s impact on business unit performance provides the “opportunities and
threats” dimensions, the resource-based view, which emphasizes a specific firm’s attempts to
develop and combine resources and capabilities, constitutes the “strengths and weaknesses”
dimensions (Foss, 1996). In other words, whereas the KSP framework closely monitors
industry structure to ensure that a firm’s controlled resources enable it to maintain competitive
advantage (gain momentous edge) because factors changes “may change the significance of
resources to the firm” (Penrose, 1959: 79), the organisational factors focus on developing and
combining resources to gain knowledge sharing efficiency by considering the impact factor of
these conditions. Since these two approaches cover different domains of performance analysis
(Barney, 1991a; Foss, 1997b), each of which generate different types of value, i.e. comparative
analysis vs. efficiency analysis (Barney and Griffin, 1992; Barney, 1992; Sirmon et al., 2007),

109
they coexist and are integrating DEA and fsQCA in providing a multi-dimensional explanation
of knowledge sharing performance (Spanos and Lioukas, 2001).
Secondly, taking into account their shared belief that sustained above-normal returns are
possible and can be achieved by an attractive strategic position (Conner, 1991), each
perspective attempts to explain the same phenomenon (sustainable competitive advantage)
from different points of view, as mentioned previously. Thirdly, taking into consideration the
similarity of the unit of analysis, both also focus on the individual firm as a critical unit of
analysis (despite their dissimilar perspectives on what is more important as a source of
competitive advantage).
3.8 Research ethics
The questionnaires were distributed with an explanation on what the study was about and how
the data would be used along with the contact information of the researcher. The questions
asked respondents on their opinions about this study, their knowledge sharing perceptions,
factors that will influence knowledge interaction and how best to measure key knowledge
performance indicators within their organisations. Those answers are sensitive to their status
and the relationship with their colleagues and organisations. Furthermore, demographics and
contact information are private and important information. To assure respondents on giving
their honest answer, the researcher stated in the covered letter that their responses and their
private information would be kept confidentially. Therefore, the respondents’ information
would not be revealed or be made for commercial purposes. Ethical consideration of this
study fulfilled the ethical principles for conducting research with Plymouth university ethical
approval.
Ethics are a critical aspect for the conduct of research and refer to the appropriateness of
research behaviour in relation to the rights of those who become the subject of the work, or
110
are affected by it (Saunders et al, 2012). The study recognises that the norms of behaviour,
which prevail within ethnical consideration, may create a number of ethical positions that will
require to be carefully considered, such as reporting relationships and presentation of
commercially sensitive information. However, in pursuing the objectives of the research, it
was important to proceed with sensitivity and respect for participants.
First, an important dimension to the ethical conduct of this study is the question of the
relationship between the researcher and the participant. This required a high degree of
sensitivity on the part of the researcher not to use the existence of such a relationship or the
nature of a ‘power relationship’ (Saunders et al, 2012) to compromise the participant in any
way. Careful planning of survey rollout was also necessary given the previous position of the
researcher and this required the researcher to remain as detached and objective as possible.
Second, absolute assurances about the use of the data collected, coupled with an unqualified
confidentiality and anonymity was critical to gain trust, especially from the staff of the
organisations. The author sought the assistance of the university IT support team, to assist in
the rollout of the questionnaire and importantly, in the almost daily follow up that was required
to achieve a high response rate. This provided the participants with sufficient information that
the survey was to better the purpose of the organisation as a whole, and that consistent and
continuous reinforcement of the confidential treatment of the information given by the
respondents, was seen as a critical success factor within the study. Finally, as previously
mentioned a letter was sent to all participates seeking participation, notwithstanding an option
to decline was a key feature of this correspondence thus ensuring self-determination for all.
3.9 Summary
Research methodology discusses the structure for discovering new knowledge based on
theories on how research should be carried out. This thesis was positioned in the positivism
111
applying deductive approach and mono method quantitative way through the web-based
survey. Subsequently, the data collection method and questionnaire design was presented in
detail. The questionnaire was designed by Churchill’s (2001) procedure and followed
Plymouth university research ethics guideline. This study follows the research philosophy
procedures by outlining deductive reasoning (abductive reasoning) in order to satistify and
response to research questions and accomplish research objectives. The research method
adopted for this study is a quantitative approach. The areas described in this chapter construct
the research design adopted in this study, and an overview of the same can be seen in Figure
3.2.
Chapter four: Data collection
4.1 Introduction
The data collection section of this study is about explaining data collection protocol,
questionnaire design, sampling strategy and pilot study as the prerequisite tools for measuring
knowledge sharing performance analysis. This chapter will provide detailed description of the
procedures that were followed for pre and post data collection by observing the basic
rudimental theories. The procedure for developing questionnaire, how the pilot testing was
carried out and types of validity will be extensively discussed in different sections in this
chapter. Also in this chapter, the measurement approaches, developed KSP model, knowledge
DEA efficiency and fsQCA will be deliberated.
4.2 Data collection protocol
Surveys can be regarded as good methods for collecting data to measure a number of peoples’
opinion and behaviour (Easterby-Smith et al., 2012). This study employs a questionnaire
survey for data collection because it can be used to identify and discern relationships between
variables that might have causal relationships (Saunders et al., 2012). Collis and Hussey (2009,

112
p. 191) stated that a questionnaire is a list of structured questions, which have been chosen
after considerable testing with a view to eliciting reliable responses from a particular group of
people.
According to Saunders et al. (2012), the questionnaire design varies according to how it is
administered and the amount of contacts for respondents. In general, self-administered
questionnaires are undertaken by the respondents. These are conducted by the Internet
(Internet-mediated questionnaires), Intranet (Intranet- mediated questionnaires), posted to
respondents by mail (postal questionnaire), or delivered in person and collected soon (delivery
and collection questionnaire). As a different way, interviewer-administered questionnaires are
a way to record a respondent’s answer by the interviewer through a telephone or a physical
meeting. Figure 4.1 indicates the various types of questionnaires
Figure 4.1 Types of questionnaire
Source: (Bryman and Bell, 2011)
A considerable growth in the number of surveys online has been detected for the last decade
(Bryman and Bell, 2011). Two categories of online social surveys are email surveys (through
emails) and web surveys (through a website). This study employs the web survey as shown in

113
Appendix B, since it is more advantageous than the email and paper survey in that it can
utilise diverse decorations, colour and variety in the format of questions in terms of appearance
(Bryman and Bell, 2011). If researchers notify potential respondents of URL (web address) by
emails, texts or phone calls or in person, respondents can answer that questionnaire by visiting
the website clicking URL via their personal computer. The reason this method is employed
for this study is because there are a variety of advantages of it. At first, the Internet-mediated
questionnaires by email provide potential respondents with greater flexibility and control (see
Appendix A), as they can respond to their own email in front of their personal computer
(Saunders et al., 2012). Therefore, filling out a questionnaire using this method is more
convenient for respondents because they can complete it when they have free time and at the
speed they want. Secondly, the cost per respondent for large samples is cheaper than other
methods if samples are widely dispersed, so it is possible to cover a widespread geographical
area. Thirdly, researchers can sometimes know who or which organisation completes the
questionnaire. Fourthly, a researcher is able to send questionnaires regardless of the number
of them in one batch without any costs. Fifthly, there will be no interviewer effects causing
bias due to characteristics of interviewer’s (Bryman and Bell, 2011). Finally, the online
questionnaire assists researchers to save much time by automatically coding respondents’
answers, so no bias issues via the coding occurs.
In contrast, the disadvantage of an online questionnaire is low response rates. First of all, it is
common that a twenty per cent response rate is seen as good, since there is no encouragement
for anonymous respondents to demand their cooperation (Easterby-Smith et al., 2012).
Secondly, this low response causes sample bias problems because there is a possibility that
respondents who filled out a questionnaire might be not representative of the targeted
population (Collis and Hussey, 2009). For example, a high proportion of executives might
hand an online questionnaire over to their subordinates because they are normally very busy.
Thirdly, there is no way to demonstrate whether respondents have a difficulty in completing a

114
question (Sekaran and Bougie, 2009). Fourthly, researchers cannot ask a number of questions
which might not be salient to respondents due to ‘respondent fatigue’ if questionnaires have a
lot of questions (Bryman and Bell, 2011). Lastly, there is the possibility that people decide not
to complete a questionnaire if they feel bored or it is irrelevant to them (Bryman and Bell,
2011).
In spite of these disadvantages, there are several ways to improve response rates for the
questionnaires. First, closed questions and short questionnaires increase response rate (Collis
and Hussey, 2009). Second, some methods such as sending follow-up letters and attaching
small monetary incentives can increase the response rates (Sekaran and Bougie, 2009). Third,
response rates can be boosted by an attractive layout and clear instructions (Bryman and Bell,
2011). Fourth, accompanying a good cover letter stating the reasons for the study also can
increase the response rates (Bryman and Bell, 2011).
4.3 Questionnaire design
The constructs postulated in this study have been extracted explicitly from the literature
review, and selected measures which have high reliability and validity. To develop and
validate reliable measures of KS, OF and PERF, subjective measures based on DEA and
fsQCA technique were canvassed. A questionnaire to capture the extent to which each
respondent’s organisation performs and perceive KS, OF and PERF were designed to ensure
coincidence between researchers’ understanding of the meaning of each measurement scale
proposed, and practitioners’ understanding as suggested by scale development research
(Churchill, 2001, Segars and Grover, 1998, Xia and Lee, 2005). This study has invited 12 post-
graduate students and knowledge experts who are also currently senior practitioners in
manufacturing and service organisations. In particular, they have attempted to ensure content
and face validity by scrutinising instruments, drafts of questionnaires and cover letter from the
stance of domain representativeness, item specificity and readability. Some instruments were

115
reworded according to above processes. If a pilot test indicates appropriate content validity of
instruments, it will be used. Item purification and development does not halt at any one of
these stages, but, rather, is an iterative process. Each variable is evaluated using a five point
Likert scale, ranging from “1 = strongly disagree” to “5 = strongly agree”. Questionnaire
design is a demanding task, so it requires a guideline on drawing appropriate questionnaires.
McDaniel and Gates (2013) put forward ten-step questionnaire design process whilst Churchill
(2001) proposed nine-step procedure. Due to simplicity and academic focus, this study decides
to use Churchill’s (2001) procedure for developing a questionnaire as shown in Figure 4.2.
As a first stage in questionnaire design, researchers should have sufficient knowledge
regarding research problem and associations to guide the study. The associations guide what
information will be pursued since they elaborate what kinds of relationships between the main
constructs will be explored. Therefore, the questionnaire was designed to measure answers
from respondents for three main constructs: KS, OF and PERF. Besides, the questionnaire
includes a cover page illustrating research objectives and author’s information. Also, some
questions that are related to both respondents’ profile and organisational profile in the
organisation. The type of questionnaire and method of administration such as an email, postal
mail, online survey, telephone and personal interviews. After carefully considering how data
is collected and what level of structure and disguise is used, a researcher should decide the
method of administration (Churchill, 2001).

116
Figure 4.2 Procedure for developing a questionnaire
Source: (McDaniel and Gates, 2013)
The research method normally affects the questionnaire design (McDaniel and Gates, 2013).
This study employs a structured questionnaire by online web-based survey (see Appendix B),
since this method of collecting data is inexpensive to create and maintain it as well as to
eliminate the risk of missing data, and facilitates accurate assembly of a complete dataset
(Froehle and Roth, 2004). The observed variables which are rigorously extracted from
literature review in the previous chapter are included in questionnaires after adequately
revising. Given the novelty of KS, OF and PERF measures in a knowledge context, the DEA
and fsQCA techniques facilitate verification and enhances content validity proceeding via a
construct description phase, a random item list phase, and finally a set of sorting instructions.
4.4 Sampling strategy and pilot study

117
The ability of this study to make unbiased inferences about populations depends on having
complete information about all selected sample units or establishing that the non-respondents
do not differ from respondents in an important way (Bryman and Bell, 2011). Since it is
difficult to rule out biased non-respondents who might use the process to protest against a
particular issue it is desirable to obtain high response rates. This can be difficult with some
populations (Bryman and Bell, 2011). Surveying the entire population within the seven chosen
countries network was seen as a realistic goal for the researcher, (total sample size over 300
employees) and as a result did not require compromise between theoretical requirements and
practical implications (Bryman and Bell, 2011). The participants for all surveys were located
across seven countires in three continents, which was evenly distributed across these
continents.
The researcher wrote to all of the respondents for their support and outlining the purpose and
range of the research being undertaken, (see Appendix A). In addition, the process of research
did have significant management support at all levels and with the support and assistance
negotiated from a general air of enthusiasm was created given the previous professional
position of the researcher with some of the organisations which were involved.
In case-oriented research (small and intermediate Ns) case selection is guided by explicit
theoretical concerns and the underlying research questions (Ragin, 2008). Once the conceptual
framework is established, two considerations need to be taken into account in defining the
sampling strategy. First, the study must define an area of homogeneity, meaning that cases
must parallel each other and be comparable in terms of their background characteristics.
Within this conceptual space, maximum heterogeneity over a minimum number of cases needs
to be achieved (Ragin, 2008). This means that the sample requires cases with both positive
and negative outcomes. The fact that fsQCA sees cases as configurations of factors enables

118
the emergence of a middle path between assuming that cases are homogenous enough to
equate their dissimilarities and attending to the specificity of each case (Ragin, 2000).
Case selection in QCA does not rely on mechanistic procedures (e.g. random sampling), but
rather on a tentative and iterative process where the criteria of sufficient homogeneity and
maximum heterogeneity are constantly pursued (Ragin, 2008). The nature of the procedure
used to construct the sample in fsCQA studies minimizes the threat of sample selection biases,
which generally affect studies that require random sampling.
In any small-N or medium-N design the quest for generalisation should always be bounded,
by comparing cases that share a sufficient number of features and that operate within
sufficiently comparable contexts. (In contrast to large-N research) the population of cases is
not a given; it is actually delimited by the researcher, informed by theory and empirical
knowledge.
In quantitative studies, the sample size usually depends on three factors:
[1] the population size
[2] the variability in the instrument
[3] the size of the effect to be measure.
It is worth nothing that a large population may not necessarily require a larger sample size and
the greater variability in the variable, or what is being measured, the larger the required sample
size in cases of research where only small effects are expected in the population, such as
exploratory medical research, a larger research may be required.
4.4.1 Sampling procedure

119
Sampling refers to the choice of a subset of a population used to derive conclusions about the
characteristics of the whole population (Hair et al., 2007). Issues regarding sampling are
important in determining the extent to which research findings are generalisable. Saunders et
al. (2012) explained that collecting data from a sample that represents the entire population
rather than from the entire population is necessary when budget and time constraints prevent
the researcher from surveying the entire population. It is argued that using sampling can
provide higher overall accuracy than surveying the entire population (Sekaran and Bougie,
2011).
Stratified Random Sampling has been found to be efficient and appropriate in extracting
information from various strata (several sub populations) within the population (Sekaran,
2003). The technique involved in this sampling is to define the strata and also to determine
how many members of each stratum to include in the sample. There are two common ways of
allocating the sample. Firstly, equal numbers could be selected from the strata regardless of
their sizes. Secondly, proportional allocation means that each stratum contributes to the sample
a number of members proportional to its size. However, the most important reason for
employing stratified random sampling is to ensure that members from each stratum are
included in the sample and no stratum is excluded (Bryman and Bell, 2011). It has advantages
over other probability samples because all groups are adequately sampled and comparisons
between groups are possible.
Online links to a web-based survey were emailed to 524 potential respondents (see Appendix
C). To increase response rates, respondents were promised to be offered anonymity and an
executive summary of findings. Questionnaires were distributed from April to August 2015,
followed by two email reminders generating over 300 responses, over 67.18% response rate.
The covariance structure preferred for subsequent analysis assumes no missing values in the
data set (Anderson and Gerbing, 1988), a condition guaranteed by the design of the web-based

120
questionnaire. In terms of sample size, there is no absolute standard. It can be considered as
small (less than 100 samples), medium (between 100 and 200 samples) and large (more than
200 samples). Therefore, over 300 samples are judged as the large size (Hair et al., 2010).
4.4.2 Pilot test
Sekaran and Bougie (2011) noted that testing questionnaire before the conducting further data
collection will help the researcher to find out if participants will understand the questions, if
the questions mean the same thing to all participants, and how long it takes to complete. In the
pilot test for this study, 21 responses were received from 30 pilot testing sent to KM experts,
knowledge researchers and industry experts. Then, Cronbach’s alpha values were calculated
to establish the reliability (internal consistency) of the questions and to check whether the
respondents understood all the questions (Saunders et al., 2012). Item-total correlations also
used in this study to assess internal consistency, it reflects how one item is correlated with the
other items in a given set of items (Saunders et al., 2012).
4.5 Validity
Validity is referred to as the accuracy of a measure. Hair et al. (2007) defined it as the extent
to which a construct measures what it is supposed to measure. An instrument should be
logically consistent and wholly cover all features of the abstract constructs or concepts to
measure as illustrated in Table 4.1. Validity of each construct can be considered as a basic and
fundamental condition in developing theory (Steenkamp and Van Trijp, 1991). Also, validity
is concerned with systematic errors rather than random errors that can be the major source of
reliability evaluation.

121
Table 4.1 Illustrates a short introduction to various types of validity
Validity Description
Content validity Does the measure adequately measure the concept?
Convergent validity Do two instruments measuring the concept correlate highly?
Discriminant validity Does the measure have a low correlation with a
variable?
Source: Sekaran and Bougie (2009, p. 160)
4.5.1 Content validity
Content validity is often referred to as measurement validity, and this concept mainly applies
to quantitative research (Bryman and Bell, 2011). In order to precisely measure latent
variables, these have to be comprehensively defined from the extant literature as well as the
author’s comprehension of those (Dunn et al., 1994). Li et al. (2006) asserted that in-depth
discussions with practitioners and academics are necessary to achieve content validity.
Content validity is referred to as the appropriateness with which the domain of the
characteristics is seized by the measure (Churchill, 2001). Churchill (2001) stated that content
validity may exist when the domain of the characteristics is appropriately reflected by the scale
items, but it largely relies on a researcher’s subjective judgment. In addition, it is evaluated by
testing the measure with a view to contending the domain being sampled. If domains are
different from the domain of the variables as perceived, it can be considered as a lack of
content validity (Churchill, 2001). On the other hand, if the instrument involves a
representative sample of the universe of the subject concerned, content validity is good (Dunn
et al., 1994). If the domain or universe of the variables is measured by a large number of items,
it is regarded as having greater content validity (Sekaran and Bougie, 2009). However, there
are no rigorous ways to confirm content validity (Dunn et al., 1994). Measuring multiple items
is a typical way to thoroughly measure the constructs (Churchill, 2001). Churchill (2001)
contended that specifying the domain of the construct, generating items that exhaust the

122
domain, and subsequently purifying the resulting scale should produce a measure which is
content, and that content validity depends on examining procedures which are used to
develop the instrument. If convergent and discriminant validity are significant, construct
validity can be supported (Dunn et al., 1994).
4.5.2 Convergent validity
Convergent validity may be seen as the extent to which constructs have a correlation with
other ways designed to measure the same construct (Churchill, 2001). Anderson and Gerbing
(1988) argued that convergent validity can be evaluated from measurement models by
determining whether each indicator’s estimated coefficient on its posited underlying construct
factors are statistically significant. This implies that it must correlate with other measures
designed to measure at the same item (Churchill, 2001). In other words, convergent validity
refers to the level of agreement between more than two attempts to gauge the same construct
through different methods (Anderson and Gerbing, 1988). Evaluation of convergent validity
can be elucidated by a confirmatory factor analysis. To appraise convergent validity, it is
necessary to check whether the single item’s standardised coefficient from the measurement
model is significant or not, larger than twice its standard error (Anderson and Gerbing, 1988).
It exists when factor loadings are all significant, meaning that the factor loading is different
from zero in accordance with the t-values.
4.5.3 Discriminant validity
Discriminant validity refers to the extent to which the measure is indeed novel and not simply
a reflection of some other variable (Churchill, 2001). According to Anderson and Gerbing
(1988, p. 416), discriminant validity can be evaluated for two estimated constructs by
constraining the estimated correlation parameter between them to 1.0 and performing a chi-
square difference test on the values obtained for the constrained and unconstrained models”.
It must not correlate highly with measures intended to assess different items (Churchill, 2001).

123
In other words, individual items employed to measure one specific latent variable should not
measure another latent variable simultaneously. Discriminant validity normally relies on the
level to which a scale measures distinct constructs (Sekaran and Bougie, 2009). It can be
assessed by testing the inter-correlations amongst the constructs that are generated and purified
by exploratory factor analysis and confirmatory factor analysis. If the chi-squared difference
value is associated with a p-value of less than 0.05, discriminant validity exists (Sekaran and
Bougie, 2009).
4.6 Measurement approaches
As shown in Figure 4.3, three attributes combined to create the outcome, but with none by
itself necessary or sufficient, these measuring approaches display a good example of the causal
complexity of social phenomena, comprising many concepts that cannot be addressed by a
correlational approach such as causal asymmetry (necessary and sufficient condition),
combination (conjunctural causal condition) and equifinality (two different viable
combinations of KS and OF). While correlation forces symmetry on asymmetric theoretical
claims, set-theoretic analysis offers an analytical system that is faithful to verbal theory, which
is largely set-theoretic in nature (Ragin, 2008), thus making it the most appropriate
methodology for this research as it truly reflects its main arguments. By applying set theoretic
notion into this research context.
[1] Relationship between KS and performance:
This study expect that a particular type of KS is a sufficient condition for a business process
to achieve a specific (relevant) performance dimension.
A1: KAD + BPD + S + C ⊂ IE + OE + EF + AD
A1a: KAD ⊂ IE

124
A1b: BPD ⊂ OE
A1c: S ⊂ EF
A1d: C ⊂ AD
[2] Relationship between OF and performance:
This study anticipate that a particular type of FC is a sufficient condition for a business process
to achieve a specific (relevant) performance dimension.
A2: OP + RD + LP + OS + CT ⊂ IE + OE + EF + AD
A2a: OP ⊂ IE
A2b: OL ⊂ OE
A2c: LP ˑ OS ⊂ EF
Ad: CT ⊂ AD
[3] Combination between KS and OF on performance:
This study argues that compatibility between a particular integration of KS and a specific type
of OF is a sufficient condition for a business unit to achieve a specific (relevant) performance
dimension.
A3: KADˑOP + OL + BPDˑOL + SˑLPˑOS + CˑCT ⊂ IE + OE + EF + AD
A3a: KADˑOP ⊂ IE
A3b: BPDˑOL ⊂ OE
A3c: SˑLPˑOS ⊂ EF

125
A3d: CˑCT ⊂ AD
The fsQCA procedure comprises three steps: constructing property space, analysing by
Boolean logic, and interpreting and evaluating the research result. (A flowchart of this
procedure is shown in Figure 4.3. The details are as follows; constructing property space:
fsQCA does not limit types of input data source. It may be derived from either primary data
(e.g. survey or interview) or secondary data (e.g. financial reports, results of other research or
economic indices). Once data have been obtained, both dependent and independent variables
will be calibrated using Ragin’s (1987, 2000) direct method, as mentioned earlier, to transform
the raw scores of relative variables into more meaningful set measures. Specifying full
membership, full non-membership, and a crossover point of maximum ambiguity (three
thresholds) regarding membership in a set of interest in accordance with external standards
allows the researcher to rescale an interval variable using the crossover point as an anchor
from which deviation scores are calculated, taking the values of full membership and full non-
membership as the upper and lower bounds. Then these deviation scores are transformed into
the metric of log odds, which is centred around 0 and has no upper or lower bound (Ragin,
2008). Thus, the rescaled measures range from 0 to 1, and the converted scores are tied to
three theoretically-led thresholds. Note that, because the laws governing the intersection of
fuzzy sets make cases with scores of exactly 0.5 difficult to analyse, Ragin (2008) recommends
avoiding the use of a precise 0.5 membership score for causal conditions.

126

According to the KSP conceptual framework mentioned in previous sections, the KSP model is as follows:
Figure 4.3 KSP implementation model

127
4.7 Knowledge DEA efficiency
This section starts by defining knowledge DEA efficiency, the technical relationship between
inputs and outputs. Athanassopoulos (1994) notes that efficiency is described in economic
terms as "the outcome of comparing the actual output of a productive unit against a
theoretically defined maximum output given the resources used". The maximum outputs that
can be obtained from a given vector of inputs are defined by the production function. The term
"efficiency" has been used by economists such as Schmidt (1985) to describe how well an
organisation is performing in terms of utilising its resources in order to produce meaningful
outputs (Norman and Stoker, 1991). The knowledge DEA efficiency has two components.
The first one is called technical or physical, this component attributes to management
capability for avoiding waste by producing as much outputs as inputs usage allows, or using
as little inputs as outputs production allows. The second component is allocative, this
component refers to management's ability to combine inputs and outputs in optimal
performance in the light of current operations factors (Fried et al., 1993). Farrell (1957)
discussed a simple measure of firm efficiency, demonstrated that the terms "efficiency" can
be divided into two different measures; these are "Allocative efficiency" and "Technical
efficiency". Technical efficiency reflects the firm's ability to generate maximum output from
a given set of inputs. Accordingly, Fried et al., (1993) technical efficiency is defined as: a
procedure is technically efficient (or Pareto optimal) if an increase in output requires a
reduction in at least one other output or an increase in at least one input. Allocative efficiency
reflects the firm's ability to use the inputs in optimal operations, given the respective processes
and the production technology (Coelli et al., 1998).
Many different classifications of the different research types exist and the boundaries between
each type can sometimes be a little fuzzy. Kontio (2005) distinguishes the following three
however:

128
[1] Exploratory research which structures and identifies new issues and problems.
[2] Constructive research which identifies and develops methods to solve issues or
problems.
[3] Empirical research which tests a solution’s feasibility using empirical data.
This particular research is exploratory due to the way in which the literature review
investigated the current state of research and identified gaps within it. However, due to the
experimental aspects this research demonstrates (i.e. to test the feasibility of measuring
knowledge sharing efficiency using DEA), the study can also be classified as a quantitative
empirical research. This research is consequently both exploratory and empirical.
In regards to applying DEA to knowledge sharing efficiency measurement, the following
research question has been formulated:
[1] How can DEA be a tool for knowledge sharing efficiency measurement?
[2] This prompts a series of other more specific research questions:
[3] What are the factors affecting knowledge sharing efficiency?
[4] What is each factor’s exact effect on knowledge sharing efficiency?
[5] How user friendly is applying a DEA tool to knowledge sharing efficiency
measurement?
[6] How useful is applying DEA to knowledge sharing efficiency?
Yin (1994) explains that the decisions of DEA approach to knowledge sharing performance
measurement depends on three conditions: the type of research question, the control an
investigator [or researcher] has over actual behavioural events, and the focus on contemporary

129
as opposed to historical phenomena. As Yin (1994) comes from a more theoretical and social
sciences background, only the first criterion (the type of research question) is relevant to this
discussion. The application of DEA to knowledge sharing efficiency measurement is believed
to be entirely new, it is consequently not possible to look at past research (although there is
extensive literature on DEA’s application to efficiency measurement). Furthermore, experts’
opinion gathered from methods such as the Delphi technique or conventional surveys can only
probe people’s opinion on this specialist subject which would unfortunately not really answer
the different research questions listed above (in this case experts would be the people using
the measure and academics specialised in the efficiency measurement). Yin (1994) mentions
that most texts about experimental efficiency measurement study’s methodology tend to focus
chiefly on data collection. He argues that the design and analysis steps are as important as the
data collection step despite being often neglected. This section will consequently briefly
discuss all of these important steps.
Yin lists five components of importance for efficiency measurement study’s methodology.
These are questions generally written in the form of ‘who’, ‘what’, ‘where’, ‘how’ and ‘why’
questions. Writing these questions helps deciding which research method should be used. This
study’s questions have already been listed above.
This is essential as it helps the researcher understanding what needs to be researched and
answered. The proposition helps the researcher to move in the right direction and to look at
the right place to find evidences. Yin (1994) notes that some studies do not have a research
proposition. This can be the case for some experiments or surveys. The study’s proposition
corresponds to the model which was introduced at the very beginning of this thesis.
This relates to ‘what the case is’ (or cases are); in many social sciences studies the unit of
analysis is an individual. In this particular study however, knowledge sharing efficiency

130
performance is measured for the organisation. Yet, as DEA is an efficient frontier
benchmarking technique, knowledge sharing efficiency can only be calculated for a group of
conditions or more precisely factors. Furthermore, and although analysis can be made
individually for each factor, knowledge sharing efficiency tend to consider DMUs wide
exercise. Consequently, and although individual performance analysis will be conducted for
some factors, this study’s real units of analysis is a whole KSP model.
Linking data to proposition. This step needs to be done in order to connect the data, or data
results, to the model. There is no clearly defined method to link data to the research proposition
although the thorough observation of the DEA results along with traditional benchmarking
analysis should provide a robust link to the proposition.
Criterion for interpreting the study’s finding. These criteria are essential to test the results’
validity and analyse the results. This study will use KSP model’ opinion on the DEA and
traditional benchmarking results to evaluate the validity and usefulness of this study’s
approach against those of others.
Criteria to interpret study’s findings include:
[1] The measure is coherent with knowledge sharing efficiency understanding.
[2] The measure can be easily understood.
[3] The measure includes OFs impacting knowledge sharing efficiency and is an essential
point in justifying an improvement on the performance measure.
[4] The measure can help organisation’ management to make better informed decisions,
which could in turn lead to better knowledge sharing efficiency (this point is also
essential in justifying an improvement on the performance measure).
[5] The measure’s calculations are reproducible (this refers to the method validity).

131
It is essential to conceptualise the DEA model first as this will tell what data need to be
gathered. Because the data are of a quantitative nature, the data collection steps do not
demonstrate the traditional caveats of qualitative data analysis in social sciences. This study’s
analysis should be done by comparing individual DEA performance score with their
corresponding scores and model’ perception of the measure. Similarly, the ranking provided
by the DEA models should be compared with a corresponding efficiency benchmarking
analysis. This theoretical triangulation (Bryman, 2001) should hopefully assist in appraising
the differences between DEA and traditional efficiency analysis results.
One of DEA’s major strength is that no assumption has to be made and that any input or output
of the efficiency process can be included in the model (Cullinane et al., 2006). However, this
characteristic introduces an element of appreciation on which variable should be actually
included in a DEA model which is a frequent criticism against DEA’s robustness. Cooper et
al (2007) recommend a careful selection of the model variables to ensure the model is robust
and correctly reflects the performance process.
The literature review chapters explained components of knowledge sharing, organisational
factors and performance management. In order to create a DEA model which would improve
knowledge efficiency measurement, it is important to include all the variables which can
impede the interpretation of performance. This section will list all the variables of interest, the
first variables to include are the ‘knowledge sharing’ and the number ‘output efficiency OE’
(during the measurement period) so that the model could be illustrated as in Figure 4.4
Figure 4.4 Knowledge sharing efficiency 1

132
Knowledge sharing efficiency 1 as an isotonic input and ‘output efficiency OE’ as an isotonic
output. Isotonic inputs are inputs which have a beneficial impact on the outputs production;
i.e. an increase in isotonic input levels should translate to greater output levels. The KS data
is to be collected from participants in the carried survey questionnaire. Another aspect of
knowledge efficiency model is organisational factors OFs. Indeed, it is conceivable that an
organisation can be efficient (i.e. in respects to the operation turnaround time), but inefficient
(i.e. in this case the cost of turnaround time). To reflect the possible fact that an organisation
might be efficient but inefficient with cost of turnaround time, the ‘organisational factors OF’
is added to the previous model. This is illustrated as in Figure 4.5
Figure 4.5 knowledge sharing efficiency 2
Although other conditions could have a potential impact on knowledge sharing efficiency
which may not be included in the study. This is because there are numerous conditions that
have short term impact which include uncertainties surrounding the organisation. This
generally hides the real cost of measuring and is the main reason for marginal errors in the
cost of the knowledge sharing efficiency model.
4.8 Summary
In this chapter, data collection for this study was discussed by looking into data collection
protocol, questionnaire design, sampling strategy and pilot study. Also KSP model was
developed after data collection was carried out. Despite the differences between DEA and
fsQCA in underlying assumptions and presupposed sources of sustainable competitive

133
advantage, both can co- exist and shape actual organisation’ performance (Spanos and
Lioukas, 2001: 911). In addition to Spanos and Lioukas (2001), a number of previous research
studies have supported integration of analysis techniques, combination between these two
analysis tools and the KSP model. For example, Williamson (1991) and Teece, Pisano and
Shuen (1997) argue that the effects of each are not mutually exclusive. Mauri and Michaels
(1998) also propose that sustainable competitive advantage may result from the effects of both,
which may also be complementary.
Furthermore, Spanos and Lioukas’ (2001) empirical test results support Henderson and
Mitchell’s (1997) argument for considering both industry and firm level effects on
performance and suggest that where industry forces influence organisational performance and
profitability, knowledge assets act upon accomplishments in the competitive arena and via the
latter, to profitability” (Spanos and Lioukas, 2001: 908). In other words, industry and firm
effects are not only both potentially significant, but instead, they need to complement each
other given that they affect distinct but strongly linked dimensions of performance (Spanos
and Lioukas, 2001: 922). Note that although there are many calls for future investigation
regarding integrating both DEA and fsQCA, the lack of proper research method in terms of
the underlying causal relationship assumptions hinders researchers from solving this puzzle
up until recently.

134
Chapter five: Data analysis and findings
5.1 Introduction
This chapter discusses the data analysis processes and report the findings of testing the first
two main entities regarding the relationship of each separate proposed research construct (KS
in A1 and OF in A2) with different performance dimensions. In addition to using two types of
performance measure for each performance dimension, and taking into consideration concern
about common method bias (Podsakoff et al., 2003), for triangulation purposes this chapter
will also report findings which match the survey data used for each performance dimension in
the analysis. Figure 5.1 shows an overall structure for the data analysis and findings reporting.
Figure 5.1 Overview of data analysis and findings reporting

135
Each section in this chapter (after the DEA analysis) and each section in the next chapter will
follow the same format, presenting a summary table of the findings (solution paths) and a brief
interpretation of the results, as well as a possible explanation for any deviation from the
proposed KSP model. At the end of the chapter, post-hoc analysis of each of the two main
entities will be conducted to examine patterns and further implications and, finally, each sub-
entity and each entity as a whole will be summarised.
5.2 Selecting the variables
The DEA approach is significantly affected by the number of inputs and outputs, the higher
the number of inputs and outputs the less discerning the analysis. The guideline for choosing
the number of inputs and outputs is less than one third of the number of DMUs. Correlation is
used to improve discrimination among DMUs.
In this work multivariate statistical analysis was implemented to specify the number of
variables to be used in the analysis. This was based on partial covariance analysis developed
by Jenkins and Anderson (2003). This approach compares the sum of covariance of certain
variable(s) relative to the sum of the covariance of the total variables so that most information
appears in the retained variables. Both correlation analysis and multivariate analysis, including
partial covariance and cluster approach, were implemented. They were applied to reduce the
inputs and outputs for performing DEA analysis on the data collected as shown in Table 5.1.
The data covered seven DMUs (countries) as follows: United Kingdom (UK), United States
of America (USA), Nigeria (NG), South Africa (KSA), Ghana (GH), Germany (GER),
Sweden (SWE). Each DMU has four inputs: A1, A2, A3 and H; and two outputs: IE and OE.
Table 5.1 KSP efficiency data
Inputs
Outputs
DMU Country

136
A1 A2 A3 H IE OE
1 UK 150 28 3517 50496 496 99
2 USA 53 3 5033 51801 632 20
3 NG 77 8 2002 108595 489 16
4 KSA 102 6 1401 103846 359 75
5 GH 76 1 902 44261 143 81
6 GER 47 12 2140 21458 234 23
7 SWE 27 1 1145 32458 147 15
Where A1 = KS, A2 = OF, A3 = PERF, H = Co efficiency, IE = Input efficiency, OE = output
efficiency
5.3 Correlation analysis
Correlation is used to improve discrimination among DMUs. For instance, if some of the input
or output variables are highly correlated, one or more of these input or output variables might
be eliminated as they have least impact on DEA outcomes (Jenkins, 2003). On the other hand,
input variables that have high correlation coefficient with output variables are recommended
to be involved in the variables set. Correlation analysis was applied to examine the relationship
between the variables in Table 5.2.
Table 5.2 Results of correlation analysis
DMU I1 I2 I3 I4 O1 O
2 I1 1
I2 0.763 1
I3 0.179 0.352 1
I4 0.379 -0.0439 -0.0922 1
O1 0.388 0.357 0.852 0.433 1
O2 0.837 0.487 -0.103 0.0971 -0.0442 1
Table 5.2 presents the correlation analysis outcome. The yellow shaded area in Table 5.2
shows the relationship (correlation) between input and output variables and the bold data are
those that need to be omitted from the correlation matrix (Table 5.2), input variables I1, I3, or
I4 could be omitted, whilst of the output variables the analysis suggests that O2 should be

137
removed. Clearly, using this analysis is not sufficient to decide which variable(s) can most
appropriately be omitted. For instance, which variable(s), if omitted, have the least effect on
DEA outcome?
5.4 Multivariate analysis
Multivariate analysis based on partial covariance was implemented to investigate the
variable(s) that if they were removed would result in least information loss. The effect on the
efficiency if one of the variables is removed is considered first and the results are presented in
Table 5.3 below, where I and O represent input and output variables respectively, whilst the
numbers before them indicate which variables have been omitted. For example, the column
headed 3I, 2O,1I shows the results from only having 3 inputs (3I) and 2 outputs (2O) when
input 1 is omitted (1I).
Table 5.3 Efficiency changes due to omitting one variable
DMU 4I,2O,0 3I,2O,1I 3I,2O,2I 3I,2O,3I 3I,2O,4I 4I,1O,1O 4I,1O,2O
1 1.000 1.000 1.000 1.000 0.787 1.000 1.000
2 1.000 1.000 1.000 1.000 1.000 0.354 1.000
3 1.000 1.000 1.000 0.715 1.000 0.195 1.000
4 1.000 1.000 1.000 0.822 1.000 0.690 1.000
5 1.000 1.000 1.000 1.000 1.000 1.000 1.000
6 0.969 0.969 0.969 0.969 0.728 0.570 0.894
7 0.822 0.762 0.818 0.768 0.822 0.521 0.900
Relative Variance 1.16E+09 1.16E+09 1.16E+09 1.15E+09 2.20E+06 1.32E+03 3.62E+04
Relative Variance
percentage 100.00 100.00 100.00 99.81 0.19 3.521 96.479
No. Of Efficient
DMUs 5 5 5 3 4 2 5
Table 5.3 shows the changes to efficiency resulting from applying basic DEA (i.e. dual CCR
output oriented model) with different inputs and outputs variables omitted. The three bottom
rows show the variance, variance percentage and number of efficient DMU changed as an
effect of omitting a variable.

138
Based on the results in Table 5.3 input 1 (A1), input 2 (A2) or output 2 (OE) can be omitted
without losing information because the number of efficient DMUs does not change. On the
other hand, much information could be missed if input 3 (A3) or output 1 (IE) are removed. It
is worth nothing that omitting output 1 (IE) omits most information, i.e. number of the efficient
DMUs is reduced to 2. For more discernment in the DEA, further reduction in the number of
variables was attempted. Partial covariance was again employed but this time when more than
one input variable was removed. Note that the column headings are defined as in Table 5.3,
for example, column 1 shows the results from the omission of inputs 1 and 2 (i.e. 12I) whilst
column 2 shows the results from omitting inputs 1 and 3 (i.e. 13I).
From the results in Table 5.4, one remarkable point can be seen, that all the information is
retained (i.e. no loss) when both inputs 1 and 2 are omitted simultaneously.

Table 5.4 Efficiency changes due to omitting more than one variable
DMU 2I,2O,12I 2I,2O,13I 2I,2O,14I 2I,2O,23O 2I,2O,24I 2I,2O,34I 1I,2O,234I 1I,2O,134I 1I,2O,124I 1I,2O,123I
1 1.000 1.000 0.550 1.000 0.821 0.742 0.742 0.097 0.550 1.000
2 1.000 1.000 0.729 1.000 1.000 1.000 1.000 1.000 0.490 1.000
3 1.000 0.370 0.978 0.538 1.000 0.538 0.538 0.290 0.953 0.370
4 1.000 0.525 1.000 0.817 1.000 0.817 0.817 0.329 1.000 0.368
5 1.000 1.000 1.000 1.000 1.000 1.000 1.000 1.000 1.000 0.933
6 0.980 0.980 0.427 0.980 0.757 0.695 0.695 0.098 0.427 0.980
7 0.724 0.566 0.719 0.777 0.861 0.777 0.777 0.741 0.501 0.409
Relative Variance 1.16E+09 2195185 1154349650 1.15E+09 1.15E+09 1744.286 1654 90.28571 2193530.6 1.15E+09
Relative Variance
percentage 100.000% 0.190% 99.810% 99.810% 99.810% 0.000% 0.000% 0.000% 0.190% 99.810%
No. Of Efficient
DMUs 5 3 2 3 4 2 2 2 2 2

140
5.5 Cluster analysis
Cluster analysis groups data objects based on information found in the data that describes the
objects and their relationship. The goal is that the objects within a group be similar (or related)
to one another and different from (or unrelated to) the objects in the other groups. The greater
the similarity (or homogeneity) within a group and the greater the difference between groups
the better or more distinct the cluster.
There are several techniques for conducting cluster analysis with binary data, all of which
involve calculating distances between groups of data based upon the observed variables and
then applying one of the standard cluster analysis algorithms to these distances. A popular
group of these measures designed for binary data is known collectively as matching
coefficients (Dillon and Goldstein, 1984). There are many techniques of matching coefficient,
all of which take as their main goal the measurement of response set similarity between any
two groups. The logic underlying these methods is that two individuals should be viewed as
similar if they share a common pattern of attribute among the binary variables (Snijders et al,
1990).
In this study cluster analysis was implemented to measure the efficiency similarity and
dissimilarity within the input variables. If input variables share a common pattern of attribute
one of them may be omitted. The omitted inputs are those that contain least information.
Cluster analysis suggests that input 1 (A1) or input 2 (A2) can be eliminated resulting in 3
inputs and 2 outputs. Table 5.5 shows the data after removing input 2 (A2).

141
Table 5.5 Country data after cluster analysis
Inputs
Outputs
DMU Country A1 A3
H IE OE
1 UK 150 3517 50496 496 99
2 USA 53 5033 51801 632 20
3 NG 77 2002 108595 489 16
4 KSA 102 1401 103846 359 75
5 GH 76 902 44261 143 81
6 GER 47 2140 21458 234 23
7 SWE 27 1145 32458 147 15
5.6 Identifying the type of returns to scale
Identification of the type of returns to scale, i.e. CCR with Constant Returns to Scale (CRS)
or BCC with Variable Returns to Scale (VRS) is essential in DEA analysis. Failing to do so
might result in inconsistent inefficiency scores. For example, if VRS is wrongly implemented
the resulting efficiency scores will be greater than the true efficiency scores because of the
restrictive property of the VRS which assumes that the efficient frontier always produces a
closer of the envelopment of the data. Hence, it is essential to examine the returns to scale
properties, which can be satisfied by using an association test. The association test allows
identification of the type of data whether it is CRS or VRS so it should be adopted for a
particular case study.
Several authors have implemented a two-sample t-test (an association test used for small
samples) to identify the type of returns to scale (Camanho and Dyson, 2005; Banker et al,
1996; Banker et al, 1993). In practice the association test compares the mean of two samples
to identify the probability that the two samples are likely to come from the same population.

142
Say βi and βj are the population means for the distributions of DEA outcome scores from
applying the CCR and BCC models. The null association assumes that there is no difference
between the mean of the two samples whilst the alternative association opposes it, i.e. In the
case that the null association does not pertain i.e. βi - βj ≠ 0 within the 5% significance interval,
it is rejected and the p-value is investigated. The p-value indicates the observed probability of
obtaining the sample results when the null association is assumed to be true (Kinnear and
Gray, 2004). If so, the βi and βj are not equal, which implies that the CCR and BCC models
have different outcome scores. Hence, it inplies that data are more likely exhibiting VRS, in
which case the BCC model should be used.
Table 5.6 The outcomes of CRS (CCR) and VRS (BCC) and their means
DMU
DEA Efficiency Scores
CRS (CCR) VRS (BCC) UK 1.000 1.000
USA 1.000 1.000 NG 1.000 1.000
KSA 1.000 1.000 GH 1.000 1.000
GER 0.980 0.980 SWE 0.933 0.933
Mean 0.988 0.988
Table 5.6 shows that the DEA efficiency scores for CRS (i.e. CCR model) and VRS (i.e. BCC
model) have similar means.
5.7 Measuring Germany KSP efficiency
This data was entered into Excel Solver and the DEA software with Excel Solver used to
identify the efficiency scores and DEA software used to determine the normal vector. The
results are shown in Table 5.7 which was obtained by running the output-oriented CCR dual
KSP model.
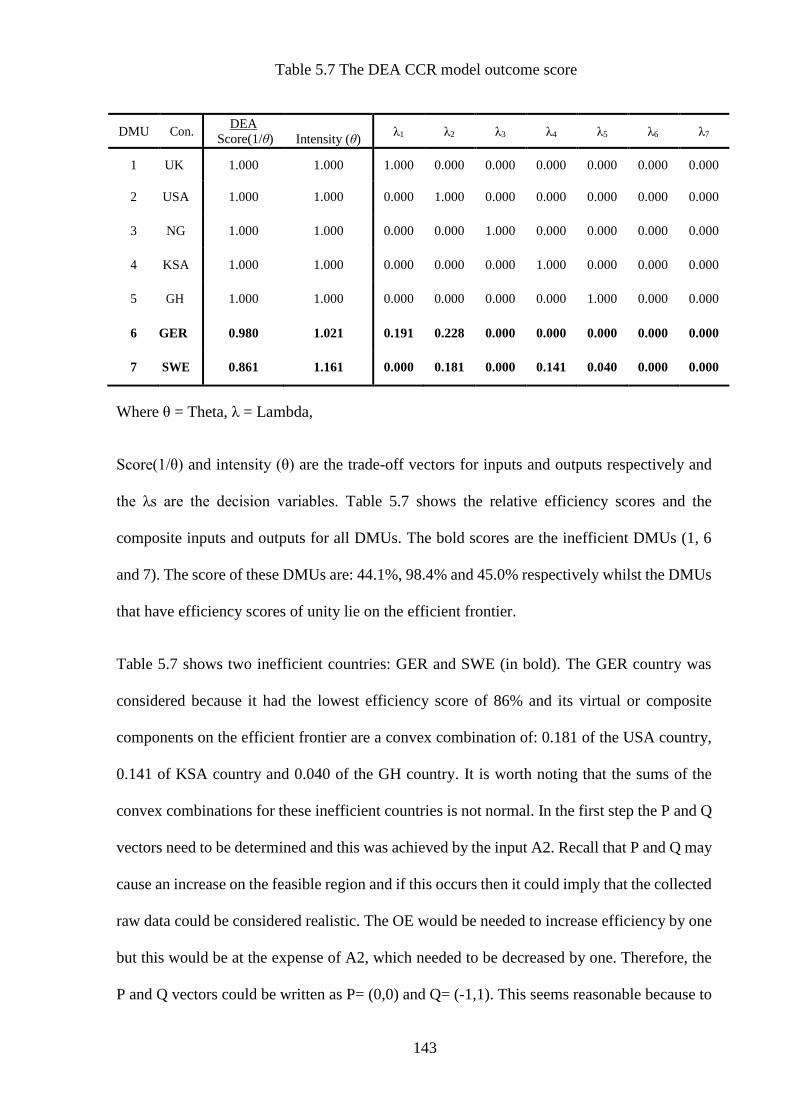
143
Table 5.7 The DEA CCR model outcome score
DMU Con. DEA
Score(1/θ)
Intensity (θ)
λ1 λ2 λ3 λ4 λ5 λ6 λ7
1 UK 1.000 1.000 1.000 0.000 0.000 0.000 0.000 0.000 0.000
2 USA 1.000 1.000 0.000 1.000 0.000 0.000 0.000 0.000 0.000
3 NG 1.000 1.000 0.000 0.000 1.000 0.000 0.000 0.000 0.000
4 KSA 1.000 1.000 0.000 0.000 0.000 1.000 0.000 0.000 0.000
5 GH 1.000 1.000 0.000 0.000 0.000 0.000 1.000 0.000 0.000
6 GER 0.980 1.021 0.191 0.228 0.000 0.000 0.000 0.000 0.000
7 SWE 0.861 1.161 0.000 0.181 0.000 0.141 0.040 0.000 0.000
Where θ = Theta, λ = Lambda,
Score(1/θ) and intensity (θ) are the trade-off vectors for inputs and outputs respectively and
the λs are the decision variables. Table 5.7 shows the relative efficiency scores and the
composite inputs and outputs for all DMUs. The bold scores are the inefficient DMUs (1, 6
and 7). The score of these DMUs are: 44.1%, 98.4% and 45.0% respectively whilst the DMUs
that have efficiency scores of unity lie on the efficient frontier.
Table 5.7 shows two inefficient countries: GER and SWE (in bold). The GER country was
considered because it had the lowest efficiency score of 86% and its virtual or composite
components on the efficient frontier are a convex combination of: 0.181 of the USA country,
0.141 of KSA country and 0.040 of the GH country. It is worth noting that the sums of the
convex combinations for these inefficient countries is not normal. In the first step the P and Q
vectors need to be determined and this was achieved by the input A2. Recall that P and Q may
cause an increase on the feasible region and if this occurs then it could imply that the collected
raw data could be considered realistic. The OE would be needed to increase efficiency by one
but this would be at the expense of A2, which needed to be decreased by one. Therefore, the
P and Q vectors could be written as P= (0,0) and Q= (-1,1). This seems reasonable because to
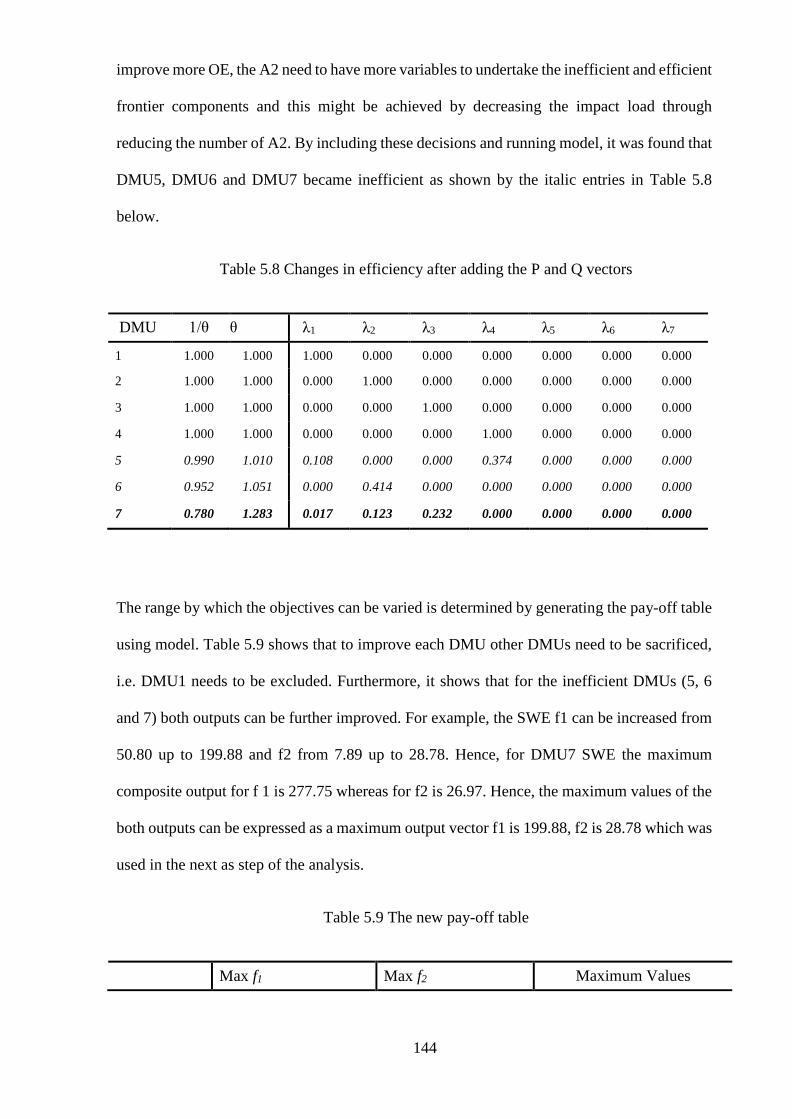
144
improve more OE, the A2 need to have more variables to undertake the inefficient and efficient
frontier components and this might be achieved by decreasing the impact load through
reducing the number of A2. By including these decisions and running model, it was found that
DMU5, DMU6 and DMU7 became inefficient as shown by the italic entries in Table 5.8
below.
Table 5.8 Changes in efficiency after adding the P and Q vectors
DMU 1/θ θ λ1 λ2 λ3 λ4 λ5 λ6 λ7
1 1.000 1.000 1.000 0.000 0.000 0.000 0.000 0.000 0.000
2 1.000 1.000 0.000 1.000 0.000 0.000 0.000 0.000 0.000
3 1.000 1.000 0.000 0.000 1.000 0.000 0.000 0.000 0.000
4 1.000 1.000 0.000 0.000 0.000 1.000 0.000 0.000 0.000
5 0.990 1.010 0.108 0.000 0.000 0.374 0.000 0.000 0.000
6 0.952 1.051 0.000 0.414 0.000 0.000 0.000 0.000 0.000
7 0.780 1.283 0.017 0.123 0.232 0.000 0.000 0.000 0.000
The range by which the objectives can be varied is determined by generating the pay-off table
using model. Table 5.9 shows that to improve each DMU other DMUs need to be sacrificed,
i.e. DMU1 needs to be excluded. Furthermore, it shows that for the inefficient DMUs (5, 6
and 7) both outputs can be further improved. For example, the SWE f1 can be increased from
50.80 up to 199.88 and f2 from 7.89 up to 28.78. Hence, for DMU7 SWE the maximum
composite output for f 1 is 277.75 whereas for f2 is 26.97. Hence, the maximum values of the
both outputs can be expressed as a maximum output vector f1 is 199.88, f2 is 28.78 which was
used in the next as step of the analysis.
Table 5.9 The new pay-off table
Max f1 Max f2 Maximum Values

145
DMU Dep f1 f2 f1 f2 f1 f2
1 UK 496.00 99.00 496.00 99.00 496.00 99.00
2 USA 632.00 20.00 99.72 56.49 632.00 56.49
3 NG 489.00 16.00 144.88 82.07 489.00 82.07
4 KSA 359.00 75.00 191.92 108.71 359.00 108.71
5 GH 208.24 9.57 143.00 81.00 208.24 81.00
6 GER 261.80 8.28 122.73 40.33 261.80 40.33
7 SWE 199.88 7.89 50.80 28.78 199.88 28.78
The interactive procedure was started by solving model after changing the weight values of
both objectives. The initial starting optimal solution came from applying the basic dual KSP
model for the SWE. The composite output will be located on the efficient frontier (the DM
can accept or reject at this point). At this point the country is a linear convex combination of
DMU1, DMU2, DMU3 and DMU4 (UK 0.0174, USA 0.123, NG 0.232 and KSA 0.000139)
at which f1(λ0) = 199.87 and f1 (λ0) =7.90. It is worth noting that the latter values are closer
to that obtained from the composite output KSP model, so the efficiency score point will be
closer to the efficient frontier. Note that f1 does not exceed the maximum value obtained from
the pay-off table.
Table 5.10 Comparison between old and new trade-off values
Objectives
Decision variables
Normal vectors
f (0 )
1
f (0 )
2
0
1
0
2
0
3
0
4
0
5
0
6
0
7
N 0
1
N 0
2 199.87 7.90 0.0173 0.123 0.232 0.000139 0.00 0.00 0.00 0.028 0.048
Table 3.14 The objectives, decision variables and normal vectors for the initial values.
Indifference trade-offs Values
Old trade-offs (199.87,7.90) ↔(199.87-1.00, 7.90+1.72)
New trade-offs (199.87,7.90) ↔(199.87-1.00, 7.90+2.00)
The KSP model suggests that to improve the efficiency of the SWE, IE should be increased
by 36% and OE increased by 47% as can be seen from Table 5.10. These results were obtained

146
with composite outputs resulting from projecting SWE on the efficient frontier. These results
(efficiency scores) were obtained by comparing the targeted DMU score, which is inefficient,
relative to efficient DMUs. It is worth noting that by using the basic CCR model these results
could not be improved or changed and hence the DM has no choice but to accept them.
Unlike basic DEA, which compares the efficiency of the targeted DMU relative to the others,
the developed DEA-KSP integrated model seeks the most preferred solution (MPS) according
to DM preferences. For instance, in the SWE, the DM managed to increase efficiency up to
28%; from the value proposed by CCR model but to do so the number of IE should be reduced
by almost 2% and H should be raised by 0.10%.
Table 5.11 Summary of target setting and resource allocation for the SWE
Inputs Outputs
A1 A3 H IE OE
Raw value 27 1145 32458 147 15
DEA results 27 1145 32458 200 8
Improvements % 0.00% 0.00% 0.00% 35.97% 47.37%
Raw value 27 1145 32458 147 15
DEA_KSP results 27 1145 32425 196 10
Improvements % 0.00% 0.00% 0.10% 33.34% 32.58%
DEA results 27 1145 32458 200 8
DEA_KSP results 27 1145 32425 196 10
Improvements % 0.00% 0.00% 0.10% 1.94% 28.11%
In comparison the DEA_KSP implemented model allows alternative outcomes according to
DM preferences which, in this case adds more flexibility to the basic DEA solution.
Nevertheless, the basic DEA method did find the composite outcome of the inefficient DMU
projection on the efficient frontier.
5.8 Knowledge fsQCA comparability

147
This section will report the findings of the data analysis the first the KSP model regarding the
relationship of each separate proposed research construct (KS in A1 and OF in A2) with
different performance dimensions. In addition to using two types of performance measure for
each performance dimension, and taking into consideration concern about common method
bias (Podsakoff et al., 2003), for triangulation purposes this section will also report findings
using data which match the survey data used for each performance dimension in the analysis.
Each segment in this section will follow the same format, presenting a summary table of the
findings (solution paths) and a brief interpretation of the results, as well as a possible
explanation for any deviation from the proposed model.
At the end of the chapter, post-hoc analysis of each of the two main KSP model will be
conducted to examine patterns and further implications and, finally, each sub-association and
each association as a whole will be summarised.
However, since fsQCA is a relatively new technique which requires some rules and pre-
specified conditions as part of the calculation, this study provides an in-depth example of an
analytical process and a justification for any rule and condition used in the analysis, as well as
an explanation of the data analysis testing which will be applied to all findings in this
dissertation. Please also refer to the summarised conventional steps in interpretation of fsQCA
results (Crilly, 2011; Fiss, 2011; Greckhamer, 2011) that involve considering both parameters
and contexuality of solution paths, especially definitions and implications of core and
peripheral conditions, first-order equifinality (different across-group), second-order
equifinality (different within-group) and an empirically dominant combination.
5.8.1 Association testing: relationship between KS and performance (A1)
148
In order to test the first main association regarding the relationship between KS and
performance dimensions (A1), each of the four sub-associations is tested separately, which
corresponds with four performance dimensions as follows;
[1] Input Efficiency: “ie” represents a high membership score with a high input efficiency
(expense ratio), while “~ie” represents a low membership score with a high input
efficiency.
[2] Output Efficiency: “oe1” and “oe2” represent high membership scores with a high
output efficiency 1 (loss ratio) and 2 (investment yield) while “~oe1” and “~oe2”
represent low membership scores with a high output efficiency 1 and 2.
[3] Effectiveness: “ef1” and “ef2” represent high membership scores with a high
effectiveness 1 (net written premium growth) and 2 (relative market shares) while “~ef
1” and “~ef 2” represent low membership scores with a high effectiveness 1 and 2.
[4] Adaptability: “ad1” and “ad2” represent high membership scores with a high
adaptability 1 (number of new products within the past year) and 2 (percentage of net
written premiums accounted for by new products within the past year) while “~ad1”
and “~ad2” represent low membership scores with a high adaptability 1 and 2). These
symbolic expressions are also applied to their financial data (ief, oef1, oef2, eff1, eff2).
Using fsQCA, this study sets one performance dimension as the outcome of interest and tests
it against all five possible KS attributes as causal conditions;
[1] Collaboration: “c” represents a high membership score with a strong characteristic
of collaboration while “~c” represents a low membership score with a strong
characteristic of collaboration.

149
[2] Systems: “s” represents a high membership score with a strong characteristic of
systems while “~s” represents a low membership score with a strong characteristic
of systems.
[3] Decision: “d” represents a high membership score with a strong characteristic of
decision while “~d” represents a low membership score with a strong characteristic
of decision.
[4] Business processes: “bp” represents a high membership score with a strong
characteristic of business processes while “~bp” represents a low membership
score with a strong characteristic of business processes.
[5] Knowledge asset: “ka” represents a high membership score with a strong
characteristic of knowledge asset while “~ka” represents a low membership score
with a strong characteristic of knowledge asset.
This section will report the results of fuzzy set analyses for each association using the notation
of the solution table recently introduced by Ragin and Fiss (2008), which has been widely
adopted by later fsQCA research (Crilly, 2011; Fiss, 2011; Greckhamer, 2011) because it is
able to present combinations of both parsimonious and intermediate solutions at the same time.
According to this notation, each row represents each causal condition or ingredient for the
outcome, while each column represents an alternative combination of causal conditions or
recipe or solution path linked to the respective outcome, consecutively numbered S1, S2, etc.
Full circles (●) indicate a condition’s presence, while barred circles (Ө) indicate a condition’s
absence. Core and peripheral conditions are distinguished by the size of the symbols: larger
circles indicate core conditions (conditions that are part of both parsimonious and intermediate
solutions), while small circles indicate peripheral conditions (conditions that occur only in
intermediate solutions). This study also adds an asterisk (*) to indicate a trivial necessary
150
condition. Blank spaces in a solution indicate a “don’t care” situation, in which that causal
condition may be either present or absent. In the numerical section, this study reports the
number of observed cases that match the respective solution path, followed by consistency,
raw coverage, unique coverage of each solution path, and all solutions in combination. A bold
number in the consistency value indicates a consistency level above 0.7 (the consistency
threshold for this research), suggesting that this solution path is at an acceptable consistency
level and will be considered further for its relative empirical weight by assessing its raw and
unique coverage, as suggested by Greckhamer (2011). Only such solution paths will be the
focus of association testing.
In addition to Ragin and Fiss’s (2008) solution table, this study presents the consistency and
raw coverage of four intersections between the model and each empirical solution path for the
model analyses mentioned. Again, a bold number in the consistency value for association test
1 (T1: H•S⊂Y) indicates a consistency level above 0.7 and suggests that the proposed
association is highly supported by this solution path derived from the empirical analysis, while
an italic bold number in the consistency value, which will be displayed only for association
tests 2, 3, and 4 ((T2: ~H•S⊂Y), (T3: H•~S⊂~Y), and (T4: ~H•~S⊂Y)) indicates a consistency
level above 0.7 and suggests that the proposed association is less supported by the solution
result. Finally, this section provides the result of each solution path association based on the
criteria previously discussed, the result for the combined solution path’s unique coverage of
the same association, and the result for the overall association for each analysis. Solution tables
for each association will be presented together to provide an overall picture of each association
as well as allowing for triangulation between different sources of outcome data.
Like that of Crilly (2011), Fiss (2011) and Greckhamer (2011), the explanation format for the
analysis of each sub-association will begin with an analysis of necessity, followed by an
analysis of sufficiency: only solution paths which pass the consistency threshold of this

151
research (0.7) will be discussed further regarding their unique coverage (issue of dominant
combination) and grouped by their core conditions (issues of first-order and second-order
equifinality (Fiss, 2011). An overview of the validity of the sub-associations will then be
supported with an interpretation of the association testing. For triangulation purposes, analysis
of another performance measure within the same dimension and analysis of financial outcome
data may be described separately from or concurrently with the primary sub-association
analysis, depending on how space can best be utilised from the observed results.
This study will suggest possible explanations for any deviation from the proposed association.
In this regard, this study expects there to be three possible explanations for deviation, ranging
from those least against the current association to those most against as follows.
[1] External validity (particularly the problem of measurement), which exists when
respondents find it difficult to answer the questionnaire (e.g. in order to answer a
comparative question correctly, respondents must closely monitor all competitors’
market positions, which they do not always do, hence the answer may not truly represent
the actual situation). This problem may be solved and the association may still be
supported only by adjusting the question to better suit the respondent’s knowledge or by
using financial rather than survey data.
[2] Empirical context, in which a specific characteristic leads to a weakly supported
association, hence the validity of the association cannot be confirmed using only current
empirical data (e.g. when a dataset’s products are treated as commodities, rather than
differentiated products, the study findings may not be generalisable). This problem may
be solved and the association may still be supported by repeating the analysis in a
different empirical context (e.g. one that is generalisable). In this way, the association
may be refined to allow for different conclusions depending on different empirical
contexts.
152
[3] Alternative theory, which suggests other explanations for the concerned phenomenon.
[4] Alternative theory may be based on either different factors within the model of the current
study (e.g. a different sub-group within the same research construct or a different research
construct) or on a completely different causal factor that has not previously been tested
in the current study. The former is less detrimental to the current study than the latter.
Obviously, these three alternative explanations provide different levels of justification for the
current association. This study will also refer to previous research findings wherever
applicable.
Reports for each sub-association of A1, which test all KS-OF integrations with one
performance dimension at a time, are as follows.
5.8.2 Analysis of A1a (KAD-IE)
Only two trivial necessary conditions (~c, ~ka) are found. Therefore, even though they are
shown in all paths, they are not necessary conditions. Rather, this situation occurs simply
because of the highly skewed distribution of the dataset toward ~c and ~ka. Consequently,
both are trivial necessary conditions for all subsequent analyses that have KS as a causal
condition of concern. From now on this study will report trivial necessary conditions only
when additional ones are observed (e.g. ~d in A1b).
A sufficiency analysis of the survey data of ie suggests three combinations of conditions that
predict input efficiency, all of which pass the consistency threshold. The consistency and
coverage of the solution are 0.72 and 0.44 respectively. These paths encompass different core
and peripheral conditions and thus cannot be grouped further, indicating a situation of first-
order (across-type) equifinality. Only S2 (ka*~bp*~d*s*~c), which can be categorised as
knowledge asset systems, is coherent with A1a. However, S2 is not the dominant combination
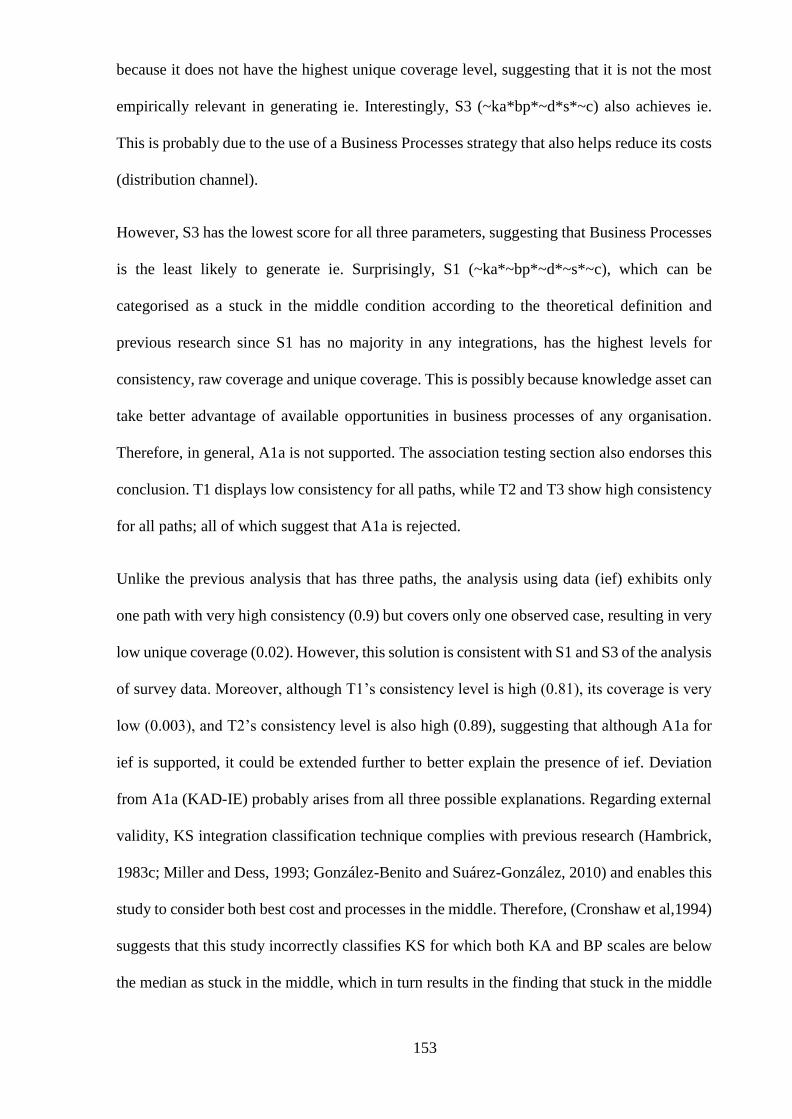
153
because it does not have the highest unique coverage level, suggesting that it is not the most
empirically relevant in generating ie. Interestingly, S3 (~ka*bp*~d*s*~c) also achieves ie.
This is probably due to the use of a Business Processes strategy that also helps reduce its costs
(distribution channel).
However, S3 has the lowest score for all three parameters, suggesting that Business Processes
is the least likely to generate ie. Surprisingly, S1 (~ka*~bp*~d*~s*~c), which can be
categorised as a stuck in the middle condition according to the theoretical definition and
previous research since S1 has no majority in any integrations, has the highest levels for
consistency, raw coverage and unique coverage. This is possibly because knowledge asset can
take better advantage of available opportunities in business processes of any organisation.
Therefore, in general, A1a is not supported. The association testing section also endorses this
conclusion. T1 displays low consistency for all paths, while T2 and T3 show high consistency
for all paths; all of which suggest that A1a is rejected.
Unlike the previous analysis that has three paths, the analysis using data (ief) exhibits only
one path with very high consistency (0.9) but covers only one observed case, resulting in very
low unique coverage (0.02). However, this solution is consistent with S1 and S3 of the analysis
of survey data. Moreover, although T1’s consistency level is high (0.81), its coverage is very
low (0.003), and T2’s consistency level is also high (0.89), suggesting that although A1a for
ief is supported, it could be extended further to better explain the presence of ief. Deviation
from A1a (KAD-IE) probably arises from all three possible explanations. Regarding external
validity, KS integration classification technique complies with previous research (Hambrick,
1983c; Miller and Dess, 1993; González-Benito and Suárez-González, 2010) and enables this
study to consider both best cost and processes in the middle. Therefore, (Cronshaw et al,1994)
suggests that this study incorrectly classifies KS for which both KA and BP scales are below
the median as stuck in the middle, which in turn results in the finding that stuck in the middle

154
also performs well in ie. (This argument also applies to any sub-association in this study that
has stuck in the middle as one of many solutions leading to high performance, a situation that
arises occasionally though infrequently.) In other words, it can be inferred from their research
that this study incorrectly classifies KS as stuck in the middle, thereby producing erroneous
findings. Rather, Cronshaw et al (1994) propose two broader interpretations: one uses strategic
clarity as a criterion (a firm which is stuck in the middle has multiple objectives rather than a
single goal), while the other uses strategic outcome as a criterion (a firm which is stuck in the
middle does not establish lower costs or better differentiated products). They prefer the latter.
However, this study would suggest that future research studies should adjust their
questionnaires and classification techniques to incorporate the concept of strategic clarity
rather than strategic outcome because the latter encounters a problem of tautology in this
research model. This format for presenting the results of fuzzy-set analysis is based on Ragin
and Fiss (2008) with additional information for subset/superset analysis. It will be applied to
all findings of this thesis.

155
Table 5.11 fsQCA findings for H1a: LCD-BCD-IE/IEF
5.8.3 Analysis of A1b: BPD-OE
Two solution paths (S3, S4) out of four pass the consistency threshold (Table 5.12). The core
conditions of both combinations show a lack of both knowledge asset and Collaboration cases,
and peripheral conditions exhibit a lack of systems. While the presence of Business Processes
is a core condition of S4, it is only a peripheral of S3. In addition, while the presence of
knowledge is a core condition of S4, neither the presence nor absence of team affects the
Legend:
(Also provided in looseleaf glossary)
● = Core causal condition present
Ө = Core causal condition absent
● = Peripheral causal condition present
Ө = Peripheral causal condition absent
* =Trivial necessary condition
Blank spaces = “don’t care”
Bold number = above 0.7 consistency level
Italic Bold number = above 0.7 consistency level
and only used for T2, T3, T4.
A1a: KS-IE A1a: KS-IEF
Condition S1 S2 S3 S1
Collaboration (C) Ө* Ө* Ө* Ө*
Systems (S)
Ө ● ● Ө
Decisionr (D) Ө Ө
Ө
Ө
Business Processes (BP)
Ө Ө ●
●
Low cost (KA)
Ө ● Ө
Observed cases 7 5 4 1
Consistency 0.724529 0.713514 0.704821 0.900405
Raw coverage 0.229618 0.209680 0.183706 0.022014
Unique coverage 0.137127 0.107350 0.069850 0.022014
Solution consistency 0.718015 0.900405
Solution coverage 0.437901 0.022014
T1: H•S⊂Y -Consistency 0.539667 0.545450 0.622072 0.808104
T1: H•S⊂Y -Raw coverage 0.043730 0.043524 0.036555 0.003689
T2: ~H•S⊂Y -Consistency 0.722497 0.713185 0.703511 0.890097
T2: ~H•S⊂Y -Raw coverage 0.227479 0.210136 0.183932 0.022590
T3: H•~S⊂~Y - Consistency 0.814957 0.814957 0.814957 0.651971
T3: H•~S⊂~Y -Raw coverage 0.112421 0.112421 0.112421 0.100733
T4: ~H•~S⊂Y -Consistency 0.463812 0.478831 0.485383 0.523584
T4: ~H•~S⊂Y -Raw coverage 0.837649 0.873858 0.891719 0.934861
Solution path hypothesis result Reject Reject Reject Support
Combined solution path unique
coverage of same hypothesis result
0.314327
0.022014 Overall hypothesis result Reject Support

156
generation of oe1 for S3. Likewise, while the absence of decision is a peripheral condition of
S3, neither the presence nor absence of decision affects the generation of oe1 for S4. This
situation suggests a trade-off the absence decision within the Business Processes group,
indicating the presence of second-order equifinality. Both have fair raw coverage but very low
unique coverage, indicating that the coverage of these combinations overlaps with each other
and perhaps with S1. From core and peripheral analysis, these two causal paths support A1b,
as shown in their high T1 and T2 consistency.
Sufficiency analysis for oe1f (survey data) fairly supports the previous analysis for oe1, as two
combinations (S2, a dominant combination with the highest unique coverage, and S4) out of
three that pass the consistency threshold are in line with S4 of the previous analysis, especially
in the core condition of Business Processes and a lack of low cost. Although the other solution
path (S3) suggests the opposite, with a core condition of low cost and a lack of Business
Processes, it covers only one observation with very low unique coverage and is therefore
negligible. Like those for oe1, the associations test results (T1, T2) of this analysis (oe1f) also
support A1b.
In considering the analysis for oe2 (in which, apart from ~c and ~d is found to be trivial
necessary conditions.) and oe2f, the sufficiency analysis produces different results (Table
5.12). Four and three paths, respectively, pass the consistency threshold, each of which
portrays first-order equifinality. Moreover, the former also displays second-order equifinality.
As in the analysis of oe2 that has three main groups of combinations – knowledge asset (S1),
a dominant combination; systems decision (S2); and differentiator and differentiated decision
(S3, S5) – the analysis of oe2f also contains three different groups: knowledge asset (S1), the
lowest unique coverage; differentiator (S2), a dominant combination; and best method (S3).
These two analyses suggest that there are many possible ways other than just being a
differentiator to achieve high oe2 or oe2f. Moreover, the high consistency level for T2 and T3

157
also suggests that A1b, using oe2 and oe2f as outcomes, can be improved further or should
even be dropped, resulting in fair support, rather than strong support for A1b. A possible
explanation for this result is that oe2 and oe2f, which is the investment yield, may not be
suitable parameters for output efficiency in this analysis because any integration of KS may
have either strong or weak resource skills. Some may be more risk-taking, while others may
be more conservative, resulting in a variety of investment yields beyond the control of the
chosen KS integration. Thus, although the overall association results are consistent with those
of oe1 and oe1f, they can be ignored as their outcomes do not strictly relate to the proposed
causal condition. In summary, A1b is supported by the analysis of oe1and oe1f.
Table 5.12a fsQCA findings for H1b: BPD-OE1/OE1F
A1b: KS-OE1 A1b: KS-OE1F
Condition S1 S2 S3 S4 S1 S2 S3 S4
Collaboration (C) Ө* Ө* Ө* Ө* Ө* Ө* Ө* Ө*
Systems (S)
Ө
Ө
● Ө Ө
Decision (D)
Ө
Ө
●
Ө Ө
●
Business Processes (BP) Ө
● ● ● Ө ●
Knowledge Asset (KA)
Ө ● Ө Ө Ө ● Ө
Observed cases 33 11 5 5 5 5 1 1
Consistency 0.625760 0.693128 0.772698 0.752416 0.663176 0.724664 0.794016 0.709135
Raw coverage 0.479140 0.226493 0.172121 0.172026 0.098641 0.159101 0.110858 0.055455
Unique coverage 0.238754 0.069801 0.002659 0.002450 0.040192 0.074229 0.019843 0.002375
Solution consistency 0.602613 0.688200
Solution coverage 0.554164 0.242285
T1: H•S⊂Y
-Consistency
0.782081
0.873616
0.775306
0.728530
0.674924
0.778808
0.824348
0.711809
T1: H•S⊂Y
-Raw coverage
0.056821
0.052946
0.054630
0.057186
0.050152
0.054088
0.043457
0.056607
T2: ~H•S⊂Y
-Consistency
0.625714
0.692681
0.771952
0.779462
0.678735
0.723961
0.793858
0.763640
T2: ~H•S⊂Y
-Raw coverage
0.478587
0.226085
0.171354
0.171172
0.100992
0.158391
0.109838
0.056607
T3: H•~S⊂~Y
- Consistency
0.666045
0.666045
0.666045
0.636616
0.670967
0.681394
0.681394
0.663628
T3: H•~S⊂~Y
-Raw coverage
0.072447
0.072447
0.072447
0.063638
0.071768
0.075269
0.075269
0.069434

158
T4: ~H•~S⊂Y
-Consistency
0.538359
0.532113
0.526908
0.527574
0.536492
0.536244
0.537995
0.530698
T4: ~H•~S⊂Y
-Raw coverage
0.623064
0.842742
0.894709
0.896900
0.936302
0.897471
0.934667
0.967440
Solution path association result Ignore Ignore Support Support Ignore Support Support Support
Combined solution path unique
coverage of same association result
0.005109
0.096447
Overall association result Support Support
Table 5.12b fsQCA findings for A1b: BPD-OE2/OE2F
A1b: KS-OE2 A1b: KS-OE2F
Condition S1 S2 S3 S4 S5 S1 S2 S3
Collaboration (C) Ө* Ө* Ө* Ө* Ө* Ө* Ө*
Systems (S) ● Ө Ө Ө Ө Ө
Decision (D) ●
Ө*
Ө*
● Ө
Business Processes (BP)
Ө ● ● ● ● ●
Knowledge Asset (KA)
●
Ө
Ө
● ●
Observed cases 11 5 5 10 1 9 11 10
Consistency 0.714269 0.745312 0.756022 0.673542 0.760762 0.821701 0.769282 0.849219
Raw coverage 0.272201 0.131173 0.196403 0.265147 0.070395 0.259547 0.284802 0.266998
Unique coverage 0.137118 0.037563 0.005708 0.054258 0.002810 0.051003 0.076259 0.060114
Solution consistency 0.660851 0.802112
Solution coverage 0.477160 0.395919
T1: H•S⊂Y-Consistency 0.901349 0.819554 0.823014 0.816842 0.760675 0.865469 0.850784 0.862620
T1: H•S⊂Y -Raw coverage 0.063707 0.072059 0.067632 0.084341 0.071578 0.071564 0.087208 0.069849
T2: ~H•S⊂Y -Consistency 0.715188 0.762347 0.755263 0.673175 0.816064 0.821572 0.760743 0.849751
T2: ~H•S⊂Y -Raw coverage 0.272237 0.134220 0.195520 0.263983 0.071578 0.256083 0.270314 0.266000
T3: H•~S⊂~Y - Consistency 0.910560 0.907633 0.910560 0.910560 0.905573 0.529645 0.595851 0.520320
T3: H•~S⊂~Y -Raw coverage 0.086160 0.083161 0.086160 0.086160 0.081162 0.054214 0.054214 0.054214
T4: ~H•~S⊂Y -Consistency 0.474625 0.472827 0.471777 0.481787 0.458589 0.478524 0.473277 0.463005
T4: ~H•~S⊂Y -Raw coverage 0.876657 0.976411 0.934270 0.900039 0.989185 0.813244 0.787465 0.786341
Solution path association result Support Support Support Ignore Support Support Support Support
Combined solution path unique
coverage of same association result
0.183199
0.187376
Overall association result Support Support
5.8.4 Analysis of A1c: S-EF
All five solution paths pass the consistency threshold (Table 5.13), which can be categorised
into three different groups, suggesting a first-order equifinality. S1 (ka*~bp*~s*~c) and S4

159
(ka*~bp*d*~c) can be grouped as same category, with S4 as a specific type with a decision
characteristic. Another group is differentiator, comprising S2 (~ka*bp*~d*~s*~c) and S3
(~ka*bp*~s*~c). Both share all core conditions (high in business processes with a lack of
collaboration, systems and knowledge asset) and differ only in one peripheral condition (lack
of decision), indicating second-order equifinality and suggesting a trade-off between these
peripheral conditions.
The last group is collaboration, S5 (ka*bp*~d*c), which is the dominant combination with the
highest unique coverage of 0.07. Interestingly, while all solutions have specific Porter’s (1980)
integrations, none has a fully-specified Miles and Snow’s (1978) integration (all paths have
one “don’t care” condition), suggesting that the presence or absence of Miles and Snow’s
(1978) integrations depend on the context provided by Porter’s (1980) integrations. In other
words, Porter’s (1980) integrations seem to better predict effectiveness than Miles and Snow’s
(1978) integrations.
The results for the survey data outcome (ef1f) are quite similar to those of the entities. Three
solutions passing the consistency threshold can be classified into two groups. The first is
differentiator (S3 (~ka*bp*~d*~s*~c) and S2 (~ka*~s*~c)), although in S2 business
processes is a “don’t care” condition and knowledge asset cannot be present. Thus, S2 may be
either a differentiator or stuck in the middle. However, the latter is unlikely to achieve high
effectiveness. The second group is knowledge asset decision (S5 (ka*~bp*d*~c)).
Nevertheless, the lack of collaborations in the survey outcome raises a concern that only the
pure form, rather than the hybrid, of Porter’s (1980) integrations leads to high effectiveness.
The analyses for ef2 and ef2f (Table 5.13) show only one group of solutions, differentiator.
All paths are high in business processes and lack knowledge asset as common core conditions,
while the remaining conditions are quite similar. Combined with the previous analysis for
ef1/ef1f, they suggest that a differentiator has a better chance of generating effectiveness than

160
other KS. Unlike the analyses for ef1, ef1f and ef2f that support A1c, analysis of ef2 rejects
A1c. This raises a concern but is not significant enough to change the overall validity of the
association owing to its low consistency (0.711).
Deviation from A1c (S-EF2) probably arises only from the empirical context. Most industry
players fall into a questionable organisational orthodoxy (Kuhn and Marsick, 2005: 31), which
is “self-imposed beliefs and theories of success about business”, particularly a belief that the
service industry is a commodity business and is a highly-regulated and mature industry.
Therefore, they mistakenly believe that truly new products and innovation are difficult to
create; conditions can only be changed slightly. Furthermore, even if they devise innovative
products, such products will be imitated almost instantly by the competition (Kuhn and
Marsick, 2005). Consequently, they tend to compete in terms of scale via price, not business
processes.
However, with a price range requirement, price competition is not a viable option to gain
competitive advantage. On the other hand, only a handful of business organisations that do not
fall into this organisational orthodoxy pursue business processes and enjoy high market share,
as shown in the findings. Evidently, an organisation gains a higher market share by pursuing
business processes rather than a systems strategy because brand capacity resulting from
business processes directly and simultaneously helps a business unit both in maintaining its
current customers and in gaining new markets, while a system must pursue both decision and
collaboration strategies in order to achieve the same result. It is more difficult to balance these
activities in the competitive market.
Table 5.13a fsQCA findings for A1c: S-EF1/EF1F
A1c: KS-EF1 A1c: KS-EF1F
Condition S1 S2 S3 S4 S5 S1 S2 S3 S4 S5
Collaboration (C)
Ө* Ө* Ө* Ө* ● Ө* Ө*
Ө* Ө* Ө*

161
Systems (S) Ө Ө Ө Ө Ө
Ө
Decision (D)
Ө
● Ө
Ө
Ө
Ө
●
Business Processes (BP)
Ө ● ●
Ө
●
● ●
Ө
Knowledge Asset (KA)
● Ө Ө ● ●
Ө Ө Ө ●
Observed cases 3 5 5 5 4 18 22 5 8 5
Consistency 0.770447 0.756489 0.739491 0.800157 0.777157 0.695167 0.701578 0.762059 0.689534 0.746008
Raw coverage 0.136668 0.185175 0.185791 0.102848 0.105708 0.341586 0.361502 0.165036 0.219214 0.084834
Unique coverage 0.008621 0.005378 0.005869 0.011813 0.071621 0.081440 0.103796 0.004758 0.056710 0.012912
Solution consistency 0.718146 0.668564
Solution coverage 0.326723 0.525807
T1: H•S⊂Y-Consistency 0.748112 0.777327 0.777656 0.766726 0.758921 0.783995 0.772517 0.851344 0.717966 0.782018
T1: H•S⊂Y -Raw coverage 0.096045 0.105565 0.105766 0.073980 0.043083 0.184637 0.153828 0.102289 0.161569 0.066757
T2: ~H•S⊂Y -Consistency 0.767797 0.754910 0.737366 0.852405 0.774985 0.695350 0.701556 0.761716 0.756305 0.777220
T2: ~H•S⊂Y -Raw coverage 0.134921 0.184143 0.184745 0.091993 0.096075 0.339862 0.360202 0.164385 0.159593 0.074210
T3: H•~S⊂~Y - Consistency 0.624387 0.624387 0.624387 0.627555 0.628727 0.573064 0.573064 0.573064 0.586666 0.575807
T3: H•~S⊂~Y -Raw coverage 0.690934 0.690934 0.690934 0.682360 0.688585 0.715457 0.715457 0.715457 0.662948 0.706377
T4: ~H•~S⊂Y -Consistency 0.601636 0.589292 0.597139 0.598663 0.582272 0.735984 0.723446 0.707032 0.708400 0.678233
T4: ~H•~S⊂Y -Raw coverage 0.499644 0.453575 0.455782 0.505462 0.464408 0.385193 0.334464 0.481466 0.484661 0.506632
Solution path association result
Support
Support
Support
Support
Support
Ignore
Support Weak
Support
Ignore
Support
Combined solution path unique
coverage of same association result
0.103302
0.116708
0.004758
Overall association result Support Support
Table 5.13b fsQCA findings for A1c: S-EF2/EF12F
A1c: KS-EF2 A1c: KS-EF2F
Condition S1 S1 S2
Collaboration (C) Ө* Ө* Ө*
Systems (S) Ө
Decision (D) Ө Ө
Business Processes (BP)
● ● ●
Knowledge Asset (KA) Ө Ө Ө
Observed cases 5 9 9
Consistency 0.710821 0.765686 0.765449
Raw coverage 0.161335 0.271478 0.276201
Unique coverage 0.161335 0.005228 0.009951
Solution consistency 0.710821 0.768799
Solution coverage 0.161335 0.281429
T1: H•S⊂Y-Consistency 0.691323 0.759535 0.759724
T1: H•S⊂Y -Raw coverage 0.087053 0.187811 0.188006
T2: ~H•S⊂Y -Consistency 0.707803 0.741407 0.742004
T2: ~H•S⊂Y -Raw coverage 0.160089 0.175810 0.180727

162
T3: H•~S⊂~Y - Consistency 0.560523 0.623238 0.623238
T3: H•~S⊂~Y -Raw coverage 0.665845 0.640238 0.640238
T4: ~H•~S⊂Y -Consistency 0.597557 0.559862 0.556151
T4: ~H•~S⊂Y -Raw coverage 0.426468 0.417932 0.411692
Solution path association result Reject Support Support
Combined solution path unique
coverage of same association result
0.161335
0.015179
Overall association result Reject Support
5.8.5 Analysis of A1d: C-AD
Three out of five solution paths pass the consistency threshold (Table 5.14), which can be
categorised in two different groups, suggesting first-order equifinality. The differentiator
group comprises S3 (~ka*bp*~d*~s*~c) and S4 (~ka*bp*~s*~c), which share the same core
and peripheral causal conditions except that the core condition lacks decision, which can be
treated as substitutes, indicating second-order equifinality. Although these combinations lack
collaboration (~c), business processes are the characteristic quite similar to collaboration (Fiss,
2011), and thus still supports the association. In the second group, knowledge asset decision,
S5 (ka*~bp*d*~c) is a dominant combination with a unique coverage of 0.032. This is
probably because current industry conditions allow copycats (market followers) to issue new
products resembling those of pioneers without incurring OL costs. Note that ~c is a trivial
necessary condition (because of data skewness); therefore, it cannot be inferred that the
association is rejected only from the observed solutions. Rather, the proposed association
testing criteria are preferred and suggest support for A1d.
Analysis of AD2 provides slightly different solutions. While S1 (~ka*bp*~d*~s),
differentiated systems, is consistent with previous analysis, S2 (ka*bp*~d*s), which is a
dominant combination with a sizeable unique coverage of 0.43, indicates best-cost systems,
contradicting the previously-observed low-cost systems. This probably suggests that in order
to achieve high adaptability it is more important to be a best-cost system than a low- cost

163
system (copycat). Moreover, both solution paths require the presence of business processes,
notwithstanding at different levels of importance, thereby fairly endorsing the association.
In summary, both tests support the association.
Table 5.14 fsQCA results for A1d: C-AD1/AD2
A1d: KS-AD1 A1d: KS-AD2
Condition S1 S2 S3 S4 S5 S1 S2
Collaboration (C) Ө* Ө* Ө* Ө*
Systems (S)
Ө
Ө
Ө
Ө ●
Decision (D)
Ө
Ө Ө ● Ө Ө
Business Processes (BP) ● ● ●
Ө
● ●
Knowledge Asset (KA)
●
Ө
Ө
●
Ө
●
Observed cases 11 40 5 5 5 1 26
Consistency 0.698892 0.692181 0.740252 0.733449 0.785004 0.970090 0.712693
Raw coverage 0.236909 0.566492 0.164245 0.167030 0.091458 0.027005 0.445208
Unique coverage 0.048374 0.336715 0.002648 0.005320 0.031859 0.010598 0.428800
Solution consistency 0.686555 0.716547
Solution coverage 0.665239 0.455806
T1: H•S⊂Y-Consistency 0.75716 0.812902 0.827317 0.827317 0.988559 0.991696 0.916804
T1: H•S⊂Y -Raw coverage 0.085357 0.067400 0.034448 0.034448 0.008089 0.006429 0.054261
T2: ~H•S⊂Y -Consistency 0.689295 0.692412 0.739000 0.731484 0.786105 0.959823 0.711222
T2: ~H•S⊂Y -Raw coverage 0.191634 0.565667 0.163395 0.166122 0.092622 0.027701 0.435212
T3: H•~S⊂~Y - Consistency 0.600079 0.466213 0.466213 0.466213 0.466213 0.548037 0.577609
T3: H•~S⊂~Y -Raw coverage 0.058389 0.074411 0.074411 0.074411 0.074411 0.076858 0.074661
T4: ~H•~S⊂Y -Consistency 0.535569 0.476600 0.532806 0.534341 0.512781 0.446069 0.388852
T4: ~H•~S⊂Y -Raw coverage 0.841081 0.505483 0.860575 0.859848 0.864034 0.910765 0.582426
Solution path association result Ignore Ignore Support Support Support Support Support
Combined solution path unique
coverage of same association result
0.039827
0.439398
Overall association result Support Support
Association testing: relationship between OF and performance (A2) In order to test the second
main association regarding the relationship between OF and performance dimensions (A2),
this study again implements fsQCA to test each of the four sub-associations separately, which
correspond with four performance dimensions, by setting one performance dimension as the

164
outcome of interest and testing it with all five possible OF attributes as causal conditions as
follows;
[1] Operations capability: “op” represents a high membership score with a strong
operations capability while “~op” represents a low membership score with a strong
operations capability.
[2] Organisational learning capability: “ol” represents a high membership score with a
strong organisational learning capability while “~ol” represents a low membership
score with a strong organisational learning capability.
[3] Leadership capability: “lp” represents a high membership score with a strong
leadership capability while “~lp” represents a low membership score with a strong
leadership capability.
[4] Organisational structure capability: “os” represents a high membership score with a
strong organisational structure capability while “~os” represents a low membership
score with a strong organisational structure capability.
[5] Culture capability: “ct” represents a high membership score with a strong culture
capability while “~ct” represents a low membership score with a strong culture
capability.
Reports for each sub-association of A2, which test all OFs against one performance dimension
at a time, are as follows.
5.8.6 Analysis of A2a: OP-IE
Since A2 concerns only OF, there is no trivial necessary condition (~c) in any of the A2
analysis. Both solution paths of the A2a analysis are above the consistency threshold with
different patterns (Table 5.15). S1 (~ct*~os*lp*os) has high leadership and a lack of

165
organisational structure as core conditions, while S2 (ct*os*~lp*ol*op) has culture and
organisational learning and lacks leadership as core conditions. S1 has a lower unique
coverage, probably because leadership has an indirect influence on input efficiency, whereas
S2’s culture and organisational learning strengths in expansion directly reduce costs through
economies of scale and risk diversification. Consequently, S1 rejects the association while S2
strongly supports it. Note that S2’s peripheral conditions are the presence of operations (the
proposed association) and organisational structure, so it has all OFs except leadership. This
may suggest that, in order to achieve high input efficiency, almost all OFs must exist and work
in cooperation.
Survey data also reveal similar patterns. All three solution paths are above the consistency
threshold and can be classified into two groups. S1 and S2 are similar to S2 of the previous
test, while S3 is similar to S1 of the previous test. The results for the association are fairly
consistent, with a slightly lower level of support in S1 and S2, which only support, rather than
strongly support, A2a.
Table 5.15 fsQCA findings for A2a: OP-IE/IEF
A2a: OF-IE A2a: OF-IEF
Condition S1 S2 S1 S2 S3
Operations (OP)
● ● Ө
Organisational Learning (OL) ● ●
Ө
●
Leadership (LP)
● Ө Ө Ө
●
Organisational Structure (OS)
Ө
● ● ●
Ө
Culture (CT)
Ө
● ● ● Ө
Observed cases 1 1 3 1 1
Consistency 0.737169 0.710147 0.764703 0.776655 0.790485
Raw coverage 0.085003 0.100142 0.115943 0.123956 0.073065
Unique coverage 0.049563 0.064702 0.025406 0.033267 0.041147
Solution consistency 0.736867 0.821077
Solution coverage 0.149705 0.191247

166
T1: H•S⊂Y-Consistency 0.695337 0.707760 0.725705 0.777665 0.693290
T1: H•S⊂Y -Raw coverage 0.055628 0.098067 0.088645 0.122538 0.041773
T2: ~H•S⊂Y -Consistency 0.739448 0.646986 0.744838 0.709019 0.792344
T2: ~H•S⊂Y -Raw coverage 0.076386 0.059097 0.082686 0.064340 0.072480
T3: H•~S⊂~Y - Consistency 0.631375 0.647222 0.607701 0.623507 0.591050
T3: H•~S⊂~Y -Raw coverage 0.595426 0.591453 0.623162 0.621822 0.630869
T4: ~H•~S⊂Y -Consistency 0.540970 0.541457 0.625643 0.623802 0.619940
T4: ~H•~S⊂Y -Raw coverage 0.552580 0.572168 0.567398 0.583724 0.560753
Solution path association result Reject Strong support Support Support Reject
Combined solution path unique
coverage of same association result
0.049563
0.064702
0.058673
0.041147
Overall association result Strong support Support
5.8.7 Analysis of A2b: OL-OE
All seven solution paths of the A2b analysis are above the consistency threshold (Table 5.16),
and can be sorted into three main groups based on the requirement for organisational learning
(proposed association). First, those for which organisational learning is a “don’t care”
condition (S1 (ct*~lp*~op) and S2 (~ct*~os*~lp*op)), which are two dominant conditions
with unique coverage of 0.063 and 0.067 respectively, suggest that there are trade-offs
between a high degree of operations and culture in generating oe1 (loss ratio, which is
equivalent to profit margin ratio). Nevertheless, the existence of this group does not reject
A2b. Secondly, those in which organisational learning is present (S3 (ct*os*ol*~op), S5
(~ct*os*ol*op), S6 (~ct*~os*lp*ol*~op) and S7 (os*~lp*ol*op)), in which organisational
learning is a core condition for three out of four paths, suggest that organisational learning is
an INUS condition (Mackie, 1974) for generating oe1. Thirdly, the group in which
organisational learning is absent (S4 (ct*os*~ol*op)) suggests that strong culture,
organisational structure, and operations can be treated as substitutes for organisational learning
in creating oe1. This agrees with the notion that business processes can be achieved through
either organisational learning or culture, or both. Clearly, all three groups support the
association.

167
Survey data reveal identical patterns, except for S6 (ct*os*~lp) which is almost a subset of S3
from the previous analysis. Similarly, analysis for oe2 provides five out of seven identical
solutions (Table 5.17) to that of oe1. The deviation is only slight as the solution for oe2 (S6)
is almost a subset of that for oe1 (S3). Likewise, all four paths of the oe2f analysis that pass
the consistency threshold are identical with those of oe2, reconfirming support for A2b.
Table 5.16 fsQCA findings for A2b: OL-OE1/OE1F
A2b: OL-OE1
Condition S1 S2 S3 S4 S5 S6 S7
Operations (OP)
Ө
● Ө
●
●
Ө
●
Organisational Learning (OL) ● Ө ● ●
●
Leadership (LP) Ө Ө ● Ө
Organisational Structure (OS)
Ө
●
●
●
Ө
●
Culture (CT)
●
Ө
● ● Ө Ө
Observed cases 3 5 5 2 5 1 2
Consistency 0.793156 0.777088 0.775229 0.755311 0.860643 0.762031 0.781217
Raw coverage 0.151049 0.134623 0.142804 0.125786 0.130888 0.070419 0.109356
Unique coverage 0.062875 0.066940 0.047280 0.029209 0.048338 0.017503 0.013124
Solution consistency 0.760072
Solution coverage 0.430462
T1: H•S⊂Y-Consistency 0.785602 0.805686 0.775045 0.825182 0.862248 0.757407 0.780279
T1: H•S⊂Y -Raw coverage 0.084181 0.080744 0.141481 0.098665 0.130956 0.069269 0.107682
T2: ~H•S⊂Y -Consistency 0.808090 0.785524 0.855294 0.754137 0.837106 0.695468 0.852027
T2: ~H•S⊂Y -Raw coverage 0.146776 0.127047 0.083998 0.124586 0.063875 0.050274 0.076678
T3: H•~S⊂~Y - Consistency 0.517142 0.518360 0.534262 0.516897 0.548324 0.526356 0.524705
T3: H•~S⊂~Y -Raw coverage 0.564092 0.563832 0.540307 0.568478 0.559569 0.568297 0.550638
T4: ~H•~S⊂Y -Consistency 0.573405 0.571344 0.545416 0.549898 0.545416 0.545416 0.545416
T4: ~H•~S⊂Y -Raw coverage 0.471235 0.475278 0.493535 0.472495 0.493535 0.493535 0.493535
Solution path association result Support Support Support Support Support Strong support Support
Combined solution path unique
coverage of same association result
0.267766
0.017503
Overall association result Support
Table 5.17 fsQCA findings for A2b: OL-OE1F
A2b: OL-OE1F
Condition S1 S2 S3 S4 S5 S6 S7
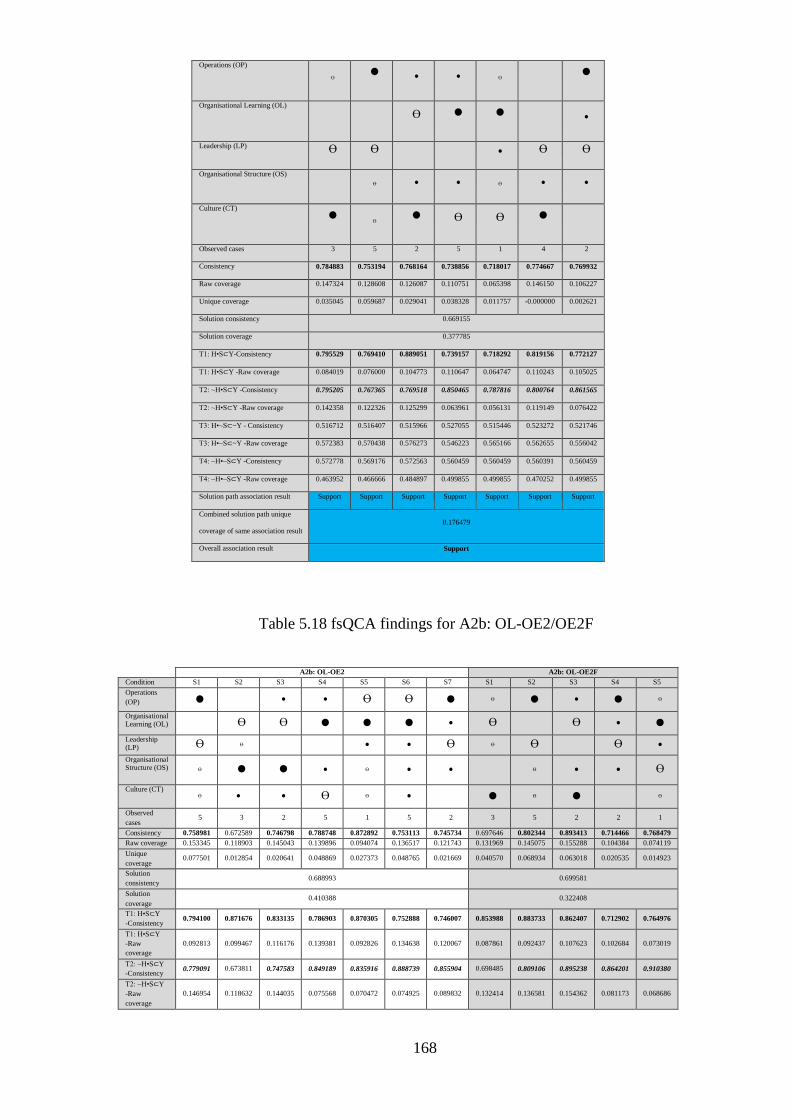
168
Operations (OP)
Ө
● ●
●
Ө
●
Organisational Learning (OL) Ө ● ●
●
Leadership (LP) Ө Ө ● Ө Ө
Organisational Structure (OS)
Ө
●
●
Ө
●
●
Culture (CT)
●
Ө
● Ө Ө ●
Observed cases 3 5 2 5 1 4 2
Consistency 0.784883 0.753194 0.768164 0.738856 0.718017 0.774667 0.769932
Raw coverage 0.147324 0.128608 0.126087 0.110751 0.065398 0.146150 0.106227
Unique coverage 0.035045 0.059687 0.029041 0.038328 0.011757 -0.000000 0.002621
Solution consistency 0.669155
Solution coverage 0.377785
T1: H•S⊂Y-Consistency 0.795529 0.769410 0.889051 0.739157 0.718292 0.819156 0.772127
T1: H•S⊂Y -Raw coverage 0.084019 0.076000 0.104773 0.110647 0.064747 0.110243 0.105025
T2: ~H•S⊂Y -Consistency 0.795205 0.767365 0.769518 0.850465 0.787816 0.800764 0.861565
T2: ~H•S⊂Y -Raw coverage 0.142358 0.122326 0.125299 0.063961 0.056131 0.119149 0.076422
T3: H•~S⊂~Y - Consistency 0.516712 0.516407 0.515966 0.527055 0.515446 0.523272 0.521746
T3: H•~S⊂~Y -Raw coverage 0.572383 0.570438 0.576273 0.546223 0.565166 0.562655 0.556042
T4: ~H•~S⊂Y -Consistency 0.572778 0.569176 0.572563 0.560459 0.560459 0.560391 0.560459
T4: ~H•~S⊂Y -Raw coverage 0.463952 0.466666 0.484897 0.499855 0.499855 0.470252 0.499855
Solution path association result Support Support Support Support Support Support Support
Combined solution path unique
coverage of same association result
0.176479
Overall association result Support
Table 5.18 fsQCA findings for A2b: OL-OE2/OE2F
A2b: OL-OE2 A2b: OL-OE2F
Condition S1 S2 S3 S4 S5 S6 S7 S1 S2 S3 S4 S5
Operations
(OP) ● ● ● Ө Ө ●
Ө ● ● ●
Ө
Organisational Learning (OL) Ө Ө ● ● ● ● Ө Ө ● ● Leadership (LP) Ө
Ө ● ● Ө
Ө Ө Ө ●
Organisational Structure (OS)
Ө ● ●
●
Ө
●
●
Ө
●
● Ө
Culture (CT) Ө ● ● Ө
Ө ● ●
Ө ●
Ө
Observed
cases 5 3 2 5 1 5 2 3 5 2 2 1
Consistency 0.758981 0.672589 0.746798 0.788748 0.872892 0.753113 0.745734 0.697646 0.802344 0.893413 0.714466 0.768479
Raw coverage 0.153345 0.118903 0.145043 0.139896 0.094074 0.136517 0.121743 0.131969 0.145075 0.155288 0.104384 0.074119
Unique
coverage 0.077501 0.012854 0.020641 0.048869 0.027373 0.048765 0.021669 0.040570 0.068934 0.063018 0.020535 0.014923
Solution
consistency 0.688993 0.699581
Solution
coverage 0.410388 0.322408
T1: H•S⊂Y
-Consistency 0.794100 0.871676 0.833135 0.786903 0.870305 0.752888 0.746007 0.853988 0.883733 0.862407 0.712902 0.764976
T1: H•S⊂Y
-Raw
coverage
0.092813
0.099467
0.116176
0.139381
0.092826
0.134638
0.120067
0.087861
0.092437
0.107623
0.102684
0.073019
T2: ~H•S⊂Y
-Consistency 0.779091 0.673811 0.747583 0.849189 0.835916 0.888739 0.855904 0.698485 0.809106 0.895238 0.864201 0.910380
T2: ~H•S⊂Y
-Raw
coverage
0.146954
0.118632
0.144035
0.075568
0.070472
0.074925
0.089832
0.132414
0.136581
0.154362
0.081173
0.068686

169
T3: H•~S⊂~Y
- Consistency 0.557086 0.556765 0.556765 0.578579 0.567134 0.572559 0.561409 0.575412 0.578739 0.575412 0.575637 0.571539
T3: H•~S⊂~Y
-Raw
coverage
0.527130
0.532670
0.532670
0.513636
0.532670
0.505430
0.512516
0.606197
0.603014
0.606197
0.578663
0.591108
T4: ~H•~S⊂Y
-Consistency 0.447217 0.447961 0.435137 0.434078 0.434078 0.434078 0.434078 0.585850 0.570792 0.550756 0.566924 0.566924
T4: ~H•~S⊂Y
-Raw
coverage
0.433866
0.444984
0.436043
0.458084
0.458084
0.458084
0.458084
0.502510
0.495574
0.493919
0.535422
0.535422
Solution path
association
result
Support
Ignore
Support Support Support Support Support
Ignore
Support Support Support Support
Combined
solution path
unique
coverage of
same
association
result
0.244818
0.16741
Overall
association
result
Support
Support
5.8.8 Analysis of A2c: OS-EF
Four out of five solution paths pass the consistency threshold (Table 5.19), and can be
categorised into two different groups: those that have either leadership (S3 (~ct*ol)) or
organisational structure (S4 (os*op)), or both (S5 (os*ol*~op)); and those that have both
leadership and organisational structure as “don’t care” conditions (S1 (~ct*op)). Obviously,
all paths are consistent with A2c at different levels of support. Among the former group, S5 is
a dominant combination with the highest unique coverage of 0.043, suggesting that having
both leadership and organisational structure covers more cases of high ef1 than having only
one of them, which in turn indicates combination between these two OFs. This path also shows
strong support for the proposed association, while the rest suggest only medium support.
Therefore, in combination, the overall association is supported. Moreover, comparing the
unique coverage of S3 and S4 suggests that, if one focuses only on core conditions,
organisational structure has more causal relevance than leadership in generating ef1.
Likewise, analysis of the questionnaire data provides a mirror image of that of the survey data.
All paths are exactly the same, which reconfirms the support result. S2 (ct*os*~ol) passes the
consistency threshold, which further reinforces the argument that organisational structure is
more relevant than leadership in generating ef1f. Analysis of ef2 (Table 5.20) provides only
one path (~ct*~ol*op) which is a superset of S1 from the ef1 analysis, and hence also supports

170
A2c. However, analysis of ef2f reveals three different paths which, although supporting A2c,
suggest slightly different messages. When focusing only on two conditions proposed in A2c,
either leadership or organisational structure or neither, but not both, are exhibited as core
conditions in these solution paths and the other is a “don’t care” condition, suggesting that
they are not complementary but substitutes for each other.

Table 5.19 fsQCA findings for A2c: OS-EF1/EF1F
A2c: OS-EF1 A2c: OS-EF1F
Condition S1 S2 S3 S4 S5 S1 S2 S3 S4 S5
Operations (OP)
● ● Ө ●
● Ө
Organisational Learning (OL) Ө
●
● Ө
●
●
Leadership (LP) ● Ө
●
● Ө
●
Organisational Structure (OS) ● ● ● ● ● ●
Culture (CT) Ө
●
Ө Ө
●
Ө
Observed cases 10 4 5 3 5 10 4 5 3 5
Consistency 0.810221 0.630946 0.794263 0.703823 0.720522 0.779445 0.787822 0.765779 0.801304 0.820539
Raw coverage 0.246446 0.134989 0.137137 0.149149 0.123738 0.209755 0.149122 0.116978 0.150232 0.124671
Unique coverage 0.088958 0.017743 0.019238 0.034994 0.042879 0.070423 0.031882 0.014005 0.028619 0.049826
Solution
consistency
0.682169
0.755792
Solution coverage 0.393117 0.385337
T1: H•S⊂Y-
Consistency
0.852770
0.737392
0.839997
0.793497
0.719166
0.814597
0.816997
0.830638
0.869343
0.821331
T1: H•S⊂Y -Raw
coverage
0.122140
0.096591
0.110706
0.086591
0.121758
0.103223
0.094682
0.096853
0.083932
0.123026
T2: ~H•S⊂Y -
Consistency
0.830457
0.659127
0.824492
0.703441
0.658091
0.779647
0.806163
0.756353
0.800525
0.853360
T2: ~H•S⊂Y -Raw
coverage
0.206736
0.118204
0.096258
0.147177
0.068250
0.171714
0.127907
0.078124
0.148182
0.078299
T3: H•~S⊂~Y -
Consistency
0.509483
0.494303
0.509483
0.495242
0.519911
0.506156
0.495533
0.506156
0.488636
0.509209
T3: H•~S⊂~Y -
Raw coverage
0.372022
0.370192
0.372022
0.385541
0.374997
0.416986
0.418702
0.416986
0.429177
0.414374

T4: ~H•~S⊂Y -
Consistency
0.426150
0.445174
0.437796
0.428749
0.438237
0.554048
0.541307
0.548544
0.536385
0.537445
T4: ~H•~S⊂Y -
Raw coverage
0.465722
0.521608
0.531317
0.494708
0.549523
0.535698
0.561133
0.588982
0.547558
0.596236
Solution path
association result
Support
Ignore
Support
Support Strong
support
Support
Support
Support
Support
Support
Combined solution
path unique
coverage of same
association result
0.14319
0.042879
0.194755
Overall association
result
Support
Support

173
Table 5.20 fsQCA findings for A2c: OS-EF2/EF2F
A2c: LP-EF2 A2c: LP-EF2F
Condition S1 S1 S2 S3
Operations (OP)
●
Ө
Ө
Organisational Learning (OL) Ө Ө Ө ●
Leadership (LP) ●
Organisational Structure (OS)
●
Culture (CT)
Ө ● ● Ө
Observed cases 4 3 4 1
Consistency 0.732735 0.710499 0.757212 0.776710
Raw coverage 0.142092 0.149561 0.157488 0.079930
Unique coverage 0.142092 0.050177 0.066607 0.031718
Solution consistency 0.732735 0.764849
Solution coverage 0.142092 0.247886
T1: H•S⊂Y-Consistency 0.800540 0.651014 0.723364 0.737608
T1: H•S⊂Y -Raw coverage 0.054945 0.056748 0.092113 0.046316
T2: ~H•S⊂Y -Consistency 0.729397 0.741126 0.767807 0.768565
T2: ~H•S⊂Y -Raw coverage 0.140281 0.146694 0.133857 0.076887
T3: H•~S⊂~Y - Consistency 0.607950 0.596473 0.610785 0.600480
T3: H•~S⊂~Y
-Raw coverage
0.507264
0.469406
0.469159
0.478379
T4: ~H•~S⊂Y -Consistency 0.608108 0.544808 0.523172 0.527446
T4: ~H•~S⊂Y
-Raw coverage
0.631034
0.596974
0.595916
0.622280
Solution path association result Support Reject Support Support
Combined solution path unique
coverage of same association result
0.142092
0.050177
0.098325
Overall association result Support Support
5.8.9 Analysis of A2d: CT-AD
Three out of four solution paths of the ad1 analysis are above the consistency threshold (Table
5.21), and can be categorised into two different groups: those that have culture, in either core
or peripheral conditions (S1 (ct*~lp*~ol*~op) and S3 (ct*os*~lp*op)); and those that do not
have culture (S4 (~ct*~os*lp*ol*~op)). A combination S4 contradictory to the association
probably exists because the business unit needs strong organisational learning capability to
design new products to suit the changing customer needs that are observed and reported in its

174
operations. However, its unique coverage is quite low at 0.032. S1, which has the presence of
culture as a core condition, is a dominant combination with 0.064 unique coverage; therefore,
A2d is supported. Moreover, S3 also suggests combination between culture and organisational
structure in generating ad1. The analysis of ad2 is very similar to that of ad1 in that its S1 and
S2 are exactly the same as S1 and S2 of the ad1 analysis respectively, and its S3 is quite similar
to S3 of the ad1 analysis, thereby reconfirming the support result for A2d with no major
contradiction.
Table 5.21 fsQCA findings for A2d: CT-AD1/AD2
A2d: CT -AD1 A2d: CT-AD2 Condition S1 S2 S3 S4 S1 S2 S3
Operations (OP) Ө ● ● Ө Ө ● ●
Organisational Learning (OL) Ө Ө ● Ө Ө ●
Leadership (LP) Ө Ө ●
Ө Ө
Organisational Structure (OS) ● ●
Ө ● ●
Culture (CT)
● ● ● Ө ● ● Observed cases 3 2 2 1 3 2 2
Consistency 0.778090 0.685793 0.717131 0.863319 0.834968 0.707299 0.736667
Raw coverage 0.140467 0.113759 0.113980 0.079466 0.173370 0.134946 0.118139
Unique coverage 0.063863 0.023117 0.023786 0.031932 0.095228 0.042382 0.036761
Solution consistency 0.726515 0.737450
Solution coverage 0.243319 0.266934
T1: H•S⊂Y-Consistency 0.780527 0.687665 0.717971 0.852982 0.835743 0.706701 0.817127
T1: H•S⊂Y -Raw coverage 0.141212 0.113158 0.112662 0.053353 0.173907 0.133754 0.114837
T2: ~H•S⊂Y -Consistency 0.869145 0.852866 0.859074 0.862612 0.899974 0.849789 0.719493
T2: ~H•S⊂Y -Raw coverage 0.127850 0.077847 0.078258 0.078580 0.152265 0.089215 0.070871
T3: H•~S⊂~Y - Consistency 0.510259 0.512996 0.515814 0.513359 0.500944 0.501170 0.513012
T3: H•~S⊂~Y
-Raw coverage 0.538882 0.520367 0.527292 0.560519 0.464858 0.446691 0.467474
T4: ~H•~S⊂Y -Consistency 0.544917 0.544917 0.544917 0.548205 0.385775 0.385775 0.389300
T4: ~H•~S⊂Y
-Raw coverage 0.497584 0.497584 0.497584 0.484937 0.405165 0.405165 0.402029
Solution path association result Support Ignore Support Support Support Support Support
Combined solution path unique
coverage of same association result 0.119581 0.174371
Overall association result
Sup port Support
5.8.10 Post-data analysis
This section considers all sub-associations within each of the two main associations tested in
this chapter to identify patterns and further implications of the relationship between causal
conditions and outcomes. For A1, ten out of twelve sub-association tests are supported. This
answers the first research question that the equivocal empirical evidence of previous research
can be improved, if not fully resolved, by selecting an appropriate performance dimension to

175
measure business units with different KSs. However, A1a and A1c are both rejected,
suggesting that ie and ef2 are likely to have causal factors other than those proposed in this
study. In this regard, A2a and A2c, for which there is strong and medium support respectively,
show that the proposed related OFs (op, lp and os, respectively) are sufficient to explain the
variation of ie and ef2, suggesting that they may be either substitutes for or complementary to
the proposed KS integrations. To answer this question, A3 is a necessary next step.
For A2, all sub-association tests are supported, except A2a which is strongly supported, thus,
further strengthening A2. To answer the second research question about whether OFs better
explain performance than KSs, as claimed by Barney and Hoskisson (1990), this study
compares solution coverages, which portrays their explanatory power, between all sub-
associations of A1 and A2 tested against the same performance dimension with a consistency
level above 0.7 (passing the consistency threshold).
The rationale behind this comparison is as follows. Firstly, although combined unique
coverage could be used in the prior analyses of this research to compare within the same
association test because it is based on the same outcome and the intersection is the same area,
it cannot be compared across different analyses because the intersection areas are different,
which may result in an incorrect interpretation. For example, it is not necessary for ie to be
covered more by KS (as in A1a (KS-IE), in which the combined unique coverage is 0.314)
than by OF (as in A2a (OF-IE), in which the combined unique coverage is 0.114) because the
commonly covered area of the A1a analysis may be less than that of the A2a analysis. Figure
5.1 illustrates this issue in a Venn diagram. Likewise, the combined raw coverage of all single
solution paths cannot be used for the same reason.

Small intersection
Y
Unique S3
coverage S3
S1 S2
Intersection area
Unique Unique
coverage S1 coverage S2
Big intersection
Y
Unique S3 coverage S3
S1
Intersection area S2
Unique Unique
coverage S1 coverage S2
Assuming 3 solution paths are exhibited from the analysis, the solution coverage is the overall area of Y covered by S1, S2 and S3. Therefore, given the same
size of S1, S2, and S3 (raw coverage), the bigger the intersection area, the smaller the unique coverage of each solution path and the smaller the solution
coverage. Therefore, comparing either the combined raw coverage or the combined unique coverage of each solution path across different analyses is
inappropriate.
Figure 5.2 Intersection area problem when comparing combined unique coverage across different analyses

177
Secondly, while two parameters can be compared across different analyses based on the same
outcome, only one provides a meaningful implication. It is possible to compare the raw
coverage between each single solution path from different analyses (e.g. to compare S1 of A1a
with S1 of A2a); however, each solution path is not a good representative for the whole
solution, thus this option is inappropriate. The only suitable alternative is to compare the
solution coverage of each analysis with each other (e.g. to compare the A1a solution with the
A2a solution). The intersection size problem is solved since it considers the amount of
outcome covered by all solution paths within the same analysis, rather than by a single path.
However, like other previous analyses, this study considers solution coverage only when the
solution consistency is above the 0.7 consistency threshold.
The results of the solution coverage comparison are mixed (Table 5.22). The empirical
evidence shows that six out of twelve performance dimensions are better explained by A1
(KS), shown in orange, while only four performance dimensions are better explained by A2
(OF), shown in purple, and two performance dimensions (oe1f and oe2) are not applicable
since both A1 and A2 sub-associations have a solution consistency lower than the 0.7
consistency threshold. It can be inferred that neither is always a better performance predictor.
In fact, it raises concern about potential improvement through the use of a combination of both
to explain performance (A3).
Table 5.22 Comparison of solution coverage of all sub-associations testing A1 and A2
Association
testing
Solution
consistency
Solution
coverage
Association
testing
Solution
consistency
Solution
coverage
Max coverage (of A: that has above
consistency threshold)
Perf
A1 A1a 0.71802 0.437901 A2 A2a 0.73687 0.149705 A1 IE
A1af 0.90041 0.022014 A2af 0.82108 0.191247 A2 IEF
A1b1 0.602613 0.554164 A2b1 0.76007 0.430462 A2 OE1
A1b1f 0.6882 0.242285 A2b1f 0.669155 0.377785 n/a OE1F
A1b2 0.660851 0.47716 A2b2 0.688993 0.410388 n/a OE2
A1b2f 0.80211 0.395919 A2b2f 0.699581 0.322408 A1 OE2F
A1c1 0.71815 0.326723 A2c1 0.682169 0.393117 A1 EF1
A1c1f 0.668564 0.525807 A2c1f 0.75579 0.385337 A2 EF1F
A1c2 0.71082 0.161335 A2c2 0.73274 0.142092 A1 EF2

178
A1c2f 0.7688 0.281429 A2c2f 0.76485 0.247886 A1 EF2F
A1d1 0.686555 0.665239 A2d1 0.72652 0.243319 A2 AD1
A1d2 0.71655 0.455806 A2d2 0.73745 0.266934 A1 AD2
The colour of the association heading is the result of previous (standalone) analysis
(red = reject, blue = support, green = strong support)
Bold indicates those that have a solution consistency above the 0.7 consistency threshold.
The colour in the last column indicates which sub-association with the same outcome has the larger solution coverage.
(orange = A1, supporting KS; light purple = A2, supporting OF)
It should be noted that the results of the previous association testing and of this analysis are
not directly related. Supporting or rejecting the association does not affect the interpretation
of the comparison of solution coverage. The former tests whether the proposed specific type
of research construct is sufficient to generate the corresponding performance dimension by
feeding all types of the research construct into fsQCA and then interpreting the results, while
the latter compares a by-product of the former analysis, which is the overall solution
consistency and coverage that are combined values of all solution paths shown, without
restricting them only to the proposed specific type of research construct, meaning that these
numbers do not take the research associations into consideration. Rather, all possible
combinations of all types of research construct are considered. Consequently, it is
unsurprising that ie and ef2 (from A1a and A1c, respectively), which were previously rejected,
are among the group of performance dimensions in which A1 has more solution coverage than
A2, suggesting that KS better explains related performance than OF. In other words, although
the proposed KS (KAD, S) is insufficient to generate the related performance dimension, other
KS integrations displayed in the solution paths still provide a better performance explanation
than that of OF.
5.8.11 Analysis of A3a: KAD-OP-IE
Five out of six solution paths pass the consistency threshold (Table 5.23). Four have systems
as either a core condition (S3 (op*~bp*~d*s*~c), S5 (~ka*bp*~d*s*~c) and S6

179
(~op*~bp*d*s*~c)) or a peripheral condition (S4 (ka*~bp*~d*s*~c)) and another attribute
present (either operations, business processes, decision or knowledge asset), suggesting a
trade-off relationship between them. Moreover, their unique coverages are quite similar,
raising a concern that high input efficiency may be achieved through a variety of causal
conditions, not just operations and low cost as proposed in the association. Furthermore, like
S1 of the A1a analysis (~kaˑ~bpˑ~dˑ~sˑ~c), S2 (~op*~bp*~d*~s*~c) of this analysis, which
can also be categorised as a stuck in the middle reactor, is the dominant condition with the
highest unique coverage (0.12), reconfirming that other OF attributes should be considered to
better explain or predict input efficiency. The association testing section also endorses such a
conclusion. T1 displays low consistency for most paths, while T2 and T3 show high
consistency for all paths, all of which suggests that A3a is weakly supported.
The data analysis (ief) displays quite a different pattern. While systems are present in most
paths in the survey analysis, its absence is a core condition in two out of three paths (S1
(~op*bp*~d*~s*~c) and S3 (~op*ka*bp*~d*~s)) and is a “don’t care” condition for the other
path (S2 (~op*~bp*d*~c)). Moreover, the absence of operations is a core condition for all
paths. It can be inferred that the proposed association regarding combination between
knowledge asset and operations is not strongly supported and more types of OF should be
added to improve explanatory power. The association testing section reconfirms this
argument, showing high consistency levels in T1, T2 and T3 of all paths, resulting in an overall
support result.
Deviation from A3a (KAD-OP-IE) probably arises only from alternative theory. In order to
understand the A3a findings clearly, it is necessary to refer to the validity of A1a and A2a
because these are the tests of the two research constructs examined in A3a and also share the
same outcome as A3a. Since A1a has already been discussed, this study will not repeat it here.
On careful examination of the combination of OFs for each solution of A2a, this study finds

180
that operations capability (OP) by itself is insufficient to generate high input efficiency (ie).
In fact, OP is only displayed as a peripheral or a “don’t care” condition. It needs culture and
organisational learning as a core part of the combination to generate high ie.
Therefore, it is not beyond expectation that A3a, which considers all types of KS as in A1a
(which is rejected) and only OP from A2a (which is shown as a peripheral or “don’t care”
condition in the solution), is weakly supported because of the weak explanatory power of each
research construct examined in this test. Consequently, according to fsQCA practice
(Schneider and Wagemann, 2012), this deviant A3a finding suggests that the researcher should
add other OFs (in this case, culture and organisational learning) in order to refine and improve
the explanatory power of the current sub-association for performance.
In order to understand clearly whether A3a provides an improvement over each of its two
research constructs alone (an argument for combination), the A1a and A2a findings must be
considered and compared. The fact that A1a is rejected while A2a is strongly supported merely
suggests that, when comparing two proposed causal factors under sub- associations A1a and
A2a, OP is a better predictor than knowledge asset decision (KAD) for high ie. This means
that having only the intention to pursue a knowledge asset and decision strategy is insufficient
to achieve high ie, whereas having OP is sufficient for a business unit to achieve
high ie. However, since all types of KS and OF, rather than only a proposed type, are examined
in A1a and A2a respectively (all KS integrations, not just KAD, are investigated in A1a),
comparing their solution coverages will indicate whether KS or OF as a whole better explains
the outcome, irrespective of each of their proposed types alone.
In other words, which research construct is better is another question that cannot be answered
on the basis of the validity of the two sub-associations. Rather, comparison between the overall
solution coverage of each sub-association is required. The fact that the solution coverage of
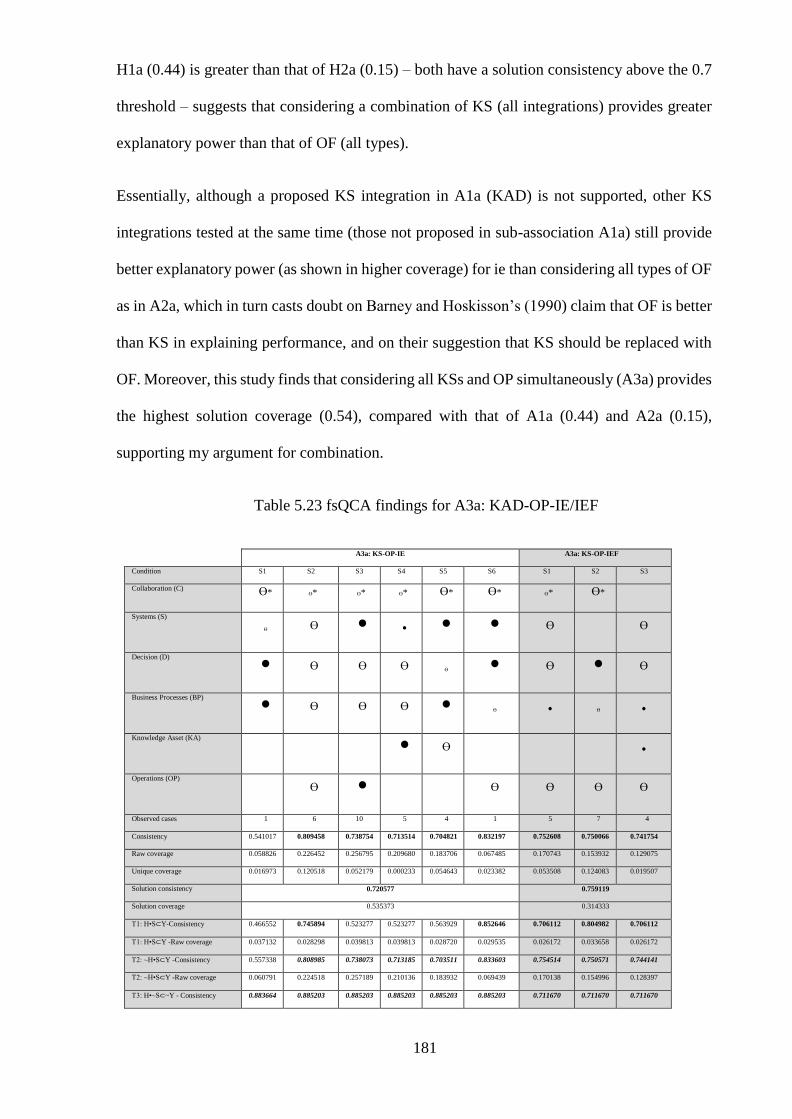
181
H1a (0.44) is greater than that of H2a (0.15) – both have a solution consistency above the 0.7
threshold – suggests that considering a combination of KS (all integrations) provides greater
explanatory power than that of OF (all types).
Essentially, although a proposed KS integration in A1a (KAD) is not supported, other KS
integrations tested at the same time (those not proposed in sub-association A1a) still provide
better explanatory power (as shown in higher coverage) for ie than considering all types of OF
as in A2a, which in turn casts doubt on Barney and Hoskisson’s (1990) claim that OF is better
than KS in explaining performance, and on their suggestion that KS should be replaced with
OF. Moreover, this study finds that considering all KSs and OP simultaneously (A3a) provides
the highest solution coverage (0.54), compared with that of A1a (0.44) and A2a (0.15),
supporting my argument for combination.
Table 5.23 fsQCA findings for A3a: KAD-OP-IE/IEF
A3a: KS-OP-IE A3a: KS-OP-IEF
Condition S1 S2 S3 S4 S5 S6 S1 S2 S3
Collaboration (C) Ө* Ө* Ө* Ө* Ө* Ө* Ө* Ө*
Systems (S)
Ө Ө ●
● ● ● Ө Ө
Decision (D)
● Ө Ө Ө
Ө
● Ө ● Ө
Business Processes (BP)
● Ө Ө Ө ●
Ө
●
Ө
●
Knowledge Asset (KA) ● Ө
●
Operations (OP) Ө ● Ө Ө Ө Ө
Observed cases 1 6 10 5 4 1 5 7 4
Consistency 0.541017 0.809458 0.738754 0.713514 0.704821 0.832197 0.752608 0.750066 0.741754
Raw coverage 0.058826 0.226452 0.256795 0.209680 0.183706 0.067485 0.170743 0.153932 0.129075
Unique coverage 0.016973 0.120518 0.052179 0.000233 0.054643 0.023382 0.053508 0.124083 0.019507
Solution consistency 0.720577 0.759119
Solution coverage 0.535373 0.314333
T1: H•S⊂Y-Consistency 0.466552 0.745894 0.523277 0.523277 0.563929 0.852646 0.706112 0.804982 0.706112
T1: H•S⊂Y -Raw coverage 0.037132 0.028298 0.039813 0.039813 0.028720 0.029535 0.026172 0.033658 0.026172
T2: ~H•S⊂Y -Consistency 0.557338 0.808985 0.738073 0.713185 0.703511 0.833603 0.754514 0.750571 0.744141
T2: ~H•S⊂Y -Raw coverage 0.060791 0.224518 0.257189 0.210136 0.183932 0.069439 0.170138 0.154996 0.128397
T3: H•~S⊂~Y - Consistency 0.883664 0.885203 0.885203 0.885203 0.885203 0.885203 0.711670 0.711670 0.711670

182
T3: H•~S⊂~Y -Raw coverage 0.101355 0.102894 0.102894 0.102894 0.102894 0.102894 0.092653 0.092653 0.092653
T4: ~H•~S⊂Y -Consistency 0.474977 0.466305 0.463463 0.480596 0.485694 0.484881 0.528534 0.521645 0.529742
T4: ~H•~S⊂Y -Raw coverage 0.966423 0.851670 0.831285 0.887879 0.901204 0.978176 0.867366 0.868442 0.897398
Solution path association result Ignore Weak support Reject Reject Reject Weak support Weak support Support Weak support
Combined solution path unique
coverage of same association result
0.1439
0.107055
0.073015
0.124083
Overall association result Weak support Support
5.8.12 Analysis of A3b: BPD-OL-OE
Only two of four paths pass the consistency threshold (Table 5.24). Both seem to support the
association in that at least one of the proposed causal conditions (BP and OL) is presented and
the other is a “don’t care” condition (S3 (ol*d*~c) and S4 (~ka*bp*~d*~s*~c)). Their T1 and
T2 consistencies are high, while those for T3 and T4 are low, showing a support result. The
data analysis exhibits five paths (out of six) that pass the consistency threshold, two of which
(S1 (ol*d*~c) and S2 (~ka*bp*~d*~s*~c)) are exactly the same as S3 and S4 of the previous
test. Another two paths (S3 (ka*~bp*~d*~s*~c) and S5 (~ol*bp*~d*s*~c)) are a subset of S1
(ka*~s*~c) and S2 (~ka*s*~c) of the previous analysis respectively, which also somewhat
supports the association owing to the “don’t care” condition for organisational learning and
the presence of business processes. Finally, S6 (~ol*ka*bp*~d*~s*c), which can be
categorised as knowledge collaboration, also corresponds with the association in the presence
of business processes. Consequently, the data analysis also supports A3a.
In the oe2 analysis, six out of seven paths pass the consistency threshold (Table 5.25). These
can be classified into three groups. The first group comprises those that show combination by
the presence of both organisational learning and business processes (S7 (ol*~ka*bp*s*~c)).
The second group is those that exhibit the presence of one of the proposed causal conditions
(S2 (ol*ka*~bp*~c), S4 (~ol*~ka*bp*~d*~s*~c) and S6 (~ol*ka*bp*~d*~s)), suggesting a
trade-off relationship between them. This group is the dominant group with a combined unique
coverage of 0.166. The third group comprises those that have a “don’t care” condition for one

183
of the proposed causal conditions (S1 (ka*~bp*~s*~c), S3 (~ka*d*s*~c) and S4
(~ol*~ka*bp*~d*~s*~c)), which may still support this association. The association testing
section also supports this pattern, suggesting support for A3a. The analysis for oe2f also shows
the same pattern as the second group (S2 (bp*~s*~c), S4 (~ol*bp*~d*~c) and S5
(ka*bp*~d*~s)) and third group (S1 (ka*~s*~c)) of the previous test, as well as providing the
same support result.
Table 5.24 fsQCA findings for A3b: BPD-OL-OE1/OE1F
A3b: KS-OL-OE1 A3b: KS-OL-OE1F
Condition S1 S2 S3 S4 S1 S2 S3 S4 S5 S6
Collaboration (C)
Ө* Ө* Ө* Ө* Ө*
Ө*
Ө*
Ө*
Ө* ●
Systems (S)
Ө ●
Ө
Ө Ө ● ●
Ө
Decision (D) ● Ө ● Ө Ө Ө Ө Ө
Business Processes (BP)
● ● Ө
●
●
Knowledge Asset (KA)
● Ө Ө Ө ●
Ө
●
Organisational Learning (OL) ● ● Ө Ө Ө
Observed cases 9 24 6 5 6 5 1 13 3 1
Consistency 0.648344 0.663247 0.782438 0.772698 0.707672 0.724664 0.794016 0.697460 0.773250 0.778194
Raw coverage 0.196212 0.374276 0.115329 0.172121 0.102809 0.159101 0.110858 0.250632 0.153986 0.033637
Unique coverage 0.054184 0.241412 0.037515 0.032313 0.032455 0.058696 0.016003 0.120965 0.028882 0.010464
Solution consistency 0.635798 0.714627
Solution coverage 0.538797 0.454133
T1: H•S⊂Y-Consistency 0.791743 0.954857 0.796242 0.875266 0.748266 0.776939 0.833337 0.672732 0.688173 0.865103
T1: H•S⊂Y -Raw coverage 0.054777 0.042356 0.059158 0.046974 0.054794 0.041098 0.039283 0.016219 0.018201 0.005915
T2: ~H•S⊂Y -Consistency 0.645642 0.663392 0.774616 0.771952 0.721813 0.723961 0.793858 0.697353 0.772928 0.780676
T2: ~H•S⊂Y -Raw coverage 0.192817 0.375529 0.111991 0.171354 0.102856 0.158391 0.109838 0.250811 0.154502 0.033991
T3: H•~S⊂~Y - Consistency 0.615825 0.600694 0.643375 0.600694 0.596100 0.600781 0.600781 0.600781 0.600781 0.600781
T3: H•~S⊂~Y -Raw coverage 0.046819 0.046819 0.046819 0.046819 0.044053 0.047553 0.047553 0.047553 0.047553 0.047553
T4: ~H•~S⊂Y -Consistency 0.544902 0.542449 0.517564 0.524309 0.525862 0.532296 0.532542 0.526383 0.539682 0.528046
T4: ~H•~S⊂Y -Raw coverage 0.897811 0.736226 0.933547 0.896900 0.934876 0.897471 0.937648 0.798192 0.905846 0.958520
Solution path association result Ignore Ignore Support Support Support Support Support Ignore Reject Support
Combined solution path unique
coverage of same association result
0.069828
0.117618
0.028882
Overall association result Support Support
Table 5.25 fsQCA findings for A3b: BPD-OL-OE2/OE2F

184
A3b: KS-OL-OE2 A3b: KS-OL-OE2F
Condition S1 S2 S3 S4 S5 S6 S7 S1 S2 S3 S4 S5
Collaboration (C)
Ө* Ө* Ө* Ө* Ө* Ө* Ө* Ө* Ө* Ө* Systems (S)
Ө ● Ө Ө ● Ө Ө Ө
Decision (D) ● Ө* Ө* Ө*
Ө
Ө Ө
Business Processes (BP) Ө Ө ● ● ● ● ● ● ● ● Knowledge Asset (KA) ● ●
Ө
Ө ● ● Ө ● Ө ●
Organisational Learning (OL) ● Ө Ө Ө ● Ө
Observed
cases 3 9 2 5 2 6 2 9 11 8 12 10
Consistency 0.787646 0.755536 0.767557 0.743361 0.688015 0.734725 0.702059 0.821701 0.769282 0.669804 0.731773 0.849219
Raw coverage 0.148281 0.240705 0.102530 0.163666 0.170731 0.140549 0.132670 0.259547 0.284802 0.228601 0.261149 0.266998
Unique
coverage 0.014541 0.102085 0.037641 0.051884 0.020881 0.011608 0.021251 0.051003 0.021670 0.013007 0.030008 0.060114
Solution
consistency 0.684780 0.755821
Solution
coverage 0.483686 0.483687
T1: H•S⊂Y -
Consistency 0.907640 0.913392 0.817749 0.732503 0.722283 0.722283 0.817749 0.887499 0.877538 0.847579 0.943977 0.884763
T1: H•S⊂Y -
Raw coverage 0.052365 0.056197 0.042304 0.027134 0.027986 0.027986 0.042304 0.064085 0.065038 0.047477 0.034352 0.062371
T2: ~H•S⊂Y -
Consistency 0.786262 0.756616 0.768671 0.741886 0.688755 0.734261 0.701126 0.821572 0.766990 0.668632 0.730965 0.849751
T2: ~H•S⊂Y -
Raw coverage 0.146633 0.241133 0.104896 0.162522 0.170091 0.139749 0.132994 0.256083 0.279841 0.227903 0.260290 0.266000
T3: H•~S⊂~Y
- Consistency 0.939062 0.939062 0.939062 0.939062 0.939062 0.939062 0.939062 0.576488 0.594456 0.562324 0.562324 0.562324
T3: H•~S⊂~Y
-Raw
coverage
0.063670
0.063670
0.063670
0.063670
0.063670
0.063670
0.063670
0.041983
0.041983
0.041983
0.041983
0.041983
T4: ~H•~S⊂Y
-Consistency 0.473974 0.462183 0.470280 0.468264 0.474937 0.459873 0.471612 0.481693 0.473723 0.504682 0.499662 0.466358
T4: ~H•~S⊂Y
-Raw
coverage
0.977570
0.893918
0.990675
0.940870
0.941842
0.938010
0.968382
0.828358
0.789290
0.845968
0.820131
0.801454
Solution path
association
result
Support Support Support Support
Ignore Support Support Support Support
Ignore
Support Support
Combined
solution path
unique
coverage of
same
association
result
0.23901
0.162795
Overall
association
result
Support Support
5.8.13 Analysis of A3c: S-LP-OS-EF
Out of seven paths (Table 5.26), only three are above the consistency threshold, and can be
categorised into two groups. The first comprises those that display a “don’t care” condition
for OF attributes (S1 (ka*~bp*~s*~c) and S2 (~ka*bp*~d*~s*~c)); this group does not reject
A3c. Since both have only one KS attribute present, they suggest a trade-off relationship
between knowledge asset and business processes in order to achieve ef1. The second group
comprises those that display attributes of both KS and OF (S6 (os*lp*~bp*d*~c)), which quite
support the combination of A3c. Likewise, the association testing section also suggests overall
support for A3c. The data analysis reveals five paths (out of seven) exceeding the consistency

185
threshold, which can be grouped in the same way as those in the previous test with one
additional group. Regarding the similarity, for the first group, S1 (~bp*~s*~c) is a superset of
the previous test’s S1. S2 (~ka*bp*~d*~s*~c) and S4 (ka*bp*~d*~s) are exactly the same as
the previous test’s S2 and S4 respectively. For the second group, S6 (os*lp*~bp*d*~c) and
S7 (os*lp*ka*bp*~d) are exactly the same as the previous test’s S6 and S7 respectively. The
additional group comprises those that display attributes of OF and have no attribute of KS
present (S5 (lp*~ka*~bp*~d*~c)). This group is also coherent with A3c, resulting in overall
support.
However, the analysis of ef2 (Table 5.27) shows only one group that has one KS attribute
present and either a “don’t care” condition or the absence of OF attributes (S1
(~ka*bp*~d*~s*~c)), which is exactly the same as S2 of the ef1 test (S2
(~lp*~ka*~bp*d*~c)). By itself, this group does not provide strong support for the association,
though it does not reject it. Thus, to find a finer grained association validity, the association
testing section is necessary and it rejects A3c because T1 of S1 (a dominant combination) is
below the consistency threshold. The data for ef2 indicate the same direction as the survey
analysis. Two groups can be classified from all six paths, four of which are similar to the
pattern of ef2 analysis (S1 (~ka*lp*~d*~c), S2 (~ka*bp*~c), S3 (~lp*ka*~bp*~c) and S4
(~os*ka*~bp*~c)). This group shows a potential trade-off relationship between business
processes and knowledge asset in generating ef2f. Another group is one supporting
combination between organisational structure and either business processes or knowledge
asset (S5 (os*bp*~d*~s*~c) and S6 (os*~lp*ka*~d*~c)). Nevertheless, the latter, which is a
dominant group with a combined unique coverage of 0.08, has a T1 consistency below the
consistency threshold, resulting in overall rejection of A3c.
Similarly, to the discussion of A3a above, deviation from A3c (S-LP-OS-EF2/EF2F) also
arises only from alternative theory, for which the validity of A1c and A2c must be referred to

186
because they are the tests of the two research constructs examined in A3c and also share the
same outcome as A3c. This study will not repeat A1c as it has been discussed earlier. Careful
examination of the combination of OFs for each solution of A2c reveals that LP and
organisational structure (OS) by themselves are insufficient to generate high performance
(ef2). In fact, they are often displayed as a peripheral or a “don’t care” condition (apart from
one solution path in which LP is exhibited as a core condition, while OS is displayed as a
“don’t care” condition). Clearly, culture and operations are required to be a core parts of the
combination to generate high ef2.
Therefore, it is not beyond expectation that A3c, which considers all types of KS as in A1c
(which is rejected) and only LP and OS from A2c (which are often shown as peripheral or
“don’t care” conditions) are rejected because of the weak explanatory power of each research
construct examined in this test. Consequently, according to fsQCA practice (Schneider and
Wagemann, 2012), this deviant A3c finding suggests that the researcher should add other OFs
(in this case, culture and operations) to refine and improve the explanatory power of the current
sub-association for performance.
In order to understand clearly whether A3c provides an improvement over each of its two
research constructs alone (an argument for combination), the findings of A1c and A2c must
be considered and compared. The fact that A1c is rejected while A2c is supported merely
suggests that, when comparing two proposed causal factors under sub-associations A1c and
A2c, LP and OS are better predictors than systems of high performance. This means that
having only the intention to pursue the systems strategy is insufficient to gain high
performance, whereas having LP and OS is sufficient for a business unit to achieve high
performance.

187
However, since all types of KS and OF, rather than only a proposed type, are examined in A1c
and A2c respectively (all KS integrations, not just systems, are investigated in A1c),
comparing their solution coverages will indicate whether KS or OF as a whole group better
explains the outcome, irrespective of each of their proposed types alone. In other words, which
research construct is better is another question that cannot be answered on the basis of the
validity of the two sub-associations. Rather, comparison of the overall solution coverage of
each sub-association is required.
The fact that the solution coverage of A1c (0.16 for ef2 and 0.28 for ef2f) is greater than that
of A2c (0.14 for ef2 and 0.25 for ef2f) – all have a solution consistency above the 0.7 threshold
suggests that considering a combination of KSs (all integrations) provides more explanatory
power for knowledge sharing than a combination of OFs (all types). Essentially, although a
proposed KS integration in A1c (systems) is not supported, other KS integrations tested at the
same time (those not proposed in sub-association A1c) still provide better explanatory power
(as shown in higher coverage) for knowledge sharing than considering all types of OF as in
A2c, which in turn again casts doubt on Barney and Hoskisson’s (1990) claim that OF is better
than KS in explaining performance, and on their suggestion that KS should be replaced with
OF. Moreover, this study finds that considering all KSs and OP simultaneously (A3c) provides
the highest solution coverage (0.27 for ef2 and 0.43 for ef2f) compared with that of A1c (0.16
for ef2 and 0.28 for ef2f) and A2c (0.14 for ef2 and 0.25 for ef2f), supporting this study
argument for combination.

188
Table 5.26 fsQCA findings for A3c: S-LP-OS-EF1/EF1F
A3c: KS-LP-OS-EF1
Condition S1 S2 S3 S4 S5 S6 S7
Collaboration (C) Ө* Ө* Ө* Ө* Ө* Systems (S)
Ө Ө Ө ●
Decision (D) Ө Ө Ө ● ● Ө
Business processes (BP) Ө ● ● ●
Ө
Ө ●
Knowledge Asset (KA)
●
Ө ●
Ө ●
Leadership (LP) ● ●
Organisational Structure (OS) ● ● ● Observed cases 3 5 30 9 2 6 28
Consistency 0.770447 0.756489 0.691651 0.695848 0.682610 0.772270 0.676070
Raw coverage 0.136668 0.185175 0.461778 0.230345 0.080959 0.090902 0.398668
Unique coverage 0.028184 0.043180 0.048283 0.037023 0.020250 0.024377 0.000000
Solution consistency 0.673365
Solution coverage 0.692684
T1: H•S⊂Y-Consistency 0.748419 0.910834 0.718837 0.840547 0.739235 0.738335 0.712783
T1: H•S⊂Y -Raw coverage 0.066208 0.063584 0.346939 0.098132 0.050418 0.065612 0.344732
T2: ~H•S⊂Y -Consistency 0.767797 0.754910 0.679861 0.694787 0.721060 0.842208 0.664079
T2: ~H•S⊂Y -Raw coverage 0.134921 0.184143 0.221752 0.228990 0.083170 0.082614 0.170646
T3: H•~S⊂~Y - Consistency 0.526228 0.526228 0.741027 0.526228 0.522128 0.525249 0.714871
T3: H•~S⊂~Y -Raw coverage 0.322003 0.322003 0.234046 0.322003 0.316754 0.312029 0.231289
T4: ~H•~S⊂Y -Consistency 0.464312 0.455414 0.448308 0.453566 0.477883 0.457350 0.456913
T4: ~H•~S⊂Y -Raw coverage 0.630372 0.578735 0.565748 0.558827 0.665093 0.647251 0.612720
Solution path association result Support Support Ignore Ignore Ignore Support Ignore
Combined solution path unique
coverage of same association result 0.095741
Overall association result Support
Table 5.27 fsQCA findings for A3c: S-LP-OS-EF2/EF2F
A3c: KS-LP-OS-EF1F
Condition S1 S2 S3 S4 S5 S6 S7
Collaboration (C) Ө* Ө* Ө* Ө* Ө* Systems (S) Ө Ө Ө Decision (D)
Ө
Ө Ө
Ө ● Ө
Business processes (BP) Ө ● ● ● Ө
Ө ●
Knowledge Asset (KA) Ө ● Ө ●
Leadership (LP) ● ● ●
Organisational Structure (OS) ● ● ● Observed cases 20 4 30 9 5 6 28
Consistency 0.735369 0.762059 0.681173 0.752217 0.738033 0.803126 0.673230
Raw coverage 0.338897 0.165036 0.402357 0.220300 0.154973 0.083637 0.351230
Unique coverage 0.163257 0.009004 0.035479 0.028725 0.060011 0.007472 0.000000
Solution consistency 0.659029
Solution coverage 0.799455
T1: H•S⊂Y-Consistency 0.881385 0.921763 0.701861 0.925860 0.787913 0.758613 0.688025
T1: H•S⊂Y -Raw coverage 0.075240 0.056929 0.299697 0.095632 0.114804 0.059643 0.294399
T2: ~H•S⊂Y -Consistency 0.735216 0.761716 0.800584 0.750830 0.746818 0.883570 0.828801
T2: ~H•S⊂Y -Raw coverage 0.337426 0.164385 0.231027 0.218935 0.120745 0.076680 0.188423
T3: H•~S⊂~Y - Consistency 0.543262 0.543262 0.646449 0.543262 0.563360 0.541911 0.628340
T3: H•~S⊂~Y -Raw coverage 0.375054 0.375054 0.230356 0.375054 0.359345 0.363209 0.229361
T4: ~H•~S⊂Y -Consistency 0.588322 0.592421 0.559641 0.576523 0.573292 0.553283 0.559987
T4: ~H•~S⊂Y -Raw coverage 0.532292 0.666058 0.624833 0.628436 0.696644 0.692755 0.664377
Solution path association result Support Support Ignore Support Support Support Ignore
Combined solution path unique
coverage of same association result 0.268469
Overall association result Support

189
Table 5.27b fsQCA findings for A3c: KS-LP-OS-EF2/EF2F
A3c: KS-LP-OS-EF2 A3c: KS-LP-OS-EF2F
Condition S1 S2 S1 S2 S3 S4 S5 S6
Collaboration (C) Ө* Ө* Ө* Ө* Ө* Ө* Ө* Ө*
Systems (S) Ө Ө
Decision (D)
Ө ● Ө
Ө
Ө
Business processes (BP) ●
Ө
● ● Ө Ө ●
Knowledge Asset (KA)
Ө
Ө Ө Ө ● ●
●
Leadership (LP) Ө Ө Ө
Organisational Structure (OS) Ө ● ●
Observed cases 5 10 9 9 2 2 5 2
Consistency 0.710821 0.707768 0.765686 0.765449 0.744607 0.721643 0.752359 0.724879
Raw coverage 0.161335 0.141693 0.271478 0.276201 0.122971 0.135516 0.176421 0.122943
Unique coverage 0.133212 0.113569 0.005228 0.009829 0.000000 0.014413 0.059603 0.020313
Solution consistency 0.698729 0.737556
Solution coverage 0.274904 0.433273
T1: H•S⊂Y-Consistency 0.577474 0.885895 0.741731 0.742281 0.738684 0.741347 0.661336 0.632467
T1: H•S⊂Y -Raw coverage 0.037379 0.019773 0.067693 0.067888 0.036445 0.060719 0.076477 0.052048
T2: ~H•S⊂Y -Consistency 0.707803 0.707659 0.758817 0.758912 0.741195 0.720002 0.751887 0.721963
T2: ~H•S⊂Y -Raw coverage 0.160089 0.142945 0.261769 0.266685 0.121413 0.135352 0.174923 0.121360
T3: H•~S⊂~Y - Consistency 0.592729 0.592729 0.646881 0.646881 0.638187 0.638187 0.638187 0.638187
T3: H•~S⊂~Y -Raw coverage 0.389349 0.389349 0.400526 0.400526 0.400526 0.400526 0.400526 0.400526
T4: ~H•~S⊂Y -Consistency 0.555285 0.560079 0.532188 0.529617 0.539168 0.545114 0.523206 0.528620
T4: ~H•~S⊂Y -Raw coverage 0.654301 0.649741 0.607637 0.601397 0.695621 0.707863 0.673700 0.697165
Solution path association result Reject Support Support Support Support Support Reject Reject
Combined solution path unique
coverage of same association result
0.133212
0.113569
0.02947
0.079916
Overall association result Reject Reject
5.8.14 Analysis of A3d: C-CT-AD
Five out of six paths pass the consistency threshold (Table 5.28), all of which have the same
pattern in that they display either a “don’t care” condition or the absence of OF attributes with
one or two KS attributes present. S2 (~ks*bp*~d*~s), S4 (~ka*bp*~s*~c) and S5
(~ka*bp*~d*~c), which is a dominant combination, are very similar in that they display the
presence of business processes and absence of the other conditions. They provide good support
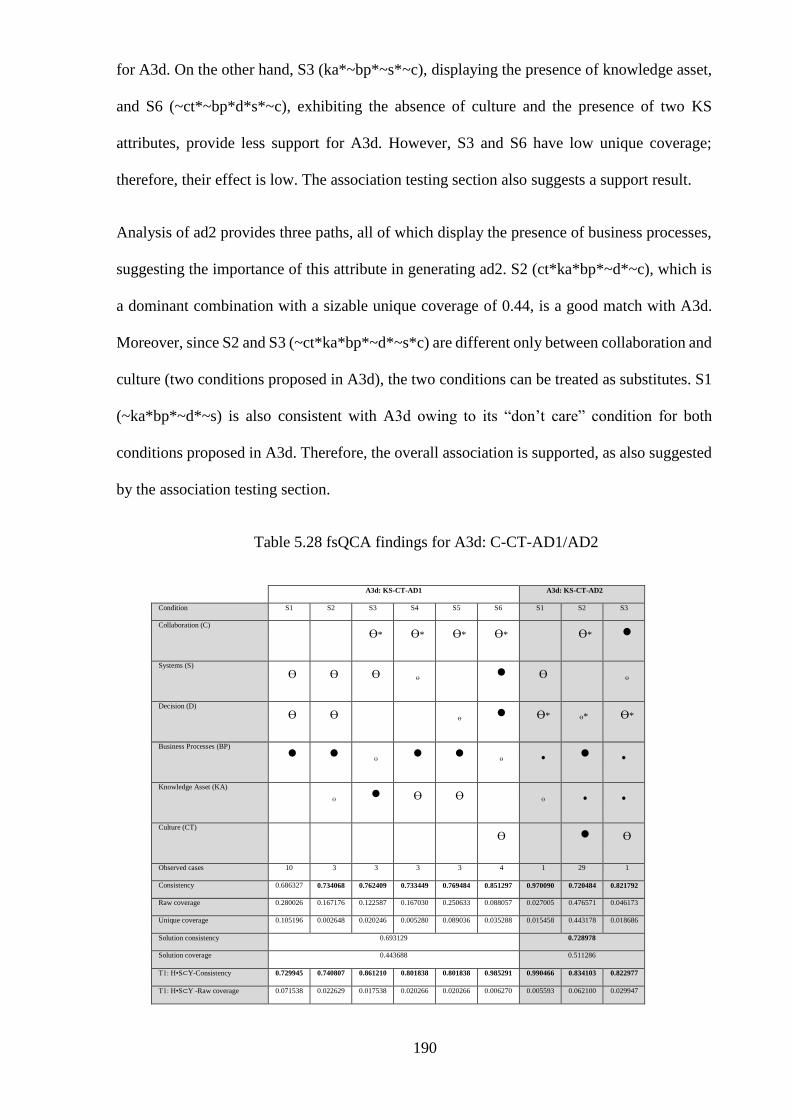
190
for A3d. On the other hand, S3 (ka*~bp*~s*~c), displaying the presence of knowledge asset,
and S6 (~ct*~bp*d*s*~c), exhibiting the absence of culture and the presence of two KS
attributes, provide less support for A3d. However, S3 and S6 have low unique coverage;
therefore, their effect is low. The association testing section also suggests a support result.
Analysis of ad2 provides three paths, all of which display the presence of business processes,
suggesting the importance of this attribute in generating ad2. S2 (ct*ka*bp*~d*~c), which is
a dominant combination with a sizable unique coverage of 0.44, is a good match with A3d.
Moreover, since S2 and S3 (~ct*ka*bp*~d*~s*c) are different only between collaboration and
culture (two conditions proposed in A3d), the two conditions can be treated as substitutes. S1
(~ka*bp*~d*~s) is also consistent with A3d owing to its “don’t care” condition for both
conditions proposed in A3d. Therefore, the overall association is supported, as also suggested
by the association testing section.
Table 5.28 fsQCA findings for A3d: C-CT-AD1/AD2
A3d: KS-CT-AD1 A3d: KS-CT-AD2
Condition S1 S2 S3 S4 S5 S6 S1 S2 S3
Collaboration (C) Ө* Ө* Ө* Ө* Ө* ●
Systems (S)
Ө Ө Ө
Ө
● Ө
Ө
Decision (D)
Ө Ө
Ө
● Ө*
Ө* Ө*
Business Processes (BP)
● ●
Ө
● ●
Ө
● ●
●
Knowledge Asset (KA)
Ө
● Ө Ө
Ө
●
●
Culture (CT) Ө ● Ө
Observed cases 10 3 3 3 3 4 1 29 1
Consistency 0.686327 0.734068 0.762409 0.733449 0.769484 0.851297 0.970090 0.720484 0.821792
Raw coverage 0.280026 0.167176 0.122587 0.167030 0.250633 0.088057 0.027005 0.476571 0.046173
Unique coverage 0.105196 0.002648 0.020246 0.005280 0.089036 0.035288 0.015458 0.443178 0.018686
Solution consistency 0.693129 0.728978
Solution coverage 0.443688 0.511286
T1: H•S⊂Y-Consistency 0.729945 0.740807 0.861210 0.801838 0.801838 0.985291 0.990466 0.834103 0.822977
T1: H•S⊂Y -Raw coverage 0.071538 0.022629 0.017538 0.020266 0.020266 0.006270 0.005593 0.062100 0.029947

191
T2: ~H•S⊂Y -Consistency 0.691858 0.740586 0.760692 0.731484 0.768836 0.851061 0.959823 0.720516 0.819252
T2: ~H•S⊂Y -Raw coverage 0.244050 0.166304 0.121164 0.166122 0.250094 0.090217 0.027701 0.476310 0.046260
T3: H•~S⊂~Y - Consistency 0.774825 0.560471 0.569823 0.569823 0.569823 0.569823 0.643419 0.643419 0.643419
T3: H•~S⊂~Y -Raw coverage 0.047083 0.064451 0.066951 0.066951 0.066951 0.066951 0.066426 0.066426 0.066426
T4: ~H•~S⊂Y -Consistency 0.530683 0.537898 0.534615 0.539583 0.531241 0.524059 0.452218 0.394305 0.449468
T4: ~H•~S⊂Y -Raw coverage 0.809864 0.881122 0.906462 0.880940 0.815159 0.909147 0.943653 0.600654 0.939324
Solution path association result Ignore Support Support Support Support Support Support Support Support
Combined solution path unique
coverage of same association result
0.152498
0.477322
Overall association result Support Support
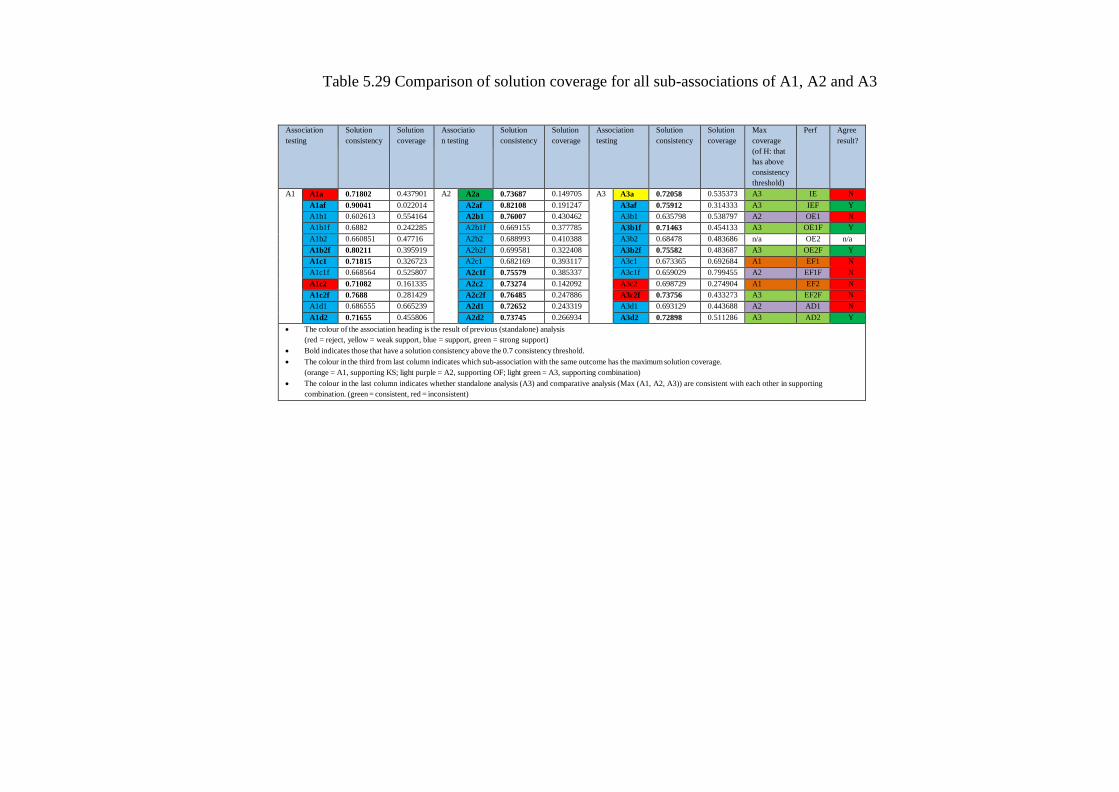
Table 5.29 Comparison of solution coverage for all sub-associations of A1, A2 and A3
Association
testing
Solution
consistency
Solution
coverage
Associatio
n testing
Solution
consistency
Solution
coverage
Association
testing
Solution
consistency
Solution
coverage
Max
coverage
(of H: that
has above
consistency
threshold)
Perf Agree
result?
A1 A1a 0.71802 0.437901 A2 A2a 0.73687 0.149705 A3 A3a 0.72058 0.535373 A3 IE N
A1af 0.90041 0.022014 A2af 0.82108 0.191247 A3af 0.75912 0.314333 A3 IEF Y
A1b1 0.602613 0.554164 A2b1 0.76007 0.430462 A3b1 0.635798 0.538797 A2 OE1 N
A1b1f 0.6882 0.242285 A2b1f 0.669155 0.377785 A3b1f 0.71463 0.454133 A3 OE1F Y
A1b2 0.660851 0.47716 A2b2 0.688993 0.410388 A3b2 0.68478 0.483686 n/a OE2 n/a
A1b2f 0.80211 0.395919 A2b2f 0.699581 0.322408 A3b2f 0.75582 0.483687 A3 OE2F Y
A1c1 0.71815 0.326723 A2c1 0.682169 0.393117 A3c1 0.673365 0.692684 A1 EF1 N
A1c1f 0.668564 0.525807 A2c1f 0.75579 0.385337 A3c1f 0.659029 0.799455 A2 EF1F N
A1c2 0.71082 0.161335 A2c2 0.73274 0.142092 A3c2 0.698729 0.274904 A1 EF2 N
A1c2f 0.7688 0.281429 A2c2f 0.76485 0.247886 A3c2f 0.73756 0.433273 A3 EF2F N
A1d1 0.686555 0.665239 A2d1 0.72652 0.243319 A3d1 0.693129 0.443688 A2 AD1 N
A1d2 0.71655 0.455806 A2d2 0.73745 0.266934 A3d2 0.72898 0.511286 A3 AD2 Y
The colour of the association heading is the result of previous (standalone) analysis
(red = reject, yellow = weak support, blue = support, green = strong support)
Bold indicates those that have a solution consistency above the 0.7 consistency threshold.
The colour in the third from last column indicates which sub-association with the same outcome has the maximum solution coverage.
(orange = A1, supporting KS; light purple = A2, supporting OF; light green = A3, supporting combination)
The colour in the last column indicates whether standalone analysis (A3) and comparative analysis (Max (A1, A2, A3)) are consistent with each other in supporting
combination. (green = consistent, red = inconsistent)

193
5.8.15 Post- data analysis 2
The results of the solution coverage comparison are mixed but still exhibit a dominant theme
(Table 5.29). The empirical evidence shows that six out of twelve performance dimensions
are better explained by A3 (by combination), shown in light green, while the rest are split
almost equally in that three are better explained by H2 (OF), shown in light purple, while two
are better explained by A1 (KS), shown in orange, and one (oe2) is not applicable because all
related sub-associations (A1b, A2b and A3b) have a solution consistency lower than the 0.7
consistency threshold. Obviously, performance is better explained by considering
combination, rather than one research construct at a time.
It can be inferred that, usually if not always, the proposed combination of KS and OF is a
better performance predictor. Interestingly, the financial data lend greater support to the
combination argument (four out of five cases) than the survey data. The latter provide mixed
results in that KS, OF and combination are equally supported by only two out of seven cases
(as shown in orange, light purple and light green, respectively) and one not applicable case
(white) is found. This is probably due to external validity issues, especially measurement
difficulty, as previously discussed.
Note that testing whether combination is a better performance predictor by identifying the
maximum solution coverage of the sub-associations of A1, A2 and A3 is independent of the
results for the validity of the a3 sub-association that examines whether a proposed combination
leads to a high corresponding performance. For example, a weakly supported A3a, as a
standalone analysis, means that the proposed combination (KA, D, OP) is insufficient to
generate ie (yellow). However, when comparing the A3a solution coverage with that of A1a
and A2a, the argument that combination better predicts performance than either KS or OF
alone still holds (lime green). Paradoxically, the two analysis dimensions seem to go against

194
each other (shown in red, otherwise green). The former supports substitution between the
proposed KS and OF while the latter supports combination between them.
Nevertheless, the validity of a particular A3 sub-association depends only on a proposed
combination between KS and OF, but does not cover combination between all integrations of
KS and all types of OF in general. In fact, other KS integrations tested at the same time (those
not proposed in each of the A3 sub-associations), together with a proposed FC, still provide
better explanatory power (as shown in higher coverage) for a particular performance
dimension than considering all integrations of KS without any OF, as in A1a, or all types of
OF without any KS, as in A2a. According to fsQCA practice (Schneider and Wagemann,
2012), the deviant findings of the A3 sub-associations suggest that the researcher should take
other OFs into consideration to refine and improve the explanatory power of the sub-
association for performance.
Considering all performance dimensions, this study finds that cases supporting the argument
that combination is a better performance predictor are in the majority, regardless of the level
of support for the A3 sub-associations.

Table 5.30 Summary test findings for A1, A2 and A3
Association
Sub-association
Sub-association result Sum of unique coverage for
paths supporting classification Dominant result for each
association
A1
A1a: KAD-IE Reject 0.314327 Rejected
A1a: KAD-IEF Support 0.022014
A1b: BPD-OE1 Support 0.005109
Supported A1b: BPD-OE1F Support 0.096447
A1b: BPD-OE2 Support 0.183199
A1b: BPD-OE2F Support 0.187376
A1c: S-EF1 Support 0.103302
Supported A1c: S-EF1F Support 0.116708
A1c: S-EF2 Reject 0.161335
A1c: S-EF2F Support 0.015179
A1d: C-AD1 Support 0.039827 Supported
A1d: C-AD2 Support 0.439398
A2
A2a: OP-IE Strong support 0.064702 Strong supported
A2a: OP-IEF Support 0.058673 A2b: OL-OE1 Support 0.267766
Supported A2b: OL-OE1F Support 0.176479
A2b: OL-OE2 Support 0.244818
A2b: OL-OE2F Support 0.16741
A2c: LP-OS-EF1 Support 0.14319
Supported A2c: LP-OS-EF1F Support 0.194755
A2c: LP-OS-EF2 Support 0.142092
A2c: LP-OS-EF2F Support 0.098325
A2d: CT-AD1 Support 0.119581 Supported
A2d: CT-AD2 Support 0.174371

Association
Sub-association
Sub-association
result
Sum of unique coverage
for paths supporting
classification
Dominant result for each
association
A3
A3a: KAD-OP-IE Weak support 0.1439 Weak supported
A3a: KAD-OP-IEF Support 0.124083
A3b: BPD-OL-OE1 Support 0.069828
Supported A3b: BPD-OL-OE1F Support 0.117618
A3b: BPD-OL-OE2 Support 0.23901
A3b: BPD-OL-OE2F Support 0.162795
A3c: S-LP-OS-EF1 Support 0.095741
Supported A3c: S-LP-OS-EF1F Support 0.268469
A3c: S-LP-OS-EF2 Reject 0.133212
A3c: S-LP-OS-EF2F Reject 0.079916
A3d: C-CT-AD1 Support 0.152498 Supported
A3d: C-CT-AD2 Support 0.477322
197
Out of nine cases that support the proposed combination between KS and OF (blue), four
display A3 as a maximum solution coverage (light green) while three display A2 (light purple)
and one displays either A1 (orange) or not applicable (white). Likewise, out of three cases that
do not support the proposed combination between KS and OF (either yellow or red), A3 still
has a maximum solution coverage (light green) for two cases, with only one case for A1
(orange). Thus, it can be inferred that no matter how strong the support for a proposed
combination of KS and OF, combination tends to provide a better explanation of performance
than considering only one research construct.
5.9 Analysis of necessary conditions
Following QCA good practice suggested by Schneider and Wagemann (2012), this study
separately conducts necessary condition analysis before conducting sufficiency condition
analysis to ensure that a statement of necessity is not automatically inferred from the results
of the sufficiency analysis. Schneider and Wagemann’s (2012: 278) recommended threshold
consistency value of 0.9 for a necessary condition is adopted. This research also tests for a
trivial necessary condition by calculating the relevance of necessity ratio (Schneider and
Wagemann, 2012: 236) ranging between 0 (meaning x is a constant) and 1, for which a low
value indicates low relevance (trivialness) while a high value indicates high relevance (non-
trivialness). Essentially, this test checks whether:
[1] the causal condition is much larger than the outcome (relation between size of x and
y), making it irrelevant as a good predictor of the outcome;
[2] and the causal condition is close to the constant (relation between size of x and ~x),
resulting in it being a superset of any outcome (either y or ~y), also known as a
simultaneous subset relation. I will declare a particular condition as a necessity only if
it passes both the 0.9 consistency threshold and the trivialness test.

198
The necessity test results for the occurrence of ie are as follows:
Table 5.31 The necessity test
c ~c s ~s D ~d bp ~bp
ka ~ka
Consistency 0.11 0.9
4
0.65 0.48 0.21 0.86 0.47 0.
63
0.47
0.64
Coverage 0.65 0.46
0.50 0.53 0.51 0.47 0.42 0.57
0.44
0.57
Both ~c has high consistency (> 0.9), supporting that they are necessary to (or a superset of)
the occurrence of ie (which is also shown in the plot under the diagonal in the xy plot of Figure
5.3. However, to be certain of their relevance, this research calculates the relevance of
necessity ratio (Schneider and Wagemann, 2012: 236), and finds that both have very low
scores of 0.133353 for ~c. Thus, the trivial necessary conditions for outcome ie (which is also
shown in the low coverage value and the concentrated plot at the far right under the diagonal
in the xy plot of Figure 5.3). Since the same distribution characteristics, which present only
that for ~c.
Figure 5.3 xy plot for ~c with ie as part of the necessary condition analysis
Low coverage Trivial
Necessary
condition

199
Moreover, in addition to testing for the occurrence of the outcome, this study also tests for the
non-occurrence of the outcome to be even more certain of the trivialness. If a particular
condition is shown as necessary in both tests, it is more likely that it is a trivial necessary
condition because it is close to constant.
The necessary test for the non-occurrence of ie (~ie) is as follows:
Table 5.32 The necessity test
c ~c a ~a d ~d bp ~bp
ka ~ka
Consistency 0.09 0.95 0.65 0.46 0.21 0.84 0.60 0.48
0.59 0.50
Coverage 0.62 0.56 0.60 0.61 0.64 0.56 0.66 0.52
0.67 0.53
~c has a high consistency (> 0.9), supporting that they are necessary to (or a superset of) the
non-occurrence of ie (which is also shown in the plot under the diagonal in the xy plot of
Figure 5.3). However, since ~c has a very low relevance of necessity ratio (Schneider and
Wagemann, 2012: 236), of 0.159904 for ~c, it is a trivial necessary condition for outcome ~ie
(which is also shown in the low coverage value and the concentrated plot in the far right under
the diagonal in the xy plot of Figure 5.3). This situation helps reconfirm that ~c is a trivial
necessary condition because it is close to constant, resulting in ~c being a superset of both ie
and ~ie. This is due to the high skew toward non-membership of c.

200
Figure 5.4 xy plots for ~c with ~ie as part of the necessary condition analysis
In summary, no necessary condition is exhibited in the test for A1a: KS-IE. This study finds
only one trivial necessary conditions, ~c, which should not be mistakenly inferred to be
necessary conditions from the results of a sufficiency analysis.
5.10 Truth table analysis for sufficiency condition
To create a truth table, this study sets ie as an outcome with the remaining factors (c, s, d, bp,
l) present (not absent according to previous theoretically-grounded assumptions) as causal
conditions. Then, adopting Schneider and Wagemann’s (2012: 200) recommendation of
conducting enhanced standard analysis (ESA) rather than standard analysis (SA) in order to
avoid the risk of producing results (both most parsimonious and intermediate solutions) based
on untenable assumptions (implausible or contradictory assumptions), this study codes “0” in
the ie column for 24 rows containing impossible logical remainders. These comprise 20 rows
that have “1” in three or four of any of c, s, or d, because these combinations cannot exist
Low coverage
Low coverage

201
according to the utilised operationalisation of Miles and Snow’s (1978) typologies, in which
only two characters may be simultaneously shown as dominant characters; and 4 rows that
have “1” in both p and d, because these combinations contradict the definition by having strong
characters of both collaboration and decision simultaneously but not exhibiting a strong
character of systems. This ensures that these combinations of causal conditions will not be
used in the Boolean minimisation (simplification) process for both the most parsimonious and
the intermediate solutions. (For A3 tests which have either one or two OFs as part of causal
conditions, the total numbers of impossible logical remainders are covered by 48 and 96 rows
respectively.)
As suggested by Ragin (2000), this study sets the minimum acceptable solution frequency at
1 by deleting all other logical remainders (any row for which the number of observed data is
less than 1, except the impossible logical remainders in the previous step) and set the lowest
acceptable consistency for solutions at > 0.7 by sorting the raw consistencies into descending
order and coding “1” for any row that has a raw consistency greater than 0.7. These two criteria
are applied to all tests in this research for purposes of comparability.
There is a supporting reason for using 0.7 as the consistency threshold for this research. Ragin
(2000: 109) originally asserts that “it is possible to assess the quasi-sufficiency of causal
combinations using linguistic qualifiers such as ‘more often than not’ (0.5), ‘usually’ (0.65),
and ‘almost always’ (0.8)”. Later, he starts to recommend a minimum threshold of 0.75 (Ragin,
2006, 2008). However, the threshold frequently employed in Boolean comparative analysis
studies is only 0.65 (Grandori and Furnari, 2008). This is probably because social science data
are far from perfectly consistent and, most importantly, if the consistency threshold is set too
high (above the raw consistency level displayed in all observed data), the truth table analysis
cannot be conducted further as all observed data will be considered to be inconsistent
according to this conservative threshold. This is also the case for the current study. The highest

202
raw consistency levels of the observed data of most of the 56 tests are lower than 0.75.
Therefore, to make all tests computable and also comparable, this study lowers the threshold
to 0.7, which is the highest level possible that is achieved by all tests.
To run a standard analysis, this study selects ~c*s*bp*~ka and ~c*s*~d*~bp*ka as prime
implicants that are consistent with the proposed association. Prime implicants are product
terms that cover many primitive Boolean expressions using minimisation rules to reduce the
truth table until no further simplification is possible. Prime implicants must be included in the
solution. However, there are often more reduced prime implicants than are needed to cover all
of the original primitive expression; therefore, the user has the option to choose from those
that are “logically tied” based on theoretical and substantive knowledge (Ragin, 2006: 64).
Again, further truth table analysis cannot be conducted without the selection of sufficient
prime implicants. Currently, there is no agreed rule for selecting prime implicants other than
basing the choice on relevant theoretical and substantive knowledge. Therefore, for
consistency within this research, my rules for selecting prime implicants for subsequent tests
are as follows:
[1] The selected terms must be as consistent as possible with the proposed association in
terms of the presence and absence of the proposed causal condition (select prime
implicants with a proposed condition being present, or without a proposed condition
being absent, or with more proposed conditions present than absent).
[2] If there are no terms having a proposed condition both present and absent:
a. the selected terms must have other conditions that can be theoretically inferred
to support the occurrence of the outcome (second-best explanation). For
example, apart from organisational learning, culture may theoretically be
inferred to support the occurrence of output efficiency (profit margin) because

203
business processes may also come from perception, not just from process
innovation.
b. selected terms that contain trivial necessary conditions are preferred because,
although less relevant, they are still necessary conditions that lead to the
outcome.
c. For testing of associations that have more than one proposed condition and for
which the prime implicants display many alternatives with different proposed
conditions, all will be selected to give the same weight to each proposed
condition, supporting that one of any proposed condition is equally sufficient
to lead to the outcome.
Once prime implicants have been selected, then select “ka” to be present, which should
contribute to ie (as in the proposed association), for the intermediate solution.
The resulting truth table as computed by the software is provided below.
Table 5.33 The truth table
c
s
d
bp
ka
Number
of cases
ie
raw
consist.
1 1 1 1 1 0 0 1
1 1 1 1 0 0 0 1
1 1 1 0 1 0 0 1
1 1 1 0 0 0 0 1
1 0 1 1 1 0 0 1
1 0 1 1 0 0 0 1
1 0 1 0 1 0 0 1
1 0 1 0 0 0 0 1
0 1 1 1 0 0 0 1
0 1 1 1 1 0 0 1

204
0 1 1 0 0 0 0 1
0 1 1 0 1 0 0 1
1 0 1 0 0 0 0 0.884519
1 0 1 1 0 0 0 0.841738
1 1 0 1 0 0 0 0.837137
1 1 0 1 1 0 0 0.835604
1 1 0 0 0 0 0 0.816455
1 1 1 0 0 0 0 0.815924
1 1 0 0 1 0 0 0.814506
1 0 1 1 1 0 0 0.809141
1 0 1 0 1 0 0 0.793854
1 1 1 0 1 0 0 0.782308
1 1 1 1 0 0 0 0.775011
1 1 1 1 1 0 0 0.763873
0 0 0 0 0 7 1 0.724529
0 1 0 0 1 5 1 0.713514
0 1 0 1 0 4 1 0.704821
0 0 0 1 0 1 0 0.698678
0 1 1 0 0 2 0 0.675603
0 1 0 0 0 18 0 0.616515
1 0 0 1 1 4 0 0.601415
0 0 0 0 1 1 0 0.590736
0 0 1 0 0 10 0 0.573731
0 0 1 1 0 1 0 0.571207
0 0 0 1 0 4 0 0.548607
0 0 1 0 1 2 0 0.530728
0 1 1 0 1 3 0 0.475697
0 1 0 1 1 26 0 0.45831
0 0 0 1 1 6 0 0.440544
This study then plots the cases’ membership scores for each intermediate solution path and
their ie in an xy plot to discern the distribution of the covered cases (shown in the area above

205
the diagonal line) in Figure 5.5. However, apart from highly consistent cases (shown in the
upper right corner), this research also observes a similar pattern of some outlier coverage cases
(which have a low membership score for a solution path but a high membership score for an
outcome, meaning they are outliers that still cover the outcome) and some individually
irrelevant cases (which have a low membership score for both a solution path and an outcome,
and are irrelevant to, albeit not against, the sufficiency analysis).
Outlier coverage
Individually
irrelevant
Outlier coverage
Individually
irrelevant
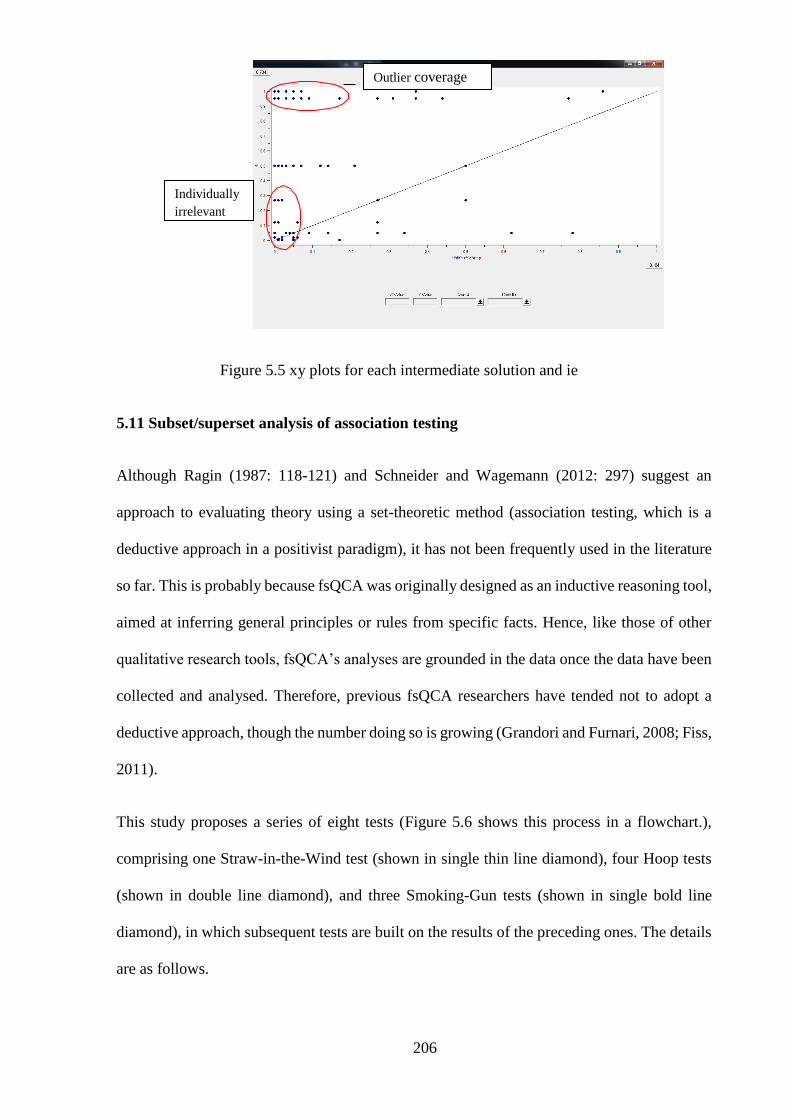
206
Figure 5.5 xy plots for each intermediate solution and ie
5.11 Subset/superset analysis of association testing
Although Ragin (1987: 118-121) and Schneider and Wagemann (2012: 297) suggest an
approach to evaluating theory using a set-theoretic method (association testing, which is a
deductive approach in a positivist paradigm), it has not been frequently used in the literature
so far. This is probably because fsQCA was originally designed as an inductive reasoning tool,
aimed at inferring general principles or rules from specific facts. Hence, like those of other
qualitative research tools, fsQCA’s analyses are grounded in the data once the data have been
collected and analysed. Therefore, previous fsQCA researchers have tended not to adopt a
deductive approach, though the number doing so is growing (Grandori and Furnari, 2008; Fiss,
2011).
This study proposes a series of eight tests (Figure 5.6 shows this process in a flowchart.),
comprising one Straw-in-the-Wind test (shown in single thin line diamond), four Hoop tests
(shown in double line diamond), and three Smoking-Gun tests (shown in single bold line
diamond), in which subsequent tests are built on the results of the preceding ones. The details
are as follows.
Outlier coverage
Individually
irrelevant
207
[1] A Hoop test for a statement that a “solution path is not unreliable” is whether the
consistency of the solution path from the sufficiency analysis is greater than 0.7 (the
consistency threshold of this research). Those that fail this test will not be considered
for further association testing because they do not have an acceptable reliability to
generate a meaningful association test result.
[2] A Hoop test for a statement that a “association is not rejected” is whether the
consistency of T1 is greater than 0.7. It is suggested that those that fail this test have a
below acceptable proportion of observed cases supporting that the association matches
the solution path in terms of outcome generation. Thus, such an association must be
rejected (red).
[3] A Smoking-Gun test for a statement that a “association is strongly supported” is
whether the consistency of all of T2, T3 and T4 is less than or equal to 0.7. It is
suggested that those that pass this test have no significant contradictory evidence,
suggesting a strong support classification (green).
[4] A Straw-in-the-Wind test, which cannot prove anything by itself but is beneficial for
subsequent tests, is whether the consistency of T3 is less than or equal to 0.7. Since T3
represents a type I error, the lower the consistency, the higher the level of support for
the association.
[5] A Hoop test for a statement that a “association is not weakly supported” is whether the
absolute value of coverage (actual number of cases) of T1 is greater than that of T3. It
is suggested that for those that fail this test their type I errors are relatively larger than
their supporting cases; hence, this is significant and suggests a weak support
classification (yellow). T1’s and T3’s coverage cannot be compared directly because
the former is calculated against Y, whereas the latter is calculated against ~Y. The

208
adjustment for comparison is based on the calibration criteria of all performance
measurements. In this regard, this study uses quartile 1 of the dataset as the anchor
point for fully out of the group of high performance (Y, membership score = 0) to
prevent all performance data from skewing toward high membership; thus, the range
for ~Y is smaller, from percentile 0 to percentile 25, while the range for Y is larger,
from percentile 25 to percentile 100. Consequently, the proportion of the number of
observations of ~Y to Y for this research is 1 to 3 (which adds up to four portions).
Hence, T3 coverage, which is based on ~Y, must be divided by three to be comparable
with T1 coverage, which is based on Y.
[6] A Smoking-Gun test for a statement that an “association is supported” is whether the
consistency of T4 is less than or equal to 0.7. It is suggested that those that pass this
test have no significant error term that cannot be captured by the current analysis,
suggesting a support classification (blue).
[7] A Hoop test for a statement that an “association is not weakly supported” is whether
the consistency of T2 is greater than 0.7. It is suggested that those that fail this test
have a significant area of improvement displayed in the solution path, suggesting a
weak support classification (yellow).
[8] A Smoking-Gun test for a statement that an “association is supported” is whether the
coverage of T2 is greater than that of T4. It is suggested that those that pass this test
have type II errors larger than the error terms that cannot be captured by the current
analysis, suggesting a support classification (blue). Conversely, for those that fail this
test the error term is quite significant and significantly challenges the association,
suggesting a weak support classification (yellow). Regarding comparison, since
coverage of both T2 and T4 are calculated against Y, they can be compared directly.

209
Once association validity classification has been conducted for each significant solution path
within an association test, the unique coverage of the solution paths (from sufficiency analysis)
that share the same association validity classification will be added up to show the significant
level of all paths within the same validity category. Using unique coverage is appropriate since
it avoids the problem of overlapping paths and is also comparable. (However, this technique
cannot capture the coverage of the overlap area; thus, only solution paths within the same
sufficiency analysis can be compared.) Lastly, the group of the same association validity
category that has the maximum sum of unique coverage will be represented as the overall
validity result of the association.
Figure 5.6 Flow chart of process tracing for association validity classification
210
5.12 Summary
This chapter has reported the findings from testing the three main associations regarding the
relationship of each separate proposed research construct with different performance
dimensions. In summary (Table 5.30), all sub-associations of A1 and A2, except A1a and A2a,
are supported. Thus, it can be inferred that either KS or OF is a “usually” sufficient condition
to generate high corresponding performance, except input efficiency. A rejected A1a and a
strongly supported A2a suggest that KS (especially knowledge asset decision) is not a
“usually” sufficient condition for input efficiency, but OF (especially operations) is a “usually”
sufficient condition for input efficiency.
For the necessity test, collaboration, decision and systems are found to be trivial necessary
conditions for some solutions. However, they are shown as necessary only because of the
skewness of the data, as suggested by Schneider and Wagemann (2012), and can be
disregarded for inference purposes.
However, since a sufficient condition can be expressed in terms of a necessary condition when
applying De Morgan’s laws, the previous summary can also be expressed as follows; The
absence of a high intensity level of either KS or OF is a “usually” necessary condition for a
business unit not to achieve the high performance that corresponds with that KS or OF, except
input efficiency. A rejected A1a and a strongly supported A2a suggest that the absence of a
high intensity level of KS (especially knowledge asset decision) is not a “usually” necessary
condition for a business unit not to achieve high input efficiency, while the absence of a high
intensity level of OF (especially operations) is a “usually” necessary condition for a business
unit not to achieve high input efficiency.

211
Chapter six: Discussion
6.1 Introduction
This chapter will discuss important issues related to the whole PhD project including the KSP
conceptual framework, KSP implementation model and the findings as well as the links to all
parts of this study. As shown in Figure 6.1, the flow of information started with the construct
and definitions of the three key areas and their components, which follows from the
understanding of the literature on KS, OF and PERF. These contructs were futher developed
into KSP conceptual framework as shown in Figure 2.9 by identifying research gaps. Hence,
this study takes a step forward by developing KSP implementation model as illustrated in
Figure 4.3, as the components of KS, OF and PERF were identified for testing. Associations
of these components were designed to show in the findings report as shown in Table (5.11,
5.30) if these associations were supported or rejected.
It can be deduced from the previous chapter that most associations are supported, suggesting
that the proposed KS integration, OFs and the combination of them are “usually” sufficient to
generate corresponding performance dimensions. In other words, each type of KS, OF and
their proposed combination is better able to explain a particular type of performance.
In addition, the analysis of survey data for performance measurement is generally consistent,
which may arise from the issue of external validity (respondents’ inability to answer those
questions accurately). The fact that more than one solution path is shown for each analysis
does not mean that the proposed model is rejected because the association is merely tested for
sufficient conditions, not simultaneously tested for both sufficient and necessary conditions as
in correlation-based research.
The causal asymmetry concept adopted in this research is useful in enhancing our
understanding of the phenomenon in question, in that it may resolve previous inconsistent

212
findings. However, some deviations suggest areas for association improvement, either by
adding more causal conditions or by completely dropping an association, depending on the
results shown in the association testing section mentioned earlier. For the necessity test,
collaboration, decision and systems are found to be trivial necessary conditions for almost all
association testing. They are shown as necessary only because of the data skewness, as
suggested by Schneider and Wagemann (2012) and are hence of little relevance for inference.

Construct
Definition
Calibration 3
anchor points
0 0.5 1
KS: Knowledge Sharing is the process of social exchange that occurs between individuals, from individuals to organisations, and from organisation to organisation.
D: Decision Regarded as the cognitive process resulting in the selection of a belief or a course of action among several alternative possibilities.
3
4.5
7
*In this dissertation, this study proposed that D could be mixed with KA or BP or both into KAD: Knowledge Asset Decision, BPD: Business Process Decision respectively.
S: Systems Business units set of interacting or interdependent component parts forming a complex/intricate whole.
C: Collaboration Business units’ process of two or more people or organisations working together to realise mutual goals.
KA: Knowledge Asset Business units the intangible value of a business, covering its people (human capital). Q1 Q2 Q3
BP: Business Process Business units collection of related, structured activities or tasks that produce a specific service or product (serve a particular goal) for customers.
OF: Organisational Factors Complex bundles of conditions related to a particular type of day-to-day operational activity, especially the principal functional area of an organisation within line and staff activities, that
enables organisation to coordinate activities and make use of their assets (or resources) to create economic value and sustain competitive advantage.
OP: Operations Capability that integrates logistics systems, controls costs, manages financial and human resources, forecasts revenues, and manages planning.
Q1
Q2
Q3
OL: Organisational Learning Capability that pertains to process of creating, retaining, and transferring knowledge within an organisation.
LP: Leadership Capability that provides both a research area and a practical skill encompassing the ability of an individual or organisation to "lead" individuals or an organisation.
OS: Organisational Structure Capability that relates to divisions of activities such as task allocation, coordination and supervision are directed toward the achievement of organisational aims.
CT: Culture Capability that encompasses values and behaviours that "contribute to the unique social and psychological environment of an organisation.
Perf: Performance Dimension (Walker & Ruekert, 1987; Grant, 2010): “f” after the acronym for each performance measurement, surveyed data.
IE: Input Efficiency Cost reduction advantage: IE: Expense ratio (equivalent to overhead cost ratio) Q1 Q2 Q3
OE: Output Efficiency Revenue expansion advantage: OE1: Loss ratio (equivalent to gross profit margin), OE2: Investment Yield. Q1 Q2 Q3
EF: Effectiveness Success of a business’ products and programmes in relation to those of its competitors in the market.
Q1 Q2 Q3
AD: Adaptability Success in responding to changing conditions and opportunities in the environment: AD1: Number of new products offered to the market within the past year, AD2: Percentage of net written premiums (equivalent to sales) of new products offered to the market within the past year
Q1 Q2 Q3
OA: Overall Performance Proxy Increase in long-run profits with a view to maximizing the value of the firm: OA1: Combined ratio (equivalent to ROS), OA2: ROE Q1 Q2 Q3
Figure 2.9 Figure 4.3 Figure (4.4, 5.6) and Table (5.11, 5.30)
KSP conceptual framework KSP implemantationmodel Results

214
Figure 6.1 Holitic view of this study
6.2 KS for organisational performance
This thesis has two main implications for KS, one of which is a foundation for the other.
[1] This study explore a new dimension from existing research, confirming Ketchen et
al.’s (1997) meta-analysis regarding the existence of a KS-performance relationship
both by correcting the long-held but mistaken assumption that this relationship is
symmetrical, whereas it is actually an asymmetrical causal relationship, by using the
business unit rather than the firm as the unit of analysis, and also by testing different
performance dimensions commensurate with each KS.
[2] Building on appropriate assumptions and research criteria, this study provides a more
refined understanding of compatibility between KS and performance dimensions and
the relationship between KS. Considering other conditions in the solution path
(contexuality) also sheds light on hybrid types and has direct implications for the
organisational competitiveness, especially with a hybrid type and a stuck in the middle
strategy (Porter, 1980) because contextuality is a factor differentiating the two. These
theoretical implications will be discussed in turn.
Unlike most previous KM and organisation research studies that have implied a linear (or
curvilinear) relationship between their theoretical constructs, this study is among the first
(Fiss, 2007, 2011; Grandori and Furnari, 2008) to investigate measurement by utilising DEA
and fsQCA, which is based on asymmetrical causal relationships. DEA and fsQCA avoid the
mismatch of previous research between assumed symmetrical theoretical relationships and
actual underlying asymmetrical causal relationships (Ragin, 1987, 2000; Fiss, 2011), which in
turn may be mistakenly critised for being inconsistent empirical findings (Rajagopalan and
Spreitzer, 1997; Daily et al., 2003).

215
For instance, if high business processes (bp) is in fact a sufficient though not necessary
condition for high output efficiency (oe), then high bp by itself will guarantee high oe.
However, business units are not limited only to having high bp to achieve high oe. Rather,
other strategies (knowledge asset, leadership or systems) may also lead to such an outcome,
supporting the equifinality notion. Although perfectly consistent with the set-theoretic method,
such a data pattern would result in weak or no correlation between bp and oe. In other words,
apart from the KSs suggested in the associations, other KSs are also sufficient for the outcome
concerned, depending on their contextual combination.
These findings do not go against the associations because, unlike correlation-based research
that relies on causal symmetry (which argues for both sufficient and necessary conditions
simultaneously), this research only claims a sufficient condition for the proposed KSP model
owing to the concept of causal asymmetry. Therefore, methodology-wise, DEA and fsQCA
holds considerable promise for resolving previous inconsistent findings.
It is also important to reiterate two other chosen research criteria (unit of analysis and
performance dimension) before discussing the findings because different choices yield
substantial differences in empirical results (Dess et al., 1993), which in turn may be further
reasons for the inconsistency of previous research. In line with previous research (Gupta and
Govindarajan, 1984; Govindarajan, 1986a; Miller, 1988; Govindarajan and Fisher, 1990), this
study examines KS separately, rather than conducting corporate-level research, in order to
reduce the potential off-setting effect between different organisations within business units
which may pursue different strategies, which in turn may reveal a clearer relationship with a
particular strategic orientation.
As raised by Hambrick (1983a) and Donaldson (1984) and highlighted by Walker and Ruekert
(1987: 20), “different strategies are expected to perform well on different performance
dimensions”. Similarly, the present study has revealed that only a few of the proposed KS

216
integrations are shown to be sufficient to accomplish a particular performance dimension and,
at the same time, only few of them are found to achieve more than one (but not all)
performance dimension. Furthermore, even if few integrations are shown as solution paths, a
single (rather than many) dominant combination usually prevails, i.e. a solution path with the
highest unique coverage, representing the combination most empirically relevant to generating
the outcome. Thus, consistent with Walker and Ruekert (1987), it can be inferred that a
particular KS is best suited to explain a few but definitely not all performance dimensions.
Furthermore, since the solution paths from the analysis of the survey data are quite similar in
many analyses. The choices of the current study mentioned above play a part in contributing
to the existing theories of previous research, as can be seen from the findings for A1 (except
A1a) which support the existence of a KS-performance relationship, reconfirming Ketchen et
al. (1997), Nair and Kotha (2001), Leask and Parker (2007) and Short et al. (2007). The
solution coverage of A4 for oa2f, representing KS’s explanatory power, for which a possible
explanation is provided, conveys the same message as the average effect size (0.276) of
Ketchen et al.’s (1997) meta-analysis, in that organisational knowledge sharing capacities for
approximately 20-30% of the utility available if one were able to perfectly predict differences
in organisational performance. By the same token, this current finding argues against previous
challenges to this research scheme regarding its lack of empirical rigour (McGee and Thomas,
1986; Thomas and Venkatraman, 1988: 548; Barney and Hoskisson, 1990), supporting the
appropriateness of the chosen approach for future research in this field.
Regarding proposed KS integrations, by taking both Miles and Snow’s (1978) and Porter’s
(1980) integrations as causal conditions in the analysis, the present finding is not only
comparable with the results of previous research (Walker and Ruekert, 1987; Fiss, 2011) but
also provides a more refined understanding of compatibility between KS and the performance
dimension. Walker and Ruekert (1987) investigate neither systems nor decision, nor

217
effectiveness and different types of efficiency, while Fiss (2011) examines only Porter’s
(1980) integration.
As mentioned earlier, a supported association (A1) under a sufficient test does not mean that
other integrations cannot exist as other sufficient solution paths (causal asymmetry). Thus, a
closer look at solution paths offers an in-depth understanding of the relationship between the
causal conditions examined because one condition may be required either to be present or
absent in tandem with a particular condition (also with different levels of importance, core or
peripheral), while still others may have no impact in any direction on such a condition (“don’t
care” condition). No solution path in this test has a single KS integration present and the rest
as “don’t care” conditions, meaning that no KS integration is a sufficient condition on its own;
rather, all of them can only be an INUS condition. Likewise, the absence of a particular KS
integration is also an INUS condition and is a requirement for a pure type of KS to be
sufficient. Clearly, contextuality, which is how KS attributes are arranged within the solution
path (as present, absent or “don’t care” conditions) as well as their levels of importance (as
core or peripheral condition), is essential to determine the sufficiency of the solution path to
which those KS attributes belong.
When contextuality is taken into account, the current findings reconfirm Walker and Ruekert’s
(1987) argument that differentiated decisions and collaborations will outperform other
integrations in efficiency and adaptability respectively (as shown in support for A1b and A1d)
but refute their claim that knowledge asset decisions will outperform other integrations in
(input) efficiency. It also provides an additional argument beyond their study that systems will
not outperform other integrations in performance (as shown in the rejection of A1a and A1c
for ef2, for which possible explanations are provided earlier). The rejection of these two sub-
associations suggests the need for further within-case and comparative studies of cases
218
identified as typical and deviant by DEA and fsQCA (Schneider and Wagemann, 2012) to
refine the proposed associations regarding ie and ef2.
With in-depth investigation of contextuality regarding Porter’s (1980) integration, the findings
of the present study shed light on a hybrid type (the presence of both knowledge asset and
business processes, which is called best practice in research) which is evidenced in real life
(Gilbert and Strebel, 1988; Miller, 1988; Baden-Fuller and Stopford, 1992; Cronshaw et al.,
1994; Dess et al., 1997) yet under-researched. Apart from a pure type consistent with Walker
and Ruekert’s (1987) findings, the current study also reveals a hybrid, which is in line with
Fiss’ (2011) findings. For instance, while some solution paths generating ef1 (in A1c) are pure
types, for example either ka (in S1 and S4) or bp (in S2 and S3), still others, although rarely,
are hybrids (ka•bp in S5), suggesting that either pure or hybrid types may achieve high
performance.
Like that of Fiss (2011), the present study provides further supporting evidence in addition to
the relatively limited previous research which has established the efficiency viability of a
combined cost leadership and business processes strategy (Hall, 1980; Dess and Davis, 1984;
White, 1986; Kim and Lim, 1988; Miller and Dess, 1993) to challenge Porter’s (1980) stuck
in the middle claim, as well as other research supporting his argument (Hambrick, 1983b;
Murray, 1988; Miller, 1989) that only ideal pure types of KS can achieve high performance
and that deviation from pure types usually results in lower performance. To make sense of this
example, it is possible that the presence of collaboration and the absence of other Miles and
Snow (1978) integrations (except systems as a “don’t care” condition) as parts of a
combination in the solution path are essential to support the hybrid type in Porter’s (1980)
integration because, with the objective of continually searching for new knowledge
opportunities, a collaboration must focus on innovation and product features, and these same
features, as well as not yet having any direct competitor in the newly-created competitive

219
market, allow it to perform well with a leadership strategy (Miller, 1986; Segev, 1989; Parnell,
1997; Fiss, 2011).
Unlike previous studies that have used variable-based approaches (Doty et al., 1993; Ketchen
et al., 1993), which disaggregate cases into independent, analytically separate aspects, the
current study applies set-theoretic methods, which treat combinations of attributes (different
KS integrations) as different types of cases. Thus, in this study, a variety of combinations give
cases their uniqueness (Fiss, 2011). Consequently, considering other conditions in a solution
path has direct implications for the organisational knowledge sharing (Tushman and O’Reilly,
1996), especially with a hybrid type and a stuck in the middle strategy (Porter, 1980), because
solution tables only list KS that consistently lead to the outcome of interest, but do not include
KS that do not lead to high performance (stuck in the middle), that do not pass the frequency
threshold, or that show no consistent pattern and thus do not pass the consistency threshold
(unreliable combination).
This research shows that contextuality is a factor differentiating the two and may improve
understanding in this literature. However, discovering the holistic context would be an
exercise in itself, and not one this study currently undertaking. A review of the findings of all
A1 sub-associations suggests that best KS will generate high ef1 (A1c) and ad2 (A1d) only if
the business unit pursues either a collaboration or systems but not a decision strategy. This is
probably because, unlike the latter two, the former two either fully or partly aim to expand to
new opportunities, which both supports business processes and allows for a cost leadership
position, as mentioned earlier.
Interestingly, best KS is a dominant combination in both analyses, meaning that best KS is the
most empirically relevant in generating ef1 and ad2. However, the result of repeating
sufficiency analysis for higher levels of ef1 than the current test supports finding and argument
that, it may be possible to achieve high performance using a hybrid type, but as one approaches

220
very high performance, trade-offs between business processes and leadership as well as their
associated characteristics of organisational structure appear to make hybrid types such as the
systems infeasible: the very high performers appear to rely on pure types.
To further test for causal asymmetry to establish whether or not the hybrid type of KS is still
a sufficient condition and to reconfirm Fiss (2011), future research should repeat the current
analytical framework with two more performance criteria (not high performance and low
performance), rather than only the high performance and very high performance tested here.
This additional test might resolve some of the mixed findings regarding the relationship
between KS and OF (Oyemomi et al., 2016).
Unlike Porter’s (1980) integration, the notion of hybrids is not new to Miles and Snow’s
(1978) integration because they perceive systems as a hybrid along a continuum between
collaboration and decision. Therefore, the systems found in the study provides no new insight
into this integration, but simply reconfirms it. The finding shows that pure types always prevail
except in only one solution path that comprises both systems and decision, none of which are
dominant combinations. This finding could be interpreted as the systems with a strategy more
inclined toward decision than collaboration characteristics, and hence also does not contradict
previous research. The new anchor points for fully in, most ambiguous point, and fully out of
the set of very high ef1 (vef1) are the 87.5, 75 and 50 percentiles, respectively.
Comparing these two integrations, this study also finds that the presence of Porter’s (1978)
integration appears to dominate that of Miles and Snow (1980) in terms of sufficiency to
generate high performance dimensions. Out of 33 solution paths for all A1 sub-associations,
26 have at least one of integrations present as an INUS condition to generate high performance
dimensions, while only 13 require at least one of Miles and Snow’s integrations to be present
as an INUS condition to generate high performance dimensions. According to Miller (1989)
and Kumar, Subramanian and Strandholm (2001), this may be because Porter’s (1978)

221
integration appears to integrate the central concepts of the other integrations (Miles and Snow,
1980; Hambrick, 1983b; Miller and Friesen, 1986) and hence covers more aspects of causal
factors. Consequently, Porter’s (1980) integration appears to be the most popular paradigm in
the literature (Dess et al., 1995; Hill, 1988; Lee and Miller, 1999; Miller, 1989; Miller and
Dess, 1993).
6.3 Impact of OFs on knowledge processes
This thesis raises three main implications for OF. The first two is similar to the previously-
mentioned implications for KS.
[1] By applying a set-theoretic approach in organisational theory and
separately testing different performance dimensions commensurate with
each FC, this study is likely to solve previous OF research inconsistencies,
which in turn provides a solid foundation for subsequent implications.
[2] This study also provides a more refined understanding of the OF-
performance relationship by suggesting a holistic combination of OF-
performance dimension as well as careful consideration of the contexuality
of solution paths, especially compatibility between OF types and the
existence of core and peripheral conditions. This research finding suggests
a shift in the understanding of the OF-performance relationship from the
original association (A2) of one-to-one (one OF to one performance
dimension) to many-to-one, although at different levels of importance (core
and peripheral), and, in a rare case, to many-to-many. Moreover,
consideration of core and peripheral conditions also raises another
implication regarding a substitution relationship between peripheral
conditions of different solution paths that share the same core condition,

222
and a “true” combination between core conditions that are displayed within
the same solution path.
[3] By using the same research technique, which allows for a direct comparison
of the explanatory power of two research constructs, the empirical findings
challenge the argument of previous criticisms of the KS literature, that
organisational factors characteristics (OF) are better performance
predictors (Barney and Hoskisson, 1990), by arguing that neither KS nor
OF provides a “universally better” explanation.
These theoretical implications will be discussed in turn.
The current study is, to the best of this study knowledge, the first to apply a set-theoretic
approach to measure the impact of organisational factor OF on knowledge sharing
performance in an organisation. As previously mentioned, DEA and fsQCA, based on
asymmetrical causal relationships, is more appropriate to describe social science relationships
than correlational tests that assume both sufficient and necessary conditions simultaneously
(Ragin, 1987, 2000; Fiss, 2011). Moreover, the separate tests for different performance
dimensions in this study are likely to resolve previous research inconsistencies because each
performance dimension should be more commensurate with some (but not all) objectives of
different OFs. Therefore, support for all proposed sub-associations in this study addresses
Godfrey and Hill’s (1995) challenge of OF regarding the accuracy of performance prediction
and Newbert’s (2007) claim that OF offers “only modest support overall” by providing even
more reliable evidence supporting previous claims that OF leads to high performance (Barney
and Arikan, 2001; Crook et al., 2008), especially with a more refined understanding of the
relationship by suggesting a holistic combination of OF performance dimension in addition
to previous research. Moreover, using the same technique allows for a direct comparison of
the explanatory power of KS and OF, as in the meta-analyses of organisational KS and OF.

223
As in the previous section, the theoretical implication arises from considering the contexuality
of solution paths. No solution path in this test has a single OF present and the rest as “don’t
care” conditions, meaning that no OF is a sufficient condition on its own; rather, each can only
be an INUS condition. Similarly, the absence of a particular OF is also an INUS condition,
which when required suggests that there are some OFs that work against each other. By the
same token, the study also shows that each solution path of the A2 analysis usually displays
the presence of more than one OF, apart from the suggested OF in the sub-associations (only
25% of all A2 solution paths display one OF attribute present and the rest absent or as a “don’t
care” condition), suggesting that OFs often work in combination, rather than alone.
Challenging Skinner (1969, 1974), who defends a trade-off between manufacturing
capabilities and the need to focus on a single competitive priority, this finding is consistent
with the more recent works of Ferdows and De Meyer (1990), Noble (1995) and González-
Benito and Suárez-González (2010), which suggest compatibilities between different
manufacturing capabilities, especially those with opposing competitive priorities such as
flexibility and cost reduction (De Meyer et al., 1989; Rosenzweig and Roth, 2004). In other
words, this study suggests combination between OF types, which raises the importance of
contexuality in this analysis.
Consideration of core and peripheral conditions raises another implication for the literature.
When considering solution paths that have more than one OF present, while most have only
one OF present as a core condition, pointing to the potential substitutability of OFs present as
peripheral conditions, still others, although quite rarely, have two OF attributes present as core
conditions, suggesting a potential “true” combination between different types of OF because
both are required with the same level of importance. Therefore, this study suggests a novel
concept to refine the current association (A2), in that actually multiple OFs rather than a single

224
OF are sufficient for the outcome, although at different levels of importance (core and
peripheral).
Moreover, a holistic view of the dominant (core) and subordinate (peripheral) OFs within a
combination provides better insight into the relationship between OFs within a combination.
Solution paths with different core conditions illustrate different unique types of business units
that equally achieve a particular performance dimension (first-order/across-group
equifinality); yet the proposed OF under each sub-association tends to be a core condition
more often than others in most analyses, consistent with support for all A2 sub-associations.
Different constellations of peripheral conditions surrounding core conditions in the same
analysis provide a finer-grained understanding of which OFs are substitutes for each other
(other peripheral OFs) under second-order (within-group) equifinality.
Paradoxically, the reverse of the notion that multiple OFs are a sufficient combination for a
particular performance dimension is also true, though quite rare. This study occasionally
observes that some OF combinations achieve more than one, though not all, performance
dimension. This is possibly either because these OF combinations allow business units to
perform particular activities that enhance many performance dimensions or because they fit
well with many strategic choices, or both. This calls for future research to investigate this
phenomenon.
This result is also in line with Noble’s (1995) cumulative model and González-Benito and
Suárez-González’s (2010) finding that a combination of different manufacturing capabilities
achieves both commercial and financial performance. Therefore, another theoretical
implication of this study is a shift in our understanding of the OF-performance relationship
from the original association of one-to-one (one OF to one performance dimension) to many-
to-one and, for a rare case, to many-to-many.

225
Thus, although the emphasis on a single OF as proposed in my sub-associations cannot by
itself explain business performance (since they are INUS conditions), it appears to facilitate a
better alignment with other OFs and contribute to one or a few performance dimensions (but
not all), in so far as combination between OFs is achieved (as displayed in this analysis).
Although this argument requires additional empirical support for full validation, because this
study sample is quite distinctive and the results leave several questions open to subjective
interpretation, this research draws attention to combinations of OFs (contexuality) as a
relevant element in explaining high performance.
Another main implication is that the empirical findings counter the arguments of previous
challenges to the KS literature, especially those of McGee and Thomas (1986) and Thomas
and Venkatraman (1988) regarding KS’s weak explanatory power for performance and that of
Barney and Hoskisson (1990) claiming that OF characteristics are better performance
predictors.
When considering only solution paths that pass the 0.7 consistency threshold of this research,
the solution coverage of A1 (explanatory power of KS) is higher than that of A2 (explanatory
power of FC) for six performance dimensions tested (out of ten), while the findings for the
remaining four performance dimensions support the opposite. In other words, the combination
of KS and OF provides a “universally better” explanation. Which matters more may also be
contextually dependent; discovering that context would be an exercise in itself, and not one
this study currently undertaking as the aim to argue that considering both will provide a better
explanation than selecting either one. This empirical result is consistent with the results of
Ketchen et al.’s (1997) and Crook et al.’s (2008) meta-analyses, which show no significant
differences between the explanatory power of KS and OF for performance, implying that both
are of equal importance in explaining performance differences between firms.

226
6.4 KSP model for organisations
This thesis raises two main theoretical implications for the combination of notion, the latter of
which offers a detailed understanding of the former.
[1] This study suggests combination of KS and OF as a proposed theory to improve
explanatory power for performance by linking both current theories that have not
previously been considered together. Careful consideration of complex causality in the
empirical findings (an increasing number of solution paths in A3 sub-associations
compared with those of A1 for the same performance dimension, the presence of both
components of proposed combinations as core INUS conditions and a high consistency
level of almost all solution paths with both components of proposed combinations)
contributes further new evidence to endorse this argument.
[2] This study provides a finer-grained understanding of the aforementioned combination
of KS and OF in explaining performance by offering a holistic examination of all
possible combinations to test a proposed compatible combination, and by presenting
evidence that raises concern about the importance of having KS combined with having
OF.
These theoretical implications will be discussed in turn. Combination is built on the previous
implication that KS and OF provides a “universally better” performance explanation, as well
as on the deviations found in some of the A1 sub-associations that also support the addition of
other potential factors, raising a theoretical implication for both current theories in that it
suggests a potential additional factor to improve explanatory power for performance that has
never been considered before. (Just as OF is introduced to KS, so too KS is recommended for
OF). In addition to support from most A3 sub-associations (except A3c), the empirical results
of the survey data also support the existence of combination by showing that the solution

227
coverage (explanatory power for performance) of the combination of KS and OF (A3) is often
higher than that of either KS or OF alone (A1 and A2).
Although the survey data show mixed results, when comparing solution coverage across
analyses with the same performance dimension, combination still displays an improvement
over each research construct individually, in that six out of twelve performance dimensions
are better explained by combination while others are split between KS and OF for two and
three performance dimensions. (Another performance dimension (oe2) shows “not applicable”
because all related solution consistencies are lower than the 0.7 threshold.) This research,
therefore, addresses Priem and Butler’s (2001) call for further development of organisational
theory to investigate conditions under which different resources and capabilities are and are
not valuable, and Crook et al.’s (2008) call for an inquiry that considers how strategic
resources and organisational KS (two competing sources of competitive advantage) interact
by providing a holistic view of combinations of KS and OF that generate high levels of
different performance dimensions. Most importantly, because DEA and fsQCA highlights the
complex causality notion in the empirical findings, this study provides a finer-grained
understanding of the relationship between KS and OF in explaining performance.
In addition to receiving support from association testing (A3), the combination argument is
also endorsed by inferences drawn from careful consideration and comparison of causal
conditions within solution paths. It is noticeable that the number of solution paths in the sub-
associations of A3 is greater than in those of A1 for the same performance dimension,
suggesting that an additional OF for a sufficient analysis of all integrations of KS assists in
identifying more successful cases for a particular performance dimension that have not
previously been covered by KS. This is probably because OF provides an internal competitive
advantage for a business unit in addition to an external one covered by KS, resulting in the
character of the business unit being taken into consideration in finer detail. This is consistent

228
with Spanos and Lioukas’ (2001) argument that KS and OF jointly supply full-dimension
explanations for organisational performance (both internal and external domains) regarding
sources of competitive advantage.
Moreover, the majority of solution paths (25 out of 62 solution paths for A3 sub-associations)
that comprise the presence of either a proposed KS or a proposed OF (but not both) as a core
INUS condition for the outcome under consideration, with the other as a “don’t care” condition
or absent, is consistent with the previous tests (A1, A2) which show that each (on its own) is
a necessary part of a combination that is sufficient to generate high performance, which in turn
seems to suggest a trade-off relationship between KS and OF.
However, the presence of both components of proposed combinations as core INUS
conditions, even as a minority of solution paths (3 out of 62 solution paths for A3 sub-
associations), implies that both are necessary parts of a conjunction that is sufficient, although
rare, to produce the outcome, which in turn helps support the existence of combination
between KS and OF.
Furthermore, when considering the tests for combination (A3), unlike other solution paths
with only one research construct present that sometimes fail to meet the 0.7 consistency
threshold, solution paths with both components of a proposed combination pass the 0.7
consistency threshold almost every time. Therefore, it can be inferred that the proposed
combinations are more reliable predictors of high performance dimensions because the higher
the consistency value, the more accurately such a condition predicts the outcome (higher
predictive power). Since consistency and coverage are inversely related (when one is high, the
other will be low.), it is unsurprising that the proposed combinations have lower coverage than
their counterparts. This implies that, although combination provides a more accurate
prediction, it covers fewer cases of high performance (lower explanatory power).

229
Furthermore, the proposed combinations are found more frequently in A3 (performance
dimension).
This is probably because these combinations achieve more than one performance dimension,
resulting in better overall performance proxies. Therefore, this research finding contributes
new evidence to confirm the arguments of research that both KS and OF play essential roles
in achieving business performance and that ignoring one may hinder or blur important
implications (Wernerfelt, 1984; Cool and Schendel, 1988; Conner, 1991; Barney, 1992;
Barney and Griffin, 1992, Mahoney and Pandian, 1992; Amit and Schoemaker, 1993; Peteraf,
1993; Barney and Zajac, 1994; Henderson and Cockburn, 1994; Spanos and Lioukas, 2001;
Short et al., 2007; Sirmon, Hitt and Ireland, 2007; González-Benito and Suárez-González,
2010).
Apart from support for the existence of combination, another main theoretical implication of
this study is compatibility between the research constructs tested. No empirical research has
jointly considered KS and OF in all possible combinations. In fact, even a specific alignment
between a particular pair such as Porter’s (1980) integrations and manufacturing strategy
(equivalent to the operations capacity of the current research) has received limited empirical
attention (Ward and Duray, 2000). In this regard, González-Benito and Suárez-González’s
(2010) work seems to be a closely comparable study for KS and operations capability (A3a).
The current finding is also consistent with their claim that “an appropriate alignment of the
manufacturing function with a business strategy emerges as a crucial circumstance that
explains a significant part of the success of that strategy” (González-Benito and Suárez-
González, 2010: 1039).
Therefore, this thesis provides offers possibilities of testing the compatible combination by
examining all integrations of KS (to allow testing for a hybrid type) and one or two types of
OF at a time. Further research should complement this by including additional OFs that are

230
also hypothetically justified or retesting the current analysis with all types of OF and one or
two integrations of KS at a time (up to the level that the total number of causal conditions still
comply with the limiting ratio of explanatory cases to characteristics (Marx, 2010) in order to
gain an understanding from a different perspective regarding which KS is compatible with a
particular combination of OFs and whether one OF is compatible with more than one KS-OF
integration.
Furthermore, some solution paths in the A3 sub-associations still have some KS integrations
present and have OF as either absent or “don’t care” conditions, and no solution path has OF
present and has the remaining KS integrations as either absent or “don’t care” conditions,
suggesting that it may be possible for business units to achieve high performance by having
only KS integrations but they are less likely to do so by having only one or two OF types
without any clear direction of KS.
The contributions of this study, therefore, strengthen Hofer and Schendel’s (1978) argument
about the intervening role played by consistent functional strategies in a business strategy’s
positive impact on performance by confirming the evidence of previous research regarding the
relevance of functional strategies for the efficacy of a business strategy (Miles and Snow,
1984; Lengnick-Hall and Lengnick-Hall, 1988; Slater and Olson, 2001). In addition, building
on the previous analysis (A2) that OF often works in combination rather than alone, it raises
concern over whether, to be successful, business units without any clear KS should have more
than one or two OF types, as proposed in the sub-associations. Further research might address
this by repeating the A3 sub-associations with the additional OFs found in the A2 sub-
associations for the same performance dimension.
Although this combination argument requires additional empirical support for full validation
(for example, because my sample has a specific characteristic) and the results leave several
questions open to further analysis (whether combination always outperforms one causal factor

231
and, if not, what is the required condition), this research draws attention to compatibility
between KS and OF as relevant in explaining high performance.
In this regard, this study would like to mention one possible future test as follows; Given that
a calibration in fsQCA predetermines a certain level of performance as an anchor point for a
high level of a particular performance dimension (any organisation that passes this anchor
point will be considered as a high performer in that dimension, no matter how high its
performance really is), it is impossible to compare the level of performance between solution
paths by considering only the results of the current analysis. Therefore, it would be possible
to establish indirectly whether complementary combinations outperform a single research
construct by conducting a separate sufficiency analysis with an even higher level of anchor
point for the performance dimension and then drawing inferences from a comparison of the
observed results. This is similar to testing whether it is feasible for hybrid types to achieve
very high performance, as suggested in the previous section.
6.5 Integrating DEA and fsQCA
This thesis raises two main theoretical implications for the notion of equifinality. Like that of
combination, the latter offers a detailed understanding of the former.
[1] This study provides holistic evidence supporting the existence of equifinality, which
in turn lends support to the validity of the KS-performance relationship because it
offers an alternative explanation for challenges regarding the equivocality of KS by
arguing that these are based on the notion of causal symmetry whereas the actual nature
of this social science relationship is asymmetrical.
[2] This study explicitly displays the existence of equifinality at all levels of analysis,
comprising equifinality within each research construct, between KS and OF, among
proposed combinations of KS and OF, and among performance dimensions, each of

232
which provides a finer-grained understanding of the field, such as the first-order
(across-group) and second-order (within-group) equifinality exhibited between
different solution paths within a particular association test.
These theoretical implications will be discussed in turn.
Although equifinality is an implicit assumption of the performance concept, particularly in
both Miles and Snow’s (1978) and Porter’s (1980) integrations (Marlin, Ketchen and Lamont,
2007), it has received less attention in the literature. Only a handful of previous research
studies in the performance literature have explicitly tested the existence of equifinality (Doty,
Glick and Huber, 1993; Gresov and Drazin, 1997; Fiss, 2011), though not exhaustively in
terms of the variety of KS integrations, other potential causal factors (OFs) and different
performance dimensions. Hence, equifinality has become a weak link in performance and has
been subject to challenges by other research paradigms.
In response to this concern, the current study reconfirms the empirical studies of Doty, Glick
and Huber, (1993), Gresov and Drazin (1997) and Fiss (2011) by providing holistic evidence
supporting the existence of equifinality, which in turn lends further support to the validity of
the KS-performance relationship because it provides an alternative explanation for the
challenges regarding KS’s “weak evidence of performance variations across groups” (McGee
and Thomas, 1986; Thomas and Venkatraman, 1988: 548). To address the challenge that
empirical evidence for the KS-performance relationship is equivocal, this study argue that the
challenges are based on the notion of causal symmetry whereas the actual nature of this social
science relationship is asymmetrical, providing holistic empirical evidence on many
dimensions. Thus, the claim of equivocality is essentially a normal characteristic of
equifinality and these assertions cannot falsify the KS-performance relationship.
233
This research finding is consistent with Fiss (2007, 2011) in that it also suggests a new
perspective on the causal asymmetry relationship for the performance literature. In addition,
because equifinality is a condition that supports the KSP concept, the attempt of this study to
measure the existence of performance for different KS integrations fosters the validity not only
of the equifinality notion (Tushman and Nadler, 1978; Scott, 1981; Van de Ven and Drazin,
1985; Hrebiniak and Joyce, 1985; Nadler and Tushman, 1988; Pennings, 1992; Galunic and
Eisenhardt, 1994; Gresov and Drazin, 1997) but also of the KSP model (Miles and Snow 1978;
Miller and Friesen, 1978; Snow and Hrebiniak, 1980; Segev et al., 1999). If equifinality exists,
then one of the implicit assumptions of KS is empirically supported. Likewise, this theoretical
implication also applies to OF and the combination literature.
Furthermore, the argument for the existence of equifinality is endorsed by inference from a
careful consideration of the findings of this research in many dimensions, each of which has
further theoretical implications as follows.
Equifinality within each research construct: The finding for A1 elaborates the concept of
equifinality in KS, raised by Doty, Glick and Huber (1993) and tested empirically by Gresov
and Drazin (1997) and Fiss (2011), by providing new empirical support in a holistic manner
in terms of a variety of performance dimensions that seem to match better with different KSs.
Unlike the KS literature, the OF literature has not previously raised the issue of equifinality.
Therefore, the finding for A2 is among the first to raise this concern in the OF field in the same
manner as that of KS.
As in Fiss’ (2011) analysis, the use of DEA and fsQCA in this research allows us to infer the
existence of efficiency in many ways. Unobserved necessary conditions suggest that there is
no one best way to achieve any performance dimension, indirectly supporting the equifinality
concept. Sufficiency analysis directly displays equifinality at two levels through several
solution paths with different core and peripheral conditions for each analysis. In a broader

234
sense, the fact that there is no single solution path for each performance dimension in the
analysis (i.e. no one best way) supports the existence of equifinality. In detail, when
considering these solution paths, those that have different core characteristics exhibit first-
order (across-group) equifinality while those that share the same core attributes but have
different peripheral conditions reveal second-order (within-group) equifinality. The presence
of first-order equifinality suggests a trade-off (substitution) in a broader sense, which is across
different groups based on their unique combination of core conditions, to achieve a same level
of desired outcome while the presence of second-order equifinality suggests a trade-off
(substitution) in a narrow sense, which is between different combinations of peripheral
conditions within a group that shares the same combination of core conditions, to also achieve
a same level of desired outcome. Therefore, different constellations of peripheral conditions
surrounding core conditions in the same analysis provide a finer-grained understanding of
which conditions are substitutes for each other (other peripheral conditions) under second-
order (within-group) equifinality.
Equifinality between KS and OF: Since this study test different research constructs with the
same performance dimensions in A1 and A2, their different solution paths for a particular
performance dimension also prove the existence of equifinality. Equifinality between
proposed combinations of KS and OF: In considering overall performance proxies (A4),
allowing comparability between different proposed combinations, this study finds that the
presence of conditions under proposed combinations are often displayed as core conditions
and that different proposed combinations, except that of collaboration and culture capability,
are sufficient to generate high overall performance proxies. This supports the existence of
equifinality between proposed complementary combinations. The deviation found not only
suggests the addition of a causal condition to improve the current sub-association but also
raises a concern to adopt long-term achievement as another performance measure in addition
to the proposed overall performance proxies that provide only a snapshot assessment. Future
235
research might repeat this study over a period of time (longitudinal test) in order to perceive
the dynamic of this relationship.
Equifinality between performance dimensions: Although A3 sub-associations exhibit
proposed combinations, the number of solution paths for a particular proposed combination
are different, suggesting that there are other possible solution paths, apart from those that
achieve a particular performance dimension, that also achieve the overall performance proxy
(this also means that some solution paths achieve more than one overall performance proxy);
and that some solution paths that achieve a particular performance dimension may not be able
to achieve the overall performance proxy. This is confirmed by the solution paths in the A3
sub-associations that require at least one performance dimensions to be present, suggesting
that achieving one performance dimension is usually sufficient on its own to achieve the
overall performance proxy. Therefore, each performance dimension is merely a component of
the overall performance proxy. This conclusion supports the claim by Walker and Ruekert
(1987), Dye (2004) and Van der Stede, Chow and Lin (2006).
6.6 Summary
This chapter discussed in-depth the efficiency measurement of the KSP model using two
techniques (DEA and fsQCA) to show the alignment of this study literature with the empirical
findings of the current study. In this thesis, this study has argued that the concept of KS may
benefit both conceptually and empirically from reorientation toward joint consideration with
OF through the concepts of causal asymmetry, neutral permutation, and causal core and
periphery. Also, a case for implementation of this research to extend this approach and show
its utility in developing the proposed KSP model of integrating and equifinality in KM
research. This research can be developed further to studies regrouping the currently available
causal conditions and/or add more causal conditions that are also hypothetically justified but
have not yet been tested in this research or include attributes that include time patterns to this

236
model up to the level that the total number of causal conditions still comply with the limiting
ratio of explanatory cases to characteristics or readjust the calibration criteria of the concerned
outcome to develop a more holistic view.

237
Chapter seven: Conclusions
7.1 Introduction
This research has aimed at measuring the efficiency of the knowledge sharing performance by
providing empirical evidence to how KS and OF, either alone or in combination, affect
different performance dimensions’ challenge regarding the lack of theoretical and empirical
rigour of this relationship. In order to do so, this study has developed three main research
questions, each of which is addressed by one association developed within the KSP model.
This chapter describes conclusions across all stages of this study, therefore shows how the
research questions were answered through empirical findings of deductive analysis, and how
the knowledge sharing relationship with organisational factors was filled through key
contributions of this study by adopting an integration of two deductive measuring techniques
DEA and fsQCA. Moreover, it discusses recap of the study and makes suggestions for further
research.
7.2 How the research questions were answered?
This research has been undertaken using a structured approach to measure knowledge sharing
efficiency, which has led to the development of an empirically evaluated KSP model from the
original conceptual framework derived from literature. Also, this research addresses the
limitations of traditional performance analysis techniques. The work undertaken stems out
from the association introduced in Figure 4.3. Figure 7.1 diagramatically illustrates the main
research activities and the links across different stages of the research process which have
provided answers to the research questions.

238
Figure 7.1 An overview and links across different stages of the research project
To address the first research question, “What are the key components of knowledge sharing
in an organisation?”, this study has developed the first association (i.e.A1): “having a high
intensity level of at least one particular components of proposed KS is a sufficient condition
for an organisation to achieve a high level of performance dimension corresponding with that
component”. This research has then tested this association, using DEA and fsQCA to
contribute a new approach to the KM research that has assumed the causal relationship to be
symmetrical rather than asymmetrical (Ragin, 1987, 2000; Fiss, 2011), and has found that ten

239
out of twelve A1 sub-association tests are supported. This has answered the first research
question that the equivocal empirical evidence of previous research can be improved, if not
resolved, by selecting an appropriate performance dimension to measure a business unit with
different KSs. To highlight, the five key components are:
Knowledge asset
Business processes
Decision
Systems
Collaboration.
In addition, as a by-product of the findings from DEA and fsQCA, considering other
conditions in the solution path carries direct implications for the organisational KS literature
(Tushman and O’Reilly, 1996). Apart from a pure type, which is consistent with Walker and
Ruekert’s (1987) finding, the current study also reveals the rare occurrence of a hybrid type
(the presence of both knowledge asset and business processes), which is in line with Fiss’
(2011) finding, suggesting that either pure or hybrid types can achieve high performance
dimension. This challenges Porter’s (1980) claim and those of other supporting research
(Hambrick, 1983b; Miller, 1989) regarding the stuck in the middle components.
In order to address the second research question, “What are the organisational factors that
facilitate effective knowledge sharing in an organisation?”, this study has developed the
second association (i.e. A2): “being part of an organisation that has a high intensity level of at
least one particular type of proposed OF is a sufficient condition for a business unit to achieve
a high level of performance dimension corresponding with that type of OF”. This research has
found that all sub-association tests are supported, and that one even gained strong support,

240
thereby addressing a previous challenge of resource-based theory, a root of OF, regarding the
accuracy of performance prediction (Cullinane et al., 2006).
Again, DEA and fsQCA allows for an even more refined understanding of compatibility
between OFs through consideration of the contextuality of each solution path. This study has
found that each solution path of the A2 analysis usually displays the presence of more than
one OF apart from the proposed OF in the sub-associations, suggesting that OFs often work
in combination, which is consistent with De Meyer et al. (1989), rather than alone as suggested
by Skinner (1969, 1974). Therefore, this thesis suggests a novel model to refine the current
association (A2) in that multiple OFs, rather than a single OF, may in fact be sufficient for the
outcome, although at different levels of importance (core and peripheral). Paradoxically, the
reverse of this notion is also true, although quite rarely. Therefore, another theoretical
implication of this study is a shift in our understanding of the OF performance relationship
from the original association of one-to-one (one OF to one performance dimension) to many-
to-one and then, for a rare case, to many-to-many.
However, considering A2 alone only answers the first part of the second research question.
This study has compared solution coverages (which portray explanatory power) between all
sub-associations of A1 and A2 tested against the same performance dimension and have found
that the results of solution coverage comparison are mixed, from which it can be inferred that
KS and FC provides a “universally better” explanation. This empirical result is consistent with
a comparison of the results of Ketchen et al.’s (1997) and Crook et al.’s (2008) meta-analyses,
which suggest that both are of equal importance in explaining performance differences
between organisations. Hence, rather than trying to determine which one matters more, this
raises a concern for potential improvement through the use of a combination of both to explain
performance (A3).

241
In order to address the third research question, “How can DEA and fsQCA be used to
measure the impact of organisational factors on knowledge sharing efficiency?”, this
research has developed the third association (i.e. A3): “being part of an organisation that has
a high intensity level of at least one type of proposed OF and having a high intensity level of
a particular components of proposed KS that is compatible with its organisations’ OF is a
sufficient combination of conditions for a business unit to achieve a high level of performance
dimension corresponding with that combination”. This study has found that nine out of twelve
sub- association tests are supported, suggesting another potential improvement to previous
research in explaining performance variance by:
1. combining a matching pair of KS and OF, as proposed in this research according to
similarity (or practices “of the same kind”) (only for those that are supported).
2. and selecting an appropriate performance dimension to measure a business unit with
those different combinations.
To answer the third research question, this study has again compared the solution coverages
of all sub-associations of A1, A2 and A3 tested against the same performance dimension. The
results of solution coverage comparison are mixed but still exhibit the dominant theme. The
empirical evidence shows that six out of twelve performance dimensions are better explained
by A3 (proposed combination), while the rest are split almost equally between A1 (KS) and
A2 (OF). It can be inferred that usually, though not always, the proposed combination between
KS and OF is a better performance predictor, raising a theoretical implication for both current
theories in that it suggests a potential additional factor to improve explanatory power for
performance that has never been considered before. (Just as OF is introduced to KS, so too KS
is recommended for OF.)

242
Once more, careful consideration of the findings from DEA and fsQCA strengthens this
argument still further (for example, an increasing number of solution paths in the A3 sub-
associations compared with those of A1 for the same performance dimension, the presence of
both components of proposed combinations as core INUS conditions, and a high consistency
level for almost all solution paths with both components of proposed combinations).
Furthermore, this study finds that nine out of sixteen sub-association tests are supported, and
one even receives strong support, suggesting that the combination of the proposed
combinations tested earlier (A3) and their corresponding performance dimensions support the
existence of equifinality. With finer consideration of the DEA and fsQCA findings (e.g.
similar solution coverage level of at least two sub-associations based on the same overall
performance proxy), the equifinality argument is further reinforced. In fact, equifinality is
explicitly displayed at all levels of analysis in this study, comprising equifinality within each
research construct, between KS and OF, between proposed combinations of KS and OF, and
between performance dimensions, each of which provides a finer-grained understanding of
this field, such as a finer-grained understanding of which conditions are substitutes for each
other under first-order and second-order equifinality exhibited in different solution paths
within a particular association test.
This dissertation not only addresses Crook et al.’s (2008) call for an inquiry that considers
how KS (knowledge power) and OF (impactful) interact, but also contributes new evidence to
confirm the arguments of previous research that both play essential roles in achieving
organisational performance, and that ignoring one may hinder or blur important implications
(Spanos and Lioukas, 2001; Short et al., 2007; González-Benito and Suárez-González, 2010).
Most importantly, it suggests that researchers should take into account compatibility between
KS and OF. This shifts the focus from falsifying and replacing the former with the latter to
searching for matching combinations of the two.

243
7.3 Key contributions
The key contributions of the findings of this study are described separately as theoretical and
managerial contributions as follows:
7.3.1 Theoretical contributions
Although knowledge efficiency remains attractive to organisation and business research, as
shown by a number of recent studies, its promise is still far from fulfilled (Short et al., 2008;
Fiss, 2011). In fact, it is being challenged because of a lack of empirical support (McGee and
Thomas, 1986; Thomas and Venkatraman, 1988) and theoretical rigour (Bacharach, 1989),
especially by its counterpart theory, the KM view (Barney and Hoskisson, 1990). This study
argued that our understanding of the cause-effect relationship between KS and performance
will become less equivocal if:
[1] Different performance dimensions are used;
[2] The analysis is based on causal asymmetry and the notion of complex causality;
[3] KS and OF are considered simultaneously (the concept of combination);
[4] The contextualisation of other causal conditions is taken into consideration (the notion
of equifinality).
This research has important theoretical contributions:
[1] This study developed a new conceptual framework KSP which integrated theories
from knowledge management, organisation and performance. The knowledge sharing
theoretical components are SECI model and Japanese Ba theory, these theories
formulate the knowledge entity in the framework. The critical organisational factors
244
that can impact on the effectiveness of knowledge activities within an organisation for
this study in the KSP framework are culture, learning, leadership and structure. The
relationship of the KS and OF was measured with key performance indictors.
[2] The evolution of KSP model as a result of successful data collection on KSP
conceptual framework through pilot study initiated the implementation of the
associations of KS, OF and PERF. The KSP model testing verifies the theoretical
contribution of this study and the emerging of new innovation to the knowledge
management field.
[3] The comprehensive view of the complex causality between KS and OF in the research
findings contributes to the theory that when organisation consider OF, they can select
either a compatible business unit KS, as proposed in the association, or one that creates
a combination similar to the solution path displayed in the findings. In doing so, they
should prioritise their resources toward core conditions, high unique coverage and the
knowledge assets related to acquiring or building such an option. Moreover, this
knowledge also allows decision makers to review the potential impact of their policies.
[4] This study use DEA and fsQCA rather than a correlation-based technique as a suitable
method to allow this research to test the proposed associations. In proposing an
alternative theory and utilising novel methodology, the current study takes a step
toward building a better understanding of the explanation of performance, a theme
central to the literature of both KM and organisation, using both KS and OF rather than
a single factor as antecedents. In this section, this study synthesises the findings and
discuss the implications of this study, first for each current literature (KS and OF)
individually, and then for both considered in combination according to this research
proposed model to shed light on the complexity of the phenomena under study.

245
7.3.2 Managerial implications
The overall concepts of combination and equifinality may be applied to other studies,
managers of these industries should bear in mind that this study is knowledge based-specific
and is suitable for knowledge orientated organisations and industries motivated to improve
their low innovation and performance across specific sections of operations. Therefore, they
should not over-generalise, especially if their industries do not generate enough knowledge or
are developing with a high potential for innovation.
This study gives managers a comprehensive view of the complex causality (contextuality, core
and peripheral conditions) between KS and OF in generating a high level of a particular type
of performance dimension. Therefore, it suggests that, although either KS or OF is likely to
be related to a particular performance in general, when considered together they may not be
of similar critical levels, depending on the context within the solution path. For instance,
although D, BP and OL are sufficient to generate high oe2, as shown in A1b and A2b, they
are displayed at different levels of importance as core, peripheral or even “don’t care”
conditions in A3b for oe2, depending on the context of the solution paths to which they belong.
For example, in A3b for oe2 there is a trade-off relationship between OL in S2 and BP in S5
(both of which are peripheral conditions in a solution path that has KA as a core condition) as
well as a substitute relationship between D in S3 and a combination of OL and BP in S7 (all
of which are core conditions in a solution path that has S present). Hence, to be more certain
about the expected result, all causal conditions must be taken into consideration.
In order to gain competitive advantage (high performance), managers should consider their
organisations’ strengths and weaknesses reflected in OF as a starting point (since OF is
difficult to create or amend in the short term owing to path dependence), and then select a
compatible KS (which is a positioning of their business units to take advantage of market
opportunities and neutralise threats) that fosters the same objective as their OF, or select a KS

246
to create a combination that is similar to the solution path displayed in the findings. For
example, to increase the likelihood of achieving a high oe2, if a firm has strong OL, its business
unit should pursue either KA, as in S2, or both BP and S, as in S7. Moreover, managers should
set incentives to motivate workers toward an appropriate performance target.
In addition, since a single causal factor, especially OF, is unlikely to be a sufficient condition
on its own to generate high performance, managers should promote only compatible ones (as
shown from my analyses). In doing so, managers should prioritise their resources toward a
core condition exhibited in this study rather than a peripheral one, and toward those that have
high unique coverage as they are more likely than others lead to the desired outcome. By
understanding possible substitution relationships between these research constructs, they will
be able to decide which choice is most economical for them.
Likewise, this study raises some concerns for implementation regarding the impact of OFs in
that, although a particular policy may serve one objective well, it may have different effects
on different business units. However, these very policies tend to jeopardise fair competition
because they allow less efficient business units still to be viable in the industry while
discouraging highly efficient business units from maximising their full potential. Thus, the
managers must weigh the costs and benefits of each objective before making a decision.
Nevertheless, the managers may do better to subsidise shared fundamental KM (back office
services) that will enhance industry-wide OF, which in turn may increase a particular
performance dimension for all business units, no matter what KS they pursue.
This study is very confident of the managerial implications within the sample because the
dataset used (organisations from the top 25 companies in 2015 according to the knowledge
asset capacities of each of their departmental resources) is a representative of the whole
population owing to very high capacity concentration.

247
None of the research constructs used here are culturally-related; thus, these findings are not
limited by socio-cultural issues and, ceteris paribus, should be applicable elsewhere. However,
the main concern in applying the findings of this study to industry is whether that industry
offers a knowledge driven or innovative product or services, whether it is developed or still in
a growth period, and whether economies of scale are not only sufficient but also necessary
conditions for the viability of the industry, because this will determine the feasibility of a
differentiated strategy, which in turn will affect the solution paths for achieving input
efficiency.
7.4 Limitations of the study
Naturally, this current study also has limitations, while using only survey questionnaire data
collected from various organisations across seven countries in three continents, this thesis
achieves the aim of enriching the study of the KS performance relationship by addressing an
untapped dataset in manufacturing and service industries, and avoids the problem of market
and environmental differences between datasets characteristic of single-industry research
(Conant et al., 1990), in doing so it also has the drawback of having multi-industry
characteristics, losing the advantage of specific-industry studies. As financial products, the
costs and revenues of various organisations are two sides of the same coin, meaning that
pursuing KS will simultaneously achieve both ie and oe. The multi-characteristics of numerous
organisations may also spoil the results, as mentioned earlier in the discussion of a possible
explanation for the deviation found in the current findings.
Although the findings of the current study are quite limited in the specific-organisational data,
the logic of its conclusions is context-specific and offers ample opportunity for further
research. Thus, in order to test the individuality of the associations of this research, especially

248
concern about the deviations found in the current findings, future research should repeat the
analytical framework of this research with a different dataset, for example a dataset from a
specific industry that is either a service or manufacturing organisation with KS and OF
characteristics, a dataset from a specific industry in a specific country of operation.
The multi-organisational data were selected because of its relatively large number of players
compared with specific-industry in one country, and because it is large data, with available,
reliable and comparable data.
7.5 Future research
A number of recommendations for further research have been emerged from the findings of
this study. The KSP model could be compared in two or more specific industries. This could
contribute to the knowledge and provide new insights into the impact of OFs on PERF through
the mediating role of KS and the potential innovation opportunities that these new
relationships contribute to growth of the specified industries.
The measures of KS with OFs used in this study were developed from two techniques studies.
Although these studies have strong reliability and validity, and strong construct validity was
obtained in this study, some variables showed low magnitude (less than 0.5) in the fsQCA and
were omitted. Thus, future research could increase the number of items and test the constructs
in a different environment for more robust results.
The study tested KS empirically as the core variable in the KS-OFs relationship as one
dimension, in spite of the fact that factor analysis distinguished between knowledge donating
and collecting. Also as indicated in this study that these KS components have different effects.
Hence, future research could further carry out individuality testing of which knowledge
components are more dominant in enhancing product and service performance in the specified
industry. Further analysis could be conducted at the industrial or department level.

249
This study looked for the performance contribution of KS with regards to OFs in organisations
across different countries. Although this distinction was useful for the purposes of this study
in terms of understanding their systems, policies and procedures, future research should
examine individuality/and management style inter- relationships of an organisation rather than
the country of operation.
KS can result in other outcomes that can lead to competitive advantage (Nonaka, 2005).
Examining the impact of KS on other outcomes such as organisational profitability, product
quality, departmental performance, and staff satisfaction would be interesting themes for
future research.
Additionally, organisational factors, as the dependent variable in this study, were studied as
one dimension. This dimension can be divided into two elements, internal and external factors,
and each element has different effects. Thus, future research should look into which type of
organisational factor is more strongly influenced by KS.
The quantitative findings reveal that performance measurement is a critical element of KS
success. So far, there is limited research in the KS literature to support this view, which offers
another area for further research.
Last but not least, the literature review in Chapter 2 showed that there are few studies
measuring the impact of the relationship between KS and OFs in the field of supply chain
management across countries. This calls for more research to be conducted in this area.
250
References
Abidi, S. S. R. 2001. Knowledge management in healthcare: towards knowledge-driven
decision-support services. International Journal of Medical Informatics, 63, 5 – 18.
Alavi, M., Kayworth, T. R., & Leidner, D. E. 2006. An empirical examination of the influence
of organizational culture on knowledge management practices. Journal of management
information systems, 22(3), 191-224.
Allsopp, D. J., Harrison, A., & Sheppard, C. 2002. A database architecture for reusable
CommonKADS agent specification components. Knowledge-based Systems, 15, 275
– 283.
AI-Tabtabai, H. 1998. A framework for developing an expert analysis and forecasting system
for construction projects. Expert Systems with Applications, 14, 259– 273.
Amit, R. and Schoemaker, P. J. H. 1993. Strategic asset and organizational rent. Strategic
Management Journal, 14: 33-46.
Anand, S. S., Bell, D. A., & Hughes, J. G. 1996. EDM: a general framework for data mining
based on evidence theory. Data and Knowledge Engineering, 18, 189 – 223.
Anand, S. S., Patrick, A. R., Hughes, J. G., and Bell, D. A. 1998. A data mining methodology
for cross-sales. Knowledge-based Systems, 10, 449 – 461.
Anderson, J.C. & Gerbing, D.W. 1988. Structural equation modelling in practice: a review
and recommended two-step approach. Psychological Bulletin, 103 (3), pp. 411-423.
Appelbaum, E., Bailey, T., Berg, P. & Kalleberg, A. L. 2000. Manufacturing Advantage: Why
High-Performance Work Systems Pay Off. New York: ILR Press.
Argyris, C., & Schon, D. 1996. Single-and double-loop learning. Organizational learning II.
Reading MA: Addison-Wesley.
Argote, L., Beckman, S. L., & Epple, D. 1990. The persistence and transfer of learning in
industrial settings. Management Science, 36(2), 140-154.
Argote, L., & Ingram, P. 2000. Knowledge transfer: A basis for competitive advantage in
firms. Organizational Behavior and Human Decision Processes, 82(1), 150-169.
Argote, L., Bill, M. & Reagans, R. 2003. Introduction to the special issue on managing
knowledge in organizations: Creating, retaining, and transferring knowledge
Management Science Vol. 49, No. 4, pp.5- 8.
Athanassopoulos A., (1994) "The evolution of non-parametric frontier analysis methods: A
review and recent developments", Warwick Business School.
Baden-Fuller, C. & Stopford, J. M. 1992. Rejuvenating the Mature Business: The Competitive
Challenge. Boston: Harvard Business School Press.
Bacharach, S. B. 1989. Organizational theories: Some criteria for evaluation. Academy of
Management Review, 14: 495-515.
Baker, D. D. & Cullen, J. B. 1993. Administrative reorganization and configurational context:
The contingent effects of age, size, and change in size. Academy of Management
Journal, 36: 1251-1277.
Banker, R.D., Kauffman, R.J., & Zweig, D. 1993. ''Repository evaluation of software reuse.''
IEEE Transactions, Software Engineering. 19(4): 379-389.
Banker, R.D., Chang, H.S. & Cooper, W.W. 1996. ''Simulation studies of efficiency returns
to scale and misspecification with nonlinear functions in DEA.'' Annals of Operations
Research 66: 233-253.
Barney, J. B. 1991a. Firm resources and sustained competitive advantage. Journal of
Management, 17(1): 99-120.
Barney, J. B. 1992. Integrating organizational behavior and strategy formulation research: A
resource based analysis. In P. Shrivastava and A. Huff (Eds), Advances in Strategic
Management, 8: 39-62. Greenwich, CT: JAI Press.

251
Barney, J. B. & Griffin, R. 1992. The Management of Organizations: Strategy, structure, and
behavior. Boston, MA: Houghton Mifflin.
Barney, J. B. & Hoskisson, R. E. 1990. Strategic groups: Untested assertions and research
propositions. Managerial and Decision Economics, 11: 187-198.
Barney, J. B. & Zajac, E. 1994. Competitive organizational behavior: Toward an
organizationally-based theory of competitive advantage. Strategic Management
Journal, Winter Special Issue, 15: 5-9.
Bartol, K. K. & Srivastava, A. 2002. Encouraging knowledge sharing: The role of
organizational reward systems Journal of Leadership and Organization Studies Vol. 9,
No. 1 pp. 64 -76.
Bass, B. 1985. Leadership and performance beyond expectations, New York, Free Press.
Bass, B. 1990. Bass and Stogdill's handbook of leadership New York Free press.
Betroci, D. 2009. Leadership in organizations- There is a difference between leaders and
managers., US, University Press of America.
Bennis, W. & Nanus, B. 1985. Leaders: The strategies for taking charge, New York, Harper
& Row.
Biddle G.C., Bowen R.M. & Wallace J.S. 1997. Does EVA Beat Earnings? Evidence on
Associations with Stock Returns and Firm Values. Journal of Accounting and
Economics. 24(3) pp301-336.
Bititci U.S., Carrie A.S. & McDevitt L. 1997. Integrated Performance Measurement Systems:
A Development Guide. International Journal of Operations & Production
Management. 17(5) pp522-534.
Bock, G., Lee, J., Zmud, R. & Kim, T. 2005. Behavioral intention formation in knowledge
sharing : Examining the role of extrinsic motivators, social - psychological forces and
organizational climate MIS Quarterly, Vol.29, No. 1, pp.87 - 111.
Bolisani, E., & Scarso, E. 1999. Information technology management: a knowledge-based
perspective. Technovation, 19, 209 – 217.
Bowman, B. J., 2002. Building knowledge management systems. Information Management
Systems, 19(3).
Bryman A. 2004. Social Research Methods. (2nd Ed.) Oxford University Press. Oxford. pp65-
75, 109-129, 225-227.
Bryman, A. & Bell, E. 2011. Business Research Methods, New York, Oxford University
Press.
Buchanan, J. & Vanderpooten, D. 2007. Ranking projects for an electricity utility using
ELECTRE III. International Transactions in Operational Research, 14, 309-323.
Burns, J. M. 1978. Leadership, New York, Harper & Row.
Calantone, R. J., Cavusgil, S. T., & Zhao, Y. 2002. Learning orientation, firm innovation
capability, and firm performance. Industrial Marketing Management, 31, 515– 524.
Camanho, A. S. & Dyson, R. 2005. "Cost efficiency, production and value-added models in
the analysis of bank branch performance." Journal of the Operational Research Society
56: 483-494.
Cannataro, M., Talia, D., & Trunfio, P. 2002. Distributed data mining on the grid. Future
Generation Computer Systems, 18, 1101 – 1112.
Caraynnnis, E. G. 1999. Fostering synergies between information technology and managerial
and organizational cognition: the role of knowledge management. Technovation, 19,
219– 231.
Caren, N. & Panofsky, A. 2005. TQCA: A technique for adding temporality to Qualitative
Comparative Analysis. Sociological Methods and Research, 34(2): 147-172.
Carter C.R. & Ellram L.M. 2003. Thirty-Five Years of the Journal of Supply Chain
Management: Where Have We Been and Where Are We Going? The Journal of Supply
Chain Management: A Global Review of Purchasing & Supply. 39(2) pp27-40.
Cauvin, S. 1996. Dynamic application of action plans in the Alexip knowledge-based system.

252
Control Engineering Practice, 4(1), 99 – 104.
Chau, K. W., Chuntian, C., & Li, C. W. 2002. Knowledge management system on flow and
water quality modeling. Expert Systems with Applications, 22, 321– 330.
Chen, Z., & Zhu, Q. 1998. Query construction for user-guided knowledge discovery in
database. Journal of Information Sciences, 109, 49 – 64.
Chen, H., Schroeder, J., Hauck, R. V., Ridgeway, L., Atabakhsh, H., Gupta, H., Boarman, C.,
Rasmussen, K., & Clements, A. W. 2002. COPLINK Connect: information and
knowledge management for law enforcement. Decision Support Systems, 34, 271–
285.
Chiesa V., Coughlan P. & Voss C.A. 1996. Development of a Technical Innovation Audit.
Journal of Product Innovation Management. 13(2) pp105-136.
Chiu, C. M. 2003. Towards integrating hypermedia and information systems on the web.
Information and Management, 40, 165– 175.
Choudhary, A. K., Harding, J. A., Koh, S.C.L., Camarinha-Matos, L.M., & Tiwari, M.K. 2013.
Knowledge Management and Supporting Tools for Collaborative Networked
Organizations, in a special issue on knowledge management and supporting tools for
collaborative networks, International Journal of Production Research, Volume 51,
Issue 7, Pages 1953-1957.
Chua, C. E. H., Chiang, R. H. L., & Lim, E. P. 2002. An intelligent middleware for linear
correlation discovery. Decision Support Systems, 32, 313– 326.
Churchill, G.A. 1979. A paradigm for developing better measures of marketing constructs.
Journal of marketing research, 16 (1), pp. 64-73.
Coelli T., Rao D., Battese G., (1998), An introduction to efficiency and productivity analysis,
Kluwer Academic Publishing, Boston.
Collis, J. & Hussey, R. 2009. Business Research: A Practical Guide for Undergraduate and
Postgraduate Students, Hampshire, Palgrave MacMillan.
Conant, J. S., Mokwa, M. P. & Varadarajan, P. R. 1990. Strategic types, distinctive marketing
competencies and organizational performance: A multiple measures- based study.
Strategic Management Journal, 11: 365-383.
Conner, K. R. 1991. An historical comparison of resource-based theory and five schools of
thought within industrial organization economics: Do we have a new theory of the
firm? Journal of Management, 17(1): 121-154.
Coombs J.E. & Bierly P.E. 2006. Measuring Technological Capability and Performance. R&D
Management. 36(4) pp421-438.
Cooper R.G. & Kleinschmidt E.J. 1987. New Products: What Separates Winners from Losers?
Journal of Product Innovation Management. 4(3) pp169-184.
Cooper, W. W. & Tone, K. 1997. Measures of inefficiency in data envelopment analysis and
stochastic frontier estimation. European Journal of Operational Research, 99, 72- 88.
Constant, D., Kiesler, S., & Sproull, L. 1994. What's mine is ours, or is it? A study of attitude
about information sharing. Information Systems Research, 5(No.4), 400- 421.
Contu, A., & Willmott, H. 2003. Re-embedding situatedness: The importance of power
relations in learning theory. Organization Science, 14(3), 283-296.
Creswell, J.W. 1994. Research Design: Qualitative and Quantitative Approaches, New York,
Sage.
Crilly, D. 2011. Predicting stakeholder orientation in the multinational enterprise: A mid-
range theory. Journal of International Business Studies, 42: 694-717.
Cronshaw, M., Davis, E. & Kay, J. A. 1994. On being stuck in the middle or good food costs
less at Sainsbury’s. British Journal of Management, 5(1): 19-32.
Cullinane, K., Wang, T.-F., Song, D.-W. & Ji, P. 2006. The technical efficiency of container
ports: Comparing data envelopment analysis and stochastic frontier analysis.
Transportation Research Part A: Policy and Practice, 40, 354-374.
Cummings, J. N. 2004. 'Work groups, structural diversity and knowledge sharing in a global

253
organisation.' Management Science, 50(3) pp. 352-364.
Cunningham, P., & Bonzano, A. 1999. Knowledge engineering issues in developing a case-
based reasoning application. Knowledge-based Systems, 12, 371– 379.
Daft, R. L. & Weick, K. E. 1984. Toward a model of organizations as interpretation systems.
Academy of Management Review, 9(2): 284-295.
Daft, R. 1999. Leadership: Theory and practice U.S.A, Harcourt Brace College Publishers.
Damanpour, F. 1987. The adoption of technological, administrative, and ancillary
innovations: Impact of organizational factors. Journal of Management Vol. 13, No. 4,
pp. 675-688.
Daily, C. M., Dalton, D. R. & Cannella, A. A. 2003. Corporate governance: Decades of
dialogue and data. Academy of Management Review, 28: 371-382.
Darr, E. D., Argote, L., & Epple, D. 1995. The acquisition, transfer, and depreciation of
knowledge in service organizations: Productivity in franchises. Management Science,
41(11), 1750-1762.
Darr, E. & Kurtzbery, T. 2000. An investigation of partner similarity dimensions on
knowledge transfer. Organizational Behavior and Human Decision processes, Vol. 82,
No. 1, pp. 28- 44.
Day M. & Lichtenstein S. 2006. Strategic Supply Management: The Relationship Between
Supply Management Practices, Strategic Orientation and Their Impact on
Organisational Performance. Journal of Purchasing & Supply Management. 12(6)
pp313-321.
De Meyer, A., Nakane, J., Miller, J. G. and Ferdows K. (1989). Flexibility: The next
competitive battle the manufacturing futures survey. Strategic Management Journal,
10: 135-144.
Dekker, R., & Hoog, R. 2000. The monetary value of knowledge assets: a micro approach.
Expert Systems with Applications, 18, 111– 124.
Delesie, L., & Croes, L. 2000. Operations research and knowledge discovery: a data mining
method applied to health care management. International Transactions in Operational
Research, 7, 159– 170.
DeLong, D. W., & Fahey, L. 2000. Diagnosing cultural barriers to knowledge management.
Academy of Management Executive, 14(4), 113-127.
Despres, C. & Chauvel, D. 1999. How to map knowledge management. Financial Times:
Mastering Information Management, 09 June, p. 4-6.
Dess, G. G., Lumpkin, G. T. & Covin, J. G. 1997. Entrepreneurial strategy making and firm
performance: Tests of contingency and configurational models. Strategic Management
Journal, 18(9): 677-695.
Dhaliwal, J. S., & Benbasat, I. 1996. The use and effects of knowledge- based system
explanations: theoretical foundations and a framework for empirical evaluation.
Information Systems Research, 7(3), 342– 362.
Dillon, W.R., & Goldstein, M. 1984. ''Multivariate Analysis; Methods and Applications. New
York, John Wiley & Sons.
Donaldson, G. 1984. Managing Corporate Wealth. New York: Praeger, Inc.
Doty, D. H. & Glick, W. H. 1994. Typologies as a unique form of theory building: Toward
improved understanding and modeling. Academy of Management Review, 19: 230-
251.
Doyle, M. D., Ang, C. S., Martin, D. C., & Noe, A. 1996. The visible embryo project:
embedded program objects for knowledge access, creation and management through
the world wide web. Computerized Medical Imaging and Graphics, 20(6), 423 – 431.
Dhar, V. 1998. Data mining in finance: using counterfactuals to generate knowledge from
organizational information. Information Systems, 23(7), 423 – 437.
Drazin, R. & Van de Ven, A. H. 1985. Alternative forms of fit in contingency theory.
Administrative Science Quarterly, 30: 514-539.

254
Drew, S. 1999. Building knowledge management into strategy: making sense of a new
perspective. Long Range Planning, 32(1), 130– 136.
Dubrin, A. 2012. Leadership: Research findings, practice, and skills, 7th ed., New York,
Houghton Mifflin company.
Dulipovici, A., & Baskerville, R. 2007. Conflicts between Privacy and Property: The
Discourse in Personal and Organizational knowledge. The Journal of Strategic
Information Systems, 16(2), 187-213.
Dunn, S.C., Seaker, R.F. & Waller, M.A. 1994. Latent variables in business logistics research:
scale development and validation. Journal of Business Logistics, 15 (2), pp. 145-172.
Dyer, J. & Nobeoka, K. 2000. Creating managing a high performance knowledge sharing
network: The Toyota case. Strategic Management Journal Vol. 21, No. 3, pp. 345 -
367.
Easterby-Smith, M., Thorpe, R. & Jackson, P.R. 2012. Management Research, London,
SAGE.
Elkjaer, B. 2009. Pragmatism: A learning theory for the future. In K. Illeris (Ed.),
Contemporary theories of learning: Learning theorists.
Epstein, J., Duerr, D., Kenworthy, L. and Ragin, C. C. 2008. Comparative employment
performance: A fuzzy-set analysis. In L. Kenworth and A. Hicks (Eds), Method and
Substance in Macro Comparative Analysis, 67-90. Basingstoke: Palgrave Macmillan.
Farbey, B., Land F. & Targett D. 1993. How to Assess Your IT Investment. A Study of
Methods and Practice. Butterworth-Heinemann. Oxford. UK. pp75-94.
Farrells M., (1957), "The measurement of productive efficiency", Journal of Royal Statistical
Society, 120, 253-281.
Feelders, A., Daniels, H., & Holsheimer, M. 2000. Methodological and practical aspects of
data mining. Information and Management, 37, 271 – 281.
Ferguson, R. & Leistikow, D. 1997. Search for the Best Financial Performance Measure.
Basics are Better. Financial Analysts Journal. 54(1) pp81-85.
Fernandez-Breis, J. T., & Martinez-Bejar, R. 2000. A cooperative tool for facilitating
knowledge management. Expert Systems with Applications, 18, 315– 330.
Fiedler, F. 1967. A theory of leadership effectiveness, New York, McMGraw-Hill.
Fiss, P. C. 2007. A set-theoretic approach to organizational configurations. Academy of
Management Review, 32(4): 1180–1198.
Fiss, P. C. 2011. Building better causal theories: A fuzzy set approach to typologies in
organization research. Academy of Management Journal, 54: 393-420.
Fleurat-Lessard, F. 2002. Qualitative reasoning and integrated management of the quality of
stored grain: a promising new approach. Journal of Stored Product Research, 38, 191–
218.
Fortuin, L. 1988. Performance Indicators – Where, Why and How? European Journal of
Operational Research. 34(1) pp1-9.
Foss, N. J. 1996. Research in strategy, economics, and Michael Porter. Journal of Management
Studies, 33: 1-24.
Fried H., Lovell K., Schmidt S., (1993), The measurement of productive efficiency techniques
and applications, Oxford University Press, London.
Frishammar, J. & Sven A.H. 2005. Managing External Information in Manufacturing Firms.
Journal of Product Innovation Management. 22(3) pp251-266.
Froehle, C.M. & Roth, A.V. 2004. New measurement scales for evaluating perceptions of
technology-mediated customer service experience. Journal of Operations
Management, 22 (1), pp. 1-21.
Furby, L. 1980. The Origins and Early Development of Possessive Behavior. Political
Psychology, 2(1), 30-42.
Ganzach, Y. 1998. Nonlinearity, multicollinearity and the probability of type II error in
detecting interaction. Journal of Management, 24: 615-622.

255
Gibson, C. B., & Birkinshaw, J. 2004. The antecedents, consequences, and mediating role of
organizational ambidexterity. Academy of Management Journal, 47(2), 209-226.
Gilbert, X. & Strebel, P. 1988. Developing competitive advantage. In J. B. Quinn, H.
Mintzberg and R. James (Eds), The Strategy Process, 82-93. Englewood Cliffs, NJ:
Prentice Hall.
Gill, J. & Johnson, P. 2010. Research Methods for Managers, London, Sage.
Globerson S. 1985. Issues in Developing a Performance Criteria System for an Organisation.
International Journal of Production Research. 23(4) pp639-646.
Godfrey, P. C. & Hill, C. W. L. 1995. The problem of unobservable in strategic management
research. Strategic Management Journal, 16(7): 519-533.
González-Benito, J. Y. & Suárez-González, I. 2010. A study of the role played by
manufacturing strategic objectives and capabilities in understanding the relationship
between Porter’s generic strategies and business performance. British Journal of
Management, 21(4): 1027-1043.
Goodman, J. 2006. Measuring the value of knowledge management. London: Ark Group.
Govindarajan, V. & Fisher, J. 1990. Strategy, control systems, and resource sharing: Effects
on business-unit performance. Academy of Management Journal, 33(2), 259- 285.
Greckhamer, T. 2011. Cross-cultural differences in compensation level and inequality across
occupations: A set-theoretic analysis. Organization Studies, 32: 85-115.
Gresov, C. & Drazin, R. 1997. Equifinality: Functional equivalence in organizational design.
Academy of Management Review, 22: 403-426.
Ha, S. H., Bae, S. M., & Park, S. C. 2002. Customer’s time-variant purchase behavior and
corresponding marketing strategies: an online retailer’s case. Computers and Industrial
Engineering, 43, 801– 820.
Haag, M., Duan, Y. & Mathews, B. 2010. The impact of culture on the application of the SECI
model. Cultural Implications of Knowledge Sharing, Management and Transfer:
Identifying Competitive Advantage, pp.26-47.
Hair, J.F., Black, W.C., Babin, B.J. & Anderson, R.E. 2010. Multivariate Data Analysis, New
York, Prentice Hall.
Hall, W. K. 1980. Survival strategies in a hostile environment. Harvard Business Review, 68:
75-87.
Hambrick, D. C. 1983. Some tests of the effectiveness and functional attributes of Miles and
Snow’s strategic types. Academy of Management Journal, 26: 5-26.
Hamel, G. & Prahalad, C. K. 1989. Strategic intent. Harvard Business Review, 67(3): 63- 76.
Hammer M. 2007. The Seven Deadly Sins of Performance Measurement and How to Avoid
Them. MIT Sloan Management Review. 48(3) pp19-28.
Hansen, G. & Wernerfelt, B. 1989. Determinants of firm performance: The relative
importance of economic and organizational factors. Strategic Management Journal,
10(5): 399-411.
Harun, M. H. 2002. Integrating e-learning into the workplace. The Internet and Higher
Education, 4, 301– 310.
Hatch, M. J. & Cunliffe, A.L. 2006. Organization Theory. Oxford: Oxford University Press.
Hayes, R. H., Wheelwright, S. C. & Clark, K. B. 1988. Measuring manufacturing
performance. Dynamic manufacturing: creating the learning organisation, pp. 130-
160.
Heijst, G., Spek, R., & Kruizinga, E. 1997. Corporate memories as a tool for knowledge
management. Expert Systems with Applications, 13(1), 41 – 54.
Henderson, R. & Cockburn, I. M. 1994. Measuring competence? Exploring firm effects in
pharmaceutical research. Strategic management Journal, 15: 63-84.
Hendricks K.B. & Singhal V.R. 2003. The Effect of Supply Chain Glitches on Shareholder
Wealth. Journal of Operations Management. 21(5) pp501-522.
Hendriks, P. H. J., & Vriens, D. J. 1999. Knowledge-based systems and knowledge

256
management: friends or foes? Information and Management, 35, 113– 125.
Hertzum, M. 2002. The importance of trust in software engineers assessment and choice if
information sources. Information and Organization, 12, 1 – 18.
Hicks, B. J., Culley, S. J., Allen, R. D., & Mullineux, G. 2002. A framework for the
requirements of capturing, storing and reusing information and knowledge in
engineering design. International Journal of Information Management, 22, 263 – 280.
Hinton, C. M. 2002. Towards a pattern language for information-centered business change.
International Journal of Information Management, 22, 325– 341.
Hitam, N. A. & Mahamad, S. A. M. 2012. Knowledge sharing practice in private sectors: A
Software house perspective. Journal of Advanced Computer Science and Technology
Research, Vol. 2 pp.1-9.
Hooff, V. & Ridder, J. 2004. Knowledge sharing in context: The influence of organizational
commitment, communication climate and CMC use on knowledge sharing Journal of
Knowledge Management, Vol. 8, No. 6, pp.117- 130.
Hooper, R. S., Galvin, T. P., Kilmer, R. A., & Liebowitz, J. 1998. Use of an expert system
in a personnel selection process. Expert Systems with Application, 14, 425– 432.
House, R., Spangler, W. & Woycke, J. 1991. Personality and Charisma in the U.S. presidency:
A psychological theory of leader effectiveness. Administrative Science Quarterly,
Vol.36, No.3, pp.364-396.
Huang, G. Q., Shi, J., & Mark, K. L. 2000. Synchronized system for design for X guidelines
over the WWW. Journal of Materials Processing Technology, 107, 71 – 78.
Huczynski, A. A. & Buchanan, D. A. 2013. Organizational Behaviour, 8th ed., Harlow:
Prentice Hall.
Hui, S. C., & Jha, G. 2000. Data mining for customer service support. Information and
Management, 38, 1 – 13.
Hultink E.J. & Atuahene-Gima K. 2000. The Effect of Sales Force Adoption on New Product
Selling Performance. Journal of Product Innovation Management. 17(6) pp435- 450.
Huysman, M. & Wit, D. 2002. Knowledge sharing in practice. Netherlands: Kluwer Academic
Publishers.
Ipe, M. 2003. Knowledge sharing in organizations: A conceptual framework. Human
Resource Development Review Vol. 2, pp. 337-359.
Islam, M., Ahmed, Z. & Mahtab, H. 2010. The Mediating effects of socialisation on
organisational contexts and knowledge sharing. Journal of Knowledge Globalization,
Vol.3, No. 1, pp.31- 48.
Ittner C.D. & Larcker D.F. 1998b. Innovations in Performance Measurement: Trends and
Research Implications. Journal of Management Accounting Research. 10 pp205-238.
Jahani, S., Ramaya, T. & Effendi, A. 2011. Is reward system and leadership important in
knowledge sharing among academics? American Journal of Economics and Business
Administration Vol. 3, No.1 pp. 87-94.
Janz, B.D. & Prasarnphanich, P. 2003. Understanding the Antecedents of Effective
Knowledge Management: The Importance of a Knowledge‐Centered Culture.
Decision sciences, 34 (2) pp.351- 384.
Jarvenpaa, S. L., & Staples, D. S. 2001. Exploring Perceptions of Organizational Ownership
of Information and Expertise. Journal of management information systems, 18(1), 151.
Jayawickrama, U., Liu, S. & Hudson Smith, M. 2013. An integrative knowledge management
framework to support ERP implementation for improved management decision
making in industry. In: Hernandez, J. E., Liu, S., Delibasic, B., Zarate, P., Dargam, F.
And Ribeiro. R. (ed.) Decision Support Systems II - Recent Developments Applied to
DSS Network Environments. Heidelberg, Dordrecht, London, New York: Springer,
86-101.
Jenkins, L. & Anderson, M. 2003. "A multivariate statistical approach to reducing the number
of variables in data envelopment analysis." European Journal of Operational Research

257
147: 51-61.
Jiang, J., Berry, M. W., Donato, J. M., Ostrouchov, G., & Grady, N. W. 1999. Mining
consumer product data via latent semantic indexing. Intelligent Data Analysis, 3, 377–
398.
Johannessen, J. A., Olsen, B., & Olaisen, 1999. Aspects of innovation theory based on
knowledge-management. International Journal of Information Management, 19, 121–
139.
Johnson, G., Scholes, K. & Whittington, R. 2007. Exploring corporate strategy. Vol. 8th,
Harlow: Financial Times Prentice Hall.
Johnson H.T. & Kaplan R.S. 1987. Relevance Lost: The Rise and Fall of Management
Accounting. Harvard Business School Press. Boston. MA. USA. pp253-262.
Jung, D., Chow, C. & Wu, A. 2003. The role of transformational leadership in enhancing
organizational innovation: Hypotheses and some preliminary findings The Leadership
Quarterly Vol. 14, pp. 525 - 544.
Kaplan R.S. & Norton D.P. 2005. The Balanced Scorecard – Measures That Drive
Performance. Harvard Business Review. 83(7/8) pp172-180.
Kaplan R.S. & Norton D.P. 1996. Using the Balanced Scorecard as a Strategic Management
System. Harvard Business Review. 74(1) pp75-85.
Kalling, T. & Styhre, A. 2003. Knowledge sharing in organisations. Sweden: Copenhagen
Business School Press.
Kang, B. S., Lee, J. H., Shin, C. K., Yu, S. J., and Park, S. C. (1998). Hybrid machine learning
system for integrated yield management in semi- conductor manufacturing. Expert
Systems with Applications, 15, 123– 132.
Kaufmann L. & Carter C.R. 2006. International Supply Relationships and Non-Financial
Performance – A Comparison of US and German Practices. Journal of Operations
Management. 24(5) pp653-675.
Kelleher, D. & Levene, S. 2001. Knowledge Management: A guide to good practice (PAS
2001). London: British Standards Institution.
Kennerley M. & Neely A. 2003. Measuring Performance in a Changing Business
Environment. International Journal of Operations & Production Management. 23(2)
pp213-229.
Ketchen, D. J., Jr., Combs, J. G., Russell, C. J., Shook, C., Dean, M. A., Runge, J., Lohrke, F.,
Naumann, S., Haptonstahl, D. E., Baker, R., Beckstein, B. A., Handlers, C., Honig, H.
& Lamoureux, S. 1997. Organizational configurations and performance: A meta-
analysis. Academy of Management Journal, 40: 222-240.
Kidwell, R. E., Mossholder, K. W., & Bennett, N. 1997. Cohesiveness and organizational
citizenship behavior: a multilevel analysis using work groups and individuals. Journal
of Management, 23(6), 775– 793.
Kim, G., Nute, D., Rauscher, H. M., & Lofits, D. L. 2000. AppBulider for DSSTools: an
application development environment for developing decision support systems in
prolog. Computers and Electronics in Agriculture, 27, 107– 125.
Kim, L. & Lim, Y. 1988. Environment, generic strategies, and performance in a rapidly
developing country: A taxonomic approach. Academy of Management Journal, 31:
802-827.
Kim, T., Lee, G., Paek, S. & Lee, S. 2013. Social capital, knowledge sharing and
organizational performance: What structural relationship do they have in hotels?
International Journal of Contemporary Hospitality Management, Vol. 25, No.5, pp.1-
14.
Kinnear, P. R. & Gray, C. D. 2004. SPSS 12 Made Simple, Psychology Press.
Kirby J. 2005. Toward a Theory of High Performance. Harvard Business Review. 83(7/8)
pp30-39.
Kitayama, S., Markus, H.R., Matsumoto, H. & Norasakkunkit, V. 1997. Individual and

258
collective processes in the construction of the self: self-enhancement in the United
States and self-criticism in Japan. Journal of personality and social psychology, 72 (6)
pp.1245.
Kitts, B., Edvinsson, L., & Beding, T. 2001. Intellectual capital: from intangible assets to
fitness landscapes. Expert Systems with Applications, 20, 35 – 50.
Knight, B., & Ma, J. 1997. Temporal management using relative time in knowledge-based
process control. Engineering Applications Artificial Intelligence, 10(3), 269– 280.
Kogut, B. 2010. Qualitative comparative analysis of social science data. In G. Morgan, J.
Campbell, C. Crouch, O. K. Pedersen and R. Whitley (Eds), The Oxford Handbook of
Comparative Institutional Analysis, 139-179. Oxford: Oxford University Press.
Kolb, A. Y., & Kolb, D. A. 2005. Learning styles and learning spaces: Enhancing experiential
learning in higher education. Academy of Management Learning & Education, 4(2),
193-212.
Kolb, D. A. 1984. Experiential learning: Experience as the source of learning and
development: Prentice-Hall Englewood Cliffs, NJ, USA.
Koschel, A., & Lockemann, P. C. 1998. Distributed events in active database systems: letting
the genie out of the bottle. Data and Knowledge Engineering, 25, 11 – 28.
Kotter, J. 1990. A force for change: How leadership differs from management New York, Free
press.
Kuhn, J. & Marsick, V. 2005. Action learning for strategic innovation in mature organizations:
Key cognitive, design and contextual considerations. Action Learning: Research and
Practice, 2(1): 27-48.
Kumbhakar, S. C. & Knox Lovell, C. A. 2000. Stochastic Frontier Analysis, Cambridge,
Cambridge University Press.
Laise, D. 2004. Benchmarking and learning organizations: ranking methods to identify “best
in class”. Benchmarking: An International Journal, 11, 9.
Lam, A. 1996. 'Engineers, management and work organization: A comparative analysis of
engineers' work roles in British and Japanese electronics firms.' Journal of
Management Studies, 33(2) pp. 183-212.
Lang, S. Y. T., Dickinson, J., & Buchal, R. O. 2002. Cognitive factors in distributed design.
Computers in Industry, 48, 89 – 98.
Langerak F., Hultink E.J. & Robben H.S.J. 2004. The Impact of Market Orientation, Product
Advantage and Launch Efficiency on New Product Performance and Organizational
Performance. Journal of Product Innovation Management. 21(2) pp79-94.
Laudon, K. C., & Laudon, J. P. 2002. Essential of management information systems (5th ed).
New Jersey: Prentice Hall.
Lave, J. 2009. The practice of learning. In K. Illeris (Ed.), Contemporary theories of learning:
Learning theorists.
Lavie, D., Stettner, U., & Tushman, M. L. 2010. Exploration and exploitation within and
across organizations. Academy of Management Annals, 4, 109-155.
Lavington, S., Dewhurst, N., Wilkins, E., & Freitas, A. 1999. Interfacing knowledge discovery
algorithms to large database management systems. Information and Software
Technology, 41, 605– 617.
Lea R. & Parker B. 1989. The JIT Spiral of Continuous Improvement. Industrial Management
and Data Systems. 89(4) pp10-13.
Leask, G. & Parker, D. 2007. Strategic groups, competitive groups and performance within
the U.K. pharmaceutical industry: Improving our understanding of the competitive
process. Strategic Management Journal, 28: 723-745.
Lebas M.J. 1995. Performance Measurement and Performance Management. International
Journal of Production Economics. 41(1-3) pp23-35.
Lee, D., & Lee, K. H. 1999. An approach to case-based system for conceptual ship design
assistant. Expert Systems with Applications, 16, 97 – 104.
259
Lee, P., Gillespie, N., Mann, L. & Wearing, A. 2010. Leadership and trus: Their effect on
knowledge sharing and team performance Management Learning, Vol.41, No. 4,
pp.473 - 491.
Leenders R.T.A.J., van Engelen J.M.L. & Kratzer J. 2007. Systematic Design Methods and
the Creative Performance of New Product Teams: Do They Contradict or Complement
Each Other? Journal of Product Innovation Management. 24(2) pp166-179.
Lemken, B. Kahler, H. & Rittenbruch, M., 2000. Sustained knowledge management by
organisational culture. Proceedings of the 33rd Hawaii International Conference on
System Sciences, 64.
Levinthal, D. A., & March, J. G. 1993. The myopia of learning. Strategic Management Journal,
14, 95-112.
Li, S., Ragu-Nathan, B., Ragu-Nathan, T.S. & Subba Rao, S. 2006. The impact of supply chain
management practices on competitive advantage and organizational performance.
Omega, 34 (2), pp. 107-124.
Liang, N., & Gao, Q. 1999. ASSG—an expert system for sandy grasslands in North China.
Expert Systems with Applications, 16, 3 – 11.
Liao, S. H. 2000. Case-based decision support system: architecture for simulating military
command and control. European Journal of Operational Research, 123, 558– 567.
Liao, S. H. 2001. A knowledge-based architecture for implementing military geographical
intelligence system on Intranet. Expert Systems with Applications, 20, 313– 324.
Liao, S. H. 2002. Problem solving and knowledge inertia. Expert Systems with Applications,
22, 21 – 31.
Liebowitz, J., & Wright, K. 1999. Does measuring knowledge make cents? Expert Systems
with Applications, 17, 99 – 103.
Liebowitz, J. 2001. Knowledge management and its link to artificial intelligence. Expert
Systems with Applications, 20, 1–6.
Liebowitz, J. 1999. Knowledge Management Handbook. London: CRC Press LLC.
Lin, F. Y., & McClean, S. 2001. A data mining approach to the prediction of corporate failure.
Knowledge-based Systems, 14, 189– 195.
Lin, H. F. 2007. Knowledge sharing and firm innovation capability: An empirical study
International Journal of Manpower, Vol. 28, No. 3/4 pp.315-337.
Liu, S., Annansingh, F., Moizer, J., Liu, L. & Sun, W. 2012. A knowledge system for
integrated production waste elimination in support of organisational decision making.
In: Hernandez, J. E., Zarate, P., Dargam, F., Delibasic, B., Liu, S. And Ribeiro. R.,
(Eds.) (ed.) Decision Support Systems - Collaborative Models and Approaches in Real
Environments, Lecture Notes in Business Information Processing. Heidelberg,
Dordrecht, London, New York: Springer, 134-150.
Liu, S., Moizer, J., Megicks, P., Kasturiratne, D. & Jayawickrama, U. 2014. A knowledge
chain management framework to support integrated decisions in global supply chains.
Production Planning and Control, 25, 8, 639-649.
Maddouri, M., Elloumi, S., & Jaoua, A. 1998. An incremental learning system for imprecise
and uncertain knowledge discovery. Journal of Information Sciences, 109, 149– 164.
Mackie, J. L. 1974. The Cement of the Universe: A study in causation. Oxford: Oxford
University Press.
Mahoney, J. T. & Pandian, J. 1992. The resource-based view within the conversation of
strategic management. Strategic Management Journal, 13(5): 363-380.
March, J. G. 1991. Exploration and exploitation in organizational learning. Organization
Science, 2(1), 71-87.
Martinsons, M. G. 1997. Human resource management applications of knowledge-based
systems. International Journal of Information Management, 17(1), 35 – 53.
Marx, A. 2010. Crisp-set qualitative comparative analysis (csQCA) and model specification:
Benchmarks for future csQCA applications. International Journal of Multiple Research
260
Approaches, 4(2): 138-158.
Masrek, M., Noordin, S., Anwar, N. & Alwi Idris, A. S. 2011. The Relationship between
cultural identity and individual knowledge sharing behavior, IBIMA Business Review.
Mauri, A. J. & Michaels, M. P. 1998. Firm and industry effects within strategic management:
An empirical examination. Strategic Management Journal, 19(3): 211-219.
Meier, M. 2011. Knowledge Management in Strategic Alliances: A Review of Empirical
Evidence. International Journal of Management Reviews, 13(1).
Melnyk S.A., Stroufe R.P. & Calantone R. 2003. Assessing the Impact of Environmental
Management Systems on Corporate and Environmental Performance. Journal of
Operations Management. 21(3) pp329-342.
Mezirow, J. 2009. An overview on transformative learning. In K. Illeris (Ed.), Contemporary
theories of learning: Learning theorists.
McCown, R. L. 2002. Locating agricultural decision support systems in the troubled past and
socio-technical complexity of models for management. Agricultural Systems, 11 – 25.
McDaniel, C. & Gates, R. 2013. Marketing Research, Singapore, John Wiley and Sons.
McFadden, F. R., Hoffer, J. A., & Prescott, M. B. 2000. Modern database management (5th
ed). New York: Prentice-Hall.
McGahan A. M. & Porter M. E. 1997. How much does industry matter, really? Strategic
Management Journal, 18: 5-14.
McGee, J. & Thomas, H. 1986. Strategic groups: Theory, research, and taxonomy. Strategic
Management Journal, 7: 141-160.
McMeekin, T. A., & Ross, T. 2002. Predictive microbiology: providing a knowledge-based
framework for change management. International Journal of Food Microbiology, 78,
133– 153.
McSherry, D. 1997. Knowledge discovery by inspection. Decision Support Systems, 21, 43
– 47.
Milgrom, P. & Robert, J. 1995. Complementarities and fit: Strategy, structure, and
organizational change in manufacturing. Journal of Accounting and Economics, 19:
179–208.
Mill, J. S. 2002. A System of Logic: Ratiocinative and inductive. Honolulu: University Press
of the Pacific.
Miller, A. & Dess, G. G. 1993. Assessing Porter’s 1980 model in terms of its generalizability,
accuracy and simplicity. Journal of Management Studies, 30: 553- 585.
Miller, D. 1988. Relating Porter's business strategies to environment and structure: Analysis
and performance implications. Academy of Management Journal, 31: 280- 308.
Millington A., Eberhardt M. & Wilkinson B. 2006. Supplier Performance and Selection in
China. International Journal of Operations & Production Management. 26(2) pp185-
201.
Mohan, S., & Arumugam, N. 1997. Expert system applications in irrigation management: an
overview. Computers and Electronics in Agriculture, 17, 263– 280.
Morgan N.A. & Vorhies D.W. 2001. Product Quality Alignment and Business Unit
Performance. Journal of Product Innovation Management. 18(6) pp396-407.
Morris, J. & Farrell, C. 2007. 'The ‘post-bureaucratic’ public sector organization. New
organizational forms and HRM in ten UK public sector organizations’, The
International Journal of Human Resource Management, 18(9) p. 1575.
Mueller, J. 2012. The interactive relationship of corporate culture and knowledge
management: a review. Review of Managerial Science, 6 (2) pp.183-201.
Muller, W., & Wiederhold, E. 2002. Applying decision tree methodology for rules extraction
under cognitive constraints. European Journal of Operational Research, 136, 282– 289.
Nair, A. & Kotha, S. 2001. Does group membership matter? Evidence from the Japanese steel
industry. Strategic Management Journal, 22: 221-235.
Narasimhan R., Swink M. & Soo W.K. 2005. An Exploratory Study of Manufacturing Practice

261
and Performance Interrelationships: Implications for Capability Progression.
International Journal of Operations & Production Management. 25(10) pp1013-1033.
Nault, B. R., & Storey, V. C. 1998. Using object concepts to match artificial intelligence
techniques to problem types. Information and Management, 34, 19 – 31.
Navon, R., & Ramsey, P. G. 1989. Possession and Exchange of Materials in Chinese and
American Preschools Journal of Research in Childhood Education, 4(1), 18 - 29.
Neely A., Gregory M. & Platts K. 2005. Performance Measurement System Design: A
Literature Review and Research Agenda. International Journal of Operations &
Production Management. 25(12) pp1228-1263.
Neely A.D. 1997. Designing Performance Measures: A Structured Approach. International
Journal of Operations & Production Management. 17(11) pp1131-1152.
Nemati, H. R., Steiger, D. M., Iyer, L. S., & Herschel, R. T. 2002. Knowledge warehouse: an
architectural integration of knowledge management, decision support, artificial
intelligence and data warehousing. Decision Support Systems, 33, 143 – 161.
Newbert, S. L. 2007. Empirical research on the resource based view of the firm: An assessment
and suggestions for future research. Strategic Management Journal, 28(2): 121-146.
Nickols, F. 2000.The knowledge in knowledge management. The Knowledge Management
Yearbook, 2000–2001.
Nisbett, R.E., Peng, K., Choi, I. & Norenzayan, A. 2001. Culture and systems of thought:
holistic versus analytic cognition. Psychological review, 108 (2) pp.291.
Noble, M. A. 1995. Manufacturing strategy: Testing the cumulative model in a multiple
country context. Decision Sciences, 26: 693-721.
Nonaka, I. 1994. A dynamic theory of organizational knowledge creation. Organization
Science, Nol. 5, No. 1, pp. 14-37.
Nonaka, I. 2005. Knowledge management- Critical perspectives on business and management
London, Routledge.
Nonaka, I., Krogh, G. V. & Voelpel, S. 2006. Organizational knowledge creation theory:
Evolutionary paths and future advances. Organization Studies, Vol.27, No.8, pp.1179-
1208.
Nonaka, I. T., H. 1995. The knowledge - creating company: How Japanese companies create
the dynamics of innovation London: Oxford university press.
Nonaka, I. & Takeuchi, H. 1995. The knowledge - creating company New Jersey, Oxford
University Press.
Nonaka, I. & Takeuchi, H. 1996. The knowledge-creating company: How Japanese companies
create the dynamics of innovation. Long range planning, 29 (4) pp.592.
Nonaka, I. & Toyama, R. 2005. The theory of the knowledge-creating firm: Subjectivity,
objectivity and synthesis. Industrial and Corporate Change, Vol.14, No.3, pp.419–436.
Nonaka, I., Umemoto, K., & Senoo, D. 1996. From information processing to knowledge
creation: a paradigm shifts in business management. Technology in Society, 18(2),
203 – 218.
Norman M., Stoker B., (1991), Data Envelopment Analysis the assessment of performance,
John Wily & Sons, New York.
Northouse, P. 2007. Leadership, Theory and practice, California, Sage publication, Inc.
O’Toole T. & Donaldson B. 2002. Relationship Performance Dimensions of Buyer-Supplier
Exchanges. European Journal of Purchasing & Supply Management. 8(4) pp197-208.
O'Reilly, C. A., III, & Tushman, M. L. 2008. Ambidexterity as a dynamic capability:
Resolving the innovator's dilemma. Research in Organizational Behavior, 28, 185-
206.
Oke, A., Munshi, N. & Fred, W. 2010. The influence of leadership on innovation processes
and activities. Organizational Dynamics, Vol. 38, No.1, pp. 64–72.
Olin, J. G., Greis, N. P., & Kasarda, J. D. 1999. Knowledge management across multi-tier
enterprise: the promise of intelligent software in the auto industry. European

262
Management Journal, 17(4), 335 – 347.
Oliver, S. & Kandadi, K. R., 2006. How to develop knowledge culture in organisations: a
multiple case study of large distributed organisations. Journal of Knowledge
Management, 10(4), p.6- 24.
Oyemomi, O., Liu, S., & Neaga, I. 2015. The contribution of knowledge sharing to
organizational performance and decision making: A literature review. Lect. Notes Bus.
Inf. Process. 1(2), 1–12.
Oyemomi, O., Liu, S., Neaga, I., & Alkhuraiji, A. 2016. How knowledge sharing and business
process contribute to organisational performance: using the fsQCA approach. Journal
of Business Research. Doi: 10.1016/j.jbusres.2016.04.116.
Owrang, M. M., & Grupe, F. H. 1996. Using domain knowledge to guide database knowledge
discovery. Expert Systems with Applications, 10(2), 173– 180.
Park, S. C., Piramuthu, S., & Shaw, M. J. 2001. Dynamic rule refinement in knowledge-based
data mining systems. Decision Support Systems, 31, 205– 222.
Paulraj A., Chen I.J. & Flynn J. 2006. Levels of Strategic Purchasing: Impact on Supply
Integration and Performance. Journal of Purchasing & Supply Management. 12(3)
pp107- 122.
Penrose, E. T. 1959. The Theory of the Growth of the Firm. New York: Oxford University
Press.
Pestana Barros, C. & Dieke, P. U. C. 2007. Performance evaluation of Italian airports: A data
envelopment analysis. Journal of Air Transport Management, 13, 184-191.
Peteraf, M. A. 1993. The cornerstones of competitive advantage. Strategic Management
Journal, 14(3): 179-191.
Podsakoff, P. M., MacKenzie, S. B., Lee, J. Y. & Podsakoff, N. P. 2003. Common method
biases in behavioral research: A critical review of the literature and recommended
remedies. Journal of Applied Psychology, 88, 879-903.
Polanyi, M. 1966. The tacit dimension. London: Routledge and Kegan Paul. Ramesh, B., &
Tiwana, A. 1999. Supporting collaborative process knowledge management in new
product development teams. Decision Support Systems, 27, 213– 235.
Ponis, S.T., Vagenas, G. & Koronis, E. 2010. Exploring the Knowledge Management
Landscape: A Critical Review of Existing Knowledge. Information Resources
Management: Concepts, Methodologies, Tools, and Applications, pp.44.
Porter, M. E. 1980. Competitive Strategy: Techniques for analyzing industries and
competitors. New York: Free Press.
Priem, R. L. & Butler, J. E. 2001. Is the resource-based “view” a useful perspective for
strategic management research? Academy of Management Review, 26: 22-40.
Ragin, C. C. 1987. The Comparative Method. Moving beyond qualitative and quantitative
strategies. Berkeley, Los Angeles and London: University of California Press.
Ragin, C. C. 1994. Constructing Social Research: The unity and diversity of method.
Thousand Oaks, CA: Pine Forge Press.
Ragin, C. C. 2000. Fuzzy Set Social Science. Chicago: University of Chicago Press.
Ragin, C. C. 2005. From fuzzy sets to crisp truth tables. Working paper, University of Arizona,
Tuscon.
Ragin, C. C. 2006. Set relations in social research: Evaluating their consistency and courage.
Political Analysis.
Ragin, C. C. 2006. User’s Guide to Fuzzy-Set/Qualitative Comparative Analysis 2.0. Tucson,
AZ: Department of Sociology, University of Arizona.
Ragin, C. C. 2008. Redesigning Social Inquiry: Fuzzy sets and beyond. Chicago: University
of Chicago Press.
Ragin, C. C. & Fiss, P. C. 2008. Net effects analysis versus configurational analysis: An
empirical demonstration. In C. C. Ragin (Ed.), Redesigning Social Inquiry: Fuzzy sets
and beyond, 190-212. Chicago: University of Chicago Press.

263
Ragin, C. C., Drass, K. A. & Davey, S. 2006. Fuzzy-Set/Qualitative Comparative Analysis
2.0. Tucson, AZ: Department of Sociology, University of Arizona.
Ragin, C. C. & Strand, S. I. 2008. Using Qualitative Comparative Analysis to study causal
order: Comment on Caren and Panofsky (2005). Sociological Methods and Research,
36(4):431-441.
Rajagopalan, N. & Spreitzer, G. M. 1997. Toward a theory of strategic change: A multi- lens
perspective and integrative framework. Academy of Management Review, 22: 48-79.
Riaz, A. & Haider, M. 2010. Role of transformational and transactional leadership on job
satisfaction and career satisfaction. Business and Economic Horizons, Vol. 1, No.1,
pp. 29-38.
Ribiere, V.M. & Sitar, A.S. 2003. Critical role of leadership in nurturing a knowledge-
supporting culture. Knowledge Management Research & Practice, 1 (1) pp.39-48.
Ridgway V.F. 1956. Dysfunctional Consequences of Performance Measurements.
Administrative Science Quarterly. 1(2) pp240-248.
Ritter T. & Gemunden H.G. 2004. The Impact of a Company’s Business Strategy on its
Technological Competence, Network Competence and Innovation Success. Journal of
Business Research. 57 pp548-556.
Robbins, S. & Coultar, M. 2005. Management, 8th edition, Person Education, Inc.
Robey, D., Boudreau, M. C., & Rose, G. M. 2000. Information technology and organizational
learning: a review and assessment of research. Accounting Management and
Information Technologies, 10, 125– 155.
Robson I. 2005. Implementing a Performance Measurement System Capable of Creating a
Culture of High Performance. International Journal of Productivity & Performance
Management. 54(2) pp137-145.
Rubenstein-Montano, B., Liebowitz, J., Buchwalter, J., McCaw, D., Newman, B., & Rebeck,
K. 2001. A systems thinking framework for knowledge management. Decision
Support Systems, 31, 5 – 16.
Rumelt, R. P. 1991. How much does industry matter? Strategic Management Journal, 12(3):
167-186.
Saaty, T. L. 1980. The Analytic Hierarchy Process: Planning, Pritority Setting, Resource
Allocation (Decision Making Series), Mcgraw-Hill.
Saenz, H. 2011. Transformational leadership (pp.299-310) in Bryman, Alan, Collinson, David,
Grint, Keith, Jackson, Brad, and Bien, Mary, The SAGE handbook of leadership,
London, SAGE Publications Ltd.
Saetang, S., Theodoulidis, B., & Ekweozor, U. 2010. The Influence of Knowledge Ownership
on Knowledge Sharing: An Empirical Study in UK and Thailand. The International
Journal of Technology, Knowledge and Society, 6(2), 17-30.
Sanghyun, C. 2009. Impact of global terminal operators on port efficiency: a tiered data
envelopment analysis approach. International Journal of Logistics: Research &
Applications, 12, 85-101.
Saunders, M., Lewis, P. & Thornhill, A. 2012. Research Methods for Business Students,
Essex, Financial Times/Prentice Hall.
Schermerhorn, J. R. 2008. Management, 9th ed., New York, Danvers, John Wiley & Sons,
Inc, MA.
Schmalensee, R. 1985. Do markets differ much? American Economic Review, 75(3): 341-
351.
Schmidt P., (1985), "Frontier production function”, Econometric Reviews, 4(2), 289- 328.
Schneider, C. Q. & Wagemann, C. 2012. Set-Theoretic Methods for the Social Sciences: A
Guide to qualitative comparative analysis (strategies for social inquiry). Cambridge:
Cambridge University Press.
Schumann, C. & Tittmann, C. 2010. Potentials for Externalizing and Measuring of Tacit
Knowledge within Knowledge Nodes in the Context of Knowledge Networks. Cultural

264
Implications of Knowledge Sharing, Management and Transfer: Identifying
Competitive Advantage, pp.84.
Segars, A.H. & Grover, V. 1998. Strategic information systems planning success: an
investigation of the construct and its measurement. MIS Quarterly, 22 (2), pp. 139-
163.
Sekaran, U. & Bougie, R. 2009. Research Methods for Business: A Skill Building Approach,
West Sussex, John Wiley and Sons.
Senge, P. 1990. The fifth discipline: The art and practice of the learning organization. New
York, NY, USA: Currency Doubleday.
Sforna, M. 2000. Data mining in a power company customer database. Electronic Power
Systems Research, 55, 201 – 209.
Skevington S. 1999. Measuring Quality of Life in Britain: An introduction to the WHOQOL-
100. Journal of Psychosomatic Research. 47(5) pp449-459.
Skinner, W. (1969). Manufacturing – missing link in corporate strategy. Harvard Business
Review, 47: 136-145.
Skinner, W. (1974). The focused factory. Harvard Business Review, 53: 112-121.
Shaalan, K., Rafea, M., & Rafea, A. 1998. KROL: a knowledge representation object language
on top of Prolog. Expert Systems with Applications, 15, 33 – 46.
Shafer, J. C., & Agrawal, R. 2000. Continuous querying in database-centric web applications.
Computer Networks, 33, 519– 531.
Shaw, M. J., Subramaniam, C., Tan, G. W., & Welge, M. E. 2001. Knowledge management
and data mining for marketing. Decision Support Systems, 31, 127– 137.
Short, J. C., Ketchen, D. J., Palmer, T. B. & Hult, T. 2007. Firm, strategic group, and industry
influences on performance. Strategic Management Journal, 28: 147-167.
Sirmon D., Hitt, M. A. & Ireland, R. D. 2007. Managing firm resources in dynamic
environments to create value: Looking inside the black box. Academy of Management
Review, 32: 273-292.
Skinner, W. 1969. Manufacturing – missing link in corporate strategy. Harvard Business
Review, 47: 136-145.
Skinner, W. 1974. The focused factory. Harvard Business Review, 53: 112-121.
Spanos, Y. E. & Lioukas, S. 2001. An examination into the causal logic of rent generation:
Contrasting Porter’s competitive strategy framework and the resource- based
perspective. Strategic Management Journal, 22 (10): 907-934.
Sohail, M. & Daud, S. 2009. Knowledge sharing in higher education institutions - perspectives
from Malaysia. The Journal of Information and Knowledge Management Systems,
Vol.39, No.2, pp.125-142.
Sokolov, A., & Wulff, F. 1999. SwingStations: a web-based client tool for the Baltic
environmental database. Computers and Geosciences, 25, 863– 871.
Spender, J. C. 2008. Organizational learning and knowledge management: Whence and
whither? Management Learning, 39(2), 159-176.
Steenkamp, J.-B.E.M. and Van Trijp, H.C.M. 1991. The use of lisrel in validating marketing
constructs. International Journal of Research in Marketing, 8 (4), pp. 283-299.
Stein, E. W., & Miscikowski, D. K. 1999. Failsafe: supporting product quality with
knowledge-based systems. Expert Systems with Applications, 16, 365– 377.
Sugumaran, V., & Storey, V. C. 2002. Ontology for conceptual modeling: their creation, use,
and management. Data and Knowledge Engineering, 42, 251 – 271.
Teece D.J. 1992. Strategies for Capturing the Financial Benefits from Technological
Innovation. In: Rosenberg N., Landau R. & Mowery D.C. (Eds.) 1992. Technology
and the Wealth of Nations. Stanford University Press. Stanford. USA. pp175-205.
Teece, D. J., Pisano, G., & Shuen, A. 1997. Dynamic capabilities and strategic management.
Strategic Management Journal, 18(7), 509-533.
Tian, Q., Ma, J., & Liu, O. 2002. A hybrid knowledge and model system for OL project

265
selection. Expert Systems with Applications, 23, 265– 271.
Tidd J., Bessant J. & Pavitt K. 2005. Managing Innovation. Integrating Technological, Market
and Organizational Change. (3rd Ed.) Wiley. Chichester. UK. pp5-77,88-97,393-
394,561-569.
Tingley, D., Pascoe, S. & Coglan, L. 2005 Factors affecting technical efficiency in fisheries:
stochastic production frontier versus data envelopment analysis approaches. Fisheries
Research, 73, 363-376.
Tu, H. C., & Hsiang, J. 2000. An architecture and category knowledge for intelligent
information retrieval agents. Decision Support Systems, 28, 255– 268.
Tucker, J. 1999 The Therapeutic Corporation. New York: Oxford University Press.
Tyndale, P. 2002. A taxonomy of knowledge management software tools: origins and
applications. Evaluation and Program Planning, 25, 183– 190.
Van de Ven, A. H. & Drazin, R. 1985. The concept of fit in contingency theory. In B. M. Staw,
and L. L. Cummings (Eds), Research in Organizational Behavior, 7, 333-365.
Greenwich, CT: JAI Press.
Walker, O. C. & Ruekert, R. W. 1987, Marketing’s role in the implementation of business
strategies: A critical review and conceptual framework. Journal of Marketing, 51: 15-
33.
Walsham, G. 2002. Knowledge management: the benefits and limitations of computer
systems. European Management Journal, 19(6), 599– 608.
Weber, R., Aha, D. W., & Becerra-Fernandez, I. 2001. Intelligent lessons learned systems.
Expert Systems With Applications, 17, 17 – 34.
Weick, K. E. 1991. The nontraditional quality of organizational learning. Organization
Science, 2(1), 116-124.
Wernerfelt, B. 1984. A resource-based view of the firm. Strategic Management Journal, 5(2):
171-180.
Wielinga, B., Sandberg, J., & Schreiber, G. 1997. Methods and techniques for knowledge
management: what has knowledge engineering to offer? Expert Systems with
Applications, 13(1), 73 – 84.
Wenger, E. 2009. A social theory of learning. Contemporary Theories of Learning: Learning
Theorists… in Their Own Words, 209-218.
Wiig, K. M. 1994. Knowledge management. The central management focus for intelligent-
acting organization. Arlington: Schema Press.
Wiig, K. M. 1997. Knowledge management: where did it come and where will it do? Expert
Systems with Applications, 13(1), 1 – 14.
Wiig, K. M., Hoog, R., & Spex, R. 1997. Supporting knowledge management: a selection of
methods and techniques. Expert Systems with Applications, 13(1), 15 – 27.
Wilkins, J., Wegen, B., & Hoog, R. 1997. Understanding and valuing knowledge assets:
overview and method. Expert Systems with Applications, 13(1), 55 – 72.
Wilkins, B., and Barrett, J. 2000. The virtual site: a web-based teaching/ learning environment
in construction technology. Automation in Construction, 10, 169– 179.
Williamson, O. E. 2004. Herbert Simon and organization theory: Lessons for the theory of the
firm. In M. Augier, and J. G. March (Eds), Herbert A. Simon. Cambridge, MA: MIT
Press.
Wirtz, K. W. 2001. Strategies for transforming fine scale knowledge to management usability.
Marine Pollution Bulletin, 43(7), 209 – 214.
Wong, M. L. 2001. A flexible knowledge discovery system using genetic programming and
logic grammars. Decision Support Systems, 31, 405 – 428.
Xia, W. and Lee, G. 2005. Complexity of information systems development projects:
conceptualization and measurement developments. Journal of Management
Information Systems, 22 (1), pp. 45-83.
Xiong, S. & Deng, H. 2008. Critical success factors for effective knowledge sharing in Chinese

266
joint ventures 19th Australasian Conference on information systems , 3-5 December,
Christchurch, New Zealand, pp. 1089-1098.
Yoo, S. B., and Kim, Y. 2002. Web-based knowledge management for sharing product data
in virtual enterprises. International Journal of Production Economics, 75, 173– 183.
Yoshida, Y. & Fujimoto, H. 2004. Japanese-airport benchmarking with the DEA and
endogenous-weight TFP methods: testing the criticism of overinvestment in Japanese
regional airports. Transportation Research Part E: Logistics and Transportation
Review, 40, 533-546.
Yu, M.-M. 2004. Measuring physical efficiency of domestic airports in Taiwan with
undesirable outputs and environmental factors. Journal of Air Transport Management,
10, 295-303.
Zhong, N., and Ohsuga, S. 1996a. A hierarchical model learning approach for refining and
managing concept clusters discovered from database. Data and Knowledge
Engineering, 20, 227 – 252.
Zhong, N., and Ohsuga, S. 1996b. System for managing and refining structural characteristics
discovered from databases. Knowledge-based Systems, 9, 267– 279.
Appendices
Appendix A: Cover letter
Research title: The impact of organisational factors on knowledge sharing performance
Dear Sir or Madam,
My name is Oluwafemi Oyedele Oyemomi. I am a PhD student at Plymouth Business
School, Plymouth University (www.plymouth.ac.uk) in the UK conducting research under
the supervision of Professor Shaofeng Liu. I am researching the impact of organisational
factors on knowledge sharing performance and aiming to use the data survey from your
organisation as a research setting.
This research aims to increase the levels of explained performance measurement across
business processes by suggesting an overall organisation’s factors as a moderator
supporting catalyse to the relationship between a knowledge sharing components and its
performance. Through your kind cooperation and participation, I eventually hope to
understand how best to match the factors within an organisation and the knowledge sharing
activities of the organisational business processes.

267
Completion of the questionnaire would take around 10 minutes of your time. Participation
in this project is completely voluntary. If there are any questions that you prefer not to
answer, you may skip them. If you would like to write additional comments on the
questionnaire, please feel free to do so.
Please be assured that all information you provide through your participation in this study
will be kept strictly confidential. Further, you will not be identified in the thesis or in any
report or publication based on this research. All results from this study will be reported as
statistical summaries only. There are no known or anticipated risks to participation in this
study. The data collected through this study will be kept for a period of three years (my
PhD study period) in a secure location.
This research hopes to make contributions to both academia and practice. Not only will it
improve the accuracy of prediction but will also offer suggestions for future emerging
research. In addition, it will enhance managers’ ability to predict the consequences of
available decision choices and choose an appropriate performance goal suitable for the
strategy used.
If, after receiving this letter, you have any questions about this study, or would like
additional information to assist you in reaching a decision about participating, please feel
free to contact myself, Oluwafemi Oyedele Oyemomi, by e-mail at
Thank you in advance for your co-operation in my research.
Kind regards,
Femi Oyemomi
PhD Research Student
Room 005 Desk 14 Mast House |
Plymouth University | 24 Sutton Road | Plymouth |PL4 0HJ | UK
Email: [email protected]

268
Appendix B: Questionnaire template
Questionnaire
The Contribution of Knowledge Sharing to Organisational Performance
This research questionnaire seeks to measure the contribution of knowledge sharing to
organisational performance. Therefore, being an employee of an organisation, this
questionnaire seeks your cooperation to give your valuable opinion which is contributing
towards the success of this research.Most of the questions merely require you to tick the
appropriate box. All the information given will be treated in the strictest confidence.
Your participation in this research is greatly appreciated. This questionnaire is aimed at
providing answers to the research conceptual framework shown in the figure below.

269
General Instructions and Information
1. All individual responses to this questionnaire will be kept STRICTLY CONFIDENTIAL
and for academic research purpose only
2. This questionnaire is divided into four parts:
Part 1: Questions about work experience and projects
Part 2: Questions on knowledge management
Part 3: Questions on organisational factors
Part 4: Questions on knowledge performance measurement
3. Please do not worry about questions that seemingly look alike. If you do not have the
exact answer to a question, please provide your best judgement by ticking the appropriate
boxes in the questions. Your answers are very important to the accuracy of the research
4. If you wish to make any comment, please feel free to use the space at the end of the
questionnaire
5. It will take approximately 10 minutes to complete the survey.
Part One
How many years of work experience do you have?
1-3 (1)
4-5 (2)
6-10 (3)
11-above (4)
How many companies/organisations have you worked including your current employer?
1-3 (1)
4-5 (2)
6-10 (3)
11-above (4)
How many projects have you undertaken?
1-3 (1)
4-5 (2)
6-10 (3)
11-above (4)
None (5)

270
What level are you in your organisation?
Operational (1)
Mid-Managerial (2)
Managerial (3)
Executive (4)
Adminstrative (5)
Q1.2 Part 2
Employees at all levels in my organisation have a general understanding of the concept of 'knowledge
sharing' (1)
Employees at all levels recognise knowledge as a key resource (2)
Employees in my organisation are aware of the need to proactively manage knowledge (3)
In my organisation, employees are encourage to use their know-how in everyday activities (4)
To make knowledge available to all employees, my organisation has a local network (manual or
automated) for documenting knowledge activities (5)
Formal networks exist to facilitate dissemination of knowledge in my organisation (7)
Intellectual assets are legally protected in my organisation (8)
In my organisation, employees are encouraged to practice knowledge sharing rather than knowledge
hoarding (11)
My organisation hones its skills for generating, aquiring and applying knowledge by learning from
other organisation's learning processes (12)
In my organisation, When a team completes a task, it distils and documents what it has learned (13)
Top management recognises knowledge sharing as an important part of the business strategy in my
organisation (14)
What are the current practices of knowledge sharing in your organisation?
Q1.3 Part 3

271
Team learning is an action strategy within my organisation for improving members technical skills
(2)
The hierarchical structure of my organisation is a determinant for knowledge sharing initiative (3)
In my orgainsation, employees intellectual assets are recognised, valued and rewarded (4)
Internal staff rotation is actively encouraged to spread best practices and ideas (5)
Top management in my organisation actively get involved in knowledge sharing initiatives. (7)
In my organisation, employees are treated as shareholders (8)
Leadership structure of my organisation affect the way employees interact and promote knowledge
sharing (9)
Training and development programs in knowledge management behaviour are undertaken from point
of recruitment (10)
Knowledge activities are always in line with the vision of my organisation (12)
My organisation has a friendly work environment for employees to interact (13)
There are systems in place to facilitate effective communication across departments and units (14)
How can organisational factors facilitate effective knowledge sharing in your organisation?
Q1.4 Part 4
272
There is a process for identifying knowledge asset in my organisation (2)
Employees are committed to continual develop their skills and are constantly generating new ideas
within the context of my organisation (5)
Resources are committed for training and development of employees in my organisation (6)
One of the benefits of knowledge sharing to my organisation is that it provide a competitive edge
for us among our competitors (9)
There is participative knowledge goal setting (10)
There is participative knowledge goal measurement (11)
There is participative knowledge feedback (12)
Knowledge sharing improves employees know-how (13)
Continuous knowledge sharing practices improved my organisational processes (14)
Continuous knowledge sharing activities improved employees turnaround time (15)
What are the Key Performance Indicators (KPIs) used in measuring Knowledge
contributions in your organisation?
If you wish to make any comment, please feel free. Your feedback will be highly useful for
the research.
Thank you for taking the time to complete this questionnaire. Your assistance in providing
this information is very much appreciated. If there is anything else you would like to tell
us about this survey or other comments you wish to make that you think may help us to
understand the contribution of knowledge sharing to organisational performance and issues
arising thereof, please do so in the space (box) provided below.
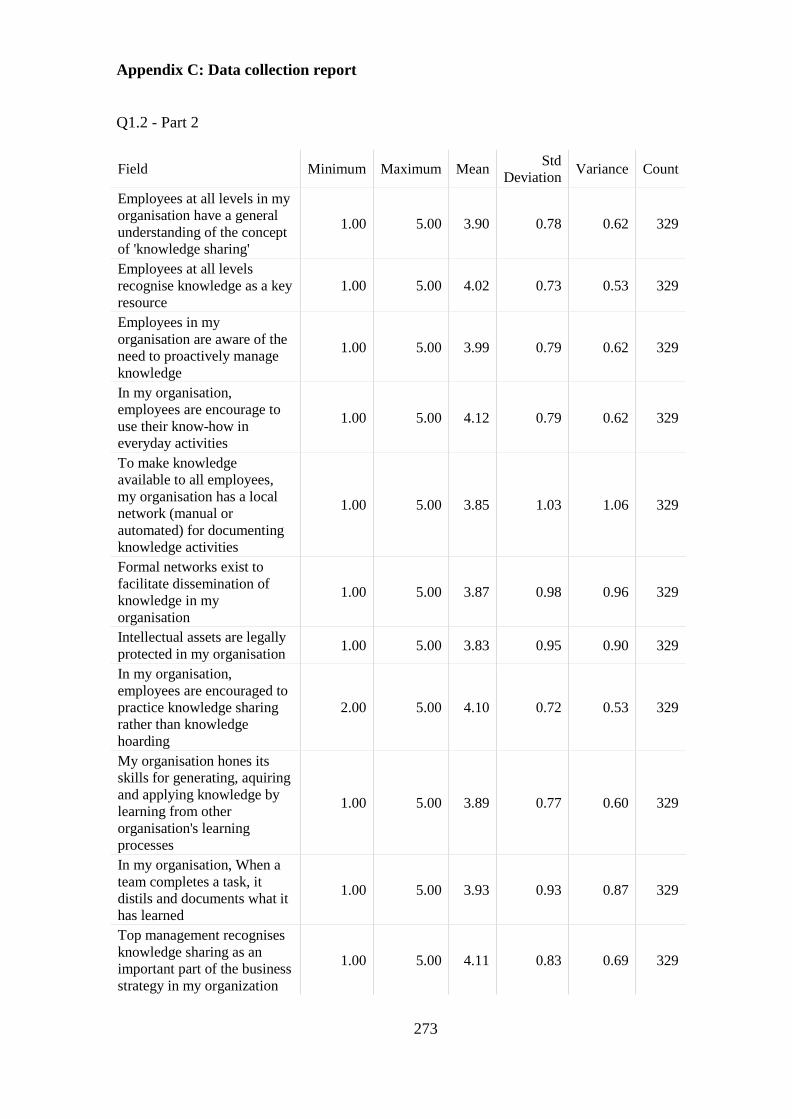
273
Appendix C: Data collection report
Q1.2 - Part 2
Field Minimum Maximum Mean Std
Deviation Variance Count
Employees at all levels in my
organisation have a general
understanding of the concept
of 'knowledge sharing'
1.00 5.00 3.90 0.78 0.62 329
Employees at all levels
recognise knowledge as a key
resource
1.00 5.00 4.02 0.73 0.53 329
Employees in my
organisation are aware of the
need to proactively manage
knowledge
1.00 5.00 3.99 0.79 0.62 329
In my organisation,
employees are encourage to
use their know-how in
everyday activities
1.00 5.00 4.12 0.79 0.62 329
To make knowledge
available to all employees,
my organisation has a local
network (manual or
automated) for documenting
knowledge activities
1.00 5.00 3.85 1.03 1.06 329
Formal networks exist to
facilitate dissemination of
knowledge in my
organisation
1.00 5.00 3.87 0.98 0.96 329
Intellectual assets are legally
protected in my organisation 1.00 5.00 3.83 0.95 0.90 329
In my organisation,
employees are encouraged to
practice knowledge sharing
rather than knowledge
hoarding
2.00 5.00 4.10 0.72 0.53 329
My organisation hones its
skills for generating, aquiring
and applying knowledge by
learning from other
organisation's learning
processes
1.00 5.00 3.89 0.77 0.60 329
In my organisation, When a
team completes a task, it
distils and documents what it
has learned
1.00 5.00 3.93 0.93 0.87 329
Top management recognises
knowledge sharing as an
important part of the business
strategy in my organization
1.00 5.00 4.11 0.83 0.69 329

274
Field Minimu
m
Maximu
m
Mea
n
Std
Deviatio
n
Varianc
e
Coun
t
Botto
m 3
Box
Top 3
Box
Employees at
all levels in
my
organisation
have a general
understanding
of the concept
of 'knowledge
sharing'
1.00 5.00 3.90 0.78 0.62 329 22.49
%
94.83
%
Employees at
all levels
recognise
knowledge as
a key resource
1.00 5.00 4.02 0.73 0.53 329 16.72
%
96.96
%
Employees in
my
organisation
are aware of
the need to
proactively
manage
knowledge
1.00 5.00 3.99 0.79 0.62 329 20.67
%
95.44
%
In my
organisation,
employees are
encourage to
use their
know-how in
everyday
activities
1.00 5.00 4.12 0.79 0.62 329 17.63
%
96.96
%
To make
knowledge
available to
all employees,
my
organisation
has a local
network
(manual or
automated)
for
documenting
knowledge
activities
1.00 5.00 3.85 1.03 1.06 329 29.48
%
85.71
%
Formal
networks exist
to facilitate
dissemination
of knowledge
in my
organisation
1.00 5.00 3.87 0.98 0.96 329 28.88
%
87.54
%

275
Intellectual
assets are
legally
protected in
my
organisation
1.00 5.00 3.83 0.95 0.90 329 34.65
%
92.71
%
In my
organisation,
employees are
encouraged to
practice
knowledge
sharing rather
than
knowledge
hoarding
2.00 5.00 4.10 0.72 0.53 329 16.41
%
97.26
%
My
organisation
hones its
skills for
generating,
aquiring and
applying
knowledge by
learning from
other
organisation's
learning
processes
1.00 5.00 3.89 0.77 0.60 329 26.14
%
96.05
%
In my
organisation,
When a team
completes a
task, it distils
and
documents
what it has
learned
1.00 5.00 3.93 0.93 0.87 329 26.14
%
90.27
%
Top
management
recognises
knowledge
sharing as an
important part
of the
business
strategy in my
organisation
1.00 5.00 4.11 0.83 0.69 329 17.63
%
95.44
%

276

277

278
Q1.3 - Part 3
Question
Strongly
Disagree
(0-19)%
Disagree
(20-
39)%
Neither
Agree
nor
Disagree
(40-59)%
Agree
(60-
79)%
Strongly
Agree
(80-
99)%
Total
Team learning is
an action strategy
within my
organisation for
improving
members
technical skills
0.31% 1 2.15% 7 11.38% 37 57.23% 186 28.92% 94 325
The hierarchical
structure of my
organisation is a
determinant for
knowledge
sharing initiative
2.15% 7 7.38% 24 24.92% 81 52.00% 169 13.54% 44 325
In my
orgainsation, 3.08% 10 8.31% 27 19.08% 62 44.62% 145 24.92% 81 325

279
employees
intellectual assets
are recognised,
valued and
rewarded
Internal staff
rotation is
actively
encouraged to
spread best
practices and
ideas
1.54% 5 9.23% 30 20.92% 68 47.08% 153 21.23% 69 325
Top management
in my
organisation
actively get
involved in
knowledge
sharing
initiatives.
0.92% 3 5.54% 18 22.46% 73 49.23% 160 21.85% 71 325
In my
organisation,
employees are
treated as
shareholders
8.00% 26 19.69% 64 27.69% 90 31.69% 103 12.92% 42 325
Leadership
structure of my
organisation
affect the way
employees
interact and
promote
knowledge
sharing
1.54% 5 10.46% 34 25.23% 82 50.46% 164 12.31% 40 325
Training and
development
programs in
knowledge
management
behaviour are
undertaken from
point of
recruitment
1.85% 6 10.15% 33 14.15% 46 41.54% 135 32.31% 105 325
Knowledge
activities are
always in line
with the vision of
my organisation
1.54% 5 6.46% 21 18.77% 61 47.69% 155 25.54% 83 325
My organisation
has a friendly
work
environment for
employees to
interact
0.31% 1 4.31% 14 14.15% 46 52.62% 171 28.62% 93 325
There are systems
in place to
facilitate
effective
communication
across
departments and
units
0.00% 0 7.69% 25 18.15% 59 48.92% 159 25.23% 82 325

280
Field Minimum Maximum Mean Std
Deviation Variance Count
Bottom
3 Box
Top 3
Box
Team learning
is an action
strategy within
my
organisation
for improving
members
technical skills
1.00 5.00 4.12 0.71 0.50 325 13.85% 97.54%
The
hierarchical
structure of my
organisation is
a determinant
for knowledge
sharing
initiative
1.00 5.00 3.67 0.88 0.77 325 34.46% 90.46%
In my
orgainsation,
employees
intellectual
assets are
recognised,
valued and
rewarded
1.00 5.00 3.80 1.00 1.01 325 30.46% 88.62%
Internal staff
rotation is
actively
encouraged to
spread best
practices and
ideas
1.00 5.00 3.77 0.94 0.88 325 31.69% 89.23%
Top
management in
my
organisation
actively get
involved in
knowledge
sharing
initiatives.
1.00 5.00 3.86 0.85 0.73 325 28.92% 93.54%
In my
organisation,
employees are
treated as
shareholders
1.00 5.00 3.22 1.14 1.30 325 55.38% 72.31%
Leadership
structure of my
organisation
affect the way
employees
interact and
promote
knowledge
sharing
1.00 5.00 3.62 0.89 0.78 325 37.23% 88.00%
Training and
development
programs in
knowledge
management
1.00 5.00 3.92 1.02 1.03 325 26.15% 88.00%

281
behaviour are
undertaken
from point of
recruitment
Knowledge
activities are
always in line
with the vision
of my
organisation
1.00 5.00 3.89 0.91 0.83 325 26.77% 92.00%
My
organisation
has a friendly
work
environment
for employees
to interact
1.00 5.00 4.05 0.79 0.63 325 18.77% 95.38%
There are
systems in
place to
facilitate
effective
communication
across
departments
and units
2.00 5.00 3.92 0.86 0.73 325 25.85% 92.31%
Q1.4 - Part 4
Question
Strongly
Disagree
(0-19)%
Disagree
(20-
39)%
Neither
Agree
nor
Disagree
(40-59)
%
Agree
(60-
79)%
Strongly
Agree
(80-
99)%
Total
There is a process
for identifying
knowledge asset
in my
organisation
1.25% 4 14.33% 46 18.69% 60 39.88% 128 25.86% 83 321
Employees are
committed to
continual develop
their skills and are
constantly
generating new
ideas within the
context of my
organisation
1.25% 4 4.67% 15 18.07% 58 55.14% 177 20.87% 67 321
Resources are
committed for
training and
development of
employees in my
organisation
1.56% 5 10.59% 34 15.26% 49 42.37% 136 30.22% 97 321
One of the
benefits of
knowledge
sharing to my
organisation is
that it provide a
1.25% 4 3.74% 12 14.95% 48 55.14% 177 24.92% 80 321

282
competitive edge
for us among our
competitors
There is
participative
knowledge goal
setting
2.18% 7 9.66% 31 27.41% 88 38.32% 123 22.43% 72 321
There is
participative
knowledge goal
measurement
1.56% 5 9.66% 31 25.23% 81 43.61% 140 19.94% 64 321
There is
participative
knowledge
feedback
1.25% 4 7.79% 25 23.05% 74 47.66% 153 20.25% 65 321
Knowledge
sharing improves
employees know-
how
0.00% 0 1.56% 5 10.90% 35 55.45% 178 32.09% 103 321
Continuous
knowledge
sharing practices
improved my
organisational
processes
0.31% 1 3.12% 10 18.38% 59 45.48% 146 32.71% 105 321
Continuous
knowledge
sharing activities
improved
employees
turnaround time
0.93% 3 0.93% 3 13.08% 42 55.14% 177 29.91% 96 321
Field Minimum Maximum Mean Std
Deviation Variance Count
Bottom
3 Box
Top 3
Box
There is a
process for
identifying
knowledge
asset in my
organisation
1.00 5.00 3.75 1.03 1.07 321 34.27% 84.42%
Employees
are
committed to
continual
develop their
skills and are
constantly
generating
new ideas
within the
context of my
organisation
1.00 5.00 3.90 0.82 0.68 321 23.99% 94.08%
Resources are
committed
for training
and
development
of employees
in my
organisation
1.00 5.00 3.89 1.00 1.01 321 27.41% 87.85%
One of the
benefits of 1.00 5.00 3.99 0.81 0.66 321 19.94% 95.02%

283
knowledge
sharing to my
organisation
is that it
provide a
competitive
edge for us
among our
competitors
There is
participative
knowledge
goal setting
1.00 5.00 3.69 0.99 0.99 321 39.25% 88.16%
There is
participative
knowledge
goal
measurement
1.00 5.00 3.71 0.94 0.89 321 36.45% 88.79%
There is
participative
knowledge
feedback
1.00 5.00 3.78 0.90 0.81 321 32.09% 90.97%
Knowledge
sharing
improves
employees
know-how
2.00 5.00 4.18 0.68 0.46 321 12.46% 98.44%
Continuous
knowledge
sharing
practices
improved my
organisational
processes
1.00 5.00 4.07 0.81 0.66 321 21.81% 96.57%
Continuous
knowledge
sharing
activities
improved
employees
turnaround
time
1.00 5.00 4.12 0.73 0.54 321 14.95% 98.13%
How many companies/organisations have you worked including your current employer?
Answer % Count
1-3 81.38% 271
4-5 15.62% 52
6-10 3.00% 10
11-above 0.00% 0
Total 100% 333

284
Field Minimum Maximum Mean Std
Deviation Variance Count
Bottom
3 Box
Top 3
Box
How many
companies/organisations
have you worked
including your current employer?
1.00 3.00 1.22 0.48 0.23 333 100.00% 18.62%
Field Minimum Maximum Mean Std
Deviation Variance Count
Bottom
3 Box
Top 3
Box
How many
companies/organisations have you worked
including your current
employer?
1.00 3.00 1.22 0.48 0.23 333 100.00% 18.62%
How many projects have you undertaken?
Answer % Count
1-3 50.60% 170
4-5 18.45% 62
6-10 10.42% 35
11-above 5.65% 19
None 14.88% 50
Total 100% 336
What level are you in your organisation?
Answer % Count
Operational 46.25% 154
Mid-Managerial 15.62% 52
Managerial 17.12% 57
Executive 6.91% 23
Adminstrative 14.11% 47
Total 100% 333
Field Minimum Maximum Mean Std
Deviation Variance Count
Bottom
3 Box
Top 3
Box
How many
projects have you
undertaken?
1.00 5.00 2.16 1.47 2.15 336 79.46% 30.95%

285
What level are you in your organisation?
Answer % Count
Operational 46.25% 154
Mid-Managerial 15.62% 52
Managerial 17.12% 57
Executive 6.91% 23
Adminstrative 14.11% 47
Total 100% 333
Field Minimum Maximum Mean Std
Deviation Variance Count
Bottom
3 Box
Top 3
Box
What level
are you in your
organisation?
1.00 5.00 2.27 1.45 2.11 333 78.98% 38.14%
Question
Strongly
Disagree (0-19)%
Disagree
(20-39)%
Neither Agree nor
Disagree (40-59)%
Agree
(60-79)%
Strongly
Agree (80-99)%
Total
Employees at all
levels in my
organisation
have a general understanding
of the concept
of 'knowledge sharing'
1.22% 4 3.95% 13 17.33% 57 58.97% 194 18.54% 61 329
Employees at all
levels recognise
knowledge as a key resource
0.91% 3 2.13% 7 13.68% 45 60.49% 199 22.80% 75 329
Employees in
my organisation
are aware of the need to
proactively
manage knowledge
0.61% 2 3.95% 13 16.11% 53 54.41% 179 24.92% 82 329
In my
organisation,
employees are encourage to
use their know-
how in everyday activities
0.61% 2 2.43% 8 14.59% 48 48.94% 161 33.43% 110 329
To make
knowledge
available to all employees, my
organisation has
a local network (manual or
automated) for
documenting knowledge
activities
1.22% 4 13.07% 43 15.20% 50 40.73% 134 29.79% 98 329
Formal
networks exist to facilitate
dissemination of
knowledge in
0.61% 2 11.85% 39 16.41% 54 42.55% 140 28.57% 94 329

286
my organisation
Intellectual assets are
legally protected in my
organisation
1.82% 6 5.47% 18 27.36% 90 38.30% 126 27.05% 89 329
In my
organisation,
employees are encouraged to
practice
knowledge sharing rather
than knowledge hoarding
0.00% 0 2.74% 9 13.68% 45 54.71% 180 28.88% 95 329
My organisation hones its skills
for generating,
aquiring and
applying
knowledge by
learning from other
organisation's
learning processes
0.61% 2 3.34% 11 22.19% 73 53.80% 177 20.06% 66 329
In my
organisation,
When a team completes a
task, it distils
and documents what it has
learned
0.61% 2 9.12% 30 16.41% 54 44.38% 146 29.48% 97 329
Top
management recognises
knowledge
sharing as an important part
of the business
strategy in my organisation
0.91% 3 3.65% 12 13.07% 43 48.33% 159 34.04% 112 329
If you wish to make any comment, please feel free. Your feedback will
be highly useful for the research.
How many years of work experience do you have?
Answer % Count
1-3 46.43% 156
4-5 24.70% 83
6-10 18.75% 63
11-above 10.12% 34

287
Total 100% 336
Field Minimum Maximum Mean Std
Deviation Variance Count
Bottom
3 Box
Top 3
Box
How
many
years of
work
experience
do you
have?
1.00 4.00 1.93 1.03 1.05 336 89.88% 53.57%
What are the current practices of knowledge sharing in your organisation?
How can organisational factors facilitate effective knowledge sharing in your organisation?