Density of Natural Gases - OnePetro
10
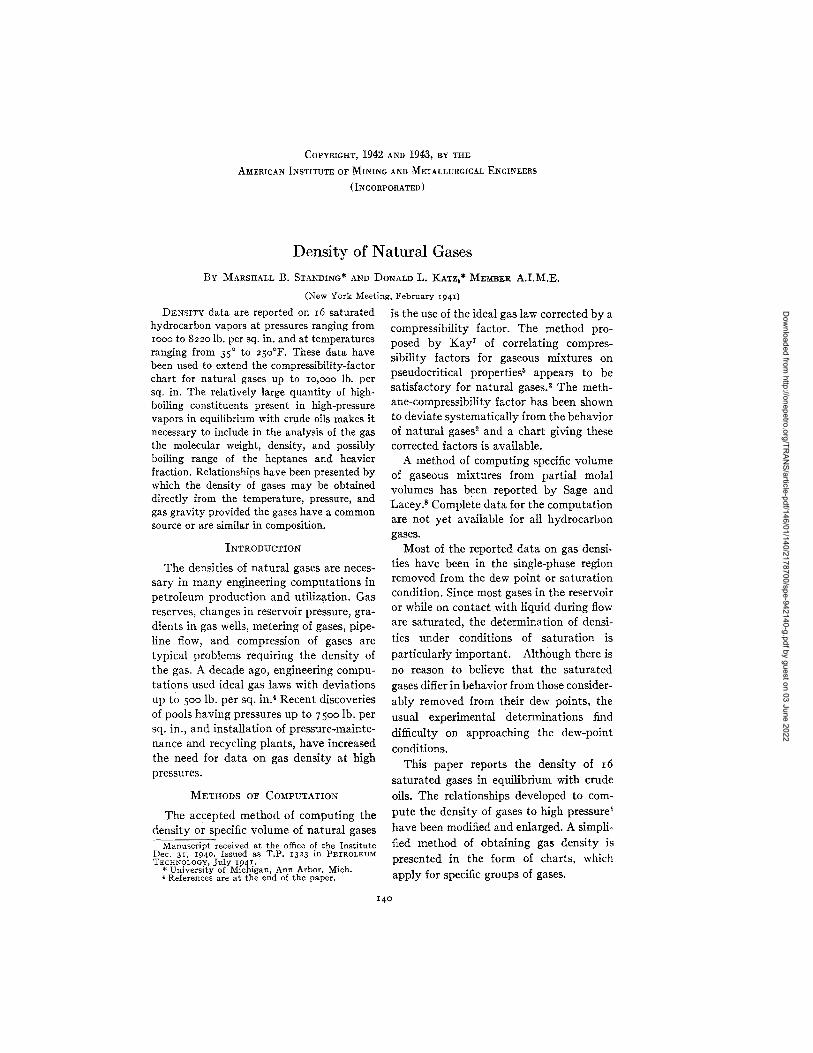
COPYRIGHT, 1942 AND 1943, BY THE AMERICAN INSTITUTE OF MINING AND METALLURGICAL ENGINEERS (INCORPORATED) Density of Natural Gases By MARSHALL B. STANDING* AND DONALD L. KATZ,* MEMBER A.I.M.E. (New York Meeting, February 1941) DENSITY data are reported on 16 saturated is the use of the ideal gas law corrected by a hydrocarbon vapors at pressures ranging from compressibility factor. The method pro- 1000 to 8220 lb. per sq. in. and at temperatures posed by K ay 7 of correlating compres- ranging from 35° to 250°F. These data have sibility factors for gaseous mixtures on been used to extend the compressibility-factor chart for natural gases up to !O,ooo lb. per pseudocritical properties 5 appears to be sq. in. The relatively large quantity of high- satisfactory for natural gases. 2 The meth- boiling constituents present in high-pressure ane-compressibility factor has been shown vapors in equilibrium with crude oils makes it to deviate systematically from the behavior necessary to include in the analysis of the gas of natural gases 2 and a chart giving these the molecular weight, density, and possibly corrected factors is available. boiling range of the heptanes and heavier A method of computing specific volume fraction. Relationships have been presented by of gaseous mixtures from partial molal which the density of gases may be obtained volumes has been reported by Sage and directly from the temperature, pressure, and L 8 Cit d t f th t t' acey. omp e e a a or e compu a IOn gas gravity provided the gases have a common source or are similar in composition. are not yet available for all hydrocarbon INTRODUCTION The densities of natural gases are neces- sary in many engineering computations in petroleum production and Gas reserves, changes in reservoir pressure, gra- dients in gas wells, metering of gases, pipe- line flow, and compression of gases are typical problems requiring the density of the gas. A decade ago, engineering compu- tations used ideal gas laws with deviations up to 500 lb. per sq. in} Recent discoveries of pools having pressures up to 7500 lb. per sq. in., and installation of pressure-mainte- nance and recycling plants, have increased the need for data on gas density at high pressures. METHODS OF COMPUTATION The accepted method of computing the density or specific volume of natural gases Manuscript received at the office of the Institute Dec. 31, 1940. Issued as T.P. 1323 in PETROLEUM TECHNOLOGY, July 1941. * University of Michigan. Ann Arbor, Mich. , References are at the end of the paper. gases. Most of the reported data on gas densi- ties have been in the single-phase region removed from the dew point or saturation condition. Since most gases in the reservoir or while on contact with liquid during flow are saturated, the determination of densi- ties under conditions of saturation is particularly important. Although there is no reason to believe that the saturated gases differ in behavior from those consider- ably removed from their dew points, the usual experimental determinations find difficulty on approaching the dew-point conditions. This paper reports the density of 16 saturated gases in equilibrium with crude oils. The relationships developed to com- pute the density of gases to high pressure! have been modified and enlarged. A simpli- fied method of obtaining gas density is presented in the form of charts, which apply for specific groups of gases. Downloaded from http://onepetro.org/TRANS/article-pdf/146/01/140/2178700/spe-942140-g.pdf by guest on 03 June 2022
-
Upload
khangminh22 -
Category
Documents
-
view
5 -
download
0
Transcript of Density of Natural Gases - OnePetro
COPYRIGHT, 1942 AND 1943, BY THE
AMERICAN INSTITUTE OF MINING AND METALLURGICAL ENGINEERS
(INCORPORATED)
Density of Natural Gases
By MARSHALL B. STANDING* AND DONALD L. KATZ,* MEMBER A.I.M.E.
(New York Meeting, February 1941)
DENSITY data are reported on 16 saturated is the use of the ideal gas law corrected by a hydrocarbon vapors at pressures ranging from compressibility factor. The method pro-1000 to 8220 lb. per sq. in. and at temperatures posed by Kay7 of correlating compresranging from 35° to 250°F. These data have sibility factors for gaseous mixtures on been used to extend the compressibility-factor chart for natural gases up to !O,ooo lb. per pseudocritical properties5 appears to be sq. in. The relatively large quantity of high- satisfactory for natural gases.2 The methboiling constituents present in high-pressure ane-compressibility factor has been shown vapors in equilibrium with crude oils makes it to deviate systematically from the behavior necessary to include in the analysis of the gas of natural gases2 and a chart giving these the molecular weight, density, and possibly corrected factors is available. boiling range of the heptanes and heavier A method of computing specific volume fraction. Relationships have been presented by of gaseous mixtures from partial molal which the density of gases may be obtained volumes has been reported by Sage and directly from the temperature, pressure, and L 8 Cit d t f th t t' acey. omp e e a a or e compu a IOn gas gravity provided the gases have a common source or are similar in composition. are not yet available for all hydrocarbon
INTRODUCTION
The densities of natural gases are necessary in many engineering computations in petroleum production and utiliz~tion. Gas reserves, changes in reservoir pressure, gradients in gas wells, metering of gases, pipeline flow, and compression of gases are typical problems requiring the density of the gas. A decade ago, engineering computations used ideal gas laws with deviations up to 500 lb. per sq. in} Recent discoveries of pools having pressures up to 7500 lb. per sq. in., and installation of pressure-maintenance and recycling plants, have increased the need for data on gas density at high pressures.
METHODS OF COMPUTATION
The accepted method of computing the density or specific volume of natural gases
Manuscript received at the office of the Institute Dec. 31, 1940. Issued as T.P. 1323 in PETROLEUM TECHNOLOGY, July 1941. * University of Michigan. Ann Arbor, Mich.
, References are at the end of the paper.
gases. Most of the reported data on gas densi
ties have been in the single-phase region removed from the dew point or saturation condition. Since most gases in the reservoir or while on contact with liquid during flow are saturated, the determination of densities under conditions of saturation is particularly important. Although there is no reason to believe that the saturated gases differ in behavior from those considerably removed from their dew points, the usual experimental determinations find difficulty on approaching the dew-point conditions.
This paper reports the density of 16
saturated gases in equilibrium with crude oils. The relationships developed to compute the density of gases to high pressure! have been modified and enlarged. A simplified method of obtaining gas density is presented in the form of charts, which apply for specific groups of gases.
Dow
nloaded from http://onepetro.org/TR
ANS/article-pdf/146/01/140/2178700/spe-942140-g.pdf by guest on 03 June 2022
MARSHALL B. STANDING AND DONALD L. KATZ
DATA OBTAINED
In the process of obtaining equilibrium data on mixtures of natural gas and crude oils, the density and analysis of the saturated vapor phases were obtained. These data were in the range of 35° to 250°F. and 1000 to 8220 lb. per sq. inch.
The vapors in equilibrium with crude oil were transferred, by mercury displacement, at constant temperature and pressure from the equilibrium cell into pycnometers of 2s-ml. capacity. The contents of the pycnometer were discharged into a lowtemperature fractionating column, to obtain the analysis of the gas. In all cases the pycnometer was weighed before and after discharging the gas and any mercury accompanying the gas was collected and weighed. The combined error on weighing is estimated as ±0.04 gram out of 1.35 gram for the gas of lowest density and 11.2 grams for the gas of highest density.
The presence of relatively large quantities of heptanes and heavier required refine-
ments over the usual gas analysis. The heptane-plus fractions were collected and weighed as a liquid. The density and molecular weight were measured if sufficient quantities were available.
A smooth curve relationship exists between the liquid density and molecular weight of the heptanes plus and was used if the data for either were lacking. It was found that there was a permanent hold-up in the fractionating column packing as high as 0.5 gram. Differences between the weight of gas out of the pycnometer and the weight of the gas accounted for in the analysis varied up to this quantity. Accordingly, the weight of the heptanes and heavier was taken as the difference between the pycnometer weight of the gas and the weight of the hydrocarbons of molecular weight lower than heptane.
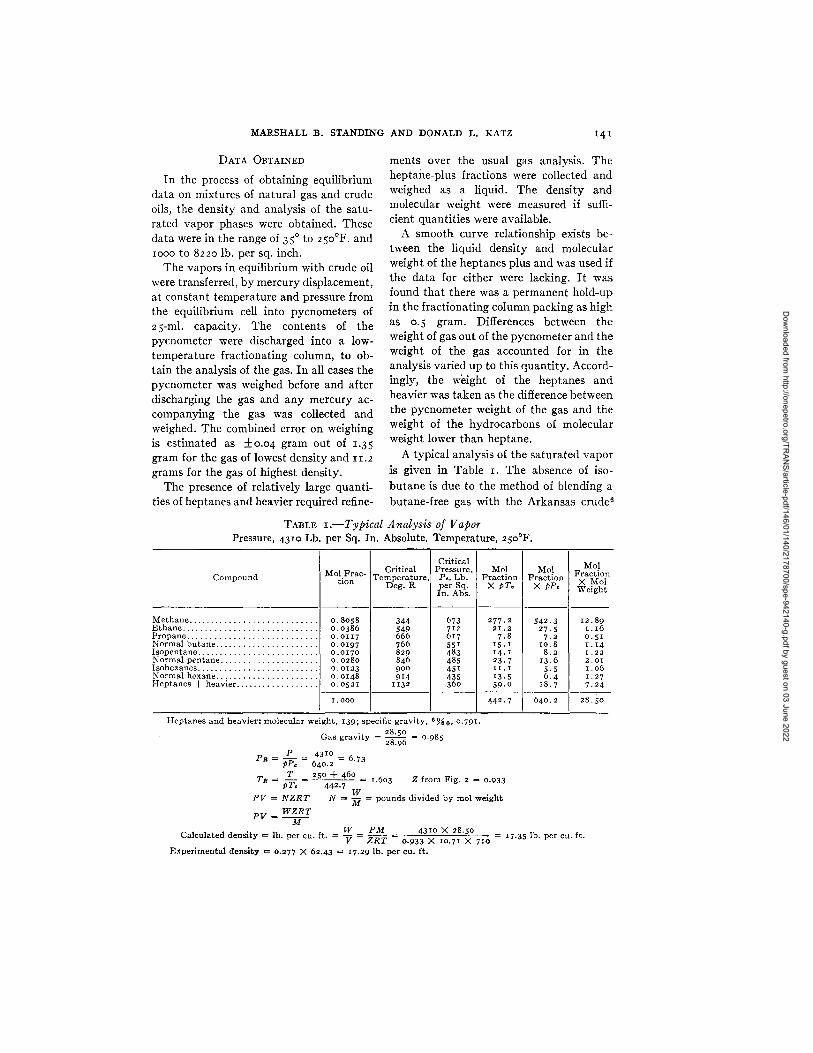
A typical analysis of the saturated vapor is given in Table I. The absence of isobutane is due to the method of blending a butane-free gas with the Arkansas crude6
TABLE I.-Typical Analysis of Vapor Pressure, 4310 Lb. per Sq. In. Absolute. Temperature, 250°F.
Compound Mol Frac- Critical
tion Temperature, Deg. R
~~i:< 0.8058 344 0.0386 549 0.0117 666 0.0197 766 0.0170 829 0.0280 846 0.0123 900
Heptanes + heavier ............ ...... 0. 0148 914 0.0521 113 2
1,000
Critical Pressure, P"Lb. per Sq. In. Abs.
673 712 617 551 483 485 451 435 360
Heptanes and heavier: molecular weight, 139; specific gravity, 69'60. 0.791.
Gas gravity = 28·50 = 0.985 28·96
PH = .!'.-- = 4310
= 673 pP, 640.2 .
Mol Fraction
X pT,
277.2 21.2 7.8
IS. I 14. I 23.7 I I. I
13.5 59.0
442 .7
_ T 250 + 460 . Til - pT, = 442.7 = 1.603 Z from F'g. 2 = 0.933
PV = NZRT N = ~ = pounds divided by mol weight
PV = WZRT M
Mol Fraction
X pp,
542 .3 27·5 7.2
10.8 8.2
13.6 5.5 6.4
18.7
640 . 2
Mol Fraction
X Mol Weight
12.89 1. 16 0.5 1 1. 14 1.22 2.01 1.06 1. 27 7.24
28. SO
Calculated density = lb. per cu. ft. = !!: = PM = 431
0 X 28·50 = 1735 lb ft V ZRT 0.933 X 10.71 X 710 . . per cu. .
Experimental density = 0.277 X 62.43 = 17·29 lb. per cu. ft.
Dow
nloaded from http://onepetro.org/TR
ANS/article-pdf/146/01/140/2178700/spe-942140-g.pdf by guest on 03 June 2022

DENSITY OF NATURAL GASES
and varying quantities of natural gasolineG
that contained normal butane but no isobutane. Data on the density and properties of 16 saturated vapors in equilibrium with a crude oil are given in Table 2.
PSEUDOCRITICAL CONDITIONS OF
HEPTANES AND HEAVIER
FRACTIONS
Computation of the pseudocritical temperature and pressure of a gas is given in Table 1. Because of the high content and high molecular weight of the heptanes and
vised to be in agreement with Smith and Watson's newly defined boiling points. This mean average boiling point may be converted to the molal average from the knowledge of the initial boiling point of about 200°F. for the heptanes and heavier fraction. The molal average boiling point and gravity give the pseudocritical temperature by Smith and Watson's relationship.
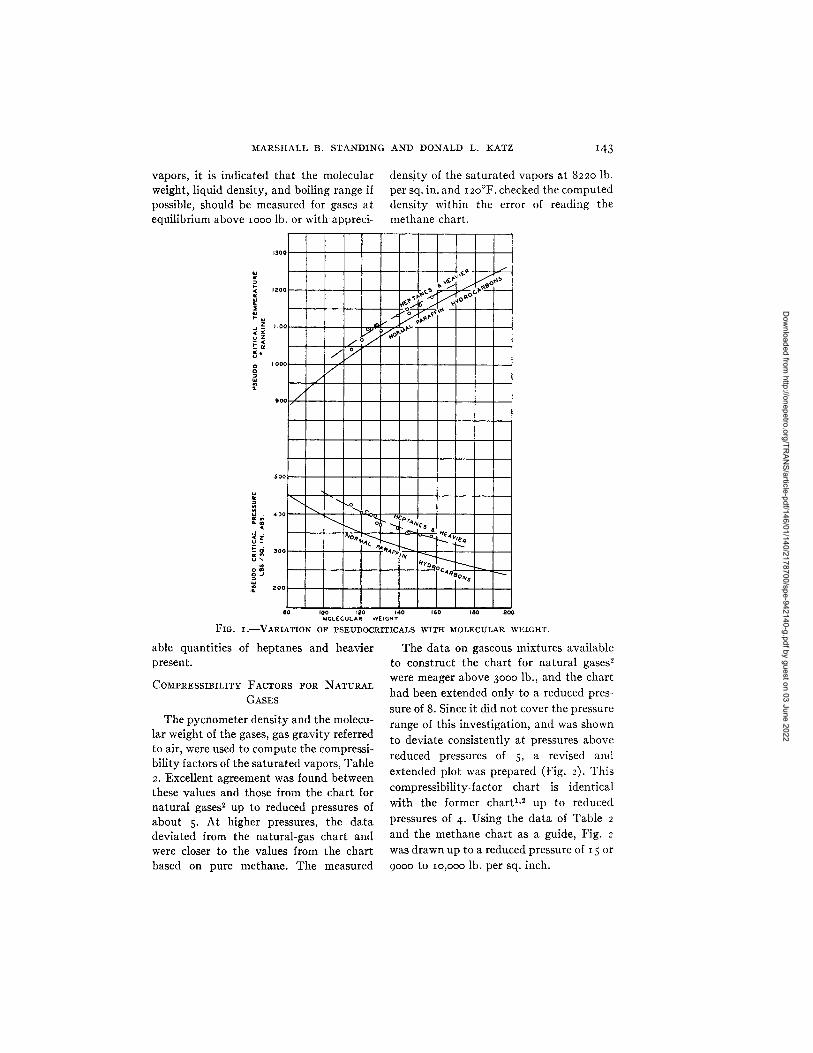
The densities and molecular weights of heptanes and heavier of Table 2 have been used to compute the pseudocriticals shown in Fig. I. It should be noted that the
TABLE 2.-Properties of Saturated Gases
Experi-Pres- Experi- mental
sure, Lb. Temper .. Gravity. Mol Per Mol Per MolWt. Density mental Com-Run NO,a per Sq. ature. Air = I
Cent Cent C7' C1+ 6%0
Density. pressi-Deg. F. CR, C,' Gram bility In. Abs. per C.C. Factor
Z
---- --------------- ------- ---
A-5 ..... ... 1,000 120 0.659 0·9200 0.0090 I lob 0.742' 0.0564 0.870 A-4L ... ... 1,600 120 0.671 0.9158 0.0124 110b 0.742' 0.097 0.826 A-I. .. .... 3. 185 120 0·766 0.8800 0.0303 131 0.775' 0 224 0.8ro A-21. .. ... 5.270 120 0.840 0.8588 0.0400 127 0.788 0.340 0·970 A-3 ... 8,220 120 0.899 0.8440 0.0444 144 0.802 0.404 1·358 B-I. .... ...... 2,920 250 0 766 0.8750 0.0268 IISb O.753b 0.154 0.884 C-2 ..... 1,010 120 0.629 0·9345 0.0021 100b O.72sb 0.0556 0.852 C-I. .... .... 2.880 120 0.736 0.8895 0.or80 1I3 0.750' 0.203 0.777 C-3I. .. ..... 5.330 120 1.040 0.7995 0.0573 151 0 800 0·400 1.031 D-1. . .... ...... 4.330 120 0.876 0.8340 0.0375 123 o. 788 0.327 0.865 E-1. ..... . . . . . . . . . . . 4. 195 120 0·736 0.8920 0.0243 130b 0.771 0.261 0.879 F-I. .... 3.185 250 0·915 0.8450 0.0495 130 0.768 0.192 0.925 F-2 .... 4.310 250 0·985 0 8060 0.0521 139 O. 791 0.277 0.931 F-3 ... .... .... 5.530 250 1.070 o. 7840 0.0588 157
I
0 808 0.349 1.031 G-2 ................ 3.485 35 0·926 0.8230 0.0434 128 0.765 0.383 0.737 G-3 ............... 4.970 35 1.074 0.7810 0.0631 145' 0.792 0.463 1.008
a Series A and B ........ . Series C. F and G ............... .
7.000 cu. ft. gas per bbl. 50 vol. crude + 50 vol. gasoline. 3.500 cu. ft. gas per bbl. 50 vol. crude + 50 vol. gasoline. 7.000 cu. ft. gas per bbl. 25 vol. crude + 75 vol. gasoline. 7.000 cu. ft. gas per bbl. 75 vol. crude + 25 vol. gasoline.
Series D ........................ . Series E .................. .
• Estimated.
Natural gas: gravity = 0.596; CH" 93.20 per cent; C2H s, 4.25 per cent; CaHg, r.6r per cent; N 2, 0.43 per cent; C02, 0.51 per cent.
heavier fractions, the usual procedure of using the critical properties of heptanes or octanes for this fraction is no longer reliable.
Smith and Watson lO reported a method of obtaining the pseudocritical pressure directly from liquid density and molecular weight. For the pseudo critical temperature, the molal average boiling point must be known in addition to the liquid density. The mean average boiling point10 may be obtained from the density and molecular weight by a chart similar to that given by Egloff and Nelson (ref. 3, p. 235) and re-
calculated values deviate somewhat from the normal paraffin curve of critical temperatures and pressures as a function of molecular weight. The difference between the calculated pseudocriticals and the criticals of the normal paraffin hydrocarbons is much smaller when using the molecular weight of the heptanes and heavier than when using the liquid density as the correlating factor. In no case would the critical properties of heptanes have been representative of the heptanes and heavier fraction. Since the data given are for saturated
Dow
nloaded from http://onepetro.org/TR
ANS/article-pdf/146/01/140/2178700/spe-942140-g.pdf by guest on 03 June 2022
MARSHALL B. STANDING AND DONALD L. KATZ I43
vapors, it is indicated that the molecular weight, liquid density, and boiling range if possible, should be measured for gases at equilibrium above 1000 lb. or with appreci-
130 0
0
density of the saturated vapors at 8220 lb. per sq. in. and 120°F. checked the computed density within the error of reading the methane chart.
(." -"
~Vo~ "'/ Q.1b ,,(."> oc.~~":"l--
~f'\po. ~..."o'"
,./ °0 po.,<f\~ V .~ ..
0
/~ v:; ,,~\o ,,0"
/' V-0 )7
00 o /
so 0
""-"'"
" .0 .....
0
'-...... o ~:r"''''e-s t--.......
40 . " 0
I"'O~ .. ~-!~ -of.~ "1""~/f'y~ 30
"'''O'iOC ·"'8 -1°"'3
200
eo 100 120 140 160 180 200 MOL.£CULAR WEIG~T
FIG. I.-VARIATION OF PSEUDOCRITICALS WITH MOLECULAR WEIGHT.
able quantities of heptanes and heavier present.
COMPRESSIBILITY FACTORS FOR NATURAL
GASES
The pycnometer density and the molecular weight of the gases, gas gravity referred to air, were used to compute the compressibility factors of the saturated vapors, Table 2. Excellent agreement was found between these values and those from the chart for natural gases2 up to reduced pressures of about 5. At higher pressures, the data deviated from the natural-gas chart and were closer to the values from the chart based on pure methane. The measured
The data on gaseous mixtures available to construct the chart for natural gases2
were meager above 3000 lb., and the chart had been extended only to a reduced pressure of 8. Since it did not cover the pressure range of this investigation, and was shown to deviate consistently at pressures above reduced pressures of 5, a revised and extended plot was prepared (Fig. 2). This compressibility-factor chart is identical with the former chartI· 2 up to reduced pressures of 4. Using the data of Table 2 and the methane chart as a guide, Fig. 2 was drawn up to a reduced pressure of IS or 9000 to 10,000 lb. per sq. inch.
Dow
nloaded from http://onepetro.org/TR
ANS/article-pdf/146/01/140/2178700/spe-942140-g.pdf by guest on 03 June 2022

144 DENSITY OF NATURAL GASES
RELATIONSHIPS OF GAS GRAVITY AND
GAS DENSITY
The gas gravity, compared to air, and pseudocritical conditions gave a smooth relationship when compared with the
curves for miscellaneous gases.! All gases whose pseudo critical temperatures and pressures fit these gravity curves have the same density for a temperature, pressure and gas gravity independent of composi-
PSEUDO REDUCED PRESSURE 2 3 4 5 6 7
0.9
NO.
cr 0 I-U ~
~ ..J III III III W cr Q.
~ 0 U
8 9 10 II 12
PSEUDO REDUCED PRESSURE FIG. 2.-COMPRESSmILITY FACTORS.
1.4 N cr 0 I-U
1.3 ~
~ ..J III
2~ w cr Q.
:!: 0 U
1.1
1.0
13 14
Dow
nloaded from http://onepetro.org/TR
ANS/article-pdf/146/01/140/2178700/spe-942140-g.pdf by guest on 03 June 2022
MARSHALL B. STANDING AND DONALD L. KATZ 145
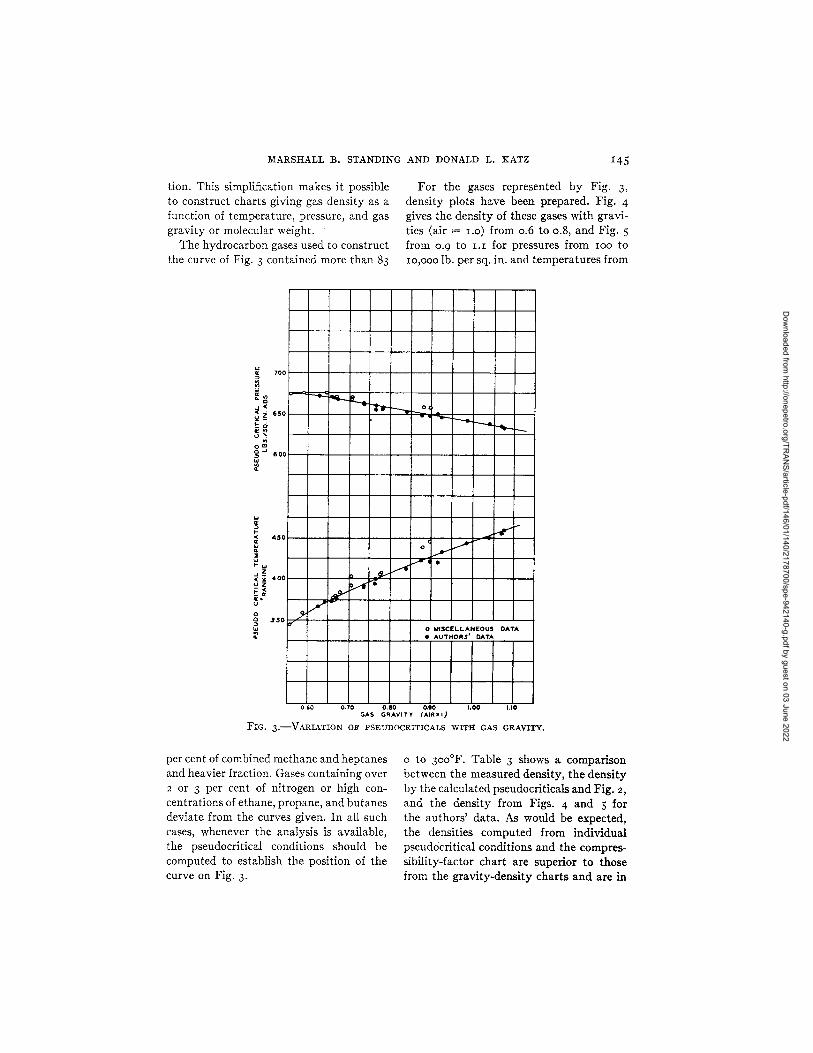
tion. This simplification makes it possible to construct charts giving gas density as a function of temperature, pressure, and gas gravity or molecular weight.
The hydrocarbon gases used to construct the curve of Fig. 3 contained more than 83
... 0:
" I-00( .5 0: ... Q. :> u 1- ...
~ i .0 \)Z
t~ 0:. \)
o
0
0
0
0
0
a 350
" ... ~
.... ~ ~ tfi-
~
I~ /YI.
.9V
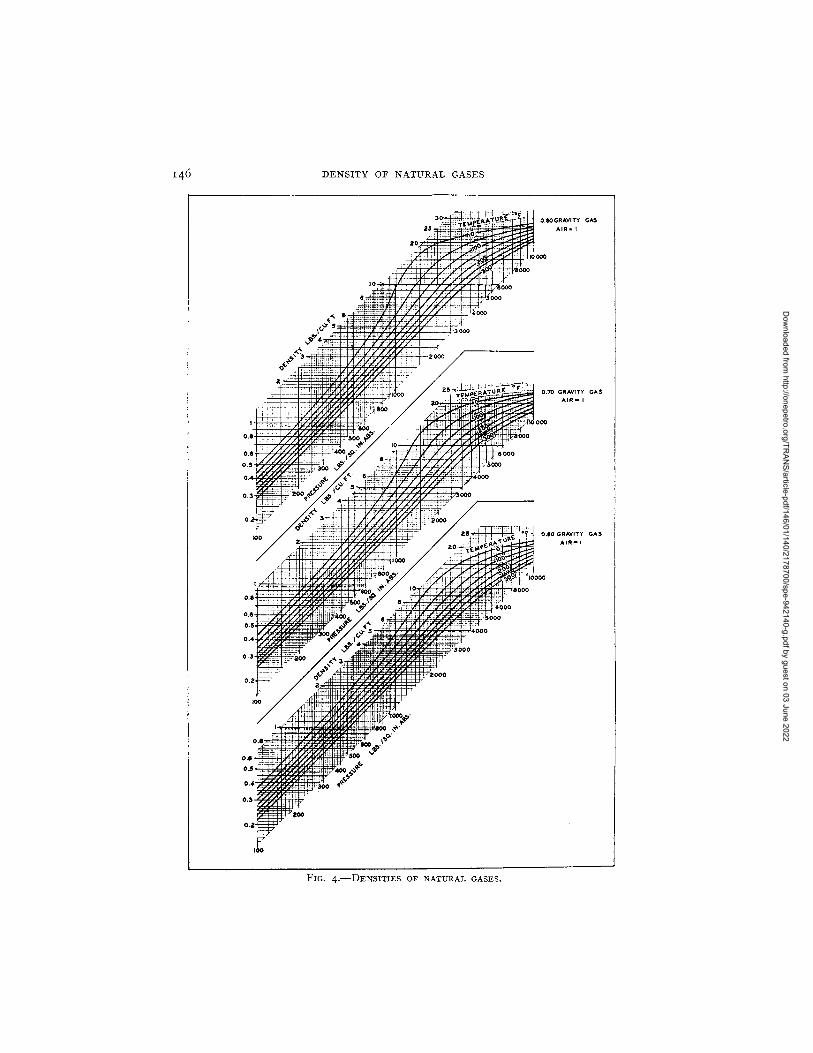
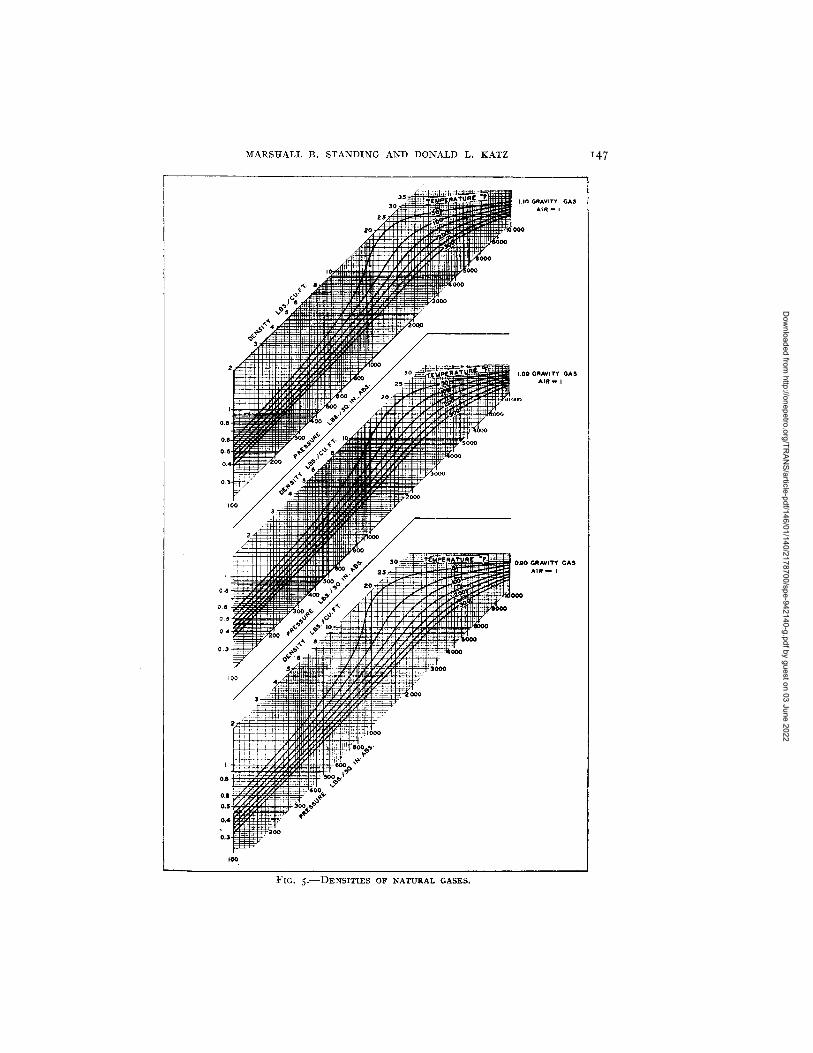
For the gases represented by Fig. 3, density plots have been prepared. Fig. 4 gives the density of these gases with gravities (air = 1.0) from 0.6 to 0.8, and Fig. 5 from 0.9 to I. I for pressures from 100 to 10,000 lb. per sq. in. and temperatures from
~ 0 .. r-r-----~ I-
~ .....
o J......- V
I---!--- •
o "ISCELL.ANEOUS DATA • AUTHORS' DATA
060 0.70 0.10 0.90 1.00 1.10 GAS GRAVITY IAIA-I)
FIG. 3.-VAR1ATION OF PSEUDOCR1TICALS WITH GAS GRAVITY.
per cen t of combined methane and heptanes and heavier fraction. Gases containing over 2 or 3 per cent of nitrogen or high concentrations of ethane, propane, and butanes deviate from the curves given. In all such cases, whenever the analysis is available, the pseudocritical conditions should be computed to establish the position of the curve on Fig. 3.
o to 300°F. Table 3 shows a comparison between the measured density, the density by the calculated pseudocriticals and Fig. 2,
and the density from Figs. 4 and 5 for the authors' data. As would be expected, the densities computed from individual pseudocritical conditions and the compressibility-factor chart are superior to those from the gravity-density charts and are in
Dow
nloaded from http://onepetro.org/TR
ANS/article-pdf/146/01/140/2178700/spe-942140-g.pdf by guest on 03 June 2022
DENSITY OF NATURAL GASES
GAS
GAS
FIG. 4.-DEN5ITIES OF NATURAL GASES.
Dow
nloaded from http://onepetro.org/TR
ANS/article-pdf/146/01/140/2178700/spe-942140-g.pdf by guest on 03 June 2022
MARSHALL B. STANDING AND DONALD L. KATZ I47
100
FIG. 5.-DENSITIES OF NATURAL GASES.
Dow
nloaded from http://onepetro.org/TR
ANS/article-pdf/146/01/140/2178700/spe-942140-g.pdf by guest on 03 June 2022
148 DENSITY OF NATURAL GASES
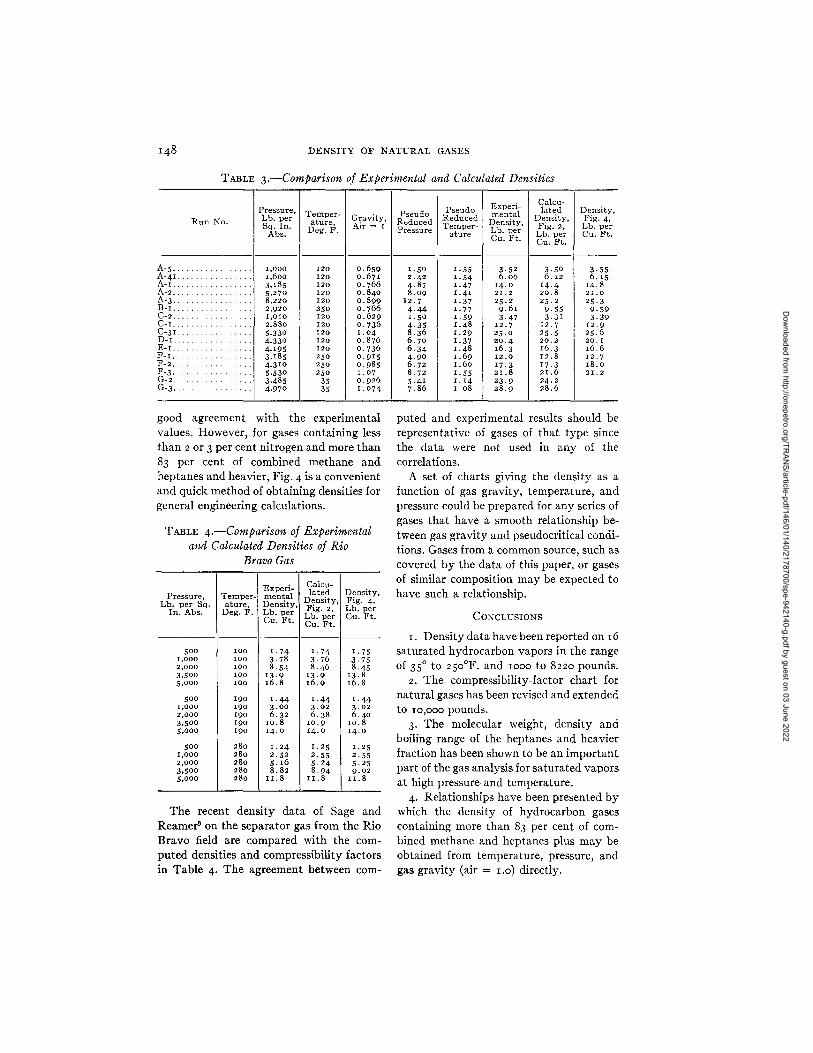
TABLE 3.-Comparison of Experimental and Calculated Densities
Pressure, Run No. Lb. per Temper~ Gravity, ature, Sq. In. Deg. F. Air =
Abs.
A-5 .... .. 1,000 120 0.659 A-41 .. 1,600 120 0.671 A-I. . 3,185 120 0.766 A-2 ... 5.270 120 0.840 A-3 .. ... 8,220 120 0.899 B-I. .. : 2.920 250 0·766 C-2 .. 1,010 120 0.629 C-r. ... ... ...... 2,880 120 0.736 C-31. ....... 5,330 120 1.04 D-I. . ... ..... 4,330 120 0.876 E-I. . ..... 4,195 120 0.736 F-I. ........ 3,185 250 0.9 15 F-2 .. . . . . . . . . . . 4,310 250 0.985 F-3 ... . . . . . . . . . . . . 5,530 250 1. 07 G-2 .... . . . . . . . . . . . . . 3,485 35 0.926 G-3 ... . . . . . . . . 4,970 35 1.074
good agreement with the experimental values. However, for gases containing less than 2 or 3 per cent nitrogen and more than 83 per cent of combined methane and heptanes and heavier, Fig. 4 is a convenient and quick method of obtaining densities for general engineering calculations.
TABLE 4.-Comparison of Experimental and Calculated Densities of Rio
Bravo Gas
Experi- Calcu-lated Density, Pressure, Temper- mental Density, Fig. 4, Lb. per Sq. ature, Density, Fig.2, Lb. per In. Abs. Deg. F. Lb. per
Cu. Ft. Lb. per Cu.Ft. Cu. Ft.
---------
500 100 I. 74 1. 74 1. 75 1,000 roo 3·78 3.76 3.75 2,000 100 8.54 8·46 8.45 3,500 roo 13.9 13.9 13·8 5.000 roo 16.8 16.9 16.8
500 190 1.44 1.44 1. 44 1,000 190 3.00 3·02 3·02 2,000 190 6.32 6·38 6·40 3.500 190 10.8 ro·9 10.8 5,000 190 14. 0 14. 0 14. 0
500 280 1. 24 1. 25 1. 25 1,000 280 2.52 2·55 2·55 2,000 280 5.16 5. 24 5·25 3,500 280 8.82 8.94 9.02 5,000 280 II.8 II.8 II.8
The recent density data of Sage and Reamer9 on the separator gas from the Rio Bravo field are compared with the computed densities and compressibility factors in Table 4. The agreement between com-
I
Experi- Calcu-Pseudo lated Density. Pseudo Reduced mental Density. Fig. 4, Reduced Density,
Pressure Temper- Lb. per Fig.2, Lb. per ature Cu. Ft. Lb. per Cu. Ft.
Cu. Ft.
1.50 1. 55 3·52 3.50 3·55 2·42 1. 54 6.06 6.12 6. IS
4·87 1.47 14. 0 14·4 14·8 8.09 1.41 2I.2 20.8 2IoO
12.7 1. 37 25. 2 25·2 25·3 4·44 1. 77 9.61 9· 55 9.59 1.50 1. 59 3·47 3.3 1 3.39 4·35 1.48 12.7 12.7 12·9 8.36 I. 29 25·0 25·5 25.6 6.70 1.37 20·4 20.2 20.1 6.34 1.48 16.3 16.3 16.6 4·90 1.69 12.0 12.8 12.7 6.72 1.60 17.3 17.3 18.0 8.72 1. 55 2I.8 21.6 21.2 5.41 I. 14 23.9 24.2 7.86 1.08 28.9 28.6
puted and experimental results should be representative of gases of that type since the data were not used in any of the correlations.
A set of charts giving the density as a function of gas gravity, temperature, and pressure could be prepared for any series of gases that have a smooth relationship between gas gravity and pseudo critical conditions. Gases from a common source, such as covered by the data of this paper, or gases of similar composition may be expected to have such a relationship.
CONCLUSIONS
I. Density data have been reported on 16 saturated hydrocarbon vapors in the range of 35° to 250°F. and 1000 to 8220 pounds.
2. The compressibility-factor chart for natural gases has been revised and extended to 10,000 pounds.
3. The molecular weight, density and boiling range of the heptanes and heavier fraction has been shown to be an important part of the gas analysis for saturated vapors at high pressure and temperature.
4. Relationships have been presented by which the density of hydrocarbon gases containing more than 83 per cent of combined methane and heptanes plus may be obtained from temperature, pressure, and gas gravity (air = 1.0) directly.
Dow
nloaded from http://onepetro.org/TR
ANS/article-pdf/146/01/140/2178700/spe-942140-g.pdf by guest on 03 June 2022
MARSHALL B. STANDING AND DONALD L. KATZ 149
ACKNOWLEDGMENT
The authors are indebted to the Humble Oil and Refining Co. for the natural gas, to the Phillips Petroleum Company for the crude oil, and to the Indian Territory Illuminating Oil Co. for the natural gasoline used in the investigation.
REFERENCES
r. G. G. Brown: Nat. Gas. Assn. Arner., Proc. 19th Annual Convention, 54. May 1940.
2. G. G. Brown and D. E. Holcomb: Pelr. Engineering (1940) II (5). 23.
3. G. Egloff and E. F. Nelson: Trans. Arner. Inst. Chern. Eng. (1936) 32, 221.
4. T. W. Johnson and W. B. Bermald: U. S. Bur. Mines Tech. Pub. 539 (1932).
5. D. L. Katz: Trans. A.I.M.E. (1938) 127, 159. 6. D. L. Katz and C. C. Singleterry: Trans. A.I.M.E.
(1939) 132, 103. 7. W. B. Kay: Ind. and Eng. Chern. (1936) 28,
101 4:--8. B. H. Sage and V\f. N. Lacey: Arner. Petro Inst.
Drill. and Prod! Practice (1939) 641. 9. B. H. Sage and H. H. Reamer: Trans. A.I.M.E.
(1941) 142,179. 10. R. L. Smith and K. M. Watson: Ind. and Eng.
Chern. (1937) 29, 1408.
Dow
nloaded from http://onepetro.org/TR
ANS/article-pdf/146/01/140/2178700/spe-942140-g.pdf by guest on 03 June 2022