Theoretical Flammability Diagram for Analyzing Mine Gases
16
Theoretical Flammability Diagram for Analyzing Mine Gases Tingguang Ma* and Michael Larran ˜aga, Department of Fire Protection & Safety Technology, Oklahoma State University, 492 Cordell South, Stillwater, OK 74078, USA Received: 10 May 2013/Accepted: 22 July 2013 Abstract. Out of the thermal balance method, a method of presenting mine fire data is proposed in this work. By grouping fuels into a pseudo fuel, grouping nitrogen and oxygen into a pseudo air, and using carbon dioxide as the diluent, a diluted flamma- bility diagram is reconstructed for this oxygen-modified environment. The flammabil- ity envelop is controlled by oxygen availability, while the operation point is controlled by fuel/diluent availability. The relative position between the envelop and the operation point shows the flammable state of this mixture. Coward’s explosive triangle is also applied using the limiting oxygen concentration derived from the dia- gram. Both are most useful in guiding the suppression operation for an underground coal mine fire. Keywords: Mine fires, Flammability envelop, Limiting oxygen concentration, Combustion diagnosis, Fire suppression Nomenclature CAFT Critical adiabatic flame temperature (K) C O The oxygen coefficient in a reaction, dimensionless H O The heating potential of oxygen based on air, dimensionless H F The heating potential of fuel based on air, dimensionless, H F =C O H O LFL Lower flammability limit (volume ratio), % or dimensionless Q D The quenching potential of diluent based on air, dimensionless Q F The quenching potential of fuel based on air, dimensionless Q O The quenching potential of oxygen based on air, dimensionless, Q D = 1.046 R The mixing ratio of diluent over fuel UFL Upper flammability limit (volume ratio), % or dimensionless x L Lower flammability limit (volume ratio), % or dimensionless x U Upper flammability limit (volume ratio), % or dimensionless Subscripts d Diluent i Component of a mixture m Sum of a mixture st Stoichiometric L Lower flammable limit U Upper flammable limit * Correspondence should be addressed to: Tingguang Ma, E-mail: [email protected] Fire Technology Ó 2013 Springer Science+Business Media New York. Manufactured in The United States DOI: 10.1007/s10694-013-0355-4 12
Transcript of Theoretical Flammability Diagram for Analyzing Mine Gases

Theoretical Flammability Diagramfor Analyzing Mine Gases
Tingguang Ma* and Michael Larranaga, Department of Fire Protection &Safety Technology, Oklahoma State University, 492 Cordell South,Stillwater, OK 74078, USA
Received: 10 May 2013/Accepted: 22 July 2013
Abstract. Out of the thermal balance method, a method of presenting mine fire data
is proposed in this work. By grouping fuels into a pseudo fuel, grouping nitrogen andoxygen into a pseudo air, and using carbon dioxide as the diluent, a diluted flamma-bility diagram is reconstructed for this oxygen-modified environment. The flammabil-
ity envelop is controlled by oxygen availability, while the operation point iscontrolled by fuel/diluent availability. The relative position between the envelop andthe operation point shows the flammable state of this mixture. Coward’s explosivetriangle is also applied using the limiting oxygen concentration derived from the dia-
gram. Both are most useful in guiding the suppression operation for an undergroundcoal mine fire.
Keywords: Mine fires, Flammability envelop, Limiting oxygen concentration, Combustion diagnosis,
Fire suppression
Nomenclature
CAFT Critical adiabatic flame temperature (K)
CO The oxygen coefficient in a reaction, dimensionless
HO The heating potential of oxygen based on air, dimensionless
HF The heating potential of fuel based on air, dimensionless, HF = COHO
LFL Lower flammability limit (volume ratio), % or dimensionless
QD The quenching potential of diluent based on air, dimensionless
QF The quenching potential of fuel based on air, dimensionless
QO The quenching potential of oxygen based on air, dimensionless, QD = 1.046
R The mixing ratio of diluent over fuel
UFL Upper flammability limit (volume ratio), % or dimensionless
xL Lower flammability limit (volume ratio), % or dimensionless
xU Upper flammability limit (volume ratio), % or dimensionless
Subscripts
d Diluent
i Component of a mixture
m Sum of a mixture
st Stoichiometric
L Lower flammable limit
U Upper flammable limit
* Correspondence should be addressed to: Tingguang Ma, E-mail: [email protected]
Fire Technology
� 2013 Springer Science+Business Media New York. Manufactured in The United States
DOI: 10.1007/s10694-013-0355-4
12

D Diluent-based potential to air potential
F Fuel-based potential to air potential
O Oxygen-based potential to air potential
LU Cross point of LFL and UFL lines, or Inertion point
1. Introduction
The explosive danger of mine gases has long been recognized since Sir HumphreyDavy’s classical experiments on methane flammability in 1816 [1]. The environ-mental awareness of underground coal fires put a new demand on determining theexplosibility of mine gas mixtures [2]. The main barriers in diagnosing coal firesare a variable oxygen level and a mixture of multiple fuels. Fuels are relativelyeasy to deal with using either Le Chatelier’s rule or thermal balance method [3].For the role of oxygen, the heat capacity of oxygen is roughly the same as nitro-gen, so the LFL in oxygen is roughly the same as in air. Without a consistent the-ory to treat oxygen, flammability diagrams are resorted to determine theflammable state of a mixture.
Recently, Cheng et al. [4] summarize that there are six graphical methods todetermine the mine gas explosibility, tertiary diagram, revised Le Chatelier’s Rule,maximum allowable oxygen (MAO) analysis, USBM method, Coward’s explosivetriangle and Kukuczka method. Tertiary diagram is the standard diagram encour-aged by Zabetakis [5], Crowl [6], Schroeder et al. [7]. Kukuczka method [8] is avariation of Coward explosive triangle, which is also the standard method foranalyzing mine gases [9, 10, 11]. USBM explosibility diagram is a popular methodused in mine industry [5], with a targeted methane–air–inert range. Revised LeChatelier’s Rule has been adopted in estimating inerting concentrations [12]. Inpractice, explosive triangle (for oxygen content) plus Le Chatelier’s Rule has beenwidely used to determine the mixture explosibility since 1948, and still beingimproved for better presentation [13]. Most above methods are relying on LeChatelier’s Rule by pairing fuel/diluent for mixture flammability [14], and com-pare the real oxygen level with LOC or MAO for clues of explosion.
More than one century of experimental and theoretical work on flammabilitystresses the ternary (fuel/oxygen/diluent) picture of a flammability problem, mak-ing a universal graphical method difficult to use and explain. How to reliably pre-dict the role of fuel/diluent/oxygen on the flammability envelop requires a detailanalysis of the thermal balance within components of a mixture. So a thermal bal-ance method [3] adopting a binary view on each species has been proposed. Allspecies has a mass, with a non-zero quenching potential, while fuel or oxygen canrelease energy, with LFL controlled by fuel and UFL controlled by oxygen. Thisbinary treatment makes the contribution of each species cumulative and additive,thus making a hand-calculation possible. This method has been applied to find theflammability of a flammable mixture. Now this method will be tailored to recon-struct the flammability envelop under various oxygen levels, with a special empha-sis on analyzing the flammable gas mixtures from a coal mine.
This paper is organized as follows. A brief summary of the thermal balancemethod is provided first. Role of oxygen will be analyzed next. A series of mine
Fire Technology 2013

gas samples are analyzed and presented to show the utility of this method onmine safety.
2. Theoretical Development
The theoretical development of the thermal balance method is provided elsewhere[3]. Here is a brief summary of assumptions and equations in this method. Thebasic assumption of thermal balance method is a constant critical adiabatic flametemperature (CAFT), so we can compare and manipulate the thermal signature ofvarious fuels within a same framework. The second assumption is that oxygen cal-orimetry applies at both lower and upper limits (implying the reaction is completeat UFL and similar to the reaction at LFL). Thus we can put LFL and UFL con-ditions side by side to solve its inherent thermal signature for the fuel.
The procedure of thermal balance methods is to get the thermal signature of allcomponents first. Fuels get their thermal signature from LFL/UFL information,while the quenching potentials of diluents and oxygen are directly computablefrom their enthalpy information (retrievable and constant in reference to airenthalpy). Then the thermal signature of this mixture is achievable by adding-upenergy terms accordingly. Flammability limits are estimated by reversing theenergy terms into the concentration domain. Flammability envelops outlined byLFL and UFL lines will be reconstructed from the thermal signature of this mix-ture. A summary of governing equations is derived and provided in Appendix.
2.1. Theoretical Flammability Diagram in Normal Air
For the gases from a mine fire, measurements are taken on oxygen, two diluents(nitrogen and carbon dioxide), and three or more fuels. They can be regroupedinto a pseudo fuel burning in a pseudo air diluted by carbon dioxide.
With flammability in normal air, the flammability envelop is composed of twolines. Using the diluent/fuel ratio, R, as the input variable, the two lines are gov-erned by (Equations (1) and (2), see derivation in Appendix 1)
xL ¼1
1þ COHO1þR �
QF1þR�
QDR1þR
ð1Þ
xU ¼0:2095 � HO � 1
0:2095 � HO � 1þ QF1þRþ
QD�R1þR
ð2Þ
A validation of the flammability diagram is shown below. The experimental dataare taken from Coward and Jones [14]. The theoretical flammability diagram isbased on thermal balance method, which assumes the flame temperature is con-stant at UFL and LFL lines. However, this assumption is breaking down near theinertion point (IP), so the derivation between experimental and theoretical can besignificant at the IP for benzene (Figure 1b).
Theoretical Flammability Diagram

The most important point in the flammability diagram is the cross point (RLU,xLU), which is controlled by
RLU ¼0:2095 � COH2
O � COHO � 0:2095 � HOQF
0:2095 � HO � QDð3Þ
xLU ¼1
1þ COHO1þRLU
� QF1þRLU
� QDRLU1þRLU
ð4Þ
If R<RLU, the mixture is conditional flammable, which means it is flammable orwill be flammable by adding fuel or air. If R ‡ RLU, the mixture is absolute non-flammable, which means it will not be flammable by adding fuel or air. So thispoint is the IP beyond which no ignition is possible. The flammable zone is shownin Figure 2.
(a) (b)
R=xD/xF
x F
0 5 10 150
0.1
0.2
0.3
0.4
0.5
0.6
C2H6+N2 (exp)C2H6+N2
C2H6+CO2 (exp)C2H6+CO2
R=xD/xF
x F
0 5 10 15 20 25 30 35 400
0.1
0.2
0.3
0.4
0.5
0.6
C6H6+N2 (exp)C6H6+N2
C6H6+CO2 (exp)C6H6+CO2
Figure 1. Flammability diagrams of ethane and benzene.
R=xD/xF
xm
0 10 20 30 400
0.2
0.4
0.6
0.8
1
xL
xU
Flammable
Non-flammable(fuel-rich/oxygen-lean)
Non-flammable(fuel-lean/oxygen-rich)
Non-flammable(fuel-lean/oxygen-lean)
RLU
xLU
UFLIP
LFL
Figure 2. Flammable states in a theoretical flammability diagram.
Fire Technology 2013

Current industrial practice of assessing the mine atmosphere is using Coward’sexplosive triangle, which rely heavily on the concept of nose limit, or limiting oxy-gen concentration (LOC), of the mixture. Given a complete flammability envelop,the LOC is defined as the minimum oxygen concentration for supporting flamepropagation. From the flammability envelop, we can see that LOC1 is also the IP.Here we use LOC1 to differentiate it from LOC2, which is a concept of explosibil-ity and will come later in this work. Here LOC1 is estimated as the oxygen frac-tion of air apart from the inerting diluent and the fuel.
LOC1 ¼ 0:2095 � 1� xLUð Þ ð5Þ
Note this equation is scaled down by 0.2095. Even the experimental IP is awayfrom the theoretical IP (see Figure 1b), the error from Equation (5) should besmall, since it receives only 1/5 of the error from fuel/diluent concentrations.
2.2. Oxygen-Modified Flammability Diagram
The above diagram is based on fuel and diluent, whereas the rest is air with aconstant oxygen fraction. If the background oxygen level is changed, mostlydepleted in a mine fire, the flammability envelop will shrink accordingly. Here is atheoretical treatment of oxygen in air.
Assume that the mole (volumetric) fraction of oxygen in air is k, then thequenching potential of air is Qm ¼ 1� kð Þ � QN þ k � QO. The range of Qm is boun-ded by 0.992 of nitrogen and 1.046 of oxygen, which are derived from enthalpydata at the critical flame temperature (usually 1,600 K), see [3].
The flammable envelop of a variable oxygen fraction is bounded by LFL line(Equation 6) and UFL line (Equation 7). Both lines cross at the IP point (RLU,xLU).
xL ¼Qm
Qm þ COHO1þR �
QF1þR�
QDR1þR
ð6Þ
xU ¼k � HO � Qm
k � HO � Qm þ QF1þRþ
QD�R1þR
ð7Þ
RLU ¼COH 2
Ok� kHOQF � COHOQm
kHOQDð8Þ
Using above equations with different k values, we have a series of flammabilityenvelops developed in Figure 3. From this diagram, we can see that the oxygen-enriched environment will expand the flammability envelop by raising the UFLline. However, if the background oxygen level continues to drop, the flammabilityenvelop will shrink to nil, which means the LOC is reached. This limit is differentfrom LOC1 of flammability, but close to the European definition of LOC, the
Theoretical Flammability Diagram

maximum oxygen concentration, below which an explosion will not occur. Herewe use LOC2 of explosibility to differentiate it from LOC1.
Usually, LOC2 is the critical oxygen concentration below which fire or explo-sion is not possible for any mixture. Theoretically, it means the UFL is approach-ing LFL line, so the flammability envelop is approaching nil. In flammabilitydiagram, it is the critical condition that LFL line is approaching UFL line, orflammability envelop approaches nil. Mathematically, it means Rw = 0. So wehave a second definition of the LOC (LOC2) as
LOC2 ¼ k � CO
COHO � QF¼ COxL
1� xLð9Þ
Theoretically, this means a conversion from fuel concentration to oxygen concen-tration, a fact long observed in history. For example, the simple conversionscheme in Crowl [15] states LOC2 ¼ COxL. Corresponding to LEL, where the fuelis fully consumed in response to the availability of oxygen, LOC2 stresses the abil-ity to consume the fuel completely. European standards define LOC2 as the maxi-mum oxygen concentration, in which an explosion will not occur, stressing theexplosion potential of a flammable mixture.
3. Graphical Representation of Mine Gases
On May 13, 1940, a fire was discovered in the Continental mine of the HazleBrook Coal Co. Centralia, PA [9]. This is a well-instrumented, well-documentedand thoroughly-analyzed fire, where typical samples of the mine fire atmosphereare listed in Table 1. In order to derive the theoretical flammability diagram, thethermal signatures of all species are provided and listed in Table 2.
For the gases from a mine fire, all fuels (CO, H2, CH4) are grouped together asa pseudo fuel, while nitrogen and oxygen are grouped together as a pseudo air.Then the carbon dioxide is treated as the diluent. From the thermal properties of
R
x F
0 5 10 150
0.1
0.2
0.3
0.4
0.5
0.6
0.7
0.8
0.9
λ=1.0λ=0.8λ=0.5λ=0.4λ=0.3λ=0.21λ=0.14
Figure 3. Methane flammability envelop in oxygen-modified air.
Fire Technology 2013

the pseudo fuel/air/diluent, we can reconstruct the flammability diagram. Fromthe diagram, we can derive the LOC, which is used for drawing Coward’s explo-sive triangle. Here an example to derive the diagram, LOC and Coward’s explo-sive triangle step by step.
3.1. Procedures for Presenting One Sample
Using the data for sample 1 in Table 1, we will develop the flammability diagramto determine the flammable state of this mixture (part A). Then the Cowardexplosive triangle is developed for the flammable sate of this mixture as a compar-ison (part B).
Part A.This is a flammability problem within a variable-oxygen environment. The air is
composed of 8.13% O2 + 80.94% N2, the fuel is composed of 0.08% CH4,0.41% H2, 0.91% CO. Or the pseudo fuel is 1.4% in total. The diluent is 9.53%CO2. In order to reconstruct the flammability diagram, the following steps are fol-lowed.
1. The oxygen fraction in the air is k = 8.13/(8.13 + 80.94) = 9.13%. So thequenching potential of the pseudo air is Qm ¼ k � QO þ 1� kð Þ � QN ¼ 0:997.
2. The thermal signature of the fuel mixture is CO ¼ 0:586; QD ¼ 2:33; HO ¼ 25:61from the spreadsheet calculation shown in Table 3.
Table 1Recordings of the Mine-Fire Atmosphere During an Underground CoalFire
Date, 1940 May 19 May 21 May 24 May 24 June 4 June 5 June 5 June 5 June 5 June 7 June 8
Sample 1 2 3 4 5 6 7 8 9 10 11
CO2 9.53 3.70 6.50 6.90 12.30 13.00 12.60 12.50 11.10 2.20 14.00
O2 8.13 15.30 11.50 10.20 2.90 0.40 0.20 0.70 4.30 18.00 2.60
CO 0.91 0.60 1.10 1.40 1.00 4.50 6.60 6.60 2.30 0.30 0.40
CH4 0.08 0.00 0.00 0.00 0.10 0.90 1.00 0.80 0.00 0.10 1.00
H2 0.41 0.60 1.50 1.90 1.50 7.00 8.80 9.90 2.70 1.00 8.30
N2 80.94 79.80 79.40 79.50 82.20 74.20 70.80 69.50 79.60 78.40 73.70
Table 2Input Data for Deriving Thermal Signature of Different Species
CO xL xU QF HO
CO2 1.75
O2 1.06
CO 0.5 12.5 74.0 0.80 15.59
CH4 2.0 5.0 15.0 13.81 16.40
H2 0.5 4.0 75.0 3.51 55.02
N2 0.99
Theoretical Flammability Diagram

3. The operation point is xm ¼ xF þ xD ¼ :014þ :0953 ¼ :1093; R ¼ 9:53=1:4 ¼ 6:81:4. Using QD ¼ 1:75 for the diluent (carbon dioxide) to reconstruct the flammabil-
ity diagram by using Equations (6) and (7) with the above inputs.5. Since the operation point is outside the flammability envelop, this mixture is
not flammable (too lean to burn).
Part B.This is a flammability problem in a variable-oxygen atmosphere. LOC is
derived from the Figure 4 or Equation (5) for the nose limit in the Coward’sexplosion triangle.
1. Find the LFL point as
xLðR ¼ 0Þ ¼ Qm
Qm þ COHO1þR �
QF1þR�
QDR1þR
¼ 0:997
0:997þ 0:586� 25:61� 2:33¼ 0:072
xO ¼ k � ð1� xLÞ ¼ 0:0913 � ð1� 0:0729Þ ¼ 0:0846
Table 3Spreadsheet Calculations for Fuels Only
Fraction xi (%) CO xL xU QF HO
0.91 65.00 0.5
12.5
74 0.80 15.59
0.08 5.71 2 5 15 13.81 16.40
0.41 29.29 0.5 4 75 3.51 55.02
1.40 100 0.586 2.33 25.61
Figure 4. Flammability diagram and flammable states of sample 1 inTable 1.
Fire Technology 2013

2. Find the UFL point as
xU ¼k � HO � Qm
k � HO � Qm þ QF1þRþ
QD�R1þR
¼ 0:0913 � 25:61� 0:993
0:0913 � 25:61� 0:993þ 2:33¼ 0:366
xO ¼ k � ð1� xU Þ ¼ 0:0913 � ð1� 0:366Þ ¼ 0:0579
3. In order to get the nose point, the IP has to be determined first.
RLU ¼k � COH2
O � k � HOQF � COHO
k � HOQD
¼ 0:0913� 0:586� 25612 � 00913� 25:61� 233� 0586� 25:61
0:0913� 25:61� 1:75
¼ 3:5766
xLU ¼Qm
Qm þ COHO1þRLU
� QF1þRLU
� QDR1þRLU
¼ 0:997
0:997þ 0:586�25:61�2:33�1:75�3:57664:5766
¼ 0:4155
Then the nose point is determined as xO ¼ k � ð1� xLU Þ ¼ 0:0913 � ð1� 0:4155Þ ¼0:0533 (Note, this is LOC1. LOC2 ¼ COxL
1�xL¼ 0:586�0:0729
1�0:0729 ¼ 0:046, but it is not usedhere.)
xF ¼xLU
1þ R¼ 0:4155
1þ 3:5766¼ 0:091
4. The operation point in Table 1 is measured as xF = 0.014, xO = 0.0813.5. With the above four points, we can reconstruct the Coward’s explosive triangle
as shown in (Figure 5).
Figure 5. Coward’s explosive triangle showing sample 1 in Table 1.
Theoretical Flammability Diagram

3.2. Data Presentation for All Samples
Following the procedure above, we can finish the rest diagrams shown in Fig-ure 6. Note, sample 1–5 were taken before a period of strong burning at sample6–8. After that, sample 9–11 were taken when the major burning has been overand the ventilation was resumed and then stopped.
Figure 6a shows the flammable states before the active burning. Initially, thesample is too lean to burn at sample 1. Then as more fuels are released, the flamma-bility envelop expands in response to oxygen level increase. Right before the activeburning (sample 5), the flammability envelop is significantly reduced due to oxygendepletion in a sealed compartment. The sample point is outside of the flammabilityenvelop, showing that the fuel is too lean to burn, consistent with fact that the fire isalmost quenched by LOC1. Without high temperature to expand the flammabilityenvelop, the sample in combustion products should be located under the envelopsince the fire is sealed. With sufficient temperature, the fuel continues burning untilfuel or oxygen is full consumed, which is a typical scenario in a furnace.
Figure 6b shows the state of the mine-gas atmosphere after the opening of theseal at sample 10. The leaked oxygen will expand the flammability envelop. Theflammable state is switching from conditional flammable (too lean to burn, sample09 and sample 10) to conditional flammable (too rich to burn, sample 11) again, inresponse to further production of fuel due to ventilation. Unfortunately, the localtemperature was not recorded and used in the analysis, so the flammability informa-tion may not be complete (oxygen level drops means the fire is burning again, so thetemperature is rising. However, no temperature information is recorded).
From the above two diagrams, we can see that the oxygen level determines theflammability envelop size (mostly through lifting the UFL line), while the fuelproduction is reflected on the position of the operation points. The flammablestate of a mixture is depending on the relative position between the envelop(mainly controlled by oxygen) and the sample point (mainly controlled by fuel).
Figure 7 shows the measured oxygen concentrations in reference to theoreticalLOCs. We cannot determine the flammable state of each sample from the relative
Figure 6. Flammable states of the mine-fire atmosphere before(a) and after (b) the active burning and the sealing.
Fire Technology 2013

position of oxygen and LOCs, as the dimension of diluent is not provided in thisfigure. LOC1 is a concept of flammability, as it is derived from and controlled byoxygen and diluent. LOC2 is a concept of explosibility, so it is a function of thefuel only. If the oxygen level drops below LOC1, the reaction is stopped becauseof insufficient oxygen or too much diluent to sustain the flame propagation. If theoxygen drops below LOC2, the reaction is stopped due to insufficient oxygen tomatch the fuel, and the flammability envelop is non-existent. This is the reasonthat we cannot make flammability diagrams for sample 6–8.
Similarly, we can present the series of Coward explosive triangles in Figure 8using the data in Table 1. Note LOC1 is used for the ‘‘nose’’ value in these explo-sive triangles, because LOC1 is traditionally used in the mine industry, which pre-fers flammability over explosibility. Sample 5 and Sample 11 have a reducedtriangle, consistent with the result in Figure 7.
Figure 7. Oxygen measurements in relative to LOCs for samples inTable 1.
Figure 8. Flammable state representation using Coward explosivetriangles.
Theoretical Flammability Diagram

4. Conclusion
Purely out of theory, oxygen-modified flammability equations are derived toexplain the role of oxygen/diluent/fuel in different flammable scenarios. Generally,LFL lines are little changed by the variable oxygen, since it is controlled mainlyby fuel properties and oxygen’s thermal property is close to that of air. Only inthe fuel rich zone, the role of oxygen begins dominating and changes the shape offlammability envelop sharply.
Two types of LOCs are derived from the flammability diagram. LOC1 is usedfor the nose limit in Coward’s explosive triangle, while LOC2 is used to determinewhether the flammable envelop exists. For the active burning period in the sealedmine, real oxygen level drops below LOC2, which means the flammable envelop isnot available. Both diluted flammability diagram and Coward explosive trianglecan display the flammable state of the mixture intuitively.
In sum, the theoretical flammability envelops are derived to present measure-ment data more effectively. The flammability envelop will adjust according tolocal oxygen levels, while the operation point is reflecting the fuel availability inthe mixture. Together, they provide a global picture of the flammable state of themixture, especially useful for diagnosing and suppressing underground mine fires.
Appendix 1: Governing Equations for Fuel Burning in air
Following previous work [3], the flammability system is treated as a binary systemwith fuel or oxygen releasing energy, and fuel/oxygen/inertant(s) absorbing energy.Since most species has non-linear temperature-dependent thermal properties, it isa natural choice to use air properties (specifically the enthalpy of air) as the refer-ence point. All other agents are scaled with the enthalpy of air, so they can bemanipulated by hand via a simple index.
Based on assumptions that most combustion products are similar to air, a non-dimensional variable is introduced by scaling with the enthalpy difference of airfrom ambient temperature to the critical flame temperature, which is typically1,600 K at LFL or UFL. Here the quenching and the heating potential of speciesi are defined as
Qi ¼Ei
Eair¼
H 0AFT � H0
298:15
� �i
H 0AFT � H0
298:15
� �air
ðA1Þ
Hi ¼Ei
Eair¼ EnergyReleasei
H 0AFT � H0
298:15
� �air
ðA2Þ
where H0AFT is the enthalpy value of this species at adiabatic flame temperature
(AFT) which is assumed to be constant around 1,600 K. Note some diluents (suchas CO2, N2, O2) can have their quenching potentials derived directly using theenthalpy information from NIST website (see [3] for details).
Fire Technology 2013
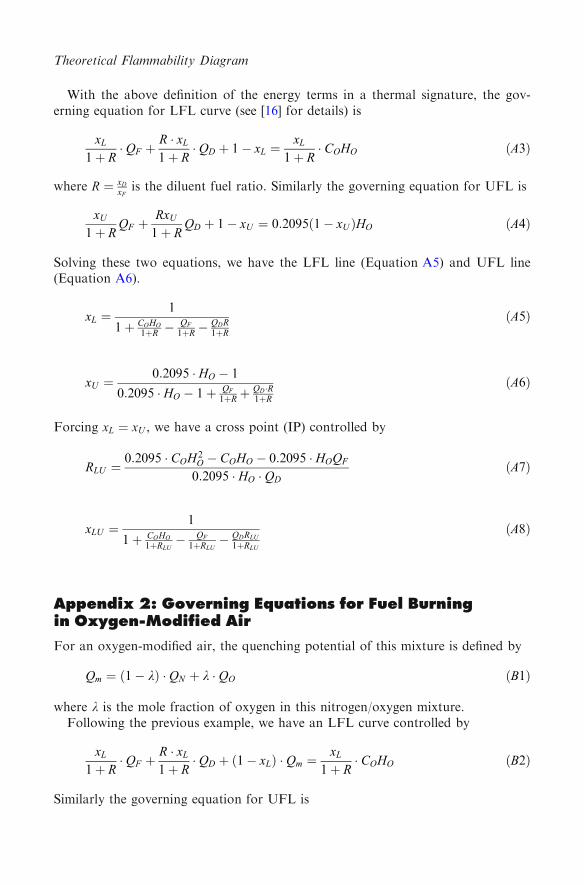
With the above definition of the energy terms in a thermal signature, the gov-erning equation for LFL curve (see [16] for details) is
xL
1þ R� QF þ
R � xL
1þ R� QD þ 1� xL ¼
xL
1þ R� COHO ðA3Þ
where R ¼ xDxF
is the diluent fuel ratio. Similarly the governing equation for UFL is
xU
1þ RQF þ
RxU
1þ RQD þ 1� xU ¼ 0:2095 1� xUð ÞHO ðA4Þ
Solving these two equations, we have the LFL line (Equation A5) and UFL line(Equation A6).
xL ¼1
1þ COHO1þR �
QF1þR�
QDR1þR
ðA5Þ
xU ¼0:2095 � HO � 1
0:2095 � HO � 1þ QF1þRþ
QD�R1þR
ðA6Þ
Forcing xL ¼ xU , we have a cross point (IP) controlled by
RLU ¼0:2095 � COH2
O � COHO � 0:2095 � HOQF
0:2095 � HO � QDðA7Þ
xLU ¼1
1þ COHO1þRLU
� QF1þRLU
� QDRLU1þRLU
ðA8Þ
Appendix 2: Governing Equations for Fuel Burningin Oxygen-Modified Air
For an oxygen-modified air, the quenching potential of this mixture is defined by
Qm ¼ 1� kð Þ � QN þ k � QO ðB1Þ
where k is the mole fraction of oxygen in this nitrogen/oxygen mixture.Following the previous example, we have an LFL curve controlled by
xL
1þ R� QF þ
R � xL
1þ R� QD þ 1� xLð Þ � Qm ¼
xL
1þ R� COHO ðB2Þ
Similarly the governing equation for UFL is
Theoretical Flammability Diagram

xU
1þ RQF þ
R � xU
1þ RQD þ 1� xUð Þ � Qm ¼ k � 1� xUð Þ � HO ðB3Þ
Solve the above three equations, we have
xL ¼Qm
Qm þ COHO1þR �
QF1þR�
QDR1þR
ðB4Þ
xU ¼k � HO � Qm
k � HO � Qm þ QF1þRþ
QDR1þR
ðB5Þ
Forcing xL ¼ xU , we have the cross point
RLU ¼COH 2
Ok� kHOQF � COHOQm
kHOQDðB6Þ
If k = 0.2095, Qm ¼ 0:992� ð1� 0:2095Þ þ 1:046� 0:2095 ¼ 1. So Equation (A7)is a special case of Equation (B6).
The limiting case for RLU is RLU = 0, or COH 2Ok� kHOQF � COHOQm ¼ 0,
which translates to
k ¼ COHOQN
COH2O � HOQF � QO � QNð Þ � COHO
ðB7Þ
Since QN ¼ 0:992 � 1, QO � QN ¼ 1:046� 0:992 ¼ 0:054 � 0 and xL ¼ 11þCOHO�QF
,the LOC is k � CO
COHO�QF¼ COxL
1�xL, which is termed LOC2 in this work.
Appendix 3: Systematic Work on Thermal BalanceMethod
Under the request of a reviewer, a review of our systematic work on thermal bal-ance method is provided here.
The original idea on thermal balance method came when the first author wasworking in a suppression company. If a thermal agent works by absorbing energyin a suppression test, then the excess air is the thermal agent in a flammabilitytest. So by scaling everything with the thermal properties of air, the flammabilitydata can be projected to different suppression tests [17]. One trouble-maker is thedifferent critical flame temperatures at ignition and extinction, which is accountedby a correction factor. Under this thermal view, not only fuels can be ranked bytheir energy-releasing potential (suppressibility, to be suppressed), but also all sup-pressing agents can be compared by their energy-absorbing potentials (also sup-pressibility, to suppress others). Some agents play a more contribution than their
Fire Technology 2013

molecular weights could explain, which is called synergistic effect, and can beexplained by the raised flame temperature, which changed the contributions ofeveryone in reaction.
Comparing with the difficulties in suppression tests, such as wall-quenching andflow stretching, the flammability tests are supposed to be independent of ignition,wall-quenching and flow-stretching, so our attention moved to flammability data.The thermal balance method for isolating the duel functions (heating and quench-ing) of a fuel was proposed first [3]. This method was also proved to be equivalentto Le Chatelier’s Rule, but expanding into the new field of including diluent intothe estimation scheme. Existing correlations were checked next to find out thatmost correlations are assuming the energy-balance implicitly [18]. Since the mostimportant factor on flammability is the ambient temperature, an improvement tothe modified Burgess-Wheeler’s Law is derived using the thermal balance methodand submitted to Fire Safety Journal [19]. It solves the discrepancy between theslope of experimental data and the slope of ambient air enthalpy, first observed byZabetakis [5].
At the suggestions from Mr. Samuel Rodgers of Honeywell, Inc. (chair ofNFPA69) in the summer of 2012, we derived the diluted flammability diagramusing the diluent/fuel ratio as the input. It was used to solve mixing problems[20], derive diagrams to solve some problems on dilution and purge [16], anddetermine the flammable state systematically [21]. Basically, it enriched ourunderstanding on the diluted flammability diagram, which was originally pro-posed by Jones to compensate the inability of Le Chatelier’s rule on diluents.Since the purge process can be analytically presented on the diluted flammabilitydiagram, this diagram is equivalent to and better than the ternary diagram cur-rently in use.
Out of the flexibility of thermal balance method to treat various gases, attentionwas paid on the variable-oxygen environment, which is frequently encountered ina mine fire. With the concept of a pseudo air (or oxygen-modified air), the firegases can be better presented with the new diluted flammability diagram andCoward’s explosive triangle. This is covered in this work. However, how toresolve the difference between LOC1 and LOC2 let us to design thought experi-ments to show the difference between flammability and explosibility [22]. It is sup-posed to clarify many misunderstandings on flammability. Most engineeringcorrelations are based on explosibility instead of flammability, though they aremeasured same experimentally.
Currently, we are working on the flammability for clean-burning technologies,where CO2-diluted fuel has a burning-stability problem to be overcome by hydro-gen-doping. Also we are working on a review of engineering approaches for flam-mability estimation and a web-based tool, www.flammabilityestimator.com. It isdesigned with four major safety-related functions, flammable state of a mixture,mine gas safety, clean burning safety, dilution and purge. If you have specialproblems and needs on flammability treatment, please email us via [email protected].
Theoretical Flammability Diagram

References
1. Davy SH (1816) On the fire-damp of coal mines, and on methods of lighting the mines
so as to prevent its explosion. Philos Trans R Soc Lond 106:1–222. Stracher GB, Prakash A, Sokol EV (2010) Coal and peat fires: a global perspective: vol-
ume 1: coal-geology and combustion, 1Elsevier, London
3. Ma T (2011) A thermal theory for estimating the flammability limits of a mixture. FireSaf J 46(8):558–567
4. Cheng J, Wang C, Zhang S (2012) Methods to determine the mine gas explosibility—anoverview. J Loss Prev Process Ind 25(3):425–435
5. Zabetakis MG (1965) Flammability characteristics of combustible gases and vapors.DTIC document. U.S. Bureau of Mines, Pittsburgh
6. Crowl DA (2010) Understanding explosions, 16Wiley-AIChE, Indianapolis
7. Schroder V, Molnarne M (2005) Flammability of gas mixtures: part 1: fire potential.J Hazard Mater 121(1):37–44
8. Kukuczka M (1982) A new method for determining explosibility of complex gas mix-
tures. Mech Autom Gorn 164(11):36–399. Ash SH, Felegy EW (1948) Analysis of complex mixtures of gases. U.S. Bureau of
Mines, Washington DC10. Shaw JF (1995) A graphic method of determining the explosibility characteristics of
mine–fire atmospheres. Bulletin 551, Bureau of Mines, Washington, DC11. Timko RJ, Derick R (2006) Methods to determine the status of mine atmospheres—an
overview. National Institute for Occupational Safety and Health Publications, Pitts-
burgh12. Greuer RE (1974) Study of mine fire fighting using inert gases. Michigan Technological
University, Houghton
13. Cheng J, Luo Y (2013) Modified explosive diagram for determining gas-mixture explo-sibility. J Loss Prev Process Ind 26(4):9
14. Coward HF, Jones GW (1952) Limits of flammability of gases and vapors. DTIC docu-ment. Bureau of Mines, Washington, DC
15. Crowl DA, Louvar JF (2001) Chemical process safety: fundamentals with applications.Prentice Hall, CSHIB
16. Ma T (2013) A thermal theory for flammability diagrams guiding purge and inertion of
a flammable mixture. Process Saf Prog 32(1):717. Ma T, Wang Q, Larranaga M (2013) From ignition to suppression, a thermal view.
Fire Technol. doi:10.1007/s10694-013-0338-5
18. Ma T, Wang Q, Larranaga M (2013) Correlations for estimating flammability limits ofpure fuels and fuel–inert mixtures. Fire Saf J 56:9–19
19. Ma T (2013) A thermal explanation to the temperature dependence of flammability lim-its. Fire Saf J (submitted)
20. Ma T, Wang Q, Larranaga M (2012) Estimating flammability limits. FS-World, Fall2012
21. Ma T (2013) Flammable state of a mixture. Process Saf Prog. (accepted)
22. Ma T (2013) Flammability vs. explosibility. Fire Mater (submitted)
Fire Technology 2013