Diagram processing: Computing with diagrams
46
Artificial Intelligence 145 (2003) 181–226 www.elsevier.com/locate/artint Diagram processing: Computing with diagrams ✩ Michael Anderson a,∗ , Robert McCartney b a Department of Computer and Information Sciences, Fordham University, 441 EastFordham Road, Bronx, NY 10458-9993, USA b Department of Computer Science and Engineering, University of Connecticut, 191 Auditorium Road, Storrs, CT 06269-315, USA Received 5 June 2002; received in revised form 7 June 2002 Abstract Of the set of behaviors that will be required of an autonomous artificially intelligent agent, a somewhat neglected member has been the ability to deal with diagrammatic information. We describe a theoretical and computational foundation for machine processing of certain forms of diagrammatic information and show its usefulness in enabling a system to draw inferences from diagrammatic information, make decisions using diagrammatic information, learn from diagrammatic information, solve problems posed diagrammatically, and communicate diagrammatically in a variety of domains. 2003 Elsevier Science B.V. All rights reserved. Keywords: Diagrammatic reasoning; Analogical reasoning; Knowledge representation 1. Introduction Pictorial representations of information predate textual representations by at least six thousand years. Fig. 1 shows one of the earliest representations known: a petrogram from the caves at Altimira, Spain (c. 14 000–c. 9500 BC). It is clearly pictorial in nature and, contrasted to the earliest extant textual representation, Mesopotamian cuneiform from the end of the 4th millennium BC (Fig. 2), it still speaks volumes to people from all cultural and linguistic backgrounds. ✩ This material is based upon work supported by the National Science Foundation under grant number IIS- 9820368. * Corresponding author. E-mail addresses: [email protected] (M. Anderson), [email protected] (R. McCartney). 0004-3702/03/$ – see front matter 2003 Elsevier Science B.V. All rights reserved. doi:10.1016/S0004-3702(02)00383-1
Transcript of Diagram processing: Computing with diagrams

Artificial Intelligence 145 (2003) 181–226
www.elsevier.com/locate/artint
Diagram processing:Computing with diagrams ✩
Michael Anderson a,∗, Robert McCartney b
a Department of Computer and Information Sciences, Fordham University, 441 East Fordham Road,Bronx, NY 10458-9993, USA
b Department of Computer Science and Engineering, University of Connecticut, 191 Auditorium Road,Storrs, CT 06269-315, USA
Received 5 June 2002; received in revised form 7 June 2002
Abstract
Of the set of behaviors that will be required of an autonomous artificially intelligent agent, asomewhat neglected member has been the ability to deal with diagrammatic information. We describea theoretical and computational foundation for machine processing of certain forms of diagrammaticinformation and show its usefulness in enabling a system to draw inferences from diagrammaticinformation, make decisions using diagrammatic information, learn from diagrammatic information,solve problems posed diagrammatically, and communicate diagrammatically in a variety of domains. 2003 Elsevier Science B.V. All rights reserved.
Keywords: Diagrammatic reasoning; Analogical reasoning; Knowledge representation
1. Introduction
Pictorial representations of information predate textual representations by at least sixthousand years. Fig. 1 shows one of the earliest representations known: a petrogram fromthe caves at Altimira, Spain (c. 14 000–c. 9500 BC). It is clearly pictorial in nature and,contrasted to the earliest extant textual representation, Mesopotamian cuneiform from theend of the 4th millennium BC (Fig. 2), it still speaks volumes to people from all culturaland linguistic backgrounds.
✩ This material is based upon work supported by the National Science Foundation under grant number IIS-9820368.
* Corresponding author.E-mail addresses: [email protected] (M. Anderson), [email protected] (R. McCartney).
0004-3702/03/$ – see front matter 2003 Elsevier Science B.V. All rights reserved.
doi:10.1016/S0004-3702(02)00383-1
182 M. Anderson, R. McCartney / Artificial Intelligence 145 (2003) 181–226
Fig. 1. Petrogram, Altimira, Spain, c. 14 000–c. 9500 BC.
Fig. 2. Cuneiform, Mesopotamia, end of the 4th millennium BC.
Interestingly, textual representations evolved from pictorial representations [25]. Thedriving force of this evolution was the search for economy of expression, pictorialrepresentations being too numerous and unwieldy. Fig. 3 shows the evolution of thecharacter “A” from its earliest incarnation as a pictograph of a bull’s head through itslogographic and syllabic stages to its final alphabetic form (still complete with horns!).This evolution not only entailed transformation of the physical appearance of the symbolbut also its semantic content. The meaning of a pictograph is the object represented itselfor some idea that the object might represent (in the example, a bull or possibly the conceptof stubbornness). Logographic symbols came to represent the spoken word for the objector idea represented. In logographic languages, words that sounded similar might share alogographic symbol regardless of the similarity of the object or idea represented by thatsymbol. This linkage between sound and symbol was further refined, first through syllabicrepresentations where each symbol represents a syllable of a word, and finally to alphabetic

M. Anderson, R. McCartney / Artificial Intelligence 145 (2003) 181–226 183
Fig. 3. Evolution of a symbol from (a) pictographic to (b) logographic to (c) syllabic and, finally, to (d) alphabeticrepresentation.
representations where symbols represent the atomic sounds of a language and are combinedto form its words.
Efforts to develop textual representations have produced a compromise: although muchhas been gained in economy of expression, much has been lost in the explicitness ofthis expression. Symbols that once graphically represented objects or ideas now simplyrepresent letters and their sounds. The direct mapping that often exists between a pictorialrepresentation and its object of concern is absent from a textual representation. Clearlythere is much information explicitly represented in the pictograph of Fig. 3(a) that wouldrequire inference and related knowledge to make perspicuous given only the alphabeticrepresentation “bull”. Much of what is explicit in pictorial representations is, at best,implicit in textual ones, requiring inference to reveal it. The adage “a picture is wortha thousand words” testifies to this fact. We hypothesize that computing with textualrepresentations also suffers from the same loss of explicitness. Our research explores whatmight be gained by the restoration of this explicitness through the practice of computingdirectly with pictorial, or analogical, representations.
Sloman [52,53] defines analogical representations as those that are in some sensehomomorphic to the things they represent. Such representations are structurally similar butsimpler than the things they represent and this similarity can be exploited by representingrelations existing in the things represented by relations existing in the representation. Forexample, a diagram of the United States (Fig. 4(a)) is an analogical representation of theUnited States in that its structurally similarity with the actual geographic entity can beexploited by using relations existing in the representation (e.g., above, below, left, andright) to represent relations in the entity represented (e.g., north, south, east, and west).Sloman contrasts this to what he terms Fregean representations, those in which relationsmust be represented by text, logic, or some other formalism since these representations bearno resemblance to the things they represent. For example, “The United States of America”is a Fregean representation of the geographic entity in that it is not structurally similar tothe entity represented. Relations concerning this entity need to be further represented usingtext, logic, or some other formalism as there is no structural similarity to exploit.
There has been recent interest in computing with analogical representations. This isevidenced by the attention given to them in recent conferences and symposia (e.g., [2,9,32,41]), journals (e.g., [36,42]), and books (e.g., [14,28]). The main thrust of thisresearch to date (from an artificial intelligence perspective) has been a search forcomputational efficiency gains through representations, and related inference mechanisms,that analogously model a problem domain. As this has been the aim of much of the seminalwork in the field (e.g., [28,37]), it is understandable that much effort has been expended

184 M. Anderson, R. McCartney / Artificial Intelligence 145 (2003) 181–226
in this direction. Although it is arguable that progress has been made through this line
of research, we believe that a more important contribution of research concerned withanalogical representations will be the development of an agent that is capable of dealingdirectly with such information in all its forms.Much attention has been paid to machine synthesis, recognition and understandingof natural language in both textual and audio forms. The assumption has been thatsuch capabilities are required of an agent if it is expected to fully communicate withhuman beings and function in human environments. Much less attention has been givento machine understanding of diagrammatic information, another important mode ofhuman communication and component of human environments. We define diagrammaticinformation as two-dimensional, analogically-represented abstractions such as maps,cartograms, and charts (versus photographs or X-ray images). Effective capabilities inthis mode and with these components will prove beneficial to an agent intended as a fullpartner in human discourse and activity. In the same way that we will require such agentsto be conversant with natural language, we will expect them to exhibit competence withdiagrammatic information and its processing. Ultimately, an agent with such capabilitieswill interact with a real world environment, rife with diagrammatic information, with ahigher degree of autonomy than those without such capabilities.
Such a diagram processing agent should be able to accept and grasp diagrammatic inputfrom us and our environment as well as be able to produce diagrams in its attempt tocommunicate diagrammatically representable notions to us. We envision a system thattakes diagrams as input, processes these diagrams, extracting information from them aloneand in concert with other forms of knowledge representation, and expresses this newlygained knowledge as output in the form of new diagrams, text, actions, etc. Such a agent,for example, should be able to draw inferences from diagrammatic information, makedecisions based upon diagrammatic information, solve problems posed diagrammatically,learn from diagrammatic information, and communicate diagrammatic information toother naturally and artificially intelligent agents. Although not necessarily mutuallyexclusive in all particulars, these tasks represent a selection of the wide variety of tasksthat a diagram processing system will be required to perform.
Such a diagram processing system will be comprised of a number of fundamentalcomponents. It will require a means to input diagrams such as a vision component ordirect link to a diagram source. It will require a way to internally represent diagrams. Thediagrammatic representations so acquired will require storage, as will knowledge neededto deal with these representations, necessitating some storage management component.A processing component will be required that synthesizes and abstracts new knowledgefrom combinations of diagrammatic and other forms of knowledge representations. Variouscomponents will be required to use the new knowledge to produce desired output in avariety of situations. Although any given system’s approach will not necessarily claimcognitive plausibility, that human beings do these things as a matter of course stands as anexistence proof that such a system has been fashioned.
Reflection on the design of these components raises a number of questions: Whatconstitutes a diagram? In what form will diagrams be accepted as input by the system? Howwill diagrams be internally represented? How will knowledge be gleaned from diagrams?What is the nature and content of a priori knowledge that will be required? How will other

M. Anderson, R. McCartney / Artificial Intelligence 145 (2003) 181–226 185
forms of representation and inference be integrated with diagrammatic representations
and inference? What is nature of the desired output? How will this output be produced?These and others are hard questions with a multiplicity of answers that in themselvesgenerate more questions. They form the parameters of the problem for which values mustbe supplied by any investigation of diagram processing.As a diagram processing system capable of dealing in full generality with diagrammaticinformation in all its variety is beyond the grasp of current theory and practice, it is ourintent to explore the space of these parameters, building test beds in which various valuesfor them can be tested, compared and contrasted, and ultimately forged into this generalpurpose diagram processing system. Currently, we are exploring one possible set of valuesto the parameters of this problem:
• We define a diagram to be a tessellation (tiling) of a finite planar area such that itis completely covered by atomic two-dimensional regions or tesserae (tiles) each ofsome grayscale or color value. Such a definition is broad enough to include arbitrarilysmall tesserae (points, at the limit), array elements, pixels, and, at the other end of thespectrum, domain-specific entities such as blocks, regions, rooms, countries, etc. Asthis definition is not tied to any particular semantics, domain-specific properties andrelations can be mapped as required to the grayscale or color values of tesserae in agiven tessellation as well as the spatial relationships that hold between them. Giventhe wide variety of semantics employed by diagrams in various domains, a generaldefinition that makes no semantic commitment is useful.
• Diagrams are input directly as images. We motivate this approach by noting that afully general diagram processing system will often need to input diagrams directly asimages from its environment and human beings with which it interacts.
• Knowledge is gleaned from diagrams by directly manipulating the image input to thesystem. Here we refer to direct manipulation of the diagram by the system as opposedto direct manipulation of the diagram by the user (as is advocated in work such asthat by Barwise and Etchemendy [15]). This approach is motivated by noting that,given diagrams input directly as images, any translation into another representationwill require some form of manipulation of this input. We have found that, as will beshown in the example applications that follow, this translation is superfluous in manycases. Given this approach, we store input directly with no further abstraction. Thisstrategy not only allows the system to manipulate input images directly but, should theneed arise, it permits us to translate this input into other representations as required.
• We use, as a basis for this direct manipulation of diagrams by the system, an inter-diagrammatic reasoning (IDR) approach [1,3,7,11]. IDR specifies a general diagramsyntax and set of operators that leverage, for computational purposes, the spatial andtemporal coherence often exhibited by groups and sequences of related diagrams.Using concepts from set theory, image processing theory, color theory, and the theoryof computation, like diagrams are combined in ways that produce new like diagramsthat are useful in enabling a system to process diagrams.
• A priori knowledge required to process diagrams is likely to be both domainand diagram specific. Facts and rules pertinent to targeted domains are necessaryas is information germane to processing diagram types represented. We represent

186 M. Anderson, R. McCartney / Artificial Intelligence 145 (2003) 181–226
this knowledge both diagrammatically and non-diagrammatically, as appropriate.
We will achieve integration of diagrammatic and non-diagrammatic knowledgeand inferencing by providing inter-lingual abstractions that furnish homogeneousinterfaces to various modes of representation and inferencing, permitting inferencesto be made with heterogeneously represented knowledge.• Output is both diagrammatic and textual, meant for direct human consumption.Although we currently are not exploring other forms of output such as action orintermediate results intended for use by some other system, there is nothing in thenature of the processing that precludes use of its product in such ways.
Although much of the following has been previously reported in a piecemeal fashion,it is presented here for the first time it in its entirety, recast under the most mature versionof our approach, with the newly gained perspective of its relationship to the notion ofdiagram processing. Seen in its entirety, the true breadth of the domains and variety of usesof our approach is made evident, bringing its generality into relief in a way not possiblepreviously.
The current goal of our research is the development of a simple general theoretical basisfor computing directly with diagrams that convey information via tonal (i.e., grayscaleor color) and spatial relationships. Our current approach to computation with suchdiagrammatic representations (IDR) strives for generality by providing a simple diagramsyntax and a general set of operators that can be used to reason with collections of relateddiagrams in a variety of problem domains. Although any one such approach will notnecessarily be all-inclusive, the development of this and other such approaches can onlyserve to illuminate the dimensions and boundaries of diagrammatic representations.
Besides an interest in investigating general approaches to diagrammatic reasoning, ourwork has also been motivated by a desire to explore the space of what can be computedvia diagrammatic representations alone. Although diagrammatic representations may needto be augmented by other representations to completely represent many problem domains,we attempt to rely upon diagrammatic representations as much as possible to bring ourunderstanding of them on par with other, better understood representation methods. Onlywhen parity is achieved in our understanding of all representation methods can we makeinformed judgments concerning their respective uses.
Although far from definitively answering the question of what might be gained bythe practice of computing directly with diagrammatic representations, an answer we hopeour research eventually will provide, we believe their use as internal representations andtheir subsequent processing may be warranted when (1) they are presented directly tothe system and translation into another representation proves unnecessary or problematic,(2) visualization of the reasoning process is desirable, and/or (3) the underlying computingarchitecture favors them.
The leftmost diagram of Fig. 4(a) can be used to illustrate the first case. Exactly howmight this diagram be represented in another form? The only representations that will notsuffer from data loss will be those that explicitly encode the spatial relationships of eachpixel, which are now encoded in the structure of the diagram itself, as well as the tonalvalues of each. An example of such a representation would be a list of triples (x, y, v)
where x and y represent the location of a given pixel and v its value. Unordered, this

M. Anderson, R. McCartney / Artificial Intelligence 145 (2003) 181–226 187
Fig. 4. (a) Diagram suite depicting the US states and grassland; (b) diagram sequence depicting consecutiveguitar chords.
list bears little structural similarity with the diagram and is therefore not an analogicalrepresentation in Sloman’s sense and does not exhibit those desirable traits that accrueto such representations. As order is imposed upon this list in an attempt to recapture thesedesirable traits, this very order tends to make redundant the spatial information stored in thetriple until, ultimately, when ordered as a two-dimensional array, the spatial informationof the triple is completely superfluous—the structure contains this information and theoriginal diagrammatic representation has been restored. Given, as we shall subsequentlypresent, a means of reasoning with such diagrammatic representations, translation of thisand similar diagrams into other representations may prove unnecessary or might entail dataloss.
Visualization of data in some diagrammatic form is often used to engage our well-developed ability to deal with such information in a quest for deeper understanding of thedata visualized. The second case intends just such visualization for reasoning processesthemselves. Examples will be presented where intermediate products of processingdiagrammatic representations constitute visualizations of the reasoning processes takingplace and provide insight into these analogous to insights provided by visualizationsof data. Again, given a means of reasoning with diagrammatic representations, constantback and forth translation between some other internal representation and a more human-understandable diagrammatic representation during the reasoning process may proveunnecessary.
The bias towards numeric and symbolic computing that has characterized computingarchitectures to date shows signs of abating including the wide availability of high-poweredhardware dedicated to the processing of images and experiments in optical computing.These serve to illustrate the third case—steps towards computing architectures that favorthe processing of diagrammatic representations. When such platforms are on par with more

188 M. Anderson, R. McCartney / Artificial Intelligence 145 (2003) 181–226
traditional platforms, representations can be chosen for their fit with that being represented
and not for their fit with the underlying architecture.Further, we have found to be beneficial, no matter what the actual internal represen-tation, the abstraction of the representation as a diagram. As with any abstraction usedin computing, from the simple notion of binary digits to more complex trees and graphs,the notion of a diagram can be useful in those domains where such representations areprevalent.
We next discuss our current approach to diagrammatic reasoning and offer a number ofexamples of how it can be used to facilitate important elements of diagram processing. Thesection entitled Inter-Diagrammatic Reasoning presents a detailed account of the generaldiagram syntax and set of operations used to facilitate diagram processing. The sectionentitled Diagram Processing Tasks explores five facets of diagram processing and givesexample applications of inter-diagrammatic reasoning that attempt to realize each. We thenpresent a selection of related research and end with a discussion of future directions of thework.
2. Inter-diagrammatic reasoning
To date, diagrammatic reasoning research has been almost exclusively from the intra-diagrammatic perspective: processes of inference realized by the application of variousoperators to a given single diagram. We, on the contrary, advocate an inter-diagrammaticapproach where the process of inference is realized by the application of various operatorsto groups of related diagrams such as diagram suites (Fig. 4(a)) which depict differentfacets of an entity at the same moment in time or diagram sequences (Fig. 4(b)) whichdepict an entity over some manner of forward moving time.
An inter-diagrammatic reasoning (IDR) approach [1,3,7,11] defines diagrams as tessel-lations—complete partitionings of subsets of two-dimensional space into unique tesserae.Tesserae take their values from an I , J , K valued subtractive CMY color scale [57],viewed in its most naive way. Intuitively, these CMY (Cyan, Magenta, Yellow) colorscale values (denoted vi,j,k ) correspond to a discrete set of transparent color filters wherei is the cyan contribution to a filter’s color, j is the magenta contribution, and k is theyellow contribution. When overlaid, these filters combine to create other color filters froma minimum of WHITE (v0,0,0) to a maximum of BLACK (vI−1,J−1,K−1). If i , j , and k
are always equal, only grayscale values from WHITE to BLACK are generated and tesseraevalues can be denoted simply vi . Two diagrams are particularly useful: the null diagram(denoted ∅) in which all tesserae have the value v0,0,0 and the max diagram (denoted ∞)in which all tesserae have the value vI−1,J−1,K−1.
IDR leverages the spatial and temporal coherence often exhibited by groups of relateddiagrams for computational purposes. Figs. 4(a) and 4(b) both display diagrams that exhibitspatial coherence—the locations of entities of interest within the diagrams (i.e., states inFig. 4(a) and finger positions in Fig. 4(b), whether present or not) remain the same in bothdiagrams of each figure. Of the two, only Fig. 4(b), a diagram sequence, exhibits temporalcoherence—meaning can be attributed to the appearance and disappearance of entities ofinterest in the diagrams. These attributes, then, characterize the types of diagram suites and

M. Anderson, R. McCartney / Artificial Intelligence 145 (2003) 181–226 189
sequences to which IDR can most likely be successfully applied. Those diagram suites and
sequences that possess either or both of these attributes, as well as a mapping of semanticcontent to the spatial and/or tonal dimensions, will be good candidates for processing viaIDR. As IDR is permitted full use of an underlying host language, the scope of problems towhich it is applicable is theoretically only bounded by the limits of computation itself. Thatsaid, a cross-section of those problems for which IDR has proven to be a useful abstractionis suggested in the examples offered in the next section. Using concepts from set theory,image processing theory, color theory, and others, like diagrams are combined in ways thatproduce new like diagrams that infer information implicit in the original diagrams. Thefollowing unary operators, binary operators, and functions provide a set of basic tools tofacilitate the process of IDR.Binary operators each take two diagrams, d1 and d2, of equal dimension and tessellationand each return a new diagram where each tessera has a value v that is some function ofthe values of the two corresponding tesserae, vi1,j1,k1 and vi2,j2,k2, in the operands.
• OR, denoted d1 ∨d2, returns the maximum of each pair of tesserae where the maximumof two corresponding tesserae is defined as
vmax(i1,i2),max(j1,j2),max(k1,k2)
• AND, denoted d1∧d2, returns the minimum of each pair of tesserae where the minimumof two corresponding tesserae is defined as
vmin(i1,i2),min(j1,j2),min(k1,k2)
• OVERLAY, denoted d1 + d2, returns the sum of each pair of tesserae where the sum ofvalues of corresponding tesserae is defined as
vmin(i1+i2,I−1),min(j1+j2,J−1),min(k1+k2,K−1)
• PEEL, denoted d1 − d2, returns the difference of each pair of tesserae where thedifference of values of corresponding tesserae is defined as
vmax(i1−i2,0),max(j1−j2,0),max(k1−k2,0)
• NOT, denoted ¬d , is a one place operator that returns the value of ∞ − d , where∞ is of equal dimension and tessellation to d . (Note that Boolean negation will besymbolized as ∼.)
• NULL, denoted η(d), is a one place Boolean function taking a single diagram thatreturns TRUE if d contains all WHITE-valued tesserae else it returns FALSE.
• ACCUMULATE, denoted α(d,ds, o), is a three place function taking an initial diagram,d , a set of diagrams of equal dimension and tessellation, ds, and a binary diagrammaticoperator, o, that returns a new diagram which is the accumulation ((d o d1) o d2) o · · ·)of the results of successively applying o to d and each diagram di in ds.
• MAP, denoted µ(f,ds1, . . . ,dsn), is an n+1 place function taking an n-place functionf and n sets (of equal cardinality) of diagrams of equal dimension and tessellation, dsi ,that returns the set of values resulting from application of f to each corresponding n
diagrams in ds1, . . . ,dsn.

190 M. Anderson, R. McCartney / Artificial Intelligence 145 (2003) 181–226
• FILTER, denoted φ(f,ds), is a two place function taking a Boolean function, f , and
a set of diagrams of equal dimension and tessellation, ds, that returns a new set ofdiagrams comprised of all diagrams in ds for which f returns TRUE.• ASSIGNMENT, denoted d1 ⇐ d2, modifies d1 such that each tessera has the valueof the corresponding tessera in d2. (Note that non-diagrammatic assignment will besymbolized as := and the equality relation as =.)
The following section details example uses of these simple operations to perform awide variety of tasks in various diagrammatic domains showing both their generality andusefulness. Although our intent is the exploration of what might be accomplished usingdiagrammatic representations, it often has been necessary to augment these with moretraditional procedural and symbolic representations to fully realize the examples. Therelationship between these different representations may be illuminated by viewing thediagram and its accompanying operations as an abstract data type (ADT). The diagram isinstantiated and procedurally manipulated in well-defined ways that produce new diagramsas well as symbolic information. The symbolic products of this processing, then, can beused as input to procedures outside the domain of the diagram ADT and put to non-diagrammatic uses or re-input to the procedures of the diagram ADT. Further, the notion ofa diagram ADT permits, as do all ADTs, details of the internal representation of diagramsto vary from application to application, platform to platform. This clear delineation ofdiagrammatic versus symbolic representations helps facilitate the study of the nature ofdiagrammatic representations and their processing.
3. Diagram processing tasks
We now explore five facets of diagram processing and give example applicationsof inter-diagrammatic reasoning that attempt to realize each. These include drawinginferences from diagrams where information implicit in a collection of diagrams is inferred,making decisions from diagrams where the best action given diagrams representing thecurrent state of affairs is decided, solving problems using diagrams where the solution toa diagrammatically posed problem is produced diagrammatically, learning from diagramswhere the use of diagrams as cases in a cased-based reasoning system and as trainingexamples in an inductive learning system are both explored, and communicating withdiagrams where the process of reasoning with diagrams itself is made perspicuous.
3.1. Drawing inferences from diagrams
A diagram processing system should be capable of inferring information implicit indiagrams. IDR has facilitated inference from diagrammatic information in various domainsincluding cartograms of the United States, Venn diagrams, and guitar chord notation.An example of diagram querying in a diagrammatic information system is provided inthe following. In this example, the system described takes queries input in an extendedstructured query language (Diagrammatic SQL) format and, using stored collections

M. Anderson, R. McCartney / Artificial Intelligence 145 (2003) 181–226 191
of diagrams, diagrammatically infers appropriate diagrammatic and non-diagrammatic
responses to these queries.3.1.1. Diagrammatic information systemsWe define a Diagrammatic Information System (DIS) [4] as an instance of a constrained
diagram processing system that permits users to pose queries concerning diagrams,seeking responses that require the system to infer information from combinations ofboth diagrammatic and non-diagrammatic data. We are developing a diagram-type anddomain independent DIS core capable of accepting domain-dependent diagrammatic andnon-diagrammatic knowledge, producing instantiations of DISs. Our first instantiationof a diagrammatic information system permits queries concerning cartograms (mapsrepresenting information as grayscale or color shaded areas) of the United States.
As an example, consider the diagram in Fig. 5(a). This is a cartogram that depicts inthree levels of gray where each of the major vegetation types are situated in the UnitedStates. The darkest gray represents forest, medium gray represents grassland, and thelightest gray represents desert. Given this diagram, the semantics of the gray levels inthis particular diagram, and diagrams representing each state, posing the query “Whichstates have grassland?” elicits the diagram in Fig. 5(b) as a response from the system. Inthis diagrammatic response, each state in which grassland exists is represented by its shapein black positioned where the state lies within the United States. We use this example toexamine the implementation of this instantiation of a diagrammatic information system infurther detail.
Fig. 5(a) is provided to the system as a bitmap and is stored as such with no furthermanipulation. The system is supplied with the semantic mapping of the gray levels of thediagram to the vegetation types present. This diagram is then parsed into three diagrams,each comprised of a single gray level. Each of these diagrams represents, then, the locationof a particular vegetation type within the United States. The rightmost diagram of Fig. 4(a),for example, shows the diagram resulting from this parsing that represents the locations ofgrassland in the United States.
A priori diagrammatic knowledge required to respond to this query is comprised of aset of diagrams that represent the extent and location of each state within the United States.Fig. 6 is an example of such a diagram that shows the extent and location of the state ofNevada within the United States by marking its area on the map in black. There are fiftysuch state diagrams.
Fig. 5. (a) Cartogram of US vegetation; (b) response to query “Which states have grassland?”.

192 M. Anderson, R. McCartney / Artificial Intelligence 145 (2003) 181–226
Fig. 6. Diagrammatic knowledge depicting the extent and location of Nevada in US.
The response to the query “Which states have grassland?” is generated by comparingeach of these state diagrams with the diagram representing grassland. When a state diagramintersects the grassland diagram (both diagrams without the United States outline), thesemantics of the domain dictate that state contains grassland. All such states are thenaccumulated on a single diagram (with the United States outline) and presented to theuser as the response to the query.
In this manner, diagrammatic responses can be generated for a wide variety of queriesconcerning vegetation in the United States including “Which states do not have forest?”,“How many states have desert?” (Simply return a count of the state diagrams that intersectthe desert diagram.), “Does Rhode Island have desert?” (Simply return true if the statediagram for Rhode Island intersects the desert diagram.), “Which vegetation type coversthe most states?”, “Do any states have both grassland and desert?”, “Which states haveeither desert or forest?”, “Do more states have grassland than desert?”, “Which states haveforest but not grassland?”, etc.
Given IDR operations, and the vegetation and state maps as described, the followingmore formally specifies the generation of a diagrammatic response to the query “Whichstates have grassland?”:
α(∅, φ(λ(x) ∼ η(Grassland ∧ x),State),+)
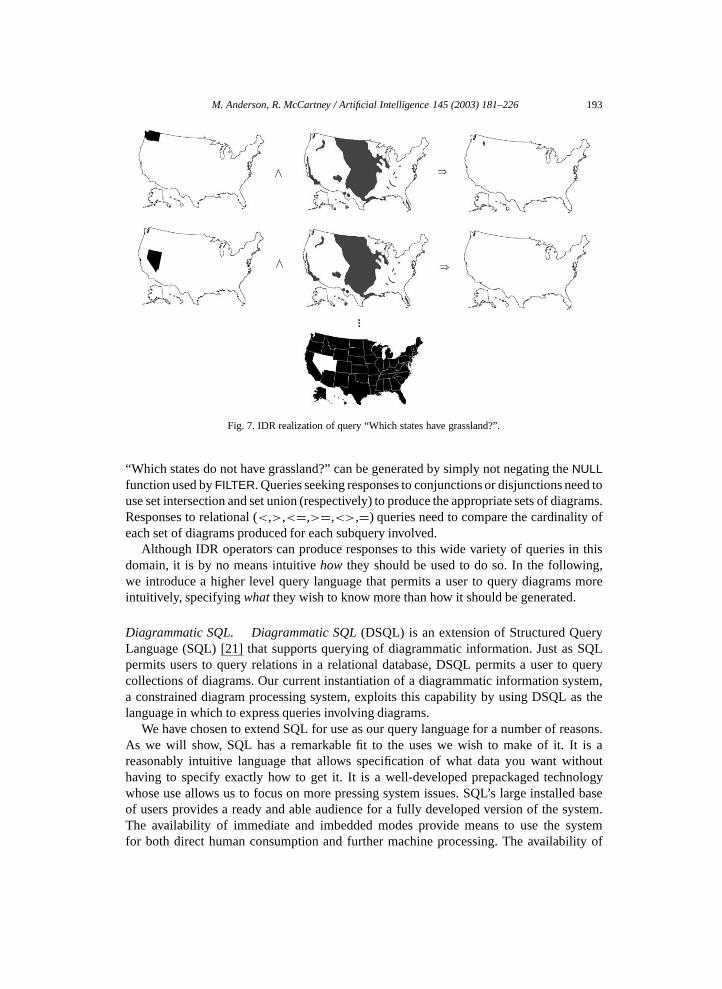
This (1) defines a lambda function that ANDs its parameter with the grassland diagramand returns true if the result is NOT NULL, (2) FILTERs out diagrams from the set ofstate diagrams for which this lambda function does not return TRUE (these are the statediagrams that do not intersect the grassland diagram), and (3) OVERLAYs the remainingstate diagrams onto the null diagram giving the desired result. Fig. 7 details this example.
Responses to all of the queries suggested previously can be generated via IDR operators.As in the example, those queries requiring a diagrammatic response produce an appropriateset of diagrams which are OVERLAYed together. Those queries requiring a numericresponse produce an appropriate set of diagrams and return the cardinality of it. Forinstance, the number of states that have grassland can be returned by taking the cardinalityof the set returned by the filtering operation instead of accumulating that set upon the nulldiagram as is done in the example. Those queries requiring a Boolean response returnthe value of the negated NULL function applied to an appropriately derived diagram. Forinstance, a response to the query “Are there any states that have grassland?” will derive adiagram as in the example and return the result of applying the negated NULL function toit. Responses to queries seeking negative information can be derived by using the NULLfunction to produce an appropriate set of diagrams. For instance, a response to the query
M. Anderson, R. McCartney / Artificial Intelligence 145 (2003) 181–226 193
Fig. 7. IDR realization of query “Which states have grassland?”.
“Which states do not have grassland?” can be generated by simply not negating the NULLfunction used by FILTER. Queries seeking responses to conjunctions or disjunctions need touse set intersection and set union (respectively) to produce the appropriate sets of diagrams.Responses to relational (<,>,<=,>=,<>,=) queries need to compare the cardinality ofeach set of diagrams produced for each subquery involved.
Although IDR operators can produce responses to this wide variety of queries in thisdomain, it is by no means intuitive how they should be used to do so. In the following,we introduce a higher level query language that permits a user to query diagrams moreintuitively, specifying what they wish to know more than how it should be generated.
Diagrammatic SQL. Diagrammatic SQL (DSQL) is an extension of Structured QueryLanguage (SQL) [21] that supports querying of diagrammatic information. Just as SQLpermits users to query relations in a relational database, DSQL permits a user to querycollections of diagrams. Our current instantiation of a diagrammatic information system,a constrained diagram processing system, exploits this capability by using DSQL as thelanguage in which to express queries involving diagrams.
We have chosen to extend SQL for use as our query language for a number of reasons.As we will show, SQL has a remarkable fit to the uses we wish to make of it. It is areasonably intuitive language that allows specification of what data you want withouthaving to specify exactly how to get it. It is a well-developed prepackaged technologywhose use allows us to focus on more pressing system issues. SQL’s large installed baseof users provides a ready and able audience for a fully developed version of the system.The availability of immediate and imbedded modes provide means to use the systemfor both direct human consumption and further machine processing. The availability of

194 M. Anderson, R. McCartney / Artificial Intelligence 145 (2003) 181–226
natural language interfaces to SQL will allow the system to provide an even more intuitive
interface for its users.Besides providing a basis for a diagrammatic query language, a relational databasethat stores image data can be used by the system as a storage management component.Further, as relational databases already manage other types of data, use of one as a storagemanagement component with a diagrammatic extension to its SQL gives the system ameans to query both diagrammatic and non-diagrammatic data simultaneously. This isa specific example of an inter-lingual abstraction as previously described and, as such,provides a linkage between heterogeneous data allowing whole new classes of queries,for example, “What is the total population of states having desert?”, “Which of the stateshaving forest has the highest per capita income?”, “What vegetation is contained by thestate with the lowest annual rainfall?”, etc. We have developed a grammar for a subsetof DSQL that allows it to handle queries of the types previously discussed. Where SQLqueries return relations, DSQL queries return sets of diagrams. These diagram sets canhave their members OVERLAYed upon a null diagram for diagrammatic results or countedto return numeric results. Further, these sets can be tested for emptiness to return Booleanresults or used as operands in set operations such as union, intersection, and difference.Examples of DSQL syntax and semantics follow.
Fig. 8 shows an example data definition and sample queries in DSQL. Fig. 8(i) usesDSQL to define a schema for the diagrammatic information required by the examplespresented previously. It creates a table named US that contains two diagram sets namedState and Vegetation.
Fig. 8(ii) is a DSQL query that represents the example query “Which states havegrassland?”. It has the same SELECT FROM WHERE clause that SQL queries have andthese share similar semantics with their SQL counterparts. Most often, the SQL SELECTclause specifies what attribute(s) will have values in the resulting relation. In DSQL, theSELECT clause specifies what diagram set(s) will have values returned from the query. The
Fig. 8. Example DSQL data definition and queries.

M. Anderson, R. McCartney / Artificial Intelligence 145 (2003) 181–226 195
SQL FROM clause specifies which table(s) are involved in the query. In DSQL, the FROM
clause specifies which list(s) of diagram sets are involved in the query. The SQL WHEREclause specifies which condition(s) have to be satisfied by values returned by the query.This is the same use to which a WHERE clause is put in DSQL.The DSQL query in Fig. 8(ii) states that the set of diagrams from the diagram set Stateof the diagram set list US that conform to the constraints specified will be returned. TheWHERE clause specifies (1) that the Vegetation diagram set of the diagram set list US isrestricted to the Grassland diagram only and (2) that the diagram in the Vegetation diagramset must intersect given State diagrams. In one context, the SQL IN Boolean operatorreturns true if and only if the value on the left-hand side is a value in the attribute onthe right-hand side. In DSQL, IN is a Boolean operator that returns true if and only if thediagrams involved intersect. When sets of diagrams are involved, as in this and followingexamples, the semantics of a DSQL query dictate that this intersection be tested for eachmember of each set. In this case, the Grassland diagram will be tested for intersection witheach member of the State diagram set, in turn, allowing the query to return only thosestates that contain grassland. As previously detailed, the response to this query is achievedby IDR operators as:
α(∅, φ(λ(x) ∼ η(Grassland ∧ x),State),+)
Fig. 8(iii) is a DSQL query that seeks a response to the question “Which states donot have forest?”. The semantics of this query is much like the previous example. In thisexample, though, the Vegetation diagram set is restricted to the Forest diagram and thisdiagram must not intersect with a state diagram for it to be included as part of the result.The response to this query is achieved by IDR operators as:
α(∅, φ(λ(x)η(Forest ∧ x),State),+)
Fig. 8(iv) is a DSQL query that seeks a response to the question “How many states havedesert?”. This change in mode from a diagrammatic response to a numeric response issignaled by the application of the COUNT function to the diagram set in the SELECTclause. It is realized by the following IDR formulation where cardinality is a functionreturning the number of members in a set:
cardinality(φ(λ(x) ∼ η(Desert ∧ x),State))
Fig. 8(v) is a DSQL query that asks “Are there any states that have both grasslandand desert?”. The fact that a Boolean response is required is signaled by the use of theEXISTS function. In SQL, the EXISTS function tests for an empty (single attributed)relation resulting from a subquery. In DSQL, it is used to test for an empty set of diagramsresulting from any query. To produce the set to be tested using IDR operations, the set ofstate diagrams that have grassland is intersected with the set of state diagrams that havedesert. If this resulting set is not empty, return true else return false. Following is the IDRrealization of this query:
¬empty(φ(λ(x) ∼ η(Grassland ∧ x),State) ∩ φ(λ(x) ∼ η(Desert ∧ x),State))
Fig. 8(vi) is a DSQL query that seeks a diagrammatic response to the question “Whichstates have either desert or forest”. This response is generated by taking the union of the
196 M. Anderson, R. McCartney / Artificial Intelligence 145 (2003) 181–226
set of states that have desert and the set of states that have forest and, then, OVERLAYing
them onto the null diagram. Expressed as IDR operations:α(∅, φ(λ(x) ∼ η(Desert ∧ x),State) ∪ φ(λ(x) ∼ η(Forest ∧ x),State),+)
In a similar vein, Fig. 8(vii) is a DSQL query that seeks a diagrammatic response tothe question “Which states have forest but not grassland?”. This response is generatedby taking the difference of the set of states that have forest and the set of states thathave grassland and, then, OVERLAYing them onto the null diagram. Expressed as IDRoperations:
α(∅, φ(λ(x) ∼ η(Forest ∧ x),State) − φ(λ(x) ∼ η(Grassland ∧ x),State),+)
A subset of a DSQL grammar required to handle the range of queries exemplified inthis work has been developed, a rudimentary compiler that translates this range of DSQLqueries into their IDR formulations has been constructed, and the IDR operations thatproduce the desired output have been realized in Common Lisp. The current instantiationof a diagrammatic information system diagrammatically infers appropriate responses to aninteresting range of queries posed against cartograms of the United States.
3.2. Making decisions using diagrams
A diagram processing system should be capable of deciding its course of action basedon information supplied to it diagrammatically. IDR can facilitate decision making fromdiagrammatic information, for instance, by providing a means to develop diagrammaticheuristics [10]. An example of diagrammatic heuristic development is provided in thefollowing for the game of Battleship. This game-playing domain is described followedby a description of the heuristic and an account of a working system based on this domain.
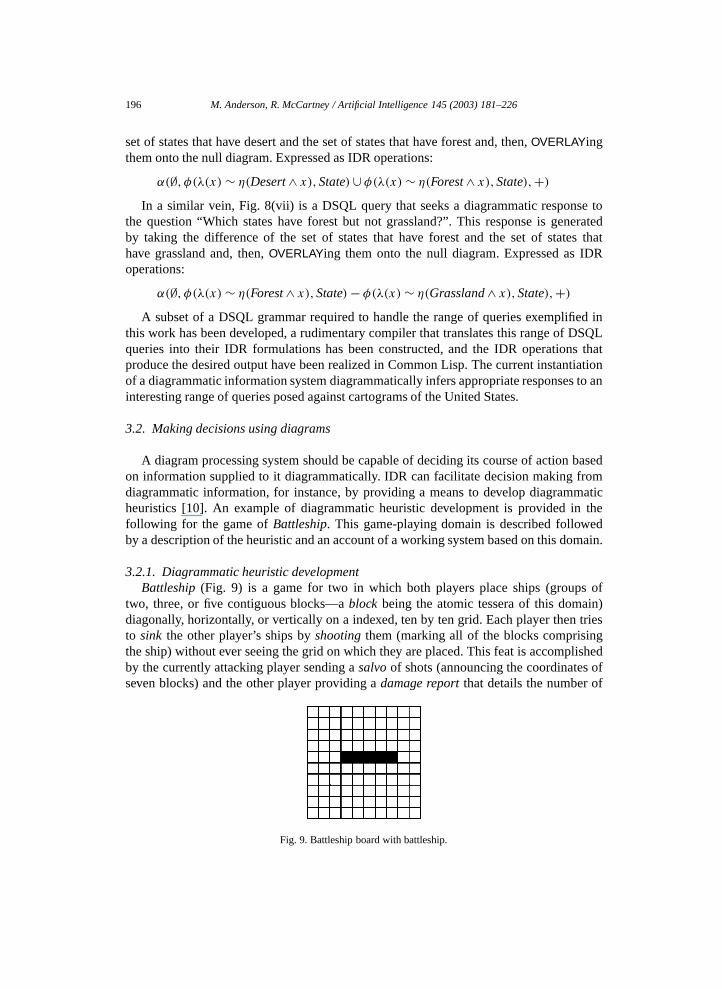
3.2.1. Diagrammatic heuristic developmentBattleship (Fig. 9) is a game for two in which both players place ships (groups of
two, three, or five contiguous blocks—a block being the atomic tessera of this domain)diagonally, horizontally, or vertically on a indexed, ten by ten grid. Each player then triesto sink the other player’s ships by shooting them (marking all of the blocks comprisingthe ship) without ever seeing the grid on which they are placed. This feat is accomplishedby the currently attacking player sending a salvo of shots (announcing the coordinates ofseven blocks) and the other player providing a damage report that details the number of
Fig. 9. Battleship board with battleship.

M. Anderson, R. McCartney / Artificial Intelligence 145 (2003) 181–226 197
hits sustained by each of his/her ships but not the indices of each hit. The winner is the
player who sinks the other player’s ships first.We use IDR to the end of developing a heuristic that predicts the best shots a playermight take given the progress of the game so far. Although there is nothing preventingimplementation of the heuristic for a full implementation of the game, for simplificationwe will discuss it in terms of a subset of Battleship limited to only a single ship, namely thebattleship (a five block group). It is possible to construct a diagram via IDR that displaysthe entire set of possible battleship positions and, by simple inspection, discover the blocksthat, absent other information, are most likely to be part of the battleship being sought.The intuition is that we would like to combine information from each possible positionof a battleship onto a single diagram. The “darkness” of a given block in this diagramindicates the number of possible battleships it could be a part of and, hence, its likelihoodof being a good candidate for a next shot. This is equivalent to numerically calculating theprobabilities for each cell of the Battleship grid.
Next, we describe the process of displaying all possible positions of a ship on a singlediagram. An example is then provided that details the IDR processing required to developa heuristic from a sequence of Battleship shot boards.
Fig. 10 details the process by which an entire set of ships can be displayed on a singlediagram. A diagram with only WHITE (v0,0,0) blocks is OVERLAYed with a second diagramwhich has one possible instance of a battleship on it, represented as a contiguous fiveblock region containing the first level of gray (v1,1,1). OVERLAYing produces anotherdiagram that, after this single step, happens to be identical to this second diagram. This
Fig. 10. Constructing the diagrammatic set of all possible ship instances.

198 M. Anderson, R. McCartney / Artificial Intelligence 145 (2003) 181–226
newly created diagram is, in turn, OVERLAYed with another diagram that has a different
possible instance of the battleship on it. Yet another diagram is produced that containsa representation of both of the ship positions so far included. This is due to the additivenature of the domain values and the semantics of the OVERLAY operator. The effect onthe diagram is that ships that overlap each other make blocks they have in common darkerthan the blocks they do not have in common. In the example, the common blocks will nowhave the value of v2,2,2 (v1,1,1 + v1,1,1) whereas the other blocks will have either the valuev1,1,1 (v0,0,0 + v1,1,1) or v0,0,0 (v0,0,0 + v0,0,0). This process is repeated until all possibleinstances of a ship have been OVERLAYed onto a single diagram.In more formal terminology, the function α(∅,ShipPositions,+) is applied where ∅(null diagram) is the diagram initialized to WHITE and ShipPositions is a domain specificset of all diagrams of possible single battleship instances. In each of these diagrams, theblocks that are part of the battleship take the value v1,1,1 while all other blocks take thevalue v0,0,0. The final result of this application of α (ACCUMULATE) is a diagrammaticrepresentation of all possible ship instances with those blocks most likely to be included ina ship being the darkest and those that are least likely, the lightest.
Figs. 11 and 12 detail an example of the process by which the set of possible ships isconstrained as the game progresses and a diagrammatic representation of the heuristicallybest shots is developed. First, a new salvo of shots is placed on the previous game boardas BLACK ( vI−1,J−1,K−1) blocks. At the start of the game, the board will contain onlyWHITE blocks but, as each turn is taken, this board will fill with shots from each turn. Todifferentiate between previous and new shots, the previous board (denoted PreviousBoard)is negated and ANDed with the current board (denoted CurrentBoard) giving the currentsalvo (denoted CurrentSalvo) of shots. Formally:
CurrentSalvo ⇐ ¬PreviousBoard ∧ CurrentBoard
Next, the number of hits (denoted Hits) scored by the salvo is determined. This isaccomplished diagrammatically by ANDing the diagram containing the current salvo of
Fig. 11. Developing the heuristic—Salvo 1.

M. Anderson, R. McCartney / Artificial Intelligence 145 (2003) 181–226 199
Fig. 12. Developing the heuristic—Salvo 2.
shots with the diagram that contains the battleship in its actual position represented asv1,1,1 blocks (denoted ActualBattleship). Since ANDing is defined as taking the minimumof each block of a diagram, the resulting diagram will contain v1,1,1 blocks for eachhit in the current salvo and WHITE blocks everywhere else. Hits can then be counted,diagrammatically, by ANDing the resulting diagram with each member of a predefinedset of inspection diagrams—diagrams used to isolate tesserae. In the current domain,the set of inspection diagrams is comprised of all possible diagrams containing a uniquesingle BLACK block (denoted SingleBlocks). As each of these are ANDed with the diagramcontaining v1,1,1 blocks for each hit in the current salvo, only those that have their singleBLACK block in the tessera corresponding with the v1,1,1 block will yield a new non-nulldiagram. The result of each operation is tested with the Boolean negated η (NULL) functionand its successes are added to a set whose cardinality, when this process is complete,will equal the number of hits. The entire process can be formally, and more compactly,stated using the diagrammatic operators and functions (λ is used in the standard way todenote function abstraction and cardinality denotes the function that returns the number ofelements in a given set):
Hits :=cardinality(φ(∼ η,µ(λ(y)(y ∧ CurrentSalvo
∧ ActualBattleship),SingleBlocks)))
In the example, the first salvo (Fig. 11) results in no shot hitting the battleship as placedin Fig. 9. This information is then reflected on a diagram by a process of overlaying similar

200 M. Anderson, R. McCartney / Artificial Intelligence 145 (2003) 181–226
to that previously described. Every possible instance of the battleship is OVERLAYed as a
contiguous five block region of v1,1,1 onto a diagram initialized to WHITE. Now, however,a possible instance of a battleship must also conform to the number of hits specified. Thatis, in order to be considered possible, each five block region must overlap the number ofhits (BLACK blocks on the current salvo diagram) exactly. In the current example, sincethere were no hits, a five block region that overlaps any BLACK block is not consideredpossible and, therefore, will not become part of the new set when displayed.This effect is achieved by ANDing a given instance of a battleship, represented withv1,1,1 blocks, with the diagram representing the current salvo. The resulting diagram willcontain v1,1,1 blocks for each hit that the given instance of a battleship overlaps and WHITEblocks everywhere else. These v1,1,1 blocks are counted via the inspection diagrams aspreviously detailed and this count compared with the number of hits needed. If thesenumbers are equal, the given battleship instance is OVERLAYed on the accumulated resultotherwise it is discarded. When all such battleship instances have been so OVERLAYed, theresulting diagram represents the current set of possible battleships newly constrained bythe information in the damage report conveyed by the defending player. This process canbe more formally stated using the diagrammatic operators and functions as:
HeuristicDiagram ⇐α(∅, φ(λ(x)(Hits =
cardinality(φ(∼ η,µ(λ(y)(y ∧ CurrentSalvo ∧ x),
SingleBlocks)))),ShipPositions),
+)
The resulting diagram is a collection of blocks with values ranging from WHITE toBLACK. BLACK blocks are most likely to be contained in the battleship given the hitinformation so far with lighter shades of gray becoming decreasingly less likely. Further,given the damage report information, WHITE blocks are guaranteed not to be included aspart of the battleship a player is seeking. This result (denoted HeuristicDiagram), then,can be considered a diagrammatic heuristic that indicates the probabilistically best shotsfor the next salvo.
The second salvo (Fig. 12) uses the information previously derived by including withinit the seven darkest blocks on the heuristic diagram. First, the previous board is negatedand ANDed with the current board giving the current salvo of shots. The number of hits isdetermined as described previously and results in a count of one. The set of possible ships,ShipPositions, is updated so as not to include any ship instances that are deemed impossibleby this salvo and the remaining possible ship instances are then OVERLAYed as before.
Lastly, since blocks of the salvo itself will be included in the heuristic diagramsgenerated from damage reports of one or more hits, these blocks need to be removedfrom the final diagrammatic heuristic as they are not available for future salvos. This isaccomplished by ANDing the negation of the current board with the heuristic diagramdeveloped so far. Thus, given the IDR definitions for CurrentSalvo and Hits, the entireprocess of developing a heuristic diagram for the constrained game of Battleship can beformalized as:

M. Anderson, R. McCartney / Artificial Intelligence 145 (2003) 181–226 201
HeuristicDiagram ⇐
¬ CurrentBoard ∧α(∅,ShipPositions :=φ(λ(x)(Hits =cardinality(φ(∼ η,µ(λ(y)(y ∧ CurrentSalvo ∧ x),
SingleBlocks)))),ShipPositions),
+)
In summary, this heuristic diagram is computed from information about where shipscan and cannot be from previous salvos (in the previous heuristic diagram) and the hitinformation from the current salvo. It provides guidance for the aggressor’s next shots andprovides information for the next heuristic diagram in the sequence. By their graphicalnature, diagrammatically computed heuristics such as this have the added benefit of beingeasily understood by a human user.
3.3. Solving problems with diagrams
Problems in many domains use diagrams in various ways, including the identificationof components available for their solution, specification of relationships between theseobjects, and delineation of constraints that must be maintained concerning them. A diagramprocessing system should be capable of solving problems so presented. IDR facilitatessolving diagrammatically posed problems in various domains including the n-queenconstraint satisfaction problem [12] and logic function minimization via Karnaugh maps.In the following, we develop an inter-diagrammatic implementation of the min-conflictsheuristic [29] to find solutions to randomly chosen n-queens problems [54].
3.3.1. Diagrammatic constraint satisfactionIDR can be used to solve constraint satisfaction problems—problems in the form
of a set of variables that must satisfy some set of constraints. The n-queens problem,for example, can be viewed as a constraint satisfaction problem that can be solveddiagrammatically.
A solution to the n-queens problem is any configuration of n queens on an n by n
chessboard in which no queen is being attacked by any other queen. Fig. 13 shows a
Fig. 13. n-queen solution where n = 8.
202 M. Anderson, R. McCartney / Artificial Intelligence 145 (2003) 181–226
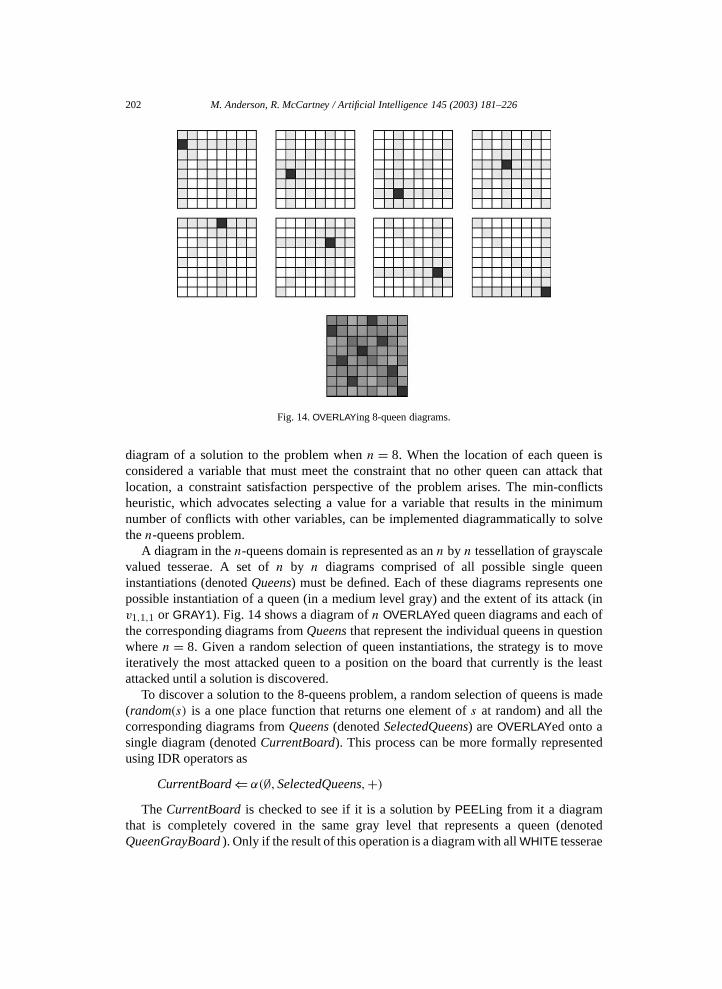
Fig. 14. OVERLAYing 8-queen diagrams.
diagram of a solution to the problem when n = 8. When the location of each queen isconsidered a variable that must meet the constraint that no other queen can attack thatlocation, a constraint satisfaction perspective of the problem arises. The min-conflictsheuristic, which advocates selecting a value for a variable that results in the minimumnumber of conflicts with other variables, can be implemented diagrammatically to solvethe n-queens problem.
A diagram in the n-queens domain is represented as an n by n tessellation of grayscalevalued tesserae. A set of n by n diagrams comprised of all possible single queeninstantiations (denoted Queens) must be defined. Each of these diagrams represents onepossible instantiation of a queen (in a medium level gray) and the extent of its attack (inv1,1,1 or GRAY1). Fig. 14 shows a diagram of n OVERLAYed queen diagrams and each ofthe corresponding diagrams from Queens that represent the individual queens in questionwhere n = 8. Given a random selection of queen instantiations, the strategy is to moveiteratively the most attacked queen to a position on the board that currently is the leastattacked until a solution is discovered.
To discover a solution to the 8-queens problem, a random selection of queens is made(random(s) is a one place function that returns one element of s at random) and all thecorresponding diagrams from Queens (denoted SelectedQueens) are OVERLAYed onto asingle diagram (denoted CurrentBoard). This process can be more formally representedusing IDR operators as
CurrentBoard ⇐ α(∅,SelectedQueens,+)
The CurrentBoard is checked to see if it is a solution by PEELing from it a diagramthat is completely covered in the same gray level that represents a queen (denotedQueenGrayBoard ). Only if the result of this operation is a diagram with all WHITE tesserae

M. Anderson, R. McCartney / Artificial Intelligence 145 (2003) 181–226 203
(the null diagram) has a solution been found. More formally stated, a solution will return
true forη(CurrentBoard − QueenGrayBoard)
As long as the gray level representing queens is greater than any gray level achievableby simply OVERLAYing the GRAY1 tesserae representing queen attack extents, a tesserawill only take on a gray level greater than that representing queens if one or more GRAY1tesserae is OVERLAYed upon a queen. If such a level of gray is found, a queen is underattack. Therefore, if the previous PEEL operation does not remove all gray from a diagram,it cannot be a solution. If a solution has yet to be found, an attacked queen is PEELed fromthe current diagram and a new queen is OVERLAYed at a minimally attacked location.
An attacked queen (denoted AttackedQueen) is found by ANDing a GRAY1-PEELedversion (which removes attack extent information) of all diagrams from SelectedQueenswith the results of the solution test and randomly selecting from those queens that do notproduce the null diagrams (i.e., those queens that correspond with non-WHITE tesserae inthe diagram resulting from the solution test). More formally:
AttackedQueen ⇐ random (φ (η, µ(λ(x)((x − Gray1Board )∧(CurrentBoard − QueenGrayBoard)),
SelectedQueens)))
AttackedQueen is PEELed from the CurrentBoard and a minimally attacked queenis OVERLAYed in its place. By definition, the minimally attacked queen (denotedMinimalQueen) on the current diagram will be the queen at the location that is thelightest gray level. These locations are found by ANDing a GRAY1-PEELed version ofall unused diagrams from Queens (denoted UnusedQueens) with the current diagram andrandomly selecting from those queens that produce the null diagram (i.e., those queens thatcorrespond with WHITE tesserae in CurrentBoard ). More formally:
MinimalQueen ⇐ random (φ (η, µ(λ(x)((x − Gray1Board )∧(CurrentBoard − AttackedQueen)),
UnusedQueens)))
If no such queen is found, a diagram that is completely covered in GRAY1 (denotedGray1Board ) is iteratively PEELed from the current diagram, making all tesserae one graylevel lighter, and the process repeated. More formally:
CurrentBoard ⇐ CurrentBoard − Gray1Board
MinimalQueen is then OVERLAYed upon the current diagram. More formally:
CurrentBoard ⇐ CurrentBoard − AttackedQueen + MinimalQueen
This new diagram is checked to see if it is a solution and the process continues untilsuch a solution is discovered.

204 M. Anderson, R. McCartney / Artificial Intelligence 145 (2003) 181–226
Fig. 15. 8-queens example, 1st iteration.
Figs. 14–16 graphically display an example of the solution finding process where n = 8.Fig. 14 shows the queen diagrams selected from Queens as well as the diagram that resultsfrom OVERLAYing these diagrams.
Fig. 15 displays one iteration of this process. Fig. 15(a) shows the solution check,QueenGrayBoard is PEELed from the current diagram. This diagram is not a solutionbecause the result is not the null diagram. In Fig. 15(b), one of the attacked queensis selected and PEELed from the current diagram. Since there are no WHITE tesserae,Gray1Board is PEELed from the result in Fig. 15(c). In Fig. 15(d), a queen diagram israndomly selected from the set of queen diagrams that correspond to the WHITE tesseraein the result and OVERLAYed on the current diagram.
Fig. 16 shows the next two iterations of the solution finding process. Fig. 16(a) displaysthe solution check for the current diagram created by the last iteration. This is also foundnot to be a solution, so an attacked queen’s diagram is PEELed from the current diagramin Fig. 16(b). Since there is a WHITE tesserae in the result, PEELing Gray1Board from itis not required. The only possible new queen diagram is then OVERLAYed on the currentdiagram in Fig. 16(c). Fig. 16(d) shows the solution check for the third iteration and, asthis is found to be a solution (i.e., the check results in the null diagram), processing stops.The result of the entire process is the 8-queen problem solution presented in Fig. 16(e).
This solution can be generalized to suit spatial constraint satisfaction in variousdomains, varying the resolution of the grid, shape of the entities, and configuration ofthe spatial constraints that must be maintained.

M. Anderson, R. McCartney / Artificial Intelligence 145 (2003) 181–226 205
Fig. 16. 8-queens example, 2nd and 3rd iterations.
3.4. Learning from diagrams
Diagram processing systems should be capable of learning from diagrams much asmachines now learn from other types of representations [40]. IDR can facilitate learningfrom diagrammatic information, for instance, by providing a means to use diagrams ascases in case-based reasoning systems, to glean and abstract information from diagrams foruse in inductive learning systems, and to query diagrams for use in data mining systems. Inthe following we provide two example diagrammatic learning domains: (1) a diagrammaticcase-based approach to what we term the n-queens best solution problem [12] where thebest solution is defined as that which solves the problem moving the fewest queens, leavingqueens that are already in place untouched (versus a solution that solves the problem in thefewest moves) and (2) a diagrammatic inductive learning approach to fingering guitar chorddiagrams [13]. In each example, we provide a brief description of the learning techniqueinvolved.

206 M. Anderson, R. McCartney / Artificial Intelligence 145 (2003) 181–226
3.4.1. n-queens best solution problem
A solution to an n-queens best solution problem is an n-queens placement obtainedby moving the fewest queens from some initial placement. Although finding this minimalsolution can only be achieved at great computational cost, we have implemented a systemthat improves its performance at this task by making use of previous solutions it hasdeveloped. Solutions to previous problems can be used to provide partial solutions tothe current problem. A description of a diagrammatic case-based reasoning solution tothis problem follows a brief overview of case-based reasoning, the paradigm used in thissolution.
Case-based reasoning. Case-based reasoning [35] is the use of previous problemsolving episodes (with solutions) to solve a new problem. Cases can be used for twopurposes: (1) to support plausible inferencing in the absence of a complete domain theory[45], and (2) to increase efficiency by either providing partial solutions or providing focusand direction to problem solving efforts [39]. For both of these purposes, case-basedreasoning provides a straightforward learning mechanism: as problems are solved, newepisodes are incorporated into the case base, which can later be used in future problemsolving.
Implementing a case-based reasoning system requires answering a number of funda-mental questions.
Representation: What is a case and how is it represented?Indexing: How is a case stored and retrieved?Similarity: How do we determine which case is most appropriate to use in solving a given
problem?Adaptation: How do we use an appropriate case once we get it?
These questions have obvious general answers from a diagram processing perspective.Cases will be diagrams, and algorithms used for indexing, similarity, and adaptation of acase will be defined in terms of IDR operators. As we are working with a complete domaintheory and no uncertainty, we are using case-based reasoning to increase efficiency andprovide a mechanism to improve performance over time.
3.4.2. Diagrammatic case-based reasoning systemPrevious solutions to the n-queens best solution problem form the cases of our
case-based reasoning solution. Case representation is defined diagrammatically as anOVERLAYed solution set of n queens without attack extent information. Case similarityis defined as cases that have the most number of queens in common with the currentproblem. This matching is accomplished diagrammatically by ANDing the current problemboard (PEELed with QueenGrayBoard ) with each of the stored solutions, counting all non-WHITE tesserae and retrieving those solutions with the highest count. A partial solution tothe current problem has then been found; all queens in common can be exempted fromfurther consideration as they are already in place. Case adaptation is the arrangement ofthose queens that are not yet in place to form a complete solution without disturbing the

M. Anderson, R. McCartney / Artificial Intelligence 145 (2003) 181–226 207
Fig. 17. 8-queens example, case matching.
positions of the exempted queens. Lastly, case indexing is expedited by diagrammaticallycomparing a new candidate case with existing cases and rejecting duplicates.
Fig. 17 details this case-based approach. Fig. 17(a) PEELs a board completely coveredin QueenGray from the current diagram resulting in a diagram that is gray only wherequeens are placed on the current diagram (denoted QueenPlacement). More formally:
QueenPlacement ⇐ CurrentBoard − QueenGrayBoard
Fig. 17(b) shows the process of ANDing QueenPlacement with each stored solutionin the CaseBase, Fig. 17(c), resulting in a set of diagrams, Fig. 17(d), that each display

208 M. Anderson, R. McCartney / Artificial Intelligence 145 (2003) 181–226
their similarity with QueenPlacement via the number of gray tessera they have (denoted
SimilaritySet). More formally:SimilaritySet := µ(λ(x)(QueenPlacement ∧ x),CaseBase)
In this example, one case’s queen placement matches six of the current diagram’s,Fig. 17(e). Such counting of certain valued tessera is accomplished diagrammaticallyusing a set of inspection diagrams as previously described. This case is chosen, then,and the placement of the remaining two queens proceeds as described previously withthe stipulation that the six matched queens are not to be moved.
Although this system cannot guarantee an optimal solution, it learns over time by storingprevious solutions and, therefore, becomes progressively better at providing near optimalsolutions at reasonable computational cost.
Case-based reasoning has generated a good deal of interest; much work has been andis being done in this area. See [35] for an overview. Interestingly, case-based reasoninghas been previously used to increase efficiency in solving constraint satisfaction problemsin [45]. Narayanan and Chandrasekaran [43] discuss what they term “visual cases” fordiagrammatic spatial reasoning but we believe that we are the first to successfully integratediagrammatic and case-based reasoning.
3.4.3. Guitar chord fingeringGuitar chord notation specifies the positions of fingers for a given chord by diagram-
matically representing strings and frets of a fingerboard along with dots to represent fingerpositions. Chord notation is superior to standard musical notation for inferring fingering in-formation since the fingerboard positioning of the chord is explicitly shown on the diagrambut must be inferred from standard musical notation. Syntactically, vertical lines representthe strings of a guitar (numbered left to right as 6, 5, 4, 3, 2, 1) whereas horizontal linesrepresent its frets (numbered from top to bottom as 1, 2, 3). A dot on a string representswhere some finger is placed to produce a desired pitch. Semantically, a fingering is a spec-ification of exactly which of four fingers (the thumb is not used) to use to realize the dotsof the diagram. Fig. 18 shows such a diagram with a fingering below it using numbers 1to represent the first finger, 2 to represent the second finger, etc. No finger is representedsimply by a blank. For example, the chord diagram in Fig. 18 specifies the use of the thirdfinger on the third fret of the fifth string, the second finger on the second fret of the fourthstring, etc.
Those familiar with the guitar can finger new chord diagrams by trial and error—tryingpossible fingerings and discarding those that do not work until one that is viable is found.A viable fingering is one that is feasible given the constraints of the human hand. Thetask we set the current system is, provided examples of fingered guitar chord diagrams,
Fig. 18. A fingered guitar chord diagram.

M. Anderson, R. McCartney / Artificial Intelligence 145 (2003) 181–226 209
learn how guitar chords are fingered in general and, further, express and use this learned
knowledge diagrammatically as well. The system is to learn diagrammatically-expressedknowledge that, using a constraint satisfaction search, provides viable fingerings for bothpreviously seen and previously unseen guitar chord diagrams. Training examples providedwill be input-output pairs where the input is a guitar chord diagram and the output is afingering for that chord diagram. For simplicity, we will restrict these examples to non-barré chords (no finger holds down more than one string) in the first three frets. Thisrestriction allows us to assume that there will be only a single finger on a string at atime and to represent the input chords uniformly. A description of a inter-diagrammaticreasoning approach to this problem follows a brief overview of inductive learning.Inductive learning. Human beings are adept at extracting general knowledge fromspecific information. For example, hearing a number of notes from some instrument allowsus to identify that instrument even when it plays different notes. Research in inductivelearning has been concerned with imbuing computers with a similar capability since thegeneral knowledge gained often proves useful in subsequent problem solving.
Inductive learning, the process by which a system arrives at general conclusions byexamining particular examples, is a well-researched subfield of the machine learningcommunity [40]. In online supervised inductive learning, a system is given a sequenceof input-output pairs as examples, one at a time, and incrementally attempts to finda function that can account for them. Traditionally, input-output examples have beenrepresented numerically and/or symbolically and derived functions as a set of rules orprocedures. As we are interested in exploring how general knowledge might be extractedfrom diagrams and how that knowledge might be applied in subsequent problem solving,we have developed a framework for an online supervised inductive learning system thatuses diagrams as examples and diagrammatic representations of learned knowledge toguide a constraint satisfaction search that serves as the basis for its derived function.
3.4.4. Diagrammatic inductive learning systemIt is trivial to derive a function that accounts for all the given training examples by
simply forming a table of fingerings indexed by their associated chord diagrams. Allexample input diagrams can then easily be used to retrieve the viable output. Unfortunately,this function will never be able to produce viable output for newly input chord diagrams.For the derived function to accomplish this, the information pertaining to fingering that ispresent in the training diagrams must be generalized for use in other situations. The strategythe current system uses for this generalization is to incrementally update normalizeddiagrammatic constraint maps for each finger as new input-output pair examples areprovided.
A constraint map represents, diagrammatically, all positions of one finger in relationto another that the system has seen so far in its training examples. It is a grid of elevenstrings by five frets and assumes that the finger for which it is diagramming relationshipinformation is centered on the sixth string, third fret (the normalization assumption). Thisunusual diagram allows all possible finger positions to be mapped in relation to the centeredfinger. Each of the four fingers used in fingering chord diagrams has three such constraintmaps associated with it—one for each of the other fingers it must work in concert with.

210 M. Anderson, R. McCartney / Artificial Intelligence 145 (2003) 181–226
For example, the first finger has constraint maps for its relationships with the second, third,
and fourth fingers. This relationship is represented as dots on the map where the fingerin question has been placed in the training examples in relation to the centered finger.Fig. 21 shows an example set of constraint diagrams constructed from a set of two trainingexamples.Constraint maps are constructed incrementally as each new example is presented tothe system and together form a restricted hypothesis space bias [40] for the system inthat only fingerings compatible with these maps will be put forth as possible candidatefingerings. An example chord diagram is centered on a constraint map, using horizontaland vertical translation as needed, such that the appropriate finger is on the center position.This normalization of diagrams generalizes the fingering information so that it can be usedin predicting future fingerings no matter where the dots appear on the fingerboard. Thediagram is then parsed into sub-diagrams each pertaining to a single finger. When multipleexamples are so normalized and parsed and sub-diagrams for each individual finger areoverlaid, each constraint map is a diagrammatic representation of all possible two fingerrelationships learned so far. This representation can be used not only to produce viablefingerings for chord diagrams previously given as training examples but also to produceviable fingerings for new, previously unseen chord diagrams serving as a model of how thehuman hand works in this domain.
Figs. 19–21 detail a supervised learning session using two training examples. Theyshow the process by which relationships between the first finger and the other fingers arenormalized, parsed, and accumulated to form the first finger’s three constraint maps (oneeach for the second, third, and fourth fingers). The examples are provided to the system asinput-output pairs the chord diagram serving as the input and a fingering vector (a vector ofsix numbers representing the fingering of the chord from string six to string one, 0 denotingno finger, 1–4 denoting the first through fourth finger) as its associated output with theassumption that the chord depicted can be correctly fingered as specified by the orderingof numbers in the fingering vector.
To facilitate chord diagram processing, two sets of inspection diagrams are initialized.String inspection diagrams are diagrams that have dots on all frets of one string; fretinspection diagrams are diagrams that have dots on all strings of one fret. These are usedto isolate pertinent portions of diagrams for further processing.
First, an example chord diagram is expanded into a representation that correspondsto the constraint maps (Fig. 19). It is then translated to center the finger in question onthis representation. The number of strings that a diagram must be translated horizontally iscomputed from the distance the finger in question is from the sixth position in the fingeringvector. The number of frets that the diagram must be vertically translated is computed fromthe distance the finger in question is from the third fret (which is determined by findingthe non-NULL result obtained by ANDing fret inspection diagrams with a chord diagramcontaining the single dot representing the finger in question). In the current example, thedots are translated to the left once and down twice.
String inspection diagrams are then used to parse (via ANDing) this normalized diagraminto three new diagrams that each contain only a single fingered dot. Since this is the firsttraining example, these become the constraint maps for the relationship that the first fingerhas with the third, fourth, and second fingers, respectively. That is, given that the first finger

M. Anderson, R. McCartney / Artificial Intelligence 145 (2003) 181–226 211
Fig. 19. Normalizing first finger information from first training chord.
is centered on any of these diagrams, the finger associated with this diagram can be placedonly where there exists a dot. It should be noted that usable, generalized information hasbeen gleaned from a single training example in that viable fingerings for a number of newchord diagrams involving the first finger can already be inferred. Completing this processfor each finger and for a number of training examples provides a wealth of such usableinformation and can be used to finger a wide variety of chords.
The current example continues to show how the process just described will use anothertraining example to expand the possibilities available when using the first finger (Fig. 20).Again, the chord has its first finger centered on a new diagram and this is then parsed intoseparate maps for each finger involved (in this case, the second and third). Since constraintmaps for the first finger’s relationships with the second and third finger already exist, thenewly learned information is combined with that previously learned by ORing togethernew and old maps for the same finger. The information so far accumulated for the firstfinger is presented at the bottom of Fig. 20.

212 M. Anderson, R. McCartney / Artificial Intelligence 145 (2003) 181–226
Fig. 20. Normalizing first finger information from second training chord.
Fig. 21 displays the constraint maps for all fingers after both training examples are fullyprocessed. As new chord diagrams are presented to the system, new constraints are addedto these maps slowly building a model of the constraints of the human hand in this domain.This is the generalized knowledge that can be used to find viable fingerings for new chorddiagrams. Figs. 22–24 detail how such a fingering can be found using this knowledge.
When a new chord diagram is presented to the system, the system is charged with thetask of finding a viable fingering for this possibly previously unseen chord. The strategy isstraightforward constraint satisfaction—try all combinations of fingers until a fingering isfound that agrees with the knowledge stored in the constraint maps. The search involved istrivial given that the largest possible search space for any given chord of up to four fingersis 4! or 24. Without the constraint maps, the system would have no way of preferring onefingering over another but the small search combined with the learned knowledge quicklycan converge on a viable fingering.
It is possible that system may not be able to finger the new chord. This outcome ispossible until the system has been presented with enough training examples to cover allthe viable relationships between fingers. In any case, the system will quickly discover thatit cannot fulfill all the constraints presented it, ask for a correct fingering for the new chord,and use the failure as a new training example, updating its knowledge to be able to handlethe failure next time it sees it as well as new chords that contain similar finger relationships.

M. Anderson, R. McCartney / Artificial Intelligence 145 (2003) 181–226 213
Fig. 21. Constraint maps after processing of training chords.
In this way, the system always gains more from a failure than simply the fingering of thatexample. In fact, training examples given to the system are examples of the system learningfrom failure.
Fig. 22 details the first pass the system makes in its attempt to find a fingering for thegiven chord given the constraint maps learned from the two training examples detailedpreviously. First, the new fingering vector is initialized to zero wherever there is no doton a string (e.g., 0???00). As before, the chord diagram is expanded into a new diagramthat corresponds with the constraint maps. The leftmost dot is then centered on this mapin a manner similar to that discussed previously. It is then PEELed off, leaving the otherdots appropriately translated. The current system has an inductive preference bias [40] inthat the use of stronger fingers is preferred over weaker ones. This is realized by assuminginitially that the first finger can be used to finger this central dot and the new diagram isANDed with each of the first finger’s constraint maps. If any of these ANDings producesanything other than the null diagram (a map with no dots on it), a viable fingering for thatdot has been found under the current assumptions. In the current example, all ANDingswith the first finger’s constraint maps result in the null diagram, so the assumption that thefirst finger is used on the central dot must be dropped—given what the system has learnedso far, no other finger can be used on any other dot of the new chord when the first fingeris so positioned.
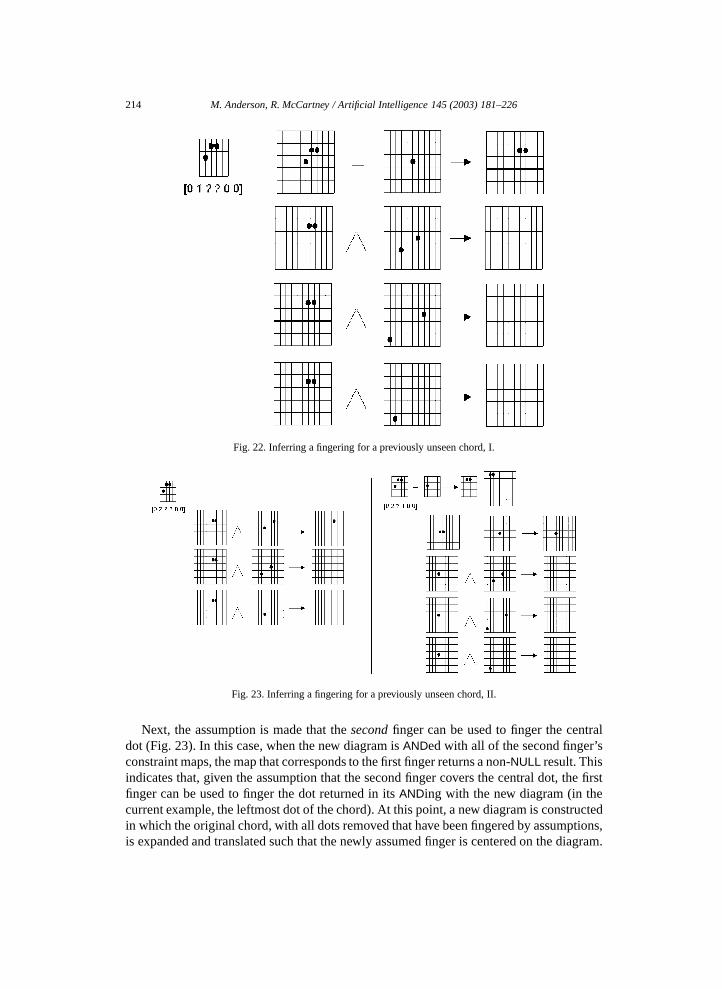
214 M. Anderson, R. McCartney / Artificial Intelligence 145 (2003) 181–226
Fig. 22. Inferring a fingering for a previously unseen chord, I.
Fig. 23. Inferring a fingering for a previously unseen chord, II.
Next, the assumption is made that the second finger can be used to finger the centraldot (Fig. 23). In this case, when the new diagram is ANDed with all of the second finger’sconstraint maps, the map that corresponds to the first finger returns a non-NULL result. Thisindicates that, given the assumption that the second finger covers the central dot, the firstfinger can be used to finger the dot returned in its ANDing with the new diagram (in thecurrent example, the leftmost dot of the chord). At this point, a new diagram is constructedin which the original chord, with all dots removed that have been fingered by assumptions,is expanded and translated such that the newly assumed finger is centered on the diagram.

M. Anderson, R. McCartney / Artificial Intelligence 145 (2003) 181–226 215
Fig. 24. Inferring a fingering for a previously unseen chord, III.
What we are left with is a sub-chord that needs fingering. In the current example, this newdiagram (which assumes the first finger) is ANDed with all constraint maps for the firstfinger. Unfortunately, only null diagrams result, so the system must backtrack. Since therewas only one possible first finger position to assume, and only one possible second fingerposition (as shown by the number of non-NULL diagrams produced), all assumptions aredropped and the system tries the next finger in turn—the third.
Under this assumption, the diagram is ANDed with all the third finger’s constraint maps(Fig. 24). The only one to produce anything but the null diagram is that which is associatedwith the second finger. As before, a new normalized diagram is made of the unfingeredsub-chord with the second finger centered on it and is ANDed with all of second finger’sconstraint maps. In this case, the constraint map associated with the first finger gives a non-NULL result, showing all assumptions hold under the knowledge learned so far and, sinceall dots are now associated with a finger, the viable fingering vector 031200 is output.
This example shows how a chord diagram seemingly unrelated to previous examplescan be fingered by the system. As an example of just how much information is gleanedfrom training examples, Fig. 25 gives a sampling of chords that can be fingered (thosechords below the line) after being given only the three training examples shown (thosechords above the line).
In this example, an assumption of transitivity is made. That is, it is assumed that if theplacement of finger A in a chord is compatible with the placement of finger B in the chordand the placement of finger B in the chord is compatible with the placement of finger Cin the chord then the placement of finger A in a chord is compatible with the placementof finger C in the chord. It is not clear that this will always be the case and, therefore,since this assumption was made in the example, its fingering might be somewhat suspect(although there actually is no problem with the fingering arrived at in the given example).

216 M. Anderson, R. McCartney / Artificial Intelligence 145 (2003) 181–226
Fig. 25. Sampling of chords fingerable after given three training examples.
It is possible to drop this assumption of transitivity and exhaustively check all constraintmaps for agreement with the inferring fingering. The search space is small and the extrachecks will not tax the system. It is clear, though, that if the system is going to only produceoutput when all finger placements have been so cross-checked it is going to require morelearned knowledge in order to do so. This conservatism results in more optimal fingeringsat the price of fewer new chords being fingerable by the system.
As a compromise, the system could produce output with varying levels of certaintyassociated with it. Its most certain output corresponds to that in which all finger positionshave been deemed compatible through exhaustive search of complete knowledge. Its leastcertain output corresponds to that produced entirely under the assumption of transitivity,as in the given example. Other degrees of certainty arise as some of the knowledge existsto cross-check a subset of the finger positions inferred. In this way, the system producesoutput for more new input while striving to produce the most reliable output it can usingits current knowledge.
The notions of using diagrammatic information as cases in a case-based reasoningsystem and generalizing diagrammatic information for use in subsequent problem solvingare likely to be useful beyond the example domains presented.
3.5. Communicating with diagrams
As stated previously, a diagram processing agent should be able to produce diagrams inits attempt to communicate diagrammatically representable notions to other naturally andartificially intelligent agents. In comparison to the other diagram processing desiderata,

M. Anderson, R. McCartney / Artificial Intelligence 145 (2003) 181–226 217
much work has been done in this area under the guise of information visualization (for
example, see IEEE Transactions on Visualization and Computer Graphics). The thrust ofthis work has been the creation of graphical representations of non-graphical data to theend of engaging the power of the human visual system in its interpretation.On the other hand, in an IDR approach, the accomplishment of a given task is oftenequivalent to the creation of a graphical representation of this task’s solution. Suchequivalence is evident, for example, in the creation of a diagram that answers queries posedto a diagrammatic database or in the development of a diagrammatic heuristic as previouslydiscussed. Other examples of this equivalence can be found in [7] where IDR is used toaccomplish simple scheduling tasks and to assist in the sequencing of DNA [19,34].
Further, it can be the case that not only final solutions but intermediate IDR processingsteps are comprehensible and useful. In the following, an IDR implementation of Venndiagrams [3] is detailed where properties of propositions and arguments in propositionallogic are made evident through the manipulation of bitmaps representing such diagrams.As unary and binary logical operations are applied to these diagrams, new diagrams arecreated that reflect the current state of the argument, making perspicuous each logical stepin the process of validation.
3.5.1. Inferring validity and satisfiability from Venn diagramsAlthough John Venn (1834–1923) first proposed his diagrams for use in solving
problems in classic logic such as syllogisms [55], he recognized that they could be usedfor solving problems in truth-valued propositional logic. This was left to others to bring tofruition.
IDR operators can be used in conjunction with the concept of Venn diagrams to show(1) that a formula in propositional logic is tautological, contradictory, or satisfiable, and(2) that an argument in propositional logic is valid or invalid.
A propositional formula is tautological if it is true no matter what the truth valuesof its atomic components might be. It is satisfiable if it is true for some assignment oftruth values of its atomic components. Lastly, it is contradictory if it is not true for anyassignment of truth values of its atomic components. When appropriate Venn diagrams areused to represent atomic components of formulas and IDR operators corresponding to thelogical operators in the formula are applied to these diagrams, a new diagram results thatcategorizes the formula. A tautological formula will result in a completely black diagram, asatisfiable formula will result in a non-NULL diagram that has some black and some whitein it, and a contradictory formula will result in the NULL diagram. Formulas that containoperators other than AND, OR, and NOT must first be transformed into equivalent formulasusing only AND, OR, and NOT.
Fig. 26 gives three example formulas and their inter-diagrammatic evaluation. A Venndiagram with a single filled circle is used to represent the proposition P . When the diagramrepresenting P is ORed with its negation, a completely BLACK diagram results indicatinga tautological formula. No matter what truth value P is given, the formula will alwaysbe true. When the diagram representing P is ANDed with its negation, the null diagramresults indicating a contradictory formula. No matter what truth value is given to P , theformula will always be false. The last example ORs the diagram representing P with itself

218 M. Anderson, R. McCartney / Artificial Intelligence 145 (2003) 181–226
Fig. 26. Tautological, contradictory, and satisfiable propositions using Venn diagrams.
resulting in a new diagram that is equivalent to that which represents P . Since this resultis non-NULL (but not completely BLACK), the formula is satisfiable but not tautological.
A propositional argument is valid if its conclusion is true when each of its premisesis true and invalid in all other cases. Again, IDR AND, OR, and NOT operators canbe used to realize their corresponding propositional operators in each proposition of theargument. The argument is then recast as a conditional formula with the conjunction of itspremises as the antecedent and its conclusion as its consequent. When atomic propositionsare represented by appropriate diagrams, a valid argument will evaluate to a completelyBLACK diagram and an invalid argument will evaluate to a not completely BLACK diagramor the null diagram. Since all arguments can be cast as conditional formulas, the notionof satisfiability can apply indirectly to them as well. As before, a satisfiable formula willproduce a non-NULL diagram.
Fig. 27 details an example three term propositional argument and its evaluation. Threepropositions are presented as premises: a disjunction, a conditional, and a negation. Theconclusion offered is simply an atomic formula. Inter-diagrammatic evaluation of thisargument is begun by associating appropriate Venn diagrams to each of the terms presentwithin it (Fig. 27(a)). The three filled circles that comprise the individual terms are arrangedas tessellations such that, when all are overlayed, the intersection of any two and all threeis not empty (analogously to a simple Venn diagram of three terms). This is followed byapplication of appropriate inter-diagrammatic operators to the tessellation correspondingto the terms within each proposition (Fig. 27(b)). The first proposition, a disjunction ofP and R, is evaluated by ORing their corresponding tessellations together, creating a newtessellation. The conditional proposition is first recast as a disjunction and then its firstdisjunct is negated, by applying NOT to its corresponding tessellation, and ORed with thetessellation corresponding to the second disjunct. This forms a new tessellation as well.The third proposition is simply a negation, so Q’s corresponding tessellation is negated.The conclusion of the argument is atomic and requires no application of operators.
The entire argument, then, is recast as a conditional with the conjunction of premises asthe antecedent and the conclusion of the argument as the consequent (Fig. 27(c)). Thepremises are represented by the new tessellations created previously from them. Eachconjunct of the antecedent is then ANDed together and the resulting simple conditional

M. Anderson, R. McCartney / Artificial Intelligence 145 (2003) 181–226 219
Fig. 27. Validating a propositional argument using Venn diagrams.
is recast as a disjunction. The first disjunct is negated and ORed with the second disjunct togive the final evaluation of the argument. In this case, the resulting diagram is completelyBLACK, indicating that this argument is valid. Since the third proposition of the argumentcombined, via Modus Tollens, with the second will produce ¬P , the argument must implyR in order to make the first proposition true. Therefore, the argument is indeed valid.
A program has been developed based on Venn diagram evaluation of propositions andpropositional arguments. Taking functional descriptions of up to three term propositions,the program uses bitmap operators to realize IDR operators and outputs diagrams thatrepresent an animation of the evaluation of a proposition. The program can further be usedto show the consistency or inconsistency of a new proposition with a consistent set ofpropositions. This program can be extended to work with arguments of more than threeterms by using diagrams appropriate for the number of terms desired. Berkeley [16] hasdeveloped a generalized Venn diagram that can be used to represent any number of terms

220 M. Anderson, R. McCartney / Artificial Intelligence 145 (2003) 181–226
so the number of terms a proposition can have in the current system is theoretically only
bounded by memory.In general, as the primary data structures used by an IDR approach are themselvesdiagrams, tasks that use such an approach can leverage the comprehensibility of theseentities in communicating partial and complete graphical solutions resulting directly fromIDR processing. In this way, an IDR approach facilitates communication of diagrammaticinformation, a crucial component of diagram processing.
4. Related research
There has long been interest in the capacity of human beings to reason withdiagrammatic representations. Such interest can be traced back to Plato (428 B.C.)and his contemporaries. Mathematician Leonhard Euler [22] and logician John Venn[55], respectively, introduced Euler’s Circles and Venn diagrams as graphical aids toformal reasoning processes. C.S. Pierce [44] expanded upon these notions and deemeddiagrammatic reasoning as “the only fertile reasoning”. More recently, interest indiagrammatic representations has begun to emerge as a field of study in its own right as isevidenced by recent conferences [9,32] and books [14,28] as well as the inauguration of anew journal, Diagrams (Kluwer Academic Publishers), dedicated to the topic. This interestin diagrams has emanated from a number of different perspectives including interest intheir nature [52,53], cognitive aspects concerning them [46,50], their status as logicalrepresentations [15,30,31,51], and their computational significance [24,33,38].
Research from a computational perspective in diagrammatic reasoning, that which hasthe most bearing on our current work, began to reappear in the 1990s after a long dormancyit experienced being virtually abandoned after a brief flirtation in the early days of AI (e.g.,[23,26]). See, for instance, [2,9,14,20,27,28,32,36,41] for a representative sample of thiswork. Evans’ [23] work in visual analogies can be considered the first research in inter-diagrammatic reasoning, although this distinction was not yet made. Bieger and Glock[17,18] and Willows and Houghton [56] have done work in human use of sets of relateddiagrams.
Although a number of scientists are actively researching how computers might harnessthe power of diagrammatic representations, only a few are attempting to empower amachine with the ability to deal directly with images of them, as our research does, andnot with symbolic representations of them. We have motivated this approach by notingthat, given a system such as we are advocating that will need to take diagrams directlyfrom its environment, any translation into another representation will require some formof manipulation of this input. We have shown that, in many cases, this translation issuperfluous. Given this, we store input diagrams directly with no further abstraction. Aspreviously stated, this strategy not only allows the system to manipulate these spatialrepresentations directly but, should the need arise, it will allow it to translate to otherrepresentations as required. Furnas, Jamnik, and Lindsay all subscribe to this “directmanipulation by the system” approach.
Furnas’ BITPICT theory [24] supports a system that deals directly with diagramsvia graphical rewrite rules that can be used to transform one diagram into another and,

M. Anderson, R. McCartney / Artificial Intelligence 145 (2003) 181–226 221
therefore, allow computation from diagrams to diagrams. Furnas’ work does not attempt
to process collections of diagrams but, rather, its crux is the generation of sequences ofdiagrams to accomplish some computational goal pertaining to a single diagram. We haveshown [3] that this theory can be subsumed by IDR by using appropriate sets of diagramsrepresenting the universal instantiation of BITPICT rules.Jamnik’s DIAMOND system [33] is concerned with automation of mathematicaltheorem proving that use geometrical operations on diagrams (i.e., diagrammatic proofs).Concrete instances of theorems are proven by direct manipulation of diagrams by thesystem and the theorem is induced from these examples. Jamnik aims to formalizediagrammatic reasoning and, in the process, show that manipulation on diagrams, whenrigorously applied, can be seen as a valid proof method.
Lindsay [38] is interested in exploring the interaction between linguistic and diagram-matic representations in the domain of geometric reasoning. Lindsay uses diagram obser-vation and direct manipulation by the system to provide support for proofs of theorems ingeometry as well as to facilitate their discovery. The diagram is used to enforce the essentialproperties of space while the diagram is observed for implicit knowledge or manipulatedto create new knowledge.
The current work differs from both Jamnik’s and Lindsay’s in that it seeks generalityand wide applicability of its theory and, in contrast to Lindsay, it attempts to explore theboundaries of what can be computed with maximal use of diagrammatic representations.
5. Future directions
We intend to extend the definition of a diagram, expand input modalities, generalizemethods of extracting knowledge from input, incorporate other means of diagrammaticinference, investigate new domains and new classes of diagrams, integrate new diagram-matic and non-diagrammatic knowledge and representations, and explore means to useoutput from diagram processing systems as input to other types of systems. These futuredirections are briefly discussed in the following.
Diagram definition extension. As we have shown, defining diagrams as semanticallynon-committed tessellations has been fruitful in that the generality of this definition haspermitted its use in a wide variety of domains and contexts. Although, given tesserae aspoints, this definition is general enough to encompass all diagrams, it may be the case thata diagram represented at so fine a granularity loses it usefulness. What is interesting abouta graph, for instance, is less in the spatial and tonal relationships of its pixel values than inthe interpretation of these pixel values as vertices and edges and the connectedness, not thespatial relationships, of these higher order entities. It seems entirely possible to constructthese entities and connections starting from the pixel level, and such a capability will berequired by the autonomous diagram processing agent postulated in this proposal, but oncethis transformation has been made there is little reason to deal any further with the originalpixel values. The essence of the graph has been distilled and this essence, which couldbe represented by an infinite number of actual diagrams, may tax the expressive power oftessellationally represented diagrams.

222 M. Anderson, R. McCartney / Artificial Intelligence 145 (2003) 181–226
As the overarching goal of this research is the development of a diagram processing
system capable of dealing with all forms of diagrammatic information, we intend to extendthe definition of a diagram to include higher level representation schemes with greatersemantic commitment such as that for the graph. From such a definition extension, it isexpected that this research will be amenable to a wider variety of domains and diagramsthan currently feasible.Input modality expansion. Ideally, an autonomous diagram processing agent should becapable of accepting diagrammatically represented data directly from its environment andfrom humans with which it interacts in all its forms including electronic, printed, hand-sketched, etc. To date, we have postponed consideration of all but the electronic modalityin the interest of making progress in the foundational issues of diagrammatic reasoning.As a step towards the generality of input modality that will be required, we intend to turnour focus to an intermediate representation, which we term a diaSketch, that will smooththe transition to a more visually adept diagram processing agent.
A diaSketch [8] consists of a sketch layer overlaid on a diagrammatic substrate.The diagrammatic portion has all of the formal, computational properties that have haddemonstrable application in the problem domains detailed previously. The sketched portionhas all of the qualities of informality, desirable ambiguity, and natural human interfacethat accrue to sketches. A diaSketch can be created and input to a diagram processingsystem via a number of modalities. These include sketches on printed forms scanned inor captured via video as well as sketches on electronically presented forms via pressure-sensitive pads or light pens. It is likely that, in many cases, diaSketch applications willrequire only minimal sketch understanding as the constant diagrammatic substrate can beused to guide it. Thus, this intermediate representation leverages our previous researchwhile permitting incremental advancement of its input modalities.
Knowledge extraction generalization. As new input modalities are introduced, our re-search can no longer rely upon the relative noiselessness, completeness and precision thathas characterized input data to date. Even a scanned in diaSketch, specifically chosen forits incremental advancement over present input data, introduces noise, incompleteness andimprecision into the input. Our knowledge extraction techniques currently operate underthe assumption that they will be working with crisp data—clearly an assumption that willno longer hold necessarily.
We intend to approach this new category of problems from two directions. Firstly,we will attempt to clean input data before any further processing. For instance, imageprocessing techniques [47–49] can be used on a diaSketch to flatten out its backgroundand thin its lines. This crisper data is then sent on for knowledge extraction. Althoughmore crisp than the original input, this cleaned data is still not as precise as ourcurrent knowledge extraction techniques expect. Secondly, we will generalize our currentknowledge extraction techniques to deal with less than the fully crisp data they will nowreceive. For instance, exact matches must be replaced by close matches, results mustsurpass certain thresholds to be valid, confidence factors may need to be assigned toextracted knowledge, etc. In short, as we introduce uncertainty into our data we need to

M. Anderson, R. McCartney / Artificial Intelligence 145 (2003) 181–226 223
investigate the relationship of this uncertainty with those cases currently in the literature
and devise and incorporate methods to contend with it.Incorporation of other inferencing mechanisms. It is not likely, given the wide variety ofdiagrams and diagrammatic domains, that any one approach will be capable of dealing withthem all. It is more likely to be the case that the ultimate diagram processing system willbe a hybrid system comprised of an amalgam of a variety of subsystems. We intend to in-corporate different approaches to diagram processing whose strengths compliment IDR’s.
Investigation of new domains and diagrams. As the diagrammatic information systemtest bed aspires to domain and diagram type independence, we propose to investigate itsuse in new domains and with new classes of diagrams.
Integration of new knowledge and representations. As we incorporate new domains,new diagram types, and new representations of diagrams into our test bed, we will needto integrate this new knowledge and these representations with previous knowledge andrepresentations. It is our intent to enhance the DSQL language and compiler as well as toexplore other means to handle this integration.
Diagrammatic output use in other systems. As the results of a diagram processing sys-tem should be useful not only to human users but to other systems as well, we intend toinvestigate how such interfacing might be achieved. For instance, we have shown [6] thatan interesting outgrowth of the development of DSQL is the capability of using this lan-guage to facilitate knowledge discovery from diagrammatic information. Given a databaseof diagrams, DSQL can be used to perform a number of data mining tasks including datacleaning, integration of heterogeneous data, retrieval of data relevant to the data miningtask at hand, diagrammatic concept hierarchies development, generalization of diagramsthrough these hierarchies, computation of interestingness measures of discovered knowl-edge, and visualization of the discovered patterns. We intend to construct such a diagrammining module as an example of a non-human consumer of the products of our test bed.
Currently, we are investigating the use of image algebra [47] as a formalism to facilitateconsolidation of research related to IDR as well as a means to expedite explorationof image processing techniques amenable to diagram processing such as mathematicalmorphology [5,48,49]. Further, just as we have explored the synergy between IDR and theAI paradigms of heuristic development, constraint satisfaction, case-base reasoning, andinductive learning, we are interested in investigating the incorporation of IDR with otherestablished AI paradigms such as fuzzy logic, genetic algorithms, and data mining [6].Given the visual nature of IDR tessellations and the independence of their tesserae, we arealso interested in exploring IDR as a paradigm for both optical and parallel computing.
6. Conclusion
A domain and task independent approach to dealing with certain forms of diagrammaticinformation has been detailed in which we have investigated the use of diagrammatic rep-

224 M. Anderson, R. McCartney / Artificial Intelligence 145 (2003) 181–226
resentations, attempting to bring our understanding of them on par with our understanding
of other representational schemes. It is our aim that this work be perceived as a compu-tational abstraction useful in the development of solutions to new diagrammatically rep-resented problems as well as a suite of challenge problems in less represented domains.Further, as we believe that it is unlikely that there exists a single comprehensive theory ofdiagram processing, it is our hope that this work serves as motivation for new work con-cerning diagrammatic reasoning and representations and as a benchmark against which tocompare new theories of diagram processing.Given that the pursuit of a fully autonomous intelligent agent is a worthy one, an agentcapable of dealing directly with diagrammatic representations will exhibit a greater degreeof autonomy than those without this facility. This diagram processing capability is arguablyas significant as natural language processing and providing such facility would be animportant contribution of research concerning diagrammatic reasoning and representationsto the field of Artificial Intelligence.
References
[1] M. Anderson, Reasoning with diagram sequences, in: Proceedings of the Conference on Information-Oriented Approaches to Logic, Language and Computation (Fourth Conference on Situation Theory andits Applications), Moraga, CA, 1994. Reprinted in: J. Seligman, D. Westerfahl (Eds.), Logic, Language andComputation, CSLI Publications, Stanford, CA, 1996.
[2] M. Anderson (Ed.), Reasoning with Diagrammatic Representations II, Papers from the 1997 FallSymposium, Technical Report FS-97-03, AAAI Press, Menlo Park, CA, 1997.
[3] M. Anderson, Inter-diagrammatic reasoning, Ph.D. Dissertation, University of Connecticut, Storrs, CT,1997.
[4] M. Anderson, Toward diagram processing: A diagrammatic information system, in: Proc. AAAI-99,Orlando, FL, 1999, pp. 394–401. Reprinted in: M. Anderson, B. Meyer, P. Olivier (Eds.), DiagrammaticRepresentation and Reasoning, Springer, Berlin, 2002.
[5] M. Anderson, Diagrammatic reasoning and mathematical morphology, in: Smart Graphics, Papers from the2000 Spring Symposium, Technical Report SS-00-04, AAAI Press, Menlo Park, CA, 2000, pp. 109–116.
[6] M. Anderson, Mining diagrams, in: Proceedings of the First International Symposium on Smart Graphics,IBM T.J. Watson Research Center, Hawthorne, NY, 2001, pp. 1–8.
[7] M. Anderson, C. Armen, Diagrammatic reasoning and color, in: Formalization of Reasoning with Visual andDiagrammatic Representations, Papers from the 1998 Fall Symposium, Technical Report FS-98-04, AAAIPress, Menlo Park, CA, 1998, pp. 13–22.
[8] M. Anderson, C. Armen, DiaSketches, in: Proceedings of the Second International Symposium on SmartGraphics, IBM T.J. Watson Research Center, Hawthorne, NY, 2002.
[9] M. Anderson, P. Cheng, V. Haarslev (Eds.), Theory and Application of Diagrams, First InternationalConference, Diagrams 2000, Springer, Berlin, 2000.
[10] M. Anderson, R. McCartney, Developing a heuristic via diagrammatic reasoning, in: Proceedings of theTenth ACM Symposium on Applied Computing, Nashville, TN, 1995, pp. 227–231.
[11] M. Anderson, R. McCartney, Inter-diagrammatic reasoning, in: Proc. IJCAI-95, Montreal, Canada, 1995,pp. 878–884.
[12] M. Anderson, R. McCartney, Diagrammatic reasoning and cases, in: Proc. AAAI-96, Portland, OR, 1996,pp. 1004–1009.
[13] M. Anderson, R. McCartney, Learning from diagrams, J. Machine Vision and Graphics 6 (1) (1997) 57–76.[14] M. Anderson, B. Meyer, P. Olivier (Eds.), Diagrammatic Representation and Reasoning, Springer, Berlin,
2002.[15] J. Barwise, J. Etchemendy, Visual information and valid reasoning, in: W. Zimmermann, S. Cunningham
(Eds.), Visualization of Mathematics, MAA Notes No. 19, Mathematical Association of America,

M. Anderson, R. McCartney / Artificial Intelligence 145 (2003) 181–226 225
Washington, DC, 1991, pp. 9–24. Reprinted in: L. Burkholder (Ed.), Philosophy and the Computer,
Westview Press, Boulder, CO, 1992, pp. 160–182.[16] E.C. Berkeley, Boolean algebra (the technique for manipulating ‘and’, ‘or’ and ‘not’ conditions) andapplications to insurance, The Record of the American Institute of Actuaries (1937).
[17] G. Bieger, M. Glock, The information content of picture-text instructions, J. Experimental Education 53 (2)(1985) 68–76.
[18] G. Bieger, M. Glock, Comprehending spatial and contextual information in picture-text instructions,J. Experimental Education 54 (4) (1986) 181–188.
[19] A. Blum, T. Jiang, M. Li, J. Tromp, M. Yannakakis, Linear approximation of shortest superstrings,J. ACM 41 (4) (1994) 630–647.
[20] B. Chandrasekaran, N. Narayanan, Y. Iwasaki, Reasoning with diagrammatic representations, AI Maga-zine 14 (2) (1993) 49–56.
[21] C. Date, A Guide to the SQL Standard, 2nd Edition, Addison-Wesley, Reading, MA, 1989.[22] L. Euler, Lettres a Une Princesse d’Allemagne, Vol. 2, 1761, Letters 102–108.[23] T.G. Evans, A heuristic program to solve geometry analogy problems, MIT AI Memo 46 (1962). Reprinted
as A program for the solution of a class of geometric-analogy intelligence-test questions in: M.L. Minsky(Ed.), Semantic Information Processing, MIT Press, Cambridge, MA, 1968, pp. 271–353.
[24] G. Furnas, Reasoning with diagrams only, in: N. Narayanan (Ed.), Working notes of AAAI SpringSymposium on Reasoning with Diagrammatic Representations, AAAI Press, Menlo Park, CA, 1992,pp. 118–123.
[25] I.J. Gelb, A Study of Writing, 2nd Edition, University of Chicago Press, Chicago, IL, 1963.[26] H. Gelernter, Realization of a geometry theorem proving machine, in: Proceedings of an International Con-
ference on Information Processing, UNESCO House, 1959, pp. 273–282. Reprinted in: E.A. Feigenbaum,J. Feldman (Eds.), Computers and Thought, McGraw-Hill, New York, NY, 1963.
[27] J. Glasgow, The imagery debate revisited: A computational perspective, Computational Intelligence 9 (4)(1993).
[28] J. Glasgow, N. Narayanan, B. Chandrasekaran (Eds.), Diagrammatic Reasoning: Cognitive and Computa-tional Perspectives, MIT Press, Cambridge, MA, 1995.
[29] J. Gu, Parallel algorithms and architectures for very fast AI search, Ph.D. Dissertation, University of Utah,Salt Lake City, UT, 1989.
[30] E. Hammer, Logic and Visual Information, CSLI Publications, Stanford, CA, 1995.[31] J. Howse, G. Stapleton, J. Flower, J. Taylor, Corresponding regions in Euler diagrams, in: M. Hegarty,
B. Meyer, N.H. Narayanan (Eds.), Diagrammatic Representation and Inference, Second InternationalConference, Diagrams 2002, Springer, Berlin, 2002.
[32] M. Hegarty, B. Meyer, N.H. Narayanan (Eds.), Diagrammatic Representation and Inference, SecondInternational Conference, Diagrams 2002, Springer, Berlin, 2002.
[33] M. Jamnik, Mathematical Reasoning with Diagrams: From Intuition to Automation, CSLI Press, Stanford,CA, 2001.
[34] J. Kececioglu, E. Myers, Exact and approximate algorithms for the sequence reconstruction problem,Algorithmica 13 (7) (1995).
[35] J.L. Kolodner, Case-based Reasoning, Morgan Kaufmann, San Mateo, CA, 1993.[36] Z. Kulpa (Ed.), J. Machine Vision and Graphics 6 (1) (1997).[37] J. Larkin, H. Simon, Why a diagram is (sometimes) worth ten thousand words, Cognitive Sci. 11 (1987)
65–99.[38] R.K. Lindsay, Knowing about Diagrams, in: J. Glasgow, N. Narayanan, B. Chandrasekaran (Eds.),
Diagrammatic Reasoning: Cognitive and Computational Perspectives, MIT Press, Cambridge, MA, 1995,pp. 15–22.
[39] R. McCartney, Episodic cases and real-time performance in a case-based planning system, Expert Systemswith Applications 6 (1993) 9–22.
[40] T. Mitchell, Machine Learning, McGraw-Hill, Boston, MA, 1997.[41] N. Narayanan (Ed.), Working notes of AAAI Spring Symposium on Reasoning with Diagrammatic
Representations, AAAI Press, Menlo Park, CA, 1992.[42] N. Narayanan (Ed.), Taking issue/Forum: The imagery debate revisited, Computational Intelligence 9 (4)
(1993).

226 M. Anderson, R. McCartney / Artificial Intelligence 145 (2003) 181–226
[43] N. Narayanan, B. Chandrasekaran, Reasoning visually about spatial interactions, in: Proc. IJCAI-91, Sydney,
Australia, 1991.[44] C. Pierce, Collected Papers, Harvard University Press, Harvard, 1933.[45] L. Purvis, Constraint satisfaction combined with case-based reasoning for assembly sequence planning,
Technical Report CSE-TR-93-20, University of Connecticut, Storrs, CT, 1995.[46] Y. Qin, H. Simon, Imagery and mental models, in: J. Glasgow, N. Narayanan, B. Chandrasekaran (Eds.),
Diagrammatic Reasoning: Cognitive and Computational Perspectives, MIT Press, Cambridge, MA, 1995.[47] G. Ritter, J. Wilson, Handbook of Computer Vision Algorithms in Image Algebra, CRC Press, Boca Raton,
FL, 1996.[48] J. Serra, Image Analysis and Mathematical Morphology, Vol. 1, Academic Press, San Diego, CA, 1982.[49] J. Serra, Image Analysis and Mathematical Morphology, Vol. 2, Academic Press, San Diego, CA, 1988.[50] P. Shah, Graph comprehension: The role of format, content and individual differences, in: M. Anderson, B.
Meyer, P. Olivier (Eds.), Diagrammatic Representation and Reasoning, Springer, Berlin, 2002.[51] S.-J. Shin, The Logical Status of Diagrams, Cambridge University Press, Cambridge, 1994.[52] A. Sloman, Musings on the roles of logical and non-logical representations in intelligence, in: J.
Glasgow, N. Narayanan, B. Chandrasekaran (Eds.), Diagrammatic Reasoning: Cognitive and ComputationalPerspectives, MIT Press, Cambridge, MA, 1995.
[53] A. Sloman, Diagrams in the Mind?, in: M. Anderson, B. Meyer, P. Olivier (Eds.), DiagrammaticRepresentation and Reasoning, Springer, Berlin, 2002.
[54] H.S. Stone, J. Stone, Efficient search techniques: An empirical study of the n-queens problem, TechnicalReport RC 12057, IBM T.J. Watson Research Center, Yorktown Heights, NY, 1986.
[55] J. Venn, Symbolic Logic, 2nd Edition, MacMillan, London, 1894.[56] D. Willows, H. Houghton, The Psychology of Illustration, Springer, Heidelberg, 1987.[57] G. Wyszecki, W.S. Stiles, Color Science, 2nd Edition, Wiley, New York, 1982.