
7 Entity Relationship Diagrams
40
ENTITY RELATIONSHIP DIAGRAMS Week 5
-
Upload
khangminh22 -
Category
Documents
-
view
5 -
download
0
Transcript of 7 Entity Relationship Diagrams

ENTITY RELATIONSHIP DIAGRAMS Week 5

OBJECTIVES
ØHow to use Entity–Relationship (ER) modeling in database design.
ØBasic concepts associated with ER model.
ØIntroduce the diagrammatic technique for displaying an ER schema
ØShow how a schema design is refined to include relationships.
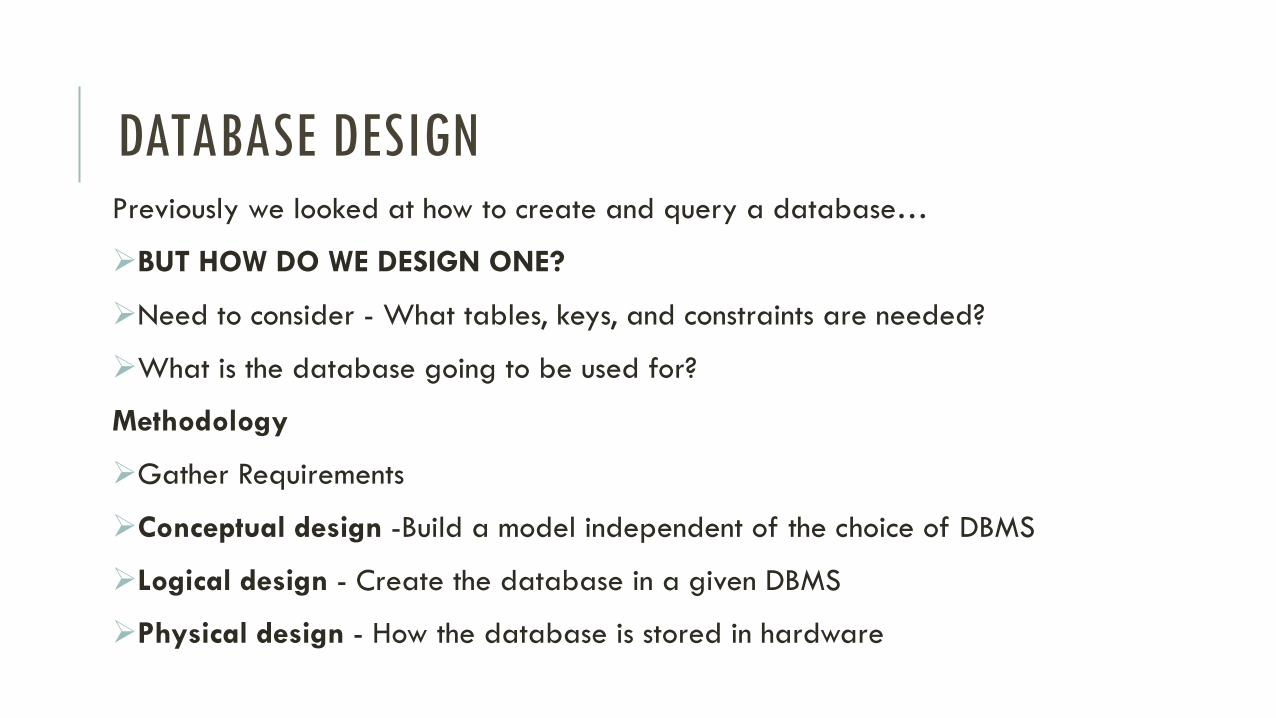
DATABASE DESIGNPreviously we looked at how to create and query a database…
ØBUT HOW DO WE DESIGN ONE?
ØNeed to consider - What tables, keys, and constraints are needed?
ØWhat is the database going to be used for?
Methodology
ØGather Requirements
ØConceptual design -Build a model independent of the choice of DBMS
ØLogical design - Create the database in a given DBMS
ØPhysical design - How the database is stored in hardware
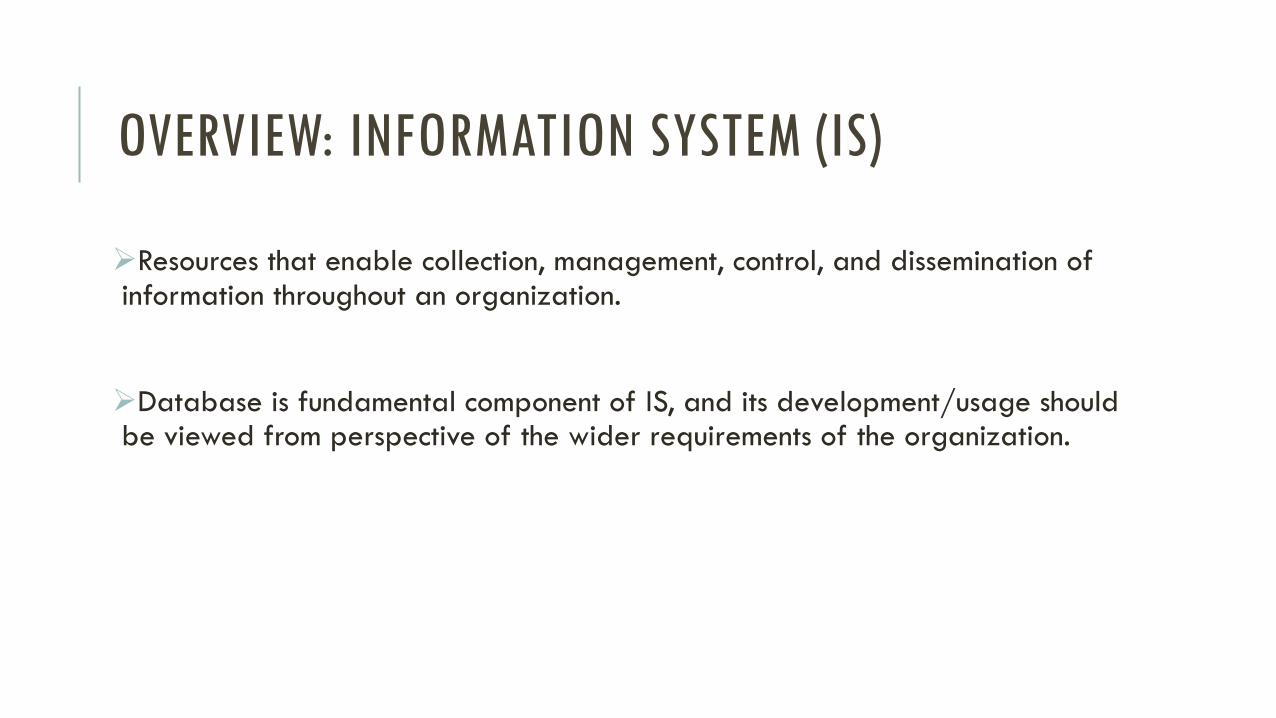
OVERVIEW: INFORMATION SYSTEM (IS)
ØResources that enable collection, management, control, and dissemination of information throughout an organization.
ØDatabase is fundamental component of IS, and its development/usage should be viewed from perspective of the wider requirements of the organization.
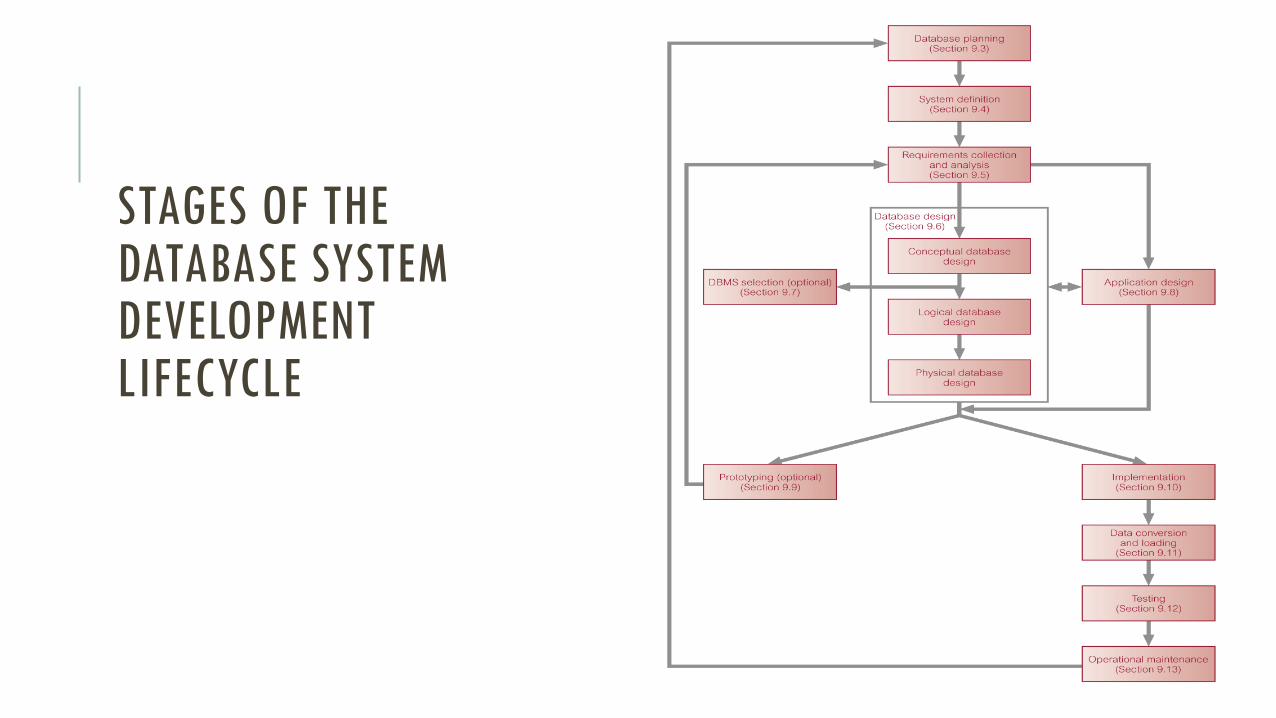
STAGES OF THE DATABASE SYSTEM DEVELOPMENT LIFECYCLE

DATABASE PLANNING AND DESIGN
ØConceptual modeling is a very important phase in designing a successful database application.
ØEntity–relationship (ER) model is a popular high-level conceptual data model.
ØHere we present the diagrammatic notation associated with the ER model, known as ER diagrams.
ENTITY RELATIONSHIP MODELLING
ØAn E-R model is a particular type of data model suited to designing relational databases.
ØThe main component of the model is the Entity-Relationship Diagram.
ØThe E-R diagram is a simple way of representing the data entities being modelled and the relationships between these data entities.
ØIt is easy to transform E-R diagrams to the Relational Model (data entities correspond to relations and relationships correspond to the implied associations created by keys and foreign keys of relations).
ENTITY RELATIONSHIP DIAGRAMS
Ø A graphical representation of the entire database system
Ø Used as a design and planning tool
Ø Provides a high-level conceptual data model supporting the user’s perception of the data
Ø DBMS and hardware independent
Ø Composed of entities, attributes and relationships

ER MODELS
ØEntityØAn entity is any object in the system that we want to model and store information about
ØThey are objects or items of interest
ØAttributesØAn attribute is a property of an entity
ØRelationshipØLinks between entities
ØIn a University Database we might have:ØEntity for Students, Modules and Lecturers
ØStudents attributes such as: StudentID, Name, Course
ØRelationships with Modules (enrolment) and Lecturers (tutor)
TYPES OF ERD (ENTITY RELATIONSHIP DIAGRAMS)
ØNumerous styles exist:ØChen model (named after the originator of ER modeling, Dr. Peter P.S. Chen)ØInformation Engineering (IE, or “crows feet”)ØUnified Modeling Language (UML)ØEtc..
• The differences between the styles are only on how the entities and their relationships are illustrated
• When you’re familiar with one style, it’s straight-forward to learn another
• This module focuses on Chen’s ERD style

ERD EXAMPLE

ENTITIES
ØEntity is a thing or object in the real world with an independent existence. An entity may be an object with a physical existence (for example, a particular person, car, house, or employee) or it may be an object with a conceptual existence (for instance, a company, a job, or a university course)ØEntities are generally nouns (a word that functions as the name of some specific thing or set of things, such as living creatures, objects, places, actions, qualities, states of existence, or ideas.)
ØEntities are represented by rectangles in Chen’s ERD’s
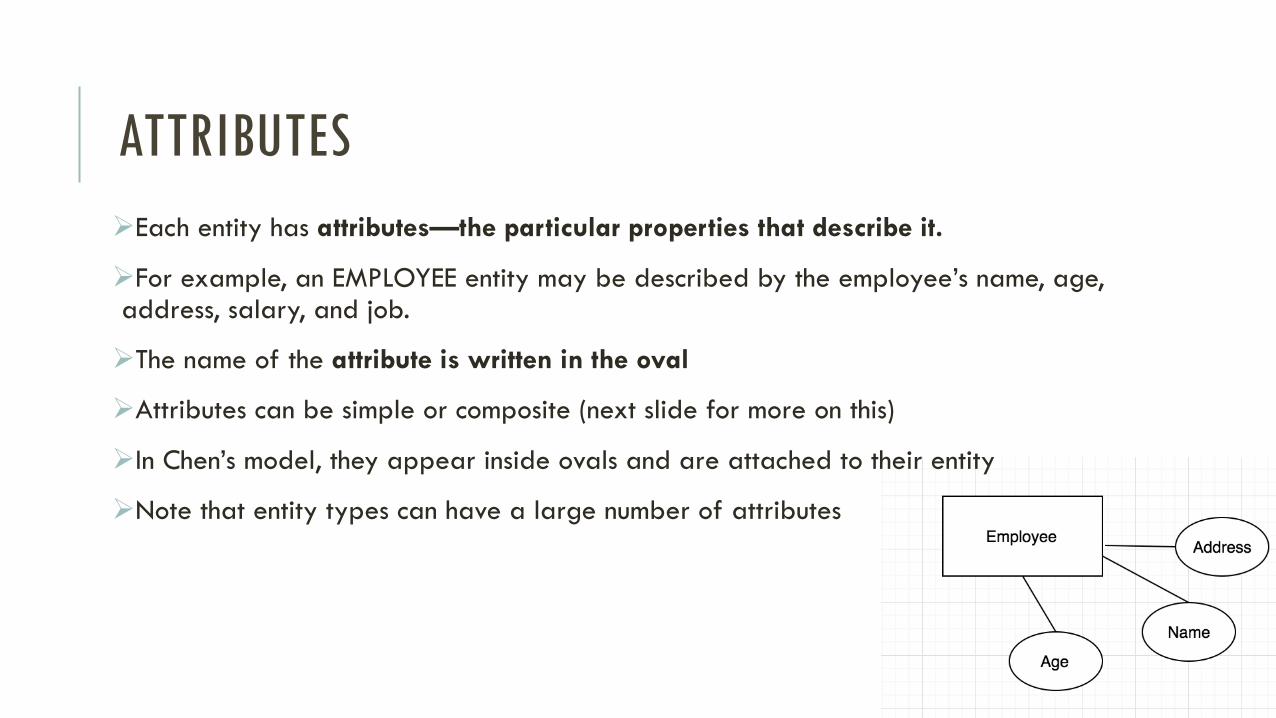
ATTRIBUTESØEach entity has attributes—the particular properties that describe it.
ØFor example, an EMPLOYEE entity may be described by the employee’s name, age, address, salary, and job.
ØThe name of the attribute is written in the oval
ØAttributes can be simple or composite (next slide for more on this)
ØIn Chen’s model, they appear inside ovals and are attached to their entity
ØNote that entity types can have a large number of attributes

ATTRIBUTE TYPESØProperties of entities that describe their characteristics
ØTypes: ØSimple: Attribute that in not divisible e.g. ageØComposite: Attribute composed of several simple attributes e.g. address (as shown above)ØMultiple (or multi-value attribute) have a set of values for the same entity—for instance, a Colors attribute
for a car, or a College_degrees attribute for a person. Cars with one color have a single value, whereas two-tone cars have two color values. Similarly, one person may not have any college degrees, another person may have one, and a third person may have two or more degrees; therefore, different people can have different numbers of values for the College_degrees attribute. Another example is phone numbers (home phone, mobile)
ATTRIBUTE TYPES (CONTINUED…)ØProperties of entities that describe their characteristics
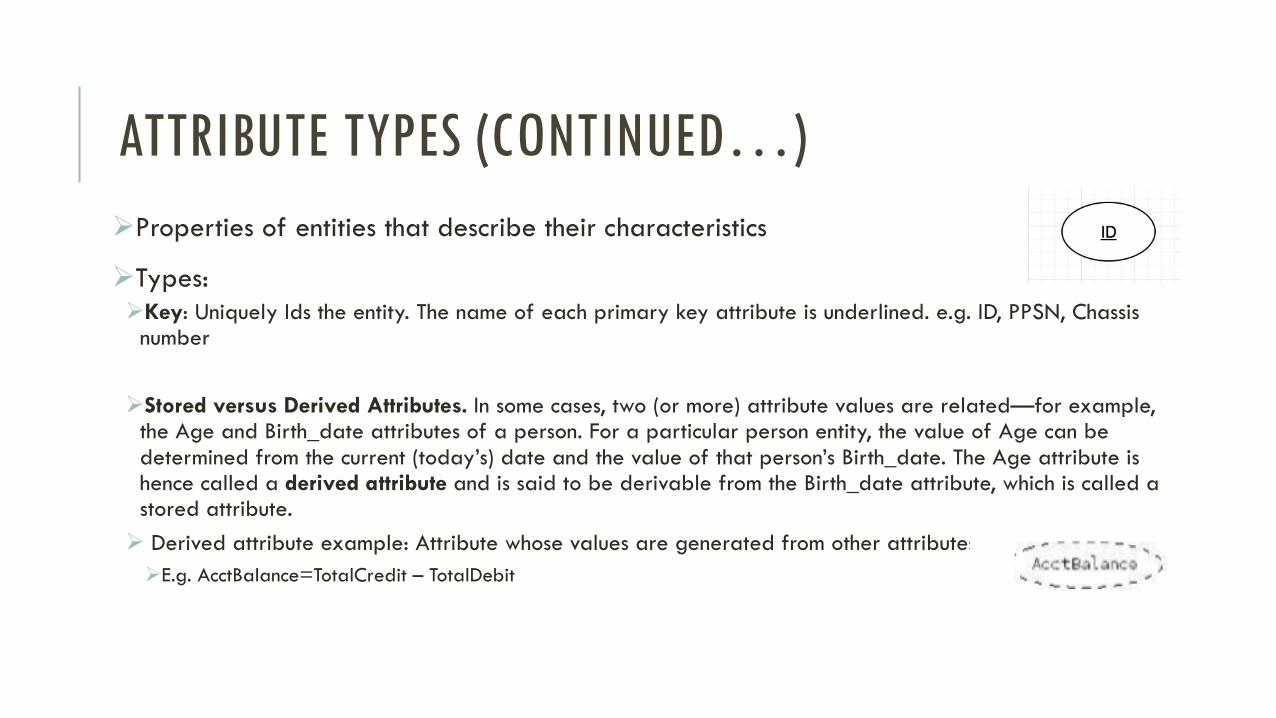
ØTypes: ØKey: Uniquely Ids the entity. The name of each primary key attribute is underlined. e.g. ID, PPSN, Chassis
number
ØStored versus Derived Attributes. In some cases, two (or more) attribute values are related—for example, the Age and Birth_date attributes of a person. For a particular person entity, the value of Age can be determined from the current (today’s) date and the value of that person’s Birth_date. The Age attribute is hence called a derived attribute and is said to be derivable from the Birth_date attribute, which is called a stored attribute.
Ø Derived attribute example: Attribute whose values are generated from other attributes:ØE.g. AcctBalance=TotalCredit – TotalDebit

RELATIONSHIPSØRelationships are an association between two or more entities
ØExamples: ØEach student takes several modulesØEach Module is taught by a lecturerØEach employee works for a single
departmentØEach manager manages a employee
ØRelationships have:ØA nameØA set of entities that participate in themØA degree (the number of entities that participate (most have a degree
of 2)ØA cardinality ratio e.g. DEPARTMENT:EMPLOYEE is of cardinality ratio
1:N, meaning that each department can be related to (that is, employs) any number of employees (N), but an employee can be related to (work for) at most one department ØN stands for any number of related entities (zero or more).
ØRelationships are represented by diamonds
ØA relationship captures how entities are related to one another. Relationships can be thought of as verbs, linking two or more nouns. Examples: an owns relationship between a company and a computer, a supervises relationship between an employee and a department, a performs relationship between an artist and a song,

DEGREE OF A RELATIONSHIP
ØThe number of participating entities in a relationship is known as the degree of the relationship
ØIf there are two entity types involved, it’s a binary relationship type
If there are three entity types involved, it’s a ternary relationship type
Ternary - involve 3 entities
Binary - involve 2 entities

DEGREE OF A RELATIONSHIP CONTINUED…
ØUnary relationships are also known as recursive relationships. It’s a relationships where the same entity participates more than once in different roles
ØIn this example, we are saying that employees are managed by other employees
Unary- involve 1 entity

CARDINALITY RATIOS
ØTypically relationships are an association between two or more entities
ØEach entity in a relationship can participate in zero, one, or more than one instances of that relationship
ØThere are three basic types of relationships that you may encounter:
Øone-to-one (1:1),
Øone-to-many (1:M), and
Ømany-to-many (M:N or M:M).

CARDINALITY RATIOS CONTINUED…Øone-to-one (1:1)ØE.g. Each lecturer has a unique officeØE.g. an employee can manage at most one department and a department can have at most one manager. ØE.g. The airport is located in one and only one town, and the town has one and only one airport.”
Øone-to-many (1:M)ØE.g. A lecturer may tutor many students, but each student has just one tutorØE.g. A painter can paint many paintings, each painting is painted by one painterØE.g. A customer places many orders and an order is placed by one customer. A “1” indicates that an order comes from one customer. The “M” (or an “N”) indicates that a customer can place many orders.
Ømany-to-many (M:N or M:M)ØEach student takes several modules and each module is taken by several students

CARDINALITY EXAMPLES (WITH DIAGRAMS)
ØA one to one relationship- a man can only marry one woman, and a woman can only marry one man, so it is a one to one (1:1) relationship
ØA one to many relationship -one manager manages many employees, but each employee only has one manager, so it is a one to many (1:m) relationship-(Crows foot notation)

CARDINALITY EXAMPLES (WITH DIAGRAMS)Ø A many to one relationship -many students study one course. They do not study more than one course, so it is a many to one (m:1) relationship
ØA many to many relationship -One lecturer teaches many students and a student is taught by many lecturers, so it is a many to many (m:n) relationship
ØNote: Remember that, when we are specifying data relationships, we are indicating possible relationships, and not necessarily requiring that all instances of all entities participate in every documented relationship.

CARDINALITY RATIOS FOR BINARY RELATIONSHIPSØThe cardinality ratio for a binary relationship specifies the maximum number of relationship instances that an entity can participate in.
ØFor example, DEPARTMENT:EMPLOYEE is typically cardinality ratio 1:N, meaning that each department can be related to (that is, employs) any number of employees (N), (N stands for any number of related entities (zero or more)) but an employee can be related to (work for) at most one department (1). This means that for this particular relationship type WORKS_FOR, a particular department entity can be related to any number of employees (N indicates there is no maximum number).
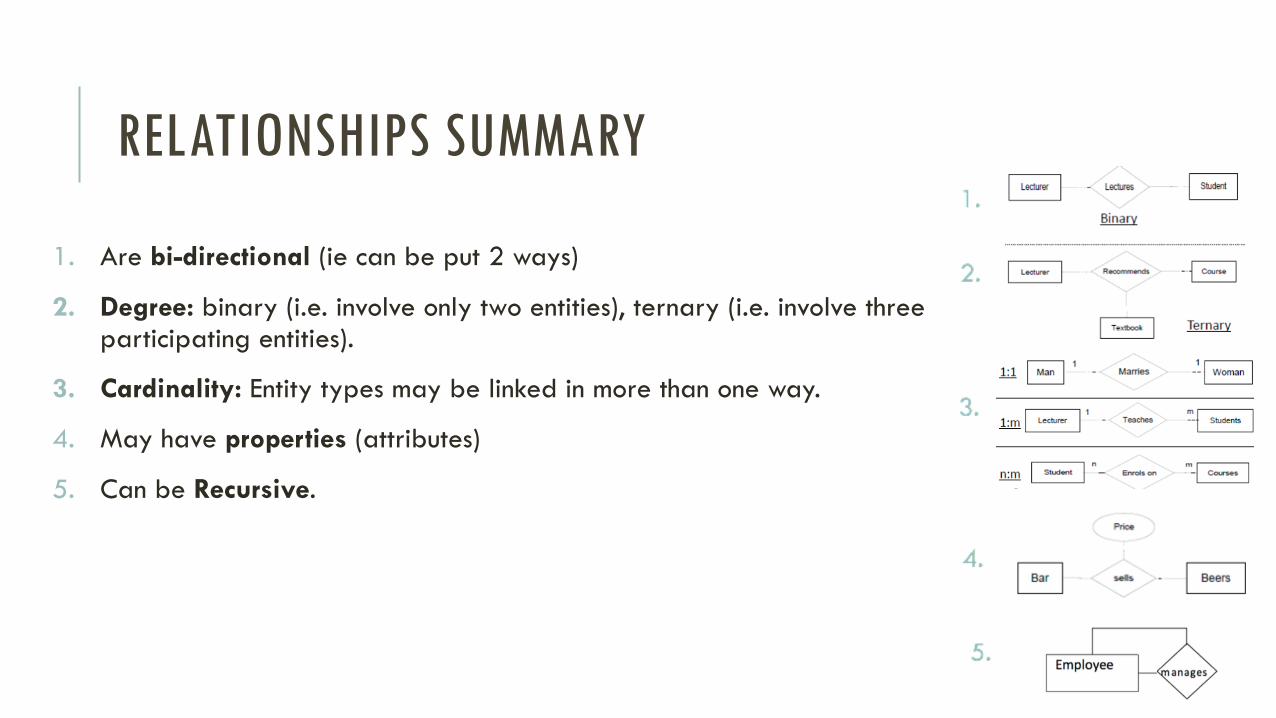
RELATIONSHIPS SUMMARY
1. Are bi-directional (ie can be put 2 ways)
2. Degree: binary (i.e. involve only two entities), ternary (i.e. involve three participating entities).
3. Cardinality: Entity types may be linked in more than one way.
4. May have properties (attributes)
5. Can be Recursive.

MORE ER DEFINITIONS – WEAK ENTITY TYPES
ØEntities belonging to a weak entity type are identified by being related to specific entities from another entity type in combination with one of their attribute values. We call this other entity type the identifying or owner entity type and we call the relationship type that relates a weak entity type to its owner the identifying relationship of the weak entity type.
ØAnother example: A weak entity is one that can only exist when owned by another one. For example: a ROOM can only exist in a BUILDING.
ØIn ER diagrams a weak entity set is indicated by a bold (or double-lined) rectangle (the entity) connected by a bold (or double-lined) type arrow to a bold (or double-lined) diamond (the relationship).
ØAnother Example: entity type DEPENDENT, related to EMPLOYEE, which is used to keep track of the dependents of each employee via a 1:N relationship

WEAK ENTITY EXAMPLE
ØIn a typical database, customers and orders entities we can store data about a customer in its database before the customer places an order. Therefore, an instance of the customer entity does not have to be related to any instances of the order entity.
ØHowever, the reverse is not true in this database. An order must be related to a customer. Without a customer, an order cannot exist. An order is, therefore, an example of a weak entity, one that cannot exist in the database, unless a related instance of another entity is present and related to it.
ØAn instance of the customer entity can be related to zero, one, or more orders. However, an instance of the order entity must be related to one and only one customer.
ØA weak entity type normally has a partial key, which is the attribute that can uniquely identify weak entities that are related to the same owner entity. The partial key attribute is underlined with a dashed or dotted line.
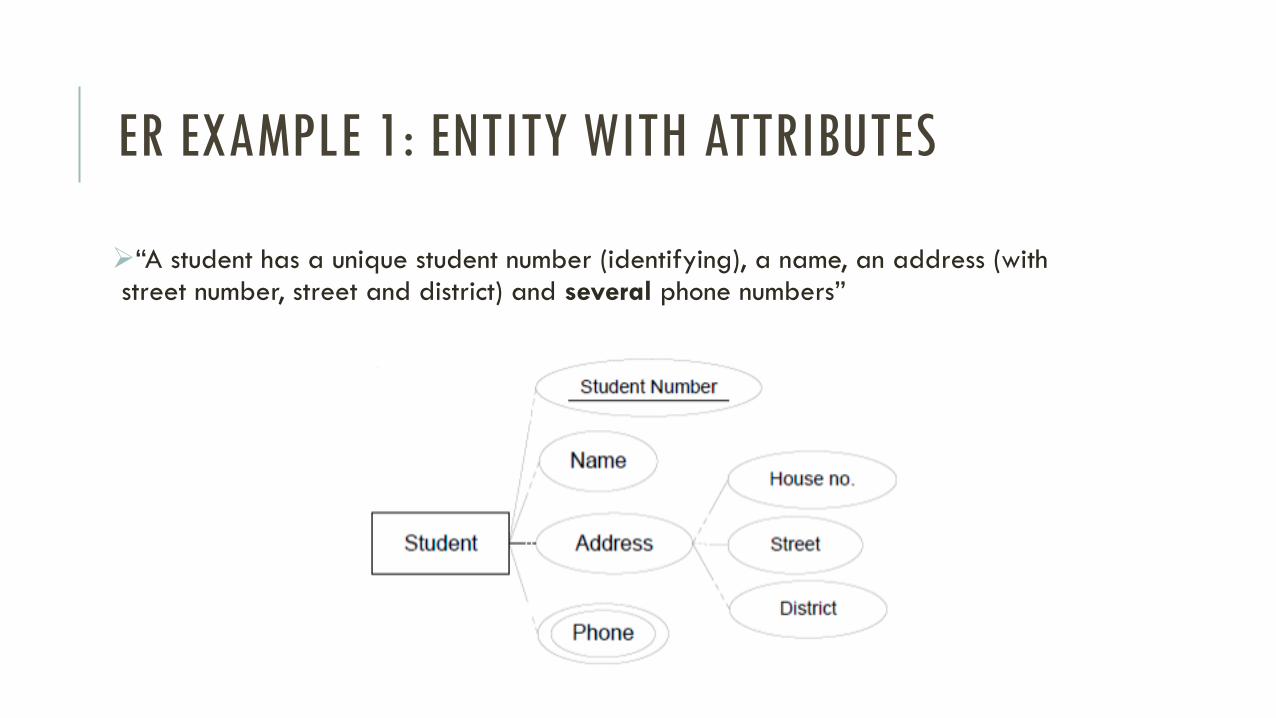
ER EXAMPLE 1: ENTITY WITH ATTRIBUTES
Ø“A student has a unique student number (identifying), a name, an address (with street number, street and district) and several phone numbers”
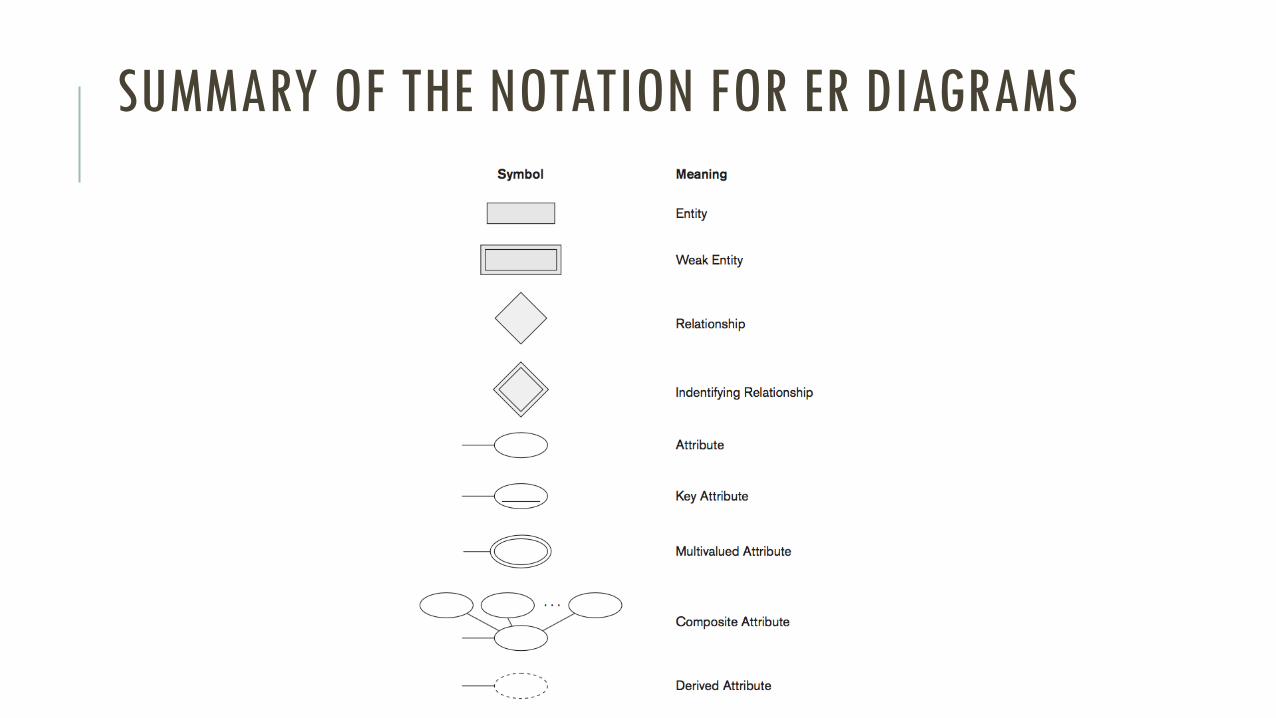
SUMMARY OF THE NOTATION FOR ER DIAGRAMS

TOTAL/PARTIAL PARTICIPATION Two types of participation constraints—total and partial—that we illustrate by example.
Total Participation: If a company policy states that every employee must work for a department
Partial Participation: If we do not expect every employee to manage a department, so the participation of EMPLOYEE in the MANAGES relationship type is partial, meaning that some or part of the set of employee entities are related to some department entity via MANAGES, but not necessarily all.
Note: In ER diagrams, total participation is displayed as a double line connecting the participating entity type to the relationship, whereas partial participation is represented by a single line

PROPER NAMING AND REFINING ER DESIGN
ØWhen designing a database schema, the choice of names for entity types, attributes, relationship types, and (particularly) roles is not always straightforward.
ØOne should choose names that convey, as much as possible, the meanings attached to the different constructs in the schema.
ØThe cardinality ratio and participation constraint of each relationship type are determined from the requirements. If some cardinality ratio or dependency cannot be determined from the requirements, the users must be questioned further to determine these structural constraints.
ØWe choose to use singular names for entity types, rather than plural ones, because the entity type name applies to each individual entity belonging to that entity type.
ØIn our ER diagrams, we will use the convention that entity type and relationship type names are in uppercase letters, attribute names have their initial letter capitalized

DESIGN CHOICES FOR ER CONCEPTUAL DESIGN
ØIt is occasionally difficult to decide whether a particular concept should be modeled as an entity type, an attribute, or a relationship type.
ØIn general, the schema design process should be considered an iterative refinement process, where an initial design is created and then iteratively refined until the most suitable design is reached.

DRAW THE DATABASE ER DIAGRAM WITH THE FOLLOWING INFORMATION:The company you work for wants to digitize their time cards.
You have been asked to design the database for submitting and approving time cards.
ØA timecard should have hours worked and date submitted
ØEach timecard is associated with exactly one employee
ØEach timecard should have a unique id
ØEach timecard has a status: it is either approved, not approved, or pending
ØEach employee has a unique id
ØEach employee has a name and address.
ØEach employee submits a time card every pay period. i.e. In 1 year, they will submit multiple time cards
ØEach employee either has direct deposit or physical cheque as their method of payment
ØEach employee is associated with exactly one manager
ØEach manager has a unique id and a name
ØEach manager is in charge of multiple employees
ØEach manager approves time cards for multiple employees

WHAT ARE THE ENTITIES?

WHAT ARE THE ATTRIBUTES?
Payment
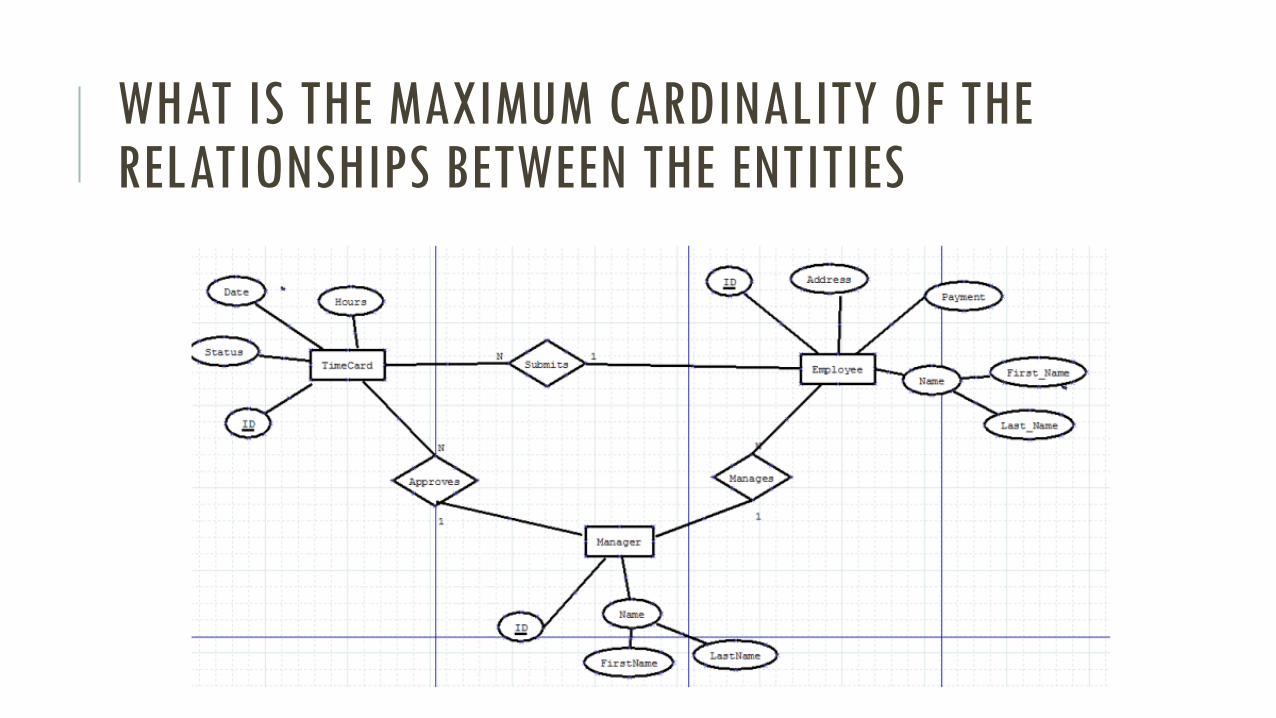
WHAT IS THE MAXIMUM CARDINALITY OF THE RELATIONSHIPS BETWEEN THE ENTITIES
EXERCISE 1 - JANUARY PAPER 2013-2014 QUESTION
ØRequirements
ØThe database must store book, author, publisher and warehouse information.
ØFor every book you must capture the title, isbn, year and price information. The isbn value is unique for a book.
ØFor every author you must store an id, name, address and the URL of their homepage. Each author can write many books, and each book can have many authors, for example.
ØFor every publisher you must store an id, name, address, phone number and an URL of their website.
ØBooks are stored at several warehouses, each of which has a code, address and phone number.
ØA book has only one publisher.
ØThe warehouse stocks many different books. A book may be stocked at multiple warehouses.
ØThe database records the number of copies of a book stocked at various warehouses.
ØDesign an ER diagram for such a bookstore. Your ER diagram must show entities, attributes and the relationships between entities. [Document any assumptions that you make] (16 marks)

PREPARING YOUR SOLUTION
ØSketch out your initial ER diagram first out on paper (use a pencil and eraser if you need to change your diagram)
ØThen use your browser to go to https://draw.io
ØYou will find most of the icons you are looking for in the General tab and also the Misc tabs to find the correct icons
EXERCISE 2 - AUGUST 2014: EXAM QUESTION
ØUnited Direct Artists (UDA) is an insurance broker that specialise in insuring paintings for galleries. You are required to design a database for this company.
ØThe database must store painters, paintings, and galleries information.
ØPainters have a unique number, Name, and phone number
ØPaintings have unique number, title and price
ØGalleries have unique number, owner, phone number, commission rate and address
ØA painting is painted by a particular artist, and that painting is exhibited in a particular gallery. A gallery can exhibit many paintings, but each painting can be exhibited in only one gallery. Similarly, a painting is painted by a single painter, but each painter can paint many paintings.

EXERCISE 3 – MORE DETAILED EXAMPLE…
Ø Book Example: Fundamentals of Database Systems (Elmasri & Navathe)
Ø Database Application Question (called Company Database)
Overview
ØThe company wishes to create a database to keep track of a company’s employees, departments and projects.
ØSuppose that after the requirements collection and analysis phase, the database designers provide the following description of the miniworld – the part of the company that will be represented in the database.

COMPANY DATABASE-QUESTION
REPRESENT THE ABOVE IN A ER DIAGRAM.