Metaphor in Diagrams - CiteSeerX
189
Metaphor in Diagrams Alan Frank Blackwell Darwin College Cambridge Dissertation submitted for the degree of Doctor of Philosophy University of Cambridge September 1998
-
Upload
khangminh22 -
Category
Documents
-
view
4 -
download
0
Transcript of Metaphor in Diagrams - CiteSeerX

Metaphor in Diagrams
Alan Frank Blackwell
Darwin College
Cambridge
Dissertation submitted for the degree of Doctor of Philosophy
University of Cambridge
September 1998

1
Abstract
Modern computer systems routinely present information to the user as a combination of text
and diagrammatic images, described as “graphical user interfaces”. Practitioners and
researchers in Human-Computer Interaction (HCI) generally believe that the value of these
diagrammatic representations is derived from metaphorical reasoning; they communicate
abstract information by depicting a physical situation from which the abstractions can be
inferred.
This assumption has been prevalent in HCI research for over 20 years, but has seldom been
tested experimentally. This thesis analyses the reasons why diagrams are believed to assist with
abstract reasoning. It then presents the results of a series of experiments testing the
contribution of metaphor to comprehension, problem solving, explanation and memory tasks
carried out using a range of different diagrams.
The results indicate that explicit metaphors provide surprisingly little benefit for cognitive
tasks using diagrams as an external representation. The benefits are certainly small compared
to the effects of general expertise in performing computational tasks. Furthermore, the
benefit of metaphor in diagram use is largely restricted to mnemonic assistance. This
mnemonic effect appears to be greatest when the user of the diagram constructs his or her
own metaphor, rather than being presented with a systematic metaphor of the type
recommended for use in HCI.

2
Acknowledgements
This work was supported by a Collaborative Studentship, awarded by the Medical Research
Council and Hitachi Europe Limited. I am grateful to the staff of the Advanced Software
Centre of Hitachi Europe for their support; to Martin Bennett, who initiated the project, and
especially Dr. Chas Church, who has provided generous support and encouragement.
I have enjoyed friendly and stimulating surroundings for this project. The staff and students
of the MRC Applied Psychology Unit (now the Cognition and Brain Sciences Unit) were
welcoming and tolerant of a stranger in their midst, and I have been fortunate to inherit the
distinguished legacy of research in Applied Cognitive Psychology and Human-Computer
Interaction previously carried out at the APU.
The students and fellows of Darwin College have broadened my horizons, developed my
confidence, and demonstrated the inestimable value of small, multi-disiciplinary academic
communities.
Thomas Green’s work of over 20 years was the inspiration for this project; I am very
fortunate that he accepted me as a student. That he has also been patient with my errors and
encouraging of my ambitions was far more than I expected. I am tremendously grateful for
the hours that Thomas has given me, especially after his departure from the Applied
Psychology Unit and from Cambridge.
I would never have aspired to academic research, and could certainly never have
contemplated this project, without the encouragement and enthusiasm of my wife, Helen
Arnold. Fifteen years of marriage already deserves more than a declaration of love and
gratitude – after the last three years of study, I look forward to Helen’s acceptance of
repayment in kind.

3
Table of Contents
CHAPTER 1: INTRODUCTION 5
OVERVIEW OF THE THESIS 6
CHAPTER 2: DIAGRAM AND METAPHOR AS TOOLS 8
DIAGRAMS 8
METAPHOR 1 0
DIAGRAMS AS TOOLS 1 2
METAPHOR AS A TOOL 1 8
SUMMARY 2 2
CHAPTER 3: METACOGNITION AMONG DIAGRAM USERS 2 3
SURVEY 1: METACOGNITIVE STATEMENTS IN THE COMPUTER SCIENCE LITERATURE24
SURVEY 2: PROFESSIONAL USERS OF CONVENTIONAL PROGRAMMING LANGUAGES38
SURVEY 3: USERS OF A VISUAL PROGRAMMING LANGUAGE 4 7
CHAPTER 4: DIAGRAMMATIC METAPHOR IN INSTRUCTION 6 0
EXPERIMENT 1: PROGRAMMING WITH AN IMPLICIT PICTORIAL METAPHOR 6 2
EXPERIMENT 2: COMPARISON OF SYSTEMATIC AND NONSENSE METAPHORS 8 0
CHAPTER 5: DIAGRAMS AND ABSTRACT STRUCTURE GENERATION 9 1
EXPERIMENT 3: VISUAL IMAGERY DURING PLANNING 9 4
EXPERIMENT 4: COMPARING DIAGRAMS TO TEXT 1 0 7
EXPERIMENT 5: USE OF INCONGRUENT PICTORIAL NODES 1 1 3
EXPERIMENT 6: OTHER FACTORS AFFECTING DIAGRAM PLANNING 1 1 9
CHAPTER 6: METAPHOR FOR MNEMONIC DIAGRAMS 1 3 0
EXPERIMENT 7: COMPARISON OF GOOD / BAD / NO METAPHOR 1 3 1
EXPERIMENT 8: EXPLICIT METAPHOR AS A MNEMONIC AID 1 3 7

4
EXPERIMENT 9: COMPARISON OF EXPLICIT AND IMPLICIT METAPHOR 1 4 8
CHAPTER 7: CONCLUSIONS 1 6 0
REVIEW OF EXPERIMENTAL FINDINGS 1 6 1
RELATED RESULTS 1 6 2
IMPLICATIONS 1 6 3
FURTHER INVESTIGATION 1 6 4
CHAPTER 8: REFERENCES 1 6 6

5
Chapter 1: Introduction
These circles, or rather these spaces, for it is of noimportance what figure they are of, are extremelycommodious for facilitating our reflections on thissubject, and for unfolding all the boasted mysteries o flogic, which that art finds it so difficult to explain;whereas by means of these signs, the whole is renderedsensible to the eye.
Letters of Euler to a German Princess, tr. H. Hunter 1795, p. 454.
For 20 years, new computer software has presented information graphically as well as in
textual form. The usual justification for this practice has been that the graphical form is easier
to learn, understand and apply because it allows metaphorical reasoning. Consider these
forthright statements from introductory textbooks on software user interface design, all
published within the last two years: “Designers of systems should, where possible, use
metaphors that the user will be familiar with.” (Faulkner 1998, p. 89). “Metaphors are the
tools we use to link highly technical, complex software with the user’s everyday world.”
(Weinschenk, Jamar & Yeo 1997, p. 60). “Select a metaphor or analogy for the defined
objects … real-world metaphors are most often the best choice.” (Galitz 1997, p. 84). “Real
world metaphors allow users to transfer knowledge about how things should look and work.”
(Mandel 1997, p. 69). “Metaphors make it easy to learn about unfamiliar objects.” (Hill
1995, p. 22). “Metaphors help users think about the screen objects much as they would think
about real world objects.” (Hackos & Redish 1998, p. 355). “Very few will debate the value
of a good metaphor for increasing the initial familiarity between user and computer
application.” (Dix et. al. 1998, p. 149).
The goal of this dissertation is to investigate the psychological evidence for these claims. This
investigation is perhaps overdue. Not only are computer science students advised to use
metaphor as the basis for their designs, but software companies routinely base their research
efforts on this assumption (Blackwell 1996d), and the most influential personal computer
companies insist on the importance of metaphor in making computers available to everyone:
You can take advantage of people's knowledge of the world around them by usingmetaphors to convey concepts and features of your application. Use metaphorsinvolving concrete, familiar ideas and make the metaphors plain, so that users havea set of expectations to apply to computer environments.
“Metaphors” from Chapter 1 of the MacintoshHuman Interface Guidelines. (Apple Computer, Inc.
1992).

6
Familiar metaphors provide a direct and intuitive interface to user tasks. Byallowing users to transfer their knowledge and experience, metaphors make it easierto predict and learn the behaviors of software-based representations.
‘Directness’, from Windows Interface Guidelines forSoftware Design (Microsoft Corp. 1995).
The conclusion of the research described in this dissertation will be that the case for the
importance of metaphor is greatly over-stated. This should not be interpreted as a deprecation
of graphical user interfaces. Graphical user interfaces provide many advantages – the
problem is simply that those advantages are misattributed as arising from the application of
metaphor. A more prosaic explanation of their success can be made in terms of the benefits
of “direct manipulation”, which indicates potential actions via the spatial constraints of a 2-
dimensional image. The concept of direct manipulation has been thoroughly described and
analysed (Shneiderman 1983, Lewis 1991). It will not be discussed in any detail here, but the
implication of the current investigation is that, if the expected benefits of metaphor have been
exaggerated, these low-level virtues and by-products of direct manipulation are even more
important than is usually acknowledged.
Overview of the Thesis
Chapter 2 considers previous work in HCI, but it also reviews theories that have been
proposed to describe diagrammatic graphical representations and to describe metaphor. It
then considers the manner in which diagrams and metaphors can be used as cognitive tools,
before returning to the question of HCI.
Chapter 3 presents the results of three contrasting surveys, investigating how computer
scientists and professional programmers regard their use of visual programming languages.
Researchers developing these languages are greatly influenced by cognitive theories,
including some theories of metaphor, but professional users appear to have little awareness of
the potential cognitive implications of diagrammatic representations, instead emphasising
more pragmatic benefits.
Chapter 4 describes two experiments which manipulated the degree of metaphor in diagrams.
The metaphor was used to teach elements of a visual programming language, then of more
general diagrams, to people who had never programmed computers. Their performance was
compared to that of experienced computer programmers, in order to judge the effect of the
metaphor on learning. The use of metaphors provided little benefit relative to that of
experience.

7
Chapter 5 investigates which properties of visual representations assist the formation of
complex abstract concepts in visuo-spatial working memory. The value of mental imagery as
a design strategy for abstract problems is an underlying assumption of much of the literature
on visual metaphor. Four experiments were conducted to measure productivity when the
appearance of the visual representation was manipulated. Metaphorical content appeared to
have little influence, and there was also little consistent evidence for significant benefits from
mental imagery use.
Chapter 6 returns to the type of explanatory diagram introduced in chapter 4, and presents
the results of three further experiments which manipulated both the metaphorical and visual
content of the notations. Diagrams were described with and without instructional metaphors,
and both memory and problem solving performance were measured. Metaphor had little
effect on problem solving, and memory was improved far more by pictorial content in the
diagram than by explicit metaphorical instructions.
Chapter 7 concludes that the main potential advantage arising from metaphor in diagrams is a
mnemonic one, rather than support for abstract problem solving or design with mental
images. Furthermore the mnemonic advantage is greater if diagram users construct their own
metaphors from representational pictures, rather than receiving metaphorical explanations of
abstract symbols. This finding has considerable importance for the future study of diagram
use and human-computer interaction.

8
Chapter 2: Diagram and Metaphor as Tools
As no image can be formed of abstract ideas, they are, o fnecessity, represented in our mind by particular, butvariable ideas; and if an idea bear any relation to quantityof any kind, that is, if it admit of the modification o fgreater and less, though the archetype, as it is called, o fthat idea be nothing that is the object of our senses, it i snevertheless universally represented in our mind by theidea of some sensible thing.
A Description of a Set of Charts of Biography, J. Priestley, 1804, p. 5.
This chapter reviews previous research that has investigated the application of both diagram
and metaphor as cognitive tools. Much research into the use of diagrams has not considered
the possibility that metaphor might be involved. Likewise, much research into metaphor has
explored metaphor in language rather than in diagrams. The chapter is divided accordingly.
After brief definitions of diagrams and of metaphor as subjects of psychological research, the
bulk of the review considers how each can be studied as tools.
The section that discusses diagrams as tools considers general theories of external
representation use in problem solving, then addresses two specific cases that have been studied
in greater detail: graphs and visual programming languages. The section that discusses
metaphor as a tool concentrates on the previous research in human-computer interaction that
has motivated this study, as described in the introduction to chapter 1. It is this research that
suggests a possible relationship between theories of metaphor and of diagram use, despite the
fact that there is relatively little empirical evidence to support some of the main theories.
Diagrams
Although this project originated in the study of graphical user interfaces, the methods and
conclusions are applicable to a broader class of cognitive artefact (Norman 1991, Payne
1992) – diagrams. Diagrams are familiarly associated with instruction manuals (Gombrich
1990), electronics (Newsham 1995, Petre & Green 1990), software design (Martin & McClure
1985), architecture (Porter 1979), geometry (Lindsay 1989, Netz in press), general
mathematics education (Pimm 1995, Kaput 1995) and symbolic logic (Shin 1991, Sowa
1993) as well as informal problem-solving (Katona 1940). Insights from these various fields
are slowly being integrated in the interdisciplinary study of Thinking with Diagrams

9
(Glasgow, Narayanan & Chandrasekaran 1995, Blackwell Ed., 1997), with conclusions that
are more widely applicable to other notations, including such examples as music notation
(Bent 1980), board games (Ellington, Addinall & Percival 1982) or proposals for a
pictographic Esperanto (Shalit & Boonzaier 1990).
TEXT PICTURES
DIAGRAMS
Representational Conventions
More arbitrary More homomorphic
Figure 2.1. Continuum of representational conventions in cognitive artefacts
Within this huge range of applicability, the common nature of diagrams is most appropriately
defined by contradistinction. Diagrams form the middle part of a continuum between two
other classes of cognitive artefact: text and pictures (see Figure 2.1). If we regard all three as
markings (Ittelson 1996) on some surface (setting aside the tasks to which they might be
applied), diagrams can be distinguished from text by the fact that some aspects of a diagram
are not arbitrary but are homomorphic to the information they convey. They can be
distinguished from pictures by the fact that some aspects must be interpreted by convention,
and cannot be deduced from structural correspondences.
A simple distinction underestimates the complexity of text and pictures, however. The
cognitive processing of text is closely related to auditory verbal comprehension, and therefore
inherits homomorphic features of speech: onomatopoeia, for example (Werner & Kaplan
1963), as well as typographic conventions and conjectured systematic origin of all abstract
verbal concepts in spatial experience (Jackendoff 1983, Johnson 1987, Lakoff 1987). The
construction and interpretation of pictures also relies on some arbitrary depictive conventions
(Willats 1990), even though those conventions may simply reflect basic perceptual abilities
(Kennedy 1975) and have been supplemented by the mechanical determinism of
photography (Ivins 1953). For the purposes of the current argument, text and pictures can be
regarded as ideals – extremes that are never observed in actual communication via markings.
Instead, all texts are to some extent diagrammatic, and all pictures are to some extent
diagrammatic. Even a photograph, despite the implied objectivity of mechanical
reproduction, conveys information diagrammatically through its composition, its context on a
surface and other factors (Stroebel, Todd & Zakia 1980).

1 0
As diagrams share aspects of both text and pictures, they can be analysed using techniques
and theories from either extreme of the continuum. Firstly, diagrams can be regarded as two-
dimensional graphical languages, composed from a lexicon of geometric elements. The
relationship between these elements can be described in terms of a syntax incorporating
various subsets of proximity, ordering, spatial enclosure and topological connection.
Interpretation of a diagram is therefore a process of deriving semantic intention from the
syntactic relationships that have been created between the lexical elements (Bertin 1981). This
view of diagrams suggests that researchers should use the structural analysis of Saussure
(Culler 1976), or the semiotic trichotomies of Peirce (1932).
Alternatively, diagrams might be regarded primarily as representations of physical situations.
If they communicate any abstract information, this would involve metaphorical reasoning, for
example relating the “upward” direction on the page to an increase of some abstract
quantity (Gattis & Holyoak 1996, Tversky, Kugelmass & Winter 1991). The individual
elements of a diagram may also be actual pictures, in which case they might be interpreted
metaphorically as representing abstract concepts (Barnard & Marcel 1978).
Metaphor
Is it justified to apply the word metaphor to diagrams? Metaphor is usually understood in a
verbal context; specifically as a figurative literary device or trope. Like irony, hyperbole and
other tropes, metaphor is identifiable by the fact that the literal meaning of the words is not
the meaning intended. There is instead a figurative meaning, which the hearer must establish
by deduction from the context of the utterance, from knowledge of the world, and by
constructing theories regarding the speaker’s intention. The cognitive resources involved in
this interpretive process are sophisticated – children have difficulty in understanding both
irony and metaphor (Winner & Gardner 1993).
Aristotle’s Poetics accords great respect to the value of metaphor (“... by far the greatest
thing is the use of metaphor. That alone cannot be learnt: it is the token of genius” xxii. 17),
and contains a detailed analysis of the way that metaphor works:
It is the application of a strange term either transferred from the genus and appliedto the species or from the species and applied to the genus, or from one species toanother by means of analogy.
Aristotle, Poetics xxi. 7
Modern cognitive theories of metaphor have often emphasised only a single aspect of this
analysis. Glucksberg and Keysar (1993), for example, emphasise that metaphors are

1 1
expressed and understood as statements about class inclusion (i.e. genus and species), where
the target of the metaphor inherits attributes from elsewhere in some categorical hierarchy.
Gentner, Falkenhainer and Skorstad (1988), on the other hand, emphasise that understanding
a metaphor is the same as drawing an analogy – it involves the mapping of structure and
attributes from one domain to another.
A third cognitive theory of metaphor emphasises the metaphors that have “fossilised” into
idiom. Lakoff and Johnson (1980) claim that individual idioms can be related to systematic
collections of metaphorical concepts. For example, when Aristotle describes Empedocles’ use
of the metaphor “the evening of life” (Poetics, xxi. 13), Lakoff and Johnson might observe
that there are many other idioms relating stages of life to time of day, and that these reflect an
underlying conceptual metaphor such as “LIFE IS A DAY”. Johnson (1987) and Jackendoff
(1983) have both proposed theories in which all abstract language must be derived from
embodied physical experience. Johnson describes this process as metaphorical, but
Jackendoff objects (1983 p. 209) that the equation of physical analogy with metaphor is
facile. The necessary grounding of abstraction in physical experience is a view that Black
(1993) attributes first to Carlyle. It is supported by Lakoff and Johnson’s conceptual
metaphor proposal, and by Gentner and Wolff’s (1997) “career of metaphor” hypothesis,
but these are vigorously debated in cognitive psychology; Murphy (1997), for example,
claims that Lakoff and Johnson’s collection of metaphors involving the vertical direction
simply neglects the polysemous multiple meanings of the word “up”, while Gibbs (1996)
defends conceptual metaphor from a review of experimental investigations of idiom
comprehension.
There are numerous other theories of metaphor interpretation, some of which are supported
by experimental evidence. Chomsky’s anomaly model of metaphor processing, for example,
suggests that we first evaluate the literal meaning of the metaphor, then reject that as a result
of identifying an anomaly. Pynte et. al. (1996) studied the time-course of metaphor
comprehension, and found evidence from event-related potential observations that the literal
meaning of a metaphoric phrase was indeed evaluated before the figurative meaning.
Tourangeau and Sternberg’s interaction view of metaphor (1982) claims that aptness is
increased by semantic separation between the source and target domains of the metaphor,
because an apt metaphor must involve reorganising the hearer’s understanding of the target
domain. These and other theories of metaphor are less commonly investigated in cognitive
psychology, and to my knowledge have never been applied either to diagrams or to HCI.
They are not considered any further here.
This discussion provides several alternative models for addressing the role of metaphor in
diagrams. If Gentner’s structure mapping theory of analogy (1983) is also involved in

1 2
processing metaphor, it might be better to describe diagrams as analogies rather than
metaphors. The value of diagrams in solving problems of structural analogy has certainly
been demonstrated (Beveridge & Parkins 1987). If this is the only sense in which diagrams
are metaphorical, they can be described in terms of structural geometric properties, rather
than requiring any consideration of pictorial depiction. Alternatively, if diagrams are
interpreted in terms of their resemblance to physical objects and situations, they should be
analysed in terms of class inclusion. If this is the case, there is perhaps a more appropriate
term applied in the visual arts. A painting in which the elements represent abstract concepts in
the class they belong to is described as an allegory rather than a metaphor.
Is there any good reason why we should describe diagrams as metaphors rather than as
structural analogies or pictorial allegories? There are three reasons why it is convenient to do
so. Firstly, the field of HCI has adopted the term metaphor, while being unaware of many of
the cognitive theories described above (although Gentner, Falkenhainer and Skorstad (1988),
explicitly reject the suggestion that their model of metaphor applies to user interfaces, and
Jackendoff (1983) insists that metaphor is more complex and subtle than physical analogy).
Secondly, there is also a small existing literature outside the fields of psychology and HCI
that has described the interpretation of diagrams as a process of metaphor: in education
(Goldsmith 1984) in graphic design (Richards 1997) and in comic book art (Kennedy, Green
& Vervaeke 1993). Thirdly, theories of conceptual metaphor have been explicitly extended
from language to diagrams (Lakoff 1993). Some interpretations of conceptual metaphor
claim that even linguistic metaphors are interpreted with the aid of mental images. Gibbs and
O’Brien (1990) found that subjects were able to report causal relationships from images
formed when interpreting a metaphor, although Cacciari & Glucksberg (1995) reported that
identification of paraphrased metaphors was slower when such images were formed. The
implied relationship between diagram use and these theories of metaphor interpretation is
reviewed in more detail in chapter 5.
Diagrams as Tools
This thesis considers three broad categories of cognitive task in which diagrams are applied as
tools. They are often used for communicating information, both as isolated presentations
(e.g. statistical graphs) and as instructional material supporting a text (e.g. textbook
illustrations). Secondly, they are used during problem solving, as external representations that
supplement working memory and efficiently express problem constraints. Thirdly, they are
used as an aid to discovery, generating potential configurations and exploring alternative
1 3
solutions. This thesis emphasises instruction, for which relevant literature is reviewed in
chapter 4, and discovery, for which relevant literature is reviewed in chapter 5. Most existing
research into diagram use emphasises problem solving – that research is summarised in this
section.
Diagrams as Tools in Problem Solving
Although diagrams may depict relationships in the real world, and may stimulate mental
imagery, it is not necessary to assume any resemblance to visual scenes (Goodman 1969), or
causal relationship to mental images (Scaife & Rogers 1996). Most theoretical treatments of
diagram use simply consider their geometric structure, rather than the metaphorical
possibilities discussed in this thesis. Larkin and Simon (1987) attributed the benefits of
diagram use during problem solving to three main information-processing operations.
Diagrams can express correspondences between elements without requiring that labels be
defined for those elements. Secondly, they can group together information that will be
needed at the same time, thus reducing the amount of search required during problem
solving. Thirdly, they support “perceptual inferences” by which information can be read
directly from the diagram.
Bauer and Johnson-Laird (1993) have extended Larkin and Simon’s analysis of geometric
correspondences in diagrams. They demonstrated that subjects were faster and more accurate
when answering a question based on a two-branch electrical circuit diagram than when
answering a logically equivalent verbal question involving double disjunction. The geometric
strategy used by subjects in this experiment is even more straightforward than that modeled
by Larkin and Simon: subjects could use the diagram to answer the question simply by
tracing (or imagining tracing) the lines of the circuit with a finger. Green (1982) has however
noted the restrictions of this type of diagram – there are only a limited number of “mental
fingers” that can be maintained when tracing flow through a complex diagram.
The perceptual inferences described by Larkin and Simon may simply involve low-level
visual processing of boundaries (Ullman 1984) – either assessing three dimensional shape
(Hoffman & Richards 1984, Grossberg 1997) or two dimensional figures (Palmer & Rock
1994, Shimaya 1997). They also enable impressive performance on computationally
intensive tasks such the “travelling salesman” optimisation problem, for which MacGregor
and Ormerod (1996) demonstrated that untrained experimental subjects could produce
solutions that were more optimal than the best available computational algorithms. In the case
of diagrams, Lindsay (1988) has demonstrated that perceptual processes make explicit
information that was only implicit in an original construction. Lindsay also observes that this
1 4
kind of reasoning with spatial representations avoids the frame problem – knowing which
aspects of a situation remain unchanged as the result of some action – because the scope of
action is defined by spatial locality. This advantage also underlies the benefits of “direct
manipulation”, to which I attributed the success of graphical user interfaces in chapter 1.
Zhang (1997) has proposed a cognitive model of diagrammatic representations in problem
solving that integrates the computational aspects observed by Larkin and Simon. He contrasts
the perceptual operations afforded by external representations with the internal
representations that support cognitive operations, including the retrieval of information from
memory. Both internal and external representations provide different means of a) looking
ahead to simulate future problem states, b) applying learned knowledge, or c) acting on the
basis of pre-existing biases that apply in a particular modality (Gestalt principles of
perception, for example, are a perceptual bias which reveal certain properties in an external
representation). The interaction between internal and external representations has also been
expressed in a computational model described by Tabachnek-Schijf, Leonardo and Simon
(1997). This model constructs lines on a simulated blackboard, then inspects the blackboard
to notice emergent properties, such as places where lines intersect. The graphical information
is stored in a memory array representing visual working memory, but is also related to
propositional knowledge about the meaning of the lines. The latter is stored in an
approximate (non-phonological) model of verbal working memory.
Expert problem solving, such as that studied by Tabachnek-Schijf and Leonardo, is
characterised by a repertoire of different diagrams and other representations, each of which
may facilitate a different range of tasks (Sloman 1995). Cox and Brna (1995) have
demonstrated the importance of teaching students how to select an appropriate diagram or
other representation, in addition to teaching the skills required to construct a diagram and
read information off from it. Whether the choice is successful or not depends on the extent to
which the diagram constrains the possible interpretations (Wang, Lee & Zeevat 1995,
Stenning & Oberlander 1995). The analysis of information transfer between multiple
representations requires a sophisticated theory of information, as well as experimental
evidence, however. The Hyperproof system (Barwise & Etchemendy 1990), successfully used
to teach propositional logic, models logical relations both algebraically and in an imaginary
three-dimensional world. A formal description of the relationship between the model, the real
world, and the symbolic system depends on very fundamental issues in philosophy of
semantics (Barwise & Perry 1983).

1 5
Diagrams as Tools: The case of graphs
Graphs constitute a class of diagram so conventionalised that a graph can stand alone without
explanatory text. Gillan (1995) has demonstrated that after simple training in graph use,
subjects can successfully interpret complex arithmetic relationships that otherwise require
complex problem solving. Graphs are so widely used by experimental psychologists
themselves that they have perhaps attracted an undue degree of research attention. Detailed
studies have been made of the semiotic (Kosslyn 1989) and perceptual properties of graphs
(Hollands & Spence 1992, Spence 1990, Pisan 1995), as well as of interpretative behaviour
(Zacks & Tversky 1997, Stone & Yates 1997, Carpenter & Shah 1998) and cross-cultural
analyses (Tversky, Kugelmass & Winter 1991). Some of these studies have provided practical
advice about when to use graphs in presenting research results (Carswell & Ramzy 1997, Shah
& Carpenter 1995).
Applied research tends to focus on the question of what notation will be most suitable in cases
where a choice can be made. In the case of graphs, this has been a focus of attention for
many years. Washburne (1927) made a classic comparison of numerical data presented as
graphs and tables, showing that graphs allow more rapid judgements. Meyer (1997) has
recently reinvestigated Washburne’s data, however, showing that his conclusions were
unjustified – they have simply not been questioned because they were unsurprising. Similar
problems pervade this type of research. Tufte’s (1983, 1990) books on the design of
quantitative graphs and other diagrams have been hugely influential in software design. They
are not unequivocally supported by empirical evidence, however (Spence 1990, Zacks et. al.
1998). Tufte expresses various assumptions about readability and usability, but they amount
largely to the personal (modernist) tastes of a practitioner. In recent years, these tastes are
being supplanted by post-modern styles including pictures, tables and diagrams within the
same frame (Wurman 1997). Although fashionable at the time of writing, post-modern
information graphics have no more foundation in empirical research than Tufte’s work. This
is unlikely to prevent their increasing adaptation from American news media to applications
in software design.

1 6
Figure 2.2. Examples of graphical presentation styles recommended by (a) Tufte and (b) Wurman.
[Sources: (a) from Tufte 1983, (b) from Wurman 1997]
Diagrams as Tools: The case of visual programming languages
This study originated in a commercial software product development project, designing a new
visual programming language (Blackwell 1996d). Visual Programming Languages (VPLs)
often resemble the diagrams used by computer programmers during the design process, but
they are used directly by the computer – a VPL specifies program behaviour to a level of
detail sufficient that the program can be executed with no further manual intervention. The
development of VPLs can be traced to research by Sutherland (1963) and Smith (1977); the
range of VPLs created since then has been surveyed by Myers (1986) and by Price, Baecker
& Small (1993). Researchers generally draw a distinction between VPL research, and the
range of programming environments marketed by Microsoft Corporation, including Visual
Basic, Visual C++ and Visual Java. Although those products were presumably named to
reflect the endeavours of VPL research, they differ from VPLs in that the program behaviour
is specified using a conventional textual programming language rather than any kind of
diagram.
Visual programming languages are an interesting topic of study in cognitive psychology,
both because programming is a complex problem-solving activity, and because VPLs include
a wide range of alternative diagrammatic representations (Blackwell, Whitley, Good & Petre,
in press). Psychological research into the use of diagrams for programming predates the
development of VPLs, in fact (Fitter & Green 1979). As commercial VPLs have become more
widely available Green has, with various collaborators, published a substantial body of

1 7
research investigating their cognitive implications (e.g. Green 1982, Gilmore & Green 1984a,
Green, Petre & Bellamy 1991, Green & Petre 1992, Green & Blackwell 1996a).
Green’s work has emphasised the nature of programming languages as information structures
(Green 1990) – the question of whether the structure of the notation does or does not match
the structure of the task is more important than the question of whether text or diagrams are
used (Gilmore & Green 1984b). Green’s analysis of information structures and the way they
are used has been unified and extended in the Cognitive Dimensions of Notations framework
(Green 1989, Green & Petre 1996). This approach to comparing the relative advantages of
different programming languages is contrasted with the superlativist claims often associated
with VPL research – that VPLs will be superior for all possible programming tasks (Green,
Petre & Bellamy 1991). The contrast between empirical results and the superlativist position
will be investigated in detail in chapter 3.
Diagrams as Tools: Empirical investigations
If graphs lie at one extreme of the diagrams that are studied experimentally, the other might
be programming languages. Graphs are widely used, can often be interpreted independent of
context or task, and might be considered a requirement of basic literacy. Programming
languages, on the other hand, support complex problem solving and interaction between
specialist users. Other diagram applications considered in human factors research, such as
vehicle instrumentation or design of instructional material, generally fall between these
extremes. Major themes in the empirical investigation of thinking with diagrams are often
represented by experiments at each point along this continuum of complexity and context.
As an example, Lohse (1997) has used gaze fixation analysis to identify the ways that layout
conventions modify working memory requirements in graph interpretation. Chandler and
Sweller (1996) have estimated working memory requirements (in the context of “cognitive
load”) that arise from the attempt to integrate text and diagrams in instructional material.
Davies (1996) has investigated working memory requirements in programming by modifying
the environment in which a program is written, thereby changing the extent to which experts
can use the notation as an external representation to assist problem solving. A further
example is the various investigations that have been made of structure in diagrams, and how it
influences interpretation. Bennett and Flach (1992) have reviewed various perspectives on
interpretative processes of information displays, such as Wickens and Carswell’s (1995)
proximity compatibility principle relating display location to function. Green’s Cognitive
Dimensions of Notations (Green 1989, Green & Petre 1996) describe the way that notational
design can affect the tasks involved in constructing and modifying as well as interpreting
programming languages and other notations.

1 8
Metaphor as a Tool
Metaphor is often thought of as a literary device; in the context of literature it is certainly a
tool used deliberately to achieve specific effects. It is also intentionally applied as a tool to
other communicative contexts – most notably to education. All education is a process of
communicating new information to students in such a way that they can assimilate it and
relate it to what they already know (Gallagher 1978). Metaphor is used by teachers to
communicate novel concepts, but always brings the danger that students may over-extend the
metaphor and draw inappropriate analogies (Nolder 1991). Ideally metaphors are used to
develop new concepts by a process of triangulation (Petrie & Oshlag 1993) – students
recognise anomalies between their existing knowledge and new information provided by the
metaphor, and create new knowledge by correcting their model to accommodate both
sources. Spiro et. al. (1989) propose that sophisticated students can be assisted in this process
if they are given multiple metaphors, each correcting invalid extensions that might have been
based on a single one.
Where the intention is to communicate purely abstract concepts however, it may be
unreasonable to expect that pure abstractions can be derived from physical examples. Pimm
(1995) observes that it is unhelpful to consider mathematical concepts as being independent
of their representations, and describes the goal of mathematics education as learning to
manipulate representations. If the goal is specific to the representation, then the use of
physical metaphors (common in mathematics education) may even be detrimental to the goal
of learning to do symbolic mathematics. In less abstract domains – physics for example –
physical metaphors may of course help to form a simplified mental model of the situation
being described. Mayer (1993) describes an experiment in which recall of physical principles
was improved when radar operation was described metaphorically.
Metaphor as a Tool in Human-Computer Interaction
The application of metaphor to user interfaces can also be justified on educational grounds.
The main obstacle associated with user interfaces is often described as a “learning curve” –
the quotes from user interface textbooks in chapter 1 make it clear that metaphor is expected
to remove this obstacle by allowing users to build on their experience from other areas. A
secondary advantage of metaphor in HCI may lie in support for problem solving. When users
experience problems with the device, they can solve those problems by analogy to solutions
that might be applied in the metaphor domain. There is a substantial literature describing this
analogical approach to problem-solving, based on various theories of analogy (Gick &

1 9
Holyoak 1983, Gentner 1983, Holland et. al. 1986, Mitchell 1993, Keane 1997). The visual
representations of a graphical user interface, besides introducing pictorial metaphor, can also
help users to form appropriate analogies by matching the problem to the surface features of
an appropriate source domain (Keane 1988, Heydenbluth & Hesse 1996). Beveridge and
Parkins (1987) carried out an experiment in which subjects were more successful at forming
analogies after seeing diagrammatic representations that depicted the required configuration.
Schunn and Dunbar (1996) have claimed, in fact, that the value of analogy lies simply in
priming of an appropriate solution – that no transfer of abstractions is involved.
In the HCI literature itself, justifications of metaphor in the user interface are usually made in
terms of one of these two research perspectives; either the metaphor assists the user to learn
the underlying abstractions of the computer system, or it provides a basis for problem-solving
while performing a specific task. An early analysis by Carroll and Thomas (1982) said that
the importance of metaphor implied a fundamental critique of the level at which psychology
is applied to user interface design. Metaphor was an essential attribute of a good user
interface, and this could only be appreciated in terms of psychological theories. Early
textbooks and collections of readings on human computer interaction always included some
representation of this view (Carroll & Mack 1985, Carroll, Mack & Kellogg 1988) and
detailed cognitive models have been proposed as a framework for evaluating metaphorical
interfaces (Rieman et. al. 1994).
Several attempts have been made to systematise the process of user interface design from
metaphorical foundations. Carroll has provided several sets of guidelines for designers, in the
texts listed above. Wozny (1989) advises the designer above all to make the metaphor explicit,
so that it is accessible to the user. Madsen (1994) has written a practical “cookbook”
instructing user interface designers on how to choose and apply a metaphor to their design. A
European research project has defined the formal characteristics of usable metaphors (Smyth,
Anderson & Alty 1995). A layered structure has also been proposed for the design of
database user interfaces, in which the data model is situated at the bottom level of the
hierarchy and the metaphor at the top level (Catarci, Costabile & Matera 1995).
There have also been critics of the metaphorical user interface. Halasz and Moran (1982)
claimed that users need to develop an abstract conceptual model, and that metaphor was only
of passing value in building that model (in the sense of Lakoff and Johnson (1980) – that all
abstractions have some linguistic metaphorical basis). Halasz and Moran claimed that drawing
new analogies from a user interface metaphor in order to solve problems was dangerous,
because so many invalid conclusions might be derived. Simos and Blackwell (1998) have
revised this argument in terms of Green’s Cognitive Dimensions of Notations (Green 1989,
Green & Petre 1996). As noted above, Gentner, Falkenhainer and Skorstad (1988)
2 0
specifically discount the application of their structure mapping theory of metaphor and
analogy to the analysis of user interfaces. Mohnkern (1997a) considers that a metaphor is
useful only as a bundle of user interface affordances (Norman 1988) and that deeper
systematic metaphors are likely to be misleading. It is certainly possible to find misguided
applications of (mixed) metaphor, such as the (possibly disingenuous) observation by
Akoumianakis and Stephanis (1997) that a pull-down menu is based on an underlying
“restaurant” metaphor, or that the desktop metaphor is based on “sheets of paper called
windows”.
Empirical Investigations of Metaphor in HCI
The generally assumed theoretical benefits of user interface metaphor are supported by
surprisingly little empirical evidence. Instead, one finds studies that appear to have set out
with the goal of demonstrating the value of metaphor, but are eventually published with much
weaker claims. Simpson and Pellegrino (1993), for example, carried out an experiment
comparing a geographical metaphor of a file system to an unadorned flow chart. Despite
participants’ subjective preferences for the metaphor, no difference was observed in the
performance of experts using either notation. Novices performed slightly better using the
metaphor: the authors conclude only that direct comparison of the two forms is not justified
because the tasks are not equivalent. It seems that a study which set out with the intention of
demonstrating the benefit of metaphor failed to do so, and was published on other grounds.
Similar results are reported, with some surprise, by the human factors editor of IEEE
Software. Potosnak (1988) reviews studies in which iconic interfaces performed poorly by
comparison to command interfaces. She notes that these unexpected results are probably due
to the fact that the iconic interfaces were poorly designed, and that the results do not
necessarily cast doubt on the value of metaphor. Other studies have attributed unsatisfactory
performance of metaphor to specific sub-groups within an experimental population; Rohr
(1987) for example, reports complex interactions between personality characteristics and
experimental task performance with graphical user interface metaphors. Those studies which
have reported unambiguous benefits from metaphor use do not assume too much about the
educational benefit of the metaphor. Schweiker and Muthig (1987), for example, describe the
spatial metaphor as supporting “naive realism” – a concept apparently identical to direct
manipulation. As mentioned at the start of this chapter, there is little doubt that direct
manipulation is responsible for the success of graphical user interfaces; it is the more
substantial claims about metaphor that give cause for doubt.

2 1
Origins of Metaphor in HCI
The idea that a user interface should be metaphorical is so widespread that it is dangerous to
attribute it to a single source. Most general concepts in computing (the “bug”, for example),
far predate the invention of computers; anecdotal reports of their invention (Grace Hopper
discovers short circuit caused by moth) are usually either apocryphal or epiphenomenal.
Nevertheless, David Canfield Smith makes a strong claim (Smith 1996) to the invention of the
“desktop” metaphor that has inspired all of the research described here. His PYGMALION
system (Smith 1977) was developed in the Stanford AI Lab, providing the basis of the Xerox
Star (Smith et. al. 1982, Johnson et. al. 1989), and subsequently the Apple Macintosh.
PYGMALION’s status as an AI project meant that it originally expressed a theory of cognition,
and was never simply a software tool. It was not based on empirical studies of metaphor and
analogy, however. Smith considered that PYGMALION would finally allow computers to be
used for creative tasks, because its graphical nature corresponded directly to the mental
imagery that forms the basis of creative thought. He based his argument in psychological
theories of aesthetics (Arnheim 1970, Koestler 1964) rather than problem-solving. The
“metaphor” in PYGMALION’s graphical interface was there because “visual imagery is a
productive metaphor for thought” (Smith 1977, p. 6). Smith’s theory of creativity is seldom
cited directly in the HCI literature, but it appears to have been influential in other areas of
computer science, as will be seen in chapter 3.
Alternatives to Metaphor in HCI
This review has focused on the arguments that might be made for the value of diagrammatic
metaphor in contexts such as HCI. It has not considered some fundamentally different
approaches to the analysis of communication and representation. Blackwell and Engelhardt
(1998) have made a more detailed study of the many different typologies that have been
proposed for classifying and studying diagrammatic representations. Some of these are
impressively detailed semiotic analyses of the potential space of graphical configurations (e.g.
Twyman 1979). Alternative reviews have included cognitive historical analyses of the origins
of graphical representations (Gregory 1970, chapters 8 and 9), naive classification of visual
representations by experimental subjects (Lohse et. al. 1994) and classifications of the
interaction between media types and sensory modalities (Stenning, Inder & Neilson 1995).
Many studies of HCI place it within a broader communicative context, in which the
effectiveness of supposed metaphors can be criticised on social grounds (Bødker 1991, Nardi
1993, Nardi & Zarmer 1993), or in terms of the user’s conversational interaction with the
interface (Payne 1990, Strothotte & Strothotte 1997, Bottoni et. al. 1996). To use the word

2 2
metaphor in a different sense, each of these analyses describes HCI in terms of some
contextual metaphor: a conversation metaphor, a social interaction metaphor, or others.
Reddy (1993) has analysed the implications of the “conduit” metaphor for communication
between people, and shown how it influences communicative intent. There have been similar
critiques of HCI. Laurel (1986) deplores the fact that most user interfaces insist that the user
is manipulating a tool, when people do not want to manipulate tools: they want to play games
or search databases. Hutchins (1989) has made a collection of the different metaphors that
might be applied to HCI – not only using a tool, or holding a conversation, but making a
declaration, acting in a model world or collaborating with an intermediary. The topic of this
thesis addresses a metaphor that is far more central in HCI – the user-interface-metaphor
metaphor. It relies on two assumptions: that graphical representations are metaphorical, and
that metaphors are valuable as cognitive tools.
Summary
This thesis evaluates the benefits of diagrammatic metaphor as a cognitive tool. Diagrams
share some structural properties of language, and many of these can be analysed to explain
how their structural characteristics assist with certain types of reasoning task. They can also be
interpreted pictorially, in which case interpretation is a metaphorical process. Metaphor is an
important educational tool, but the claims made for the value of metaphor in graphical user
interfaces are more contentious. This thesis aims to supplement the studies of structural
characteristics of diagram use, some of which also provide sufficient explanation for the
benefits of graphical user interface. The research described here explicitly manipulates the
metaphorical content of diagrams, while leaving the structure unchanged.
These results are applicable to many classes of diagram, even though they address the specific
claims made by the HCI community. The point at which those claims become most relevant
to other diagrams is in the discussion of visual programming languages – complete and
sophisticated diagrammatic tools with a clearly defined semantics that can be applied to a
broad range of problem solving tasks. The instructional benefits of metaphor should be
clearly apparent in this class of diagram.

2 3
Chapter 3: Metacognition among Diagram Users
These paradigms change the very way you think. Theylead to new habits and models of behaviour that are morepowerful and productive. They can lead to a human-machine synergism.
Smith, Irby, Kimbal, Verplank & Harslem (1982), p. 272.
As described in chapter 2, a class of diagrammatic tools which support particularly complex
problem solving is the class of visual programming languages (VPLs). VPLs are also unusual
in that they have a relatively recent history compared to other types of diagram, and it is
therefore possible to investigate the reasons why they have been developed and promoted.
Green, with various collaborators, has made many empirical studies of VPL use. This
empirical approach to comparing the relative advantages of different programming languages
can be contrasted with superlativist claims for the superiority of VPLs (Green, Petre &
Bellamy 1991). Several studies have supported Green’s contention that superlativism is
unjustified – the empirical evidence is reviewed by Whitley (1997), and dates back to
comparisons finding no difference in performance between flowchart users and those writing
plans in English (Soloway, Bonar & Ehrlich 1983).
Despite the paucity of empirical evidence, and the availability of analytic tools such as
Green’s Cognitive Dimensions, superlativism has been widespread in VPL research. At one
level, superlativist claims might appear ridiculous, as though someone were advocating the
replacement of written language with images (Dondis 1973, Barker & Manji 1989). In fact,
some researchers candidly acknowledge the lack of empirical evidence for the benefits of
their work, and suggest that novelty is sufficient justification for new notations to be
developed (e.g. Hyrskykari 1993). Other developers of VPLs report negative findings after
empirical evaluations of their own projects, but this is seldom regarded as a reason to abandon
the project (e.g. Ladret & Rueher 1991, Grant in press). It is far more common, however, to
expend considerable effort on designing graphical alternatives to existing textual notations
without ever questioning why the textual notations are inadequate (e.g. Missikoff &
Pizzicanella 1996).
This chapter does not evaluate the empirical evidence for and against visual languages, nor
the theoretical considerations that cause an information structure to be well suited to a
particular task. Instead, it investigates the metacognitive assumptions that underlie the
superlativist claims made in VPL research. Those assumptions are generally based on the

2 4
beliefs that VPL researchers hold about the nature of problem-solving and programming, and
about the nature and uses of diagrams. These metacognitive beliefs – beliefs about the nature
of our own thought processes (Flavell 1979) – are important for several reasons. Firstly,
metacognitive beliefs can have significant effects on the way that people choose cognitive
tools. For example, many people believe that hiding an object in an unusual place will make it
easier to remember. This particular metacognitive belief is unfounded (Winograd & Soloway
1986), a fact which is useful to know when planning one’s household affairs.
Secondly, the metacognitive beliefs of VPL designers influence the choices that they make
when designing new languages, and hence affect the characteristics of the languages
themselves. These beliefs may not be questioned where they are in accordance with popular
introspection, as observed by Meyer (1997) in his reanalysis of Washburne’s classic study of
graphs. Thirdly, metacognitive beliefs influence the strategies that people use when solving
problems using diagrams (Schoenfeld 1983). Users of a VPL will similarly use the tool in
ways determined by their own beliefs about the value of diagrams. Unfortunately,
metacognition is not always an accurate guide for performance in comprehension and
problem-solving: Glenberg, Wilkinson and Epstein (1982) found that 92% of experimental
subjects were certain they had understood a passage that was actually self-contradictory, while
Metcalfe and Wiebe (1987) found that success in solving insight problems was unrelated to
subjects’ expectations of their performance.
This chapter presents three studies of metacognitive beliefs. All three survey the opinions of
experts regarding the cognitive advantages of VPLs, but the three survey populations have
very different experiences of visual programming. The first survey investigates the
metacognitive beliefs of VPL researchers, as published in the visual programming research
literature. The second compares the opinions of experienced programmers who had not used
a visual programming language. The third investigates the opinions of programmers who are
experienced users of a commercially available VPL.
Survey 1: Metacognitive statements in the computer science literature
This first study investigates the systematic nature of metacognitive beliefs among VPL
researchers. Other fields of computer science exaggerate the intuitiveness of the innovations
they introduce, but the underlying assumption is often a straightforward simplification (such
as the contention that an “object” in object-oriented programming is as easy to identify and
manipulate as an object in the real world – Blackwell 1993). A corresponding simplification
in VPL research (as in research into diagrams and illustration) might be an appeal to the
2 5
1920s marketing slogan, now would-be Chinese proverb “a picture is worth a thousand
words” (Mieder 1990, Blackwell 1997a). The justification for VPL research is seldom so
simple, however. This study investigates the range of statements that have been made by VPL
researchers.
The results of this study have previously been published in Blackwell (1996b).
Population
The main source of data for this survey was a two-volume collection of well-known papers in
visual language research, published by the IEEE (Glinert, Ed. 1990a, 1990b). This was
supplemented by several textbooks on visual programming languages (Shu 1988b, Chang,
Ed. 1990a, 1990b, Burnett, Goldberg & Lewis, Eds. 1995), by two volumes of the Journal of
Visual Languages and Computing, and by a search for visual programming articles in two
popular computer science journals (Communications of the ACM and IEEE Software) over
the period after the publication of the Glinert collection. Approximately 140 publications
were considered in all. The original publication dates ranged from 1977 to 1995, with a
median year of 1988.
Method
The first stage in data collection involved the identification of passages in these papers where
the research was justified, or the significance of the results discussed, in terms not directly
derived from the technology described. These passages generally appeared in either the
introduction or the concluding sections of the paper. A statement such as “visual
programming languages will result in improved productivity because the human mind is
optimised for vision” (not an actual quote from the study) would be a typical target for
analysis.
Once these passages had been collected, they were divided into individual phrases, and each
phrase was classified according to the theme that it addressed. This segmentation and
classification was repeated at two different stages of the research. The initial classification
(described in Blackwell 1996b) considered only the material collected in the current survey
(i.e. it did not include distinctions discovered during the analysis of surveys 2 and 3), and was
not based on any external reference point. The second classification considered material
collected in all three of the surveys that are described in this chapter, and provided a common
coding framework for all three sets of data. It is the later of the two classifications that is

2 6
described here. An analysis based on this second classification has been published previously
by Whitley and Blackwell (1997).
The classification framework was based on an initial sample (20%) of the material from all
three surveys, which was considered by two coders – coding decisions regarding this sample
were discussed at length, in order to clarify the interpretation of each theme. A separate
sample was used to assess inter-rater reliability at the end of the third survey. The theoretical
motivation for the framework was mixed, addressing relatively independent research
questions arising from the respective projects of Whitley and myself. Nevertheless, each
phrase in the survey material was allocated uniquely to one theme in the classification
framework. The allocation of phrases to independent research questions is most relevant in
survey 3, and is discussed further there.
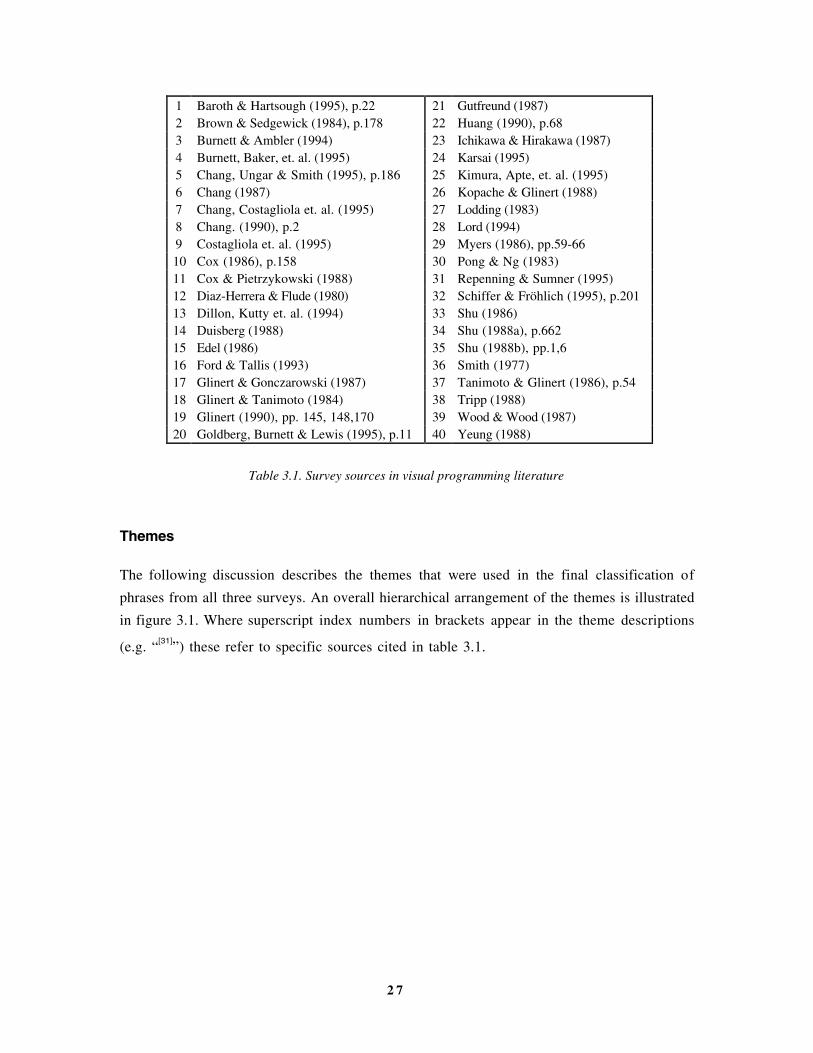
Sample responses
40 passages describing metacognitive beliefs were identified in the corpus of 140 research
publications surveyed. In the following summary of the themes that were addressed,
publications are identified by an index number. The actual publications are listed in table 3.1,
with page numbers identifying the locations of those passages which were found within
longer texts – full citations can be found in the bibliography.
2 7
1 Baroth & Hartsough (1995), p.22 21 Gutfreund (1987)2 Brown & Sedgewick (1984), p.178 22 Huang (1990), p.683 Burnett & Ambler (1994) 23 Ichikawa & Hirakawa (1987)4 Burnett, Baker, et. al. (1995) 24 Karsai (1995)5 Chang, Ungar & Smith (1995), p.186 25 Kimura, Apte, et. al. (1995)6 Chang (1987) 26 Kopache & Glinert (1988)7 Chang, Costagliola et. al. (1995) 27 Lodding (1983)8 Chang. (1990), p.2 28 Lord (1994)9 Costagliola et. al. (1995) 29 Myers (1986), pp.59-6610 Cox (1986), p.158 30 Pong & Ng (1983)11 Cox & Pietrzykowski (1988) 31 Repenning & Sumner (1995)12 Diaz-Herrera & Flude (1980) 32 Schiffer & Fröhlich (1995), p.20113 Dillon, Kutty et. al. (1994) 33 Shu (1986)14 Duisberg (1988) 34 Shu (1988a), p.66215 Edel (1986) 35 Shu (1988b), pp.1,616 Ford & Tallis (1993) 36 Smith (1977)17 Glinert & Gonczarowski (1987) 37 Tanimoto & Glinert (1986), p.5418 Glinert & Tanimoto (1984) 38 Tripp (1988)19 Glinert (1990), pp. 145, 148,170 39 Wood & Wood (1987)20 Goldberg, Burnett & Lewis (1995), p.11 40 Yeung (1988)
Table 3.1. Survey sources in visual programming literature
Themes
The following discussion describes the themes that were used in the final classification of
phrases from all three surveys. An overall hierarchical arrangement of the themes is illustrated
in figure 3.1. Where superscript index numbers in brackets appear in the theme descriptions
(e.g. “[31]”) these refer to specific sources cited in table 3.1.

2 8
EMiscellaneous observations
B.2Documentation
B.5Power and scalability
BNotational
characteristicsB.1
Readability
B.3Syntax
reduction
B.4Modularity
B.6Retention
of text
A.2Learnability
A.1General impact
A.3Productivity
AContextual significance
DMetaphorical comparisonsD.2
Making the abstract concrete
D.1Applying real
world experience
D.3Comparisons to natural language
CCognitive processes
C.1Perception and
memory
C.2Mental models
C.3Preference and affect
Visual Themes in Survey
Responses
Figure 3.1. Hierarchical organisation of classification themes
A) Contextual significance
This category includes several themes describing the benefits that might be found when VPLs
were applied to an actual task, possibly in a commercial programming environment. It is
broken down into three themes: the first describes the general impact of VPLs, the second
specifically considers the benefits of VPLs in learning to use a new language, and the third
considers the productivity that can be achieved using a VPL.
A.1) General impact
Many statements found in this survey described visual languages as being easy to use (user
friendly[8], helpful[19], straightforward[9], reliable[4] etc.) without mentioning any specific
benefits or justifications. Often these statements were extended to claims about the particular
relevance of VP to classes of users who may find textual programming to be too difficult
(e.g. students[23,39] “end-users” [24], “common users”[7], or pre-literate children[37]). As no
reasons are given for these statements, they can be regarded as direct expressions of the
superlativism described by Green, Petre and Bellamy (1991). These statements provide little
further ground for analysis, although it is interesting to note that it is apparently easy to

2 9
publish unsupported statements such as this in well-regarded scientific forums. Furthermore,
the positive attributes described are not recognisably specific to programming.
A.2) Learnability
A very common statement of the main advantage of VPLs is that they will no longer require
effortful learning or training[25,39], because they use skills that come naturally[12] use native
intelligence[18] or are intuitively meaningful[7,9] even to people who are not familiar with
computers[23]or computer illiterates[39]. Software developers often claim the virtue of
intuitiveness for their interface designs, while being unclear of how this has been achieved. In
the statements here, the main justification seems to be that the VPL can be understood
immediately by analogy from previous experience. This belief is considered as the main
concern of theme D.1, but it should be noted at this point that new notations are far more
likely to require lengthy acquisition of expertise (Petre & Green 1993), rather than being
accessible, immediate and obvious[37].
A.3) Productivity
Professional programmers are highly concerned with their productivity – how fast they can
complete a project. For the professional, this is even more important than the ease of learning
a new language, because learning a language is a worthwhile investment if it results in
increased productivity. This issue is regularly mentioned in the two surveys of professional
programmers, but also receives some attention in the research literature[19,32]. These are
generally simple statements of opinion or anecdotal reports of widespread success[17], rather
than citing any empirical evidence, although one of the papers covered in the survey does
report an empirical comparison of projects using a VPL and a text language[1]. The reasons
why a language might increase productivity include ease of use[4], of writing[29], and of
modification[20]. Readability (theme B.1) possibly has even more impact on productivity, but it
was the professional programmers in the second two surveys who were more likely to
consider software development tasks other than coding.
B) Notational characteristics
This category includes those statements that concentrate on the characteristics of the notation
itself, rather than the context in which it is used, or the cognitive processes involved in
interpretation and creation. These other issues are always implicit, of course, so this is a matter
of emphasis rather than discontinuity. The category is divided into six themes, most of which
can be related to one or more of Green’s cognitive dimensions (Green 1989, Green & Petre
1996): readability (hidden dependencies, visibility, diffuseness) is the most common concern
when evaluating a notation; documentation (secondary notation, role expressiveness)
describes the value of a notation for communicating with other people; and syntax reduction

3 0
(repetition viscosity, premature commitment) describes the ways in which a notation can
obstruct manipulation. Modularity (abstraction gradient, knock-on viscosity) and power
(diffuseness, abstraction gradient) consider whether the notation supports standard software
engineering practice, while real projects also require programs that mix notations, because
most software must process text, whether or not the program is created diagrammatically.
B.1) Readability
Respondents in the surveys of professional programmers (surveys 2 and 3) paid great
attention to the value of a VPL in reading programs, rather than in creating them. They also
tended to consider specific syntactic constructs or overall views of program function. Those
responses are discussed in more detail later – the research literature sampled in this survey
emphasised more general questions. Graphical notations were described as being generally
easier to comprehend than text[41,37], largely because they explicitly represent meaningful
relationships between elements[4,32]. This is in accordance with Larkin and Simon’s (1987)
model of locality and connectivity in diagram use. There is an element of overstatement,
however – complex systems are unlikely to be trivially easy to comprehend[24], even when
presented visually, because it is seldom possible to represent all possible relationships in two
dimensions (the cognitive dimension of hidden dependencies). It is also suggested that a
visual notation can better express the structure of the computer itself, so that we can
understand its internal state[15] – this is a proposal which is investigated in experiment 1 in the
next chapter. Readability is also compromised by the cognitive dimension of diffuseness –
but researchers tended to claim that visual notations are less diffuse than text i.e. “a picture is
worth ten thousand words”, but with a scientific gloss “Pictures are more powerful than
words as a means of communication. They can convey more meaning in a more concise unit
of expression.”[33]
B.2) Documentation
Programmers generally object to the drudgery of documenting the behaviour of code they
have written. If a visual notation successfully communicates the intention of the designer[32,25],
then additional documentation may be unnecessary. This question was of far more concern to
professional programmers than to researchers, who were more likely to describe the same
notational attributes in terms of the way that they directly express semantics during
programme construction (B.3) or facilitate communication between members of a
programming team or between designers and users of a system[1].
B.3) Syntax reduction
In the ideal intuitive programming language, no work would be needed to write a program.
The user can express what they want naturally, and the programming work would be

3 1
“automatic”[24,33]. New programming languages have been described as automatic ever since
the development of FORTRAN. The way in which VPLs achieve this goal is often expressed
in a comparison between syntax and semantics; the programmer need not be concerned with
the syntax of a program[32], which is of interest only to the computer. It is the semantics of the
program, what it is supposed to do, that is important. These views perhaps reflect some
confusion about the nature of linguistic syntax – some discussions suggest that design
notations contain purely semantic information, which is ‘translated’ into syntax when the
program is written (this is addressed further under theme C.2). This is taken to mean either
that the translation process is unnecessary when a VPL is used[3] or that semantics and syntax
can be divorced and even written down side-by-side in a visual environment[25]. The real
concern underlying these statements is likely to come from programming languages that
require syntactic elements purely for the convenience of the compiler: making sure that
keywords are used, variable types defined or lines terminated by a semicolon[12]. It is as these
“low-level” syntactic constructs are obviated by more intelligent compilers[24,31] that the main
advances are achieved in each generation of ‘automatic’ programming.
B.4) Modularity
Support for modularity is an important attribute of any programming language. Surveys 2
and 3 were conducted during a period when modularity was being given paramount emphasis
via the promotion of “object-oriented” programming languages. Discussions of the
advantages of VPLs sometimes attribute those advantages to the ways that VPLs encourage
modularity or object-orientation: by presenting modules as icons on the screen or by
physically enclosing modules within a diagrammatic boundary, for example. Research
publications tended to make a clear distinction between the advantages of visual
programming and the advantages of modularity, however.
B.5) Power and scalability
Respondents in survey 2 often commented that VPLs were unlikely to be as powerful as the
languages they already used. The definition of “power” in this case is open to debate. Some
programmers consider the most powerful languages to be those which encourage the highest
level of abstraction. Research publications do claim that VPLs are good at showing
abstraction[2], or communicate a higher level of abstraction[32], while others note that abstract
data is challenging for VP precisely because it is not inherently visual[8]. As will be discussed
in survey 2, these respondents were more likely to be concerned about reduced access to
lower levels of abstraction within the computer.

3 2
B.6) Retention of text
Respondents in surveys 2 and 3 often noted situations in which text would continue to be
necessary, even when using a VPL. Research publications on visual programming were
unlikely to make this criticism of VPLs, however. It is an observation that tends to be
assumed, rather than being an interesting subject for comment.
C) Cognitive processes
This category includes three themes that describe cognitive aspects of the programming task,
rather than notational elements. Classification decisions for these themes were conservative: a
statement saying that visual languages were easier to read, for example, is classified as a
statement about the notation rather than about the cognitive processes involved in reading.
The category is divided into three themes: the first deals with perception of visual languages,
and short term visual memory. The second includes descriptions of mental models in visual
terms, and the third includes questions of affect.
C.1) Perception and memory
The statements central to this theme claim that VPLs take better advantage of the visual
sensory modality than do textual languages. It is observed that the human mind is
“optimised” for vision[29,14], making shapes easier to process than words[22,16]. Many of these
statements refer to mental processes in specifically computational terms. In computer science
research, image processing algorithms are often implemented using parallel computer
architectures, whereas language parsing algorithms seldom are. Some computer scientists
appear to draw a direct analogy to human cognition, saying that vision makes the fullest use
of the parallel computational architecture of the human brain[29,18,27]. Similar analogies are
drawn in descriptions of visual memory. Visual percepts are considered to provide a superior
basis for mnemonic chunking, because an entire image as treated as a “single unit” by the
brain, thereby providing a high communication bandwidth when compared to words, which
must be recognised one at a time[18]. Although it must be a tempting speculation, only a few
writers suggest that VPLs employ right hemisphere resources while textual programming
languages employ left hemisphere linguistic resources[34]. Perhaps increased popular
awareness of functional localisation in neuroscience may cause such speculation to be more
common in the VPL literature in future.
C.2) Mental models
Statements were assigned to theme C.1 when they referred to cognitive processes involved in
perception of visual languages. A number of statements considered the process of generating
new programs, starting from the premise that the mental model of the program might already
be in a visual rather than a linguistic form[5] – an introspection that is also reported by expert
programmers (Petre & Blackwell 1997). A VPL might therefore represent this visual mental

3 3
model better than text can[28]. If there is a “semantic gap” between the programmer’s
conceptual model of what their program should do, and the computational model of the
program itself[31], this gap can be “bridged” because the VPL depicts concepts directly[4,36].
This discussion is obviously related to theme B.3 (syntax reduction), but statements were
assigned to the current theme where they expressly described the nature of the mental model.
C.3) Preference and affect
Many of the respondents in survey 3 simply stated that the VPL they used was more fun than
textual equivalents. This is a perfectly good reason to choose a programming language, and
may directly facilitate improved performance (Petre, Blackwell & Green 1998). Publications
in the visual programming literature note that visual programming is more satisfying[17],
appealing[24] or alluring[27] than text, which is time consuming, frustrating and labour-
intensive[34]. The spirit of the advertising slogan “a picture is worth a thousand words” may
be better captured by statements of attitude than of information content – these research
publications observe the visual bias of modern society, in which people generally prefer
pictures to words[35], motion pictures to books[37], and graphs to tables[18].
D) Metaphorical comparisons
This category contains themes with a direct bearing on the discussion of chapter 1. These
authors are of course familiar with the desktop metaphor, and with the school of HCI research
that teaches the importance of metaphorical interfaces. It is divided into three themes: the first
refers to the analogical processes through which we can understand computers by relating
them to our experience of the real world. The second refers to the claims of conceptual
metaphor, that we understand abstractions in terms of concrete physical experience. The third
refers to the metaphors of communication by which we compare human-computer interaction
to natural language and conversation.
D.1) Applying real world experience
As in other HCI contexts, direct manipulation interfaces are a valuable aspect of a VPL. The
reasons why this might be so are described in different ways, however. It is unlikely that icons
are more “intuitively meaningful” [7] than words for many programming constructs, but
Larkin and Simon’s (1987) description of location as a coding mechanism (one which avoids
hidden dependencies in reasonably small, planar diagrams) is echoed by these responses[10].
Direct manipulation employs manipulation skills based on ordinary actions in the physical
world[10,27], but VPLs also use metaphors based on more specialised experience. Technical
specialists in many fields choose to draw diagrams in order to help them understand complex
situations[13]. Reference is made to the standard diagram forms used by software engineers as
being “familiar”[31], or even “traditional”[24]. Perhaps other graphical representations such as

3 4
musical scores, recipe books and construction schedules[37] could also be used directly as
metaphors for programming.
D.2) Making the abstract concrete
Several of these extracts stated that people find it easier to deal with the concrete than the
abstract[5], and that solutions are easier to perceive if abstract information is converted to a
concrete (i.e. visual) form[13]. This may simply be reflecting an extension of the principle of
direct manipulation, but more detailed cognitive theories are advanced, for example that
abstract mental models are more easily processed in well structured problems, but that
concrete models are better for semi-structured problems[21]. This sense of abstraction as
distinct from concrete representations has been separated in the theme classification from
level of abstraction, which is usually used in a more specialised sense by computer scientists
(and is included in B.5).
D.3) Comparisons to natural language
The high-level contextual metaphor of user interface as a dialogue between the user and the
machine is even more seductive when programming – where the form of interface is
described as a “language”. Programming languages are often compared to human language,
as are the visual languages considered in this survey[19]. Visual languages are, of course, far
less like human language than earlier computer languages such as COBOL, but this has not
prevented attempts to extend the metaphor. Some passages found in this survey suggest that
people have always found it natural to communicate with images[27], that pictures are a
universal form of communication[35], and that VPLs will transcend language barriers and allow
exchange of programs between different nations[37] (although the vocabulary must first be
designed not to be culture-specific[33]). Support for these arguments comes from some
interesting sources – although some writers observe that written languages have evolved from
hieroglyphics to more advanced modern forms[26], others suggest that logographic scripts such
as Chinese are superior to the scripts of Indo-European languages which are constrained by
the need to follow phonetic structures[11].
E) Miscellaneous observations
A few statements in surveys 2 and 3 could not be assigned to any of the themes described
above, either because they could not be interpreted, or because they expressed a unique
opinion that did not touch on any of the defined themes. These are not analysed in further
detail.

3 5
Results
Each statement was allocated to one of the themes, and classified as to whether it drew a
negative or positive conclusion about VPLs within the terms of the theme. (Statements could
also be classified as equivocal or ambiguous). Note that the tallies reported below count the
number of respondents addressing each theme, not the total number of statements. If one
respondent made multiple statements on the same theme, this contributed a count of one to
the tally. If a respondent made both positive and negative statements on the same theme
however, this would contribute to both tallies. Figure 3.2 illustrates the distribution of
statements among the themes in survey 1.
0% 5% 10% 15% 20%
A.1) General impact
A.2) Learnability
A.3) Productivity
B.1) Readability
B.2) Documentation
B.3) Syntax reduction
B.4) Modularity
B.5) Power/scalability
B.6) Text retention
C.1) Perception/memory
C.2) Mental models
C.3) Preference/affect
D.1) Real world
D.2) Abstract/concrete
D.3) Natural language
E) Miscellaneous
Percentage of statements
Figure 3.2. Distribution of statements between themes in survey 1
This distribution is compared to surveys 2 and 3 below. The proportion of statements found
in each theme was very different in each survey, as was the proportion of positive and
negative statements; figure 3.6 will show that the statements found in research publications
included very few negative statements regarding any aspect of VPL use.
The classification category containing the largest total number of statements across several
themes was category A (contextual significance) – that VPLs would have a positive general
impact, producing improvements in productivity while also being easy to learn.
The theme receiving most attention overall was that of readability – this is obviously seen as a
fundamental reason for introducing visual programming. Other notational properties

3 6
(category B) are not emphasised to the same extent, especially where they describe features
that VPLs share with other programming languages (modularity, for example). Notational
characteristics that affect program writing, such as syntax reduction, also receive less attention.
Statements regarding category C (cognitive effects of VPL use) include substantial numbers
addressing all three themes. Mental models and perception/memory are particularly frequent,
with levels of attention similar to those devoted to learnability and general impact. The three
themes within category D, metaphorical correspondences between VPLs and previous
experience, abstraction, and natural language receive approximately equal amounts of
attention.
These themes are considered in more detail when contrasted with surveys 2 and 3 later in this
chapter.
Discussion
The number of non-specific statements that are made about the general advantages of visual
programming can be seen as a quantitative estimate of the predominance in the VPL literature
of superlativism, as defined by Green, Petre and Bellamy (1991). This type of statement may
also occur in other scientific disciplines – wherever it is necessary to describe the significance
of research in general terms, even if the research itself is not applied. It is a matter for
concern, however, where claims are made with no empirical support, when they could have
been tested empirically. This is particularly true of the claims for learnability of VPLs –
learning effects could be evaluated experimentally, but this has not been done in the
publications surveyed.
Across the three surveys, a relatively wide range of themes addressed the notational properties
of VPLs when compared to textual languages. This is an important comparison to make –
Green’s work on cognitive dimensions (Green 1989, Green & Petre 1996) has demonstrated
the profound influence that notational structure can have on the ability to perform different
cognitive tasks. In this survey, however, one type of task is addressed more often than all
others. Despite the fact that reading a computer program is rather less demanding than
writing or modifying one, it is the readability of VPLs that attracts most attention here. The
reasons for that imbalance will not be addressed in the rest of this thesis, but the possibilities
are worth considering. It is not that researchers are unaware of the need to write programs as
well as read them: the themes in categories C and D address issues related to program writing.
It is possible that improving readability is considered to be a more fundamental or tractable
research issue than writability – either because writability is little affected by the language
used, or because writing a program requires that the author continually read the code being

3 7
generated (Green’s parsing-gnisrap model – Green, Bellamy & Parker 1987). Alternatively,
researchers may suspect that VPLs are less writable than textual languages, but choose not to
comment on this in their publications. There is some evidence for this latter possibility in the
statements made by professional users of a VPL in survey 3.
The themes in category C include most of the more explicitly metacognitive statements found
in this survey about mental processing of visual languages. These statements are very much
statements of psychological theory, but psychological research is almost never cited in their
support. What is their status, in that case? They include a consistent range of arguments, and
could be described as a theory of naive psychology (Hayes 1985) analogous to McCloskey’s
(1983) observations of naive models of physical phenomena. The population under
consideration in this survey have a rather unusual basis for their psychological theories,
however – as computer scientists, their simulation of mental processes (Gordon 1986) may be
influenced by their experience of computers, just as Watt (1997) suggests that non-
programmers understand computers on the basis of anthropocentric psychological models.
Computational metaphors of mind do occasionally appear in the literature on reasoning with
diagrams (e.g. Waisel, Wallace and Willemain’s (1997) description of Johnson-Laird’s mental
models as “analogous to a Structured Query Language database”), but the statements found
in this survey tend to be less precise. This is particularly notable in the statements describing
human cognition in terms of “bandwidth”, “efficiency” or “parallel processing”. When
computer scientists speak of cognition, they may be unduly influenced by the nature of their
work, as claimed by Roszak:
[The computer] brings with it certain deep assumptions about the nature ofmentality. Embodied in the machine there is an idea of what the mind is and how itworks. The idea is there because scientists who purport to understand cognition andintelligence have put it there ... The subliminal lesson that is being taught wheneverthe computer is used (unless a careful effort is made to offset that effect) is the dataprocessing model of the mind.
Roszak (1986), pp. 245,246
The metacognitive models found in this survey are not derived solely from observations of
computers, however. The terminology used in some of the publications does indicate origins
in psychological research – use of the term “chunking”, for example[18]. It is possible that
many of these statements can be traced to the earliest research into visual programming,
which was directly motivated by the same cognitive theories that have been influential in HCI.
Chapter 3 considered the influence of Smith’s theory of metaphor as a tool for manipulating
abstraction in graphical user interfaces (Smith 1996). The PYGMALION system that he
developed to express those theories (Smith 1977) was not only one of the earliest graphical
user interfaces, however, but one of the earliest VPLs. Popular descriptions of his work on the
Xerox Star (Smith, Irby, Kimball & Harslem 1982, Smith, Irby, Kimball, Verplank & Harslem

3 8
1982, Johnson, Roberts et. al. 1989) may be partly responsible for broad dissemination of his
theories of mental representation, visual short-term memory, creative use of mental images,
and other related topics – his book cites the sources of these psychological theories, but few
of those that follow him do so.
Survey 2: Professional users of conventional programming languages
This second survey was designed to answer the main question raised by the first. Are the
metacognitive beliefs expressed by VPL researchers commonplace among computer
programmers, or do they simply reflect the research traditions of the VPL academic
community? In order to answer this, I selected a survey population who were unlikely to have
been exposed to the research literature on VPLs, but who were both familiar with computer
programming and accustomed to comparisons of different programming languages and
techniques.
The results of this study have previously been published in Blackwell (1996c).
Population
This survey was conducted at a trade show organised by a computer magazine – the EXE
Developer’s Show – held in London on June 15-16, 1995. The nature of the magazine gives
some insight into the survey population. EXE Magazine is a popular British programming
magazine, similar to (but with a smaller circulation than) the American publications American
Programmer or Dr. Dobb’s Journal – it contains a mixture of opinion columns and
educational articles and is widely read by professional programmers, as well as by
knowledgeable hobbyist programmers. It does not publish academic papers, but would
discuss topics such as visual programming in the context of a product review. Such reviews
would normally be based on manufacturer’s press releases rather than academic analyses,
however. Readers of the magazine might therefore have some awareness of new commercial
trends in programming languages, but would probably not have encountered the cognitive
theories motivating VPL research. Although there was a small conference associated with the
show, the speakers addressed commercial issues rather than scientific ones – a programmer
with a strong interest in programming language research would have chosen to attend one of
the many more technical conferences held in London in 1995, rather than this one.

3 9
Method
The survey was conducted using a written questionnaire, reproduced in Appendix A. It started
with two qualifying questions. The first question tested whether the respondents were
professional programmers, as expected by the trade show organisers. The title and the second
introductory question were worded in order to avoid confusion between VPLs and the
Microsoft Visual Basic and Visual C++ products (which would have been very familiar to
most respondents). The body of the questionnaire consistently used the term ‘graphical
programming’ rather than ‘visual programming’, and the second introductory question
explained this as follows:
Do you have any experience of a graphical programming language, where theprogrammer does almost all programming by manipulating diagrams instead oftyping text? Please note that this definition does not include tools like Visual Basic,where the program logic is created using a text language.
In order to ensure that the point about Visual Basic had been assimilated, respondents were
asked to name a VPL that they had used, seen or read about.
The third question asked respondents to compare a graphical and a textual programming
language along five different dimensions: ease of use, power, enjoyability, readability and
changeability. They were asked to name the text language they were comparing, and to either
name a graphical language or write “guess” if they did not know the name of one. Two
Likert scales were provided for each dimension, so that the respondent made separate
assessments of graphical and textual languages on each dimension. The extremes of the scales
were labelled separately, as follows: “hard to write/easy to write”, “weak/powerful”,
“irritating/enjoyable”, “unreadable/readable”, “hard to change/easy to change”. A further
three unlabelled scales were provided, so that respondents could make comparisons on other
dimensions that they might consider to be important. A differential response was encouraged
by using six point scales, with no mid-point.
The final question was designed to elicit statements about the cognitive nature of the
programming task, as investigated in survey 1. It read:
Please explain in a few sentences how you think a graphical programminglanguage might make a difference to the "brain-work" involved in programming.
The responses to this final question were analysed using the same coding frame that was
described under the heading of survey 1. As for survey 1, an initial analysis of the results was
published before survey 3 was carried out (Blackwell 1996c). The results reported here are
based on the single coding frame that was formulated later to encompass surveys 1, 2 and 3
(Whitley & Blackwell 1997). The results that are presented in the following section are

4 0
therefore organised according to the same structure of themes and categories that was
described earlier.
Results
The number of people attending the EXE Developer’s Show was somewhat less than 1000
people (the organisers did not release exact figures). I distributed 506 questionnaires to
visitors as they arrived at the show, and 88 of these were returned, either to a collection point
on one of the exhibition stands, or by post afterwards.
According to their answers to Question 1, all but two of the respondents (98%) were
professional programmers. This is as expected from the target readership of EXE Magazine.
Despite the instructions given in Question 2, 25% of the respondents did name Visual Basic
(or a similar product) as the VPL that they were familiar with. This is a severe difficulty when
surveying opinions about novel programming languages. Although the questionnaire never
used the word “visual” and explicitly excluded Visual Basic, respondents who were
unfamiliar with visual programming tended to respond confidently, but by reference to
languages that they knew. The responses were divided into three groups according to
reported experience with VPLs. (Seven respondents did not complete this question).
Group I had seen, or were familiar with, a VPL (N=23).
Group II had no prior experience of VPLs (N=37).
Group III named Visual Basic or a similar product as a VPL (N=21).
The three groups of respondents differed significantly in only some of the relative ratings
that they assigned to text and graphical languages, as shown in figure 3.3.
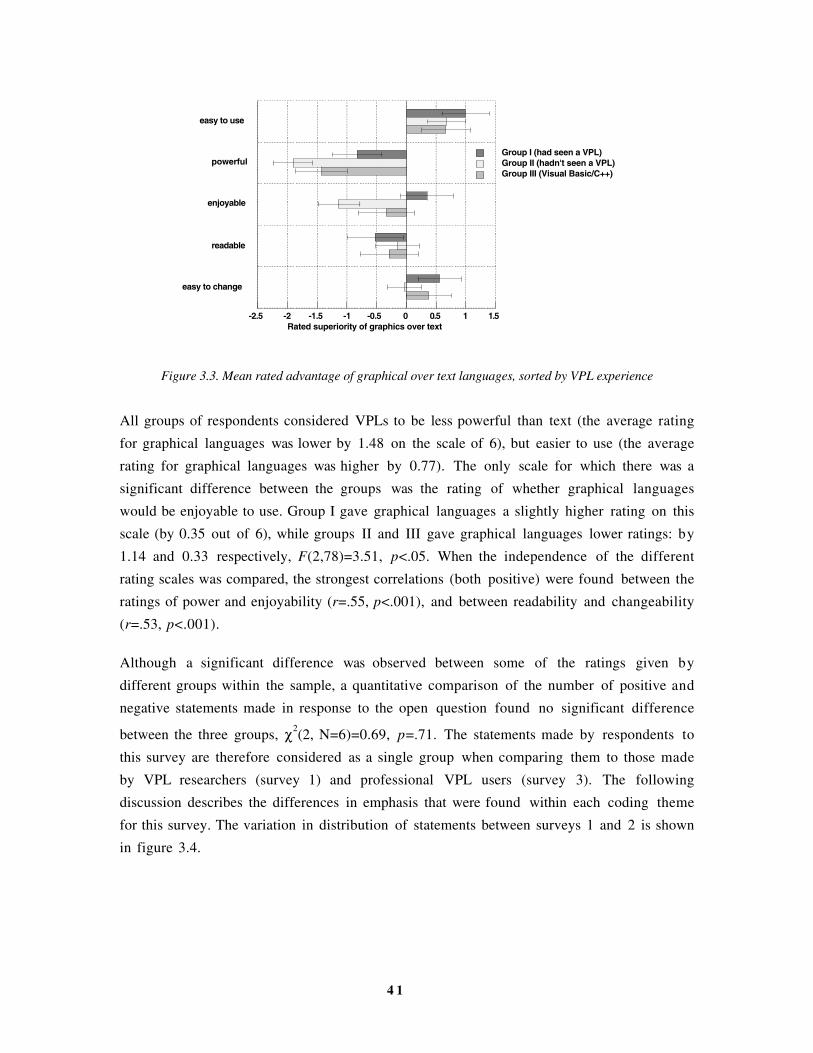
4 1
-2.5 -2 -1.5 -1 -0.5 0 0.5 1 1.5
easy to use
powerful
enjoyable
readable
easy to change
Group I (had seen a VPL)
Group II (hadn't seen a VPL)
Group III (Visual Basic/C++)
Rated superiority of graphics over text
Figure 3.3. Mean rated advantage of graphical over text languages, sorted by VPL experience
All groups of respondents considered VPLs to be less powerful than text (the average rating
for graphical languages was lower by 1.48 on the scale of 6), but easier to use (the average
rating for graphical languages was higher by 0.77). The only scale for which there was a
significant difference between the groups was the rating of whether graphical languages
would be enjoyable to use. Group I gave graphical languages a slightly higher rating on this
scale (by 0.35 out of 6), while groups II and III gave graphical languages lower ratings: by
1.14 and 0.33 respectively, F(2,78)=3.51, p<.05. When the independence of the different
rating scales was compared, the strongest correlations (both positive) were found between the
ratings of power and enjoyability (r=.55, p<.001), and between readability and changeability
(r=.53, p<.001).
Although a significant difference was observed between some of the ratings given by
different groups within the sample, a quantitative comparison of the number of positive and
negative statements made in response to the open question found no significant difference
between the three groups, χ2(2, N=6)=0.69, p=.71. The statements made by respondents to
this survey are therefore considered as a single group when comparing them to those made
by VPL researchers (survey 1) and professional VPL users (survey 3). The following
discussion describes the differences in emphasis that were found within each coding theme
for this survey. The variation in distribution of statements between surveys 1 and 2 is shown
in figure 3.4.

4 2
- 5 % 0 % 5 % 1 0 % 1 5 % 2 0 %
General impact
Learnability
Productivity
Readabil i ty
Documentation
Syntax reduction
Modulari ty
Power/scalabil i ty
Text retention
Perception/memory
Mental models
Preference/affect
Real world
Abstract/concrete
Natural language
Miscellaneous
% positive statements% negative statements
Survey 1
- 5 % 0 % 5 % 1 0 % 1 5 % 2 0 %
Survey 2
Figure 3.4. Theme distributions in surveys 1 and 2 – % of total statements in each survey
A) Contextual significance
Respondents in this survey were more likely to describe VPLs as having limited applicability,
or only being appropriate for use in certain contexts.
A.1) General impact
Where VPL researchers often made superlativist claims regarding the benefits of VPLs,
programmers in this survey were more cautious about the advantages. They were also readier
to impute practical disadvantages to VPLs, including increased effort, reduced quality, or
difficulty of maintenance. The motivation for this hostility might be partly explained by the
concern expressed by some respondents that the ultimate objective of VPLs was to make
professional programmers redundant by allowing other employees of a company to do
programming work.

4 3
A.2) Learnability
Whereas VPL researchers often claimed that VPLs are naturally intuitive, the only
professional programmer who mentioned intuition stated that VPLs were less intuitive than
text.
A.3) Productivity
Professional programmers generally accord greater importance to productivity than to ease of
learning. Responses to this survey considered that VPLs were intended for casual users, with a
shallow learning curve that limits productivity.
B) Notational characteristics
Some respondents, having used many different programming languages, considered that their
work is little affected by the language that they use. They observed that all languages are
equivalent in their computational potential, and apparently have no regard for the cognitive
ergonomics of the notation they used. Nevertheless, many respondents did make statements
on notational issues.
B.1) Readability
Some respondents to this survey did agree with VPL researchers that VPLs can clarify
relationships within a program. Many also expressed reservations about whether visual
programs would scale up to large programs, or could contain more complex information.
B.2) Documentation
Where documentation was mentioned, respondents considered that a VPL would be beneficial,
because easier to read.
B.3) Syntax reduction
While researchers proposed that VPLs allow direct manipulation of semantic information
without syntax, programmers did not describe them in these terms. They did say that the
programmer may be better able to concentrate on design and functionality rather than
coding. This view was also commonly found in survey 3, and it interacts with theme C.2,
which proposes that the suitability of the VPL for design tasks arises because of a
resemblance to the mental model of the programmer.
B.4) Modularity
Many respondents were particularly concerned with the principles of structured design,
stating that VPLs might encourage modularisation, decomposition, assembly of software
components or object-orientation. All of these are topics that were of common concern in the
industry at the time the survey was conducted, and might have been attributed to any new
product.

4 4
B.5) Power and scalability
The tone of statements addressing this theme was divided: 33 respondents made positive
comments regarding the power of VPLs, while 40 were sceptical or completely negative.
Many limitations were mentioned, including that VPLs did not allow direct access to the
machine, that large programs exceeded or cluttered the view area, or that program
functionality is fragmented and obscured by event-driven code.
B.6) Retention of text
Several respondents pointed out that VPLs still require typing; for names, expressions, or
component customisation.
C) Cognitive processes
Question 4 in the survey explicitly asked respondents to comment on the brain work involved
in programming. This should have produced a strong bias toward the type of statements
found in survey 1 on the themes related to cognitive processes. Despite this encouragement,
respondents in survey 2 made proportionally fewer statements on these themes than were
found in survey 1.
C.1) Perception and memory
Some programmers proposed that VPLs might reduce cognitive load, freeing the
programmer to think about other problems. No statements were made about perceptual
resources or working memory.
C.2) Mental models
Several programmers did describe VPLs as corresponding to their mental models. As in
surveys 1 and 3, some respondents said that VPLs could directly express ideas – a property
described in one case as ‘direct stimulation of the brain’.
C.3) Preference and affect
As noted earlier, groups II and III (who had no experience of VPLs) were more likely than
group I to give a poor rating to the enjoyability of visual programming. This is borne out in
responses to this open question. Where researchers stated that a major benefit of VPLs would
be programmer’s enjoyment in using them, a number of respondents in survey 2 objected
that VPLs would reduce the quality of their work, make maintenance more difficult, waste
their time, and reduce the intellectual challenge in their work.
D) Metaphorical comparisons
Do the statements made by VPL researchers about the value of metaphor reflect a general
belief among professional computer users, or are they specific to the research community,
perhaps due to the influence of only a few publications, as suggested in the analysis of survey
1?

4 5
D.1) Applying real world experience
Respondents in this survey never observed that VPLs might resemble the real world. They did
make some comments about the use of direct manipulation interfaces, but these were often
negative – objecting that icons were hard to remember and manipulate. Group III
respondents were positive about the general benefits of graphical user interfaces, but this is
unsurprising, given that for Visual Basic/C++ programmers, the creation of graphical user
interfaces is their livelihood.
D.2) Making the abstract concrete
Where VPL researchers stated that people find it easier to deal with the concrete than the
abstract, and that solutions are easier to perceive if abstractions are converted to a visual form,
some programmers mentioned that the use of diagrams can restrict the development of
abstractions.
D.3) Comparisons to natural language
One respondent in group III did echo the ambitions of VPL researchers, that VPLs might
help to cross language barriers by being less dependent on English. As a Visual Basic/C++
user, this concern was probably derived from the emphasis on internationalisation in those
tools.
E) Miscellaneous observations
A few respondents made comments relevant to only one product. These were not analysed
any further.
Discussion
The assessments made by respondents in this survey can be reasonably summarised by the
relative ratings they made of VPLs and textual programming languages on Likert scales. The
attitude towards VPLs was generally sceptical, and even hostile in some respects. This was true
for each of the three groups identified in the sample, although respondents who had at least
seen a VPL were more likely to be charitable, particularly in perceiving VPLs as being
enjoyable to use – the same attitude is observed on a larger scale in survey 3. It is notable that
Group II, with no experience at all of VPLs, were completely convinced that they would be
unpleasant to use. This type of response is consistent with other studies of professional
computer users, which find that their attitudes to their tools are often a matter of vigorous
allegiance – this effect is strongest when the new tool is substantially different to the old, as in
the case of the Macintosh (Jones 1990).
This attitude appears to be linked to the niche that VPLs are considered to fill in the spectrum
of software tools. Respondents expressed the main advantage of VPLs as being that they were

4 6
easy to use. This ease of use is thought to be achieved to the detriment of the tool’s power,
however. For these professional tool users, it is the power of the tool that is most strongly
correlated with their assessment of whether they would enjoy using it – this correlation will be
seen again in survey 3.
The responses to the open question follow the same broad pattern of opinion. VPLs are
described as easy to use in some respects, but deficient in many aspects important to
professional programmers. The general impact of VPLs (category A) is defined by the fact
that they are designed for casual users, but at the expense of reduced productivity. They even
threaten the livelihood of professional programmers, by encouraging non-professionals to
meddle with programming.
Statements made about the notational advantages of VPLs (category B) were generally
realistic, indicating that programmers have some appreciation of the characteristics described
by Green’s Cognitive Dimensions. Rather than appealing to intuition, it is more reasonable to
attribute the advantages of a visual representation to the fact that it clarifies relationships, and
expresses functionality in a way less obscured by typographical syntax. This advantage is
offset by the fact that the visual representation may allow a more limited repertoire of
expression, or may not scale up to the description of larger systems.
Despite the fact that the open question specifically asked respondents to speculate about the
cognitive processes involved in programming, most of them restricted their comments to
aspects of programming with which they were familiar – the notation itself, and the context in
which it is used. The proportion of statements describing cognitive processes (category C)
and the use of metaphor (category D) was far lower than had been found in survey 1. The
few respondents who did mention these issues seemed to do so on the basis of some
familiarity with HCI research (for example, in referring to cognitive load). The one exception
in these categories was theme C.2 - mental models. Of those respondents who made any
statement about cognitive issues, the great majority described visual representations as
corresponding to the mental model they had of the design. This is in accordance with the
introspective statements found by Petre and Blackwell (1997) in their analysis of expert
programmers’ descriptions of mental imagery. The respondents in this survey did not
elaborate their descriptions, so it is not possible to tell whether they are referring to the
complex images described by Petre and Blackwell, or simpler representations such as
flowcharts – further evidence on this question was found in survey 3.

4 7
Survey 3: Users of a visual programming language
A large difference was found between the opinions expressed in surveys 1 & 2. This result
does not give any support to the hypothesis proposed in the analysis of survey 1 – that there
are widespread and consistent metacognitive theories of naive psychology regarding the way
that programmers use visual representations. The responses in survey 2 appeared to be
heavily biased, however, by the hostility that the respondents expressed toward VPLs. It may
be the case that survey 2 respondents have similar metacognitive theories to VPL researchers,
but they chose not to express them, concentrating instead on negative aspects of VPLs. In
order to test this, a further survey was made of experienced users of visual languages
This study was used to collect data for two relatively independent projects – the second
project being an investigation of the computational advantages of LabVIEW, conducted by
Vanderbilt University PhD student Kirsten Whitley. It has previously been published by
Whitley and Blackwell (1997).
The population of survey 3 were users of LabVIEW (Laboratory Virtual Instrument
Engineering Workbench), a programming environment marketed by National Instruments for
development of data acquisition, analysis, display and control applications. LabVIEW features
a dataflow-based VPL, called G, which is promoted as being usable by scientists and engineers
having limited programming experience, but who need to write software to interact with
laboratory equipment. LabVIEW has been commercially available for 10 years, and has
enjoyed relatively wide success compared to other VPLs, the majority of which are research
prototypes. It is therefore an ideal candidate for studying a VPL with a sizable population of
experienced users.
There have also been previous empirical studies of LabVIEW. Baroth and Hartsough (1995)
describe the experience of their company using VPLs. In one case study they compared the
progress of two development teams, one using LabVIEW and the other using the textual
language C. The teams developed systems concurrently, to the same specification. After three
months, the C team had not yet achieved the specification, while the LabVIEW team had
exceeded it. On the basis of this and other studies, Baroth and Hartsough report that
LabVIEW projects are 4 to 10 times faster than those using a textual programming language.
They attribute this superiority to the fact that VPLs are easier to read, and that the style of
LabVIEW makes it familiar to the electronics engineers in their company. In contrast, an
experimental study by Green, Petre and Bellamy (1991) revealed no performance benefits
resulting from LabVIEW’s visual notations for conditional logic. In fact, their sample of

4 8
experienced LabVIEW users and electronic designers were uniformly faster at interpreting
conditional logic written in a textual language than in LabVIEW.
The clarification of these apparently contradictory findings was one of the main concerns in
the design of survey 3. It is possible that Baroth and Hartsough were incorrect in attributing
performance improvements to LabVIEW’s visual notation. It may be that LabVIEW does
improve programming but that the cause of the improvement stems from language features
other than the visual syntax. These issues are the concern of Whitley’s project (Whitley 1997),
and are described by Whitley and Blackwell (1997, 1998). Those parts of survey 3 which
relate to Whitley’s project are not described in any further detail in the current discussion.
Population
The respondents in this survey were recruited from two sources of LabVIEW users. The main
source was info-labview, a mailing list for LabVIEW programmers. As of January, 1997, info-
labview had approximately 2,300 subscribers. The second source was an email directory,
compiled by National Instruments, of academic users of LabVIEW. We sent invitations to
participate to 104 addresses from this directory. The third source was readers of the Internet
newsgroup comp.lang.visual. National Instruments also created a link to our survey from
their home page on the World Wide Web.
Method
This survey was administered electronically in two versions: an HTML form accessible via the
World Wide Web, and an e-mail form for which responses could be inserted between question
texts. The majority of responses used the HTML version, which can be seen in Appendix A.
When a response was submitted from the Web page, a program on our Web server (a cgi-
script implemented in Perl) analysed the response, checking for complete answers. If the
script detected missing information, it asked the respondent to fill in the missing information.
This precaution resulted in a substantial increase in the number of complete responses.
The questionnaire was divided into four parts. The first requested information about the
respondent’s programming background. Question 1 asked for an email address (this was
optional – in case clarification was needed – but was eventually used only to award incentive
prizes supplied by National Instruments). Question 2, like the first question in survey 2, asked
whether the respondents were professional programmers. Question 3 asked respondents to
make a qualitative estimate of programming experience, in terms of the number and size of

4 9
projects completed in LabVIEW and in other languages. Question 4 asked respondents to
name the programming language that they had had the most experience using.
The second part of the questionnaire elicited opinions about LabVIEW as a whole, without
emphasizing its visual aspects. This part was exploratory, and included several open questions
designed to invite comments about non-visual aspects of LabVIEW, if respondents considered
those to be important. Questions 5, 7 and 8 asked respondents for their overall opinion of
LabVIEW, examples of how LabVIEW makes programming easier, and examples of how
LabVIEW makes programming difficult. Question 6 directly addressed Whitley’s hypothesis
regarding Baroth and Hartsough’s observed productivity increases from LabVIEW use. It
asked respondents to assess the relative importance of various LabVIEW features using a 6-
point Likert scale. The visual language G was only one of these features – others included
reusable libraries of LabVIEW code, data acquisition hardware, and user interface
development facilities.
The third part of the questionnaire asked explicit questions about the visual aspects of
LabVIEW (i.e. the VPL G), and was very similar to the questionnaire used in survey 2. In
Question 9, respondents are asked to compare G along several dimensions against a textual
programming language of their choice. The first five of the dimensions are identical to the
dimensions used in survey 2: power, ease of use, readability, changeability and enjoyability.
We also added two further dimensions specifically to address the findings of Green, Petre and
Bellamy (1991) – these asked respondents to compare support in G for conditional logic (as
tested by Green et. al) and repetitive logic. Finally, question 10 is identical to the final
question in survey 2; it asks respondents to explain how and why the graphical nature of G
affects the “brain-work” required in programming.
The coding frame used for open questions was described above in the discussion of survey 1,
although the five theme categories described earlier only constitute half of the themes to
which statements could be assigned in survey 3. A second hierarchy of themes dealt with non-
visual aspects of LabVIEW, as described by Whitley and Blackwell (1998). Those themes are
not discussed here. Although respondents were not asked specifically about the effect of
using the graphical language until the end of the questionnaire, some respondents did choose
to describe cognitive effects when answering the earlier questions. We therefore aggregated all
responses to open questions, and coded them as referring to visual or non-visual aspects of
LabVIEW according to the content of the response, rather than the context of the question
being answered. This is consistent with the approach taken in survey 1, where metacognitive
statements were found in contexts ostensibly describing questions of computer science rather
than questions of psychology.

5 0
Results
The survey was advertised on 11 March 1997, and we received 227 complete responses by
1 April. The majority of respondents (132) were professional programmers, as in survey 2.
Of the remainder, 75 said that programming was only part of their job, 14 were academics
and 6 gave ‘other’ responses. No significant differences were found between these groups in
their responses to any of the questions discussed below.
As expected, LabVIEW users held far more positive opinions about VPLs than the
programmers questioned in survey 2. When the relative differences between the ratings given
to text languages and LabVIEW were compared to the relative differences in survey 2,
multivariate analysis of variance (MANOVA) indicates a significant difference across all five
rating scales, F(5,297)=0.317, p<.001. The rating differences between the two surveys are
illustrated in figure 3.5. LabVIEW programmers rated LabVIEW as superior to text in all
respects, including those where survey 2 respondents thought that VPLs would be worse than
text: power, readability and enjoyability, t(305)=8.53, p<.001, t(306)=5.80, p<.001 and
t(302)=8.18, p<.001 respectively. Although survey 2 respondents considered VPLs less
powerful than text, they did accept that VPLs might make programs easier to write. Survey 3
respondents also considered that LabVIEW improved ease of writing more than power,
t(225)=7.70, p<.001. The relative size of this difference is greater in survey 2 than in survey
3 however, t(305)=3.51, p<.001. Both survey 2 and survey 3 respondents considered that
VPLs facilitated writing programs more than reading them: t(80)=3.95, p<.001 and
t(226)=2.90, p<.005 respectively.
-2.0 -1.5 -1.0 -0.5 0.0 0.5 1.0 1.5 2.0
easy to change
easy to write
enjoyable
powerful
readable
Survey 2
Survey 3
Rated superiority of graphics over text
Figure 3.5. Relative ranking of text and VPL factors in surveys 2 and 3

5 1
In survey 2, the sub-group who had never encountered a VPL were found to be more
negative in their opinions. A complementary effect was observed in this survey. Respondents
who were not familiar with any textual programming language were instructed to enter
“guess” when naming a textual language to compare to LabVIEW. The 21 respondents who
did so gave significantly poorer ratings to textual languages than other survey 3 respondents,
especially regarding the power of text relative to LabVIEW, t(224)=4.68, p<.001). As with
survey 2, programmers who know little about a language are likely to have a poor opinion of
how powerful it is. This hypothesis is supported by correlations between the amount of
experience reported by respondents and the total rating marks given. The total rating given to
LabVIEW was positively correlated with amount of LabVIEW experience, but there was no
correlation with general programming experience, r=.35, p<.001. The reverse was true of
total rating given to text which was only correlated with general experience, r=.34, p<.001.
This suggests that programmers do not normally assess programming languages by critical
generalisation from their experience of other languages, but rather by a switch of opinion
from scepticism to comfort and familiarity.
One of the objectives of this survey was to find out whether LabVIEW programmers were
aware of its weakness in expressing conditional logic, as observed by Green et al. (Green,
Petre & Bellamy 1991; Green & Petre 1992). If so, they should give a lower rating to
LabVIEW when comparing its conditional logic to text languages than they do when
comparing repetition constructs. In fact, respondents’ awareness of this issue depended on the
amount of familiarity they had with textual languages. Those who entered “guess” in
question 9 were significantly more positive than other respondents in their assessment of
conditional logic in LabVIEW, t(224)=2.76, p<.01, but not in their assessment of repetition
constructs. Similarly, respondents who reported having completed more projects with other
languages than with LabVIEW generally gave a negative assessment of LabVIEW’s
conditional logic (poorer than text by 0.36), while the rest of the sample gave it a positive
assessment (better than text by 0.39), t(224)=3.13, p<.005. These textually-experienced
respondents gave a neutral assessment of LabVIEW’s repetition constructs (the mean
assessment differed only by 0.008 from that given to text languages).
The coding framework for responses to open format questions has been discussed in the
presentation of surveys 1 and 2. The version of the framework described in this thesis was
created to encompass all three surveys, however. In the case of survey 3, the sample was
sufficiently large to allow a simple assessment of coding reliability between the two raters.
One rater coded all responses, then the second rater coded a randomly selected 20% sample,
excluding those responses that had been used when creating the coding framework. The
codes assigned by the second rater agreed with the first in 92% of the statements.

5 2
The total proportion of negative and positive opinions found in survey 3 was intermediate
between surveys 1 and 2, as shown in figure 3.6. Survey 3 respondents were more likely to be
positive about VPLs than in survey 2, but less than in survey 1. They were more likely to be
negative than survey 1, but less than survey 2. This is consistent with the assessments made on
the rating scales of surveys 2 and 3. The following paragraphs compare the level of interest in
each of the themes across the three surveys.
Survey 1
Positive Negative Other
96.8%
3.2%0%
Survey 2
56.0%
36.6%
7.5%
Survey 3
70.0%
28.5%
1.5%
Figure 3.6. Proportion of positive and negative opinions expressed in each survey
A) Contextual significance
Figure 3.7 summarises the relative proportion of statements made on contextual significance
themes in surveys 1, 2 and 3.
- 5 % 0 % 5 % 1 0 % 1 5 %
General impact
Learnability
Productivity
% positive statements% negative statements
Survey 1
- 5 % 0 % 5 % 1 0 % 1 5 %
Survey 2
- 5 % 0 % 5 % 1 0 % 1 5 %
Survey 3
Figure 3.7. Attention to contextual themes in surveys 1, 2 and 3

5 3
A.1) General impact
As with statements found in survey 1, LabVIEW programmers often mentioned general ease
of use as an advantage of VPLs. Survey 2 respondents more often stated that this goal would
not be achieved – that VPLs would make no difference to users, or even be more difficult to
use.
A.2) Learnability
Both VPL researchers and LabVIEW programmers cited ease of learning as a benefit of
VPLs, where survey 2 respondents were more likely to criticise the time required to learn
simplistic languages. LabVIEW programmers did express reservations about the difficulty of
learning the dataflow paradigm of LabVIEW, which was very different to languages that they
had used previously.
A.3) Productivity
LabVIEW programmers reported productivity benefits not only in coding, but in the design,
debugging and maintenance phases of software development. The survey 2 programmers
believed the reverse – that the advantages of visual programming would be found only during
coding and that these other phases would see no change or even decreased productivity.
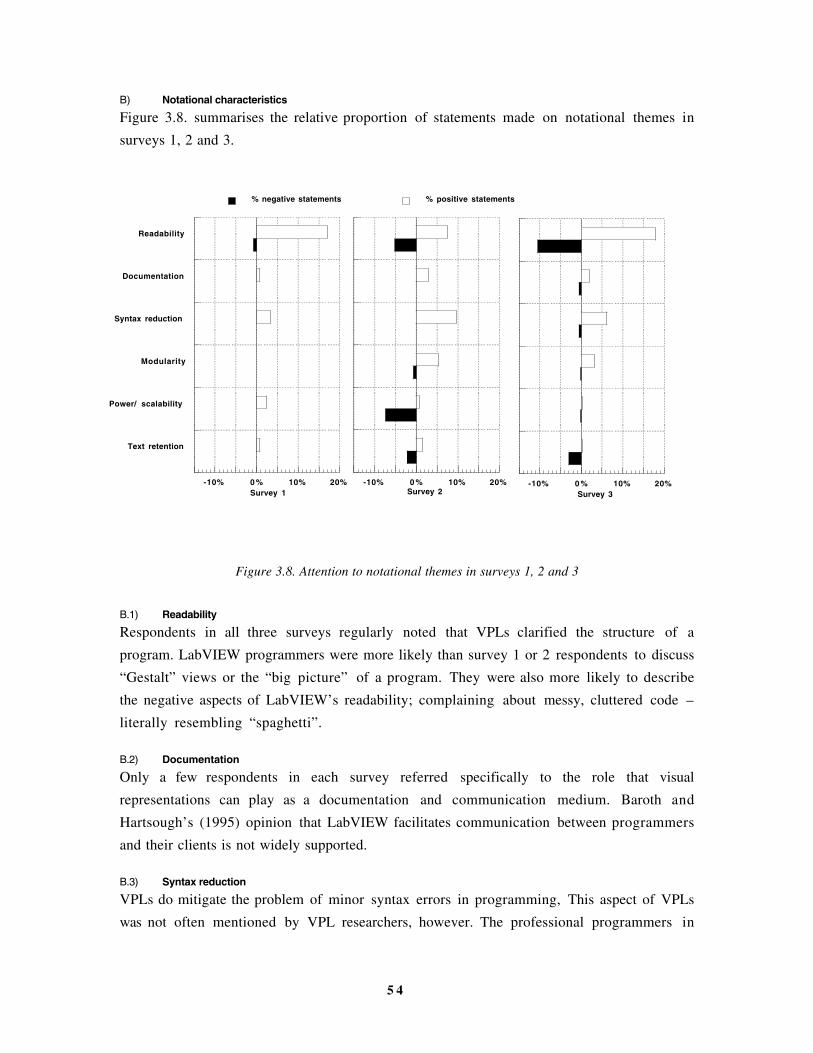
5 4
B) Notational characteristics
Figure 3.8. summarises the relative proportion of statements made on notational themes in
surveys 1, 2 and 3.
-10% 0 % 10% 20%
Readability
Documentation
Syntax reduction
Modularity
Power/ scalability
Text retention
% positive statements% negative statements
Survey 1
-10% 0 % 10% 20%Survey 2
-10% 0 % 10% 20%
Survey 3
Figure 3.8. Attention to notational themes in surveys 1, 2 and 3
B.1) Readability
Respondents in all three surveys regularly noted that VPLs clarified the structure of a
program. LabVIEW programmers were more likely than survey 1 or 2 respondents to discuss
“Gestalt” views or the “big picture” of a program. They were also more likely to describe
the negative aspects of LabVIEW’s readability; complaining about messy, cluttered code –
literally resembling “spaghetti”.
B.2) Documentation
Only a few respondents in each survey referred specifically to the role that visual
representations can play as a documentation and communication medium. Baroth and
Hartsough’s (1995) opinion that LabVIEW facilitates communication between programmers
and their clients is not widely supported.
B.3) Syntax reduction
VPLs do mitigate the problem of minor syntax errors in programming, This aspect of VPLs
was not often mentioned by VPL researchers, however. The professional programmers in

5 5
survey 2 and 3 were concerned with minimising syntax. In fact, two LabVIEW programmers
complained about the novel syntactic demands in wiring up large programs.
B.4) Modularity
Survey 2 respondents mentioned modular programming more often than survey 3. This is
not a major emphasis in LabVIEW, whereas survey 2 was conducted at a time when object-
orientation was the main technical trend being adopted in commercial programming.
B.5) Power and scalability
Survey 2 respondents appeared concerned that high-level VPLs might deny them access to
the low-level facilities of the machine that are so important in PC programming. This has
often been a matter of concern with new generations of programming language, and it was
most uniformly seen as a disadvantage by survey 2 respondents. Neither researchers nor
LabVIEW programmers appeared as concerned.
B.6) Retention of text
A few survey 2 respondents seemed to find it hard to believe that an arbitrary computational
operation could be represented graphically; stating that there would always be some level
where the visual representation would be inadequate. This is not the case in LabVIEW.
C) Cognitive processes
Figure 3.9. summarises the relative proportion of statements made on cognitive process
themes in surveys 1, 2 and 3.
0 % 5 % 1 0 % 1 5 %
Perception/ memory
Mental models
Preference/ affect
% positive statements% negative statements
Survey 1
0 % 5 % 1 0 % 1 5 %
Survey 2
0 % 5 % 1 0 % 1 5 %
Survey 3
Figure 3.9. Attention to cognitive themes in surveys 1, 2 and 3

5 6
C.1) Perception and memory
Survey 3 respondents seldom mentioned perceptual processes. One respondent explicitly
discounted the type of statement made in survey 1: “the human brain is massively parallel
but basically operates in a linear fashion. G is parallel, but not in the least bit linear.”
C.2) Mental models
As in surveys 1 and 2, LabVIEW programmers also stated that the designs they construct in
their minds are in some sense pictorial or that VPLs are closer in nature to their thoughts than
are textual languages. These opinions may be influenced by the predominance of
diagrammatic notations in software design, but they are supported by the introspective
evidence reported by Petre and Blackwell (1997).
C.3) Preference and affect
Survey 1 researchers stated that VPLs would be popular simply because people would enjoy
using them. Several LabVIEW programmers said that they think using LabVIEW is fun, but
the conservative coding policy followed in this survey meant that those statements were not
interpreted as relating to the G language unless respondents explicitly said so – it may be the
case that respondents consider the editing environment or the front panel assembly in
LabView to be fun, rather than the G language.
D) Metaphorical comparisons
Figure 3.10. summarises the relative proportion of statements made on metaphorical
comparison themes in surveys 1, 2 and 3.
0 % 2 % 4 % 6 % 8 %
Real world
Abstract/ concrete
Natural language
% positive statements% negative statements
Survey 1
0 % 2 % 4 % 6 % 8 %
Survey 2
0 % 2 % 4 % 6 % 8 %
Survey 3
Figure 3.10. Attention to metaphorical themes in surveys 1, 2 and 3

5 7
D.1) Applying real world experience
LabVIEW exemplifies the principle of presenting abstraction in terms of real-world concepts
that are already familiar to the programmer. Several LabVIEW users agreed that their
previous experience in engineering or electronic circuit-building had been very important to
them in learning the wiring metaphor that is central to LabVIEW.
D.2) Making the abstract concrete
The claim made by VPL researchers, that VPLs make abstract concepts easier to understand
by presenting them in the form of concrete images, was hardly mentioned by respondents in
either survey 2 or 3.
D.3) Comparisons to natural language
Survey 3 respondents seldom compared VPLs to human languages; a comparison that was
found in survey 1.
E) Miscellaneous observations
In survey 3, some issues specific to LabVIEW were not compared directly to other surveys,
despite the fact that they can be seen as general problems in VPLs – for example, the fact that
it can be difficult to produce a paper print-out of a visual program. This type of issue may be
a significant irritation to professional users of a VPL, but neither researchers nor non-VPL
users would be likely to consider it.
Discussion
The results of this survey have emphasised the conservatism of professional programmers’
opinions about their tools. In both surveys 2 and 3, respondents were most positive about the
tools that they had most experience using. Their opinion of new techniques or unfamiliar
languages was generally sceptical and even hostile. These opinions were often expressed
confidently, but appear to be associated with lack of experience and understanding of the
tools being discussed. The reasons for this attitude have not been investigated here, but there
are several obvious candidates: the highly competitive market for software tools, the existence
of support groups where programmers meet to reinforce their allegiance to specific
languages, and the desire to protect one’s professional specialist knowledge of existing tools,
among other factors. In the context of these attitudes, it is not surprising that so many
respondents in survey 2, rather than echoing the opinions of VPL researchers about the
benefits of visual programming, denied that VPLs would bring any advantages at all. The
balance of opinion was restored in survey 3, where, with much the same motivation, LabVIEW
programmers were highly positive about VPLs and derided textual programming languages
(especially if they had not used them).

5 8
In cases where the survey respondents analysed language facilities on a more critical basis, it
seems that the area of improvement most interesting to professional programmers is facilities
that might improve their productivity during mundane tasks. These improvements can be
analysed in terms of relatively well-understood usability measures, especially Green’s
Cognitive Dimensions. Survey 3 respondents with experience of both VPL and text languages
confirmed the finding of Green, Petre and Bellamy (1991) that experimental subjects are
slower to interpret conditional logic in LabVIEW than in BASIC.
There are further observations made by respondents that have not yet been investigated
empirically, and may be worthy of research. The VPL researchers in survey 1 appear to
consider that the main advantage of visual representations is that they are easier to read.
Respondents in both surveys 2 and 3, however, reported that the main contribution is that they
are easier to write, with readability being relatively poor. A similar distinction between the
appearance of comprehension and actual lack of understanding has also been found in
studies of English text reading (Glenberg, Wilkinson & Epstein 1982). Another theme
expressed in both surveys 2 and 3 is the perceived trade-off between power and usability in
programming languages. There is no obvious theoretical reason why a powerful language
should be difficult to use. It would be interesting to investigate whether this perception comes
from the dichotomous marketing of programming tools in “student” or “end-user” versus
“professional” categories, or whether the perceived trade-off arises from cognitive
dimensions such as diffuseness and abstraction gradient.
Professional programmers, while aware of potential improvements in productivity from new
languages, give little attention to the theories of cognition that are mentioned by so many
VPL researchers as motivating the development of VPLs. The one topic in this area that is
addressed regularly in all three surveys is the belief that programming involves the creation of
image-like mental representations. This intuition is supported by in-depth interviews with
expert programmers, as reported by Petre and Blackwell (1997). Despite this common
intuition, it is not a necessary fact that the formation of image-like mental models will be
facilitated by the use a diagrammatic external representation – what Scaife and Rogers (1996)
call the resemblance fallacy. The relationship between mental imagery and diagrams
motivates the first experiment to be discussed in chapter 3, and is investigated in considerable
detail in chapter 4.
The hypothesis that VPLs are essentially metaphorical is seldom raised by the professional
programmers of surveys 2 and 3. LabVIEW includes a quite specific metaphor – of
programming as the creation of an electronic circuit (the cursor, when connecting
components, resembles a spool of wire). Despite this emphasis, relatively few LabVIEW
programmers mentioned it as an important benefit. If the idea of programming languages as

5 9
metaphors is not widespread amongst programmers, why is it so often mentioned by VPL
researchers? The researchers do not cite specific sources, so it would appear that this
metacognitive theory has been transmitted through the VPL research community by informal
means, perhaps originating from Smith’s (1977) description of visual programming as a
“metaphor for thought”. After completing the formal analysis of survey 1, and throughout
this research project, I continued to find statements in the research literature making even
more explicit claims about the relationship between abstraction, mental imagery and
metaphor. These might easily have appeared in Smith’s original publication. A typical
example is:
Rather than forcing the programmer to make his concepts of how a system shouldwork conform to a given programming language and environment, the environmentand language should conform to the programmer’s concepts. […] Attempting tohave programmers directly [sic] with their conceptualizations has several interestingimplications: The environment has to be graphical. People often think usingpictures. Many of the conceptual views of programming are two-dimensional,graphical ones. The programmer must be able to work using the pictures thatcompose his conceptualizations and to assign meaning to these pictures.
Reiss (1987), p. 178
The remainder of the current thesis principally investigates this premise of VPL research. If
the intuitive claims of VPL research are justified, and if Smith’s original insights are
supported by empirical evidence, then the use of metaphor must be treated far more seriously
as a fundamental design principle for all types of diagram. The experiments in the next
chapter and in chapter 5 undertake this investigation.

6 0
Chapter 4: Diagrammatic Metaphor in Instruction
The giving form and shape, to what otherwise would onlyhave been an abstract idea, has, in many cases, beenattended with much advantage.
The Commercial and Political AtlasW. Playfair, 1801, p. xi.
The experiments reported in this chapter test the fundamental claim of the user interface
metaphor, and one of the underlying assumptions of visual programming language advocates
– that novel abstract concepts can be presented diagrammatically in terms of familiar physical
experience. In the context of building user interfaces, it may be reasonable to claim that an
interactive diagram imitates what Gibson (1979) called the perceptual affordances of the
physical world. As in the physical world, graphical affordances indicate potential actions
within the interface (Norman 1988, Larkin 1989). Affordances do not require explicit
metaphor (Mohnkern 1997a), and may even fail if metaphors are drawn too far from their
source domain (Lewis 1991). Theories of user interface affordances have often been
conflated with the role of visual structure in forming analogies. This role was demonstrated in
a more general investigation by Beveridge and Parkins (1987), showing that analogical
solutions are more easily discovered when their structure is presented visually – but those
findings have not been tested in user interface applications.
Many theories of diagrammatic reasoning claim, however, that knowledge of the physical
world is used to interpret diagrams even when they do not support interaction. These are
often related to theories of conceptual metaphor and thematic relations claiming that all
abstractions, even linguistic ones, are derived from embodied experience (Jackendoff 1983,
Johnson 1987, Lakoff 1987). Conceptual metaphor theories attract considerable debate, with
theoretical and experimental evidence both for (Gibbs & O’Brien 1990, Gibbs 1996, De
Vega, Rodrigo & Zimmer 1996) and against (Murphy 1996, 1997, McGlone 1996,
Rumelhart 1993). Spatial representations are equally contentious when proposed as a
cognitive basis for grammar (proposed by Talmy 1983, but challenged by Choi & Bowerman
1991) or for memory (proposed by Glenberg 1997, and sure to be challenged soon). Despite
the disputed status of conceptual metaphor theories, HCI researchers such as Tauber (1987)
and Hutchins (1989) argue that user interfaces similarly reflect spatial representations of
abstract structure. Gattis & Holyoak (1996) make the same argument regarding the
interpretation of Cartesian graphs. Lakoff (1993) has also extended his observations on the
linguistic consequences of spatial experience to encompass the use of diagrams to express
abstraction.

6 1
The experiments reported in this chapter address these claims by testing whether spatial
representations, when used in the context of visual programming, do facilitate abstract
problem-solving. Surveys 1 and 3 discovered a range of beliefs that appear similar in some
ways to the claims about conceptual metaphor. In fact, programming is a far more complex
activity than those that are used in typical metaphor experiments. Writing a computer
program is a loosely constrained problem solving exercise rather than being like generation
of natural language (Green 1980, Green, Bellamy & Parker 1987, Visser 1992, Koenemann
& Robertson 1991). Many studies of problem solving have demonstrated the potential for
using one or more external representations as a cognitive tool (Katona 1940, Schwartz 1971,
Carroll, Thomas & Malhotra 1980, Anderson 1996, Cox 1997, Zhang 1997). In solving
programming problems, the language acts both as the solution medium and the problem
solving representation. A visual programming language must therefore be effective as a
diagrammatic tool for problem solving.
The two experiments in this chapter compare the effect of metaphor in the representation to
the effect of programming expertise. Many studies have observed that expertise in using a
specific notation has a significant effect on both problem-solving strategies and performance,
in fields including not only programming (Adelson 1981, McKeithen et. al. 1981) but
electronic circuit design (Egan & Schwartz 1979, Petre & Green 1993), meteorology (Lowe
1993b), abacus use (Hishitani 1990) and blindfold chess (Saariluoma & Kalakoski 1997).
Visual programming languages, however, are not primarily designed for use by expert
programmers. Graphical representations are expected to be more appropriate for
inexperienced computer users (van der Veer, van Beek & Cruts 1987, Sohn & Doane 1997),
and the value of visual programming languages for inexperienced users has been
demonstrated in studies by Cunniff & Taylor (1987) and Mendelsohn, Green & Brna (1990),
as well as being an explicit claim when programming languages are promoted for use by
novices without any empirical verification (di Sessa 1986, Bonar & Liffick 1990). Nardi
(1993) on the other hand, has strongly criticised the notion of any programming language
being suitable for novices or “end-users”.
The experiments reported here have used participants without programming experience
partly in order to separate the issue of notational expertise from the effect of metaphor in
learning to use a notation. They also compare experts and novices. Experienced
programmers have knowledge about programming that is independent of the representation
being used as noted by Mayer (1988), and they apply consistent strategies for code
comprehension even when using a language that does not explicitly reveal their preferred
structures (Boehm-Davis, Fox & Philips 1996). The design of these experiments is based on
the premise that expert programmers will out-perform novices, even using a notation they

6 2
have not seen before, and that the degree of this performance difference will provide a
reference scale for the degree by which metaphor improves the performance of novices in the
same task.
Experiment 1: Programming with an implicit pictorial metaphor
Despite surface similarities, the process of learning a programming language has little in
common with learning a natural language. Inappropriate generalisations from natural
language are a major source of confusion to programming novices. Bonar and Soloway
(1985) report that novice bugs found in think-aloud protocols often result from
generalisations of natural language, while Scapin (1981) found that novices make more errors
when using a text editing command set derived from natural language than when using more
“computational” terminology. The use of metaphor in a computer language is also unlike
the use of metaphor to extend the expressive potential of natural languages (Gentner &
Clement 1988). Natural language tropes such as metaphor rely on the potential for ambiguity
in language (Empson 1984), while computer languages are designed to be unambiguous
(Green 1980, Cohen 1993). Gentner, Falkenhainer & Skorstad (1988), in describing their
structural model of metaphor interpretation, warn explicitly that the interpretation of user
interface “metaphors” involves a different process to the interpretation of linguistic
metaphors.
In what sense, then, can programming languages be metaphorical? The metaphor that is
addressed in this experiment is an explanatory metaphor by which those learning to use the
programming language understand its operation. Users of any device form a mental model of
its behaviour, explaining why it responds as it does to their actions. This is true of complex
machinery (Moray 1990), pocket calculators (Young 1981, 1983), computer operating
systems (Tauber 1987) and automatic teller machines (Payne 1991). The mental model is
sufficiently detailed to explain the observed behaviour, but does not describe all the details of
the device’s design (du Boulay, O’Shea & Monk 1981).
In computer science terminology, the model that defines the behaviour of a programming
language is a “virtual machine”. Cognitive ergonomics (van der Veer 1990) and program
understanding (Tenenberg 1996) depend on whether the user’s mental model is consistent
with the virtual machine. Programming languages for use by novices have therefore
attempted to make the virtual machine more explicit (e.g. Esteban, Chatty & Palanque 1995)
perhaps most originally in the form of cartoon characters acting in a computational town of
function houses and message-carrying birds (Kahn 1996). If novice programmers are not

6 3
explicitly given a virtual machine, they create their own metaphors to explain the behaviour
of the language (Jones 1984). Even in languages which supposedly describe computation in
purely mathematical terms, novices want to know how functions will be evaluated (Segal &
Schuman 1992). If novices are not given a model of a virtual machine, they may invent an
inappropriate explanation (Booth 1992, Eisenberg, Resnick & Turbak 1987, Eisenstadt,
Breuker & Evertsz 1984), working from sources of information such as observing a debugger
(Cañas, Bajo & Gonsalvo 1994) extrapolating from tutorial code examples (Noble 1992), or
imagining the behaviour of the machine from the viewpoint of an internal agent (Watt 1998).
Programming languages must therefore serve a dual purpose: a notation for solving a
problem in some problem domain, as well as representation of some virtual machine (Taylor
1990, Blackwell 1996a). Their effectiveness depends on how well information can be mapped
from the problem domain to the notation, and from the notation to the virtual machine
(Payne, Squibb & Howes 1990, Norman 1991). The structure of the virtual machine, and the
nature of the mapping, combine to form what is often called the “programming paradigm”
– families of languages that support the same programming techniques. Overly complex
mappings can easily compromise performance (Nardi & Zarmer 1993), but one of the main
challenges in improving programming language usability is providing metaphors that are
appropriate for the user (Carroll & Olson 1988, Pane & Myers 1996, Pane 1997). Visual
programming languages can potentially achieve this goal by depicting the virtual machine as
if it were a physical machine (Glinert 1990) which can be understood by analogy from the
user’s experience of real world machines (Tauber 1987, Treglown 1994).
Metaphors of the virtual machine have been used for some time when teaching programming
as well as other aspects of computer use: the effectiveness of metaphor has been demonstrated
experimentally when learning programming languages (Mayer 1975), command languages
(Payne 1988) and system behaviour (van der Veer 1990). Chee (1993) has proposed a theory
of analogical mapping from metaphor to programming language. When the metaphor is
incorporated into the language as a pictorial diagram, however, it is constantly available for
inspection, unlike the situations in which mental models and virtual machines are conjectural
cognitive structures. For a visual programming language, the programming paradigm and the
user interface metaphor should ideally become indistinguishable.
The way that this type of metaphor is interpreted may involve very different cognitive
processes from those used in interpreting textual programming languages. Diagrammatic
representations of physical machines are often interpreted via a process of mental animation.
Hegarty (1992) used this term to describe experiments in which the gaze of subjects
reasoning about the motion of pulleys in a mechanical diagram followed the imagined
direction of motion. Similar results have been reported by Fallside and Just (1994),

6 4
Narayanan, Suwa and Motoda (1995) and Sims and Hegarty (1997). Schwartz has shown that
making a visual representation of a mechanism more or less pictorial can influence the choice
of a mental animation strategy (Schwartz 1995, Schwartz & Black 1996a). In his experiments,
subjects asked to assess lengths on either side of a hinged joint appeared to mentally rotate
the joint into place if it was presented pictorially, but used an analytic strategy (with reaction
time consequently independent of joint angle) when the pictorial detail was removed.
In the experiment presented here, two forms of a visual programming notation are used. Both
express a virtual machine, and both express it diagrammatically. One of them, however,
depicts the virtual machine as a metaphorical physical machine, as recommended in many of
the publications cited above for teaching programming or assisting novice programmers. It
uses cartoon-like representations of physical machines, intended to produce mental models
corresponding closely to the virtual machine. It is also intended to encourage reasoning about
program behaviour using mental animation strategies of the kind described by Schwartz
(1995) and Hegarty (1992).
Notation
The diagrammatic notation used in this experiment was based on the most common paradigm
for visual programming languages. In a “data flow” language, computational operations are
represented by nodes in a graph. The arcs between these nodes indicate potential transfer of
data between different operations. The overall behaviour of the program is defined by the
topology of the graph. Data flow languages are considered to be particularly appropriate for
describing concurrent computation (Finkel 1996), but the claim that they provide advantages
to any particular class of user by assisting comprehension, problem-solving or program
design is still under investigation (Karsai 1995, Good 1996).
Figure 4.1. Example of LabVIEW program

6 5
Figure 4.2. Example of JavaStudio program
Dataflow is already considered particularly appropriate for exploitation in commercial visual
programming languages, however. Two examples of commercially available visual
programming languages employing dataflow are illustrated in figures 4.1 and 4.2. Both
describe dataflow in a metaphorical way, although the metaphors are presented using
different modes. The LabVIEW language, shown in figure 4.1, depicts the paths between
nodes as simple lines (although these are coloured to indicate the type of data). The
documentation for LabVIEW, however, describes these lines metaphorically as “wires” like
those connecting components in an electronic circuit. The JavaStudio language, shown in
figure 4.2, depicts paths as miniature pipes, including visible plumbing joints. The metaphor
implicit here is that data flows from one component to another like a fluid through plumbing.

6 6
>
=?
a) without metaphor b) with metaphor
Figure 4.3. Comparison operations without and with metaphor
Two different presentation modes were also used in this experiment. In one of them, nodes
were connected together using unadorned lines, and the nodes themselves were represented as
abstract symbols. An example of one of these nodes, representing a comparison operation, is
shown in figure 4.3a. The symbol provides some mnemonic assistance using mathematical
conventions, but there is no explicit physical metaphor. In the second presentation mode,
nodes were connected by tracks with balls rolling along them. The nodes themselves were
fanciful “Heath Robinson” mechanisms showing a computational function implemented by
controlling the motion of balls, as in the proposed ball-bearing computer described by Pilton
(1971). A comparison operation, in which an arriving ball is weighed against a predefined
value to determine the outcome, is shown in figure 4.3b.

6 7
Repetition
Selection
Guard
Figure 4.4. Examples of computational operations
These two versions of the dataflow notation, one depicting dataflow metaphorically as the
motion of balls, and the other using a relatively simple geometric depiction, were otherwise
made as similar as possible. The component nodes and connections between them were given
to participants in the form of paper cut-outs, whose profiles were identical in each version.
Figure 4.4 shows a selection of computational operations, comparing the two versions of each
(the full set of components is reproduced in Appendix B.1). Participants arranged these cut-
outs on a tabletop by matching the convex data outputs on the right hand side of node and
path profiles to the concave data inputs on the left hand side of another node or path. Figure
4.5 shows an example of a complete program (using the metaphorical notation) which would
simply display the numbers from 1 to 10.
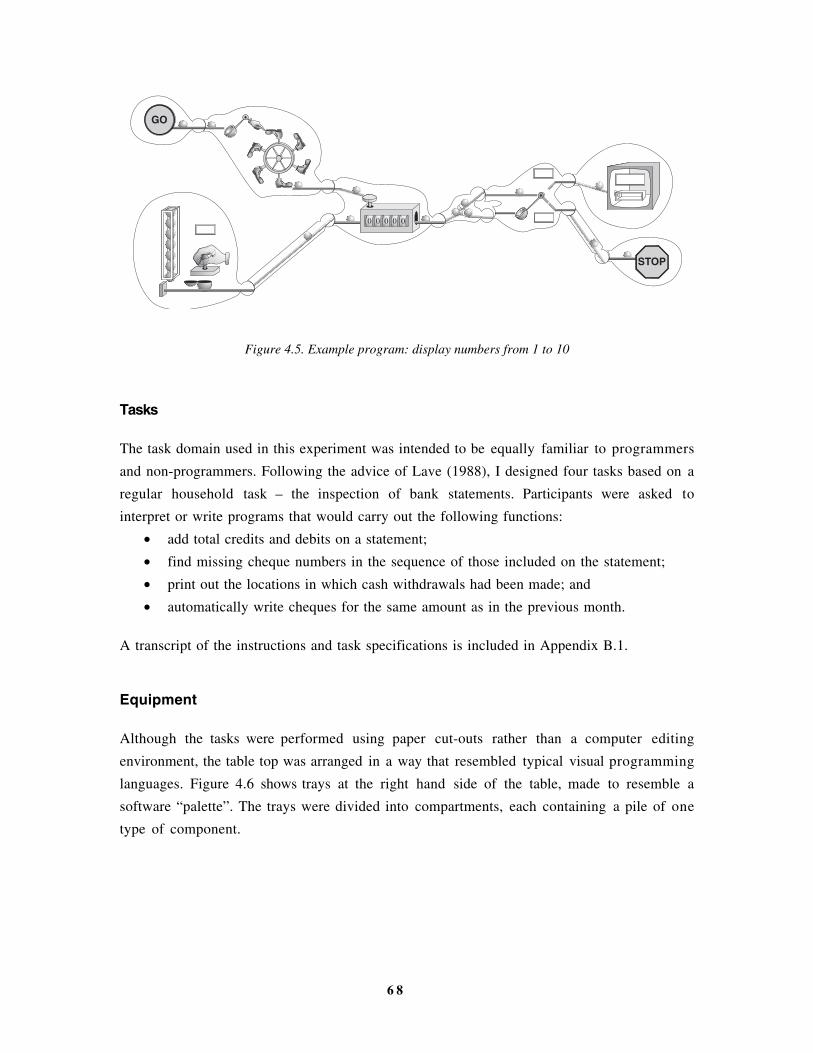
6 8
0 0 0 0 0
STOP
GO
Figure 4.5. Example program: display numbers from 1 to 10
Tasks
The task domain used in this experiment was intended to be equally familiar to programmers
and non-programmers. Following the advice of Lave (1988), I designed four tasks based on a
regular household task – the inspection of bank statements. Participants were asked to
interpret or write programs that would carry out the following functions:
• add total credits and debits on a statement;
• find missing cheque numbers in the sequence of those included on the statement;
• print out the locations in which cash withdrawals had been made; and
• automatically write cheques for the same amount as in the previous month.
A transcript of the instructions and task specifications is included in Appendix B.1.
Equipment
Although the tasks were performed using paper cut-outs rather than a computer editing
environment, the table top was arranged in a way that resembled typical visual programming
languages. Figure 4.6 shows trays at the right hand side of the table, made to resemble a
software “palette”. The trays were divided into compartments, each containing a pile of one
type of component.

6 9
Figure 4.6. Experiment 1 working environment
The behaviour of each component was described on individual printed pages. When using a
component for the first time, participants were given one of these descriptions to read, but it
was then placed out of view of the participant, who could ask to see it again at any time. This
was intended to be similar to the operation of an on-line help facility.
Participants were also given a mock-up of a bank statement to be used for reference during
the bank statement processing tasks.
Hypotheses
1. That the provision of a diagrammatic metaphor will make it easier for novices to
learn to write computer programs.
2. That this assistance will reduce the differences in performance that would
normally be expected between novices and expert programmers.
3. That novices will think in terms of the metaphor when reasoning about the
computational virtual machine.
Participants and design
Twelve participants were recruited from volunteers registered with the Applied Psychology
Unit Subject Panel, and from amongst staff at the Unit. They were divided into two groups on
the basis of their prior experience of computer programming. Four participants had
previously worked as professional programmers; eight had never written a computer program

7 0
(“novices”). The second group were broadly matched in educational achievement and
intelligence to the experienced programmers (they were educated to degree level, and during
previous experiments at the APU, their scores on Cattell’s Culture Fair test had corresponded
to an IQ of between 120 and 140).
The second independent variable was the version of the data flow notation given to the
participant, either with or without the rolling ball metaphor. Assignment was balanced within
each experience group: I presented each version of the notation to four non-programmers,
and to two of the programmers. I made this allocation in the expectation that the metaphor
would bring novice performance closer to that of the expert programmers, whereas it would
have little effect on the experts. If this were the case, the expert programmers could be
aggregated into a single group for analysis, and the performance of this group would provide
a point of reference for the claim that metaphor can improve the performance of novices with
respect to experts.
Performance was measured using two dependent variables. The first was the total time that the
participant took to complete each of the four activities described below. The second was the
degree of elaboration that the participant produced in the two program construction tasks.
The program specification that they were given allowed several different solutions, but
complete solutions had similar degrees of complexity, while incomplete solutions omitted
some of the required components. The relative quality of the solutions might be subject to
interpretation, but the degree of completeness could be estimated by the simple measure of
the number of nodes included. The third dependent variable was the number of times that
participants asked to review component explanations after they had initially read them.
Three further dependent variables were used to measure awareness of the metaphor. A think-
aloud protocol was recorded while the participant worked on each task. I compared the
vocabulary of these protocols in order to identify the frequency with which the participant
referred to the problem domain, to the computational metaphor, and to abstract mathematical
or computational terms. These were compared using three different vocabulary
classifications: nouns were classified according to the domain they referred to, verbs were
divided into physical and abstract behaviour, and descriptions of flow were classified into
references to the virtual machine and references to the problem domain.
The first two hypotheses were assessed on the basis of the time and elaboration performance
measures, comparing performance of novices to that of experts, and also comparing
performance with and without diagrammatic metaphor. The effect of the metaphor on
learning was evaluated in terms of the number of review requests made by participants.

7 1
Vocabulary in the think-aloud protocols was used to evaluate the extent to which participants
used the metaphor when reasoning about the program.
Procedure
Before the start of the experiment, I instructed participants in the procedure for “thinking
aloud” during problem solving, using the instructional procedure prescribed by Ericsson and
Simon (1993). As the participant performed each task, the tape recorder seen in Figure 4.6
recorded this verbal protocol. In order to confirm the assumption of task domain familiarity,
I asked all participants to confirm that they were familiar with bank statements.
For the first task, I demonstrated the creation of a program to add total credits and debits,
describing the operation of the program as each component was added. I read the description
from a script that was identical in the two versions of the language (this script is included in
appendix B.1). The participant was shown a description of each component as it was added to
the program, which they read at their own pace. The layout of the component descriptions is
shown in figure 4.7. Only the picture was changed in the two versions of the language – the
description texts were identical (the full set of component descriptions is reproduced in
Appendix B.1). After the program was complete, I shuffled the paper components, and asked
the participant to reassemble to program while thinking aloud.

7 2
Wait
At first, this part does nothing with its input value •
It waits until a control input arrives here •
When the control input arrives, the original input value will be passed through to the output •
Figure 4.7. Layout of component descriptions
In the second task, I showed a completed program to the participant, printed to the same scale
as the paper cut-outs on the tabletop. I told the participant that the program was designed to
find missing cheque numbers in a sequence, and asked them to explain how it worked. The
program contained an error (it compared each number to itself rather than to the previous
one in the sequence), and I asked them to find this error and suggest a way of fixing it. This
program included two more components that had not been used in the first task, and I
described the function of these components in the same way as before.
In the third task, the participant was given a description of a program that would check the
locations of cash withdrawals, and display any that had been made outside Cambridge. I then
asked the participant to create a program that would carry out this function. As before, I
described a further component that would be required in this task.
In the final task, the participant was given a description of a program that would find a
cheque paid to a particular recipient, and automatically write another cheque for the same
amount. I did not describe any new components, but told the participant that some new
components would be required. When this occurred, they were to use “mystery components”
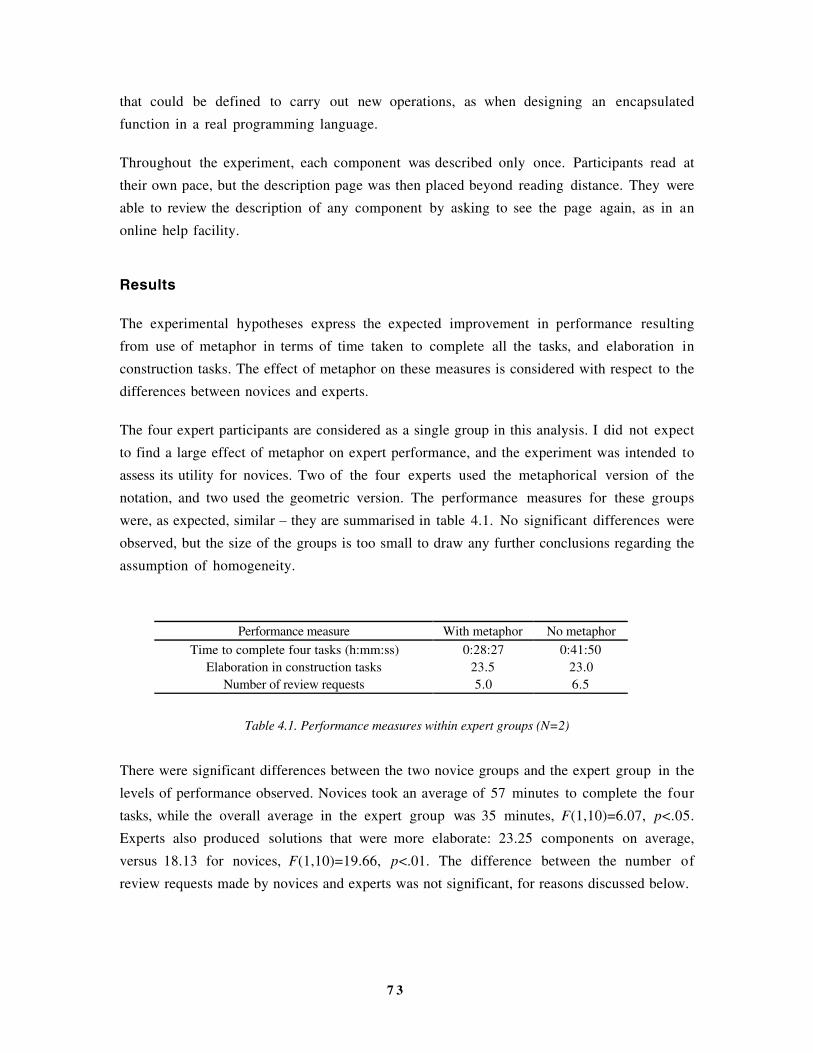
7 3
that could be defined to carry out new operations, as when designing an encapsulated
function in a real programming language.
Throughout the experiment, each component was described only once. Participants read at
their own pace, but the description page was then placed beyond reading distance. They were
able to review the description of any component by asking to see the page again, as in an
online help facility.
Results
The experimental hypotheses express the expected improvement in performance resulting
from use of metaphor in terms of time taken to complete all the tasks, and elaboration in
construction tasks. The effect of metaphor on these measures is considered with respect to the
differences between novices and experts.
The four expert participants are considered as a single group in this analysis. I did not expect
to find a large effect of metaphor on expert performance, and the experiment was intended to
assess its utility for novices. Two of the four experts used the metaphorical version of the
notation, and two used the geometric version. The performance measures for these groups
were, as expected, similar – they are summarised in table 4.1. No significant differences were
observed, but the size of the groups is too small to draw any further conclusions regarding the
assumption of homogeneity.
Performance measure With metaphor No metaphor
Time to complete four tasks (h:mm:ss) 0:28:27 0:41:50Elaboration in construction tasks 23.5 23.0
Number of review requests 5.0 6.5
Table 4.1. Performance measures within expert groups (N=2)
There were significant differences between the two novice groups and the expert group in the
levels of performance observed. Novices took an average of 57 minutes to complete the four
tasks, while the overall average in the expert group was 35 minutes, F(1,10)=6.07, p<.05.
Experts also produced solutions that were more elaborate: 23.25 components on average,
versus 18.13 for novices, F(1,10)=19.66, p<.01. The difference between the number of
review requests made by novices and experts was not significant, for reasons discussed below.

7 4
Performance measure With metaphor No metaphor
Time to complete four tasks (h:mm:ss) 0:53:42 1:00:19Elaboration in construction tasks 17.8 18.5
Number of review requests 7.0 17.0
Table 4.2. Performance measures within novice groups (N=4)
The main hypothesis in this experiment was that the novice group given the metaphorical
version of the language would be intermediate in performance between novices with no
metaphor and experts. The relative performance of the three groups is compared in figure
4.8. Although there is a significant difference between the expert and novice groups in task
completion time, there is no significant difference between the two novice groups,
F(1,6)=0.33, p=.586. The same is true of the elaboration measure, F(1,6)=0.57, p=.477.
0
5
10
15
20
25
programmers metaphor no metaphor
Ela
bo
rati
on
- n
um
ber
of
co
mp
on
en
ts
Group
01000
2000
3000
4000
5000
programmers no metaphor metaphor
Tim
e t
o c
om
ple
te f
ou
r ta
sk
s (
se
co
nd
s)
Group
Figure 4.8. Comparison of expert performance to novices with metaphor
The first hypothesis referred specifically to the effects of metaphor on learning, rather than
on performance. There is an effect in the expected direction on the mean number of times
that novices asked to review the component explanation (see table 4.2); the mean number of
requests is much higher in the novice group with no metaphor. This difference is not
statistically significant, however, F(1,6)=3.35, p=0.117. The large difference is in fact due to
only two of the four participants in the no metaphor condition – the other two made review
requests no more often than those in the metaphor condition. The effect of metaphor on
learning is investigated with a larger sample of novice programmers in the next experiment,

7 5
and in the experiments discussed in chapter 6, where it is found to be a significant source of
variation.
In order to measure the extent to which the dataflow metaphor was used in reasoning about
the notation, I compared the vocabulary used by novices in the verbal protocols. This
involved three separate comparisons. The first two were comparisons of the categories of
noun phrases and verbs found in the protocol transcripts. Noun phrases were divided into
references to the virtual machine, references to the metaphor, references to the problem
domain of bank statements and references to other material (material outside the scope of the
experiment). Figure 4.9 shows the mean number of references made in each category by the
three experimental groups. The most significant observation is that none of the participants in
the metaphor group ever referred to the implicit metaphor while thinking aloud. Neither are
there any other significant differences between novices in the metaphor and no-metaphor
group. Experts do, however, make significantly more references than novices to the problem
domain while thinking aloud, F(1,10)=12.12, p<.01.
1
10
100
1000
Domain Machine Irrelevant
programmers
novices - no metaphor
novices - metaphor
Nu
mb
er
of
refe
ren
ces p
er
1000 w
ord
s
Referent category
Figure 4.9. Distribution of transcript noun phrase referents
In a second analysis of vocabulary, all verbs in the protocol transcripts were classified into
categories comprising references to motion, propulsion, decision, alteration, expression, state
change, observation, layout, arithmetic, ownership, mental process, and necessity. If
participants were thinking of a virtual machine in terms influenced by the metaphor, they
should be more likely to use verbs of motion or propulsion.
Most participants used a rather constrained vocabulary while thinking aloud, some of them
using certain verbs continually. This resulted in a skewed distribution of category sizes

7 6
between subjects, and of vocabulary within the categories. I therefore based this analysis on
log transformed frequencies of verbs within each category, relative to the total number of
verbs used by that participant. The log frequencies for each verb category are illustrated in
figure 4.10. No significant differences were found between the metaphor and no-metaphor
cases in these distributions.
1.0
10.0
100.0
1000.0
Arith
metic
Decis
ion
Men
tal
Mo
tion
Ob
serv
atio
n
Ow
ners
hip
Pro
pu
lsio
n
Req
uire
men
t
Sta
te c
han
ge
no metaphor
with metaphor
Occu
rren
ces p
er
1000 v
erb
s
Verb category
Figure 4.10. Log frequency distribution of transcript verb categories
A third comparison of the verbal protocols concentrated specifically on occasions when
participants described interaction between components. These were divided according to the
type of information or entities that were described as moving between components: they
could refer to program values (either control information or specific data), to entities in the
problem domain (such as account numbers), or to abstract entities (such as “item”, “value”
etc.). The number of references that fell into each of these categories is shown in figure 4.11.
There are no significant differences between the first two categories in the metaphor and no-
metaphor conditions, but there is a large difference in the number of references that are made
to abstract values moving between components, F(1,6)=12.07, p<.05.

7 7
1
10
100
Abstract Entities Control Data Domain Entities Non-Control Data
no metaphor
with metaphor
Inte
racti
on
s d
escri
bed
betw
een
co
mp
on
en
ts
Interaction type
Figure 4.11. Descriptions of interaction between components
Discussion
The measures used in this experiment were successful in measuring different levels of
performance – they clearly distinguished between the expert and novice groups. Despite the
fact that the measures appear to be sufficiently sensitive, the expected improvement in
performance when novices were given a metaphorical diagram was not observed. This is a
new finding in HCI. Some previous experiments in HCI areas other than programming have
failed to find improvements in performance when metaphors are introduced (e.g. Eberts &
Bitianda 1993; Sutcliffe & Patel 1996), but those studies have generally suggested that
specific usability problems reduced the benefits expected of an otherwise valuable interaction
metaphor.
The design of this experiment did assume that expert programmer performance would be
relatively consistent, whether or not they were given an explanatory metaphor. This
expectation was derived from studies of expert programmers such as that of Scholtz &
Wiedenbeck (1992), who observed that experts learning a new language used strategies
already familiar to them, rather than learning how the features of the new language might
require a different approach. A similar effect may, however, have resulted in the unexpected
consistency in novice performance. Studies of novice programmers have observed that, while
they cannot transfer strategic knowledge from other programming languages, they do
transfer the structures of everyday tasks into the programming domain (Eisenstadt, Breuker &
Evertsz 1984) and that this produces strategic preferences for procedural explanations even

7 8
where a programming language (Prolog) encourages declarative explanations (Noble 1992).
This type of strategic transfer may have reduced reliance on the metaphor in this experiment.
It is possible that novices simply ignored the illustrations, as their attention was never drawn to
them explicitly. This behaviour has been observed in studies of illustration by Wright, Milroy
and Lickorish (in press). It may be a sensible strategy for readers whose comprehension and
reading speed would otherwise be reduced by the effort involved in integrating text and
illustrations, as observed by Willows (1978) in studies of reading speed in children, and by
Mayer and Sims (1994) in a comparison of students with high and low scores on spatial
reasoning tests. Advice on illustrating educational material also recognises that some students
are likely to follow a text without attending to illustrations (Dale 1969). Furthermore, several
participants in this experiment commented that they found the illustrations unsympathetic
(the experts, however, found them entertaining). This element of affect may have caused
novices to give less attention to the illustrations. The problem of metaphors that users simply
do not like has previously been noted in HCI by Halewood & Woodward (1993), and
Pinkpank and Wandke have observed anxiety when users are asked to use interfaces that they
expect to be difficult (1995). These effects may inhibit use of graphical metaphors in the
same way that Hesse, Kauer and Spiers (1997) have noted reductions in analogical transfer
when the source domain has negative emotional connotations.
Evidence taken from the verbal protocols in this experiment does suggest that novices may
not have been aware of the metaphorical illustrations. Alternatively, participants may have
reasoned about the motion of the metaphorical machines using mental animation strategies
that are not accessible to verbalisation, as noted by Schwartz and Black (1996a). Lowe
(1993b) makes a fundamental criticism of the use of verbal protocols in diagram experiments
for this reason, although other researchers have defended their use in more general studies of
HCI (Fisher 1987). The critiques of Schwartz and Black or Lowe are relatively benign,
however. A more worrying possibility is that verbalisation altered performance by
“overshadowing” insights that might otherwise have been derived from the visual material.
Early studies in problem solving considered that verbalisation improved performance by
forcing participants to think (e.g. Gagné & Smith 1962, Berry 1990), but Schooler working
with several colleagues has found that verbalisation impairs performance on non-verbal
memory tasks (Schooler, Ohlsson & Brooks 1993, Brandimonte, Schooler & Gabbino 1997,
Melcher & Schooler 1996).
The requirement of verbalisation may also have imposed an unnecessarily linear structure on
the way that participants used the visual representation. The imposition of narrative structures
on visual and spatial material is well documented in experiments involving description of
geometric structures (Levelt 1981) and of building layouts (Linde & Labov 1975) although
7 9
Taylor and Tversky (1996) noted that the study by Linde and Labov may simply have
reflected linear structures in their experimental task. Davies and Castell (1992) have also
noted that expert programmers tend to rationalise their problem solving processes to comply
with recommended design methods when thinking aloud during programming tasks. In
recognition of these concerns, think-aloud protocols were not used in any of the other
experiments described in this thesis.
Notwithstanding any possible effect of verbalisation on reasoning strategy, the visual
metaphor used in this experiment may have improved mnemonic performance as a result of
dual coding effects (Paivio 1971, 1983), Two of the four novices working without an
explanatory metaphor made many more requests to review the diagram component
definitions. This may indicate that lack of a metaphor made the definitions more difficult to
remember, but it is not possible to draw definite conclusions when the effect was only
observed among half of a small treatment group. The potential effect of explanatory
metaphors on memory for diagram definitions is examined in far more detail in chapter 6.
No similar effect was observed in experts, but this is unsurprising. Firstly, the computational
domain provides a familiar context within which experts could encode the definitions of the
components. Secondly, studies of experts in other domains have shown that they are more
likely to attend to configuration in abstract material while novices attend to surface detail
(Hekkert & van Wieringen 1996, Lowe 1993b).
The interaction between representational detail and abstraction is perhaps the most interesting
observation to be drawn from the verbal protocol data in this experiment. It appears that
novices may have inhibited abstract descriptions of the problem when using the metaphorical
representation. Several observers have noted that the use of concrete representations can limit
the formation of abstractions in fields such as mathematics education (Pimm 1995), learning
programming (di Sessa 1986) and more general educational contexts (Dale 1969). This may
lend support to theories describing the limitations of visual representations for reasoning
about abstraction (Wang, Lee & Zeevat 1995, Green & Blackwell 1996b) or negation
Dopkins (1996). A more prosaic potential explanation is that the version of the notation with
geometric symbols, having a cultural association with technical matters, may have encouraged
participants to use “technical” terms that would not otherwise be common in their
vocabulary. Similar instances of novices adopting an overtly technical vocabulary have been
observed before by van der Veer, van Beek & Cruts (1987) and Scapin (1981). The apparent
relationship between geometric notations and abstract reasoning is investigated in far more
detail in chapter 5.
8 0
Experiment 2: Comparison of systematic and nonsense metaphors
Experiment 1 failed to find the anticipated benefits of incorporating a metaphorical virtual
machine in the design of a visual programming language. Those benefits were expected on
the basis of much previous research describing mental models and virtual machines in
programming. Experiment 1 could be refined and extended, further to investigate the
cognitive tasks involved in programming, such as those reviewed by Davies (1993). The main
concern of this thesis, however, is to explore the claims that visual representations support
abstract problem solving through their metaphorical reference to entities and structures in the
physical world. The validity of those claims is widely assumed in visual programming
language research, as described in the surveys of chapter 3. The results of this investigation
can therefore be relevant to visual programming language design, without covering the same
ground considered in many other theories of program construction.
This second experiment therefore considers experimental tasks that do not, on the surface,
resemble computer programming. Neither were participants told that the experiment had any
relationship to computer programming. Instead, it attempts to isolate the use of metaphor to
represent abstract concepts in physical terms. In this experiment, moreover, the diagrams do
not resemble physical machines. The metaphorical interpretation is provided in explanatory
text, in a way that is more typical of visual programming languages, where the diagrams are
displayed using simple geometric elements, and users are only aware of the metaphor as a
result of explicit instruction.
Notation
The four diagrams used in this experiment did not refer specifically to computer programs,
although they expressed concepts that are more often found in computer programs than in
everyday life. I presented the diagrams to participants using (slightly contrived) non-software
task contexts where the concepts could be applied. The four computational concepts were:
• closure (a set of values that is defined for use in a specific context);
• database join (combining tables of data on the basis of common values in each table);
• flow of control (sequences of execution states such as repetition and choice); and
• visibility (hiding working material within a function to simplify its interface).
I developed four diagrams to express these concepts, based on verbal descriptions of the
concept by Finkel (1996), and employing conventional symbolic elements from fields other
than software, as collected in Dreyfuss (1972). The explanation of each diagram incorporated
either a systematic metaphor that compared the graphical elements to some physical situation

8 1
with an appropriate structure, or a nonsense metaphor that compared them to an irrelevant
physical situation.
The diagram expressing closure is shown in Figure 4.12. The task context described a sports
team on tour, where a playing side is allocated for each game. The diagram shows each game
as a separate line, with the original tour team at the bottom of the diagram, and successive
games drawn above that line. The introduction of new players is shown as a “bump” in the
appropriate position corresponding to the player in the original team who has been replaced.
Smith Jones Brown Black Cole Green Clare Wright
Bloggs
Biggs
Originally selected team
First game
Second game
First half
Second half
First half
Second half
First half
Second half Bloggs
Third game
Figure 4.12. Diagram showing closure in terms of sports teams.
Eg: Cole plays in the first game, but is replaced by Biggs for the second and third
For this diagram, the systematic metaphor described the lines as layers of new surfacing laid
on top of a road, so that the inclusion of new material is visible as a bump in later layers. The
nonsense metaphor described the overall shape as an ice-cream cone with jelly beans stuck in
it, and the junction at the left of the diagram as a fork.

8 2
The diagram expressing database joins is shown in Figure 4.13. The task context described an
airline booking system, in which a flight information table must be matched with a passenger
booking table and a checked luggage table. Each table of information is shown as a vertical
line of connected data items. Where tables are joined on particular data items, those items are
linked together by a line drawn between the appropriate items. The data items that will be
returned as the result of the join are indicated by a funnel shape at the side of each selected
item.
Passenger Info.
Flight No.
Destination
DepartureSize
Fragile
Items
Seat No.
Flight No.
Name
Payment
Flight No.
Smoking
Seat No.
Class
Flight Info.
Luggage Info.
Figure 4.13. Diagram showing database join in terms of airline bookings.
Eg: find all records of passengers and luggage on a particular flight, and match them by seat number
For this diagram, the systematic metaphor described the vertical lines as tags threaded onto
pieces of string, with matching tags joining the pieces of string together. Output of data items
was described in terms of the tags dropping into funnels. The nonsense metaphor described
the lines as cracks in a flagstone, and the circles as manhole covers which were dangerous
when missing.

8 3
The diagram expressing flow of control is shown in Figure 4.14. The task context described a
washing machine cycle, in which a range of processes must be started, stopped or repeated a
certain number of times according to conditions such as water level and temperature. Each
process is shown as a circle, which may include other sub-processes. The signal to start a
process is shown by a line with a star at the end, while a stop signal is shown by an arc at the
end. One process can be made to start when another stops, shown by a jagged line at the first
process.
Time
Empty
Full
Wash
Turn
Cold Hot
Fill
Drain
PumpCold Hot
Fill
Turn
Spin
Turn
Rinse
Go
B
A
Figure 4.14. Diagram showing flow of control in terms of a washing machine cycle.
Eg: Once filling has completed, start washing, until a fixed time has elapsed
For this diagram, the systematic metaphor described the process circles as turning cogs. The
star showing when a process starts resembles a starting cog, while the arc showing when it
stops resembles a brake shoe. The jagged line is a spring which rebounds when the cog that it
is attached to stops. The nonsense metaphor described the circles as rock pools, with the stars
and jagged lines resembling starfish and worms. As in experiment 1, the dynamic nature of
the systematic metaphor in this case was intended to support depictive mental animation as
proposed by Schwartz and Black (1996a, 1996b), whose experimental investigation of
reasoning from mechanical diagrams did in fact describe a diagram based on turning cogs.

8 4
The diagram expressing visibility is shown in Figure 4.15. The task context described a
telephone switchboard in a large organisation. There are some people in the organisation who
would never deal directly with queries from the public, while others would often do so. This
diagram is a modification of an organisation chart, showing which people are prepared to
deal with the public (a circle by their name, rather than a square or half-circle), and how calls
might be referred by the receptionist from one person to another (dashed lines).
Chairman
Finance Dir. Production Dir. Sales Dir.Personnel Dir.
Solicitor
Accounts Mgr
Accounts Ass.
Accountant
Service Mgr
Complaints Mgr
Help Operator
Factory Mgr
Foreman
Operator Apprentice
Storeman
Store Mgr.
Press Officer
Accounts Ass.
Sales Mgr.
Salesman
Figure 4.15. Diagram showing visibility in terms of a telephone switchboard.
Eg: one of the accounts assistants will always take queries from the public, while the other never will
For this diagram, the systematic metaphor described the chart as a railway network, and each
person’s office as a station. The circle represented a public revolving door, the square a
closed door, and the half circle a door that was ajar. The different dashed lines represented
the relative priority of railway lines and roads. The nonsense metaphor described the diagram
as representing an airport, with circles being bicycles, the squares garages, and the half circles
as aircraft hangars. The dashed lines were described as rows of people sitting behind each
other on an aircraft.
Tasks
After reading the explanations of the diagrams, participants completed three different tasks
using each diagram. In the first task, participants answered comprehension questions relating
to an example of the diagram. These questions were phrased to involve an element of

8 5
problem solving using the notation, rather than simply providing definitions of diagram
elements, or reading information directly from the diagram.
In the second task, participants completed an incomplete diagram. The diagram was
accompanied by text stating, in terms of the problem domain, what information was missing.
Participants then completed the diagram by drawing the missing graphical elements in
appropriate places. An example constraint for the closure diagram is: “Bloggs played in the
whole of the first game, and also in the second half of the third game. Biggs was substituted
for the whole series after Cole was injured.” (This is the constraint shown in figure 4.12).
The third task also involved completion of an incomplete diagram. In this task, participants
completed the diagram by writing missing labels onto a diagram that was otherwise complete.
As before, the position of the labels was deduced from text describing a problem situation,
and listing the labels that were to be added. An example for the visibility diagram is: “The
service manager can be contacted sometimes, but does not pass on queries, the store manager
would always pass on queries to the storeman. The production director can only receive
queries from the chairman.”
All task instructions, together with the diagram they apply to, are reproduced in Appendix
B.2.
Equipment
The experimental material was presented as a bound booklet containing both explanations of
the diagrams and comprehension tests. Participants were instructed to work through the
booklet in order, without turning back to look at previous pages. At the top of each page was
a box where the participant wrote the time when they started work on that page. Participants
read the time from a large stopwatch placed on the table in front of them.
Hypotheses
1. That experts would perform better than novices.
2. That metaphor would bring novice performance closer to expert.
3. That metaphor would have little effect on experts.
8 6
Participants and design
Sixteen participants were recruited from two different populations. The first independent
variable was level of expertise in these populations: eight participants were volunteers
registered with the APU Subject Panel, none of whom had any experience of computer
programming (“novices”). The other eight were experienced programmers employed at the
Advanced Software Centre of Hitachi Europe Limited. A further two programmers were
recruited from the same population after two of the expert cohort did not complete the
experiment. This was as a result of work-related interruptions. The two who were replaced are
not considered any further.
The second independent variable was the type of metaphor provided in the explanation of the
diagram. This was varied as a repeated measure: each participant received two explanations
with the systematic metaphor, and two with the nonsense. Diagrams could not be presented to
a given participant with both forms of the explanation, however. This design was therefore a
balanced confound between diagram and metaphor type.
The order of the four diagrams was balanced within each group of eight participants. The
order of the instruction types was not varied; a pilot experiment had shown that if participants
received the nonsense metaphor first they would ignore the rest of the metaphors as being
irrelevant. Presentation order was therefore: systematic, nonsense, systematic, nonsense.
The third independent variable was the type of task performed: answering comprehension
questions, drawing missing graphical elements on an incomplete diagram, and writing missing
text on an incomplete diagram. The three types of task were always presented in this order.
There were two dependent variables. The first was the speed with which participants
completed each comprehension task. The second was accuracy on the comprehension tasks.
The possible total score for each diagram type and comprehension task varied according to
diagram complexity, but the balanced confound design meant that it was necessary to
compare scores between different diagrams. I therefore calculated a normalised score for
each task, in which the lowest score was assigned a normalised value of zero, and the highest a
value of 100. All other scores were normalised by a linear interpolation between these values.
The three hypotheses are described in terms of relative performance, which was evaluated in
terms of both speed and accuracy in order to identify possible speed-accuracy trade-offs
made by participants.

8 7
Procedure
Participants read a page of general instructions at the front of the booklet, then worked
through at their own pace, writing the time at the top of each page as instructed. (The
instructions are reproduced in appendix B.2).
The experimental procedure was determined by the order of the pages in the booklet. The
order was as follows:
Page Contents
1 General instructions: completing the booklet, and writing times.2 Explanation of an example of the first diagram.3 Questions testing comprehension of the first example.4 Explanation of an example of the second diagram.5 Questions testing comprehension of the second example.6 Explanation of an example of the third diagram.7 Questions testing comprehension of the third example.8 Explanation of an example of the fourth diagram.9 Questions testing comprehension of the fourth example.
10−13 Drawing missing elements on examples of each diagram.14−17 Writing missing text on examples of each diagram.
Table 4.3. Booklet presentation order
The comprehension questions were scored by awarding one point for each item of
information that corresponded to the worked solution, and subtracting one point for each
incorrect piece of information. Drawing tasks were scored by awarding a mark for each
element added in an appropriate place and a further mark if the element was the correct
shape. A mark was subtracted for each unnecessary element, and a further mark if the
additional element violated either the task constraints or the original diagram definition. The
writing task was scored by awarding a mark for each label written in the correct place, and
subtracting a mark for each label written in a place that violated the constraints.
Results
The first hypothesis was that experts would perform better than novices. The times taken by
each group to complete the three tasks, as well as the mean accuracy achieved by each group,
are shown in Figure 4.16. Analysis of variance (ANOVA) indicates that experts were
significantly more accurate, F(1,14)=5.48, p<.05. Experts did not finish the tasks more
quickly - in fact they spent slightly longer, but this difference was not significant.

8 8
0 %
20%
40%
60%
80%
1 0 0 %
expert novice
Ac
cu
rac
y
Group
0
5 0
100
150
200
expert novice
Tim
e to
c
om
ple
te (s
ec
on
ds
)
Group
Figure 4.16. Relative performance of experts and novices
The second hypothesis was that a systematic metaphor would bring novice performance
closer to that of the experts. Figure 4.17 shows the interaction between expertise and
metaphor type. As expected, accuracy is poorer when the nonsense metaphor has been given.
This difference does appear to be greater for novices than for experts, but the interaction is
not significant. The effect of this interaction on the time taken to complete the tasks indicates
that novices spend more time trying to use the nonsense metaphor, while experts spend less
time. This interaction is not significant either, however.
0 %
20%
40%
60%
80%
100%
expert novice
Ac
cu
rac
y
Group
0
50
100
150
200
250
expert novice
Nonsense
Systematic
TIm
e t
o c
om
ple
te (
se
co
nd
s)
Group
Figure 4.17. Interaction of systematic metaphor with expertise
There was a significant interaction of task type with experience, F(2,28)=5.60, p<.01. Experts
performed best in the task where a diagram was completed by drawing in missing elements.
Novices performed more poorly on this task than on other tasks, with an average drawing
score of 34%, versus 65% for experts. If the effect of metaphor is considered separately for

8 9
each task type within the novice sample, metaphor appears to have had no effect at all on
drawing task performance. As shown in figure 4.18. mean performance on comprehension
and text completion tasks is higher in the metaphor condition, but this interaction between
task and metaphor is not statistically significant, F(2,6)=0.95, p=.436.
0%
20%
40%
60%
80%
100%
Drawing Comprehension Text completion
Nonsense metaphor
Systematic metaphor
Accu
racy
Task
Figure 4.18. Effects of metaphor by task type for novices
Discussion
As in experiment 1, the performance measures used in this experiment provide a meaningful
distinction between novice and expert performance which sets a reference point for the
amount of benefit that metaphorical instruction provides to novices. Unlike experiment 1,
experts did not perform these tasks significantly faster than novices. They did achieve far
greater accuracy, however. In experiment 1 metaphor had little further effect on the
performance of experts, and that finding was repeated here. The accuracy of the experts was
near ceiling, however, so metaphor might have had more effect with a more difficult task.
That possibility is not of great concern here, as this thesis concentrates on the benefit that
metaphor can provide for novices.
The difference between novices and experts in this experiment may, however, have resulted as
much from the fact that experts were better able to identify and ignore the nonsense
metaphors – novices tended to spend more time on tasks for which they had been given
nonsensical explanations. This effect is investigated in more detail in experiment 7, which
compares systematic and nonsense metaphors to a further condition in which no metaphor is
given at all.
The final point of interest in these results is the differences observed in performance for the
diagram drawing task. Experts performed better than novices on this task – this may be a

9 0
result of the fact that experienced programmers are more accustomed to drawing diagrams, so
their advantage arose from being comfortable and practised with similar tasks. In contrast,
several of the experiments reported in the next chapter asked non-programmers to draw
complete diagrams. The participants in those experiments often reported anxiety regarding
their ability to draw.
In this experiment, novice performance in the drawing task was least affected of all the tasks
by the provision of an explanatory metaphor. This may arise from the anxiety factor
described above – the drawing task may have been subject to a floor effect, and a consequent
reduction in the effect of metaphor, in the same way postulated earlier as arising from a
ceiling effect in experts. Alternatively, participants may have relied on an uninterpreted visual
image of the whole diagram, treating the drawing task as a short term visual memory problem
rather than a comprehension problem. For novices using this strategy, a systematic metaphor
would be less likely to have any effect on performance. The distinction between memory and
comprehension, as well as between visual and relational components of diagrams, is
investigated in far more detail in the experiments reported in chapter 6.

9 1
Chapter 5: Diagrams and Abstract Structure Generation
Those weird designs, they only showWhat’s going on in weirder minds,
Cause when you doodle thenYour noodle’s flying blind.
Every little thing that you writeJust conceivably might
Be a thought that you catchIf while caught in a wink.
Doodling takes you beyond what you thinkThen you draw what you feel.
Doodlin’ – Horace Silver
The experiments described in the previous chapter found large differences in performance
between experts and novices, but only small relative changes in novice performance as a result
of using metaphorical notations. The apparent lack of educational benefits is disappointing. It
is possible, however, that the notations used the wrong kind of metaphors.
In experiment 1, evidence from think-aloud protocols suggested that novice programmers
paid little attention to implicit visual metaphors, yet regarded the problem in less abstract
terms when using a physical metaphor. These findings concur with some of the intuitions of
visual programming language designers and users – one of the themes that I found in the
surveys of chapter 3 was the claim that visual languages would reduce the degree of
abstraction required in programming. Diagrams may help users avoid abstraction by
depicting an abstract concept in terms of physical experience (Lakoff 1993). Alternatively,
diagrams may be more computationally tractable because they have less potential for
expressing abstraction than symbolic languages (Stenning & Oberlander 1995).
We can thus distinguish between diagrams in which the components illustrate a simple
physical metaphor, as in experiment 1 and 2, and diagrams whose geometric structure acts
directly as an alternative concrete metaphor for some abstract structure. The latter is more like
the case of an electrical schematic where the possible set of causal relationships is constrained
by the connection paths in the diagram.
In experiment 1, participants appeared to use fewer abstract terms when using an overtly
metaphorical pictorial notation. It is possible that an increased level of visual detail constrains
the representation to refer to a specific situation, rather than an abstract set of potential
situations. It is for precisely this reason that pictures have long been considered not to be
abstract representations; Berkeley’s early 18th century theory of vision (1705/1910)
distinguished between the visible abstractions of geometry and perceptual experience of the

9 2
real world. Bartlett quotes Napoleon as distrusting the use of mental images: “those who form
a picture of everything are unfit to command” (Bartlett 1932, p. 220). Modern work in
cognitive psychology has also observed that mental image-based strategies are unable to
represent indeterminacy (Mani & Johnson-Laird 1982), and that generalisation from multiple
examples requires the translation of descriptions from images into verbal abstractions
(Goldberg & Costa 1981) – the consequent loss of these visual-turned-verbal abstractions has
been observed in psychiatric patients during left hemisphere ECT suppression (Deglin &
Kinsbourne 1996).
The inability of mental images to support abstraction is considered by Stenning &
Oberlander (1991, 1995) to be their principal advantage, because reducing the range of
possible interpretations (they call this specificity) makes reasoning with a diagram more
computationally efficient. Restricting the range of interpretations can also be a disadvantage,
of course. Pimm (1995) believes that using concrete representations in mathematical settings
may prevent children from forming necessary abstractions. Other theories, however,
emphasise that mental images are at least more abstract than visual percepts because they do
not specify all possible details (Paivio 1971, Miller 1993). This observation has also been
made of representational conventions in drawing (Arnheim 1970) and of diagram use (Wang,
Lee & Zeevat 1995).
If diagrammatic images are interpreted metaphorically, which of these possibilities would be
the most relevant? The interpretation of metaphor is itself a process of abstraction from one
situation to some interpretive domain (Verbrugge & McCarrell 1977, Gentner & Wolff 1997),
but this abstraction makes metaphor difficult to understand because of the range of potential
interpretations (Winner & Gardner 1993). If images could be used as intermediaries when
interpreting metaphors (Beck 1978), this might provide the advantage of specificity –
constraining potential interpretations. In fact, many theories of metaphor comprehension
propose that mental images are central to use of metaphor (Cacciari & Glucksberg 1995,
Gibbs & O’Brien 1990, Kaufmann 1979, Walsh 1990). Tentative proposals have been made
of a functional relationship between the cognitive resources applied in diagram use and
metaphorical image use (Lewis 1991, Lakoff 1993), but these have not been as confident as
the claims made by computer scientists about the benefits of HCI metaphor.
The use of strategies based on mental imagery to solve verbal problems has historically been
one of the central issues in the mental imagery debate. Much of the existing research into
diagram use appears to have been motivated by entrenched positions in that debate, as
reviewed by Blackwell (1997b). This discussion can only briefly summarise that review, which
considered experimental tasks involving picture naming (e.g. Potter & Faulconer 1975),
identity judgements (e.g. Theios & Amrhein 1989), evaluating sentences about diagrammatic

9 3
situations (e.g. Clark & Chase 1972) and problem solving (e.g. Frandsen & Holder 1969,
Schwartz 1981). Blackwell also reviewed the main theoretical positions in the debate (Kieras
1978, Pylyshyn 1981, Kosslyn 1981) and some of the philosophical approaches to resolving
it (Dennett 1981, Goodman 1990, Sloman 1995).
The most convincing evidence in the imagery debate has come from purely visual tasks such
as mental rotation (Shepard & Metzler 1971) and map construction (Kosslyn, Ball & Reiser
1978), but many experiments have investigated the diagrammatic use of images to represent
logical propositions (Huttenlocher 1968, Shaver, Pierson & Lang 1974/75, Mani & Johnson-
Laird 1982, Fuchs, Goschke & Gude 1988, Matsuno 1987). Many computational models of
mental imagery have been constructed as supporting evidence that images can be used for
logical reasoning (Lindsay 1988, Greeno 1989, Glasgow & Papadias 1995), as well as for
reasoning about the abstract structure of physical situations (Koedinger & Anderson 1990,
McDougal & Hammond 1995, Novak 1995, Gardin & Meltzer 1995, Forbus 1983, Faltings
1987, Blackwell 1989).
The most ambitious claims found in the surveys of chapter 3 extend well beyond such
restricted problem-solving activities, however. Some researchers apparently claim that all
software design problems are solved by thinking in images, and that visual programming
languages directly facilitate the solution process. This intuition is consistent with the
introspections of programmers who use conventional languages (Petre & Blackwell 1997).
Several other studies have also found evidence for use of mental images during software
design (Gilmore & Green 1984a, Buckingham Shum et. al. 1997, Green & Navarro 1995,
Saariluoma & Sajaniemi 1994).
When mental images are reported by expert programmers, the activities they refer to are not
simple problem-solving, but large-scale design. The processes of system design in
programming have more in common with other design disciplines, such as engineering and
architecture, than with the type of experimental tasks described earlier in this review.
Ferguson (1992) has described the way in which the development of modern engineering
depended on the ability to publish pictorial representations of engineering designs. Ferguson,
along with many eminent engineers whom he quotes, believes that engineering designs are
constructed as mental images, and that communicating those designs depends on non-verbal
representations. Similar claims have been made regarding the use of visual representations in
architecture. Goel (1992, 1995) challenges the computational theory of mind on the basis
that it cannot account for the way that architects use sketches, as documented in protocol
studies of architects at work by Goldschmidt (1991, 1994) and Suwa and Tversky (1997).
Fish and Scrivener (1990) have proposed a general model of the use of sketches in creative
9 4
design – they claim that perception of sketches interacts directly with mental imagery to
enable creative problem solutions.
The use of both visual representations and mental images to discover creative solutions has
also been proposed as a fundamental mechanism of scientific discovery (Dreistadt 1968,
Gooding 1996, Nersessian 1995, Qin & Simon 1995), as well as in other fields of creativity
(Koestler 1964, Shepard 1978, Johnson-Laird 1988). It has even been proposed that almost
all problem solving involves structural analogies constructed from mental images (Paivio
1971, Kaufmann 1979). Recent experimental investigations of this proposal have
concentrated on a single question, however: once a mental image has been formed, is it
possible to reinterpret this image in order to discover new properties? This question is crucial
to proposed models of image-based creativity, and highly relevant to the theories of
engineering and architectural design described above. Finke, with various colleagues, has
carried out a series of experiments in which he has found evidence for discovery of new
structure in images when subjects are shown apparently unrelated elements, then asked to
combine them in working memory (Finke & Slayton 1988, Finke, Pinker & Farah 1989,
Finke 1996). Other experiments, however, have found that memorised ambiguous images
cannot be reinterpreted, although the subject can later reproduce the image on paper and then
reinterpret their own drawing (Chambers & Reisberg 1985, Slezak 1992, Walker et. al. 1997).
The experiments in this chapter investigate the way that diagram use interacts with mental
imagery during design tasks. It addresses several of the questions that have been discussed in
this introduction, but concentrates on their relevance to diagram use, rather than speculating
on general properties of mental images.
Experiment 3: Visual imagery during planning
Is there any evidence that diagrams are direct expressions of image-like mental
representations? One way to investigate this question is by analysing external signs of
cognition associated with both diagrams and imagery. Brandt and Stark (1997), for example,
found that the same sequence of gaze fixations was involved in imagining a simple diagram
as in observing it. A second alternative is to use dual-task studies: if a certain task has been
observed to impair the formation of mental images (presumably, but not necessarily, because
it uses the same cognitive resources), will that task also impair the planning of diagrams? This
experiment takes the second approach; if diagram planning is impaired by the secondary
task, we can infer that diagrams express image-like mental representations.

9 5
It also addresses two further questions arising from experiment 1 by using tasks that may
involve different encodings in working memory. The first is related to the possible distinction
between physical information and abstract information. Experiment 1 suggested that pictorial
representations may cause physical information to be emphasised rather than abstract
information. Previous research into working memory has found experimental and
neurological evidence that spatial information is encoded separately from categorical
information (McNamara 1986, Mecklinger & Muller 1996, Kosslyn et. al. 1989) but also that
the two are combined when abstract information must be memorised in association with a
spatial context, as when functions are assigned to buildings on a map (McNamara, Halpin &
Hardy 1992). It seems likely that visual material presented in diagrams involves both
categorical and spatial information. Must a combination of abstract information within a
spatial metaphor hence rely on different working memory resources?
The second working memory question arising from experiment 1 is the distinction between
encoding the spatial arrangement of the elements in a diagram and encoding their visual
appearance. Just as there is strong evidence for separate working memory resources for
categorical and spatial information, there is also substantial evidence for a distinction between
the visual and spatial components of working memory, including neurological (Farah et. al.
1988), developmental (Logie & Pearson 1997), anatomical (Mishkin, Ungerleider & Macko
1983) and functional imaging (Smith & Jonides 1997) studies, as well as evidence from
conventional cognitive experiments. An example of the latter is the report by Tresch,
Sinnamon and Seamon (1993) that memory for objects or for location is selectively impaired
after tasks involving colour identification and motion detection respectively. In experiment 1,
the mental animation process that was postulated as a basis for analysing pictures of a
physical machine can be identified as primarily visual, while the process of arranging nodes
and connections into a complete diagrammatic solution is primarily spatial.
There is a diverse spectrum of hypotheses relating the two distinctions: coordinate/categorical
and spatial/visual. It is quite possible that there is only a single representational dichotomy,
but that it is simply poorly understood. Either distinction, however, may be relevant to the
current investigation – the distinction between abstract and physical information, or between
pictorial metaphor and simple geometry, might easily interact as a result of their respective
working memory requirements. This experiment addresses these questions by considering
separately abstract and physical situations, and by using separate secondary tasks that exercise
either visual or spatial short term memory.

9 6
Notation
The notation used in this experiment was designed to be as simple as possible while
maintaining the visual dataflow metaphor introduced in experiment 1. It was intended for use
by participants with no experience of computer programming, without requiring that they
learn any computational concepts. The form of the notation was nodes connected by arcs, as
in experiment 1, but these were given only minimal semantics. Four different types of node
were defined, but these had no semantic implication – I told participants that they could
choose whichever node they liked, and use them to stand for anything they liked. Each node
type included a selection of terminals to which arcs could be connected. Terminals on the left
hand side of a node were described as “inputs”, and those on the right hand side as
“outputs”, so that flow implicitly proceeded from left to right, even though (as in experiment
1) I never explicitly mentioned flow. Each terminal could have any number of arcs connected
to it.
As in experiment 1, there were two forms of this notation, each with identical semantics, but
with different pictorial images representing nodes and arcs. The first of these used simple
geometric shapes, connected by plain lines, shown in figure 5.1.
Figure 5.1. Simple geometric nodes and arcs
In the second form of the notation, nodes were connected together by images of cylindrical
ducts (actually miniaturised bitmap images produced from digitised photographs of air-
conditioning ducts). The nodes themselves were also small photographic images, designed to
be obviously mechanical, and plausibly producing flow through the attached ducts, but
without having any identifiable function. They were produced from digitised photographs of
air conditioning components and garage tools, but the original devices would only be

9 7
identified by an experienced engineer – participants in the experiment did not recognise
them. This implicit data flow version is shown in figure 5.2.
Figure 5.2. Mechanical nodes and arcs with implicit data flow
Participants created diagrams by manipulating the appropriate set of nodes with an editor on
a computer screen. The editor screen is illustrated in Figure 5.3. The editor included a palette
in one corner with four different node images; participants created new nodes by clicking on
any one of these images with the mouse. Nodes could be moved to any location on the screen
by clicking in the middle of the image, and dragging it. Connections between nodes could be
made by dropping one node so that its input coincided with the output of another node, or by
clicking on the output of one node, and dragging from there to the input of another node. If
the node at either end of a connection was dragged to a new location, the arc would move to
follow it.

9 8
Figure 5.3. Simple node and arc editor
Most participants in this experiment had little experience of computers, and some had never
used a mouse before. To make it easier to arrange nodes and connect them together, the
screen was therefore divided into a grid of points with approximately 1 cm spacing, as shown
in Figure 5.3 (for the geometric version, the grid was simple dots, while for the pictorial
version, it resembled a grid of rivet heads on a steel plate). When a node was moved to a new
position, it would “jump” to the nearest location on the grid. This made it relatively easy to
connect terminals together – the participant only needed to click within the 1 cm2 region
around the terminal.
The editor also included an “erase mode” allowing nodes or arcs to be removed (the erase
mode button is at the top right of figure 5.3). If the participant moved the mouse cursor over
any shape on the screen after selecting erase mode the shape would turn into a cloud
containing the words “click me”; clicking would then erase it. When not in erase mode,
clicking on a node caused a selection box to be drawn around that shape. For the geometric
version, this was a simple box and arrow, and for the pictorial version, it was a piece of paper
and a pencil. The participant could assign a label to each node by clicking to select it, and
then typing the label. Labels were only required after the diagram was complete, however, as
in experiments by Szlichinski (1979).
These various features of the diagram editors are illustrated in appendix B.3.

9 9
Tasks
Participants were asked to use the editor to draw diagrams describing the workings of six
different devices. Three devices incorporated moving parts and physical processes, while the
other three had no internal moving parts, and only abstract processes. Table 5.1 shows the six
devices used and the categories they were assigned to.
Concrete Abstract
washing machine telephonemotorbike calculator
coffee vending machine television
Table 5.1. Abstract/concrete devices
Participants were told that the diagram should show the way that the named device worked on
the inside, and should not be a picture of the device.
Participants were also asked to perform secondary tasks while planning their diagrams. The
first of these tasks, spatial tracking, was designed to interfere with spatial working memory, as
in the motion detection task described by Tresch et. al. (1993). The participant moved the
mouse pointer to follow a circle moving slowly around the computer screen with random
changes in direction. If the mouse pointer moved outside the circle, the circle changed colour
– the participant was instructed not to let this happen (more positive alarms were also tried,
but were found during pilot testing to induce excessive anxiety). The exact form of this task
was proposed by Professor Alan Baddeley (personal communication 18 June 1996). The
second task, visual noise, has been shown by Quinn and McConnell (1996) to interfere with
memory for a list of items specifically when subjects are asked to use a visual mnemonic
strategy. The participant watched a continually changing random grid of black and white
squares. In the third task, blank screen, the participant simply watched a blank screen with a
fixation cross in the centre.
Equipment
The editor was implemented using the animation package MacroMedia Director, version 4.0.
I captured the pictorial node and arc images using a Kodak DC500 digital camera, reduced
the resolution to 40 pixels square using Adobe Photoshop, and edited them to provide
uniform connection points on each node before importing them as bitmaps for use in

1 0 0
Director. The animated behaviour of the nodes and arcs in response to user actions was
implemented in the Lingo scripting language provided with the Director product.
The experiment procedure was controlled by a presentation sequence implemented in
Director. This provided an animated tutorial demonstrating the use of the editor (the tutorial
script is reproduced in appendix B.3), then invoked the editor program. The editor program
maintained a log of all actions made by the participant, with the system time (reported as the
previous whole second) recorded at the time of each action. The experimental software ran on
a Macintosh PowerPC 8200/120 computer with a 17 inch monitor displaying a resolution of
832 x 624 pixels at 24-bit colour.
The secondary tasks to be performed while planning diagrams were also implemented as
movies in MacroMedia Director. The spatial tracking task was designed to have minimal
visual contrast. A dark grey circle slowly followed a randomised path over a light grey field.
The speed of motion was kept constant, with the direction of motion changing by small
randomised increments. As long as the mouse pointer was kept over the top of the moving
circle, it would stay the same colour, but if the participant let the pointer move away, the circle
would change to a slightly different shade of grey.
The visual noise task was based on a C program originally developed for the IBM PC by Jean
McConnell (McConnell, personal communication 26 July 1996), as used in the research
described by Quinn & McConnell (1996). The original program was not reused, but I created
a close visual equivalent using the facilities of Director. I first wrote a LISP program to
generate a series of images consisting of a grid of black and white squares. In each image the
squares of the grid were randomly coloured either black or white. These images were then
imported as a sequence of animated frames in Director, with the transition between frames
taking place as a random fade, where the fade grid corresponded exactly to the grid of
random squares. The result of this was a randomly changing sequence of grid squares
practically indistinguishable from the stimulus used by Quinn and McConnell.
Hypotheses
1. Based on the inhibitory effect of pictorial representations on reasoning about
abstract tasks observed in experiment 1, the same effect should result in an
interaction between the type of editor and the type of device being explained.
2. On the basis of the previous literature describing use of mental images,
introducing a secondary task that has been shown to impair visuo-spatial short
term memory would inhibit planning of the diagram.

1 0 1
3. That abstract and concrete diagrams might be prepared as different image types,
and that different secondary tasks would therefore have different inhibitory
effects on planning each device type, possibly interacting with the two types of
editor.
Participants and design
Twenty-four participants were recruited from the APU panel of volunteers. None of them had
any experience of computer programming. Two further participants were recruited after two
of the original cohort misinterpreted the description of the editor palette, concluding that
each diagram should have exactly four nodes.
One independent variable was assigned randomly between subjects – twelve participants used
the editor with simple geometric shapes and twelve used the pictorial editor with implicit data
flow. A second independent variable was the nature of the diagram drawing task. Each
participant drew six diagrams, three of which explained physical processes and three abstract
processes. The third independent variable was the secondary task performed by the
participant while planning each diagram: spatial tracking, designed to interfere with spatial
working memory, visual noise, designed to interfere with visual working memory, and blank
screen, in which the participant simply watched a fixation cross in the centre of an otherwise
blank screen.
The experiment included three dependent variables. The first was the degree of elaboration –
the number of nodes in the diagram, as measured in experiment 1. The second was the speed
with which the diagram was created – the average interval between addition of new nodes or
arcs. The third was the proportion of changes made to the diagram – the proportion of nodes
or arcs that were moved or erased after their initial creation.
In order to test the hypothesis of an interaction between the type of editor and the type of
process being explained, I tested for different degrees of diagram elaboration for each device
type in the two groups. In order to test the second hypothesis, that the secondary tasks would
inhibit planning, I compared the speed of creation of the first ten additions to the diagram
immediately after the end of the planning period. I also compared the proportion of changes
made to the diagram. The third hypothesis of an interaction between the type of secondary
task and the pictorial representation or process type was tested in terms of diagram
elaboration.

1 0 2
Procedure
The experiment started with an explanation of the editor functions, at a pace controlled by the
participant. The first part of the explanation covered basic mouse operation – clicking on a
shape and dragging it from one place to another. This was followed by an animated
demonstration of the editor functions, using the appropriate (geometric or pictorial) version
of the editor. The secondary tasks were then demonstrated, so that the participant could
practise following the moving circle, and see the random grid display. Finally, the participant
was asked to draw a diagram as a practise exercise using the editor. The instructions for the
exercise specified that the diagram should show how a toaster works on the inside. It stressed
that the diagram should not be a picture of a toaster, and that it did not need to look like any
part of a toaster – it would simply show how a toaster worked. No further instructions were
given regarding the intended use of the nodes and arcs.
During this instructional sequence, I sat beside the participant, and answered any questions
asked by the participant. Most participants had no questions. Some needed assistance with the
procedure for dragging using the mouse. Some asked for clarification of the difference
between an input terminal of a node and an output terminal. Some asked for clarification of
the instruction that the diagram should show how the toaster works, rather than what it looks
like. Several participants were quite anxious about the task, and protested that they would be
unable to draw any diagrams. I reassured these participants in general terms, and all of them
proved able to draw acceptable diagrams using the editor – it was not necessary to remove
any participants as a result of inability to use the editor.
During the remainder of the experiment, participants worked on their own, drawing diagrams
to describe the workings of the six different devices. The presentation sequence displayed a
description of the required diagram, including a reminder that the diagram should show the
way that the named device worked on the inside, and should not be a picture of the device.
The participant was then given 60 seconds to plan their diagram, during which they had to
perform one of the three secondary tasks. The allocation of secondary task to device
description was balanced across subjects, and the presentation order of both devices and
secondary tasks was also balanced.
After the planning period, the editor screen was displayed. The participant then had a period
of five minutes in which to draw the diagram they had planned. At the end of the five
minutes, they were given a further two minutes in which to type labels for each node in the
diagram. During this second period, the node creation and erase functions were disabled. This
planning / drawing / labelling sequence was repeated six times by each participant.

1 0 3
When participants had completed the diagram drawing tasks, I asked them to complete a
debriefing questionnaire. This questionnaire asked:
• how easy it was to plan the diagrams in advance;
• which was the most difficult diagram to plan;
• whether they felt that the secondary task had made the diagrams more difficult to
plan;
• how they decided which shapes to use;
• whether shapes were chosen during planning, or only while drawing the diagram; and
• whether they had been able to assign names to shapes in advance.
Results
The analysis approach is a multivariate analysis of variance (MANOVA) with repeated
measures, having two within subjects factors (abstract/concrete processes and blank
screen/visual noise/spatial tracking secondary task), and one between subjects factor
(geometric/pictorial editor). The three dependent variables were elaboration (number of
nodes), initial speed of production, and proportion of diagram elements changed. The
MANOVA results reported here are calculated using Pillai’s Trace method; alternative
MANOVA techniques did not result in any difference of significance values.
Initial univariate tests showed that both the editor type and the type of process had significant
effects on elaboration F(1,22)=5.74 and 5.81 respectively, p<.05. As shown in figure 5.4,
abstract processes were drawn with more nodes (an average of 8.74) than were concrete
processes (7.90). Diagrams drawn with the geometric editor were also more elaborate (9.46
nodes) than those drawn with the pictorial editor (7.18 nodes). The hypothesised interaction
between these two factors did occur in the predicted direction – diagrams describing abstract
processes were more elaborate when using the geometric editor. Although the difference in
the means was relatively large, this interaction was not significant F(1,22)=2.33, p=.14. A
similar interaction effect was observed for the other dependent variables. Participants
constructed the diagram more quickly when using the geometric editor for abstract processes,
and they made a smaller proportion of changes to their diagrams, as shown in Figure 5.5.
MANOVA analysis indicates that these interactions when taken together are significant,
F(3,20)=5.77, p<.01.

1 0 4
0
2
4
6
8
10
12
abstract concrete
Geometric editor
Pictorial editor
Ela
bo
rati
on
(n
um
ber
of
no
des)
Process type
Figure 5.4. Effects of editor type and process type on diagram elaboration
0
2
4
6
8
1 0
1 2
abstract concrete
Geometric editor Pictorial editor
Ela
bo
rati
on
(n
um
be
r o
f n
od
es
)
Process type
0
2
4
6
8
1 0
1 2
1 4
abstract concrete
Sp
ee
d
of
no
de
c
rea
tio
n
(se
co
nd
s)
Process type
0 . 0 %
20 .0%
40 .0%
60 .0%
80 .0%
100 .0%
abstract concrete
%
of
ele
me
nts
c
ha
ng
ed
Process type
Figure 5.5. Interactions of editor type and process type: elaboration, speed and number of changes, taken together, show a significant effect.
The second hypothesis was that secondary tasks during the planning period would have an
effect on speed of production and the proportion of changes made. There was no evidence
that the secondary task had any effect on either speed of production F(2,44)=0.034, p=.96 or
on proportion of changes F(2,44)=0.116, p=.89. There was also no evidence of the
interactions postulated in the third hypothesis – a multivariate analysis of variance found no
interaction of secondary task with process type F(6,86)=1.373, p=.51 or with editor type
F(6,86)=0.562, p=.21. Univariate ANOVA tests on each variable also found no significant
interactions with the secondary task.
When answering the questions in the debriefing questionnaire, only five of the 24 participants
said that they had been able to choose shapes in advance while planning the diagram,
although a further six said that they could do so occasionally. Twelve of the participants said

1 0 5
that it was “not easy”, “hard”, “difficult” or “impossible” to plan diagrams in advance.
The performance of these twelve was then considered separately from the twelve who reported
that advance planning was relatively easy. As can be seen in figure 5.6., there was no overall
difference between the performance of the groups in any measure, with the MANOVA test
result F(3,20)=0.425, p=.73. There were however marginally significant covariances of self-
reported planning with the effect of secondary tasks, F(6,82)=2.074, p=.065. Those who
reported that it was easy to plan in advance actually performed slightly better (more elaborate
diagrams and faster production) when carrying out secondary tasks, while the reverse was true
of those who had difficulty planning.
0
2
4
6
8
10
12
No Planning Planning
Blank secondary task Noise secondary task Spatial secondary task
Ela
bo
rati
on
(n
um
be
r o
f n
od
es
)
Self-reported planning
0
2
4
6
8
10
12
14
16
No Planning Planning
Sp
ee
d o
f n
od
e c
rea
tio
n (
se
co
nd
s)
Self-reported planning
0.0%
20.0%
40.0%
60.0%
80.0%
100.0%
No Planning Planning%
of
ele
me
nts
ch
an
ge
dSelf-reported planning
Figure 5.6. Effect on performance of self-reported advance planning
Discussion
As in experiment 1, there is evidence in this experiment that novices are not completely
happy when asked to use pictorial elements diagrammatically. In experiment 1, several
participants commented that they found the level of detail in the pictorial notation confusing.
At the end of the experiment I showed some of these participants the geometric version of the
language, and they claimed that they would prefer to use that version. I also showed two of
the participants in the geometric condition the pictorial version, and they said that they would
prefer not to use it. This supports the finding of Strothotte and Strothotte (1997), amongst
others, who have noted that pictogram users tend to choose more “abstract” symbols such as
asterisks or arrows when representing abstract concepts.
In this experiment, the informally expressed preference has been supported by performance
measures. Participants were less productive when using a pictorial metaphor to create

1 0 6
diagrams than when using simple geometric shapes. This difference was most pronounced in
the case of diagrams describing abstract processes. My explanation for this is that participants
regard the illustrations as being literal rather than metaphorical, and that this results in
incongruity between the task and the notation. No participants commented that they found
the pictorial notation inappropriate for particular tasks, but this hypothesis is tested in greater
detail in experiment 5.
The main intention of this experiment, however, was to test the way in which choice of
notation affects the user’s ability to form diagrams as mental images. Only some participants
in this experiment appeared to carry out any planning using mental imagery. Secondary tasks
during the planning period had no overall effect on speed of production, despite the fact that
these tasks have reliably been shown to impair mental images in short term visuo-spatial
memory. Those participants who reported that they found it easy to carry out advance
planning actually improved their performance when a secondary task was given. It is possible
that the plans involved verbal rehearsal rather than images – this is investigated further in
experiment 6B, in which some participants were given no planning time at all.
Overall, this experiment found a reduction in performance when pictorial elements were used
to describe abstract processes. A further relationship had been expected between performance
and the use of mental images for diagram planning, but no clear evidence was found for this.
The different reports regarding advance planning reflect a wider range of individual
differences that are relevant to this experiment. The underlying causes of these differences
may be complex. Several researchers have reported differences in mental imagery ability
correlated with gender (Casey 1996, Delgado & Prieto 1996, Paivio & Clark 1991, Silverman,
Phillips & Silverman 1996), handedness, or an interaction between the two (Halpern 1996).
Further proposed distinctions include the difference between verbalizer and visualizer
“cognitive styles” (Richardson 1977), interaction of cognitive style with handedness (Casey
et. al. 1993), cognitive style with gender (Winner & Casey 1992), with age (Johnson 1991) or
self reported vividness of mental imagery (Katz 1983). This is a very complex issue, and I
found no obvious correlations with (for example) gender in post hoc tests. It is certainly true
that there was a wide range of individual variation in performance in this task, and this
variation has contributed to the marginal significance of the reasonably large effects
observed. Stenning and Gurr (1997) have also observed the difficulty of evaluating external
representation use in the face of individual differences such as these.
Van der Veer (1990) has explicitly investigated the effect of cognitive style on the
interpretation of software diagrams, but found that individual differences in mathematical
experience had a greater effect than cognitive style. Previous experience of mathematics

1 0 7
notations has also been identified as a factor in image memory by Winner and Casey (1992)
and by Manger and Eikeland (1998). Most of these studies have also noted an interaction of
experience with gender or gender image. This is in accordance with casual comments made
by many of the female participants in this and later experiments, along the lines of “I’m not
much good with mathematical things – you should have got my husband/son to do this
experiment”.
Experiment 4: Comparing diagrams to text
Participants in experiment 3 were selected on the basis that they had no experience of
computer programming – indeed most had little experience of computers, and some had
never used a mouse before taking part in the experiment. The training phase did take account
of this, and all participants successfully completed the experiment. Nevertheless, the
environment was not one with which they were comfortable. This may have caused
participants to produce diagrams that were unusually simple. The use of a computer-based
editor may also have removed the potential in pencil sketches for discovery through
ambiguity, as has been suggested by Goel (1995) in the case of architectural CAD systems. In
this related experiment, participants were therefore asked to explain the same devices, but by
either drawing diagrams using pencil and paper or writing a verbal explanation.
Notation
This experiment retained the minimal prescription of semantic interpretation as in experiment
3. Participants were instructed to construct diagrams by drawing simple shapes and
connecting them together with arrows, as if each shape had inputs and outputs. The
instructions included three examples of what this would look like – these are reproduced in
figure 5.7 (a full reproduction of the instructions is included in appendix B.4). As in
experiment 3, participants were given no further guidance regarding how nodes or arcs
should be interpreted. Participants were asked to write labels next to each shape, but only after
all the shapes in the diagram had been drawn.

1 0 8
Figure 5.7. Examples of shapes connected by arrows
In a second notational condition, participants were asked to describe devices by “writing an
explanation in words”. No further constraints were given, other than the constraints of time,
and of scale implicit in the size of the paper provided.
Tasks
Participants in this experiment were asked to describe the same six devices introduced in
experiment 3, divided in the same way into three that involved abstract processes and three
involving physical processes.
Equipment
In order to encourage free production of diagrams, participants worked with pencils rather
than ink pens. They were not given erasers, however, so that there would be a clear record of
any changes they made to their productions. Both the diagrams and the written descriptions
were produced on A3 sized sheets of paper. I used a stopwatch to allocate the amount of time
provided for each task.
Hypotheses
1. That the use of pencil and paper would allow participants to be more productive,
resulting in more elaborate diagrams than those produced in experiment 3.
2. That written descriptions would be more suitable for describing abstract devices,
and that those descriptions would be more elaborate than when abstract devices
were described with diagrams.

1 0 9
Participants and design
Six participants were recruited from the APU volunteer panel. There were no factors varied
between subjects, and two independent variables within subjects. The first independent
variable was the instruction to explain devices either by drawing a diagram, or by writing text.
The second independent variable was the nature of the devices. The use of three devices of
each type, but only two conditions of the first independent variable, produced an unbalanced
design. It was therefore not possible to test directly for interaction between the two factors.
Two dependent variables were measured. The first was the number of referents. This was
established in diagrams by counting the number of nodes, and in text by counting the
number of noun phrases that referred to independent entities. The second dependent variable
was the number of relations. This was established by counting the number of arcs in
diagrams, and the number of phrases describing any relationship between two referents in the
text.
The first hypothesis concerned elaboration relative to experiment 3. It was tested by
comparing the number of nodes in experiment 3 to the number of referents described in this
experiment. The second hypothesis regarding interaction of writing with abstract device type
was measured in terms of the number of referents and relations.
Procedure
The experimental material was assembled into a booklet, and participants simply worked
through this booklet in the order it was constructed. The instructions started with:
General Instructions
In this experiment, you will be asked to explain what happens inside some thing that might
be used around the house. You will be asked to explain what happens either by drawing a
diagram, or by writing your explanation in words.
Written Explanations
When you are asked to make an explanation in words, you can choose whatever way you
prefer to write the explanation.
Diagram Explanations
When you are asked to make the explanation using a diagram, you should make the
diagram by choosing simple shapes and joining them together with arrows. The shapes
you use should be quite simple – they don’t have to look like anything in particular.
After these instructions, the participant completed a practice exercise, drawing a diagram that
shows what happens inside a toaster. A further page of instructions then repeated the

1 1 0
instruction that the diagram should “use simple shapes connected together with arrows” and
“does not have to look like the thing you are explaining”.
Six separate pages of instructions then followed – each naming one of the six devices, and
specifying whether the explanation should be a diagram, or written text. Each page of
instructions was followed by a blank A3 page on which to draw the diagram or write the text.
I restricted the time available both for planning the explanation, and for producing it. The
participant was not allowed to start drawing or writing for one minute after reading each
instruction – they were told that this time was to be used for planning. At the end of the
minute, they were then given three minutes in which to complete the task.
Results
There were two different measures of diagram complexity in this experiment: the number of
referents in descriptions, and the number of relations described between them. This was
intended to distinguish diagrams that contained the same number of nodes, but were more
topologically complex, as there is evidence that this type of complexity may not be
represented as a simple image – Chechile et. al. (1996) report that recall of paired associate
network diagrams is poorer for more complex diagrams, even when all other aspects of image
complexity are rigorously controlled. In fact, only 6 of the 36 descriptions produced in this
experiment included more than the minimum number of relations needed to connect all the
referents. The numbers of referents and relations are therefore very highly correlated
(r=.848, p<.001), with no significant difference (Z=0.52) between the correlation found in
diagram descriptions (r=.898) and in text descriptions (r=.854). The remainder of this
analysis therefore uses number of referents as the sole measure of elaboration.
My main concern in designing this experiment was to test whether the editors used by
participants in experiment 3 might have reduced their productivity in terms of diagram
elaboration. I therefore compared the number of nodes contained in diagrams produced in
experiment 3 to the number of referents contained in the diagram and text productions of
experiment 4. The mean elaboration in experiment 3 was 8.3 nodes, and in this experiment
was 8.8 referents. This difference is not statistically significant, whether or not the
distributions of the two experiments are assumed to have equal variances, t(52.6)=.738,
p=.46. The same devices were described in both experiments, and there was no significant
difference in the overall level of elaboration for each device, F(5,174)=1.185, p=.318. There
was a large difference between the two experiments for two of the devices, however. As shown
in Figure 5.8, the calculator description was less elaborate in this experiment, and the
motorbike description was more elaborate, F(12, 168)=84.4, p<.001.

1 1 1
0
2
4
6
8
10
12
14
tele
vis
ion
tele
ph
on
e
calc
ula
tor
wash
ing
mo
torb
ike
ven
din
g
Experiment 3
Experiment 4
Ela
bo
rati
on
(n
um
ber
of
no
des)
Device being described
Figure 5.8. Elaboration of device descriptions in experiments 3 and 4
The second hypothesis was that text descriptions would be more suitable for describing
abstract devices. As described above, the unbalanced design of this experiment does not allow
a repeated measures analysis of this hypothesis. I therefore analysed the complete set of 36
descriptions produced in this experiment as independent observations. Text descriptions did
contain more referents than diagrams, as shown in figure 5.9. This effect was statistically
significant, F(1,32)=12.65, p<.01. There was not however any significant interaction between
the form of the description and the type of device, F(1,32)=0.093, p=.762.
0
2
4
6
8
10
12
14
concrete abstract
Text
Diagram
Ela
bo
rati
on
(n
um
ber
of
no
des)
Process
Figure 5.9. Text and diagram descriptions of abstract/concrete devices
The text descriptions produced in this experiment, if considered as an independent group,
appear to have a slightly higher level of elaboration than the diagrams produced in
experiment 3 (this is shown in Figure 5.10). This demonstrates that other members of the
same volunteer population do know more about the six devices than participants in

1 1 2
experiment 3 chose to include in their diagrams, t(160)=2.67, p<.01. The diagrams produced
with pencil and paper in this experiment do not however differ significantly in their degree of
elaboration from those produced in experiment 3, t(178)=0.75, p=.453. This suggests that
the computer editors used in experiment 3 did not inhibit diagram elaboration any further
than plain pencil and paper do.
0
2
4
6
8
10
12
Expt 3 editor Expt 4 text Expt 4 drawing
Ela
bo
rati
on
(n
um
ber
of
no
des)
Figure 5.10. Text and pencil diagrams compared to experiment 3
Discussion
On the basis of these results, it is possible to discount some potential confounds in experiment
3. Firstly, there is no evidence that participants in experiment 3 were especially affected by
the use of a computer to draw diagrams – in fact, their diagrams were more elaborate than
those produced simply with pencil and paper. Secondly, there is no evidence that participants
in experiment 3 were constrained by not knowing enough about the devices being explained
– members of the same population were easily able to supply more information about the
devices (but in text) than others had done in their diagrams.
This difference in elaboration between text and diagrams has disturbing implications for
those who claim that diagrams are “intuitive” in some sense. In a previously published paper
I have reported the difference in mean elaboration found in this experiment as “Correction:
A picture is worth 84.1 words” (Blackwell 1997a). A more intriguing observation is that part
of the difference in elaboration between text and diagrammatic descriptions comes from the
fact that participants generally included either themselves or a third person as an actor in their
text descriptions. Diagrams describing the same operations almost never included an actor as
a node in the diagram. Further investigation of this observation is beyond the scope of this
thesis, but it may be of interest when pragmatic conventions of diagram use are studied in the
context of applied linguistics (e.g. Oberlander 1996). This observation only accounts for a

1 1 3
maximum mean difference of one between the number of referents in text and diagrams;
even when subtracting one from the text counts, there is still a significant difference between
the level of elaboration in text and diagrams, t(34)=2.67, p<.05.
One further observation can be made about these results on the basis of other research into
drawing. Although participants in experiment 3 may have found computerised diagram
editors uncomfortable to use, most people also have a very restricted repertoire of
representational devices that are available to them when drawing (van Sommers 1984,
Edwards 1979, Thomas & Silk 1990, Karmiloff-Smith 1990). In this experiment participants
were instructed to use specific symbols in ways that were possibly remote from their usual
habits of drawing. The basic elements were only lines and simple shapes, but these do have
conventional pictorial implications – whether because of fundamental perceptual mechanisms
(Kennedy 1975) or depictive conventions (Willats 1990). On the other hand, most people
normally produce even supposedly representational drawings as semi-diagrammatic
arrangements of conventional pictorial symbols rather than using a naturalistic style. Snyder
and Thomas (1997) propose that these diagrammatic drawings simply reflect efficient
abstract codings of the environment, a facility that is absent in the highly naturalistic
productions of autistic children (Selfe 1985, Scott & Baron-Cohen 1996). The interaction
between diagrammatic and depictive conventions may provide some explanation for the fact
that the hand drawn diagrams of novice diagram users in this experiment were less elaborate
than either those produced with computers or written text, but firm conclusions would require
further investigation beyond the scope of this thesis.
Experiment 5: Use of incongruent pictorial nodes
I suggested in the discussion of experiment 3 that the interaction of mechanical and
geometric pictures with explanations of abstract and concrete devices may simply result from
a perceived incongruity between the task and the notation. Everyone knows that pocket
calculators do not contain moving parts, so it requires more imagination to describe one using
photographs of complex machinery. Carroll and Thomas (1982) have noted that this type of
incongruity can compromise the use of physical metaphors for computer systems. Many
theories of metaphor claim that metaphors are made more apt when there is greater separation
between source and target domains (e.g. Tourangeau & Sternberg 1982), but this has been
challenged by Heydenbluth and Hesse (1996), who found that analogical problem solutions
were less elaborate when the source and target domains were dissimilar, even though the
problem was structurally identical to another relating similar domains.

1 1 4
In order to test this hypothesis, I carried out a further experiment along the same lines as
experiment 3, but with even greater incongruity between the notations provided and the
devices to be described.
Notation
This experiment is based on the same diagram editor program that was used in experiment 3.
Experiment 3 used two different versions of this program: in the first the nodes were simple
geometric shapes and the arcs were unadorned lines, while in the second the nodes were
photographs of mechanical components and the arcs were ducts (providing an implicit
metaphor of flow between the components).
In this experiment there were two further versions of the editor, designed to have no apparent
relationship to the devices being explained. The first of these depicted the four different node
types as vegetables. The arcs were shown as lines of spring onions arranged between the
vegetables. An example of the resulting diagram is shown in figure 5.11.
Figure 5.11. Diagram editor based on vegetables
The second new version of the editor depicted the four node types as farmyard animals, and
the arcs between them as lines of paw-prints, as shown in figure 5.12.

1 1 5
Figure 5.12. Diagram editor based on farmyard animals
The animal editor includes an implicit metaphor of travel between nodes, while there is no
such metaphor in the vegetable editor. The metaphor implicit in the animal tracks is more
obvious than it is in the mechanical editor, while there is no implicit motion in the vegetable
editor. The geometric and mechanical versions of the editor described in experiment 3 were
also included as alternatives in this experiment.
Tasks
As in experiment 3, this experiment compared devices incorporating abstract processes to
those incorporating concrete processes. Eight new devices were used, however, and there was a
second axis of variation: in the complexity of the device to be explained. The eight devices
are listed in table 5.2.
Complexity level Concrete Abstract
1 pencil sharpener electric light2 construction crane transistor radio3 central heating system bank account4 baked bean factory British Parliamentary system
Table 5.2. Second set of abstract/concrete devices
The second and third levels of complexity in these devices were intended to correspond to the
range of devices in experiments 3 and 4, while the first level was substantially more simple,
and the fourth level as complex as possible while being familiar to a lay person.
1 1 6
Equipment
The equipment used in this experiment was identical to that in experiment 3: digitised
photographs of the node and arc types, edited with Photoshop, and animated in Director. The
secondary tasks used in experiment 3 were removed from the program for this experiment.
Hypotheses
1. That the explicit manipulation of task complexity should result in increased
elaboration of the diagrams that are produced.
2. To measure any effect of abstraction and editor size by comparison to the effect
of task complexity.
Participants and design
Sixteen participants were recruited from the APU volunteer panel. There were no between
subjects factors, and three factors varied within subjects. The first independent variable was
the type of device being explained. As in experiment 3, half of the devices involved abstract
processes, and half involved physical concrete processes. There were eight devices altogether,
and the second independent variable was the ordinal degree of complexity of the device to be
explained – there were four levels of complexity for both the abstract and concrete processes.
The third independent variable was the type of diagram used for each task – either animal,
vegetable, mechanical or geometric. The allocation of diagram type to complexity and device
type was balanced across subjects, producing a balanced confound design as in experiment 4.
A single measure of performance was recorded. As in experiments 3 and 4, this was the
degree of elaboration of the diagram, measured in terms of the number of nodes. This
measure was used to test both hypotheses.
Procedure
The procedure used in this experiment was very similar to that of experiment 3. It included
an animated explanation of the editor operation, followed by a practice exercise, and then
eight device explanation tasks. In this experiment, however, the animated explanation
demonstrated the geometric editor to all participants. Participants were then shown each of the
four editor variants and given an opportunity to experiment with them, in order to confirm
that they all worked in the same way, before starting work on the practice exercise. Unlike

1 1 7
experiment 3, there was no planning period (or secondary task) between the allocation of the
device to be explained, and the use of the diagram editor.
The eight devices that were explained by participants were designed to incorporate a large
range of variation in complexity. They included two extremely simple devices: a pencil
sharpener (concrete) and an electric light (abstract). Two corresponded to the least complex
devices in experiments 3 and 4: a construction crane (concrete) and a transistor radio
(abstract). Two were more complex: a central heating system (concrete) and a bank account
(abstract). Two were as complex as possible while being familiar to a layman: a baked bean
factory (concrete), and the British Parliamentary system (abstract).
Results
As in experiment 4, the balanced confound design of four levels of complexity with four
editor types across only eight tasks did not allow a repeated measures analysis of variance
including both factors. Instead, I directly compared effect sizes for the factors of complexity
and editor type in a single analysis of all trials. The effect of complexity on elaboration of the
diagrams was highly significant, even with this loss of statistical power, F(3,96)=12.67,
p<.001. The effect of the editor type and of abstract versus concrete devices was very small in
comparison, as shown in Figure 5.13. Neither the effect of editor nor device type reached
statistical significance, F(3,96)=1.21, p=.31 and F(1,96)=0.02, p=.90 respectively.
0
2
4
6
8
1 0
1 2
1 4
1 6
an
ima
l
ge
om
etric
me
ch
an
ica
l
ve
ge
tab
le
Ela
bo
rati
on
Editor
0
2
4
6
8
1 0
1 2
1 4
1 6
ab
stra
ct
co
nc
rete
Ela
bo
rati
on
Device type
0
2
4
6
8
1 0
1 2
1 4
1 6
1 2 3 4
Ela
bo
rati
on
Complexity level
Figure 5.13. Relative effect sizes of complexity, editor, and device type
In order to check for any interaction between the editor being used and the device being
explained, I normalised the level of elaboration, relative to all descriptions that were
constructed of that device. On this normalised scale, the number of nodes in the most

1 1 8
elaborate description of that device was assigned a value of 100, and the number of nodes in
the least elaborate description was assigned a value of zero. I then calculated the normalised
elaboration of each diagram linearly along this scale. Figure 5.14 shows the relative
elaboration for each task/editor combination. As any participant only used one of the four
editors for each device, each point on the graph represents one quarter of the total times that
device was described, N=4. There are certain editors which seem to produce more favourable
results for particular tasks. Farmyard animals can productively be used to describe the British
Parliamentary system, for example. These interactions are not statistically significant over
such a small number of trials, unfortunately.
0
2
4
6
8
10
12
animal geometric mechanical vegetable
Abstract devices
Concrete devices
Ela
bo
rati
on
(n
um
ber
of
no
des)
Editor
Figure 5.14. Interaction of editor with device type
The normalised scale was used to compare the relative elaboration produced using each editor
in the abstract and concrete device sets. There was no significant difference between the
editors over all devices, F(3,45)=1.12, p=.352, and no interaction between the
abstract/concrete device manipulation and the elaboration produced with any given editor,
F(3,45)=0.83, p=.482.
Discussion
This experiment was unlike experiment 3, in that each participant used a range of different
notations. Every participant experimented with all four editors before the experiment started,
and was therefore quite familiar with the distinction between the behaviour of the editor
(which was the same in all four cases) and the appearance of the nodes and arcs (different in
all four cases). This presentation made the distinction between the syntactic conventions and
the arbitrary symbols quite obvious. The instructions given to participants in experiment 3
did imply that they were to treat the symbols as arbitrary, by repeating that the diagram did

1 1 9
not have to “look like anything”. Nevertheless, the experience of using several different
symbol sets for the same purpose makes the arbitrary assignment of symbols far more
explicit.
The results of this experiment show practically no variation in the elaboration of abstract and
concrete device descriptions using different symbol sets. It seems likely that this results from
participants consistently treating the symbols as arbitrary decorations of otherwise abstract
networks. Sometimes those decorations are entertaining (in the case of the farmyard animals),
and hence encourage extra productivity, but I do not believe that those cases reflect any
underlying difference in the way that the participant has conceptualised the diagram. Even
the geometric shapes may be seen as simply another decoration. As Liu and Kennedy (1994)
have observed in recall experiments, even simple geometric shapes such as squares and circles
can be interpreted as having metaphorical associations with associated mnemonic benefits for
recall of congruent associations. More complex geometric figures have also been found to
have uniform semantic associations in different cultures (Pickford 1979, Takahashi 1998),
explained by Werner and Kaplan (1963) as “concrete-affective” associations.
Experimental work with children has also shown that they are prepared to regard symbols
they know to be meaningful as being arbitrary for the purposes of play. This “pre-object”
use of symbols has been observed in children using computer drawing packages (Labbo
1996). It has in fact been shown to impede the discovery of representational relationships
between the real world and a physical symbol domain, when children are allowed to play with
a model of a room in which a toy has been hidden (DeLoache & Marzolf 1992). These
observations lend support to the hypothesis that participants in the present experiment treated
the symbols in a more arbitrary way as a result of “playing” with each of the editors during
the preparation phase of the experiment.
Experiment 6: Other factors affecting diagram planning
In the discussion of the previous experiment, I have suggested that interaction between
abstract/concrete devices and different symbol types depends on novelty of the symbols. If
this is the case, there were no differences in diagram elaboration in that experiment because
participants had become familiar with the notational differences and therefore treated them as
more arbitrary.
There are several other potential reasons why the interaction found in experiment 3 was not
replicated, however. Firstly, the assignment of devices to the “abstract” and “concrete”

1 2 0
categories was made on a purely intuitive basis. This approach has been typical of previous
experimental work comparing abstract and concrete categories (e.g. D’Esposito et. al. 1997),
but the distinction may be more subtle than the experimenter assumes. Experiment 6A tests
this categorisation on the basis of reports from 20 independent raters.
Secondly, the planning time provided in experiment 3 may have contributed to the difference
observed between abstract and concrete devices. Experiment 5 did not allow any planning
time, based on the observation that secondary tasks had not affected diagram production.
Participants in experiment 3 may however have found it easier to plan abstract devices in the
geometric condition, perhaps using verbal strategies. Experiment 6B tests the effect of
planning, in an experiment that is otherwise intended to replicate the results of experiment 3
with a different set of devices.
A third possibility is that the experimental situation included a substantial degree of implicit
experimental demand. Participants had a fixed amount of time in which to produce their
diagram, and they were working in an unfamiliar environment where the addition of each
node may have seemed laborious. Experiment 4 has already demonstrated that the
environment itself did not unduly constrain diagram elaboration, but experiment 4 tried to
reproduce the other conditions of experiment 3, including a fixed time limit for diagram
production. Experiment 6C tests the effect of experimental demand by manipulating the time
that participants expect to spend on each diagram.
Experiment 6A: Verify abstract/concrete classification
This experiment used the assessments of independent raters to test the earlier assumptions
regarding assignment of devices into abstract and concrete categories.
Tasks
Participants in this experiment simply assigned an abstract/concrete rating to each of the
devices used in the previous experiments. The devices that were rated were all 15 devices that
had been used in experiment 3 and experiment 5 (including the practice example; a toaster).
Equipment
The experimental material consisted of a single page questionnaire. It listed fifteen devices,
with a line across the page underneath each one (the questionnaire is reproduced in appendix
B.6). The devices were randomly ordered on the page. Each line had a marker at both ends,

1 2 1
with the words ‘abstract’ and ‘concrete’ marked at opposite ends. Participants made a mark
on each line to reflect their judgement of abstractness or concreteness for each device.
Hypothesis
That those devices defined as being abstract in previous experiments would be
rated as more abstract.
Participants and design
Twenty participants were recruited from students registered for postgraduate degrees at
Darwin College, Cambridge. All participants completed the same single page questionnaire.
The only independent variable was the distinction between the 15 different devices, each of
which had been assigned in previous experiments to abstract or concrete categories.
The questionnaire used a single measurement technique. The abstract/concrete judgement was
treated as a semantic differential scale – a continuous line which participants could mark at
any position. The dependent variable was the position of the mark. The hypothesis was tested
by comparing whether those devices defined as being abstract were placed toward the abstract
end of the scale, relative to the overall mean.
Procedure
The questionnaire was distributed to students who were waiting for a meeting to begin. The
introduction to the questionnaire described the difference between concrete devices (those
that involve moving parts or physical processes) and abstract devices (those that do not).
Instructions to the participant asked them to make a mark on each line to reflect their
judgement of abstractness or concreteness for each device.
Results
The hypothesis was that those devices defined earlier as being “abstract” would all be placed
toward the abstract end of the scale, relative to the overall mean. The scale was 150 mm long.
With the abstract end of the scale defined as 0, and the concrete end as 150, the mean point of
all marks made by participants was toward the concrete end, at 94 mm. All “abstract” devices
from the earlier experiments had mean positions closer to the abstract end of the scale than
this, and all of the “concrete” devices had mean positions closer to the concrete end. The

1 2 2
toaster, which was chosen as a practice exercise on the basis that it was not too abstract or too
concrete, had a mean position of 108 mm: closer to the concrete end than the abstract.
I also compared the relative rankings of the two sets of devices used in earlier experiments.
The devices introduced later, in experiment 5, generally received more extreme ratings than
those used in experiment 3. Three of the four abstract devices in experiment 5 fell into the
first quartile. Only the least complex, the electric lamp, had a more ambiguous position in the
second quartile. All four of the concrete devices in experiment 5 fell into the fourth quartile.
Experiment 6B: Planning effect, replicate abstraction effect
This experiment explicitly tested the effect of planning on diagram production, and is also
intended to replicate the abstraction effects found in experiment 3 with a different set of
devices.
Notation
This experiment used only the two diagram editors based on geometric shapes and
mechanical components that had been used in experiment 3, rather than the more fanciful
animal and vegetable editors introduced in experiment 5.
Tasks
Participants in this experiment drew diagrams to explain six different devices. These were the
six devices that had been found to be either abstract or concrete with the least ambiguity in
experiment 6A, as shown in table 5.3.
Complexity level Concrete Abstract
2 construction crane transistor radio3 central heating system bank account4 baked bean factory British Parliamentary system
Table 5.3. Third set of abstract/concrete devices

1 2 3
Equipment
The equipment used in this experiment was identical to that in experiment 3 and 5: digitised
photographs of the node and arc types, edited with Photoshop, and animated in Director.
Although a planning period was included, this consisted of a blank screen with a fixation
cross in the centre – the spatial tracking and visual noise tasks of experiment 3 were removed
from the program.
Hypotheses
1. That the effect of device complexity on elaboration would be observed again.
2. That the interaction of device abstraction and editor type observed in experiment
3 would reappear.
3. That the provision of planning time would increase speed of production, even for
participants who plan using verbal rehearsal, as proposed in experiment 3.
Participants and design
Sixteen participants were recruited from the APU volunteer panel. I varied two between-
subjects factors, and two within subjects factors. The first independent variable returned to the
between-subjects allocation of editors as used in experiment 3; each participant used only the
editor based on mechanical nodes and arcs or on geometric nodes. The second between-
subjects factor was whether or not participants were given time to plan their diagram after
learning what it was. Half of the participants were given one minute planning time before
starting each diagram, while the other half were given none. The between-subjects factors
were balanced across all participants.
There were also two independent variables designed as within-subjects factors. The
participants explained six devices; these were classified as either abstract or concrete, and they
included three different levels of complexity.
Two dependent variables were measured – the degree of elaboration, measured as the number
of nodes in the diagram, and the speed of production, measured as the average time interval
between creation of the first ten elements. The first two experimental hypotheses were tested
in terms of the effects of device complexity, device abstraction and editor type on
elaboration. The third was tested in terms of the effect of planning time on speed of
production.

1 2 4
Procedure
The procedure used in this experiment was almost identical to that of experiment 3, except
that participants in the planning condition were not required to carry out a secondary task
while planning their diagrams. Participants watched an animated explanation of the editor
operation, drew a practice diagram, and then drew diagrams to explain six different devices.
Presentation order was balanced as for experiment 5.
Results
The first hypothesis was that the previously observed effect of device complexity on diagram
elaboration would again be found. This was in fact observed. The mean elaboration of the six
devices is shown in figure 5.15. In testing this first hypothesis, there was a significant main
effect of complexity on elaboration , F(2,24)=4.92, p<.05. As before, the abstract and
concrete devices at each level of complexity did not result in significantly different levels of
elaboration, F(1,12)=1.00, p=.338, and there was no interaction between complexity and
abstraction, F(2,24)=0.09, p=.916.
0
2
4
6
8
10
rad
io
ban
k
parlia
men
t
cra
ne
heatin
g
facto
ry
Ela
bo
rati
on
Device being explained
Figure 5.15. Mean elaboration of diagrams explaining six devices
The second hypothesis was that the interaction between device abstraction and the use of
mechanical or geometric editors observed in experiment 3 would be replicated in this
experiment. The results from this experiment did not replicate that finding. As before, there
was no main effect of editor type, F(1,12)=0.51, p=.489. In this experiment, however, neither
was there any significant interaction between device abstraction and the editor type,
F(1,12)=1.56, p=.236.

1 2 5
The third hypothesis was that providing planning time would increase speed of production in
the early part of diagram creation. There was a significant effect of the planning variable on
speed, F(1,12)=7.52, p<.05, but this effect was in the opposite direction to that predicted.
Participants who were given planning time drew their diagrams more slowly than those who
had no planning time. There is an interaction between planning time and device complexity
that may help to explain this. As shown in figure 5.16, devices at different levels of
complexity are explained with similar degrees of elaboration when no planning time is
provided. When participants were given a minute to plan the diagram, they apparently
produced diagrams that were elaborated in proportion to the complexity of the device being
explained. For the simplest devices, there was a tendency for participants to produce less
complex diagrams when they were given time to plan the diagram than when they were not
given planning time. This interaction was only marginally significant, however, F(2,24)=4.92,
p=.065.
0
2
4
6
8
10
12
14
No planning Planning
Sp
ee
d o
f n
od
e c
rea
tio
n (
se
co
nd
s)
0
2
4
6
8
10
1 2 3
No planning
Planning
Ela
bo
rati
on
Device complexity
Figure 5.16. Effect of planning time on diagram elaboration and production speed
Experiment 6C: Experimental demand
This experiment tested the effect of experimental demand by manipulating the time that
participants expected to spend on each diagram. These results have previously been reported
in Blackwell (1997a).
Notation
In this experiment participants drew diagrams by hand, as in experiment 4. The instructions
given to participants about the form of diagrams were identical to those in experiment 4.

1 2 6
Tasks
This experiment returned to the complete set of eight devices first introduced in experiment
5. Device abstraction was not considered as a factor in this experiment, so the two simplest
devices, although found to be ambiguous regarding abstract/concrete judgments in
experiment 6A, were included to give a wider range of complexity.
Equipment
Participants in this experiment used pencil and paper, as in experiment 4.
Hypotheses
1. That the variation in device complexity should result in the same variation in
elaboration observed in experiment 6B, despite the fact that diagrams were being
drawn on paper rather than with a special editor.
2. That the effect of experimental demand might be sufficiently large by
comparison to the effect of device complexity to explain the variations associated
with the planning factor in experiment 6B.
Participants and design
Eight participants were recruited from the APU volunteer panel. There were no between
subjects factors, and two within-subjects factors. The first independent variable was the degree
of complexity of the devices to be explained, as in experiment 5. Device abstraction was not
considered as a factor in this experiment. The second independent variable was an implicit
manipulation of experimental demand. While drawing four of the diagrams, participants used
a stopwatch to monitor the length of time that they spent drawing, providing an implicit
concern with speed of drawing. When drawing the other four, subjects were explicitly told that
time was not important, and they should make the diagrams as detailed as possible.
There was a single dependent variable – the degree of elaboration, in terms of the number of
nodes in the diagram. The two hypotheses were tested with respect to this variable.

1 2 7
Procedure
The procedure for this experiment was similar to that of experiment 4, in which diagrams
were drawn in a booklet containing A3 sheets of paper. The booklet first described the
required form of diagram, using the same text that was used in experiment 4. Participants
then completed a practice exercise, explaining the internal workings of a toaster.
Participants then drew four diagrams in the speed condition. The booklet asked them to start
a stopwatch, draw the first four diagrams, and then write down the time that they had spent
drawing. After this, the booklet instructed them to stop the stopwatch and put it away, then
spend as much time as they liked drawing four more diagrams, which were to be made as
detailed as possible. The presentation order of the eight devices, and allocation of devices to
the speed/detailed conditions were balanced across all participants.
Results
The first hypothesis was that the variation in device complexity should result in the same
variation in elaboration observed in experiment 6B, despite the fact that diagrams were being
drawn on paper rather than with a special editor. As shown in figure 5.17 there was a
significant variation of diagram elaboration, in the direction expected with increasing device
complexity, F(3,21)=6.57, p<.01.
0
5
10
15
20
25
1 2 3 4
Detail
Fast
Ela
bo
rati
on
Device complexity
Figure 5.17. Variation in elaboration with device complexity and experimental demand

1 2 8
The second hypothesis was that the effect of experimental demand might be comparable to
the effect of device complexity. As can be seen in figure 5.17, the difference in elaboration
between the two demand conditions is significant, F(1,7)=13.06, p<.01. There is also,
however, a large interaction effect between complexity and demand condition. When
participants are working with an implicit time constraint, there is relatively little variation
between the elaboration of the least complex and most complex descriptions. When asked to
make their diagrams more detailed, participants were able to produce far more elaborate
diagrams for the more complex devices. This interaction is only marginally significant,
however: F(3,21)=2.97, p=.055.
Discussion
These three experiments investigated several areas of uncertainty arising from experiment 3, 4
and 5. Firstly, the categorisation of devices into those involving abstract and concrete
processes appears to have been quite straightforward. The discovery that the second set of
devices (first introduced in experiment 5) were more strongly differentiated than the original
set also encouraged the attempt to replicate the original interaction with a different set of
devices.
Experiment 6B failed to replicate the result of experiment 3, however. There was no evidence
at all in support of the previously observed interaction. This suggests that the interaction
observed in experiment 3, if it were to be verified as robust, probably resulted from the
specific set of devices used in that experiment. In fact, a single device contributed most of the
interaction effect. The pocket calculator was explained to a far greater level of elaboration
when geometric symbols were being used; an average of 13.0 nodes, compared to 7.8 nodes
in the pictorial condition. This was the largest difference in means for any device, but the
interaction over all devices was only marginally significant, F(5,110)=2.24, p=.055. On
inspection of the diagrams produced in that experiment, it seems there is a straightforward
explanation why the calculator should be a special case. Geometric symbols are readily used
to express mathematical operations, so the diagrams produced often included several elements
representing each arithmetic operation. The pictorial nodes were used to represent processing,
but were less likely to represent individual mathematical operations.
The most surprising result in experiment 6B was that participants drew less complex diagrams
when they were given time to plan in advance. This effect appeared to be restricted to the least
complex devices, however. It suggests that participants who drew diagrams “on the f ly”
simply elaborated them until they looked sufficiently complex, rather than thinking in
advance about the level of elaboration that was justified. This proposal suggests that the

1 2 9
observed effect is due to experimental demand rather than any performance deficit associated
with planning. Experiment 6B also confirmed an unusual observation made in experiment 3.
In experiment 3, those participants who reported no difficulty with planning actually
produced their diagrams more quickly when they were given a secondary task. A similar
effect is observed here – when participants were given no planning time, they produced their
diagrams more quickly. This suggests that speed of production is not a good measure of
whether a diagram has been planned in advance. In this case, lack of planning also resulted in
greater consistency between tasks – perhaps because participants resorted to a standard
schema rather than planning a more original diagram.
All of the experiments described in this chapter have involved participants describing the
operation of some device under time constraints. Furthermore, none of the experiments
included any explicit instructions on the level of elaboration that participants were expected
to produce. The level of elaboration that they did produce was therefore influenced not only
by their knowledge of the device, by their planning strategies and by the tools that they were
given, but by the implicit requirements of the experimental context – they were unlikely to
expend much more effort on each diagram than they believed was required of them. This
factor is likely to have affected all tasks equally, but may have had the effect of reducing the
range of elaboration produced. As a result, the manipulations of editor and task
characteristics in these experiments may have had larger effects in other circumstances.
Despite this caution, if there was an effect of pictorial metaphor or task abstraction in the
experiments reported in this chapter, it was too small to be observed. It was certainly far
smaller than either the effects of device complexity or experimental demand as observed in
Experiment 6C.

1 3 0
Chapter 6: Metaphor for Mnemonic Diagrams
The advantages proposed by this mode of representationare to facilitate the attainment of information, and aid thememory in retaining it: which two points form theprincipal business in what we call learning.
The Statistical Breviary, W. Playfair, 1801, p. 14.
Chapters 4 and 5 have described investigations of two widely held theories of diagram use:
that novices can use diagrams as physical metaphors of abstraction to gain expertise, and that
diagrams accommodate the use of mental images in problem solving. Neither series of
experiments found convincing evidence for the expected strategies, but this does not
necessarily mean that the claimed advantage of metaphorical diagrams, as reviewed in
chapters 1 and 2, is completely unjustified. Even if metaphors simply provide a mnemonic
aid when learning to use a diagram, this could result in substantial improvements in task
performance. This could explain the results found in experiment 2, where a nonsensical
metaphor may simply have prompted bizarre (but effective) mnemonics.
In experiment 1, I tested for differences in memorability between metaphorical and non-
metaphorical diagrams. Of the four novices who used the non-metaphorical version, two of
them asked far more often for reminders about component functions. The fact that this effect
was only observed for half of an already small experimental group made firm conclusions
impossible, but it supports the possibility that metaphors support mnemonic performance
rather than problem solving.
The literature certainly includes numerous claims (besides those reviewed in survey 1) that
metaphor makes representation systems easy to learn. Payne (1988) describes improved
memory for abbreviated command languages when they have a metaphorical explanation,
while Simpson and Pellegrino (1993) describe small (10%) improvements in recall when
novices use a visual representation involving a geographical metaphor. Where memory for
visual representations is concerned, however, it may be the case that any systematic
interpretation will improve memory. Bower, Karlin and Dueck (1975) found that
reproduction of abstract visual riddles was far more accurate when participants were given a
meaningful interpretation of the picture. Liu and Kennedy (1994) found that verbal recall
was improved when the words were inscribed within simple geometrical symbols having
stereotypical interpretations congruent with the words. Bartlett (1932) also proposed that
memory for abstract shapes would be improved by seeing them as real objects.

1 3 1
Experiment 7: Comparison of good / bad / no metaphor
In experiment 2, participants carried out a combination of problem-solving and mnemonic
tasks, using four diagrams composed of abstract shapes. The meaning of each diagram was
described either with the addition of a systematic metaphor, or with a nonsensical metaphor.
The quality of the metaphor given appeared to make little difference in performance to
novice diagram users. This result can be seen as supporting the occasional critiques of
metaphor use in HCI. Kieras and Bovair claimed that understanding of complex devices
would not be improved by a metaphor or analogy because it is “unlikely to support precise
inferences” about specific actions that the user should make (Kieras & Bovair 1984, p. 272).
Furthermore, Kieras and Bovair warned that the metaphor might be poorly designed, or that
novices may draw invalid conclusions from it, in which case it would impair performance by
comparison to more precise instructions. This might certainly have been expected with the
nonsense metaphors of experiment 2.
This experiment further explores the result of experiment 2, by introducing a third condition
with no metaphor at all. It also modifies the tasks that were used to evaluate diagram
understanding in experiment 2. In that experiment, one of the tasks involved completing a
diagram by drawing missing graphical elements. The drawing task was least affected by the
use of metaphor. It seems possible that some participants treated it as a simple figure
reconstruction task, perhaps as a result of having carried out visually similar tasks (such as the
Rey-Osterrieth complex figure recall test) in previous experiments encountered during their
membership of the APU volunteer panel. If the drawing task had encouraged participants to
rely on image-based memory strategies, rather than using the metaphor to interpret the
diagram, this might have resulted in a modality-specific interference effect, similar to the
finding by De Beni, Moé and Cornoldi (1997) that using the mnemonic method of loci
interferes with recall of written texts, but not oral presentations of the same text. Interference
of this type might also suggest dual-coding effects (Paivio 1971) governing the mnemonic
benefit of the symbols. This is explored further in experiment 9. In the current experiment,
the diagram drawing task used in experiment 2 was simply removed.
Notation
This experiment used novel diagrams: the four that had been used in experiment 2, and two
further diagrams that, as in experiment 2, expressed computational concepts in familiar
situations. As for the original four diagrams, the explanation of each diagram could
incorporate either a systematic metaphor that compared the graphical elements to some

1 3 2
physical situation with an appropriate structure, or a nonsense metaphor that compared them
to an irrelevant physical situation. The original four diagrams expressed the following
concepts:
• closure (a set of values that is defined for use in a specific context);
• database join (combining tables of data on the basis of common values in each table);
• flow of control (sequences of execution states such as repetition and choice); and
• visibility (hiding working material within a function to simplify its interface).
The two new diagrams were designed to be at the less difficult extreme of those used earlier.
They expressed the concepts of:
• remote execution (defining an algorithm that can spread across several computers);
and
• selection (choosing the next state of the program based on some logical criterion).
The diagram expressing remote execution is shown in Figure 6.1. The task context described
a car manufacturing operation, where the manufacture of some parts or sub-assemblies might
be subcontracted to other factories. The diagram shows each sub-assembly as a box that can
contain other sub-assemblies (a recursive definition). A rectangle without decoration indicates
that the assembly will take place in the same location as for the containing box. A rectangle
with a “V” marked across the top indicates that the assembly will take place in a different
location.
Chassis
Engine
Body
Carburettor
Brakes
Ignition
Pistons
Suspension
Boot
Bonnet
Doors
Wheels
Seats
Spark Plugs
Radio
Gearbox
Fully Assembled Car
Differential
Transmission
Dashboard
Figure 6.1. Diagram showing remote execution in terms of car manufacture.
Eg: Seats are made in a different factory from the body, but the bonnet is made in the same factory
For this diagram, the systematic metaphor described the plain rectangles as sheets of paper
which could be used to instruct the factory workers about assembly operations. The rectangle
with the “V” at the top was described as resembling an envelope in which instructions would
have to be posted to a different factory if the assembly was being done elsewhere. The

1 3 3
nonsense metaphor described the boxes as toolboxes, with the “V” being an open drawer
allowing you to see what is inside the box.
The diagram expressing selection is shown in Figure 6.2. The task context described a
decision in planning a dinner menu: the decision of whether or not to eat salad depends on
the weather, and on whether some combination of appropriate ingredients are available in the
garden, at shops or in the refrigerator. The diagram shows contributing factors linked by
lines, where several lines can be combined conjunctively (shown as a series of links) or
disjunctively (shown as a twisted rod).
Tomatos in shop
Eating at home
Eating at pub
Weather hot
Not eating roast
Not too hungry
Salad on menu
Tomatos in season
Tomatos in garden
Lettuce in fridge
Lettuce at market
Going to market
Have mayonnaise
Have salad cream
Have oil & vinegar
Eat salad for dinner
Leftover salad
Figure 6.2. Diagram showing selection in terms of menu planning.
Eg: leftover salad or some other combination results in eating salad for dinner
For this diagram, the systematic metaphor described the diagram as a system of strings being
pulled. The conjunction symbol resembled a chain – if one link in the chain breaks, it will not
pull the string attached to its end. The disjunction symbol resembled a rope – any number of
strands can break, but so long as one remains, it will pull the string attached to its end. The
nonsense metaphor described the disjunction symbol as resembling a furled umbrella, and the
conjunction symbol as resembling a string of sausages.
Tasks
As in experiment 2, participants answered comprehension questions for examples of each
diagram. These questions were phrased to involve an element of problem solving using the
notation, rather than simply providing definitions of diagram elements, or reading
information directly from the diagram.

1 3 4
In a second task, participants completed incomplete diagrams by writing in missing labels. A
list of the missing labels was provided, along with some problem-domain constraints stating
where those labels could be placed.
Experiment 2 had also included a test in which incomplete diagrams were completed by
drawing, but that task was omitted from this experiment, for reasons explained in the
introduction. This also reduced the number of tasks using each diagram from three to two,
thereby providing sufficient time in the experimental session to learn six diagrams rather than
four as in experiment 2.
Equipment
As in experiment 2, material was presented to participants in booklet form. Participants wrote
directly in the booklet, and used a stopwatch to record the amount of time they spent working
on each page. Pages from the booklet are reproduced in appendix B.7.
Hypothesis
That performance when no metaphor was provided would be intermediate
between the systematic metaphor and nonsense metaphor cases.
Participants and design
Twelve participants were recruited from the APU volunteer panel. There were no factors
varied between subjects, and two factors within subjects. The first independent variable had
three values in this case: diagrams were presented to participants with either the systematic
metaphor, the nonsense metaphor, or no metaphor at all. As in experiment 2, the design was a
balanced confound, with the allocation of metaphor condition to each of the six diagrams
balanced across subjects. The second independent variable was the form of task:
comprehension questions or completion of incomplete diagrams.
As in experiment 2, two dependent variables were used to measure performance: the speed
with which participants completed comprehension and completion tasks, and accuracy in
those tasks. Accuracy scores were again normalised for each task, so that treatment effects
could be compared using scores on different tasks. The first hypothesis regarding
performance was tested in terms of both shorter task completion times and higher normalised
scores.

1 3 5
Procedure
Participants in this experiment worked through a booklet, as in experiment 2. The first page
instructed them to work through the booklet in order, and to write at the top of each page the
time that they started work on that page.
The main part of the booklet contained 18 pages: three pages for each of the six diagrams. In
each group of three pages, the first page explained the diagram with the appropriate
metaphor condition, the second page asked comprehension questions, and the third page
asked the participant to complete a diagram by adding text.
The assignment of metaphor condition to each diagram was balanced across participants, as
was the presentation order of metaphor condition. The six diagrams were always presented in
the same order for all participants, with the least difficult (those that had resulted in the best
performance in experiment 2) presented first in order to increase the confidence of
participants at the start of the experimental session.
Completed booklets were scored by comparison to ideal worked solutions, and marking was
done while blind to the metaphor condition with which diagrams had been explained.
Comprehension questions were scored by awarding one mark for each piece of information
that was in accordance with the worked solution, and subtracting one mark for any additional
pieces of information given, if it was inconsistent with either the problem constraints or the
definition of the diagram. Diagram completion tasks were scored by awarding one mark for
each label that was in the same place as the worked solution, and subtracting one mark for
each label in a place that was inconsistent with the problem constraints or the diagram
definition.
Results
The hypothesis for this experiment was that performance with no metaphor would be
intermediate between that in the systematic metaphor and nonsense metaphor cases. In fact,
there was no significant difference in speed between the three cases, F(2,22)=0.31, p=.735.
Furthermore, the mean accuracy in the no-metaphor case was actually slightly higher overall
than in either of the other cases, as shown in table 6.1. This difference in accuracy was not
significant either, however, F(2,126)=0.37, p=.694.
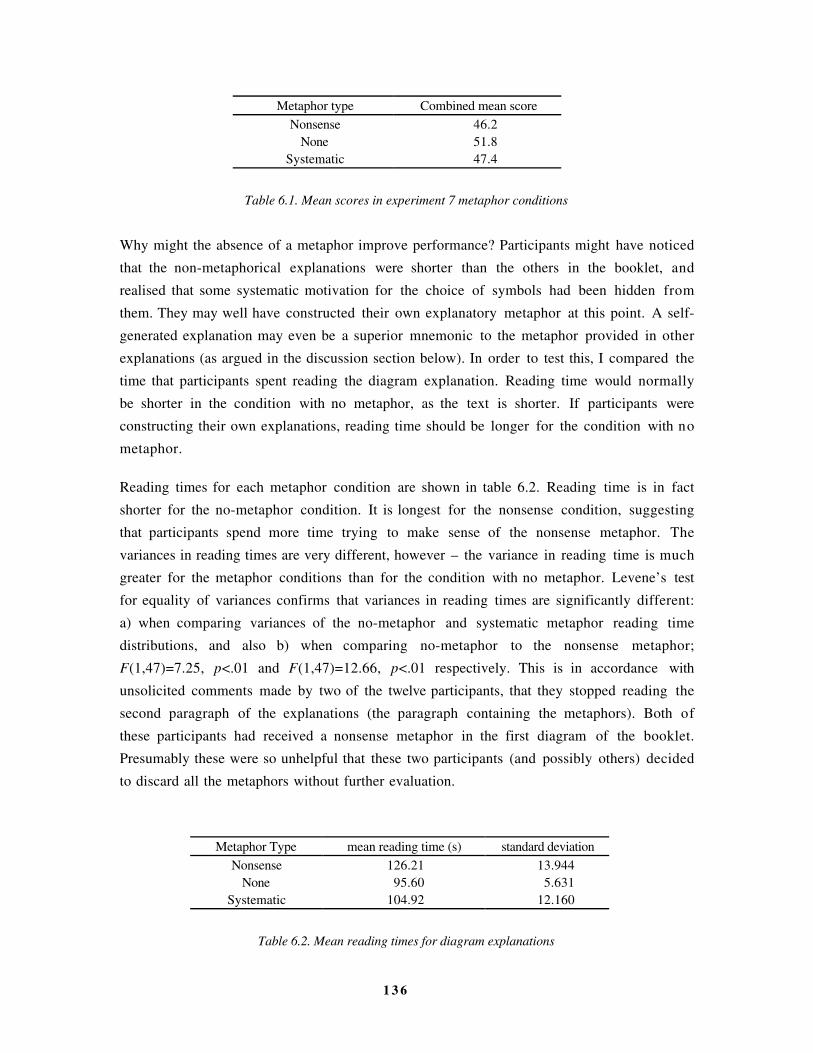
1 3 6
Metaphor type Combined mean score
Nonsense 46.2None 51.8
Systematic 47.4
Table 6.1. Mean scores in experiment 7 metaphor conditions
Why might the absence of a metaphor improve performance? Participants might have noticed
that the non-metaphorical explanations were shorter than the others in the booklet, and
realised that some systematic motivation for the choice of symbols had been hidden from
them. They may well have constructed their own explanatory metaphor at this point. A self-
generated explanation may even be a superior mnemonic to the metaphor provided in other
explanations (as argued in the discussion section below). In order to test this, I compared the
time that participants spent reading the diagram explanation. Reading time would normally
be shorter in the condition with no metaphor, as the text is shorter. If participants were
constructing their own explanations, reading time should be longer for the condition with no
metaphor.
Reading times for each metaphor condition are shown in table 6.2. Reading time is in fact
shorter for the no-metaphor condition. It is longest for the nonsense condition, suggesting
that participants spend more time trying to make sense of the nonsense metaphor. The
variances in reading times are very different, however – the variance in reading time is much
greater for the metaphor conditions than for the condition with no metaphor. Levene’s test
for equality of variances confirms that variances in reading times are significantly different:
a) when comparing variances of the no-metaphor and systematic metaphor reading time
distributions, and also b) when comparing no-metaphor to the nonsense metaphor;
F(1,47)=7.25, p<.01 and F(1,47)=12.66, p<.01 respectively. This is in accordance with
unsolicited comments made by two of the twelve participants, that they stopped reading the
second paragraph of the explanations (the paragraph containing the metaphors). Both of
these participants had received a nonsense metaphor in the first diagram of the booklet.
Presumably these were so unhelpful that these two participants (and possibly others) decided
to discard all the metaphors without further evaluation.
Metaphor Type mean reading time (s) standard deviation
Nonsense 126.21 13.944None 95.60 5.631
Systematic 104.92 12.160
Table 6.2. Mean reading times for diagram explanations

1 3 7
Discussion
This experiment repeats the finding of experiment 2, that systematic metaphors are of little
assistance in remembering and interpreting these diagrams. Performance with systematic
metaphors is once again similar to that with nonsensical metaphors. These two treatments have
more in common, in fact, than a case with no metaphor at all.
In analysing these results, I have considered the possibility that participants may be
constructing their own metaphor in the case when none is given. This has previously been
found to assist novices learning to use computer systems. Carroll and Mack (1985) describe
an unpublished study by Carroll and Lasher, in which learning was improved when users
created their own metaphor. Jones (1984) has also noted that novices learning a
programming language invent their own metaphors to explain the behaviour of their program
by comparing it to other types of software that they are familiar with, such as word
processors.
There is certainly clear evidence that some participants in this experiment ignored the
metaphorical explanations, presumably substituting their own mnemonic strategies. The range
of potential strategies is very large, and is subject to individual variation (MacLeod, Hunt &
Mathews 1978, Kaufmann 1979, Matsuno 1987, Riding & Douglas 1993, Sein et. al. 1993) as
well as cultural variation (Kearins 1981) and differences in self-image (Katz 1983). This
possibility is explored in the following two experiments by asking participants to report, after
completing the experiment, what mnemonic strategy they had used for each diagram.
Experiment 8: Explicit metaphor as a mnemonic aid
In experiment 7, as in experiment 2, diagram metaphor was assessed in terms of the benefits it
would provide in learning to use the diagram for problem-solving tasks. Experiment 7 raised
an interesting question regarding the effect of individual mnemonic strategies – some
differences in performance appeared to result from mnemonic benefits which may have been
mostly obscured by the substantial problem-solving demands in the experimental tasks. A
similar distinction between memory and comprehension of diagrammatic material can be
found in an experiment by Potter et. al. (1986). Participants were presented with rebus
sentences – sentences in which some of the words were replaced by pictures. They then
performed both recall tasks and plausibility judgement tasks. Potter et. al. found that
plausibility tasks took longer when pictures were included in a sentence, but that recall tasks
took the same amount of time. They use these results to argue that semantic judgements

1 3 8
involve lexical representations, and that additional time is required to translate pictorial
material into lexical form.
The tasks used in experiments 2 and 7 involved a substantial degree of problem solving. If, as
Potter et. al. claim, semantic processing of pictorial material is slower than that of verbal
material, interpreting the problem statements in metaphorical terms may actually have
impaired performance. This could have some bearing on the slight improvement in
performance when no metaphor was given in experiment 7.
In this experiment, the tasks were therefore modified to emphasise recall of the instructional
material rather than problem solving. All the diagram explanations were given at the start of
the experiment, resulting in an interval of around 20 minutes between presentation and test.
An explicit recall test, with no problem-solving component, replaced the comprehension
questions. The diagrams themselves were also modified, including two new diagram types
which emphasised recall of individual symbols rather than complex geometric syntax. In
these simpler diagrams and tasks, any potential handicaps arising from semantic access to
pictorial material should be reduced, and the residual mnemonic advantages of instructional
metaphor should be clearer. The expected mnemonic advantage can again be explained in
terms of the experiment by Bower, Karlin and Dueck (1975) that was described in the
introduction to experiment 7 – they found that recall of a visual riddle was improved when a
pictorial interpretation was given.
Notation
Participants in this experiment learned to use novel types of diagram, as in experiments 2 and
7. These included two of the diagrams that had been used in those experiments: one
presenting flow of control as a washing machine cycle, and one presenting visibility as
telephone availability. There were also two new diagrams. These expressed spatial concepts
rather than abstract computational concepts, and the spatial organisation of the diagram had a
direct correspondence with the spatial layout of the situation that it referred to. The full
explanations of these diagrams, as presented to participants, have been reproduced in
appendix B.8.
The first of these new diagrams was essentially a map: the two dimensions of the paper were
used to show the plan view of a gold mine. The map was schematic rather than pictorial, and it
was annotated with symbols indicating what sort of excavation would be required at different
locations. An example of the diagram is shown in figure 6.3. The six symbols represent large
deposits of gold, individual whole gold nuggets, sprinkled gold powder, rock which must be

1 3 9
crushed to yield gold ore, as well as places where it was necessary to cut through rock walls, or
removing blockages from tunnels.
D2
E6
A2
B2
D7
A8
G4
B7
E2
E7
C1
C3
1 2 3 4 5 6 7 8
A
B
C
D
E
F
G
A4
B4
C4
E3
C8
Figure 6.3. Diagram showing gold mine layout
Each of the six symbols could be explained by giving it a metaphorical interpretation. A
single metaphor domain was chosen, in which gold mining operations were related to table
cutlery. The metaphorical explanation of the diagram compared three of the symbols to a
knife, fork and spoon: the knife expressed cutting through rock walls, the fork picking up
individual nuggets and the spoon scooping up bulk deposits of gold. The other three symbols
were compared to a salt shaker (sprinkling of gold dust), a nut cracker (crushing gold ore)
and a corkscrew (removing blockages from tunnels).
The second new diagram used the two dimensions of the paper to represent altitude and
time/distance as an aeroplane approaches landing. An example of the diagram is shown in
figure 6.4. This schematic diagram also included six symbols to represent actions taken by
the pilot: checking for a clear path, lining up with the runway, turning landing lights on,
selecting different ranges of engine speeds, slowing down and lowering landing gear.

1 4 0
t-19 t-17 t-15 t-13 t-11 t-9 t-7 t-5 t-3 t-1
Figure 6.4. Diagram showing aircraft landing approach
The explanatory metaphor for this diagram was created by analogy to the controls of a car.
Lining up with the runway was represented by a simple circle like a steering wheel. The
symbol for selecting ranges of engine speeds was compared to a gearlever, the symbol for
slowing down to a brake pedal, and the symbol for lowering landing gear to a handbrake.
The symbol showing when the pilot should check for other planes in the area was compared
to a rear vision mirror. Finally, the symbol for turning on landing lights was described as an
indicator stalk on the side of a steering column.
The two computational diagrams from experiments 2 and 7 were also modified slightly, so
that they also included six different symbols which had to be memorised. I added another
symbol to the flow of control diagram to indicate the measurement of some quantity (such as
temperature or water level) which might start or stop a process. This symbol was described
metaphorically as a gauge. The modified diagram is shown in Figure 6.5.

1 4 1
Wash
Turn
Cold Hot
Fill
Drain
PumpCold Hot
Fill
Turn
Spin
Turn
Rinse
Too Hot
Too Cold
Rinse Cycle
Water Full
Time Over
Water Empty
Operator Start
Figure 6.5. Flow of control diagram including six different symbols
The visibility diagram introduced in experiment 2 (and illustrated in appendix B.2.) was used
again here. No further symbols were added to it, but the instructions now explicitly described
straight lines as a sixth meaningful element (they had previously been treated as default
“plain” lines distinguished only because of the fact that they were not dashed). The
metaphorical explanations of the two types of dashed line were the same as in experiments 2
and 7. Plain lines were now described as a footpath, along which a postman could walk to
deliver messages in writing, as opposed to the higher speed road and rail connections
represented by dashed lines.
Tasks
Memory for the diagram definitions was tested using two different tasks. In the first,
participants completed a diagram from which all the symbols had been removed, drawing
appropriate symbols according to a set of problem constraints phrased in terms of the
problem domain. This task tests both comprehension of the diagram definition and memory
for symbol form.
In the second task, participants were shown a set of six symbols taken out of the diagram
context, and were asked to write the meaning of each symbol alongside it as a straightforward
recall test. All tasks are illustrated in appendix B.8.
1 4 2
Equipment
As in experiments 2 and 7, material was presented to participants in booklet form. Participants
wrote directly in the booklet, and used a stopwatch to record the amount of time they spent
working on each page.
Hypotheses
1. That problem solving performance using the two concrete diagram types (mine
layout/cutlery and landing path/car controls) would be superior to that using the
abstract diagrams.
2. That provision of a metaphor would improve memory for the symbols used in the
diagram, and that this effect would be larger in the case of the abstract diagram
types than for the concrete diagrams.
Participants and design
Eight participants were recruited from the APU volunteer panel. There were no factors varied
between subjects, and three independent variables within subjects, The first independent
variable had two levels: the metaphor was either present in the explanation of the diagram, or
absent. The second independent variable was the nature of the diagram. The two new
diagrams both map space in the diagram to a concrete physical dimension: to the ground
plan of the gold mine, or to altitude along the flight path. The two diagrams expressing
computational concepts only use space topologically to represent abstract relationships.
These two factors form a latin square, but the allocation of metaphor/space conditions to
diagrams was balanced across participants, producing the same balanced confound as in
experiments 2 and 7. The third independent variable was the type of task used to test memory
for the diagram definitions; the completion and recall tasks described above.
There were three dependent variables: the time taken to read the diagram explanation, speed
in the completion and recall tasks, and accuracy for the completion and recall tasks.
Accuracy scores were again normalised for each task, so that treatment effects could be
compared using scores on different tasks. The two hypotheses were tested in terms of these
normalised scores.

1 4 3
Procedure
As in experiments 2 and 7, presentation order was established by order of pages in the
booklet. In this experiment all four diagrams were presented together at the beginning of the
booklet. These were followed by four diagram completion tasks (in the same order as the
diagrams had been explained), and then by the four symbol definition tasks. At the end of
the booklet, a page of debriefing questions asked participants to report what technique they
had used to remember each set of symbols.
Completed booklets were scored by comparison to ideal worked solutions, and marking was
done while blind to the metaphor condition with which diagrams had been explained.
Diagram completion tasks were scored by awarding up to three marks for each of the six
symbols. One mark was awarded if the form of the symbol was recognised by a rating panel
(the organisation of the rating panel is described separately below, under the heading
Experiment 8A). A further mark was awarded if the form of the symbol was precisely as in
the original explanation (i.e. all elements of the symbol are present and they are oriented
correctly to each other). A third mark was awarded if the symbol was included in all the
locations where it appeared on the worked solution, and no more.
The symbol definition tasks were scored by awarding up to three marks for the definition of
each of the six symbols. One mark was awarded if the definition distinguished the
interpretation of this symbol from that of the other five symbols. A second mark was given if
the definition was completely accurate. A mark was subtracted if the symbol was given an
interpretation that should have been allocated to a different symbol.
Results
One participant in the original group of eight completed the test booklet out of order, after
missing the page that provided the initial explanation of one of the diagrams. A ninth
participant was recruited to replace those results, and the out-of-order results have not been
considered any further.
The first hypothesis was that tasks using the two simpler concrete diagram types would be
completed more quickly than those using the abstract diagrams. Task completion times in the
different conditions are shown in Figure 6.6. As predicted, participants took twice as long to
complete tasks using the abstract diagrams, F(1,7)=12.20, p<.01. There was no main effect of
metaphor presence on mean task completion time, and there was no interaction of metaphor
with the time taken to complete either type of diagram or either task.

1 4 4
0
5 0
100
150
200
250
Abstract Concrete
Co
mp
leti
on
ti
me
(s
ec
on
ds
)
Diagram Type
0
5 0
100
150
200
250
Absent Present
Co
mp
leti
on
ti
me
(s
ec
on
ds
)
Metaphor
Figure 6.6. Task completion times for each condition in experiment 8
The second hypothesis was that provision of a metaphor would improve memory for the
symbols used in the diagram, and that this effect would be larger in the case of the abstract
diagram types than for the concrete diagrams. A multivariate comparison of completion time
and accuracy (MANOVA) shows a two way interaction between diagram type and recall task
performance, F(2,6)=9.96, p<.05 – in the abstract diagrams, accuracy in the symbol recall
task was superior to that in diagram completion tasks. For the concrete diagrams, the reverse
was true, as shown in figure 6.7. The inclusion of metaphor was apparently associated with a
slight improvement in accuracy for recall tasks, and a slightly greater improvement for
diagram completion tasks, but neither the main effect of metaphor nor the interaction is
significant, F(1,7)=0.29, p=.605 and F(1,7)=0.001, p=.978. There was no improvement at all
for abstract diagram types, however. Inclusion of an explanatory metaphor produced
improved scores in the concrete diagrams, but actually impaired performance in abstract
diagrams, as shown in figure 6.8. This interaction is marginally significant, F(1,7)=5.161,
p=.057.

1 4 5
3 0 %
4 0 %
5 0 %
6 0 %
7 0 %
8 0 %
Abstract Concrete
R e c a l l Completion
No
rma
lis
ed
p
erf
orm
an
ce
Diagram Type
3 0 %
4 0 %
5 0 %
6 0 %
7 0 %
8 0 %
Absent Present
No
rma
lis
ed
p
erf
orm
an
ce
Metaphor
Figure 6.7. Recall and completion performance for each diagram type and metaphor
30%
40%
50%
60%
70%
80%
Abstract Concrete
No metaphor
Metaphor
No
rmalised
perf
orm
an
ce
Diagram type
Figure 6.8. Interaction of diagram type and metaphor
As in experiment 7, I also compared the times spent reading the diagram explanations, in
order to examine any strategic differences in mnemonic strategies. Reading times were again
longer when metaphors were included in the explanation than when they were not,
F(1,7)=10.54, p<.05. This is consistent with the fact that the metaphorical explanation texts
were longer. Reading times were also longer for abstract diagram types than for concrete
diagrams, F(1,7)=19.37, p<.01, but this is not the result of any difference in the length of the
texts: it reflects the fact that the abstract diagrams are simply more complex, and take longer
to understand with or without a metaphor. Participants tended to spend longer reading
explanations of abstract diagrams when a metaphor was provided, as shown in Figure 6.9 –

1 4 6
this implies that they did spend time forming a metaphorical model of the more complex
diagrams, but the tendency is not statistically significant, F(1,7)=3.75, p=.094.
0
50
100
150
200
250
Abstract Concrete
No metaphor
Metaphor
Read
ing
tim
e (
seco
nd
s)
Diagram type
Figure 6.9. Explanation reading time: interaction of metaphor with diagram type
At the end of the booklet, participants reported the method they had used to remember
symbols. Of the sixteen diagrams for which no metaphor was provided (two for each
participant), participants reported for nine of them that they had constructed their own
metaphors. Some of these constructed metaphors appeared to be related to the intentional
design of the symbols; for example in the case of the gold mine (“symbols partly look like
the job they are doing”) or for the flight path (“imagined flying plane”). Other metaphors
were completely original; again in the case of the gold mine, the “fork” symbol for picking
up individual nuggets was described by one participant as “like a coffee bean (one nugget)”
and by another as “rounded like chicken nuggets”. Some mnemonic techniques were
apparently verbal (“I remembered circle triangle square in order”), and one participant
appeared to use synesthetic mnemonics – “a circle was a green go sign and a square a red
stop sign” (the symbols were not printed in colour), and “the rock was angular and harsh”.
Experiment 8A): Rating of symbol forms
In experiment 8, participants were asked to draw symbols from memory in the diagram
completion task. Some of the productions were not immediately identifiable as corresponding
to any of the defined symbols. The causes of this inaccuracy may be related to the fact that so
many adults are unable to draw what they see. Cohen and Bennett (1997) attribute this to
misperception of the object being drawn, resulting from biases in existing knowledge. In
children’s drawing, the ability to reproduce figures also relies on developing a repertoire of
standard components (Fenson 1985) that may not be combined strictly according to the

1 4 7
visual appearance of a shape being copied. Whatever the cause of inaccuracy, it is quite
possible that some of the inaccurate reproductions in this experiment were influenced by the
instructional metaphor. If I had rated these productions myself, my familiarity with the
metaphor would certainly have biased my assessment in favour of those that were consistent
with the metaphor, thereby favouring implicit recall of the metaphor rather than accurate
recall of the diagram. Experiment 8 was therefore followed by this independent rating
exercise.
Procedure
Five raters were recruited from staff and students at the APU. None of the raters had
previously seen the diagrams, their definitions or the metaphorical explanations. Each rater
was given a set of photocopied pages, each one of which contained one of the sets of six
symbols defined for the diagrams, but included neither any verbal explanation nor diagram
context. In addition to the six original symbols, the page contained photocopies of all
ambiguous productions created during the diagram completion tasks. I asked the raters to
decide whether each production corresponded unambiguously to one of the symbols, and if
so, which symbol.
Results
In general, the raters were conservative in identifying productions, and judged a relatively
large number of symbols to be ambiguous. The majority decision from the five raters was
used to score each symbol that had been produced by subjects in experiment 8. The scores
based on these ratings are the ones that are reported in the results section for experiment 8.
Discussion
This experiment introduced two new diagrams where the interpretation of the diagram
involved a simple spatial correspondence between the diagram layout and the problem
domain, rather than a more complex abstract syntax. Tasks using these diagrams were
completed far more quickly, reflecting the relative simplicity of representations based on
spatial correspondence. In the more complex abstract diagrams, participants were able to
recall symbols, but had greater difficulty in using them to complete partial diagrams. The
reverse was true for the simple concrete diagrams – performance on completion tasks was
improved relative to symbol recall tasks. Experiment 9 further investigates the distinction
between symbol recall and structural comprehension tasks.
1 4 8
The effect of the instructional metaphor in this experiment can be considered in terms of this
difference between the two diagram types. The metaphor appears to have provided a greater
advantage in the case of simpler, concrete diagrams. In these diagrams the problem-solving
component is reduced even further, as the metaphor is used mainly as a pictorial mnemonic,
rather than as an aid to interpreting the structure of the diagram. In the complex abstract
tasks, introduction of the metaphor may even impair performance as a result of the additional
demands associated with interpreting the metaphor – these increased demands are reflected in
longer reading times.
Experiment 7 discussed the possibility that some participants gained more advantage by
developing their own explanatory metaphors, rather than reading an instructional metaphor
that was provided for them. The benefits of self-generated metaphor have been reported by
Carroll and Mack (1985) and by Jones (1984). In the debriefing questionnaire of this
experiment, most participants did report using metaphorical mnemonic strategies even when
no metaphor had been provided. These mnemonic metaphors must have been constructed
while participants were reading the diagram explanations, but reading times were shorter in
the cases where no metaphor was provided. These mnemonic metaphors must therefore have
been constructed more quickly than the time it takes to read and interpret an existing
metaphor. Furthermore these self-generated metaphors are equally effective as mnemonic
devices. This is considered further in experiment 9, where more detailed pictorial content
facilitates self-generated metaphors.
Experiment 9: Comparison of explicit and implicit metaphor
This experiment compares the two styles of diagrammatic metaphor that have been
considered separately in the rest of this thesis. Experiments 1, 3, 5 and 6 evaluated the results
of implicit diagrammatic metaphor: diagrams which incorporate pictorial symbols, but
without explicitly describing how those symbols should be interpreted. This is the general
practice in the graphical user interfaces of many commercially available software packages,
anticipated by the cognitive theories of metaphorical abstract concept representation
proposed by Smith (1977). Experiments 2, 7 and 8 investigated explicit diagrammatic
metaphors; the intended interpretation was explained using instructional metaphors. Most
psychological theories of metaphor use in HCI accordingly consider it to be an instructional
device (Mayer 1975, Carroll & Thomas 1982, van der Veer 1990).
This experiment compares diagrams constructed from pictorial and abstract symbols, both
with and without explicit descriptions of the intended metaphorical interpretation. The

1 4 9
observations of experiments 7 and 8 allow two hypotheses that have not been anticipated by
previous theories of metaphor use. The first is that the benefits of metaphor will be mainly
observed in improved recall for symbol definitions, but will not improve performance in tasks
where structural interpretation of the diagram is the main task component. The second is that
implicit pictorial metaphor will provide a greater advantage than explicit instructional
metaphor because it will facilitate the construction of self-generated metaphors, which will
provide greater benefit in recall tasks.
Notation
Participants in this experiment learned to use novel types of diagram, as in experiments 2, 7
and 8. The diagrams used in experiments 2 and 7 expressed computational concepts, while
experiment 8 introduced more straightforward spatial representations (goldmine layout, and
aeroplane landing path). The two spatial representations from experiment 8 were used again
here, along with two new diagram types. These two also relied on conventional usage of
space. One expressed spatial layout as a direct mapping. The other presented timelines
running from left to right and symbols that associated height with increasing quantity. These
conventions have been verified experimentally by Gattis and Holyoak (1996), who reported
reduced accuracy when the conventions are not observed during graph construction, and by
Tversky, Kugelmass and Winter (1991), who found that even pre-literate children tend to
organise quantitative information along these axes.
The first of the new diagrams introduced in this experiment shows predicted performance of
stocks over several years in the market. The diagram is laid out in a conventional tabular
form, with the time axis running from left to right, as shown in Figure 6.10. Each row of the
table is a time line showing predicted performance of a particular stock in future years. The
symbols that can be placed along the timeline show whether the stock is expected to rise or
fall, to oscillate or become unstable, and whether it is cyclical around a stable price or
climbing overall.

1 5 0
Company A
Company B
1999 2000 2001 2002 2003 2004
Company C
Company D
2005
Figure 6.10. Stock market diagram.
E.g. the stock of company D is expected to climb in 2003
As in experiment 8, these symbols can be explained in terms of a systematic metaphor, where
some resemblance is described between the symbol that is used and an element of the
metaphor source domain. In this experiment, however, that resemblance is made far more
apparent by replacing the stylised symbol with a small photograph of the actual source
metaphor element. The corresponding photographs used in place of each symbol for the
stock market diagram are shown in Figure 6.11. The systematic metaphor in this case is the
range of motions made by playground equipment.
A seesaw represents a stock that is simply oscillating without rising. A slide represents a
falling stock, and a swing is used for a stock that is oscillating, but rising higher each time. An
unstable stock is represented by a rocking horse, a rising stock by a climbing frame, and a
cyclical one by a roundabout.
Figure 6.11. Stock market playground metaphor

1 5 1
Figure 6.12 shows the same stock market diagram as in Figure 6.10, but with the stylised
symbols replaced by photographic icons.
Company A
Company B
1999 2000 2001 2002 2003 2004
Company C
Company D
2005
Figure 6.12. Stock market diagram with metaphorical photographs
The second new diagram expressed constraints in the layout of a newspaper front page; an
example is shown in Figure 6.13. As in the previous diagram, constraints are represented by
six different symbols that can be placed anywhere on the page layout. These symbols indicate
attributes of the stories that should be placed in different locations: the main story of the day,
an attractive photograph, an analysis story, a dull story, or stories that should be placed at the
top of the page or in small gaps.

1 5 2
Daily Planet
Figure 6.13. Newspaper layout diagram
The metaphorical presentation of the newspaper layout symbols is shown in Figure 6.14. The
systematic basis of the metaphor comes from the attributes assigned by convention to
different animals. A dull story is represented by a tortoise, a story at the top of the page by a
giraffe, a story for filling small gaps by a mouse, an analysis story by an owl, a large main
story by a whale, and an attractive photograph by a butterfly. As drawings of animals are
more easily obtained than photographs, I used realistic line drawings in the pictorial version
of the diagram.
Figure 6.14. Newspaper layout animal metaphor
I also prepared pictorial versions of the two diagrams that were introduced in experiment 8.
For the aeroplane landing diagram I used photographs of appropriate car controls, treated in

1 5 3
the same way as has been described for playground equipment. For the gold mine diagram I
used photographs of cutlery, taken against a white background. These two sets of
photographs are shown alongside the corresponding stylised symbols in Figures 6.15 and
6.16.
Figure 6.15. Aeroplane landing symbols and car controls metaphor
Figure 6.16. Gold mine symbols and cutlery metaphor
Tasks
Participants completed two tasks using each diagram. The first was a comprehension task
similar to that used in experiments 2 and 7. In the stock market task, participants identified
stocks to buy according to certain criteria. In the gold mine task, participants identified which
shaft in the mine would involve the greatest total effort or profit. The tasks used for the
aeroplane landing and newspaper layout diagrams involved finding inconsistencies in a
complete diagram, when assessed according to a supplied set of constraints. These tasks are
reproduced in appendix B.9.
The second task was the recall task previously used in experiment 8, in which all six symbols
that had been used in each diagram were presented out of context, and participants wrote
definitions of each symbol.

1 5 4
Diagram completion tasks were not included in this experiment because it was not practical
for participants to complete diagrams by drawing the photographic symbols.
Equipment
As in experiments 2, 7 and 8, material was presented to participants in booklet form.
Participants wrote directly in the booklet, and used a stopwatch to record the amount of time
they spent working on each page.
The photographic versions of the diagram symbols were prepared by taking photographs of
playground equipment, car controls and cutlery with a digital camera. I then used Adobe
Photoshop software to mask the structural aspects of the scene that were relevant to the
metaphor, and reduced the contrast of the background. The photographs then cropped to
emphasise the metaphorical features, and reduced to cover an area of approximately 3 or 4
cm2 at a resolution of 200 dpi. The animal drawings were scanned from stimuli used in
another experiment at the APU, and reduced to the same size and resolution.
Hypotheses
1. That neither the implicit nor explicit metaphor will significantly improve problem
solving performance.
2. That an implicit pictorial metaphor will improve recall more than explicit
metaphor, because it will facilitate self-generated metaphor.
3. That reading time will be shorter when pictorial symbols are provided, indicating
that generation of a metaphor is more efficient than interpretation of
metaphorical instruction.
Participants and design
Twenty four participants were recruited from the APU panel of volunteers. There were no
factors varied between subjects, and three independent variables within subjects. The first
independent variable had two levels: the metaphor was either explicitly present in the verbal
explanation of the diagram, or absent. The second independent variable was the form of
symbols used as elements in the diagram: these were either pictorial or stylised. These two
independent variables were balanced in a latin square design, but as in previous experiments
there was a partial confound with the actual diagram. As before, this partial confound was

1 5 5
balanced across all participants. Performance was again tested using two different tasks: the
comprehension and recall tasks described above.
There were three dependent variables: the time taken to read the diagram explanation, speed
in the comprehension and recall tasks, and normalised accuracy scores for comprehension
and recall tasks. The first hypothesis was tested in terms of speed and accuracy, the second in
terms of accuracy in the recall task, and the third in terms of reading time.
Procedure
Participants followed the same time-keeping procedure as in previous experiments, recording
the time when they started working on each page. All four diagrams were presented at the
start of the booklet, with explicit metaphor either present or absent from the explanations as
appropriate. The presentation order of the different diagrams was the same for every
participant: this meant that the presentation order of the different metaphor conditions was
appropriately balanced.
The presentation of the diagrams was followed either by four pages with a comprehension test
for each diagram, or by four pages with a recall test for each diagram. The comprehension
test in this experiment involved finding inconsistencies in a complete diagram, when assessed
according to a supplied set of constraints. This style of test was used rather than the diagram
completion tasks of experiment 8 because it was impractical to ask participants to complete
diagrams by drawing photographic symbols. The tests for each diagram were presented in the
same order as the diagrams had been explained, but the order of the two blocks of tests,
comprehension and recall, was balanced across participants. As in experiment 8, a debrief
questionnaire at the end of the booklet asked participants to report what technique they had
used to remember each set of symbols.
Completed booklets were scored by comparison to ideal worked solutions, and marking was
done while blind to the metaphor condition with which diagrams had been explained. The
straightforward memory task, in which participants wrote the definition of a symbol, was
scored using the same procedure as described in experiment 8. The comprehension tasks
were scored by subtracting one mark for every problem constraint that was violated in the
solution. Where no response was made to some parts of a question, further marks were
subtracted. These were allocated so that each solution started with a possible ten marks, which
were reduced to zero if no answer was given. A large number of constraint violations could
result in a score below zero, however.

1 5 6
Results
The first hypothesis was that neither the form of the symbols nor the provision of a verbal
metaphor would improve problem solving performance. Both problem solving scores and
recall scores are shown in figure 6.17. Problem solving performance in tasks with an explicit
verbal metaphor supplied actually tended to be poorer than for those without the verbal
metaphor, although this difference was not statistically significant, F(1,23)=0.84, p=.368.
There was, however, a significant improvement in performance as a result of the implicit
pictorial metaphor, F(1,23)=4.49, p<.05.
3 0 %
4 0 %
5 0 %
6 0 %
7 0 %
8 0 %
9 0 %
Recal l Problem solving
Explicit metaphor
Absent Present
No
rma
lis
ed
p
erf
orm
an
ce
T a s k
3 0 %
4 0 %
5 0 %
6 0 %
7 0 %
8 0 %
9 0 %
Recal l Problem solving
Implicit Metaphor
Absent Present
No
rma
lis
ed
p
erf
orm
an
ce
T a s k
Figure 6.17. Problem solving and recall scores with implicit and explicit metaphors
The mean times taken to complete the recall and problem-solving tasks were approximately
10% slower in cases where an explicit metaphor had been provided, although this was not
statistically significant for either recall or problem solving, F(1,23)=3.49, p=.121 and
F(1,23)=2.59, p=.074 respectively.
The second hypothesis was that the pictorial symbols of the implicit metaphor would
selectively improve recall performance. This was the largest effect observed in the experiment,
F(1,23)=26.09, p<.001. Unlike the problem solving scores, inclusion of explicit metaphor did
produce a slight trend toward improving the recall score, but the effect of explicit metaphor is
not significant, F(1,23)=0.90, p=.353.
The third hypothesis was that reading time would be shorter when pictorial symbols are used
rather than abstract ones. This was the case, as shown in figure 6.18, F(1,23)=5.51, p<.05.
The difference was larger than the difference in length of the text resulting from presence of
an explicit metaphor. The effect of pictorial symbols on reading time also tended to be larger

1 5 7
when no explicit metaphor was included in the explanation, although the interaction was not
significant, F(1,23)=1.14, p=.297. This supports the conclusion made in experiment 7, that
users of diagrams can generate mnemonic metaphors relatively quickly compared to the time
that it takes to understand a metaphor provided with the diagram explanation.
80
90
100
110
120
130
Absent Present
Re
ad
ing
tim
e (
se
co
nd
s)
Explicit metaphor
80
90
100
110
120
130
Absent Present
Re
ad
ing
tim
e (
se
co
nd
s)
Implicit metaphor
Figure 6.18. Variation in reading time with implicit and explicit metaphors
The presentation of results for experiment 8 included a simple count of the number of
occasions on which participants described a mnemonic technique involving their own
metaphorical system. In this experiment, each of the 24 participants received instructions
without a metaphor for one diagram with pictorial symbols, and for one diagram with
geometric symbols. Of the 24 pictorial cases, 20 participants reported the creation of a
metaphor based on the pictures. Of the 24 geometric cases, only 9 participants reported the
creation of a metaphor. As in experiment 8, the metaphors developed for geometric symbols
were often imaginative. The grid that represented a climbing frame for rising share prices was
remembered by one participant as a “prison gate to lock in profits” and by another as “ a
grate time to buy”. The non-metaphorical strategies that were reported included non-specific
verbal strategies (“associate a word with each symbol”) and sequential strategies (“tried to
remember them in order”). Of the four pictorial cases where a metaphor was not reported,
one participant reported a verbal strategy (“talked myself through them”), one a spatial
strategy (“tried to remember positions on the page”), one indeterminate (“by association”)
and one simple failure (“I didn’t construct a method”).
I also tested for any effect of varying the order of problem solving and recall tasks, to
determine whether the presentation of problem solving tasks before recall tasks in experiment
8 may have improved recall performance as a result of rehearsal effects unrelated to the
metaphor treatment. There was no significant difference between any of the four independent
variables in cases where recall was tested before and after problem solving: t-tests of order

1 5 8
effects on scores for problem solving and recall respectively were t(22)=0.220, p=.82
t(22)=0.501, p=.62, while t-tests on the times taken to complete these tasks were also non-
significant: t(22)=0.762, p=.45 and t(22)=0.923, p=.36 respectively.
Discussion
The results of this experiment confirm the hypotheses regarding the relative benefits of
implicit pictorial metaphor and explicit explanatory metaphor. Metaphor in diagrams is
mainly a mnemonic aid rather than a structural aid to interpretation of the diagram.
Furthermore, this mnemonic aid is more pronounced where the pictorial content allows users
to generate their own metaphors, rather than when an explicit instructional metaphor is
provided.
The mnemonic advantage of pictorial material is predicted by several theoretical models.
Paivio’s dual coding model predicts that associating any concrete image with the presentation
of verbal information will improve recall (Paivio 1971,1983). Marschark and Hunt (1985)
have demonstrated that a high rating of imageability of a verbal metaphor is a good predictor
for later free recall of that metaphor. Glenberg and Langston (1992) explain the value of
illustrations accompanying text as resulting from the formation of a richer mental model,
where the additional information in the illustration facilitates the noticing of many
relationships that might only be implicit in the text (although Langston, Kramer & Glenberg
(1998) have recently reconsidered the assumption that noticing results from mental image
representations – it seems that implicit spatial relationships in simple verbal descriptions are
seldom noticed). In any case, mental models constructed as self-generated metaphors are
likely to be richer than those formed while interpreting texts.
The effect on performance of changing the degree of pictorial detail, and hence varying the
amount of information provided in pictures, has been investigated before. The work of
D. Schwartz (1995) was reported in chapter 4 – he found that lower fidelity representations
were more likely to be analysed symbolically rather than by mental animation strategies.
Goolkasian (1996) reports that comparative judgements made from simple geometric stimuli
are faster than those made from verbal stimuli, whereas Potter et. al. (1986), as discussed in
experiment 8, find that pictorial stimuli take longer to process than words. Nelson, Metzler
and Reed (1974) compared recognition performance for words, line drawings and
photographs. They found an advantage of pictures over words, but no further advantage from
increasing pictorial detail (although their black and white photographs were relatively poor
compared to modern experimental stimuli). Ryan and C.ÊSchwartz (1956) found that
caricatures were interpreted faster than either line drawings or photographs – this seems

1 5 9
unsurprising, as the caricatures made salient features more prominent. These rather mixed
results do not provide a firm foundation for generalisation to either diagrams or to HCI.
Strothotte and Strothotte (1997) note that, although graphical symbols in a user interface
must ultimately be interpreted by convention, the benefits of representational detail are
disputed. They quote Dale (1969) as recommending realism for educational purposes, while
Travers (1964, cited by Strothotte & Strothotte) criticises this practice as the “worship of a
false god”.
An interesting investigation of pictorial detail in user interface icons that does support the
findings of this experiment is reported by A.ÊGreen and Barnard (1990). They observed the
time that users took to select a specific icon from an array of distractors. The icons in the
array were either abstract symbols or representational pictures. They found that search times
for the representational pictures were initially slower than for abstract symbols, but that
improvement with practice was significantly greater for representational pictures. Rohr (1987)
has also investigated two alternative models of pictorial information in user interfaces. The
first is derived from Jackendoff’s theory of conceptual semantics (1983), in which the
structural categories of the physical world are applied systematically to the interface
representation. The second is derived from Paivio’s dual coding theory (1971), in which
images provide mnemonic codes. Rohr found that experimental participants could be divided
into two groups: visualisers were more likely to improve their recall using pictures as a result
of dual coding; formalisers were more likely to apply structural categories to the user
interface, but they did this using verbal strategies rather than visual strategies.
These two studies support the results found in this experiment – Green and Barnard report
that representational detail supports learning, and Rohr reports that pictorial icons are more
likely to be used to assist recall than they are to support systematic metaphors. They are
relatively unusual amongst previous studies of user interface metaphor, however. Most
previous research has emphasised the benefits of systematic metaphor in designing graphical
or diagrammatic user interfaces. The results found here suggest that simple mnemonic effects
are far more significant.

1 6 0
Chapter 7: Conclusions
Then thought I to understand this:but it was too hard.
Psalm 73:15
This thesis set out to investigate a widely held belief about the diagrams in graphical user
interfaces: that they are interpreted in terms of metaphor. As with other types of diagram, user
interfaces cannot be treated simply as if they are a form of language, or as if they are objects
to be perceived without interpretation. The user of any diagram must interpret it according to
the intention with which it was constructed (Ittelson 1996), and there are many cases in which
diagrams are intended as figurative rather than literal representations. The figurative intention
in a diagram might be regarded either as analogical, transferring the structure of graphical
variables to the domain of a problem (Bertin 1981, Larkin & Simon 1987), or as allegorical,
embodying abstractions as some analogue of objects in physical space (Jackendoff 1983,
Johnson 1987).
When user interface design textbooks recommend the use of metaphor as a basis for new
designs they do not investigate these theoretical alternatives too carefully. Such investigation
might even seem foolhardy, because empirical research projects in HCI often fail to find
significant benefits when metaphors are compared to non-metaphorical interfaces (Simpson
& Pellegrino 1993, Potosnak 1988). At a time when many technical resources are being
devoted to extending allegorical metaphor into three dimensional virtual worlds, it is worrying
that such projects similarly fail to find advantages of 3-D metaphors (e.g. Sutcliffe & Patel
1996).
The demonstrable advantages of graphical user interfaces, as with many types of diagram, can
be explained in other terms. Direct manipulation – representing abstract computational
entities as graphical objects that have a constant location on the screen until the user chooses
to move them – facilitates reasoning about the interface by reducing the number of possible
consequences of an action (Lindsay 1988). Similar constraints provide the cognitive benefits
of most types of diagrammatic representational system (Stenning & Oberlander 1995), and
valuable new diagrams can be invented by selecting geometric constraints that apply to a
specific abstraction (e.g. Cheng 1998). Where these types of cognitive benefits arise from a
notational system, there is little need to invoke theories of metaphor to explain them. Many of
the Cognitive Dimensions of Notations (Green 1989, Green & Petre 1996) are little affected
by the degree to which the notation is intended to be figurative.

1 6 1
These pragmatic principles for the analysis of notations are only gradually becoming
accepted among designers of new diagrammatic user interfaces. Chapter 3 reported a survey
of research publications describing visual programming languages. These publications
reflected widespread superlativist theories of diagram use (Green, Petre & Bellamy 1991).
They also appeared to reflect a consensus of opinion within this community about the nature
of diagram use – much of which can be attributed to the pioneering work of Smith (1977),
where he argued that visual images support creative abstract thought by metaphorical
processes. Despite this consensus, two surveys of professional programmers showed that these
beliefs appear to be restricted to the research community. Programmers who have no specific
allegiance to visual programming are sceptical about any potential benefits – probably simple
professional conservatism. Those who do use a visual language professionally are not
sceptical, but they often describe its pragmatic advantages and disadvantages in terms of
notational features that are better explained by the Cognitive Dimensions of the language
than by theories of metaphor.
Review of experimental findings
Visual programming languages have often been described as suitable for inexperienced
programmers because the diagram expresses the behaviour of the program in terms of some
metaphorical virtual machine. In chapter 4, this was tested by making the metaphor more or
less available to inexperienced programmers, and evaluating the resulting changes in
performance by comparison to experienced programmers. In experiment 1, the metaphor was
conveyed by making the elements of the diagram more pictorial, while in experiment 2 the
metaphor was explicitly described in instructional material. In neither case did the provision
of the metaphor result in appreciable performance improvements relative to more
experienced programmers, despite the fact that the computational concepts included in the
diagrams of experiment 2 were heavily disguised, and that the diagrams were equally novel to
all participants.
Early research publications in HCI regularly equated graphical user interfaces with metaphor
on a basic cognitive level: “the use of appropriate verbal metaphors was enhanced by the use
of diagrams (which are of course also metaphors)” (Carroll & Thomas 1982, p. 111);
“images are metaphors for concepts” (Smith 1977, p. 23); “visual imagery is a productive
metaphor for thought” (ibid. p. 6); “concepts in the short term memory are metaphorical
images derived from sense perceptions” (ibid. p. 11). The role of visual imagery in the
production of diagrams was investigated in the experiments of chapter 5. These found little

1 6 2
evidence for the use of visual imagery when planning diagrams. Experiment 3 did find some
evidence that a physical metaphor might inhibit abstract reasoning, but this appears to have
been an artefact of a specific combination of stimulus and task, as several attempts to replicate
the effect failed.
Whereas experiment 6 found that using metaphorical elements in a diagram had less effect on
solution elaboration than either task complexity or experimental demand, experiment 5 failed
even to find any effect resulting from the use of severely incongruent metaphors. The tasks
used in these experiments were admittedly simple by comparison to the demands of design
and problem-solving in many computer applications, but they suggest that many people
construct diagrams without systematic use of either mental imagery or physical metaphor.
The experiments in chapter 6 returned to the question of metaphor as an instructional device.
A number of variations on experiment 2 found that metaphor did provide some advantages in
learning the conventions of a new diagram. Rather than supporting complex problem solving,
however, those advantages seemed to be simple mnemonic ones. Performance in
comprehension tasks was scarcely improved by systematic metaphors that explained diagrams
in terms of virtual machines and other metaphorical conventions. Furthermore, the mnemonic
advantage was equally great where participants created their own metaphors rather than being
given an explicit instructional metaphor. If the diagram included pictorial elements, this
facilitated self-generated metaphor – a factor that seems to have greater mnemonic value than
systematic explanations.
Related results
These findings are consistent with a small number of previous studies. Marschark and Hunt
(1985) found superior recall of verbal metaphors in cases when it was easy to form a concrete
visual image of the metaphor subject, but inferior recall of metaphors with strong semantic
relations. If theories of verbal metaphor can be extended to diagrams, their work supports the
contention that diagrammatic metaphor brings more advantage for mnemonic tasks than for
systematic problem solving. Payne (1988) found that metaphorical instruction had a
mnemonic benefit when learning a command language, although this effect was smaller than
the benefit of making the language itself systematic and consistent.
Martin and Jones (1998) observed that memory for even familiar symbolic conventions is
influenced by people constructing their own systematic interpretations. These interpretations
will often reflect some schema that was not intended in the original symbol design, resulting

1 6 3
in surprisingly inaccurate memory among the general population for common symbols such
as road signs.
Self-generated metaphor has been employed to great advantage in an educational variation of
the visual programming language. Ford (1993) asked introductory computing students to
create their own animated visual language, metaphorically expressing fundamental
computational concepts. He reported significant benefits to his students. On the basis of the
experimental evidence reported in this thesis, such an approach would be expected to be far
more valuable than many proposed visual programming languages.
Implications
The findings described in this thesis have often encountered scepticism from other HCI
researchers. Metaphor is so widely recognised as forming the basis for graphical user
interfaces that it might seem unreasonable to question this assumption. Metaphor is almost
always recommended as a basis for design in user interface textbooks, and publications
describing the benefits of metaphor have appeared in the research literature for many years.
Substantial commercial empires are attributed to the success of the “desktop metaphor”, and
millions of personal computer users have experienced dramatic improvements in usability
when moving to this interface from previous generations of command-line system.
My contention is that the benefits of the “desktop metaphor” are misattributed. These
systems were the first commercial products to allow direct manipulation of elements on the
display, and I believe that their benefits derive almost completely from direct manipulation
rather than from metaphor. Indeed, I have encountered anecdotal evidence that personal
computer users outside the computer industry are often completely unaware of the intended
metaphor in the systems they use. They understand “Windows” to be an arbitrary trade
name rather than a metaphorical description of some aspect of the user interface (perhaps
someone might compare the usability advantages of the “Apple” metaphor for fruitier user
interfaces).
To those who have experienced the benefits of direct manipulation, and are aware of the
supposed benefits of user interface metaphor, it is still difficult to explain those benefits in
terms of cognitive theories. There are several competing theories of metaphor, with
differences that may appear overly subtle by comparison to the obvious benefits of direct
manipulation. Some respected cognitive scientists explicitly discount the application of their
theories to computer interfaces (e.g. Gentner, Falkenhainer & Skorstad 1988), but this leaves

1 6 4
the HCI researcher with numerous other theories to choose from, some of which claim a very
strong link to diagram interpretation (e.g. Lakoff 1993).
The most important factor in the general acceptance of diagrammatic metaphor as a design
principle in HCI, however, is the fact that it has not been empirically tested. The current
project appears to have been the first attempt to isolate diagrammatic metaphor (rather than
more general instructional metaphor) as a factor in controlled experiments. Previous
experiments have compared metaphorical graphical interfaces to non-metaphorical interfaces,
with disappointing results (Potosnak 1988). It has always been possible, however, to attribute
those negative results to other aspects of the systems that were being compared (e.g. Simpson
& Pellegrino 1993), or to confounding individual differences in the experimental sample
(e.g. Rohr 1987).
The findings of this study do suggest some limited advantages from employing metaphor in
diagrams – pictorial metaphor brings some mnemonic advantages, especially if the pictures
are realistic (more realistic than those usually included in graphical user interfaces). In the
absence of strong evidence for the broader benefits of metaphor, it might be wiser for user
interface designers to turn to empirical findings that have shown advantages resulting from
other aspects of notation design – particularly the correspondence between geometric
structure, tools for manipulating those structures, and cognitive information processing tasks.
Further Investigation
Most of the experiments described in this thesis have taken at face value some of the
“superlativist” claims of the HCI and visual languages community. In particular, they have
tested the assumption that diagrams are universally beneficial in problem solving and design.
This is obviously not the case – even within the scope of these studies, a simple distinction
between “experts” and “novices” has revealed not universal benefits, but a large difference
between individuals with different amounts of experience. Some of this difference may well
be attributable to imagery strategies, as found in studies of experts by Hishitani (1990) and
Saariluoma and Kalakoski (1997). Other studies have also found differences between the
strategies of individuals given the opportunity to employ imagery when using diagrammatic
representations (Schwartz & Black 1996b, Stenning & Gurr 1997). It would be valuable to
investigate the relationship between individual strategies and the type of metaphorical
diagrams studied here – the result of such a study may well explain the vehemence of
superlativist positions, as well as the historical context of diagram research within the imagery
debate.

1 6 5
This study also shares a practical deficiency with many other experimental studies in
psychology and HCI. Although it purports to investigate learning effects, the period of
learning in each experimental trial is extremely short – the longest experiment reported here
lasted two hours, and almost all were shorter than an hour. No real design notation or user
interface would be learned in such a short time, and as a consequence the experimental tasks
have been almost trivially simple. Other experiments have shown significant effects of
practice when using similar notations (Scaife & Rogers 1996, Schwartz & Black 1996a, van
der Veer 1990). Despite this weakness, the current study is valuable because many researchers
have claimed large and immediate effects for the benefits of metaphor. The conclusion of this
study is that, although there may well be effects to be observed, they are not necessarily large
or immediate.
The notations used in this study have been rather artificially simple, in order to be acquired
and applied within an experimental session. They have also been made unlike any widely
used diagrammatic notation, in order not to introduce a confound of individual experience
beyond the basic level of professional background (Cox 1997). For any real notation,
however, many of its elements are based on diagrammatic conventions that are already
familiar to users from other contexts (S. Smith 1981, Wang, Lee & Zeevat 1995). Consistent
application of these conventions is an essential aspect of the professional skills of information
designers and other developers of new notations. This is also an area that deserves further
investigation.
Finally, this study has only partially explained the almost universal acceptance of metaphor as
a basis for user interface design. It is possible that part of this popularity results from
confusion between the functions of metaphor and direct manipulation in HCI. It is also
possible that the pioneering work of D.C. Smith (1977), popularised and achieving huge
commercial success through the Xerox Star, Apple Macintosh, and Microsoft Windows, has
had more influence than is justified by the psychological evidence he presented. It is still
possible, however, that the advantages attributed to metaphor are really due to some
unexplored aspect of systematic conceptual metaphors. One candidate for this is the principle
of abstraction congruence proposed by Simos and Blackwell (1998), which will be the
subject of extended investigation in the near future (Blackwell 1998).

1 6 6
Chapter 8: References
Adelson, B. (1981). Problem solving and the development of abstract categories in programming languages.Memory & Cognition, 9(4), 422-433.
Akoumianakis, D. & Stephanis, C. (1997). Supporting user-adapted interface design: The USE-IT system.Interacting with Computers, 9(1), 73-104.
Anderson, J.R. (1996). ACT: A simple theory of complex cognition. American Psychologist, 51(4), 355-365.
Apple Computer, Inc. (1992). Macintosh Human Interface Guidelines. Reading, MA: Addison-Wesley.
Aristotle (1927). Poetics. (W.H. Fyfe, Trans.) London: William Heinemann.
Arnheim, R. (1970). Visual Thinking. London: Faber and Faber.
Barker, P.G. & Manji, K.A. (1989). Pictorial dialogue methods. International Journal of Man-MachineStudies, 31(3), 323-347.
Barnard, P. & Marcel, T. (1978). Representation and understanding in the use of symbols and pictograms. InR. Easterby & H. Zwaga (Eds.), Information Design. Chichester: John Wiley and Sons, pp. 37-75.
Baroth, E. & Hartsough, C. (1995). Visual programming in the real world. In M. Burnett, A. Goldberg & T.Lewis (Eds.), Visual Object-Oriented Programming Concepts and Environments. Greenwich, CT: Manning,pp. 21-42.
Bartlett, F.C. (1932). Remembering: A study in experimental and social psychology. Cambridge, CambridgeUniversity Press.
Barwise, J. & Etchemendy, J. (1990). Information, infons and inference. In R. Cooper, K. Mukai & J. Perry(Eds.), Situation Theory and its Applications: Volume 1. (CSLI Lecture Notes Number 22). Stanford:CSLI Publications, pp. 33-78.
Barwise, J. & Perry, J. (1983). Situations and attitudes. Cambridge, MA: MIT Press.
Bauer, M.I. & Johnson-Laird, P.N. (1993). How diagrams can improve reasoning. Psychological Science,4(6), 372-378.
Beck, B.E.F. (1978). The metaphor as a mediator between semantic and analogic modes of thought. CurrentAnthropology, 19(1), 83-97.
Bennett, K.B. & Flach, J.M. (1992). Graphical displays: Implications for divided attention, focused attentionand problem solving. Human Factors, 34(5), 513-533.
Bent, I.D. (1980). Notation – I: General, II: Notational systems. In S. Sadie (Ed.), The new Grove dictionaryof music and musicians. London: Macmillan, pp. 333-344.
Berkeley, G. (1705/1910). A new theory of vision. London: J.M. Dent & Sons.
Berry, D.C. (1990). Talking about cognitive processes. In K.J. Gilhooly, M.T.G. Keane, R.H. Logie & G.Erdos (Eds.), Lines of Thinking: Reflections on the psychology of thought, Volume 2. Chichester: JohnWiley and Sons, pp. 87-98.
Bertin, J. (1981). Graphics and Graphic Information Processing. (Tr. W.J. Berg & P. Scott) Berlin: Walter deGruyter.
Beveridge, M. & Parkins, E. (1987). Visual representation in analogical problem solving. Memory &Cognition, 15(3), 230-237.

1 6 7
Black, M. (1993). More about metaphor. In A. Ortony (Ed.), Metaphor and Thought (2nd ed.). Cambridge:Cambridge University Press. pp. 19-41.
Blackwell, A.F. (1989). Spatial reasoning with a qualitative representation. Knowledge-Based Systems, 2(1),37-45.
Blackwell, A.F. (1993). Bottom-up design and this thing called an 'object'. EXE Magazine, 8(7), 28-32.
Blackwell, A.F. (1996a). Metaphor or analogy: How should we see programming abstractions? In P.Vanneste, K. Bertels, B. De Decker & J.-M. Jaques (Eds.), Proceedings of the 8th Annual Workshop of thePsychology of Programming Interest Group, pp. 105-113.
Blackwell, A.F. (1996b). Metacognitive theories of visual programming: What do we think we are doing?Proceedings IEEE Symposium on Visual Languages. Los Alamitos, CA: IEEE Computer Society Press,pp. 240-246.
Blackwell, A.F. (1996c). Do programmers agree with computer scientists on the value of visualprogramming? In A. Blandford & H. Thimbleby (Eds.), Adjunct Proceedings of the 11th British ComputerSociety Annual Conference on Human Computer Interaction, HCI'96. British HCI Group, pp. 44-47.
Blackwell, A.F. (1996d). Chasing the intuition of an industry: Can pictures really help us think? In M.Ireland (Ed.), Proceedings of the first Psychology of Programming Interest Group Postgraduate StudentWorkshop, pp. 13-24.
Blackwell, A.F. (1997a). Correction: A picture is worth 84.1 words. In C. Kann (Ed.), Proceedings of theFirst ESP Student Workshop, pp. 15-22.
Blackwell, A.F. (1997b). Diagrams about thoughts about thoughts about diagrams. In M. Anderson (Ed.),Reasoning with Diagrammatic Representations II: Papers from the AAAI 1997 Fall Symposium. TechnicalReport FS-97-02. Menlo Park, CA: AAAI Press, pp. 77-84.
Blackwell, A.F. (1998). New paradigms for visual interaction. EPSRC Research Proposal Case for Support.
Blackwell, A.F. (Ed.). (1997). Thinking with diagrams discussion papers. First Conference on Thinking withDiagrams. Portsmouth, England.
Blackwell, A.F. & Engelhardt, Y. (1998). A taxonomy of diagram taxonomies. In Proceedings of Thinkingwith Diagrams 98: Is there a science of diagrams? pp. 60-70.
Blackwell, A.F., Whitley, K.N., Good, J. & Petre, M. (in press). Programming in pictures, pictures ofprograms. In A. Blackwell (Ed.), Thinking with Diagrams [Special issue]. Artificial Intelligence Review.
Bødker, S. (1991). Through the interface: A human activity approach to user interface design. Hillsdale, NJ:Lawrence Erlbaum Associates.
Boehm-Davis, D.A., Fox, J.E. & Philips, B.H. (1996). Techniques for exploring program comprehension. InW.D. Gray & D.A. Boehm-Davis (Eds.), Empirical Studies of Programmers: Sixth Workshop. Norwood,NJ: Ablex, pp. 3-38.
Bonar, J. & Soloway, E. (1985). Preprogramming knowledge: A major source of misconceptions in noviceprogrammers. Human-Computer Interaction, 1(2), 133-161.
Bonar, J.G. & Liffick, B.W. (1990). A visual programming language for novices. In S.-K. Chang (Ed.),Principles of Visual Programming Systems. Prentice Hall, pp. 326-366.
Booth, S. (1992). The experience of learning to program. Example: recursion. Proceedings of the 5thWorkshop of the Psychology of Programming Interest Group: INRIA, pp. 122-145.
Bottoni, P., Costabile, M.F., Levialdi, S. & Mussio, P. (1996). A visual approach to HCI. SIGCHIBulletin, 28(3), 50-55.
Bower, G.H., Karlin, M.B. & Dueck, A. (1975). Comprehension and memory for pictures. Memory &Cognition, 3(2), 216-220.

1 6 8
Brandimonte, M.A., Schooler, J.W. & Gabbino, P. (1997). Attenuating verbal overshadowing through colorretrieval cues. Journal of Experimental Psychology: Learning, Memory & Cognition, 23(4), 915-931.
Brandt, S. A. & Stark, L.W. (1997). Spontaneous eye movements during visual imagery reflect the content ofthe visual scene. Journal of Cognitive Neuroscience, 9(1), 27-38.
Brown, M.H. & Sedgewick, R. (1984). A system for algorithm animation. ACM Computer Graphics, 18(3),177-186.
Buckingham-Shum, S.J., MacLean, A., Bellotti, V.M.E. & Hammond, N.V. (1997). Graphicalargumentation and design cognition. Human-Computer Interaction, 12(3), 267-300.
Burnett, M., Goldberg, A. & Lewis, T. (Eds.). (1995). Visual object-oriented programming concepts andenvironments. Greenwich, CT: Manning.
Burnett, M.M. & Ambler, A.L. (1994). Interactive visual data abstraction in a declarative visual programminglanguage. Journal of Visual Languages and Computing, 5(1), 29-60.
Burnett, M.M., Baker, M., Bohus, C., Carlson, P., Yang S. & van Zee, P. (1995). Scaling up visualprogramming languages. IEEE Computer, 28(3), 45-54.
Cacciari, C. & Glucksberg, S. (1995). Understanding idioms: do visual images reflect figurative meanings?European Journal of Cognitive Psychology, 7(3), 283-305.
Cañas, J.J., Bajo, M.T. & Gonsalvo, P. (1994). Mental models and computer programming. InternationalJournal of Human-Computer Studies, 40(5), 795-811.
Carpenter, P.A. & Shah, P. (1998). A model of the perceptual and conceptual processes in graphcomprehension. Journal of Experimental Psychology: Applied, 4(2), 75-100.
Carroll, J.M & Olson, J.R. (1988). Mental models in human-computer interaction. In M. Helander (Ed.),Handbook of Human-Computer Interaction. Elsevier., pp. 45-66.
Carroll, J.M, Mack, R. L. & Kellogg, W. A. (1988). Interface metaphors and user interface design. In M.Helander (Ed.), Handbook of Human-Computer Interaction. Elsevier, pp. 67-86.
Carroll, J.M. & Mack, R.L. (1985). Metaphor, computing systems and active learning. International Journalof Man-Machine Studies, 22(1), 39-57.
Carroll, J.M. & Thomas, J.C. (1982). Metaphor and the cognitive representation of computing systems.IEEE Transactions on Systems, Man and Cybernetics, 12(2), 107-116.
Carroll, J.M., Thomas, J.C. & Malhotra, A. (1980). Presentation and representation in design problem-solving. British Journal of Psychology, 71, 143-153.
Carswell, C.M. & Ramzy, C. (1997). Graphing small data sets: Should we bother? Behaviour andInformation Technology, 16(2), 61-71.
Casey, M.B. (1996). Understanding individual differences in spatial ability within females: A nature/nurtureinteractionist framework. Developmental Review, 16(3), 241-260.
Casey, M.B., Winner, E., Benbow, C., Hayes, R. & DaSilva, D. (1993). Skill at image generation:Handedness interacts with strategy preference for individuals majoring in spatial fields. CognitiveNeuropsychology, 10(1), 57-77.
Catarci, T., Costabile, M.F. & Matera, M. (1995). Which metaphor for which database? In M.A.R. Kirby,A.J.Dix & J.E.Finlay (Eds.), People and Computers X (Proceedings HCI ’95). Cambridge UniversityPress, pp. 151-165.
Chambers, D. & Reisberg, D. (1985). Can mental images be ambiguous? Journal of ExperimentalPsychology: Human Perception and Performance, 11(3), 317-328.
Chandler, P. & Sweller, J. (1996). Cognitive load while learning to use a computer program. AppliedCognitive Psychology, 10(2), 151-170.
1 6 9
Chang, B.-W., Ungar D. & Smith, R.B. (1995). Getting close to objects. In M. Burnett, A. Goldberg & T.Lewis, (Eds.), Visual Object-Oriented Programming Concepts and Environments. Greenwich, CT:Manning, pp. 185-198.
Chang, S.-K. (1987). Visual languages: a tutorial and survey. IEEE Software, 4(1), 29-39.
Chang, S.-K. (1990). Principles of visual languages. In S-K. Chang, (Ed.) Principles of Visual ProgrammingSystems, Englewood Cliffs, NJ: Prentice-Hall, pp. 1-59.
Chang, S.-K. (Ed.). (1990a). Principles of visual programming systems. Englewood Cliffs, NJ: Prentice-Hall.
Chang, S.-K. (Ed.). (1990b). Visual languages and visual programming. New York: Plenum Press.
Chang, S.-K., Costagliola, G., Pacini, G., Tucci, M., Tortora, G., Yu B. & Yu, J.S. (1995). Visual-language system for user interfaces. IEEE Software, 12(2), 33-44.
Chechile, R.A., Anderson, J.E., Krafczek, S.A. & Coley, S.L. (1996). A syntactic complexity effect withvisual patterns: Evidence for the syntactic nature of the memory representation. Journal of ExperimentalPsychology: Learning, Memory & Cognition, 22(3), 654-669.
Chee, Y. S. (1993). Applying Gentner’s theory of analogy to the teaching of computer programming.International Journal of Man Machine Studies, 38(3), 347-368.
Cheng, P.C. (1998). AVOW diagrams: A novel representational system for understanding electricity. InProceedings Thinking with Diagrams 98: Is there a science of diagrams? pp. 86-93.
Choi, S. & Bowerman, M. (1991). Learning to express motion events in English and Korean: The influenceof language-specific lexicalisation patterns. Cognition, 41(1-3), 83-121.
Clark, H.H. & Chase, W.G. (1972). On the process of comparing sentences against pictures. CognitivePsychology, 3, 472-517.
Cohen, D.J. & Bennett, S. (1997). Why can’t most people draw what they see? Journal of ExperimentalPsychology: Human Perception and Performance, 23(3), 609-621.
Cohen, L.J. (1993). The semantics of metaphor. In A. Ortony (Ed.), Metaphor and Thought (2nd ed.).Cambridge: Cambridge University Press. pp. 58-70.
Costagliola, G., De Lucia, A., Orefice S. & Tortora, G. (1995). Automatic generation of visual programmingenvironments. IEEE Computer, 28(3), 56-66.
Cox, B.J. (1986). Object oriented programming: An evolutionary approach. Addison Wesley.
Cox, P.T. & Pietrzykowski, T. (1988). Using a pictorial representation to combine dataflow and object-orientation in a language independent programming mechanism. In Proceedings International ComputerScience Conference, Hong Kong, pp. 695-704.
Cox, R. (1997). Representation interpretation versus representation construction: An ILE-based study usingswitchERII. In Proceedings of the 8th World Conference of the Artificial Intelligence in Education Society(AI-ED 97). Amsterdam: IOS Press, pp. 434-441.
Cox, R. & Brna, P. (1995). Supporting the use of external representations in problem solving: the need forflexible learning environments. Journal of Artificial Intelligence in Education, 6(2), 239-302.
Culler, J. (1976). Saussure. Glasgow: Collins.
Cunniff, N. & Taylor R.P. (1987). Graphical vs. textual representation: An empirical study of novices’program comprehension. In G.M. Olson, S. Sheppard & E. Soloway (Eds.), Empirical Studies ofProgrammers: Second Workshop. Norwood, NJ: Ablex, pp. 114-131.
D’Esposito, M., Detre, J.A., Aguirre, G.K., Stallcup, M., Alsop, D.C., Tippet, L.J. & Farah, M.J. (1997).A functional MRI study of mental image generation. Neuropsychologia, 35(5), 725-730.

1 7 0
Dale, E. (1969). Audiovisual methods in teaching (3rd edition). New York, Holt, Rhinehart & Winston.
Davies, S.P. (1993). Models and theories of programming strategy. International Journal of Man MachineStudies, 39(2), 237-268.
Davies, S.P. (1996). Display-based problem solving strategies in computer programming. In W.D. Gray &D.A. Boehm-Davis (Eds.), Empirical Studies of Programmers: Sixth Workshop. Norwood, NJ: Ablex, pp.59-76.
Davies, S.P & Castell, A.M. (1992). Doing design and describing it: accounting for divergent perspectives insoftware design. In Proceedings 5th Workshop of the Psychology of Programming Interest Group. INRIA.,pp. 72-88.
De Beni, R., Moé, A & Cornoldi, C. (1997). Learning from texts or lectures: Loci mnemonics can interferewith reading but not with listening. European Journal of Cognitive Psychology, 9(4), 401-415.
De Vega, M., Rodrigo, M.J. & Zimmer, H. (1996). Pointing and labelling directions in egocentricframeworks. Journal of Memory and Language, 35(6), 821-839.
Deglin, V.L. & Kinsbourne, M. (1996). Divergent thinking styles of the hemispheres: How syllogisms aresolved during transitory hemisphere suppression. Brain and Cognition, 31(3), 285-307.
Delgado, A.R. & Prieto, G. (1996). Sex differences in visuospatial ability: Do performance factors play suchan important role? Memory & Cognition, 24(4), 504-510.
DeLoache, J.S. & Marzolf, D.P. (1992). When a picture is not worth a thousand words: Young children’sunderstanding of pictures and models. Cognitive Development, 7, 317-329.
Dennett, D.C. (1981). Two approaches to mental images. In N. Block (Ed.), Imagery. Cambridge, MA: MITPress, pp. 87-107.
di Sessa, A.A. (1986). Notes on the future of programming: breaking the utility barrier. In D.A. Norman &S.W. Draper (Eds.), User Centered System Design: New Perspectives on Human-Computer Interaction.Hillsdale, NJ: Lawrence Erlbaum, pp. 125-152.
Diaz-Herrera, J.L. & Flude, R.C. (1980). PASCAL/HSD: a graphical programming system. In ProceedingsCOMPSAC’80, Chicago, IEEE Computer Society Press. pp. 723-728.
Dillon, L.K.. Kutty, G. Melliar-Smith, P.M., Moser L.E. & Ramakrishna, Y.S. (1994). Visualspecifications for temporal reasoning. Journal of Visual Languages and Computing, 5(1), 61-81.
Dix, A., Finlay, J., Abowd, G.L. & Beale, R. (1998). Human computer interaction (2nd ed.). HemelHempstead, UK: Prentice Hall.
Dondis, D.A. (1973). A primer of visual literacy. Cambridge, MA: MIT Press.
Dopkins, S. (1996). The role of imagery in the mental representation of negative sentences. American Journalof Psychology, 109(4), 551-565.
Dreistadt, R. (1968). An analysis of the use of analogies and metaphors in science. The Journal ofPsychology, 68, 97-116.
Dreyfuss, H. (1972). Symbol sourcebook. New York: McGraw-Hill.
du Boulay, B., O’Shea, T. & Monk, J. (1981). The black box inside the glass box: Presenting computingconcepts to novices. International Journal of Man-Machine Studies, 14(3), 237-249.
Duisberg, R.A. (1988). Animation using temporal constraints: an overview of the animus system. HumanComputer Interaction, 3(3), 275-307.
Eberts, R.E. & Bittianda, K.P. (1993). Preferred mental models for direct manipulation and command-basedinterfaces. International Journal of Man Machine Studies, 38(5), 769-786.

1 7 1
Edel, M. (1986). The Tinkertoy graphical programming environment. In Proceedings COMPSAC’86,Chicago, IEEE Computer Society Press. pp. 466-471.
Edwards, B. (1979). Drawing on the right side of the brain. Los Angeles: Tarcher.
Egan, D.E. & Schwartz, B.J. (1979). Chunking in recall of symbolic drawings. Memory & Cognition, 7(2),149-158.
Eisenberg, M., Resnick, M. & Turbak, F. (1987). Understanding procedures as objects. In G.M. Olson, S.Sheppard & E. Soloway (Eds.), Empirical Studies of Programmers: Second Workshop. Norwood, NJ:Ablex, pp. 14-32.
Eisenstadt, M., Breuker, J. & Evertsz, R. (1984). A cognitive account of ‘natural’ looping constructs. In B.Shackel (Ed.), Human-Computer Interaction – Interact ‘84. Amsterdam: Elsevier, pp. 455-460.
Ellington, H., Addinall, E. & Percival, F. (1982). A handbook of game design. London: Kogan Page.
Empson, W. (1984). Seven types of ambiguity (3rd edition). London: Hogarth Press.
Ericsson, K.A. & Simon, H.A. (1993). Protocol analysis: Verbal reports as data. (revised ed.). Cambridge,MA: MIT Press.
Esteban, O., Chatty, S. & Palanque, P. (1995). Whizz’ed: A visual environment for building highlyinteractive software. In K. Nordby, P. Helmersen, D.J. Gilmore & S.A. Arnesen (Eds.), Human ComputerInteraction: Interact ‘95. London: Chapman & Hall, pp. 121-126.
Fallside, D.C. & Just, M.A. (1994). Understanding the kinematics of a simple machine. Visual Cognition,1(4), 401-432.
Faltings, B. (1987). A theory of qualitative kinematics in mechanisms. In Proceedings of the InternationalJoint Conference on Artificial Intelligence, pp. 436-442.
Farah,M.J., Hammond,K.M., Levine,D.N. & Calvanio,R. (1988). Visual and spatial mental imagery:Dissociable systems of representation. Cognitive Psychology, 20, 439-462.
Faulkner, C. (1998). The Essence of Human-Computer Interaction. Hemel Hempstead, UK: Prentice Hall.
Fenson, L. (1985). The transition from construction to sketching in children’s drawings. In N.H. Freeman &M.V. Cox (Eds.), Visual order: The nature and development of pictorial representation. Cambridge:Cambridge University Press, pp. 374-384.
Ferguson, E.S. (1992). Engineering and the Mind’s Eye. Cambridge, MA: MIT Press.
Finke, R.A. (1996). Imagery, creativity, and emergent structure. Consciousness and Cognition, 5(3), 381-393.
Finke, R.A., Pinker, S. & Farah, M.J. (1989). Reinterpreting visual patterns in mental imagery. CognitiveScience, 13(1), 51-78.
Finke, R.A. & Slayton, K. (1988). Explorations of creative visual synthesis in mental imagery. Memory &Cognition, 16(3), 252-257.
Finkel, R.A. (1996). Advanced programming language design. Menlo Park, CA: Addison-Wesley.
Fish, J. & Scrivener, S. (1990). Amplifying the mind’s eye: Sketching and visual cognition. Leonardo,23(1), 117-126.
Fisher, C. (1987). Advancing the study of programming with computer-aided protocol analysis. In G.M.Olson, S. Sheppard & E. Soloway (Eds.), Empirical Studies of Programmers: Second Workshop. Norwood,NJ: Ablex, pp. 198-216.
Fitter, M. & Green, T.R.G. (1979). When do diagrams make good computer languages? International Journalof Man-Machine Studies, 11(2), 235-261.

1 7 2
Flavell, J.H. (1979). Metacognition and cognitive monitoring. American Psychologist, 34(10), 906-911.
Forbus, K.D. (1983). Qualitative reasoning about space and motion. In D. Gentner & A. Stevens (Eds.)Mental Models. Lawrence Erlbaum Associates, pp. 53-73.
Ford, L. (1993). How programmers visualise programs. (Report No. R.271). University of Exeter,Department of Computer Science. Available FTP: ftp://ftp.dcs.ex.ac.uk/pub/media/sv/esp.ps.Z
Ford, L. & Tallis, D. (1993). Interacting visual abstractions of programs. In Proceedings IEEE Workshop onVisual Languages.
Frandsen, A.N. & Holder, J.R. (1969). Spatial visualization in solving complex verbal problems. TheJournal of Psychology, 73, 229-233.
Fuchs, A., Goschke, T & Gude, D. (1988). On the role of imagery in linear syllogistic reasoning.Psychological Research, 50, 43-49.
Gagné, R.M. & Smith, E.C. Jr. (1962). A study of the effects of verbalisation on problem-solving. Journalof Experimental Psychology, 63(1), 12-18.
Galitz, W.O. (1997). The essential guide to user interface design. New York: Wiley.
Gallagher, J.M. (1978). The future of formal thought research: The study of analogy and metaphor. In B.Z.Presseisen, D. Goldstein & M.H. Appel (Eds.), Topics in Cognitive Development, Volume 2: Languageand Operational Thought. New York: Plenum Press, pp. 77-98.
Gardin, F. & Meltzer, B. (1995). Analogical representations of naive physics. In J. Glasgow, N.H. Narayanan& B. Chandrasekaran (Eds.), Diagrammatic Reasoning: Cognitive and Computational Perspectives. MenloPark, CA: AAAI Press, pp. 669-689.
Gattis, M. & Holyoak, K.J. (1996). Mapping conceptual to spatial relations in visual processing. Journal ofExperimental Psychology: Learning, Memory & Cognition, 22(1), 231-239.
Gentner, D. (1983). Structure-mapping: a theoretical framework for analogy. Cognitive Science, 7(2), 155-170.
Gentner, D. & Clement, C. (1988). Evidence for relational selectivity in the interpretation of analogy andmetaphor. In G.H. Bower (Ed.), The Psychology of Learning and Motivation: Volume 22. San Diego:Academic Press, pp. 307-358.
Gentner, D., Falkenhainer, B. & Skorstad, J. (1988). Viewing metaphor as analogy. In D.H. Helman (Ed.),Analogical Reasoning: Perspectives of Artificial Intelligence, Cognitive Science and Philosophy. Kluwer,pp. 171-177.
Gentner, D. & Wolff, P. (1997). Alignment in the processing of metaphor. Journal of Memory andLanguage, 37(3), 331-355.
Gibbs, R.W. Jr. (1996). Why many concepts are metaphorical. Cognition, 61(3), 195-324.
Gibbs, R.W. Jr. & O'Brien, J.E. (1990). Idioms and mental imagery: The metaphorical motivation foridiomatic meaning. Cognition, 36(1), 35-68.
Gibson, J.J. (1979). The ecological approach to visual perception. Boston, MA: Houghton Mifflin.
Gick, M.L. & Holyoak, K.J. (1983). Schema induction and analogical transfer. Cognitive Psychology,15(1), 1-38.
Gillan, D.J. (1995). Visual arithmetic, computational graphics and the spatial metaphor. Human Factors,37(4), 766-780.
Gilmore, D.J. & Green, T.R.G. (1984a). Comprehension and recall of miniature programs. InternationalJournal of Man-Machine Studies, 21(1), 31-48.

1 7 3
Gilmore, D.J. & Green, T.R.G. (1984b). The comprehensibility of programming notations. In B. Shackel(Ed.), Human-Computer Interaction – Interact ‘84. Amsterdam: Elsevier, pp. 461-464.
Glasgow, J., Narayanan, N.H. & Chandrasekaran, B. (Eds.). (1995). Diagrammatic Reasoning: Cognitive andComputational Perspectives. Menlo Park, CA: AAAI Press.
Glasgow, J.I. & Papadias, D. (1995). Computational imagery. In J. Glasgow, N.H. Narayanan & B.Chandrasekaran (Eds.), Diagrammatic Reasoning: Cognitive and Computational Perspectives. Menlo Park,CA: AAAI Press, pp. 435-480.
Glenberg, A.M. (1997). What memory is for. Behavioral and Brain Sciences, 20(1), 1-55.
Glenberg, A.M., Langston, W.E. (1992). Comprehension of illustrated text: Pictures help to build mentalmodels. Journal of Memory and Language, 31, 129-151.
Glenberg, A.M., Wilkinson, A.C. & Epstein, W. (1982). The illusion of knowing: Failure in the self-assessment of comprehension. Memory & Cognition, 10(6), 597-602.
Glinert, E.P. (1990). Nontextual programming environments. In S-K. Chang, (Ed.), Principles of VisualProgramming Systems. Prentice-Hall, pp. 144-232.
Glinert, E.P. (Ed.). (1990a). Visual programming environments: Applications and issues. IEEE ComputerSociety Press.
Glinert, E.P. (Ed.). (1990b). Visual programming environments: Paradigms and Systems. IEEE ComputerSociety Press.
Glinert, E.P. & Gonczarowski, J. (1987). A (formal) model for (iconic) programming environments. InProceedings Interact ’87, Elsevier. pp. 283-290.
Glinert, E.P. & Tanimoto, S.L. (1984). Pict: an interactive graphical programming environment. IEEEComputer, 17(11), 7-25.
Glucksberg, S. & Keysar, B. (1993). How metaphors work. In A. Ortony (Ed.), Metaphor and Thought (2nded.). Cambridge: Cambridge University Press. pp. 401-424.
Goel, V. (1992). ‘Ill-structured representations’ for ill-structured problems. Proceedings 14th AnnualConference Cognitive Science Society pp. 130-135.
Goel, V. (1995). Sketches of thought. Cambridge MA: MIT Press.
Goldberg, A., Burnett M. & Lewis, T. (1995). What is visual object-oriented programming? In M. Burnett,A. Goldberg & T. Lewis, (Eds.), Visual Object-Oriented Programming Concepts and Environments.Greenwich, CT: Manning, pp. 3-20.
Goldberg, E. & Costa, L.D. (1981). Hemisphere differences in the acquisition and use of descriptive systems.Brain and Language, 14(1), 144-173.
Goldschmidt, G. (1991). The dialectics of sketching. Creativity Research Journal, 4(2), 123-143.
Goldschmidt, G. (1994). On visual design thinking: The vis kids of architecture. Design Studies, 15(2), 158-174.
Goldsmith, E. (1984). Research into Illustration: An approach and a review. Cambridge: CambridgeUniversity Press.
Gombrich, E. (1990). Pictorial illustrations. In H. Barlow, C. Blakemore & M. Weston-Smith (Eds.), Imagesand Understanding. Cambridge: Cambridge University Press, pp. 26-45.
Good, Judith R. (1996). The ‘right’ tool for the task: an investigation of external representations, programabstractions and task requirements. In W.D. Gray & D.A. Boehm-Davis (Eds.), Empirical Studies ofProgrammers: Sixth Workshop. Norwood, NJ: Ablex, pp. 77-98.

1 7 4
Gooding, D. (1996). Diagrams in the generation and dissemination of new science: Some examples andapplications. Thinking with Diagrams. Digest No. 96/010. London: IEE Computing and Control Division,pp. 3/1-3/6.
Goodman, N. (1969). Languages of art: An approach to a theory of symbols. London: Oxford UniversityPress.
Goodman, N. (1990). Pictures in the mind? In H. Barlow, C. Blakemore & M. Weston-Smith (Eds.), Imagesand Understanding. Cambridge: Cambridge University Press, pp. 358-364.
Goolkasian, P. (1996). Picture-word differences in a sentence verification task. Memory & Cognition, 24(5),584-594.
Gordon, R.M. (1986). Folk psychology as simulation. Mind and Language 1(2), 158-171.
Grant, C. (in press). Visual language editing using a grammar-based structure editor. To appear in Journal ofVisual Languages and Computing.
Green, A.J.K. & Barnard, P.J. (1990). Iconic interfacing: the role of icon distinctiveness and fixed or variablescreen locations. In D. Diaper, D. Gilmore, G. Cockton & B. Shackel (Eds.), Human-Computer Interaction– Interact ‘90. Amsterdam: Elsevier, pp. 457-462.
Green, T.R.G. (1980). Programming as a cognitive activity. In H.T.Smith and T.R.G. Green (Eds.), HumanInteraction with Computers. Academic Press, pp. 271-320.
Green, T.R.G. (1982). Pictures of programs and other processes, or how to do things with lines. Behaviourand Information Technology, 1(1), 3-36.
Green, T.R.G. (1989). Cognitive dimensions of notations. In A. Sutcliffe & L. Macaulay (Eds.), People andComputers V. Cambridge University Press.
Green, T.R.G., Bellamy, R.K.E. & Parker, J.M. (1987). Parsing and gnisrap: A model of device use. InG.M. Olson, S. Sheppard & E. Soloway (Eds.), Empirical Studies of Programmers: Second Workshop.Norwood, NJ: Ablex, pp. 132-146.
Green, T.R.G. & Blackwell, A.F. (1996a). Thinking about visual programs. Thinking with Diagrams. DigestNo. 96/010. London: IEE Computing and Control Division, pp. 5/1-5/4.
Green, T.R.G. & Blackwell, A.F. (1996b). Ironies of Abstraction. Paper presented at the Third InternationalConference on Thinking. British Psychological Society, London.
Green, T.R.G. & Navarro, R. (1995). Programming plans, imagery and visual programming. In ProceedingsInteract ’95, pp. 139-144.
Green, T.R.G. & Petre, M. (1992). When visual programs are harder to read than textual programs. In G.C.van der Veer & S. Bagnarola (Eds.), Proceedings of ECCE-6 (European Conference on CognitiveErgonomics).
Green, T.R.G. & Petre, M. (1996). Usability analysis of visual programming environments: a 'cognitivedimensions' approach. Journal of Visual Languages and Computing, 7,131-174.
Green, T.R.G., Petre, M. & Bellamy, R.K.E. (1991). Comprehensibility of visual and textual programs: Atest of superlativism against the ‘match-mismatch’ conjecture. In J. Koenemann-Belliveau, T.G. Moher &S.P. Robertson (Eds.): Empirical Studies of Programmers: Fourth Workshop Norwood, NJ: Ablex, pp.121-146.
Greeno, J.G. (1989). Situations, mental models, and generative knowledge. In D. Klahr & K. Kotovsky(Eds.), Complex information processing: The impact of Herbert A. Simon. Hillsdale, NJ: LawrenceErlbaum Associates, pp. 285-318.
Gregory, R.L. (1970). The Intelligent Eye. London: Weidenfeld & Nicolson.
Grossberg, S. (1997). Cortical dynamics of three-dimensional figure-ground perception of two-dimensionalpictures. Psychological Review, 104(3), 618-658.

1 7 5
Gutfreund, S.H. (1987). Maniplicons in ThinkerToy. In Proceedings OOPSLA 87, ACM Press, pp. 307-317.
Hackos, J.T. & Redish, J.C. (1998). User and Task Analysis for Interface Design. New York: Wiley.
Halasz, F. & Moran, T.P. (1982). Analogy considered harmful. Proceedings Conference Human Factors inComputer Systems, pp. 383-386.
Halewood, K. & Woodward, M.R. (1993). A uniform graphical view of the program construction process:GRIPSE. International Journal of Man Machine Studies, 38(5), 805-838.
Halpern, D.F. (1996). Sex, brains, hands, and spatial cognition. Developmental Review, 16(3), 261-270.
Hayes, P.J. (1985) The second naive physics manifesto. In J.R Hobbs & R.C. Moore (Eds.), FormalTheories of the Commonsense World. Norwood, NJ: Ablex, pp. 1-36.
Hegarty, M. (1992). Mental animation: Inferring motion from static displays of mechanical systems. Journalof Experimental Psychology: Learning, Memory & Cognition, 18(5), 1084-1102.
Hekkert, P. & van Wieringen, P.C.W. (1996). The impact of level of expertise on the evaluation of originaland altered versions of post-impressionistic paintings. Acta Psychologica, 94(2), 117-132.
Hesse, F.W., Kauer, G. & Spies, K. (1997). Effects of emotion-related surface similarity in analogicalproblem solving. American Journal of Psychology, 110(3), 357-383.
Heydenbluth, C. & Hesse, F.W. (1996). Impact of superficial similarity in the application phase of analogicalproblem solving. American Journal of Psychology, 109(1), 37-57.
Hill, S. (1995). A practical introduction to the human computer interface in a semester. London: DPPublications.
Hishitani, S. (1990). Imagery experts: How do expert abacus operators process imagery? Applied CognitivePsychology, 4(1), 33-46.
Hoffman, D.D. & Richards, W.A. (1984). Parts of recognition. Cognition, 18, 65-96.
Holland, J.H., Holyoak, K.J., Nisbett, R.E. &Thagard, P.R. (1986). Induction: Processes of inference,learning, and discovery. MIT Press.
Hollands, J.G. & Spence, Ian. (1992). Judgements of change and proportion in graphical perception. HumanFactors, 34(3), 313-334.
Huang, K.-T. (1990). Visual interface design systems. In S.-K. Chang, (Ed.), Principles of VisualProgramming Systems. Prentice-Hall, pp. 60-143.
Hutchins E. (1989). Metaphors for interface design. In M.Taylor, F.Neel & D.Bouwhuis (Eds.), The Structureof Multimodal Dialogue. Amsterdam, North-Holland: Elsevier, pp. 11-28.
Huttenlocher, J. (1968). Constructing spatial images: a strategy in reasoning. Psychological Review, 75(6),550-560.
Hyrskykari, A. (1993, March). Development of program visualization systems. Paper presented at the 2ndCzech British Symposium of Visual Aspects of Man-Machine Systems, Prague.
Ichikawa, T.& Hirakawa, M. (1987). Visual programming – toward realization of user-friendly programmingenvironments. In Proceedings 2nd Fall Joint Computer Conference, IEEE Computer Society Press, pp.129-137.
Ittelson, W.H. (1996). Visual perception of markings. Psychonomic Bulletin & Review, 3(2), 171-187.
Ivins, W.M. Jr. (1953). Prints and visual communication. London, Routledge & Kegan Paul.
Jackendoff, R. (1983). Semantics and cognition. Cambridge, MA: MIT Press.
Johnson, J., Roberts, T.L., Verplank, W., Smith, D.C., Irby, C.H., Beard, M. & Mackey, K. (1989). TheXerox Star: A retrospective. IEEE Computer, 22(9), 11-26.

1 7 6
Johnson, M. (1987). The body in the mind: The bodily basis of meaning, imagination and reason. Chicago:University of Chicago Press.
Johnson, S.H. (1991). Adult age differences in visual mental imagery: Evidence for differentially age-sensitivecomponents. Proceedings 13th Annual Conference Cognitive Science Society pp. 755–759.
Johnson-Laird, P.N. (1988). Freedom & constraint in creativity. In R.J. Sternberg (Ed.), The nature ofcreativity: Contemporary psychological perspectives. Cambridge: Cambridge, pp. 202-219.
Jones, A. (1984). How novices learn to program. In B. Shackel (Ed.), Human Computer Interaction –INTERACT’84. North Holland: Elsevier, pp. 777-783.
Jones, M.R. (1990). Mac-thusiasm: social aspects of microcomputer use. In D. Diaper, D. Gilmore, G.Cockton & B. Shackel (Eds.), Human-Computer Interaction – Interact ‘90. Amsterdam: Elsevier, pp. 21-26.
Kahn, K. (1996). Seeing systolic computations in a video game world. Proceedings IEEE Symposium onVisual Languages. Los Alamitos, CA: IEEE Computer Society Press, pp. 95-101.
Kaput, J.J. (1995). Overcoming physicality and the eternal present: cybernetic manipulatives. In R.Sutherland & J. Mason (Eds.), Exploiting Mental Imagery with Computers in Mathematics Education.Nato ASI Series F, Volume 138, pp. 161-177.
Karmiloff-Smith, A. (1990). Constraints on representational change: Evidence from children’s drawing.Cognition, 34(1), 57-83.
Karsai, G. (1995). A configurable visual programming environment: a tool for domain-specific programming.IEEE Computer, 28(3), 36-44.
Katona, G. (1940). Organizing and Memorizing. New York: Columbia University Press.
Katz, A.N. (1983). What does it mean to be a high imager? In J.C. Yuille (Ed.), Imagery, Memory andCognition: Essays in honor of Allan Paivio. Hillsdale, NJ: Erlbaum, pp. 39-63.
Kaufmann, G. (1979). Visual imagery and its relation to problem solving. Oslo, Norway:Universitetsforlaget.
Keane, M.T. (1988). Analogical problem solving. Ellis Horwood Ltd.
Keane, M.T. (1997). What makes an analogy difficult? The effects of order and causal structure on analogicalmapping. Journal of Experimental Psychology: Learning, Memory and Cognition, 23(4), 946-967.
Kearins, J.M. (1981). Visual spatial memory in Australian Aboriginal children of desert regions. CognitivePsychology, 13, 434-460.
Kennedy, J.M. (1975). Drawing was discovered, not invented. New Scientist, 67(965), 523-525.
Kennedy, J.M., Green, C.D. & Vervaeke, J. (1993). Metaphoric thought and devices in pictures. Metaphorand symbolic activity, 8(3), 243-255.
Kieras, D. (1978). Beyond pictures and words: alternative information-processing models for imagery effectsin verbal memory. Psychological Bulletin, 85(3), 532-554.
Kieras, D.E. & Bovair, S. (1984). The role of a mental model in learning to operate a device. CognitiveScience, 8(3), 255-273.
Kimura, T.D., Apte, A., Sengupta S. & Chan, J.W. (1995). Form/Formula: A visual programming paradigmfor user-definable user interfaces. IEEE Computer, 28(3), 27-35.
Koedinger, K.R & Anderson, J.R. (1990). Abstract planning and perceptual chunks: elements of expertise ingeometry. Cognitive Science, 14(4), 511-550.
Koenemann, J. & Robertson, S.P. (1991). Expert problem solving strategies for program comprehension. InRobertson, S.P., Olson, G.M. & Olson, J.S. (Eds.), Proceedings CHI’91. ACM, pp. 125-130.

1 7 7
Koestler, A. (1964). The act of creation. London: Hutchinson.
Kopache, M.E. & Glinert, E.P. (1988). C2: A mixed textual/graphical environment for C. In ProceedingsIEEE Workshop on Visual Languages, pp. 231-238.
Kosslyn, S.M. (1981). The medium and the message in mental imagery: a theory. Psychological Review,88(1), 46-66.
Kosslyn, S.M. (1989). Understanding charts and graphs. Applied Cognitive Psychology, 3(3), 185-226.
Kosslyn, S.M., Ball, T.M. & Reiser, B.J. (1978). Visual images preserve metric spatial information:Evidence from studies of image scanning. Journal of Experimental Psychology: Human Perception andPerformance, 4, 47-60.
Kosslyn, S.M., Koenig, O., Barrett, A., Cave, C.B., Tang, J., & Gabrieli, J.D.E. (1989). Evidence for twotypes of spatial representations: hemispheric specialization for categorical and coordinate relations. Journalof Experimental Psychology: Human Perception and Performance, 15(4), 723-735.
Labbo, L.D. (1996). A semiotic analysis of young children’s symbol making in a classroom computer centre.Reading Research Quarterly, 31(4), 356-385.
Ladret, D. & Rueher, M. (1991). VLP: A visual logic programming language. Journal of Visual Languagesand Computing, 2(2) , 163-188.
Lakoff, G. (1987). Women, fire and dangerous things. Chicago: University of Chicago Press.
Lakoff, G. (1993). The contemporary theory of metaphor. In A. Ortony (Ed.), Metaphor and Thought (2nded.). Cambridge: Cambridge University Press. pp. 202-251.
Lakoff, G. & Johnson, M. (1980). Metaphors We Live By. Chicago, The University of Chicago Press.
Langston, W., Kramer, D.C. & Glenberg, A.M. (1998). The representation of space in mental models derivedfrom text. Memory & Cognition, 26(2), 247-262.
Larkin, J.H. (1989). Display-based problem solving. In D. Klahr & K. Kotovsky (Eds.), ComplexInformation Processing: The impact of Herbert A. Simon. Hillsdale, NJ: Lawrence Erlbaum Associates, pp.319-342.
Larkin, J.H. & Simon, H.A. (1987). Why a diagram is (sometimes) worth ten thousand words. CognitiveScience, 11, 65-99.
Laurel, B. (1986). Interface as mimesis. In D.A. Norman & S.W. Draper (Eds.), User Centered SystemDesign: New Perspectives on Human-Computer Interaction. Hillsdale, NJ: Lawrence Erlbaum, pp. 67-86.
Lave, J. (1988). Cognition in Practice: Mind, mathematics and culture in everyday life. Cambridge, UK:Cambridge University Press.
Levelt, W.J.M. (1981). The speaker’s linearisation problem. Philosophical Transactions of the Royal SocietyB, 295, 305-315.
Lewis, C.M. (1991). Visualization and situations. In J. Barwise, J.M. Gawron, G. Plotkin & S. Tutiya(Eds.), Situation Theory and Its Applications: Volume 2. Stanford University: CSLI, pp. 553-580.
Linde, C. & Labov, W. (1975). Spatial structures as a site for the study of language and thought. Language,51, 924-939.
Lindsay, R.K. (1988). Images and inference. Cognition, 29(3), 229-250.
Lindsay, R.K. (1989). Qualitative geometric reasoning. Proceedings 11th Annual Conference CognitiveScience Society pp. 418-425.
Liu, C.H. & Kennedy, J.M. (1994). Symbolic forms can be mnemonics for recall. Psychonomic Bulletin &Review, 1(4), 494-498.

1 7 8
Lodding, K.N. (1983). Iconic interfacing. IEEE Computer Graphics and Applications, 3(2), 11-20.
Logie, R.H. & Pearson, D.G. (1997). The inner eye and the inner scribe of visuo-spatial working memory:Evidence from developmental fractionation. European Journal of Cognitive Psychology, 9(3), 241-257.
Lohse, G.L. (1997). The role of working memory on graphical information processing. Behaviour andInformation Technology, 16(6), 297-308.
Lohse, G.L., Biolski, K., Walker, N. & Rueter, H.H. (1994). A classification of visual representations.Communications of the ACM, 37(12), 36-49.
Lord, H.D. (1994). Visual programming for visual applications: a new look for computing. Object Magazine,4(4), 37-40.
Lowe, R.K. (1993a). Successful instructional diagrams. London: Kogan Page.
Lowe, R.K. (1993b). Diagrammatic information: techniques for exploring its mental representation andprocessing. Information Design Journal, 7(1), 3-18.
McCloskey, M. (1983). Naive theories of motion. In D. Gentner & A.L. Stevens (Eds.), Mental Models.Lawrence Erlbaum Associates, pp. 299-324.
McDougal, T.F. & Hammond, K.J. (1995). Using diagrammatic features to index plans for geometrytheorem-proving. In J. Glasgow, N.H. Narayanan & B. Chandrasekaran (Eds.), Diagrammatic Reasoning:Cognitive and Computational Perspectives. Menlo Park, CA: AAAI Press, pp. 691-709.
McGlone, M.S. (1996). Conceptual metaphors and figurative language interpretation: Food for thought?Journal of Memory and Language, 35(4), 544-565.
MacGregor, J.N. & Ormerod, T. (1996). Human performance on the travelling salesman problem. Perceptionand Psychophysics, 58(4), 527-539.
McKeithen, K.B., Reitman, J.S., Rueter, H.H. & Hirtle, S.C. (1981). Knowledge organization and skilldifferences in computer programmers. Cognitive Psychology, 13, 307-325.
MacLeod, C.M., Hunt, E.B. & Mathews, N.N. (1978). Individual differences in the verification of sentence-picture relationships. Journal of Verbal Learning and Verbal Behavior, 17, 493-507.
McNamara, T.P. (1986). Mental representations of spatial relations. Cognitive Psychology, 18, 87-121.
McNamara, T.P., Halpin, J.A. & Hardy, J.K. (1992). The representation and integration in memory of spatialand nonspatial information. Memory & Cognition, 20(5), 519-532.
Madsen, K.H. (1994). A guide to metaphorical design. Communications of the ACM, 37(12), 57-62.
Mandel, T. (1997). The elements of user interface design. New York: Wiley.
Manger, T. & Eikeland, O.-J. (1998). The effects of spatial visualization and students’ sex on mathematicalachievement. British Journal of Psychology, 89(1), 17-25.
Mani, K. & Johnson-Laird, P.N. (1982). The mental representations of spatial descriptions. Memory &Cognition, 10(2), 181-187.
Marschark, M. & Hunt, R.R. (1985). On memory for metaphor. Memory & Cognition, 13(5), 413-424.
Martin, J. & McClure, C. (1985). Diagramming techniques for analysts and programmers. Englewood Cliffs,NJ: Prentice-Hall.
Martin, M. & Jones, G.V. (1998). Generalizing everyday memory: Signs and handedness. Memory &Cognition, 26(2), 193-200.
Matsuno, T. (1987). Cognitive style and representational strategies in categorical syllogistic reasoning.Tohoku Psychologica Folia, 46(1-4), 97-102.

1 7 9
Mayer, R.E. & Sims, V.K. (1994). For whom is a picture worth a thousand words? Extensions of a dual-coding theory of multimedia learning. Journal of Educational Psychology, 86(3), 389-401.
Mayer, R.E. (1975). Different problem-solving competencies established in learning computer programmingwith and without meaningful models. Journal of Educational Psychology, 67(6), 725-734.
Mayer, R.E. (1988). From novice to expert. In M. Helander (Ed.), Handbook of Human-ComputerInteraction. Elsevier, pp. 569-580.
Mayer, R.E. (1993). The instructive metaphor: Metaphoric aids to student’s understanding of science. In A.Ortony (Ed.), Metaphor and Thought (2nd ed.). Cambridge: Cambridge University Press. pp. 562-578.
Mecklinger, A. & Müller, N. (1996). Dissociations in the processing of “what” and “where” information inworking memory: An event-related potential analysis. Journal of Cognitive Neuroscience, 8(5), 453-473.
Melcher, J.M. & Schooler, J.W. (1996). The misremembrance of wines past: Verbal and perceptual expertisedifferentially mediate verbal overshadowing of taste memory. Journal of Memory and Language, 35(2),231-245.
Mendelsohn, P., Green, T.R.G. & Brna, P. (1990). Programming languages in education: The search for aneasy start. In Hoc, J.-M., Green, T.R.G., Samurçay, R. & Gilmore, D.J. (Eds.), Psychology ofprogramming. London: Academic Press, pp. 175-200.
Metcalfe, J. & Wiebe, D. (1987). Intuition in insight and noninsight problem solving. Memory &Cognition, 15(3), 238-246.
Meyer, J. (1997). A new look at an old study on information display: Washburne (1927) reconsidered. HumanFactors, 39(3), 333-340.
Microsoft Corporation (1995). The Windows interface guidelines for software design. Redmond, WA: Author.
Mieder, W. (1990). “A picture is worth a thousand words”: From advertising slogan to American proverb.Southern Folklore, 47, 207-225.
Miller, George A. (1993). Images and models, similes and metaphors. In A. Ortony (Ed.), Metaphor andThought (2nd ed.). Cambridge: Cambridge University Press. pp. 357-400.
Mishkin, M., Ungerleider, L.G. & Macko, K.A. (1983). Object vision and spatial vision: Two corticalpathways. Trends in Neurosciences, 6(10), 414-417.
Missikoff, M. & Pizzicanella, R. (1996). A visual approach to object-oriented analysis based on abstractdiagrams. SIGCHI Bulletin, 28(3), 56-64.
Mitchell, M. (1993). Analogy-making as perception: A computer model. Cambridge, MA: MIT Press.
Mohnkern, K. (1997a). Affordances, metaphor and interface design. Unpublished Master’s thesis, Departmentof Design, College of Fine Arts, Carnegie Mellon University.
Mohnkern, K. (1997b). Beyond the interface metaphor. SIGCHI Bulletin, 29(2), 11-15.
Moray, N. (1990). A lattice theory approach to the study of mental models. Philosophical Transactions of theRoyal Society B, 327, 577-583.
Murphy, G.L. (1996). On metaphoric representation. Cognition, 60(2), 173-204.
Murphy, G.L. (1997). Reasons to doubt the present evidence for metaphoric representation. Cognition, 62(1),99-108.
Myers, B.A. (1986). Visual programming, programming by example, and program visualization: Ataxonomy. Proceedings CHI 86, pp. 59-66.
Narayanan, N.H., Suwa, M. & Motoda, H. (1995). Hypothesising behaviors from device diagrams. In J.Glasgow, N.H. Narayanan & B. Chandrasekaran (Eds.), Diagrammatic Reasoning: Cognitive andComputational Perspectives. Menlo Park, CA: AAAI Press, pp. 501-534.

1 8 0
Nardi, B.A. (1993). A small matter of programming: Perspectives on end user computing. Cambridge, MA:MIT Press.
Nardi, B.A. & Zarmer, C.L. (1993). Beyond models and metaphors: visual formalisms in user interfacedesign. Journal of Visual Languages and Computing, 4(1), 5-33.
Nelson, T.O., Metzler, J. & Reed, D.A. (1974). Role of details in the long-term recognition of pictures andverbal descriptions. Journal of Experimental Psychology, 102(1), 184-186.
Nersessian, N.J. (1995). Capturing the dynamics of conceptual change in science. In J. Glasgow, N.H.Narayanan & B. Chandrasekaran (Eds.), Diagrammatic Reasoning: Cognitive and ComputationalPerspectives. Menlo Park, CA: AAAI Press, pp. 137-181.
Netz, R. (in press). The shaping of deduction in Greek mathematics. Cambridge: Cambridge University Press.
Newsham, R. (1995). Symbolic representation in object-oriented methodologies: Modelling the essence of thecomputer system. Unpublished Master’s thesis, Department of Computer Science, Nottingham TrentUniversity.
Noble, R. (1992). Preferential use of examples by novices learning Prolog. In Proceedings 5th Workshop ofthe Psychology of Programming Interest Group. INRIA, pp. 146-158.
Nolder, R. (1991). Mixing metaphor and mathematics in the secondary classroom. In K. Durkin & B. Shire(Eds.), Language in Mathematical Education: Research and Practice. Buckingham, UK: Open UniversityPress. pp. 105-114.
Norman, D.A. (1988). The psychology of everyday things. New York, Basic Books.
Norman, D.A. (1991). Cognitive artifacts. In J.M. Carroll (Ed.), Designing Interaction: Psychology at theHuman-Computer Interface. Cambridge: Cambridge University Press, pp. 17-38.
Novak, G.S. Jr. (1995). Diagrams for solving physical problems. In J. Glasgow, N.H. Narayanan & B.Chandrasekaran (Eds.), Diagrammatic Reasoning: Cognitive and Computational Perspectives. Menlo Park,CA: AAAI Press, pp. 753-774.
Oberlander, J. (1996). Grice for graphics: pragmatic implicature in network diagrams. Information DesignJournal , 8(6), 163-179.
Paivio, A. (1971). Imagery and Verbal Processes. New York, Holt, Rinehart and Winston.
Paivio, A. (1983). The empirical case for dual coding. In J.C. Yuille (Ed.), Imagery, Memory & Cognition:Essays in honor of Allan Paivio. Hillsdale, NJ: Erlbaum, pp. 307-332.
Paivio, A. & Clark, J.M. (1991). Static versus dynamic imagery. In C. Cornoldi & M.A. McDaniel (Eds.),Imagery and Cognition. New York, Springer-Verlag, pp. 221-245.
Palmer, S. & Rock, I. (1994). Rethinking perceptual organization: the role of unifom connectedness.Psychonomic Bulletin & Review, 1(1), 29-55.
Pane, J. (1997). A programming system for children that is designed for usability. In C. Kann (Ed.),Proceedings of the First ESP Student Workshop, pp. 15-22.
Pane, J.F. & Myers, B.A. (1996). Usability issues in the design of novice programming systems. School ofComputer Science, Carnegie Mellon University. Technical Report CMU-CS-96-132.
Payne, S.J. (1988). Metaphorical instruction and the early learning of an abbreviated-command computersystem. Acta Psychologica, 69, 207-230.
Payne, S.J. (1990). Looking HCI in the I. In D. Diaper, D. Gilmore, G. Cockton & B. Shackel (Eds.),Human-Computer Interaction – Interact ‘90. Amsterdam: Elsevier, pp. 185-191.
Payne, S.J. (1991). A descriptive study of mental models. Behaviour and Information Technology, 10(1), 3-21.

1 8 1
Payne, S.J. (1992). On mental models and cognitive artefacts. In Y. Rogers, A. Rutherford & P.A. Bibby(Eds.), Models in the Mind: Theory, Perspective and Application. Academic Press, pp. 103-118.
Payne, S.J., Squibb, H.R. & Howes, A. (1990). The nature of device models: the yoked state spacehypothesis and some experiments with text editors. Human-Computer Interaction, 5(4), 415-444.
Peirce, C.S. (1932). Elements of Logic. In Hartshorne, C. & Weiss, P. (Eds.), Collected papers of CharlesSanders Peirce, Volume II. Cambridge, MA: Harvard University Press.
Petre, M. & Blackwell, A.F. (1997). A glimpse of expert programmer's mental imagery. In S. Wiedenbeck &J. Scholtz (Eds.), Proceedings of the 7th Workshop on Empirical Studies of Programmers, pp. 109-123.
Petre, M. Blackwell, A.F. and Green, T.R.G. (1998). Cognitive questions in software visualisation. In J.Stasko, J. Domingue, M. Brown, and B. Price (Eds.) Software Visualization: Programming as a Multi-Media Experience. Cambridge, MA: MIT Press, pp. 453-480.
Petre, M. & Green, T.R.G. (1990). Where to draw the line with text: some claims by logic designers aboutgraphics in notation. In D. Diaper, D. Gilmore, G. Cockton & B. Shackel (Eds.), Human-ComputerInteraction – Interact ‘90. Amsterdam: Elsevier, pp. 463-468.
Petre, M. & Green, T.R.G. (1993). Learning to read graphics: some evidence that ‘seeing’ an informationdisplay is an acquired skill. Journal of Visual Languages and Computing, 4(1), 5-33.
Petrie, H.G. & Oshlag, R.S. (1993). Metaphor and learning. In A. Ortony (Ed.), Metaphor and Thought (2nded.). Cambridge: Cambridge University Press. pp. 579-609.
Pickford, R.W. (1979). Semantic differential judgements of geometric figures of aesthetic interest. InNodine,C.F. & Fisher, D.F. (Eds.), Perception and Pictorial Representation. New York: Praeger, pp. 316-327.
Pilton, B. (1971). The intelligent ball bearing. Manifold-9. Mathematics Institute, University of Warwick,pp. 17-20.
Pimm, D. (1995). Symbols and meanings in school mathematics. London, Routledge.
Pinkpank, T. & Wandke, H. (1995). Mental effort with the use of different dialogue techniques in human-computer interaction. Zeitschrift für Psychologie, 203, 119-137.
Pisan, Y. (1995). A visual routines based model of graph understanding. Proceedings 17th Annual ConferenceCognitive Science Society pp. 692-697.
Pong, M.C. & Ng, N. (1983). PIGS – A system for programming with interactive graphical support.Software – Practice and Experience, 13, 847-855.
Porter, T. (1979). How architects visualize. London: Studio Vista.
Potosnak, K. (1988). Do icons make user interfaces easier to use? IEEE Software, May, pp. 97-99.
Potter, M.C. & Faulconer, B.A. (1975). Time to understand pictures and words. Nature, 253, 437-438.
Potter, M.C., Kroll, J.F, Yachzel, B., Carpenter, E. & Sherman, J. (1986). Pictures in sentences:understanding without words. Journal of Experimental Psychology: General, 115(3), 281-294.
Price, B.A., Baecker, R.M. & Small, I.S. (1993). A principled taxonomy of software visualization. Journalof Visual Languages and Computing, 4(3), 211-266.
Pylyshyn, Z.W. (1981). The imagery debate: analogue media versus tacit knowledge. Psychological Review,88(1), 16-45.
Pynte, J., Besson, M., Robichon, F.-H. & Poli, J. (1996). The time-course of metaphor comprehension: Anevent-related potential study. Brain and Language, 55(3), 293-316.

1 8 2
Qin, Y. & Simon, H. (1995). Imagery and mental models. In J. Glasgow, N.H. Narayanan & B.Chandrasekaran (Eds.), Diagrammatic Reasoning: Cognitive and Computational Perspectives. Menlo Park,CA: AAAI Press, pp. 403-434.
Quinn, J.G. & McConnell, J. (1996). Irrelevant pictures in visual working memory. The Quarterly Journal ofExperimental Psychology, 49A, 200-215.
Reddy, M.J. (1993). The conduit metaphor: A case of frame conflict in our language about language. In A.Ortony (Ed.), Metaphor and Thought (2nd ed.). Cambridge: Cambridge University Press. pp. 164-201.
Reiss, S.P. (1987). Visual languages and the GARDEN system. In P. Gorny & M.J. Tauber (Eds.),Visualization in Programming. Lecture Notes in Computer Science Vol. 282. Berlin: Springer-Verlag. pp.178-191.
Repenning, A. & Sumner, T. (1995). Agentsheets: A medium for creating domain-oriented visual languages.IEEE Computer, 28(3), 17-25.
Richards, C. (1997). Getting the picture: Diagram design and the information revolution. ProfessorialLectures:16; Coventry University.
Richardson, A. (1977). Verbalizer-visualizer: A cognitive style dimension. Journal of Mental Imagery, 1,109-126.
Riding, R. & Douglas, G. (1993). The effect of cognitive style and mode of presentation on learningperformance. British Journal of Educational Psychology, 63, 297-307.
Rieman, J., Lewis, C. Young, R.M. & Polson, P. (1994). Why is a raven like a writing desk? Lessons ininterface consistency and analogical reasoning from two cognitive architectures. Proceedings Human Factorsin Computing Systems CHI 94, pp. 438-444.
Rohr, G. (1987). How people comprehend unknown system structures: Conceptual primitives in systems’surface representations. In P. Gorny & M.J. Tauber (Eds.), Visualization in Programming. Lecture Notes inComputer Science Vol. 282. Berlin: Springer-Verlag, pp. 89-105.
Roszak, T. (1986). The cult of information: The folklore of computers and the true art of thinking. London:Paladin Press.
Rumelhart, D.E. (1993). Some problems with the notion of literal meanings. In A. Ortony (Ed.), Metaphorand Thought (2nd ed.). Cambridge: Cambridge University Press. pp. 71-82.
Ryan, T.A. & Schwartz, C.B. (1956). Speed of perception as a function of mode of representation. AmericanJournal of Psychology, 69, 60-69.
Saariluoma, P. & Kalakoski, V. (1997). Skilled imagery and long-term working memory. American Journalof Psychology, 110(2), 177-202.
Saariluoma, P. & Sajaniemi, J. (1994). Transforming verbal descriptions into mathematical formulas inspreadsheet calculation. International Journal of Human Computer Studies, 41(6), 915-948.
Scaife, M. & Rogers, Y. (1996). External cognition: how do graphical representations work? InternationalJournal of Human Computer Studies, 45, 185-214.
Scapin, D.L. (1981). Computer commands in restricted natural language: some aspects of memory andexperience. Human Factors, 23(3), 365-375.
Schiffer, S. & Fröhlich, J.H. (1995). Visual programming and software engineering with Vista. In M.Burnett, A. Goldberg & T. Lewis, (Eds.), Visual Object-Oriented Programming Concepts andEnvironments. Greenwich, CT: Manning, pp. 199-228.
Schoenfeld, A.H. (1983). Beyond the purely cognitive: Belief systems, social cognitions and metacognitionsas driving forces in intellectual performance. Cognitive Science, 7(4), 329-363.
Scholtz, J. & Wiedenbeck, S. (1992). The role of planning in learning a new programming language.International Journal of Man Machine Studies, 37(2), 191-214.

1 8 3
Schooler, J.W., Ohlsson, S. & Brooks, K. (1993). Thoughts beyond words: When language overshadowsinsight. Journal of Experimental Psychology: General, 122(2), 166-183.
Schunn, C.D. & Dunbar, K. (1996). Priming, analogy and awareness in complex reasoning. Memory &Cognition, 24(3), 271-284.
Schwartz, D.L. (1995). Reasoning about the referent of a picture versus reasoning about the picture as thereferent: An effect of visual realism. Memory & Cognition, 23(6), 709-722.
Schwartz, D.L. & Black, J.B. (1996a). Analog imagery in mental model reasoning: Depictive models.Cognitive Psychology, 30(2), 154-219.
Schwartz, D.L. & Black, J.B. (1996b). Shuttling between depictive models and abstract rules: Induction andfallback. Cognitive Science, 20(4), 457-497.
Schwartz, R. (1981). Imagery – There’s more to it than meets the eye. In N. Block (Ed.), Imagery.Cambridge, MA: MIT Press, pp. 109-130.
Schwartz, S.J. (1971). Modes of representation and problem solving: Well evolved is half solved. Journal ofExperimental Psychology, 91(2), 347-350.
Schweiker, H. & Muthig, K.-P. (1987). Solving interpolation problems with LOGO and BOXER. In P.Gorny & M.J. Tauber (Eds.), Visualization in Programming. Lecture Notes in Computer Science Vol. 282.Berlin: Springer-Verlag. pp. 164-177.
Scott, F.J. & Baron-Cohen, S. (1996). Imagining real and unreal things: Evidence of a dissociation in autism.Journal of Cognitive Neuroscience, 8(4), 371-382.
Segal, J. & Schuman, S. (1992). Empirical studies of learners of functional programming. In ProceedingsFifth Workshop of the Psychology of Programming Interest Group. INRIA., pp. 197-206.
Sein, M.K., Olfman, L., Bostrom, R.P. & Davis, S.A. (1993). Visualization ability as a predictor of userlearning success. International Journal of Man-Machine Studies, 39, 599-620.
Selfe, L. (1985). Anomalous drawing development: Some clinical studies. In N.H. Freeman & M.V. Cox(Eds.), Visual order: The nature and development of pictorial representation. Cambridge: CambridgeUniversity Press, pp. 135-154.
Shah, P. & Carpenter, P.A. (1995). Conceptual limitations in comprehending line graphs. Journal ofExperimental Psychology: General, 124(1), 43-61.
Shalit, A. & Boonzaier, D.A. (1990). HyperBliss: A Blissymbolics communication enhancement interfaceand teaching aid based on a cognitive semantographic technique with adaptive-predictive capability. In D.Diaper, D. Gilmore, G. Cockton & B. Shackel (Eds.), Human-Computer Interaction – Interact ‘90.Amsterdam: Elsevier, pp. 499-503.
Shaver, P., Pierson, L. & Lang, S. (1974/75). Converging evidence for the functional significance of imageryin problem solving. Cognition, 3(4), 359-375.
Shepard, R.N. (1978). Externalization of mental images and the act of creation. In B.S. Randhawa & W.E.Coffman (Eds.), Visual Learning, Thinking and Communication. New York, Academic Press, pp. 133-189.
Shepard, R.N. & Metzler, J. (1971). Mental rotation of three-dimensional objects. Science, 171, 701-703.
Shimaya, A. (1997). Perception of complex line drawings. Journal of Experimental Psychology: HumanPerception and Performance, 23(1), 25-50.
Shin, S.-J. (1991). A situation-theoretic account of valid reasoning with Venn diagrams. In J. Barwise, J.M.Gawron, G. Plotkin & S. Tutiya (Eds.), Situation Theory and Its Applications: Volume 2. StanfordUniversity: CSLI, pp. 581-605.
Shneiderman, B. (1983). Direct manipulation: A step beyond programming languages. IEEE Computer,August, pp. 57-69.

1 8 4
Shu, N.C. (1986). Visual programming languages: A perspective and a dimensional analysis. In S.K. Chang,T. Ichikawa & P.A. Ligomenides, (Eds.), Visual Languages. Plenum, pp. 11-34.
Shu, N.C. (1988a). A visual programming environment for automatic programming. In Proceedings 21stHawaii International Conference on System Sciences, IEEE Computer Society Press, pp. 662-671.
Shu, N.C. (1988b). Visual programming. New York: Van Nostrand Reinhold.
Silverman, I., Phillips, K. & Silverman, L.K. (1996). Homogeneity of effect sizes for sex across spatial testsand cultures: Implications for hormonal theories. Brain and Cognition, 31(1), 90-94.
Simos, M. & Blackwell, A.F. (1998). Pruning the tree of trees: The evaluation of notations for domainmodeling. In J. Domingue & P. Mulholland (Eds.), Proceedings of the Tenth Annual Meeting of thePsychology of Programming Interest Group, pp. 92-99.
Simpson, H.K. & Pellegrino, J.W. (1993). Descriptive models in learning command languages. Journal ofEducational Psychology, 85(3), 539-550.
Sims, V.K. & Hegarty, M. (1997). Mental animation in the visuospatial sketchpad: Evidence from dual-taskstudies. Memory & Cognition, 25(3), 321-332.
Slezak, P. (1992). When can visual images be re-interpreted? Non-chronometric tests of pictorialism. InProceedings 14th Annual Conference of the Cognitive Science Society, pp. 124-129.
Sloman, A. (1995). Musings on the roles of logical and nonlogical representations in intelligence. In J.Glasgow, N.H. Narayanan & B. Chandrasekaran (Eds.), Diagrammatic Reasoning: Cognitive andComputational Perspectives. Menlo Park, CA: AAAI Press, pp. 7-32.
Smith, D.C. (1977). PYGMALION: A computer program to model and stimulate creative thinking.Birkhäuser.
Smith, D.C. (1996). Making computers accessible to people. Contribution to panel on “Perspectives fromthe Pioneers”, In Proceedings 1996 IEEE Symposium on Visual Languages. IEEE Computer SocietyPress, pp. 332-333.
Smith, D.C., Irby, C., Kimball, R. & Harslem, E. (1982). The Star user interface: An overview. InProceedings of the National Computer Conference, AFIPS Vol. 51, pp. 515-528.
Smith, D.C., Irby, C., Kimball, R., Verplank, B. & Harslem, E. (1982). Designing the Star user interface.Byte 7(4), 242-282.
Smith, E.E. & Jonides, J. (1997). Working memory: A view from neuroimaging. Cognitive Psychology,33(1), 5-42.
Smith, S.L. (1981). Exploring compatibility with words and pictures. Human Factors, 23(3), 305-351.
Smyth, M., Anderson, B. & Alty, J.L. (1995). Metaphor reflections and a tool for thought. In M.A.R.Kirby, A.J. Dix & J.E. Finlay (Eds.), People and Computers X. Cambridge University Press, pp. 137-150.
Snyder, A.W. & Thomas, M. (1997). Autistic artists give clues to cognition. Perception, 26(1), 93-96.
Sohn, Y.W. & Doane, S.M. (1997). Cognitive constraints on computer problem-solving skills. Journal ofExperimental Psychology: Applied, 3(4), 288-312.
Soloway, E., Bonar, J & Ehrlich, K. (1983). Cognitive strategies and looping constructs: An empirical study.Communications of the ACM, 26(11), 853-860.
Sowa, J.F. (1993). Relating diagrams to logic. In G. Mineau, B. Moulin & J.F. Sowa (Eds.), ConceptualGraphs for Knowledge Representation. Berlin: Springer-Verlag, pp. 1-35.
Spence, I. (1990). Visual Psychophysics of simple graphical elements. Journal of Experimental Psychology:Human Perception and Performance, 16(4), 683-692.

1 8 5
Spiro, R.J., Feltovich, P.J., Coulson, R.L & Anderson, D.K. (1989). Multiple analogies for complexconcepts: antidotes for analogy-induced misconception in advanced knowledge acquisition. In S. Vosniadou& A. Ortony (Eds.), Similarity and Analogical Reasoning. Cambridge University Press, pp. 498-531.
Stenning, K. & Gurr, C. (1997). Human-formalism interaction: Studies in communication throughformalism. Interacting with Computers, 9(2), 111-128.
Stenning, K., Inder, R. & Neilson, I. (1995). Applying semantic concepts to analysing media and modalities.In B. Chandrasekaran, J. Glasgow & H. Narayanan (Eds.), Diagrammatic Reasoning: Computational andCognitive Perspectives on Problem Solving with Diagrams. Menlo Park, CA: AAAI Press / MIT Press,pp. 303-338.
Stenning, K. & Oberlander, J. (1991). Reasoning with words, pictures and calculi: computation versusjustification. In J. Barwise, J.M. Gawron, G. Plotkin & S. Tutiya (Eds.), Situation Theory and ItsApplications: Volume 2. Stanford University: CSLI, pp. 607-621.
Stenning, K. & Oberlander, J. (1995). A cognitive theory of graphical and linguistic reasoning: Logic andimplementation. Cognitive Science, 19(1), 97-140.
Stone, E.R. & Yates, J.F. (1997). Effects of numerical and graphical displays on professed risk-takingbehaviour. Journal of Experimental Psychology: Applied, 3(4), 243-256.
Stroebel, L., Todd, H. & Zakia, R. (1980). Visual concepts for photographers. London: Focal Press.
Strothotte, C. & Strothotte, T. (1997). Seeing between the pixels: Pictures in interactive systems. SpringerVerlag.
Sutcliffe, A. & Patel, U. (1996). 3D or not 3D: Is it nobler in the mind? In M.A. Sasse, R.J. Cunningham& R.L. Winder (Eds.), People and computers XI: Proceedings of HCI’96. London: Springer-Verlag, pp. 79-94.
Sutherland, I.E. (1963). Sketchpad: A man-machine graphical communication system. AFIPS ConferenceProceedings, Spring Joint Conference, pp. 2-19.
Suwa, M. & Tversky, B. (1997). What do architects and students perceive in their design sketches? A protocolanalysis. Design Studies, 18, 385-403.
Szlichcinski, K.P. (1979). Diagrams and illustrations as aids to problem solving. Instructional Science, 8,253-274.
Tabachnek-Schijf, H.J.M., Leonardo, A.M. & Simon,H.A. (1997). CaMeRa: A computational model ofmultiple representations. Cognitive Science, 21(3), 305-350.
Takahashi, S. (1995). Aesthetic properties of pictorial perception. Psychological Review, 102(4), 671-683.
Talmy, L. (1983). How language structures space. In H.L. Pick & L.P. Acredolo (Eds.), Spatial orientation:Theory, research and application. New York: Plenum Press, pp. 225-282.
Tanimoto, S.L. & Glinert, E.P. (1986). Designing iconic programming systems: representation andlearnability. Proceedings IEEE Workshop on Visual Languages. IEEE Computer Society Press, pp. 54-60.
Tauber, M.J. (1987). On visual interfaces and their conceptual analysis. In P. Gorny & M.J. Tauber (Eds.),Visualization in Programming. Lecture Notes in Computer Science Vol. 282. Berlin: Springer-Verlag. pp.106-123.
Taylor, H.A. & Tversky, B. (1996). Perspective in spatial descriptions. Journal of Memory and Language,35(3), 371-391.
Taylor, J. (1990). Analysing novices analysing Prolog: What stories do novices tell themselves aboutProlog? Instructional Science, 19, 283-309.
Tenenberg, J.D. (1996). Virtual machines and program comprehension. In P. Vanneste, K. Bertels, B. DeDecker & J.-M. Jaques (Eds.), Proceedings of the 8th Annual Workshop of the Psychology ofProgramming Interest Group, pp. 60-82.

1 8 6
Theios, J. & Amrhein, P.C. (1989). Theoretical analysis of the cognitive processing of lexical and pictorialstimuli: reading, naming and visual and conceptual derivatives. Psychological Review, 96(1), 5-24.
Thomas, G.V. & Silk, A.M.J. (1990). An introduction to the psychology of children’s drawings. HemelHempstead: Harvester Wheatsheaf.
Tourangeau, R. & Sternberg, R.J. (1982). Understanding and appreciating metaphors. Cognition, 11(3), 203-244.
Treglown, M. (1994). Qualitative models of user interfaces. In G. Cockton, S.W. Draper & G.R.S. Weir(Eds.), People and computers IX: Proceedings of HCI’94. London: Springer-Verlag, pp. 261-272.
Tresch, M.C., Sinnamon, H.M. & Seamon, J.G. (1993). Double dissociation of spatial and object visualmemory: Evidence from selective interference in intact human subjects. Neuropsychologia, 31(3), 211-219.
Tripp, L.L. (1988). A survey of graphical notations for program design – an update. Software EngineeringNotes, 13(4), 39-44.
Tufte, E.R. (1983). The visual display of quantitative information. Cheshit, CT: Graphics Press.
Tufte, E.R. (1990). Envisioning information. Cheshit, CT: Graphics Press.
Tversky, B., Kugelmass, S. & Winter, A. (1991). Cross-cultural and developmental trends in graphicproductions. Cognitive Psychology, 23, 515-557.
Twyman, M. (1979). A schema for the study of graphical language. In P.A. Kolers, M.E. Wrolstad, & H.Bouma (Eds.), Processing of Visible Language, Vol. 1. New York: Plenum Press, pp. 117-150.
Ullman, S. (1984). Visual routines. Cognition, 18, 97-159.
van der Veer, G.C. (1990). Human-Computer Interaction: Learning, Individual Differences and DesignRecommendations. PhD Thesis, Free University of Amsterdam.
van der Veer, G.C., van Beek, J. & Cruts, G.A.N. (1987). Learning structured diagrams – effect ofmathematical background, instruction and problem solving. In P. Gorny & M.J. Tauber (Eds.),Visualization in Programming. Lecture Notes in Computer Science Vol. 282. Berlin: Springer-Verlag. pp.70-88.
van Sommers, P. (1984). Drawing and cognition. Cambridge: Cambridge University Press.
Verbrugge, Robert R. & McCarrell, Nancy S. (1977). Metaphoric comprehension: studies in reminding andresembling. Cognitive Psychology, 9, 494-533.
Visser, W. (1992). Use of analogical relationships between design problem-solution representations:Exploitation at the action-execution and action-management levels of the activity. Studia Psychologica, 34,351-357.
Waisel, L., Wallace, W.A. & Willemain, T.R. (1997). Using diagrammatic representations in mathematicalmodeling: The sketches of expert modelers. In M. Anderson (Ed.), Reasoning with DiagrammaticRepresentations II: Papers from the AAAI 1997 Fall Symposium. Technical Report FS-97-02. MenloPark, CA: AAAI Press, pp. 125-135.
Walker, P., Hitch, G.J., Dewhurst, S.A., Whiteley, H.E. & Brandimonte, M.A. (1997). The representation ofnonstructural information in visual memory: Evidence from image combination. Memory & Cognition,25(4), 484-491.
Walsh, Paul. (1990). Imagery as a heuristic in the comprehension of metaphorical analogies. In K.J.Gilhooly, M.T.G. Keane, R.H.Logie & G.Erdos (Eds.), Lines of Thinking: Reflections on the Psychologyof Thought. Chichester: John Wiley and Sons, pp. 237-250.
Wang, D., Lee, J. & Zeevat, H. (1995). Reasoning with diagrammatic representations. In J. Glasgow, N.H.Narayanan & B. Chandrasekaran (Eds.), Diagrammatic Reasoning: Cognitive and ComputationalPerspectives. Menlo Park, CA: AAAI Press, pp. 339-393.

1 8 7
Washburne, J.N. (1927). An experimental study of various graphical, tabular and textual methods ofpresenting quantitative material. Journal of Educational Psychology, 18, 361-376 & 465-476.
Watt, S. (1997). Naive psychology and alien intelligence. In M. Garns et. al. (Eds.) Mind versus computer.IOS Press, pp. 46-51.
Watt, S. (1998). Syntonicity and the psychology of programming. In J. Domingue & P. Mulholland (Eds.),Proceedings of the Tenth Annual Meeting of the Psychology of Programming Interest Group, pp. 75-86.
Weinschenk, S., Jamar, P. & Yeo, S.C. (1997). GUI design essentials. New York: Wiley.
Werner, H. & Kaplan, B. (1963). Symbol formation: An organismic-developmental approach to language andthe expression of thought. New York, John Wiley.
Whitley, K. N. (1997). Visual programming languages and the empirical evidence for and against. Journal ofVisual Languages and Computing, 8(1), 9-142.
Whitley, K.N. & Blackwell, A.F. (1997). Visual programming: The outlook from academia and industry. InS. Wiedenbeck & J. Scholtz (Eds.), Proceedings of the 7th Workshop on Empirical Studies ofProgrammers, pp. 180-208.
Whitley, K.N. & Blackwell, A.F. (1998). Visual programming in the wild: A survey of LabVIEWprogrammers. Technical Report CS-98-03, Computer Science Department, Vanderbilt University.Nashville, TN.
Wickens, C.D. & Carswell, C.M. (1995). The proximity compatibility principle: Its psychologicalfoundation and relevance to display design. Human Factors, 37(3), 473-494.
Willats, J. (1990). The draughtsman’s contract: How an artist creates an image. In H. Barlow, C. Blakemore& M. Weston-Smith (Eds.), Images and Understanding . Cambridge: Cambridge University Press, pp. 235-254.
Willows, D.M. (1978). A picture is not always worth a thousand words: pictures as distractors in reading.Journal of Educational Psychology, 70, 255-262.
Winner, E. & Casey, M.B.. (1992). Cognitive profiles of artists. In G.C. Cupchik & J. László (Eds.),Emerging visions of the aesthetic process: Psychology, semiology and philosophy. Cambridge: CambridgeUniversity Press, pp. 154-170.
Winner, E. & Gardner, H. (1993). Metaphor and irony: Two levels of understanding. In A. Ortony (Ed.),Metaphor and Thought (2nd ed.). Cambridge: Cambridge University Press. pp. 425-443.
Winograd, E. & Soloway, R.M. (1986). On forgetting the location of things stored in special places. Journalof Experimental Psychology: General, 115(4), 366-372.
Wood, W.T. & Wood, S.K. (1987). Icons in everyday life. In Proceedings INTERACT ’87. Elsevier, pp. 97-104.
Wozny, Lucy A. (1989). The application of metaphor, analogy and conceptual models in computer systems.Interacting with Computers, 1(3), 273-283.
Wright, P., Milroy, R. & Lickorish, A. (in press). Static and animated graphics in learning from interactivetexts. In W. Schnotz (Ed.), Visual Learning with New Technologies [Special issue]. European Journal ofPsychology of Education.
Wurman, R.S. (1997). Information architects. New York: Graphis Publications.
Yeung, R. (1988). MPL – A graphical programming environment for matrix processing based on constraints.In Proceedings IEEE Workshop on Visual Languages. IEEE Computer Society Press, pp. 137-143.
Young, R.M. (1981). The machine inside the machine: Users’ models of pocket calculators. InternationalJournal of Man-Machine Studies, 15(1), 51-85.

1 8 8
Young, R.M. (1983). Surrogates and mappings: Two kinds of conceptual models for interactive devices. InGentner, D. & Stevens, A. (Eds.), Mental Models. Hillsdale, NJ: Erlbaum, pp. 33-52.
Zacks, J., Levy, E., Tversky, B. & Schiano, D.J. (1998). Reading bar graphs: Effects of extraneous depthcues and graphical context. Journal of Experimental Psychology: Applied, 4(2), 119-138.
Zacks, J. & Tversky, B. (1997). Bars and lines: A study of graphic communication. In M. Anderson (Ed.),Reasoning with Diagrammatic Representations II: Papers from the AAAI 1997 Fall Symposium. TechnicalReport FS-97-02. Menlo Park, CA: AAAI Press, pp. 144-150.
Zhang, J. (1997). The nature of external representations in problem solving. Cognitive Science, 21(2), 179-217.