The Hydrogeochemistry of the Karst Aquifer System of the Northern Yucatan Peninsula, Mexico
Upload
khangminh22Category
view
0download
0
HYDROGEOCHEMISTRY MODELLING OF CHIWETA GEOTHERMAL PROSPECT, NORTHERN MALAWI
Gift Wellington Tsokonombwe
Report 3December 2017
Sulphur deposits in Leirhnjúkur, Krafla area, NE-Iceland

Orkustofnun, Grensasvegur 9, Reports 2017 IS-108 Reykjavik, Iceland Number 3
HYDROGEOCHEMISTRY MODELLING OF CHIWETA GEOTHERMAL PROSPECT, NORTHERN MALAWI
MSc thesis School of Engineering and Natural Sciences
Faculty of Earth Sciences University of Iceland
by
Gift Wellington Tsokonombwe Geological Survey Department
Regional Office Centre P.O. Box 30737, Lilongwe 3
MALAWI [email protected]
United Nations University Geothermal Training Programme
Reykjavík, Iceland Published in December 2017
ISBN 978-9979-68-461-9 (PRINT)
ISBN 978-9979-68-462-6 (PDF) ISSN 1670-7427

ii
This MSc thesis has also been published in December 2017 by the School of Engineering and Natural Sciences, Faculty of Earth Sciences
University of Iceland

iii
INTRODUCTION
The Geothermal Training Programme of the United Nations University (UNU) has operated in Iceland since 1979 with six-month annual courses for professionals from developing countries. The aim is to assist developing countries with significant geothermal potential to build up groups of specialists that cover most aspects of geothermal exploration and development. During 1979-2017, 670 scientists and engineers from 60 developing countries have completed the six month courses, or similar. They have come from Africa (39%), Asia (35%), Latin America (14%), Europe (11%), and Oceania (1%). There is a steady flow of requests from all over the world for the six-month training and we can only meet a portion of the requests. Most of the trainees are awarded UNU Fellowships financed by the Government of Iceland. Candidates for the six-month specialized training must have at least a BSc degree and a minimum of one-year practical experience in geothermal work in their home countries prior to the training. Many of our trainees have already completed their MSc or PhD degrees when they come to Iceland, but many excellent students with only BSc degrees have made requests to come again to Iceland for a higher academic degree. From 1999 UNU Fellows have also been given the chance to continue their studies and study for MSc degrees in geothermal science or engineering in co-operation with the University of Iceland. An agreement to this effect was signed with the University of Iceland. A similar agreement was also signed with Reykjavik University in 2013. The six-month studies at the UNU Geothermal Training Programme form a part of the graduate programme. It is a pleasure to introduce the 54th UNU Fellow to complete the MSc studies under a UNU-GTP Fellowship. Gift Wellington Tsokonombwe, BSc in Geology and Demography at the Geological Survey Department, Malawi, completed the six-month specialized training in Geological Exploration at UNU Geothermal Training Programme in October 2012. His research report was entitled: Geological and structural mapping of the Midfell-Flúdir low-temperature geothermal field, S-Iceland. After two years of geological and geothermal energy work in Malawi, he came back to Iceland for MSc studies in Geological Exploration at the School of Engineering and Natural Sciences, Faculty of Earth Sciences, University of Iceland in August 2014. In June 2017, he defended his MSc thesis presented here, entitled: Hydrogeochemistry modelling of Chiweta geothermal prospect, northern Malawi. His studies in Iceland were financed by the Government of Malawi and partially through a UNU-GTP Fellowship from the UNU Geothermal Training Programme. We congratulate Gift on the achievements and wish him all the best for the future. We thank the School of Engineering and Natural Sciences, Faculty of Earth Sciences, University of Iceland for the co-operation, and his supervisors for the dedication. Finally, I would like to mention that Gift’s MSc thesis with the figures in colour is available for downloading on our website www.unugtp.is, under publications.
With warmest greetings from Iceland, Lúdvík S. Georgsson, Director United Nations University Geothermal Training Programme

iv
ACKNOWLEDGEMENTS
Sincere thanks goes to the Government of Malawi through the Director of Geological Survey Department and Human Resources Management Department (HRMD) for financial support that made this study possible. Many thanks should go to the Government of Iceland through the Director Lúdvík S. Georgsson and the entire staff of UNU-GTP for financial support that made my stay and studies at university of Iceland possible. I owe a great deal to my supervisors Dadi Thorbjörnsson, Sigurdur Kristinsson and Andri Stefánsson for the knowledge they imparted to me and time they spent on commenting and editing this thesis. Many thanks should also go to Ríkey Kjartansdóttir and Rósa Ólafsdóttir for technical assistance in sample analysis. I am indebted to my UNU-GPT fellows who gave me tremendous support by making stay in Iceland livable. Many thanks go to my wife Wemha and my family for love and patience they demonstrated throughout my study.

v
ABSTRACT
The geothermal and non-geothermal water chemistry, structures and geology associated with Chiweta geothermal prospect was studied. The aim was to identify structures and associated geology controlling the geothermal system recharge and discharge. It also necessitated to quantify main chemical and physical characteristics of the geothermal water. Litho-structural surface mapping and remote sensing data was used to delineate structures and associated geology. Hydrogeological, geothermal mapping coupled with water chemistry was used to track water movement and quantification of related processes. Tectonic structures play an essential role in enhancing water flow from recharge area, within the geothermal system and out flow zone of the Chiweta. Driven by hydraulic gradient at an elevation of 1200 m, the recharged water percolates underground through reactivated pre-Cenozoic and Cenozoic faults and fractures of NW-SE and NE-SW trending that sliced Karroo sedimentary beds and metamorphosed basement rock. At depth, the faults and fractures are assumed to create a geothermal reservoir by enhancing the permeability of the subsurface rocks. Thermal water hosted by metamorphic and Karroo sedimentary rocks emerge along the NW-SE fault lineaments as hot springs, thermally altered grounds and shallow hot water borehole. Surface temperatures of thermal springs are about 80°C. The discharged thermal water from the 32 m depth well registered a temperature of 46°C. The proposed preliminary conceptual model of the geothermal system suggests the Chiweta geothermal prospect is a low temperature fault controlled geothermal system in sedimentary environment. The recharge waters belong to Ca-Mg-HCO3
type with temperature between 23 to 33°C and pH of 5.7-7.5. The inflow waters attain the heat from elevated geothermal gradient at depth, an anomaly assumed to be associated with crustal thinning due to Malawi Rift spreading. All thermal waters belong to Na-Cl-SO4-HCO3 facies. Chemical geothermometers suggest the subsurface reservoir temperature of about 132-157°C. Multiple mineral equilibria and mixing models are in good agreement with the solute geothermometers estimated subsurface temperature range. The elevated temperature is enough to drive dissolution of the host rock and ion exchange reaction in the reservoir of the geothermal system that modify chemical composition of reservoir and thermal springs water to Na-Cl-SO4-HCO3 facies from recharged Ca-Mg-HCO3 water type. The thermal water Cl/B ratio approached that of Cl/B rock ratio. No boiling is occurring during the ascent of the thermal waters but steaming at the surface causes minimal δD and δ18O isotopic fractionation. Reservoir pH is slightly lower than in situ pH in the liquid phase due to loss of acid gases, mainly CO2. Saturation of calcite and quartz is low in thermal spring waters indicating limited scaling potential. Reconstructed reservoir waters are saturated in talc, chrysotile, quartz and calcite indicating high chanced of scaling. Both thermal and non-thermal waters of the Chiweta system originate as precipitation in the western highlands as indicated by depleted δD and δ18O stable isotopes values. Heavily enriched δD and δ18O isotope lake water does not contribute to recharge of the geothermal system.

vi
TABLE OF CONTENTS Page
1. INTRODUCTION ................................................................................................................................1 1.1 General overview .........................................................................................................................1 1.1.1 Geological and structural mapping ...................................................................................2 1.1.2 Geochemical investigations ...............................................................................................2 1.2 Objectives ....................................................................................................................................3 1.3 Study area location ......................................................................................................................3 2. OUTLINE OF GEOLOGY .................................................................................................................5 2.1 Geological setting of Malawi ......................................................................................................5 2.1.1 Tectonics ...........................................................................................................................5 2.1.2 Geology .............................................................................................................................6 2.2 Geology of Uzumara South .........................................................................................................7 2.2.1 Basement complex ............................................................................................................9 2.2.2 K1 (Basal beds) .................................................................................................................9 2.2.3 K2 (The coal measures) .....................................................................................................9 2.2.4 K3 (Arkosic sandstone, siltstones and mudstones) ...........................................................9 2.2.5 K5 (Mudstones and calcareous siltstone) ..........................................................................9 2.2.6 K6 and K7 (The Chiweta beds) ....................................................................................... 10 2.3 Geothermal exploration in Malawi ............................................................................................ 10 2.4 Hydrogeology and hydro-geochemistry of Rumphi area .......................................................... 10 2.5 Chemistry of geothermal waters within Western Branch of EAR ............................................ 11 3. METHODOLOGY ............................................................................................................................ 12 3.1 Desk studies ............................................................................................................................... 12 3.2 Geological mapping ................................................................................................................... 12 3.2.1 Geological data analysis .................................................................................................. 12 3.3 Hydrogeological studies ............................................................................................................ 12 3.4 Geothermal mapping and soil temperature measurements ........................................................ 12 3.4.1 Soil temperature measurement ........................................................................................ 13 3.5 Water sampling, treatment and analysis .................................................................................... 13 4. RESULTS ......................................................................................................................................... 15 4.1 Geology and structures .............................................................................................................. 15 4.1.1 Basement complex .......................................................................................................... 15 4.1.2 Basal beds, K1 ................................................................................................................. 15 4.1.3 Coal measures, K2 .......................................................................................................... 15 4.1.4 Sandstones, mudstones-siltstones and arkosic siltstone: K3 a, b, & c ............................ 16 4.1.5 Mudstone and calcareous siltstones, K5 a & b ................................................................ 18 4.1.6 The Chiweta beds, K6 and K7 ........................................................................................ 18 4.1.7 Alluvium and talus .......................................................................................................... 19 4.2 Tectonics ................................................................................................................................... 19 4.2.1 Faults and lineaments ...................................................................................................... 19 4.2.2 Tilting .............................................................................................................................. 20 4.3 Geothermal mapping ................................................................................................................... 22 4.3.1 Soil temperature measurement ........................................................................................ 22 4.3.2 Groundwater movement .................................................................................................. 22 4.4 Discussion ................................................................................................................................... 26 4.4.1 Erosional processes and depositional environment ......................................................... 27 4.4.2 Strike and dip .................................................................................................................. 28 4.4.3 Geological structures orientation .................................................................................... 28 4.4.4 Relation between geological structures, groundwater flow and geothermal manifestation ................................................................................................................... 29 4.4.5 Secondary mineralisation ................................................................................................ 29

vii
Page
4.4.6 Rifting and the geothermal system .................................................................................. 30 5. WATER CHEMISTRY .................................................................................................................... 32 5.1 Major hydro-geochemical characteristics .................................................................................. 32 5.1.1 Surface water ................................................................................................................... 32 5.1.2 Groundwater .................................................................................................................... 32 5.1.3 Geothermal water ............................................................................................................ 33 5.2 Water classification ................................................................................................................... 33 5.3 Geothermometry ........................................................................................................................ 34 5.3.1 Silica geothermometers ................................................................................................... 36 5.3.2 Cation geothermometers ................................................................................................. 37 5.3.3 Multiple mineral equilibria .............................................................................................. 39 5.4 Mixing models ........................................................................................................................... 42 5.4.1 The silica-carbonate model ............................................................................................. 43 5.4.2 Silica-enthalpy hot spring model ..................................................................................... 43 5.4.3 The chloride-enthalpy model .......................................................................................... 45 5.5 Reconstructing reservoir water composition ............................................................................. 45 5.6 Assessing origin of water using isotopes and mobile elements ................................................. 48 5.6.1 Tracing water-rock interaction using recalculated aquifer isotope composition ............. 50 5.6.2 Boron and chlorine .......................................................................................................... 52 5.7 Discussion ................................................................................................................................. 52 5.7.1 Conceptual model ............................................................................................................ 53 5.7.2 Tectonics and geology ..................................................................................................... 54 6. CONCLUSION AND RECOMMENDATIONS .............................................................................. 56 6.1 Conclusion ................................................................................................................................. 56 6.2 Recommendations ..................................................................................................................... 56 REFERENCES ....................................................................................................................................... 58 LIST OF FIGURES 1. Methods used in geothermal surface exploration stage ................................................................. 2 2. Map of Malawi showing location of study area and the location of the Chiweta hot springs ....... 4 3. East Africa Rift System showing cratons, rift branches, faults and plate motion, and Malawi rift showing major faults, mobile belts and Rungwe Volcano ................................... 5 4. DEM map of Malawi showing earthquake occurrence in Malawi from 1901 to 2012 .................. 6 5. Geological map of Malawi ............................................................................................................. 7 6. Geology of Uzumara South showing the study area ...................................................................... 8 7. Stratigraphic column of Karoo beds at Uzumara South-Chiweta area .......................................... 9 8. Field assistant hammering a steel rod into the ground creating a soil temperature measurement hole at Chiweta ...................................................................................................... 13 9. Study area ASTAR DEM map showing water sampling points .................................................. 14 10. Locations of Figure 14, Figure 15 and Figure 17 shown in text below ....................................... 15 11. Chiweta escapement basement muscovite micaceous schist with feldspathic lineation quartzite and garnet of 5 mm diameter ......................................................................... 16 12. Chiweta coal seams and interbedded sandstone arkoses separated by white dotted line ............. 16 13. Chiweta K3a sandstone display cross-bedding ............................................................................ 16 14. Chiweta escarpment inferred, mapped faults and Karoo beds ..................................................... 17 15. NE dipping Karoo rocks and faults south of North Rumphi River .............................................. 17 16. K3b beds of chocolate and grey mudstones interbedded siltstone ............................................... 18 17. Chiweta hot springs inferred verified faults and Karoo beds ....................................................... 19

viii
Page
18. Tilted and folded strata and a fault with a 65 cm thick quartz vain, south of Chiweta hot spring. ........................................................................................................ 20 19. Structural map and rose diagram of the Chiweta area showing fault trending pattern ................ 21 20. Geological structures of Chiweta including the foot wall, hanging wall, main NE-SW, NW-SE faults and hot springs. ............................................................................. 22 21. Chiweta hot springs flow, thermal altered surfaces along hot spring area and thermal spring oozing from bottom of exposed Chiweta Beds ................................................................. 23 22. Geothermal manifestation map of Chiweta geothermal prospect ................................................ 24 23. Soil isotherm and soil temperature measurements map of the Chiweta farmland ....................... 24 24. Piezometric level and flow direction map .................................................................................... 25 25. Geological map of Chiweta geothermal prospect with cross-section lines .................................. 26 26. Rose diagrams showing orientation of old and current mapped faults ........................................ 29 27. Secondary quartz in veins and vugs structures of Chiweta .......................................................... 30 28. Cross-section O-P showing Chiweta strata’s and faults ............................................................... 30 29. Cross-section U-V showing Chiweta strata’s and faults .............................................................. 30 30. Cross-section I-J showing Chiweta strata’s and faults ................................................................. 31 31. Structural and Geological map of Chiweta geothermal prospect ................................................. 31 32. Cl-SO4-HCO3 water classification ternary diagram showing investigated water samples of Chiweta.. .......................................................................................................... 34 33. Na-K-Mg0.5 triangular diagram of Chiweta thermal water samples ............................................. 35 34. Distribution of Chiweta thermal waters in squire plot ................................................................. 36 35. Saturation state of Chiweta geothermal aquifer water with respect to indicated hydrothermal minerals .................................................................................................. 41 36. Saturation state of Chiweta geothermal aquifer water with respect to selected hydrothermal minerals.................................................................................................... 41 37. Saturation state of Chiweta geothermal hot spring water with respect indicated hydrothermal minerals .................................................................................................. 42 38. Mineral saturation diagram for Chiweta hot spring sample CH-13 ............................................. 42 39. Silica-carbonate mixing model for thermal springs and non-thermal water of Chiweta ............. 43 40. Silica-enthalpy hot spring mixing model of Chiweta geothermal prospect ................................. 44 41. Chloride-enthalpy diagram for Chiweta geothermal springs ....................................................... 45 42. Modelling of aquifer and up-flow boiling of Chiweta hot spring ................................................ 46 43. The relationship between isotopes (δD and δ18O) of Chiweta sampled waters and Globe Meteoric Line (GML) ........................................................................................................ 49 44. The relationship between calculated reservoir water isotopes (δD and δ18O) values for Chiweta area (dots) and Globe Meteoric Line (GML) ........................................................... 51 45. Illustration of Cl/B ratios and B and Cl concentrations in meteoric source water and subsequent dissolution from the rock .................................................................................... 52 46. Preliminary conceptual model of Chiweta geothermal prospect ................................................. 55 LIST OF TABLES 1. Borehole location data (eastings, nothings of and height above sea level) including groundwater depth and calculated altitude ................................................................................... 25 2. Chemical analysis of major elements and isotopes ...................................................................... 32 3. Solute geothermometers for the Chiweta thermal spring water samples ..................................... 39 4. Measured chemical composition of hot spring and calculated reservoir aquifer of the Chiweta prospect .................................................................................................................... 48 5. Calculated isotope reservoir composition based on Equations 26 and 27 ................................... 51

1
1. INTRODUCTION 1.1 General overview Energy plays a key role in all three dimensions of sustainable development of society, namely economic, social and environmental prosperity. Malawi Growth and Development Strategy II (MGDS II), Malawi government’s development blue print, acknowledges energy as one of the drivers of social-economic development and improvement in the wellbeing of Malawians (Government of Malawi, 2012). As the key to improved standards of living of the poor is to make clean energy available to them at affordable price (Fridleifsson, 2001). However, Malawi continues to experience insufficient energy supply in spite of several available untapped clean renewable energy resources. Out of 16 million population, about 90% use unclean traditional biomass (wood and charcoal burning) as an energy source, accounting for about 88.4% of the country’s energy requirements. The remaining 8.8% use hydrocarbons and only 2.8% hydroelectricity (Gamula et al., 2013). Heavily dependence on biomass has led to widespread deforestation and reduced the carbon storage in trees and forest soils. Approximately 3.2 million tonnes of carbon dioxide are released into atmosphere annually due to deforestation (Openshaw, 2010). In addition, deforestations also have exposed the soil to erosion. Currently, the country’s generation capacity stands at 351 MWe with only 8% of 16 million population having access to electricity (MCC-Malawi, 2015), while energy and electricity demand registered an annual increase of 1.2% and 6-8%, respectively (Taulo et al., 2015). Malawi has renewable geothermal energy resources due to its geological architecture as it is situated within western arm of East Africa Rift System (EARS). A notable example is Kenya where geothermal generates about 573 MWe and 10 MWt (Omenda and Simiyu, 2015). The potential of geothermal sources in Malawi is manifested by the presence of hot springs. Despite signs of availability of the resource no other exploitation has been registered apart from bathing and washing. Inadequate data, lack of policy direction, technical capacity and financial resources are some of major challenges that hinder the development of geothermal in the country. Very few attempts have been made for Malawi to assess the applicability of its geothermal resources and none has produced tangible results. Understanding features of geothermal is beneficial for successful utilization of the resource. Geothermal energy is defined as the thermal energy contained within the earth (Saemundsson et al., 2009). Geothermal system refers to all parts of the hydrological system, including the recharge zone, the subsurface domains or reservoir and the outflow pathways (Saemundsson et al., 2009). Geothermal systems are classified into two categories namely high-temperature (>150°C) and low-temperature systems (<150°C) (Saemundsson et al., 2009). In case of high-temperature systems, the heat source is often taken to be shallow crustal magma bodies which are commonly associated with central volcanoes and more rarely dyke swarms (Arnórsson, 1995a). Relatively high regional geothermal gradient results in “hot rock” at shallow levels, which in turn become the effective heat source for low temperature systems, where deep water circulation is promoted by the regional tectonic structures and/or highly permeable sedimentary units at depth (Arnórsson, 1995b; Saemundsson et al., 2009). The heat needs a carrier to be transferred and in geothermal systems a fluid in form of liquid or steam is the thermal carrier. The fluid transport requires pathways, such as structural lineament in the form of joints, fractures and faults or alternatively a porous media. The highest (or most productive) permeability is generally associated with sub-vertical fractures and faults. Intrusive crystalline bodies are examples of rocks with poor permeability (Arnórsson, 1995a). Awareness of all aspects mentioned above and the manner they interact is paramount for sustainable development of a geothermal resource. It determines whether the field is exploitable and reinforces assessments of potential environmental impact upon utilization. The early stages of a geothermal resource exploration and development, the understanding of the system begins with geological mapping, geochemical investigation, geophysical surveys and conceptual modelling. Reservoir monitoring and modelling become critical during resource exploitation. Geological mapping and geochemical investigation provide basic data that is essential in subsequent

2
stages. Consequently, focusing on these two methods at initial phases is a prerequisite. As demonstrated in Figure 1, geological mapping along with geochemical and geophysical investigations are the main methods used at surface investigation stage (IGA, 2013). The current project has combined geochemical investigation, geological and structural studies part of surface investigation methods in order to understand geology, hydrogeology and hydrogeochemistry of the Chiweta geothermal prospect. The main focus is on the chemistry of the water recharging the geothermal system, structures that controls inflow, reservoir fluid composition, water-rock interaction, outflow structures of hot water and processes arising as hot water ascend to the surface. 1.1.1 Geological and structural mapping Exploitation of geothermal resources requires information on the basic geology to enable optimum utilization of the resource. This can be obtained through detailed mapping of the area. A geological map provides information on key rock types within the geothermal prospect as well as help with constraining the age of lithological succession. It also delineates the surface expression of critical structures, such as faults and fractures, and as such provides key information on the structures that control inflow and up-flow within the geothermal system (Curewitz and Karson, 1997). Geological mapping gives an idea of the cap-rock of the geothermal reservoir. Combining knowledge of surface geology, tectonics and related structure and stratigraphy observed from the ground gives an idea on reservoir characteristics. 1.1.2 Geochemical investigations Application of chemical techniques is an integral part of any geothermal exploration and monitoring programme (Arnórsson, et al., 2007). Geochemistry is essential tool for geothermal investigation during exploration stage as it can track back the origin of geothermal water and its flow direction. Waters and gases discharged at the surface generally carry imprints of their deeper processes such as fluid-rock interaction (Arnórsson, et al., 2007). As the primary fluid rises from deep apart of the system towards the surface it may go under phase separation due depressurisation boiling and result in formation of secondary fluid. In addition, secondary fluid is also formed when primary fluid mixes with surface waters (Arnórsson, et al., 2007). All these processes are captured in the chemistry of geothermal fluid discharged as geothermal manifestation. Geothermal geochemistry aims at studying water-rock
Sur
face
exp
lora
tion
Geological and structural
studies
1. Tectonics and structural geology2. Hydrogeology 3. Hydrothermal altaration 4. Volcanology5. Geohazard assesment
Geochemical investigation1. Chemistry of thermal fluid2. Soil and water sampling 3. Flowrate measurements
Geophysical studies
1. Heatflow measurements
2. Eletrical (resistivity) survey
3. Magnetic survey
5. Seisimic and surfarce deformation studies
6. Gravity survey
FIGURE 1: Methods used in geothermal surface exploration stage (modified from IGA, 2013)

3
interaction as dissolved constituents in the geothermal fluids as a product of fluid-rock interaction at depth and other processes (Arnórsson, et al., 2007). Understanding of chemical processes within active geothermal systems has been advanced by thermodynamic and kinetic experiments and numerical modelling of fluid flow (Arnórsson et al., 2007). The chemical composition and isotope ratios of geothermal fluids provide important information about the geological, geochemistry and hydrogeological characteristics of geothermal systems. During exploitation geochemistry has been used for monitoring reservoir response to utilization. 1.2 Objectives Very few investigations have been conducted at Chiweta geothermal prospect and none have been carried out to narrate the geothermal activities of the area with respect to the main geological structures, hydrogeology and chemistry. Therefore the main aim of this study is to define the geological and hydrogeological properties of thermal and non-thermal waters. Special emphasis is put on study of ground water movement from recharge zone to geothermal reservoir through geological structures, modelling of reservoir fluid composition and water-rock interaction. To achieve these broad ideas the following objectives were set:
• To understand the basic hydrogeology of the study area in terms of the origin and movement of groundwater
• Define the geological structures (e.g. faults, fault type, relative ages, strike and dip) controlling inflow and outflow of non-thermal and thermal water
• Map the rock units of Chiweta geothermal prospect and determine the reservoir • Estimate maximum subsurface reservoir temperature of the system by application of
geothermometers • Quantify and explain various geochemical processes leading to the surface chemistry of hot
water and reconstruct reservoir fluid composition • Construct preliminary conceptual model
1.3 Study area location Chiweta is a trading centre located south of the Chiweta hot springs. However, in the current study the name is used loosely referring to the entire study area shown in Figure 2. Chiweta geothermal prospect is located in north part of Rumphi District, northern region of Malawi between longitude 34.08°E and 34.21°E and latitude 10.62°S and 10.75°S (Figure 2). The prospect can be accessed through M1 road, about 120 km from Mzuzu City. The field is comprised of Nyika escarpments belt of rugged country, consisting mainly of deeply dissected spurs which are almost V-shaped in the east and southwest. Elevation varies from 480 m at the shore of Lake Malawi to 1640 m above sea level at the crest of the escarpment. Flat areas are concentrated along the valleys and lake shore in the eastern side. The area experiences tropical climate with most of rains fall in the moths of November to April. Annual average atmospheric temperature is 24°C along the lake whereas along the escarpment is 21°C but it goes higher in October through April. The area receive average rainfall of 1081 mm annually (Climate Data, 2017). Chiweta has the highest recorded temperature hot springs in Malawi, within a spring zone, sitting parallel to Mphinzi stream near the mouth of North Rumphi River, where temperature of 79°C is found. Few surrounding residences use the stream emanating from the spring for bathing and washing. A 32 m deep shallow borehole drilled in March 2000 for cold water intercepted hot water that was used for bathing and washing. The borehole is located in the northeast of Chiweta hot spring, southeast of Luwuchi Primary School and was functional until 2012 when it was damaged due to corrosion of the steel rods. During the current study the borehole was repaired and sampled at a downhole temperature of 46°C.

4
FIGURE 2: Map of Malawi (A) showing location of study area (B) and the location of the Chiweta hot springs by the North of Chiweta trading centre

5
2. OUTLINE OF GEOLOGY 2.1 Geological setting of Malawi 2.1.1 Tectonics Malawi is located within seismically active intracontinental and southward propagating divergent plate boundary of the East Africa Rift System (EARS) (Deprez et al., 2013). The rifting associated with the EARS (Figure 3A) results in crustal thinning at depth as well as extension within the rift system. The crustal thinning promotes upwelling of the mantle due to decompression, which in turn can produce partial melting within the rising mantle. Via the rifting, structures such as faults and fractures are formed, which in turn provide passage for meteoric and/or sea water into the subsurface. The same rifting structures are also the pathways for magma moving through the crust. The downward percolating water is heated up as it moves through hot and permeable rocks and form geothermal reservoirs. Hot springs, mud pools and fumaroles are the typical surface manifestation of these geothermal reservoirs. Geothermal activity in Western branch of EARS is dominated by low temperature geothermal systems with few high temperature systems (Hardarson, 2014).The Malawi Rift in Figure 3B is part of the western branch of the Cenozoic EARS (Figure 3A). It extends for about 800 km, from the Rungwe volcanics to southern Malawi. The rift structures extend for a further 600 km to the southern Africa via the Urema graben and Dombe trough in Mozambique. In Malawi the rift is classified as being in an initial-stage of rifting, characterized by divergences and subsidence along with frequent earthquakes (Chorowicz and Sorlien, 1992). The estimated relative spreading rate is about 2.2mm/year in the north
FIGURE 3: East Africa Rift System (A) showing cratons, rift branches, faults and plate motion (grey arrows) and Malawi rift in black box (B) showing major faults, mobile
belts and Rungwe volcano (modified from Chorowicz, 2005)

6
and 1.5mm/yr in the south (Saria et al., 2014). It features less fault density and typified by extensional oblique-slip normal faulting basin. The basins are comprised of tens of km-long and 30-40 km wide box-like half-grabens, which at present are largely covered by Lake Malawi (Chorowicz and Sorlien, 1992). Initiation of rifting is estimated to be in late Miocene (Flannery and Rosendahl, 1990), or even earlier as oldest structures are estimated to be of Permian to Jurassic age (280-65 Ma) and linked to the orogenic episode associated with Karroo rifting (Mdala, 2015). The north to south trending Chimaliro fault (Figure 3B) and northwest to southeast dyke swarms in southern province belong to this group. The second group belongs to the Cenozoic rifting of the East Africa Rift System border faults of north south trending structures. Northern Malawi Livingstonia fault belongs to this group and trends northwest to southeast. The northeast trending Zomba fault and southwest trending Thyolo fault in the southern province of the country belong also to this category. Still active, the Malawi rift features a number of earthquakes
(Figure 4) at different depth since historical times. Figure 4 shows that most of the recorded earthquakes registered magnitude between 4 and 5. The recent earthquake of 6.2 magnitude was reported in Karonga District 105 km north of Chiweta prospect in December 2009 (Geological Survey Department, 2010). The earthquake had an epicentre at 9.8941 °S and 33.8813 °E and hypocentre of 8 km depth. Mapping of the earthquake revealed three major new faults, twenty minor ones and reactivation of old faults. All faults has either N-S or NW-SE orientation with average vertical and horizontal offset of 15 cm and 30 cm, respectively (Geological Survey Department, 2010). In 1978, an offshore earthquake of 4.9 magnitude was recorded 2.5 km southeast of Chiweta hot spring at a depth of 5 km. 2.1.2 Geology The geology of Malawi is dominated by Precambrian to Lower Palaeozoic high-grade metamorphic rocks of the amphibolite and granulite facies (Figure 5; Carter and Bennett, 1973). Typical rock types are pelities and semi-pelitites commonly intercalated with calc-silicate gneisses and marbles along with bands of amphibolites and basic and ultrabasic assemblages mainly comprised of pyroxenites, serpentinites and metagabbros. The Permian to Triassic Karoo sedimentary rock sequences are superimposed on the metamorphosed basement rocks and are best developed in troughs present in
FIGURE 4: DEM map of Malawi showing earthquake occurrence in Malawi from 1901 to 2012 (Geological Survey Department, 2013)

7
northern and southern parts of the country. Examples include sandstones, limestones and mudstones intercalated with coal seams. The Karoo rocks of the south were punctuated by Jurassic to Cretaceous alkaline igneous rocks (lavas, dykes, sills and plutons), including basalts, dolerites, granites, syenites, carbonatites, and foidolites. The Tertiary sedimentary rocks include Sungwa, Chiwondo and Chitimwe dinosaur beds are prominent in the northern region of the country. Quaternary alluvium sediments of probable lacustrine affinity mainly covers lakeshore areas and along the major drainage systems. Pleistocene volcanic extension of Rungwe volcanic from southern Tanzania is reported to be part of Malawi rift (Dulanya et al., 2010; Fontijn et al., 2012). Although the Malawi’s central and southern rift has not feature volcanism, studies indicate that it has experienced crustal thinning of about 25% (Fadaie and Ranalli, 1990). The rheology of the lithosphere basing on geothermal data has estimated a brittle layer of 18 ± 5 km in the whole western rift.Seismic reflection studies in Lake Malawi reveal geological structures consisting of several asymmetric basins with complex fault geometries, infilled with thick sedimentary sequences with dyke-like bodies penetrate different parts of the succession at the bottom of the Lake (Flannery and Rosendahl, 1990). A pronounced negative Bouguer anomaly in this area is explained by asthenospheric intrusions into the lithosphere (Chorowicz, 2005). Structurally, the country underwent three series of brittle deformation. The first two events occurred in the northern sub-province are Ubendian mobile belt (2300-1800 my) from Tanzania and Irumide (1300-950 my) from Zambia (Ring and Betzler, 1993). The last Mozambique orogenic belt (900-400 my) from Mozambique affected the whole country and super imposed some of the signatures of the earlier belts (Mdala, 2015). 2.2 Geology of Uzumara South Understanding of the sequence, nature and style of the stratigraphy is fundamental for understanding both the surface and sub-surface geology of the Uzumara area. The geology of Uzumara South (Figure 6) and its surroundings presented hereafter, derives from work of many authors (e.g. Ring, 1995, Kemp, 1975, Thatcher, 1974). Their work has provided the basis upon which subsequent work dwell on. The
FIGURE 5: Geological map of Malawi. modified from Carter and Bennett (1973)

8
Geology of Livingstonia area in which the area under current study falls is mainly dominated by Karoo
FIGURE 6: Geology of Uzumara South showing the study area (red rectangle), modified from Kemp (1975)

9
rocks, the unit that is found in Africa, Asia, Australia and South America and it correlate well in all these continents. Karoo beds is critically important as it represent the geology of Gondwana (Ring, 1995). EARS Karoo graben is syn-depositional tectonic rifting related to incipient of break-up pattern of Gondwana connected to convective mantle. Lithostratigraphic nomenclature adopted for Karoo system ranges from K1 up to K7. Figure 7 shows general stratigraphic column of the Chiweta area as proposed by (Ring, 1995) Thatcher (1974) and Kemp (1975), summarise the geology of Uzumara South around Chiweta area. Units K1-K7 discussed below are shown in Figure 6 and Figure 7: 2.2.1 Basement complex The basement complex of Livingstonia near North Rumphi River is characterised by amphibolite associated with biotite gneisses and schist. Beneath Livingstonia escarpments the garnetiferous schist occurs below Karoo sedimentary beds. 2.2.2 K1 (Basal beds) The basal beds lie un-conformably on micaceous schist basement complex rocks. The outcrops are visible in few places. The basal is composed of course conglomerates and pebble sandstone. Overlying the basal is siltstone and fine laminated shales with rock fragments and sandstone. Some drilled holes crosscut the beds at depth. 2.2.3 K2 (The coal measures) This unit is only visible on the escarpment east and northeast of Chombe and northern part of Kaziwiziwi. Like the previous strata, the K2 beds occurs in most drill-hole cores of the area. Some cores shows dark grey and black carbonaceous shale, and siltstone grading into sandstone. Inter-banded with these share are yellowish feldspathic sandstone with carbonaceous matrix grading into arkose sandstone. The author interpreted the presence of arkose sandstone and feldspathic sandstone signifies cold weather conditions of deposition with seasonal growth vegetation, as most coal is detrital or peaty origin. 2.2.4 K3 (Arkosic sandstone, siltstones and mudstones) Unit K3 is widely exposed in the crest of the escarpment of Livingstonia and form the base of Luwatizi River valley. It is also well exposed in the lakeshore escarpment south of Chombe point and North Rumphi and South Rukuru Rivers. The dominant rock is arkosic pink feldspar sandstone and pebbly grits with small bands of grey mudstone and siltstones. The colours range from chocolate-brown, purple or greenish and calcareous. The bed is capped by pink, fine to medium grain hard arkoses siltstone with intercalation of coarse grit. Near the top several thin carbonaceous mudstone interpreted as K4, the upper coal measure of Ruhuhu Basin of Tanzania. 2.2.5 K5 (Mudstones and calcareous siltstone) Overlying the intermediate beds, the K5 are main ruminants forming larger part of Livingstonia and Chombe plateaus. The base of this unit is composed of pink and grey mudstone turn yellow and buff
FIGURE 7: Stratigraphic column of Karoo beds at Uzumara South-
Chiweta area (Ring, 1995)

10
tint when weathered. The resistant top layer is made of calcareous siltstone capping the Chombe and Livingstonia plateaux. In some places the K5 overlaid the K3 beds whereas in other places the K5 beds sit on basement rocks. This shows that the pre-Karoo landscape in later areas was exposed until K5 time. 2.2.6 K6 and K7 (The Chiweta beds) The Chiweta beds occur in a small down-faulted block few tens metres to the mouth of North Rumphi River. The beds composed principally of purplish mudstones dipping 10° northwards. The unconformity separate the mudstone is made of thick bedded purplish grits with small patches of sandstone. The grits are made of pebbles composed of limestone, mudstone and Dicynodont reptile bone fragment. The basal is made of mudstone sequence including nodular limestone, mudstone and marly conglomerate of rolled limestone pebbles. 2.3 Geothermal exploration in Malawi Hot springs in Malawi were first reported in the 1890’s, yet only a few studies have been conducted to assess its potential. Hitherto these studies have yielded limited data and not enough for engaging with a full development plan. Majority of these studies ended at reconnaissance stage focusing on mapping the lithology and structures that appear to control the presence of the hot springs as well as their physio-chemical characteristics. The previous study found the thermal water of Chiweta as carbonate and sodium chloride type with fluorine content of 20 mg/kg (Kemp, 1975). Maximum temperature recorded was 78.3°C with total dissolved solids of 1198 mg/kg. The occurrence of hot springs has been interpreted as indicating presence of magmatism linked to the tectonic activity of EARS (Harrison and Chapusa, 1975) but a review of the available literature shows that main Malawi Rift has not been subjected to volcanic activity in recent times. The only known active volcanoes (erupted in the Holocene) (Fontijn et al., 2012) in the rift is located at Rungwe, Ngozi and Kyejo in the Rungwe Volcanic Province (RVP) in southwest Tanzania, about 280 km northeast of the Chiweta geothermal prospect. However, tectonism in Rungwe Volcanic Province affected northern part of Malawi rift (Dulanya et al., 2010). In 2003, the Geological Survey of Malawi documented the location of known hot springs within the country and produced a map as the first step in accessing the suitability of the geothermal fields for harvesting energy (Dulanya, 2006). Furthermore, Dulanya et al. (2010) undertook a geothermometric study, using silica (quartz and chalcedony) and cation (Na–K, Na–K–Ca and K–Mg) geothermometers, to determine the subsurface temperatures of geothermal fields. This was achieved by using data published by Bloomfield and Garson, (1965), Harrison and Chapusa, (1975) and Ray (1975). Using methods proposed by Fournier (1977); and Fournier and Truesdell (1973); they predicted subsurface temperature of 214°C at the Chinuka hot spring located at northern tip of Malawi (Dulanya et al., 2010). Geothermal Projects Limited of Malawi with technical support from Geothermal Development Company of Kenya conducted a geochemical reconnaissance study in 2010 (Geothermal Development Company, 2010) and calculated the subsurface temperatures of the Malawi geothermal systems using Na/K cation geothermometer of Fournier (1979) and Giggenbach (1988). Among hot springs studied, Chiweta springs registered the highest subsurface temperatures of 249°C. As part of investigation on the early stages of continental extension project in Malawi Oklahoma State University collaborated with Geological Survey of Malawi in 2013 and collected thermal fluid samples around the country. For comparison, the current study incorporated data collected by Oklahoma and Geothermal Development Company. 2.4 Hydrogeology and hydro-geochemistry of Rumphi area Two main rivers, North Rumphi and South Rukuru and several small streams Figure 2 flow from Nyika plateau throughout the year. Geological Survey Department drilled 34 boreholes (Kemp, 1975) by 1974.

11
With average depth of 40 m, these boreholes strike sedimentary aquifers of moderate yield. Several potable water boreholes have been drilled in the area lately. However lack of borehole data such as lithology logs and description of aquifers remains a challenge. Wanda et al., (2013) evaluated groundwater in entire the Rumphi area for irrigation suitability. Their study characterised the groundwater of the area as under-saturated with respect calcite and dolomite suggesting that a majority of the waters can allow dilution. High PCO2 values were obtained in soil zones than in atmospheric suggesting that the groundwater system is enriched of soil CO2. The groundwater is also saturated with respect to calcite and kaolinite stability field suggesting equilibrium of the groundwater with respect to silicates. Their study concluded that chemical weathering and dissolution controls chemistry of groundwater of the area. 2.5 Chemistry of geothermal waters within Western Branch of EAR A great deal of research has been done in Uganda, Rwanda and the Rungwe volcanic of Tanzania in relation to chemistry of geothermal water. Water chemistry analysis of Rungwe volcanic field in the Mbeya region are known to be low B/Cl ratios, suggesting that they are derived from an old hydrothermal system (Delalande et al., 2011). The Cl rich water of Ngozi hot springs shows subsurface temperature of 201°C to 234°C (Mnjokava, 2007) using Na-K (Giggenbach, 1988) and Na-K-Ca (Fournier, 1977) geothermometers. Whereas silica-enthalpy mixing model (Truesdell and Fournier, 1977) predicts a subsurface reservoir temperature of 166°C at Kilambo, Kandete and Lake Ngozi geothermal prospects. In western Uganda a number of studies has been done in geothermal areas, including at Katwe-Kikorongo (Katwe), Buranga, and Kibiro areas (Bahati et al., 2005). Oxygen isotope geothermometry based on aqueous sulfate and water equilibrium fractionation, indicates a subsurface temperature of 200°C at Buranga. On contrary the chemical geothermometry shows subsurface temperature ranges of 140–170°C at Kabiro and 140–150°C for Katwe and Kibiro. High isotope geothermometer represent older high temperatures with is cooling as reflected by low solute geothermometers. The isotopic compositions of thermal waters are comparable with the local meteoric water line (LMWL), suggesting the meteoric origin of the water circulating in the geothermal systems. River waters are found to be more enriched in δ2H than the hot spring waters, an indication that they are not the source of recharge for the thermal system. Similarly, lake Kikorongo, Kasenyi, Kitagata and Katwe waters were found to be highly evaporated and most likely not a source of recharge for geothermal systems. The mixing model demonstrated that geothermal water at Katwe-Kikorongo is a mixture of lake and geothermal waters (Bahati et al., 2005). Using chemistry of the thermal fluid, the geothermal water of NW Rwanda are classified as Na-HCO3 water that has not attain full equilibrium representing deep and shallow aquifer reservoirs (Niyigena, 2013). The quartz (Fournier and Potter, 1982) and chalcedony (Fournier, 1977) geothermometers showed temperature variation from 80 to 129°C while Na/K geothermometer (Arnórsson et al., 1983) estimated higher temperature values from 142 to 270°C. The δ18O and δD stable isotopes showed that the geothermal system is recharged from local precipitation as it plotted close to Global and Local Kenyan Meteoric Lines.

12
3. METHODOLOGY 3.1 Desk studies Half of desk study was carried out at the University of Iceland in June 2016 while the other half was done in Malawi in August, 2016. In Iceland, the work involved downloading and pre-processing remote sensing data of the ASTER Global Digital Elevation Models (GDEM), Landsat and Arc GIS imagery. The data was pre-processed to extract data of interested. It also involved retrieving and compilation of previous geological data of interest. Old geological and structural maps were digitised in Arc GIS Software version 10.2 (Esri, 2011). A geodatabase was created comprising of raster and vector data obtained from both old maps and satellite images. The desk study continued in Malawi through reading of relevant literatures. The combination of these methods of desk study identified the gaps, which the current research is addressing and target area was generated for reconnaissance. 3.2 Geological mapping The remote sensing as a tool cannot completely replace field geological mapping but complement through generation of targets. Mapping exercise started with reconnaissance work in the last week of August 2016. The aim was to get familiar with the study area, plan for proper traverse and assessing the status of the existing road networks. Detailed litho-structural mapping through ground truthing was started in September and continued to October 2016. The surface traces of features such as bedding, banding, foliation fabrics, bedrock, surficial cover, contacts and lineament structures such as faults, fractures and veins were marked directly from the field observations. Description of rock formations, texture and colour were noted. For accurate recording of the data, supporting equipment such as GPS, camera, compass clinometer, base maps, geological hammer, sample bags and field note book were used. Structural features including faults and fractures were tracked using a GPS where accessible. Where not accessible, the features were delineated from the base map, aerial photo and satellite images. A topographical map of 1:10,000 was used as a base map for the drafting of the geological features. Notes and sketches were written in the field book. 3.2.1 Geological data analysis Remote sensing data, old and new geological data sets were compiled in Arc GIS software (Esri, 2011) for easy integration. This method was used to correlate various spatial data in one platform to establishment the relationship between geological features using Arc GIS overly analysis tools. Rose diagrams for all fractures and faults were projected using Arc GIS and Rockworks software. As a final product, digital geological and structural maps, alongside with cross-sections were produced.
3.3 Hydrogeological studies The hydrogeological study involved collection of borehole location data (eastings, northings and elevations) of existing shallow drinking water boreholes and cold springs. The aim was to determine the general groundwater table and flow direction. To do so the altitude / the height above datum plane of groundwater was determined by subtracting borehole depth from surface elevation obtained by handheld GPS. The groundwater level was assumed to be 5 m above borehole depth. In total, 15 boreholes were located and the sixteenth borehole was retrieved from Department of Water database. Equipotential lines connecting water levels of the area was constructed from the boreholes and cord springs water table elevation data from using Arc GIS interpolation function. Groundwater flow direction was determined using Arc GIS hydrology spatial analysis tool. 3.4 Geothermal mapping and soil temperature measurements Geothermal mapping included locating thermal springs and alteration surfaces. It also encompassed soil temperature measurement that was done around Mphinzi Stream during the first week of November

13
2016. The aim of the measurements was to define the thermal pattern of a sediment covered geothermal manifestation and to delineate its extent in relation to geological structures. 3.4.1 Soil temperature measurement To start with, the atmospheric temperature of the day was recorded. Then a straight line was drawn with accuracy of the measuring tape. At an interval of 5 m, using the straight line, a steel rod was hammered 50 cm into the ground (as shown in Figure 8). A thermocouple was inserted into the hole and temperature was recorded after few minutes. Measuring lines were at 15 m interval at places of temperature <50°C. Whereas > 50°C temperature sites line spacing was gradually decreased to 5 m. Each temperature reading was recorded with respect to associated GPS waypoint which were combined afterwards and processed in ArcGIS. The end product of this exercise was an isotherm map. 3.5 Water sampling, treatment and analysis Sampling of water was done from 24th to 29th October 2016. The exercise comprised of gathering information on chemical and physical characteristics on thermal and no-thermal water of the area. This involved collection of representative samples using sampling technics explained by Arnórsson et al., (2006) and Ármannsson and Ólafsson (2006). For the thermal spring sampling, the selection of sample site depended on temperature, flow rate, geographic distribution and hydrogeological observation. Therefore one hot spring with highest temperature, maximum flow rate and small aperture with minimum contact with the soil was sampled. The hot water borehole was sampled as well. One sample was from North Rumphi River whereas the other one was from Lake Malawi. Two samples were collected from cold springs while the rest of the samples were from shallow drinking water boreholes. In total twelve water samples were collected as shown in Figure 9. Samples were filtered on-site using cellulose acetate 0.2µm filter then each stored in a pair of polyethylene bottles. To prevent adsorption on the bottles wall, one of the bottles from the pair was acidified with 1 ml nitric acid (HNO3) for determination of cations. The other sample was kept un-acidified for anion analyses. Temperature, electric conductivity (EC) and pH were measured directly during sample collection. The dissolved inorganic CO2 was determined on-site in using alkalinity titration where the sample was titrated from pH 8.4 using 0.1M of HCl to pH of 3.4. The concentration of CO2 was determined using the following formula:
CO2 =
x 4400 - 6.76
Dissolved H2S was also determined onsite in thermal water samples by adding dithizone indicator into the sample, followed by titration with Hg acetate until the colour changed to pink. The amount of H2S in the sample was derived using the following formula:
H2S =
x 34
The Cl and SO4 were determined using Inductively Coupled Plasma Optical-Emission Spectrometry (ICP-OES) in un-acidified samples at the University of Iceland. Major cations such as Si, Na, K, Ca, Mg, Fe, Al and B were measured using the same ICP-OES on acidified sample. Florine and duplicate boron analysis was done using Ion
FIGURE 8: Field assistant hammering a steel rod into the ground creating a soil temperature
measurement hole at Chiweta

14
Chromatography (IC-2000). For quality control of the analytical data, each sample was measured in duplicate and analysis of geothermal water standard was repeated at every 5 samples. The duplicate analytical precision at 95 % confidence level was less than 5 % for all measured elements. The stable isotopes of hydrogen (δD) and oxygen (δ18O) were analysed with an Inductively Coupled Plasma - Mass Spectrometer (ICP-MS). Additional unpublished analytical data of Chiweta waters by Oklahoma State University and Geothermal Development Company (2010) were also included in this study. Geochemical calculations including geothermometry, mineral saturation state, and reservoir composition of major elements were carried out with the aid of the WATCH (Bjarnason, 2010) and methods explained by Arnórsson et al., 2007 and D’Amore and Arnórsson (2000). Mixing models and stable isotope calculation were done using methods proposed by Arnórsson (2000) and Fournier and Potter (1982). Through integration analysis of geological mapping, hydrogeology, hydrogeochemical and geothermal mapping, a preliminary conceptual model of Chiweta geothermal prospect was constructed.
FIGURE 9: Study area DEM map showing water sampling points

15
4. RESULTS 4.1 Geology and structures Two main rock types were encountered at Chiweta namely medium- to high-grade metamorphic and sedimentary rocks. The metamorphic rocks outcropped in few places forming a basement while sedimentary rocks dominantly overlaid on the metamorphosed basement. The nomenclature of sedimentary rocks reported here is based on Karoo system terminology proposed by Stockley (1932) which was also adopted by Kemp (1975) and Ring (1995). From the oldest to youngest, six main Karoo beds were identified as K1, K2, K3, K5, K6, and K7 rocks. Overlaid the Karoo were the recent alluvium deposits and talus. Figure 10 shows location and angle of sight of features that were mapped during the current study and are displayed in subsequent Figure 14, Figure 15 and Figure 17. 4.1.1 Basement complex The basement was mainly composed of silvery mica schist with lineated feldsparthic quartzite and garnetiferous amphiboles. Figure 11 shows the mica schist with garnet from Chiweta escarpment. The basement complex rock of was partially exposed at the escarpment at Chiweta area laid in the bottom of K3b bed and dissected by NW-SE trending fault. 4.1.2 Basal beds, K1 The K1 of the Chiweta bed refers to basal beds of heterolithic conglomerate with sandstone and siltstone-clay matrix. The lithic components varied in size from 50 to 100 mm diameter and composed of poorly sorted of sub-angular to rounded fragments of quartz, micaceous rock fragments. The consolidated matrix consisted of poorly sorted coarse to medium-grained sandstone mixed with green and grey silt-mudstone. They graded upwards to sandstone and siltstone. Due to difficult in accessibility no thickness was measured but Kemp (1975) indicated thickness of 76 m. The dominant colour was green with minor brown and chocolate. The beds outcropped north of Chombe point within the escarpment overlying on basement gneiss. The basal beds followed fairly south eastwards dip of the basement. 4.1.3 Coal measures, K2 Exposed at southern and northern Chiweta escapement at location where Nchenga and Rukuru coal mining companies are extracting coal. The K2 is mainly composed of black micaceous coal seams and
FIGURE 10: Locations of Figure 14, Figure 15 and Figure 17 shown in text below

16
medium interbedded with 15 to 30 cm (Figure 12) yellow feldspathic sandstones and siltstones. The sandstone and siltstone has carbonaceous matrix grading to arkoses. The sandstone was composed of angular clastic feldspar and quarts grains of about 1 mm. The siltstone has also similar composition as sandstone. 4.1.4 Sandstones, mudstones-siltstones and arkosic siltstone: K3 a, b, and c The K3 beds were composed of arkoses, sandstone and mudstone. In this report the beds has been subdivided into three lithological units namely K3a, K3b and K3c representing sandstones, arkoses and mudstone respectively. Sandstone, K3a The fine to coarse grained K3a was made up of 0.1 to 1 mm angular to sub-angular quartz, with some feldspar. This layer was fairly homogeneous and well sorted sandstone associated with cross-bedded (Figure 13) at north of Chiweta hot springs. The bed placed on top of coal seam and basal bed formations in few locations. In many localities, K3a was situated on basement complex rock. The strata outcropped at NE-SW escarpment of Chiweta main fault where secondary mineral quartz veins intercepted the bed (Figure 14). The bed has a dip of 8° NW and
10-25° to the SE. Located to the north of Chiweta hot springs, the cross-bedded K3a in Figure 13 was dip at an angle of 18° to the NW while to the south of North Rumphi River in Figure 15 the bed dip at angle 25-35 to the NE. In all locations the strata varied in thickness from few to tens of metres.
FIGURE 11: Chiweta escapement basement muscovite micaceous schist with ferdsparthic
lineation quartzite and garnet of 5 mm diameter. The actual location is
displayed in Figure 14
FIGURE 12: Chiweta coal seams (C) and interbedded sandstone arkoses (S) separated by white dotted line
FIGURE 13: K3a sandstone display cross-bedding where layers inclined to the horizontal

17
FIGURE 14: Chiweta escarpment inferred (black doted lines), mapped (black continues lines) faults, Karoo beds (Coloured labelled and demarcated with white dotted lines), garnetiferous
(diamond shape) talus (Ta) and secondary quartz (Qt). A photo taken from SE and shows area WNW of Chiweta hot spring area. Figure 10 shows angle of sight and location of the photo
FIGURE 15: NE dipping Karoo rocks and faults located in south of North Rumphi River. Figure 10 shows angle of sight and location of the photo

18
Mudstone and siltstone, K3b K3b was composed of chocolate to reddish mudstone overlaid on grey mudstone interbedded with chocolate siltstone as shown in Figure 16. These layers kept alternating up to 10s of metres thick. South of North Rumphi River, in Figure 15, the bed showed magnetism while striking at S 135° E and dipping at 55° NE. Figure 16 bed dip to south at an angle of 6° S E while striking a 310° N. Secondary mineral quartz veins of 10 to 80 cm thickness intercepted these layers at various location. Similar to other beds, K3b has also dissected by several faults and fractures at several locations. Arkosic siltstone, K3c The K3c is made of very massive bedded arkosic siltstone of approximately 120 m thickness. It is composed of fine grained feldspars and quartz. The bed outcropped at a number of location including Chiweta escarpment (Figure 14) and east of North Rumphi River in Figure 15 striking at N 40° E it dips 25° to 55 SE. South of Chiweta trading centre shown in Figure 16, the bed dip to south at 6° S E while striking 310° N. 4.1.5 Mudstone and calcareous siltstones, K5 a and b The K5 has successions consisted of yellow to grey mudstone and calcareous siltstones from bottom to top with total thickness about 300 m (Kemp, 1975). For easy description the author divided the bed into two lithological units K5a and K5b. Grey mudstone, K5a The K5a forms the lower part of K5 strata mainly composed of 7 to 20 m massive bedded yellow to grey mudstone with minor fracturing. Road cut on K5a splayed more than 10 m massive bedded of mudstone South of Chiweta striking at 310°and gently dipping westward at angle of 10°. Siltstone and mudstone, K5b The K5b was composed of greyish to yellow mudstone alternating with siltstone which Kemp, (1975) referred to as to calcareous siltstones. The bed formed the highest points of the Chiweta area and well exposed at many locations including west and south of Chiweta hot springs as shown in Figure 14 and Figure 15 respectively. The bed was sliced by faults of different directions and dip resulted in variation in dip angle of the strata. While dipping at different direction between 6 and 20°, the bed was also fairly fractured. 4.1.6 The Chiweta beds, K6 and K7 The K7 and K6 according to Karoo naming system (Stockley, 1932) are Chiweta beds. Composed of grey to purple mudstone, the Chiweta beds are the youngest Karoo sedimentary sequences of the area. Within the entire Karoo system the beds only occurred in a small down faulted block lying just to the north of the mouth of North Rumphi River (Dixey, 1926) as shown in Figure 17. Out of total thickness of 300 m mentioned by Ring (1995) only 100 m was observed outcropping. The exposed section was composed of K7 sandstone grits and highly fractured mudstone dipping northeast at about 10° and striking at N 300° W. The top grits with sandstone was what was referred to as K7 and it was mostly
FIGURE 16: K3b beds of chocolate to reddish and grey mudstones interbedded siltstone

19
eroded. The grits were mixed with the weathered part of the purplish to grey mudstone from K6 as such it was difficult to differentiate the two beds. However the grey sandstones, nodular limestone and conglomerates dominate in the lower bed representing K6. Figure 17 displays Chiweta hot springs located in the SW of the beds. Close to the hot springs the beds were composed of 4 to 6 mm round pebbles, nodular limestone and mudstone. According to Kemp, (1975) this represent the middle part of the sequence. The lower submerged part of the beds were composed of mudstone with sandstone including nodular limestone, fossil bones and marly conglomerates containing rolled pebbles limestone according to Kemp, (1975) and Ring, (1995).
4.1.7 Alluvium and talus Alluvium stratum of about 6 m thick was identified along the banks of North Rumphi River shown in Figure 15 and Figure 17 and close to the Chiweta trading centre. It extended across the level country south of Chiweta beds and east of the Chiweta escarpment. The lower conglomerate section is composed of horizontally bedded and formed a base for the sand and silt. Rock falls formed brecciated talus within the lower part of the NE-SW escarpment. 4.2 Tectonics The basement and Karoo rock sequences of Chiweta and its surroundings were sliced by numerous normal faults trending NE-SW and NW-SE (Figure 18). In addition to down faulting to the southeast, the area experienced tilting to the northeast, east and southeast. The structural trend of the area is approximately tangential (at high angle) to the axis of main N-S Cenozoic Malawi rift zone to the east. 4.2.1 Faults and lineaments The Chiweta faults were grouped into four categories basing on orientation. The fault geospatial analysis rose diagram in Figure 19 shows detailed orientations of all faults. The first group was composed of faults trended almost NW-SE, between 300 and 320° with fault planes dip between 70° and 80°
FIGURE 17: Chiweta hot springs (stars) inferred (dotted lines) verified (black continuous lines) faults and Karoo beds (coloured labelled and demarcated with white dotted lines). The photo taken from WSW (Chiweta footwall block) and shows NE and ESE area (Chiweta hanging wall block)
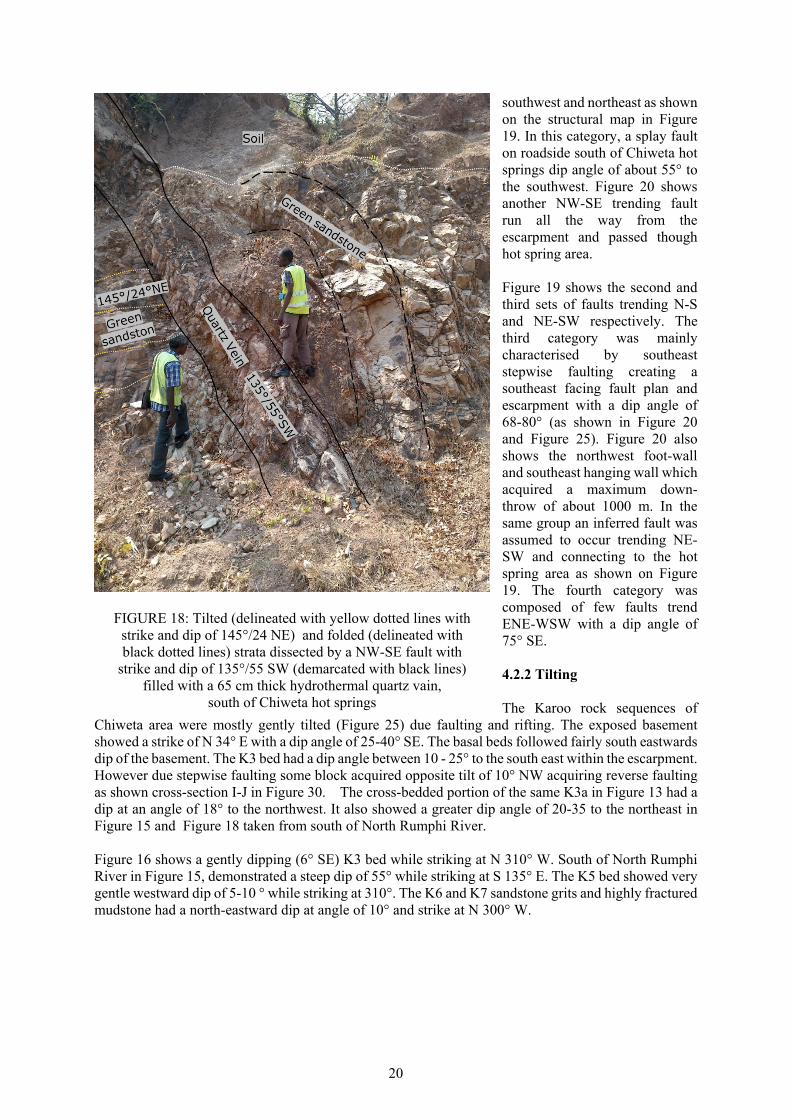
20
southwest and northeast as shown on the structural map in Figure 19. In this category, a splay fault on roadside south of Chiweta hot springs dip angle of about 55° to the southwest. Figure 20 shows another NW-SE trending fault run all the way from the escarpment and passed though hot spring area. Figure 19 shows the second and third sets of faults trending N-S and NE-SW respectively. The third category was mainly characterised by southeast stepwise faulting creating a southeast facing fault plan and escarpment with a dip angle of 68-80° (as shown in Figure 20 and Figure 25). Figure 20 also shows the northwest foot-wall and southeast hanging wall which acquired a maximum down-throw of about 1000 m. In the same group an inferred fault was assumed to occur trending NE-SW and connecting to the hot spring area as shown on Figure 19. The fourth category was composed of few faults trend ENE-WSW with a dip angle of 75° SE. 4.2.2 Tilting The Karoo rock sequences of
Chiweta area were mostly gently tilted (Figure 25) due faulting and rifting. The exposed basement showed a strike of N 34° E with a dip angle of 25-40° SE. The basal beds followed fairly south eastwards dip of the basement. The K3 bed had a dip angle between 10 - 25° to the south east within the escarpment. However due stepwise faulting some block acquired opposite tilt of 10° NW acquiring reverse faulting as shown cross-section I-J in Figure 30. The cross-bedded portion of the same K3a in Figure 13 had a dip at an angle of 18° to the northwest. It also showed a greater dip angle of 20-35 to the northeast in Figure 15 and Figure 18 taken from south of North Rumphi River. Figure 16 shows a gently dipping (6° SE) K3 bed while striking at N 310° W. South of North Rumphi River in Figure 15, demonstrated a steep dip of 55° while striking at S 135° E. The K5 bed showed very gentle westward dip of 5-10 ° while striking at 310°. The K6 and K7 sandstone grits and highly fractured mudstone had a north-eastward dip at angle of 10° and strike at N 300° W.
FIGURE 18: Tilted (delineated with yellow dotted lines with strike and dip of 145°/24 NE) and folded (delineated with black dotted lines) strata dissected by a NW-SE fault with
strike and dip of 135°/55 SW (demarcated with black lines) filled with a 65 cm thick hydrothermal quartz vain,
south of Chiweta hot springs

21
FIGURE 19: Structural map (A) and rose diagram (B) of the Chiweta area showing fault trending pattern of mostly NW-SE (300- 320 °), seconded by NE-SW trend (0-15°) and N-S

22
4.3 Geothermal mapping The Chiweta geothermal prospect has near to boiling hot springs. Figure 17, Figure 21 (A and B), and Figures 22 and 23 display Chiweta springs oozing within N 310° W striking fault. The flow of hot water was about 30 L/s with most of the water coming from springs of temperature range between 60 and 80°C Figure 21A). Traces of sulphur and silica were noted deposited around springs and hot grounds area (Figure 21B). The hot spring area also smells sulphur. The highest temperature measured in the hot springs was 79°C. Shallow water borehole drilled on Chiweta beds about 450 m northeast of the springs (Figure 22) close to Luwichi Primary School strike 46 °C hot water at a depth of 32 m. 4.3.1 Soil temperature measurement Figure 23 shows an isotherm map of Chiweta farmland from the study plotted in 5 step isotherms. The highest measured soil temperature was 77°C at 60 cm depth at the most north-westerly line of the surveyed area. The minimum temperature recorded was 26°C. The soil temperature map showed high temperature anomalies trending NW-SE as most of the area enclosed by the isotherms of more than 50°C. The anomaly oriented in NW-SE direction overlapping with hot spring and fault direction. This indicates that NW-SE fault traversing the prospect and acting as the outflow zone for the geothermal system. 4.3.2 Groundwater movement The groundwater movement was determined using borehole data shown in Table 1 and altitude of cold springs. Figure 24 shows equipotential lines connecting points of equal head as indication of groundwater table and arrows display flow direction. The results of groundwater table mapped in boreholes and cold springs shows a variation in water levels from 423 to 1200 m above sea level from east to west, respectively, as shown in Figure 24. This charge in groundwater elevation is mostly likely driving force of groundwater flow as it creates differences in head. Consequently, groundwater move downhill from northwest, west, southwest and south merging within Chiweta basin then moving towards east as shown by the groundwater direction map (Figure 24).
FIGURE 20: Geological structures of Chiweta including the foot wall, hanging wall, main NE-SW, NW-SE faults and hot springs

23
FIGURE 21: Chiweta hot springs flow (A), thermal altered surfaces along hot spring area (B) and thermal spring oozing from bottom of exposed Chiweta Beds(C). The actual
location is shown in Figure 17 and Figure 22

24
FIGURE 22: Geothermal manifestation map of Chiweta geothermal prospect
FIGURE 23: Soil isotherm (dotted lines) and soil temperature measurements (straight continues lines) map of the Chiweta farmland

25
TABLE 1: Borehole location data (eastings, nothings of and height above sea level) including groundwater depth and calculated altitude
Borehole Location (m) Borehole Estimated
Name Eastings Northings Altitude Depth Water level (m.a.s.l) CT-10 630126 8818852 555.35 32 528.35 CT-2 630281 8819096 518.97 33 490.97 CT-7 618274 8823991 1025.65 42 988.65 CT-8 624531 8824802 1047.93 48 1004.93 CT-5 624883 8816581 978.86 37 946.86 CT-1 630352 8820747 500.12 40 465.12 BH13 625461 8812289 907.72 48 864.72 BH14 625000 8811840 861.12 46 820.13 BH15 630464 8821561 456.78 37 424.78 BH16 630351 8820748 455.58 36 424.59 BH17 630403 8819139 459.04 30 434.04 BH18 630285 8818969 461.82 33 433.82 CT-4 629532 8817314 500.57 40 460.57 CT-3 629031 8819305 510.25 15 495.25 BH19 630904 8824329 463.07 40 423.07
NBC/LT1/67 630370 8819608 500.00 34 471.00
FIGURE 24: Piezometric level and flow direction map constructed based borehole data in Table 1 and cold spring (squre dotes) elevation data and ASTAR DEM
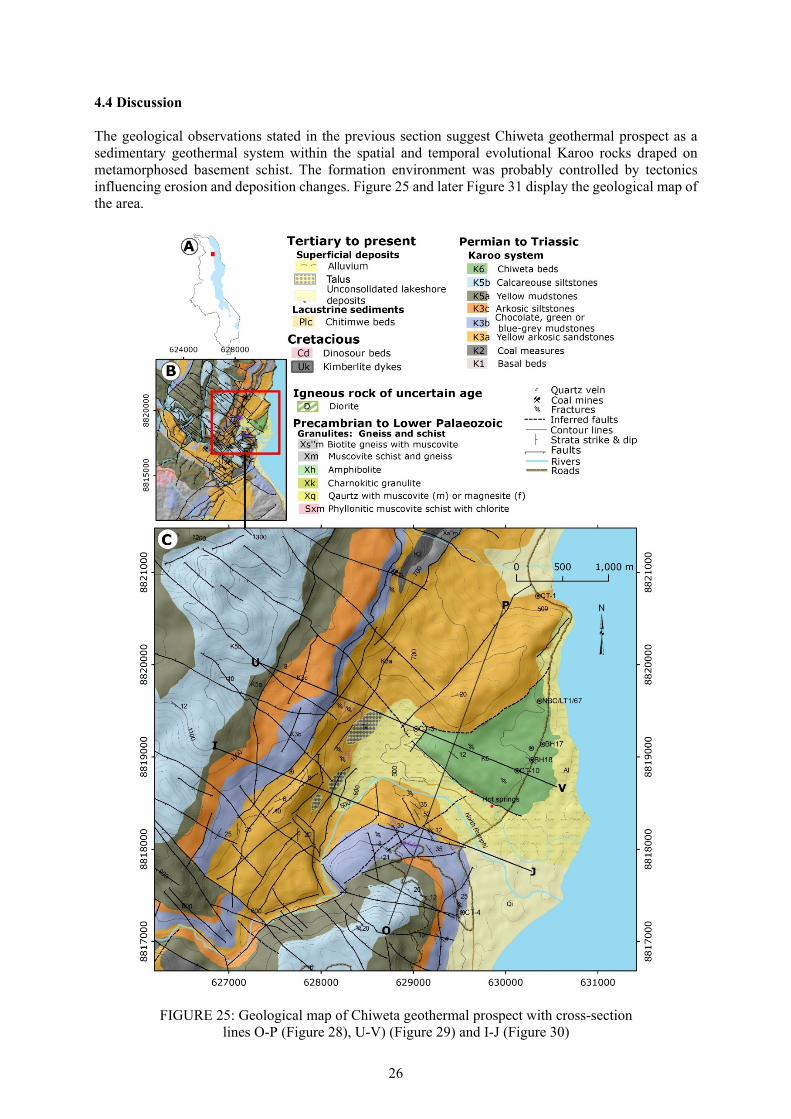
26
4.4 Discussion The geological observations stated in the previous section suggest Chiweta geothermal prospect as a sedimentary geothermal system within the spatial and temporal evolutional Karoo rocks draped on metamorphosed basement schist. The formation environment was probably controlled by tectonics influencing erosion and deposition changes. Figure 25 and later Figure 31 display the geological map of the area.
FIGURE 25: Geological map of Chiweta geothermal prospect with cross-section lines O-P (Figure 28), U-V) (Figure 29) and I-J (Figure 30)

27
4.4.1 Erosional processes and depositional environment Before deposition of the sedimentary Karoo the metamorphosed basement formed uneven high relief surface that progressively subsided and accommodate the accumulation of sedimentary units. The sedimentary Karoo suggested to be formed from eroded material of metamorphic basement (Cooper and Habgood, 1959) Textural characteristics such as shape, roundness, and fabric of sedimentary grains provide information on transportation distance (Tucker, 2003). Angular immature sediments indicate short distance travelled from erosional source to area of deposition while round mature sediments means long travel distance from the source to depositional area. Sorting gives the behaviour of deposition whether dumped at once or winnowed. A poor matrix sandstone with well sorted and angular and sub-angular grains mean the immature arkose deposited near to the source by sediments of fluvial processes (Tucker, 2003). Based on textural features observed, the K1 bed is suggested to be deposited by debris flows accompanied with sliding by gravity on a slope (Nilsen, 1982). Wopfner and Kreuser (1986) proposed the basal beds as tillites and periglacial sediments deposited during the onset of Karoo rifting in late Early Permian. The high proportion of the matrix composed of coarse to medium poorly sorted sands, mixed with clay indicates that the flow remained highly concentrated during transport and that the clasts remained closely packed during deposition. The green and chocolate brown colours indicated non-marine environment deposition (Coe, 2010). For K2, the occurrence of coal indicated organic fossils especially plants buried in anoxic low oxygen conditions without decomposition (Coe, 2010). The present of arkoses and feldspathic sandstones as interbedded within the coal seams pointed to cold or dry weather conditions favourable for feldspar existence interrupted coal formation. It suggests rapid erosion induced by rifting and buried the coal forming vegetation at different time intervals. The K3 crossbedding is inferred as the presents of currents, such the flow of the river across the delta or a flow of strong tidal currents as mounds of sand in shallow water were moved forward as sand grains trickled down the frontal inclined shore-face environment (Tucker, 2003). Occasionally the direction of the transporting agent can be seen acting from northeast. This means that during the time of deposition, the land surface had a dip towards northeast. As previous stated, the presents of angular and sub-angular quartz with feldspars indicate that the climatic conditions were too dry or too cold to allow much weathering as the feldspar remained largely undecomposed, or the source area was uplifted and eroded so rapidly such that there was insufficient time for complete weathering of feldspars (Tucker, 2003). The first type of arkoses is referred as climatic arkoses because feldspar is related to dry or cool climate. The second type is the tectonic arkoses, which is associated with rapid tectonic uplift (Tucker, 2003). Both type of arkoses occurred in Chiweta representing the too dry or cold climate associated with uplifting, rapid erosion and deposition. The chocolate to reddish brown siltstone and mudstone of K3 indicated non-marine oxidised environment deposition (Coe, 2010) which represents dry climate erosion and deposited on low energy environment. The presence of secondary quartz indicated elevated fluid temperature migrated through the faults and fractures of the strata at certain point in time. The K5 mudstone was formed from suspension weathered material settling in a calm environment far away from wave action (Reading and Collinson, 1996) particularly on river floodplain, lakeshore, lagoon, delta or outer-marine shelf (Coe, 2010). The grey colour reflect deposition in lacustrine or marine environment (Coe, 2010) while yellow to brown colour indicate oxidized terrestrial mudstone (Stow, 2005). The stratum is very hard to break suggesting made of high silica material. High resistant to weathering also suggested higher calcium carbonate content of mudstones (Coe, 2010). For K6 and 7, the present of nodules limestone and fossils indicated that the strata was formed under sediment – water interface under particular geochemical conditions nucleated on fossils (Coe, 2010) and (Stow, 2005). Also nodules limestone within mudstone certainly was deposited in a tidal flat

28
environment (Coe, 2010). The mudstone interpreted as deposition from suspension settling and from weak traction currents calm environment (Reading and Collinson, 1996) usually found in deep waters, on high energy deposited pebbles. The alluvium is a post erosion fluvial deposit. The origin of the sediment was due to rapid weathering of the surrounding Karoo rocks and ample loose deposits left over by fluvial erosion. The conglomerate indicates that the deposition was due to transporting agency with high energy followed by lower energy agent witnessed by siltation topping. 4.4.2 Strike and dip Most of rock strata of Chiweta strike to the southeast and southwest. The dip is mostly gently and moderately to the southeast and northeast respectively at an angle between 6 and 55°. Both type of dip are related to late the Carboniferous-Early Jurassic (Karoo) rifting, an extensional tectonics that affect southern Africa including Henga-Ruhuhu graben of northern Malawi and southern Tanzania (Ring, 1994) on which Chiweta prospect is located. These are pre-Cenozoic rift faults that were rejuvenated in strike and dip-slip pattern during the east and southeast extension at the second and third stage of rifting (Ring, 1994), respectively. 4.4.3 Geological structures orientation Orientations of current mapped faults were also compared to previous mapped faults. Rose diagrams generated from old geological map and current mapped faults were plotted. It was observed that both previous and current mapped faults and lineaments had a similar general orientation pattern of NW-SE which is associated with geological structures related to the Ubendian mobile belt (Carter and Bennett, 1973) of 2300 to 1800 million years old (Ring and Betzler, 1993). However, current mapped faults had a well pronounced orientation pattern in the N-S direction which somehow reflects geological structures related to the Mozambiquian mobile belt (~900 – 400 m.y.) (Carter and Bennett, 1973; Ring and Betzler, 1993). That pattern was under estimated in the previous map as shown in Figure 19 (A and B) and Figure 26 (A and B). It was assumed here that the under reported of N-S orientation faults on previous geological map might have been missed during the earlier survey. Both old and current fault showed NE-SW orientation structures which might related to Irumide mobile belt (1350 – 950 million years). Ring (1994) grouped south Karonga faults into three stages of rifting. Chiweta faults shares the similar characteristics with Karonga faults. Therefore, Ring (1994) rifting stages were used to group the Chiweta fault. The first stage was characterised by normal faulting of WSW/SW and ENE/NE dipping with ENE (N75°E) as a principle extension (>5 - <2 m.y). This stage was the driving force for the formation of Malawi rift half grabens. In Chiweta area this stage is related to the formation of NW-SE trending faults and their related lineament structures shown in Figure 15. Chiweta fault related to geothermal manifestation in Figure 22 was in this category. The second stage was characterised by strike-slip motion on the older normal faults with extension in E-W direction (<2 m.y. - recent). This group is related to the N-S trending fault of Chiweta showed in Figure 19 and Figure 26. The third stage involved formation N to NE faults. The faults showed strike-slip, oblique-slip and dip-slip motion. The extension direction this time was ESE to SE. The major faults of Chiweta which forms well exposed SE facing escapement in Figure 20 and stepwise faulting in Figure 14 are in this category. On a larger scale, the Karoo aged Henga Valley rift where Chiweta geothermal prospect is part, followed the last stage of NE strike. There were changes in slip direction in all three stages, from dip-slip to strike-slip. The northeast tilt of Chiweta Beds and K3 beds north and south of the Chiweta hot springs respectively are suggested to be caused by reactivation of NW-SE Cenozoic faults during Karoo rifting. This resulted the youngest sedimentary block (K6) down thrown about 1000 m during the second or third stage. The area experienced tilting due to oblique-slip and dip-slip motion after the build-up of the most of sedimentary sequences and its faulting.

29
4.4.4 Relation between geological structures, groundwater flow and geothermal manifestation The piezometric map in Figure 24 shows that water table of the area is subdue replica of the topography with difference in head being likely dominant driving force of groundwater movement. Overlay analysis of the groundwater flow direction and structural map in Figure 24 shows that NW-SE trending structures correspond with the flow direction whereas equal potential line are not perpendicular to the flow direction of groundwater. It is possible that the NW-SE trending faults controls anisotropy into Chiweta geothermal system. The same overlay analysis of faults, fractures, soil temperature measurements and geothermal manifestation as shown in Figure 22 and Figure 23 it is suggested that the hot spring are fault and fracture controlled by NW-SE trending fault. Thus, at several places along Mphizi stream, hot springs oriented in NW-SW direction were observed in the overburden in the survey area, producing hot water of about 80°C. The high temperature anomaly from soil temperature survey has a similar trend of NW supporting the NW trending fault controlling the outflow of the geothermal water. 4.4.5 Secondary mineralisation Secondary minerals are recrystallized stable or metastable minerals formed by alteration of unstable primary rock minerals due to increase in temperature and pressure as water interact a rock (Browne, 1984). The stability of the secondary minerals is determined by their solubility and the rock dissolution process. Thus, type of secondary minerals formed depends on several factors including the chemistry of parent rock, fluid chemistry, permeability of hosting rock and temperature. For example, occurrence of secondary quartz in geothermal system indicate temperature of above 180°C (Franzson, 1998). Within the vicinity of Chiweta hot springs, secondary mineralisation of quartz (Figure 27) were spotted in several locations, as shown in Figures 14, 18 and 22. The mineralisation mainly occurred in intermediate K3 by filling the lineament structures such as vains and vesicles of the NE-SW fault escarpment and NW–SE fault south of North Rumphi River. The secondary mineralisation intensity is medium to low. Its presents on the surface indicate a low to medium pre-erosion subsurface temperature of more than 180°C (Franzson, 1998).
FIGURE 26: Rose diagrams showing orientation of old (A) and current (B) mapped faults. Note the similarity in the NW-SE orientation pattern. The Current mapped faults have a
pronounced N-S orientation, which is minimal in the old faults

30
4.4.6 Rifting and the geothermal system Chiweta geothermal prospect falls within Malawi rift and was initiated by extension movement resulted into series of normal faulting in the basement of the basin exposing hydrothermal mineral to the surface. The replay of these faults created frequent subsidence and tilting movements. These processes have been at the base of the changes in the nature of the depositional environment and today’s architecture of the prospect. High faulting and fracturing increased permeability and allows the movement of rain fed groundwater from NW and W into the geothermal system due to difference in head. NW-SE faults west of Chiweta are inflow path for the geothermal system. The K3 sandstone may have sufficient permeability to act as reservoir rock at depth. The NW-SE fault south of Chiweta beds may be act as an outflow zone.
FIGURE 27: Secondary quartz in veins and vugs structures of Chiweta
FIGURE 28: Cross-section O-P showing Chiweta strata’s and dipping faults. For location of the section see Figure 25
FIGURE 29: Cross-section U-V showing Chiweta strata’s and dipping faults. For location of the section see Figure 25

31
FIGURE 30: Cross-section I-J showing Chiweta strata’s and dipping faults. For location of the cross-section see Figure 25
FIGURE 31: Structural and geological map of Chiweta geothermal prospect based on Kemp (1975)

32
5. WATER CHEMISTRY 5.1 Major hydro-geochemical characteristics The results of the chemical analysis from Chiweta hot springs, boreholes, North Rumphi River and Lake Malawi waters are presented in Table 2. The table also include analytical data from the previous investigations by Oklahoma State University of USA (sample: CH-13, LM-13 and NR-13) and Geothermal Development Company (GDC) of Kenya (sample: CH-10 and LM-10) (Geothermal Development Company, 2010). 5.1.1 Surface water Temperature of North Rumphi River (CT-12 and NR-13) and Lake Malawi waters (CT-11 and LM-13) were close to ambient 16 to 27°C. The electric conductivity (EC) ranged from 29 to 250 µS/cm. The dominant anion was bicarbonate. The pH of the lake and the river were neutral to slightly basic (7.6-8.8). The dominant cations in the Lake water were Ca and Na whereas Si and Ca dominate in the river water. Boron concentration of the waters was very negligible (<0.068 ppm). 5.1.2 Groundwater For the cold groundwater (CT-2, CT-3, CT-4, CT-7 and CT-9), temperatures between 23 and 33°C was obtained, EC between 85 and 726 µS/cm. The pH varied from slightly acidic to neutral (5.7-7.5). Silica concentration was relatively medium ranging from 32 to 54 ppm whereas boron was very miniature. HCO3 was dominant anion typically with concentration between 60- 220 ppm while Na and Si were dominant cations. Concentrations of many metals were low including Al and Fe whereas Mg was relatively high. The mild acidic pH groundwater was characterised with high CO2 as well
Sample
Nam
e
Description
T (°C)
pH
pH/°C
Ec(µS)
SiO
2
Na
K
Ca
Mg
Fe
Al
B
SO4²ˉ
Fˉ
Clˉ
CO
2
H2S
Dδ
δ18O
CT‐1
Borehole
31
6
30.5
139.0
29.77
5.012
7.184
26.38
2.145
0.0488
0.0149
< 0.01
2.062
0.410
1.554
71.5
n.a.
‐26.10
‐4.90
CT‐2
Borehole
33
7
30.9
500.0
39.77
40.59
2.969
47.36
13.31
0.0429
< 0.0075
0.0167
27.89
1.149
5.233
165
n.a.
‐18.78
‐3.07
CT‐3
Borehole
27
6.59
35.9
246.0
27.91
8.642
5.012
17.82
6.182
7.734
0.0158
0.0331
1.069
0.701
3.671
60.1
n.a.
‐22.20
‐3.96
CT‐4
Borehole
30
6.80
30.8
726.0
44.85
26.42
1.398
47.85
24.30
0.223
< 0.0075
< 0.01
17.26
0.645
1.614
220
n.a.
‐23.66
‐4.38
CT‐5
Borehole
27.0
6.80
30.2
505.0
31.02
27.49
2.754
46.61
20.42
0.104
< 0.0075
< 0.01
6.426
0.740
3.319
155
n.a.
‐27.25
‐4.96
CT‐8
Borehole
24
5.80
25.5
91.0
53.92
10.77
2.911
9.508
2.035
0.0190
< 0.0075
< 0.01
1.134
0.059
0.730
77.7
n.a.
‐29.01
‐5.21
CT‐10
Borehole
46
7.5
39.5
1771.0
72.83
287.6
18.44
43.82
8.277
0.4035
< 0.0075
0.4924
245.8
8.846
230.8
106
0.230
‐19.19
‐3.56
CT‐6
Hot spring
78.0
7.80
38.4
1900.0
99.43
383.0
23.20
17.96
0.387
< 0.005
0.0114
0.6954
295.7
12.63
336.7
59.3
2.02
‐23.77
‐4.08
CH‐13a
Hot spring
80
7.5
35
2001
65.8
389.2
21.30
17.23
0.419
n.a.
n.a.
n.a.
287.3
12.82
316
28.0
n.a.
‐26.0
‐4.96
CH‐10b
Hot spring
79.3
7.78
30.0
1 994
31.0
183.3
22.4
146.4
14.70
0.110
n.a.
n.a.
207
1.18
283.8
226
n.a.
n.a.
n.a.
CT‐7
Cold spring
23.0
5.70
27.6
85.0
52.85
8.727
2.815
7.516
4.273
0.0175
< 0.0075
< 0.01
0.500
0.216
0.884
59.3
n.a.
‐30.61
‐5.24
CT‐9
Cold spring
28
7.5
34.6
460.0
32.41
9.360
2.052
46.99
17.55
< 0.005
< 0.0075
< 0.01
12.09
0.531
1.759
122
n.a.
‐23.00
‐4.48
CT‐11
L. M
alaw
i 26
8.20
27.3
251.0
0.571
20.96
6.376
19.13
7.430
< 0.005
0.0105
0.0117
2.208
0.476
5.266
49.5
n.a.
15.06
2.27
LM‐13a
L. M
alaw
i 25.7
8.76
25.7
240
n.d.
20.04
6.01
17.53
6.89
n.a.
n.a.
n.a.
1.44
0.452
5.13
22.7
n.a.
12.49
1.67
LM‐10b
L. M
alaw
i 18.0
7.68
23.6
248
22.00
16.70
6.20
23.00
4.90
0.030
n.a.
n.a.
3.57
0.75
9.70
107
n.a.
n.a.
n.a.
CT‐12
N. R
umphi R
iver
22
7.6
22.3
29.6
13.81
2.078
1.141
3.021
1.117
0.0670
0.0229
< 0.01
1.218
0.059
0.737
2.19
n.a.
‐34.01
‐5.78
NR‐13a
N. R
umphi R
iver
16.5
8.3
17.0
31.0
9.270
2.220
0.909
2.72
0.992
n.a.
n.a.
n.a.
1.390
0.095
0.317
2.43
n.a.
‐33.94
‐6.50
Analytical uncertainties at 95% confiden
ce level (unit %)
2.3
4.1
2.2
1.4
1.7
2.4
3.4
2.1
4.3
23.1
3.3
34.2
0.9
0.6
Detection limit (ppm)
0.1
0.25
0.4
0.025
0.005
0.005
0.0075
0.01
0.2
<0.1
1.0
EC: electric conductivity
n.a.: not an
alysed, n.d.: not detected
a Oklah
oma & GSD
(2013), b GDC (2010)
TA
BL
E 2
: Che
mic
al a
naly
sis
of m
ajor
ele
men
ts d
eter
min
ed b
y IC
P-E
OS
and
IC
200
0. I
soto
pes
wer
e m
easu
red
usin
g IC
P-M
S. T
empe
ratu
re, p
H, E
C, C
O2
and
H2S
wer
e m
easu
red
in th
e fi
eld
wit
h po
rtab
le in
stru
men
ts. C
once
ntra
tion
s of
all
che
mic
al c
ompo
nent
s ar
e sh
own
in p
pm a
nd is
otop
es in
‰

33
as slightly elevated Ca concentration. 5.1.3 Geothermal water Geothermal water had higher EC ranging from 1771 to 2000 µS/cm. The surface temperature of thermal water registered minimum and maximum temperature of 60 and 79°C respectively with neutral pH of 7.8. The concentration of SiO2 were relatively higher ranging from 31 to 99 ppm with sample CT-6 recorded the highest and the borehole water sample (CT-10) registered 72.83 ppm. The governing cations were Si and Na whereas leading anions were Cl and SO4. Hot spring water registered low concentration in metals except for Mg, which was slightly high in thermal water from the borehole. 5.2 Water classification White (1986) classified subsurface water into six groups namely; meteoric, oceanic, evolved connate, metamorphic, magmatic and juvenile waters. Ellis and Mahon (1977) further classified geothermal water into four groups basing on major anions as follows: Alkali-chloride water: These are sodium and potassium chloride waters, some cases with calcite concentration. In such waters, Cl is the only major conservative component with concentration normally ranges from hundreds in basalts to few thousand ppm in sedimentary evaporates (Arnórsson et al., 2007). These waters have normally wider pH variation (4-11) buffered by CO2/HCO3
−. Salinity of such geothermal water depends available soluble salts leaching from aquifer rock or added from magmatic fluids (Arnórsson et al., 2007). Increase in temperature above 100°C result in concentration of most major elements in Na-Cl waters and approaches to local equilibrium with secondary minerals. This type of water is made of well equilibrated fluid from major outflow zones and is very useful in determining subsurface reservoir characteristics such as temperature and also estimation of production properties of geothermal system. Acid sulphate water: These waters formed from the oxidation of H2S to SO4 near the surface, containing most of constituents from dissolved near surface rock. These waters are therefore not useful in subsurface temperature prediction as dissolved constituents bear no relation to mineral-fluid equilibria in the reservoir. Steam-heated acid-sulphate waters are characterized by low Cl and relatively high sulphate concentrations with more metals due to low pH as high acidity water dissolves primary minerals of rocks leaving a residue rich in amorphous silica, anatase, native sulfur, sulfides, aluminous sulfates and smectite or kaolinite. Acid sulphate-chloride waters: It’s a mixture of alkali chloride and acid sulphate waters or it can formed from oxidation of H2S→ SO4 in alkali-chloride water or dissolution of sulphur from rock followed by oxidation. The pH in these waters is normally buffered by HSO4
−/SO4−2. In the high temperature aquifer,
the pH of acid sulphate water is nearly neutral while at the wellhead temperature of 25°C the pH reaches 2. The mild acid sulphate-chloride water reflect subsurface equilibria and are useful in subsurface temperature prediction and reservoir response upon utilization. Bicarbonate water: Derived from CO2 rich steam condensate or mixing of geothermal water with surface water, bicarbonate water is very common in in old geothermal waters or peripheries of geothermal outflow zones. They are mostly represent shallow and deep equilibrated aquifers therefore doubtful to use in geothermometry. Giggenbach (1991) developed chloride-sulphate-bicarbonate ternary diagram which has been used to classify geothermal waters. A triangular diagram of (Giggenbach, 1991) in Figure 32 displays cold groundwater and surface waters (samples; CT-1, CT-2, CT-3, CT-4, CT-5, CT-8, CT-9, CT-11, CT-12, ML-10, ML-13 and NR-13, ) of Chiweta plotted in the peripheral water field of HCO3 (bicarbonate). The geothermal water samples CT-6, CH-10, and CH-13 plotted in alkaline sulphate-chloride water region. Thermal water (CT-10) from the borehole plotted in steam heated field showing SO4 component. According Giggenbach, (1991) techniques, plotting of hot spring water sample CT-6 and CH-13 in

34
chloride region shows high input of geothermal water originating from controlled reactions dependent on temperature, pressure and rock composition of the subsurface. Therefore, these two samples were useful in prediction of subsurface processes. The hot water from the borehole plotted sulphate water region suggesting oxidation of H2S to SO4 with most components dissolved from near surface rock. In such cases, this thermal water CT-10 was not fully represents subsurface properties as it indicates near surface processes. Therefore, use of such data in explaining subsurface processes should be handled with cation. The cold groundwater from borehole, cold springs, North Rumphi River and Lake Malawi plotted in bicarbonate field representing peripheral waters as such they cannot used to explain any subsurface geothermal processes. In general, cold waters were not useful in identification of any subsurface geothermal processes. Figure 32 and 33 and Table 2 illustrated that the geothermal waters of Chiweta are Na-Cl-SO4-HCO3 (alkaline chloride) whereas the groundwater and surface water are Ca-Mg-HCO3 (bicarbonate) water type.
5.3 Geothermometry Temperature controls solubility of minerals such that at low temperature mineral are slow to re-equilibrate (Arnórsson et al., 2007). Consequently, fluids are separated from the mineral controlling the equilibria. Thus, the hot equilibrium temperature is returned and reflected in the solute concentration. From this principle geothermometers have been developed to estimate sub-surface temperature of geothermal system during exploration and even throughout exploitation. Geothermometers are equations inferring conditions at which a sample equilibrated by measuring equilibrium constant value and using that value to calculate temperature at particular pressure at source depth (Arnórsson, 2000). When using geothermometers a number of assumptions are made (Arnórsson, 2000):
• The concentration of the elements in a geothermometer equations are controlled by temperature depended mineral-fluid equilibria;
• Abundant of minerals exist in the reservoir for the reaction to occur; • Fluid composition does not change in response to conductive cooling as the fluid ascend from
the reservoir to the surface; • Boiling is adiabatic;
FIGURE 32: Cl-SO4-HCO3 water classification ternary diagram (Giggenbach, 1991) showing investigated water samples of Chiweta. Samples CH-13, NR-13 and ML-13 collected by
Oklahoma State University in 2013. Samples CH-10 and ML-10 by GDC in 2010

35
• Chemical and isotopic reactions do not ominously change the composition of the fluid as it ascends from the source aquifer to the outflow zone.
All this means that temperature dependent chemical or isotopic equilibria is maintained reflecting the source aquifer characteristics. As such thermal water samples collected at the geothermal out flow zone can estimate subsurface temperature conditions. However, not all geothermal waters can carry imprint of its subsurface reservoirs. Such being the case, the Na/1000–K/100–Mg0.5 ternary diagram developed by Giggenbach (1988) has been used to discriminate hydrothermal minerals equilibrated mature waters from immature waters that has not attain equilibrium due to mixing with cold water or re-equilibration along circulation path. The current study sample (CT-6) and Oklahoma State University sample (CH-13) plotted in partial equilibrium region. Borehole sample from current study (CT-10) and spring sample collected by GDC (CH-10) plotted in immature field. Figure 33 shows investigated samples plotted in Na-K-Mg0.5 triangular diagram of (Giggenbach, 1988). Chiweta hot spring samples CT-6 and CH-13 plotted in partially equilibrated region implying that low Mg content reflected deeper water-mineral equilibration at high temperatures, followed by minor equilibration and uptake of Mg during ascent and discharge. In the same triangular plot in Figure 33 geothermal waters sampled from the borehole (CT-10) and hot spring (CH-10) plotted in immature water section suggesting more mixing and re-equilibration with near surface water such that they cannot be used to estimate subsurface temperature or else their geothermometry should be treated with caution.
Diverse approach by Giggenbach, 1986) uses Na-K-Ca-Mg square diagram to eliminate non-equilibrated samples. The square plot curve in Figure 34 represent Na, K, Ca and Mg concentration of geothermal waters in full equilibrium with thermodynamically stable minerals similar to average crustal rock. Figure 34 shows Chiweta hot spring sample CT-6 and CH-10 plotted close to full equilibrium curve indicating that these samples are very close to full equilibrium. This explains that the re-equilibration and mixing was very minimal. Sample CT-10 from the borehole and CH-13 from the hot spring plotted far from the full equilibration curve indicating these waters are not fully equilibrated or high degree of mixing with cold groundwater and or re-equilibration.
FIGURE 33: Na-K-Mg0.5 triangular diagram (Giggenbach, 1988) of Chiweta thermal water samples

36
Sample CT-6 demonstrated to be partially equilibrated in both methods of evaluation of sample for geothermometry calculation. Sample CH-13 qualified for geothermometry based on the first method. The two samples were therefore regarded as a true representation of the geothermal fluid at depth than the rest of samples. Therefore their geothermometer calculation can be trusted (Arnórsson et al., 1983; Fournier and Potter, 1982; Fournier and Truesdell, 1973; Giggenbach, 1988). For comparison purpose, the other two analytical data (CT-10 and CH-10) were also used to in geothermometry calculations. Geothermometers are grouped into three categories namely, water or solute geothermometers, steam or gas geothermometers and isotope geothermometers (Arnórsson, 2000). Water and gas geothermometers are collectively known as chemical geothermometers. The current study focused on water or solute geothermometers as the analytical data was based on thermal water samples. The most commonly used water geothermometers of silica, Na/K and Na-K-Ca (Arnórsson, 2000) were employed. 5.3.1 Silica geothermometers Silica geothermometers include quartz, chalcedony and amorphous silicas are unitary geothermometers governed by temperature and pressure dependent solubility of silica species determined through experiment. The governing equation for silica reaction is:
2 (1)
Amorphous silica geothermometer At temperature ranges of 100-120°C, the chalcedony geothermometer may represent true reservoir temperature (Fournier and Potter, 1982). However if the calculated reservoir temperature is below 100°C, the amorphous silica controls the solubility. In such cases the amorphous silica equation of 25-250°C valid temperature range is most appropriate (Fournier, 1977):
°
7314.52 log
273.15 (2)
Chalcedony geothermometer Geothermal systems with temperatures <150°C, the high solubility chalcedony controls concentration of silica (Arnórsson et al., 1983). Under such circumstances, the chalcedony geothermometer may be applicable with the following equation:
°
11124.69 log
273.15 (3)
FIGURE 34: Distribution of Chiweta thermal waters in squire plot of (Giggenbach, 1986). Plotting of water sample close to equilibrium curve refers little mixing with cold groundwater
or re-equilibration while samples plotted far from the equilibrium curve means a great deal of mixing with
cold groundwater and/or re-equilibration

37
Quartz geothermometer Quartz has the lowest solubility compared to less crystal structured silica polymorphs such as chalcedony, opal, and cristobalite that have higher solubility and form at temperature <180°C (D’Amore and Arnórsson, 2000). Most geothermal systems with temperature >180°C, are at equilibrium with quartz. Quartz can even withstand temperatures up to 870°C. Apart from being a common primary mineral quartz is also a secondary rock-forming mineral. Quartz geothermometers are appropriate in estimating reservoir temperature of >150°C. A number of quartz geothermometers have been developed: Conductive cooling (no steam loss) by Fournier and Potter, (1982): This geothermometer equation represent experimentally determined solubility and it is applicable geothermal waters that cool slowly by conduction during ascent. This silica geothermometer is suitable for springs at near boiling temperature. The governing equation for silica no steam loss geothermometer applicable at temperature range of 25-250°C is:
°
13095.19 log
273.15 (4)
Adiabatic cooling (maximum steam loss) by Fournier and Potter (1982): This quartz geothermometer equation compensate the loss of steam due to boiling and cooling of the solution due to adiabatic expansion which resulted in increased concentration of silica. This geothermometer is suitable for well discharge and vigorous boiling springs or springs at high discharge rate (= >2 kg/sec) accompanied by deposition of silica sinter. In this scenario, the governing geothermometer equation valid for temperature of 25-250°C is given by:
°
15225.75 log
273.15 (5)
5.3.2 Cation geothermometers Cation geothermometers are ion exchange reactions thermometers that has temperature dependent equilibrium constants (Fournier, 1981). These geothermometers are applicable to hot spring and drillhole water samples with high flow rate. As oppose to unitary silica geothermometers, cation geothermometers are ratio geothermometers of two or more cations. Due to dependence on a ratio, cation geothermometer are suggested to estimate reservoir temperature with less erroneous as the ratio is less prone to modification due to dilution and steam loss during fluid ascent to the sampling point (Arnórsson, 2000). A number of cation geothermometers have been proposed including Na-K, Na-K-Ca and Na-K-Mg. They all normally give different results. Na-K geothermometers Na-K geothermometers are cation geothermometers based on temperature dependent ion exchange reaction between coexisting sodium (albite) and potassium (adularia) feldspars (Nicholson, 1993). The ion exchange reaction of the two feldspars are given as:
Albite Adularia
(6)
Several Na-K geo-indicators have been developed in the past decades and two of them are governed by the following geothermometry equations:
°.
273.15 ( Truesdell, 1975) (7)
°.
273.15 (Arnórsson et al., 1983) (8)
Na-K geothermometers are suitable for chloride rich waters with high reservoir temperature range between 180 and 350°C as the equilibration of Na is slower than of silica (Nicholson, 1993). Depending on hydrogeological system, Na-K geothermometers can also predict temperatures at deeper part of the

38
geothermal system compared to silica if water circulation is higher enough as slower rising fluid turn to re-equilibrate at shallower and cooler temperatures. Low temperature reservoir with long resident time fluids may also be applicable (Arnórsson et al., 2007). Na-K geothermometers give erroneous results at temperatures <100°C and also only suitable for water with low concentration of calcium such that log(Ca0.5/Na)+2.6 is negative. Na-K-Ca geothermometer This is an empirical geothermometer, theoretically constrained by equilibration of Na-K feldspars plus conversion of calcium-alumino-silicate minerals to calcite. The geothermometer was developed by Fournier and Truesdell (1973) and applicable to geothermal waters with high concentration of calcium such that log(Ca0.5/Na)+2.06 is positive. The advantage of this geothermometer is that it does not give more erroneous results for cold or non-equilibrated thermal waters compared to quartz and Na/K geothermometers. The governing equation is as follows:
°
1647
log log √ 2.24273.15
(9)
43,
.
1 100°
13,
.
1 100°
where Ca, Na and K concentration are given in mol/kg Na-K-Ca geothermometers are not applicable in acid water which mostly not equilibrium with feldspars. Geothermal waters with low or high alkali rocks are also not applicable unless there is direct correlation with measured temperature. Na-K-Ca geothermometer can also be affected by boiling which result to loss of carbon dioxide and lead to calcite precipitation. The loss of dissolved calcite gives too high Na-K-Ca geothermometer and the error is proportional to amount of CO2 in the fluid (Arnórsson et al., 2007). Na-K-Mg geothermometers Na-K-Mg are ionic solute geo-indicators based on Na-K (Ellis and Mahon, 1977) and Na-K-Ca content (Fournier and Truesdell, 1973). Giggenbach (1988) proposed K-Mg geothermometer with the following equation:
°
4410
14.00 log273.15
(10)
The triangular diagram in Figure 33 (Giggenbach, 1988) was developed by combining subsystems expressed Na-K and K-Mg geothermometer equations and used for calculation of Na-K-Mg geothermometer. Subsurface temperature of the Chiweta geothermal system Table 3 shows solute geothermometers for the Chiweta geothermal prospect calculated from hot spring data in Table 2 using Powell and Cumming (2010) Excel calculator, Bjarnason (2010) WATCH program and geothermometry equations reported by D’Amore and Arnórsson (2000). The calculated silica geothermometer of Fournier (1977) based chalcedony equilibration using Equation 3 gave temperature range of 47 - 107°C for all samples. Field observation showed occurrence of hydrothermal quartz as opposite to chalcedony or amorphous silica meaning that eroded part of the hydrothermal alteration was at equilibrium with respect to quartz. Therefore chalcedony geothermometer cannot give representative temperature despite sample CT-6 reservoir temperature of 107°C falls within chalcedony geothermometer applicable range. Silica and cation geothermometers (Arnórsson et al., 1983; Fournier, 1977; Fournier and Potter, 1982; Fournier and Truesdell, 1973; Truesdell, 1975) for samples CT-10,

39
CH-13 and CH-10 gave a wide range of temperatures from 48 to 391°C. Such wide variation cannot be entrusted as subsurface temperature. Quartz geothermometer conductive cooling by Fournier (1977) calculated from Equation 4 and adiabatic cooling based on Equation 5 gave reservoir temperature of 137 and 132°C, respectively, for sample CT-6. Fournier and Potter (1982) quartz geothermometer gave temperature of 134°C for the same sample. Using Equation 7 of Truesdell (1975) and Equation 8 of Arnórsson et al., (1983), Na-K geothermometers gave subsurface temperature of 139 and 149°C respectively for the same sample CT-6 again. The Na-K-Ca geothermometer of Fournier and Truesdell (1973) indicated subsurface temperature of 157°C. The Na-K and Na-K-Ca geothermometers gave slightly higher temperatures than quartz geothermometer. The slight differences among cation and silica geothermometers in sample CT-6 indicate existence of equilibrium. All unitary geothermometers are prone to dilution such that low temperatures given by quartz and chalcedony geothermometers might be induced by dilution of geothermal water due to mixing with groundwater. On the other hand Na-K cation geothermometer is least affected by dilution and conductive cooling where the flow rate is high. Therefore Na-K and Na-K-Ca geothermometers calculated above can be trusted considering that Chiweta springs flowrate is high (30 l/sec), the condition that qualify it to be least affected by conductive cooling. Therefore, the cation and silica geothermometers indicates true subsurface temperature represented by these geothermometers. However, both quartz and Na-K geothermometers gave temperature below their applicable range of > 150 and 180°C, respectively. As stated earlier, field observations identified hydrothermal quartz, a signature of quartz equilibration on the eroded surface. Na-K can also predict low temperature geothermal system with long resident time water (D’Amore and Arnórsson, 2000). Sample CT-6 of Chiweta geothermal waters have high concentration of calcium such that log(Ca0.5/Na)+2.06 was positive (2.071) Therefore use of Na-K-Ca geothermometer was applicable (Fournier and Truesdell, 1973). As such, quartz, Na-K and Na-K-Ca geothermometer were suggested be true representative of the reservoir temperature. Based on sample CT-6 Chiweta geothermal system was therefore suggested to have subsurface temperature ranges between 132 and 157°C controlled by either quartz solubility or last equilibrated by Na-K and Na-K-Ca.
TABLE 3: Solute geothermometers for the Chiweta thermal spring water samples (values in °C)
Sample Chalcedony a Quartz a Quartz a Quartz b Na/K c Na/K d Na-K-Ca e
CT-6 107 137 132 134 139 149 157 CT-10 90 120 118 119 144 156 116 CH-13 85 81 72 114 391 140 61 CH-10 48 67 84 80 210 223 88 Equation 3 4 5 7 8 9
a(Fournier, 1977); d (Arnórsson et al., 1983) b (Fournier and Potter, 1982) e (Fournier and Truesdell, 1973) c (Truesdell, 1975)
5.3.3 Multiple mineral equilibria Different approach of estimating subsurface temperature in geothermal system is calculation of reaction quotient Q (ionic activity product) and mass action K (equilibrium constant) of different species from analytical data of the hot springs, the method proposed by Reed and Spycher (1984). K is linked to Gibbs energy of reaction in the following equation:
∆ (11)
Where ∆ Gibbs energy of reaction, R is gas constant, T represent temperature in kelvin and K is equilibrium constant. K can be derived from the equation above. Given reaction as: (12)
Q is expressed as:

40
(13)
where ‘a’ is ionic activity. The logarithmic ratio of Q and K gives what is known as saturation index. Saturation index (SI) is a measure that explains whether the mineral is formed or dissolved at a given conditions and is calculated by the following equation:
(14)
SI=0 means solute and the mineral is at equilibrium SI>1 means the solute is supersaturated with respect to particular mineral and the mineral will form. SI<1 means the solute is under-saturated with respect to the mineral such that dissolution will proceed. Multiple mineral equilibria assume that temperature equilibrium exist between solute and minerals or mineral-mineral within which a set of minerals occur over a range of temperature. The equilibrium state of mineral such as silica (mainly quartz and chalcedony), sulphate (mainly gypsum and anhydrite) and carbonate (mainly calcite, aragonite, dolomite, siderite and magnesite) is the function of temperature, such that the saturation indices are used as geothermometer (Arnórsson, 2000; Giggenbach, 1988). The solute mineral equilibria temperature is a range or cluster between minimum and maximum equilibrium temperature for selected minerals over which most of the minerals appear to attain equilibrium. Where many minerals indicate close equilibrium temperatures, the average of equilibrium temperatures for a set of minerals is regarded as best subsurface temperature estimate. Apart from subsurface temperature estimation saturation indices also entails possible problems such as calcite deposition and silica scaling that can arise due geothermal utilization. Using mineral equilibria criteria, the geothermometry of Chiweta geothermal prospect was evaluated by calculating saturation indices of different minerals using WATCH software (Bjarnason, 2010). Solute mineral that attained equilibria were selected and plotted in graphs. The minimum and maximum temperature at which most of selected minerals appear to attain equilibrium was regarded as the subsurface temperature. Small difference between maximum and minimum temperature mineral equilibria means the geothermal system is at equilibria. Therefore, such temperature range was regarded as the subsurface temperature of the system. Figure 35 displays that mineral equilibrium is close to geothermal system equilibrium range (130 - 140°C) indicating equilibrium conditions in reconstructed reservoir composition based on sample CT-6. Figure 36 shows mineral equilibrium range (110 - 130°C) indicating disequilibrium conditions in recalculated reservoir composition from sample CH-13. In general, multiple mineral equilibria shows calculated reservoir temperatures varying between 130 and 140°C which is in the same range with temperature calculated using quartz and Na-K geothermometers in Table 3. The reservoir water showed highly saturated with respect to talc and chrysotile at temperatures lower than 140°C and slightly saturated with respect to calcite, quartz and microcline (Figure 35). These minerals were likely for form below that temperature. In Figure 37 hot spring water (sample CT-6) showed that most of the minerals including calcite, anhydrite, adularia, prehnite and muscovite were at disequilibrium. Similarly in Figure 38 discharged thermal water (CH-13) was at disequilibrium with respect to chalcedony and anhydrite. Both Figures 37 and 38 (CT-6 and CHI-13) demonstrated that the hot spring waters were supersaturated with respect to calcite below 160°C and 130°C respectively. This mean calcite is likely to form below these temperatures. Figure 38 shows under saturation of chalcedony in hot spring waters from the aquafer temperature to discharging temperature substantiating that its geothermometer could not reliable. The disequilibrium conditions obtained in thermal spring (Figure 36 and Figure 37) and recalculated reservoir (Figure 35) waters may be explained by mixing of thermal water with shallow waters.
41
FIGURE 35: Saturation state of Chiweta geothermal aquifer water (based on sample CT-6) with respect to selected hydrothermal minerals as indicated. Equilibrium prevail
within narrow range (130-140°C) indicating equilibrium conditions
FIGURE 36: Saturation state of Chiweta geothermal aquifer water (sample CH-13) with respect to selected hydrothermal minerals as indicated. Equilibrium prevail within wider range (110-130°C)
indicating disequilibrium conditions

42
5.4 Mixing models Chemical geothermometers estimate subsurface temperature from surface outflow composition with the notion that water cool in up-flow zone by either conductive cooling or adiabatically or both. Nevertheless, thermal water also cools through mixing with shallow cold groundwater. Cold groundwater are lower in dissolved solid such that mixing act as dilution to geothermal water (Arnórsson, 2000) that lead to erroneous geothermometer estimation. The application of mixing model to estimate subsurface temperature in geothermal system has demonstrated that mixture of two components of different composition can maintain composition of reactive component such that the concentration cannot change much after mixing has occurred in the up flow zone. Mixing models allows
FIGURE 37: Saturation state of Chiweta geothermal hot spring water (sample CT-6) with respect to selected hydrothermal minerals as indicated. Equilibrium prevail within wider range (95-130°C)
indicating disequilibrium conditions
FIGURE 38: Mineral saturation diagram for Chiweta hot spring sample CH -13. Aquifer is close to saturation with most minerals at 110-139°C, except for chalcedony and anhydrite

43
estimation of hot water component in the mixed waters emerging in spring or shallow drillhole. Three types of mixing models were proposed namely, silica-carbonate, silica-enthalpy and chloride-enthalpy mixing models (Arnórsson, 2000). 5.4.1 The silica-carbonate model The silica-carbonate model is based on the relationship between silica and carbonate and assumes that all silica exist in geothermal system as H4SiO4 and all carbonate as CO2. The model assumes that both aqueous silica and total CO2 concentrations are fixed by temperature dependent solute-mineral equilibrium in the reservoir whereas temperature dependence of silica is controlled by quartz. This model estimate the temperature of the hot water component. This model can also differentiate boiled geothermal water from non-boiled. The model curve in Figure 39 was created from SiO2 and CO2 concentration using the method described by Arnórsson (2000) and Fournier and Potter (1982).
Hot spring data points plotted below the curve indicating that hot spring waters were un-boiled. The intersection of an extrapolated line (from cold to mixed thermal water) with the model curve represents silica and carbonate concentration in the hot water component. The silica-carbonate model in Figure 39 demonstrates that silica content in thermal water component of Chiweta prospect as about 140 ppm. Assuming adiabatic (maximum steam loss) cooling in Equation 5 and conductive cooling (no steam loss) by Fournier and Potter (1982) in Equation 4, the subsurface temperature of Chiweta geothermal prospect was estimated to be 149°C and 157°C respectively, consistent with geothermometer estimations of Na-K and Na-K-Ca. 5.4.2 Silica-enthalpy hot spring model Unlike chloride-enthalpy model, silica-enthalpy model handles non-boiled and boiled mixed water separately. The model assumes that no conductive cooling occurred after mixing. If the mixed water has cooled conductively after mixing, the calculated temperature of the hot water component will be too high. The other assumption is that no silica deposition has been occurred before or after mixing, and quartz controls the solubility of silica in the hot water component. The model uses quartz solubility curve and constructed using the following equation (Arnórsson, 2000):
° 55.3 0.3659 5.3954 10 5.5132 1074.360 log
(15)
FIGURE 39: Silica-carbonate mixing model (Arnórsson, 2000) for thermal springs and non-thermal water at Chiweta. The intersection of dotted line and model curve gives the silica and
carbonate concentration in hot water component. Silica is about 140 ppm
44
where t is temperature in °C and S represent silica concentration in ppm. The calculated temperature is then converted to enthalpy. This paper used H2O ChemicaLogic SteamTab companion software (Cheng and Saini, 2003) to convert temperatures into enthalpy. The point of intersection between the data point extrapolated line and quartz solubility curve represent enthalpy of the hot water component in the mixture. Figure 40 shows Chiweta hot water component as about 660 kJ/kg corresponding to temperature of 156°C derived from steam tables.
The pH of 7.8 indicated that the water is gaseous and has not boiled. The extrapolated line for non-boiled water intersected the silica solubility curve meaning that the thermal springs have not cooled conductively. In this case, enthalpy changes from thermal water component (660 kJ/kg) to that of mixed water (thermal spring water, 330 kJ/kg) is due to mixing with non-thermal water of 120 kJ/kg (CT-9, 28°C). Therefore the ratio of mixing can be obtained from the silica enthalpy in Figure 40 as follows:
Total thermal water enthalpy Mixed water enthalpy
Cold water enthalpy Enthalpy from the reservoir
Enthalpy of hot water in mixed water Ratio of hot water to total enthalpy
= 660 kJ/kg (Figure 40) = 330 kJ/kg = 120 kJ/kg = 660 kJ/kg -120 kJ/kg = 540 kJ/kg = 330 kJ/kg - 120 kJ/kg = 210 kJ/kg = 210 kJ/kg / 540 kJ/kg = 0.38 = 38% parent hot water Therefore, cold groundwater is about 62%
The calculated ratio was used to estimate the reservoir composition of non-conservative component silica as follows:
Given: Measured silica (TABLE 2) in the mixed
Hot water component in the mixed waters Silica composition in the reservoir
= 99.43 ppm from = 0.38 = 99.43 ppm x 1.38 = 137.2 ppm
The estimated silica composition of 137 ppm using silica-enthalpy mixing model was close to the composition estimated by silica-carbonate mixing model. Using geothermometer Equations 4 and 5 by Fournier and Potter (1982), the calculated silica reservoir composition gives subsurface temperatures of
FIGURE 40: Silica-Enthalpy hot spring mixing model (Arnórsson, 2000) of Chiweta geothermal prospect

45
155°C and 148°C, respectively. These subsurface temperatures were in agreement with Na-K and Na-K-Ca geothermometers displayed in Table 3. 5.4.3 The chloride-enthalpy model The chloride-enthalpy diagram in Figure 41 was constructed using enthalpy values and chloride concentration from the water samples. The enthalpy values of data points indicated by dots (hot springs) were derived from quartz geothermometers calculated on WATCH (Bjarnason, 2010). Enthalpy values of points represented by circles, squires and triangle (local cold waters), derived from measured temperatures. In both cases enthalpy values were calculated using H2O ChemicaLogic SteamTab companion version 2.0 software (Cheng and Saini, 2003). The model lines in the diagram were derived using the procedure explained by Arnórsson (2000). The enthalpy of 600 kJ/kg of parent hot water corresponds to the apex of the triangle. With the aid of steam tables taking the enthalpy as that of steam saturated water, the temperature of the parent hot was estimated to be 143°C.
5.5 Reconstructing reservoir water composition Boiling, conductive cooling and mixing are very multifaceted processes and unavoidable in up-flow zone of geothermal systems (Arnórsson et al., 2007). They involve mineral dissolution and precipitation reactions. Where there is no mixing and temperatures are below 200°C, with considerable high flow rate making conductive cooling of rising fluid insignificant, aquifer fluid composition can be reasonably reconstructed below the zone of boiling. Under such conditions the boiling is assumed to be adiabatic. Studies have shown that mineral-solution equilibrium is closely approached for all major components of geothermal fluids except for Cl (Arnórsson et al., 1983; (Giggenbach, 1991). This constrains relative activities of aqueous species and also individual component concentrations and help in model validation. Cation/proton activity ratios in equilibrated liquids are constant at any specific temperature for a system of specific mineralogy. Chemical speciation program WATCH (Bjarnason, 2010) allows to back-calculate aquifer water composition from data on the chemical composition of the boiling hot spring water. Basically, the calculation involves correction of dissolved solids content of hot spring water for the vapour loss and adding back the lost gases including CO2 and H2S. To run the program a reference geothermometer temperature whether quartz, Na-K or arbitrary of aquifer is selected. The degassing coefficient (ҫ) needs to be selected as well. (Arnórsson et al., 2007) proposed a method of selecting ҫ by relating it with calcite saturation. The selected ҫ should correspond to calcite saturation in the aquifer at selected aquifer temperature as it has been proven that geothermal reservoir water are close to calcite
FIGURE 41: Chloride-enthalpy diagram (Arnórsson, 2000) for Chiweta geothermal springs

46
saturation at temperature >100°C (Arnórsson et al., 2007). The concentration of other gases apart from CO2 and H2S in the un-boiled aquifer is usually approximated. Chiweta hot spring sample CT-6 and CH-13 analytical data were used for calculation of aquifer water composition. First the WATCH programme was run at different ҫ values taking the last temperature of last equilibrated with Na-K (149°C) as an un-boiled temperature of aquifer feeding the hot spring from depth. The first boiling was assumed to be at 100°C with 0.01 as degassing factor at about 180 m depth. Then single step adiabatic boiling was calculated in nine stages of 10°C from 160°C to hot spring temperature of 80°C. Figure 42A shows variation of calcite saturation in aquifer in relation various degassing factor (ҫ) values. Figure 32A shows that aquifer liquid equilibrated with calcite at ҫ of 0.16, indicating mild degassing. This may indicate that 16% of CO2 in the initial aquifer liquid was transferred into vapour relative to the transfer needed to establish equilibrium distribution of CO2 between liquid and vapour at the surface. Figure 42B illustrate that degassing of 0.16 correspond to pH of 7.45 which is close to in situ pH of 7.8. At this rate of degassing > 600 mg/kg of CO2 escaped from the aquifer as shown in Figure 42C. This type of degassing accompanied by adiabatic cooling led to calcite saturation in Figure 42D. The temperature saturation of calcite in Figure 42D is corresponding to calculated SiO2 geothermometer temperature of 130 °C.
FIGURE 42: Modelling of aquifer (black square) and up-flow boiling of Chiweta hot spring (CH-13). A: Variation in calcite saturation in relation to CO2 degassing of boiled water. B: pH variation
in relation to degassing due to boiling. C: CO2 steam composition against degassing of boiling water. D: Variation of calcite saturation in boiled water (adiabatic) under CO2 degassing of 16%

47
Chiweta hot spring sample CT-6 and CH-13 analytical data were used for calculation of aquifer water composition. First the WATCH program was run at different ҫ values taking the last temperature of last equilibrated with Na-K (149°C) as an un-boiled temperature of aquifer feeding the hot spring from depth. The first boiling was assumed to be at 100°C with 0.01 as degassing factor at about 180 m depth. Then single step adiabatic boiling was calculated in nine stages of 10°C from 160°C to hot spring temperature of 80°C. Figure 42A shows variation of calcite saturation in aquifer in relation various degassing factor (ҫ) values. Figure 32A shows that aquifer liquid equilibrated with calcite at ҫ of 0.16, indicating mild degassing. This may indicate that 16% of CO2 in the initial aquifer liquid was transferred into vapour relative to the transfer needed to establish equilibrium distribution of CO2 between liquid and vapour at the surface. Figure 42B illustrate that degassing of 0.16 correspond to pH of 7.45 which is close to in situ pH of 7.8. At this rate of degassing > 600 mg/kg of CO2 escaped from the aquifer as shown in Figure 42C. This type of degassing accompanied by adiabatic cooling led to calcite saturation in Figure 42D. The temperature saturation of calcite in Figure 42D is corresponding to calculated SiO2 geothermometer temperature of 130 °C. The borehole which was drilled into Chiweta geothermal water was very shallow (32 m deep) and contained more diluted geothermal water. In addition, thermal water from the borehole was not equilibrated such that thermal water coming from this drillhole was not representative of geothermal reservoir water. Therefore, reservoir fluid composition was estimated based on the surface thermal spring composition. The close to boiled alkaline water of Chiweta was suggested to represent boiled reservoir water at the surface. Based on adiabatic boiling Arnórsson et al. (2007) developed a model for construction of reservoirs fluid composition using data from boiled hot spring at the surface. Björke et al., (2015) developed three steps for modelling reservoir fluid composition. Firstly, estimation of reservoir fluid temperature as the geothermal system is assumed to be thermodynamically isolated. In this paper the aquifer temperature of last equilibrated with Na-K (149°C) was selected. Secondly, the degree of degassing needs to be selected as well. The extent of degassing was taken from calculation in Figure 42 A as 16% which correspond to calcite saturation. Thirdly, by assuming a closed system the reservoir fluid composition is given by the following equation:
1 (16)
where mitotal is the reservoir fluid composition of i-th composition, mi
v and mil are concentration in vapour
and liquid phase respectively and Xv is the calculated vapour fraction. For the spring, the boiling was assumed to be from the estimated reservoir temperature (149°C) to the surface temperature 80°C along water vapour saturation curve (Psat). Steam fraction wass calculated using the following equation:
X
h hL
(17)
where hfluid is the initial fluid enthalpy obtained from the estimated reservoir temperature, hl is the liquid enthalpy at the surface and Ll is the latent heat of vaporization. The steam phase is mv = 0 for the conservative element that do not enter into steam phase. For CO2 and H2S volatiles that are found in both liquid and steam phases but only analysed in liquid phase the steam phase was calculated by the following equation:
m m X
55.51P K ς 1
1 (18)
The reconstructed reservoir water belongs to Na-Cl-SO4-HCO3 facies. Table 4 displays re-calculated reservoir composition with lower concentrations than in situ. This may be explained by phase separation of the aquifer water as it ascends to the sampling point. As explained by D’Amore and Arnórsson (2000) that cooling bring modification in the chemical composition of the ascending fluid by phase separation of steam and liquid water phases giving rise to an increase of non-volatile components in the discharged hot spring water. Though concentration changed, the calculated reservoir composition gave Na-Cl type

48
similar to the water discharged from the hot springs. The reservoir pH is slightly low compared to the in situ due to loss of CO2 to the atmosphere leaving the spring water more basic.
TABLE 4: Measured chemical composition of hot spring and calculated reservoir aquifer of the Chiweta prospect. Concentration in ppm
CT-6 CH-13
Hot spring Aquifer water Hot spring Aquifer water pH/°C 7.8/38.4 7.52/140 7.5 7.45/130 CO2 59.3 51.43 28 22.85 H2S 2.02 1.9 n.a. B 0.6954 0.6427 n.a. SiO2 99.43 91.9 65.8 62.07 Na 383 353.98 389.2 367.11 K 23.2 21.44 21.3 20.09 Mg 0.387 0.358 0.419 0.395 Ca 17.96 16.6 17.23 16.25 F 12.63 11.673 12.82 12.092 Cl 336.7 311.19 316 298.06 SO4 295.7 273.29 287.3 270.99 Al 0.0114 0.0105 n.a. Fe n.d. n.a. TDS n.a. 1300 1226.22 Vapour phase CO2 n.a. 1285.65 n.a. 754.93 H2S n.a. 10.91 n.a.
The reconstructed reservoir water belongs to Na-Cl-SO4-HCO3 facies. Table 4 displays re-calculated reservoir composition with lower concentrations than in situ. This may be explained by phase separation of the aquifer water as it ascends to the sampling point. As explained by D’Amore and Arnórsson (2000) that cooling bring modification in the chemical composition of the ascending fluid by phase separation of steam and liquid water phases giving rise to an increase of non-volatile components in the discharged hot spring water. Though concentration changed, the calculated reservoir composition gave Na-Cl type similar to the water discharged from the hot springs. The reservoir pH is slightly low compared to the in situ due to loss of CO2 to the atmosphere leaving the spring water more basic. 5.6 Assessing origin of water using isotopes and mobile elements Deuterium, boron and chloride are natural tracers that have been used to establish origin of water in geothermal fields. Giggenbach (1991) defined them as non-reactive (chemically inert) constituency in natural waters that remained unchanged and act as a tag for mapping movement of water. In this paper these three tracers were used to determine the original component of geothermal water and to assess water rock-interaction process. Deuterium has been used as a tracer of groundwater movement as indicated by Arnórsson (1995b). Isotopes are any two are more species of atoms of a chemical element with the same atomic number and nearly identical chemical behaviour but with distinct atomic mass (Arnórsson, 2000). Some isotopes are stable whereas others are radioactive. Stable isotopes especially δD and δ18O has become essential component in geothermal investigation. Similar to other isotopes, δD and δ18O ratios are sensitive to changes in temperature, water-rock interaction and other physicochemical processes such as mixing and steam separation (Arnórsson, 2000) as ion exchange reactions in the natural system achieve equilibrium depending on temperature. Isotopes fractionate in the chemical processes responding to natural systems. The fractionation is greatest in lighter element such as hydrogen and oxygen. Understanding the recharge zone to the geothermal system is one of the importance aspect of geothermal studies. The δD and δ18O isotopes are suitable tracer of the origin of water and its flow direction as it have ability to

49
retain its physical and chemical characteristics (Arnórsson, 2000; Sharp, 2007). As such, δD and δ18O has been used to define hydrogeological conditions and evaluate the processes that have affect the fluid. This due to the fact that δD and δ18O isotopes ratio have little change over a long distance. Deuterium (δD) is one of the three hydrogen isotopes (protium, deuterium and tritium) containing one neutron and a proton within its nucleus with atomic mass of 2 atomic mass unit (amu) (Sharp, 2007). There are three types of oxygen isotopes namely 16O, 17O and 18O. The 16O and 18O are commonly used isotopes expressed as delta (δ) (Sharp, 2007) Isotopes are expressed as a ratio of heavy isotope (rare) against light (abundant) isotope. For oxygen and hydrogen isotopes, the concentration is written with reference to international a standard known as standard mean oceanic water (SMOW). For example oxygen isotopes are expressed as follows:
/ .
/ //
1000 (19)
The result are expressed as per mille (‰) meaning a sample with δ18O value =20‰ has 20‰ (2%) more 18O relative to the standard. A sample with δ18O value =-7‰ has 7 ‰ (0.7%) less 18O relative to the standard. Table 1 shows the deuterium (δD) and oxygen (δ18O) isotope values of Chiweta geothermal prospect obtained from ICP-MS. Craig (1963) and White (1986) established that originate of most geothermal water is mainly meteoric therefore the data was compared to global meteoric water line. The globe precipitation line (GML) in Figure 43 shows the relationship of δD and δ18O isotopic values of geothermal water, cold groundwater and surface waters (Lake Malawi and North Rumphi River) in Chiweta area. It was observed that geothermal water and groundwater (δD=-30.61 to -18.87‰, δ18O= -5.4 to -3.07‰) follow closely to global meteoric water line (δD=8δ18O+10) demonstrating meteoric origin of both waters. Also noted was very slight shift of δ18O in thermal water (CT-6= -4.08‰ and CT-10=-3.56‰) and groundwater (CT-2= -3.07‰) which can be attributed to progressive water-rock interaction.
FIGURE 43: The relationship between isotopes (δD and δ18O) of Chiweta sampled waters and Globe Meteoric Line (GML) (Arnórsson, 2000)

50
Lake Malawi water was enriched in heavy δD and δ18O (δD=12.49 -15.06‰ and δ18O=1.67-2.27‰) compared to the groundwater (δD=-30.61 to -18.87‰, δ18O= -5.4 to -3.07‰) as demonstrated by the shift away from GML in same Figure 43. The explanation to that behaviour was that, the lake was very much exposed to evaporation. Vapour pressure of lighter isotope (H2
16O) is higher than vapour pressure of both heavier ones (HDO and H2
18O). As such, evaporation takes lighter δH and 16O isotopes into the lake water vapour phase leaving heavy isotopes in liquid phase of the lake water. Therefore, remaining lake water is enriched in heavier HDO and H2
18O. North Rumphi water showed relatively more depleted in heavy isotopes (δD= -34.04 to -33.94‰ and δ18O = -6.50 to -4.96‰) compared to rest of the samples. This may be explained by different source of river water than groundwater, probably originated as precipitation farther western highlands on high altitude. 5.6.1 Tracing water-rock interaction using recalculated aquifer isotope composition Apart from water-rock interaction, other processes also affect isotopic fractionation. Therefore, before considering water-rock interaction process, isotopic data obtained from boiled or close to boiled hot spring need to calculated to reservoir conditions to account for effect of isotopic changes due to boiling and phase separation (D’Amore and Arnórsson, 2000). Isotopic investigations has ability to quantify processes occurred in geothermal system such as boiling, steam separation and condensation. As geothermal water ascend to the surface physical processes and chemical changes brought about by conduction, mixing and boiling are replicated in both chemical and isotopic component of the fluid (D’Amore and Arnórsson, 2000). According to steam separation mechanism, phases of steam separation has different effects on isotopic fractionation (D’Amore and Arnórsson, 2000). One stage separation yield maximum isotopic fractionation than multi-stage which resulted into minimum isotopic fractionation. Boiling leads to fractionation of deuterium and 18O through enrichment of the heavier isotopes in water phase consistent with depletion of the same in the steam phase. The δ18O of geothermal water usually displaced from meteoric line towards higher values (less negative) due to exchange of 18O between water and rock (Arnórsson, 2000). The extent of the shift is proportional to degree of water-rock interaction. Which follows that the more the water -rock interaction the higher the shift. Increase in temperature enhances chemical reaction including water-rock interaction, which in turn intensifies δ18O shift (D’Amore and Arnórsson, 2000). In case of Chiweta the shift is very minimal which may be possibly caused by limited water-rock interaction. In this paper the assessment of isotopic reservoir condition was done using the method proposed by D’Amore and Arnórsson, (2000). By assuming one stage adiabatic boiling to attain maximum fractionation from quartz and Na-K geothermometer of 140 °C to temperature of 100 °C, isotope composition of the aquifer was calculated. The first step involved calculation steam fraction using the following equation:
(20)
where is the steam fraction formed by the boiling from reservoir temperature to 100 °C whereas and represent the enthalpy of the aquifer water and the steam saturated water at 100 °C respectively.
is the latent heat of vaporization at 100°C. Using steam table (Cheng and Saini, 2003), the aquifer temperatures and 100 °C temperature were converted to enthalpy and steam fraction was calculated using Equation 20 above as follows:
589 4192257
0.0753 (21)
Conservation mass of isotopes was given by the following equation:
, 1 , (22)
where is isotopic value in the reservoir water and , and , are its δ values in two phase respectively at 100 °C.

51
The second step was determination of fractionation factor between two phases using the following equation:
10 (23)
The fractionation factor for 2H and 18O between water and steam from Truesdell et al. (1977) as reported by D’Amore and Arnórsson (2000) are 5.24 and 27.8 respectively. From Equation 23 the fractionation factors can be written as:
10 27.8 (24) 10 5.24 (25)
Combination of Equations 22 and 23 and elimination of δB resulted in formulation of the following equation:
, . 10 , (26) , . 10 , (27)
For sample CT-6 the reservoir isotope values were:
23.77 0.0753x27.8 25.86 4.08 0.0753x5.24 4.47
TABLE 5: Calculated isotope reservoir composition based on Equations 26 and 27
Sample Reservoir
Name δD δ18O δD δ18O CT-6 -23.77 -4.08 -25.86 -4.47
CH-13 -26.0 -4.96 -28.11 -5.35CT-10 -19.19 -3.56 -21.28 -3.96
Figure 44 shows the relationship of δD and δ18O isotopic values of calculated reservoir geothermal water (Table 5) and global meteoric line. The reservoir water CT-6 and CT-10 plotted on global meteoric water line (δD=8δ18O+10) demonstrating total meteoric component. Its only sample CH-13 which plotted further left of the meteoric line. All samples showed the same behaviour of shifting left (becoming more negative) comparing to hot spring isotopic values plots in Figure 43. This characteristic
FIGURE 44: The relationship between calculated reservoir water isotopes (δD and δ18O) values for Chiweta area (dots) and Globe Meteoric Line (GML) from Arnórsson (2000)
52
may not be interpreted as due water-rock interaction in the reservoir. Other processes such as phase segregation might be responsible for such behaviour. 5.6.2 Boron and chlorine Mobile elements chlorine and boron have been used to detect source of mixing components of geothermal water in up flow zones of geothermal systems (Truesdell, 1975; White, 1986). Surface water and cold groundwater have considerably lower concentration of both boron and chloride (B<0.01-few ppm, C<1-several tens ppm) compared to geothermal water (Arnórsson, 1995a; Giggenbach, 1991). The source of boron and chloride in surface water is mostly atmosphere whereas groundwater the source is soil or rocks (Arnórsson, 1995a). There is a relationship between boron and chloride concentration in water and associated rock types. The concentration of boron and chloride in water interact with basalts, granites and gneisses is the lowest compered to water associated with sedimentary rock and everporites which has highest concentration (Arnórsson, 1995a). Geothermal waters with temperature >100°C have similar Cl/B ratio to the associated rocks (Arnórsson, 1995a). The Cl/B ratio in sea water is 4200 (Richardson and McSween, 1989). Table 2 shows concentrations of Cl and B in thermal and non-thermal water. The Cl/B ratio of the sea, Lake Malawi and groundwater were plotted in Figure 45 to establish their relationship with thermal spring water. Figure 45 shows both thermal and non-thermal water plotted away from sea water line. The geothermal water plotted almost along the Lake Malawi Cl/B ratio. This may suggest the contribution of lake water to geothermal water at depth. However, the δD and δ18O isotopes demonstrated that the recharge waters were from the western highlands other than the lake. Therefore, plotting of thermal water away from parent groundwater ratio line is due to water rock interaction. The concentration of Chloride in geothermal water (336.7 ppm) was higher than in non-thermal water (3.319 ppm). Thermal water boron concentration was 0.6954 ppm greater than 0.5 ppm meaning that thermal water Cl/B ratio approached that of Cl/B rock ratio (Arnórsson and Andrésdóttir, 1995). Therefore, elevated concentration of boron and Cl in the thermal water is due to water-rock interaction.
5.7 Discussion The low EC in surface water reflecting low water-rock interaction but O2 consumption of decaying organic matter typically shows a HCO3- alkaline-earth composition. The low concentration of chloride implies low salinity reflecting predominance of meteoric contribution supported by HCO3 being the
FIGURE 45: Illustarion of Cl/B ratios and B and Cl concentrations in meteoric source water and subsquence dissolution from the rock. Dots represent
thermal water and circles for groundwater from boreholes

53
main anion. Substantial acidic in cold groundwater denote meteoric component with relatively shallow and fast underground circulation within the aquifer. This is supported by previous study (Wanda et al., 2013) which found groundwater enriched with soil CO2. The low concentration of silica in lake water suggested precipitation or consumption of silica forming organisms or chert formation. Substantial shift of lake water δD and δ18O from global meteoric line to more positive values signify high isotopic fractionation due to high rate of evaluation in the lake. The North Rumphi River water showed lower δ18O and δD values (more negative) than groundwater meaning that the river water originated as precipitation from farther away from western highlands on high altitude. According to water classification (Ellis and Mahon, 1977; Giggenbach, 1991; White, 1986) the surface and groundwater of the Chiweta area is categorized as bicarbonates water of meteoric origin. Silica was the major continuant in the Chiweta hot spring waters together with sodium being major cation. Sulphate was dominant anion seconded by chloride and bicarbonate. The relative abundant of chloride in geothermal water means increased salinity (Arnórsson, 1995a). Using Ellis and Mahon, (1977); Giggenbach (1991); and White (1986) methods of water classification geothermal water of Chiweta is referred as sodium-chloride water with small bicarbonate component. Similar water type was also reported by Kemp (1975) as the main type the Chiweta. The neutral pH of geothermal water denotes meteoric origin but with slightly modified pH compared to surface and cold groundwater due to deeper circulation. The origin of geothermal waters was the groundwater from local rain other than the lake water as verified by close similarities in δD and δ18O values between groundwater and geothermal water. The differences in isotopic values between geothermal water and lake water indicate that the origin of geothermal water is not the lake. The higher EC in hot spring water reflect relatively more water-rock interaction as the result of deeper and long circulation path. However, the interaction is not high enough to cause isotopic fractionation. No boiling has been registered in the up-flow zone as demonstrated by silica-carbonated mixing model. Isotopic studies of thermal water and non-thermal water showed that δ18O and δD values of groundwater and calculated geothermal reservoir water plotted on global meteoric line whereas hot spring water showed slightly higher values (less negative). This indicates that both the groundwater and geothermal water were from local precipitation but spring thermal water deuterium and oxygen isotopes fractionated. Loss of steam might be responsible increased concentration and isotopic fractionation of the hot spring water compared to reservoir water. Chiweta geothermal prospect is suggested to fall within low temperature geothermal system bracket (Saemundsson, Axelsson, and Steingrímsson, 2009) as verified by the estimated reservoir temperature of 132-157 °C using solute geothermometers (Arnórsson et al., 1983; Fournier and Potter, 1982; Fournier and Truesdell, 1973; Truesdell, 19765). Multiple mineral equilibrium estimated subsurface temperature within the same range 130-140°C of silica and Na-K geothermometers. Mixing models (Arnórsson, 2000; Fournier and Potter, 1982) subsurface temperature estimation is in agreement with cation geothermometers (Arnórsson et al., 1983; Fournier and Truesdell, 1973; Truesdell, 1975). The geothermal system is located within elevated geothermal gradient geological setting. The low temperature Chiweta can further categorized as sedimentary geothermal system type as demonstrated by circulation of water through NW-SE and NE-SW trending faults into the tectonically lifted hot sedimentary and metamorphic rocks. 5.7.1 Conceptual model The proposed conceptual model of the Chiweta is based on surface geology and hydrogeochemistry. Figure 46 displays the preliminary conceptual model of the area. The model suggest that both thermal and non-thermal waters of Chiweta prospect represent the local precipitation fallen in the southwest, western and northwest close highlands. Driven by hydraulic gradient at an elevation above1200 m, the recharging Ca-Mg-HCO3 groundwater originate from the highlands at temperatures of around 23 to 33°C and pH of 5.7-7.5. These waters percolate underground through faults and fractures of NW-SE and NE-SW trending that sliced Karroo sedimentary beds and metamorphosed basement rock as verified by both hydro-geological analysis of the flow direction, δD and δ18O stable isotopes. The inflow waters

54
are considered to attain the heat from increased geothermal gradient at depth. The heat source might be the hot rocks in the roots of the geothermal system (Arnórsson, 1995a). The estimated subsurface temperature based on quartz, Na-K and Na-K-Ca geothermometers indicated subsurface temperature of about 132 to 157°C. Multiple mineral equilibria temperature estimation showed similar range of temperatures despite some deviation. Silica-carbonate, silica enthalpy and chloride enthalpy mixing models also supported the estimated geothermometers. Assessment of saturation indices, activity coefficients of the sample above 100°C take into account the reconstructed reservoir composition. The saturation indices for both hot spring water sample CT-6 and CH-13 from the study area give negative values for anhydrite. Calcite and quartz are saturated in both hot spring water. However the saturation is low to cause scaling problems. Talc and chrysotile, quartz and calcite saturation are high in the recalculated reservoir composition. Therefore, possibilities of deposition of such minerals are high. As temperature increases due to increased geothermal gradient, water-rock interaction progresses, dissolving some mineral from the rock into aqueous phase. This in turn changes the initial composition of Ca-Mg-HCO3 water to Na-Cl type. The increase in temperature and change in chemical composition by water-rock interaction has minimal effect the isotopic composition of thermal water as witnessed by calculated δD and δ18O isotope composition of thermal water slight negative shift and plotted on the global meteoric line. The upward movement of water to the out-flow zone is convectively driven due to different in density of the hot and cold water columns within and outside the geothermal system respectively. This density difference create enough pressure difference to sustain the water convection (Arnórsson, 1995b). The bottom of groundwater convection in Chiweta may be around 2-4 km depth. As concluded by Arnórsson (1995b) that permeability created by normal faulting tend to decrease with depth progressively due to sealing of hydrothermal alteration minerals. There is no boiling in the upflow zone as demonstrated by silica-carbonate mixing model. As such, degassing at the surface is only suggested possible process affecting the isotope fractionation by allowing depleted vapour escape from thermal water, leaving the hot spring water relatively enriched in heavier δD and δ18O isotopes compared to reservoir water. Silica-enthalpy mixing model showed mixing of 62% of shallow groundwater with geothermal water in the upflow zone contributing to dilution of the thermal spring waters. At the surface Chiweta geothermal system is manifested by linear cluster of hot springs. The estimated total flow rate of the springs is about 30 L/s producing nonreactive alkaline water which favours growth of ague and other surrounding vegetation. No silica sinter was deposited around the hot springs. However miner silica and sulphur deposits were noticed with odor of sulphur smell. 5.7.2 Tectonics and geology Chiweta geothermal prospect is sedimentary geothermal system within Karoo rocks that overlying metamorphosed basement schist and gneiss. Before deposition of the sediments, the metamorphosed basement was formed on uneven high relief surface. The formation of sedimentary rock was probably controlled by tectonically influenced transgressive and regressive movements of fluvial and lacustrine sediments. Progressive subsidence accommodated the accumulation of sediments units eroded from metamorphic basement material (Cooper and Habgood, 1959) The distribution of the geothermal manifestation correlates well with major tectonic features of the Malawi rift. Chiweta thermal springs are merged linearly on NW-SE fault related to Ubendian mobile belt (2300-1800 my) (Carter and Bennett, 1973) and was reactivated during the first stage of rifting (>5-<2 my) with principle extension of ENE (Ring, 1994). This fault dip nearly vertical (75-80° SW) represent permeability anomaly along which the hot water ascend. Irumide mobile belt related faults and fractures perpendicular to the NW-SW fault may contribute to the outflow zone maintenance and

55
they were formed in the third stage of rifting which had ESE extension with dip-slip to strike-slip motion. They produced a well pronounced fault cliff with a vertical displacement of more than 1000 m. This displacement was accompanied by NE titling of rock beds due to dip-slip and strike motion. Exposure of hydrothermal alteration quartz minerals on the surface is related to the rifting and post-rifting erosion. This indicates that more than hundreds of meters of land surface have been removed.
FIGURE 46: Preliminary conceptual model of Chiweta geothermal prospect, an extention of cross-section U-V on Figure 29. Cold groundwater poracoration (black arrows). Thermal waters (red
arrows). Normal faulting dispacement (thick black up-facing and downfacing arrows)

56
6. CONCLUSION AND RECOMMENDATIONS 6.1 Conclusion The application of geology and hydrogeochemistry techniques is demonstrated to be an integral part of geothermal exploration program. Careful and thoughtful use of hydrogeochemistry techniques has acquired very useful information on the resource temperature, process reservoir and up-flow processes, its chemistry and potential problems likely to affect exploitation of the resource. Similarly, geological mapping provided information on type of rock and constrained age of lithological succession within the geothermal prospect. It has also delineated critical structures such as faults and fractures that control inflow and up-flow of the system. Precambrian to lower Palaeozoic gneiss and mica schist with lineated feldsparthic quartzite and garnetiferous amphiboles are the basement of the study area. Permian to Triassic Karoo sedimentary rocks cover basement rocks. Impermeable mudstone of Chiweta sedimentary and calcareous mudstones plus siltstones beds cap the Chiweta geothermal system. Increasing geothermal gradient due to half graben tectonism could be the heat source of the geothermal system. The origin of recharge water is from the local precipitation fallen in the southwest, western and northwest close highlands. This Ca-Mg-HCO3 water type is driven by hydraulic gradient from an elevation above1200 m. These waters percolate underground through faults and fractures of NW-SE and NE-SW orientation. There is no lake water feeding the geothermal system. Both geological mapping and geochemistry investigations demonstrated that the Chiweta is a low temperature sedimentary geothermal system with reservoir temperature of about 132-157°C based on quartz (Fournier, 1977), Na-K, (Arnórsson et al., 1983) and Na-K-Ca cation geothermometers supported by multiple mineral equilibria and mixing models. This elevated temperature is enough to drive minimal water rock interaction leading to increased chloride and boron but with minimal stable isotopic fractionation. The permeability of the geothermal system is fault controlled enhanced by Karroo sandstones. The thermal spring waters are undersaturated with respect to anhydrite. The same hot spring waters are mildly saturated with regard to calcite and quartz. This indicates minimal chances of scaling problems. There are high chances of talc and chrysotile, quartz and calcite deposition from recalculated reservoir composition due their high saturation. Stable isotopes in thermal water suggested fractionation due to phase separation at the surface, without boiling according to silica-carbonate mixing model. However mixing of shallow groundwater and geothermal was noted according to silica-enthalpy mixing model and chloride-boron plots. Thermal water from the boreholes had higher proportion of cold groundwater than hot spring water. At the surface thermal water have temperatures between 60-80°C and are mostly Na-Cl-SO4-HCO3 type with SiO2 content raring from 31 to 99 ppm. The distribution of the geothermal manifestation is tectonically controlled by NW-SE re-activated Cenozoic fault and fractures. The fault act as conduit through which the thermal water migrate upwards to outflow zone as verified by geological mapping and soil temperature measurements. Nearly vertical NE-SW Karoo rifting faults are responsible for 1000 m down-faulting and northeast gently tilting of sedimentary beds including Chiweta beds. 6.2 Recommendations If the development of the field is to continue, combination and comparison of findings from multiple disciplines including geophysics and environmental studies is recommended for better understanding of the system. Detailed geological, geochemistry and geophysical studies of the area will help to locate the

57
Chiweta geothermal reservoir, structures and suitable site for wells. Geothermal gradient wells might be important to establish the extent of geothermal gradient anomaly. Although the study found indication of geothermal system recharge from the NW-highlands, it was not possible to determine the barrier that prevent the recharge from the lake despite continuity of the fault to the lake and the fact that the lake is located < 2 km from the hot spring points. Geodetic studies complemented with ground geophysics study are recommended to delineate hidden structures and will help to understand the barrier of the recharge from the lake. Such type of studies will also help to understand the brittle-ductile boundary, the factor that controls the depth of water circulation. The current study further failed to establish the relationship between Lake Malawi water and geothermal water as the two displayed similarities in Cl/B ratio. Further studies are therefore necessary to establish the relationship, and determine the origin of B and Cl in the lake water. Geohazard assessment is also recommended as the prospect is located within seismic active region and characterized with steep terrain, an area prone to seismic and landslide hazards. Environmental and social impact assessment is recommended as the hot springs are located few hundred metres from the lake and also surrounded by few villages.

58
REFERENCES Ármannsson, H. and Ólafsson, M., 2006: Collection of geothermal fluids for chemical analysis. ÍSOR – Iceland GeoSurvey, Reykjavík, report ISOR-2006/016, 17 pp. Arnórsson, S., 1995a: Geothermal systems in Iceland: Structure and conceptual models – I. High-temperature areas. Geothermics, 24-5/6, 561–602. Arnórsson, S., 1995b: Geothermal systems in Iceland: Structure and conceptual models – II. Low-temperature areas. Geothermics, 24-5/6, 603–629. Arnórsson, S., (ed.) 2000: Isotopic and chemical techniques in geothermal exploration, development and use. International Atomic Energy Agency, Vienna, 351 pp. Arnórsson, S., and Andrésdóttir, A., 1995: Processes controlling the distribution of boron and chlorine in natural waters in Iceland. Geochim. Cosmochim. Acta, 59-20, 4125–4146. Arnórsson, S., Bjarnason, J.Ö., Giroud, N., Gunnarsson, I., and Stefánsson, A., 2006: Sampling and analysis of geothermal fluids. Geofluids, 6-3, 203–216. Arnórsson, S., Gunnlaugsson, E., and Svavarsson, H., 1983: The chemistry of geothermal waters in Iceland. III. Chemical geothermometry in geothermal investigations. Geochim. Cosmochim. Acta, 47-3, 567–577. Arnórsson, S., Stefánsson, A., and Bjarnason, J. Ö., 2007: Fluid-fluid interactions in geothermal systems. Reviews in Mineralogy and Geochemistry, 65-1, 259–312. Bahati, G., Pang, Z., Ármannsson, H., Isabirye, E. M., and Kato, V., 2005: Hydrology and reservoir characteristics of three geothermal systems in western Uganda. Geothermics, 34-5, 568–591. Bjarnason, J.Ö., 2010: The chemical speciation program WATCH, version 2.4. ÍSOR – Iceland GeoSurvey, Reykjavik, website: www.geothermal.is/software. Björke, J. K., Stefánsson, A., and Arnórsson, S., 2015: Surface water chemistry at Torfajökull, Iceland—Quantification of boiling, mixing, oxidation and water–rock interaction and reconstruction of reservoir fluid composition. Geothermics, 58, 75–86. Bloomfield, K., and Garson, M.S., 1965: The geology of the Kirk Range – Lisungwe valley area. Zomba, Malawi: Geological Survey Department, Bulletin, 17, 33 pp. Browne, P., 1984: Lectures on geothermal geology and petrology. UNU Geothermal Training Programme, National Energy Authority Reykjavik. Carter, G.S., and Bennett, J.D., 1973: Geology and mineral resources of Malawi. Malawi Geol. Surv. Dep., Bull., 6, 1-62. Cheng, G.C., and Saini, R., 2003: ChemicaLogic SteamTab companion (Version 2.0). ChemicaLogic Corporation, Burlington, USA: Chorowicz, J., 2005: The East African Rift System. J. African Earth Sciences, 43-1, 379–410. Chorowicz, J., and Sorlien., 1992: Oblique extensional tectonics in the Malawi rift, Africa. Geological Society of America Bulletin, 104-8, 1015–1023. Climate Data, 2017: Climate Chiweta: Temperature, Climate graph, Climate table for Chiweta. Climate-Data.org. Retrieved 24 May 2017, from website: en.climate-data.org/location/207402/

59
Coe, A.L., 2010: Geological field techniques. John Wiley and Sons, 336 pp. Cooper, W.G.G., and Habgood, F., 1959: The geology of the Livingstonia coalfield. Government Printer, Malawi. Craig, H., 1963: The isotopic geochemistry of water and carbon in geothermal areas. In: Tongiorgi, E. (ed.), Nuclear geology on geothermal areas. Consiglio Nazionale delle Ricerche, Laboratorio di Geologia Nucleare, Pisa, 17-53. Curewitz, D., and Karson, J.A., 1997: Structural settings of hydrothermal outflow: Fracture permeability maintained by fault propagation and interaction. J. Volcanology and Geothermal Res., 79-3/4, 149–168. D’Amore, F., and Arnórsson, S., 2000: Geothermometry. In: Arnórsson, S. (ed.), Isotopic and chemical techniques in geothermal exploration, development and use. Sampling methods, data handling, interpretation. International Atomic Energy Agency, Vienna, 152-199. Delalande, M., Bergonzini, L., Gherardi, F., Guidi, M., Andre, L., Abdallah, I., and Williamson, D., 2011: Fluid geochemistry of natural manifestations from the Southern Poroto–Rungwe hydrothermal system (Tanzania): Preliminary conceptual model. J. Volcanology and Geoth. Res., 199-1/2, 127–141. Deprez, A., Doubre, C., Masson, F., and Ulrich, P., 2013: Seismic and aseismic deformation along the East African Rift System from a reanalysis of the GPS velocity field of Africa. Geophys. J. International, 193-3, 1353–1369. Dixey, F., 1926: Notes on the Karroo sequence north-west of Lake Nyasa. South African J. Geology, 29-1, 59–68. Dulanya, Z., 2006: Geothermal resources of Malawi – an overview. Proceedings of the 31st Workshop on Geothermal Reservoir Engineering, Stanford University, Stanford, Ca, 5 pp. Dulanya, Z., Morales-Simfors, N., and Sivertun, Å., 2010: Comparative study of the silica and cation geothermometry of the Malawi hot springs: Potential alternative energy source. J. African Earth Sciences, 57-4, 321–327. Ellis, A.J., and Mahon, W.A.J., 1977: Chemistry and geothermal systems. Academic Press, New York, 392 pp. Esri, 2011: ArcGIS Desktop Desktop (release 10). Environmental Systems Research Institute, Redlands. Ca. Fadaie, K., and Ranalli, G., 1990: Rheology of the lithosphere in the East African Rift System. Geophys. International, 102-2, 445–453. Flannery, J.W., and Rosendahl, B.R., 1990: The seismic stratigraphy of Lake Malawi, Africa: implications for interpreting geological processes in lacustrine rifts. J. African Earth Sciences (and the Middle East), 10-3, 519–548. Fontijn, K., Williamson, D., Mbede, E., and Ernst, G.G., 2012: The Rungwe Volcanic Province, Tanzania–A volcanological review. J. African Earth Sciences, 63, 12–31. Fournier, R.O., 1977: Chemical geothermometers and mixing models for geothermal systems. Geothermics, 5-1/4, 41–50. Fournier, R.O., 1979: A revised equation for the Na/K geothermometer. Geothermal Resources Council, Transactions, 3, 221–224.

60
Fournier, R.O., 1981: Application of water chemistry to geothermal exploration and reservoir engineering. In: Rybach, L., and Muffler, L.J.P. (editors), Geothermal system: Principles and case histories. John Wiley and Sons Ltd., Chichester, 109-143. Fournier, R.O., and Potter, R.W. II, 1982: A revised and expanded silica (quartz) geothermometer. Geoth. Res. Council Bull.,11-10, 3-12. Fournier, R.O., and Truesdell, A.H., 1973: An empirical Na-K Ca geothermometer for natural waters. Geochim. Cosmochim. Acta, 37-5, 1255–1275. Franzson, H., 1998: Reservoir geology of the Nesjavellir high-temperature field in SW-Iceland. Proceedings of the 19th Annual PNOC-EDC Geothermal Conference, Manila, 13-20. Fridleifsson, I.B., 2001: Geothermal energy for the benefit of the people. Renewable and Sustainable Energy Reviews, 5-3, 299–312. Gamula, G.E.T., Hui, L., and Peng, W., 2013: An Overview of the Energy Sector in Malawi. Energy and Power Engineering, 5-1, 8–17. Geological Survey Department, 2010: Report on geological and structural mapping of the Karonga earthquakes affected areas. Ministry of Natural Resources, Energy and Environment, unpubl. report. Geological Survey Department, 2013: Seismic catalogue, Zomba, Malawi. Ministry of Natural Resources, Energy and Environment, unpubl. report. Geothermal Development Company, 2010: Assessment of the geothermal potential of Malawi. GDC, Nairobi, Kenya, unpubl. report. Giggenbach, W.F., 1986: Graphical techniques for the evaluated water/rock equilibration conditions by use of Na, K, Mg and Ca contents of discharge water. Proceedings of the 8th New Zealand Geothermal Workshop, Auckland, NZ, 37-43. Giggenbach, W.F., 1988: Geothermal solute equilibria. Derivation of Na-K-Mg-Ca geoindicators. Geochim. Cosmochim. Acta, 52-12, 2749–2765. Giggenbach, W.F., 1991: Chemical techniques in geothermal exploration. In: D’Amore, F. (coordinator), Application of geochemistry in geothermal reservoir development. UNITAR/UNDP publication, Rome, 119-144. Giggenbach, W.F., 1995: Geochemical exploration of a ‘difficult’geothermal system, Paraso, Vella Lavella, Solomon Islands. Proceedings 2 of the World Geothermal Congress 1995, Florence Italy, 995-1000. Government of Malawi, 2012: Malawi growth and development strategy II 2011-2016. Government of Malawi. Hardarson, B.S., 2014: Structural geology of the western branch of the East African Rift: tectonics, volcanology and geothermal activity. Proceedings at Short Course IX on Exploration for Geothermal Resources, organized by UNU-GTP, GDC and KenGen, at Lake Bogoria and Lake Naivasha, Kenya, 14 pp. Harrison, D.R., and Chapusa, F.W.P., 1975: The geology of the Nkhotakota-Benga Area. Zomba, Malawi, Geological Survey Department, Bulletin 32, 33 pp. IGA, 2013: Handbook of geothermal exploration best practices: a guide to resource data collection. analysis, and presentation for geothermal projects. IGA, website:

61
www.geothermal-energy.org/fileadmin/user_upload/documents/best_practice_guide/IFC-IGA_Geothermal_Exploration_Best_Practices-March2013.pdf, 74 pp. Kemp, J., 1975: The geology of the Uzumara area. Government Printer, Zomba, Malawi. MCC-Malawi., 2015: Investment outlook - business opportunities in the Malawi power sector. Millenium Challenge Corp., Lilongwe, Malawi. Mdala, H., 2015: Determination of structural variations between northern and southern provinces of Malawi rift by using of automatic lineament extraction methods. University of Twente, report. Mnjokava, T.T., 2007: Interpretation of Exploration geochemical data for geothermal fluids from the geothermal field of the Rungwe volcanic area, SW-Tanzania. Report 14 in: Geothermal training in Iceland 2007. UNU-GTP, Iceland, 303–332. Nicholson, K., 1993: Geothermal fluids. Springer, NY, 263 pp. Nilsen, T.H., 1982: Alluvial fan deposits. University of Vermont, Vm, ?? pp. Niyigena, J.P., 2013: Geochemistry of thermal water from the Theistareykir geothermal field in NE-Iceland compared to that of the geothermal prospects in NW-Rwanda. Report 23 in: Geothermal training in Iceland 2013. UNU-GTP, Iceland, 531-546. Omenda, P., and Simiyu, S., 2015: Country update report for Kenya 2010-2014. Proceedings of the World Geothermal Congress 2015, Melbourne, Australia, 6 pp. Openshaw, K., 2010: Biomass energy: Employment generation and its contribution to poverty alleviation. Biomass and Bioenergy, 34-3, 365–378. Powell, T., and Cumming, W., 2010: Spreadsheets for geothermal water and gas geochemistry. Proceedings of the 35th Workshop on Geothermal Reservoir Engineering, Stanford University, Stanford, Ca, 10 pp. Ray, G.E., 1975: The geology of the Chitipa-Karonga area. Zomba, Malawi, Geological Survey Department, Bulletin, 42, 33 pp. Reading, H.G., and Collinson, J.D., 1996: Clastic coasts. Sedimentary Environments: Processes, Facies and Stratigraphy, 3, 154–231. Reed, M., and Spycher, N., 1984: Calculation of pH and mineral equilibria in hydrothermal waters with application to geothermometry and studies of boiling and dilution. Geochim. Cosmochim Acta, 48-7, 1479–1492. Richardson, S.M., and McSween Jr., H.Y., 1989: Geochemistry: pathways and processes. Prentice-Hall, Englewood Cliffs, NJ, 488 pp. Ring, U., 1994: The influence of preexisting structure on the evolution of the Cenozoic Malawi rift (East African rift system). Tectonics, 13-2, 313–326. Ring, U., 1995: Tectonic and lithological constraints on the evolution of the Karoo graben of northern Malawi (East Africa). Geologische Rundschau, 84-3, 607–625. Ring, U., and Betzler, C., 1993: Architecture, tectonics and sedimentology of the Malawi Rift (East Africa). Zeitschrift Der Deutschen Geologischen Gesellschaft, 30–44.

62
Saemundsson, K., Axelsson, G., and Steingrímsson, B., 2009: Geothermal systems in global perspective. Proceedings of “Short Course IV on Exploration for Geothermal Resources”, organized by UNU-GTP, KenGen and GDC, Naivasha, Kenya, 22 pp. Saria, E., Calais, E., Stamps, D S., Delvaux, D., and Hartnady, C.J.H., 2014: Present-day kinematics of the East African Rift. J. Geophysical Research: Solid Earth, 119-4, 3584–3600. Sharp, Z., 2007: Principles of stable isotope geochemistry. Pearson Education, Upper Saddle River, NJ, 10 pp. Stockley, G.M., 1932: The geology of the Ruhuhu coalfields, Tanganyika Territory. Quart. J. Geological Society, 88-1/4. Stow, D. A., 2005: Sedimentary rocks in the field: a color guide. Gulf Professional Publ. Taulo, J.L., Gondwe, K.J., and Sebitosi, A.B., 2015: Energy supply in Malawi: Options and issues. J. Energy in Southern Africa, 26-2, 19–32. Thatcher, E. C., 1974: The geology of the Nyika area. Government Printer, South Africa. Truesdell, A.H., 1976: Summary of section III - geochemical techniques in exploration. Proceedings of the 2nd U.N. Symposium on the Development and Use of Geothermal Resources, San Francisco, 1, liii-lxxix. Truesdell, A.H., and Fournier, R.O., 1977: Procedure for estimating the temperature of a hot water component in a mixed water using a plot of dissolved silica vs. enthalpy. U.S. Geol. Survey J. Res., 5, 49-52. Truesdell, A.H., Nathenson, M., and Rye, R.O., 1977: The effects of subsurface boiling and dilution on the isotopic compositions of Yellowstone thermal waters. J. Geophysical Research, 82-26, 3694–3704. Tucker, M.E., 2003: Sedimentary rocks in the field. John Wiley and Sons, 408 pp. Wanda, E.M., Gulula, L.C., and Phiri, A., 2013: Hydrochemical assessment of groundwater used for irrigation in Rumphi and Karonga districts, Northern Malawi. Physics and Chemistry of the Earth, Parts A/B/C, 66, 51–59. White, D., 1986: Subsurface waters of different origins. The 5th International Symposium on Water-Rock Interaction. Extended abstracts. International Association of Geochemistry and Cosmochemistry, Orkustofnun, Reykjavík, 629–632. Wopfner, H., and Kreuser, T., 1986: Evidence for Late Palaeozoic glaciation in southern Tanzania. Palaeogeography, Palaeoclimatology, Palaeoecology, 56-3/4, 259–275.
Copyright © 2022 FDOKUMEN