Hydrogeochemistry of surface and spring waters in the surroundings of the CO2 injection site at...
18
International Journal of Greenhouse Gas Control 14 (2013) 151–168 Contents lists available at SciVerse ScienceDirect International Journal of Greenhouse Gas Control j ourna l ho mepage: www.elsevier.com/locate/ijggc Hydrogeochemistry of surface and spring waters in the surroundings of the CO 2 injection site at Hontomín–Huermeces (Burgos, Spain) Barbara Nisi a,∗ , Orlando Vaselli b,c , Franco Tassi b,c , Javier de Elio d,e , António Delgado Huertas f , Luis Felipe Mazadiego d , Marcelo F. Ortega d a CNR-IGG Institute of Geosciences and Earth Resources, Via Moruzzi 1, 56124 Pisa, Italy b Department of Earth Sciences, Via G. La Pira 4, 50121 Florence, Italy c CNR-IGG Institute of Geosciences and Earth Resources, Via G. La Pira 4, 50121 Florence, Italy d ETS Ingenieros de Minas Universidad Politécnica de Madrid, Calle de Ríos Rosas 21, 28003 Madrid, Spain e Ciudad de la Energia, II Av. de Compostilla 2, 24400 Ponferrada, Leon, Spain f Instituto Andaluz de Ciencias de la Tierra IACT(CSIC-UGR), Avda. de las Palmeras 4, 18100 Armilla, Granada, Spain a r t i c l e i n f o Article history: Received 10 March 2012 Received in revised form 8 December 2012 Accepted 8 January 2013 Keywords: Hontomín–Huermeces CO2 injection Geochemical monitoring Dissolved gases Trace elements Carbon isotopes a b s t r a c t In this paper the very first geochemical and isotopic data related to surface and spring waters and dissolved gases in the area of Hontomín–Huermeces (Burgos, Spain) are presented and discussed. Hontomín–Huermeces has been selected as a pilot site for the injection of pure (>99%) CO 2 . Injection and monitoring wells are planned to be drilled close to 6 oil wells completed in the 1980s for which detailed stratigraphical logs are available, indicating the presence of a confined saline aquifer at the depth of about 1500 m into which less than 100,000 tons of liquid CO 2 will be injected, possibly starting in 2013. The chemical and features of the spring waters suggest that they are related to a shallow hydro- geological system as the concentration of the Total Dissolved Solids approaches 800 mg/L with a Ca 2+ (Mg 2+ )-HCO 3 − composition, similar to that of the surface waters. This is also supported by the oxygen and hydrogen isotopic ratios that have values lying between those of the Global and the Mediterranean Meteoric Water Lines. Some spring waters close to the oil wells are characterized by relatively high con- centrations of NO 3 − (up to 123 mg/L), unequivocally suggesting an anthropogenic source that adds to the main water–rock interaction processes. The latter can be referred to Ca-Mg-carbonate and, at a minor extent, Al-silicate dissolution, being the outcropping sedimentary rocks characterized by Palaeozoic to Quaternary rocks. Anomalous concentrations of Cl − , SO 4 2− , As, B and Ba were measured in two springs discharging a few hundred meters from the oil wells and in the Rio Ubierna. These contents are signif- icantly higher than those of the whole set of the studied waters and are possibly indicative of mixing processes, although at very low extent, between deep and shallow aquifers. No evidence of deep-seated gases interacting with the Hontomín–Huermeces waters was recognized in the chemistry of the dis- solved gases. This is likely due to the fact that they are mainly characterized by an atmospheric source as highlighted by the high contents of N 2 , O 2 and Ar and by N 2 /Ar ratios that approach that of ASW (Air Sat- urated Water) and possibly masking any contribution related to a deep source. Nevertheless, significant concentrations (up to 63% by vol.) of isotopically negative CO 2 (<−17.7‰ V-PDB) were found in some water samples, likely related to a biogenic source. The geochemical and isotopic data of this work are of particular importance when a monitoring program will be established to verify whether CO 2 leakages, induced by the injection of this greenhouse gas, may be affecting the quality of the waters in the shallow hydrological circuits at Hontomín–Huermeces. In this respect, carbonate chemistry, the isotopic carbon of dissolved CO 2 and TDIC (Total Dissolved Inorganic Carbon) and selected trace elements can be considered as useful parameters to trace the migration of the injected CO 2 into near-surface environments. © 2013 Elsevier Ltd. All rights reserved. ∗ Corresponding author. Tel.: +39 050 3152320; fax: +39 050 3152323. E-mail addresses: [email protected], barbara.nisi@unifi.it (B. Nisi). 1750-5836/$ – see front matter © 2013 Elsevier Ltd. All rights reserved. http://dx.doi.org/10.1016/j.ijggc.2013.01.012
-
Upload
independent -
Category
Documents
-
view
4 -
download
0
Transcript of Hydrogeochemistry of surface and spring waters in the surroundings of the CO2 injection site at...
Hi
BLa
b
c
d
e
f
a
ARRA
KHCGDTC
1h
International Journal of Greenhouse Gas Control 14 (2013) 151–168
Contents lists available at SciVerse ScienceDirect
International Journal of Greenhouse Gas Control
j ourna l ho mepage: www.elsev ier .com/ locate / i jggc
ydrogeochemistry of surface and spring waters in the surroundings of the CO2
njection site at Hontomín–Huermeces (Burgos, Spain)
arbara Nisia,∗, Orlando Vaselli b,c, Franco Tassib,c, Javier de Eliod,e, António Delgado Huertas f,uis Felipe Mazadiegod, Marcelo F. Ortegad
CNR-IGG Institute of Geosciences and Earth Resources, Via Moruzzi 1, 56124 Pisa, ItalyDepartment of Earth Sciences, Via G. La Pira 4, 50121 Florence, ItalyCNR-IGG Institute of Geosciences and Earth Resources, Via G. La Pira 4, 50121 Florence, ItalyETS Ingenieros de Minas Universidad Politécnica de Madrid, Calle de Ríos Rosas 21, 28003 Madrid, SpainCiudad de la Energia, II Av. de Compostilla 2, 24400 Ponferrada, Leon, SpainInstituto Andaluz de Ciencias de la Tierra IACT(CSIC-UGR), Avda. de las Palmeras 4, 18100 Armilla, Granada, Spain
r t i c l e i n f o
rticle history:eceived 10 March 2012eceived in revised form 8 December 2012ccepted 8 January 2013
eywords:ontomín–HuermecesO2 injectioneochemical monitoringissolved gasesrace elementsarbon isotopes
a b s t r a c t
In this paper the very first geochemical and isotopic data related to surface and spring waters anddissolved gases in the area of Hontomín–Huermeces (Burgos, Spain) are presented and discussed.Hontomín–Huermeces has been selected as a pilot site for the injection of pure (>99%) CO2. Injectionand monitoring wells are planned to be drilled close to 6 oil wells completed in the 1980s for whichdetailed stratigraphical logs are available, indicating the presence of a confined saline aquifer at thedepth of about 1500 m into which less than 100,000 tons of liquid CO2 will be injected, possibly startingin 2013.
The chemical and features of the spring waters suggest that they are related to a shallow hydro-geological system as the concentration of the Total Dissolved Solids approaches 800 mg/L with aCa2+(Mg2+)-HCO3
− composition, similar to that of the surface waters. This is also supported by the oxygenand hydrogen isotopic ratios that have values lying between those of the Global and the MediterraneanMeteoric Water Lines. Some spring waters close to the oil wells are characterized by relatively high con-centrations of NO3
− (up to 123 mg/L), unequivocally suggesting an anthropogenic source that adds to themain water–rock interaction processes. The latter can be referred to Ca-Mg-carbonate and, at a minorextent, Al-silicate dissolution, being the outcropping sedimentary rocks characterized by Palaeozoic toQuaternary rocks. Anomalous concentrations of Cl−, SO4
2−, As, B and Ba were measured in two springsdischarging a few hundred meters from the oil wells and in the Rio Ubierna. These contents are signif-icantly higher than those of the whole set of the studied waters and are possibly indicative of mixingprocesses, although at very low extent, between deep and shallow aquifers. No evidence of deep-seatedgases interacting with the Hontomín–Huermeces waters was recognized in the chemistry of the dis-solved gases. This is likely due to the fact that they are mainly characterized by an atmospheric source ashighlighted by the high contents of N2, O2 and Ar and by N2/Ar ratios that approach that of ASW (Air Sat-urated Water) and possibly masking any contribution related to a deep source. Nevertheless, significantconcentrations (up to 63% by vol.) of isotopically negative CO2 (<−17.7‰ V-PDB) were found in somewater samples, likely related to a biogenic source.
The geochemical and isotopic data of this work are of particular importance when a monitoring programwill be established to verify whether CO2 leakages, induced by the injection of this greenhouse gas, maybe affecting the quality of the waters in the shallow hydrological circuits at Hontomín–Huermeces. In thisrespect, carbonate chemistry, the isotopic carbon of dissolved CO2 and TDIC (Total Dissolved InorganicCarbon) and selected trace elements can be considered as useful parameters to trace the migration of theinjected CO2 into near-surface environments.
∗ Corresponding author. Tel.: +39 050 3152320; fax: +39 050 3152323.E-mail addresses: [email protected], [email protected] (B. Nisi).
750-5836/$ – see front matter © 2013 Elsevier Ltd. All rights reserved.ttp://dx.doi.org/10.1016/j.ijggc.2013.01.012
© 2013 Elsevier Ltd. All rights reserved.
1 Greenh
1
arBbiSPssodAasR
ptgtdCea
aaowCavCfrtTutaOaut22omt
fgvatfecfgs
t
52 B. Nisi et al. / International Journal of
. Introduction
The Hontomín–Huermeces (hereafter HH) area (Fig. 1) is locatedt about 30 km north of Burgos (Spain) and lies in the north-centralegion of the Iberian Peninsula, where the NE sector of the Dueroasin is bordered by the Basque-Cantabrian Range to the north andy the Iberian Range to the southeast. The Basque-Cantabrian Basin
s considered one of the most prospective sedimentary basins inpain in terms of hydrocarbon exploration (Quesada et al., 1997;ermanyer et al., 2013), due to the presence of a large variety ofource rocks, reservoirs and seals and abundant structural andtratigraphic traps. In the surrounding areas of the target site,il and gas production were carried out onshore (Ayoluengo oil,iscovered 1964, and Castillo gas fields) and offshore (Gaviota andlbatros gas fields). Moreover, non-commercial oil discoveriesre reported in several zones, e.g. Huidobro, Tozo and Hontomíntructures (e.g. Quesada et al., 1993, 1995, 1997; Quesada andobles, 1995).
The HH area was selected as a site to establish a scientificlant for CO2 capture and storage (Lupion et al., 2011). A mul-idisciplinary (geophysics, structural geology, hydrogeology andeochemistry) approach, funded by the Spanish Government andhe European Community through a state-owned Foundation (Ciu-ad de la Energia), is presently carried out to demonstrate thatCS (Carbon Capture and Storage) is feasible and can be consid-red one of the most suitable techniques to reduce the emission ofnthropogenic greenhouse gases.
Six wells (namely Hontomín-1 to Hontomín-4, Hontomín SW1nd Montorio-1), drilled in HH for oil exploration (Fig. 1), aren important source for geological and structural informationf both the aquifer-bearing horizon where the injection of CO2ill be occurring and the cap rock. Once injected underground,O2 can be retained at depth (Gunter et al., 1993, 2000, 2004),s: (a) supercritical fluid (physical trapping), (b) fluid migratingery slowly in an aquifer (hydrodynamic trapping), (c) dissolvedO2(aq) into reservoir water (solubility trapping), and (d) newlyormed carbonates (mineral trapping) (e.g. Cantucci et al., 2009 andeferences therein). Among these sequestration processes, mineralrapping is likely the most stable (e.g. Gunter et al., 1993, 1997).he injection of CO2 in oil, gas and coal-bed methane fields can besed to recover methane and other hydrocarbons (Carbon Seques-ration with Enhanced Gas Recovery and Oil Recovery: CSEGRnd CSEOR, respectively, referred collectively as CO2-EHR, e.g.ldenburg, 2003; Solomon et al., 2008), representing an economicdvantage that can partly decrease the costs of the CO2 storagenderground. Risks of CO2 leakage and seepage from the reservoiro the surface need to be carefully evaluated (e.g. Pruess and García,002; Rutqvist and Tsang, 2002; Damen et al., 2006; Jones et al.,006; Voltattorni et al., 2006; Cantucci et al., 2009). Detectionf escaped CO2 is a challenge since the release of the stored CO2ay occur shortly after the injection or be delayed for few to
housands years.The presence of CO2 plume in an aquifer-bearing geological
ormation requires geophysical and geochemical monitoring pro-rams to understand the fate of injected CO2 in terms of safety anderification purposes. CO2 storage monitoring programs are alsoddressed to demonstrate whether CO2 storage projects are effec-ive in reducing atmospheric levels of CO2 by both predicting theate of the stored carbon dioxide and recognizing leakages to thenvironment (e.g. IPCC, 2005; Korre et al., 2011). In this respect geo-hemical investigation plays a key role in detecting CO2 leakagesrom the reservoir since if they occur migration into the shallow
roundwater systems, through the topsoil and then into the atmo-phere might be expected.CCS pilot sites, such as that at HH, are also aimed to test that thisechnique is a viable option for CO2 mitigation and allow to define
ouse Gas Control 14 (2013) 151–168
the most adequate physical and chemical monitoring methodolo-gies to prove the reliability of CO2 storage at depth. Nevertheless,the definition of the chemical and isotopic background of the waterdischarges is the correct approach before a carbon dioxide injectionand is useful for the subsequent intra- and post-injection geochem-ical monitoring programs.
A pre-injection geochemical survey of natural water dischargesis thus mandatory in order to establish whether their chemicaland isotopic features can be modified when CO2 leaks are inter-fering with the shallow waters. Consequently, this paper reports adetailed geochemical and isotopic study in the HH area with theaim to: (i) provide a geochemical characterization of the surfaceand spring water discharges,(ii) assess the main geochemical pro-cesses that affect the shallow hydrogeological system, (iii) proposea geochemical approach to ascertain the origin of CO2 in the dis-solved gases prior the injection and (iv) suggest which geochemicaland isotopic parameters can be regarded as suitable tracers of CO2leakages at the near-surface.
2. Geological and hydrogeological setting
2.1. Geological outlines
Palaeozoic metasediments are the oldest geological formationsrecorded in the HH area and are discordantly overlain by the Alpinecycle, which consists of Triassic (lime- and dolostones and evap-orites), Jurassic (lime- and dolostones and marls) and Cretaceous(turbidites, conglomerates, shale and lime- and dolostones) for-mations (Fig. 1). Sanchez-Moya and Sopena (2004) suggested thatthese sediments are associated with the rifting process occurringduring the closure of the Tethys and the opening of the AtlanticOcean. In the Cretaceous-Paleogene, the very first compressivemovements of the Alpine orogeny occurred, producing the onsetof the formation of the Duero Basin. The climax of the deformationtook place in the Oligocene-Lower Miocene, when the sedimen-tation of the synorogenic complex was underway (Santistebanet al., 1996). The Neogene sedimentation produced fluvial deposits,mainly located in the western margin and alluvial fan systemsclose to the active northern and eastern margins in the DueroBasin (Mediavilla et al., 1996). In the north-eastern region of theDuero Basin the sequence consists of Lower Miocene marls, clays,evaporitic and limestone deposits. In the Middle Miocene theemplacement of alluvial facies along the north and north-east mar-gins of the Duero Basin occurred. A limestone layer closes thesequence (Mediavilla et al., 1996) and is topped by lacustrine sed-iments of Middle-Upper Miocene age. The Pliocene-Pleistocenesedimentation includes alluvial fan gravels. Quaternary depositsconsist of gravels, sands, silts and clays.
From a structural point of view, this region corresponds tothe Cenozoic basins (NE Duero and Bureba Depression) and theAlpine orogenic system (Iberian and Basque-Cantabria Ranges).The Basque-Cantabrian Range is the eastern extension of the Pyre-nean system and refers to the compressive tectonics that hasproduced displacement of the Cantabrian Sea crust under theIberian plate (Hernaiz et al., 1994; Tavani and Anton Munoz, 2012;Tavani et al., 2011). The Iberian Range forms a NW-SE strikingintraplate fold belt (Benito-Calvo and Perez-Gonzalez, 2007 andreferences therein), which started with the Mesozoic extensionalstages, whereas the compressive phase occurred in the Cretaceous.The studied area includes the westernmost part of the PaleozoicSierra de la Demanda and a zone of Mesozoic materials struc-tured in NW-SE/WNW-ESE anticlines and synclines (Benito-Calvo
and Perez-Gonzalez, 2007 and references therein). The outcrop-ping Mesozoic rocks of the Sierra de Atapuerca are located in theNeogene basins between the two ranges. With the exception ofthe fold and fracture systems affecting the Paleogene deposits, the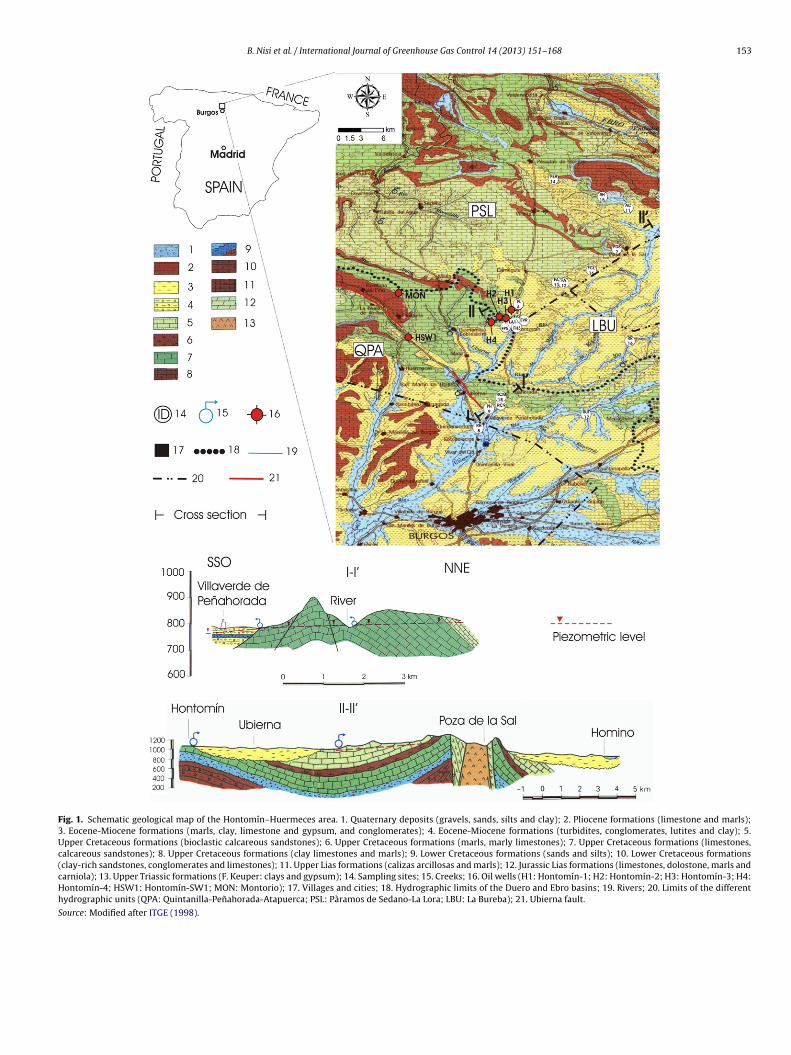
B. Nisi et al. / International Journal of Greenhouse Gas Control 14 (2013) 151–168 153
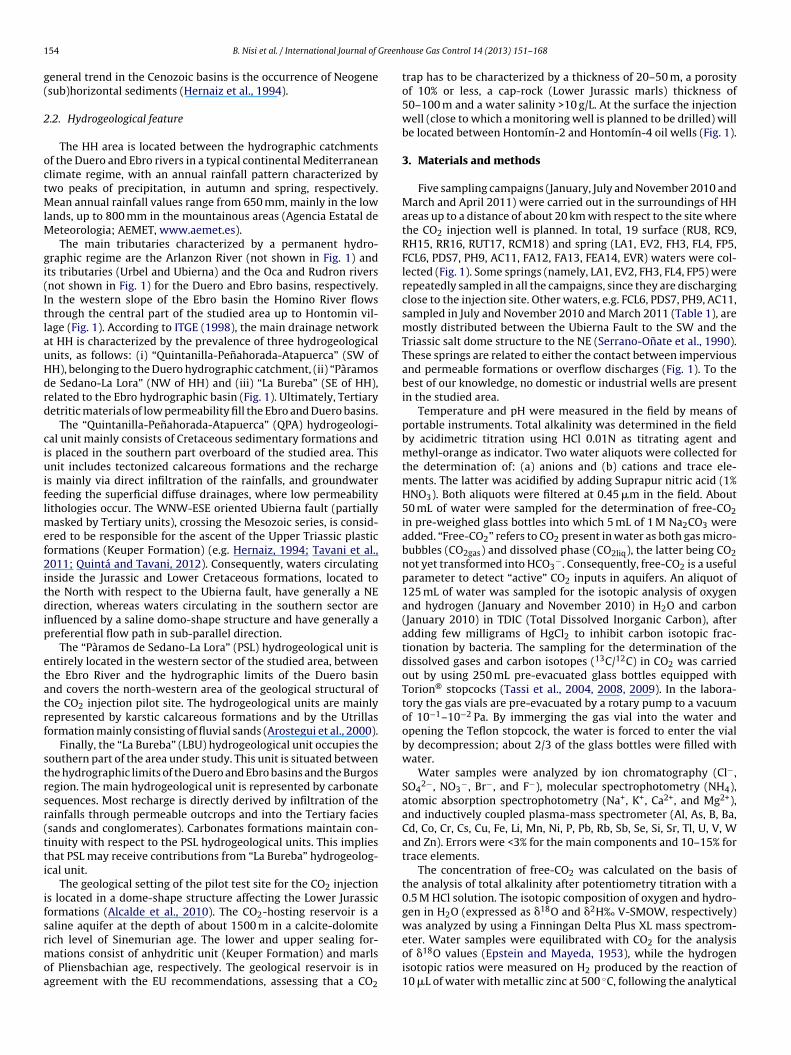
Fig. 1. Schematic geological map of the Hontomín–Huermeces area. 1. Quaternary deposits (gravels, sands, silts and clay); 2. Pliocene formations (limestone and marls);3. Eocene-Miocene formations (marls, clay, limestone and gypsum, and conglomerates); 4. Eocene-Miocene formations (turbidites, conglomerates, lutites and clay); 5.Upper Cretaceous formations (bioclastic calcareous sandstones); 6. Upper Cretaceous formations (marls, marly limestones); 7. Upper Cretaceous formations (limestones,calcareous sandstones); 8. Upper Cretaceous formations (clay limestones and marls); 9. Lower Cretaceous formations (sands and silts); 10. Lower Cretaceous formations(clay-rich sandstones, conglomerates and limestones); 11. Upper Lias formations (calizas arcillosas and marls); 12. Jurassic Lias formations (limestones, dolostone, marls andcarniola); 13. Upper Triassic formations (F. Keuper: clays and gypsum); 14. Sampling sites; 15. Creeks; 16. Oil wells (H1: Hontomín-1; H2: Hontomín-2; H3: Hontomín-3; H4:Hontomín-4; HSW1: Hontomín-SW1; MON: Montorio); 17. Villages and cities; 18. Hydrographic limits of the Duero and Ebro basins; 19. Rivers; 20. Limits of the differenthydrographic units (QPA: Quintanilla-Penahorada-Atapuerca; PSL: Pàramos de Sedano-La Lora; LBU: La Bureba); 21. Ubierna fault.
Source: Modified after ITGE (1998).
1 Greenh
g(
2
octMlM
gi(ItlauHdrd
ciuiflmef2itdip
etatrf
strsr(tti
ifsrmoa
54 B. Nisi et al. / International Journal of
eneral trend in the Cenozoic basins is the occurrence of Neogenesub)horizontal sediments (Hernaiz et al., 1994).
.2. Hydrogeological feature
The HH area is located between the hydrographic catchmentsf the Duero and Ebro rivers in a typical continental Mediterraneanlimate regime, with an annual rainfall pattern characterized bywo peaks of precipitation, in autumn and spring, respectively.
ean annual rainfall values range from 650 mm, mainly in the lowands, up to 800 mm in the mountainous areas (Agencia Estatal de
eteorologia; AEMET, www.aemet.es).The main tributaries characterized by a permanent hydro-
raphic regime are the Arlanzon River (not shown in Fig. 1) andts tributaries (Urbel and Ubierna) and the Oca and Rudron riversnot shown in Fig. 1) for the Duero and Ebro basins, respectively.n the western slope of the Ebro basin the Homino River flowshrough the central part of the studied area up to Hontomin vil-age (Fig. 1). According to ITGE (1998), the main drainage networkt HH is characterized by the prevalence of three hydrogeologicalnits, as follows: (i) “Quintanilla-Penahorada-Atapuerca” (SW ofH), belonging to the Duero hydrographic catchment, (ii) “Pàramose Sedano-La Lora” (NW of HH) and (iii) “La Bureba” (SE of HH),elated to the Ebro hydrographic basin (Fig. 1). Ultimately, Tertiaryetritic materials of low permeability fill the Ebro and Duero basins.
The “Quintanilla-Penahorada-Atapuerca” (QPA) hydrogeologi-al unit mainly consists of Cretaceous sedimentary formations ands placed in the southern part overboard of the studied area. Thisnit includes tectonized calcareous formations and the recharge
s mainly via direct infiltration of the rainfalls, and groundwatereeding the superficial diffuse drainages, where low permeabilityithologies occur. The WNW-ESE oriented Ubierna fault (partially
asked by Tertiary units), crossing the Mesozoic series, is consid-red to be responsible for the ascent of the Upper Triassic plasticormations (Keuper Formation) (e.g. Hernaiz, 1994; Tavani et al.,011; Quintá and Tavani, 2012). Consequently, waters circulating
nside the Jurassic and Lower Cretaceous formations, located tohe North with respect to the Ubierna fault, have generally a NEirection, whereas waters circulating in the southern sector are
nfluenced by a saline domo-shape structure and have generally areferential flow path in sub-parallel direction.
The “Pàramos de Sedano-La Lora” (PSL) hydrogeological unit isntirely located in the western sector of the studied area, betweenhe Ebro River and the hydrographic limits of the Duero basinnd covers the north-western area of the geological structural ofhe CO2 injection pilot site. The hydrogeological units are mainlyepresented by karstic calcareous formations and by the Utrillasormation mainly consisting of fluvial sands (Arostegui et al., 2000).
Finally, the “La Bureba” (LBU) hydrogeological unit occupies theouthern part of the area under study. This unit is situated betweenhe hydrographic limits of the Duero and Ebro basins and the Burgosegion. The main hydrogeological unit is represented by carbonateequences. Most recharge is directly derived by infiltration of theainfalls through permeable outcrops and into the Tertiary faciessands and conglomerates). Carbonates formations maintain con-inuity with respect to the PSL hydrogeological units. This implieshat PSL may receive contributions from “La Bureba” hydrogeolog-cal unit.
The geological setting of the pilot test site for the CO2 injections located in a dome-shape structure affecting the Lower Jurassicormations (Alcalde et al., 2010). The CO2-hosting reservoir is aaline aquifer at the depth of about 1500 m in a calcite-dolomite
ich level of Sinemurian age. The lower and upper sealing for-ations consist of anhydritic unit (Keuper Formation) and marlsf Pliensbachian age, respectively. The geological reservoir is ingreement with the EU recommendations, assessing that a CO2
ouse Gas Control 14 (2013) 151–168
trap has to be characterized by a thickness of 20–50 m, a porosityof 10% or less, a cap-rock (Lower Jurassic marls) thickness of50–100 m and a water salinity >10 g/L. At the surface the injectionwell (close to which a monitoring well is planned to be drilled) willbe located between Hontomín-2 and Hontomín-4 oil wells (Fig. 1).
3. Materials and methods
Five sampling campaigns (January, July and November 2010 andMarch and April 2011) were carried out in the surroundings of HHareas up to a distance of about 20 km with respect to the site wherethe CO2 injection well is planned. In total, 19 surface (RU8, RC9,RH15, RR16, RUT17, RCM18) and spring (LA1, EV2, FH3, FL4, FP5,FCL6, PDS7, PH9, AC11, FA12, FA13, FEA14, EVR) waters were col-lected (Fig. 1). Some springs (namely, LA1, EV2, FH3, FL4, FP5) wererepeatedly sampled in all the campaigns, since they are dischargingclose to the injection site. Other waters, e.g. FCL6, PDS7, PH9, AC11,sampled in July and November 2010 and March 2011 (Table 1), aremostly distributed between the Ubierna Fault to the SW and theTriassic salt dome structure to the NE (Serrano-Onate et al., 1990).These springs are related to either the contact between imperviousand permeable formations or overflow discharges (Fig. 1). To thebest of our knowledge, no domestic or industrial wells are presentin the studied area.
Temperature and pH were measured in the field by means ofportable instruments. Total alkalinity was determined in the fieldby acidimetric titration using HCl 0.01N as titrating agent andmethyl-orange as indicator. Two water aliquots were collected forthe determination of: (a) anions and (b) cations and trace ele-ments. The latter was acidified by adding Suprapur nitric acid (1%HNO3). Both aliquots were filtered at 0.45 �m in the field. About50 mL of water were sampled for the determination of free-CO2in pre-weighed glass bottles into which 5 mL of 1 M Na2CO3 wereadded. “Free-CO2” refers to CO2 present in water as both gas micro-bubbles (CO2gas) and dissolved phase (CO2liq), the latter being CO2not yet transformed into HCO3
−. Consequently, free-CO2 is a usefulparameter to detect “active” CO2 inputs in aquifers. An aliquot of125 mL of water was sampled for the isotopic analysis of oxygenand hydrogen (January and November 2010) in H2O and carbon(January 2010) in TDIC (Total Dissolved Inorganic Carbon), afteradding few milligrams of HgCl2 to inhibit carbon isotopic frac-tionation by bacteria. The sampling for the determination of thedissolved gases and carbon isotopes (13C/12C) in CO2 was carriedout by using 250 mL pre-evacuated glass bottles equipped withTorion® stopcocks (Tassi et al., 2004, 2008, 2009). In the labora-tory the gas vials are pre-evacuated by a rotary pump to a vacuumof 10−1–10−2 Pa. By immerging the gas vial into the water andopening the Teflon stopcock, the water is forced to enter the vialby decompression; about 2/3 of the glass bottles were filled withwater.
Water samples were analyzed by ion chromatography (Cl−,SO4
2−, NO3−, Br−, and F−), molecular spectrophotometry (NH4),
atomic absorption spectrophotometry (Na+, K+, Ca2+, and Mg2+),and inductively coupled plasma-mass spectrometer (Al, As, B, Ba,Cd, Co, Cr, Cs, Cu, Fe, Li, Mn, Ni, P, Pb, Rb, Sb, Se, Si, Sr, Tl, U, V, Wand Zn). Errors were <3% for the main components and 10–15% fortrace elements.
The concentration of free-CO2 was calculated on the basis ofthe analysis of total alkalinity after potentiometry titration with a0.5 M HCl solution. The isotopic composition of oxygen and hydro-gen in H2O (expressed as �18O and �2H‰ V-SMOW, respectively)was analyzed by using a Finningan Delta Plus XL mass spectrom-
eter. Water samples were equilibrated with CO2 for the analysisof �18O values (Epstein and Mayeda, 1953), while the hydrogenisotopic ratios were measured on H2 produced by the reaction of10 �L of water with metallic zinc at 500 ◦C, following the analytical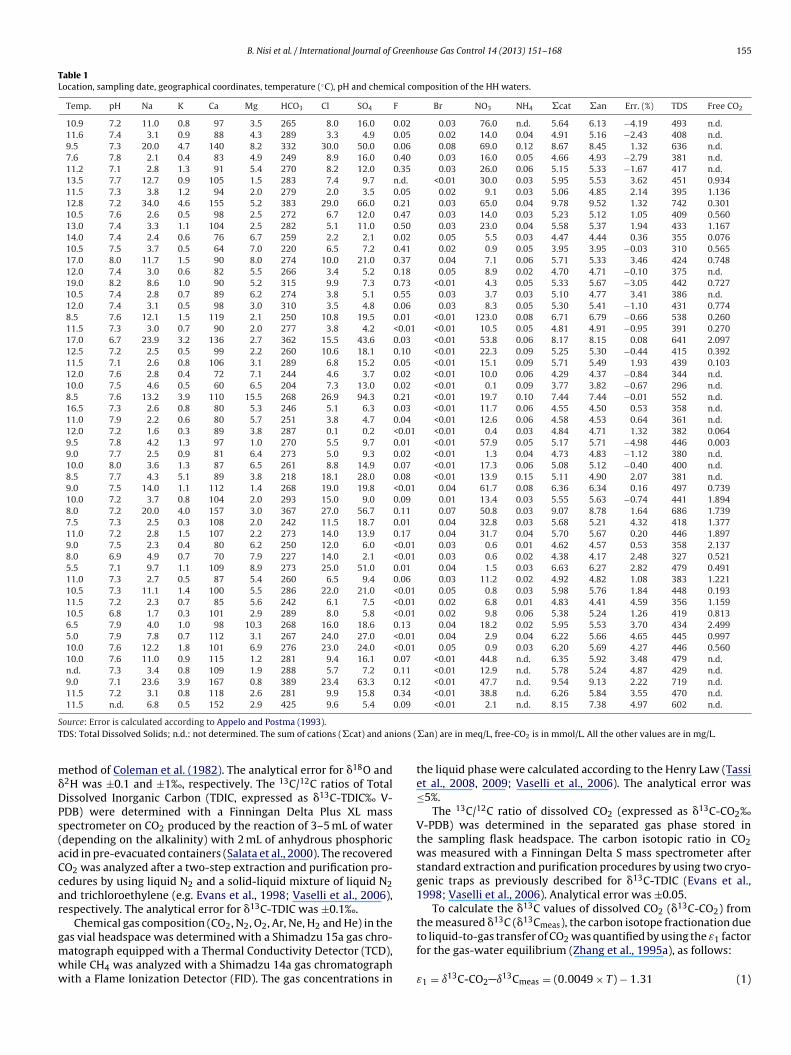
B. Nisi et al. / International Journal of Greenhouse Gas Control 14 (2013) 151–168 155
Table 1Location, sampling date, geographical coordinates, temperature (◦C), pH and chemical composition of the HH waters.
Temp. pH Na K Ca Mg HCO3 Cl SO4 F Br NO3 NH4 �cat �an Err. (%) TDS Free CO2
10.9 7.2 11.0 0.8 97 3.5 265 8.0 16.0 0.02 0.03 76.0 n.d. 5.64 6.13 −4.19 493 n.d.11.6 7.4 3.1 0.9 88 4.3 289 3.3 4.9 0.05 0.02 14.0 0.04 4.91 5.16 −2.43 408 n.d.9.5 7.3 20.0 4.7 140 8.2 332 30.0 50.0 0.06 0.08 69.0 0.12 8.67 8.45 1.32 636 n.d.7.6 7.8 2.1 0.4 83 4.9 249 8.9 16.0 0.40 0.03 16.0 0.05 4.66 4.93 −2.79 381 n.d.11.2 7.1 2.8 1.3 91 5.4 270 8.2 12.0 0.35 0.03 26.0 0.06 5.15 5.33 −1.67 417 n.d.13.5 7.7 12.7 0.9 105 1.5 283 7.4 9.7 n.d. <0.01 30.0 0.03 5.95 5.53 3.62 451 0.93411.5 7.3 3.8 1.2 94 2.0 279 2.0 3.5 0.05 0.02 9.1 0.03 5.06 4.85 2.14 395 1.13612.8 7.2 34.0 4.6 155 5.2 383 29.0 66.0 0.21 0.03 65.0 0.04 9.78 9.52 1.32 742 0.30110.5 7.6 2.6 0.5 98 2.5 272 6.7 12.0 0.47 0.03 14.0 0.03 5.23 5.12 1.05 409 0.56013.0 7.4 3.3 1.1 104 2.5 282 5.1 11.0 0.50 0.03 23.0 0.04 5.58 5.37 1.94 433 1.16714.0 7.4 2.4 0.6 76 6.7 259 2.2 2.1 0.02 0.05 5.5 0.03 4.47 4.44 0.36 355 0.07610.5 7.5 3.7 0.5 64 7.0 220 6.5 7.2 0.41 0.02 0.9 0.05 3.95 3.95 −0.03 310 0.56517.0 8.0 11.7 1.5 90 8.0 274 10.0 21.0 0.37 0.04 7.1 0.06 5.71 5.33 3.46 424 0.74812.0 7.4 3.0 0.6 82 5.5 266 3.4 5.2 0.18 0.05 8.9 0.02 4.70 4.71 −0.10 375 n.d.19.0 8.2 8.6 1.0 90 5.2 315 9.9 7.3 0.73 <0.01 4.3 0.05 5.33 5.67 −3.05 442 0.72710.5 7.4 2.8 0.7 89 6.2 274 3.8 5.1 0.55 0.03 3.7 0.03 5.10 4.77 3.41 386 n.d.12.0 7.4 3.1 0.5 98 3.0 310 3.5 4.8 0.06 0.03 8.3 0.05 5.30 5.41 −1.10 431 0.7748.5 7.6 12.1 1.5 119 2.1 250 10.8 19.5 0.01 <0.01 123.0 0.08 6.71 6.79 −0.66 538 0.26011.5 7.3 3.0 0.7 90 2.0 277 3.8 4.2 <0.01 <0.01 10.5 0.05 4.81 4.91 −0.95 391 0.27017.0 6.7 23.9 3.2 136 2.7 362 15.5 43.6 0.03 <0.01 53.8 0.06 8.17 8.15 0.08 641 2.09712.5 7.2 2.5 0.5 99 2.2 260 10.6 18.1 0.10 <0.01 22.3 0.09 5.25 5.30 −0.44 415 0.39211.5 7.1 2.6 0.8 106 3.1 289 6.8 15.2 0.05 <0.01 15.1 0.09 5.71 5.49 1.93 439 0.10312.0 7.6 2.8 0.4 72 7.1 244 4.6 3.7 0.02 <0.01 10.0 0.06 4.29 4.37 −0.84 344 n.d.10.0 7.5 4.6 0.5 60 6.5 204 7.3 13.0 0.02 <0.01 0.1 0.09 3.77 3.82 −0.67 296 n.d.8.5 7.6 13.2 3.9 110 15.5 268 26.9 94.3 0.21 <0.01 19.7 0.10 7.44 7.44 −0.01 552 n.d.16.5 7.3 2.6 0.8 80 5.3 246 5.1 6.3 0.03 <0.01 11.7 0.06 4.55 4.50 0.53 358 n.d.11.0 7.9 2.2 0.6 80 5.7 251 3.8 4.7 0.04 <0.01 12.6 0.06 4.58 4.53 0.64 361 n.d.12.0 7.2 1.6 0.3 89 3.8 287 0.1 0.2 <0.01 <0.01 0.4 0.03 4.84 4.71 1.32 382 0.0649.5 7.8 4.2 1.3 97 1.0 270 5.5 9.7 0.01 <0.01 57.9 0.05 5.17 5.71 −4.98 446 0.0039.0 7.7 2.5 0.9 81 6.4 273 5.0 9.3 0.02 <0.01 1.3 0.04 4.73 4.83 −1.12 380 n.d.10.0 8.0 3.6 1.3 87 6.5 261 8.8 14.9 0.07 <0.01 17.3 0.06 5.08 5.12 −0.40 400 n.d.8.5 7.7 4.3 5.1 89 3.8 218 18.1 28.0 0.08 <0.01 13.9 0.15 5.11 4.90 2.07 381 n.d.9.0 7.5 14.0 1.1 112 1.4 268 19.0 19.8 <0.01 0.04 61.7 0.08 6.36 6.34 0.16 497 0.73910.0 7.2 3.7 0.8 104 2.0 293 15.0 9.0 0.09 0.01 13.4 0.03 5.55 5.63 −0.74 441 1.8948.0 7.2 20.0 4.0 157 3.0 367 27.0 56.7 0.11 0.07 50.8 0.03 9.07 8.78 1.64 686 1.7397.5 7.3 2.5 0.3 108 2.0 242 11.5 18.7 0.01 0.04 32.8 0.03 5.68 5.21 4.32 418 1.37711.0 7.2 2.8 1.5 107 2.2 273 14.0 13.9 0.17 0.04 31.7 0.04 5.70 5.67 0.20 446 1.8979.0 7.5 2.3 0.4 80 6.2 250 12.0 6.0 <0.01 0.03 0.6 0.01 4.62 4.57 0.53 358 2.1378.0 6.9 4.9 0.7 70 7.9 227 14.0 2.1 <0.01 0.03 0.6 0.02 4.38 4.17 2.48 327 0.5215.5 7.1 9.7 1.1 109 8.9 273 25.0 51.0 0.01 0.04 1.5 0.03 6.63 6.27 2.82 479 0.49111.0 7.3 2.7 0.5 87 5.4 260 6.5 9.4 0.06 0.03 11.2 0.02 4.92 4.82 1.08 383 1.22110.5 7.3 11.1 1.4 100 5.5 286 22.0 21.0 <0.01 0.05 0.8 0.03 5.98 5.76 1.84 448 0.19311.5 7.2 2.3 0.7 85 5.6 242 6.1 7.5 <0.01 0.02 6.8 0.01 4.83 4.41 4.59 356 1.15910.5 6.8 1.7 0.3 101 2.9 289 8.0 5.8 <0.01 0.02 9.8 0.06 5.38 5.24 1.26 419 0.8136.5 7.9 4.0 1.0 98 10.3 268 16.0 18.6 0.13 0.04 18.2 0.02 5.95 5.53 3.70 434 2.4995.0 7.9 7.8 0.7 112 3.1 267 24.0 27.0 <0.01 0.04 2.9 0.04 6.22 5.66 4.65 445 0.99710.0 7.6 12.2 1.8 101 6.9 276 23.0 24.0 <0.01 0.05 0.9 0.03 6.20 5.69 4.27 446 0.56010.0 7.6 11.0 0.9 115 1.2 281 9.4 16.1 0.07 <0.01 44.8 n.d. 6.35 5.92 3.48 479 n.d.n.d. 7.3 3.4 0.8 109 1.9 288 5.7 7.2 0.11 <0.01 12.9 n.d. 5.78 5.24 4.87 429 n.d.9.0 7.1 23.6 3.9 167 0.8 389 23.4 63.3 0.12 <0.01 47.7 n.d. 9.54 9.13 2.22 719 n.d.11.5 7.2 3.1 0.8 118 2.6 281 9.9 15.8 0.34 <0.01 38.8 n.d. 6.26 5.84 3.55 470 n.d.11.5 n.d. 6.8 0.5 152 2.9 425 9.6 5.4 0.09 <0.01 2.1 n.d. 8.15 7.38 4.97 602 n.d.
ST ions (
m�DPs(aCcar
gmww
ource: Error is calculated according to Appelo and Postma (1993).DS: Total Dissolved Solids; n.d.: not determined. The sum of cations (�cat) and an
ethod of Coleman et al. (1982). The analytical error for �18O and2H was ±0.1 and ±1‰, respectively. The 13C/12C ratios of Totalissolved Inorganic Carbon (TDIC, expressed as �13C-TDIC‰ V-DB) were determined with a Finningan Delta Plus XL masspectrometer on CO2 produced by the reaction of 3–5 mL of waterdepending on the alkalinity) with 2 mL of anhydrous phosphoriccid in pre-evacuated containers (Salata et al., 2000). The recoveredO2 was analyzed after a two-step extraction and purification pro-edures by using liquid N2 and a solid-liquid mixture of liquid N2nd trichloroethylene (e.g. Evans et al., 1998; Vaselli et al., 2006),espectively. The analytical error for �13C-TDIC was ±0.1‰.
Chemical gas composition (CO2, N2, O2, Ar, Ne, H2 and He) in the
as vial headspace was determined with a Shimadzu 15a gas chro-atograph equipped with a Thermal Conductivity Detector (TCD),hile CH4 was analyzed with a Shimadzu 14a gas chromatographith a Flame Ionization Detector (FID). The gas concentrations in�an) are in meq/L, free-CO2 is in mmol/L. All the other values are in mg/L.
the liquid phase were calculated according to the Henry Law (Tassiet al., 2008, 2009; Vaselli et al., 2006). The analytical error was≤5%.
The 13C/12C ratio of dissolved CO2 (expressed as �13C-CO2‰V-PDB) was determined in the separated gas phase stored inthe sampling flask headspace. The carbon isotopic ratio in CO2was measured with a Finningan Delta S mass spectrometer afterstandard extraction and purification procedures by using two cryo-genic traps as previously described for �13C-TDIC (Evans et al.,1998; Vaselli et al., 2006). Analytical error was ±0.05.
To calculate the �13C values of dissolved CO2 (�13C-CO2) fromthe measured �13C (�13Cmeas), the carbon isotope fractionation due
to liquid-to-gas transfer of CO2 was quantified by using the ε1 factorfor the gas-water equilibrium (Zhang et al., 1995a), as follows:ε1 = ı13C-CO2 ı13Cmeas = (0.0049 × T) − 1.31 (1)

156 B. Nisi et al. / International Journal of Greenhouse Gas Control 14 (2013) 151–168
ers, wS
vICf
ε
f
ı
vpwa
Fig. 2. Square and triangular diagrams for the HH watource: Langelier and Ludwig (1942).
The �13C-TDIC values were computed by combining the �13Calues of the main inorganic carbon species (HCO3
− and CO2).sotopic fractionation caused by the reaction between dissolvedO2 and HCO3
− is quantified by the enrichment factor (ε2), asollows (Mook et al., 1974):
2 = ı13C-HCO−3 ı13C-CO2 = 9483/T(K) − 23.9 (2)
The theoretical �13CTDIC values (�13CTDICcalc) were computed, asollows:
13CTDICcalc = ı13C-CO2 + ε2 × (HCO−3 )/[(HCO−
3 ) + (CO2)] (3)
With the exception of the January 2010 sampling, the �13CTDIC
alues were calculated according to equations (2) and (3). Finally,CO2, element speciation, saturation index (SI) and ionic activityere calculated using the aqueous speciation model EQ3/6 (Wolerynd Jarek, 2003).
hich are grouped according to the period of sampling.
4. Results
4.1. Water chemistry
The chemical composition of the sampled waters (N = 52) islisted in Table 1. Temperatures were between 5 and 19 ◦C as afunction of the sampling period. The pH values and the Total Dis-solved Solids (TDS) ranged between 6.7 to 8.2 and 296 to 742 mg/L,respectively. The square (Langelier and Ludwig, 1942) and theHCO3
−-Cl−-SO42− and Ca2+-Mg2+-(Na+ + K+) ternary classification
diagrams are reported in Fig. 2, where the sampled waters aredistinguished according to the period of sampling. The HH watersamples are Ca2+(Mg2+)-HCO3
− in composition, typical of sur-
face and shallow underground waters (e.g. Drever, 1997). In theanion ternary diagram they show a nearly constant SO42−/Cl−
ratio (Fig. 2b), whereas in that of the cations (Fig. 2b) they clusteraround the Ca2+ vertex with a relatively variable Na/Mg ratio. No

B. Nisi et al. / International Journal of Greenhouse Gas Control 14 (2013) 151–168 157
centra
ss
r<fHd
rc1wcIru(b(mcmaaTc<1a
4
twtttav
cess. The �13C-CO2 (expressed with the � notation ‰ and referred toV-PDB) values in the dissolved gases were rather negative, varyingbetween −23.4 and −17.7‰ (V-PDB). Similar negative values were
Fig. 3. Box-plot diagrams of trace element con
ignificant chemical differences are recorded between surface andpring waters.
Fluoride and Br− contents were generally <0.7 and 0.08 mg/L,espectively. Ammonium was characterized by concentrations0.15 mg/L, whereas those of NO3
− had a large variability, rangingrom 0.1 to 123 mg/L. The spring discharges, located close to theH oil wells, showed the highest NO3
− values among the wholeataset.
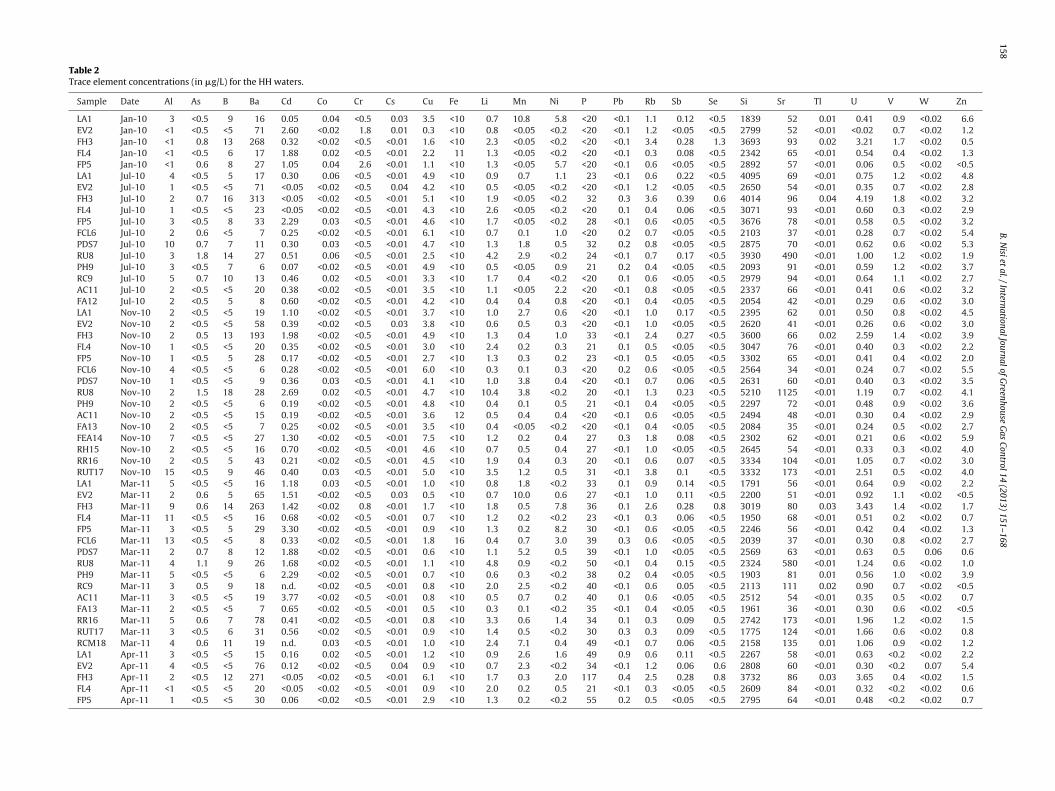
Trace element concentrations are listed in Table 2, while theespective box-plot diagrams are reported in Fig. 3. The highestoncentrations were observed for Si (up to 5210 �g/L), Sr (up to125 �g/L), Ba (up to 312 �g/L) and P (up to 117 �g/L) (Fig. 3a),hereas all the other elements were <18 �g/L (Fig. 3b) and often
haracterized by contents below the instrumental detection limit.t is worth to mention that the highest concentrations of As wereecorded in the Rio Ubierna (RU8) and the Fuente Hontomín (FH3):p to 1.5 and 0.8 �g/L, respectively. Among the heavy metalsCd, Co, Cr, Cu, Fe, Mn, Ni, Pb, Sb, Se, Tl and Zn), Fe was usuallyelow the detection limit (<10 �g/L), similarly to Co (<0.02 �g/L), Cr<0.05 �g/L), Pb (<0.1 �g/L), Se (<0.5 �g/L) and Tl (<0.01 �g/L). Cad-
ium, Cu, Mn and Zn had contents up to few �g/L, while Ni showedoncentrations that were mostly <1 �g/L. Large ion lithofile ele-ents, such as Ba, Cs, Rb and Sr, ranged between 6 (FCL 6 and PH9)
nd 313 (FH3), <0.01 and 0.04 (EV2), 0.3 (FL4, RR16 and RUT17)nd 3.8 (RUT17) and 34 (FCL) and 1125 (RU8) �g/L, respectively.he highest Al content was 15 (RUT17) �g/L, although most con-entrations clustered around 1 and 5 �g/L, B was ranging between5 and 16 (FH3) �g/L, Li varied between 0.3 (FCL6 and FA13) and0.4 (RU8) �g/L, the highest content of U (4.19 �g/L) was recordedt the spring water FH3. Vanadium was always <1.8 (FH3) �g/L.
.2. Dissolved gas chemistry
Dissolved gas composition was determined in the springs withhe exception of the April 2011 sampling when no measurementsere carried out. The chemical composition (in % by volume) and
he sum of the dissolved gas concentrations (�DG in mmol/L) for
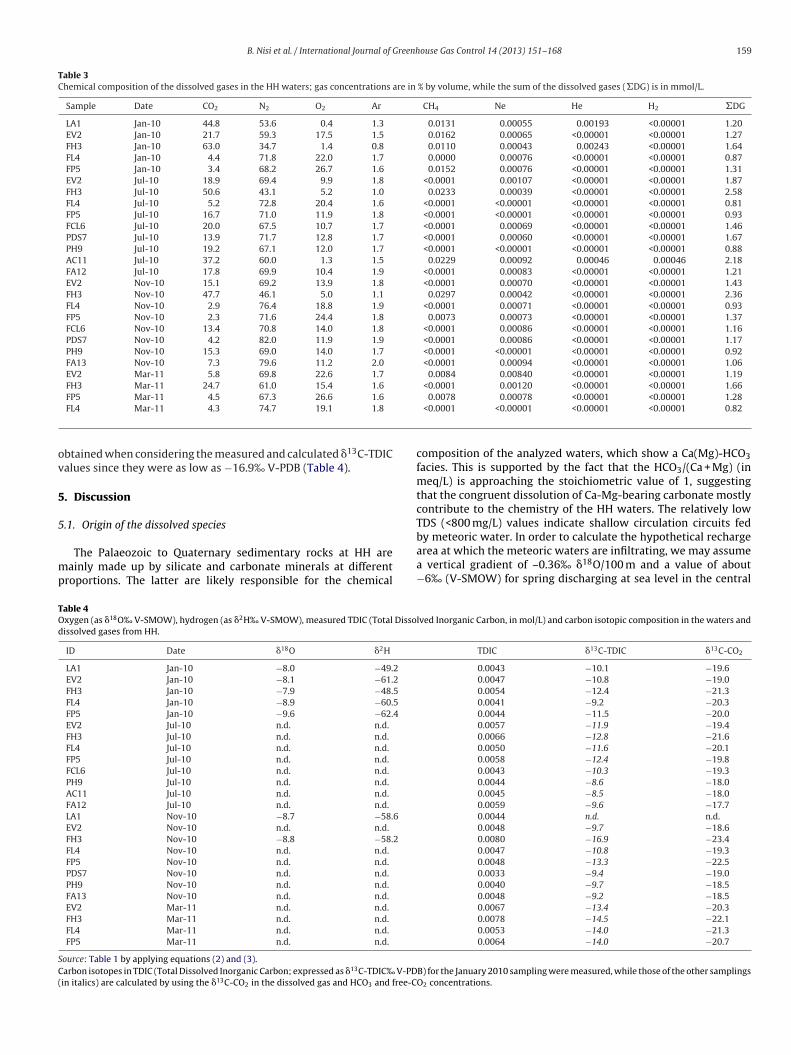
he HH waters are listed in Table 3. The total dissolved gas concen-ration did not exceed 2.6 mmol/L. Most gases were dominated byn atmospheric component since N2, O2 and Ar were often the pre-ailing gases. Nevertheless, carbon dioxide was always >2.3% by vol.tions from the HH waters. Values are in �g/L.
and a few samples were characterized by CO2 concentrations up to63% by vol. Methane, Ne and He were up to 0.03, 0.008 and 0.002%by vol., respectively, while H2 was mostly below the instrumentaldetection limit (<0.00001% by vol.).
4.3. Stable isotopes
The oxygen and hydrogen isotopic ratios in the water molecule(expressed with the � notation ‰ and referred to V-SMOW) weremeasured in seven water spring discharges. The �18O and �2Hvalues ranged from −9.6 to −7.9‰ (V-SMOW) and from –62.4 to–48.4‰ (V-SMOW), respectively (Table 4), The �18O and �2H valuesindicate that the HH waters are of meteoric origin, plotting betweenthe Global (Craig, 1961) and the Mediterranean (Gat and Carmi,1971) meteoric water lines (Fig. 4). The slightly more positive �18Ovalue for the EV2 sample was likely due to some evaporative pro-
Fig. 4. Hydrogen (as �2H‰ V-SMOW) and Oxygen (as �18O‰ V-SMOW) binary dia-gram for the HH waters collected in January 2010 and altitude of the meteoric watersrecharging the HH shallow hydrological circuits.
158
B. N
isi et
al. /
International Journal
of G
reenhouse G
as Control
14 (2013)
151–168
Table 2Trace element concentrations (in �g/L) for the HH waters.
Sample Date Al As B Ba Cd Co Cr Cs Cu Fe Li Mn Ni P Pb Rb Sb Se Si Sr Tl U V W Zn
LA1 Jan-10 3 <0.5 9 16 0.05 0.04 <0.5 0.03 3.5 <10 0.7 10.8 5.8 <20 <0.1 1.1 0.12 <0.5 1839 52 0.01 0.41 0.9 <0.02 6.6EV2 Jan-10 <1 <0.5 <5 71 2.60 <0.02 1.8 0.01 0.3 <10 0.8 <0.05 <0.2 <20 <0.1 1.2 <0.05 <0.5 2799 52 <0.01 <0.02 0.7 <0.02 1.2FH3 Jan-10 <1 0.8 13 268 0.32 <0.02 <0.5 <0.01 1.6 <10 2.3 <0.05 <0.2 <20 <0.1 3.4 0.28 1.3 3693 93 0.02 3.21 1.7 <0.02 0.5FL4 Jan-10 <1 <0.5 6 17 1.88 0.02 <0.5 <0.01 2.2 11 1.3 <0.05 <0.2 <20 <0.1 0.3 0.08 <0.5 2342 65 <0.01 0.54 0.4 <0.02 1.3FP5 Jan-10 <1 0.6 8 27 1.05 0.04 2.6 <0.01 1.1 <10 1.3 <0.05 5.7 <20 <0.1 0.6 <0.05 <0.5 2892 57 <0.01 0.06 0.5 <0.02 <0.5LA1 Jul-10 4 <0.5 5 17 0.30 0.06 <0.5 <0.01 4.9 <10 0.9 0.7 1.1 23 <0.1 0.6 0.22 <0.5 4095 69 <0.01 0.75 1.2 <0.02 4.8EV2 Jul-10 1 <0.5 <5 71 <0.05 <0.02 <0.5 0.04 4.2 <10 0.5 <0.05 <0.2 <20 <0.1 1.2 <0.05 <0.5 2650 54 <0.01 0.35 0.7 <0.02 2.8FH3 Jul-10 2 0.7 16 313 <0.05 <0.02 <0.5 <0.01 5.1 <10 1.9 <0.05 <0.2 32 0.3 3.6 0.39 0.6 4014 96 0.04 4.19 1.8 <0.02 3.2FL4 Jul-10 1 <0.5 <5 23 <0.05 <0.02 <0.5 <0.01 4.3 <10 2.6 <0.05 <0.2 <20 0.1 0.4 0.06 <0.5 3071 93 <0.01 0.60 0.3 <0.02 2.9FP5 Jul-10 3 <0.5 8 33 2.29 0.03 <0.5 <0.01 4.6 <10 1.7 <0.05 <0.2 28 <0.1 0.6 <0.05 <0.5 3676 78 <0.01 0.58 0.5 <0.02 3.2FCL6 Jul-10 2 0.6 <5 7 0.25 <0.02 <0.5 <0.01 6.1 <10 0.7 0.1 1.0 <20 0.2 0.7 <0.05 <0.5 2103 37 <0.01 0.28 0.7 <0.02 5.4PDS7 Jul-10 10 0.7 7 11 0.30 0.03 <0.5 <0.01 4.7 <10 1.3 1.8 0.5 32 0.2 0.8 <0.05 <0.5 2875 70 <0.01 0.62 0.6 <0.02 5.3RU8 Jul-10 3 1.8 14 27 0.51 0.06 <0.5 <0.01 2.5 <10 4.2 2.9 <0.2 24 <0.1 0.7 0.17 <0.5 3930 490 <0.01 1.00 1.2 <0.02 1.9PH9 Jul-10 3 <0.5 7 6 0.07 <0.02 <0.5 <0.01 4.9 <10 0.5 <0.05 0.9 21 0.2 0.4 <0.05 <0.5 2093 91 <0.01 0.59 1.2 <0.02 3.7RC9 Jul-10 5 0.7 10 13 0.46 0.02 <0.5 <0.01 3.3 <10 1.7 0.4 <0.2 <20 0.1 0.6 <0.05 <0.5 2979 94 <0.01 0.64 1.1 <0.02 2.7AC11 Jul-10 2 <0.5 <5 20 0.38 <0.02 <0.5 <0.01 3.5 <10 1.1 <0.05 2.2 <20 <0.1 0.8 <0.05 <0.5 2337 66 <0.01 0.41 0.6 <0.02 3.2FA12 Jul-10 2 <0.5 5 8 0.60 <0.02 <0.5 <0.01 4.2 <10 0.4 0.4 0.8 <20 <0.1 0.4 <0.05 <0.5 2054 42 <0.01 0.29 0.6 <0.02 3.0LA1 Nov-10 2 <0.5 <5 19 1.10 <0.02 <0.5 <0.01 3.7 <10 1.0 2.7 0.6 <20 <0.1 1.0 0.17 <0.5 2395 62 0.01 0.50 0.8 <0.02 4.5EV2 Nov-10 2 <0.5 <5 58 0.39 <0.02 <0.5 0.03 3.8 <10 0.6 0.5 0.3 <20 <0.1 1.0 <0.05 <0.5 2620 41 <0.01 0.26 0.6 <0.02 3.0FH3 Nov-10 2 0.5 13 193 1.98 <0.02 <0.5 <0.01 4.9 <10 1.3 0.4 1.0 33 <0.1 2.4 0.27 <0.5 3600 66 0.02 2.59 1.4 <0.02 3.9FL4 Nov-10 1 <0.5 <5 20 0.35 <0.02 <0.5 <0.01 3.0 <10 2.4 0.2 0.3 21 0.1 0.5 <0.05 <0.5 3047 76 <0.01 0.40 0.3 <0.02 2.2FP5 Nov-10 1 <0.5 5 28 0.17 <0.02 <0.5 <0.01 2.7 <10 1.3 0.3 0.2 23 <0.1 0.5 <0.05 <0.5 3302 65 <0.01 0.41 0.4 <0.02 2.0FCL6 Nov-10 4 <0.5 <5 6 0.28 <0.02 <0.5 <0.01 6.0 <10 0.3 0.1 0.3 <20 0.2 0.6 <0.05 <0.5 2564 34 <0.01 0.24 0.7 <0.02 5.5PDS7 Nov-10 1 <0.5 <5 9 0.36 0.03 <0.5 <0.01 4.1 <10 1.0 3.8 0.4 <20 <0.1 0.7 0.06 <0.5 2631 60 <0.01 0.40 0.3 <0.02 3.5RU8 Nov-10 2 1.5 18 28 2.69 0.02 <0.5 <0.01 4.7 <10 10.4 3.8 <0.2 20 <0.1 1.3 0.23 <0.5 5210 1125 <0.01 1.19 0.7 <0.02 4.1PH9 Nov-10 2 <0.5 <5 6 0.19 <0.02 <0.5 <0.01 4.8 <10 0.4 0.1 0.5 21 <0.1 0.4 <0.05 <0.5 2297 72 <0.01 0.48 0.9 <0.02 3.6AC11 Nov-10 2 <0.5 <5 15 0.19 <0.02 <0.5 <0.01 3.6 12 0.5 0.4 0.4 <20 <0.1 0.6 <0.05 <0.5 2494 48 <0.01 0.30 0.4 <0.02 2.9FA13 Nov-10 2 <0.5 <5 7 0.25 <0.02 <0.5 <0.01 3.5 <10 0.4 <0.05 <0.2 <20 <0.1 0.4 <0.05 <0.5 2084 35 <0.01 0.24 0.5 <0.02 2.7FEA14 Nov-10 7 <0.5 <5 27 1.30 <0.02 <0.5 <0.01 7.5 <10 1.2 0.2 0.4 27 0.3 1.8 0.08 <0.5 2302 62 <0.01 0.21 0.6 <0.02 5.9RH15 Nov-10 2 <0.5 <5 16 0.70 <0.02 <0.5 <0.01 4.6 <10 0.7 0.5 0.4 27 <0.1 1.0 <0.05 <0.5 2645 54 <0.01 0.33 0.3 <0.02 4.0RR16 Nov-10 2 <0.5 5 43 0.21 <0.02 <0.5 <0.01 4.5 <10 1.9 0.4 0.3 20 <0.1 0.6 0.07 <0.5 3334 104 <0.01 1.05 0.7 <0.02 3.0RUT17 Nov-10 15 <0.5 9 46 0.40 0.03 <0.5 <0.01 5.0 <10 3.5 1.2 0.5 31 <0.1 3.8 0.1 <0.5 3332 173 <0.01 2.51 0.5 <0.02 4.0LA1 Mar-11 5 <0.5 <5 16 1.18 0.03 <0.5 <0.01 1.0 <10 0.8 1.8 <0.2 33 0.1 0.9 0.14 <0.5 1791 56 <0.01 0.64 0.9 <0.02 2.2EV2 Mar-11 2 0.6 5 65 1.51 <0.02 <0.5 0.03 0.5 <10 0.7 10.0 0.6 27 <0.1 1.0 0.11 <0.5 2200 51 <0.01 0.92 1.1 <0.02 <0.5FH3 Mar-11 9 0.6 14 263 1.42 <0.02 0.8 <0.01 1.7 <10 1.8 0.5 7.8 36 0.1 2.6 0.28 0.8 3019 80 0.03 3.43 1.4 <0.02 1.7FL4 Mar-11 11 <0.5 <5 16 0.68 <0.02 <0.5 <0.01 0.7 <10 1.2 0.2 <0.2 23 <0.1 0.3 0.06 <0.5 1950 68 <0.01 0.51 0.2 <0.02 0.7FP5 Mar-11 3 <0.5 5 29 3.30 <0.02 <0.5 <0.01 0.9 <10 1.3 0.2 8.2 30 <0.1 0.6 <0.05 <0.5 2246 56 <0.01 0.42 0.4 <0.02 1.3FCL6 Mar-11 13 <0.5 <5 8 0.33 <0.02 <0.5 <0.01 1.8 16 0.4 0.7 3.0 39 0.3 0.6 <0.05 <0.5 2039 37 <0.01 0.30 0.8 <0.02 2.7PDS7 Mar-11 2 0.7 8 12 1.88 <0.02 <0.5 <0.01 0.6 <10 1.1 5.2 0.5 39 <0.1 1.0 <0.05 <0.5 2569 63 <0.01 0.63 0.5 0.06 0.6RU8 Mar-11 4 1.1 9 26 1.68 <0.02 <0.5 <0.01 1.1 <10 4.8 0.9 <0.2 50 <0.1 0.4 0.15 <0.5 2324 580 <0.01 1.24 0.6 <0.02 1.0PH9 Mar-11 5 <0.5 <5 6 2.29 <0.02 <0.5 <0.01 0.7 <10 0.6 0.3 <0.2 38 0.2 0.4 <0.05 <0.5 1903 81 0.01 0.56 1.0 <0.02 3.9RC9 Mar-11 3 0.5 9 18 n.d. <0.02 <0.5 <0.01 0.8 <10 2.0 2.5 <0.2 40 <0.1 0.6 0.05 <0.5 2113 111 0.02 0.90 0.7 <0.02 <0.5AC11 Mar-11 3 <0.5 <5 19 3.77 <0.02 <0.5 <0.01 0.8 <10 0.5 0.7 0.2 40 0.1 0.6 <0.05 <0.5 2512 54 <0.01 0.35 0.5 <0.02 0.7FA13 Mar-11 2 <0.5 <5 7 0.65 <0.02 <0.5 <0.01 0.5 <10 0.3 0.1 <0.2 35 <0.1 0.4 <0.05 <0.5 1961 36 <0.01 0.30 0.6 <0.02 <0.5RR16 Mar-11 5 0.6 7 78 0.41 <0.02 <0.5 <0.01 0.8 <10 3.3 0.6 1.4 34 0.1 0.3 0.09 0.5 2742 173 <0.01 1.96 1.2 <0.02 1.5RUT17 Mar-11 3 <0.5 6 31 0.56 <0.02 <0.5 <0.01 0.9 <10 1.4 0.5 <0.2 30 0.3 0.3 0.09 <0.5 1775 124 <0.01 1.66 0.6 <0.02 0.8RCM18 Mar-11 4 0.6 11 19 n.d. 0.03 <0.5 <0.01 1.0 <10 2.4 7.1 0.4 49 <0.1 0.7 0.06 <0.5 2158 135 0.01 1.06 0.9 <0.02 1.2LA1 Apr-11 3 <0.5 <5 15 0.16 0.02 <0.5 <0.01 1.2 <10 0.9 2.6 1.6 49 0.9 0.6 0.11 <0.5 2267 58 <0.01 0.63 <0.2 <0.02 2.2EV2 Apr-11 4 <0.5 <5 76 0.12 <0.02 <0.5 0.04 0.9 <10 0.7 2.3 <0.2 34 <0.1 1.2 0.06 0.6 2808 60 <0.01 0.30 <0.2 0.07 5.4FH3 Apr-11 2 <0.5 12 271 <0.05 <0.02 <0.5 <0.01 6.1 <10 1.7 0.3 2.0 117 0.4 2.5 0.28 0.8 3732 86 0.03 3.65 0.4 <0.02 1.5FL4 Apr-11 <1 <0.5 <5 20 <0.05 <0.02 <0.5 <0.01 0.9 <10 2.0 0.2 0.5 21 <0.1 0.3 <0.05 <0.5 2609 84 <0.01 0.32 <0.2 <0.02 0.6FP5 Apr-11 1 <0.5 <5 30 0.06 <0.02 <0.5 <0.01 2.9 <10 1.3 0.2 <0.2 55 0.2 0.5 <0.05 <0.5 2795 64 <0.01 0.48 <0.2 <0.02 0.7
B. Nisi et al. / International Journal of Greenhouse Gas Control 14 (2013) 151–168 159
Table 3Chemical composition of the dissolved gases in the HH waters; gas concentrations are in % by volume, while the sum of the dissolved gases (�DG) is in mmol/L.
Sample Date CO2 N2 O2 Ar CH4 Ne He H2 �DG
LA1 Jan-10 44.8 53.6 0.4 1.3 0.0131 0.00055 0.00193 <0.00001 1.20EV2 Jan-10 21.7 59.3 17.5 1.5 0.0162 0.00065 <0.00001 <0.00001 1.27FH3 Jan-10 63.0 34.7 1.4 0.8 0.0110 0.00043 0.00243 <0.00001 1.64FL4 Jan-10 4.4 71.8 22.0 1.7 0.0000 0.00076 <0.00001 <0.00001 0.87FP5 Jan-10 3.4 68.2 26.7 1.6 0.0152 0.00076 <0.00001 <0.00001 1.31EV2 Jul-10 18.9 69.4 9.9 1.8 <0.0001 0.00107 <0.00001 <0.00001 1.87FH3 Jul-10 50.6 43.1 5.2 1.0 0.0233 0.00039 <0.00001 <0.00001 2.58FL4 Jul-10 5.2 72.8 20.4 1.6 <0.0001 <0.00001 <0.00001 <0.00001 0.81FP5 Jul-10 16.7 71.0 11.9 1.8 <0.0001 <0.00001 <0.00001 <0.00001 0.93FCL6 Jul-10 20.0 67.5 10.7 1.7 <0.0001 0.00069 <0.00001 <0.00001 1.46PDS7 Jul-10 13.9 71.7 12.8 1.7 <0.0001 0.00060 <0.00001 <0.00001 1.67PH9 Jul-10 19.2 67.1 12.0 1.7 <0.0001 <0.00001 <0.00001 <0.00001 0.88AC11 Jul-10 37.2 60.0 1.3 1.5 0.0229 0.00092 0.00046 0.00046 2.18FA12 Jul-10 17.8 69.9 10.4 1.9 <0.0001 0.00083 <0.00001 <0.00001 1.21EV2 Nov-10 15.1 69.2 13.9 1.8 <0.0001 0.00070 <0.00001 <0.00001 1.43FH3 Nov-10 47.7 46.1 5.0 1.1 0.0297 0.00042 <0.00001 <0.00001 2.36FL4 Nov-10 2.9 76.4 18.8 1.9 <0.0001 0.00071 <0.00001 <0.00001 0.93FP5 Nov-10 2.3 71.6 24.4 1.8 0.0073 0.00073 <0.00001 <0.00001 1.37FCL6 Nov-10 13.4 70.8 14.0 1.8 <0.0001 0.00086 <0.00001 <0.00001 1.16PDS7 Nov-10 4.2 82.0 11.9 1.9 <0.0001 0.00086 <0.00001 <0.00001 1.17PH9 Nov-10 15.3 69.0 14.0 1.7 <0.0001 <0.00001 <0.00001 <0.00001 0.92FA13 Nov-10 7.3 79.6 11.2 2.0 <0.0001 0.00094 <0.00001 <0.00001 1.06EV2 Mar-11 5.8 69.8 22.6 1.7 0.0084 0.00840 <0.00001 <0.00001 1.19FH3 Mar-11 24.7 61.0 15.4 1.6 <0.0001 0.00120 <0.00001 <0.00001 1.66
ov
5
5
mp
TOd
SC(
FP5 Mar-11 4.5 67.3 26.6 1.6
FL4 Mar-11 4.3 74.7 19.1 1.8
btained when considering the measured and calculated �13C-TDICalues since they were as low as −16.9‰ V-PDB (Table 4).
. Discussion
.1. Origin of the dissolved species
The Palaeozoic to Quaternary sedimentary rocks at HH areainly made up by silicate and carbonate minerals at different
roportions. The latter are likely responsible for the chemical
able 4xygen (as �18O‰ V-SMOW), hydrogen (as �2H‰ V-SMOW), measured TDIC (Total Dissoissolved gases from HH.
ID Date �18O �2H
LA1 Jan-10 −8.0 −49.2
EV2 Jan-10 −8.1 −61.2
FH3 Jan-10 −7.9 −48.5
FL4 Jan-10 −8.9 −60.5
FP5 Jan-10 −9.6 −62.4
EV2 Jul-10 n.d. n.d.
FH3 Jul-10 n.d. n.d.
FL4 Jul-10 n.d. n.d.
FP5 Jul-10 n.d. n.d.
FCL6 Jul-10 n.d. n.d.
PH9 Jul-10 n.d. n.d.
AC11 Jul-10 n.d. n.d.
FA12 Jul-10 n.d. n.d.
LA1 Nov-10 −8.7 −58.6
EV2 Nov-10 n.d. n.d.
FH3 Nov-10 −8.8 −58.2
FL4 Nov-10 n.d. n.d.
FP5 Nov-10 n.d. n.d.
PDS7 Nov-10 n.d. n.d.
PH9 Nov-10 n.d. n.d.
FA13 Nov-10 n.d. n.d.
EV2 Mar-11 n.d. n.d.
FH3 Mar-11 n.d. n.d.
FL4 Mar-11 n.d. n.d.
FP5 Mar-11 n.d. n.d.
ource: Table 1 by applying equations (2) and (3).arbon isotopes in TDIC (Total Dissolved Inorganic Carbon; expressed as �13C-TDIC‰ V-PDin italics) are calculated by using the �13C-CO2 in the dissolved gas and HCO3 and free-C
0.0078 0.00078 <0.00001 <0.00001 1.28<0.0001 <0.00001 <0.00001 <0.00001 0.82
composition of the analyzed waters, which show a Ca(Mg)-HCO3facies. This is supported by the fact that the HCO3/(Ca + Mg) (inmeq/L) is approaching the stoichiometric value of 1, suggestingthat the congruent dissolution of Ca-Mg-bearing carbonate mostlycontribute to the chemistry of the HH waters. The relatively lowTDS (<800 mg/L) values indicate shallow circulation circuits fed
by meteoric water. In order to calculate the hypothetical rechargearea at which the meteoric waters are infiltrating, we may assumea vertical gradient of –0.36‰ �18O/100 m and a value of about−6‰ (V-SMOW) for spring discharging at sea level in the centrallved Inorganic Carbon, in mol/L) and carbon isotopic composition in the waters and
TDIC �13C-TDIC �13C-CO2
0.0043 −10.1 −19.60.0047 −10.8 −19.00.0054 −12.4 −21.30.0041 −9.2 −20.30.0044 −11.5 −20.00.0057 −11.9 −19.40.0066 −12.8 −21.60.0050 −11.6 −20.10.0058 −12.4 −19.80.0043 −10.3 −19.30.0044 −8.6 −18.00.0045 −8.5 −18.00.0059 −9.6 −17.70.0044 n.d. n.d.0.0048 −9.7 −18.60.0080 −16.9 −23.40.0047 −10.8 −19.30.0048 −13.3 −22.50.0033 −9.4 −19.00.0040 −9.7 −18.50.0048 −9.2 −18.50.0067 −13.4 −20.30.0078 −14.5 −22.10.0053 −14.0 −21.30.0064 −14.0 −20.7
B) for the January 2010 sampling were measured, while those of the other samplingsO2 concentrations.
1 Greenhouse Gas Control 14 (2013) 151–168
Mtc
ncoetdCrNassosiwta5ttCtpwtNe
cwsbttpsaHsHtsitt(vriwcHH(f(CIcfir
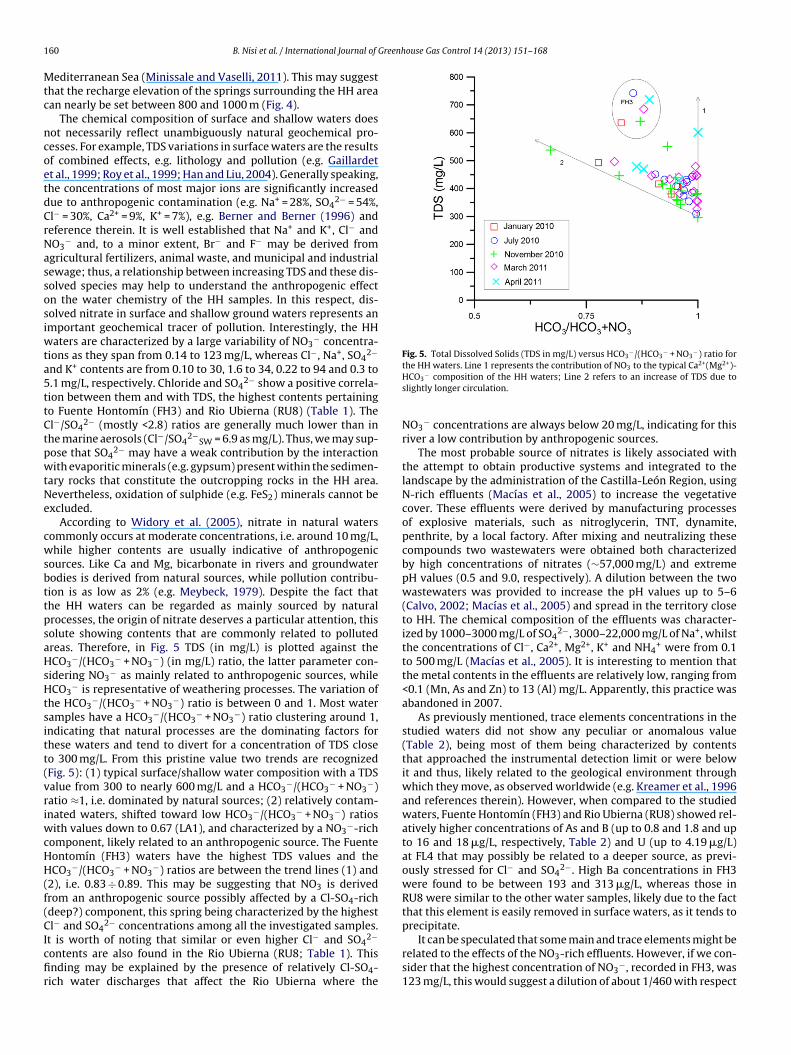
Fig. 5. Total Dissolved Solids (TDS in mg/L) versus HCO3−/(HCO3
− + NO3−) ratio for
the HH waters. Line 1 represents the contribution of NO to the typical Ca2+(Mg2+)-
60 B. Nisi et al. / International Journal of
editerranean Sea (Minissale and Vaselli, 2011). This may suggesthat the recharge elevation of the springs surrounding the HH areaan nearly be set between 800 and 1000 m (Fig. 4).
The chemical composition of surface and shallow waters doesot necessarily reflect unambiguously natural geochemical pro-esses. For example, TDS variations in surface waters are the resultsf combined effects, e.g. lithology and pollution (e.g. Gaillardett al., 1999; Roy et al., 1999; Han and Liu, 2004). Generally speaking,he concentrations of most major ions are significantly increasedue to anthropogenic contamination (e.g. Na+ = 28%, SO4
2− = 54%,l− = 30%, Ca2+ = 9%, K+ = 7%), e.g. Berner and Berner (1996) andeference therein. It is well established that Na+ and K+, Cl− andO3
− and, to a minor extent, Br− and F− may be derived fromgricultural fertilizers, animal waste, and municipal and industrialewage; thus, a relationship between increasing TDS and these dis-olved species may help to understand the anthropogenic effectn the water chemistry of the HH samples. In this respect, dis-olved nitrate in surface and shallow ground waters represents anmportant geochemical tracer of pollution. Interestingly, the HH
aters are characterized by a large variability of NO3− concentra-
ions as they span from 0.14 to 123 mg/L, whereas Cl−, Na+, SO42−
nd K+ contents are from 0.10 to 30, 1.6 to 34, 0.22 to 94 and 0.3 to.1 mg/L, respectively. Chloride and SO4
2− show a positive correla-ion between them and with TDS, the highest contents pertainingo Fuente Hontomín (FH3) and Rio Ubierna (RU8) (Table 1). Thel−/SO4
2− (mostly <2.8) ratios are generally much lower than inhe marine aerosols (Cl−/SO4
2−SW = 6.9 as mg/L). Thus, we may sup-
ose that SO42− may have a weak contribution by the interaction
ith evaporitic minerals (e.g. gypsum) present within the sedimen-ary rocks that constitute the outcropping rocks in the HH area.evertheless, oxidation of sulphide (e.g. FeS2) minerals cannot bexcluded.
According to Widory et al. (2005), nitrate in natural watersommonly occurs at moderate concentrations, i.e. around 10 mg/L,hile higher contents are usually indicative of anthropogenic
ources. Like Ca and Mg, bicarbonate in rivers and groundwaterodies is derived from natural sources, while pollution contribu-ion is as low as 2% (e.g. Meybeck, 1979). Despite the fact thathe HH waters can be regarded as mainly sourced by naturalrocesses, the origin of nitrate deserves a particular attention, thisolute showing contents that are commonly related to pollutedreas. Therefore, in Fig. 5 TDS (in mg/L) is plotted against theCO3
−/(HCO3− + NO3
−) (in mg/L) ratio, the latter parameter con-idering NO3
− as mainly related to anthropogenic sources, whileCO3
− is representative of weathering processes. The variation ofhe HCO3
−/(HCO3− + NO3
−) ratio is between 0 and 1. Most wateramples have a HCO3
−/(HCO3− + NO3
−) ratio clustering around 1,ndicating that natural processes are the dominating factors forhese waters and tend to divert for a concentration of TDS closeo 300 mg/L. From this pristine value two trends are recognizedFig. 5): (1) typical surface/shallow water composition with a TDSalue from 300 to nearly 600 mg/L and a HCO3
−/(HCO3− + NO3
−)atio ≈1, i.e. dominated by natural sources; (2) relatively contam-nated waters, shifted toward low HCO3
−/(HCO3− + NO3
−) ratiosith values down to 0.67 (LA1), and characterized by a NO3
−-richomponent, likely related to an anthropogenic source. The Fuenteontomín (FH3) waters have the highest TDS values and theCO3
−/(HCO3− + NO3
−) ratios are between the trend lines (1) and2), i.e. 0.83 ÷ 0.89. This may be suggesting that NO3 is derivedrom an anthropogenic source possibly affected by a Cl-SO4-richdeep?) component, this spring being characterized by the highestl− and SO4
2− concentrations among all the investigated samples.
t is worth of noting that similar or even higher Cl− and SO42−
ontents are also found in the Rio Ubierna (RU8; Table 1). Thisnding may be explained by the presence of relatively Cl-SO4-ich water discharges that affect the Rio Ubierna where the
3
HCO3− composition of the HH waters; Line 2 refers to an increase of TDS due to
slightly longer circulation.
NO3− concentrations are always below 20 mg/L, indicating for this
river a low contribution by anthropogenic sources.The most probable source of nitrates is likely associated with
the attempt to obtain productive systems and integrated to thelandscape by the administration of the Castilla-León Region, usingN-rich effluents (Macías et al., 2005) to increase the vegetativecover. These effluents were derived by manufacturing processesof explosive materials, such as nitroglycerin, TNT, dynamite,penthrite, by a local factory. After mixing and neutralizing thesecompounds two wastewaters were obtained both characterizedby high concentrations of nitrates (∼57,000 mg/L) and extremepH values (0.5 and 9.0, respectively). A dilution between the twowastewaters was provided to increase the pH values up to 5–6(Calvo, 2002; Macías et al., 2005) and spread in the territory closeto HH. The chemical composition of the effluents was character-ized by 1000–3000 mg/L of SO4
2−, 3000–22,000 mg/L of Na+, whilstthe concentrations of Cl−, Ca2+, Mg2+, K+ and NH4
+ were from 0.1to 500 mg/L (Macías et al., 2005). It is interesting to mention thatthe metal contents in the effluents are relatively low, ranging from<0.1 (Mn, As and Zn) to 13 (Al) mg/L. Apparently, this practice wasabandoned in 2007.
As previously mentioned, trace elements concentrations in thestudied waters did not show any peculiar or anomalous value(Table 2), being most of them being characterized by contentsthat approached the instrumental detection limit or were belowit and thus, likely related to the geological environment throughwhich they move, as observed worldwide (e.g. Kreamer et al., 1996and references therein). However, when compared to the studiedwaters, Fuente Hontomín (FH3) and Rio Ubierna (RU8) showed rel-atively higher concentrations of As and B (up to 0.8 and 1.8 and upto 16 and 18 �g/L, respectively, Table 2) and U (up to 4.19 �g/L)at FL4 that may possibly be related to a deeper source, as previ-ously stressed for Cl− and SO4
2−. High Ba concentrations in FH3were found to be between 193 and 313 �g/L, whereas those inRU8 were similar to the other water samples, likely due to the factthat this element is easily removed in surface waters, as it tends toprecipitate.
It can be speculated that some main and trace elements might berelated to the effects of the NO3-rich effluents. However, if we con-sider that the highest concentration of NO3
−, recorded in FH3, was123 mg/L, this would suggest a dilution of about 1/460 with respect
Greenhouse Gas Control 14 (2013) 151–168 161
ttcttsptOeoh
aiFssmddwmrZeatchithsestTNC(bs
5
aaci1dous(caotrP(p
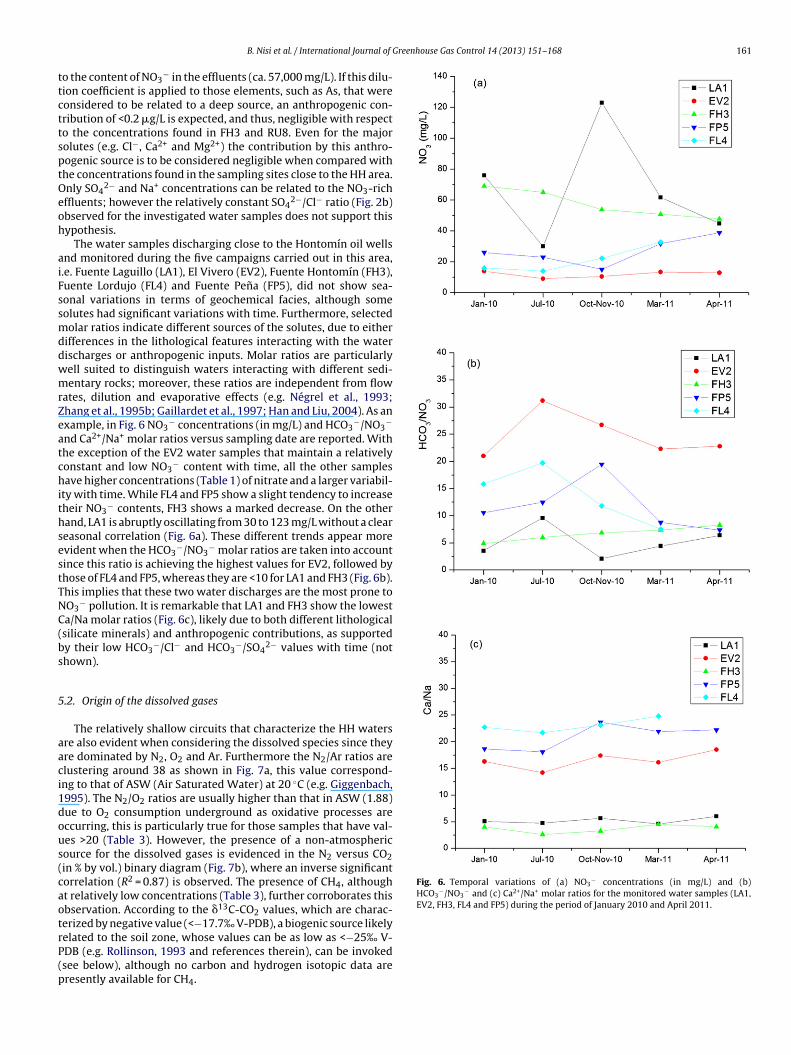
Fig. 6. Temporal variations of (a) NO3− concentrations (in mg/L) and (b)
HCO3−/NO3
− and (c) Ca2+/Na+ molar ratios for the monitored water samples (LA1,EV2, FH3, FL4 and FP5) during the period of January 2010 and April 2011.
B. Nisi et al. / International Journal of
o the content of NO3− in the effluents (ca. 57,000 mg/L). If this dilu-
ion coefficient is applied to those elements, such as As, that wereonsidered to be related to a deep source, an anthropogenic con-ribution of <0.2 �g/L is expected, and thus, negligible with respecto the concentrations found in FH3 and RU8. Even for the majorolutes (e.g. Cl−, Ca2+ and Mg2+) the contribution by this anthro-ogenic source is to be considered negligible when compared withhe concentrations found in the sampling sites close to the HH area.nly SO4
2− and Na+ concentrations can be related to the NO3-richffluents; however the relatively constant SO4
2−/Cl− ratio (Fig. 2b)bserved for the investigated water samples does not support thisypothesis.
The water samples discharging close to the Hontomín oil wellsnd monitored during the five campaigns carried out in this area,.e. Fuente Laguillo (LA1), El Vivero (EV2), Fuente Hontomín (FH3),uente Lordujo (FL4) and Fuente Pena (FP5), did not show sea-onal variations in terms of geochemical facies, although someolutes had significant variations with time. Furthermore, selectedolar ratios indicate different sources of the solutes, due to either
ifferences in the lithological features interacting with the waterischarges or anthropogenic inputs. Molar ratios are particularlyell suited to distinguish waters interacting with different sedi-entary rocks; moreover, these ratios are independent from flow
ates, dilution and evaporative effects (e.g. Négrel et al., 1993;hang et al., 1995b; Gaillardet et al., 1997; Han and Liu, 2004). As anxample, in Fig. 6 NO3
− concentrations (in mg/L) and HCO3−/NO3
−
nd Ca2+/Na+ molar ratios versus sampling date are reported. Withhe exception of the EV2 water samples that maintain a relativelyonstant and low NO3
− content with time, all the other samplesave higher concentrations (Table 1) of nitrate and a larger variabil-
ty with time. While FL4 and FP5 show a slight tendency to increaseheir NO3
− contents, FH3 shows a marked decrease. On the otherand, LA1 is abruptly oscillating from 30 to 123 mg/L without a cleareasonal correlation (Fig. 6a). These different trends appear morevident when the HCO3
−/NO3− molar ratios are taken into account
ince this ratio is achieving the highest values for EV2, followed byhose of FL4 and FP5, whereas they are <10 for LA1 and FH3 (Fig. 6b).his implies that these two water discharges are the most prone toO3
− pollution. It is remarkable that LA1 and FH3 show the lowesta/Na molar ratios (Fig. 6c), likely due to both different lithologicalsilicate minerals) and anthropogenic contributions, as supportedy their low HCO3
−/Cl− and HCO3−/SO4
2− values with time (nothown).
.2. Origin of the dissolved gases
The relatively shallow circuits that characterize the HH watersre also evident when considering the dissolved species since theyre dominated by N2, O2 and Ar. Furthermore the N2/Ar ratios arelustering around 38 as shown in Fig. 7a, this value correspond-ng to that of ASW (Air Saturated Water) at 20 ◦C (e.g. Giggenbach,995). The N2/O2 ratios are usually higher than that in ASW (1.88)ue to O2 consumption underground as oxidative processes areccurring, this is particularly true for those samples that have val-es >20 (Table 3). However, the presence of a non-atmosphericource for the dissolved gases is evidenced in the N2 versus CO2in % by vol.) binary diagram (Fig. 7b), where an inverse significantorrelation (R2 = 0.87) is observed. The presence of CH4, althought relatively low concentrations (Table 3), further corroborates thisbservation. According to the �13C-CO2 values, which are charac-erized by negative value (<−17.7‰ V-PDB), a biogenic source likely
elated to the soil zone, whose values can be as low as <−25‰ V-DB (e.g. Rollinson, 1993 and references therein), can be invokedsee below), although no carbon and hydrogen isotopic data areresently available for CH4.
162 B. Nisi et al. / International Journal of Greenhouse Gas Control 14 (2013) 151–168
binar
5
(ptaetdtddt1
isseebaKacmepcdb
mdAtoac
Fig. 7. (a) Argon and (b) CO2 versus N2 (in % by vol.)
.3. Processes governing water composition
SI, activity values, log(pCO2) and measured and calculated TDICin mol/L) are reported in Table 5. The SI confirms that the majorrocess controlling the surface and shallow water composition ishe dissolution of calcite and dolomite (SIcal is from −0.63 to +1.06nd SIdol from −1.1 to +2.26), whereas SI for the main silicatic min-rals is largely negative. Thus, meteoric waters as interact withhe substratum become saturated in calcite and to a lesser extentolomite; consequently, a Ca(Mg)-HCO3 composition is attained inhe initial stages of water–rock interaction processes due to calciteissolution even in small amount. This is related to the fact that theissolution rate of calcite is 2–6 orders of magnitude higher thanhat of Al-silicates, depending upon the pH (Stumm and Morgan,996 and references therein).
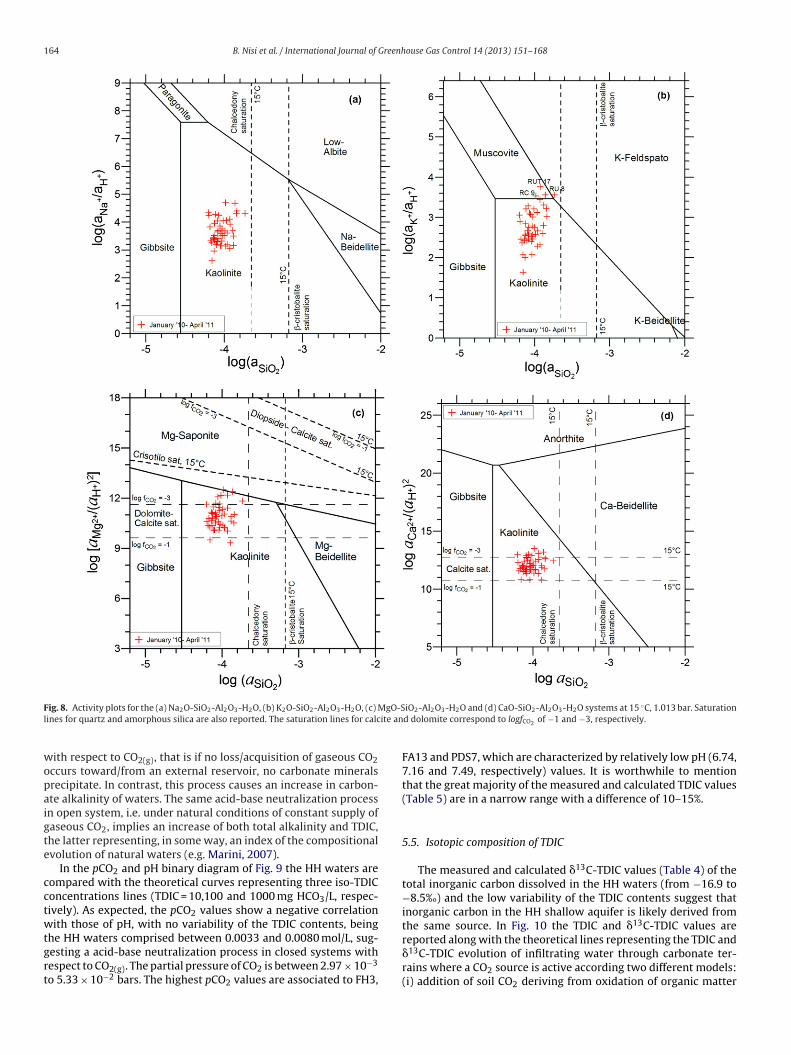
Activity plots represent a very effective tool for investigat-ng the saturation state of a number of waters with respect toeveral, relevant solid phases, provided that temperature and pres-ure are kept constant or nearly so (Helgeson, 1968; Bowerst al., 1984). The use of activity plots also allows a quickvaluation of the effects of mixing in the solid state, as the sta-ility field limits of solid mixture end-members are taken intoccount. The activity plots for the Na2O–Al2O3–SiO2–H2O (Fig. 8a),2O–Al2O3–SiO2–H2O (Fig. 8b), MgO–Al2O3–SiO2–H2O (Fig. 8c),nd CaO–Al2O3–SiO2–H2O (Fig. 8d) systems were plotted assumingonservation of Al in the solid phases; as a consequence, among clayinerals only kaolinite and beidellites were considered, with the
xception Mg-saponite whose stability field is shown in the activitylot for the MgO–Al2O3–SiO2–H2O system (Fig. 8c). The theoreti-al grids were computed for 15 ◦C and 1.013 bar. Activities of theifferent ions and SiO2(aq) were computed for each water sampley means of EQ3/6 code (Wolery and Jarek, 2003) (Table 5).
The HH waters are found in the stability field of kaolinite andost waters are saturated with dolomite and calcite (Fig. 8c and
). The activity plots for the MgO-SiO2-Al2O3-H2O and CaO-SiO2-l2O3-H2O chemical systems (Fig. 8c and d) also report the satura-
ion lines for calcite and dolomite corresponding to log fCO2 valuesf −1 and −3, confirming the control of calcite (or Ca-carbonates)nd dolomite on Ca2+ and Mg2+ activity, respectively. Basically, cal-ite and dolomite saturation acts as a sort of geochemical barrier in
y diagrams for the dissolved gases in the HH waters.
determining the possible attainment of saturation with primary Ca-silicates, e.g. anorthite, at very low CO2 fugacity. These waters areindeed strongly undersaturated with respect to the most importantNa-, Mg- and Ca-bearing primary minerals, i.e., albite, and anor-thite, and diopside, although some samples approach saturationfor Mg-Saponite, muscovite and K-feldspar (Fig. 8a–c).
5.4. Total dissolved inorganic carbon (TDIC) and pCO2
Calcite and dolomite dissolution affecting the studied watersare strictly controlled by pCO2. The range of variation of the pCO2values is directly related, through the mass action law, to the con-tent of dissolved carbonic acid, H2CO3, which is the main acidicsubstance driving mineral dissolution reactions in most naturalenvironments, as follows:
H2CO∗3 = CO2(g) + H2O KH
fCO2
aH2CO3
=(
FCO2
mH2CO∗3�H2CO∗
3
)
= 10+1.47 25 ◦C (4)
where KH is the Henry constant of gaseous CO2.The amount of carbonic acid is progressively reduced as a con-
sequence of water–rock interaction, which leads to conversion ofboth carbonic acid to the conjugate base, bicarbonate ion, and thelatter to the carbonate ion at higher pH values:
H2CO3 = HCO−3 + H+ K1
(aH+mHCO−
3�HCO−
3
)mH2CO∗
3�H2CO∗
3
= 10−6.35 25 ◦C
(5)
HCO−3 = CO2−
3 + H+ K2
(aH+mCO2−
3�CO2−
3
)mHCO−
3�HCO−
3
= 10−10.33 25 ◦C (6)
Carbonic acid, total bicarbonate (HCO3− and related complexes)
and total carbonate ion (CO32− and related complexes) form the
so-called total dissolved inorganic carbon (TDIC).Conversion of carbonic acid in the conjugate bases during
weathering is a process at constant TDIC only in systems closed

B. N
isi et
al. /
International Journal
of G
reenhouse G
as Control
14 (2013)
151–168
163
Table 5Saturation index, activity of the main ions and SiO2, log(pCO2) and measured and calculated TDIC (in mol/L) for the HH waters.
Sample Date Sicalc Sidol Simusc SIab SIK-feld SIanh SIgyp SIan SImagns aCa aMg aNa aK aHCO3 aSiO2 log(pCO2) TDICmeas. TDICcalc.
LA1 Jan-10 −0.08 −0.26 −1.04 −3.62 −1.70 −2.64 −2.33 −9.49 −1.90 1.61E-03 9.84E-05 4.36E-04 1.86E-05 3.85E-03 6.54E-05 −1.9 0.0043 0.0050EV2 Jan-10 0.18 0.39 −0.74 −3.58 −1.07 −3.18 −2.87 −8.98 −1.51 1.48E-03 1.23E-04 1.23E-04 2.10E-05 4.21E-03 9.93E-05 −2.1 0.0047 0.0052FH3 Jan-10 0.20 0.51 −0.20 −3.63 −0.19 −2.09 −1.76 −9.33 −1.42 2.12E-03 2.13E-04 7.79E-05 1.07E-04 4.69E-03 1.31E-04 −1.9 0.0054 0.0062FL4 Jan-10 0.38 0.85 −0.78 −3.45 −1.06 −2.71 −2.36 −8.70 −1.27 1.40E-03 1.40E-04 8.37E-05 9.35E-06 3.63E-03 8.28E-05 −2.5 0.0041 0.0043FP5 Jan-10 −0.18 −0.24 −0.92 −3.91 −1.20 −2.78 −2.47 −9.67 −1.78 1.52E-03 1.53E-04 1.11E-04 3.03E-05 3.93E-03 1.03E-04 −1.8 0.0044 0.0053EV2 Jul-10 0.10 −0.13 −0.71 −3.62 −1.08 −3.30 −2.99 −9.14 −1.95 1.59E-03 5.73E-05 1.51E-04 2.80E-05 4.07E-03 9.41E-05 −2.0 0.0057 0.0051FH3 Jul-10 0.25 0.40 −0.27 −2.50 −0.35 −1.93 −1.63 −9.14 −1.56 2.25E-03 1.30E-04 1.31E-03 1.04E-04 5.36E-03 1.43E-04 −1.7 0.0066 0.0072FL4 Jul-10 0.34 0.44 −0.84 −3.38 −1.03 −2.76 −2.44 −8.70 −1.63 1.63E-03 7.08E-05 1.03E-04 1.16E-05 3.95E-03 1.09E-04 −2.3 0.0050 0.0047FP5 Jul-10 0.21 0.15 −0.68 −3.39 −0.85 −2.76 −2.47 −8.86 −1.76 1.72E-03 7.02E-05 1.31E-04 2.56E-05 4.08E-03 1.30E-04 −2.1 0.0058 0.0051FCL6 Jul-10 0.08 0.47 −0.92 −4.02 −1.63 −3.57 −3.29 −8.87 −1.32 1.30E-03 1.95E-04 9.58E-05 1.41E-05 3.80E-03 7.46E-05 −2.1 0.0043 0.0046PDS7 Jul-10 0.01 0.39 −0.92 −3.37 −1.18 −3.11 −2.79 −9.05 −1.34 1.12E-03 2.07E-04 1.48E-04 1.18E-05 3.25E-03 1.02E-04 −2.3 0.0042 0.0039RU8 Jul-10 0.81 1.96 0.12 −2.24 −0.19 −2.52 −2.26 −7.29 −0.54 1.47E-03 2.22E-04 4.63E-04 3.48E-05 3.94E-03 1.38E-04 −2.7 0.0052 0.0046PH9 Jul-10 0.13 0.44 −0.90 −3.84 −1.51 −3.17 −2.86 −8.95 −1.41 1.39E-03 1.59E-04 1.20E-04 1.40E-05 3.89E-03 7.43E-05 −2.1 0.0044 0.0048RC9 Jul-10 1.06 2.26 0.11 −2.50 −0.53 −2.95 −2.72 −6.80 −0.46 1.48E-03 1.46E-04 3.41E-04 2.32E-05 4.51E-03 1.03E-04 −2.8 0.0059 0.0052RL10 Jul-10 0.53 0.57 −0.46 −2.41 −0.56 −2.81 −2.52 −8.19 −1.66 1.73E-03 4.20E-05 5.02E-04 2.09E-05 4.08E-03 1.45E-04 −2.4 0.0056 0.0049AC11 Jul-10 0.09 0.36 −0.91 −3.80 −1.34 −3.17 −2.85 −9.18 −1.45 1.50E-03 1.77E-04 1.11E-04 1.63E-05 3.99E-03 8.30E-05 −2.1 0.0045 0.0050FA12 Jul-10 0.18 0.20 −1.06 −3.93 −1.69 −3.15 −2.85 −9.04 −1.70 1.63E-03 8.47E-05 1.23E-04 1.16E-05 4.50E-03 7.29E-05 −2.0 0.0059 0.0056EV2 Nov-10 −0.01 −0.33 −1.03 −3.83 −1.42 −3.23 −2.91 −9.34 −2.04 1.52E-03 5.75E-05 1.19E-04 1.64E-05 4.05E-03 9.31E-05 −1.9 0.0048 0.0052FH3 Nov-10 −0.21 −0.72 −0.84 −3.29 −1.22 −2.10 −1.84 −9.70 −2.20 2.06E-03 6.96E-05 9.31E-04 7.30E-05 5.13E-03 1.28E-04 −1.3 0.0080 0.0083FL4 Nov-10 −0.03 −0.35 −1.20 −3.84 −1.51 −2.57 −2.27 −9.27 −2.03 1.64E-03 6.19E-05 9.76E-05 1.16E-05 3.78E-03 1.08E-04 −1.9 0.0047 0.0049FP5 Nov-10 −0.14 −0.46 −1.18 −3.89 −1.36 −2.63 −2.32 −9.68 −2.04 1.74E-03 8.64E-05 1.02E-04 1.86E-05 4.18E-03 1.17E-04 −1.7 0.0048 0.0058FCL6 Nov-10 0.16 0.67 −0.96 −3.58 −1.39 −3.36 −3.05 −8.76 −1.21 1.24E-03 2.08E-04 1.10E-04 9.39E-06 3.59E-03 9.09E-05 −2.3 0.0040 0.0043PDS7 Nov-10 −0.08 0.21 −0.95 −3.36 −1.25 −2.88 −2.55 −9.16 −1.44 1.06E-03 1.92E-04 1.85E-04 1.18E-05 3.02E-03 9.34E-05 −2.3 0.0033 0.0036RU8 Nov-10 0.31 1.12 0.04 −2.16 0.41 −1.92 −1.58 −8.88 −0.92 1.64E-03 3.96E-04 5.15E-04 8.91E-05 3.81E-03 1.85E-04 −2.3 0.0044 0.0047PH9 Nov-10 0.01 0.21 −0.89 −4.08 −1.63 −3.06 −2.80 −8.83 −1.48 1.36E-03 1.53E-04 1.03E-04 1.87E-05 3.61E-03 8.16E-05 −2.0 0.0040 0.0045RL10 Nov-10 0.32 0.21 −0.41 −2.91 −0.72 −2.51 −2.17 −8.88 −1.84 1.95E-03 5.82E-05 4.78E-04 3.47E-05 3.59E-03 8.49E-05 −2.3 0.0044 0.0044AC11 Nov-10 0.57 1.34 −0.42 −3.32 −0.82 −3.23 −2.91 −8.07 −0.95 1.37E-03 1.66E-04 8.58E-05 1.41E-05 3.66E-03 8.79E-05 −2.7 0.0041 0.0042FA13 Nov-10 −0.08 −0.19 −1.48 −4.40 −2.09 −4.51 −4.21 −9.47 −1.82 1.51E-03 1.09E-04 6.37E-05 7.01E-06 4.19E-03 7.41E-05 −1.8 0.0048 0.0055FEA14 Nov-10 0.56 0.47 −0.23 −3.17 −0.62 −2.81 −2.48 −8.33 −1.82 1.62E-03 2.85E-05 1.60E-04 2.80E-05 3.91E-03 8.13E-05 −2.5 0.0044 0.0046RH15 Nov-10 0.34 0.91 −0.51 −3.39 −0.75 −2.95 −2.61 −8.75 −1.17 1.37E-03 1.83E-04 1.00E-04 2.10E-05 3.99E-03 9.37E-05 −2.4 0.0045 0.0047RR16 Nov-10 0.63 1.47 −0.07 −2.80 −0.16 −2.72 −2.39 −8.08 −0.89 1.46E-03 1.85E-04 1.41E-04 3.03E-05 3.78E-03 1.17E-04 −2.7 0.0043 0.0044RUT17 Nov-10 0.27 0.50 0.24 −2.94 0.23 −2.44 −2.10 −8.76 −1.50 1.49E-03 1.08E-04 1.72E-04 1.19E-04 3.18E-03 1.18E-04 −2.5 0.0036 0.0038EV2 Mar-11 −0.05 −0.48 −1.08 −3.94 −1.54 −2.87 −2.55 −9.61 −2.15 1.72E-03 5.62E-05 1.46E-04 1.86E-05 4.25E-03 7.82E-05 −1.8 0.0067 0.0057FH3 Mar-11 0.15 −0.08 −0.40 −2.88 −0.48 −2.01 −1.67 −9.66 −1.97 2.33E-03 7.74E-05 7.75E-04 9.08E-05 5.16E-03 1.07E-04 −1.8 0.0078 0.0071FL4 Mar-11 −0.05 −0.51 −1.46 −4.05 −1.89 −2.56 −2.21 −9.64 −2.20 1.79E-03 5.63E-05 9.91E-05 6.51E-06 3.51E-03 6.93E-05 −2.0 0.0053 0.0046FP5 Mar-11 −0.07 −0.47 −0.82 −4.08 −1.32 −2.67 −2.35 −9.52 −2.12 1.76E-03 6.27E-05 1.11E-04 3.37E-05 3.95E-03 7.99E-05 −1.8 0.0064 0.0053FCL6 Mar-11 0.06 0.34 −1.06 −3.90 −1.53 −3.13 −2.80 −9.23 −1.45 1.37E-03 1.79E-04 9.17E-05 1.03E-05 3.66E-03 7.24E-05 −2.2 0.0062 0.0045PDS7 Mar-11 −0.63 −0.89 −1.45 −3.93 −1.67 −3.64 −3.29 −10.56 −2.00 1.22E-03 2.32E-04 1.96E-04 1.64E-05 3.35E-03 9.14E-05 −1.6 0.0042 0.0051RU8 Mar-11 −0.25 −0.26 −1.09 −3.45 −1.25 −2.17 −1.80 −10.24 −1.77 1.71E-03 2.39E-04 3.81E-04 2.46E-05 3.92E-03 8.27E-05 −1.8 0.0050 0.0056PH9 Mar-11 −0.01 0.11 −1.13 −4.09 −1.77 −2.90 −2.59 −9.30 −1.60 1.47E-03 1.54E-04 1.07E-04 1.17E-05 3.80E-03 6.76E-05 −2.0 0.0055 0.0048RC9 Mar-11 0.08 0.25 −0.66 −3.35 −1.18 −2.53 −2.21 −9.27 −1.56 1.62E-03 1.52E-04 4.40E-04 3.33E-05 4.13E-03 7.51E-05 −2.0 0.0049 0.0052RL10 Mar-11 0.27 −0.02 −0.61 −3.17 −1.20 −2.52 −2.19 −8.98 −2.03 1.83E-03 3.93E-05 5.53E-04 2.48E-05 3.86E-03 6.36E-05 −2.2 0.0051 0.0047AC11 Mar-11 −0.14 −0.13 −1.09 −4.04 −1.51 −2.99 −2.68 −9.47 −1.71 1.50E-03 1.61E-04 9.12E-05 1.64E-05 3.53E-03 8.93E-05 −1.9 0.0051 0.0046FA13 Mar-11 −0.43 −1.05 −1.87 −4.76 −2.46 −3.07 −2.75 −10.31 −2.35 1.68E-03 8.32E-05 6.74E-05 6.98E-06 4.20E-03 6.98E-05 −1.5 0.0056 0.0067RR16 Mar-11 0.52 1.37 −0.33 −2.93 −0.41 −2.62 −2.26 −8.61 −0.89 1.61E-03 2.88E-04 1.59E-04 2.30E-05 3.86E-03 9.69E-05 −2.6 0.0069 0.0046RUT17 Mar-11 0.56 0.86 −0.50 −2.98 −0.87 −2.41 −2.03 −8.69 −1.46 1.87E-03 8.58E-05 3.08E-04 1.62E-05 3.83E-03 6.28E-05 −2.6 0.0054 0.0045RCM18 Mar-11 0.34 0.86 −0.30 −3.00 −0.77 −2.48 −2.15 −8.75 −1.21 1.64E-03 1.91E-04 4.81E-04 4.09E-05 3.98E-03 7.65E-05 −2.3 0.0051 0.0048EV2 Apr-11 −0.10 −0.67 −1.11 −3.39 −0.78 −3.01 −2.58 −10.42 −2.36 1.81E-03 5.45E-05 1.34E-04 1.77E-05 4.17E-03 9.99E-05 −2.0 n.d. n.d.RL10 Apr-11 0.40 0.15 −0.59 −3.01 −1.02 −2.59 −2.27 −8.71 −1.97 1.88E-03 3.33E-05 4.34E-04 2.13E-05 4.04E-03 8.04E-05 −2.3 n.d. n.d.FH3 Apr-11 0.12 −0.72 −0.48 −2.73 −0.43 −1.94 −1.61 −9.70 −2.58 2.44E-03 2.01E-05 9.13E-04 8.90E-05 5.45E-03 1.33E-04 −1.7 n.d. n.d.FP5 Apr-11 0.01 −0.30 −1.06 −3.85 −1.39 −2.59 −2.27 −9.40 −2.02 1.92E-03 7.11E-05 1.20E-04 1.85E-05 4.04E-03 9.94E-05 −1.9 n.d. n.d.
calc: calcite; dol: dolomite; musc: muscovite; ab: albite; K-feld: K-feldspar; any: anhydrite; gyp: gypsum; mangs: magnesite.
164 B. Nisi et al. / International Journal of Greenhouse Gas Control 14 (2013) 151–168
F gO-Sl ite an
wopaigte
cctwtgrt
ig. 8. Activity plots for the (a) Na2O-SiO2-Al2O3-H2O, (b) K2O-SiO2-Al2O3-H2O, (c) Mines for quartz and amorphous silica are also reported. The saturation lines for calc
ith respect to CO2(g), that is if no loss/acquisition of gaseous CO2ccurs toward/from an external reservoir, no carbonate mineralsrecipitate. In contrast, this process causes an increase in carbon-te alkalinity of waters. The same acid-base neutralization processn open system, i.e. under natural conditions of constant supply ofaseous CO2, implies an increase of both total alkalinity and TDIC,he latter representing, in some way, an index of the compositionalvolution of natural waters (e.g. Marini, 2007).
In the pCO2 and pH binary diagram of Fig. 9 the HH waters areompared with the theoretical curves representing three iso-TDIConcentrations lines (TDIC = 10,100 and 1000 mg HCO3/L, respec-ively). As expected, the pCO2 values show a negative correlationith those of pH, with no variability of the TDIC contents, being
he HH waters comprised between 0.0033 and 0.0080 mol/L, sug-esting a acid-base neutralization process in closed systems withespect to CO2(g). The partial pressure of CO2 is between 2.97 × 10⁻³
o 5.33 × 10⁻² bars. The highest pCO2 values are associated to FH3,
iO2-Al2O3-H2O and (d) CaO-SiO2-Al2O3-H2O systems at 15 ◦C, 1.013 bar. Saturationd dolomite correspond to logfCO2 of −1 and −3, respectively.
FA13 and PDS7, which are characterized by relatively low pH (6.74,7.16 and 7.49, respectively) values. It is worthwhile to mentionthat the great majority of the measured and calculated TDIC values(Table 5) are in a narrow range with a difference of 10–15%.
5.5. Isotopic composition of TDIC
The measured and calculated �13C-TDIC values (Table 4) of thetotal inorganic carbon dissolved in the HH waters (from −16.9 to−8.5‰) and the low variability of the TDIC contents suggest thatinorganic carbon in the HH shallow aquifer is likely derived fromthe same source. In Fig. 10 the TDIC and �13C-TDIC values are
reported along with the theoretical lines representing the TDIC and�13C-TDIC evolution of infiltrating water through carbonate ter-rains where a CO2 source is active according two different models:(i) addition of soil CO2 deriving from oxidation of organic matter
B. Nisi et al. / International Journal of Greenh
Frr
aa
E0FomwdomtitMa
FdC
ig. 9. pCO2 versus pH binary diagram for HH waters. The theoretical curves rep-esenting three iso-TDIC concentrations lines (TDIC = 10, 100 and 1000 mg HCO3/L,espectively) are also reported.
nd root respiration (biogenic), (ii) addition of deeply derived CO2nd in equilibrium with calcite.
The theoretical curves were computed by means of theQ3/6 code, starting from low to middle TDIC values, 0.003 and.005 mol/kg, respectively, according to Chiodini et al. (2000) androndini et al. (2008). In order to investigate the effects of CO2n the TDIC and �13C-TDIC values, the input of CO2 biogenic wasodeled by the addition of 0.01 mol of carbon to infiltrating watersith a �13C value of −20‰ (V-PDB), whilst the �13C values ofeep CO2 added to the solution were ranging from −7 (typicalf mantle-derived) to 0.0‰ (calcite dissolution). The geochemicalodeling that best fit the observed TDIC-�13C-TDIC composition of
he HH waters is reported in Fig. 10. The HH waters are character-zed by TDIC <0.008 mol/kg and are generally positioned along the
heoretical curves representing the addition of biogenic soil CO2.oreover, the pCO2 values that are higher than the atmosphericverage (10−3.5 bar), testify a variable contribution to waters of
ig. 10. Total Dissolved Solids (TDIC) vs. �13C-TDIC for the HH waters. Solid andash lines represent the theoretical trends related to the input of deep and biogenicO2. The HH water samples are clearly associated with a biogenic source.
ouse Gas Control 14 (2013) 151–168 165
CO2 produced through biological activity of plants and decomposi-tion/oxidation of organic matter in soils (Appelo and Postma, 1993)that, in oxidized environments, can be expressed through the fol-lowing simplified reaction:
CH2O + O2 → CO2 + ¦H2O (7)
where CH2O stoichiometry closely represents the mean compo-sition of organic matter. Thus, we may conclude that no evidenceof a deep-routed CO2 was highlighted in the HH waters.
5.6. Implications for the water and dissolved gas geochemicalmonitoring
The HH area can be considered suitable for CO2 storage sincethe injection will be located in a 3 km × 5 km dome-shape struc-ture (Alcalde et al., 2010) where porous and permeable aquifershosted in Lower Jurassic carbonate and dolomite beds occur atabout 1500 m depth. The overlying marl strata are a potentialcap rock, while anhydrites can be regarded as a lower seal. Thethermal gradient in the area, derived by the oil wells, has amean value of 26 ◦C/km (Fernàndez et al., 1998). The integrityof the cap rock once CO2 will be injected is also apparentlyguaranteed by the low seismicity affecting this area. In fact, accord-ing to the National Institute of Geography, from 1939 to 2011about fifteen >2.0 M seismic events were recorded (http://www.ign.es/ign/layoutIn/sismoTerremotosEspana.do?value=2) in theBurgos region, the highest magnitude being recorded in 1939(4.3 M). Nevertheless, in this span of time at HH only one sig-nificant event occurred NW of Huermeces with a magnitudeof 2.3 M.
These features suggest that CO2 can safely be injected. How-ever, the HH area is interested by a main structure, namely theUbierna-Ventaniella fault system (e.g. Tavani, 2012) (Fig. 1). Itformed the southern boundary of the Baque-Cantabrian Basin inthe Late Jurassic-Early Cretaceous (e.g. Rat, 1988) along with NE-SWstriking and NW dipping faults (Tavani and Anton Munoz, 2012).This structure may act as a permeable zone favoring the fluids upris-ing if a CO2 leakage would occur through the cap rock. Similarly,other fracture or fault systems, covered by the Quaternary sedi-ments, can be present in the proximity of the oil wells (Fig. 1),the latter potentially being leakage points. This would apparentlyexplain the presence of possible contribution by deeper waters insome springs (e.g. samples FH3 and FL4) fed by the shallow hydro-logical circuits and surface waters (RU8).
The maximum, minimum and mean values (11 samples col-lected in 2010) of the main solutes measured from the H-2 wellbrine, kindly provided by A. Perez Estuan and described in a tech-nical report of CIEMAT (Barcelona, Spain) by Buil et al. (2012), arelisted in Table 6. The brine has a salinity is 26 g/L (as NaCl) and aslightly alkaline pH value (7.3). The Cl/SO4 molar ratio is about 26and strongly differs of about one order of magnitude with respectto those calculated in the studied waters, similarly to other molarratios less affected by secondary processes (e.g. salt precipitation),such as Na/K and Mg/Cl. Despite the fact that no trace elements areavailable for the HH brine, on the basis of the sole main solutes anybrine leakage to the surface should be detected. However, it hasto be considered that the injection of CO2 (in the case of HH lessthan 100,000 tons will be injected with a purity >99%) may inducethe formation of a CO2 plume. According to Chadwick et al. (2005),less than 1000 tons of CO2 should be detectable at depths of lessthan 1000 m by seismic methods. In near-surface environments,such as ground waters, CO2 flow should be migrating as bubbles in
fault systems and/or near borehole. Thus, we may speculate that theequilibrium of the carbonate species should first be modified caus-ing an acidification of the shallow waters and the increase of HCO3−
(e.g. Myrttinen et al., 2012 and references therein) and free-CO2.
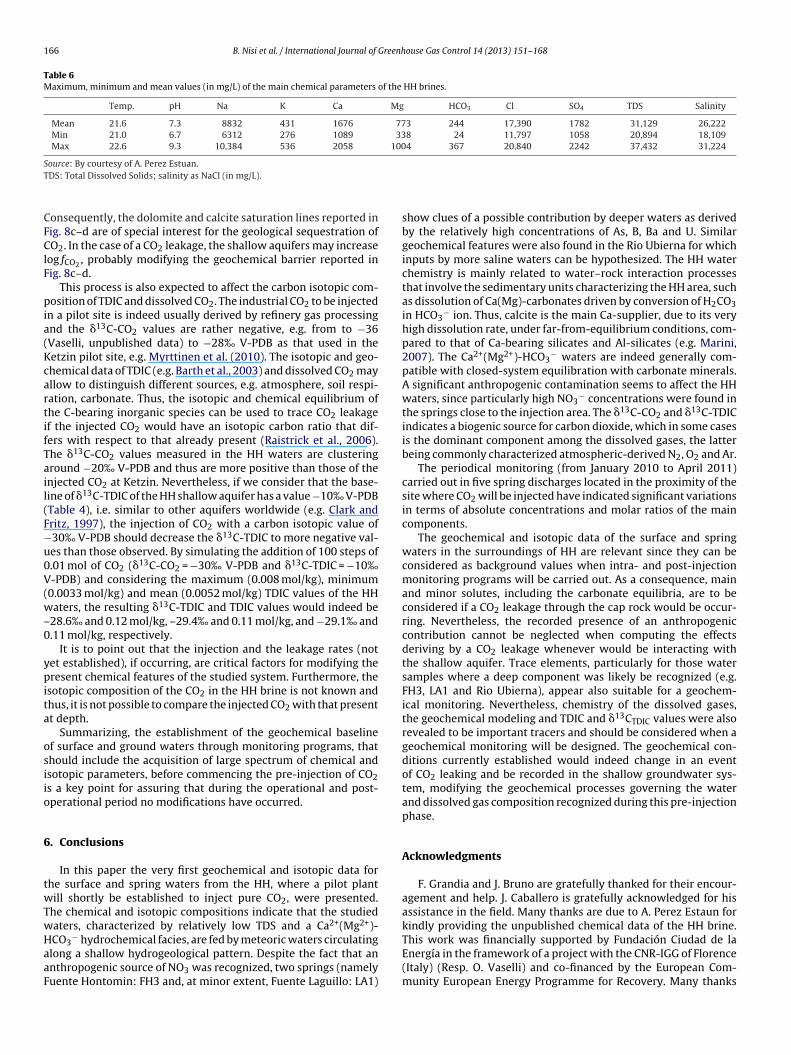
166 B. Nisi et al. / International Journal of Greenhouse Gas Control 14 (2013) 151–168
Table 6Maximum, minimum and mean values (in mg/L) of the main chemical parameters of the HH brines.
Temp. pH Na K Ca Mg HCO3 Cl SO4 TDS Salinity
Mean 21.6 7.3 8832 431 1676 773 244 17,390 1782 31,129 26,222Min 21.0 6.7 6312 276 1089 338 24 11,797 1058 20,894 18,109Max 22.6 9.3 10,384 536 2058 1004 367 20,840 2242 37,432 31,224
ST
CFClF
pia(KcartifTail(F−u0V(w–0
ypita
osiio
6
twTwHaaF
ource: By courtesy of A. Perez Estuan.DS: Total Dissolved Solids; salinity as NaCl (in mg/L).
onsequently, the dolomite and calcite saturation lines reported inig. 8c–d are of special interest for the geological sequestration ofO2. In the case of a CO2 leakage, the shallow aquifers may increase
og fCO2 , probably modifying the geochemical barrier reported inig. 8c–d.
This process is also expected to affect the carbon isotopic com-osition of TDIC and dissolved CO2. The industrial CO2 to be injected
n a pilot site is indeed usually derived by refinery gas processingnd the �13C-CO2 values are rather negative, e.g. from to −36Vaselli, unpublished data) to −28‰ V-PDB as that used in theetzin pilot site, e.g. Myrttinen et al. (2010). The isotopic and geo-hemical data of TDIC (e.g. Barth et al., 2003) and dissolved CO2 mayllow to distinguish different sources, e.g. atmosphere, soil respi-ation, carbonate. Thus, the isotopic and chemical equilibrium ofhe C-bearing inorganic species can be used to trace CO2 leakagef the injected CO2 would have an isotopic carbon ratio that dif-ers with respect to that already present (Raistrick et al., 2006).he �13C-CO2 values measured in the HH waters are clusteringround −20‰ V-PDB and thus are more positive than those of thenjected CO2 at Ketzin. Nevertheless, if we consider that the base-ine of �13C-TDIC of the HH shallow aquifer has a value −10‰ V-PDBTable 4), i.e. similar to other aquifers worldwide (e.g. Clark andritz, 1997), the injection of CO2 with a carbon isotopic value of30‰ V-PDB should decrease the �13C-TDIC to more negative val-es than those observed. By simulating the addition of 100 steps of.01 mol of CO2 (�13C-CO2 = −30‰ V-PDB and �13C-TDIC = −10‰-PDB) and considering the maximum (0.008 mol/kg), minimum
0.0033 mol/kg) and mean (0.0052 mol/kg) TDIC values of the HHaters, the resulting �13C-TDIC and TDIC values would indeed be
28.6‰ and 0.12 mol/kg, –29.4‰ and 0.11 mol/kg, and −29.1‰ and.11 mol/kg, respectively.
It is to point out that the injection and the leakage rates (notet established), if occurring, are critical factors for modifying theresent chemical features of the studied system. Furthermore, the
sotopic composition of the CO2 in the HH brine is not known andhus, it is not possible to compare the injected CO2 with that presentt depth.
Summarizing, the establishment of the geochemical baselinef surface and ground waters through monitoring programs, thathould include the acquisition of large spectrum of chemical andsotopic parameters, before commencing the pre-injection of CO2s a key point for assuring that during the operational and post-perational period no modifications have occurred.
. Conclusions
In this paper the very first geochemical and isotopic data forhe surface and spring waters from the HH, where a pilot plantill shortly be established to inject pure CO2, were presented.
he chemical and isotopic compositions indicate that the studiedaters, characterized by relatively low TDS and a Ca2+(Mg2+)-
CO3− hydrochemical facies, are fed by meteoric waters circulatinglong a shallow hydrogeological pattern. Despite the fact that annthropogenic source of NO3 was recognized, two springs (namelyuente Hontomin: FH3 and, at minor extent, Fuente Laguillo: LA1)
show clues of a possible contribution by deeper waters as derivedby the relatively high concentrations of As, B, Ba and U. Similargeochemical features were also found in the Rio Ubierna for whichinputs by more saline waters can be hypothesized. The HH waterchemistry is mainly related to water–rock interaction processesthat involve the sedimentary units characterizing the HH area, suchas dissolution of Ca(Mg)-carbonates driven by conversion of H2CO3in HCO3
− ion. Thus, calcite is the main Ca-supplier, due to its veryhigh dissolution rate, under far-from-equilibrium conditions, com-pared to that of Ca-bearing silicates and Al-silicates (e.g. Marini,2007). The Ca2+(Mg2+)-HCO3
− waters are indeed generally com-patible with closed-system equilibration with carbonate minerals.A significant anthropogenic contamination seems to affect the HHwaters, since particularly high NO3
− concentrations were found inthe springs close to the injection area. The �13C-CO2 and �13C-TDICindicates a biogenic source for carbon dioxide, which in some casesis the dominant component among the dissolved gases, the latterbeing commonly characterized atmospheric-derived N2, O2 and Ar.
The periodical monitoring (from January 2010 to April 2011)carried out in five spring discharges located in the proximity of thesite where CO2 will be injected have indicated significant variationsin terms of absolute concentrations and molar ratios of the maincomponents.
The geochemical and isotopic data of the surface and springwaters in the surroundings of HH are relevant since they can beconsidered as background values when intra- and post-injectionmonitoring programs will be carried out. As a consequence, mainand minor solutes, including the carbonate equilibria, are to beconsidered if a CO2 leakage through the cap rock would be occur-ring. Nevertheless, the recorded presence of an anthropogeniccontribution cannot be neglected when computing the effectsderiving by a CO2 leakage whenever would be interacting withthe shallow aquifer. Trace elements, particularly for those watersamples where a deep component was likely be recognized (e.g.FH3, LA1 and Rio Ubierna), appear also suitable for a geochem-ical monitoring. Nevertheless, chemistry of the dissolved gases,the geochemical modeling and TDIC and �13CTDIC values were alsorevealed to be important tracers and should be considered when ageochemical monitoring will be designed. The geochemical con-ditions currently established would indeed change in an eventof CO2 leaking and be recorded in the shallow groundwater sys-tem, modifying the geochemical processes governing the waterand dissolved gas composition recognized during this pre-injectionphase.
Acknowledgments
F. Grandia and J. Bruno are gratefully thanked for their encour-agement and help. J. Caballero is gratefully acknowledged for hisassistance in the field. Many thanks are due to A. Perez Estaun forkindly providing the unpublished chemical data of the HH brine.
This work was financially supported by Fundación Ciudad de laEnergía in the framework of a project with the CNR-IGG of Florence(Italy) (Resp. O. Vaselli) and co-financed by the European Com-munity European Energy Programme for Recovery. Many thanks
Greenh
ai
Tm
R
A
A
A
B
B
B
B
B
C
C
C
C
C
CC
D
D
E
E
F
F
G
G
G
G
G
B. Nisi et al. / International Journal of
re due to J.J. Gale and three anonymous reviewers who greatlymproved an early version of the manuscript.
The sole responsibility of this publication lies with the authors.he European Union is not responsible for any use that may beade of the information contained therein.
eferences
lcalde, J., Carbonell, R., Martí, D., Calahorrano, A., Palomeras, I., Ayarza, P., Pérez-Estaún, A., 2010. Seismic characterization of a CO2 storage pilot plant in a SalineAquifer (Hontomín, Spain). American Geophysical Union, Fall Meeting 2010.abstract #NS41A-1505.
ppelo, C.A.J., Postma, D., 1993. Geochemistry, Groundwater and Pollution. A.A.Balkema, Rotterdam, 536 pp.
rostegui, J., Irabien, M.J., Sangüesa, J., Zuluaga, M.C., 2000. La formacion de Utrillasen el borde sur de la Cuenca Vasco-Cantabrica: aspectos estratigraficos, miner-alogicos y geneticos. Estudios Geológicos 56, 251–267.
arth, J.A.C., Cronin, A.A., Dunlop, J., Kalin, R.M., 2003. Influence of carbonates onthe riverine carbon cycle in an anthropogenically dominated catchment basin:evidence from major elements and stable carbon isotopes in the Lagan River (N.Ireland). Chemical Geology 200, 203–216.
enito-Calvo, A., Perez-Gonzalez, A., 2007. Erosion surfaces and Neogene land-scape evolution in the NE Duero Basin (north-central Spain). Geomorphology88, 226–241.
erner, E.K., Berner, R.A. (Eds.), 1996. Global Environmental: Water, Air and Geo-chemical Cycles. Prentice-Hall, Upper Saddle River, NJ.
owers, T.S., Jackson, K.J., Helgeson, H.C., 1984. Equilibrium activity diagrams forcoexisting minerals and aqueous solutions at pressures and temperatures to5 kb and 600 ◦C. Springer, New York, pp. 397.
uil, B., Gómez, P., Pena, J., Garralón, A., Galarza, C., Durán, J.M., Domínguez, R.,Escribano, A., Turrero, M.J., Robredo, L.M., Sánchez, L., 2012. Caracterizacióny monitorización hidrogeoquímica de los acuíferos superiores a la formaciónalmacenamiento de CO2 (Hontomín, Burgos) y actualización de la caracteri-zación de aguas superficiales. Informe técnico CIEMAT/DMA/2G010/1/2012 (InSpanish).
alvo, J.M., 2002. Caracterización del valor fertilizante y posible utilización de aguasresiduales del proceso de fabricación de explosivos en el Páramo de Masa. MasterThesis in Environmental Engineering. University of Santiago Spain) (In Spanish).
antucci, B., Montegrossi, G., Vaselli, O., Tassi, F., Quattrocchi, F., Perkins,E.H., 2009. Geochemical modeling of CO2 storage in deep reservoirs: theWeyburn Project (Canada) case study. Chemical Geology. 265, 181–197,http://dx.doi.org/10.1016/j.chemgeo.2008.12.029.
hadwick, R.A., Arts, R., Eiken, O., 2005. 4D seismic quantification of a growingCO2 plume at Sleipner, North Sea. Petroleum Geology Conference Series 6,1385–1399.
lark, I.D., Fritz, P., 1997. Environmental Isotopes in Hydrogeology. Lewis, BocaRaton.
oleman, M.L., Shepherd, T.J., Rouse, J.E., Moore, G.R., 1982. Reduction of water withzinc for hydrogen isotope analysis. Analytical Chemistry 54, 993–995.
raig, H., 1961. Isotopic variations in meteoric waters. Science 133, 1702–1703.hiodini, G., Frondini, F., Cardellini, C., Parello, F., Peruzzi, L., 2000. Rate of dif-
fuse carbon dioxide Earth degassing estimated from carbon balance of regionalaquifers: the case of central Apennine, Italy. Journal of Geophysical Research105, 8423–8434.
amen, K., Faaij, A., Turkenburg, W., 2006. Health, safety and environmental risksof underground CO2 storage—overview of mechanisms and current knowledge.Climatic Change 74, 289–318.
rever, J.I., 1997. The Geochemistry of Natural Waters – Surface and GroundwaterEnvironments. Prentice Hall, New Jersey, USA, pp. 208.
pstein, S., Mayeda, T.K., 1953. Variation of the 18O/16O ratio in natural waters.Geochimica Cosmochimca Acta 4, 213–224.
vans, White, W.C., Rapp, L.D., 1998. Geochemistry of some gases in hydrothermalfluids from the southern Juan de Fuca ridge. Journal of Geophysical Research 15,305–313.
ernàndez, M., Marzán, I., Correia, A., Ramalho, E., 1998. Heat flow, heat production,and lithospheric thermal regime in the Iberian Peninsula. Tectonophysics 291,29–53.
rondini, F., Caliro, S., Cardellini, C., Chiodini, G., Morgantini, N., Parello, F., 2008.Carbon dioxide degassing from Tuscany and Northern Latium (Italy). Global andPlanetary Change 61, 89–102.
aillardet, J., Dupré, B., Allègre, C.J., Négrel, P., 1997. Chemical and physical denuda-tion in the Amozon River Basin. Chemical Geology 142, 141–173.
aillardet, J., Dupré, B., Louvat, P., Allegre, C.J., 1999. Global silicate weathering andCO2 consumption rates deduced from the chemistry of large rivers. ChemicalGeology 159, 3–30.
at, J.R., Carmi, H., 1971. Evolution of the isotopic composition of atmosphericwaters in the Mediterranean Sea area. Journal of Geophysical Research 75,3039–3040.
iggenbach, W.F., 1995. Composition of fluids in geothermal systems of the Taupo
Volcanic Zone, New Zealand, as a function of source magma. In: Chudaev, K.A.(Ed.), Water–Rock Interaction, vol. 8, pp. 9–12.unter, W.D., Perkins, E.H., McCann, T.J., 1993. Aquifer disposal of CO2-rich gases:reaction design for added capacity. Energy Conversion and Management 34,941–948.
ouse Gas Control 14 (2013) 151–168 167
Gunter, W.D., Wiwchar, B., Perkins, E.H., 1997. Aquifer disposal of CO2-rich gases:extension of the time scale of experiment for CO2-sequestering reactions bygeochemical modeling. Mineralogy and Petrology 59, 121–140.
Gunter, W.D., Perkins, E.H., Hutcheon, I., 2000. Aquifer disposal of CO2-rich gases:modeling of water–rock reactions for trapping of acid wastes. Applied Geochem-istry 15, 1085–1095.
Gunter, W.D., Bachu, S., Benson, S.M., 2004. The role of hydrogeological and geo-chemical trapping in sedimentary basins for secure geological storage for carbondioxide. In: Baines, S.J., Worden, R.H. (Eds.), Geological Storage of Carbon Diox-ide, vol. 233. Geological Society Special Publication, London, UK, pp. 129–145.
Han, G., Liu, C.-Q., 2004. Water geochemistry controlled by carbonate dissolution: astudy of the river waters draining karst-dominated terrain, Guizhou Province,China. Chemical Geology 204, 1–21.
Helgeson, H.C., 1968. Evaluation of irreversible reactions in geochemical pro-cesses involving minerals and aqueous solutions: I. Thermodynamic relations.Geochimica Cosmochimica Acta 32, 853–877.
Hernaiz, P.P., 1994. La falla Ubierna (margen SO de la cuenca Cantábrica). Geogazeta16, 39–42 (In Spanish with English Abstract).
Hernaiz, P.P., Serrano, A., Malagon, J., Rodriguez Canas, C., 1994. Evolucion structuraldel margen SO de la Cuenca Vasco-Cantabrica. Geogaceta 15, 143–146.
IPCC, 2005. IPCC special report on carbon dioxide capture and storage. In: Metz,B., Davidson, O., de Coninck, H.C., Loos, M., Meyer, L.A. (Eds.), Preparedby Work ing Group III of the Intergovernmental Panel on Climate Change.Cambridge University Press, Cambridge, United Kingdom/New York, NY, USA,p. 442.
ITGE-Instituto Tecnológico GeoMinero de Espana 1998. Diputación Provincial deBurgos, 1998. Atlas del medio hídrico de la provincia de Burgos.
Jones, D.J., Beaubien, S.E., Baubron, J.C., Cinti, D., Davis, J.R., Emery, C., Fascetti, A.,Lombardi, S., Michel, K., Morgantini, N., Penner, L., Quattrocchi, F., Strutt, M.H.,2006. Continued Soil Gas Monitoring at the Weyburn Unit in 2004. Report No.COAL R288 DTI/Pub URN 05/1261, p. 20.
Korre, A., Imrie, C.E., May, F., Beaubien, S.E., Vandermeijer, V., Persoglia, S., Golmen, L.,Fabriol, H., Dixon, T., 2011. Quantification techniques for potential CO2 leakagefrom geological storage sites. Energy Processes 4, 3413–3420.
Kreamer, D.K., Hodge, V.F., Rabinowitz, I., Johannesson, K.H., Stetzenbach, J., 1996.Trace element geochemistry in water from selected springs in Death ValleyNational Park, California. Ground Water 34, 95–103.
Langelier, W., Ludwig, H., 1942. Graphical methods for indicating the mineral charac-ter of natural waters. Journal of American Water Works Association 34, 335–352.
Lupion, M., Diego, R., Loubeau, L., Navarrete, B., 2011. CIUDEN CCS project: statusof the CO2 capture technology development plant in power generation. EnergyProcedia 4, 5639–5646.
Macías, F., Bao, M., Rodríguez, L., Castresana, J.M., Allué, C., Garzía-López, J.M., 2005.Procesos de regeneración de suelos y sistemas forestales en parameras calizas.Ensayos en el Páramo de Masa (Burgos). Proceed. 4th Congress on Spanish Forsts,26-30 Septiembre 2005. Zaragoza, Spain (In Spanish).
Marini, L., 2007. Geological sequestration of carbon dioxide: thermodynamics, kinet-ics, and reaction path modeling. In: Developments in Geochemistry. ElsevierScience, Amsterdam, p. 453.
Mediavilla, R., Dabrio, C.J., Martin-Serrano, A., Santisteban, J.L., 1996. Lacustrine Neo-gene systems of the Duero Basin: evolution and controls. In: Friend, P.F., Dabrio,C.J. (Eds.), Tertiary Basins of Spain: the Stratigraphic Record of the Crustal Kine-matics. Cambridge University Press, UK, pp. 228–236.
Meybeck, M., 1979. Concentrations de eaux fluviales en èlèments majeurs et apportsen solution aux ocèans. Rev. Gèol. Dyn. Gèogr. Phys. 21, 215–246.
Minissale, A., Vaselli, O., 2011. Karst springs as natural pluviometers: constraints onthe isotopic composition of rainfall in the Apennines of central Italy. AppliedGeochemistry 26, 838–852.
Myrttinen, A., Becker, V., van Geldern, R., Würdemann, H., Morozova, D., Zimmer, M.,Taubald, H., Blum, P., Barth, J.A.C., 2010. Carbon and oxygen isotope indicationsfor CO2 behaviour after injection: First results from the Ketzin site (Germany).International. Journal of Greenhouse Gas Control 4, 1000–1006.
Myrttinen, A., Becker, Barth, J.A.C., 2012. A review of methods used for equilibriumisotope fractionation investigations between CO2 and dissolved inorganic car-bon. Earth Science Reviews 115, 192–199, http://dx.doi.org/10.1016/j.earscirev.2012.08.004.
Mook, W.G., Bommerson, J.C., Staverman, W.H., 1974. Carbon isotope fractionationbetween dissolved bicarbonate and gaseous carbon dioxide. Earth Planetary.Science Letters 22, 169–176.
Négrel, Ph, Allegre, C.J., Dupre, B., Levin, E., 1993. Erosion sources determined byinversion of major and trace element ratios and strontium isotopic ratios in riverwater: the Congo Basin case. Earth and Planetary. Science Letters 120, 59–76.
Oldenburg, C.M., 2003. Carbon dioxide as cushion gas for natural gas storage. Energy& Fuels 17, 240–246.
Permanyer, A., Márquez, G., Gallego, J.R., 2013. Compositional variability in oilsand formation waters from the Ayoluengo and Hontomín fields (Burgos, Spain).Implications for assessing biodegradation and reservoir compartmentalization.Organic Geochemistry 54, 125–139.
Pruess, K., García, J., 2002. Multiphase flow dynamics during CO2 injection into salineaquifers. Environmental Geology 42, 282–295.
Quesada, S., Dorronsoro, C., Robles, S., 1995. Genetic relationship between the oil
of the Ayoluengo field and the Liassic source-rock of the Southwestern Basque-Cantabrian Basin (Northern Spain). In: Edited by Grimalt, J.O., Dorronsoro, C.(Eds.), Organic Geochemistry: Developments and Applications to Energy, Cli-mate, Environment and Human History. A.I.G.O.A., Donostia-San Sebastian, p.461463.
1 Greenh
Q
Q
Q
Q
R
R
RR
R
S
S
S
S
68 B. Nisi et al. / International Journal of
uesada, S., Dorronsoro, C., Robles, S., Chaler, R., Grimalt, J.O., 1997. Geochemicalcorrelation of oil form the Ayoluengo field to Liassic black shale units in thesouthwestern Basque-Cantabrian Basin (northern Spain). Organic Geochemistry27, 25–40.
uesada, S., Robles, S., 1995. Organic geochemistry, distribution and depositionaldynamics of the Liassic or- ganic facies of the Basque-Cantabrian Basin (NorthernSpain). In: Grimalt, J.O., Dorronsoro, C. (Eds.), Organic Geochemistrw Develop-ments and Applications to Energy, Climate, Environment and Human History.A.1.G.O.A, Donostia- San Sebastian, pp. 464–465.
uesada, S., Robles, S., Pujalte, V., 1993. E1 Jurásico marino del margen suroccidentalde la Cuenca Vasco-Cantábrica y su relación con la explotación de hidrocarburos.Geogaceta 13, 92–96.
uintá, A., Tavani, S., 2012. The foreland deformation in the south-western Basque-Cantabrian Belt (Spain). Tectonophysics 576-577, 4–19.
aistrick, M., Mayer, B., Shevalier, M., Perez, R.J., Hutcheon, I., Perkins, E., Gunter, B.,2006. Using chemical and isotopic data to quantify ionic trapping of injectedcarbon dioxide in oil field brines. Environmental Science & Technology 40,6744–6749.
at, P., 1988. The Basque–Cantabrian Basin between the Iberian and European platessome facts but still many problems. Revista de la Sociedad. Geológica de Espana1, 327–348.
ollinson, H., 1993. Using Geochemical Data. Longman, London, UK, pp. 352.oy, S., Gaillardet, J., Allègre, C.J., 1999. Geochemistry of dissolved and suspended
loads of the Seine river, France: anthropogenic impact, carbonate and silicateweathering. Geochimica et Cosmochimica Acta 63, 1277–1292.
utqvist, J., Tsang, C.-F., 2002. A study of caprock hydromechanical changes asso-ciated with CO2 injection into a brine aquifer. Environmental Geology 42,296–305.
alata, G.G., Roelke, L.A., Cifuentes, L.A., 2000. A rapid and precise method formeasuring stable carbon isotope ratios of dissolved inorganic carbon. MarineChemistry 69, 153–161.
antisteban, J.L., Mediavialla, R., Martin-Serrano, A., Dabrio, C.J., 1996. In: Friend,P.F., Dabrio, C.J. (Eds.), Tertiary Basins of Spain: the Stratigraphic Record of theCrustal Kinematics. Cambridge University Press, UK, pp. 183–187.
anchez-Moya, Y., Sopena, A., 2004. El Rift Mesozoico Iberico. In: Vera, J.A. (Ed.),
Geologia de Espana, Sociedad. Geológica de Espana. IGME, Madrid, pp. 484–485.errano-Onate, A., Martínez del Olmo, W., Cámara Rupelo P., 1990. Diapirismodel Trías salino en el Dominio Cántabro-Navarro. In Libro Homenaje aRafael Soler: Asociación de Geólogos y Geofísicos del Petróleo, pp. 115–122(In Spanish).
ouse Gas Control 14 (2013) 151–168
Solomon, S., Carpenter, M., Flach, T.A., 2008. Intermediate storage of carbon diox-ide in geological formations: a technical perspective. International Journal ofGreenhouse Gas Control 2, 502–510.
Stumm, W., Morgan, J.J., 1996. Aquatic Chemistry. Chemical Equilibrium and Ratesin Natural Waters. New York, John Wiley.
Tassi, F., Montegrossi, G., Vaselli, O., 2004. Metodologie di campionamento ed analisiin fase gassosa. CNR-IGG Florence, Internal Report 1/2004, pp. 17 (in Italian).
Tassi, F., Vaselli, O., Luchetti, G., Montegrossi, G., Minissale, A., 2008. Metodo per ladeterminazione dei gas disciolti in acque naturali. CNR-IGG Rapporto Interno n.2/2008, pp. 10 (in Italian).
Tassi, F., Vaselli, O., Tedesco, D., Montegrossi, G., Darrah, T., Cuoco, E., Mapen-dano, M.Y., Poreda, R., Delgado Huertas, A., 2009. Water and gas chemistryat Lake Kivu (DRC): geochemical evidence of vertical and horizontal hetero-geneities in a multi-basin structure. Geochemistry, Geophysics, Geosystems 10(2), http://dx.doi.org/10.1029/2008GC002191.
Tavani, S., Anton Munoz, J., 2012. Mesozoic rifting in the Basque–Cantabrian Basin(Spain): inherited faults, transversal structures and stress perturbation. TerraNova, http://dx.doi.org/10.1111/j. 1365-3121.2011.01040x.
Tavani, S., Quintà, A., Granado, P., 2011. Cenozoic right-lateral wrench tectonics inthe Western Pyrenees (Spain): the Ubierna Fault System. Tectonophysics 509,238–253.
Vaselli, O., Tassi, F., Montegrossi, G., Capaccioni, B., Giannini, L., 2006. Sampling andanalysis of volcanic gases. Acta Vulcanologica 18, 65–76.
Voltattorni, N., Caramanna, G., Cinti, D., Galli, G., Pizzino, L., Quattrocchi, F., 2006.Study of CO2 natural emissions in different Italian geological scenarios: refine-ment of natural hazard and risk assessment. In: Lombardi, S., Altunina, K.L.,Beaubien, S.E. (Eds.), Advances in Geological Storage of Carbon Dioxide. NATOScience Series. Springer Publishing, Berlin, pp. 175–190.
Widory, D., Petelet-Giraud, E., Négrel, P., Ladouche, B., 2005. Tracking the sources ofnitrate in groundwater using coupled nitrogen and boron isotopes: a synthesis.Environmental Science & Technology 39, 539–548.
Wolery, T.W., Jarek R.L., 2003. Software User’s Manual. EQ3/6, Version 8.0. SandiaNational Laboratories–U.S. Department of Energy Report. pp. 376.
Zhang, J., Quay, P.D., Wilbur, D.O., 1995a. Carbon isotope fractionation during gas-water exchange and dissolution of CO2. Geochimica Cosmochimca Acta 59,
107–114.Zhang, J., Takahashi, K., Wushiki, H., Yabuki, S., Xiong, J.-M., Masuda, A., 1995b.Water geochemistry of the rivers around the Taklimakan Desert (NW China):crustal weathering and evaporation processes in arid land. Chemical Geology119, 225–237.