Spatial analysis of GM populations in Sardinia using geostatistical and climate models

Hydrogeology of the Nurra Region, Sardinia (Italy): basement-coverinfluences on groundwater occurrence and hydrogeochemistry
Giorgio Ghiglieri & Giacomo Oggiano &
Maria Dolores Fidelibus & Tamiru Alemayehu &
Giulio Barbieri & Antonio Vernier
Abstract The Nurra district in the Island of Sardinia(Italy) has a Palaeozoic basement and covers, consistingof Mesozoic carbonates, Cenozoic pyroclastic rocks andQuaternary, mainly clastic, sediments. The faulting andfolding affecting the covers predominantly control thegeomorphology. The morphology of the southern part iscontrolled by the Tertiary volcanic activity that generateda stack of pyroclastic flows. Geological structures andlithology exert the main control on recharge and ground-water circulation, as well as its availability and quality.The watershed divides do not fit the groundwater divide;the latter is conditioned by open folds and by faults. TheMesozoic folded carbonate sequences contain appreciableamounts of groundwater, particularly where structural
lows are generated by synclines and normal faults. Theregional groundwater flow has been defined. The investi-gated groundwater shows relatively high TDS andchloride concentrations which, along with other hydro-geochemical evidence, rules out sea-water intrusion as thecause of high salinity. The high chloride and sulphateconcentrations can be related to deep hydrothermalcircuits and to Triassic evaporites, respectively. Thesource water chemistry has been modified by variousgeochemical processes due to the groundwater–rockinteraction, including ion exchange with hydrothermalminerals and clays, incongruent solution of dolomite, andsulphate reduction.
Keywords Groundwater flow . Hydrogeochemistry .Salinization . Groundwater management . Italy
Introduction
The Nurra district is located in the northwestern part of theisland of Sardinia (Italy) in the Sassari Province, with80 km of coastline with the Mediterranean Sea (Fig. 1a).Its geology records a long history from Paleozoic toQuaternary, resulting in relative structural complexity andin a wide variety of rocks.
Due to intensive human activities and recent climaticchanges, the area has become vulnerable to desertification.As a result, the area is included in the national researchnetwork under the RIADE project (Integrated research forapplying new technologies and processes for combatingdesertification (RIADE project 2002–2006), set up by theItalian Ministry of Research (Ghiglieri et al. 2006).
The water demand in the study area is considerable,water being required for industry, domestic use, tourism,agriculture, and animal rearing. Nurra relies on bothsurface and groundwaters. The seasonal and perennialrivers of the area are exploited using the Cuga andSurigheddu dams, built on the highlands. However, likeon other Mediterranean islands, surface-water resourcescan periodically suffer from drastic shortage. Groundwaterin different aquifers is exploited using deep boreholeswhich can attain discharges as high as 145 l/s. The waterdemand of the city of Alghero, for example, is partially
Received: 31 March 2006 /Accepted: 15 September 2008Published online: 15 October 2008
© Springer-Verlag 2008
G. Ghiglieri ())Department of Territorial Engineering,Geopedology and Applied Geology Section,Desertification Research Group (NRD), University of Sassari,Viale Italia, 07100, Sassari, Italye-mail: [email protected]: +39-79-229261
G. OggianoInstitute of Geological Sciences and Mineralogy,University of Sassari,Corso Angioy 10, 07100, Sassari, Italy
M. D. FidelibusDepartment of Civil and Environmental Engineering,Technical University of Bari,Via Orabona 4, 70125, Bari, Italy
T. AlemayehuSchool of Geosciences,Wits University,Private bag 3, P. O. Box Wits 2050, Johannesburg, South Africa
G. Barbieri :A. VernierDepartment of Territorial Engineering,Applied Geology and Applied Geophysics Section,University of Cagliari,Piazza D’Armi, 09100, Cagliari, Italy
Hydrogeology Journal (2009) 17: 447–466 DOI 10.1007/s10040-008-0369-z

448
Hydrogeology Journal (2009) 17: 447–466 DOI 10.1007/s10040-008-0369-z

satisfied by groundwater withdrawn through five wellsdischarging a total of 96 l/s.
Notwithstanding the importance of local groundwateras the main source of good quality water and its role ofstrategic reserve in such semiarid conditions, exploitationup to now has been uncontrolled (Barbieri et al. 2005a, b;Ghiglieri et al. 2006). An additional problem in the Nurradistrict is that water users have a very scant knowledge ofthe provenance and value of the fresh water they exploit,thus leading to a high rate of unofficial exploitation.
The extensive exploitation of the Nurra aquifers and theconsequent water-quality deterioration require a revision ofcurrent water management practices. This revision has to bebased on good knowledge of both the potential of aquifersin terms of geometry and storage and quality in terms ofhydrogeochemical features, which, up to now, has beendisregarded. This report presents the synthesis of lengthyresearch, of which the main aims of have been: (1) toreconstruct the hydrogeological setting and the regionalgroundwater flow; (2) to ascertain the origin of salinity; (3)to recognise the boundary conditions of different hydro-geologic units by mean of processes that control theconcentration of major constituents in the different aquifers.Achieving these aims will establish a basis for developing anappropriate monitoring programme and therefore improvedmanagement of the water resources of the region (Ghiglieriet al. 2006, 2007, 2008).
Methodology
A geological and structural map of the area has beenprepared on the basis of recent data and field surveys. Theconceptualization of the hydrogeological setting led to theidentification of the recharge and discharge areas andmajor controlling structures. The field data have beenintegrated with aerial photo interpretation and geophysicalprospecting (gravimetric profiles) (Ghiglieri et al. 2006).
For the purposes of the RIADE project, technical dataand relevant information from 424 boreholes werecollected together with data from 87 springs. A globalpositioning system (GPS) was used to locate each feature(Ghiglieri et al. 2006).
From these locations, 99 wells and 21 springs wereselected for chemical monitoring purposes. In order toinvestigate the behaviour of the aquifers at two differenttimes of the year, water was sampled for chemical analysisfrom 118 water points (97 wells and 21 springs) inDecember 2004, and from 55 water points (51 wells and 4springs) in June 2005 (Fig. 1c).
Water samples were collected from pumped wells anddirectly from springs in 1,000-ml polyethylene bottles.Electrical conductivity, pH, alkalinity and temperaturewere measured in the field while Eh was determined in the
laboratory. The chemical analyses were performed at theUniversity of Sassari (Italy), immediately after samplecollection. The analysis of cations was undertaken usingan Analyst 200 atomic absorption spectrometer. Anionswere analyzed by an ion chromatograph with fourcomponents: a Waters pump (model 590), a Waterselectrical conductivity detector (model 431), an Alltechsolid phase chemical suppressor (SPCS, model 335) and aSRI PeakSimple data system (model 203).
For stable oxygen and hydrogen isotopes, sevengroundwater samples were collected from one spring andsix boreholes. For tritium analysis only three watersrepresentative of the three main hydrogeologic units weresampled. The analysis was carried out in the CNR isotopehydrology laboratory, Pisa, Italy.
Geological setting
The Nurra district encompasses a structural high, whichdeveloped during the Tertiary and where older rocksequences are progressively exposed westward (Fig. 1b).The northeastern limit of the area is marked by the upperMiocene deposits of a half-graben Porto Torres basin(Thomas and Gennessaux 1986; Funedda et al. 2000) thatcover the older rocks. The Variscan metamorphic basementis well exposed in the westernmost sector near the coast(Fig. 1b). As regards the basement, grey Autunian arenitesand silts, and upper Permian and Triassic continental redbeds with interlayered alkaline volcanics occur. The firstmarine transgressive deposits consist of dolostones, lime-stones and evaporites of Middle Triassic age showing thetypical Germanic facies.
Since this time, shallow marine sedimentation, in acarbonate platform environment, had been almost contin-uous until Aptian-Albian time. During the Albian-Aptiantime, an important tectonic phase took place in Nurra,referred to as the Bedoulian movement (Oggiano et al.1987). This tectonic event was responsible for theemersion that gave rise to widespread bauxite depositsand caused the partial erosion of the Jurassic succession.
During the Coniacian stage, all the Nurra bauxiticpalaeosurface was submerged, due to a new transgression,which led to carbonate-terrigenous sedimentation lastingup to the Maastrichtian. The post-Maastrichtian emersion issupposedly related to a new tectonic phase (Laramic phase;Oggiano et al. 1987). Since the Paleocene, the entireregion experienced weathering, erosion, widespread cal-calkaline volcanism and two important deformation eventslinked both to the Pirenaic and to the North Apennine(Carmignani et al. 1995) orogenesis. These deformationsgenerated minor thrusts and mild NE trending folds whichdominate the present geometry of the Mesozoic cover and,as a consequence, the geometry of the main aquifers.
The Variscan basement outcrops in the westernmost partof the study area, consisting chiefly of black phyllites withminor quartzites, meta-basalts and oolitic ironstones. To-wards the north, due to the increased metamorphic grade, itconsists of micaschists and paragneisses, while the phyllites
�Fig. 1 The Nurra district of Sardinia: a location map; b geologicalmap; c location of water sampling points in the Calich catchment(delineated in b). In the legend gw stands for groundwater
449
Hydrogeology Journal (2009) 17: 447–466 DOI 10.1007/s10040-008-0369-z

inhibit vertical infiltration in this area. The only rock withvery low secondary permeability (1×10⁻⁷ m/s) is thequartzite which is jointed due to its brittle nature.
The Mesozoic succession overlies the basement(Fig. 2). The lowest unit is an arenite-conglomeratedeposit, Permo-Triassic in age, which shows highlyvariable thickness and medium permeability. The remainingpart of the Triassic rocks consists of transgressive dolomitic,calcareous and evaporitic deposits. The thickness of thecarbonate portion is about 80 m, whereas the stratigraphicthickness of the evaporitic deposits, mainly gypsum, is notknown; due to their ductile behaviour, these depositsare severely deformed. The permeability of the Triassiccarbonate and gypsum is high (Fig. 3) and the depositplays an important role in conditioning the groundwatersalinity.
A carbonate sequence that encompasses the entireJurassic system lies on the Triassic evaporites. Its baseconsists of alternations of marls and limestones with thindark pyrite-rich shale levels. Most of the sequence is madeof dolostones and limestones; green marls with typicalPurbeckian facies also occur towards the top of this systemgrading into the Cretaceous limestone. The Jurassicdeposits tend to increase their thickness to the southeastand attain maximum thickness of 800 m to the south, closeto the Su Zumbaru Fault (central part of the study area,Figs. 1–3). The permeability and the transmissivity of theJurassic sequence are high due to fractures and karsticconduits.
The Cretaceous succession lies on “Purbeckian” marls;it consists of two sequences separated by an angularunconformity, which is marked by bauxite deposits andrepresents a hiatus corresponding to the mid-Cretaceous.The lower sequence is represented by limestone with
typical Urgonian facies. This limestone consists of astrongly karstified biosparite that, where not completelyeroded, reaches 180 m in thickness (Figs. 1b and 2).
The upper Cretaceous sequence also consists of lime-stones with an important intercalation of glauconite-bearing,more or less arenitic marls. Some boreholes penetrate 300 mof upper Cretaceous deposits in the area south of Olmedo(Oggiano et al. 1987).
Above a karstic palaeosurface, developed on theMesozoic carbonate rocks, several pyroclastic flows weredeposited during the lower Miocene. The pyroclasticdeposits formed the volcanic plateau in the southeasternpart of the area. The different flow units are separated bypalaeosols; the thickness of each flow varies from a few tohundreds of metres. Bentonite deposits deriving from thehydrothermal alteration of feldspar and glassy materialgenerally seal the bottom of the pyroclastic stack. Thewelded tuffs that occur as a top cover are intensivelyfractured favouring vertical infiltration.
The pyroclastic flows (Figs. 1b and 2) are capped byBurdigalian calcarenites that outcrop only at the easternboundary of the study area along with sands andconglomerates of Tortonian age derived from a reworkingof the basement. The latter clastic deposits are confinedwithin structural lows interpreted as strike slip basins.
Quaternary aeolian sands, travertines and loose sedi-ments consisting of alluvial sands and gravels cover mostof the plains in the west of the region, occurring aspediment slope deposits and valley fill materials that rangein thickness from 10 to 40 m. All these deposits have
Fig. 2 Representative geological cross sections
Fig. 3 Hydrogeological map. K hydraulic conductivity �
450
Hydrogeology Journal (2009) 17: 447–466 DOI 10.1007/s10040-008-0369-z

451
Hydrogeology Journal (2009) 17: 447–466 DOI 10.1007/s10040-008-0369-z

generally good permeability, allowing infiltration into thelower aquifers.
Structural framework
The basement tectonics reflect the polyphase evolution ofthe Variscan events in Sardinia. The only hydrogeologi-cally relevant structure of this unit is linked to the latestVariscan folding phase that generated a wide synform withan east striking and dipping axis. This structure controlsthe superficial drainage, which is roughly directedeastwards, i.e. toward the Mesozoic limestones. The firsttectonic instability affecting the Mesozoic cover started inthe Middle-Cretaceous time with transtensive Bedoulianmovements followed by a transpressive regime (Oggiano etal. 1987); these caused the angular unconformity betweenthe Lower Aptian and the Coniacian (Oggiano et al. 1987),an interval which lead to the development of the bauxitementioned above. These tectonic movements resulted in thedevelopment of some uplifted blocks bounded by normalfaults and mild folding within a sinistral wrench shear beltrunning between the Olmedo area and Porto Conte bay(Fig. 2). Hence, during the peneplanation of the bauxiticsurface, due to the erosive removal of at least 600 m ofMesozoic sequence towards the north, the actual thicknessof the Mesozoic cover increases to the south.
The evidence for tectonic movements subsequent to thedevelopment of the bauxite horizon and its Coniaciancover comprise syn-tectonic breccias and olistostromeswithin Upper Cretaceous sediments close to an importantfault. These tectonic movements caused the uplift of theMesozoic platform south of a line joining Uri and Alghero(Mamuntanas-Su Zumbaru Fault, Oggiano et al. 1987).This tectonic activity was tentatively ascribed to theLaramic phase. Other faults and folds, with NE axialstrike, involving the whole Mesozoic sequence except thedeposits younger than Lower Miocene; can be referred tothe Eocene Pyrenaic phase and the Oligocene Apenniniccollision. During the Oligocene and early Miocene, newleft lateral movements caused the reactivation of the ENEoriented, strike-slip fault (Carmignani et al. 1995) of mid-Cretaceous age. From the Burdigalian, at the same time asthe opening of the Balearic basin, until the Pliocene, anextensional regime was present, giving rise to normalfaults with various orientations.
Hydrogeological features
The thickness of the Mesozoic sequences is known onlyapproximately because of the uncertainties associatedwith the deep erosion during the Middle Cretaceous andother erosion events, which occurred since the begin-ning of the Cenozoic. However, in the main structurallows, the Mesozoic aquifer can easily reach thicknessesof 1,000 m (Ghiglieri et al. 2006, 2007). The deforma-tion history of the Mesozoic rocks exerted a strong
control on the following features of the geometry of theaquifers:
– TheMid-Cretaceous erosive stage controls the thickness ofthe Mesozoic carbonate rocks. In general, the thicknessincreases southwards and progressively diminishes north-ward in consequence of the presence of a palaeo-structuralhigh. The Mesozoic sequences, due to their hugethickness, represent the main aquifer of the region, whichis shallower and thinner moving northward (Figs. 2 and 3).
– Locally synformal geometries, due to Upper Creta-ceous deformation involving marly strata, can allowthe formation of perched aquifers; moreover, theshortening, accommodated by folds, causes the thick-ening of the cover and, consequently, of the aquifers.
The volcanic succession thickens southward, where italso crops out at high topographic levels (500 m a.s.l.). Thisunit hosts a multilayer aquifer due to alternance of weaklywelded, ignimbrites and deeply fractured high-grade ignim-brite. Each permeable layer is confined by clay-rich paleosolsor by pumice and ash flows converted into bentonite.
The strike-slip faults, due to their steep dip and deeppenetration, allowed discharge of hypothermal fluid thatresulted in the development of bentonite and zeolitesdeposits in the volcanic rocks. Because of their high cationexchange capacities (CEC), these minerals exert a controlon water chemistry. Hydrothermal alteration, which oc-curred in Upper Miocene, is a widespread phenomena inthe study area and in the neighbouring localities. In thestudy area, in particular, epigenetic kaolin and bentonite arepresent (Mameli 2000). Zeolites with high CEC aredescribed by Cerri et al. (2001) and Cerri and Mameli(2004). Bentonite occurs mostly in the calcium form,while zeolite occurs in calcium-, sodium- and potassium-rich varieties (Cerri et al. 2001). With regards to chloride,concentrations up to 20,000 ppm have been detected insome deeply kaolinized volcanic rocks (Mameli 2001).
In the southeastern and southern part of the area there arehypothermal manifestations in the form of thermal springsassociated with deep running strike-slip faults. The fielddata also indicate that groundwaters in the volcanic rockshave high temperatures that range between 19 and 24°C,including the cold winter season. In order to identify therecharge area, the groundwater divide has been recognized(Fig. 3), allowing the mean annual recharge to beestimated (about 37×106 m3, Ghiglieri et al. 2006, 2008).
Growndwater regional flow
The mean annual rainfall in the Nurra district, calculatedover 30 years (1960–1990), averages 607 mm with abimodal pattern within a year, which is typical of theMediterranean region. The mean annual temperature ofthe area is 15.7°C. The recharge to the aquifers is alsoexpected to take place during the rainy months of Octoberto December and February to April after soil moisturereplenishment. The main aquifer is represented by the
452
Hydrogeology Journal (2009) 17: 447–466 DOI 10.1007/s10040-008-0369-z

Mesozoic carbonate successions with a yield that variesbetween 20 and 145 l/s. The groundwater flow direction inthis aquifer is strictly controlled by structural deformationand weathering processes (Ghiglieri et al. 2006, 2008).Due to prevalent NE–SW aligned synclines and anticlines,the direction of groundwater flow in the carbonate rocks istowards the SW. Anticlinal folds of the Paleozoic andMesozoic sedimentary rocks gave rise to high risingground in the western sector of the area; they play a veryimportant role in recharging or dispersing surface waterflows and by reducing water-rock contact time, thusgenerating relatively fresh water (see the following). Thestructural highs of Monte Doglia, Monte Pedrosu, MonteZirra, Monte Timidone and Monte Cugiareddu act asrecharge areas for the confined Jurassic aquifer; theculminations of the major anticlines also representeffective recharge areas. On the other hand, the synclinesact as storage areas for groundwater. The most prominentsynclines are those of Campu Calvagiu and Sabadiga-Alghero (Figs. 2 and 3). In the huge Sabadiga-Algherosyncline, groundwater converges from all directions andwells are high-yielding. Therefore, this synclinal zonecontains huge reserves of groundwater. Folded anticlinesforce groundwater flow through the synclinal axis andinfluence the direction of groundwater flow, as confirmedby numerical modelling in similar geometries occurring inIsrael (Ben-Itzhak and Gvirtzman 2005). The structuralframe also controls the boundary conditions: to the westthe aquifers are encircled by the contact with very lowpermeability Variscan basement, which is also the imper-meable lower boundary; to the east the Mesozoic aquiferis buried below the Miocene-hosted aquifers that feed itlaterally. To the south the main aquifers are in contact withthe volcanic complex through important strike-slip faults.
The productivity of the volcanic deposit is very lowdue to intensive weathering. The groundwater flowdirection in the volcanic massifs is towards the NW, dueto the dipping of the Pyroclastic units.
Insights from analytical results
Data reported in Table 1 relate to the superficial, springand groundwaters sampled in the Nurra district, sampledin the period September–December 2004.
Total dissolved solids (TDS)The principal feature emerging from the whole data set isthat a widespread salinization affects most of the analyzedgroundwaters. Since many different salt sources, besidespresent-day sea water, can be involved in salinizationprocesses (salt spray, evaporite dissolution, mixing withsaline fluids and thermal fluids inflows) of coastalaquifers, the identification of the sources can be difficult.
Tellam (1995) considered a number of potential saltsources and salinization processes in a Triassic sandstoneaquifer (Cheshire Basin, NE England, UK) such as sea
water concentrated by permafrost salt exclusion, reverseosmosis, leakage of brines known to be present in aCarboniferous deltaic coal-containing sequence underly-ing the sandstones, evaporite dissolution from an overly-ing Triassic mudstone/evaporite sequence, present daysea-water intrusion. Whatever the salt source, its involve-ment is normally partly obscured by water–rock interac-tion processes triggered by ionic strength increase. As anexample, groundwater salinization in carbonate aquiferscauses a renewal of karstification, with an enhancement ofsecondary porosity (Hanshaw and Back 1979; Hermanand Back 1984; Tulipano et al. 2005; Whitaker and Smart1997; Sanford and Konikow 1989a, b; Liu and Chen1996). In intergranular-flow aquifers, as well as infractured or karstic aquifers with a few percent of claysor other exchangers, salinization activates ion-exchange(Appelo and Geirnaert 1983).
The geological history of the Nurra Basin makes itlikely that among the several sources of salinity, sea water,evaporites (mainly NaCl and CaSO4), and Tertiaryhydrothermal deposits (derived from hydrothermal fluidswith dissolved salts as KCl, CaCl2, NaCl, alunite) are themore reliable. Figure 4 shows the relationship betweenTDS and chloride concentration. The TDS-Cl plot and allthe following plots distinguish all analyzed waters accordingto their type—surface-, spring- or groundwater—and, in thecase of groundwaters, their aquifer. Data from drillings, fieldsurveys and the geological and structural studies, allowedinitial attribution of the groundwater and spring samples tothe different aquifers; the hydrochemical study subsequentlyconfirmed this attribution for the 95% of samples.
Moreover, no distinction is made as to the periods ofsampling. The June 2005 sampling covered only 51% ofthe wells and 20% of the springs sampled in December2004, with the addition of other well points: the meanvariation of TDS in repeated samples was only 10%,indicating that mineralization does not vary much withseason. Therefore, both data-sets are taken into account,with the main aim of describing the general characteristicsof the different aquifers.
Figure 4 shows that TDS ranges from minimum valuesof about 200 mg/l (springs from Oligo-Miocene volcaniccomplex) to maximum values of 5,000 mg/l (groundwatersfrom Triassic aquifer). Most of the springs, a large part ofthe Jurassic groundwaters and part of the Oligo-Miocenegroundwaters show a TDS in the range 500–1,000 mg/l,while almost all Quaternary and Triassic groundwatersshow TDS higher than 1,000 mg/l. Cretaceous ground-waters cover the TDS range from 400 to 2,000 mg/l. Thevalue of about 4 meq/l has been chosen as an upper limitfor freshwater. The maximum TDS of waters having lessthan 4 meq/l of chlorides is about 1,000 mg/l.
The TDS-Cl binary plot shows the lines representingthe chemically inert mixing between present-day sea water(represented by the mean of four samples of sea watercollected offshore from the local coastal area) and,respectively, the freshest waters (springs) sampled in thehighland (corresponding to the Oligo-Miocene volcanicaquifer) and in the plain (where all the other aquifers
453
Hydrogeology Journal (2009) 17: 447–466 DOI 10.1007/s10040-008-0369-z

Tab
le1
Hyd
rochem
ical
parametersforthegrou
ndwaterssampled
inDecem
ber20
04
IDUTM
EUTM
NHU
TDS
TpH
EC
Ca
Mg
Na
KHCO3
Cl
SO4
DIC
NO3
SiO
2Δca+ΔMg
ΔNa+
ΔK
ΔSO4
SI
calcite
SI
dolomite
SI
gypsum
PCO2
10C
4430
9744
9371
4Q
1,53
919
.26.7
2,38
08.68
2.80
15.66
0.13
7.34
13.79
3.50
10.26
154
28.2
3.07
4.25
1.77
−0.1
−0.7
−1.3
7.24
E-02
15C
4418
3344
9401
4Q
2,45
317
.56.5
4,19
09.48
9.05
28.71
0.52
8.48
33.37
6.26
10.13
4930
.55.23
1.35
2.30
0.0
0.0
−1.1
3.98
E-02
20C
4430
0744
9452
2Q
1,23
018
.86.8
1,66
07.88
2.63
7.83
0.19
7.59
8.33
2.61
10.06
9226
.43.48
1.04
1.51
0.0
−0.5
−1.4
6.17
E-02
21C
4434
2844
9524
9Q
1,58
817
.86.9
2,83
04.89
5.10
20.44
0.38
8.02
16.16
5.75
9.66
031
.40.99
7.31
3.75
−0.1
−0.1
−1.3
3.89
E-02
28C
4427
5444
9477
9Q
1,14
019
.56.6
1,54
08.28
2.30
6.18
0.15
7.23
7.77
2.19
10.94
6722
.33.69
−0.19
1.15
−0.2
−0.9
−1.4
9.33
E-02
32C
4431
2744
9629
2Q
1,34
617
.87.1
1,69
07.68
3.79
9.13
0.15
5.61
6.65
4.77
6.53
278
22.8
4.85
3.71
3.86
0.0
−0.1
−1.2
2.19
E-02
4C44
1986
4493
156
Q2,04
019
.07.2
2,98
015
.22
5.43
14.35
0.29
5.46
22.11
3.06
6.10
309
46.9
10.16
−3.83
0.39
0.0
0.0
−1.2
1.62
E-02
112C
4502
0144
9192
1OM
997
19.0
6.2
1,90
02.00
2.72
14.14
0.46
2.20
15.87
1.54
3.66
593
.3−4
.22
1.33
−0.42
−1.4
−2.7
−2.1
3.63
E-02
145C
4487
7044
9734
0OM
2,71
619
.76.9
5,14
04.24
10.37
35.67
1.76
9.78
35.88
4.40
12.11
235
62.4
0.68
7.46
0.16
−0.2
0.0
−1.6
5.89
E-02
152C
4504
5144
8699
9OM
600
18.5
6.5
9,91
1.30
3.05
6.09
0.20
1.47
8.19
0.79
6.53
1171
.0−2
.67
−0.57
−0.30
−2.4
−4.4
−2.5
1.23
E-01
157S
451199
4497
403
OM
1,45
519
.06.0
2,31
06.29
6.75
11.14
0.15
8.56
13.17
2.13
11.29
6253
.34.78
0.27
0.48
−0.1
−0.1
−1.6
6.76
E-02
165S
4548
4044
9505
3OM
1,98
518
.76.8
4,08
06.74
7.41
27.40
0.61
2.73
35.63
2.98
3.26
6448
.70.28
−1.75
−1.23
−0.4
−0.8
−1.5
1.32
E-02
167S
4527
7744
9462
9OM
1,91
322
.47.0
3,78
05.34
9.05
23.49
0.51
3.29
34.81
2.57
4.26
1160
.50.73
−5.08
−1.55
−0.6
−0.8
−1.7
2.63
E-02
173S
4615
9944
9229
9OM
822
20.2
6.8
1,32
22.99
1.15
8.87
0.30
6.53
6.01
1.19
8.25
035
.5− 2
.32
4.13
0.35
−0.3
−1.0
−2.0
4.47
E-02
174S
4624
9344
9382
8OM
713
18.8
7.6
1,08
51.90
1.15
7.31
0.33
5.12
4.99
0.78
6.23
288
.3−3
.16
3.45
0.06
−0.5
−1.2
−2.3
2.75
E-02
178S
4582
2744
9236
4OM
1,98
017
.77.1
4,42
07.14
11.52
25.66
0.41
0.30
35.93
4.03
0.53
9947
.84.72
−3.95
−0.22
−2.0
−3.7
−1.4
5.62
E-03
180S
4579
6444
9088
9OM
979
18.4
7.0
1,89
03.14
4.94
11.40
0.24
2.66
14.59
1.50
4.88
754
.2−0
.53
−0.56
−0.32
−1.3
−2.3
−2.0
5.37
E-02
181S
4552
4444
9116
2OM
525
17.0
7.7
998
1.10
1.32
6.96
0.17
1.40
7.16
0.64
3.41
2060
.5−4
.34
1.13
−0.33
−2.1
−4.1
−2.6
4.68
E-02
192S
4598
0544
9031
4OM
540
16.9
5.8
980
1.62
1.93
5.39
0.13
1.86
6.38
0.58
4.52
2557
.4−3
.00
0.18
−0.30
−1.8
−3.6
−2.5
6.17
E-02
197S
4553
2844
87011
OM
1,09
417
.66.9
1,78
04.84
4.94
9.79
0.23
3.65
13.50
1.68
6.07
5161
.91.44
−1.28
−0.01
−0.9
−1.7
−1.8
5.75
E-02
201S
4521
3544
8720
6OM
692
21.6
6.6
1,31
21.90
1.32
9.35
0.32
2.37
10.70
0.55
2.68
042
.8−4
.42
0.72
−0.82
−0.6
−1.3
−2.5
8.13
E-03
205S
4530
4744
8972
3OM
900
17.2
7.2
1,56
03.57
4.12
8.26
0.33
1.26
10.30
1.48
6.67
133
88.3
0.15
−0.03
0.15
−2.2
−4.4
−1.9
1.29
E-01
206S
4540
4544
9089
4OM
1,35
618
.16.4
3,05
04.54
7.82
16.96
0.31
2.16
25.07
2.02
6.52
01.13
−3.67
−0.99
−1.7
−3.0
−1.8
1.05
E-01
115C
4440
5144
9398
4C
1,67
319
.87.5
2,41
02.89
4.61
13.48
0.21
6.29
12.61
4.06
6.79
453
35.5
−0.61
3.15
2.47
0.0
0.0
−1.6
1.29
E-02
118C
4456
0444
9389
7C
2,07
221
.06.8
3,50
06.09
6.09
26.53
0.36
9.19
24.62
5.81
9.38
6237
.31.06
6.32
2.85
0.1
0.1
−1.3
7.08
E-03
125S
4515
9745
0282
6C
1,119
18.2
6.7
1,36
38.28
2.30
5.31
0.10
7.59
7.04
2.07
10.75
5921
.83.87
−0.49
1.11
−0.1
−0.7
−1.4
7.76
E-02
126C
4464
7044
9670
2C
1,17
218
.57.5
1,90
02.89
2.63
15.66
0.45
7.79
12.19
1.88
8.29
028
.2−2
.48
5.91
0.34
0.0
0.0
−1.9
1.26
E-02
135C
4447
5444
9477
8C
1,59
920
.77.0
2460
6.49
3.46
18.70
0.24
9.67
12.57
4.69
11.56
8232
.31.84
8.42
3.10
0.0
0.0
−1.3
4.90
E-02
139S
4487
9645
0038
6C
2,22
019
.66.2
3600
8.98
11.11
24.36
0.52
7.74
30.26
3.50
11.41
6162
.87.57
−0.40
−0.10
−0.3
−0.4
−1.4
9.33
E-02
142C
4485
6844
9660
3C
1,46
519
.96.4
2,58
02.30
2.47
23.49
0.98
7.56
18.45
1.77
8.78
2776
.9−4
.81
9.05
−0.49
−0.3
−0.4
−2.1
3.09
E-02
18C
4423
4944
9434
3C
1,75
819
.46.7
2,60
09.68
5.10
10.87
0.31
8.38
17.87
4.64
11.67
6325
.05.36
−3.76
2.45
−0.1
−0.3
−1.1
8.32
E-02
1C44
0876
4494
010
C1,76
521
.37.2
2,90
04.19
3.46
24.79
0.64
10.79
19.95
3.08
12.10
2329
.1−2
.30
8.76
0.65
0.0
0.0
−1.7
3.47
E-02
29C
4434
6344
9449
3C
446
17.5
6.6
673
2.82
1.03
3.00
0.10
2.76
3.00
0.80
3.26
2212
.3−1
.86
0.58
0.30
−0.5
−1.4
−2.1
1.17
E-02
43C
4428
6644
9828
4C
2,21
219
.57.8
4,31
04.49
4.44
37.41
0.78
5.56
40.98
2.82
5.69
049
.2−6
.27
3.95
−2.00
0.0
0.0
−1.7
4.27
E-03
49C
4384
1144
9477
4C
1,48
520
.56.6
1,93
012
.18
5.93
5.83
0.20
9.90
13.32
0.79
14.69
018
.29.81
−5.12
−0.88
0.0
−0.1
−1.8
1.26
E-01
79S
4427
9945
0822
7C
876
17.7
7.0
1,110
5.49
1.15
4.35
0.07
6.88
4.21
1.21
8.37
868.6
0.63
0.88
0.58
0.0
−0.6
−1.7
3.55
E-02
98C
4470
3844
9302
7C
1,25
220
.95.7
2,07
02.89
3.46
18.27
0.53
7.74
12.41
2.43
8.01
1941
.9−1
.71
8.42
0.86
0.0
0.0
−1.8
7.94
E-03
98S
4436
0045
0613
9C
1,12
520
.07.5
1,40
07.78
2.47
6.79
0.07
7.01
7.80
1.88
7.42
5754
.23.34
0.32
0.84
0.0
0.1
− 1.5
1.15
E-02
100S
4459
3545
0640
5J
872
18.6
6.6
1,03
48.03
2.30
2.70
0.10
7.07
3.44
1.06
10.80
3910
.04.52
−0.10
0.51
−0.2
−0.9
−1.7
9.12
E-02
101S
4456
9545
0402
2J
1,03
015
.26.7
1,17
88.68
2.30
3.48
0.45
8.21
5.02
1.32
11.83
3110
.04.77
−0.29
0.59
−0.1
−0.7
−1.6
7.94
E-02
107C
4473
5744
9398
7J
1,15
117
.66.5
2,06
02.89
2.72
16.75
0.52
3.92
16.66
1.94
4.12
1067
.4−3
.52
3.33
−0.11
0.0
0.0
−1.9
4.90
E-03
112S
4457
2545
0108
5J
598
18.3
7.2
893
4.69
1.98
3.57
0.20
3.04
6.04
0.59
3.45
98.6
0.20
−1.30
−0.25
−0.2
−0.7
−2.1
1.00
E-02
114S
444118
4504
686
J89
218
.76.5
1,07
67.58
2.63
2.83
0.10
7.41
3.89
0.79
12.32
3812
.34.29
−0.34
0.19
−0.3
−1.0
−1.8
1.20
E-01
120S
4504
0045
0374
6J
1,02
121
.66.6
1,31
46.49
3.62
4.70
0.15
8.15
6.75
0.87
12.22
2015
.03.46
−0.81
−0.05
−0.4
−1.0
−0.6
1.10
E-01
121C
4443
7344
9704
5J
842
16.4
7.5
1,05
25.69
1.81
5.92
0.08
6.86
3.36
2.28
7.32
1214
.61.70
3.17
1.74
0.0
0.0
−1.5
1.10
E-02
122S
4492
7045
0259
5J
673
18.1
7.3
802
4.79
3.46
1.83
0.07
5.50
2.41
1.17
6.08
237.3
2.68
−0.14
0.74
0.0
0.0
−1.8
1.41
E-02
128S
4482
7645
0350
7J
917
21.2
7.1
1,15
65.19
3.62
3.57
0.32
9.11
4.26
0.21
10.56
013
.22.79
0.31
−0.43
0.0
0.0
−2.6
3.89
E-02
130S
4488
1345
07119
J1,09
719
.16.5
1,47
48.18
3.62
5.87
0.12
7.79
7.91
1.06
12.82
3414
.64.87
−0.63
0.00
−0.3
−0.9
−1.7
1.26
E-01
131C
4441
8645
0168
5J
856
18.8
6.9
1,04
26.99
2.63
3.48
0.10
7.01
3.89
0.94
8.86
3210
.53.69
0.31
0.34
0.0
0.0
−1.3
4.57
E-02
454
Hydrogeology Journal (2009) 17: 447–466 DOI 10.1007/s10040-008-0369-z

140S
4482
8745
0155
9J
952
18.4
6.7
1,12
27.68
1.81
3.65
0.11
7.01
4.25
1.43
9.96
7918
.23.47
0.19
0.79
−0.1
−0.9
−1.6
7.24
E-02
143S
4451
7345
0277
3J
916
19.0
6.7
1,15
57.49
2.96
3.39
0.09
7.47
4.29
0.95
10.57
3411.8
4.42
−0.12
0.31
−0.1
−0.6
−1.8
7.76
E-02
16S
4360
0245
0100
3J
1,36
718
.76.9
1,93
08.18
4.12
11.09
0.36
7.03
11.35
4.41
8.82
4912
.74.50
1.95
2.96
0.0
−0.2
−1.2
4.47
E-02
33C
4424
2944
9673
5J
910
18.4
7.1
1,17
76.69
1.65
5.48
0.15
6.76
4.67
2.13
7.89
2912
.72.20
1.71
1.44
0.0
−0.2
−1.5
2.75
E-02
36S
4470
2645
0070
2J
847
19.2
6.7
1,16
07.29
2.14
3.31
0.09
5.98
5.03
1.05
8.47
3417
.33.21
−0.83
0.32
−0.2
−0.9
−1.7
6.17
E-02
39S
4384
8744
9945
8J
1,112
18.5
7.1
1,59
07.78
3.29
6.31
0.15
7.14
8.36
2.08
8.30
3612
.34.03
−0.55
0.97
0.0
0.0
−1.5
2.88
E-02
41S
4381
0844
9802
2J
1,07
918
.27.0
1,51
08.68
2.96
5.65
0.15
7.05
7.50
1.85
8.51
3711.8
4.81
−0.48
0.84
−1.7
−1.5
−1.5
3.55
E-02
43S
4389
4444
9725
1J
1,05
718
.86.7
1,49
46.69
3.13
7.61
0.13
7.22
7.81
1.85
10.20
3013
.22.90
1.20
0.81
−0.2
−0.7
−1.6
7.41
E-02
63C
4403
6644
9979
6J
952
20.0
6.9
1,21
04.69
1.98
8.26
0.19
8.30
4.72
2.00
10.46
1015
.90.53
4.49
1.31
−0.1
−0.4
−1.6
5.50
E-02
64S
4378
0345
1042
1J
1,26
518
.67.0
2,02
06.39
6.09
10.00
0.14
5.22
13.42
3.81
6.28
398.6
4.16
−1.08
2.13
−0.1
−0.2
−1.3
2.63
E-02
69S
4401
0645
1012
6J
1,14
718
.66.5
1,36
69.98
3.13
4.35
0.10
6.97
5.81
4.23
11.50
3310
.56.69
−0.43
3.41
−0.3
−1.0
−1.1
1.12
E-01
71C
4405
5945
0371
6J
1,15
617
.76.9
1,72
07.98
4.12
8.48
0.17
4.66
12.66
2.78
5.87
319.6
3.97
−1.94
1.18
−0.2
−0.6
−1.4
2.88
E-02
72S
4437
7645
0787
8J
1,00
518
.36.5
1,36
86.79
1.65
6.74
0.10
5.08
6.72
1.88
8.46
162
14.1
1.79
1.21
0.96
−0.5
−1.7
−1.5
8.32
E-02
73S
4420
8145
1002
1J
711
18.1
6.6
889
5.56
2.22
2.91
0.09
5.35
3.45
1.27
8.25
248.6
1.96
0.11
0.72
−0.5
−1.3
−1.7
6.92
E-02
74C
4410
6445
0262
6J
676
16.3
6.8
867
5.29
0.99
3.48
0.08
5.62
3.15
0.85
7.62
239.6
0.53
0.91
0.34
−0.3
−1.3
−1.9
4.57
E-02
76S
4414
2045
0824
4J
1,31
918
.06.6
1,86
09.38
5.76
7.18
0.16
6.06
10.83
4.99
9.17
238.2
7.47
−1.73
3.60
−0.3
−0.8
−1.1
7.59
E-02
77C
4431
2145
0147
7J
919
17.2
6.7
1,21
06.59
3.29
5.48
0.06
6.53
5.49
1.39
9.31
4015
.93.55
0.94
0.61
−0.3
−0.8
−1.7
6.61
E-02
80S
4444
6645
0872
5J
869
18.2
6.5
1,00
28.38
1.40
2.61
0.12
6.86
3.10
0.85
11.47
7510
.04.05
0.11
0.34
−0.3
−1.3
−1.8
1.12
E-01
81C
4405
6044
9838
1J
792
20.0
6.9
1,07
14.49
1.81
3.91
0.13
6.99
3.24
0.83
8.83
5115
.00.53
1.32
0.31
−0.1
−0.6
−2.0
4.68
E-02
81S
4452
4445
0738
9J
830
17.8
6.7
1,00
07.39
1.98
2.91
0.11
6.04
3.40
1.99
8.63
348.6
3.55
0.16
1.45
−0.2
−1.0
−1.4
6.17
E-02
84S
4426
3145
0678
5J
1,16
218
.26.8
1,50
08.18
2.14
6.96
0.06
7.70
7.22
3.04
10.25
5612
.33.56
0.97
2.06
0.0
−0.6
−1.3
6.17
E-02
87S
4383
7445
1092
4J
943
19.6
6.6
1,20
67.49
2.63
3.91
0.14
7.93
5.07
0.74
12.03
1910
.93.89
−0.20
0.01
−0.2
−0.8
−1.9
1.05
E-01
89S
4406
7545
1075
8J
1,34
918
.76.4
1,57
012
.38
2.63
5.22
0.13
6.11
5.33
8.23
11.04
6810
.58.72
0.88
7.47
−0.4
−1.4
−0.8
1.23
E-01
90S
4450
4445
0580
1J
802
17.6
6.9
978
7.39
1.48
2.70
0.07
6.44
3.05
0.89
8.19
5410
.03.14
0.20
0.39
0.0
−0.6
−1.8
4.17
E-02
11S
4344
0445
0045
9T
1,42
819
.76.9
2,14
08.98
3.95
11.53
0.26
6.78
11.20
6.06
8.47
4112
.35.17
2.42
4.63
0.0
−0.2
−1.0
4.27
E-02
1S43
4641
4498
480
T1,82
421
.26.9
3,28
05.49
4.12
27.40
0.27
8.73
21.58
4.01
10.84
5855
.1−0
.75
9.64
1.40
−0.1
−0.2
−1.5
5.62
E-02
26S
4348
1145
0181
9T
885
21.1
8.9
1,87
02.40
2.80
16.31
0.49
3.37
14.62
0.40
3.09
01.0
−3.42
4.57
−1.42
0.1
0.1
−2.6
1.86
E-04
29S
4364
9145
0186
4T
1,58
916
.26.8
2,80
08.38
5.43
16.53
0.35
5.43
21.87
3.07
7.22
3414
.13.39
−1.41
0.42
−0.2
−0.7
−1.4
4.07
E-02
2S43
5375
4500
215
T3,12
319
.07.0
3,31
028
.04
11.19
8.05
0.39
4.82
7.28
37.74
5.72
013
.232
.46
2.34
36.76
−0.1
−0.2
−1.5
2.24
E-02
31S
4360
8945
0259
6T
3,72
419
.87.3
7,35
08.73
14.81
62.64
1.61
4.67
75.85
3.87
5.08
537.3
−0.38
0.90
−4.93
0.0
0.0
−1.5
1.05
E-02
34S
4339
7145
0228
6T
1,54
021
.98.2
3,45
01.10
1.15
35.74
0.49
6.76
22.05
4.65
6.74
09.1
−8.22
17.79
1.98
0.0
0.1
−2.0
2.14
E-03
48S
4355
6345
0490
9T
3,69
318
.86.6
7,14
08.23
17.28
61.77
1.42
6.09
71.84
5.18
8.84
010
.52.60
3.19
−3.16
−0.5
−0.6
−1.4
6.92
E-02
56S
4391
8145
0806
1T
1,85
816
.97.0
3,05
07.39
5.76
20.01
0.36
5.53
21.63
4.81
6.66
223
24.1
2.78
2.29
2.19
−0.1
−0.3
−1.2
2.63
E-02
57S
4391
6445
0923
4T
3,48
018
.86.7
4,61
023
.45
18.93
23.49
0.47
6.35
30.94
25.27
8.63
016
.829
.69
−1.89
21.59
0.0
0.0
−0.3
5.62
E-02
5S43
4142
4499
760
T3,28
717
.26.6
3,75
028
.74
12.67
8.92
0.35
6.01
14.14
33.85
8.88
017
.332
.92
−2.56
32.08
−0.1
−0.4
−0.1
6.76
E-02
66C
4388
5845
0212
8T
1,62
020
.06.3
2,07
013
.67
2.14
5.31
1.15
7.64
8.62
2.60
15.16
340
10.5
8.70
−0.76
1.46
−0.3
−1.3
−1.2
1.95
E-01
71S
4405
7245
1047
5T
2,36
718
.66.7
3,02
07.98
15.23
11.31
0.20
9.55
16.50
5.17
13.21
549
15.5
14.12
−2.29
3.14
−0.1
0.0
−1.3
9.12
E-02
75S
4418
6645
0869
6T
1,97
116
.57.1
2,75
014
.87
6.75
10.22
0.17
6.52
13.92
11.68
7.57
8216
.813
.18
−1.26
9.94
0.0
0.0
−0.6
2.40
E-02
86S
4401
7245
0705
2T
1,58
615
.66.9
2,73
07.24
5.02
18.05
0.27
4.03
26.54
2.73
5.11
010
.00.66
−3.86
−0.45
−0.3
−0.8
−1.5
2.40
E-02
90C
4375
0945
0178
9T
1,63
420
.86.5
2,56
09.98
5.27
14.35
0.23
9.19
15.79
3.40
14.77
2811.8
6.34
1.38
1.45
−0.2
−0.5
−1.3
1.48
E-01
93C
4370
0045
0552
5T
2,14
319
.86.8
4,37
04.89
8.56
29.14
0.77
4.08
40.07
3.73
5.32
010
.0−1
.53
−3.56
−0.99
−0.6
−0.9
−1.6
3.16
E-02
210S
4498
9445
0541
0T
2,68
719
.27.2
3,24
021
.36
9.22
10.00
0.58
5.94
12.49
25.98
6.63
2314
.622
.49
0.14
24.40
0.0
0.0
−0.3
1.78
E-02
TDS,S
iO2,N
O3,m
ajor
catio
nsandanions
arein
mg/l;temperature
(T)isin
°C;electricalcond
uctiv
ity(EC)isat18°C
inmS/cm;dissolvedinorganiccarbon
(DIC)isin
mmole/l;ΔCa+
ΔMg,
ΔNa+ΔK
andΔSO4arein
meq/l.
HU
hydrog
eologicun
it(refer
tolegend
inFig.3);SI
saturatio
nindex;
PCO2partialpressure
ofCO2(atm
)
455
Hydrogeology Journal (2009) 17: 447–466 DOI 10.1007/s10040-008-0369-z

locate). Moreover, to take into account other potential saltend-members besides sea water, the plot of Fig. 4 alsoshows the lines representing the chemically inert additionof soluble salts, as CaSO4, NaCl and a CaSO4 (NaClproportion of 1:0.5, mole ratio). The comparison ofgroundwater sample distribution with the above linesmay indicate that groundwater mineralization is due tomultiple factors. As a whole, groundwaters from the plainaquifers show a higher TDS than groundwaters circulatingin the highland.
Major ions and Hydrochemical water typesThe Piper plot of Fig. 5 shows, that in spring waters, thedominant anions are either bicarbonate or chloride, whilegroundwater samples can be described as bicarbonate,chloride or sulphate dominant.Figure 6 shows moreclearly that groundwaters belonging to the Jurassic aquifershow a dominant calcium-bicarbonate type that, whenTDS is over 1.1 g/l, convert into a Ca–SO4 or Ca–Cl2type. Fresh groundwaters from Oligo-Miocene aquifershow a Na–Cl–HCO3 type, evolving to a Na–Cl typewhen TDS exceeds 2 g/l. Waters from the Triassic aquifervary from Ca–SO4 to Ca–Cl2 and finally to a Na–Cl typeaccording to TDS increase; fresh Cretaceous groundwatersshow a Ca or Na-HCO3 type, which evolve to Ca or Mg–Cl2 and Na–Cl with increasing mineralization. Fresh
groundwaters of Quaternary aquifers are mostly of a Ca–Cl2 type, shifting to a Na–Cl type at the highest TDS. Thewaters labelled in Fig. 6, being of the chloride-sulphatetype, actually contain low percentages of sulphate; thus,
Fig. 4 Variation of total dissolved solids (TDS) concentrationswith chloride concentration. Curves fit data concerning sea water–freshwater conservative mixing, pure solution of calcium sulphate,sodium chloride and a mole proportion (1:0.5) of both salts. In thelegend, gw stands for groundwater
Fig. 5 Piper diagram for groundwaters (gw) of the Nurra Basin
Fig. 6 The relationship between the concentration of Na + K as apercentage of total cations (meq/l per meq/l) and bicarbonateconcentration as a percentage of total anions (meq/l per meq/l). Inthe legend, gw stands for groundwater
456
Hydrogeology Journal (2009) 17: 447–466 DOI 10.1007/s10040-008-0369-z

the increase in TDS is mainly related to the increase inchloride. Sulphate percentages greater than 20% are onlyfound in groundwaters from the Triassic and Jurassicaquifers.
Plots of Fig. 7 show the major cation–chloride relationsand include the lines representing fresh water and present-day sea-water mixing and, when appropriate, linesrepresenting the chemically inert solution of variableamounts of soluble salts. As previously discussed, thechemical composition of waters derived from mixingdifferent proportions of fresh and sea water, or from othersources, rarely matches the composition defined by acalculation that excludes the occurrence of reactions.
Indeed, Fig. 7a–d shows, above the limit of 4 meq/l ofchloride (see the preceding), either excess or deficit of themajor cations with respect to the conservative mixinglines; excess prevails for calcium and magnesium, anddeficit for sodium and potassium. The waters, which plotat concentrations below the limit, are mainly groundwatersfrom the Jurassic aquifer and spring waters, thoughmembers of both these groups also plot above the4 meq/l Cl boundary. These waters are interpreted asresulting from water–rock interaction with carbonate rockswith limited addition of soluble salts. Figure 7e shows thatsulphate concentrations are mainly in excess with respectto mixing lines; high excesses agree with the solution ofCaSO4 with variable proportion of NaCl. Bicarbonates(Fig. 7f) span a range of 0.3–11 meq/l, maintaining highconcentrations also at high TDS. Although there may besome component of mixing, the spread of data indicatesthat there is a range of other processes occurring.
SiO2Sulphate, bicarbonate (Fig. 7e and f) and silica contentsallow further characterization of the groundwaters intotwo main groups (highland and plain aquifers). Figure 8shows the relation between SiO2 and bicarbonate. Onegrouping of samples (A) can be defined by sulphate andsodium deficits relative to pure mixing with sea water,bicarbonates lower than 4 meq/l and silica concentrationsgreater than 35 mg/l. Group (A) includes samples ofgroundwaters from the Oligo-Miocene volcanic aquifer.Group (B), including groundwaters sampled from theplain aquifers, shows mainly sulphate excess, bicarbonateranging from 4 to 11 meq/l and silica concentrations lessthan 35 mg/l (and mostly in the range 0–30 mg/l). A fewgroundwater samples from the Oligo-Miocene volcanicaquifer and a few samples belonging to the Cretaceoussequence (group C) have both bicarbonate contents higherthan 4 meq/l and silica contents higher than 35 mg/l; suchwaters (showing sulphate and sodium excess) come fromwells reaching depths between 50 and 100 m below meansea level (m.s.l.) or are located near or at the easternboundary of the volcanic sequence. Due to the complexstructural setting, it is likely that aquifers come intocontact both laterally and vertically. Thus, high bicarbon-ate contents in volcanic groundwater might originate frominterconnection with carbonate aquifers. Conversely, high
silica contents in Cretaceous groundwater could originateas a result of silicate (probably the glassy fraction)leaching from the overlying porous pyroclastic flows.Figure 3 shows clearly that groundwater flow from theOligo-Miocene aquifer is directed towards the NW andcan feed the Cretaceous aquifer near Olmedo. Alterna-tively the high silica in the groundwater hosted in theCretaceous aquifer can derive from the thick (up to 200 m)glauconite rich calcarenites.
CO2Regarding bicarbonate concentrations (Fig. 7f), most ofmeasured values for Jurassic and Cretaceous carbonateformations are higher than typical for groundwaters fromcarbonate aquifers at normal temperatures and CO2 partialpressures. Moreover, groundwater maintains such highvalues under salinization as well.
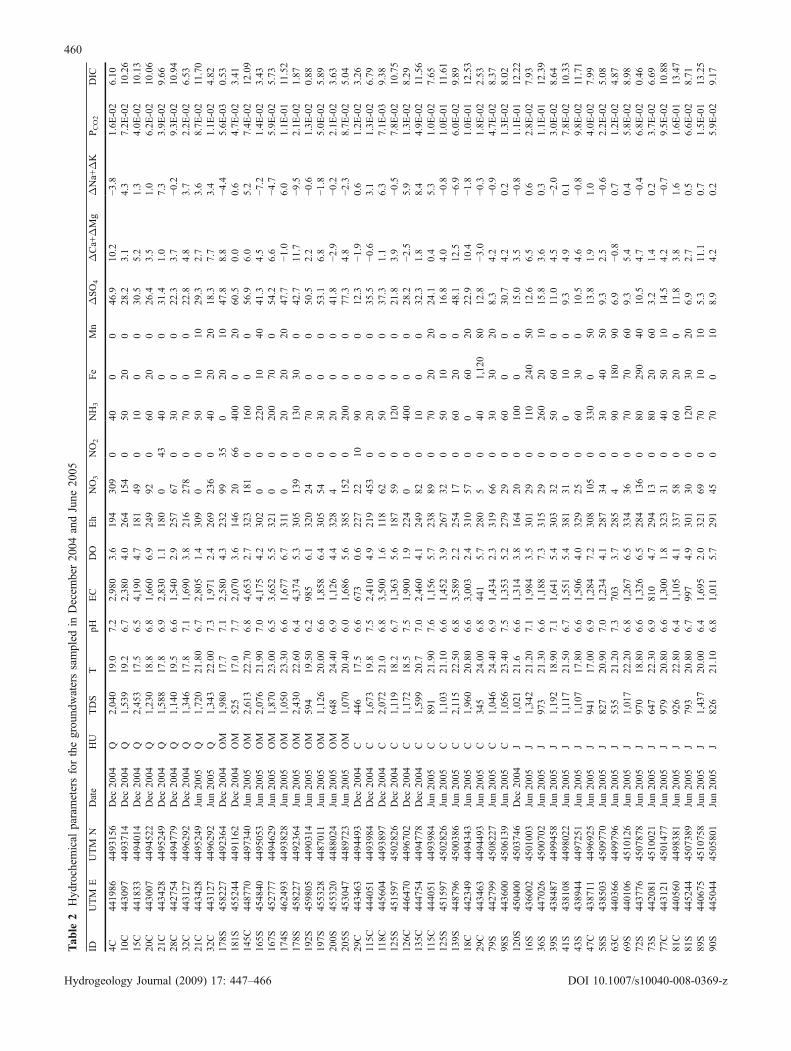
The highest bicarbonate concentrations (8–11 meq/l)might be justified by high CO2 partial pressures. Thespeciation of inorganic carbon (by PHREEQC, Parkhurst1995), for the data set of the winter 2004 survey (Table 1),shows that PCO2 varies between 1.9×10⁻⁴ and 1.95×10⁻¹ atm. For the data set of June 2005, PCO2 variesbetween 3.5×10⁻⁴ and 2.29×10⁻¹ atm (Table 2). Byconsidering both the surveys, the 13% of groundwatersand the 10% of spring waters, however, show valueshigher than 10−1 atm. The PCO2 frequency distribution ofNurra waters is lognormal and skewed to the left, whichconfirms that the dominant population is characterized bymoderately high PCO2 values.
On the whole, pH ranges from 5.7 to 8.9, but mostgroundwaters and spring waters (75%) are acidic, with apH between 6 and 7. For waters of both surveys, thedecrease of pH with increasing PCO2 is shown in Fig. 9a,while Fig. 9b shows that groundwaters are progressivelymore sub-saturated with respect to calcite as soon as PCO2increases, thus indicating that they are not in equilibriumwith calcite and its dissolution takes place in an opensystem.
There is no straightforward account for such high PCO2values. Influxes of carbon dioxide from depth throughtectonic discontinuities, CO2 production due to redoxreactions or continuous dissolution of carbonates due toion-exchange could be responsible of anomalous values.
In any case, influxes of carbon dioxide from sub-crustal depth can be easily ruled out on a geologicalbasis. Even if Sardinia Island is characterized bynumerous fault-controlled geothermal systems, theirorigin is clearly independent from the recent alkaline totransitional volcanic activity, which, in any case, endedaround 80 ka before present (Beccaluva et al. 1977).These systems are normally located, regardless thecrosscut formation, along inactive regional faults, mainlystrike–slip faults of Oligocene–Aquitanian age. Somethermal sources are located within the Variscan basement,others within the Oligocene-Miocene calc-alkaline volca-nic complex or at the tectonic contact between thebasement and the Tertiary or Mesozoic covers; no thermal
457
Hydrogeology Journal (2009) 17: 447–466 DOI 10.1007/s10040-008-0369-z

458
Hydrogeology Journal (2009) 17: 447–466 DOI 10.1007/s10040-008-0369-z

springs are linked to the Pliocene–Pleistocene basaltfloods.
Figure 10 shows the trend of the above parameters forgroundwater samples arranged according to DIC (dis-solved inorganic carbon) increase. The grey shadowedarea in each single plot marks the samples with DICbetween 10 and 15.8 mmole/l (Fig. 10a), characterizing,as results from the analysis of the log probability plot ofDIC show, the highest of almost six populations of Nurrawaters.
As a first approximation, water samples having DO >0.5 mg/l can be classified as aerobic; out of the 86 samples,83 are aerobic (with DO ranging from 1.1 to 9 mg/l), andthree have DO less than 0.5 mg/l, whereas of the latterwaters, which show appreciable contents of Fe, Mn andNH4, two also have nitrate exceeding 0.5 mg/l (NO3
− -reducing samples) and the remaining (from the Triassicaquifer, with TDS of about 3.7 g/l) have nitrate less than0.1 mg/l, also indicating a sulphate deficit (Fe or sulphatereducing samples). However, some of the aerobic sampleswith low DO contents have NH4 as the dominant Nspecies; moreover, a few waters, with DO in the range 0.5–3 mg/l, show high Fe contents. These findings indicateanaerobic conditions; classification on the basis of DOseems to underestimate the reducing conditions of theaquifers (Tesoriero et al. 2004).
Another source of CO2 could be the action of H2SO4
deriving from oxidization of both lower Jurassic pyrite-rich coaly layers and pyrite occurring in the blackphyllites of the exposed basement on carbonate rocks;the Eh-pH diagram indicates that moderately high-PCO2water samples are located in the stability field of Fe2O3(s),which could justify the very low values of Fe in the greyshadowed area of Fig. 10c.
TemperatureGroundwater temperature was measured at all waterpoints during the two monitoring surveys. During winter2004, the highland aquifer springs and groundwatersshow temperatures ranging respectively from 13.4 to17.5°C and from 17.7 to 22.4°C (mean T of ground-waters=19.3°C). In the same period, in the plain aquifers,groundwater temperature is in the range 15.2–21.9°C(mean T=18.7), the maximum value corresponding to theTriassic aquifer: plain springs show little variationbetween 16.6 and 17.9°C.
In the studied area, the recharge waters have a meantemperature of about 10°C, corresponding to the averagevalue of the atmospheric temperature during the rechargeperiod (autumn-winter). Such a temperature is close to thetemperature measured in winter 2004 at some of thehighland springs: the Oligo-Miocene aquifer has the highestelevation of the area and the temperature of most springs in
wintertime reflects the presence of recharge areas at highelevations in the same aquifer.
In June 2005 the mean temperature of groundwaters inthe region of the plains increases up to on average 17–25°C(average temperature 21.7°C); in the highland aquifertemperature varies between 19.5 and 24.4°C (meantemperature 22°C). This range of temperature reflects theseasonal variation of the local isotherms. The onlyexception is represented by the groundwater coming froma well close to the Su Zumbaru fault, which also in wintershows a water temperature of 24°C. This important strike-slip fault is deeply rooted in the Tertiary volcanic complexand allows relatively quick upwelling of water heated bythermal gradient which in western Sardinia is particularlyhigh (Della Vedova et al. 1995) with HFD (heat flowdensity) in the range 50–70 mW/m−2.
Sulphate solution and dedolomitizationBeside the large contribution of chloride, both parts aand e of Fig. 7 indicate that the solution of gypsumcontributes to the increase of salt content. In general,calcium correlates with DIC (Fig. 11) except for watersclose to Triassic evaporites, while magnesium correlateswith sulphate (Fig. 12), according to different trendscorresponding to different Mg/SO4 ratios. Mg/SO4 ratiovaries between about 4 and 0.5 and waters from theTriassic aquifer belong to both extreme trends.
The two highest values of magnesium (maximum19 meq/l) correspond to sulphate concentrations of 8 and25.3; the highest sulphate concentrations accompanylower Mg concentrations and the highest calcium concen-
Fig. 8 Relationship between bicarbonate concentration and SiO2concentration. In the legend gw stands for groundwater
�Fig. 7 Variation of major constituents with respect to chloride: aCa, b Mg, c Na, d K, e SO4, and f HCO3. Lines indicate sea water–freshwater conservative mixing and pure solution of gypsum and/orsodium chloride. In the legend, gw stands for groundwater
459
Hydrogeology Journal (2009) 17: 447–466 DOI 10.1007/s10040-008-0369-z
Tab
le2
Hyd
rochem
ical
parametersforthegrou
ndwaterssampled
inDecem
ber20
04andJune
2005
IDUTM
EUTM
NDate
HU
TDS
TpH
EC
DO
Eh
NO3
NO2
NH3
Fe
Mn
ΔSO4
ΔCa+ΔMg
ΔNa+
ΔK
PCO2
DIC
4C44
1986
4493
156
Dec
2004
Q2,04
019
.07.2
2,98
03.6
194
309
040
00
46.9
10.2
−3.8
1.6E
-02
6.10
10C
4430
9744
9371
4Dec
2004
Q1,53
919
.26.7
2,38
04.0
264
154
050
200
28.2
3.1
4.3
7.2E
-02
10.26
15C
4418
3344
9401
4Dec
2004
Q2,45
317
.56.5
4,19
04.7
181
490
100
030
.55.2
1.3
4.0E
-02
10.13
20C
4430
0744
9452
2Dec
2004
Q1,23
018
.86.8
1,66
06.9
249
920
6020
026
.43.5
1.0
6.2E
-02
10.06
21C
4434
2844
9524
9Dec
2004
Q1,58
817
.86.9
2,83
01.1
180
043
400
031
.41.0
7.3
3.9E
-02
9.66
28C
4427
5444
9477
9Dec
2004
Q1,14
019
.56.6
1,54
02.9
257
670
300
022
.33.7
−0.2
9.3E
-02
10.94
32C
4431
2744
9629
2Dec
2004
Q1,34
617
.87.1
1,69
03.8
216
278
070
00
22.8
4.8
3.7
2.2E
-02
6.53
21C
4434
2844
9524
9Jun20
05Q
1,72
021
.80
6.7
2,80
51.4
309
00
5010
1029
.32.7
3.6
8.7E
-02
11.70
32C
4431
2744
9629
2Jun20
05Q
1,34
322
.00
7.3
1,97
12.4
269
236
040
2020
18.3
7.7
3.4
1.1E
-02
4.82
178S
4582
2744
9236
4Dec
2004
OM
1,98
017
.77.1
2,58
04.3
232
9935
020
1047
.88.8
−4.4
5.6E
-03
0.53
181S
4552
4444
9116
2Dec
2004
OM
525
17.0
7.7
2,07
03.6
146
2066
400
020
60.5
0.0
0.6
4.7E
-02
3.41
145C
4487
7044
9734
0Jun20
05OM
2,61
322
.70
6.8
4,65
32.7
323
181
016
00
056
.96.0
5.2
7.4E
-02
12.09
165S
4548
4044
9505
3Jun20
05OM
2,07
621
.90
7.0
4,17
54.2
302
00
220
1040
41.3
4.5
−7.2
1.4E
-02
3.43
167S
4527
7744
9462
9Jun20
05OM
1,87
023
.00
6.5
3,65
25.5
321
00
200
700
54.2
6.6
−4.7
5.9E
-02
5.73
174S
4624
9344
9382
8Jun20
05OM
1,05
023
.30
6.6
1,67
76.7
311
00
2020
2047
.7−1
.06.0
1.1E
-01
11.52
178S
4582
2744
9236
4Jun20
05OM
2,43
022
.60
6.4
4,37
45.3
305
139
013
030
042
.711.7
−9.5
2.1E
-02
1.87
192S
4598
0544
9031
4Jun20
05OM
594
19.50
6.2
985
6.1
320
240
700
050
.52.2
−0.6
1.3E
-02
0.88
197S
4553
2844
87011
Jun20
05OM
1,12
620
.00
6.6
1,85
86.4
305
540
300
053
.16.8
−1.8
5.0E
-02
5.89
200S
4553
2044
8802
4Jun20
05OM
648
24.40
6.9
1,12
64.4
328
40
200
041
.8−2
.9−0
.22.1E
-02
3.63
205S
4530
4744
8972
3Jun20
05OM
1,07
020
.40
6.0
1,68
65.6
385
152
020
00
077
.34.8
−2.3
8.7E
-02
5.04
29C
4434
6344
9449
3Dec
2004
C44
617
.56.6
673
0.6
227
2210
900
012
.3−1
.90.6
1.2E
-02
3.26
115C
4440
5144
9398
4Dec
2004
C1,67
319
.87.5
2,41
04.9
219
453
020
00
35.5
−0.6
3.1
1.3E
-02
6.79
118C
4456
0444
9389
7Dec
2004
C2,07
221
.06.8
3,50
01.6
118
620
500
037
.31.1
6.3
7.1E
-03
9.38
125S
4515
9745
0282
6Dec
2004
C1,119
18.2
6.7
1,36
35.6
187
590
120
00
21.8
3.9
−0.5
7.8E
-02
10.75
126C
4464
7044
9670
2Dec
2004
C1,17
218
.57.5
1,90
01.9
224
00
400
00
28.2
−2.5
5.9
1.3E
-02
8.29
135C
4447
5444
9477
8Dec
2004
C1,59
920
.77.0
2,46
04.1
249
820
100
032
.31.8
8.4
4.9E
-02
11.56
115C
4440
5144
9398
4Jun20
05C
891
21.90
7.6
1,15
65.7
238
890
7020
2024
.10.4
5.3
1.0E
-02
7.65
125S
4515
9745
0282
6Jun20
05C
1,10
321
.10
6.6
1,45
23.9
267
320
5010
016
.84.0
−0.8
1.0E
-01
11.61
139S
4487
9645
0038
6Jun20
05C
2,115
22.50
6.8
3,58
92.2
254
170
6020
048
.112
.5−6
.96.0E
-02
9.89
18C
4423
4944
9434
3Jun20
05C
1,96
020
.80
6.6
3,00
32.4
310
570
060
2022
.910
.4−1
.81.0E
-01
12.53
29C
4434
6344
9449
3Jun20
05C
345
24.00
6.8
441
5.7
280
50
401,12
080
12.8
−3.0
−0.3
1.8E
-02
2.53
79S
4427
9945
0822
7Jun20
05C
1,04
624
.40
6.9
1,43
42.3
319
660
3030
208.3
4.2
−0.9
4.7E
-02
8.37
98S
4436
0045
0613
9Jun20
05C
1,05
623
.40
7.5
1,35
35.2
279
290
600
030
.74.2
0.2
1.3E
-02
8.02
120S
4504
0045
0374
6Dec
2004
J1,02
121
.66.6
1,31
43.8
164
200
100
00
15.0
3.5
−0.8
1.1E
-01
12.22
16S
4360
0245
0100
3Jun20
05J
1,34
221
.20
7.1
1,98
43.5
301
290
110
240
5012
.66.5
0.6
2.8E
-02
7.93
36S
4470
2645
0070
2Jun20
05J
973
21.30
6.6
1,18
87.3
315
290
260
2010
15.8
3.6
0.3
1.1E
-01
12.39
39S
4384
8744
9945
8Jun20
05J
1,19
218
.90
7.1
1,64
15.4
303
320
5060
011.0
4.5
−2.0
3.0E
-02
8.64
41S
4381
0844
9802
2Jun20
05J
1,117
21.50
6.7
1,55
15.4
381
310
010
09.3
4.9
0.1
7.8E
-02
10.33
43S
4389
4444
9725
1Jun20
05J
1,10
717
.80
6.6
1,50
64.0
329
250
6030
010
.54.6
−0.8
9.8E
-02
11.71
47C
4387
1144
9692
5Jun20
05J
941
17.00
6.9
1,28
47.2
308
105
033
00
5013
.81.9
1.0
4.0E
-02
7.99
58S
4385
0345
0977
0Jun20
05J
827
20.90
7.0
1,23
44.1
287
340
3040
509.3
2.5
−0.6
2.2E
-02
5.08
63C
4403
6644
9979
6Jun20
05J
535
21.20
7.3
703
3.7
285
40
9018
090
6.9
−0.8
0.7
1.2E
-02
4.87
69S
4401
0645
1012
6Jun20
05J
1,01
722
.20
6.8
1,26
76.5
334
360
7070
609.3
5.4
0.4
5.8E
-02
8.98
72S
4437
7645
0787
8Jun20
05J
970
18.80
6.6
1,32
66.5
284
136
080
290
4010
.54.7
−0.4
6.8E
-02
0.46
73S
4420
8145
1002
1Jun20
05J
647
22.30
6.9
810
4.7
294
130
8020
603.2
1.4
0.2
3.7E
-02
6.69
77C
4431
2145
0147
7Jun20
05J
979
20.80
6.6
1,30
01.8
323
310
4050
1014
.54.2
−0.7
9.5E
-02
10.88
81C
4405
6044
9838
1Jun20
05J
926
22.80
6.4
1,10
54.1
337
580
6020
011.8
3.8
1.6
1.6E
-01
13.47
81S
4452
4445
0738
9Jun20
05J
793
20.80
6.7
997
4.9
301
300
120
3020
6.9
2.7
0.5
6.6E
-02
8.71
89S
4406
7545
1075
8Jun20
05J
1,43
720
.00
6.4
1,69
52.0
321
690
7010
105.3
11.1
0.7
1.5E
-01
13.25
90S
4450
4445
0580
1Jun20
05J
826
21.10
6.8
1,011
5.7
291
450
700
108.9
4.2
0.2
5.9E
-02
9.17
460
Hydrogeology Journal (2009) 17: 447–466 DOI 10.1007/s10040-008-0369-z

101S
4456
9545
0402
2Jun20
05J
1,05
821
.80
6.6
1,22
44.8
304
320
800
1010
.16.1
0.2
1.3E
-01
13.98
107C
4473
5744
9398
7Jun20
05J
1,13
323
.50
7.5
2,05
66.0
240
80
100
050
61.6
1.1
2.3
6.9E
-03
4.31
120S
4504
0045
0374
6Jun20
05J
543
23.50
7.1
714
1.9
290
80
7024
020
9.4
−0.1
−0.1
1.9E
-02
4.92
121C
4443
7344
9704
5Jun20
05J
905
20.30
6.9
1,12
55.7
300
110
7030
2012
.62.8
2.3
5.2E
-02
9.87
128S
4482
7645
0350
7Jun20
05J
956
24.20
6.8
1,21
41.4
261
160
200
013
.44.9
0.4
7.8E
-02
11.56
131C
4441
8645
0168
5Jun20
05J
910
22.20
7.0
1,114
5.7
294
270
00
07.6
3.9
−0.7
4.1E
-02
9.11
143S
4451
7345
0277
3Jun20
05J
963
18.60
6.7
1,23
56.5
303
330
4020
2011.8
4.8
−0.4
8.1E
-02
11.36
1S43
4641
4498
480
Dec
2004
T1,82
421
.26.9
3,28
06.1
260
580
100
00
55.1
−0.8
9.6
5.6E
-02
10.84
11S
4344
0445
0045
9Dec
2004
T1,42
819
.76.9
2,14
05.9
242
410
400
1012
.35.2
2.4
4.3E
-02
8.47
26S
4348
1145
0181
9Dec
2004
T88
521
.18.9
1,87
03.3
115
054
200
2010
1.0
−3.4
4.6
1.9E
-04
3.09
29S
4364
9145
0186
4Dec
2004
T1,58
916
.26.8
2,80
08.5
234
340
500
014
.13.4
−1.4
4.1E
-02
7.22
2S43
5375
4500
215
Dec
2004
T3,12
319
.07.0
3,31
03.0
234
00
5010
6013
.232
.52.3
2.2E
-02
5.72
31S
4360
8945
0259
6Dec
2004
T3,72
419
.87.3
7,35
01.4
136
5354
1,50
030
140
7.3
−0.4
0.9
1.0E
-02
5.08
34S
4339
7145
0228
6Dec
2004
T1,54
021
.98.2
3,45
04.3
130
08
020
09.1
−8.2
17.8
2.1E
-03
6.74
48S
4355
6345
0490
9Dec
2004
T3,69
318
.86.6
7,14
00.4
159
00
5,80
014
050
010
.52.6
3.2
6.9E
-02
8.84
56S
4391
8145
0806
1Dec
2004
T1,85
816
.97.0
3,05
06.6
234
223
050
00
24.1
2.8
2.3
2.6E
-02
6.66
57S
4391
6445
0923
4Dec
2004
T3,48
018
.86.7
4,61
09.1
192
00
700
1010
16.8
29.7
−1.9
5.6E
-02
8.63
5S43
4142
4499
760
Dec
2004
T3,28
717
.26.6
3,75
03.0
125
00
120
3020
17.3
32.9
−2.6
6.8E
-02
8.88
66C
4388
5845
0212
8Dec
2004
T1,62
020
.06.3
2,07
05.6
246
340
070
00
10.5
8.7
−0.8
1.9E
-01
15.16
71S
4405
7245
1047
5Dec
2004
T2,36
718
.66.7
3,02
02.2
189
549
020
020
015
.514
.1−2
.39.1E
-02
13.21
75S
4418
6645
0869
6Dec
2004
T1,97
116
.57.1
2,75
07.0
268
820
1,60
010
016
.813
.2−1
.32.4E
-02
7.57
86S
4401
7245
0705
2Dec
2004
T1,58
615
.66.9
2,73
06.1
185
00
120
010
10.0
0.7
−3.9
2.4E
-02
5.11
90C
4375
0945
0178
9Dec
2004
T1,63
420
.86.5
2,56
04.8
203
280
400
2011.8
6.3
1.4
1.5E
-01
14.77
93C
4370
0045
0552
5Dec
2004
T2,14
319
.86.8
4,37
02.6
450
040
120
160
10.0
−1.5
−3.6
3.2E
-02
5.32
210S
4498
9445
0541
0Dec
2004
T2,68
719
.27.2
3,24
03.1
256
230
130
020
14.6
22.5
0.1
1.8E
-02
6.63
1S43
4641
4498
480
Jun20
05T
2,09
624
.60
7.2
2,76
93.8
282
00
140
030
9.0
16.3
3.1
2.1E
-02
7.34
26S
4348
1145
0181
9Jun20
05T
978
23.40
8.7
2,011
1.3
166
00
1,60
037
030
1.0
−5.1
3.5
3.5E
-04
3.34
31S
4360
8945
0259
6Jun20
05T
3,07
523
.80
6.9
6,40
32.2
237
00
1,00
02,61
019
05.7
2.5
−2.5
3.9E
-02
7.61
34S
4339
7145
0228
6Jun20
05T
1,23
723
.60
8.2
2,35
41.6
197
30
100
790
405.3
−3.8
10.2
2.4E
-03
7.20
48S
4355
6345
0490
9Jun20
05T
3,96
425
.00
6.5
7,44
90.4
184
10
1,00
061
010
08.5
2.4
−9.6
9.8E
-02
9.68
56S
4391
8145
0806
1Jun20
05T
1,57
722
.70
6.7
2,71
52.3
262
890
220
730
4014
.64.9
−0.4
6.8E
-02
8.99
71S
4405
7245
1047
5Jun20
05T
2,20
221
.00
6.9
3,08
42.1
252
291
040
3010
7.7
15.7
−1.8
6.3E
-02
12.59
75S
4418
6645
0869
6Jun20
05T
2,30
619
.30
7.1
3,08
45.8
300
700
6015
070
11.4
17.1
−4.2
2.5E
-02
7.61
HUishy
drog
eologicalu
nit(referto
legend
inFig.3);TDS,N
O3,N
O2arein
mg/l;FeandMnarein
µg/l;Tem
perature
(T)isin
°C;electricalcon
ductivity
(EC)isat18
°Cin
mS/cm;redox
potential(Eh)
isin
mV;dissolvedinorganiccarbon
(DIC)isin
mmole/l;ΔCa+ΔMg,
ΔNa+
ΔK
andΔSO4arein
meq/l
461
Hydrogeology Journal (2009) 17: 447–466 DOI 10.1007/s10040-008-0369-z

trations (maximum 29 meq/l): related groundwaters are ofthe Ca–Mg–SO4 water type.
Various processes compete in determining the calciumand magnesium concentrations, including calcite precipi-tation and solution, incongruent solution of dolomite anddedolomitization driven by sulphate solution, which isparticularly active at the contact between Giurassic dolo-stone and Triassic evaporites.
In addition, within the Oligo-Miocene aquifer, theseprocesses occur concurrently with increase of sodium andchloride concentrations; due to the presence of potentialion exchangers in concerned formations, one other factor,ion-exchange, competes in determining the calcium andmagnesium concentrations. In some cases, a deficit ofsulphate with respect to conservative mixing is observed,the leaching of welded or unwelded tuffs and of theremnants of hydrothermal alteration might increasegroundwater salt contents. The hydrothermal alterationcan be traced back to hydrothermal fluid circulation; deeprunning strike slip faults, present in the southern part ofthe Nurra area, functioned as conduits for the risinghydrothermal fluids that altered rocks by forming clayminerals and these potentially have played and play veryimportant roles in affecting water quality due to ionexchange. Thus, deposits of kaolin, zeolite, bentonite, andtravertine, which actually cover both the Miocene volcanictuffs and the Quaternary sediments, represent the memoryof the widespread hydrothermal activity. Presently, thearea does not show important thermal waters, fumarolesand hot grounds. The only memories of this hydrothermalactivity, as already shown, are some warm waters, whichemerge close to the deep strike-slip faults. Hydrothermalfluids which altered volcanic rocks could have been saline,and contained dissolved salts as NaCl, KCl, CaSO4 and
CaCl2. The chemistry of groundwaters in the volcanic areais therefore mainly controlled by leaching of volcanicrocks, ion-exchange with kaolinite, zeolite and bentoniteof calcium type and solution of salts, remnants of thehydrothermal activity (Mameli 2001), all of whichcompete in defining the mutual concentrations of Ca, Naand Mg. The efficacy of ion-exchange is suggested by thebinary plots of Fig. 7a–d as well; after the limit of freshwater (4 meq/l of chloride), as previously described,calcium and magnesium show an excess and sodium andpotassium show a deficit relative to the sea water mixingline.
NitrateNitrate concentrations in the Nurra aquifers range frombelow detection limit (about 1 mg/l) to more than 500 mg/l.Concentrations above 50 mg/l affect both fresh andsalinized waters: nitrate is likely to be derived from thewidespread use of fertilizers in the plain. High contentsaffect also the groundwaters of Jurassic sequence, whichare destined for potable use.
Stable isotopes and tritium
Seven water samples (Table 3), taken during November–December 2005, have been analyzed for stable isotope(18O and 2H) and tritium contents.The stable isotope dataare reported in Fig. 13 in comparison to the EMWL (EastMediterranean water line) and the GMWL (globalmeteoric water line). According to Longinelli and Selmo(2003), the local meteoric water line (LMWL) for central
Fig. 9 a Relationship between PCO2 and pH; b Variation of SI (calcite) with respect to PCO2. In the legend gw stands for groundwater
462
Hydrogeology Journal (2009) 17: 447–466 DOI 10.1007/s10040-008-0369-z

Italy, where geographically the study area lies, is δ2H=7.05 δ18O + 5.6. The same study indicates that theweighted mean 18O and 2H values for the rain at Sassari(period February 1999–January 2000) is respectively -6.58‰ and -37.3‰.
The clustering of stable isotope compositions of thegroundwaters near the LMWL and the weighted meanprecipitation indicates that the recharge to the volcanicand carbonate aquifers is derived from local precipitation.However, without a larger data set, the effective reference,the weighted mean of “recharge waters” cannot becalculated and used for the comparison: the effectivevalue should be somewhat more negative, because of theexclusion of summer precipitation.
However, even with respect to weighted mean rainfallvalues, the analyzed groundwaters show a shift which
could represent the effect of evaporation during infiltra-tion. As an example, the groundwater sample no. 157S(located at the extreme right) lies on the Su Zumbarustrike-slip fault; its position could correspond to enrich-ment due to evaporation before infiltration. This hypoth-esis could hold true due to the fact that the fault borders astructural depression towards which the surroundingsurface flow converges and consequently evaporates dueto the low permeability enhanced by the occurrence oftuffs whose clay content has been increased by weather-ing/hydrothermal fluids. However, other factors may beimportant, especially in the light of the previouslydiscussed thermal anomalies and/or the possible additionof carbon dioxide; present data are not sufficient to solvethe uncertainties, which would need to be clarified at leastby the analysis of 13C.
Fig. 10 Diagram of the variation of a Eh (left axis) and dissolved inorganic carbon (DIC, right axis); b pH; c Fe (left axis) and Mn(right axis); d ΔSO4 (where Δ indicates excess or deficit with respect to sea water-freshwater conservative mixing); e dissolved oxygen;f nitrate; g ammonium (as N); h nitrite. Data refer to 51 samples the June 2005 survey with 33 samples of the December 2004 survey:they are arranged according to increasing DIC (mmole/l). Grey shadowed areas mark the 24 samples with DIC ranging between 10 and15.2 mmole/l
463
Hydrogeology Journal (2009) 17: 447–466 DOI 10.1007/s10040-008-0369-z

The limited tritium values gave rise to meaningfulinformation on the timing of recharge and the nature of theaquifer. Very low tritium levels (0.3±0.4 TU) in thevolcanic aquifer of well 167S could indicate lowpermeability or deep circulation of groundwater, whichcan both result in large residence time. Samples comingfrom the Jurassic aquifer also show relatively low values(3.6±0.6, 3.1±0.6 TU). These values indicate only alimited degree of fracture development in the aquifer andslow groundwater circulation derived from rainwater. Thethree samples chosen for tritium analyses (43S, 143S and167S) show that the decrease of tritium may be correlatedwith increasing TDS and temperature.
Conclusions
The geological and hydrogeological survey on the Nurraregion allow a good reconstruction of stratigraphy,structures and related aquifers in an area where base-ment-cover relationships exert the prominent role incontrolling the path and the storage of groundwaters.
In detail:
1. The basement that crops out to the west of the studyarea experiences poor infiltration; the surface waterfrom this exposed sector of metamorphic rocks, due toits eastward tilt, when moving to the east, enters thecarbonate aquifers. Possibly a basal detachment existsbetween the Mesozoic covers and the basement actingas a barrier.
2. Within the Mesozoic carbonate platform the ground-water flow path is controlled by wide, typically
ejective, folding-style strata related to the occurrenceof evaporites and by later, generally normal, faults.Thus, in the quasi-flat area, where the Mesozoic rockscrop out, there is no relation between the topographicwatershed and the hydrogeological basin.
3. The geometry of the folded and faulted Mesozoic coverallow for the identification of areas with prevailingTriassic rocks, mostly dolostones and evaporites, alongwith areas, in Jurassic and Cretaceous rocks, mostlymade of limestones and marlstones. The latter gener-ally act as a barrier so that, in the Jurassic-Cretaceoussequence, several superposed aquifers can occur.
4. Within the Tertiary volcanic complex, infiltration is lesseffective with respect to the carbonate complex, thetopographic watershed widely matches the hydrogeo-logical one, and the deepening of the piezometriccontours follows the topography. This complex isaffected by strike-slip faults along which deep circuitscan develop giving rise to hypothermal waters thatshow the same temperature (24°C) regardless of the theseasonality. The residence time of waters in this circuitis very long as inferred by the close to zero tritiumconcentration.
The aquifers that develop in the different hydrogeo-logical units reflect the composition of the host rocks:sulphate (Triassic dolomites and gypsum aquifers), bicar-bonate (Jurassic and Cretaceous limestone aquifer), andsilica (Oligo-Miocene volcanic aquifer). These ions can beused as markers for discriminating groundwater fromdifferent aquifers. Lithology and structural setting controlthe hydro-geochemical processes, which in turn determine
Fig. 12 Relationship between magnesium concentration andsulphate concentration. Lines indicate two different Mg/SO4 ratios.In the legend, gw stands for groundwaters
Fig. 11 Relationship between calcium concentration and DICconcentration. In the legend gw stands for groundwater
464
Hydrogeology Journal (2009) 17: 447–466 DOI 10.1007/s10040-008-0369-z

the enrichment in cations and anions; ultimately thechemical evolution leads to deterioration of water quality.
The springs show hydrogeochemical characteristicsthat allow their clear separation into two main groups:bicarbonate-rich waters were found in springs emergingfrom the limestones, whereas chloride type groundwatersare dominantly found in the volcanic rocks despite theheight above the sea level of the aquifers. Considerationof the water compositions indicates that salinization in theNurra Basin derives from various sources, even thoughmost of the acquired salinity derives from sodium andchloride input.
The carbonate aquifer in contact with Triassic evaporitecontains high sulphate groundwaters of poor quality. Asfor the other aquifers, this poor quality does not changeappreciably during the hydrologic year. TDS variesbetween 1.5 and 6.5 g/l. The solution of importantamounts of calcium sulphate in the gypsum levels reflectson the considerable excess of calcium and magnesium dueto dedolomitization. The presence of marls causes ionexchange; due to the masking effect of gypsum solution,ion exchange between calcium and sodium is moreevident only in correspondence to high positive excessof sodium (dilution). Typical water types are NaCl (havingeither excess or deficit of sodium), CaCl2 (salinization),and CaSO4.
Jurassic limestones represent the most productive(confined) aquifer in the Nurra district: groundwaters aremainly of calcium bicarbonate type and contain up to 20%of dissolved sulphate. The most saline groundwaters (1–1.5 g/l) are CaCl2 in character. Groundwaters from theJurassic aquifer have the highest average PCO2 in the area,reflected in the high mean DIC. Green marls are thesubstratum in which the most ion exchange takes place(Fidelibus et al. 2004), directly and indirectly, affectingalmost all waters. The Jurassic aquifer is the only reservoirof water with good natural quality in the district, but highnitrate concentrations deriving from intensive agriculturalpractices carried out in the area must be controlled.
Most of groundwaters from the Cretaceous aquiferhave a TDS higher than 1 g/l. They show quite clear ionexchange, evidenced by the presence of NaHCO3, MgCl2,and CaCl2 water types. Silica contents higher than theother aquifers of the plain are possibly linked withglauconitic bearing materials and/or with a connectionbetween this aquifer and the volcanic sequence; PCO2 islow, with some isolated peaks.
The groundwater in the volcanic massif (Oligo-Mio-cene) has high hydraulic heads, thus excluding theinfluence of sea water as the main salt source: thechemical evolution of volcanic groundwaters developsthrough water–rock interaction with welded and unweldedtuffs, addition of salts derived from past hydrothermalactivity (Mark and Mauk 2001), and ion-exchange withzeolite, kaolinite, and bentonite, alteration products of thesame activity. Dissolution of silicates and increase inalkalinity is facilitated by the acidity of groundwaters.Quaternary aquifers have groundwaters with TDS higherthan 1.3 g/l all through the year; these groundwaters areNaCl and CaCl2 in character (with deficit and excess ofboth sodium and calcium).
Sea water does not seem to play the principal role inthe salinization of groundwaters of the area. Enlargingthe spectrum of parameters to minor ions and isotopeswill need to be part of future detailed studies of thecomplex Nurra basin. Finally this study represents abasic tool for sustainable water management in theframework of multidisciplinary research activities aimingto combat and/or mitigate desertification processes and todefine appropriate policies for prospecting new ground-water resources and assessment of their quality andconservation.
Fig. 13 Relationship between 2H and 18O. In the legend, gwstands for groundwater
Table 3 Stable isotopes and tritium in groundwaters
ID Type Date δ18O‰ VSMOW δ2H‰ VSMOW 3H TU Aquifer
S6 Spring 30/11/2005 −6.44 −35.6 – Tuff (Oligo-Miocene)157S Borehole 30/11/2005 −5.03 −34.4 – Tuff (Oligo-Miocene)167S Borehole 06/12/2005 −5.95 −34.6 0.3±0.4 Tuff (Oligo-Miocene)43S Borehole 06/12/2005 −5.81 −36.8 3.6±0.6 Limestone (Jurassic)98C Borehole 30/11/2005 −5.72 −34.7 – Tuff and limestone (Cretaceus)43C Borehole 30/11/2005 −5.53 −33.4 – Limestone (Jurassic)143S Borehole 06/12/2005 −5.36 −33.8 3.1±0.6 Limestone (Jurassic)
VSMOW Vienna standard mean ocean water; TU tritium units
465
Hydrogeology Journal (2009) 17: 447–466 DOI 10.1007/s10040-008-0369-z

Acknowledgements The financial support from Ministry of Edu-cation, University and Research (MIUR) for the development of theresearch RIADE (Integrated Research for Applying new technolo-gies and processes for combating Desertification: www.riade.net) isacknowledged. Thanks are due to A. Carletti, N. Demurtas, R.Pinna and A. Vigo for the sampling campaigns and samplepreparation. The work of M. De Roma on chemical analysis isparticularly appreciated. We are also grateful to D. Pinna of theSilver & Barite S.p.A. for having allowed us to access the boreholedata. The authors wish to thank G. M. Zuppi and B. Gambardellafor the supporting discussion. Finally, the authors greatly appreciatethe critical review and the many helpful suggestions of J. Tellam.
References
Appelo CAJ, Geirnaert W (1983) Processes accompanying theintrusion of salt water, Proc. of 8th SWIM, Bari, 1983. GeolAppl Idrogeol 18(2):19–40
Barbieri G, Ghiglieri G, Vernier A (2005a) Design of a groundwatermonitoring network and identification of environmental qualityindicators for combating desertification. 2nd InternationalWorkshop–AVR 05 Aquifer Vulnerability and Risk. Parma,Italy, September 2005, IGEA Ing Geol Acquifer 21:71–80
Barbieri G, Ghiglieri G, Vernier A (2005b) Aquifer vulnerability inthe Alghero plain for integrated water resources management inNW Sardinia. 2nd International Workshop–AVR 05 AquiferVulnerability and Risk, Parma, Italy, September 2005
Beccaluva L, Deriu M, Savelli C, Venturelli G (1977) Geochronol-ogy and magmatic character of the Pliocene–Pleistocenevolcanism in Sardinia. Bull Volcanol 40:1–16
Ben-Itzhak LL, Gvirtzman H (2005) Groundwater flow along andacross structural folding: an example from the Judean Desert,Israel. J Hydrol 312:51–69
Carmignani L, Decandia FA, Disperati L, Fantozzi PL, LazzarettoA, Lotta D, Oggiano G (1995) Relationship between theTertiary structural evolution of the Sardinia-Corsica ProvencalDomain and the Northern Apennines. Terra Nova 7:128–137
Cerri G, Mameli P (2004) Secondary mineral assemblages withinepiclastites of western Logudoro, Sardinia, Italy. Rocky Moun-tain (56th Annual) and Cordilleran (100th Annual) JointMeeting (3–5 May 2004), Geol Soc Am Abstr 36(4):81
Cerri G, Cappelletti P, Langella A, de’ Gennaro M (2001)Zeolitization of Oligo-Miocene volcaniclastic rocks fromLogudoro (northern Sardinia, Italy). Contrib Mineral Petrol140(4):404–421
Della Vedova B, Lucazeau F, Pasquale V, Pellis G, Verdoya M(1995) Heat flow in the tectonic provinces crossed by thesouthern segment of the European Geotraverse. Tectonophysics244:57–74
Fidelibus MD, Lambrakis N, Morell I, Zuppi GM (2004) Role ofclay sediments in karst coastal aquifers. In: Tulipano L et al.(eds) Final Report of COST Action 621 “Groundwatermanagement of coastal karstic aquifers”, II, EUR 21366, Officefor the Official Publications of European Communities, Brus-sels, pp 172–180
Funedda A, Oggiano G, Pasci S (2000) The Logudoro basin: a keyarea for the Tertiary tectono-sedimentary evolution of NorthSardinia. Boll Soc Geol It 119:31–38
Ghiglieri G, Barbieri, Vernier A (2006) Studio sulla gestionesostenibile delle risorse idriche: dall’analisi conoscitiva allestrategie di salvaguardia e tutela [Sustainable water resourcesmanagement: knowledge and protection criteria]. ENEA, Rome,550 pp
Ghiglieri G, Barbieri, Vernier A, Carletti A, Demurtas N, DeromaM, Pinna R, Pittalis D, Vigo A (2007) Carta idrogeologica e rete
di monitoraggio corpi idrici superficiali e sotterranei Nurra(Sardegna Nord-Occidentale): scala 1:50.000 [Hydrogeologicalmap of the Nurra area (NW Sardinia): surface water andgroundwater monitoring network: Scale 1:50.000]. Composita,Groningen, The Netherlands
Ghiglieri G, Barbieri, Vernier A (2008) Vulnerabilità all’inquina-mento degli acquiferi della Nurra di Alghero (SS) per lagestione integrata delle risorse idriche (Sardegna Nw) [Aquifervulnerability in the Nurra Region (Alghero) for integrated waterresources management: NW Sardinia]. IGEA Ing Geol Acquifer123:77–86
Hanshaw BB, Back W (1979) Major geochemical processes in theevolution of carbonates aquifer systems. J Hydrol 43:287–312
Herman JS, Back W (1984) Mass transfer simulation of diageneticreactions in the groundwater mixing zone. 97th Annual Meetingof the Geological Society of America Reno, Nevada, July 1984Abstract book, p 16
Liu CW, Chen JF (1996) The simulation of geochemical reactionsin the Heng-Chun limestone formation, Taiwan. Appl MathModel 20:540–558
Longinelli A, Selmo E (2003) Isotopic composition of precipitationin Italy: a first overall map. J Hydrol 270:75–88
Mameli P (2000) Rilevamento e caratterizzazione mineralogicadella caolina della Sardegna settentrionale e proposta di impiegoin settori non convenzionati. [Mapping and characterization ofcaolin from northwestern Sardinia. Proposal for its non conve-tional emploiment]. PhD Thesis, University of Sassari, Italy,125 pp
Mameli P (2001) Occurrence of halite in kaolin of NW Sardinia:genetic implications. 10th Int. Symp. on Water–Rock Interac-tion, vol 1, Balkema, Lisse, pp 729–733
Mark PS, Mauk JL (2001) Hydrothermal alteration and hydrologicevolution of the golden cross epithermal Au-Ag Deposit, NewZealand. Econ Geol 96:773–796
Oggiano G, Sanna G, Temussi I (1987) Caractéres géologiques etgèochemiques de la bauxite de la region de la Nurra [Geologicaland geochemical features of Nurra bauxite]. ‘Groupe Françaisdu Crétacé’, Sardinia, 24–29 May 1987, pp 72–124
Parkhurst DL (1995) Users guide to PHREEQC: a computerprogram for speciation, reaction-path, advective transport, andinverse geochemical calculations. US Geol Surv Water ResInvest Rep 95–4227
RIADE project (2004) Integrated research for applying newtechnologies and processes for combating desertification.RIADE, Sassari, Italy. July http://www.riade.net. Cited July2004
Sanford WE, Konikow LF (1989a) Porosity development in coastalcarbonate aquifers. Geology 17:249–252
Sanford WE, Konikow LF (1989b) Simulation of calcite dissolutionand porosity changes in saltwater mixing zones in coastalaquifers. Water Res Res 25(4):655–667
Tellam JH (1995) Hydrochemistry of the saline groundwaters of theLower Mersey Basin Permo-Triassic sandstone aquifer, UK. JHydrol 165:45–84
Thomas B, Gennesseaux M (1986) A two stage rifting in the basinof Corsica-Sardinia strait. Mar Geol 72:225–239
Tesoriero AJ, Spruill TB, Eimers JL (2004) Geochemistry ofshallow ground water in coastal plain environments in thesoutheastern United States: implications for aquifer susceptibil-ity. Appl Geochem 19:1471–1482
Tulipano L, Fidelibus MD, Panagopoulos A (eds) (2005) Finalreport of Action COST 621, Groundwater management ofcoastal karstic aquifers. II, EUR 21366, Office for the OfficialPublications of European Communities, Brussels, 366 pp
Whitaker FF, Smart P (1997) Groundwater circulation and geo-chemistry of a karstified bank-marginal fracture system, SouthAndros Island, Bahamas. J Hydrol 197:293–315
466
Hydrogeology Journal (2009) 17: 447–466 DOI 10.1007/s10040-008-0369-z
Copyright © 2022 FDOKUMEN