Modelling growth of Ruppia cirrhosa
16
Aquatic Botany 68 (2000) 29–44 Modelling growth of Ruppia cirrhosa Gonçalo Calado a,* , Pedro Duarte b a Unidade de Investigação em Eco-Etologia, Instituto Superior de Psicologia Aplicada, Rua Jardim do Tabaco, 34, 1149-041, Lisbon, Portugal b Universidade Fernando Pessoa, Praça 9 de Abril, 349, 4200, Oporto, Portugal Received 30 November 1998; received in revised form 5 January 2000; accepted 13 April 2000 Abstract The main objectives of this work were to synthesise information on the autoecology of Ruppia cirrhosa Petagna (Grande) in a mathematical model and to use the model to simulate its growth, production and harvest. Model parameters were allowed to vary as a result of acclimation, following experimental data reported in the literature. Biomass data from Santo André lagoon (SW Portugal) were used to calibrate the model. Validation was carried out with independent data sets from Santo André lagoon and from Tancada lagoon (NE Spain). Model simulations show a reasonable agreement with observed data with a similar biomass temporal dynamics and peaks. Self-shading appears to be an important self-regulating mechanism of biomass growth and production. The results obtained predict an annual net primary production of 361 g DW m -2 well within the estimates based on harvesting techniques (295–589 g DW m -2 ). Model results suggest that controlled harvesting of macrophyte biomass may be carried out without affecting macrophyte real net production, through the reduction of light limitation under the plant canopy. © 2000 Elsevier Science B.V. All rights reserved. Keywords: Macrophyte production; Coastal lagoon; Modelling; Ruppia cirrhosa 1. Introduction Aquatic macrophytes normally represent an important part of primary productivity in shallow waters, particularly in land-locked systems, such as some coastal lagoons (Wetzel, 1975). Some species are able to form dense stands covering wide areas in the lagoons, being very important primary contributors to many food webs, that may include resources used * Corresponding author. Present address: Laboratorio de Zoolox´ ıa Mariña, Departamento de Biolox´ ıa Animal, Universidade de Santiago de Compostela, 15706 Santiago de Compostela, Spain. Tel.: +34-981-563100 ext. 13272; fax: +43-981-547165. E-mail address: [email protected] (G. Calado) 0304-3770/00/$ – see front matter © 2000 Elsevier Science B.V. All rights reserved. PII:S0304-3770(00)00104-2
-
Upload
independent -
Category
Documents
-
view
1 -
download
0
Transcript of Modelling growth of Ruppia cirrhosa
Aquatic Botany 68 (2000) 29–44
Modelling growth ofRuppia cirrhosa
Gonçalo Caladoa,∗, Pedro Duarteba Unidade de Investigação em Eco-Etologia, Instituto Superior de Psicologia Aplicada,
Rua Jardim do Tabaco, 34, 1149-041, Lisbon, Portugalb Universidade Fernando Pessoa, Praça 9 de Abril, 349, 4200, Oporto, Portugal
Received 30 November 1998; received in revised form 5 January 2000; accepted 13 April 2000
Abstract
The main objectives of this work were to synthesise information on the autoecology ofRuppiacirrhosaPetagna (Grande) in a mathematical model and to use the model to simulate its growth,production and harvest. Model parameters were allowed to vary as a result of acclimation, followingexperimental data reported in the literature. Biomass data from Santo André lagoon (SW Portugal)were used to calibrate the model. Validation was carried out with independent data sets fromSanto André lagoon and from Tancada lagoon (NE Spain). Model simulations show a reasonableagreement with observed data with a similar biomass temporal dynamics and peaks. Self-shadingappears to be an important self-regulating mechanism of biomass growth and production. The resultsobtained predict an annual net primary production of 361 g DW m−2well within the estimates basedon harvesting techniques (295–589 g DW m−2). Model results suggest that controlled harvesting ofmacrophyte biomass may be carried out without affecting macrophyte real net production, throughthe reduction of light limitation under the plant canopy. © 2000 Elsevier Science B.V. All rightsreserved.
Keywords:Macrophyte production; Coastal lagoon; Modelling;Ruppia cirrhosa
1. Introduction
Aquatic macrophytes normally represent an important part of primary productivity inshallow waters, particularly in land-locked systems, such as some coastal lagoons (Wetzel,1975). Some species are able to form dense stands covering wide areas in the lagoons, beingvery important primary contributors to many food webs, that may include resources used
∗ Corresponding author. Present address: Laboratorio de Zooloxıa Mariña, Departamento de Bioloxıa Animal,Universidade de Santiago de Compostela, 15706 Santiago de Compostela, Spain. Tel.:+34-981-563100 ext.13272; fax:+43-981-547165.E-mail address:[email protected] (G. Calado)
0304-3770/00/$ – see front matter © 2000 Elsevier Science B.V. All rights reserved.PII: S0304-3770(00)00104-2
30 G. Calado, P. Duarte / Aquatic Botany 68 (2000) 29–44
by man. Mann (1972) suggests that macrophyte production in shallow waters can be tentimes higher then phytoplankton production.
Ruppia cirrhosaPetagna (Grande) is an aquatic angiosperm inhabiting European coastalbrackish waters, never found in places with a permanent tidal regime. It is common in largepermanent water bodies and in these environments it is the only macrophyte to surviveand show healthy growth in salinities above 20 ppt (Verhoeven, 1979). It has an annual lifecycle, hibernating as short quiescent leaf-bearing stolons. In spring, it starts a fast vegetativegrowth, with budding of rhizomes and strongly branching stems colonising the bottom andthe water. A few weeks later flowers are induced and fruits are produced. In late autumnvertical stems begin to lose contact with the vegetation mat near the bottom and are graduallydecomposed and washed ashore (Verhoeven, 1979; Menéndez and Peñuelas, 1993).
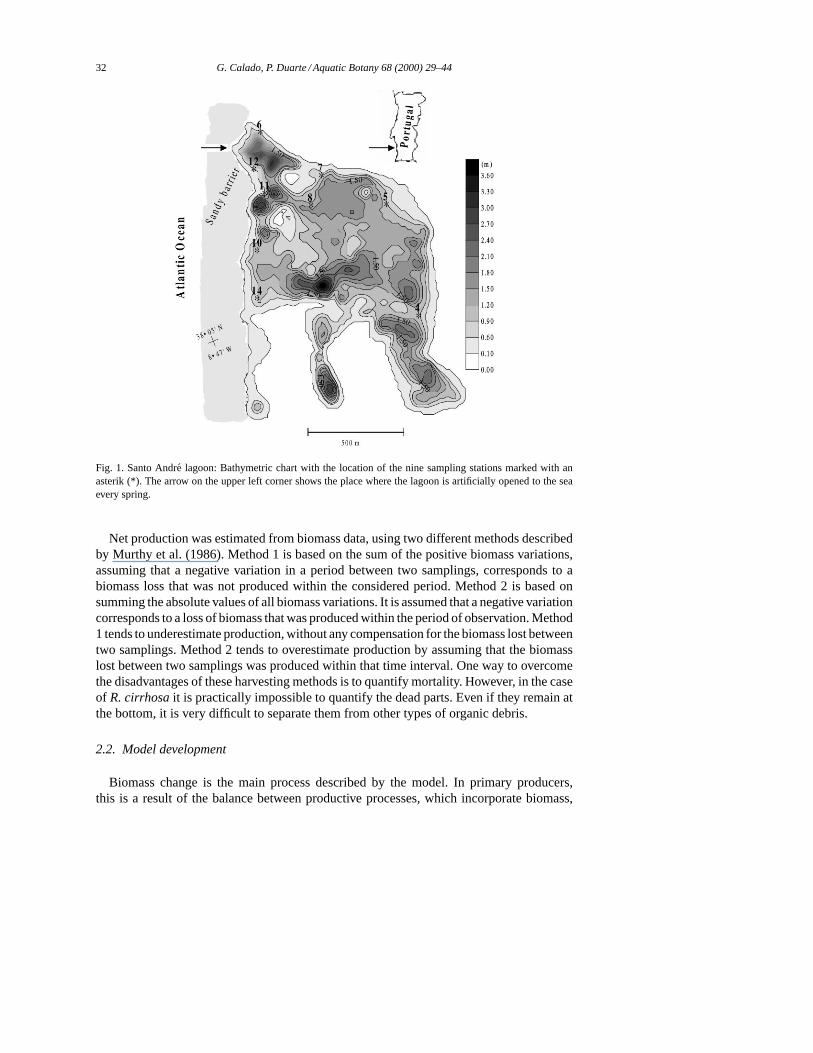
Santo André lagoon is a shallow land-locked coastal system located in the PortugueseSouthwest coast (38◦05′N; 8◦47′W). It receives inflows from six small rivers forming adrainage basin of about 96 km2. Its average annual depth is about 1 m, with a maximumof 5 m reached in autumn in certain zones due to freshwater inflows. Marine colonisationdevelops during about one month when a man-made channel connects the lagoon with thesea in the spring. Low salinity water and sediments are exported through this inlet. Afterthe lagoon is closed by the accumulation of sand, salinity progressively decreases, exceptin summer, and organic matter accumulates leading to eutrophy and summer dystrophicprocesses (Cancela da Fonseca et al., 1989). Salinity values oscillate from ca. 35 ppt afterthe opening to the sea to almost zero at the end of winter.
Macrophyte production can represent an important part of primary production in coastallagoons. High macrophyte biomasses may contribute to night anoxia during summer, es-pecially in shallow waters during calm weather, when water column stratification is mostlikely to occur. These biomasses are also an important reservoir of nutrients and their harvestmay help to prevent eutrophication and dystrophic crisis.
Lagoon eutrophication and dystrophic crisis could probably be reduced by harvestingmacrophytes to remove nutrients and organic matter. This would improve its recreationalusage. Macrophyte harvesting for fertiliser has been a traditional activity in Portugal sinceat least the Middle Ages (Veiga de Oliveira et al., 1975) and may prevent eutrophication insemi-enclosed water bodies (Thornton et al., 1995).
Santo André lagoon is used not only for recreation but also as a fishing ground, and theremoval of macrophytes could lead to a reduction in secondary production. One way toevaluate this effect is to develop a mathematical model capable of simulatingR. cirrhosabiomass dynamics and productivity, as well as macrophyte harvest. Biomass removal mayhelp to decrease intraspecific competition for light, nutrients or space, and thus increase thegrowth of the remaining biomass.
Macrophyte production can be evaluated by means of harvesting techniques and in-cubation experiments. The former, based on biomass differences, are a function of timeand have important errors proportional to the time lag between two consecutive samplings(Murthy et al., 1986). These methods allow only the estimation of net production. Thelatter are based on the production and consumption of oxygen or inorganic carbon and arelimited to short-time experiments (Vollenweider, 1974). These methods allow the estima-tion of net and gross production. Once demographic and physiological processes are wellknown, modelling can be a useful method for estimating primary production as a function of
G. Calado, P. Duarte / Aquatic Botany 68 (2000) 29–44 31
environmental forcing (Duarte and Ferreira, 1993). Demographic processes (mortality andrecruitment) can be studied by sampling and tagging experiments. Physiological processes(photosynthesis and respiration) can be measured in situ or in the laboratory. Modelling cantherefore be used as a way to synthesise the results of both the harvest and the incubationtechniques.
A central question in ecology, is in regard to the mechanisms which regulate populationsize (Krebs, 1994). It is common to observe that species develop biomasses until certainasymptotic values that are a result of some negative feedback mechanisms. These mecha-nisms stabilise species biomass and therefore community structure and function. Environ-mental factors, whether biotic or abiotic and self-regulating factors have all been proposedas controlling mechanisms in different populations (Krebs, 1994). In the case ofR. cirrhosaone such mechanism is its annual life cycle. However, the limitation imposed by the lifecycle itself is not enough to explain why biomass is not greater than that observed dur-ing the growing season. Self-regulating mechanisms have been described for plant speciesincluding the self-thinning rule (Westoby, 1984).
For a mathematical model to have stability, feedback mechanisms are also needed. Infact, mathematical models may be used to test the effect of alternative feedbacks in speciesbiomass regulation. If the correct mechanisms are included in the model, it is expectedthat the model results will mimic reasonably well the observed dynamics. It needs to berecognised however, that a model may predict the right dynamics even if the processesare incorrectly formulated. However, modelling may be a useful way to test the validity ofhypotheses regarding the natural regulation of population size.
The objectives of this work are:• to develop a mathematical model to simulate biomass dynamics and productivity ofR.
cirrhosa;• to use the model to test the importance of some factors in regulating population size in
the studied species;• to quantifyR. cirrhosaproduction;• to quantify the impact ofR. cirrhosaharvest on secondary production;• to evaluate the usefulness of the model with data from other ecosystems.
2. Methods
2.1. Field work
In order to follow biomass dynamics during the years 1996–97 four sampling regimeswere carried out in Santo André lagoon (Fig. 1) between August 1996 and February 1997.Five replicate samples were collected at nine different sites in the main water body. A 16 cmdiameter cylindrical sampler ‘core’ (Menéndez and Comın, 1989) was sunk up to 20 cminto the sediment in monospecific stands ofR. cirrhosa. Plants and sediment were sortedfrom the core through a 5 mm mesh bag and sieved in the water. Samples were frozen(−18◦C) until subsequent analysis. Plant material was then separated and dried to constantweight at 105◦C. Aliquots were incinerated at 550◦C for 3 h to obtain the ash content(Verhoeven, 1980; Menéndez and Comın, 1989). Ash content remained fairly constantduring the sampling period (20% DW).
32 G. Calado, P. Duarte / Aquatic Botany 68 (2000) 29–44
Fig. 1. Santo Andre lagoon: Bathymetric chart with the location of the nine sampling stations marked with anasterik (*). The arrow on the upper left corner shows the place where the lagoon is artificially opened to the seaevery spring.
Net production was estimated from biomass data, using two different methods describedby Murthy et al. (1986). Method 1 is based on the sum of the positive biomass variations,assuming that a negative variation in a period between two samplings, corresponds to abiomass loss that was not produced within the considered period. Method 2 is based onsumming the absolute values of all biomass variations. It is assumed that a negative variationcorresponds to a loss of biomass that was produced within the period of observation. Method1 tends to underestimate production, without any compensation for the biomass lost betweentwo samplings. Method 2 tends to overestimate production by assuming that the biomasslost between two samplings was produced within that time interval. One way to overcomethe disadvantages of these harvesting methods is to quantify mortality. However, in the caseof R. cirrhosait is practically impossible to quantify the dead parts. Even if they remain atthe bottom, it is very difficult to separate them from other types of organic debris.
2.2. Model development
Biomass change is the main process described by the model. In primary producers,this is a result of the balance between productive processes, which incorporate biomass,
G. Calado, P. Duarte / Aquatic Botany 68 (2000) 29–44 33
and degradative processes, which consume biomass. The variation of the biomass can bedescribed by the differential Eq. (1)
dB
dt= P − R − M − G − H (1)
whereB is the biomass ofR. cirrhosa, P the photosynthetic production,R the respiration,M the natural (non-predatory) mortality,G the grazing by macroinvertebrates andH is theharvesting when simulated (see later).
Exudation and photorespiration were not included since no data were available for thisspecies. In the literature, estimates of dissolved organic carbon (DOC) losses through ex-udation are highly variable. Values ranging from almost zero to 90% of carbon fixed aregiven by different authors (see Khailov and Burlakova (1969) and Jørgensen et al. (1991)).There is also variability in the literature concerning the factors affecting DOC loss. In thecase of phytoplankton, some authors refer increased losses with poor growth conditions(e.g. Ittekot et al., 1981), and others have found greater DOC exudation at high productivityrates.
A depth integrated Michaelis–Menten type Eq. (2) was used to describe production as afunction of light. Irradiance at surface was simulated according to Brock (1981) and Portelaand Neves (1994). Photosynthetically active radiation (PAR) was assumed to represent 42%of global radiation (Parsons et al., 1984). The variation of light with depth was calculatedaccording to the Lambert–Beer law.
P = B
Zb − Zc
∫ ZT
Zb
PmaxIc e−kcz
Ik + Ice−kcz∂z = BPmax
(Zb − Zc)kcln
[Ik + Ice−kwZc]
[Ik + Ice−kcZb](2)
whereZT is the depth at the top of the macrophyte stand,Zb the depth at the bottom ofthe macrophyte stand,kw the light extinction coefficient in the water,kc the light extinctioncoefficient within the canopy,Pmax the maximal photosynthetic growth rate,Ik the halfsaturation irradiance andIT the irradiance at the top of the macrophyte stand (calculatedwith the Lambert–Beer law, from irradiance at the surface andkw, the light extinctioncoefficient in the water above the macrophyte stand).
The integration ofP over time allows the calculation of gross production and the inte-gration ofR allows the calculation of total respiration. The difference between the resultsof both integrations gives net production. All these calculations were included in the modelin order to calculate total gross and net production for any time interval.
In Eq. (2), gross production is a function ofPmax andIk. It was assumed thatR. cirrhosais not nutrient limited, since rooted aquatic macrophytes usually uptake nutrients both fromthe bottom and from the water column (Short and McRoy, 1984; Thursby and Harlin, 1984;Harlin, 1995), transferring them through different parts of the plant (Brix and Lyngby, 1985).Thus,Pmax may be assumed to depend mainly on temperature and physiologic adaptation,(Menendez and Peñuelas, 1993) as has been observed in algae (Davison, 1991; Falkowskiand LaRoche, 1991).Ik is a measure of efficiency in light utilisation. The smaller the valueof Ik the larger the initial slope of theP–I relationship and therefore the quantum yieldof photosynthesis. In the present model, adaptation was taken into account by changingPmax and Ik has a function of water temperature, season and ambient irradiance.Pmaxvalues measured in Tancada lagoon (NE Spain) (Menéndez and Peñuelas, 1993) at different
34 G. Calado, P. Duarte / Aquatic Botany 68 (2000) 29–44
temperatures similar to those of Santo André lagoon were chosen to use in the model.Linear interpolations were used to recalculate those parameters over time as a function oftemperature and season. The same procedure was used to obtain values for respiration, alsomeasured by Menéndez and Peñuelas (1993) in Tancada lagoon.
Ik is considered a measure of photoadaptation (Parsons et al., 1984; Menéndez andPeñuelas, 1993). This parameter must be related to turbidity, self-shading and depth. In themodelIk is calculated as a function of the daily average irradiance within the macrophytecanopy, that is calculated by integrating vertically irradiance between the canopy top andbottom over a day (Eq. (3)). Then, Eq. (4) is used to calculateIk. The rationale behindthis equation is that plants exposed to higher average light intensities tend to have a higherIk and a lower quantum yield then plants exposed to low light. This has been observed inalgae (e.g. Falkowski and LaRoche, 1991) and is presumably true for other plants due to thecommon physiological basis of photosynthesis. When the biomass standing stock is veryhigh,kc will increase (see below) andId will decrease, leading to a decrease inIk.
Id = 1
(Zb − ZT)kc·∫ t=24
t=0Is[e
−kwZT − e−kcZb] dIs (3)
whereIs is the surface irradiance,Id the daily average irradiance within the macrophytecanopy.
Ik = max(22× Idk1) (4)
wherek1 is a dimensionless calibration factor with a value of 1.5.The range of values obtained from Eq. (4) (22.0–102.5mmol m−2 s−1) is lower to those
reported in Menéndez and Peñuelas (1993).ZT from Eq. (2) will depend on the averagedepth of the lagoon in theR. cirrhosastand, and average height of its canopy (Hc), whileZb will only depend on the average depth of the lagoon in theR. cirrhosastand. The morethe plants grow, the more the canopy will be closer to the water surface, being exposed tohigher irradiance. At the same time, self-shading increases reducing the light in near-bottomzones. At the beginning of the annual vegetative growth,kw is identical tokc when plantstems are just a few centimetres long. When the canopy becomes higher self-shading willincreasekc.
Forkw transparency (Secchi disc) values measured monthly in Santo André lagoon duringthe years 1984 and 1985 (Cancela da Fonseca, 1989) were used according to the empiricalexpression
kw = 1.7
Sd(5)
where Sd is the transparency measured with a Secchi disc (Parsons et al., 1984).kc results not only from water turbidity but also from the self-shading effect of the
macrophyte canopy. It was calculated with a Michaelis–Menten like expression relatingbiomass (g DW m−2) with self-shading (Eq. (6)). This expression was calibrated with PARvalues measured in Santo André lagoon in autumn 1997, using a underwater quantum sensor(LI-COR mod. 193SA) when vegetative growth was near maximum (kc=8 m−1). For valuesof biomass (Bi ) obtained at the beginning of vegetative growth (late spring),kc takes the
G. Calado, P. Duarte / Aquatic Botany 68 (2000) 29–44 35
same values ofkw=1.5, whereas values of 10 correspond to asymptotic biomass values(Bmax) — 360 g DW m−2, assuming 20% ash content forR. cirrhosa(Verhoeven, 1980):
kc = Biomass
k2 + Biomassk3 (6)
wherek2 is the biomass value that forces the ratioBi /(k2+Bi ) to be 1.5 and the ratioBmax/(k2+Bmax) to be 10, whilek3 converts it inkc units (m−1). The rationale beyond thisis thatkc will grow almost linearly until an asymptotic value of 10 m−1. The increase inkcis potentially an important negative feedback regulating biomass growth.
A similar method was used to relate canopy height (Hc) with biomass, according withaverage values obtained in Santo André lagoon (7 cm in late spring; 40 cm as maximalheight in August), as described in Eq. (7):
Hc = Biomass
k4 + Biomassk5 (7)
wherek4 is the biomass value that forces the ratioBi /(k4+Bi ) to be 7 and the ratioBAug/(k4+BAug) to be 40, whilek3 converts it toHc units (cm).
For values of biomass greater thanBAug, canopy is maintained at 40 cm, as it was observedduring field surveys in Santo André lagoon.
The dynamic formulations described above in Eqs. (4), (6) and (7) were chosen in orderto synthesise current knowledge regarding the autoecology of the studied species and alsoas a result of preliminary model simulations, in order to achieve a population dynamicssimilar to that observed in nature.
At Santo André lagoonR. cirrhosais consumed by macroinvertebrates, mainlyGam-marussp. andSphaeromasp. Grazing was treated as a forcing function. Biomass data forthese two species obtained in Santo André between 1984 and 1985 (Cancela da Fonseca,1989), together with consumption rates measured in Tancada lagoon forGammarus ae-quicaudaandSphaeroma hookeri(Menéndez and Comın, 1990) were used to calculate thegrazing pressure onR. cirrhosa.
A situation of harvesting (H in Eq. (1)) was simulated with an outflow of biomass of 50%in 1 day (15 August), representing a summer situation, just before the biomass reached itsmaximum, when dystrophic phenomena are more likely to occur in the lagoon. Since nodata were available on natural (non-predatory) mortality, a constant rate was assumed andused to calibrate the model.
A time step of 0.1 day was used in all model runs. Each simulation started on Day 146 (26May) corresponding to the first field survey, approximately at the beginning of vegetativegrowth. Table 1 synthesises the parameters used in the model. The model was implementedin Stella II 3.0.
3. Results and discussion
3.1. Field work
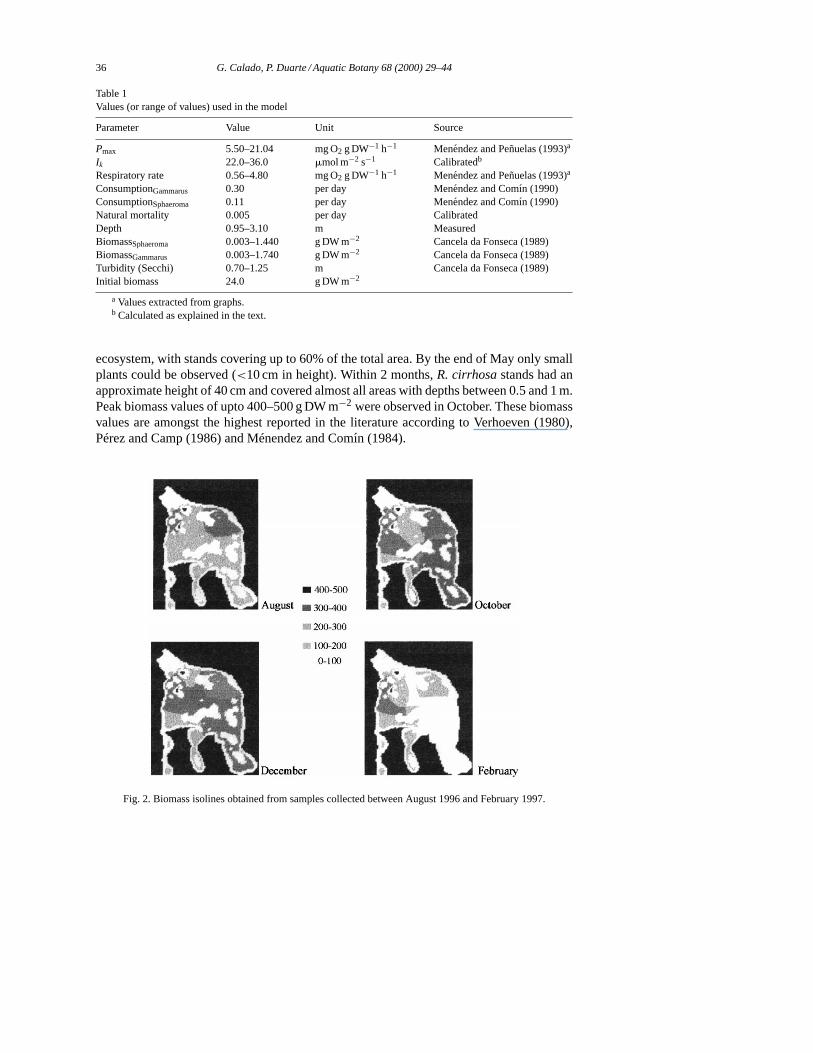
In Fig. 2 R. cirrhosabiomass isolines corresponding to the four sampling periods areshown for the whole lagoon.R. cirrhosais one of the most abundant macrophytes in this
36 G. Calado, P. Duarte / Aquatic Botany 68 (2000) 29–44
Table 1Values (or range of values) used in the model
Parameter Value Unit Source
Pmax 5.50–21.04 mg O2 g DW−1 h−1 Menendez and Peñuelas (1993)a
Ik 22.0–36.0 mmol m−2 s−1 Calibratedb
Respiratory rate 0.56–4.80 mg O2 g DW−1 h−1 Menendez and Peñuelas (1993)a
ConsumptionGammarus 0.30 per day Menendez and Comın (1990)ConsumptionSphaeroma 0.11 per day Menendez and Comın (1990)Natural mortality 0.005 per day CalibratedDepth 0.95–3.10 m MeasuredBiomassSphaeroma 0.003–1.440 g DW m−2 Cancela da Fonseca (1989)BiomassGammarus 0.003–1.740 g DW m−2 Cancela da Fonseca (1989)Turbidity (Secchi) 0.70–1.25 m Cancela da Fonseca (1989)Initial biomass 24.0 g DW m−2
a Values extracted from graphs.b Calculated as explained in the text.
ecosystem, with stands covering up to 60% of the total area. By the end of May only smallplants could be observed (<10 cm in height). Within 2 months,R. cirrhosastands had anapproximate height of 40 cm and covered almost all areas with depths between 0.5 and 1 m.Peak biomass values of upto 400–500 g DW m−2 were observed in October. These biomassvalues are amongst the highest reported in the literature according to Verhoeven (1980),Pérez and Camp (1986) and Ménendez and Comın (1984).
Fig. 2. Biomass isolines obtained from samples collected between August 1996 and February 1997.
G. Calado, P. Duarte / Aquatic Botany 68 (2000) 29–44 37
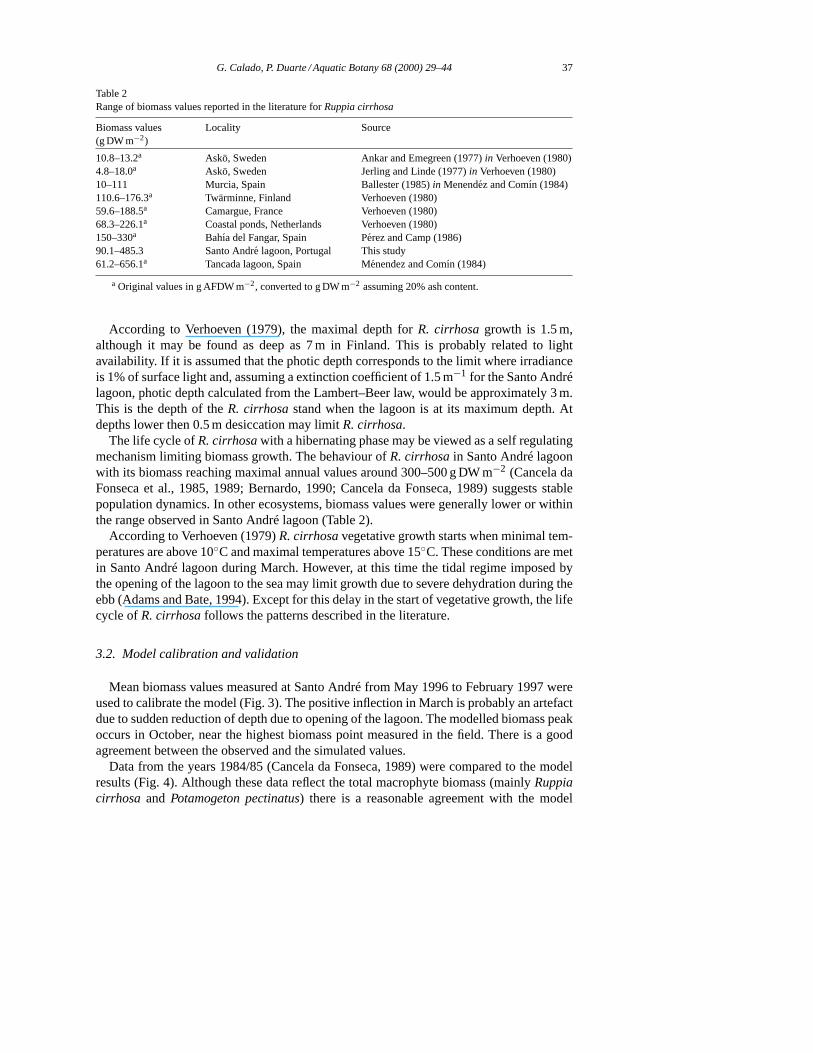
Table 2Range of biomass values reported in the literature forRuppia cirrhosa
Biomass values(g DW m−2)
Locality Source
10.8–13.2a Askö, Sweden Ankar and Emegreen (1977)in Verhoeven (1980)4.8–18.0a Askö, Sweden Jerling and Linde (1977)in Verhoeven (1980)10–111 Murcia, Spain Ballester (1985)in Menendez and Comın (1984)110.6–176.3a Twärminne, Finland Verhoeven (1980)59.6–188.5a Camargue, France Verhoeven (1980)68.3–226.1a Coastal ponds, Netherlands Verhoeven (1980)150–330a Bahıa del Fangar, Spain Perez and Camp (1986)90.1–485.3 Santo Andre lagoon, Portugal This study61.2–656.1a Tancada lagoon, Spain Menendez and Comın (1984)
a Original values in g AFDW m−2, converted to g DW m−2 assuming 20% ash content.
According to Verhoeven (1979), the maximal depth forR. cirrhosagrowth is 1.5 m,although it may be found as deep as 7 m in Finland. This is probably related to lightavailability. If it is assumed that the photic depth corresponds to the limit where irradianceis 1% of surface light and, assuming a extinction coefficient of 1.5 m−1 for the Santo Andrélagoon, photic depth calculated from the Lambert–Beer law, would be approximately 3 m.This is the depth of theR. cirrhosastand when the lagoon is at its maximum depth. Atdepths lower then 0.5 m desiccation may limitR. cirrhosa.
The life cycle ofR. cirrhosawith a hibernating phase may be viewed as a self regulatingmechanism limiting biomass growth. The behaviour ofR. cirrhosain Santo André lagoonwith its biomass reaching maximal annual values around 300–500 g DW m−2 (Cancela daFonseca et al., 1985, 1989; Bernardo, 1990; Cancela da Fonseca, 1989) suggests stablepopulation dynamics. In other ecosystems, biomass values were generally lower or withinthe range observed in Santo André lagoon (Table 2).
According to Verhoeven (1979)R. cirrhosavegetative growth starts when minimal tem-peratures are above 10◦C and maximal temperatures above 15◦C. These conditions are metin Santo André lagoon during March. However, at this time the tidal regime imposed bythe opening of the lagoon to the sea may limit growth due to severe dehydration during theebb (Adams and Bate, 1994). Except for this delay in the start of vegetative growth, the lifecycle ofR. cirrhosafollows the patterns described in the literature.
3.2. Model calibration and validation
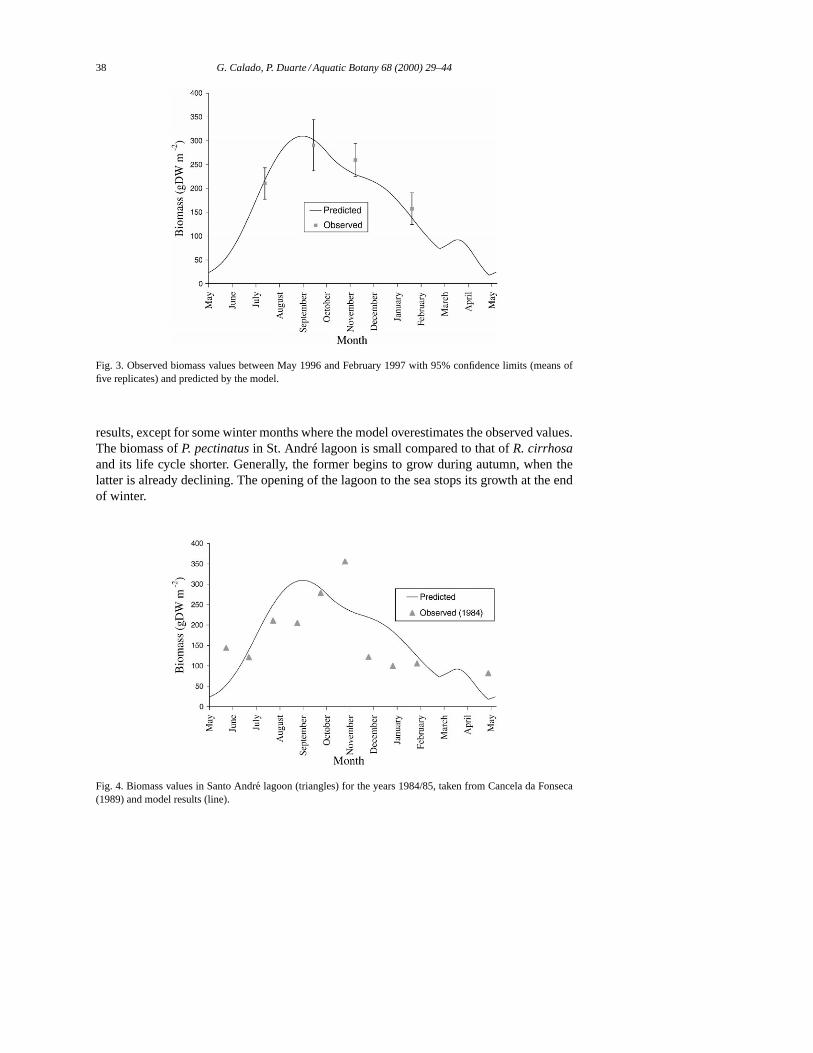
Mean biomass values measured at Santo André from May 1996 to February 1997 wereused to calibrate the model (Fig. 3). The positive inflection in March is probably an artefactdue to sudden reduction of depth due to opening of the lagoon. The modelled biomass peakoccurs in October, near the highest biomass point measured in the field. There is a goodagreement between the observed and the simulated values.
Data from the years 1984/85 (Cancela da Fonseca, 1989) were compared to the modelresults (Fig. 4). Although these data reflect the total macrophyte biomass (mainlyRuppiacirrhosa and Potamogeton pectinatus) there is a reasonable agreement with the model
38 G. Calado, P. Duarte / Aquatic Botany 68 (2000) 29–44
Fig. 3. Observed biomass values between May 1996 and February 1997 with 95% confidence limits (means offive replicates) and predicted by the model.
results, except for some winter months where the model overestimates the observed values.The biomass ofP. pectinatusin St. André lagoon is small compared to that ofR. cirrhosaand its life cycle shorter. Generally, the former begins to grow during autumn, when thelatter is already declining. The opening of the lagoon to the sea stops its growth at the endof winter.
Fig. 4. Biomass values in Santo Andre lagoon (triangles) for the years 1984/85, taken from Cancela da Fonseca(1989) and model results (line).
G. Calado, P. Duarte / Aquatic Botany 68 (2000) 29–44 39
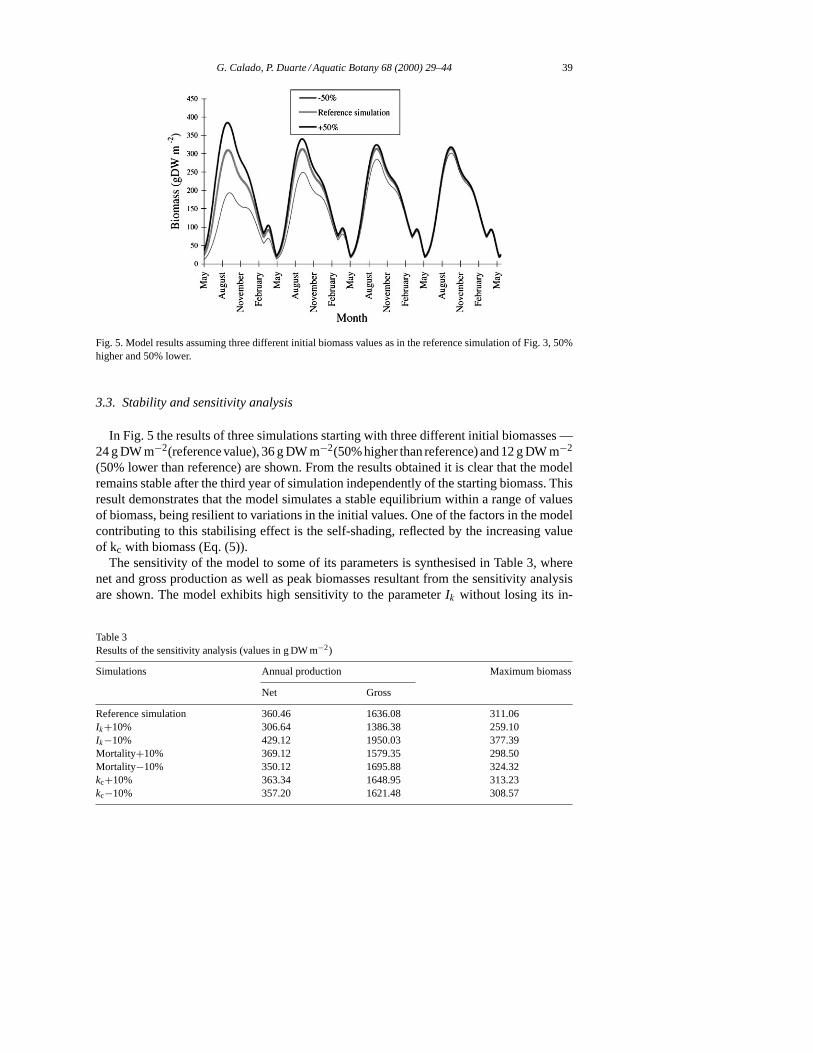
Fig. 5. Model results assuming three different initial biomass values as in the reference simulation of Fig. 3, 50%higher and 50% lower.
3.3. Stability and sensitivity analysis
In Fig. 5 the results of three simulations starting with three different initial biomasses —24 g DW m−2(reference value), 36 g DW m−2(50% higher than reference) and 12 g DW m−2
(50% lower than reference) are shown. From the results obtained it is clear that the modelremains stable after the third year of simulation independently of the starting biomass. Thisresult demonstrates that the model simulates a stable equilibrium within a range of valuesof biomass, being resilient to variations in the initial values. One of the factors in the modelcontributing to this stabilising effect is the self-shading, reflected by the increasing valueof kc with biomass (Eq. (5)).
The sensitivity of the model to some of its parameters is synthesised in Table 3, wherenet and gross production as well as peak biomasses resultant from the sensitivity analysisare shown. The model exhibits high sensitivity to the parameterIk without losing its in-
Table 3Results of the sensitivity analysis (values in g DW m−2)
Simulations Annual production Maximum biomass
Net Gross
Reference simulation 360.46 1636.08 311.06Ik+10% 306.64 1386.38 259.10Ik−10% 429.12 1950.03 377.39Mortality+10% 369.12 1579.35 298.50Mortality−10% 350.12 1695.88 324.32kc+10% 363.34 1648.95 313.23kc−10% 357.20 1621.48 308.57

40 G. Calado, P. Duarte / Aquatic Botany 68 (2000) 29–44
terannual stability. A 10% increase in this parameter reduces annual gross production byapproximately 20%, whereas a 10% decrease has the opposite effect. The sensitivity ofthe model to this parameter reveals its importance in the results obtained. This is a goodevidence of its real importance as a biomass regulating mechanism.
It is important to note that an increase in mortality results in an increase of net productionand a decrease of gross production. This is because the flows ‘production’ and ‘respiration’depend on the biomass pool. As ‘production’ is only active during daylight hours, while‘respiration’ is always active, a decrease in biomass (caused by mortality) in each time stepwill have more impact on production than on respiration.
Net production calculated with the model (360.5 g DW m−2) is slightly higher than val-ues obtained by Verhoeven (1980) from biomass differences, of 150–360 g DW m−2forlenthic ecosystems in Northern and Central Europe. When compared with other aquaticphanerogams the calculated value for net production is lower than that measured forZosterain Denmark (Petersen (1913)in Mann (1972)) — 870 g DW m−2. Net production calcu-lated with the model (360.5 g DW m−2) is between the values estimated from biomassharvest data — 294.6 g DW m−2 with Method 1 and 589.2 g DW m−2 with Method 2 (seeSection 2).
Consumption ofR. cirrhosaby the grazersGammarussp. andSphaeromasp. calculatedfrom the model is 86.4 g DW m−2 per year. It represents 24% of annual net production.Thus, grazing seems to have an important role on biomass consumption, which contrastswith the results obtained in Tancada Lagoon, NE Spain (Menéndez and Comın, 1990).
3.4. Harvesting
Fig. 6 represents a harvesting simulation on 15 August, with the extraction of 25% of thetotal biomass, every year and in alternate years. The model is only sustainable with crops inalternate years, with biomass maxima lower than those observed in the field and predictedby the reference simulation (Fig. 3).
Fig. 6. Model results with a 25% harvest of total biomass in 15 August, every year and in alternate years.
G. Calado, P. Duarte / Aquatic Botany 68 (2000) 29–44 41
Table 4Results of the harvesting simulations (25 and 50% extractions) and reference simulation (values in g DW m−2)
Simulations Annual production Maximum biomass
Net Gross
Reference simulation 360.46 1636.08 311.0625% extraction 381.84 1444.53 248.6050% extraction 387.29 1289.30 248.60
Harvesting may cause an additional input of nutrients to the water by disturbing thesediments, when roots and subterranean stems are pulled from the surface. Furthermore, re-suspended organic matter could induce a rapid reduction in dissolved oxygen concentration.These effects may be reduced by harvesting with a cutting device and removing only thebranching stems above the bottom. Besides that, the time for harvesting could be adjustedin order to avoid periods of water stratification and therefore minimising any deleterioussecondary effects.
Table 4 summarises the results obtained with the harvesting simulations (25% and 50%extractions of total biomass in August). Because of harvest, net production increases andgross production decreases. The variation of net production does not follow the biomassdecrease, due to the reduction in selfshading. This reduction allows the remaining biomassto receive more light and grow faster. Thus harvesting does not seem to imply a reductionin secondary production. However, it is important to evaluate the harvest impact on benthicfauna to prevent potential losses on the second and third levels of the food chain.
3.5. The model in other ecosystems
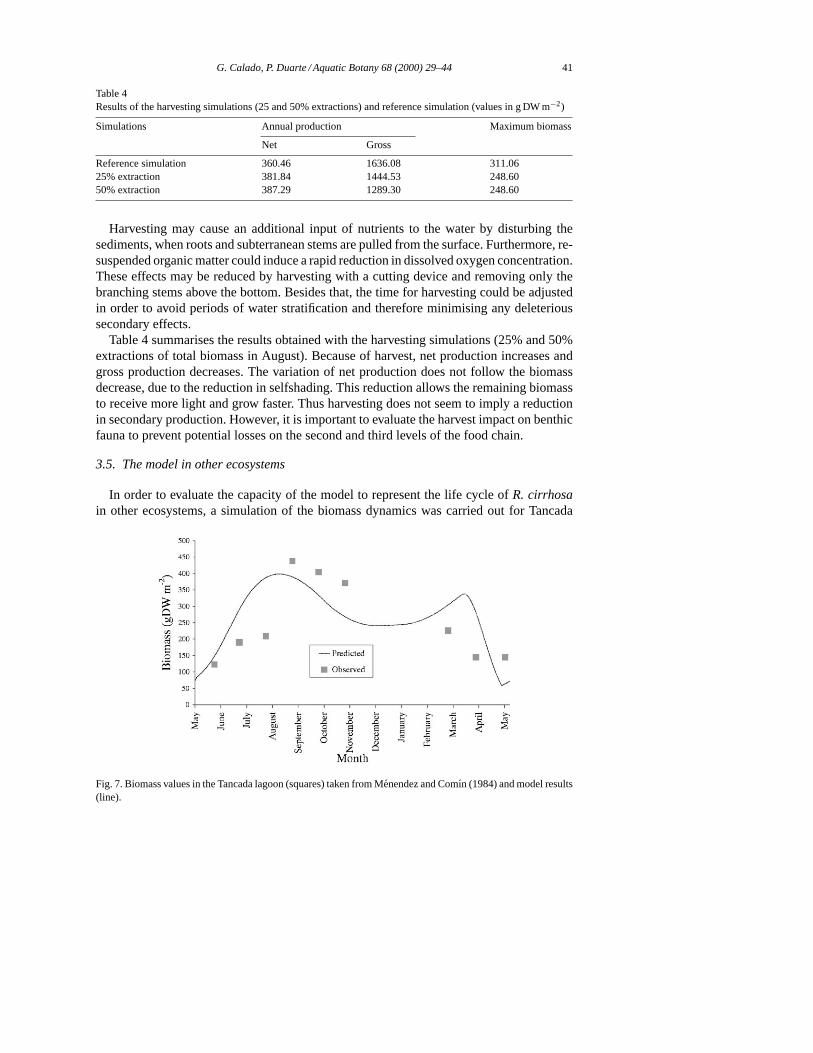
In order to evaluate the capacity of the model to represent the life cycle ofR. cirrhosain other ecosystems, a simulation of the biomass dynamics was carried out for Tancada
Fig. 7. Biomass values in the Tancada lagoon (squares) taken from Menendez and Comın (1984) and model results(line).
42 G. Calado, P. Duarte / Aquatic Botany 68 (2000) 29–44
lagoon. It is a small (1.8 km2) and shallow (ca. 37 cm) coastal lagoon in Ebro Delta (NESpain) (Menéndez and Peñuelas, 1993). Its hydrology is artificially controlled by inputsof freshwater irrigation from rice fields, with low salinity in spring and summer (Comın,1984). Model parameters were the same as for Santo André lagoon. Lagoon depth andbiomasses ofGammarus aequicaudaandSphaeroma hookeriwere obtained from the liter-ature (Menéndez and Comın, 1989, 1990). Since no data on turbidity and self-shading wereavailable in the literature, the Santo André values were assumed.
The results obtained with the model are shown in Fig. 7 together with biomass datafrom Menéndez and Comın, (1989). The model simulates reasonably well the biomassdynamics of Tancada lagoon, except for the August value, which was considerably lowerthan predicted.
4. Conclusions
Considering the information reported in the literature and the results of the present work,some conclusions arise regarding the autoecology ofRuppia cirrhosa. Some biotic andabiotic external factors such as light availability, desiccation probability (near the marginsof the lagoon), the tidal regime imposed by the artificial opening of the lagoon and grazingpressure play a role in the distribution, biomass standing stocks and production of the studiedspecies. Its annual life cycle may be viewed as an internal limiting factor. Peak biomassmay be reached well before the end of the vegetative cycle. Therefore, some other controlmechanisms must work to halt further increases in biomass. Self-shading of the canopyseems to be another important internal limiting factor in controlling peak biomasses andproduction. It is also important to note that the model did not accurately simulate the biomassdynamics until acclimation of its parameters was taken into account. Parameter dynamicsbecame an important topic in ecological modelling during the last decade with severalauthors describing acclimation patterns and stressing the importance of their inclusion inmathematical models (e.g. Jørgensen, 1992; Duarte and Ferreira, 1995, 1997).
The model showed a reasonable adjustment to independent datasets. Its predictions re-garding primary production for Santo André lagoon suggest that harvest of upto 25% ofmacrophyte biomass may be carried out in summer in alternate years, without affectingmacrophyte net production and therefore secondary production.
Acknowledgements
This work was supported by Fundação para a Ciência e Tecnologia (Project PBICT/MAR/2245/95 and Grant JNICT/FMRH/BM 4860). The authors acknowledge the editor and twoanonymous referees, whose comments and criticism helped to improve the current versionof the paper.
References
Adams, J.B., Bate, G.C., 1994. The tolerance of desiccation of the submerged macrophytesRuppia cirrhosa(Petagna) Grande andZostera capensisSetchell. J. Exp. Mar. Biol. Ecol. 183 (1), 53–62.
G. Calado, P. Duarte / Aquatic Botany 68 (2000) 29–44 43
Bernardo, J., 1990. Dinâmica de uma lagoa costeira eutrófica (Lagoa de Santo André). Ph.D. Thesis, Universityof Lisbon.
Brix, H., Lyngby, J.E., 1985. Uptake and translocation of phosphorus in eelgrass (Zostera marinaL.). Mar. Biol.90, 111–116.
Brock, T.D., 1981. Calculating solar radiation for ecological studies. Ecol. Model. 14, 1–9.Cancela da Fonseca, L.M.Q., Bernardo, J.M., Costa, A.M., Fonseca, R., 1985. Lagoa de Santo André, Projecto
‘Estrutura, Dinâmica e Produção de Ecossitemas Estuarinos e Lagunares Costeiros’, INIC, 2◦ RelatórioProgresso.
Cancela da Fonseca, L.M.Q., 1989. Estudo da influência da ‘abertura ao mar’ sobre um sistema lagunar costeiro:a Lagoa de Santo André. Ph.D. Thesis, University of Lisbon.
Cancela da Fonseca, L.M.Q., Costa, A.M., Bernardo, J.M., 1989. Seasonal variation of benthic and fishcommunities in a shallow land-locked coastal lagoon (Santo André, SW Portugal). Scient. Mar. 53 (2-3),663–669.
Comın, F.A., 1984. Caracretısticas fısicas y quımicas y fitopláncton de las lagunas costeras, Encañizada, Tancaday Buda (Delta del Ebro). Oecol. Aquat. 7, 79–162.
Davison, I.R., 1991. Minireview. Environmental effects on algal photosynthesis: temperature. J. Phycol. 19, 516–522.
Duarte, P., Ferreira, J.G., 1993. A methodology for parameter estimation in seaweed productivity modelling.Hydrobiologia 260/261, 183–189.
Duarte, P., Ferreira, J.G., 1995. Seasonal adaptation and short-term metabolic responses ofGelidium sesquipedaleto varying light intensity and temperature. Mar. Ecol. Prog. Ser. 121, 189–300.
Duarte, P., Ferreira, J.G., 1997. Dynamic modelling of photosynthesis in marine and estuarine ecosystems. Environ.Model. Ass. 2, 83–93.
Falkowski, P.G., LaRoche, J., 1991. Minireview. Acclimation to spectral irradiance in algae. J. Phycol. 27, 8–14.Harlin, M.M., 1995. Changes in major plant groups following nutrient enrichement, In: McComb, A.J. (Ed.)
Eutrophic Shallow Estuaries and Lagoons, CRC Press, Boca Raton, pp. 173–188.Ittekot, V., Brockmann, U., Michaelis, W., Degens, E.T., 1981. Dissolved, free and combined carbon hydrates
during a phytoplankton bloom in the northern North Sea. Mar. Ecol. Progr. Ser. 4, 259–305.Jørgensen, S.E., Nielsen, S., Jørgensen, L., 1991. Handbook of Ecological Parameters and Ecotoxicology, Elsevier,
Amsterdam.Jørgensen, S.E., 1992. Integration of Ecosystem Theories. A Pattern, Kluwer Academic Publishers, Dordrecht.Khailov, K.M., Burlakova, Z.P., 1969. Release of dissolved organic matter by marine seaweeds and distribution
of their total organic production to inshore communities. Limnol. Oceanogr. 14, 521–527.Krebs, C.J., 1994. Ecology: The Experimental Analysis of Distribution and Abundance. Harper Collins College
Publishers.Mann, K.H., 1972. Macrophyte production and detritus food chains in coastal waters. Mem. Ist. Ital. Idrobiol. 29,
353–383.Menéndez, M., Comın, F.A., 1989. Seasonal patterns of biomass variation ofRuppia cirrhosa(Petagna) Grande
andPotamogeton pectinatusL in a coastal lagoon. Topics in Marine Biology. Ros, J.D. (Ed.), Scient. Mar. 53(2–3), 633–638.
Menéndez, M., Comın, F.A., 1990. Consumption of macrophytes by invertebrates in Tancada lagoon (NE Spain).Scient. Mar. 54 (2), 139–144.
Menéndez, M., Peñuelas, J., 1993. Sesonal photosynthetic and respiratory responses ofRuppia cirrhosa(Petagna)Grande to changes in light and temperature. Arch. Hidrobiol. 129 (2), 221–230.
Murthy, M.S., Ramakrishna, T., Sarat Babu, G.V., Rao, D., 1986. Estimation of net primary productivity of intertidalseaweeds — limitations and latent problems. Aquat. Bot. 23, 383–387.
Parsons, T.R., Takahashi, M., Hargrave, B., 1984. Biological oceanographic prosseses. 3rd Edition, PergamonPress,New York, 233 pp.
Pérez, M., Camp, J., 1986. Distribuición espacial y biomassa de las fanerógamas marinas de las bahıas del deltadel Ebro. Inv. Pesq. 50 (4), 519–530.
Portela, L.I., Neves, R., 1994. Modelling temperature distribution in the shallow Tejo estuary. In: Tsakiris,G., Santos, M.A. (Eds.), Advances in Water Resources Technology and Management. Balkema, Rotterdam,pp. 457–463.
44 G. Calado, P. Duarte / Aquatic Botany 68 (2000) 29–44
Short, F.T., McRoy, C.P., 1984. Nitrogen uptake by leaves and roots of the seagrassZostera marinaL. Bot. Mar.27, 547–555.
Thornton, J.A., Beekman, H., Boddington, G., Dick, R., Harding, W.R., Lief, M., Morrison, I.R., Quick, A.J.R.,1995. The ecology and management of Zandvlei (Cape Province, South Africa), na enriched shallow Africanestuary. In: McComb, A.J. (Ed.), Eutrophic Shallow Estuaries and Lagoons, CRC Press, London, pp. 109–128.
Thursby, G.B., Harlin, M.M., 1984. Interaction of leaves and roots ofRuppia maritimain the uptake of phosphate.Mar. Biol. 83, 61–67.
Veiga de Oliveira, E., Galhano, F., Pereira, B., 1975. Actividades Agro-Marıtimas em Portugal. Instituto de AltaCultura, Lisboa.
Verhoeven, J.T.A., 1979. The ecology ofRuppia-dominated communities in Western Europe. I. Distribution ofR.cirrhosarepresentatives in relation to their autoecology. Aquat. Bot. 6, 197–268.
Verhoeven, J.T.A., 1980. The ecology ofRuppia-dominated communities in Western Europe. III. Aspects ofproduction, consumption and decomposition. Aquat. Bot. 8, 209–253.
Vollenweider, R.A., 1974. A manual on methods for measuring primary productivity in aquatic environments.Blackwell Scientific Publications, Oxford.
Westoby, M., 1984. The self-thinning rule. Adv. Ecol. Res. 14, 167–225.Wetzel, R.G., 1975. Limnology. Sauders, Philadelphia.