Mathematical modelling of drying of bay leaves
13
Mathematical modelling of drying of bay leaves Tuncay Gunhan a , Vedat Demir a , Ebru Hancioglu b , Arif Hepbasli c, * a Department of Agricultural Machinery, Faculty of Agriculture, Ege University, 35100 Bornova, Izmir, Turkey b Graduate School of Natural and Applied Sciences, Solar Energy Science Branch, Ege University, 35100 Bornova, Izmir, Turkey c Department of Mechanical Engineering, Faculty of Engineering, Ege University, 35100 Bornova, Izmir, Turkey Received 3 June 2004; accepted 3 October 2004 Available online 21 November 2004 Abstract This paper presents a study on the mathematical modelling of bay (Laurus nobilis L. ) leaves. Drying experiments were performed in a laboratory scale dryer constructed in the Department of Agricultural Machinery, Faculty of Agriculture, Ege University, Izmir, Turkey. The leaves were 90–100 mm long and 30–40 mm wide, and ones with no blemish were selected and used for the drying tests. The tests were per- formed with various relative humidities (5%, 15% and 25%) and temperatures (40, 50 and 60 °C) at a con- stant air velocity of 1.5 m/s. Fifteen different mathematical drying models were compared based on their correlation coefficient, root mean square error, mean bias error, reduced chi-square and t-statistic method to estimate the drying curves. It may be concluded that the Page model could sufficiently describe drying of bay leaves. Ó 2004 Elsevier Ltd. All rights reserved. Keywords: Drying; Bay (Laurel) leaves; Modelling 0196-8904/$ - see front matter Ó 2004 Elsevier Ltd. All rights reserved. doi:10.1016/j.enconman.2004.10.001 * Corresponding author. Tel.: +90 232 388 4000/1898; fax: +90 232 388 8562. E-mail addresses: [email protected], [email protected] (A. Hepbasli). www.elsevier.com/locate/enconman Energy Conversion and Management 46 (2005) 1667–1679
Transcript of Mathematical modelling of drying of bay leaves
www.elsevier.com/locate/enconman
Energy Conversion and Management 46 (2005) 1667–1679
Mathematical modelling of drying of bay leaves
Tuncay Gunhan a, Vedat Demir a, Ebru Hancioglu b, Arif Hepbasli c,*
a Department of Agricultural Machinery, Faculty of Agriculture, Ege University, 35100 Bornova, Izmir, Turkeyb Graduate School of Natural and Applied Sciences, Solar Energy Science Branch, Ege University, 35100 Bornova,
Izmir, Turkeyc Department of Mechanical Engineering, Faculty of Engineering, Ege University, 35100 Bornova, Izmir, Turkey
Received 3 June 2004; accepted 3 October 2004
Available online 21 November 2004
Abstract
This paper presents a study on the mathematical modelling of bay (Laurus nobilis L.) leaves. Drying
experiments were performed in a laboratory scale dryer constructed in the Department of Agricultural
Machinery, Faculty of Agriculture, Ege University, Izmir, Turkey. The leaves were 90–100mm long and
30–40mm wide, and ones with no blemish were selected and used for the drying tests. The tests were per-
formed with various relative humidities (5%, 15% and 25%) and temperatures (40, 50 and 60 �C) at a con-
stant air velocity of 1.5m/s. Fifteen different mathematical drying models were compared based on theircorrelation coefficient, root mean square error, mean bias error, reduced chi-square and t-statistic method
to estimate the drying curves. It may be concluded that the Page model could sufficiently describe drying of
bay leaves.
� 2004 Elsevier Ltd. All rights reserved.
Keywords: Drying; Bay (Laurel) leaves; Modelling
0196-8904/$ - see front matter � 2004 Elsevier Ltd. All rights reserved.
doi:10.1016/j.enconman.2004.10.001
* Corresponding author. Tel.: +90 232 388 4000/1898; fax: +90 232 388 8562.
E-mail addresses: [email protected], [email protected] (A. Hepbasli).

Nomenclature
a, b, c, g, h, n dimensionless drying constant in drying modelsk, k0, k1 drying velocity constant in drying models (1/h)L slice half thickness (mm)Mt moisture content (% dry basis) (gwater/gdry solids)MBE mean bias errorMR moisture ratioN total number of observationsn number of constantsR correlation coefficientR2 coefficient of determinationRH mean effective relative humidity in drying chamber (decimal)RMSE root mean square errorT temperature (�C)t time (h)t-stat t-statistic method
Greek symbols
m degrees of freedomr standard deviationv2 reduced chi-square
Subscripts0 initialcrit criticale equilibriumexp experimentalm meanpre predicted
1668 T. Gunhan et al. / Energy Conversion and Management 46 (2005) 1667–1679
1. Introduction
In many agricultural countries, large quantities of food products are dried to improve shelf life,reduce packing costs, lower shipping weights, enhance appearance, encapsulate original flavourand maintain nutritional value. In this regard, the goals of drying process research in the foodindustry may be classified in three groups as follows: (a) economic considerations, (b) environ-mental concerns and (c) product quality aspects. Though the primary objective of food dryingis preservation, depending on the drying mechanisms, the raw material may end up a completelydifferent material with significant variation in product quality [1].
Drying is an energy intensive operation of some industrial significance. In most industrializedcountries, the energy used in drying accounts for 7–15% of the nation�s industrial energy, often

T. Gunhan et al. / Energy Conversion and Management 46 (2005) 1667–1679 1669
with relatively low thermal efficiencies ranging from 25% to 50% [2,3]. The most important aspectof drying technology is the mathematical modelling of the drying processes and equipment. Itspurpose is to allow design engineers to choose the most suitable operating conditions and thensize the drying equipment and drying chamber accordingly to meet desired operating conditions.The principle of modelling is based on having a set of mathematical equations that can adequatelycharacterize the system. In particular, the solution of these equations must allow prediction of theprocess parameters as a function of time at any point in the dryer based only on the initial con-ditions [4,5].
In recent years, the drying behaviour of different products has been studied by many investiga-tors [6–12]. Some products studied are as follows: Sultana grape [6], banana [7], apricot [8], seed-less grape, fig, green pea, tomato and onion [9], pistachio [10], potato slice [11], pumpkin slice [12]and eggplant [13]. There are, however, few works on the drying process of bay leaves in the liter-ature [14].
The main objective of the present study is to develop a mathematical model for drying of bayleaves.
2. Material and method
2.1. Dryer
Drying experiments were performed in a laboratory scale dryer constructed in the Departmentof Agricultural Machinery, Faculty of Agriculture, Ege University, Izmir, Turkey. A schematicdiagram of the laboratory dryer is illustrated in Fig. 1, while the drying system has been describedin detail elsewhere [15]. The dryer consists mainly of three subsystems, namely (a) air supplyunit, (b) drying unit with heater and humidifier and (c) data acquisition and electronic controlunit.
Temperature control, data acquisition and storage as well as the general supervision of the unit:start-up and shut down of electric heaters, injecting hot water into the air stream and circulatingcold water through the cooling tower, are done by the GENIE data acquisition software.
2.2. Experiments
Experiments were performed to determine the effect of the drying air temperature and relativehumidity. Three temperature points of 40, 50 and 60 �C at a relative humidity of 15% were selectedto determine the effect of the temperature of the drying air on the drying coefficient. The tests werealso performed to determine the effect of relative humidity of the air flow on the drying with rel-ative humidity of 5–25% at temperatures of 50 and 60 �C. All experiments were conducted at anair velocity of 1.5m/s in three replications. Before starting the experiments, the system was run forat least one hour to obtain steady state conditions. The leaves were 90–100mm long and 30–40mm wide, and ones with no blemish were selected and used for the drying tests. The leaves werehung in a vertical drying channel, as the surface of the leaves was held parallel to the direction ofair flow. The initial moisture content of the bay leaves was determined by leaving the samples inan air-circulated oven for 5h at 105 �C.

Fig. 1. Schematic diagram of the laboratory dryer (1—centrifugal fan; 2—orifice plate; 3—differential manometer; 4—
cooling and saturating tower; 5—cold water tank and evaporator; 6,9,11,15—thermocouples (T type); 7—cold water
circulation pump; 8—cold water shower; 10—electric heaters; 12—mixing chamber and drying air channels; 13—steam
tank; 14—electric water heater; 16—injector and solenoid valve; 17—relative humidity and temperature sensor; 18—
anemometer; 19—balance; 20—bay leaves; 21—computer with data acquisition and control cards).
1670 T. Gunhan et al. / Energy Conversion and Management 46 (2005) 1667–1679
2.3. Mathematical modelling of drying curves
The drying curves obtained were processed to find the most convenient one among 15 differentexpressions defining drying rates, as given in Table 1, by several investigators [16–34]. 630 experi-ments of bay leaves were performed with various relative humidities (5%, 15% and 25%) and tem-peratures (40, 50 and 60�C) at a constant air velocity of 1.5m/s. The initial moisture content of the
Table 1
Mathematical models given by various authors for the drying curves
Model no. Model name Model equation References
1 Lewis MR = exp(�kt) [16,17]
2 Page MR = exp(�ktn) [18,19]
3 Modified Page MR = exp[�(kt)n] [20,21]
4 Henderson and pabis MR = aexp(�kt) [22,23]
5 Yagcioglu et al. MR = aexp(�kt) + c [14]
6 Two-term MR = aexp(�k0t) + bexp(�k1t) [24,25]
7 Two-term exponential MR = aexp(�kt) + (1�a)exp(�kat) [26]
8 Wang and Singh MR = 1 + at + bt2 [27]
9 Thomson t = a.ln(MR) + b[ln(MR)]2 [28,29]
10 Diffusion approach MR = aexp(�kt) + (1�a)exp(�kbt) [30]
11 Verma et al. MR = aexp(�kt) + (1�a)exp(�gt) [31]
12 Modified Henderson and pabis MR = aexp(�kt) + bexp(�gt) + cexp(�ht) [32]
13 Simplified Fick�s diffusion (SFFD) equation MR = aexp[�c(t/L2)] [33]
14 Modified Page equation-II MR = exp[�k(t/L2)n] [34]
15 Midilli and Kucuk MR = aexp(�ktn) + bt [35]

T. Gunhan et al. / Energy Conversion and Management 46 (2005) 1667–1679 1671
bay leaves ranged from 0.86 to 1.15kg water per kg drymatter andwas reduced to the final moisturecontent of 0.04747–0.07032kg water per kg dry matter. The moisture ratio was calculated usingMR = (Mt�Me)/(M0�Me), which was simplified to Mt/M0 by some investigators [6,8,10] becauseof the continuous fluctuation of the relative humidity of the drying air during their drying processes.
In the literature, there are several statistical test methods used to evaluate statistically the per-formance of the drying models. Among these, the correlation coefficient (R2), the mean bias error(MBE), the root mean square error (RMSE) and the reduced chi-square (v2) are the most widelyused ones [8–17,35–37], as given below.
2.3.1. Correlation coefficient (R)
The correlation coefficient, R can be used to test the linear relation between measured and esti-mated values, which can be calculated from the equation
R2 ¼PN
i¼1ðMRi �MRpre;iÞ � ðMRi �MRexp;iÞffiffiffiffiffiffiffiffiffiffiffiffiffiffiffiffiffiffiffiffiffiffiffiffiffiffiffiffiffiffiffiffiffiffiffiffiffiffiffiffiffiffiffiffiffiffiffiffiffiffiffiffiffiffiffiffiffiffiffiffiffiffiffiffiffiffiffiffiffiffiffiffiffiffiffiffiffiffiffiffiffiffiffiffiffiffiffiffiffiffiffiffiffiffiffiPN
i¼1ðMRi �MRpre;iÞ2
h i�
PNi¼1ðMRi �MRexp;iÞ
2h ir ð1Þ
where R2 is called the coefficient of determination, MRexp,i stands for the experimental moistureratio found in any measurement, MRpre,i is the predicted moisture ratio for this measurementand N is the total number of observations.
2.3.2. Mean bias error (MBE)
The mean bias error is given as:
MBE ¼ 1
N
XNi¼1
ðMRpre;i�MRexp;iÞ ð2Þ
The MBE provides information on the long term performance of the correlations by allowing acomparison of the actual deviation between predicted and measured values term by term. Theideal value of MBE is �zero�.
2.3.3. Root mean square error (RMSE)The root mean square error may be computed from the following equation
RMSE ¼ 1
N
XNi¼1
ðMRpre;i�MRexp;iÞ
" #1=2
ð3Þ
which provides information on the short term performance. The value of RMSE is always posi-tive, represented as �zero� in the ideal case.
2.3.4. Reduced chi-square (v2)
The reduced v-square may be calculated as:
v2 ¼PN
i¼1ðMRexp;i �MRpre;iÞ2
N � nð4Þ
1672 T. Gunhan et al. / Energy Conversion and Management 46 (2005) 1667–1679
where n is the number of constants. The lower are the values of the reduced v-square, the better isthe goodness of fit [10].
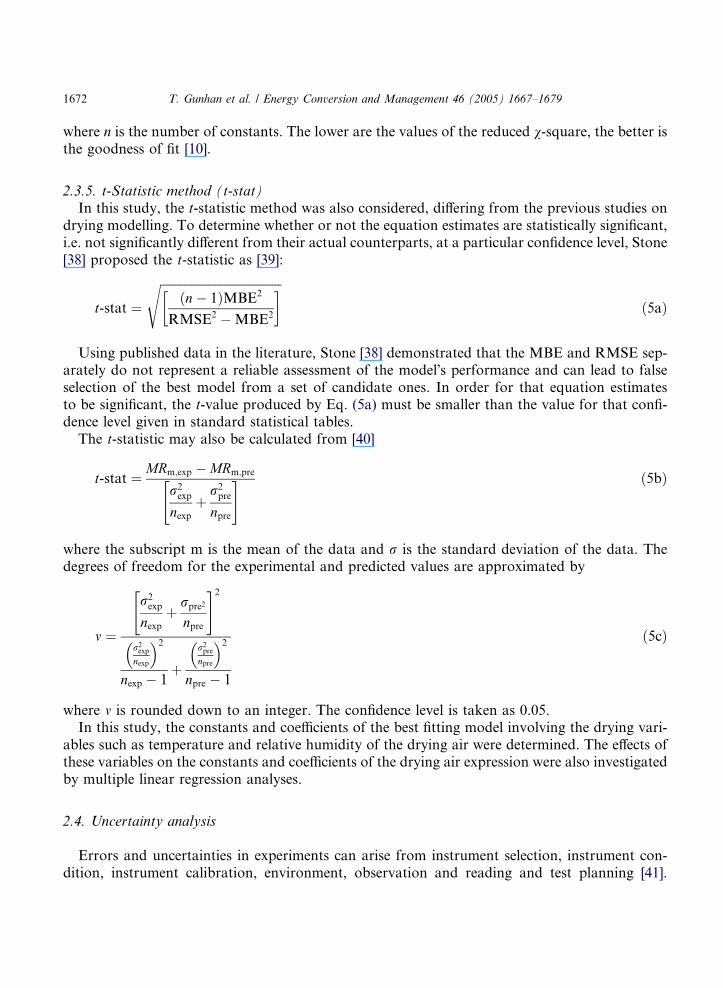
2.3.5. t-Statistic method (t-stat)In this study, the t-statistic method was also considered, differing from the previous studies on
drying modelling. To determine whether or not the equation estimates are statistically significant,i.e. not significantly different from their actual counterparts, at a particular confidence level, Stone[38] proposed the t-statistic as [39]:
t-stat ¼
ffiffiffiffiffiffiffiffiffiffiffiffiffiffiffiffiffiffiffiffiffiffiffiffiffiffiffiffiffiffiffiffiffiffiffiffiffiffiffiffiðn� 1ÞMBE2
RMSE2 �MBE2
sð5aÞ
Using published data in the literature, Stone [38] demonstrated that the MBE and RMSE sep-arately do not represent a reliable assessment of the model�s performance and can lead to falseselection of the best model from a set of candidate ones. In order for that equation estimatesto be significant, the t-value produced by Eq. (5a) must be smaller than the value for that confi-dence level given in standard statistical tables.
The t-statistic may also be calculated from [40]
t-stat ¼ MRm;exp �MRm;pre
r2exp
nexpþ
r2pre
npre
" # ð5bÞ
where the subscript m is the mean of the data and r is the standard deviation of the data. Thedegrees of freedom for the experimental and predicted values are approximated by
m ¼
r2exp
nexpþ rpre2
npre
" #2
r2expnexp
� 2
nexp � 1þ
r2prenpre
� 2
npre � 1
ð5cÞ
where m is rounded down to an integer. The confidence level is taken as 0.05.In this study, the constants and coefficients of the best fitting model involving the drying vari-
ables such as temperature and relative humidity of the drying air were determined. The effects ofthese variables on the constants and coefficients of the drying air expression were also investigatedby multiple linear regression analyses.
2.4. Uncertainty analysis
Errors and uncertainties in experiments can arise from instrument selection, instrument con-dition, instrument calibration, environment, observation and reading and test planning [41].

Table 2
Uncertainties in measurement of parameters during drying of bay leaves
Instrument Range Estimated uncertainty
Electronic balance 0–610g ± 0.01g (based on manufacturer�s specification)Hygrometer Humidity 0–100% RH ± 3% RH (based on calibration data)
Temperature �20 to +120 �C ± 0.5 �C (�20 to +50 �C); ± 1.5% (>50 �C)(based on calibration data)
Thermocouples
(type T; copper + constantan)
0–400�C ± 0.5 �C (based on manufacturer�s specification)
Anemometer 0–20m/s ± 0.1m/s (based on manufacturer�s specification)
T. Gunhan et al. / Energy Conversion and Management 46 (2005) 1667–1679 1673
Uncertainty analysis is needed to prove the accuracy of the experiments. An uncertainty anal-ysis was performed using the method described by Holman [40]. This calculation method con-cerning uncertainty analysis was also used in many studies [42–44]. In the present study, the airtemperatures, velocities, weights and humidities were measured with appropriate instruments asexplained previously. The total uncertainties of these parameters are presented in Table 2.Using a similar calculation procedure explained in detail elsewhere [38,44], the uncertaintiesin calculating the moisture content and ratio were obtained to be ± 4.24% and 5.99%,respectively.
3. Results and discussion
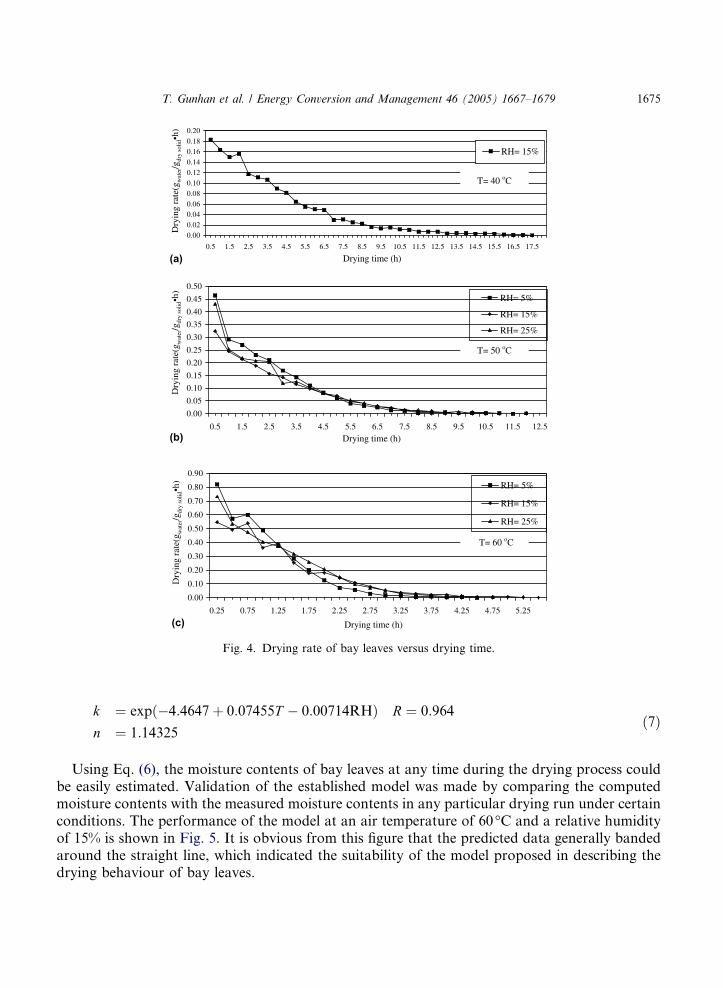
Figs. 2–4 illustrate the changes in the moisture ratio of the bay leaves with drying time, anddrying rates versus drying time. It is clear from these figures that the drying rate decreases
T= 40 oC
T= 50 oC
T= 60 oC
0.0
0.2
0.4
0.6
0.8
1.0
1.2
0 1 2 3 4 5 6 7 8 9 10 11 12 13 14 15 16 17
Drying time (h)
Moi
stur
e ra
tio
Fig. 2. Relationship between the moisture ratio and drying time at different air temperatures at 15% relative humidity.

0.0
0.2
0.4
0.6
0.8
1.0
1.2
0 0.5 1 1.5 2 2.5 3 3.5 4 4.5 5 5.5Drying time (h)
Moi
stur
e ra
tio
RH= 5%
RH= 15%
RH= 25%
Fig. 3. Relationship between the moisture ratio and drying time at different relative humidity at 60 �C air temperatures.
1674 T. Gunhan et al. / Energy Conversion and Management 46 (2005) 1667–1679
continuously with the moisture content or drying time. There is not any constant rate drying per-iod in these curves, and all the drying operations are seen to occur in the falling rate period. Finaldrying duration takes 5–18h in the dryer, while it takes about 8 and 25–30 days in the months ofSeptember and October in open air sun drying, respectively. As can be seen from Figs. 2–4, one ofthe main factors influencing the drying kinetics of bay leaves is the drying air temperature duringthe falling rate drying period. An increase in drying air temperature resulted in a decrease in thedrying time.
The moisture content data obtained for different drying air temperatures and relative humidi-ties were converted to the moisture ratio expression and then curve fitting computations with thedrying time were performed on the 15 drying models given by previous investigators. These mod-els and the results of the statistical analyses are shown in Tables 2 and 3. As can be seen from thestatistical analysis results, generally high correlation coefficients are found for the drying models.Nevertheless, the results have shown that the highest values of R and the lowest values of v2,MBE, RMSE and t-stat could be obtained with the Page, Modified Page, Modified Page equationII and Midilli and Kucuk expressions. In this study, the Page model was preferred due to its sim-plicity. Thus, the Page model may be assumed to represent the drying behaviour of bay leaves (seeTable 4).
Further regressions were made to take into account the effect of the drying variables on thePage model constant k (h�1). The effects of temperature, T (�C) and relative humidity, RH (%)of the drying air on k were also included in the model by multiple regression analyses. The multi-ple combinations of the variables that gave the highest R were finally covered in the final model.Based on the multiple regression analyses, the accepted model constants and coefficients were asfollows:
MR ¼ expð�ktnÞ ð6Þ
where
0.000.02
0.040.06
0.080.10
0.120.14
0.160.18
0.20
0.5 1.5 2.5 3.5 4.5 5.5 6.5 7.5 8.5 9.5 10.5 11.5 12.5 13.5 14.5 15.5 16.5 17.5
RH= 15%
0.00
0.05
0.10
0.15
0.20
0.25
0.30
0.35
0.40
0.45
0.50
0.5 1.5 2.5 3.5 4.5 5.5 6.5 7.5 8.5 9.5 10.5 11.5 12.5
RH= 5%
RH= 15%
RH= 25%
0.00
0.10
0.20
0.30
0.40
0.50
0.60
0.70
0.80
0.90
0.25 0.75 1.25 1.75 2.25 2.75 3.25 3.75 4.25 4.75 5.25
RH= 5%
RH= 15%
RH= 25%
T= 60 oC
T= 50 oC
T= 40 oC
Drying time (h)
Drying time (h)
Drying time (h)
Dry
ing
rate
(gw
ater
/gdr
y so
lid•h
)D
ryin
g ra
te(g
wat
er/g
dry
solid
•h)
Dry
ing
rate
(gw
ater
/gdr
y so
lid•h
)
(a)
(b)
(c)
Fig. 4. Drying rate of bay leaves versus drying time.
T. Gunhan et al. / Energy Conversion and Management 46 (2005) 1667–1679 1675
k ¼ expð�4:4647þ 0:07455T � 0:00714RHÞ R ¼ 0:964
n ¼ 1:14325ð7Þ
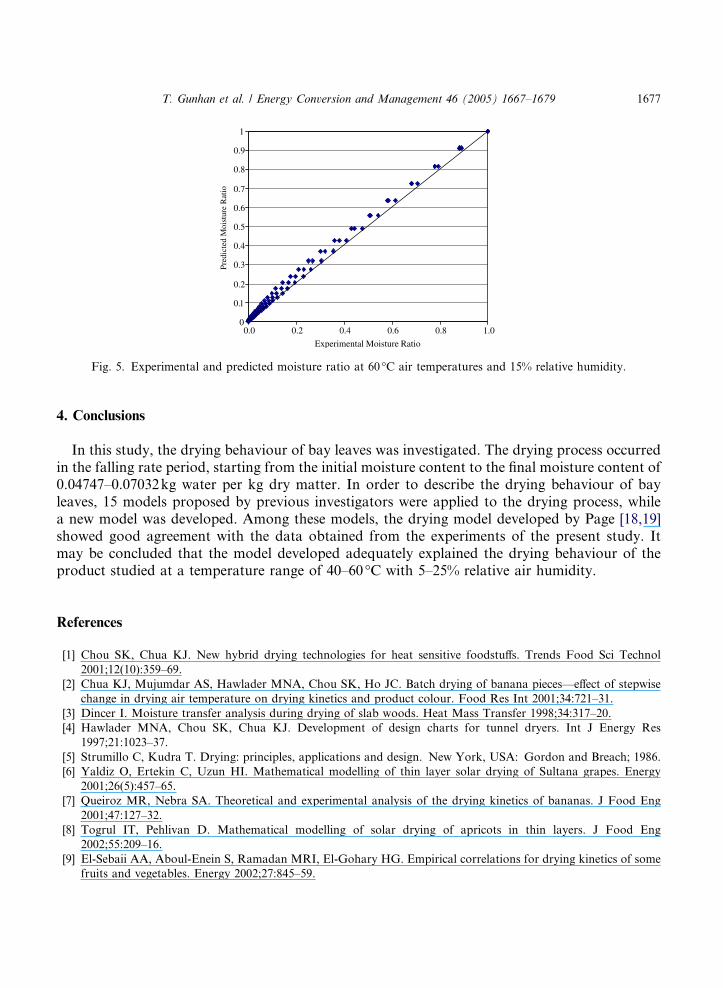
Using Eq. (6), the moisture contents of bay leaves at any time during the drying process couldbe easily estimated. Validation of the established model was made by comparing the computedmoisture contents with the measured moisture contents in any particular drying run under certainconditions. The performance of the model at an air temperature of 60�C and a relative humidityof 15% is shown in Fig. 5. It is obvious from this figure that the predicted data generally bandedaround the straight line, which indicated the suitability of the model proposed in describing thedrying behaviour of bay leaves.
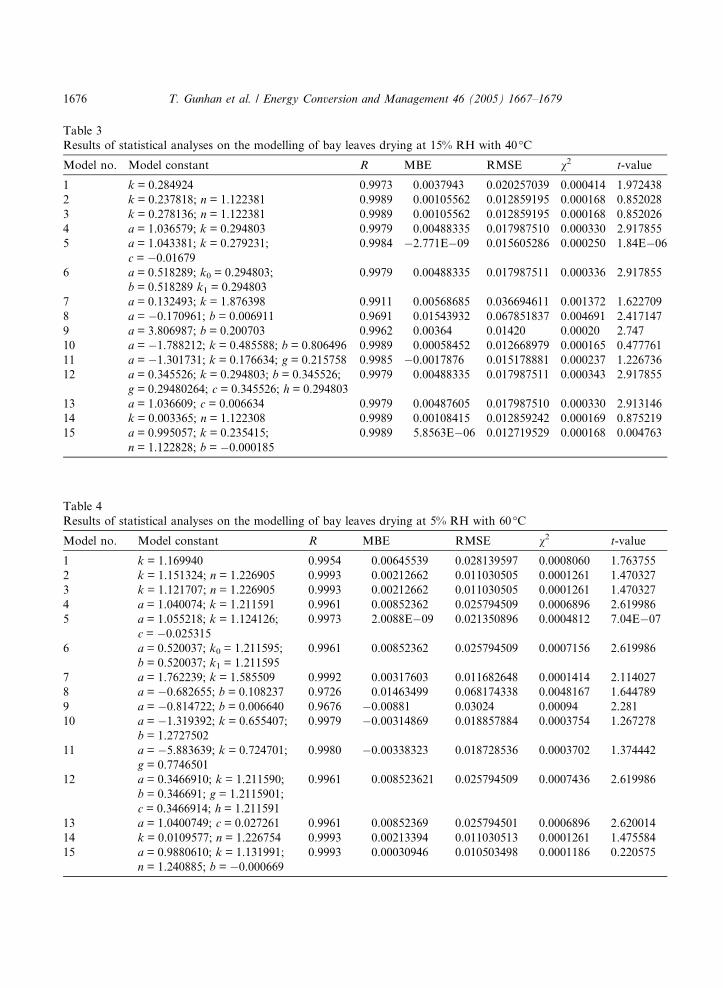
Table 3
Results of statistical analyses on the modelling of bay leaves drying at 15% RH with 40 �C
Model no. Model constant R MBE RMSE v2 t-value
1 k = 0.284924 0.9973 0.0037943 0.020257039 0.000414 1.972438
2 k = 0.237818; n = 1.122381 0.9989 0.00105562 0.012859195 0.000168 0.852028
3 k = 0.278136; n = 1.122381 0.9989 0.00105562 0.012859195 0.000168 0.852026
4 a = 1.036579; k = 0.294803 0.9979 0.00488335 0.017987510 0.000330 2.917855
5 a = 1.043381; k = 0.279231;
c = �0.01679
0.9984 �2.771E�09 0.015605286 0.000250 1.84E�06
6 a = 0.518289; k0 = 0.294803;
b = 0.518289 k1 = 0.294803
0.9979 0.00488335 0.017987511 0.000336 2.917855
7 a = 0.132493; k = 1.876398 0.9911 0.00568685 0.036694611 0.001372 1.622709
8 a = �0.170961; b = 0.006911 0.9691 0.01543932 0.067851837 0.004691 2.417147
9 a = 3.806987; b = 0.200703 0.9962 0.00364 0.01420 0.00020 2.747
10 a = �1.788212; k = 0.485588; b = 0.806496 0.9989 0.00058452 0.012668979 0.000165 0.477761
11 a = �1.301731; k = 0.176634; g = 0.215758 0.9985 �0.0017876 0.015178881 0.000237 1.226736
12 a = 0.345526; k = 0.294803; b = 0.345526;
g = 0.29480264; c = 0.345526; h = 0.294803
0.9979 0.00488335 0.017987511 0.000343 2.917855
13 a = 1.036609; c = 0.006634 0.9979 0.00487605 0.017987510 0.000330 2.913146
14 k = 0.003365; n = 1.122308 0.9989 0.00108415 0.012859242 0.000169 0.875219
15 a = 0.995057; k = 0.235415;
n = 1.122828; b = �0.000185
0.9989 5.8563E�06 0.012719529 0.000168 0.004763
Table 4
Results of statistical analyses on the modelling of bay leaves drying at 5% RH with 60 �C
Model no. Model constant R MBE RMSE v2 t-value
1 k = 1.169940 0.9954 0.00645539 0.028139597 0.0008060 1.763755
2 k = 1.151324; n = 1.226905 0.9993 0.00212662 0.011030505 0.0001261 1.470327
3 k = 1.121707; n = 1.226905 0.9993 0.00212662 0.011030505 0.0001261 1.470327
4 a = 1.040074; k = 1.211591 0.9961 0.00852362 0.025794509 0.0006896 2.619986
5 a = 1.055218; k = 1.124126;
c = �0.025315
0.9973 2.0088E�09 0.021350896 0.0004812 7.04E�07
6 a = 0.520037; k0 = 1.211595;
b = 0.520037; k1 = 1.211595
0.9961 0.00852362 0.025794509 0.0007156 2.619986
7 a = 1.762239; k = 1.585509 0.9992 0.00317603 0.011682648 0.0001414 2.114027
8 a = �0.682655; b = 0.108237 0.9726 0.01463499 0.068174338 0.0048167 1.644789
9 a = �0.814722; b = 0.006640 0.9676 �0.00881 0.03024 0.00094 2.281
10 a = �1.319392; k = 0.655407;
b = 1.2727502
0.9979 �0.00314869 0.018857884 0.0003754 1.267278
11 a = �5.883639; k = 0.724701;
g = 0.7746501
0.9980 �0.00338323 0.018728536 0.0003702 1.374442
12 a = 0.3466910; k = 1.211590;
b = 0.346691; g = 1.2115901;
c = 0.3466914; h = 1.211591
0.9961 0.008523621 0.025794509 0.0007436 2.619986
13 a = 1.0400749; c = 0.027261 0.9961 0.00852369 0.025794501 0.0006896 2.620014
14 k = 0.0109577; n = 1.226754 0.9993 0.00213394 0.011030513 0.0001261 1.475584
15 a = 0.9880610; k = 1.131991;
n = 1.240885; b = �0.000669
0.9993 0.00030946 0.010503498 0.0001186 0.220575
1676 T. Gunhan et al. / Energy Conversion and Management 46 (2005) 1667–1679
0
0.1
0.2
0.3
0.4
0.5
0.6
0.7
0.8
0.9
1
0.0 0.2 0.4 0.6 0.8 1.0
Experimental Moisture Ratio
Pred
icte
d M
oist
ure
Rat
io
Fig. 5. Experimental and predicted moisture ratio at 60 �C air temperatures and 15% relative humidity.
T. Gunhan et al. / Energy Conversion and Management 46 (2005) 1667–1679 1677
4. Conclusions
In this study, the drying behaviour of bay leaves was investigated. The drying process occurredin the falling rate period, starting from the initial moisture content to the final moisture content of0.04747–0.07032kg water per kg dry matter. In order to describe the drying behaviour of bayleaves, 15 models proposed by previous investigators were applied to the drying process, whilea new model was developed. Among these models, the drying model developed by Page [18,19]showed good agreement with the data obtained from the experiments of the present study. Itmay be concluded that the model developed adequately explained the drying behaviour of theproduct studied at a temperature range of 40–60�C with 5–25% relative air humidity.
References
[1] Chou SK, Chua KJ. New hybrid drying technologies for heat sensitive foodstuffs. Trends Food Sci Technol
2001;12(10):359–69.
[2] Chua KJ, Mujumdar AS, Hawlader MNA, Chou SK, Ho JC. Batch drying of banana pieces—effect of stepwise
change in drying air temperature on drying kinetics and product colour. Food Res Int 2001;34:721–31.
[3] Dincer I. Moisture transfer analysis during drying of slab woods. Heat Mass Transfer 1998;34:317–20.
[4] Hawlader MNA, Chou SK, Chua KJ. Development of design charts for tunnel dryers. Int J Energy Res
1997;21:1023–37.
[5] Strumillo C, Kudra T. Drying: principles, applications and design. New York, USA: Gordon and Breach; 1986.
[6] Yaldiz O, Ertekin C, Uzun HI. Mathematical modelling of thin layer solar drying of Sultana grapes. Energy
2001;26(5):457–65.
[7] Queiroz MR, Nebra SA. Theoretical and experimental analysis of the drying kinetics of bananas. J Food Eng
2001;47:127–32.
[8] Togrul IT, Pehlivan D. Mathematical modelling of solar drying of apricots in thin layers. J Food Eng
2002;55:209–16.
[9] El-Sebaii AA, Aboul-Enein S, Ramadan MRI, El-Gohary HG. Empirical correlations for drying kinetics of some
fruits and vegetables. Energy 2002;27:845–59.
1678 T. Gunhan et al. / Energy Conversion and Management 46 (2005) 1667–1679
[10] Midilli A, Kucuk H. Mathematical modelling of thin layer drying of pistachio by using solar energy. Energy
Convers Manage 2003:1111–22.
[11] Akpinar E, Midilli A, Bicer Y. Single layer drying behaviour of potato slices in a convective cyclone dryer and
mathematical modelling. Energy Convers Manage 2003;44(10):1689–705.
[12] Akpinar EK, Midilli A, Bicer Y. Experimental investigation of drying behaviour and conditions of pumpkin slices
via a cyclone-type dryer. J Sci Food Agric 2003;83(14):1480–6.
[13] Ertekin C, Yaldiz O. Drying of eggplant and selection of a suitable thin layer drying model. J Food Eng
2004;63(3):349–59.
[14] Yagcioglu A, Degirmencioglu A, Cagatay F. Drying characteristic of laurel leaves under different conditions. In:
Bascetincelik A, editor. Proceeding of the 7th international congress on agricultural mechanization and energy, 26–
27 May, Adana, Turkey. Faculty of Agriculture, Cukurova Universty, 1999. p. 565–9.
[15] Yagcioglu AK, Demir V, Gunhan T. Determination of the drying characteristics of laurel leaves. Ege University
Research Fund Project Final Report, Faculty of Agriculture, Agricultural Machinery Department, Project No. 99
ZRF 029, 2001 [in Turkish].
[16] Lui Q, Bakker-Arkema FW. Stochastic modelling of grain drying. Part 2: Model development. J Agricult Eng Res
1997;66:275–80.
[17] O�Callaghan JR, Menzies DJ, Bailey PH. Digital simulation of agricultural dryer performance. J Agricul Eng Res
1971;16:223–44.
[18] Agrawal YC, Singh RP. Thin layer drying studies on short grain rough rice. ASAE Paper No. 3531, 1997.
[19] Zhang Q, Litchfield JB. An optimization of intermittent corn drying in a laboratory scale thin layer dryer. Drying
Technol 1991;9:383–95.
[20] Overhults DD, White GM, Hamilton ME, Ross IJ. Drying soybeans with heated air. Trans ASAE 1973;16:
195–200.
[21] White GM, Ross IJ, Ponelert R. Fully exposed drying of popcorn. Trans ASAE 1981;24:466–8.
[22] Chhinnan MS. Evaluation of few selected mathematical models for describing thin layer drying of in-shell pecans.
Trans ASAE 1984;27(2):610–5.
[23] Westerman PW, White GM, Ross IJ. Relative humidity effect on the high temperature drying of shelled corn.
Trans ASAE 1973;16:1136–9.
[24] Henderson SM. Progress in developing the thin layer drying equation. Trans ASAE 1974;17:1167–8.
[25] Rahman MS, Perera CO, Theband C. Desorption isoterm and heat pump drying kinetics of peas. Food Res Int
1998;30:485–91.
[26] Sharaf-Elden YI, Blaisdell JL, Hamdy MY. A model for ear corn drying. Trans ASAE 1980;23:1261–5.
[27] Wang CY, Singh RP. A single layer drying equation for rough rice. ASAE Paper No. 3001, 1978.
[28] Paulsen MR, Thomson TL. Drying endysus of grain sorghum. Trans ASAE 1973;16:537–40.
[29] Thomson TL, Peart PM, Foster GH. Mathematical simulation of corn drying: A new model. Trans ASAE
1968;11:582–6.
[30] Kassem AS. Comparative studies on thin layer drying models for wheat. In: 13th international congress on
agricultural engineering, vol. 6, 2–6 February, Morocco, 1998.
[31] Verma LR, Bucklin RA, Endan JB, Wratten FT. Effects of drying air parameters on rice drying models. Trans
ASAE 1985;28:296–301.
[32] Karathanos VT. Determination of water content of dried fruits by drying kinetics. J Food Eng 1999;39:337–44.
[33] Diamente LM, Munro PA. Mathematical modelling of hot air drying of sweet potato slices. Int J Food Sci
Technol 1991;26:99.
[34] Diamente LM, Munro PA. Mathematical modelling of the thin layer solar drying of sweet potato slices. Solar
Energy 1993;51:271–6.
[35] Midilli A, Kucuk H, Yapar Z. A new model for single layer drying. Drying Technol 2002;20(7):
1503–13.
[36] Yaldiz O, Ertekin C. Thin layer solar drying of some vegetables. Drying Technol 1991;9:551–88.
[37] Sarsavadia PN, Sawhney RL, Pangavhave DR, Singh SP. Drying behavior of brined onion slices. J Food Eng
1999;40:219–26.
T. Gunhan et al. / Energy Conversion and Management 46 (2005) 1667–1679 1679
[38] Stone RJ. Improved statistical procedure for the evaluation of solar radiation estimation models. Solar Energy
1993;51(4):298–391.
[39] Elagib NA, Alvi SH, Mansell MG. Correlations between clearness index and relative sunshine duration for Sudan.
Renew Energy 1999;17:473–98.
[40] Holman JP. Experimental methods for engineers. seventh ed.. New York: McGraw-Hill; 2001. p. 48–143.
[41] Midilli A. Wastewater distillation via natural vacuum technique. Ph.D. thesis, Karadeniz Technical University,
Trabzon, Turkey, 2001 [in Turkish].
[42] Asan H, Namli L. Uncertainty analysis of experimental studies of heat transfer and pressure drops. In: Proceedings
of 11th national heat science congress, Edirne, Turkey, 1997. p. 369–78 [in Turkish].
[43] Hawlader MNA, Chou SK, Chua J. Development of design charts for tunnel dryers. Int J Energy Res 1997;
21:1023–37.
[44] Hepbasli A, Akdemir O. Energy and exergy analysis of a ground source (geothermal) heat pump system. Energy
Convers Manage 2004;45(5):737–53.