Modelling mussel growth in ecosystems with low suspended matter loads
13
Modelling local food depletion effects in mussel rafts of Galician Rias Pedro Duarte a, ⁎ , Uxio Labarta b , Maria José Fernández-Reiriz b a University Fernando Pessoa. CIAGEB, 349 Praça 9 de Abril, 4249-004 Porto, Portugal b Consejo Superior de Investigaciones Científicas. Instituto de Investigaciones Marinas, Eduardo Cabello 6, 36208 Vigo, Spain Received 9 March 2007; received in revised form 6 November 2007; accepted 7 November 2007 Abstract Mollusc culture is one of the most important types of mariculture, with suspension feeding bivalves being among the most cultivated organisms. In the last years, there has been a growing concern about carrying capacity (CC) of natural ecosystems for bivalve culture, because of decreases in growth rates and mass mortalities due to overstocking. Several methods have been proposed for CC estimation. The simplest are based on average properties integrated over various time scales, like water renewal rate, phytoplankton primary production and bivalve clearance rate. If the time scale of the former two processes is larger than the time scale for bivalve filtration than, bivalve standing stock is over ecosystem CC. More complex approaches are based on ecosystem box modelling or coupled physical-biogeochemical models. The objective of this work is to evaluate production CC for mussel rafts in Galician Rias as a function of mussel loads and current velocities. For this purpose an analytical model was developed and used to find conditions that maximize raft production. Obtained results suggest that CC at the raft scale has not been exceeded by current culture practices. However, it does not seem advisable to increase mussel loads per raft. Therefore, any possible increase in mussel production should be considered at a higher spatial scale. © 2007 Elsevier B.V. All rights reserved. Keywords: Carrying capacity; Mussel rafts; Mathematical modelling; Mytilus galloprovincialis 1. Introduction Carrying capacity (CC) for bivalve cultivation has been the subject of several research projects, stimulated by declines of growth and survival rates in areas where bivalves are abundant. CC estimates for different ecosystems that may be used to regulate aquaculture practices, have been published (Bacher et al., 1998; Ferreira et al., 1998; Duarte et al., 2003). In areas where aquaculture of molluscs is incipient, farmers need to know the maximal densities that may be cultivated in order to obtain maximum economic benefit (Héral, 1993). Overcrowded culture conditions may lead to an increased incidence of shellfish diseases (Dijkema and van Stralen, 1989). Addition- ally, environmental agencies could benefit with the knowledge of how to regulate bivalve aquaculture in order to prevent ecological impacts. High culture biomass may result in a negative impact on local environment through an increase on organic loading and consequent increased oxygen demand beneath culture leases, phytoplankton biomass reduction and increased nutrient turnovers (Prins et al., 1998; Smaal et al., 2001), compromising the sustainability of culture environ- ments. On the other hand, bivalve growth may assist in eutrophication control through nitrogen and phosphorus removal from the water column (Shpigel, 2005). CC has been defined with respect to bivalve culture, as the maximum standing stock that may be kept within a particular ecosystem to maximize production without negatively affecting growth rate (Carver and Mallet, 1990). Alternatively, CC as been defined as the standing stock at which the annual production of the marketable cohort is maximized (Bacher et al., 1998; Smaal and Héral, 1998), or the total bivalve biomass supported by a given ecosystem as a function of the water residence time, primary production time and bivalve clearance time (Dame and Prins, 1998). These definitions are focused on target species, despite a growing tendency in Eastern Countries for “ecological aquaculture” that is based on multi- species culture where producers and consumers are grown Available online at www.sciencedirect.com Aquaculture 274 (2008) 300 – 312 www.elsevier.com/locate/aqua-online ⁎ Corresponding author. Tel.: +351225071300; fax: +351225508269. E-mail address: [email protected] (P. Duarte). 0044-8486/$ - see front matter © 2007 Elsevier B.V. All rights reserved. doi:10.1016/j.aquaculture.2007.11.025
Transcript of Modelling mussel growth in ecosystems with low suspended matter loads

Available online at www.sciencedirect.com
008) 300–312www.elsevier.com/locate/aqua-online
Aquaculture 274 (2
Modelling local food depletion effects in mussel rafts of Galician Rias
Pedro Duarte a,⁎, Uxio Labarta b, Maria José Fernández-Reiriz b
a University Fernando Pessoa. CIAGEB, 349 Praça 9 de Abril, 4249-004 Porto, Portugalb Consejo Superior de Investigaciones Científicas. Instituto de Investigaciones Marinas, Eduardo Cabello 6, 36208 Vigo, Spain
Received 9 March 2007; received in revised form 6 November 2007; accepted 7 November 2007
Abstract
Mollusc culture is one of the most important types of mariculture, with suspension feeding bivalves being among the most cultivatedorganisms. In the last years, there has been a growing concern about carrying capacity (CC) of natural ecosystems for bivalve culture, because ofdecreases in growth rates and mass mortalities due to overstocking. Several methods have been proposed for CC estimation. The simplest arebased on average properties integrated over various time scales, like water renewal rate, phytoplankton primary production and bivalve clearancerate. If the time scale of the former two processes is larger than the time scale for bivalve filtration than, bivalve standing stock is over ecosystemCC. More complex approaches are based on ecosystem box modelling or coupled physical-biogeochemical models. The objective of this work isto evaluate production CC for mussel rafts in Galician Rias as a function of mussel loads and current velocities. For this purpose an analyticalmodel was developed and used to find conditions that maximize raft production. Obtained results suggest that CC at the raft scale has not beenexceeded by current culture practices. However, it does not seem advisable to increase mussel loads per raft. Therefore, any possible increase inmussel production should be considered at a higher spatial scale.© 2007 Elsevier B.V. All rights reserved.
Keywords: Carrying capacity; Mussel rafts; Mathematical modelling; Mytilus galloprovincialis
1. Introduction
Carrying capacity (CC) for bivalve cultivation has been thesubject of several research projects, stimulated by declines ofgrowth and survival rates in areas where bivalves are abundant.CC estimates for different ecosystems that may be used toregulate aquaculture practices, have been published (Bacheret al., 1998; Ferreira et al., 1998; Duarte et al., 2003). In areaswhere aquaculture of molluscs is incipient, farmers need toknow the maximal densities that may be cultivated in order toobtain maximum economic benefit (Héral, 1993). Overcrowdedculture conditions may lead to an increased incidence ofshellfish diseases (Dijkema and van Stralen, 1989). Addition-ally, environmental agencies could benefit with the knowledgeof how to regulate bivalve aquaculture in order to preventecological impacts. High culture biomass may result in anegative impact on local environment through an increase on
⁎ Corresponding author. Tel.: +351225071300; fax: +351225508269.E-mail address: [email protected] (P. Duarte).
0044-8486/$ - see front matter © 2007 Elsevier B.V. All rights reserved.doi:10.1016/j.aquaculture.2007.11.025
organic loading and consequent increased oxygen demandbeneath culture leases, phytoplankton biomass reduction andincreased nutrient turnovers (Prins et al., 1998; Smaal et al.,2001), compromising the sustainability of culture environ-ments. On the other hand, bivalve growth may assist ineutrophication control through nitrogen and phosphorusremoval from the water column (Shpigel, 2005).
CC has been defined with respect to bivalve culture, as themaximum standing stock that may be kept within a particularecosystem to maximize production without negatively affectinggrowth rate (Carver and Mallet, 1990). Alternatively, CC asbeen defined as the standing stock at which the annualproduction of the marketable cohort is maximized (Bacheret al., 1998; Smaal and Héral, 1998), or the total bivalvebiomass supported by a given ecosystem as a function of thewater residence time, primary production time and bivalveclearance time (Dame and Prins, 1998). These definitions arefocused on target species, despite a growing tendency in EasternCountries for “ecological aquaculture” that is based on multi-species culture where producers and consumers are grown
301P. Duarte et al. / Aquaculture 274 (2008) 300–312
together in order to facilitate nutrient recycling (e.g. Fang et al.,1996; Grant, 1999). In this approach, the objective is not only tomaximize production, but also to optimize species combinationsand distributions in such a way as to reduce the environmentalimpacts of aquaculture.
CC is a broad concept that may be divided into four functionalcategories, regarding coastal aquaculture development, as definedby Inglis et al. (2000) and adopted by McKindsey et al. (2006):
(i) physical CC — the total area of marine farms that can beaccommodated in the available physical space;
(ii) production CC — the stocking density of bivalves atwhich harvests are maximized;
(iii) ecological CC — the stocking or farm density whichcauses unacceptable ecological impacts;
(iv) social CC — the level of farm development that causesunacceptable social impacts.
However, different authors may define some of the abovecategories in a slightly different manner. For example, pro-duction CC was defined as the theoretical maximum culture thatcould be supported in an embayment (Jiang and Gibbs, 2005).Alternatively, production CC was defined as the maximumsustainable yield of culture that can be produced within a region,whereas ecological CC was defined as the level of culture thatcan be supported without leading to significant changes toecological processes, species, populations or communities in thegrowing environment (Gibbs, 2007). Therefore, in definingproduction CC, most authors choose to express it as a stockmeasure (e.g. Carver and Mallet, 1990; Bacher et al., 1998;Smaal and Héral 1998; Inglis et al., 2000; Jiang and Gibbs,2005), whereas others define it as a yield (e.g. Gibbs, 2007).
There are several examples where production carrying ca-pacities for bivalve cultivation have been exceeded by non-sustainable practices. These include the bay ofMarennes-Óleron(France), where oyster (Crassostrea gigas) growth has beensignificantly reduced with increased stock densities over theyears (Héral, 1993; Raillard and Ménesguen, 1994). Similarly,mussel (Mytilus edulis) growth in the Oosterschelde estuary(Netherlands) has been compromised by increased standingstocks (Smaal et al., 2001).
Production and ecological CC estimates depend on availabledata and knowledge on bivalve ecophysiology — a field wherethere were considerable progresses over the last years.Generally, bivalve growth is calculated using scope for growth(SFG). SFG depends on clearance, filtration, ingestion,absorption, respiration and excretion rates. These rates arecomputed as a function of food quantity and quality, tem-perature and physiological parameters. In the literature it ispossible to find equations and parameters describing the eco-physiology of several species — e.g. Barillé et al. (1997) andRen and Ross (2001) for oyster (C. gigas); Hawkins et al.(1998) for clam (Cerastoderma edule), oyster (C. gigas) andmussel (Mytilus edulis); Scholten and Smaal (1998) for mussel(Mytilus edulis); Hawkins et al. (1999) for green-lipped mussel(Perna canaliculus); Hawkins et al. (2002) for scallop (Chlamysfarreri); Navarro et al. (1991), Babarro et al. (2000), Figueiras
et al. (2002) and Fernandéz-Reiriz et al. (2007) for mussel(Mytilus galloprovincialis).
The problem of CC may be approached at several spatialscales, ranging from a whole ecosystem, e.g a bay or an estuary,through a particular cultivation area, including several cultiva-tion units, to a cultivation unit, such as a raft (Anderson et al.,2006; Broekhuizen et al., 2002). Different processes andvariables may limit CC at these different scales. At the eco-system scale, bivalve production is more likely to be limited byphytoplankton production, whereas at smaller scales, physicalmixing is more likely to be the limiting factor. For example, atthe scale of a mussel raft, it is expectable that mussels clear thewater faster than phytoplankton divides. Therefore, feedingdepends upon food input from adjacent water (Duarte et al.,2005).
The methods used for production and ecological CCestimation may be divided into two main categories: calculationbudgets and mathematical models. Models may be divided inbox models, coupled physical-biogeochemical models and localdepletion models. For a revision on these different approachessee Duarte (2003).
The focus of the present work will be on local depletionmodels (e.g. Grant et al., 1998) and production CC. Thesemodels are usually applied to the cultivation unit scale, which isdivided in several cells or long line arrays, allowing modellingof seston supply decay downstream, as a result of bivalvefeeding. Examples may be found in Pouvreau et al. (2000),Pilditch et al. (2001), Bacher et al. (2003), Aure et al. (2007) andin Ferreira et al. (2007). Local depletion models are forced bycurrent velocities at the boundaries, solving the transport Eq.(1), including those boundary conditions and local sources andsinks.
dSdt
þ ∂ uSð Þ∂x
þ ∂ vSð Þ∂y
þ ∂ wSð Þ∂z
¼ Ax∂2S∂x2
þ Ay∂2S∂y2
þ Az∂2S∂z2
þ Sources� Sinks ð1Þ
where, u, v and w — current speeds in x, y and z directions (ms−1); A — Coefficient of eddy diffusivity (m2 s-1); S — Aconservative (Sources and Sinks are null) or a non conservativevariable in the respective concentration units.
Local depletion models emphasize the potential importanceof altering the geometry of cultivation structures to optimizeseston supply. In these models, there is no feedback from thecultivation units to the ecosystem. However, they may be veryuseful, among other things, to parameterize local depletioneffects at larger scale models. Bacher et al. (2003) developed asoftware tool that integrates a local depletion model with aGeographical Information System (GIS) interface for SungoBay (People's Republic of China). This tool allows the user tochoose a particular area on the GIS and run it, using the modelto analyze area's production potential. A similar approach wasfurther developed by Ferreira et al. (2007) to screen foreconomically optimal production, using marginal analysis. Thelast authors also provided a tool to examine interactions bet-ween shellfish aquaculture and eutrophication.

Fig. 1. Location of main mussel production rias on the NW of the Iberian Peninsula.
Fig. 2. Scheme of a mussel raft with symbols as described for the model (see text).
302 P. Duarte et al. / Aquaculture 274 (2008) 300–312
Mussel raft culture takes place in Galician Rias since 1946. Itstarted with 125 m2 rafts and evolved to 500 m2 rafts (Pérez-Camacho and Labarta, 2004). After a period of rapid increase inraft numbers, between 1960 and 1970 (Pérez-Camacho et al.,1991), an increase in raft area took place, probably, with the aimof increasing mussel production. Empirical evidence (datapresented by Pérez-Camacho et al. (1991)), as well as commonsense, suggests that larger rafts allow larger yields. However, itis expectable that over a certain raft size, part of the musselsmay be food limited, specially, under low current velocities, aswater flowing beneath the raft is cleared from food particles bymussels located upstream, with potential negative implicationson raft yields. This leads to the need of optimizing raftdimensions and to understand whether it is better to invest in alarger number of smaller rafts or a smaller number of largerrafts. Furthermore, in order to optimize mussel production at theecosystem scale, it is important to quantify local food depletioneffects. Therefore, the objectives of the present work are to:
1) Develop a production carrying capacity model (CC) basedon local food depletion effects at mussel rafts;
2) Use the model to estimate raft production CC as a function ofwater flow, food concentration, mussel physiology and raftdimensions.
2. Methodology
2.1. Study area
Galician Rias are flooded tectonic valleys on the northwestof the Iberian Peninsula (Fig. 1). They are the ground for thehighest mussel production in Europe — 250×106 kg year−1.This production is based on floating rafts. At present, there are
over three thousand mussel rafts in Galician Rias, with an areaof 500 m2, with 500 hanging ropes 12 m long (Fig. 2) (Figueiraset al., 2002). The cultivation process may be divided in threestages: (i) obtaining the seed; (ii) growing the seed; (iii) thinningout the juveniles and growing them until commercial (adult)size. The different duration of the commercial cycle (1 year) andthe cultivation cycle (16–18 months) leads to the frequent needof keeping different size mussels in the same rafts.
2.2. Conceptuals
The model presented here is a local depletion model and wasconceived to estimate carrying capacity (CC) of mussel rafts asa function of water flow, food concentration, mussel physiologyand raft dimensions. It was designed to estimate CC at the

303P. Duarte et al. / Aquaculture 274 (2008) 300–312
cultivation leases scale, not accounting for feedbacks betweenlocal food depletion effects and ecosystem properties.
Fig. 2 is a simplified scheme of a mussel raft of the type usedin Galicean Rias, showing the transport of food in onehorizontal dimension. Rafts may be fixed to the bottom byone or two anchors. In the former case, they are allowed torotate with the tides and the same end of the raft is alwayslocated upstream. The present model deals with this type ofsituation. Given the area of mussel rafts (500 m2) it is assumedthat bivalve food supply depends on advection of suspendedparticles from adjacent waters, that food production within therafts is negligible and that clearance rate (CR) is constant alongthe raft. Under these assumptions, food concentration changes,as water flows across a mussel raft, may be described by Eq. (2):
QdCdx
¼ �CR:C:N ML�1T�1� � ð2Þ
where, Q — Water flow [L3T−1]; C — Food concentration[ML−3] (particulate organic matter or POM); x — Horizontaldistance [L]; CR — Clearance rate of an average mussel L3T−1
mussel–1]; N — Mussel number per unit of length [musselL− 1] (obtained by dividing the total number of mussels in a raftby the distance travelled by the water within the raft).
This equation holds for those situations when water flowsperpendicular to the sides of mussel rafts and food supplyremains constant for the period of time under analysis. Thesolution of Eq. (2) is:
Cx ¼ C0:exp �CR:N :xQ
� �ð3Þ
where C0 and Cx are food concentrations before water enters themussel raft and at a distance x within the raft, respectively.Filtration rate (FR) at distance x from water entrance into themussel raft [MT−1 mussel−1] may be calculated from theproduct of CR by Eq. (3), obtaining Eq. (4):
FRx ¼ CR:C0:exp �CR:N :x
Q
� �: ð4Þ
Assuming no pseudo faeces production, as is the case inGalicean Rias, due to low suspended matter loads (Figueiraset al., 2002) ingestion rate IR=FR. According to (4) IRincreases asymptotically with Q towards CR.C0 and decreasesexponentially with N towards zero.
An average IR̄ , integrated over the water path within the raftmay be calculated as:
PIR ¼
CR:C0Rx1x0
exp � CR:N :xQ
� �dx
Dx⇔
C0:Q �exp � x1:CR:NQ
� �þ exp � x0:CR:N
Q
� �h iN :Dx
:
ð5Þ
Mussel scope for growth (SFG) may be obtained from 6:
SFG ¼ PIR:AE� R ð6Þ
where, AE is absorption efficiency and R respiration.
Total scope for growth (TSFG) (also referred as production)may be calculated by inserting Eq. (5) and multiplying the resultby N:
TSFG¼C0Q �exp � x1:CR:N
Q
� �þ exp � X0:CR:N
Q
� �h iN :Dx
AE� R
8<:
9=;N : ð7Þ
The value of N that maximizes TSFG may be obtained byderivation of TSFG with respect to N:
dTSFGdN
¼
C0:Q �exp � x1:CR:N
Q
� �� x1:CR
Q
� �þ exp � x0:CR:N
Q
� �� x0:CR
Q
� �� N :Dx
�C0Q �exp � x1:CR:N
Q
� �þ exp � x0:CR:N
Q
� �� Dx
N :Dxð Þ2 AE:N
þC0:Q �exp � x1:CR:N
Q
� �þ exp � x0:CR:N
Q
� �h iN :Dx
AE� R:ð8Þ
Assuming x0=0,
dTSFGdN
¼C0:Q �exp � x1:CR:N
Q
� �� x1:CR
Q
� �h iN :Dx� C0:Q �exp � x1:CR:N
Q
� �þ 1
h iDx
N :Dxð Þ2 AE:N
þC0Q �exp � x1:CR:N
Q
� �þ 1
h iN :Dx
AE� R:
ð9Þ
The number of mussels per metre that maximizes productionmay be calculated by maximizing the derivative above, i.e.,equating it to zero and finding the solution of the equationobtained with respect to N:
N ¼ �ln R:Dx
C0:AE:x1:CR
� �x1:CRQ
� � ð10Þ
The corresponding total number of mussels within the raft isobtained from (11):
Ntotal ¼ N :Dx: ð11ÞThe product of SFG by Ntotal is raft production. The
relationships between IR, SFG and Production, on one hand,and current velocity (a surrogate for flow) and bivalve abundance,on the other hand, are depicted in Figs. 3, 4 and 5, showing theparabolic relationship between the Production and abundance,described in Bacher et al. (1998), and the asymptotic increase ofProduction with current speed (a surrogate for flow rate).
2.3. Calculations
Several calculations were performed with the aboveequations, to analyse the dependence of IR, SFG and raftproduction on food concentration, current speeds – used as asurrogate for flow rate – and mussel biomass. Eq. (10) was usedto obtain estimates of the mussel number maximizing raftproduction for seeds, juveniles and adults. These estimates werecompared with approximate values reported in the literature. Inthis case, it was assumed only one type of mussels per raft.
Another set of calculations was carried out for hypotheticalrafts containing all mussel types in different layouts: seeds,
ð8Þ
ð9Þ

304 P. Duarte et al. / Aquaculture 274 (2008) 300–312
juveniles and adults, (i) along the downstream direction; (ii) alongthe upstream direction; (iii) parallel to the flow. In these cases, the“normal” (Labarta et al., 2004) number of mussels was assumed(2500, 1000 and 700 mussels per metre of rope for seeds,juveniles and adults, respectively) and several combinations ofcurrent speeds and food concentrations tested to compute SFG foreach mussel type. It was assumed that seeds occupy 14% of raftarea, whereas juveniles and adults occupy 43% each. In cases (i)and (ii) food concentration at the upstream limit of the raft areaallocated to eachmussel classwas calculated using Eq. (3). Eq. (7)was used for each class to evaluate production.
Fig. 3. Ingestion rate (a),mean scope for growth (b) andmussel production (c) for araft with “seed” mussels solely (0.05 g meat DW) as a function of musselabundance and current speed, assuming a concentration of POMof 0.5mgL−1 andranges in mussel abundance and current speed within those observed (see text).
Fig. 4. Ingestion rate (a), mean scope for growth (b) andmussel production (c) for araft with juvenile mussels solely (1.0 g meat DW) as a function of musselabundance and current speed, assuming a concentration of POMof 0.5mgL−1 andranges in mussel abundance and current speed within those observed (see text).
Finally, calculations were made after the “best” of the cul-tivation layouts described in the previous paragraph wasachieved in terms of raft production, to analyse the possibilityof increasing the number of ropes per raft. Therefore, raftproduction was calculated as a function of increasing number ofropes with mussels, keeping the number of mussels per ropeconstant. In these calculations, two approaches were followed:(i) assuming that current speed within the rafts is not affected byrope density; (ii) reducing within raft current speed and flow asa function of drag exerted by mussel ropes. To estimate drag

Fig. 5. Ingestion rate (a), mean scope for growth (b) and mussel production (c)for a raft with adult mussels solely (2.25 g meat DW) as a function of musselabundance and current speed, assuming a concentration of POM of 0.5 mg L−1
and ranges in mussel abundance and current speed within those observed (seetext).
Fig. 6. Mussel number per metre of rope (obtained from Eq. (10)) that optimizesglobal SFG and production for a raft with “seed” (a), juveniles (b) and adults (c),as a function of current speed and POM concentration (see text).
305P. Duarte et al. / Aquaculture 274 (2008) 300–312
effects, the approach described by Jackson and Winant (1983)for a kelp bed and applied to Saldanha Bay mussel raft cultureby Grant et al. (1998), was followed. Drag (D) exerted byindividual mussel ropes is described by Eq. (12):
D ¼ CDqu2dlropes ð12Þ
CD—Drag coefficient (0.5 for flow approaching a cylinder);ρ — seawater density (1.03 g cm−3); u — current velocity(variable); d — diameter of the cluster of mussels surrounding
the rope (c.a. 12 cm); l — rope length (12 m); ropes — ropenumber per m2 (c.a. 0.9).
From Eq. (12) it is possible to estimate drag per unit areawithin the raft as 0.75 u2. Increasing rope density leads toincreased drag. Since drag scales as u2, it is possible to estimatethe relative decrease in current velocity as a function of a dragincrease.
For all calculations the following conditions were used:
(i) A CR of 2.7 L/h/mussel for a standard 0.3 g meat DWindividual (Fernández-Reiriz and Labarta, 2004).
(ii) An AE of 0.59 was calculated from AE=0.95–0.18/OCI.OCI stands for organic contents of ingested matter, where a
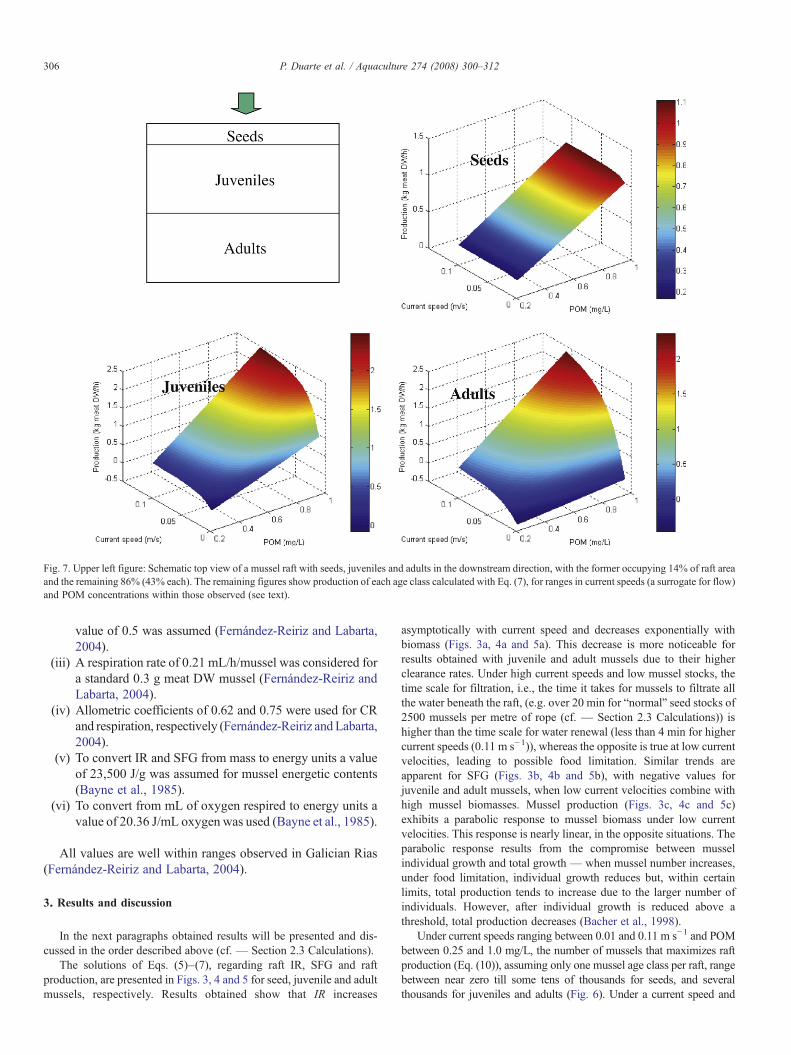
Fig. 7. Upper left figure: Schematic top view of a mussel raft with seeds, juveniles and adults in the downstream direction, with the former occupying 14% of raft areaand the remaining 86% (43% each). The remaining figures show production of each age class calculated with Eq. (7), for ranges in current speeds (a surrogate for flow)and POM concentrations within those observed (see text).
306 P. Duarte et al. / Aquaculture 274 (2008) 300–312
value of 0.5 was assumed (Fernández-Reiriz and Labarta,2004).
(iii) A respiration rate of 0.21 mL/h/mussel was considered fora standard 0.3 g meat DW mussel (Fernández-Reiriz andLabarta, 2004).
(iv) Allometric coefficients of 0.62 and 0.75 were used for CRand respiration, respectively (Fernández-Reiriz andLabarta,2004).
(v) To convert IR and SFG from mass to energy units a valueof 23,500 J/g was assumed for mussel energetic contents(Bayne et al., 1985).
(vi) To convert from mL of oxygen respired to energy units avalue of 20.36 J/mL oxygen was used (Bayne et al., 1985).
All values are well within ranges observed in Galician Rias(Fernández-Reiriz and Labarta, 2004).
3. Results and discussion
In the next paragraphs obtained results will be presented and dis-cussed in the order described above (cf. — Section 2.3 Calculations).
The solutions of Eqs. (5)–(7), regarding raft IR, SFG and raftproduction, are presented in Figs. 3, 4 and 5 for seed, juvenile and adultmussels, respectively. Results obtained show that IR increases
asymptotically with current speed and decreases exponentially withbiomass (Figs. 3a, 4a and 5a). This decrease is more noticeable forresults obtained with juvenile and adult mussels due to their higherclearance rates. Under high current speeds and low mussel stocks, thetime scale for filtration, i.e., the time it takes for mussels to filtrate allthe water beneath the raft, (e.g. over 20 min for “normal” seed stocks of2500 mussels per metre of rope (cf. — Section 2.3 Calculations)) ishigher than the time scale for water renewal (less than 4 min for highercurrent speeds (0.11 m s−1)), whereas the opposite is true at low currentvelocities, leading to possible food limitation. Similar trends areapparent for SFG (Figs. 3b, 4b and 5b), with negative values forjuvenile and adult mussels, when low current velocities combine withhigh mussel biomasses. Mussel production (Figs. 3c, 4c and 5c)exhibits a parabolic response to mussel biomass under low currentvelocities. This response is nearly linear, in the opposite situations. Theparabolic response results from the compromise between musselindividual growth and total growth — when mussel number increases,under food limitation, individual growth reduces but, within certainlimits, total production tends to increase due to the larger number ofindividuals. However, after individual growth is reduced above athreshold, total production decreases (Bacher et al., 1998).
Under current speeds ranging between 0.01 and 0.11 m s−1 and POMbetween 0.25 and 1.0 mg/L, the number of mussels that maximizes raftproduction (Eq. (10)), assuming only one mussel age class per raft, rangebetween near zero till some tens of thousands for seeds, and severalthousands for juveniles and adults (Fig. 6). Under a current speed and

Fig. 8. Upper left figure: Schematic top view of a mussel raft with seeds, juveniles and adults in the upstream direction, with the former occupying 14% of raft area andthe remaining 86% (43% each). The remaining figures show production of each age class calculated with Eq. (7), for ranges in current speeds (a surrogate for flow) andPOM concentrations within those observed (see text).
307P. Duarte et al. / Aquaculture 274 (2008) 300–312
POM concentration representative of “normal” conditions observed nearcultivation rafts within the Galician Rias (Pérez-Camacho and Labarta,2004) – up to 2–3 cm s−1 and 0.5 mg L−1, respectively – predicted seed,juveniles and adult values permetre of cultivation rope arewithin the sameorder of magnitude as those used in the cultivation rafts: a few thousandsfor seeds and several hundreds for juveniles and adults. Considering thatin the model, these mussel abundances are those that maximize total SFG,it is apparent that under the mentioned “normal” conditions, raft CC hasnot been exceeded. It is noteworthy that in these calculations, self-thinningeffects at the rope level, related to the multilayer matrices formed by themussels (Guiñez and Castilla, 1999), were not taken into account. Musselnumber was predicted under the assumption that intraspecific competitionfor food occurs only at the raft level.
Figs. 7, 8 and 9 synthesize results obtained with Eq. (7) for threedifferent cultivation scenarios as described above (cf. – Section 2Methodology–Section 2.3 Calculations). It is apparent that under verylow food concentrations and current speeds, mussels located downstreammay exhibit negative production values. Average production estimatesintegrated over all food concentrations, current speeds and mussel classeswere 0.78, 0.70 and 0.12 kgmeat DWh−1 for the scenarios represented inFigs. 7, 8 and 9, respectively. Therefore, when seed mussels are locatedupstream, receiving more food, raft production is larger than when adultmussels occupy that position. This may be explained by the fact that adultmussels clear the water very quickly and less food remains for musselslocated downstream. Studies of raft culture demonstrate that there is localseston depletion due to suspension feeding, with chlorophyll reduction up
to 60% as it passes though the rafts (Pérez-Camacho et al., 1991). Thesame authors state that production on the parts of the raft locatedupstream, tend to be higher than at the opposite side. This probably holdsfor those rafts that have only one anchoring system, as those simulated inthe present work, which allows them to rotate with the tides.
When a parallel disposition is used in relation to the flow, with allmussel classes receiving food without prior filtration, production isreduced because each class receives a smaller proportion of inflowingwater (proportional to the percentage of the raft they occupy). Therefore,it is apparent that disposing differentmussel classes in the seeds, juvenilesand adults sequence, within cultivation densities normally used inGalician Rias, seems a good option in terms of raft production, when therafts are allowed to rotate with seeds located at the upstream end.
Considering this mussel sequence, raft production was calculated as afunction of increasing number of ropes (cf. – Section 2 Methodology–Section 2.3 Calculations). Results obtained are presented in Fig. 10, wheremussel production is plotted as a function of rope density. The choice ofplotting adult mussel production together with overall production isjustified by the fact that, according to preliminary calculations, adultmusselSFG is the most sensitive to increases in raft standing stocks. Increasingrope density from 0.9 (normal value) till 4.7 per m2, leads to a 5-foldincrease in drag and a corresponding 50.5=2.2 decrease in current speedand current flow.When drag is considered, even a 1.5 fold increase in ropedensity leads to a reduction on adult mussel production (located at thedownstreamend of the raft). Increasing rope density over 2-times its normalvalue, may lead to a decrease in overall production. When drag effects are

Fig. 9. Upper left figure: Schematic top view of a mussel raft with seeds, juveniles and adults aligned with the current direction, with the former occupying 14% of raftarea and the remaining 86% (43% each). The remaining figures show production of each age class calculated with Eq. (7), for ranges in current speeds (a surrogate forflow) and POM concentrations within those observed (see text).
308 P. Duarte et al. / Aquaculture 274 (2008) 300–312
neglected, adult mussel production decreases for rope densities above 1.5times its normal value. However, overall production may increase until arope density 3 times its normal value.
From the results obtained in this work, it is apparent that musselnumber per raft is close to raft CC. Any increase in rope density may leadto a decrease in adult mussel growth. Under the assumption that intra andinterspecific (with other suspension-feeders present in the rafts)competition effects may be important at the rope level (not consideredin this work), the last two statements are more likely to be true.
In fact, the predicted decrease could be even more important if othersuspension feeders (epifauna fouling) that may be present on the ropeswere considered, such as sponges and barnacles. Mussel and epifaunalbiomass per metre of rope were compared by Tenore and González(1975) for rafts located in Ria de Arosa. These data includes mussel andtotal epifaunal ash free dry weight per metre of rope length. However,mussel biomass concerns only soft tissue. Therefore, total mussel drybiomass (including shell weight) is approximately six times larger thanpresented values. Considering this, mussel biomass is at least c.a. 12times larger than epifaunal biomass, according to the results presentedby those authors. According to Pérez-Camacho et al. (1991), theintensive filtering activity of mussels and their dominance in the raftfauna (95% of total biomass) outcompetes most filter feeders. Theimportance of these potentially competing organisms was discussed byGrant et al. (1998) in the light of available literature. However, the cited
authors did not reach a clear conclusion, suggesting the need for furtherresearch. According to the same authors, rope density in culture rafts inSaldanha Bay is c.a. 3 ropes m−2, with average current speeds of0.075 m s−1-well within the ranges observed in Galician Rias. InSaldanha Bay, raft size is smaller (c.a. 11X14m) than values consideredin this work, leading to shorter time scales of water renewal, which maysupport a large rope density. In fact, rope density reached 4 ropes/m2 inGalicia, at the beginning of mussel farming activity in 1946, when raftarea was solely 125 m2 (Pérez-Camacho and Labarta, 2004).
In order to get some insight into the potential effects of raft size onmussel production, calculations were carried out with Eq. (10), toestimate the number of mussels optimising overall raft production forrafts with areas from 125 till 500 m2 (Pérez-Camacho et al., 1991; Pérez-Camacho and Labarta, 2004). Eq. (7) was then used to estimate raftproduction. Since production is based on an optimal mussel number, itcorresponds to a “potential” maximum yield. These calculations wereperformed separately for rafts with seed, juvenile and adultmussels, usingthe same POM concentration ranges and current velocities synthesised inFig. 6. Afterwards, overall averages were calculated for each raft size,pooling together data for seeds, juveniles and adults. Since currentvelocity and POM ranges were not subjected to any probability densityfunction, the calculated averages are not representative of the real system.Nevertheless, they may be used for comparison purposes. Obtainedresults are shown in Fig. 11, suggesting that an increase in raft size of c.a.

Fig. 10. Raft production calculated with Eq. (7) as a function of rope density (normal density, 1.5X, 2X, 3X, 4X and 5X normal density). Each point corresponds toaverage production for adults (a) or overall average production for seeds, juveniles and adults (b), integrated for all combinations of three input food concentrations(0.25, 0.50 and 1.00 mg POM/L) and eleven current speeds (0.01–0.11 m/s, with a step of 0.01 m/s). The cultivation layout is the same described in Fig. 7, with seedmussels at the upstream end of the raft. When drag is considered, current speed within the raft is reduced as a function of drag (see text).
309P. Duarte et al. / Aquaculture 274 (2008) 300–312
300% (from 125 till 500 m2), corresponds to an increase in potential raftyield of solely 73%. Separate results for rafts with seeds, juveniles oradults, lead to the same results. The predicted decrease in raft potentialyield per unit area (70%), as a result of an increase in raft area, suggeststhat mussels became more food limited under larger rafts. Therefore,these results suggest that raft area is an important variable to take intoaccount when mussel production is to be optimized at the level of raftparks. Here, a compromise should be achieved between production costs– higher whenmore rafts are used- andmussel production per raft. Largerscale effects (e.g. at the level of raft parks and at the ecosystem level)should also be investigated prior to any definite recommendation.Furthermore, maximizing production does not necessarily correspond tomaximising profit. In fact, according to Ferreira et al. (2007), a producerwho bases his decisions on average or total production and revenueprinciples will earn less profit than one who uses marginal analysis.
The main difference between the models of Grant et al. (1998),Pouvreau et al. (2000), Pilditch et al. (2001), Bacher et al. (2003) and
Ferreira et al. (2007) (cf.— Section 1 Introduction) and the one presentedhere if that whereas the former are based on a numerical solution of atransport equation (cf. — Section 1 Introduction), where the cultivationleases are discretized into boxes or long line arrays, the latter is based on ananalytical model. In most situations, it is not possible to find an analyticalsolution to the CC problem. For example, when bivalve biomass densitychanges across model domain and over time, as in models that simulatebivalve growth, there are feedbacks between biomass and food consump-tion that prevent obtaining an analytical solution. However, in the presentcase, the model was designed for application over short time and spatialscales, when it is reasonable to assume that mussel biomass density doesnot change significantly. In this situation, it is possible to assume thatbivalve feeding is a constant flux and therefore obtain a relatively simpleanalytical solution. The main advantage of the current approach is theeasiness to obtain an estimate of CC, once the necessary parameters areintroduced into Eq. (10), using a simple spreadsheet. To achieve the samegoal with a numerical model, it is necessary to perform several simulations

Fig. 11. Raft production (total and areal) calculated with Eq. (7), for the number of mussels that maximize overall SFG, calculated with Eq. (10), as a function of raftarea (125, 261, 352, 369 and 500 m2). These production values are average results integrated over ranges in current speeds (a surrogate for flow) and POMconcentrations within those observed and considering rafts with seed, juveniles and adult mussels (see text).
310 P. Duarte et al. / Aquaculture 274 (2008) 300–312
under different bivalve densities and to find, iteratively, the value thatmaximizes TSFG.A similar approach to the one described in thisworkwasbased on a model by Incze et al. (1981) and applied by Sarà and Mazzola(2004), to calculate the number of rafts that maximise food ingestion bybivalves. In the model developed by those authors, a geometric decrease infood concentration across each raft was assumed, in accordance with theexponential decaying function presented above (Eq. (2)). An analyticalsolution to the problemwas also obtained. Thismodel differed from the onepresented herein, not only because it was applied to a different spatial scale(an array of rafts), but also because it did not include a SFG maximizingfunction. The focus of the present work was optimizing mussel productionat the raft level.
The main assumptions of the approach developed in this work anddiscussed below are: (i) Mussel size and mass homogeneity in the rafts orparts of them, when different age classes are considered in the same raft;(ii) Constant CR in the rafts or parts of them, when different age classesare considered in the same raft; (iii) Unidirectional flow across the rafts;(iv) Intraspecific competition for food occurs only at the raft level.
Whenmussel producers have several rafts, it is normal to keepmusselsof approximately the same size (same cultivation phase) in different rafts.When producers have only one raft, they have to manage mussels indifferent growth phases simultaneously, to guarantee the continuity of theproduction cycle. In the last case, the model may be applied separately todifferent parts of the raft, within which the mentioned assumptions are areasonable approximation as done in this study.
Assumption (iii) is a common place in local depletion models (e.g.Bacher et al. (2003) and Ferreira et al. (2007)), over spatial scales on theorder of hundreds to thousands of meters, therefore it seems moreacceptable at the scale of a cultivation raft, especially when the anchoringsystems allows the raft to turn as a function of flow direction. Thisassumption may not hold in cases when strong turbulence developsbetween mussel ropes. However, assuming that turbulence will beisotropic, the average behaviour across the direction perpendicular to thedominant flow will be similar to that described by Eq. (2). Somepreliminary experimental evidence suggests that lateral flow maybeimportant in mussel rafts (Blanco et al., 1996) contradicting, at leastpartially, the above assumption. However, in this case, the model
presented here behaves conservatively, leading to an underestimate ofCC, since it will not take into account lateral seston fluxes.
Regarding assumption (iv), as mentioned above, self-thinningeffects at the rope level, were not taken into account. By analogy withstudies on rocky substrates (Guiñez and Castilla, 1999) they are likelyto occur. However, up to our knowledge, these effects were notquantified in terms that allow their inclusion in the present model.
Calculations discussed above were designed to analyse the instanta-neous model response in terms of ingestion rate, scope for growth and raftproduction to different scenarios regarding mussel size, food concentra-tion, current speed and mussel loads. They are not valid to make anyassessment about mussel growth within a particular raft over time. For thistype of assessment it would be necessary to take into account musseldifferential growth within the raft. Obtained results merely point out topotential effects of food limitation under a particular raft setup.
4. Conclusions
From the above results, it is apparent that current musselculture practices in Galician Rias are close to CC at the raft scale.In fact, increasing rope density 1.5Xmay lead to a decline in adultmussel production, suggesting that there is not much room for anincrease on mussel loads. Therefore, any possible increase inmussel production should be considered at a higher spatial scale.Alternatively, changing raft dimensions and the total number ofrafts should be considered, for it seems plausible that by reducingraft size, better yields per unit area may be obtained. In any case,larger scale effects of mussel culture – at the scale of the raft parksand at the ecosystem scale– should be considered before any finalrecommendation is given.
Acknowledgements
This work was supported by the project-contract with dePROINSA mussel farm (PGIDIT06RMA018E and CSIC

311P. Duarte et al. / Aquaculture 274 (2008) 300–312
20061089). The authors wish to thank Maria João Guerreiro forher helpful comments on an earlier version of this manuscript.
References
Anderson, M.R., Cranford, P., McKindsey, C.W., Strain, P., Hargrave, B.T., Li, W.K.W., Harrison, W.G., 2006. Cumulative and far-field fish habitat effects.Canadian ScienceAdvisory Secretariat ResearchDocument # 2006/037. 30 pp.
Aure, J., Strohmeier, T., Strand, O., 2007. Modelling current speed and carryingcapacity in long-line blue mussel (Mytilus edulis) farms. Aquac. Res. 38,304–312.
Babarro, J.M.F., Fernández-Reiriz, M.J., Labarta, U., 2000. Feeding behaviourof seed mussel Mytilus galloprovincialis cultivated on the raft: environ-mental parameters and seed origin. J. Shellfish Res. 19, 195–201.
Bacher, C., Duarte, P., Ferreira, J.G., Héral, M., Raillard, O., 1998. Assessmentand comparison of the Marennes-Oléron Bay (France) and CarlingfordLough (Ireland) carrying capacity with ecosystem models. Aquat. Ecol. 31,379–394.
Bacher, C., Grant, J., Hawkins, A.J.S., Fang, J., Zhu, M., Besnard, M., 2003.Modelling the effect of food depletion on scallop growth in Sungo Bay(China). Aquat. Living Resour. 16, 10–24.
Barillé, L., Héral, M., Barillé-Boyer, A., 1997. Modélisation de l'ecophysiologiede l'huître Crassostrea gigas dans un environment estuarien. Aquat. LivingResour. 10, 31–48.
Bayne, B.L., Brown, D.A., Burns, K., Dixon, D.R., Ivanovici, A., Livingstone,D.R., Lowe, D.M., Moore, M.N., Stebbing, A.R.D., Widdows, J., 1985. Theeffects of stress and pollution on marine animals. Praeger Publisher, NewYork. 384 pp.
Blanco, J., Zapata, M., Moroño, Á., 1996. Some aspects of the water flowthough mussel rafts. Sci. Mar. 60, 275–282.
Broekhuizen, N., Zeldis, J., Stephens, S.A., Oldman, J.W., Ross, A.H., Ren, J.,James, M.R., 2002. Factors related to the sustainability of shellfishaquaculture operations in the Firth of Thames: a preliminary analysis.Hamilton, New Zealand. 106 pp.
Carver, C.E.A., Mallet, A.L., 1990. Estimating carrying capacity of a coastalinlet for mussel culture. Aquaculture 88, 39–53.
Dame, R.F., Prins, T.C., 1998. Bivalve carrying capacity in coastal ecosystems.Aquat. Ecol. 31, 409–421.
Dijkema, R., van Stralen, M., 1989. Mussel cultivation in the Netherlands.World Aquac. 20, 53–62.
Duarte, P., 2003. A review of current methods in the estimation of environmentalcarrying capacity for bivalve culture in Europe. In: Yu, H., Bermas, N.(Eds.), Determining environmental carrying capacity of coastal and marineareas: progress, constraints and future options. PEMSEA WorkshopProceedings, Asia-Pacific Conference on Marine Science & Technology,May 2002, Kuala Lumpur, Malaysia, vol. 11, pp. 37–51.
Duarte, P., Meneses, R., Hawkins, A.J.S., Zhu, M., Fang, J., Grant, J., 2003.Mathematical modelling to assess the carrying capacity for multi-speciesculture within coastal water. Ecol. Model. 168, 109–143.
Duarte, P., Hawkins, A.J.S., Pereira, A., 2005. How does estimation of en-vironmental carrying capacity for bivalve culture depend upon spatial andtemporal scales? In: Dame, R., Olenin, S. (Eds.), The comparative role ofsuspension feeders in aquatic systems. Kluwer Academic Publishers, Dor-drecht, pp. 121–135.
Fang, J., Sun, H., Yan, J., Kuang, S., Feng, L., 1996. Polyculture of scallopLaminaria japonica in Sungo Bay. Chin. J. Oceanol. Limnol. 14, 322–329.
Fernández-Reiriz, M., Labarta, U., 2004. Procesos fisiológicos y disponibilidadde alimento del mejillón en las rías gallegas. In: Labarta, U. (Ed.), Bateeiros,mar, mejillón. Una perspectiva bioeconómica. CIEF. Fundación Caixaga-licia. Santiago, pp. 49–77.
Fernandéz-Reiriz, M., Duarte, P., Labarta, U., 2007. Modelos de comporta-miento alimentario en el mejillón de las Rìas de Galicia. In: Figueras, A.(Ed.), Biología y cultivo del mejillón (Mytilus galloprovincialis) en Galicia.Biblioteca de Ciencias. Consejo Superior de Investigaciones Científicas,Madrid, pp. 195–223.
Ferreira, J., Duarte, P., Ball, B., 1998. Trophic capacity of Carlingford Lough foraquaculture- analysis by ecological modelling. Aquat. Ecol. 31, 361–379.
Ferreira, J., Hawkins, A.J.S., Bricker, S.B., 2007. Management of productivity,environmental effects and profitability of shellfish aquaculture — the FarmAquaculture Resource Management (FARM) model. Aquaculture, 264,160–174.
Figueiras, F.G., Labarta, U., Fernández-Reiriz, M.J., 2002. Coastal upwelling,primary production and mussel growth in the Rias Baixas of Galicia.Hydrobiologia 484, 121–131.
Grant, J., S.D., J., Monteiro, P., Pitcher, G., Heasman, K., 1998. Shellfish culturein the Benguela system: a carbon budget of Saldanha Bay for raft culture ofMytilus galloprovincialis. J. Shellfish Res. 17, 41–49.
Grant, J., 1999. Ecological constraints on the sustainability of bivalveaquaculture. In: Svennevig, N., Reinertsen, H., New, M. (Eds.), SustainableAquaculture: Food for the Future? Proceedings of the Second InternationalSymposium on Sustainable Aquaculture. Balkema, Rotterdam, pp. 85–96.
Gibbs, M.T., 2007. Sustainability performance indicators for suspended bivalveaquaculture activities. Ecol. Ind. 7, 94–107.
Guiñez, R., Castilla, J.C., 1999. A tridimensional self-thinning model formultilayered intertidal mussels. Am. Nat. 154, 341–357.
Hawkins, A.J.S., Bayne, B.L., Bougrier, S., Héral, M., Iglesias, J.I.P., Navarro,E., Smith, R.F.M., Urrutia, M.B., 1998. Some general relationships incomparing the feeding physiology of suspension-feeding bivalve molluscs.J. Exp. Mar. Biol. Ecol. 219, 87–103.
Hawkins, A.J.S., James, M.R., Hickman, R.W., Hatton, S., Weatherhead, M.,1999. Modelling of suspension-feeding and growth in the green-lippedPerna canaliculus exposed to natural and experimental variations of sestonavailability in the Marlborough Sounds, New Zealand. Mar. Ecol., Prog. Ser.191, 217–232.
Hawkins, A.J.S., Duarte, P., Fang, J.G., Pascoe, P.L., Zhang, J.H., Zhang, X.L.,Zhu, M., 2002. A functional model of responsive suspension-feeding andgrowth in bivalve shellfish, configured and validated for the scallop Chla-mys farreri during culture in China. J. Exp. Mar. Biol. Ecol. 281, 13–40.
Héral, M., 1993. Why carrying capacity models are useful tools for managementof bivalve molluscs culture. In: Dame, R. (Ed.), Bivalve filter-feeders inestuarine and coastal ecosystems.NATO ASI Series, pp. 455–477.
Incze, L.S., Lutz, R.A., True, E., 1981. Modelling carrying capacity for bivalvemolluscs in open, suspended-culture systems. J.WorldMaric. Soc. 12, 135–143.
Inglis, G.J., Hayden, B.J., Ross, A.H., 2000. An overview of factors affectingthe carrying capacity of coastal embayments for mussel culture. NIWA,Christchurch. Client Report CHCOO/69, 31 pp.
Jackson, G.A., Winant, C.D., 1983. Effect of a kelp forest on coastal currents.Cont. Shelf Res. 2, 75–80.
Jiang, W., Gibbs, M.T., 2005. Predicting the carrying capacity of bivalveshellfish culture using a steady, linear food web model. Aquaculture 244,171–185.
Bateeiros, mar, mejillón, 2004. In: Labarta, U., Fernández-Reiriz, M.J., Perez-Camacho, A., Perez-Corbacho, E. (Eds.), Una perspectiva bioeconómica.Centro de Investigaciones Económicas y Financieras (CIEF), FundaciónCaixaGalicia, Santiago de Compostela. 274 pp.
McKindsey, C.W., Thetmeyer, H., Landry, T., Silvert, W., 2006. Review ofrecent carrying capacity models for bivalve culture and recommendationsfor research and management. Aquaculture 261, 451–462.
Navarro, E., Iglesias, J.I.P., Pérez-Camacho, A., Labarta, U., Beiras, R., 1991.The physiological energetics of mussels (Mytilus galloprovincialis) fromdifferent cultivation rafts in the Ria de Arousa. Aquaculture 94, 197–212.
Pérez-Camacho, A., Gonzalez, R., Fuentes, J., 1991. Mussel cultura in Galicia(N.W. Spain). Aquaculture 94, 263–278.
Pérez-Camacho, A., Labarta, U., 2004. Rendimientos y producción del mejillón:Bases biológicas para la innovación. In: Labarta, U. (Ed.), Bateeiros, mar,mejillón. Una perspectiva bioeconómica. Centro de InvestigacionesEconómicas y Financieras (CIEF), Fundación CaixaGalicia, Santiago deCompostela, pp. 93–121.
Pilditch, C.A., Grant, J., Bryan, K.R., 2001. Seston supply to sea scallops(Placopecten magellanicus) in suspended culture. Can. J. Fish. Aquat. Sci.58, 241–253.
Pouvreau, S., Bacher, C., Héral, M., 2000. Ecophysiological model of growthand reproduction of the black pearl oyster, Pinctada margaritifera: potentialapplications for pearl farming in French Polynesia. Aquaculture 186,117–144.
312 P. Duarte et al. / Aquaculture 274 (2008) 300–312
Prins, T.C., Smaal, A., Dame, R., 1998. A review of the feedbacks betweenbivalve grazing and ecosystem processes. Aquat. Ecol. 31, 349–359.
Raillard, O., Ménesguen, A., 1994. An ecosystem model for the estimating thecarrying capacity of a macrotidal shellfish system. Mar. Ecol. Prog. Ser. 115,117–130.
Ren, J.S., Ross, A.H., 2001. A dynamic energy budget model of the Pacificoyster Crassostrea gigas. Ecol. Model. 142, 105–120.
Sarà, G., Mazzola, A., 2004. The carrying capacity for Mediterranean bivalvesuspension feeders: evidence from analysis of food availability and hydro-dynamics and their integration into a local model. Ecol. Model. 179, 281–296.
Scholten, H., Smaal, A.C., 1998. Responses ofMytilus edulis L. to varying foodconcentrations: testing EMMY, an ecophysiological model. J. Exp. Mar.Biol. Ecol. 219, 217–239.
Shpigel, M., 2005. Bivalves as biofilters and valuate by-products in land-basedaquaculture systems. In: Dame, R.F., Olenin, S. (Eds.), The Comparative
Roles of Suspenson-Feeders in Ecosystems. Kluwer Academic Publishers,Dordrecht, pp. 183–198.
Smaal, A.C., Héral, M. (Eds.), 1998. Modelling bivalve carrying capacity.Aquat. Ecol., vol. 4, p. 439.
Smaal, A., Stralen, M., Schuiling, E., 2001. The interaction between shellfishculture and ecosystem processes. Can. J. Fish. Aquat. Sci. 58, 991–1002.
Tenore, K.R., González, N., 1975. Food chain patterns in the Ria de Arosa,Spain: an area of intense mussel aquaculture. In: Persoone, G., Jaspers, E.(Eds.), Proceedings of the 10th European Symposium on Marine Biology,Ostend, Belgium, September 17-23, 1975. Vol 2: Population dynamics ofmarine organisms in relation with nutrient cycling in shallow waters.Universa Press, Wetteren, pp. 601–619.