Analysis of Permit Vehicle Loads in Wisconsin
199
Analysis of Permit Vehicle Loads In Wisconsin m a r g o r P h c r a e s e R y a w h g i H n i s n o c s i W W HRP 09-03 Jian Zhao and Habib Tabatabai Department of Civil Engineering and Mechanics University of Wisconsin Milwaukee September 2009 SPR # 0092-08-15
-
Upload
khangminh22 -
Category
Documents
-
view
3 -
download
0
Transcript of Analysis of Permit Vehicle Loads in Wisconsin
Analysis of Permit Vehicle Loads In
Wisconsin
margorPhcraese
Rya
whgiH
nisnocsiW W HRP 09-03
Jian Zhao and Habib Tabatabai Department of Civil Engineering and Mechanics
University of Wisconsin Milwaukee
September 2009
SPR # 0092-08-15

i
WISCONSIN HIGHWAY RESEARCH PROGRAM #0092-08-15
ANALYSIS OF PERMIT VEHICLE LOADS IN WISCONSIN
FINAL REPORT
BY
Jian Zhao and
Habib Tabatabai
of the
Department of Civil Engineering and Mechanics
University of Wisconsin-Milwaukee
SUBMITTED TO THE WISCONSIN DEPARTMENT OF
TRANSPORTATION
September 2009

ii
Disclaimer: This research was funded through the Wisconsin Highway Research Program by the Wisconsin
Department of Transportation and the Federal Highway Administration under Project #0092-08-
15. The contents of this report reflect the views of the authors who are responsible for the facts
and the accuracy of the data presented herein. The contents do not necessarily reflect the official
views of the Wisconsin Department of Transportation or the Federal Highway Administration at
the time of publication.
This document is disseminated under the sponsorship of the Department of Transportation in the
interest of information exchange. The United States Government assumes no liability for its
contents or use thereof. This report does not constitute a standard, specification or regulation.
The United State Government does not endorse products or manufacturers. Trade and
manufacturers’ names appear in this report only because they are considered essential to the
object of the document.

iii
ACKNOWLEDGMENTS The authors acknowledge technical contributions for this project from the following individuals:
Mr. Scott Beker, Wisconsin Department of Transportation (WisDOT), Mr. Travis McDaniel,
WisDOT, Laura Shadewald, WisDOT, and Dr. Al Ghorbanpoor, UWM.

iv
Report No.
WHRP 09-03 Government Accession No
Recipient’s Catalog No
Title and Subtitle
Analysis of Permit Vehicle Loads in Wisconsin Report Date
September 30, 2009 Performing Organization Code
Wisconsin Highway Research Program
Authors
Jian Zhao and Habib Tabatabai
Performing Organization Report No.
WHRP 09-002
Performing Organization Name and Address
Department of Civil Engineering & Mechanics
University of Wisconsin-Milwaukee
3200 N. Cramer St.
Milwaukee, WI 53211
Work Unit No. (TRAIS)
Contract or Grant No. WisDOT SPR# 0092-08-15
Sponsoring Agency Name and Address
Wisconsin Department of Transportation
Division of Business Services
Research Coordination Section
4802 Sheboygan Ave. Rm 104
Madison, WI 53707
Type of Report and Period Covered
Final Report 2007-2009
Sponsoring Agency Code
Supplementary Notes
Research was funded by the Wisconsin DOT and FHWA through the Wisconsin Highway Research
Program. Wisconsin DOT contact: Travis McDaniel
Abstract
This study evaluated the impact of the 250-kip Wisconsin Standard Permit Vehicle against the
overloaded vehicles operating on Wisconsin roads in recent years. The evaluation was conducted using
three sets of data: 1) overloaded vehicle records within weigh-in-motion data collected in 2007; 2) the
single-trip permit application records from 2004 to 2007; and 3) overloaded vehicles in neighboring
states, including Minnesota, Iowa, Michigan, and Illinois. Descriptive statistical analyses were
conducted for the collected overloaded vehicle data, and model vehicles that represent heavies 5% of
the overloaded vehicles were created. The maximum moment/shear in simply supported, 2-span and 3-
span continuous girders by the representative vehicles were calculated and compared with the impact of
Wis-SPV. The study indicates Wis-SPV envelopes almost all single-unit trucks with less than 9 axles,
which attributes 80% of the total permit records. The analysis of WIM records shows that about
0.035% of total overloaded vehicles (records) may exceed the impact of the 250-kip Wis-SPV. A 5-
axle short truck was proposed to supplement Wis-SPV for possible use in the WisDOT Bridge Manual.
Key Words
Permit vehicle, load, standard, OSOW, oversize,
overweight, bridge analysis, Weigh-in-motion,
freight transportation
Distribution Statement
No restriction. This document is available to the
public through the National Technical Information
Service
5285 Port Royal Road
Springfield VA 22161
Security Classif.(of this report)
Unclassified Security Classif. (of this page)
Unclassified No. of Pages
183 Price
Form DOT F 1700.7 (8-72) Reproduction of completed page authorized

v
EXECUTIVE SUMMARY
Summary
This study evaluated the impact of the 250-kip Wisconsin Standard Permit Vehicle against the
overloaded vehicles operating on Wisconsin roads in recent years. The evaluation was conducted
using three sets of data: 1) overloaded vehicle records within weigh-in-motion data collected in
2007; 2) the single-trip permit application records from 2004 to 2007; and 3) overloaded vehicles
in neighboring states, including Minnesota, Iowa, Michigan, and Illinois.
The weigh-in-motion records were categorized into legal loads and overloads per Wisconsin
Statute 348 and WisDOT Bridge manual. A total of 1.4 million overloaded vehicle records out of
over 6 million total truck records were used to evaluate the WisDOT Standard Permit Vehicle.
The recorded overloads in individual classes (per FHWA definitions) were further divided into
groups, in which the vehicles had similar axle configurations. Descriptive statistical analyses
were conducted for the vehicles in each class/group to define representative vehicles that best
describe the heaviest 5% vehicles in the class/group. The representative vehicles were evaluated
using randomly selected vehicles within the heaviest 10% vehicles in the corresponding
class/group. The girder responses (i.e., moments and shear) due to loading from the randomly
selected vehicles were calculated for randomly selected span lengths to assess whether the heavy
vehicles in each class/group might cause larger girder responses than Wis-SPV.
The application records for single-trip permits from July 2004 to July 2007 were used to further
evaluate the 250-kip Wisconsin Standard Permit Vehicle. Only the overloaded vehicle records
were used, resulting in roughly 50 thousand records in total. The number of axles in over 99% of
the records was from three to thirteen. Hence, the recorded vehicles were classified based upon
their total number of axles. The configurations for each class/group were determined such that
representative vehicles can be configured. The trucks in the WIM records were checked against
the configuration patterns of the single-trip permit vehicles in order to properly define the
configurations of the representative vehicles. The pattern comparison was conducted for the
permit vehicles with less than 9 axles, which contributes about 80% of the total records. Multiple
tandem axles were assumed for vehicles with more axles because only nondivisible vehicles are
eligible for permits in Wisconsin. The responses in simply-supported girders with various span
lengths by the representative vehicles were then compared with those by the Wis-SPV.
The Standard Permit Vehicle in Wisconsin is being used for permit rating of new bridges and for
posting bridges. Hence the impact of the representative overloaded vehicles utilized in the
neighboring states was compared with that by the WisDOT Standard Permit Vehicle. Again, the
comparison was made using the worst girder responses using the influence line concept.
Based upon the above analyses, modifications to the current permitting practice were proposed.
Wis-SPV is a 63-ft long tractor-trailer, which is longer than the length limits for single-unit
vehicles eligible for permits. Hence, the recommended change focused on a supplementary and
shorter 5-axle truck to the Wis-SPV to increase the positive moments (and potential negative
moments) in short span girders.

vi
Conclusions
The analysis of WIM records indicated that 0.035% of total overloaded vehicles (records) may
exceed the impact of the 250-kip Wis-SPV. A close examination of the selected overloaded
vehicles indicated that some short vehicles with 5 to 7 axles, currently on Wisconsin highway
with annual permits, could exceed the maximum anticipated internal forces. These vehicles were
likely Class 7 trucks with multiple lift axles as well as Class 9 short trailers. The representative
vehicles for Classes 11 through 14 indicated that the Wis-SPV envelopes almost all truck-trailer
combinations, except Class 13 vehicles. Class 13 records includes large portion of vehicles with
permits, hence the representative vehicles did not address Type 3S2-2 truck-trailer combinations
well.
The analysis of Wisconsin single-trip permit trucks indicated that Wis-SPV envelopes almost all
single-unit trucks with less than 9 axles, which attributes 80% of the total permit records.
Representative vehicles with 7 axles could cause larger girder responses than the Wis-SPV. A
closer close look at these vehicles indicated that the potential worst vehicles are short vehicles
with distributed multiple axles (oftentimes with lift axles). This observation was similar to that
obtained in the analysis of WIM records in Chapter 4.
Comparison with the typical representative overloaded vehicles in the neighboring states
indicated that longer vehicles, similar to the MnDOT Type P413 vehicle, could cause larger
negative moments for two- and three-span simply supported girders. This situation was discussed
in Chapters 4 and 5 of this report using representative vehicles and randomly selected vehicles.
Specifically, some representative vehicles may have a variable spacing that ranges from 4ft to
over 70ft. Hence the vehicle with the smaller spacing may cause severe positive moments (and
likely shear) while the vehicle with greater spacing may cause severe negative moments.
Nevertheless, the proposed Short Permit Truck (SPT) did not consider long vehicle option
because most likely the vehicles are longer than 50ft (for trucks) and 75ft (for trailers and vehicle
combinations), the limit for vehicles eligible for permits. In such cases the vehicles will need a
single-trip permit, and would be rigorously examined before the permit is issued.
Future studies
It is generally believed that heavy weights distributed on multiple axles that spaced far would
cause less bridge damage than short closely spaced overloads. Hence, the permitting fee may be
based upon the ration of the gross vehicle weight with the legal weight calculated using the
Federal bridge formula. It was shown in Chapter 3 that plot of the maximum girder responses vs.
this ratio showed less scattering than the gross vehicle weight. A simple yet reasonably accurate
permitting fee base should be studied in details to reflect the level of damage overload vehicles
may cause to bridges. The consideration should include damage to bridge decks and the related
potential damage to durability of the bridges.
The gross weight distribution of Class 9 vehicles showed some deviation from the characteristics
described in an NCHRP study.10
Specifically the low peak (representing the empty trailers) and
the high peak (representing overloaded trailers) are higher. This might be due to the special
freight transport needs in Wisconsin, or this might indicate larger variations in the WIM
recording. The accuracy of the WIM records needs to be studied before these records can e used
for other purposes.

vii
The WIM records can be used to assess and predict the traffic patterns, especially for trucks and
overloads. The number of the overloads recorded by each station is very uneven as shown below,
indicating drastically different overloads on Wisconsin highway bridges. For example, Station #
410240 on Interstate highway 94 near Tomah, WI captured nearly 50% of the total overloads.
This might be duo to the fact that overloads on highway 90 captured by Station #410253 near
Sparta, WI would also pass Station # 410240. Hence, highway bridges near Tomah, WI would be
more likely subjected to accumulated overloads, leading to less service life or higher
maintenance costs. The reasonably predicted truck and overload pattern would help the design to
tailor to the specific loads to the bridges.

viii
TABLE OF CONTENT
Disclaimer: ...................................................................................................................................... ii
ACKNOWLEDGMENTS ............................................................................................................. iii
EXECUTIVE SUMMARY ............................................................................................................ v
Summary ..................................................................................................................................... v
Conclusions ................................................................................................................................ vi
Future studies ............................................................................................................................. vi
TABLE OF CONTENT ............................................................................................................... viii
LIST OF FIGURES ....................................................................................................................... xi
Chapter 1 Introduction .................................................................................................................... 1
Background ................................................................................................................................. 1
Research Objectives and Scope .................................................................................................. 2
Organization of the report ........................................................................................................... 3
Chapter 2 Review of Permitting Practice....................................................................................... 5
Introduction ................................................................................................................................. 5
Federal Regulations .................................................................................................................... 5
State of Wisconsin (WisDOT) Regualtions ................................................................................ 6
State of Minnesota (MnDOT) Regulations ................................................................................. 7
State of Iowa (IaDOT) Regulations ............................................................................................ 9
State of Michigan (MDOT) Regulations .................................................................................. 10
State of Illinois (IDT) Regulations ........................................................................................... 11
Chapter 3 Comparison of Wis-SPV with Collected Overloaded Vehicles from Neighboring
States ............................................................................................................................................. 13
Introduction ............................................................................................................................... 13
Comparison of moment envelopes with WisDOT Bridge Manual ........................................... 13
One-span simply supported girders .......................................................................................... 15
Two-span simply supported girders .......................................................................................... 19
Three-span simply supported girders ........................................................................................ 24
Summary ................................................................................................................................... 29
Chapter 4 Analysis of Wisconsin WIM Data .............................................................................. 33

ix
Introduction ............................................................................................................................... 33
Overview of Wisconsin Weigh-in-Motion (WIM) data ........................................................... 35
Analysis of Overloaded WIM Records ..................................................................................... 39
Comparison of Representative Overloaded Vehicles with Wis-SPV ....................................... 51
Evaluation of representative overloaded vehicles ..................................................................... 63
Examination of randomly selected heavy vehicles ................................................................... 68
Summary ................................................................................................................................... 71
Chapter 5 Analysis of Wisconsin Single-Trip Permit Vehicles ................................................... 73
Introduction ............................................................................................................................... 73
Overview of vehicles with single-trip permits .......................................................................... 73
Analysis of single-trip permit records....................................................................................... 74
Comparison of Wis-SPV with single-trip permit vehicles ....................................................... 84
Summary ................................................................................................................................... 96
Chapter 6 Suggested Modifications to Wis-SPV .......................................................................... 97
Introduction ............................................................................................................................... 97
Proposed Short Permit Truck .................................................................................................... 98
Recommendations regarding the WisDOT Standard Permit Vehicle..................................... 102
Chapter 7 Summary and Conclusions ......................................................................................... 121
Summary ................................................................................................................................. 121
Conclusions ............................................................................................................................. 122
Future studies .......................................................................................................................... 122
References ................................................................................................................................... 123
Appendix 1 Line Girder Analysis Using SAP2000 ................................................................... 127
Introduction ............................................................................................................................. 127
Analysis Procedures ................................................................................................................ 127
Export Analysis Results .......................................................................................................... 135
Appendix 2 Introduction to the Matlab® Programs .................................................................. 138
Introduction to Weigh-in-Motion analysis (WIMan) program ............................................... 138
Operation procedures of WIMan ............................................................................................ 138
Introduction to Moving Load analysis (MLan) program ........................................................ 144
Operation Procedures of Mola ................................................................................................ 144
Appendix 3 Fundamentals of Statistical Analysis in this Project .............................................. 151
Introduction ............................................................................................................................. 151

x
Population mean...................................................................................................................... 153
Population standard deviation ................................................................................................. 153
Population percentiles ............................................................................................................. 153
Appendix 4 Multivariate Statistical Analysis of WIM data....................................................... 155
Introduction ............................................................................................................................. 155
Weigh-in-Motion data ............................................................................................................. 156
Statistical Distributions for H5P Data..................................................................................... 159
COPULAS .............................................................................................................................. 166
MONTE CARLO Simulations ................................................................................................ 167
Summary and Conclusions ..................................................................................................... 182
References ............................................................................................................................... 183

xi
LIST OF FIGURES
Fig. 1.1 Wisconsin OSOW permits in recent years ........................................................................ 1
Fig. 1.2 Wisconsin Standard Permit Vehicle .................................................................................. 2
Fig. 2.1 Design truck in AASHTO LRFD and WisDOT Bridge Manual....................................... 6
Fig. 2.2 Standard Mn/DOT Overload Permit Trucks ..................................................................... 8
Fig. 2.3 Iowa rating vehicles ........................................................................................................... 9
Fig. 2.4 Michigan Legal Vehicles with GVW larger than federal limit ....................................... 10
Fig. 2.5 Illinois load rating and posting trucks ............................................................................. 11
Fig. 2.6 Truck configurations for multi-trip permits in Illinois .................................................... 12
Fig. 3.1 Comparison of SAP2000 analysis results with WisDOT Bridge Manual (one-span) ..... 14
Fig. 3.2 Comparison of SAP2000 analysis results with WisDOT Bridge Manual (two-span) .... 14
Fig. 3.3 Comparison of SAP2000 analysis results with WisDOT Bridge Manual (three-span) .. 15
Fig. 3.4 Comparison of the maximum moments in simply-supported girders ............................. 16
Fig. 3.5 R-values for the moment/shear envelopes in simply-supported girders.......................... 16
Fig. 3.6 Comparison of the peak moments in 2-span simply-supported girders .......................... 20
Fig. 3.7 R-values for the moment/shear envelopes in two-span girders ....................................... 20
Fig. 3.8 Comparison of the peak moments in3-span simply-supported girders ........................... 24
Fig. 3.9 R-values for the moment/shear envelopes in three-span girders ..................................... 25
Fig. 3.10 Demonstration of breaching peak negative moment of Wis-SPV ................................. 25
Fig. 3.11 Maximum moment distribution in 1-span girders ......................................................... 29
Fig. 3.12 Maximum moment distribution in 2-span girders ......................................................... 30
Fig. 3.13 Maximum moment distribution in 3-span girders ......................................................... 31
Fig. 4.1 Locations of Wisconsin WIM stations using Google® Map............................................ 34
Fig. 4.2 Weight distribution of Class 9 semi-trailers .................................................................... 35
Fig. 4.3 Overview of vehicles recorded in WIM data ................................................................... 37
Fig. 4.4 Distribution of overweight type of vehicles in WIM data ............................................... 38
Fig. 4.5 Distribution of overweight vehicles recorded in WIM data ............................................ 39
Fig. 4.6 Representative vehicle for Class 4 vehicles (2-axle) ....................................................... 40
Fig. 4.5 Representative vehicle for Class 4 vehicles (3-axle) ....................................................... 41
Fig. 4.8 Representative vehicle for Class 5 vehicles .................................................................... 41
Fig. 4.9 Representative vehicle for Class 6 vehicles .................................................................... 42

xii
Fig. 4.10 Representative vehicle for Class 7 vehicles (4-axle) ..................................................... 42
Fig. 4.11 Representative vehicle for Class 7 vehicles (5-axle) ..................................................... 43
Fig. 4.12 Representative vehicle for Class 8 vehicles (Type 2S1) ............................................... 44
Fig. 4.13 Representative vehicle for Class 8 vehicles (Type 3S1) ............................................... 44
Fig. 4.14 Representative vehicle for Class 8 vehicles (Type 2S2) ............................................... 44
Fig. 4.15 Representative vehicle for Class 9 vehicles (Type 3S2) ............................................... 45
Fig. 4.14 Representative vehicle for Class 9 vehicles (Type 3S2 split) ....................................... 46
Fig. 4.17 Representative vehicle for Class 10 vehicles (Type 3S3) ............................................. 47
Fig. 4.18 Representative vehicle for Class 10 vehicles (Type 3S4) ............................................. 47
Fig. 4.19 Representative vehicle for Class 11 vehicles ................................................................ 48
Fig. 4.20 Representative vehicle for Class 12 vehicles ................................................................ 49
Fig. 4.21 Representative vehicle for Class 13 vehicles ................................................................ 50
Fig. 4.22 Representative vehicle for Class 13 vehicles ................................................................ 50
Fig. 4.23 Representative vehicle for Class 14 vehicles ................................................................ 51
Fig. 4.24 Peak moment/shear values for overweight vehicles on one-span girders ..................... 52
Fig. 4.25 R-values for overweight vehicles on one-span girders .................................................. 52
Fig. 4.26 Peak moment/shear values for overweight vehicles on two-span girders ..................... 55
Fig. 4.27 R-values for overweight vehicles on two-span girders ................................................. 55
Fig. 4.27 Peak moment/shear values for overweight vehicles on three-span girders ................... 59
Fig. 4.28 R-values for overweight vehicles on three-span girders ............................................... 59
Fig. 4.29 Comparison of randomly selected vehicles with the representative vehicle (Type 3S2)
....................................................................................................................................................... 65
Fig. 4.30 Statistical evaluation of the representative vehicle for Class 9 (Type 3S2) .................. 66
Fig. 4.31 gross weight distribution of the randomly selected vehicles ......................................... 68
Fig. 4.32 gross weight distribution of the randomly selected vehicles ......................................... 71
Fig. 5.1 Overview of vehicles with single-trip permits ................................................................ 74
Fig. 5.2 Representative vehicle for 3-axle permit vehicles ........................................................... 75
Fig. 5.3 Representative vehicle for 4-axle permit vehicles (Type 3S1) ........................................ 75
Fig. 5.4 Representative vehicle for 4-axle permit vehicles (Type 2S2) ........................................ 76
Fig. 5.5 Representative vehicle for 5-axle permit vehicles (Type 3S2) ........................................ 76
Fig. 5.6 Representative vehicle for 5-axle permit vehicles (Type 3S2 split) ................................ 77
Fig. 5.7 Representative vehicle for 6-axle permit vehicles (Type 3S3) ........................................ 77
Fig. 5.8 Representative vehicle for 7-axle permit vehicles ........................................................... 78

xiii
Fig. 5.9 Representative vehicle for 7-axle permit vehicles ........................................................... 78
Fig. 5.10 Representative vehicle for 8-axle permit vehicles ......................................................... 79
Fig. 5.11 Representative vehicle for 9-axle permit vehicles (Type a) .......................................... 80
Fig. 5.12 Representative vehicle for 9-axle permit vehicles (Type b) .......................................... 80
Fig. 5.13 Representative vehicle for 10-axle permit vehicles (Type a) ........................................ 81
Fig. 5.14 Representative vehicle for 10-axle permit vehicles ....................................................... 82
Fig. 5.15 Representative vehicle for 11-axle permit vehicles ....................................................... 82
Fig. 5.16 Representative vehicle for 12-axle permit vehicles ....................................................... 83
Fig. 5.17 Representative vehicle for 13-axle permit vehicles ....................................................... 84
Fig. 5.18 Peak moment/shear values for representative permit vehicles on one-span girders ..... 85
Fig. 5.19 R-values for representative permit vehicles on one-span girders .................................. 85
Fig. 5.20 Peak moment/shear values for representative permit vehicles on two-span girders ..... 88
Fig. 5.21 R-values for representative permit vehicles on two-span girders .................................. 88
Fig. 5.22 Peak moment/shear values for representative permit vehicles on three-span girders ... 92
Fig. 5.23 R-values for representative permit vehicles on three-span girders ................................ 92
Fig. 5.24 Example of short trucks with lift axles .......................................................................... 96
Fig. 5.25 Permit vehicles with more than 9 axles ......................................................................... 96
Fig. 6.1 Demonstration of short vehicles causing the worst negative moments ........................... 97
Fig. 6.2 Examples of specialized hauling vehicles (SHVs) from various online sources ............ 98
Fig. 6.3 The proposed 5-axle vehicle to supplement the Wis-SPV .............................................. 98
Fig. 6.4 Gross weight distribution of 5-axle short trucks in 2007 WIM records .......................... 99
Fig. 6.5 Comparison of the proposed short truck with randomly selected 5-axle trucks ........... 100
Fig. 6.6 Statistical analysis of randomly selected 5-axle trucks ................................................. 101
Fig. 6.7 Relative locations of peak moments in simply supported girders ................................. 102
Fig. 6.8 Moment/shear envelope for one-span simply supported girders ................................... 103
Fig. 6.9 Regression analysis of the peak responses under Wis-SPV in 1-span girders .............. 105
Fig. 6.10 Models of the peak responses under Wis-SPV in 1-span girders ................................ 105
Fig. 6.11 Regression analysis of the peak responses under Wis-SPV in 1-span girders ............ 106
Fig. 6.12 Models of the peak responses under Wis-SPT in 1-span girders ................................ 106
Fig. 6.13 Moment/shear envelope for one-span simply supported girders ................................. 107
Fig. 6.14 Regression analysis of the peak responses under Wis-SPV in 2-span girders ............ 109
Fig. 6.15 Models of the peak responses under Wis-SPV in 2-span girders ................................ 109
Fig. 6.16 Regression analysis of the peak responses under Wis-SPV in 2-span girders ............ 110

xiv
Fig. 6.17 Models of the peak responses under Wis-SPT in 2-span girders ................................ 110
Fig. 6.18 Moment/shear envelope for one-span simply supported girders ................................. 111
Fig. 6.19 Regression analysis of the peak responses under Wis-SPV in 3-span girders ............ 113
Fig. 6.20 Models of the peak responses under Wis-SPV in 3-span girders ................................ 114
Fig. 6.21 Regression analysis of the peak responses under Wis-SPT in 3-span girders ............. 115
Fig. 6.22 Models of the peak responses under Wis-SPT in 3-span girders ................................ 115
Fig. 6.23 Moment envelops of a 3-span slab bridge under permit vehicles ............................... 116
Fig. 7.1 The overloaded vehicles captured in various WIM stations in Wisconsin .................... 121
Fig. A3.1 Wisconsin Standard Permit Vehicle ........................................................................... 151
Fig. A3.2 Structural safety in LRFD structural design ............................................................... 152
Fig. A3.3 Standard normal distribution ...................................................................................... 152
Fig. A4.1. Spreadsheets for determining moment and shear envelopes due to any truck .......... 167
Fig. A4.2. The 250-kip and 190-kip Wisconsin Permit Vehicles. .............................................. 167
Fig. A4.3. Selections from Simulation Report for H5P Class 9 Trucks. .................................... 170
Fig. A4.4. Wisconsin 250-WPV Moment Results Compared to H5P Class 9 Truck Simulations
..................................................................................................................................................... 172
Fig. A4.5. Wisconsin 250-WPV Shear Results Compared to H5P Class 9 Truck Simulations . 173
Fig. A4.6. Plot of 250-WPV moments as percentile of H5P data versus span length (ft) for each
truck class-axle group. ................................................................................................................ 175
Fig. A4.7. Plot of 250-WPV shear as percentile of H5P data versus span length (ft) for each truck
class-axle group. ......................................................................................................................... 177
Fig. A4.8. Plot of 190-WPV moments as percentile of H5P data versus span length (ft) for each
truck class-axle group. ................................................................................................................ 179
Fig. A4.9. Plot of 190-WPV shear as percentile of H5P data versus span length (ft) for each truck
class-axle group. ......................................................................................................................... 181

1
Chapter 1 Introduction
Background
Trucking accounts for about eighty percent of expenditures on freight transportation in the
United States;1 thus, allowing heavy trucks to operate on highways will improve the efficiency of
the highway system and benefit the economy. Wisconsin Department of Transportation
(WisDOT) issues more than two hundred oversize/overweight (OSOW) permits everyday on
average to trucking businesses2 (as indicated by Fig. 1.1). Permits are required when the gross
vehicle weight exceeds 80 kips or the size and/or the axle weights exceed the legal limits
stipulated in Wisconsin Statute 348.3 Currently, carriers that occasionally haul OSOW loads can
purchase a single trip permit, which is rigorously controlled through a review of the route.4 Note
that these occasional loads are not necessarily the heavier loads as revealed in Chapters 4 and 5.
Meanwhile, multi-trip permits can be purchased for frequent OSOW loads regardless the
configurations and the gross weight of the loads.5 WisDOT does not control the route and the
number of trips of the loads with multi-trip permits. As the total weight of the trucks increases
(with an increased permit fee), permit application review and decision making become a concern
for WisDOT. It is necessary to understand the overweight loads currently on the highways and
their impacts on the bridges in order to manage safe and sustainable freight transportation.
Fig. 1.1 Wisconsin OSOW permits in recent years
Furthermore, fees for overweight permits in Wisconsin currently increase over a base fee as the
gross vehicle weight increases. As shown in Table 1.1, the fee increase for single-trip permits is
$10 per 10,000 lbs up to 150,000 lbs.4 For annual permits, the fee increase is $100 per 10,000 lbs
up to 170,000 lbs.5 Permit fee system is not a focus of this research; nevertheless, it should be
noted that the permit fees should reflect the actual potential damage the overweight vehicles may
cause to the highway infrastructure. The impact of heavy axle weight generally is more
significant to shorter-span bridges and pavements, especially when combined with closely
spaced axles; whereas the gross vehicle weight is more significant to longer-span bridges. In
addition, as the gross vehicle weight increase, moment and shear in bridge members may not be
the sole parameters that need to be considered in bridge rating; other significant load effects such
as overstresses in concrete decks (for crack control and durability checking) and stress ranges in
steel girders (for potential fatigue checking) become important as well.7,8

2
Table 1.1 Wisconsin Permit Fees GVW (lbs) Single-trip permits Annual permits
<90,000 $20 $200
100,000 $35 $350
110,000 $45 $450
120,000 $55 $550
130,000 $65 $650
140,000 $75 $750
150,000 $85 $850
160,000 $85 $950
170,000 $85 $1050
WisDOT has used the AASHTO HL-93 loading as well as the Standard Permit Vehicle (Wis-
SPV) to describe the maximum safe load carrying capacity of highway bridges.6 The Wis-SPV
shown in Fig. 1.2 represents the typical configuration of nondivisible trucks with single-trip
permits. The steering axle is 25 kips, higher than the limits of the trucks eligible for multi-trip
permits. The rest of the axles are divided into two groups, in which the axle spacings are
idealized as 4ft – the typical spacing for tandem axles. The WisDOT SPV is 63 ft long, which is
within the 75-ft limit for an annual permit. The Wis-SPV is an important design parameter in the
Bridge Manual because all newly designed bridges are required to safely carry this load.6 The
Wis-SPV is also important for issuing annual permits and/or single-trip permits because all
bridges are rated using this vehicle, and the permit rating values are available for truck operators
to evaluate their permit application needs.
The Standard Permit Vehicle (Wis-SPV) load was increased from 190 kips to 250 kips in 1999 to
accommodate the increase in truck loads in Wisconsin.6 The axle configuration, on the other
hand, remained the same to facilitate the transition. However, this change may not sufficiently
reflect the impact of the overweight loads on Wisconsin highway. Both the axle configurations
and the gross weight of a vehicle can affect the bridge responses.9 Hence the effect of Wis-SPV
needs to be evaluated, and compared with the effects of the existing overloaded vehicles on
Wisconsin highways.
13' 4' 4' 30' 4' 4' 4'63'
25 35 35 35 30 30 30 30 Fig. 1.2 Wisconsin Standard Permit Vehicle
Research Objectives and Scope
The objectives of this project were to:
Gather and evaluate information on overloaded vehicles operating on Wisconsin
highways. Three datasets were collected and analyzed: 1) the database of single-trip
permits that WisDOT has collected from 2004 to 2007, 2) the Weigh-in-Motion (WIM)
truck records in Wisconsin in 2007, and 3) the representative overloaded vehicles in the

3
neighboring States. Detailed vehicle configurations were collected, including the gross
vehicle weights, axle weights, and axle spacings.
Identify vehicle configurations that best envelop the overloaded vehicles in Wisconsin.
The bridge responses subjected to overloaded vehicles were compared with those of Wis-
SPV. The exceeding probability based on the maximum moment and shear in
representative bridge spans were calculated for the collected overloaded vehicles.
Provide modifications to the Wis-SPV. A short permit truck (Wis-SPT) was proposed to
compliment the existing standard permit vehicle. The 150-kip Wis-SPT would be suitable
for using in short-span bridges such as slab bridges less than 80ft. The rating example in
Chapter 45 of the Wisconsin Bridge Manual was reevaluated and modified. Peak
moments/shear in single and continuous span bridges were tabulated to facilitate the
implementation.
Establish tools for future evaluation and adaptation of further increased permit vehicle
weights and future overloaded vehicle configurations.
Organization of the report
A review of the permitting vehicles in the bordering states, including Minnesota, Iowa, and
Michigan, and Illinois is provided in Chapter 2. The Wis-SPV was compared with the collected
permit vehicles in Chapter 3. The Weight-in-Motion (WIM) data obtained from the Wisconsin
Transportation Center is analyzed in Chapter 4. Representative vehicles were proposed and
compared with the Wis-SPV. In Chapter 5, the trucks in the single-trip permit records were
analyzed using the same methodology. Modifications to the Wis-SPV are proposed based on the
comparison of these representative vehicles in Chapter 6. A summary was provided in Chapter 7.
The line girder analysis using SAP2000® is summarized in Appendix 1. The two computer tools
produced in this project are explained in Appendix 2. The fundamentals of the statistical analysis
used in this project were provided in Appendix 3 to analyze the effect of overloaded vehicles.
The multivariate statistical analysis of the WIM records is shown in Appendix 4.

4
This page is blank

5
Chapter 2 Review of Permitting Practice
Introduction
Truck size and weight regulations are needed to promote safety and to prevent excessive damage
to highways and bridges.10-11
Frequent overweight loads on bridges may reduce their service life
or cause permanent structural damage if the impacts are not assessed properly.12-14
Bridges that
cannot carry the "Maximum Weight by Statutes" of standard trucks are typically posted.15
Various idealized trucks have been used in the bridge rating practice. The representative
overloaded vehicles in the states of Minnesota, Michigan, Iowa, and Illinois are reviewed in this
chapter. The legal vehicle loads are briefly presented while the focus is on the trucks used for
permit rating. The collected overloaded vehicles will be compared to the Wis-SPV in Chapter 3.
Federal Regulations
Legal Dimensions and Weights
The federal Truck Size and Weight (TS&W) limits were first enacted in the Federal-Aid
Highway Act of 1956.16
The Act established the following limits:
Single-axle weight limit of 18,000 lb;
Tandem-axle weight limit of 32,000 lb;
Gross Vehicle Weight (GVW) of 73,280 lb; and
Maximum width limit of 96 inches.
The limits were increased in 1974 based on the Federal-Aid Highway Amendments:17
Single-axle weight limit of 20,000 lb;
Tandem-axle weight limit of 34,000 lb; and
Gross Vehicle Weight (GVW) of 80,000 lb except where lower gross vehicle weight is
dictated by the "bridge formula":
For axle groups and vehicles, the maximum legal weight is calculated using the Federal Bridge
Formula:18
3612
1500 N
N
LNW , (2.1)
where W is the maximum weight in pounds that can be carried on a group of two or more axles
to the nearest 500 pounds, L is the spacing in feet between the outer axles of any two or more
consecutive axles, and N is the number of axles being considered. Federal law states that two or
more consecutive axles may not exceed the weight computed by the Bridge Formula even though
single axles, tandem axles, and gross vehicle weights are within legal limits. For the 250-kip
Wis-SPV, with 8 axles and a 63 ft maximum spacing, the maximum gross weight should be 102
kips according to the Bridge Weight Formula in Eq. (2.1).

6
Vehicle Configuration for Load Rating
AASHTO Guide Manual for Condition Evaluation and Load and Resistance Factor Rating
(LRFR) of Highway Bridges suggests using the design vehicular live load, designated as HL-93,
in permit load rating.19
HL-93 consists of a combination of a design truck (Fig. 2.1) or a design
Tandem (a pair of 25-kip axles spaced 4 ft apart) with a design lane load (0.64kips/ft in the
longitudinal direction and distributed over a10 ft width in the transverse direction).
14' 14'~30'
8 32 32
28'~54'
GVW=72 k
Fig. 2.1 Design truck in AASHTO LRFD and WisDOT Bridge Manual
State of Wisconsin (WisDOT) Regualtions
Legal Dimensions and Weights3
The maximum legal dimensions of vehicles that may be operated without permits on Wisconsin
highways are in general 8'-6" (Width) and 13'-6" (Height) with exceptions for seasonal loads.
The general length limits (including front and rear overhang) are shown below:
Single motor vehicle 40'
Semi trailer or trailer operated as part of a 2−vehicle combination 48'
Tractor − semi trailer combination 75'
Mobile homes, motor homes, and motorbuses. 45'
Mobile crane 48'
The weight limitations for vehicles on Class "A" highways: all state trunk highways, connecting
highways, and some county trunk highways, town highways and city and village streets are
Single wheel or multiple wheels on one end of an axle - 11,000 Pounds;
Single axle - 20,000 pounds, and steering axle - 13,000 Pounds,
Gross weight for any vehicle or vehicle combination- 80,000 Pounds.
Legal Sizes and Weights for Annual Permits
Permits are required when the load dimension exceeds the above statutory limits. There is a
length limitation of 50 feet for single-unit vehicles and 75 feet for vehicle combinations for
vehicles with annual permits.3-6
The following gross weights are allowed for vehicles with
annual permits:
Single Axle (steering axle) 20,000 Pounds (2 Tires)
Single Axle 30,000 Pounds (3 Tires)
2-Axle Tandem 55,000 Pounds
3-Axle Tandem 70,000 Pounds
4-Axle Tandem 80,000 Pounds
Total Gross Vehicle Weight 170,000 Pounds

7
Load Rating in Bridge Manual
The Standard Permit Vehicle, as shown in Fig. 1.2, is intended to roughly represent the most
vehicles with single-trip permits and to envelope all vehicles with multi-trip permits. The 250-
kip vehicle is used to estimate whether a bridge should be posted, and the rating is usually
determined by
(kips) 250load VehiclePermit Standard kip-250 by the causedMoment
capacitymoment load Live . (2.2)
The calculation of the live load capacity (or resistance) must consider various failure modes
depending upon the bridge structure types (e.g., reinforced concrete slab, slab on steel girders,
and slab on prestressed concrete girders). The live load moment should also be modified by
lateral load distribution factors.
State of Minnesota (MnDOT) Regulations
Legal Dimensions and Weights20
The Maximum legal dimensions of vehicles (loaded or unloaded) that may be operated without
special permits on Minnesota highways are 13'-6" (Height), 8'-6" (Width), and the legal vehicle
length (include front and rear overhang) is shown below
Single motor vehicle 40'
Each trailer or semi-trailer of a twin trailer combination 28'-6"
Trailer of two-vehicle combination 45'
Semi-trailer of two-vehicle combination 48'
Mobile crane 48'
Drive-away saddle mount combination 75'
Truck-tractor with semi-trailer combination, 75'
Weight, axle and tire limitations for vehicles on Minnesota highways and certain designated
local (county) highways are:
Single or dual wheel - 10,000 pounds;
Single axle - 20,000 pounds; and
Vehicle combination with five or more axles and minimum spacing - 80,000 pounds.
Legal Sizes and Weights for Annual Permits20
The annual permit can be issued to vehicles within the following limits on the total overall
dimensions, maximum axle weight, or special limits. The vehicle width must not exceed 8'. The
vehicle height limit is 14', and the vehicle length limit is 60' for single motor vehicle and 85' for
vehicle combinations. The maximum overall axle spacing is 75' while the minimum axle spacing
between any two axles is 3'-9". The weight limits are

8
Single Axle 20,000 Pounds GVW for 5-axle vehicles 92,000 Pounds
2-Axle Tandem 40,000 Pounds GVW for 6-axle vehicles 112,000 Pounds
3-Axle Tandem 60,000 Pounds GVW for 7-axle vehicles 132,000 Pounds
4-Axle Tandem 72,000 Pounds GVW for 8-axle vehicles 145,000 Pounds
5 or more axles group Not allowed for annual
permits
GVW for 9+-axle
vehicles
Not allowed for annual
permits
Load Rating in Minnesota Bridge Manual21
The bridge load rating determines the safe load carrying capacity. In addition to the operating
and inventory rating, bridge capacities are calculated for a new bridge and are recalculated
throughout the bridge's life as changes occur. In addition to the two different levels ("inventory
rating" and "operating rating") that have historically been used for load rating, the Standard
MnDOT Overload Permit Trucks as shown in Fig. 2.2 should be checked. The lowest or critical
rating factor should be reported for each permit truck. Influence lines should be used for
calculating the critical negative and positive moment (and shear if critical).
12' 4' 4' 4' 4'18'
8 16 16 16 16 16 16
Stadard A
GVW=104 k
46'
10' 4' 4' 4' 4'23'
15 18 18 18 18 18 18
Stadard C
GVW=159 k
57'
4'
18
4'
18
10' 4' 4' 35'
15 19.219.2
19.2
Stadard P411
GVW=207 k
93'
12' 4'
19.2 19.2
4'4'
19.219.2
19.2
12'4'
19.219.2
10' 4' 4' 4' 4'23'
16 20 20 20 20 20 20
Stadard B
GVW=136 k
49'
10' 4' 4' 35'
15
Stadard P413
GVW=255 k
93'
20' 4'
20 20 20
4'
20 20 20
4' 4' 20' 4'
20 20 20
4'
20 20 20
Fig. 2.2 Standard Mn/DOT Overload Permit Trucks

9
State of Iowa (IaDOT) Regulations
Legal Dimensions and Weights22
The dimensions of vehicles (loaded or unloaded) that may be operated without special permits on
Iowa highways should not exceed 13'-6" (height), 8'-6" (width), and the length (inclusive of front
and rear bumpers) should not exceed 40' for single trucks and 70' for three-vehicle combinations.
Vehicle gross weight and axle weight limitations are:
Single axle - 20,000 pounds for pneumatic tires, and 14,000 pounds for solid rubber tires;
Tandem-axle weight limit of 34,000 lbs;
the maximum gross vehicle weight of the fence-line feeder, grain cart, tank wagon, or
tracked implement of husbandry shall not exceed 96,000 lbs; and
The maximum gross weight allowed to be carried on a vehicle or combination of vehicles
on interstate highways is controlled by the bridge formula, with a maximum 80,000 lbs.
Legal Sizes and Weights for Annual Permits22
Vehicles with the following maximum dimensions and weights can be issued an annual permit:
Vehicles with indivisible loads having a maximum width of 12'-5", a maximum length of
120', a maximum overall height of 13'-10", and a total gross weight of 80,000 lbs.
Vehicles with indivisible loads, or mobile homes including appurtenances, having a
maximum width of 13'-5", a maximum length of 120', a maximum height of 15'-5", and a
total gross weight not to exceed 156,000 lbs.
Load Rating for Standard Bridges23
The inventory and operating ratings are based on the AASHTO design vehicle loading shown in
Fig. 2.1. The legal load ratings are based on the five typical Iowa legal vehicles using allowable
operating rating stresses. The term "Legal" indicates the Iowa vehicle does not induce stresses
exceeding allowable operating rating stresses. The Iowa rating vehicles are shown in Fig. 2.3.
11' 4' 4'
12.5 14 14 14
Type 4
GVW=54.5 k
19'
15' 4' 10' 4'10'
14.5 12 12 13.5 14 14
Type 3-3
GVW=80 k
43'
12' 4' 7' 4'33'
12 17 17 10 17 17
Type 353B
GVW=90 k
60'
12' 4' 4'34'
12 14 14 14 14 14
Type 453
GVW=96 k
62'
4'
14
4'
11' 4' 4' 4'20'
12 13 13 14 14 14
Type 353A
GVW=80 k
43'
Fig. 2.3 Iowa rating vehicles
10
State of Michigan (MDOT) Regulations
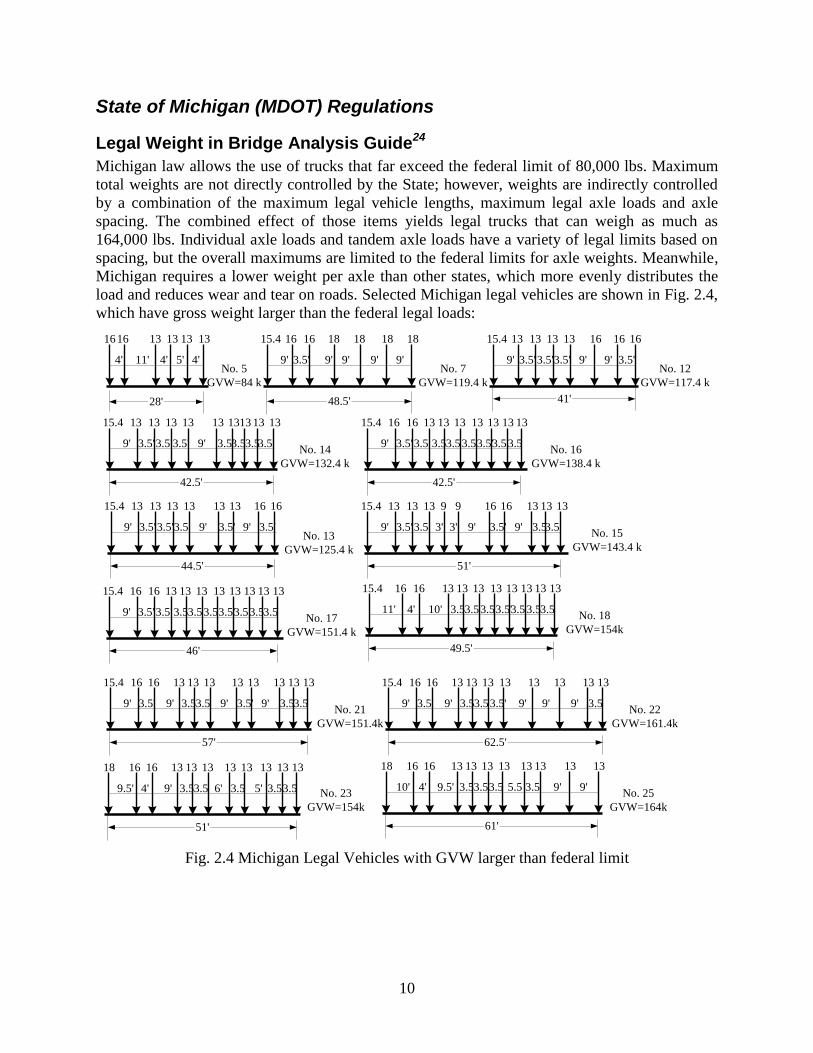
Legal Weight in Bridge Analysis Guide24
Michigan law allows the use of trucks that far exceed the federal limit of 80,000 lbs. Maximum
total weights are not directly controlled by the State; however, weights are indirectly controlled
by a combination of the maximum legal vehicle lengths, maximum legal axle loads and axle
spacing. The combined effect of those items yields legal trucks that can weigh as much as
164,000 lbs. Individual axle loads and tandem axle loads have a variety of legal limits based on
spacing, but the overall maximums are limited to the federal limits for axle weights. Meanwhile,
Michigan requires a lower weight per axle than other states, which more evenly distributes the
load and reduces wear and tear on roads. Selected Michigan legal vehicles are shown in Fig. 2.4,
which have gross weight larger than the federal legal loads:
3.5'9' 3.5' 9'3.5'
15.4 13 13 13 13 13
44.5'
No. 13
GVW=125.4 k
16
9'
16
3.5'
13
3.5'
3.5'9' 3.5' 9'3.5'
15.4 13 13 13 13 13
42.5'
No. 14
GVW=132.4 k
13
3.5
13
3.5'
13
3.5'
13
3.5
3.5'9' 3.5' 3'3'
15.4 13 13 13 9 16
51'
No. 15
GVW=143.4 k
13
3.5
13
3.5'
16
3.5'
13
9'9'
9
3.5'9' 3.5' 3.53.5
15.4 16 16 13 13 13
42.5'
No. 16
GVW=138.4 k
13
3.5
13
3.5'
13
3.53.5
13
3.5'9' 3.5' 3.53.5
15.4 16 16 13 13 13
46'
No. 17
GVW=151.4 k
13
3.5
13
3.5'
13
3.53.5
13 13
3.5 4'11' 10' 3.53.5
15.4 16 16 13 13 13
49.5'
13
3.5
13
3.5'
13
3.53.5
13 13
3.5No. 18
GVW=154k
3.5'9' 9' 3.53.5
15.4 16 16 13 13 13
62.5'
No. 22
GVW=161.4k
13
9'
13
3.5'
13
9'9'
13 13
3.5
4'10' 9.5' 3.53.5
18 16 16 13 13 13
61'
No. 25
GVW=164k
13
9'
13
3.5
13
3.55.5
13 13
9'4'9.5' 9' 3.53.5
18 16 16 13 13 13
51'
No. 23
GVW=154k
13
3.5
13
6'
13
5'3.5
13 13
3.5
3.5'9' 9' 3.53.5
15.4 16 16 13 13 13
No. 21
GVW=151.4k
13
3.5
13
3.5'
13
9'9'
13 13
3.5
57'
48.5'
3.5'9' 9' 9'9'
15.4 16 16 18 18 18
No. 7
GVW=119.4 k
18
9' 3.5'9' 3.5' 9'3.5'
15.4 13 13 13 13 16
41'
No. 12
GVW=117.4 k
16
9'
16
3.5'11'4' 4' 4'5'
16 16 13 13 13 13
28'
No. 5
GVW=84 k
Fig. 2.4 Michigan Legal Vehicles with GVW larger than federal limit

11
Permit Vehicles in Bridge Analysis Guide24
Overload vehicles are required to obtain a permit from the State or local agencies. It is prudent to
analyze the capacity of the specific bridges to be crossed for their ability to safely carry the
overload. Permit Load Rating is used when a request has been made to transport a load that is not
included in the Michigan legal loads. The load to be carried may have heavier axles or more
closely spaced axles, larger gross weight than those allowed by law, or a combination of these
features. The load to be used for analysis should be the exact load requested to be transported,
with that one vehicle placed so as to produce the maximum desired effect. Load rating
calculations for overload vehicles are identical to normal load ratings for operating level ratings.
MDOT has established a list of 20 different common overload vehicle configurations; however,
the vehicles have smaller gross weight than the vehicle shown in Fig. 2.4 while the vehicle
lengths are comparable. Hence, the vehicles in Fig. 2.4 will be used for the purpose of this study.
State of Illinois (IDT) Regulations
Legal Dimensions and Weights25
The maximum length of a single vehicle on any Illinois highway may not exceed 42' with
exceptions, the maximum height 13'-6", and the maximum width 8'-6". The Maximum legal
weight of any vehicle in Illinois is 80,000 lb except where lower gross vehicle weight is dictated
by the Federal bridge formula. Permit vehicles may exceed this weight but are limited to IDT's
"Practical Maximum Weights," which is based upon the federal bridge weight formula. The
following rating trucks (Fig. 2.5) are used in the load rating and bridge posting.
12' 4'
12 16 16
Type3
GVW=44 k
16'
10' 4' 14'
8.5 16 16 18
Type 3-S1
GVW=58.5 k
28'
10' 4' 12'
8 16 16 16
Type 3-S2
GVW=72 k
30'
16
4'
Fig. 2.5 Illinois load rating and posting trucks
Maximum Permit Vehicles in Structural Services Manual26
Overweight trucks in excess of the practical maximums or on nonstandard vehicles or with
nonstandard axle configurations may be authorized. Annual overweight permits for loads up to
120,000 lbs may be issued. Note that IDT regulates the maximum axle weights while the axle
spacings are not limited except that the maximum vehicle dimensions, including a tractor and a
semi-trailer are 14'6"wide, 145' long and 15' high. The vehicle configuration shown in Fig. 2.6
was created from the IDT legal document. Note that the vehicles are not used for bridge rating or
posting; hence they were not used in Chapter 3 for the comparison with WisDOT SPV

12
16' 4' 4' 4'19'~117'
20 24 24 20 20 20
47~145'
Class A
GVW=128 k
16' 4' 4'19'~121'
20 24 24 24 24
43~145'
Class B
GVW=116 k
15'~52'4' 4'
17 17 22 22
Class M
GVW=78 k
23'~60'
19'~56' 4'
20 24 24
Class N
GVW=68 k
23'~60'
Fig. 2.6 Truck configurations for multi-trip permits in Illinois
13
Chapter 3 Comparison of Wis-SPV with Collected Overloaded Vehicles
from Neighboring States
Introduction
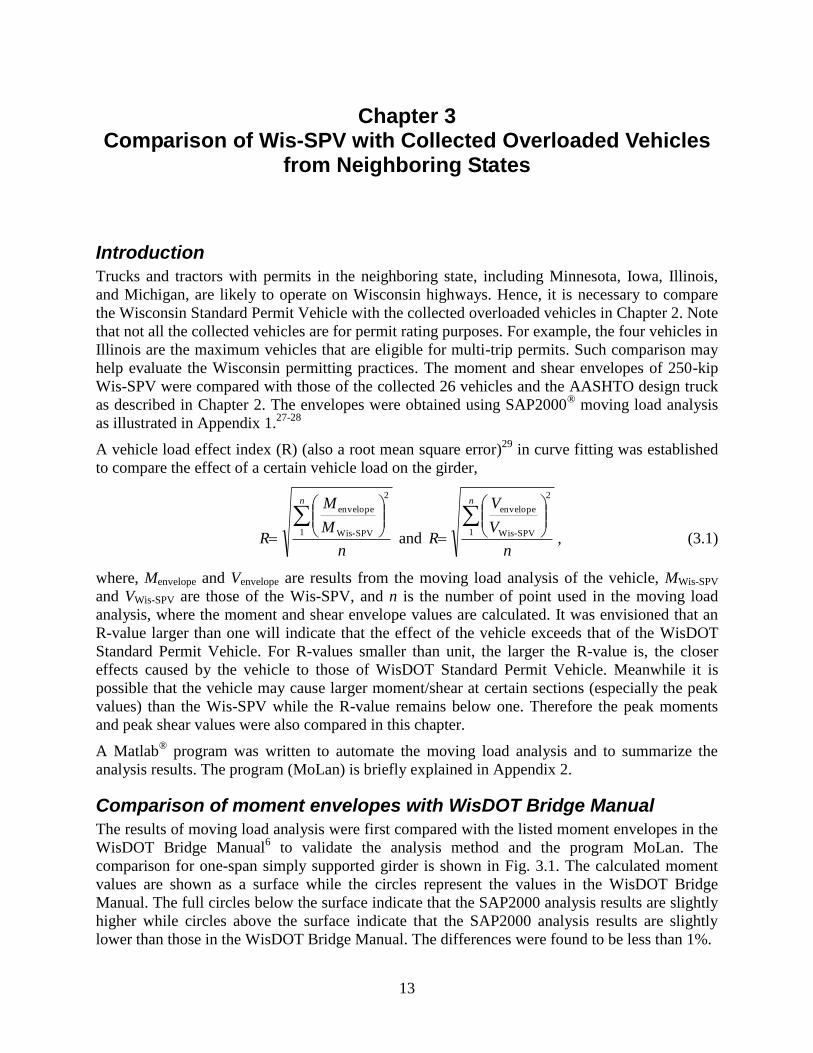
Trucks and tractors with permits in the neighboring state, including Minnesota, Iowa, Illinois,
and Michigan, are likely to operate on Wisconsin highways. Hence, it is necessary to compare
the Wisconsin Standard Permit Vehicle with the collected overloaded vehicles in Chapter 2. Note
that not all the collected vehicles are for permit rating purposes. For example, the four vehicles in
Illinois are the maximum vehicles that are eligible for multi-trip permits. Such comparison may
help evaluate the Wisconsin permitting practices. The moment and shear envelopes of 250-kip
Wis-SPV were compared with those of the collected 26 vehicles and the AASHTO design truck
as described in Chapter 2. The envelopes were obtained using SAP2000®
moving load analysis
as illustrated in Appendix 1.27-28
A vehicle load effect index (R) (also a root mean square error)29
in curve fitting was established
to compare the effect of a certain vehicle load on the girder,
n
M
M
R
n
1
2
SPV-Wis
envelope
and n
V
V
R
n
1
2
SPV-Wis
envelope
, (3.1)
where, Menvelope and Venvelope are results from the moving load analysis of the vehicle, MWis-SPV
and VWis-SPV are those of the Wis-SPV, and n is the number of point used in the moving load
analysis, where the moment and shear envelope values are calculated. It was envisioned that an
R-value larger than one will indicate that the effect of the vehicle exceeds that of the WisDOT
Standard Permit Vehicle. For R-values smaller than unit, the larger the R-value is, the closer
effects caused by the vehicle to those of WisDOT Standard Permit Vehicle. Meanwhile it is
possible that the vehicle may cause larger moment/shear at certain sections (especially the peak
values) than the Wis-SPV while the R-value remains below one. Therefore the peak moments
and peak shear values were also compared in this chapter.
A Matlab® program was written to automate the moving load analysis and to summarize the
analysis results. The program (MoLan) is briefly explained in Appendix 2.
Comparison of moment envelopes with WisDOT Bridge Manual
The results of moving load analysis were first compared with the listed moment envelopes in the
WisDOT Bridge Manual6 to validate the analysis method and the program MoLan. The
comparison for one-span simply supported girder is shown in Fig. 3.1. The calculated moment
values are shown as a surface while the circles represent the values in the WisDOT Bridge
Manual. The full circles below the surface indicate that the SAP2000 analysis results are slightly
higher while circles above the surface indicate that the SAP2000 analysis results are slightly
lower than those in the WisDOT Bridge Manual. The differences were found to be less than 1%.

14
00.2
0.40.6
0.81
0
50
100
150
0
1000
2000
3000
4000
5000
Normalized positionSpan length (ft)
Mom
ent
envel
ope(
kip
s-ft
)
Fig. 3.1 Comparison of SAP2000 analysis results with WisDOT Bridge Manual (one-span)
The comparison for two-span girders is shown in Fig. 3.2. The complete envelop for maximum
and minimum moments are not available in the WisDOT Bridge Manual; hence a transition line
exists in the calculated values shown as a surface in Fig. 3.2. The comparison indicated that the
negative peak moments at the interior support are identical. One circle fell below the surface,
representing a possible typographic in the moment value in the WisDOT Bridge Manual.
00.2
0.40.6
0.81
0
50
100
150
-3000
-2000
-1000
0
1000
2000
3000
4000
Normalized positionSpan length (ft)
Mom
ent
envel
ope(
kip
s-ft
)
Fig. 3.2 Comparison of SAP2000 analysis results with WisDOT Bridge Manual (two-span)

15
The comparison for three equal span girders is shown in Fig. 3.3. The moment table in the
WisDOT Bridge Manual (LRFD version) includes an impact factor. The impact factor,
3.1)125(
501
L, where L is span length, was considered in the comparison.
00.5
11.5
0
50
100
150
-3000
-2000
-1000
0
1000
2000
3000
4000
Normalized position)Span length (ft)
Mom
ent
envel
ope(
kip
s-ft
)
Fig. 3.3 Comparison of SAP2000 analysis results with WisDOT Bridge Manual (three-span)
One-span simply supported girders
The comparison focuses on the maximum positive moments. Note that the moment envelops of
the permitting vehicles are not shown in the report due to limitation in report space. Instead, the
maximum positive moments and shear in girders with various plan lengths by the vehicles are
shown in Fig. 3.4, and the values are listed in Table 3.1. The R-values for the envelopes are
shown in Fig. 3.5 and Table 3.2.
The peak moment increases with an increase in girder spans. The Wis-SPV moment envelopes
may be simplified as two straight lines connection and changing slope at around 60ft, which is
close to the maximum axle spacing of the Wis-SPV. The two lines have different slopes,
indicating that the gross vehicle weight controls the responses for long girders while an axle
group (likely the rear tandem axle) controls the responses of short girders. Wis-SPV envelopes
the effects of all the permitting vehicles collected from the neighboring states. However, many
permit vehicles, which have shorter length, may cause similar moments to Wis-SPV for short
girders (less than 60ft) though their gross weight is much smaller than that of Wis-SPV.
The comparison figures are presented to show whether the Wis-SPV envelops the collected
permitting vehicles. Hence, the Wis-SPV is shown in solid (blue) lines in the following
comparison figures while other vehicles are shown in various colors and line types. The details
of the comparisons are shown in the tables following the comparison figures.

16
20 40 60 80 100 120 1400
2000
4000
6000
8000
Peak
mo
men
t (k
ips-
ft)
20 40 60 80 100 120 140-200
-100
0
100
200
Beam spans (ft)
Peak
sh
ear
(kip
s)
Fig. 3.4 Comparison of the maximum moments in simply-supported girders
20 40 60 80 100 120 1400.2
0.4
0.6
0.8
1
R-v
alu
es
(mo
men
t)
20 40 60 80 100 120 140-1
-0.5
0
0.5
1
Beam spans (ft)
R-v
alu
es
(sh
ear)
Fig. 3.5 R-values for the moment/shear envelopes in simply-supported girders
Note that labels were not included in the figures to simplify the presentations.
Wis-SPV

17
Table 3.1(a) Peak positive moment in one-span girders (kips-ft) Span
(ft)
Wis
SPV
AASH
TO
Mn
A
Mn
B
Mn
C
Mn
P411
Mn
P413
IA
Type4
IA
353A
IA
453
Mi
No5
Mi
No6
Mi
No7
Mi
No8
Mi
No12
Mi
No13
Mi
No14
Mi
No15
Mi
No17
Mi
No18
Mi
No21
Mi
No22
Mi
No23
Mi
No25
32 723.7 326.6 322.3 421.1 447.4 403.7 419.6 285.3 280.0 285.3 308.3 318.8 318.8 318.8 358.5 355.5 387.8 361.1 470.5 470.5 332.4 365.4 393.6 396.8
36 843.3 397.4 378.0 496.6 534.3 491.4 494.1 338.7 322.0 338.7 381.2 388.0 388.0 385.2 442.9 441.2 476.0 435.3 574.1 574.1 414.8 455.4 497.3 483.7
40 962.9 468.4 433.8 572.1 621.3 595.6 568.6 392.2 364.0 392.2 463.7 470.9 470.9 464.5 528.2 534.6 578.2 535.6 680.8 678.0 511.7 557.4 600.9 583.8
44 1085.3 539.7 491.9 647.7 708.3 705.5 643.3 445.9 406.0 445.9 547.4 554.0 554.0 554.7 619.6 628.0 692.9 639.6 802.5 792.9 608.7 659.3 704.6 693.8
48 1214.6 611.0 568.8 723.4 795.2 815.3 719.0 499.5 458.5 499.5 631.4 638.1 638.1 645.2 727.7 722.3 809.5 743.6 938.5 919.1 712.5 762.8 825.3 815.8
52 1344.2 682.5 670.8 799.2 882.2 925.6 818.8 553.2 525.5 553.2 715.3 739.3 739.3 735.7 844.5 839.4 926.3 861.3 1074.5 1054.5 824.8 879.7 961.2 943.8
56 1473.7 754.0 773.3 886.6 969.2 1035.9 943.6 607.0 592.7 607.0 799.3 840.6 851.3 826.5 961.7 964.4 1054.3 989.1 1212.8 1190.5 942.6 1015.1 1097.1 1071.8
60 1603.2 825.6 875.8 1002.5 1057.4 1146.2 1076.6 660.8 660.0 660.8 883.3 941.8 970.5 917.3 1078.9 1089.3 1186.2 1119.1 1363.7 1326.5 1078.4 1150.5 1238.0 1205.8
64 1732.8 897.2 978.6 1136.2 1184.0 1257.0 1209.9 714.6 733.2 714.6 967.2 1043.1 1089.7 1008.1 1196.2 1214.3 1318.1 1261.6 1514.8 1472.8 1225.9 1285.9 1389.8 1354.8
68 1865.6 969.0 1081.5 1270.2 1325.0 1368.0 1343.5 768.5 811.1 768.5 1051.2 1144.5 1208.9 1099.0 1313.6 1339.2 1450.0 1404.4 1665.9 1626.2 1376.8 1426.8 1541.8 1518.8
72 2042.4 1040.7 1184.5 1404.3 1478.9 1479.0 1477.2 822.3 889.5 822.3 1135.2 1245.8 1328.1 1190.1 1430.9 1464.2 1582.1 1547.3 1817.1 1779.7 1527.6 1587.9 1693.7 1682.8
76 2267.4 1112.4 1287.5 1538.8 1633.6 1590.0 1610.9 880.4 967.9 880.4 1219.1 1347.2 1447.4 1281.2 1548.3 1589.4 1714.3 1690.2 1968.3 1933.1 1678.5 1749.2 1845.7 1846.8
80 2509.5 1184.2 1390.8 1673.4 1789.5 1701.0 1744.9 966.4 1046.4 966.4 1303.1 1448.5 1566.6 1372.2 1665.6 1714.6 1846.4 1833.3 2119.4 2086.6 1829.3 1910.5 1997.6 2010.8
84 2753.1 1255.9 1494.2 1808.0 1946.9 1812.0 1879.1 1058.6 1125.2 1058.6 1387.1 1549.9 1685.8 1463.3 1783.0 1839.8 1978.6 1976.4 2270.6 2240.1 1980.5 2071.9 2149.5 2174.8
88 2996.7 1327.7 1597.5 1942.7 2104.3 1923.0 2013.2 1151.8 1204.1 1151.8 1471.0 1651.2 1805.2 1554.4 1900.3 1965.0 2110.8 2119.6 2421.7 2393.8 2131.9 2233.2 2301.5 2338.8
92 3241.0 1399.6 1700.9 2077.7 2261.7 2034.0 2147.3 1245.9 1282.9 1245.9 1555.0 1752.6 1924.5 1645.4 2017.7 2090.2 2243.0 2262.8 2572.9 2547.6 2283.3 2394.5 2453.4 2502.8
96 3486.1 1471.5 1804.2 2212.8 2419.6 2145.0 2281.5 1340.1 1362.0 1340.1 1639.0 1854.0 2043.9 1736.6 2135.0 2215.4 2375.2 2406.0 2724.1 2701.3 2434.7 2555.9 2605.4 2666.8
100 3731.3 1543.4 1907.8 2347.9 2577.6 2270.3 2415.7 1434.7 1441.2 1434.7 1723.0 1955.3 2163.2 1827.9 2252.4 2340.6 2507.4 2549.1 2875.2 2855.1 2586.1 2717.2 2757.3 2830.8
104 3976.4 1615.2 2011.4 2483.0 2735.6 2416.7 2550.3 1529.3 1520.4 1529.3 1807.0 2056.7 2282.6 1919.1 2369.7 2465.8 2639.6 2692.3 3026.5 3008.9 2737.5 2878.5 2909.2 2994.8
108 4222.8 1687.1 2115.0 2618.2 2893.6 2563.5 2742.6 1624.0 1599.6 1624.0 1891.0 2158.0 2401.9 2010.4 2487.1 2591.0 2771.8 2835.5 3177.8 3162.6 2888.9 3039.9 3061.2 3158.8
112 4469.2 1759.0 2218.6 2753.3 3051.5 2731.3 2937.3 1718.6 1678.8 1718.6 1975.0 2259.4 2521.3 2101.6 2604.4 2716.2 2904.0 2978.6 3329.2 3316.4 3040.3 3201.2 3213.1 3322.8
116 4715.6 1830.9 2322.3 2888.6 3209.5 2933.0 3132.0 1813.6 1758.1 1813.6 2059.0 2360.8 2640.6 2192.9 2721.8 2841.4 3036.1 3121.8 3480.5 3470.1 3191.7 3362.6 3365.0 3486.8
120 4962.0 1902.8 2425.9 3024.1 3367.6 3135.1 3326.6 1908.6 1837.6 1908.6 2143.0 2462.1 2760.0 2284.2 2839.1 2966.6 3168.4 3265.0 3631.8 3623.9 3343.1 3523.9 3517.0 3650.8
124 5208.7 1974.7 2529.5 3159.6 3526.0 3338.1 3521.3 2003.6 1917.1 2003.6 2227.0 2563.5 2879.3 2375.4 2956.5 3091.9 3300.8 3408.1 3783.2 3777.6 3494.5 3685.2 3668.9 3814.8
128 5456.2 2046.6 2633.1 3295.1 3684.5 3541.0 3716.0 2098.7 1996.6 2098.7 2311.0 2664.8 2998.7 2466.7 3073.9 3217.3 3433.1 3551.3 3934.5 3931.4 3645.9 3846.6 3820.9 3978.8
132 5703.7 2118.4 2736.8 3430.6 3842.9 3744.0 3924.0 2193.7 2076.1 2193.7 2395.0 2766.2 3118.0 2557.9 3191.2 3342.6 3565.5 3694.6 4085.9 4085.1 3797.3 4007.9 3972.8 4142.8
136 5951.3 2190.3 2840.4 3566.1 4001.3 3946.9 4162.2 2288.8 2155.6 2288.8 2479.0 2867.6 3237.4 2649.2 3308.6 3468.0 3697.8 3838.0 4237.2 4238.9 3948.7 4169.2 4124.7 4306.8
140 6198.8 2262.2 2944.3 3701.6 4159.7 4151.3 4413.3 2384.0 2235.0 2384.0 2563.0 2968.9 3356.7 2740.4 3425.9 3593.3 3830.2 3981.3 4388.5 4392.7 4100.1 4330.6 4276.7 4470.8

18
Table 3.1(b) Peak shear in one-span girders (kips) Span
(ft)
Wis
SPV
AASH
TO
Mn
A
Mn
B
Mn
C
Mn
P411
Mn
P413
IA
Type4
IA
353A
IA
453
Mi
No5
Mi
No6
Mi
No7
Mi
No8
Mi
No12
Mi
No13
Mi
No14
Mi
No15
Mi
No17
Mi
No18
Mi
No21
Mi
No22
Mi
No23
Mi
No25
32 100.4 52.5 46.0 59.5 63.2 62.4 59.0 41.2 38.4 41.2 47.4 47.9 47.9 48.3 52.2 52.2 57.5 53.7 64.2 64.2 51.2 54.2 58.1 57.0
36 103.7 54.7 50.6 61.3 65.8 66.1 60.8 42.7 41.7 42.7 51.5 52.2 52.2 51.4 57.8 57.0 63.5 58.0 69.7 69.3 56.2 59.2 63.2 61.3
40 106.3 56.4 55.2 62.8 67.9 69.1 66.0 43.8 44.3 43.8 54.7 55.6 55.8 53.8 62.2 62.3 68.9 62.9 75.9 74.9 60.3 63.2 68.3 65.9
44 108.5 57.8 58.9 66.8 69.7 71.5 70.9 44.7 46.7 44.7 57.4 58.3 60.2 56.4 65.8 66.7 73.8 68.2 81.4 80.5 64.5 67.9 73.9 70.3
48 110.8 59.0 62.3 71.2 73.5 74.8 75.6 45.5 49.5 45.5 59.6 60.6 63.8 59.3 69.4 70.3 78.7 73.2 86.6 85.1 69.3 72.2 79.0 74.8
52 118.2 60.0 65.5 75.9 78.9 77.5 80.2 46.1 51.8 46.1 61.5 63.1 66.9 61.8 73.1 73.7 82.8 77.4 91.6 89.9 74.4 76.4 83.7 78.9
56 125.9 60.8 68.3 80.2 83.6 79.9 84.1 46.7 53.8 46.7 63.1 65.8 69.6 63.9 76.3 77.4 86.3 81.0 95.8 94.5 78.8 81.0 88.6 83.0
60 132.5 61.6 70.7 83.9 88.3 82.0 87.5 49.0 55.6 49.0 64.5 68.2 71.9 65.8 79.0 80.6 89.4 84.5 99.5 98.4 82.6 85.3 92.8 87.2
64 138.6 62.2 72.7 87.2 92.7 83.8 90.5 51.6 57.1 51.6 65.7 70.3 74.6 67.4 81.4 83.4 92.1 88.2 102.8 101.9 86.0 89.1 96.5 90.9
68 145.2 62.8 74.6 90.0 96.6 85.4 93.1 54.2 58.5 54.2 66.8 72.1 77.3 68.8 83.5 85.9 94.5 91.5 105.6 105.0 89.6 92.5 99.8 94.1
72 151.0 63.3 76.2 92.6 100.1 86.9 95.4 56.5 59.7 56.5 67.7 73.7 79.6 70.0 85.4 88.1 96.6 94.3 108.2 107.7 93.0 95.4 102.7 97.0
76 156.2 63.8 77.7 94.9 103.2 89.7 97.5 58.6 60.7 58.6 68.6 75.2 81.7 71.2 87.1 90.1 98.5 96.9 110.5 110.1 96.1 98.1 105.3 99.6
80 160.9 64.2 79.0 96.9 106.0 93.1 99.4 60.4 61.7 60.4 69.4 76.5 83.6 72.2 88.6 91.8 100.2 99.2 112.5 112.3 98.8 100.5 107.6 101.9
84 165.1 64.6 80.2 98.8 108.5 97.1 101.1 62.1 62.6 62.1 70.1 77.7 85.3 73.1 90.0 93.4 101.7 101.3 114.4 114.3 101.3 102.7 109.7 104.6
88 169.0 64.9 81.3 100.5 110.8 101.4 104.3 63.7 63.4 63.7 70.7 78.8 86.8 73.9 91.2 94.9 103.1 103.3 116.0 116.1 103.6 105.1 111.7 107.3
92 172.5 65.2 82.2 102.0 112.9 105.4 107.6 65.1 64.1 65.1 71.3 79.7 88.3 74.7 92.4 96.2 104.4 105.0 117.6 117.8 105.7 107.5 113.4 109.8
96 175.8 65.5 83.2 103.4 114.8 109.4 110.6 66.4 64.7 66.4 71.8 80.7 89.6 75.4 93.4 97.4 105.5 106.6 119.0 119.3 107.6 109.8 115.0 112.0
100 178.7 65.8 84.0 104.7 116.6 113.3 113.6 67.6 65.4 67.6 72.3 81.5 90.7 76.0 94.4 98.5 106.6 108.1 120.3 120.7 109.3 111.9 116.5 114.1
104 181.5 66.0 84.8 105.9 118.2 116.9 117.1 68.6 65.9 68.6 72.7 82.2 91.9 76.6 95.2 99.6 107.6 109.4 121.5 121.9 111.0 113.8 117.9 116.0
108 184.0 66.2 85.5 107.1 119.7 120.3 121.1 69.7 66.4 69.7 73.2 83.0 92.9 77.2 96.1 100.5 108.5 110.7 122.6 123.1 112.5 115.5 119.1 117.8
112 186.4 66.4 86.1 108.1 121.1 123.4 125.3 70.6 66.9 70.6 73.5 83.6 93.8 77.7 96.8 101.4 109.4 111.9 123.6 124.2 113.9 117.2 120.3 119.5
116 188.6 66.6 86.8 109.1 122.4 126.3 129.3 71.5 67.4 71.5 73.9 84.2 94.7 78.1 97.5 102.2 110.2 112.9 124.6 125.3 115.1 118.7 121.4 121.0
120 190.6 66.8 87.3 110.0 123.7 129.0 133.3 72.3 67.8 72.3 74.2 84.8 95.5 78.6 98.2 103.0 110.9 114.0 125.5 126.2 116.4 120.1 122.4 122.4
124 192.5 67.0 87.9 110.8 124.8 131.5 137.3 73.1 68.2 73.1 74.6 85.3 96.3 79.0 98.8 103.7 111.6 114.9 126.3 127.1 117.5 121.4 123.4 123.8
128 194.3 67.1 88.4 111.6 125.9 133.8 141.0 73.8 68.6 73.8 74.9 85.8 97.0 79.4 99.4 104.4 112.2 115.8 127.1 127.9 118.5 122.7 124.3 125.0
132 196.0 67.3 88.8 112.3 126.9 136.1 144.4 74.4 68.9 74.4 75.1 86.3 97.7 79.7 99.9 105.1 112.9 116.6 127.8 128.7 119.5 123.9 125.1 126.2
136 197.6 67.4 89.3 113.0 127.8 138.1 147.7 75.1 69.2 75.1 75.4 86.8 98.3 80.1 100.5 105.7 113.4 117.4 128.5 129.5 120.5 125.0 125.9 127.3
140 199.1 67.5 89.7 113.7 128.7 140.1 150.7 75.7 69.5 75.7 75.6 87.2 98.9 80.4 100.9 106.2 114.0 118.2 129.2 130.2 121.4 126.0 126.6 128.4

19
Two-span simply supported girders
The peak moments and shear for two-span girders with various span lengths by all the permitting
vehicles are shown in Fig. 3.6 and the corresponding R-values in Fig. 3.7. The comparison of the
maximum positive moment shows a similar trend to the one-span cases, in which some vehicles
produce comparable positive moments for short girders. The negative moments by the vehicles
are comparable to those of Wis-SPV for girders with a span around 60ft as indicated by R-values
in Fig. 3.7. Furthermore, a permitting vehicle, MnDOT Standard P413 causes larger negative
moments than Wis-SPV for girders with 82-ft to 124-ft spans) as shown in Table 3.2. The P413
vehicle has a gross weight similar to that of the Wisconsin Standard Permit Vehicle (255kips);
however, the weight is distributed to thirteen axles with a total vehicle length of 117 ft as
illustrated below. In particular, the center of the first two tandem axles and the last two tandem
axles are spaced 71ft such that the axles may be placed in an optimized position to cause larger
negative moment. Table 3.2(b) indicates that the MnDOT Standard P413 vehicle can cause about
15% more negative moments than Wis-SPV though the gross weight is only 2% more.
Nevertheless, this vehicle exceeds the maximum length limit for an annual permit in Wisconsin.
The vehicle was not further studied in this project because such a vehicle, likely nondivisible, is
required to obtain a single-trip permits and the vehicle will likely be studied for all bridges on the
proposed route.
10' 4' 4' 35'
15
Stadard P413
GVW=255 k
117'
20' 4'
20 20 20
4'
20 20 20
4' 4' 20' 4'
20 20 20
4'
20 20 20
13' 4' 4' 4' 4'30'
25 35 35 35 30 30 30
63'
4'
30
Wisconsin Stadard
GVW=250 k

20
20 40 60 80 100 120 140-4000
-2000
0
2000
4000
6000
Peak
mo
men
t (k
ips-
ft)
20 40 60 80 100 120 140-400
-200
0
200
400
Beam spans (ft)
Peak
sh
ear
(kip
s)
Fig. 3.6 Comparison of the peak moments in 2-span simply-supported girders
20 40 60 80 100 120 140-1.5
-1
-0.5
0
0.5
1
R-v
alu
es
(mo
men
t)
20 40 60 80 100 120 140-1
-0.5
0
0.5
1
Beam spans (ft)
R-v
alu
es
(sh
ear)
Fig. 3.7 R-values for the moment/shear envelopes in two-span girders
Wis-SPV

21
Table 3.2(a) Peak positive moment in two-span girders (kips-ft) Span
(ft)
Wis
SPV
AASH
TO
Mn
A
Mn
B
Mn
C
Mn
P411
Mn
P413
IA
Type4
IA
353A
IA
453
Mi
No5
Mi
No6
Mi
No7
Mi
No8
Mi
No12
Mi
No13
Mi
No14
Mi
No15
Mi
No17
Mi
No18
Mi
No21
Mi
No22
Mi
No23
Mi
No25
32 577.2 264.2 261.5 339.4 354.1 325.4 338.1 232.0 224.9 232.0 244.2 250.5 250.5 250.5 283.8 283.6 309.3 283.3 364.6 364.6 260.1 290.9 304.9 312.4
36 675.0 316.8 306.0 399.7 423.2 390.7 397.8 274.1 259.5 274.1 303.6 306.2 306.2 303.6 346.5 343.8 376.4 345.8 446.6 446.6 322.0 355.2 384.5 377.7
40 774.3 373.2 351.0 460.5 492.9 473.8 458.0 316.8 294.1 316.8 367.1 370.2 370.2 368.6 413.7 414.4 457.2 418.4 530.7 529.7 393.3 430.0 465.6 459.7
44 878.2 430.2 398.1 521.9 563.2 558.9 518.6 359.9 333.5 359.9 431.7 435.3 435.3 438.0 487.5 487.9 545.0 498.9 631.7 621.5 469.3 510.2 547.9 544.3
48 982.8 487.7 461.7 583.6 633.8 645.2 581.5 403.3 379.1 403.3 497.3 506.0 506.0 508.6 575.3 570.2 634.6 580.5 736.7 725.6 553.8 598.8 643.9 630.1
52 1088.0 545.5 533.2 645.5 704.6 732.5 665.3 446.9 428.8 446.9 563.6 582.4 582.4 580.0 664.7 661.5 725.4 669.1 843.0 831.1 640.6 689.8 747.9 727.4
56 1193.6 603.5 609.0 724.6 775.7 820.6 759.5 490.8 479.5 490.8 630.3 660.1 660.1 652.2 755.5 756.3 825.8 764.5 952.4 937.8 730.9 781.8 853.2 831.0
60 1299.5 661.7 687.5 816.6 857.8 909.2 858.3 534.8 531.1 534.8 697.5 738.7 750.7 724.9 847.3 852.5 928.9 871.8 1068.8 1045.4 836.9 887.1 959.7 942.8
64 1405.7 720.2 768.2 915.2 956.2 998.3 958.8 578.9 589.4 578.9 764.9 818.0 843.9 798.0 939.8 949.8 1033.0 981.5 1187.6 1161.7 951.8 997.7 1077.3 1055.9
68 1528.5 778.9 849.6 1015.5 1068.5 1087.8 1060.7 623.1 649.9 623.1 832.6 898.0 938.0 871.6 1033.0 1047.8 1137.9 1092.5 1307.7 1282.0 1068.2 1114.8 1196.9 1170.5
72 1678.4 837.7 931.7 1117.5 1185.2 1177.6 1163.8 667.3 711.3 667.3 900.7 978.5 1032.6 945.3 1126.7 1146.6 1243.4 1205.3 1428.7 1403.6 1185.7 1238.5 1317.4 1297.9
76 1844.9 896.6 1014.1 1220.5 1303.7 1267.7 1267.8 726.3 773.3 726.3 969.0 1059.2 1127.7 1019.3 1220.8 1246.4 1349.4 1318.8 1550.3 1526.0 1304.1 1363.4 1438.5 1426.4
80 2022.6 955.6 1096.9 1324.5 1423.7 1358.0 1373.9 794.3 835.8 794.3 1037.4 1140.4 1223.2 1093.6 1315.3 1347.4 1455.8 1433.0 1672.2 1649.0 1423.6 1489.2 1560.1 1555.9
84 2203.4 1014.7 1180.1 1429.4 1544.9 1448.5 1481.4 863.6 898.6 863.6 1105.9 1221.8 1319.1 1167.9 1410.1 1448.6 1562.6 1547.6 1794.5 1772.5 1543.8 1615.9 1682.2 1686.4
88 2386.8 1073.9 1263.6 1535.0 1667.3 1539.1 1589.3 933.9 961.8 933.9 1174.6 1303.8 1415.3 1242.4 1505.1 1550.1 1669.6 1662.6 1917.2 1896.4 1664.6 1743.4 1804.6 1818.0
92 2572.4 1133.0 1347.4 1641.5 1790.5 1629.8 1697.6 1005.1 1025.3 1005.1 1243.3 1386.5 1511.8 1317.0 1600.4 1651.9 1777.0 1778.1 2040.2 2020.7 1785.9 1871.5 1927.4 1949.9
96 2760.0 1192.3 1431.5 1749.6 1914.6 1738.5 1806.3 1077.0 1089.1 1077.0 1312.2 1469.4 1608.4 1391.8 1695.8 1753.8 1884.6 1893.8 2163.3 2145.3 1907.5 2000.1 2050.6 2082.2
100 2951.9 1251.6 1515.6 1858.4 2039.3 1850.8 1915.1 1149.5 1153.0 1149.5 1381.1 1552.3 1705.3 1466.6 1791.5 1856.0 1992.3 2009.9 2286.7 2270.2 2029.4 2129.1 2173.8 2214.9
104 3146.4 1310.9 1600.2 1967.4 2164.5 1964.2 2024.4 1222.7 1217.1 1222.7 1450.0 1635.3 1802.4 1541.5 1887.2 1958.2 2100.3 2126.1 2410.3 2395.3 2151.7 2258.6 2297.5 2347.7
108 3341.7 1370.2 1684.7 2077.0 2290.4 2078.5 2148.5 1296.3 1281.4 1296.3 1519.0 1718.4 1899.6 1616.5 1983.1 2060.6 2208.3 2242.6 2534.0 2520.6 2274.2 2388.6 2421.3 2480.8
112 3537.9 1429.6 1769.4 2186.8 2416.6 2197.0 2298.0 1370.3 1345.9 1370.3 1588.1 1801.6 1996.9 1691.5 2079.1 2163.1 2316.6 2359.2 2657.8 2646.2 2397.0 2519.2 2545.1 2614.1
116 3734.9 1489.0 1854.2 2296.9 2543.3 2331.2 2448.4 1444.7 1410.5 1444.7 1657.2 1884.9 2094.5 1766.6 2175.2 2265.8 2424.9 2476.1 2781.8 2771.8 2519.9 2650.0 2669.3 2747.5
120 3932.7 1548.4 1939.1 2407.1 2670.3 2407.9 2599.7 1519.5 1475.1 1519.5 1726.4 1968.2 2192.2 1841.8 2271.4 2368.5 2533.3 2593.0 2905.9 2897.6 2643.1 2780.9 2793.5 2881.2
124 4131.0 1607.8 2024.1 2517.5 2797.6 2640.4 2751.7 1594.5 1539.9 1594.5 1795.6 2051.6 2289.9 1917.0 2367.7 2471.3 2641.9 2710.2 3030.1 3023.6 2766.3 2912.2 2917.8 3015.1
128 4330.0 1667.2 2109.2 2628.0 2925.3 2796.8 2913.1 1670.1 1604.8 1670.1 1864.8 2135.1 2387.8 1992.2 2464.0 2574.2 2750.5 2827.4 3154.4 3149.7 2889.8 3043.5 3042.3 3149.0
132 4529.5 1726.7 2194.4 2738.8 3053.1 2954.2 3096.1 1746.0 1669.7 1746.0 1934.1 2218.5 2485.7 2067.5 2560.4 2677.2 2859.2 2944.7 3278.7 3275.8 3013.4 3175.1 3166.9 3283.1
136 4729.4 1786.2 2279.6 2849.7 3181.2 3112.6 3284.8 1822.1 1734.8 1822.1 2003.3 2302.0 2583.7 2142.8 2656.9 2780.2 2968.0 3062.2 3403.2 3402.1 3137.1 3306.8 3291.6 3417.3
140 4929.8 1845.7 2364.9 2960.6 3309.5 3271.8 3474.9 1898.5 1799.9 1898.5 2072.6 2385.6 2681.7 2218.1 2753.4 2883.3 3076.8 3179.7 3527.6 3528.5 3260.9 3438.5 3416.3 3551.6

22
Table 3.2(b) Peak negative moment in two-span girders (kips-ft) Span
(ft)
Wis
SPV
AASH
TO
Mn
A
Mn
B
Mn
C
Mn
P411
Mn
P413
IA
Type4
IA
353A
IA
453
Mi
No5
Mi
No6
Mi
No7
Mi
No8
Mi
No12
Mi
No13
Mi
No14
Mi
No15
Mi
No17
Mi
No18
Mi
No21
Mi
No22
Mi
No23
Mi
No25
32 -548 -209 -287 -359 -383 -284 -368 -196 -221 -196 -220 -245 -277 -226 -293 -309 -337 -338 -358 -361 -318 -318 -328 -319
36 -688 -238 -326 -427 -470 -313 -426 -252 -254 -252 -239 -276 -325 -249 -331 -353 -379 -397 -416 -425 -388 -384 -390 -380
40 -832 -266 -360 -484 -548 -377 -476 -312 -282 -312 -255 -304 -366 -268 -363 -391 -415 -448 -466 -481 -451 -456 -447 -433
44 -961 -290 -389 -534 -616 -501 -519 -365 -307 -365 -273 -329 -402 -286 -391 -424 -445 -492 -510 -530 -506 -521 -498 -496
48 -1074 -311 -413 -578 -676 -634 -570 -412 -328 -412 -311 -350 -433 -316 -414 -452 -472 -530 -549 -574 -555 -578 -544 -553
52 -1175 -330 -435 -615 -728 -762 -680 -454 -346 -454 -349 -370 -460 -359 -435 -476 -494 -563 -584 -613 -598 -629 -584 -604
56 -1265 -348 -454 -649 -775 -888 -821 -492 -362 -492 -386 -416 -484 -401 -472 -498 -535 -592 -616 -648 -636 -674 -621 -652
60 -1345 -379 -471 -679 -816 -1005 -971 -525 -376 -525 -422 -463 -505 -441 -527 -539 -597 -619 -670 -680 -670 -716 -654 -695
64 -1417 -408 -490 -705 -853 -1111 -1116 -555 -389 -555 -458 -509 -541 -482 -581 -597 -657 -642 -739 -727 -701 -753 -691 -735
68 -1482 -438 -538 -729 -887 -1210 -1261 -582 -406 -582 -494 -554 -597 -521 -634 -655 -717 -704 -807 -793 -729 -787 -762 -775
72 -1541 -467 -585 -751 -917 -1300 -1398 -607 -442 -607 -529 -599 -652 -561 -686 -712 -775 -771 -875 -862 -756 -825 -832 -819
76 -1594 -497 -632 -770 -945 -1384 -1526 -629 -478 -629 -564 -643 -706 -599 -738 -768 -833 -837 -941 -931 -828 -862 -900 -890
80 -1643 -526 -678 -827 -970 -1461 -1645 -650 -514 -650 -599 -686 -760 -638 -789 -823 -890 -902 -1007 -999 -899 -932 -968 -967
84 -1688 -555 -723 -889 -993 -1532 -1757 -669 -549 -669 -633 -730 -813 -676 -839 -878 -947 -966 -1072 -1066 -969 -1007 -1036 -1043
88 -1730 -584 -768 -950 -1052 -1599 -1862 -687 -584 -687 -668 -773 -865 -714 -889 -932 -1003 -1030 -1137 -1133 -1038 -1081 -1102 -1118
92 -1768 -613 -813 -1010 -1125 -1660 -1960 -703 -618 -703 -702 -815 -917 -752 -938 -985 -1059 -1092 -1201 -1199 -1106 -1155 -1168 -1192
96 -1803 -641 -857 -1070 -1197 -1718 -2052 -718 -652 -718 -736 -857 -969 -789 -988 -1039 -1114 -1154 -1265 -1264 -1174 -1227 -1233 -1265
100 -1883 -670 -901 -1130 -1269 -1772 -2138 -732 -687 -732 -770 -899 -1020 -826 -1037 -1092 -1169 -1216 -1328 -1329 -1240 -1299 -1298 -1338
104 -1997 -698 -945 -1188 -1339 -1822 -2220 -754 -720 -754 -804 -941 -1070 -864 -1085 -1144 -1224 -1277 -1391 -1394 -1306 -1370 -1363 -1410
108 -2110 -727 -988 -1247 -1409 -1869 -2296 -798 -754 -798 -837 -983 -1121 -901 -1134 -1196 -1279 -1338 -1453 -1458 -1372 -1441 -1427 -1481
112 -2223 -755 -1032 -1305 -1479 -1913 -2369 -841 -787 -841 -871 -1024 -1171 -938 -1182 -1248 -1333 -1399 -1516 -1522 -1437 -1511 -1490 -1552
116 -2334 -784 -1075 -1363 -1547 -1955 -2437 -884 -820 -884 -904 -1066 -1220 -974 -1230 -1300 -1387 -1459 -1578 -1586 -1502 -1580 -1554 -1622
120 -2444 -812 -1117 -1420 -1616 -1975 -2501 -927 -854 -927 -938 -1107 -1270 -1011 -1278 -1351 -1441 -1518 -1640 -1649 -1566 -1649 -1617 -1691
124 -2554 -840 -1160 -1477 -1684 -2031 -2563 -969 -886 -969 -971 -1148 -1319 -1047 -1325 -1403 -1495 -1578 -1701 -1713 -1630 -1718 -1679 -1761
128 -2663 -869 -1202 -1534 -1751 -2066 -2621 -1011 -919 -1011 -1004 -1189 -1368 -1084 -1373 -1454 -1548 -1637 -1763 -1775 -1694 -1786 -1742 -1830
132 -2771 -897 -1245 -1590 -1818 -2100 -2676 -1053 -952 -1053 -1038 -1230 -1417 -1120 -1420 -1505 -1601 -1696 -1824 -1838 -1757 -1854 -1804 -1898
136 -2878 -925 -1287 -1646 -1885 -2131 -2728 -1095 -985 -1095 -1071 -1270 -1466 -1157 -1467 -1555 -1655 -1755 -1885 -1901 -1820 -1922 -1866 -1967
140 -2985 -953 -1329 -1702 -1952 -2161 -2778 -1136 -1017 -1136 -1104 -1311 -1515 -1193 -1514 -1606 -1708 -1813 -1946 -1963 -1883 -1989 -1928 -2035

23
Table 3.2(c) Peak shear in two-span girders (kips) Span
(ft)
Wis
SPV
AASH
TO
Mn
A
Mn
B
Mn
C
Mn
P411
Mn
P413
IA
Type4
IA
353A
IA
453
Mi
No5
Mi
No6
Mi
No7
Mi
No8
Mi
No12
Mi
No13
Mi
No14
Mi
No15
Mi
No17
Mi
No18
Mi
No21
Mi
No22
Mi
No23
Mi
No25
32 107.4 55.9 51.0 65.8 70.3 68.9 66.4 44.1 40.6 44.1 51.9 53.3 53.3 53.7 58.3 58.2 63.1 60.5 75.1 75.0 59.8 63.1 67.3 66.6
36 111.8 58.2 55.2 68.7 74.1 72.9 69.0 45.6 44.4 45.6 56.4 58.0 58.0 57.0 64.5 63.6 69.9 65.5 79.8 79.9 64.7 69.3 73.1 71.5
40 115.9 59.9 60.5 70.9 77.3 75.9 72.3 47.2 47.4 47.2 59.9 61.6 61.9 59.5 69.3 69.5 75.9 70.8 84.0 83.6 68.5 74.1 77.6 76.6
44 119.7 61.3 64.6 73.1 79.8 79.9 78.4 48.7 50.1 48.7 62.7 64.5 66.8 62.2 73.2 74.3 81.3 76.1 90.0 88.9 72.2 77.8 81.6 81.4
48 123.0 62.4 68.0 78.1 81.6 83.9 84.8 50.1 53.3 50.1 65.0 66.9 70.8 65.3 76.5 78.1 86.7 81.7 95.7 93.9 77.1 80.7 87.4 85.5
52 126.4 63.4 71.4 82.3 86.6 87.4 90.8 51.2 55.9 51.2 66.8 69.7 74.1 67.9 80.5 81.4 91.2 86.3 101.1 99.1 82.9 85.1 92.5 89.9
56 135.3 64.1 74.3 87.2 91.9 90.5 95.8 52.1 58.1 52.1 68.4 72.6 76.9 70.0 83.9 85.4 95.0 90.1 105.7 104.1 87.8 90.2 97.9 93.5
60 142.9 64.8 76.9 91.4 96.4 93.4 99.9 53.3 60.0 53.3 69.7 75.1 79.3 71.8 86.7 88.8 98.2 93.6 109.6 108.3 91.9 95.0 102.5 97.7
64 149.9 65.3 79.0 95.0 101.4 96.1 103.6 55.8 61.6 55.8 70.8 77.2 82.5 73.4 89.2 91.8 100.9 97.6 112.9 111.9 95.5 99.1 106.5 101.6
68 157.4 65.8 80.9 98.1 105.7 98.4 106.9 58.5 63.0 58.5 71.8 79.0 85.3 74.7 91.3 94.3 103.2 101.0 115.8 115.1 99.2 102.6 109.9 105.0
72 164.0 66.2 82.6 100.8 109.5 100.4 110.1 61.2 64.2 61.2 72.6 80.6 87.7 75.9 93.2 96.5 105.3 104.0 118.3 117.8 102.9 105.7 112.9 107.9
76 169.8 66.6 84.0 103.2 112.9 102.1 113.1 63.5 65.2 63.5 73.4 81.9 89.9 76.9 94.8 98.4 107.1 106.7 120.5 120.3 106.2 108.5 115.5 110.5
80 175.0 66.9 85.3 105.3 115.8 103.5 115.7 65.6 66.2 65.6 74.0 83.2 91.7 77.8 96.2 100.1 108.7 109.0 122.5 122.4 109.1 110.9 117.8 113.2
84 179.6 67.2 86.4 107.2 118.5 105.6 117.9 67.5 67.0 67.5 74.6 84.3 93.4 78.6 97.5 101.7 110.1 111.1 124.2 124.3 111.7 113.6 119.9 116.3
88 183.7 67.5 87.4 108.8 120.8 110.6 119.9 69.2 67.8 69.2 75.1 85.2 94.9 79.3 98.6 103.0 111.4 113.0 125.8 126.0 114.0 116.4 121.8 119.1
92 187.4 67.7 88.3 110.3 123.0 115.1 121.7 70.7 68.4 70.7 75.6 86.1 96.3 80.0 99.6 104.3 112.5 114.7 127.2 127.5 116.1 118.9 123.4 121.6
96 190.8 67.9 89.1 111.7 124.9 119.2 123.2 72.0 69.0 72.0 76.0 86.9 97.5 80.6 100.6 105.4 113.6 116.2 128.4 128.9 117.9 121.2 124.9 123.8
100 193.8 68.1 89.9 112.9 126.6 123.6 124.6 73.3 69.6 73.3 76.4 87.6 98.6 81.1 101.4 106.4 114.5 117.6 129.6 130.2 119.6 123.2 126.3 125.9
104 196.6 68.3 90.6 114.1 128.2 127.7 128.3 74.4 70.1 74.4 76.8 88.3 99.6 81.6 102.2 107.3 115.3 118.8 130.6 131.3 121.2 125.1 127.5 127.7
108 199.1 68.5 91.2 115.1 129.7 131.5 132.8 75.4 70.5 75.4 77.1 88.9 100.5 82.0 102.9 108.1 116.1 120.0 131.6 132.4 122.6 126.8 128.7 129.4
112 201.4 68.6 91.7 116.0 131.0 135.0 137.7 76.4 71.0 76.4 77.4 89.4 101.4 82.4 103.5 108.9 116.8 121.0 132.4 133.3 123.9 128.4 129.7 131.0
116 203.6 68.7 92.3 116.9 132.2 138.2 142.2 77.2 71.3 77.2 77.6 89.9 102.1 82.8 104.1 109.6 117.5 122.0 133.2 134.2 125.1 129.8 130.7 132.4
120 205.6 68.9 92.7 117.7 133.3 139.7 146.4 78.0 71.7 78.0 77.9 90.4 102.8 83.1 104.6 110.2 118.1 122.9 134.0 135.0 126.2 131.2 131.5 133.8
124 207.4 69.0 93.2 118.4 134.4 143.9 150.8 78.8 72.0 78.8 78.1 90.8 103.5 83.5 105.1 110.8 118.7 123.7 134.7 135.8 127.2 132.4 132.3 135.0
128 209.1 69.1 93.6 119.1 135.4 146.4 155.0 79.5 72.3 79.5 78.3 91.2 104.1 83.8 105.6 111.4 119.2 124.4 135.3 136.5 128.2 133.5 133.1 136.1
132 210.6 69.2 94.0 119.7 136.3 148.8 158.9 80.1 72.6 80.1 78.5 91.6 104.7 84.0 106.0 111.9 119.7 125.2 135.9 137.1 129.0 134.6 133.8 137.2
136 212.1 69.3 94.3 120.3 137.1 151.0 162.5 80.7 72.9 80.7 78.7 91.9 105.2 84.3 106.4 112.4 120.1 125.8 136.4 137.7 129.9 135.6 134.5 138.2
140 213.5 69.4 94.7 120.9 137.9 153.1 165.9 81.2 73.1 81.2 78.9 92.3 105.7 84.5 106.8 112.8 120.5 126.4 137.0 138.3 130.6 136.5 135.1 139.1

24
Three-span simply supported girders
Similar to two-span girders, Wis-SPV envelops the positive peak positive moments of the
permitting vehicles as shown in Fig. 3.8. The peak negative moments by MnDOT Type P413
vehicle exceed those of the Wisconsin Standard Permit Vehicle for girders with span between
84ft and 118ft. The R-values in Fig. 3.9 indicates that the breaches of the peak moments by Wis-
SPV is contained because all R-values are smaller than 0.9. The limited number of breaches are
demonstrated within a circle in Fig. 3.10 for a girder with three equal spans of 92 ft: the peak
negative moments (dashed (yellow) lines) are larger than those of the Wis-SPV (solid (blue) line)
only at the interior supports.
20 40 60 80 100 120 140-4000
-2000
0
2000
4000
6000
Peak
mo
men
t (k
ips-
ft)
20 40 60 80 100 120 140-400
-200
0
200
400
Beam spans (ft)
Peak
sh
ear
(kip
s)
Fig. 3.8 Comparison of the peak moments in3-span simply-supported girders
Wis-SPV

25
20 40 60 80 100 120 140-1.5
-1
-0.5
0
0.5
1
R-v
alu
es
(mo
men
t)
20 40 60 80 100 120 140-1
-0.5
0
0.5
1
Beam spans (ft)
R-v
alu
es
(sh
ear)
Fig. 3.9 R-values for the moment/shear envelopes in three-span girders
0 50 100 150 200 250-2000
-1000
0
1000
2000
Mo
men
ts (
kip
s-ft
)
0 50 100 150 200 250-200
-100
0
100
200
Position along span (ft)
Sh
ear
(kip
s)
Moment/Shear envelopes for span=92ft
Fig. 3.10 Demonstration of breaching peak negative moment of Wis-SPV

26
Table 3.3(a) Peak positive moment in two-span girders (kips-ft) Span
(ft)
Wis
SPV
AASH
TO
Mn
A
Mn
B
Mn
C
Mn
P411
Mn
P413
IA
Type4
IA
353A
IA
453
Mi
No5
Mi
No6
Mi
No7
Mi
No8
Mi
No12
Mi
No13
Mi
No14
Mi
No15
Mi
No17
Mi
No18
Mi
No21
Mi
No22
Mi
No23
Mi
No25
32 575.6 260.5 257.7 334.5 348.4 335.3 336.5 228.8 221.6 228.8 240.2 246.2 246.2 246.2 279.3 279.1 304.3 278.7 358.0 358.0 255.6 286.2 299.3 307.2
36 667.4 311.7 301.6 393.9 416.4 407.5 405.3 270.2 255.7 270.2 298.7 300.9 300.9 298.4 340.5 338.3 370.1 340.2 438.9 438.9 316.3 349.4 377.4 371.2
40 763.4 367.3 345.9 453.9 485.1 487.7 468.4 312.3 289.9 312.3 361.0 363.9 363.9 362.4 406.6 407.2 449.6 411.0 521.7 520.8 385.9 422.1 457.3 451.9
44 865.7 423.5 392.3 514.4 554.3 562.9 532.2 354.8 329.1 354.8 424.6 428.0 428.0 430.5 479.4 479.5 535.8 489.9 621.0 611.3 460.7 501.1 538.6 535.0
48 968.8 480.2 454.8 575.1 623.9 637.4 603.6 397.6 374.0 397.6 489.2 497.8 497.8 499.8 565.4 560.7 623.8 570.2 724.2 713.4 544.1 588.5 632.7 619.4
52 1072.3 537.2 525.1 636.1 693.9 720.3 685.6 440.6 422.7 440.6 554.5 572.8 572.8 570.2 653.2 650.5 713.2 657.6 828.7 817.2 629.4 677.9 734.7 713.8
56 1176.4 594.5 599.4 714.3 764.1 807.0 768.7 483.8 472.6 483.8 620.3 649.1 649.1 641.2 742.4 743.7 811.1 751.7 937.0 922.1 718.6 768.4 838.3 816.2
60 1280.8 652.0 675.8 804.6 845.7 894.4 852.4 527.2 523.3 527.2 686.6 726.5 736.8 712.9 832.6 838.2 912.6 856.0 1051.5 1028.1 821.4 870.5 943.0 926.0
64 1385.6 709.7 755.2 901.2 941.7 982.2 943.6 570.6 580.3 570.6 753.1 804.7 828.4 784.9 923.8 934.0 1015.1 964.0 1167.6 1143.3 934.1 980.0 1057.8 1037.8
68 1507.7 767.6 835.4 999.8 1051.7 1070.4 1043.9 614.1 639.9 614.1 820.0 883.5 920.9 857.4 1015.5 1030.5 1118.4 1073.3 1286.2 1260.8 1048.3 1095.7 1175.5 1150.7
72 1655.1 825.5 916.2 1099.9 1166.3 1159.0 1145.3 657.8 700.2 657.8 887.1 962.8 1014.0 930.1 1107.8 1127.9 1222.3 1184.0 1405.4 1380.6 1164.1 1217.1 1294.0 1274.3
76 1818.0 883.6 997.5 1201.3 1282.6 1247.9 1247.8 716.5 761.1 716.5 954.3 1042.5 1107.6 1003.0 1200.6 1225.9 1326.7 1295.7 1525.2 1501.1 1281.1 1339.9 1413.2 1400.6
80 1991.9 941.7 1079.2 1303.7 1400.4 1337.0 1351.3 783.0 822.4 783.0 1021.7 1122.6 1201.8 1076.3 1293.7 1325.2 1431.5 1408.2 1645.5 1622.3 1398.9 1463.6 1532.9 1528.1
84 2169.0 999.9 1161.3 1407.1 1519.5 1426.3 1457.1 850.9 884.2 850.9 1089.2 1202.9 1296.5 1149.7 1387.2 1425.0 1536.8 1521.1 1766.1 1744.0 1517.3 1588.3 1653.2 1657.2
88 2349.0 1058.3 1243.6 1511.1 1639.6 1515.7 1563.5 919.9 946.5 919.9 1156.9 1283.5 1391.5 1223.2 1480.9 1525.1 1642.4 1634.5 1887.1 1866.1 1636.3 1713.8 1773.8 1786.7
92 2531.3 1116.7 1326.2 1615.8 1760.6 1605.4 1670.1 989.7 1009.1 989.7 1224.6 1364.9 1486.9 1296.9 1574.9 1625.5 1748.4 1748.4 2008.5 1988.8 1755.9 1840.0 1894.8 1916.7
96 2715.6 1175.2 1409.0 1721.7 1882.7 1713.6 1777.2 1060.4 1072.0 1060.4 1292.4 1446.7 1582.4 1370.7 1669.1 1726.1 1854.5 1862.5 2130.0 2111.7 1875.7 1966.6 2016.1 2047.1
100 2901.8 1233.8 1491.9 1829.0 2005.6 1823.8 1884.4 1131.7 1135.0 1131.7 1360.5 1528.7 1678.1 1444.5 1763.5 1826.9 1960.8 1976.9 2251.7 2234.9 1995.9 2093.8 2137.9 2177.8
104 3093.2 1292.4 1575.2 1936.6 2129.0 1935.2 1992.1 1203.8 1198.4 1203.8 1428.6 1610.7 1774.0 1518.5 1858.0 1927.8 2067.4 2091.6 2373.7 2358.3 2116.5 2221.4 2260.1 2308.7
108 3285.5 1350.9 1658.5 2044.6 2253.1 2047.6 2110.6 1276.3 1261.8 1276.3 1496.7 1692.8 1870.1 1592.5 1952.7 2028.9 2174.0 2206.6 2495.8 2482.0 2237.4 2349.5 2382.4 2439.8
112 3478.8 1409.6 1741.9 2152.7 2377.6 2165.4 2257.3 1349.2 1325.5 1349.2 1565.0 1775.0 1966.2 1666.6 2047.5 2130.1 2280.9 2321.6 2618.1 2605.9 2358.5 2477.8 2504.8 2571.3
116 3673.0 1468.3 1825.5 2261.2 2502.5 2292.0 2404.9 1422.5 1389.2 1422.5 1633.2 1857.3 2062.6 1740.8 2142.3 2231.5 2387.8 2437.0 2740.5 2729.9 2479.8 2606.4 2627.4 2702.8
120 3868.0 1527.0 1909.1 2369.8 2627.9 2442.9 2553.5 1496.2 1453.1 1496.2 1701.5 1939.6 2159.0 1815.0 2237.3 2332.9 2494.9 2552.4 2863.0 2854.1 2601.3 2735.4 2750.2 2834.7
124 4063.5 1585.7 1992.9 2478.6 2753.5 2595.3 2703.1 1570.2 1517.0 1570.2 1769.9 2021.9 2255.5 1889.3 2332.4 2434.4 2602.1 2668.0 2985.7 2978.4 2723.0 2864.7 2873.0 2966.6
128 4259.8 1644.4 2076.8 2587.4 2879.4 2748.8 2863.6 1644.5 1581.1 1644.5 1838.3 2104.3 2352.1 1963.6 2427.5 2536.0 2709.3 2783.8 3108.4 3103.0 2844.8 2994.5 2996.1 3098.7
132 4456.5 1703.2 2160.9 2696.5 3005.6 2903.5 3042.1 1719.1 1645.3 1719.1 1906.7 2186.8 2448.8 2037.9 2522.7 2637.7 2816.6 2899.6 3231.2 3227.5 2966.8 3124.5 3119.1 3231.0
136 4653.8 1762.0 2245.1 2805.8 3132.1 3059.2 3226.8 1793.8 1709.5 1793.8 1975.2 2269.3 2545.6 2112.3 2618.0 2739.4 2924.1 3015.6 3354.1 3352.2 3089.0 3254.6 3242.3 3363.3
140 4851.5 1820.8 2329.3 2915.1 3258.7 3215.8 3413.9 1868.8 1773.9 1868.8 2043.7 2351.8 2642.4 2186.7 2713.3 2841.2 3031.5 3131.6 3477.0 3477.0 3211.2 3384.8 3365.6 3495.8

27
Table 3.3(b) Peak negative moment in two-span girders (kips-ft) Span
(ft)
Wis
SPV
AASH
TO
Mn
A
Mn
B
Mn
C
Mn
P411
Mn
P413
IA
Type4
IA
353A
IA
453
Mi
No5
Mi
No6
Mi
No7
Mi
No8
Mi
No12
Mi
No13
Mi
No14
Mi
No15
Mi
No17
Mi
No18
Mi
No21
Mi
No22
Mi
No23
Mi
No25
32 -504 -200 -272 -337 -355 -283 -348 -178 -210 -178 -218 -237 -263 -217 -282 -294 -321 -318 -353 -353 -300 -303 -314 -309
36 -641 -228 -312 -405 -440 -314 -407 -233 -243 -233 -239 -272 -311 -244 -322 -339 -363 -376 -414 -419 -367 -368 -383 -371
40 -776 -255 -347 -464 -518 -366 -459 -291 -272 -291 -257 -303 -353 -271 -355 -378 -399 -426 -467 -478 -431 -440 -444 -427
44 -900 -281 -377 -515 -587 -463 -503 -344 -297 -344 -291 -330 -389 -294 -385 -411 -431 -470 -514 -531 -488 -506 -498 -491
48 -1015 -306 -403 -560 -649 -582 -542 -392 -318 -392 -332 -354 -421 -337 -413 -441 -459 -509 -557 -578 -538 -565 -547 -552
52 -1117 -339 -426 -600 -703 -705 -644 -435 -337 -435 -372 -392 -453 -383 -444 -474 -511 -544 -595 -620 -583 -618 -591 -607
56 -1209 -371 -446 -636 -752 -826 -765 -473 -354 -473 -411 -443 -485 -427 -504 -511 -571 -575 -642 -658 -623 -667 -631 -658
60 -1292 -404 -471 -667 -795 -940 -901 -508 -369 -508 -450 -493 -516 -471 -562 -575 -636 -614 -714 -711 -660 -712 -671 -705
64 -1366 -436 -523 -696 -835 -1045 -1038 -539 -393 -539 -489 -542 -577 -514 -620 -637 -701 -678 -788 -770 -694 -761 -736 -757
68 -1434 -467 -574 -721 -870 -1144 -1177 -568 -432 -568 -527 -591 -636 -556 -676 -699 -764 -751 -861 -845 -736 -807 -812 -806
72 -1496 -499 -624 -747 -903 -1235 -1309 -594 -471 -594 -564 -638 -695 -598 -732 -759 -827 -822 -933 -920 -807 -850 -887 -868
76 -1552 -530 -674 -815 -932 -1320 -1434 -618 -510 -618 -602 -685 -753 -639 -787 -819 -888 -893 -1004 -993 -884 -912 -960 -949
80 -1603 -561 -723 -882 -964 -1399 -1552 -640 -548 -640 -639 -732 -810 -680 -841 -878 -949 -962 -1074 -1065 -959 -994 -1033 -1031
84 -1651 -592 -772 -948 -1044 -1472 -1664 -661 -585 -661 -676 -778 -867 -721 -895 -936 -1010 -1030 -1144 -1137 -1034 -1074 -1105 -1112
88 -1695 -622 -820 -1013 -1122 -1541 -1769 -679 -622 -679 -712 -824 -923 -762 -948 -994 -1070 -1098 -1212 -1208 -1107 -1153 -1175 -1192
92 -1759 -653 -867 -1078 -1200 -1605 -1868 -697 -659 -697 -749 -869 -978 -802 -1001 -1051 -1129 -1165 -1281 -1278 -1180 -1231 -1246 -1271
96 -1884 -684 -914 -1141 -1277 -1664 -1962 -713 -696 -713 -785 -914 -1033 -842 -1053 -1108 -1188 -1231 -1349 -1348 -1252 -1309 -1316 -1349
100 -2008 -714 -961 -1205 -1353 -1721 -2050 -757 -732 -757 -821 -959 -1087 -881 -1106 -1164 -1247 -1297 -1416 -1418 -1323 -1385 -1385 -1427
104 -2129 -745 -1008 -1268 -1428 -1773 -2134 -804 -768 -804 -857 -1004 -1142 -921 -1157 -1220 -1306 -1362 -1483 -1487 -1393 -1461 -1453 -1503
108 -2251 -775 -1054 -1330 -1503 -1823 -2212 -851 -804 -851 -893 -1048 -1195 -961 -1209 -1276 -1364 -1427 -1550 -1555 -1464 -1536 -1522 -1579
112 -2371 -805 -1100 -1392 -1577 -1869 -2287 -897 -840 -897 -929 -1093 -1249 -1000 -1261 -1331 -1422 -1492 -1617 -1624 -1533 -1611 -1590 -1655
116 -2489 -836 -1146 -1453 -1650 -1913 -2358 -943 -875 -943 -964 -1137 -1302 -1039 -1312 -1386 -1479 -1556 -1683 -1692 -1602 -1685 -1657 -1730
120 -2607 -866 -1192 -1514 -1723 -1955 -2425 -989 -910 -989 -1000 -1181 -1355 -1078 -1363 -1441 -1537 -1619 -1749 -1759 -1671 -1759 -1724 -1804
124 -2724 -896 -1237 -1575 -1796 -1995 -2489 -1034 -945 -1034 -1036 -1224 -1407 -1117 -1413 -1496 -1594 -1683 -1815 -1827 -1739 -1832 -1791 -1878
128 -2840 -927 -1282 -1636 -1868 -2032 -2549 -1079 -980 -1079 -1071 -1268 -1460 -1156 -1464 -1551 -1651 -1746 -1880 -1894 -1806 -1905 -1858 -1952
132 -2955 -957 -1328 -1696 -1940 -2068 -2607 -1123 -1015 -1123 -1107 -1311 -1512 -1195 -1515 -1605 -1708 -1809 -1945 -1961 -1874 -1978 -1924 -2025
136 -3070 -987 -1373 -1756 -2011 -2152 -2662 -1168 -1050 -1168 -1142 -1355 -1564 -1234 -1565 -1659 -1765 -1872 -2010 -2027 -1941 -2050 -1991 -2098
140 -3184 -1017 -1418 -1816 -2082 -2256 -2714 -1212 -1085 -1212 -1177 -1398 -1616 -1272 -1615 -1713 -1822 -1934 -2075 -2094 -2008 -2121 -2057 -2171

28
Table 3.3(c) Peak shear in two-span girders (kips) Span
(ft)
Wis
SPV
AASH
TO
Mn
A
Mn
B
Mn
C
Mn
P411
Mn
P413
IA
Type4
IA
353A
IA
453
Mi
No5
Mi
No6
Mi
No7
Mi
No8
Mi
No12
Mi
No13
Mi
No14
Mi
No15
Mi
No17
Mi
No18
Mi
No21
Mi
No22
Mi
No23
Mi
No25
32 107.7 56.1 50.3 65.3 70.0 69.1 65.7 44.2 40.8 44.2 52.2 53.3 53.3 53.8 58.4 58.3 63.4 60.3 74.8 74.6 59.2 62.7 66.9 66.2
36 111.6 58.4 55.4 68.0 73.5 73.1 68.1 45.7 44.6 45.7 56.7 58.1 58.1 57.1 64.7 63.8 70.4 65.4 79.6 79.5 64.0 68.8 72.8 71.1
40 115.2 60.2 60.7 70.0 76.4 76.2 72.5 47.1 47.6 47.1 60.3 61.8 62.1 59.7 69.6 69.8 76.4 70.7 84.6 83.3 67.8 73.5 77.4 76.3
44 118.5 61.6 64.9 73.2 78.7 79.8 78.2 48.4 50.3 48.4 63.1 64.7 67.1 62.6 73.5 74.6 81.8 76.5 90.6 89.5 72.2 77.3 82.1 81.1
48 121.5 62.7 68.3 78.4 80.6 83.8 84.4 49.6 53.5 49.6 65.3 67.1 71.1 65.7 76.9 78.5 87.3 82.1 96.3 94.5 77.5 80.9 87.9 85.6
52 126.9 63.6 71.7 82.8 86.9 87.1 90.2 50.6 56.2 50.6 67.2 70.2 74.4 68.3 81.0 81.9 91.8 86.7 101.8 99.7 83.3 85.5 93.1 90.0
56 135.9 64.3 74.7 87.7 92.3 90.0 95.1 51.6 58.4 51.6 68.7 73.1 77.2 70.4 84.4 85.9 95.5 90.6 106.4 104.7 88.2 90.6 98.5 93.7
60 143.6 65.0 77.3 91.9 96.9 92.7 99.3 53.5 60.3 53.5 70.0 75.5 79.8 72.2 87.3 89.4 98.7 94.2 110.3 109.0 92.4 95.4 103.2 98.2
64 150.7 65.5 79.5 95.5 101.9 95.2 102.9 56.0 61.9 56.0 71.2 77.6 83.1 73.8 89.7 92.3 101.5 98.2 113.6 112.6 96.0 99.6 107.1 102.1
68 158.3 66.0 81.4 98.6 106.3 97.3 106.1 58.8 63.3 58.8 72.1 79.4 85.8 75.1 91.8 94.8 103.8 101.7 116.5 115.8 99.8 103.2 110.6 105.5
72 164.9 66.4 83.0 101.4 110.1 99.1 109.1 61.5 64.5 61.5 72.9 81.0 88.3 76.3 93.7 97.1 105.9 104.7 119.0 118.5 103.6 106.3 113.6 108.5
76 170.7 66.8 84.4 103.7 113.5 100.7 111.9 63.9 65.5 63.9 73.7 82.4 90.4 77.3 95.3 99.0 107.7 107.3 121.2 120.9 106.9 109.0 116.2 111.1
80 175.9 67.1 85.7 105.8 116.5 102.1 114.3 66.0 66.5 66.0 74.3 83.6 92.3 78.2 96.7 100.7 109.3 109.7 123.1 123.1 109.8 111.4 118.5 113.9
84 180.6 67.4 86.8 107.7 119.1 106.0 116.5 67.9 67.3 67.9 74.9 84.7 94.0 79.0 98.0 102.2 110.7 111.8 124.9 125.0 112.4 114.4 120.6 117.1
88 184.7 67.6 87.8 109.4 121.5 111.0 118.4 69.5 68.0 69.5 75.4 85.7 95.5 79.7 99.1 103.6 111.9 113.7 126.4 126.7 114.7 117.2 122.4 119.8
92 188.4 67.9 88.7 110.9 123.6 115.6 120.1 71.1 68.7 71.1 75.9 86.5 96.8 80.3 100.1 104.8 113.1 115.3 127.8 128.2 116.8 119.7 124.1 122.3
96 191.8 68.1 89.5 112.3 125.6 119.8 121.6 72.4 69.3 72.4 76.3 87.3 98.0 80.9 101.0 105.9 114.1 116.8 129.0 129.6 118.6 122.0 125.6 124.6
100 194.8 68.3 90.3 113.5 127.3 124.3 124.9 73.7 69.9 73.7 76.7 88.0 99.1 81.4 101.9 106.9 115.0 118.2 130.2 130.8 120.3 124.0 126.9 126.7
104 197.6 68.4 90.9 114.6 128.9 128.5 128.9 74.8 70.4 74.8 77.0 88.7 100.1 81.9 102.6 107.8 115.9 119.4 131.2 131.9 121.9 125.9 128.2 128.5
108 200.1 68.6 91.6 115.6 130.3 132.3 133.5 75.8 70.8 75.8 77.3 89.3 101.0 82.3 103.3 108.6 116.6 120.6 132.2 133.0 123.3 127.6 129.3 130.2
112 202.5 68.7 92.1 116.5 131.7 135.8 138.4 76.8 71.2 76.8 77.6 89.8 101.9 82.7 103.9 109.4 117.3 121.6 133.0 133.9 124.6 129.1 130.3 131.8
116 204.6 68.9 92.6 117.4 132.9 139.0 143.0 77.6 71.6 77.6 77.9 90.3 102.6 83.1 104.5 110.1 118.0 122.6 133.8 134.8 125.8 130.6 131.3 133.2
120 206.6 69.0 93.1 118.2 134.0 142.0 147.2 78.4 72.0 78.4 78.1 90.8 103.3 83.5 105.0 110.7 118.6 123.5 134.5 135.6 126.9 131.9 132.1 134.5
124 208.4 69.1 93.5 118.9 135.0 144.7 151.7 79.2 72.3 79.2 78.4 91.2 104.0 83.8 105.5 111.3 119.1 124.3 135.2 136.3 127.9 133.1 132.9 135.7
128 210.0 69.2 93.9 119.6 136.0 147.3 155.9 79.8 72.6 79.8 78.6 91.6 104.6 84.1 106.0 111.9 119.6 125.0 135.8 137.0 128.8 134.2 133.7 136.9
132 211.6 69.3 94.3 120.2 136.9 149.7 159.8 80.5 72.9 80.5 78.8 92.0 105.2 84.3 106.4 112.4 120.1 125.7 136.4 137.7 129.7 135.3 134.4 137.9
136 213.1 69.4 94.7 120.8 137.7 151.9 163.5 81.1 73.1 81.1 79.0 92.3 105.7 84.6 106.8 112.8 120.6 126.4 137.0 138.3 130.5 136.3 135.0 138.9
140 214.4 69.5 95.0 121.4 138.5 153.9 166.9 81.6 73.4 81.6 79.1 92.6 106.2 84.8 107.2 113.3 121.0 127.0 137.5 138.8 131.2 137.2 135.6 139.8

29
Summary
The effects of the overloaded vehicles collected in the neighboring states were compared with
those by the Wis-SPV. Wis-SPV has relatively short vehicle length compared with the vehicles
with similar gross weights. Hence Wis-SPV cause larger positive moments in simply supported
or continuous girders. Longer vehicles similar to the MnDOT Type P413 vehicle would cause
larger negative moments for two- and three-span simply supported girders.
The maximum moments in the simply-supported girders considered in this Chapter were plotted
against the gross vehicle weights in Figs. 11 through 13. Regression analyses showed that the
maximum positive moments in the girders have a poor linear correlation with the vehicle weights
(the coefficient of determination, R2, is around 0.6). This indicates that the current permitting fee
schedule, which is solely dependent upon the vehicle weight, may not properly reflect the impact
of overloaded vehicles on bridges. The correlation is somewhat improved for positive moments
when the gross vehicle weight is normalized by the maximum weight defined by the Federal
bridge formula. Meanwhile, the maximum negative moments by these permitting vehicles are
closely related to the gross vehicle weight. The correlation is not improved for negative moments
with the normalized gross vehicle weight.
The Wis-SPV was further studied in Chapter 4 using the trucks recorded in the Weigh-in-Motion
(WIM) data.
50 100 150 200 250 3000.4
0.6
0.8
1
y=0.0023131x+0.37535 R2=0.58912
M/M
SPV
Gross vehicle weight (kips)
0.4 0.6 0.8 1 1.2 1.4 1.6 1.8 20.4
0.6
0.8
1
y=0.45209x+0.26214 R2=0.74355
M/M
SPV
Gross weight/bridge formula
Fig. 3.11 Maximum moment distribution in 1-span girders

30
50 100 150 200 250 3000.4
0.6
0.8
1
y=0.0022571x+0.35843 R2=0.62053
M/M
SPV
Gross vehicle weight (kips)
0.4 0.6 0.8 1 1.2 1.4 1.6 1.8 20.4
0.6
0.8
1
y=0.43924x+0.24977 R2=0.77642
M/M
SPV
Gross weight/bridge formula
50 100 150 200 250 3000
0.5
1
1.5
y=0.0037318x+0.13137 R2=0.95761
M/M
SPV
Gross vehicle weight (kips)
0.4 0.6 0.8 1 1.2 1.4 1.6 1.8 20
0.5
1
1.5
y=0.6283x+0.044344 R2=0.89684
M/M
SPV
Gross weight/bridge formula
Fig. 3.12 Maximum moment distribution in 2-span girders

31
50 100 150 200 250 3000.4
0.6
0.8
1
y=0.0022535x+0.35715 R2=0.62252
M/M
SPV
Gross vehicle weight (kips)
0.4 0.6 0.8 1 1.2 1.4 1.6 1.8 20.4
0.6
0.8
1
y=0.43841x+0.24879 R2=0.77842
M/M
SPV
Gross weight/bridge formula
50 100 150 200 250 3000
0.5
1
1.5
y=0.0034191x+0.18258 R2=0.95769
M/M
SPV
Gross vehicle weight (kips)
0.4 0.6 0.8 1 1.2 1.4 1.6 1.8 20
0.5
1
1.5
y=0.58681x+0.092297 R2=0.93202
M/M
SPV
Gross weight/bridge formula
Fig. 3.13 Maximum moment distribution in 3-span girders

32
This page is blank

33
Chapter 4 Analysis of Wisconsin WIM Data
Introduction
Overweight loads, especially those with multi-trip permits, can be applied to bridges with
uncontrolled frequency, potentially impacting and hurting the performance and safety of bridges.
These vehicles were analyzed in this chapter using the Weigh-in-Motion (WIM) data. WIM
records were used because the database for annual permits in Wisconsin is not inclusive: the
information from only about three thousand vehicles out of more than fifteen thousand annual
permits issued per year is available.
Similar to static weigh stations, WIM systems are designed to capture and record truck axle
weights, axle spacings, and gross vehicle weights.30
WIM systems can record configurations of
vehicles as they drive over the sensors. The recorded vehicle data are classified in terms of their
configurations per Federal Highway Administration (FHWA) Traffic Monitoring Guide
(TMG),31
and reported to FHWA in W-cards and E-cards.32-33
W-cards are in metric units while
the E-cards are in the same format but in English units. A sample W-card record is interpreted
below:
W55250529310602010005 009502032040064
55: Federal Information Processing Standard (FIPS) state code - state of Wisconsin.
250529: Station identification number (see Fig. 4.1 for the stations in Wisconsin).
3: Direction of travel
1: Lane of travel
06020100: Travel date and time, in yy-mm-dd-hr
05: Vehicle class (see the analysis section for details)
0095: Total weight of vehicle to the nearest tenth of a metric ton (100 kilograms) without a
decimal point.
02: Total number of axles
032: The axle weight from the front to the nearest tenth of a metric ton without a decimal point.
040: (A-B) The axle spacing from the front to the nearest tenth of a meter (100 mm) without a
decimal point.
032040: The axle weight and axle spacing pair repeated for (the number of axles – 1)
064: The axle weight of the last axle to the nearest tenth of a metric ton without a decimal point.
There are seventeen WIM stations in Wisconsin as listed in Table 4.1.34
The positions of the
stations are illustrated in Fig. 4.1 using Google®
map service. The FHWA Traffic Monitoring
Guide recommends classifying the vehicles into 13 different categories. Another two categories
were also used in Wisconsin WIM systems, including a class for system errors or unrecognized
vehicles. Representative overloaded vehicles for each class were created based on statistical
analysis of the WIM records for Year 2007 (note that not all stations have 12 month operation
schedule). The effect of these vehicles was analyzed in this chapter and the results were used to
examine the Wisconsin standard permit vehicle(s).

34
Table 4.1 WIM stations in Wisconsin Station Location AADT
030010 USH 53, Cameron 10,057
040002 USH 2, Ino 3,842
100001 STH 29, Thorp 10,797
220001 USH 61/1 51, Dickeyville 7,511
250529 USH 18,151, Dodqeville 14,221
260001 USH 151, Mercer 2,332
360002 II I 43, Cooperstown 19,415
370006 STH 29, Hatley 9,437
390105 IH39, Edeavor 17,442
410240 IH94, Tomah 23,598
410253 IH 90, Sparta 16,430
450239 IH43, Port Washington 26,120
470102 STH 29 River Falls 3,535
530001 IH 39/90, Newville 46,301
576051 USH63,Hayward 1,156
590608 STH 23, Kohler 22,651
640343 IH 43 Delevan 13,477
Fig. 4.1 Locations of Wisconsin WIM stations using Google
® Map

35
Overview of Wisconsin Weigh-in-Motion (WIM) data
Data Quality check
AASHTO Guidelines for Traffic Data Programs recommends that WIM data can be subjected to
three different data-quality checks:35
1) comparing the daily volume of cars (Class 2) to that of 2-
axle, 4-tire single units (Class 3); 2) comparing the combined daily volume of cars (Class 2), 2-
axle, 4-tire single units (Class 3) and 5-axle single trailers (Class 9) to historical volumes; and 3)
checking whether the weight distribution of 5-axle single trailers (Class 9) is a bimodal (i.e., two
peaks are expected in the weight distribution). WIM data collected in this study excluded the
Class 2 and Class 3 units; hence the WIM records were subjected to the last data-quality check.
The weight distribution of Class 9 vehicles is shown in Fig. 4.2. Three peaks were observed: the
first peak around 40,000 pounds for unloaded vehicles, the second around 70,000 pounds for
loaded vehicles, and the third peak around 130,000 pounds for overweight vehicles. The above
observation indicates that the WIM records in Wisconsin are reliable.
20 40 60 80 100 120 140 160 180 2000
2
4
6
8
10
12
14x 10
4
Gross Weight (kips)
Nu
mb
er
of
veh
icle
s
Total 3600000 vehicles: Max. 242.5085kips - Min. 0kips
Fig. 4.2 Weight distribution of Class 9 semi-trailers
A Matlab® program (WIMan) was coded to process the WIM records. WIMan conducts three
additional internal consistency checks: 1) compares the gross vehicle weight to the summation of
individual axle weights. The gross weight was replaced by the summation of individual axle
weights if they were different; (2) compares the total length (close to the vehicle length) to the
summation of individual axle-spacings. The vehicle length was replaced by the summation of
individual axle weights if it were smaller; (3) filters out records with errors. For example, some
records contain the character '-' that disturbed the partition of W-cards.
Over six million truck records (including buses) are available for year 2007 from all seventeen
stations in Wisconsin. Note that not all stations collect data for the entire 12 month. An overview
of all the 6 million recorded vehicles is shown in Fig. 4.3, including the distribution of gross
weight, vehicle classification and the total axle numbers. Note that the zero-kip minimum weight

36
was caused by rounding off some erroneous recorded values. The distribution of vehicle classes
and total axles numbers of the vehicles indicate that over sixty percent of the vehicles have five
axles, indicating large number of Class 9 semi-trailers on the road. In addition, 32% of the
vehicles have two or three axles, indicating Class 4 (likely busses), Class 5 and Class 6 (likely
utility trucks and small delivery trucks). In addition, four-axle concrete trucks and other 4-axle
trucks take up another 5% of the total vehicles. Class 10 vehicles' share is about 1.3% while
vehicles in Classes 10 through 15 contribute around 5% of total records. In addition, over 50
percent of the total vehicles have gross weight less than 50kips, which may be small trucks and
empty trucks.
0 50 100 150 200 250 300 350 400 4500
1
2
3
4
5
6
7
8
9x 10
5
728
228
887260
541
666
717
679
698
449
659
936
658
100
524
249
289
069
127
349
710
00
505
60
410
08
357
71
241
31
119
70
410
9112
9298
119
83
47
24
25
14
7 6 4 5 3 1 1 2 1 1 1 0 0 0 0 0 0 1Gross Weight (kips)
Nu
mber
of
veh
icle
s
Total 6072306 vehicles: Max. 430kips - Min. 0kips
1 2 3 4 5 6 7 8 9 10 11 12 13 14 150
0.5
1
1.5
2
2.5
3
3.5
4x 10
6
0 445
89
536
85
212
989
749
409
251
904
731
72
848
923
3554615
777
84
945
78
305
77
108
07
113
1
681
43
Vehicle Classification
Nu
mber
of
veh
icle
s
Total 6072306 vehicles:

37
1 2 3 4 5 6 7 8 9 10 11 12 13 140
0.5
1
1.5
2
2.5
3
3.5
4x 10
6
0
101
0134
949
771
254
159
3706849
123
690
183
82
552
4
139
7
826
513
402
365
294
Number of axles
Num
ber
of
veh
icle
s
Total 6072306 vehicles:
Fig. 4.3 Overview of vehicles recorded in WIM data
The light vehicles will unlikely have an impact on highway bridges, thus can excluded from the
study. WIMan divides the vehicles into three categories according to the criteria shown in Table
4.2. The criteria were established per Wisconsin Statute Chapter 3483 and WisDOT Bridge
Manual.6
Table 4.2 Overweight criteria per Wisconsin Statute 0348 Axle configurations Legal weight Vehicles likely with
annual permit
Vehicles likely with
single-trip permit
Leading axle ≤13kips ≤20kips >20kips
Single axle ≤20kips ≤30kips >30kips
2-axle tandem ≤40kips ≤55kips >55kips
3-axle tandem ≤60kips ≤70kips >70kips
4-axle tandem ≤73kips ≤80kips >80kips
5+-axle tandem The gross weight of vehicles with permits likely exceeds the limits
Gross Weight ≤80kips ≤170kips >170kips
Note that the tandem axles are defined as groups of axles with spacing smaller than 6ft.
The distribution of the WIM records per vehicle type is shown in Fig. 4.4. The vehicles likely
having permits are about 22% of the total truck records, which is slightly higher than the
reported ratio - the number of the records caused by vehicles potentially with permits should be
below 20%.35
The difference was believed reasonable because trucks could be loaded unevenly
such that these vehicles may have one or multiple overloaded axles, thus being classified to those
with permits.
Note that one truck may pass multiple WIM stations during its travel, creating multiple records
in WIM data. Among the overweight records, around 1 million records are likely from the
vehicles with multi-trip permits. Considering the fifteen thousand annual permits WisDOT issues
every year, the classification indicates that each vehicle with annual permits may travel (pass) 65
station-times per year. Meanwhile, Fig. 4.4 also indicates that each vehicle with single-trip

38
permits may pass 25 stations per trip considering the forty five thousand permits issued per year.
This seemed unreasonable because the longest route from Minnesota border to Illinois border
only contains seven WIM stations. This error was caused by the strict application of the criteria
shown in Table 4.2. For example, a 100-kip truck (likely with an annual permit) might have a 35-
kip axle weight record due to an uneven load, in which case the truck would be classified as a
record for single-trip permits. Such variation in both axle weights and gross vehicle weights may
also have been caused by inaccurate recording. It is not uncommon to have recoding variations
from 10% to 15%.30, 35-36
In addition, Wisconsin Statute Chapter 348 allows 10~15% increase in
gross vehicle weights for seasonal loads.3 Hence, a sensitivity analysis was conducted, in which
the upper limits for vehicles likely with annual permits were increase by 32% while the lower
limits remained the same. This analysis resulted in 1,216,626 records for annual permits and
123,581 records for single-trip permits, which seemed to be the lowest (i.e., 2.7 WIM stations on
average per trip).
Fig. 4.4 Distribution of overweight type of vehicles in WIM data
All overweight vehicle records were included in this study due to the lack of a clear criteria for
differentiating the vehicle with annual permits from vehicles with single-trip permits. The
records for vehicles likely with single-trip permits were included because these vehicles are not
necessarily heavier than the vehicles with annual permits as shown in Chapter 5. On the other
hand, this also inevitably brought in superheavy vehicle records (i.e., vehicles with gross weight
larger than 250 kips) to the data sets that were subjected to the statistical analyses shown below.
The inclusion of super heavy vehicles was deemed insignificant for the statistical analysis due to
the small percentage of such records as shown in Fig. 4.5. This hypothesis was partly proved in
Appendix 3.
The majority of the total 1.4 million overweight records indicate that the total vehicle weight is
below 170kips, the maximum gross weight of vehicles that is listed in the annual permit fee
table. Specifically 1782 vehicles have gross weights that are larger than 170 kips, and only thirty
three vehicles have gross vehicle weight larger than 250 kips. In addition, over 99% of the
1 2 30
0.5
1
1.5
2
2.5
3
3.5
4
4.5
5x 10
6
4732099
966626
373581
Over-weight type (1=Legal load;2=Annual Permit;3=Single-trip)
Num
ber
of
veh
icle
s
Total 6072306 vehicles:

39
records show that the overall vehicle length is less than 75 ft, the upper limit for vehicles that can
apply for annual permits. This indicates that the probability-based analysis adopted in this study
is appropriate. The effect of small quantity of superheavy vehicles is illustrated in Appendix 3.
0 50 100 150 200 250 300 350 400 4500
0.5
1
1.5
2
2.5
3x 10
5
171
5 226
95
683
78
986
28 1
25
313
162
376
204
363
289069
127
349
710
00
505
60
410
08
357
71
241
31
119
70
410
9112
9298
119
83
47
24
25
14
7 6 4 5 3 1 1 2 1 1 1 0 0 0 0 0 0 1
Gross Weight (kips)
Num
ber
of
veh
icle
s
Total 1340207 vehicles: Max. 430kips - Min. 10kips
0 50 100 150 200 250 3000
1
2
3
4
5
6
7
8x 10
5
703 4
12
83
151
435
178
74
443
77
721843
348
595
123
33
527
534
473
105
37
23
11
19
12
9 4 2 1 1 3 0 2 0 0 1
Vehicle Length (ft)
Nu
mber
of
veh
icle
s
Total 1340207 vehicles: Max. 280.0ft - Min. 0.0ft
Fig. 4.5 Distribution of overweight vehicles recorded in WIM data
Analysis of Overloaded WIM Records
The fundamentals of the statistical analysis used in this chapter are briefly summarized in
Appendix 3. Vehicle records in each class were divided into groups based upon the total number

40
of axles, and analyzed separately. The vehicles in each group are called data population. A
statistical modeling of the vehicle population is described in Appendix 4 while a descriptive
statistical analysis was used in this chapter. The characteristic values (e.g., the maximum, the
minimum, the mean values, and the standard deviation) are calculated for each vehicle group. A
representative vehicle was created to represent the approximate upper bound of the responses in
simply-supported girders caused by the vehicles in the group. The representative vehicles were
then compared with the Wis-SPV. The axle weights corresponding to 95th
percentile of all axle
weights in the group are used in the representative vehicles in each class. Axle spacings were
analyzed individually: most axle spacings in a representative vehicle were taken as the average
axle spacings; the spacings for tandem axles were taken as 4ft rather than the average spacings;
and one axle spacing was taken as a variable spacing defined by the 5th
percentile and 95th
percentile values. Only one variable axle spacing is allowed because the program for the moving
load analysis, SAP2000, can only take one variable axle spacing per vehicle.
The analysis of each vehicle is shown below. All pictures are modified from the pictures in
http://onlinemanuals.txdot.gov/txdotmanuals/tda/fhwavehicleclassificationfigures.htm
Class 4 Vehicles
Class 4 vehicles are for traditional passenger
carrying buses with two axles or three axles.
Two-axle buses: The statistical characteristics are shown below, based on which a representative
vehicle was created as shown in Fig. 4.6. The axles weights are in lbs and the axle spacings in ft.
21064
vehicles
Minimum Maximum Mean Standard
deviation
5th
percentile
95th
percentile Gross weight 13448 99208 34588.28 8358.67 22046.23 50265.40
Axle weight 1 441 43872 15615.52 4216.87 9700.34 23589.47
Axle spacing 1 20 40 22.85 2.72 20.34 27.56
Axle weight 2 220 64155 18972.95 6905.49 3968.32 29762.41
20~28'
24 30
20~28'
Class 4 - 2 axle
GVW=54 k
Fig. 4.6 Representative vehicle for Class 4 vehicles (2-axle)
Three-axle buses: The statistical characteristics are shown below, and a representative vehicle
was created as shown in Fig. 4.7. Note that the last two axles likely form a tandem axle because
the axle spacing 2 ranges from 2ft to 6ft with an average of 4ft.
20351
vehicles
Minimum Maximum Mean Standard
deviation
5th
percentile
95th
percentile Gross weight 13669 113979 49878.51 12861.58 34392.12 76941.34
Axle weight 1 441 39904 17053.33 4642.62 12786.81 26675.94
Axle spacing 1 20 40 25.56 3.41 20.34 33.46
Axle weight 2 220 39904 18132.89 5760.93 9700.34 29321.49
Axle spacing 2 2 6 4.05 .30 3.61 4.59
Axle weight 3 220 43431 14691.73 5399.50 6613.87 24691.78

41
20~34'
27 29
24~38'
Class 4 - 3 axle
GVW=81 k
25
4'
Fig. 4.5 Representative vehicle for Class 4 vehicles (3-axle)
Class 5 Vehicles
Class 5 vehicles are for two-axle, six-tire,
single-unit trucks, including camping and
recreational vehicles, and motor homes.
The statistical characteristics are shown below, and a representative vehicle was created as
shown in Fig. 4.8. For the variable axle spacing, a smaller integer than the 5th
percentile value
was used as the lower bound while a larger integer than the 95th
percentile value was used for the
upper bound.
20069
vehicles
Minimum Maximum Mean Standard
deviation
5th
percentile
95th
percentile Gross weight 13228 78485 33339.49 7719.48 21164.38 47399.39
Axle weight 1 220 40786 14441.25 4106.92 8157.11 21605.31
Axle spacing 1 7 23 16.58 2.18 13.12 19.69
Axle weight 2 220 49604 18898.82 6761.30 4629.71 29101.02
13~20'
22 30
13~20'
Class 5 - 2 axle
GVW=52 k
Fig. 4.8 Representative vehicle for Class 5 vehicles
Class 6 Vehicles
Class 6 vehicles are for three-axle single-unit
trucks, including camping and recreational
vehicles, motor homes, etc.
The statistical characteristics are shown below, based on which a representative vehicle was
created as shown in Fig. 4.9. The spacing 1 in this class are affected by the wheelbase of the
trucks, hence a variable spacing is used for axle spacing 1. The axle spacing 2 is dominated by
length around 4.5ft, hence tandem axle spacing was used for axle spacing 2 though the recorded
values varies from 2ft to 81 ft.

42
78523
vehicles
Minimum Maximum Mean Standard
deviation
5th
percentile
95th
percentile
Gross weight 14110 119931 42419.32 12201.99 26896.40 64815.92
Axle weight 1 220 41888 15613.52 3812.44 10582.19 23148.54
Axle spacing 1 4 41 17.33 2.70 12.47 21.65
Axle weight 2 220 46518 12729.35 5328.61 5952.48 22707.62
Axle spacing 2 2 81 4.38 1.82 3.94 4.59
Axle weight 3 220 51809 14075.93 6923.83 5291.10 27116.86
12~22'
23 23
16~26'
Class 6 - 3 axle
GVW=73 k
27
4'
Fig. 4.9 Representative vehicle for Class 6 vehicles
Class 7 Vehicles
Class 7 vehicles are for all trucks on a single
frame with four or more axles.
Four-axle trucks: The statistical characteristics are shown below, based on which a representative
vehicle was created as shown in Fig. 4.10. The vehicle configuration was determined based upon
the sample vehicle show above, where the rear three axles form a tandem axle. Hence the first
spacing was set as the variable spacing while the other two axles were set as 4ft. Note that the
gross weight of the representative vehicle is 99kips, which is larger than the 95th
percentile of the
gross weight (85kips) and smaller than the maximum gross weight (187kips).
15988
vehicles
Minimum Maximum Mean Standard
deviation
5th
percentile
95th
percentile Gross weight 20944 187172 60172.07 13355.22 41226.45 84657.52
Axle weight 1 220 40345 17045.27 4078.27 11904.96 24691.78
Axle spacing 1 6 23 14.01 3.84 8.20 20.01
Axle weight 2 0 65698 10917.38 4881.32 4409.25 19621.14
Axle spacing 2 2 9 4.88 1.12 3.94 7.22
Axle weight 3 220 55336 16410.82 5480.89 8157.11 26235.01
Axle spacing 3 2 12 4.50 .75 3.94 5.91
Axle weight 4 220 59304 15797.90 6755.95 5070.63 27557.79
8~20'
25 20
16~28'
Class 7 - 4 axle
GVW=99 k
26
4'
28
4'
Fig. 4.10 Representative vehicle for Class 7 vehicles (4-axle)

43
Five-axle trucks: Similarly the statistical characteristics for the five-axle trucks are shown below,
based on which a representative vehicle was created as shown in Fig. 4.11. The last three axle
spacings are dominantly around 4ft, hence they were set as tandem axle spacing. Note that the
middle two axles might be the lift axle, which are put in action when the truck is heavily loaded.
36234
vehicles
Minimum Maximum Mean Standard
deviation
5th
percentile
95th
percentile Gross weight 20503 171961 71689.29 13614.29 55115.58 96782.95
Axle weight 1 220 45856 16860.91 3388.76 13007.28 22928.08
Axle spacing 1 3 23 9.87 1.88 7.87 13.78
Axle weight 2 220 39683 8126.03 2858.46 4188.78 13227.74
Axle spacing 2 2 9 4.16 .46 3.61 5.25
Axle weight 3 220 44533 11540.57 5890.71 4850.17 22707.62
Axle spacing 3 2 9 4.15 .25 3.94 4.59
Axle weight 4 220 44092 18014.21 4511.80 12345.89 26675.94
Axle spacing 4 2 9 4.35 .38 3.94 4.92
Axle weight 5 220 44974 17147.96 5863.93 7275.26 27337.33
7~14'
23 14
19~26'
Class 7 - 5 axle
GVW=113 k
23
4'
27
4'
27
4'
Fig. 4.11 Representative vehicle for Class 7 vehicles (5-axle)
Class 8 Vehicles
Class 8 vehicles are for four or fewer axle
single-trailer trucks -- All vehicles with four or
fewer axles consisting of two units, one of
which is a tractor or straight truck power unit.
Three-axle trucks: These trucks are likely AASHTO type 2S1. Their statistical characteristics are
shown below, based on which a representative vehicle was created as shown in Fig. 4.12. An
average spacing of all vehicles was used for the steering spacing while a variable spacing is used
for the second axle spacing to accommodate trailers in different sizes.
5789
vehicles
Minimum Maximum Mean Standard
deviation
5th
percentile
95th
percentile Gross weight 14991 145285 47056.99 12938.70 29431.72 72862.79
Axle weight 1 220 39683 14340.07 4793.76 6613.87 22266.69
Axle spacing 1 6 23 12.97 2.23 9.19 16.40
Axle weight 2 220 72312 18542.33 6059.67 9369.65 28660.10
Axle spacing 2 11 40 25.04 6.57 15.91 37.40
Axle weight 3 220 72312 14173.91 7483.40 2425.09 26455.48

44
13'
23 29
28~51'
Class 8 - 3 axle
GVW=78 k
26
15~38'
Fig. 4.12 Representative vehicle for Class 8 vehicles (Type 2S1)
Four-axle trucks (a): These trucks are AASHTO type 3S1. The statistical characteristics are
shown below, based on which a representative vehicle was created as shown in Fig. 4.13. Again,
an average spacing for the axle spacing of the truck power unit was used.
18469
vehicles
Minimum Maximum Mean Standard
deviation
5th
percentile
95th
percentile Gross weight 14771 153001 64889.60 17772.36 36376.28 93255.55
Axle weight 1 220 39242 15352.84 4166.36 9479.88 22707.62
Axle spacing 1 4 38 16.21 2.31 11.81 19.36
Axle weight 2 220 39904 15635.57 5473.72 6834.33 24250.85
Axle spacing 2 1 6 4.27 .32 3.94 4.92
Axle weight 3 220 72312 17763.37 6586.90 7275.26 29541.95
Axle spacing 3 3 52 30.28 7.03 10.66 38.06
Axle weight 4 220 40786 16137.15 6963.89 4188.78 26896.40
16'
23 24
30~59'
Class 8 - 4 axle a
GVW=104 k
30
4'
27
10~39'
Fig. 4.13 Representative vehicle for Class 8 vehicles (Type 3S1)
Four-axle trucks (b): These trucks are AASHTO type 2S2. The statistical characteristics are
shown below, based on which a representative vehicle was created as shown in Fig. 4.14.
9813
vehicles
Minimum Maximum Mean Standard
deviation
5th
percentile
95th
percentile Gross weight 16535 150576 61545.31 17194.59 39683.21 97730.94
Axle weight 1 220 38581 14106.31 4614.69 7275.26 21825.77
Axle spacing 1 3 38 13.44 2.26 11.48 16.73
Axle weight 2 220 42990 20002.38 5948.90 9920.80 29762.41
Axle spacing 2 4 59 31.98 6.16 18.70 38.71
Axle weight 3 220 39683 12937.70 5754.70 5511.56 24912.24
Axle spacing 3 2 6 3.98 .40 3.61 4.59
Axle weight 4 220 61509 14498.61 6866.19 5511.56 27778.25
13'
22 30
35~56'
Class 8 - 4 axle b
GVW=105 k
25
4'
28
18~39'
Fig. 4.14 Representative vehicle for Class 8 vehicles (Type 2S2)

45
Class 9 Vehicles
Class 9 vehicles are for five-axle single-trailer
trucks -- All five-axle vehicles consisting of
two units, one of which is a tractor or straight
truck power unit.
Due to the importance of this class (76 percent of the vehicles are in this class), the 2.5
th and
97.5th
percentile values were used to construct the representative vehicles. This is also justified
by the distribution of gross vehicle weight: a small hump exists after 120kips, indicating
considerably large number of vehicles. In addition, an average spacing for the axle spacing of the
truck power unit was used. The distribution of axle spacing 4 shows two spikes: one near 4ft and
the other at 10ft, indicating two distinguished vehicle types as show above Type 3S2 and Type
3S2 split. They were considered individually
Five-axle trucks (a): The statistical characteristics are shown below, based on which a
representative vehicle was created as shown in Fig. 4.15.
889230
vehicles
Minimum Maximum Mean Standard
deviation
2.5th
percentile
97.5th
percentile
Gross weight 17637 242509 84500.69 24627.43 44092.46 144843.73
Axle weight 1 220 47399 15663.98 4350.63 9038.95 25794.09
Axle spacing 1 2 31 16.28 2.16 11.15 20.01
Axle weight 2 220 46297 17063.44 5664.01 7716.18 30644.26
Axle spacing 2 2 46 4.19 .67 3.94 4.59
Axle weight 3 220 70548 18280.68 6093.33 7936.64 32187.50
Axle spacing 3 2 93 32.76 3.61 27.23 37.07
Axle weight 4 0 57100 16120.09 6089.37 5732.02 29982.87
Axle spacing 4 2 6 3.97 .21 3.61 4.59
Axle weight 5 0 70768 17372.47 6595.37 5952.48 31526.11
16'
26 31
51~61'
Class 9 - 5 axle a
GVW=151 k
32
4'
30
27~37'
32
4'
Fig. 4.15 Representative vehicle for Class 9 vehicles (Type 3S2)
Five-axle trucks (b): The statistical characteristics are shown below, based on which a
representative vehicle is created as shown in Fig. 4.16. Note that the gross weight of this vehicle
is similar to the Type 3S2 representative vehicle. Not that the split axle spacing was set to be 10
ft, close to the average spacing.
133972
vehicles
Minimum Maximum Mean Standard
deviation
2.5th
percentile
97.5th
percentile
Gross weight 20062 217596 85501.24 25551.90 41667.37 145284.66
Axle weight 1 220 39904 15413.54 4240.16 9038.95 25353.16
Axle spacing 1 3 44 17.94 2.09 13.12 21.33

46
Axle weight 2 220 39904 17160.95 5503.02 7936.64 29982.87
Axle spacing 2 2 45 4.24 .87 3.94 4.59
Axle weight 3 220 69005 18186.18 5824.22 7936.64 31085.18
Axle spacing 3 2 82 28.79 4.51 12.47 34.12
Axle weight 4 0 72312 17305.22 6902.23 4629.71 31746.57
Axle spacing 4 6 59 10.23 1.63 8.86 15.09
Axle weight 5 220 72312 17435.00 7061.48 4629.71 32187.5
18'
25 30
44~67'
Class 9 - 5 axle b
GVW=150 k
31
4'
32
12~35'
32
10'
Fig. 4.14 Representative vehicle for Class 9 vehicles (Type 3S2 split)
Class 10 Vehicles
Class 10 vehicles are for six or more axle
single-trailer trucks -- All vehicles with six or
more axles consisting of two units, one of
which is a tractor or straight truck power unit..
Six-axle trucks: The statistical characteristics are shown below, based on which a representative
vehicle is created as shown in Fig. 4.17. The last three axles likely form a tandem axle; hence the
last two spacings were set to be 4ft though the average values were different. The third spacing,
which dictates the size of the trailer, varies from 4ft to 37ft, indicating that some single-unit
trucks were included in this class. The heavy axle weight combined with the short spacing would
likely cause large positive moment in simply supported girders.
27574
vehicles
Minimum Maximum Mean Standard
deviation
5th
percentile
95th
percentile Gross weight 18078 267200 91073.17 23019.53 54895.11 136025.24
Axle weight 1 220 39463 13182.49 4188.96 7936.64 21605.31
Axle spacing 1 0 93 15.77 2.94 11.48 20.01
Axle weight 2 220 57100 16232.44 4895.11 9038.95 25353.16
Axle spacing 2 0 89 4.76 2.86 3.94 6.23
Axle weight 3 220 72312 17697.65 5775.52 9700.34 29101.02
Axle spacing 3 0 45 24.77 9.50 4.59 37.07
Axle weight 4 0 65257 12609.14 5481.83 4629.71 22266.69
Axle spacing 4 0 99 5.71 4.74 3.94 13.45
Axle weight 5 220 57982 15920.13 6282.96 5732.02 27116.86
Axle spacing 5 0 89 5.23 4.07 3.94 9.19
Axle weight 6 220 72312 15429.95 6862.19 3747.86 27557.79

47
16' 4' 4' 4'4~37'
22 25 29 22 27 28
32~65'
Class 10 - 6 axle
GVW=153 k
Fig. 4.17 Representative vehicle for Class 10 vehicles (Type 3S3)
Seven-axle trucks: The statistical characteristics for these trucks are shown below, based on
which a representative vehicle was created as shown in Fig. 4.18. Similar to Type 3S3 vehicles,
the third axle spacing varies from 4ft to 38ft. Hence, the short trucks would cause large positive
moments in the simply-supported girder as shown later. Meanwhile, the total number of these
vehicles is small, indicating a potentially insignificant impact to bridges.
2552
vehicles
Minimum Maximum Mean Standard
deviation
5th
percentile
95th
percentile Gross weight 17857 235674 95229.00 30635.63 55556.50 157928.17
Axle weight 1 220 35054 13933.96 4074.49 8818.49 21384.84
Axle spacing 1 6 22 15.77 2.49 10.17 19.36
Axle weight 2 220 39904 15928.83 5435.96 8377.57 26235.01
Axle spacing 2 3 6 4.27 .23 3.94 4.59
Axle weight 3 441 39463 17124.27 6005.44 9259.42 29178.19
Axle spacing 3 3 40 28.24 9.68 3.94 37.40
Axle weight 4 220 35494 11183.80 5921.75 3968.32 22928.08
Axle spacing 4 3 13 5.02 1.59 3.61 8.86
Axle weight 5 220 39242 12413.44 6562.46 4409.25 24691.78
Axle spacing 5 3 12 4.23 .66 3.94 4.92
Axle weight 6 220 39904 12640.56 6457.33 4629.71 25132.70
Axle spacing 6 3 11 4.62 1.24 3.94 8.86
Axle weight 7 220 39022 12003.01 6183.32 4409.25 24250.85
16' 4' 4' 4'4~38'
21 26 29 23 25 25
36'~70'
4'
24
Class 10 - 7 axle
GVW=173 k
Fig. 4.18 Representative vehicle for Class 10 vehicles (Type 3S4)
Class 11 Vehicles
Class 11 vehicles are for five or fewer axle multi-trailer trucks -- All vehicles with five or fewer axles
consisting of three or more units, one of which is a tractor or straight truck power unit.
The statistical characteristics are shown below, based on which a representative vehicle was
created as shown in Fig. 4.19. The trailers might have similar dimensions; hence, the
representative vehicle does not have any variable spacing. The spacing between the trailers was
set to the average value - 9ft. The wheelbases of the trailers are close (around 21ft).

48
28618
vehicles
Minimum Maximum Mean Standard
deviation
5th
percentile
95th
percentile Gross weight 18739 181000 90554.27 23032.07 59304.36 132718.30
Axle weight 1 882 38140 16205.44 3948.83 10582.19 22928.08
Axle spacing 1 6 17 12.38 .45 11.81 13.12
Axle weight 2 441 39904 22814.27 5756.00 14550.51 33510.27
Axle spacing 2 11 25 20.98 .54 20.34 21.98
Axle weight 3 882 39683 18786.93 5812.25 10141.27 29101.02
Axle spacing 3 6 19 9.30 .39 8.86 9.84
Axle weight 4 220 39242 17325.68 5852.00 8598.03 27998.71
Axle spacing 4 11 25 21.87 .51 21.33 22.64
Axle weight 5 220 38140 15422.11 5227.66 7716.18 24912.24
12'
23 34
64'
Class 11 - 5 axle
GVW=139 k
29
21'
28
9'
25
22'
Fig. 4.19 Representative vehicle for Class 11 vehicles
Class 12 Vehicles
Class 12 vehicles are for six-axle multi-trailer Trucks -- All six-axle vehicles consisting of three or more
units, one of which is a tractor or straight truck power unit.
These vehicles are the combination of a semi-trailer and a trailer. Hence the configurations of the
semi-trailers should be similar to those of Class 8 vehicles. The statistical characteristics are
shown below, based on which a representative vehicle was created as shown in Fig. 4.20. The
second axle spacing ranges from 3ft to 6ft for all eleven thousand Class 12 vehicles, indicating
that the number of type 2S2-2 vehicles seem rare in the WIM records. Hence the representative
vehicle was created only for Type 3S1-2 vehicles. In addition, the dimension and weight of the
trailers were same as those trailers in Class 11.
11011
vehicles
Minimum Maximum Mean Standard
deviation
5th
percentile
95th
percentile Gross weight 34392 205250 96193.94 25863.89 61068.06 144182.34
Axle weight 1 1323 36597 16525.42 4204.99 10361.73 24250.85
Axle spacing 1 10 22 15.59 2.48 10.83 19.03
Axle weight 2 220 37258 14270.70 4310.195 8157.11 22266.69
Axle spacing 2 3 6 4.14 .235 3.94 4.27
Axle weight 3 220 39022 14678.29 4299.667 8377.57 22266.69
Axle spacing 3 3 25 19.24 3.746 4.59 21.33

49
Axle weight 4 1984 39022 17772.89 5728.475 9479.88 27998.71
Axle spacing 4 6 18 9.22 1.198 8.20 11.15
Axle weight 5 1102 39242 17049.24 5698.778 8598.03 27557.79
Axle spacing 5 11 25 21.75 1.645 18.04 22.97
Axle weight 6 2425 39683 15897.63 5427.705 7936.64 26014.55
16'
24 22
55~73'
Class 12 - 6 axle
GVW=152 k
30
4~22'
28
9'
26
22'
22
4'
Fig. 4.20 Representative vehicle for Class 12 vehicles
Class 13 Vehicles
Class 13 vehicles are for seven or more axle multi-trailer trucks -- All vehicles with seven or more axles
consisting of three or more units, one of which is a tractor or straight truck power unit.
Class 13 includes both combination of trailers and nondivisible trucks potentially with permits.
As a result, the distributions of the axle spacings were significantly scattered. In addition, 4579
out of 5105 Class 13 vehicles in the category are seven axle vehicles. Hence, the representative
vehicles created below represents the 7-axle nondivisable trucks rather than Type 3S2-2 vehicles.
Seven-axle trucks (a): The statistical characteristics are shown below, based on which a
representative vehicle was created as shown in Fig. 4.21. The vehicle shown in Fig. 4.21 is the
representative of total 1116 trucks. The distribution of axle spacing 1 shows two peaks,
indicating two distinctive vehicle types. However, considering the small total number of this
category, an average spacing is used for the first axle spacing.
1116
vehicles
Minimum Maximum Mean Standard
deviation
5th
percentile
95th
percentile Gross weight 22708 219580 89124.65 23196.26 52183.43 129984.57
Axle weight 1 220 36376 12581.96 4268.67 7054.79 20315.60
Axle spacing 1 3 27 13.26 5.58 5.91 21.98
Axle weight 2 220 34613 12406.73 5930.91 3527.40 22928.08
Axle spacing 2 0 105 7.69 9.09 3.94 15.14
Axle weight 3 220 39683 14905.50 5859.51 5511.56 25132.70
Axle spacing 3 3 45 16.50 14.51 3.94 41.99
Axle weight 4 220 30865 13123.63 5519.14 3527.40 21384.84
Axle spacing 4 3 6 4.42 .58 3.61 5.91
Axle weight 5 220 48722 10162.40 7325.10 1543.24 22046.23
Axle spacing 5 3 106 21.56 15.19 3.94 41.99
Axle weight 6 220 39683 13369.18 6901.66 1763.70 22928.08
Axle spacing 6 2 45 6.54 4.64 3.61 14.76
Axle weight 7 220 46077 12554.50 7375.30 1322.77 23589.47

50
13'
20 23
34~73'
Class 13 - 7 axle a
GVW=158 k
21
3~42'
22
4'
24
6'
25
4'
23
4'
Fig. 4.21 Representative vehicle for Class 13 vehicles
Seven-axle trucks (b): The statistical characteristics are shown below, based on which a
representative vehicle was created as shown in Fig. 4.22. The vehicle represents 3463 trucks.
Note that the forth spacing ranges from 7ft to 39ft, and the short truck would likely cause large
positive moments in simply-supported girders.
3463
vehicles
Minimum Maximum Mean Standard
deviation
5th
percentile
95th
percentile Gross weight 23589 248241 102497.72 25361.47 80027.81 154852.72
Axle weight 1 661 34613 11554.69 3433.36 7319.35 18077.91
Axle spacing 1 2 42 13.85 4.01 6.56 19.69
Axle weight 2 220 37699 12697.11 4793.58 5952.48 20502.99
Axle spacing 2 3 38 5.46 2.55 3.94 11.48
Axle weight 3 220 72312 17226.11 5045.03 11464.04 26896.40
Axle spacing 3 3 37 5.54 4.04 3.94 11.15
Axle weight 4 220 52470 15796.76 6395.99 5952.48 27293.23
Axle spacing 4 6 64 27.43 9.83 7.55 38.39
Axle weight 5 220 36817 15335.66 5654.44 3086.47 23986.30
Axle spacing 5 2 94 6.85 6.78 3.94 24.28
Axle weight 6 220 39904 16395.38 5993.86 3747.86 25794.09
Axle spacing 6 3 86 4.96 2.91 3.94 8.86
Axle weight 7 220 42108 13477.61 7615.91 1984.16 24912.24
14'
18 21
37~69'
Class 13 - 7 axle b
GVW=168 k
27
4'
24
7~39'
25
4'
27
4'
26
4'
Fig. 4.22 Representative vehicle for Class 13 vehicles
Class 14 Vehicles
Class 14 vehicles are for five-axle truck-trailer combinations-- vehicles with five axles consisting of two
units, one of which is a truck and the other is a trailer.
The statistical characteristics are shown below, based on which a representative vehicle was
created as shown in Fig. 4.23. The total number of Class 14 vehicles is small compared with
other classes; hence the statistical analysis should be treated with caution. With all four scattered
spacing distributions, the axle spacing three was chosen to be the variable spacing only to
separate the two relatively large load groups.

51
115
vehicles
Minimum Maximum Mean Standard
deviation
5th
percentile
95th
percentile Gross weight 37699 101192 64233.13 16762.16 39903.68 88273.10
Axle weight 1 10141 21605 14932.01 2284.46 11419.95 19753.42
Axle spacing 1 8 26 19.80 2.07 16.93 22.05
Axle weight 2 5291 24692 14167.10 4685.64 7936.64 22222.60
Axle spacing 2 4 6 4.52 .28 4.27 4.92
Axle weight 3 6173 25574 13793.27 4799.73 6613.87 21561.21
Axle spacing 3 7 20 14.47 2.58 9.38 19.03
Axle weight 4 1323 23810 10622.45 4568.02 2866.01 17901.54
Axle spacing 4 12 27 16.70 3.03 12.47 22.11
Axle weight 5 2425 22928 10689.55 4921.15 3703.77 19488.87
20'
20 22
50~60'
Class 14 - 5 axle
GVW=101 k
22
4'
18
9~19'
19
17'
Fig. 4.23 Representative vehicle for Class 14 vehicles
Comparison of Representative Overloaded Vehicles with Wis-SPV
The effects of the above representative overweight vehicles were compared with those of the
250-kip Wis-SPV. The analysis and the comparison used the same method as in Chapter 3.
One-span simply supported girders
The maximum positive moments and shear in simply-supported girders with various plan lengths
by the 18 representative vehicles are shown in Fig. 4.24, and the R-values are shown in Fig. 4.25.
Again, the effects of the Wisconsin Standard Permit Vehicle are shown in solid (blue) lines. The
effects of the representative vehicles for Classes 10 and 13 exceed those of Wis-SPV, for spans
form 40 to 80 ft as confirmed in Table 4.3. In addition, the R-values for the representative
vehicles for Classes 10 and 13 exceed 1.0, indicating that the moment envelopes exceeds that of
the Wis-SPV throughout the entire span of the girders (from 40ft to 80ft).
This might have been due to the fact that these three representative vehicles had a variable axle
spacing. The vehicle with heavy loads could have short length when the variable spacing took
the lower bound. Such short vehicles would likely cause large positive moment for short- to
medium-span girders, for which several axles of Wis-SPV had to be placed outside the girder to
obtain the maximum girder responses.

52
20 40 60 80 100 120 1400
2000
4000
6000
8000
Peak
mo
men
t (k
ips-
ft)
20 40 60 80 100 120 140-200
-100
0
100
200
Beam spans (ft)
Peak
sh
ear
(kip
s)
Fig. 4.24 Peak moment/shear values for overweight vehicles on one-span girders
20 40 60 80 100 120 1400.2
0.4
0.6
0.8
1
1.2
R-v
alu
es
(mo
men
t)
20 40 60 80 100 120 140-1
-0.5
0
0.5
1
Beam spans (ft)
R-v
alu
es
(sh
ear)
Fig. 4.25 R-values for overweight vehicles on one-span girders
Wis-SPV
Wis-SPV
Wis-SPV
Wis-SPV

53
Table 4.3(a) Peak positive moments in two-span girders by overweight vehicles (kips-ft)
Span
(ft)
Wis.
SPV
Class4
2axle
Class4
3axle
Class5
2axle
Class6
3axle
Class7
4axle
Class7
5axle
Class8
3axle
Class8
4axle a
Class8
4axle b
Class9
5axle a
Class9
5axle b
Class10
6axle
Class10
7axle
Class11
5axle
Class12
6axle
Class13
7axle a
Class13
7axle b
Class14
5axle
32 723.7 238.4 384.0 285.3 395.0 551.7 596.8 280.3 467.9 375.5 447.3 506.7 724.0 763.5 338.7 558.0 698.0 512.1 371.7
36 843.3 270.6 437.8 335.9 467.7 650.0 709.5 358.2 548.6 436.3 535.4 599.1 855.0 915.1 394.7 660.0 836.5 594.3 433.6
40 962.9 321.0 501.4 386.8 540.4 748.5 823.5 436.1 631.8 517.7 623.8 700.1 986.0 1066.8 450.9 762.0 975.0 687.7 495.5
44 1085.3 372.0 580.7 437.9 613.1 847.1 937.5 514.1 735.5 599.5 712.3 821.1 1117.0 1218.6 531.3 864.0 1121.2 781.1 557.5
48 1214.6 423.3 660.3 489.2 686.0 945.8 1051.5 592.0 839.1 681.4 800.8 942.8 1256.7 1370.4 621.2 986.2 1280.1 874.7 629.5
52 1344.2 475.0 740.0 540.5 758.8 1044.4 1165.5 670.0 942.7 763.6 889.5 1087.2 1409.2 1542.5 711.3 1112.2 1439.0 968.4 710.6
56 1473.7 526.9 819.9 592.0 831.7 1143.1 1279.5 748.0 1046.4 855.3 978.2 1238.0 1561.6 1715.4 801.4 1238.1 1598.0 1076.0 802.3
60 1603.2 579.0 899.8 643.5 904.6 1242.0 1393.5 825.9 1150.2 956.9 1078.9 1388.7 1714.1 1888.4 902.0 1364.1 1756.9 1236.9 903.3
64 1732.8 631.3 979.9 695.1 977.5 1340.8 1507.5 903.9 1254.1 1058.8 1227.7 1539.5 1866.5 2061.3 1012.5 1490.0 1915.8 1403.9 1004.2
68 1865.6 683.7 1060.0 746.8 1050.4 1439.7 1621.5 981.9 1357.9 1161.1 1376.5 1690.3 2019.1 2234.2 1123.6 1636.1 2074.8 1571.4 1105.2
72 2042.4 736.2 1140.2 798.4 1123.3 1538.5 1735.5 1059.8 1461.7 1263.7 1525.7 1841.0 2171.8 2407.2 1256.9 1788.1 2233.7 1739.0 1206.2
76 2267.4 788.8 1220.4 850.1 1196.1 1637.4 1849.5 1137.8 1565.6 1366.6 1675.2 1991.8 2324.6 2580.1 1395.7 1940.0 2392.6 1906.9 1307.1
80 2509.5 841.5 1300.7 901.8 1269.1 1736.2 1963.5 1215.8 1669.4 1469.5 1824.7 2142.5 2477.3 2753.0 1534.5 2092.0 2551.6 2075.2 1408.1
84 2753.1 894.2 1381.1 953.6 1342.1 1835.0 2077.5 1293.8 1773.2 1572.8 1974.2 2293.4 2630.1 2925.9 1673.2 2243.9 2710.5 2243.5 1509.0
88 2996.7 947.1 1461.5 1005.5 1415.0 1933.9 2191.5 1371.7 1877.1 1676.3 2124.1 2444.4 2782.9 3098.9 1812.0 2395.8 2869.5 2411.8 1610.0
92 3241.0 1000.0 1541.9 1057.3 1488.0 2032.8 2305.5 1449.7 1980.9 1779.8 2274.1 2595.3 2935.6 3271.8 1950.8 2547.8 3028.5 2580.3 1711.0
96 3486.1 1052.8 1622.3 1109.1 1561.0 2131.7 2419.5 1527.7 2084.9 1883.3 2424.1 2746.2 3088.4 3444.7 2089.6 2699.7 3187.5 2749.2 1812.0
100 3731.3 1105.7 1702.7 1160.9 1634.0 2230.7 2533.5 1605.6 2188.8 1987.2 2574.2 2897.2 3241.1 3617.7 2228.4 2851.7 3346.5 2918.2 1913.0
104 3976.4 1158.8 1783.1 1212.7 1706.9 2329.7 2647.5 1683.6 2292.8 2091.2 2724.2 3048.1 3393.9 3790.6 2367.1 3003.6 3505.5 3087.1 2014.0
108 4222.8 1211.8 1863.5 1264.5 1779.9 2428.6 2761.5 1761.6 2396.7 2195.2 2874.2 3199.0 3546.6 3963.5 2506.0 3155.5 3664.5 3256.0 2115.0
112 4469.2 1264.9 1944.0 1316.4 1852.9 2527.6 2875.5 1839.5 2500.7 2299.1 3024.5 3350.0 3699.4 4136.5 2644.9 3307.5 3823.5 3424.9 2216.0
116 4715.6 1318.0 2024.6 1368.3 1925.8 2626.5 2989.5 1917.5 2604.7 2403.1 3175.0 3500.9 3852.3 4309.4 2783.8 3459.4 3982.5 3593.8 2317.0
120 4962.0 1371.0 2105.2 1420.2 1998.8 2725.5 3103.5 1995.5 2708.6 2507.2 3325.4 3651.9 4005.3 4482.3 2922.8 3611.4 4141.5 3763.2 2418.0
124 5208.7 1424.1 2185.7 1472.1 2071.8 2824.5 3217.5 2073.5 2812.6 2611.6 3475.9 3802.8 4158.2 4655.3 3061.7 3763.3 4300.5 3932.5 2519.0
128 5456.2 1477.1 2266.3 1524.1 2144.7 2923.4 3331.5 2151.5 2916.5 2715.9 3626.3 3953.7 4311.2 4828.2 3200.7 3915.2 4459.5 4101.9 2620.0
132 5703.7 1530.3 2346.9 1576.0 2217.7 3022.4 3445.5 2229.5 3020.5 2820.2 3776.8 4104.7 4464.1 5001.1 3339.6 4067.2 4618.5 4271.3 2721.0
136 5951.3 1583.5 2427.4 1627.9 2290.7 3121.3 3559.5 2307.5 3124.4 2924.6 3927.3 4255.6 4617.0 5174.0 3478.6 4219.1 4777.5 4440.7 2822.0
140 6198.8 1636.7 2508.0 1679.8 2363.7 3220.3 3673.5 2385.5 3228.4 3028.9 4077.7 4406.6 4770.0 5347.0 3617.5 4371.1 4936.5 4610.1 2923.0

54
Table 4.3(b) Peak shear in two-span girders by overweight vehicles (kips)
Span
(ft)
Wis.
SPV
Class4
2axle
Class4
3axle
Class5
2axle
Class6
3axle
Class7
4axle
Class7
5axle
Class8
3axle
Class8
4axle a
Class8
4axle b
Class9
5axle a
Class9
5axle b
Class10
6axle
Class10
7axle
Class11
5axle
Class12
6axle
Class13
7axle a
Class13
7axle b
Class14
5axle
32 100.44 38.39 56.71 43.05 58.61 78.22 85.94 44.26 65.42 59.23 68.85 79.97 98.72 105.71 50.95 76.85 95.31 73.10 53.10
36 103.72 40.06 59.38 44.04 60.21 80.53 89.06 48.01 67.15 62.48 71.09 84.97 104.74 110.85 55.40 79.64 100.16 75.42 56.20
40 106.35 41.39 61.51 44.84 61.49 82.38 91.55 51.01 70.83 66.73 72.88 88.97 109.57 115.06 58.96 82.92 104.05 78.67 58.68
44 108.50 42.48 63.26 45.49 62.53 83.89 93.59 53.46 73.84 70.21 75.48 92.25 113.52 120.33 62.91 86.84 108.92 85.34 60.71
48 110.80 43.39 64.71 46.03 63.40 85.15 95.29 55.51 76.36 73.11 79.60 94.98 116.81 124.72 67.17 90.10 113.10 90.89 62.40
52 118.23 44.16 65.94 46.49 64.14 86.22 96.73 57.24 78.48 75.56 83.23 97.29 119.59 128.43 70.77 93.02 116.63 95.59 63.83
56 125.86 44.82 66.99 46.89 64.78 87.13 97.97 58.72 80.31 77.66 88.07 99.27 121.98 131.62 73.86 95.52 119.66 100.58 65.06
60 132.47 45.40 67.91 47.23 65.32 87.92 99.03 60.01 81.89 79.49 92.26 101.75 124.05 134.38 76.53 97.68 122.28 105.21 66.12
64 138.64 45.90 68.71 47.52 65.80 88.61 99.97 61.13 83.27 81.08 95.93 104.82 125.86 136.79 78.88 99.58 124.57 109.26 67.05
68 145.19 46.34 69.41 47.79 66.23 89.22 100.80 62.12 84.49 82.49 99.17 107.54 127.45 138.92 80.94 101.25 126.60 112.83 67.87
72 151.01 46.73 70.04 48.02 66.60 89.77 101.53 63.01 85.57 83.74 102.05 109.96 128.87 140.81 82.78 102.74 128.40 116.01 68.60
76 156.22 47.08 70.60 48.23 66.94 90.25 102.19 63.79 86.54 84.86 104.63 112.12 130.14 142.51 84.50 104.07 130.01 118.85 69.25
80 160.91 47.40 71.11 48.42 67.24 90.69 102.78 64.50 87.41 85.86 106.95 114.06 131.28 144.03 87.22 105.26 131.46 121.41 69.84
84 165.15 47.68 71.56 48.59 67.52 91.09 103.31 65.15 88.20 86.77 109.04 115.82 132.32 145.41 89.68 106.34 132.77 123.72 71.08
88 169.00 47.94 71.98 48.75 67.77 91.44 103.80 65.73 88.92 87.60 110.95 117.41 133.26 146.66 91.93 108.05 133.96 125.82 72.44
92 172.53 48.18 72.36 48.89 67.99 91.77 104.24 66.26 89.58 88.36 112.69 118.88 134.12 147.81 93.97 109.96 135.05 127.74 73.68
96 175.75 48.40 72.70 49.02 68.20 92.07 104.65 66.75 90.18 89.05 114.29 120.21 134.90 148.86 95.85 111.71 136.05 129.50 74.82
100 178.72 48.60 73.02 49.14 68.39 92.35 105.02 67.20 90.73 89.69 115.75 121.45 135.63 149.82 97.58 113.32 136.97 131.12 75.87
104 181.47 48.78 73.32 49.25 68.57 92.61 105.37 67.62 91.24 90.28 117.11 122.58 136.29 150.72 99.17 114.81 137.81 132.62 76.84
108 184.00 48.95 73.59 49.35 68.74 92.84 105.69 68.00 91.71 90.82 118.37 123.63 136.91 151.54 100.64 116.19 138.60 134.00 77.73
112 186.36 49.11 73.85 49.44 68.89 93.06 105.98 68.36 92.15 91.33 119.53 124.61 137.49 152.31 102.01 117.47 139.33 135.29 78.56
116 188.56 49.26 74.08 49.53 69.03 93.27 106.26 68.69 92.56 91.80 120.62 125.52 138.02 153.02 103.29 118.66 140.00 136.49 79.34
120 190.60 49.40 74.30 49.61 69.16 93.46 106.52 69.00 92.94 92.24 121.63 126.37 138.52 153.69 104.48 119.77 140.64 137.60 80.06
124 192.52 49.53 74.51 49.69 69.29 93.64 106.76 69.29 93.30 92.65 122.58 127.17 138.99 154.31 105.59 120.81 141.23 138.65 80.73
128 194.32 49.65 74.70 49.76 69.40 93.81 106.98 69.57 93.63 93.04 123.47 127.91 139.43 154.89 106.64 121.79 141.79 139.63 81.37
132 196.00 49.76 74.89 49.83 69.51 93.96 107.20 69.82 93.95 93.40 124.30 128.61 139.84 155.44 107.62 122.70 142.31 140.55 81.96
136 197.59 49.87 75.06 49.89 69.61 94.11 107.40 70.06 94.24 93.74 125.09 129.27 140.23 155.96 108.54 123.56 142.80 141.41 82.52
140 199.09 49.97 75.22 49.95 69.71 94.25 107.59 70.29 94.52 94.07 125.83 129.89 140.59 156.45 109.41 124.38 143.26 142.23 83.05

55
Two-span simply supported girders
The maximum positive moments and shear in two-span simply-supported girders with various
span lengths by the 18 representative vehicles are shown in Fig. 4.26, and the R-values in Fig.
4.27. Similarly as shown in Table 4.4, the effects of the Wis-SPV were exceeded by the three
representative vehicles, whose variable axle spacing could cause short heavy vehicles.
20 40 60 80 100 120 140-4000
-2000
0
2000
4000
6000
Peak
mo
men
t (k
ips-
ft)
20 40 60 80 100 120 140-400
-200
0
200
400
Beam spans (ft)
Peak
sh
ear
(kip
s)
Fig. 4.26 Peak moment/shear values for overweight vehicles on two-span girders
20 40 60 80 100 120 140-2
-1
0
1
2
R-v
alu
es
(mo
men
t)
20 40 60 80 100 120 140-2
-1
0
1
2
Beam spans (ft)
R-v
alu
es
(sh
ear)
Fig. 4.27 R-values for overweight vehicles on two-span girders
Wis-SPV
Wis-SPV
Wis-SPV

56
Table 4.4(a) Peak positive moments in two-span girders by overweight vehicles (kips-ft)
Span
(ft)
Wis.
SPV
Class4
2axle
Class4
3axle
Class5
2axle
Class6
3axle
Class7
4axle
Class7
5axle
Class8
3axle
Class8
4axle a
Class8
4axle b
Class9
5axle a
Class9
5axle b
Class10
6axle
Class10
7axle
Class11
5axle
Class12
6axle
Class13
7axle a
Class13
7axle b
Class14
5axle
32 577.2 197.9 313.8 233.8 316.9 441.6 480.0 228.9 375.2 306.7 367.7 407.4 565.6 596.3 273.8 438.1 548.0 412.7 297.4
36 675.0 229.8 358.3 274.0 374.9 520.8 569.5 282.1 440.4 358.7 436.0 481.2 672.0 717.9 319.2 520.5 658.8 485.3 347.7
40 774.3 267.7 415.1 314.8 433.4 600.5 660.0 341.8 509.3 421.3 505.5 570.2 778.8 840.5 364.9 603.3 770.6 559.2 398.2
44 878.2 306.8 476.2 355.9 492.4 680.8 751.4 402.9 590.0 485.2 575.9 663.5 890.8 963.8 429.1 692.7 885.6 634.0 449.9
48 982.8 346.8 538.4 397.4 551.7 761.4 843.2 464.6 671.8 550.0 647.0 758.6 1010.8 1089.2 497.7 789.8 1011.8 709.3 512.2
52 1088.0 387.7 601.4 439.3 611.1 842.3 935.5 526.7 754.3 618.7 718.6 855.1 1132.0 1226.3 567.5 888.3 1138.9 785.2 575.6
56 1193.6 429.0 665.0 481.4 670.8 923.3 1028.0 589.3 837.5 696.0 790.5 968.3 1254.2 1364.5 641.1 987.8 1266.8 878.6 639.8
60 1299.5 470.6 729.1 523.6 730.5 1004.5 1120.8 652.1 921.1 774.7 869.6 1087.3 1377.0 1503.5 724.7 1088.1 1395.3 993.1 712.1
64 1405.7 512.6 793.5 565.9 790.4 1085.8 1213.9 715.2 1005.1 854.5 981.3 1207.1 1500.5 1643.1 809.7 1188.9 1524.2 1116.0 791.1
68 1528.5 554.9 858.2 608.3 850.3 1167.2 1307.3 778.5 1089.3 935.2 1094.9 1327.6 1624.3 1783.1 895.8 1300.8 1653.5 1241.3 871.2
72 1678.4 597.3 923.2 650.7 910.4 1248.8 1400.9 841.9 1173.8 1016.6 1210.0 1448.7 1748.7 1923.7 982.9 1419.8 1783.2 1370.3 951.7
76 1844.9 639.9 988.4 693.2 970.5 1330.3 1494.6 905.5 1258.5 1098.5 1326.3 1570.2 1873.2 2064.6 1081.0 1540.3 1913.1 1502.2 1032.5
80 2022.6 682.7 1053.8 735.8 1030.6 1412.0 1588.4 969.2 1343.4 1180.9 1443.6 1692.1 1998.0 2205.7 1189.3 1661.5 2043.1 1635.0 1113.7
84 2203.4 725.8 1119.3 778.4 1090.8 1493.6 1682.2 1033.0 1428.4 1263.7 1561.7 1814.3 2123.1 2347.1 1298.3 1783.1 2173.4 1768.6 1195.1
88 2386.8 769.0 1185.1 821.0 1151.0 1575.3 1776.1 1096.9 1513.6 1347.0 1680.6 1936.9 2248.4 2488.7 1407.8 1905.2 2303.8 1902.9 1276.7
92 2572.4 812.2 1251.0 863.6 1181.1 1657.1 1870.1 1160.8 1598.8 1430.9 1800.1 2059.7 2373.7 2630.5 1517.9 2027.6 2434.4 2037.8 1358.5
96 2760.0 855.6 1317.0 906.3 1271.5 1738.8 1964.1 1224.9 1684.1 1515.1 1920.1 2182.9 2499.3 2772.4 1628.4 2150.4 2565.0 2173.2 1440.5
100 2951.9 899.0 1383.0 949.1 1331.7 1820.6 2058.1 1289.0 1769.5 1599.5 2040.6 2306.0 2624.8 2914.3 1739.4 2273.5 2695.8 2309.1 1522.6
104 3146.4 942.5 1449.2 992.0 1392.0 1902.5 2152.2 1353.1 1855.0 1684.1 2161.5 2429.6 2750.7 3056.7 1850.6 2396.8 2826.7 2445.2 1604.9
108 3341.7 986.1 1515.4 1034.9 1452.4 1984.3 2246.4 1417.2 1940.6 1769.0 2282.8 2553.1 2876.5 3199.0 1962.3 2520.3 2957.6 2582.2 1687.2
112 3537.9 1029.6 1581.7 1077.8 1512.7 2066.2 2340.6 1481.4 2026.1 1853.8 2404.3 2676.8 3002.5 3341.4 2074.1 2644.0 3088.7 2719.3 1769.7
116 3734.9 1073.3 1648.0 1120.8 1573.1 2148.1 2434.8 1545.7 2111.8 1939.0 2526.3 2800.6 3128.5 3483.9 2186.1 2768.0 3219.7 2856.8 1852.3
120 3932.7 1116.9 1714.4 1163.7 1633.4 2230.0 2529.0 1610.0 2197.5 2024.2 2648.3 2924.5 3254.5 3626.4 2298.5 2892.0 3350.9 2994.5 1934.9
124 4131.0 1160.6 1780.8 1206.7 1693.8 2311.9 2623.2 1674.2 2283.1 2109.5 2770.7 3048.5 3380.6 3769.0 2411.1 3016.3 3482.1 3132.5 2017.7
128 4330.0 1204.3 1847.2 1249.6 1754.2 2393.8 2717.5 1738.5 2368.9 2194.9 2893.2 3172.6 3506.8 3911.7 2523.7 3140.5 3613.3 3270.6 2100.5
132 4529.5 1248.1 1913.7 1292.6 1814.6 2475.8 2811.7 1802.9 2454.7 2280.4 3015.9 3296.7 3632.9 4054.4 2636.6 3265.0 3744.6 3409.0 2183.3
136 4729.4 1291.8 1980.2 1335.6 1875.0 2557.7 2906.0 1867.3 2540.6 2366.0 3138.7 3420.8 3759.2 4197.2 2749.7 3389.5 3876.0 3547.5 2266.2
140 4929.8 1335.6 2046.7 1378.6 1935.4 2639.6 3000.3 1931.7 2626.4 2451.6 3261.7 3545.1 3885.5 4340.0 2862.8 3514.1 4007.3 3686.1 2349.2

57
Table 4.4(b) Peak negative moments in two-span girders by overweight vehicles (kips-ft)
Span
(ft)
Wis.
SPV
Class4
2axle
Class4
3axle
Class5
2axle
Class6
3axle
Class7
4axle
Class7
5axle
Class8
3axle
Class8
4axle a
Class8
4axle b
Class9
5axle a
Class9
5axle b
Class10
6axle
Class10
7axle
Class11
5axle
Class12
6axle
Class13
7axle a
Class13
7axle b
Class14
5axle
32 -469.3 -153.7 -229.1 -144.1 -206.7 -273.5 -298.1 -195.2 -258.6 -270.5 -339.9 -334.1 -378.8 -410.8 -281.3 -307.0 -368.6 -404.3 -213.0
36 -547.7 -164.0 -244.9 -150.6 -219.4 -291.5 -316.8 -211.9 -276.7 -292.5 -371.3 -360.6 -409.3 -448.3 -308.7 -335.6 -397.3 -441.6 -228.9
40 -620.5 -174.0 -260.6 -156.4 -231.1 -308.2 -334.3 -228.4 -293.6 -314.3 -409.7 -394.2 -438.3 -485.7 -334.0 -365.4 -432.0 -479.6 -243.6
44 -688.0 -183.2 -276.3 -161.7 -241.8 -323.8 -350.8 -244.8 -309.6 -336.0 -448.4 -427.5 -465.9 -522.6 -357.1 -393.3 -466.3 -519.6 -257.4
48 -760.7 -191.6 -292.0 -166.6 -251.7 -338.3 -366.5 -261.1 -324.8 -357.6 -484.6 -460.5 -496.7 -559.3 -378.5 -419.7 -500.4 -556.9 -274.8
52 -831.6 -199.3 -307.8 -177.7 -260.8 -351.9 -386.0 -277.2 -347.1 -379.0 -518.3 -493.2 -528.9 -595.7 -398.3 -445.5 -534.4 -592.3 -297.5
56 -898.1 -206.5 -323.4 -188.7 -269.5 -364.8 -410.3 -293.2 -369.1 -400.3 -550.2 -525.7 -560.6 -631.8 -426.6 -478.6 -567.9 -627.4 -319.1
60 -960.5 -213.0 -338.3 -199.6 -278.0 -384.6 -434.3 -309.1 -391.0 -421.5 -581.5 -558.0 -592.2 -667.7 -455.7 -510.5 -601.4 -662.3 -339.6
64 -1019.2 -219.0 -352.4 -210.5 -293.2 -405.0 -458.1 -325.1 -412.9 -442.7 -612.7 -590.0 -623.8 -703.6 -483.6 -541.2 -634.6 -697.2 -358.9
68 -1074.3 -224.7 -365.5 -221.2 -308.4 -425.4 -481.9 -340.9 -434.6 -463.8 -643.8 -621.9 -655.3 -739.1 -509.9 -570.7 -667.7 -731.9 -377.2
72 -1126.3 -229.9 -378.0 -231.9 -323.5 -445.7 -505.6 -356.6 -456.2 -484.8 -674.8 -653.6 -686.6 -774.5 -534.9 -599.5 -700.8 -766.5 -394.7
76 -1175.1 -234.8 -389.6 -242.6 -338.5 -465.8 -528.9 -372.1 -477.7 -505.7 -705.5 -685.1 -717.6 -809.8 -558.7 -626.9 -733.4 -800.8 -411.0
80 -1221.2 -239.3 -400.8 -253.2 -353.5 -485.8 -552.3 -386.9 -499.0 -526.6 -736.1 -716.4 -748.6 -845.0 -581.1 -653.5 -765.9 -835.1 -426.7
84 -1264.7 -247.4 -411.3 -263.8 -368.4 -505.8 -575.5 -401.0 -519.6 -547.0 -765.3 -747.2 -779.4 -880.0 -602.6 -679.4 -798.4 -869.3 -441.5
88 -1305.9 -259.0 -421.1 -274.4 -383.2 -525.8 -598.7 -414.5 -539.3 -566.3 -793.1 -776.6 -809.4 -915.0 -623.0 -704.5 -830.8 -903.5 -455.6
92 -1344.9 -270.5 -430.6 -284.9 -398.0 -545.7 -621.9 -427.2 -558.2 -584.7 -819.5 -804.6 -837.7 -949.5 -642.4 -728.9 -863.2 -937.4 -469.1
96 -1381.9 -281.9 -439.7 -295.4 -412.8 -565.5 -644.8 -439.3 -576.3 -602.0 -844.7 -831.2 -864.7 -982.4 -660.9 -752.6 -895.1 -969.9 -481.9
100 -1417.0 -293.3 -448.2 -305.8 -427.5 -585.3 -667.8 -450.9 -593.8 -618.5 -868.4 -856.5 -890.2 -1013.6 -678.5 -775.6 -925.8 -1000.9 -494.1
104 -1450.2 -304.5 -457.8 -316.2 -442.2 -605.0 -690.8 -462.0 -610.6 -634.1 -891.4 -880.8 -914.7 -1043.7 -695.3 -798.2 -955.3 -1030.5 -505.9
108 -1482.2 -315.7 -474.8 -326.6 -456.9 -624.7 -713.7 -472.5 -626.9 -648.9 -912.8 -903.9 -937.8 -1072.0 -711.3 -820.1 -983.6 -1058.6 -517.2
112 -1511.9 -326.9 -491.6 -337.0 -471.4 -644.4 -736.4 -482.7 -642.5 -663.2 -933.5 -925.8 -959.9 -1099.4 -726.7 -841.8 -1010.9 -1085.3 -527.9
116 -1540.8 -338.1 -508.4 -347.4 -486.0 -664.1 -759.2 -492.5 -657.6 -676.5 -953.3 -947.1 -981.0 -1125.1 -741.4 -862.9 -1037.1 -1111.0 -548.5
120 -1568.2 -349.2 -525.2 -357.7 -500.6 -683.7 -781.9 -501.8 -676.5 -689.6 -972.2 -967.2 -1007.2 -1150.1 -755.6 -883.5 -1062.6 -1135.5 -571.6
124 -1594.4 -360.2 -541.9 -368.1 -515.1 -703.3 -804.6 -516.2 -698.1 -701.7 -990.2 -986.4 -1038.6 -1173.9 -771.6 -903.6 -1086.8 -1158.9 -594.6
128 -1619.3 -371.3 -558.5 -378.4 -529.5 -722.9 -827.2 -532.6 -719.6 -713.5 -1007.6 -1005.1 -1069.8 -1198.5 -793.0 -923.6 -1110.4 -1181.3 -617.5
132 -1643.3 -382.2 -575.2 -388.7 -544.0 -742.4 -849.8 -548.8 -741.1 -724.8 -1024.2 -1022.8 -1101.0 -1234.2 -814.1 -957.4 -1141.0 -1203.0 -640.1
136 -1666.4 -393.1 -591.7 -399.0 -558.5 -761.9 -872.4 -565.1 -762.4 -735.6 -1040.3 -1039.9 -1132.1 -1269.5 -834.5 -991.1 -1173.5 -1223.5 -662.7
140 -1688.3 -404.0 -608.2 -409.2 -573.0 -781.4 -895.0 -581.2 -783.8 -752.2 -1055.6 -1063.0 -1163.3 -1304.8 -854.9 -1024.7 -1205.9 -1243.4 -685.2

58
Table 4.4(c) Peak shear in two-span girders by overweight vehicles (kips)
Span
(ft)
Wis.
SPV
Class4
2axle
Class4
3axle
Class5
2axle
Class6
3axle
Class7
4axle
Class7
5axle
Class8
3axle
Class8
4axle a
Class8
4axle b
Class9
5axle a
Class9
5axle b
Class10
6axle
Class10
7axle
Class11
5axle
Class12
6axle
Class13
7axle a
Class13
7axle b
Class14
5axle
32 105.01 39.09 57.90 44.57 60.98 82.20 90.62 46.66 70.65 60.84 71.84 84.64 106.05 114.48 53.40 83.53 103.49 78.03 55.64
36 107.45 40.25 59.72 45.16 61.94 83.53 92.48 47.72 71.69 62.62 73.92 88.15 108.24 117.68 55.74 85.23 106.47 80.23 57.86
40 109.56 41.26 61.30 45.68 62.76 84.68 94.08 50.01 72.57 64.16 75.94 91.18 110.38 120.43 58.65 86.68 109.05 82.30 59.79
44 111.81 42.14 62.68 46.12 63.48 85.67 95.48 52.01 73.33 66.26 77.69 93.81 113.36 122.82 61.20 87.93 111.28 84.07 61.47
48 113.78 42.91 63.89 46.51 64.12 86.55 96.71 53.77 75.03 68.85 79.21 96.12 116.00 124.91 63.44 90.22 113.23 85.60 62.95
52 115.88 43.59 64.97 46.86 64.68 87.33 97.79 55.33 76.88 71.16 80.52 98.16 118.34 126.75 65.42 92.72 114.95 86.92 64.26
56 117.73 44.20 65.93 47.17 65.17 88.01 98.75 56.73 78.53 73.22 81.67 99.96 120.42 128.56 67.18 94.93 116.94 88.41 65.41
60 119.71 44.74 66.79 47.44 65.61 88.63 99.62 57.98 80.00 75.08 82.78 101.56 122.30 131.12 70.05 96.92 119.38 92.16 66.44
64 121.46 45.23 67.57 47.69 66.01 89.18 100.39 59.10 81.34 76.75 85.26 103.00 123.98 133.43 72.65 98.69 121.57 95.56 67.36
68 123.03 45.66 68.27 47.91 66.37 89.69 101.09 60.11 82.54 78.27 87.50 104.29 125.51 135.52 75.00 100.29 123.55 98.63 68.19
72 124.41 46.06 68.91 48.11 66.70 90.14 101.73 61.03 83.63 79.65 89.54 105.46 126.90 137.42 77.14 101.74 125.35 101.44 68.94
76 126.35 46.42 69.48 48.30 67.00 90.56 102.31 61.87 84.62 80.90 91.39 106.51 128.16 139.14 79.08 103.05 126.99 103.99 69.62
80 130.98 46.75 70.01 48.47 67.27 90.93 102.84 62.64 85.53 82.05 93.08 107.47 129.31 140.73 80.86 104.24 128.49 106.33 70.23
84 135.25 47.06 70.50 48.62 67.52 91.28 103.33 63.34 86.37 83.11 94.95 108.34 130.37 142.18 82.49 105.33 129.86 109.20 70.79
88 139.21 47.33 70.94 48.76 67.75 91.60 103.77 63.98 87.14 84.08 97.44 109.50 131.35 143.52 83.99 106.33 131.13 111.89 71.30
92 142.87 47.59 71.35 48.89 67.96 91.90 104.19 64.58 87.84 84.97 99.74 111.27 132.25 144.75 85.36 107.24 132.29 114.39 71.77
96 146.27 47.83 71.73 49.01 68.16 92.17 104.57 65.13 88.50 85.80 101.88 112.92 133.09 145.90 86.64 108.09 133.37 116.70 72.21
100 149.93 48.05 72.09 49.13 68.34 92.43 104.92 65.64 89.11 86.57 103.86 114.44 133.86 146.95 87.82 108.87 134.38 118.85 72.61
104 153.81 48.25 72.41 49.23 68.51 92.66 105.26 66.11 89.67 87.28 105.71 115.86 134.58 147.94 88.91 109.59 135.31 120.85 72.98
108 157.44 48.44 72.72 49.33 68.67 92.88 105.56 66.55 90.20 87.95 107.44 117.18 135.25 148.86 89.93 110.26 136.17 122.71 73.32
112 160.84 48.62 73.00 49.42 68.82 93.09 105.85 66.96 90.69 88.57 109.05 118.42 135.87 149.71 90.87 110.88 136.99 124.46 73.63
116 164.03 48.78 73.27 49.50 68.96 93.28 106.12 67.35 91.15 89.15 110.55 119.57 136.46 150.52 91.76 111.47 137.74 126.08 73.93
120 167.02 48.94 73.52 49.58 69.09 93.46 106.37 67.71 91.58 89.69 111.97 120.65 137.01 151.27 92.58 112.01 138.46 127.62 74.20
124 169.84 49.08 73.75 49.66 69.21 93.63 106.61 68.05 91.98 90.20 113.30 121.67 137.53 151.98 93.36 112.51 139.12 129.05 74.95
128 172.50 49.22 73.97 49.73 69.32 93.79 106.83 68.36 92.36 90.68 114.55 122.62 138.01 152.64 94.35 113.00 139.75 130.41 75.81
132 175.00 49.35 74.18 49.80 69.43 93.95 107.04 68.66 92.72 91.13 115.72 123.52 138.47 153.27 95.79 114.25 140.34 131.68 76.62
136 177.36 49.47 74.37 49.86 69.53 94.09 107.24 68.95 93.06 91.56 116.84 124.37 138.90 153.86 97.14 115.42 140.90 132.88 77.38
140 179.60 49.59 74.56 49.92 69.63 94.22 107.43 69.21 93.38 91.96 117.88 125.18 139.31 154.41 98.43 116.53 141.42 134.01 78.10

59
Three-span simply supported girders
The maximum moments and shear in three-span simply-supported girders with various span
lengths by the 18 representative vehicles are shown in Fig. 4.28, and the R-values in Fig. 4.29.
The three representative vehicles caused larger positive moments than Wis-SPV in almost all
spans as shown in Table 4.5.
20 40 60 80 100 120 140-4000
-2000
0
2000
4000
6000
Peak
mo
men
t (k
ips-
ft)
20 40 60 80 100 120 140-400
-200
0
200
400
Beam spans (ft)
Peak
sh
ear
(kip
s)
Fig. 4.27 Peak moment/shear values for overweight vehicles on three-span girders
20 40 60 80 100 120 140-2
-1
0
1
2
R-v
alu
es
(mo
men
t)
20 40 60 80 100 120 140-2
-1
0
1
2
Beam spans (ft)
R-v
alu
es
(sh
ear)
Fig. 4.28 R-values for overweight vehicles on three-span girders
Wis-SPV
Wis-SPV
Wis-SPV

60
Table 4.5(a) Peak positive moments in three-span girders by overweight vehicles (kips-ft)
Span
(ft)
Wis.
SPV
Class4
2axle
Class4
3axle
Class5
2axle
Class6
3axle
Class7
4axle
Class7
5axle
Class8
3axle
Class8
4axle a
Class8
4axle b
Class9
5axle a
Class9
5axle b
Class10
6axle
Class10
7axle
Class11
5axle
Class12
6axle
Class13
7axle a
Class13
7axle b
Class14
5axle
32 528.0 183.3 287.9 211.0 283.9 396.4 429.2 206.4 337.6 287.2 335.6 365.3 503.9 526.8 247.6 390.7 484.8 383.0 268.3
36 575.6 195.5 309.8 230.5 312.1 435.1 472.7 225.7 369.5 307.4 362.7 401.2 556.1 586.2 269.9 431.1 538.9 410.7 293.0
40 622.1 209.2 331.7 250.3 340.6 473.9 516.6 248.5 401.6 326.5 396.0 437.4 608.5 646.0 292.3 471.6 593.3 442.6 317.8
44 667.4 227.1 353.7 270.2 369.2 513.0 560.9 277.2 433.7 353.8 429.7 473.9 661.0 706.1 314.7 512.3 648.0 478.5 342.6
48 713.1 245.5 380.2 290.2 398.0 552.2 605.4 306.4 466.1 384.3 463.7 516.9 713.7 766.4 337.3 553.0 703.0 514.7 367.5
52 763.4 264.3 409.7 310.4 426.9 591.6 650.1 336.1 501.8 415.2 498.0 561.8 766.4 826.9 359.9 593.9 758.2 551.2 392.5
56 814.5 283.4 439.5 330.7 456.0 631.1 695.1 365.9 541.3 446.5 532.6 607.4 819.3 887.7 389.5 635.1 813.6 587.9 417.5
60 865.7 302.7 469.6 351.0 485.1 670.7 740.3 396.0 581.1 478.1 567.4 653.5 877.5 948.5 422.5 682.2 871.2 624.8 443.5
64 917.2 322.3 500.1 371.5 514.2 710.3 785.5 426.3 621.3 509.8 602.4 700.1 936.3 1009.5 455.9 729.9 933.1 661.9 473.9
68 968.8 342.0 530.8 392.0 543.5 750.1 830.9 456.7 661.6 541.8 637.5 747.1 995.5 1071.8 489.7 777.9 995.4 699.1 504.7
72 1020.4 361.9 561.7 412.5 572.8 789.9 876.4 487.2 702.1 574.0 672.6 794.5 1055.0 1139.0 523.8 826.2 1057.8 736.4 535.8
76 1072.3 382.1 592.8 433.1 602.2 829.9 922.0 517.9 742.9 609.8 708.0 842.2 1114.8 1206.7 558.3 874.9 1120.5 773.9 567.1
80 1124.3 402.4 624.1 453.7 631.6 869.9 967.7 548.6 783.8 647.5 743.4 893.0 1174.9 1274.6 593.0 923.8 1183.5 813.9 598.6
84 1176.4 422.8 655.5 474.6 661.1 909.9 1013.4 579.5 824.8 685.7 778.9 951.2 1235.2 1342.7 631.4 972.9 1246.5 866.0 630.3
88 1228.5 443.3 687.1 495.4 690.6 950.0 1059.2 610.4 866.0 724.2 814.5 1009.6 1295.7 1411.0 672.1 1022.2 1309.7 919.2 662.1
92 1280.8 463.9 718.7 516.2 720.1 990.1 1105.1 641.4 907.2 763.0 855.9 1068.2 1356.3 1479.5 713.4 1071.7 1373.1 978.4 700.0
96 1333.2 484.6 750.4 537.1 749.6 1030.2 1151.0 672.4 948.6 802.2 910.2 1127.1 1417.1 1548.4 754.9 1121.3 1436.6 1038.2 739.0
100 1385.6 505.3 782.2 558.0 779.2 1070.4 1151.0 703.5 990.0 841.5 965.2 1186.1 1478.0 1617.4 796.8 1171.0 1500.2 1098.8 778.2
104 1439.0 526.2 814.2 578.9 808.8 1110.5 1242.9 734.7 1031.6 881.2 1020.7 1245.4 1539.0 1686.5 839.0 1222.9 1563.8 1160.1 817.5
108 1507.7 547.0 846.1 599.9 838.4 1150.8 1288.9 765.9 1073.2 921.0 1076.5 1304.9 1600.2 1755.8 881.6 1280.7 1627.6 1221.8 856.9
112 1577.8 568.0 878.2 620.9 868.0 1191.0 1335.0 797.2 1114.8 961.0 1132.8 1364.7 1661.5 1825.2 924.3 1338.9 1691.5 1284.0 896.5
116 1655.1 588.9 910.3 641.8 897.7 1231.3 1381.2 828.5 1156.5 1001.2 1189.5 1424.6 1722.9 1894.7 967.3 1397.3 1755.4 1347.4 936.1
120 1733.1 609.9 942.5 662.8 927.3 1271.6 1427.3 859.9 1198.3 1041.5 1246.4 1484.5 1784.3 1964.2 1010.5 1456.2 1819.6 1412.1 975.9
124 1818.0 631.0 974.7 683.9 957.0 1311.9 1473.4 891.4 1240.2 1082.0 1303.7 1544.7 1845.8 2033.9 1061.2 1515.7 1883.8 1477.1 1015.7
128 1904.5 652.0 1006.9 704.9 986.7 1352.2 1519.6 922.8 1282.0 1122.6 1361.2 1604.8 1907.4 2103.6 1114.3 1575.2 1948.0 1542.4 1055.7
132 1991.9 673.2 1039.2 725.9 1016.4 1392.5 1565.8 954.3 1323.9 1163.3 1419.1 1665.2 1969.0 2173.3 1167.5 1635.0 2012.3 1607.9 1095.7
136 2080.0 694.3 1071.5 747.0 1046.1 1432.8 1612.1 985.8 1365.9 1204.1 1477.1 1725.5 2030.8 2243.1 1221.0 1694.8 2076.6 1673.6 1135.8
140 2169.0 715.5 1103.9 768.0 1075.8 1473.2 1658.4 1017.3 1407.8 1245.1 1535.4 1785.9 2092.5 2313.0 1274.6 1754.7 2141.0 1739.5 1175.9

61
Table 4.5(b) Peak negative moments in three-span girders by overweight vehicles (kips-ft)
Span
(ft)
Wis.
SPV
Class4
2axle
Class4
3axle
Class5
2axle
Class6
3axle
Class7
4axle
Class7
5axle
Class8
3axle
Class8
4axle a
Class8
4axle b
Class9
5axle a
Class9
5axle b
Class10
6axle
Class10
7axle
Class11
5axle
Class12
6axle
Class13
7axle a
Class13
7axle b
Class14
5axle
32 -430.7 -148.0 -226.3 -141.3 -205.3 -275.2 -305.5 -190.6 -262.7 -257.9 -316.8 -317.2 -390.0 -412.2 -264.3 -312.6 -374.8 -377.0 -213.8
36 -504.5 -157.9 -241.9 -148.2 -218.9 -294.4 -325.8 -207.3 -282.3 -278.7 -348.1 -342.5 -422.8 -452.3 -290.9 -338.8 -409.6 -414.1 -230.7
40 -574.7 -167.8 -257.5 -154.5 -231.3 -312.4 -345.1 -223.7 -300.8 -299.3 -384.8 -375.4 -454.2 -490.7 -315.7 -368.4 -443.1 -451.2 -246.6
44 -640.8 -177.4 -273.0 -165.7 -242.9 -329.3 -363.2 -240.0 -318.2 -319.7 -424.0 -407.9 -484.1 -527.6 -338.7 -398.0 -475.0 -490.9 -261.5
48 -708.6 -186.2 -288.6 -177.6 -253.7 -345.1 -385.5 -256.2 -334.7 -340.1 -460.9 -440.1 -512.9 -563.1 -360.1 -426.2 -505.9 -528.8 -275.6
52 -775.6 -194.3 -304.2 -189.4 -263.7 -366.0 -411.5 -272.2 -350.5 -360.5 -495.6 -472.2 -540.7 -597.6 -379.9 -452.8 -535.8 -564.3 -293.0
56 -839.3 -201.8 -319.6 -201.1 -279.9 -388.1 -437.3 -288.1 -368.1 -380.7 -528.1 -504.0 -567.3 -630.6 -404.7 -487.0 -564.6 -598.3 -313.7
60 -900.1 -208.7 -335.1 -212.8 -296.3 -410.0 -463.0 -303.9 -390.3 -400.8 -559.1 -535.4 -593.2 -662.8 -434.4 -521.2 -595.3 -632.1 -333.8
64 -959.0 -215.2 -350.0 -224.4 -312.6 -431.8 -488.4 -319.7 -412.3 -420.8 -589.5 -566.7 -618.3 -694.1 -462.9 -554.2 -628.6 -665.7 -353.2
68 -1014.7 -221.2 -364.1 -235.9 -328.8 -453.5 -513.8 -335.4 -434.3 -440.9 -619.9 -597.8 -642.8 -724.7 -490.1 -586.0 -661.7 -699.3 -371.9
72 -1067.2 -226.8 -377.4 -247.3 -344.9 -475.2 -539.0 -351.1 -456.2 -460.9 -650.2 -628.8 -666.8 -754.7 -516.2 -616.9 -694.8 -732.7 -390.1
76 -1117.2 -238.9 -390.0 -258.7 -360.9 -496.6 -563.9 -366.6 -477.8 -480.8 -680.1 -659.6 -697.9 -783.6 -540.9 -646.8 -727.5 -765.9 -407.4
80 -1164.4 -251.4 -402.1 -270.0 -376.9 -518.0 -588.8 -382.1 -499.4 -500.6 -710.0 -690.1 -733.0 -814.7 -564.4 -675.8 -760.1 -799.0 -424.4
84 -1209.1 -263.8 -413.4 -281.3 -392.8 -539.4 -613.7 -397.1 -520.9 -520.4 -739.8 -720.6 -767.7 -852.1 -586.9 -704.0 -792.6 -832.1 -440.8
88 -1251.5 -276.1 -424.2 -292.6 -408.6 -560.7 -638.4 -411.3 -542.0 -539.9 -768.8 -750.7 -802.4 -891.8 -608.4 -731.4 -827.9 -865.1 -456.8
92 -1291.7 -288.5 -434.7 -303.8 -424.4 -581.9 -663.1 -424.8 -562.2 -558.5 -796.5 -779.8 -836.9 -931.2 -628.9 -758.0 -864.1 -898.0 -472.4
96 -1330.0 -300.6 -451.7 -315.0 -440.1 -603.1 -687.6 -437.9 -581.7 -576.2 -822.8 -807.5 -871.1 -970.3 -648.6 -784.0 -900.1 -930.8 -487.5
100 -1366.4 -312.7 -470.0 -326.1 -455.9 -624.1 -687.6 -450.4 -605.2 -593.0 -848.0 -834.1 -905.2 -1009.4 -667.3 -809.4 -935.8 -962.8 -502.3
104 -1400.9 -324.7 -488.2 -337.2 -471.6 -645.2 -736.6 -462.3 -628.6 -609.1 -872.2 -859.6 -939.2 -1048.4 -685.3 -834.2 -971.3 -993.5 -516.8
108 -1434.3 -336.6 -506.3 -348.3 -487.2 -666.2 -761.1 -479.9 -652.0 -624.3 -894.9 -883.8 -973.2 -1087.0 -704.4 -858.3 -1006.8 -1022.8 -534.8
112 -1465.3 -348.6 -524.3 -359.4 -502.8 -687.2 -785.4 -497.8 -675.4 -639.0 -917.0 -907.1 -1006.9 -1125.4 -730.3 -881.9 -1042.2 -1050.6 -559.9
116 -1495.7 -360.5 -542.2 -370.5 -518.3 -708.2 -809.6 -515.4 -698.5 -657.4 -938.1 -929.6 -1040.6 -1163.8 -755.4 -905.1 -1077.3 -1077.5 -584.9
120 -1524.3 -372.4 -560.1 -381.5 -533.8 -729.1 -833.9 -532.9 -721.5 -681.9 -958.3 -958.0 -1074.2 -1202.1 -780.1 -927.8 -1112.3 -1103.3 -609.5
124 -1551.8 -384.2 -577.9 -392.5 -549.3 -750.0 -858.1 -550.5 -744.5 -706.2 -977.6 -993.6 -1107.6 -1240.2 -804.1 -950.3 -1147.3 -1127.8 -634.1
128 -1578.1 -396.0 -595.7 -403.5 -564.7 -770.9 -882.2 -568.0 -767.4 -730.4 -996.3 -1028.9 -1140.9 -1278.2 -827.7 -984.8 -1182.2 -1151.5 -658.5
132 -1603.3 -407.6 -613.4 -414.5 -580.2 -791.8 -906.3 -585.3 -790.3 -754.5 -1014.2 -1063.9 -1174.2 -1316.2 -850.6 -1021.0 -1216.9 -1174.3 -682.7
136 -1627.7 -419.2 -631.1 -425.5 -595.6 -812.5 -930.4 -602.6 -813.1 -778.5 -1031.5 -1098.8 -1207.4 -1353.9 -873.3 -1057.0 -1251.5 -1196.1 -706.8
140 -1650.9 -430.9 -648.7 -436.4 -611.1 -833.3 -954.5 -619.9 -835.9 -802.3 -1048.1 -1133.7 -1240.6 -1391.6 -895.2 -1092.9 -1286.1 -1217.2 -730.8

62
Table 4.5(c) Peak shear in three-span girders by overweight vehicles (kips)
Span
(ft)
Wis.
SPV
Class4
2axle
Class4
3axle
Class5
2axle
Class6
3axle
Class7
4axle
Class7
5axle
Class8
3axle
Class8
4axle a
Class8
4axle b
Class9
5axle a
Class9
5axle b
Class10
6axle
Class10
7axle
Class11
5axle
Class12
6axle
Class13
7axle a
Class13
7axle b
Class14
5axle
32 105.43 39.20 58.09 44.70 61.20 82.55 91.05 46.39 70.49 61.05 71.79 84.48 106.19 114.72 52.91 83.47 103.75 77.64 55.44
36 107.68 40.38 59.91 45.30 62.15 83.88 92.91 47.95 71.54 62.84 73.65 88.02 108.39 117.94 55.46 85.18 106.76 79.62 57.67
40 109.66 41.39 61.50 45.81 62.98 85.02 94.51 50.25 72.43 64.39 75.43 91.09 110.94 120.71 58.38 86.65 109.35 81.46 59.61
44 111.64 42.27 62.89 46.26 63.70 86.01 95.90 52.27 73.33 66.51 77.01 93.75 113.93 123.11 60.95 87.91 111.59 83.09 61.31
48 113.41 43.05 64.12 46.65 64.33 86.88 97.12 54.04 75.42 69.12 78.41 96.09 116.57 125.21 63.21 90.19 113.56 84.52 62.81
52 115.21 43.74 65.20 46.99 64.89 87.65 98.20 55.62 77.28 71.45 79.64 98.15 118.92 127.06 65.21 92.70 115.29 85.77 64.13
56 116.84 44.34 66.17 47.30 65.38 88.33 99.16 57.02 78.93 73.53 80.74 99.97 121.00 129.27 67.00 94.94 117.63 88.57 65.30
60 118.51 44.89 67.03 47.57 65.82 88.94 100.02 58.27 80.41 75.40 82.72 101.59 122.88 131.83 69.90 96.94 120.07 92.37 66.34
64 120.03 45.38 67.80 47.82 66.21 89.49 100.78 59.40 81.74 77.08 85.24 103.04 124.56 134.14 72.53 98.73 122.26 95.80 67.28
68 121.45 45.81 68.51 48.04 66.57 89.99 101.48 60.42 82.95 78.61 87.51 104.35 126.08 136.23 74.91 100.34 124.24 98.92 68.12
72 123.22 46.21 69.14 48.24 66.90 90.44 102.11 61.34 84.04 79.99 89.58 105.53 127.47 138.13 77.08 101.80 126.04 101.75 68.88
76 126.89 46.57 69.72 48.42 67.19 90.84 102.68 62.18 85.03 81.26 91.46 106.59 128.73 139.85 79.05 103.12 127.67 104.33 69.57
80 131.56 46.90 70.24 48.58 67.46 91.21 103.20 62.94 85.94 82.41 93.18 107.56 129.88 141.43 80.85 104.32 129.17 106.83 70.19
84 135.88 47.20 70.73 48.73 67.70 91.56 103.68 63.64 86.77 83.47 95.41 108.45 130.93 142.88 82.51 105.43 130.54 109.77 70.76
88 139.87 47.48 71.17 48.87 67.93 91.87 104.12 64.29 87.53 84.44 97.92 110.13 131.90 144.21 84.03 106.43 131.80 112.49 71.28
92 143.56 47.74 71.58 49.00 68.14 92.16 104.53 64.88 88.24 85.34 100.24 111.90 132.80 145.44 85.42 107.36 132.96 115.00 71.76
96 146.99 47.97 71.96 49.12 68.33 92.43 104.90 65.43 88.89 86.17 102.39 113.55 133.62 146.58 86.71 108.21 134.03 117.32 72.19
100 150.67 48.19 72.31 49.23 68.51 92.68 104.90 65.94 89.49 86.93 104.39 115.08 134.39 147.63 87.91 109.00 135.03 119.48 72.60
104 154.59 48.39 72.64 49.33 68.68 92.91 105.58 66.41 90.05 87.65 106.25 116.50 135.11 148.61 89.01 109.72 135.95 121.49 72.97
108 158.25 48.58 72.94 49.43 68.83 93.13 105.88 66.85 90.58 88.31 107.98 117.82 135.77 149.52 90.04 110.40 136.81 123.37 73.32
112 161.68 48.76 73.22 49.52 68.98 93.33 106.16 67.25 91.06 88.93 109.61 119.06 136.39 150.37 91.00 111.02 137.61 125.12 73.64
116 164.89 48.92 73.48 49.60 69.11 93.52 106.42 67.63 91.52 89.51 111.12 120.21 136.97 151.16 91.89 111.61 138.37 126.75 73.94
120 167.91 49.07 73.73 49.68 69.24 93.69 106.67 67.99 91.94 90.05 112.54 121.29 137.51 151.91 92.73 112.16 139.07 128.29 74.51
124 170.75 49.22 73.96 49.75 69.36 93.86 106.90 68.33 92.34 90.56 113.87 122.30 138.02 152.60 93.51 112.67 139.73 129.73 75.42
128 173.42 49.35 74.18 49.82 69.47 94.02 107.12 68.64 92.72 91.04 115.13 123.26 138.49 153.26 94.91 113.70 140.35 131.09 76.28
132 175.94 49.48 74.38 49.89 69.58 94.16 107.33 68.94 93.07 91.49 116.31 124.15 138.95 153.88 96.36 114.95 140.93 132.36 77.08
136 178.31 49.60 74.58 49.95 69.68 94.30 107.52 69.22 93.41 91.91 117.42 125.00 139.37 154.46 97.72 116.12 141.48 133.56 77.84
140 180.56 49.71 74.76 50.01 69.77 94.43 107.71 69.48 93.72 92.31 118.47 125.80 139.77 155.01 99.01 117.23 142.00 134.70 78.56

63
Summary of the girder responses to representative vehicles
The positive moment / shear envelopes of the Wis-SPV were breached by the following three
representative vehicles all three types of girders (i.e., simply supported, 2-sapn continuous and 3-
span continuous girders). This is due to the fact that the variable spacings in these representative
vehicles all have a small lower bound (e.g., 4ft) such that the last five or six axles literally
becomes a heavy axle group. Considering the definitions of the two classes, it was very likely
that some nondivisable trucks had been recorded in Class 13 vehicles, and some single unit
trucks, potentially with multiple lift axles, had been recorded in Class 10 vehicles.
Meanwhile, it should be noted that heavy vehicles in other classes, the representative vehicles of
which did not show larger maximum girder response, could possibly cause large moments than
Wis-SPV. This is due to the fact that the representative were established to only represent top 5%
heavy vehicles in each class rather than representing the heaviest trucks. Hence, the
representative vehicles were quantified before being used for estimating the probability of the
heavy trucks cause larger bridge response than the Wis-SPV.
16' 4' 4' 4'4~37'
22 25 29 22 27 28
32~65'
Class 10 - 6 axle
GVW=153 k
16' 4' 4' 4'4~38'
21 26 29 23 25 25
36'~70'
4'
24
Class 10 - 7 axle
GVW=173 k
13'
20 22
34~71'
Class 13 - 7 axle a
GVW=159 k
23
3~40'
22
4'
24
6'
25
4'
23
4'
Evaluation of representative overloaded vehicles
To determine how closely the proposed representative vehicles represents the overweight
vehicles in the term of bridge girder responses. Fifty vehicles were randomly selected from the
vehicles that have top 5% of gross vehicle weight in each vehicle class/group. It was deemed that
heavier vehicles in a certain class/group would most likely produce larger girder responses
because the vehicle configurations are similar in the class/group. Girder analyses were conducted
for each randomly selected vehicle on two randomly selected girder spans. The representative
vehicles could then be positioned within the top 5% heaviest vehicles in each class/group by
comparing the obtained girder responses with that of the representative vehicle. The comparison
for the representative vehicle in Class 9, Type 3S2 vehicles is shown below in details to illustrate
the process. The comparison for other representative vehicles was tabulated in Table 4.6.

64
The girder responses of the randomly selected vehicles are plotted in Fig. 4.29, in which the
responses by the representative vehicle as shown in Fig. 4.15 for Type 3S2 vehicles are shown in
solid (blue) lines, the responses by the Wis-SPV are shown in black dashed lines, and the
randomly selected vehicles are shown in various marks. Due to the random nature of the
analyses, the selected vehicles covered the entire span range of interest though only two spans
were calculated for each vehicle. The girder responses of the selected vehicles closely followed
the responses of the representative vehicle, indicating that the representative vehicle had properly
represented the top 5% overweight vehicles.
20 40 60 80 100 120 1400
2000
4000
6000
8000
Span length (ft)
Max
Mo
men
t (k
ips-
ft)
20 40 60 80 100 120 14050
100
150
200
Span length (ft)
Max
shear
(kip
s)
20 40 60 80 100 120 140-5000
0
5000
Span length (ft)
Max
Mo
men
t (k
ips-
ft)
20 40 60 80 100 120 14050
100
150
200
250
Span length (ft)
Max
shear
(kip
s)
1-span girders
2-span girders
Wis-SPV
Representative vehicle
Wis-SPV
Representative vehicle

65
20 40 60 80 100 120 140-5000
0
5000
Span length (ft)
Max
Mo
men
t (k
ips-
ft)
20 40 60 80 100 120 14050
100
150
200
250
Span length (ft)
Max
shear
(kip
s)
Fig. 4.29 Comparison of randomly selected vehicles with the representative vehicle (Type 3S2)
The calculated responses for the randomly selected vehicles were divided by the responses of the
representative vehicles for the selected span lengths to get the response ratios. The responses
ratios for the maximum positive moments, the maximum negative moments, and the maximum
shear are shown in Fig. 4.30, and the last bar chart in the figure shows the distribution of the total
ratios. The mean ratios () and the standard deviations () are listed in Table 4.6 and shown on
the subfigures. Most distributions failed the Lilliefors normality tests, indicating that the
randomly generated responses may not be modeled as a normal distribution. However, a normal
distribution was shown in Fig. 4.30 for comparison purposes.
Similarly, the response distributions of the vehicles in the entire class/group may not be modeled
using a normal distribution using the sample mean ratio of and the sample standard deviation
of listed in table 4.6. However, normal distributions with the mean ratios of and the standard
deviations of were assumed to describe the statistical characteristics of the vehicles of the
entire class/group. An upper confidence bound (ucb in Fig. 4.30) for each representative vehicle
was calculated for each distribution as the cumulative distribution function corresponding to the
response ratio of 1.0. The upper confidence bound indicates that ucb% of the vehicles within the
top 5% gross vehicle weights in a class/group would cause girder responses less than that by the
representative vehicles in the class/group. For example, the representative vehicle for Class 9
Type 3S2 vehicles had an upper confidence bound of 84.7%, indicating that the representative
vehicle would envelop the positive moments by 84.7% vehicles in the top 5% of this class/group.
Note that an optimization procedure may be used to modify the representative vehicles such that
the obtained upper confidence bound for each representative vehicle can maintain constant.
3-span girders
Wis-SPV
Representative vehicle

66
0.8 1 1.2 1.40
0.05
0.1
0.15
0.2
positive moment ratio
pro
bab
ilit
y =0.924=0.078ucb=83.5%
0.8 1 1.2 1.40
0.05
0.1
0.15
0.2
negative moment ratio
=0.934=0.062ucb=85.7%
0.8 1 1.2 1.40
0.05
0.1
0.15
0.2
maximum shear ratio
pro
bab
ilit
y =0.928=0.068ucb=85.7%
0.8 1 1.2 1.40
0.05
0.1
0.15
0.2
overall ratio
=0.928=0.070ucb=84.7%
Fig. 4.30 Statistical evaluation of the representative vehicle for Class 9 (Type 3S2)
Table 4.6 summary of the statistical analysis of response ratios
Vehicles Positive moments Negative moments Maximum shear
ucb ucb ucb
Class 4 2-axle 1.004 0.086 48.3 1.006 0.084 47.0 1.013 0.088 44.3
Class 4 3-axle 0.984 0.091 57.1 0.998 0.104 50.7 1.002 0.092 49.1
Class 5 2-axle 0.983 0.101 56.7 1.012 0.109 45.5 1.006 0.099 47.5
Class 6 3-axle 0.959 0.122 63.1 0.983 0.122 55.4 0.979 0.116 57.3
Class 7 4-axle 0.886 0.074 93.8 0.911 0.074 88.5 0.910 0.073 89.1
Class 7 5-axle 0.956 0.124 63.9 0.970 0.126 59.3 0.967 0.127 60.2
Class 8 3-axle 0.968 0.166 57.5 1.000 0.140 50.0 1.009 0.171 48.0
Class 8 4-axle a 0.885 0.122 82.7 0.962 0.138 60.8 0.919 0.126 74.1
Class 8 4-axle b 0.907 0.133 75.7 0.979 0.133 56.3 0.925 0.125 72.7
Class 9 5-axle a 0.924 0.078 83.5 0.934 0.062 85.7 0.928 0.068 85.7
Class 9 5-axle b 0.786 0.067 99.9 0.900 0.078 90.0 0.830 0.070 99.3
Class 10 6-axle 0.722 0.113 99.3 0.880 0.095 89.6 0.808 0.125 93.8
Class 10 7-axle 0.785 0.098 98.6 0.933 0.094 76.4 0.861 0.111 89.4
Class 11 5-axle 1.011 0.054 41.7 1.002 0.042 48.3 1.000 0.047 49.9
Class 12 6-axle 0.755 0.099 99.3 0.912 0.058 93.5 0.848 0.093 94.9
Class 13 7-axle a 0.662 0.147 98.9 0.847 0.203 77.5 0.745 0.158 94.7
Class 13 7-axle b 0.974 0.173 56.0 0.983 0.173 53.8 0.976 0.162 55.8
Class 14 5-axle 0.878 0.072 95.5 0.908 0.051 96.4 0.905 0.062 93.7
The mean response ratios and the corresponding standard deviations are not same for the girder
internal forces (i.e., moments and shear). This indicates that some overloaded vehicles may cause
large positive moments, and the others may cause large negative moments depending upon their
configurations. To evaluate the representative vehicles, all responses ratios (including moment

67
and shear ratios) were used as shown in Table 4.7. The mean ratios and the standard deviations
for the combined samples were calculated similar to the analysis for individual internal forces.
The upper confidence bound is similar to those listed in Table 4.6. An ucb near 50% indicates
that the representative vehicles properly represent the top 5% overweight vehicles. The upper
confidence bounds near 90% indicate that the representative vehicles may overestimate the top
5% overweight vehicles.
Table 4.7 Evaluation of the representative vehicles Vehicle
(Class/group) ucb (%)
rep/spv
(250 k) poe (%)
# of
vehicles
# of
exceeds
rep/spv
(190 k) poe (%)
# of
exceeds
Class 4 2-axle 1.008 0.086 46.4 0.393 0.0 21064 0 0.517 0.0 0
Class 4 3-axle 0.994 0.095 52.4 0.585 0.0 20351 0 0.770 0.0 0
Class 5 2-axle 0.999 0.103 50.4 0.431 0.0 20069 0 0.567 0.0 0
Class 6 3-axle 0.973 0.120 59.0 0.585 0.0 78523 0 0.770 0.3 13
Class 7 4-axle 0.901 0.075 90.7 0.783 0.0 15988 0 1.030 17.6 141
Class 7 5-axle 0.964 0.125 61.4 0.870 7.0 36234 126 1.145 76.5 1385
Class 8 3-axle 0.991 0.163 52.1 0.526 0.0 5789 0 0.693 0.3 1
Class 8 4-axle a 0.917 0.131 73.7 0.728 0.0 18469 0 0.958 16.5 153
Class 8 4-axle b 0.932 0.133 69.6 0.660 0.0 9813 0 0.868 4.9 24
Class 9 5-axle a 0.928 0.070 84.7 0.747 0.0 889230 0 0.983 10.2 4536
Class 9 5-axle b 0.831 0.083 97.9 0.906 0.1 133972 2 1.192 46.4 3106
Class 10 6-axle 0.794 0.129 94.4 1.082 15.8 27574 217 1.424 76.1 1049
Class 10 7-axle 0.851 0.117 89.9 1.198 55.3 2552 71 1.576 96.7 123
Class 11 5-axle 1.005 0.049 46.1 0.626 0.0 28618 0 0.824 0.0 0
Class 12 6-axle 0.829 0.108 94.3 0.879 0.2 11011 1 1.156 37.0 204
Class 13 7-axle a 0.739 0.181 92.5 1.112 18.8 1116 11 1.463 62.1 35
Class 13 7-axle b 0.977 0.169 55.4 0.875 16.4 3463 28 1.152 74.0 128
Class 14 5-axle 0.896 0.065 94.6 0.593 0.0 115 0 0.780 0.0 0
Within a certain class/group, vehicles with a smaller gross vehicle weight than the representative
vehicle would cause smaller girder responses. Assuming a normal distribution for girder
responses by various vehicles, the probability of exceeding (poe) was calculated for the Wis-SPV
for each vehicle class/group. Similar to the calculation of the ucb values, a target response ratio
(i.e. the inverse of the tabulated values of rep/spv in Table 4.7) was needed for the probability of
exceeding. This ratio was determined using the maximum moments/shear calculated for the
representative vehicles listed in Tables 4.3 through 3.5 divided by the responses of the 250-kip
Wis-SPV for various girders. Note that these response ratios were rather random; hence the
maximum response ratios were used in the calculation of the probability of exceeding. Note that
the probability of exceeding indicates that poe% of top 5% over weight vehicles are likely to
cause larger girder responses than the Wis-SPV. Finally the estimated number of vehicles was
calculated by multiply the poe% by 5% of the total number of the vehicles in the class/group
(note that 2.5% was used for Class 9 vehicles). The total number of vehicles in each class/group
is shown in the first cell in the table of the statistical characteristics of the vehicles class/group.
In addition to the Class 10 and Class 13 vehicles, for which the representative vehicles caused
larger positive moments as shown in Tables 4.3 through 4.5, significant number of Class 7
vehicles (with 6 axles) may exceed the 250-kip Wisconsin Standard Permit Vehicle. The random
simulation for the Class 7 vehicles showed large variations. It is common that the exceeding
probability increases with an increase in standard deviation as shown in Appendix 1. Meanwhile,

68
the estimated situation may have reflected the real situation because Class 7 vehicles are short
single unit trucks: the representative is 26 ft long while has 113 kip gross weight. Hence, it is
possible to create large positive moments, and sometimes large negative moments.
The total number of estimated vehicles (note that a vehicle may cause multiple records in the
WIM data) was 456, which corresponding to 0.035% of total overweight vehicles (records).
These vehicles were examined next to reveal their common features.
The gross weight distribution of the randomly selected vehicles that caused larger responses than
the representative vehicles is shown in Fig. 4.31. Sixteen vehicles (records) had a gross weight
larger than 250 kips, and 266 vehicles (records) showed a gross weight larger than 170 kips.
These heavy vehicles (records) took a slightly higher percentage than the actual data because a
certain vehicle may be selected multiple times in the random process.
50 100 150 200 250 300 3500
50
100
150
200
250
217
75
74
246
76
125
70
62
119
139
85
56
55
70 74
21
16
8 6
0 0 0
6 4 0 0 2 4
Gross Weight (kips)
Nu
mb
er
of
veh
icle
s
Total 1610 vehicles: Max. 328.0479kips - Min. 50.0449kips
Fig. 4.31 gross weight distribution of the randomly selected vehicles
Examination of randomly selected heavy vehicles
Fifty vehicles were randomly selected to conduct the above evaluation analysis for each
representative vehicle on each simply-supported girder, resulting in 54 cases in total. Among the
total 2,700 randomly selected vehicles in the 54 cases, 1,610 vehicles caused larger girder
responses (i.e., positive moment, negative moment, or shear) than the representative vehicles. A
close look at these vehicles indicated that the vehicle configurations were similar to the
corresponding representative vehicles. Meanwhile almost all the 1,610 vehicles had a gross
vehicle weight higher than the representative vehicles. In addition most axle spacings, especially
the largest spacings were within the range of the variable spacings in the representative vehicles.
This observation actually validated the methodology used in this study.
A list of heavy vehicles in each class/group was identified as shown in Fig. 4.32 to demonstrate
the worst cases in permit vehicles in Wisconsin. Almost all these vehicles have a gross weight
larger than 80 kips except the 2-axle buses (trucks). Most vehicles have an outermost axle

69
spacing less than the legal length: trucks less than 50 ft and vehicle combinations less than 75 ft.
Most single axle weights are blow 40 kips except for some Class 8 trucks with three axles, which
have axle weights as large as 72 kips. The heavy rear axles actually reduced the load on the
steering axle such that the steering axle was only 1kip. This seemed unreasonable; however there
was no obvious evidence that they were error in the WIM records. The heaviest steering axle is
38 kips in single unit trucks while the steering axle weights were smaller in semi-trailers and
vehicle combinations.
Some Class 7 vehicles with 5 axles were particularly heavy (170 kips) and short, which would
cause large girder responses in both positive moments and the negative moments. The worst
Class 9 semi-trailers are slightly heavier than 170 kips, the upper limit for vehicles eligible for
multi-trip permits. The worst Class 10 semi-trailers weighed close to 200 kips; hence they may
need single-trip permits. Meanwhile, there were short vehicles in this class which might have
been due to a wrong vehicle classification though their axle configurations followed the same
pattern as the Type 3S3 and Type 3S4 vehicles. These short trucks were captured in the
representative vehicles, which were the major contributors to the large girders responses. Two
such trucks are shown in Fig. 4.31 with 200-kip gross weight as the worst possible cases. The
configuration of typical Type 3S2-2 vehicle combinations was not captured in the representative
vehicles. This might have been due to the fact that Class 13 also includes non-divisible permit
trucks/trailers, and the permit vehicles dominated the WIM records. Instead, the representative
vehicles in Class 13 captured two typical non-divisible permit trucks/trailers as shown at the
bottom of Fig. 4.31.
Class 10 - 6 axle
GVW=199 k
6' 5' 8' 5'9'
32 33 34 36 32 32
33'
25'
36 40
29'
Class 4 - 3 axle
GVW=107 k
31
4'21'
36 37
21'
Class 4 - 2 axle
GVW=73 k
18'
34 40
18'
Class 5 - 2 axle
GVW=74 k
15'
28 37
52'
Class 9 - 3S2
GVW=175 k
38
4'
36
29'
36
4' 13'
34 34
51'
Class 9 - 3S2 split
GVW=179 k
39
4'
34
24'
38
10'
14' 4' 4' 4'26'
26 34 33 35 33 32
52'
Class 10 - 3S3
GVW=193 k
17'
29 34
21'
Class 6 - 3 axle
GVW=101 k
38
4'
28'
18'
35 20
Class 7 - 4 axle
GVW=122 k
32
6'
35
4' 15'
38 20
29'
Class 7 - 5 axle
GVW=170 k
39
5'
40
4'
33
5'
11'
1 72
36'
Class 8 - 2S1
GVW=145 k
72
25' 17'
31 38
49'
Class 8 - 3S1
GVW=147 k
39
4'
39
28' 15'
31 37
52'
Class 8 - 2S2
GVW=144 k
39
4'
39
33'

70
16'
20 26
68'
Class 12 - 3S1-2
GVW=183 k
32
4~22'
38
9'
40
22'
27
4'15
19 28
71'
Class 13 - 3S2-2
GVW=177 k
21
9'
21
17'
29
22'
28
4'
31
4'
17'
18 21
78'
Class 13 - STP 1
GVW=183 k
27
5'
24
42'
25
5'
27
4'
26
5' 12'
13 21
64'
Class 13 - STP 2
GVW=195 k
29
4'
22
36'
39
4'
32
4'
39
4'
11' 4' 6' 4'26'
15 33 35 24 36 28
55'
4'
28
Class 10 - 3S4
GVW=199 k
13'
30 33
65'
Class 11 - 2S1-2
GVW=163 k
29
21'
36
9'
35
22'Class 10
GVW=194 k
6' 5' 4' 4'10'
34 34 35 23 24 20
33'
4'
24
Fig. 4.31 gross weight distribution of the randomly selected vehicles
These occasional overloads might cause damage to highway bridges,37
especially on bridge
decks.38
Some exceptionally high axle loads were recorded in WIM data such as the Class 8
example (with two 72-kip axles) in Fig. 4.31. Finite element analyses were conducted using
ABAQUS® to investigate the potential local damage these high axle loads on bridge decks. The
analysis results of a three-span slab bridge, which was used in Chapter 6 as permit rating
example, are shown in Fig. 4.32. The slab bridge was subjected to a group of two 72-kip axle
loads at two locations. Normal stresses in the longitudinal direction are examined.

71
Fig. 4.32 gross weight distribution of the randomly selected vehicles
In the model shown in Fig. 4.32, concrete slab was modeled using solid brick element with
nonlinear concrete material model considering plastic damage. Haunch plates were used near the
interior supports to represent the real design. Steel reinforcements were embedded in concrete
elements. Both the reinforcements and the nonlinear plastic damage concrete model facilitated
the convergence of the analyses, in which the vehicle load, combined with the self weight, can
cause concrete cracking near peak moments. The axle loads, applied to the slab through four
rubber blocks, were place at two locations to examine the potential local damage to the slab
bridge. High stress concentration near the simulated tires was not observed in the analyzed two
cases; however, the high axle loads did increase the normal stress distribution near the loads.
Although the overloaded vehicle might have been considered in the design process, the increased
stress may cause cracks, which may affect the durability of the bridge.
Summary
The weigh-in-motion records in Wisconsin in 2007 were used to evaluate the WisDOT Standard
Permit Vehicle. The recorded vehicles (records) in individual classes per FHWA definitions
were further divided into groups, in which the vehicles had similar configuration patterns.
Descriptive statistical analyses were conducted for the vehicles in each class/group to define
representative vehicles that best describe the vehicles with top 5% gross weights in that
class/group. The representative vehicles were evaluated using randomly selected vehicles in the
top 5% vehicles in the corresponding class/group. The girder responses by the randomly selected

72
vehicles on the girders with randomly selected span lengths were used to estimate the probability
that the heavy vehicles in each class/group might cause larger girder response than Wis-SPV.
The analysis indicated that 0.035% of total overweight vehicles (records) may exceed the 250-
kip Wis-SPV. Meanwhile about 1% of vehicle potentially with permits would cause larger girder
responses than the 190-kip Standard Permit Vehicle. A close examination of the selected
overweight vehicles indicated that some short vehicles with 5 to 7 axles, currently on Wisconsin
highway with annual permits, could generate severe bridge internal forces than the 250-kip
Standard Permit Vehicle. These observations were similar to those obtained using multivariate
statistical analyses of top 5% heaviest vehicles shown in Appendix 4.
The 250-kip Standard Permit Vehicle was compared with the vehicles with single-trip permits in
recent years in the next chapter. Recommendations to the current permitting practice are
provided in the Chapter 6.

73
Chapter 5 Analysis of Wisconsin Single-Trip Permit Vehicles
Introduction
The 250-kip Wis-SPV was intended to represent vehicles with single-trip permit in addition to
enveloping all vehicles with multi-trip permits;6 In this chapter, the impact of Wis-SPV is
compared with that by vehicles that applied for single-trip permits in recent years. Oversized (but
not overloaded) vehicles that have single-trip permits are excluded from the vehicle data set.
Overview of vehicles with single-trip permits
The single-trip permits issued between July 2004 and July 2007 were analyzed. Approximately
forty nine thousand vehicle records were considered in the analysis (49,434 in total recorded
during the period of time). The analyses excluded super-heavy vehicles, which in this study was
defined as vehicles with gross weights of over 300kips. Vehicles with a gross weight of less than
40kips were also excluded because they are unlikely to be critical. This filtering process
eliminated about 0.75% of the total records under consideration.
An overview of all the 49 thousand records is shown in Fig. 5.1, including the distribution of
gross weight, vehicle length and the total axle numbers. The distribution of gross vehicle weight
scatters with a peak at 90kips. More than 75% of the vehicles have a gross weight above the
legal weight - 80kips. Almost all vehicles have a length over 50 ft, and over fifty percent of the
vehicles have a length more than 75 ft, the maximum vehicle length for vehicles eligible for
multi-trip permits. In addition, less than 0.1% of the vehicles have two axles, and less than 0.3%
of the vehicles have more than 13 axles. Hence the statistical analysis was performed for vehicles
with three to thirteen axles.
0 50 100 150 200 250 3000
1000
2000
3000
4000
5000
6000
7000
8000
9000
72
1445
360
906
5851
8527
4587
6504
2222
4286
1844
1274
1498
2694
2571
1499
463
638
650
505
227
337
60
31
15 29
Gross Weight (kips)
Nu
mb
er
of
veh
icle
s
Total 49095 vehicles: Max. 300.0kips - Min. 40.0kips

74
20 40 60 80 100 120 140 160 180 200 2200
0.5
1
1.5
2x 10
4
4
1752
1143
503
6464
19715
7122
2950
2554
2082
1258
831
587
653
232
421
351
245
212
16
Vehicle Length (ft)
Nu
mb
er
of
veh
icle
s
Total 49095 vehicles: Max. 215.0ft - Min. 26.7ft
0 5 10 15 20 250
5000
10000
15000
0 42
1547
1130
7993
14178
8126
7323
2723
2172
1041
1590
1102
37
4 13
7 32
25
10
Number of axles
Nu
mb
er
of
veh
icle
s
Total 49095 vehicles:
Fig. 5.1 Overview of vehicles with single-trip permits
Analysis of single-trip permit records
The same descriptive statistical analysis was used to analyze the permit trucks in this section.
The histograms of axle weights and axle spacings are shown in Appendix 5. The characteristic
values (e.g., the maximum, the minimum, and the mean values, and the standard deviations)
were tabulated for each vehicle group based on axles (note that the permit trucks were classified
based on their total number of axles). A representative vehicle was determined for each group.
The axle weights corresponding to 95th
percentile were used for the representative vehicles in
each group. The average spacing was used for the first spacing and 4 ft was used for all tandem
axles (i.e., groups of axles with spacings less than 6ft). The values corresponding to 5th
percentile
and 95th
percentile were used to define one variable spacing per vehicle. No vehicle combination
was considered in the interpolation of the statistical analyses.

75
Note that the available population is relatively small; hence, the statistical analysis should be
viewed with caution.
Three-axle Vehicles
A representative vehicle was created as shown in Fig. 5.2. These vehicles are likely FHWA Class
4 three-axle buses and Class 6 three-axle trucks.
1547
vehicles
Minimum Maximum Mean Standard
deviation
5th
percentile
95th
percentile
99th
percentile
Gross weight 40500 90000 57972.53 4174.489 52980 64000 74000.00
Axle weight 1 8000 32600 19292.57 1819.069 15000 20000 22500.00
Axle spacing 1 8 37 16.33 1.728 14.117 19.417 21.00
Axle weight 2 9000 35000 19365.08 1920.142 17016 22488 26880.00
Axle spacing 2 3 30 4.77 3.383 4.08 4.75 25.72
Axle weight 3 9000 35000 19314.87 1841.393 17080 22000 26630.00
14~20'
20 23
18~24'
STP - 3 axle
GVW=65 k
22
4'
Fig. 5.2 Representative vehicle for 3-axle permit vehicles
Four-axle Vehicles
Vehicles (a): A representative vehicle was created as shown in Fig. 5.3. These vehicles are likely
FHWA Class 8, Type 3S1 trucks.
272
vehicles
Minimum Maximum Mean Standard
deviation
5th
percentile
95th
percentile
99th
percentile
Gross weight 40000 112000 64844.58 9594.493 54065.00 80700.00 112000.00
Axle weight 1 6980 29000 18147.82 3294.010 12000.00 21000.00 29000.00
Axle spacing 1 4 29 15.46 3.570 7.50 19.61 23.00
Axle weight 2 0 29000 12907.46 4661.659 8000.00 20250.00 29000.00
Axle spacing 2 0 10 5.15 1.457 4.08 7.53 10.00
Axle weight 3 0 29584 16789.65 3131.732 13151.45 20250.00 27697.68
Axle spacing 3 0 53 7.34 8.587 4.08 33.57 43.00
Axle weight 4 2780 31000 16661.42 4421.767 8000.00 26400.00 29584.00
16'
21 20
25~55'
STP - 4 axle a
GVW=87 k
20
5'
26
4~34'
Fig. 5.3 Representative vehicle for 4-axle permit vehicles (Type 3S1)
Vehicles (b): A representative vehicle was created as shown in Fig. 5.4. These vehicles are likely
FHWA Class 8, Type 2S2 trucks.
856
vehicles
Minimum Maximum Mean Standard
deviation
5th
percentile
95th
percentile
99th
percentile

76
Gross weight 57320 130000 81351.19 10005.847 72000.00 97000.00 126430.00
Axle weight 1 4000 31000 18790.81 2722.025 15750.00 22500.00 29000.00
Axle spacing 1 4 18 5.93 1.398 4.08 7.50 10.62
Axle weight 2 9000 31000 18879.94 2663.627 15794.00 22500.00 29430.00
Axle spacing 2 10 42 15.79 3.037 12.83 19.67 31.17
Axle weight 3 9750 35000 21840.39 3098.021 19000.00 28000.00 34000.00
Axle spacing 3 4 11 4.40 .455 4.17 5.00 5.17
Axle weight 4 9750 36000 21840.05 3106.667 19000.00 28000.00 34000.00
6'
22.5 22.5
22~30'
STP - 4 axle b
GVW=101 k
28
4'
28
12~20'
Fig. 5.4 Representative vehicle for 4-axle permit vehicles (Type 2S2)
Five-axle Vehicles
Non-split vehicles: A representative vehicle was created as shown in Fig. 5.5. These vehicles are
likely FHWA Class 9 trucks (Type 3S2).
5901
vehicles
Minimum Maximum Mean Standard
deviation
5th
percentile
95th
percentile
99th
percentile
Gross weight 50000 152500 90817.72 7349.784 81000.00 100000.00 112000.00
Axle weight 1 5860 31000 12164.64 1273.724 11000.00 13000.00 19500.00
Axle spacing 1 2 29 17.67 2.963 12.00 21.00 22.50
Axle weight 2 5850 32500 19222.22 2363.345 14000.00 22000.00 24000.00
Axle spacing 2 4 44 4.63 1.627 4.17 5.00 13.58
Axle weight 3 5850 32500 19203.85 2705.876 12500.00 22000.00 25000.00
Axle spacing 3 3 97 36.81 9.542 25.50 54.00 68.16
Axle weight 4 7690 50000 20165.18 2146.179 17500.00 23000.00 28500.00
Axle spacing 4 1 6 4.42 .339 4.00 5.00 6.00
Axle weight 5 7690 50000 20061.84 2132.427 17500.00 22500.00 28500.00
17'
13 22
50~79'
STP - 5 axle a
GVW=103 k
22
4'
23
25~54'
23
4'
Fig. 5.5 Representative vehicle for 5-axle permit vehicles (Type 3S2)
Split vehicles: A representative vehicle was created as shown in Fig. 5.6. These vehicles are
likely FHWA Class 9 trucks (Type 3S2 split).
2091
vehicles
Minimum Maximum Mean Standard
deviation
5th
percentile
95th
percentile
99th
percentile
Gross weight 48000 214000 91401.65 7417.666 82000.00 102000.00 118680.00
Axle weight 1 0 23000 12036.05 1097.481 11000.00 13000.00 18000.00
Axle spacing 1 0 25 17.66 2.837 12.00 20.83 22.75
Axle weight 2 5500 27500 19204.29 2005.635 16000.00 22000.00 24000.00
Axle spacing 2 3 19 4.54 1.381 4.17 4.58 14.67

77
Axle weight 3 5500 33500 19237.76 2060.049 16000.00 22000.00 25000.00
Axle spacing 3 4 64 31.98 5.404 27.00 38.00 47.07
Axle weight 4 9000 35000 20457.98 2144.360 18000.00 24000.00 32500.00
Axle spacing 4 6 43 10.17 1.586 10.00 10.33 12.00
Axle weight 5 6500 35000 20410.57 2189.241 18000.00 24000.00 32500.00
17'
13 22
58~69'
STP - 5 axle b
GVW=105 k
22
4'
24
27~38'
24
10'
Fig. 5.6 Representative vehicle for 5-axle permit vehicles (Type 3S2 split)
Six-axle Vehicles
A representative vehicle was created as shown in Fig. 5.7. These vehicles are likely FHWA Class
10 trucks (Type 3S3).
14178
vehicles
Minimum Maximum Mean Standard
deviation
5th
percentile
95th
percentile
99th
percentile
Gross weight 44000 200000 106498.75 13652.457 87000.00 135000.00 135700.00
Axle weight 1 4000 25000 12287.89 1469.588 11000.00 14000.00 20000.00
Axle spacing 1 3 26 17.00 3.254 12.00 20.75 22.42
Axle weight 2 5380 50000 20418.66 3165.096 16000.00 27000.00 27000.00
Axle spacing 2 3 44 4.58 1.280 4.00 5.00 13.42
Axle weight 3 5428 50000 20436.01 3131.435 16000.00 27000.00 27000.00
Axle spacing 3 1 117 37.10 12.647 11.96 59.00 85.00
Axle weight 4 6000 50000 17761.33 2939.650 13300.00 23000.00 25000.00
Axle spacing 4 1 96 5.41 5.396 4.00 6.00 37.04
Axle weight 5 6000 41000 17811.86 2978.226 13000.00 23000.00 25000.00
Axle spacing 5 3 16 4.76 1.423 4.00 5.50 14.08
Axle weight 6 5000 41000 17783.01 2996.797 13000.00 23000.00 25000.00
17 4' 4' 4'11~59'
14 27 27 23 23 23
40~88'
STP - 6 axle
GVW=137 k
Fig. 5.7 Representative vehicle for 6-axle permit vehicles (Type 3S3)
Seven-axle vehicles
Vehicles (a): A representative vehicle was created as shown in Fig. 5.8. These vehicles are likely
FHWA Class 10 trucks (Type 3S4).
1161
vehicles
Minimum Maximum Mean Standard
deviation
5th
percentile
95th
percentile
99th
percentile Gross weight 78000 200000 124383.86 18168.319 96000.00 150000.00 185000.00
Axle weight 1 8000 31500 15106.13 4485.624 12000.00 27000.00 27000.00
Axle spacing 1 4 25 14.01 4.960 5.42 20.00 21.50
Axle weight 2 0 31500 20275.49 2981.010 15410.00 25000.00 28000.00
Axle spacing 2 0 16 5.21 2.003 4.17 6.75 14.67

78
Axle weight 3 7000 33000 20356.83 2852.151 16349.70 25000.00 28000.00
Axle spacing 3 4 121 32.53 23.490 5.00 79.00 91.00
Axle weight 4 0 36200 17301.35 3495.736 12000.00 23000.00 25000.00
Axle spacing 4 0 15 5.45 2.067 4.08 11.00 13.83
Axle weight 5 7167 36200 17202.41 3616.101 12000.00 23000.00 25731.80
Axle spacing 5 3 58 7.91 6.549 4.00 19.50 27.90
Axle weight 6 7167 47000 17083.85 3754.708 12000.00 23000.00 26586.46
Axle spacing 6 3 15 4.91 1.445 4.00 6.67 14.08
Axle weight 7 7166 47000 17001.82 3825.604 11500.00 23000.00 26586.46
14' 4' 4' 4'5~79'
27 25 25 23 23 23
35~109'
4'
23
STP - 7 axle a
GVW=169 k
Fig. 5.8 Representative vehicle for 7-axle permit vehicles
Vehicles (b): A representative vehicle was created as shown in Fig. 5.9. These vehicles are likely
FHWA the Class 13 permit vehicles in Chapter 4.
6965
vehicles
Minimum Maximum Mean Standard
deviation
5th
percentile
95th
percentile
99th
percentile
Gross weight 81000 200000 122877.70 15583.952 95000.00 150000.00 162000.00
Axle weight 1 7000 20200 12716.70 1484.404 11000.00 15000.00 18000.00
Axle spacing 1 4 28 15.30 2.235 11.67 19.25 20.58
Axle weight 2 4000 30000 17710.60 2989.662 12166.00 22000.00 25000.00
Axle spacing 2 3 8 4.51 .264 4.17 5.00 5.50
Axle weight 3 7867 30000 18181.66 2703.787 13333.00 22000.00 25000.00
Axle spacing 3 4 15 4.54 .532 4.25 5.00 6.67
Axle weight 4 7867 30000 18181.23 2698.615 13334.00 22000.00 25000.00
Axle spacing 4 17 116 38.96 9.732 31.00 57.00 83.00
Axle weight 5 7000 31000 18703.58 2730.326 14000.00 24000.00 25800.00
Axle spacing 5 4 14 4.55 .363 4.17 5.00 5.59
Axle weight 6 7700 31000 18704.40 2721.374 14000.00 24000.00 25800.00
Axle spacing 6 4 14 4.77 1.447 4.17 5.00 14.08
Axle weight 7 7700 31000 18679.54 2712.891 14000.00 24000.00 25556.44
15' 4' 4' 4'31~57'
15 22 22 22 24 24
62~88'
4'
24
STP - 7 axle b
GVW=153 k
Fig. 5.9 Representative vehicle for 7-axle permit vehicles
Eight-axle vehicles
A representative vehicle was created as shown in Fig. 5.10. These vehicles are likely FHWA the
WisDOT Standard Permit Vehicle.
7323
vehicles
Minimum Maximum Mean Standard
deviation
5th
percentile
95th
percentile
99th
percentile
Gross weight 80000 205000 160421.67 22933.351 120000.00 190000.00 193000.00

79
Axle weight 1 4000 22000 14892.31 3012.295 12000.00 20000.00 21000.00
Axle spacing 1 4 28 13.45 2.775 8.50 18.08 20.00
Axle weight 2 6000 30000 20034.84 4363.146 12500.00 27000.00 27000.00
Axle spacing 2 3 14 4.57 .837 4.00 5.00 10.50
Axle weight 3 5000 30000 22414.52 3926.847 16000.00 29960.00 30000.00
Axle spacing 3 3 75 5.06 4.094 4.17 5.90 31.99
Axle weight 4 6000 30000 22404.47 3954.900 16000.00 29200.00 30000.00
Axle spacing 4 2 128 41.80 24.251 5.50 107.80 116.00
Axle weight 5 6000 28000 20277.13 3061.095 15000.00 24000.00 26500.00
Axle spacing 5 1 84 5.40 5.584 4.00 5.42 35.00
Axle weight 6 5000 28700 20239.99 3123.612 14750.00 24278.00 26500.00
Axle spacing 6 3 32 5.13 3.021 4.00 13.50 23.92
Axle weight 7 5000 28000 20139.40 3027.797 14750.00 23750.00 25000.00
Axle spacing 7 0 27 5.18 2.502 4.00 14.00 14.17
Axle weight 8 0 28000 20016.93 3117.515 14500.00 23500.00 25000.00
14' 4' 4' 4'5~108'
20 27 30 30 24 24
39~142'
4'
24
STP - 8 axle
GVW=203 k
4'
24
Fig. 5.10 Representative vehicle for 8-axle permit vehicles
Nine-axle vehicles
Vehicles (a): A representative vehicle was created as shown in Fig. 5.11. These vehicles would
be classified as Class 13 or as unrecognized in Class 15 in WIM records. Note that the two
tandem axles could have a slightly different configuration: the two wheel groups may be spaced
14ft rather than 4 ft. The shorter spacing (4ft) was used to be conservative in the following
analysis.
1105
vehicles
Minimum Maximum Mean Standard
deviation
5th
percentile
95th
percentile
99th
percentile
Gross weight 67000 229000 170984.47 19355.730 137342.00 195700.00 209880.00
Axle weight 1 5000 20000 13145.07 1680.151 12000.00 17000.00 18940.00
Axle spacing 1 11 28 17.90 2.675 12.17 21.75 23.83
Axle weight 2 5000 30000 19548.25 2574.975 15000.00 22500.00 24477.50
Axle spacing 2 2 6 4.51 .219 4.25 5.00 5.08
Axle weight 3 5000 30000 19579.18 2563.781 15000.00 22500.00 24477.50
Axle spacing 3 4 38 13.87 4.250 4.50 17.00 31.17
Axle weight 4 6000 30000 19731.60 2557.778 15145.00 22500.00 25000.00
Axle spacing 4 4 10 4.62 .755 4.25 5.00 10.08
Axle weight 5 6000 30000 19704.81 2573.964 15145.00 22500.00 25000.00
Axle spacing 5 21 99 38.23 8.665 29.33 57.08 72.83
Axle weight 6 6150 27000 19842.32 2487.490 15000.00 23000.00 24000.00
Axle spacing 6 4 5 4.55 .200 4.17 5.00 5.00
Axle weight 7 6150 27000 19844.41 2485.940 15000.00 23000.00 24000.00
Axle spacing 7 1 18 11.84 4.101 4.17 14.50 15.42
Axle weight 8 6150 27000 19799.38 2468.964 15000.00 23000.00 24000.00
Axle spacing 8 4 16 5.01 2.002 4.33 11.35 14.49

80
Axle weight 9 6150 27000 19789.45 2521.420 15000.00 23000.00 24000.00
18' 4' 4' 4'29~57'
17 23 23 23 23 23
71~99'
4'
23
STP - 9 axle a
GVW=201 k
4'
2323
4'14' 14'
Fig. 5.11 Representative vehicle for 9-axle permit vehicles (Type a)
Vehicles (b): A representative vehicle was created as shown in Fig. 5.12.
1618
vehicles
Minimum Maximum Mean Standard
deviation
5th
percentile
95th
percentile
99th
percentile
Gross weight 87000 300000 167533.52 29428.268 102000.00 207000.00 220000
Axle weight 1 6500 20000 15117.19 2395.242 12000.00 20000.00 20000
Axle spacing 1 5 22 11.74 4.005 5.58 18.00 20.08
Axle weight 2 2000 35000 18571.31 4248.955 12000.00 26000.00 27000
Axle spacing 2 4 12 5.84 2.491 4.25 10.50 10.5
Axle weight 3 6500 35000 20760.29 3555.155 14000.00 26000.00 27000
Axle spacing 3 4 60 6.25 7.033 4.25 14.00 42.89
Axle weight 4 6600 35000 20553.00 4031.203 12500.00 26000.00 27000
Axle spacing 4 4 120 34.99 26.248 5.00 88.33 110
Axle weight 5 6700 35000 19240.50 4458.718 10100.00 24000.00 26666
Axle spacing 5 4 20 4.95 1.466 4.00 6.08 13.62
Axle weight 6 6000 35000 19238.85 4496.292 10100.00 24000.00 27000
Axle spacing 6 4 69 8.75 7.746 4.00 18.50 36
Axle weight 7 6600 35000 18060.69 3915.999 10100.00 24000.00 27000
Axle spacing 7 4 51 8.48 4.777 4.17 14.83 17
Axle weight 8 5000 35000 18003.58 4041.870 10000.00 24000.00 27000
Axle spacing 8 3 15 4.56 .918 4.00 5.00 6
Axle weight 9 5000 35000 17988.13 4055.228 10000.00 24000.00 27000
12' 4' 4' 4'5~89'
20 26 26 26 24 24
41~125'
4'
24
STP - 9 axle b
GVW=218 k
4'
2424
4'
Fig. 5.12 Representative vehicle for 9-axle permit vehicles (Type b)
Ten-axle vehicles
Vehicles (a): A representative vehicle was created as shown in Fig. 5.13.
692
vehicles
Minimum Maximum Mean Standard
deviation
5th
percentile
95th
percentile
99th
percentile
Gross weight 85000 296000 188093.45 22504.109 152825.00 226000.00 241490.00
Axle weight 1 8000 20000 12797.54 1460.332 12000.00 16000.00 20000.00
Axle spacing 1 4 22 16.10 1.929 12.67 19.67 20.84
Axle weight 2 6500 32500 16632.55 2910.458 12565.00 21600.00 25000.00
Axle spacing 2 4 6 4.53 .219 4.33 5.00 5.42

81
Axle weight 3 6500 32500 16694.07 2860.584 12666.00 21677.90 25000.00
Axle spacing 3 4 40 5.81 5.196 4.33 14.03 36.33
Axle weight 4 6500 34000 16623.74 2882.248 12667.00 20000.00 25140.00
Axle spacing 4 2 32 13.27 3.312 4.50 16.00 18.50
Axle weight 5 8000 34000 20923.79 3184.720 15130.00 27000.00 27000.00
Axle spacing 5 4 10 4.58 .335 4.33 5.00 6.00
Axle weight 6 8000 34000 20929.57 3180.960 15130.00 27000.00 27000.00
Axle spacing 6 21 84 39.94 8.035 32.00 56.42 70.00
Axle weight 7 8000 36000 20924.43 2716.401 17000.00 25000.00 25140.00
Axle spacing 7 4 6 4.58 .252 4.33 5.00 6.00
Axle weight 8 8000 36000 20929.06 2712.702 17000.00 25000.00 25140.00
Axle spacing 8 4 19 11.84 4.108 4.50 15.00 16.17
Axle weight 9 8000 36000 20813.13 2704.452 17000.00 25000.00 25070.00
Axle spacing 9 4 16 4.90 1.676 4.33 6.00 14.09
Axle weight 10 8000 36000 20825.56 2715.307 17000.00 25000.00 25070.00
16' 4' 4' 4'32~57'
16 22 22 20 25 25
85~110'
4'
25
STP - 10 axle a
GVW=234 k
4'
2527
4'
27
13'
Fig. 5.13 Representative vehicle for 10-axle permit vehicles (Type a)
Vehicles (b): A representative vehicle was created as shown in Fig. 5.14. The variable spacing
indicated that the vehicles would also include flatbed trailers with multiple evenly spaced axles.
1480
vehicles
Minimum Maximum Mean Standard
deviation
5th
percentile
95th
percentile
99th
percentile
Gross weight 88500 290000 191569.53 36274.807 107000.00 240000.00 241000.00
Axle weight 1 5000 21000 16167.01 2832.925 12000.00 20000.00 20000.00
Axle spacing 1 5 25 13.40 4.284 5.58 20.00 20.83
Axle weight 2 8500 30000 19560.92 3924.445 14000.00 27000.00 27000.00
Axle spacing 2 2 10 5.32 2.116 4.00 10.50 10.50
Axle weight 3 8500 30000 20942.86 3695.340 14000.00 27000.00 27000.00
Axle spacing 3 4 38 7.59 5.108 4.17 15.67 18.00
Axle weight 4 8000 30000 21521.57 3829.703 14000.00 27000.00 27000.00
Axle spacing 4 4 88 15.91 16.581 4.25 46.00 66.00
Axle weight 5 6600 30000 19943.67 4111.165 9000.00 25000.00 25000.00
Axle spacing 5 4 117 25.25 24.783 4.00 57.32 117.00
Axle weight 6 5000 30000 19800.06 4344.118 8508.35 25000.00 25000.00
Axle spacing 6 4 20 6.68 5.023 4.00 18.58 18.58
Axle weight 7 5000 30000 18709.08 4492.831 8682.70 25000.00 25000.00
Axle spacing 7 4 57 6.14 4.357 4.00 14.50 16.22
Axle weight 8 5000 30000 18559.52 4608.262 8683.65 25000.00 25000.00
Axle spacing 8 4 19 8.82 4.337 4.50 14.41 18.42
Axle weight 9 5000 30000 18147.70 5497.941 8000.00 25000.00 25000.00
Axle spacing 9 4 6 4.63 .323 4.00 5.08 5.08
Axle weight 10 5000 30000 18217.14 5448.610 8000.00 25000.00 25000.00

82
14' 4' 4' 4'4~46'
20 27 27 27 25 25
46~88'
4'
25
STP - 10 axle b
GVW=251 k
4'
2525
4'
25
4'
Fig. 5.14 Representative vehicle for 10-axle permit vehicles
Eleven-axle vehicles
A representative vehicle was created as shown in Fig. 5.15. Note that the third and seventh
spacing can be either 4ft or 14ft, reflecting two different arrangements of tandem axles. Though
both spacing 6 and spacing 7 have large scattering, the spacing 7 was dominated by a short
spacing near 4ft, hence spacing 6 was selected as the variable spacing.
1041
vehicles
Minimum Maximum Mean Standard
deviation
5th
percentile
95th
percentile
99th
percentile
Gross weight 78000 266000 200626.46 26752.097 165000.00 237000.00 254000.00
Axle weight 1 8000 20000 13652.83 2032.584 11000.00 18000.00 20000.00
Axle spacing 1 5 22 14.97 2.559 11.17 19.50 21.22
Axle weight 2 5000 25000 17756.24 3130.528 12699.40 22500.00 25000.00
Axle spacing 2 4 6 4.46 .248 4.00 5.00 5.08
Axle weight 3 5000 25000 18056.84 3031.116 13030.00 22500.00 25000.00
Axle spacing 3 4 37 7.39 6.386 4.17 27.92 28.00
Axle weight 4 5000 25000 17413.82 3036.093 12667.10 22000.00 24596.86
Axle spacing 4 4 38 14.00 8.345 4.08 32.00 36.00
Axle weight 5 6000 31000 19151.70 3269.969 14000.00 24000.00 25000.00
Axle spacing 5 4 54 7.11 9.066 4.08 36.50 45.80
Axle weight 6 4600 31000 19034.39 3308.489 13667.10 24000.00 25000.00
Axle spacing 6 4 116 32.93 23.665 4.17 88.25 105.00
Axle weight 7 4600 25000 18270.64 2938.342 14000.00 22000.00 25000.00
Axle spacing 7 4 113 18.56 31.524 4.00 107.00 111.00
Axle weight 8 4800 27000 19050.74 3380.679 14000.00 24500.00 25000.00
Axle spacing 8 4 20 5.33 2.737 4.00 14.08 15.50
Axle weight 9 5000 28000 19049.90 3321.379 14000.00 24500.00 25000.00
Axle spacing 9 4 36 11.46 4.319 4.17 15.00 16.50
Axle weight 10 3000 28000 19623.11 3242.605 15000.00 24500.00 25000.00
Axle spacing 10 4 15 4.60 .815 4.00 5.00 10.08
Axle weight 11 3000 28000 19566.25 3318.997 15000.00 24500.00 25000.00
15' 4' 4' 4'4~88'
18 23 23 22 25 25
51~135'
4'
25
STP - 11 axle
GVW=256 k
4'
2522
4'
24
4'
24
4'
Fig. 5.15 Representative vehicle for 11-axle permit vehicles
Twelve-axle vehicles
A representative vehicle was created as shown in Fig. 5.16.

83
1590
vehicles
Minimum Maximum Mean Standard
deviation
5th
percentile
95th
percentile
99th
percentile
Gross weight 88000 295000 205544.20 29641.935 164000.00 246200.00 255000.00
Axle weight 1 10000 20000 13859.54 1535.971 12000.00 16000.00 19000.00
Axle spacing 1 5 22 13.42 2.709 10.50 19.00 20.25
Axle weight 2 6500 27000 16513.18 2734.014 12000.00 20000.00 22000.00
Axle spacing 2 0 6 4.43 .224 4.33 5.00 5.17
Axle weight 3 6500 27000 17057.90 2625.704 13000.00 20000.00 22000.00
Axle spacing 3 4 35 5.53 3.892 4.33 15.00 18.12
Axle weight 4 6700 27000 16888.00 2730.999 12000.00 20000.00 21500.00
Axle spacing 4 4 56 21.59 8.654 5.00 29.00 34.55
Axle weight 5 6000 35000 16787.78 3010.505 12000.00 21000.00 22817.00
Axle spacing 5 4 8 4.35 .417 4.08 5.00 5.75
Axle weight 6 6000 35000 16787.74 3007.660 12000.00 21000.00 22817.00
Axle spacing 6 2 78 7.77 11.482 4.08 39.00 59.67
Axle weight 7 4300 35000 16710.74 3060.617 12000.00 21000.00 22600.00
Axle spacing 7 1 124 72.04 39.383 5.00 120.67 124.00
Axle weight 8 4300 35000 18095.60 3044.741 12000.00 21000.00 22760.00
Axle spacing 8 4 71 4.87 4.909 4.00 5.00 34.08
Axle weight 9 4400 35000 18115.12 3011.348 13500.00 21000.00 22760.00
Axle spacing 9 4 30 5.21 3.094 4.00 14.25 15.52
Axle weight 10 6000 25000 18121.49 2824.081 13500.00 21000.00 22760.00
Axle spacing 10 4 17 11.80 2.665 5.00 14.50 15.00
Axle weight 11 6700 25000 18303.67 2952.021 13000.00 22760.00 24000.00
Axle spacing 11 4 14 4.31 .473 4.00 5.00 5.50
Axle weight 12 6600 25000 18303.42 2950.536 13000.00 22760.00 24000.00
14' 4' 4' 4'5~121'
16 20 20 20 21 21
80~196'
11'
23
STP - 12 axle
GVW=248 k
4'
2321
22'
21
4'
21
4'
21
4'
Fig. 5.16 Representative vehicle for 12-axle permit vehicles
Thirteen-axle vehicles
A representative vehicle was created as shown in Fig. 5.17.
1102
vehicles
Minimum Maximum Mean Standard
deviation
5th
percentile
95th
percentile
99th
percentile
Gross weight 85000 300000 201808.56 64800.794 90000.00 270850.00 292000.00
Axle weight 1 10000 20000 13836.31 2173.282 12000.00 18000.00 20000.00
Axle spacing 1 11 22 15.29 1.775 12.25 18.00 20.81
Axle weight 2 4300 23400 15569.66 5339.225 6250.00 21000.00 22600.00
Axle spacing 2 4 5 4.60 .191 4.33 5.00 5.00
Axle weight 3 4300 23300 15619.61 5352.360 6250.00 21000.00 22700.00
Axle spacing 3 4 26 4.86 1.889 4.33 5.00 14.08
Axle weight 4 4400 23300 15564.10 5371.536 6250.00 21000.00 22700.00
Axle spacing 4 4 40 15.06 3.333 13.33 17.92 33.96
Axle weight 5 6000 27000 15762.98 5257.973 6500.00 21500.00 23400.00

84
Axle spacing 5 4 25 4.85 .865 4.50 5.00 5.25
Axle weight 6 6000 27000 15762.79 5260.868 6500.00 21666.00 23300.00
Axle spacing 6 4 34 4.92 1.547 4.50 5.00 5.25
Axle weight 7 6000 27000 15771.13 5258.072 6500.00 21668.00 23300.00
Axle spacing 7 4 131 48.39 20.076 24.00 78.00 131.00
Axle weight 8 4600 26500 15496.61 5771.854 5000.00 21487.40 25425.00
Axle spacing 8 4 47 4.92 1.754 4.50 5.00 5.25
Axle weight 9 4600 26500 15493.10 5774.004 5000.00 21487.40 25425.00
Axle spacing 9 4 14 4.84 .637 4.50 5.00 5.25
Axle weight 10 4667 26000 15486.58 5757.669 5000.00 21405.40 24940.00
Axle spacing 10 4 23 14.00 2.269 10.00 16.00 18.50
Axle weight 11 3507 26000 15811.05 5237.982 6500.00 21320.55 24455.00
Axle spacing 11 2 16 5.14 1.767 4.50 5.00 14.33
Axle weight 12 3507 26000 15818.99 5286.196 6500.00 21416.00 24970.00
Axle spacing 12 4 10 4.82 .405 4.50 5.00 5.25
Axle weight 13 3507 26000 15815.65 5285.281 6500.00 21368.00 24970.00
15' 4' 4' 4'24~78'
18 21 21 21 21 21
99~153'
14'
21
STP - 13 axle
GVW=273 k
4'
2121
4'
22
4'
22
14'
22
4'
21
4'
Fig. 5.17 Representative vehicle for 13-axle permit vehicles
Comparison of Wis-SPV with single-trip permit vehicles
The effects of the above representative permit vehicles were compared with those of the 250-kip
Wisconsin Standard Permit Vehicle for simply supported girders.
One-span simply supported girders
The maximum positive moments and shear in simply-supported girders with various plan lengths
by the 16 representative permit vehicles are shown in Fig. 5.18, and the values are listed in Table
5.1. The effects of the Wisconsin Standard Permit Vehicle are shown in blue dark lines. Again,
the legends for other vehicles were not shown to simplify the presentation.

85
20 40 60 80 100 120 1400
2000
4000
6000
8000
Peak
mo
men
t (k
ips-
ft)
20 40 60 80 100 120 140-400
-200
0
200
400
Beam spans (ft)
Peak
sh
ear
(kip
s)
Fig. 5.18 Peak moment/shear values for representative permit vehicles on one-span girders
20 40 60 80 100 120 1400
0.5
1
1.5
R-v
alu
es
(mo
men
t)
20 40 60 80 100 120 140-2
-1
0
1
2
Beam spans (ft)
R-v
alu
es
(sh
ear)
Fig. 5.19 R-values for representative permit vehicles on one-span girders
Wis-SPV
Wis-SPV
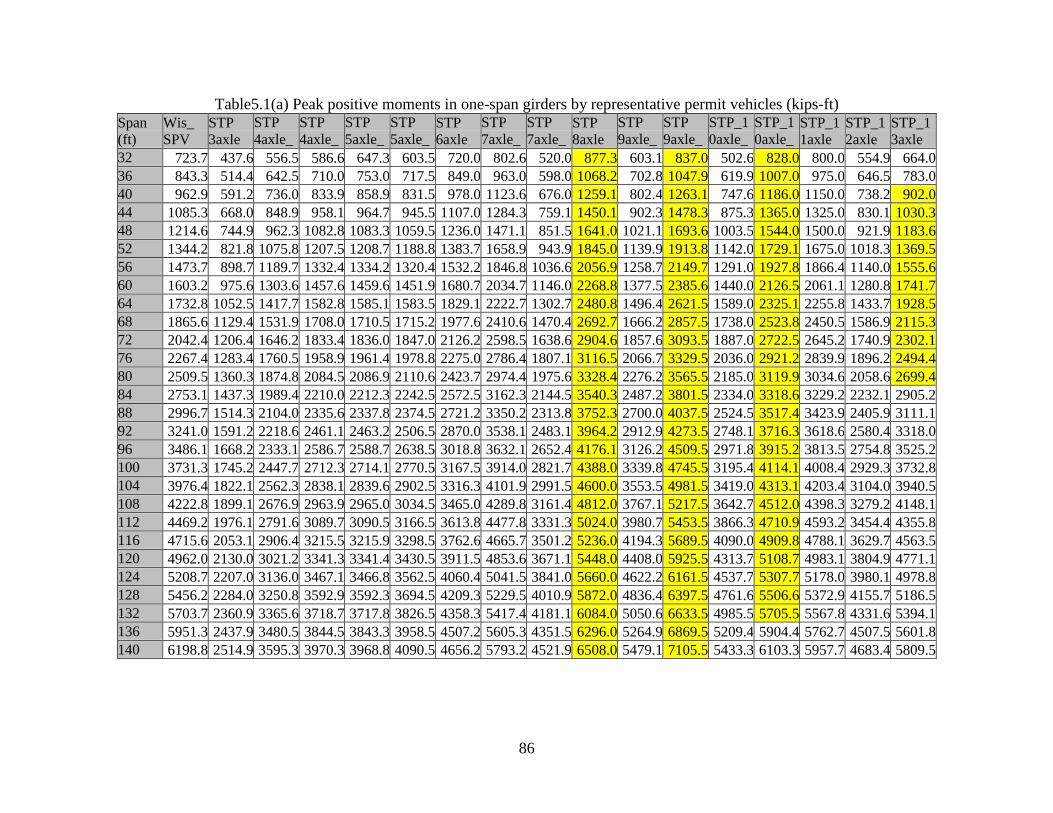
86
Table5.1(a) Peak positive moments in one-span girders by representative permit vehicles (kips-ft)
Span
(ft)
Wis_
SPV
STP
3axle
STP
4axle_
a
STP
4axle_
b
STP
5axle_
a
STP
5axle_
b
STP
6axle
STP
7axle_
a
STP
7axle_
b
STP
8axle
STP
9axle_
a
STP
9axle_
b
STP_1
0axle_
a
STP_1
0axle_
b
STP_1
1axle
STP_1
2axle
STP_1
3axle
32 723.7 437.6 556.5 586.6 647.3 603.5 720.0 802.6 520.0 877.3 603.1 837.0 502.6 828.0 800.0 554.9 664.0
36 843.3 514.4 642.5 710.0 753.0 717.5 849.0 963.0 598.0 1068.2 702.8 1047.9 619.9 1007.0 975.0 646.5 783.0
40 962.9 591.2 736.0 833.9 858.9 831.5 978.0 1123.6 676.0 1259.1 802.4 1263.1 747.6 1186.0 1150.0 738.2 902.0
44 1085.3 668.0 848.9 958.1 964.7 945.5 1107.0 1284.3 759.1 1450.1 902.3 1478.3 875.3 1365.0 1325.0 830.1 1030.3
48 1214.6 744.9 962.3 1082.8 1083.3 1059.5 1236.0 1471.1 851.5 1641.0 1021.1 1693.6 1003.5 1544.0 1500.0 921.9 1183.6
52 1344.2 821.8 1075.8 1207.5 1208.7 1188.8 1383.7 1658.9 943.9 1845.0 1139.9 1913.8 1142.0 1729.1 1675.0 1018.3 1369.5
56 1473.7 898.7 1189.7 1332.4 1334.2 1320.4 1532.2 1846.8 1036.6 2056.9 1258.7 2149.7 1291.0 1927.8 1866.4 1140.0 1555.6
60 1603.2 975.6 1303.6 1457.6 1459.6 1451.9 1680.7 2034.7 1146.0 2268.8 1377.5 2385.6 1440.0 2126.5 2061.1 1280.8 1741.7
64 1732.8 1052.5 1417.7 1582.8 1585.1 1583.5 1829.1 2222.7 1302.7 2480.8 1496.4 2621.5 1589.0 2325.1 2255.8 1433.7 1928.5
68 1865.6 1129.4 1531.9 1708.0 1710.5 1715.2 1977.6 2410.6 1470.4 2692.7 1666.2 2857.5 1738.0 2523.8 2450.5 1586.9 2115.3
72 2042.4 1206.4 1646.2 1833.4 1836.0 1847.0 2126.2 2598.5 1638.6 2904.6 1857.6 3093.5 1887.0 2722.5 2645.2 1740.9 2302.1
76 2267.4 1283.4 1760.5 1958.9 1961.4 1978.8 2275.0 2786.4 1807.1 3116.5 2066.7 3329.5 2036.0 2921.2 2839.9 1896.2 2494.4
80 2509.5 1360.3 1874.8 2084.5 2086.9 2110.6 2423.7 2974.4 1975.6 3328.4 2276.2 3565.5 2185.0 3119.9 3034.6 2058.6 2699.4
84 2753.1 1437.3 1989.4 2210.0 2212.3 2242.5 2572.5 3162.3 2144.5 3540.3 2487.2 3801.5 2334.0 3318.6 3229.2 2232.1 2905.2
88 2996.7 1514.3 2104.0 2335.6 2337.8 2374.5 2721.2 3350.2 2313.8 3752.3 2700.0 4037.5 2524.5 3517.4 3423.9 2405.9 3111.1
92 3241.0 1591.2 2218.6 2461.1 2463.2 2506.5 2870.0 3538.1 2483.1 3964.2 2912.9 4273.5 2748.1 3716.3 3618.6 2580.4 3318.0
96 3486.1 1668.2 2333.1 2586.7 2588.7 2638.5 3018.8 3632.1 2652.4 4176.1 3126.2 4509.5 2971.8 3915.2 3813.5 2754.8 3525.2
100 3731.3 1745.2 2447.7 2712.3 2714.1 2770.5 3167.5 3914.0 2821.7 4388.0 3339.8 4745.5 3195.4 4114.1 4008.4 2929.3 3732.8
104 3976.4 1822.1 2562.3 2838.1 2839.6 2902.5 3316.3 4101.9 2991.5 4600.0 3553.5 4981.5 3419.0 4313.1 4203.4 3104.0 3940.5
108 4222.8 1899.1 2676.9 2963.9 2965.0 3034.5 3465.0 4289.8 3161.4 4812.0 3767.1 5217.5 3642.7 4512.0 4398.3 3279.2 4148.1
112 4469.2 1976.1 2791.6 3089.7 3090.5 3166.5 3613.8 4477.8 3331.3 5024.0 3980.7 5453.5 3866.3 4710.9 4593.2 3454.4 4355.8
116 4715.6 2053.1 2906.4 3215.5 3215.9 3298.5 3762.6 4665.7 3501.2 5236.0 4194.3 5689.5 4090.0 4909.8 4788.1 3629.7 4563.5
120 4962.0 2130.0 3021.2 3341.3 3341.4 3430.5 3911.5 4853.6 3671.1 5448.0 4408.0 5925.5 4313.7 5108.7 4983.1 3804.9 4771.1
124 5208.7 2207.0 3136.0 3467.1 3466.8 3562.5 4060.4 5041.5 3841.0 5660.0 4622.2 6161.5 4537.7 5307.7 5178.0 3980.1 4978.8
128 5456.2 2284.0 3250.8 3592.9 3592.3 3694.5 4209.3 5229.5 4010.9 5872.0 4836.4 6397.5 4761.6 5506.6 5372.9 4155.7 5186.5
132 5703.7 2360.9 3365.6 3718.7 3717.8 3826.5 4358.3 5417.4 4181.1 6084.0 5050.6 6633.5 4985.5 5705.5 5567.8 4331.6 5394.1
136 5951.3 2437.9 3480.5 3844.5 3843.3 3958.5 4507.2 5605.3 4351.5 6296.0 5264.9 6869.5 5209.4 5904.4 5762.7 4507.5 5601.8
140 6198.8 2514.9 3595.3 3970.3 3968.8 4090.5 4656.2 5793.2 4521.9 6508.0 5479.1 7105.5 5433.3 6103.3 5957.7 4683.4 5809.5

87
Table 5.1(b) Peak shear in two-span girders by representative permit vehicles (kips)
Span
(ft)
Wis_
SPV
STP
3axle
STP
4axle_
a
STP
4axle_
b
STP
5axle_
a
STP
5axle_
b
STP
6axle
STP
7axle_
a
STP
7axle_
b
STP
8axle
STP
9axle_
a
STP
9axle_
b
STP_1
0axle_
a
STP_1
0axle_
b
STP_1
1axle
STP_1
2axle
STP_1
3axle
32 100.4 62.8 80.7 90.9 89.0 84.4 97.5 111.1 70.7 122.1 82.4 118.9 80.8 112.1 109.3 74.7 91.4
36 103.7 64.4 84.5 94.8 93.0 87.7 101.3 117.3 73.1 129.8 86.5 129.7 86.1 119.5 116.6 77.9 98.3
40 106.3 65.7 87.6 97.9 96.3 90.4 106.1 124.4 76.4 135.9 89.7 138.3 90.4 126.5 123.0 82.6 106.1
44 108.5 66.7 90.1 100.5 98.9 92.5 110.0 130.2 82.8 140.9 92.4 146.8 93.9 133.1 129.5 88.4 113.6
48 110.8 67.5 92.1 102.6 101.2 95.8 113.2 135.0 88.7 145.7 98.0 154.2 96.9 138.5 135.0 94.2 119.8
52 118.2 68.3 93.9 104.4 103.0 98.6 116.0 139.1 93.6 150.8 105.0 160.5 100.8 143.2 139.6 99.1 125.0
56 125.9 68.9 95.4 105.9 104.6 101.0 118.3 142.6 97.9 155.2 111.5 165.9 104.3 147.2 143.5 103.3 130.6
60 132.5 69.4 96.7 107.3 106.0 103.0 120.4 145.6 102.7 159.0 117.2 170.6 107.4 150.6 147.0 108.2 135.7
64 138.6 69.9 97.9 108.5 107.2 104.8 122.2 148.3 107.0 162.3 122.1 174.6 113.1 153.7 150.0 112.5 140.3
68 145.2 70.3 98.9 109.5 108.3 106.4 123.7 150.6 110.8 165.2 126.4 178.3 118.4 156.3 152.6 116.3 144.2
72 151.0 70.7 99.8 110.4 109.3 107.9 125.1 152.7 114.1 167.8 130.3 181.5 123.2 158.7 155.0 119.7 147.8
76 156.2 71.0 100.6 111.2 110.1 109.1 126.4 154.5 117.1 170.1 134.1 184.3 127.4 160.8 157.1 122.7 151.0
80 160.9 71.3 101.3 112.0 110.9 110.3 127.5 156.2 119.8 172.2 138.1 186.9 131.3 162.7 159.0 125.4 153.8
84 165.1 71.6 101.9 112.6 111.6 111.3 128.6 157.7 122.2 174.1 141.8 189.2 134.7 164.5 160.7 127.9 156.4
88 169.0 71.8 102.5 113.2 112.2 112.2 129.5 159.1 124.4 175.8 145.1 191.4 137.9 166.0 162.3 130.1 158.7
92 172.5 72.1 103.1 113.8 112.8 113.1 130.3 160.4 126.5 177.4 148.1 193.3 140.7 167.5 163.7 132.2 160.9
96 175.8 72.3 103.6 114.3 113.3 113.9 131.1 160.9 128.3 178.9 150.9 195.1 143.4 168.8 165.0 134.0 162.8
100 178.7 72.5 104.0 114.8 113.8 114.6 131.8 162.6 130.0 180.2 153.5 196.7 145.8 170.0 166.2 135.7 164.6
104 181.5 72.6 104.5 115.2 114.3 115.3 132.5 163.5 131.6 181.4 155.9 198.2 148.0 171.1 167.3 137.3 166.3
108 184.0 72.8 104.8 115.6 114.7 115.9 133.1 164.4 133.1 182.5 158.0 199.6 150.1 172.1 168.3 138.8 167.9
112 186.4 72.9 105.2 116.0 115.1 116.5 133.7 165.3 134.4 183.6 160.1 200.9 152.0 173.1 169.3 140.2 169.3
116 188.6 73.1 105.5 116.3 115.4 117.0 134.2 166.1 135.7 184.6 162.0 202.1 153.8 174.0 170.2 141.4 170.6
120 190.6 73.2 105.9 116.6 115.8 117.5 134.7 166.8 136.9 185.5 163.7 203.3 155.9 174.8 171.0 142.6 171.9
124 192.5 73.3 106.2 116.9 116.1 118.0 135.2 167.5 138.0 186.3 165.4 204.3 158.1 175.6 171.8 143.7 173.0
128 194.3 73.5 106.4 117.2 116.4 118.4 135.6 168.1 139.0 187.1 166.9 205.3 160.2 176.3 172.5 144.8 174.1
132 196.0 73.6 106.7 117.5 116.6 118.8 136.0 168.7 140.0 187.9 168.4 206.2 162.1 177.0 173.2 145.7 175.2
136 197.6 73.7 106.9 117.7 116.9 119.2 136.4 169.3 140.9 188.6 169.8 207.1 163.9 177.7 173.8 146.7 176.1
140 199.1 73.8 107.2 118.0 117.2 119.6 136.7 169.8 141.7 189.3 171.1 207.9 165.6 178.3 174.4 147.5 177.0

88
Two-span simply supported girders
The maximum moments and shear in simply-supported girders with various plan lengths by the
16 representative permit vehicles are shown in Fig. 5.20, and the values are listed in Table 5.2.
20 40 60 80 100 120 140-4000
-2000
0
2000
4000
6000
Peak
mo
men
t (k
ips-
ft)
20 40 60 80 100 120 140-400
-200
0
200
400
Beam spans (ft)
Peak
sh
ear
(kip
s)
Fig. 5.20 Peak moment/shear values for representative permit vehicles on two-span girders
20 40 60 80 100 120 140-2
-1
0
1
2
R-v
alu
es
(mo
men
t)
20 40 60 80 100 120 140-2
-1
0
1
2
Beam spans (ft)
R-v
alu
es
(sh
ear)
Fig. 5.21 R-values for representative permit vehicles on two-span girders
Wis-SPV
Wis-SPV

89
Table 5.2(a) Peak positive moments in two-span girders by representative permit vehicles (kips-ft)
Span
(ft)
Wis_
SPV
STP
3axle
STP
4axle_
a
STP
4axle_
b
STP
5axle_
a
STP
5axle_
b
STP
6axle
STP
7axle_
a
STP
7axle_
b
STP
8axle
STP
9axle_
a
STP
9axle_
b
STP_1
0axle_
a
STP_1
0axle_
b
STP_1
1axle
STP_1
2axle
STP_1
3axle
32 577.2 351.2 445.5 472.2 517.0 474.3 563.8 626.8 417.6 681.5 481.0 648.2 411.7 636.2 613.6 442.5 520.0
36 675.0 412.9 516.8 568.7 603.5 565.8 668.6 755.4 481.9 830.2 562.5 813.4 495.6 778.2 752.1 517.5 616.7
40 774.3 475.1 603.1 666.9 690.3 658.0 773.9 885.1 546.2 980.9 644.3 982.1 589.7 922.1 892.7 592.7 716.9
44 878.2 537.6 691.3 766.4 781.4 750.6 880.4 1016.9 616.5 1133.7 729.1 1153.2 690.3 1066.9 1034.2 668.2 827.4
48 982.8 600.4 780.8 866.8 879.0 850.1 997.0 1164.8 690.7 1294.8 822.9 1325.7 792.1 1216.3 1176.2 743.8 951.3
52 1088.0 663.4 871.3 967.8 977.8 954.3 1114.9 1314.1 765.4 1462.4 917.6 1504.3 894.8 1373.6 1329.6 831.1 1087.0
56 1193.6 726.5 962.6 1069.2 1077.4 1059.4 1233.8 1464.4 840.5 1631.4 1013.0 1689.6 1010.8 1532.2 1484.5 932.4 1231.8
60 1299.5 789.7 1054.4 1171.1 1177.6 1165.1 1353.3 1615.6 935.0 1801.4 1109.0 1876.6 1128.9 1691.8 1640.4 1046.6 1378.2
64 1405.7 853.0 1146.7 1273.3 1278.3 1271.3 1473.4 1767.3 1051.9 1972.2 1209.2 2064.8 1247.7 1852.2 1797.1 1163.1 1525.9
68 1528.5 916.3 1239.3 1375.7 1379.4 1378.0 1594.0 1919.7 1175.3 2143.6 1345.2 2254.0 1367.1 2013.0 1954.5 1281.4 1674.8
72 1678.4 979.7 1332.3 1478.3 1480.9 1485.0 1715.0 2072.5 1301.0 2315.7 1497.7 2444.0 1487.0 2174.6 2112.5 1401.2 1832.1
76 1844.9 1043.2 1425.5 1581.1 1582.6 1592.3 1836.3 2225.7 1428.5 2488.1 1655.5 2634.6 1607.4 2336.4 2270.8 1522.3 1993.2
80 2022.6 1106.7 1518.8 1684.0 1684.5 1699.8 1957.8 2379.1 1557.4 2660.9 1815.7 2826.7 1728.0 2498.6 2429.5 1650.2 2155.6
84 2203.4 1170.3 1612.4 1787.3 1786.9 1807.6 2079.5 2532.8 1687.7 2834.1 1977.8 3019.2 1862.4 2661.1 2588.6 1782.9 2319.0
88 2386.8 1233.8 1706.0 1890.7 1889.9 1915.5 2201.5 2686.8 1821.4 3007.5 2141.5 3212.1 2011.4 2823.9 2747.9 1916.9 2483.3
92 2572.4 1297.4 1800.2 1994.4 1993.0 2023.6 2323.5 2840.9 1956.0 3181.1 2306.6 3405.2 2174.4 2986.9 2907.5 2052.1 2648.3
96 2760.0 1361.0 1894.3 2098.0 2096.1 2131.7 2445.7 2995.2 2091.2 3354.8 2473.0 3598.6 2339.6 3150.0 3067.1 2190.7 2814.0
100 2951.9 1424.7 1988.7 2201.6 2199.4 2240.0 2568.0 3149.6 2227.0 3528.7 2640.4 3792.1 2506.6 3313.1 3226.9 2330.0 2980.1
104 3146.4 1488.3 2083.1 2305.5 2302.8 2348.4 2690.5 3304.3 2363.2 3703.0 2808.6 3985.9 2675.0 3476.7 3387.0 2470.1 3147.0
108 3341.7 1552.0 2177.6 2409.4 2406.2 2457.0 2813.1 3459.0 2500.0 3877.3 2977.8 4179.8 2844.8 3640.3 3547.3 2610.6 3314.1
112 3537.9 1615.7 2272.2 2513.3 2509.7 2565.5 2935.7 3613.8 2637.0 4051.7 3147.6 4373.8 3015.9 3804.1 3707.6 2751.7 3481.7
116 3734.9 1679.4 2366.8 2617.2 2613.2 2674.2 3058.4 3768.7 2774.4 4226.2 3317.9 4568.0 3191.6 3967.8 3868.0 2893.0 3649.6
120 3932.7 1743.1 2461.5 2721.2 2716.7 2782.8 3181.1 3923.6 2912.0 4400.7 3488.8 4762.3 3370.0 4131.7 4028.5 3034.8 3817.7
124 4131.0 1806.8 2556.2 2825.2 2820.3 2891.5 3303.9 4078.6 3049.9 4575.4 3660.3 4956.6 3549.0 4295.7 4189.1 3176.9 3986.1
128 4330.0 1870.5 2651.0 2929.3 2923.9 3000.3 3426.8 4233.7 3188.3 4750.1 3832.1 5151.1 3728.5 4459.7 4349.8 3319.3 4154.7
132 4529.5 1934.2 2745.8 3033.3 3027.5 3109.2 3549.6 4388.8 3327.0 4924.9 4004.3 5345.6 3908.2 4623.8 4510.5 3462.0 4323.6
136 4729.4 1998.0 2840.7 3137.5 3131.2 3218.0 3672.6 4543.9 3465.9 5099.8 4176.9 5540.2 4088.5 4787.9 4671.2 3604.8 4492.8
140 4929.8 2061.7 2935.5 3241.6 3234.9 3326.9 3795.6 4699.1 3604.9 5274.8 4349.9 5734.9 4269.1 4952.1 4832.1 3747.9 4662.5

90
Table 5.2(b) Peak negative moments in two-span girders by representative permit vehicles (kips-ft)
Span
(ft)
Wis_
SPV
STP
3axle
STP
4axle_
a
STP
4axle_
b
STP
5axle_
a
STP
5axle_
b
STP
6axle
STP
7axle_
a
STP
7axle_
b
STP
8axle
STP
9axle_
a
STP
9axle_
b
STP_1
0axle_
a
STP_1
0axle_
b
STP_1
1axle
STP_1
2axle
STP_1
3axle
32 -547.7 -229.6 -322.7 -376.2 -352.9 -339.2 -400.6 -491.8 -433.9 -552.8 -503.5 -610.7 -369.4 -518.1 -481.9 -442.9 -518.7
36 -688.0 -251.8 -354.2 -425.9 -396.3 -390.6 -457.0 -572.6 -512.4 -643.3 -613.7 -712.8 -483.0 -603.2 -555.2 -528.1 -606.3
40 -831.6 -270.9 -381.9 -475.5 -435.9 -444.0 -513.2 -652.1 -592.2 -732.5 -708.1 -813.1 -608.6 -687.2 -629.1 -608.8 -682.2
44 -960.5 -298.5 -413.8 -524.7 -483.1 -499.8 -575.1 -730.2 -663.5 -820.6 -799.6 -911.7 -720.8 -769.9 -712.6 -679.1 -748.1
48 -1074.3 -330.2 -451.6 -569.8 -534.8 -554.8 -636.5 -807.6 -733.5 -907.7 -890.4 -1009.2 -820.9 -851.8 -795.2 -740.7 -805.9
52 -1175.1 -361.7 -496.9 -609.2 -586.1 -609.3 -697.2 -884.3 -803.1 -994.3 -979.6 -1105.9 -917.7 -933.0 -876.9 -794.9 -856.9
56 -1264.7 -392.9 -546.1 -643.8 -636.9 -663.5 -757.6 -960.4 -872.2 -1080.1 -1068.0 -1201.6 -1017.2 -1013.7 -957.9 -842.9 -903.3
60 -1344.9 -423.9 -594.5 -674.4 -687.6 -717.1 -817.6 -1036.1 -940.9 -1165.4 -1155.9 -1296.9 -1114.3 -1093.7 -1038.3 -886.0 -975.1
64 -1417.0 -454.8 -642.7 -723.8 -738.0 -770.4 -877.3 -1111.4 -1009.4 -1250.5 -1243.3 -1391.5 -1210.6 -1173.7 -1118.1 -925.6 -1067.5
68 -1482.2 -485.5 -690.4 -775.3 -788.0 -823.5 -936.8 -1186.3 -1077.6 -1335.1 -1330.3 -1485.8 -1305.6 -1253.2 -1197.5 -961.8 -1158.4
72 -1540.8 -516.0 -737.7 -826.3 -838.0 -875.7 -996.1 -1260.9 -1145.3 -1419.2 -1416.6 -1579.7 -1399.8 -1332.1 -1276.3 -995.8 -1248.5
76 -1594.4 -546.5 -784.8 -877.2 -887.9 -923.7 -1055.2 -1335.3 -1213.0 -1503.2 -1502.7 -1673.3 -1493.3 -1410.9 -1354.9 -1027.3 -1337.6
80 -1643.3 -576.9 -831.5 -927.8 -937.6 -967.9 -1114.1 -1409.6 -1280.5 -1587.0 -1588.6 -1766.7 -1586.1 -1489.5 -1433.2 -1103.8 -1426.0
84 -1688.3 -607.3 -878.2 -978.2 -987.1 -1008.8 -1172.9 -1483.6 -1347.9 -1670.6 -1674.2 -1859.7 -1678.4 -1568.1 -1511.2 -1183.0 -1513.7
88 -1729.5 -637.6 -924.6 -1028.4 -1036.5 -1047.2 -1231.5 -1557.4 -1415.1 -1753.9 -1759.5 -1952.6 -1770.2 -1646.3 -1588.9 -1261.4 -1600.7
92 -1767.5 -667.9 -970.8 -1078.5 -1085.7 -1100.8 -1290.2 -1631.3 -1482.2 -1837.1 -1844.6 -2045.3 -1861.7 -1724.5 -1666.4 -1339.1 -1687.3
96 -1803.4 -698.0 -1016.9 -1128.6 -1132.2 -1154.4 -1348.8 -1705.1 -1549.2 -1920.4 -1929.6 -2138.0 -1952.7 -1801.4 -1744.0 -1416.1 -1773.3
100 -1882.8 -728.1 -1062.9 -1178.7 -1176.1 -1207.8 -1407.2 -1778.9 -1616.3 -2003.6 -2014.6 -2230.7 -2043.3 -1874.1 -1821.3 -1492.6 -1859.0
104 -1996.6 -758.1 -1108.9 -1228.3 -1216.7 -1260.7 -1465.5 -1852.2 -1683.2 -2086.4 -2099.2 -2322.8 -2133.6 -1941.3 -1898.2 -1567.9 -1944.1
108 -2110.2 -788.2 -1154.5 -1277.8 -1262.2 -1313.4 -1523.6 -1925.5 -1749.9 -2169.1 -2181.2 -2414.9 -2222.2 -2004.7 -1974.9 -1643.2 -2029.0
112 -2222.7 -818.2 -1200.1 -1327.4 -1311.8 -1366.1 -1581.7 -1998.8 -1816.5 -2251.8 -2258.5 -2507.0 -2307.5 -2064.9 -2051.6 -1717.9 -2113.4
116 -2333.9 -848.3 -1245.7 -1376.9 -1361.4 -1418.9 -1638.7 -2072.0 -1880.7 -2334.4 -2331.7 -2599.0 -2388.5 -2136.4 -2128.2 -1792.3 -2197.6
120 -2444.4 -878.3 -1291.1 -1426.2 -1410.8 -1471.3 -1693.1 -2145.1 -1941.4 -2416.9 -2400.8 -2690.9 -2465.4 -2215.6 -2204.7 -1866.1 -2281.6
124 -2554.1 -908.3 -1336.4 -1475.6 -1460.2 -1523.8 -1744.5 -2217.9 -1998.9 -2499.5 -2466.5 -2782.7 -2538.6 -2294.7 -2281.2 -1939.8 -2365.3
128 -2662.9 -938.3 -1381.7 -1524.9 -1509.7 -1576.0 -1793.2 -2288.2 -2053.7 -2582.0 -2528.6 -2874.5 -2608.8 -2373.6 -2357.6 -2013.0 -2448.9
132 -2770.9 -968.1 -1427.0 -1574.2 -1559.1 -1628.1 -1845.6 -2355.1 -2105.7 -2664.4 -2587.8 -2966.3 -2675.8 -2452.6 -2433.9 -2085.9 -2532.1
136 -2878.4 -998.0 -1472.2 -1623.6 -1608.3 -1680.3 -1904.2 -2418.8 -2155.0 -2746.8 -2643.8 -3058.0 -2739.6 -2531.3 -2510.1 -2158.6 -2615.2
140 -2985.5 -1027.9 -1517.4 -1672.9 -1657.5 -1732.4 -1962.7 -2479.4 -2202.0 -2829.0 -2697.3 -3149.6 -2801.3 -2609.6 -2586.1 -2231.0 -2698.2

91
Table 5.2(c) Peak shear in two-span girders by representative permit vehicles (kips)
Span
(ft)
Wis_
SPV
STP
3axle
STP
4axle_
a
STP
4axle_
b
STP
5axle_
a
STP
5axle_
b
STP
6axle
STP
7axle_
a
STP
7axle_
b
STP
8axle
STP
9axle_
a
STP
9axle_
b
STP_1
0axle_
a
STP_1
0axle_
b
STP_1
1axle
STP_1
2axle
STP_1
3axle
32 107.4 66.4 86.1 97.8 95.2 92.9 107.4 124.3 77.1 136.6 90.2 131.8 89.4 125.4 122.7 82.8 102.1
36 111.8 67.9 90.2 101.7 99.4 96.1 110.8 129.8 81.2 144.5 95.9 143.9 95.3 133.2 130.4 85.7 106.8
40 115.9 69.0 93.3 104.8 102.7 98.6 114.8 136.0 84.4 150.7 100.8 153.3 99.9 139.2 136.3 88.3 115.6
44 119.7 69.9 95.8 107.2 105.3 100.5 118.7 141.9 88.4 155.5 104.8 161.8 105.1 145.8 141.9 95.0 123.9
48 123.0 70.6 97.8 109.2 107.4 103.8 121.8 146.8 95.3 159.8 107.9 169.6 111.0 151.4 147.5 101.6 130.7
52 126.4 71.2 99.5 110.8 109.1 106.5 124.5 150.8 100.9 164.9 115.1 176.1 115.9 156.1 152.1 107.2 136.3
56 135.3 71.7 100.9 112.1 110.6 108.8 126.6 154.1 105.7 169.1 122.5 181.6 119.9 159.9 156.0 111.8 142.3
60 142.9 72.1 102.0 113.3 111.8 110.8 128.5 157.0 111.3 172.7 128.9 186.1 123.2 163.2 159.2 117.3 147.9
64 149.9 72.5 103.0 114.3 112.9 112.4 130.1 159.4 116.1 175.8 134.4 190.1 126.0 166.0 162.0 122.1 152.7
68 157.4 72.8 103.9 115.1 113.8 113.9 131.5 161.5 120.2 178.5 139.1 193.5 129.8 168.4 164.5 126.2 156.8
72 164.0 73.1 104.7 115.8 114.6 115.1 132.7 163.3 123.8 180.8 143.2 196.4 135.1 170.5 166.6 129.8 160.5
76 169.8 73.3 105.3 116.5 115.3 116.2 133.7 164.9 127.0 182.8 146.9 199.0 139.8 172.4 168.4 133.0 163.6
80 175.0 73.5 105.9 117.0 115.9 117.2 134.6 166.3 129.8 184.6 150.8 201.4 144.0 174.0 170.1 135.8 166.5
84 179.6 73.7 106.4 117.5 116.4 118.0 135.5 167.6 132.4 186.2 154.8 203.4 147.7 175.5 171.5 138.3 169.0
88 183.7 73.9 106.9 118.0 116.9 118.8 136.2 168.7 134.6 187.6 158.3 205.2 151.0 176.8 172.8 140.6 171.2
92 187.4 74.1 107.3 118.4 117.4 119.5 136.9 169.7 136.6 188.9 161.4 206.9 154.0 178.0 174.0 142.6 173.2
96 190.8 74.2 107.7 118.8 117.8 120.1 137.5 170.7 138.5 190.1 164.3 208.4 156.7 179.0 175.1 144.4 175.0
100 193.8 74.3 108.1 119.1 118.1 120.7 138.0 171.5 140.1 191.2 166.9 209.7 159.2 180.0 176.0 146.1 176.7
104 196.6 74.4 108.4 119.4 118.5 121.2 138.5 172.3 141.6 192.1 169.3 210.9 161.4 180.9 176.9 147.6 178.2
108 199.1 74.6 108.7 119.7 118.8 121.7 139.0 172.9 143.0 193.0 171.4 212.1 163.4 181.7 177.7 149.0 179.6
112 201.4 74.7 108.9 120.0 119.1 122.1 139.4 173.6 144.3 193.8 173.4 213.1 165.7 182.4 178.5 150.2 180.8
116 203.6 74.7 109.2 120.2 119.3 122.5 139.8 174.2 145.4 194.6 175.2 214.1 168.3 183.1 179.1 151.4 182.0
120 205.6 74.8 109.4 120.4 119.6 122.9 140.2 174.7 146.5 195.3 176.9 214.9 170.6 183.7 179.8 152.5 183.1
124 207.4 74.9 109.6 120.6 119.8 123.3 140.5 175.2 147.5 195.9 178.5 215.7 172.9 184.3 180.4 153.4 184.1
128 209.1 75.0 109.8 120.8 120.0 123.6 140.8 175.7 148.4 196.5 179.9 216.5 174.9 184.9 180.9 154.4 185.0
132 210.6 75.0 110.0 121.0 120.2 123.9 141.1 176.1 149.3 197.0 181.3 217.2 176.8 185.4 181.4 155.2 185.8
136 212.1 75.1 110.2 121.2 120.4 124.2 141.4 176.5 150.1 197.6 182.5 217.9 178.6 185.8 181.9 156.0 186.6
140 213.5 75.2 110.3 121.3 120.5 124.4 141.6 176.9 150.8 198.0 183.7 218.5 180.2 186.3 182.3 156.8 187.4

92
Three-span simply supported girders
The maximum moments and shear in 3-span simply-supported girders by the 16 representative
permit vehicles are shown in Fig. 5.22, and the values are listed in Table 5.3.
20 40 60 80 100 120 140-4000
-2000
0
2000
4000
6000
Peak
mo
men
t (k
ips-
ft)
20 40 60 80 100 120 140-400
-200
0
200
400
Beam spans (ft)
Peak
sh
ear
(kip
s)
Fig. 5.22 Peak moment/shear values for representative permit vehicles on three-span girders
20 40 60 80 100 120 140-2
-1
0
1
2
R-v
alu
es
(mo
men
t)
20 40 60 80 100 120 140-2
-1
0
1
2
Beam spans (ft)
R-v
alu
es
(sh
ear)
Fig. 5.23 R-values for representative permit vehicles on three-span girders
Wis-SPV
Wis-SPV

93
Table 5.3(a) Peak positive moments in three-span girders by representative permit vehicles (kips-ft)
Span
(ft)
Wis_
SPV
STP
3axle
STP
4axle_
a
STP
4axle_
b
STP
5axle_
a
STP
5axle_
b
STP
6axle
STP
7axle_
a
STP
7axle_
b
STP
8axle
STP
9axle_
a
STP
9axle_
b
STP_1
0axle_
a
STP_1
0axle_
b
STP_1
1axle
STP_1
2axle
STP_1
3axle
32 575.6 345.9 438.9 464.9 509.1 466.6 554.4 616.1 437.2 670.3 503.4 636.4 429.1 624.3 602.0 437.0 511.3
36 667.4 406.8 509.9 559.7 594.5 556.7 657.8 742.8 505.4 816.6 588.3 798.8 513.6 764.7 739.0 509.6 606.6
40 763.4 468.1 594.6 656.4 680.1 647.5 761.6 870.7 573.6 965.1 673.4 965.0 610.7 906.4 877.4 583.9 706.1
44 865.7 529.8 681.3 754.5 770.5 738.8 867.4 1000.3 641.9 1115.3 758.5 1133.4 712.9 1049.1 1016.8 658.4 815.3
48 968.8 591.7 769.5 853.4 866.7 837.3 982.1 1145.7 709.9 1274.2 835.5 1303.4 814.2 1197.2 1157.7 733.1 936.9
52 1072.3 653.9 858.6 953.1 964.0 939.9 1098.2 1292.5 773.7 1439.2 914.8 1479.2 913.0 1352.2 1308.8 819.8 1068.8
56 1176.4 716.2 948.6 1053.3 1062.2 1043.4 1215.3 1440.6 832.1 1605.7 998.5 1661.6 1015.8 1508.4 1461.4 919.6 1211.0
60 1280.8 778.6 1039.2 1153.9 1161.1 1147.6 1333.1 1589.9 921.5 1773.2 1093.2 1845.7 1115.4 1665.7 1615.0 1031.5 1354.9
64 1385.6 841.1 1130.3 1254.8 1260.5 1252.3 1451.6 1739.8 1036.2 1941.7 1192.1 2031.1 1227.0 1823.8 1769.5 1145.8 1500.4
68 1507.7 903.7 1221.7 1355.9 1360.3 1357.5 1570.5 1890.3 1157.1 2110.7 1324.1 2217.6 1344.7 1982.5 1924.7 1262.0 1647.0
72 1655.1 966.3 1313.5 1457.3 1460.5 1463.1 1689.9 2041.3 1280.4 2280.5 1473.9 2404.9 1462.9 2141.8 2080.5 1379.9 1803.2
76 1818.0 1029.0 1405.5 1558.9 1560.9 1569.0 1809.5 2192.6 1405.7 2450.6 1628.5 2592.9 1581.5 2301.5 2236.7 1499.1 1961.7
80 1991.9 1091.7 1497.8 1660.6 1661.6 1675.1 1929.4 2344.2 1532.5 2621.2 1785.6 2781.6 1700.6 2461.6 2393.4 1624.9 2121.6
84 2169.0 1154.5 1590.2 1762.4 1762.5 1781.4 2049.6 2496.1 1660.6 2792.1 1944.8 2971.4 1834.6 2622.1 2550.3 1755.3 2282.6
88 2349.0 1217.3 1682.7 1864.4 1863.9 1888.0 2170.0 2648.2 1791.0 2963.3 2105.7 3161.6 1981.6 2782.7 2707.6 1887.1 2444.5
92 2531.3 1280.1 1775.5 1966.4 1965.8 1994.7 2290.6 2800.4 1923.6 3134.7 2268.0 3352.1 2141.6 2943.6 2865.1 2020.2 2607.2
96 2715.6 1343.0 1868.3 2068.5 2067.7 2101.5 2411.2 2952.8 2056.8 3306.3 2431.7 3542.8 2303.7 3104.7 3022.8 2155.1 2770.7
100 2901.8 1405.9 1961.2 2170.6 2169.7 2208.4 2532.0 3105.2 2190.8 3477.9 2596.6 3733.7 2467.8 3265.8 3180.6 2292.3 2934.5
104 3093.2 1468.8 2054.2 2272.9 2271.8 2315.4 2652.9 3258.1 2325.1 3650.1 2762.2 3925.1 2633.4 3427.4 3338.7 2430.5 3099.2
108 3285.5 1531.7 2147.3 2375.5 2373.9 2422.6 2774.0 3410.9 2460.1 3822.2 2928.8 4116.6 2800.4 3589.0 3497.0 2569.0 3264.1
112 3478.8 1594.6 2240.5 2478.1 2476.2 2529.9 2895.1 3563.8 2595.3 3994.5 3096.2 4308.3 2968.7 3750.7 3655.3 2708.2 3429.6
116 3673.0 1657.6 2333.6 2580.8 2578.4 2637.2 3016.3 3716.8 2730.9 4166.8 3264.2 4500.2 3138.1 3912.4 3813.7 2847.6 3595.4
120 3868.0 1720.5 2427.2 2683.5 2680.7 2744.5 3137.6 3869.8 2866.8 4339.2 3432.7 4692.1 3310.8 4074.2 3972.2 2987.5 3761.4
124 4063.5 1783.5 2520.8 2786.3 2783.1 2851.9 3258.8 4022.9 3002.9 4511.8 3601.8 4884.1 3487.0 4236.3 4130.9 3127.7 3927.7
128 4259.8 1846.5 2614.4 2889.1 2885.4 2959.3 3319.5 4176.1 3139.3 4684.4 3771.3 5076.2 3663.7 4398.3 4289.6 3268.3 4094.3
132 4456.5 1909.4 2708.0 2991.9 2987.7 3066.9 3501.6 4329.4 3275.9 4857.1 3941.2 5268.4 3840.7 4560.4 4448.3 3409.1 4261.1
136 4653.8 1972.4 2801.7 3094.7 3090.2 3174.4 3623.0 4482.6 3412.7 5029.9 4111.6 5460.7 4018.5 4722.5 4607.1 3550.1 4428.1
140 4851.5 2035.4 2895.5 3197.7 3192.7 3282.0 3744.5 4636.0 3549.7 5202.7 4282.3 5653.0 4196.9 4884.8 4766.1 3691.5 4595.4

94
Table 5.3(b) Peak negative moments in three-span girders by representative permit vehicles (kips-ft)
Span
(ft)
Wis_
SPV
STP
3axle
STP
4axle_
a
STP
4axle_
b
STP
5axle_
a
STP
5axle_
b
STP
6axle
STP
7axle_
a
STP
7axle_
b
STP
8axle
STP
9axle_
a
STP
9axle_
b
STP_1
0axle_
a
STP_1
0axle_
b
STP_1
1axle
STP_1
2axle
STP_1
3axle
32 -504.5 -230.5 -329.0 -360.3 -364.6 -350.0 -414.3 -486.1 -405.1 -527.1 -465.6 -589.8 -354.7 -498.7 -478.1 -421.9 -505.1
36 -640.8 -254.6 -363.5 -408.0 -411.7 -405.5 -475.2 -563.5 -482.2 -611.6 -573.2 -687.7 -450.3 -578.4 -561.3 -503.9 -589.7
40 -775.6 -284.0 -394.1 -455.6 -455.1 -456.7 -531.7 -634.9 -560.1 -701.7 -667.5 -784.4 -574.7 -659.0 -646.3 -581.6 -665.1
44 -900.1 -318.2 -423.1 -502.9 -495.4 -504.7 -584.4 -703.4 -631.4 -786.7 -756.9 -879.4 -688.0 -739.3 -725.9 -650.9 -732.0
48 -1014.7 -352.1 -476.9 -548.8 -533.4 -549.8 -634.1 -777.7 -698.9 -867.4 -848.0 -973.5 -790.7 -815.6 -801.5 -712.6 -791.4
52 -1117.2 -385.6 -529.8 -604.5 -585.1 -592.8 -681.6 -851.4 -766.0 -944.8 -934.3 -1066.8 -888.0 -891.0 -876.9 -767.5 -844.4
56 -1209.1 -418.9 -582.3 -660.8 -641.6 -646.4 -748.8 -924.7 -832.7 -1034.7 -1019.8 -1159.4 -990.9 -968.8 -958.8 -816.5 -892.0
60 -1291.7 -452.0 -634.0 -716.5 -697.4 -706.9 -816.0 -1010.0 -898.9 -1132.5 -1104.8 -1251.5 -1087.8 -1060.5 -1040.0 -860.5 -972.6
64 -1366.4 -484.9 -685.3 -771.9 -753.0 -766.9 -882.5 -1095.3 -964.8 -1229.0 -1189.2 -1342.9 -1183.6 -1151.2 -1120.6 -900.7 -1066.6
68 -1434.3 -517.7 -736.3 -826.7 -808.2 -826.3 -948.4 -1179.9 -1030.5 -1324.8 -1273.2 -1437.2 -1278.2 -1241.0 -1208.9 -937.8 -1159.1
72 -1495.7 -550.3 -786.7 -881.2 -862.8 -885.2 -1014.2 -1263.5 -1095.7 -1419.4 -1356.6 -1544.5 -1371.9 -1330.1 -1296.4 -972.4 -1250.6
76 -1551.8 -582.8 -836.9 -935.5 -917.3 -943.5 -1079.3 -1346.7 -1160.8 -1513.6 -1439.7 -1651.0 -1464.9 -1418.4 -1383.3 -1052.2 -1341.2
80 -1603.3 -615.3 -886.8 -989.4 -971.6 -1001.7 -1144.2 -1429.4 -1225.9 -1607.0 -1522.6 -1756.6 -1557.1 -1506.2 -1469.5 -1135.8 -1431.0
84 -1650.9 -647.7 -936.6 -1043.2 -1025.6 -1059.5 -1208.7 -1511.5 -1290.7 -1699.9 -1605.2 -1861.5 -1648.8 -1593.4 -1555.2 -1218.2 -1520.0
88 -1694.6 -680.0 -986.1 -1096.8 -1079.4 -1116.9 -1273.0 -1593.3 -1355.3 -1792.2 -1687.6 -1965.7 -1739.9 -1680.2 -1640.5 -1299.8 -1608.3
92 -1758.6 -712.3 -1035.4 -1150.2 -1133.0 -1174.1 -1337.0 -1674.6 -1419.8 -1884.2 -1769.6 -2069.4 -1830.7 -1766.6 -1725.4 -1380.5 -1696.2
96 -1884.1 -744.4 -1084.5 -1203.7 -1186.6 -1231.2 -1400.9 -1755.8 -1484.2 -1976.0 -1851.5 -2172.6 -1921.0 -1852.7 -1809.9 -1460.6 -1790.8
100 -2008.1 -776.5 -1133.6 -1257.1 -1240.1 -1288.1 -1464.7 -1837.0 -1548.7 -2067.7 -1933.5 -2275.1 -2010.9 -1938.5 -1894.3 -1540.1 -1886.1
104 -2129.5 -808.6 -1182.7 -1310.0 -1293.3 -1344.6 -1528.1 -1917.2 -1613.0 -2158.2 -2015.0 -2377.2 -2100.4 -2023.7 -1977.9 -1618.4 -1979.7
108 -2250.7 -840.6 -1231.4 -1362.9 -1346.2 -1400.8 -1591.2 -1997.4 -1677.1 -2248.7 -2096.5 -2479.1 -2189.6 -2108.9 -2061.5 -1698.5 -2073.2
112 -2370.6 -872.7 -1280.0 -1415.7 -1399.2 -1457.1 -1654.3 -2077.3 -1741.2 -2339.2 -2176.6 -2580.6 -2278.2 -2194.0 -2145.0 -1780.0 -2166.2
116 -2489.3 -904.7 -1328.6 -1468.5 -1452.0 -1513.3 -1717.3 -2157.2 -1805.3 -2429.4 -2252.6 -2681.9 -2363.8 -2278.6 -2228.1 -1860.7 -2258.8
120 -2607.2 -936.8 -1377.0 -1521.2 -1504.7 -1569.3 -1780.2 -2237.0 -1868.1 -2519.4 -2324.8 -2782.7 -2445.5 -2363.1 -2311.1 -1941.0 -2350.8
124 -2724.2 -968.8 -1425.4 -1573.9 -1557.5 -1625.2 -1843.1 -2316.6 -1943.6 -2609.2 -2393.4 -2883.4 -2524.1 -2447.4 -2393.8 -2020.8 -2442.4
128 -2840.3 -1000.7 -1473.7 -1626.5 -1610.2 -1680.9 -1874.5 -2395.9 -2020.8 -2698.8 -2467.9 -2984.0 -2599.2 -2531.7 -2476.5 -2100.3 -2533.8
132 -2955.5 -1032.6 -1522.1 -1679.1 -1662.9 -1736.6 -1968.5 -2475.2 -2097.6 -2788.4 -2566.5 -3084.3 -2671.0 -2615.9 -2559.1 -2179.4 -2625.0
136 -3070.2 -1064.5 -1570.3 -1731.7 -1715.4 -1792.2 -2031.0 -2554.5 -2173.8 -2877.8 -2664.2 -3184.3 -2740.3 -2699.8 -2641.4 -2258.2 -2715.7
140 -3184.3 -1096.4 -1618.4 -1784.3 -1767.9 -1847.8 -2093.5 -2633.4 -2249.8 -2967.0 -2761.7 -3284.2 -2806.7 -2783.4 -2723.6 -2336.4 -2806.0

95
Table 5.3(c) Peak shear in three-span girders by representative permit vehicles (kips)
Span
(ft)
Wis_
SPV
STP
3axle
STP
4axle_
a
STP
4axle_
b
STP
5axle_
a
STP
5axle_
b
STP
6axle
STP
7axle_
a
STP
7axle_
b
STP
8axle
STP
9axle_
a
STP
9axle_
b
STP_1
0axle_
a
STP_1
0axle_
b
STP_1
1axle
STP_1
2axle
STP_1
3axle
32 -107.7 -66.6 -86.5 -98.2 -95.6 -93.0 -107.6 -124.5 -76.7 -137.1 -90.0 -132.5 -89.5 -125.8 -123.1 -82.3 -101.3
36 -111.6 -68.1 -90.6 -102.2 -99.8 -96.2 -110.9 -130.1 -80.4 -145.1 -95.3 -144.6 -95.4 -133.7 -130.9 -84.9 -107.4
40 -115.2 -69.2 -93.7 -105.3 -103.1 -98.7 -115.4 -136.7 -83.3 -151.2 -99.8 -154.0 -100.0 -139.8 -136.8 -88.7 -116.2
44 -118.5 -70.1 -96.2 -107.7 -105.7 -101.0 -119.3 -142.7 -88.8 -156.0 -103.5 -162.8 -104.3 -146.7 -142.7 -95.4 -124.6
48 -121.5 -70.8 -98.2 -109.6 -107.8 -104.3 -122.4 -147.6 -95.7 -160.7 -107.0 -170.7 -110.2 -152.3 -148.3 -102.1 -131.4
52 -126.9 -71.4 -99.9 -111.2 -109.5 -107.1 -125.0 -151.5 -101.4 -165.8 -115.3 -177.2 -115.0 -156.9 -152.9 -107.7 -137.0
56 -135.9 -71.9 -101.2 -112.6 -111.0 -109.3 -127.2 -154.9 -106.2 -170.1 -122.9 -182.6 -119.0 -160.8 -156.8 -112.4 -143.1
60 -143.6 -72.3 -102.4 -113.7 -112.2 -111.3 -129.0 -157.7 -111.8 -173.6 -129.3 -187.2 -122.4 -164.0 -160.0 -117.9 -148.7
64 -150.7 -72.7 -103.4 -114.6 -113.2 -112.9 -130.6 -160.1 -116.7 -176.7 -134.9 -191.1 -125.2 -166.8 -162.8 -122.7 -153.5
68 -158.3 -73.0 -104.2 -115.5 -114.1 -114.3 -132.0 -162.2 -120.8 -179.3 -139.6 -194.5 -130.3 -169.2 -165.2 -126.9 -157.7
72 -164.9 -73.2 -105.0 -116.2 -114.9 -115.6 -133.2 -164.0 -124.5 -181.6 -143.8 -197.4 -135.6 -171.3 -167.3 -130.5 -161.3
76 -170.7 -73.5 -105.6 -116.8 -115.6 -116.7 -134.2 -165.6 -127.7 -183.7 -147.5 -200.0 -140.4 -173.2 -169.2 -133.7 -164.5
80 -175.9 -73.7 -106.2 -117.4 -116.2 -117.6 -135.1 -167.0 -130.5 -185.4 -151.7 -202.3 -144.6 -174.8 -170.8 -136.5 -167.3
84 -180.6 -73.9 -106.7 -117.9 -116.8 -118.5 -135.9 -168.2 -133.0 -187.0 -155.6 -204.3 -148.3 -176.2 -172.2 -139.0 -169.8
88 -184.7 -74.0 -107.2 -118.3 -117.2 -119.2 -136.7 -169.4 -135.3 -188.4 -159.2 -206.1 -151.7 -177.5 -173.5 -141.3 -172.0
92 -188.4 -74.2 -107.6 -118.7 -117.7 -119.9 -137.3 -170.4 -137.3 -189.7 -162.3 -207.8 -154.7 -178.7 -174.7 -143.3 -174.0
96 -191.8 -74.3 -108.0 -119.1 -118.1 -120.5 -137.9 -171.3 -139.1 -190.9 -165.2 -209.2 -157.4 -179.7 -175.7 -145.1 -175.9
100 -194.8 -74.5 -108.3 -119.4 -118.4 -121.1 -138.5 -172.1 -140.8 -191.9 -167.8 -210.6 -159.8 -180.7 -176.7 -146.8 -177.5
104 -197.6 -74.6 -108.6 -119.7 -118.8 -121.6 -138.9 -172.8 -142.3 -192.8 -170.2 -211.8 -162.1 -181.5 -177.6 -148.3 -179.0
108 -200.1 -74.7 -108.9 -120.0 -119.1 -122.1 -139.4 -173.5 -143.7 -193.7 -172.3 -212.9 -164.1 -182.3 -178.4 -149.6 -180.4
112 -202.5 -74.8 -109.2 -120.2 -119.3 -122.5 -139.8 -174.1 -144.9 -194.5 -174.3 -213.9 -166.6 -183.0 -179.1 -150.9 -181.6
116 -204.6 -74.9 -109.4 -120.5 -119.6 -122.9 -140.2 -174.7 -146.1 -195.2 -176.1 -214.8 -169.2 -183.7 -179.7 -152.0 -182.8
120 -206.6 -74.9 -109.6 -120.7 -119.8 -123.3 -140.5 -175.3 -147.1 -195.9 -177.8 -215.7 -171.6 -184.3 -180.4 -153.1 -183.8
124 -208.4 -75.0 -109.8 -120.9 -120.0 -123.6 -140.9 -175.7 -148.1 -196.5 -179.4 -216.5 -173.8 -184.9 -180.9 -154.1 -184.8
128 -210.0 -75.1 -110.0 -121.1 -120.2 -123.9 -141.0 -176.2 -149.0 -197.1 -180.8 -217.2 -175.9 -185.4 -181.5 -155.0 -185.7
132 -211.6 -75.1 -110.2 -121.2 -120.4 -124.2 -141.4 -176.6 -149.9 -197.7 -182.1 -217.9 -177.8 -185.9 -182.0 -155.8 -186.6
136 -213.1 -75.2 -110.4 -121.4 -120.6 -124.5 -141.7 -177.0 -150.7 -198.2 -183.4 -218.6 -179.6 -186.4 -182.4 -156.6 -187.3
140 -214.4 -75.3 -110.5 -121.6 -120.8 -124.7 -141.9 -177.4 -151.4 -198.6 -184.5 -219.2 -181.2 -186.8 -182.8 -157.4 -188.1

96
Summary
The 250-kip Wisconsin Standard Permit Vehicle is reasonably positioned within the single-trip
permit vehicles as far as load impacts on simply supported, 2-span, and 3-span continuous
girders. Specifically, Wis-SPV may envelope almost all single-unit trucks with less than 9 total
axles, which attrbutes 80% of the total permit records. The representative vehicles with 7 axles
and 8 axles could cause larger girder responses than the Wis-SPV. A close look at these vehicles
indicated that the potential worst vehicles are short vehicles with distributed multiple axles likely
FHWA the vehicle in Fig. 5.24. This observation is likely FHWA that obtained in the analysis of
WIM records in Chapter 4.
Fig. 5.24 Example of short trucks with lift axles
Many permit vehicles with 9+ axles may cause larger girder responses than Wis-SPV. The
permit vehicles with 9+ axles are about 20% of the total permit records. The representative
vehicles indicated that these vehicles may likely be heavier than the Wis-SPV. Two typical
vehicles, represented by the proposed vehicles in this chapter, are shown in Fig. 5.24.
a) distribution beam b) hydraulic platform
Fig. 5.25 Permit vehicles with more than 9 axles

97
Chapter 6 Suggested Modifications to Wis-SPV
Introduction
The Wisconsin Standard Permit Vehicle (Wis-SPV) is 63-ft long with a gross weight of 250
kips; hence Wis-SPV would control the internal force responses in long-span simply-supported
girders (L > 100ft). Meanwhile Wis-SPV has a heavy axle group – the four-axle tandem weighs
140 kips; hence, Wis-SPV would also dominate the responses in short-span simply-supported
girders (L < 40ft). However, short trucks with five to seven axles, might cause larger forces in
medium-span girders as shown in the analyses in Chapters 4 and 5. In addition to positive
moments, the configuration and the gross weight of the vehicles also have impact on negative
moments in continuous girders. The analyses in the previous chapters indicated that some
vehicles, especially long vehicles such as MnDOT Type P413, may cause larger negative
moments. This was not deemed as a concern in this study because the overweight vehicles in
Wisconsin that are eligible for annual permits should be shorter than 75ft. Hence, a longer
vehicle than the 63ft Wis-SPV was not proposed to the standard permit vehicles.
Note that a short truck may cause large negative moments in many cases in addition to large
positive moments. For example, both the long vehicle and the short vehicle in Fig. 6.1 (showing
influence lines for the moment at the interior support) would produce similar negative moment in
the two-span simply-supported girders because the two points corresponded to the same
influence line values for the negative moment at the middle support. Hence, a short truck was
proposed in this Chapter such that together with Wis-SPV, the standard permit vehicles would
envelop most overloaded vehicles in Wisconsin.
P5P
Veh_L
P5PVeh_S
Fig. 6.1 Demonstration of short vehicles causing the worst negative moments
The prototype vehicle for the proposed short vehicle was the specialized hauling vehicles
(SHVs), such as dump trucks, transit mixers, and trash trucks as illustrated in Fig. 6.2. Note that
the proposed short truck was based on the statistical analyses as shown below, and does not have
any indication that the vehicles shown in Fig. 6.2 are overweight. SHVs represent more than
forty percent of the single-unit trucks operating with three or more axles.1 The common
commodities that SHVs haul are construction materials, gravel, ready-mix concrete, grain, and
garbage or waste. These vehicles are usually three axle trucks with two to four lifting axles.
When being fully loaded, all axles carry weight, resulting in short heavy trucks with five to seven
axles. A fully loaded specialized hauling vehicle may be particularly heavy when the loaded
materials are wet (or saturated).

98
Fig. 6.2 Examples of specialized hauling vehicles (SHVs) from various online sources
Proposed Short Permit Truck
All 5-axle short vehicles with gross vehicle weight between 80 kips and 250 kips were selected
from the WIM records and analyzed (out of 43,570 5-axle overload trucks). There were 8417
vehicles in total, including 6833 Class 7 trucks, 1418 Class 9 trailers, 166 Class 15 vehicles. The
results of the descriptive statistical analysis of these vehicles are shown below. A representative
vehicle was created with the first axle spacing as the mean value and all other spacings 4 ft. Axle
weights in the proposed short vehicle were slightly higher than the 95% percentile values. The
axle weights were slightly modified to create a 150-kip truck as illustrated in Fig. 6.3.
8417
vehicles Minimum Maximum Mean
Standard
deviation
5th
percentile
95th
percentile
Gross weight 80028 242509 92551.45 13925.688 80468.74 122797.50
Axle weight 1 4850 47399 19779.50 4612.622 12786.81 27998.71
Axle spacing 1 4 21 10.72 2.175 8.20 14.44
Axle weight 2 882 39683 10305.49 3792.207 5291.10 16755.13
Axle spacing 2 3 7 4.36 .530 3.94 5.25
Axle weight 3 220 55556 16624.59 7370.003 6613.87 30203.34
Axle spacing 3 3 8 4.21 .274 3.94 4.59
Axle weight 4 1323 57100 23482.84 5171.193 16534.67 33730.73
Axle spacing 4 3 8 4.48 .449 3.94 5.25
Axle weight 5 1764 57320 22359.15 6948.196 10361.73 34612.58
11'
30 20
23'
30
4'
35
4'
35
4'
GVW=150k
Fig. 6.3 The proposed 5-axle vehicle to supplement the Wis-SPV
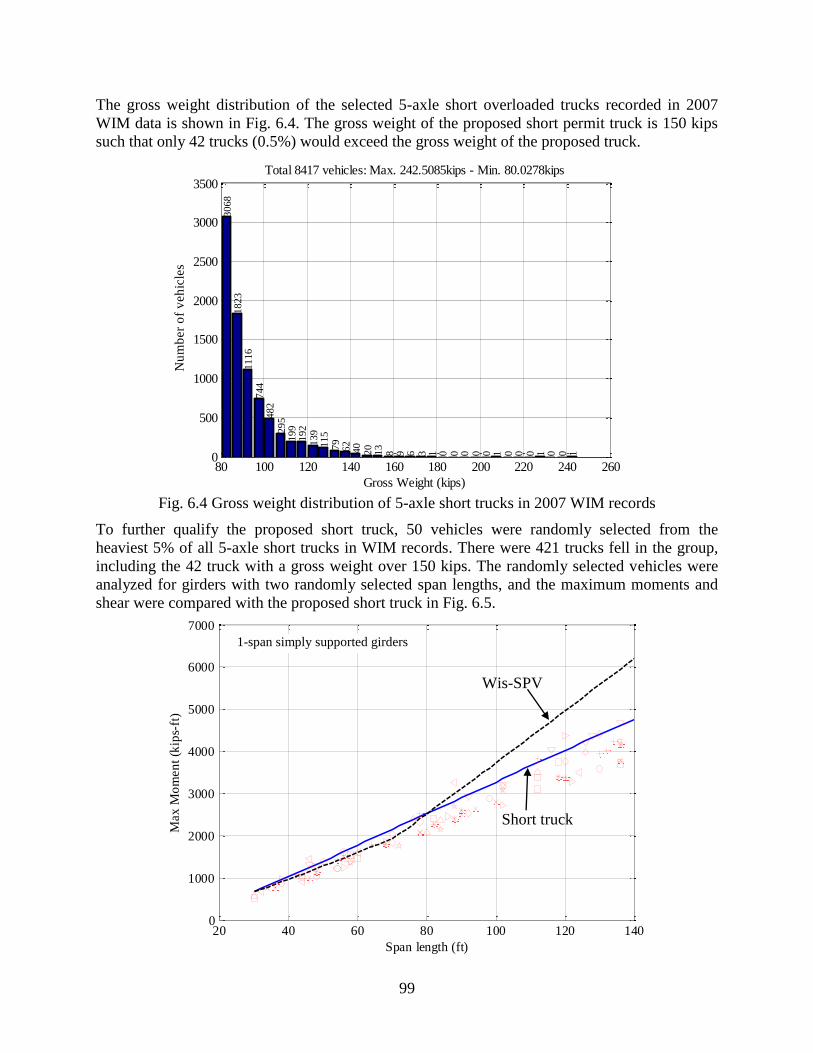
99
The gross weight distribution of the selected 5-axle short overloaded trucks recorded in 2007
WIM data is shown in Fig. 6.4. The gross weight of the proposed short permit truck is 150 kips
such that only 42 trucks (0.5%) would exceed the gross weight of the proposed truck.
80 100 120 140 160 180 200 220 240 2600
500
1000
1500
2000
2500
3000
3500
3068
1823
1116
744
482
295
199
192
139
115
79
62
40
20
13
8 9 6 3 1 0 0 0 0 0 1 0 0 0 1 0 0 1
Gross Weight (kips)
Nu
mb
er
of
veh
icle
sTotal 8417 vehicles: Max. 242.5085kips - Min. 80.0278kips
Fig. 6.4 Gross weight distribution of 5-axle short trucks in 2007 WIM records
To further qualify the proposed short truck, 50 vehicles were randomly selected from the
heaviest 5% of all 5-axle short trucks in WIM records. There were 421 trucks fell in the group,
including the 42 truck with a gross weight over 150 kips. The randomly selected vehicles were
analyzed for girders with two randomly selected span lengths, and the maximum moments and
shear were compared with the proposed short truck in Fig. 6.5.
20 40 60 80 100 120 1400
1000
2000
3000
4000
5000
6000
7000
Span length (ft)
Max
Mo
men
t (k
ips-
ft)
1-span simply supported girders
Wis-SPV
Short truck

100
20 40 60 80 100 120 140-3000
-2000
-1000
0
1000
2000
3000
4000
5000
Span length (ft)
Max
Mo
men
t (k
ips-
ft)
20 40 60 80 100 120 140-3000
-2000
-1000
0
1000
2000
3000
4000
5000
Span length (ft)
Max
Mo
men
t (k
ips-
ft)
Fig. 6.5 Comparison of the proposed short truck with randomly selected 5-axle trucks
The peak moments by Wis-SPV were shown in dashed (black) lines and the proposed short truck
was represented by solid (blue) lines in Fig. 6.5. The moments of randomly selected vehicles are
shown in various marks. The ratios of peak moments or shear produced by the randomly selected
vehicles over the proposed short truck are shown in Fig. 6.6. The distribution of the response
ratios indicated an average value of 0.89 with a standard deviation of 0.083. The normal
distribution model predicted a probability of exceedance of roughly 10% with these two
characteristic values. Hence, only 0.5% of the 8417 short five-axle trucks could cause larger
moments/shear than the proposed 150-kip short truck. Therefore, the proposed short permit truck
should well represent the overloaded 5-axle short trucks and trailers.
2-span continuous girders
3-span continuous girders
Wis-SPV
Short truck
Wis-SPV
Short truck

101
0.8 1 1.20
0.05
0.1
0.15
0.2
positive moment ratio
pro
bab
ilit
y
=0.891=0.085ucb=90.0%
0.8 1 1.20
0.05
0.1
0.15
0.2
negative moment ratio
=0.894=0.083ucb=89.8%
0.8 1 1.20
0.05
0.1
0.15
0.2
maximum shear ratio
pro
bab
ilit
y
=0.891=0.082ucb=90.8%
0.8 1 1.20
0.05
0.1
0.15
0.2
overall ratio
=0.892=0.083ucb=90.3%
Fig. 6.6 Statistical analysis of randomly selected 5-axle trucks
A total of 135 overloaded vehicles with six axles were identified in the 2007 WIM records,
including 50 Class 10 vehicles and 85 Class 15 vehicles. Most of these vehicles had a gross
weight below 150 kips though a 200 kip short truck was captured in the analysis in Chapter 4.
Hence no short 6-axle vehicle was proposed. In addition, 120 seven-axle overloaded short
vehicles were identified, including 96 Class 10 vehicles, 21 Class 13 vehicles, and 10 Class 15
vehicles. Again most of these vehicles were found to weigh less than 150kips. This indicates that
the representative vehicles for Class 10 in Chapter 4 may have poorly interpolated the WIM
records because short vehicles in Classes 10 and 13 seemed not as heavy as 160kips as shown by
the corresponding representative vehicles in Chapter 4. No short 7-axle vehicle was proposed.
The proposed short truck caused higher positive moments in simply supported girders with span
lengths between 30ft and 80ft. In addition, the moments by the short truck are larger than those
by HL-93 loading (the design truck plus the 0.64k/ft lane load) for the studied girder spans.
Consequently, many vehicles that caused larger positive moments than Wis-SPV would be
enveloped by the proposed short truck (Wis-SPT). The statistical analysis in Chapter 4 (shown in
Table 4.6) was repeated with the increased positive peak moments, as listed in Table 6.1.
Table 6.1 Evaluation of the proposed short permit truck
Vehicle
(Class/group)
without proposed short
truck with proposed short truck
# of
vehicles
rep/spv
(250 k)
poe
(%)
# of
exceeds
rep/spv
(250 k) poe (%)
# of
exceeds
Class 4 2-axle 21064 0.393 0.0 0 0.354 0.0 0
Class 4 3-axle 20351 0.585 0.0 0 0.529 0.0 0
Class 5 2-axle 20069 0.431 0.0 0 0.399 0.0 0
Class 6 3-axle 78523 0.585 0.0 0 0.542 0.0 0
Class 7 4-axle 15988 0.783 0.0 0 0.741 0.0 0
Class 7 5-axle 36234 0.870 7.0 126 0.808 1.4 26

102
Class 8 3-axle 5789 0.526 0.0 0 0.481 0.0 0
Class 8 4-axle a 18469 0.728 0.0 0 0.661 0.0 0
Class 8 4-axle b 9813 0.660 0.0 0 0.617 0.0 0
Class 9 5-axle a 889230 0.747 0.0 0 0.735 0.0 0
Class 9 5-axle b 133972 0.906 0.1 2 0.849 0.0 0
Class 10 6-axle 27574 1.082 15.8 217 0.981 4.1 56
Class 10 7-axle 2552 1.198 55.3 71 1.090 28.5 36
Class 11 5-axle 28618 0.626 0.0 0 0.614 0.0 0
Class 12 6-axle 11011 0.879 0.2 1 0.829 0.0 0
Class 13 7-axle a 1116 1.112 18.8 11 1.011 8.3 5
Class 13 7-axle
b
3463 0.875 16.4 28
0.875 16.4 28
Class 14 5-axle 115 0.593 0.0 0 0.558 0.0 0
The total number of estimated vehicles (note that a vehicle may cause multiple records in the
WIM data) reduced to 0.011% of total overloaded vehicles (records). Hence the short 5-alxe
truck can be used as the secondary standard permit vehicle for permit rating in the WisDOT
Bridge Manual. The detailed recommendations are shown below.
Recommendations regarding the WisDOT Standard Permit Vehicle
Moment/shear envelopes
The moment caused by the 250-kip WisDOT Standard Permit Vehicle on simply supported
girders are listed in Table 45.9 of the Bridge Manual.6 Instead of creating additional moment
tables, empirical moment/shear envelope models were proposed to for possible use in the Bridge
Manual. The empirical models considered peak girder responses (e.g., moment and shear) and
quadric equations with various parameters for response distribution along the girders. The
comparison of peak responses in Chapter 3 indicated that the peak moment values can be
calculated using SAP2000 moving load analysis for Wis-SPV. However, the peak moments
occur at different locations form that indicated in Table 45.9 (0.4L or 0.5L, where L is the girder
span) of the WisDOT Bridge Manual. The calculated positions of peak moments, shown in Fig.
6.7, varied from 0.36L to 0.48L. Hence the empirical models described below considered both
the accurate peak responses and the locations of the peak responses.
20 40 60 80 100120140160180200220240260Girder span, L (ft)
0.36
0.4
0.44
0.48
Pea
k m
om
ent
po
siti
on
s
1-span girders
2-span girders
3-span girders
20 40 60 80 100120140160180200220240260Girder span, L (ft)
0.36
0.4
0.44
0.48
Pea
k m
om
ent
po
siti
on
s
1-span girders
2-span girders
3-span girders
(a) Wis-SPV (b) Wis-SPT
Fig. 6.7 Relative locations of peak moments in simply supported girders

103
Moment and shear envelopes for one-span girders
The moment/shear envelop for one-span simply supported girders is illustrated in Fig. 6.8. The
moment envelope consisted of three regions: two symmetric regions at girder ends and a constant
moment region with the peak value, Mmax near the mid-span. The shear envelope for one-span
simply supported girders is symmetric with peak shear, Vmax, at the supports and the minimum
shear, Vmin, at the mid-span.
L
x1
M
x
Mmax
L
V
x
Vmax
Vmin
0 0.5 1 0 0.5 1
Fig. 6.8 Moment/shear envelope for one-span simply supported girders
The equations for the moment envelope is (only half girder is shown below in the equations)
5.0
02
1max
1
2
12
1
max
xxM
xxxxxx
M
M , (6.1)
where, x1 defines the location of peak moments. Note that the variable x in all empirical models
in this section is the normalized location from 0 at left support and 1 at the right support.
The equation for the shear envelope is
5.002 minmaxmax xxVVVV . (6.2)
The characteristic values in the above models (e.g., Mmax and x1) for both Wis-SPV and the
proposed short permit truck (SPT) are shown in Table 6.2 for the selected span lengths. Note that
the models of the girder responses are for half wheel line to be comparable with the current
Bridge Manual. No impact factors were included in the models because a dynamic allowance
factor (IM) is used in the rating examples in the WisDOT Bridge Manual.
1. WisDOT Standard Permit Vehicle. The peak moment positions, x1 values, are tabulated in
Table 6.2. Note that x1 for spans from 60ft to 72ft (near the length of Wis-SPV) were reduced
from that shown in Fig. 6.7(a) to better fit the real moment envelopes. An average value of 0.44,
or a lower bound (0.4) could be used for x1 to simplify the model. The maximum moments can
also be determined using two regression equations as shown in Fig. 6.9,
ft250ft7011827.30
ft70ft201366.15max
LL
LLM . (6.3)
Regression analyses were also conducted for the maximum and minimum shear in the girders,
leading to the following two peak shear equations,
1.1609.0001.05.2
1.191.1004.01.623
min
23
max
LLLV
LLLV. (6.4)

104
The 3rd
polynomials were needed to such that the peak shear values approaches to a fixed value
as the girder span increases. Note that the regression models were for girders with a span
between 20ft and 250ft while the tabulated values are from 32ft to 140ft.
Table 6.2 Characteristic values for the moment/shear envelope models in one-span girders
Span (ft) Wis-SPV Wis-SPT
Mmax x1 Vmax Vmin Mmax x1 Vmax Vmin
20 192.50 0.50 41.98 15.75 196.02 0.47 44.48 15.50
24 245.00 0.50 45.29 17.50 255.82 0.48 47.68 17.10
28 302.11 0.46 48.11 18.75 315.73 0.48 51.59 18.93
32 361.87 0.47 50.22 19.69 375.63 0.48 54.51 20.31
36 421.66 0.47 51.86 20.42 439.12 0.43 56.79 21.39
40 481.44 0.47 53.17 21.00 513.00 0.44 58.61 22.25
44 542.67 0.46 54.25 21.82 587.72 0.49 60.10 22.95
48 607.32 0.47 55.40 22.66 662.69 0.49 61.34 23.85
52 672.08 0.47 59.12 23.41 737.66 0.49 62.39 24.90
56 736.85 0.47 62.93 24.06 812.63 0.49 63.29 25.80
60 801.62 0.45 66.23 24.63 887.60 0.49 64.07 26.58
64 866.38 0.42 69.32 25.12 962.57 0.49 64.76 27.27
68 932.78 0.40 72.60 25.55 1037.5
4 0.49 65.36 27.87
72 1021.18 0.40 75.51 25.94 1112.5
1 0.49 65.89 28.40
76 1133.68 0.41 78.11 26.28 1187.5
0 0.49 66.37 28.88
80 1254.75 0.42 80.46 26.59 1262.5
0 0.49 66.80 29.31
84 1376.55 0.42 82.57 26.88 1337.5
0 0.49 67.19 29.70
88 1498.35 0.42 84.50 27.13 1412.5
0 0.49 67.55 30.06
92 1620.52 0.43 86.26 27.36 1487.5
0 0.49 67.87 30.38
96 1743.07 0.43 87.88 27.71 1562.5
0 0.49 68.17 30.68
100 1865.63 0.43 89.36 28.50 1637.5
0 0.49 68.44 30.95
104 1988.20 0.44 90.73 29.57 1712.5
0 0.49 68.70 31.20
108 2111.40 0.44 92.00 30.56 1787.5
0 0.49 68.93 31.44
112 2234.60 0.44 93.18 31.47 1862.5
0 0.49 69.15 31.65
116 2357.80 0.44 94.28 32.33 1937.5
0 0.49 69.35 31.85
120 2481.00 0.44 95.30 33.13 2012.5
0 0.49 69.54 32.04
124 2604.37 0.45 96.26 33.87 2087.5
0 0.49 69.71 32.22
128 2728.12 0.45 97.16 34.67 2162.5
0 0.49 69.88 32.38
132 2851.87 0.45 98.00 35.51 2237.5
0 0.49 70.03 32.54
136 2975.63 0.45 98.80 36.31 2312.5
0 0.49 70.18 32.68
140 3099.38 0.45 99.54 37.05 2387.5
0 0.49 70.32 32.82

105
20 40 60 80 100120140160180200220240Girder span, L (ft)
0
2000
4000
6000P
eak
mo
men
t (k
-ft)
Mmax=15.6L-136
Mmax=31L-1229
20 40 60 80 100120140160180200220240Girder span, L (ft)
0
20
40
60
80
100
120
Pea
k s
hea
r (k
ips)
Vmax=6.1L3-0.004L2+1.1L+19.1
Vmin=-2.5L3+0.001L2+0.09L+16.1
Fig. 6.9 Regression analysis of the peak responses under Wis-SPV in 1-span girders
The regression models shown in Eqs. (6.1) and (6.2) with parameters in Table 6.2 was compared
with the calculated moment/shear envelopes in Fig. 6.10, in which the moment envelopes are
shown in solid lines while the proposed empirical models are shown in dashed lines. The
moment envelopes were fit closely with occasional overestimation of the moments. The shear
envelopes were also slightly overestimated for several spans.
0 20 40 60 80 100 120 1400
2000
4000
6000
8000
Mo
men
ts (
kip
s-ft
)
R2=0.9845
0 20 40 60 80 100 120 14050
100
150
200
Position along span (ft)
Sh
ear
(kip
s)
Moment/Shear envelopes for span=140ft
R2=0.99996
WisDOT Standard
Fitting curve
0 10 20 30 40 50 60 70 80 900
1000
2000
3000
4000M
om
en
ts (
kip
s-ft
)
R2=0.98165
0 10 20 30 40 50 60 70 80 9050
100
150
200
Position along span (ft)
Sh
ear
(kip
s)
Moment/Shear envelopes for span=90ft
R2=0.96751
WisDOT Standard
Fitting curve
0 10 20 30 40 50 600
500
1000
1500
2000
Mo
men
ts (
kip
s-ft
)
R2=0.97704
0 10 20 30 40 50 6050
100
150
Position along span (ft)
Sh
ear
(kip
s)
Moment/Shear envelopes for span=64ft
R2=0.93632
WisDOT Standard
Fitting curve
0 5 10 15 20 25 30 35 400
500
1000
Mo
men
ts (
kip
s-ft
) R2=0.9874
0 5 10 15 20 25 30 35 4040
60
80
100
120
Position along span (ft)
Sh
ear
(kip
s)
Moment/Shear envelopes for span=40ft
R2=0.99596
WisDOT Standard
Fitting curve
Fig. 6.10 Models of the peak responses under Wis-SPV in 1-span girders
2. WisDOT Short Permit Truck (SPT). The peak moment and shear location (x1) were mostly
from 0.48L to 0.5L except for girders with 36ft to 40ft spans (F9g. 6.7(b)). Hence a value of 0.48
could be used for x1 in the models. The peak responses could be determined using the following
regression equations as shown in Fig. 6.11. The peak moment equation is for girder spans less
than 80ft such that the peak moments can be better represented in the critical region.

106
ft80 1961.18max LLM , and (6.5)
3302.0407
75002.0634
min
max
LL
V
LL
V. (6.6)
Again the regression equations ensure bounded peak shear values. The regression models are
compared with the calculated envelopes for selected spans in Fig. 6.12.
20 40 60 80 100120140160180200220240Girder span, L (ft)
0
1000
2000
3000
4000
5000
Pea
k m
om
ent
(k-f
t)
Mmax=18.1L-196
20 40 60 80 100120140160180200220240Girder span, L (ft)
0
20
40
60
80
Pea
k s
hea
r (k
ips)
Vmax=-634/L+0.002L+75
Vmin=-407/L+0.02L+33
Fig. 6.11 Regression analysis of the peak responses under Wis-SPV in 1-span girders
0 10 20 30 40 50 60 70 800
1000
2000
3000
Mo
men
ts (
kip
s-ft
)
R2=0.98624
0 10 20 30 40 50 60 70 8050
100
150
Position along span (ft)
Sh
ear
(kip
s)
Moment/Shear envelopes for span=80ft
R2=0.99992
PSH 5axle
Fitting curve
0 5 10 15 20 25 300
200
400
600
800
Mo
men
ts (
kip
s-ft
)
R2=0.97404
0 5 10 15 20 25 300
50
100
150
Position along span (ft)
Sh
ear
(kip
s)
Moment/Shear envelopes for span=30ft
R2=0.97477
PSH 5axle
Fitting curve
Fig. 6.12 Models of the peak responses under Wis-SPT in 1-span girders
Moment and shear envelope for two equal span girders.
The moment/shear envelops for two-span simply supported girders is illustrated in Fig. 6.13. The
moment/shear envelopes are symmetric in the two spans. The peak positive moment, Mmax in
each span is located close to the exterior supports. The peak shear, Vmax, is located at the supports
and the minimum shear, Vmin, is located near mid-span close to the exterior supports. The shear at
exterior supports is slightly smaller than the shear at the interior support; however the same
maximum shear was used in the model to simplify the presentations.

107
x1
M
x
Mmax
V
x
Vmax
Vmin
L L
x1
Mmin
0 0.4 1 0 0.4 1
Fig. 6.13 Moment/shear envelope for one-span simply supported girders
The models were developed for the left span of the two-span girders. Hence, x=1 is located at the
interior supports. The equation for the positive moment envelope, Mpos, is
12211
02
1
2
112
1
max
1
2
12
1
max
pos
xxxxxxx
M
xxxxxx
M
M . (6.7)
The negative moment envelope (Mneg) was modeled as a straight line from zero at the exterior
supports to Mmin at the interior support,
10minn xxMM eg . (6.8)
The shear envelope was modeled as two segments of straight lines within the each span as
illustrated in Fig. 6.13,
11
0
1
1
1minmaxmin
1
1
minmaxmax
xxx
xxVVV
xxx
xVVV
V . (6.9)
The characteristic values for the above models are shown in Table 6.3 for the selected span
lengths followed by empirical models from regression analyses of peak values.
1. WisDOT Standard Permit Vehicle. The locations of peak positive moments varies from 0.38L
to 0.44L as shown in Fig 6.7(a); hence the average location (x1=0.4) could be used in the moment
model. The minimum shear location in the exterior spans varies from 0.38L to 0.44L. The
average location (x1=0.42) could be used in the shear model. The regression analyses are shown
in Fig. 6.14.
The regression equations for the peak positive moments are,
ft70102325
ft701209.12max
LL
LLM . (6.10)
The regression equations for the peak negative moments are,
ft10033013
ft1003576.2311.0 2
minLL
LLLM . (6.11)
The equations for the maximum and minimum shear are,

108
7.1613.0
3.192.1005.07.7
min
23
max
LV
LLLV. (6.12)
Table 6.3 Characteristic values for the moment/shear envelope models in two-span girders
Span (ft) Wis-SPV Wis-SPT
Mmax Mmin Vmax Vmin Mmax Mmin Vmax Vmin
20 152.1 -112.37 45.86 15.62 155.1 -120.24 48.0 15.34
24 194.9 -136.84 48.71 17.90 203.2 -150.76 51.3 17.12
28 240.0 -192.60 51.35 20.36 251.7 -176.43 55.5 18.63
32 288.6 -283.5 53.72 21.56 300.6 -198.7 58.6 19.8
36 337.5 -350.0 55.90 22.58 357.3 -218.4 60.9 20.8
40 387.2 -412.6 57.94 23.26 415.4 -241.7 62.6 21.6
44 439.1 -471.4 59.85 24.01 474.4 -274.0 64.0 22.7
48 491.4 -526.4 61.51 23.63 533.9 -306.0 65.2 23.7
52 544.0 -577.6 63.18 24.27 593.8 -337.6 66.1 24.5
56 596.8 -625.0 67.63 24.85 654.1 -368.9 66.9 25.3
60 649.8 -668.6 71.44 24.92 714.6 -399.9 67.6 26.0
64 702.9 -708.4 74.96 24.94 775.4 -430.6 68.1 26.6
68 764.3 -744.3 78.72 25.07 836.2 -461.2 68.6 27.1
72 839.2 -776.5 82.01 25.27 897.3 -491.5 69.0 27.6
76 922.4 -804.9 84.92 25.66 958.4 -521.8 69.4 28.1
80 1011.3 -829.4 87.50 26.04 1019.8 -551.9 69.8 28.5
84 1101.7 -850.1 89.80 26.38 1081.3 -581.8 70.1 28.9
88 1193.4 -867.1 91.86 26.87 1142.9 -611.7 70.3 29.3
92 1286.2 -880.2 93.72 27.77 1204.5 -641.6 70.6 29.7
96 1380.0 -889.5 95.39 28.62 1266.2 -671.4 70.8 30.1
100 1475.9 -945.0 96.92 28.95 1327.9 -701.1 71.0 30.4
104 1573.2 -
1000.1 98.30 29.16 1389.7 -730.7 71.2 30.7
108 1670.8 -
1055.2 99.56 29.37 1451.5 -760.2 71.3 31.0
112 1768.9 -
1110.4 100.72 30.15 1513.3 -789.6 71.5 31.2
116 1867.4 -
1165.5 101.79 31.06 1575.2 -819.1 71.6 31.5
120 1966.3 -
1220.6 102.78 32.05 1637.0 -848.5 71.7 31.7
124 2065.5 -
1275.7 103.69 32.93 1699.0 -878.0 71.9 31.9
128 2165.0 -
1330.8 104.53 33.61 1760.9 -907.4 72.0 32.1
132 2264.7 -
1386.0 105.32 34.27 1822.8 -936.7 72.1 32.3
136 2364.7 -
1441.1 106.05 34.90 1884.7 -966.0 72.2 32.4
140 2464.9 -
1496.2 106.73 35.50 1946.7 -995.2 72.3 32.6

109
20 40 60 80 100120140160180200220240Girder span, L (ft)
-4000
-2000
0
2000
4000
6000P
eak
mo
men
t (k
-ft)
Mmax=25L-1023
Mmax=12.9L-120
Mmin=0.11L2-23.6L+357
Mmin=-13L+330
20 40 60 80 100120140160180200220240Girder span, L (ft)
0
40
80
120
Pea
k s
hea
r (k
ips)
Vmin=0.13L+16.7
Vmax=7.7L3-0.005L2+1.2L+19.3
Fig. 6.14 Regression analysis of the peak responses under Wis-SPV in 2-span girders
The empirical models with parameters in Table 6.3 were compared with the calculated response
envelopes in Fig. 6.15. The positive moment envelopes were fit closely up to 0.7L. The empirical
models overestimate the positive moments near the interior support, indicating the need for a
higher order polynomial model. This was not further pursued because the positive moments near
support would not be critical. The negative moment envelops were overestimated by the linear
model in Eq. (6.8), especially in short span girders. In addition, the shear envelopes were slightly
underestimated for short-span girders.
0 50 100 150 200 250-5000
0
5000
Mo
men
ts (
kip
s-ft
)
R2=0.87998
0 50 100 150 200 25050
100
150
200
250
Position along span (ft)
Sh
ear
(kip
s)
Moment/Shear envelopes for span=140ft
R2=0.95311
analysis
model
0 20 40 60 80 100 120 140 160 180-2000
0
2000
4000
Mo
men
ts (
kip
s-ft
)
R2=0.86346
0 20 40 60 80 100 120 140 160 18050
100
150
200
Position along span (ft)
Sh
ear
(kip
s)
Moment/Shear envelopes for span=90ft
R2=0.91462
0 20 40 60 80 100 120-2000
-1000
0
1000
2000
Mo
men
ts (
kip
s-ft
)
R2=0.88253
0 20 40 60 80 100 12050
100
150
Position along span (ft)
Sh
ear
(kip
s)
Moment/Shear envelopes for span=64ft
R2=0.92616
0 10 20 30 40 50 60 70 80-1000
-500
0
500
1000
Mo
men
ts (
kip
s-ft
) R2=0.88512
0 10 20 30 40 50 60 70 8040
60
80
100
120
Position along span (ft)
Sh
ear
(kip
s)
Moment/Shear envelopes for span=40ft
R2=0.92406
Fig. 6.15 Models of the peak responses under Wis-SPV in 2-span girders
2. WisDOT Short Permit Truck (SPT). The peak moment location varies slightly from 0.4L to
0.44L. Hence x1=0.42 (or 0.4 to be conservative) could be used in the empirical model for

110
moments. Similarly x1=0.42 could be used for shear. The peak moments/shear may be
determined using the following equations from the regression analyses in Fig. 6.16,
ft80208.343.7
ft80201606.14
min
max
LLM
LLM, and (6.13)
ft250203202.0390
ft250207801.0616
min
max
LLL
V
LLL
V. (6.14)
Note that the peak moment equations are only for short span girders, for which the Wis-SPT
would be critical in design. The models were compared with the calculated response envelopes
in Fig. 6.17. The low R2 values for the moments were due to the poor fit near the interior
support. This was deemed acceptable because the models are conservative and the fact that
positive moments near the interior supports are usually not critical in practice.
20 40 60 80 100120140160180200220240Girder span, L (ft)
-2000
0
2000
4000
6000
Pea
k m
om
ent
(k-f
t)
Mmax=14.6L-160
Mmin=-7.3L+34.8
20 40 60 80 100120140160180200220240Girder span, L (ft)
0
20
40
60
80
Pea
k s
hea
r (k
ips)
Vmin=-390/L+0.02L+32
Vmax=-616/L-0.01L+78
Fig. 6.16 Regression analysis of the peak responses under Wis-SPV in 2-span girders
0 20 40 60 80 100 120 140 160-2000
0
2000
4000
Mo
men
ts (
kip
s-ft
)
R2=0.8843
0 20 40 60 80 100 120 140 16050
100
150
Position along span (ft)
Sh
ear
(kip
s)
Moment/Shear envelopes for span=80ft
R2=0.95571
analysis
model
0 10 20 30 40 50 60-500
0
500
1000
Mo
men
ts (
kip
s-ft
)
R2=0.86443
0 10 20 30 40 50 600
50
100
150
Position along span (ft)
Sh
ear
(kip
s)
Moment/Shear envelopes for span=30ft
R2=0.94265
Fig. 6.17 Models of the peak responses under Wis-SPT in 2-span girders
Moment and shear envelope for three equal span girders.
The moment/shear envelop for three-span simply supported girders is illustrated in Fig. 6.18. The
moment envelopes for two exterior spans are symmetric with the peak positive moment, Mmax
and the peak negative moment Mmin at the supports. The shear envelope for the exterior spans is

111
also symmetric with peak shear, Vmax, at the supports and the minimum shear, Vmin, near the mid
span. The positive moments and the shear in the interior span are similar to those in a one-span
girder.
x1
M
x
M'max
V
x
Vmax
Vmin
L
x1
Mmax
Mmin
M'min L L
0 0.4 1 0.50 0 0.4 1 0.50
Fig. 6.18 Moment/shear envelope for one-span simply supported girders
The equation for the moment envelopes for the exterior spans is
12211
02
1
2
112
1
max
1
2
12
1
max
pos
xxxxxxx
M
xxxxxx
M
M , and (6.15)
10minn xxMM eg . (6.16)
The moment equations for the interior span are
5.0'
02'
'
1max
1
2
12
1
max
pos
xxM
xxxxxx
M
M , and (6.17)
5.00''2'' minmaxminn xxMMMM eg . (6.18)
The negative moment models may overestimate the real moments near the spike at the interior
support for sort span girders. In addition, there are small positive moments near the interior
supports, which were not considered in Eqs. (6.17) and (6.18).
The shear envelope was modeled as segments of straight lines within each span as illustrated in
Fig. 6.15. The peak shear at the exterior supports was smaller than that at the interior support;
however, the same maximum shear was used in the model to simplify the presentation. The
equations for the shear envelopes were defined for the exterior spans and interior spans as
11
0
1
1
1minmaxmin
1
1
minmaxmax
xxx
xxVVV
xxx
xVVV
V , and (6.19)
5.002' minmaxmax xxVVVV . (6.20)
The characteristic values for the above models are shown in Table 6.4 for the selected span
lengths. Regression models were proposed for the peak values.

112
1. WisDOT Standard Permit Vehicle. The locations of peak positive moments for the exterior
spans varies from 0.38L to 0.42L as shown in Fig 6.7(a); hence the average location (x1=0.4)
could be used in the model. The peak moment position for the interior span varies from 0.44L to
0.48L, hence (x1=0.45) could be used in the model. The minimum shear location in the exterior
spans varies from 0.38L to 0.44L with an average at (x1=0.42), which could used in the model to
simplify the presentation.
The regression equations for the peak positive moments are shown in Fig. 6.19,
ft2507010137.24
ft70201105.12max
LL
LLM , and (6.21)
2235.11027.0' 2
max LLM . (6.22)
The regression equations for the peak negative moments are,
ft250903528.13
ft902028520074.0 2
minLL
LLLM , and (6.23)
1231.5'min LM . (6.24)
The equations for the maximum and minimum shear are,
5.1613.0
9.182.1005.08.7
min
23
max
LV
LLLV. (6.25)
Table 6.4 Characteristic values for the moment/shear envelope models in three-span girders
Span (ft) Wis-SPV Wis-SPT
Mmax Mmin M'max M'min Vmax Vmin Mmax Mmin M'max M'min Vmax Vmin
20 160.0 -114.0 122.4 -71.0 46.0 15.8 152.7 -121.1 122.9 -37.3 48.2 15.1
24 199.4 -140.4 157.7 -85.2 49.0 17.8 200.1 -153.8 161.9 -47.9 51.5 16.3
28 241.2 -177.1 193.4 -86.8 51.6 19.6 248.0 -181.7 201.8 -58.2 55.7 17.9
32 287.8 -252.2 230.3 -83.4 53.8 24.8 296.2 -206.1 242.1 -70.1 58.8 19.5
36 333.7 -320.4 270.7 -89.2 55.8 26.6 352.1 -228.0 282.9 -83.5 61.1 20.5
40 381.7 -387.8 311.4 -90.8 57.6 27.4 409.3 -257.6 329.5 -96.8 62.9 21.5
44 432.9 -450.0 353.9 -97.9 59.3 27.8 467.4 -292.1 377.4 -109.7 64.3 22.4
48 484.4 -507.4 397.0 -108.8 60.7 27.9 526.1 -326.2 426.0 -122.5 65.4 23.3
52 536.2 -558.6 440.5 -119.5 63.4 27.7 585.2 -360.0 475.3 -135.1 66.4 24.1
56 588.2 -604.5 484.2 -130.2 67.9 27.4 644.7 -393.3 525.1 -147.6 67.1 24.9
60 640.4 -645.9 528.1 -140.8 71.8 26.8 704.5 -426.4 575.2 -160.0 67.8 25.6
64 692.8 -683.2 572.3 -163.3 75.3 26.5 764.4 -459.2 625.8 -172.3 68.4 26.2
68 753.9 -717.2 616.5 -186.0 79.1 26.2 824.6 -491.8 676.9 -184.5 68.8 27.0
72 827.6 -747.8 666.8 -208.3 82. 5 26.1 884.9 -524.1 728.3 -196.7 69.3 27.6
76 909.0 -775.9 723.0 -232.6 85.4 25.9 945.3 -556.4 779.7 -208.8 69.6 28.2
80 995.9 -801.7 784.2 -257.5 88.0 26.0 1005.8 -588.5 831.2 -220.8 70.0 28.8
84 1084.5 -825.5 850.8 -282.0 90.3 26.1 1066.4 -620.5 882.8 -232.8 70.2 29.2
88 1174.5 -847.3 921.9 -306.1 92.4 26.4 1127.0 -652.4 934.5 -244.7 70.5 29.7
92 1265.6 -879.3 994.1 -329.9 94.2 26.6 1187.7 -684.2 986.3 -256.7 70.7 30.1
96 1357.8 -942.1 1068.5 -353.4 95.9 26.9 1248.4 -716.1 1038.1 -268.6 71.0 30.4

113
100 1450.9 -
1004.0 1145.0 -376.6 97.4 27.4 1309.2 -747.8 1089.9 -280.5 71.1 30.7
104 1546.6 -
1064.7 1222.5 -399.4 98.8 28.2 1370.3 -779.3 1141.9 -292.3 71.3 30.7
108 1642.8 -
1125.4 1300.6 -422.1 100.1 29.0 1431.3 -810.8 1193.9 -304.1 71.5 30.9
112 1739.4 -
1185.3 1379.2 -444.6 101.2 29.8 1492.4 -842.2 1245.9 -315.9 71.6 31.1
116 1836.5 -
1244.6 1458.4 -466.8 102.3 30.6 1553.5 -873.6 1298.0 -327.7 71.8 31.3
120 1934.0 -
1303.6 1538.2 -488.9 103.3 31.3 1614.6 -905.0 1350.1 -339.4 71.9 31.5
124 2031.8 -
1362.1 1618.3 -510.9 104.2 32.0 1675.8 -936.4 1402.1 -351.2 72.0 31.7
128 2129.9 -
1420.1 1698.8 -532.6 105.0 32.7 1737.0 -967.8 1454.3 -363.0 72.1 31.9
132 2228.2 -
1477.7 1779.7 -554.2 105.8 33.4 1798.2 -999.1 1506.4 -374.7 72.2 32.0
136 2326.9 -
1535.1 1861.0 -575.7 106.5 34.2 1859.4 -
1030.3 1558.6 -386.4 72.3 32.2
140 2425.7 -
1592.2 1942.6 -597.1 107.2 34.9 1920.6 -
1061.5 1610.8 -398.1 72.4 32.3
20 40 60 80 100120140160180200220240Girder span, L (ft)
-4000
-2000
0
2000
4000
6000
Pea
k m
om
ent
(k-f
t) Mmax=24.7L-1013
Mmax=12.5L-110
Mmin=0.074L2-20L+285
Mmin=-13.8L+352
End-spans
20 40 60 80 100120140160180200220240Girder span, L (ft)
-2000
0
2000
4000
6000
Pea
k m
om
ent
(k-f
t)
Mmax=0.027L2+11.5L-223
Mmin=-5.1L+123
Mid-span
20 40 60 80 100120140160180200220240Girder span, L (ft)
0
40
80
120
Pea
k s
hea
r (k
ips)
Vmin=0.13L+16.5
Vmax=7.8L3-0.005L2+1.2L+18.9
Fig. 6.19 Regression analysis of the peak responses under Wis-SPV in 3-span girders
The empirical model with parameters in Table 6.4 was compared with the calculated response
envelopes in Fig. 6.20. Again, the moment envelopes at the exterior spans were fit closely up to
0.7L. The positive moments at the interior spans were overestimated by using the fixed x1 value
(0.45). The small positive moments at the supports were not captured by the model. The
empirical model overestimated the negative moments near the interior support due to the sharp
spike in the negative moments. The shear envelopes were closely followed except the shear in
the exterior spans, which were overestimated by using the same peak shear along the entire span.

114
0 50 100 150 200 250 300 350 400-5000
0
5000M
om
en
ts (
kip
s-ft
) R2=0.85087
0 50 100 150 200 250 300 350 40050
100
150
200
250
Position along span (ft)
Sh
ear
(kip
s)
Moment/Shear envelopes for span=140ft
R2=0.95717
analysis
model
0 50 100 150 200 250-2000
0
2000
4000
Mo
men
ts (
kip
s-ft
)
R2=0.84405
0 50 100 150 200 25050
100
150
200
Position along span (ft)
Sh
ear
(kip
s)
Moment/Shear envelopes for span=90ft
R2=0.91363
0 20 40 60 80 100 120 140 160 180-2000
-1000
0
1000
2000
Mo
men
ts (
kip
s-ft
)
R2=0.84208
0 20 40 60 80 100 120 140 160 18050
100
150
200
Position along span (ft)
Sh
ear
(kip
s)
Moment/Shear envelopes for span=64ft
R2=0.9334
0 20 40 60 80 100 120-1000
-500
0
500
1000
Mo
men
ts (
kip
s-ft
)
R2=0.85495
0 20 40 60 80 100 12040
60
80
100
120
Position along span (ft)
Sh
ear
(kip
s)Moment/Shear envelopes for span=40ft
R2=0.9474
Fig. 6.20 Models of the peak responses under Wis-SPV in 3-span girders
2. WisDOT Short Permit Truck (SPT). The locations of peak positive moments for the exterior
spans are around 0.4L as shown in Fig 6.7(b); hence the location (x1=0.4) was used in the model.
Similar to Wis-SPV, the location (x1=0.45) could be used for the peak positive moments in
interior spans. The minimum shear location in the exterior spans is close to (x1=0.42), which
could used in the model to simplify the presentation. Meanwhile the minimum shear is located at
the mid-span of the interior spans.
The regression equations for the peak positive moments are,
1380.12'
ft80201595.14
max
max
LM
LLM. (6.26)
The regression equations for the peak negative moments are,
7.271.3'
ft80207.459.7
min
min
LM
LLM. (6.27)
The equations for the maximum and minimum shear are,
ft250203.3102.0/390
ft250204.7801.0/615
min
max
LLLV
LLLV. (6.10)

115
20 40 60 80 100120140160180200220240Girder span, L (ft)
-2000
0
2000
4000P
eak
mo
men
t (k
-ft)
Mmax=14.5L-159
Mmin=-7.9L+45.7
End-spans
20 40 60 80 100120140160180200220240Girder span, L (ft)
-1000
0
1000
2000
3000
4000
Pea
k m
om
ent
(k-f
t)
Mmax=12L-138
Mmin=-3.1L+27.7
Mid-span
20 40 60 80 100120140160180200220240Girder span, L (ft)
0
20
40
60
80
Pea
k s
hea
r (k
ips)
Vmin=-390/L+0.02L+31.3
Vmax=-615/L-0.01L+78.4
Fig. 6.21 Regression analysis of the peak responses under Wis-SPT in 3-span girders
The models for Wis-SPT were compared with the calculated response envelopes in Fig. 6.22.
Again the positive moments are fit well except near the interior supports. The small positive
moments at the interior supports are ignored. The negative moments are generally over estimated
because the linear models use peak negative moment at the interior supports, where moment
spikes exist as shown in Fig. 6.22.
0 50 100 150 200-2000
0
2000
4000
Mo
men
ts (
kip
s-ft
)
R2=0.87027
0 50 100 150 20050
100
150
Position along span (ft)
Sh
ear
(kip
s)
Moment/Shear envelopes for span=80ft
R2=0.96372
analysis
model
0 10 20 30 40 50 60 70 80 90-500
0
500
1000
Mo
men
ts (
kip
s-ft
)
R2=0.83673
0 10 20 30 40 50 60 70 80 900
50
100
150
Position along span (ft)
Sh
ear
(kip
s)
Moment/Shear envelopes for span=30ft
R2=0.94502
Fig. 6.22 Models of the peak responses under Wis-SPT in 3-span girders
Impact on Permit Load Rating processes in WisDOT Bridge Manual
The Permit Load Rating in the WisDOT Bridge Manual may be impacted by the proposed short
permit truck (Wis-SPT). The short permit truck will likely impact the moment/shear in short-

116
span girders, hence, the rating of a slab bridge in Chapters 18 and 45 of the WisDOT Bridge
Manual for permit vehicles is examined below.
The three-span continuous example slab bridge has two 38 ft spans and one 51ft interior span.
The slab width is 42.5 ft with a clear roadway width of 40 ft. The slab (4-ksi concrete) has been
designed to be 17in thick with a ½-in wearing surface. The slab thickness is increased to 28 in
within 8 ft at the interior supports. The reinforcement of the slab is #9 @ 7in (1.71 in2 per foot
slab) at 0.4L and #8 @ 5in (1.88 in2 per foot slab) at the interior supports. The concrete cover is
1.5 in for the bottom rebars and 2.0 in for top rebars. The moment envelops of the three-span
bridge under the 190k Wis-SPV and 114k Wis-SPT is shown in Fig. 6.23. Note that the short
permit truck was scaled down following the current permit rating practice for slab bridges.
8220 k-in
7368 k-in
0 100 200 300 400 500 600 700Position (in)
-10000-8000-6000-4000-2000
02000400060008000
10000
Pea
k m
om
ent
(k-i
n)
190k Wis-SPV
5553 k-in
7926 k-in
0 100 200 300 400 500 600 700Position (in)
-10000-8000-6000-4000-2000
02000400060008000
10000
Pea
k m
om
ent
(k-i
n)
114k Wis-SPT
Fig. 6.23 Moment envelops of a 3-span slab bridge under permit vehicles
The permit vehicle load rating in Chapter 45 of the WisDOT Bridge Manual was conducted for
the peak negative moment at the interior supports. The rating considers 1) single-lane load
distribution with future wearing surface and 2) multiple-lane distribution without future wearing
surface. The permit vehicle rating using the 190-k Wis-SPV and 114-k WisSPT is compared as
follows.
1. Single-lane distribution with future wearing surface (FWS).
The rating equation is IMLLL
DWDWDCDCnsc
M
MMMRF
_
permit
. The parameters used in the
rating are listed in Table 6.5, and the calculation is shown in Table 6.6.
Table 6.5 Parameters in permit vehicle load rating Item Values References
Equivalent strip width (E) 178 in LRFD [4.6.2.1.2, 4.6.2.3]
Distribution factor (DF) 0.0562 lanes/ft-slab LRFR [6.4.5.4.2.2]
Dynamic load allowance (IM) 0.33 LRFR [6.4.5.5]
Condition Factor (φc) 1.0 WisDOT [45.3.2.4]
System Factor (φs) 1.0 WisDOT [45.3.2.5]
Resistance Factor (φ) 0.9 LRFD [5.7.2.1]
Load factor (γDC) 1.25 WisDOT [45.3-1]
Load factor (γDW) 1.5 WisDOT [45.3-1]
Load factor (γL) 1.5 WisDOT [45.3-3]

117
Table 6.6 Permit vehicle load rating for single-lane distribution with FWS Position Item Wis-SPV Wis-SPT
Support
Dead load moment (MDC) 59.2 k-ft
FWS moment (MDW) 4.9 k-ft
Nominal moment capacity 226.7 k-ft
Live moment for 1-ft slab 51.2 k-ft 34.6 k-ft
RFpermit 1.66 2.46
0.4L
Dead load moment (MDC) 18.1 k-ft
FWS moment (MDW) 1.5 k-ft
Nominal moment capacity 116.6 k-ft
Live moment for 1-ft slab 45.9 k-ft 49.4 k-ft
RFpermit 1.16 1.08
2. Multiple-lane distribution without future wearing surface (FWS).
The rating equation is IMLLL
DCDCnsc
M
MMRF
_
permit
. The parameters used in the rating are listed
in Table 6.7, and the calculation is shown in Table 6.8.
Table 6.7 Parameters in permit vehicle load rating Item Values References
Equivalent strip width (E) 141 in LRFD [4.6.2.1.2, 4.6.2.3]
Distribution factor (DF) 0.0709 lanes/ft-slab LRFR [6.4.5.4.2.2]
Dynamic load allowance (IM) 0.33 LRFR [6.4.5.5]
Condition Factor (φc) 1.0 WisDOT [45.3.2.4]
System Factor (φs) 1.0 WisDOT [45.3.2.5]
Resistance Factor (φ) 0.9 LRFD [5.7.2.1]
Load factor (γDC) 1.25 WisDOT [45.3-1]
Load factor (γL) 1.3 WisDOT [45.3-3]
Table 6.8 Permit vehicle load rating for multiple-lane distribution without FWS Position Item Wis-SPV Wis-SPT
Support
Dead load moment (MDC) 59.2 k-ft
Nominal moment capacity 226.7 k-ft
Live moment for 1-ft slab 64.6 k-ft 43.6 k-ft
RFpermit 1.55 2.29
0.4L
Dead load moment (MDC) 18.1 k-ft
Nominal moment capacity 116.6 k-ft
Live moment for 1-ft slab 57.9 k-ft 62.3 k-ft
RFpermit 1.09 1.02
Note that if the effect of multiple-presence factor were not removed in the calculation of the
distribution factors in this rating, the DF would become 0.0851 lanes/ft. The live load moment
caused by the permit vehicles would be 69.5 k-ft (SPV) and 74.8 k-ft (SPT). The rating factors
would be then reduced to 0.91 and 0.85, respectively. This indicates that the slab design is not
adequate in the positive moment design. Roughly 15% more reinforcement (e.g., #9 @ 6in) is
needed for the mid-spans, especially in the interior span.

118
Instead of the peak moments and shear used in rating calculations, especially for girders with
spans less than 80ft, the following impacts are expected in the bridge design:
1. Moments and shear used at critical sections different from the peak response locations, which
are generally located from 0.4L to 0.5L. For example, a moment value different form Mmax
should be used for checking moment capacity of a prestressed concrete girder with draped
strands at the draping points. The proposed moment/shear envelope models can be used in
these cases.
2. Capacity check with varied rebar configurations and varied transverse reinforcement along
the span. Again, the proposed envelope models can be used.

119
Chapter 7 Summary and Conclusions
Summary
This study evaluated the impact of the 250-kip Wisconsin Standard Permit Vehicle against the
overloaded vehicles operating on Wisconsin roads in recent years. The evaluation was conducted
using three sets of data: 1) overloaded vehicle records within weigh-in-motion data collected in
2007; 2) the single-trip permit application records from 2004 to 2007; and 3) overloaded vehicles
in neighboring states, including Minnesota, Iowa, Michigan, and Illinois.
The weigh-in-motion records were categorized into legal loads and overloads per Wisconsin
Statute 348 and WisDOT Bridge manual. A total of 1.4 million overloaded vehicle records out of
over 6 million total truck records were used to evaluate the WisDOT Standard Permit Vehicle.
The recorded overloads in individual classes (per FHWA definitions) were further divided into
groups, in which the vehicles had similar axle configurations. Descriptive statistical analyses
were conducted for the vehicles in each class/group to define representative vehicles that best
describe the heaviest 5% vehicles in the class/group. The representative vehicles were evaluated
using randomly selected vehicles within the heaviest 10% vehicles in the corresponding
class/group. The girder responses (i.e., moments and shear) due to loading from the randomly
selected vehicles were calculated for randomly selected span lengths to assess whether the heavy
vehicles in each class/group might cause larger girder responses than Wis-SPV.
The application records for single-trip permits from July 2004 to July 2007 were used to further
evaluate the 250-kip Wisconsin Standard Permit Vehicle. Only the overloaded vehicle records
were used, resulting in roughly 50 thousand records in total. The number of axles in over 99% of
the records was from three to thirteen. Hence, the recorded vehicles were classified based upon
their total number of axles. The configurations for each class/group were determined such that
representative vehicles can be configured. The trucks in the WIM records were checked against
the configuration patterns of the single-trip permit vehicles in order to properly define the
configurations of the representative vehicles. The pattern comparison was conducted for the
permit vehicles with less than 9 axles, which contributes about 80% of the total records. Multiple
tandem axles were assumed for vehicles with more axles because only nondivisible vehicles are
eligible for permits in Wisconsin. The responses in simply-supported girders with various span
lengths by the representative vehicles were then compared with those by the Wis-SPV.
The Standard Permit Vehicle in Wisconsin is being used for permit rating of new bridges and for
posting bridges. Hence the impact of the representative overloaded vehicles utilized in the
neighboring states was compared with that by the WisDOT Standard Permit Vehicle. Again, the
comparison was made using the worst girder responses using the influence line concept.
Based upon the above analyses, modifications to the current permitting practice were proposed.
Wis-SPV is a 63-ft long tractor-trailer, which is longer than the length limits for single-unit
vehicles eligible for permits. Hence, the recommended change focused on a supplementary and
shorter 5-axle truck to the Wis-SPV to increase the positive moments (and potential negative
moments) in short span girders.

120
Conclusions
The analysis of WIM records indicated that 0.035% of total overloaded vehicles (records) may
exceed the impact of the 250-kip Wis-SPV. A close examination of the selected overloaded
vehicles indicated that some short vehicles with 5 to 7 axles, currently on Wisconsin highway
with annual permits, could exceed the maximum anticipated internal forces. These vehicles were
likely Class 7 trucks with multiple lift axles as well as Class 9 short trailers. The representative
vehicles for Classes 11 through 14 indicated that the Wis-SPV envelopes almost all truck-trailer
combinations, except Class 13 vehicles. Class 13 records includes large portion of vehicles with
permits, hence the representative vehicles did not address Type 3S2-2 truck-trailer combinations
well.
The analysis of Wisconsin single-trip permit trucks indicated that Wis-SPV envelopes almost all
single-unit trucks with less than 9 axles, which attributes 80% of the total permit records.
Representative vehicles with 7 axles could cause larger girder responses than the Wis-SPV. A
closer close look at these vehicles indicated that the potential worst vehicles are short vehicles
with distributed multiple axles (oftentimes with lift axles). This observation was similar to that
obtained in the analysis of WIM records in Chapter 4.
Comparison with the typical representative overloaded vehicles in the neighboring states
indicated that longer vehicles, similar to the MnDOT Type P413 vehicle, could cause larger
negative moments for two- and three-span simply supported girders. This situation was discussed
in Chapters 4 and 5 of this report using representative vehicles and randomly selected vehicles.
Specifically, some representative vehicles may have a variable spacing that ranges from 4ft to
over 70ft. Hence the vehicle with the smaller spacing may cause severe positive moments (and
likely shear) while the vehicle with greater spacing may cause severe negative moments.
Nevertheless, the proposed Short Permit Truck (SPT) did not consider long vehicle option
because most likely the vehicles are longer than 50ft (for trucks) and 75ft (for trailers and vehicle
combinations), the limit for vehicles eligible for permits. In such cases the vehicles will need a
single-trip permit, and would be rigorously examined before the permit is issued.
Future studies
It is generally believed that heavy weights distributed on multiple axles that spaced far would
cause less bridge damage than short closely spaced overloads. Hence, the permitting fee may be
based upon the ration of the gross vehicle weight with the legal weight calculated using the
Federal bridge formula. It was shown in Chapter 3 that plot of the maximum girder responses vs.
this ratio showed less scattering than the gross vehicle weight. A simple yet reasonably accurate
permitting fee base should be studied in details to reflect the level of damage overload vehicles
may cause to bridges. The consideration should include damage to bridge decks and the related
potential damage to durability of the bridges.
The gross weight distribution of Class 9 vehicles showed some deviation from the characteristics
described in an NCHRP study.10
Specifically the low peak (representing the empty trailers) and
the high peak (representing overloaded trailers) are higher. This might be due to the special
freight transport needs in Wisconsin, or this might indicate larger variations in the WIM
recording. The accuracy of the WIM records needs to be studied before these records can e used
for other purposes.

121
The WIM records can be used to assess and predict the traffic patterns, especially for trucks and
overloads. The number of the overloads recorded by each station is very uneven as shown below,
indicating drastically different overloads on Wisconsin highway bridges. For example, Station #
410240 on Interstate highway 94 near Tomah, WI captured nearly 50% of the total overloads.
This might be duo to the fact that overloads on highway 90 captured by Station #410253 near
Sparta, WI would also pass Station # 410240. Hence, highway bridges near Tomah, WI would be
more likely subjected to accumulated overloads, leading to less service life or higher
maintenance costs. The reasonably predicted truck and overload pattern would help the design to
tailor to the specific loads to the bridges.
Fig. 7.1 The overloaded vehicles captured in various WIM stations in Wisconsin

122
This page is blank

123
References
1. Transportation Research Board, (2002). Regulation of Weights, Lengths, and Widths of
Commercial Motor Vehicles, Special Report 267, National Academy Press, Washington,
D.C. 2002.
2. Wisconsin Department of Transportation, (2006) Fact and Figures 2005, Oversize /
Overweight Permit. http://www.dot.wisconsin.gov/drivers/docs/overs-wpermit.pdf.
3. Wisconsin, (2006) Statute Chapter 348: Vehicles - Size, Weight And Load.
http://www.legis.state.wi.us/Statutes/Stat0348.pdf.
4. Wisconsin Department of Transportation, (2006) Oversize/Overweight Single Trip Permit
Information. http://www.dot.wisconsin.gov/business/carriers/forms/mv2600.pdf
5. Wisconsin Department of Transportation, (2006) Multiple Trip Permit Information for
Nondivisible Oversize/Overweight Vehicles/Loads. http://www.dot.wisconsin.gov /business/
carriers/forms/mv2614.pdf
6. Wisconsin Department of Transportation, (2009) Bridge Manual Part I and Part II.
7. McIlrath, D., Frank, K., Wood, S., and Yura, J. (2000) Improving Bridge Rating And Truck
Permitting Procedures Through Finite Element Analysis, Report FWHA/TX-04/0-1746-2,
Texas Department of Transportation. pp. 127.
8. Altay, A., Arabbo, D., Corwin, E., Dexter, R., and French, C. (2003) Effects of Increasing
Truck Weight on Steel and Prestressed Bridges, Minnesota Department of Transportation
Report MN/RC – 2003-16 pp. 129.
9. Barker, R. and Puckett, J ((2007) Design of Higway Bridges: an LRFD approach (2ed),
Wiley.
10. Fu, G., Feng, J., and Dekelbab, W. (2003) "Effect of Truck Weight on Bridge Network
Costs." NCHRP report 495, National Cooperative Highway Research Program, Washington,
D.C.
11. Fu, G. and Fu, C. (2006) "Bridge Rating Practices and Policies for Overweight Vehicles."
NCHRP Synthesis 359, National Cooperative Highway Research Program, Washington, D.C.
12. Turer, A., and Aktan, E. A. (1999) Issues in Superload Crossing of Three Steel Girder
Bridges in Toledo, Ohio. Transportation Research Record 1688, pp. 87-96.
13. O. Hag-Elsafi and J. Kunin (2004) "Monitoring prestressed concrete box-beam bridge for
superloads." Transportation Research Record 1892, 2004: 126-136.
14. M. P. Culmo, J. T. DeWolf, and M. R. DelGrego (2004) "Behavior of steel bridges under
superload permit vehicles." Transportation Research Record 1892, 2004: 107-114.
15. American Association of State Highway Transportation Officials (AASHTO). LRFD Bridge
Design Specifications. 3rd Edition, Washington, D.C., 2004.
16. US Department of Transportation (2000) Comprehensive Truck Size and Weight (CTS&W)
Study. http://www.fhwa.dot.gov/reports/tswstudy/TSWfinal.htm.

124
17. Truck Characteristics Analysis, Federal Highway Administration, Washington, DC July 1999
18. U.S. DOT Federal Highway Administration, Bridge Formula Weights,
http://ops.fhwa.dot.gov/freight/publications/brdg_frm_wghts/index.htm.
19. American Association of State Highway and Transportation Officials (AASHTO), Manual
for Condition Evaluation and Load Rating of Highway Bridges Using Load and Resistance
Factor Philosophy, AASHTO, Washington, D.C., 2001.
20. Minnesota Department of Transportation. Limits for Oversize/Overweight Annual Permits.
http://www.dot.state.mn.us/motorcarrier/permits/limits_os_ow_annual.pdf.
21. Minnesota Department of Transportation. LRFD Bridge Design Manual.
http://www.dot.state.mn.us/bridge/Manuals/LRFD/LRFD-CoversAndTOC.pdf.
22. Iowa Code 2003, Chapter 321E: Vehicles of Excessive Size and Weight:
http://www.legis.state.ia.us/IACODE/2003/321E/.
23. Iowa Highway Research Board 1998, Project HR – 239 Phase III, Load Ratings For Standard
Bridges, Ames, IA 50010
24. Michigan Department of Transportation, (2005) Bridge Analysis Guide, 2005 Edition, Part 1.
25. Illinois Vehicle Code, http://www.ilga.gov/legislation/ilcs/ilcs.asp.
26. Illinois Department of transportation, Bureau of Structures and Bridges (1999) Structural
service manual.
27. Computers and Structures, Inc., SAP2000 Analysis Reference – Volume 1, Version 7.04,
1998.
28. Wood, S. M. (2004). Effects of Superload Trucks on a Steel Girder Highway Bridge. M.S.
Thesis, Purdue University, W. Lafayette, IN.
29. Montgomery, D. and Runger, G. (2004) Applied Statistics and Probability for Engineers,
Wiley
30. McCall, B. and Vodrazka, W (1997) State's Successful Practices Wieigh-in-Motion
Handbook,
31. FHWA Traffic Monitoring Guide, 3rd Edition, http://www.fhwa.dot.gov/ohim/tmgbook.pdf.
32. FHWA (2001) Guide to LTPP Traffic Data Collection and Processing.
http://www.tfhrc.gov/pavement/ltpp/pdf/trfcol.pdf
33. Center for Transportation Analysis, Oak Ridge National Laboratory (1998). Analysis of
Vehicle Classification and Truck Weight Data of the New England States, Final Report.
34. Pavement research by WHRP
35. American Association of State Highway and Transportation Officials (2009) AASHTO
Guidelines for Traffic Data Programs.
36. Harvey, B. A., Champion, G. H., Ritchie, S. M., and Ruby, C. D. (1995) Accuracy of Traffic
Monitoring Equipment, Georgia Technical Research Institute, A-9291.

125
37. Dicleli, M., and M. Bruneau. (1995). "Fatigue-Based Methodology for Managing Impact of
Heavy-Permit Trucks on Steel Highway Bridges." Journal of Structural Engineering, Vol.
121, No. 11, pp. 1651–1659.
38. Kostem, C. N. (1978). Overloading of Highway Bridges — Initiation of Deck Damage.
Transportation Research Record 664, pp. 212-220.
39. E. J., O’Brien, (1999) Bridge deck analysis, E&FN SPON, London, UK
40. Lichtenstein Consulting Engineers, Inc. "NCHRP Web Document 28 (Project C12-46):
Contractor's Final Report: "Manual for Condition Evaluation and Load Rating of Highway
Bridges Using Load and Resistance Factor Philosophy." May 2001.
http://gulliver.trb.org/publications/nchrp/nchrp_w28.pdf.

cxxvi
This page is blank

127
Appendix 1 Line Girder Analysis Using SAP2000
Introduction
Steps for doing line girder analysis using SAP2000 (Ver. 11.0.6 Advanced) are shown below.
This example shows the procedures used to obtain moment/shear envelops of a 2-span bridge
(with a span length of 100 ft) loaded by the WisDOT Standard Permit Vehicle shown below:
13' 4' 4' 4' 4'30'
25 353535 30303063'
4'
30
100' 100'
Analysis Procedures
1. File>New Model: create a new Beam model (two spans of 100ft). Note that the forces are in
kips and dimensions are in inches.

128
2. Define>Frame Sections: use the default section for line girder analysis
3. Define>Bridge Loads>Lanes: define lanes that describe how vehicles move on the structure
a) Click Add New Lane from Frame, use the default lane name or a new name; select frame
member 1, leave Centerline Offset and Lane Width zero, and click Add

129
b) Change to frame member 1, leave Centerline Offset and Lane Width zero, and click Add
c) Increase Additional Lane Load Discretization to smooth the solution (e.g. 1/50 span)
4. Define>Bridge Loads>Vehicles: define Vehicle loads (e.g., HS20-44)
a) Click Add General Vehicle to define the WisDOT Standard Permit Vehicle

130
b) Use a name for the vehicle (e.g., WisDOT Standard Permit Vehicle)
c) Select Leading Load from Loads>Load length Type, put 25(kips) in Axle Load, select
Two Points from the next column, put 72 (inches) in the last column, and click Add
d) Select Fixed Length from Loads>Load length Type, put 156(inches) in Min. Distance, put
35(kips) in Axle Load, leave everything else intact, and click Add
e) Put 48(inches) in Min. Distance, put 35(kips) in Axle Load, leave everything else intact,
and click Add, and click Add again to input the last middle axle

131
f) Put 360(inches) in Min. Distance, put 30(kips) in Axle Load, leave everything else intact,
and click Add. Put 48(inches) in Min. Distance, and click Add three times
5. Define>Bridge Loads>Vehicle Classes: specify sets of one or more vehicles that can be
assigned to act on lanes in a moving-load analysis case
a) Click Add New Class
b) Use the default name or a new name for the class
c) Select the vehicle name (e.g., WisDOT Standard Permit Vehicle), and click Add

132
6. Define>Bridge Loads>Vehicle Response Requests: specify the response categories to be
analyzed and the calculation method to be used
a) Check the first three requests and uncheck all others
7. Define>Analysis Case: define one or more moving-load analysis cases that assign the
vehicles classes to the traffic lanes
a) Click Add New Case

133
b) Select Moving Load in Analysis Case Type, and choose the Zero Initial Conditions:
Unstressed State option in Stiffness to Use,
c) Select Vehicle Class as defined (e.g., VECL1), and click Add
8. Analyze>Run Analysis: define load cases to run
a) Highlight all load cases other than the defined moving load case, and click Run/Do Not
Run Case

134
b) Click Run Now, SAP2000 prompt to save the model
9. Display>Show Forces/Stresses>Frames/Cables: watch the moment/shear envelopes
a) Select Moment 3-3 for bending moments of the beam, select Show Values on Diagram,
and click OK

135
b) Select Shear 2-2 for shear of the beam
c) The values shown the peak points on the moment diagram
Export Analysis Results
10. Display>Choose Tables for Display: output the results
a) Select ANALYSIS RESULTS>Element Output>Frame Output
b) Leave all others options intact because there is only one load case

136
c) On the displayed table, File>Export Current Table>To Excel
d) Column V2 shows the shear envelop, and M2 bending moment envelop. The moments
are in kips-in.
e) Note that the ElemStation column shows the position of calculated values in each element
starts from i-node to j-node. The correct plot shows when the length of Member 1 is
added to each position of Member 2.

137
Note:
Phrases such as "File>Export Current Table>To Excel" show the command tree.
Underlined phrases (e.g., Click Run Now ) show buttons to be clicked.
Italic phrases (e.g., select Show Values on Diagram) show items on the screens to be
selected.

138
Appendix 2 Introduction to the Matlab® Programs
Introduction to Weigh-in-Motion analysis (WIMan) program
The program WIMan is introduced below. WIMan reads in and mines the WIM records in
FHWA W-cards. The program plots histograms of vehicle configurations and output
configuration data in text file for post processing. If vehicles have analyzed using
WIM_PVEHICLES, the results can be checked using randomly selected vehicles.
Operation procedures of WIMan
The program window is shown below. The window is divided into three regions as illustrated in
the following figure: a plot region, an information region that is below the plot region, and a
command region on the right side.
Plot region
Information region
Command region

139
The analysis starts with loading vehicle configurations (either in W-cards or in a .mat file) as
noted in the information region by clicking the list box on the upper right side of the window.
The program asks for a spreadsheet file that contains the vehicle configurations as shown in the
following figure.
To facilitate the batch reading, a text file containing the W-cards can be specified. The read-in
process will produce a mat file named "ALLVEHS.mat,"which can be reloaded to speedup the
data mining. The vehicles will be listed after the W-cards are loaded. The program automatically
filters out records with errors. For example, some records contain '-' that disturbed the partition
of W-cards. These records (about 2,300) have been filtered out from the obtained 6 million
records. These records can be further studied next quarter. Another error has been identified in
the obtained vehicle data. For example, this record, W55250529710703160105
045802032025032, indicates that the vehicle is class 5 and has 2 axles in total. The two axle
weights are 032+032 = 064 (=14kips) while the gross weight shows 0458, which is equivalent to
101kips. The program replaces the recorded gross weight with the summation of axle weights
when the two values are not equal.
The vehicle configuration can be plotted by highlighting the code of the vehicle as shown below.

140
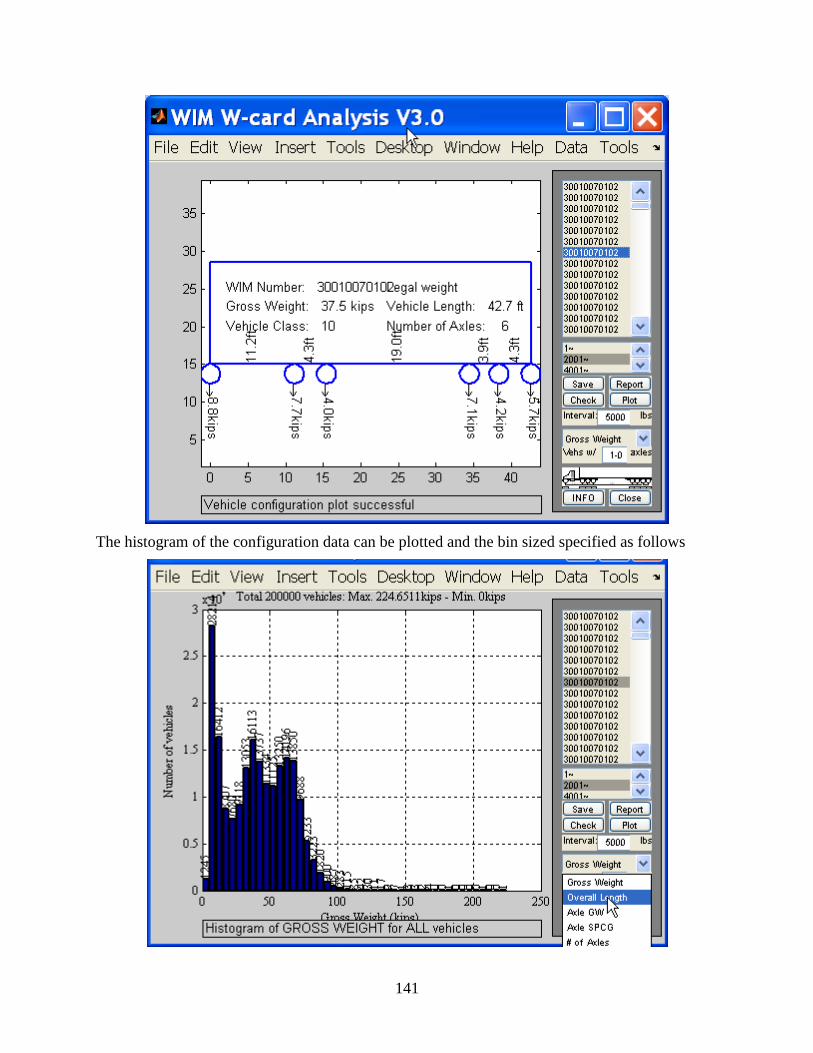
141
The histogram of the configuration data can be plotted and the bin sized specified as follows

142
The axle number can be specified for axle weight distribution as total axle # - axle #
The data set can be refined by clicking the image of the WisDOT SPV, and an input window will
show to allow refining requirements. The last input informs the program to save the refined
dataset in a mat file. Note that 1 gigabyte of memory is required for every two million records.
This option allows a closer examination of any data set of interest.

143
The distribution of the refined data set can be plotted individually by clicking report button, and
saved by clicking save button.

144
Introduction to Moving Load analysis (MLan) program
The program MLan is introduced below. The Matlab program provides interface between user
inputs on vehicle configurations and girder geometry information and the SAP2000 line girder
analysis. The program also controls the SAP2000 line girder analysis and collects the analysis
results into a database, which can be saved as a spreadsheet. The results can be viewed
immediately after the analysis is finished and can be compared with that of the Wisconsin
Standard Permit Vehicle. The comparison can be reported in terms of peak moment/shear values
and R-values as defined in Chapter 4.
Operation Procedures of Mola
The program window is shown below. The window is divided into three regions as illustrated in
the following figure: a plot region, an information region that is below the plot region, and a
command region on the right side.
The analysis starts with loading vehicle configurations as noted in the information region by
clicking the list box on the upper right side of the window. The program asks for a spreadsheet
file that contains the vehicle configurations as shown in the following figure.
Plot region
Information region
Command region

145
The spreadsheet contains a vehicle per sheet, the name of which is the vehicle name as shown in
the list box of the following figure. The format of the vehicle configuration in spreadsheet is
Load Min. Spacing Max. Spacing
Leading load (kips) 0 0
Axle weight (kips) Spacing to leading load (in) 0
Axle weight (kips) Spacing to previous load (in.) Spacing to previous load (in.)
Note that the maximum spacing to the previous load is zero for fixed axle spacing and has a
value for variable axle spacing. For example the input for the AASHTO design truck is shown
below: the third axle has a variable spacing from 13ft to 30ft. Note that the sheet name in the
spreadsheet cannot contain '_'.

146
The vehicle configurations can be viewed briefly by highlighting the vehicle name from the list
box. An error message would be generated if the vehicle configuration were not input correctly.

147
Specify the number of spans the girder to be analyzed has and specify the range of the span
length. The program assumes that SAP2000 (Ver. 11 in this study) is installed at the default
locations: C:\Progra~1\Comput~1\SAP200~1\Sap2000.exe. The analysis results can be viewed
by selecting the span length using the slide bar and clicking the plot button.

148
The analysis results can be save as Matlab mat file and spreadsheet file by clicking the save
button. And the results can be reloaded to the program by clicking the program logo. The result
file name follows the following format for appropriate interpolation of the analysis case:
vehicle name_minmum span_maximum span_span numberspan.mat

149
Enable the check box before 'WI_SPV 30~140ft" to show the comparison between the effect of
the selected vehicle with that of the WIsDOT Standard Permit Vehicle. Click Summary button to
show the comparison of peak values. The effect of the WisDOT Standard Permit Vehicle will be
in dashed lines (red) while the selected vehicle will be in solid lines (blue).

150
Click Report button to show the comparison of moment/shear envelops for a group of selected
vehicles for the specified span length. Enable check box before 'WI_SPV 30~140ft" to show the
effect of the selected vehicle with that of the WIsDOT Standard Permit Vehicle and to calculate
R-values. Note that the vehicle names must be same as the names in the result files.
The following files must be in the same directory of the program:
SELECTVEH.xls
Singlespan.s2k
Twoeqspan.s2k
Threespan.s2k
WisDOT Standard_30-140_1span.mat
WisDOT Standard_30-140_2span.mat
WisDOT Standard_30-140_3span.mat

151
Appendix 3 Fundamentals of Statistical Analysis in this Project
Introduction
WisDOT has used the Standard Permit Vehicle (shown in Fig. A3.1) for many years to describe
the maximum safe load carrying capacity of highway bridges. The Standard Permit Vehicle load
also has been used as a design parameter because all newly designed bridges are required to
safely carry this load. The Standard Permit Vehicle is also an important guide for issuing annual
permits and/or single-trip permits.
13' 4' 4' 30' 4' 4' 4'63'
25 35 35 35 30 30 30 30
Fig. A3.1 Wisconsin Standard Permit Vehicle
The Standard Permit Vehicle was created with intentions: 1) to envelope all vehicles with annual
permits; and 2) to represent the non-divisible trucks with single-trip permits. This means that the
internal forces (i.e., moments and shear) caused by the WisDOT SPV in bridge girders should be
larger than those of most vehicles on Wisconsin highway bridges.
In statistics language, the objective of this study is to test the following hypothesis:
The load effects of the Standard Permit Vehicle on Wisconsin bridges are larger than those of
most vehicles on Wisconsin highways, where,
The load effects are moments (both positive and negative moments, for continuous girders) and
shear in bridge girders in this study. Although the load effects should also include deflections
and local effects on decks, they are not included in the study. This is because these effects are
usually controlled with serviceability checks of a bridge rather than permit rating of the bridge.
The details of bridges should be taken into consideration for the calculation of load effects. To
serve general design and rating practices, the bridges in this study are general simply supported
girders with one to three equal spans. The span length varies form 30ft to 140ft similar to those
in Wisconsin Bridge Manual.
"Vehicles" should be the population, of which information s sought: all trucks and trailers on
Wisconsin highways. However, due to the inevitable variability and limitations in data
collection, the available vehicles are only a subset of the population. Nevertheless, the vehicle
data available collected in all weigh-in-motion stations is treated as the population due to a large
data body (i.e. over six million vehicles excluding passenger cars and motorcycles.
The comparison is performed using moment/shear envelopes in simply-supported girders with

152
various span lengths and the peak moment/shear values in the girders.
'Most' indicates that the comparison of load effects cannot be performed with the entire
population of vehicles due to limited computation power. Hence a subset of vehicles (named a
sample) are analyzed and compared with the Wisconsin Standard Permit Vehicle. Based on the
limited number of comparison, the conclusion needs to be drawn with certain confidence level.
For example, the exceeding probability should be less than 0.0233% (corresponding to a safety
index of 3.5 as illustrated in Fig. A3.2).
Fig. A3.2 Structural safety in LRFD structural design
Similar to the probability based structural analysis, the distribution of the subject was assumed to
be normal. Another assumption needed was that the statistical characteristics of the entire
population, though unknown, were assumed to be the same as that of the samples (e.g., the
sample mean values and the sample standard deviation) .The probability of exceeding ('poe' as
the failure probability in the structural design shown in Fig. A.2) is affected by both the mean
value and the standard deviation. This was shown for standard normal distributions in Fig. A3.3.
Fig. A3.3 Standard normal distribution

153
If the hypothesis is rejected, a modification should be proposed to the standard permit vehicle
should be created to ensure that the hypothesis is true with certain confidence level.
Population mean
The population mean for a discrete random variable (X) is given by
x
X xXxP ,
where xXP is the probability mass function. Often time The mean value is also calculated
as n
xX
, where n is the total number of values in the population.
In the above example, 10
1 xXP because each number has one appearance in the
population. Hence 5.510
)10987654321(
X
Population standard deviation
The population standard deviation ( X ) for a discrete random variable (X) is given by
1
2
2
n
xx
X
X
,
In the above example, 5.822
x
Xx , and the standard deviation is 03.3)110/(5.82
Population percentiles
The median of a sample is defined as the middle number of the average of the two middle
numbers when the sample values are arranged from smallest to largest. In terms of the
probability density function, the median is the point at which half the area under the curve is to
the left and half the area is to the right. Similarly, the pth percentile (0<p<100) of a population is
the value such that p% of the population are less than or equal to the value. A median is 50th
percentile. For example, to find the 90th
percentile of the following population,
3, 4, 7, 1, 2, 6, 8, 9, 10, 5
Reordering the population from smallest to largest gives
1, 2, 3, 4, 5, 6, 7, 8, 9, 10.
Any value between 9 and 10 would ensure 90% of the population is smaller than the value. SPSS
calculates the 90th
percentile as 9.9%90)910(9 . For the 95th
percentile of the same
population, there is actually not a value that can ensure 95% of the population is less than or
equal to the value. This is because the total number of population is 10 such that 95% of the
population would result in nine and half numbers, which is invalid. In this case, SPSS find the
value such that 10 values (100%) are less than or equal to the value. This indicates that the 95th
percentile is for the above population is 10.

154
The sample used in this study included both vehicles with annual permits and vehicles with
single-trip permits. This was due to lacking of reliable criteria to separate single-trip permit
vehicles form all other vehicles in the WIM records. In addition, Chapter 5 indicated that many
vehicles with single-trip permits have reasonable gross vehicle weights. The number of vehicles
heavier than 250-kips is small. It was demonstrated here that the inclusion of small quantities of
the heavy trucks would not affect significantly the results of the descriptive statistical analyses
used in this study.
Consider a value of 20 is included in the group of data such that the probability of this value is as
large as 1%
0.1, 0.2, 0.3 … 1.1, 1.2, 1.3 … 2.1, 2.2, 2.3 … 10.0, 20
The 90th
percentile of the new data set would be 9.18 compared with 9.09 for the data set without
the number 20. The 95th
percentile would 9.69 compared with 9.60. The effect of the small
number of high values would cause insignificant impact in the calculation of the percentile
values.

155
Appendix 4 Multivariate Statistical Analysis of WIM data
Introduction
There are 17 Weigh-In-Motion (WIM) stations in Wisconsin that record truck weight
information as vehicles pass over their sensors at normal speeds. These WIM data include all
legal and illegal trucks that may cross the WIM sensors, and thus provide a reasonably complete
picture of truck loads. Understanding the statistical variability of different classes of truck loads
is considered important with respect to probabilistic evaluation of overweight truck impacts on
bridges and pavements. This study is designed to collect and analyze WIM truck data from all
stations in Wisconsin for the entire year of 2007. Approximately 6 million truck records (truck
classes 5 through 15) were evaluated in this study. Statistical analyses were performed on the
heaviest 5 percent of trucks in each class-axle grouping.
The objectives of this research were as follows:
Analyze Wisconsin WIM data to obtain axle weight and spacing information for heavy
trucks in various truck classes. This will provide detailed information on load characteristics
of heavy trucks traveling on Wisconsin highways.
Determine unimodal and multimodal statistical distributions for all axle loads and spacings
for the heaviest 5% of all trucks in each truck class-axle group, and determine multivariate
―copulas‖ that map relationships between different distributions.
Conduct multivariate Monte-Carlo simulation studies using the statistical distributions and
copulas.
W-card data from the Wisconsin WIM stations were obtained from WisDOT. W-cards refer to
the WIM data in metric units. These data were exported into Microsoft Excel spreadsheets for
analyses. Excel truck data were checked to ensure that all sets of data were valid. Data were then
sorted based on truck class. Only records for truck classes 5 through 15 were retained. For each
truck class-axle grouping, two sets of data were developed: A complete set as well as a partial set
containing the heaviest 5 percent (H5P) of all trucks in each class-axle group. The H5P data are
significant with respect to impact of heavy loads on bridges and pavements. By separating and
analyzing the H5P data, the accuracy of predictions on heavy loads would be improved
significantly. For example, fitting a statistical distribution to the H5P data would be more
accurate that looking at the tail of a distribution fit to the entire dataset.
Srinivas, Menon, and Prasad(1)
describe an approach for determining multivariate statistical
distributions of truck axle weights and spacing using copulas. This approach was used to
determine relevant distributions in this study. It is believed that considering axle weight and axle
spacing as independent variables would not be as accurate since the important interdependencies
between various axle loads and spacings would be overlooked. Also, conducting multivariate
analyses using linear correlation coefficients would not accurately describe the dependence for
non-elliptical distributions (1), (4)
. Therefore, multivariate analyses and simulations using copulas
were used in this study.

156
The software used in the data analyses phase of this study included Crystal Ball(2)
, which is a
forecasting and Monte Carlo simulation program that runs within the MS Excel platform, and
ModelRisk(3)
, which is a quantitative risk analysis program that also runs within MS Excel. Both
Crystal Ball and ModelRisk
can fit statistical distributions to a given dataset. ModelRisk can also
fit copulas or determine empirical copulas based on data. Crystal Ball and ModelRisk can be run
together to perform Monte Carlo simulations involving the determined distributions and copulas.
Weigh-in-Motion data
All data produced by Wisconsin WIM stations in 2007 were obtained from WisDOT. A total of
nearly 6 million vehicle WIM records were obtained. A few stations did not record any data in
2007, while others were operating part of the year only. Table A4.1 shows the number of vehicle
records (classes 2 through 15) obtained from all stations in 2007. There were some records with
the station identified as ―0‖. Those records were included in the analyses.
For data analyses, only vehicle classes 5 through 15 (i.e. trucks) were considered (i.e. non-truck
classes 2,3, and 4 were removed). Truck data were first tested to make sure that they were valid,
and invalid truck records were discarded (approximately 0.1% of all truck data). Three validity
tests were performed on each data line (truck record):
1. Is the total weight reported on the W-card for each truck within ±5% of the sum of all
axle weights reported?
2. Does the number of axles reported on the card match the number of axle weights
reported?
3. Are all axle spacings reported reasonable? Records that showed axle spacing of less than
20 inches were discarded.
Data that failed these tests were not included in further analyses. Of the total of 5,761,802
unfiltered records for classes 5 through 15, only 4,352 records (or 0.08%) were discarded based
on the above three criteria. Table A4.2 shows the number of unfiltered truck records as grouped
within different classes for different months of 2007.
Some truck classes may have different number of axles. For example, class 7 trucks could have
either 4 or 5 axles (designated as class-axle groups 07-04 and 7-05) while class 8 trucks could
have 3 or 4 axles (class-axle groups 08-03 and 08-04). Table A4.3 breaks down the number of
trucks based on class and number of axles. WIM data for class 13 and 15 trucks include a large
number of axle variations within the same class.
Data associated with the same number of axles within each class had to be separated before
calculating the best fit statistical distributions. For example, two sets of statistical distributions
were determined for class 7.
Table A4.3 also shows the number of filtered trucks in each class (and axle) category as a
percentage of trucks in each class as well as percentage of all filtered trucks. Class 9 trucks make
up over 61.7% of all WIM trucks. There were over 3.5 million class 9 vehicles in the 2007 data.
The second and third most common trucks are classes 8 and 5 at 14.7% and 13.0%, respectively.
The minimum, maximum, and 95 percentile values for the total weight of each truck class are
also shown in Table A4.3. For example, the maximum recorded total weight for a class 9 was
242.5 kips and the 95 percentile weight was 104.9 kips.

157
It is extremely important that the heaviest trucks in each class are accurately represented in the
analyses and simulations. Therefore, the heaviest 5 percent (H5P) of trucks in each class-axle
category (i.e. trucks that weigh more than the 95th
percentile value) were separated and analyzed.
This is considered preferable (more accurate) relative to fitting distributions to the entire data and
estimating the worst effects from the distribution tails. Basic H5P information for each class-axle
category is shown in Table A4.1.
Table A4.1. Number of Raw Vehicle Records from all WIM Stations in All Months of 2007
Station Jan. Feb. Mar. Apr. May June July Aug. Sept. Oct. Nov. Dec. TOTAL
0 21456 19122 22183 17186 31204 32899 35081 35617 30815 30399 21611 14416 311989
30010 12807 0 0 0 60055 66559 20478 22227 54777 32949 41365 35311 346528
40002 0 0 0 0 0 0 6050 29519 22726 24098 18394 13667 114454
100001 89409 39056 57911 27132 42302 17412 2041 17082 16896 24379 15069 0 348689
220001 27203 26492 35286 38605 70501 63663 67780 73481 61924 74553 61278 46063 646829
250529 88486 74797 83352 48932 51497 71679 35772 0 0 0 0 0 454515
260001 0 0 0 0 0 0 0 0 0 0 0 0 0
360002 8054 6208 0 249 34997 0 0 0 0 24775 80140 77903 232326
370006 0 0 0 0 0 0 0 0 0 0 0 0 0
390105 61578 24319 8345 7591 35253 0 0 0 0 0 0 0 137086
410240 0 0 0 0 228030 215906 200444 222604 198999 234690 199252 177924 1677849
410253 0 0 0 0 129640 126113 138187 148541 117502 136091 111740 97566 1005380
450239 0 0 0 0 0 0 0 0 0 0 0 0 0
470102 6087 4968 6073 3298 2641 0 6230 9115 7421 8761 6687 5047 66328
530001 0 0 0 0 0 0 0 0 0 0 0 0 0
576051 7291 6772 5655 0 13174 13650 16876 15345 11252 11087 8102 6807 116011
590608 38395 27317 35086 41011 49887 47827 54562 57059 44703 53391 41148 33859 524245
640348 0 0 0 0 0 0 0 0 0 0 0 0 0
Total 360766 229051 253891 184004 749181 655708 583501 630590 567015 655173 604786 508563 5982229
Table A4.2. Number of Unfiltered Truck Records in Each Vehicle Class (Year 2007)
Classification Jan Feb Mar Apr May Jun Jul Aug Sep Oct Nov Dec Total
Class 05 61472 42417 44533 31252 87485 77963 70912 72290 64979 70679 68312 57115 749409
Class 06 15133 9470 12368 11901 31637 25314 23411 27597 26198 27075 24445 17365 251914
Class 07 1656 1257 3156 3041 9796 6952 8239 9915 7818 10315 7760 3267 73172
Class 08 25836 17226 22899 18617 124162 121046 117640 122218 101025 79634 60791 37978 849072
Class 09 204243 117930 124366 90877 442906 364234 323198 369110 336788 418136 403424 359488 3554700
Class 10 5547 3778 4560 3024 9676 7498 6044 7877 6346 8574 8491 6349 77764
Class 11 3362 1625 1432 955 12768 10631 9091 11039 9798 12271 11348 10258 94578
Class 12 687 408 307 185 3977 3402 3004 3570 3164 4165 4016 3692 30577
Class 13 971 909 1399 734 1713 1533 1076 510 506 626 570 360 10907
Class 14 72 66 396 254 111 148 84 1131
Class 15 9730 8708 13921 7183 8430 10611 7167 512 601 721 649 345 68578
Total 328709 203794 229337 168023 732661 629332 569866 624638 557223 632196 589806 496217 5761802

158
Table A4.3. Detailed Information on Different Truck Classes
Filtered Truck Data H5P
Class
Class -
Axles
Un-
filtered
Count Count
Count
% of
Total
Count
% of
Class
Min Wt.
(Kips)
Max Wt.
(Kips)
95th
%ile
(Kips) Count
Min Wt.
(Kips)
Max Wt.
(Kips)
Class 5 05-02 749409 748658 13.00% 100.00% 0.22 78.48 24.69 38565 24.69 78.48
Class 6 06-03 251914 251795 4.37% 100.00% 0.66 119.93 53.35 12730 53.35 119.93
Total 73172 73138 1.27% 1.10 187.17 89.51 3674 89.51 187.17
Class 7 07-04 25753 0.45% 35.21% 1.10 187.17 79.81 1313 79.81 187.17
07-05 47385 0.82% 64.79% 1.32 171.96 93.26 2386 93.26 171.96
Total 849072 848482 14.74% 0.66 153.00 46.30 42763 46.30 153.00
Class 8 08-03 634745 11.02% 74.81% 0.66 145.28 26.01 32061 26.01 145.28
08-04 213738 3.71% 25.19% 0.88 153.00 68.34 10836 68.34 153.00
Class 9 09-05 3554700 3553613 61.72% 100.00% 1.10 242.51 104.94 177857 104.94 242.51
Total 77764 77185 1.34% 1.32 267.20 116.62 3883 116.62 267.20
Class 10 10-06 72939 1.27% 94.50% 1.32 267.20 114.64 3662 114.64 267.20
10-07 4246 0.07% 5.50% 1.76 235.67 143.52 215 143.52 235.67
Class 11 11-05 94578 94572 1.64% 100.00% 3.31 181.00 116.85 4747 116.85 181.00
Class 12 12-06 30577 30576 0.53% 100.00% 1.76 205.25 129.85 1537 129.85 205.25
Total 10907 10595 0.18% 1.54 328.05 130.29 534 130.29 328.05
13-07 9738 0.17% 91.91% 1.54 328.05 128.75 490 128.75 328.05
13-08 680 0.01% 6.42% 28.66 160.94 122.14 35 122.14 160.94
13-09 75 0.00% 0.71% 37.70 177.25 162.99 5 162.92 177.25
Class 13 13-10 65 0.00% 0.61% 38.36 200.62 161.51 4 162.92 200.62
13-11 10 0.00% 0.09% 66.80 169.76 167.28 1 169.76 169.76
13-12 8 0.00% 0.08% 65.04 209.22 207.60 1 209.22 209.22
13-13 19 0.00% 0.18% 88.41 246.26 227.41 1 246.26 246.26
Class 14 14-05 1131 1128 0.02% 100.00% 12.13 101.19 71.21 58 71.21 101.19
Total 68578 67708 1.18% 1.76 423.95 97.89 3388 97.89 423.95
15-02 3071 0.05% 4.54% 4.63 49.60 34.61 157 34.61 49.60
15-03 13617 0.24% 20.11% 6.17 55.34 26.90 682 26.90 55.34
15-04 10013 0.17% 14.79% 7.50 93.04 57.10 507 57.10 93.04
15-05 9057 0.16% 13.38% 12.57 104.72 73.85 465 73.85 104.72
15-06 19507 0.34% 28.81% 13.23 135.80 93.04 987 93.04 135.80
Class 15 15-07 4164 0.07% 6.15% 19.62 130.95 100.09 214 100.09 130.95
15-08 4781 0.08% 7.06% 1.76 266.32 162.70 242 162.70 266.32
15-09 1264 0.02% 1.87% 1.98 345.91 182.26 64 182.32 345.91
15-10 727 0.01% 1.07% 2.20 423.95 202.16 39 202.16 423.95
15-11 489 0.01% 0.72% 2.20 239.86 166.85 25 167.11 239.86
15-12 384 0.01% 0.57% 2.43 359.79 91.45 20 92.37 359.79
15-13 341 0.01% 0.50% 2.65 322.10 61.29 18 61.29 322.10
15-14 293 0.01% 0.43% 3.09 131.40 51.72 15 52.91 131.40

159
Statistical Distributions for H5P Data
The H5P data for all class-axle groups were used to generate best-fit statistical distributions
using the ModelRisk software. Data from all stations were combined. Limited Analysis of
Variance (ANOVA) showed that truck weights in different WIM stations did not belong to the
same distribution. Best fit distributions were determined for each axle weight, axle spacing and
the total weight in each truck class-axle category. ModelRisk reportedly utilizes the following
information criteria to find the best fit distribution for each parameter:
SIC (Schwarz Information Criterion), also known as Bayesian Information Criterion (BIC)
AIC (Akaike Information Criterion)
HQIC (Hannan-Quinn Information Criterion)
The fitting options within ModelRisk cannot directly accommodate bimodal (―double hump‖) or
multi-modal statistical distributions. However, many axle load and axle spacing distributions are
in fact multi-modal. When data warranted such considerations, a semi-manual approach was
used to determine multi-modal best fit distributions. The following approach was used:
A histogram of data was generated in MS Excel.
ModelRisk® was used to find the best fit single-mode distributions.
If the histogram indicated multi-modal (―multi-hump‖) behavior, then the histogram data was
manually separated into grouping around each peak. Best fit single-mode distributions for
each group were determined using ModelRisk. The number of data points within each
grouping divided by the total number of data points is the probability (P) associated with the
distribution in that grouping. For example, for a tri-modal distribution:
Multi-Modal Distribution = P1 x Distribution1 + P2 x Distribution2+ P3 x Distribution3
The resulting multi-modal distribution was plotted and compared with the histogram to make
sure that the data agrees with the distribution.
All single-mode distributions for all class-axle groupings are shown in Appendix A (These
include distributions for which a unimodal assumption is not appropriate). Table A4.4 shows the
single-mode best fit distributions for class 09 (5 axle truck). As stated earlier, not all single-mode
distributions are appropriate. When the histogram shape indicated multimodal response, the
multimodal distributions were determined as well and used in simulations in lieu of single-mode
distributions. Table A4.5 shows the multi-modal distributions fit to class 9 data that were
considered multi-modal. Appendix B includes all such multi-modal data for all classes. For
reference, Table A4.6 shows typical shapes associated with different unimodal distributions.
Selected histogram and distribution plot for class 9 are shown in Table A4.7. More such plots are
provided in Appendix C. Table A4.8 shows the axle loads and spacings for the heaviest three
trucks in each class-axle group obtained from the H5P data. Table A4.9 shows percentages of
permit/illegal trucks within each class-axle groupings in H5P data. The criteria for classification
as permit/illegal were: a) gross weight > 80 kips, b) front axle > 13 kips, and c) any axle > 20
kips.

160
Table A4.4. Best Fit Single-Mode Distributions for Class 9 Trucks.
Class 09-05
Wt. or Spacing Distribution Parameters*
Total Wt Beta4 1.199, 6.460, 475.618, 1100.592
A axle Wt Student3 96.110, 18.620, 15
A-B spacing** Student3 51.296, 7.023, 3
B axle Wt Student3 118.086, 18.667, 302
B-C spacing Student3 12.761, 0.658,5
C axle Wt Student3 122.246, 19.266, 43
C-D spacing Student3 100.460, 8.277, 6
D axle Wt Student3 116.664, 18.978, 50
D-E spacing** Student3 12.008, 0.444, 3
E axle Wt Student3 121.745, 19.450, 34
* Parameters are determined using W-Card units. W-Card load data are given in 100kg’s. W-
Card spacing data are given in 100mm’s. The parameters are used to generate the particular
distributions, say beta4 or student3.
** The histogram is not unimodal. Use multi-mode distribution given in Table A4.4 instead.
Table A4.5. Best Fit Multi-Modal Distributions for Class 9 Spacings.
Class 09-05 AB spacing
Distribution Parameters* Weight
% of
Total
Student3 36.560, 2.952, 10 13483 7.58%
Logistic 50.746, 1.740 137860 77.51%
Student3 59.601, 2.069, 4 26514 14.91%
Class 09-05 DE spacing
Distribution Parameters* Weight
% of
Total
Gamma 362.838, 0.033 153114 86.09%
Student3 30.143, 0.943, 3 24743 13.91%
* Parameters are determined using W-Card units. W-Card load data are given in 100kg’s. W-
Card spacing data are given in 100mm’s. The parameters are used to generate the particular
distributions, say beta4 or student3.
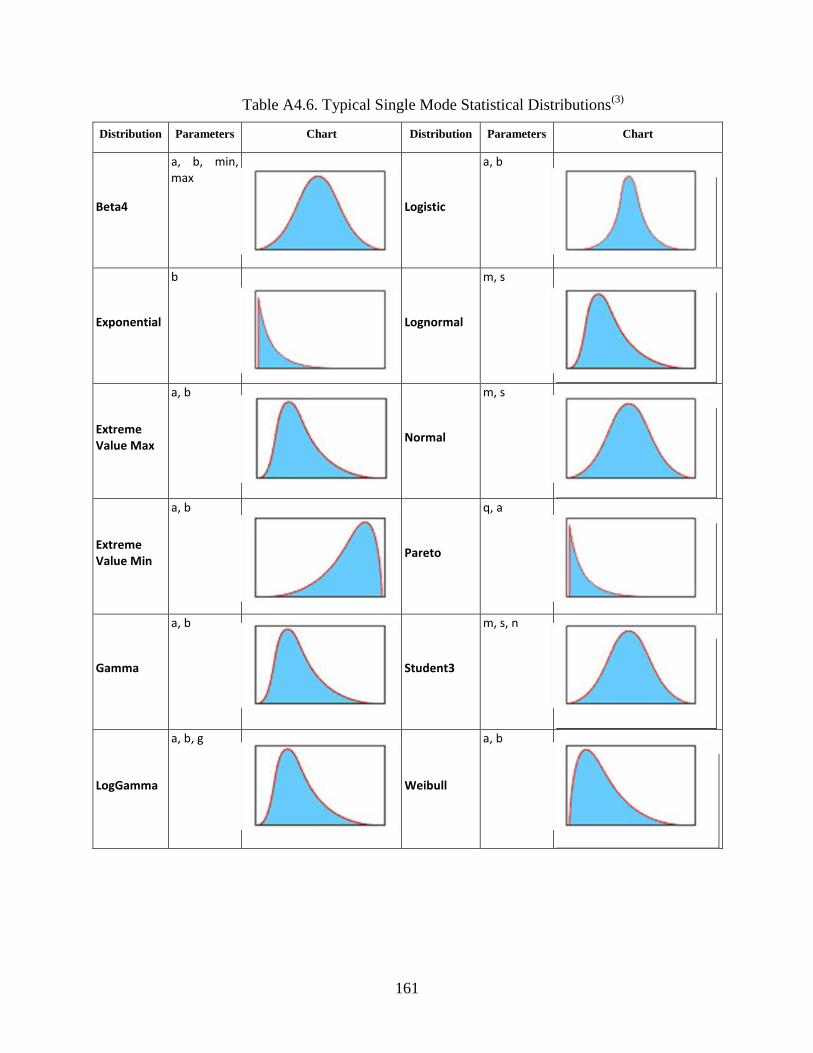
161
Table A4.6. Typical Single Mode Statistical Distributions(3)
Distribution Parameters Chart Distribution Parameters Chart
Beta4
a, b, min, max
Logistic
a, b
Exponential
b
Lognormal
m, s
Extreme Value Max
a, b
Normal
m, s
Extreme Value Min
a, b
Pareto
q, a
Gamma
a, b
Student3
m, s, n
LogGamma
a, b, g
Weibull
a, b

162
Table A4.7 – H5P Histograms and distributions for Class 9 trucks.
Axle A
Axle B
Axle C
Axle D
Axle E
AB Spacing
BC Spacing
DE Spacing

163
Table A4.8 – Axle loads and spacings for the three heaviest trucks in each class-axle.
Class
No.
of
axles
Total
WT
kips
A
axle
Wt
kips
A-B
sp.
(ft)
B
axle
Wt
kips
B-C
sp.
(ft)
C
axle
Wt
kips
C-D
sp.
(ft)
D
axle
Wt
kips
D-E
sp.
(ft)
E
axle
Wt
kips
5 2 78.5 28.9 18.0 49.6
5 2 75.4 39.5 13.5 36.2
5 2 74.5 38.4 13.5 36.2
6 3 119.9 34.0 12.1 46.5 4.6 39.5
6 3 116.8 39.7 18.0 38.1 4.3 39.0
6 3 115.5 38.6 14.1 37.9 4.3 39.0
7 4 187.2 39.2 17.1 33.1 4.6 55.3 4.6 59.3
7 4 149.3 38.6 13.1 34.8 6.6 37.5 4.3 38.4
7 4 141.3 40.3 16.1 20.9 4.9 35.7 4.6 44.1
7 5 172.0 36.4 14.8 21.8 4.9 37.5 4.3 39.5 4.6 36.8
7 5 172.0 45.9 9.5 28.9 4.3 27.6 4.3 36.8 4.3 32.8
7 5 170.0 38.1 14.8 20.5 4.9 38.6 4.3 39.7 4.9 33.1
8 3 145.3 0.9 10.8 72.3 24.6 72.3 0.0 0.0
8 3 127.6 5.7 8.9 56.7 36.7 65.0 0.0 0.0
8 3 121.5 1.3 7.5 54.5 31.8 65.7 0.0 0.0
8 4 153.0 38.6 17.4 37.9 4.6 39.2 33.1 37.3
8 4 151.9 34.6 17.1 39.2 4.3 39.9 29.9 38.1
8 4 150.6 34.0 16.7 39.9 4.3 39.9 31.5 36.8
8 4 150.6 34.8 14.4 39.7 36.4 36.8 3.9 39.2
9 5 242.5 47.4 13.1 39.5 4.9 52.9 4.6 56.9 4.9 45.6
9 5 229.7 44.8 12.8 28.9 4.9 55.6 4.6 57.1 4.9 43.4
9 5 217.6 15.2 26.6 25.6 13.5 67.5 23.3 37.3 15.1 72.3

164
Table A4.8 (Cont.) Axle loads and spacings for the three heaviest trucks in each class-axle.
Class
No.
of
axles
Total
WT
kips
A axle
Wt
kips
A-B
sp.
(ft)
B axle
Wt
kips
B-C
sp.
(ft)
C axle
Wt
kips
C-D
sp.
(ft)
D axle
Wt
kips
D-E
sp.
(ft)
E axle
Wt
kips
E-F
sp.
(ft)
F axle
Wt
kips
F-G
sp.
(ft)
G axle
Wt
kips
G-H
sp.
(ft)
H axle
Wt
kips
H-I
sp.
(ft)
I axle
Wt
kips
I-J
sp.
(ft)
J axle
Wt
kips
J-K
sp.
(ft)
K axle
Wt
kips
K-L
sp.
(ft)
L axle
Wt
kips
10 6 267.2 26.0 16.1 54.2 4.3 53.8 30.2 17.0 4.3 58.0 4.3 58.2
10 6 264.3 23.4 15.7 57.1 4.3 57.3 31.5 29.1 4.3 47.4 4.3 50.3
10 6 227.7 22.3 24.3 34.8 6.2 72.3 6.2 42.1 57.7 26.9 34.1 29.3
10 7 235.7 33.1 13.8 38.6 3.9 38.8 38.1 29.5 3.9 30.9 3.9 31.7 4.3 33.1
10 7 217.6 26.5 14.4 32.2 4.3 32.4 24.3 27.8 5.9 29.8 3.9 34.0 3.9 35.1
10 7 206.1 33.7 17.1 27.3 4.3 34.6 33.1 25.4 4.3 27.6 4.3 30.4 4.3 27.1
11 5 181.0 27.3 12.5 39.5 21.0 39.7 9.2 37.9 22.0 36.6
11 5 172.6 30.9 12.8 35.1 21.0 37.5 9.2 32.8 22.6 36.4
11 5 172.6 34.2 13.1 37.5 22.6 37.0 10.2 35.9 23.6 28.0
12 6 205.3 36.6 16.4 37.3 4.6 30.4 21.0 36.2 11.2 35.5 23.6 29.3
12 6 185.6 24.5 18.4 28.7 3.9 24.7 22.3 36.8 8.9 35.7 24.0 35.3
12 6 184.3 24.3 11.5 30.0 4.3 28.0 20.0 31.1 9.8 39.2 21.3 31.7
13 7 328.0 20.9 27.9 26.9 6.6 72.3 19.7 30.2 5.9 72.3 61.7 33.3 5.9 72.3
13 7 313.1 31.5 20.0 32.6 6.6 67.5 6.2 51.6 21.0 26.9 7.2 31.1 6.2 72.3
13 7 281.3 18.3 20.7 25.8 5.2 39.9 5.6 61.3 18.4 31.5 5.9 72.3 82.3 32.6
14 5 101.2 14.8 18.4 23.8 4.3 23.4 15.7 21.2 18.4 18.1 0.0 0.0
14 5 95.7 20.7 22.0 17.6 4.6 18.5 14.4 18.5 16.7 20.3 0.0 0.0
14 5 93.9 11.7 16.4 16.1 4.9 22.5 9.8 23.8 16.4 19.8 0.0 0.0
15 10 423.9 20.7 19.0 14.3 6.2 65.0 5.9 72.3 20.0 28.7 5.6 51.4 50.9 28.4 5.9 61.9 5.9 55.3 18.7 25.8
15 12 359.8 37.3 17.7 30.4 4.6 30.4 16.4 22.5 4.3 27.6 4.3 28.0 18.7 30.4 4.3 30.6 4.3 34.0 13.8 30.0 4.3 30.2 4.3 28.4
15 9 345.9 17.4 19.7 15.7 6.2 58.6 5.9 56.4 21.0 19.8 64.3 25.8 6.9 53.1 6.9 72.3 21.0 26.5

165
Table A4.9 – Legal or illegal/permit trucks within H5P data.
Class Class-Axle Count
Legal* Trucks
(% of H5P)
(a)
Gross
Weight > 80 kips (%
of H5P)
(b)
Leading
Axle > 13 kips (%
of H5P)
(c)
Any Single
Axle > 20 kips
(% of H5P)
5 05-02 38565 53.1% 0.0% 32.6% 27.5%
6 06-03 12730 0.0% 7.4% 87.4% 81.3%
7 Total 3674
07-04 1313 0.0% 97.9% 96.6% 99.1%
07-05 2386 0.0% 100.0% 94.8% 100.0%
8 Total 42763
08-03 32061 82.2% 0.4% 12.9% 9.2%
08-04 10836 0.8% 36.9% 82.7% 84.8%
9 09-05 177857 0.0% 100.0% 97.1% 100.0%
10 Total 3883
10-06 3662 0.0% 100.0% 68.8% 99.8%
10-07 215 0.0% 100.0% 54.9% 100.0%
11 11-05 4747 0.0% 100.0% 99.9% 100.0%
12 12-06 1537 0.0% 100.0% 100.0% 100.0%
13 Total 534
13-07 490 0.0% 100.0% 71.6% 99.8%
13-08 35 0.0% 100.0% 17.1% 88.6%
13-09 5 0.0% 100.0% 60.0% 100.0%
13-10 4 0.0% 100.0% 50.0% 100.0%
13-11 1 0.0% 100.0% 100.0% 100.0%
13-12 1 0.0% 100.0% 0.0% 100.0%
13-13 1 0.0% 100.0% 100.0% 100.0%
14 14-05 58 15.5% 36.2% 74.1% 24.1%
15 Total 3388
15-02 157 0.0% 0.0% 94.3% 45.9%
15-03 682 70.7% 0.0% 19.9% 13.2%
15-04 507 13.8% 1.6% 56.2% 57.2%
15-05 465 7.1% 40.4% 83.0% 73.1%
15-06 987 0.0% 100.0% 15.5% 93.2%
15-07 214 0.0% 100.0% 15.4% 91.1%
15-08 242 0.0% 100.0% 75.6% 100.0%
15-09 64 0.0% 100.0% 75.0% 100.0%
15-10 39 0.0% 100.0% 94.9% 100.0%
15-11 25 0.0% 100.0% 32.0% 68.0%
15-12 20 0.0% 100.0% 50.0% 35.0%
15-13 18 22.2% 44.4% 55.6% 27.8%
15-14 15 53.3% 26.7% 13.3% 20.0%
*”Legal” means that the limited criteria (columns a, b, c) are not met. It does not check tandem limitations

166
COPULAS
The motivation behind determining statistical distributions for each parameter in a truck class-
axle group is to be able to run Monte Carlo simulations using those marginal distributions. One
could perform such simulations assuming that the various axle loads and spacings are
independent of each other. If such parameters were considered independent of each other, then
the relationships between different axle loads and spacings, if any, would be ignored. Srinivas et
al.(1)
suggest that copulas be used to model the interdependence of truck load information.
Copulas have been widely used in financial and insurance industries to assess risk in financial
instruments such as derivatives. Copulas were first introduced by Sklar in 1959(1), (7)
. Copula
functions can completely describe the dependence between the variables involved. The
multivariate distribution can be determined by linking the marginal distributions with the copula
function.(1)
There are many types of functions that can serve as copulas. Two prominent groups
of copulas are Elliptical Copulas and Archimedean Copulas. The Gaussian and Student’s T
copulas belong in the Elliptical group while Clayton, Gumbel and Frank copulas belong in the
Archimedean group.(1)
Empirical copulas are based on actual data and are not fit to particular
mathematical functions.(8)
The ModelRisk software can determine best fit standard copulas based on data entered into an
Excel spreadsheet. Alternatively, it can determine empirical copulas. The empirical copulas
employed within ModelRisk are proprietary. According to the developer of the software, the
ModelRisk empirical copulas are ―based on re-sampling paired Dirichlet distributions, where
each Dirichlet represents the univariate uncertainty of the empirical percentiles based on order
statistics theory.‖ In this study, both approaches (standard and empirical copulas) were
examined. Best fit standard couplas were determined (see Appendix D for results) and empirical
copulas were utilized as well. Table A4.10 shows the 9-parameter (5 axle loads and 4 spacings)
best fit copula correlation matrix for the Class 9 truck. However, based on simulations of axle
weights and spacings for each truck class, it was determined that the empirical copulas (which
utilize actual data each time) were best able to simulate total truck weight distributions when
such simulations were compared with corresponding histograms. Therefore, empirical copulas
were used for the Monte Carlo simulations. The Crystal Ball software was used for Monte Carlo
simulations. Both Crystal Ball and ModelRisk conveniently run with MS Excel. So, copulas and
distributions were determined in Excel using ModelRisk, and these were used by Crystal Ball to
conduct simulations.
Table A4.10. The Best-Fit Student-T Coupla for Class 9 H5P Data
Class 09-05 Student-T Copula
Correlation Matrix
1.000 0.075 0.456 0.155 0.283 0.111 0.321 0.161 0.183
0.075 1.000 0.073 0.193 0.054 -0.042 0.080 0.399 0.026
0.456 0.073 1.000 0.139 0.697 0.072 0.596 0.167 0.472
0.155 0.193 0.139 1.000 0.240 0.177 0.163 0.448 0.194
0.283 0.054 0.697 0.240 1.000 0.059 0.491 0.176 0.546
0.111 -0.042 0.072 0.177 0.059 1.000 -0.047 -0.037 -0.052
0.321 0.080 0.596 0.163 0.491 -0.047 1.000 0.251 0.770
0.161 0.399 0.167 0.448 0.176 -0.037 0.251 1.000 0.252
0.183 0.026 0.472 0.194 0.546 -0.052 0.770 0.252 1.000
Parameter 9

167
MONTE CARLO Simulations
As a first step in the simulation effort, a MS Excel spreadsheet was setup to calculate bending
moment and shear envelopes for any moving truck arrangements (up to 10 axles) using influence
lines. A simple-span bridge condition with spans ranging from 20 ft to 250 ft was considered.
Fig. A4.1 shows the primary sheet for this Excel workbook. The simulations were run in this
spreadsheet. The distributions and copulas were applied to axle loads and spacings. In addition,
the Wisconsin Permit Vehicles (250-WPV and 190-WPV) was run, and the maximum moments
and shears due to WPV’s were compared with the simulation results to determine the effect of
WPV (as a percentile of the simulation results) for each truck class–axle grouping. Fig. A4.2
shows the 190-kip and 250-kip WPV trucks.
Fig. A4.1. Spreadsheets for determining moment and shear envelopes due to any truck
arrangement.
Fig. A4.2. The 250-kip and 190-kip Wisconsin Permit Vehicles.

168
Each simulation consisted of 10,000 runs using the determined distributions and empirical
copulas. The results were then analyzed and presented by Crystal Ball. The total computer run
time for each simulation (for each class) was on the order of 80 minutes. Summary of results for
Class 9 trucks are shown in Tables 14 and 15. Representative sheets from simulation report are
shown in Fig. A4.3. Summaries and reports for different class-axle configurations are shown in
Appendix E.
Table A4.11. Summary of Moments - Monte Carlo Simulation results for H5P Class 9 Trucks. Max
Moment Forecast Percentile (K-FT)
Span (FT) 0 10 20 30 40 50 60 70 80 90 100
20 133.3 193.6 207.2 217.5 226.8 235.2 244.0 253.8 264.7 279.9 371.2
30 252.8 334.6 352.8 368.4 381.4 395.4 409.8 424.3 441.4 465.6 610.7
40 372.3 473.2 498.5 520.0 539.8 558.9 578.2 599.6 623.4 657.0 960.5
50 525.7 633.6 665.5 694.5 721.8 748.3 774.1 803.1 834.7 882.8 1318.5
60 685.0 799.1 839.3 876.6 910.7 944.5 977.4 1013.5 1054.9 1115.3 1847.5
70 848.0 977.1 1026.1 1074.8 1115.8 1156.0 1196.5 1241.2 1293.9 1364.4 2430.2
80 1003.9 1203.8 1268.0 1324.5 1374.3 1425.7 1477.4 1530.9 1600.7 1692.4 2999.0
90 1220.3 1481.8 1557.0 1623.4 1684.0 1749.7 1812.7 1880.9 1964.3 2076.5 3562.1
100 1471.8 1769.5 1854.1 1931.6 2003.7 2079.4 2156.5 2236.9 2336.6 2465.3 4164.7
110 1748.2 2057.7 2154.3 2241.0 2324.4 2413.1 2503.9 2597.2 2710.2 2857.8 4709.7
120 2026.3 2346.4 2451.7 2549.5 2643.6 2745.8 2849.8 2954.0 3084.0 3255.2 5277.5
130 2300.9 2637.2 2749.7 2857.7 2965.7 3081.0 3195.0 3316.3 3459.2 3650.7 5894.9
140 2587.6 2924.3 3047.4 3163.0 3284.2 3413.1 3540.8 3673.3 3832.4 4044.3 6478.3
150 2869.0 3214.5 3345.1 3473.5 3605.0 3744.6 3889.8 4036.1 4205.9 4444.0 7046.3
160 3139.5 3502.3 3643.5 3784.3 3925.7 4080.3 4238.7 4394.7 4580.0 4841.7 7588.5
170 3409.9 3790.8 3942.1 4089.6 4249.1 4413.0 4585.8 4756.7 4954.0 5239.6 8182.1
180 3695.7 4081.0 4239.6 4397.6 4568.9 4746.7 4932.4 5116.1 5333.0 5634.1 8746.4
190 3960.7 4368.5 4538.5 4710.8 4888.5 5084.0 5283.2 5478.9 5707.2 6030.8 9321.1
200 4244.5 4655.1 4835.5 5012.2 5215.2 5413.3 5627.3 5837.9 6083.8 6422.8 9904.0
210 4534.0 4940.7 5133.7 5320.8 5531.4 5744.9 5972.3 6194.0 6456.5 6816.8 10494.2
220 4806.4 5231.6 5432.3 5631.3 5853.9 6080.0 6319.6 6559.6 6828.6 7218.8 11046.7
230 5081.8 5518.7 5732.0 5938.3 6175.7 6414.2 6669.6 6919.8 7203.6 7615.4 11655.0
240 5333.9 5807.5 6029.6 6246.3 6496.6 6747.1 7013.7 7275.5 7576.8 8004.6 12161.8
250 5618.0 6093.8 6330.0 6556.4 6817.6 7083.4 7363.7 7639.3 7955.4 8403.0 12781.6

169
Table A4.12. Summary of Shears - Monte Carlo Simulation results for H5P Class 9 Trucks. Max Shear Forecast Percentile (Kips)
Span 0% 10% 20% 30% 40% 50% 60% 70% 80% 90% 100%
20 27.8 41.4 43.7 45.6 47.4 49.1 50.9 52.8 54.9 58.0 78.3
30 39.4 47.1 49.6 51.8 53.9 55.8 57.8 60.0 62.3 65.9 95.6
40 43.5 50.9 53.6 56.0 58.1 60.3 62.4 64.8 67.5 71.2 105.8
50 48.2 55.2 57.9 60.1 62.3 64.6 66.7 69.3 72.0 75.9 124.8
60 51.9 60.2 62.9 65.3 67.6 70.2 72.6 75.3 78.5 83.1 138.9
70 55.0 66.0 68.7 71.4 74.0 76.8 79.7 82.7 86.3 91.3 151.1
80 60.3 71.2 73.9 76.7 79.5 82.6 85.8 89.2 92.9 98.2 158.2
90 64.7 75.3 78.1 81.0 84.0 87.3 90.7 94.2 98.3 103.7 164.3
100 69.0 78.5 81.4 84.5 87.6 91.1 94.7 98.2 102.4 108.1 169.6
110 72.0 81.2 84.1 87.2 90.6 94.2 97.9 101.7 106.0 111.7 174.0
120 74.6 83.4 86.4 89.6 93.0 96.7 100.6 104.4 108.8 114.7 176.6
130 76.8 85.3 88.3 91.6 95.1 98.9 102.9 106.8 111.2 117.4 180.1
140 78.5 86.9 90.0 93.3 96.9 100.7 104.8 108.8 113.3 119.5 183.6
150 80.1 88.3 91.4 94.8 98.5 102.3 106.5 110.6 115.1 121.5 185.4
160 82.0 89.5 92.7 96.1 99.8 103.8 108.0 112.1 116.7 123.2 186.7
170 82.7 90.5 93.8 97.2 101.0 105.0 109.3 113.5 118.2 124.7 188.4
180 83.7 91.5 94.8 98.2 102.1 106.1 110.4 114.7 119.4 126.1 189.3
190 84.8 92.4 95.6 99.2 103.1 107.2 111.5 115.8 120.5 127.3 191.9
200 85.9 93.1 96.4 100.0 103.9 108.0 112.3 116.7 121.6 128.3 192.8
210 86.8 93.8 97.1 100.7 104.7 108.9 113.2 117.5 122.4 129.3 194.1
220 87.4 94.4 97.8 101.4 105.4 109.5 114.0 118.4 123.3 130.2 195.0
230 87.9 95.0 98.3 102.0 106.1 110.3 114.7 119.1 124.0 131.0 195.9
240 89.0 95.5 98.9 102.6 106.7 110.8 115.3 119.8 124.6 131.8 195.9
250 89.6 96.0 99.4 103.1 107.2 111.4 115.9 120.4 125.3 132.4 197.2
Moments and shear effects of 250-WPV loads are compared with H5P simulation results in
Tables 16 and 17. The 250-WPV percentiles (with respect to H5P) were determined by
comparing moments and shear due to 250-WPV with the tabular percentile values for each class.
However, to improve accuracy between 90 and 100 percentiles, analyses were run between 90
and 100 percentiles at 1 percentile increments. Therefore, interpolations were made within 1-
percentile increments. Tables 16 and 17 include percentiles of H5P and ―total‖ data. The term
―total‖ refers to all trucks within that class. Since H5P data have the heaviest overall weights in
that class-axle group, it is reasonable to assume that the effects due to H5P vehicles will result in
higher moments and shears compared to the remaining 95% of trucks in that class. Therefore, the
―total‖ percentile is estimated through the following relationship:
Total percentile = 95 + (H5P percentile) x 0.05
Figures 5 and 6 show plots of 250-WPV results versus span length (in percentiles of H5P
simulations). For moments, the 250-WPV results fall below 100 percentile of class 9 H5P results
for span lengths 40 through 140 ft. The 250-WPV shear results also fall below 100 percentile for
spans 40 through 60 ft. However, in both cases, the H5P percentiles never reach below 99.7.
Tables 18 and 19 (as well as Figures 7 and 8) compare results for all classes. For moments and
shears, the lowest percentiles belong to classes 07-05, 13-07, 10-06 and 07-04. However, the
lowest H5P percentiles do not go below 96 percentile.

170
Forecast: Max Moment (Span 100)
Cell:
B18
Entire range is from 1387.9 to 4139.1
Base case is 1771.5
After 10,000 trials, the std. error of the mean
is 2.7
Forecast values
Trials 10,000
Mean 2101.1
Median 2077.9
Mode ---
Standard Deviation 266.5
Variance 71038.2
Skewness 0.4926
Kurtosis 3.18
Coeff. of Variability 0.1269
Minimum 1387.9
Maximum 4139.1
Range Width 2751.2
Mean Std. Error 2.7
Forecast: Max Moment (Span 100) (cont'd)
Percentiles: Forecast values
0% 1387.9
10% 1774.9
20% 1857.6
30% 1932.9
40% 2004.3
50% 2077.9
60% 2153.0
70% 2231.8
80% 2327.4
90% 2462.6
100% 4139.1
Fig. A4.3. Selections from Simulation Report for H5P Class 9 Trucks.

171
Table A4.13. Summary of Moments – 250-WPV Data Compared With Monte Carlo Simulation
Results for H5P Class 9 Trucks. Max Moment 250-WPV
Span (FT) Moment
(k-ft) Percentile of H5P Percentile of Total
20 415.5 100.00% 100.00%
30 720.3 100.00% 100.00%
40 1043.0 100.00% 100.00%
50 1380.7 100.00% 100.00%
60 1729.9 99.80% 99.99%
70 2081.3 99.61% 99.98%
80 2586.4 99.62% 99.98%
90 3172.1 99.68% 99.98%
100 3845.2 99.77% 99.99%
110 4506.6 99.86% 99.99%
120 5164.3 99.93% 100.00%
130 5835.8 99.97% 100.00%
140 6492.5 100.00% 100.00%
150 7166.9 100.00% 100.00%
160 7844.0 100.00% 100.00%
170 8464.9 100.00% 100.00%
180 9167.9 100.00% 100.00%
190 9788.0 100.00% 100.00%
200 10467.5 100.00% 100.00%
210 11157.8 100.00% 100.00%
220 11823.2 100.00% 100.00%
230 12519.1 100.00% 100.00%
240 13184.3 100.00% 100.00%
250 13859.5 100.00% 100.00%

172
Table A4.14. Summary of Shears – 250-WPV Data Compared With Monte Carlo Simulation
Results for Class 9 Trucks. Max Shear 250-WPV
Span Shear (kips) Percentile of H5P Percentile of Total
20 84.0 100.00% 100.00%
30 98.9 100.00% 100.00%
40 106.3 100.00% 100.00%
50 114.0 99.73% 99.99%
60 133.2 99.87% 99.99%
70 149.0 99.96% 100.00%
80 161.4 100.00% 100.00%
90 169.6 100.00% 100.00%
100 178.8 100.00% 100.00%
110 184.8 100.00% 100.00%
120 190.5 100.00% 100.00%
130 195.6 100.00% 100.00%
140 200.3 100.00% 100.00%
150 203.2 100.00% 100.00%
160 205.1 100.00% 100.00%
170 207.3 100.00% 100.00%
180 209.2 100.00% 100.00%
190 211.4 100.00% 100.00%
200 214.3 100.00% 100.00%
210 217.4 100.00% 100.00%
220 217.7 100.00% 100.00%
230 218.7 100.00% 100.00%
240 219.7 100.00% 100.00%
250 220.6 100.00% 100.00%
Fig. A4.4. Wisconsin 250-WPV Moment Results Compared to H5P Class 9 Truck Simulations

173
Fig. A4.5. Wisconsin 250-WPV Shear Results Compared to H5P Class 9 Truck Simulations
For comparison, results for the 190-WPV loads are shown in Tables 20 and 21 and Figures 9 and
10. For moments and shears, the lowest percentiles belong to classes 07-05, 13-07, 10-06 and 07-
04. The H5P data for the 190-WPV reached as low as 50 percentile.

174
Table A4.15. Moments (as Percentile of H5P Data) on Simply Supported Bridge Due to 250-WPV
Loading
Span
(ft)
Class
05-06
Class
06-03
Class
07-04
Class
07-05
Class
08-03
Class
08-04
Class
09-05
Class
10-06
Class
11-05
Class
12-06
Class
13-07
Class
15-03
Class
15-04
Class
15-05
Class
15-06
20 100.0 99.4 99.2 99.0 100.0 100.0 100.0 99.3 100.0 100.0 99.2 100.0 100.0 100.0 100.0
30 100.0 99.6 99.3 98.5 100.0 100.0 100.0 99.5 100.0 100.0 99.1 100.0 100.0 100.0 100.0
40 100.0 99.7 99.3 98.0 100.0 100.0 100.0 99.5 100.0 100.0 99.0 100.0 100.0 100.0 100.0
50 100.0 99.8 99.2 97.1 100.0 100.0 100.0 99.2 100.0 100.0 98.4 100.0 100.0 100.0 100.0
60 100.0 99.8 99.2 96.6 100.0 100.0 99.8 99.0 100.0 100.0 97.3 100.0 100.0 100.0 100.0
70 100.0 99.9 99.2 96.0 100.0 100.0 99.6 97.9 100.0 100.0 96.3 100.0 100.0 100.0 100.0
80 100.0 100.0 99.3 98.4 100.0 100.0 99.6 98.4 100.0 100.0 96.6 100.0 100.0 100.0 100.0
90 100.0 100.0 99.5 99.3 100.0 100.0 99.7 99.0 100.0 100.0 97.1 100.0 100.0 100.0 100.0
100 100.0 100.0 99.7 99.8 100.0 100.0 99.8 99.2 100.0 100.0 97.6 100.0 100.0 100.0 100.0
110 100.0 100.0 99.8 100.0 100.0 100.0 99.9 99.3 100.0 100.0 98.0 100.0 100.0 100.0 100.0
120 100.0 100.0 99.9 100.0 100.0 100.0 99.9 99.4 100.0 100.0 98.2 100.0 100.0 100.0 100.0
130 100.0 100.0 100.0 100.0 100.0 100.0 100.0 99.5 100.0 100.0 98.4 100.0 100.0 100.0 100.0
140 100.0 100.0 100.0 100.0 100.0 100.0 100.0 99.5 100.0 100.0 98.5 100.0 100.0 100.0 100.0
150 100.0 100.0 100.0 100.0 100.0 100.0 100.0 99.6 100.0 100.0 98.8 100.0 100.0 100.0 100.0
160 100.0 100.0 100.0 100.0 100.0 100.0 100.0 99.7 100.0 100.0 98.9 100.0 100.0 100.0 100.0
170 100.0 100.0 100.0 100.0 100.0 100.0 100.0 99.7 100.0 100.0 98.9 100.0 100.0 100.0 100.0
180 100.0 100.0 100.0 100.0 100.0 100.0 100.0 99.7 100.0 100.0 99.0 100.0 100.0 100.0 100.0
190 100.0 100.0 100.0 100.0 100.0 100.0 100.0 99.7 100.0 100.0 99.0 100.0 100.0 100.0 100.0
200 100.0 100.0 100.0 100.0 100.0 100.0 100.0 99.7 100.0 100.0 99.0 100.0 100.0 100.0 100.0
210 100.0 100.0 100.0 100.0 100.0 100.0 100.0 99.8 100.0 100.0 99.1 100.0 100.0 100.0 100.0
220 100.0 100.0 100.0 100.0 100.0 100.0 100.0 99.8 100.0 100.0 99.1 100.0 100.0 100.0 100.0
230 100.0 100.0 100.0 100.0 100.0 100.0 100.0 99.8 100.0 100.0 99.1 100.0 100.0 100.0 100.0
240 100.0 100.0 100.0 100.0 100.0 100.0 100.0 99.8 100.0 100.0 99.1 100.0 100.0 100.0 100.0
250 100.0 100.0 100.0 100.0 100.0 100.0 100.0 99.8 100.0 100.0 99.1 100.0 100.0 100.0 100.0

175
Fig. A4.6. Plot of 250-WPV moments as percentile of H5P data versus span length (ft) for each truck class-axle group.

176
Table A4.16. Shears (as Percentile of H5P Data) on Simply Supported Bridge Due to 250-WPV Loading
Span
(ft)
Class
05-06
Class
06-03
Class
07-04
Class
07-05
Class
08-03
Class
08-04
Class
09-05
Class
10-06
Class
11-05
Class
12-06
Class
13-07
Class
15-03
Class
15-04
Class
15-05
Class
15-06
20 100.0 99.4 99.1 98.0 100.0 100.0 100.0 99.3 100.0 100.0 99.0 100.0 100.0 100.0 100.0
30 100.0 99.7 99.2 97.8 100.0 100.0 100.0 99.3 100.0 100.0 99.0 100.0 100.0 100.0 100.0
40 100.0 99.8 99.2 96.6 100.0 100.0 100.0 98.7 100.0 100.0 98.1 100.0 100.0 100.0 100.0
50 100.0 100.0 99.2 97.2 100.0 100.0 99.7 97.8 100.0 100.0 97.2 100.0 100.0 100.0 100.0
60 100.0 100.0 99.5 99.5 100.0 100.0 99.9 99.1 100.0 100.0 98.4 100.0 100.0 100.0 100.0
70 100.0 100.0 99.8 100.0 100.0 100.0 100.0 99.3 100.0 100.0 99.0 100.0 100.0 100.0 100.0
80 100.0 100.0 99.9 100.0 100.0 100.0 100.0 99.4 100.0 100.0 99.1 100.0 100.0 100.0 100.0
90 100.0 100.0 100.0 100.0 100.0 100.0 100.0 99.5 100.0 100.0 99.1 100.0 100.0 100.0 100.0
100 100.0 100.0 100.0 100.0 100.0 100.0 100.0 99.6 100.0 100.0 99.2 100.0 100.0 100.0 100.0
110 100.0 100.0 100.0 100.0 100.0 100.0 100.0 99.7 100.0 100.0 99.2 100.0 100.0 100.0 100.0
120 100.0 100.0 100.0 100.0 100.0 100.0 100.0 99.7 100.0 100.0 99.2 100.0 100.0 100.0 100.0
130 100.0 100.0 100.0 100.0 100.0 100.0 100.0 99.8 100.0 100.0 99.2 100.0 100.0 100.0 100.0
140 100.0 100.0 100.0 100.0 100.0 100.0 100.0 99.8 100.0 100.0 99.3 100.0 100.0 100.0 100.0
150 100.0 100.0 100.0 100.0 100.0 100.0 100.0 99.8 100.0 100.0 99.3 100.0 100.0 100.0 100.0
160 100.0 100.0 100.0 100.0 100.0 100.0 100.0 99.8 100.0 100.0 99.2 100.0 100.0 100.0 100.0
170 100.0 100.0 100.0 100.0 100.0 100.0 100.0 99.9 100.0 100.0 99.2 100.0 100.0 100.0 100.0
180 100.0 100.0 100.0 100.0 100.0 100.0 100.0 99.9 100.0 100.0 99.2 100.0 100.0 100.0 100.0
190 100.0 100.0 100.0 100.0 100.0 100.0 100.0 99.9 100.0 100.0 99.2 100.0 100.0 100.0 100.0
200 100.0 100.0 100.0 100.0 100.0 100.0 100.0 99.9 100.0 100.0 99.2 100.0 100.0 100.0 100.0
210 100.0 100.0 100.0 100.0 100.0 100.0 100.0 100.0 100.0 100.0 99.3 100.0 100.0 100.0 100.0
220 100.0 100.0 100.0 100.0 100.0 100.0 100.0 100.0 100.0 100.0 99.3 100.0 100.0 100.0 100.0
230 100.0 100.0 100.0 100.0 100.0 100.0 100.0 100.0 100.0 100.0 99.2 100.0 100.0 100.0 100.0
240 100.0 100.0 100.0 100.0 100.0 100.0 100.0 100.0 100.0 100.0 99.2 100.0 100.0 100.0 100.0
250 100.0 100.0 100.0 100.0 100.0 100.0 100.0 100.0 100.0 100.0 99.2 100.0 100.0 100.0 100.0

177
Fig. A4.7. Plot of 250-WPV shear as percentile of H5P data versus span length (ft) for each truck class-axle group.

178
Table A4.17. Moments (as Percentile of H5P Data) on Simply Supported Bridge Due to 190-WPV
Loading
Span
(ft)
Class
05-06
Class
06-03
Class
07-04
Class
07-05
Class
08-03
Class
08-04
Class
09-05
Class
10-06
Class
11-05
Class
12-06
Class
13-07
Class
15-03
Class
15-04
Class
15-05
Class
15-06
20 100.0 98.6 92.1 66.6 100.0 99.0 99.0 87.4 100.0 99.9 85.8 100.0 100.0 100.0 100.0
30 100.0 99.1 94.1 64.0 100.0 99.3 99.3 91.4 100.0 99.7 82.9 100.0 100.0 100.0 99.9
40 100.0 99.1 93.6 60.4 100.0 99.4 99.2 92.2 100.0 99.5 82.5 100.0 100.0 100.0 99.8
50 100.0 99.1 92.3 53.6 100.0 99.3 99.2 83.0 100.0 99.4 80.6 100.0 100.0 100.0 99.7
60 100.0 99.1 91.2 50.4 100.0 99.3 99.1 69.9 100.0 99.2 76.9 100.0 100.0 100.0 99.5
70 100.0 99.1 90.2 48.1 100.0 99.2 99.0 56.4 100.0 98.8 71.1 100.0 100.0 100.0 99.5
80 100.0 99.3 94.8 63.7 100.0 99.3 99.0 62.0 99.9 98.9 76.0 100.0 100.0 100.0 99.8
90 100.0 99.5 97.5 76.1 100.0 99.4 99.1 71.3 99.8 99.1 80.1 100.0 100.0 100.0 100.0
100 100.0 99.7 98.8 87.0 100.0 99.7 99.1 80.8 100.0 99.2 83.1 100.0 100.0 100.0 100.0
110 100.0 99.9 99.1 93.1 100.0 99.8 99.1 85.6 100.0 99.4 84.8 100.0 100.0 100.0 100.0
120 100.0 100.0 99.2 96.0 100.0 99.9 99.2 89.0 100.0 99.6 85.7 100.0 100.0 100.0 100.0
130 100.0 100.0 99.3 97.7 100.0 100.0 99.2 91.5 100.0 99.6 86.3 100.0 100.0 100.0 100.0
140 100.0 100.0 99.3 98.4 100.0 100.0 99.2 93.0 100.0 99.7 86.7 100.0 100.0 100.0 100.0
150 100.0 100.0 99.4 98.9 100.0 100.0 99.2 94.6 100.0 99.7 87.2 100.0 100.0 100.0 100.0
160 100.0 100.0 99.4 99.1 100.0 100.0 99.2 95.4 100.0 99.6 87.5 100.0 100.0 100.0 100.0
170 100.0 100.0 99.5 99.2 100.0 100.0 99.2 95.6 100.0 99.6 87.2 100.0 100.0 100.0 100.0
180 100.0 100.0 99.5 99.3 100.0 100.0 99.3 96.4 100.0 99.7 87.9 100.0 100.0 100.0 100.0
190 100.0 100.0 99.5 99.3 100.0 100.0 99.3 96.4 100.0 99.6 87.6 100.0 100.0 100.0 100.0
200 100.0 100.0 99.5 99.4 100.0 100.0 99.3 96.7 100.0 99.6 87.9 100.0 100.0 100.0 100.0
210 100.0 100.0 99.6 99.5 100.0 100.0 99.3 97.1 100.0 99.7 88.4 100.0 100.0 100.0 100.0
220 100.0 100.0 99.6 99.5 100.0 100.0 99.3 97.3 100.0 99.7 88.5 100.0 100.0 100.0 100.0
230 100.0 100.0 99.6 99.6 100.0 100.0 99.3 97.6 100.0 99.7 89.1 100.0 100.0 100.0 100.0
240 100.0 100.0 99.6 99.6 100.0 100.0 99.3 97.8 100.0 99.7 89.2 100.0 100.0 100.0 100.0
250 100.0 100.0 99.7 99.7 100.0 100.0 99.3 97.8 100.0 99.7 89.5 100.0 100.0 100.0 100.0

179
Fig. A4.8. Plot of 190-WPV moments as percentile of H5P data versus span length (ft) for each truck class-axle group.

180
Table A4.18. Shears (as Percentile of H5P Data) on Simply Supported Bridge Due to 190-WPV Loading
Span
(ft)
Class
05-06
Class
06-03
Class
07-04
Class
07-05
Class
08-03
Class
08-04
Class
09-05
Class
10-06
Class
11-05
Class
12-06
Class
13-07
Class
15-03
Class
15-04
Class
15-05
Class
15-06
20 100.0 98.6 88.3 56.9 100.0 99.0 98.4 85.1 100.0 99.6 81.0 100.0 100.0 100.0 99.8
30 100.0 99.1 91.4 58.6 100.0 99.1 99.0 84.3 100.0 99.9 82.4 100.0 100.0 100.0 99.9
40 100.0 99.0 89.8 51.0 100.0 99.1 99.0 65.7 100.0 99.7 79.3 100.0 100.0 100.0 100.0
50 100.0 99.1 91.9 56.5 100.0 99.2 99.0 55.9 100.0 99.5 76.2 100.0 100.0 100.0 100.0
60 100.0 99.5 97.9 80.3 100.0 99.8 99.2 74.5 100.0 100.0 85.2 100.0 100.0 100.0 100.0
70 100.0 99.9 99.1 92.5 100.0 100.0 99.2 84.4 100.0 100.0 88.2 100.0 100.0 100.0 100.0
80 100.0 100.0 99.2 97.0 100.0 100.0 99.3 90.3 100.0 100.0 89.4 100.0 100.0 100.0 100.0
90 100.0 100.0 99.3 98.3 100.0 100.0 99.3 92.1 100.0 100.0 89.1 100.0 100.0 100.0 100.0
100 100.0 100.0 99.4 99.1 100.0 100.0 99.3 95.0 100.0 100.0 90.4 100.0 100.0 100.0 100.0
110 100.0 100.0 99.5 99.3 100.0 100.0 99.3 95.9 100.0 100.0 90.2 100.0 100.0 100.0 100.0
120 100.0 100.0 99.5 99.4 100.0 100.0 99.3 96.7 100.0 100.0 90.5 100.0 100.0 100.0 100.0
130 100.0 100.0 99.6 99.5 100.0 100.0 99.3 97.2 100.0 100.0 90.8 100.0 100.0 100.0 100.0
140 100.0 100.0 99.6 99.7 100.0 100.0 99.4 97.7 100.0 100.0 91.1 100.0 100.0 100.0 100.0
150 100.0 100.0 99.7 99.7 100.0 100.0 99.4 97.9 100.0 100.0 91.0 100.0 100.0 100.0 100.0
160 100.0 100.0 99.7 99.7 100.0 100.0 99.4 98.0 100.0 100.0 90.5 100.0 100.0 100.0 100.0
170 100.0 100.0 99.7 99.8 100.0 100.0 99.4 98.0 100.0 100.0 90.3 100.0 100.0 100.0 100.0
180 100.0 100.0 99.7 99.8 100.0 100.0 99.4 98.1 100.0 100.0 90.2 100.0 100.0 100.0 100.0
190 100.0 100.0 99.7 99.9 100.0 100.0 99.4 98.2 100.0 100.0 90.2 100.0 100.0 100.0 100.0
200 100.0 100.0 99.8 100.0 100.0 100.0 99.4 98.3 100.0 100.0 90.6 100.0 100.0 100.0 100.0
210 100.0 100.0 99.8 100.0 100.0 100.0 99.4 98.5 100.0 100.0 91.1 100.0 100.0 100.0 100.0
220 100.0 100.0 99.8 100.0 100.0 100.0 99.4 98.5 100.0 100.0 90.7 100.0 100.0 100.0 100.0
230 100.0 100.0 99.8 100.0 100.0 100.0 99.4 98.5 100.0 100.0 90.6 100.0 100.0 100.0 100.0
240 100.0 100.0 99.8 100.0 100.0 100.0 99.4 98.5 100.0 99.9 90.4 100.0 100.0 100.0 100.0
250 100.0 100.0 99.8 100.0 100.0 100.0 99.4 98.5 100.0 99.9 90.3 100.0 100.0 100.0 100.0

181
Fig. A4.9. Plot of 190-WPV shear as percentile of H5P data versus span length (ft) for each truck class-axle group.

182
Summary and Conclusions
This study involved statistical evaluation of heavy truck loads that were recorded using Weigh-
In-Motion (WIM) stations located throughout the State of Wisconsin. All 2007 WIM records
(approximately 6 million vehicles) were obtained from the Wisconsin Department of
Transportation (WisDOT). Of those, only data associated with FHWA trucks Classes 5 through
15 were retained. Vehicle classes 4 (buses) or less represent smaller vehicles and buses, and were
thus excluded from analyses.
When a truck class did not have a fixed number of axles (i.e. numbers of axles could vary within
the same class), then that class was further sub-divided such that each sub-group contained only
one particular number of axles. For example, sub-groups 08-03 and 08-04 contained class 08
vehicles with 3- and 4-axles, respectively. Data for each class-axle group were sorted based on
gross vehicle weight, and the heaviest 5 percent (H5P) of truck records in each group were
separated and analyzed. Statistical analyses were performed on the H5P data.
Using the H5P data, best-fit unimodal and/or multimodal probability distributions (―marginal‖
distributions) were determined for each axle weight and spacing in each truck class-axle group.
Furthermore, copulas were determined to allow multivariate Monte Carlo simulations. Copulas
help perform multivariate simulations while maintaining interdependence between various
marginal distributions.
Multivariate Analyses of Variance (ANOVA) were performed on a few class-axle groupings
based on different WIM station results. ANOVA indicated that the various WIM stations records
did not belong to the same distributions. Therefore, data from all stations were combined in
various class-axle groupings.
Multivariate Monte Carlo simulations on H5P data in each class-axle group were conducted
using the Crystal Ball and ModelRisk software programs running within Microsoft Excel. A
spreadsheet program was written to calculate maximum moments and shears in a simply
supported beam with spans ranging from 20 ft to 250 ft. Each simulated vehicle was ―marched‖
across the bridge to find maximum moment and shear effects. Each simulation analysis consisted
of 10,000 runs (i.e. 10,000 trucks automatically generated from marginal distributions and
copulas). The maximum moments and shear for each of the spans and each of the 10,000 runs
were calculated, and the percentile values for the simulation results were determined. In addition,
maximum moments and shears associated with the 190-kip and 250-kip Wisconsin Permit
Vehicles (190-WPV and 250-WPV) were also calculated for each span length, and compared
with simulation results.
The following observations are made regarding the results of these analyses:
1) Truck simulations for each class-axle grouping were performed and successfully tested
for validity.
2) Some H5P axle loads and axle spacing distributions are multimodal, and therefore
multimodal marginal distributions must be used in such cases for proper simulations.
3) Empirical copulas provide more accurate simulations when compared to conventional
copula functions determined by data fitting. All simulation results reported here are based
on empirical copulas determined using the ModelRisk software program.
4) The percentile results derived can be used to assess the relative impact of any truck
arrangement compared to simulation results. Moments and shears due to the 250-kip

183
Wisconsin Permit Vehicle were, in all cases, above the 96 percentile mark for the H5P
simulation data. This is approximately equivalent to the 99.8 percentile for all trucks in
each class.
5) It is clear that the 250-kip Wisconsin Permit Vehicle results completely envelope most of
the longer span length results (at 100 percentile). However, at shorter spans and for some
truck classes, the percentile mark is reduced. This indicates that the probability of
exceeding the permit vehicle effects is not uniform across all span lengths in simply
supported bridges.
6) The marginal distributions and copulas determined here can also be used to statistically
assess heavy truck impact on bridges and pavements based any load-dependent metric.
The following recommendations are made for future studies:
1) Expand determinations of marginal distributions and copulas to the entire dataset of
trucks (not just H5P data).
2) With data from the previous recommendation, perform detailed bridge fatigue studies.
These data would help achieve much greater detail and precision that would otherwise be
feasible without such information.
3) Conduct statistical analyses using the existing H5P information developed in this study as
well as data from recommendation No. 1 to enhance understanding of degree of
reliability and performance in Portland cement concrete and asphalt pavements.
References
1. Srinivas, S., Menon, D., and Prasad, A.M., ―Multivariate Simulation and Multimodal
Dependence Modeling of Vehicle Axle Weights and Copulas,‖ Journal of Transportation
Engineering, ASCE, Vol. 132, No. 12, December 2006, pp. 945-955.
2. ―Crystal Ball‖, Software by Oracle, http://www.oracle.com/crystalball/index.html
3. ―ModelRisk‖, by Vose Software, http://www.vosesoftware.com/modelrisk.htm
4. Joe, H., ―Multivariate Models and Dependence Concepts,‖ Chapman and Hall Publishers,
London, 1997.
5. ―Traffic Monitoring Guide,‖ Federal Highway Administration, available online at
http://www.fhwa.dot.gov/ohim/tmguide/index.htm
6. Lu, Q., Harvey, J., Le, T., Lea, J., Quinley, R., Redo, D., and Avis, J., ―Truck Traffic
Analysis using Weigh-In-Motion (WIM) Data in California,‖ Report by Pavement Research
Center, University of California, Berkeley, June 2002, available online at
http://www.its.berkeley.edu/pavementresearch/PDF/WIMreport.pdf
7. Sklar, A., ―Fonctions de repa’rticion a’ n dimensions et leurs marges,‖ Publications de
l’Institut de Statistiue del’Universit de Paris, Paris, 8, 1959, pp. 229-231.
8. Nelsen, R.B., ―Introduction to Copulas‖, Springer, 2nd
edition, 2007.

184