
Estimating life cycle greenhouse gas emissions from corn–ethanol: a critical review of current...
7
Estimating the life cycle greenhouse gas emissions of Australian ambulance services Lawrence H. Brown a, * , Petra G. Buettner a , Deon V. Canyon b , J. Mac Crawford c , Jenni Judd a a Anton Breinl Centre for Public Health and Tropical Medicine, James Cook University, Townsville, QLD 4810, Australia b John A Burns School of Medicine, University of Hawaii at Manoa, Honolulu, HI, USA c College of Public Health, Ohio State University, Columbus, OH, USA article info Article history: Received 9 April 2012 Received in revised form 24 June 2012 Accepted 24 June 2012 Available online xxx Keywords: Emergency medical services Life cycle analysis Inputeoutput Greenhouse gas emissions abstract Emergency medical services, or ‘ambulance services’, are a vehicle-intense component of the health sector that could contribute to that sector’s emissions reduction efforts. This analysis uses data from an inventory of ambulance service Scope 1 (arising from direct energy consumption) and Scope 2 (arising from purchased energy consumption) emissions, along with publicly available expenditure data and emissions multipliers derived from economy-wide inputeoutput tables, to estimate the life cycle greenhouse gas emissions of Australian ambulance services. Total emissions are estimated at between 216,369 and 546,688 t CO 2 e annually, and represent between 1.8% and 4.4% of total Australian health sector emissions. Approximately 20% of ambulance service emissions arise from direct consumption of vehicle fuels (diesel and petrol) and aircraft fuels, with 22% arising from electricity consumption, and 58% arising from Scope 3 (e.g., supply chain; waste disposal) processes. Incorporating alternative fuels and higher efficiency vehicles into Australian ambulance services’ vehicle fleets could reduce their direct greenhouse emissions, but broader efforts targeting reduced electricity consumption, greener electricity generation, and environmentally friendly purchasing practices will be required to substantially reduce their total carbon footprint. Ó 2012 Elsevier Ltd. All rights reserved. 1. Introduction There is both scientific and political consensus that human activity, rising atmospheric carbon dioxide (CO 2 ) levels and increasing global surface temperatures are inter-related (Ramanathan and Xu, 2010; Solomon et al., 2007). While the 15th Conference of the Parties of the United Nations Framework Convention on Climate Change (UNFCCC) failed to achieve agree- ment on how best to mitigate climate change, all but five of the 193 participating nations supported the “Copenhagen Accord” and its opening paragraphs. They state, “We underline that climate change is one of the greatest challenges of our time..” and “We agree that deep cuts in global emissions are required..” (Ramanathan and Xu, 2010). Much of the international emphasis on reducing greenhouse gas emissions has placed responsibility on national governments (Cushman and Jones, 2002; Macintosh, 2010). In reality, however, a country’s total emissions are the sum of the emissions from many thousands of relatively low-emitting institutions, firms, and orga- nisations, as well as thousands, millions ordin the case of India and Chinadbillions of individuals. While national governments might be able to influence the behaviour of organisations, firms and individuals through policy efforts such as green energy initiatives or carbon taxes, reducing global greenhouse gas emissions will ultimately depend on the cumulative successes of multiple strate- gies implemented on international, national, local, institutional, organisational and individual scales (Cushman and Jones, 2002; Mulugetta et al., 2010; Pacala and Socolow, 2004; Reynolds, 2010). Healthcare is one example of an economic sector with substantial total greenhouse gas emissions arising from the aggregation of many low-emitting activities. On a per-patient or per-procedure basis, healthcare related emissions are quite small: reflux control surgery emits about one ton of CO 2 equivalents (CO 2 e) per patient (Gatenby, 2011); cataract surgery emits approximately 37 kg CO 2 e per operation (Somner et al., 2009); 0.23 kg of CO 2 is directly emitted in the form of CO 2 gas used in each Abbreviations: IeO, inputeoutput; TBL, triple bottom line; Hs, health services sector; Gv, government services sector; Os, other services sector; H1, hybrid approach 1; H2, hybrid approach 2. * Corresponding author. Tel.: þ61 7 4781 4390; fax: þ61 7 4781 5254. E-mail address: [email protected] (L.H. Brown). Contents lists available at SciVerse ScienceDirect Journal of Cleaner Production journal homepage: www.elsevier.com/locate/jclepro 0959-6526/$ e see front matter Ó 2012 Elsevier Ltd. All rights reserved. http://dx.doi.org/10.1016/j.jclepro.2012.06.020 Journal of Cleaner Production xxx (2012) 1e7 Please cite this article in press as: Brown, L.H., et al., Estimating the life cycle greenhouse gas emissions of Australian ambulance services, Journal of Cleaner Production (2012), http://dx.doi.org/10.1016/j.jclepro.2012.06.020
Transcript of Estimating life cycle greenhouse gas emissions from corn–ethanol: a critical review of current...

at SciVerse ScienceDirect
Journal of Cleaner Production xxx (2012) 1e7
Contents lists available
Journal of Cleaner Production
journal homepage: www.elsevier .com/locate/ jc lepro
Estimating the life cycle greenhouse gas emissions of Australian ambulanceservices
Lawrence H. Brown a,*, Petra G. Buettner a, Deon V. Canyon b, J. Mac Crawford c, Jenni Judd a
aAnton Breinl Centre for Public Health and Tropical Medicine, James Cook University, Townsville, QLD 4810, Australiab John A Burns School of Medicine, University of Hawaii at Manoa, Honolulu, HI, USAcCollege of Public Health, Ohio State University, Columbus, OH, USA
a r t i c l e i n f o
Article history:Received 9 April 2012Received in revised form24 June 2012Accepted 24 June 2012Available online xxx
Keywords:Emergency medical servicesLife cycle analysisInputeoutputGreenhouse gas emissions
Abbreviations: IeO, inputeoutput; TBL, triple botsector; Gv, government services sector; Os, otherapproach 1; H2, hybrid approach 2.* Corresponding author. Tel.: þ61 7 4781 4390; fax
E-mail address: [email protected] (L.H.
0959-6526/$ e see front matter � 2012 Elsevier Ltd.http://dx.doi.org/10.1016/j.jclepro.2012.06.020
Please cite this article in press as: Brown, L.Hof Cleaner Production (2012), http://dx.doi.o
a b s t r a c t
Emergency medical services, or ‘ambulance services’, are a vehicle-intense component of the healthsector that could contribute to that sector’s emissions reduction efforts. This analysis uses data from aninventory of ambulance service Scope 1 (arising from direct energy consumption) and Scope 2 (arisingfrom purchased energy consumption) emissions, along with publicly available expenditure data andemissions multipliers derived from economy-wide inputeoutput tables, to estimate the life cyclegreenhouse gas emissions of Australian ambulance services. Total emissions are estimated at between216,369 and 546,688 t CO2e annually, and represent between 1.8% and 4.4% of total Australian healthsector emissions. Approximately 20% of ambulance service emissions arise from direct consumption ofvehicle fuels (diesel and petrol) and aircraft fuels, with 22% arising from electricity consumption, and 58%arising from Scope 3 (e.g., supply chain; waste disposal) processes. Incorporating alternative fuels andhigher efficiency vehicles into Australian ambulance services’ vehicle fleets could reduce their directgreenhouse emissions, but broader efforts targeting reduced electricity consumption, greener electricitygeneration, and environmentally friendly purchasing practices will be required to substantially reducetheir total carbon footprint.
� 2012 Elsevier Ltd. All rights reserved.
1. Introduction
There is both scientific and political consensus that humanactivity, rising atmospheric carbon dioxide (CO2) levels andincreasing global surface temperatures are inter-related(Ramanathan and Xu, 2010; Solomon et al., 2007). While the 15thConference of the Parties of the United Nations FrameworkConvention on Climate Change (UNFCCC) failed to achieve agree-ment on how best to mitigate climate change, all but five of the 193participating nations supported the “Copenhagen Accord” and itsopening paragraphs. They state, “We underline that climate changeis one of the greatest challenges of our time..” and “We agree thatdeep cuts in global emissions are required..” (Ramanathan and Xu,2010).
tom line; Hs, health servicesservices sector; H1, hybrid
: þ61 7 4781 5254.Brown).
All rights reserved.
., et al., Estimating the life cycrg/10.1016/j.jclepro.2012.06.0
Much of the international emphasis on reducing greenhouse gasemissions has placed responsibility on national governments(Cushman and Jones, 2002; Macintosh, 2010). In reality, however,a country’s total emissions are the sum of the emissions frommanythousands of relatively low-emitting institutions, firms, and orga-nisations, as well as thousands, millions ordin the case of India andChinadbillions of individuals. While national governments mightbe able to influence the behaviour of organisations, firms andindividuals through policy efforts such as green energy initiativesor carbon taxes, reducing global greenhouse gas emissions willultimately depend on the cumulative successes of multiple strate-gies implemented on international, national, local, institutional,organisational and individual scales (Cushman and Jones, 2002;Mulugetta et al., 2010; Pacala and Socolow, 2004; Reynolds, 2010).
Healthcare is one example of an economic sector withsubstantial total greenhouse gas emissions arising from theaggregation of many low-emitting activities. On a per-patient orper-procedure basis, healthcare related emissions are quite small:reflux control surgery emits about one ton of CO2 equivalents(CO2e) per patient (Gatenby, 2011); cataract surgery emitsapproximately 37 kg CO2e per operation (Somner et al., 2009);0.23 kg of CO2 is directly emitted in the form of CO2 gas used in each
le greenhouse gas emissions of Australian ambulance services, Journal20
L.H. Brown et al. / Journal of Cleaner Production xxx (2012) 1e72
laparoscopic surgery (Gilliam et al., 2008). Even on a larger scale,a 5000 m2 healthcare facility would emit only 500e900 tonnes (t)of CO2e annually as a result of onsite fuel and electricityconsumption, depending on its location, the services it houses,and its ventilation system (Lomas and Ji, 2009; Murray et al.,2008). Cumulative health sector emissions, on the other hand, aresignificant: they are estimated to represent 3% of total greenhousegas emissions in England (Sustainable Development Commission-Stockholm Environment Institute, 2008), and 8% of greenhousegas emissions in the United States (Chung and Meltzer, 2009), withmore than half those emissions arising upstream in the supplychain. As with global emissions, for the health sector to substan-tially reduce its total greenhouse gas emissions will require thecumulative efforts of hundreds of component sub-sectors eachreducing their emissions on what might appear to be relativelysmall scales.
Emergency medical services, or ‘ambulance services’, area vehicle-intense subsector of healthcare that might be able todisproportionately contribute to the sector’s emissions reductionefforts. In North America, each ground ambulance response is esti-mated to produce36.6 kg (median) to 45.5 kg (mean)CO2e of Scope1and Scope 2 emissions; that is, emissions arising from vehicle fuel(Scope 1) and electricity (Scope 2) energy consumption (Blanchardand Brown, 2011). In Australia, ground ambulance services emitapproximately 22 kg CO2e of Scope 1 and Scope 2 emissions perambulance response (Brown et al., in press). To date, no attempt tocharacterise the Scope 3 (e.g., supply chain; waste disposal) and lifecycle emissions of ambulance services has been reported.
This study attempts, for the first time, to estimate the life cyclegreenhouse gas emissions associated with Australian ambulanceservices through a hybrid assessment incorporating bothinventory-based and inputeoutput (IeO) based emissions esti-mates. In addition to quantifying the contributions of Scope 1,Scope 2 and Scope 3 emissions in the ‘carbon footprint’ of Austra-lian ambulance agencies, this study explores the leading structuralpaths that ambulance services might target in efforts to reducetheir greenhouse gas emissions. Finally, this study exemplifies thedifficulties associated with using aggregate sectoral IeO basedmultipliers for estimating emissions from diverse sub-sectoral orcross-sectoral activities.
The remainder of this paper proceeds as follows: Section 2describes the data sources used in this analysis; Section 3describes the methods used to calculate the estimates of ambu-lance service emissions; Section 4 details the resulting estimationsand identifies the most potentially relevant structural pathways;Section 5 discusses the practical utility of these findings forambulance services and highlights the limitations of using the IeObased multipliers; Section 6 concludes the paper by summarisingthe main findings.
2. Data sources
2.1. Inventory of Scope 1 and Scope 2 emissions
A recent study inventoried the Scope 1 and Scope 2 energyconsumption and greenhouse gas emissions of Australian ambu-lance services (Brown et al., in press), duplicating a methodologypreviously used in a similar assessment of North American emer-gency medical services agencies (Blanchard and Brown, 2011).Briefly, Australian state- or territory-based ambulance systemsserving 58% of the Australian population and performing 59% of allAustralian ambulance responses reported their vehicle fuel, aviationfuel, natural gas and electricity consumption for a 12-month periodin 2009e2010. Emission factors from the Australian government’s“National Greenhouse Accounts” (Australian Government
Please cite this article in press as: Brown, L.H., et al., Estimating the life cycof Cleaner Production (2012), http://dx.doi.org/10.1016/j.jclepro.2012.06.
Department of Climate Change, 2009) were then used to calculatethe CO2e emissions associated with that energy consumption.Emissions for ground and air ambulance activities combined totalled35 kg CO2e per ambulance response, or 5 kg CO2e per capita.Extrapolating these data to the whole of Australia (3.5 millionambulance responses, 22million inhabitants), the Scope 1 andScope2 emissions fromall Australian groundandair ambulanceoperationswere estimated to total approximately 110,000 to 120,000 t of CO2eeach year, with electricity consumption representing 26% of thattotal. For this study, themid-pointof that estimate (115,000 t CO2e) isused as an inventory-based estimate of annualAustralian ambulanceservice Scope 1 and Scope 2 emissions, with 85,100 t CO2e (74%)arising from direct energy consumption and 29,900 t CO2e (26%)arising from electricity consumption.
2.2. Inputeoutput based multipliers and structural path analyses
IeO analysis and structural path analysis are both well knownand widely described in the ecological- and energy-economicsliterature. IeO analysis “. is a top-down macroeconomic tech-nique using sectoral monetary transactions . to account for thecomplex interdependencies of industries in modern economies”(Lenzen, 2003). Leontief (1970) demonstrated that IeO analysiscould be used to analyse pollutants (as opposed to monetarytransactions) as integral components of economic processes, andsince then the technique has been used in numerous studies todetermine the resourceflows and environmental impacts associatedwith the final consumption of economic sectors (Wiedmann et al.,2006). Structural path analysis, or decomposition analysis, is theprocess of “unravelling” the flows and transactions represented inIeO analyses in order to identify the principal production chainscontributing to thefinal consumptionwithin, and the environmentalimpacts of, an economic sector (Lenzen, 2002, 2003). Structuralpaths can be described as ‘zero order’, resulting from transactionswithin an individual economic sector, ‘first order’, resulting from thedirect transactions between one economic sector and another, or‘second (and more distal) order’ resulting from successive trans-actions between three (or more) sectors in the production chain.
In 2005, researchers from Australia’s Commonwealth Scientificand Industrial Research Organisation (CSIRO) and the University ofSydney published a comprehensive “Triple Bottom Line” (TBL)analysis of the Australian Economy (Foran et al., 2005). Titled“Balancing Act”, this analysis used Australia’s 1994e1995 economy-wide IeO tables to develop a TBL accounting for three financial,three social and four environmental indicators for all 135 sectors ofthe Australian economy. Included in this analysis are TBL multi-pliers showing the relationship between each of the indicators andgross national expenditure (GNE) or gross national turnover (GNT)within each sector. One of the included multipliers is greenhousegas emissions in kg CO2e per dollar of expenditure; this multiplieris further differentiated into a multiplier for direct emissions anda multiplier for total emissions. The “Balancing Act” analysis alsoidentifies the leading structural paths contributing to the green-house gas emissions of each economic sector, including their first-order electricity consumption and the proportion of total emissionsattributable to that electricity consumption.
Ambulance services in Australia are formally classified asa component of the “Health Services” economic sector (Foran et al.,2005), but they are delivered by state and territory governments aspublic goods and they are not universally situated within Depart-ments of Health; in four Australian states and territories ambulanceservices are either delivered by the departments responsible forother emergency services or function as independent statutoryauthorities. However they are administratively structured, theoperational characteristics of ambulance systems are less like those
le greenhouse gas emissions of Australian ambulance services, Journal020

Table 2Calculations used to estimate the life cycle greenhouse gas emissions of Australianambulance services.
Estimate Component Calculation
IeO only IeO S1 (TBL “Direct” Multiplier) � (Expenditures)IeO LC (TBL “Total” Multiplier) � (Expenditures)IeO S2 (% First Order Electricity / 100) � (IeO LC)IeO S3 (IeO LC) � [(IeO S1) þ (IeO S2)]
HybridApproach 1(H1)
H1 S1 Inventory S1 DeterminationH1 S2&S3 (IeO LC) � (IeO S1)H1 LC (H1 S1) þ (H1 S2&S3)H1 S2 (% First Order Electricity/100) � (H1 LC)H1 S3 (H1 S2&S3) � (H1 S2)
HybridApproach 2(H2)
H2 S1 Inventory S1 DeterminationH2 S2 Inventory S2 DeterminationH2 S3 (H1 S2&S3) � (IeO S2)H2 LC (H2 S1) þ (H2 S2) þ (H2 S3)
IeO ¼ inputeoutput based estimate; H1 ¼ hybrid approach 1; H2 ¼ hybridapproach 2; S1 ¼ Scope 1 (direct) emissions; S2 ¼ Scope 2 (electricity) emissions;S3 ¼ Scope 3 emissions; S2&S3 ¼ total indirect emissions; LC ¼ life cycle emissions;TBL ¼ triple-bottom-line.
L.H. Brown et al. / Journal of Cleaner Production xxx (2012) 1e7 3
of, for example, hospitals and more like those of other emergencyservices such as police departments and fire departments. InAustralia, police departments and fire departments are formallyclassified as components of the “Other Services” economic sector.Due to this cross-sectoral nature of ambulance services, this anal-ysis incorporates the TBL multipliers and structural paths reportedfor the Health Services (Hs), Government Services (Gv) and OthersServices (Os) sectors of the Australian economy.
Both the direct and total TBL multipliers for the Hs, Gv, and Ossectors, along with the percentage of emissions arising from theirfirst order electricity consumption, are shown in Table 1.
2.3. Ambulance service expenditures data
According to the Australian Council of Ambulance Authorities(2010), state and territory governments spent $2.1 billion deliv-ering 3.5 million ambulance responses in 2009e2010. As theseexpenditure data are reported in 2008e2009 dollars and the TBLmultipliers described above were developed from IeO tables using1994e1995 dollar amounts, the ambulance expenditure data wereadjusted using consumer price index data from the AustralianBureau of Statistics (2012); $2.1 billion in 2008e2009 dollars isequivalent to $1.4 billion in 1994e1995 dollars.
3. Estimations
The formulas for, and the sequences of, all of the calculations areshown in Table 2.
3.1. IeO based Scope 1, 2 & 3 emissions estimates
Three estimations of life cycle greenhouse gas emissions ofambulance services were calculated based solely on the IeO TBLmultipliers: one based on themultipliers reported for the Hs sector;one using the multipliers for the Os sector; and one using the Gvsector multipliers. The estimates of total emissions and direct(Scope 1) emissions were calculated as the product of the appro-priate TBL multiplier and ambulance service expenditures. Theestimates of Scope 2 emissions from electricity consumption werethen calculated as the percentage of total emissions arising fromfirst order electricity consumption, as indicated in the respectivestructural path analyses. Finally, Scope 3 emissions were thencalculated as the difference between total emissions and the sum ofScope 1 and Scope 2 emissions.
3.2. Hybrid approach 1: inventory based Scope 1 and IeO basedScope 2 & 3 emissions
The first set of hybrid estimates (H1) of ambulance service lifecycle greenhouse gas emissions assumed that the inventory-baseddetermination of direct emissions was more accurate than the IeObased determinations. For these estimates, the inventory-based
Table 1Triple-bottom-line (TBL) CO2e multipliers (kg per $ GNE) and first order electricityconsumption for the Health Services (Hs), Other Services (Os), and Governmentservices (Gv) sectors of the Australian economy (Foran et al., 2005).
Sector Direct TBLmultiplier
Total TBLmultiplier
% from 1st orderelectricity consumption
Hs 0.02 0.15 32%Os 0.11 0.36 25%Gv 0.01 0.33 27%
kg ¼ kilograms; CO2e ¼ carbon dioxide equivalents; $ ¼ 1994e1995 Australiandollars; GNE ¼ gross national expenditure.
Please cite this article in press as: Brown, L.H., et al., Estimating the life cycof Cleaner Production (2012), http://dx.doi.org/10.1016/j.jclepro.2012.06.0
determination was used for Scope 1 emissions, while the Hs, Osand Gv TBL multipliers were each used to estimate indirect emis-sions. Scope 2 emissions from electricity were again estimated asthe percentage of total emissions reported for first order electricityconsumption in the existing structural path analyses.
3.3. Hybrid approach 2: inventory based Scope 1 & 2 and IeO basedScope 3 emissions
The second set of hybrid estimates (H2) of ambulanceservice life cycle greenhouse gas emissions assumed that theinventory-based determinations of both direct emissions andelectricity-related emissions were more accurate than the IeObased determinations. For these estimates, the inventory-baseddeterminations were used for both direct (Scope 1) and elec-tricity (Scope 2) emissions. Scope 3 emissions were calculated asthe difference between the indirect emissions calculated in the H1estimates and the electricity emissions estimated using the pureIeO approach.
4. Results
Table 3 shows the results of all the emissions estimates. Theestimates of annual life cycle greenhouse gas emissions fromAustralian ambulance services range from 216,369 t CO2e (62 kgCO2e/ambulance response) to 546,688 t CO2e (156 kg CO2e/ambu-lance response); the average of these estimates is 389,315 t CO2e(111 kg CO2e/ambulance response). In all of the estimates, thecontribution of indirect emissions is substantial, ranging from 63%to 97% of total emissions. On average, indirect (Scope 2 and Scope 3)emissions account for 80% of total estimated emissions.
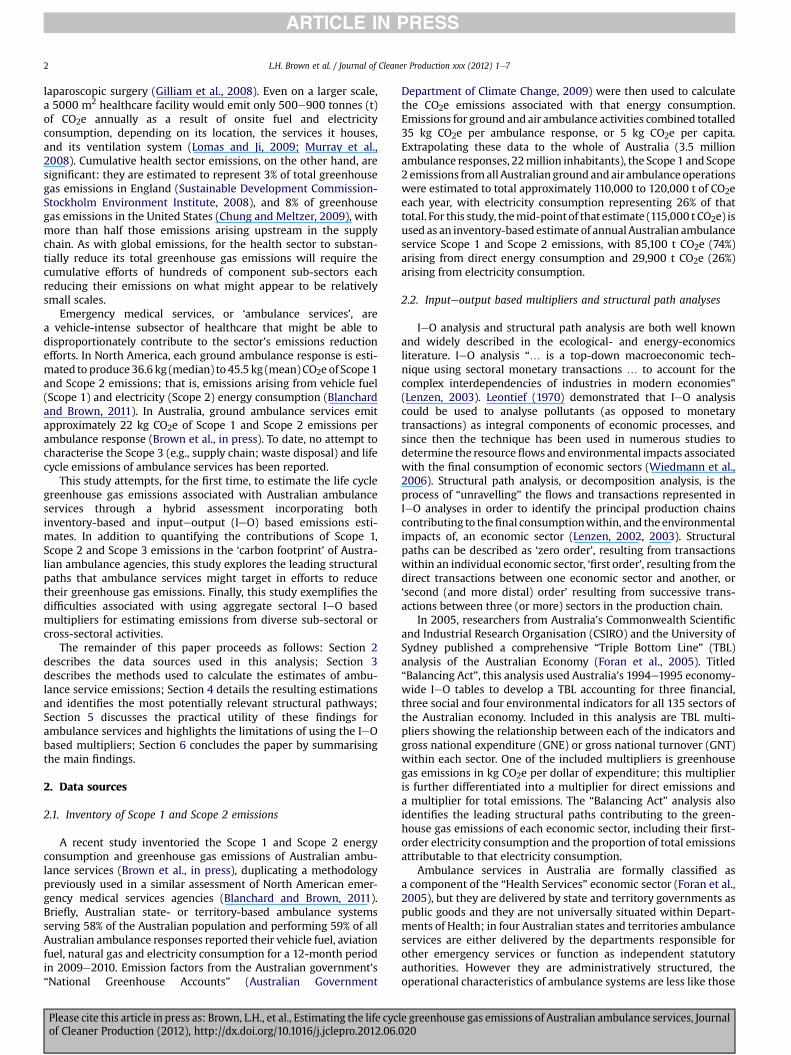
Fig. 1 provides a visual representation of the emissions esti-mates. The lowest estimates of life cycle greenhouse gas emissionsfrom Australian ambulance systems arise from the calculationsincorporating TBL multipliers from the Hs sector; emissions esti-mates based on the Os and Gv TBL multipliers are approximately1.5e2.4 times greater than those based on the Hs TBL multipliers,depending on the estimation procedure.
Regardless of the TBL multipliers used, including the inventory-based determination of Scope 2 emissions substantially reduces theproportion of estimated emissions arising from first order elec-tricity consumption. The structural path analyses suggest first orderelectricity consumption would be responsible for 25%e32% of totalambulance service emissions; using the inventory based
le greenhouse gas emissions of Australian ambulance services, Journal20

Table 3Estimates of Australian ambulance services’ annual greenhouse gas emissions.
TBL multiplier Direct (Scope 1) Electricity (Scope 2) (Scope 3) Total % Direct % Electricity % Indirect
Inventory based determination n/a 85,100 29,900 n/a 115,000 74% 26% n/aIeO Based Estimate Hs 28,849 69,238 118,282 216,369 13% 32% 87%
Os 158,671 129,822 230,794 519,286 31% 25% 69%Gv 14,425 128,523 330,064 476,012 3% 27% 97%
Hybrid Approach 1 (H1) Estimate Hs 85,100 87,238 100,282 272,620 31% 32% 69%Os 85,100 111,429 249,186 445,715 19% 25% 81%Gv 85,100 147,606 313,982 546,688 16% 27% 85%
Hybrid Approach 2 (H2) Estimate Hs 85,100 29,900 118,282 233,282 37% 13% 63%Os 85,100 29,900 230,794 345,794 25% 9% 75%Gv 85,100 29,900 333,064 448,064 19% 7% 81%
Mean of IeO, H1 and H2 Estimates n/a 79,172 84,840 225,353 389,315 20% 22% 80%
IeO ¼ inputeoutput; H1 ¼ hybrid approach 1; H2 ¼ hybrid approach 2; Hs ¼ Health Services; Os ¼ Other Services; Gv ¼ Government Services; bolded values are extractedfrom source data (Brown et al., in press; Foran et al., 2005), non-bolded values are derived from this analysis.
L.H. Brown et al. / Journal of Cleaner Production xxx (2012) 1e74
determination of Scope 2 emissions reduces those proportions tobetween 7% and 13%. On average, electricity consumption isresponsible for 22% of the estimated ambulance service emissions.
Table 4 shows the top five structural pathways for the threeeconomic sectors used in this analysis; in all of these sectors, zeroorder transactions within the sector and first order electricityconsumption are among the topfive structural paths. The remainingleading structural paths include some that would be intuitivelyrelated to ambulance servicesdsuch as chemicals, wholesale trade,and paper productsdas well as some that are not intuitive. This isparticularly truewithin theOs sector,where ‘lime’, ‘sheep and shornwool’ and ‘beef cattle for meat products’ are among the leadingstructural paths. The top five structural paths account for 53%, 63%,and 37% of emissions estimated using only the IeO based TBLmultipliers for the Hs, Os and Gv sectors, respectively.
5. Discussion
In the 2009e2010 financial year, Australia’s national expendi-tures on healthcare totalled $121.4 billion dollars (AustralianInstitute of Health and Welfare, 2011). Converting this sum to1994e1995 dollars and applying the Hs TBL total emissionsmultiplier indicates Australian health services were responsible forapproximately 12.3 million t of CO2e emissions in the 2009e2010financial year. Using the average estimate from this analysissuggests that ambulance services were responsible for 3.2% of allAustralian health sector emissions in that year; the best case andworst case estimates of ambulance service emissions are 1.8% and4.4% of total health sector emissions, respectively. Since ambulanceservice expenditures ($2.1 billion) represent 1.7% of total healthexpenditures, all except the most conservative estimates indicate
0
100,000
200,000
300,000
400,000
500,000
600,000
I-O / Hs I-O / Os I-O / Gv H1 / Hs H1 / Os H1 / G
Estimat
t CO
2e
Fig. 1. Estimated annual Australian
Please cite this article in press as: Brown, L.H., et al., Estimating the life cycof Cleaner Production (2012), http://dx.doi.org/10.1016/j.jclepro.2012.06.
that ambulance services are a disproportionate contributor tohealth sector emissions. As such, they might play an important rolein reducing health sector emissions.
5.1. Reducing the Scope 1 emissions of ambulance services
Reducing emissions from vehicle fuel consumption isprobably the most obvious strategy ambulance systems couldemploy to reduce their carbon footprint. In this analysis,direct emissionsdprimarily from diesel, petrol and aviationfuelsdaccounted on average for only 20% of all ambulance systememissions. However, when using the inventory based Scope 1 andScope2 emissions andassuming that IeObased Scope3 emissions ofambulance services are consistent with those of the Hs sector (thatis, when using the “H2/Hs” estimate in Table 3 and Fig. 1), thecontribution of emissions from vehicle fuels could be as high as 37%of total emissions. At 3.5million ambulance responses per year, evenmarginal reductions in emissions from each individual ambulanceresponse could result in substantial cumulative emissions reduc-tions. Operational strategies for reducing vehicle fuel consumptionandScope 1 emissions could include reducing ambulance idling timeat emergency scenes and receiving hospitals, or limiting the use ofmedical helicopters to only those emergency situations in whichthey have been shown to improve patient outcomes.
Other strategies for reducing ambulance system Scope 1 emis-sions would mirror those of the broader transportation sector.Conversion to bio-diesel as a vehicle fuel would reduce directemissions, although the life cycle emissions of bio-fuels are notnecessarily significantly less than those of fossil-based liquid fuels(Nanaki and Koroneos, 2012; Solomon, 2010; von Blottnitz andCurran, 2007). For example, in Australia low sulphur diesel
v H2 / Hs H2 / Os H2 / Gv Average
e
Scope 3
Scope 2
Scope 1
ambulance service emissions.
le greenhouse gas emissions of Australian ambulance services, Journal020

Table 4Top five structural paths for emissions from the Health Services (Hs), Other Services (Os) and Government Services (Gv) sectors (Foran et al., 2005).
Hs Order; % Os Order; % Gv Order; %
Health Services 0; 15.0 Other Services 0; 30.0 Government Services 0; 3.2Electricity 1; 32.0 Electricity 1; 25.0 Electricity 1; 2.7Basic Chemicals 1; 3.7 Lime 1; 2.3 Air and Space Transport 1; 3.5Wholesale Trade 1; 1.7 Sheep and Shorn Wool 1; 1.5 Pulp, Paper and Paperboard 1; 1.4Gas Production
and Distribution1; 1.0 Beef Cattle for Meat Products 2; 4.2 Softwoods for Pulp, Paper, Paperboard 2; 1.4
L.H. Brown et al. / Journal of Cleaner Production xxx (2012) 1e7 5
emissions are only marginally greater than emissions from “E15Ddiesohol” (a blend of low sulphur diesel and 15% ethanol): 925 gCO2e/km versus 862 g CO2e/km (Beer and Grant, 2007). Bio-fuelsare also often associated with other detrimental environmentaland land use effects, although the exact impacts vary depending onthe feedstock and production processes (von Blottnitz and Curran,2007). For example, bio-fuels can produce more particulatematter, nitrous oxide, and nitrogen oxides than diesel and petrol;they might also emit more of the agents responsible for eutrophi-cation of lakes and rivers, including phosphorous and nitrogen(Nanaki and Koroneos, 2012; von Blottnitz and Curran, 2007).Growing the feedstock for bio-fuels diverts land from use for foodcrops and grazing, stresses water supplies, and potentiallythreatens biodiversity (Solomon, 2010).
Another potential strategy is to transition to a more efficientambulance and support vehicle fleet. Plug-in hybrid electric vehicles(PHEVs) are one option, but depending on the fuel source for elec-tricity generation, they might simply shift Scope 1 greenhouse gasemissions to Scope 2 emissions. A case study from Milan, Italyasserted that thermal power stations there were efficient enough tojustify the introduction of electric vehicles into the private vehiclefleet, although they could dramatically increase peak electricitydemand (Perujo and Ciuffo, 2010). Sioshansi et al. (2010) came to thesame conclusion for PHEVs in Ohio despite that U.S. state’s highpenetration of coal-fired power plants, although emissions ofsulphur dioxide and nitrogen oxides were substantially higher forPHEVs compared to conventional vehicles. An analysis from Cal-ifornia also found that PHEVsdas well as battery electric vehicles(BEVs)dwould produce lower life cycle greenhouse gas emissionsthan both conventional and hybrid internal combustion engines(McCarthy and Yang, 2010). To our knowledge, an assessment of theenvironmental impacts of PHEVs in Australia has not been reported.
Hydrogen fuel cell vehicles (FCVs) are another option for bothsupport and transport vehicles, but again the process of hydrogenproduction can profoundly impact their life cycle emissions (Ozalpet al., 2010; Pro et al., 2005). McCarthy and Yang (2010) predictedFCVs would produce more greenhouse gas emissions thanconventional or hybrid internal combustion engines given currentelectricity and hydrogen generation processes in California, whileLeaver and Gillingham (2010) estimated that FCVs, alongwith BEVs,would be the best alternative vehicle technologies for reducinggreenhouse gas emissions in New Zealand. A further immediatelimitation on FCVs is the lack of a sufficient hydrogen distributionand refuelling infrastructure (Vergragt and Brown, 2007).
5.2. Reducing the Scope 2 emissions of ambulance services
Reducing emissions from electricity consumption is anotherway inwhich ambulance services could reduce their environmentalimpact. In this analysis, electricity consumption accounted onaverage for 22% of total ambulance system emissions. In contrast tothe data for Scope 1 emissions, using the inventory based deter-minations of electricity-related emissions reduced their contribu-tion to the total carbon footprint of ambulance systems. This makessense: while ambulance systems must maintain some
Please cite this article in press as: Brown, L.H., et al., Estimating the life cycof Cleaner Production (2012), http://dx.doi.org/10.1016/j.jclepro.2012.06.0
administrative office space and facilities for housing ambulancesand staff, they are primarily mobile services. Even the most opti-mistic estimate in this analysis, however, would put electricity-related emissions at 7% of total emissions, which would stillmake first order electricity consumption a leading structural pathfor ambulance service emissions.
Conservation efforts aimed at reducing electricity consumptioncould directly reduce the Scope 2 emissions of ambulance services,but advocating for ‘green’ electricity generation could have an evenmore profound indirect impact. All of the estimates in this analysisindicate that upstream Scope 3 emissions are the largest contrib-utor to ambulance system emissions. Reducing the emissionsintensity of electricity production could reduce not only theelectricity-related Scope 2 emissions of ambulance services, butalso the upstream Scope 3 emissions associated with electricityconsumption in the supply chain.
5.3. Reducing the Scope 3 emissions of ambulance services
Supply chain emissions are an important component of thecarbon footprint of both transport systems (Roth and Kaberger,2002) and health systems (Chung and Meltzer, 2009; Karlsson andOhman, 2005; Sustainable Development Commission-StockholmEnvironment Institute, 2008). Implementing environmentallyfriendly purchasing practices would further reduce ambulancesystem life cycle greenhouse gas emissions. In this analysis, Scope 3emissions represent nearly 60% of ambulance services’ life cyclegreenhouse gas emissions. This is consistent with previous datashowing that indirect emissions constitute the majority of emis-sions arising from service sectors and service industries (Larson andHertwich, 2011; Nansai et al., 2009; Suh, 2006).
The leading structural paths reported for the Hs, Os and Gvsectors provide some insights into the products and services thatambulance services might target in their efforts to reduceupstream, supply chain emissions. In the absence of amore detailedanalysis of ambulance system purchases, it should not be presumedthat the leading structural paths for ambulance services moreclosely resemble those of the Hs or Gv sectors simply because theyseem more intuitive than those of the Os sector. Ambulanceservices should consider the potential benefits of reducing theirconsumption of, and pursuing environmentally friendly purchasingpractices for, products in all of these paths. One aspect of life cycleemissions unique to transport systems is the end-of-life manage-ment of vehicles (Manomaivibool, 2008). While the greenhouse gasemissions and environmental impacts of decommissioning ambu-lances and other vehicles might technically accrue to the manu-facturers of those vehicles, ambulance systems should none-the-less pursue and promote environmentally friendly vehicle disposal.
5.4. Limitations
Admittedly, the structural paths described in “Balancing Act”(Foran et al., 2005) might not represent the actual leading struc-tural paths for ambulance services. This study did not incorporatean inventory of ambulance service purchases and, as the Scope 1
le greenhouse gas emissions of Australian ambulance services, Journal20

L.H. Brown et al. / Journal of Cleaner Production xxx (2012) 1e76
and Scope 2 data demonstrate, the aggregate TBL multipliers andstructural paths for the Hs, Os, and Gv sectors might not accuratelyreflect the true environmental impact of Australian ambulancesystems. This is a common limitation of top-down estimates ofcarbon footprints and structural path analyses using aggregatesectoral IeO multipliers (Baboulet and Lenzen, 2010; Lenzen et al.,2004; Su et al., 2010). This analysis further highlights how theproblem might be even more pronounced for activities thatorganisationally fit within one economic sector, but that are oper-ationally more similar to activities in other economic sectors.
Ideally, estimating the life cycle greenhouse gas emissions ofAustralian ambulance services would incorporate not only aninventory of their Scope 1 and Scope 2 energy consumption, butalso an inventory of their purchases from which more specific IeObased estimates of Scope 3 emissions could be made. Unfortu-nately, that was not logistically possible for this analysis. Even if ithad been possible, the study would still be limited in that the IeOtables used to construct the TBLmultipliers were from 1994 to 1995(Foran et al., 2005). Thus this analysis, and any analysis using thosemultipliers, assumes that production processes and inter-sectoraltransactions in the Australian economy have not changedsubstantially in the last 15 years. This too, is a common shortcomingof IeO based analyses (Foran et al., 2005; Lenzen, 2002; Su et al.,2010). These are, none-the-less, the most recent TBL multiplierspublicly available for the Australian economy.
Another limitation of this analysis is that it essentially uses‘Scope 2’ emissions and ‘electricity-related’ emissions synony-mously. This is not technically correct: the direct emissions of otherpurchased services, most notably travel on commercial airlines, arealso considered Scope 2 emissions. In the case of ambulanceservices, these additional Scope 2 emissions are poorly tracked(Blanchard and Brown, 2011; Brown et al., in press) but they shouldbe relatively small. Also, in this analysis, those emissions are stillrepresented in the calculations of indirect and Scope 3 emissions;that is, they might be misclassified, but they are not omitted.
Finally, only a few of the potential strategies for reducingambulance relatedgreenhousegas emissionshavebeendiscussed inthis paper. None of these potential strategies, however, have yetbeen empirically evaluated. Their actual impacts on direct and lifecycle greenhouse gas emissions, as well as their operational andeconomic impacts on ambulance services, remain to be determined.
6. Conclusion
This analysis used a recent inventory of Scope 1 and Scope 2emissions from Australian ambulance services, along with publiclyavailable expenditure data and IeO based TBL multipliers, to esti-mate the life cycle greenhouse emissions of Australian ambulanceservices. Life cycle greenhouse gas emissions are estimated atbetween 62 and 156 kg CO2e per ambulance response, or between216,369 and 546,688 t CO2e annually. Ambulance services areresponsible for between 1.8% and 4.4% of total Australian healthsector emissions, and can play an important role in reducing healthsector emissions.
Direct emissions from vehicle fuels including diesel, petrol andaviation fuel represent approximately 20% (but perhaps as much as37%) of total ambulance system emissions and are an obvious targetfor reducing the environmental impact of ambulance systems, butindirect (Scope 2 and Scope 3) emissions are responsible for themajority of ambulance service emissions. Incorporating alternativefuels and higher efficiency vehicles into the ambulance service fleetcould reduce their direct Scope 1 emissions, but the majority ofambulance system greenhouse gas emissions are indirect Scope 2and Scope 3 emissions. Broader efforts promoting reduced elec-tricity consumption, greener electricity generation, and
Please cite this article in press as: Brown, L.H., et al., Estimating the life cycof Cleaner Production (2012), http://dx.doi.org/10.1016/j.jclepro.2012.06.
environmentally friendly purchasing practices will be required tosubstantially reduce the total carbon footprint of Australianambulance services.
Disclosure statement
There was no external funding for this research. We know of noactual conflicts of interest with regards to this work, but one of theauthors (JMC) has engaged in paid consultancy work for the orga-nisation Healthcare Without Harm, which some might perceive asa potential conflict.
References
Australian Bureau of Statistics, 2012. Consumer Price Index, Australia, Dec 2011.Commonwealth of Australia, Canberra, ACT. Retrieved from. www.abs.gov.au.on 27 January 2012.
Australian Government Department of Climate Change, 2009. National GreenhouseAccounts (NGA) Factors. Commonwealth of Australia, Canberra.
Australian Institute of Health and Welfare, 2011. Spending on Health Exceeds $120Billion. Commonwealth of Australia, Canberra, ACT. Retrieved from. www.aihw.gov.au. on 30 January 2012.
Baboulet, O., Lenzen, M., 2010. Evaluating the environmental performance ofa university. J. Clean Prod. 18, 1134e1141.
Beer, T., Grant, T., 2007. Life-cycle analysis of emissions from fuel ethanol and blendsin Australian heavy and light vehicles. J. Clean Prod. 15, 833e837.
Blanchard, I.E., Brown, L.H., 2011. Carbon footprinting of North American emergencymedical services systems. Prehosp. Emerg. Care 15, 23e29.
Brown, L.H., Canyon, D.V., Buettner, P.G., Crawford, J.M., Judd, J. in press. The carbonfootprint of Australian ambulance services. Emerg. Med. Austral.
Chung, J.W., Meltzer, D.O., 2009. Estimate of the carbon footprint of the US healthcare sector. JAMA 302, 1970e1972.
Council of Ambulance Authorities, 2010. 2009e2010 Annual Report. The Council ofAmbulance Authorities Inc, Findon, SA. Retrieved from. www.caa.net.au. on 26May 2011.
Cushman, R.M., Jones, S.B., 2002. The relative importance of sources of greenhousegas emissions: comparison of global through subnational perspectives. Environ.Manage. 29, 360e372.
Foran, B., Lenzen, M., Dey, C., 2005. Balancing Act: a Triple Bottom Line Analysis ofthe Australian Economy. Commonwealth of Australia, Canberra, ACT.
Gatenby, P.A.C., 2011. Modelling the carbon footprint of reflux control. Int. J. Surg. 9,72e74.
Gilliam, A.D., Davidson, B., Guest, J., 2008. The carbon footprint of laparoscopicsurgery: should we offset? Surg. Endosc. 22, 573.
Karlsson, M., Ohman, D.P., 2005. Material consumption in the healthcare sector:strategies to reduce its impact on climate changedThe case of Region Scania inSouth Sweden. J. Clean Prod. 13, 1071e1081.
Larson, H.N., Hertwich, E.G., 2011. Analyzing the carbon footprint from publicservices provided by counties. J. Clean Prod. 19, 1975e1981.
Leaver, J., Gillingham, K., 2010. Economic impact of the integration of alternativevehicle technologies into the New Zealand vehicle fleet. J. Clean Prod. 18,908e916.
Lenzen, M., Pade, L.-L., Munksgaard, J., 2004. CO2 multipliers in multi-region input-output models. Econ. Syst. Res. 16, 391e412.
Lenzen, M., 2002. A guide for compiling inventories in hybrid life-cycle assess-ments: some Australian results. J. Clean Prod. 10, 545e572.
Lenzen, M., 2003. Environmentally important paths, linkages and key sectors in theAustralian economy. Struct. Change Econ. Dynam 14, 1e34.
Leontief, W., 1970. Environmental repercussions and the economic structure: aninput-output approach. Rev. Econ. Stat. 52, 262e271.
Lomas, K.J., Ji, Y., 2009. Resilience of naturally ventilated buildings to climate change:advanced natural ventilation and hospital wards. Energ Buildings 41, 629e653.
Macintosh, A., 2010. Keeping warming within the 2�C limit after Copenhagen.Energy Policy 38, 2964e2975.
Manomaivibool, P., 2008. Network management and environmental effectiveness:the management of end-of-life vehicles in the United Kingdom and in Sweden.J. Clean Prod. 16, 2006e2017.
McCarthy, R., Yang, C., 2010. Determining marginal electricity for near-term plug-inand fuel cell vehicle demands in California: impacts on vehicle greenhouse gasemissions. J. Power Sources 195, 2099e2109.
Mulugetta, Y., Jackson, T., van der Horst, D., 2010. Carbon reduction at communityscale. Energy Policy 38, 7541e7545.
Murray, J., Pahl, O., Burek, S., 2008. Evaluating the scope for energy-efficiencyimprovements in the public sector: benchmarking NHSScotland’s smallerhealth buildings. Energy Policy 36, 1236e1242.
Nanaki, E.A., Koroneos, C.J., 2012. Comparative LCA of the use of biodiesel, dieseland gasoline for transportation. J. Clean Prod. 2012, 14e19.
Nansai, K., Kagawa, S., Suh, S., Fujil, M., Inaba, R., Hashimoto, S., 2009. Materialenergy dependence of services and its implications for climate change. Environ.Sci. Technol. 43, 4241e4246.
le greenhouse gas emissions of Australian ambulance services, Journal020

L.H. Brown et al. / Journal of Cleaner Production xxx (2012) 1e7 7
Ozalp, N., Epstein, M., Kogan, A., 2010. Cleaner pathways of hydrogen, carbon nano-materials and metals production via solar thermal processing. J. Clean Prod. 18,900e907.
Pacala, S., Socolow, R., 2004. Stabilization wedges: solving the climate problem forthe next 50 years with current technologies. Science 305, 968e972.
Perujo, A., Ciuffo, B., 2010. The introduction of electric vehicles in the private fleet:potential impact on the electric supply system and the environment. A casestudy for the Province of Milan, Italy. Energy Policy 38, 4549e4561.
Pro, B.H., Hammerschlag, R., Mazza, P., 2005. Energy and land use impacts ofsustainable transportation scenarios. J. Clean Prod. 13, 1309e1319.
Ramanathan, V., Xu, Y., 2010. The Copenhagen Accord for limiting global warming:criteria, constraints, and available avenues. Proc. Natl. Acad. Sci. USA 107,8055e8062.
Reynolds, L., 2010. The sum of the parts: can we really reduce our carbon emissionsthrough individual behaviour change? Perspect. Public Health 130, 41e46.
Roth, A., Kaberger, T., 2002. Making transport systems sustainable. J. Clean Prod. 10,361e371.
Sioshansi, R., Fagiani, R., Marano, V., 2010. Costs and emissions impacts of plug-inhybrid vehicles on the Ohio power system. Energy Policy 38, 6703e6712.
Solomon, S., Qin, D., Manning, M., Chen, Z., Marquis, M., Averyt, K.B., Tignor, M.,Miller, H.L., 2007. Climate Change 2007: the Physical Science Basis. Contribution
Please cite this article in press as: Brown, L.H., et al., Estimating the life cycof Cleaner Production (2012), http://dx.doi.org/10.1016/j.jclepro.2012.06.0
of Working Group I to the Fourth Assessment Report of the IntergovernmentalPanel on Climate Change. Cambridge University Press, Cambridge.
Solomon, B.D., 2010. Biofuels and sustainability. Ann. NY Acad. Sci. 1185, 119e134.Somner, J., Scott, K., Morris, D., Gaskell, A., Shepherd, I., 2009. Ophthalmology
carbon footprint: something to be considered? J. Cataract Refract Surg. 35,202e203.
Su, B., Huang, H.C., Ang, B.W., Zhou, P., 2010. Input-output analysis of CO2 emissionsembodied in trade: the effects of sector aggregation. Energy Econ. 32, 166e175.
Suh, S., 2006. Are services better for climate change? Environ. Sci. Technol. 40,6555e6560.
Sustainable Development Commission-Stockholm Environment Institute, 2008.NHS England Carbon Emissions Carbon Footprinting Report. SustainableDevelopment Commission, London.
Vergragt, P.J., Brown, H.S., 2007. Sustainable mobility: from technological innova-tion to societal learning. J. Clean Prod. 15, 1104e1115.
von Blottnitz, H., Curran, M.A., 2007. A review of assessments conducted on bio-ethanol as a transportation fuel from a net energy, greenhouse gas, and envi-ronmental life cycle perspective. J. Clean Prod. 15, 607e619.
Wiedmann, T., Minx, J., Barrett, J., Wackernagel, M., 2006. Allocating ecologicalfootprints to final consumption categories with input-output analysis. Ecol.Econ. 56, 28e48.
le greenhouse gas emissions of Australian ambulance services, Journal20