Corn-Based Ethanol Production and Environmental Quality: A Case of Iowa and the Conservation Reserve...
13
Corn-Based Ethanol Production and Environmental Quality: A Case of Iowa and the Conservation Reserve Program Silvia Secchi Philip W. Gassman Jimmy R. Williams Bruce A. Babcock Received: 12 December 2007 / Accepted: 28 July 2009 / Published online: 26 August 2009 Ó Springer Science+Business Media, LLC 2009 Abstract Growing demand for corn due to the expansion of ethanol has increased concerns that environmentally sensitive lands retired from agricultural production and enrolled into the Conservation Reserve Program (CRP) will be cropped again. Iowa produces more ethanol than any other state in the United States, and it also produces the most corn. Thus, an examination of the impacts of higher crop prices on CRP land in Iowa can give insight into what we might expect nationally in the years ahead if crop prices remain high. We construct CRP land supply curves for various corn prices and then estimate the environmental impacts of cropping CRP land through the Environmental Policy Integrated Climate (EPIC) model. EPIC provides edge-of-field estimates of soil erosion, nutrient loss, and carbon sequestration. We find that incremental impacts increase dramatically as higher corn prices bring into production more and more environmentally fragile land. Maintaining current levels of environmental quality will require substantially higher spending levels. Even allowing for the cost savings that would accrue as CRP land leaves the program, a change in targeting strategies will likely be required to ensure that the most sensitive land does not leave the program. Keywords Agricultural markets Á Ethanol Á Conservation Reserve Program Á Environmental quality Á Environmental Policy Integrated Climate model Introduction Growing demand for corn due to the expansion of ethanol has increased concerns that higher levels of corn produc- tion might cause environmental damage. Higher crop pri- ces could negatively affect soil and water resources as farmers till more land and remove environmentally sensi- tive land from conservation programs, including the Con- servation Reserve Program (CRP) and the Wetlands Reserve Program. Additionally, intensification of produc- tion could also lead to larger nutrient and soil losses as farmers attempt to increase their yields. In this article we focus on the environmental benefits that would be lost if land is taken out of the CRP. The CRP program pays landowners an annual rental payment in exchange for their agreement not to plant their contracted land. Contract duration is between 10 and 15 years. The CRP was authorized in the 1985 farm bill during a period when the United States had excess supplies of wheat and feed grains. Thus, it is not surprising that the program began with an objective of maximizing the amount of land taken out of production. In the early 1990s, enrollment criteria were changed and land began to be accepted into CRP based on the level of offered environ- mental benefits and cost. Today the program attempts to maximize environmental benefits. There is an ample liter- ature discussing the environmental benefits of the CRP program, which tends to enroll less productive and more environmentally sensitive land (Lubowski and others 2006; Claassen and others 2001; Babcock and others 1996). S. Secchi (&) Agribusiness Economics, Southern Illinois University, Agriculture Building, Mailcode 4410, 1205 Lincoln Drive, Carbondale, IL 62901, USA e-mail: [email protected] P. W. Gassman Á B. A. Babcock Center for Agricultural and Rural Development, Iowa State University, Ames, IA, USA J. R. Williams Blackland Research and Extension Center, Temple, TX, USA 123 Environmental Management (2009) 44:732–744 DOI 10.1007/s00267-009-9365-x
Transcript of Corn-Based Ethanol Production and Environmental Quality: A Case of Iowa and the Conservation Reserve...

Corn-Based Ethanol Production and Environmental Quality:A Case of Iowa and the Conservation Reserve Program
Silvia Secchi Æ Philip W. Gassman ÆJimmy R. Williams Æ Bruce A. Babcock
Received: 12 December 2007 / Accepted: 28 July 2009 / Published online: 26 August 2009
� Springer Science+Business Media, LLC 2009
Abstract Growing demand for corn due to the expansion
of ethanol has increased concerns that environmentally
sensitive lands retired from agricultural production and
enrolled into the Conservation Reserve Program (CRP) will
be cropped again. Iowa produces more ethanol than any
other state in the United States, and it also produces the
most corn. Thus, an examination of the impacts of higher
crop prices on CRP land in Iowa can give insight into what
we might expect nationally in the years ahead if crop prices
remain high. We construct CRP land supply curves for
various corn prices and then estimate the environmental
impacts of cropping CRP land through the Environmental
Policy Integrated Climate (EPIC) model. EPIC provides
edge-of-field estimates of soil erosion, nutrient loss, and
carbon sequestration. We find that incremental impacts
increase dramatically as higher corn prices bring into
production more and more environmentally fragile land.
Maintaining current levels of environmental quality will
require substantially higher spending levels. Even allowing
for the cost savings that would accrue as CRP land leaves
the program, a change in targeting strategies will likely be
required to ensure that the most sensitive land does not
leave the program.
Keywords Agricultural markets � Ethanol �Conservation Reserve Program � Environmental quality �Environmental Policy Integrated Climate model
Introduction
Growing demand for corn due to the expansion of ethanol
has increased concerns that higher levels of corn produc-
tion might cause environmental damage. Higher crop pri-
ces could negatively affect soil and water resources as
farmers till more land and remove environmentally sensi-
tive land from conservation programs, including the Con-
servation Reserve Program (CRP) and the Wetlands
Reserve Program. Additionally, intensification of produc-
tion could also lead to larger nutrient and soil losses as
farmers attempt to increase their yields. In this article we
focus on the environmental benefits that would be lost if
land is taken out of the CRP.
The CRP program pays landowners an annual rental
payment in exchange for their agreement not to plant their
contracted land. Contract duration is between 10 and
15 years. The CRP was authorized in the 1985 farm bill
during a period when the United States had excess supplies
of wheat and feed grains. Thus, it is not surprising that the
program began with an objective of maximizing the
amount of land taken out of production. In the early 1990s,
enrollment criteria were changed and land began to be
accepted into CRP based on the level of offered environ-
mental benefits and cost. Today the program attempts to
maximize environmental benefits. There is an ample liter-
ature discussing the environmental benefits of the CRP
program, which tends to enroll less productive and more
environmentally sensitive land (Lubowski and others 2006;
Claassen and others 2001; Babcock and others 1996).
S. Secchi (&)
Agribusiness Economics, Southern Illinois University,
Agriculture Building, Mailcode 4410,
1205 Lincoln Drive, Carbondale, IL 62901, USA
e-mail: [email protected]
P. W. Gassman � B. A. Babcock
Center for Agricultural and Rural Development,
Iowa State University, Ames, IA, USA
J. R. Williams
Blackland Research and Extension Center, Temple, TX, USA
123
Environmental Management (2009) 44:732–744
DOI 10.1007/s00267-009-9365-x

Therefore, a return of CRP land to crop production is likely
to lead to lower environmental quality. There is little doubt
that the increased crop prices as a result of expanded bio-
fuel production will have consequences for CRP. A recent
study has analyzed impacts at a national level in an
aggregated manner, with a focus on the impact that crop
production on CRP land would have on crop prices (Tok-
goz and others 2007). Another study has focused on the
logistical aspects of harvesting, storing and transporting
biomass in the southern Great Plains of the United States
(Mapemba and others 2007).
This study extends the current literature by focusing on
the link between crop production on CRP land and envi-
ronmental impacts. It focuses on the state of Iowa because
Iowa has almost three quarters of a million hectares of CRP
land, it produces more ethanol than any other state, and it
produces the most corn. Thus, an examination of the
impacts of higher crop prices on Iowa land moving out of
the CRP and the resulting impacts on soil erosion, nutrient
losses, and carbon sequestration will give insight into what
we might expect nationally in the years ahead if crop prices
remain high because of ethanol production.
Data Description and Modeling Approach
Figure 1 shows the location of CRP parcels in Iowa by
county in 2008 according to the US Department of Agri-
culture Farm Service Agency (USDA-FSA), which
administers the program, and Iowa’s ecoregions. In order to
identify the characteristics of the land enrolled in the
program, we use a land use geographic information system
(GIS) layer obtained from the Farm Service Agency (FSA)
combined with the Iowa Soil Properties and Interpretations
Database (ISPAID) GIS soil data layer (Iowa Cooperative
Soil Survey 2003) and the Soil Survey Geographic Data-
base (SSURGO) GIS soil data layer (USDA Natural
Resources Conservation Service 2006). The data we
obtained from FSA does not specify the land cover that the
CRP land is in. However, the great majority of CRP land in
Iowa is planted with grasses (FSA 2007). Therefore, we
assume that the whole area is planted in bromegrass.
Comparing the CRP land to the full soil layer for Iowa,
it is apparent that the CRP land is of a lesser quality for
agricultural purposes. We focus here on a few indicators to
run the comparison: the Corn Suitability Rating, the Highly
Erodible Land Code, and slope. The HEL code refers to
land classified by the Natural Resource Conservation Ser-
vice in Land Capability Class 4, 6, 7, or 8; or land that, if
used to produce an agricultural commodity, would have an
excessive annual rate of erosion as determined by the
Universal Soil Loss Equation and the wind erosion equa-
tion. The three categories are 1 for a highly erodible map
unit, 2 for a potentially highly erodible map unit, and 3 for
a not highly erodible map unit. To measure productivity,
we use the Corn Suitability Rating (CSR), which is an
index from 0 to 100 that measures land’s productivity in
corn production. CSR data was obtained from the ISPAID
soil data layer (Iowa Cooperative Soil Survey 2003).
Table 1 shows the characteristics of CRP land, all Iowa
land, and land planted to either corn or soybeans (the two
dominant crops in Iowa) in 2002 (Iowa Department of
Des Moines Lobe
Northwest Iowa Loess Prairies
Paleozoic Plateau
Iowan Surface
Loess Hills and Rolling Prairies
Southern Iowa Rolling Loess Prairies
Interior River Lowland
Central Irregular Plains
Loess Hills
Missouri Alluvial Plain
Hectares 375 - 1,8 1,868 - 3,0 3,094 - 3,8 3,813 - 4,9 4,903 - 6,3 6,385 - 7,9 7,978 - 10,310,342 - 12,612,648 - 15,315,306 - 21,6
EcoregionsFig. 1 Location of CRP in
2008 (quantiles), and Iowa
ecoregions
Environmental Management (2009) 44:732–744 733
123

Natural Resources 2004). As shown, CRP land is, on
average, less productive, more erodible, and it has a higher
slope than either all of Iowa land or all land planted to corn
and soybeans.
There are some substantial differences in land charac-
teristics within CRP areas as well. Figure 2 illustrates how
land enrolled in CRP in North Central Iowa is of higher
productivity than CRP land in the rest of the state. This
area corresponds to the Des Moines Lobe geological for-
mation, the highly fertile southern extremity of the North
American Prairie Pothole region, and it includes some of
the most fertile soils in the world (Fig. 1).
Land in this region is also less erodible (Fig. 3), as
measured by the proportion of CRP land that is classified
as Highly Erodible Land (HEL). Because of this higher
productivity, enrolling land into CRP in North Central
Iowa is more expensive (Fig. 4). Higher erodibility
and, correspondingly, lower rental rates are the reasons
why more land is enrolled in southern and northeastern
Iowa.
We construct CRP supply curves by estimating whether
each of the land parcels currently enrolled in CRP would
earn more by remaining in the program or by being crop-
ped for various corn and soybean prices. Thus, the net
returns from cropping represent the opportunity cost, or
next best alternative, for the land currently in CRP. The key
factors in this calculation are crop prices, crop yields, and
CRP rental rates. We use FSA Soil Rental Rates (SRR) as
an approximation of CRP payments. Because there are
several categories of CRP in which land can be enrolled,
actual payments do not always match a parcel’s SRR.
However, using SRR gives us a reasonable approximation.
According to the FSA, in 2004, the last year for which
county-level outlays are available, payments for CRP rental
Table 1 Average land characteristics in Iowa
Hectares CSR HEL Slope (%)
CRP lands 729,508 53 1.76 8
All Iowa land 14,576,062 62 2.17 7
Corn and soybean land (2006) area (planted) 9,210,526 71 2.46 5
CSR Corn Suitability Rating. The CSR is an index from 0 to 100 that measures land’s productivity in corn production; HEL code Highly erodible
land code. This refers to land classified in Land Capability Class 4, 6, 7, or 8; or land that, if used to produce an agricultural commodity, would
have an excessive annual rate of erosion as determined by the Universal Soil Loss Equation and the wind erosion equation. (The code has three
possible values: 1 = Yes, this map unit is highly erodible; 2 = This map unit is potentially highly erodible; 3 = No, this map unit is not highly
erodible) Slope is expressed on a percentage scale based on the difference in the number of meters of rise or fall per 30 m of horizontal distance
Average CSR for CRP land35 - 4242 - 5050 - 5151 - 5555 - 5858 - 6060 - 6363 - 6565 - 6767 - 71
Fig. 2 Corn suitability rating of
CRP land by county (quantiles)
734 Environmental Management (2009) 44:732–744
123

rates in Iowa amounted to $152,296,812, and overall CRP
payments amounted to $179,349,226 (FSA 2004). Using
the SRRs, our estimate is that it would cost $181,237,348
to enroll the 2004 CRP area in Iowa. Thus, our estimate is
quite close to the actual outlay. Moreover, our estimates of
the county-level payments are very closely correlated to
FSA’s reported county-level payments, with a correlation
coefficient of 0.9915.
We obtain predicted crop yields by constructing a
regression equation of corn yield on CSR and adjusting the
average yield so as to calibrate to realistic current yields.
Both CSR and raw yield information were obtained from the
Average CRP payment /ha160 - 200200 - 235235 - 255255 - 267267 - 279279 - 286286 - 299299 - 316316 - 329329 - 354
Fig. 4 County average per
hectare rental payment for CRP
land (quantiles)
% Highly erodible CRP land3 - 1111 - 1616 - 2525 - 4141 - 5757 - 6363 - 6868 - 7373 - 7979 - 91
Fig. 3 Percentage highly
erodible land in CRP by county
(quantiles); Highly erodible
land is either classified in Land
Capability Class 4, 6, 7, or 8; or
land that, if used to produce an
agricultural commodity, would
have an excessive annual rate of
erosion as determined by the
Universal Soil Loss Equation
and the wind erosion equation.
The slope is expressed on a
percentage scale based on the
difference in the number of
meters of rise or fall per 30 m of
horizontal distance
Environmental Management (2009) 44:732–744 735
123

ISPAID soil data layer. We use a linear equation, without
intercept: Corn yield (tons/ha) = 0.141242938 * CSR. We
use a similar methodology to predict soybean yields. The
equation used for soybeans is Soybean yield (tons/
ha) = 0.045057162 * CSR.
For a given level of crop price we then estimate which
CRP parcels would be returned to production and which
would remain enrolled in CRP. The environmental impacts
of growing crops on the land that leaves CRP are estimated
through the Environmental Policy Integrated Climate
(EPIC) model, originally developed by the US Department
of Agriculture Agricultural Research Service (ARS). The
EPIC model (Williams and others 1984; Williams 1990,
1995; Izaurralde and others 2006) is a field-scale model
that is designed to simulate drainage areas that are char-
acterized by homogeneous weather, soil, landscape, crop
rotation, and management system parameters. It operates
on a continuous basis using a daily time step and can
perform long-term simulations of hundreds of years. A
wide range of crop rotations, tillage systems, and other
management practices can be simulated with EPIC. The
most recent versions of EPIC feature improved soil carbon
cycling routines (Izaurralde and others 2006) that are based
on routines used in the Century model (Kelley and others
1997). EPIC provides crop yield and biomass estimates as
well as estimates of soil erosion, nutrient loss, carbon
sequestration, and other edge-of-field environmental indi-
cators. The model has been applied to a wide range of
environmental problems in many different regions across
the globe as documented in Gassman and others (2005).
This approach of estimating supply curves of environ-
mental damage closely follows the approach of Pautsch
and others (2001) and allows us to make parcel-level
estimates of the environmental impacts of land returning to
crop production for various crop prices. To determine net
returns to crop production, we use 2007 cost-of-production
budgets for Iowa (Duffy and Smith 2007) to obtain the
appropriate variable costs. We restrict the analysis to no till
corn soybean rotations and conventional till continuous
corn. The reason is that cropland in Iowa has traditionally
been in 2-year corn soybean rotations. In more recent
years, there has been an increase in continuous corn due to
high prices for that crop. Thus, these two rotations repre-
sent the two most likely choices for farmers returning their
CRP parcels into production. Since there is evidence that
continuous corn production delivers higher yields and
profits under conventional tillage (Vyn and others 2000;
Wilhelm and Wortmann 2004; Vetsch and others 2007),
continuous corn is simulated as under a conventional till-
age regime. Conventional tillage is simulated as a pass of a
chisel plow in the fall after the harvest and a tandem disk
and field cultivator in the spring before planting.
For highly erodible land, conservation compliance
requirements limit tillage practices, and therefore the most
likely crop choice for farmers returning marginal CRP land
to production is no till corn soybeans. For the no till corn
soybean rotation, the per-hectare costs are $672.1 for corn
and $393.3 for soybeans. The per-hectare costs for continu-
ous corn are $770.6. To calculate the net supply curves if the
land is not highly erodible, the determination of its allocation
is given by Max{pCB, pCC, pCRP}, where pCB, pCC, and pCRP
denotes average returns to a corn soybean rotation, to con-
tinuous corn, and to CRP. In order to be consistent with the
existence of conservation compliance measures, as noted
above, we also assume that, on highly erodible land, the
choice set is limited to Max{pCB, pCRP}. As there is agro-
nomic evidence that there is a yield drag from growing corn
after corn, even after adjusting fertilizer rates and using
conventional tillage (Vyn and others 2000; Wilhelm and
Wortmann 2004), we assume a 3% yield loss for corn grown
after corn. The decision about whether to participate in the
CRP program is therefore based on the 2-year profit margins.
For simplicity, we do not use any discounting and we
abstract from risk to aversion considerations. We use a price
wedge between corn and soybeans which approximates the
recent equilibrium between the two markets and is consistent
with both recent historical trends and some long-term pro-
jections (Elobeid and others 2006). The wedge is shown in
Table 2. The model could easily accommodate any other
type of relationship between the two prices.
To estimate the environmental impact of cropping land
previously set aside from production, we use the EPIC
model to estimate 30-year averages for soil erosion,
nitrogen and phosphorus loss, and carbon sequestration.
The EPIC model was run using daily climate data
generated on the basis of historical monthly statistical
weather parameters from 26 weather stations available in
the EPIC weather generator database for the state of Iowa.
The generated weather parameters from these stations were
allocated to each soil/CRP parcel on the basis of proximity.
We also used the Soil Survey Geographic Database
(SSURGO) to run EPIC, because it has all the required soil
Table 2 Crop prices used in the analysis
Corn price per ton Soybean price per ton Difference
78.74 202.09 141.72
98.42 220.46 140.41
118.11 238.83 139.10
137.79 263.08 137.79
157.48 422.55 136.47
177.16 284.76 135.16
196.84 312.32 133.85
736 Environmental Management (2009) 44:732–744
123

information to run the model (USDA Natural Resources
Conservation Service 2006). Nitrogen and phosphorus
losses in surface pathways are estimated in EPIC via sol-
uble losses in surface runoff and by attachment to sedi-
ment. Nitrate losses can further occur in subsurface
pathways through leaching to groundwater, outflow
through tiles to streams, and by lateral subsurface flow.
Much of the leached nitrate in the soil profile in intensely
tiled and row cropped areas, such as the Des Moines Lobe
region in north central Iowa (Fig. 1), is exported to stream
systems through the tiles instead of leaching to ground-
water. It can be assumed that much of the leached nitrate
would be removed through tile drains in cropped areas
managed with subsurface drainage, as demonstrated by
Chung and others (2001, 2002) in validation studies of
EPIC for tile-drained field sites in southern Minnesota and
northeast Iowa. However, it was assumed in this study that
subsurface tile drains do not exist below the known CRP
fields, due to fact that the vast majority of CRP fields are
located on higher sloped marginal land that does not
require subsurface drainage. Thus, nitrate losses via tile
drainage would not be considered to be a loss pathway for
CRP managed land.
To replicate the management differences between crop
rotations, we assume a fertilizer rate application of
134.4 kg/ha for nitrogen in corn planted after soybeans and
a rate of 201.6 kg/ha for corn planted after corn. Moreover,
we assume a phosphorus rate of 67 kg/ha for corn and
45 kg/ha for soybeans. The phosphorus rates were obtained
from the Agricultural Resource Management Survey
(ARMS), conducted by the USDA (USDA 2000–2006).
The ARMS survey has a very small sample of corn after
corn management practices, therefore the nitrogen rates
were obtained from the Corn Nitrogen Rate Calculator
(Sawyer 2006; Sawyer and others 2006). The Calculator
uses a large database of nitrogen response trials for the State
of Iowa to determine the optimal rates of nitrogen appli-
cation by rotation. The rates correspond to those optimal for
a price ratio of price per pound of nitrogen divided by the
expected per bushel corn price of 0.1. For example, nitrogen
at $0.4/lb ($0.88/kg) and corn at $4/bu ($157.47/Mt) is a
0.10 price ratio (Sawyer 2006). The timing of application
was assumed to be in the Spring because the rates were
derived from spring and sidedress fertilizer applications.
This is likely to result in more conservative nitrogen losses
than if Fall applications are simulated.
Planting is simulated as occurring at the beginning of
May throughout the State, while corn harvesting is in the
middle of October and soybean at the end of September.
The EPIC model was run on all the SSURGO soils
present in the CRP land, and the results we report are
weighted by the area of each soil in the CRP parcels. The
area was calculated by overlaying the SSURGO soils GIS
layer with the CRP GIS layer. Almost 8,400 different
SSURGO soils were simulated in EPIC.
The major nitrogen cycling components were also
incorporated in the simulations based primarily on standard
approaches that have been used in the model as described
by Williams (1990, 1995). Two different approaches have
been used in the EPIC model over its history to simulate
nitrogen mineralization: straight mineralization from
organic nitrogen to nitrate (NO3) versus transformation
from organic N to ammonia (NH3) first, and then further
transformation to NO3. The latter approach was used for
this study, which was believed to more realistically capture
the higher mineralization rates of the high carbon content
soils simulated in this study and also allows for simulation
of nitrification and volatilization. A new alternative deni-
trification routine option developed by Kemanian (2008,
Personal communication. Blacklands Research and
Extension Center, Texas AgriLIFE, Texas A&M System,
Temple, Texas) was also used in this study which produces
improved results over a wide range of conditions.
Results
We construct the CRP land supply curves for corn prices
ranging from $78.75 to $196.84 per ton. This range spans
from historical corn prices to the high corn prices seen in
the last 2 years. Figure 5 illustrates the statewide curves.
At $118.10 corn, we estimate that almost 400,000 ha,
almost half of the land in the program, would go back into
production. Note that not all the area would go back into
continuous corn because highly erodible land is restricted
to corn soybean no till. We estimate that over 420,000 ha
of CRP in Iowa are highly erodible land and would
therefore be planted in a corn soybean rotation to follow
conservation compliance measures. Our assessment pre-
sumes that profit is the main driver of CRP enrollment
Fig. 5 Area out of CRP as a function of corn prices
Environmental Management (2009) 44:732–744 737
123

decisions. However, there are many reasons why land-
owners decide to enroll in the CRP program; in practice,
profit is not always the driving force behind their choice to
enroll. Therefore, our estimates should be considered an
upper-bound estimate of the area that would go back into
production. It is also important to note that this is a long-
term equilibrium analysis of the alternative land uses for
CRP land. We are abstracting from penalties for early
termination and re-enrollment provisions such as the re-
enrollment and extension (REX) offer being implemented
by FSA.
Figure 6 illustrates the geographical location of the
areas that would go back into production with corn prices
at $118.10/ton. The majority of the land in CRP is in the
eastern and southern parts of Iowa, and a large part of the
land that would go back into production is located in those
areas. However, note that since CRP land in the Des
Moines Lobe (Fig. 1) is quite productive, high corn prices
would drastically reduce the amount of land retired from
production in that area.
To estimate how the CRP program may respond to
higher corn prices to maintain enrollment, we increase the
SRRs by 25, 50, 75, and 100% to estimate the CRP land
supply curves with higher CRP payments. We then calcu-
late program costs for all these scenarios. Figure 7 illus-
trates how higher CRP payments would limit the return of
land into production. For example, at a corn price of
$118.10/ton, we estimate that it would cost over $277
million to limit the return of CRP land into production to
less than 70,000 ha. For higher corn prices, even doubling
the payments becomes a relatively ineffective policy. For
example, we estimate that for corn prices of $157.47/ton,
doubling the rental rate paid to farmers would result in
program costs of slightly more than $182 million, a sum
comparable to recent historical costs for Iowa, but would
only result in the enrollment of a little more than
420,000 ha. The tables in the Appendix detail the program
outlays and corresponding areas enrolled in the program in
this simulation exercise.
It is important to note that a driving force behind the
current and projected spatial distribution of CRP land is the
relationship between SRRs and the productivity of the land.
CRP payments are quite inelastic with respect to the CSR
index. This implies that highly productive land tends to be
under-enrolled because of higher returns from production.
As corn prices rise, there is a pivoting of the returns to
Hectares 201 - 1,7751,775 - 2,6032,603 - 3,3603,360 - 4,8174,817 - 10,312
Fig. 6 Distribution of area out
of CRP at $118.10/ton corn
Fig. 7 Land out of CRP as a function of corn prices and CRP
payments. SRR soil rental rate, or current estimated payment
738 Environmental Management (2009) 44:732–744
123

production. At corn prices of $118/ton, CRP payments are
higher than returns from production for land with CSR of
less than 50 or so. At corn prices of $157/ton, land with a
CSR index as low as 39 can gain higher returns if put back
into production.
The soil information necessary to run EPIC was not
available for around 18,600 ha. Therefore, our results have
to be considered somewhat of an underestimate, though
almost 97% of the CRP area is included in the analysis.
The economic analysis was conducted on the basis of
expected yields calibrated to current realized Iowa yields,
as discussed in the methods section. The realized EPIC
yields compare quite well with expected yields for both
soybeans and corn. The average EPIC soybean yield for
CRP land converted to a corn soybean rotation was
2.6 tons/ha, while the economic model’s average yield was
2.39 tons/ha. The average EPIC corn yield for CRP land
converted to a corn soybean rotation was 8.17 tons/ha, and
the yield for continuous corn was 7.22 tons/ha, while the
corresponding economic model’s average yields were 7.49
and 7.27 tons/ha, respectively. Therefore, the EPIC simu-
lations well captured the yield drag effects of continuous
corn.
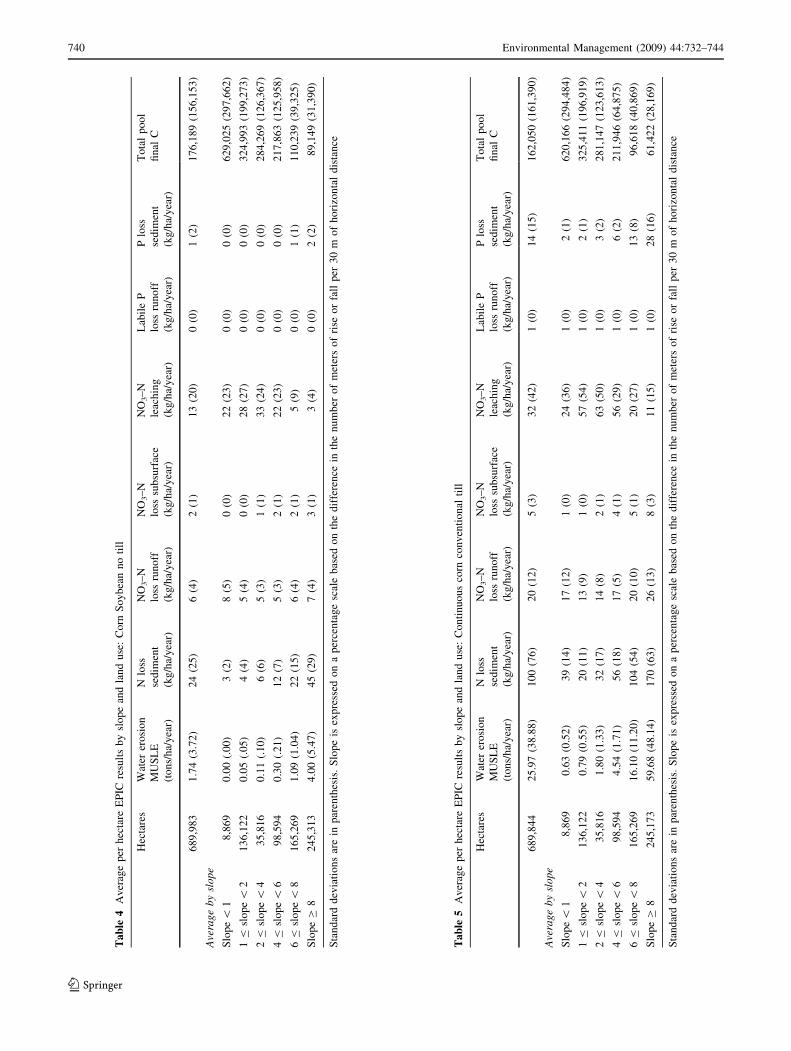
Tables 3, 4 and 5 illustrate the environmental impacts
by slope for the three crop rotations included in the
analysis. On average, the main pathway of nutrient loss
for CRP land is nitrate leaching. However, there are large
variations in the amounts of nitrate leaching across CRP
soils. In particular, the flat land currently in CRP, which
also tends to be the most productive, has very high
carbon levels (see Table 3). This is the main reason
behind the high leaching numbers. The nitrate losses are
comparatively small when the CRP land is converted
back into cropland due to the relatively high slope of the
fields and the lack of tile drainage, so on average
nitrogen lost through sediment and surface runoff become
much more important pathways (Tables 4, 5). This is
consistent with recent preliminary results from the Con-
servation Effectiveness Assessment Project (CEAP) on
the conservation benefits of CRP in the Upper Missis-
sippi River Basin, which estimate that almost 70% of
nitrogen losses in CRP occur via groundwater losses
(Atwood 2008).
The levels of soil erosion for no till corn soybeans and
for conventional till continuous corn on flat land are
comparable to those reported by the CEAP project
(Potter and others 2006). The CEAP report estimated an
average soil loss of 4.5 tons per ha per year in the Upper
Midwest for cropland. Our EPIC simulations produce
much higher sediment losses in highly sloping land for
conventional till continuous corn, which is why this land
is under conservation compliance and would not be
cropped under intensive tillage. This indirectly illustrates Ta
ble
3A
ver
age
per
hec
tare
EP
ICre
sult
sb
ysl
op
ean
dla
nd
use
:C
RP
Hec
tare
sW
ater
ero
sio
n
MU
SL
E
(to
ns/
ha/
yea
r)
Nlo
ss
sed
imen
t
(kg
/ha/
yea
r)
NO
3–
N
loss
run
off
(kg
/ha/
yea
r)
NO
3–
N
loss
sub
surf
ace
(kg
/ha/
yea
r)
NO
3–
N
leac
hin
g
(kg
/ha/
yea
r)
Lab
ile
P
loss
run
off
(kg
/ha/
yea
r)
Plo
ss
sed
imen
t
(kg
/ha/
yea
r)
To
tal
po
ol
fin
alC
68
9,9
83
0.1
0(.
66
)1
(2)
0(0
)0
(0)
4(1
0)
0(0
)0
(0)
18
9,8
60
(16
2,1
62
)
Ave
rag
eb
ysl
op
e
Slo
pe\
18
,86
90
.00
(.0
0)
0(0
)1
(1)
0(0
)1
3(1
9)
0(0
)0
(0)
65
0,8
47
(30
0,4
46
)
1B
slo
pe\
21
36
,12
20
.00
(.0
0)
0(0
)0
(0)
0(0
)1
1(1
4)
0(0
)0
(0)
34
3,1
24
(20
5,7
38
)
2B
slo
pe\
43
5,8
16
0.0
0(.
00
)0
(0)
0(0
)0
(1)
16
(15
)0
(0)
0(0
)3
02
,04
9(1
31
,80
1)
4B
slo
pe\
69
8,5
94
0.0
0(.
00
)0
(0)
0(0
)0
(0)
6(1
1)
0(0
)0
(0)
23
6,4
53
(13
2,2
51
)
6B
slo
pe\
81
65
,26
90
.02
(.0
6)
0(1
)0
(0)
0(0
)1
(3)
0(0
)0
(0)
12
0,0
58
(46
,14
9)
Slo
pe
C8
24
5,3
13
0.2
6(1
.09
)2
(4)
0(0
)0
(0)
0(0
)0
(0)
0(0
)1
00
,06
9(3
7,9
35
)
Sta
nd
ard
dev
iati
on
sar
ein
par
enth
esis
.S
lop
eis
exp
ress
edo
na
per
cen
tag
esc
ale
bas
edo
nth
ed
iffe
ren
cein
the
nu
mb
ero
fm
eter
so
fri
seo
rfa
llp
er3
0m
of
ho
rizo
nta
ld
ista
nce
Environmental Management (2009) 44:732–744 739
123
Ta
ble
4A
ver
age
per
hec
tare
EP
ICre
sult
sb
ysl
op
ean
dla
nd
use
:C
orn
So
yb
ean
no
till
Hec
tare
sW
ater
ero
sio
n
MU
SL
E
(to
ns/
ha/
yea
r)
Nlo
ss
sed
imen
t
(kg
/ha/
yea
r)
NO
3–
N
loss
run
off
(kg
/ha/
yea
r)
NO
3–
N
loss
sub
surf
ace
(kg
/ha/
yea
r)
NO
3–
N
leac
hin
g
(kg
/ha/
yea
r)
Lab
ile
P
loss
run
off
(kg
/ha/
yea
r)
Plo
ss
sed
imen
t
(kg
/ha/
yea
r)
To
tal
po
ol
fin
alC
68
9,9
83
1.7
4(3
.72
)2
4(2
5)
6(4
)2
(1)
13
(20
)0
(0)
1(2
)1
76
,18
9(1
56
,15
3)
Ave
rag
eb
ysl
op
e
Slo
pe\
18
,86
90
.00
(.0
0)
3(2
)8
(5)
0(0
)2
2(2
3)
0(0
)0
(0)
62
9,0
25
(29
7,6
62
)
1B
slo
pe\
21
36
,12
20
.05
(.0
5)
4(4
)5
(4)
0(0
)2
8(2
7)
0(0
)0
(0)
32
4,9
93
(19
9,2
73
)
2B
slo
pe\
43
5,8
16
0.1
1(.
10
)6
(6)
5(3
)1
(1)
33
(24
)0
(0)
0(0
)2
84
,26
9(1
26
,36
7)
4B
slo
pe\
69
8,5
94
0.3
0(.
21
)1
2(7
)5
(3)
2(1
)2
2(2
3)
0(0
)0
(0)
21
7,8
63
(12
5,9
58
)
6B
slo
pe\
81
65
,26
91
.09
(1.0
4)
22
(15
)6
(4)
2(1
)5
(9)
0(0
)1
(1)
11
0,2
39
(39
,32
5)
Slo
pe
C8
24
5,3
13
4.0
0(5
.47
)4
5(2
9)
7(4
)3
(1)
3(4
)0
(0)
2(2
)8
9,1
49
(31
,39
0)
Sta
nd
ard
dev
iati
on
sar
ein
par
enth
esis
.S
lop
eis
exp
ress
edo
na
per
cen
tag
esc
ale
bas
edo
nth
ed
iffe
ren
cein
the
nu
mb
ero
fm
eter
so
fri
seo
rfa
llp
er3
0m
of
ho
rizo
nta
ld
ista
nce
Ta
ble
5A
ver
age
per
hec
tare
EP
ICre
sult
sb
ysl
op
ean
dla
nd
use
:C
on
tin
uo
us
corn
con
ven
tio
nal
till
Hec
tare
sW
ater
ero
sio
n
MU
SL
E
(to
ns/
ha/
yea
r)
Nlo
ss
sed
imen
t
(kg
/ha/
yea
r)
NO
3–
N
loss
run
off
(kg
/ha/
yea
r)
NO
3–
N
loss
sub
surf
ace
(kg
/ha/
yea
r)
NO
3–
N
leac
hin
g
(kg
/ha/
yea
r)
Lab
ile
P
loss
run
off
(kg
/ha/
yea
r)
Plo
ss
sed
imen
t
(kg
/ha/
yea
r)
To
tal
po
ol
fin
alC
68
9,8
44
25
.97
(38
.88
)1
00
(76
)2
0(1
2)
5(3
)3
2(4
2)
1(0
)1
4(1
5)
16
2,0
50
(16
1,3
90
)
Ave
rag
eb
ysl
op
e
Slo
pe\
18
,86
90
.63
(0.5
2)
39
(14
)1
7(1
2)
1(0
)2
4(3
6)
1(0
)2
(1)
62
0,1
66
(29
4,4
84
)
1B
slo
pe\
21
36
,12
20
.79
(0.5
5)
20
(11
)1
3(9
)1
(0)
57
(54
)1
(0)
2(1
)3
25
,41
1(1
96
,91
9)
2B
slo
pe\
43
5,8
16
1.8
0(1
.33
)3
2(1
7)
14
(8)
2(1
)6
3(5
0)
1(0
)3
(2)
28
1,1
47
(12
3,6
13
)
4B
slo
pe\
69
8,5
94
4.5
4(1
.71
)5
6(1
8)
17
(5)
4(1
)5
6(2
9)
1(0
)6
(2)
21
1,9
46
(64
,87
5)
6B
slo
pe\
81
65
,26
91
6.1
0(1
1.2
0)
10
4(5
4)
20
(10
)5
(1)
20
(27
)1
(0)
13
(8)
96
,61
8(4
0,8
69
)
Slo
pe
C8
24
5,1
73
59
.68
(48
.14
)1
70
(63
)2
6(1
3)
8(3
)1
1(1
5)
1(0
)2
8(1
6)
61
,42
2(2
8,1
69
)
Sta
nd
ard
dev
iati
on
sar
ein
par
enth
esis
.S
lop
eis
exp
ress
edo
na
per
cen
tag
esc
ale
bas
edo
nth
ed
iffe
ren
cein
the
nu
mb
ero
fm
eter
so
fri
seo
rfa
llp
er3
0m
of
ho
rizo
nta
ld
ista
nce
740 Environmental Management (2009) 44:732–744
123

the importance of conservation compliance measures on
working lands.
The results of Tables 4, 5 represent lower and upper
bounds for any other tillage/rotation choices likely to
occur in Iowa, since no till corn soybeans is the less
intensive form of row crop production currently prac-
ticed, and continuous corn using conventional tillage is
one of the most intensive ones. Thus, because of the
impact of conventional tillage on more fragile land and
the higher levels of fertilizer required by continuous corn,
the conversion of land to conventional tillage continuous
corn would have much more dramatic effects than no till
corn soybeans cultivation for soil erosion and nitrogen
losses.
Our results show that some of the environmental
impacts increase drastically as higher corn prices bring into
production more and more environmentally fragile land.
Table 6 shows the marginal impact of additional hectares
put into production. In particular, per hectare sediment
losses and nitrogen and phosphorus lost through sediment
increase quite substantially as crop prices increase. For
example, per hectare sediment losses increase from 0.1
tons/ha for the almost 700,000 ha of CRP included in the
EPIC analysis to almost 1.9 tons/ha at corn prices of
$196.84/ton, for the over half a million hectares that would
go back into production.
Per hectare nitrogen and phosphorus losses follow a
similar pattern. Losses through sediment have the largest
increase because more erodible land goes into production
as crop prices increase. The nitrate losses through leaching
stay more or less constant because, as we noted before,
they are driven by the high carbon levels of the most
productive CRP land. To put our estimates in context, the
national 2006 CEAP report estimated nitrogen losses of
32.3 kg/ha/year for corn in cropland of the Upper Midwest,
and 20.2 kg/ha/year for soybeans, with over 50% of the
losses occurring though sediment. Note that the CEAP
report did not explicitly account for tile drainage because
of the lack of information on this in their sample (Potter
and others 2006).
The same report estimated phosphorus losses of 4.8 and
1.8 kg/ha/year for corn and soybeans, respectively, in the
Upper Midwest, with 70–80% of the losses occurring
through sediment (Potter and others 2006).
The carbon sequestration numbers illustrate that it is the
most productive, high carbon land that goes back into
production first. That is the reason why the per hectare final
carbon pool levels are higher for land back into row crop
production than they are for the average CRP parcel
(Table 3). However, the carbon sequestration levels would
have been higher for the parcels going back to production if
they had remained into CRP. For example, at corn prices of
$78.74/ton, we estimate that the final per hectare carbon Ta
ble
6A
ver
age
env
iro
nm
enta
lim
pac
tso
fla
nd
bac
kin
pro
du
ctio
nat
var
iou
sco
rnp
rice
s(s
tan
dar
dd
evia
tio
ns
inp
aren
thes
is)
Co
rnp
rice
/to
n$
78
.74
$9
1.7
3$
10
4.7
2$
11
8.1
0$
13
1.1
0$
14
4.0
9$
15
7.4
7$
17
0.4
6$
18
3.4
6$
19
6.8
4
Hec
tare
s2
8,9
70
12
3,4
14
25
4,4
93
33
8,0
36
41
5,9
81
45
3,3
71
48
3,9
73
50
3,0
86
51
7,6
93
53
1,7
20
Wat
erer
osi
on
MU
SL
E(t
on
s/h
a/y
ear)
0.1
2(0
.11
)0
.16
(0.2
0)
0.2
4(0
.31
)0
.34
(0.4
9)
0.8
8(1
.34
)1
.39
(2.0
8)
1.7
1(2
.47
)1
.83
(2.6
4)
1.8
5(2
.66
)1
.90
(2.7
4)
Nlo
ssse
dim
ent
(kg
/ha/
yea
r)5
(4)
6(6
)8
(8)
10
(10
)1
7(1
8)
25
(28
)2
9(3
2)
30
(33
)3
0(3
3)
31
(34
)
NO
3–
Nlo
ssru
no
ff(k
g/h
a/y
ear)
4(3
)4
(3)
5(3
)5
(3)
7(6
)9
(9)
10
(10
)1
0(1
0)
10
(10
)1
0(1
0)
NO
3–
Nlo
sssu
bsu
rfac
e(k
g/h
a/y
ear)
1(1
)1
(1)
1(1
)1
(1)
2(1
)2
(2)
2(2
)2
(2)
2(2
)1
(1)
NO
3–
Nle
ach
ing
(kg
/ha/
yea
r)2
0(2
4)
23
(24
)2
1(2
4)
19
(23
)2
4(3
4)
28
(41
)3
0(4
6)
30
(46
)3
0(4
6)
29
(46
)
Plo
ssru
no
ff(k
g/h
a/y
ear)
0(0
)0
(0)
0(0
)0
(0)
0(0
)0
(0)
0(0
)0
(0)
0(0
)0
(0)
Plo
ssse
dim
ent
(kg
/ha/
yea
r)0
(0)
0(0
)0
(0)
0(1
)1
(1)
2(3
)2
(3)
2(3
)2
(3)
2(3
)
To
tal
po
ol
fin
alC
(kg
/ha/
yea
r)2
25
,95
5
(13
5,1
49
)
25
8,1
94
(15
1,1
79
)
25
1,8
72
(14
9,6
02
)
22
9,0
49
(14
3,9
57
)
21
7,1
22
(15
8,5
95
)
20
9,9
18
(16
1,0
74
)
20
3,7
99
(16
2,9
96
)
20
0,1
71
(16
4,9
48
)
19
7,3
66
(16
4,6
63
)
19
4,4
34
(16
4,1
29
)
Environmental Management (2009) 44:732–744 741
123

pool for land going back into production would be
225,955 kg/ha. If those same parcels had remained in CRP,
their final carbon pool would have averaged 241,839 kg/ha.
Similarly, for corn prices of 157.47/ton, the final carbon
pool of the almost half a million hectares back into pro-
duction is estimated at 203,799 kg/ha. If those same par-
cels had remained enrolled into CRP, they would have had
a final carbon pool of 219,030 kg/ha.
Note that, even with very high crop prices, there are
over 158,000 ha included in the EPIC simulations that do
not go back into production. This suggests that some of the
land in CRP is too marginal to be considered for crop
production.
Conclusions
The results of our work carry implications for large parts of
the United States, particularly in the Corn Belt. The results
indicate that the land returning to production will be spa-
tially distributed according to the quality of the land in
CRP in the area, which is itself likely a function of overall
land productivity. These results suggest that conservation
policy could be substantially impacted by the increase in
commodity prices. Maintaining current levels of environ-
mental quality will require either substantial budget
increases or a focused targeting approach to increase the
cost/benefit ratios of land retired from production. In par-
ticular, high corn prices may accelerate the trend that
started with the 2002 farm bill in which CRP has shifted
from the idling of whole fields for conservation purposes
toward implementing ‘‘high-priority ‘buffer’ practices
(e.g., filter strips, grassed waterways) that support working
lands by reducing the environmental implications of
ongoing agricultural production (USDA 2006, p. 24).’’ To
preserve whole fields in CRP, higher payments will have to
be considered. Since these will keep only part of the land
out of production, it is not certain that more money will
have to be devoted to conservation programs. For example,
at corn prices of $170.46/ton, doubling soil rental rates
would keep over 349,000 ha in the program, as opposed to
less than 206,000 ha with current payment levels, and the
program costs would be lower than they are now by over
$36 million.
In any case, some areas could see considerable reduc-
tions in CRP enrollment, thereby affecting wildlife popu-
lations. In particular, several recent studies indicate that
CRP land has positive impacts on game birds and that their
populations could be severely affected (Nielson and others
2006; Schroeder and Vander Haegen 2006; Riffell and
Burger 2006).
Acknowledgments We thank Todd Campbell for excellent com-
putational assistance. This research was made possible in part by
USDA-CSREES grant 2005-51130-02366, USDA-Rural Develop-
ment grant 68-3A75-6-511 and EPA Collaborative agreement
CR83371701-1. The views expressed here are those of the authors
and do not necessarily represent the view of USDA or EPA.
Appendix
Area and Program Costs Results From the Economic
Simulations
See Tables 7 and 8.
Table 7 Area remaining in
CRP for various crop prices and
rental payments
SRR Soil Rental Rate, used to
approximate CRP payments
Corn price/ton Hectares
SRR SRR*1.25 SRR*1.5 SRR*1.75 SRR*2
$78.74 680,177 704,806 708,077 708,628 708,628
$91.73 585,715 667,530 699,197 706,834 708,616
$104.72 454,636 574,403 651,504 692,419 703,507
$118.10 371,094 447,763 560,600 641,669 683,380
$131.10 293,148 370,434 445,481 535,876 624,513
$144.09 255,759 295,506 367,112 437,557 514,656
$157.47 225,157 258,036 296,150 355,770 422,185
$170.46 206,043 225,412 256,849 290,843 349,519
$183.46 191,437 207,950 226,808 257,386 288,261
$196.84 177,410 191,707 210,064 227,542 254,374
Baseline 708,704
742 Environmental Management (2009) 44:732–744
123

References
Atwood J (2008) CEAP assessment of CRP benefits in upper
Mississippi. Paper presented at the annual meeting of the soil and
water conservation society, 26–31 July 2008, Tucson, Arizona
Babcock BA, Lakshminarayan PG, Wu J, Zilberman D (1996) The
economics of a public fund for environmental amenities: a study
of CRP contracts. American Journal of Agricultural Economics
78:961–971
Chung SW, Gassman PW, Huggins DR, Randall GW (2001)
Evaluation of EPIC for tile flow and tile nitrate losses from
three Minnesota cropping systems. Journal of Environment
Quality 30(3):822–830
Chung SW, Gassman PW, Gu R, Kanwar RS (2002) Evaluation of
EPIC for assessing tile flow and nitrogen losses for alternative
agricultural management systems. Transactions of the ASAE
45(4):1135–1146
Claassen R, Hansen L, Peters M, Breneman V, Weinberg M, Cattaneo
A, Feather P, Gadsby D, Hellerstein D, Hopkins J, Johnston P,
Morehart M, Smith M (2001) Agri-environmental policy at the
crossroads: guideposts on a changing landscape. Agricultural
Economics Report No. 794. Economic Research Service, US
Department of Agriculture. http://www.ers.usda.gov/publica
tions/aer794/. Accessed 10 Oct 2007
Duffy M, Smith D (2007) Estimated costs of crop production in
Iowa—2007. File A1-20. Iowa State University Extension,
Ames, Iowa. http://www.extension.iastate.edu/agdm/crops/pdf/
a1-20.pdf. Accessed 11 Dec 2007
Elobeid A, Tokgoz S, Hayes DJ, Babcock BA, Hart CE (2006) The
Long-run impact of corn-based ethanol on the grain, oilseed, and
livestock sectors: a preliminary assessment. Briefing paper 06-
BP 49. Center for Agricultural and Rural Development, Iowa
State University, Ames, Iowa. http://www.card.iastate.edu/publi
cations/DBS/PDFFiles/06bp49.pdf. Accessed 17 Oct 2008
Farm Service Agency (FSA) (2004) Cumulative crp enrollment by
county, FY—2004. http://www.fsa.usda.gov/Internet/FSA_File/
fy2004public.xls. Accessed 10 Dec 2007
Farm Service Agency (FSA) (2007) The conservation reserve pro-
gram: summary and enrollment statistics 2007. http://www.fsa.
usda.gov/Internet/FSA_File/annual_consv_2007.pdf. Accessed
18 Sept 2008
Gassman PW, Williams JR, Benson VW, Izaurralde RC, Hauck L,
Jones CA, Atwood JD, Kiniry J, Flowers JD (2005) Historical
development and applications of the EPIC and APEX models.
Working paper 05-WP 397. Center for Agricultural and Rural
Development, Iowa State University, Ames, Iowa. http://www.
card.iastate.edu/publications/synopsis.aspx?id=763. Accessed 5
May 2007
Iowa Cooperative Soil Survey (2003) Iowa soil properties and
interpretation database. http://icss.agron.iastate.edu/. Accessed
12 Feb 2007
Iowa Department of Natural Resources (IDNR) (2004) Land cover of
the state of Iowa in the year 2002, Grid dataset. ftp://ftp.igsb.
uiowa.edu/gis_library/IA_State/Land_Description/Land_Cover/
Land_Cover_2002/lc_2002.htm. Accessed 12 Feb 2007
Izaurralde RC, Williams JR, McGill WB, Rosenberg NJ (2006)
Simulating soil C dynamics with EPIC: model description and
testing against long-term data. Ecological Modelling 192(3–4):
362–384
Kelley RH, Parton WJ, Crocker GJ, Grace PR, Klır J, Korschens M,
Poulton PR, Richter DD (1997) Simulating trends in soil organic
carbon in long-term experiments using the century model.
Geoderma 81:75–90
Lubowski R, Bucholtz S, Claassen R, Roberts MJ, Cooper JC,
Gueorguieva A, Johansson R (2006) Environmental effects of agri-
cultural land-use change. Economic research report No. 25. Eco-
nomic Research Service, US Department of Agriculture. http://
www.ers.usda.gov/Publications/ERR25/. Accessed 10 Oct 2007
Mapemba LD, Epplin FM, Taliaferro CM, Huhnke RL (2007)
Biorefinery feedstock production on conservation reserve pro-
gram land. Review of Agricultural Economics 29(2):227–246
Nielson RM, McDonald LL, Howlin S, Sullivan JP, Burgess C,
Johnson DS (2006) Estimating response of ring-necked pheasant
(Phasianus Colchicus) to the conservation reserve program.
http://www.fsa.usda.gov/Internet/FSA_File/crp_pheasants_final_
report.pdf. Accessed 18 Aug 2007
Pautsch GR, Kurkalova LA, Babcock BA, Kling CL (2001)
Efficiency of sequestering carbon in agricultural soils. Contem-
porary Economic Policy 19(2):123–134
Potter SR, Andrews S, Atwood JD, Kellogg RL, Lemunyon J, Norfleet
L, Oman D (2006) Model simulation of soil loss, nutrient loss,
and change in soil organic carbon associated with crop produc-
tion. US Department of Agriculture, Natural Resources Conser-
vation Service, Conservation Effects Assessment Project Report.
http://www.nrcs.usda.gov/technical/nri/ceap/croplandreport/.
Accessed 26 Oct 2008
Table 8 Program costs corresponding to the CRP area above
Corn price Program costs
SRR SRR*1.25 SRR*1.5 SRR*1.75 SRR*2
$78.74 $170,332,771 $222,879,682 $268,760,041 $313,792,968 $358,620,535
$91.73 $139,269,773 $208,083,090 $265,086,096 $313,000,936 $358,614,879
$104.72 $100,030,010 $170,165,733 $242,308,499 $305,889,528 $356,064,685
$118.10 $76,376,423 $122,884,447 $197,951,626 $277,302,467 $344,441,922
$131.10 $55,811,884 $95,624,770 $146,646,096 $220,164,741 $305,850,819
$144.09 $46,588,722 $70,746,640 $114,229,342 $167,376,134 $238,202,924
$157.47 $39,467,784 $59,056,194 $85,242,145 $127,988,797 $182,471,374
$170.46 $35,002,623 $49,480,352 $70,553,212 $97,136,575 $143,154,509
$183.46 $31,825,882 $44,280,332 $59,904,254 $82,566,684 $110,091,175
$196.84 $29,094,866 $40,007,865 $53,956,431 $70,210,235 $93,289,500
Baseline $179,325,900
Environmental Management (2009) 44:732–744 743
123
Riffell SK, Burger LW (2006) Estimating wildlife response to the
conservation reserve program: Bobwhite and Grassland
birds. http://www.fsa.usda.gov/Internet/FSA_File/quail_study.pdf.
Accessed 18 Aug 2007
Sawyer J (2006) Corn nitrogen rate calculator web tool updated. IC-
496(24), Iowa State University Extension, Ames, Iowa. http://
www.ipm.iastate.edu/ipm/icm/2006/9-18/ntool.html. Accessed 5
Sept 2008
Sawyer J, Nafziger E, Randall G, Bundy L, Rehm G, Joern B (2006)
Concepts and rationale for regional nitrogen rate guidelines
for corn. PM 2015 Iowa State University Extension, Ames,
Iowa. http://www.extension.iastate.edu/Publications/PM2015.pdf.
Accessed 31 Aug 2008
Schroeder MA, Vander Haegen WM (2006) Use of CRP Fields by
Greater Sage-grouse and other Shrubsteppe associated Wildlife in
Washington. Farm Service Agency, US Department of Agricul-
ture. http://www.fsa.usda.gov/Internet/FSA_File/sage_grouse.
pdf. Accessed 18 Aug 2007
Tokgoz S, Elobeid A, Fabiosa JF, Hayes DJ, Babcock BA, Yu T,
Dong F, Hart CE, Beghin JC (2007) Emerging biofuels: outlook
of effects on U.S. grain, oilseed, and livestock markets. Staff
Report 07-SR 101. Center for Agricultural and Rural Develop-
ment, Iowa State University, Ames, IA
USDA (2000–2006) Farm business and household survey data:
customized data summaries from ARMS. http://www.ers.usda.
gov/Data/ARMS/app/Crop.aspx. Accessed 9 Nov 2008
USDA (2006) 2007 Farm bill theme papers: conservation and the
environment. http://www.usda.gov/documents/FarmBill07con
senv.pdf. Accessed 10 Nov 2007
USDA Natural Resources Conservation Service (2006) Soil survey
geographic (SSURGO) database for Iowa. http://soildatamart.
nrcs.usda.gov. Accessed 10 Feb 2007
Vetsch JA, Randall GW, Lamb JA (2007) Corn and soybean
production as affected by tillage systems. Agronomy Journal
99:952–959
Vyn TJ, West TD, Steinhardt GC (2000) Corn and soybean response
to tillage and rotation systems on a dark prairie soil: 25 year
review. No. 196 (p. 1-10. In Proceedings of 15th conference on
international soil tillage research organisation, 2–6 July 2000.
Fort Worth, Texas
Wilhelm WW, Wortmann CS (2004) Tillage and rotation interactions
for corn and soybean grain yield as affected by precipitation and
air temperature. Agronomy Journal 96:425–432
Williams JR (1990) The erosion productivity impact calculator
(EPIC) model: a case history. Philosophical Transaction of the
Royal Society of London 329:421–428
Williams JR (1995) The EPIC model. In: Singh VP (ed) Computer
models of watershed hydrology. Water Resources Publications,
Highlands Ranch, CO, pp 909–1000
Williams JR, Jones CA, Dyke PT (1984) A modeling approach to
determining the relationship between erosion and soil produc-
tivity. Transactions of the ASAE 27:129–144
744 Environmental Management (2009) 44:732–744
123