Laboratory based assessment of cookstove performance using energy and emission parameters for North...
11
Laboratory based assessment of cookstove performance using energy and emission parameters for North Indian cooking cycle Pooja Arora a , Suresh Jain a,b,* , Kamna Sachdeva a a Department of Natural Resources, TERI University, 10, Institutional Area, Vasant Kunj, New Delhi 110070, India b Department of Energy and Environment, TERI University, 10, Institutional Area, Vasant Kunj, New Delhi 110070, India article info Article history: Received 15 December 2013 Received in revised form 9 July 2014 Accepted 13 July 2014 Available online Keywords: Specific energy consumption Controlled cooking test Biomass energy Air emissions Cooking cycle Water boiling test abstract The study was conducted to evaluate the performance of cookstoves using controlled cooking test (CCT) with cooking cycles of Northern India, i.e., Uttar Pradesh (UP) and Uttarakhand (UK). Cooking time, specific energy consumption (SEC), and emission factors (EFs) of carbon monoxide (CO) and particulate matter (PM) were monitored for three improved and one traditional cookstoves. Cooking was conducted by residents of the study area. The findings from the study showed that the difference in thickness of roti baked in UP and UK resulted in a significant change in emission and energy performance in all the four cookstoves. The low-power inputs required for baking thinner roti resulted in higher CO and PM emissions in case of CCT-UK. The results of CCT were also compared to Water Boiling Test (WBT) for all the four cookstoves. The percent reductions in terms of energy and emission parameters in the three improved cookstoves compared to traditional cookstove were found to differ in CCT and WBT. Large variations were also observed during the emission performance (40% decrease in CO EF) of the fan cookstove with change in fan speed, which was usually unreported in previous studies. Overall, results show significant influence of cooking cycles on cookstove performance, which was found to alter the cookstove rankings. Therefore, the study thrusts upon the inclusion of user centric cook- stove testing protocols in order to identify actual benefits for targeted rural communities. © 2014 Elsevier Ltd. All rights reserved. 1. Introduction In most of the developing countries, biomass based cook- stoves are a lifeline of any rural household, given the limited financial resources. These bottom of the pyramid (BoP) energy systems are being regularly redesigned and tested, in order to provide the underprivileged sections of the society, a healthy and sustainable lifestyle [1]. Testing of cookstoves is one of the most crucial steps in any cookstove dissemination program. Cookstove testing is conducted in a laboratory, and/or in field conditions, to assess the performance in terms of fuel savings (energy efficiency) and environmental parameters, i.e., emis- sion of air pollutants. Particulate matter (PM) and carbon * Corresponding author. Department of Natural Resources, TERI University, 10, Institutional Area, Vasant Kunj, New Delhi 110070, India. Tel.: þ91 11 2612 2222; fax: þ91 11 2612 2874. E-mail addresses: [email protected], [email protected] (S. Jain). Available online at www.sciencedirect.com ScienceDirect http://www.elsevier.com/locate/biombioe biomass and bioenergy 69 (2014) 211 e221 http://dx.doi.org/10.1016/j.biombioe.2014.07.012 0961-9534/© 2014 Elsevier Ltd. All rights reserved.
-
Upload
independent -
Category
Documents
-
view
4 -
download
0
Transcript of Laboratory based assessment of cookstove performance using energy and emission parameters for North...
ww.sciencedirect.com
b i om a s s a n d b i o e n e r g y 6 9 ( 2 0 1 4 ) 2 1 1e2 2 1
Available online at w
ScienceDirect
http: / /www.elsevier .com/locate/biombioe
Laboratory based assessment of cookstoveperformance using energy and emissionparameters for North Indian cooking cycle
Pooja Arora a, Suresh Jain a,b,*, Kamna Sachdeva a
a Department of Natural Resources, TERI University, 10, Institutional Area, Vasant Kunj, New Delhi 110070, Indiab Department of Energy and Environment, TERI University, 10, Institutional Area, Vasant Kunj, New Delhi 110070,
India
a r t i c l e i n f o
Article history:
Received 15 December 2013
Received in revised form
9 July 2014
Accepted 13 July 2014
Available online
Keywords:
Specific energy consumption
Controlled cooking test
Biomass energy
Air emissions
Cooking cycle
Water boiling test
* Corresponding author. Department of NatuTel.: þ91 11 2612 2222; fax: þ91 11 2612 2874
E-mail addresses: [email protected]://dx.doi.org/10.1016/j.biombioe.2014.07.0961-9534/© 2014 Elsevier Ltd. All rights rese
a b s t r a c t
The study was conducted to evaluate the performance of cookstoves using controlled
cooking test (CCT) with cooking cycles of Northern India, i.e., Uttar Pradesh (UP) and
Uttarakhand (UK). Cooking time, specific energy consumption (SEC), and emission factors
(EFs) of carbon monoxide (CO) and particulate matter (PM) were monitored for three
improved and one traditional cookstoves. Cooking was conducted by residents of the study
area. The findings from the study showed that the difference in thickness of roti baked in
UP and UK resulted in a significant change in emission and energy performance in all the
four cookstoves. The low-power inputs required for baking thinner roti resulted in higher
CO and PM emissions in case of CCT-UK. The results of CCT were also compared to Water
Boiling Test (WBT) for all the four cookstoves. The percent reductions in terms of energy
and emission parameters in the three improved cookstoves compared to traditional
cookstove were found to differ in CCT andWBT. Large variations were also observed during
the emission performance (40% decrease in CO EF) of the fan cookstove with change in fan
speed, which was usually unreported in previous studies. Overall, results show significant
influence of cooking cycles on cookstove performance, which was found to alter the
cookstove rankings. Therefore, the study thrusts upon the inclusion of user centric cook-
stove testing protocols in order to identify actual benefits for targeted rural communities.
© 2014 Elsevier Ltd. All rights reserved.
1. Introduction
In most of the developing countries, biomass based cook-
stoves are a lifeline of any rural household, given the limited
financial resources. These bottom of the pyramid (BoP) energy
systems are being regularly redesigned and tested, in order to
ral Resources, TERI Unive.om, [email protected] (S012rved.
provide the underprivileged sections of the society, a healthy
and sustainable lifestyle [1]. Testing of cookstoves is one of the
most crucial steps in any cookstove dissemination program.
Cookstove testing is conducted in a laboratory, and/or in field
conditions, to assess the performance in terms of fuel savings
(energy efficiency) and environmental parameters, i.e., emis-
sion of air pollutants. Particulate matter (PM) and carbon
rsity, 10, Institutional Area, Vasant Kunj, New Delhi 110070, India.
. Jain).
b i om a s s a n d b i o e n e r g y 6 9 ( 2 0 1 4 ) 2 1 1e2 2 1212
monoxide (CO) due to their relevance in terms of health and
climatic impacts are the most commonly studied indoor pol-
lutants [2,3]. Themostwidely used laboratory test is theWater
Boiling Test (WBT), which is a simulation of actual cooking
style. The latest version of WBT (Version 4.1.2) provides a
methodology to test energy efficiency and emissions simul-
taneously, in order to understand the trade-offs that exist
between these two parameters [4]. Under the Household
Environment and Health (HEH) Project, two more testing
protocol were developed apart from WBT, namely, Controlled
Cooking Test (CCT), and Kitchen Performance Test (KPT). CCT
and KPT give a better representation of cookstove perfor-
mance because of the direct involvement of the beneficiaries.
Some CCT and KPT based studies have evidently shown a
weak link between the actual and simulated cooking condi-
tions [5e10]. These studies have relied on either fuel savings
or emission reduction to assess the cookstove designs. How-
ever, for a better assessment, energy and emission parame-
ters should be monitored concomitantly. Besides the
understanding of these factors, region specific cooking re-
gimes are also crucial part for the cookstove testing [11]. WBT
has also been used to associate the cookstove performance
with different variables such as fuel and vessel characteristics
[12e14]. These variables are representative of varied field
scenarios, and the individual impact of these variables can be
better understood under controlled laboratory conditions. The
concept of ‘burns cycle’ or ‘cooking cycle’ introduced by
Johnson et al. [15] and has been considered as a critical factor
in assessing the actual performance of cookstoves. CCT can
prove to be a better method for testing cookstoves as it can
easily capture the intricate details of cooking cycles, which
can help both stove designers and researchers engaged in
development of cookstove testing protocols. In the best of the
author's knowledge, no study has been carried out for Indian
conditions, where energy and emissions from cookstoves
have been reported using regional cooking cycles except one
study conducted in Tamilnadu by MacCarty et al. [16].
Therefore, this study proposes to assess cookstove perfor-
mance in terms of energy and emissions based on ‘Indian
cooking cycles. These results would be able to measure the
variations in cookstove performance using CCT protocol,
owing to the difference in cooking cycles existing in two
different regions of northern India i.e. Uttar Pradesh (UP) and
Uttarakhand (UK).
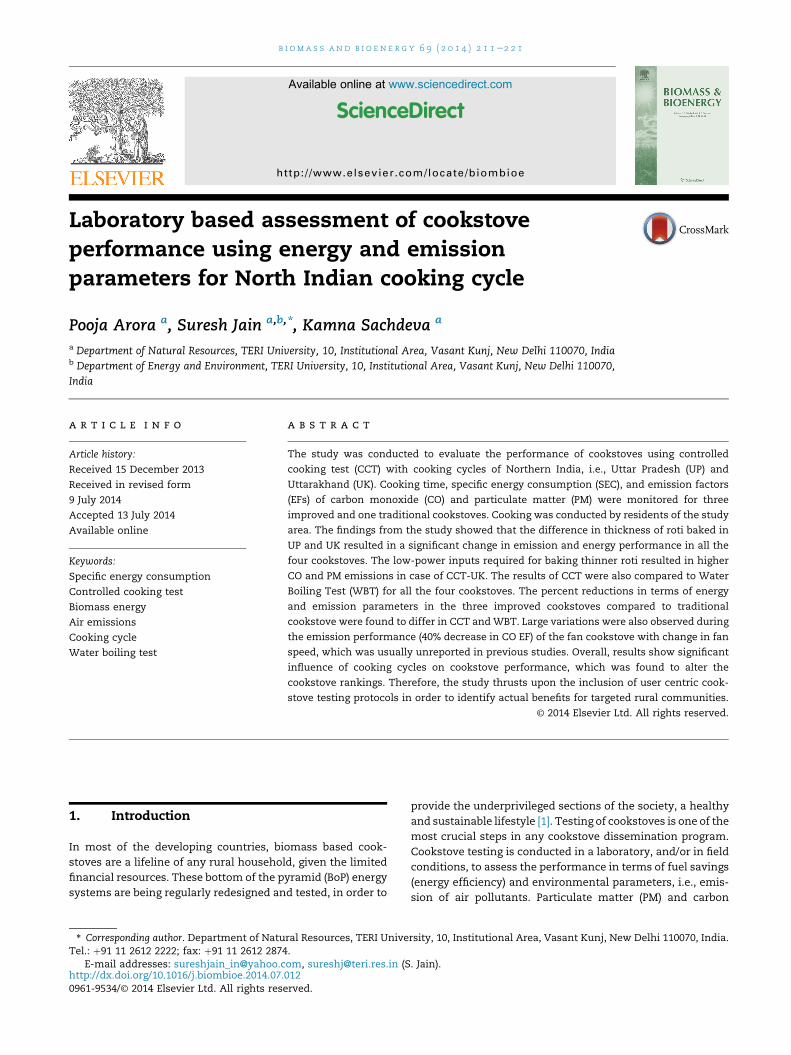
Fig. 1 e Photographs of the cookstoves tested. (a) Philips
forced draft (PF), (b) Philips natural draft (PN), (c) Envirofit
front feed (EN), (d) Traditional brick-mud cookstove (TR).
2. Methodology
2.1. Cookstoves tested, and test fuels used
The cookstoves selected in the study are among some of the
popular designs available in the Indian markets as shown in
Fig. 1. The four cookstoves differed from each other in terms of
the build material, size of the combustion chamber, fuel
feeding style and source of air supply (fan/free convection).
The top feed forced draft cookstove manufactured by Philips
India Limited, was selected under the advanced cookstove
category. The top feed natural draft (manufactured by Philips)
and front feed natural draft (manufactured by Envirofit In-
ternational Limited) were selected under improved cookstove
category. However, for the ease of discussion the above
mentioned cookstoves would be denoted as “improved cook-
stove” in the rest of the paper. The improved cookstoves were
tested against a commonly used traditional brick-mud cook-
stove (front feed mud cookstove, TR) design used in Northern
India. The TR cookstove was fabricated in the laboratory on a
metal sheet in order tomake it portable for the ease of testing.
Although in some areas within the study region, double pot
cookstoves are also used. This study, however, is limited to
single pot cookstoves.
All the tests were conducted using one wood, i.e., Acacia
nilotica (commonly known as Keeker), which is the most
commonly used wood for cooking at testing site. It was also
observed during the survey thatA. niloticawas also found to be
common cooking fuel in UP, in combination with other
biomass fuels such as cow dung and crop residue. During the
survey conducted in UK, the frequently used wood has been
oak (Quercus leucotrichophora and Quercus semecarpifolia); how-
ever, past studies have shown that the performance of cook-
stove more depends on cookstove designs rather than wood
types, except hardwoods and softwoods [17]. The wood size
used in each cookstove was set according to the manufac-
turer's product manuals. The wood size for the two top feed
cookstoves (PF and PN cookstoves) was 2 � 3 � 10 cm and
1.5� 1.5� 25 cm for the EN cookstove and 3� 3� 25 cm for the
TR cookstove. The wood moisture mass fraction during the
testing period was 8e14% (wet basis) measured using oven
method, which is also the case in the field. The dry seasons in
northern India can last upto nine months including winter
and summer during thewhich the fuelmoisture can vary from
�5% to �15%. The wood moisture can vary under different
relative humidity and temperature conditions also demon-
strated by Simpson and TenWolde [18]. The calorific values for
b i om a s s a n d b i o e n e r g y 6 9 ( 2 0 1 4 ) 2 1 1e2 2 1 213
wood and charcoal were calculated using bomb calorimeter
(Widsons Scientific Works, India) and were found to be
20.8 MJ kg�1 and 32.0 MJ kg�1 respectively.
2.2. Survey for food consumption and cooking cycle
Number of food items and their composition in a single meal
was set according to the most widely used cooking style in
Northern part of India. The cooking styles and food itemswere
identified by the help of a survey conducted in two states of
India, UK and UP. The survey was conducted in two villages in
the UK, Thalan village (30� 42� 56Ø N/78� 29� 06Ø E) in the
district of Uttarkashi and AamKheri (29� 47� 35Ø N/77� 52� 46Ø
E) village in Roorkee lying on the plains of UK. In Western UP,
Asoda (28� 45� 16Ø N/77� 46� 21ØE) and Dhaulana (28� 42� 43Ø
N/77� 39� 15ØE) villages in Ghaziabad district and Isagarh (25�
27� 28Ø N/78� 31� 16Ø E)and Bakhtar (25� 15� 03Ø N/79� 06� 37Ø
E) villages in Jhansi district were surveyed. While, in Eastern
UP, the survey was conducted to the village named Balia (25�
45� 31Ø N/84� 08� 55Ø E). The sampling was conducted using
stratified random sampling with 50e100 households within
each village. The survey was conducted using a semi-
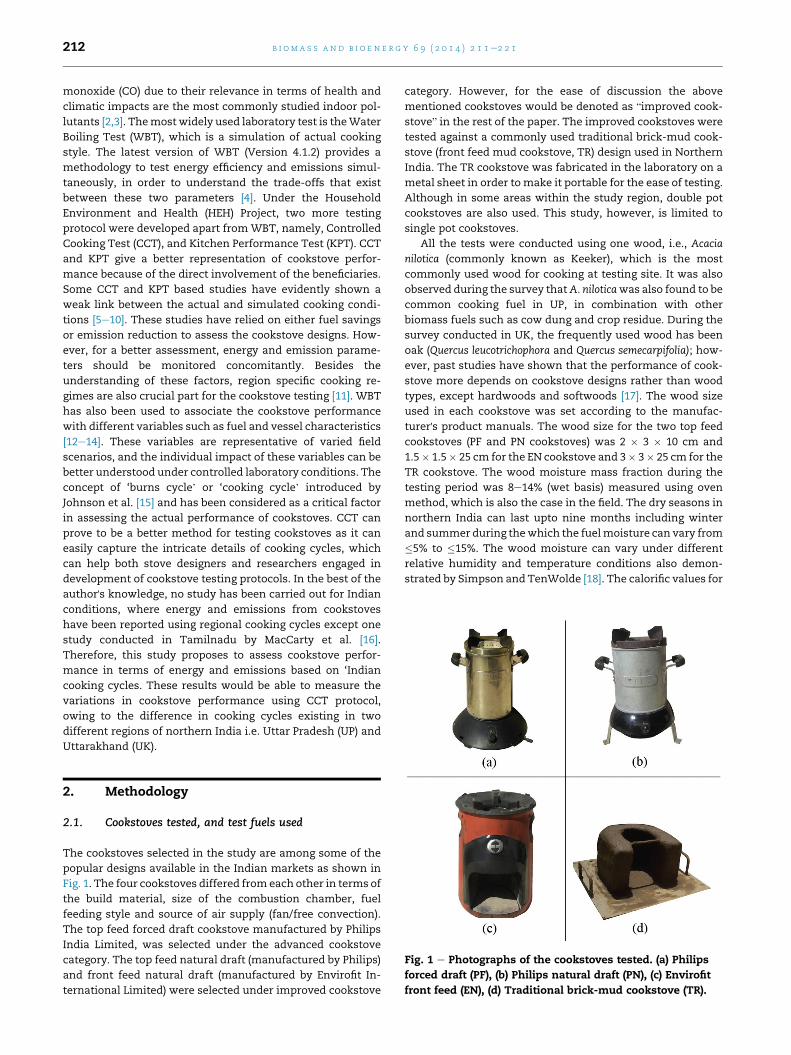
Fig. 2 e Schematic diagram showing steps f
structured questionnaire which comprised of questions
related to the primary food items, its quantity and frequency
and cooking sequence of each food item.
2.3. Test protocols
The protocol used to assess the cookstove performance is
commonly known as CCT Version 2.0 [19], developed under
HEH Program, Shell Foundation. CCT allows comparing
cookstoves assuming their adaptability to the predominant
meals cooked in the community to be benefited. Themeal was
prepared by two female cooks who were residents of UP and
UK, respectively. The cook was appointed only after it was
made sure that they followed a similar cooking style as
observed within the study area. Weight of each food item, i.e.
raw rice and pulse along with water and cooking vessel and
wheat flour was recorded at the end of the test as presented in
Fig. 2. Sampling was begun as soon as the vessel was put over
the cookstove, and initial time was recorded. Ignition style
was kept constant for all the tests using wood chips prepared
from the same lot of wood used as fuel. The charcoal formed
ollowed during controlled cooking test.
b i om a s s a n d b i o e n e r g y 6 9 ( 2 0 1 4 ) 2 1 1e2 2 1214
was also weighed along with the cookstove and was used for
next cooking phase.
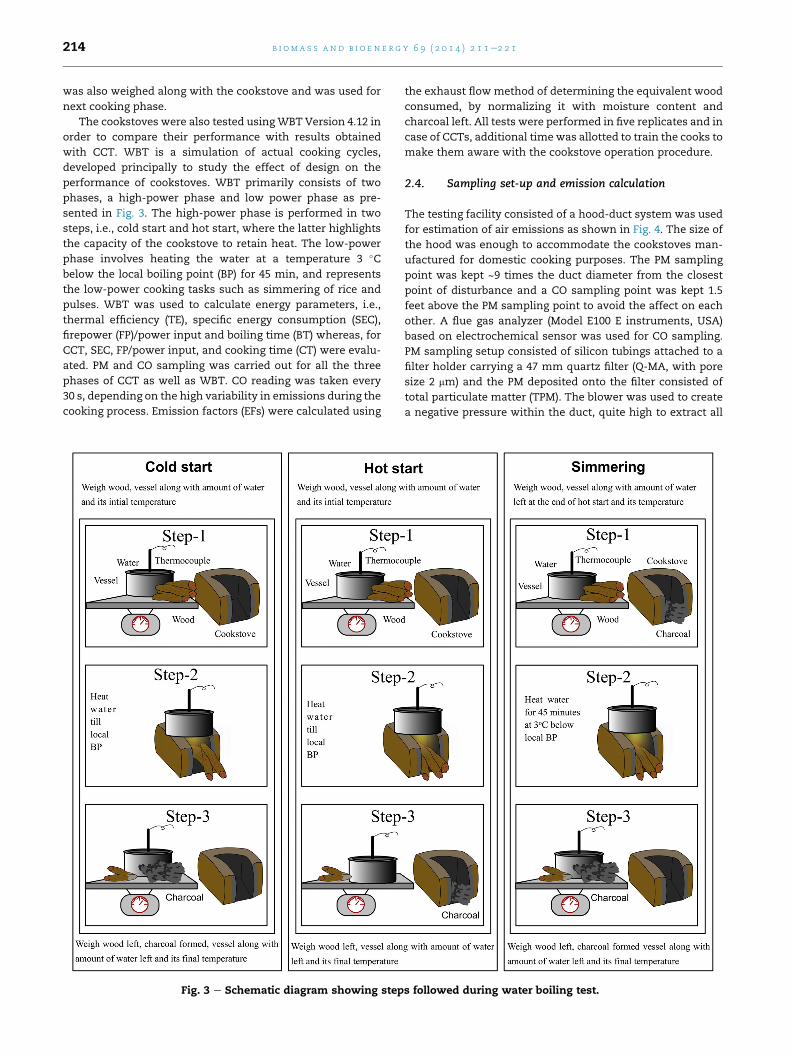
The cookstoves were also tested usingWBT Version 4.12 in
order to compare their performance with results obtained
with CCT. WBT is a simulation of actual cooking cycles,
developed principally to study the effect of design on the
performance of cookstoves. WBT primarily consists of two
phases, a high-power phase and low power phase as pre-
sented in Fig. 3. The high-power phase is performed in two
steps, i.e., cold start and hot start, where the latter highlights
the capacity of the cookstove to retain heat. The low-power
phase involves heating the water at a temperature 3 �Cbelow the local boiling point (BP) for 45 min, and represents
the low-power cooking tasks such as simmering of rice and
pulses. WBT was used to calculate energy parameters, i.e.,
thermal efficiency (TE), specific energy consumption (SEC),
firepower (FP)/power input and boiling time (BT) whereas, for
CCT, SEC, FP/power input, and cooking time (CT) were evalu-
ated. PM and CO sampling was carried out for all the three
phases of CCT as well as WBT. CO reading was taken every
30 s, depending on the high variability in emissions during the
cooking process. Emission factors (EFs) were calculated using
Fig. 3 e Schematic diagram showing step
the exhaust flow method of determining the equivalent wood
consumed, by normalizing it with moisture content and
charcoal left. All tests were performed in five replicates and in
case of CCTs, additional time was allotted to train the cooks to
make them aware with the cookstove operation procedure.
2.4. Sampling set-up and emission calculation
The testing facility consisted of a hood-duct system was used
for estimation of air emissions as shown in Fig. 4. The size of
the hood was enough to accommodate the cookstoves man-
ufactured for domestic cooking purposes. The PM sampling
point was kept ~9 times the duct diameter from the closest
point of disturbance and a CO sampling point was kept 1.5
feet above the PM sampling point to avoid the affect on each
other. A flue gas analyzer (Model E100 E instruments, USA)
based on electrochemical sensor was used for CO sampling.
PM sampling setup consisted of silicon tubings attached to a
filter holder carrying a 47 mm quartz filter (Q-MA, with pore
size 2 mm) and the PM deposited onto the filter consisted of
total particulate matter (TPM). The blower was used to create
a negative pressure within the duct, quite high to extract all
s followed during water boiling test.
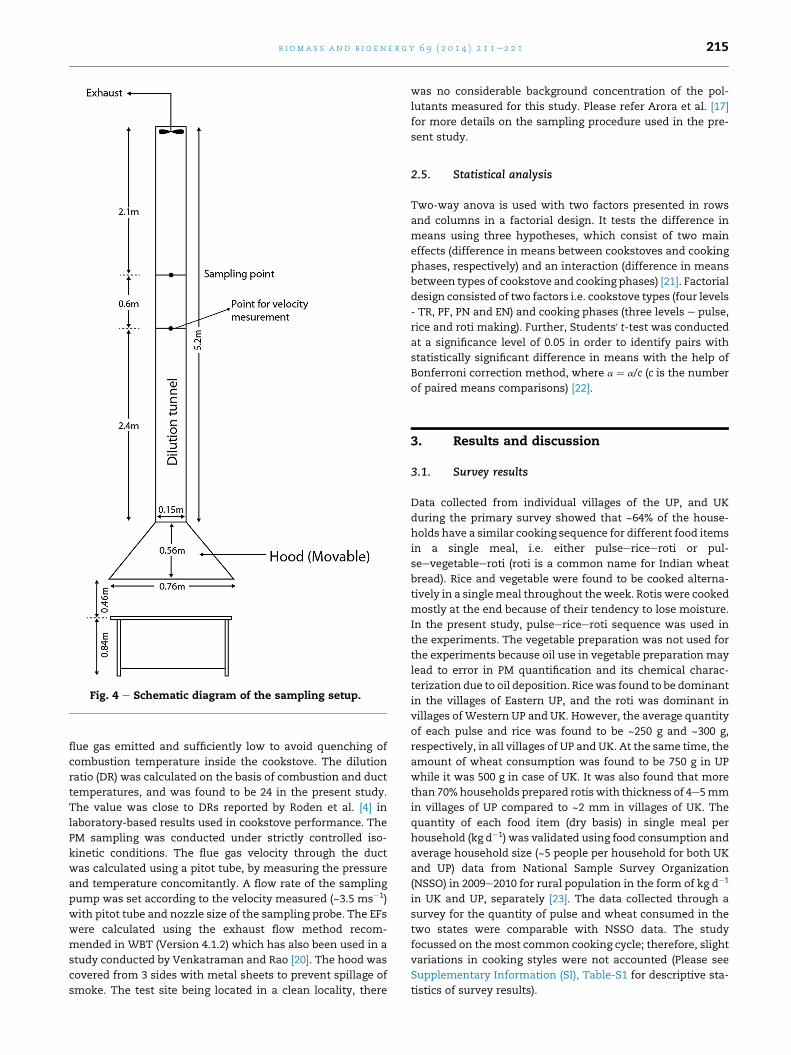
Fig. 4 e Schematic diagram of the sampling setup.
b i om a s s a n d b i o e n e r g y 6 9 ( 2 0 1 4 ) 2 1 1e2 2 1 215
flue gas emitted and sufficiently low to avoid quenching of
combustion temperature inside the cookstove. The dilution
ratio (DR) was calculated on the basis of combustion and duct
temperatures, and was found to be 24 in the present study.
The value was close to DRs reported by Roden et al. [4] in
laboratory-based results used in cookstove performance. The
PM sampling was conducted under strictly controlled iso-
kinetic conditions. The flue gas velocity through the duct
was calculated using a pitot tube, by measuring the pressure
and temperature concomitantly. A flow rate of the sampling
pump was set according to the velocity measured (~3.5 ms�1)
with pitot tube and nozzle size of the sampling probe. The EFs
were calculated using the exhaust flow method recom-
mended in WBT (Version 4.1.2) which has also been used in a
study conducted by Venkatraman and Rao [20]. The hood was
covered from 3 sides with metal sheets to prevent spillage of
smoke. The test site being located in a clean locality, there
was no considerable background concentration of the pol-
lutants measured for this study. Please refer Arora et al. [17]
for more details on the sampling procedure used in the pre-
sent study.
2.5. Statistical analysis
Two-way anova is used with two factors presented in rows
and columns in a factorial design. It tests the difference in
means using three hypotheses, which consist of two main
effects (difference in means between cookstoves and cooking
phases, respectively) and an interaction (difference in means
between types of cookstove and cooking phases) [21]. Factorial
design consisted of two factors i.e. cookstove types (four levels
- TR, PF, PN and EN) and cooking phases (three levels e pulse,
rice and roti making). Further, Students' t-test was conducted
at a significance level of 0.05 in order to identify pairs with
statistically significant difference in means with the help of
Bonferroni correction method, where a ¼ a/c (c is the number
of paired means comparisons) [22].
3. Results and discussion
3.1. Survey results
Data collected from individual villages of the UP, and UK
during the primary survey showed that ~64% of the house-
holds have a similar cooking sequence for different food items
in a single meal, i.e. either pulseericeeroti or pul-
seevegetableeroti (roti is a common name for Indian wheat
bread). Rice and vegetable were found to be cooked alterna-
tively in a singlemeal throughout theweek. Rotis were cooked
mostly at the end because of their tendency to lose moisture.
In the present study, pulseericeeroti sequence was used in
the experiments. The vegetable preparation was not used for
the experiments because oil use in vegetable preparation may
lead to error in PM quantification and its chemical charac-
terization due to oil deposition. Ricewas found to be dominant
in the villages of Eastern UP, and the roti was dominant in
villages of Western UP and UK. However, the average quantity
of each pulse and rice was found to be ~250 g and ~300 g,
respectively, in all villages of UP and UK. At the same time, the
amount of wheat consumption was found to be 750 g in UP
while it was 500 g in case of UK. It was also found that more
than 70%households prepared rotis with thickness of 4e5mm
in villages of UP compared to ~2 mm in villages of UK. The
quantity of each food item (dry basis) in single meal per
household (kg d�1) was validated using food consumption and
average household size (~5 people per household for both UK
and UP) data from National Sample Survey Organization
(NSSO) in 2009e2010 for rural population in the form of kg d�1
in UK and UP, separately [23]. The data collected through a
survey for the quantity of pulse and wheat consumed in the
two states were comparable with NSSO data. The study
focussed on the most common cooking cycle; therefore, slight
variations in cooking styles were not accounted (Please see
Supplementary Information (SI), Table-S1 for descriptive sta-
tistics of survey results).
b i om a s s a n d b i o e n e r g y 6 9 ( 2 0 1 4 ) 2 1 1e2 2 1216
Vessel dimensions and material were kept the same as
noted over the field area. Therefore, aluminum flat bottomed
vessels were selected, and size was selected on the basis of
quantity of each food item. The water required for each food
item was taken according to the data procured from the field.
The pulse and rice were cooked by adding spices (in case of
pulses only) before putting onto the cookstove andwas heated
until it came to boil. The pulse was cooked for a few more
minutes until a certain texture was observed, indicating the
end of cooking. Preparation of roti involved making of dough
and dividing it into equal parts. Each part was subsequently
rolled upon and flattened into a disc-shaped roti and put on
the hot pan/tava. Roti was then partially baked from two sides
on a low flame and was then baked on high flame leading to
puffing up of the roti.
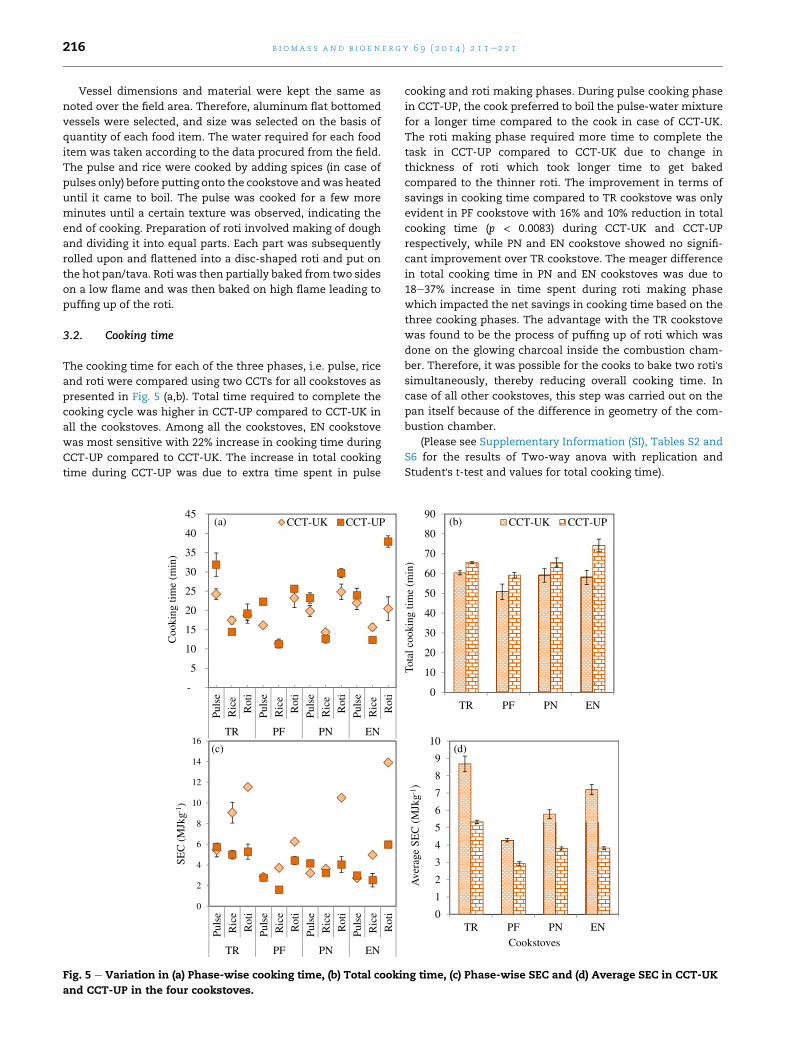
3.2. Cooking time
The cooking time for each of the three phases, i.e. pulse, rice
and roti were compared using two CCTs for all cookstoves as
presented in Fig. 5 (a,b). Total time required to complete the
cooking cycle was higher in CCT-UP compared to CCT-UK in
all the cookstoves. Among all the cookstoves, EN cookstove
was most sensitive with 22% increase in cooking time during
CCT-UP compared to CCT-UK. The increase in total cooking
time during CCT-UP was due to extra time spent in pulse
-
5
10
15
20
25
30
35
40
45
Puls
e
Ric
e
Rot
i
Puls
e
Ric
e
Rot
i
Puls
e
Ric
e
Rot
i
Puls
e
Ric
e
Rot
i
TR PF PN EN
Coo
king
tim
e (m
in)
(a) CCT-UK CCT-UP
0
2
4
6
8
10
12
14
16
Puls
e
Ric
e
Rot
i
Puls
e
Ric
e
Rot
i
Puls
e
Ric
e
Rot
i
Puls
e
Ric
e
Rot
i
TR PF PN EN
SEC
(M
Jkg-1
)
(c)
Fig. 5 e Variation in (a) Phase-wise cooking time, (b) Total cooki
and CCT-UP in the four cookstoves.
cooking and roti making phases. During pulse cooking phase
in CCT-UP, the cook preferred to boil the pulse-water mixture
for a longer time compared to the cook in case of CCT-UK.
The roti making phase required more time to complete the
task in CCT-UP compared to CCT-UK due to change in
thickness of roti which took longer time to get baked
compared to the thinner roti. The improvement in terms of
savings in cooking time compared to TR cookstove was only
evident in PF cookstove with 16% and 10% reduction in total
cooking time (p < 0.0083) during CCT-UK and CCT-UP
respectively, while PN and EN cookstove showed no signifi-
cant improvement over TR cookstove. The meager difference
in total cooking time in PN and EN cookstoves was due to
18e37% increase in time spent during roti making phase
which impacted the net savings in cooking time based on the
three cooking phases. The advantage with the TR cookstove
was found to be the process of puffing up of roti which was
done on the glowing charcoal inside the combustion cham-
ber. Therefore, it was possible for the cooks to bake two roti'ssimultaneously, thereby reducing overall cooking time. In
case of all other cookstoves, this step was carried out on the
pan itself because of the difference in geometry of the com-
bustion chamber.
(Please see Supplementary Information (SI), Tables S2 and
S6 for the results of Two-way anova with replication and
Student's t-test and values for total cooking time).
0
10
20
30
40
50
60
70
80
90
TR PF PN EN
Tota
l coo
king
tim
e (m
in)
(b) CCT-UK CCT-UP
0
1
2
3
4
5
6
7
8
9
10
TR PF PN EN
Ave
rage
SE
C (
MJk
g- 1)
Cookstoves
(d)
ng time, (c) Phase-wise SEC and (d) Average SEC in CCT-UK
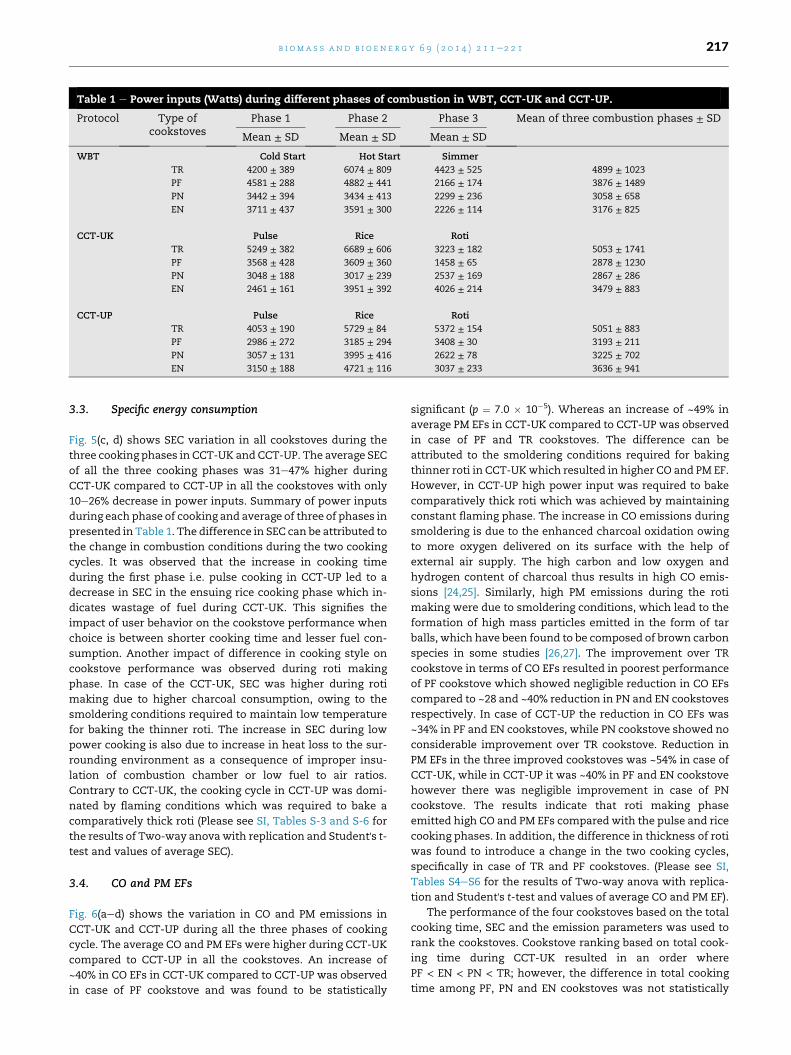
Table 1 e Power inputs (Watts) during different phases of combustion in WBT, CCT-UK and CCT-UP.
Protocol Type ofcookstoves
Phase 1 Phase 2 Phase 3 Mean of three combustion phases ± SD
Mean ± SD Mean ± SD Mean ± SD
WBT Cold Start Hot Start Simmer
TR 4200 ± 389 6074 ± 809 4423 ± 525 4899 ± 1023
PF 4581 ± 288 4882 ± 441 2166 ± 174 3876 ± 1489
PN 3442 ± 394 3434 ± 413 2299 ± 236 3058 ± 658
EN 3711 ± 437 3591 ± 300 2226 ± 114 3176 ± 825
CCT-UK Pulse Rice Roti
TR 5249 ± 382 6689 ± 606 3223 ± 182 5053 ± 1741
PF 3568 ± 428 3609 ± 360 1458 ± 65 2878 ± 1230
PN 3048 ± 188 3017 ± 239 2537 ± 169 2867 ± 286
EN 2461 ± 161 3951 ± 392 4026 ± 214 3479 ± 883
CCT-UP Pulse Rice Roti
TR 4053 ± 190 5729 ± 84 5372 ± 154 5051 ± 883
PF 2986 ± 272 3185 ± 294 3408 ± 30 3193 ± 211
PN 3057 ± 131 3995 ± 416 2622 ± 78 3225 ± 702
EN 3150 ± 188 4721 ± 116 3037 ± 233 3636 ± 941
b i om a s s a n d b i o e n e r g y 6 9 ( 2 0 1 4 ) 2 1 1e2 2 1 217
3.3. Specific energy consumption
Fig. 5(c, d) shows SEC variation in all cookstoves during the
three cooking phases in CCT-UK and CCT-UP. The average SEC
of all the three cooking phases was 31e47% higher during
CCT-UK compared to CCT-UP in all the cookstoves with only
10e26% decrease in power inputs. Summary of power inputs
during each phase of cooking and average of three of phases in
presented in Table 1. The difference in SEC can be attributed to
the change in combustion conditions during the two cooking
cycles. It was observed that the increase in cooking time
during the first phase i.e. pulse cooking in CCT-UP led to a
decrease in SEC in the ensuing rice cooking phase which in-
dicates wastage of fuel during CCT-UK. This signifies the
impact of user behavior on the cookstove performance when
choice is between shorter cooking time and lesser fuel con-
sumption. Another impact of difference in cooking style on
cookstove performance was observed during roti making
phase. In case of the CCT-UK, SEC was higher during roti
making due to higher charcoal consumption, owing to the
smoldering conditions required to maintain low temperature
for baking the thinner roti. The increase in SEC during low
power cooking is also due to increase in heat loss to the sur-
rounding environment as a consequence of improper insu-
lation of combustion chamber or low fuel to air ratios.
Contrary to CCT-UK, the cooking cycle in CCT-UP was domi-
nated by flaming conditions which was required to bake a
comparatively thick roti (Please see SI, Tables S-3 and S-6 for
the results of Two-way anovawith replication and Student's t-test and values of average SEC).
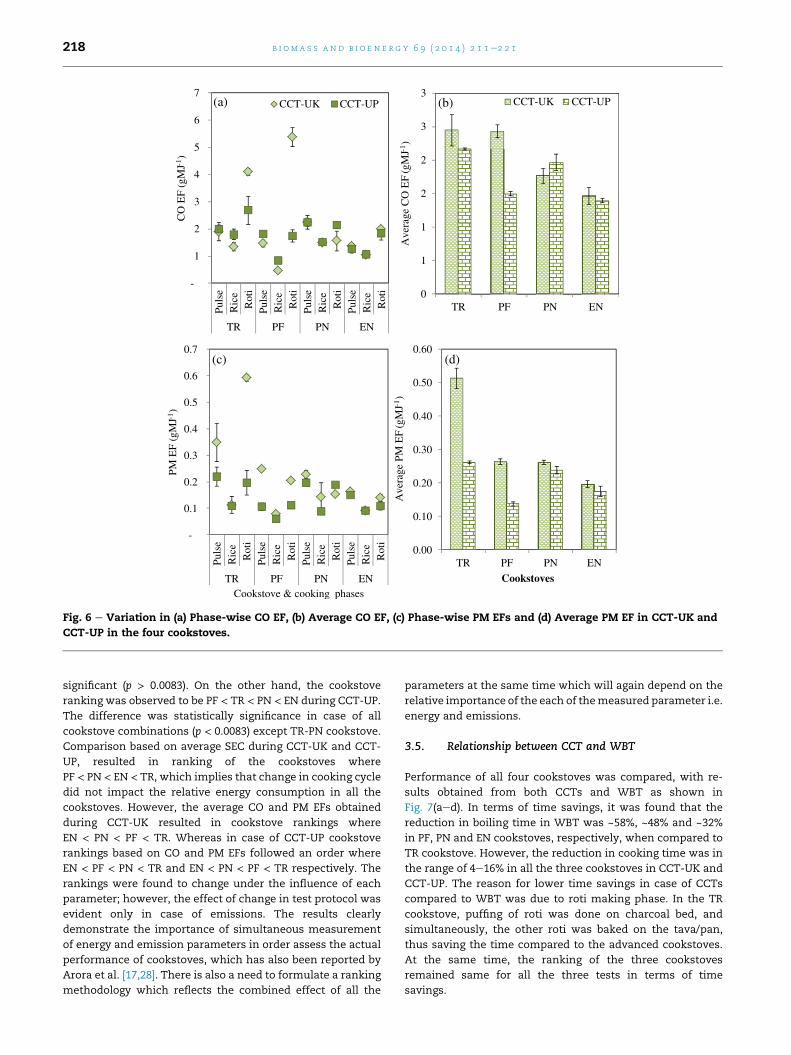
3.4. CO and PM EFs
Fig. 6(aed) shows the variation in CO and PM emissions in
CCT-UK and CCT-UP during all the three phases of cooking
cycle. The average CO and PM EFs were higher during CCT-UK
compared to CCT-UP in all the cookstoves. An increase of
~40% in CO EFs in CCT-UK compared to CCT-UP was observed
in case of PF cookstove and was found to be statistically
significant (p ¼ 7.0 � 10�5). Whereas an increase of ~49% in
average PM EFs in CCT-UK compared to CCT-UP was observed
in case of PF and TR cookstoves. The difference can be
attributed to the smoldering conditions required for baking
thinner roti in CCT-UKwhich resulted in higher CO and PM EF.
However, in CCT-UP high power input was required to bake
comparatively thick roti which was achieved by maintaining
constant flaming phase. The increase in CO emissions during
smoldering is due to the enhanced charcoal oxidation owing
to more oxygen delivered on its surface with the help of
external air supply. The high carbon and low oxygen and
hydrogen content of charcoal thus results in high CO emis-
sions [24,25]. Similarly, high PM emissions during the roti
making were due to smoldering conditions, which lead to the
formation of high mass particles emitted in the form of tar
balls, which have been found to be composed of brown carbon
species in some studies [26,27]. The improvement over TR
cookstove in terms of CO EFs resulted in poorest performance
of PF cookstove which showed negligible reduction in CO EFs
compared to ~28 and ~40% reduction in PN and EN cookstoves
respectively. In case of CCT-UP the reduction in CO EFs was
~34% in PF and EN cookstoves, while PN cookstove showed no
considerable improvement over TR cookstove. Reduction in
PM EFs in the three improved cookstoves was ~54% in case of
CCT-UK, while in CCT-UP it was ~40% in PF and EN cookstove
however there was negligible improvement in case of PN
cookstove. The results indicate that roti making phase
emitted high CO and PM EFs compared with the pulse and rice
cooking phases. In addition, the difference in thickness of roti
was found to introduce a change in the two cooking cycles,
specifically in case of TR and PF cookstoves. (Please see SI,
Tables S4eS6 for the results of Two-way anova with replica-
tion and Student's t-test and values of average CO and PM EF).
The performance of the four cookstoves based on the total
cooking time, SEC and the emission parameters was used to
rank the cookstoves. Cookstove ranking based on total cook-
ing time during CCT-UK resulted in an order where
PF < EN < PN < TR; however, the difference in total cooking
time among PF, PN and EN cookstoves was not statistically
-
1
2
3
4
5
6
7
Puls
eR
ice
Rot
iPu
lse
Ric
eR
oti
Puls
eR
ice
Rot
iPu
lse
Ric
eR
oti
TR PF PN EN
CO
EF
(gM
J-1)
(a) CCT-UK CCT-UP
-
0.1
0.2
0.3
0.4
0.5
0.6
0.7
Puls
eR
ice
Rot
iPu
lse
Ric
eR
oti
Puls
eR
ice
Rot
iPu
lse
Ric
eR
oti
TR PF PN EN
PM E
F (g
MJ-1
)
Cookstove & cooking phases
(c)
0
1
1
2
2
3
3
TR PF PN EN
Ave
rage
CO
EF
(gM
J-1)
(b) CCT-UK CCT-UP
0.00
0.10
0.20
0.30
0.40
0.50
0.60
TR PF PN EN
Ave
rage
PM
EF
(gM
J- 1)
Cookstoves
(d)
Fig. 6 e Variation in (a) Phase-wise CO EF, (b) Average CO EF, (c) Phase-wise PM EFs and (d) Average PM EF in CCT-UK and
CCT-UP in the four cookstoves.
b i om a s s a n d b i o e n e r g y 6 9 ( 2 0 1 4 ) 2 1 1e2 2 1218
significant (p > 0.0083). On the other hand, the cookstove
ranking was observed to be PF < TR < PN < EN during CCT-UP.
The difference was statistically significance in case of all
cookstove combinations (p < 0.0083) except TR-PN cookstove.
Comparison based on average SEC during CCT-UK and CCT-
UP, resulted in ranking of the cookstoves where
PF < PN < EN < TR, which implies that change in cooking cycle
did not impact the relative energy consumption in all the
cookstoves. However, the average CO and PM EFs obtained
during CCT-UK resulted in cookstove rankings where
EN < PN < PF < TR. Whereas in case of CCT-UP cookstove
rankings based on CO and PM EFs followed an order where
EN < PF < PN < TR and EN < PN < PF < TR respectively. The
rankings were found to change under the influence of each
parameter; however, the effect of change in test protocol was
evident only in case of emissions. The results clearly
demonstrate the importance of simultaneous measurement
of energy and emission parameters in order assess the actual
performance of cookstoves, which has also been reported by
Arora et al. [17,28]. There is also a need to formulate a ranking
methodology which reflects the combined effect of all the
parameters at the same time which will again depend on the
relative importance of the each of themeasured parameter i.e.
energy and emissions.
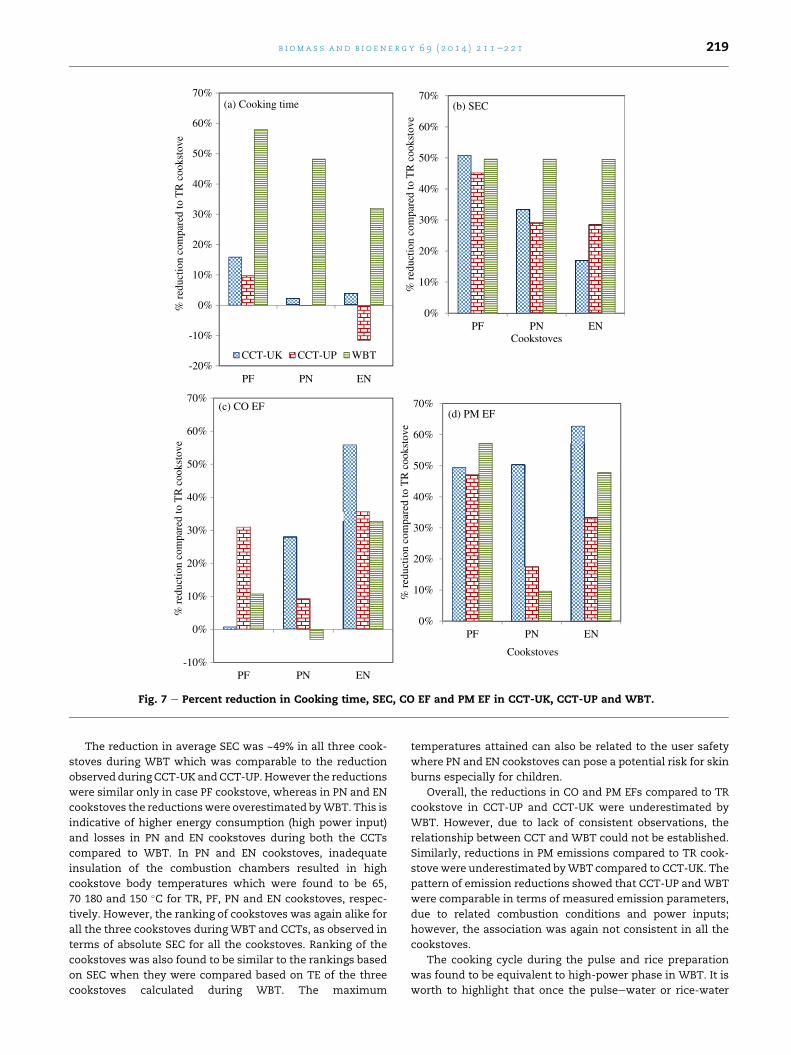
3.5. Relationship between CCT and WBT
Performance of all four cookstoves was compared, with re-
sults obtained from both CCTs and WBT as shown in
Fig. 7(aed). In terms of time savings, it was found that the
reduction in boiling time in WBT was ~58%, ~48% and ~32%
in PF, PN and EN cookstoves, respectively, when compared to
TR cookstove. However, the reduction in cooking time was in
the range of 4e16% in all the three cookstoves in CCT-UK and
CCT-UP. The reason for lower time savings in case of CCTs
compared to WBT was due to roti making phase. In the TR
cookstove, puffing of roti was done on charcoal bed, and
simultaneously, the other roti was baked on the tava/pan,
thus saving the time compared to the advanced cookstoves.
At the same time, the ranking of the three cookstoves
remained same for all the three tests in terms of time
savings.
0%
10%
20%
30%
40%
50%
60%
70%
PF PN EN
% r
educ
tion
com
pare
d to
TR
coo
ksto
ve
Cookstoves
(b) SEC
-20%
-10%
0%
10%
20%
30%
40%
50%
60%
70%
PF PN EN
% r
educ
tion
com
pare
d to
TR
coo
ksto
ve
(a) Cooking time
CCT-UK CCT-UP WBT
-10%
0%
10%
20%
30%
40%
50%
60%
70%
PF PN EN
% r
educ
tion
com
pare
d to
TR
coo
ksto
ve
(c) CO EF
0%
10%
20%
30%
40%
50%
60%
70%
PF PN EN
% r
educ
tion
com
pare
d to
TR
coo
ksto
ve
Cookstoves
(d) PM EF
Fig. 7 e Percent reduction in Cooking time, SEC, CO EF and PM EF in CCT-UK, CCT-UP and WBT.
b i om a s s a n d b i o e n e r g y 6 9 ( 2 0 1 4 ) 2 1 1e2 2 1 219
The reduction in average SEC was ~49% in all three cook-
stoves during WBT which was comparable to the reduction
observed during CCT-UK andCCT-UP. However the reductions
were similar only in case PF cookstove, whereas in PN and EN
cookstoves the reductionswere overestimated byWBT. This is
indicative of higher energy consumption (high power input)
and losses in PN and EN cookstoves during both the CCTs
compared to WBT. In PN and EN cookstoves, inadequate
insulation of the combustion chambers resulted in high
cookstove body temperatures which were found to be 65,
70 180 and 150 �C for TR, PF, PN and EN cookstoves, respec-
tively. However, the ranking of cookstoves was again alike for
all the three cookstoves during WBT and CCTs, as observed in
terms of absolute SEC for all the cookstoves. Ranking of the
cookstoves was also found to be similar to the rankings based
on SEC when they were compared based on TE of the three
cookstoves calculated during WBT. The maximum
temperatures attained can also be related to the user safety
where PN and EN cookstoves can pose a potential risk for skin
burns especially for children.
Overall, the reductions in CO and PM EFs compared to TR
cookstove in CCT-UP and CCT-UK were underestimated by
WBT. However, due to lack of consistent observations, the
relationship between CCT and WBT could not be established.
Similarly, reductions in PM emissions compared to TR cook-
stove were underestimated byWBT compared to CCT-UK. The
pattern of emission reductions showed that CCT-UP andWBT
were comparable in terms of measured emission parameters,
due to related combustion conditions and power inputs;
however, the association was again not consistent in all the
cookstoves.
The cooking cycle during the pulse and rice preparation
was found to be equivalent to high-power phase in WBT. It is
worth to highlight that once the pulseewater or rice-water

b i om a s s a n d b i o e n e r g y 6 9 ( 2 0 1 4 ) 2 1 1e2 2 1220
mixture reached the BP, the cook in both the CCTs kept boiling
the mixture at the same feeding rate for ~5 and ~10 min in
CCT-UK and CCT-UP, respectively. WBT states the low power
to be a simulation of simmer phase in pulse and rice cooking.
However, due to small food quantity, pulse and rice cooking
were not found to exhibit any considerable simmer phase as
stated by WBT. The simulation would be more representative
to the region where staple diet is rice leading to higher food
quantity, which might lead longer simmer phases. It was
observed that the North Indian cooking cycle is dominated by
high power in case of pulse, rice and roti (in case of thick roti).
In the present study, the average of CO EFs in all cookstoves
were found to be ~55% lower than the values 5.1 g MJ�1 re-
ported by Roden et al. [6] in a field study. Whereas, CO EFs of
the present study were comparable to CO EFs reported by
Jetter and Kariher [29], Roden et al. [10] and McCarty et al. [5]
estimated using WBT. Whereas, PM EFs were found to be
closer to field results reported by Roden et al. [6] (Please see SI,
Table S7 for comparison of present study CO and PM EFs with
values reported in the literature).
3.6. Effect of fan speed in PF cookstove
The PF cookstove was operated at the highest fan speed dur-
ing all three phases of WBT and CCTs. However, PF cookstove
was also operated at minimum air supply where, TE was
found to increase by ~15%; whereas, the CO EF decreased by
~42%. Thus, the results show that the extent to which the
amount of air supplied in forced draft cookstoves vary the
performance of a cookstove that in turn dependent upon the
discretion of the tester or the end user to set at the desired
level. TE achieved in the present study was 20e30% lower
compared to a recent study carried out by Jetter and Kariher
[29] and Raman et al. [30]. The difference in TE may be due to
the effect of air supply levels, which were not reported in their
results as well as the difference in surface area to the volume
ratio of wood pieces (4 compared to 2 in the present study)
used in PF cookstove conducted by Raman et al. [30] were 50%
higher than the present study. The higher surface area to
volume ratios helps to accelerate the combustion process and
efficient heat transfer [31].
4. Conclusion
The aim of the study was to measure the effect of change in
cooking cycle on cookstove performance, in terms of energy
and emission parameters. The results from this study indicate
the origin of variation in performance indicators due to dif-
ference in cooking cycles in a particular region of India. In
absolute terms, the total cooking time did not show any sig-
nificant difference with change in cooking cycle, however, the
performance of cookstoves in terms of SEC and CO and PM EFs
was found to vary with change in cooking cycles. The major
difference found in the cooking cycle of the UP andUKwas the
thickness of the roti. The thinner roti in UK was found to in-
crease average SEC, CO and PM EFs compared to the CCT-UP. It
was also observed that the roti making task takes more time
for all three “improved” cookstoves and also resulted in higher
CO emissions in forced draft cookstove in comparison to the
TR cookstove because of their inability to cater roti making
style. There were inconsistencies when performance of
“improved” cookstoves was compared to the traditional
cookstove. WBTwas found to underestimate the performance
at several instances, especially in terms of emissions.
Conclusively, even slight variation in power levels at which
actual and simulated cookingwas found to alter both absolute
and relative performance of cookstoves. Therefore, these
types of user centric studies focused on cooking cycles in
different regions can help in identifying the power levels
involved in specific cooking tasks. This will further benefit to
test cookstoves using only those power levels that are domi-
nant in certain regions. The results also indicated that after
considerable training, the users can show similarities in stove
operation style, thus making it easier to compare cookstoves
on their actual performance, based on specific cooking cycles.
Eventually, the testing results will help to enhance the
acceptability of new cookstoves among rural communities
with diverse cooking habits. These data sets can also be used
as an input for cookstove emission modeling studies in order
to create a regional emission database by using food and
cooking fuel consumption patterns of the targeted
communities.
Acknowledgment
The authors would like to thank Ministry of New and
Renewable Energy India (MNREeGrant No. NREF/TU/2011/10),
McArthur Foundation (Grant no. 09-92304-000-GSS) and Min-
istry of Human Resource Development (MHRD e Grant no. 16-
53/2009-DL), Government of India, for the financial support
provided during the course of this study. The authors grate-
fully acknowledge the cooperation of Mr. Neeraj Sharma from
Department of Natural Resources, TERI University for editorial
assistance. The authors also acknowledge the contribution of
Ms. Priyanka Chauhan in preparation of graphics.
Appendix A. Supplementary data
Supplementary data related to this article can be found at
http://dx.doi.org/10.1016/j.biombioe.2014.07.012.
r e f e r e n c e s
[1] Dhoble R, Bairiganjan S. Cooking practices and cookstovesfield insights: a pilot study of user experience withtraditional and improved cookstoves. Chennai: Institute forFinancial Management and Research (IFMR); 2009 November.p. 32.
[2] Naeher LP, Smith KR, Leaderer BP, Neufeld L, Mage DT.Carbon monoxide as a tracer for assessing exposures toparticulate matter in wood and gas cookstove householdsof highland Guatemala. Environ Sci Technol2001;35(3):575e81.
[3] Grieshop AP, Marshall JD, Kandlikar M. Health and climatebenefits of cookstove replacement options. Energy Policy2011;39(12):7530e42.

b i om a s s a n d b i o e n e r g y 6 9 ( 2 0 1 4 ) 2 1 1e2 2 1 221
[4] [Internet] Water boiling test (WBT) version 4.1.2Cookstoveemissions and efficiency in a controlled laboratory setting;2009 Oct [cited 2013 Oct 14]. Available from:, http://www.pciaonline.org/files/WBT4.1.2_0_0.pdf.
[5] MacCarty N, Still D, Ogle D. Fuel use and emissionsperformance of fifty cooking stoves in the laboratory andrelated benchmarks of performance. Energy Sustain Dev2010;14(3):161e71.
[6] Roden CA, Bond TC, Conway S, Benjamin A, Pinel O,MacCarty N, et al. Laboratory and field investigations ofparticulate and carbon monoxide emissions from traditionaland improved cookstoves. Atmos Environ2009;43(6):1170e81.
[7] Boy E, Bruce N, Smith KR, Hernandez R. Fuel efficiency of animproved wood-burning stove in rural Guatemala:implications for health, environment and development.Energy Sustain Dev 2000;4(2):23e31.
[8] Bailis R, Berrueta V, Chengappa C, Dutta K, Edwards R,Masera O, et al. Performance testing for monitoringimproved biomass stove interventions: experiences of thehousehold energy and health project. Energy Sustain Dev2007;11(2):57e70.
[9] Berrueta VM, Edwards RD, Masera OR. Energy performanceof wood-burning cookstoves in Michoacan, Mexico. RenewEnergy 2008;33(5):859e70.
[10] Roden CA, Bond TC, Conway S, Pinel ABO. Emission factorsand real-time optical properties of particles emitted fromtraditional wood burning cookstoves. Environ Sci Technol2006;40(21):6750e7.
[11] Lambe F, Atteridge A. Putting the cook before the stove: auser-centred approach to understanding household energydecision-making: a case study of Haryana State, northernIndia. Sweden: Stockholm Environment Institute; 2012 May.p. 27. Working paper no. 2012e03.
[12] Bhattacharya SC, Albina DO, Khaing AM. Effects of selectedparameters on performance and emission of biomass-firedcookstoves. Biomass Bioenergy 2002;23(5):387e95.
[13] Yuntenwi EAT, MacCarty N, Still D, Ertel J. Laboratory studyof the effects of moisture content on heat transfer andcombustion efficiency of three biomass cook stoves. EnergySustain Dev 2008;12(2):66e77.
[14] L'Orange C, DeFoort M, Willson B. Influence of testingparameters on biomass stove performance and developmentof an improved testing protocol. Energy Sustain Dev2012;16(1):3e12.
[15] Johnson M, Edwards R, Berrueta V, Masera O. Newapproaches to performance testing of improved cookstoves.Environ Sci Technol 2009;44(1):368e74.
[16] MacCarty N, Still D, Ogle D, Drouin T. Assessing cook stoveperformance: field and lab studies of three rocket stovescomparing the open fire and traditional stoves in TamilNadu, India on measures of time to cook, fuel use, total
emissions, and indoor air pollution. Oregon: AprovechoResearch Center; 2008 January. p. 18.
[17] Arora P, Jain S, Sachdeva K. Physical characterization ofparticulate matter emitted from wood combustion inimproved and traditional cookstoves. Energy Sustain Dev2013;17(5):497e503.
[18] Simpson W, TenWolde A. Physical properties and moisturerelations of wood. Wood handbook: wood as an engineeringmaterial. Madison, WI: USDA Forest Service, Forest ProductsLaboratory; 1999. p. 3.1e3.24. General technical report FPL;GTR-113.
[19] Bailis R. Controlled cooking test (CCT) version 2.0 [Internet].Household Energy and Health Programme. Shell Foundation;2004 Aug [cited 2013 Oct 14]. Available from:, http://www.pciaonline.org/files/CCT_Version_2.0_0.pdf.
[20] Venkataraman C, Rao GUM. Emission factors of carbonmonoxide and size-resolved aerosols from biofuelcombustion. Environ Sci Technol 2001;35(10):2100e7.
[21] Frank H, Althoen SC. Statistics: concepts and applications.New York: Cambridge university press; 1994.
[22] Hochberg Y. A sharper Bonferroni procedure for multipletests of significance. Biometrika 1988;75(4):800e2.
[23] [Internet] National Sample Survey OrganisationNSS 66thRound; 2011 [cited 2013 Nov 25]. Available from:, http://mospi.nic.in/Mospi_New/upload/NSS_Report_538.pdf.
[24] Ohlemiller TJ. Smoldering combustion propagation on solidwood. Fire Saf Sci 1991;3:565e74.
[25] Koppmann R, Czapiewski KV, Reid JS. A review of biomassburning emissions, part I: gaseous emissions of carbonmonoxide, methane, volatile organic compounds, andnitrogen containing compounds. Atmos Chem Phys Discuss2005;5(5):10455e516.
[26] Chakrabarty RK, Moosmuller H, Chen LW, Lewis K,Arnott WP, Mazzoleni C, et al. Brown carbon in tar balls fromsmoldering biomass combustion. Atmos Chem Phys2010;10(13):6363e70.
[27] Maruf Hossain AMM. Volatility and mixing states of ultrafineparticles from biomass burning. J Hazard Mater 2012;205-206(29):189e97.
[28] Arora P, Das P, Jain S, Kishore VVN. A laboratory basedcomparative study of Indian testing protocol and waterboiling test. Energy Sustain Dev 2014;21:81e8.
[29] Jetter JJ, Kariher P. Solid-fuel household cookstoves:characterization of performance and emissions. BiomassBioenergy 2009;33(2):294e5.
[30] Raman P, Murali J, Sakthivadivel D, Vigneswaran VS.Performance evaluation of three types of forced draftcookstoves using fuel wood and coconut shell. BiomassBioenergy 2013;49:333e40.
[31] Thomas PA, McAlpine RS. Fire in the forest. New York:Cambridge University Press; 2010.