Cooking with Electricity: A Cost Perspective
185
Public Disclosure Authorized Public Disclosure Authorized Public Disclosure Authorized Public Disclosure Authorized
-
Upload
khangminh22 -
Category
Documents
-
view
0 -
download
0
Transcript of Cooking with Electricity: A Cost Perspective

CO
OK
ING
WITH
ELECTR
ICITY
: A C
OS
T PER
SP
ECTIV
E
Pub
lic D
iscl
osur
e A
utho
rized
Pub
lic D
iscl
osur
e A
utho
rized
Pub
lic D
iscl
osur
e A
utho
rized
Pub
lic D
iscl
osur
e A
utho
rized

COOKING WITH ELECTRICITYA COST PERSPECTIVE

ESMAP | Cooking with Electricity: A Cost Perspectivei i
© 2020 September | International Bank for Reconstruction and Development / The World Bank1818 H Street NW, Washington, DC 20433Telephone: 202-473-1000; Internet: www.worldbank.orgSome rights reserved
This work is a product of the staff of the World Bank and the Modern Energy Cooking Services (MECS) program. The findings, interpretations, and conclusions expressed in this work do not necessarily reflect the views of the World Bank, its Board of Executive Directors, or the governments they represent. The World Bank does not guarantee the accuracy of the data included in this work. The boundaries, colors, denominations, and other information shown on any map in this work do not imply any judgment on the part of the World Bank concerning the legal status of any territory or the endorsement or acceptance of such boundaries. Nothing herein shall constitute or be considered to be a limitation upon or waiver of the privileges and immunities of The World Bank, all of which are specifically reserved.
The MECS program is funded by UK aid from the UK government; however, the views expressed do not necessarily reflect the UK government’s official policies.
Rights and Permissions
This work is available under the Creative Commons Attribution 3.0 IGO license (CC BY 3.0 IGO) http://creativecommons.org/licenses/by/3.0/igo. Under the Creative Commons Attribution license, you are free to copy, distribute, transmit, and adapt this work, including for commercial purposes, under the following conditions:
Attribution—Please cite the work as follows: Energy Sector Management Assistance Program (ESMAP). 2020. Cooking with Electricity: A Cost Perspective. Washington, DC: World Bank. License: Creative Commons Attribution CC BY 3.0 IGO
Translations—If you create a translation of this work, please add the following disclaimer along with the attribution: This translation was not created by The World Bank and should not be considered an official World Bank translation. The World Bank shall not be liable for any content or error in this translation.
Adaptations—If you create an adaptation of this work, please add the following disclaimer along with the attribution: This is an adaptation of an original work by The World Bank. Views and opinions expressed in the adaptation are the sole responsibility of the author or authors of the adaptation and are not endorsed by The World Bank.
Third-party content—The World Bank does not necessarily own each component of the content contained within the work. The World Bank therefore does not warrant that the use of any third-party-owned individual component or part contained in the work will not infringe on the rights of those third parties. The risk of claims resulting from such infringement rests solely with you. If you wish to re-use a component of the work, it is your responsibility to determine whether permission is needed for that re-use and to obtain permission from the copyright owner. Examples of components can include, but are not limited to, tables, figures, or images.
All queries on rights and licenses should be addressed to World Bank Publications, The World Bank Group, 1818 H Street NW, Washington, DC 20433, USA; e-mail: [email protected] CreditsEditor | Barbara KarniProduction Editor | Heather Austin, The World BankDesigner | Will Kemp, The World BankImages | Jon Leary @ Loughborough University and Gamos (p. x, p. 4, p. 6, p. 12, p. 14, p. 18, p. 20, p. 24, p. 27, p. 35 [Figure 3.7], p. 36, p. 37, p. 39, p. 41 [Figure 3.10], p. 42, p. 43, p. 45, p. 47, p. 51 [Figure 3.16], p. 52 [Figure 3.17, Figure 3.18], p. 53, p. 55, p. 66, p. 69 [Figure 3.28, Figure 3.29], p. 70, p. 73, p. 74, p. 81, p. 82, p. 87, p. 88, p. 89, p. 94, p. 123), Shima Sago @ TaTEDO (p. 57 [Figure 3.21], p. 61, p. 67, p. 83, p. 92, Hannah Blair @ CLASP (cover, p. 7, p. 63), Mercy Kamau @ SCODE (p. 68 [Figure 3.26], p. 69 [Figure 3.27, Figure 3.28]), Jacob Fodio Todd @ University of Sussex (p. 95, p. 110).
All images remain the sole property of their source and may not be used for any purpose without written permission from the source.

CONTENTS
Abbreviations . . . . . . . . . . . . . . . . . . . . . . . . . . . . . . . . . . . . . . . . . . . . . . . . . . . . . . . . . . . . . . . . . ix
Acknowledgments . . . . . . . . . . . . . . . . . . . . . . . . . . . . . . . . . . . . . . . . . . . . . . . . . . . . . . . . . . . . x
Executive Summary . . . . . . . . . . . . . . . . . . . . . . . . . . . . . . . . . . . . . . . . . . . . . . . . . . . . . . . . . . xiii
Report Overview . . . . . . . . . . . . . . . . . . . . . . . . . . . . . . . . . . . . . . . . . . . . . . . . . . . . . . . . . . . . . xv
1 | BACKGROUND . . . . . . . . . . . . . . . . . . . . . . . . . . . . . . . . . . . . . . . . . . . . . . . . . . . . . . . . . . . . . . 1
1.1. State of Access to Clean Cooking and Electricity . . . . . . . . . . . . . . . . . . . . . . . . . . . . . . . . . .1
1.2. The Burden of Cooking with Biomass Fuels . . . . . . . . . . . . . . . . . . . . . . . . . . . . . . . . . . . . . 3
1.3. Objective and Scope of the Report . . . . . . . . . . . . . . . . . . . . . . . . . . . . . . . . . . . . . . . . . . . . . 4
1.4. The Case for Cooking with Electricity . . . . . . . . . . . . . . . . . . . . . . . . . . . . . . . . . . . . . . . . . . . 5
1.5. A New Generation of Highly Efficient eCooking Appliances . . . . . . . . . . . . . . . . . . . . . . . . 9
1.6. Electrical Infrastructure in Sub-Saharan Africa . . . . . . . . . . . . . . . . . . . . . . . . . . . . . . . . . . . 11
2 | METHODOLOGY . . . . . . . . . . . . . . . . . . . . . . . . . . . . . . . . . . . . . . . . . . . . . . . . . . . . . . . . . . . 13
2.1. Techno-Economic Modelling . . . . . . . . . . . . . . . . . . . . . . . . . . . . . . . . . . . . . . . . . . . . . . . . . 13
2.2. System Architectures for eCooking in Strong-Grid, Weak-Grid, and Off-Grid Contexts . 15
2.3. Cost Trends . . . . . . . . . . . . . . . . . . . . . . . . . . . . . . . . . . . . . . . . . . . . . . . . . . . . . . . . . . . . . . . 16
2.4. Summary of Contexts, Systems, and Fuel Prices . . . . . . . . . . . . . . . . . . . . . . . . . . . . . . . . . 18
2.5. Demand for Electricity for Cooking . . . . . . . . . . . . . . . . . . . . . . . . . . . . . . . . . . . . . . . . . . . . 20
2.6. Business Models and Financing Horizons . . . . . . . . . . . . . . . . . . . . . . . . . . . . . . . . . . . . . . 24
3 | ECOOKING IN GRID-CONNECTED AND OFF-GRID SYSTEMS: MODELLING RESULTS AND DISCUSSION . . . . . . . . . . . . . . . . . . . . . . . . . . . . . . . . . . . 25
3.1. Overview of Case Studies . . . . . . . . . . . . . . . . . . . . . . . . . . . . . . . . . . . . . . . . . . . . . . . . . . . 25
3.2. eCooking on National Grids . . . . . . . . . . . . . . . . . . . . . . . . . . . . . . . . . . . . . . . . . . . . . . . . . . 28
Case Study 1: Building on the Success of LPG to Displace Charcoal in Urban East African Kitchens with a Clean Fuel Stack . . . . . . . . . . . . . . . . . . . . . . . . . . . . . . . 35
Case Study 2: Tackling Load Shedding in Lusaka, Zambia, by Time Shifting and Reducing Electricity Demand for Cooking . . . . . . . . . . . . . . . . . . . . . . . . . . . . . . . . . . 41
3.3. eCooking on Mini Grids . . . . . . . . . . . . . . . . . . . . . . . . . . . . . . . . . . . . . . . . . . . . . . . . . . . . . 48
Case Study 3: Enabling 24-Hour eCooking on Micro-Hydro Mini Grids in Myanmar . . . . . . . . . . . . . . . . . . . . . . . . . . . . . . . . . . . . . . . . . . . . . . . . . . . . . . . . . . . . 51
Case Study 4: Exploring the Range of Opportunities for eCooking on Solar Hybrid Mini Grids . . . . . . . . . . . . . . . . . . . . . . . . . . . . . . . . . . . . . . . . . . . . . . . . . . . . . . . 57
3.4. eCooking with Stand-alone Systems . . . . . . . . . . . . . . . . . . . . . . . . . . . . . . . . . . . . . . . . . . 63
Case Study 5: The Next Generation of Cooking-Enabled Solar Home Systems . . . 68
3.5. Implications for eCooking in Off-Grid and Grid-Connected Contexts . . . . . . . . . . . . . . . 74

ESMAP | Cooking with Electricity: A Cost Perspectiveiv
4 | DELIVERY APPROACHES . . . . . . . . . . . . . . . . . . . . . . . . . . . . . . . . . . . . . . . . . . . . . . . . 83
4.1. Appliance Value Chain . . . . . . . . . . . . . . . . . . . . . . . . . . . . . . . . . . . . . . . . . . . . . . . . . . . . . . 84
4.2. Peer-to-Peer Women-Led Product Distribution Models . . . . . . . . . . . . . . . . . . . . . . . . . . . 85
4.3. Pay-as-You-Go Models . . . . . . . . . . . . . . . . . . . . . . . . . . . . . . . . . . . . . . . . . . . . . . . . . . . . . . 86
4.4. Productive Applications . . . . . . . . . . . . . . . . . . . . . . . . . . . . . . . . . . . . . . . . . . . . . . . . . . . . . 87
4.5. Utility Model: Cooking as a Service . . . . . . . . . . . . . . . . . . . . . . . . . . . . . . . . . . . . . . . . . . . 88
4.6. Distribution through Consumer Lending Institutions . . . . . . . . . . . . . . . . . . . . . . . . . . . . . 88
5 | FINANCING THE TRANSITION TO ECOOKING . . . . . . . . . . . . . . . . . . . . . . . . . . 89
5.1. Consolidating Investment Strategies . . . . . . . . . . . . . . . . . . . . . . . . . . . . . . . . . . . . . . . . . . 89
5.2. Financing the Cost of eCooking for Households . . . . . . . . . . . . . . . . . . . . . . . . . . . . . . . . . 90
5.3. Financing Developers’ Capital Expenses and Working Capital . . . . . . . . . . . . . . . . . . . . . 91
5.4. Results-Based Financing and Impact-Linked Financing . . . . . . . . . . . . . . . . . . . . . . . . . . . 93
6 | DISCUSSION, RECOMMENDATIONS, AND AREAS FOR FURTHER RESEARCH . . . . . . . . . . . . . . . . . . . . . . . . . . . . . . . . . . . . . . . . . . . . . . . . . . . . . . . . . 95
6.1. Support Policy Makers’ Efforts to Create an Enabling Environment that Bridges the Division between the Electrification and Clean Cooking Sectors . . . . . . . . . . . . . . . . . . . 95
6.2. Conduct Strategic Evidence-Based Research to Inform Decision Makers, Private Sector Players, and Consumers of Emerging Opportunities . . . . . . . . . . . . . . . . . . . . . . . 99
6.3. Support Private Sector Efforts to Develop Products and Services Tailored to the Needs and Aspirations of the Poor . . . . . . . . . . . . . . . . . . . . . . . . . . . . . . . . . . . . . . . . . . . 102
6.4. Help Consumers Understand the Benefits of Adopting Modern eCooking Solutions and Reduce Barriers to Behavioral Change . . . . . . . . . . . . . . . . . . . . . . . . . . . . . . . . . . . . 107
7 | CONCLUSION . . . . . . . . . . . . . . . . . . . . . . . . . . . . . . . . . . . . . . . . . . . . . . . . . . . . . . . . . . . . . .111
Endnotes . . . . . . . . . . . . . . . . . . . . . . . . . . . . . . . . . . . . . . . . . . . . . . . . . . . . . . . . . . . . . . . . . . . .112
References . . . . . . . . . . . . . . . . . . . . . . . . . . . . . . . . . . . . . . . . . . . . . . . . . . . . . . . . . . . . . . . . . . . 114
Appendix A: The Modern Energy Cooking Solutions Program . . . . . . . . . . . . . . . . . . .119
Appendix B: Typology of eCooking System Architectures . . . . . . . . . . . . . . . . . . . . . . .121
Appendix C: Assessing Electricity Demand for Cooking . . . . . . . . . . . . . . . . . . . . . . . 122
Appendix D: Comparison of eCooking Appliances. . . . . . . . . . . . . . . . . . . . . . . . . . . . . 132
Appendix E: Outline of the eCooking Model . . . . . . . . . . . . . . . . . . . . . . . . . . . . . . . . . . 134
Appendix F: Model Input Data . . . . . . . . . . . . . . . . . . . . . . . . . . . . . . . . . . . . . . . . . . . . . . . . 145
Appendix G: Solar eCooking Cross-Comparison . . . . . . . . . . . . . . . . . . . . . . . . . . . . . . 155
Appendix H: Multi-Tier Framework . . . . . . . . . . . . . . . . . . . . . . . . . . . . . . . . . . . . . . . . . . . 156

v
FIGURES
Figure ES.2 Comparison of system architectures using aggregated data from all case studies . . . . . . . .xxi
Figure ES.3 Impact of energy-efficient appliances and fuel stacking on cost of AC and battery-supported DC eCooking . . . . . . . . . . . . . . . . . . . . . . . . . . . . . . . . . . . . . . . . . . . xxiii
Figure 1.1 Actual and projected global access to electricity and clean cooking, 2000–30 . . . . . . . . . . . 2
Figure 1.2 Share of population with access to clean cooking fuels and technologies, by region, 2017 . . . 2
Figure 1.3 Access to electricity and clean cooking in Zambia, Myanmar, and Kenya . . . . . . . . . . . . . . . . 8
Figure 1.4 Assessment of eCooking appliances featured in this report . . . . . . . . . . . . . . . . . . . . . . . . 10
Figure 2.1 Actual and projected prices for PV modules and lithium-ion battery storage, 2010–22 . . . . . 16
Figure 3.1 Comparison of the five case studies and rationale for selection . . . . . . . . . . . . . . . . . . . . . 26
Figure 3.2 Percentage of households cooking primarily with electricity in Sub-Saharan African and South/Southeast Asian countries . . . . . . . . . . . . . . . . . . . . . . . . . . . . . . . . . . . . . . . . 28
Figure 3.3 Sensitivity analysis comparing the cost of eCooking with the cost of cooking with charcoal across Sub-Saharan Africa . . . . . . . . . . . . . . . . . . . . . . . . . . . . . . . . . . . . . . . . . . . . . . . . 30
Figure 3.4 Percentage of households with grid connections that still cook primarily with fuels other than electricity in Sub-Saharan Africa and South/Southeast Asia . . . . . . . . . . . . . . . . . . . . . 33
Figure 3.5 Percentage of households cooking primarily with commercialized polluting fuels and technologies (charcoal, coal, or kerosene) in Sub-Saharan Africa and South/Southeast Asia . 33
Figure 3.6 Primary cooking fuel used in selected countries in East and Southern Africa . . . . . . . . . . . . 34
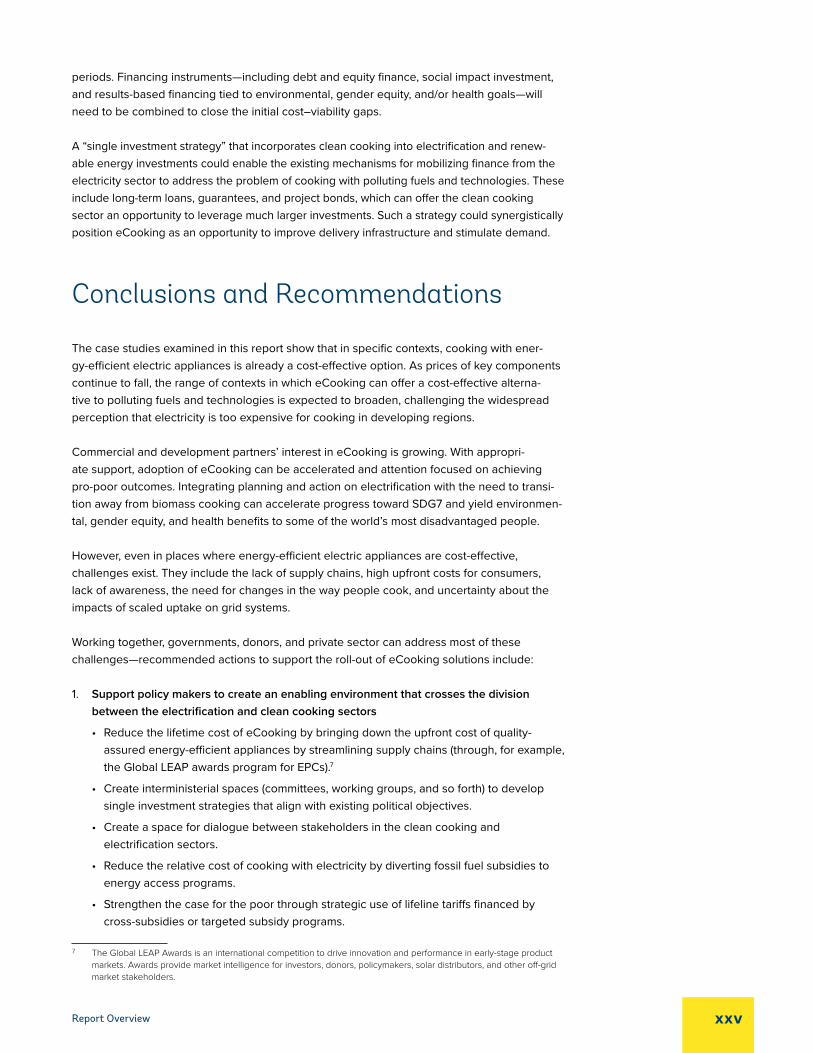
Figure 3.7 Fuel stacking using LPG for manual control and an electric pressure cooker for automatic control . . . . . . . . . . . . . . . . . . . . . . . . . . . . . . . . . . . . . . . . . . . . . . . . . . . . . . 35
Figure 3.8 Monthly cost of cooking with main fuels in Nairobi, 2020 and 2025 . . . . . . . . . . . . . . . . . . . 38
Figure 3.9 Sensitivity of modelling results to charcoal price in Nairobi, Dar es Salaam, and Kampala, 2020 . . . . . . . . . . . . . . . . . . . . . . . . . . . . . . . . . . . . . . . . . . . . . . . . . . . . . 40
Figure 3.10 Charcoal market in Lusaka, Zambia, alongside electricity distribution infrastructure . . . . . . . 41
Figure 3.11 Comparison of mbaula, hot plate, and electric pressure cooker . . . . . . . . . . . . . . . . . . . . . . 42
Figure 3.12 Monthly cost of cooking using main fuels in Lusaka, Zambia, 2020 and 2025 . . . . . . . . . . . . 44
Figure 3.13 Sensitivity of modelling results to potential tariff increases by ZESCO, 2020 and 2025 . . . . . 46
Figure 3.14 Break-even tariffs for typical solar hybrid mini grid in India at different levels of energy consumption . . . . . . . . . . . . . . . . . . . . . . . . . . . . . . . . . . . . . . . . . . . . . . . . . . . . . . . . . . 48
Figure 3.15 Effect of increasing load factor on levelized cost of electricity of power-limited mini grids . . . 50
Figure 3.16 Powerhouse at one of the many small community-owned micro-hydro systems in Shan State, Myanmar . . . . . . . . . . . . . . . . . . . . . . . . . . . . . . . . . . . . . . . . . . . . . . . . . . . . 51
Figure 3.17 Voltage stabiliser in Myanmar . . . . . . . . . . . . . . . . . . . . . . . . . . . . . . . . . . . . . . . . . . . . . 52
Figure 3.18 Voltmeter installed in kitchen in Myanmar . . . . . . . . . . . . . . . . . . . . . . . . . . . . . . . . . . . . . 52
Figure 3.19 Monthly cost of cooking using main fuels in Shan State, Myanmar, 2020 and 2025 . . . . . . . . 54
Figure 3.20 Sensitivity of modelling results to mini grid tariffs in Myanmar, 2020 and 2025 . . . . . . . . . . 56
Figure 3.21 Kibindu village residents experimenting with range of efficient eCooking appliances during a focus group session . . . . . . . . . . . . . . . . . . . . . . . . . . . . . . . . . . . . . . . . . . . . . . 57
Figure 3.22 Monthly cost of cooking using main fuels in Kibindu, Tanzania, 2020 and 2025 . . . . . . . . . . 59
Figure 3.23 Break-even analysis for mini grid tariffs for household cooking, 2020 and 2025 . . . . . . . . . . 60
Figure 3.24 Break-even analysis for mini grids tariffs for microenterprise cooking, 2020 and 2025 . . . . . 62
Figure 3.25 Monthly cost of cooking with different fuel options projected by various models . . . . . . . . . 65
Figure 3.26 Early prototype of a battery-supported DC electric pressure cooker designed by SCODE . . . 68

ESMAP | Cooking with Electricity: A Cost Perspectivevi
TABLES
Table 1.1 Types of electric cooking physically possible with each tier of electricity access. . . . . . . . . . . 7
Table 2.1 Summary of data collection methodologies used in this report . . . . . . . . . . . . . . . . . . . . . . 14
Table 2.2 Simplified typology of eCooking devices for strong, weak, and off-grid settings . . . . . . . . . . 15
Table 2.3 Parameter values used in high- and low-cost scenarios for eCooking systems . . . . . . . . . . . .17
Table 2.4 System architectures and modelling parameters in each case study context . . . . . . . . . . . . 19
Table 2.5 Measured energy consumption for eCooking and modelling assumptions . . . . . . . . . . . . . . 21
Table 2.6 Normalized energy consumption cooking with traditional fuel, by fuel type . . . . . . . . . . . . . 22
Table 3.1 Electricity supply factors in Kenya, Tanzania, Uganda, and Zambia . . . . . . . . . . . . . . . . . . . 29
Table 3.2 Fuel prices in Nairobi, Kampala, and Dar es Salaam in 2020 and 2025 used in modelling . . . 37
Table 3.3 Electricity tariffs in Kenya, Tanzania, and Uganda. . . . . . . . . . . . . . . . . . . . . . . . . . . . . . . . 39
Table 3.4 Key parameters of selected studies modelling the costs of solar eCooking systems . . . . . . . 64
Table 3.5 Range of opportunities for cost-effective eCooking that open up at different tariff levels . . . 78
Table 4.1 Applicability of various delivery approaches to each system architecture. . . . . . . . . . . . . . . 84
Table 6.1 Targeted recommendations for creating interministerial spaces . . . . . . . . . . . . . . . . . . . . . 96
Table 6.2 Targeted recommendations for encouraging intersectoral dialogue . . . . . . . . . . . . . . . . . . 96
Table 6.3 Targeted recommendations for using lifeline tariffs . . . . . . . . . . . . . . . . . . . . . . . . . . . . . . 97
Table 6.4 Targeted recommendations for diverting fossil fuel subsidies . . . . . . . . . . . . . . . . . . . . . . . 98
Table 6.5 Targeted recommendations for enabling quality-assured energy-efficient appliances . . . . . . 98
Table 6.6 Targeted recommendations for identifying culturally appropriate appliances . . . . . . . . . . . . 99
Table 6.7 Targeted recommendations for understanding target market segments . . . . . . . . . . . . . . 100
Figure 3.27 Participatory cooking session with prototype of DC electric pressure cooker in Echariria, Kenya . . . . . . . . . . . . . . . . . . . . . . . . . . . . . . . . . . . . . . . . . . . . . . . . . . . . . . . . . . . . . . . 69
Figure 3.28 Residents of Echariria, Kenya at a community meeting with a DC electric pressure cooker . . 69
Figure 3.29 Charcoal stove and battery that is regularly charged at Echariria’s solar hub . . . . . . . . . . . . 69
Figure 3.30 Monthly cost of cooking using main fuels in Echariria, Kenya, 2020 and 2025 . . . . . . . . . . . .71
Figure 3.31 Sensitivity of solar battery–eCooking and fuel-stacking scenarios to charcoal price with a five-year repayment horizon, 2020 . . . . . . . . . . . . . . . . . . . . . . . . . . . . . . . . . . . . . . . . . . 72
Figure 3.32 Breakdown of solar eCooking and fuel costs for systems sized to meet needs of average Kenyan household in 2025 . . . . . . . . . . . . . . . . . . . . . . . . . . . . . . . . . . . . . . . . . . . . . . . . 73
Figure 3.33 Emerging opportunities for cost-effective eCooking identified in each of the five case studies . . . . . . . . . . . . . . . . . . . . . . . . . . . . . . . . . . . . . . . . . . . . . . . . . . . . . . . . . . 75
Figure 3.34 Optimal-system diagrams for household cooking, based on electricity/charcoal price combination and quality of the grid, 2025 . . . . . . . . . . . . . . . . . . . . . . . . . . . . . . . . . . . . . 76
Figure 3.35 Optimal-system diagram for productive-use case (precooking beans/cereals with an electric pressure cooker) on reliable grid, 2025 . . . . . . . . . . . . . . . . . . . . . . . . . . . . . . . . . 77
Figure 3.36 Comparison of system architectures using aggregated data from all case studies . . . . . . . . 79
Figure 3.37 Impact of energy-efficient appliances and fuel stacking on cost of AC and battery- supported DC eCooking . . . . . . . . . . . . . . . . . . . . . . . . . . . . . . . . . . . . . . . . . . . . . . . . . . 80
Figure 5.1 Market financing of electric cooking appliances . . . . . . . . . . . . . . . . . . . . . . . . . . . . . . . . . 90
Figure 5.2 Range of appliance financing options for utilities and mini grid developers . . . . . . . . . . . . . 91
Figure C.3 Enumerator training study participant to record cooking diary data in Nairobi . . . . . . . . . . 125

vii
Table 6.8 Targeted recommendations for enhancing the modelling of solar battery–powered eCooking . . . . . . . . . . . . . . . . . . . . . . . . . . . . . . . . . . . . . . . . . . . . . . . . . . . . . . . . . . . 100
Table 6.9 Targeted recommendations for modelling load management on grid systems . . . . . . . . . . .101
Table 6.10 Targeted recommendations for developing utility and mini grid business models . . . . . . . . 102
Table 6.11 Targeted recommendations for producing and selling appliances that appeal to customers at the bottom of the pyramid . . . . . . . . . . . . . . . . . . . . . . . . . . . . . . . . . . . . . . . . . . . . . 103
Table 6.12 Targeted recommendations for developing business models for solar home systems . . . . . 104
Table 6.13 Targeted recommendations for enhancing the role of players in the clean cooking value chain . . . . . . . . . . . . . . . . . . . . . . . . . . . . . . . . . . . . . . . . . . . . . . . . . . . . . . . . . . 104
Table 6.14 Targeted recommendations for empowering women to promote eCooking . . . . . . . . . . . . 105
Table 6.15 Targeted recommendations for balancing consumer and private sector financing needs . . . 105
Table 6.16 Targeted recommendations for bridging initial cost–viability gaps . . . . . . . . . . . . . . . . . . 106
Table 6.17 Targeted recommendations for developing “pay-as-you-cook” financing . . . . . . . . . . . . . . 107
Table 6.18 Targeted recommendations for helping consumers understand the cost of eCooking . . . . . 108
Table 6.19 Targeted recommendations for conducting eCooking demonstrations and offering trial periods for consumers . . . . . . . . . . . . . . . . . . . . . . . . . . . . . . . . . . . . . . . . . . . . . . . . . . 108
Table 6.20 Targeted recommendations for translating evidence into easy-to-understand content . . . . 109
Table 6.21 Targeted recommendations for encouraging wider use of energy-efficient appliances . . . . 109


ix
ABBREVIATIONS
AC alternating currentBMS battery management systemCapEx capital expenseCO2 carbon dioxideCO2-eq carbon dioxide equivalentDC distributed currentEPC electric pressure cookerESMAP Energy Sector Management Assistance ProgramGJ gigajouleGOOGLA Global Off-Grid Lighting AssociationGW gigawattKPLC Kenya Power and Lighting CompanykW kilowattkWh kilowatt hourkWp kilowatt peakLCoE levelized cost of electricityLED light emitting diodeLPG liquified petroleum gasMECS Modern Energy Cooking SolutionsMJ megajouleMTF Multi-Tier FrameworkPAYG pay-as-you-goPM2.5 atmospheric particulate matter with diameter of less than 2.5 micrometersPV photovoltaicSACCO savings and credit cooperativeSCODE Sustainable COmmunity DEvelopmentSDG Sustainable Development GoalSHS solar home systemTANESCO Tanzania Electric Supply CompanyTaTEDO Tanzania Traditional Energy Development OrganisationV voltWh watt hourZESCO Zambia Electricity Supply Corporationμg/m3 micrograms per cubic meter
All currency in United States dollars (US$, USD), unless otherwise indicated.

ESMAP | Cooking with Electricity: A Cost Perspectivex
ACKNOWLEDGMENTS
This report was prepared under the overall guidance of ESMAP’s Program Manager, Rohit Khanna, and MECS’ Research Director, Prof. Ed Brown. Besnik Hyseni, a World Bank energy specialist, managed the project, from inception to publication. The report’s lead authors were Dr. Jon Leary (Loughborough University and Gamos), Besnik Hyseni, Prof. Matt Leach (Gamos), and Dr. Simon Batchelor (Loughborough University and Gamos).
Many of the data presented in this report were collected during the projects that laid the foundation for the MECS program. They included (a) “The Next Generation of Low Cost Energy Efficient Products for the Bottom of The Pyramid” project, supported by the Understanding Sustainable Energy Solutions (USES) program, co-funded by UK Aid from the Foreign, Commonwealth and Development Office (FCDO), the Engineering and Physical Sciences Research Council (EPSRC), the Research Councils UK (RCUK), and the Department for Energy and Climate Change (DECC) and (b) the “eCook: A Transformational Household Solar Battery-Electric Cooker for Poverty Alleviation” project, co-funded by UK Aid (FCDO) via Innovate UK Energy Catalyst and Gamos.
The findings presented in this report would not have been possible without the dedication and enthusiasm of the 80 households that diligently recorded data on everything they cooked for six weeks. Their willingness to experiment with new appliances and share their experi-ences created a rich learning opportunity. We are grateful to our partners the African Centre for Technology Studies (ACTS), the Tanzania Traditional Energy Development Organisation (TaTEDO), the Renewable Energy Association of Myanmar (REAM), and the Centre for Energy, Environment and Engineering Zambia (CEEEZ) for facilitating the cooking diary studies. These were complemented by a range of activities to explore emerging opportunities in Kenya, Myanmar, Tanzania, and Zambia, including 13 focus group sessions, 6 stakeholder workshops, 14 concept prototypes, and a survey of 800 households.
For their time, expertise, and thoughtful comments, we are exceptionally grateful to our peer reviewers: Eliot Avila (A2EI), Iwona Bisaga (BBOXX), Richard Blanchard (Loughborough University), Ewan Bloomfield (Power Africa), Jonathan Bowes (University of Strathclyde), William Brent (Power for All), Malcolm Bricknell (Loughborough University), Toby Couture (E3 Analytics), Aran Eales (University of Strathclyde), Chris Emmott (Fenix International), Jacob Fodio Todd (University of Sussex), Stuart Galloway (University of Strathclyde), Rupert Gammon (De Montfort University), Peter George (Clean Cooking Alliance), Ray Gorman (Power Africa), Sam Grant (CLASP), Rebecca Hanlin (ACTS), Tarek Kettleson (Amperes), Alessandra Leach (independent consultant), Eva Lee (Power for All), Jacquetta Lee (independent consul-tant/University of Surrey), Peter Lilienthal (HOMER), John Maina (Sustainable Community Development Services [SCODE]), Daisy Mkandawire (Zambia Energy Services Company [ZESCO]), Katherine Manchester (Clean Cooking Alliance), Job Ngeni (Power Africa), Samson Ondiek (Kenya Power and Lighting Company), Jessie Press-Williams (Burn Manufacturing), Surabhi Rajagopal (Hivos), Oli Rasion (Biolite), Charlotte Ray (independent consultant), Nick Rousseau (Loughborough University), Dana Rysankova (ESMAP), Estomih Sawe (TaTEDO), Nigel Scott (Gamos), Meron Tesfamichael (University College London), Dipti Vaghela (Hydropower Empowerment Network), Robert Van Buskirk (Enervee), Neal Wade (Newcastle University), and Yabei Zhang (ESMAP).

xiAcknowledgments
ABOUT ESMAP
The Energy Sector Management Assistance Program (ESMAP) is a partnership between the World Bank and development partners and private nonprofit organizations that helps low- and middle-income countries reduce poverty and boost growth through sustainable energy solutions. ESMAP’s analytical and advisory services are fully integrated within the World Bank’s country financing and policy dialogue in the energy sector. Through the World Bank Group (WBG), ESMAP works to accelerate the energy transition required to achieve Sustainable Development Goal 7 (SDG 7) to ensure access to affordable, reliable, sustainable, and modern energy for all. It helps to shape WBG strategies and programs to achieve International Development Association (IDA) policy commitments and the WBG Climate Change Action Plan targets.
ESMAP is funded by Australia, Austria, Canada, ClimateWorks Foundation, Denmark, the European Commission, Finland, France, Germany, Iceland, Italy, Japan, Lithuania, Luxembourg, the Netherlands, Norway, the Rockefeller Foundation, Sweden, Switzerland, and the United Kingdom, as well as by the World Bank. Lear more at www.esmap.org.
ABOUT MECS
The Modern Energy Cooking Services (MECS) Program a five-year initiative funded by UK Aid of the Foreign, Commonwealth & Development Office (FCDO) and led by Loughborough University and the World Bank’s Energy Sector Management Assistance Program (ESMAP). The MECS Program aims to accelerate the global transition from traditional biomass-based cooking to modern-energy cooking solutions.
By integrating modern energy cooking services into the planning for electricity access, quality, reliability and sustainability, MECS hopes to leverage investment in renewable energies (both grid and off-grid) to address the clean cooking challenge. MECS is implementing a strategy focused on including the cooking needs of households into the investment and action on “access to affordable, reliable, sustainable modern energy for all.”

ESMAP | Cooking with Electricity: A Cost Perspectivexii ESMAP | Cooking with Electricity: A Cost Perspective
A hybrid clean cooking system pairing LPG with a DC EPC powered from a solar home system in Kenya (case study 5).

xiiiExecutive Summary
EXECUTIVE SUMMARY
Through five case studies, this report compares the current and projected costs to the consumer of a range of electric cooking (eCooking) solutions with the costs of cooking with currently widely-used fuels in each context. The use of energy-efficient electric cooking appliances challenges the widespread perception that electricity is too expensive for cooking. The analysis shows that eCooking can already be a cost-effective option in a variety of settings and is likely to become increasingly effective in the near future.
2.8 billion people globally are still cooking with solid biomass, however, just 789 million are now without access to electricity (ESMAP 2020). This implies that approximately 2 billion people now have access to some form of electricity, but continue to cook with biomass. The case studies show that in some settings, using modern energy-efficient appliances to cook with reliable grid electricity already offers a cost-effective opportunity to enable clean cooking. For people with unreliable electricity access, as well as people who are still not connected to the grid, a suite of new clean cooking technologies and business models is emerging. The results indicate that there is a growing potential to enable modern energy-efficient electric cooking with grid and off-grid electricity, enhancing both reliability and access.
Taking the case studies as a baseline, the report extrapolates the results to illustrate the wider application of eCooking for a range of costs and fuel prices and carries out sensitivity analyses to explore emerging trends. The results highlight the cost thresholds that can be used to identify the markets where the levelized costs1 of eCooking systems are already lower than current expenditures on cooking fuels. When the models are projected to include 2025 costs and expenditures, the comparison looks even more favorable, meaning that eCooking is likely to become cost-effective in a broader range of markets.
The uptake of eCooking will depend substantially on the willingness of the private sector—in particular solar companies, mini-grid operators and utilities—to adopt the technology as part of the suite of services it offers its customers. Utilities with excess generating capacity could stimulate demand by developing an on-bill financing mechanism for energy-efficient cooking appliances. Financial institutions also have an important role to play, as financing will be needed across the value chain to offset the high upfront costs of eCooking solutions, especially battery-supported models. End-users will require credit to allow them to pay for the high upfront cost of eCooking devices in affordable installments or reframe them as eCook-ing services, where the provider retains ownership of the assets, leasing or renting them to the user.
1 The net present value of investment and operating costs per month of cooking service delivered.

ESMAP | Cooking with Electricity: A Cost Perspectivexiv
The report seeks to build the evidence base to assess whether cooking with electricity could make a significant contribution to the Sustainable Development Goals (SDGs) by simulta-neously enabling cost-effective access to modern energy and clean cooking. The results suggest that integrating planning and action on electrification with the need to transition away from biomass cooking could add momentum to the quest to achieve SDG7 in particular (ensuring access to affordable, reliable, sustainable, and modern energy). Commercial and political interest in eCooking is growing. With appropriate support from governments, adoption of eCooking can be accelerated, yielding substantial environmental, gender equity, and health benefits to some of the world’s most disadvantaged people.
Experimenting by cooking ugali in a rice cooker at a workshop in East Africa (case study 1).

xvReport Overview
REPORT OVERVIEW
Modern energy-efficient electric cooking (eCooking) has the potential to achieve a broad range of developmental goals—for energy access, the environment, gender equity, and health—by enabling access to clean cooking and reliable electricity. Battery-supported cook-ing devices can make cooking with electricity more reliable and offer the co-benefit of also making low power energy services (such as LED lighting or phone charging) more reliable. This emerging opportunity leverages rapid progress in the electricity sector to drive the clean cooking sector toward achieving the seventh Sustainable Development Goal (SDG7) of univer-sal access to affordable, reliable, sustainable, and modern energy by 2030.
A new generation of highly efficient eCooking appliances is now available that can drastically lower costs by reducing the amount of electricity required to cook (Zubi and others 2017; Leary, Serenje, Mwila and others 2019; Couture and Jacobs 2019). The electric pressure cooker (EPC) is the most energy-efficient appliance for cooking the most energy-intensive foods. Recent field trials2 have shown that it is also attractive to cooks, as it cooks more quickly and includes automatic controls that allow for multitasking (Leary, Fodio Todd, Batchelor, Chepkurui and others 2019). IMARC (2019) reports that worldwide sales of EPCs totaled 8 million units or $578 million in 2018. It reports that convenience and speed are primary driv-ers of sales. Awareness of the energy efficiency potential of EPCs is still low among consum-ers, but it is growing within the development community, who are searching for cost-effective solutions to the clean cooking challenge.
The prices of lithium-ion batteries and solar photovoltaic (PV) power have dropped significantly in recent years, and the cost of biomass fuels is rising rapidly in many heavily degraded or deforested areas (Batchelor 2015; Couture and Jacobs 2019). This trend is opening the door to a range of potentially transformative solutions for cooking with both alternating current (AC) electricity and battery-supported direct current (DC) devices that can enable cooking on weak grids, mini-grids, and stand-alone systems. As a result, mini-grid developers, solar home system companies, and utilities are starting to take a closer look at eCooking.
In many developing countries, electricity grids are expanding their coverage and becoming more reliable (Power Africa 2015, 2018), while battery-supported appliances can support weaker grids and enable off-grid access. This development is important, as energy-efficient eCooking appliances can also be powered by batteries, as they draw much less power than conventional electric hotplates. Advancements in energy storage can shift electricity demand away from peak times and allow users to cook during blackouts or brownouts. Advancements in battery storage and solar PV also have the potential to provide electricity access in even the most remote parts of the world (Batchelor and others 2018).
2 Cooking diary studies with 80 households and 13 focus groups across Kenya, Tanzania, Zambia and Myanmar (Batchelor et al. 2019; Scott et al. 2019; Leary, Scott, Serenje, Mwila, et al. 2019b; Leary et al. 2019).

ESMAP | Cooking with Electricity: A Cost Perspectivexvi
Case Study Methodology and Modeling
This report compares the costs to the consumer of cooking with electricity versus other fuels based on detailed empirical data on cooking energy demand. Five case study sites were selected to represent a cross section of contexts in the countries where cooking energy demand data is available, including both urban and rural areas and for households with access to reliable grids, unreliable grids, and no grid access. The report identifies settings where eCooking is likely to be as affordable as (if not cheaper than) current practice by comparing typical expenditures on cooking fuels in the study sites with the levelized costs of a range of eCooking solutions. As further cost reductions of key components are expected, the report compares actual costs in 2020 with projections for 2025.
The affordability of cooking is usually assessed based on the proportion of household income spent on cooking fuel, suggesting that even existing expenditures may not be considered “affordable” for households that are already spending a large proportion of their income on cooking fuels. However, this report does not seek to compare cooking fuel expenditures to household incomes. It highlights opportunities where eCooking is already, or will soon be, cost-competitive with current practice. In addition to offering benefits to individual households, eCooking could provide an opportunity to redirect expenditures away from polluting fuels and technologies,3 especially where they are used inefficiently, to support the roll-out of modern energy infrastructure.
A model was constructed to simulate the monthly costs of cooking on a range of eCooking systems and compare them with typical expenditures on other fuels (Leach and others 2019). The modeling considers cooking using AC appliances and battery-supported DC appliances, connected to national grid, mini-grid, and stand-alone systems. It also compares two business models: (a) the private sector pay-as-you-go (PAYG) model, with a 5-year financing horizon and (b) the utility (or energy service) model, with a 20-year horizon.
The study team collected data on energy consumption, cooking practices, and user experi-ences from households in four countries: Kenya, Myanmar, Tanzania, and Zambia (Leary, Scott, Sago and others 2019; Leary, Scott, Serenje and others 2019a; Leary, Scott, Numi and others 2019; Leary, Scott, Hlaing and others 2019). Data were collected using cooking diary studies, which included assessment of the acceptability and desirability of appliances and electricity usage based on preparation of typical dishes. The data reveal that using a mixture of conven-tional and energy-efficient appliances, the average household (assumed to include 4.2 people) in these countries can perform its daily cooking with 0.88–2.06 kilowatt hours (kWh) of elec-tricity. Under a “fuel-stacking scenario” (in which half the menu is cooked using an EPC and the other half is cooked with another fuel), daily electricity consumption is projected to be just 0.30–0.67 kWh per household.
3 According to the World Health Organization (WHO 2016, 31), polluting fuels and technologies include “biomass (wood, dung, crop residues and charcoal), coal (including coal dust and lignite) and kerosene.”

xvii
CASELOCATION
CONTEXT SUPPLY SIDEDEMAND SIDE:
BASELINE FUELS/APPLIANCES
KEY OPPORTUNITYTO ENABLE 100%CLEAN COOKING
ENERGYSTORAGE
CONSIDERED
NoneStimulate demandfor surplus national
grid electricity
Mitigate loadshedding onnational gridswith energy
storage
Mitigate peakloading
constraints onmicro hydro
mini-grids withenergy storage
Stimulate demand forelectricity in rapidly
growing solar-hybridmini-grid sector
Enable electricityaccess and cleancooking with solar
systems
Urban,national grid
Urban,national grid
LPG, charcoaland kerosene
Clean fuel stack: LPGand most e�cientelectric appliances
(EPCs)
Clean fuel stack: LPGand most e�cientelectric appliances
(EPCs)
Clean fuel stack: LPGand most e�cientelectric appliances
(EPCs)
Nairobi,Kenya
1
Lusaka,Zambia
2
Shan State,Myanmar
3
Kibindu village,Tanzania
4
Echaririavillage, Kenya
5
Firewood and e�cientelectric appliances
(induction stove, ricecooker and insulated
electric frying pan)
Only e�cient electricappliances (inductionstove, rice cooker and
insulated electricfrying pan)
Rural, micro-hydro mini-grid
Rural, solarhybrid mini-grid
Rural, o�-grid
Centralizedbattery bank
Charcoal and firewood
Charcoal, keroseneLPG and firewood
Householdbattery
Householdbattery
Householdbattery
Ine�cient electricappliances (hotplates,
oven) and charcoal
Most e�cient (EPCs)and minimal use of
less e�cient appliances(hotplates, oven)
TABLE ES.1 Comparison of the five case studies and rationale for selection
Report Overview

ESMAP | Cooking with Electricity: A Cost Perspectivexviii
CASE STUDY MODELING RESULTS
The case studies illustrate real-world contexts where the levelized cost of eCooking solutions can be lower than existing expenditures on biomass. A range of system architectures and fuel-stacking scenarios was modelled, using actual costs. Figure ES.1 shows the most viable clean cooking solution in each setting. Except for the Tanzania minigrid case, modern energy cooking services are already cost-competitive with the dominant biomass fuel, including elec-tric solutions as well as clean fuel stacking with liquefied petroleum gas (LPG). In some cases, eCooking can be more cost-effective than biomass even if the appliance must be supported by a battery.
The first case study explores an opportunity for urban East Africans to transition completely away from biomass by fuel stacking LPG with an EPC. Kenya Power has surplus generation capacity and is looking to increase demand for electricity, which is currently barely used for cooking. LPG is currently the aspirational fuel across most of East Africa, yet many households with an LPG stove still purchase charcoal to cook “heavy foods”. Case study 1 illustrates an urban context with high charcoal prices ($0.49/kg), low LPG prices ($1.08/kg), and average electricity prices (lifeline tariff of 100kWh/month at 0.17/kWh). It shows that a clean fuel stack of LPG and an AC EPC ($7–$10/month) is already one of the lowest-cost cooking solutions and substantially cheaper than charcoal ($23–$34/month).
40
35
30
25
20
15
10
5
0Charcoal Charcoal Charcoal CharcoalFirewoodGrid-eCook
and LPGGrid-battery-
eCookMini-grid-
battery-eCookMini-grid-
eCook and LPGSolar-battery-
eCook and LPG
Kenya Grid Zambia Grid MyanmarMini-grid
TanzaniaMini-grid
KenyaSHS
Cos
t of C
ooki
ng ($
/mon
th)
Fuel Stacking: AC eCooking / Battery-supported DC eCookingFuel Stacking: LPG / AC eCooking
Fuel Stacking: Battery-supported DC eCooking / LPGAC eCookingBattery-supported DC eCookingLPG
FirewoodCharcoal
CASE STUDY 1 CASE STUDY 2 CASE STUDY 3 CASE STUDY 4 CASE STUDY 5
2020
2020
2020 2020
2020
2020
2020
2020
2025
2020
2020
2025
20252025 2025
2025
2025
2025
2025
2025
FIGURE ES.1 Cost of cooking with biomass (charcoal/firewood) versus cost of cooking with the most cost-effective technically viable eCooking solution in each of the five case study contexts
Note: Case study 1, Kenya grid: Fuel stack of 50 percent liquefied petroleum gas (LPG) and 50 percent AC electric pressure cooker (EPC); private sector model (five-year financing horizon). Case study 2, Zambia grid: Hybrid AC/DC appliances with battery sized for 50 percent of cooking; utility model (20-year financing horizon). Case study 3, Myanmar mini-grid: Hybrid AC/DC appliances with battery sized to power 50 percent of cooking; utility model (20-year financing horizon). Case study 4, Tanzania mini-grid: Fuel stack of 50 percent LPG and 50 percent AC EPC; private sector model (five-year financing horizon). Case study 5, Kenya solar home system: Fuel stack of 50 percent LPG and 50 percent solar home system with DC EPC and battery sized to power 50 percent of household cooking; private sector model (five-year financing horizon).

xixReport Overview
The second case study illustrates an opportunity for countries with significant populations already cooking with electricity but using inefficient appliances, to optimize loading on their grids. Although electricity is already the aspirational cooking fuel in Zambia, the national utility (ZESCO) has repeatedly been forced to carry out load shedding over the past few years, as late rainfall has severely limited generation capacity on its hydropower-dominated grid. Case study 2 illustrates an urban context with lower charcoal prices ($0.21/kg) and low electricity prices (lifeline tariff of 200kWh/month at $0.01/kWh). The findings show that by 2025, a hybrid AC/DC eCooking system with a battery sized for half the day’s cooking using energy-efficient appliances and practices will be the cheapest option ($7–$8/month), substantially cheaper than charcoal ($6–$12/month)
The third case study highlights the opportunity for micro-hydro minigrid developers that have already enabled cooking on their systems to allow their customers to do all of their cooking with electricity. At peak times, grids often reach capacity and the voltage dips. This case study explores the potential role of battery storage in overcoming the supply constraints on micro-hydro minigrids in Myanmar. Case study 3 shows a rural area, with moderate firewood prices ($0.12/kg) and electricity access from a micro-hydro minigrid with a low tariff ($0.16/kWh). By 2025, a battery sized to support half the day’s cooking load could enable 24-hour eCook-ing ($9–$10/month), the cost of which would be on a par with firewood ($6–$11/month).
The fourth case study explores how the rapidly falling prices of batteries and solar PV are opening up new opportunities for integrating energy-efficient eCooking into solar-hybrid minigrids. Urbanization is causing many people who used to collect fuel to start paying for it, creating an opportunity to translate expenditures on biomass fuels into electricity units, which could drive down the tariff for the minigrid as a whole. Case study 4 depicts a rural area with low-cost biomass fuels available (firewood: $0.04/kg, charcoal: $0.13/kg) and access to elec-tricity via a minigrid with a very high tariff ($1.35/kWh). By 2025, tariffs in the solar hybrid mini-grid sector are expected to have fallen considerably (to $0.25–$0.38/kWh), enabling eCooking at marginal extra cost by fuel stacking an EPC. The most cost-effective clean cooking solution is a clean fuel stack of LPG and an EPC ($12–$21/month).
A participant in an EPC trial on a solar-hybrid mini-grid in Tanzania (case study 4).

ESMAP | Cooking with Electricity: A Cost Perspectivexx
The fifth case study describes a Kenyan village, where cooking was previously dominated by collected firewood, but dwindling forest resources and increasing livelihood opportunities have led many residents to start paying for firewood (or adopt charcoal, kerosene, or LPG). It explores whether pairing a DC EPC with lithium-ion battery storage and a suitably sized solar panel may be able to offer a cost-effective off-grid eCooking solution. Case study 5 illustrates an off-grid rural area with moderate fuel prices (charcoal: $0.30/kg; LPG: $1.33/kg). In 2025, the cheapest option is expected to be LPG ($8–$12/month). However, a clean fuel stack of LPG with a solar home system powering a DC EPC ($11–$14/month) can offer valuable co-ben-efits by enabling access to electricity for other purposes at marginal extra cost.
The global perspective
Figure ES.2 shows the outlook for eCooking at a global level by comparing the range of costs of the eCooking technologies explored in this paper with those of the most widely used cook-ing fuels. Input data were drawn from across the four case study countries (Kenya, Zambia, Tanzania, and Myanmar) and the three system architectures (grid, mini-grid, solar home system).
The results show that AC eCooking on national grids or mini-/micro-hydropower is already cost-effective for many people today and that battery-supported DC eCooking and solar-hy-brid minigrids become cost-effective in 2025, although clean fuel stacks with LPG can make all of these technologies cost-effective today. Cooking with AC grid electricity can be the cheap-est option for many people ($3–$17/month), but it is not always possible due to access and grid stability challenges. Supporting 50 percent of cooking loads with a battery increases the cost of cooking ($5–$22/month in 2025) but is still competitive with LPG, charcoal, and fire-wood ($6–$24/month, $5–$41/month, and $0–$23/month, respectively in 2025). Supporting 100 percent of the cooking loads increases the cost substantially (to $8–$39/month in 2025) but may still be competitive in contexts with low tariffs and low energy demand. By 2025, the costs of cooking with AC appliances connected to solar hybrid mini-grids ($8–$25/month) and with DC appliances powered by solar home systems ($11–$24/month) become compet-itive. LPG can play an important role as a transition fuel since a clean fuel stack of electricity and LPG can make battery-supported eCooking cost-competitive for some households today ($6–$29/month).
Training a cooking diary participant on cooking beans in an EPC in Kenya (case study 1).

xxiReport Overview
FIGURE ES.2 Comparison of system architectures using aggregated data from all case studies
20202025
YearAC without household battery
Electrical System Architecture
Battery-supported DC (household battery)
0
5
10
15
20
25
30
35
40
Cos
t of C
ooki
ng S
ervi
ce ($
/mon
th)
100% Electric Clean Fuel Stack (Electricity and LPG) Cooking Fuels
Cooking fuel
LPGFirewood
CharcoalFuel stacking
AC eCooking / Battery-supported DC eCookingLPG / AC eCookingBattery-supported DC eCooking / LPG
Note: The cost of cooking service is calculated over a five-year financing period for all system architectures. The range on each bar represents sensitivities to energy demand, to the grid tariff or solar resource and to key system performance and cost parameters. The ranges for energy demand are derived from the range of median values from the four country cooking diary studies for 100 percent eCooking (0.87–2.06kWh/household/day). The ratios of energy demand for cooking fuels: electricity calculated from the cooking diaries were used to model demand for LPG (2: 1), charcoal (10: 1) and firewood (10: 1). Grid-connected system architectures use a tariff range encompassing 90 percent of Sub-Saharan African utilities from AFREA and ESMAP (2016): $0.04–$0.25/kWh. National grids and mini-/micro-hydropower are grouped together, as tariff ranges are almost identical ($0.05–$0.25/kWh for mini-/micro-hydropower) (Skat 2019). Solar hybrid mini grid system architectures use a current tariff range of $0.55–$0.85/kWh and a range of $0.25–$0.38/kWh in 2025. The solar resource range is the range of average monthly solar irradiation in the least sunny months in each of the four case study countries (3.68–4.30kWh/kWpeak). eCook system performance and cost ranges are as reported in Table 2.3. Batteries are LiFePO4, sized to meet 100 percent and 50 percent of daily cooking loads, at 1–3kWh and 0.34–0.98kWh, respectively. PV is 300–700W for 100 percent and 100–200W for 50 percent. For full details of modelling input and output parameters, see appendix F.
The critical role of energy-efficient appliances
Both energy-efficient appliances and fuel stacking can substantially reduce the costs of electric cooking, with or without a battery (figure ES.3). An uninsulated four-plate cooker and oven may be cost-effective for households with reliable grid electricity and low tariffs ($7/month at $0.04/kWh). It is unlikely that anyone would consider supporting it with a battery, which would need 4.56kWh capacity ($28/month even at $0.04/kWh). In contrast, the appli-ance stack of uninsulated (hotplate, induction, infra-red cooker, or kettle) and insulated (EPC, rice cooker, electric frying pan, or thermo-pot) appliances can offer a much more affordable solution that is capable of covering 100 percent of a household’s everyday cooking needs. It would cost $4–$13/month for AC (where the grid is reliable enough) and $13–$29/month for battery-supported DC. Simply cooking with a single uninsulated appliance will be cheaper for some AC users as the upfront cost of appliances is lower but cooking may be less convenient. For the DC systems, the cost of the battery dominates, so spending more on an additional

ESMAP | Cooking with Electricity: A Cost Perspectivexxii
energy-efficient appliance actually reduces overall costs (from $16–$37/month to $13–$29/month), as the battery capacity is reduced (from 2.85kWh to 2.14kWh).
Although it cannot cook all food types, the EPC is likely to be an attractive first step into eCooking for many, as it can deliver the cheapest cooking service by some considerable margin. Systems could be designed to cook 50 percent of the menu (at a cost of $2–$5/month for AC or $5–$11/month for battery-supported DC) or simply what the EPC does most efficiently, which is boil heavy foods (at a cost of $2–$3/month for AC and $3–$4/month for battery-supported DC).
MAIN FINDINGS
Several key findings emerge from this report:
● Field trials with 80 households show that modern energy-efficient eCooking appliances (notably EPCs) are highly attractive to consumers and can substantially lower the cost of eCooking by reducing energy demand. Compared with electric hotplates, EPCs can reduce energy demand by 80 percent for “heavy foods” (foods that require boiling for more than an hour) and by 50 percent across the entire range of foods that they are able to cook.4
● The cost of cooking with energy-efficient appliances is significantly lower than the cost of cooking with electric hotplates, but the upfront cost is higher (typically $50–$80 for an EPC, compared with $10–$30 for a hotplate).
● eCooking with AC grid electricity is already cheaper than cooking with charcoal in some of the urban centers studied, where charcoal costs more than $0.40/kg and electricity tariffs are below $0.35/kWh.
4 Analysis of the menu recorded during these trials showed that participants cooked 50 percent of their meals on an energy-efficient appliance and that with additional training this share could increase to up to 90 percent.
A community solar hub acts as a demonstration, distribution and after-sales service centre for solar electric cooking systems in a Kenyan village (case study 5).

xxiiiReport Overview
● Using a clean fuel stack of LPG and a highly efficient eCooking appliance is often the most cost-effective way to cook.5
● Battery-supported eCooking is already cost-effective for charcoal users in urban centers with electricity tariffs below $0.15/kWh.
● By 2025, expected increases in charcoal prices and the falling costs of battery-supported solutions suggest that the cost of eCooking will likely be comparable to the cost of cooking with charcoal in weak-grid and off-grid contexts ($8–39/month vs. $5–41/month respectively).
● Battery-supported cooking devices can also provide access to other low power energy services such as lighting and mobile phone charging.
● Stand-alone solar systems start to become competitive with their grid-connected counterparts at tariffs of $0.15–$0.35/kWh (see figure ES.3).
5 LPG is a good complementary fuel to eCooking since it is popular for frying and preparing quick meals
FIGURE ES.3 Impact of energy-efficient appliances and fuel stacking on cost of AC and battery-supported DC eCooking
0
5
10
15
20
25
30
35
40
Cos
t of C
ooki
ng S
ervi
ce ($
/mon
th)
100% of householdcooking
50% of householdcooking
Boiling heavyfoods only
100% of householdcooking
50% of householdcooking
Boiling heavyfoods only
Uninsulated four-plate with integrated oven
Uninsulated single-plate (hotplate and induction or infra-red cooker)
Single insulated and pressurized appliance (EPC)
Appliance stack of uninsulated (hotplate, induction, and infra-red cooker or kettle) and insulated (EPC, rice cooker, and electric frying pan or thermo-pot)
100% grid eCook (AC w/o battery)
100% grid-battery-eCook(DC w/battery)
Note: The cost of the cooking service is calculated over a five-year financing period for all system architectures. Component costs are from 2025. The range on each bar encompasses 90 percent of Sub-Saharan African utility tariffs from AFREA and ESMAP (2016) ($0.04–$0.25/kWh). Daily household energy demand values are from Figure 2.2 (100 percent eCooking: uninsulated plate with oven, 3kWh; uninsulated single plate, 2kWh; appliance stack, 1.5kWh; 0.5kWh. 50 percent eCooking: EPC, 0.5kWh. Boiling heavy foods only: EPC, 0.15kWh). Fuel-stacking scenarios model only the eCooking service, not the cost of the cooking fuel.
ESMAP | Cooking with Electricity: A Cost Perspectivexxiv
● Lifeline tariffs of 100kWh/month at $0.10/kWh would be sufficient to allow most consumers to cook with electricity, even if the cooking appliance had to be supported by a battery.
HOW CAN ECOOKING BE DELIVERED AND FINANCED?
Innovative delivery and financing models will be needed to support the roll-out of eCooking since even where it is cost-competitive, challenges remain, especially if energy storage is required. In markets that do not require energy storage, supply chains for energy-efficient appliances are emerging but are not yet strong and the high upfront cost prevents many poorer households from accessing them. For example, private sector retail supply of EPCs is increasing in Asia, but is not yet common in Sub-Saharan Africa (IMARC 2019), where awareness among consumers remains low. In markets where energy storage will be needed, batteries further increase the upfront cost, which will require financing with longer repayment horizons, additional supply chain development, consumer awareness, and after-sales support.
End-users will require credit options to break down the high upfront cost of eCooking devices into affordable installments or reframe them as eCooking services, where the provider retains ownership of the assets and rents them to the user. For example, pay-as-you-go for lease-to-own solutions and on-bill financing for energy service models.6 The uptake of eCooking will depend substantially on the willingness of energy service companies to integrate it into the suite of services they offer. For example, utilities with excess generating capacity could stimulate demand by developing an on-bill financing mechanism for EPCs and support women entrepreneurs to leverage their social networks to demonstrate new cooking technologies and practices.
Grant funding could support an initial feasibility study and piloting, with results-based financing and other instruments accelerating scale up. Distributors and retailers will require working capital to finance the appliances and roll out supporting services over longer repayment
6 Pay-as-you-go systems rely on a “lock-out” mechanism to prevent the device from functioning if the user does not keep up with regular repayments. On-bill financing allows installments to be repaid automatically when topping up electricity units on prepaid meters or adding to the monthly bill on post-paid meters.
Comparing energy-efficiency and service delivery amongst popular electric cooking appliances in Myanmar (case study 3).
xxvReport Overview
periods. Financing instruments—including debt and equity finance, social impact investment, and results-based financing tied to environmental, gender equity, and/or health goals—will need to be combined to close the initial cost–viability gaps.
A “single investment strategy” that incorporates clean cooking into electrification and renew-able energy investments could enable the existing mechanisms for mobilizing finance from the electricity sector to address the problem of cooking with polluting fuels and technologies. These include long-term loans, guarantees, and project bonds, which can offer the clean cooking sector an opportunity to leverage much larger investments. Such a strategy could synergistically position eCooking as an opportunity to improve delivery infrastructure and stimulate demand.
Conclusions and Recommendations
The case studies examined in this report show that in specific contexts, cooking with ener-gy-efficient electric appliances is already a cost-effective option. As prices of key components continue to fall, the range of contexts in which eCooking can offer a cost-effective alterna-tive to polluting fuels and technologies is expected to broaden, challenging the widespread perception that electricity is too expensive for cooking in developing regions.
Commercial and development partners’ interest in eCooking is growing. With appropri-ate support, adoption of eCooking can be accelerated and attention focused on achieving pro-poor outcomes. Integrating planning and action on electrification with the need to transi-tion away from biomass cooking can accelerate progress toward SDG7 and yield environmen-tal, gender equity, and health benefits to some of the world’s most disadvantaged people.
However, even in places where energy-efficient electric appliances are cost-effective, challenges exist. They include the lack of supply chains, high upfront costs for consumers, lack of awareness, the need for changes in the way people cook, and uncertainty about the impacts of scaled uptake on grid systems.
Working together, governments, donors, and private sector can address most of these challenges—recommended actions to support the roll-out of eCooking solutions include:
1. Support policy makers to create an enabling environment that crosses the division between the electrification and clean cooking sectors
• Reduce the lifetime cost of eCooking by bringing down the upfront cost of quality-assured energy-efficient appliances by streamlining supply chains (through, for example, the Global LEAP awards program for EPCs).7
• Create interministerial spaces (committees, working groups, and so forth) to develop single investment strategies that align with existing political objectives.
• Create a space for dialogue between stakeholders in the clean cooking and electrification sectors.
• Reduce the relative cost of cooking with electricity by diverting fossil fuel subsidies to energy access programs.
• Strengthen the case for the poor through strategic use of lifeline tariffs financed by cross-subsidies or targeted subsidy programs.
7 The Global LEAP Awards is an international competition to drive innovation and performance in early-stage product markets. Awards provide market intelligence for investors, donors, policymakers, solar distributors, and other off-grid market stakeholders.

ESMAP | Cooking with Electricity: A Cost Perspectivexxvi
2. Conduct strategic, evidence-based research to inform decision makers, private sector players, and consumers of emerging opportunities
• Identify and popularize culturally appropriate energy-efficient eCooking appliances.
• Gain a deeper understanding of target market segments, particularly of their existing expenditures on cooking fuels.
• Enhance techno-economic models by including the expected costs of marketing, selling and supporting solar battery–powered eCooking devices in rural areas.
• Model the implications of encouraging eCooking for load management on national grids and mini-grids, in order to establish the likely impact on overall costs and the integrity of the systems.
3. Support private sector efforts to develop appropriate products and services tailored to the needs and aspirations of the poor
• Enable utilities and minigrid developers to pilot, and scale up eCooking services that are compatible with their existing business models.
• Enable solar home system companies to develop, pilot, and scale up innovative new eCooking products and services.
• Incentivize appliance manufacturers to develop products targeted at the bottom of the pyramid, in particular DC– and battery-supported eCooking products.
• Enable players in the existing clean cooking value chain to expand their product range to include eCooking appliances.
• Empower women entrepreneurs to lead the development and dissemination of innovative eCooking solutions.
• Identify viable business models that will both unlock consumer responses and meet private sector financing needs.
• Bridge initial cost–viability gaps in new markets by combining financing instruments, including including grants, social impact investment and results-based financing tied to environmental, gender equity, and health outcomes.
4. Help consumers understand the benefits of adopting modern eCooking solutions, and reduce barriers to behavioral change
• Help consumers determine how much it would really cost them to cook with electricity.
• Make it possible for consumers to explore eCooking through participatory eCooking demonstrations and trial periods with limited financial risk to the consumer.
• Encourage consumers to cook as much of their typical menu on energy-efficient appliances as possible.
• Translate evidence-based research into easy-to-understand content that can be shared on popular media (by, for example, creating targeted content on EPCs for social media groups on cooking).
• Develop “pay-as-you-cook” financing (flexible repayment schemes that are based on how consumers currently pay for biomass).
The Modern Energy Cooking Services (MECS) program is supporting strategic interventions in each of the five case study contexts featured in this report (plus many more). Over the next decade, the relative price points of key technologies will continue to change, which will likely open the door to an even broader range of cost-effective eCooking solutions. The program intends to keep close track of these developments, create a range of market-ready innova-tions, and shape enabling environments to make a valuable contribution toward SDG7.
xxvi

xxviiReport Overview
References
Batchelor, S., E. Brown, J. Leary, N. Scott, A. Alsop, and M. Leach. 2018. “Solar Electric Cooking in Africa: Where Will the Transition Happen First?” Energy Research and Social Science 40. https://doi.org/10.1016/j.erss.2018.01.019.
Batchelor, S. 2015. “Solar Electric Cooking in Africa in 2020: A Synthesis of the Possibilities.” Evidence on Demand, prepared at the request of the UK FCDO (Department for International Development. https://doi.org/10.12774/eod_cr.december2015.batchelors.
Batchelor, S, J Leary, S Sago, A Minja, K Chepkurui, E Sawe, J Shuma, and N Scott. 2019. “Opportunities & Challenges for ECook Tanzania—October 2019 Working Paper.” TaTEDO (Tanzania Traditional Development Organisation), Loughborough University, University of Surrey & Gamos Ltd. supported by Innovate UK, UK Aid (FCDO) & Gamos Ltd. Available. www.MECS.org.uk.
Couture, T., and D. Jacobs. 2019. “Beyond Fire: How to Achieve Electric Cooking.” HIVOS & World Future Council.
ESMAP (Energy Sector Management Assistance Programme). 2020a. Tracking SDG7 Progress Towards Sustainable Energy. Washington, DC. https://trackingsdg7.esmap.org//.
IMARC. 2019. “Multi Cooker Market: Global Industry Trends, Share, Size, Growth, Opportunity and Forecast 2019–2024.”
Leach, M., J. Leary, N. Scott, S. Batchelor, X. Chen, K.-S. Ng, R. Oduro, and E. Brown. 2019. “ECook Modelling.” www.MECS.org.uk.
Leary, J., J. Fodio Todd, S. Batchelor, K. Chepkurui, M. Chepkemoi, A. Numi, R. Hanlin, N. Scott, and E. Brown. 2019. The Kenya ECookBook: Beans & Cereals Edition. MECS, ACTS, Loughborough University, Gamos and University of Sussex supported by EPSRC and UK Aid (FCDO): Available from: www.MECS.org.uk.
Leary, J., N. Scott, W. W. Hlaing, A. Myint, S. Sane, P. P. Win, T. M. Phyu, et al. 2019. “ECook Myanmar Cooking Diaries—October 2019 Working Paper.” REAM, Loughborough University, University of Surrey & Gamos Ltd. supported by Innovate UK, UK Aid (FCDO) & Gamos Ltd. Available. www.MECS.org.uk.
Leary, J., N. Scott, A. Numi, K. Chepkurui, R. Hanlin, M. Chepkemoi, S. Batchelor, M. Leach, and E. Brown. 2019. “ECook Kenya Cooking Diaries—September 2019 Working Paper.” http://www.sussex.ac.uk/spru/research/projects/lct.
Leary, J., N. Scott, S. Sago, A. Minja, B. Batchelor, K. Chepkurui, E. Sawe, M. Leach, and E. Brown. 2019. “ECook Tanzania Cooking Diaries—October 2019 Working Paper.” REAM (Renewable Energy Association of Mynamar), Loughborough University, University of Surrey & Gamos Ltd. supported by Innovate UK, UK Aid (FCDO) & Gamos Ltd. www.MECS.org.uk.
Leary, J., N. Scott, N. Serenje, F. Mwila, S. Batchelor, M. Leach, E. Brown, and F. Yamba. 2019a. “ECook Zambia Cooking Diaries—October 2019 Working Paper.” CEEEZ (Centre for Energy, Environment and Engineering Zambia), Loughborough University, University of Surrey & Gamos Ltd. supported by Innovate UK, UK Aid & Gamos Ltd. www.MECS.org.uk.
———. 2019b. “Opportunities & Challenges for ECook in Zambia—October 2019 Working Paper.” CEEEZ, Loughborough University, University of Surrey & Gamos Ltd. supported by Innovate UK, UK Aid & Gamos Ltd. www.MECS.org.uk.
Leary, J., N. Serenje, F. Mwila, S. Batchelor, M. Leach, E. Brown, N. Scott, and F. Yamba. 2019. “ECook Zambia Prototyping Report.” Implemented by CEEEZ, Gamos, Loughborough University, University of Surrey. Funded by FCDO, Innovate UK, Gamos. www.MECS.org.uk.
Power Africa. 2015. “Development of Kenya’s Power Sector 2015–2020.” Nairobi, Kenya.
———. 2018. “Power Africa in Uganda.” 2018. https://www.usaid.gov/powerafrica/uganda.
Scott, N., J. Leary, W. W. Hlaing, A. Myint, S. Sane, P. P. Win, T. M. Phyu, et al. 2019. “Opportunities & Challenges for ECook in Myanmar—October 2019 Working Paper.” REAM, Loughborough University, University of Surrey & Gamos Ltd. supported by Innovate UK, UK Aid & Gamos Ltd. www.MECS.org.uk.
WHO (World Health Organisation). 2016. “Burning Opportunity: Clean Household Energy for Health, Sustainable Development, and Wellbeing of Women and Children.” Geneva, Switzerland. http://apps.who.int/iris/bitstream/10665/204717/1/9789241565233_eng.pdf?ua=1.
Zubi, G., F. Spertino, M. Carvalho, R. S. Adhikari, and T. Khatib. 2017. “Development and Assessment of a Solar Home System to Cover Cooking and Lighting Needs in Developing Regions as a Better Alternative for Existing Practices.” Solar Energy 155: 7–17. https://doi.org/10.1016/j.solener.2017.05.077.


1 Background
Ch A P T ER 1
BACKGROUND
1.1. State of Access to Clean Cooking and Electricity
Sustainable Development Goal 7 (SDG7) seeks to ensure access to affordable, reliable, sustainable, and modern energy for all. It indicates that households require access to both electricity and clean cooking. A new paradigm is emerging that sees an opportunity to tackle both problems by creating a symbiotic relationship in which actors from both sides can support each other in achieving universal access to modern energy (Batchelor et al. 2019; Couture and Jacobs 2019).
The proportion of the global population with access to electricity increased from 83 percent in 2010 to 90 percent in 2018 (ESMAP 2020a), with the number of people living without electricity dipping to 789 million, down from 1.2 billion in 2010. At the same time, an estimated 2.8 billion people still cook with biomass (ESMAP 2020a). Some of the 2 billion people that have access to electricity but still cook with biomass already have access to reliable electricity and could directly transition to cooking with electricity. Data from the Multi-Tier Framework (MTF)—used to measure the level and quality of energy access—provide insights at the country level on the proportion of households that are still cooking primarily with polluting fuels and technologies but that have Tier 3, 4, or 5 electricity access (see Figure 1.3 for details).1
A forthcoming report by the World Bank’s Energy Sector Management Assistance Program (ESMAP) looks at a 71-country sample of 5.3 billion people representing 90 percent of lower- and lower-middle-income countries. It uses the Modern Energy Cooking Solutions (MECS) definition of access.2 It finds that some 4 billion people—about half the global population—lack the ability to cook efficiently, cleanly, conveniently, reliably, safely, and affordably, suggesting that the problem may be graver than previously thought. Increasing the number of people who cook with electricity is one way of reducing this figure significantly.
In order to align with the tracking of the SDG7 goals, this report uses the latest estimates on progress toward achiev-ing SDG7, which indicate that the share of the population with access to clean cooking increased to 61 percent in 2017, up from 57 percent in 2010 (ESMAP 2020a). However, because population growth outpaced annual access gains, the global access deficit remained stable, at about 2.9 billion. Assuming the rate of increase in access of 0.5 percentage points a year seen between 2010 and 2017, clean cooking solutions would reach only 68 percent of the global popu-lation by 2030 (Figure 1.1). In 2010, it was estimated that an average annual increase of 2 percentage points would be necessary to achieve universal access to clean cooking. To make up for slower progress than required over the period 2010–17, access would need to increase by a rate at least 3 percentage points a year (ESMAP 2020a).
Although there is evidence of some progress toward meet-ing SDG7, it tends to be uneven across the globe (Figure 1.2). In Sub-Saharan Africa, the annual average population growth rate is about 2.7 percent (World Bank 2020). As a result, a large number of additional people increasingly rely on biomass fuels for cooking. As a result of population growth, some countries are experiencing a decline in the share of the population with access to clean cooking solutions (ESMAP 2020a). The rapid pace of urbanization also means that households are often switching from collecting biomass residue in rural areas to purchasing wood fuels (mainly charcoal) from urban markets. Adam Smith International (2016) finds that a 1 percent rise in urbanization can increase charcoal consumption by 14 percent. In 2017, the average annual rate of urbanization in Sub-Saharan Africa was about 4.1 percent (in some countries as high as 5.7 percent) (World Bank 2020). At these rates, the population currently living in African cities—about 472 million people—is projected to double by 2050 (CSIS 2018).

ESMAP | Cooking with Electricity: A Cost Perspective2
FIGURE 1.1 Actual and projected global access to electricity and clean cooking, 2000–30
Clean Cooking ElectricityLinear (Clean Cooking) Linear (Electricity)
0
10
20
30
40
50
60
70
80
90
100
2000 2005 2010 2015 2020 2025 2030
Glo
bal a
cces
s (p
erce
nt)
8.5 Population (billion people)
0.8
4.6
2.1
4% Short
32% Short
Business asusual 2030Predictions
Unelectrified withoutClean Cooking
Electrified with Clean Cooking
7.87.0 6.1
Electrified but without Clean Cooking = 28%
Note: Energy access statistics from World Bank (2019b). Population forecasts from United Nations World Population Prospectus (UN 2017). Linear forecasting was used to project global access beyond 2016.
Source: Adapted from Batchelor et al. (2019).
FIGURE 1.2 Share of population with access to clean cooking fuels and technologies, by region, 2017
IBRD 44349 | APRIL 2019
Less than 1010-4950-99100Data not available
POPULATION WITH ACCESS TO CLEANCOOKING FUELS AND TECHNOLOGIES (%)
Top 20 AccessDeficit Countries
Source: ESMAP (2020).

3Background
Three-quarters of the 570 million people who gained access to electricity since 2011 are concentrated in Asia (IEA 2018). However, clean cooking remains a challenge for many Asian countries. China, for example, which has reportedly reached 100 percent electrification, is one of the highest deficit coun-tries for access to clean cooking (Figure 1.2).
1.2. The Burden of Cooking with Biomass Fuels
The 2.9 billion people worldwide using biomass for cook-ing use a variety of fuels, including wood, charcoal, animal dung, crop waste, or other solid fuels, such as coal, in open fires and traditional stoves, as the primary source of cooking and heating energy. Four million people a year die as a result of household air pollution; more than half of these deaths are among children under five (WHO 2018). In addition to the direct health burden from premature deaths and ill health, exposure to household air pollution is linked to low birthweight, which increases the risk of poor health outcomes throughout life. This avoidable, first-order public health problem has been an impetus behind recent initia-tives for delivery and adoption of clean cooking solutions. Smith et al. (2014) estimate that household air pollution cost low- and middle-income countries $1.5 trillion in 2013 in welfare losses, primarily as a result of the health impacts, an amount equivalent to 3.3 percent of GDP (World Bank 2016). The public health crisis caused by Covid-19 is threatening to exacerbate complications from exposure to household air pollution. A study conducted at the Harvard University School of Public Health (Wu et al. 2020) suggests that there is significant overlap between exposure to particulate matter and Covid-19 deaths. An increase of only 1μg/m3 in atmospheric particulate matter with a diameter of less than 2.5 micrometers (PM2.5) is associated with an 8 percent increase in the Covid-19 death rate.
In addition to the obvious impact on indoor air quality, household combustion of solid fuels contributes to ambient air pollution. Investigators contributing to the analysis of the latest global burden of disease estimated the global average proportion of ambient PM2.5 attributable to household cook-ing at 12 percent.3 In some places, unsustainable harvesting of biomass also leads to degradation of landscapes, loss of biodiversity and wildlife habitat, and net greenhouse
gas emissions.4 In addition, certain components of partic-ulate matter, collectively referred to as black carbon, are a powerful climate change forcing agent, as a result of their heat absorption characteristics. When black carbon settles on otherwise reflective surfaces (such as snow or ice), the forcing effect is compounded (World Bank 2013). Cooking with solid fuels is the largest source of black carbon emis-sions globally.
Where fuel must be purchased, the increasing cost of char-coal (and in some cases fuel wood) places a burden on poor and vulnerable families struggling to meet basic needs. In Uganda, for example, charcoal prices increased by almost 30 percent in 2017 (inflation was less than 10 percent). On average, a household spends as much as $24 for a 75-kg bag of charcoal, which lasts about a month (Musoke 2017). This figure represents about 10 percent of the average income of Kampala residents, almost 13 percent of average income in other urban areas, and 29 percent of average income in rural areas (UBOS 2017). The rising prices are partly a result of the growing distances for transporting the fuel from its source to urban areas. Households are thus spending a significant and growing share of their monthly income on wood fuels. What is more, the poorest house-holds often pay a premium for their daily fuel purchases (45 percent on average for the urban poor), as a result of cash flow constraints, and allocate a significant proportion of their household expenditures to cooking fuels such as charcoal (World Bank 2015).
Where fuel is collected for self-consumption rather than purchased, the time spent collecting it—mostly by women—could often be better spent on income generation, farming, education, childcare, or leisure. Carrying heavy bundles of firewood—often over long distances—can cause injuries, and foraging for firewood can expose girls and women to gender-based violence. Access to modern energy cooking services could address some of these problems and release time into the labor market.
The biomass sustainability problem is worsening, as a result of population growth and rapid urbanization, accelerating charcoal consumption. Although cooking with charcoal may be cleaner than wood in terms of household air pollution impacts, the use of charcoal for cooking has approximately four times the deforestation impact that cooking with wood has, because approximately 75 percent of wood’s chemical energy is lost in the conversion to charcoal (Falcão 2008). In several countries, governments have banned the production of charcoal, without offering a viable alternative. A transition from solid fuels to clean and more sustainable fuels needs to accelerate considerably.

ESMAP | Cooking with Electricity: A Cost Perspective4
1.3. Objective and Scope of the Report
This report identifies opportunities for cooking with electricity that are already cost-effective in developing regions and opportunities that are likely to open up in the near future. It aims to build the evidence base on whether cooking with electricity could make a significant contri-bution to achieving SDG7 (ensuring access to afford-able, reliable, sustainable, and modern energy for all) by simultaneously enabling cost-effective access to modern energy and clean cooking.
The report provides insights on the techno-economic viabil-ity of cooking with electricity in specific country contexts. It is based on new data on how people cook with electricity in cultures where biomass cooking is prevalent. In each context, it compares the cost of cooking with traditional fuels with the cost of cooking with electricity across a range of system architectures (grid-connected, mini grid, and stand-alone systems).
The report presents case studies from Sub-Saharan Africa and Southeast Asia to explore the range of opportunities in
each context; the results are therefore relevant only for each context. However, the report contextualizes these findings by drawing on broader datasets and undertaking sensitivity analysis to support more general conclusions that may be relevant to other developing countries that have large popu-lations without access to clean cooking solutions.
The report concludes with recommendations for what governments and development organizations can do to support the transition to cooking with electricity in the right contexts. Integrating planning and action on electrification with the need to transition away from biomass cooking could add momentum to the mission of achieving SDG7 in particu-lar. With appropriate support from governments, adoption of eCooking can be accelerated, yielding substantial environ-mental, gender equity, and health benefits to some of the world’s most disadvantaged people.
eCooking may not currently feature prominently in the mindset of utility, mini grid, and off-grid developers, but that may change soon, as commercial and political interest in eCooking is growing. ESMAP, Loughborough University, and their partners are collaborating on Modern Energy Cooking Services (MECS), a major new UK Aid–funded program that aims to bring together the clean cooking and electricity sectors to develop emerging opportunities for cooking with electricity.

5Background
1.4. The Case for Cooking with Electricity
Until recently, the development community has not viewed electricity as a viable option for enabling access to clean cooking, because of reliability, safety, access, affordability, and sustainability challenges. Blackouts and brownouts on weak grids prevent people from cooking when they need to, and collective usage causes peak loads on already strained grids to spike and exacerbate underlying problems. There is also concern about poor-quality wiring, which could burn out and start a fire if high currents are drawn by inefficient cooking devices.
However, a growing community of actors is drawing atten-tion to the fact that through technological developments, these challenges can now be addressed in some contexts (Couture and Jacobs 2019; Batchelor 2013; Batchelor et al. 2019). Electricity grids are growing stronger and gaining greater coverage (Kenya Power 2018; Power Africa 2018; Eberhard, Gratwick, and Kariuki 2018), and advance-ments in battery storage and solar photovoltaic (PV) can now enable access in even the remotest corners of the globe. Where the grid is reliable, powering energy- efficient electric cooking (eCooking) appliances draws much lower current and places less strain than conventional eCooking appliances; it also reduces costs to users. Where the grid is not reliable enough to cook directly, trickle- charging a battery acts as a buffer and time-shifts electricity demand away from busy peak times, enabling users to cook during blackouts or brownouts.
Lease-to-own solutions have achieved significant uptake in Africa, mainly for solar lighting (Lighting Global 2018). Like many renewable energy technologies, eCooking solutions, in particular battery-supported models, tend to be capital expense (CapEx) heavy. For eCooking, these innovative business models enable direct substitution of daily/weekly/monthly charcoal expenditure and a reframing of the concept of the battery-supported cooking device not as an improved cookstove but as a repurposing of household expenditure to support the roll-out of electrical infrastructure (whether national grid, mini grid, or off-grid PV), which could
therefore attract private and government investment in a way that improved cookstoves have not.
The cost of biomass fuels is rising substantially in many contexts. Even in contexts with higher unit costs of electric-ity, higher biomass prices and lower consumption with new energy-efficient appliances mean that the common percep-tion that electricity is too expensive for cooking is no longer true in many contexts. Although biomass energy will likely continue to be the predominant fuel for cooking in many parts of the developing world for some time, in particular in Sub-Saharan Africa, and addressing the efficiency of its use is important, the development community needs to push the switch to clean fuels more actively, supported and driven by the public and private sectors.
Cooking with electricity can be a truly clean cooking solu-tion, in terms of direct emissions in the kitchen, which affect both ambient and household air quality, as well as environ-
mental sustainability (assum-ing electricity is produced from low- or zero-emission sources). Electricity has the potential to very quickly switch entire urban and peri-urban communities that are already grid-connected from traditional fuels, as the power source is already available in people’s homes. Doing so would make tackling household air pollution more effective at the local level,
as outdoor air pollution from cooking with biomass has also been shown to have significant health impacts for the entire community (Das et al. 2018).
Cooking with electricity can present a transformative value proposition for households, allowing for more efficient and faster cooking times, multitasking, safer cooking, elimina-tion of dangerous indoor emissions, and a cleaner cooking environment. Focus group discussions in the four countries studied in detail in this report—Kenya, Tanzania, Zambia, and Myanmar—emphasize the aspirational nature of eCooking (see Table 2.1). They reveal that consumers’ focus is on the cleanliness of the process (no soot, less spillage, less burnt food, and less sweat), which leaves clothes clean at the end of the process, rather than its environmental and health impacts.
The extent to which people adopt new technologies in their daily routine is considered a make or break point for programs promoting clean cooking solutions.
Cooking with electricity can present a transformative value proposition for households, allowing for more efficient and faster cooking times, multitasking, safer cooking, elimination of dangerous indoor emissions, and a cleaner cooking environment.

ESMAP | Cooking with Electricity: A Cost Perspective6
Many programs have seen technologies dispersed to households but then set aside after a few months. eCooking has already seen widespread uptake in several developing countries. This report examines two examples: Zambia and Myanmar, where 12 percent and 4 percent of the population, respectively, are already using electricity as the primary cooking fuel (WHO 2017). However, cooking is a highly culturally embedded practice; it is yet to be seen whether the many benefits of eCooking will be sufficiently attractive and apparent to households to sustain use and change behaviors across a broader range of contexts.
There is a need to create awareness and build the capac-ity of households to sustain the shift in cooking practices. Research suggests that adoption and sustained change are eminently reachable, at least in urban areas (Batchelor et al. 2019; Leary et al. 2019b; Scott et al. 2019). The behavioral implications for switching to cooking with electricity will vary widely, however, as a result of diversity in cooking practices and the multitude of eCooking appliances available.
In many clean cooking programs, “fuel stacking” often persists even when clean fuels are available (Gould et al. 2018; WHO 2016). Households often use a primary and a secondary fuel (and sometimes others as well) based on the type of meal prepared and the perceived value of using a
particular fuel to prepare the meal. Fuel stacking may also occur when fuel is seen as an energy security issue. From a household perspective, charcoal, even if not cheap, is reliable, in the sense that it is pervasive and provides assur-ance that a household can cook its next meal. In the case of electricity, households are likely to fear that blackouts or brownouts will leave them unable to cook. Therefore, they need to have a secondary cooking method, unless reliable energy storage is available within the eCooking subsystem. As with any new fuel, reliability will thus need to be estab-lished and demonstrated over a period of time to assure households that electricity can be used as their primary, or even their only, source of energy for cooking.
However, fuel stacking can also strengthen the value proposition of specialized eCooking appliances, which can enable households to take their first step toward cook-ing with electricity without having to take a leap of faith. Traditional fuels used within fuel-stacking behaviors may have mixed effects on the health benefits from cooking with clean fuels. It is therefore important to understand the extent of stacking practices. Fuel stacking with other clean fuels, such as liquified petroleum gas (LPG), to create a clean stack can also offer a highly attractive value proposi-tion to everyday cooks, drawing on the unique advantages of each energy source.

7Background
eCooking using renewable energy can offer a viable pathway to achieving sustainable cooking. In fact, of all the pathways investigated by Jacobs et al. (2016) in Beyond Fire, eCooking on mini grids and solar home systems yields the greatest co-benefits, as it simultaneously enables access to electricity for other applications.
Gender dynamics within households also need to be well understood. Early responses in communities that switched to electric appliances in Tanzania suggest that the quick nature of eCooking is more attractive to men, which could provoke a shift in responsibilities in the kitchen (Chepkurui et al. 2019). Battery-supported cooking devices are particularly likely to be popular with all members of the family, as they also enable access to reliable electricity for other purposes, such as TV and lighting.
As cases from pilot studies highlighted in this report show, most of the demand-side barriers described above can be overcome by demonstrating the safety, convenience, and affordability aspects of eCooking for popular local foods. Improving the perception of safety will be vital in increasing adoption rates, as some households may not fully trust effi-cient eCooking appliances, in particular the electric pres-sure cooker (EPC), which is associated with the mixed track record of regular stove-top pressure cookers. Active work on consumer-oriented communication highlighting quality
assurance and safety, in particular live cooking demonstra-tions, will be critical in increasing adoption.
In tandem with these demand-side interventions, technical and economic feasibility studies will need to be carried out to find the most appropriate solutions. Once they are developed, they will need to be made available at scale at an affordable basis.
Many more people have reliable access to electricity than are cooking with clean fuels. In Zambia, for example, 28–36 percent of the population has access to electricity but just 17 percent cook with electricity. And households already cooking with electricity can benefit from efficiency improve-ments (by adopting more efficient appliances, for example), which would ease the load on power systems and improve load-shedding scenarios. In Myanmar, mini grids should be able to provide reliable access to electricity and help increase the share of the population cooking with electricity (currently at 24 percent). In Kenya, less than 1 percent of people cook with electricity, 16 percent cook primarily with LPG, and the rest of the population cooks primarily with polluting fuels and technologies. These figures indicate a big opportunity for uptake of eCooking, where 26 percent of the population has at least Tier 4 electricity access (Table 1.1 and Figure 1.3).5
TABLE 1.1 Types of electric cooking physically possible with each tier of electricity access
TIER TYPE OF eCOOKING
0 Solar electric cooking system is only option.
1 Small solar home systems and solar lanterns;upgrade to dedicated solar eCooking system is essential.
2 Solar home systems. Energy (minimum 200Wh) may just be enough for very efficient eCooking using an electric pressure cooker once a day, but power may be a bigger restriction (minimum 50W). Upgrade to dedicated solar eCooking system is advised.
3 Voltage fluctuations may affect performance of stoves; energy may restrict 100 percent eCooking (minimum 1kWh/day), and power (minimum 200W) may be too limited for even energy-efficient eCooking appliances. Informal grid connections with poor-quality wiring may be used, so battery is advisable in most cases.
4 Energy is sufficient, but power limitations (minimum 800W) and reliability (minimum 16 hours/day, with up to 14 disruptions a week) may prevent some households from using off-the-shelf AC eCooking appliances. More efficient appliances with lower power ratings and small batteries may be required in some cases.
5 Energy, power, reliability, and availability are sufficient for off-the-shelf AC eCooking appliances. Battery is not required.
Note: See appendix H for descriptions of the tiers in the Multi-Tier Framework.
Source: Author estimates.

ESMAP | Cooking with Electricity: A Cost Perspective8
FIGURE 1.3 Access to electricity and clean cooking in Zambia, Myanmar, and Kenya
46%
30%
60%
11%
19%
2%
5%
12%
2%
12%
9%
8%
12%
17%
7%
14%
13%
21%
Kenya
Myanmar
Zambia
Tier 0 Tier 1 Tier 2 Tier 3 Tier 4 Tier 5
Population by Tier of Electricity Access
84%
83%
16%
1%
24%
17%
Kenya
Myanmar
Zambia
Population with access to Clean Cooking
Polluting Fuels and Technologies LPG Electric Cooking
75%
Note: Clean fuels such as biogas or ethanol constituted less than 0.2 percent of the total and are not included. See appendix H for descriptions of the tiers in the Multi-Tier Framework.
Source: Author estimates using data from MTF reports.

9Background
1.5. A New Generation of Highly Efficient eCooking Appliances
A new generation of energy-efficient eCooking appliances is available. Many of these devices are highly efficient at a specific task (for example, kettles for water boiling) and must therefore be combined with other appliances to cook the range of foods that make up a full menu. Induction stoves are gaining in popularity as a result of their versatility for a wide range of dishes and ability to heat a pot directly through magnetic induction, making the heat source as responsive as gas (Parikh et al. 2020). Large-scale programs have been set up to facilitate the adoption of induction stoves in a variety of developing country contexts, including India and Ecuador. In many of these trials, uptake has not been as promising as initially hoped (Banerjee et al. 2016; Gould et al. 2018). Although induction stoves are efficient at transferring heat to the pot, heat leaves the pot just as easily as it does on a conventional stove.
In contrast, an EPC uses other mechanisms—insulation, automatic control. and pressurization—to significantly reduce energy demand to an extent that is not possible with any other fuel or appliance. As Batchelor et al. (2018, p. 1) note, “It is temperature that cooks food,” not energy per se. Therefore, raising the boiling point of water and stopping heat from escaping from the pot, rather than just raising the efficiency of converting energy from a fuel into heat in the pot, are extremely effective ways of improving the efficiency of the cooking process. The benefits of using EPCs are most significant when cooking dishes that require boiling for half an hour or more. However, the need to pressurize the pot to accelerate cooking times reduces the cook’s access to the dish to stir and check on progress. Initially, this drawback can present a significant psychological barrier for users. However, once overcome, this feature can actually be an asset, freeing up the cook’s time to perform other tasks while food is cooking, as the device’s automatic control mechanisms and sealed cooking chamber mean it requires minimal supervision. Other devices, such as rice cookers and slow cookers, also embody the insulation and automatic control elements, allowing cooks to multitask and occasion-ally check on the food if they want to (see appendix C for a discussion of assessing electricity demand for cooking).
As households in developed economies (where marketing for eCooking devices has focused to date) have gener-ally prioritized fast cooking and electricity networks have
been able to support it, most appliances are rated at a relatively high power level. The power level is potentially a key constraint for battery-supported eCooking systems, as the more rapidly a battery is discharged, the shorter its life. Mass-production of DC eCooking appliances has already begun (see, for example, Tesga Power 2019). They typically have power ratings of 25–50 percent of their AC equivalents.
Reducing overall energy consumption is also important, as it affects the cost of cooking. Simply preventing heat from escaping from the cooking chamber using insulation can enable the same food to be cooked with a fraction of the energy. This feature becomes very important when oper-ating from battery storage with a limited capacity. Several groups of researchers (Batchelor et al. 2018; Watkins et al, 2017) have already used this principle to create highly insulated environments and feed in a trickle of solar elec-tricity to create a very low-cost solar eCooking system (see Section 3.4 for details).
Figure 1.4 compares the eCooking appliances featured in this report, categorizing them as inefficient conventional, more efficient, and most efficient modern appliances. A drawback of many of the highly efficient eCooking solutions is that most require specifically shaped and sized pots and pans, made of compatible materials. These standardized shapes, sizes, and materials may present a challenge for households that use different pots for different foods and want flexibility in this sense when cooking.

10 ESMAP | Cooking with Electricity: A Cost Perspective
FIGURE 1.4 Assessment of eCooking appliances featured in this report
APPLIANCEHEAT
TRANSFERINTO POT
HEATTRANSFER
OUT OF POT
TYPICALPOWER
REQUIREMENTS
TOTALCOOKING TIME(incl. preheating)
VERSATILITY
More e�cient modern appliances
Convection andradiation from
uninsulated pot;evaporationwithout lid
1–2kW per hobInduction/radiation
Anyflat-bottomed
(ferrous forinduction) pot;
frying andboiling
Fast frying andbringing to boil
Most e�cient modern appliances
Rice cooker
Average
Single deeppot only;
boiling andsome frying
Insulation andfixed lid, but
not completelysealed
300W–1kW(DC: 200–400W)
Conductionvia insulated
element
Insulatedelectric
frying panSingle shallow
pot only;frying and
boiling
Insulation;evaporationwithout lid
700W–1.5kW Fast frying andbringing to boil
Conductionvia insulated
elementstuck to pan
Electricpressurecooker Single deep
pot only;boiling andsome frying
Very fast(pressurized)
boiling
Insulation andfixed lid;
completelysealed
700W–1.2kW(DC: 200–400W)
Conduction viainsulatedelement
Ine�cient conventional appliances
HotplateConduction when
pot in contactwith element
Convection andradiation from
uninsulated pot;evaporationwithout lid
1–2kW per hotplate(DC: 300–700W) Average
Any pot(round bottomdi�cult); frying
and boiling
Electric oven
Convection
Cooking chamberinsulated, but not
sealed; whole ovenspace around
pot/dish heated
1–5kW SlowBaking,roasting,
grilling only
Disadvantage compared with other appliances
No particular advantage over other appliances
Advantage over other appliances
Induction/infra-red stove
Note: For a broader range of appliances, see appendix D.

11Background
1.6. Electrical Infrastructure in Sub-Saharan Africa
The proposition that electricity could be used for clean cooking is deeply integrated with progress on electrifica-tion. Conceptualizing cooking as a part of the investment in electrification and in modern energy more broadly, including investment in renewable energy, could spur more progress toward eCooking in the years to come. The case studies described in this report highlight examples in which grid and off-grid capacity increased substantially in recent years. This section briefly overviews the broader state of investment in electrical infrastructure, particularly in Sub-Saharan Africa. where the majority of people without access reside.
Providing universal access to affordable, reliable, sustainable, and modern energy for all remains an ambitious goal. The popula-tion of Sub-Saharan Africa is expected to double by 2050; by 2030, electricity supply across Africa will need to triple to meet the demand from demographic growth in these economies and their changing lifestyles and expec-tations. Of the 840 million people remaining without access to electricity globally, about 573 million or 68 percent are in Sub-Saharan Africa (ESMAP 2020a).
Africa could meet a quarter of its energy demand by increas-ing its renewable capacity to 310GW by 2030, up from 42GW available in 2017 (IRENA 2020). The Africa Renewable Energy Initiative aims to mobilize investment for at least 300GW of renewable energy generation by 2030.6 Energy trade through regional power pools is a core part of the long-term strategy for increasing distributed generation and the share of renewable energies. A simple calculation suggest that 1.5kWh consumption per household per day spread out over 10 hours of trickle-charging a battery would require just 32GW of additional peak load capacity to enable eCooking for Sub-Saharan Africa’s 900 million households currently without access to clean fuels. If the battery could be charged during off-peak hours, this generating capacity may already exist. AC cooking without household batteries would require 214GW of additional peak load capacity, assuming energy- efficient appliances with a 1kWpeak demand per household.
Increasing generating capacity alone will not solve the elec-trification problems. Substantial investment in transmission and distribution infrastructure will be needed to contribute to grid electrification and to realize competitive electricity costs. In many Sub-Saharan Africa contexts, distribution and transmission infrastructure remains poor, presenting a huge challenge for channeling increased generation capacity to end-users. The distribution segment of a power system is closest to the end-consumer; there are many stories of communities “under the grid,” where transmission lines are visible but communities remain unconnected.
Although grid extension–based electrification has long been regarded as the reference model in developing economies, the private sector is spearheading the design of innovative electricity supply models based on off-grid technologies. Beyond grid connections, decentralized generation and “prosuming” (consumers producing their own electricity) are two practices changing the landscape and increasing
the pace of electrification in ways that grid extension has not been able to do. Cost reductions of renewable technologies and improved reliability make off-grid technologies, notably stand-alone systems and mini grids, reliable alternatives to grid power infrastructure.
ESMAP (2019a) estimates that mini grids could cost-effectively supply half a billion people in Africa and Asia with electricity. These solutions hold potential in peri-urban and rural contexts characterized by limited, sparse demand and lower ability to pay. Fifty-seven percent of planned mini grids are based on solar-hybrid technologies. They aim to connect more than 27 million people globally, at an investment cost of $12 billion (ESMAP 2019a). As of 2019, cumulative mini grid investments in Sub-Saharan Africa and South Asia were about $5 billion (ESMAP 2019a). Mini grid models are evolving, from providing only basic electricity services for households to providing electricity services for income-generating activities.
In 2017, Lighting Global (2018) estimated that the off-grid solar sector was providing electricity access to 73 million households worldwide. Most providers started with basic lighting and phone-charging, increasingly using prepaid mobile payments and other pay-as-you-go (PAYG) approaches, which are now also making larger systems and DC-powered energy-efficient appliances more afford-able. The development of mobile money enabled many companies to reduce the costs associated with bill recovery
In many Sub-Saharan African contexts, distribution and transmission infrastructure remains poor, presenting a huge challenge for channeling increased generation capacity to end-users.

ESMAP | Cooking with Electricity: A Cost Perspective12
in remote rural areas while maximizing affordability and responding to customers’ need to make small regular payments. The Global Off-Grid Lighting Association (GOGLA) reported that the off-grid solar industry sold 4.4 million off-grid solar lighting products and 460,000 appliances in the first half of 2019 (GOGLA 2019). The number of PAYG solar home systems sold in Kenya alone is about to reach 300,000 kits per year—about equivalent to the annual growth in rural households. More than 30 PAYG solar compa-nies are now operating in the peri-urban and rural areas of
Kenya, Rwanda, Tanzania, and Uganda, and a handful of new companies appear every year in neighboring countries. As of December 2019, close to 1 million solar home system units had been sold in Kenya (GOGLA 2019).
It would be a missed opportunity not to consider integrating eCooking into the planning for each of these electrification modes, all of which are gaining momentum, to make faster progress toward addressing both the clean cooking and elec-trification challenges of the SDG7 goals.

13 Methodology
Ch A P T ER 2
METHODOLOGY
2.1. Techno-Economic Modelling
A key ambition of this report is to explore the opportunities for cooking with electricity using different technological approaches and in a variety of contexts. It uses a tech-no-economic model to estimate the monthly costs of cooking in various scenarios.
Leach and Oduro (2015) developed a numerical simulation model of cooking by a household linked to a system design model for a battery-supported eCooking device (either a stand-alone solar-powered or a grid-connected device).7 Their model is a simple proof of concept simulation, charac-terizing the technologies and cooking energy requirements from secondary data. It included a single eCooking appli-ance, the hot plate.
This model was recently updated to model a wider range of eCooking appliances and to reflect current cost trends of the major components. An empirical model for battery degradation was also added, capturing the high current drain of cooking and the likely high ambient temperatures of the system in use. Appendix E outlines the model (for more detail, see Leach et al. 2019).
The techno-economic model of the eCooking system was applied to represent the daily cooking requirements of a household based on data on meals, cooking habits, and fuel use collected in 2017 and 2018 through a series of studies undertaken as part of a project funded by Innovate UK, Gamos, and UK Aid designed to assess the opportunities and challenges that lay ahead for eCooking in high-impact potential markets. The country studies were conducted in Kenya, Zambia, Tanzania, and Myanmar.
Table 2.1 breaks down the activities carried out in each country, highlighting the most relevant output data from each. Appendix C outlines the key findings. For the full analyses, see the MECS Working Papers indicated in Table 2.1 or the summaries of the key opportunities and challenges in each country (Batchelor et al. 2019; Leary et al. 2019; Scott et al. 2019).
The daily energy demand figures from the cooking diaries were used to calculate the eCooking system size and any additional fuel use needed. The model follows a traditional approach of discounted cashflow analysis, accounting for initial capital costs of cooking appliances (and where applicable, supporting energy storage and power genera-tion system components); their replacement costs at end of component life; and operating costs, with the output the levelized monthly cost of cooking.8
The model was applied in different scenarios, to explore opportunities for cost-effective eCooking in a range of contexts. It was also used to explore assumptions about technology performance and cost, the business model employed, and two points in time (2020 and 2025).
The results are used to explore the economic viability of eCooking compared with use of traditional fuels. They are presented in the following sections as case studies, clus-tered by access to electricity. Although the analysis includes a wide range of parameters and assumptions, and wider generalization of the results is discussed, it still explores only a subset of the possibilities, as an initial scoping. Section 6.2 suggests areas for further development.

ESMAP | Cooking with Electricity: A Cost Perspective
TABLE 2.1 Summary of data collection methodologies used in this report
DATA COLLECTION
METHODLOGY
NUMBER CARRIED OUT IN EACH
COUNTRY
NUMBER OF PARTICIPANTS PER ACTIVITY KEY OUTPUT DATA MECS WORKING PAPER
Cooking diary studies
1 20 Energy demand for cooking, compatibility of local cooking practices with eCooking appliances, fuel prices
Leary, Scott, Sago, et al. (2019); Leary, Scott, Numi, et al. (2019); Leary, Scott, Hlaing, et al. (2019); Leary, Scott, Serenje, et al. (2019a)
Household surveys
1 200 Fuel prices, fuel choices, verification of monthly expenditures
Scott, Leary, Serenje, et al. (2019); Scott, Leary, Sago, et al. (2019); Scott, Leary, Hlaing, et al. (2019); Scott, Batchelorand Jones (2019)
Focus groups 4 5–15 Identification and exploration of opportunities for eCooking, compatibility of local cooking practices with eCooking appliances, fuel choices, verification of monthly expenditures
Leary, Serenje, Mwila, et al. (2019); Leary, Win, Myint, et al. (2019); Leary, Scott, Sago et al. (2019); Chepkurui, Leary, Numi, et al. (2019)
Stakeholder workshops
1–2 20–60 Identification and exploration of opportunities for eCooking
REAM et al. (2018); Leary, Mwila, Serenje, et al. (2019); Villema et al. (2018); Chepkemoi et al. (2019)

15Methodology
2.2. System Architectures for eCooking in Strong-Grid, Weak-Grid, and Off-Grid Contexts
Table 2.2 categorizes the range of system architectures that can enable eCooking in strong, weak, and off-grid contexts. This report focuses on three architectures:
● off-the-shelf AC eCooking appliances that can be connected directly to strong grids
● hybrid battery-supported appliances that can run on both AC and on DC (via the battery), suitable for use on weak grids
● DC appliances that can be connected directly to a battery charged by a solar panel in an off-grid system.
Throughout the report references to “AC cooking” describe the first category (cooking on an AC grid using appliances without battery support).
The report focuses on electricity stored in chemical batter-ies. Other technologies, including the use of phase-change materials for thermal storage, are possible. A number of groups are working on prototyping thermal storage for a low-cost stand-alone system. These efforts are at an early stage of development, however, and most details are not in the public domain. They are therefore not included in the modelling.
STRONG GRIDS
AC cooking is possible on strong grids, mainly national grids but potentially also larger hydro-powered grids or solar hybrid mini grids with significant battery storage. When feasi-ble, it is likely to be the most cost-effective solution (unless the grid tariff is extremely high), as it involves simply plug-ging in off-the-shelf AC appliances.
TABLE 2.2 Simplified typology of eCooking devices for strong, weak, and off-grid settings
USE OF BATTERY GRID OR MINI GRID SOLAR HOME SYSTEM
Without battery Strong grid
AC grid eCooking
+
Off-grid
DC solar eCooking
+
Battery-supported
Weak grid
DC grid battery-powered eCooking
+ +
Off-grid
DC solar battery–powered eCooking
+ +
Note: For a more complete set of definitions, see appendix B. For the system architectures modelled in this report, see table 2.4.

ESMAP | Cooking with Electricity: A Cost Perspective16
WEAK GRIDS (INCLUDING SOME MINI GRIDS)
Battery-supported cooking can enable eCooking in weak grid and other mini grid contexts, with a charger used to recharge the battery. Off-the-shelf AC appliances can be used via an inverter or DC appliances that can be connected directly to the battery (using the built-in battery management system). Appliances can be configured to run solely from the battery or from the grid when available and the battery when not (in a configuration similar to that of an uninterrupt-able power supply). Alternatively, a hybrid AC/DC appliance can eliminate the need for an inverter, the configuration modelled in this report.
STAND-ALONE SOLAR SYSTEMS
For remote off-grid regions, this report focuses on solar-powered battery-supported eCooking. For isolated off-grid households, stand-alone systems are the only option. They are likely to be powered by solar, although other gener-ation sources, such as small-scale wind or pico-hydro, could also be employed. DC cooking appliances can be connected directly to the solar panels to enable cooking during sunny periods (this option is not modelled in this study but is explored in Section 3.4.
2.3. Cost Trends
Although other power generation and energy storage technologies exist, PV panels and lithium-ion batteries are particularly important for expanding access to eCooking. Solar PV is the most readily deployable technology for both stand-alone systems and mini grids across the global South. Lithium-ion batteries are particularly well suited for eCook-ing, because they offer a longer cycle life and greater depth of discharge and can tolerate more rapid discharge than lead acid batteries, the standard off-grid electricity storage for over 100 years (Batchelor 2015; Zubi et al. 2017). Lead acid batteries and their variants have been improved significantly in recent years and continue to be the most cost-effective solution for many off-grid applications. However, they are not generally recommended for continuous high-drain applica-tions such as cooking, because such conditions reduce both their lifetime and usable capacity (Battery University 2019).
Figure 2.1 shows the price trends for PV modules and lithium-ion battery packs. For PV, the World Bank’s Off-Grid Solar Market Trends Report 2018 anticipates some price stabilization, but the International Renewable Energy Agency (IRENA 2019) projects continuation of the recent price reduction trends. The price of a lithium-ion battery pack fell
FIGURE 2.1 Actual and projected prices for PV modules and lithium-ion battery storage, 2010–22
0
20102011
20122013
20142015
20162017
2020 (f)
2022 (f) 20102011
20122013
20142015
20162017
2020 (f)
2022 (f)
0.5
1.0
1.5
2.0
a. Crystalline silicon solar module b. Lithium-ion battery pack
2.5 2.392.08 –25%
–20%
200
0
400
600
800
1,000
1.06
1,000
800689
599540
350273
209 200125
0.73 0.780.61 0.55
0.330.46
0.33
Pric
e ($
/W)
Pric
e ($
/kW
h)
Note: These figures are for commercialized PV and battery technologies and chemistries. Different technologies may well take over in future, but they would likely do so mainly because of lower cost, so the cost trajectories should be largely technology independent. (f) = forecast.
Source: Lighting Global (2018).

17Methodology
by an average rate of 20 percent a year between 2010 and 2017, and reductions at a similar rate are forecast for the next five years (Goldie-Scot 2019). However, these projections are for PV panels and battery packs alone; they do not include transport, installation, and supply chain margins, which are unlikely to decline as rapidly as the core technology, suggesting that the rate of cost reduction for PV and batteries in use will be lower. (See appendix E for analysis of cost trends and the detailed assumptions and calculations made for the modelling. See appendix F for a summary of the data inputs for each of the cases.)
This report presents a comparison between the costs of eCooking in 2020 and 2025, exploring two expected trends: reducing costs for battery-supported eCooking through technical and organizational learning; and increasing charcoal, LPG, firewood and kerosene prices. The analysis incorporates some simple parameter value uncertainty, reflecting more optimistic and more pessimistic outlooks for the key vari-ables in performance and cost (table 2.3).
Assumptions about battery price and performance strongly influence the overall costs of battery-supported eCooking systems. Battery prices are from The 2019 Lithium-Ion
Battery Price Survey (Goldie-Scot 2019), which includes Bloomberg New Energy Finance’s forecasts to 2030 for lithium-ion pack prices, which are assumed to be at scale for electric vehicle applications. A 51 percent premium is applied to reflect the higher costs of packaging stationary batteries and the economies of scale seen in the very large electric vehicle market, as Frith (2017) suggests. Another 20 percent is added to reflect the costs for transportation to and impor-tation into Africa. These assumptions lead to the low-cost value in Table 2.3. The high-cost value reflects a more pessimistic view of the stationary battery market, either a
battery price reduction profile that lags by about two years or an additional 25 percent premium on battery costs for implementation in-country. The other parameters for battery and system efficiency reflect technical uncertainty about the real-life perfor-mance of these systems. Product sales, marketing, and local distribution costs are not
included in this modelling. Throughout the modelling, finan-cial values are in 2019 dollars. Appendix E provides other technical and cost assumptions.
Fuel prices for each country are based on the results from household surveys carried out alongside the cooking diary studies in 2017–19 (Scott, Leary, Hlaing, Myint, Sane, Win,
TABLE 2.3 Parameter values used in high- and low-cost scenarios for eCooking systems
2020 2025
PARAMETERLOW-COST
VALUEHIGH-COST
VALUELOW-COST
VALUEHIGH-COST
VALUE
Battery price (lithium-ion, $/kWh) 280 350 180 220
Usable maximum capacity remaining at replacement (%)
80 90 80 90
Battery life (cycles) 3,000 2,000 3,000 2,000
PV-battery roundtrip efficiency (%) 90 85 90 85
Price of fuel 2/3 of 2018a mean value
4/3 of 2018 mean value
2018 low value + 3% a year
2018 high value + 3% a year
Note: All financial values are in 2018 U.S. dollar prices.
a. Some values are from late 2017 or early 2019.
The price of a lithium-ion battery pack fell by an average rate of 20 percent a year between 2010 and 2017, and reductions at a similar rate are forecast for the next five years.

ESMAP | Cooking with Electricity: A Cost Perspective18
Phyu, Moe, Batchelor, et al. 2019; Batchelor, Leary, et al. 2019; Leary, Scott, Serenje, et al. 2019b; Leary, Scott, Numi, et al. 2019), plus an assumption of a 3 percent price increase each year thereafter. A high/low range is then applied around these values by adding/subtracting one third. The price range assumptions are based on observations during the cooking diary and related studies in East Africa and Myanmar. The price trends reflect an assumption that there will be increasing pressure on charcoal production through policy initiatives for environmental protection (see case study 1) and upward pressure on fossil oil prices internationally, affecting LPG. These assumptions are not the result of a comprehensive analysis. Some sensitivity analysis to key assumptions is reported in the case study results, but further exploration of fuel price trends will be important in future work.
2.4. Summary of Contexts, Systems, and Fuel Prices
By inputting local fuel/electricity prices and the quantity of each that is required to cook local foods, the tech-no-economic model can compare the relative costs of cooking with each type of fuel across a range of system architectures.
Table 2.4 summarizes the contexts and the system architec-tures modelled. For the national and mini grid architectures, the tariff is the key cost variable; for the stand-alone archi-tecture, the price of PV modules and the solar resource are fundamental. Battery price and performance are important for all battery-supported cases.

19Methodology
TAB
LE 2
.4
Syst
em a
rchi
tect
ures
and
mod
ellin
g pa
ram
eter
s in
eac
h ca
se s
tudy
con
text
CAS
E ST
UD
YSY
STEM
A
RCH
ITEC
TURE
MO
DEL
LED
APP
LIA
NC
ESM
OD
ELLE
D F
UEL
PRI
CES
DAT
A
SOU
RCE
100
PERC
ENT
ECO
OKI
NG
a
50
PERC
ENT
ECO
OKI
NG
ELEC
TRIC
ITY
TARI
FF ($
/KW
H)
FIRE
WO
OD
($
/KG
)C
HA
RCO
AL
($/K
G)
KERO
SEN
E ($
/LIT
ER)
LPG
($/K
G)
Urb
an
1: N
airo
bi,
Keny
aN
atio
nal
grid
AC a
nd
batte
ry-
supp
orte
d D
C
Appl
ianc
e st
ack
of e
ffici
ent
and
ineffi
cien
t ap
plia
nces
Elec
tric
pres
sure
co
oker
(EPC
) on
ly
0.17
n.a.
0.49
1.11.0
8C
ooki
ng
diar
ies
(n =
20)
an
d ut
ility
(K
PLC
201
9a)
2: L
usak
a,
Zam
bia
Nat
iona
l gr
idAC
and
ba
ttery
-su
ppor
ted
DC
Appl
ianc
e st
ack
of e
ffici
ent
and
ineffi
cien
t ap
plia
nces
Base
line
only
: In
tegr
ated
four
-pla
te
cook
er w
ith o
ven
EPC
onl
y0.
01n.
a.0.
21n.
a.2.
07H
ouse
hold
su
rvey
(n
=200
), co
okin
g di
arie
s (n
=20)
an
d ut
ility
(Z
ESC
O 2
019)
Rura
l
3: S
han
Stat
e,
Mya
nmar
Min
i grid
AC a
nd
batte
ry-
supp
orte
d D
C
Appl
ianc
e st
ack
of e
ffici
ent
and
ineffi
cien
t ap
plia
nces
EPC
onl
y0.
160.
130.
150.
821.0
8H
ouse
hold
su
rvey
(n =
200
), in
terv
iew
w
ith m
ini g
rid
deve
lope
r
4: K
ibin
du,
Tanz
ania
Min
i grid
AC a
nd
sola
r ba
ttery
–su
ppor
ted
DC
Appl
ianc
e st
ack
of e
ffici
ent
and
ineffi
cien
t ap
plia
nces
EPC
onl
y1.3
50.
040.
130.
821.1
6H
ouse
hold
su
rvey
(n =
200
), in
terv
iew
w
ith m
ini g
rid
deve
lope
r
5: E
char
iria,
Ke
nya
Off-
grid
Sola
r ba
ttery
–su
ppor
ted
DC
Appl
ianc
e st
ack
of e
ffici
ent
and
ineffi
cien
t ap
plia
nces
EPC
onl
yn.
a.0.
130.
311.1
81.3
3In
terv
iew
s w
ith
com
mun
ity
mem
bers
and
ho
useh
old
surv
ey (n
= 2
00)
Not
e: a
. See
tabl
e 2.
5 fo
r det
ails
on
appl
ianc
es te
sted
in e
ach
coun
try c
onte
xt. T
he b
lend
of i
neffi
cien
t and
effi
cien
t app
lianc
es w
as m
odel
led
as tw
o ap
plia
nces
per
hou
seho
ld: a
n EP
C a
nd a
hot
pla
te. S
ee
appe
ndix
E fo
r det
ails
.
n.a.
: Not
app
licab
le.

ESMAP | Cooking with Electricity: A Cost Perspective20
2.5. Demand for Electricity for Cooking
As cooking is a highly culturally specific practice, the type of appliances and the amount of power required varies significantly. Very little information is available on how much energy is needed to cook a meal, in particular how much electricity and how it varies across cultures. Apart from the availability of electricity, the viability of eCooking solutions depends on the cooking processes employed, the cooking
intensity and frequency, and the compatibility of local cooking practices with the broad range of energy-efficient eCooking appliances available.
The cooking diary studies tracked the energy use and cooking practices of 80 households in 4 countries over 6 weeks. They generated qualitative data on the compatibility of various electric appliances with local cooking practices and quantitative data on energy demand for cooking. Tables 2.5 and 2.6 list the figures used as inputs for the modelling in this report. Further details on the cooking diary studies can be found in appendix C and the cooking diary country reports (see Table 2.1).

21Methodology
Fuel stacking is a complex behavior that allows households to optimize cost, usability, and other factors by using multiple cooking fuels in their household. Appendix C provides a detailed explanation of how it was modelled in this study. The electricity demand of a typical household stacking an EPC with its traditional fuel is estimated by multiplying the
measured median daily energy consumption figures for 100 percent eCooking presented in Table 2.5 by one third. This proportion is derived from analysis of the cooking diary data, which show that with minimal training, participants with a hot plate and an EPC chose to cook 50 percent of the menu on an EPC. Across the range of foods households
TABLE 2.5 Measured energy consumption for eCooking and modelling assumptions
COUNTRY APPLIANCESa
100 PERCENT ELECTRICITY (MEASURED DURING COOKING
DIARY STUDIES)
PROPORTION OF ENERGY CONSUMED BY ELECTRIC PRESSURE COOKER (EPC) COOKING 50 PERCENT OF
MEALS (MODELLED)
INPUT DATA FOR CASE STUDY MODELLING
(4.2 PEOPLE PER HH)c
Number of daysb
Median daily
energy per HH
Mean HH size
Median daily per
capita energy
Median daily energy per HH (kWh)
Median daily per capita
energy (kWh)
100 percent eCooking
(kWh)
50 percent eCooking
(kWh)
Kenya EPC, rice cooker, hot
plate
431 1.4kWh (5.1 MJ)
3.1 0.46kWh (1.65 MJ)
0.47 0.15 1.92 0.64
Myanmar Rice cooker,
induction stove,
infra-red stove, EPC, thermo-pot
476 1.02kWh (3.7 MJ)
4 0.26kWh (0.93 MJ)
0.34 0.09 1.08 0.36
Tanzania Rice cooker,
induction stove, hot plate, EPC,
thermo-pot, kettle
423 2.06kWh (7.4 MJ)
4.2 0.49kWh (1.76 MJ)
0.69 0.16 2.06 0.68
Zambia (efficient and inefficient appliances)
EPC, hot plate
99 1.63kWh (5.9 MJ)
7.9 0.21kWh (0.75 MJ)
0.55 0.07 0.87 0.29
Average for efficient and inefficient appliances 1.48 0.49
Zambia (very inefficient appliances and practices)
Integrated four-plate
cooker with oven
494 2.47kWh (8.9MJ)
3.3 0.75kWh (2.71MJ)
0.82 0.25 3.15 1.05
Note: Tables shows measured energy consumption for 100 percent eCooking on a mixture of inefficient and efficient appliances and modelled energy consumption for 50 percent eCooking on EPCs (assuming the other 50 percent is met by traditional fuels). HH = household.
a. Households may also have used other eCooking appliances they already owned.b. Number of days refers to number of days of data using only that fuel.c. Figure refers to number of household members cooked for (mean of means).

ESMAP | Cooking with Electricity: A Cost Perspective22
chose to cook using it, the EPC used an average of 50 percent of the energy of the hot plate. The accompa-nying energy for traditional fuels in fuel-stacking scenarios is therefore simply half of the measured median figures presented in Table 2.5.
In this report, a household is modelled as comprising 4.2 people, the average size in the cooking diaries. The charcoal, LPG, firewood, kerosene, and electrical energy use data for each country relate to households of different sizes and are scaled linearly from the median per capita energy values.
Figure 2.2 shows the three fuel-/appliance-stacking scenarios modelled in this report:
● Household cooking: 100 percent electric, stacking of inefficient appliances (for example, hotplate); more effi-cient appliances (for example, electric frying pan); and most efficient appliances (for example, EPC)
● Household cooking: 50 percent electric, stacking most efficient appliances (for example, EPC), with baseline fuels for remaining 50 percent
● Cooking as a microenterprise: Use of EPCs for boiling “heavy foods” only.9
Case Studies 1–5 model the first two options. Part 2 of case study 4 explores the third option, the most efficient form of eCooking. Case study 2 also models 100 percent eCooking with very inefficient appliances and practices.
TABLE 2.6 Normalized energy consumption cooking with traditional fuel, by fuel type
COUNTRY
FIREWOOD (KG) CHARCOAL (KG) KEROSENE LPG (KG)
100 PERCENT
50 PERCENT
100 PERCENT
50 PERCENT
100 PERCENT
50 PERCENT
100 PERCENT
50 PERCENT
Kenya 3.50a 1.75a 1.75b 0.87b 0.25 kg (0.31 liters)
0.12 kg (0.15 liters)
0.23 0.11
Myanmar 1.54 0.77 n.a. n.a. n.a. n.a. 0.20 0.10
Tanzania 3.50a 1.75a 1.75 0.87 n.a. n.a. 0.33 0.16
Zambia n.a. n.a. 1.04 0.52 n.a. n.a. 0.17c 0.08c
Note: Data are from cooking diary periods for traditional fuel use only. Values are normalized to a 4.2 person household. For measured values of median energy consumption for each fuel, see table C.2.
n.a.: Not available.
a. Firewood data were not available in the Kenya or Tanzania cooking diary datasets, so consumption data were estimated using the ratio of firewood to charcoal energy consumption (approximately 1:1) from Myanmar and the ratio of firewood to charcoal energy density (approximately 1:2) from appendix C.b. Insufficient records were available for charcoal cooking from the cooking diary study in Kenya to make a reliable measurement of charcoal consumption. As cook-ing practices in Kenya are similar to practices in Tanzania and electricity consumption was measured to be similar in the two counties, the values for charcoal cooking in Tanzania were used as model inputs for Kenya.c. LPG data were not available in the Zambia cooking diary datasets, so consumption data were estimated using the average of the Tanzania to Zambia ratios for charcoal and eCooking with energy-efficient appliances (approximately 2:1).

23Methodology
FIGURE 2.2 Energy storage required to support eCooking with different appliances, practices, and fuel-stacking options
HOUSEHOLDCOOKING
NOT MODELLED IN THIS REPORT
Ine�cient appliances only 2 kWh
CASE STUDY 2
3 kWhVery ine�cient
appliances & practices
CASE STUDIES 1–5
Appliance stack: e�cient & ine�cient 1.5 kWh
0.5 kWhFuel stack: EPC with other fuels
+
COOKING ASA MICRO-
ENTERPRISE
CASE STUDY 4 PART 2
EPC for boiling heavy foods once a day 0.15 kWh

ESMAP | Cooking with Electricity: A Cost Perspective24
2.6. Business Models and Financing Horizons
This study examines both utility and lease-to-own business models. For utility, or energy service, business models, the costs of cooking on each system are calculated over a repayment period spanning an expected 20-year system lifetime. For the lease-to-own business model, cooking costs are calculated for recovery of capital costs over a five-year financing period. At the end of five years, users could be left with the device. However, for the battery-supported solu-tions, they would face ongoing costs for the replacement of the battery and other components. Creative business models will therefore be needed (see Chapter 4). The real discount rate applied for both business models is 9.6 percent.10
In grid-connected scenarios, the plots of modelling results in the next section show both battery-supported eCooking, with the battery charged from the grid/mini grid, and direct eCooking, where the only capital cost to be financed is the cost of the appliances. Each of the two business models could be applied to any of the battery-supported and AC eCooking scenarios. However, the 20-year financing option for AC eCooking seems highly unlikely. To reduce complex-ity, it was therefore omitted from the results charts. For AC eCooking, financing a $50 EPC even over a period as long as five years seems unnecessary, but this business model assumption was applied to make the cost results comparable to those for battery-supported cooking. With the exception of Zambia (case study 2), where tariffs are exceptionally low, the effect of moving to a one- or two-year financing period for direct cooking should not be significant, as the major cost will be electricity units.

25 eCooking in Grid-Connected and Off-Grid Systems: Modelling Results and Discussion
Ch A P T ER 3
ECOOKING IN GRID-CONNECTED AND OFF-GRID SYSTEMS: MODELLING RESULTS AND DISCUSSION
3.1. Overview of Case Studies
Five case studies were chosen to illustrate the range of opportunities available for eCooking in both urban and rural areas utilizing power from national grids, mini grids, and solar home systems (Figure 3.1). Leary et al. (2018) carried out a global market assessment to identify high-potential markets for battery-supported eCooking. Cooking diary studies were carried out in four high-scoring countries to gather empiri-cal data on electricity demand for cooking local foods with efficient and inefficient appliances.
The case studies draw attention to opportunities identi-fied during the course of the cooking diary research. They feature a range of system architectures from Table 2.2, illus-trating the broad range of solutions that have the potential to achieve social impact by enabling eCooking on stand-alone systems, mini grids, weak grids, and reliable grids. Sections 3.2–3.4 present the results of the case study analyses; Section 3.5 cuts across the case study results, drawing out generalizable findings on the cost-effectiveness of eCooking compared with current practice.
The section on eCooking on national grids explores the dynamics of cooking with grid electricity in Nairobi, Kenya and Lusaka, Zambia. The motivations for encouraging or managing the uptake of eCooking on urban grids in African cities vary substantially, as do electricity tariffs and the
structure of tariff bands. Kenya Power, for example, now has surplus generation capacity and is looking to increase demand for electricity, which is currently barely used for cooking. At the same time, the government of Kenya issued a logging ban in 2019 to protect the country’s dwindling forest reserves, causing charcoal prices to double overnight. In contrast, although electricity is already the aspirational cooking fuel in Zambia, the national utility (ZESCO) has repeatedly been forced to carry out load shedding over the past few years, as late rainfall has severely limited genera-tion capacity on its hydropower-dominated grid.
The first case study explores an opportunity for East Africans to transition completely away from biomass by fuel stacking LPG with an EPC. LPG is currently the aspirational fuel across most of East Africa yet many households with an LPG stove still purchase charcoal to cook “heavy foods” such as tripe, which they believe is cheaper (Leary, Fodio Todd et al. 2019).
The second case study illustrates an opportunity for coun-tries with significant populations already cooking with electricity but using inefficient appliances, to optimize loading on their grids. The evidence from the cooking diaries shows that for households currently cooking on highly inefficient appliances (such as integrated four-plate cookers with ovens), energy-efficient eCooking appliances

26 ESMAP | Cooking with Electricity: A Cost Perspective
CASELOCATION
CONTEXT SUPPLY SIDEDEMAND SIDE:
BASELINE FUELS/APPLIANCES
KEY OPPORTUNITYTO ENABLE 100%CLEAN COOKING
ENERGYSTORAGE
CONSIDERED
NoneStimulate demandfor surplus national
grid electricity
Mitigate loadshedding onnational gridswith energy
storage
Mitigate peakloading
constraints onmicro hydro
mini-grids withenergy storage
Stimulate demand forelectricity in rapidly
growing solar-hybridmini-grid sector
Enable electricityaccess and cleancooking with solar
systems
Urban,national grid
Urban,national grid
LPG, charcoaland kerosene
Clean fuel stack: LPGand most e�cientelectric appliances
(EPCs)
Clean fuel stack: LPGand most e�cientelectric appliances
(EPCs)
Clean fuel stack: LPGand most e�cientelectric appliances
(EPCs)
Nairobi,Kenya
1
Lusaka,Zambia
2
Shan State,Myanmar
3
Kibindu village,Tanzania
4
Echaririavillage, Kenya
5
Firewood and e�cientelectric appliances
(induction stove, ricecooker and insulated
electric frying pan)
Only e�cient electricappliances (inductionstove, rice cooker and
insulated electricfrying pan)
Rural, micro-hydro mini-grid
Rural, solarhybrid mini-grid
Rural, o�-grid
Centralizedbattery bank
Charcoal and firewood
Charcoal, keroseneLPG and firewood
Householdbattery
Householdbattery
Householdbattery
Ine�cient electricappliances (hotplates,
oven) and charcoal
Most e�cient (EPCs)and minimal use of
less e�cient appliances(hotplates, oven)
FIGURE 3.1 Comparison of the five case studies and rationale for selection

27eCooking in Grid-Connected and Off-Grid Systems: Modelling Results and Discussion
and practices can reduce electricity demand for cooking by two-thirds (see Table 2.5). Supporting eCooking appli-ances with a battery can also time shift energy demand for cooking and reduce peak loading, as well as enable custom-ers to cook during blackouts or load shedding.
The section on eCooking on mini grids contrasts a micro- hydro mini grid with a relatively low tariff in Myanmar (where users are already cooking with electricity at off-peak times) with a solar hybrid mini grid in Tanzania with a tariff an order of magnitude higher. However, with the rapidly falling prices of batteries and solar PV, new opportunities are opening up for integrating energy-efficient eCooking into a broader range of systems. Mini grids are usually installed in areas where biomass fuels can be collected or purchased at very low cost. However, urbanization is causing many people who used to collect fuel to start paying for it, creating an opportunity to translate expenditures on biomass fuels into electricity units, which could drive down the tariff for the mini grid as a whole. Peak loading is a major concern for eCook-ing on power-limited mini grids, but many are already using a variety of time-shifting techniques, which could decouple cooking from overall electricity demands on the mini grid, smoothing out the load profile and further reducing the unit cost.11
The third case study, on Myanmar, highlights the opportu-nity for micro-hydro mini grid developers who have already enabled cooking on their systems to allow their customers to do all of their cooking with electricity. At peak times, grids often reach capacity and the voltage dips. Some innovative mini grid developers have been able to enable off-peak eCooking by getting users to agree to cook with electricity only when the voltage is high enough (indicated by a volt-meter installed by the mini grid developer in every kitchen). This case study explores the potential role of battery storage in overcoming the supply constraints to enable eCooking at any time.
The fourth case study looks at the prospects for cooking on a 20kW solar/biomass hybrid mini grid in Tanzania that connects 58 households that currently cook with firewood or charcoal, both of which are available at very low cost. There is interest in eCooking among connected households and the grid infrastructure can support cooking loads. However, the tariff is very high. The case study explores two eCooking scenarios: (a) regular household cooking and (b) a concept tailored to maximize cooking efficiency for users operating microenterprises to precook beans for sale using an EPC.
The section on eCooking with stand-alone systems explores the opportunity for eCooking powered by solar home systems. Energy-efficient eCooking appliances can be paired
with high-performance battery storage and a suitably sized solar panel to create a solar home system capable of deliv-ering cooking services. Until recently, such a device would have been unrealistically expensive for most households in developing countries. However, this is no longer the case, due to the falling prices of the two main cost components, PV and batteries. This approach offers important co-benefits, in the form of access to electricity for other applications.
The fifth case study describes a Kenyan village, where cook-ing was previously dominated by collected firewood, but dwindling forest resources and increasing livelihood oppor-tunities have led many residents to start paying for firewood (or adopt charcoal, kerosene, or LPG). It explores whether pairing a DC EPC with lithium-ion battery storage and a suit-ably sized solar panel may be able to offer a cost-effective off-grid eCooking solution.

ESMAP | Cooking with Electricity: A Cost Perspective28
3.2. eCooking on National Grids
Grid electricity in much of Sub-Saharan Africa and South/Southeast Asia has capacity, reliability, access, and afford-ability challenges that generally preclude cooking with electricity. Strong grids can enable a wide range of energy services; however, on weak grids, load shedding, voltage fluctuations (brownouts), blackouts, and other inconsisten-cies in the power supply limit the range of energy services on offer and frequently disrupt the delivery of the services that are available. Historically, cooking with electricity has not been encouraged in these contexts, because eCooking appliances, especially older and more inefficient models, draw much more energy and power than basic appliances such as lights, radios, and TVs. Not all grids are strong enough to support eCooking. However, emerging trends in many places suggest that new opportunities are arising.
The case studies in this section highlight two contexts in which there are clear opportunities to achieve social impact
by enabling on-grid eCooking. Case study 1 explores the opportunity for fuel stacking an EPC with LPG in Kenya (and neighboring East African countries), where 0 percent of the population currently uses electricity as its primary cooking fuel (WHO 2017). Figure 3.2 shows that electricity is not a mainstream cooking solution in many Sub-Saharan African countries. Southern Africa is a notable exception to this trend, as electricity is already widely adopted there. In fact, of the 58 million people in Sub-Saharan Africa who already cook primarily with electricity, 41 million reside in South Africa (WHO 2017). However, in many countries, reliability is still a challenge, so case study 2 explores the opportunity for mitigating load shedding in Zambia with energy-efficient and battery-supported appliances.
Table 3.1 compares statistics on the affordability, reliability, access to, and renewable fraction of grid electricity in the countries studied in detail in this section of the report. The following section explores some of the trends, with particular reference to achievements in Southern Africa and emerging opportunities in East Africa.
FIGURE 3.2 Percentage of households cooking primarily with electricity in Sub-Saharan African and South/Southeast Asian countries
IBRD 45267 | AUGUST 2020
Cooking primarilywith electricity
>60 %40 - 60 %20 - 40 %0 - 20 %No data1 million people
Note: Populations of more than 1 million people cooking primarily with electricity are indicated by black circles, the size of which is proportional to the number of people. See Figure 3.5 for a breakdown of the fuel mix in selected Sub-Saharan African countries.
Source: Data from WHO (2017).

29eCooking in Grid-Connected and Off-Grid Systems: Modelling Results and Discussion
AFFORDABILITY
South Africa is the only Sub-Saharan African country in which the majority of the population (73 percent [WHO 2017]) already cook primarily using electricity. A household survey conducted by the Republic of South Africa (2012) showed a steady increase in eCooking with income levels, with 55 percent of households in the poorest quintile using elec-tricity and up to 90 percent of households in the richest quin-tile doing so. Even electrified low-income households were more likely to rely on firewood than electricity, however, which “suggests the existence of barriers or practices amongst poorer households that inhibit a fuller transition” (Republic of South Africa 2012, p. 25). Sebitosi and Pillay (2005), Bekker et al. (2008), and Cowan (2008) all suggest that cultural resistance to change plays a significant part, which is cemented by the perceived high cost of electricity.
Cowan (2008) studied the informal settlement of Imizamo Yethu on the outskirts of Cape Town. He showed that even with inefficient hot plates, cooking with electricity was by far the cheapest option. However, the upfront cost of the appliance was a barrier, as the most popular appliance (the double hot plate) was considerably more expensive than a paraffin stove (although less expensive than an LPG stove). He combined participatory field methods with laboratory testing to evaluate the energy requirements for the prepara-tion of local meals using the most common energy sources: electricity, LPG, ethanol gel, and paraffin. The results clearly showed that other than collected fuelwood (which is assumed to be free), electricity was by far the cheapest option for all types of dish.12
To counter the false perception that electricity is too expen-sive for cooking and incentivize the transition away from paraffin and firewood among the poor, the South African
TABLE 3.1 Electricity supply factors in Kenya, Tanzania, Uganda, and Zambia
CASE STUDY
PERCENT OF POPULATION WITH ACCESS
TO ELECTRICITY
ANNUAL NUMBER AND DURATION OF BLACKOUTS (SAIFI, SAIDI)a
ELECTRICITY TARIFF ($/KWH)
LIFELINE TARIFF AND MONTHLY
ALLOWANCE
GENERATION MIX (PERCENT RENEWABLE)
SHARE OF POPULATION
COOKING PRIMARILY WITH ELECTRICITY (%)
Case study 1
Kenya Total: 64Urban: 81
Number: 13Average duration: 60 hours
0.23 Lifeline tariff: $0.17/kWh Allowance: 100kWh
87 0
Tanzania Total: 33Urban: 65
Number: 47Average duration: 21 hours
0.15 Lifeline tariff: $0.04/kWhAllowance: 75kWh
34 1
Uganda Total: 22Urban: 57
Number: 42Average duration: 59 hours
0.20 Lifeline tariff: $0.06/kWhAllowance: 15kWh
93 0
Case study 2
Zambia Total: 40Urban: 75
Number: 5Average duration: 50 hours
0.09 Lifeline tariff: $0.02/kWhAllowance: 200kWh
97 12
Note: a. SAIFI (the System Average Interruption Frequency Index) is the average number of service interruptions experienced by a customer in a year. SAIDI (the System Average Interruption Duration Index) is the average duration of outages experienced by a customer over the course of a year, measured in hours.
Source: World Bank (2019a, 2019c); ZESCO (2019); KPLC (2019a); TANESCO (2019); Umeme (2019); WHO (2017).

ESMAP | Cooking with Electricity: A Cost Perspective30
government launched the Free Basic Electricity policy in 2003. It entitled poorer households to 50kWh/month free of charge (Bekker et al. 2008; Lemaire 2011). As a result, the proportion of households cooking with electricity grew from 59 percent in 2003 to 73 percent in 2011 (WHO 2017).
Figure 3.3 shows that South Africa has one of the lowest tariffs on the continent ($0.07/kWh). However, ener-gy-efficient appliances and rising charcoal prices have now opened up opportunities for affordable eCooking in other African countries as well. Electricity tariffs have remained relatively affordable, while charcoal prices have risen significantly in many East and Southern African countries (Batchelor 2015), meaning that it is now cost-effective for many urban charcoal users to switch to eCooking. Electricity
prices in Zambia are still below $0.10/kWh, and although standard residential tariffs in Kenya, Tanzania, and Uganda are higher, they are all still below $0.25/kWh (see Table 3.2).
Figure 3.3 compares the cost of cooking with charcoal and electricity across a range of typical charcoal prices and electricity tariffs in Sub-Saharan African cities. In cities with high charcoal prices, such as Nairobi ($0.49/kg), cooking diary demand data suggest that consumers are likely to be paying around $27/month to cook with charcoal. At this price, it would be more cost-effective for consumers who are connected to 38 of the 39 Sub-Saharan African utilities studied by AFREA and ESMAP (2016) to cook all their food with electricity. Even in cities with lower charcoal prices, such as Lusaka ($0.21/kg), eCooking would still be cost-effective
FIGURE 3.3 Sensitivity analysis comparing the cost of eCooking with the cost of cooking with charcoal across Sub-Saharan Africa
35
30
100% electricity 100% Charcoal
25
20
15
10
Cos
t of C
ooki
ng ($
/mon
th)
5
00 0.05 0.10 0.15 0.20 0.25 0.30 0.35 0.40
Electricity tari� ($/kWh)
At 0.2$/kg: eCooking cheaper than Charcoalfor 23/39 Sub-Saharan African Utilities
At 0.5$/kg: eCooking cheaperthan Charcoal for 38/39 Sub-Saharan
African Utilities
0.45 0.50
$0.5/kg
$0.2/kg
TypicalCharcoalprice rangein Sub-SaharanAfrican Cities
Ethiopia, Sudan
Gambia, Kenya, Mauritania, Mauritius, Uganda
Benin, Burkina Faso, Gabon, Mali, Rwanda, Senegal, Togo
Sierra Leone LiberiaSeychelles
Cape Verde
Botswana, Burundi, Guinea, Lesotho, Malawi, Mozambique, Nigeria, Rep. of Congo, South Africa, Zambia, Zimbabwe
Cameroon, Central African Republic, Comoros, Côte d’Ivoire, Ghana, Madagascar, Niger, São Tomé & Principe, Swaziland, Tanzania
Note: Grid tariffs are the average cash collected per kWh reported by AFREA and ESMAP (2016). They therefore differ from the tariffs used as modelling inputs in the case studies, which used the latest available retail tariff for the first 100kWh/month. Cooking demand values are based on Tanzania cooking diaries data. All electric solutions are AC, modelled with a five-year financing horizon. Modelled charcoal prices represent the range of prices recorded by the study team in the Sub-Saharan African cities studied in this section: Lusaka ($0.21/kg), Dar es Salaam ($0.32/kg), Kampala ($0.28/kg), and Nairobi ($0.49/kg).

31eCooking in Grid-Connected and Off-Grid Systems: Modelling Results and Discussion
for grid-connected charcoal users in over half (23 out of 39) of the surveyed countries.
Although South Africa’s Free Basic Electricity program is exceptionally generous, a number of utilities offer discounted social or lifeline tariffs, designed to enable affordable access to basic energy services for lower-income households (AFREA and ESMAP 2016). These tariffs offer a fixed amount of electricity each month at a reduced price, ranging from 15kWh to 500kWh, with discounts of 10–100 percent off of regular retail tariffs. Pricing structures for electricity tariffs can be complex, making direct comparisons between them difficult. For example, many utilities use a rising block tariff (19 out of 39 surveyed), where the lower consumption blocks are discounted at several different rates, gradually rising to the regular tariff. However, 10 of the 39 utilities surveyed by AFREA and ESMAP had a tariff in which the first block (which is the only block if only a lifeline and regular retail tariff are offered) had an allowance of 100kWh/month or more; 24 offered 50kWh/month or more.
In some countries, lifeline tariff allowances are already enough to enable poorer households to access afford-able modern energy cooking services. Since AFREA and ESMAP’s (2016) study, Kenya Power increased its lifeline tariff allowance to 100kWh/month. It is unlikely that poorer households own a wide range of appliances, in particular energy-intensive appliances. Analysis of customer data from Kenya Power’s (2018) annual report shows that its domestic customers spent an average of just $6.22/month, which if divided by the lifeline tariff of $0.17/kWh suggests an average consumption of less than 37kWh/month.13 The average household in the Kenya cooking diaries study used 0.46kWh/capita/day, or 14kWh/capita/month, to cook all its meals (see Table 2.5). These figures imply that the average Kenyan household (modelled in this study as 4.2 people) could cook all its food with electricity and maintain its regular electricity consumption within the lifeline tariff allowance.
In Zambia, the lifeline tariff allowance is 200kWh/month, and the cooking demand figures in Table 2.5 are consider-ably lower, giving even more flexibility. However, the focus groups carried out in parallel with the cooking diaries studies indicated that shared meters (one metered connection supporting multiple households) are prevalent in poorer
neighborhoods, vastly reducing the lifeline allowance per user.
AFREA and ESMAP (2016) note that lifeline tariffs are usually cross-subsidized by revenue from regular retail tariffs and that utilities in only two Sub-Saharan African countries (Seychelles and Uganda) currently have cost-reflective tariffs. Utilities may be reluctant to encourage greater utilization of lifeline tariff allowances without further subsidization (from national budgets, official development assistance, or further cross-subsidization by increasing the regular household,
commercial, or industrial tariffs). As a result, although the modelling in Case Studies 1 and 2 is carried out with the lifeline tariff, a sensitivity analysis is presented to show the effect of using the regular retail tariff or future potential tariff increases.
GENERATING CAPACITY AND RENEWABLE ENERGY
Howells et al. (2006) criticized South Africa’s focus on electricity as a replacement for basic cooking fuels on the grounds that demand for electricity for cooking was likely to be highest in the evening, when electricity demand for other applications was also highest, putting additional strain on South Africa’s already overloaded coal-driven power grid. Instead, they advocated for exchangeable credits that could be used to purchase LPG for cooking, as both options depend on fossil fuels.
In contrast, Zambia’s grid is dominated by hydropower (97 percent), offering a renewable alternative to unsustain-able charcoal production. But supply is extremely vulnera-ble to seasonal shortfalls in energy production as a result of limited rainfall. Case study 2 explores the opportunities for mitigating load shedding on Zambia’s overloaded grid. On grids that reach their limits at peak times but still have spare capacity, utilities could strategically incentivize households to prepare foods that are not time critical or trickle-charge a household battery by using price signaling (for example, off-peak tariffs).
In contrast, East African grids, driven by long-term economic growth ambitions, have been increasing their generation capacity and now have surplus generation, presenting an opportunity to expand electrical demand into new sectors,
In some countries, lifeline tariff allowances are already enough to enable poorer households to access affordable modern energy cooking services.

ESMAP | Cooking with Electricity: A Cost Perspective32
such as cooking. With the notable exception of Tanzania, the majority of electricity in the region is generated from renew-able sources (see Table 3.1). Although utilities in the region have historically shied away from stimulating demand as a result of shortfalls in supply, this is now changing. Recent installations in Uganda have increased generating capacity to 950 MW (Akena and Wanless 2020), creating a surplus of predominantly renewable generation (93 percent). What is more, Power Africa has identified another 1,900 MW of proj-ects for completion by 2030 (Power Africa 2018). Generating capacity in Tanzania was roughly 1,500 MW in 2017 (EWURA 2017), but with a further 1,600 MW planned, this capacity was projected to double shortly (Eberhard, Gratwick, and Kariuki 2018). In addition, the Stiegler’s Gorge hydropower project will bring an additional 2,100 MW online (Eberhard, Gratwick, and Kariuki 2018), so the government’s targets of reaching 5,000 MW by 2020 (Export.gov 2019) and 10,000 MW by 2025 (EEG 2016) appear feasible. This increase in generating capacity is encouraging, but many transmission and infrastructure challenges and management issues within the private and public sectors remain. These problems notwithstanding, in some countries eCooking could now be considered as a tool to stimulate demand for excess electricity.
RELIABILITY
The reliability of grid electricity in urban East Africa is now relatively high: the System Average Interruption Duration Index (SAIDI) and the System Average Interruption Frequency Index (SAIFI) from each country’s economic center indicates that in all four countries, power outages total less than five hours/month (see Table 3.1). Although user experience varies significantly within any city (for example, users with illegal connections will surely have less reliable access to electricity than the statistics suggest), the data suggest that the reliability of grid electricity in major cities is already sufficient for many people to consider eCooking.
Drawing power for cooking activities can have a detrimental impact on weak electrical systems where load shedding and load limitations are common. In systems with low voltage (for example, less than 150V on a grid designed for 220V), even the most efficient electrical cooking appliances would not be able to function. Voltage stabilization and/or stor-age-based reinforcement could help overcome this problem. If used in a grid-connected context, such systems would be particularly effective if the built-in battery capacity can be controlled by the utility. For instance, a smart-charge control-ler that allowed users to charge their batteries only at night could increase grid utilization ratios and avoid peak loading constraints.
Fuel stacking is an alternative strategy to enable households with unreliable grid connections to cook some of their food with electricity. Case study 1 explores a clean fuel stack of LPG and electricity. The survey conducted by the Republic of South Africa (2012) showed that 42 percent of South African households relied entirely on electricity for cooking, indicat-ing that grid connections for those users must be sufficiently reliable. However, where grid reliability is lower, fuel stacking can be a highly effective way of achieving a more resilient household energy system. If the fuel stacked with electricity is a clean fuel, such as LPG, health outcomes can be compa-rable to a fully electric solution.
ENERGY ACCESS
The high rates of eCooking uptake in South Africa have been enabled by energy policy that focused heavily on expanding electricity access (Beute 2012). Just a third of the population had access to electricity before 1990 (Bekker et al. 2008); by 2012, the figure had grown to more than 80 percent (Republic of South Africa 2012). South Africa increased access by both extending transmission lines into rural areas formerly far away from the grid and by densifying connec-tions in urban communities lying “under the grid.”
In almost every country in Sub-Saharan African and South/Southeast Asian, a sizable population now has access to electricity but still cooks primarily with other fuels, indicating considerable untapped potential (Figure 3.4). Case study 1 explores how Kenya—which raised electricity access rates from 19 percent in 2010 to 75 percent in 2018 (ESMAP 2020) but still has 0 percent of the population using electricity as its primary cooking fuel (WHO 2017)—could increase the use of electricity for cooking.14
Of course, many of the people who do not use their electricity connection for cooking may well be cooking with other clean fuels, such as LPG, or fuels that can be collected for free, such as firewood. In India, for example, where the electrification rate is 79 percent, just 4 percent of the population cooks with commercialized polluting fuels and technologies (charcoal, coal, and kerosene). In contrast, in many countries in East Africa, West Africa, and South East Asia, many households cook primarily with charcoal, coal, or kerosene (Figure 3.5)—all fuels that the World Health Organization has declared as responsible for premature deaths from respiratory illnesses (WHO 2016). In virtually all contexts, people are purchasing these fuels. This spending could be redirected into purchas-ing electricity units for cooking. In Kenya, 29 percent of the population cooks with commercialized polluting fuels and technologies; in Zambia, the figure is 37 percent.

33eCooking in Grid-Connected and Off-Grid Systems: Modelling Results and Discussion
Urbanization is spreading rapidly across the African continent; many areas that were previously rural are becoming peri-urban, meaning that many people who used to collect firewood are now forced to pay for it (or to purchase charcoal instead). As nearby forests
are exhausted, charcoal has to be brought from farther and farther away, pushing up the price in urban centers (Adam Smith International 2016). “Another Nigeria” will be added to the continent’s total urban population by 2025, and urban centers are set to double in size over
FIGURE 3.4 Percentage of households with grid connections that still cook primarily with fuels other than electricity in Sub-Saharan Africa and South/Southeast Asia
IBRD 45265 | AUGUST 2020
Grid-Connected,Cooking primarilywith other fuels
80 - 100 %60 - 80 %40 - 60 %20 - 40 %0 - 20 %No data
Source: Data from WHO (2017) and World Bank (2019c).
FIGURE 3.5 Percentage of households cooking primarily with commercialized polluting fuels and technologies (charcoal, coal, or kerosene) in Sub-Saharan Africa and South/Southeast Asia
IBRD 4526 6 | AUGUST 2020
Cooking primarilywith commercialized polluting fuels and technologies (charcoal, coal, or karosene)
80 - 100 %60 - 80 %40 - 60 %20 - 40 %0 - 20 %No Data
Source: Data from WHO (2017).

ESMAP | Cooking with Electricity: A Cost Perspective34
the next 25 years, reaching 1 billion people by 2040 (Lall, Henderson, and Venables 2017).
Charcoal still dominates cooking in urban areas of East and Southern Africa (Figure 3.6). Ironically, despite having surplus electricity and high access rates in urban areas (57 percent in Uganda, 65 percent in Tanzania, and 81 percent in Kenya), less than 1 percent of the urban population in all three coun-tries uses electricity as a primary cooking fuel (WHO 2017). In contrast, a substantial proportion of the urban population in Zambia (27 percent) and Ethiopia (18 percent) already cooks with electricity, most likely facilitated by the low unit cost of electricity (under $0.02/kWh in both countries for the first 200kWh/month).
Collectively, Ethiopia, Kenya, Tanzania, Uganda, and Zambia are home to 38 million people who have a grid connection but choose to cook with commercialized polluting fuels and technologies, charcoal, or kerosene (Leary et al. 2018). There is thus considerable latent opportunity for expanding the use of electricity for clean cooking.
LPG has become the fuel of choice for urban elites in Kenya and Tanzania, with 24 percent and 8 percent of the urban population, respectively, using it as their primary cooking fuel. However, many of these households still use charcoal for certain foods, creating an opportunity for a clean fuel stack that can enable households to move completely away from biomass (Case Study 1).
FIGURE 3.6 Primary cooking fuel used in selected countries in East and Southern Africa
10
0
Perc
enta
ge o
f Pop
ulat
ion
usin
g as
Prim
ary
Coo
king
Fue
l
20
30
40
50
60
70
80
90
100
Urban Total
ZambiaUgandaTanzaniaKenya ZambiaUgandaTanzaniaKenya
Generator LPG Natural Gas Biogas Kerosene AlcoholCool Charcoal Solar Wood Dung Crop WasteElectricity
CASE STUDY 1 CASESTUDY 2
CASE STUDY 1 CASESTUDY 2
Ethiopia South Africa Ethiopia South Africa
Source: Adapted from Leary et al. (2018), based on data from WHO (2017).
35eCooking in Grid-Connected and Off-Grid Systems: Modelling Results and Discussion
CASE STUDY 1
Building on the Success of LPG to Displace Charcoal in Urban East African Kitchens with a Clean Fuel Stack
SUMMARY
Power generation source: National grid (Kenya Power and Lighting Company [KPLC]) (with references to TANESCO and Umeme)
Tariff: $0.17/kWh
Baseline fuels:
• charcoal ($0.49/kg)
• LPG ($1.08/kg)
• kerosene ($1.1/liter)
Future scenarios:
• AC electricity and battery-supported DC electricity
• most efficient appliances (rice cookers, EPCs) and hot plates
Location: Nairobi, Kenya (with references to Dar es Salaam, Tanzania and Kampala, Uganda)
The results of this case study show that in urban contexts with relatively high traditional fuel prices and average electricity prices, both AC and battery-supported DC eCooking options already offer considerable cost savings (charcoal: $23–$34/month; AC: $12/month; AC/battery-supported DC hybrid: $15–$17/month). These options will become more competitive if, as expected, traditional fuel prices continue to increase. LPG currently offers the lowest-cost cooking ($6–$11/month), but many users currently stack LPG with charcoal for cooking heavier foods. In urban areas with well-established LPG markets, stacking LPG with efficient eCooking appliances can offer an affordable and desirable pathway to moving completely away from biomass ($7–$10/month).
Introduction
East Africa presents a strategic opportunity, because it contains many of the world’s largest charcoal markets and electricity grids are becoming stronger and reaching more people than ever before. eCooking has seen limited uptake in East Africa, because of intertwined challenges
on the supply (reliability, access, poor-quality wiring, partic-ularly in informal connections) and demand (perception of cost, taste, behavioral change) sides. However supply-side barriers are decreasing and energy-efficient appliances are offering a new opportunity to overcome many demand-side challenges.
Kenya is rapidly expanding and strengthening its national electricity grid. Like its neighbors Uganda and Tanzania, Kenya now generates substantially more electricity than it needs. In 2018, generation capacity stood at 2,351MW, although peak demand was just 1,802MW, creating a power generation surplus of 549MW. Kenya Power reported over 500,000 new customers in its 2018 annual report, bringing its customer base to 6.7 million in 2018. The Last Mile Connectivity Project15 has seen massive expansion of the grid into rural areas, raising the national electricity access rate from both grid and off-grid solutions from 29 percent to 73 percent in just five years (Kenya Power 2018). Many of these new customers have very low demand, however, bringing in limited extra revenue for the utility, and the costs of connecting and maintaining the infrastructure in rural areas, where transmission and distribu-tion lines are substantially longer, has been a challenge.
To increase demand, Kenya Power’s demand stimulation team has been showcasing what households can do with electricity,
FIGURE 3.7 Fuel stacking using LPG for manual control and an electric pressure cooker for automatic control

36 ESMAP | Cooking with Electricity: A Cost Perspective
including demonstrating eCooking with its Pika na Power (Cook with Electricity) program (KPLC 2019b). The program has aired as a prime-time TV show and set up a demonstra-tion kitchen open to the public with live cooking classes and the option to take home the appliances used on the show. Any of Kenya Power’s 10,000 employees can pay for appli-ances in installments deducted from their salary, and on-bill financing is under consideration as a way of extending this option to all 6.7 million customers. Pika na Power had focused on induction and infra-red stoves, but it recently added a new appliance to the program, the EPC.
LPG is the aspirational fuel across East Africa, with wide-spread uptake across Nairobi and Dar es Salaam and an emerging market in Kampala. LPG is distributed in pressurized cylinders, connected by a regulator and hose to an LPG stove or, alternatively, with a cylinder-top burner. Prices have fallen considerably as markets have become more established and supply chain efficiency improved. However, many house-holds with an LPG stove still purchase charcoal to cook heavy foods, such as beans, because they believe that it is cheaper. Although this may have been the case 10 years ago, today the relative price points of LPG and charcoal have reversed, and the eCookBook and cooking diary studies show that LPG is now competitive for all food types (Leary, Scott, Numi, et al. 2019; Leary et al. 2019; Leary et al. 2019).
This case study explores an opportunity for East Africans who have already partially adopted modern energy in the form of LPG to transition completely away from biomass and
reduce the cost of cooking even further by fuel stacking LPG with an EPC (see Figure 3.7). LPG offers quick lighting, high maximum heat output, and manual heat control, and it can heat any shape utensil, making it ideal for dishes such as chapati. EPCs offer automatic control of an insulated and pressurized cooking pot, making them ideal for heavy foods like beans.
After the cooking diaries studies in Nairobi and Dar es Salaam were completed, participants were able to keep the appliances they tested. As many already had LPG stoves, this fuel-stacking configuration of LPG with an EPC is how the majority of these cooks choose to prepare their food, as both manual and automatic control are important for different cooking processes (Leary, Scott, Numi, et al. 2019; Leary et al. 2019).
Nairobi, Dar es Salaam, and Kampala are all regional defor-estation hotspots. As a result, the price of charcoal has been steadily increasing (World Bank 2015), as the forests around these urban centers are stripped bare and charcoal has to be brought from farther and farther away. Deforestation is a major issue in Kenya, where an estimated 64 percent of the biomass harvested each year for household fuel is classi-fied as nonrenewable (Drigo et al. 2014). In 2018, a logging ban was put in place to protect the nation’s dwindling forest reserves, causing the price of wood fuels to double over-night. Although prices have now settled down, they are still the highest in the region, causing many people to consider other options.

37eCooking in Grid-Connected and Off-Grid Systems: Modelling Results and Discussion
This case study focuses on Nairobi, extrapolating the results to compare opportunities in Kampala and Dar es Salaam, where electricity prices are similar but charcoal is much cheaper (Table 3.2). Charcoal forms a much larger part of the fuel mix in urban East Africa; in Uganda, two-thirds of the urban population use it as their primary cooking fuel. The statistics are similar in Tanzania. In urban Kenya, kerosene and charcoal are equally popular (see Figure 3.6).
Results
In Nairobi, charcoal is already by far the most expensive fuel. Although there is a widespread perception that electricity is too expensive for cooking, it is actually cheaper than both charcoal and kerosene (Figure 3.8). Supporting part of the daily cooking demand with a battery is already far more cost-effective than using charcoal, regardless of the
TABLE 3.2 Fuel prices in Nairobi, Kampala, and Dar es Salaam in 2020 and 2025 used in modelling
FUEL PRICE
2020 2025
NAIROBI KAMPALA DAR ES SALAAM NAIROBI (MODELLED)
Charcoal ($/kg) 0.49 0.28 0.32 0.62
LPG ($/kg) 1.08 1.41 0.77 1.42
Kerosene ($/liter) 1.1 n/a 0.82 1.55
Note: All financial values are in 2019 dollars. Fuel prices were obtained from household surveys and interviews with local practitioners.

38 ESMAP | Cooking with Electricity: A Cost Perspective
FIGURE 3.8 Monthly cost of cooking with main fuels in Nairobi, 2020 and 2025
0
5
10
15
20
25
30
35
40
100% AC
5-yr
100%Bat DC20-yr
100%Bat DC
5-yr
50% AC50% Bat DC
20-yr
50% AC50% Bat DC
5-yr
100%Charcoal
50% Bat DC50% Char
20-yr
50% Bat DC50% Char
5-yr
50% AC50% Char
5-yr
100%LPG
50% Bat DC50% LPG
20-yr
50% Bat DC50% LPG
5-yr
50% AC50% LPG
5-yr
100%Kerosene
50% Bat DC50% Kero
20-yr
50% Bat DC50% Kero
5-yr
50% AC50% Kero
5-yr
AC andbattery DC
AC andbattery DC
LPG and Electricity
LPG and Electricity
Electricity-National Grid
Electricity-National Grid
Kerosene andElectricity
Kerosene andElectricity
Charcoal andElectricity
Charcoal andElectricity
a. 2020
b. 2025
Cos
t of C
ooki
ng ($
/mon
th)
5
10
15
20
25
30
35
40
100% AC
5-yr
100%Bat DC20-yr
100%Bat DC
5-yr
50% AC50% Bat DC
20-yr
50% AC50% Bat DC
5-yr
100%Charcoal
50% Bat DC50% Char
20-yr
50% Bat DC50% Char
5-yr
50% AC50% Char
5-yr
100%LPG
50% Bat DC50% LPG
20-yr
50% Bat DC50% LPG
5-yr
50% AC50% LPG
5-yr
100%Kerosene
50% Bat DC50% Kero
20-yr
50% Bat DC50% Kero
5-yr
50% AC50% Kero
5-yr
Cos
t of C
ooki
ng ($
/mon
th)
Fuel Stacking: AC eCooking / Battery-supported DC eCooking
Fuel Stacking: Kerosene / AC eCooking
Fuel Stacking: Battery-supported DC eCooking / LPG
Fuel Stacking: Kerosene / Battery-supported DC eCookingFuel Stacking: LPG / AC eCooking
Fuel Stacking: Battery-supported DC eCooking / CharcoalFuel Stacking: Direct AC eCooking / Charcoal
Direct AC eCookingBattery-supported DC eCooking
LPGKerosene
Charcoal
Note: Grid tariff of $0.17/kWh corresponds to price of the first 100kWh/month from KPLC in 2019. Where applicable, batteries are LiFePO4 sized for 50 percent (0.93kWh) or 100 percent (2.78kWh) of daily cooking load.

39eCooking in Grid-Connected and Off-Grid Systems: Modelling Results and Discussion
repayment horizon. In Nairobi, charcoal is so expensive that even sizing a battery bank large enough to meet 100 percent of daily cooking demand is already cost-effective under a utility model (20-year horizon); by 2025, it is projected to be cost-effective with lease-to-own business models (5-year horizon) as well.
Fuel stacking with electricity decreases the cost of cooking for both charcoal and kerosene users. Fuel stacking with battery-supported devices is already a cost-effective option for charcoal users. When trees were more abundant and the LPG market was nascent, cooking with LPG was relatively expensive. The huge disparity in the cost of cooking with LPG and charcoal illustrates just how much the tables have turned. Many households that cook primarily with LPG still buy charcoal to cook heavy foods, however, because of the persistent but now false perception that it is the cheapest way of cooking them.
In 2020, the cheapest way to cook in Nairobi is either stacking LPG with efficient eCooking appliances or using LPG alone.16 By 2025, the projected rise in LPG prices will mean that stacking LPG with electricity is likely to become the cheapest option. Although the LPG bar dips lower than the LPG/electricity bar in Figure 3.8, it does so only because of the broad range of uncertainty over LPG prices (+/–33 percent).
At $0.23/kWh, Kenya’s regular electricity tariff is the highest in the region (Table 3.3). However, at 100kWh/month, the lifeline tariff offers the most generous allowance and is likely to be sufficient for cooking on top of other applications. However, Kenya Power’s lifeline tariff does not reflect a very deep discount; in Tanzania and Uganda, standard tariffs bracket this rate, at $0.15 and $0.20/kWh, respectively. Both countries’ utilities offer more generous discounts, but the monthly allowance is more limited (in Uganda, Umeme’s
discount is just 15kWh/month). The assumptions about eCooking within a lifeline tariff band inevitably involve wider complexities about the economics and politics of cross-sub-sidies, as discussed above.
TABLE 3.3 Electricity tariffs in Kenya, Tanzania, and Uganda
COUNTRY UTILITYELECTRICITY TARIFF
($/KWH)LIFELINE TARIFF ($/
KWH)LIFELINE ALLOWANCE
(KWH/MONTH)
Kenya Kenya Power 0.23 0.17 100
Tanzania TANESCO 0.15 0.04 75
Uganda Umeme 0.20 0.06 15
Source: KPLC (2019a); TANESCO (2019); Umeme (2019).

40 ESMAP | Cooking with Electricity: A Cost Perspective
Electricity tariffs and popular foods are similar across the three countries. In contrast, the cost of charcoal varies widely. Figure 3.9 shows the sensitivity of cooking costs to the price of charcoal, for both AC and battery-sup-ported DC eCooking in 2020, using the demand values and electricity price for the Nairobi case modelled above. The vertical blue lines indicate current charcoal prices in the largest city of each country (Nairobi, Dar es Salaam, and Kampala). The other lines show the relationship between cooking cost and the price of charcoal for a variety of cooking approaches. At the charcoal price relevant to a locality, any cooking approach that is below
the black charcoal line offers lower cooking costs. For Nairobi, where charcoal prices are highest, even sizing a battery to support 100 percent of cooking demand is cost comparable with charcoal, although all other options are significantly cheaper. With lower charcoal prices in Dar es Salaam, stacking battery-supported DC eCooking devices with charcoal and 100 percent eCooking with a battery sized to support 50 percent of daily demand are on a par with charcoal; all AC options are still cheaper. With even lower charcoal prices in Kampala, 100 percent AC cook-ing and stacking charcoal with AC electricity are the only cost-effective options in 2020.
FIGURE 3.9 Sensitivity of modelling results to charcoal price in Nairobi, Dar es Salaam, and Kampala, 2020
50% Direct AC 50% Charcoal
50% Battery DC 50% Charcoal
Charcoal
Direct AC
50% AC 50% DC
100% Battery DC
0
5
10
15
20
25
30
35
40
45
0.1 0.2 0.3 0.4 0.5 0.6 0.7
Cos
t of C
ooki
ng ($
/mon
th)
Price of Charcoal ($/kg)
Nairobi:$0.49/kg
Kampala:$0.28/kg
Dar es Salaam:$0.32/kg
Note: Lines follow the midpoints of the range of costs for each scenario (the middle of the bars in Figure 3.8). All scenarios are modelled with a 20-year financing horizon. Where applicable, batteries are LiFePO4 sized for 50 percent (0.93kWh) or (2.78kWh) of daily cooking load.

41eCooking in Grid-Connected and Off-Grid Systems: Modelling Results and Discussion
CASE STUDY 2
Tackling Load Shedding in Lusaka, Zambia, by Time Shifting and Reducing Electricity Demand for Cooking
SUMMARY
Power generation source: National grid (ZESCO)
Tariff: $0.01/kWh
Baseline fuels:
• AC electricity (hotplates and ovens)
• charcoal ($0.21/kg)
Future scenario:
• more efficient appliances, battery-supported DC electricity, LPG ($2.07/kg)
Location: Lusaka, Zambia
The results of this case study show that in contexts with low electricity tariffs, both AC and battery-sup-ported eCooking can already offer considerable cost savings for charcoal users even if charcoal is relatively cheap (charcoal: $5–$10/month; AC: $2/month; AC/battery-DC hybrid: $3–$5/month; battery-DC: $6–$9/month). However, supporting inefficient eCooking appliances and practices with batteries is not cost-effective ($19–$28/month versus $6–$9/month), as the battery bank must be three times larger. In contexts with emerging LPG markets and low electric-ity tariffs, electricity is the cheapest option for moving away from biomass, even if load shedding is severe and the entire day’s cooking load has to be supported by a battery, as long as energy-efficient appliances and practices are employed (LPG: $8–$13/month; battery-DC: $6–$9/month).
Introduction
This case study illustrates an opportunity for countries with significant populations already cooking on electricity to optimize the loading on their grid. Efficient eCooking appliances and practices can significantly reduce energy demand and peak loading for households currently cooking on inefficient appliances, such as hot plates and ovens. Supporting eCooking appliances with a battery can time-shift energy demand for cooking and reduce peak loading; it can also enable customers to cook during blackouts or load shedding.
FIGURE 3.10 Charcoal market in Lusaka, Zambia, alongside electricity distribution infrastructure

42 ESMAP | Cooking with Electricity: A Cost Perspective
Zambia’s national grid is 97 percent dependent on hydro-power. When the rains came late in 2015 and hydropower capacity was vastly reduced, the national utility (ZESCO) was left with no choice but to implement load shedding. The situation improved in 2016 and 2017, when load shedding seemed like a thing of the past. However, water levels at key hydropower installations were low in 2019, leading to 4 hours of scheduled blackouts per day initially, rising to 8 hours/day (14 hours/day in residential areas) in 2019.
Twenty-seven percent of urban Zambians already cook with electricity as their primary fuel. Charcoal and electricity are the fuels of choice in urban Zambia; even when grid electric-ity is available, many people still chose charcoal (Figure 3.10). ZESCO’s recent load shedding caused a significant number of users to revert back to charcoal, rapidly accelerating
deforestation (Dlamini et al. 2016). Two-thirds of urban Zambians use charcoal as their primary fuel, but many fuel stack electricity and charcoal. Charcoal production increased dramatically to meet the growing demand during load shed-ding, stepping up the pressure on Zambia’s already strained natural resources (Dlamini et al. 2016).
The opportunity to dramatically reduce energy consumption with energy-efficient cooking appliances is a highly attrac-tive proposition (Figure 3.11). eCooking is the aspirational solution for most people in Zambia, but the legacy of old and inefficient equipment makes cooking with electricity unnec-essarily slow and expensive, despite extremely low tariffs. As a result, ZESCO, is looking for ways to manage electricity demand more sustainably. Finding a more efficient alterna-tive to hot plates is vitally important.
FIGURE 3.11 Comparison of mbaula, hot plate, and electric pressure cooker
Hotplate
• Aspirational
• Popular for quicker-cooking dishes
• Efficient for quick dishes, healthier and less environmentally destructive than charcoal.
• Still slow, expensive, and unpopular for “long boilers”
Mbaula
• Ubiquitous across urban Zambia
• Inefficient, requires expensive fuel, unhealthy, environmentally destructive
• Popular for “long boilers”
Electric pressure cooker
• Available but not yet popularized
• Far more energy efficient, quicker, and easy for “long boilers”
• Can also cook “medium boiler/friers” and “quick friers”

43eCooking in Grid-Connected and Off-Grid Systems: Modelling Results and Discussion
Household energy storage in the form of battery-sup-ported eCooking systems is also an attractive proposition for users, although it may exacerbate ZESCO’s problems. Battery-supported eCooking systems can enable cook-ing during load shedding. Solar suppliers in Lusaka now report selling more battery/inverter systems for back-up power supplies in grid-connected households than off-grid solar systems. Battery-supported eCooking systems also enable access to other low-power energy services, such as lighting, at no additional cost. However, depending on how much hydropower generation is run-of-the-river and how much has reservoir storage, ZESCO may well already have the ability to schedule generation at scale. If high levels of water storage are already built into the system, the power supply is likely to be limited by energy, not peak power. Therefore, introducing more loads, even battery-supported loads, may be detrimental, as some energy is lost during the charge/discharge cycle, which may further reduce the amount of energy available on the grid. In contrast, if the
system is power limited, adding battery storage can help reduce peak demand by time-shifting electricity demand for cooking. Detailed power system modelling is needed to explore the effects of adding battery-supported eCooking onto ZESCO’s overloaded grid.
Results
Comparing figures 3.8 and 3.12 reveals that the outlook in Lusaka is very different from the outlook in Nairobi. In Lusaka, cooking with energy-efficient appliances is already by far the cheapest option ($2/month) and LPG is the most expensive ($8–$13/month). Cooking with charcoal is cheap: Evidence from cooking diaries shows that households typically pay just $5–$10/month (Leary, Scott, Serenje, et al. 2019a). At only $0.21/kg, the price of charcoal in Lusaka is less than half the price in Nairobi. However, at $0.014/kWh, ZESCO’s generous lifeline tariff is 1/10th that of KPLC.

44 ESMAP | Cooking with Electricity: A Cost Perspective
FIGURE 3.12 Monthly cost of cooking using main fuels in Lusaka, Zambia, 2020 and 2025
0
5
10
15
20
25
30
35
40
100% AC5-yr
100%Bat DC20-yr
100%Bat DC
5-yr
50% AC50% Bat DC
20-yr
50% AC50% Bat DC
5-yr
50% AC50% Bat DC
5-yr
100% BatDC5-yr
100% BatDC
20-yr
50% AC50% Bat DC
20-yr
100% AC5-yr
100%Charcoal
50% Bat DC50% Char
20-yr
50% Bat DC50% Char
5-yr
50% AC50% Char
5-yr
100%LPG
50% Bat DC50% LPG
20-yr
50% Bat DC50% LPG
5-yr
50% AC50% LPG
5-yr
LPG
AC andBattery DC
Ine�cient Appliancesand Practices
Energy-e�cient Appliancesand Practices
Charcoal andElectricity
Charcoal andElectricity
LPG and Electricity
LPG and Electricity
AC andBattery DC
AC andBattery DC
AC andBattery DC
Charcoal
100% AC5-yr
100%Bat DC20-yr
100%Bat DC
5-yr
50% AC50% Bat DC
20-yr
50% AC50% Bat DC
5-yr
50% AC50% Bat DC
5-yr
100% BatDC5-yr
100% BatDC
20-yr
50% AC50% Bat DC
20-yr
100% AC5-yr
100%Charcoal
50% Bat DC50% Char
20-yr
50% Bat DC50% Char
5-yr
50% AC50% Char
5-yr
100%LPG
50% Bat DC50% LPG
20-yr
50% Bat DC50% LPG
5-yr
50% AC50% LPG
5-yr
LPGIne�cient Appliancesand Practices
Energy-e�cient Appliancesand Practices
Charcoal
Electricity-National Grida. 2020
b. 2025
Co
st o
f C
oo
kin
g (
$/m
on
th)
Co
st o
f C
oo
kin
g (
$/m
on
th)
Electricity-National Grid
0
5
10
15
20
25
30
35
40
Fuel Stacking: AC eCooking / Battery-supported DC eCooking
Fuel Stacking: Kerosene / AC eCooking
Fuel Stacking: Battery-supported DC eCooking / LPG
Fuel Stacking: Kerosene / Battery-supported DC eCookingFuel Stacking: LPG / AC eCooking
Fuel Stacking: Battery-supported DC eCooking / CharcoalFuel Stacking: Direct AC eCooking / Charcoal
Direct AC eCookingBattery-supported DC eCooking
LPGKerosene
Charcoal
Note: Figure uses energy demand data from neighboring Tanzania, where cooking practices are similar, because insufficient cooking diary data were available for LPG in Zambia. Where applicable, batteries are LiFePO4 sized for 50 percent (0.42kWh) or 100 percent (1.46kWh) of daily cooking load. Grid tariff used is $0.014/kWh, which corresponds to the 2019 price of the first 200kWh per month from ZESCO.

45eCooking in Grid-Connected and Off-Grid Systems: Modelling Results and Discussion
The evidence from the cooking diaries shows that Zambian households with inefficient appliances and practices use three times as much energy as households with energy-efficient appliances and practices (95kWh/month versus 26kWh/month). However, even inefficient cooking still falls well within the 200kWh/month lifeline allowance. Zambia has historically had one of the lowest electricity tariffs in the world. As a result, many Zambians have adopted highly inefficient eCooking appliances (such as integrated four-plate hot plate and ovens) and have had little incentive to adopt energy-efficient practices. The modelling results show that cooking with inefficient appliances ($3/month) is more expensive than cooking with efficient appliances ($2/month), although the majority of the cost in this scenario is in the appliance financing rather than the electricity. However, inefficient cooking puts a much bigger load on Zambia’s already overstretched national grid.
Although the cost savings for switching to AC efficient appliances may be small, the difference is magnified many times over when the cooker must be supported by a battery. Supporting energy-efficient appliances and practices with a battery sized to support 100 percent of cooking on a five-year business model costs $10–$12/month. Supporting inefficient appliances and practices is estimated to cost $32–$40/month.
ZESCO is actively encouraging users to switch to LPG , but LPG prices are currently high, as the market has yet to develop. LPG adoption could reduce the severity of load shedding by reducing demand for electricity and offer customers an alternative to charcoal when load shedding does happen. However, safety concerns among potential users and a long overland supply chain into this landlocked Southern African country present significant barriers (Leary et al. 2019). As a result, at $2.07/kg, LPG is twice as expen-sive in Lusaka as in Nairobi, putting the cost of cooking with gas at $8–$13/month.
The modelling suggests that battery-supported cooking with energy-efficient appliances and practices is already the cheapest way for users to mitigate load shedding in Lusaka. With four-hour blackouts, a battery sized to meet half the daily demand (0.42kWh) could allow ZESCO’s customers to cook whenever they wanted to. If ZESCO were able to develop an on-bill financing mechanism to break down the high upfront cost, their customers could cook for just $3–$5/month in 2020 (assuming a 20-year repayment horizon, including battery and other equipment replacement). Even under a private sector initiative that required a five-year horizon, the price would be just $5–$6/month, which is
still cheaper than charcoal. If load shedding became more severe and the battery had to be sized for a full day’s cook-ing (1.26kWh), the cost of battery-supported cooking would rise to $6–$9/month for the utility model (20-year), which is already cost comparable with charcoal in 2020. For the private sector (five-year) model, the costs in 2020 would rise slightly above charcoal, to $10–$12/month, but still sit far below LPG.
By 2025, the opportunities open up even farther, with even batteries sized to meet a full day’s cooking demand from efficient appliances and practices paid back over five years resulting in cooking costs on a par with charcoal. Unless the LPG market develops and prices fall significantly, LPG

46 ESMAP | Cooking with Electricity: A Cost Perspective
FIGURE 3.13 Sensitivity of modelling results to potential tariff increases by ZESCO, 2020 and 2025
b. 2025
14
12
10
8
6
4
2
0
>300 kWh/mth
>200 kWh/mth
>100, <300 kWh/mth
Grid electricity tari� ($/kWh)Lifeline
<200 kWh/mth)Lifeline<100 kWh/mth)
CurrentZESCO tari�s
ProposedZESCO tari�s
50% Direct AC 50% Battery DC
100% Direct AC
Cos
t of C
ooki
ng ($
/mon
th)
0 0.04 0.08 0.12 0.16 0.20
50% Direct AC 50% Charcoal
50% Battery DC 50% Charcoal100% Charcoal
14
a. 2020
12
10
8
6
4
2
00
Lifeline<200 kWh/mth
Lifeline<200 kWh/mth
>200 kWh/mth
>200 kWh/mth
Grid electricity tari� ($/kWh)
CurrentZESCO tari�s
PreviousZESCO tari�s
50% Direct AC 50% Battery DC
100% Direct AC
0.04
Cos
t of C
ooki
ng ($
/mon
th)
0.08 0.12 0.16 0.20
50% Direct AC 50% Charcoal
50% Battery DC 50% Charcoal
100% Charcoal
100% Battery DC
100% Battery DC
Note: Where applicable, batteries are LiFePO4 sized for 50 percent (0.42kWh) or 100 percent (1.3kWh) of daily cooking load. All scenarios are modelled with a 20-year financing horizon.

47eCooking in Grid-Connected and Off-Grid Systems: Modelling Results and Discussion
is likely to remain a luxury fuel for the elite, as costs are projected to rise to $9–$16 a month.
Electricity prices in Zambia have historically been very low, as ZESCO has been heavily subsidized by the Zambian government. However, tariffs have been gradually increasing toward cost-reflective levels. In 2017, tariffs were raised from K 0.61 ($0.05)/kWh to K 1.06 ($0.08)/kWh, but a lifeline tariff of K 0.18 ($0.014)/kWh still applied for consumption below 200kWh/month (19 percent tax included for all). ZESCO recently applied to the Energy Regulatory Board to raise and restructure tariffs.17 Public outcry led the president to step in and veto any further tariff increases until after the next election, in 2021.
The results of the sensitivity analysis show that even if tariffs are raised after the next election, eCooking will still be the cheapest option. Figure 3.13 explores the sensitivity of the cooking cost to the grid tariff. Any cooking approach that is below the charcoal cost line at the relevant tariff level offers cost savings compared with cooking with charcoal alone. The proposed tariffs had two monthly consumption thresholds, 100kWh and 300kWh. For a household whose consumption fits into the lowest tariff bracket, even a battery sized for a full day’s cooking is cheaper than charcoal in 2020. For the middle band (100–300kWh/month), this option becomes cost-effective by 2025; all other options
are cost-effective in 2020. For the upper band (more than 300kWh/month), a battery sized for 50 percent of daily cook-ing would have a monthly cost similar to charcoal ($8–$9/month), regardless of whether AC electricity or charcoal were used for the other 50 percent. Even at this highest proposed tariff, AC eCooking is still the cheapest option, at just $6/month.
It may seem unlikely that poorer households would ever reach consumption levels of 300kWh/month. But focus groups revealed that it is possible, because of shared meter-ing, which may pose a significant barrier for eCooking (Leary et al. 2019). Poorer households are more likely to share a connection with their landlord/lady, because connection fees and monthly standing charges are high. Two tenants sharing a meter with their landlord/lady could use only 100kWh/month before they slipped into the highest bracket; five tenants would have just 50kWh/month. What is more, many tenants with shared meters pay a fixed monthly fee for utilities to their landlord/lady. Although electricity is very cheap in Zambia, cooking heavy foods on a hot plate uses many units. For this reason, many landlords/ladies ban their tenants from cooking heavy foods with electricity. Targeting social marketing campaigns at landlords/ladies to make them aware of just how little electricity EPCs consume (and there-fore why they should allow their tenants to use them) could be a key enabler for eCooking.

ESMAP | Cooking with Electricity: A Cost Perspective48
3.3. eCooking on Mini Grids
Electricity is the most versatile energy vector, and trans-forming this “high-grade” energy into “lower- grade heat is often seen as wasteful. This perception is accentuated in many mini grid contexts, where the unit cost of electricity is relatively high compared with national grid tariffs and cook-ing fuel expenditure relatively low, because it can often be collected for free or purchased at a lower cost than in urban centers. As a result, many mini grids prohibit the use of high-power electrical appliances (for example, appliances that produce heat) in order to avoid overloading the system and conserve limited power and energy for other applications.
Cabling is a major cost for mini grid developers. To reduce costs, many developers install cables and distribution boards that are rated for lower power usage. However, the unit cost of electricity on mini grids is strongly influenced by
demand, and many developing regions are rapidly urbaniz-ing, creating an opportunity to stimulate demand by substi-tuting expenditures on biomass fuels with expenditures on electricity.
Without significant subsidy or other financial assistance, mini grid operators often struggle to bring in enough revenue to cover the cost of establishing the infrastructure. Tariffs are often very high, because demand is typically low, as newly connected rural households often use only low-power energy services, such as lighting. A study by the Institute for Transformative Technology (ITT 2016) notes the “chicken and egg problem”: Until most customers adopt higher-power appliances and increase total demand on the grid, the tariff must be prohibitively high to be break even, but customers will not want to adopt higher-power appliances as long as the tariff is high.
Cooking offers a valuable tool for stimulating demand and bringing mini grid consumption above the break-even point. Figure 3.14 illustrates the break-even tariff for a typical 30kW solar hybrid mini grid in India supplying a village of 1,000
FIGURE 3.14 Break-even tariffs for typical solar hybrid mini grid in India at different levels of energy consumption
3.50
3.00LED plus phone
charge, 2–5 kWh
Plus Fan 3–5 kWh
Plus Small TV5 kWh
Break-even consumption at current cost
Plus Cooking30–60 kWhPlus Refrigerator,
20–30 kWh
Plus Irrigation pump,40–50 kWh
Current cost($0.40/kWh)
2.50
2.00
1.50
Bre
ak-e
ven
Tari�
(kW
h)
1.00
0.50
Currentconsumption
1 10 20 30 40
Paid consumption (KWh/month/household)
50 60 70 80 90 100
Source: Adapted from ITT (2016).
49eCooking in Grid-Connected and Off-Grid Systems: Modelling Results and Discussion
people. ITT (2016) notes that to break even at current levels of consumption (LED lights and phone-charging only), the mini grid operator would have to charge significantly more than current typical tariffs of $0.40/kWh. However, if house-holds consumed 30kWh each month, the mini grid could break even. The cooking diary studies show that house-holds in Kenya, Myanmar, Tanzania, and Zambia consumed 30–60kWh/month to cook all their food (see Table 2.5).
Cooking offers a rare opportunity to capture an existing expenditure and divert it into the revenue of mini grid devel-opers. Lighting (by kerosene, candles, or dry-cell batteries) is usually an existing household expenditure; other appli-cations (TV, radio, refrigeration) usually are not. In order to create more demand and use the infrastructure more effectively (and therefore bring down the unit cost), there is often a strong drive to add productive applications (such as irrigation), which can both increase demand and simultane-ously create/enhance the ability to pay.
Cooking is also a productive application (for restaurants, street food vendors, and so forth), and in many contexts, it already requires expenditure. In many rural areas, cooking fuel is often collected; however in urban, peri-urban, and an increasing number of rural areas, people have to pay for it. The potential for time saving for fuel collectors and/or expenditure substitution for fuel purchasers presents a valuable opportunity for mini grid developers to boost their revenue and lower the unit cost for all consumers by increas-ing demand on the grid. In addition, as communities urban-ize, the demand for quick, easy, and clean cooking tends to increase, as people want more time for their paid employ-ment and households aspire to modernize. Urbanization also reduces access to forest resources, driving people who used to collect biomass fuel for cooking to start paying for it and people who already pay to pay more.
Mini grids can be broadly categorized into those that are power limited (for example, run-of-the-river micro-hydro) and those that are energy limited (for example, PV power-ing small DC loads with oversized cables). Most mini grids exhibit characteristics of both (for example, PV with AC loads is power limited by the power rating of the inverter, although micro-hydro systems with reservoir storage are also energy limited), but it is useful to differentiate the two, as each pres-ents different opportunities and challenges for eCooking.
The case studies in this section explore the cost of adding household batteries to support eCooking on a power-limited micro-hydro mini grid to mitigate peak loading constraints (Case Study 3) and AC eCooking on an energy-limited solar hybrid mini grid with spare energy and power available (Case Study 4). Of course, rather than simply expanding
the capabilities of existing mini grids, cooking loads can be considered at the design stage. Doing so can enable the cost of building higher-capacity centralized infrastructure to support AC cooking to be objectively compared with the costs of enabling DC eCooking with battery-supported devices, adding load management devices, or any of the other options discussed here.
ECOOKING ON POWER-LIMITED MINI GRIDS
Cooking on mini grids is not a new idea: Many consumers in South and Southeast Asia are already using power-lim-ited mini grids for cooking. The abundance of hydropower resources has enabled the establishment of mini grids with very low unit costs. Rice is the major staple across much of Asia. It presents a particularly attractive opportunity, as electric rice cookers are very easy to use and relatively low powered, and energy-efficient insulated appliances are already available. However, further development of eCook-ing on power-limited micro-hydro mini grids is often held back by peak loading constraints, as generating capacity is limited by the size of the turbine installed and/or the head/flow characteristics of the watercourse.
Peak loading is a major issue for eCooking on power- limited mini grids, but a variety of time-shifting techniques can decouple electricity demand from supply, smoothing out the load profile and bringing down the levelized cost of electricity (LCoE) (Figure 3.15).18 In systems with low load factors, the additional demand generated from cooking could increase this ratio and generate more income for the mini grid developer/operator, by using energy that may otherwise be wasted. For example, run-of-the-river hydropower systems usually do not have any storage; they simply divert the flow around the turbine when demand is low. This energy could be captured and stored with battery storage, either centrally or at the household level as part of a battery-supported eCooking system.
Smart metering, distributed load control, and collabora-tive agreements can also mitigate peak loading issues. Many mini grid developers are already implementing such approaches, which they can simply apply to eCooking. Smart metering can empower users to decide when they want to cook based on price and other signals sent by mini grid operators. Distributed load controllers can allow mini grid developers to restrict users to activating cooking appliances only when excess power and energy are available (Gammon, Boait, and Advani 2016) and ensure that cooking appliances do not switch on simultaneously (instead cycling on and off alternately). Case Study 3, on Myanmar, illustrates another

ESMAP | Cooking with Electricity: A Cost Perspective50
option: developing agreements among customers regarding the use of eCooking appliances, either by specifying variable times or getting them to agree to cook only when the volt-age is high enough, indicating spare capacity.
ECOOKING ON ENERGY-LIMITED MINI GRIDS
New opportunities are opening up for the integration of energy-efficient eCooking in a broader range of systems, in particular solar and solar/diesel hybrid mini grids. Costs in the mini grid sector have dropped significantly as a result of both dramatic declines in the prices of key components (PV panels and battery storage) and a number of nontechno-logical drivers, such as bundling, standardization, reduced regulatory uncertainty, and reduced costs of capital (ESMAP 2019). In addition, the availability of new energy-efficient eCooking appliances greatly reduce the amount of electricity required to deliver eCooking services. As a result, eCooking on mini grids should no longer be confined to micro-hydro systems with very low tariffs.
Battery storage and generation on solar mini grids can be added in a centralized or decentralized manner—by, for example, adding additional storage to the main battery bank in a solar mini grid or adding household battery
storage. Although the former requires the mini grid devel-oper to plan and implement the expansion, household batteries can allow users to add storage without having to wait for the mini grid developer to upgrade the system. In solar hybrid mini grids, there is also the option of adding additional dispatchable generation to increase capacity at peak times.
Lombardi et al. (2019) investigated the cost implications of upgrading the centralized infrastructure on an energy-limited solar mini grid to meet eCooking demand. They found mini-mal change in the LCoE. They modelled two representative cases from Tanzania, focusing on induction cookers. They found that the levelized cost of cooking a meal with induc-tion cookers ($0.17–$0.38) was similar to that of cooking with charcoal and less than the cost of cooking with kerosene or LPG. Assuming an average of 2.5 meals per day, the average monthly cost would be $13–$29, which is comparable to the values obtained for optimized solar hybrid mini grids in Case Study 4 of $17–$25/ month. Although the total capital costs of fully transitioning to eCooking in residential scenarios would be would almost three times the costs associated with the base load, the LCoE would increase only slightly, as a result of a parallel increase in the load demand. In the case of community centers with high-load appliances, the incre-mental capital costs would be only 17 percent higher.
FIGURE 3.15 Effect of increasing load factor on levelized cost of electricity of power-limited mini grids
100
80
60
40
20
01 2
Perc
enta
ge o
f pea
k lo
ad
3 4 5 6 7 8 9 10 11 12 13 14 15 16 17 18 19 20 21 22 23 24
LCOE = $0.35/kWh
LCOE = $0.42/kWh
LCOE = $0.55/kWh
22% load factor 40% load factor 80% load factor
Source: ESMAP (2019a).

51eCooking in Grid-Connected and Off-Grid Systems: Modelling Results and Discussion
CASE STUDY 3
Enabling 24-Hour eCooking on Micro-Hydro Mini Grids in Myanmar
SUMMARY
Power generation source: 80kW micro-hydro mini grid
Tariff: $0.16/kWh
Baseline fuels:
• AC electricity (rice cookers, insulated electric frying plans, induction stoves)
• firewood ($0.12/kg)
Future scenarios:
• battery-supported DC electricity, LPG ($1.08/kg)• rice cookers, insulated electric frying plans,
induction stoves
Location: Shan State, Myanmar
The results of this case study show that adding battery storage can enable customers of power-constrained mini grids to do all of their cooking with electricity. Cooking entirely with AC electricity is the cheapest option (AC: $7/month; firewood: $5–$10), but doing so would overload the mini grid. Supporting the entire cooking load with a battery would not be cost effec-tive ($15–$18/month). A battery is required only when the grid is overloaded, however, so a much smaller (and cheaper) battery could enable 100 percent eCooking (AC/battery-DC hybrid: $9–$10/month). The results suggest that by 2025, such approaches will be cost competitive with firewood (firewood: $6–$12/month; AC/battery-DC hybrid: $8–$9/month).
Introduction
This case study highlights the opportunity for mini grid developers who have already enabled eCooking, to allow their customers to carry out all of their cooking with electric-ity. Peak loading is often the major constraint on mini grids; time-shifting electricity demand for cooking into off-peak periods can increase the load factor of the mini grid. It also increases customer satisfaction, by enhancing the quality of one of the most important energy services, as customers are
able to cook when they want to rather than when the energy level in the mini grid allows them to.
Myanmar’s Shan State has an estimated hydropower poten-tial of 100GW, yet most of the region is not connected to the national grid. During the 60 years of military rule, the country was cut off from the rest of the world. As a result, local devel-opers and communities took matters into their own hands, setting up over 5,000 micro-hydro-powered mini grids to satisfy the region’s growing demand for electricity.
These systems can be classified into three categories:
● Household pico-hydro systems are used largely for lighting, because they generate only up to 2kW. They could be used for eCooking, however.
● Community-owned micro-hydro systems are systems in which the peak load demand often surpasses the system output, forcing them to load-shed during the dry season. The systems usually have a flat tariff structure. eCooking presents a strong value proposition for these systems, which could benefit by increasing their load factors during off-peak hours. Many communities with these system are now within reach of the national grid, but because the national grid is not reliable, many
FIGURE 3.16 Powerhouse at one of the many small community-owned micro-hydro systems in Shan State, Myanmar

52 ESMAP | Cooking with Electricity: A Cost Perspective
communities seek to upgrade their micro-hydro systems instead of using the national grid.
● Cooperative-owned mini-hydro systems have been built by local decentralized renewable energy developers since the early 1990s (Figure 3.16). They often feature multiple productive end-uses. One such system is the 80kW mini grid at Naung Pain Lay, Pyn Oo Lwin. It extends to 11 villages, reaching over 600 households with more than 65 kilometers of distribution and transmission lines, supplying 36,000kWh a month and enabling a range of household and enterprise energy services, including cooking. The system is developed and owned by a local cooperative that includes consumers from each village. The motivation for the cooperative to develop the mini grid has been to provide energy access and to establish a locally owned electricity-based enterprises that can uplift the local economy and meet some of its development needs.
A typical tariff for a cooperative-owned system in Shan State is K 250 ($0.16)/kWh. This tariff is used to model the compar-ative costs of eCooking in this case study. From an interna-tional perspective, this tariff seems affordable. However, the cooperative is competing with a highly subsidized national grid that sells electricity at just K 30 ($0.02)/kWh). However, the government grid sacrifices quality for cost (Figure 3.17). During the rainy season, blackouts often last several days. Many cooperatives have chosen to develop medium-quality infrastructure that balances affordability with reliability. As a result, many customers choose to stay connected to mini grids even when the government grid arrives, installing volt-age stabilizers if they want to connect delicate loads such as TVs or refrigerators (Figure 3.17).
Many mini grids do not allow users to plug in eCooking appli-ances, out of fear of overloading the system. Several coop-erative-owned mini-hydro systems have empowered their customers to partially enable eCooking without overloading the grid. Lighting for households is not profitable enough to pay back the cost of infrastructure on its own, so developers had to look for other energy services to increase revenue. Traditionally, almost all households in Myanmar cooked on firewood, with many households paying other people to collect it for them. In rural areas, firewood is usually purchased by the bullock cart load or in bundles weighed by viss (1.63 kgs). Household surveys carried out in parallel with the cooking diary studies revealed an average price of K 300 ($0.12)/viss. Many cooperative-owned mini-hydro system customers have now switched to electricity for cooking. Most of them already use energy-efficient appliances, such as rice cookers or electric frying pans. However, at peak times, grids often reach capacity, causing the voltage to dip. Volt meters have been installed in kitchens (Figure 3.18) and collabora-tive agreements negotiated with users to allow eCooking appliances to be plugged in only when users can see that the grid is not overloaded. Above 180V, eCooking appliances can be plugged in.
This case study models two future scenarios—battery-supported cooking and LPG—that could enable a transition to 100 percent clean cooking. Supporting the efficient eCooking appliances with a battery would enable users to cook whenever they wanted, potentially enabling them to cook all their food using electricity, smoothing out the load profile, and freeing up capacity at peak time. Although Myanmar is a gas-producing country, the domes-tic LPG market is only just emerging, as during the military government, only government officials were allowed to buy LPG. According to household surveys, where it is available, LPG in rural Myanmar is already affordable, at an average price of $1.08/kg.
FIGURE 3.17 Voltage stabiliser in Myanmar
FIGURE 3.18 Voltmeter installed in kitchen in Myanmar

53eCooking in Grid-Connected and Off-Grid Systems: Modelling Results and Discussion
Rice is the major staple in Myanmar, and rice cookers are already widely adopted. The insulated rice cooker and electric frying pan are two of the most popular eCooking appliances in Myanmar. They are inexpensive (less than $20) and widely available, and their insulation and low power draw make them highly compatible with the power and energy constraints inherent with cooking on mini grids. Rice cookers are also commonly used to prepare soup, one of the main components of a typical Myanmar meal. Insulated electric frying pans are also widely used for cooking the third component in Myanmar cuisine, curries, for which induction and infra-red stoves are also gaining popularity. Kettles and thermo-pots (insulated kettles) are often used to boil water. EPCs are starting to enter the market, but they have not yet become standard issue. Cooking diary participants used a blend of all of these appliances, so the modelling below represents cooking with a range of energy-efficient appli-ances (rather than hot plates and efficient appliances as in the other case studies).
Results
In 2020, AC eCooking was cheaper than cooking with firewood in Myanmar (Figure 3.19). As direct cooking on the mini grid involves no use of traditional fuels, there is no cost range (the bar is just a line) Supporting the entire
cooking load with a battery would not be cost-effective, but it is also not necessary, as a battery is required only when the grid is overloaded. Therefore, a much smaller (and cheaper) battery can enable 100 percent eCooking. This option is already cost comparable with firewood in 2020 with a 20-year financing horizon and by 2025 with a 5-year horizon. From a technical point of view, this option could be performed manually, with users switching to DC battery-supported appliances when the voltage drops below 180V. A simple safeguard device (already widely used in Myanmar) could also be reconfigured to switch from the AC supply to the DC battery–supported supply at the same 180V threshold. Hybrid AC/DC appliances are already on the market, meaning that the user would barely notice the transition from one to the other.
Although LPG is not yet available and is more expensive than firewood and electricity, the overlapping bars in Figure 3.19 show that it would be cost competitive in 2020. Fuel stacking between battery-supported electricity and LPG or firewood pushes up the price in 2020, but by 2025, increasing fuel costs mean the reverse is true for LPG. In fact, by 2025, even 100 percent battery-supported cooking would be cost competitive with LPG on a 20-year financing plan, should LPG price trends be toward the upper end of the modelled range.

54 ESMAP | Cooking with Electricity: A Cost Perspective
FIGURE 3.19 Monthly cost of cooking using main fuels in Shan State, Myanmar, 2020 and 2025
100% AC5-yr
100%Bat DC20-yr
100%Bat DC
5-yr
50% AC50% Bat DC
20-yr
50% AC50% Bat DC
5-yr
100%LPG
50% Bat DC50% LPG
20-yr
50% Bat DC50% LPG
5-yr
50% AC50% LPG
5-yr
100%Wood
50% Bat DC50% Wood
20-yr
50% Bat DC50% Wood
5-yr
50% AC50% Wood
5-yr
AC and battery DC
20
25
15
10
5
0
LPG and Electricity
Electricity: Micro-Hydro Mini Grid
Firewood andElectricity
a. 2020
Cos
t of C
ooki
ng ($
/mon
th)
20
25
15
10
5
0
AC and Battery DC
LPG and Electricity Firewood andElectricity
100% AC5-yr
100%Bat DC20-yr
100%Bat DC
5-yr
50% AC50% Bat DC
20-yr
50% AC50% Bat DC
5-yr
100%LPG
50% Bat DC50% LPG
20-yr
50% Bat DC50% LPG
5-yr
50% AC50% LPG
5-yr
100%Wood
50% Bat DC50% Wood
20-yr
50% Bat DC50% Wood
5-yr
50% AC50% Wood
5-yr
Electricity: Micro-Hydro Mini Grid
b. 2025
Cos
t of C
ooki
ng ($
/mon
th)
Fuel Stacking: AC eCooking / Battery-supported DC eCookingFuel Stacking: Battery-supported DC eCooking / LPGFuel Stacking: LPG / AC eCookingFuel Stacking: Firewood / AC eCookingFuel Stacking: Firewood / Battery-supported DC eCooking
Direct AC eCookingBattery-supported DC eCookingLPGFirewood
Note: Mini grid tariff is $0.16/kWh. Where applicable, batteries are LiFePO4 sized for 50 percent (0.52kWh) or 100 percent (1.56kWh) of daily cooking load.

55eCooking in Grid-Connected and Off-Grid Systems: Modelling Results and Discussion
At just $7 a month, cooking with micro-hydro-generated electricity is already one of the cheapest options in 2020, but many mini grids are not currently able to support cooking at peak times. Figure 3.19 shows that at the current mini grid tariff of $0.16/kWh, the most popular current cooking of stacking AC electricity with firewood is the cheapest viable option, at $6–$8/month. However, supporting the cooker with a battery during peak hours (50 percent battery DC, 50 percent AC) is only marginally more expensive, at $9–$11/month, and is comparable to using firewood alone for house-holds that are paying for it. Sizing the battery to cover 100 percent of the daily cooking load would be significantly more expensive, at $14–$22/month.
By 2025, battery-supported cooking is projected to become one of the cheapest viable options, at $8/month. Falling battery storage costs and rising fuel prices mean that all of the fuel-stacking options for battery-supported eCooking are cost comparable with the use of that fuel alone.
Figure 3.20 explores the sensitivity of cooking costs to the mini grid tariff. Supporting the eCooker with a battery at peak times becomes cheaper than stacking firewood/electricity below $0.11/kWh in 2020 and $0.13/kWh in 2025. In fact, by 2025, even supporting the whole day’s cooking with a
battery becomes cost-effective with tariffs below $0.13/kWh. For mini grids with spare capacity at peak times, AC eCook-ing is cheaper than stacking firewood/electricity (50 percent firewood 50 percent AC) with tariffs below $0.21/kWh in 2020 and $0.20/kWh in 2025. AC eCooking is cheaper than firewood below tariffs of $0.27/kWh in 2020 and $0.32/kWh in 2025.

56 ESMAP | Cooking with Electricity: A Cost Perspective
FIGURE 3.20 Sensitivity of modelling results to mini grid tariffs in Myanmar, 2020 and 2025
Firewood
00.10 0.15
Current tari�0.16 $/kWh
Current tari�0.16 $/kWh
0.20 0.25
Minigrid Tari� ($/kWh)
Minigrid Tari� ($/kWh)
0.30 0.35 0.40 0.45 0.50
0.10 0.15 0.20 0.25 0.30 0.35 0.40 0.45 0.50
5
25
20
15
10
0
5
25
20
15
10
a. 2020
b. 2025
100% Battery DC
50% Direct AC 50% FirewoodFirewood
50% Direct AC 50% Battery DC
100% Direct AC
100% Battery DC
50% Direct AC 50% Firewood
50% Direct AC 50% Battery DC100% Direct AC
Cos
t of C
ooki
ng ($
/mon
th)
Cos
t of C
ooki
ng ($
/mon
th)
Note: Figure shows when each eCooking scenario could become cost-effective. It therefore uses the upper bound of the traditional fuel price ranges and the lower-bound assumptions for eCooking costs, with the 20-year financing model. Where applicable, batteries are LiFePO4 sized for 50 percent (0.52kWh) or 100 percent (1.56kWh) of daily cooking load.
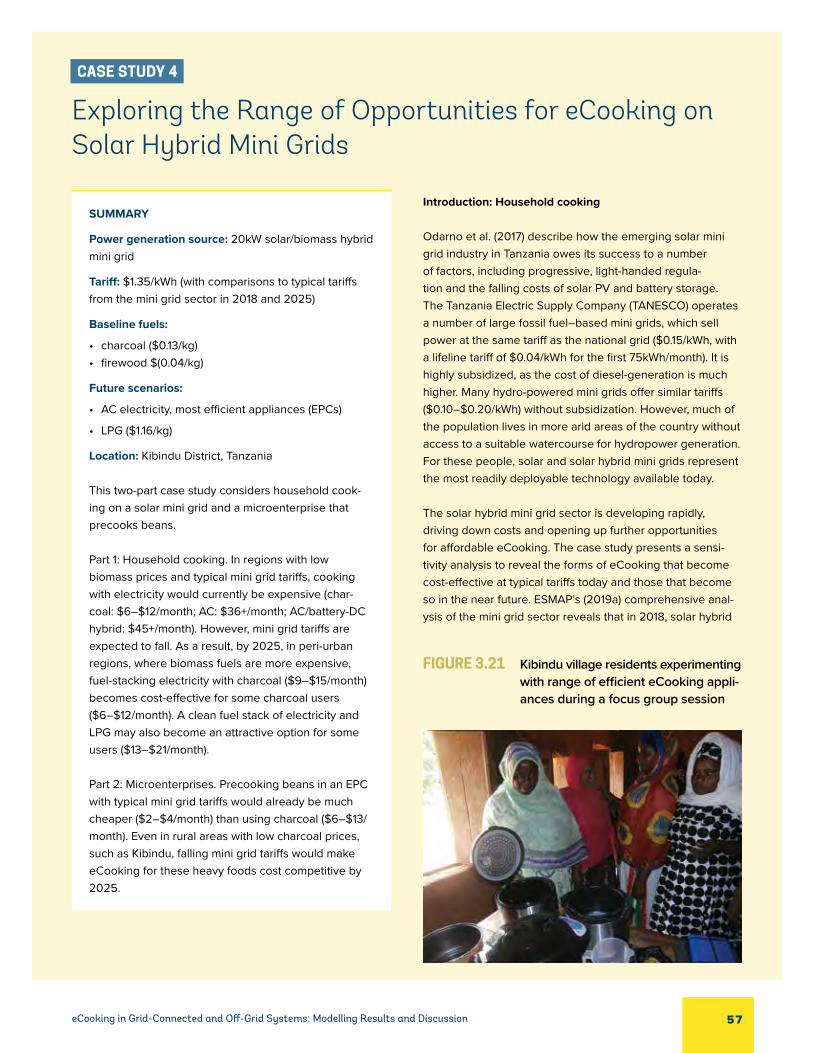
57eCooking in Grid-Connected and Off-Grid Systems: Modelling Results and Discussion
CASE STUDY 4
Exploring the Range of Opportunities for eCooking on Solar Hybrid Mini Grids
SUMMARY
Power generation source: 20kW solar/biomass hybrid mini grid
Tariff: $1.35/kWh (with comparisons to typical tariffs from the mini grid sector in 2018 and 2025)
Baseline fuels:
• charcoal ($0.13/kg)• firewood $(0.04/kg)
Future scenarios:
• AC electricity, most efficient appliances (EPCs)
• LPG ($1.16/kg)
Location: Kibindu District, Tanzania
This two-part case study considers household cook-ing on a solar mini grid and a microenterprise that precooks beans.
Part 1: Household cooking. In regions with low biomass prices and typical mini grid tariffs, cooking with electricity would currently be expensive (char-coal: $6–$12/month; AC: $36+/month; AC/battery-DC hybrid: $45+/month). However, mini grid tariffs are expected to fall. As a result, by 2025, in peri-urban regions, where biomass fuels are more expensive, fuel-stacking electricity with charcoal ($9–$15/month) becomes cost-effective for some charcoal users ($6–$12/month). A clean fuel stack of electricity and LPG may also become an attractive option for some users ($13–$21/month).
Part 2: Microenterprises. Precooking beans in an EPC with typical mini grid tariffs would already be much cheaper ($2–$4/month) than using charcoal ($6–$13/month). Even in rural areas with low charcoal prices, such as Kibindu, falling mini grid tariffs would make eCooking for these heavy foods cost competitive by 2025.
Introduction: Household cooking
Odarno et al. (2017) describe how the emerging solar mini grid industry in Tanzania owes its success to a number of factors, including progressive, light-handed regula-tion and the falling costs of solar PV and battery storage. The Tanzania Electric Supply Company (TANESCO) operates a number of large fossil fuel–based mini grids, which sell power at the same tariff as the national grid ($0.15/kWh, with a lifeline tariff of $0.04/kWh for the first 75kWh/month). It is highly subsidized, as the cost of diesel-generation is much higher. Many hydro-powered mini grids offer similar tariffs ($0.10–$0.20/kWh) without subsidization. However, much of the population lives in more arid areas of the country without access to a suitable watercourse for hydropower generation. For these people, solar and solar hybrid mini grids represent the most readily deployable technology available today.
The solar hybrid mini grid sector is developing rapidly, driving down costs and opening up further opportunities for affordable eCooking. The case study presents a sensi-tivity analysis to reveal the forms of eCooking that become cost-effective at typical tariffs today and those that become so in the near future. ESMAP’s (2019a) comprehensive anal-ysis of the mini grid sector reveals that in 2018, solar hybrid
FIGURE 3.21 Kibindu village residents experimenting with range of efficient eCooking appli-ances during a focus group session

58 ESMAP | Cooking with Electricity: A Cost Perspective
mini grid tariffs typically ranged from $0.55–$0.85/kWh. With a combination of increased load factor, streamlined planning, further declines in component costs, and other measures, tariffs are projected to fall to $0.25–$0.38/kWh by 2025. As tariffs decline, cooking with electricity is becoming an increasingly affordable option for households connected to solar hybrid mini grids in Tanzania.
The Tanzania Traditional Energy Development Organisation (TaTEDO) has been championing the use of efficient eCooking appliances in Dar es Salaam. It hopes to be able to enable its mini grid customers to cook with electricity shortly. The 20kW solar-biomass (maize cob) hybrid mini grid in Kibindu is a partnership between TaTEDO’s social enterprise, Sustainable Energy Services Company (SESCOM), and Husk Power, financed by Power Africa. As of 2020, 58 households were connected, with plans to increase to 100 in the next phase. The mini grid already has centralized battery storage and distributes in 230V AC. The connections are not load limited, so efficient eCooking appliances can be plugged in directly. The tariff is currently very high (T Sh 3,100 ($1.35)/kWh), as it is a small-scale pilot project with innovative gener-ation technologies. Tariffs will be regularly reviewed as the load factor increases as more customers connect and consumption per customer increases.
An initial focus group in Kibindu village revealed significant interest in eCooking (Figure 3.21). Household surveys carried out by the study team revealed the relative price points of cooking fuels. No one in the village had ever cooked with electricity, LPG is not available, and kerosene is not used for cooking. Firewood is bought in bundles, with a small bundle (estimated at about 6 kg) for cooking one meal going for T Sh 500 ($0.22) and a large one (estimated at 15 kg) for a whole day’s cooking selling for T Sh 1,000 ($0.43). Charcoal costs T Sh 1,500 ($0.65) for a 20-litre bucket (estimated to contain 5 kg of charcoal) during the dry season and TSh 2,000 ($0.87) during the rainy season. In a household survey undertaken for the project, average fuel prices were found to be T Sh 88 ($0.04)/kg) for firewood and T Sh 292 ($0.13)/kg for charcoal. LPG in Dar es Salaam sells for about T Sh 1,779 ($0.77)/kg). The cost is estimated to increase by 50 percent if charcoal is transported to Kibindu.
Results: Household cooking
Figure 3.22 illustrates the cost–viability gaps for the 50 percent and 100 percent household eCooking scenarios by comparing the monthly cost of cooking using ESMAP’s (2019a) typical and projected mini grid tariffs (for 2020 and 2025, respectively) and typical charcoal prices in rural
Kibindu village ($0.13/kg). The price of charcoal is so low that even when modelling with the considerably lower typical tariffs from ESMAP’s (2019a) study ($0.55–$0.83/kWh, as opposed to $1.35/kWh), the cost–viability gap in Kibindu is still considerable in 2020.
However, by 2025, charcoal prices are projected to have risen an average of 3 percent per year, as a result of the increasing scarcity of forest resources, and ESMAP (2019a) projects tariffs to have fallen by 55 percent by optimizing solar hybrid mini grid design and deployment. Figure 3.22 shows that at $9–$15/month, fuel stacking electricity with charcoal becomes cost-effective for some charcoal users, who will be paying $6–$12/month. What is more, at $13–$21/month, a clean fuel stack of electricity and LPG may become an attractive option for some.
Although it is unlikely that mini grid users will be paying the high charcoal prices typical of urban areas (more than $0.4/kg), the household surveys conducted by the study team suggest that users of mini grids installed in peri-urban areas of East Africa are likely to be paying $0.2–$-0.4/kg. Figure 3.23 shows that with ESMAP’s (2019a) typical tariffs from 2018 ($0.55–$0.83/kWh), even cooking 50 percent of the Tanzanian menu with electricity was unlikely to be cost-effective for most solar hybrid mini grid custom-ers. For peri-urban mini grid customers paying tariffs at the bottom end of this range ($0.55/kWh) and charcoal prices at the top end ($0.40/kg), fuel-stacking electric appliances with charcoal (at a cost of $22/month) is less expensive than cooking solely with charcoal ($23/month). However, for all other customers, charcoal is more cost-effective. As a result, there is still a cost–viability gap of up to $11/month. This gap represents the maximum difference between the cost of cooking with charcoal and the cost of fuel-stacking charcoal and electricity (that is, the cost when the mini grid tariff is highest [$0.83/kWh] and the cost of charcoal lowest [$0.2/kg]).
By 2025, tariffs for optimized solar hybrid mini grids are projected to be 55 percent lower than in 2018 (ESMAP 2019a), opening up a broader range of opportunities for cost-effective eCooking. By 2025, optimized mini grid tariffs are projected to fall to $0.25–$0.38/kWh (ESMAP 2019a), reducing the monthly cost of fuel stacking to $11–$19 (Figure 3.23). At these tariffs, it would be cost-effective for most peri-urban charcoal users to switch, as they would be paying $12–$23/month. The cost of cooking solely with electricity would drop to $18–$28/month, making it cost-effective for consumers on mini grids in peri-urban areas with tariffs at the lower end of the range to switch to fully eCooking solutions.

59eCooking in Grid-Connected and Off-Grid Systems: Modelling Results and Discussion
FIGURE 3.22 Monthly cost of cooking using main fuels in Kibindu, Tanzania, 2020 and 2025
0
5
10
15
20
25
30
35
40
45
50
100% AC5-yr
100%Bat DC20-yr
100%Bat DC
5-yr
50% AC50% Bat DC
20-yr
50% AC50% Bat DC
5-yr
100%Charcoal
50% Bat DC50% Char
20-yr
50% Bat DC50% Char
5-yr
50% AC50% Char
5-yr
100%LPG
50% Bat DC50% LPG
20-yr
50% Bat DC50% LPG
5-yr
50% AC50% LPG
5-yr
100%Firewood
50% Bat DC50%
Firewood20-yr
50% Bat DC50%
Firewood5-yr
50% AC50%
Firewood5-yr
AC andBattery DC
LPG and Electricity
Electricity—Solar Hybrid Mini Grid
Firewood andElectricity
Charcoal andElectricity
Cos
t of C
ooki
ng ($
/mon
th)
a. 2020
100% AC5-yr
100%Bat DC20-yr
100%Bat DC
5-yr
50% AC50% Bat DC
20-yr
50% AC50% Bat DC
5-yr
100%Charcoal
50% Bat DC50% Char
20-yr
50% Bat DC50% Char
5-yr
50% AC50% Char
5-yr
100%LPG
50% Bat DC50% LPG
20-yr
50% Bat DC50% LPG
5-yr
50% AC50% LPG
5-yr
100%Firewood
50% Bat DC50%
Firewood20-yr
50% Bat DC50%
Firewood5-yr
50% AC50%
Firewood5-yr
Electricity—Solar Hybrid Mini Grid
0
5
10
15
20
25
30
35
40
45
50
AC andBattery DC
LPG and Electricity
Firewood andElectricity
Charcoal andElectricity
Cos
t of C
ooki
ng ($
/mon
th)
b. 2025
Fuel Stacking: AC eCooking / Battery-supported DC eCooking
Fuel Stacking: Battery-supported DC eCooking / LPGFuel Stacking: LPG / AC eCooking
Fuel Stacking: Battery-supported DC eCooking / CharcoalFuel Stacking: Direct AC eCooking / Charcoal
Direct AC eCookingBattery-supported DC eCooking
LPGFirewood
Charcoal
Fuel Stacking: Firewood / Battery-supported DC eCookingFuel Stacking: Firewood / AC eCooking
Note: ESMAP’s (2019a) typical solar hybrid mini grid tariffs of $0.55–$0.85/kWh from 2018 are assumed applicable in 2020; its optimized solar hybrid mini grid tariffs of $0.25–$0.38/kWh are applied in 2025. Where applicable, batteries are LiFePO4 sized for 50 percent (0.97kWh) or 100 percent (2.98kWh) of daily cooking load.
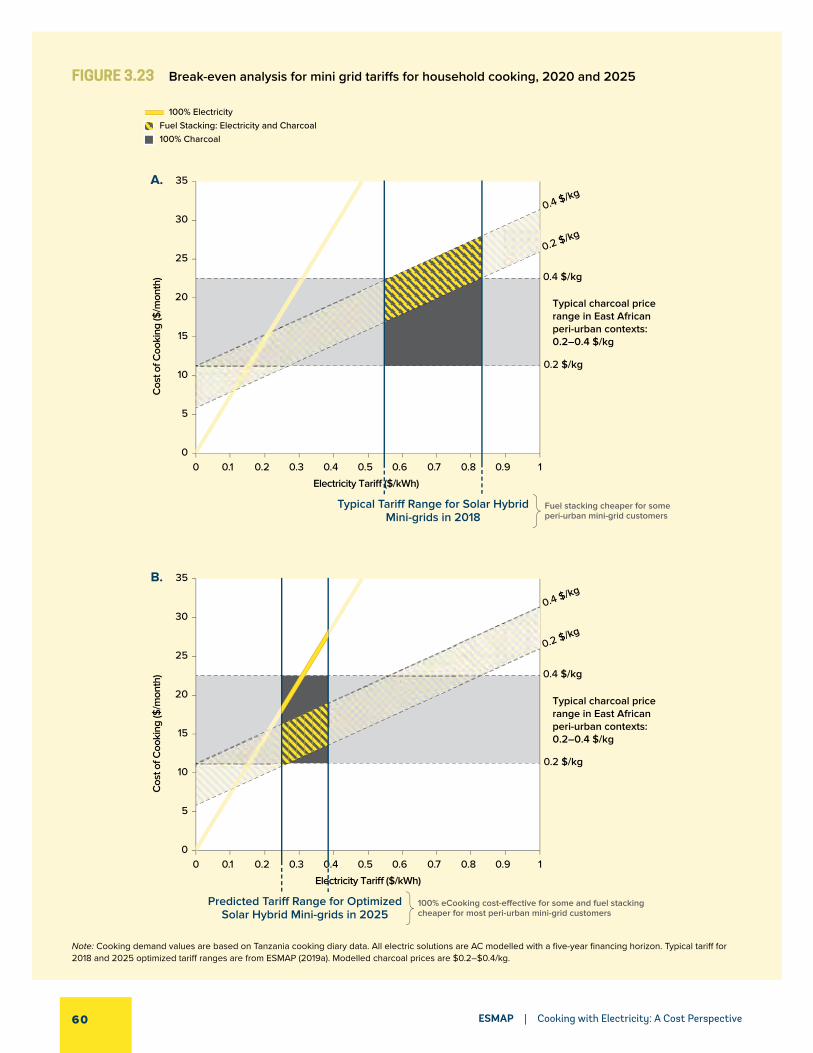
60 ESMAP | Cooking with Electricity: A Cost Perspective
FIGURE 3.23 Break-even analysis for mini grid tariffs for household cooking, 2020 and 2025
0
5
10
15
20
25
30
35
0 0.1 0.2 0.3 0.4 0.5 0.6 0.7 0.8 0.9 1
Cos
t of C
ooki
ng ($
/mon
th) 0.4 $/kg
0.2 $/kg
0.4 $/kg
0.2 $/kg
A.
B.
Electricity Tari� ($/kWh)
100% ElectricityFuel Stacking: Electricity and Charcoal100% Charcoal
0
5
10
15
20
25
30
35
0 0.1 0.2 0.3 0.4 0.5 0.6 0.7 0.8 0.9 1
Cos
t of C
ooki
ng ($
/mon
th) 0.4 $/kg
0.2 $/kg
0.4 $/kg
0.2 $/kg
Electricity Tari� ($/kWh)
Typical Tari� Range for Solar HybridMini-grids in 2018
Fuel stacking cheaper for someperi-urban mini-grid customers
Predicted Tari� Range for OptimizedSolar Hybrid Mini-grids in 2025
100% eCooking cost-e�ective for some and fuel stackingcheaper for most peri-urban mini-grid customers
Typical charcoal pricerange in East Africanperi-urban contexts:0.2–0.4 $/kg
Typical charcoal pricerange in East Africanperi-urban contexts:0.2–0.4 $/kg
Note: Cooking demand values are based on Tanzania cooking diary data. All electric solutions are AC modelled with a five-year financing horizon. Typical tariff for 2018 and 2025 optimized tariff ranges are from ESMAP (2019a). Modelled charcoal prices are $0.2–$0.4/kg.

61eCooking in Grid-Connected and Off-Grid Systems: Modelling Results and Discussion
Introduction: Cooking as a microenterprise
The second part of this case study highlights what is expected to be the first step for eCooking in the most economically challenging contexts. In a context such as Kibindu, with very expensive electricity and very cheap biomass, only the most efficient eCooking solutions will be cost-effective.
The EPC is the most efficient cooking appliance, leveraging efficiency gains that are possible only with electricity (insu-lation and automation) and combining them with pressuriza-tion. It is most efficient at boiling heavy foods. By combining it with energy-efficient practices, the EPC offers the most efficient eCooking solution that has the greatest impact on the foods that require the most energy—namely, heavy foods. Controlled cooking tests carried out for the eCook-Book (Leary et al. 2019) showed that boiling half a kilogram of yellow beans requires almost 1 kg of charcoal or 0.3. kg of LPG but just 0.15kWh of power using an EPC.19
Precooking (parboiling) beans is a growing microenterprise activity in East Africa. It involves boiling cereals (or other heavy foods) to the point at which they become soft, with the expectation that frying will be carried out later to make the final dish as tasty as possible. Many street vendors who sell vegetables and charcoal in small quantities to people living
close by also sell precooked foods, in particular foods that are time-consuming to prepare, such as beans. Customers can take the precooked beans home and quickly prepare a tasty meal by frying the ingredients for the sauce and stirring in the softened cereals. Many households use charcoal in the same way—boiling heavy foods in bulk and then frying portions on a different fuel at a later date (Leary, Fodio Todd et al. 2019).
Results: Cooking as a microenterprise
For typical solar hybrid mini grids, the most efficient forms of eCooking was already cheaper than charcoal in peri-urban areas in 2018 (Figure 3.24). A microenterprise precooking cereals once a day would spend $2–$4/month with an EPC or $6–$13/month with charcoal. However, charcoal prices in Kibindu are very low ($0.13/kg) and the tariff very high ($1.35/kWh), so in 2020 there is still a cost–viability gap of $1/month, even for this most efficient form of eCooking ($4/month for charcoal versus $5/month for an EPC). However, even if the tariff in Kibindu does not fall any further, by 2025, the projected 3 percent annual increase in charcoal prices is likely to make the two options cost comparable. In contrast, with optimized solar hybrid mini grids, the cost of precooking cereals once a day is projected to drop far below the cost of cooking with char-coal, to just $1–$2/month.

62 ESMAP | Cooking with Electricity: A Cost Perspective
FIGURE 3.24 Break-even analysis for mini grids tariffs for microenterprise cooking, 2020 and 2025
0
2
4
6
8
10
12
14
0.20 0.4 0.6 0.8 1.0 1.2 1.4
Electricity tari� ($/kWh)
Cost of eCooking at Kibindu in 2020
Cost of cooking with charcoal in Kibinduin 2020
o
0.4 $/kg
0.2 $/kg
Kibindu experimentalSolar Hybrid Mini-grid
Tari� in 2020
Cos
t of C
ooki
ng ($
/mon
th)
Cos
t of C
ooki
ng ($
/mon
th)
0
2
4
6
8
10
12
14
0 0.2 0.4 0.6 0.8 1.0 1.2 1.4
Electricity Tari� ($/kWh)
0.4 $/kg
0.2 $/kg
100% Electricity100% Charcoal
Typical charcoal pricerange in East Africanperi-urban contexts:0.2–0.4 $/kg
Typical charcoal pricerange in East Africanperi-urban contexts:0.2–0.4 $/kg
Optimized Solar HybridMini-grid tari�s in 2025
100% eCooking cheaper for all peri-urban mini-gridcustomers
Typical Solar HybridMini-grids Tari�s
in 2018
100% eCooking cheaperfor all peri-urban mini-gridcustomers
A.
B.
Note: Cooking demand values are based on controlled cooking tests for the eCookBook (Leary, Fodio Todd, et al. 2019). All electric solutions are AC modelled with a five-year financing horizon. Typical tariffs for 2018 and 2025 optimized tariff ranges are from ESMAP (2019a). Modelled charcoal prices are $0.2–$0.4/kg.

63eCooking in Grid-Connected and Off-Grid Systems: Modelling Results and Discussion
3.4. eCooking with Stand-alone Systems
Stand-alone systems are the only way of supplying elec-tricity in remote off-grid locations. In the last decade, solar home systems have become the default solution for off-grid programs. Although most systems are designed to support low-power energy services, such as lighting and mobile phone-charging, they can also support energy-efficient eCooking appliances paired with high-performance battery storage and a suitably sized solar panel, to create a fully electric household cooking system that has the poten-tial to meet all of a household’s everyday cooking needs. Until recently, such a device would have been unrealisti-cally expensive for most families in developing countries. However, over the last decade, the price of the two main cost components, PV and batteries, has fallen considerably, and highly efficient eCooking appliances, such as the EPC, are now available on the mass market.
Case Study 5 shows that in some markets, a solar home system sized for highly efficient eCooking can already be cost-effective. This finding is supported by a growing body of evidence from academics and practitioners (Leach and Oduro 2015; Jacobs et al. 2016; Couture and Jacobs 2019; Zubi et al. 2017). However, the size of the initial investment required for a PV-battery system for cooking (some hundreds of dollars) puts it outside the ability and willingness of most customers to purchase directly. Appropriate consumer financing models will therefore be essential, as discussed in detail in Chapter 4.
Solar eCooking solutions are likely to be most valuable in rural areas. However, rural households may produce or gather their fuel with their own labor and no cash expendi-ture (Buskirk 2019). In contrast, access to wood fuel in urban centers is usually highly constrained, meaning that charcoal use is generally more prevalent than firewood and that the prices of biomass fuels are usually higher than in peri-ur-ban and rural areas. As a result, for hundreds of millions of households that have access to self-produced or low-cost wood fuel, it is much harder for eCooking to compete, because the increased efficiency of using wood directly for cooking fuel makes it about five times less expensive than charcoal on a per energy unit basis, as the efficiency of char-coal production in Sub-Saharan African contexts is typically 10–25 percent (Falcão 2008).
However, two long-term trends will likely make eCooking competitive in the not too distant future even for many of the
people who currently have access to low- or no-cost wood fuel. First, with increasing incomes, increasing population, and decreasing resources, the cost of wood fuel is likely to continue to rise. Second, with continuing declines in input technology costs and further innovations in eCooking system efficiencies, eCooking holds the potential for substantial cost declines. Case Study 5 demonstrates that even before these two trends take effect, eCooking can already be the most cost-effective cooking solution in some markets, which hold the potential of becoming early adopters.
COMPARING THE COSTS OF DIFFERENT MODELS
Several studies have modelled the cost of cooking with solar-powered battery-supported eCooking systems. Recent studies highlight the potential of EPCs to dramatically reduce costs (Leach and Oduro 2015; Jacobs et al. 2016; Couture and Jacobs 2019; Zubi et al. 2017). Each model takes a slightly different approach and is built on its own set of assumptions and input parameters. Table 3.4 summa-rizes the key parameters from each study (for details, see appendix G).

ESMAP | Cooking with Electricity: A Cost Perspective64
In 2015, Leach and Oduro modelled the cost of cooking on a solar home system. They concluded that at the time it was not cost-effective compared with charcoal or LPG but that by 2020 it could be. Leach and Oduro’s original model focused solely on a 500W hot plate as, at the time, it was believed
that it offered the most viable pathway, as it would require minimal behavior change from charcoal. By 2020, they projected costs of $7–$70/household/month, depending on a wide variety of input parameters, including household size
TABLE 3.4 Key parameters of selected studies modelling the costs of solar eCooking systems
SOURCEMODELED
YEAR
FINANCING HORIZON (YEARS)
AC OR DC APPLIANCE
HOUSE-HOLD SIZE (NUMBER
OF PEOPLE)BATTERY STORAGE PV (W)
UPFRONT COST ($)
LOW HIGH
Case Study 5 2020 5 DC EPC and hot plate
4.2 2.2kWh LiFePO4
630 1,162 1,342
2020 5 DC EPC and LPG
4.2 0.74kWh LiFePO4
220 453 513
2025 5 DC EPC and hot plate
4.2 2.2kWh LiFePO4
630 869 976
2025 5 DC EPC and LPG
4.2 0.74kWh LiFePO4
220 351 387
Beyond Fire Electric Cooking (Couture and Jacobs 2019)
2019 3 DC Hotplate 5 1.5kWh lithium-ion
400 1,526 1,799
2019 3 DC Induction 5 1.2kWh lithium-ion
300 1,390 1,635
2019 3 DC Slow cooker
5 0.45kWh lithium-ion
100 491 572
2019 3 DC EPC 5 0.36kWh lithium-ion
80 600 681
Zubi et al. (2017)
2020 10 DC EPC 6 2.1kWh LiFePO4
420 2,266 2,266
2025 12 DC EPC 6 2.1kWh LiFePO4
420 1,926 1,926
2030 14 DC EPC 6 2.1kWh LiFePO4
420 1,644 1,644
2035 15 DC EPC 6 2.1kWh LiFePO4
420 1,426 1,426
Beyond Fire (Jacobs et al. 2016)
2016 20 AC Hotplate 5 Not stated Not stated
1,032 6,202
2016 20 AC Induction 5 Not stated Not stated
1,008 6,060
Leach and Oduro (2015)
2015 20 AC Hotplate 4 2.2–9.8kWh LiFePO4
367–1,331 1,032 6,202
2025 20 AC Hotplate 4 2.2-8.7kWh LiFePO4
367–13,31 718 3,550

65eCooking in Grid-Connected and Off-Grid Systems: Modelling Results and Discussion
and uncertainty about the performance, cost, and lifetime of key components.
In 2016, the first Beyond Fire study (Jacobs et al. 2016) projected that there was still a long way to go before cook-ing on a solar home system could be cost competitive. The sequel, published just three years later (Couture and Jacobs 2019), found that it was already cost competitive. Couture and Jacobs (2019) reported an 82 percent reduction in PV costs and a 76 percent reduction in battery storage costs since 2010. More importantly, they expanded their modelling of demand to include the most efficient appliances, dramat-ically reducing their estimates for the cost of cooking on solar eCooking systems. Their 2016 report estimated the cost of solar eCooking with a hot plate or induction stove at $56–$162/ household/month financed on a three-year PAYG contract. Their updated 2019 report estimated that this cost had dropped to $44–$59 and found that replacing the induction stove or hot plate with an EPC reduced the cost to just $20–$23.
Zubi et al. (2017) modelled a solar home system designed to power a DC EPC. They concluded that it was already cost
competitive with kerosene and LPG. They did not include the cost of financing, but the net present cost and system lifetime can be used to estimate monthly costs of cooking, which by 2020 were $19/household/month, falling to $14 by 2025 and $9 by 2035.
Figure 3.25 compares the projected monthly cost of the cooking service from each model. It shows that cooking with an EPC powered by a solar battery/electric system built between 2020 and 2035 is likely to cost the consumer $9–$30/month. However, it is unlikely that most households would be able to cook all their food on an EPC (or a slow cooker) without significantly changing their menu. As a result, this study builds on the work of Zubi et al. (2017) and Couture and Jacobs (2019) to incorporate the cost of using an additional appliance or fuel for foods that are incompat-ible with EPCs. This study predicts that solar home systems designed for 100 percent eCooking with a hot plate and an EPC would cost $20–$29/household/month in 2020. Smaller solar home systems powering just the EPC and paired with LPG to offer a clean fuel stack are projected to be the more cost-effective, at $13–$17/household/month, falling to $11–$15 by 2025.
FIGURE 3.25 Monthly cost of cooking with different fuel options projected by various models
0
10
20
30
40
50
60
70
80
EPC andhotplatein 2020
EPC andLPG in2020
EPC andhotplatein 2025
EPC andLPG in2025
Hotplatein 2019
Inductionin 2019
Slowcookerin 2019
EPC in2019
EPC in2020
EPC in2025
EPC in2030
EPC in2035
Hotplatein
2016
Inductionin
2016
Hotplatein
2015
Hotplatein
2020
Cost
of C
ooki
ng ($
/mon
th)
Fuel Stacking: Battery-supported DC eCooking / LPGBattery-supported DC eCookingBattery-supported AC eCooking
Case Study 5 Beyond Fire: Electric Cooking(Couture and Jacobs 2019)
Zubi et al. (2017) Beyond Fire(Jacobs et al.
2016)
Leach and Oduro(2015)
Note: Table 3.4 shows additional parameters.

ESMAP | Cooking with Electricity: A Cost Perspective66
ALTERNATIVE SOLUTIONS
The stand-alone systems section of this report focuses on substituting existing expenditures on biomass fuels with payments for a modern energy cooking service supplied by a solar-powered battery-supported system. Other solutions—including directly driven DC appliances, alternative energy storage technologies, alternative power generation sources, and income generation with productive appliances—can also enable eCooking in off-grid regions.
Income generation with productive appliances
As an alternative to designing customized systems to power an eCooking appliance, it is possible to simply plug an eCooking appliance into a larger solar home system designed for other purposes. Although smaller systems designed for lighting and other low-power applications would be overloaded by eCooking appliances, many larger systems designed for productive applications could support them. Such systems also open up new markets, as the productive applications enable a direct repurposing of time
spent on fuel collection and tending fires into income-gener-ating activities. This additional income can substitute for the lack of existing expenditure on cooking fuels in rural commu-nities where firewood is collected for free.
SunCulture are using this model by experimenting with eCooking as an additional service for their RainMaker2 with ClimateSmart Battery™ solar home system, which features a 310W PV panel and 444Wh lithium-ion battery origi-nally designed to power the RainMaker2 irrigation pump. Low-power appliances such as LED light bulbs and TVs are already packaged with the system, offering significant extra value to users. Initial pilots are underway to explore the viability of extending the system’s range of energy services to include eCooking by offering a DC EPC that plugs into the same port as the pump. Both appliances have similar peak power ratings (of about 300W), so they can be used interchangeably. Demand for irrigation is lower in the rainy season, when wood fuel becomes harder to access. Usage of the DC EPC is therefore likely to peak when usage of the pump is likely to dip.

67eCooking in Grid-Connected and Off-Grid Systems: Modelling Results and Discussion
Direct-drive DC appliances
Early prototypes of DC cooking appliances that can be connected directly to solar panels to enable cooking during sunny periods are under development (Batchelor et al. 2018; Gius et al. 2019; Watkins et al. 2017). Omitting the battery enables the development of very low-cost solutions, with capital costs below $100. To make maximum use of solar energy, these appliances are highly insulated, which also offers thermal energy storage. With a standard resistive heat-ing element, a load controller is required, however.
Gius et al. (2019) show how a chain of diodes connected directly to a PV panel can offer an even cheaper solution by acting as both a heating element and a voltage controller. In sunny locations where a significant proportion of cook-ing involves boiling, which typically takes place during the daytime, this option can provide much more efficient use of solar energy, as energy storage inherently involves energy loss (Buskirk 2019). However, as a result of the low power input (typically 100–300W), frying is challenging, and cook-ing in the evening, after the sun has set, or in the morning, before it has risen, will require fuel stacking, additional generation sources, or energy storage.
Alternative energy storage technologies
Energy storage options for solar electricity for the end-use of cooking include the following:
● thermal (highly insulated appliances, a hot fluid, phase-change materials)
● mechanical (using a micro-flywheel) ● chemical (power to gas, storing as hydrogen or with
further conversion to some gaseous or liquid fuel) ● electro-chemical (in the form of batteries).
Thermal energy storage could be cheapest, but losses can be considerable without very careful use by the cook. Automatic control of the cooking process is much easier to achieve with an electric appliance, but conversion of stored thermal energy back to electricity is unrealistic at small scale. Chemical energy storage is attractive, as the cooking experi-ence would be similar to cooking with LPG. Propositions for
small electrolyzers to produce hydrogen for cooking exist, but proof of concept is still required for these technologies at household scale. Further conversion to other energy carriers (which might be easier to handle than hydrogen) would be implausible at small scale. Despite its relatively high capital cost, the main advantages of electro- chemical storage is that batteries are modular and can be deployed at any scale, maintenance requirements are low or zero, and the stored energy can easily be used for other applications (as it can quickly and efficiently be converted back into electricity).
Alternative power generation sources
Other renewable generation sources, such as small-scale wind or pico-hydro, could also be employed in place of or as part of a hybrid system alongside solar. With the exception of diesel generators, additional generation sources are often very site specific. This report focuses on solar eCooking as the most universally deployable stand-alone renewable energy solution currently available.

68 ESMAP | Cooking with Electricity: A Cost Perspective
CASE STUDY 5
The Next Generation of Cooking-Enabled Solar Home Systems
SUMMARY
Power generation source: Solar PV
Solar resource: 3.85kWh/day/kWp in lowest insolation month
Baseline fuels:
• charcoal ($0.30/kg)• LPG ($1.33/kg)• kerosene ($1.18/liter)• firewood ($0.13/kg)
Most viable future scenarios:
• Clean fuel stack: LPG and PV-powered battery-supported DC EPCs
Location: Echariria, Nakuru County, Kenya
The case study results show that with suitable busi-ness models, high biomass fuel prices in some heav-ily deforested contexts can already make fuel stacking solar eCooking cost-effective for some biomass users (charcoal: $12–$22/month; charcoal/solar electric fuel stack: $12-18/month; firewood: $10–$19/month; firewood/solar electric fuel stack: $12–$17/month). The cheapest option is currently LPG ($6–$11/month). However, although fuel stacking LPG with a battery-supported solar-powered DC EPC increases the cost ($8–$13/month), it yields important co-ben-efits by enabling electricity access for other uses. By 2025, fuel stacking LPG with a DC EPC ($8–$13/month) starts to become cost comparable with cook-ing all food on LPG ($7–$13/month), meaning that the low-power energy services typically enabled by solar home systems (lighting and so forth) will be available at marginal extra cost. This benefit is likely to be a key purchasing trigger, as it offers value to everyone in the household, not just the cook. Hundreds of thou-sands of Kenyan households are already paying $10/month or more to PAYG solar providers for solar home systems.
Introduction
Kenya is East Africa’s commercial hub. It has a strong track record for innovation in the energy for development space. The M-Pesa mobile money system has reached scale in Kenya, enabling innovative energy service companies to roll out PAYG solar solutions in the mass market. In the first half of 2019, 974,000 pico-solar products and solar home systems were sold in Kenya, making it the biggest solar home system market in the world, overtaking India, which has 27 times more people, for the first time (GOGLA 2019).
This case study shows that eCooking is now a possibility for people who live beyond the reach of electricity grids. The solar revolution that has enabled access to low-power energy services for millions of people provides an ideal platform to build a solar eCooking industry to cater to Kenya’s vast off-grid population and pave the way for a similar transformation across Africa. LED made solar lighting systems affordable by reducing energy demand by an order of magnitude; the EPC may well hold an equally transforma-tive potential for solar eCooking.
Although the village center in Echariria, located in the Kenyan highlands, has been grid connected for several years, the connection fee is too high for many people living on the periphery, who remain off-grid. A community solar
FIGURE 3.26 Early prototype of a battery-supported DC electric pressure cooker designed by SCODE

69eCooking in Grid-Connected and Off-Grid Systems: Modelling Results and Discussion
project begun in 2016 enabled approximately 40 households to charge a small (480Wh) lead acid battery at a central hub equipped with a 3kW PV array. Productive energy services, such as egg incubation, are also available at the solar hub. However, the household systems can support only basic energy services, such as lighting and TV.
Just a few years ago, firewood dominated cooking in Echariria. As the pace of life has slowly increased, charcoal, kerosene, and LPG have crept into kitchens throughout the village. In fact, most households now fuel stack several of these options. Access to firewood has become more and more difficult, as the village expands and people have to walk farther and farther to collect firewood. Instead of doing so, many people pay others to collect it for them or buy char-coal, which has a higher energy density and can therefore be transported from further away. Kenya’s 2018 logging ban caused the price of wood fuels to spike.
Although biomass fuel prices have stabilized, many people have now experienced modern cooking with LPG and are reluctant to go back to biomass, at least not for all their cooking needs. Interviews with local residents revealed that a tin of charcoal currently sells for K Sh 50 (K Sh 30 [$0.30]/kg); a sack typically costs K Sh 1,000–K Sh 1,300 and weighs approximately 40–50 kg (K Sh 20–K Sh 32/kg). Firewood is typically bought in bundles for K Sh 50, K Sh 100, or K Sh 250. The largest is a 20-kg bundle carried overhead that costs an estimated K Sh 13/kg. Most people use kerosene for lighting, but some also use it for cooking. To prevent the adulteration of vehicle fuel with cheaper kerosene, the government recently increased prices; kerosene now sells for K Sh 115–K Sh 120/liter. LPG refills are available at K Sh 750–K Sh 800 for 6 kg and K Sh 1,750–K Sh 1,800 for 13 kg (K Sh 125–K Sh 138/kg).
FIGURE 3.27 Participatory cooking session with prototype of DC electric pressure cooker in Echariria, Kenya
FIGURE 3.28 Residents of Echariria, Kenya at a community meeting with a DC electric pressure cooker
FIGURE 3.29 Charcoal stove and battery that is regularly charged at Echariria’s solar hub
Note: Two previously unrelated energy services—electricity for entertainment and for cooking—could be united into a single product that can make cooking cleaner, faster, and easier. The battery could be charged directly from each household’s rooftop PV to power SCODE’s DC EPC.

70 ESMAP | Cooking with Electricity: A Cost Perspective
Supported by the MECS program’s challenge funds, SCODE (Sustainable COmmunity DEvelopment) is developing and testing an innovative solar eCooking system consisting of solar panels, battery storage, and a DC EPC (Figure 3.26). SCODE brings several decades of experience with a range of clean cooking and off-grid solutions in Nakuru County, including biogas, improved charcoal stoves, and solar home systems. Until now, however, clean cooking and off-grid electricity access were two very different activities. SCODE has developed an early prototype, and participatory cooking sessions have enabled community members to try out this new technology (figures 3.27, 3.28, and 3.29).
Results
The modelling results in Figure 3.30 show that high biomass fuel prices already make fuel stacking solar eCooking cost-effective for charcoal and firewood users in Echariria. In fact, if SCODE were able to develop an energy service business model with a 20-year financing horizon, a 100 percent solar eCooking solution would already be cost-effective. However, lease-to-own or business models
with much shorter repayment horizons (typically one to two years) are currently standard in the solar lighting industry. Fuel stacking the battery-supported solar-powered DC EPC being developed by SCODE is already cost competitive for charcoal users in Echariria in 2020 on a five-year repay-ment horizon.
The least expensive option is currently LPG. However, although stacking LPG with SCODE’s battery-supported solar-powered DC EPC increases costs, it yields important co-benefits. Diverting existing expenditure on charcoal or LPG into a solar eCooking system also embeds electric power generation into households, enabling them to charge directly from their own rooftop PV rather than having to carry a heavy battery to the solar hub and wait for it to charge. The energy left over in the battery after cooking is likely to be sufficient to run the low-power appliances that house-holds currently use (see Figure 3.29). Further analysis of time-of-day usage will be needed to determine which addi-tional energy services can be supported. Of course, these co-benefits would be even greater for villagers who do not currently have electricity access.

71eCooking in Grid-Connected and Off-Grid Systems: Modelling Results and Discussion
FIGURE 3.30 Monthly cost of cooking using main fuels in Echariria, Kenya, 2020 and 2025
0
5
10
15
20
25
30
Charcoal and PV
Charcoal100% PV BatDC
20-yr
100% PV BatDC5-yr
50% PV BatDC
50% Charcoal20-yr
50% PV BatDC
50% Charcoal5-yr
50% PV BatDC
50% LPG20-yr
50% PV BatDC
50% LPG25-yr
50% PV BatDC
50% Kero20-yr
50% PV BatDC
50% Kero5-yr
50% PV BatDC
50% Firewood20-yr
50% PV BatDC
50% Firewood5-yr
Firewood
Firewood andPV
Kerosene
Kerosene and PV
LPG
LPG and PV
Cos
t of C
ooki
ng ($
/mon
th)
a. 2020
Charcoal100% PV BatDC
20-yr
100% PV BatDC5-yr
50% PV BatDC
50% Charcoal20-yr
50% PV BatDC
50% Charcoal5-yr
50% PV BatDC
50% LPG20-yr
50% PV BatDC
50% LPG25-yr
50% PV BatDC
50% Kero20-yr
50% PV BatDC
50% Kero5-yr
50% PV BatDC
50% Firewood20-yr
50% PV BatDC
50% Firewood5-yr
FirewoodKeroseneLPG0
5
10
15
20
25
30
Charcoal and PV Firewood andPV
Kerosene and PV
LPG and PV
Cos
t of C
ooki
ng ($
/mon
th)
b. 2025
Electricity—Solar Home System
Electricity—Solar Home System
Fuel Stacking: Battery-supported DC eCooking / LPGFuel Stacking: LPG / AC eCooking
Fuel Stacking: Battery-supported DC eCooking / CharcoalBattery-supported DC eCooking
LPGFirewood
Charcoal
Fuel Stacking: Firewood / Battery-supported DC eCooking
Fuel Stacking: Kerosene / AC eCookingFuel Stacking: Kerosene / Battery-supported DC eCookingKerosene
Note: Where applicable, batteries are LiFePO4 sized for 50 percent of the menu on a DC PV-powered battery-supported EPC (0.74kWh capacity, 220Wpeak PV) and stacking with charcoal, LPG, or kerosene, or cooking 100 percent of the menu ( 2.2kWh battery and 630Wpeak PV.)

72 ESMAP | Cooking with Electricity: A Cost Perspective
By 2025, traditional fuel costs are projected to have increased by 15 percent and the price of solar eCooking system costs to have fallen by 23 percent. As a result, fuel stacking LPG with SCODE’s DC EPC using a five-year repay-ment horizon starts to become cost comparable with cook-ing all food with LPG, meaning that at marginal extra cost, LPG users can gain access to the low-power energy services typically enabled by solar home systems. What is more, the modelling results show that 100 percent solar eCooking system with a five-year repayment horizon would be at cost parity with charcoal and only marginally more costly than purchased firewood.
Figure 3.31 explores the opportunities in 2020 for cost-effective eCooking on sites with similar levels of solar irradiation (3.85kWh/day/kWp in lowest insolation month) but different charcoal prices. SCODE’s solar-pow-ered DC EPC is not yet cost-effective for charcoal users in Echariria. But in Nairobi, where charcoal prices are consid-erably higher, a solar home system sized for a full day’s cooking (via a hot plate and EPC, at a cost of $26–$29/month) would already be cost comparable with charcoal ($27/month). In Kibindu, Tanzania (Case Study 4), char-coal prices are much lower, so 100 percent eCooking is not at all competitive with charcoal ($6/month). However,
the co-benefits of access to electricity for other purposes may entice some users to fuel stack (at a cost of $13–$14/month). In 2020, fuel stacking SCODE’s solar-powered DC EPC starts to become cost comparable with charcoal when prices hit $0.35/kg; for 100 percent solar eCooking, it becomes cost comparable at $0.45/kg.
The battery is the main cost component in battery-supported solar eCooking systems, making the optimization of energy demand with energy-efficient appliances and practices critical. Figure 3.32 shows the breakdown of the compo-nent costs for each of the modelled scenarios. It reveals that solar panels make up a relatively small fraction of the overall system cost. In the 50 percent fuel-stacking case, the system comprises a lithium iron phosphate (LiFePO4) battery of 0.74kWh rated capacity (with up to 80 percent usable capacity assumed), charged by a 220Wpeak PV panel. This battery meets half of the daily cooking requirements with an EPC; the other half is met by kerosene, charcoal, or LPG. In this scenario, cost recovery occurs over five years, so the battery and balance of system components should not require replacement (battery life is 3,000 cycles in this lower-bound scenario, equivalent to eight years of daily use).20 In the 100 percent eCooking case, a 2.2kWh LiFEPO4 battery pack is charged by a 630Wpeak PV panel.
FIGURE 3.31 Sensitivity of solar battery–eCooking and fuel-stacking scenarios to charcoal price with a five-year repayment horizon, 2020
PV (low cost)
PV (high cost)
50% PV50% Charcoal(lower bound)
50% PV50% Charcoal(upper bound)
100% Charcoal
0
5
10
15
20
25
30
35
0.1 0.2 0.3 0.4 0.5
Cts
o of
Coo
king
($/m
onth
)
Charcoal Price ($/kg)
Echariria0.31 $/kg
Nairobi0.49 $/kg
Kibindu, Tanzania0.11 $/kg

73eCooking in Grid-Connected and Off-Grid Systems: Modelling Results and Discussion
FIGURE 3.32 Breakdown of solar eCooking and fuel costs for systems sized to meet needs of average Kenyan household in 2025
0
2
4
6
8
10
12
14
16
18
20
100% PV 50% PV50% Charcoal
50% PV50% LPG
50% PV50% Kero
100% Charcoal 1% LPG 100% Kerosene
Cos
t of C
ooki
ng ($
/mon
th)
Replacements Cooking appliances Balance of system Controls/charger Battery PV
Charcoal
LPG
Kerosene
Fuel Stacking withSolar Battery-Supported DC EPC
Note: Figure is based on lower-bound costs in 2025 with a five-year financing horizon.

ESMAP | Cooking with Electricity: A Cost Perspective74
3.5. Implications for eCooking in Off-Grid and Grid-Connected Contexts
CROSS-COMPARISON OF CASE STUDIES
Figure 3.33 compares the results from the five case studies. The main results include the following:
● Case Study 1 illustrates an urban context with high charcoal prices ($0.49/kg), low LPG prices ($1.08/kg), and average electricity prices (0.17/kWh). By 2025, both LPG ($7–$12/month) and a clean fuel stack of LPG and an AC EPC ($8–$10/month) are likely to the lowest-cost options; both will be substantially cheaper than charcoal ($27–$39/month). The EPC offers a particularly desirable solution for cooking heavy foods that can encourage households to move completely away from biomass.
● Case Study 2 illustrates an urban context with lower charcoal prices ($0.21/kg), high LPG prices ($2.07/kg), and low electricity prices ($0.01/kWh) but recurring load shedding that prevents households from cooking when they want to. The findings show that by 2025, a hybrid AC/DC eCooking system with a battery sized for half the day’s cooking using energy-efficient appliances and practices will be the cheapest option ($7–$8/month), substantially cheaper than charcoal ($6–$12/month) or fuel stacking charcoal or LPG with electricity ($4–$7/month and $11–$17/month, respectively). Even if load shedding is more severe and the battery needs to be sized for an entire day’s cooking load ($10–$12/month), eCooking would still be cheaper than charcoal.
● Case Study 3 shows a rural area, with moderate firewood prices ($0.12/kg) and electricity access from a micro-hydro mini grid with a low tariff ($0.16/kWh). By 2025, fuel stacking electricity with firewood is likely to remain the cheapest option ($6–$9/month), unless the generating capacity of the mini grid is upgraded to enable 24-hour AC cooking. However, for marginal additional cost, a battery sized to support half the day’s cooking load could enable 24-hour eCooking ($9–$10/month), the cost of which would be on a par with firewood ($6–$11/month).
● Case Study 4 depicts a rural area with low-cost biomass fuels available (firewood: $0.04/kg, charcoal: $0.13/kg) and access to electricity via a mini grid with a very high tariff ($1.35/kWh). By 2025, tariffs in the solar hybrid mini grid sector are expected to have fallen considerably (to $0.25–$0.38/kWh), enabling eCooking at marginal extra cost by fuel stacking an EPC (firewood: $4–$6/month;
firewood/EPC: $8–$12/month; charcoal: $6–$12/month; charcoal/EPC: $10-16/month). The most cost-effective clean cooking solution is a clean fuel stack of LPG and an EPC ($12–$21/month).
● Case Study 5 illustrates an off-grid rural area with moderate biomass fuel prices (charcoal: $0.30/kg; firewood: $0.13/kg) and moderate kerosene and LPG prices ($1.18/liter, $1.33/kg). By 2025, a solar home system designed to support both a hot plate and an EPC to cook all foods ($19–$21/month) is expected to be cost comparable with charcoal ($14–$24/month) and marginally more expensive than firewood ($10–$19/month). The cheapest option is expected to be LPG ($8–$12/month). However, a clean fuel stack of LPG with a solar home system powering a DC EPC ($11–$14/month) can offer valuable co-benefits by enabling access to electricity for other purposes at marginal extra cost.

75eCooking in Grid-Connected and Off-Grid Systems: Modelling Results and Discussion
FIGURE 3.33 Emerging opportunities for cost-effective eCooking identified in each of the five case studies
Cos
t of C
ooki
ng ($
/mon
th)
Current practice New opportunities for eCooking
0
4
8
12
0
5
10
15
20
25
0
10
20
30
0
10
20
30
40
0
5
10
15
20
Kenya GridCASE STUDY 1
Zambia GridCASE STUDY 2
Myanmar Micro-Hydro Mini-GridCASE STUDY 3
Tanzania Solar Hybrid Mini-GridCASE STUDY 4
Kenya O�-Grid—Solar Home SystemCASE STUDY 5
Charcoal
Kerosene
LPGFirewood
Battery-supported DC eCooking
AC eCooking
Fuel Stacking: Battery-supported DC eCooking / LPG
Fuel Stacking: AC eCooking / Battery-supported DC eCooking
Fuel Stacking: LPG / AC eCooking
Fuel Stacking: AC eCooking / Charcoal
Fuel Stacking: Firewood / AC eCooking
Note: Reference year is 2025; all solutions are modelled with a 5-year financing horizon, except grid-connected battery-supported systems, which are modelled with a 20-year horizon.

ESMAP | Cooking with Electricity: A Cost Perspective76
BEYOND THE CASE STUDY RESULTS
The following section interpolates and extrapolates the results obtained from the five case studies to compare the costs of eCooking with grid-connected (both AC and battery-supported) and stand-alone system architectures in a broader range of contexts.
Figures 3.34 and 3.35 show which system architectures are most cost-effective at each combination of charcoal price
and electricity tariff. An array of results was created for each system architecture and fuel-stacking combination. Charcoal was used as the baseline fuel of reference. Prices from $0 to $0.6/kg and electricity tariffs from $0 to $1.4/kWh were modelled, reflecting the range of values seen in the case studies (only tariffs up to $0.6/kWh are shown in the figures below). Figure 3.34 models households cooking using the energy demand data from the cooking diary study carried out in Tanzania (see Table 2.6). Figure 3.35 models the productive use case for Tanzania described in Case Study 4 part 2.
FIGURE 3.34 Optimal-system diagrams for household cooking, based on electricity/charcoal price combination and quality of the grid, 2025
0.1
0
0.2
0.3
0.4
0.5
0.6
Electricity Tari� ($/kWh)
0.10 0.2 0.3 0.4 0.5 0.6
Fuel Stacking: Grid-eCooking and Charcoal
Fuel Stacking: Solar-Battery-eCookingand Charcoal
50 percent AC/50 percent DC-Grid-Battery-eCooking
Charcoal
0.6
Cha
rcoa
l Pric
e ($
/kg)
Cha
rcoa
l Pric
e ($
/kg)
Cha
rcoa
l Pric
e ($
/kg)
0.5
0.4
0.3
0.2
0.1
0
Electricity Tari� ($/kWh)
0.10 0.2 0.3 0.4 0.5 0.60
0
0.6
0.5
0.4
0.3
0.2
0.1
Electricity Tari� ($/kWh)
0.1 0.2 0.3 0.4 0.5 0.6
Grid-eCookingSolar-Battery-eCooking
A. Reliable Grid
C. Very Unreliable/Weak Grid
B. Unreliable/Weak Grid
Note: All scenarios are based on data from the Tanzania cooking diaries. Areas show which system architecture is most cost-effective at each electricity/charcoal price combination. For reliable grids (panel a), blackouts/voltage instability are assumed to have a negligible effect on grid-connected eCooking, so no battery is required for grid-connected architectures. For unreliable/weak grids (panel b), blackouts/voltage instability are assumed to affect 50 percent of grid-connected eCooking, during which a hybrid appliance switches from AC power to DC battery-supported mode. Batteries for grid/battery cooking are therefore sized at 1.0kWh to meet half the daily load.
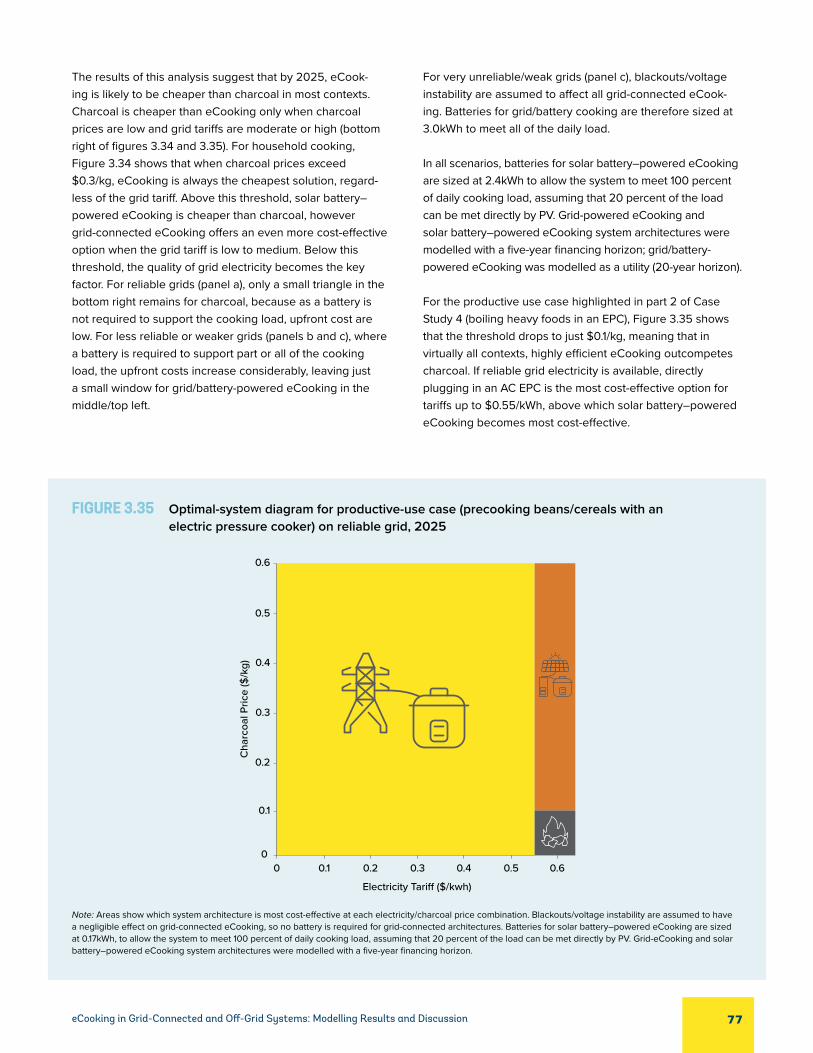
77eCooking in Grid-Connected and Off-Grid Systems: Modelling Results and Discussion
The results of this analysis suggest that by 2025, eCook-ing is likely to be cheaper than charcoal in most contexts. Charcoal is cheaper than eCooking only when charcoal prices are low and grid tariffs are moderate or high (bottom right of figures 3.34 and 3.35). For household cooking, Figure 3.34 shows that when charcoal prices exceed $0.3/kg, eCooking is always the cheapest solution, regard-less of the grid tariff. Above this threshold, solar battery–powered eCooking is cheaper than charcoal, however grid- connected eCooking offers an even more cost-effective option when the grid tariff is low to medium. Below this threshold, the quality of grid electricity becomes the key factor. For reliable grids (panel a), only a small triangle in the bottom right remains for charcoal, because as a battery is not required to support the cooking load, upfront cost are low. For less reliable or weaker grids (panels b and c), where a battery is required to support part or all of the cooking load, the upfront costs increase considerably, leaving just a small window for grid/battery-powered eCooking in the middle/top left.
For very unreliable/weak grids (panel c), blackouts/voltage instability are assumed to affect all grid-connected eCook-ing. Batteries for grid/battery cooking are therefore sized at 3.0kWh to meet all of the daily load.
In all scenarios, batteries for solar battery–powered eCooking are sized at 2.4kWh to allow the system to meet 100 percent of daily cooking load, assuming that 20 percent of the load can be met directly by PV. Grid-powered eCooking and solar battery–powered eCooking system architectures were modelled with a five-year financing horizon; grid/battery- powered eCooking was modelled as a utility (20-year horizon).
For the productive use case highlighted in part 2 of Case Study 4 (boiling heavy foods in an EPC), Figure 3.35 shows that the threshold drops to just $0.1/kg, meaning that in virtually all contexts, highly efficient eCooking outcompetes charcoal. If reliable grid electricity is available, directly plugging in an AC EPC is the most cost-effective option for tariffs up to $0.55/kWh, above which solar battery–powered eCooking becomes most cost-effective.
FIGURE 3.35 Optimal-system diagram for productive-use case (precooking beans/cereals with an electric pressure cooker) on reliable grid, 2025
Cha
rcoa
l Pric
e ($
/kg)
0.6
0.5
0.4
0.3
0.10 0.2 0.3
Electricity Tari� ($/kwh)
0.6
0.2
0.1
00.4 0.5
Note: Areas show which system architecture is most cost-effective at each electricity/charcoal price combination. Blackouts/voltage instability are assumed to have a negligible effect on grid-connected eCooking, so no battery is required for grid-connected architectures. Batteries for solar battery–powered eCooking are sized at 0.17kWh, to allow the system to meet 100 percent of daily cooking load, assuming that 20 percent of the load can be met directly by PV. Grid-eCooking and solar battery–powered eCooking system architectures were modelled with a five-year financing horizon.

ESMAP | Cooking with Electricity: A Cost Perspective78
Exploring opportunities for cost-effective eCooking in diverse economic contexts
In contexts where charcoal is cheap and electricity tariffs are high, only the most efficient eCooking solutions are cost- effective. As charcoal prices increase and tariffs decrease, more opportunities for cost-effective eCooking open up.
Table 3.5 aggregates the findings from the case studies and summarizes the types of grid-connected eCooking that are likely to be cost-effective at different combi-nations of tariffs and charcoal prices. With low tariffs (below $0.25/kWh), typical of national grid (AFREA and ESMAP 2016) or micro-/mini-hydro (Skat 2019) and high charcoal prices typical of urban deforestation hotspots ($0.40–0.60/kg), all eCooking solutions are cost- effective. In peri- urban areas, where charcoal prices are typi-cally at medium levels ($0.20–$0.40/kg), 100 percent
grid/battery-powered eCooking (where the entire day’s cooking demand has to be supported by the battery) is no longer cost-effective. In rural charcoal- producing areas, charcoal prices are typically low ($0.10–0.20/kg), so 100 percent grid-powered eCooking and 50 percent grid/battery-powered eCooking (EPC only) become more expensive than charcoal. With medium tariffs ($0.25–0.55/kWh), typical of optimized solar hybrid mini grids in 2025 (ESMAP 2019) and high charcoal prices, all eCooking solutions except 100 percent grid/battery- powered eCooking are cost-effective. With high tariffs (above $0.55/kWh), typical of solar hybrid mini grids today (ESMAP 2019), 100 percent grid-powered eCooking and 50 percent grid/battery-powered eCooking (EPC only) also become more expensive than charcoal. In contexts with high tariffs and low charcoal prices, only the most efficient forms of eCooking (boiling heavy foods on an EPC) can compete with charcoal on cost.
TABLE 3.5 Range of opportunities for cost-effective eCooking that open up at different tariff levels
AREA
TYPICAL CHARCOAL
COST RANGE ($/KG)
TYPICAL TARIFF RANGE ($/KWH)
NATIONAL GRID AND MINI-/MICRO-HYDRO
TODAY
OPTIMIZED SOLAR HYBRID MINI GRIDS IN
2025TYPICAL SOLAR HYBRID
MINI GRIDS TODAY
LOW(LESS THAN 0.25)
MEDIUM(0.25–0.55)
HIGH(MORE THAN 0.55)
Urban deforestation hotspot
High(0.40–0.60)
All eCooking All AC and fuel stacking battery-supported
eCooking
Fuel stacking AC eCooking
Peri-urban area Medium(0.20–0.40)
All AC and fuel stacking battery-supported
eCooking
Fuel stacking AC eCooking
Most efficient eCooking
Rural charcoal-producing region
Low(0.10–0.20)
Fuel stacking AC eCooking
Most efficient eCooking Most efficient eCooking
Note: Figures are based on modelling outcomes using projected component costs for 2025. “All eCooking” includes 100 percent grid/battery-powered eCooking, 100 percent grid-powered eCooking, 50 percent grid/battery-powered eCooking (EPC only), 50 percent grid-powered eCooking (EPC only) and boiling heavy foods in an EPC. “All AC and fuel stacking battery-supported eCooking” includes 100 percent grid-powered eCooking, 50 percent grid/battery-powered eCooking (EPC only), 50 percent grid-powered eCooking (EPC only) and boiling heavy foods in an EPC. “Fuel stacking AC eCooking” includes 50 percent grid-powered eCooking (EPC only) and boiling heavy foods in an EPC. “Most efficient eCooking” includes only boiling heavy foods in an EPC.

79eCooking in Grid-Connected and Off-Grid Systems: Modelling Results and Discussion
The global perspective
Figure 3.36 shows the outlook for eCooking at a global level by comparing the range of costs of the eCooking technologies explored in this paper with those of the most widely used cooking fuels. Leach and Oduro (2015) and both Beyond Fire papers (2016, 2019) directly compare the cost of cooking with a range of different electric cooking system architectures. However, all of these models were based on secondary data or laboratory data for energy demand.
In contrast, Figure 3.36 is based on empirical data for energy demand from the cooking diaries. It extends the
understanding of the range of opportunities for eCooking by including grid-connected and mini-/micro-hydropower system architectures, as well as fuel-stacking scenarios. Input data were drawn from across the four case study coun-tries (Kenya, Zambia, Tanzania, and Myanmar) and the three system architectures (grid, mini grid, solar home system). Appendix F describes the input data and assumptions.
The results show that AC eCooking on national grids or mini-/micro-hydropower is already cost-effective for many people today and that battery-supported DC eCooking and solar-hybrid mini grids become cost-effective in 2025, although clean fuel stacks with LPG can make all of these
FIGURE 3.36 Comparison of system architectures using aggregated data from all case studies
20202025
YearAC without household battery
Electrical System Architecture
Battery-supported DC (household battery)
0
5
10
15
20
25
30
35
40
Cos
t of C
ooki
ng S
ervi
ce ($
/mon
th)
100% Electric Clean Fuel Stack (Electricity and LPG) Cooking Fuels
Cooking fuel
LPGFirewood
CharcoalFuel stacking
AC eCooking / Battery-supported DC eCookingLPG / AC eCookingBattery-supported DC eCooking / LPG
Note: The cost of cooking service is calculated over a five-year financing period for all system architectures. The range on each bar represents sensitivities to energy demand, to the grid tariff or solar resource and to key system performance and cost parameters. The ranges for energy demand are derived from the range of median values from the four country cooking diary studies for 100 percent eCooking (0.87–2.06kWh/household/day). The ratios of energy demand for cooking fuels: electricity calculated from the cooking diaries were used to model demand for LPG (2: 1), charcoal (10: 1) and firewood (10: 1). Grid-connected system architectures use a tariff range encompassing 90 percent of Sub-Saharan African utilities from AFREA and ESMAP (2016): $0.04–$0.25/kWh. National grids and mini-/micro-hydropower are grouped together, as tariff ranges are almost identical ($0.05–$0.25/kWh for mini-/micro-hydropower) (Skat 2019). Solar hybrid mini grid system architectures use a current tariff range of $0.55–$0.85/kWh and a range of $0.25–$0.38/kWh in 2025. The solar resource range is the range of average monthly solar irradiation in the least sunny months in each of the four case study countries (3.68–4.30kWh/kWpeak). eCook system performance and cost ranges are as reported in Table 2.3. Batteries are LiFePO4, sized to meet 100 percent and 50 percent of daily cooking loads, at 1–3kWh and 0.34–0.98kWh, respectively. PV is 300–700W for 100 percent and 100–200W for 50 percent. For full details of modelling input and output parameters, see appendix F.

ESMAP | Cooking with Electricity: A Cost Perspective80
technologies cost-effective today. Cooking with AC grid elec-tricity can be the cheapest option for many people ($3–$17/month), but is not always possible due to access and grid stability challenges. Supporting 50 percent of cooking loads with a battery increases the cost of cooking ($5–$22/month in 2025) but is still competitive with LPG, charcoal, and fire-wood ($6–$24/month, $5–$41/month, and $0–$23/month, respectively in 2025). Supporting 100 percent of the cooking loads increases the cost substantially (to $8–$39/month) but may still be competitive in contexts with low tariffs and low energy demand. By 2025, the cost of cooking with AC appliances connected to solar hybrid mini grids ($8–$25/month) and with DC appliances powered by solar home systems ($11–$24/month) become competitive. LPG can play an important role as a transition fuel, as a clean fuel stack
of electricity and LPG can make battery-supported eCook-ing cost-competitive for some households today ($6–$29/month).
The critical role of energy-efficient appliances
Both energy-efficient appliances and fuel stacking can substantially reduce the costs of battery-supported electric cooking (Figure 3.37). An uninsulated four-plate cooker and oven may be cost-effective for households with reliable grid electricity and low tariffs ($7/month at $0.04/kWh). It is unlikely that anyone would consider supporting it with a battery, which would need 4.56kWh capacity ($28/month even at $0.04/kWh). In contrast, the appliance stack of uninsulated (hotplate, induction, infra-red cooker, or
FIGURE 3.37 Impact of energy-efficient appliances and fuel stacking on cost of AC and battery-supported DC eCooking
0
5
10
15
20
25
30
35
40
Cos
t of C
ooki
ng S
ervi
ce ($
/mon
th)
100% of householdcooking
50% of householdcooking
Boiling heavyfoods only
100% of householdcooking
50% of householdcooking
Boiling heavyfoods only
Uninsulated four-plate with integrated oven
Uninsulated single-plate (hotplate and induction or infra-red cooker)
Single insulated and pressurized appliance (EPC)
Appliance stack of uninsulated (hotplate, induction, and infra-red cooker or kettle) and insulated (EPC, rice cooker, and electric frying pan or thermo-pot)
100% grid eCook (AC w/o battery)
100% grid-battery-eCook(DC w/battery)
Note: The cost of the cooking service is calculated over a five-year financing period for all system architectures. Component costs are from 2025. The range on each bar encompasses 90 percent of Sub-Saharan African utility tariffs from AFREA and ESMAP (2016) ($0.04–$0.25/kWh). Daily household energy demand values are from Figure 2.2 (100 percent eCooking: uninsulated plate with oven, 3kWh; uninsulated single plate, 2kWh; appliance stack, 1.5kWh; 0.5kWh. 50 percent eCooking: EPC, 0.5kWh. Boiling heavy foods only: EPC, 0.15kWh). Fuel-stacking scenarios model only the eCooking service, not the cost of the cooking fuel.

81eCooking in Grid-Connected and Off-Grid Systems: Modelling Results and Discussion
kettle) and insulated (EPC, rice cooker, electric frying pan, or thermo-pot) can offer a much more affordable solution that is capable of covering 100 percent of a household’s everyday cooking needs. It would cost $4–$13/month for AC and $13–$29/month for battery-supported DC. Simply cooking with a single uninsulated appliance may be slightly cheaper for some AC users ($3–$15/month), as the upfront cost of the appliance is lower (modelled at $20 as opposed to $70) for the appliance stack). For the DC systems, the cost of the battery dominates, so spending more on an additional energy-efficient appliance actually
reduces overall costs (from $16–$37/month to $13–$29/month), as the battery capacity is reduced (from 2.85kWh to 2.14kWh). Although it cannot cook all food types, the EPC is likely to be an attractive first step into eCooking for many, as it can deliver the cheapest cooking service by some considerable margin. Systems could be designed to cook 50 percent of the menu (at a cost of $2–$5/month for AC or $5–$11/month for battery-supported DC) or simply what the EPC does most efficiently, which is boil heavy foods (at a cost of $2–$3/month for AC and $3–$4/month for battery-supported DC).


83 Delivery Approaches
Ch A P T ER 4
DELIVERY APPROACHES
This section explores the delivery models that may be well suited for promoting eCooking solutions depending on the system architecture and value chain players involved. eCooking appliances and systems should be integrated into existing delivery infrastructure as much as possible and use payment mechanisms that have already been established by energy service delivery players and the electric appliance industry.
Table 4.1 provides an overview of the delivery models discussed in the following section, highlighting examples of how each approach could be applied. Of course, the most effective solutions will often combine these delivery approaches. For example, a solar-hybrid mini grid developer wanting to stimulate demand for electricity may partner with local women’s groups, which can act as sales agents by carrying out live cooking demonstrations at group meetings.
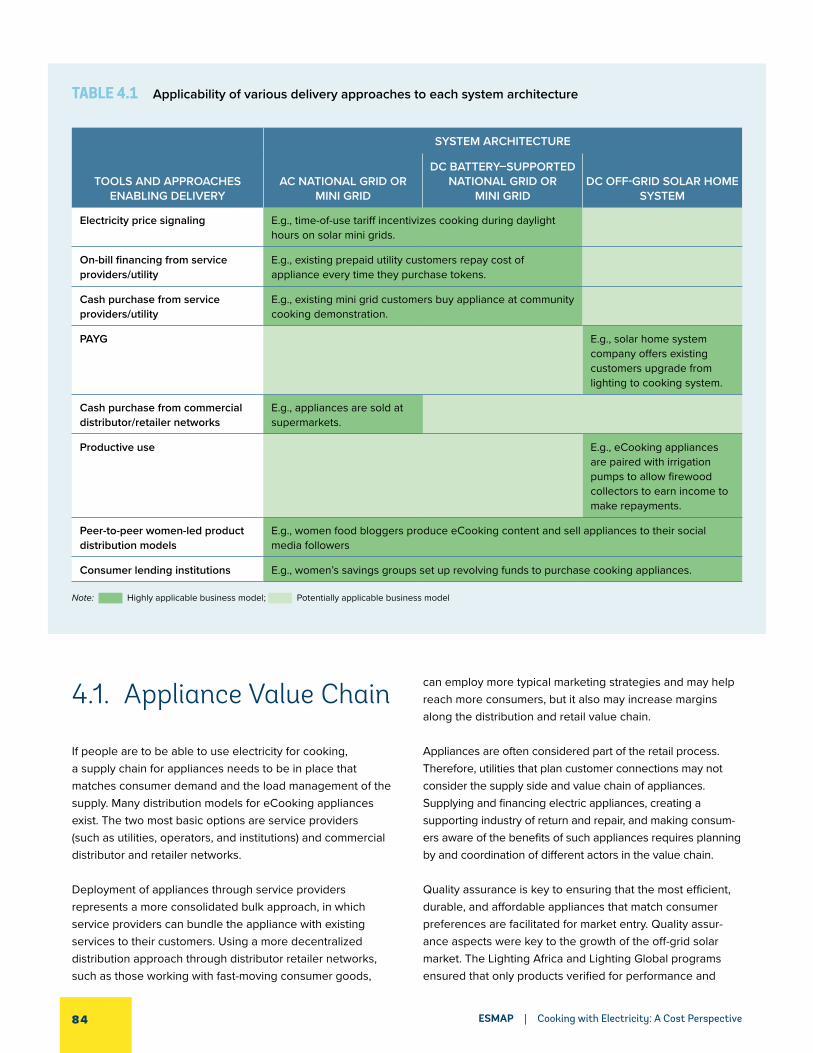
ESMAP | Cooking with Electricity: A Cost Perspective84
4.1. Appliance Value Chain
If people are to be able to use electricity for cooking, a supply chain for appliances needs to be in place that matches consumer demand and the load management of the supply. Many distribution models for eCooking appliances exist. The two most basic options are service providers (such as utilities, operators, and institutions) and commercial distributor and retailer networks.
Deployment of appliances through service providers represents a more consolidated bulk approach, in which service providers can bundle the appliance with existing services to their customers. Using a more decentralized distribution approach through distributor retailer networks, such as those working with fast-moving consumer goods,
can employ more typical marketing strategies and may help reach more consumers, but it also may increase margins along the distribution and retail value chain.
Appliances are often considered part of the retail process. Therefore, utilities that plan customer connections may not consider the supply side and value chain of appliances. Supplying and financing electric appliances, creating a supporting industry of return and repair, and making consum-ers aware of the benefits of such appliances requires planning by and coordination of different actors in the value chain.
Quality assurance is key to ensuring that the most efficient, durable, and affordable appliances that match consumer preferences are facilitated for market entry. Quality assur-ance aspects were key to the growth of the off-grid solar market. The Lighting Africa and Lighting Global programs ensured that only products verified for performance and
TABLE 4.1 Applicability of various delivery approaches to each system architecture
TOOLS AND APPROACHES ENABLING DELIVERY
SYSTEM ARCHITECTURE
AC NATIONAL GRID OR MINI GRID
DC BATTERY–SUPPORTED NATIONAL GRID OR
MINI GRIDDC OFF-GRID SOLAR HOME
SYSTEM
Electricity price signaling E.g., time-of-use tariff incentivizes cooking during daylight hours on solar mini grids.
On-bill financing from service providers/utility
E.g., existing prepaid utility customers repay cost of appliance every time they purchase tokens.
Cash purchase from service providers/utility
E.g., existing mini grid customers buy appliance at community cooking demonstration.
PAYG E.g., solar home system company offers existing customers upgrade from lighting to cooking system.
Cash purchase from commercial distributor/retailer networks
E.g., appliances are sold at supermarkets.
Productive use E.g., eCooking appliances are paired with irrigation pumps to allow firewood collectors to earn income to make repayments.
Peer-to-peer women-led product distribution models
E.g., women food bloggers produce eCooking content and sell appliances to their social media followers
Consumer lending institutions E.g., women’s savings groups set up revolving funds to purchase cooking appliances.
Note: Highly applicable business model; Potentially applicable business model

85Delivery Approaches
durability were supported. These products began to gain market share through brand recognition and increased investments, displacing poorly performing appliances that had created market spoilage in the sector.
Bulk orders can help achieve economies of scale, driving down the unit cost of appliances. But identifying the most appropriate appliance is often difficult. CLASP’s Global LEAP (Lighting and Energy Access Partnership) Awards program provides incentives to the manufacturers of energy- efficient appliances to focus on market products that have been identified as high-quality, easy to use, affordable, and energy efficient (Global LEAP 2020). The program was originally established to demonstrate the viability of off-grid appliance sales (solar lanterns, DC refrigerators, or TVs) to commer-cial lenders and appliance manufacturers that are not yet engaged in the market. The program has expanded into the grid-connected market. A Global LEAP competition for EPCs was launched in 2020, in collaboration with the MECS program. Such an exercise is useful for development programs wanting to facilitate the uptake of eCooking as well as for energy service providers wanting to offer the best-in-class appliances their customers can afford (in terms of both upfront costs and ongoing consumption).
The global EPC market exceeded $580 million in 2018 (IMARC 2019). Approximately 70 percent of the market for these cookers is households, with the balance restau-rants and institutions. The market leader is Instant Pot cookers, which are sold mainly in developed economies. In 2018, 45 percent of EPCS were sold in the United States; 25 percent in the European Union; 20 percent in Asia; and
the balance in Latin America, Africa, and the Middle East. The majority of EPCs are made in China on commission.
eCooking appliance value chains are already well estab-lished in a number of low- and middle-income countries. Analysis of data from Seair Exim Solutions (2020) reveals that in the last six months of 2019, the top five importers in Kenya brought a total of $12 million worth of eCooking appliances into the country. Over this period, 330,000 electric kettles (the most popular eCooking appliance) were imported, followed by ovens/cookers (74,000) and micro-wave ovens (63,000). EPCs are gaining in popularity, but import volumes are still orders of magnitude lower in Kenya. An in-depth market assessment is recommended in order to understand which cooking appliance brands are being sold in developing countries and the distribution networks and marketing approaches that are being used.
4.2. Peer-to-Peer Women-Led Product Distribution Models
The peer-to-peer delivery model works by recruiting sales representatives who can tap into their own social networks. The model relies on word of mouth and capital-izes on the fact that trust and familiarity between the sales
ESMAP | Cooking with Electricity: A Cost Perspective86
representatives and the consumers (family, friends and acquaintances) can be more persuasive than conventional retail methods.
An example of this model is Solar Sister, an organiza-tion that recruits, trains, and mentors sales reps who are expected to invest their own capital to buy the products and then resell them, first to family members and friends, then to friends of friends, and finally to the community at large (Chepkurui, Leary, Minja, et al. 2019). Although this model could work for efficient eCooking appliances without batteries, such as EPCs, it would need to be adapted to focus on finding new subscribers for services that involve making ongoing payments to spread the costs of more expensive battery-supported eCooking products, which the modelling results suggest will likely cost several hundred dollars.
The aspirational nature of modern eCooking appliances is likely to be a strong driver in attracting new users. Watching someone one knows cook one’s favorite dishes and interacting directly with her could help overcome some of the initial reservations about this new technology. Another advantage of the peer-to-peer business model is that sales agents can offer after-sales services, supplying parts, such as sealing rings for pressure cookers, and offering friendly advice on how to make the tastiest meals with this new equipment.
Leveraging existing social media communities (through both physical and digital channels) could greatly expand the scalability of the peer-to-peer business model as a market-ing strategy for eCooking. Some cooking-themed Facebook groups in East Africa have over 1 million users, and local food bloggers regularly receive hundreds of thousands of hits on their video recipes on YouTube (Chepkurui, Leary, Numi, et al. 2019).
4.3. Pay-as-You-Go Models
A number of enterprises providing energy for lighting solu-tions are leveraging digital consumer financing to enhance the affordability of their products and services. M-KOPA, a solar home system company based in Nairobi, has deployed PAYG to reach 3 million people with 750,000 units across Kenya, Tanzania, and Uganda. PAYG customers typically make payments via mobile money or an agent-based energy
credit model (for example, scratch cards sold to top up customer accounts). Monitoring of payments and system use occurs through machine-to-machine technologies and Internet-of-Things integration that send information via GSM (Global System for Mobile communications) networks to system management centers and facilitates real-time data communication and remote monitoring of energy demand, time-of-day usage for appliances, and so forth. PAYG providers are incentivized to offer quality after-sales service, because ongoing payments are tied to the system continu-ing to function.
There are two main approaches of PAYG financing. Under a lease-to-own system, consumers pay a fixed fee at set intervals until the total value of the system plus financing is paid off, at which point, they become the owner of the equip-ment. Under a fee-for-service arrangement (similar to a utility model), consumers pay for the service for the duration of the contract (typically long term), but ownership remains with the company.
The current repayment horizon for energy supply systems designed to power lighting, TV, and other low-power appliances is typically one to three years. Systems sized for cooking will need to be an order of magnitude larger, which would push up the size of each repayment signifi-cantly. Increasing the recovery period to three to five years would reduce the required daily/weekly/monthly customer outlay, but it would also increase the need for longer warranties from manufacturers. However, where a house-hold is currently paying for cooking fuels, payments toward new eCooking appliances would be offset by reductions in expenditure on cooking fuel.
Under the fee-for-service model, payments are typically made when the consumer needs and can afford power. This model is more compatible with the way many biomass or kerosene users pay for their fuel and with the longer repayment horizons that will be needed to make larger cooking systems affordable. Companies such as BBOXX use the fee-for-service model, in which consumers never own the system but instead pay for the ability to use it. Under the lease-to-own model, the customer eventually becomes responsible for maintaining the system. Doing so can be particularly challenging when expensive components with short life expectancies (such as batteries) inevitably fail. Under the fee-for-service model, the company (or utility) retains responsibility for maintaining the system over the contract period. With either approach, service can be interrupted when the user runs out of credit or the financing payment is not made. Under the ownership model, the system is lockable until the full amount of the loan is paid.

87Delivery Approaches
A growing number of specialized companies are now offer-ing value chain services for PAYG. This model reduces entry costs for new companies, which can focus on their business model and relationship with customers instead of building technology and systems that can now be handled by third parties that focus on building and maintaining such plat-forms. For many PAYG companies, the challenge is manag-ing an ongoing financing relationship with lower-income customers. Once established, new products and services can be offered to existing customers. Upon completion of a financed energy purchase, customers build a credit history and can hence become eligible for additional products using the stream of expenditures that helped them pay for other appliances. As in the case with utility value-added-services, some distributed energy service companies offer new products and services as a way of moving customers up a services or product ladder that caters to customers’ specific preferences. Cooking could be a highly desirable service that could both encourage existing customers to upgrade and attract new customers.
The PAYG model may yield higher gross margins than direct cash sales, but it also has higher operating costs and risks associated with default. PAYG businesses also require regu-lar fundraising for covering working capital costs to cover their receivables and can be complex in their organization, especially if they cover services such as financial services. Whether the PAYG model will be suitable for delivering eCooking solutions will depend on many factors, including the cost of appliances and systems to be financed (which can be high if dedicated batteries are included), customers’ ability to pay, the financing plan, and other features.
4.4. Productive Applications
As an alternative to designing customized systems to power an eCooking appliance, it is possible to simply plug an eCooking appliance into a larger solar home system designed for other purposes, such as solar irrigation (see Section 3.4). Although smaller systems designed for lighting and other low-power applications would be overloaded by an eCooking appliance, many larger systems designed for productive applications could support them with existing or additional storage capacity. Such systems could open up new markets, as the productive applications enable a direct repurposing of time spent on fuel collection and tending fires into income-generating activities. This additional income could substitute for the lack of existing expenditure on cooking fuels in rural communities where firewood is collected for free.
Cooking can also be a productive use of energy. Many restaurants in Sub-Saharan Africa already use task-specific eCooking appliances, such as rice cookers and kettles. An early opportunity for cost-effective eCooking that has the potential to increase revenue generation for street vendors and other microenterprises is precooking heavy foods, such as beans, in an EPC (see Case Study 4).

ESMAP | Cooking with Electricity: A Cost Perspective88
4.5. Utility Model: Cooking as a Service
Many utilities are starting to move toward an integrated service delivery model. Some energy service companies have started to shift their business model toward service packaging and delivery, going beyond selling electrons and deriving value from establishing strong relationships with customers based on understanding their needs and aspirations. Through such relationships, it will be possible to stimulate demand more organically and include a range of productive use and consumer appliances according to customer demand. New distributed and digital technologies will become important tools through which innovative utilities distinguish themselves by developing a proactive and value-driven approach to customer relationship management.
Such approaches constitute value-added services to enhance customer experience but also maximize revenue. For example, utilities may offer electric appliances as part of a special promotion, bundling them with existing services, offering on-bill financing, and amortizing the cost through utility bills (in a manner similar to that of PAYG companies that include the price of appliances in the service fee charged to the customer). Cooking as a service could consti-tute such a value-added service. Integrating eCooking thus calls for utilities to become more efficient and agile, which means using different business models and offers to their customers.
In urban centers where grid connections are strong enough to supply additional demand from eCooking, the willingness of distribution network operators to facilitate eCooking needs to be considered. Many distribution utilities struggle to maintain quality of service to existing customers; expanding the grid to new customers typically requires government subsidies. Utilities thus need to think of ways to increase revenue from existing connections as a way of planning for improvements in other areas of their business, including grid expansion.
Utilities with flexible metering and detailed data on load profiles could offer discounted tariffs during off-peak times, when there is surplus power in the system, to encourage usage at these times in order to smooth the load profile. Although collecting additional revenue thanks to increased demand, such as eCooking, could improve a utility’s finan-cial position, peak loading could lead to a return of load shedding and brown-outs on systems with limited genera-tion capacity. Energy storage and smart-charge controllers are likely to play a key role in this business model. Load management for cooking needs to be deeply embedded in all electrification planning.
4.6. Distribution through Consumer Lending Institutions
Where microfinance institutions and savings and credit cooperatives (SACCOs) are strong, they can sometimes double as both distribution/retail actors and financiers of energy-efficient appliances. The availability of consumer financing from microfinance institutions has been one of the biggest drivers of pico PV lanterns and, to an extent, solar home system sales globally.
Microfinance institutions can also establish agreements with well-known and high-quality brands and manufactur-ers with reliable warranties, in order to mitigate the risk of nonpayment by their members. Working with eCook-ing appliances brands (such as brands that have been screened and recommended by the Global LEAP Awards), microfinance institutions and SACCOs can help deliver and finance high-quality products to their members. In countries where microfinance institutions do not have a strong presence, users will be left without this option or subject to high premiums from a limited range of microfi-nance institutions.

89 Financing the Transition to eCooking
Ch A P T ER 5
FINANCING THE TRANSITION TO ECOOKING
5.1. Consolidating Investment Strategies
Technological advances are helping make electric solutions an affordable new path for increasing the pace of progress toward both the electricity access and clean cooking goals of SDG7. For some of the 2 billion people who have access to reliable electricity but nevertheless cook with biomass, AC eCooking and battery-supported cooking are already affordable and less expensive than the high and increasing costs of traditional fuels.
Large-scale financing mechanisms are largely unavailable for clean cooking as a stand-alone sector. By introducing a “single investment strategy,” incorporating clean cooking into the growth of the electrification sector and renew-able energy technology for grid and off-grid development, the various financial instruments currently in play in these sectors could encourage both growth of energy access through renewable energy and utilization of this energy for clean cooking. As renewable energy investments grow in the coming years, clean cooking has an opportunity to leverage instruments available in the renewable energy space, such as long-term loans, guarantees, and project bonds to bridge the shortfall in meeting the SDG7 clean cooking targets.
Simply mobilizing further financing is not sufficient, however. This financing needs to be directed to the key aspects of the value chain to fill the investment void, in particular the innovative delivery models discussed in the previous section and innovative financing
Financing will be needed across the spectrum of the value chain, as much as possible building on the mechanisms being used to mobilize finance for electrification and renew-able energy projects. End-users will require credit to be able
to afford the upfront investments in appliances or systems covering eCooking. Distributors and retailers will require additional access to working capital to be able to finance the systems and roll out supporting services related to eCooking over the potentially lengthy repayment periods, depending on the terms offered. The sector as a whole will require financing as part of a consolidated investment strategy that considers eCooking as one of the areas where incremental financing can make a big difference in closing the gaps in electricity generation, supply infrastructure, and demand stimulation.

ESMAP | Cooking with Electricity: A Cost Perspective90
5.2. Financing the Cost of eCooking for Households
The competitiveness of eCooking is highly dependent on financing options, which are needed to mitigate the upfront cost of devices to consumers. The case studies show that in some contexts, the discounted cost of a range eCooking solutions over 5 or 20-year financing scenarios is already lower than expenditures on biomass over the same period. However, cash flow that aligns with consumer spending remains a key constraint. An EPC that can cook a meal for 1/10th the cost of charcoal but involves an upfront cost that is orders of magnitude higher is not an attractive proposition. Delivery models must enable consumers to pay in a way that is compatible with how they currently pay for biomass.
Innovative business models could enable direct substitu-tion of daily/weekly/monthly charcoal expenditure and a
reframing of the eCooking concept as a repurposing of household expenditure to support the roll-out of electrical infrastructure (whether national grid, mini grid, or off-grid PV). This proposition could therefore attract private and govern-ment investment in a way that improved cookstoves have not. Biomass stoves can be purchased for as little as $2–$10 across Sub-Saharan Africa, but they tend to be lower-tier stoves, with limited efficiency improvements and durability profiles. Higher-tier stoves cost $30–$50 but reduce ongo-ing fuel expenditure. The high upfront cost of these stoves has limited uptake. Electric hot plates are relatively inexpen-sive (typically $10–$30), but the ongoing expenditures on electricity are relatively high because of their low efficiency. Efficient electric appliances are typically more expensive, with basic EPCs typically retailing for $50–$100.
As is the case for many renewable energy and energy- efficient technologies, the cost of efficient eCooking solutions is heavily weighted toward CapEx, with savings possible for poorer consumers only if the initial payment is not prohibitively high. Integrating a battery into the appli-ance will likely increase CapEx (although proportionally
FIGURE 5.1 Market financing of electric cooking appliances
Service Provider• On-bill financing mechanisms established by utility or mini-grid developer • Asset financing provided by specialist organization or financial institutions• PAYG via o�-grid service provider
Manufacturers
Uses ofFinancing
• Capital investmentfor R&D
• Working capital tosustain production
• Brand building andmarketing
• Trade finance to enableprocurement activity
• Working capital formarketing, after-salessupport, andmaintenance
• Loans for bulkpurchases ofo�-grid appliances
• Loans or equityinvestment to supportconsumer financing
• PAYG or otherConsumer financingmechanisms toenable productpurchases
Distributors Retailers Consumers
Source: Adapted from Global LEAP (2018).

91Financing the Transition to eCooking
much less for efficient appliances than for inefficient ones). Consequently, creative consumer financing will be essen-tial to enable poorer consumers to access this potentially transformative opportunity. For example, utilities or mini grid developers with excess generating capacity wanting to encourage more demand could offer the initial cost of an EPC on a PAYG lease basis through on-bill-financing. Subsidy may not be required; instead, the upfront costs could be spread over many months on the regular electric utility bill.
Lifeline tariffs may be another useful instrument for financing some of the ongoing cost of cooking with electricity (see Section 3.2). They subsidize the rate up to a certain number of kWhs, which is often enough to cover basic needs. Cooking with electricity may fall partially under the lifeline tariff and partially above it, making the ongoing cost of cooking more expensive. Targeted subsidies tied to extend-ing the lifeline tariffs to enable cooking for households in need could be designed. Restricting the price subsidy to the initial block of consumption offers a less costly alternative to across-the-board price subsidies while preserving their politically attractive universal protection feature.
The case study modelling explored the costs of cooking for both lifeline and regular tariffs. It shows that by using highly efficient appliances and/or cooking only part of the house-hold’s food with electricity, households can eCook within existing lifeline tariff thresholds. Extended lifeline tariffs would allow more cooking to fall under the first (subsidized) block of consumption. Doing so could be one targeted way of enabling the bottom of the pyramid segment of the population to cook with electricity. Where such schemes may not be viable, because of the inability of the utility to finance these lower tariffs directly (via cross-subsidies from other
customer segments, for example), demand-side subsidies tied to the incremental cost of eCooking that target the more vulnerable segments of society could be implemented, with help from the government or development partner programs.
5.3. Financing Developers’ Capital Expenses and Working Capital
Like many renewable energy technologies, eCooking solutions, in particular battery-supported models designed for weak grid and off-grid environments, tend to have high upfront costs. Uptake of eCooking will depend substantially on the willingness of the private sector—solar companies, mini grid operators, and utilities—to adopt the technology as part of the suite of services offered to their customers.
In the case of financing for mini grids, high upfront costs and long-term payback are particular challenges for developers. However, recent technology innovations on metering and control processes by firms such as Powerhive, SteamaCo, SparkMeter, and Inensus are enabling innovations through prepaid smart metering, mobile payments, load limits, and remote monitoring/control to improve mini grid operations and offer proactive customer care. The upfront investment for new consumer appliances could be made by the supply company and recovered through sales of electricity. For this to be possible, however, supply companies will often need upfront financing.
FIGURE 5.2 Range of appliance financing options for utilities and mini grid developers
Low Involvement
Creates open platformfor customers to sharerepayment data with
potential lenders
Partners with nationwideretailer to market appliances
to prequalifies customers. Retailero�ers financing and shares
interest revenue with the utility.
Finances the purchase ofcertain appliances for select
customers on utility’s balancesheet, raising funds from bond
markets or local banks.
High Involvement
Source: Waldron and Hacker (2020).

ESMAP | Cooking with Electricity: A Cost Perspective92
Debt finance may be an effective instrument in cases where larger companies with established track records (such as PAYG solar companies and private utilities) are looking to expand to eCooking. However, as experience from the solar sector shows, many companies do not qualify for these loans, for a host of reasons, including inadequate collateral and the perception of risk by lenders. The establishment of concessional credit facilities (for example, Lighting Global-supported programs) and guarantees to capitalize and de-risk commercial loans are providing some assurance to lending institutions, which as a result are able to lend to developers at market interest rates but at longer loan tenors than are typically available to them.
CapEx subsidies, often provided by government programs or development agencies, have played a major role in many energy infrastructure projects, including the development of mini grids. Electricity tariffs are often not affordable to
consumers without such subsidies. Financing could be scaled up proportionately to cover the incremental costs of cooking with electricity while maintaining the tariff at similar levels. Eligible appliances could also receive a subsidy at the manufacturer or distributor level, with the remainder paid by the customer in cash or installments. Preinvestment support is also crucial in carrying out assessments related to the integration of cooking loads and system optimization, understanding the market for eCooking options.
Many strategic investors have recently entered the off-grid and mini grid sectors, including ENGIE, EDF, Total, Shell, Mitsubishi, Caterpillar, Schneider, and General Electric. The strength of these multinational companies lies in their ability to work across energy systems, bringing techno-logical innovation, research and development resources, capital, and financial and operational discipline to their subsidiaries.

93Financing the Transition to eCooking
5.4. Results-Based Financing and Impact-Linked Financing
Results-based financing offers a particularly attractive means of achieving development goals. It can be tied to outputs or outcomes of an intervention, such as the number of inde-pendently verified appliances sold to customers or the number of new customers with cooking service plans. Such finance would allow for partial compensation of the service provider for results (outputs), which they could reinvest in expansion of company operations. Results-based financing schemes have been applied to improved cookstoves and solar home systems in various programs supported by development agencies, including EnDev, the World Bank, SNV, and others.
Other forms of results-based financing also present promis-ing transformational opportunities for promoting clean cook-ing solutions. As cooking with electricity produces virtually zero kitchen emissions, it can have a significant impact on offsetting traditional fuels, which emit harmful particulate matter at the household level, causing a range of respiratory complications and diseases. An early form of such support was carbon finance. Additional quantifiable co-benefits with monetizing potential have started to emerge.
A results-based financing mechanism could be tied to clear measurement and monetization of impact units for verified climate, health, and gender impact results. Work is under-way at the World Bank through ESMAP’s Clean Cooking Fund (ESMAP 2019c) to establish a dedicated source of financing to pilot this approach using established method-ologies. Critical features underpinning the monetization of these benefits include (a) the development of widely agreed methodologies for measuring and monetizing the impacts; (b) credible, independent, third-party verification of results; and (c) clear demand for financing of the verified results by donors and impact investors.
Impact-linked finance is another important emerging area, which lies at the intersection of blended finance, impact investing, and results-based financing. It refers to linking financial rewards for market-based organizations to the achievements of positive social outcomes. It goes a step beyond verification of connections or sales, proposing to mainstream outcomes (such as end-user welfare) as part of payment. Impact performance metrics can be linked to different financing instruments. It has the potential to attract further investment and de-risk lending. This approach can attract donors and impact investors because of the stronger link of the funding to the desired outcomes. The financing mobilized could help companies obtain working capital and open new markets by bridging the gap in contexts where eCooking is not quite cost-effective yet.


95 Discussion, Recommendations, and Areas for Further Research
Ch A P T ER 6
DISCUSSION, RECOMMENDATIONS, AND AREAS FOR FURTHER RESEARCH
Enabling eCooking as a mainstream solution in developing countries requires a change in the current narrative that portrays electrification and clean cooking as two separate problems. The mindset of actors in both spheres has to evolve so that eCooking is seen as a viable alternative to cooking with biomass and a valuable anchor load for electri-fication programs at all scales.
This section lays out the changes needed, the actors concerned, and the concrete actions that the development community can take to support these processes. Each recommendation is accompanied by a short discussion and a table identifying whom to target and how.
6.1. Support Policy Makers’ Efforts to Create an Enabling Environment that Bridges the Division between the Electrification and Clean Cooking Sectors
National governments need to develop a supportive regu-latory environment and incentives for the private sector that bring together the clean cooking and electrification sectors, including both grid and off-grid service providers.
CREATE INTERMINISTERIAL SPACES TO DEVELOP SINGLE INVESTMENT STRATEGIES THAT ALIGN WITH POLITICAL OBJECTIVES
The evidence in this report suggests that a single investment in modern energy inclusive of cooking can offer a more cost-effective route to meeting the twin goals of access to electricity and clean cooking than investing separately in each. Currently, most developing countries have strat-egies for electrification, and some have strategies for
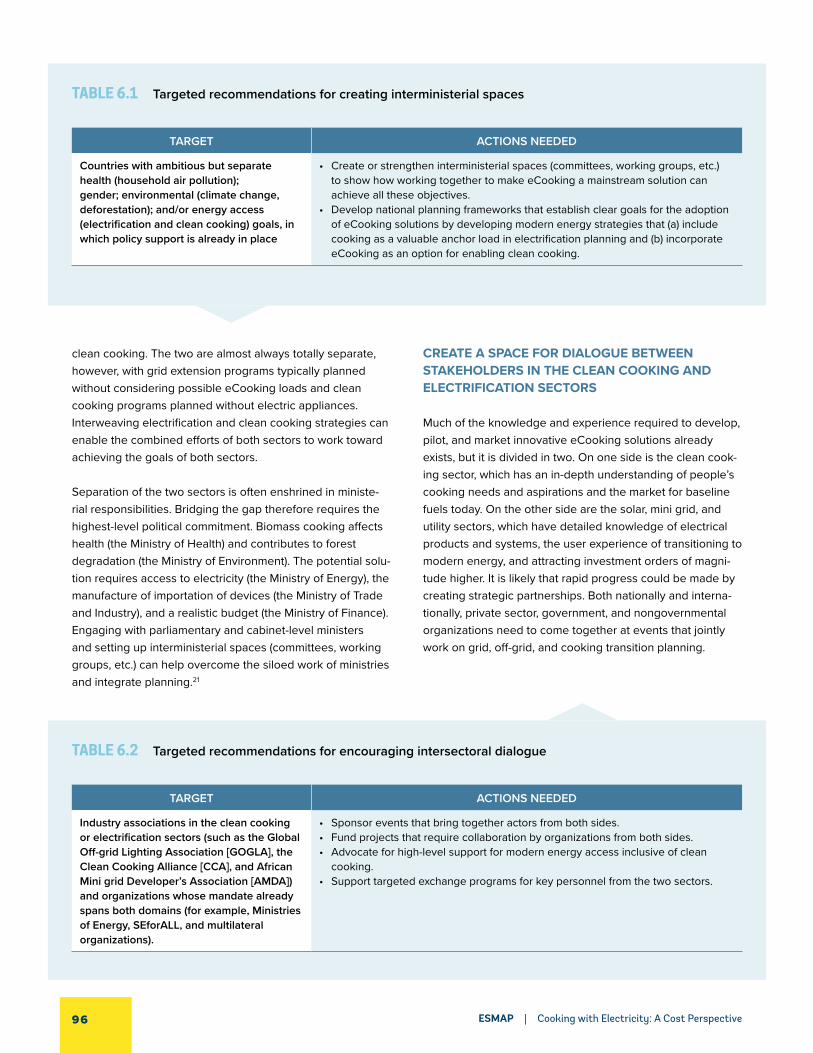
ESMAP | Cooking with Electricity: A Cost Perspective96
TABLE 6.1 Targeted recommendations for creating interministerial spaces
TARGET ACTIONS NEEDED
Countries with ambitious but separate health (household air pollution); gender; environmental (climate change, deforestation); and/or energy access (electrification and clean cooking) goals, in which policy support is already in place
• Create or strengthen interministerial spaces (committees, working groups, etc.) to show how working together to make eCooking a mainstream solution can achieve all these objectives.
• Develop national planning frameworks that establish clear goals for the adoption of eCooking solutions by developing modern energy strategies that (a) include cooking as a valuable anchor load in electrification planning and (b) incorporate eCooking as an option for enabling clean cooking.
TABLE 6.2 Targeted recommendations for encouraging intersectoral dialogue
TARGET ACTIONS NEEDED
Industry associations in the clean cooking or electrification sectors (such as the Global Off-grid Lighting Association [GOGLA], the Clean Cooking Alliance [CCA], and African Mini grid Developer’s Association [AMDA]) and organizations whose mandate already spans both domains (for example, Ministries of Energy, SEforALL, and multilateral organizations).
• Sponsor events that bring together actors from both sides.• Fund projects that require collaboration by organizations from both sides.• Advocate for high-level support for modern energy access inclusive of clean
cooking.• Support targeted exchange programs for key personnel from the two sectors.
clean cooking. The two are almost always totally separate, however, with grid extension programs typically planned without considering possible eCooking loads and clean cooking programs planned without electric appliances. Interweaving electrification and clean cooking strategies can enable the combined efforts of both sectors to work toward achieving the goals of both sectors.
Separation of the two sectors is often enshrined in ministe-rial responsibilities. Bridging the gap therefore requires the highest-level political commitment. Biomass cooking affects health (the Ministry of Health) and contributes to forest degradation (the Ministry of Environment). The potential solu-tion requires access to electricity (the Ministry of Energy), the manufacture of importation of devices (the Ministry of Trade and Industry), and a realistic budget (the Ministry of Finance). Engaging with parliamentary and cabinet-level ministers and setting up interministerial spaces (committees, working groups, etc.) can help overcome the siloed work of ministries and integrate planning.21
CREATE A SPACE FOR DIALOGUE BETWEEN STAKEHOLDERS IN THE CLEAN COOKING AND ELECTRIFICATION SECTORS
Much of the knowledge and experience required to develop, pilot, and market innovative eCooking solutions already exists, but it is divided in two. On one side is the clean cook-ing sector, which has an in-depth understanding of people’s cooking needs and aspirations and the market for baseline fuels today. On the other side are the solar, mini grid, and utility sectors, which have detailed knowledge of electrical products and systems, the user experience of transitioning to modern energy, and attracting investment orders of magni-tude higher. It is likely that rapid progress could be made by creating strategic partnerships. Both nationally and interna-tionally, private sector, government, and nongovernmental organizations need to come together at events that jointly work on grid, off-grid, and cooking transition planning.
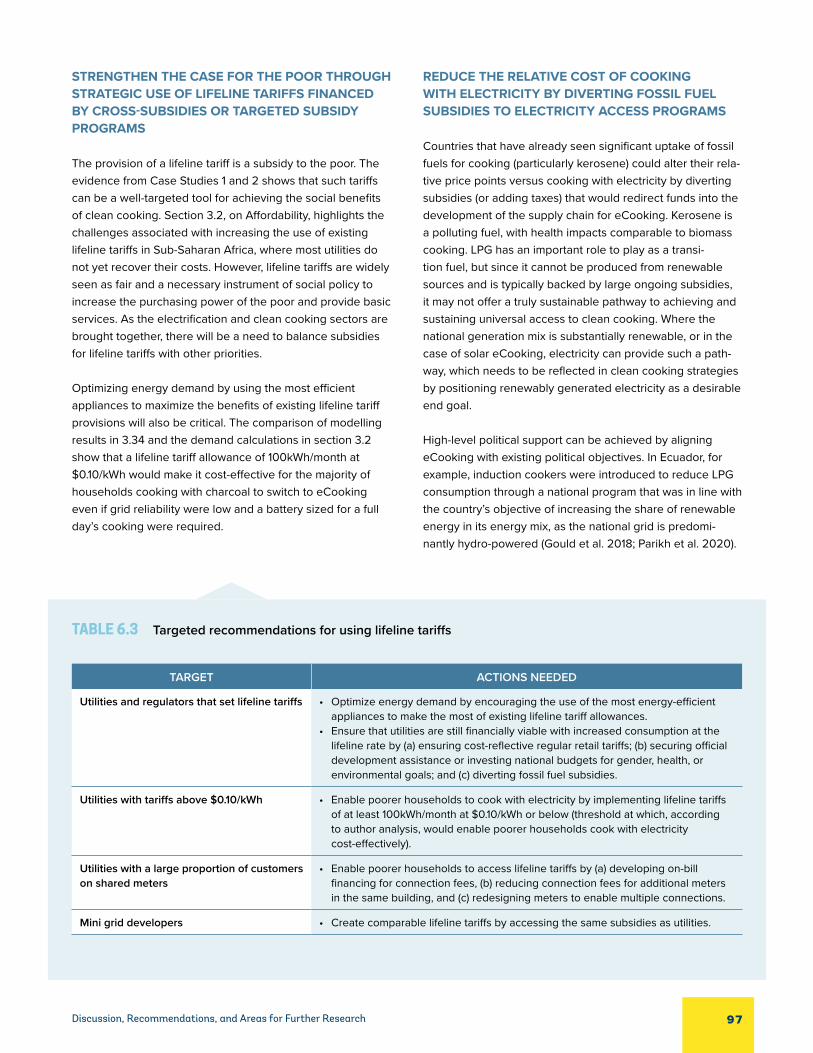
97Discussion, Recommendations, and Areas for Further Research
STRENGTHEN THE CASE FOR THE POOR THROUGH STRATEGIC USE OF LIFELINE TARIFFS FINANCED BY CROSS-SUBSIDIES OR TARGETED SUBSIDY PROGRAMS
The provision of a lifeline tariff is a subsidy to the poor. The evidence from Case Studies 1 and 2 shows that such tariffs can be a well-targeted tool for achieving the social benefits of clean cooking. Section 3.2, on Affordability, highlights the challenges associated with increasing the use of existing lifeline tariffs in Sub-Saharan Africa, where most utilities do not yet recover their costs. However, lifeline tariffs are widely seen as fair and a necessary instrument of social policy to increase the purchasing power of the poor and provide basic services. As the electrification and clean cooking sectors are brought together, there will be a need to balance subsidies for lifeline tariffs with other priorities.
Optimizing energy demand by using the most efficient appliances to maximize the benefits of existing lifeline tariff provisions will also be critical. The comparison of modelling results in 3.34 and the demand calculations in section 3.2 show that a lifeline tariff allowance of 100kWh/month at $0.10/kWh would make it cost- effective for the majority of households cooking with charcoal to switch to eCooking even if grid reliability were low and a battery sized for a full day’s cooking were required.
REDUCE THE RELATIVE COST OF COOKING WITH ELECTRICITY BY DIVERTING FOSSIL FUEL SUBSIDIES TO ELECTRICITY ACCESS PROGRAMS
Countries that have already seen significant uptake of fossil fuels for cooking (particularly kerosene) could alter their rela-tive price points versus cooking with electricity by diverting subsidies (or adding taxes) that would redirect funds into the development of the supply chain for eCooking. Kerosene is a polluting fuel, with health impacts comparable to biomass cooking. LPG has an important role to play as a transi-tion fuel, but since it cannot be produced from renewable sources and is typically backed by large ongoing subsidies, it may not offer a truly sustainable pathway to achieving and sustaining universal access to clean cooking. Where the national generation mix is substantially renewable, or in the case of solar eCooking, electricity can provide such a path-way, which needs to be reflected in clean cooking strategies by positioning renewably generated electricity as a desirable end goal.
High-level political support can be achieved by aligning eCooking with existing political objectives. In Ecuador, for example, induction cookers were introduced to reduce LPG consumption through a national program that was in line with the country’s objective of increasing the share of renewable energy in its energy mix, as the national grid is predomi-nantly hydro-powered (Gould et al. 2018; Parikh et al. 2020).
TABLE 6.3 Targeted recommendations for using lifeline tariffs
TARGET ACTIONS NEEDED
Utilities and regulators that set lifeline tariffs • Optimize energy demand by encouraging the use of the most energy-efficient appliances to make the most of existing lifeline tariff allowances.
• Ensure that utilities are still financially viable with increased consumption at the lifeline rate by (a) ensuring cost-reflective regular retail tariffs; (b) securing official development assistance or investing national budgets for gender, health, or environmental goals; and (c) diverting fossil fuel subsidies.
Utilities with tariffs above $0.10/kWh • Enable poorer households to cook with electricity by implementing lifeline tariffs of at least 100kWh/month at $0.10/kWh or below (threshold at which, according to author analysis, would enable poorer households cook with electricity cost-effectively).
Utilities with a large proportion of customers on shared meters
• Enable poorer households to access lifeline tariffs by (a) developing on-bill financing for connection fees, (b) reducing connection fees for additional meters in the same building, and (c) redesigning meters to enable multiple connections.
Mini grid developers • Create comparable lifeline tariffs by accessing the same subsidies as utilities.

ESMAP | Cooking with Electricity: A Cost Perspective98
STREAMLINE SUPPLY CHAINS, IN ORDER TO DECREASE THE LIFETIME COST OF ECOOKING BY REDUCING THE UPFRONT COST OF QUALITY-ASSURED ENERGY-EFFICIENT APPLIANCES
To avoid market spoilage associated with poor-quality prod-ucts, there is a need to reduce the upfront cost and increase the availability of high-quality eCooking appliances. To optimize the cost of cooking with electricity, these products should also be the most energy efficient, especially in the case of battery-supported systems, as the most expensive component (the battery) can then be considerably smaller.
The Global LEAP Awards competition for EPCs is a good example of how such a quality assurance program could be implemented (Global LEAP 2020). Manufacturers are invited to submit their products for testing in both lab and field-test-ing categories. The key output is a buyer’s guide that can inform future bulk purchasing of high-quality appliances that are well matched to the needs and aspirations of consumers in underserved markets.
TABLE 6.5 Targeted recommendations for enabling quality-assured energy-efficient appliances
TARGET ACTIONS NEEDED
Appliance manufacturers and distributors • Support quality assurance programs, such as the Global LEAP.
All countries • Develop national quality standards with energy-efficiency criteria.
Countries with strong supply chains for imported products already in place
• Identify the most appropriate energy-efficient appliances for local cooking practices.
• Provide tax exemptions for quality-assured, energy-efficient, and culturally appropriate appliances.
Countries with strong local manufacturing industries
• Incentivize local manufacture of culturally appropriate appliances and/or assembly of eCooking systems, through local market development programs.
TABLE 6.4 Targeted recommendations for diverting fossil fuel subsidies
TARGET ACTIONS NEEDED
Countries with fossil fuel subsidies for cooking fuels
• Conduct evidence-based research on the benefits and drawbacks of subsidy diversion into (a) financing the higher upfront cost of energy-efficient and battery-supported eCooking solutions that can ultimately reduce both the cost of cooking for consumers and national expenditures, (b) extending lifeline tariffs to make eCooking more attractive to poorer households, and/or (c) providing tax exemptions for key components (energy-efficient eCooking appliances, as well as higher-capacity lithium-ion batteries).
• Conduct evidenced-based research on “feebates” or cross-subsidies for highly efficient eCooking solutions from levies on commercialized polluting fuels and technologies or inefficient appliances (for example, kerosene/charcoal or electric four-plate cookers with ovens).

99Discussion, Recommendations, and Areas for Further Research
6.2. Conduct Strategic Evidence-Based Research to Inform Decision Makers, Private Sector Players, and Consumers of Emerging Opportunities
More evidence on cooking with electricity is needed in developing country contexts. Cooking is a deeply cultural experience; only by fully understanding the compatibility of the broad range of solutions on offer with each local context can the right decisions be made.
Key inputs for the analysis in this report are the prices people are paying for traditional fuels and how much of their current cooking practice can be readily transferred to eCooking. Both of these factors vary widely, as the development of traditional fuel markets and cultural cooking practices are different in each setting. Key questions include the following:
● Who is already paying for cooking fuel (and how much are they paying)?
● Which eCooking appliance and system architecture are best matched to people’s needs and aspirations?
● How often will consumers actually use each device?
IDENTIFY CULTURALLY APPROPRIATE ENERGY-EFFICIENT ECOOKING APPLIANCES AND EXPLORE FUEL STACKING
The affordability of eCooking is directly linked to the amount of energy required to cook and how much fuel stacking is likely to occur. Given the diverse range of foodstuffs avail-able and cooking practices used across the world, there is a need to match eCooking appliances with cuisines.
An array of modern eCooking appliances are now available on the market. However, many of them are highly specialized (toasters, kettles) or too expensive for poorer households to afford. There is a need to determine which appliances are most desirable and offer the greatest energy and time savings on popular local foods in each local context. Predicting where eCooking will slot into potential customers’ fuel-stacking behavior is critically important: If a new eCook-ing device is used for only half the cooking, then only half the baseline expenditure is available to repay the cost of the device. This metric is also important for understanding how much progress is being made toward the achievement of SDG 7 and in unlocking results-based funding, in particular, climate finance.
TABLE 6.6 Targeted recommendations for identifying culturally appropriate appliances
TARGET ACTIONS NEEDED
Local research institutions specializing in action research in (a) cultures with major staples that are easy to cook in energy-efficient eCooking appliances (such as rice, couscous, and maize) and (b) cultures in which “heavy foods” represent a significant portion of the menu, as EPCs can provide significant energy, cost, and time savings.
• Conduct market assessments and value chain analyses on appliances currently available, and facilitate market entry for ones that are not.
• Map out local menus to establish which dishes are cooked and how often.• Test appliances in kitchen laboratory settings to establish which are most
compatible with local cooking practices.• Conduct cooking diary studies to understand how people cook and the amount
of energy required, and test the most promising appliances as part of real kitchen routines.
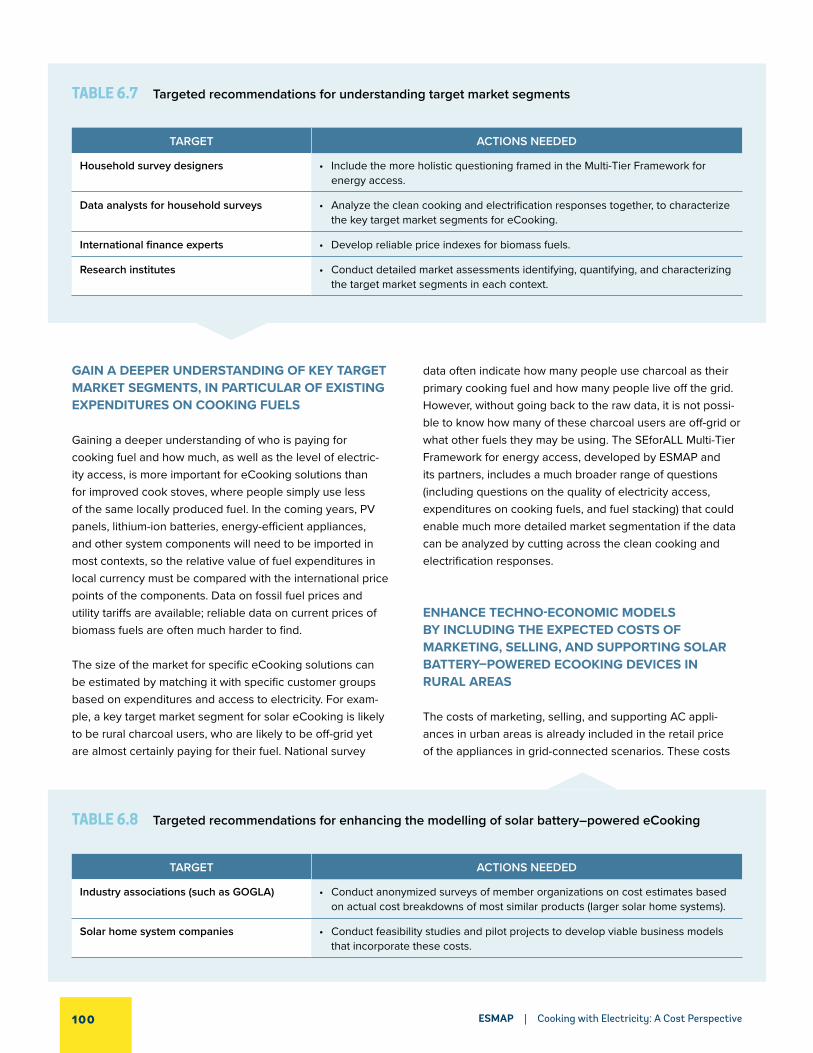
ESMAP | Cooking with Electricity: A Cost Perspective100
GAIN A DEEPER UNDERSTANDING OF KEY TARGET MARKET SEGMENTS, IN PARTICULAR OF EXISTING EXPENDITURES ON COOKING FUELS
Gaining a deeper understanding of who is paying for cooking fuel and how much, as well as the level of electric-ity access, is more important for eCooking solutions than for improved cook stoves, where people simply use less of the same locally produced fuel. In the coming years, PV panels, lithium-ion batteries, energy-efficient appliances, and other system components will need to be imported in most contexts, so the relative value of fuel expenditures in local currency must be compared with the international price points of the components. Data on fossil fuel prices and utility tariffs are available; reliable data on current prices of biomass fuels are often much harder to find.
The size of the market for specific eCooking solutions can be estimated by matching it with specific customer groups based on expenditures and access to electricity. For exam-ple, a key target market segment for solar eCooking is likely to be rural charcoal users, who are likely to be off-grid yet are almost certainly paying for their fuel. National survey
data often indicate how many people use charcoal as their primary cooking fuel and how many people live off the grid. However, without going back to the raw data, it is not possi-ble to know how many of these charcoal users are off-grid or what other fuels they may be using. The SEforALL Multi-Tier Framework for energy access, developed by ESMAP and its partners, includes a much broader range of questions (including questions on the quality of electricity access, expenditures on cooking fuels, and fuel stacking) that could enable much more detailed market segmentation if the data can be analyzed by cutting across the clean cooking and electrification responses.
ENHANCE TECHNO-ECONOMIC MODELS BY INCLUDING THE EXPECTED COSTS OF MARKETING, SELLING, AND SUPPORTING SOLAR BATTERY–POWERED ECOOKING DEVICES IN RURAL AREAS
The costs of marketing, selling, and supporting AC appli-ances in urban areas is already included in the retail price of the appliances in grid-connected scenarios. These costs
TABLE 6.8 Targeted recommendations for enhancing the modelling of solar battery–powered eCooking
TARGET ACTIONS NEEDED
Industry associations (such as GOGLA) • Conduct anonymized surveys of member organizations on cost estimates based on actual cost breakdowns of most similar products (larger solar home systems).
Solar home system companies • Conduct feasibility studies and pilot projects to develop viable business models that incorporate these costs.
TABLE 6.7 Targeted recommendations for understanding target market segments
TARGET ACTIONS NEEDED
Household survey designers • Include the more holistic questioning framed in the Multi-Tier Framework for energy access.
Data analysts for household surveys • Analyze the clean cooking and electrification responses together, to characterize the key target market segments for eCooking.
International finance experts • Develop reliable price indexes for biomass fuels.
Research institutes • Conduct detailed market assessments identifying, quantifying, and characterizing the target market segments in each context.

101Discussion, Recommendations, and Areas for Further Research
are likely to be much higher in rural areas. What is more, although the estimated costs of shipping and import taxes (plus the cost of financing in the discounted monthly costs) is added to the factory gate prices of the other system compo-nents, retail costs are not included. The cost of establishing marketing, distribution, and after-sales support network in sparsely populated rural areas with limited infrastructure is likely to be substantially higher than the relatively slim margins retailers add to the products they sell in urban areas. It is unclear exactly how much higher it is, however, as no commercial solar eCooking products are currently avail-able and many companies are reluctant to share this type of commercially sensitive data.
MODEL THE IMPLICATIONS OF ENCOURAGING ECOOKING FOR LOAD MANAGEMENT ON NATIONAL GRIDS AND MINI GRIDS, IN ORDER TO ESTABLISH THE LIKELY IMPACT ON OVERALL COSTS AND THE INTEGRITY OF THE SYSTEMS
Cooking with electricity puts additional load on grid infra-structure, which can increase revenue for the grid operator
if it occurs when there is spare capacity. However, the increased load must be balanced against the cost of any upgrades to the infrastructure (larger transformers, additional generation) that may be needed (Lombardi et al. 2019).
There is a need to model future scenarios in which uptake may happen at scale, in order to enable planners to design appropriate generating capacity, transmission, and distri-bution infrastructure and delivery models. Multiple options are often available. For example, a mini grid that is likely to exceed its peak generating capacity if all customers adopt eCooking, may want to compare the cost of additional centralized energy storage or generation with the cost of decentralized household storage. Such analysis could also explore techniques to shape the load profile by influencing consumer behavior, such as flexible tariff structures (for example, off-peak tariffs) or smart appliances/storage that can be controlled by the grid operator. In many countries of interest, the regulatory regimes are complex and prescrip-tive, stifle innovation, and act as a barrier to new entrants. If clean cooking is to be integrated with planning for elec-trification, then detailed analysis of the implications for the power system will be vital to enable policy makers to make evidence-based decisions.
TABLE 6.9 Targeted recommendations for modelling load management on grid systems
TARGET ACTIONS NEEDED
Electrification planners, regulatory agencies, utilities, and mini grids developers considering eCooking
• Conduct studies on load management, to evaluate the relative costs and benefits of future scenarios for managing scaled uptake of eCooking.

ESMAP | Cooking with Electricity: A Cost Perspective102
6.3. Support Private Sector Efforts to Develop Products and Services Tailored to the Needs and Aspirations of the Poor
ENABLE UTILITIES AND MINI GRID DEVELOPERS TO DEVELOP, PILOT, AND SCALE UP ECOOKING SERVICES THAT ARE COMPATIBLE WITH THEIR EXISTING BUSINESS MODELS
Knowledge of and attitudes toward eCooking vary widely in the utility and mini grid sectors. Understanding them is crucial to ensuring that support is correctly targeted. Some providers already have many customers cooking with elec-tricity and are looking to manage demand more sustainably
(see, e.g., Case Study 2). Others are keen to increase the electricity consumption per connection to increase their profitability in challenging markets (see Case Studies 1, 3, and 4). Many utilities and mini grid developers are now taking a more holistic approach, going beyond simply selling units to trying to understand the needs and aspirations of their customers. Raising awareness of the opportunities for delivering eCooking services that align with the priorities of each service provider will be key.
TABLE 6.10 Targeted recommendations for developing utility and mini grid business models
TARGET ACTIONS NEEDED
Utilities or mini grid developers with demand stimulation programs (typically energy-limited grids [such as solar] or power-limited grids [such as micro-hydro] with spare capacity at peak times)
• Conduct feasibility studies to determine (a) which grids are already able to support AC eCooking and which need strengthening and (b) which energy-efficient appliances are most attractive to their customers and how much they are paying for their fuel.
• Support knowledge exchange and partnerships with the clean cooking sector to understand cooking needs and aspirations.
• Establish on-bill financing mechanisms for eCooking appliances and/or subsidized appliance costs (recovering costs through sales of electricity units).
• Experiment with different tariffs, including extended lifeline and off-peak tariffs, to stimulate demand.
Utilities with a large share of renewable energy or renewable/hybrid mini grid developers
• Establish time-of-use tariffs to encourage users to cook with electricity when renewable power is available.
Utilities or mini grid developers with demand-side management programs (typically power-limited grids [such as micro-hydro] without spare capacity at peak times grids or grids with frequent load shedding, blackouts, or voltage instability or grids that provide power only during set hours)
• If customers are not already cooking with electricity, conduct feasibility studies to determine whether (a) battery-supported eCooking can also enable 24-hour electricity access without overloading the grid and (b) off-peak tariffs can encourage users to cook with electricity without significantly increasing peak loading.
• If many customers are already cooking with electricity, explore the viability of decreasing peak loading with demand management techniques, such as time-shifting demand with battery-supported appliances or encouraging users to adopt more energy-efficient eCooking appliances.

103Discussion, Recommendations, and Areas for Further Research
INCENTIVIZE ECOOKING APPLIANCE MANUFACTURERS TO DEVELOP PRODUCTS TARGETED AT THE BOTTOM OF THE PYRAMID, PARTICULARLY DC- AND BATTERY-SUPPORTED ECOOKING PRODUCTS
The needs and aspirations of poor people are often differ-ent from those of better-off people. To achieve widespread uptake, eCooking appliances must be seen as accessible but highly desirable products by the poor. eCooking appli-ances are usually designed for urban elites, who will likely already own an array of kitchen gadgets and be familiar with digital technologies. eCooking appliances targeted at poorer consumers can be developed by simplifying control mech-anisms, tailoring them to local foods, and ensuring that they offer a strong value proposition to consumers over charcoal, kerosene, coal, and LPG. The poor are much more likely to be living in off-grid and weak-grid areas. Designing DC and battery-integrated versions of existing eCooking appliances is therefore a key pro-poor action that major manufacturers should be encouraged to take.
ENABLE SOLAR HOME SYSTEM COMPANIES TO DEVELOP, PILOT, AND SCALE UP INNOVATIVE NEW ECOOKING PRODUCTS AND SERVICES
Developers/distributors of solar home systems can lever-age existing customer relationships and credit histories to offer cooking as a new energy service. They may also be able to attract new customers, who can repurpose their existing expenditures on cooking fuels to sign up for a solar eCooking service that also offers lighting, phone-charging, TV, and radio. Solar home systems are often packaged with customized appliances that have been carefully selected to match the system’s power generation and storage capabili-ties. For most companies, eCooking appliances will be a big step up, requiring a significant product redesign. Cooking is a highly culturally embedded process, so understanding the cooking needs/aspirations of the customer base is likely to require much more detailed market research than lighting, phone-charging, TV, or radio, use of which is much more homogeneous.
TABLE 6.11 Targeted recommendations for producing and selling appliances that appeal to customers at the bottom of the pyramid
TARGET ACTIONS NEEDED
Manufacturers of energy-efficient eCooking appliances with a presence in developing countries
• Conduct research and development on the most promising appliances to enable customers at the bottom of the pyramid to (a) cook a wider range of foods, (b) cook even more efficiently, (c) integrate energy metering into the device to indicate to the user exactly how much has been spent on each meal, (d) facilitate the adoption of energy-saving practices, (e) withstand blackouts and voltage/frequency fluctuations, and (f) develop DC and battery-integrated models.
• Develop longer warranties, in line with longer repayment horizons.• Establish service networks in rural and poor urban areas to make spare parts and
expertise available locally.• Partner with financing institutions to enable households to use innovative
financing mechanisms (such as on-bill financing, microcredit, and PAYG) to repay the high upfront cost of appliances.
• Develop social marketing campaigns based on (a) cost (cheaper than other common local fuels); (b) convenience (faster cooking, cleaner kitchen, multitasking); and (c) ways to save even more time and money by cooking efficiently.
• Package (or repackage) international models with advice on (a) how to cook local foods (putting stickers on EPCs indicating cooking times, for example ) and (b) energy-efficient cooking practices (recipe books, community cooking demonstrations).

ESMAP | Cooking with Electricity: A Cost Perspective104
ENABLE PLAYERS IN THE EXISTING CLEAN COOKING VALUE CHAIN TO EXPAND THEIR PRODUCT RANGE TO INCLUDE ECOOKING APPLIANCES
Improved cookstove manufacturers/distributors are likely to lack expertise in electrical system design and consumer
financing. Most improved cookstoves do not contain elec-trical components and are sold without consumer financing, because the upfront cost is much lower than for electric appliances. Capacity building of actors in the clean cook-ing value chain will be needed to develop the specific skill sets needed to design, manufacture, and support electrical products.
TABLE 6.13 Targeted recommendations for enhancing the role of players in the clean cooking value chain
TARGET ACTIONS NEEDED
Improved cookstove manufacturers/ distributors that already use innovative financing mechanisms to sell their products
• Expand from using simple thermal efficiency of heat transfer from the fuel into the cooking pot toward a more holistic understanding of how much energy is required to cook popular local foods with energy-efficient eCooking appliances.
• Develop/extend innovative consumer financing (by connecting with specialist PAYG providers, for example).
• Support knowledge exchange and partnerships with actors in the electrification sector to understand electrical system design and the user experience of transitioning to electricity.
TABLE 6.12 Targeted recommendations for developing business models for solar home systems
TARGET ACTIONS NEEDED
Solar home systems companies that• already offer fee-for-service (utility)
business models (which are likely to be more compatible with longer repayment horizons)
• have customers paying high prices for polluting fuels and technologies
• have strong relationships with their customers (to facilitate the gathering of in-depth information on their cooking needs and aspirations)
• have a history of innovative product/service design.
• Support knowledge exchange and partnerships with actors in the clean cooking sector to understand their cooking needs and aspirations.
• Conduct feasibility studies and pilot projects with grant funding.
PAYG solar companies with one- to two-year recovery periods
• Develop and pilot longer recovery periods (three to five years) or fee-for-service (utility) business models.
Solar home systems designed for productive applications
• Conduct feasibility studies and piloting to assess the viability of adapting existing products to power eCooking appliances.

105Discussion, Recommendations, and Areas for Further Research
EMPOWER WOMEN ENTREPRENEURS TO LEAD THE DEVELOPMENT AND DISSEMINATION OF INNOVATIVE NEW ECOOKING SOLUTIONS
No one understands the needs and aspirations of women as well as women themselves. As the primary beneficiaries of eCooking solutions, women should be at the center of any eCooking initiative. They cannot simply be passive beneficia-ries of products/services developed and marketed primar-ily by men. Women must be empowered to co-create the eCooking solutions they aspire to use and to leverage their social networks to enable successful solutions to rapidly reach scale.
IDENTIFY VIABLE BUSINESS MODELS THAT WILL BOTH UNLOCK CONSUMER RESPONSES AND MEET PRIVATE SECTOR FINANCING NEEDS
The flow of finance needs to be better understood, in order to stimulate the development of new service-orientated business models and help ensure the longer-term recovery of investment. For example, utilities looking to become more agile and user-focused could proactively stimulate energy demand with eCooking (see Case Study 1). Doing so may require the use of on-bill financing for appliances, as well as price signaling (for example, time-of-use tariffs) to smooth out the daily load profile. However, it is important for the market capitalization of the company to consider who owns the
TABLE 6.14 Targeted recommendations for empowering women to promote eCooking
TARGET ACTIONS NEEDED
Women-led businesses or women in key roles in the electrification and clean cooking sectors
• Empower women to develop innovative eCooking solutions within their organizations (through targeted exchange programs between the solar and clean cooking industries, for example).
Electrification or clean cooking initiatives designed to empower women as entrepreneurs as well as end-usersOrganizations already using women-led peer-to-peer business models for other products/services
• Expand the range of products/services promoted by women into eCooking.
TABLE 6.15 Targeted recommendations for balancing consumer and private sector financing needs
TARGET ACTIONS NEEDED
Private sector organizations seeking to attract investment in eCooking, such as service providers (utilities, mini grid developers) wanting to stimulate demand via eCooking
• Develop delivery models for investment scenarios (for example, discounted returns and cash flow projections for PAYG models).
Large-scale private sector investors in renewable technology, including donors who contribute to special purpose vehicles
• Establish partnerships with specialist asset financing companies willing to take on the financial risk of appliance ownership.

ESMAP | Cooking with Electricity: A Cost Perspective106
assets “on the books.” Where the operating company retains ownership, the investment is depreciated over time and the loss is a part of the company’s operational expenses. Where the company hands over the equipment to the consumer at the end of the loan or lease period, the asset comes off the balance sheet. A more attractive proposition may be a partnership between a service provider and a separate asset financing organization that could take on this financial risk.
BRIDGE INITIAL COST–VIABILITY GAPS IN NEW MARKETS BY COMBINING FINANCING INSTRUMENTS SUCH AS GRANTS, SOCIAL IMPACT INVESTMENT, AND RESULTS-BASED FINANCING TIED TO ENVIRONMENTAL, GENDER EQUITY, AND HEALTH OUTCOMES
Grant funding has an important role to play in facilitating early stage experimentation among private sector actors that are curious to explore emerging opportunities. Results-based financing and impact-linked finance tie finance to
developmental outcomes, making it a promising tool for leveraging the transformational potential of eCooking. Such financing can support the development of supply chains for eCooking through bulk procurement of culturally appropri-ate, energy-efficient, high-quality appliances and eCooking systems. Social investment finance—through patient equity capital, soft debt finance, or crowd-sourced funding—could help facilitate the emerging convergence of electric modern energy provision and clean cooking. Enabling new players to explore new approaches and business models on each side of the clean cooking and electrification divide would acceler-ate the convergence of these sectors.
TABLE 6.16 Targeted recommendations for bridging initial cost–viability gaps
TARGET ACTIONS NEEDED
Private sector organizations interested in investing in or implementing eCooking solutions
• Conduct feasibility studies and piloting with grant funding.
Established companies in the clean cooking or electrification sectors
• Forge partnerships with companies on the other side of the “great divide.”
Governments and donors developing results-based financing programs or impact-linked financing focused on health, gender, and environmental impacts
• Link eCooking impacts to addressing local and global development challenges, leveraging climate finance and financing linked to other impacts to mobilize funds for de-risking impact investors and service providers.
Private sector actors with proven eCooking solutions
• Create a toolkit to assess how attractive the various forms of results-based financing may be for their products/services, focusing on (a) the displaced fuels (for example, whether the biomass fuel is sustainably sourced); (b) the utilization rate of the eCooking solution (how much of the traditional fuel will be replaced); and (c) calculation of environmental, health, and gender equity key performance indicators (such as carbon equivalent emissions reduction, disability-adjusted life years averted, women’s time saved).
Social investment funds and private sector actors with proven eCooking solutions
• Broker between social investors and businesses.• Develop clean cooking funds that include a focus on eCooking within their
mandate.

107Discussion, Recommendations, and Areas for Further Research
6.4. Help Consumers Understand the Benefits of Adopting Modern eCooking Solutions and Reduce Barriers to Behavioral Change
DEVELOP “PAY-AS-YOU-COOK” FINANCING (FLEXIBLE REPAYMENT SCHEMES BASED ON HOW CONSUMERS CURRENTLY PAY FOR BIOMASS)
If consumers are going to switch to eCooking, it must be cheaper than alternatives on a levelized cost basis, and consumers must be able to pay for it in the same way they currently pay for biomass. For consumers who currently buy kerosene or charcoal each time they cook,
because it can be purchased in small quantities, a regular monthly repayment on a battery-supported eCooking device is not likely to be attractive. Prepaid electricity meters allow consumers to buy just enough units to cook a single meal, but doing so does not allow them to see how much they paid to cook the meal, as it is unclear whether the units are consumed by cooking devices or other appliances. In addition, they still face the upfront cost of the appliance.
TABLE 6.17 Targeted recommendations for developing “pay-as-you-cook” financing
TARGET ACTIONS NEEDED
Improved cookstove manufacturers/distributors
• Develop PAYG and utility business models to reframe clean cooking as a service rather than a product.
PAYG companies • Offer more flexible repayment plans, including by (a) extending PAYG contracts for battery replacement; (b) aligning payment with income-generating events such as harvests, providing flexibility in repayments beforehand, and planning marketing activities to recruit new customers shortly after; and (c) leveraging progress with mobile money to enable smaller and more irregular repayments.
System developers • Pair eCooking devices with productive appliances such as water pumps to enable users to repurpose the time they currently spend on fuel collection with income-generating activities.
Microfinance organizations • Support interventions that can enable micro–savings and loan groups (such as self-help groups, Savings and Credit Cooperative Organisations [SACCOs], and chamas) to understand how repayment of a loan for an eCooking device can be achieved by savings on cooking fuels.
Banks, agricultural finance companies, and credit companies
• Conduct case studies and illustrations that show that the risk is low if the loan to consumers is for quality-assured equipment and is based on realistic data on existing expenditures.

ESMAP | Cooking with Electricity: A Cost Perspective108
HELP CONSUMERS UNDERSTAND HOW MUCH IT WOULD REALLY COST THEM TO COOK WITH ELECTRICITY
Many consumers do not even consider cooking with elec-tricity, because even people who have access to reliable electricity often assume it is too expensive for cooking. Even with prepaid meters, most consumers are unaware of how much electricity each appliance is consuming. Charcoal and kerosene can be bought in small quantities, and it is very clear how much is used to cook each meal. In contrast, elec-tricity is invisible, and a meter is needed to show how much has been consumed at each point in the network.
CONDUCT PARTICIPATORY ECOOKING DEMONSTRATIONS AND OFFER TRIAL PERIODS WITH LIMITED FINANCIAL RISK TO THE CONSUMER TO ENABLE THEM TO EXPLORE ECOOKING
People who have not cooked with electricity often worry that the appliances are too complicated and the food will not taste as good. They need to be assured that they can produce the same delicious food they are used to cooking and that eCooking can make the process quicker and easier.
TABLE 6.19 Targeted recommendations for conducting eCooking demonstrations and offering trial periods for consumers
TARGET ACTIONS NEEDED
Consumers without experience cooking with electricity
• Support peer-to-peer women-led initiatives that enable entrepreneurs to demonstrate eCooking to people in their social network.
• Offer trial periods that allow consumers to take home eCooking devices and cook for their family without having to commit to a full service contract.
• Conduct cooking demonstrations in public places, where people can taste the finished product.
TABLE 6.18 Targeted recommendations for helping consumers understand the cost of eCooking
TARGET ACTIONS NEEDED
Food bloggers, cooking shows, and retail outlets
• Demonstrate cooking local foods with energy-efficient appliances while monitoring energy consumption to compare cost with traditional fuels.
Appliance distributors and utilities • Offer appliance-level submetering via plug-in electricity meters displaying local electricity tariffs.
Utilities • Tackle the issue of shared meters (see table 6.3).
Appliance manufacturers • Integrate energy meters into cooking appliances.

109Discussion, Recommendations, and Areas for Further Research
TRANSLATE EVIDENCE-BASED RESEARCH INTO EASY-TO-UNDERSTAND CONTENT THAT CAN BE SHARED ON POPULAR MEDIA
As new opportunities emerge and early adopters take up the new approaches, it will be important to communicate early successes to the wider population in accessible and engaging formats, such as cookbooks, social media toolkits, and live cooking demonstrations. Social media, TV, and radio provide opportunities to communicate the benefits enjoyed by early adopters.
ENCOURAGE CONSUMERS TO COOK AS MUCH OF THEIR TYPICAL MENU ON ENERGY-EFFICIENT APPLIANCES AS POSSIBLE
The cost savings from increased appliance efficiency are directly proportional to the amount of cooking that is done using energy-efficient appliances. Many energy-efficient cooking appliances are highly specialized, performing just one task very well (an example is a toaster). Others, such as the EPC or rice cooker, can be used to cook many foods but tend to be used for specific foods (heavy foods and rice, respectively). Encouraging users to cook as much as possi-ble using energy-efficient appliances can reduce the use of inefficient appliances and/or fuel stacking with biomass.
TABLE 6.21 Targeted recommendations for encouraging wider use of energy-efficient appliances
TARGET ACTIONS REQUIRED
Consumers who have purchased energy-efficient appliances
• Use local cookbooks, YouTube video recipes, and cooking demonstrations to showcase the range of dishes that can be cooked using the new appliance.
• Train sales agents in women-led peer-to-peer business models and social media groups to share tips for making the most of their new appliances.
TABLE 6.20 Targeted recommendations for translating evidence into easy-to-understand content
TARGET ACTIONS NEEDED
Consumers that:• have already adopted improved cooking
solutions (as they have shown a willingness to change)
• have access to electricity (grid or off-grid) but have not yet adopted eCooking
• already use a range of modern electrical goods (as they are likely to be familiar with electric devices and value modern solutions)
• use mobile money or other mechanisms that can facilitate smaller transactions
• Launch media campaigns focusing on cost (cheaper than charcoal) and convenience (faster cooking and multitasking).
• Have appliance retailers and service providers carry out cooking demonstrations showing how easy it is to cook popular local foods with electricity and how delicious the food is.
• Improve consumer-facing communication of quality assurance and safety, with regard to cooking with an EPC, electric shocks, and lithium-ion batteries.
• Have social media groups share recipes and cooking techniques.• Use a variety of delivery mechanisms, including mainstream media outlets (social
media, TV, radio, billboards, live cooking demonstrations).


111 Conclusion
Ch A P T ER 7
CONCLUSION
This report highlights the transformative potential of eCook-ing to achieve a broad range of development goals span-ning the gender, environmental, health, and energy access domains by simultaneously enabling access to clean cooking and reliable electricity. The five case studies illustrate early potential markets—contexts where eCooking is not only cost-effective but also offers additional value to consumers and/or service providers.
New energy-efficient appliances, such as the EPC, can already make eCooking affordable for the ever-increasing number of grid-connected households. There is also an emerging opportunity with battery-supported eCooking. Cost trends suggest that the price of components will continue to fall while the cost of biomass fuels continues to rise. Battery support would also extend the opportunity to cook with elec-tricity to off-grid households and households with unreliable grid access.
Realizing this potential will take concerted global effort. The report therefore concludes with a call for action, highlighting how support for eCooking should be delivered to achieve the greatest development impact for the nearly 3 billion people currently cooking with biomass:
1. Support policy makers’ efforts to create an enabling environment that bridges the gap between the electrification and clean cooking sectors.
2. Conduct strategic, evidence-based research to inform decision makers, private sector players, and consumers of emerging opportunities.
3. Support private sector efforts to develop appropriate technical and financial products and services tailored to the needs and aspirations of the poor.
4. Help consumers understand the benefits of adopting modern eCooking solutions, and reduce barriers to behavioral change.
The MECS program is supporting strategic interventions in each of the five case study contexts featured in this report (as well as many more). Over the next decade, the relative price points of key technologies will continue to evolve, likely opening the door to an even broader range of cost-effective eCooking solutions. The program intends to keep close track of these developments, create a range of market-ready inno-vations, and shape enabling environments in order to make a valuable contribution toward achievement of SDG7.

ESMAP | Cooking with Electricity: A Cost Perspective112
ENDNOTES
1. The MTF redefines the way energy access is measured, going beyond the traditional binary measure of “connected or not connected” and allowing for a more nuanced tracking of SDG7 targets. For more information, see ESMAP (2020b).
2. Access for households is defined as meeting Tier 4 standards or above (following ISO/TR 19867-3:2018 Voluntary Performance Targets) across all six measurement attributes of the MTF: convenience, (fuel) availability (a proxy for reliability), safety, affordability, efficiency, and exposure (a proxy for health related to exposure to pollutants from cooking activities).
3. The figure is 0 in five regions, 10 percent in East Asia including China, 26 percent in South Asia including India, and 37 percent in southern Sub-Saharan Africa (Smith et al. 2014).
4. The scale and severity of the environmental impacts of wood-based biomass fuel use vary greatly over space and time. There is general agreement that collecting fuelwood has not led to major deforestation, although it can lead to local landscape degradation and alterations, sometimes causing local fuelwood shortages. Analysis is much more complex and divergent for charcoal, which is nearly exclusively consumed for cooking and heating in urban settlements, including for industrial and commercial uses.
5. Levels of electricity access are as defined by the MTF for the case study countries (except Tanzania, data for which are not yet available)].
6. The Africa Renewable Energy Initiative (AREI) is an Africa-led initiative that aims to accelerate and scale up the harnessing of the continent’s renewable energy potential.
7. These devices were previously referred to as PV-eCook and Grid-eCook/Battery-eCook, respectively, although both contain a battery.
8. Levelized cost is a measure of net present cost averaged over some period or some output quantity. The levelized monthly cost of cooking is the net present value of initial capital investment, any required replacement capital investments, and recurrent electricity and fuel purchases throughout a specified financing period, averaged as cost per month. It is directly comparable with the costs of traditional cooking fuel for a household.
9. “Heavy foods” refer to foods such as beans that require significant energy, cost and time to cook, and which are often particularly amenable to cooking in an EPC.
10. A 9.6 percent real discount rate is used throughout this report, following Lombardi et al. (2019). Reported interest rates are frequently nominal rates, taking no account of inflation. For a country with average inflation of 10 percent (typical in parts of East Africa, for example), a 9.6 percent real rate equates to a 19.6 percent nominal rate.
11. Techniques include centralized or decentralized battery storage, smart metering, distributed-load control, and collaborative agreements.
12. Ethanol gel was found to be the most expensive fuel. LPG was approximately 15 percent, paraffin 35 percent, and electricity 70 percent cheaper.
13. Of course, many customers exceed the lifeline threshold and are paying the regular retail tariff of $0.23/kWh, suggesting that average consumption is actually lower, as such customers make up a larger share of average spending.
14. Figures from the SDG7 Global Tracking Framework differ from official government statistics, but they also report a comparably sized increase (from 29 percent to 73 percent) over a similar period (five years) (Kenya Power 2018).
15. The Last Mile Connectivity Project (LMCP) was launched in 2015 to scale up connectivity in rural and peri-urban areas by providing subsidies for grid extension to enable customers purchase electricity at an affordable cost.
16. LPG prices have a wider uncertainty than grid tariffs, so the green bar in Figure 3.8 is wider, but the midpoints are aligned.
17. The proposed restructured ZESCO tariffs are as follows: K 0.56Z (($0.04)/kWh for less than 100kWh/month, K 1.01 ($0.08)/kWh for 100–300kWh/month, and K 2.31 ($0.18)/kWh for more than 300kWh/month.
18. LCoE is the discounted cost of producing each unit of electricity (the minimum tariff that will enable the mini grid developer to break even).
19. Tests for charcoal and LPG were originally carried out with highly efficient cooking practices. Fuel consumption was scaled up by one-third to model everyday cooking conditions.

113Endnotes
20. The battery lifetimes chosen for the lower- and higher-cost system assumptions are stated in Section 2.1. For a discussion of battery lifetime modelling, see appendix E.
21. For example, the Health and Energy Platform for Action (HEPA) is a recent initiative co-led by the World Health Organization (WHO), the United Nations Development Programme (UNDP), the United Nations Department of Economic and Social Affairs (UNDESA), and the World Bank that links energy (including clean cooking) to health provision. It calls for political and technical cooperation between the health and energy sectors at both the global and country levels, in order to recognize the health burden of cooking with polluting fuels and technologies and use energy investment to make progress toward SDG3 (ensuring healthy lives and promoting well-being for all at all ages).

ESMAP | Cooking with Electricity: A Cost Perspective114
REFERENCES
Adam Smith International. 2016. “Black Gold—the Real Cost of Charcoal in Africa.” https://medium.com/@adamsmithinternational92/black-gold-the-real-cost-of-charcoal-in-africa-7d241a2f3084.
AFREA (Africa Renewable Energy and Access Program) and ESMAP ( Energy Sector Management Assistance Programme). 2016. Power Affordable for Africa and Viable for Its Utilities. World Bank (AFREA and ESMAP). Washington, DC.
Akena, A.K., and E. Wanless. 2020. Achievements and Challenges of Uganda’s Power Sector. Rocky Mountain Institute. Basalt, CO. https://rmi.org/achievements-and-challenges-of-ugandas-power-sector/.
Banerjee, M., Prasad, R., Rehman, I.H. and Gill, B. 2016. “Induction Stoves as an Option for Clean Cooking in Rural India.” Energy Policy. https://doi.org/10.1016/j.enpol.2015.10.021.
Batchelor, S. 2013. “Is It Time for Solar Electric Cooking for Africa?” Gamos Concept Note, May, Reading, United Kingdom.
Batchelor, S., Brown, E., Scott, N. and Leary, J. 2019. “Two Birds, One Stone: Reframing Cooking Energy Policies in Africa and Asia.” Energies 12 (9): 1591. https://doi.org/10.3390/en12091591.
———. 2015. Solar Electric Cooking in Africa in 2020: A Synthesis of the Possibilities. UK Department for International Development, London. https://doi.org/10.12774/eod_cr.december2015.batchelors.
Batchelor, S., Leary, J., Sago, S., Minja, A., Chepkurui, K., Sawe, E., Shuma, J., and Scott,N. 2019. “Opportunities & Challenges for eCook Tanzania.” MECS Working Paper, Modern Energy Cooking Services. www.MECS.org.uk.
Batchelor, S., M. Talukder, M. Uddin, S. Mondal, S. Islam, R. Redoy, R. Hanlin, et al. 2018. “Solar E-Cooking: A Proposition for Solar Home System Integrated Clean Cooking.” Energies 11 (11): 2933. https://doi.org/10.3390/en11112933 .
Battery University. 2019. Lead-Acid Batteries. https://batteryuniversity.com/learn/article/lead_based_batteries.
Bekker, Bernard, Anton Eberhard, Trevor Gaunt, and Andrew Marquard. 2008. “South Africa’s Rapid Electrification Programme: Policy, Institutional, Planning, Financing and Technical Innovations.” Energy Policy 36 (8): 3125–37. https://doi.org/10.1016/j.enpol.2008.04.014.
Beute, Nico. 2012. “Electrification in South Africa over the Last 20 Years.” In Proceedings of the 20th Domestic Use of Energy (DUE) Conference, 55–63. Cape Town.
Buskirk, Robert Van. 2019. Can Efficiency Be Sufficient for African Cooking? European Council for Energy Efficient Economy Summer Study.
Chepkemoi, M., J. Leary, V. Chengo, and J.F. Todd. 2019. East Africa Launch Workshop Report. Modern Energy Cooking Services (MECS). www.MECS.org.uk.
Chepkurui, K., J. Leary, A. Minja, S. Sago, S. Batchelor, E. Sawe, E. Brown, M. Leach, N. Scott, and J. Shuma. 2019. ECook and Gender in Tanzania. MECS Working Paper, Modern Energy Cooking Services. www.MECS.org.uk.
Chepkurui, K., J. Leary, A. Numi, J. Fodio-Todd, R. Hanlin, S. Batchelor, E. Brown, and N. Scott. 2019. Nairobi eCookBook Focus Group Discussion. MECS Working Paper, Modern Energy Cooking Services. www.MECS.org.uk.
Couture, T., and Jacobs, D. 2019. Beyond Fire: How to Achieve Electric Cooking. Hivos & World Future Council. https://www.worldfuturecouncil.org/beyond-fire/.
Cowan, B. 2008. Identification and Demonstration of Selected Energy Best Practices for Low-Income Urban Communities in South Africa. Alleviation of Poverty through the Provision of Local Energy Services (APPLES), Energy Research Centre, University of Cape Town.
CSIS (Center for Strategic and International Studies). 2018. Urbanization in Sub Saharan Africa. Washington, DC. https://www.csis.org/analysis/urbanization-sub-saharan-africa.
Das, Ipsita, Joseph Pedit, Sudhanshu Handa, and Pamela Jagger. 2018. “Household Air Pollution (HAP), Microenvironment and Child Health: Strategies for Mitigating HAP Exposure in Urban Rwanda.” Environmental Research Letters 13 (045011).
Dlamini, C., Moombe, K.B., Syampungani, S., Samboko, P.C., 2016. Load Shedding and Charcoal Use in Zambia: What Are the Implications on Forest Resources? Indaba Agricultural Policy Research Institute (IAPRI), Lusaka, Zambia.
Drigo, R., Bailis, R., Ghilardi, A., Masera, O., and Suber, M. 2014. Tier I Final Report: Pan-tropical Analysis of Woodfuel Supply, Demand and Sustainability. Yale-UNAM Project, Global Alliance for Clean Cookstoves (GACC).

115References
Eberhard, A., Gratwick, K. and Kariuki, L. 2018. “A Review of Private Investment in Tanzania’s Power Generation Sector.” Journal of Energy in Southern Africa 29 (2): 1–11. https://doi.org/10.17159/2413-3051/2018/v29i2a4389.
EcoDirect. Solar Panels for Your Home and Energy Efficient Products 2020. https://www.ecodirect.com/Default.asp.
EEG (Energy and Economic Growth). 2016. “Tanzania Energy Sector Overview.” Energy for Economic Growth Research Programme. https://energyeconomicgrowth.org/index.php/publication/tanzania-energy-sector-overview.
ESMAP (Energy Sector Management Assistance Program). 2015. Beyond Connections: Energy Access Redefined. Washington, DC. https://openknowledge.worldbank.org/bitstream/handle/10986/24368/Beyond0connect0d000technical0report.pdf?sequence=1&isAllowed=y.
———. 2019a. Mini Grids for Half a Billion People: Market Outlook & Handbook for Decision Makers. Executive Summary. Washington, DC. https://openknowledge.worldbank.org/bitstream/handle/10986/31926/Mini Grids-for-Half-a-Billion-People-Market-Outlook-and-Handbook-for-Decision-Makers-Executive-Summary.pdf?sequence=1&isAllowed=y.
——— 2019b. “UK Commits $250 Million; France, Netherlands Pledge $120 Million to World Bank Initiatives on Energy Storage, Solar Power and Clean Cooking.” ESMAP News. Washington, DC. https://www.esmap.org/node/187647.
——— 2019c. “ESMAP Leads New Clean Cooking Program.” ESMAP News. Washington, DC. https://www.esmap.org/node/181461.
———. 2020a. Tracking SDG7|Progress Towards Sustainable Energy. Washington, DC. https://trackingsdg7.esmap.org//.
———. 2020b. Multi-Tier Framework|Tracking Progress Toward Sustainable Energy Goals. https://mtfenergyaccess.esmap.org/.
ESMAP (Energy Sector Management Assistance Program), and MECS (Modern Energy Cooking Services). Forthcoming. The State of Access to Modern Energy Cooking Services. Washington, DC: World Bank.
EWURA (Energy and Water Utilities Regulatory Authority). 2017. Annual Report for the Year Ended 30th June 2016, vol. 255. Dar es Salaam.
Export.gov. 2019. “Tanzania: Energy.” 2019. https://www.export.gov/article?id=Tanzania-Energy.Falcão, M. P. 2008. “Charcoal Production and Use in Mozambique, Malawi, Tanzania, and Zambia:
Historical Overview, Present Situation and Outlook.” Paper presented at the conference on Charcoal and Communities in Africa, June,16–18. Maputo, Mozambique. https://energypedia.info/images/b/bb/EN-”Charcoal_production_and_use_in_Mozambique,_MalawEN_i,_Tanzania,_and_Zambia_-_historical_overview,_present_situation_and_outlENook”-Falcão,_M._P..pdf.
Frith, J. 2017. The 2017 Lithium-Ion Battery Price Survey. Bloomberg New Energy Finance.Gamos. 2017. Beyond Fire. https://elstove.com/2017/07/28/beyond-fire/.Gammon, R., Boait, P. and Advani, V. 2016. “Management of Demand Profiles on Mini Grids in Developing
Countries Using Timeslot Allocation.” Paper presented at the Institute of Electrical and Electronics Engineers (IEEE) PowerAfrica Conference, June 28–July 2, Livingstone, Zambia.
Gius, G., Walker, M., Li, A., Adams, N.J., Van Buskirk, R. and Schwartz, P. 2019. “Hot Diodes! Dirt Cheap Cooking and Electricity for the Global Poor?” Development Engineering 4 (October): 100044. https://doi.org/10.1016/j.deveng.2019.100044.
Global LEAP. 2016. The State of the Off-Grid Appliance Market. https://dalberg.com/wp-content/uploads/2016/06/Global_LEAP_The_State_of_the_Global_Off-Grid_Appliance_Market_1.pdf.
Global LEAP (Lighting and Energy Access Partnership). 2020. “2020 Global LEAP Awards Electric Pressure Cooker Competition.” https://globalleapawards.org/electric-pressure-cookers.
GOGLA (Global Off-Grid Lighting Association). 2019. Global Off-Grid Solar Market Report Semi-Annual Sales and Impact Data, January–June 2019, Public Report. Utrecht, the Netherlands.
Goldie-Scot, L. 2019. “A Behind the Scenes Take on Lithium-Ion Battery Prices.” Bloomberg New Energy Finance, March 5. https://about.bnef.com/blog/behind-scenes-take-lithium-ion-battery-prices/.
Gould, C.F.., Schlesinger, S., Toasa, A.O., Thurber, M., Waters, W.F., Graham, J.P. and Jack, D.W. 2018. “Government Policy, Clean Fuel Access, and Persistent Fuel Stacking in Ecuador.” Energy for Sustainable Development 46: 111–22. https://doi.org/10.1016/j.esd.2018.05.009.
Howells, M., Victor, D.G., Gaunt, T., Elias, R.J. and Alfstad, T. 2006. “Beyond Free Electricity: The Costs of Electric Cooking in Poor Households and a Market-Friendly Alternative.” Energy Policy 34 (17): 3351–58. https://doi.org/10.1016/j.enpol.2005.07.006.
IEA (International Energy Agency). 2018. SDG7: Data and Projections. Access to Electricity. https://www.iea.org/reports/sdg7-data-and-projections/access-to-electricity.
IEA (International Energy Agency), IRENA (International Renewable Energy Association), UNSD (United Nations Statistics Division), WB (World Bank), and WHO (World Health Organization). 2019. Tracking SDG 7: The Energy Progress Report 2019. Washington DC. https://trackingsdg7.esmap.org/.
IMARC (Information Management Research Centre). 2019. Multi Cooker Market: Global Industry Trends, Share, Size, Growth, Opportunity and Forecast 2019–2024.
IRENA (International Renewable Energy Agency). 2012. “Solar Photovoltaics. International Renewable Energy Agency.” Renewable Energy Technologies: Cost Analysis Series 1 (4/5). Abu Dhabi.

ESMAP | Cooking with Electricity: A Cost Perspective116
———. 2016. Remap: Roadmap for a Renewable Energy Future. Abu Dhabi.———. 2018. Renewable Power Generation Costs in 2017. Abu Dhabi.———. 2019. Renewable Capacity Statistics 2019. Abu Dhabi.———. 2020. “Scaling Up Renewable Energy Deployment in Africa.” Abu Dhabi. https://www.irena.org/-/
media/Files/IRENA/Agency/Publication/2020/Feb/IRENA_Africa_Impact_Report_2020.pdf.ITT (Institute for Transformative Technology). 2016. Achieving Universal Electrification in India. A Roadmap
for Rural Solar Mini Grids. Rockefeller Foundation. https://www.rockefellerfoundation.org/wp-content/uploads/Achieving-Universal-Electrification-in-India.ITTReport.April2016.pdf/.
Jacobs, D., Schurig, D., Matser, E., Leidreiter, A. and García, I. 2016. Beyond Fire: How to Achieve Sustainable Cooking. World Future Council, Hamburg, Germany. https://www.worldfuturecouncil.org/beyond-fire/.
Kenya Power. 2018. Annual Report and Financial Statements for the Year Ended 30th June 2018. Nairobi.KPLC (Kenya Power and Lighting Company). 2019a. Implementation of New Tariffs. https://kplc.co.ke/img/
full/rZr6LLCjVqVw_1st November 2018 - Tarrifs.jpg.———. 2019b. “Pika Na Power.” 2019. https://www.facebook.com/PikaNaPower/.Lall, S.V., Henderson, J.V. and Venables, A.J. 2017. “Africa’s Cities: Opening Doors to the World.” Nouvelles
Dermatologiques, vol. 15. World Bank and UK Aid.Leach, M., J. Leary, N. Scott, S. Batchelor, X. Chen, K.-S. Ng, R. Oduro, and E. Brown. 2019. eCook
Modelling. MECS Working Paper, Modern Energy Cooking Services. www.MECS.org.uk.Leach, M. and Oduro, R. 2015. “Preliminary Design and Analysis of a Proposed Solar and Battery Electric
Cooking Concept : Costs and Pricing.” Evidence on Demand (prepared at the request of the UK Department for International Development). https://doi.org/10.12774/eod_cr.november2015.leachm.
———. 2019b. “Why Understanding Real Cooks Is Fundamental to Going beyond Fire.” MECS blog. https://www.mecs.org.uk/why-understanding-real-cooks-is-fundamental-to-going-beyond-fire/.
Leary, J., S. Batchelor, M. Leach, E. Brown, and A. Alsop. 2018. “eCook Global Market Assessment Where Will the Transition Take Place First ?” MECS Working Paper, Modern Energy Cooking Services. www.MECS.org.uk.
Leary, J., S. Batchelor, and N. Scott. 2019. “Cooking Diaries 3.0 Protocols.” MECS Working Paper, Modern Energy Cooking Services. www.MECS.org.uk.
Leary, J., S. Batchelor, N. Scott, E. Brown, and M. Leach. 2018. “Electric Pressure Cooker Selection Guide.” MECS Working Paper, Modern Energy Cooking Solutions. www.mecs.org.uk/wp-content/uploads/2019/10/Pressure-cooker-selection-guide-v1.2-8-3-18.pdf.
Leary, J., J. Fodio Todd, S. Batchelor, K. Chepkurui, M. Chepkemoi, A. Numi, R. Hanlin, N. Scott, and E. Brown. 2019. The Kenya eCookBook: Beans & Cereals Edition. MECS Working Paper, Modern Energy Cooking Services. www.MECS.org.uk.
Leary, J., F. Mwila, N. Serenje, F. Yamba, S. Batchelor, E. Brown, M. Leach, and N. Scott. 2019. “eCook Zambia Design Challenge Workshop Report.” MECS Working Paper, Modern Energy Cooking Services. www.MECS.org.uk
Leary, J., N. Scott, W. W. Hlaing, A. Myint, S. Sane, P. P. Win, T. M. Phyu, et al. 2019. “eCook Myanmar Cooking Diaries.” MECS Working Paper, Modern Energy Cooking Services. www.MECS.org.uk.
Leary, J., N. Scott, A. Numi, K. Chepkurui, R. Hanlin, M. Chepkemoi, S. Batchelor, et al.. 2019. “eCook Kenya Cooking Diaries.” MECS Working Paper, Modern Energy Cooking Services. www.MECS.org.uk.
Leary, J., N. Scott, S. Sago, A. Minja, S. Batchelor, K. Chepkurui, E. Sawe, M. Leach, and E. Brown. 2019. “eCook Tanzania Cooking Diaries.” MECS Working Paper, Modern Energy Cooking Services. www.MECS.org.uk.
Leary, J., N. Scott, N. Serenje, F. Mwila, S. Batchelor, M. Leach, E. Brown, and F. Yamba. 2019a. “eCook Zambia Cooking Diaries.” MECS Working Paper, Modern Energy Cooking Services. www.MECS.org.uk.
———. 2019b. “Opportunities & Challenges for ECook in Zambia.” MECS Working Paper, Modern Energy Cooking Services. www.MECS.org.uk.
Leary, J., N. Serenje, F. Mwila, S. Batchelor, M. Leach, E. Brown, N. Scott, and F. Yamba. 2019. “eCook Zambia Focus Group Discussions Summary Report.” MECS Working Paper, Modern Energy Cooking Services. www.MECS.org.uk.
Leary, J., P. P. Win, A. Myint, S. Sane, P. P. Win, T. M. Phyu, E. T. Moe, et al. 2019. “eCook Myanmar Focus Group Discussions.” MECS Working Paper, Modern Energy Cooking Services. www.MECS.org.uk.
Lemaire, X. 2011. “Off-Grid Electrification with Solar Home Systems: The Experience of a Fee-for-Service Concession in South Africa.” Energy for Sustainable Development 15 (3): 277–83. https://doi.org/10.1016/j.esd.2011.07.005.
Lighting Global. 2018. Off-Grid Solar Market Trends Report 2018. Washington, DC: World Bank Group. https://www.lightingglobal.org/resource/2018-global-off-grid-solar-market-trends-report/.
Lombardi, F., Fabio, R., Marco, S. and Emanuela, C. 2019. “Enabling Combined Access to Electricity and Clean Cooking with PV-Microgrids: New Evidences from a High-Resolution Model of Cooking Loads.” Energy for Sustainable Development 49: 78–88. https://doi.org/10.1016/j.esd.2019.01.005.
Musoke, R. 2017. “Charcoal Users Feel Price Heat.” Independent Uganda, October 16. https://www.independent.co.ug/charcoal-users-feel-price-heat/.

117References
Odarno, L., Sawe, E., Swai, M., Katyega, M.J.J. and Lee, A. 2017. Accelerating Mini Grid Deployment in Sub-Saharan Africa: Lessons from Tanzania. World Resources Institute (WRI) and Tanzania Traditional Energy Organisation (TaTEDO), Dar es Salaam.
Parikh, J., Cloke, J., Puzzolo, E., Pope, D., and Singh, C. 2020. Electric Cooking. MECS Briefing Paper, Modern Energy Cooking Services. www.MECS.org.uk.
Power Africa. 2018. Power Africa in Uganda. Nairobi. https://www.usaid.gov/powerafrica/uganda.REAM (Renewable Energy Association of Myanmar), DRI (Department for Research and Innovation),
Gamos, Loughborough University, and University of Surrey. 2018. eCook Myanmar Stakeholder Workshop Report. www.MECS.org.uk.
Republic of South Africa. 2012. A Survey of Energy-Related Behaviour and Perceptions in South Africa. Department of Energy, Pretoria.
Scott, N., J. Leary, W. W. Hlaing, A. Myint, S. Sane, P. P. Win, T. M. Phyu, E. T. Moe, S. Batchelor, et al.. 2019. “Opportunities & Challenges for eCook in Myanmar.” Working Paper.” MECS Working Paper, Modern Energy Cooking Services. www.MECS.org.uk.
Scott, N., J. Leary, W.W. Hlaing, A. Myint, S. Sane, P.P. Win, T.M. Phyu, E.T. Moe, T. Htay, et al. 2019. “eCook Myanmar Discrete Choice Modelling.” MECS Working Paper, Modern Energy Cooking Services. www.MECS.org.uk.
Scott, N., J. Leary, S. Sago, A. Minja, S. Batchelor, K. Chepkurui, E. Sawe, M. Leach, and E. Brown. 2019. “eCook Tanzania Discrete Choice Modelling.” MECS Working Paper, Modern Energy Cooking Services. www.MECS.org.uk.
Scott, N., J. Leary, N. Serenje, F. Mwila, S. Batchelor, M. Leach, E. Brown, and F. Yamba. 2019. “eCook Zambia Discrete Choice Modelling.” MECS Working Paper, Modern Energy Cooking Services. www.MECS.org.uk.
Scott, N., S. Batchelor, and T. Jones. 2019. “Discrete Choice Modelling Survey: Kenya.” MECS Working Paper, Modern Energy Cooking Services. www.MECS.org.uk.
Seair Exim Solutions. 2020. Market Intelligence Data, Kenya. https://www.seair.co.in/.Sebitosi, A. B., and Pillay, P. 2005. “Energy Services in Sub-Saharan Africa: How Conducive Is the
Environment?” Energy Policy 33 (16): 2044–51. https://doi.org/10.1016/j.enpol.2004.03.025.Skat. 2019. Mini Grid Technologies. https://energypedia.info/images/a/ad/Mini-grid_Technology_
Comparison.pdf.Smith, K.R., Bruce, N., Balakrishnan, K., Adair-Rohani, H., Balmes, J., Chafe, Z., Dherani, M., Hosgood, H.D.,
Mehta, S., Pope, D. and Rehfuess, E.. 2014. “Millions Dead: How Do We Know and What Does It Mean? Methods Used in the Comparative Risk Assessment of Household Air Pollution.” American Review of Public Health 35: 185–206.
Šúri, M., Huld, T. A. and Dunlop, E. D.. 2005. “PVGIS: A Web-Based Solar Radiation Database for the Calculation of PV Potential in Europe.” International Journal of Sustainable Energy 24 (2): 55-67.
TANESCO (Tanzania Electricity Supply Company Ltd.). 2019. Bei Za Umeme Zilizoidhinishwa. http://www.tanesco.co.tz/index.php/customer-service/tariffs/7-bei-za-umeme-zilizoidhinishwa/file.
Tesga Power. 2019. Dc 12v 24v Stainless Steel Electric Pressure Cooker 5l. https://www.alibaba.com/product-detail/DC-12V-24V-stainless-steel-electric_60760544437.html?spm=a2700.7724857.normalList.26.24e5228dC893aj.
UBOS (Uganda Bureau of Statistics) 2017. Uganda National Household Survey 2016/17. Kampala. https://www.ubos.org/wp-content/uploads/publications/03_20182016_UNHS_FINAL_REPORT.pdf.
Umeme. 2019. Power Tariffs. 2019. https://www.umeme.co.ug/tariffs.UN (United Nations). 2017. “World Population Prospectus: The 2017 Revision, Key Findings and Advance
Tables.” Working Paper ESA/P/WP/248. New York. https://esa.un.org/unpd/wpp/publications/Files/WPP2017_KeyFindings.pdf.
Villema, N., S. Sago, E. Sawe, A. Minja, J. Leary, K. Chepkurui, J. Shuma, E. Brown, S. Batchelor, and M. Leach. 2018. The National Stakeholders’ Solar Electric Cooking Workshop Report. MECS Working Paper, Modern Energy Cooking Services. www.MECS.org.uk.
Waldron, D., and Hacker, S. 2020. Electric Bankers: Utility-Enabled Finance in Sub-Saharan Africa. CGAP (Consultative Group to Assist the Poor) and CLASP (Collaborative Labelling and Appliance Standards Programme). https://www.cgap.org/sites/default/files/publications/2020_05_Working_Paper_Electric_Bankers.pdf.
Wang J., P. Liua, J. Hicks-Garner, E. Sherman, S. Soukiazian, M. Verbrugge, H. Tataria, J. Musser, and T. Finamore. 2011. “Cycle-Life Model for Graphite-LiFePO4 Cells.” Journal of Power Sources 196. doi:10.1016/j.jpowsour.2010.11.134.
Watkins, T., P. Arroyo, R. Perry, R. Wang, O. Arriaga, M. Fleming, C. O’Day, et al. 2017. “Insulated Solar Electric Cooking: Tomorrow’s Healthy Affordable Stoves?” Development Engineering 2 (January): 47–52. https://doi.org/10.1016/j.deveng.2017.01.001.
WHO (World Health Organization). 2016. Burning Opportunity: Clean Household Energy for Health, Sustainable Development, and Wellbeing of Women and Children. Geneva. http://apps.who.int/iris/bitstream/10665/204717/1/9789241565233_eng.pdf?ua=1.

ESMAP | Cooking with Electricity: A Cost Perspective118
———. 2017. Household Energy Database. Geneva. https://www.who.int/airpollution/data/household-energy-database/en/#:~:text=The%20WHO%20Household%20energy%20database,cooking%2C%20heating%20and%20lighting%20fuels.
———. 2018. “Household Air Pollution and Health.” Geneva. https://www.who.int/en/news-room/fact-sheets/detail/household-air-pollution-and-health.
World Bank. 2013. On Thin Ice. Washington, DC. https://www.worldbank.org/content/dam/Worldbank/document/SDN/Full_Report_On_Thin_Ice_How_Cutting_Pollution_Can_Slow_Warming_and_Save_Lives.pdf.
———. 2014. Clean and Improved Cooking in Sub-Saharan Africa: A Landscape Report. Africa Clean Cooking Energy Solutions Initiative, Washington, DC.
———. 2018. Off-Grid Solar Market Trends Report 2018. Washington, DC.———. 2019a. Getting Electricity: Doing Business. Washington, DC. https://www.doingbusiness.org/en/data/
exploretopics/getting-electricity.———. 2019b. World Development Indicators. Washington, DC. https://datacatalog.worldbank.org/.———. 2019c. World Development Indicators (WDI) Data Catalog. Washington, DC. https://datacatalog.
worldbank.org/dataset/world-development-indicators.World Bank. 2020. Data. https://data.worldbank.org/indicator/SP.URB.GROW?locations=ZGWorld Bank, and IHME (Institute for Health Metrics and Evaluation). 2016. The Cost of Air Pollution.
Washington, DC. http://documents.worldbank.org/curated/en/781521473177013155/pdf/108141-REVISED-Cost-of-PollutionWebCORRECTEDfile.pdf.
Wu, X., R. Nethery, R., M.B. Sabath, D. Braun, F. Dominici. 2017. “Exposure to Air Pollution and COVID-19 Mortality in the United States: A Nationwide Cross-Sectional Study.” Journal of Chemical Information and Modeling. DOI: 10.1017/CBO9781107415324.004.
ZESCO (Zambia Electricity Supply Corporation Ltd.). 2019. Current ZESCO Tariffs. https://www.zesco.co.zm/home.
Zubi, G., F. Spertino, M. Carvalho, R. S. Adhikari, and T. Khatib. 2017. “Development and Assessment of a Solar Home System to Cover Cooking and Lighting Needs in Developing Regions as a Better Alternative for Existing Practices.” Solar Energy 155 (October): 7–17. https://doi.org/10.1016/j.solener.2017.05.077.
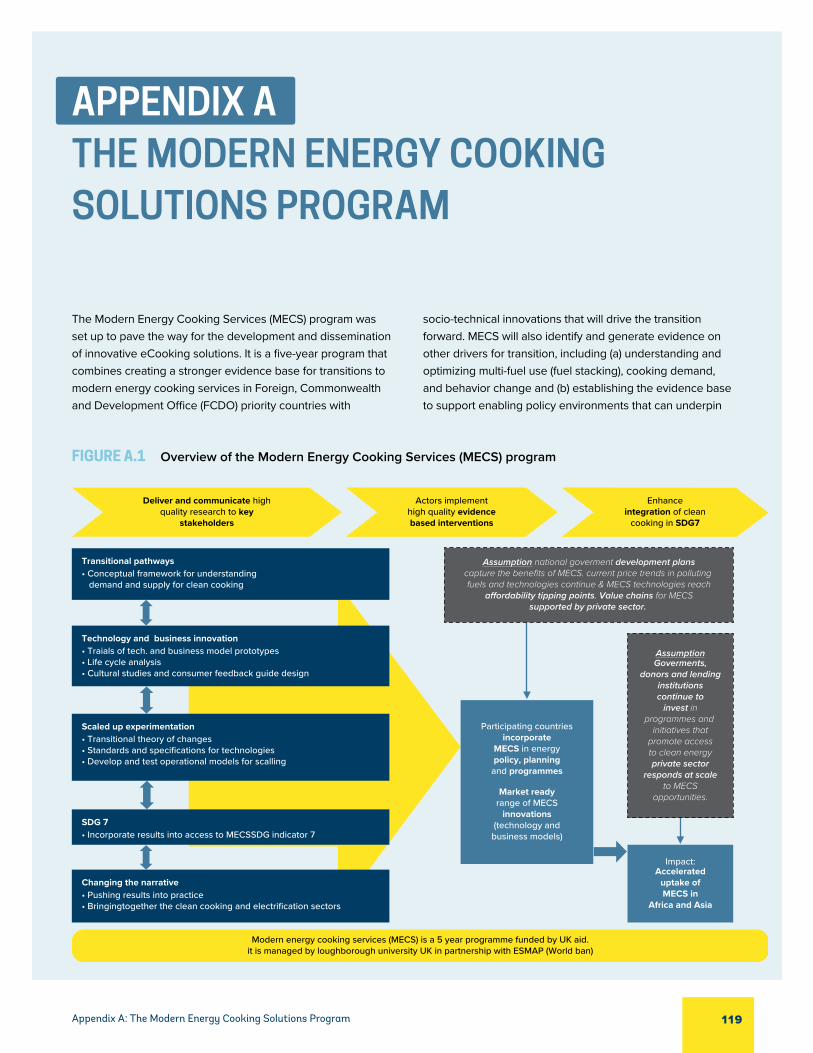
119Appendix A: The Modern Energy Cooking Solutions Program
APPENDIX ATHE MODERN ENERGY COOKING SOLUTIONS PROGRAM
The Modern Energy Cooking Services (MECS) program was set up to pave the way for the development and dissemination of innovative eCooking solutions. It is a five-year program that combines creating a stronger evidence base for transitions to modern energy cooking services in Foreign, Commonwealth and Development Office (FCDO) priority countries with
socio-technical innovations that will drive the transition forward. MECS will also identify and generate evidence on other drivers for transition, including (a) understanding and optimizing multi-fuel use (fuel stacking), cooking demand, and behavior change and (b) establishing the evidence base to support enabling policy environments that can underpin
FIGURE A.1 Overview of the Modern Energy Cooking Services (MECS) program
Deliver and communicate highquality research to key
stakeholders
Technology and business innovation• Traials of tech. and business model prototypes• Life cycle analysis• Cultural studies and consumer feedback guide design
Scaled up experimentation• Transitional theory of changes• Standards and specifications for technologies• Develop and test operational models for scalling
SDG 7• Incorporate results into access to MECSSDG indicator 7
Changing the narrative• Pushing results into practice• Bringingtogether the clean cooking and electrification sectors
Assumption national goverment development planscapture the benefits of MECS. current price trends in polluting fuels and technologies continue & MECS technologies reach
a�ordability tipping points. Value chains for MECSsupported by private sector.
AssumptionGoverments,
donors and lendinginstitutionscontinue to
invest inprogrammes and
initiatives thatpromote accessto clean energyprivate sector
responds at scaleto MECS
opportunities.Market readyrange of MECS
innovations(technology and
business models)
Participating countriesincorporate
MECS in energypolicy, planning
and programmes
Impact:Accelerated
uptake ofMECS in
Africa and Asia
Modern energy cooking services (MECS) is a 5 year programme funded by UK aid.it is managed by loughborough university UK in partnership with ESMAP (World ban)
Transitional pathways• Conceptual framework for understanding demand and supply for clean cooking
Actors implementhigh quality evidencebased interventions
Enhanceintegration of clean
cooking in SDG7

120 ESMAP | Cooking with Electricity: A Cost Perspective
a pathway to scale and support well-understood markets and enterprises. The program is managed as an integrated whole but split into two complementary workstreams, one lead by Loughborough University and the other led by the World Bank’s Energy Sector Management Assistance Program (ESMAP). Figure A.1 outlines the program.
The intended outcome of MECS is a market-ready range of innovations (both technology and business models) that lead to improved choice of sustainable, affordable, and reliable modern energy cooking services for consumers. MECS includes a series of challenge funds, designed to facilitate feasibility studies, prototyping, piloting, and scaling up of innovative eCooking solutions, as exemplified by many of the case studies in this report. MECS principles will be integrated into the SDG 7.1 global tracking framework, with the aim of encouraging participating countries to incorporate modern energy cooking services in energy policies and planning.
The MECS program focuses on 15 countries in the Global South. They are divided into Tier 1 and Tier 2 categories, depending on the strength of their connection and relevance
to the MECS program. The countries of interest will be reassessed every six months throughout the duration of the MECS program, based on the following criteria:
● The main source of fuel for cooking is biomass, and the government is seeking to do something different.
● Access to modern energy is poor, as a result of weak supply chains and key infrastructure, but the govern-ment wants to improve the situation.
● The country is a FCDO priority country, and a large share of the population is poor.
● A substantial resource of renewable energy exists but is barely tapped.
Tier 1 countries fulfill the criteria and have existing connec-tions and activities with MECS. They include Bangladesh, Ethiopia, Ghana, Kenya, Malawi, Nepal, Rwanda, Tanzania, Uganda, and Zambia. Tier 2 countries also seem to fulfill the criteria, but MECS has so far had more limited connections with them. They include Cambodia, Cameroon, The Gambia, Myanmar, and Nigeria.

121Appendix B: Typology of eCooking System Architectures
APPENDIX BTYPOLOGY OF ECOOKING SYSTEM ARCHITECTURES
FIGURE B.1 Typology of eCooking devices for strong, weak, and off-grid regions
Grid-Connected eCooking
Solar eCooking
Direct or Battery-less eCooking Battery-Supported eCooking
Grid-Connected Battery-Supported eCooking
Solar Powered Battery Supported eCooking
Direct ACeCooking
Direct DCeCooking
ACbattery-supported
eCooking+ +
DCBattery-Supported
eCooking+
National Grid Direct AC eCooking
+
Mini-Grid Direct AC eCooking
+
Direct Solar eCooking (DC)
+
Solar Power Battery-Supported eCooking (DC)
+ +
or AC
+
National-Grid Battery-Supported eCooking (DC)
+ + +
or AC
+
Mini-Grid Battery-Supported eCooking (DC)
+ + +
or AC
+
Note: eCooking = Electric Cooking
The system architectures modelled in this report are listed in table 2.4.

122 ESMAP | Cooking with Electricity: A Cost Perspective
APPENDIX CASSESSING ELECTRICITY DEMAND FOR COOKING
Cooking diaries are a novel methodology for addressing the lack of data about how people currently cook with biomass and how they might cook with electricity. Cooking is a deeply culturally embedded practice. Understanding the nuances of how the intended beneficiaries of a clean cooking interven-tion actually cook is therefore critical.
Data on cooking practices, fuel/electricity use, and the user experience were collected in each of the four case study countries. Focus groups offered deeper qualitative insights into how people currently cook, how they aspire to cook in the future, and the compatibility of their cooking practices with the strengths and weaknesses of cooking on battery-supported electrical appliances. The results show that unlike many other clean cooking technologies, which have struggled to achieve acceptance, many energy-efficient eCooking appliances are highly desirable to everyday cooks.
Cooking with Electricity
A barrier to cooking with electricity is the high level of power required, which can be an issue in terms of both the quality of the connection to an individual house and the aggregate loads the additional power may impose on a distribution network. Boiling and simmering can easily be done on lower-power insulated devices. Higher power is needed for other processes, however, such as frying.
Many people think that eCooking appliances consume their rated power constantly. In fact, most appliances are automati-cally controlled to oscillate between no power and full power (figure C.1), depending on user input or the temperature in the pot. As a result, they rarely consume their maximum rated capacity, even when cooking on high, so even a 1kW hot plate is unlikely to use a full 1kWh if left on for an hour.
FIGURE C.1 Electricity demand profile of a 600W electric pressure cooker cooking for one hour
1,000
800
600
400
200
01 201 401 601 801 1,001 1,201 1,401
Seconds
Wat
t
1,601 1,801 2,000 2,201 2,401 2,601 2,801 3,001 3,201 3,401 3,601
Source: Couture and Jacobs (2019).

123Appendix C: Assessing Electricity Demand for Cooking
The amount of electricity required for cooking depends on the following factors:
1. the efficiency of heat transfer into the pot (for example, induction) or (better) directly into the food (as in a microwave)
2. control of the cooking process (through, for example, a timer on a microwave or a temperature sensor on a rice cooker)
3. the efficiency of heat transfer out of the pot (which is reduced by lids and insulation)
4. the temperature in the pot
5. energy-efficient cooking practices (such as soaking beans as chopping ingredients finely).
The focus of the clean cooking industry has been on the first factor, often using the efficiency of heat transfer from the fuel into the pot as the key performance indicator for improved cookstoves. Many people claim that induction stoves increase the “efficiency of cooking” by 10–20 percent over hot plates. This claim is based on the first factor only. Induction stoves can be used in tandem with other equip-ment that address the third and fourth factor (insulation and pressurization) through the use of insulated and/or pressur-ized stove-top pots. However, in rice cookers and electric pressure cookers (EPCs), insulation and pressurization (for EPCs) are integrated into the appliance itself. Rice cookers and EPCs may not use induction to heat the pot, but their strategic use of insulation means that there is minimal wast-age in the heat transfer process; in many cases they mimic the efficiencies of the induction hob and exceed it by also retaining heat with insultation. The EPC also offers significant advantages over the combination of induction and stove-top pressure pans in relation to the second factor, through the level of automatic control. The integrated appliance is completely controlled to avoid excessive pressurization, yielding further energy savings, increasing safety, and reducing the need for monitoring of the cooking process by the cook.
Much of the research on the performance of improved cooking appliances has used standardized water boiling tests, which are effective at measuring heat transfer and thus losses and efficiency in a laboratory setting. However, the amount of energy actually saved depends on the meal being cooked. The greater control offered by electricity means that
1 The authors state that the exact number is not necessary for their analysis, because they focus on monthly cooking costs rather than the initial capital cost. They therefore need only a baseline to compare the four technological pathways.
the savings and comparisons are particularly sensitive to what is cooked.
Cowan (2008) studied energy use by 80 households in South Africa cooking a wide range of foods and meal types using a number of fuels, including electricity (figure C.2). The study subdivided meals into quick (for example, rice); medium (for example, chicken stew); and long (for example, offal) categories. A typical meal of rice and chicken stew for four people used 0.71kWh. Three meals a day with a mix of meal types could thus be delivered for perhaps 2kWh/day. However, Cowan used a cheap and inefficient commercial hot plate. Recent research has shown that an EPC can yield significant savings over such a device and significantly reduce the energy required (Leary, Fodio Todd, et al. 2019).
Building on these insights into meal-based energy consump-tion, the ground-breaking Beyond Fire series of reports investigated the viability of four potential pathways to achieve truly sustainable cooking: solar eCooking, eCook-ing on mini grids, biogas, and renewably generated “power to gas” (Jacobs et al. 2016; Couture and Jacobs 2019). The researchers concluded that of all the pathways, the two eCooking configurations offered the greatest co-benefits, although they were also the most expensive.
Key to understanding the viability of each pathway was establishing the amount of energy needed to cook. In their first report, the authors used a figure of 1GJ (278kWh)/person/year in the pot, which is equivalent to 3.2 kWh/household/day for an average household of 4.2 people.1 They focused solely on hot plates and induction stoves, ignoring insulation, pressurization, automatic control and energy saving practices, which offer significant energy saving potential (Gamos 2017).
In their second report (Couture and Jacobs 2019), which focused exclusively on the two eCooking pathways, they expanded their analysis to include two more energy-efficient eCooking appliances: the EPC and the slow cooker. The energy demand modelled in their original report seemed to understate the opportunity for eCooking solutions. The findings in the second report are more positive. This report also concludes that induction stoves provide limited savings over hot plates and highlights the substantial energy savings for the most efficient appliances (slow cookers and EPCs). Their electricity consumption figures are based on the

124 ESMAP | Cooking with Electricity: A Cost Perspective
extrapolation of laboratory-based measurements, however, with the lid left closed for the full duration of the cooking.2
Fully understanding how much electricity is needed to cook underpins all eCooking cost comparisons. Couture and Jacobs (2019, 8) therefore end their report with a call to “governments and donors around the world… to fund a greater range of R&D projects, including… providing further analysis of cooking with different electric appliances, such as slow cookers, pressure cookers and even infrared cookers [and] analysis of [their] behavioral and cultural acceptance.”
This report extends Beyond Fire’s analysis to take forward the collective understanding of how much it really costs to cook with electricity by using empirical data recorded by
2 For discussion of the implications of the test methods, see Leary and Batchelor (2019b).3 The project reports for each country are available at https://www.mecs.org.uk/working-papers/.
80 households in four countries as input data for a compa-rable techno-economic model. These data were collected using a range of multidisciplinary techniques, including cook-ing diaries, focus groups, and kitchen laboratories, building on Cowan’s practical controlled cooking tests. The studies aimed to understand how households in Sub-Saharan Africa and Southeast Asia currently cook and how they aspire to cook.
These techniques were applied in Kenya, Myanmar, Tanzania, and Zambia.3 Under the MECS program, they will be applied in all 15 focus countries. As of June 2020, data collection was already underway in Ethiopia, Ghana, Nepal, and Uganda. The analysis described below focuses on the data from Kenya, the most detailed dataset currently available.
FIGURE C.2 Electricity required to prepare typical meals for four people in South Africa
12 3,0
2,5
2,0
1,5
1,0
0,5
0
10
8
6
4
2
0Staple Starch
Meals(e.g., Potatoes,
Cassava)
Ener
gy C
onsu
mpt
ion
per M
eal (
in M
J)
Ener
gy C
onsu
mpt
ion
per M
eal (
in k
Wh)
Boiled Rice Pasta Soft Meats(e.g., Liver)
Medium-LengthStews
(e.g., Chickenand Vegetable
Stew)
Longer-CookingMeat Stews(e.g., Beef/
Mutton Stew)
Longer-CookingDried Vegetable
Dishes(e.g., Beef/Maize
and Beans)
Very SlowCooking Meat
Electricity Parafin LPG Ethanol Gel
Source: Adapted from Cowan (2008) by Couture and Jacobs (2019).

125Appendix C: Assessing Electricity Demand for Cooking
The Cooking Diaries Studies
By gathering data on how people cook in their own homes, cooking diary studies provide insights into the unique cooking practices of individual households and quantita-tive measurements of the energy used in the home (Leary, Batchelor, and Scott 2019). It is usually easier to control heat levels with modern fuels such as gas and electricity than it is with biomass, as they can be turned up/down and on/off in an instant. There is also a wide range of eCooking appli-ances, each designed for specific processes (for example, kettles for heating water). Therefore, it is important to know how often people need to fry, boil, reheat, or use other cook-ing methods.
This mixed-methods approach gathered data from cook-ing diary forms (foods cooked, cooking processes/times, appliances used); energy measurements (weighing fuels and
plug-in kWh meters [figure C.3]); registration surveys (simple demographic data); and exit surveys (qualitative user expe-rience feedback and observational eCooking challenges). In each country studied, 20 households recorded data in two stages. In the first stage, participants collected baseline data for two weeks. During this time, they cooked the way they always do. In the second “transition” stage, participants cooked only with electric appliances for two weeks.
Details on the methods used and the findings in each coun-try can be found in the synthesis and country reports for Kenya, Myanmar, Tanzania, and Zambia (see table 2.1). The following sections present some key results and learning from the Kenyan study.
BENEFITS OF USING ELECTRIC PRESSURE COOKERS TO PREPARE “HEAVY FOODS”
Almost all 19 households that participated in the Githeri eCooking Challenge at the end of the Kenya cooking diaries
FIGURE C.3 Enumerator training study participant to record cooking diary data in Nairobi
Note: eCooking appliances are plugged into an energy meter in the top right of the photo.

126 ESMAP | Cooking with Electricity: A Cost Perspective
study achieved dramatic energy savings cooking “heavy foods” in a kitchen laboratory setting. On a hot plate, cook-ing 500 grams of githeri (a traditional Kenyan meal of maize and beans) usually consumes more than 2kWh and can consume as much as 4kWh if no efficiency measures are in place (using the slowest-cooking beans, leaving the lid off, and so forth). Using an EPC, 16 of 19 households prepared the meal using less than 0.4kWh—an 80 percent saving over hot plates (figure C.4). One participant managed to beat the figure the Beyond Fire report cites as low consumption for one hour of cooking on an EPC (0.164kWh); many others consumed around the average level (0.221kWh).
Four of the participants in the Kenya cooking diaries study were featured in the Kenya eCookBook (Leary, Fodio Todd, et al. 2019). Kitchen laboratory experiments involve controlled experiments to explore which factors make
4 Leary et al. did not test the use of stove-top pressure cookers on charcoal, kerosene, LPG, hot plates, or stove-top pressure cookers in combination with a fireless cooker. The difference between nonelectric fuels and an EPC would presumably be smaller if the nonelectric fuels used a conventional stove-top pressure cooker.
the biggest difference to the time and money spent in the kitchen. They show that EPCs can save up to 85 percent of the cost of cooking heavy foods using charcoal, LPG, or an electric hot plate (figure C.5).4
In the Kenya cooking diaries, households were provided with three key devices: a hot plate, a rice cooker, and an EPC and were thus able to cook all their food with electricity. The menu did not vary significantly from the baseline data obtained during the preceding weeks with participants’ stoves and fuels. The analysis below shows that it is possible to cook over 90 percent of this typical Kenyan menu in an EPC. After limited training, with three appliances to choose from, participants chose to cook approximately half their menu using efficient appliances (EPC or rice cooker). When the did, they used about half the energy of a hot plate.
FIGURE C.4 Energy consumption during the Githeri eCooking Challenge, by participant, appliance, and process
0
Household ID
1 2 3 4 5 6 7 8 9 10 11 12 13 14 15 16 17 18 19
0.1
0.2
0.3
0.4
0.5
0.6
0.7
0.8
0.9
Ener
gy (k
Wh)
EPC First pressurization EPC Second pressurization EPC fry Hotpate fry

127Appendix C: Assessing Electricity Demand for Cooking
GOING BEYOND HEAVY FOODS
Energy savings on heavy foods are substantial in controlled and semi-controlled conditions. It is important to understand how they fit into the kitchen routines of cooks at home.
Evidence from the cooking diaries shows that heavy foods comprise about a third of all dishes on a typical urban Kenyan household’s menu (table C.1). Many other dishes can also be cooked on an EPC. Some (such as rice) are quickly grasped and require little in the way of behavior change. Others (such as using a heatproof material to hold the pot still while stirring ugali, a maize flour porridge), are less intu-itive and require some behavior change. A few dishes (such as chapati) cannot be prepared using the EPCs available on the market today.
A typical East/Southern African menu consists of various categories of dishes. Leary, Scott, Numi, et al. (2019) propose the following categories:
● Heavy foods: Heavy foods usually require boiling the main ingredient (for example, beans) for over an hour on a conventional stove. Their preparation may also involve a separate frying stage with extra ingredients to add flavor (for example, a tomato and onion sauce).
● Staples: Staples are normally boiled for about half an hour. Some (for example, ugali, porridge) require stirring; others (for example, rice) are simply left to boil.
● Quick fryers: Food is usually fried for 5–15 minutes. A shallow pan and high heat are often preferred but are not essential. Access to the pan is usually required to stir the food and prevent burning.
● Deep fryers: Food is completely submerged in oil at 175°C–190°C.
● Flatbreads: Medium heat, evenly distributed across a shallow pan is required to cook flatbread at the same rate. Access to the pan is required to turn the bread frequently.
FIGURE C.5 Cost of preparing 500 grams of dried yellow beans using most popular fuels in urban Kenya
10
0
20KSh
30
40
Note: Costs are based on prices in Nairobi in July 2018.
Source: Leary, Fodio Todd, et al. (2019).

128 ESMAP | Cooking with Electricity: A Cost Perspective
The Kenya cooking diaries data suggest that EPCs use roughly half the energy of electric hot plates across the full range of dishes they are able to cook. On average, rice cookers used 39 percent (median of 0.09 kWh/person/event, n = 46) and EPCs used 76 percent (0.18 MJ/person/event, n = 49) of the energy of a hot plate (0.23 MJ/person/event, n = 119). However, EPCs were chosen to cook heavier(and therefore more energy-intensive) dishes (figure C.6). They can also be used for lighter staples (such as rice). As all participants in the Kenya cooking diaries had an electric hot plate, a rice cooker, and an EPC, it can be assumed that all the dishes that were cooked in a rice cooker could also have been cooked in the EPC with the same energy consumption. The average per capita, per heating event energy consump-tion figure for rice cookers and EPCs comes to just under half (45 percent) that of the electric hot plate.
Further analysis of the Kenya cooking diaries data suggests that with minimal training, households would choose to use an EPC to cook half their menu if it were the only electric
appliance available. A total of 645 dishes were cooked on EPCs and rice cookers (see figure C.6). Ignoring all other appliances (which were used for only 150 dishes and were mainly microwaves) and comparing directly to the 739 dishes cooked on a hot plate, roughly half (47 percent) of a total of 1,387 dishes were cooked by choice on an EPC or rice cooker. Without additional training or design modifications, households with an EPC as their efficient appliance are thus likely to choose to cook roughly half their menu with it.
Broadening to results from all four of the country studies, table 2.5 in the main report shows the median daily energy consumption figures from the 100 percent eCooking stage of the cooking diaries in each country. Table 2.6 shows compa-rable figures for the traditional fuels studied in each country. Inspection of the daily cooking demands across the cooking diary samples shows that the distribution is not normal but has instead a substantial tail toward higher loads. It represents a mixture of days on which special meals are cooked and the presence of some cooks who routinely use more energy
TABLE C.1 Categorization of typical Kenyan foods by compatibility with electric pressure cooker and associated energy savings
FOOD CATEGORY
FREQUENCY OF HOME COOKING IN
URBAN KENYAN MENU (PERCENT OF TOTAL) TYPICAL DISHES
COMPATIBILITY WITH EPC
ENERGY SAVINGS VERSUS
HOTPLATEREQUIREMENTS AND ENABLERS
Heavy foods 32 Beans, matumbo (tripe), meat
stews
Users instinctively use
EPCs
High (50–90 percent)
Provide cooks with cooking times and water quantities for popular local foods
Staples 39 Ugali (maize meal), rice
Users use EPCs if encouraged
Moderate (20–50 percent)
Demonstrations, extra EPC
Quick fry 20 Sukuma wiki (kale), eggs
Users use EPCs if encouraged
Low (5–20 percent)
Demonstrations, manual heat control, extra EPC, shallow pan
Deep fry 2 Mandazi (donuts), fried chicken,
chips
Users cannot currently use
EPCs
Low (5–20 percent)
Manual heat control or deep fry settings (160°C–190°C)
Flatbreads 4 Chapati (flatbread)
Users cannot currently use
EPCs
Low (5–20 percent)
Manual heat control and shallow pan
Other 3 Unknown

129Appendix C: Assessing Electricity Demand for Cooking
than others when cooking comparable dishes (and may thus be described as engaging in energy-inefficient practices). The median is lower than the mean. Using the median in this analysis represents the sort of eCooking device that would be needed to cook food on the majority of days.
If indeed urban Kenyan households could cook over 90 percent of their menu on an EPC with greater user training and experience combined with design improve-ments, total energy consumptions would likely drop below the figures shown in table 2.5. Heavy foods, staples, and quick-frying foods can all be cooked on an EPC, which together make up 91 percent of the urban Kenyan menu (table C.1). With the exception of sausages, participants attempted to cook every dish in these three categories at least once. For instance, there were 102 meal events for ugali with a hot plate, but there were also 105 events with a rice cooker and 11 with an EPC. These data could be interpreted as meaning that the EPC was not the preferred device for these foods. However, the cooking diary study looked only at the first month in which participants used these appliances and only minimal training was given. It is likely that experimentation with cooking a broader range of dishes in the EPC did not occur until the end of that period.
This hypothesis is supported by the focus groups and kitchen laboratory experimentation that followed the cooking diary study to produce the eCookBook (Chepkurui, Leary, Numi, et al. 2019; Leary, Fodio Todd, et al. 2019). There was also very limited choice of EPC models in Nairobi at the time, so some participants had to use models with known issues, such as intermittent shallow frying, complicated user interfaces, and inability to deep fry. What is more, as many participants were used to cooking on a four-plate gas stove, the hot plate may well have been chosen simply to allow more dishes to be cooked simultaneously. Households with only a single burner cooking device are forced to cook each dish sequentially.
ENERGY USED FOR COOKING
Table C.2 shows the measured energy demand values for cooking fuels recorded during the cooking diary study (elec-tricity demand values can be found in table 2.6). Tables 2.5 and 2.6 present the normalized values for electricity and fuel consumption (for a 4.2-person household) that were used as inputs for the case study modelling in this report. Table E.7, in appendix E, lists the calorific values of each fuel that were used to convert between energy content and weight.
FIGURE C.6 Number of each category of dish cooked on inefficient (hot plate) and efficient (rice cooker or electric pressure cooker) appliances reported in the Kenya cooking diaries
0
50
100
150
200
250
300
Heavy Foods Staples Quick Fryers Deep Fryers Long Fryers Other
Num
ber o
f Dis
hes
Electric Hotplate EPC Rice Cooker
Note: Omitted from these figures are 127 records for dishes cooked on microwaves and kettles already owned by some participants.

130 ESMAP | Cooking with Electricity: A Cost Perspective
ELECTRICITY LOAD PROFILE
It is important to understand not only the total amount of energy required for cooking but also when that energy is needed. Figure C.7 aggregates the data from all households over all the days on which they cooked solely with elec-tricity to produce a set of load profiles. In Kenya, Zambia, and Tanzania, the lunchtime peak occurs just after midday, enabling solar electricity to be used directly on off-grid
eCooking systems or off-peak electricity on mini grid or national grid systems. In Myanmar, most cooking occurs in the morning, which means that battery storage is required for stand-alone systems. There is an evening peak in all coun-tries, but it is clearly greatest in Kenya, Zambia, and Tanzania. For mini grid or national grid systems where demand peaks in the evening and generating capacity is already at its limit, battery storage or additional generation will be required to meet this additional load.
TABLE C.2 Measured energy consumption for cooking all food on individual traditional fuels, by case study country
FIREWOOD CHARCOAL KEROSENE LPG
CO
UN
TRY
nd MED
IAN
DA
ILY
ENER
GY
PER
HH
e (M
J)
HH
SIZ
Ef
MED
IAN
DA
ILY P
ER
CA
PITA
EN
ERG
Y (M
J)
nd MED
IAN
DA
ILY
ENER
GY
PER
HH
e (M
J)
HH
SIZ
Ef
MED
IAN
DA
ILY P
ER
CA
PITA
EN
ERG
Y (M
J)
nd MED
IAN
DA
ILY
ENER
GY
PER
HH
e (M
J)
HH
SIZ
Ef
MED
IAN
DA
ILY P
ER
CA
PITA
EN
ERG
Y (M
J)
nd MED
IAN
DA
ILY
ENER
GY
PER
HH
e (M
J)
HH
SIZ
Ef
MED
IAN
DA
ILY P
ER
CA
PITA
EN
ERG
Y (M
J)
Kenyaa,b 17 10 4 2.50 129 8.1 3.2 2.53
Myanmar 62 23.9 4.2 5.69 26 32.1 5.9 5.44 26 7.2 3.3 2.18
Tanzaniaa 31 80.4 6.1 13.18 109 14.8 4.1 3.61
Zambiac 71 49.3 6.3 7.83
Note: Data are from cooking diary periods for traditional fuel use only. HH = household.
a. Firewood data were not available in the Kenya or Tanzania cooking diary datasets, so consumption data were estimated using the ratio of firewood: charcoal energy consumption (approximately 1:1) from Myanmar and the ratio of firewood: charcoal energy density (approximately 1:2).
b. Insufficient records were available for charcoal cooking from the cooking diaries study in Kenya to make a reliable measurement of charcoal consumption. As cooking practices are similar to those in Tanzania and electricity consumption was measured to be similar in the two counties, the values for charcoal cooking in Tanzania were also used as model inputs for Kenya.
c. LPG data were not available in the Zambia cooking diary datasets, so consumption data were estimated using the average of the Tanzania: Zambia ratios for charcoal and eCooking with energy-efficient appliances (approximately 2:1).
d. n = number of days of data using only that fuel.
e. Median daily energy per HH = median daily energy consumption (kWh or MJ/household/day).
f. Household size = household members cooked for (mean of means).

131Appendix C: Assessing Electricity Demand for Cooking
FIGURE C.7 Normalized 24-hour load profile aggregated from all households in Myanmar, Kenya, Tanzania, and Zambia
0%
20%
40%
60%
80%
100%
0:00:00
1:00:00
2:00:00
3:00:00
4:00:00
5:00:00
6:00:00
7:00:00
8:00:00
9:00:00
10:00:00
11:00:00
12:00:00
13:00:00
14:00:00
15:00:00
16:00:00
17:00:00
18:00:00
19:00:00
20:00:00
21:00:00
22:00:00
23:00:00
24:00:00
Kenya Myanmar Tanzania Zambia

132 ESMAP | Cooking with Electricity: A Cost Perspective
APPENDIX DCOMPARISON OF ECOOKING APPLIANCES
Table D.1 compares a broad range of eCooking appliances, categorizing them into inefficient conventional, more effi-cient, and most efficient modern appliances. Section 1.4. discusses some of these appliances.
TABLE D.1 Energy efficiency and versatility of eCooking appliances featured in this report
APPLIANCEHEAT TRANSFER
INTO POTHEAT TRANSFER
OUT OF POTTYPICAL POWER REQUIREMENTS SPEED VERSATILITY
Inefficient conventional appliances
Hot plate Conduction when pot in contact with
element
Convection and radiation from uninsulated pot; evaporation without lid
1–2kW per hob(DC: 300–700W)
Average Any pot (round bottom difficult); frying and boiling
Electric oven Convection Cooking chamber insulated, but not sealed; whole oven space around pot/dish heated
1–5kW Slow Baking, roasting, grilling only
More efficient modern appliances
Kettle Conduction via immersed element
Convection and radiation from uninsulated pot; fixed lid, but not completely sealed
1.5–2.5kW Fast Single vessel; water boiling only
Slow cooker Conduction via insulated element
Insulation and fixed lid, but not completely sealed
100–200W Very slow Single deep pot; simmering only
Electric frying pan
Conduction via element stuck to pan
Convection and radiation from uninsulated pot; evaporation without lid
1–2kW Average Single shallow pot only; frying and boiling

133Appendix D: Comparison of eCooking Appliances
APPLIANCEHEAT TRANSFER
INTO POTHEAT TRANSFER
OUT OF POTTYPICAL POWER REQUIREMENTS SPEED VERSATILITY
Induction stove Induction Convection and radiation from uninsulated pot; evaporation without lid
1–2kW per hob Fast frying and bringing to
boil
Any flat-bottomed ferrous pot; frying and boiling
Infra-red stove Radiation Convection and radiation from uninsulated pot; evaporation without lid
1–2kW per hob Fast frying and bringing to
boil
Any flat-bottomed pot; frying and boiling
Halogen oven Radiation Convection and radiation from uninsulated chamber; lid, but not completely sealed
700W–1.5kW Average Baking, roasting, grilling only
Most efficient modern appliances
Rice cooker Conduction via insulated element
Insulation and fixed lid, but not completely sealed
300W–1kW(DC: 200–400W)
Average Single deep pot only; boiling and some frying,
Microwave Microwave Cooking chamber insulated, but not sealed
700W–1.5kW Fast Any nonmetallic dish; boiling
Insulated electric frying
pan
Conduction via insulated element
stuck to pan
Insulation; evaporation without lid
700W–1.5kW Fast frying and bringing to
boil
Single shallow pot only; frying and boiling
Thermo-pot Conduction via immersed element
Insulation and fixed lid, but not completely sealed
500W–1.5kW(DC: 200–400W)
Slow Single vessel; water boiling only
Electric pressure cooker
Conduction via insulated element
Insulation and fixed lid; completely sealed
700W–1.2kW(DC: 200–400W)
Very fast (pressurized)
boiling
Single deep pot only; boiling and some frying
Note: Results are based on findings of focus group discussions in Kenya, Tanzania, Zambia, and Myanmar, as summarized in table 2.1.
Advantage over other appliances No particular advantage over other appliances Disadvantage compared with other appliances

134 ESMAP | Cooking with Electricity: A Cost Perspective
APPENDIX EOUTLINE OF THE ECOOKING MODEL
This appendix overviews the model structure and describes and explains the assumptions made in the modelling, includ-ing for the values used for key model parameters (Leach, Leary, Scott, and Batchelor 2019) provide more detail). The full set of model inputs are summarized for each case study in appendix F.
Model Structure
The model is designed to explore alternative ways to deliver the cooking service currently delivered by traditional stoves and fuels. The important metric is not cost per unit of elec-tricity delivered from an eCooking system but cost per meal.
The eCooking model uses numerical simulations of the cook-ing undertaken by a household and the energy required, linked to a system design model for an eCooking device, either stand-alone (powered by a solar panel and battery) or grid connected. The aim is to be able to compare the costs of eCooking with a baseline alternative (such as cooking with charcoal or LPG).
The model includes a detailed treatment of cooking prac-tices based on primary data, characterization of the costs of the major components based on learning rates, and an empirically based model for battery degradation that captures the high current drain and harsh operating condi-tions for this application.
FIGURE E.1 eCooking model schematic showing key parameters
Solar PV
CookingCharcoal, firewood,kerosene or LPG stoveSolar insolation
• Foods cooked• Electricity required• Fuel stacking choices
• Calorific value of fuel• E�ciency of stove• Unit price of fuel
• Daily peak Sun Hours
Replacements required over 20 year system lifetime
Total discounted investmentand operating cost
Financingassumptions
Cost of Cooking per Day
• Tari�s
• Discount rate• Financing period
Charge controller Battery pack Inverter (for AC Cooking)
Electric Cooking Appliances (AC or DC)
• Power rating • Inverter e�ciency • Other cabling losses• Lifetime • Purchase cost
• Voltage, Storage factor• Minimum depth of charge• Round trip e�ciency• Degradation• Lifetime• Battery capacity • Battery unit price
• Lifetime of PV• Peak power rating• PV unit price
• Power rating• Lifetime of controller• Purchase cost
• Peak load• E�ciency• Lifetime • Purchase costGrid
(National or Mini-)

135Appendix E: Outline of the eCooking Model
The energy needs for cooking define the requirements of one or more eCooking appliances and a matching inverter (if appliance uses AC electricity). The eCooking system is sized to meet a user-defined fraction of this total cooking demand, with the balance met from a specified traditional fuel.
The required battery storage capacity can then be deter-mined, along with a suitable charge controller. The solar PV can be sized based on the daily need for battery charging and the solar insolation available. Alternatively, for an on-grid or on-mini grid application, the load on the grid is calculated. The battery, solar PV (if used), and balance of plant are sized for daily load balancing. A user-defined factor is included, oversizing storage to allow for both unusually high cooking demands and/or reduction in grid or PV supply input so that the system can “ride through” an unusually cloudy day without the battery running flat, for example. Power losses are modelled in the wiring (typically 5 percent), the charge/discharge cycle (typically 10 percent), and the inverter (if used).
Appropriate information is thus needed on each of the elements in this system, first for the system design and sizing and then for costing. Financing assumptions follow the business model to be represented, with the final result a comparison of the daily costs of the eCooking system and cooking with traditional fuel purchases.
SolarSOLAR INSOLATION AND PV OUTPUT
The job of the PV system in this application is to deliver suffi-cient electricity each day to recharge the batteries so that they are able to deliver the required electricity for cooking. A simple deterministic approach is taken to balancing electric-ity inputs and outputs within each day, estimating the aver-age daily electricity output per kW peak and sizing the PV panels so that this average output is sufficient to recharge the batteries that day. However, a factor is added to explore the cost of increasing battery capacity so that it can “ride through” one or more days of low PV output, delivering cooking service without running out before it is recharged; PV capacity is increased to match any such increase in battery capacity.
Although a fully dynamic model is beyond the scope of this study, it is essential to consider seasonal variation in
irradiance, as additional battery capacity cannot help smooth out month by month changes in PV output. Irradiance declines in the winter or monsoon months and rises in the summer or dry seasons. The PV-battery cooking system can be sized in two ways: (a) with a larger PV to operate year round as the principal means of cooking or (b) with a smaller PV, capable of producing sufficient energy each day in sunnier periods. The latter might work perfectly well for some households happy to fuel stack. However, although a smaller system would be cheaper, the capital cost of the system is spread out over fewer days, affecting its afford-ability. In some locations, the variation in irradiance can be large—easily a factor of two—making the choice between a small or large system important. However, in many places in Africa the variation is much smaller. The model defaults to sizing the system so that it operates year-round and explores alternatives in sensitivity analysis. The model also calculates the likely “surplus” electricity stored in the battery each day during sunnier periods, which will be available for other elec-tricity end-uses as a co-benefit.
The online calculator of the European Union’s PVGIS project (Šúri, Huld, and Dunlop 2005) can be used to estimate PV electricity generation (per 1kW peak or rated output), with user selection of the location of the system. The main result is the average daily electricity output per kWpeak. The aver-age value for the month with the lowest output is used to size the system to operate year-round).
The solar PV is sized as follows:
CPV: Capacity of PV (kWp)
Edischarge: Daily battery discharge required (kWh/day)
Ed,min: Average daily electricity production in the least sunny month (kWh/kWp/day)
ηbattery: Battery roundtrip efficiency ( percent)
FPV decay: PV performance decay factor ( percent over lifetime)
FPV oversize: Uprating factor to match battery oversize ( percent).
PV COSTS
A solar PV system can be described as a set of PV modules comprising individual solar cells held in some form of casing and the balance of system, made up of wiring, installation equipment, and any inverter needed. For most PV systems, such as residential power or utility-scale solar farms, there is also a significant installation cost. For the current application, the installation costs should be low.

136 ESMAP | Cooking with Electricity: A Cost Perspective
PV cost projections are derived from historic data on module prices (IRENA 2018), demonstrating current prices of about $0.4/kWh. Price projections are based on expectations of growth in PV installed capacity leading of 1,760GW by 2030 (IRENA, 2016), up from some 500GW today (IRENA 2019) and the learning rate (the percent cost reduction for each doubling of installed capacity). Historically, the PV module learning rate has been 18–22 percent, but IRENA (2019) suggest 35 percent between 2010 and 2020. A continued learning rate of 20 percent for modules out to 2030 is assumed here.
To the resulting factory gate prices for modules alone, costs are added for balance of plant (estimated as 15 percent, prin-cipally for wiring costs, following IRENA [2012]) and on-costs for transport and retailing in the study country (estimated as 40 percent). Table E.1 shows the default PV price assump-tions used in the model.
BatteriesThis study focuses on the specific end-use of residen-tial-scale off-grid battery storage coupled with generation from solar PV, with relatively rapid discharge on a daily cycle, in what may well be hot and dusty conditions. The set of technical performance characteristics and specifications for batteries is complex and interwoven. For example, the number of cycles possible depends directly on the typical depth of discharge, and the relationships between these parameters is highly dependent on the specific battery type and chemistry as well as the management systems applied. This modelling seeks to identify key characteristics and realistic ranges of values for each parameter, through which sensitivity analysis of the performance and costs of the system can be performed.
It is not easy to transfer data on battery performance in the literature to this specific eCooking application, because battery lifetime is complex, influenced by battery chemistry and construction, the conditions in the operating environ-ment, and the loads drawn. Leach and Oduro (2015) discuss these issues.
TABLE E.1 PV prices by model year ($/Wp)
YEAR TOTAL PRICEMODULE COST (AT
FACTORY GATE)OTHER BALANCE OF
SYSTEM COSTS SALES COSTS
2018 0.72 0.46 0.07 0.19
2019 0.68 0.44 0.07 0.18
2020 0.65 0.42 0.06 0.17
2021 0.62 0.40 0.06 0.16
2022 0.59 0.38 0.06 0.15
2023 0.57 0.37 0.06 0.15
2024 0.56 0.36 0.05 0.14
2025 0.54 0.35 0.05 0.14
2026 0.53 0.34 0.05 0.14
2027 0.52 0.33 0.05 0.13
2028 0.50 0.33 0.05 0.13
2029 0.49 0.32 0.05 0.13
2030 0.48 0.31 0.05 0.12

137Appendix E: Outline of the eCooking Model
BATTERY SIZING
The model focuses on lithium-Ion batteries, using iron-phosphate chemistry. Table E.2 shows the parameters used in the model for the required battery capacity, with illustrative values representing an example system.
Fstorage= × × ×EdischargeCbatt1
1 DoDmin− Fdecay 1+
= ×Edischarge ηinverter
Ebatt,avg ωcable1 +
The evidence base on battery performance and decay for cooking applications (high power draw) in high ambient
temperature conditions is thin. The model of Wang et al. (2011) is used, which presents a generalized model for graph-ite-LiFePO4 cells (table E.3 sets out the parameters and the illustrative values).
=Fcycledecay I 0.55A exp× ×× Crate31700 370.3−
×R T+
So rearranging:
= 0.55I Fcycledecay
A exp×× Crate31700 370.3−
×R T+
TABLE E.2 Lithium-Ion battery capacity model parameters
PARAMETER NOTATION ILLUSTRATIVE VALUE
Daily battery discharge required Edischarge 0.60 kWh/day
Average electricity input to cooking appliance from battery Ebatt,avg 0.51 kWh/day
Inverter efficiency ηinverter 0.9 (90 percent)
Cable losses ωcable 0.05 (5 percent)
Required battery capacity Cbatt 0.83 kWh
Daily battery discharge required Edischarge 0.6 kWh/day
Storage oversize factor (days [1 = full charge/discharge each day]) Fstorage 1
Minimum remaining charge level DoDmin 0.2 (20 percent)
Additional design capacity added to account for decay loss in capacity of the battery (default is to add half the capacity lost by end of life: 20 percent/2 = 10 percent)
Fdecay 0.1 (10 percent)
TABLE E.3 Battery decay model parameters
PARAMETER NOTATION ILLUSTRATIVE VALUE
Ah-throughput (amount of charge delivered by battery during its lifetime) I 3,600Ah
Loss of capacity as a result of charge and discharge over the operating life; normally chosen to be 20 percent
Fcycledecay 0.2 (20 percent)
Pre-exponential factor, empirically dependent on Crate, calculated below A 31,630 (see figure E.2)
C rate (discharge current divided by the theoretical current draw under which battery would deliver its nominal rated capacity in one hour)
Crate 0.5 (full discharge in 2 hours)
Universal gas constant R 8.314 J/mol K
Battery temperature T 40°C

138 ESMAP | Cooking with Electricity: A Cost Perspective
Now,
= × ×I Cycleslife DoDavg Full cell capacity
So
= I Cycleslife ×DoDavg Full cell capacity
For the value of A, Wang et al. (2011) present an empirical relationship between A and discrete values of Crate (from 0.5 to 10). Figure E.2 shows the discrete values and the esti-mated continuous C rate used in the model.
Thus the cycle life of the battery can be estimated based on the operating temperature and the current drawn for cooking. It would typically be 2,300 cycles, or six years of daily use.
BATTERY PRICES
There is little evidence reported in the literature on the costs of modern batteries as implemented in developing coun-tries at household or mini grid scales. Projection of battery prices is undertaken here based on expectations for electric vehicles, with assumptions for the transfer of learning to the eCooking market. Leach and Oduro (2015) provide a detailed discussion of the historical evolution of battery prices.
The annual Bloomberg New Energy Finance (BNEF) battery price survey shows that prices have continued to fall—at a faster rate than anticipated. In its publicly available data, BNEF shows only a single set of average historic prices and forecasts, acknowledging that there will be variation around the mean (Goldie-Scot 2019). Figure E.3 shows their most recent results.
TABLE E.4 Battery cycle life model parameters
PARAMETER NOTATION ILLUSTRATIVE VALUE
Charge/discharge cycles before battery is replaced Cycleslife 2,300
Ah-throughput (amount of charge delivered by battery during its lifetime) I 3,600Ah
Average depth of discharge in cycling DoDavg 0.8 (80 percent)
Full cell capacity (standard cell size used to derive empirical relationship) 2Ah
FIGURE E.2 Empirical relationship for battery life model
0 2 4 6 8 10 12
C Rate
y = 448.96x2 – 6301.1x + 33840
0
5000
10000
15000
20000
25000
30000
35000
Pre
-exp
onen
tial A
val
ue
A values

139Appendix E: Outline of the eCooking Model
Factors were used to transfer these projections for electric vehicle battery pack prices into estimates for eCooking battery packs. As suggested by Frith (2017), 51 percent was added to account for the typical cost premium for stationary battery pack prices. Another 20 percent was added to reflect the costs for transport and import into Africa, leading to esti-mates of $270/kWh in 2020 and $161/kWh by 2025.
The use of static factors of this sort represents a major simplification. However, there is little evidence on the real costs of household-scale battery pack prices in Africa; further analysis is required in this area. New battery chemistries may also enter the market, offering improved performance, longer lifetimes, and lower costs. Limited data or market intelligence on these developments are available, however. Sensitivity analysis will need to take account of the uncer-tainty about battery performance and prices .
Balance of System
In addition to the PV/grid supply, battery, and cooking appli-ances, other components are required to ensure an efficient, safe, and long-lasting eCooking device. They include the battery charge controller, the battery management system, the inverter, and additional wiring.
BATTERY CHARGE CONTROLLER
A controller is needed to manage the interaction between the source of electricity (grid or PV panel) and the batteries, in order to protect the battery from being overcharged or overdischarged, to protect against battery overheating, and to maximize the efficiency of the use of the solar power. The model allows user choice between cheaper pulse width modulation (PWM) and more expensive and more efficient maximum power point tracking (MPPT) controllers: for the current report, PWM has been chosen.
All PV controllers need to be sized to cope with the system’s voltage and the maximum amount of current that might flow through them. To size the PWM controller, the required rated current in amps is calculated from the PV output wattage divided by the PV’s peak power output voltage (for exam-ple, 17v), which is taken from the solar PV panel or array specifications. It is recommended to oversize the controller to allow for peak outputs and to provide a safety margin against overheating in continuous use. The modelling here allows separate user-defined safety factors for each of these margins, defaulting to +25 percent each, following typical industry practice.
The cost of the controller depends strongly on its rated capacity. However, at any capacity level, there is a wide price range for battery charge controllers, reflecting the features (for example, the degree of battery temperature protection
FIGURE E.3 Actual and forecasted prices of battery packs, 2010–25
0
100
200
300
400
500
600
700
800
900
1000
1100
1200
2010 2011 2012 2013 2014 2015 2016 2017 2018 2019 2020 2021 2022 2023 2024 2025
Bat
tery
Pac
k P
rice
($/k
Wh)
EV battery packs EV battery packs (forecast) eCook battery pack (forecast)
Note: EV = electric vehicle.
Source: Goldie-Scot (2019).
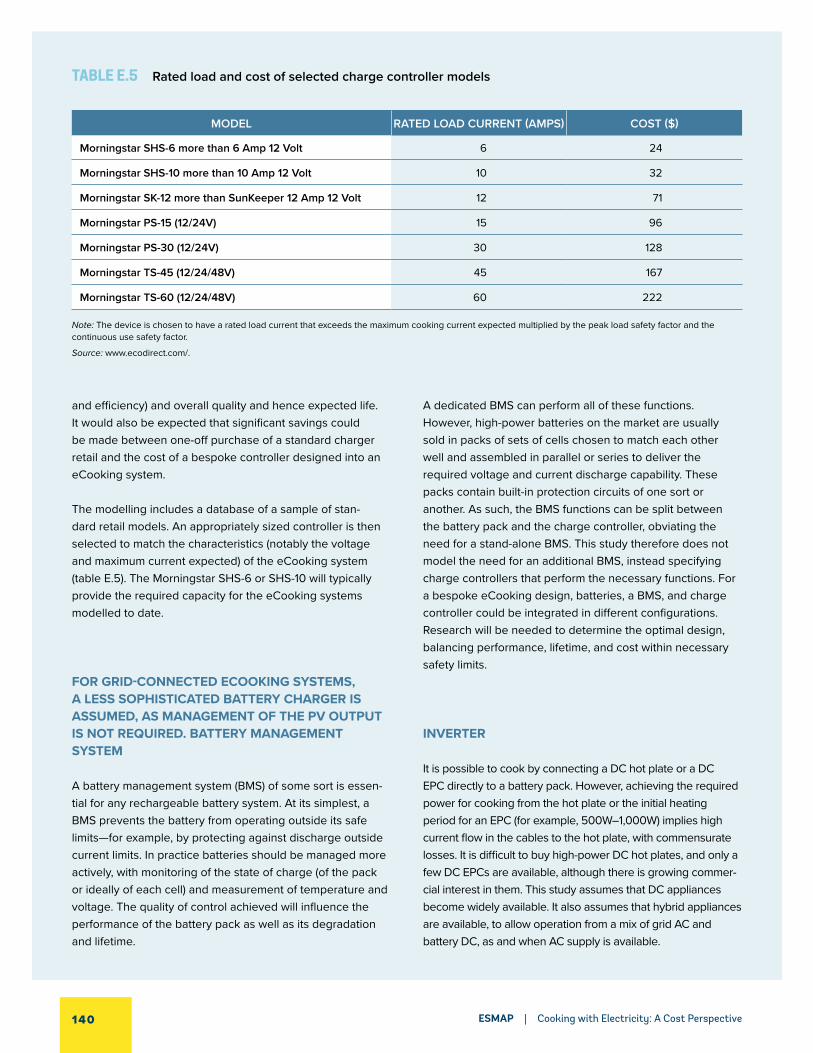
140 ESMAP | Cooking with Electricity: A Cost Perspective
and efficiency) and overall quality and hence expected life. It would also be expected that significant savings could be made between one-off purchase of a standard charger retail and the cost of a bespoke controller designed into an eCooking system.
The modelling includes a database of a sample of stan-dard retail models. An appropriately sized controller is then selected to match the characteristics (notably the voltage and maximum current expected) of the eCooking system (table E.5). The Morningstar SHS-6 or SHS-10 will typically provide the required capacity for the eCooking systems modelled to date.
FOR GRID-CONNECTED ECOOKING SYSTEMS, A LESS SOPHISTICATED BATTERY CHARGER IS ASSUMED, AS MANAGEMENT OF THE PV OUTPUT IS NOT REQUIRED. BATTERY MANAGEMENT SYSTEM
A battery management system (BMS) of some sort is essen-tial for any rechargeable battery system. At its simplest, a BMS prevents the battery from operating outside its safe limits—for example, by protecting against discharge outside current limits. In practice batteries should be managed more actively, with monitoring of the state of charge (of the pack or ideally of each cell) and measurement of temperature and voltage. The quality of control achieved will influence the performance of the battery pack as well as its degradation and lifetime.
A dedicated BMS can perform all of these functions. However, high-power batteries on the market are usually sold in packs of sets of cells chosen to match each other well and assembled in parallel or series to deliver the required voltage and current discharge capability. These packs contain built-in protection circuits of one sort or another. As such, the BMS functions can be split between the battery pack and the charge controller, obviating the need for a stand-alone BMS. This study therefore does not model the need for an additional BMS, instead specifying charge controllers that perform the necessary functions. For a bespoke eCooking design, batteries, a BMS, and charge controller could be integrated in different configurations. Research will be needed to determine the optimal design, balancing performance, lifetime, and cost within necessary safety limits.
INVERTER
It is possible to cook by connecting a DC hot plate or a DC EPC directly to a battery pack. However, achieving the required power for cooking from the hot plate or the initial heating period for an EPC (for example, 500W–1,000W) implies high current flow in the cables to the hot plate, with commensurate losses. It is difficult to buy high-power DC hot plates, and only a few DC EPCs are available, although there is growing commer-cial interest in them. This study assumes that DC appliances become widely available. It also assumes that hybrid appliances are available, to allow operation from a mix of grid AC and battery DC, as and when AC supply is available.
TABLE E.5 Rated load and cost of selected charge controller models
MODEL RATED LOAD CURRENT (AMPS) COST ($)
Morningstar SHS-6 more than 6 Amp 12 Volt 6 24
Morningstar SHS-10 more than 10 Amp 12 Volt 10 32
Morningstar SK-12 more than SunKeeper 12 Amp 12 Volt 12 71
Morningstar PS-15 (12/24V) 15 96
Morningstar PS-30 (12/24V) 30 128
Morningstar TS-45 (12/24/48V) 45 167
Morningstar TS-60 (12/24/48V) 60 222
Note: The device is chosen to have a rated load current that exceeds the maximum cooking current expected multiplied by the peak load safety factor and the continuous use safety factor.
Source: www.ecodirect.com/.

141Appendix E: Outline of the eCooking Model
The model also allows for an alternative approach: use of a DC to AC inverter, allowing the use of readily available and low-cost AC electric hot plates and other AC cooking appli-ances. The other advantage of integrating an inverter is that the household could potentially use the resulting AC power for other purposes (lighting, mobile phone charging, radio, TV). The use of an inverter is not modelled in the current study, but the model is able to do so. Modelling of systems with an inverter and the use of different combinations of AC and DC appliances will be necessary in the future.
Different inverter technologies offer varying quality in output power. There are three main types: sine wave, modified sine wave, and square wave. Most devices will operate accept-ably well with a modified sine wave.
There is a wide range of specifications and prices for inverters on the market. This model includes a small data-base of popular types (table E.6). Sizing is based on both the continuous power rating required, to meet anticipated cooking loads, and the “surge” rating (the maximum power the inverter can supply for a short period), to cope with the high start-up load some devices draw. Modern inverters can typically cope with a surge of up to 300 percent for 3–15 seconds, which is sufficient to cope with the load profile of almost all appliances. Inverters are not 100 percent efficient: The model includes a user-defined value for efficiency, defaulting to 90 percent. The efficiency affects the required battery sizing and hence the PV sizing (or power drawn from the grid).
ADDITIONAL BALANCE OF SYSTEM
The rest of the model looks at the major components as individual items, sizing and choosing them from databases of typical options on the market rather than attempting an engineering design of an integrated whole system. In terms
of impact on likely costs of a real system, this approach has both positive and negative effects. A bespoke eCooking design should be able to achieve some cost savings by integrating functionality in, for example, battery control and sizing components more precisely. However, it would add costs (for system wiring, for example) that are not captured by assuming a collection of stand-alone components.
The potential benefits of tighter system integration in mass-market eCooking design are ignored at this stage, in order to avoid making overly optimistic assumptions. However, the additional balance of system, such as wiring, is reflected in a user-defined parameter, defaulting by adding 5 percent to the total system investment cost.
Cooking Appliances
Data from the cooking diary studies were used to estimate the energy required for cooking with different fuels and electricity. The current version of the model was set up to represent hot plates and EPCs. Devices were assumed to be either low-cost two-ring hot plates purchased for $20 or EPCs purchased for $50 (Leary et al. 2018 provide a review of EPCs).
Component Lifetimes and Replacements
Each component is assigned a technical lifetime within an overall system modelling horizon of 20 years, chosen to reflect the notional lifetime of the longest-lived major component, the PV. The battery lifetime is derived from the
TABLE E.6 Capacity and cost of selected modified sine wave (12v) inverter models
MODEL INVERTER OUTPUT CONTINUOUS LOAD (KW) COST ($)
Samlex SAM-1000-12 1.0 96.29
Samlex SAM-1500-12 1.5 174.93
Samlex SAM-2000-12 2.0 251.75
Samlex SAM-3000-12 3.0 367.50
Source: EcoDirect (2020).

142 ESMAP | Cooking with Electricity: A Cost Perspective
decay model presented above. Component replacement is modelled throughout the system life, with additional capital cost added each time a replacement component is needed. The model allows for changes in the cost of components over time, such that replacements are made with the costs expected at the time of replacement. Cost changes are most significant for batteries, for which significant cost reductions are projected and which require one or more replacements during the 20-year system lifetime. Table E.7 shows the assumptions made for lifetime and replacement cost param-eters. All parameter values are user-definable and therefore open to sensitivity analysis.
Business Models and Investment Financing
The model is structured to calculate the costs required to deliver the eCooking service for 20 years, including replace-ment costs for the other components during that period. The basis of the service fee calculation is the levelized cost of the cooking service, expressed as the monthly cost of cooking.
System cost is the sum of operating costs (grid electricity purchase, traditional fuel purchase); the initial capital cost; installation costs; and component replacement costs. Costs are discounted back to present-day values using a user- defined discount rate. The cost basis throughout the model uses real costs, ignoring inflation; a real discount rate is therefore applied.5 The key output metric is the net present
5 A 9.6 percent real discount rate is used throughout, following (Lombardi et al. 2019) the techno-economic feasibility of e-cooking has never been evaluated through (i. Reported interest rates are frequently nominal rates, taking no account of the effect of inflation. For a country with average inflation of 10 percent (typical in parts of East Africa), a 9.6 percent real equates to a 19.6 percent nominal rate.
cost of cooking per month, which can be directly compared with the cost of traditional fuel purchases to undertake the same cooking.
The core business model envisages a supplier of the eCook-ing service who pays the initial and replacement capital costs over the 20-year period in exchange for a daily or monthly user fee, as it is unrealistic to imagine that a low-income user would make any form of agreement for 20 years. A 20-year financing model could reflect some form of utility-based business model, where the electricity supplier bears the risk and recovers the investment costs through an additional fee alongside the regular bill. Some other risk-bearing arrange-ment with the same effect is conceivable if installation of eCooking devices is made part of national energy access infrastructure or via development aid or carbon finance.
The more traditional model would be for cost recovery over a shorter period, as for solar home systems. The model thus incorporates a shorter time period for this form of commer-cial business model. The time period is user-definable. This study uses five years—still longer than for many commer-cial services, including solar home systems (for example, two years). Further innovation in business models may be needed to make this high-capital cost type of appliance and service accessible.
The normal practice in similar markets is that after the end of the financing period, ownership of the equipment transfers to the user. This means that responsibility for further compo-nent replacements also transfers to the user, with the risk that the system falls into disrepair and thus disuse when a major component fails.
TABLE E.7 Lifetime and price assumptions about eCooking components
COMPONENT LIFETIME (YEARS) PROJECTED PRICE TRAJECTORY
Overall eCooking system 20 Based on components
PV 20 Decline, based on learning rate
Battery Calculated in model Decline, based on learning rate
Inverter 10 Decline by 2 percent a year
Charge controller 6 Decline by 2 percent a year
Cooking appliances 5 Constant

143Appendix E: Outline of the eCooking Model
Fuel/Appliance Stacking
The model seeks to represent the energy used to meet a household’s daily cooking requirements, which can be met by an eCooking system sized to meet the full cooking load itself or by a combination of a smaller eCooking system and fuel stacking with a traditional fuel and/or grid electricity directly. The proportions of each source are user defined. The characteristics of each energy source are defined by parameters for traditional fuels (calorific value, CO2-eq emissions per kWh, price per kWh) and for grid electricity (marginal CO2-eq emissions per kWh, price per kWh for a series of tariff bands [free lifeline plus up to three tariff bands can be user-defined]).
All parameter values are user-definable; ideally, they come from the area being studied. Fuel and electricity prices in particular vary widely by location and change over time, and electricity emission factors vary by country. The assump-tions used in this study are described in the main body of the report. Table E.8 shows the default calorific values and greenhouse gas emission factors for traditional fuels. If These figures can be tailored to reflect local conditions.
Treatment of UncertaintyThere is a wide range of uncertainty in the design, sizing, and costing of a system to deliver cooking services. The modelling distinguishes between parameters for which the values are uncertain as a result of four factors:
TABLE E.8 Calorific value and greenhouse gas emissions of selected fuels
FUELCALORIFIC VALUE (KWH/KG, LOWER
HEATING VALUE)GREENHOUSE GAS EMISSIONS FACTOR
(KG CO2-EQ EMISSIONS PER KWH)
Charcoal 7.9 0.32168
Firewood 4.1 0.015a
LPG 12.6 0.2303
Kerosene 11.9 0.2574
Note: a. The greenhouse gas emission factor for firewood depends on assumptions about the sustainability of wood harvesting. It is assumed here that wood is harvested sustainably, with replanting and regrowth. The low emission factor reflects non-CO2 emissions.
TABLE E.9 Parameter values used for the high- and low-cost scenarios for eCooking systems
2020 2025
PARAMETER LOW-COST VALUE HIGH-COST VALUE LOW-COST VALUE HIGH-COST VALUE
Battery price (lithium-ion, $/kWh) 280 350 180 220
Battery minimum depth of charge (percent)
10 20 10 20
Battery life (cycles) 3,000 2,000 3,000 2,000
PV-battery roundtrip efficiency (percent)
90 85 90 85
Fuel prices 2/3 of 2018 mean valuea
4/3 of 2018 mean value
2018 low value + 3 percent/year
2018 high value + 3 percent/year
Note: All financial values are in 2018 dollars.
a. Some values are from late 2017 or early 2019.

144 ESMAP | Cooking with Electricity: A Cost Perspective
● different or varying household cooking needs and practices
● uncertainty in appropriate values for parameters
● different financing assumptions
● changes in parameter values over time.
Application of the model in this study is intended to be illustrative and not comprehensive. It focuses on appropriate values for parameters, captured through sets of assumptions that lead to lower or higher cost systems, and changes in values over time, through a comparison between eCooking systems implemented in 2020 or 2025. For changes over time, two main differences are represented: (a) declining costs for eCooking as a result of technical and organizational learning and (b) an assumption of increasing charcoal, LPG, firewood, and kerosene prices.
Table E.9 shows the assumptions, most of which are discussed in the report. Fuel prices reflect results obtained from household surveys carried out alongside the cooking diary studies in 2017–19 and an assumption of 3 percent annual price increases thereafter. A high/low range is then applied around these values by adding/subtracting one-third.
Model Implementation
The model is implemented in Microsoft Excel, using a set of Visual Basic macros to automate certain processes. The structure is modular, with separate tabs for each major component and modelling process.
Implementation is intended to be user-friendly, but the model remains a research tool, lacking a comprehen-sive graphical user interface. Drop-down boxes are used for discrete choices, and parameter values can be entered directly throughout the spreadsheet, with cells intended for user-input indicated by red outlines. The screenshot in figure E.4 is of the front tab, where key user choices are brought together, along with reporting of key results.
This is a simulation model and is computationally not inten-sive. The input data and output results can be saved at any moment to a tab that accumulates results, so that a series of scenario or sensitivity runs (for example, incrementing the cost of charcoal) can be run very easily.
FIGURE E.4 Screenshot of eCook model user interface

145Appendix F: Model Input Data
APPENDIX FMODEL INPUT DATA
Table F.1 presents the parameter values used as inputs to the model and shows key intermediate and final calculated outputs. Not all variants shown in the table are relevant to
every case study, and not all components are used in every case study (for example, PV is used only in case 5). For this reason, some cells are empty.

146 ESMAP | Cooking with Electricity: A Cost Perspective
TAB
LE F
.1
Mod
el p
aram
eter
s an
d va
lues
use
d
Case
1 Na
irobi
, Ken
ya
Input, INT mediate, Output
Inst
alla
tion
ye
ar
2020
2020
2020
2020
2020
2020
2020
2020
2020
2025
2025
2025
2025
2025
2025
2025
2025
2025
Desc
riptio
nUr
ban
hous
ehol
ds sw
itch
from
char
coal
to
eCoo
k &
LPG
Cook
ing
scen
ario
100% AC electric
100% DC battery- electric
50% AC, 50% Batt DC
50% AC, 50% Traditional
50% batt DC, 50% Traditional
100% charcoal
100% LPG
100% firewood
100% Kerosene
100% AC electric
100% DC battery- electric
50% AC, 50% Batt DC
50% AC, 50% Traditional
50% batt DC, 50% Traditional
100% charcoal
100% LPG
100% firewood
100% Kerosene
Com
pone
ntPa
ram
eter
Units
Cook
ing
eCoo
k ele
ctric
ity u
se fo
r coo
king
IkW
h/da
y1.9
21.9
21.9
20.
640.
641.9
21.9
21.9
20.
640.
64Fu
el st
acke
d wi
th e
Cook
: cha
rcoa
lIN
Tkg
/day
0.87
0.87
0.87
0.87
Fuel
stac
ked
with
eCo
ok: L
PGIN
Tkg
/day
0.11
0.11
0.11
0.11
Fuel
stac
ked
with
eCo
ok: f
uelw
ood
INT
kg/d
ayFu
el st
acke
d wi
th e
Cook
: ker
osen
eIN
Tkg
/day
0.12
0.12
0.12
0.12
Base
line:
fuel
use
d: ch
arco
alIN
Tkg
/day
1.75
1.75
Base
line:
fuel
use
d: LP
GIN
Tkg
/day
0.23
0.23
Base
line:
fuel
use
d: fu
elwo
odIN
Tkg
/day
Base
line:
fuel
use
d: ke
rose
neIN
Tkg
/day
0.25
0.25
Cook
ing
appl
iance
sAp
plian
ce(s)
use
dI
EPC
& ho
tplat
eEP
C &
hotp
late
EPC
& ho
tplat
eEP
CEP
CEP
C &
hotp
late
EPC
& ho
tplat
eEP
C &
hotp
late
EPC
EPC
Lifet
ime
of co
okin
g ap
plian
ces
IYe
ars
55
55
55
55
55
Purc
hase
cost
of co
okin
g ap
plian
ces
I$
70.0
70.0
70.0
50.0
50.0
63.3
63.3
63.3
45.2
45.2
Elect
ricity
inpu
tsSo
urce
of e
lect
ricity
IGr
idGr
idGr
idGr
idGr
idGr
idGr
idGr
idGr
idGr
idAC
or D
C co
okin
gI
ACDC
Hybr
idAC
DCAC
DCHy
brid
ACDC
Fuel
pric
esEle
ctric
ity ta
riffs
I$/
kWh
0.17
0.17
0.17
0.17
0.17
0.17
0.17
0.17
0.17
0.17
Char
coal
I$/
kg (L
ow, H
igh)
0.4,
0.6
0.4,
0.6
0.4,
0.6
0.46
, 0.70
0.46
, 0.70
0.46
, 0.70
LPG
I$/
kg (L
ow, H
igh)
0.8,
1.5
0.8,
1.5
0.8,
1.5
0.93
, 1.74
0.93
, 1.74
0.93
, 1.74
Firew
ood
I$/
kg (L
ow, H
igh)
Kero
sene
I$/
kg (L
ow, H
igh)
0.87
, 1.6
20.
87, 1
.62
0.87
, 1.6
21.0
1, 1.8
81.0
1, 1.8
81.0
1, 1.8
8PV
sizin
gLif
etim
eI
Year
sEn
ergy
from
solar
irra
dian
ceI
KWh/
KWpe
akPV
per
form
ance
dec
ay (a
nd o
vers
ize fa
ctor
)I
% ov
er lif
eCo
okin
g di
rect
ly fro
m P
VI
%De
sign
peak
pow
er ra
ting
INT
Wpe
akUn
it pr
ice (d
elive
red)
I$/
Wpe
akPu
rcha
se co
st of
PV
pane
lsO
$Ch
arge
co
ntro
ller
Lifet
ime
IYe
ars
66
66
66
Char
ge co
ntro
ller c
apac
ity (in
cl. sa
fety
fact
ors)
INT
Amps
126
612
66
Batte
ry ch
argi
ng ro
undt
rip e
fficie
ncy
I%
(Low,
Hig
h)90
, 85
90, 8
590
, 85
90, 8
590
, 85
90, 8
5Pu
rcha
se co
st of
cont
rolle
rO
$9.
229.
229.
228.
348.
348.
34Pu
rcha
se co
st of
addi
tiona
l Bala
nce
of S
yste
mO
$39
.4, 4
9.113
.4, 1
6.7
13.4
, 16.
725
.4, 3
1.08.
8, 10
.68.
8, 10
.6Ba
ttery
Batte
ry vo
ltage
IV
24.0
24.0
24.0
24.0
24.0
24.0
Batte
ry m
inim
um d
epth
of c
harg
eI
%20
.020
.020
.020
.020
.020
.0Us
eabl
e m
ax ca
pacit
y rem
ainin
g at
repl
acem
ent
I%
(Low,
Hig
h)90
.0, 8
0.0
90.0
, 80.
090
.0, 8
0.0
90.0
, 80.
090
.0, 8
0.0
90.0
, 80.
0Ca
pacit
y add
ition
to ac
coun
t for
dec
ayI
%10
.010
.010
.010
.010
.010
.0Effi
cienc
y los
s in
wirin
gI
%5.
05.
05.
05.
05.
05.
0Cy
cle lif
etim
e of
bat
tery
INT
Cycle
s (Lo
w, H
igh)
3000
, 20
0030
00,
2000
3000
, 20
0030
00,
2000
3000
, 20
0030
00,
2000
Batte
ry ca
pacit
yIN
TkW
h2.
80.
930.
932.
80.
930.
93Un
it pr
ice (d
elive
red)
I$/
kWh (
Low,
High
)28
0, 3
5028
0, 3
5028
0, 3
5018
0, 2
2018
0, 2
2218
0, 2
26Pu
rcha
se co
st of
bat
tery
O$ (
Low,
High
)77
7.8,
972.
325
9.0,
32
4.0
259.
0,
324.
050
0.0,
61
1.116
7.4,
204.
616
7.4,
204.
6To
tal s
yste
mIn
itial
purc
hase
cost
O$ (
Low,
High
)70
.00
896.
4,
1100 .
635
1.6,
419.
950
.0, 5
0.0
331.6
, 39
9.9
63.3
059
7.0,
713.7
247.8
, 28
6.9
45.2
, 45.
222
9.7,
268.
8

147Appendix F: Model Input Data
Case
2: e
fficie
nt
appl
ianc
esLu
saka
, Zam
bia
Input, INT mediate, Output
Inst
alla
tion
year
2020
2020
2020
2020
2020
2020
2020
2020
2020
2025
2025
2025
2025
2025
2025
2025
2025
2025
Desc
riptio
nUr
ban
hous
ehol
ds u
sing
elec
tricit
y,
switc
h to
effi
cient
app
lianc
esCo
okin
g sc
enar
io
100% AC electric
100% DC battery- electric
50% AC, 50% Batt DC
50% AC, 50% Traditional
50% batt DC, 50% Traditional
100% charcoal
100% LPG
100% firewood
100% Kerosene
100% AC electric
100% DC battery- electric
50% AC, 50% Batt DC
50% AC, 50% Traditional
50% batt DC, 50% Traditional
100% charcoal
100% LPG
100% firewood
100% Kerosene
Com
pone
ntPa
ram
eter
Units
Cook
ing
eCoo
k ele
ctric
ity u
se fo
r coo
king
IkW
h/da
y0.
870.
870.
870
290.
290.
870.
870.
870.
290.
29Fu
el st
acke
d wi
th e
Cook
: cha
rcoa
lIN
Tkg
/day
0.52
0.52
0.52
0.52
Fuel
stac
ked
with
eCo
ok: L
PGIN
Tkg
/day
0.03
0.08
0.08
0.08
Fuel
stac
ked
with
eCo
ok: f
uelw
ood
INT
kg/d
ayFu
el st
acke
d wi
th e
Cook
: ker
osen
eIN
Tkg
/day
Base
line:
fuel
use
d: ch
arco
alIN
Tkg
/day
1.04
1.04
Base
line:
fuel
use
d: LP
GIN
Tkg
/day
0.17
0.17
Base
line:
fuel
use
d: fu
elwo
odIN
Tkg
/day
Base
line:
fuel
use
d: ke
rose
neIN
Tkg
/day
Cook
ing
appl
iance
sAp
plian
ce(s)
use
dI
EPC
&ho
tplat
eEP
C &
hotp
late
EPC
&ho
tplat
eEP
CEP
CEP
C &
hotp
late
EPC
& ho
tplat
eEP
C &
hotp
late
EPC
EPC
Lifet
ime
of co
okin
g ap
plian
ces
IYe
ars
55
55
55
55
55
Purc
hase
cost
of co
okin
g ap
plian
ces
$70
.070
7050
5063
.363
6345
45Ele
ctric
ity in
puts
Sour
ce o
f ele
ctric
ityI
Grid
Grid
Grid
Grid
Grid
Grid
Grid
Grid
Grid
Grid
AC o
r DC
cook
ing
IAC
DCHy
brid
ACDC
ACDC
Hybr
idAC
DCFu
el p
rices
Elect
ricity
tariff
sI
$/kW
h0.
010.
010.
010.
010.
010.
010.
010.
010.
010.
01Ch
arco
alI
$/kg
(Low
, High
)0.1
5, 0.
300.1
5, 0.
300.1
5, 0.
300.1
7, 0.
350.1
7, 0.
350.1
7, 0.
35LP
GI
$/kg
(Low
, High
)1.5
0, 2
.50
1.50,
2.5
01.5
0, 2
.50
1.74,
2.9
01.7
4, 2
,90
1.74,
2.9
0Fir
ewoo
dI
$/kg
(Low
, High
)Ke
rose
neI
$/kg
(Low
, High
)PV
sizin
gLif
etim
eI
Year
sEn
ergy
from
solar
irra
dian
ceI
KWh/
KWpe
akPV
per
form
ance
dec
ay (a
nd o
vers
ize fa
ctor
)I
% ov
er lif
eCo
okin
g di
rect
ly fro
m P
VI
%De
sign
peak
pow
er ra
ting
INT
Wpe
akUn
it pr
ice (d
elive
red)
I$/
Wpe
akPu
rcha
se co
st of
PV
pane
ls0
$Ch
arge
co
ntro
ller
Lifet
ime
IYe
ars
66
66
66
Char
ge co
ntro
ller c
apac
ity (in
cl. sa
fety
facto
rs)IN
TAm
ps6
66
66
6Ba
ttery
char
ging
roun
dtrip
effi
cienc
yI
% (Lo
w, H
igh)
90,8
590
,85
90, 8
590
,85
90, 8
590
, 85
Purc
hase
cost
of co
ntro
ller
0$
9.22
9.22
9.22
8.34
8.34
8.34
Purc
hase
cost
of ad
ditio
nal B
alanc
e of
Sys
tem
0$
18.1,
22.
56.
3, 7.
86.
3, 7.
811.
8, 14
.34.
2, 5
.04.
2, 5
.0Ba
ttery
Batte
ry vo
ltage
IV
24.0
24.0
24.0
24.0
24.0
24.0
Batte
ry m
inim
um d
epth
of c
harg
eI
%20
.020
.020
.020
.020
.020
.0Us
eabl
e m
ax ca
pacit
y rem
ainin
g at
repl
acem
ent
I%
(Low,
High
)90
.0, 8
0.0
90.0
, 80.
090
.0, 8
0.0
90.0
, 80.
090
.0, 8
0.0
90.0
, 80.
0Ca
pacit
y add
ition
to ac
coun
t for
dec
ayI
%10
,010
.010
.010
.010
.010
.0Effi
cienc
y los
s in
wirin
gI
%5.
05.
05.
05.
05.
05.
0Cy
cle lif
etim
e of
bat
tery
INT
Cycle
s (Lo
w,
High
)30
00,
2000
3000
, 20
0030
00,
2000
3000
, 20
0030
00,
2000
3000
, 20
00Ba
ttery
capa
city
INT
kWh
1.30.
420.
421.3
0.42
0.42
Unit
price
(del
ivere
d)I
$/kW
h (Lo
w, H
igh)
280.
0028
0.00
280.
0018
0.00
180.
0018
0.00
Purc
hase
cost
of b
atte
ry0
$ (Lo
w, H
igh)
355.1
, 44
1.4117
.7, 14
7.1117
.7, 14
7.122
7.0,
277.4
75.7,
92.
575
.7, 9
2.5
Tota
l sys
tem
Initi
al pu
rcha
se co
st0
$ (Lo
w, H
igh)
70.0
045
0.4,
54
3.120
3.3,
23
4.2
50.0
, 50.
018
3.3,
21
4.2
63.2
731
0.4,
36
3.3
151.5
, 16
9.145
.2, 4
5.2
133.
4,
151.1

148 ESMAP | Cooking with Electricity: A Cost Perspective
Case
3
Shan
Sta
te, M
yanm
ar
Input, INT mediate, Output
Inst
alla
tion
year
2020
2020
2020
2020
2020
2020
2020
2020
2020
2025
2025
2025
2025
2025
2025
2025
2025
2025
Desc
riptio
nM
icro-
hydr
o m
inig
rid; h
ousd
ehol
ds sw
itch
to
efficie
nt a
pplia
nces
Cook
ing
scen
ario
100% AC electric
100% DC battery- electric
50% AC, 50% Batt DC
50% AC, 50% Traditional
50% batt DC, 50% Traditional
100% charcoal
100% LPG
100% firewood
100% Kerosene
100% AC electric
100% DC battery- electric
50% AC, 50% Batt DC
50% AC, 50% Traditional
50% batt DC, 50% Traditional
100% charcoal
100% LPG
100% firewood
100% Kerosene
Com
pone
ntPa
ram
eter
Units
Cook
ing
eCoo
k elec
tricit
y use
for c
ookin
gI
kWh/
day
1.08
1.08
1.08
0.36
0.36
1.08
1.08
1.08
0.36
0.36
Fuel
stack
ed w
ith eC
ook:
char
coal
INT
kg/d
ayFu
el sta
cked
with
eCoo
k: LP
GIN
Tkg
/day
0.10
0.10
0.10
0.10
Fuel
stack
ed w
ith eC
ook:
fuelw
ood
INT
kg/d
ay0.7
70.7
70.7
70.7
7Fu
el sta
cked
with
eCoo
k: ke
rose
neIN
Tkg
/day
Base
line:
fuel
used
: cha
rcoal
INT
kg/d
ayBa
selin
e: fu
el us
ed: L
PGIN
Tkg
/day
0.20
0.20
Base
line:
fuel
used
: fuelw
ood
INT
kg/d
ay1.5
41.5
4Ba
selin
e: fu
el us
ed: k
eros
ene
INT
kg/d
ayCo
okin
g ap
plian
ces
Appli
ance
(s) us
edEP
C &
hotp
late
EPC&
ho
tplat
eEP
C&
hotp
late
EPC
EPC
EPC
& ho
tplat
eEP
C&ho
tplat
eEP
C &
hotp
late
EPC
EPC
Lifet
ime o
f coo
king a
pplia
nces
IYe
ars
55
55
55
55
55
Purch
ase c
ost o
f coo
king a
pplia
nces
|$
70.0
7070
5O50
63.3
6363
4545
Elect
ricity
inpu
tsSo
urce
of el
ectri
city
|Mi
ningr
idMi
ningr
idMi
ningr
idMi
ningr
idMi
ningr
idMi
ningr
idMi
ningr
idMi
ningr
idMi
ningr
idMi
ningr
idAC
or D
C co
oking
|AC
DCHy
brid
ACDC
ACDC
Hybr
idAC
DCFu
el p
rices
Electr
icity
tariff
s|
$/kW
h0.1
60.1
60.1
60.1
60.1
60.1
60.1
60.1
60.1
60.1
6Ch
arco
al|
$/kg
(Low
, High
)LP
GI
$/kg
(Low
, High
)1.0
, 2.0
1.0, 2
.01.0
, 2.0
1.16,
2.3
21.1
6, 2
.32
1.16,
2.3
2Fir
ewoo
d|
$/kg
(Low
, High
)0.1
0, 0
.20
0.10,
0.2
00.1
0, 0
.20
0.12,
0.2
30.1
2, 0
.23
0.12,
0.2
3Ke
rose
neI
$/kg
(Low
, High
)PV
sizin
gLif
etim
eI
Year
sEn
ergy
from
solar
irrad
iance
|KW
h/KW
peak
PV pe
rform
ance
deca
y (an
d ove
rsize
facto
r)|
% ov
er lif
eCo
oking
dire
ctly f
rom
PV|
%De
sign p
eak p
ower
ratin
gIN
TW
peak
Unit p
rice (
deliv
ered
)I
$/W
peak
Purch
ase c
ost o
f PV
pane
ls0
$Ch
arge
co
ntro
ller
Lifet
ime
|Ye
ars
66
66
66
Char
ge co
ntro
ller c
apac
ity (in
cl. sa
fety
facto
rs)IN
TAm
ps6
66
66
6Ba
ttery
char
ging r
ound
trip e
fficie
ncy
I%
(Low,
High
)90
, 85
90, 8
590
, 85
90, 8
590
, 35
90, 8
5Pu
rchas
e cos
t of c
ontro
ller
0$
9.22
9,22
9.22
8.34
8.34
8.34
Purch
ase c
ost o
f add
itiona
l Bala
nce o
f Sys
tem
0$
22.3
, 27.8
7.8, 9
.67.8
, 9.6
15.6
, 18.
95.1
, 6.1
5.1, 6
.1Ba
ttery
Batte
ry vo
ltage
|v
24.0
24.0
24.0
24.0
24.0
24.0
Batte
ry m
inim
um de
pth o
f cha
rge
|%
20.0
20.0
20.0
20.0
20.0
20.0
Usea
ble m
ax ca
pacit
y rem
aining
at re
place
men
t|
% (Lo
w, H
igh)
90.0
, 80.
090
.0, 8
0.0
90.0
, 80.
090
.0, 8
0.0
90.0
, 80.
090
.0, 8
0.0
Capa
city a
dditio
n to a
ccou
nt fo
r dec
ay|
%10
.010
.010
.010
.010
.010
.0Effi
cienc
y los
s in w
iring
|%
5.0
5.0
5.0
5.0
5.0
5.0
Cycle
lifet
ime o
f bat
tery
INT
Cycle
s (Lo
w,
High
)30
00,
2000
3000
, 20
0030
00,
2000
3000
, 20
0030
00,
2000
3000
, 20
00Ba
ttery
capa
city
INT
kWh
1.60.
520.
521.6
0.52
0.52
Unit p
rice (
deliv
ered
)|
$/kW
h (Lo
w, H
igh)
280.
0028
0.00
280.
0018
0.00
180.
0018
0.00
Purch
ase c
ost o
f bat
tery
0$ (
Low,
High
)43
7.3,
546.
714
5.8,
18
2.2
145.
8,
182.
230
4.0,
36
9.6
93.7,
114.
593
.7, 11
4.5
Tota
l sys
tem
Initia
l pur
chas
e cos
t0
$ (Lo
w, H
igh)
70.0
053
8.9,
65
3.723
2.8,
27
1.050
.0, 5
0.0
212.
8,
251.0
63.2
739
1.2,
460.1
170.
4,
192.
345
.2, 4
5.2
152.
4,
174.
2

149Appendix F: Model Input Data
Case
4
Kibi
ndu
dist
rict,
Tanz
ania
Input, INT mediate, Output
Inst
alla
tion
year
2020
2020
2020
2020
2020
2020
2020
2020
2020
2020
2025
2025
2025
2025
2025
2025
2025
2025
2025
2025
Desc
riptio
nSo
lar-h
ybrid
min
igrid
; hou
seho
lds
eCoo
k &
LPG.
Micr
obus
ines
s eC
ook
Cook
ing
scen
ario
Micro business 100% AC electric
100% AC electric
100% DC battery- electric
50% AC, 50% Batt DC
50% AC, 50% Traditional
50% batt DC, 50% Traditional
100% charcoal
100% LPG
100% firewood
100% Kerosene
Micro business 100% AC electric
100% AC electric
100% DC battery- electric
50% AC, 50% Batt DC
50% AC, 50% Traditional
50% batt DC, 50% Traditional
100% charcoal
100% LPG
100% firewood
100% Kerosene
Com
pone
ntPa
ram
eter
Units
Cook
ing
eCoo
k ele
ctric
ity u
se fo
r coo
king
IkW
h/da
y0.1
52.
062.
062.
060.
685
0.6S
50.1
52.
062.
062.
OS0.
690.
69Fu
el st
acke
d wi
th e
Cook
: cha
rcoa
lIN
Tkg
/day
0.87
0.87
0.87
0.87
Fuel
stac
ked
with
eCo
ok: L
PGIN
Tkg
/day
0.16
0.16
0.16
0.16
Fuel
stac
ked
with
eCo
ok: f
uelw
ood
INT
kg/d
ay1.7
51.7
51,7
51.7
5Fu
el st
acke
d wi
th e
Cook
: ker
osen
eIN
Tkg
/day
Base
line:
fuel
use
d: ch
arco
alIN
Tkg
/day
1.75
1.75
Base
line:
fuel
use
d: LP
GIN
Tkg
/day
0.33
0.33
Base
line:
fuel
use
d: fu
elwo
odIN
Tkg
/day
3,50
5.50
Base
line:
fuel
use
d: ke
rose
neIN
Tkg
/day
Cook
ing
appl
iance
sAp
plian
ce(s)
use
dI
EPC
EPC
&ho
tplat
eEP
C &
hotp
late
EPC
&ho
tplat
eEP
CEP
CEP
CEP
C &
hotp
late
EPC
&ho
tplat
eEP
C &
hotp
late
EPC
EPC
Lifet
ime
of co
okin
g ap
plian
ces
IYe
ars
55
55
55
55
55
55
Purc
hase
cost
of co
okin
g ap
plian
ces
I$
50.0
70.0
7070
5050
4563
.363
6345
45Ele
ctric
ity
inpu
tsSo
urce
of e
lect
ricity
Minin
grid
Minin
grid
Minin
grid
Minin
grid
Minin
grid
Minin
grid
Minin
grid
Minin
grid
Minin
grid
Minin
grid
Minin
grid
Minin
grid
AC o
r DC
cook
ing
ACAC
DCHy
brid
ACDC
ACAC
DCHy
brid
ACDC
Fuel
pric
esEle
ctric
ity ta
riffs
$/kW
h0.1
1.41.3
51.3
51.3
51.3
51.3
50.1
–1.4
1.35
1.35
1 35
1.35
1.35
0.10,
0.2
0Ch
arco
al$/
kg (L
ow. H
igh)
0.10
0.10
0.10,
0.2
00.1
20.1
21.0
, 2.0
LPG
$/kg
(Low
. High
)1.0
01.0
01.0
, 2.0
1.16
1.16
0.03
, 0.
05Fir
ewoo
d$/
kg (L
ow. H
igh)
0.03
0.03
0.03
, 0.
050.
030.
03
Kero
sene
$/kg
(Low
. High
)PV
sizin
gLif
etim
eI
Year
sEn
ergy
from
solar
irra
dian
ceI
KWh/
KWpe
akPV
per
form
ance
dec
ay (a
nd
over
size
fact
or)
l%
over
life
Cock
ing
dire
ctly
from
PV
I%
Desig
n pe
ak p
ower
ratin
gIN
TW
peak
Unit
price
(del
ivere
d)I
$/W
peak
Purc
hase
cost
of P
V pa
nels
0$
Char
ge
cont
rolle
rLif
etim
eI
Year
s6
66
66
6Ch
arge
cont
rolle
r cap
acity
(incl.
sa
fety
fact
ors)
INT
Amps
126
612
66
Batte
ry ch
argi
ng ro
und
trip
efficie
ncy
I%
(Low,
High
)90
, 85
90, 8
590
, 85
90, 8
590
, 85
90, 8
5Pu
rcha
se co
st of
cont
rolle
r0
$9.
229.
229.
228.
348.
348.
34Pu
rcha
se co
st of
addi
tiona
l Bala
nce
of S
yste
m0
$42
.1, 5
2.5
14.3
, 17.8
14.3
, 17.8
77.2
, 33.1
9.3,
11.5
9.3,
11.3
Batte
ryBa
ttery
volta
geI
v24
.024
.024
.024
.024
.024
.0Ba
ttery
min
imum
dep
th o
f cha
rge
I%
20.0
20.0
20,0
20,0
20.0
20.0
Usea
ble
man
capa
city r
emain
ing
at
repl
acem
ent
% (Lo
w, H
igh)
90.0
, 80
.090
.0,
80.0
90.0
, 80
.090
.0,
80.0
90.0
, 80
.090
.0,
80.0
Capa
city a
dditi
on to
acco
unt fo
r dec
ay%
10.0
10.0
10.0
10.0
10.0
10.0
Efficie
ncy l
oss i
n wi
ring
I%
5.0
5.0
5.0
5.0
5.0
5.0
Cycle
lifet
ime
of b
atte
ryIN
TCy
cles (
low. H
igh)
3000
, 20
0030
00,
2000
3000
, 20
0030
00,
2000
3000
, 20
0030
00,
2000
Batte
ry ca
pacit
yIN
TkW
h3.
00.
990.
993.
00.
990.
99Un
it pr
ice (d
elive
red)
l$/
kWh (
Law,
High
)28
0.00
280.
0028
0.00
180.
0018
0.00
180.
00Pu
rcha
se co
st of
bat
tery
0$ {
L ow.
High
)83
3.0,
10
41.3
277.7
, 34
7.127
7.7,
347.1
535.
5,
654.
517
8.5,
21
8.2
173.
5,
213.
2To
tal s
yste
mIn
itial
purc
hase
cost
0$ (
Law,
fligh
t)50
.00
70.0
095
4.4,
13
73.0
371.2
, 44
4.150
.00
351.2
, 42
4.145
.20
63.2
763
4.3,
75
9.3
259.
5,
301.1
45.2
024
1.4,
283.
0

150 ESMAP | Cooking with Electricity: A Cost Perspective
Case
5
Echa
riria
, Ken
ya
Input, INT mediate, Output
Inst
alla
tion
year
2020
2020
2020
2020
2020
2020
2020
2020
2020
2025
2025
2025
2025
2025
2025
2025
2025
2025
Desc
riptio
nOff
grid
sola
r-bat
tery
cook
ing
Cook
ing
scen
ario
100% AC electric
100% DC battery- electric
50% AC, 50% Batt DC
50% AC, 50% Traditional
50% batt DC, 50% Traditional
100% charcoal
100% LPG
100% firewood
100% Kerosene
100% AC electric
100% DC battery- electric
50% AC, 50% Batt DC
50% AC, 50% Traditional
50% batt DC, 50% Traditional
100% charcoal
100% LPG
100% firewood
100% Kerosene
Com
pone
ntPa
ram
eter
Units
Cook
ing
eCoo
k ele
ctric
ity u
se fa
r coo
king
IkW
h/da
y1.9
20.
641.9
20.
64Fu
el st
acke
d wi
th e
Cook
: cha
rcoa
lIN
Tkg
/day
0.87
0.87
Fuel
stac
ked
with
eCo
ok: L
PGIN
Tkg
/day
0.11
0.11
Fuel
stac
ked
with
eCo
ok: f
uel w
ood
INT
kg/d
ayFu
el st
acke
d wi
th e
Cook
: ker
osen
eIN
Tkg
/day
0.12
0.12
Base
line:
fuel
use
d: ch
arco
alIN
Tkg
/day
1.75
1.75
Base
line:
fuel
use
d: LP
GIN
Tkg
/day
0.23
0,23
Base
line:
fuel
use
d: fu
el w
ood
INT
kg/d
ay3.
503.
50Ba
selin
e: fu
el u
sed:
kero
sene
INT
kg/d
ay0.
250.
25Co
okin
g ap
plian
ces
Appl
iance
(s) u
sed
IEP
C &
hotp
late
EPC
EPC
& ho
tplat
eEP
C
Lifet
ime
of co
okin
g ap
plian
ces
IVe
ars
55
55
Purc
hase
cost
of co
okin
g ap
plian
ces
I$
7050
6345
Elect
ricity
inpu
tsSo
urce
of e
lect
ricity
IPV
PVPV
PVAC
or D
C co
ckin
gI
DCDC
DCDC
Fuel
pric
esEle
ctric
ity ta
riffs
I$/
kwh
Char
coal
I$/
kg (L
ow, H
igh)
0.20
, 0.4
00.
20, 0
.40
0.23
,0.4
60.
23, 0
.46
LPG
I$/
kg (L
ow, H
igh)
0.80
, 1.5
00.
80, 1
.50
0.93
, 1.74
0.93
, 1.74
Firew
ood
I$/
kg (L
ow, H
igh)
0.09
, 0.17
0,09
, 0.17
0.10,
0.2
00.1
0, 0
,20
Kero
sene
I$/
kg (L
ow, H
igh)
0,87
, 1.6
20.
87, 1
.62
1.01,
1.88
1.01,
1.88
PV si
zing
Lifet
ime
Iye
ars
20.0
020
.00
20.0
020
.00
Ener
gy fr
om so
lar ir
radi
ance
IKW
h/KW
peak
3,85
3.85
3,85
3.85
PV p
erfo
rman
ce d
ecay
(and
ove
rsee
fact
or)
I%o
ver li
fe10
.00
10.0
010
.00
10.0
0Co
okin
g di
rect
ly fro
m P
VI
%20
.00
20.0
020
.00
20.0
0De
sign
peak
pow
er ra
ting
INT
Wpe
ak0.
630.
210.
630.
21Un
it pr
ice (d
elive
red)
I$/
Wpe
ak0.
420.
420.
350.
35Pu
rcha
se co
st of
PV
pane
lsO
$26
4.46
88.15
221.9
573
.98
Char
ge
cont
rolle
rLif
etim
eI
Vear
s6
66
6Ch
arge
cont
rolle
r cap
acity
(incl.
safe
ty fa
ctor
s)IN
TAm
ps45
4545
45Ba
ttery
char
ging
roun
dtrip
effi
cienc
yI
% (Lo
w, H
igh)
90, 8
590
, 85
90, 8
590
, 85
Purc
hase
cost
of co
ntro
ller
0$
154.
0415
4.04
139.
2413
9.24
Purc
hase
cost
of ad
ditio
nal B
alanc
e of
Sys
tem
O$
52.0
, 60.
622
.5, 2
5.3
38.1,
43.
217.
3, 19
.0Ba
ttery
Batte
ry vo
ltage
IV
24.0
24.0
24.0
24.0
Batte
ry m
inim
um d
epth
of c
harg
eI
%20
.020
.020
.020
.0Us
eabl
e m
ax ca
pacit
y rem
ainin
g at
repl
acem
ent
I%
(Low,
High
)90
.0, 8
0.0
90.0
, 80.
090
.0, 8
0.0
90.0
, 80.
0Ca
pacit
y add
ition
to ac
coun
t for
dec
ayI
%10
.010
.010
.010
.0Effi
cienc
y los
s in
wirin
gI
%5.
05.
05.
05.
0Cy
cle lif
etim
e of
bat
tery
INT
Cycle
s (Lo
w,
High
)30
00,
2000
3000
, 20
0030
00,
2000
3000
, 20
00Ba
ttery
capa
city
INT
kWh
2.2
0.74
2.2
0.74
Unit
price
(del
ivere
d)I
$/kW
h (Lo
w, H
igh)
280.
0028
0.00
180.
0018
0,00
Purc
hase
cost
of b
atte
ry0
$ (Lo
w, H
igh)
622.
3,
777.8
207.4
, 25
9.3
400.
0,
488.
913
3.3,
16
3.0
Tota
l sys
tem
Initi
al pu
rcha
se co
st0
$ (Lo
w, H
igh)
1162.
8,
1342
.552
2.1,
582.
085
2.5,
96
9.6
409.1
, 44
4.8
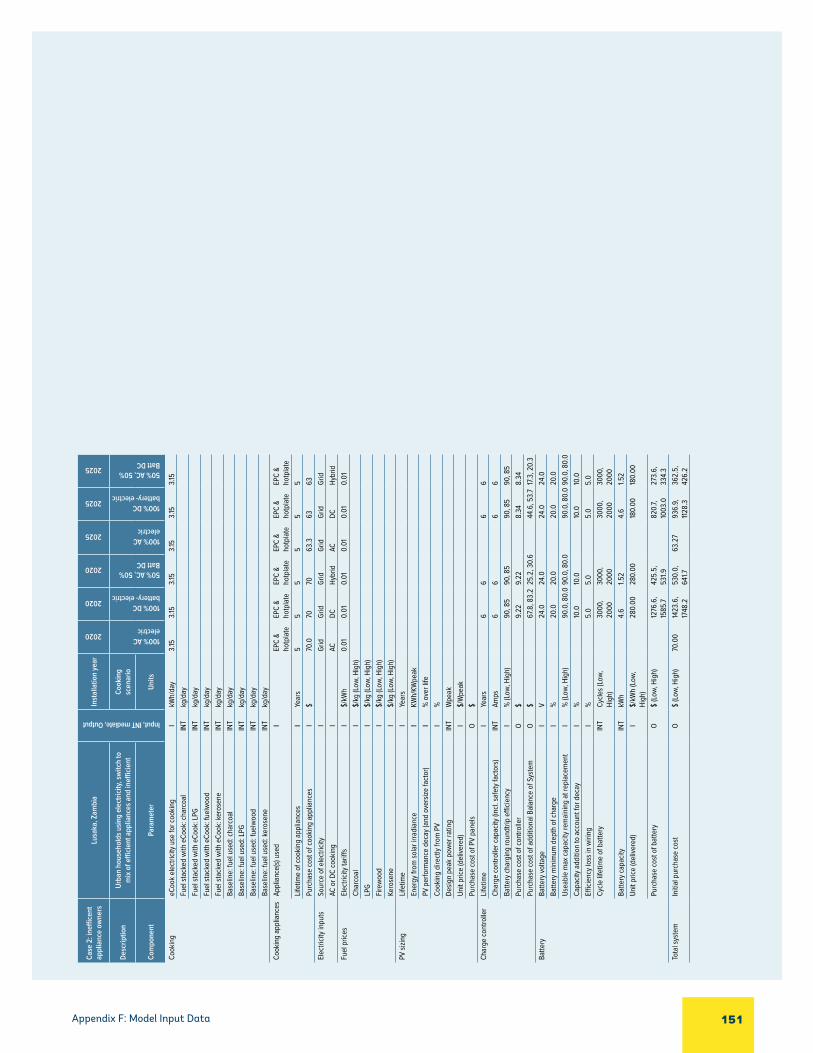
151Appendix F: Model Input Data
Case
2: i
neffi
cent
ap
plia
nce
owne
rsLu
saka
, Zam
bia
Input, INT mediate, Output
Inst
alla
tion
year
2020
2020
2020
2025
2025
2025
Desc
riptio
nUr
ban
hous
ehol
ds u
sing
elec
tricit
y, sw
itch
to
mix
of e
fficie
nt a
pplia
nces
and
ineffi
cient
Cook
ing
scen
ario
100% AC electric
100% DC battery- electric
50% AC, 50% Batt DC
100% AC electric
100% DC battery- electric
50% AC, 50% Batt DC
Com
pone
ntPa
ram
eter
Units
Cook
ing
eCoo
k ele
ctric
ity u
se fo
r coo
king
IkW
h/da
y3.1
53.1
53.1
53.1
53.1
53.1
5Fu
el st
acke
d wi
th e
Cook
: cha
rcoa
lIN
Tkg
/day
Fuel
stac
ked
with
eCo
ok: L
PGIN
Tkg
/day
Fuel
stac
ked
with
eCo
ok: f
uelw
ood
INT
kg/d
ayFu
el st
acke
d wi
th e
Cook
: ker
osen
eIN
Tkg
/day
Base
line:
fuel
use
d: ch
arco
alIN
Tkg
/day
Base
line:
fuel
use
d: LP
GIN
Tkg
/day
Base
line:
fuel
use
d: fu
elwo
odIN
Tkg
/day
Base
line:
fuel
use
d: ke
rose
neIN
Tkg
/day
Cook
ing
appl
iance
sAp
plian
ce(s)
use
dI
EPC
& ho
tplat
eEP
C &
hotp
late
EPC
& ho
tplat
eEP
C &
hotp
late
EPC
& ho
tplat
eEP
C &
hotp
late
Lifet
ime
of co
okin
g ap
plian
ces
IYe
ars
55
55
55
Purc
hase
cost
of co
okin
g ap
plian
ces
I$
70.0
7070
63.3
6363
Elect
ricity
inpu
tsSo
urce
of e
lect
ricity
IGr
idGr
idGr
idGr
idGr
idGr
idAC
or D
C co
okin
gI
ACDC
Hybr
idAC
DCHy
brid
Fuel
pric
esEle
ctric
ity ta
riffs
I$/
kWh
0.01
0.01
0.01
0.01
0.01
0.01
Char
coal
I$/
kg (L
ow, H
igh)
LPG
I$/
kg (L
ow, H
igh)
Firew
ood
I$/
kg (L
ow, H
igh)
Kero
sene
I$/
kg (L
ow, H
igh)
PV si
zing
Lifet
ime
IYe
ars
Ener
gy fr
om so
lar ir
radi
ance
IKW
h/KW
peak
PV p
erfo
rman
ce d
ecay
(and
ove
rsize
fact
or)
I%
over
life
Cook
ing
dire
ctly
from
PV
I%
Desig
n pe
ak p
ower
ratin
gIN
TW
peak
Unit
price
(del
ivere
d)I
$/W
peak
Purc
hase
cost
of P
V pa
nels
O$
Char
ge co
ntro
ller
Lifet
ime
IYe
ars
66
66
Char
ge co
ntro
ller c
apac
ity (in
cl. sa
fety
fact
ors)
INT
Amps
66
66
Batte
ry ch
argi
ng ro
undt
rip e
fficie
ncy
I%
(Low,
Hig
h)90
, 85
90, 8
590
, 85
90, 8
5Pu
rcha
se co
st of
cont
rolle
rO
$9.
229.
228.
348.
34Pu
rcha
se co
st of
addi
tiona
l Bala
nce
of S
yste
mO
$67
.8, 8
3.2
25.2
, 30.
644
.6, 5
3.717.
3, 2
0.3
Batte
ryBa
ttery
volta
geI
V24
.024
.024
.024
.0Ba
ttery
min
imum
dep
th o
f cha
rge
I%
20.0
20.0
20.0
20.0
Usea
ble
max
capa
city r
emain
ing
at re
plac
emen
tI
% (Lo
w, H
igh)
90.0
, 80.
090
.0, 8
0.0
90.0
, 80.
090
.0, 8
0.0
Capa
city a
dditi
on to
acco
unt f
or d
ecay
I%
10.0
10.0
10.0
10.0
Efficie
ncy l
oss i
n wi
ring
I%
5.0
5.0
5.0
5.0
Cycle
lifet
ime
of b
atte
ryIN
TCy
cles (
Low,
Hi
gh)
3000
, 20
0030
00,
2000
3000
, 20
0030
00,
2000
Batte
ry ca
pacit
yIN
TkW
h4.
61.5
24.
61.5
2Un
it pr
ice (d
elive
red)
I$/
kWh
(Low,
Hi
gh)
280.
0028
0.00
180.
0018
0.00
Purc
hase
cost
of b
atte
ryO
$ (Lo
w, H
igh)
1276
.6,
1585
.742
5.5,
53
1.982
0.7,
1003
.027
3.6,
33
4.3
Tota
l sys
tem
Initi
al pu
rcha
se co
stO
$ (Lo
w, H
igh)
70.0
014
23.6
, 17
48.2
530.
0,
641.7
63.2
793
6.9,
112
8.3
362.
5,
426.
2

152 ESMAP | Cooking with Electricity: A Cost Perspective
Gene
ric (a
s use
d fo
r ca
ses m
odel
led
in
Figu
re 3
.36)
Ev
eryw
here
Input, INTmediate output, Output
Inst
alla
tion
year
2020
2020
2020
2020
2025
2025
2020
2020
2025
2025
2020
2020
2025
2025
2020
2020
2025
2025
Desc
riptio
n10
0% e
lect
ric so
lutio
nsCo
okin
g sc
enar
io D
IREC
T OR
BAT
TERY
100% AC electric
100% AC electric
100% DC battery- electric
100% DC battery- electric
100% DC battery- electric
100% DC battery- electric
50% AC, 50% Batt DC
50% AC, 50% Batt DC
50% AC, 50% Batt DC
50% AC, 50% Batt DC
100% AC electric
100% AC electric
100% AC electric
100% AC electric
100% DC battery- electric
100% DC battery- electric
100% DC battery- electric
100% DC battery- electric
Com
pone
ntPa
ram
eter
Low
or h
igh
co
st
Low
High
High
Low
High
Low
High
Low
High
Low
High
Low
High
Low
High
Low
High
Cook
ing
eCoo
k ele
ctric
ity u
se fo
r coo
king
IkW
h/da
y0.
872.
060.
872.
060.
872.
060.
872.
060.
872.
060.
872.
060.
872.
060.
872.
060.
872.
06Fu
el st
acke
d wi
th e
Cook
: cha
rcoa
lI
kg/d
ayFu
el st
acke
d wi
th e
Cook
: LPG
Ikg
/day
Fuel
stac
ked
with
eCo
ok: f
uelw
ood
Ikg
/day
Fuel
stac
ked
with
eCo
ok: k
eros
ene
Ikg
/day
Base
line:
fuel
use
d: ch
arco
alI
kg/d
ayBa
selin
e: fu
el u
sed:
LPG
Ikg
/day
Base
line:
fuel
use
d: fu
elwo
odI
kg/d
ayBa
selin
e: fu
el u
sed:
kero
sene
Ikg
/day
Cook
ing
appl
iance
sAp
plian
ce(s)
use
dI
EPC
& ho
tplat
eEP
C &
hotp
late
EPC
& ho
tplat
eEP
C &
hotp
late
EPC
& ho
tplat
eEP
C &
hotp
late
EPC
& ho
tplat
eEP
C &
hotp
late
EPC
& ho
tplat
eEP
C &
hotp
late
EPC
& ho
tplat
eEP
C &
hotp
late
EPC
& ho
tplat
eEP
C &
hotp
late
EPC
& ho
tplat
eEP
C &
hotp
late
EPC
& ho
tplat
eEP
C &
hotp
late
Lifet
ime
of co
okin
g ap
plian
ces
IYe
ars
55
55
55
55
55
55
55
55
55
Purc
hase
cost
of co
okin
g ap
plian
ces
I$
70.0
70.0
70.0
70.0
63.3
63.3
70.0
70.0
63.3
63.3
70.0
70.0
63.3
63.3
70.0
70.0
63.3
63.3
Elect
ricity
inpu
tsSo
urce
of e
lect
ricity
IGr
idGr
idGr
idGr
idGr
idGr
idGr
idGr
idGr
idGr
idGr
idGr
idGr
idGr
idPV
PVPV
PVAC
or D
C co
okin
gI
ACAC
DCDC
DCDC
Hybr
idHy
brid
Hybr
idHy
brid
DCDC
DCDC
DCDC
DCDC
Fuel
pric
esEle
ctric
ity ta
riffs
I$/
kWh
0.04
0.25
0.04
0.25
0.04
0.25
0.04
0.25
0.04
0.25
0.55
0.85
0.25
0.38
Char
coal
I$/
kgLP
GI
$/kg
Fuel
wood
I$/
kgKe
rose
neI
$/kg
PV si
zing
Lifet
ime
IYe
ars
20.0
020
.00
20.0
020
.00
Ener
gy fr
om so
lar ir
radi
ance
IKW
h/KW
peak
4.30
3.68
4.30
3.68
PV p
erfo
rman
ce d
ecay
(and
ove
rsize
fact
or)
I%
over
life
1010
1010
Cook
ing
dire
ctly
from
PV
I20
2020
20De
sign
peak
pow
er ra
ting
IW
peak
11
11
Unit
price
(del
ivere
d)I
$/W
peak
0.42
0.42
0.35
0.35
Purc
hase
cost
of P
V pa
nels
O$
264.
4628
0.01
221.9
523
5.01
Char
ge co
ntro
ller
Lifet
ime
IYe
ars
6.0
6.0
6.0
6.0
6.0
6.0
6.0
6.0
6.0
6.0
6.0
6.0
Char
ge co
ntro
ller c
apac
ity (in
cl. sa
fety
fa
ctor
s)I
Amps
6.0
6.0
6.0
6.0
6.0
6.0
6.0
6.0
45.0
45.0
45.0
45.0
Batte
ry ch
argi
ng ro
undt
rip e
fficie
ncy
I90
8590
8590
8590
8590
8590
85Pu
rcha
se co
st of
cont
rolle
rO
$9.
29.
28.
38.
39.
29.
28.
38.
315
4.0
154.
013
9.2
139.
2Ba
ttery
Batte
ry vo
ltage
IV
2424
2424
2424
2424
2424
2424
Batte
ry m
inim
um d
epth
of c
harg
eI
20.0
20.0
20.0
20.0
20.0
20.0
20.0
20.0
20.0
20.0
20.0
20.0
Usea
ble
max
capa
city r
emain
ing
at
repl
acem
ent
I80
.090
.080
.090
.080
.090
.080
.090
.080
.090
.080
.090
.0
Capa
city a
dditi
on to
acco
unt f
or d
ecay
I10
.010
.010
.010
.010
.010
.010
.010
.010
.010
.010
.010
.0Eff
ficie
ncy l
oss i
n wi
ring
I5.
05.
05.
05.
05.
05.
05.
05.
05.
05.
05.
05.
0Cy
cle lif
etim
e of
bat
tery
INT
Cycle
s30
0020
0030
0020
0030
0020
0030
0020
0030
0020
0030
0020
00Ba
ttery
capa
city
NTkW
hUn
it pr
ice (d
elive
red)
I$/
kWh
280
350
180
220
280
350
180
220
280
350
180
220
Purc
hase
cost
of b
atte
ryO
$77
7.80
972.
3050
0.00
611.1
025
9.00
324.
0075
.66
92.4
862
2.26
777.8
240
0.02
488.
92To
tal s
yste
mIn
itial
purc
hase
cost
O$ (
Low,
High
)85
7.010
51.5
571.6
682.
733
8.2
403.
214
7.316
4.170
.070
.063
.363
.3111
0.8
1281
.982
4.5
926.
4

153Appendix F: Model Input Data
Gene
ric
(as u
sed
for c
ases
m
odel
led
in F
igur
e 3.
36)
Ever
ywhe
re
Input, INT mediate, Output
Inst
alla
tion
year
2020
2020
2020
2020
2025
2025
2020
2020
2025
2025
2020
2020
2025
2025
2020
2020
2020
2020
2020
2020
2025
2025
2025
2025
2025
2025
Desc
riptio
nCl
ean
fuel
stac
kCo
okin
g sc
enar
io
50% AC electric
50% AC electric
50% DC battery- electric
50% DC battery- electric
50% DC battery- electric
50% DC battery- electric
50% AC electric
50% AC electric
50% AC electric
50% AC electric
50% DC battery- electric
50% DC battery- electric
50% DC battery- electric
50% DC battery- electric
100% LPG
100% LPG
100% charcoal
100% charcoal
100% firewood
100% firewood
100% LPG
100% LPG
100% charcoal
100% charcoal
100% firewood
100% firewood
Com
pone
ntPa
ram
eter
Low
or h
igh
co
st
Low
High
Low
High
Low
High
Low
High
Low
High
Low
High
Low
High
Low
High
Low
High
Low
High
Low
High
Low
High
Low
High
Cook
ing
eCoo
k ele
ctric
ity u
se fo
r coo
king
IkW
h/da
y0.
290.
680.
290.
680.
290.
680.
290.
680.
290.
680.
290.
680.
290.
68Fu
el st
acke
d wi
th e
Cook
: cha
rcoa
lI
kg/d
ayFu
el st
acke
d wi
th e
Cook
: LPG
Ikg
/day
0.07
0.16
0.07
0.16
0.07
0.16
0.07
0.16
0.07
0.16
0.07
0.16
0.07
0.16
Fuel
stac
ked
with
eCo
ok: f
uelw
ood
Ikg
/day
Fuel
stac
ked
with
eCo
ok: k
eros
ene
Ikg
/day
Base
line:
fuel
use
d: ch
arco
alI
kg/d
ay1.1
02.
611.1
02.
61Ba
selin
e: fu
el u
sed:
LPG
Ikg
/day
0.14
0.33
0.14
0.33
Base
line:
fuel
use
d: fu
elwo
odI
kg/d
ay2.1
25.
022.1
25.
02Ba
selin
e: fu
el u
sed:
kero
sene
Ikg
/day
Cook
ing
appl
iance
sAp
plian
ce(s)
use
dI
EPC
EPC
EPC
EPC
EPC
EPC
EPC
EPC
EPC
EPC
EPC
EPC
EPC
Lifet
ime
of co
okin
g ap
plian
ces
IYe
ars
55
55
55
55
55
55
5Pu
rcha
se co
st of
cook
ing
appl
iance
sI
$50
.050
.050
.045
.045
.050
.050
.045
.045
.050
.050
.045
.045
.0Ele
ctric
ity
inpu
tsSo
urce
of e
lect
ricity
IGr
idGr
idGr
idGr
idGr
idGr
idGr
idGr
idGr
idPV
PVPV
PVAC
or D
C co
okin
gI
ACDC
DCDC
DCDC
DCDC
DCDC
DCDC
DCFu
el p
rices
Elect
ricity
tariff
sI
$/kW
h0.
040.
250.
040.
250.
040.
250.
550.
850.
250.
38Ch
arco
alI
$/kg
0.13
0.49
LPG
I$/
kg1.0
82.
071.0
82.
071.2
52.
401.0
82.
071.2
52.
401.0
82.
071.2
52.
401.0
82.
071.2
52.
40Fir
ewoo
dI
$/kg
0.04
0.13
Kero
sene
I$/
kgPV
sizin
gLif
etim
eI
Year
s20
.00
21.0
020
.00
21.0
0En
ergy
from
solar
irra
dian
ceI
KWh/
KWpe
ak4.
303.
684.
303.
68PV
per
form
ance
dec
ay (a
nd
over
size
fact
or)
I%
over
life
1010
1010
Cock
ing
dire
ctly
from
PV
I%
2021
2021
Desig
n pe
ak p
ower
ratin
gI
Wpe
ak0.
631
10.
67Un
it pr
ice (d
elive
red)
I$/
Wpe
ak0.
420.
420.
350.
35Pu
rcha
se co
st of
PV
pane
lsO
$26
4.5
280.
022
1.923
5.0
Char
ge
cont
rolle
rLif
etim
eI
Year
s6.
06.
06.
06.
06.
06.
06.
06.
0Ch
arge
cont
rolle
r cap
acity
(in
cl. sa
fety
fact
ors)
IAm
ps6.
06.
06.
06.
045
.045
.045
.045
.0
Batte
ry ch
argi
ng ro
und
trip
efficie
ncy
I%
9085
9085
9085
9085
Purc
hase
cost
of co
ntro
ller
O$
9.2
9.2
8.3
8.3
154.
015
4.0
139.
213
9.2
Batte
ryBa
ttery
volta
geI
V24
2424
2424
24.0
2424
Batte
ry m
inim
um d
epth
of c
harg
eI
%20
.020
.020
.020
.020
.020
.020
.020
.0Us
eabl
e m
an ca
pacit
y rem
ainin
g at
re
plac
emen
tI
%80
.090
.080
.090
.080
.090
.080
.090
.0
Capa
city a
dditi
on to
acco
unt fo
r dec
ayI
%10
.010
.010
.010
.010
.010
.010
.010
.0Effi
cienc
y los
s in
wirin
gI
%5.
05.
05.
05.
05.
05.
05.
05.
0Cy
cle lif
etim
e of
bat
tery
INT
Cycle
s30
0020
0030
0020
0030
0020
0030
0020
00Ba
ttery
capa
city
NTkW
hUn
it pr
ice (d
elive
red)
I$/
kWh
280
350
180
220
280
350
180
220
Purc
hase
cost
of b
atte
ryO
$77
7.80
972.
3050
0.00
611.1
062
2.3
777.8
400.
048
8.9
Tota
l sys
tem
Initi
al pu
rcha
se co
stO
$ (Lo
w, H
igh)

154 ESMAP | Cooking with Electricity: A Cost Perspective
Gene
ric (a
s use
d fo
r ca
ses m
odel
led
in
Figu
re 3
.37
Ever
ywhe
re
Input, INTmediate output, Output
Inst
alla
tion
year
2025
2025
2025
2025
2025
2025
2025
2025
2025
2025
2025
2025
2025
2025
2025
2025
2025
2025
2025
2025
Desc
riptio
nCo
okin
g effi
cienc
y
Cook
ing
scen
ario
DI
RECT
OR
BATT
ERY
100% AC electric
100% AC electric
100% AC electric
100% AC electric
100% AC electric
100% AC electric
50% AC electric
50% AC electric
foods only AC electric
foods only AC electric
100% DC battery- electric
100% DC battery- electric
100% DC battery- electric
100% DC battery- electric
100% DC battery- electric
100% DC battery- electric
50% AC electric
50% AC electric
heavy foods only AC electric
heavy foods only AC electric
Com
pone
ntPa
ram
eter
Low
or h
igh
cost
case
Low
High
Low
High
Low
High
Low
High
Low
High
Low
High
Low
High
Low
High
Low
High
Low
High
Cook
ing
eCoo
k ele
ctric
ity u
se fo
r coo
king
IkW
h/da
y3.1
53.1
51.9
71.9
71.4
81.4
80.
490.
490.1
50.1
53.1
53.1
51.9
71.9
71.4
81.4
80.
490.
490.1
50.1
5Fu
el st
acke
d wi
th e
Cook
: cha
rcoa
lI
kg/d
ayFu
el st
acke
d wi
th e
Cook
: LPG
Ikg
/day
Fuel
stac
ked
with
eCo
ok: f
uelw
ood
Ikg
/day
Fuel
stac
ked
with
eCo
ok: k
eros
ene
Ikg
/day
Base
line:
fuel
use
d: ch
arco
alI
kg/d
ayBa
selin
e: fu
el u
sed:
LPG
Ikg
/day
Base
line:
fuel
use
d: fu
elwo
odI
kg/d
ayBa
selin
e: fu
el u
sed:
kero
sene
Ikg
/day
Cook
ing
appl
iance
sAp
plian
ce(s)
use
dI
4 pl
ate
& ov
en4
plat
e &
oven
Hotp
late,
in
duct
ion
or in
fra-
red
Hotp
late,
in
duct
ion
or in
fra-
red
1 ins
u-lat
ed, 1
un
insu
-lat
ed
1 ins
u-lat
ed, 1
un
insu
-lat
ed
EPC
EPC
EPC
EPC
4 pl
ate
& ov
en4
plat
e &
oven
Hotp
late,
in
duct
ion
or in
fra-
red
Hotp
late,
in
duct
ion
or in
fra-
red
1 ins
u-lat
ed, 1
un
insu
-lat
ed
1 ins
u-lat
ed, 1
un
insu
-lat
ed
EPC
EPC
EPC
EPC
Lifet
ime
of co
okin
g ap
plian
ces
IYe
ars
55
55
55
55
55
55
55
55
55
55
Purc
hase
cost
of co
okin
g ap
plian
ces
I$
135.
613
5.6
18.1
18.1
63.3
63.3
45.2
45.2
45.2
45.2
135.
613
5.6
18.1
18.1
63.3
63.3
45.2
45.2
45.2
45.2
Elect
ricity
inpu
tsSo
urce
of e
lect
ricity
IGr
idGr
idGr
idGr
idGr
idGr
idGr
idGr
idGr
idGr
idGr
idGr
idGr
idGr
idGr
idGr
idGr
idGr
idGr
idGr
idAC
or D
C co
okin
gI
ACAC
ACAC
ACAC
ACAC
ACAC
DCDC
DCDC
DCDC
DCDC
DCDC
Fuel
pric
esEle
ctric
ity ta
riffs
I$/
kWh
0.04
0.25
0.04
0.25
0.04
0.25
0.04
0.25
0.04
0.25
0.04
0.25
0.04
0.25
0.04
0.25
0.04
0.25
0.04
0.25
Char
coal
I$/
kgLP
GI
$/kg
Fuel
wood
I$/
kgKe
rose
neI
$/kg
PV si
zing
Lifet
ime
IYe
ars
Ener
gy fr
om so
lar ir
radi
ance
IKW
h/KW
peak
PV p
erfo
rman
ce d
ecay
(and
ove
rsize
fa
ctor
)I
% ov
er lif
e
Cook
ing
dire
ctly
from
PV
I%
Desig
n pe
ak p
ower
ratin
gI
Wpe
akUn
it pr
ice (d
elive
red)
I$/
Wpe
akPu
rcha
se co
st of
PV
pane
lsO
$Ch
arge
cont
rolle
rLif
etim
eI
Year
s6.
06.
06.
06.
06.
06.
06.
06.
06.
06.
0Ch
arge
cont
rolle
r cap
acity
(incl.
sa
fety
fact
ors)
IAm
ps6.
06.
06.
06.
06.
06.
06.
06.
06.
06.
0
Batte
ry ch
argi
ng ro
undt
rip e
fficie
ncy
I%
9085
9085
9085
9085
9085
Purc
hase
cost
of co
ntro
ller
O$
9.2
9.2
9.2
9.2
9.2
9.2
9.2
9.2
9.2
9.2
Batte
ryBa
ttery
volta
geI
V24
24.0
2424
2424
2424
2424
Batte
ry m
inim
um d
epth
of c
harg
eI
%20
.020
.020
.020
.020
.020
.020
.020
.020
.020
.0Us
eabl
e m
ax ca
pacit
y rem
ainin
g at
re
plac
emen
tI
%80
.090
.080
.090
.080
.090
.080
.090
.080
.090
.0
Capa
city a
dditi
on to
acco
unt f
or
deca
yI
%10
.010
.010
.010
.010
.010
.010
.010
.010
.010
.0
Efficie
ncy l
oss i
n wi
ring
I%
5.0
5.0
5.0
5.0
5.0
5.0
5.0
5.0
5.0
5.0
Cycle
lifet
ime
of b
atte
ryIN
TCy
cles
3000
2000
3000
2000
3000
2000
3000
2000
3000
2000
Batte
ry ca
pacit
yNT
kWh
Unit
price
(del
ivere
d)I
$/kW
h28
035
028
035
028
035
028
035
028
035
0Pu
rcha
se co
st of
bat
tery
O$
777.8
972.
3077
7.80
972.
3077
7.80
972.
3077
7.80
972.
3077
7.80
972.
30To
tal s
yste
mIn
itial
purc
hase
cost
O$
(Low,
Hig
h)18
.118
.163
.363
.345
.245
.245
.245
.292
2.6
1117.1
805.1
999.
685
0.3
1044
.883
2.2
1026
.783
2.2
1026
.7

155Appendix G: Solar eCooking Cross-Comparison
APPENDIX GSOLAR ECOOKING CROSS-COMPARISON
TABLE G.1 Key parameters and assumptions for solar eCooking techno-economic models
SOU
RCE
MO
DEL
YEA
R
FIN
AN
CIN
G H
ORI
ZON
(YEA
RS)
AC/D
C
APP
LIA
NC
E
CA
PABL
E O
F C
OV
ERIN
G
100
PERC
ENT
OF
CO
OKI
NG
?
HO
USE
HO
LD S
IZE
(N
UM
BER
OF
PEO
PLE)
HO
USE
HO
LD C
OO
KIN
G
ELEC
TRIC
ITY
DEM
AN
D (K
WH
)
BATT
ERY
STO
RAG
E
PV (W
PEA
K)
INITIAL CAPITAL
COST (S)
MONTHLY EXPENDITURE
(S)
KEY
ASSU
MPT
ION
S
LOW
HIG
H
MO
NTH
LY
LOW
HIG
H
Cas
e St
udy
5
2020 5 DC EPC and hot plate
Yes 4.2 1.92 2.2 kWh LiFePO4
630 1,163 1,343 25 29 Assumes 20 percent of energy direct from PV, 0 days autonomy2020 5 DC EPC and
LPGYes 4.2 0.64 0.74 kWh
LiFePO4220 522 582 13 17
2025 5 DC EPC and hot plate
Yes 4.2 1.92 2.2 kWh LiFePO4
630 863 970 19 21
2025 5 DC EPC and LPG
Yes 4.2 0.64 0.74 kWh LiFePO4
220 409 445 11 15
Beyo
nd F
ire: E
Coo
king
(2
019)
2019 3 DC Hot plate Yes 5 1.2 1.5kWh lithium-ion
400 1,526 1,799 49 59 0 days autonomy, 2hours cooking/day
2019 3 DC Induction Yes 5 1 1.2kWh lithium-ion
300 1,390 1,635 44 52
2019 3 DC Slow cooker
Unlikely 5 0.36 0.45kWh li-on
100 491 572 16 20 Assumes slow cooker can cook all dishes in 2hours/day, 0 days autonomy
2019 3 DC EPC Unlikely 5 0.22Wh 0.36kWh lithium-ion
80 600 681 20 23 Assumes EPC can cook all dishes and only opened twice/day, 0 days autonomy
Zubi
et a
l.
(201
7)
2020 10 DC EPC Unlikely 6 0.6 2.1kWh LiFePO4
420 2,266 2,266 19 19 Assumes EPC can cook all dishes, 2 days of autonomy, only cooking lunch and dinner, also powering lights and charging phone
2025 12 DC EPC Unlikely 6 0.6 2.1kWh LiFePO4
420 1,926 1,926 14 14
2030 14 DC EPC Unlikely 6 0.6 2.1kWh LiFePO4
420 1,644 1,644 11 11
2035 15 DC EPC Unlikely 6 0.6 2.1kWh LiFePO4
420 1,426 1,426 9 9
Beyo
nd F
ire
(201
6)
2016 20 AC Hot plate Yes 5 5.45 Not stated Not stated
1,032 6,202 72 162 Based on Leach and Oduro (2015)—calculates cost for electricity from SHS sized for cooking (0.40–0.90 EUR/kWh) by est. demand.
2016 20 AC Induction Yes 5 4.25 Not stated Not stated
1,008 6,060 56 126
Leac
h an
d O
duro
(2
015)
2015 20 AC Hot plate Yes 4 1.4 – 4.2kWh
2.2–9.8 kWh LiFePO4
367– 1331W
1,032 6,202 10 162 AC appliances, 0 days autonomy, wide range of values with high/low cooking energy demand and optimistic/pessimistic techno-economic scenarios
2025 20 AC Hot plate Yes 4 1.4 – 4.2kWh
2.2–8.7 kWh LiFePO4
367– 1331W
718 3,550 7 70

156 ESMAP | Cooking with Electricity: A Cost Perspective
APPENDIX HMULTI-TIER FRAMEWORK
TABLE h.1 Multi-tier framework for measuring household electricity access
ATTRIBUTES TIER O TIER 1 TIER 2 TIER 3B TIER 4 TIER 5
Capacity Power capacity ratings(W or daily Wh)
Less than 3 W
At least 3 W
At least 50 W
At least 200 W At least 800 W
At least 2 kW
Less than 12 Wh
At least 12 Wh
At least 200 Wh
At least 1 kWh At least 3.4 kWh
At least 8.2 kWh
Services Lighting of 1,000 Imhr per day
Electrical lighting, air circulation, television, and phone charging are possible
Availabilitya DailyAvailability
Less than 4 hours
At least 4 hours At least 8 hours At least 16 hours
At least 23 hours
EveningAvailability
Less than 1 hour
At least 1 hour
At least 2 hours
At least 3 hours At least 4 hours
Reliability More than 14 disruptions per week At most 14 disruptions per week or At most 3 disruptions per week with total duration more than 2 hours
(> 3 to 14 disruptions / week) or 3 disruptions / week with > 2 hours of outage
At most 3 disruptions per week with total duration of less than 2 hours
Quality Household experiences voltage problems that damage appliances
Voltage problems do not affect the use of desired appliances
Affordability Cost of a standard consumption package of 365 kWh per year is more than 5% of household income
Cost of a standard consumption package of 365 kWh per year is less than 5% of household income
Formality No bill payments made for the use of electricity Bill is paid to the utility, prepaid card seller, or authorized representative
Health and Safety
Serious or fatal accidents due to electricity connection Absence of past accidents
a. Previously referred to as “Duration” in the 2015 Beyond Connections report, this MTF attribute is now referred to as “Availability,” examining access to electricity through levels of “Duration’ (day and evening). Aggregate tier is based on lowest tier value across all attributes * Color signifies tier categorization.
Source: ESMAP (2015).