Social Vulnerability Assessment for Landslide Hazards ... - MDPI
19
land Review Social Vulnerability Assessment for Landslide Hazards in Malaysia: A Systematic Review Study Mohd Idris Nor Diana 1, * , Nurfashareena Muhamad 1 , Mohd Raihan Taha 2 , Ashraf Osman 3 and Md. Mahmudul Alam 4 Citation: Nor Diana, M.I.; Muhamad, N.; Taha, M.R.; Osman, A.; Alam, M..M. Social Vulnerability Assessment for Landslide Hazards in Malaysia: A Systematic Review Study. Land 2021, 10, 315. https://doi.org/ 10.3390/land10030315 Academic Editor: Marina Cabral Pinto Received: 11 February 2021 Accepted: 28 February 2021 Published: 19 March 2021 Publisher’s Note: MDPI stays neutral with regard to jurisdictional claims in published maps and institutional affil- iations. Copyright: © 2021 by the authors. Licensee MDPI, Basel, Switzerland. This article is an open access article distributed under the terms and conditions of the Creative Commons Attribution (CC BY) license (https:// creativecommons.org/licenses/by/ 4.0/). 1 Institute for Environment and Development, Universiti Kebangsaan Malaysia, Bangi 43600, Selangor, Malaysia; [email protected] 2 Department of Civil Engineering, Universiti Kebangsaan Malaysia, Bangi 43600, Selangor, Malaysia; [email protected] 3 Department of Engineering, The Palatine Centre, Durham University, Stockton Road, Durham DH1 3LE, UK; [email protected] 4 School of Economics, Finance and Banking, Universiti Utara Malaysia, Sintok 06010, Kedah, Malaysia; [email protected] * Correspondence: [email protected]; Tel.: +60-3-89214862 Abstract: Landslides represent one of the world’s most dangerous and widespread risks, annually causing thousands of deaths and billions of dollars worth of damage. Building on and around hilly areas in many regions has increased, and it poses a severe threat to the physical infrastructure and people living within such zones. Quantitative assessment of social vulnerability in Malaysia is worrying because it has been given less attention than hazard-related studies. Therefore, this study’s objective is to find out the indicators used for social vulnerability assessment in the context of a landslide in Malaysia. The analysis is critical for understanding the measures of social vulnerability, given that the incorporation of climate change and disaster risk mitigation issues in urban planning and management are considered priorities in ensuring a stable population growth and avoiding economic disruption. A systematic study on the Scopus and Web of Science repositories was conducted based on the PRISMA Report analysis method. This article concluded that there are six important indicators of social vulnerability in the context of landslide in Malaysia. Keywords: social vulnerability assessment; landslide; social indicator; disaster risk reduction; Malaysia 1. Introduction In recent years, extreme events have increased in intensity and frequency globally, leading to rising economic losses and casualties. It is believed that these events will con- tinue to accelerate in future climate scenarios. An accurate understanding of the physical and socioeconomic drivers of these extreme events is crucial and can ultimately enhance adaptive strategies. The frequency and intensity of geophysical events is increasing. This is the result of the interaction between humans and the environment. Climate change and increasingly aggressive human activities contribute to the vulnerability of catastrophic haz- ards to humans, their infrastructure, and the environment [1]. Faced with ever-increasing societal impacts arising from such events, a wealth of research and analysis has focused on understanding causal processes and outcomes [2]. Landslides are a type of geophysical event that plays a significant role in the evolution of a landscape [3]. However, landslides do pose a serious threat to local populations given that these events are being triggered in- creasingly by a changing climate and more unpredictable weather patterns. In recent years, it has become clear from previous research that the location, abundance, activity, frequency of landslides as well as the social and economic consequences are increasing over time and more people are exposed to the risks [4–10]. It was reported in [11] that geophysical Land 2021, 10, 315. https://doi.org/10.3390/land10030315 https://www.mdpi.com/journal/land
-
Upload
khangminh22 -
Category
Documents
-
view
3 -
download
0
Transcript of Social Vulnerability Assessment for Landslide Hazards ... - MDPI
land
Review
Social Vulnerability Assessment for Landslide Hazards inMalaysia: A Systematic Review Study
Mohd Idris Nor Diana 1,* , Nurfashareena Muhamad 1 , Mohd Raihan Taha 2, Ashraf Osman 3
and Md. Mahmudul Alam 4
Citation: Nor Diana, M.I.; Muhamad,
N.; Taha, M.R.; Osman, A.; Alam,
M..M. Social Vulnerability
Assessment for Landslide Hazards in
Malaysia: A Systematic Review Study.
Land 2021, 10, 315. https://doi.org/
10.3390/land10030315
Academic Editor: Marina
Cabral Pinto
Received: 11 February 2021
Accepted: 28 February 2021
Published: 19 March 2021
Publisher’s Note: MDPI stays neutral
with regard to jurisdictional claims in
published maps and institutional affil-
iations.
Copyright: © 2021 by the authors.
Licensee MDPI, Basel, Switzerland.
This article is an open access article
distributed under the terms and
conditions of the Creative Commons
Attribution (CC BY) license (https://
creativecommons.org/licenses/by/
4.0/).
1 Institute for Environment and Development, Universiti Kebangsaan Malaysia, Bangi 43600, Selangor,Malaysia; [email protected]
2 Department of Civil Engineering, Universiti Kebangsaan Malaysia, Bangi 43600, Selangor, Malaysia;[email protected]
3 Department of Engineering, The Palatine Centre, Durham University, Stockton Road, Durham DH1 3LE, UK;[email protected]
4 School of Economics, Finance and Banking, Universiti Utara Malaysia, Sintok 06010, Kedah, Malaysia;[email protected]
* Correspondence: [email protected]; Tel.: +60-3-89214862
Abstract: Landslides represent one of the world’s most dangerous and widespread risks, annuallycausing thousands of deaths and billions of dollars worth of damage. Building on and aroundhilly areas in many regions has increased, and it poses a severe threat to the physical infrastructureand people living within such zones. Quantitative assessment of social vulnerability in Malaysia isworrying because it has been given less attention than hazard-related studies. Therefore, this study’sobjective is to find out the indicators used for social vulnerability assessment in the context of alandslide in Malaysia. The analysis is critical for understanding the measures of social vulnerability,given that the incorporation of climate change and disaster risk mitigation issues in urban planningand management are considered priorities in ensuring a stable population growth and avoidingeconomic disruption. A systematic study on the Scopus and Web of Science repositories wasconducted based on the PRISMA Report analysis method. This article concluded that there are siximportant indicators of social vulnerability in the context of landslide in Malaysia.
Keywords: social vulnerability assessment; landslide; social indicator; disaster risk reduction;Malaysia
1. Introduction
In recent years, extreme events have increased in intensity and frequency globally,leading to rising economic losses and casualties. It is believed that these events will con-tinue to accelerate in future climate scenarios. An accurate understanding of the physicaland socioeconomic drivers of these extreme events is crucial and can ultimately enhanceadaptive strategies. The frequency and intensity of geophysical events is increasing. This isthe result of the interaction between humans and the environment. Climate change andincreasingly aggressive human activities contribute to the vulnerability of catastrophic haz-ards to humans, their infrastructure, and the environment [1]. Faced with ever-increasingsocietal impacts arising from such events, a wealth of research and analysis has focused onunderstanding causal processes and outcomes [2]. Landslides are a type of geophysicalevent that plays a significant role in the evolution of a landscape [3]. However, landslidesdo pose a serious threat to local populations given that these events are being triggered in-creasingly by a changing climate and more unpredictable weather patterns. In recent years,it has become clear from previous research that the location, abundance, activity, frequencyof landslides as well as the social and economic consequences are increasing over timeand more people are exposed to the risks [4–10]. It was reported in [11] that geophysical
Land 2021, 10, 315. https://doi.org/10.3390/land10030315 https://www.mdpi.com/journal/land
Land 2021, 10, 315 2 of 19
disasters such as landslides are the deadliest. The presence of humans, infrastructure, andother forms of vulnerabilities in one location will make things worse.
Historically, efforts to reduce landslides are physically oriented resulting in a pro-liferation of technocratic approaches in the literature, while financial losses and socialvulnerability from the geophysical events continue to increase. Over time, this gave riseto an alternative explanation that mounting losses are related less to the dynamics ofthe events but more to the vulnerability of exposed human populations [2]. Althoughassessing the magnitude and intensity of disasters is critical, the nature of population de-mographics and various socioeconomic contexts may also lead to a greater risk of disasters.Understanding the complexities of vulnerability to disasters, including those caused bygeophysical events, is at the heart of disaster risk reduction. Efforts to reduce disaster riskinvolve various disciplines and should be viewed from numerous perspectives to providelong-term benefits. A comprehensive disaster risk reduction strategy that incorporatesphysical and socio-economic aspects is the key determinant of vulnerability.
In spite of very high importance of socioeconomic data to assess landslide vulner-ability, there are lack of social data documented for analysis and mapping in Malaysia.Therefore, the objective of this study is to find out the indicators that are used for socialvulnerability assessment in the context of landslides in Malaysia. The analysis is criticalfor understanding the measures of social vulnerability, since the incorporation of climatechange and disaster risk mitigation issues in urban planning and management are a priorityfor ensuring stable population growth and evading economic disruption.
2. Literature Review
The definition of vulnerability is “the quality of being vulnerable (able to be easilyhurt, influenced, or attacked), or something that is vulnerable” [12]. Vulnerability meansthe risk of being vulnerable or easily hurt by something or someone. Vulnerability is aconcept that has being used over a long period of time, and it has been recognised inmuch research covering various fields of endeavour [13], for instance, the social sciences,economics, psychology, and engineering. It should be noted that there is no consensusregarding how vulnerability is defined [14]. It has, in fact, been interpreted in many waysaccording to the subject area being investigated.
According to [15], vulnerability refers to situations where individuals and societiesare exposed to social, economic, and cultural risks and in essence the dangers posedby harm to them. All people and all communities at some point cannot avoid risk orharm, so at best each individual needs to prepare for every situation. Moreover, stressthat social vulnerability is partly the result of social difference or social inequality, whichaffects or forms the susceptibility of different groups to harm or at risk and regulatestheir capacity to react to a certain situation [16]. There is inequality in every societyand the unequal distribution of wealth and resources is something that has permeatedall of human history. For instance, in a farmer’s perspective, inequality can take manyforms such as unequal distribution of wealth, water allocation, rights to land and water,taxation inequity, economic poverty, land tenure issues, and much more. The definitionof climate vulnerability according to the Intergovernmental Panel on Climate Change(IPCC) is “ . . . the degree to which geophysical, biological and socio-economic systemsare susceptible to, and unable to cope with, adverse impacts of climate change” [17]. Theconcept of vulnerability has been refined over the decades so that people understandthe disasters and hazards that occur in communities susceptible to this kind of situation.Vulnerability is something that can help people achieve a level of sustainable developmentrealistically. Economic development or progress should be engaged with as long as thenatural environment in which they occur can be sustained.
For this reason, vulnerability can be defined as individuals, households, or com-munities that are dealing with external shock from the outside and are unexpected [18].Vulnerability is present in both internal and external factors that influence the lives of indi-viduals and communities. Furthermore, vulnerability can be understood as the capacity of
Land 2021, 10, 315 3 of 19
individuals, groups or communities to reciprocate, cooperate, survive, and recover fromthe impact of environmental events that have happened around them [19]. Landslidesare very indicative of how the characteristics of a social group can overcome this kind ofdisaster but also reflect the harsh realities of social vulnerability to natural events.
2.1. Social Vulnerability to Disaster
Vulnerability is broadly defined as the potential to suffer loss or harm. The theoryincludes structural vulnerability of buildings, physical exposure of people, and places tonatural events, while social vulnerability describes different kinds of susceptibility basedon social, economic, and political factors [20,21]. Vulnerability and exposure are dynamic,varying in temporal and spatial scales, and depend on economic, social, geographical, de-mographic, cultural, institutional, governance, and environmental variables [22]. Analysesof vulnerability in the engineering context of landslide or slope (or any disaster) are quitecommon [23,24]. The study by [25] has described vulnerability as the characteristic of aperson or group and their situation that influences their capacity to anticipate, cope with,resist, and recover from the impact of a natural hazard (an extreme natural event or process).Despite its importance in disaster risk reduction, there is still a lack of approaches thatcontribute to a better understanding of social vulnerability hidden in dynamic contextualconditions [26].
The definition of social vulnerability within the disaster framework was introduced inthe 1970s when researchers realised that exposure included socioeconomic factors affectinggroup resilience [27,28]. Social vulnerability is useful as an indicator in determining thedifferential recovery potential from disasters. Social vulnerability normally employedindividual characteristics of people such as age, race, health, income, type of dwelling unit,and employment [29]. Social vulnerability is a concept that can explain social imbalancesthat are happening in society in some parts of the world. It is one of the results of socialinequalities that occur in many communities. Factors affecting social disparities evidentin a society include: lack of resources such as information, knowledge, and technology;limited access to political power or representation; social capital; social networks andconnections; beliefs and customs; building stock and age of infrastructure; and type anddensity of infrastructure and lifelines [30]. Next, the 18 social vulnerability indicatorswas introduced as follows: socioeconomic status (income, political power, and prestige),gender, race and ethnicity, age, commercial and industrial development, employment loss,rural/urban, residential property, infrastructure and lifelines, renters, occupation, familystructure, education, population growth, medical services, social dependence, and socialneeds population [16].
The design of these indicators depends on their expected use, and it must be relevant tothe hazard context, methodologies, and data availability [31]. However, social vulnerabilityexists based on the underlying characteristic of a population, and it does not rely onthe hazard or susceptibility of an area. Apart from indicators, numerous indices havebeen developed in order to measure social vulnerability. Many pioneer researchers havedevoted much effort to formulating the concept of social vulnerability. Social VulnerabilityIndex (SoVI) was introduced [32] to quantify social vulnerability through an empiricalbasis to compare social differences within a community regarding social variables selectedto mitigate the disadvantageous effects of certain events. It was asserted that sociallyvulnerable communities are more likely to be adversely affected in disaster events becausethey are much less likely to recover from them and more likely to die [33]. Even though theSoVI was devised with the United States in mind, many studies have adapted SoVI for avariety of contexts, no matter the nature of the population or places being investigated.
2.2. Landslides: Malaysia’s Experience
Malaysia is located in the south-east of Asia. It is divided into two archipelagos,Peninsular Malaysia and Borneo Island. Malaysia is a tropical country with a warm andhumid climate throughout the year. Over a recent 20-year period (1998–August 2018),
Land 2021, 10, 315 4 of 19
Malaysia has witnessed 51 disaster events [34–43]. During that time, 281 people died,more than 3 million people were affected, and disasters caused nearly US$2 billion indamage [44]. Flood, landslides, drought, and forest fires are common in Malaysia, whilethe annual rainfall is the main contributor due to two monsoon periods, i.e., South West(SW) and North East (NE) occurring between April and October and from November toMarch, respectively. These monsoons contribute to high annual rainfalls amounting to2000–4000 mm with a maximum of about 200 rainy days [45]. The amount of rainfallvaries from one rainy day to the next [46]. The rain and consistently high temperaturesthroughout the year lead to intensive and extensive weathering of features on the ground.These combinations of climate and geological conditions together with other causativefactors such as slope angle, drainage conditions, geological boundaries, etc. [47] have ledto landslides becoming one of Malaysia’s most common natural disasters.
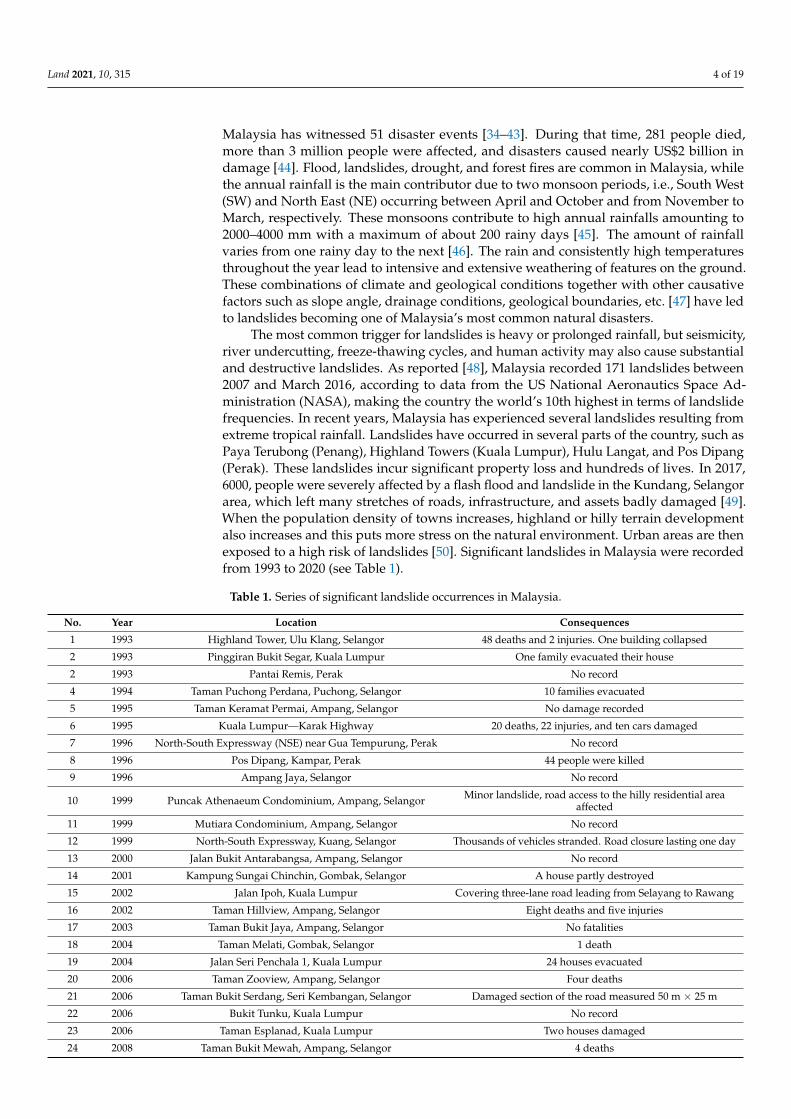
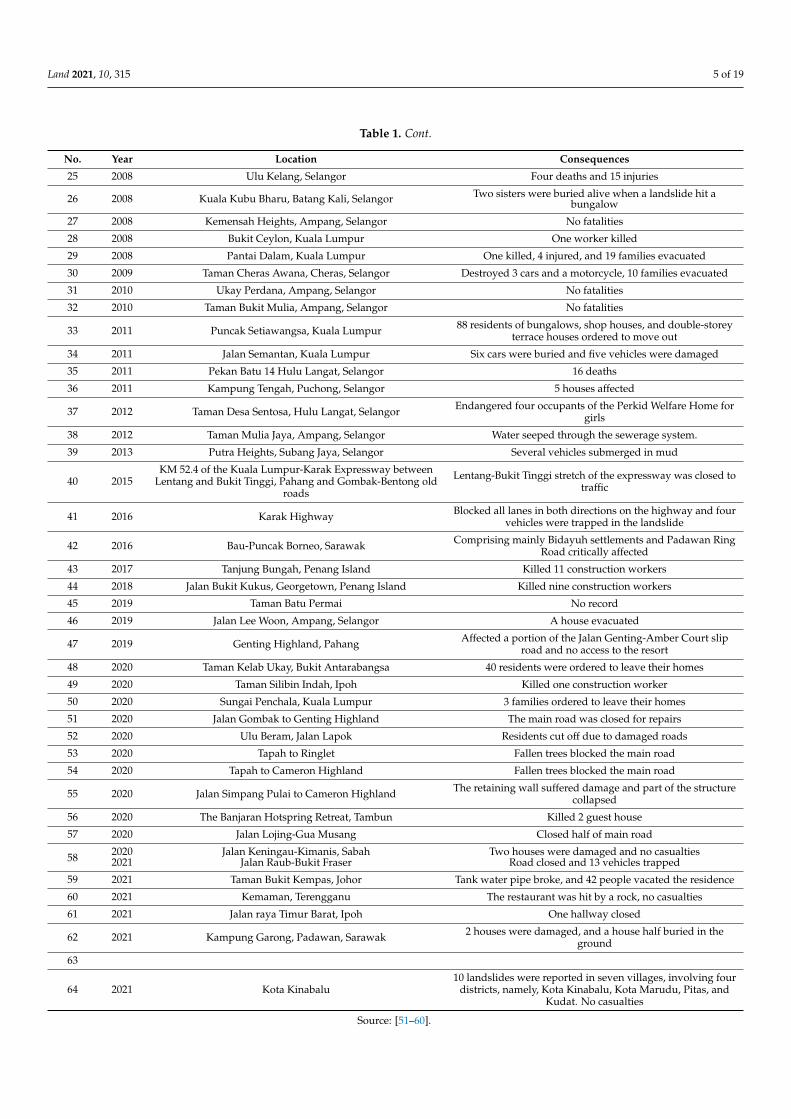
The most common trigger for landslides is heavy or prolonged rainfall, but seismicity,river undercutting, freeze-thawing cycles, and human activity may also cause substantialand destructive landslides. As reported [48], Malaysia recorded 171 landslides between2007 and March 2016, according to data from the US National Aeronautics Space Ad-ministration (NASA), making the country the world’s 10th highest in terms of landslidefrequencies. In recent years, Malaysia has experienced several landslides resulting fromextreme tropical rainfall. Landslides have occurred in several parts of the country, such asPaya Terubong (Penang), Highland Towers (Kuala Lumpur), Hulu Langat, and Pos Dipang(Perak). These landslides incur significant property loss and hundreds of lives. In 2017,6000, people were severely affected by a flash flood and landslide in the Kundang, Selangorarea, which left many stretches of roads, infrastructure, and assets badly damaged [49].When the population density of towns increases, highland or hilly terrain developmentalso increases and this puts more stress on the natural environment. Urban areas are thenexposed to a high risk of landslides [50]. Significant landslides in Malaysia were recordedfrom 1993 to 2020 (see Table 1).
Table 1. Series of significant landslide occurrences in Malaysia.
No. Year Location Consequences
1 1993 Highland Tower, Ulu Klang, Selangor 48 deaths and 2 injuries. One building collapsed
2 1993 Pinggiran Bukit Segar, Kuala Lumpur One family evacuated their house
2 1993 Pantai Remis, Perak No record
4 1994 Taman Puchong Perdana, Puchong, Selangor 10 families evacuated
5 1995 Taman Keramat Permai, Ampang, Selangor No damage recorded
6 1995 Kuala Lumpur—Karak Highway 20 deaths, 22 injuries, and ten cars damaged
7 1996 North-South Expressway (NSE) near Gua Tempurung, Perak No record
8 1996 Pos Dipang, Kampar, Perak 44 people were killed
9 1996 Ampang Jaya, Selangor No record
10 1999 Puncak Athenaeum Condominium, Ampang, Selangor Minor landslide, road access to the hilly residential areaaffected
11 1999 Mutiara Condominium, Ampang, Selangor No record
12 1999 North-South Expressway, Kuang, Selangor Thousands of vehicles stranded. Road closure lasting one day
13 2000 Jalan Bukit Antarabangsa, Ampang, Selangor No record
14 2001 Kampung Sungai Chinchin, Gombak, Selangor A house partly destroyed
15 2002 Jalan Ipoh, Kuala Lumpur Covering three-lane road leading from Selayang to Rawang
16 2002 Taman Hillview, Ampang, Selangor Eight deaths and five injuries
17 2003 Taman Bukit Jaya, Ampang, Selangor No fatalities
18 2004 Taman Melati, Gombak, Selangor 1 death
19 2004 Jalan Seri Penchala 1, Kuala Lumpur 24 houses evacuated
20 2006 Taman Zooview, Ampang, Selangor Four deaths
21 2006 Taman Bukit Serdang, Seri Kembangan, Selangor Damaged section of the road measured 50 m × 25 m
22 2006 Bukit Tunku, Kuala Lumpur No record
23 2006 Taman Esplanad, Kuala Lumpur Two houses damaged
24 2008 Taman Bukit Mewah, Ampang, Selangor 4 deaths
Land 2021, 10, 315 5 of 19
Table 1. Cont.
No. Year Location Consequences
25 2008 Ulu Kelang, Selangor Four deaths and 15 injuries
26 2008 Kuala Kubu Bharu, Batang Kali, Selangor Two sisters were buried alive when a landslide hit abungalow
27 2008 Kemensah Heights, Ampang, Selangor No fatalities
28 2008 Bukit Ceylon, Kuala Lumpur One worker killed
29 2008 Pantai Dalam, Kuala Lumpur One killed, 4 injured, and 19 families evacuated
30 2009 Taman Cheras Awana, Cheras, Selangor Destroyed 3 cars and a motorcycle, 10 families evacuated
31 2010 Ukay Perdana, Ampang, Selangor No fatalities
32 2010 Taman Bukit Mulia, Ampang, Selangor No fatalities
33 2011 Puncak Setiawangsa, Kuala Lumpur 88 residents of bungalows, shop houses, and double-storeyterrace houses ordered to move out
34 2011 Jalan Semantan, Kuala Lumpur Six cars were buried and five vehicles were damaged
35 2011 Pekan Batu 14 Hulu Langat, Selangor 16 deaths
36 2011 Kampung Tengah, Puchong, Selangor 5 houses affected
37 2012 Taman Desa Sentosa, Hulu Langat, Selangor Endangered four occupants of the Perkid Welfare Home forgirls
38 2012 Taman Mulia Jaya, Ampang, Selangor Water seeped through the sewerage system.
39 2013 Putra Heights, Subang Jaya, Selangor Several vehicles submerged in mud
40 2015KM 52.4 of the Kuala Lumpur-Karak Expressway between
Lentang and Bukit Tinggi, Pahang and Gombak-Bentong oldroads
Lentang-Bukit Tinggi stretch of the expressway was closed totraffic
41 2016 Karak Highway Blocked all lanes in both directions on the highway and fourvehicles were trapped in the landslide
42 2016 Bau-Puncak Borneo, Sarawak Comprising mainly Bidayuh settlements and Padawan RingRoad critically affected
43 2017 Tanjung Bungah, Penang Island Killed 11 construction workers
44 2018 Jalan Bukit Kukus, Georgetown, Penang Island Killed nine construction workers
45 2019 Taman Batu Permai No record
46 2019 Jalan Lee Woon, Ampang, Selangor A house evacuated
47 2019 Genting Highland, Pahang Affected a portion of the Jalan Genting-Amber Court sliproad and no access to the resort
48 2020 Taman Kelab Ukay, Bukit Antarabangsa 40 residents were ordered to leave their homes
49 2020 Taman Silibin Indah, Ipoh Killed one construction worker
50 2020 Sungai Penchala, Kuala Lumpur 3 families ordered to leave their homes
51 2020 Jalan Gombak to Genting Highland The main road was closed for repairs
52 2020 Ulu Beram, Jalan Lapok Residents cut off due to damaged roads
53 2020 Tapah to Ringlet Fallen trees blocked the main road
54 2020 Tapah to Cameron Highland Fallen trees blocked the main road
55 2020 Jalan Simpang Pulai to Cameron Highland The retaining wall suffered damage and part of the structurecollapsed
56 2020 The Banjaran Hotspring Retreat, Tambun Killed 2 guest house
57 2020 Jalan Lojing-Gua Musang Closed half of main road
58 2020 Jalan Keningau-Kimanis, Sabah Two houses were damaged and no casualties2021 Jalan Raub-Bukit Fraser Road closed and 13 vehicles trapped
59 2021 Taman Bukit Kempas, Johor Tank water pipe broke, and 42 people vacated the residence
60 2021 Kemaman, Terengganu The restaurant was hit by a rock, no casualties
61 2021 Jalan raya Timur Barat, Ipoh One hallway closed
62 2021 Kampung Garong, Padawan, Sarawak 2 houses were damaged, and a house half buried in theground
63
64 2021 Kota Kinabalu10 landslides were reported in seven villages, involving four
districts, namely, Kota Kinabalu, Kota Marudu, Pitas, andKudat. No casualties
Source: [51–60].
Land 2021, 10, 315 6 of 19
In Malaysia, there have been numerous landslide events in the mountains, alongthe valleys, rivers, and coastal regions [61,62] but the most massive have generally beenassociated with rivers. Findings from the literature have shown that landslides occurfrequently along hilly areas in the rainy season. There is a strong correlation betweenthe density of drainage and distance to the river due to landslides in the mountainousregion being triggered by erosion-related phenomena [63]. Development on hilly areas inMalaysia has increased the risk and likelihood of landslides [64]. Hilly areas are attractivefor building residential areas, hotels, or resorts. This poses a severe threat to the physicalinfrastructure and population living within that area. This situation will lead to manycasualties and significant financial losses if these hilly regions are struck by landslides [65].
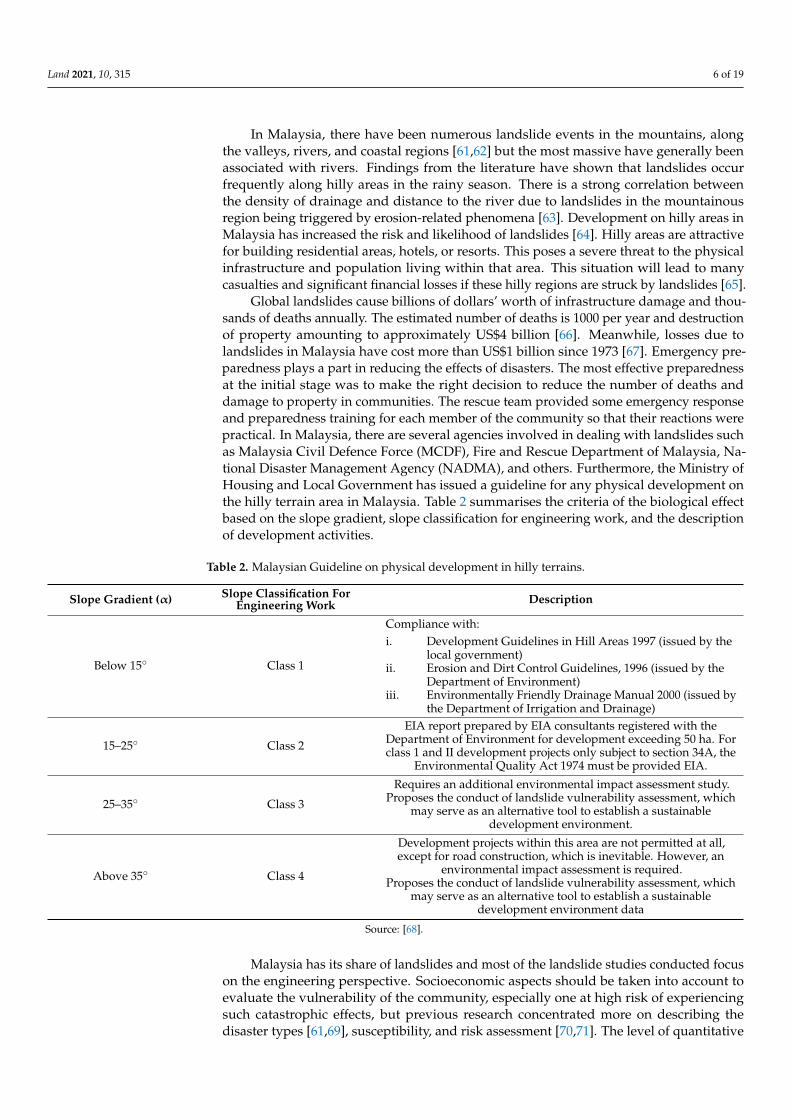
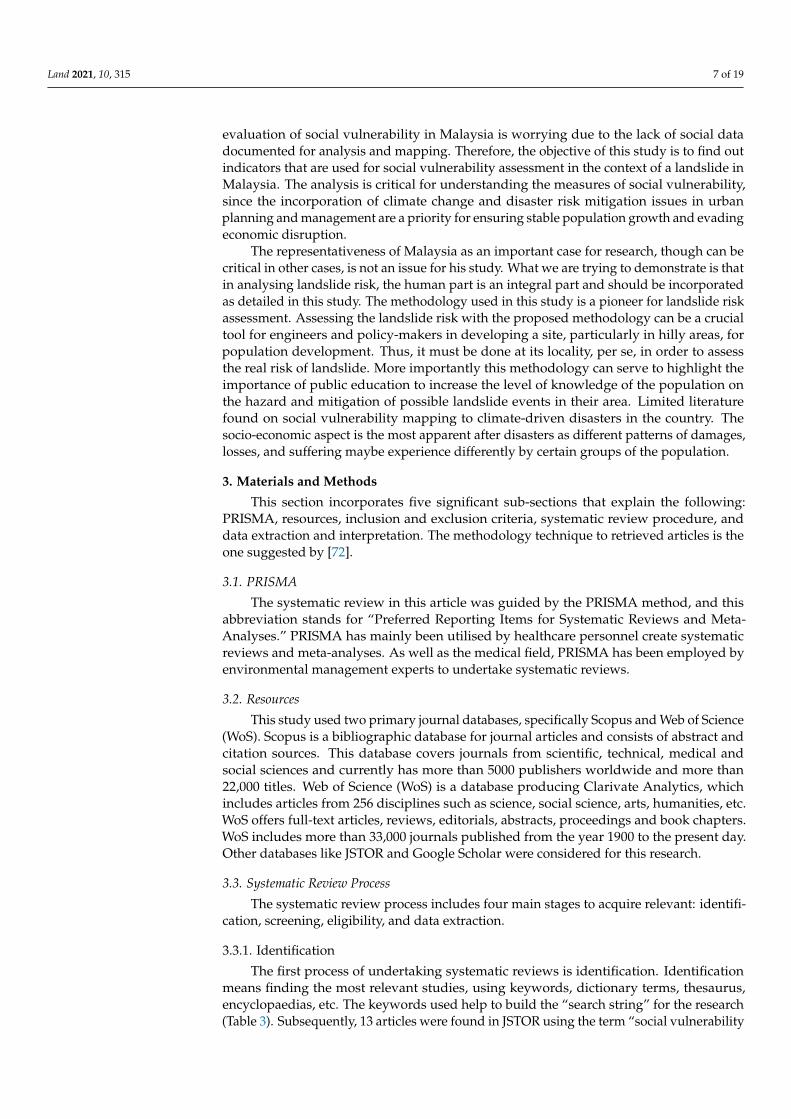
Global landslides cause billions of dollars’ worth of infrastructure damage and thou-sands of deaths annually. The estimated number of deaths is 1000 per year and destructionof property amounting to approximately US$4 billion [66]. Meanwhile, losses due tolandslides in Malaysia have cost more than US$1 billion since 1973 [67]. Emergency pre-paredness plays a part in reducing the effects of disasters. The most effective preparednessat the initial stage was to make the right decision to reduce the number of deaths anddamage to property in communities. The rescue team provided some emergency responseand preparedness training for each member of the community so that their reactions werepractical. In Malaysia, there are several agencies involved in dealing with landslides suchas Malaysia Civil Defence Force (MCDF), Fire and Rescue Department of Malaysia, Na-tional Disaster Management Agency (NADMA), and others. Furthermore, the Ministry ofHousing and Local Government has issued a guideline for any physical development onthe hilly terrain area in Malaysia. Table 2 summarises the criteria of the biological effectbased on the slope gradient, slope classification for engineering work, and the descriptionof development activities.
Table 2. Malaysian Guideline on physical development in hilly terrains.
Slope Gradient (α) Slope Classification ForEngineering Work Description
Below 15 Class 1
Compliance with:i. Development Guidelines in Hill Areas 1997 (issued by the
local government)ii. Erosion and Dirt Control Guidelines, 1996 (issued by the
Department of Environment)iii. Environmentally Friendly Drainage Manual 2000 (issued by
the Department of Irrigation and Drainage)
15–25 Class 2
EIA report prepared by EIA consultants registered with theDepartment of Environment for development exceeding 50 ha. Forclass 1 and II development projects only subject to section 34A, the
Environmental Quality Act 1974 must be provided EIA.
25–35 Class 3
Requires an additional environmental impact assessment study.Proposes the conduct of landslide vulnerability assessment, which
may serve as an alternative tool to establish a sustainabledevelopment environment.
Above 35 Class 4
Development projects within this area are not permitted at all,except for road construction, which is inevitable. However, an
environmental impact assessment is required.Proposes the conduct of landslide vulnerability assessment, which
may serve as an alternative tool to establish a sustainabledevelopment environment data
Source: [68].
Malaysia has its share of landslides and most of the landslide studies conducted focuson the engineering perspective. Socioeconomic aspects should be taken into account toevaluate the vulnerability of the community, especially one at high risk of experiencingsuch catastrophic effects, but previous research concentrated more on describing thedisaster types [61,69], susceptibility, and risk assessment [70,71]. The level of quantitative
Land 2021, 10, 315 7 of 19
evaluation of social vulnerability in Malaysia is worrying due to the lack of social datadocumented for analysis and mapping. Therefore, the objective of this study is to find outindicators that are used for social vulnerability assessment in the context of a landslide inMalaysia. The analysis is critical for understanding the measures of social vulnerability,since the incorporation of climate change and disaster risk mitigation issues in urbanplanning and management are a priority for ensuring stable population growth and evadingeconomic disruption.
The representativeness of Malaysia as an important case for research, though can becritical in other cases, is not an issue for his study. What we are trying to demonstrate is thatin analysing landslide risk, the human part is an integral part and should be incorporatedas detailed in this study. The methodology used in this study is a pioneer for landslide riskassessment. Assessing the landslide risk with the proposed methodology can be a crucialtool for engineers and policy-makers in developing a site, particularly in hilly areas, forpopulation development. Thus, it must be done at its locality, per se, in order to assessthe real risk of landslide. More importantly this methodology can serve to highlight theimportance of public education to increase the level of knowledge of the population onthe hazard and mitigation of possible landslide events in their area. Limited literaturefound on social vulnerability mapping to climate-driven disasters in the country. Thesocio-economic aspect is the most apparent after disasters as different patterns of damages,losses, and suffering maybe experience differently by certain groups of the population.
3. Materials and Methods
This section incorporates five significant sub-sections that explain the following:PRISMA, resources, inclusion and exclusion criteria, systematic review procedure, anddata extraction and interpretation. The methodology technique to retrieved articles is theone suggested by [72].
3.1. PRISMA
The systematic review in this article was guided by the PRISMA method, and thisabbreviation stands for “Preferred Reporting Items for Systematic Reviews and Meta-Analyses.” PRISMA has mainly been utilised by healthcare personnel create systematicreviews and meta-analyses. As well as the medical field, PRISMA has been employed byenvironmental management experts to undertake systematic reviews.
3.2. Resources
This study used two primary journal databases, specifically Scopus and Web of Science(WoS). Scopus is a bibliographic database for journal articles and consists of abstract andcitation sources. This database covers journals from scientific, technical, medical andsocial sciences and currently has more than 5000 publishers worldwide and more than22,000 titles. Web of Science (WoS) is a database producing Clarivate Analytics, whichincludes articles from 256 disciplines such as science, social science, arts, humanities, etc.WoS offers full-text articles, reviews, editorials, abstracts, proceedings and book chapters.WoS includes more than 33,000 journals published from the year 1900 to the present day.Other databases like JSTOR and Google Scholar were considered for this research.
3.3. Systematic Review Process
The systematic review process includes four main stages to acquire relevant: identifi-cation, screening, eligibility, and data extraction.
3.3.1. Identification
The first process of undertaking systematic reviews is identification. Identificationmeans finding the most relevant studies, using keywords, dictionary terms, thesaurus,encyclopaedias, etc. The keywords used help to build the “search string” for the research(Table 3). Subsequently, 13 articles were found in JSTOR using the term “social vulnerability
Land 2021, 10, 315 8 of 19
index.” From the Scopus database, in total, 147 articles related to the search string werediscovered while a total of 69 items emerged from Web of Science (WoS). Meanwhile,29 studies were found in Google Scholar search engine, where the data covers a huge rangeof subjects and is essentially a superset of WoS and Scopus [73].
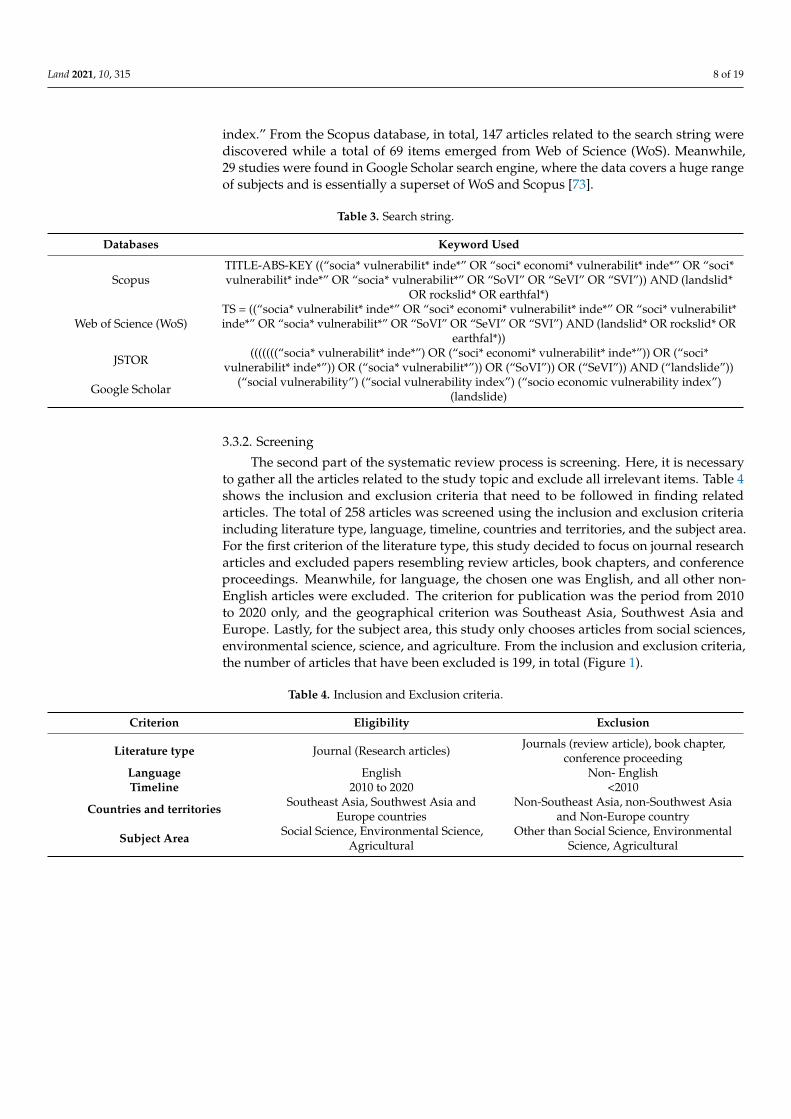
Table 3. Search string.
Databases Keyword Used
ScopusTITLE-ABS-KEY ((“socia* vulnerabilit* inde*” OR “soci* economi* vulnerabilit* inde*” OR “soci*vulnerabilit* inde*” OR “socia* vulnerabilit*” OR “SoVI” OR “SeVI” OR “SVI”)) AND (landslid*
OR rockslid* OR earthfal*)
Web of Science (WoS)TS = ((“socia* vulnerabilit* inde*” OR “soci* economi* vulnerabilit* inde*” OR “soci* vulnerabilit*inde*” OR “socia* vulnerabilit*” OR “SoVI” OR “SeVI” OR “SVI”) AND (landslid* OR rockslid* OR
earthfal*))
JSTOR (((((((“socia* vulnerabilit* inde*”) OR (“soci* economi* vulnerabilit* inde*”)) OR (“soci*vulnerabilit* inde*”)) OR (“socia* vulnerabilit*”)) OR (“SoVI”)) OR (“SeVI”)) AND (“landslide”))
Google Scholar (“social vulnerability”) (“social vulnerability index”) (“socio economic vulnerability index”)(landslide)
3.3.2. Screening
The second part of the systematic review process is screening. Here, it is necessaryto gather all the articles related to the study topic and exclude all irrelevant items. Table 4shows the inclusion and exclusion criteria that need to be followed in finding relatedarticles. The total of 258 articles was screened using the inclusion and exclusion criteriaincluding literature type, language, timeline, countries and territories, and the subject area.For the first criterion of the literature type, this study decided to focus on journal researcharticles and excluded papers resembling review articles, book chapters, and conferenceproceedings. Meanwhile, for language, the chosen one was English, and all other non-English articles were excluded. The criterion for publication was the period from 2010to 2020 only, and the geographical criterion was Southeast Asia, Southwest Asia andEurope. Lastly, for the subject area, this study only chooses articles from social sciences,environmental science, science, and agriculture. From the inclusion and exclusion criteria,the number of articles that have been excluded is 199, in total (Figure 1).
Table 4. Inclusion and Exclusion criteria.
Criterion Eligibility Exclusion
Literature type Journal (Research articles) Journals (review article), book chapter,conference proceeding
Language English Non- EnglishTimeline 2010 to 2020 <2010
Countries and territories Southeast Asia, Southwest Asia andEurope countries
Non-Southeast Asia, non-Southwest Asiaand Non-Europe country
Subject Area Social Science, Environmental Science,Agricultural
Other than Social Science, EnvironmentalScience, Agricultural
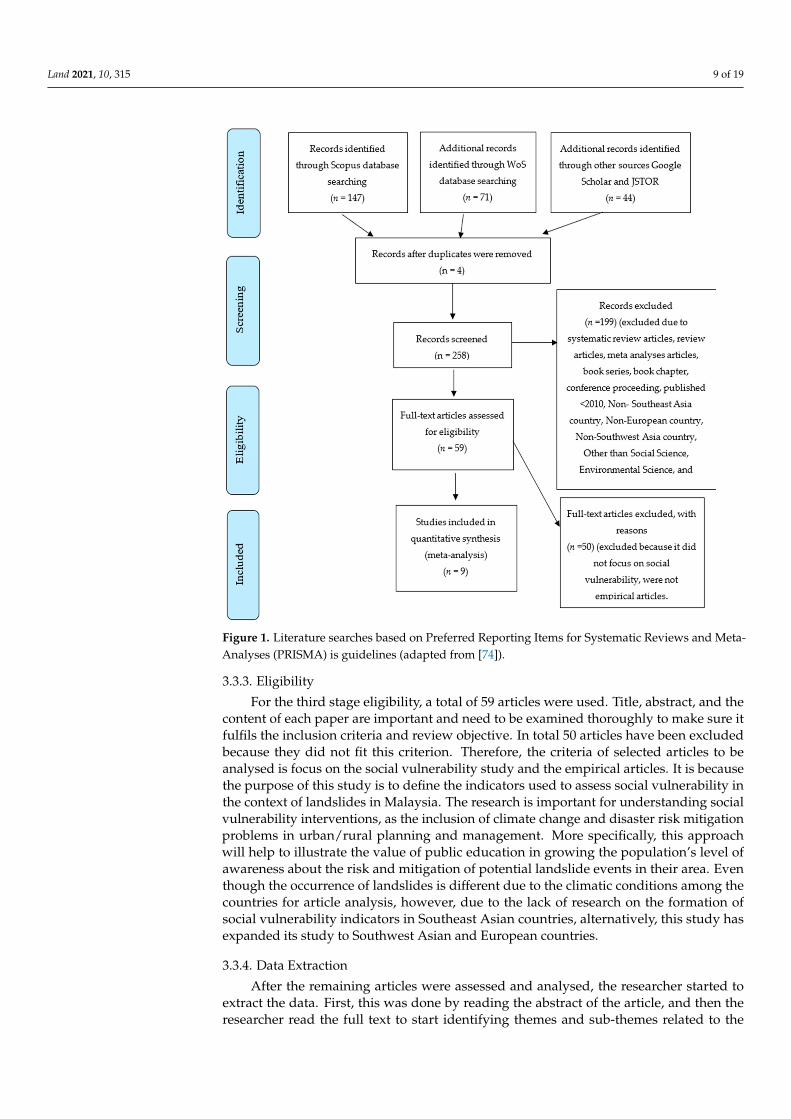
Land 2021, 10, 315 9 of 19
Figure 1. Literature searches based on Preferred Reporting Items for Systematic Reviews and Meta-Analyses (PRISMA) is guidelines (adapted from [74]).
3.3.3. Eligibility
For the third stage eligibility, a total of 59 articles were used. Title, abstract, and thecontent of each paper are important and need to be examined thoroughly to make sure itfulfils the inclusion criteria and review objective. In total 50 articles have been excludedbecause they did not fit this criterion. Therefore, the criteria of selected articles to beanalysed is focus on the social vulnerability study and the empirical articles. It is becausethe purpose of this study is to define the indicators used to assess social vulnerability inthe context of landslides in Malaysia. The research is important for understanding socialvulnerability interventions, as the inclusion of climate change and disaster risk mitigationproblems in urban/rural planning and management. More specifically, this approachwill help to illustrate the value of public education in growing the population’s level ofawareness about the risk and mitigation of potential landslide events in their area. Eventhough the occurrence of landslides is different due to the climatic conditions among thecountries for article analysis, however, due to the lack of research on the formation ofsocial vulnerability indicators in Southeast Asian countries, alternatively, this study hasexpanded its study to Southwest Asian and European countries.
3.3.4. Data Extraction
After the remaining articles were assessed and analysed, the researcher started toextract the data. First, this was done by reading the abstract of the article, and then theresearcher read the full text to start identifying themes and sub-themes related to the
Land 2021, 10, 315 10 of 19
objective. After that, themes and sub-themes were organised to establish a typology forthe article.
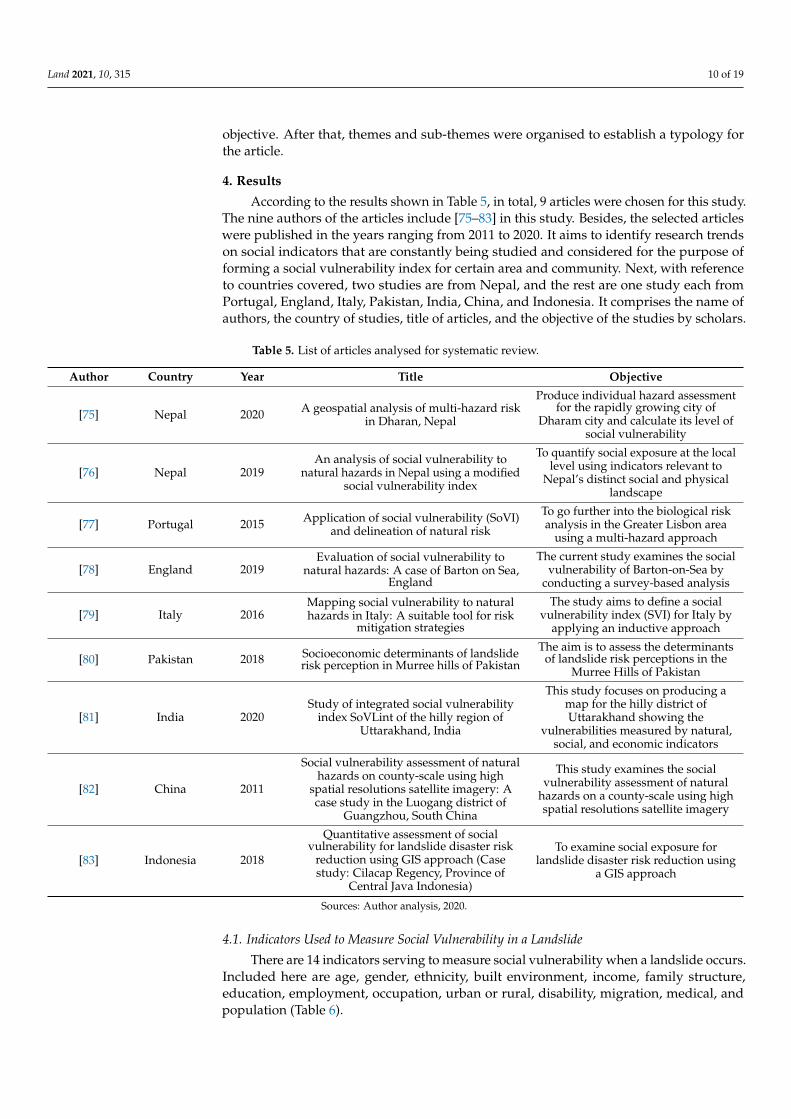
4. Results
According to the results shown in Table 5, in total, 9 articles were chosen for this study.The nine authors of the articles include [75–83] in this study. Besides, the selected articleswere published in the years ranging from 2011 to 2020. It aims to identify research trendson social indicators that are constantly being studied and considered for the purpose offorming a social vulnerability index for certain area and community. Next, with referenceto countries covered, two studies are from Nepal, and the rest are one study each fromPortugal, England, Italy, Pakistan, India, China, and Indonesia. It comprises the name ofauthors, the country of studies, title of articles, and the objective of the studies by scholars.
Table 5. List of articles analysed for systematic review.
Author Country Year Title Objective
[75] Nepal 2020 A geospatial analysis of multi-hazard riskin Dharan, Nepal
Produce individual hazard assessmentfor the rapidly growing city of
Dharam city and calculate its level ofsocial vulnerability
[76] Nepal 2019An analysis of social vulnerability to
natural hazards in Nepal using a modifiedsocial vulnerability index
To quantify social exposure at the locallevel using indicators relevant to
Nepal’s distinct social and physicallandscape
[77] Portugal 2015 Application of social vulnerability (SoVI)and delineation of natural risk
To go further into the biological riskanalysis in the Greater Lisbon area
using a multi-hazard approach
[78] England 2019Evaluation of social vulnerability to
natural hazards: A case of Barton on Sea,England
The current study examines the socialvulnerability of Barton-on-Sea by
conducting a survey-based analysis
[79] Italy 2016Mapping social vulnerability to naturalhazards in Italy: A suitable tool for risk
mitigation strategies
The study aims to define a socialvulnerability index (SVI) for Italy by
applying an inductive approach
[80] Pakistan 2018 Socioeconomic determinants of landsliderisk perception in Murree hills of Pakistan
The aim is to assess the determinantsof landslide risk perceptions in the
Murree Hills of Pakistan
[81] India 2020Study of integrated social vulnerability
index SoVLint of the hilly region ofUttarakhand, India
This study focuses on producing amap for the hilly district ofUttarakhand showing the
vulnerabilities measured by natural,social, and economic indicators
[82] China 2011
Social vulnerability assessment of naturalhazards on county-scale using high
spatial resolutions satellite imagery: Acase study in the Luogang district of
Guangzhou, South China
This study examines the socialvulnerability assessment of natural
hazards on a county-scale using highspatial resolutions satellite imagery
[83] Indonesia 2018
Quantitative assessment of socialvulnerability for landslide disaster risk
reduction using GIS approach (Casestudy: Cilacap Regency, Province of
Central Java Indonesia)
To examine social exposure forlandslide disaster risk reduction using
a GIS approach
Sources: Author analysis, 2020.
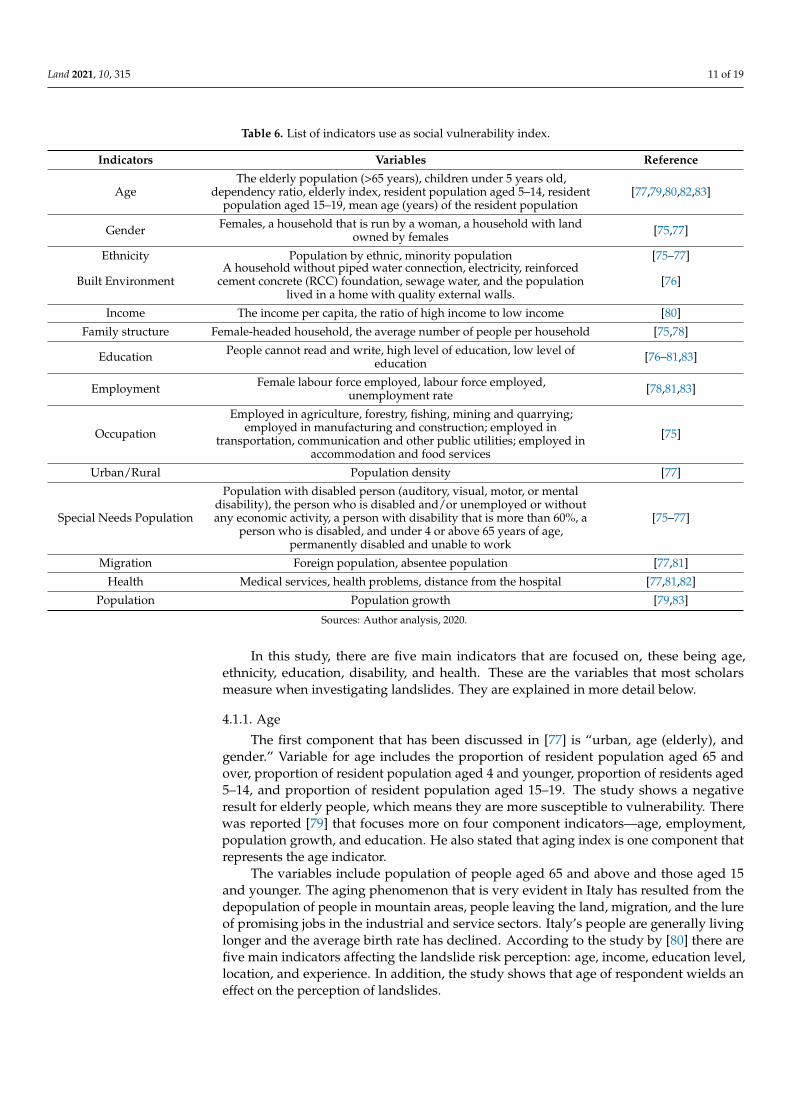
4.1. Indicators Used to Measure Social Vulnerability in a Landslide
There are 14 indicators serving to measure social vulnerability when a landslide occurs.Included here are age, gender, ethnicity, built environment, income, family structure,education, employment, occupation, urban or rural, disability, migration, medical, andpopulation (Table 6).
Land 2021, 10, 315 11 of 19
Table 6. List of indicators use as social vulnerability index.
Indicators Variables Reference
AgeThe elderly population (>65 years), children under 5 years old,
dependency ratio, elderly index, resident population aged 5–14, residentpopulation aged 15–19, mean age (years) of the resident population
[77,79,80,82,83]
Gender Females, a household that is run by a woman, a household with landowned by females [75,77]
Ethnicity Population by ethnic, minority population [75–77]
Built EnvironmentA household without piped water connection, electricity, reinforced
cement concrete (RCC) foundation, sewage water, and the populationlived in a home with quality external walls.
[76]
Income The income per capita, the ratio of high income to low income [80]
Family structure Female-headed household, the average number of people per household [75,78]
Education People cannot read and write, high level of education, low level ofeducation [76–81,83]
Employment Female labour force employed, labour force employed,unemployment rate [78,81,83]
Occupation
Employed in agriculture, forestry, fishing, mining and quarrying;employed in manufacturing and construction; employed in
transportation, communication and other public utilities; employed inaccommodation and food services
[75]
Urban/Rural Population density [77]
Special Needs Population
Population with disabled person (auditory, visual, motor, or mentaldisability), the person who is disabled and/or unemployed or withoutany economic activity, a person with disability that is more than 60%, a
person who is disabled, and under 4 or above 65 years of age,permanently disabled and unable to work
[75–77]
Migration Foreign population, absentee population [77,81]
Health Medical services, health problems, distance from the hospital [77,81,82]
Population Population growth [79,83]
Sources: Author analysis, 2020.
In this study, there are five main indicators that are focused on, these being age,ethnicity, education, disability, and health. These are the variables that most scholarsmeasure when investigating landslides. They are explained in more detail below.
4.1.1. Age
The first component that has been discussed in [77] is “urban, age (elderly), andgender.” Variable for age includes the proportion of resident population aged 65 andover, proportion of resident population aged 4 and younger, proportion of residents aged5–14, and proportion of resident population aged 15–19. The study shows a negativeresult for elderly people, which means they are more susceptible to vulnerability. Therewas reported [79] that focuses more on four component indicators—age, employment,population growth, and education. He also stated that aging index is one component thatrepresents the age indicator.
The variables include population of people aged 65 and above and those aged 15and younger. The aging phenomenon that is very evident in Italy has resulted from thedepopulation of people in mountain areas, people leaving the land, migration, and the lureof promising jobs in the industrial and service sectors. Italy’s people are generally livinglonger and the average birth rate has declined. According to the study by [80] there arefive main indicators affecting the landslide risk perception: age, income, education level,location, and experience. In addition, the study shows that age of respondent wields aneffect on the perception of landslides.
Land 2021, 10, 315 12 of 19
4.1.2. Ethnicity
According to [76], the ethnicity indicators focus on the Dalit population and minoritypopulation such as Muslims and Sikhs/Punjabis. They found that this group was lessthan 5% of the total population in Nepal, and it is considering as disadvantage groups.In [77], “nationality and ethnicity” is one of the five main indicators in that particular study.The variables for ethnicity indicator include person of African origin living in the country,foreign nationality, and resident who was born outside the country as a marginal group.Like age, ethnicity can be an indicator in the social vulnerability index and help assesswhat is happening in a given society.
4.1.3. Education
Education has always been regarded as one of the key vulnerabilities all communitieshave to deal with. Educated people are more likely to have advantages in everything theydo compared to people without or with little education. There are three main variablesrelating to education as follows [75]: percentage of the population who can read andwrite, percentage who completed school certificate (SLC), and percentage who completed acollege or university degree. In the study by [77], one of the indicators “development andeducation” included variables such as the proportion of illiterate people. The communitycan be very vulnerable when the proportions of literate and illiterate are dangerouslydisproportionate.
Furthermore, the level of education and qualification can affect vulnerability in onecommunity. The higher the qualification in education that someone has, the more unlikely itis that they will experience vulnerability from any hazards. According to [78], an individualwho has enough education and knowledge regarding about a certain issue will generallybetter understand the nature of a hazard and its likely effect on them. Not only caneducation affect individuals’ knowledge of certain issues but it also helps to reduce poverty,improve health, get more and better job opportunities, higher salaries, etc.
4.1.4. Special Need Population
The population with special needs is usually much more vulnerable than peoplewithout a disability. Disability can be a huge factor for assessing vulnerabilities, especiallywhen disasters or hazards occur. As mentioned by [76], this factor is closely linked tosocioeconomic status, education and built environment, and ethnicity—all components ofvulnerability assessment. It is shown by the variance for socioeconomic status (45.12%),education and built environment (19.74%), ethnicity (10.98%), and disability (10.78%).
4.1.5. Health
Health is one of the major indicators of this study. Variables such as medical services,health problems, and distance from the hospital are important factors of measuring socialvulnerability as mentioned by [77,81,82]. Being healthy and having a good public healthcaresystem is important for communities that are more vulnerable to a disaster or hazard. Poorpublic health systems can simply make problems worse, and lead to more accidentsand disruptions.
5. Discussion
There are not many studies concerning the Social Vulnerability Index (SoVI) withreference to landslides. Based on the research undertaken, articles regarding landslide inthe context of social vulnerability index usually consider other types of hazard or wherelandslides are bracketed with other natural disasters. Articles based only on social vulnera-bility and landslides are difficult to locate. Social vulnerability or the social vulnerabilityindex has many types—not only SoVI but also referred to as SEVI or SVI. Even though thefocus is only on SoVI in this paper, the researcher has taken note of other types of socialvulnerability index.
Land 2021, 10, 315 13 of 19
There are 14 indicators that have been employed to measure social vulnerability inthe context of landslide including (see Table 5): age, gender, ethnicity, built environment,income, family structure, education, employment, occupation, urban or rural, disability,migration, medical, and population. Based on the analysis, the researcher only focuseson five main indicators that have been used by many scholars: age, ethnicity, education,special needs population, and health. These were chosen because they are very relevantto the more vulnerable in society, especially where inequalities and imperiled areas arevery evident.
5.1. Education
There are a few factors that affect social vulnerability including lack of access to: re-sources such as information, knowledge, and technology; social networks and connectionswith other individuals; social capital; and infrastructure [83]. In this study, educationemerges as a major indicator employed in other studies regarding social vulnerability andlandslides. Education is a bridge to success for many people, and it can refer to both formaland informal education. Education can also mean information, knowledge, and technologyregarding the scope of discussion. The importance of education is to help people achievemore success and status in society, get a better job and understand the issues involved in ahazard or disaster. Furthermore, it helps individuals to be prepared for any circumstances.According to [84], people who have better response mechanisms, always prepare andconstantly recover from a disaster, and this is certainly the case for those individuals,households, and societies with better and more widespread higher education outcomescompared to others.
5.2. Age
Indicators such as age can also mean susceptibility to social vulnerability. Older andvery young people are more vulnerable to hazards and disasters than people in the middle.A higher proportion of senior citizens means that a society is at greater risk of disaster andthe strategies needed to repair any given situation, simply because older people are morevulnerable to hazards than other age groups. Older people normally need a lot of physicaland emotional care and support services. They can also be more disadvantaged comparedto other age groups. The indicators that have been collected from previous studies do notrepresent the population or the place.
5.3. Ethnicity
Racism or ethnic discord is one of the factors of disaster risk, and especially forminority groups such as migrants and/or non-residents in a given location [85]. They arealso known as marginalised groups, considered to be inferior in terms of their economicstatus, health, social relationships, and environment. If this situation continues, it willresult in lasting social, political, and economic losses [86]. Although a mixture of socio-spatial and biophysical influences forms people’s susceptibility to environmental hazards,race/ethnicity, and class have been central to understanding social dynamics during hazardevents [87].
5.4. Special Needs Population
Special needs populations such as people with a disability are the most-at-risk personswhen a disaster occurs. Disability means that the person with a physical or mental conditionhas limited movements, senses, or ability to participate in activities. Characteristics that areconsidered to be a disability are deafness, blindness, diabetes, autism, epilepsy, depression,and HIV. According to [88], disability emerges from the connection between people withhealth problems, such as cerebral palsy, Down syndrome, depression, as well as personaland environmental influences, including negative attitudes, limited transport facilities,public service facilities, and insufficient social support systems. They are generally the firstvictims of natural disasters. Indeed, early warning systems that alert the public may not
Land 2021, 10, 315 14 of 19
actually reach the disabled individuals in time. The death toll from a disaster is two to fourtimes larger than for those who are not disabled [89].
5.5. Healthcare Accessibility
Those with health problems are particularly vulnerable to landslides. They requireconstant attention and healthcare services to ensure their safety and good health. Therefore,access to health services such as hospitals, healthcare clinics, and pharmacies is an impor-tant need for this community. One of the principal components of emergency managementis healthcare management to cope with disasters [90]. In disaster prevention activities, welltargeted healthcare supply chain management can function effectively and efficiently. Asubstantial number of disaster casualties or even fatalities could be absorbed as long ashealthcare services are up and running when a disaster occurs [91].
All the variables are listed above give an essential role in determining the securityof a community based on social inductors. However, the results of the author’s studyfound that income indicators and social capital are less emphasised. Income indicatorsreferring to those with low incomes and belonging to the group below 40% of Malaysia’sincome are very vulnerable to disasters. For example, the floods that occur every year havecaused suffering because they cannot work, and the worst consequences, they will losetheir jobs. The study [92] found that the income sub-domain is the largest contributor andgives high value to the index of endangered livelihoods of rural communities in Pahangin 2014. Low-income conditions will also affect the period for them to recover after acatastrophic event. The results of the author’s research found that there are no studiesthat explore social asset indicators. Social assets carry meaning as resources available toindividuals and groups through membership in social networks. If the household hasa higher position in a group or social institution, he or she will produce higher socialstrengths and resources [93]. Longer membership history as well as more participationin other social groups make it easier for access to information, business opportunities,social strength, and influence. The ability to access other assets is also simpler [94]. Theevolution of social capital through the interaction of relationships between people andgroups in community social networks [95,96]. Social networking means the interactionof an individual with other individuals, organisations, and groups to obtain informationand assistance on something related to their livelihood [96,97]. The lack and absence ofthese elements within the social life environment of an individual will contribute to theirvulnerability factors, as emphasised by [98,99]. Social capital influences, the sustainablelife they possess significantly to strengthen the ability to develop a network of cooperationbetween groups both internally and externally and through enhancing the institutionalcapacity of community groups to improve the well-being of society.
State government agencies, local governments, and community leaders are the mostfamiliar with the people in their communities. The social vulnerability index’s importanceis design to assist them in ensuring the security and well-being of their population. TheSVI components can help the state and local people involved in all phases of the disastersequence, in particular, landslides. Knowledge of locations and community informationthat is vulnerable to landslides can help planners in identifying target groups and ac-celerating assistance in efforts to reduce and impact property damage and loss of life,as well as prepare for disaster events. The stakeholders and management planners cansetting the evacuation centre to places in secure condition to those are needs emergencyassistances such as elderly people, single mothers with kids and infants, no transportationspeople and migrants whose are not influent in local language. In the recovery process,local governments may recognise communities that may require additional funding forhuman services or as a mitigation gauge to avoid a need for more costs due to the postsupport [100]. The slower to recover are those with the socioeconomically low-incomecommunity with hazardous areas of landslide occurrence. Therefore, the analysis resultsshow that there are seven indicators as outlined that should be used as a social vulnerabilityindex in measuring the level of susceptibility of landslides events. It consisted of education,
Land 2021, 10, 315 15 of 19
age, ethnicity, special need population, healthcare accessibility, income, and social assetindicators. Future research will examine how SoVI can be used in the planning and miti-gation processes to help target disaster management interventions as part of the system.Besides, the SoVI outcome can lead to geological mapping of disaster risk management inMalaysia’s decision-making systems based on specific zones.
6. Conclusions
In this study, we have reviewed a selection of socioeconomic vulnerability components.At the searching stage, 258 articles were found in key databases, and after inclusion andexclusion criteria using the PRISMA guideline, only nine articles were chosen as being validto this research. Fourteen variables were listed, and five variables of social vulnerability,which were typically used by scholars, proved to be relevant to Malaysia. Not all places orlocations have the same experiences of landslides, and so the level of social vulnerabilitywill differ and how these are measured. Although people may experience the same hazardor disaster, it does not mean that all individuals go through the same processes of destruc-tion, recovery, evaluation, etc., as others. There are individuals who experience muchhigher social vulnerability than others, and it depends on which indicators are employed.As a climatic condition and the landslides occurrences in Malaysian context, there are sevenindicators underlined which are education, age, ethnicity, special needs population, healthaccessibility, income, and social capital. These are the important indicator to measure thesocial vulnerability index to the high-risk communities towards landslide hazard. Theresult of these indicator measurement should be useful to authorities to include it as acomplementary data to their geological mapping of disaster risk management based onthe location of the landslide events. Furthermore, that is why, this study is important forunderstanding the social vulnerability index in the context of landslides in Malaysia.
Author Contributions: Conceptualization, M.I.N.D.; methodology, M.I.N.D.; software, M.I.N.D.;validation, M.I.N.D., M.R.T., and N.M.; formal analysis, M.I.N.D.; investigation, M.M.A.; resources,M.I.N.D.; data curation, M.M.A.; writing—original draft preparation, M.I.N.D.; writing—review andediting, M.M.A.; visualization, N.M.; supervision, M.R.T.; project administration, M.R.T. and A.O.;funding acquisition, M.R.T. and A.O. All authors have read and agreed to the published version ofthe manuscript.
Funding: This research was funded by Dana Padanan Antarabangsa—(MyPAIR)—Natural Environ-ment Research Council (NERC), grant number NEWTON/1/2018/TK01/UKM/2.
Institutional Review Board Statement: Not applicable.
Informed Consent Statement: Not applicable.
Data Availability Statement: Not applicable.
Acknowledgments: The authors acknowledged the technical support by Nurul Atikah Zulkepli andSiti Nursakinah Selamat for the searching material of this study. We are also thanking to four anony-mous reviewers whose give the comments/suggestion helped improve and clarify this manuscript.
Conflicts of Interest: The authors declare no conflict of interest.
References1. Peduzzi, P. The Disaster Risk, Global Change, and Sustainability Nexus. Sustainability 2019, 11, 957. [CrossRef]2. Burton, C.; Betts, R.A.; Jones, C.D.; Williams, K. Will fire danger be reduced by using Solar Radiation Management to limit global
warming to 1.5 C compared to 2.0 C? Geophys. Res. Lett. 2018, 45, 3644–3652. [CrossRef]3. Parker, R.N.; Densmore, A.L.; Rosser, N.J.; de Michele, M.; Li, Y.; Huang, R.; Whadcoat, S.; Petley, D.N. Mass wasting triggered by
the 2008 Wenchuan earthquake is greater than orogenic growth. Nat. Geosci. 2011, 4, 449–452. [CrossRef]4. Sultana, N. Analysis of Landslide-induced Fatalities and Injuries in Bangladesh: 2000–2018. Cogent Soc. Sci. 2020, 6, 1737402.
[CrossRef]5. Dai, F.C.; Lee, C.F.; Ngai, Y.Y. Landslide risk assessment and management: An overview. Eng. Geol. 2002, 64, 65–87. [CrossRef]6. Guzzetti, F. Landslide fatalities and the evaluation of landslide risk in Italy. Eng. Geol. 2000, 58, 89–107. [CrossRef]
Land 2021, 10, 315 16 of 19
7. Haque, U.; da Silva, P.F.; Devoli, G.; Pilz, J.; Zhao, B.; Khaloua, A.; Wilopo, W.; Andersen, P.; Lu, P.; Lee, J.; et al. The human costof global warming: Deadly landslides and their triggers (1995–2014). Sci. Total Environ. 2019, 682, 673–684. [CrossRef]
8. Keefer, D.K.; Larsen, M.C. Assessing Landslide Hazards. Science 2007, 316, 1136–1138. [CrossRef] [PubMed]9. Petley, D.N.; Dunning, S.; Rosser, N.; Hungr, O. The analysis of global landslide risk through the creation of a database of
worldwide landslide fatalities. In Landslide Risk Management; Hungr, O., Fell, R., Couture, R., Eberhardt, E., Eds.; BalkemaPublishers: Rotterdam, The Netherlands, 2005; pp. 367–374.
10. Schuster, R.L.; Highland, L.M. Socioeconomic Impacts of Landslides in the Western Hemisphere; U.S. Geological Survey: Reston, VA,USA, 2001; p. 47.
11. CRED. Disaster Risk Profile: South East Asia-EM-DAT. The Emergency Events Database—Université Catholique de Louvain(UCL). 2018. Available online: http://emdat.be/emdat_db/ (accessed on 3 September 2020).
12. Vulnerability. Cambridge University Press. 2020. Available online: https://dictionary.cambridge.org/dictionary/english/vulnerability (accessed on 22 February 2020).
13. Smit, B.; Wandel, J. Adaptation, adaptive capacity and vulnerability. Glob. Environ. Chang. 2006, 16, 282–292. [CrossRef]14. Hufschmidt, G. A comparative analysis of several vulnerability concepts. Nat. Hazards 2011, 58, 621–643. [CrossRef]15. Bankoff, G.; Frerks, G.; Hilhorst, D. Disasters, Development & People; Routledge: London, UK, 2004; pp. 1–233.16. Cutter, S.L.; Boruff, B.J.; Shirley, W.L. Social vulnerability to environmental hazards. Soc. Sci. Q. 2003, 84, 242–261. [CrossRef]17. IPCC. Climate Change 2007: Impacts, Adaptation, and Vulnerability; Contribution of Working Group II to the Fourth Assessment
Report of the Intergovernmental Panel on Climate Change; Parry, M.L., Canziani, O.F., Palutikof, J.P., van der Linden, P.J., Hanson,C.E., Eds.; Cambridge University Press: Cambridge, UK, 2007.
18. Henninger, N. Mapping and Geographic Analysis of Human Welfare and Poverty Review and Assessment; World Resources Institute:Washington, DC, USA, 1998.
19. Idrus, S.; Lim, C.-S.; Hadi, A.-S. Kemudahterancaman (Vulnerability) Penduduk Terhadap Perubahan Guna Tanah di Selangor.Malays. J. Environ. Manag. 2005, 5, 79–98.
20. O’Keefe, P.; Westgate, K.; Wisner, B. Taking the naturalness out of natural disasters. Nature 1976, 260, 566–567. [CrossRef]21. Cutter, S.L. The secret history of natural disaster. Glob. Environ. Change Part B Environ. Hazards 2001, 3, 29. [CrossRef]22. IPCC. Summary for Policymakers. In Managing the Risks of Extreme Events and Disasters to Advance Climate Change Adaptation; Field,
C.B., Barros, V., Stocker, T.F., Qin, D., Dokken, D.J., Ebi, K.L., Mastrandrea, M.D., Mach, K.J., Plattner, G.-K., Allen, S.K., et al.,Eds.; A Special Report of Working Groups I and II of the Intergovernmental Panel on Climate Change; Cambridge UniversityPress: Cambridge, UK; New York, NY, USA, 2012; pp. 3–21.
23. Roslee, R.; Jamaludin, T.A.; Simon, N. Landslide vulnerability assessment (LVAs): A case study from Kota Kinabalu, Sabah,Malaysia. Indones. J. Geosci. 2017, 4, 49–59. [CrossRef]
24. CIDB. Guidelines for Landslide Vulnerability Assessment and Risk Analysis for Critical Infrastructure in Malaysia; CIDB: Kuala Lumpur,Malaysia, 2020; 54p.
25. Wisner, B.; Blaikie, P.; Cannon, T.; Davis, I. At Risk: Natural Hazards, People Vulnerability and Disasters, 2nd ed.; Routledge: London,UK, 2004.
26. Mavhura, E.; Manyena, B.; Collins, A.E. An approach for measuring social vulnerability in context: The case of flood hazards inMuzarabani district, Zimbabwe. Geoforum 2017, 86, 103–117. [CrossRef]
27. Juntunen, L. Addressing social vulnerability to hazards. Disaster Saf. Rev. 2006, 4, 3–10.28. Emrich, C.T.; Cutter, S.L. Social vulnerability to climate-sensitive hazards in the Southern United States. Am. Meteorol. Soc. 2011,
3, 193–208. [CrossRef]29. Cutter, S.L.; Emrich, C.T.; Morath, D.P.; Dunning, C.M. Integrating social vulnerability into federal flood risk management
planning. J. Flood Risk Manag. 2013, 6, 332–344. [CrossRef]30. Putnam, R.D. Bowling Alone: Collapse and Revival of the American Community; Simon & Schuster: New York, NY, USA, 2000.31. Fekete, A. Social Vulnerability (Re-)Assessment in Context to Natural Hazards: Review of the Usefulness of the Spatial Indicator
Approach and Investigations of Validation Demands. Int. J. Disaster Risk Sci. 2019, 10, 220–232. [CrossRef]32. Roder, G.; Sofia, G.; Wu, Z.; Tarolli, P. Assessment of Social Vulnerability to Floods in the Floodplain of Northern Italy. Weather
Clim. Soc. 2017, 9, 717–737. [CrossRef]33. Johnson, K. SAMHSA Disaster Technical Assistance Center Supplemental Research Bulletin Greater Impact: How Disasters
Affect People of Low Socioeconomic Status. Phys. Health Health Probl. 2017. Available online: https://www.samhsa.gov/sites/default/files/programs_campaigns/dtac/srb-low-ses.pdf (accessed on 3 March 2021).
34. Lee, S.; Pradhan, B. Probabilistic landslide hazards and risk mapping on Penang Island, Malaysia. J. Earth Syst. Sci. 2006, 115,661–672. [CrossRef]
35. Nhu, V.H.; Mohammadi, A.; Shahabi, H.; Ahmad, B.; Al-Ansari, N.; Shirzadi, A.; Geertsema, M.; Kress, V.R.; Karimzadeh, S.;Kamran, K.V.; et al. Landslide detection and susceptibility modeling on cameron highlands (Malaysia): A comparison betweenrandom forest, logistic regression and logistic model tree algorithms. Forests 2020, 11, 830. [CrossRef]
36. Ohkubo, T.; Tani, M.; Akojima, I.; Takahashi, S.; Yamakura, T.; Itoh, A.; Kanzaki, M.; Lee, H.S.; Ashton, P.S.; Ogino, K. Spatialpattern of landslides due to heavy rains in a mixed Dipterocarp forest, North-Western Borneo. Tropics 2007, 16, 59–70. [CrossRef]
37. Sharir, K.; Roslee, R.; Ern, L.K.; Simon, N. Landslide Factors and susceptibility mapping on natural and artificial slopes inKundasang, Sabah. Sains Malays. 2017, 46, 1531–1540. [CrossRef]
Land 2021, 10, 315 17 of 19
38. Yusof, N.M.; Pradhan, B. Landslide susceptibility mapping along PLUS expressways in Malaysia using probabilistic based modelin GIS. IOP Conf. Ser. Earth Environ. Sci. 2014, 20. [CrossRef]
39. Ya’Acob, N.; Tajudin, N.; Yusof, A.L.; Ali, D.M.; Sarnin, S.S. Rainfall thresholds for possible landslide occurrence in Ulu Kelang,Selangor, Malaysia using TRMM satellite precipitation estimates. IOP Conf. Ser. Earth Environ. Sci. 2018, 169. [CrossRef]
40. Alnaimat, A.; Choy, L.K.; Jaafar, M. An Assessment of Current Practices on Landslides Risk Management: A Case of KualaLumpur Territory. Geogr. Malays. J. Soc. Space 2017, 13, 1–12.
41. Mollaee, S.; Pirasteh, S.; Ramli, M.F.; Rizvi, S.M.A. Identifying effecting factors and landslide mapping of cameron highlandMalaysia. In Proceedings of the 2013 5th International Conference on Geo-Information Technologies for Natural DisasterManagement, GiT4NDM 2013, Mississauga, ON, Canada, 9–11 October 2013; pp. 73–83. [CrossRef]
42. Qasim, S.; Osman, S.B.S. Causal factors of Malaysian landslides: A narrative study. Res. J. Appl. Sci. Eng. Technol. 2013, 5,2303–2308. [CrossRef]
43. Sulaiman, M.S.; Nazaruddin, A.; Salleh, N.M.; Abidin, R.Z.; Miniandi, N.D.; Yusoff, A.H. Landslide occurrences in Malaysiabased on soil series and lithology factors. Int. J. Adv. Sci. Technol. 2019, 28, 1–26.
44. CFE-DHMA. Malaysia: Disaster Management Reference Handbook, Center for Excellence in Disaster Management and HumanitarianAssistance; Pearl Harbour-Hickam: Hawaii, HI, USA, 2019; 95p.
45. Jamaluddin, S.; Abd Aziz, J. Fitting Daily Rainfall Amount in Malaysia Using the Normal Transform Distribution. J. Appl. Sci.2007, 7, 1880–1886.
46. Muhammad, N.S.; Julien, P.Y.; Salas, J.D. Probability structure and return period of multiday monsoon rainfall. J. Hydrol. Eng.2016, 21, 04015048. [CrossRef]
47. Dou, J.; Tien Bui, D.; Yunus, A.P.; Jia, K.; Song, X.; Revhaug, I. Optimization of causative factors for landslide susceptibilityevaluation using remote sensing and GIS data in parts of Niigata, Japan. PLoS ONE 2015, 10, e0133262. [CrossRef] [PubMed]
48. Sim, L.L.; Adrian, C.; Trisha, N. Malaysia among Countries Especially Prone to Landslides. 4 December 2018. Availableonline: https://www.thestar.com.my/news/nation/2018/12/04/msia-ranks-highly-for-landslides-country-experienced-185-occurrences-annually-in-past-10-years#:~:text=According%20to%20data%20from%20the,)%20and%20China%20(426) (accessedon 27 February 2021).
49. Prevention Web Malaysia. Disaster Risk Reduction is Everyone’s Business. Dr Khamarrul Azahari Razak, UTM GeohazardsLeader. 2 May 2019. Available online: https://www.preventionweb.net/news/view/65076 (accessed on 7 September 2020).
50. Rahman, H.; Mapjabil, J. Landslides disaster in Malaysia: An overview. Health 2017, 8, 58–71.51. Majid, N.; Taha, M.; Selamat, S. Historical landslide events in Malaysia 1993–2019. Indian J. Sci. Technol. 2020, 13, 3387–3399.
[CrossRef]52. Saadatkhah, N.; Kassim, A.; Lee, M. Spatial patterns of precipitation, altitude and monsoon directions in Hulu Kelang area,
Malaysia. EJGE C 2014, 19, 521–534.53. Syah Hairizal Kamalul Arifin. Dua Rumah Terlibat Tanah Runtuh di Lereng Bukit di Papar. 10 November 2020. Available online:
https://www.astroawani.com/berita-malaysia/dua-rumah-terlibat-tanah-runtuh-di-lereng-bukit-di-papar-267692 (accessed on18 February 2021).
54. Bernama. Police: 13 Vehicles Trapped by Fraser’s Hill landslides, No Injuries. 3 January 2021. Available online: https://www.thestar.com.my/news/nation/2021/01/03/police-13-vehicles-trapped-by-fraser039s-hill-landslides-no-injuries (accessed on 19February 2021).
55. Nik Nur Izzatul Hazawani Nik Adnan. Tanah Runtuh, Kedai di Medan Selera Geliga Dihempap Bongkah Batu. 4 January 2021.Available online: https://www.utusan.com.my/nasional/2021/01/tanah-runtuh-kedai-di-medan-selera-geliga-dihempap-bongkah-batu/ (accessed on 18 February 2021).
56. Bernama. Hujan Lebat Punca Tanah Runtuh di JRTB. 7 January 2021. Available online: https://www.astroawani.com/berita-malaysia/hujan-lebat-punca-tanah-runtuh-di-jrtb-276444 (accessed on 18 February 2021).
57. Khairul Mohd Ali. 42 Penduduk Kosongkan Rumah Ekoran Tanah Runtuh. Utusan Malaysia Online. 11 January 2021. Availableonline: https://www.utusan.com.my/berita/2021/01/42-penduduk-kosongkan-rumah-ekoran-tanah-runtuh/ (accessed on 18February 2021).
58. Bernama. Jalan Bukit Fraser-Raub Ditutup. 16 January 2021. Available online: https://www.hmetro.com.my/mutakhir/2021/01/664819/jalan-bukit-fraser-raub-ditutup (accessed on 18 January 2021).
59. Bernama. Banjir Sabah: 25 Jalan Terjejas, 10 Kejadian Tanah Runtuh. 9 February 2021. Available online: https://www.sinarharian.com.my/article/119525/BERITA/Semasa/Banjir-Sabah-25-jalan-terjejas-10-kejadian-tanah-runtuh (accessed on 18 February2021).
60. Bernama. Women Saves Four Grandchildren as House Collapes during Landslides in Padawan, Sawarak. 13 January 2021. Avail-able online: https://www.thestar.com.my/news/nation/2021/01/13/woman-saves-four-grandchildren-as-house-collapses-during-landslide-in-padawan-sarawak (accessed on 19 February 2021).
61. Abdul Rahman, H. An overview of environmental disaster in Malaysia and preparedness strategies. Iran. J. Public Health 2014, 43,17–24.
62. Ahmad, J.; Lateh, H.; Saleh, S. Landslide hazards: Household vulnerability, resilience and coping in Malaysia. J. Educ. Hum. Dev.2014, 3, 149–155. [CrossRef]
Land 2021, 10, 315 18 of 19
63. Sun, X.; Chen, J.; Han, X.; Bao, Y.; Zhan, J.; Peng, W. Application of a GIS-based slope unit method for landslide susceptibilitymapping along the rapidly uplifting section of the upper Jinsha River, South-Western China. Bull. Eng. Geol. Environ. 2020, 79,533–549. [CrossRef]
64. Soma, A.S.; Kubota, T. The Performance of Land Use Change Causative Factor on Landslide Susceptibility Map in UpperUjung-Loe Watersheds South Sulawesi, Indonesia. Geoplanning J. Geomat. Plan. 2017, 4, 157. [CrossRef]
65. Mukhlisin, M.; Semarang, P.N.; Nizam, K.; Maulud, A.; Taha, M.R.; Water, S.; Using, R.; Pivot, C. GIS Based Landslide HazardMapping Prediction in Ulu Klang, Malaysia. ITB Sci. J. A 2010, 42, 163–178. [CrossRef]
66. Pradhan, B.; Youssef, A.M. Manifestation of remote sensing data and GIS on landslide hazard analysis using spatial-basedstatistical models. Arab. J. Geosci. 2010, 3, 319–326. [CrossRef]
67. Abdullah, C.H. Landslide risk management in Malaysia. Disaster Manag. Hum. Health Risk III 2013, 133, 255–265. [CrossRef]68. Ministry of Housing and Local Government. Corporate Communications Unit, Kuala Lumpur. 2009. Available online: https://
www.kpkt.gov.my/resources/index/user_1/siaran_media/ogos/SIARAN_AKHBAR_Garis_Panduan_Tanah_Tinggi09.pdf (ac-cessed on 30 December 2020).
69. Shaluf, I.M.; Ahmadun, F.R. Disaster types in Malaysia: An overview. Disaster Prev. Manag. Int. J. 2006, 15, 286–298. [CrossRef]70. Elmahdy, S.I.; Mostafa, M.M. Natural hazards susceptibility mapping in Kuala Lumpur, Malaysia: An assessment using remote
sensing and geographic information system (GIS). Geomat. Nat. Hazards Risk. 2013, 4, 71–91. [CrossRef]71. Jamaludin, S.; Hussein, A.N. Landslide hazard and risk assessment: The Malaysian experience. IAEG 2006, 455, 1–10.72. Mohamed Shaffril, H.A.; Samah, A.A.; Samsuddin, S.F.; Ali, Z. Mirror-mirror on the wall, what climate change adaptation
strategies are practiced by the Asian’s fishermen of all? J. Clean. Prod. 2019, 232, 104–117. [CrossRef]73. Martín-Martín, A.; Orduna-Malea, E.; Thelwall, M.; López-Cózar, E.D. Google scholar, web of science, and scopus: A systematic
comparison of citations in 252 subject categories. J. Informetr. 2018, 12, 1160–1177. [CrossRef]74. Moher, D.; Liberati, A.; Tetzlaff, J.; Altman, D.G. The Prisma Group. Preferred reporting items for systematic reviews and
meta-analyses: The PRISMA statement. PLoS Med. 2009, 6, e1000097. [CrossRef] [PubMed]75. Aksha, S.K.; Juran, L.; Resler, L.M.; Zhang, Y. An analysis of social vulnerability to natural hazards in Nepal using a modified
social vulnerability index. Int. J. Disaster Risk Sci. 2019, 10, 103–116. [CrossRef]76. Aksha, S.K.; Resler, L.M.; Juran, L.; Carstensen, L.W., Jr. A geospatial analysis of multi-hazard risk in Dharan, Nepal. Geomat. Nat.
Hazards Risk 2020, 11, 88–111. [CrossRef]77. Guillard-Gonçalves, C.; Cutter, S.L.; Emrich, C.T.; Zêzere, J.L. Application of Social Vulnerability Index (SoVI) and delineation of
natural risk zones in Greater Lisbon, Portugal. J. Risk Res. 2015, 18, 651–674. [CrossRef]78. Kantamaneni, K. Evaluation of social vulnerability to natural hazards: A case of Barton on Sea, England. Arab. J. Geosci. 2019, 12,
1–11. [CrossRef]79. Frigerio, I.; Amicis, M.D. Mapping social vulnerability to natural hazards in Italy: A suitable tool for risk mitigation strategies.
Environ. Sci. Policy 2016, 6, 187–196. [CrossRef]80. Qasim, S.; Qasim, M.; Shrestha, R.P.; Khan, N. Socioeconomic determinants of landslide risk perception in Murree hills of Pakistan.
Aims Environ. Sci. 2018, 5, 305–314. [CrossRef]81. Kumar, D.; Bhattacharjya, R.K. Study of integrated social vulnerability index SoVIint of hilly region of Uttarakhand, India.
Environ. Clim. Technol. 2020, 24, 105–122. [CrossRef]82. Zeng, J.; Zhu, Z.Y.; Zhang, J.L.; Ouyang, T.P.; Qiu, S.F.; Zou, Y.; Zeng, T. Social vulnerability assessment of natural hazards on
county-scale using high spatial resolution satellite imagery: A case study in the Lougang district of Guangzhou, South China.Environ. Earth Sci. 2012, 65, 173–182. [CrossRef]
83. Wijaya, A.P.; Hong, J.H. Quantitative assessment of social vulnerability for landslide disaster risk reduction using GIS approach.Int. Arch. Photogramm. Remote Sens. Spat. Inf. Sci. 2018, XLII, 703–709. [CrossRef]
84. Blaikie, P.; Canon, T.; Davis, I.; Wisner, B. At Risk: Natural Hazards People’s Vulnerability and Disasters; Routledge: London, UK,1994.
85. Elstad, J.L. Inequalities in health related to women’s marital, parental, and employment status: A comparison between the early70s and the late 80s, Norway. Soc. Sci. Med. 1996, 42, 75–89. [CrossRef]
86. Bolin, B. Race, Class, Ethnicity, and Disaster Vulnerability. In Handbook of Disaster Research. Handbooks of Sociology and SocialResearch; Springer: New York, NY, USA, 2007. [CrossRef]
87. Winant, H. The World Is a Ghetto. Basic Books; Latin American Faculty of Social Sciences Ecuador Headquarters–FLACSO: NewYork, NY, USA, 2001.
88. World Health Organization. Disability. 2021. Available online: https://www.who.int/health-topics/disability#tab=tab_1(accessed on 29 January 2021).
89. Castro, C.-P.; Sarmiento, J.-P.; Edwards, R.; Hoberman, G.; Wyndham, K. Disaster risk perception in urban contexts and for peoplewith disabilities: Case study on the city of Iquique (Chile). Nat. Hazards 2017, 86, 411–436. [CrossRef]
90. Pourhosseini, S.S.; Ardalan, A.; Mehrolhassani, M.H. Key Aspects of Providing Healthcare Services in Disaster Response Stage.Iran. J. Public Health 2015, 44, 111–118. [PubMed]
91. Syahrir, I.; Vanany, I. Healthcare and Disaster Supply Chain: Literature Review and Future Research. Procedia Manuf. 2015, 4, 2–9.[CrossRef]
Land 2021, 10, 315 19 of 19
92. Nurul Ashikin, A.; Nor Diana, M.I.; Siwar, C.; Alam, M.M.; Yasar, M. Community Preparation and Vulnerability Indices forFloods in Pahang State of Malaysia. Land 2021, 10, 198. [CrossRef]
93. Dehghani Pour, M.; Barati, A.A.; Azadi, H.; Scheffran, J. Revealing the role of livelihood assets in livelihood strategies: Towardsenhancing conservation and livelihood development in the Hara Biosphere Reserve, Iran. Ecol. Indic. 2018, 94, 336–347. [CrossRef]
94. Singgalen, Y.A.; Sasongko, G.; Wiloso, P.G. Community participation in regional tourism development: A case study in NorthHalmahera Regency—Indonesia. Insights Reg. Dev. 2019, 1, 318–333. [CrossRef]
95. Po, J.Y.T.; Hickey, G.M. Cross-scale relationships between social capital and women’s participation in decision-making on thefarm: A multilevel study in semi-arid Kenya. J. Rural Stud. 2020, 78, 333–349. [CrossRef]
96. Kumar, A.; Cabral-Pinto, M.; Kumar, A.; Kumar, M.; Dinis, P.A. Estimation of Risk to the Eco-Environment and Human Health ofUsing Heavy Metals in the Uttarakhand Himalaya, India. Appl. Sci. 2020, 10, 7078. [CrossRef]
97. Kumar, A.; Mishra, S.; Kumar, A.; Singhal, S. Environmental quantification of soil elements in the catchment of hydroelectricreservoirs in India. Human Ecol. Risk Assess. An Int. J. 2017, 23, 1202–1218. [CrossRef]
98. Majid, N.A.; Nazi, N.M.; Idris ND, M.; Taha, M.R. GIS-based livelihood vulnerability index mapping of the socioeconomy of thePekan community. Sustainability 2019, 11, 6935. [CrossRef]
99. Nor Diana, M.I.; Chamburi, S.; Mohd Raihan, T.; Nurul Ashikin, A. Assessing local vulnerability to climate change by usingLivelihood Vulnerability Index: Case study in Pahang region, Malaysia. IOP Conf. Ser. Mater. Sci. Eng. 2019, 506. [CrossRef]
100. Kumar, A.; Cabral-Pinto, M.M.S.; Chaturvedi, A.K.; Shabnam, A.A.; Subrahmanyam, G.; Mondal, R.; Gupta, D.K.; Malyan, S.K.;Kumar, S.S.; A Khan, S.; et al. Lead Toxicity: Health Hazards, Influence on Food Chain, and Sustainable Remediation Approaches.Int. J. Environ. Res. Public Health 2020, 17, 2179. [CrossRef] [PubMed]