Community-Based Landslide Risk Reduction ... - ReliefWeb
447
Public Disclosure Authorized Public Disclosure Authorized Public Disclosure Authorized Public Disclosure Authorized Public Disclosure Authorized Public Disclosure Authorized Public Disclosure Authorized Public Disclosure Authorized
-
Upload
khangminh22 -
Category
Documents
-
view
0 -
download
0
Transcript of Community-Based Landslide Risk Reduction ... - ReliefWeb
Pub
lic D
iscl
osur
e A
utho
rized
Pub
lic D
iscl
osur
e A
utho
rized
Pub
lic D
iscl
osur
e A
utho
rized
Pub
lic D
iscl
osur
e A
utho
rized
Pub
lic D
iscl
osur
e A
utho
rized
Pub
lic D
iscl
osur
e A
utho
rized
Pub
lic D
iscl
osur
e A
utho
rized
Pub
lic D
iscl
osur
e A
utho
rized
wb425962
Typewritten Text
74917
wb425962
Typewritten Text
wb425962
Typewritten Text

Community-Based Landslide Risk Reduction

Washington, DC
Community-Based Landslide Risk Reduction
Managing Disasters in Small Steps
Malcolm G. Anderson
Elizabeth Holcombe
© 2013 International Bank for Reconstruction and Development / The World Bank1818 H Street NW, Washington DC 20433Telephone: 202-473-1000; Internet: www.worldbank.org
Some rights reserved1 2 3 4 16 15 14 13
This work is a product of the staff of The World Bank with external contributions. Note that The World Bank does not necessarily own each component of the content included in the work. The World Bank therefore does not warrant that the use of the content contained in the work will not infringe on the rights of third parties. The risk of claims resulting from such infringement rests solely with you.
The findings, interpretations, and conclusions expressed in this work do not necessarily reflect the views of The World Bank, its Board of Executive Directors, or the governments they represent. The World Bank does not guarantee the accuracy of the data included in this work. The boundaries, colors, denominations, and other information shown on any map in this work do not imply any judgment on the part of The World Bank concerning the legal status of any territory or the endorsement or acceptance of such boundaries.
Nothing herein shall constitute or be considered to be a limitation upon or waiver of the privileges and immunities of The World Bank, all of which are specifically reserved.
Rights and Permissions
This work is available under the Creative Commons Attribution 3.0 Unported license (CC BY 3.0) http://creativecommons.org/licenses/by/3.0. Under the Creative Commons Attribution license, you are free to copy, distribute, transmit, and adapt this work, including for commercial purposes, under the following conditions:Attribution—Please cite the work as follows: Anderson, Malcolm G., and Elizabeth Holcombe. 2013. Community-Based Landslide Risk Reduction: Managing Disasters in Small Steps. Washington, D.C.: World Bank. doi:10.1596/978-0-8213-9456-4. License: Creative Commons Attribution CC BY 3.0
Translations—If you create a translation of this work, please add the following disclaimer along with the attribution: This translation was not created by The World Bank and should not be considered an official World Bank translation. The World Bank shall not be liable for any content or error in this translation.
All queries on rights and licenses should be addressed to the Office of the Publisher, The World Bank, 1818 H Street NW, Washington, DC 20433, USA; fax: 202-522-2625; e-mail: [email protected].
ISBN (paper): 978-0-8213-9456-4ISBN (electronic): 978-0-8213-9491-5DOI: 10.1596/978-0-8213-9456-4
Cover photo: © iStockphotocom/luoman; cover design: Drew Fasick
Library of Congress Cataloging-in-Publication Data
Anderson, M. G. Community-based landslide risk reduction : managing disasters in small steps / Malcolm G. Anderson, Elizabeth Holcombe. p. cm. Includes bibliographical references and index. ISBN 978-0-8213-9456-4 — ISBN 978-0-8213-9491-5 (electronic) 1. Landslide hazard analysis. 2. Landslides—Risk assessment. I. Holcombe, Elizabeth. II. Title. QE599.2.A53 2013 363.34'9—dc23 2012030220
v
Contents
PREFACE xxi
ACKNOWLEDGMENTS xxxiii
ABOUT THE AUTHORS xxxv
ABBREVIATIONS xxxvii
1 FOUNDATIONS: REDUCING LANDSLIDE RISK IN COMMUNITIES 1
1.1 Key chapter elements 11.1.1 Coverage 11.1.2 Documents 11.1.3 Steps and outputs 21.1.4 Community-based aspects 2
1.2 Getting started 21.2.1 Briefing note 21.2.2 What is unique about MoSSaiC? 51.2.3 Guiding principles 61.2.4 Risks and challenges 6
1.3 Disaster risk: context and concepts 71.3.1 Global disaster risk 71.3.2 Disaster risk management 111.3.3 Recent influences on disaster risk management policy and implications for MoSSaiC 141.3.4 Landslide risk and other development policy issues 23
1.4 MoSSaiC 251.4.1 Overview 251.4.2 MoSSaiC: The science basis 261.4.3 MoSSaiC: The community basis 291.4.4 MoSSaiC: The evidence base 341.4.5 MoSSaiC project components 341.4.6 MoSSaiC pilots 35
1.5 Starting a MoSSaiC intervention 421.5.1 Define the project scale 421.5.2 Define the project teams and stakeholders 42
v i CO N T E N TS
1.5.3 Adhere to safeguard policies 451.5.4 Establish a project logframe 451.5.5 Brief key leaders 47
1.6 Resources 481.6.1 Who does what 481.6.2 Chapter checklist 481.6.3 References 48
2 PROJECT INCEPTION: TEAMS AND STEPS 55
2.1 Key chapter elements 552.1.1 Coverage 552.1.2 Documents 552.1.3 Steps and outputs 562.1.4 Community-based aspects 56
2.2 Getting started 562.2.1 Briefing note 562.2.2 Guiding principles 572.2.3 Risks and challenges 572.2.4 Adapting the chapter blueprint to existing capacity 58
2.3 Establishing the MoSSaiC Core Unit 602.3.1 Rationale 602.3.2 MCU roles and responsibilities 622.3.3 MCU membership 65
2.4 Identifying the government task teams 652.4.1 Mapping task team 672.4.2 Community liaison task team 672.4.3 Landslide assessment and engineering task team 682.4.4 Technical support task team 692.4.5 Communications task team 692.4.6 Advocacy task team 69
2.5 Identifying the community task teams 712.5.1 Community residents 712.5.2 Construction task team 732.5.3 Landowners 73
2.6 Integration of MoSSaiC teams and project steps 742.6.1 Team structure and reporting lines 742.6.2 Integrating teams with project steps 742.6.3 Establishing a user group community 75
2.7 Resources 782.7.1 Who does what 782.7.2 Chapter checklist 792.7.3 References 79
3 UNDERSTANDING LANDSLIDE HAZARD 81
3.1 Key chapter elements 813.1.1 Coverage 813.1.2 Documents 813.1.3 Steps and outputs 823.1.4 Community-based aspects 82
CO M M U N I T Y- BA S E D L A N DS L I D E R I S K R E D U CT I O N v i i
3.2 Getting started 823.2.1 Briefing note 823.2.2 Guiding principles 833.2.3 Risks and challenges 843.2.4 Adapting the chapter blueprint to existing capacity 85
3.3 Landslide types and those addressed by MoSSaiC 853.3.1 Types of slope movement and landslide material 853.3.2 Landslide geometry and features 873.3.3 Landslide triggering events: Rainfall and earthquakes 873.3.4 Slope stability over time 91
3.4 Slope stability processes and their assessment 933.4.1 Landslide preparatory factors and triggering mechanisms 933.4.2 Overview of slope stability assessment methods 933.4.3 GIS-based landslide susceptibility mapping 953.4.4 Direct landslide mapping 973.4.5 Empirical rainfall threshold modeling 983.4.6 Physically based slope stability modeling 99
3.5 Slope stability variables 1013.5.1 Rainfall events 1013.5.2 Slope angle 1033.5.3 Material type and properties 1043.5.4 Slope hydrology and drainage 1073.5.5 Vegetation 1083.5.6 Loading 111
3.6 Scientific methods for assessing landslide hazard 1123.6.1 Coupled dynamic hydrology and slope stability models 1133.6.2 Resistance envelope method for determining suction control 1163.6.3 Modeling the impact of small retaining walls 117
3.7 Resources 1193.7.1 Who does what 1193.7.2 Chapter checklist 1203.7.3 Rainfall thresholds for triggering landslides 1203.7.4 CHASM principle equation set 1203.7.5 Static hydrology retaining wall stability analysis 1223.7.6 References 123
4 SELECTING COMMUNITIES 129
4.1 Key chapter elements 1294.1.1 Coverage 1294.1.2 Documents 1294.1.3 Steps and outputs 1304.1.4 Community-based aspects 130
4.2 Getting started 1304.2.1 Briefing note 1304.2.2 Guiding principles 1314.2.3 Risks and challenges 1314.2.4 Adapting the chapter blueprint to existing capacity 132
4.3 Defining the community selection process 1324.3.1 Approaches to comparing levels of landslide risk at multiple locations 1344.3.2 Methods for community selection 1364.3.3 Roles and responsibilities in community selection 140
v i i i CO N T E N TS
4.4 Landslide susceptibility and hazard assessment methods 1404.4.1 Qualitative landslide hazard assessment: Field reconnaissance and hazard ranking
methods 1414.4.2 Qualitative landslide susceptibility mapping: GIS index overlay methods 1464.4.3 Semi-quantitative and quantitative landslide susceptibility and hazard mapping
methods 149
4.5 Assessing community vulnerability to landslides 1514.5.1 Field reconnaissance and vulnerability ranking methods 1534.5.2 GIS-based mapping methods for vulnerability assessment 155
4.6 Assessing landslide risk and confirming community selection 1564.6.1 Combining the hazard and vulnerability information 1574.6.2 Confirming selected communities 157
4.7 Preparing a base map for detailed community mapping 1594.7.1 Useful features 1594.7.2 Supporting data 1594.7.3 Sources of spatial data 159
4.8 Resources 1614.8.1 Who does what 1614.8.2 Chapter checklist 1624.8.3 References 162
5 COMMUNITY-BASED MAPPING FOR LANDSLIDE HAZARD ASSESSMENT 165
5.1 Key chapter elements 1655.1.1 Coverage 1655.1.2 Documents 1655.1.3 Steps and outputs 1665.1.4 Community-based aspects 166
5.2 Getting started 1675.2.1 Briefing note 1675.2.2 Guiding principles 1685.2.3 Risks and challenges 1695.2.4 Adapting the chapter blueprint to existing capacity 170
5.3 Deciding on how to work within a community 1705.3.1 Community participation: Principles 1705.3.2 Community participation: Practices 1745.3.3 Community knowledge and participation in the mapping process 176
5.4 Community slope feature mapping 1785.4.1 Hillside scale: Mapping overall topography and drainage 1785.4.2 Household scale: Mapping the detail 1825.4.3 Indicators of slope stability issues 1855.4.4 Finalizing the community slope feature map 187
5.5 Qualitative landslide hazard assessment 1885.5.1 Landslide hazard assessment for MoSSaiC projects 1885.5.2 Identify landslide hazard zones 1895.5.3 Identify the dominant landslide mechanisms 191
5.6 Physically based landslide hazard assessment 1915.6.1 Models 1915.6.2 Data for slope stability models 194
CO M M U N I T Y- BA S E D L A N DS L I D E R I S K R E D U CT I O N i x
5.6.3 Using slope stability models 1945.6.4 Analyzing the role of pore water pressure 1985.6.5 Uncertainty in physically based landslide hazard assessment 1995.6.6 Interpreting physically based landslide hazard assessment results 201
5.7 Prioritize zones for drainage interventions 2035.7.1 Assign a potential drainage intervention to each zone 2035.7.2 Draw an initial drainage plan 2055.7.3 Assign priorities to the different zones 2065.7.4 Sign-off on the map and the proposed intervention 207
5.8 Resources 2085.8.1 Who does what 2085.8.2 Chapter checklist 2095.8.3 References 209
6 DESIGN AND GOOD PRACTICE FOR SLOPE DRAINAGE 213
6.1 Key chapter elements 2136.1.1 Coverage 2136.1.2 Documents 2136.1.3 Steps and outputs 2146.1.4 Community-based aspects 214
6.2 Getting started 2146.2.1 Briefing note 2146.2.2 Guiding principles 2156.2.3 Risks and challenges 2156.2.4 Adapting the chapter blueprint to existing capacity 216
6.3 Principles and tools for general alignment of drains 2176.3.1 Drainage alignment patterns and principles 2186.3.2 Calculating drain flow and drain dimensions 2226.3.3 Estimating surface water discharge 2236.3.4 Estimating the discharge from houses 2266.3.5 Estimating dimensions for main drains 2276.3.6 Example to demonstrate intercept drain effectiveness 2276.3.7 Example to demonstrate the impact of drain channel slope on flow capacity 2286.3.8 Example to demonstrate the impact of household water 229
6.4 Drain types and detailed alignments 2296.4.1 Intercept drains 2316.4.2 Downslope drains 2326.4.3 Footpath drains 2326.4.4 Incomplete existing drainage 2336.4.5 Drains above landslides to stabilize the slope 2346.4.6 Incorporating debris traps into drain alignment 2356.4.7 Proposed drainage plan 236
6.5 Drain construction specifications: materials and details 2366.5.1 Reinforced concrete block drains 2386.5.2 Low-cost, appropriate technology for drain construction 2396.5.3 Combining different drain construction approaches 2416.5.4 Construction design details 242
6.6 Incorporating household water capture into the plan 2426.6.1 Houses requiring roof guttering 2426.6.2 Rainwater harvesting 244

x CO N T E N TS
6.6.3 Gray water capture 2466.6.4 Connection to the drainage network 2476.6.5 Hurricane strapping 249
6.7 Signing off on the final drainage plan 2506.7.1 Drawing the final drainage plan and estimating costs 2506.7.2 Community agreement 2516.7.3 Formal approval and next steps 253
6.8 Resources 2546.8.1 Who does what 2546.8.2 Chapter checklist 2556.8.3 Local designs for concrete drains, catchpits, and baffles 2556.8.4 References 259
7 IMPLEMENTING THE PLANNED WORKS 261
7.1 Key chapter elements 2617.1.1 Coverage 2617.1.2 Documents 2617.1.3 Steps and outputs 2627.1.4 Community-based aspects 262
7.2 Getting started 2627.2.1 Briefing note 2627.2.2 Guiding principles 2657.2.3 Risks and challenges 2657.2.4 Adapting the chapter blueprint to existing capacity 266
7.3 Preparing work packages 2667.3.1 Prepare a bill of quantities 2687.3.2 Define work packages 2717.3.3 Prepare a plan for procurement of materials 2727.3.4 Prepare detailed construction specifications 2727.3.5 Compile documents for each work package 272
7.4 The tendering process 2747.4.1 Identifying contractors from the community 2747.4.2 Briefing potential contractors 2747.4.3 Evaluating tenders and awarding contracts 2767.4.4 Contractors and safeguard policies 277
7.5 Implementing the works: on-site requirements 2787.5.1 Importance of site supervision 2787.5.2 Beginning construction: Excavation and alignment requirements 2797.5.3 Ensure that water can enter drains 2817.5.4 Capture household roof water 2827.5.5 Connect household water to drains 284
7.6 Implementing the works: good practices 2857.6.1 Cast concrete in good weather 2857.6.2 Store materials securely 2877.6.3 Keep an inventory 2877.6.4 Provide access for residents 2877.6.5 Minimize leakage from pipes 288
7.7 Implementing the works: practices to be avoided 2887.7.1 Wasted materials and no surface water capture 2887.7.2 Restricted capacity of footpath drains 288
CO M M U N I T Y- BA S E D L A N DS L I D E R I S K R E D U CT I O N x i
7.7.3 Hazardous access for residents 2917.7.4 Construction detailing notes 291
7.8 Signing off on the completed works 291
7.9 Postconstruction bioengineering 2927.9.1 What is bioengineering? 2937.9.2 The effect vegetation on slope stability 2937.9.3 Vegetation and urban slope management 294
7.10 Resources 2977.10.1 Who does what 2977.10.2 Chapter checklist 2987.10.3 Low-cost appropriate construction methods 2987.10.4 Questionable or corrupt practices in construction 3007.10.5 References 301
8 ENCOURAGING BEHAVIORAL CHANGE 305
8.1 Key chapter elements 3058.1.1 Coverage 3058.1.2 Documents 3058.1.3 Steps and outputs 3068.1.4 Community-based aspects 306
8.2 Getting started 3068.2.1 Briefing note 3068.2.2 Guiding principles 3078.2.3 Risks and challenges 3088.2.4 Adapting the chapter blueprint to existing capacity 309
8.3 Adoption of change: from risk perception to behavioral change 3098.3.1 The behavioral change process 3098.3.2 Understanding stakeholder perceptions 3128.3.3 Combining knowledge and action 314
8.4 Communication purpose and audience 3158.4.1 Defining communication purposes and functions 3178.4.2 Identifying audiences 317
8.5 Forms of communication and project messages 3178.5.1 Direct communication, consultation, and dialogue 3208.5.2 Community demonstration sites and show homes 3218.5.3 Written and visual materials for communities 3238.5.4 TV, radio, and newspaper coverage 3248.5.5 Scientific and professional publications 3288.5.6 Finalizing project messages 329
8.6 Ways of building local capacity 3298.6.1 For individuals 3308.6.2 For teams 3318.6.3 For politicians 3318.6.4 For communities 3328.6.5 For all user groups 333
8.7 Finalizing the integrated behavioral change strategy 3348.7.1 Encouraging adoption of good drain maintenance practices 3348.7.2 The integrated behavior change strategy 338
x i i CO N T E N TS
8.8 Resources 3408.8.1 Who does what 3408.8.2 Chapter checklist 3418.8.3 MoSSaiC certification 3418.8.4 References 342
9 PROJECT EVALUATION 345
9.1 Key chapter elements 3459.1.1 Coverage 3459.1.2 Documents 3459.1.3 Steps and outputs 3469.1.4 Community-based aspects 346
9.2 Getting started 3469.2.1 Briefing note 3469.2.2 Guiding principles 3499.2.3 Risks and challenges 3499.2.4 Adapting the chapter blueprint to existing capacity 350
9.3 Data requirements for project evaluation 3509.3.1 MoSSaiC project evaluation data 3509.3.2 Community knowledge and project evaluation data 352
9.4 Project outputs: evaluating immediate impact 3539.4.1 Typical key performance indicators 3539.4.2 Output key performance indicators for MoSSaiC projects 354
9.5 Project outcomes: evaluating medium-term performance 3549.5.1 Observed slope stability 3559.5.2 Rainfall and slope stability information 3579.5.3 Cracks in houses 3589.5.4 Surface and subsurface water 3609.5.5 Drain performance 3629.5.6 Environmental health benefits 3629.5.7 Economic appraisal: Project value for money 3649.5.8 Adoption of good landslide risk reduction practices 3679.5.9 Development of new landslide risk reduction policies 3679.5.10 Finalizing the project evaluation process 369
9.6 Addressing landslide risk drivers over the longer term 3709.6.1 Disaster risk reduction and climate proofing 3709.6.2 Connecting hazard reduction and insurance 3719.6.3 Anticipating future disaster risk scenarios 374
9.7 Resources 3799.7.1 Who does what 3799.7.2 Chapter checklist 3799.7.3 Installing crack monitors 3799.7.4 Installing and using simple piezometers 3809.7.5 Cost-benefit analysis 3819.7.6 References 383
GLOSSARY 387
INDEX 393
CO M M U N I T Y- BA S E D L A N DS L I D E R I S K R E D U CT I O N x i i i
FIGURES1.1 Global landslide risk 31.2 MoSSaiC premises, vision, and foundations 41.3 Number of great natural catastrophes and associated economic losses worldwide,
1950–2010 81.4 Normalized losses from U.S. Gulf and Atlantic hurricane damage, 1900–2005 91.5 Exposure and fatalities associated with rainfall-triggered landslides, by income class 101.6 Global rainfall-triggered landslide fatalities 111.7 Disaster risk management options 141.8 Societal landslide risk in Hong Kong SAR, China 151.9 International advocacy landscape for disaster risk reduction 151.10 UN disaster response organizational framework 161.11 Benefit-cost ratio for hurricane-proofing prevention measures for houses in
Canaries and Patience, St. Lucia 181.12 Mitigation benefit-cost ratio for wood frame building in Canaries, St. Lucia,
with and without the effect of climate change 191.13 Efficiency of risk management instruments and occurrence probability 191.14 Evolution of social fund objectives and activities 221.15 Population growth and urbanization drivers of landslide risk 241.16 MoSSaiC architecture—integrating science, communities, and evidence 271.17 Housing stock can reflect community vulnerability 281.18 Stakeholder connections in Guatemala City’s precarious settlements, showing how
money flows around, but not into, the settlements 301.19 Learning from community residents 321.20 Effects of prompt and informed action 321.21 MoSSaiC components 361.22 Typical communities and risk drivers for MoSSaiC interventions 401.23 Countries with damages from disasters exceeding 1 percent of GDP 411.24 Impact of Hurricane Allen (1980) on the economy of St. Lucia 411.25 MoSSaiC is applicable to many locations outside the Eastern Caribbean 412.1 Five missions of the MoSSaiC core unit 632.2 Mapping team from a national disaster management agency demonstrates
GIS software to MCU team leader 672.3 Coordinating with Social Development Ministry and community residents on site 682.4 Examples of landslide assessment and engineering task team responsibilities 682.5 Technical team training course attendees: Sharing and developing expertise across
ministries 692.6 Aspects of communication 702.7 On-site briefing 702.8 Media film elected officials during a MoSSaiC project 712.9 Funding agency staff on site at initial stage of MoSSaiC project 712.10 Aspects of community resident involvement in MoSSaiC 722.11 Briefing potential contractors on site after calling for expressions of interest
from within the community 732.12 Contractor briefs government technical officers on project implemented in his
community 742.13 Typical MoSSaiC team reporting structure 752.14 User group forum activities 753.1 Characteristics of rotational and translational slides in predominantly weathered
materials 873.2 Definitional features of a landslide 883.3 Typical surface and subsurface water sources and flow paths associated with
unauthorized construction on hillslopes 893.4 Rotational and translational landslides 903.5 Distribution of seismicity during the 2001 El Salvador earthquakes 913.6 Aerial view of earthquake-triggered landslide in Las Colinas, El Salvador,
January 13, 2001 91
x i v CO N T E N TS
3.7 Progressive landslide 923.8 Postfailure slope stability 933.9 Classified spatial factor data 973.10 Landslide susceptibility map 983.11 Three landslide inventory maps 983.12 Global rainfall intensity-duration thresholds 993.13 Discretization of a slope into slices to facilitate slope stability calculations 1003.14 Preparatory factors that can influence slope stability 1023.15 Hurricane Tomas over the Eastern Caribbean, 2010 1033.16 An Abney level and its use 1043.17 Slope benched by resident to build a house 1043.18 Typical weathering profiles of tropical soils 1053.19 Weathering profiles 1063.20 Shear box used to determine soil strength parameters 1063.21 Exposed soil pipe some 30 cm below the soil surface 1063.22 Definition of the planimetric contributing area at two locations in a hypothetical
landscape 1073.23 Shallow rotational slip on an 18-degree slope at the foot of an extensive hillside 1083.24 Common drainage issues in unauthorized communities 1093.25 Examples of adverse and beneficial effects of vegetation on slopes 1103.26 Model of post-landslide vegetation succession for the Caribbean 1113.27 Examples of incremental construction 1123.28 Examples of reconstruction on former landslide sites 1133.29 Representation of a slope cross-section for analysis in CHASM software 1143.30 CHASM representation of a natural hillslope 1153.31 Outputs from a CHASM simulation 1163.32 Superimposition of resistance and strength envelopes 1173.33 Resistance envelope plots 1173.34 Inadequate retaining wall design 1183.35 A simple retaining wall geometry used for the retaining wall analysis 1224.1 Top-down and bottom-up community selection methods 1374.2 Field reconnaissance 1434.3 Method for developing a national landslide risk index map for Cuba 1494.4 Quantitative GIS-based hazard map for Tegucigalpa, Honduras 1504.5 Resilience of structures depending on construction type 1534.6 Generating the base map from a topography map and an aerial photo 1605.1 Access and control over resources in Ethiopia by women and men 1735.2 Listening to community residents is important 1755.3 Engaging community representatives and guides in identifying slope features and
landslide issues 1765.4 Discussing slope stability and drainage hazards around residents’ houses 1775.5 Informal group discussion held at an accessible location 1775.6 Local community hall used as venue for hearing residents’ views 1785.7 Community base map and supplementary aerial photograph 1795.8 Topographic elements to be distinguished and identified in the field 1805.9 Example of a tropical hillslope profile illustrating common weathering features 1805.10 Soil depth and stability 1805.11 Seepage occurring in dry weather conditions where there is no sign of a zone of
topographic convergence 1815.12 Looking for natural and altered slope drainage 1825.13 Potential landslide hazard driver: Cutting platforms to build houses 1835.14 Potential landslide hazard driver: Household roof and gray water discharged
directly onto slopes 1845.15 Potential landslide hazard driver: Failure of poorly designed and constructed
water storage structure 1855.16 Evidence of minor slope movement 1865.17 Cracks in a wall: Past slope instability or poor construction? 186

CO M M U N I T Y- BA S E D L A N DS L I D E R I S K R E D U CT I O N x v
5.18 Example of a community slope feature map showing household-level detail 1875.19 Piped water supplied to unauthorized communities 1895.20 The qualitative landslide hazard assessment process 1905.21 Example of a slope process zone map with supporting observations and
interpretations 1925.22 Typical slope selected for stability analysis 1955.23 Zone E of the example community with two slope cross-sections marked for
analysis 1965.24 Model configuration and predicted location of landslides 1975.25 Predicted landslide locations and estimated runout 1985.26 Predicted improvements in the factor of safety for different drainage interventions 1985.27 Example of heterogeneity in angle of internal friction and cohesion, classified by
weathering grade 2005.28 Number of geotechnical engineers selecting various friction angles as
characteristic for a given set of soil strength data 2005.29 Effect of soil parameter variability on CHASM simulation results 2015.30 Slope stability modeling workshop for landslide assessment and engineering
task team 2025.31 Complete community-based landslide hazard assessment process for MoSSaiC
interventions 2045.32 Example of an initial drainage plan 2055.33 Proposed midslope intercept drain alignment 2066.1 Iterative design process for developing final drainage plan 2196.2 Idealized hillside drainage plan showing intercept and downslope drains 2206.3 Generalized alignment for use with top-of-slope intercept drains 2206.4 Intercept drain built on a slope with few restrictions to alignment 2206.5 Drain alignment complexities 2216.6 Network of small intercept drains intercepting surface water along entire
uppermost contour of slope 2216.7 Downslope drain 2216.8 Drain alignment to minimize surface and immediate subsurface water flow into
previously failed material 2226.9 Drain aligned to intercept surface water and routed around a major preexisting
landslide 2226.10 Drain alignment for site of progressive failure 2226.11 Iterative process for designing drain alignments and dimensions 2236.12 Estimating observed drain flows 2286.13 Impact of drain gradient on flow velocity and discharge 2296.14 Effect of household water drainage in a typical community 2306.15 Potential effectiveness of household drainage measures 2306.16 Drain alignment must be correctly specified in communities 2316.17 Main cross-slope intercept drain constructed on a 35 degree slope angle 2316.18 Poor practice: Downslope drain construction begun at top of hillside rather than
base of slope 2326.19 Examples of footpath and footpath drains being constructed simultaneously 2336.20 Incomplete and damaged drains 2346.21 Drain construction above a failed slope 2356.22 Postconstruction maintenance: Keeping drains free of debris 2356.23 Debris trap in an urban area of Hong Kong, SAR, China 2356.24 Example of an initial drainage plan 2376.25 Example of a draft final drainage plan 2376.26 Rubble wall as part of drain construction 2396.27 Example of concrete block drain design 2396.28 Shipping construction material to site can be expensive 2406.29 Installation of plastic-lined drain 2406.30 Community innovation and skills at work after project completion 2416.31 Combination of block drain and low-cost drain 241
x v i CO N T E N TS
6.32 Number of days slope surface is saturated per year with and without household water capture 242
6.33 Process for incorporating household water capture into the drainage plan 2446.34 Retrofitting roof guttering 2446.35 Rainwater harvesting 2456.36 A system for filtering and purifying water for human consumption 2456.37 Cost components of small domestic rainwater harvesting system 2466.38 Capturing gray water from showers and washing machines 2466.39 Gray water and roof water connections to block drain 2476.40 Household connections to main drains 2486.41 Concrete chambers connecting water from multiple houses to a single collection
point with an outflow pipe to a main drain 2496.42 Fragile roof structure 2496.43 Hurricane strapping ties 2506.44 Roof hurricane strap 2506.45 Extracts from a final drainage plan for agreement with stakeholders and sign-off 2526.46 Community involvement in finalizing the drainage plan 2536.47 U-channel 2566.48 Baffle wall junction 2566.49 Typical debris/sand trap 2576.50 Stepped channel 2586.51 Catchpit junction 2597.1 MCU meeting to agree on responsibilities during construction process 2637.2 Contractor site meeting 2647.3 Modifications to roof structure for roof guttering installation 2697.4 Downpipe installation detail 2697.5 Roof guttering and downpipe components 2707.6 Connection of downpipe to drain awaits purchase of a connecting section 2707.7 Spreadsheet to assist in developing bills of quantities 2707.8 Confirming with residents connection of households to drains 2717.9 On-site meetings with potential community contractors 2747.10 Some issues to address during on-site briefing 2757.11 Double handling of materials can require temporary storage 2767.12 Contractor signing on site with implementing agency representative 2777.13 Importance of training in reducing rework costs 2787.14 Clear markings help remove issues of ambiguity for site supervisor 2797.15 Site supervisor is critical to project success and to ensuring good construction
practice 2797.16 Supervision issue: Large numbers of residents engaging with contractors 2807.17 Example of detailed alignment issue encountered at construction start 2807.18 Self-cleaning stepped drains 2817.19 Finished drain wall height same as adjoining ground surface 2827.20 Weep hole formation 2827.21 Drain construction providing for eventual connection with gray water pipes 2827.22 Issues involved in roof repair 2837.23 Newly installed roof guttering 2837.24 Household roof water connections to main drains 2847.25 Concrete connection chambers 2857.26 Connecting water tank overflow pipes to nearby drains 2867.27 Examples of drain bases 2867.28 Providing adequate temporary access to houses during construction 2877.29 Using sleeving to join drainage pipe sections 2887.30 Illustrations of frequently overlooked drainage design and construction details 2907.31 Drain built with inappropriately high sidewalls 2907.32 Identify maximum drain capacity adjacent to footpath steps 2917.33 Some construction practices can pose dangers to small children 291
CO M M U N I T Y- BA S E D L A N DS L I D E R I S K R E D U CT I O N x v i i
7.34 Typical development of plant communities under a bioengineering and maintenance program 293
7.35 Lateral root spread 2947.36 Four vegetation covers typically found on hillsides housing vulnerable communities 2967.37 Bioengineered slope in Hong Kong SAR, China 2967.38 Choosing a debris trap location 2987.39 Welding in-situ and completion of debris trap 2997.40 Construction of low-cost drain 3008.1 The Johari Window for increasing common ground and knowledge among
stakeholders 3138.2 Show homes 3228.3 Meeting invitation and project flier given to community residents at project start 3258.4 Example of a leaflet or small poster to use in informal conversations with residents 3258.5 Using posters to convey project messages 3268.6 Media filming during construction 3278.7 Opening frame of a MoSSaiC TV documentary 3278.8 Community surveyor and contractor receive MoSSaiC certification 3318.9 MoSSaiC training in the Eastern Caribbean 3318.10 Building team capacity 3328.11 Combined slope process zone map and initial drainage plan 3328.12 Building political capacity 3328.13 Building community capacity 3338.14 Building regional capacity: In conferences and on site 3348.15 Unintended consequences of drainage interventions 3358.16 Absence of building controls can lead to inappropriate construction 3368.17 Importance of promoting community clean-up days 3378.18 Debris traps should be installed and cleared regularly 3378.19 Debris collection and disposal 3389.1 Links between project objectives and overall project success 3479.2 Residents showing issues to be addressed by MoSSaiC interventions 3539.3 Maximum observed flow level in a MoSSaiC drain during Hurricane Tomas 3539.4 Landslide in an area immediately adjacent to a slope successfully stabilized by a
MoSSaiC intervention 3569.5 Daily and cumulative rainfall with associated return periods for a location in
St. Lucia, October 2008 3589.6 Benchmarking major rainstorms with satellite imagery 3609.7 Assessing and monitoring structural cracks 3619.8 Surface and subsurface water undermining stability of house structures 3619.9 Convergence of water upslope results in slope instability and property
destruction on shallow slope 3629.10 Drain performance 3629.11 Stagnant water and disease transmission: The health consequences of poor
drainage 3639.12 Laboratory-confirmed dengue hemorraghic fever in the Americas prior to 1981
and 1981–2003 3649.13 MoSSaiC and mosquito breeding habitats 3649.14 Dynamics of policy making 3689.15 Process of strategic incrementalism 3699.16 Generalized impact of MoSSaiC interventions on reducing the burden of coping 3729.17 Model used in St. Lucia for hurricane-resistant home improvement program for
low-income earners 3759.18 Hypothetical calculation base for the resource gap 3769.19 Media recognition of the world’s urban population crossing the 50 percent mark 3779.20 Conceptual diagram of a scenario funnel 3779.21 Crack monitoring gauge and crack record charts 3809.22 Installing piezometers 3819.23 Components of an integrated model of landslide hazard and risk assessment 382
x v i i i CO N T E N TS
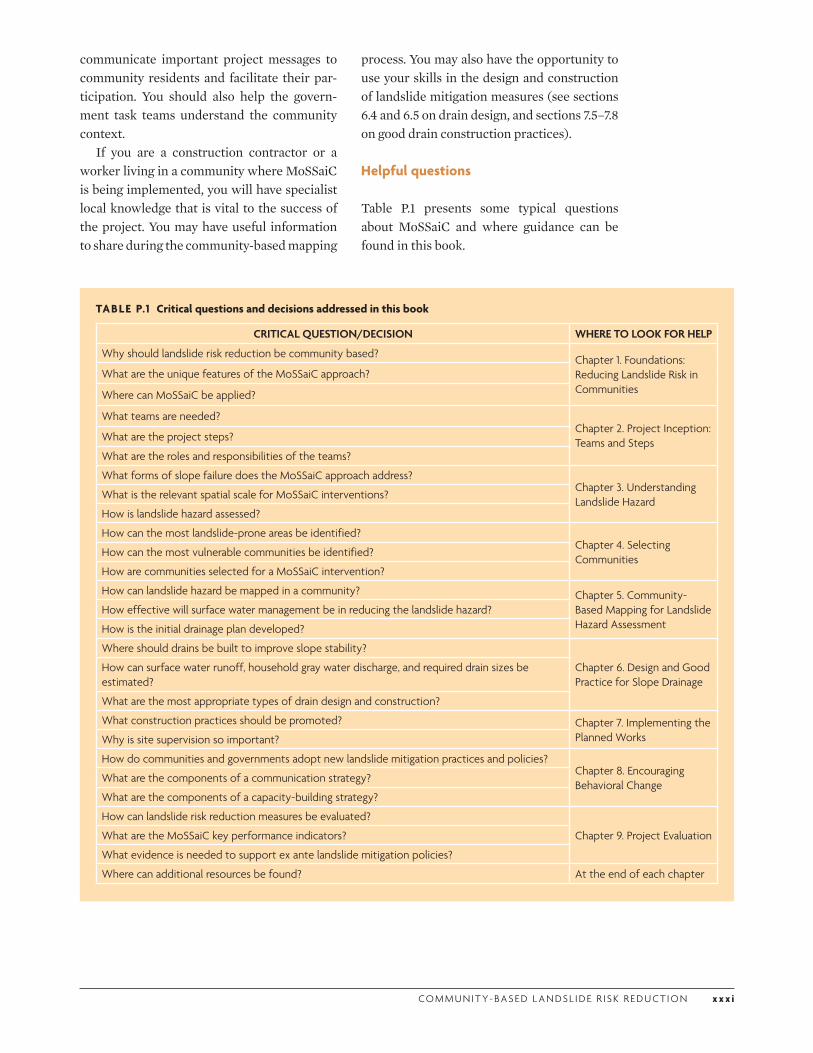
TABLESP.1 Critical questions and decisions addressed in this book xxxi1.1 The key teams and tasks in MoSSaiC 51.2 Categories of catastrophe 91.3 Disaster risk management components 131.4 Lessons learned from World Bank natural disaster projects 171.5 Percentage of owner occupancy, unauthorized housing, and squatter housing by
country income group, 1990 251.6 The foundations of MoSSaiC 261.7 Coping mechanisms deployed by individual residents in vulnerable communities to
reduce landslide risk 311.8 Value of community engagement 331.9 Basic MoSSaiC outputs and outcomes providing evidence for ex ante landslide
mitigation 351.10 Broad impacts of community-based landslide risk reduction program in St. Lucia and
Dominica, 2005–10 351.11 MoSSaiC framework 361.12 Characteristics of MoSSaiC project locations in the Eastern Caribbean, 2004–10 401.13 Magnitudes of scale-up 421.14 Issues to consider when scaling up MoSSaiC 431.15 Likely stakeholders and their potential involvement in a MoSSaiC intervention 441.16 Typical safeguard policy considerations 461.17 Example of a logframe format 472.1 Key characteristics of highly successful social development projects 572.2 Typical landslide risk management project cycle 602.3 The active Samaritan’s Dilemma 612.4 Landslide risk reduction issues that need to be offset by a policy entrepreneur 622.5 Government task team selection factors 662.6 Task teams and guidance notes 662.7 Summary template of MoSSaiC project teams, steps, and milestones 763.1 Typical landslide risk management project steps and associated scientific basis for
MoSSaiC 843.2 Slope instability classification 873.3 Arias intensity and associated landslide categories 913.4 Landslide velocity scale 923.5 Factors determining slope stability and associated assessment methods 943.6 Spatial scales of landslide triggering mechanisms, preparatory factors and
anthropogenic influences 943.7 Advantages and disadvantages of different forms of landslide susceptibility and
hazard assessment 963.8 Vegetation influences on slope stability 1103.9 Units for the parameters used in CHASM 1213.10 Results of an illustrative standard static hydrology retaining wall stability analysis 1234.1 Schematic representation of the basic data sets for landslide susceptibility,
hazard, and risk assessment 1354.2 Framework of potential data and analysis methods 1384.3 Overview of environmental factors and their relevance to landslide susceptibility
and hazard assessment 1424.4 Typical sections of a slope reconnaissance form 1444.5 Example of a landslide likelihood rating system 1454.6 Main elements at risk used in landslide risk assessment studies and their spatial
representation at four mapping scales 1524.7 Typical sections of a slope reconnaissance form that relate to vulnerability assessment 1544.8 Example of a numerical scoring system for landslide damage to houses 1554.9 Typical components of a locally derived poverty index 1564.10 Example of a risk rating matrix 1574.11 Sample justification for community selection 158
CO M M U N I T Y- BA S E D L A N DS L I D E R I S K R E D U CT I O N x i x
5.1 Types of community participation 1725.2 Checklist for gender-sensitive risk assessment 1745.3 Hillside scale features to mark on slope feature map 1835.4 Household-scale contributors to slope instability to mark on slope feature map 1855.5 Slope instability evidence to mark on slope feature map 1875.6 Interpreting the influence of surface water infiltration on slope stability for
different slope process zones 1935.7 Quantitative physically based landslide hazard assessment models appropriate
for use as part of MoSSaiC 1945.8 Typical input parameters and their measurement for slope stability analysis 1955.9 Summary of the physically based landslide hazard assessment process 2025.10 Illustrative slope process zones and associated potential drainage measures 2065.11 Illustrative prioritization of different drainage interventions in each of the zones 2076.1 Calculations for estimating discharge into drains and drain size 2246.2 Values of runoff coefficient C for the rational method 2256.3 Drainage alignment summary for use in developing final drainage plan 2386.4 Construction design details related to aspects of drain alignment 2436.5 Initial costs for drain construction and for household water connections 2516.6 Illustrative drawings for drain design 2557.1 Yardsticks for selected community-based performance measures 2657.2 Items to include when surveying houses identified for household water capture 2697.3 Requirements and specifications to be developed for work packages 2737.4 Illustrative safeguard checklist for contractors 2777.5 Examples of frequently overlooked drainage design and construction details 2897.6 Example of an informal schedule of construction defects and outstanding works 2927.7 Decision aid for choosing a bioengineering technique 2958.1 Steps in the ladder of adoption and associated MoSSaiC context 3118.2 Behavior change factors: From motivation to action 3128.3 Knowledge and action as part of the adoption of the MoSSaiC process 3168.4 Questions to guide the design of a MoSSaiC communication strategy 3168.5 Examples of local factors affecting communication 3188.6 Examples of communication tools by mode, channel, and purpose 3188.7 Deciding which forms of communication to use for each stakeholder audience 3198.8 Examples of direct two-way communication tools for use throughout the
MoSSaiC project process 3208.9 Example uses of demonstration sites and show homes during the MoSSaiC project
process 3228.10 Examples of written/visual materials to be used during the MoSSaiC project process 3248.11 Examples of media coverage during the MoSSaiC project process 3278.12 Factors for the MCU to consider when commissioning a TV documentary 3288.13 MoSSaiC capacity requirements at individual, organizational, and institutional levels 3308.14 Examples of capacity-building tools by learning mode 3308.15 Mapping the integrated behavioral change strategy 3399.1 Data needed to evaluate outputs and outcomes by category of evaluation 3529.2 Typical donor-focused key performance indicators for project outputs 3549.3 Detailed MoSSaiC key performance indicators for project outputs 3559.4 MoSSaiC key performance indicators for project outcomes 3569.5 Landslides reported pre- and post-project with respect to major rainfall events
in the Eastern Caribbean 3599.6 Transmission routes of water-related diseases 3639.7 Simple questions to help measure MoSSaiC project value for money 3659.8 Requirements for achieving evidence-based policy in ex ante disaster risk reduction 3699.9 Summary of MoSSaiC elements contributing to climate proofing 3719.10 Holistic context of prevention, insurance, and coping strategies of individuals,
communities, and governments 3729.11 Design issues and challenges for linking risk reduction and insurance 3739.12 Sources of postdisaster financing 376


x x i
ABOUT MOSSAIC
MoSSaiC (Management of Slope Stability in Communities) is an integrated method for engaging policy makers, project managers, practitioners, and vulnerable communities in reducing urban landslide risk in developing countries.
MoSSaiC was begun with the idea of com-bining research, policy, and humanitarian interests to address rainfall-triggered land-slide hazards through community-based implementation of surface water manage-ment measures in vulnerable urban commu-nities. The vision was to lay sustainable foun-dations for community-based landslide risk reduction.
This vision was driven by the following premises:
• Disaster risk mitigation pays, and invest-ment in reducing rainfall-triggered land-slide hazards in vulnerable communities can often be justified.
• Engaging existing government expertise for implementing risk reduction measures can build capacity, embed good practice, and change policy.
• Ensuring community engagement from start to finish can establish ownership of solutions.
To achieve the vision and demonstrate the validity of these premises, three foundations need to be established: the scientific base, the community base, and the evidence base for landslide risk reduction in this setting.
1. From a scientific standpoint, the root causes of many landslides in urban com-munities are aggravated by human activi-ties that can addressed in relatively simple and practical ways. A commonly observed situation is the negative effect of poor drainage on the stability of slopes com-prised of weathered materials. This situa-tion can often be remedied through the construction of a strategically aligned net-work of surface drains. Intercepting and conveying surface water runoff, household gray water, and roof runoff to ravines and main drains can significantly improve the stability of such slopes.
2. Community residents have detailed knowledge of the slopes in their immediate vicinity—where there have been minor landslides, where surface water runs, how the topography and vegetation have been changed. This information on slope fea-tures is frequently the scale at which land-slide-triggering processes operate and the scale at which solutions can be found. Vul-nerable communities are also where there is the greatest need for short-term employ-
Preface
x x i i P R E FAC E
ment (in constructing landslide mitigation measures) and for embedding good slope management practices. Generally, govern-ments have sufficient technical and mana-gerial skills that can be harnessed to design and deliver appropriate landslide risk reduction measures in communities. By creating a cross-disciplinary management unit from such a skill base, it is possible to embed MoSSaiC in government practice and policy.
3. An evidence base for the effectiveness of such targeted landslide risk reduction measures was needed. MoSSaiC was started small, with a pilot intervention in one community, a catalytic advocate in government, and a small team of in-house project managers and practitioners. On the evidence of its success, further govern-ment funding and demand for more inter-ventions followed. This evidence was in the form of finished construction works, improved stability of slopes, community endorsement and ownership of the proj-ect, and demonstration of the combined skills of the government team. Savings in terms of avoided losses to the community and costs to the government were also esti-mated. Decision makers require such evi-dence in order to endorse expenditure on landslide risk reduction and to adopt ex ante policies.
CONTEXT FOR MoSSaiC
The MoSSaiC approach was researched and developed in a selection of Eastern Caribbean small island developing states with the sup-port and funding of governments and interna-tional development agencies. Implementation of the hazard reduction measures was under-taken by government agencies and community residents in conjunction with contractors from the community.
This book offers a flexible blueprint for countries that want to use the MoSSaiC approach to reduce landslide risk in communi-
ties. It provides guidance on how to imple-ment MoSSaiC, evidence of what has worked (and of potential risks and challenges), and guidance on options that should be considered to make it work within a specific country. It may be necessary to adapt the methodology for environments outside the Eastern Carib-bean—in terms of both general approach and specific implementation—to take into account local landslide risk conditions and institu-tional contexts.
This is not intended to be a book detailing construction methods. Specific solutions are not offered; rather the book presents a sum-mary of our experience, observations, and research. In that regard, two broad issues deserve emphasis: ensuring the long-term fea-sibility of the approach, and being sensitive to the scale and extent of the landslide risk prob-lem.
• To ensure long-term sustainability of MoSSaiC projects requires the identifica-tion of localized landslide-triggering pro-cesses. The structural cause of landslide risk in many vulnerable urban communities is the absence of regulation regarding con-struction, infrastructure, and land use, resulting in increased exposure to land-slides and increased landslide hazard. Changes in the natural stability conditions of slopes are mainly a consequence of changes in natural slope form, drainage, loading, and surface cover. In urban set-tings, the dominant destabilizing factors can often be attributed to insufficient drain-age and sanitation infrastructure, cutting and filling of slope material, removal of veg-etation, and high-density construction of houses. Therefore, from a public policy per-spective, landslide risk management is strongly linked to the feasibility of address-ing these unauthorized conditions in a politically, financially, and technically coor-dinated manner. If a coordinated strategy is adopted, the appropriate community-based landslide mitigation works can be imple-mented in accord with other policies to address both the immediate and underlying
CO M M U N I T Y- BA S E D L A N DS L I D E R I S K R E D U CT I O N x x i i i
causes of the landslide risk. However, if an ad hoc approach to landslide mitigation is taken, the root causes of the landslide prob-lem may remain. This can result in ineffi-cient, unsustainable projects that create a false sense of security, provide incentives for new unauthorized occupation, bring conflicts into communities and/or with the government, and potentially lose any short-term landslide risk reduction benefits over the medium and long term.
• There are large numbers of cities in the humid tropics with very similar problems, but that are very different in terms of the spatial scale to which MoSSaiC projects have, to date, been implemented. The same problem (vulnerable communities at risk from landslides) in medium or large cities is likely to require that the approach to land-slide mitigation be adjusted to reflect broader issues. For instance, in larger cities (those whose populations exceed 1 million), disaster risk management policies are typi-cally more complex and demand strategic integration and consideration in the con-text of wider development policies. This does not mean that communities do not play a key role in delivering the solution, but rather that their vision and understand-ing of landslide risk are not unique ele-ments in the process.
Success of community-based disaster risk management programs is conditioned by local cultural and social systems. Arguably this is best undertaken through careful learning by doing, as opposed to a wholesale application of best practices from projects that were success-ful in other contexts (Mansuri and Rao 2003).
ABOUT THIS BOOK
This book has two main aims:
• To demonstrate to international develop-ment agencies, governments, policy mak-ers, project managers, practitioners, and community residents that landslide hazard
can often be reduced in vulnerable urban communities in the developing world
• To provide practical guidance for those in charge of delivering MoSSaiC on the ground.
In reflecting on and seeking to communi-cate our experience of landslide hazard miti-gation, this is neither a conventional policy book nor an explicit field manual.
The purpose of the book is to take readers into the most vulnerable communities in order to understand and address rainfall-triggered landslide hazards in these areas. Community residents are not just seen as those at risk, but as the people with the best practical knowl-edge of the slopes in their neighborhood. As used here, “community based” means engag-ing and working with communities to find and deliver solutions to landslide risk together. This approach leads governments to develop new practices and policies for tackling land-slide risk.
The book is directed at those responsible for initiating, delivering, and sustaining MoSSaiC in a particular country or city:
• Funders and policy makers, typically gov-ernment officials and international devel-opment agency staff
• MoSSaiC core unit (MCU) personnel (MoSSaiC project managers), typically senior government personnel responsible for managing government agencies, depart-ments, or projects; and leading local experts in disaster risk management, landslide haz-ard assessment, and community develop-ment
• Government task teams, comprising experts and practitioners responsible for designing and implementing physical works or directly coordinating with com-munities; these are typically engineers, community development workers, and technical staff
• Community task teams with responsibili-ties at the community level; these are typi-cally comprised of community residents,
x x i v P R E FAC E
community representatives, and commu-nity-based contractors.
In addressing these four audiences, the book is intended to
• assist in securing the political will to under-take community-based landslide risk reduc-tion,
• illustrate how that objective might be real-ized by engaging the community,
• provide a scientific grounding in landslide hazard processes and solutions,
• demonstrate the steps involved in on-the-ground delivery, and
• emphasize the importance of evaluating project outcomes.
To these ends, the book contains several standard sections in each chapter:
• The “Getting started” section is aimed at helping the reader quickly and clearly understand the chapter’s rationale and how to apply MoSSaiC to the local context.
• Guiding principles associated with each of the major activities of the program help the policy maker, project manager, or practitio-ner advocate for the methodology with stakeholders and demonstrate the central role played by community residents.
• The capacity assessment exercise (chap-ters 2–9) enables the MoSSaiC blueprint to be adapted depending on institutional structures, protocols, strengths, and weak-nesses; the nature of the communities; local construction practices; and the degree to which the local context allows replication of MoSSaiC.
This book standardizes those elements of MoSSaiC that have led to its successful imple-mentation in the Eastern Caribbean, and that are essential to the overall objectives (such as community engagement, mapping localized slope features, and broad drainage design principles). In providing a flexible blueprint for MoSSaiC, this book aims to balance the
respective benefits of low and high levels of process standardization:
• Low levels of standardization can promote motivation of those charged with delivering the project and adaptation to local issues, but can jeopardize the consistency and quality of risk reduction measures.
• High levels of standardization can promote high levels of quality and speed of delivery, but can suppress innovation and lead to inflexibility in the local context.
ORGANIZATION AND CONTENTS OF THIS BOOK
The book’s nine chapters provide guidance to project managers and practitioners on the entire end-to-end process of community-based landslide risk reduction. While certain chapters are more directly relevant to one audience than another, it is helpful for all audi-ences to read the “Getting started” section of each chapter and be alerted to the nine project milestones. The shared knowledge of mile-stones assists in achieving project ownership and encourages the likelihood of successful project continuity, implementation, and post-project outcome assessment.
Policy makers and MoSSaiC project manag-ers should note that chapters 1 (MoSSaiC foundations), 2 (project inception), 4 (com-munity selection), and 9 (project evaluation) give guidance in areas that predominantly fall within the remit of policy makers to ensure the existence of a suitable framework. However, it may fall to project managers to alert the rele-vant policy maker if local policies are incom-plete or require refinement in order to fully allow project implementation.
An overview of the book follows.
Chapter 1. Foundations: Reducing Landslide Risk in Communities
The more socially, economically, and physically vulnerable people are, the more disastrous a landslide event will be. While there is growing
CO M M U N I T Y- BA S E D L A N DS L I D E R I S K R E D U CT I O N x x v
recognition of the increased occurrence of nat-ural disasters, there is equal recognition of the lack of on-the-ground implementation of ex ante landslide risk reduction measures.
This chapter provides an introduction to the MoSSaiC approach, which is focused on delivering landslide risk reduction measures in vulnerable urban communities in develop-ing countries. Specifically, MoSSaiC identifies and, where appropriate, addresses some of the physical causes of landslide hazard.
The chapter’s aim is to both inform the reader of the context within which the MoSSaiC approach is designed to work and to impart something of the vision behind the approach. The message is that the rainfall-triggered landslide hazard faced by the poor-est urban communities can often be reduced using relatively simple measures—namely, the construction of surface drains in appropriate locations. This can be achieved if there is cooperation between government technicians and community residents; hands-on applica-tion of science and local knowledge; and pro-active support from managers, politicians, and donor agencies.
In introducing MoSSaiC, the chapter pro-vides the following:
• A framework for understanding disaster risk and, more specifically, landslide risk
• An overview of trends and lessons learned in disaster risk management
• Advocacy for taking a proactive approach to tackling landslide risk in communities
• An introduction to MoSSaiC and who should be involved
• An overview of how to start a MoSSaiC landslide risk reduction project.
This chapter should be read by all stake-holders and should be used by practitioners, project managers, and policy makers alike when explaining the project basis and advo-cating the MoSSaiC methodology.
Milestone 1: Key catalytic staff briefed on MoSSaiC methodology
Chapter 2. Project Inception: Teams and Steps
This chapter provides guidelines for the for-mation of the MCU which will manage the project, and of the task teams of practitioners who will be responsible for project implemen-tation. The typical project steps, roles, and responsibilities are illustrated. While this pro-cess of configuring the teams and project steps may be led by policy makers, established proj-ect managers and expert practitioners may provide significant assistance.
To achieve the MoSSaiC vision of laying sustainable foundations for community-based landslide risk reduction, project managers will need to
• build local capacity in the broad area of landslide hazard reduction while seeking cost-effective solutions;
• identify community projects that can be undertaken by existing government-based staff and local communities; and
• establish team structures to deliver the vision: an MCU that can develop and com-municate the vision, and task teams to develop project strategies and implement specific project steps.
To deliver landslide risk reduction mea-sures in vulnerable communities requires the coordination of a diverse team including com-munity residents, field and mapping techni-cians, landslide experts, engineers, contrac-tors, and social development practitioners. This calls for a strong multidisciplinary MCU to configure and manage specific project steps, roles, and responsibilities.
Milestone 2: MoSSaiC core unit formed; key responsibilities agreed on and defined
Chapter 3. Understanding Landslide Hazard
This chapter provides project managers and practitioners with an introduction to landslide processes and illustrates ways of analyzing
x x v i P R E FAC E
landslide hazard. A core feature of the MoSSaiC approach is that it seeks to ensure that all those participating in the program have as clear an understanding of the funda-mental science of landslide processes as pos-sible. Shared technical understanding encour-ages ownership of landslide mitigation solutions by both government and community.
The first step in the management of land-slide risk is to define the scope of the project and correctly identify the form of the landslide risk. The landslide risk reduction and manage-ment process will only be successful if land-slides are understood in terms of their under-lying mechanisms and triggers.
Understanding landslide processes and potential triggering mechanisms
• ensures that any landslide risk assessment is scientifically informed,
• ensures that any proposed landslide hazard management strategies are appropriate to the specific local landslide hazard,
• determines if a MoSSaiC-style drainage intervention will actually address the land-slide hazard,
• increases the ability of those implementing the project to justify the landslide hazard reduction measures,
• helps build confidence within the commu-nity that the fundamental causes of the landslide hazard are being tackled, and
• encourages a holistic and strategic approach to delivering effective landslide hazard reduction measures.
The content of this chapter is designed to be accessible to policy makers, project manag-ers, practitioners, community contractors, and community members; however, it is likely to be project managers and expert practitioners who take the lead in communicating the sci-ence.
Milestone 3: Presentation made to MoSSaiC teams on landslide processes and slope stability
software
Chapter 4. Selecting Communities
This chapter describes the community selec-tion process and provides a framework for identifying areas where slopes are susceptible to landslides, the exposure and vulnerability of communities to these potential landslide events, and hence the overall landslide risk. The aim is to develop a prioritized list of com-munities for the implementation of landslide hazard reduction measures using the MoSSaiC approach.
Policy makers and project managers need to coordinate on community selection to ensure that there is a transparent process the MCU can endorse. Failure in this regard can lead to unintended consequences such as non-selected communities seeking political redress, vocal individuals being given a plat-form to promote related agendas, and in extreme cases, the demotivation of the MCU due to the lack of a robust decision-making process. This chapter is designed to help the MCU avoid these issues to the extent possible.
The sophistication of the methods used will depend on local data and software availability, and the level of expertise of the government task team involved. Practitioners with knowl-edge of local landslide issues, of digital map-ping methods, or of assessing community vul-nerability will be able to provide valuable guidance in this task. The outputs could range from a simple prioritized list of communities to a detailed landslide risk map for a region or country. Whatever the method used, commu-nity selection should be justifiable in terms of the science and rationale underpinning the landslide susceptibility assessment and vul-nerability of the communities.
After the communities have been selected, the mapping task team seeks to assemble the most detailed maps available for these com-munities. These maps form the basis for the community-based landslide hazard and drainage mapping exercise described in chapter 5.
Milestone 4: Process for community selection agreed upon and communities selected
CO M M U N I T Y- BA S E D L A N DS L I D E R I S K R E D U CT I O N x x v i i
Chapter 5. Community-Based Mapping for Landslide Hazard Assessment
This chapter provides guidance on the com-munity-based process to map localized slope stability features and identify the dominant causes of the landslide hazard in different zones of the slope. This is a central chapter for project managers and practitioners in the fields of mapping, community development, and engineering. The construction of such a community slope feature map and subsequent slope process zone map is the basis for assess-ing whether interventions that manage sur-face water would be likely to reduce the land-slide hazard. Quantitative methods are introduced that can be used to investigate the physical slope stability processes and confirm the landslide hazard and effective solutions. The final stage described in this chapter is the production of an initial drainage plan and intervention prioritization matrix for the com-munity.
Community members need to be fully engaged in the mapping process, not just as providers of the information, but as active par-ticipants in the development of the maps. The motivation for community member engage-ment at this level will vary locally. In some cases, there will already be formal community groups able to mobilize the rest of the commu-nity; in others, policy makers and project man-agers may need to take a much more active role in establishing suitable frameworks and approaches to facilitate community engage-ment.
The contents of this chapter are primarily directed to the project manager and those team members with engineering or other technical expertise; however, it is expected that key community members would use this chapter to develop local awareness of urban landslide processes and acquire landslide haz-ard mapping skills.
The chapter emphasizes that community-based slope stability mapping is a central ele-ment of the MoSSaiC program. As such, it is important that the project manager, in partic-ular, ensures that all residents participate in
the mapping process. This helps create com-munity ownership and gives recognition to the fact that residents can be involved in the immediate solutions to landslide risk and lon-ger-term improvement in slope management practices.
Milestone 5: Sign-off on prioritized zones and initial drainage plan
Chapter 6. Design and Good Practice for Slope Drainage
This chapter is concerned with the detailed design of drains and other surface water man-agement strategies in communities where sur-face water has been identified as the main con-tributor to landslide hazard. The aim is to design an integrated drainage intervention plan against a fixed budget that has been approved by all stakeholders.
The products of the community-based mapping process detailed in chapter 5 are a community slope feature map, a slope process zone map identifying relative landslide haz-ard, and an initial drainage plan. Having iden-tified surface water management as an appro-priate measure for landslide hazard reduction, government engineers and technicians should find the steps outlined in this chapter helpful in developing the final drain alignments and detailed construction specifications.
Project managers and engineers will find useful resources and methods for estimating surface water and household water discharge into drains, designing the alignment and dimensions of drains, and estimating con-struction costs.
Milestone 6: Sign-off on final drainage plan
Chapter 7. Implementing the Planned Works
This chapter outlines the major issues to be addressed when undertaking drain construc-tion. The aim is to provide guidance on the con-tracting process (tendering and letting of con-tracts to community contractors), construction
x x v i i i P R E FAC E
(implementing the works and good construc-tion practice), and the need to achieve high quality in both (supervision of works is central to project success). Project managers and prac-titioners in charge of construction should use and adapt these resources to local practices and standards and ensure good-quality works.
The proposed drainage plan agreed upon in chapter 6 is the document that forms the basis for all the activities relating to the construc-tion and delivery of the intervention outlined in this chapter.
The construction phase of the project is of particular interest to policy makers, project managers, practitioners, community mem-bers, and the media. It is the point of project delivery as far as construction of landslide hazard reduction measures is concerned. See-ing that this process is successfully managed within time and budgetary constraints not only maximizes the likelihood of sound con-struction but also lays the foundation for com-munity ownership postcompletion. A success-fully managed project enhances the likelihood of the community becoming a powerful advo-cate for additional interventions and of influ-encing future policy. Poor construction and subsequent rejection of the intervention by the community has the reverse effect—and the potential of making landslide and flooding issues worse. This chapter provides guidance on how to run the implementation process in recognition of these potential challenges.
Milestone 7: Sign-off on completed construction
Chapter 8. Encouraging Behavioral Change
This chapter is concerned with developing communication and capacity-building strate-gies that encourage the adoption of good land-slide hazard reduction practices and policies by communities and governments.
The strategies that work best are likely to be highly dependent on local situations. The aim of this chapter is to review behavior change processes and principles, and potential com-
munication and capacity-building methods, in order to guide the development of locally rel-evant strategies. This chapter gives an indica-tion of some such approaches that have been used for MoSSaiC programs.
Guidance is provided on who should be told what and when—identifying and understand-ing project audiences, developing appropriate project messages, and using different forms of communication. Formal and informal dialogue and community participation are emphasized as the basis for communication throughout the project. Ways of building local capacity are identified for different stakeholder groups, and learning by doing is highlighted as a fun-damental part of the MoSSaiC capacity-build-ing process.
Milestone 8: Communication and capacity-building strategies agreed upon and
implemented
Chapter 9. Project Evaluation
This chapter stresses the importance of evalu-ating project outputs and outcomes. It pro-vides a rationale for undertaking an evaluation and a blueprint for an evaluation strategy.
Monitoring and evaluation are widely spo-ken of in the context of project management, yet in many disaster risk reduction initiatives adequate baseline data are not collected. Con-sequently, it can be difficult to find adequate measures of success on which a project may be evaluated after just two or three years post-project. This in turn gives rise to the recogni-tion that longer-term project impact evalua-tions are rarely, if ever, instigated (Benson and Twigg 2004). Landslide risk reduction evi-dence faces the challenge of counterfactual analysis—how to demonstrate conclusively what would have happened if a different action had been taken.
The MCU should therefore understand and communicate the following:
• The need to secure relevant data both dur-ing and after the project to support project impact
CO M M U N I T Y- BA S E D L A N DS L I D E R I S K R E D U CT I O N x x i x
• How the immediate benefits (outputs) and longer-term benefits (outcomes) relate to the overall program objectives
• That delivering effective landslide hazard reduction measures provides evidence that ex ante landslide risk reduction can both work and pay.
This evidence base is important if the per-ceptions, practices, and policies of individuals, governments, and international funding agen-cies are to be changed regarding community-based landslide risk reduction.
Milestone 9: Evaluation framework agreed upon and implemented
HOW TO USE THIS BOOK
Note to funders and policy makers
It is important to provide a context when advocating for policy change. Globally, the amount of aid given to the developing world is increasing and represents only a small fraction of that needed with regard to natural disasters (Mills 2004)—the number of which continues to rise despite efforts to date. Mitigation mea-sures are widely recommended but rarely implemented (Holmes 2008) because the ben-efits are not tangible; they are disasters that did not happen. Not surprisingly, there is clear evidence of the continued accumulation of urban disaster risk (Bull-Kamanga et al. 2003), driven largely by the speed of societal change, as the vulnerable move to urban areas, the hill-sides of which are so often already prone to landslides. Thus, as Yunus (2011) comments, “The more time spent with poor people, the more one realizes that their circumstances are dictated by the systems society has con-structed.”
As a funder or policy maker, you should anticipate various stakeholder interests aris-ing within community-based interventions. Issues that might need to be reconciled include political priorities, seeking objectivity in com-munity selection, landowner interests, and
governance of the MoSSaiC project manage-ment structure.
You may be responsible for working with MoSSaiC project managers and managing their reporting line to the government. This book provides guidance on how to undertake that process, evidence of what has worked, and information on options to consider.
Of the entire delivery process, chapters 1 (MoSSaiC foundations), 2 (project inception), 4 (community selection), and 9 (project evalu-ation) are perhaps the most significant in pol-icy terms. They represent areas that demand clear policy frameworks within which the more technical aspects of mitigation measure delivery can be undertaken. Lack of clarity in these areas can lead to inefficiency, delay, and failure to align stakeholder expectations.
Funders and policy makers play a key role in promoting structures that guide the transfer of project funds to the relevant implementing and community agencies in an efficient and timely manner. Project funds are finite, and governments can therefore fund only limited construction efforts. Funders and policy mak-ers can seek to ensure that policies are in place to harmonize disaster risk reduction expendi-ture arising from different sources within a single community.
Funders and policy makers can encourage the use of this book within government and by other national agencies, nongovernmental organizations, and civil society organizations to communicate the vision of community-based landslide risk reduction and to encour-age feedback so as to further refine the approach and provide additional content. You thus have an important role in creating a cul-ture of commitment and delivery efficiency, and ultimately in driving changes in ex ante landslide risk mitigation practice and policy.
Note to the MoSSaiC core unit
The MoSSaiC process begins with a series of decisions that have to be made almost immedi-ately to configure the MCU (the project man-agement team). MCU personnel typically com-prise senior government personnel responsible
x x x P R E FAC E
for managing government agencies, depart-ments, or projects; and/or with expertise in a particular field such as disaster risk manage-ment, landslide hazard assessment, engineer-ing, or community development.
Your role as a MoSSaiC project manager or expert advisor means that you should be familiar with the entire contents of this book. You will be responsible for implementing the policy decisions and for ensuring delivery of the appropriate measures on the ground in communities. You will need to apply the resources in this book according to local fac-tors.
Replication should not be considered an automatic process. Sometimes things work for idiosyncratic reasons—a charismatic and liter-ally irreplaceable leader or a particular and unrepeatable crisis that solidifies support for a politically difficult innovation. One-time suc-cesses thus may not be replicable (World Bank 2004, 108).
This book explains the project steps, teams, and supervision levels that are necessary to deliver appropriate construction of hazard reduction measures on the ground. It empha-sizes the importance of basing the entire pro-gram in the community. It provides a logical description of how to configure teams and design physical measures to reduce landslide hazard in vulnerable communities. The book does not tell you exactly what to do, but it should improve the likelihood of good project outcomes and of delivering a strategic and holistic community-based landslide risk reduction program. Managing and delivering community-based projects is hard work, but working with the community empowers both residents and government teams to contribute their knowledge and skills.
Note to government task teams
Government task teams (typically government engineers, community development workers, and technical staff ) are responsible for spe-cific tasks related to implementing physical works on the ground or directly coordinating with communities.
If you are a task team leader, you will need to work closely with the MCU to adapt each project step according to local capacity, ensure that the tasks required to complete each step are appropriately assigned to a task team, and identify and build your team. As a practitio-ner—and since this book is a blueprint—you will be responsible for capturing and incorpo-rating local good practice insofar as it relates to your area of expertise and the MoSSaiC methodology. Under the guidance of the MCU, you will be responsible for implementing spe-cific project steps and tasks, and for ensuring delivery of the appropriate landslide mitiga-tion measures on the ground in communities.
Note to community task teams
Community task teams comprise community residents and those with responsibilities at the community level, such as community repre-sentatives and community-based contractors.
Community residents are the most critical partners in the program; they are
• participants in the entire process,
• those to whom the initiative is directed,
• those who will “own” the implementation long after construction has finished,
• an important source of knowledge of local slope stability and drainage features in the community, and
• catalytic in making the project happen.
Each chapter begins with a “Getting started” section; these are intended to provide an accessible overview to allow communities to understand key project concepts. If you are a community representative, you may find it helpful to read these in depth. Other particu-larly relevant book sections to refer to are chapter 5, which describes the community-based mapping process; and chapter 8, which provides guidance on formal and informal community meetings, written and visual resources (e.g., leaflets and posters), and the use of the media. You will need to work with the government task teams to understand and
CO M M U N I T Y- BA S E D L A N DS L I D E R I S K R E D U CT I O N x x x i
communicate important project messages to community residents and facilitate their par-ticipation. You should also help the govern-ment task teams understand the community context.
If you are a construction contractor or a worker living in a community where MoSSaiC is being implemented, you will have specialist local knowledge that is vital to the success of the project. You may have useful information to share during the community-based mapping
process. You may also have the opportunity to use your skills in the design and construction of landslide mitigation measures (see sections 6.4 and 6.5 on drain design, and sections 7.5–7.8 on good drain construction practices).
Helpful questions
Table P.1 presents some typical questions about MoSSaiC and where guidance can be found in this book.
TABLE P.1 Critical questions and decisions addressed in this book
CRITICAL QUESTION/DECISION WHERE TO LOOK FOR HELP
Why should landslide risk reduction be community based? Chapter 1. Foundations: Reducing Landslide Risk in Communities
What are the unique features of the MoSSaiC approach?
Where can MoSSaiC be applied?
What teams are needed? Chapter 2. Project Inception: Teams and StepsWhat are the project steps?
What are the roles and responsibilities of the teams?
What forms of slope failure does the MoSSaiC approach address?Chapter 3. Understanding Landslide Hazard
What is the relevant spatial scale for MoSSaiC interventions?
How is landslide hazard assessed?
How can the most landslide-prone areas be identified?Chapter 4. Selecting Communities
How can the most vulnerable communities be identified?
How are communities selected for a MoSSaiC intervention?
How can landslide hazard be mapped in a community? Chapter 5. Community-Based Mapping for Landslide Hazard Assessment
How effective will surface water management be in reducing the landslide hazard?
How is the initial drainage plan developed?
Where should drains be built to improve slope stability?
Chapter 6. Design and Good Practice for Slope Drainage
How can surface water runoff, household gray water discharge, and required drain sizes be estimated?
What are the most appropriate types of drain design and construction?
What construction practices should be promoted? Chapter 7. Implementing the Planned WorksWhy is site supervision so important?
How do communities and governments adopt new landslide mitigation practices and policies?Chapter 8. Encouraging Behavioral Change
What are the components of a communication strategy?
What are the components of a capacity-building strategy?
How can landslide risk reduction measures be evaluated?
Chapter 9. Project EvaluationWhat are the MoSSaiC key performance indicators?
What evidence is needed to support ex ante landslide mitigation policies?
Where can additional resources be found? At the end of each chapter
x x x i i P R E FAC E
REFERENCES
Benson, C., and J. Twigg. 2004. “Measuring Mitigation Methodologies for Assessing Natural Hazard Risks and the Net Benefits of Mitigation—A Scoping Study.” ProVention Consortium, Geneva.
Bull-Kamanga, L., K. Diagne, A. Lavell, E. Leon, F. Lerise, H. MacGregor, A. Maskrey, M. Meshack, M. Pelling, H. Reid, D. Satterthwaite, J. Songsore, K. Westgate, and A. Yitambe. 2003. “From Everyday Hazards to Disasters: The Accumulation of Risk in Urban Areas.” Environment and Urbanization 15 (1): 193–203.
Holmes, J. 2008. “More Help Now Please.” The Economist November 19.
Mansuri, G., and V. Rao. 2003. Evaluating Community-Based and Community-Driven Development: A Critical Review of the Evidence. Development Research Group. Washington, DC: World Bank.
Mills, E. 2004. “Insurance in a Climate of Change.” Science 309 (5737): 1040–44.
—. 2004. Making Services Work for Poor People. World Development Report. Washington, DC: World Bank.
Yunus, M. 2011. Blog post August 28. https://plus.google.com/114848435876861502546/posts/9SwwVFedo9P.
x x x i i i
This book was written while the authors were working in the Latin America and the Carib-bean Disaster Risk Management team at the World Bank, Washington, D.C. Colleagues in that team deserve our thanks for supporting and resourcing our continued commitment to deliver MoSSaiC (Management of Slope Sta-bility in Communities) to communities more widely in the region and beyond.
In particular, we thank Francis Ghesquiere and Niels Holm-Nielsen for their continued support of initiatives that led to this book. Dis-cussions with other World Bank team mem-bers, including Joaquin Toro, Maricarman Esquivel, Tiguist Fisseha, and Rossella Della Monica were enormously helpful throughout.
Review comments received from colleagues in the Latin America and the Caribbean Region's Disaster Risk Management and Urban Unit and Water Supply and Sanitation Unit at the World Bank, Washington, D.C., Kirk Frankson (Office of Disaster Prepared-ness and Emergency Management, Jamaica), Chamberlain Emmanuel (government of St. Lucia), Abhas K. Jha (East Asia and Pacific Infrastructure Unit, World Bank) and M. Yaa Pokua Afriyie Oppong (Social Development Department, World Bank), as part of the World Bank review process chaired by Francis Ghes-quiere, are acknowledged with grateful thanks.
The Office of the Publisher provided edito-rial, design, composition, and printing services
under the supervision of Patricia Katayama, Andrés Meneses, and Dina Towbin; and Nita Congress undertook copyediting, typesetting, and proofreading of the manuscript.
This book is based on a community-focused approach and has involved the authors spend-ing many months working in communities with residents who are among the most vul-nerable. We are grateful to members of com-munities in Bequia, Dominica, St. Lucia, and St. Vincent and the Grenadines with whom we have spent so much time, and from whom we have learned so much. We especially acknowl-edge the support and friendship of Robert Charles, McArthur Edwards, and Ruben Leon in St. Lucia.
Our vision for MoSSaiC would not have been realized had it not received support from Calixte George, Ignatius Jean, and Kenny Anthony as then-members of the government of St. Lucia. Equally accepting of the vision, Donovan Williams, then-Director of the Pov-erty Reduction Fund in St. Lucia, facilitated us in undertaking a pilot program in St. Lucia. This support was continued by his successor, Joachim Henry. We acknowledge with thanks the technical support for program delivery we have received from government of St. Lucia personnel: David Alphonse, Chamberlain Emmanuel, Peter Gustave, and Cheryl Mathurin. Within the Eastern Caribbean sub-region, David Popo of the Organisation of East-
Acknowledgments
x x x i v AC K N OW L E D G M E N TS
ern Caribbean States helped facilitate pilot projects in Dominica and St. Vincent and the Grenadines.
During our time working overseas in com-munities and in writing this book in Washing-ton, D.C., and Bristol, United Kingdom, we received support from many colleagues at the University of Bristol, especially Neil Bradshaw and Eric Thomas.
Funding for the work undertaken by the authors that provided the context for much of this book was provided by the World Bank, the governments of St. Lucia and Dominica, the United Nations Development Programme, the U.S. Agency for International Development, the University of Bristol, SETsquared Partner-ship UK, and the British High Commission, St. Lucia.
x x x v
Malcolm Anderson is Visiting Fellow at Brasenose College and Visiting Professor of Hydrology at the University of Oxford, a Senior Landslide Risk Management Specialist Consultant in the World Bank’s Latin America and the Caribbean Disaster Risk Management Team in Washington, D.C., and Professor at the University of Bristol, United Kingdom, where he was Pro Vice-Chancellor (Research) from 2005 to 2009. He holds a PhD from the University of Cambridge, and was elected to a Research Fellowship at Sidney Sussex Col-lege, Cambridge. He is the author of over 200 papers, as well as of industry standard soft-ware, and Founder and Editor-in-Chief of the journal Hydrological Processes. He has worked on many government research projects world-wide, principally in the Far East (Hong Kong SAR, China; Indonesia; and Malaysia), the United States, and the Caribbean. He is an elected Fellow of the Institution of Civil Engi-neers, London, and was a Council Member of the U.K. Natural Environment Research Council (2001–07), and a Board Member of the U.K. Engineering and Physical Sciences Research Council’s Technology Strategy Board (2009–11).
Elizabeth Holcombe holds a PhD and an MSci from the University of Bristol, where she is a Lecturer in Civil Engineering. She is a Landslide Risk Management Specialist Con-sultant in the World Bank’s Latin America and the Caribbean Disaster Risk Manage-ment Team in Washington, D.C. Her back-ground is in environmental science and the numerical modeling of hillslope hydrology and stability. She has had extensive overseas experience in research, project management, and implementation of landslide risk reduc-tion projects in vulnerable communities in the Eastern Caribbean. She has presented invited papers at international conferences in the Caribbean, Europe, and the Far East, and is the author of numerous papers and book chapters in the field of landslide risk reduc-tion. Her research on MoSSaiC was high-lighted in the 2010 World Development Report and profiled at the Aid Effectiveness Show-case hosted at the World Bank in 2011. She received the 2007 Trevithick Award from the Institution of Civil Engineers, London, and managed the team that was awarded the Grand Prize at the 2010 Random Hacks of Kindness hackathon in Washington, D.C.
About the Authors
Disclaimer
The material in this book is• information of a general nature only that is not intended to address the specific
circumstances of any particular project or application;• not necessarily comprehensive, complete, accurate, or up to date; and• not professional or legal advice—if specific advice is needed, a suitably qualified
professional should be consulted.It follows that none of the individual contributors, authors, developers, or sponsors of
this book, nor anyone else connected to it, can take any responsibility for the results or consequences of any use or adoption of any of the materials or information presented within this book. To the fullest extent permitted by law, the authors accept no responsibility for any loss or damage, which may arise from reliance on the guidance, materials or information contained within this book.
x x x v i i
Abbreviations
cf cubic footCHASM Combined Hydrology and Slope Stability ModelDRM disaster risk managementDRR disaster risk reductionft footgal gallonGDP gross domestic productGIS geographic information systemGPS global positioning systemh hourin inchkm kilometerkPa kilopascalKPI key performance indicatorL literm meterMCU MoSSaiC core unitmin minutemm millimeterMoSSaiC Management of Slope Stability in CommunitiesNGO nongovernmental organizationRFT request for tenderSAR special administrative regions secondSIDS small island developing statesUN United Nations
All dollar amounts are U.S. dollars unless otherwise indicated.
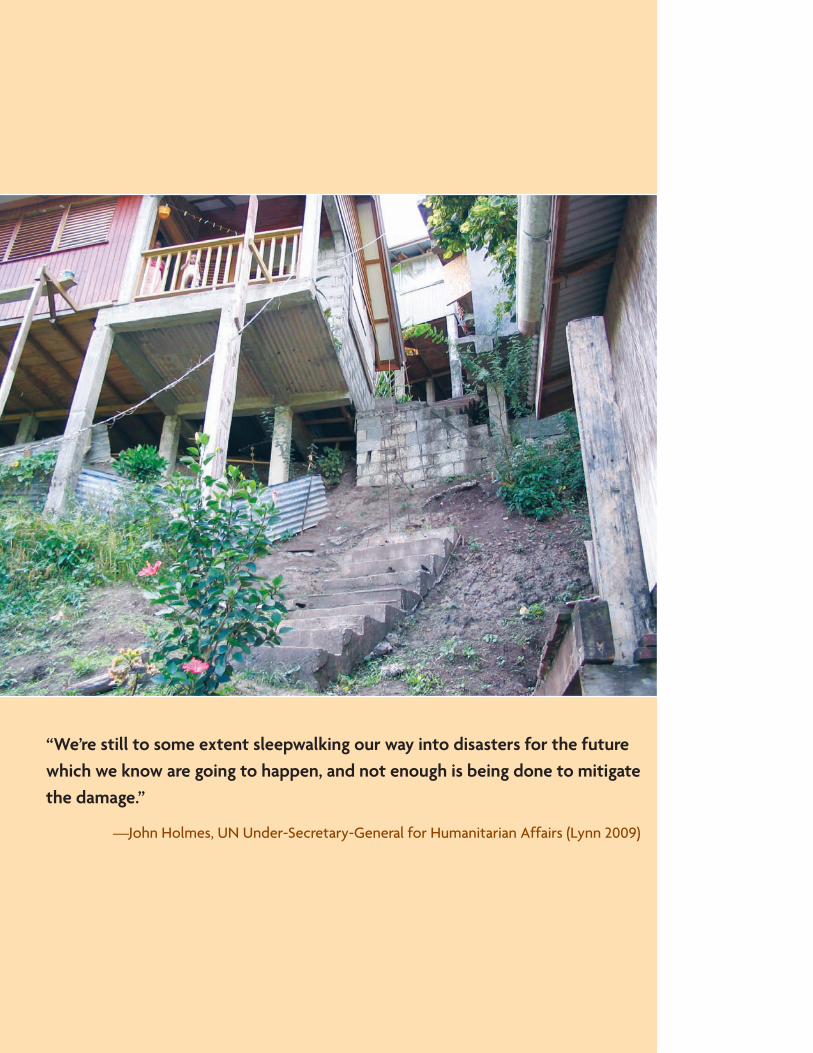
“We’re still to some extent sleepwalking our way into disasters for the future which we know are going to happen, and not enough is being done to mitigate the damage.”
—John Holmes, UN Under-Secretary-General for Humanitarian Affairs (Lynn 2009)
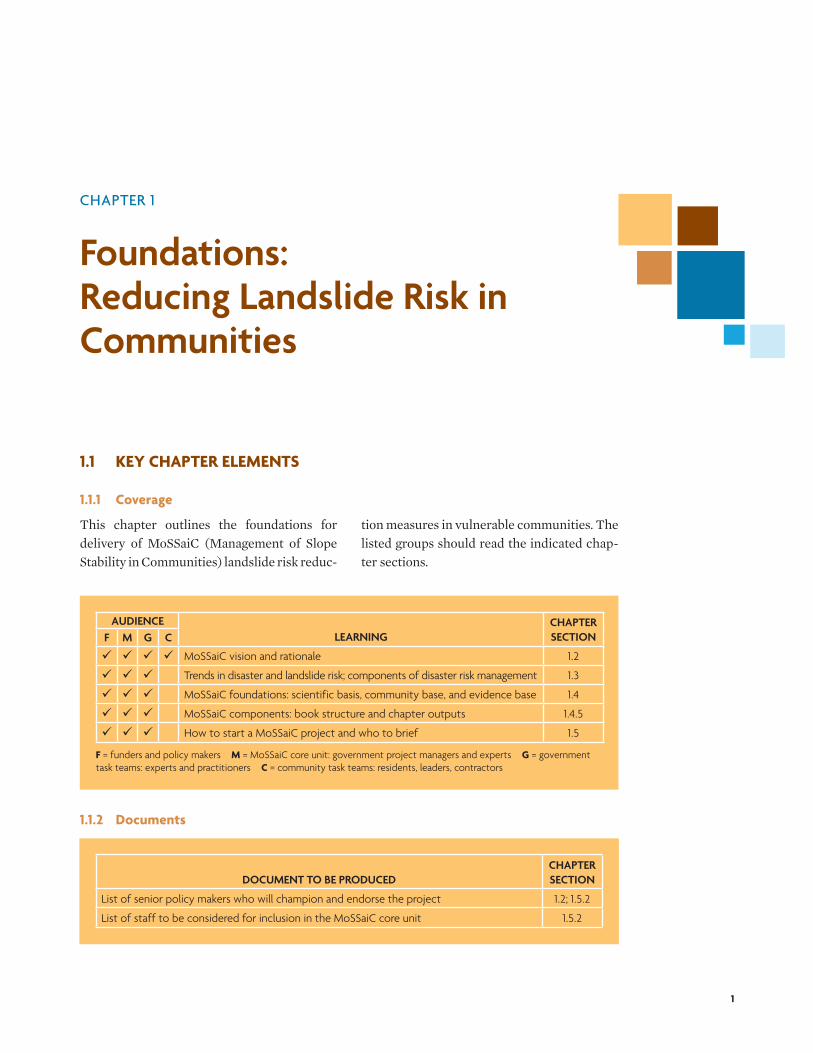
1
CHAPTER 1
Foundations: Reducing Landslide Risk in Communities
1.1 KEY CHAPTER ELEMENTS
1.1.1 Coverage
This chapter outlines the foundations for delivery of MoSSaiC (Management of Slope Stability in Communities) landslide risk reduc-
tion measures in vulnerable communities. The listed groups should read the indicated chap-ter sections.
AUDIENCELEARNING
CHAPTER SECTIONF M G C
MoSSaiC vision and rationale 1.2
Trends in disaster and landslide risk; components of disaster risk management 1.3
MoSSaiC foundations: scientific basis, community base, and evidence base 1.4
MoSSaiC components: book structure and chapter outputs 1.4.5
How to start a MoSSaiC project and who to brief 1.5
F = funders and policy makers M = MoSSaiC core unit: government project managers and experts G = government task teams: experts and practitioners C = community task teams: residents, leaders, contractors
1.1.2 Documents
DOCUMENT TO BE PRODUCEDCHAPTER SECTION
List of senior policy makers who will champion and endorse the project 1.2; 1.5.2
List of staff to be considered for inclusion in the MoSSaiC core unit 1.5.2
2 C H A P T E R 1 . F O U N DAT I O N S : R E D U C I N G L A N DS L I D E R I S K I N CO M M U N I T I ES
1.1.3 Steps and outputs
1.1.4 Community-based aspects
The chapter introduces MoSSaiC as an inte-grated method for engaging policy makers, project managers, practitioners, and vulnera-ble communities in reducing urban landslide risk in developing countries. Community resi-dents are not just seen as those at risk, but as the people with the best practical knowledge of the slopes in their area. By engaging and working with communities to find and deliver solutions to landslide risk, governments will develop new practices and policies.
1.2 GETTING STARTED
1.2.1 Briefing note
A practical approach to reducing landslide risk
In introducing MoSSaiC, the chapter provides
• a framework for understanding disaster risk, specifically landslide risk;
• an overview of recent influences on disaster risk management (DRM);
• advocacy for a proactive approach in tack-ling landslide risk in communities;
• an introduction to MoSSaiC’s three founda-tions; and
• an overview on starting a MoSSaiC land-slide risk reduction project.
Many areas of the world are at risk from landslides and their consequences (figure 1.1). Rainfall-triggered landslides particularly affect developing countries in the humid trop-
ics. Rapid urbanization and the associated growth of unauthorized and densely popu-lated communities in hazardous locations (such as steep slopes) are powerful drivers in a cycle of disaster risk accumulation. Frequently, it is the most socioeconomically vulnerable who inhabit marginal landslide-prone slopes—thus increasing their exposure to landslide hazards and often increasing the hazard itself.
The more socially, economically, and physi-cally vulnerable people are, the more disas-trous a landslide event will be. While recogni-tion is growing of the increased occurrence of landslide disasters, there is equal recognition that on-the-ground implementation of land-slide risk reduction measures is lacking.
MoSSaiC aims to address these issues. Its key premises follow.
• Disaster risk mitigation pays, and invest-ment in reducing rainfall-triggered land-slide hazards in vulnerable communities can often be justified.
• Engaging existing government expertise for implementing risk reduction measures can build capacity, embed good practice, and change policy.
• Ensuring community engagement from start to finish can establish ownership of solutions.
Specifically, construction of relatively sim-ple measures such as surface water drains can often improve slope stability, reduce the land-slide risk to communities, and reduce future disaster management costs to governments. Landslide mitigation can be achieved through cooperation between government technicians
STEP OUTPUT
1. Understand the disaster risk context with respect to landslides Relevance of MoSSaiC approach to local landslide risk context identified
2. Understand the innovative features and foundations of MoSSaiC
3. Identify general in-house expertise and the appropriate institutional struc-tures for codifying a local approach toward landslide risk reduction
4. Brief key individuals on MoSSaiC (politicians, relevant ministries, in-house experts)
Core unit of team members identified
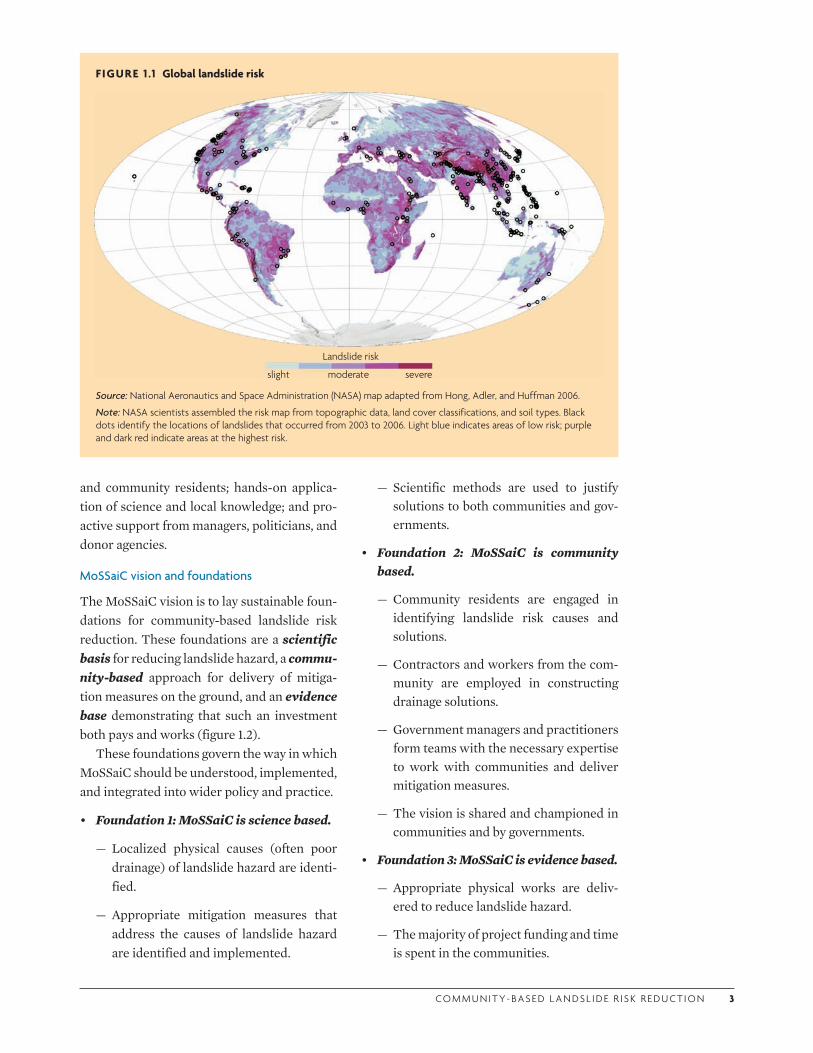
CO M M U N I T Y- BA S E D L A N DS L I D E R I S K R E D U CT I O N 3
and community residents; hands-on applica-tion of science and local knowledge; and pro-active support from managers, politicians, and donor agencies.
MoSSaiC vision and foundations
The MoSSaiC vision is to lay sustainable foun-dations for community-based landslide risk reduction. These foundations are a scientific basis for reducing landslide hazard, a commu-nity-based approach for delivery of mitiga-tion measures on the ground, and an evidence base demonstrating that such an investment both pays and works (figure 1.2).
These foundations govern the way in which MoSSaiC should be understood, implemented, and integrated into wider policy and practice.
• Foundation 1: MoSSaiC is science based.
— Localized physical causes (often poor drainage) of landslide hazard are identi-fied.
— Appropriate mitigation measures that address the causes of landslide hazard are identified and implemented.
— Scientific methods are used to justify solutions to both communities and gov-ernments.
• Foundation 2: MoSSaiC is community based.
— Community residents are engaged in identifying landslide risk causes and solutions.
— Contractors and workers from the com-munity are employed in constructing drainage solutions.
— Government managers and practitioners form teams with the necessary expertise to work with communities and deliver mitigation measures.
— The vision is shared and championed in communities and by governments.
• Foundation 3: MoSSaiC is evidence based.
— Appropriate physical works are deliv-ered to reduce landslide hazard.
— The majority of project funding and time is spent in the communities.
FIGURE 1 .1 Global landslide risk
Source: National Aeronautics and Space Administration (NASA) map adapted from Hong, Adler, and Huffman 2006.
Note: NASA scientists assembled the risk map from topographic data, land cover classifications, and soil types. Black dots identify the locations of landslides that occurred from 2003 to 2006. Light blue indicates areas of low risk; purple and dark red indicate areas at the highest risk.
Landslide risk
slight moderate severe
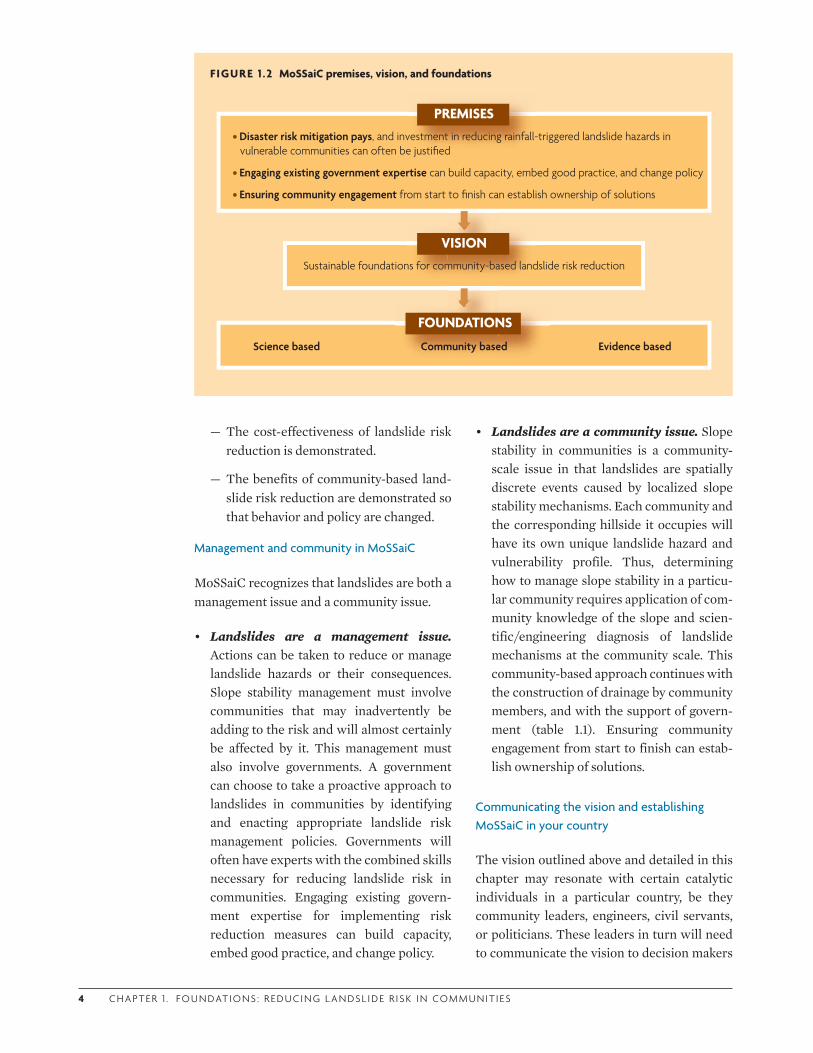
4 C H A P T E R 1 . F O U N DAT I O N S : R E D U C I N G L A N DS L I D E R I S K I N CO M M U N I T I ES
— The cost-effectiveness of landslide risk reduction is demonstrated.
— The benefits of community-based land-slide risk reduction are demonstrated so that behavior and policy are changed.
Management and community in MoSSaiC
MoSSaiC recognizes that landslides are both a management issue and a community issue.
• Landslides are a management issue. Actions can be taken to reduce or manage landslide hazards or their consequences. Slope stability management must involve communities that may inadvertently be adding to the risk and will almost certainly be affected by it. This management must also involve governments. A government can choose to take a proactive approach to landslides in communities by identifying and enacting appropriate landslide risk management policies. Governments will often have experts with the combined skills necessary for reducing landslide risk in communities. Engaging existing govern-ment expertise for implementing risk reduction measures can build capacity, embed good practice, and change policy.
• Landslides are a community issue. Slope stability in communities is a community-scale issue in that landslides are spatially discrete events caused by localized slope stability mechanisms. Each community and the corresponding hillside it occupies will have its own unique landslide hazard and vulnerability profile. Thus, determining how to manage slope stability in a particu-lar community requires application of com-munity knowledge of the slope and scien-tific/engineering diagnosis of landslide mechanisms at the community scale. This community-based approach continues with the construction of drainage by community members, and with the support of govern-ment (table 1.1). Ensuring community engagement from start to finish can estab-lish ownership of solutions.
Communicating the vision and establishing MoSSaiC in your country
The vision outlined above and detailed in this chapter may resonate with certain catalytic individuals in a particular country, be they community leaders, engineers, civil servants, or politicians. These leaders in turn will need to communicate the vision to decision makers
FIGURE 1 .2 MoSSaiC premises, vision, and foundations
• Disaster risk mitigation pays, and investment in reducing rainfall-triggered landslide hazards in vulnerable communities can often be justified
• Engaging existing government expertise can build capacity, embed good practice, and change policy
• Ensuring community engagement from start to finish can establish ownership of solutions
Science based Community based Evidence based
Sustainable foundations for community-based landslide risk reduction
PREMISES
VISION
FOUNDATIONS
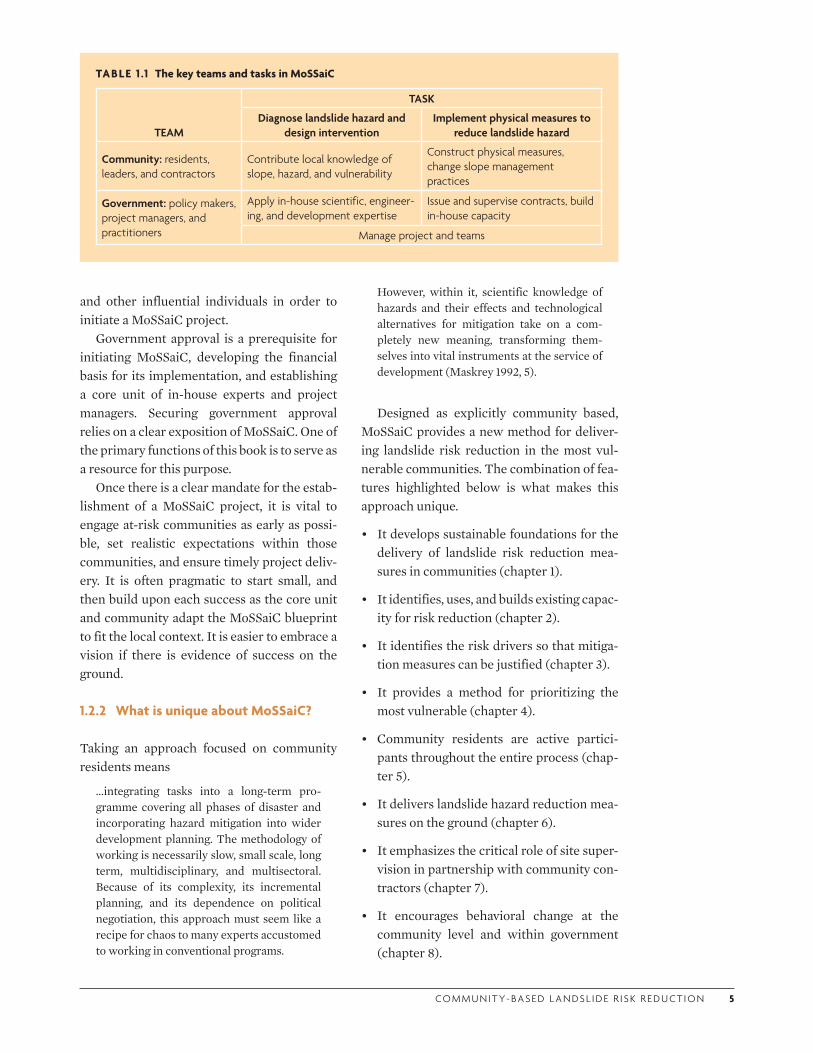
CO M M U N I T Y- BA S E D L A N DS L I D E R I S K R E D U CT I O N 5
and other influential individuals in order to initiate a MoSSaiC project.
Government approval is a prerequisite for initiating MoSSaiC, developing the financial basis for its implementation, and establishing a core unit of in-house experts and project managers. Securing government approval relies on a clear exposition of MoSSaiC. One of the primary functions of this book is to serve as a resource for this purpose.
Once there is a clear mandate for the estab-lishment of a MoSSaiC project, it is vital to engage at-risk communities as early as possi-ble, set realistic expectations within those communities, and ensure timely project deliv-ery. It is often pragmatic to start small, and then build upon each success as the core unit and community adapt the MoSSaiC blueprint to fit the local context. It is easier to embrace a vision if there is evidence of success on the ground.
1.2.2 What is unique about MoSSaiC?
Taking an approach focused on community residents means
…integrating tasks into a long-term pro-gramme covering all phases of disaster and incorporating hazard mitigation into wider development planning. The methodology of working is necessarily slow, small scale, long term, multidisciplinary, and multisectoral. Because of its complexity, its incremental planning, and its dependence on political negotiation, this approach must seem like a recipe for chaos to many experts accustomed to working in conventional programs.
However, within it, scientific knowledge of hazards and their effects and technological alternatives for mitigation take on a com-pletely new meaning, transforming them-selves into vital instruments at the service of development (Maskrey 1992, 5).
Designed as explicitly community based, MoSSaiC provides a new method for deliver-ing landslide risk reduction in the most vul-nerable communities. The combination of fea-tures highlighted below is what makes this approach unique.
• It develops sustainable foundations for the delivery of landslide risk reduction mea-sures in communities (chapter 1).
• It identifies, uses, and builds existing capac-ity for risk reduction (chapter 2).
• It identifies the risk drivers so that mitiga-tion measures can be justified (chapter 3).
• It provides a method for prioritizing the most vulnerable (chapter 4).
• Community residents are active partici-pants throughout the entire process (chap-ter 5).
• It delivers landslide hazard reduction mea-sures on the ground (chapter 6).
• It emphasizes the critical role of site super-vision in partnership with community con-tractors (chapter 7).
• It encourages behavioral change at the community level and within government (chapter 8).
TABLE 1 .1 The key teams and tasks in MoSSaiC
TEAM
TASK
Diagnose landslide hazard and design intervention
Implement physical measures to reduce landslide hazard
Community: residents, leaders, and contractors
Contribute local knowledge of slope, hazard, and vulnerability
Construct physical measures, change slope management practices
Government: policy makers, project managers, and practitioners
Apply in-house scientific, engineer-ing, and development expertise
Issue and supervise contracts, build in-house capacity
Manage project and teams
6 C H A P T E R 1 . F O U N DAT I O N S : R E D U C I N G L A N DS L I D E R I S K I N CO M M U N I T I ES
• It promotes the importance of providing evidence of risk reduction achieved (chap-ter 9).
1.2.3 Guiding principles
• Develop a “mitigation mindset” with respect to urban landslide risk.
• Understand that there is no “one size fits all” solution to landslide risk reduction—each country and community will have its own landslide risk profile.
• Recognize that there is often something that can be done to reduce the risk—learn from other approaches and adapt the MoSSaiC blueprint.
• Learn the value of community knowledge and the importance of community involve-ment throughout.
• Realize that the government may already have the skills and know-how to tackle landslide risk in communities.
• Look for key individuals in government and communities who see the big picture and can drive behavioral change.
1.2.4 Risks and challenges
Getting commitment from all key stakeholders
Securing a mandate for MoSSaiC from govern-ment is necessary for establishing and manag-ing the requisite teams, procuring services and resources, and implementing landslide mitiga-tion measures in communities. The multidis-ciplinary nature of MoSSaiC means that its components may fall between or across the purview of different ministries, or that minis-tries may not wish to collaborate. A political champion may be able to overcome this, but energetic individuals from different agencies will also need to join forces.
In addition to requiring top-down govern-ment action, MoSSaiC is a bottom-up approach to landslide mitigation and needs to have a secure grounding in communities. This grounding can only be achieved through sub-stantial interaction with communities, neces-
sitating clear communication and a major time commitment. In the MoSSaiC approach, com-munity residents are seen not as passive recip-ients of information, but as agents contribut-ing both to the landslide hazard and to the solutions. The challenge is to ensure that indi-viduals are major participants at every stage in the process so that everyone can own the proj-ect. Only in this manner can behavioral change be achieved.
Similarly, government field teams, techni-cians, and construction supervisors should be treated as contributors and their extensive field experience seen as a valuable resource. These team members are the interface with the community. If they are not well informed and involved by their managers, their owner-ship of the project cannot be ensured.
Sound project management delivers quality interventions. Conversely, poor management can actually make a landslide problem worse, alienate communities and field teams, result in budget overruns, and prevent the MoSSaiC approach from being established in a country. The project management and technical teams are responsible for designing and supervising construction, and for achieving a sufficiently high level of engagement with all stakehold-ers, so that the intervention meets the required goals, complies with necessary standards and safeguards, and encourages replication.
Securing evidence that risk reduction is working
Many disaster risk reduction (DRR) projects lack analysis of medium-term impacts. The challenge is to keep project engagement by all stakeholders sufficiently strong so that evi-dence of postproject performance is kept, ana-lyzed, and communicated. Only with such evi-dence can policy be changed or existing DRR policy measures reinforced. Evidence of risk reduction is also important, since evaluations of mitigation measures have to respond to the counterfactual argument of what would have happened in the absence of the intervention.
Psychological and situational barriers
There are several reasons why relatively few people, communities, and governments are
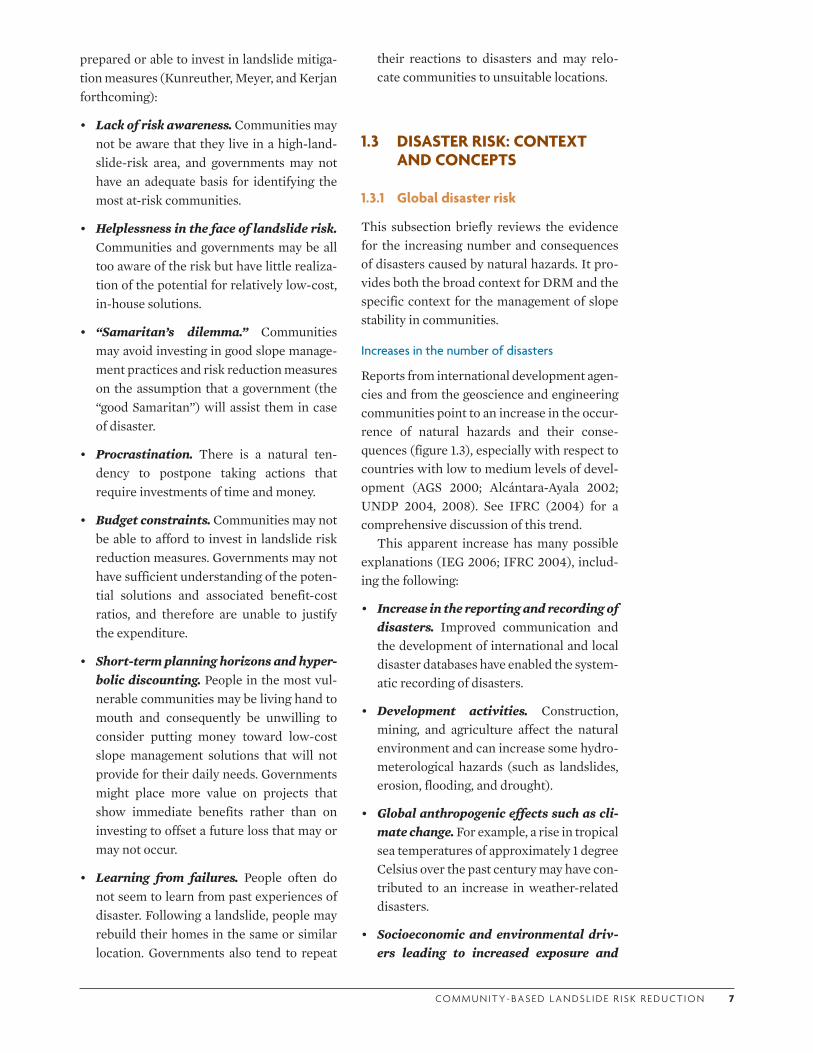
CO M M U N I T Y- BA S E D L A N DS L I D E R I S K R E D U CT I O N 7
prepared or able to invest in landslide mitiga-tion measures (Kunreuther, Meyer, and Kerjan forthcoming):
• Lack of risk awareness. Communities may not be aware that they live in a high-land-slide-risk area, and governments may not have an adequate basis for identifying the most at-risk communities.
• Helplessness in the face of landslide risk. Communities and governments may be all too aware of the risk but have little realiza-tion of the potential for relatively low-cost, in-house solutions.
• “Samaritan’s dilemma.” Communities may avoid investing in good slope manage-ment practices and risk reduction measures on the assumption that a government (the “good Samaritan”) will assist them in case of disaster.
• Procrastination. There is a natural ten-dency to postpone taking actions that require investments of time and money.
• Budget constraints. Communities may not be able to afford to invest in landslide risk reduction measures. Governments may not have sufficient understanding of the poten-tial solutions and associated benefit-cost ratios, and therefore are unable to justify the expenditure.
• Short-term planning horizons and hyper-bolic discounting. People in the most vul-nerable communities may be living hand to mouth and consequently be unwilling to consider putting money toward low-cost slope management solutions that will not provide for their daily needs. Governments might place more value on projects that show immediate benefits rather than on investing to offset a future loss that may or may not occur.
• Learning from failures. People often do not seem to learn from past experiences of disaster. Following a landslide, people may rebuild their homes in the same or similar location. Governments also tend to repeat
their reactions to disasters and may relo-cate communities to unsuitable locations.
1.3 DISASTER RISK: CONTEXT AND CONCEPTS
1.3.1 Global disaster risk
This subsection briefly reviews the evidence for the increasing number and consequences of disasters caused by natural hazards. It pro-vides both the broad context for DRM and the specific context for the management of slope stability in communities.
Increases in the number of disasters
Reports from international development agen-cies and from the geoscience and engineering communities point to an increase in the occur-rence of natural hazards and their conse-quences (figure 1.3), especially with respect to countries with low to medium levels of devel-opment (AGS 2000; Alcántara-Ayala 2002; UNDP 2004, 2008). See IFRC (2004) for a comprehensive discussion of this trend.
This apparent increase has many possible explanations (IEG 2006; IFRC 2004), includ-ing the following:
• Increase in the reporting and recording of disasters. Improved communication and the development of international and local disaster databases have enabled the system-atic recording of disasters.
• Development activities. Construction, mining, and agriculture affect the natural environment and can increase some hydro-meterological hazards (such as landslides, erosion, flooding, and drought).
• Global anthropogenic effects such as cli-mate change. For example, a rise in tropical sea temperatures of approximately 1 degree Celsius over the past century may have con-tributed to an increase in weather-related disasters.
• Socioeconomic and environmental driv-ers leading to increased exposure and
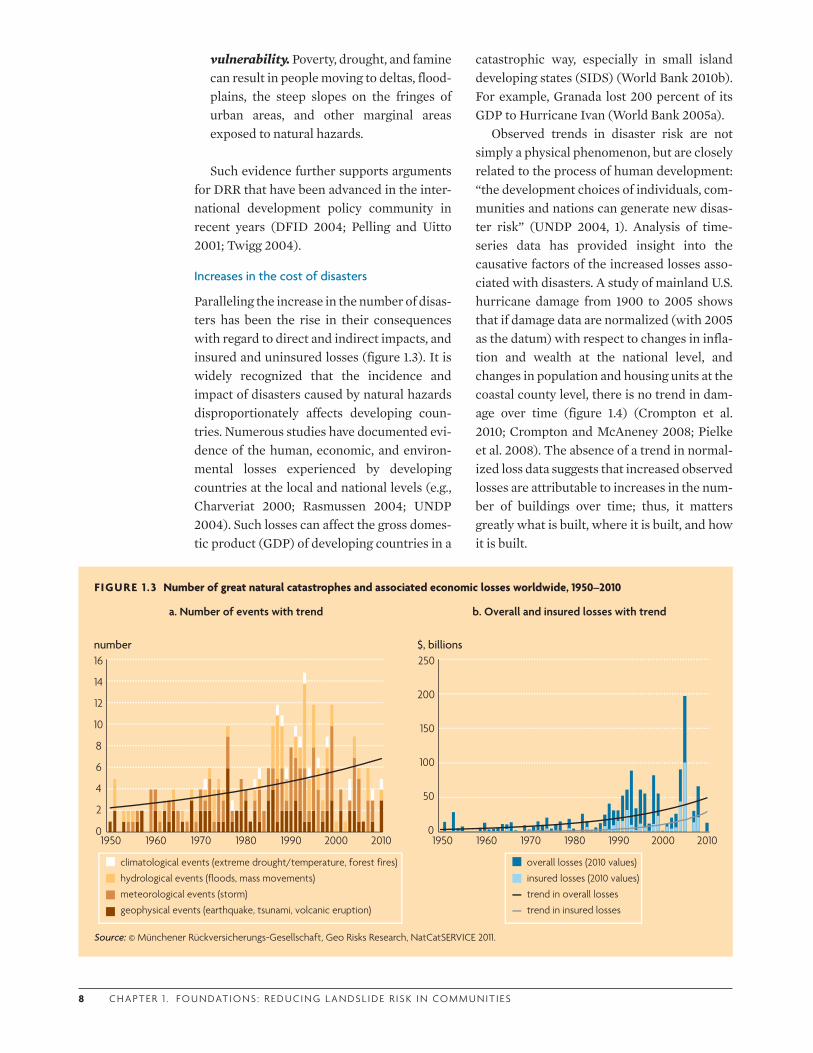
8 C H A P T E R 1 . F O U N DAT I O N S : R E D U C I N G L A N DS L I D E R I S K I N CO M M U N I T I ES
vulnerability. Poverty, drought, and famine can result in people moving to deltas, flood-plains, the steep slopes on the fringes of urban areas, and other marginal areas exposed to natural hazards.
Such evidence further supports arguments for DRR that have been advanced in the inter-national development policy community in recent years (DFID 2004; Pelling and Uitto 2001; Twigg 2004).
Increases in the cost of disasters
Paralleling the increase in the number of disas-ters has been the rise in their consequences with regard to direct and indirect impacts, and insured and uninsured losses (figure 1.3). It is widely recognized that the incidence and impact of disasters caused by natural hazards disproportionately affects developing coun-tries. Numerous studies have documented evi-dence of the human, economic, and environ-mental losses experienced by developing countries at the local and national levels (e.g., Charveriat 2000; Rasmussen 2004; UNDP 2004). Such losses can affect the gross domes-tic product (GDP) of developing countries in a
catastrophic way, especially in small island developing states (SIDS) (World Bank 2010b). For example, Granada lost 200 percent of its GDP to Hurricane Ivan (World Bank 2005a).
Observed trends in disaster risk are not simply a physical phenomenon, but are closely related to the process of human development: “the development choices of individuals, com-munities and nations can generate new disas-ter risk” (UNDP 2004, 1). Analysis of time-series data has provided insight into the causative factors of the increased losses asso-ciated with disasters. A study of mainland U.S. hurricane damage from 1900 to 2005 shows that if damage data are normalized (with 2005 as the datum) with respect to changes in infla-tion and wealth at the national level, and changes in population and housing units at the coastal county level, there is no trend in dam-age over time (figure 1.4) (Crompton et al. 2010; Crompton and McAneney 2008; Pielke et al. 2008). The absence of a trend in normal-ized loss data suggests that increased observed losses are attributable to increases in the num-ber of buildings over time; thus, it matters greatly what is built, where it is built, and how it is built.
FIGURE 1 .3 Number of great natural catastrophes and associated economic losses worldwide, 1950–2010
2
4
6
8
10
12
14
16
1950 1960 1970 1980 1990 2000 2010
meteorological events (storm)hydrological events (floods, mass movements)climatological events (extreme drought/temperature, forest fires)
geophysical events (earthquake, tsunami, volcanic eruption)
01950 1960 1970 1980 1990 2000 2010
50
100
150
200
250
0
number $, billions
trend in overall lossesinsured losses (2010 values)overall losses (2010 values)
trend in insured losses
a. Number of events with trend b. Overall and insured losses with trend
2
Source: © Münchener Rückversicherungs-Gesellschaft, Geo Risks Research, NatCatSERVICE 2011.
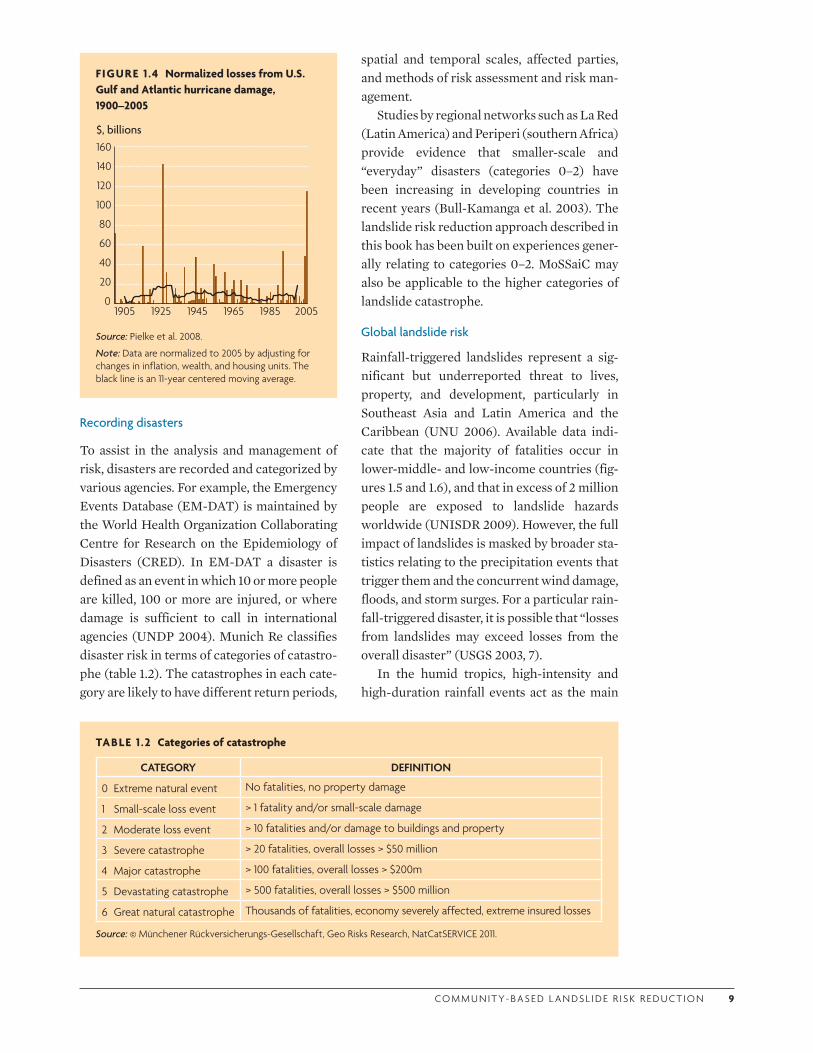
CO M M U N I T Y- BA S E D L A N DS L I D E R I S K R E D U CT I O N 9
Recording disasters
To assist in the analysis and management of risk, disasters are recorded and categorized by various agencies. For example, the Emergency Events Database (EM-DAT) is maintained by the World Health Organization Collaborating Centre for Research on the Epidemiology of Disasters (CRED). In EM-DAT a disaster is defined as an event in which 10 or more people are killed, 100 or more are injured, or where damage is sufficient to call in international agencies (UNDP 2004). Munich Re classifies disaster risk in terms of categories of catastro-phe (table 1.2). The catastrophes in each cate-gory are likely to have different return periods,
spatial and temporal scales, affected parties, and methods of risk assessment and risk man-agement.
Studies by regional networks such as La Red (Latin America) and Periperi (southern Africa) provide evidence that smaller-scale and “everyday” disasters (categories 0–2) have been increasing in developing countries in recent years (Bull-Kamanga et al. 2003). The landslide risk reduction approach described in this book has been built on experiences gener-ally relating to categories 0–2. MoSSaiC may also be applicable to the higher categories of landslide catastrophe.
Global landslide risk
Rainfall-triggered landslides represent a sig-nificant but underreported threat to lives, property, and development, particularly in Southeast Asia and Latin America and the Caribbean (UNU 2006). Available data indi-cate that the majority of fatalities occur in lower-middle- and low-income countries (fig-ures 1.5 and 1.6), and that in excess of 2 million people are exposed to landslide hazards worldwide (UNISDR 2009). However, the full impact of landslides is masked by broader sta-tistics relating to the precipitation events that trigger them and the concurrent wind damage, floods, and storm surges. For a particular rain-fall-triggered disaster, it is possible that “losses from landslides may exceed losses from the overall disaster” (USGS 2003, 7).
In the humid tropics, high-intensity and high-duration rainfall events act as the main
FIGURE 1 .4 Normalized losses from U.S. Gulf and Atlantic hurricane damage, 1900–2005
$, billions
0
20
40
60
80
100
120
140
160
1905 1925 1945 1965 1985 2005
Source: Pielke et al. 2008.
Note: Data are normalized to 2005 by adjusting for changes in inflation, wealth, and housing units. The black line is an 11-year centered moving average.
TABLE 1 .2 Categories of catastrophe
CATEGORY DEFINITION
0 Extreme natural event No fatalities, no property damage
1 Small-scale loss event > 1 fatality and/or small-scale damage
2 Moderate loss event > 10 fatalities and/or damage to buildings and property
3 Severe catastrophe > 20 fatalities, overall losses > $50 million
4 Major catastrophe > 100 fatalities, overall losses > $200m
5 Devastating catastrophe > 500 fatalities, overall losses > $500 million
6 Great natural catastrophe Thousands of fatalities, economy severely affected, extreme insured losses
Source: © Münchener Rückversicherungs-Gesellschaft, Geo Risks Research, NatCatSERVICE 2011.
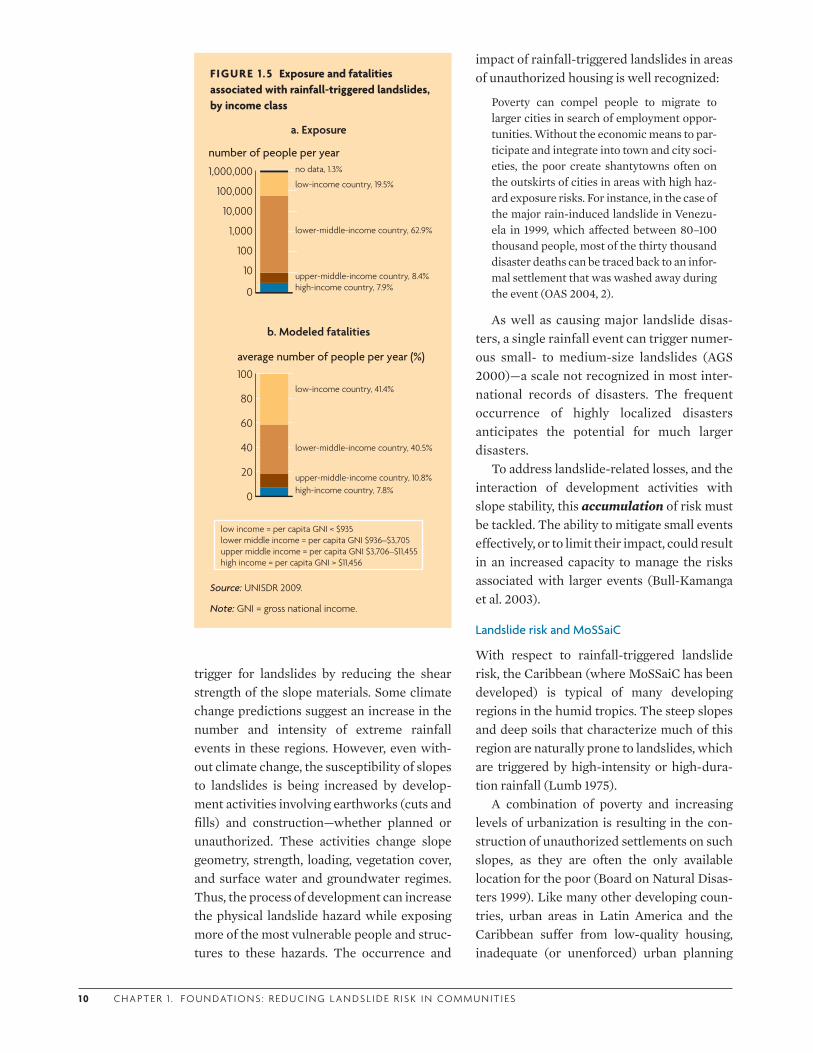
1 0 C H A P T E R 1 . F O U N DAT I O N S : R E D U C I N G L A N DS L I D E R I S K I N CO M M U N I T I ES
trigger for landslides by reducing the shear strength of the slope materials. Some climate change predictions suggest an increase in the number and intensity of extreme rainfall events in these regions. However, even with-out climate change, the susceptibility of slopes to landslides is being increased by develop-ment activities involving earthworks (cuts and fills) and construction—whether planned or unauthorized. These activities change slope geometry, strength, loading, vegetation cover, and surface water and groundwater regimes. Thus, the process of development can increase the physical landslide hazard while exposing more of the most vulnerable people and struc-tures to these hazards. The occurrence and
impact of rainfall-triggered landslides in areas of unauthorized housing is well recognized:
Poverty can compel people to migrate to larger cities in search of employment oppor-tunities. Without the economic means to par-ticipate and integrate into town and city soci-eties, the poor create shantytowns often on the outskirts of cities in areas with high haz-ard exposure risks. For instance, in the case of the major rain-induced landslide in Venezu-ela in 1999, which affected between 80–100 thousand people, most of the thirty thousand disaster deaths can be traced back to an infor-mal settlement that was washed away during the event (OAS 2004, 2).
As well as causing major landslide disas-ters, a single rainfall event can trigger numer-ous small- to medium-size landslides (AGS 2000)—a scale not recognized in most inter-national records of disasters. The frequent occurrence of highly localized disasters anticipates the potential for much larger disasters.
To address landslide-related losses, and the interaction of development activities with slope stability, this accumulation of risk must be tackled. The ability to mitigate small events effectively, or to limit their impact, could result in an increased capacity to manage the risks associated with larger events (Bull-Kamanga et al. 2003).
Landslide risk and MoSSaiC
With respect to rainfall-triggered landslide risk, the Caribbean (where MoSSaiC has been developed) is typical of many developing regions in the humid tropics. The steep slopes and deep soils that characterize much of this region are naturally prone to landslides, which are triggered by high-intensity or high-dura-tion rainfall (Lumb 1975).
A combination of poverty and increasing levels of urbanization is resulting in the con-struction of unauthorized settlements on such slopes, as they are often the only available location for the poor (Board on Natural Disas-ters 1999). Like many other developing coun-tries, urban areas in Latin America and the Caribbean suffer from low-quality housing, inadequate (or unenforced) urban planning
FIGURE 1 .5 Exposure and fatalities associated with rainfall-triggered landslides, by income class
a. Exposure
b. Modeled fatalities
low-income country, 41.4%
lower-middle-income country, 40.5%
upper-middle-income country, 10.8%high-income country, 7.8%
20
40
60
80
100
0
average number of people per year (%)
no data, 1.3%
low-income country, 19.5%
lower-middle-income country, 62.9%
upper-middle-income country, 8.4%high-income country, 7.9%0
10
100
1,000
10,000
100,000
1,000,000
number of people per year
low income = per capita GNI < $935lower middle income = per capita GNI $936–$3,705upper middle income = per capita GNI $3,706–$11,455high income = per capita GNI > $11,456
Source: UNISDR 2009.
Note: GNI = gross national income.
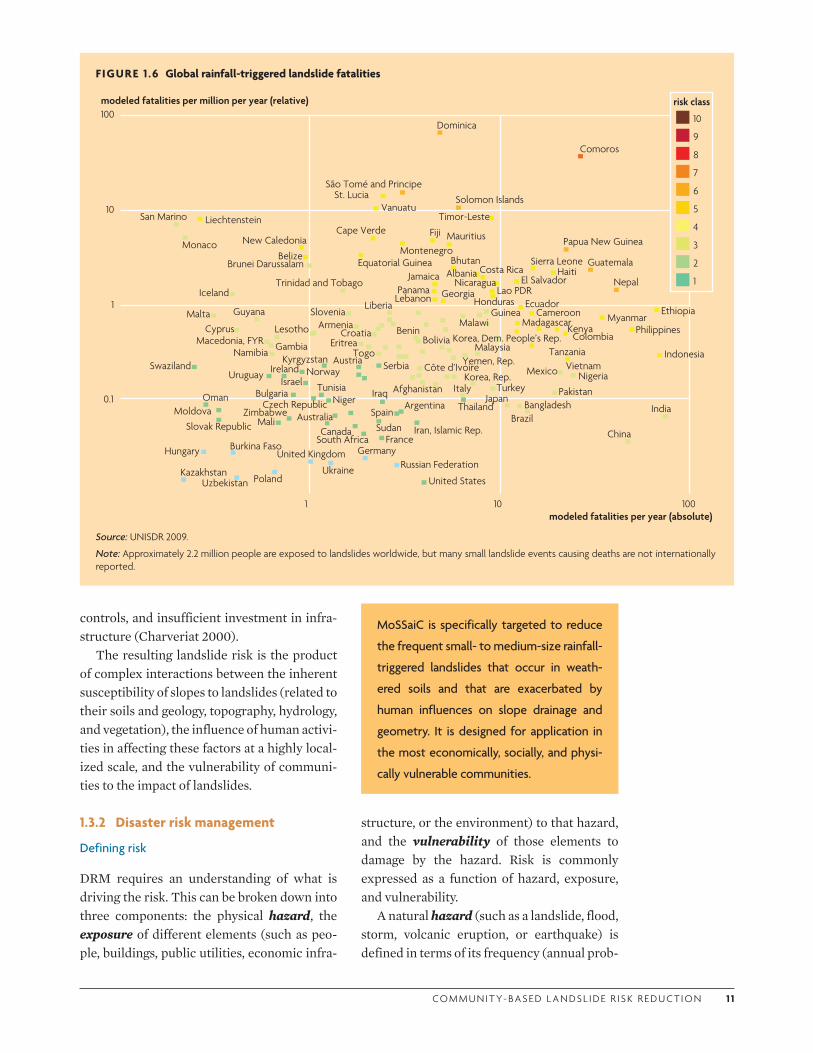
CO M M U N I T Y- BA S E D L A N DS L I D E R I S K R E D U CT I O N 1 1
F IGURE 1 .6 Global rainfall-triggered landslide fatalities
modeled fatalities per million per year (relative)
modeled fatalities per year (absolute)
0.1
1
10
100
101 100
risk class
9
10
8
7
6
4
5
3
2
1
Comoros
São Tomé and PrincipeSolomon Islands
Papua New Guinea
Guatemala
Nepal
Dominica
Liechtenstein
New CaledoniaBelize
Equatorial Guinea
Cape Verde
PanamaLebanon
Jamaica
Georgia
BhutanAlbania Costa Rica
Lao PDRHonduras
Nicaragua
Korea, Dem. People’s Rep.Madagascar
Ecuador
Tanzania
Cameroon
KenyaColombia
Vietnam
VanuatuSt. Lucia
Montenegro
Fiji Mauritius
Timor-Leste
El Salvador
Sierra LeoneHaiti
MyanmarPhilippines
Ethiopia
Indonesia
MaltaCyprus
Guyana
GambiaNamibiaMacedonia, FYR
Lesotho
SloveniaArmenia
EritreaTogo
Croatia
Liberia
Côte d’Ivoire
Afghanistan ItalyKorea, Rep.
TurkeyJapan
BangladeshBrazil
San Marino
Monaco
Iceland
Brunei Darussalam
Trinidad and Tobago
BeninBolivia
Yemen, Rep.Malaysia
GuineaMalawi
Pakistan
Mexico Nigeria
China
India
Swaziland
OmanMoldova
Slovak Republic MaliZimbabwe
Niger
AustraliaCanada
South AfricaSudan
Spain
France
Iraq
United States
Uruguay Ireland
Bulgaria
NorwayIsrael
Czech Republic
Tunisia
Kyrgyzstan Austria Serbia
Argentina
Iran, Islamic Rep.
Thailand
Kazakhstan
Hungary Burkina Faso
Uzbekistan PolandUkraine
United Kingdom GermanyRussian Federation
Source: UNISDR 2009.
Note: Approximately 2.2 million people are exposed to landslides worldwide, but many small landslide events causing deaths are not internationally reported.
controls, and insufficient investment in infra-structure (Charveriat 2000).
The resulting landslide risk is the product of complex interactions between the inherent susceptibility of slopes to landslides (related to their soils and geology, topography, hydrology, and vegetation), the influence of human activi-ties in affecting these factors at a highly local-ized scale, and the vulnerability of communi-ties to the impact of landslides.
1.3.2 Disaster risk management
Defining risk
DRM requires an understanding of what is driving the risk. This can be broken down into three components: the physical hazard, the exposure of different elements (such as peo-ple, buildings, public utilities, economic infra-
structure, or the environment) to that hazard, and the vulnerability of those elements to damage by the hazard. Risk is commonly expressed as a function of hazard, exposure, and vulnerability.
A natural hazard (such as a landslide, flood, storm, volcanic eruption, or earthquake) is defined in terms of its frequency (annual prob-
MoSSaiC is specifically targeted to reduce
the frequent small- to medium-size rainfall-
triggered landslides that occur in weath-
ered soils and that are exacerbated by
human influences on slope drainage and
geometry. It is designed for application in
the most economically, socially, and physi-
cally vulnerable communities.
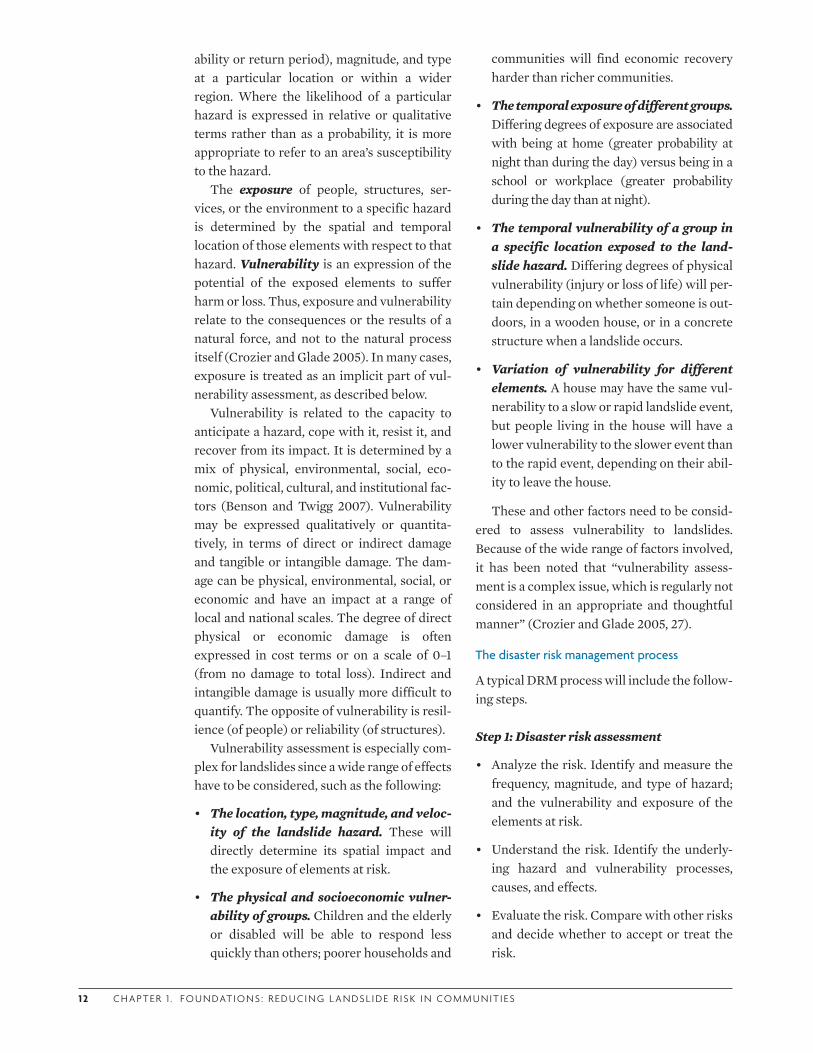
1 2 C H A P T E R 1 . F O U N DAT I O N S : R E D U C I N G L A N DS L I D E R I S K I N CO M M U N I T I ES
ability or return period), magnitude, and type at a particular location or within a wider region. Where the likelihood of a particular hazard is expressed in relative or qualitative terms rather than as a probability, it is more appropriate to refer to an area’s susceptibility to the hazard.
The exposure of people, structures, ser-vices, or the environment to a specific hazard is determined by the spatial and temporal location of those elements with respect to that hazard. Vulnerability is an expression of the potential of the exposed elements to suffer harm or loss. Thus, exposure and vulnerability relate to the consequences or the results of a natural force, and not to the natural process itself (Crozier and Glade 2005). In many cases, exposure is treated as an implicit part of vul-nerability assessment, as described below.
Vulnerability is related to the capacity to anticipate a hazard, cope with it, resist it, and recover from its impact. It is determined by a mix of physical, environmental, social, eco-nomic, political, cultural, and institutional fac-tors (Benson and Twigg 2007). Vulnerability may be expressed qualitatively or quantita-tively, in terms of direct or indirect damage and tangible or intangible damage. The dam-age can be physical, environmental, social, or economic and have an impact at a range of local and national scales. The degree of direct physical or economic damage is often expressed in cost terms or on a scale of 0–1 (from no damage to total loss). Indirect and intangible damage is usually more difficult to quantify. The opposite of vulnerability is resil-ience (of people) or reliability (of structures).
Vulnerability assessment is especially com-plex for landslides since a wide range of effects have to be considered, such as the following:
• The location, type, magnitude, and veloc-ity of the landslide hazard . These will directly determine its spatial impact and the exposure of elements at risk.
• The physical and socioeconomic vulner-ability of groups. Children and the elderly or disabled will be able to respond less quickly than others; poorer households and
communities will find economic recovery harder than richer communities.
• The temporal exposure of different groups. Differing degrees of exposure are associated with being at home (greater probability at night than during the day) versus being in a school or workplace (greater probability during the day than at night).
• The temporal vulnerability of a group in a specific location exposed to the land-slide hazard. Differing degrees of physical vulnerability (injury or loss of life) will per-tain depending on whether someone is out-doors, in a wooden house, or in a concrete structure when a landslide occurs.
• Variation of vulnerability for different elements. A house may have the same vul-nerability to a slow or rapid landslide event, but people living in the house will have a lower vulnerability to the slower event than to the rapid event, depending on their abil-ity to leave the house.
These and other factors need to be consid-ered to assess vulnerability to landslides. Because of the wide range of factors involved, it has been noted that “vulnerability assess-ment is a complex issue, which is regularly not considered in an appropriate and thoughtful manner” (Crozier and Glade 2005, 27).
The disaster risk management process
A typical DRM process will include the follow-ing steps.
Step 1: Disaster risk assessment
• Analyze the risk. Identify and measure the frequency, magnitude, and type of hazard; and the vulnerability and exposure of the elements at risk.
• Understand the risk. Identify the underly-ing hazard and vulnerability processes, causes, and effects.
• Evaluate the risk. Compare with other risks and decide whether to accept or treat the risk.
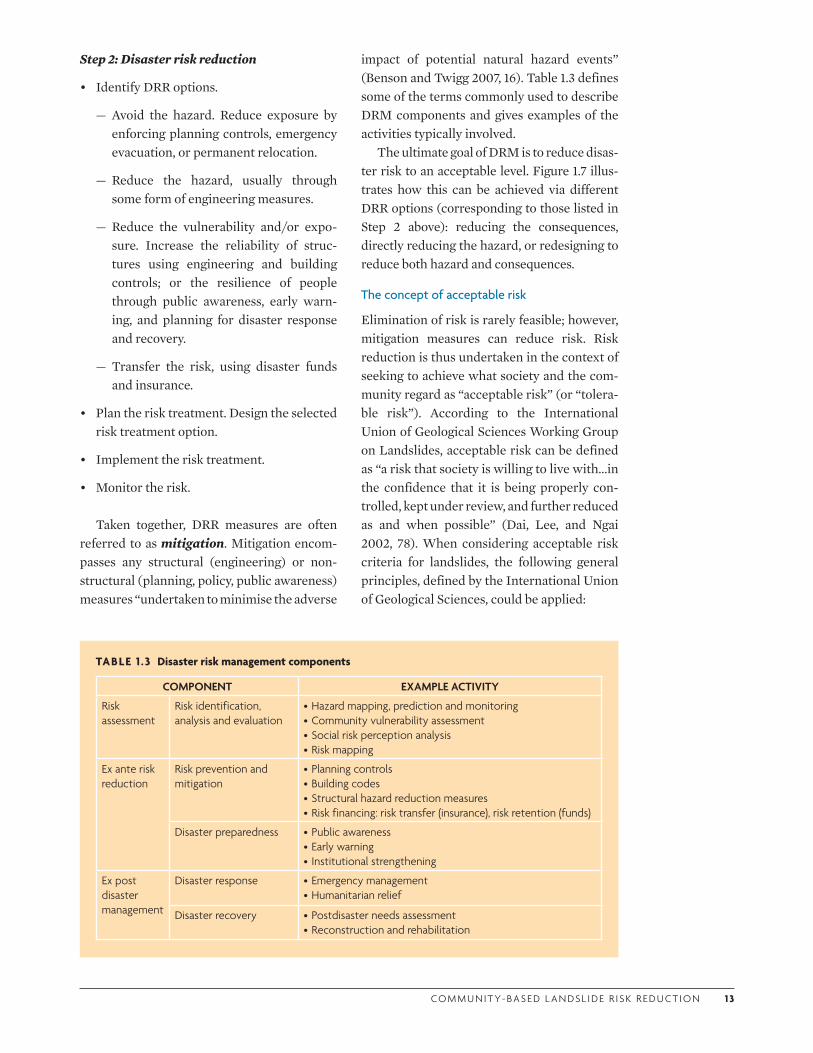
CO M M U N I T Y- BA S E D L A N DS L I D E R I S K R E D U CT I O N 1 3
Step 2: Disaster risk reduction
• Identify DRR options.
— Avoid the hazard. Reduce exposure by enforcing planning controls, emergency evacuation, or permanent relocation.
— Reduce the hazard, usually through some form of engineering measures.
— Reduce the vulnerability and/or expo-sure. Increase the reliability of struc-tures using engineering and building controls; or the resilience of people through public awareness, early warn-ing, and planning for disaster response and recovery.
— Transfer the risk, using disaster funds and insurance.
• Plan the risk treatment. Design the selected risk treatment option.
• Implement the risk treatment.
• Monitor the risk.
Taken together, DRR measures are often referred to as mitigation. Mitigation encom-passes any structural (engineering) or non-structural (planning, policy, public awareness) measures “undertaken to minimise the adverse
impact of potential natural hazard events” (Benson and Twigg 2007, 16). Table 1.3 defines some of the terms commonly used to describe DRM components and gives examples of the activities typically involved.
The ultimate goal of DRM is to reduce disas-ter risk to an acceptable level. Figure 1.7 illus-trates how this can be achieved via different DRR options (corresponding to those listed in Step 2 above): reducing the consequences, directly reducing the hazard, or redesigning to reduce both hazard and consequences.
The concept of acceptable risk
Elimination of risk is rarely feasible; however, mitigation measures can reduce risk. Risk reduction is thus undertaken in the context of seeking to achieve what society and the com-munity regard as “acceptable risk” (or “tolera-ble risk”). According to the International Union of Geological Sciences Working Group on Landslides, acceptable risk can be defined as “a risk that society is willing to live with…in the confidence that it is being properly con-trolled, kept under review, and further reduced as and when possible” (Dai, Lee, and Ngai 2002, 78). When considering acceptable risk criteria for landslides, the following general principles, defined by the International Union of Geological Sciences, could be applied:
TABLE 1 .3 Disaster risk management components
COMPONENT EXAMPLE ACTIVITY
Risk assessment
Risk identification, analysis and evaluation
•Hazard mapping, prediction and monitoring•Community vulnerability assessment •Social risk perception analysis •Risk mapping
Ex ante risk reduction
Risk prevention and mitigation
•Planning controls•Building codes •Structural hazard reduction measures•Risk financing: risk transfer (insurance), risk retention (funds)
Disaster preparedness •Public awareness•Early warning• Institutional strengthening
Ex post disaster management
Disaster response •Emergency management•Humanitarian relief
Disaster recovery •Postdisaster needs assessment•Reconstruction and rehabilitation
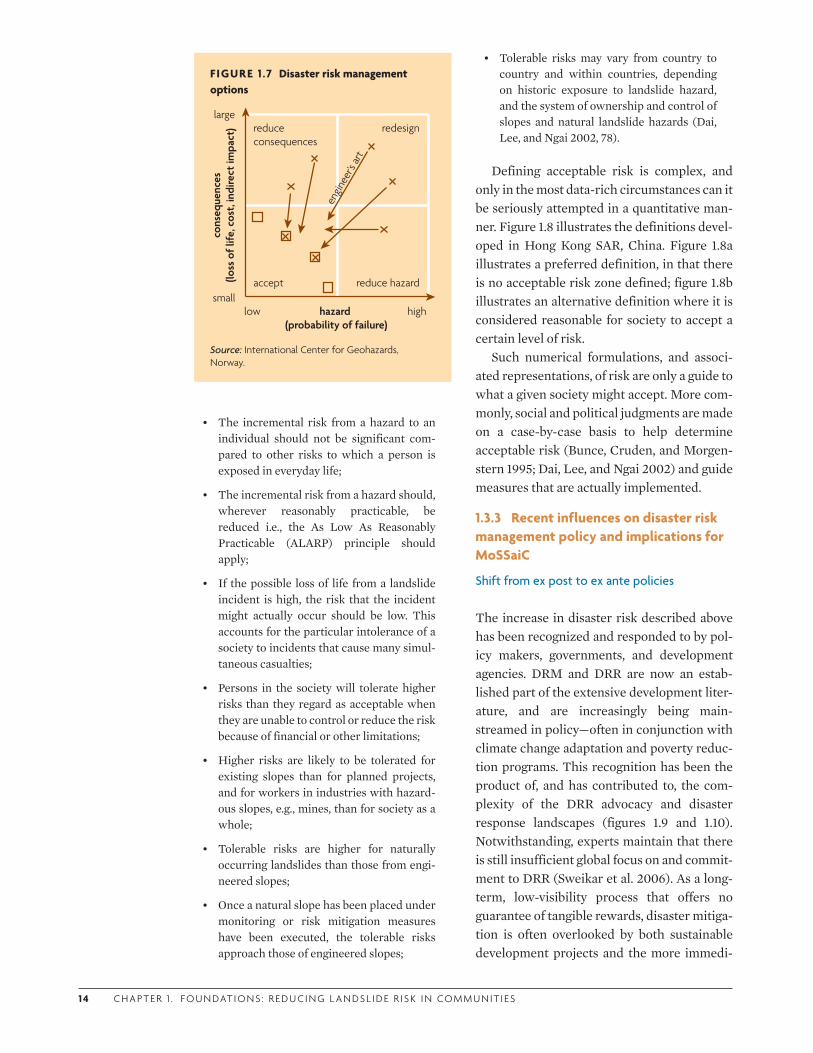
1 4 C H A P T E R 1 . F O U N DAT I O N S : R E D U C I N G L A N DS L I D E R I S K I N CO M M U N I T I ES
• The incremental risk from a hazard to an individual should not be significant com-pared to other risks to which a person is exposed in everyday life;
• The incremental risk from a hazard should, wherever reasonably practicable, be reduced i.e., the As Low As Reasonably Practicable (ALARP) principle should apply;
• If the possible loss of life from a landslide incident is high, the risk that the incident might actually occur should be low. This accounts for the particular intolerance of a society to incidents that cause many simul-taneous casualties;
• Persons in the society will tolerate higher risks than they regard as acceptable when they are unable to control or reduce the risk because of financial or other limitations;
• Higher risks are likely to be tolerated for existing slopes than for planned projects, and for workers in industries with hazard-ous slopes, e.g., mines, than for society as a whole;
• Tolerable risks are higher for naturally occurring landslides than those from engi-neered slopes;
• Once a natural slope has been placed under monitoring or risk mitigation measures have been executed, the tolerable risks approach those of engineered slopes;
• Tolerable risks may vary from country to country and within countries, depending on historic exposure to landslide hazard, and the system of ownership and control of slopes and natural landslide hazards (Dai, Lee, and Ngai 2002, 78).
Defining acceptable risk is complex, and only in the most data-rich circumstances can it be seriously attempted in a quantitative man-ner. Figure 1.8 illustrates the definitions devel-oped in Hong Kong SAR, China. Figure 1.8a illustrates a preferred definition, in that there is no acceptable risk zone defined; figure 1.8b illustrates an alternative definition where it is considered reasonable for society to accept a certain level of risk.
Such numerical formulations, and associ-ated representations, of risk are only a guide to what a given society might accept. More com-monly, social and political judgments are made on a case-by-case basis to help determine acceptable risk (Bunce, Cruden, and Morgen-stern 1995; Dai, Lee, and Ngai 2002) and guide measures that are actually implemented.
1.3.3 Recent influences on disaster risk management policy and implications for MoSSaiC
Shift from ex post to ex ante policies
The increase in disaster risk described above has been recognized and responded to by pol-icy makers, governments, and development agencies. DRM and DRR are now an estab-lished part of the extensive development liter-ature, and are increasingly being main-streamed in policy—often in conjunction with climate change adaptation and poverty reduc-tion programs. This recognition has been the product of, and has contributed to, the com-plexity of the DRR advocacy and disaster response landscapes (figures 1.9 and 1.10). Notwithstanding, experts maintain that there is still insufficient global focus on and commit-ment to DRR (Sweikar et al. 2006). As a long-term, low-visibility process that offers no guarantee of tangible rewards, disaster mitiga-tion is often overlooked by both sustainable development projects and the more immedi-
FIGURE 1 .7 Disaster risk management options
accept
reduce consequences
reduce hazard
redesign
engin
eer’s
art
cons
eque
nces
(loss
of l
ife, c
ost,
indi
rect
impa
ct)
hazard (probability of failure)
low highsmall
large
Source: International Center for Geohazards, Norway.
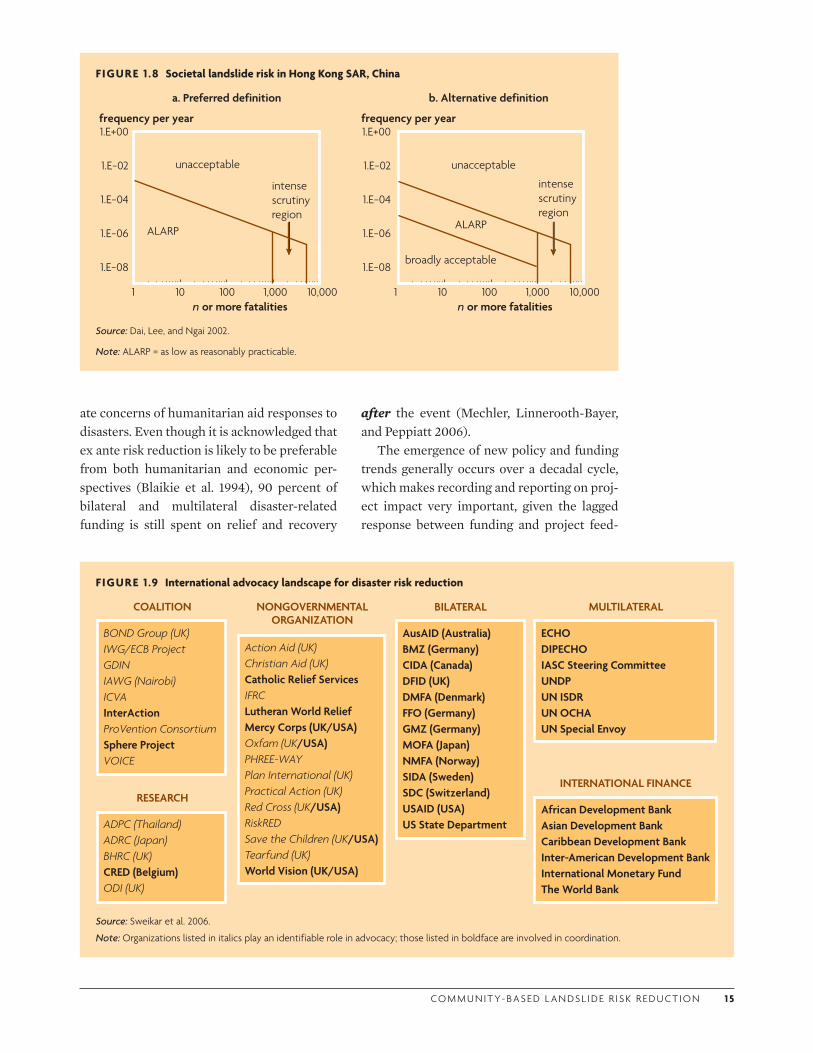
CO M M U N I T Y- BA S E D L A N DS L I D E R I S K R E D U CT I O N 1 5
ate concerns of humanitarian aid responses to disasters. Even though it is acknowledged that ex ante risk reduction is likely to be preferable from both humanitarian and economic per-spectives (Blaikie et al. 1994), 90 percent of bilateral and multilateral disaster-related funding is still spent on relief and recovery
after the event (Mechler, Linnerooth-Bayer, and Peppiatt 2006).
The emergence of new policy and funding trends generally occurs over a decadal cycle, which makes recording and reporting on proj-ect impact very important, given the lagged response between funding and project feed-
FIGURE 1 .8 Societal landslide risk in Hong Kong SAR, China
1.E+00
1.E−02
1.E−04
1.E−06
1.E−08
1 10 100 1,000 10,000n or more fatalities
frequency per year1.E+00
1.E−02
1.E−04
1.E−06
1.E−08
1 10 100 1,000 10,000n or more fatalities
frequency per year
a. Preferred definition b. Alternative definition
ALARP
unacceptable
intense scrutinyregion
broadly acceptable
ALARP
unacceptable
intense scrutiny region
Source: Dai, Lee, and Ngai 2002.
Note: ALARP = as low as reasonably practicable.
FIGURE 1 .9 International advocacy landscape for disaster risk reduction
BILATERAL
AusAID (Australia)BMZ (Germany)CIDA (Canada)DFID (UK)DMFA (Denmark)FFO (Germany)GMZ (Germany)MOFA (Japan)NMFA (Norway)SIDA (Sweden)SDC (Switzerland)USAID (USA)US State Department
MULTILATERAL
ECHODIPECHOIASC Steering CommitteeUNDPUN ISDRUN OCHAUN Special Envoy
INTERNATIONAL FINANCE
African Development BankAsian Development BankCaribbean Development BankInter-American Development BankInternational Monetary FundThe World Bank
RESEARCH
ADPC (Thailand)ADRC (Japan)BHRC (UK)CRED (Belgium)ODI (UK)
COALITION
BOND Group (UK)IWG/ECB ProjectGDINIAWG (Nairobi)ICVAInterActionProVention ConsortiumSphere ProjectVOICE
NONGOVERNMENTAL ORGANIZATION
Action Aid (UK)Christian Aid (UK)Catholic Relief ServicesIFRCLutheran World ReliefMercy Corps (UK/USA)Oxfam (UK/USA)PHREE-WAYPlan International (UK)Practical Action (UK)Red Cross (UK/USA)RiskREDSave the Children (UK/USA)Tearfund (UK)World Vision (UK/USA)
Source: Sweikar et al. 2006.
Note: Organizations listed in italics play an identifiable role in advocacy; those listed in boldface are involved in coordination.
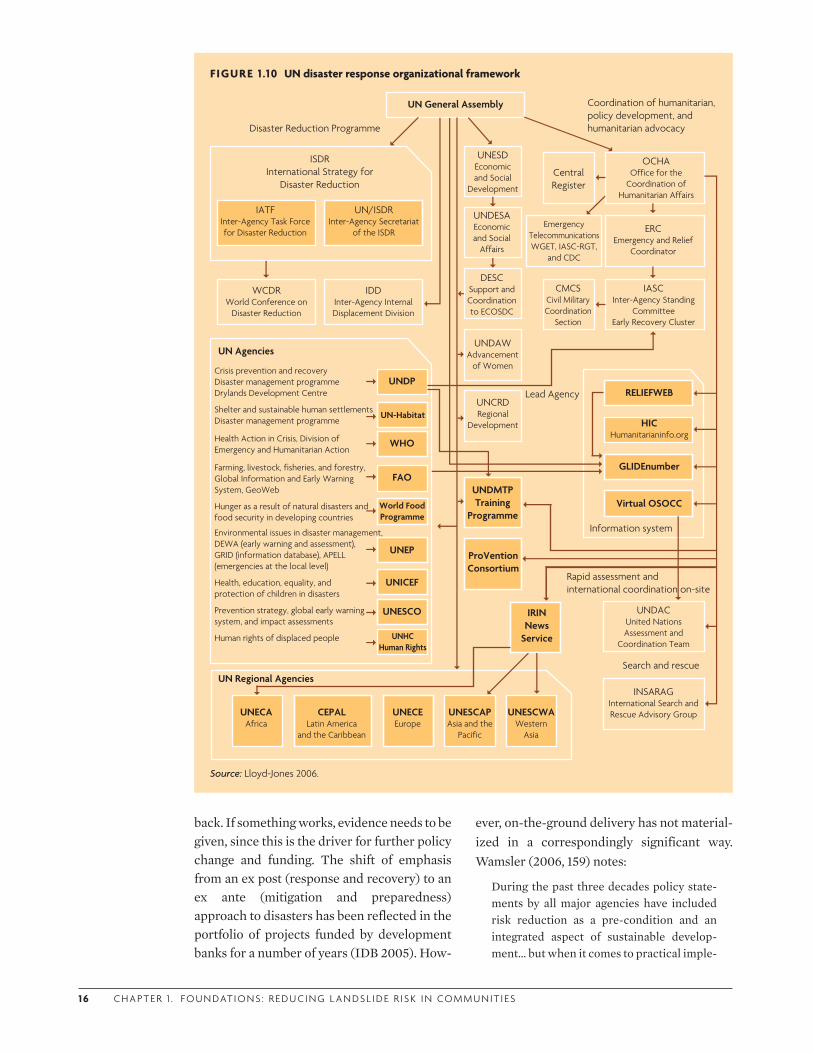
1 6 C H A P T E R 1 . F O U N DAT I O N S : R E D U C I N G L A N DS L I D E R I S K I N CO M M U N I T I ES
FIGURE 1 .10 UN disaster response organizational framework
UN General Assembly Coordination of humanitarian,policy development, andhumanitarian advocacyDisaster Reduction Programme
Rapid assessment andinternational coordination on-site
Search and rescue
Lead Agency
Information system
ISDRInternational Strategy for
Disaster Reduction
UN/ISDRInter-Agency Secretariat
of the ISDR
IATFInter-Agency Task Forcefor Disaster Reduction
Crisis prevention and recoveryDisaster management programmeDrylands Development Centre
Shelter and sustainable human settlementsDisaster management programme
Health Action in Crisis, Division ofEmergency and Humanitarian Action
Farming, livestock, fisheries, and forestry, Global Information and Early WarningSystem, GeoWeb
Hunger as a result of natural disasters andfood security in developing countries
Environmental issues in disaster management,DEWA (early warning and assessment),GRID (information database), APELL(emergencies at the local level)
Health, education, equality, andprotection of children in disasters
Prevention strategy, global early warningsystem, and impact assessments
Human rights of displaced people
UNDP
UN-Habitat
WHO
FAO
World FoodProgramme
UNEP
UNICEF
UNESCO
CentralRegister
UNDMTPTraining
Programme
UNESCWAWestern
Asia
UNESCAPAsia and the
Pacific
UNECEEurope
CEPALLatin America
and the Caribbean
UNECAAfrica
RELIEFWEB
GLIDEnumber
Virtual OSOCC
UNHCHuman Rights
WCDRWorld Conference on
Disaster Reduction
IDDInter-Agency InternalDisplacement Division
UN Regional Agencies
UN Agencies
ProVentionConsortium
IRINNews
Service
UNCRDRegional
Development
UNDAWAdvancement
of Women
DESCSupport andCoordinationto ECOSDC
UNDESAEconomicand Social
Affairs
UNESDEconomicand Social
Development
OCHAOffice for the
Coordination ofHumanitarian Affairs
ERCEmergency and Relief
Coordinator
CMCSCivil MilitaryCoordination
Section
IASCInter-Agency Standing
CommitteeEarly Recovery Cluster
HICHumanitarianinfo.org
UNDACUnited NationsAssessment and
Coordination Team
INSARAGInternational Search andRescue Advisory Group
EmergencyTelecommunicationsWGET, IASC-RGT,
and CDC
Source: Lloyd-Jones 2006.
back. If something works, evidence needs to be given, since this is the driver for further policy change and funding. The shift of emphasis from an ex post (response and recovery) to an ex ante (mitigation and preparedness) approach to disasters has been reflected in the portfolio of projects funded by development banks for a number of years (IDB 2005). How-
ever, on-the-ground delivery has not material-ized in a correspondingly significant way. Wamsler (2006, 159) notes:
During the past three decades policy state-ments by all major agencies have included risk reduction as a pre-condition and an integrated aspect of sustainable develop-ment… but when it comes to practical imple-
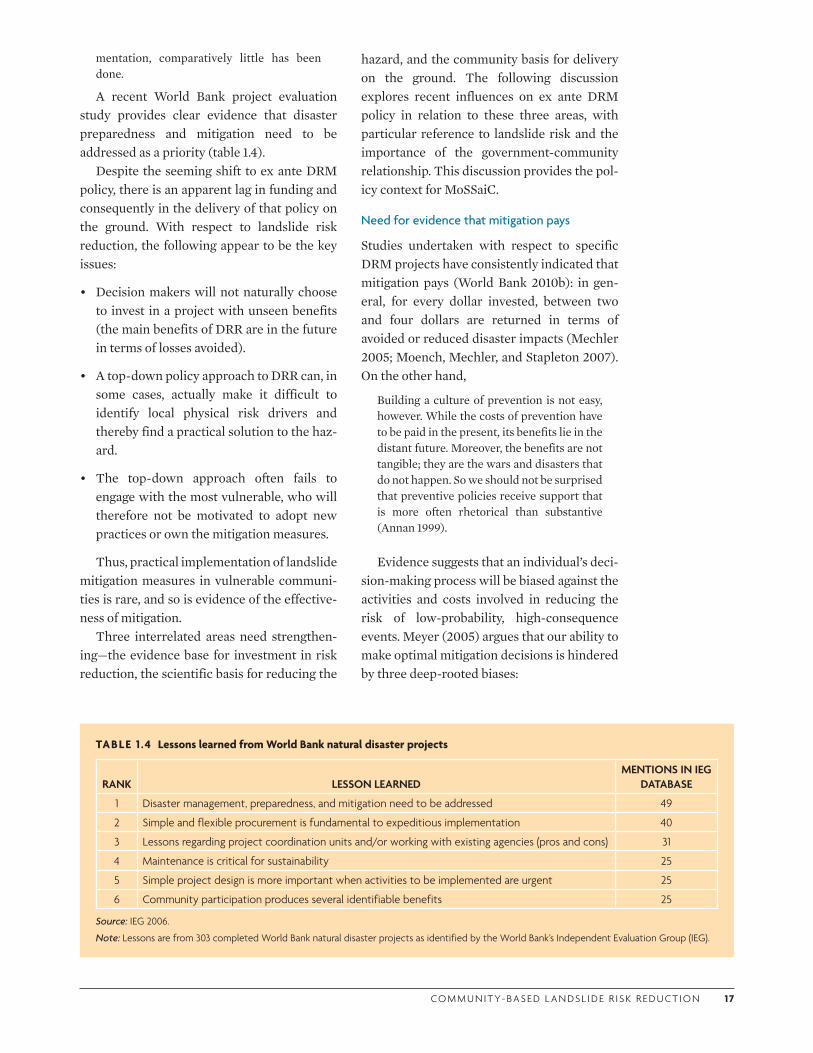
CO M M U N I T Y- BA S E D L A N DS L I D E R I S K R E D U CT I O N 1 7
mentation, comparatively little has been done.
A recent World Bank project evaluation study provides clear evidence that disaster preparedness and mitigation need to be addressed as a priority (table 1.4).
Despite the seeming shift to ex ante DRM policy, there is an apparent lag in funding and consequently in the delivery of that policy on the ground. With respect to landslide risk reduction, the following appear to be the key issues:
• Decision makers will not naturally choose to invest in a project with unseen benefits (the main benefits of DRR are in the future in terms of losses avoided).
• A top-down policy approach to DRR can, in some cases, actually make it difficult to identify local physical risk drivers and thereby find a practical solution to the haz-ard.
• The top-down approach often fails to engage with the most vulnerable, who will therefore not be motivated to adopt new practices or own the mitigation measures.
Thus, practical implementation of landslide mitigation measures in vulnerable communi-ties is rare, and so is evidence of the effective-ness of mitigation.
Three interrelated areas need strengthen-ing—the evidence base for investment in risk reduction, the scientific basis for reducing the
hazard, and the community basis for delivery on the ground. The following discussion explores recent influences on ex ante DRM policy in relation to these three areas, with particular reference to landslide risk and the importance of the government-community relationship. This discussion provides the pol-icy context for MoSSaiC.
Need for evidence that mitigation pays
Studies undertaken with respect to specific DRM projects have consistently indicated that mitigation pays (World Bank 2010b): in gen-eral, for every dollar invested, between two and four dollars are returned in terms of avoided or reduced disaster impacts (Mechler 2005; Moench, Mechler, and Stapleton 2007). On the other hand,
Building a culture of prevention is not easy, however. While the costs of prevention have to be paid in the present, its benefits lie in the distant future. Moreover, the benefits are not tangible; they are the wars and disasters that do not happen. So we should not be surprised that preventive policies receive support that is more often rhetorical than substantive (Annan 1999).
Evidence suggests that an individual’s deci-sion-making process will be biased against the activities and costs involved in reducing the risk of low-probability, high-consequence events. Meyer (2005) argues that our ability to make optimal mitigation decisions is hindered by three deep-rooted biases:
TABLE 1 .4 Lessons learned from World Bank natural disaster projects
RANK LESSON LEARNED MENTIONS IN IEG
DATABASE
1 Disaster management, preparedness, and mitigation need to be addressed 49
2 Simple and flexible procurement is fundamental to expeditious implementation 40
3 Lessons regarding project coordination units and/or working with existing agencies (pros and cons) 31
4 Maintenance is critical for sustainability 25
5 Simple project design is more important when activities to be implemented are urgent 25
6 Community participation produces several identifiable benefits 25
Source: IEG 2006.
Note: Lessons are from 303 completed World Bank natural disaster projects as identified by the World Bank’s Independent Evaluation Group (IEG).

1 8 C H A P T E R 1 . F O U N DAT I O N S : R E D U C I N G L A N DS L I D E R I S K I N CO M M U N I T I ES
FIGURE 1 .1 1 Benefit-cost ratio for hurricane-proofing prevention measures for houses in Canaries and Patience, St. Lucia
0 2 4 6 8 10 12 140
1
2
3
4
5
discount rate (%)
benefit-cost ratio
1 year
25 years
10 years5 years
Source: Hochrainer-Stigler et al. 2010.
• How we learn from the past—We tend to learn by focusing on short-term feedback.
• How we see the future—We tend to see the future as a simple extension of the present rather than anticipating low-probability events such as disasters.
• How we make the trade-off between imme-diate capital investment in risk reduction compared with future savings in avoided losses—We tend to overly discount the value of ambiguous future rewards com-pared to short-term costs.
Taken together, Meyer argues, these limita-tions seem to explain many of the biases that have been observed in real-world DRM deci-sions—and, most critically, why we seem to have such difficulty correcting them. To over-come these biases, it is even more urgent that physical evidence be provided for the effective-ness of DRR—not just on the basis of economic investment, but also in terms of the social and indirect benefits to those most at risk.
An example showing that mitigation pays is provided by a series of studies conducted by the Wharton School of the University of Penn-sylvania. These studies used catastrophe risk models to enable cost-benefit assessments to be made of mitigation measures. The four basic components of a catastrophe model—hazard, inventory, vulnerability, and loss—enable risk to be quantified in terms of cost (Wharton School 2008). In the case of a hur-ricane, the four components can be defined as follows:
• Hazard, quantified by the frequency, mag-nitude, and path of the hurricane
• Inventory, the list (or portfolio) of proper-ties exposed to the predicted hurricane
• Vulnerability, the susceptibility to damage of the exposed structures
• Loss, the resulting direct or indirect finan-cial loss to the property inventory
For a given hazard, catastrophe modeling allows the costs and benefits of different DRM
investments to be compared. For example, modeling the costs and benefits of preventing hurricane damage to properties (by protecting windows and doors and upgrading roofs) in two villages in St. Lucia demonstrated attrac-tive benefit-cost ratios for a wide range of potential discount rates (Hochrainer-Stigler et al. 2010) (figure 1.11).
Cost-benefit analysis uses a discount rate to compare economic effects occurring at differ-ent times. Discounting converts future eco-nomic impacts to their present-day value. The discount rate is usually positive because resources invested today can, on average, be transformed into more resources later. If hur-ricane mitigation is viewed as an investment, the return on that investment can be used to decide how much should be spent on mitiga-tion. Assuming a 25-year project lifetime and a 12 percent discount rate, the example in fig-ure 1.11 shows such an intervention yields a benefit-cost ratio of 1.5:1—in other words, it pays; but with an assumed project lifetime of only five years, cost exceeds benefit (benefit-cost ratio of 0.75:1).
The application of catastrophe modeling to wooden homes in Canaries, St. Lucia, illus-trates how the effect of climate change on the benefits of hurricane mitigation measures can be assessed (Ou-Yang 2010). Figure 1.12 shows the change in benefit-cost ratios for different mitigation measures over different time scales
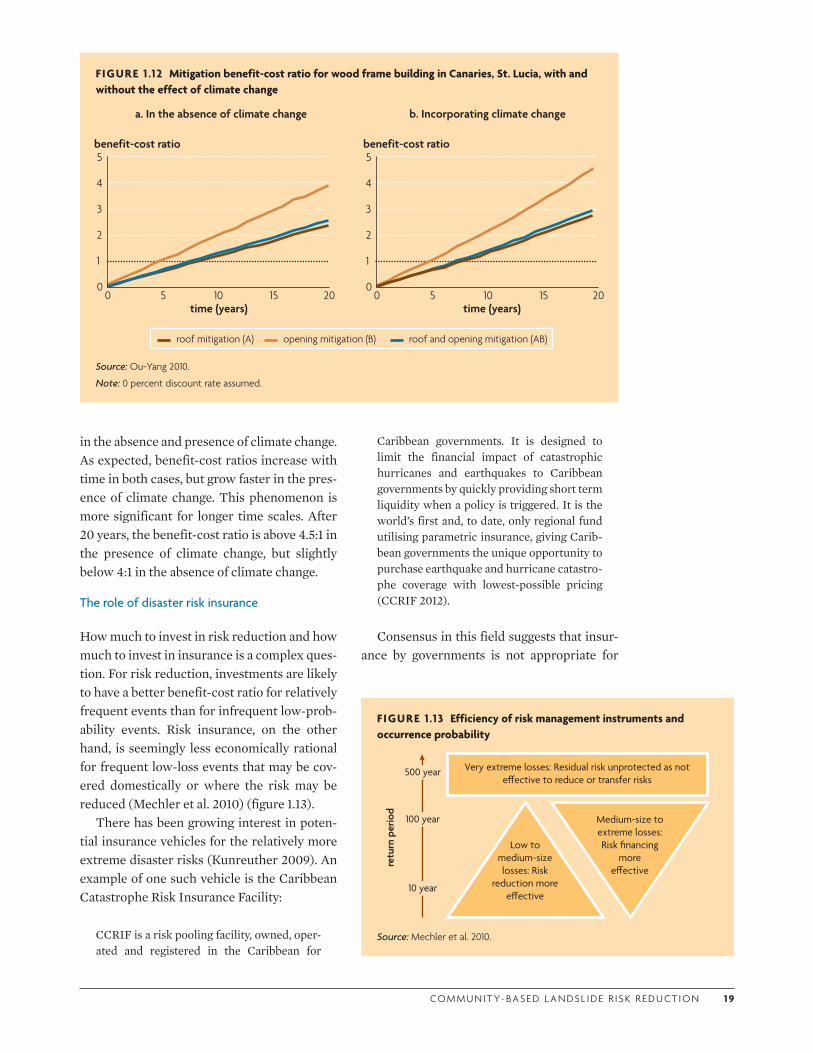
CO M M U N I T Y- BA S E D L A N DS L I D E R I S K R E D U CT I O N 1 9
in the absence and presence of climate change. As expected, benefit-cost ratios increase with time in both cases, but grow faster in the pres-ence of climate change. This phenomenon is more significant for longer time scales. After 20 years, the benefit-cost ratio is above 4.5:1 in the presence of climate change, but slightly below 4:1 in the absence of climate change.
The role of disaster risk insurance
How much to invest in risk reduction and how much to invest in insurance is a complex ques-tion. For risk reduction, investments are likely to have a better benefit-cost ratio for relatively frequent events than for infrequent low-prob-ability events. Risk insurance, on the other hand, is seemingly less economically rational for frequent low-loss events that may be cov-ered domestically or where the risk may be reduced (Mechler et al. 2010) (figure 1.13).
There has been growing interest in poten-tial insurance vehicles for the relatively more extreme disaster risks (Kunreuther 2009). An example of one such vehicle is the Caribbean Catastrophe Risk Insurance Facility:
CCRIF is a risk pooling facility, owned, oper-ated and registered in the Caribbean for
Caribbean governments. It is designed to limit the financial impact of catastrophic hurricanes and earthquakes to Caribbean governments by quickly providing short term liquidity when a policy is triggered. It is the world’s first and, to date, only regional fund utilising parametric insurance, giving Carib-bean governments the unique opportunity to purchase earthquake and hurricane catastro-phe coverage with lowest-possible pricing (CCRIF 2012).
Consensus in this field suggests that insur-ance by governments is not appropriate for
FIGURE 1 .12 Mitigation benefit-cost ratio for wood frame building in Canaries, St. Lucia, with and without the effect of climate change
benefit-cost ratio benefit-cost ratio
0 5 10 15 20time (years)
a. In the absence of climate change b. Incorporating climate change
0 5 10 15 20time (years)
roof mitigation (A) opening mitigation (B) roof and opening mitigation (AB)
0
1
2
3
4
5
0
1
2
3
4
5
Source: Ou-Yang 2010.
Note: 0 percent discount rate assumed.
FIGURE 1 .13 Efficiency of risk management instruments and occurrence probability
500 year
100 year
10 year
retu
rn p
erio
d
Source: Mechler et al. 2010.
Medium-size to extreme losses: Risk financing
more e�ective
Low to medium-size losses: Risk
reduction more e�ective
Very extreme losses: Residual risk unprotected as not e�ective to reduce or transfer risks
2 0 C H A P T E R 1 . F O U N DAT I O N S : R E D U C I N G L A N DS L I D E R I S K I N CO M M U N I T I ES
frequently occurring risks; rather, expenditure on risk reduction is relevant in such circum-stances. Since MoSSaiC seeks to reduce land-slide risk by directly addressing local urban landslide hazard drivers, it may play a role in reducing the accumulation of just such fre-quently occurring events. MoSSaiC could also potentially have attractive benefit-cost ratios in reducing the landslide hazard associated with more extreme rainfall events (Holcombe et al. 2011).
Need for science-based risk assessment
The move toward investment in ex ante DRR carries with it the need to assess and address the underlying risk drivers—hazard, exposure, and vulnerability (defined in section 1.3.2). Risk assessment provides the basis for effec-tive DRM by answering the following ques-tions and identifying what risk management options will be most effective (Ho, Leroi, and Roberds 2000; Lee and Jones 2004):
• Hazard identification. What are the likely types of hazards?
• Hazard assessment. What is causing each hazard, and what is the frequency and mag-nitude of that hazard?
• Identification of elements at risk. What are the elements exposed to each hazard?
• Vulnerability assessment. What might be the degree of damage to these elements?
• Risk quantification/estimation. What is the risk associated with each hazard?
• Risk evaluation. What is the significance of these estimated risks, and what are the options for managing them?
The United Nations (UN) has provided clear recommendations on the need for effec-tive risk assessment; these call for the underly-ing risk drivers to be addressed:
A failure to address the underlying risk driv-ers will result in dramatic increases in disas-ter risk and associated poverty outcomes. In contrast, if addressing these drivers is given priority, risk can be reduced, human
development protected and adaptation to cli-mate change facilitated. Rather than a cost, this should be seen as an investment in build-ing a more secure, stable, sustainable and equitable future. Given the urgency posed by climate change, decisive action needs to be taken now (UN 2009, 4; emphasis added).
In the case of landslide risk, there is a need to better understand landslide hazard drivers and provide a scientific basis for landslide risk management. This means understanding the physical processes affecting slope stability (and the effect of human activities on those physical processes) and the scale at which they operate (the hillside/community scale), so that appropriate hazard reduction mea-sures can be identified and implemented. Rel-evant landslide hazard drivers and assessment methods are introduced in chapters 2, 3, and 4.
The need for the geoscience disciplines to inform an integrated approach to landslide risk reduction has been widely voiced:
While all regions experience landslide disas-ters, the harm they cause is most acute in developing countries, where the knowledge base required to identify landslide prone areas is often either nonexistent or fragmen-tary (UNU 2006).
In order to mitigate landslide hazard effec-tively, new methodologies are required to develop a better understanding of landslide hazard and make rational decisions on the allocation of funds for management of land-slide risk… this relies crucially on a better understanding and on greater sophistication, transparency and rigour in the application of science (Dai, Lee, and Ngai 2002, 65, 82).
Scientific methods for assessing landslide hazard (location, frequency, magnitude) should be combined with an assessment of the vulnerability of those communities exposed to the hazard, so that the most at-risk communi-ties are identified. The UN’s specific recom-mendations are as follows:
• Shift the emphasis of social protection from an exclusive focus on response to including pre-disaster mechanisms and more effec-tive targeting of the most vulnerable groups; [and]
CO M M U N I T Y- BA S E D L A N DS L I D E R I S K R E D U CT I O N 2 1
• Promote a culture of planning and imple-mentation of disaster risk reduction that builds on government-civil society part-nerships and cooperation and is supportive of local initiative, in order to dramatically reduce the costs of risk reduction, ensure local acceptance, and build social capital (UN 2009, 5; emphasis added).
Commentaries by Maskrey (1989), Pelling and High (2005), and Twigg (2001) all bear on the community potential in this context. Social funds are perhaps one example of the formal-ization of this type of government–civil society partnership, in that such agencies might be well placed to contribute to MoSSaiC land-slide risk reduction implementation projects.
Need to complement national risk maps with local studies
In the context of international and national DRM policies, a natural first step is to attempt to carry out a disaster risk assessment at a regional or national scale. This often involves using geographic information system (GIS) software to generate maps delineating broad zones of hazard, vulnerability, and risk. The accuracy and spatial resolution of risk maps are determined by the quality and resolution of the underlying layers of data—multiple digital maps of the different variables that affect hazard, exposure, and vulnerability. For example, landslide hazard may be expressed qualitatively, and at low spatial resolution, as landslide “susceptibility” according to general maps of slope angle, soil type, and land use.
In the last decade, there have been signifi-cant advances in spatially distributed landslide analysis. Glade and Crozier (2005) review cur-rent qualitative and quantitative approaches to the analysis of landslides at scales ranging from less than 1:10,000 to greater than 1:750,000. However, even at the most detailed spatial scales, GIS-based mapping methods are not able to identify detailed slope proper-ties and local landslide mechanisms. National landslide susceptibility or hazard maps devel-oped in this way are effectively decoupled from the dominant local landslide processes.
The scale of the map is incompatible with the scale of the physical processes.
Ideally, the most appropriate use of these maps would be to enable the identification of planning control zones—preventing occupa-tion or development of the most landslide-prone areas and thereby avoiding exposure to the hazard altogether. However, in developing countries, there is often limited capacity for enforcing planning controls or for removing people from such areas.
If exposure of communities to landslide hazards cannot be easily reduced, the next question is whether the hazard or its conse-quences can be reduced. Unfortunately, wide-area landslide susceptibility/hazard maps will not yield answers about what is actually caus-ing slope instability on a particular hillside or when a landslide might happen. Without such an understanding, an appropriate mitigation approach cannot readily be identified. This mismatch of scales may be one factor leading to the observation that, despite numerous major regional approaches, the uptake of haz-ard maps has been minimal (Opadeyi, Ali, and Chin 2005; Zaitchik and van Es 2003).
As noted, wide-area landslide hazard map-ping represents the first step in the risk assess-ment process. Having identified broad zones of landslide hazard, the next step is to move to a more detailed scale—to go on site to identify the local hazard drivers. In this way, MoSSaiC involves communities and government teams combining local knowledge and scientific expertise to understand the local slope pro-cesses and identify potential landslide mitiga-tion measures. Complementing existing wide-area landslide risk maps with this bottom-up approach can enable national DRM policies to be translated into the delivery of effective mit-igation measures.
The role of social funds
In seeking to assist the most vulnerable com-munities, social funds have had a major role in many developing countries and have become increasingly focused on vulnerability reduc-tion as part of DRM. Such funds are often assimilated into government as institutions
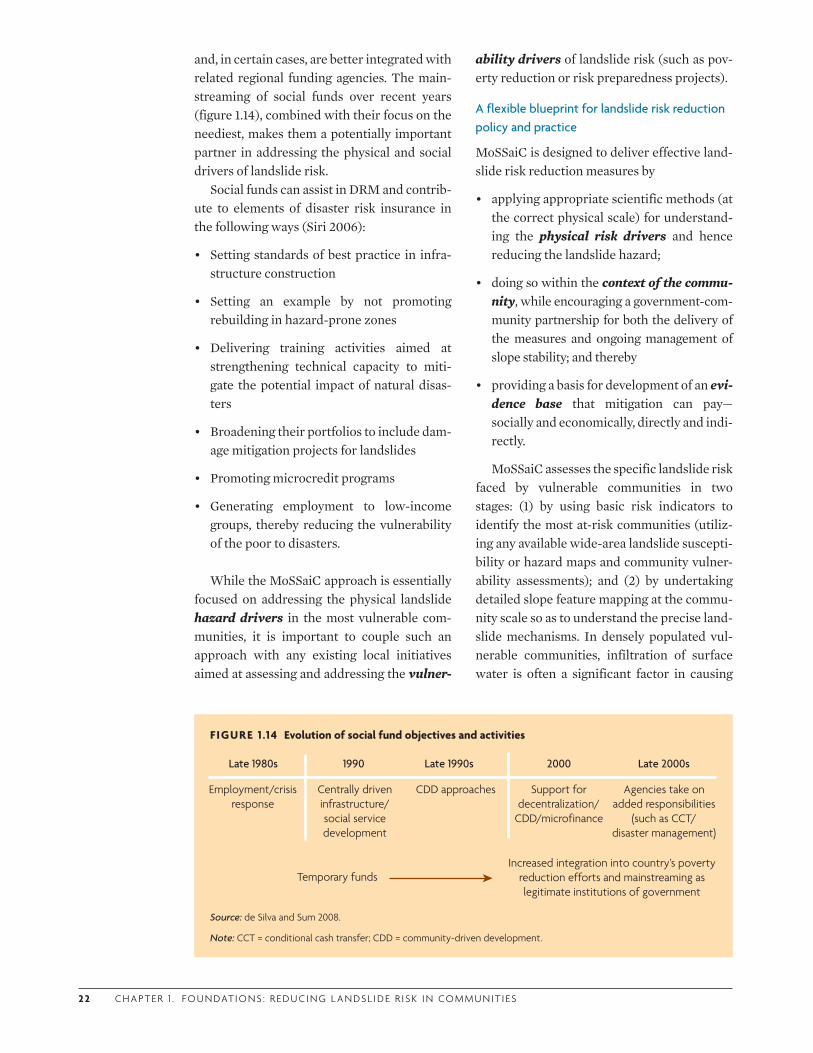
2 2 C H A P T E R 1 . F O U N DAT I O N S : R E D U C I N G L A N DS L I D E R I S K I N CO M M U N I T I ES
and, in certain cases, are better integrated with related regional funding agencies. The main-streaming of social funds over recent years (figure 1.14), combined with their focus on the neediest, makes them a potentially important partner in addressing the physical and social drivers of landslide risk.
Social funds can assist in DRM and contrib-ute to elements of disaster risk insurance in the following ways (Siri 2006):
• Setting standards of best practice in infra-structure construction
• Setting an example by not promoting rebuilding in hazard-prone zones
• Delivering training activities aimed at strengthening technical capacity to miti-gate the potential impact of natural disas-ters
• Broadening their portfolios to include dam-age mitigation projects for landslides
• Promoting microcredit programs
• Generating employment to low-income groups, thereby reducing the vulnerability of the poor to disasters.
While the MoSSaiC approach is essentially focused on addressing the physical landslide hazard drivers in the most vulnerable com-munities, it is important to couple such an approach with any existing local initiatives aimed at assessing and addressing the vulner-
ability drivers of landslide risk (such as pov-erty reduction or risk preparedness projects).
A flexible blueprint for landslide risk reduction policy and practice
MoSSaiC is designed to deliver effective land-slide risk reduction measures by
• applying appropriate scientific methods (at the correct physical scale) for understand-ing the physical risk drivers and hence reducing the landslide hazard;
• doing so within the context of the commu-nity, while encouraging a government-com-munity partnership for both the delivery of the measures and ongoing management of slope stability; and thereby
• providing a basis for development of an evi-dence base that mitigation can pay—socially and economically, directly and indi-rectly.
MoSSaiC assesses the specific landslide risk faced by vulnerable communities in two stages: (1) by using basic risk indicators to identify the most at-risk communities (utiliz-ing any available wide-area landslide suscepti-bility or hazard maps and community vulner-ability assessments); and (2) by undertaking detailed slope feature mapping at the commu-nity scale so as to understand the precise land-slide mechanisms. In densely populated vul-nerable communities, infiltration of surface water is often a significant factor in causing
FIGURE 1 .14 Evolution of social fund objectives and activities
Temporary fundsIncreased integration into country’s poverty
reduction efforts and mainstreaming as legitimate institutions of government
Employment/crisis response
Centrally driven infrastructure/social service development
CDD approaches Support for decentralization/
CDD/microfinance
Agencies take onadded responsibilities
(such as CCT/disaster management)
Late 1980s 1990 2000Late 1990s Late 2000s
Source: de Silva and Sum 2008.
Note: CCT = conditional cash transfer; CDD = community-driven development.
CO M M U N I T Y- BA S E D L A N DS L I D E R I S K R E D U CT I O N 2 3
landslides. Treatment of this hazard involves designing and constructing drains in key loca-tions to capture surface water; this is under-taken by government teams and community contractors. Evidence of the effectiveness of the hazard reduction measures is evaluated. The role of the government in addressing both the physical and social risk drivers, and at the correct scale (hillside/community level), is vital.
This approach to community-based land-slide risk reduction is discussed more fully in section 1.4. Indeed, this book as a whole aims to provide a flexible blueprint for this form of landslide risk management.
1.3.4 Landslide risk and other development policy issues
A range of development policy issues and pro-cesses can result in intensified landslide occur-rence, including climate change, urbanization, land-use practices (deforestation, cutting of slopes for housing construction), and inade-quate management of water and sewage sys-tems. Two such issues are useful to introduce at this stage because of their connection to the predominant landslide risk drivers MoSSaiC seeks to mitigate.
• Some predictions (e.g., UNISDR 2009) maintain that climate change may cause an increase in the intensity of rainfall events in the humid tropics. Knutson et al. (2010, 157) additionally comment that “it must be acknowledged that trend detection is ham-pered by the substantial limitations in the availability and quality of globally available data.” Because rainfall is one of the physical drivers of landslide hazard, it is possible that climate change could increase the fre-quency of rainfall-triggered landslides in this region.
• Urbanization is a major socioeconomic driver with respect to landslide risk. As noted above, the activity of developing landslide-prone slopes can increase land-slide hazard, while those living on the slopes tend to be the most vulnerable to such disasters.
Landslide-triggering rainfall and climate change
Many developing tropical and subtropical regions are subject to rainfall events that trig-ger landslides on steep slopes. Certain current climate change predictions point to the likeli-hood of an increase in the intensity of hurri-canes and other extreme rainfall events in those regions, which could be expected to result in an increase in the number and magni-tude of landslides (Mann and Kerry 2006).
The links between climate change, devel-opment, and DRR are strongly emphasized by international development agencies. For example, the United Nations International Strategy for Disaster Reduction notes that “Disaster risk reduction and climate change mitigation and adaptation share common goals. Both fields aim to reduce the vulnerabil-ity of communities and achieve sustainable development” (UNISDR 2012). This bolsters an earlier statement that “the impact of any increases in weather-related hazards will be highly asymmetric. Poorer countries that con-centrate most existing risk will be dispropor-tionately affected by climate change” (UNISDR 2009, 20).
Where possible, predicted changes in the recurrence intervals of landslide-triggering rainfall events should be incorporated in land-slide hazard assessment. The risk of not doing so may leave a significant public liability, either because the private sector will no longer bear the risk or due to the increased costs of disas-ter recovery (UNISDR 2009). In some cases, even relatively simple structural measures could yield both short- and long-term benefits to climate change. Because such measures could include landslide mitigation, MoSSaiC is consistent with this policy agenda.
Urbanization
Societal change is more rapid than climate change. Four important societal drivers pro-vide a critical context for the accumulation of landslide risk: a significant rise in the global population (figure 1.15a), accompanied by increased urbanization (figure 1.15b) and poor housing (figure 1.15c), which results in the
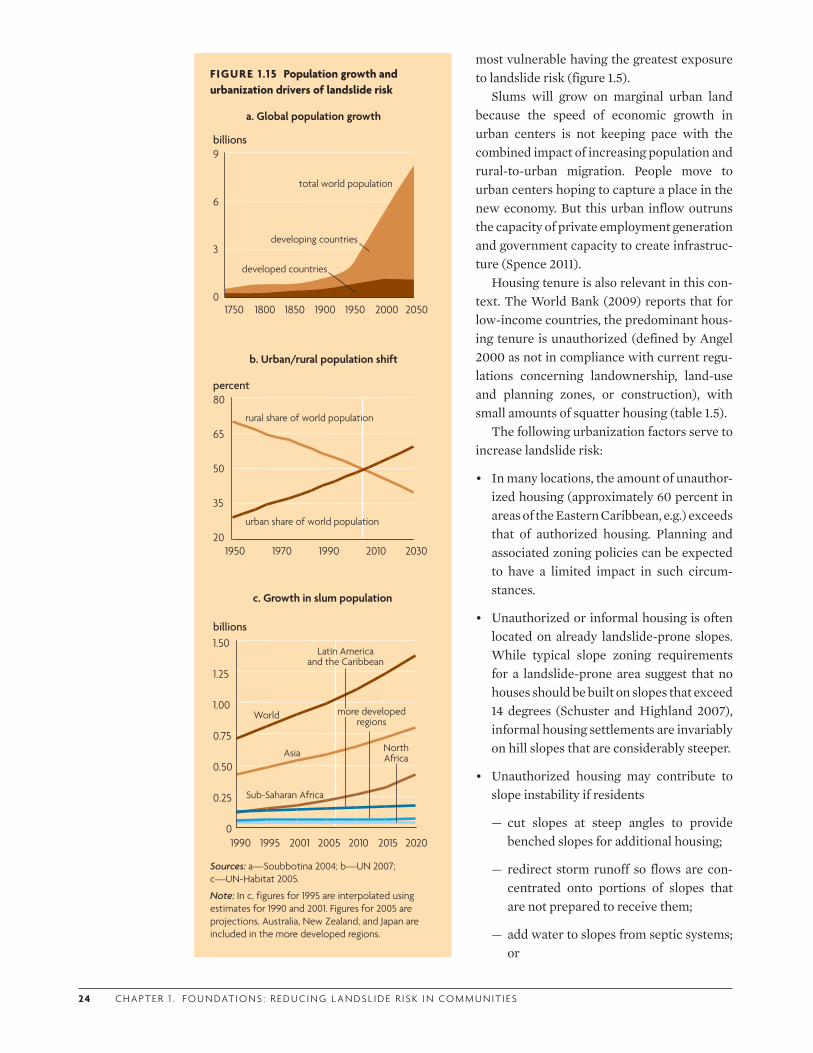
24 C H A P T E R 1 . F O U N DAT I O N S : R E D U C I N G L A N DS L I D E R I S K I N CO M M U N I T I ES
most vulnerable having the greatest exposure to landslide risk (figure 1.5).
Slums will grow on marginal urban land because the speed of economic growth in urban centers is not keeping pace with the combined impact of increasing population and rural-to-urban migration. People move to urban centers hoping to capture a place in the new economy. But this urban inflow outruns the capacity of private employment generation and government capacity to create infrastruc-ture (Spence 2011).
Housing tenure is also relevant in this con-text. The World Bank (2009) reports that for low-income countries, the predominant hous-ing tenure is unauthorized (defined by Angel 2000 as not in compliance with current regu-lations concerning landownership, land-use and planning zones, or construction), with small amounts of squatter housing (table 1.5).
The following urbanization factors serve to increase landslide risk:
• In many locations, the amount of unauthor-ized housing (approximately 60 percent in areas of the Eastern Caribbean, e.g.) exceeds that of authorized housing. Planning and associated zoning policies can be expected to have a limited impact in such circum-stances.
• Unauthorized or informal housing is often located on already landslide-prone slopes. While typical slope zoning requirements for a landslide-prone area suggest that no houses should be built on slopes that exceed 14 degrees (Schuster and Highland 2007), informal housing settlements are invariably on hill slopes that are considerably steeper.
• Unauthorized housing may contribute to slope instability if residents
— cut slopes at steep angles to provide benched slopes for additional housing;
— redirect storm runoff so flows are con-centrated onto portions of slopes that are not prepared to receive them;
— add water to slopes from septic systems; or
FIGURE 1 .15 Population growth and urbanization drivers of landslide risk
20302010199019701950
percent
20
35
50
65
80
rural share of world population
urban share of world population
b. Urban/rural population shift
1750 2050200019501900185018000
9
6
3
billions
total world population
developing countries
developed countries
a. Global population growth
billions
2020201520102005200119951990
0.25
0.50
0.75
1.00
1.25
1.50
North Africa
Latin Americaand the Caribbean
c. Growth in slum population
World
Asia
0
more developed regions
Sub-Saharan Africa
Sources: a—Soubbotina 2004; b—UN 2007; c—UN-Habitat 2005.
Note: In c, figures for 1995 are interpolated using estimates for 1990 and 2001. Figures for 2005 are projections. Australia, New Zealand, and Japan are included in the more developed regions.
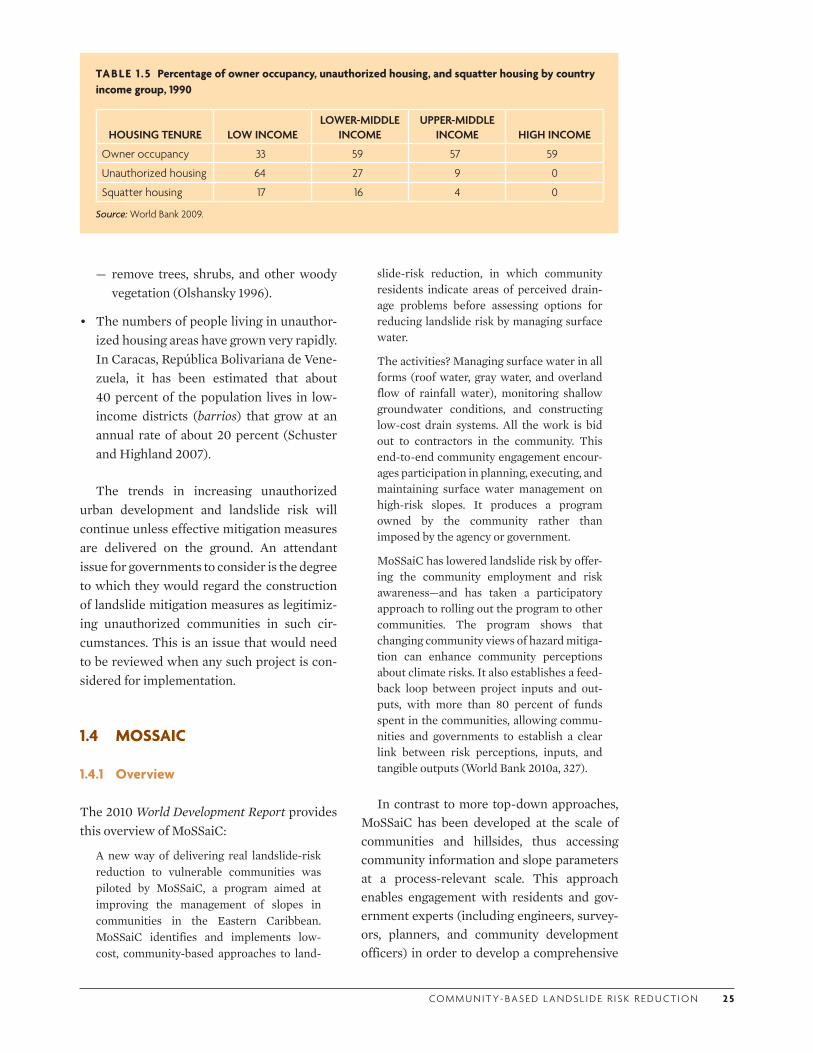
CO M M U N I T Y- BA S E D L A N DS L I D E R I S K R E D U CT I O N 2 5
— remove trees, shrubs, and other woody vegetation (Olshansky 1996).
• The numbers of people living in unauthor-ized housing areas have grown very rapidly. In Caracas, República Bolivariana de Vene-zuela, it has been estimated that about 40 percent of the population lives in low-income districts (barrios) that grow at an annual rate of about 20 percent (Schuster and Highland 2007).
The trends in increasing unauthorized urban development and landslide risk will continue unless effective mitigation measures are delivered on the ground. An attendant issue for governments to consider is the degree to which they would regard the construction of landslide mitigation measures as legitimiz-ing unauthorized communities in such cir-cumstances. This is an issue that would need to be reviewed when any such project is con-sidered for implementation.
1.4 MOSSAIC
1.4.1 Overview
The 2010 World Development Report provides this overview of MoSSaiC:
A new way of delivering real landslide-risk reduction to vulnerable com munities was piloted by MoSSaiC, a program aimed at improving the management of slopes in communi ties in the Eastern Caribbean. MoSSaiC identifies and implements low-cost, community-based approaches to land-
TABLE 1 .5 Percentage of owner occupancy, unauthorized housing, and squatter housing by country income group, 1990
HOUSING TENURE LOW INCOMELOWER-MIDDLE
INCOMEUPPER-MIDDLE
INCOME HIGH INCOME
Owner occupancy 33 59 57 59
Unauthorized housing 64 27 9 0
Squatter housing 17 16 4 0
Source: World Bank 2009.
slide-risk reduction, in which community residents indicate areas of perceived drain-age problems before assessing options for reducing land slide risk by managing surface water.
The activities? Managing surface water in all forms (roof water, gray water, and overland flow of rainfall water), monitoring shallow ground water conditions, and constructing low-cost drain systems. All the work is bid out to contractors in the com munity. This end-to-end community engagement encour-ages participa tion in planning, executing, and maintaining surface water manage ment on high-risk slopes. It produces a program owned by the community rather than imposed by the agency or government.
MoSSaiC has lowered landslide risk by offer-ing the community employ ment and risk awareness—and has taken a participatory approach to rolling out the program to other com munities. The program shows that changing community views of hazard mitiga-tion can enhance community perceptions about climate risks. It also establishes a feed-back loop between project inputs and out-puts, with more than 80 percent of funds spent in the communities, allowing commu-nities and governments to establish a clear link between risk perceptions, inputs, and tangible outputs (World Bank 2010a, 327).
In contrast to more top-down approaches, MoSSaiC has been developed at the scale of communities and hillsides, thus accessing community information and slope parameters at a process-relevant scale. This approach enables engagement with residents and gov-ernment experts (including engineers, survey-ors, planners, and community development officers) in order to develop a comprehensive
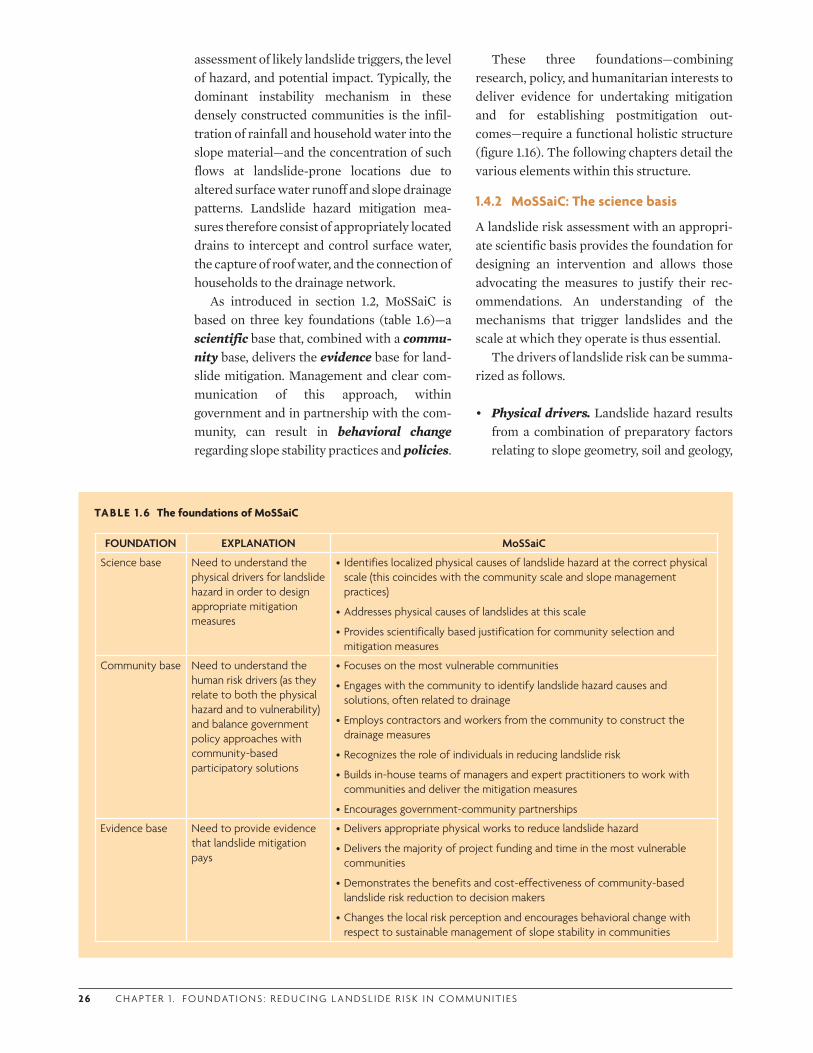
2 6 C H A P T E R 1 . F O U N DAT I O N S : R E D U C I N G L A N DS L I D E R I S K I N CO M M U N I T I ES
assessment of likely landslide triggers, the level of hazard, and potential impact. Typically, the dominant instability mechanism in these densely constructed communities is the infil-tration of rainfall and household water into the slope material—and the concentration of such flows at landslide-prone locations due to altered surface water runoff and slope drainage patterns. Landslide hazard mitigation mea-sures therefore consist of appropriately located drains to intercept and control surface water, the capture of roof water, and the connection of households to the drainage network.
As introduced in section 1.2, MoSSaiC is based on three key foundations (table 1.6)—a scientific base that, combined with a commu-nity base, delivers the evidence base for land-slide mitigation. Management and clear com-munication of this approach, within government and in partnership with the com-munity, can result in behavioral change regarding slope stability practices and policies.
These three foundations—combining research, policy, and humanitarian interests to deliver evidence for undertaking mitigation and for establishing postmitigation out-comes—require a functional holistic structure (figure 1.16). The following chapters detail the various elements within this structure.
1.4.2 MoSSaiC: The science basis
A landslide risk assessment with an appropri-ate scientific basis provides the foundation for designing an intervention and allows those advocating the measures to justify their rec-ommendations. An understanding of the mechanisms that trigger landslides and the scale at which they operate is thus essential.
The drivers of landslide risk can be summa-rized as follows.
• Physical drivers. Landslide hazard results from a combination of preparatory factors relating to slope geometry, soil and geology,
TABLE 1 .6 The foundations of MoSSaiC
FOUNDATION EXPLANATION MoSSaiC
Science base Need to understand the physical drivers for landslide hazard in order to design appropriate mitigation measures
• Identifies localized physical causes of landslide hazard at the correct physical scale (this coincides with the community scale and slope management practices)
•Addresses physical causes of landslides at this scale
•Provides scientifically based justification for community selection and mitigation measures
Community base Need to understand the human risk drivers (as they relate to both the physical hazard and to vulnerability) and balance government policy approaches with community-based participatory solutions
•Focuses on the most vulnerable communities
•Engages with the community to identify landslide hazard causes and solutions, often related to drainage
•Employs contractors and workers from the community to construct the drainage measures
•Recognizes the role of individuals in reducing landslide risk
•Builds in-house teams of managers and expert practitioners to work with communities and deliver the mitigation measures
•Encourages government-community partnerships
Evidence base Need to provide evidence that landslide mitigation pays
•Delivers appropriate physical works to reduce landslide hazard
•Delivers the majority of project funding and time in the most vulnerable communities
•Demonstrates the benefits and cost-effectiveness of community-based landslide risk reduction to decision makers
•Changes the local risk perception and encourages behavioral change with respect to sustainable management of slope stability in communities
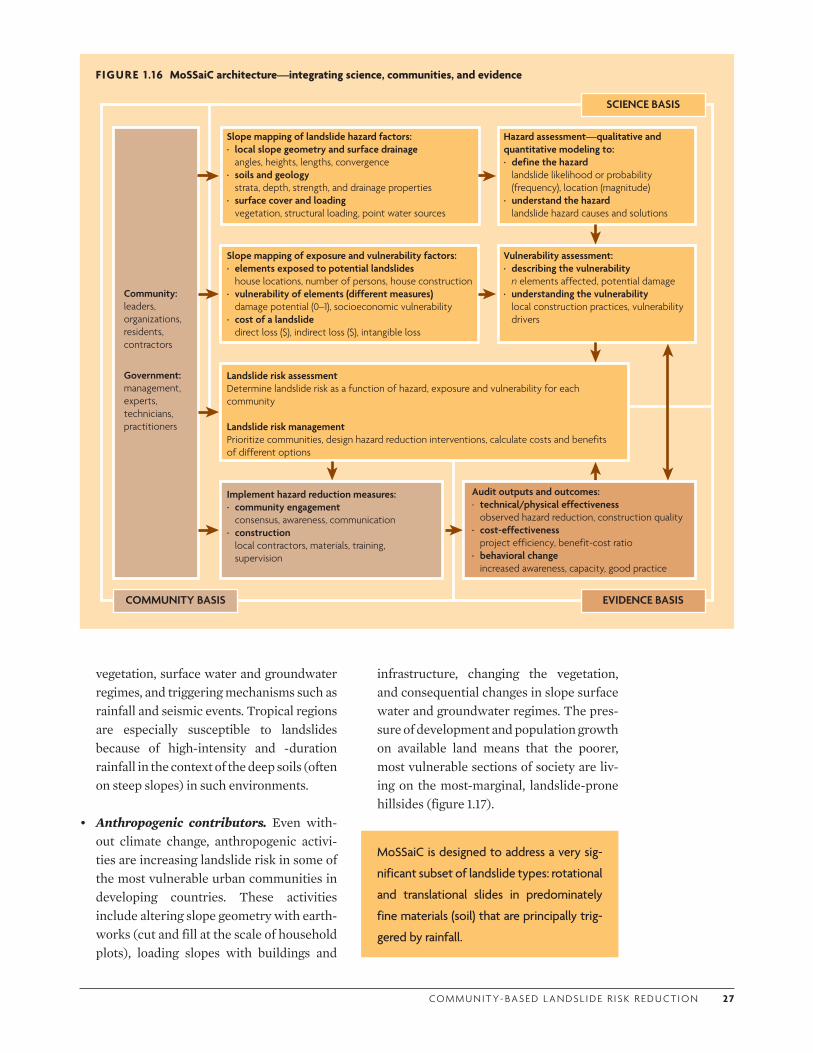
CO M M U N I T Y- BA S E D L A N DS L I D E R I S K R E D U CT I O N 2 7
vegetation, surface water and groundwater regimes, and triggering mechanisms such as rainfall and seismic events. Tropical regions are especially susceptible to landslides because of high-intensity and -duration rainfall in the context of the deep soils (often on steep slopes) in such environments.
• Anthropogenic contributors. Even with-out climate change, anthropogenic activi-ties are increasing landslide risk in some of the most vulnerable urban communities in developing countries. These activities include altering slope geometry with earth-works (cut and fill at the scale of household plots), loading slopes with buildings and
infrastructure, changing the vegetation, and consequential changes in slope surface water and groundwater regimes. The pres-sure of development and population growth on available land means that the poorer, most vulnerable sections of society are liv-ing on the most-marginal, landslide-prone hillsides (figure 1.17).
FIGURE 1 .16 MoSSaiC architecture—integrating science, communities, and evidence
COMMUNITY BASIS
Government:management,experts,technicians,practitioners
Community:leaders, organizations, residents,contractors
Slope mapping of landslide hazard factors:· local slope geometry and surface drainage angles, heights, lengths, convergence· soils and geology strata, depth, strength, and drainage properties· surface cover and loading vegetation, structural loading, point water sources
Slope mapping of exposure and vulnerability factors:· elements exposed to potential landslides house locations, number of persons, house construction· vulnerability of elements (different measures) damage potential (0–1), socioeconomic vulnerability· cost of a landslide direct loss ($), indirect loss ($), intangible loss
Hazard assessment—qualitative and quantitative modeling to:· define the hazard landslide likelihood or probability (frequency), location (magnitude)· understand the hazard landslide hazard causes and solutions
Vulnerability assessment:· describing the vulnerability n elements affected, potential damage· understanding the vulnerability local construction practices, vulnerability
drivers
Landslide risk assessmentDetermine landslide risk as a function of hazard, exposure and vulnerability for each community
Landslide risk managementPrioritize communities, design hazard reduction interventions, calculate costs and benefits of different options
Implement hazard reduction measures:· community engagement consensus, awareness, communication· construction local contractors, materials, training,
supervision
Audit outputs and outcomes:· technical/physical effectiveness observed hazard reduction, construction quality· cost-effectiveness project efficiency, benefit-cost ratio· behavioral change increased awareness, capacity, good practice
EVIDENCE BASIS
SCIENCE BASIS
MoSSaiC is designed to address a very sig-
nificant subset of landslide types: rotational
and translational slides in predominately
fine materials (soil) that are principally trig-
gered by rainfall.
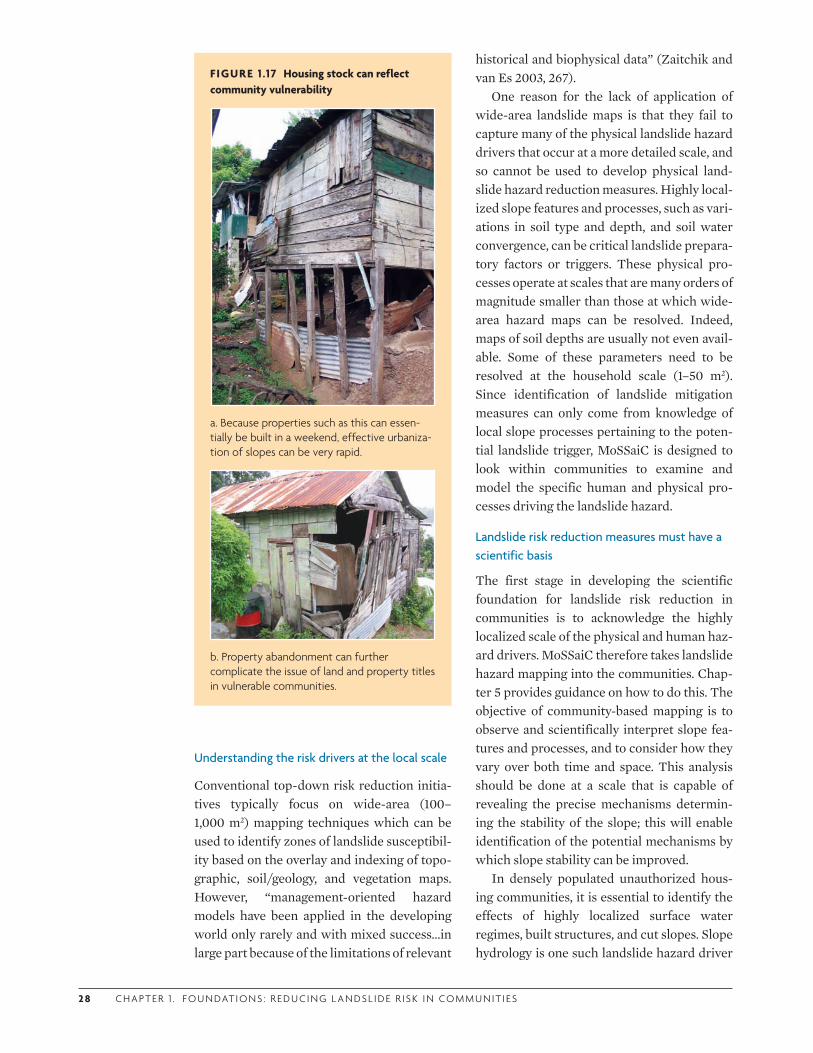
2 8 C H A P T E R 1 . F O U N DAT I O N S : R E D U C I N G L A N DS L I D E R I S K I N CO M M U N I T I ES
FIGURE 1 .17 Housing stock can reflect community vulnerability
a. Because properties such as this can essen-tially be built in a weekend, effective urbaniza-tion of slopes can be very rapid.
b. Property abandonment can further complicate the issue of land and property titles in vulnerable communities.
Understanding the risk drivers at the local scale
Conventional top-down risk reduction initia-tives typically focus on wide-area (100–1,000 m2) mapping techniques which can be used to identify zones of landslide susceptibil-ity based on the overlay and indexing of topo-graphic, soil/geology, and vegetation maps. However, “management-oriented hazard models have been applied in the developing world only rarely and with mixed success…in large part because of the limitations of relevant
historical and biophysical data” (Zaitchik and van Es 2003, 267).
One reason for the lack of application of wide-area landslide maps is that they fail to capture many of the physical landslide hazard drivers that occur at a more detailed scale, and so cannot be used to develop physical land-slide hazard reduction measures. Highly local-ized slope features and processes, such as vari-ations in soil type and depth, and soil water convergence, can be critical landslide prepara-tory factors or triggers. These physical pro-cesses operate at scales that are many orders of magnitude smaller than those at which wide-area hazard maps can be resolved. Indeed, maps of soil depths are usually not even avail-able. Some of these parameters need to be resolved at the household scale (1–50 m2). Since identification of landslide mitigation measures can only come from knowledge of local slope processes pertaining to the poten-tial landslide trigger, MoSSaiC is designed to look within communities to examine and model the specific human and physical pro-cesses driving the landslide hazard.
Landslide risk reduction measures must have a scientific basis
The first stage in developing the scientific foundation for landslide risk reduction in communities is to acknowledge the highly localized scale of the physical and human haz-ard drivers. MoSSaiC therefore takes landslide hazard mapping into the communities. Chap-ter 5 provides guidance on how to do this. The objective of community-based mapping is to observe and scientifically interpret slope fea-tures and processes, and to consider how they vary over both time and space. This analysis should be done at a scale that is capable of revealing the precise mechanisms determin-ing the stability of the slope; this will enable identification of the potential mechanisms by which slope stability can be improved.
In densely populated unauthorized hous-ing communities, it is essential to identify the effects of highly localized surface water regimes, built structures, and cut slopes. Slope hydrology is one such landslide hazard driver
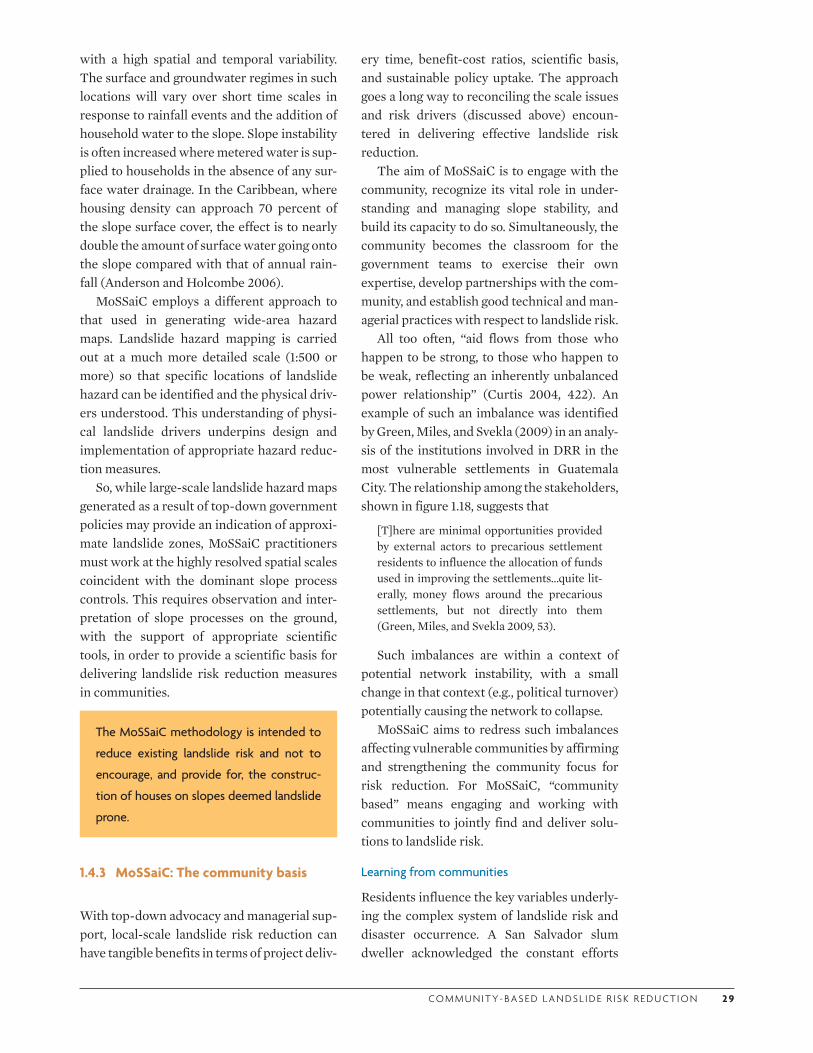
CO M M U N I T Y- BA S E D L A N DS L I D E R I S K R E D U CT I O N 2 9
with a high spatial and temporal variability. The surface and groundwater regimes in such locations will vary over short time scales in response to rainfall events and the addition of household water to the slope. Slope instability is often increased where metered water is sup-plied to households in the absence of any sur-face water drainage. In the Caribbean, where housing density can approach 70 percent of the slope surface cover, the effect is to nearly double the amount of surface water going onto the slope compared with that of annual rain-fall (Anderson and Holcombe 2006).
MoSSaiC employs a different approach to that used in generating wide-area hazard maps. Landslide hazard mapping is carried out at a much more detailed scale (1:500 or more) so that specific locations of landslide hazard can be identified and the physical driv-ers understood. This understanding of physi-cal landslide drivers underpins design and implementation of appropriate hazard reduc-tion measures.
So, while large-scale landslide hazard maps generated as a result of top-down government policies may provide an indication of approxi-mate landslide zones, MoSSaiC practitioners must work at the highly resolved spatial scales coincident with the dominant slope process controls. This requires observation and inter-pretation of slope processes on the ground, with the support of appropriate scientific tools, in order to provide a scientific basis for delivering landslide risk reduction measures in communities.
The MoSSaiC methodology is intended to
reduce existing landslide risk and not to
encourage, and provide for, the construc-
tion of houses on slopes deemed landslide
prone.
1.4.3 MoSSaiC: The community basis
With top-down advocacy and managerial sup-port, local-scale landslide risk reduction can have tangible benefits in terms of project deliv-
ery time, benefit-cost ratios, scientific basis, and sustainable policy uptake. The approach goes a long way to reconciling the scale issues and risk drivers (discussed above) encoun-tered in delivering effective landslide risk reduction.
The aim of MoSSaiC is to engage with the community, recognize its vital role in under-standing and managing slope stability, and build its capacity to do so. Simultaneously, the community becomes the classroom for the government teams to exercise their own expertise, develop partnerships with the com-munity, and establish good technical and man-agerial practices with respect to landslide risk.
All too often, “aid flows from those who happen to be strong, to those who happen to be weak, reflecting an inherently unbalanced power relationship” (Curtis 2004, 422). An example of such an imbalance was identified by Green, Miles, and Svekla (2009) in an analy-sis of the institutions involved in DRR in the most vulnerable settlements in Guatemala City. The relationship among the stakeholders, shown in figure 1.18, suggests that
[T]here are minimal opportunities provided by external actors to precarious settlement residents to influence the allocation of funds used in improving the settlements…quite lit-erally, money flows around the precarious settlements, but not directly into them (Green, Miles, and Svekla 2009, 53).
Such imbalances are within a context of potential network instability, with a small change in that context (e.g., political turnover) potentially causing the network to collapse.
MoSSaiC aims to redress such imbalances affecting vulnerable communities by affirming and strengthening the community focus for risk reduction. For MoSSaiC, “community based” means engaging and working with communities to jointly find and deliver solu-tions to landslide risk.
Learning from communities
Residents influence the key variables underly-ing the complex system of landslide risk and disaster occurrence. A San Salvador slum dweller acknowledged the constant efforts
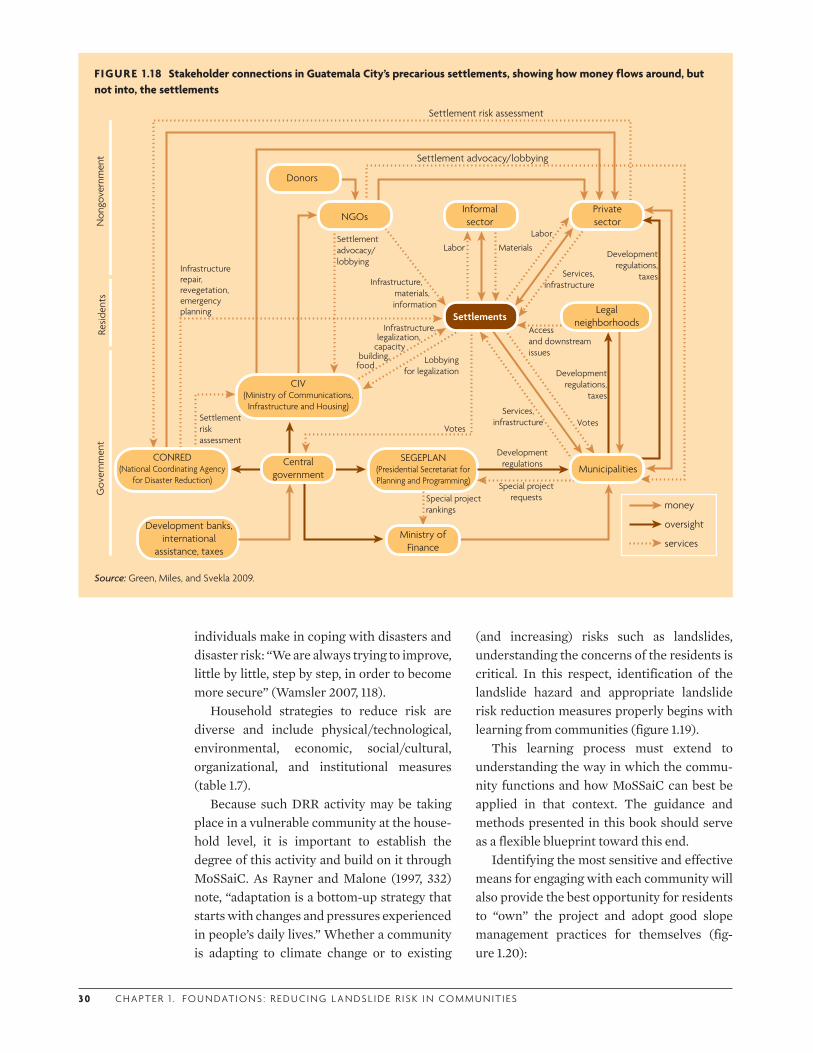
3 0 C H A P T E R 1 . F O U N DAT I O N S : R E D U C I N G L A N DS L I D E R I S K I N CO M M U N I T I ES
individuals make in coping with disasters and disaster risk: “We are always trying to improve, little by little, step by step, in order to become more secure” (Wamsler 2007, 118).
Household strategies to reduce risk are diverse and include physical/technological, environmental, economic, social/cultural, organizational, and institutional measures (table 1.7).
Because such DRR activity may be taking place in a vulnerable community at the house-hold level, it is important to establish the degree of this activity and build on it through MoSSaiC. As Rayner and Malone (1997, 332) note, “adaptation is a bottom-up strategy that starts with changes and pressures experienced in people’s daily lives.” Whether a community is adapting to climate change or to existing
(and increasing) risks such as landslides, understanding the concerns of the residents is critical. In this respect, identification of the landslide hazard and appropriate landslide risk reduction measures properly begins with learning from communities (figure 1.19).
This learning process must extend to understanding the way in which the commu-nity functions and how MoSSaiC can best be applied in that context. The guidance and methods presented in this book should serve as a flexible blueprint toward this end.
Identifying the most sensitive and effective means for engaging with each community will also provide the best opportunity for residents to “own” the project and adopt good slope management practices for themselves (fig-ure 1.20):
FIGURE 1 .18 Stakeholder connections in Guatemala City’s precarious settlements, showing how money flows around, but not into, the settlements
Special project rankings
Special projectrequests
Developmentregulations
Settlement advocacy/lobbying
Settlement advocacy/lobbying
Infrastructure,materials, information
Infrastructure, legalization,
capacitybuilding,
food
Services, infrastructure
Labor
MaterialsLabor
VotesServices,
infrastructure
Development regulations,
taxes
Development regulations,
taxes
Settlement risk assessment
Infrastructure repair, revegetation, emergency planning
Settlementriskassessment
Votes
Lobbying for legalization
money
oversight
services
Informal sector
Legalneighborhoods
Private sectorNGOs
MunicipalitiesCentral
government
Ministry of Finance
CIV (Ministry of Communications, Infrastructure and Housing)
CONRED (National Coordinating Agency
for Disaster Reduction)
Development banks, international
assistance, taxes
SEGEPLAN (Presidential Secretariat for Planning and Programming)
Donors
Non
gove
rnm
ent
Resid
ents
Gov
ernm
ent
Accessand downstreamissues
Settlements
Source: Green, Miles, and Svekla 2009.
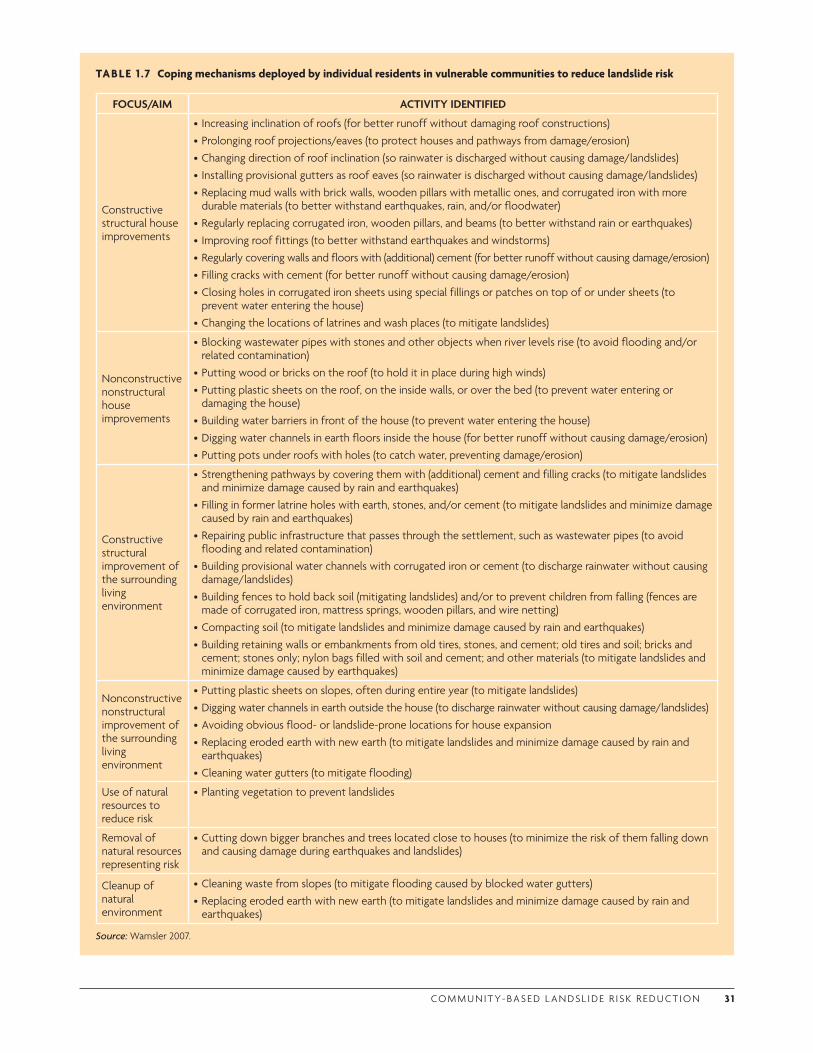
CO M M U N I T Y- BA S E D L A N DS L I D E R I S K R E D U CT I O N 3 1
TABLE 1 .7 Coping mechanisms deployed by individual residents in vulnerable communities to reduce landslide risk
FOCUS/AIM ACTIVITY IDENTIFIED
Constructive structural house improvements
• Increasing inclination of roofs (for better runoff without damaging roof constructions)•Prolonging roof projections/eaves (to protect houses and pathways from damage/erosion)•Changing direction of roof inclination (so rainwater is discharged without causing damage/landslides)• Installing provisional gutters as roof eaves (so rainwater is discharged without causing damage/landslides)•Replacing mud walls with brick walls, wooden pillars with metallic ones, and corrugated iron with more
durable materials (to better withstand earthquakes, rain, and/or floodwater)•Regularly replacing corrugated iron, wooden pillars, and beams (to better withstand rain or earthquakes)• Improving roof fittings (to better withstand earthquakes and windstorms) •Regularly covering walls and floors with (additional) cement (for better runoff without causing damage/erosion)•Filling cracks with cement (for better runoff without causing damage/erosion)•Closing holes in corrugated iron sheets using special fillings or patches on top of or under sheets (to
prevent water entering the house)•Changing the locations of latrines and wash places (to mitigate landslides)
Nonconstructive nonstructural house improvements
•Blocking wastewater pipes with stones and other objects when river levels rise (to avoid flooding and/or related contamination)•Putting wood or bricks on the roof (to hold it in place during high winds)•Putting plastic sheets on the roof, on the inside walls, or over the bed (to prevent water entering or
damaging the house)•Building water barriers in front of the house (to prevent water entering the house)•Digging water channels in earth floors inside the house (for better runoff without causing damage/erosion)•Putting pots under roofs with holes (to catch water, preventing damage/erosion)
Constructive structural improvement of the surrounding living environment
•Strengthening pathways by covering them with (additional) cement and filling cracks (to mitigate landslides and minimize damage caused by rain and earthquakes)•Filling in former latrine holes with earth, stones, and/or cement (to mitigate landslides and minimize damage
caused by rain and earthquakes)•Repairing public infrastructure that passes through the settlement, such as wastewater pipes (to avoid
flooding and related contamination)•Building provisional water channels with corrugated iron or cement (to discharge rainwater without causing
damage/landslides)•Building fences to hold back soil (mitigating landslides) and/or to prevent children from falling (fences are
made of corrugated iron, mattress springs, wooden pillars, and wire netting)•Compacting soil (to mitigate landslides and minimize damage caused by rain and earthquakes)•Building retaining walls or embankments from old tires, stones, and cement; old tires and soil; bricks and
cement; stones only; nylon bags filled with soil and cement; and other materials (to mitigate landslides and minimize damage caused by earthquakes)
Nonconstructive nonstructural improvement of the surrounding living environment
•Putting plastic sheets on slopes, often during entire year (to mitigate landslides)•Digging water channels in earth outside the house (to discharge rainwater without causing damage/landslides)•Avoiding obvious flood- or landslide-prone locations for house expansion•Replacing eroded earth with new earth (to mitigate landslides and minimize damage caused by rain and
earthquakes)•Cleaning water gutters (to mitigate flooding)
Use of natural resources to reduce risk
•Planting vegetation to prevent landslides
Removal of natural resources representing risk
•Cutting down bigger branches and trees located close to houses (to minimize the risk of them falling down and causing damage during earthquakes and landslides)
Cleanup of natural environment
•Cleaning waste from slopes (to mitigate flooding caused by blocked water gutters)•Replacing eroded earth with new earth (to mitigate landslides and minimize damage caused by rain and
earthquakes)
Source: Wamsler 2007.
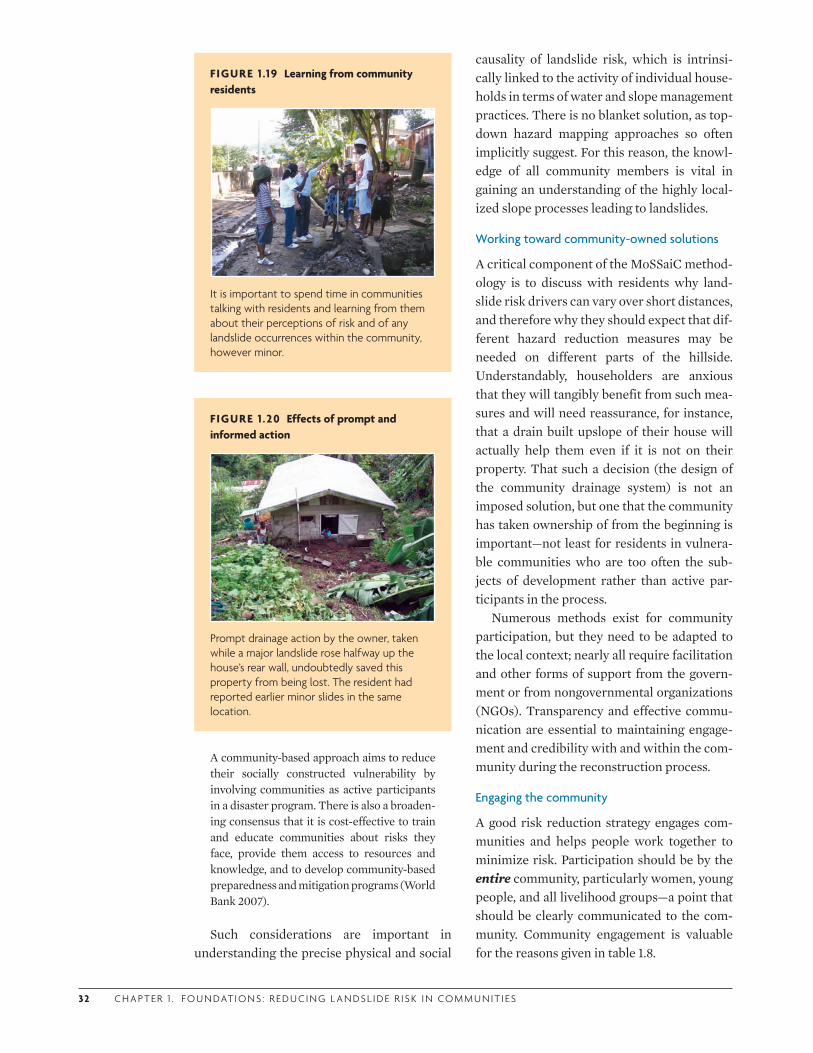
32 C H A P T E R 1 . F O U N DAT I O N S : R E D U C I N G L A N DS L I D E R I S K I N CO M M U N I T I ES
A community-based approach aims to reduce their socially constructed vulnerability by involving communities as active participants in a disaster program. There is also a broaden-ing consensus that it is cost-effective to train and educate communities about risks they face, provide them access to resources and knowledge, and to develop community-based preparedness and mitigation programs (World Bank 2007).
Such considerations are important in understanding the precise physical and social
causality of landslide risk, which is intrinsi-cally linked to the activity of individual house-holds in terms of water and slope management practices. There is no blanket solution, as top-down hazard mapping approaches so often implicitly suggest. For this reason, the knowl-edge of all community members is vital in gaining an understanding of the highly local-ized slope processes leading to landslides.
Working toward community-owned solutions
A critical component of the MoSSaiC method-ology is to discuss with residents why land-slide risk drivers can vary over short distances, and therefore why they should expect that dif-ferent hazard reduction measures may be needed on different parts of the hillside. Understandably, householders are anxious that they will tangibly benefit from such mea-sures and will need reassurance, for instance, that a drain built upslope of their house will actually help them even if it is not on their property. That such a decision (the design of the community drainage system) is not an imposed solution, but one that the community has taken ownership of from the beginning is important—not least for residents in vulnera-ble communities who are too often the sub-jects of development rather than active par-ticipants in the process.
Numerous methods exist for community participation, but they need to be adapted to the local context; nearly all require facilitation and other forms of support from the govern-ment or from nongovernmental organizations (NGOs). Transparency and effective commu-nication are essential to maintaining engage-ment and credibility with and within the com-munity during the reconstruction process.
Engaging the community
A good risk reduction strategy engages com-munities and helps people work together to minimize risk. Participation should be by the entire community, particularly women, young people, and all livelihood groups—a point that should be clearly communicated to the com-munity. Community engagement is valuable for the reasons given in table 1.8.
FIGURE 1 .19 Learning from community residents
It is important to spend time in communities talking with residents and learning from them about their perceptions of risk and of any landslide occurrences within the community, however minor.
FIGURE 1 .20 Effects of prompt and informed action
Prompt drainage action by the owner, taken while a major landslide rose halfway up the house’s rear wall, undoubtedly saved this property from being lost. The resident had reported earlier minor slides in the same location.
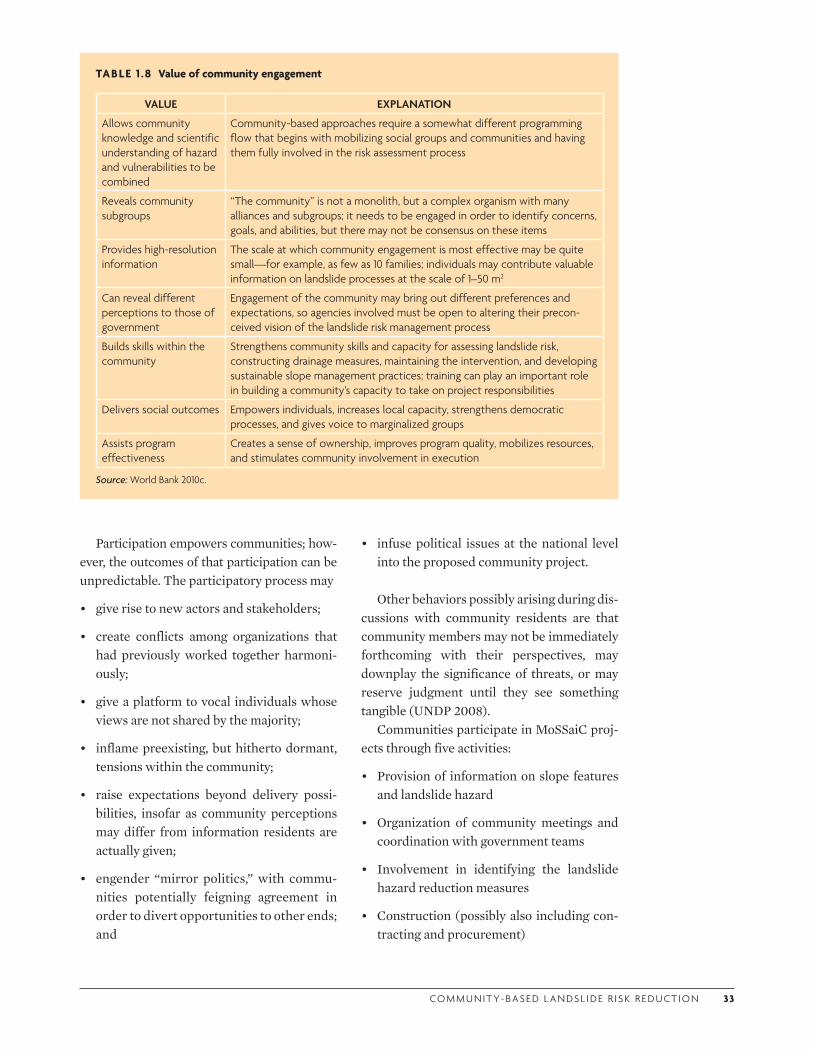
CO M M U N I T Y- BA S E D L A N DS L I D E R I S K R E D U CT I O N 33
Participation empowers communities; how-ever, the outcomes of that participation can be unpredictable. The participatory process may
• give rise to new actors and stakeholders;
• create conflicts among organizations that had previously worked together harmoni-ously;
• give a platform to vocal individuals whose views are not shared by the majority;
• inflame preexisting, but hitherto dormant, tensions within the community;
• raise expectations beyond delivery possi-bilities, insofar as community perceptions may differ from information residents are actually given;
• engender “mirror politics,” with commu-nities potentially feigning agreement in order to divert opportunities to other ends; and
• infuse political issues at the national level into the proposed community project.
Other behaviors possibly arising during dis-cussions with community residents are that community members may not be immediately forthcoming with their perspectives, may downplay the significance of threats, or may reserve judgment until they see something tangible (UNDP 2008).
Communities participate in MoSSaiC proj-ects through five activities:
• Provision of information on slope features and landslide hazard
• Organization of community meetings and coordination with government teams
• Involvement in identifying the landslide hazard reduction measures
• Construction (possibly also including con-tracting and procurement)
TABLE 1 .8 Value of community engagement
VALUE EXPLANATION
Allows community knowledge and scientific understanding of hazard and vulnerabilities to be combined
Community-based approaches require a somewhat different programming flow that begins with mobilizing social groups and communities and having them fully involved in the risk assessment process
Reveals community subgroups
“The community” is not a monolith, but a complex organism with many alliances and subgroups; it needs to be engaged in order to identify concerns, goals, and abilities, but there may not be consensus on these items
Provides high-resolution information
The scale at which community engagement is most effective may be quite small—for example, as few as 10 families; individuals may contribute valuable information on landslide processes at the scale of 1–50 m2
Can reveal different perceptions to those of government
Engagement of the community may bring out different preferences and expectations, so agencies involved must be open to altering their precon-ceived vision of the landslide risk management process
Builds skills within the community
Strengthens community skills and capacity for assessing landslide risk, constructing drainage measures, maintaining the intervention, and developing sustainable slope management practices; training can play an important role in building a community’s capacity to take on project responsibilities
Delivers social outcomes Empowers individuals, increases local capacity, strengthens democratic processes, and gives voice to marginalized groups
Assists program effectiveness
Creates a sense of ownership, improves program quality, mobilizes resources, and stimulates community involvement in execution
Source: World Bank 2010c.
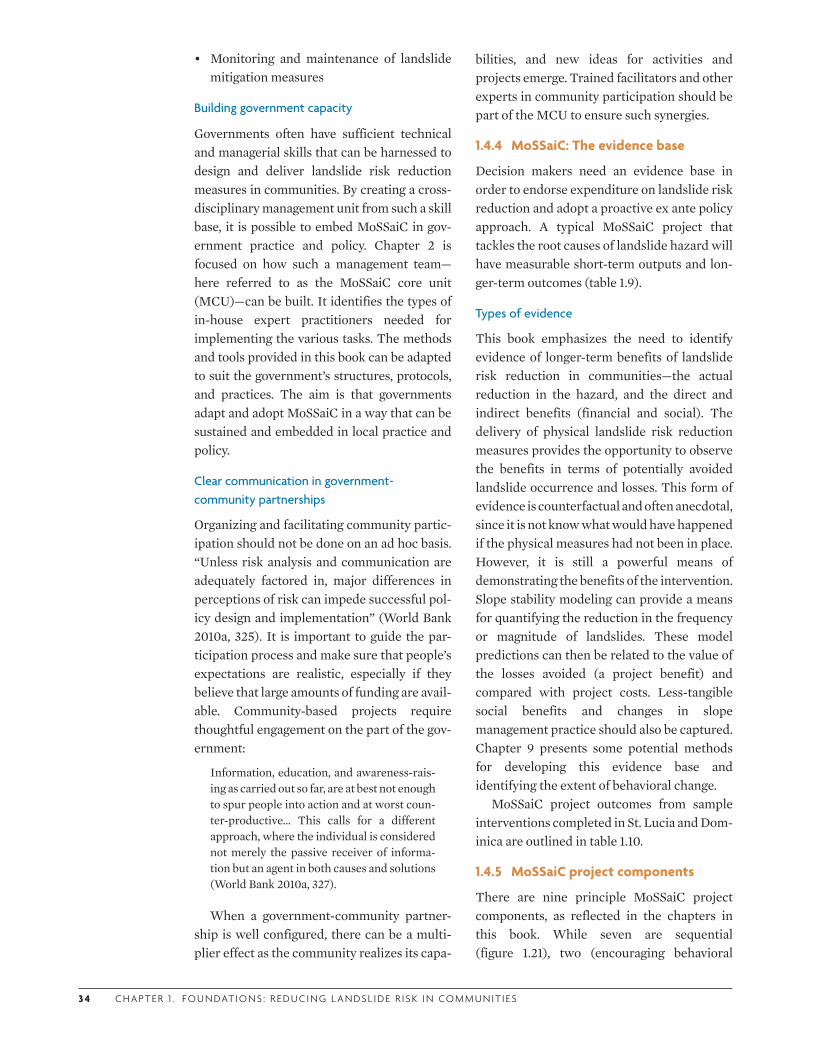
3 4 C H A P T E R 1 . F O U N DAT I O N S : R E D U C I N G L A N DS L I D E R I S K I N CO M M U N I T I ES
• Monitoring and maintenance of landslide mitigation measures
Building government capacity
Governments often have sufficient technical and managerial skills that can be harnessed to design and deliver landslide risk reduction measures in communities. By creating a cross-disciplinary management unit from such a skill base, it is possible to embed MoSSaiC in gov-ernment practice and policy. Chapter 2 is focused on how such a management team—here referred to as the MoSSaiC core unit (MCU)—can be built. It identifies the types of in-house expert practitioners needed for implementing the various tasks. The methods and tools provided in this book can be adapted to suit the government’s structures, protocols, and practices. The aim is that governments adapt and adopt MoSSaiC in a way that can be sustained and embedded in local practice and policy.
Clear communication in government-community partnerships
Organizing and facilitating community partic-ipation should not be done on an ad hoc basis. “Unless risk analysis and communication are adequately factored in, major differences in perceptions of risk can impede successful pol-icy design and implementation” (World Bank 2010a, 325). It is important to guide the par-ticipation process and make sure that people’s expectations are realistic, especially if they believe that large amounts of funding are avail-able. Community-based projects require thoughtful engagement on the part of the gov-ernment:
Information, education, and awareness-rais-ing as carried out so far, are at best not enough to spur people into action and at worst coun-ter-productive… This calls for a different approach, where the individual is considered not merely the passive receiver of informa-tion but an agent in both causes and solutions (World Bank 2010a, 327).
When a government-community partner-ship is well configured, there can be a multi-plier effect as the community realizes its capa-
bilities, and new ideas for activities and projects emerge. Trained facilitators and other experts in community participation should be part of the MCU to ensure such synergies.
1.4.4 MoSSaiC: The evidence base
Decision makers need an evidence base in order to endorse expenditure on landslide risk reduction and adopt a proactive ex ante policy approach. A typical MoSSaiC project that tackles the root causes of landslide hazard will have measurable short-term outputs and lon-ger-term outcomes (table 1.9).
Types of evidence
This book emphasizes the need to identify evidence of longer-term benefits of landslide risk reduction in communities—the actual reduction in the hazard, and the direct and indirect benefits (financial and social). The delivery of physical landslide risk reduction measures provides the opportunity to observe the benefits in terms of potentially avoided landslide occurrence and losses. This form of evidence is counterfactual and often anecdotal, since it is not know what would have happened if the physical measures had not been in place. However, it is still a powerful means of demonstrating the benefits of the intervention. Slope stability modeling can provide a means for quantifying the reduction in the frequency or magnitude of landslides. These model predictions can then be related to the value of the losses avoided (a project benefit) and compared with project costs. Less-tangible social benefits and changes in slope management practice should also be captured. Chapter 9 presents some potential methods for developing this evidence base and identifying the extent of behavioral change.
MoSSaiC project outcomes from sample interventions completed in St. Lucia and Dom-inica are outlined in table 1.10.
1.4.5 MoSSaiC project components
There are nine principle MoSSaiC project components, as reflected in the chapters in this book. While seven are sequential (figure 1.21), two (encouraging behavioral
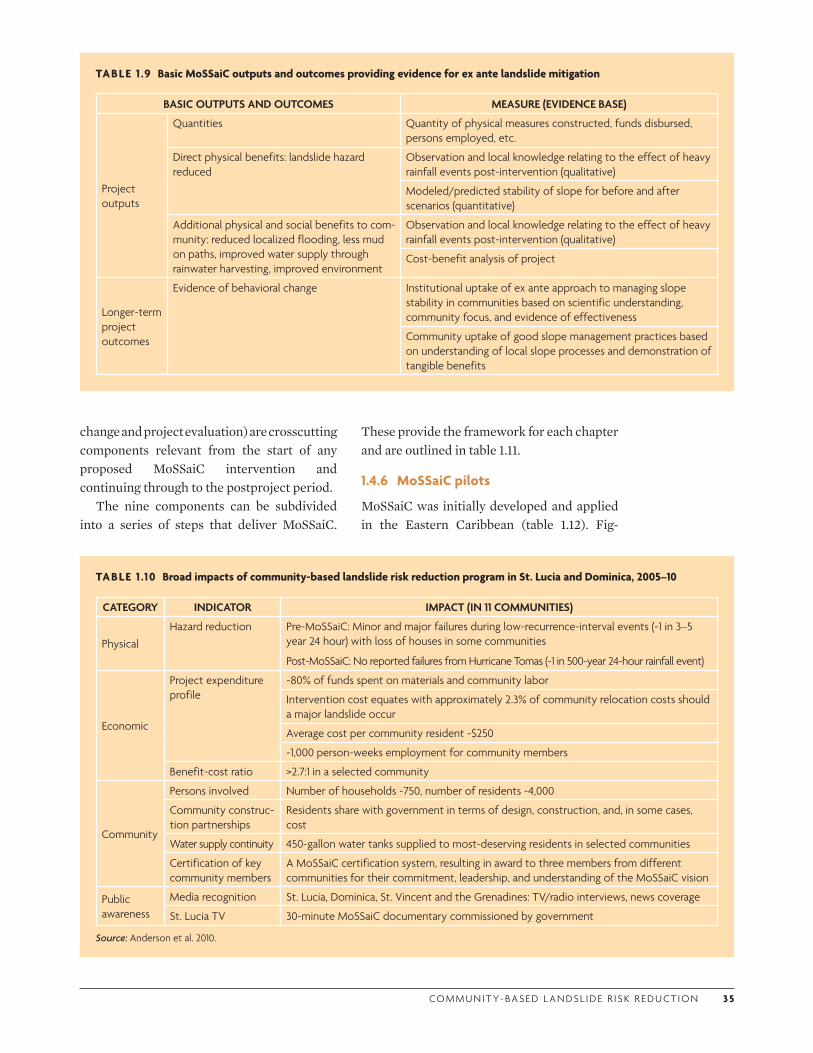
CO M M U N I T Y- BA S E D L A N DS L I D E R I S K R E D U CT I O N 3 5
change and project evaluation) are crosscutting components relevant from the start of any proposed MoSSaiC intervention and continuing through to the postproject period.
The nine components can be subdivided into a series of steps that deliver MoSSaiC.
These provide the framework for each chapter and are outlined in table 1.11.
1.4.6 MoSSaiC pilots
MoSSaiC was initially developed and applied in the Eastern Caribbean (table 1.12). Fig-
TABLE 1 .9 Basic MoSSaiC outputs and outcomes providing evidence for ex ante landslide mitigation
BASIC OUTPUTS AND OUTCOMES MEASURE (EVIDENCE BASE)
Project outputs
Quantities Quantity of physical measures constructed, funds disbursed, persons employed, etc.
Direct physical benefits: landslide hazard reduced
Observation and local knowledge relating to the effect of heavy rainfall events post-intervention (qualitative)
Modeled/predicted stability of slope for before and after scenarios (quantitative)
Additional physical and social benefits to com-munity: reduced localized flooding, less mud on paths, improved water supply through rainwater harvesting, improved environment
Observation and local knowledge relating to the effect of heavy rainfall events post-intervention (qualitative)
Cost-benefit analysis of project
Longer-term project outcomes
Evidence of behavioral change Institutional uptake of ex ante approach to managing slope stability in communities based on scientific understanding, community focus, and evidence of effectiveness
Community uptake of good slope management practices based on understanding of local slope processes and demonstration of tangible benefits
TABLE 1 .10 Broad impacts of community-based landslide risk reduction program in St. Lucia and Dominica, 2005–10
CATEGORY INDICATOR IMPACT (IN 11 COMMUNITIES)
PhysicalHazard reduction Pre-MoSSaiC: Minor and major failures during low-recurrence-interval events (~1 in 3–5
year 24 hour) with loss of houses in some communities
Post-MoSSaiC: No reported failures from Hurricane Tomas (~1 in 500-year 24-hour rainfall event)
Economic
Project expenditure profile
~80% of funds spent on materials and community labor
Intervention cost equates with approximately 2.3% of community relocation costs should a major landslide occur
Average cost per community resident ~$250
~1,000 person-weeks employment for community members
Benefit-cost ratio >2.7:1 in a selected community
Community
Persons involved Number of households ~750, number of residents ~4,000
Community construc-tion partnerships
Residents share with government in terms of design, construction, and, in some cases, cost
Water supply continuity 450-gallon water tanks supplied to most-deserving residents in selected communities
Certification of key community members
A MoSSaiC certification system, resulting in award to three members from different communities for their commitment, leadership, and understanding of the MoSSaiC vision
Public awareness
Media recognition St. Lucia, Dominica, St. Vincent and the Grenadines: TV/radio interviews, news coverage
St. Lucia TV 30-minute MoSSaiC documentary commissioned by government
Source: Anderson et al. 2010.
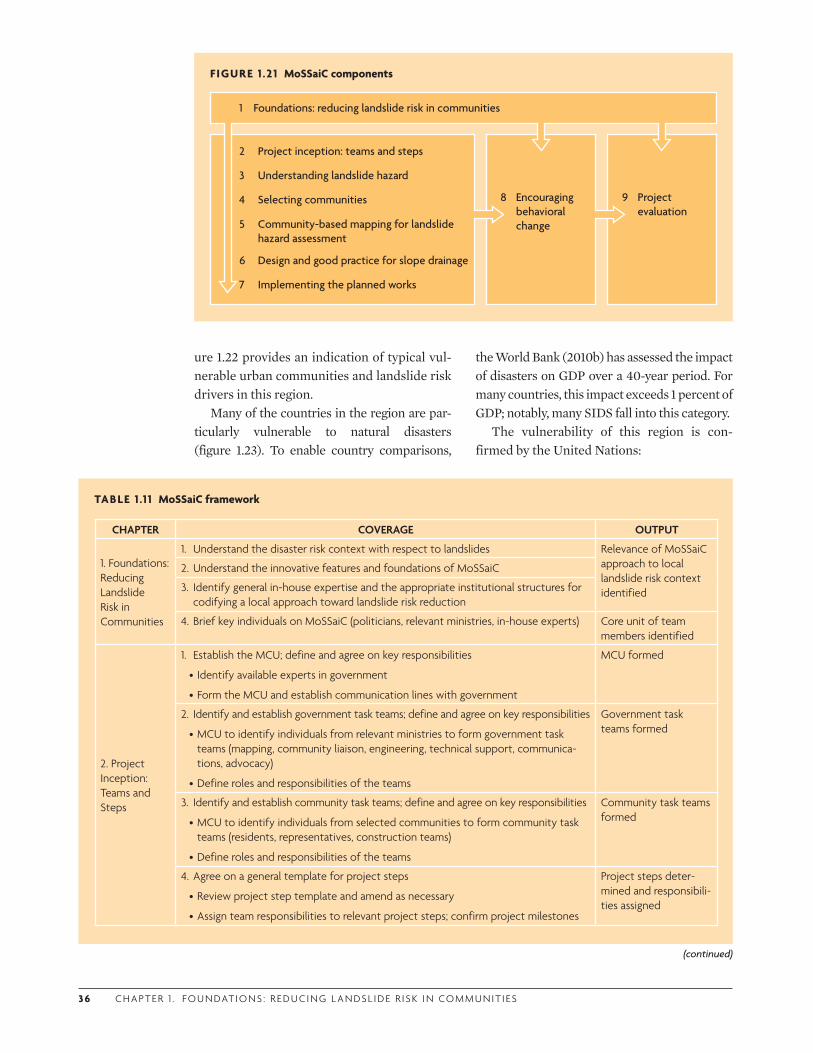
3 6 C H A P T E R 1 . F O U N DAT I O N S : R E D U C I N G L A N DS L I D E R I S K I N CO M M U N I T I ES
TABLE 1 .1 1 MoSSaiC framework
CHAPTER COVERAGE OUTPUT
1. Foundations: Reducing Landslide Risk in Communities
1. Understand the disaster risk context with respect to landslides Relevance of MoSSaiC approach to local landslide risk context identified
2. Understand the innovative features and foundations of MoSSaiC
3. Identify general in-house expertise and the appropriate institutional structures for codifying a local approach toward landslide risk reduction
4. Brief key individuals on MoSSaiC (politicians, relevant ministries, in-house experts) Core unit of team members identified
2. Project Inception: Teams and Steps
1. Establish the MCU; define and agree on key responsibilities
• Identify available experts in government
•Form the MCU and establish communication lines with government
MCU formed
2. Identify and establish government task teams; define and agree on key responsibilities
•MCU to identify individuals from relevant ministries to form government task teams (mapping, community liaison, engineering, technical support, communica-tions, advocacy)
•Define roles and responsibilities of the teams
Government task teams formed
3. Identify and establish community task teams; define and agree on key responsibilities
•MCU to identify individuals from selected communities to form community task teams (residents, representatives, construction teams)
•Define roles and responsibilities of the teams
Community task teams formed
4. Agree on a general template for project steps
•Review project step template and amend as necessary
•Assign team responsibilities to relevant project steps; confirm project milestones
Project steps deter-mined and responsibili-ties assigned
FIGURE 1 .21 MoSSaiC components
Projectevaluation
9Encouraging behavioral change
8
1 Foundations: reducing landslide risk in communities
Understanding landslide hazard3
Selecting communities4
Project inception: teams and steps2
Community-based mapping for landslide hazard assessment
5
Implementing the planned works7
Design and good practice for slope drainage6
ure 1.22 provides an indication of typical vul-nerable urban communities and landslide risk drivers in this region.
Many of the countries in the region are par-ticularly vulnerable to natural disasters (figure 1.23). To enable country comparisons,
the World Bank (2010b) has assessed the impact of disasters on GDP over a 40-year period. For many countries, this impact exceeds 1 percent of GDP; notably, many SIDS fall into this category.
The vulnerability of this region is con-firmed by the United Nations:
(continued)
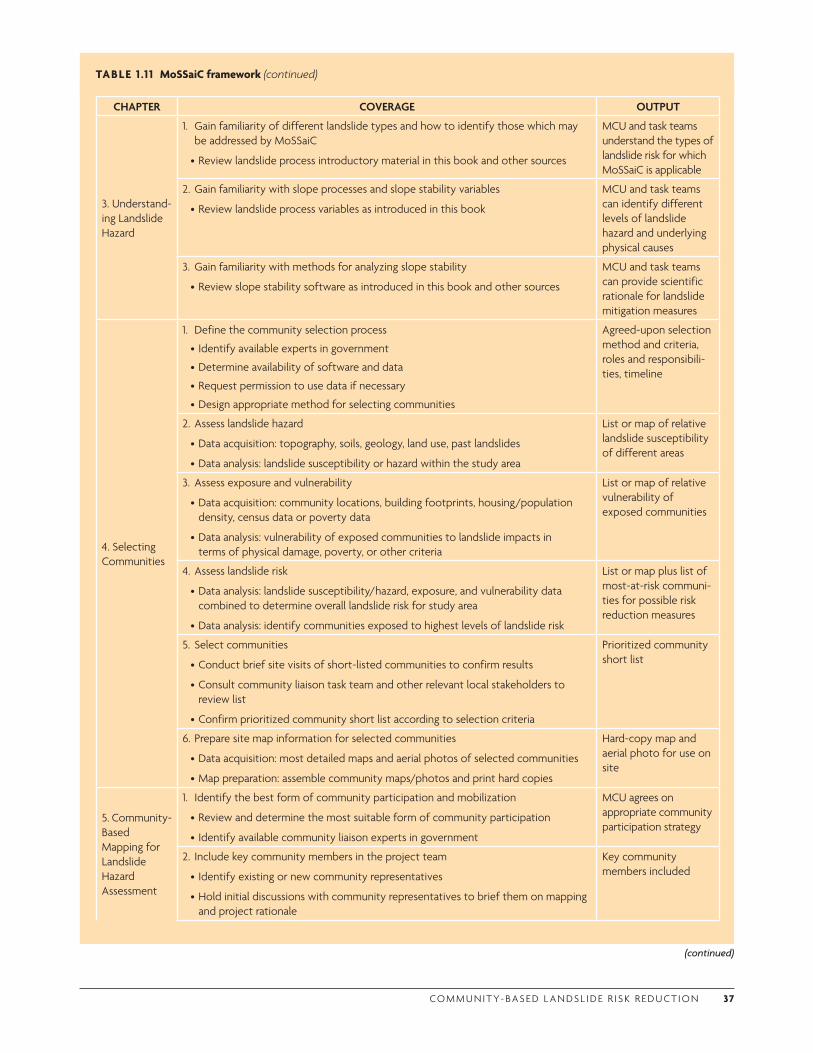
CO M M U N I T Y- BA S E D L A N DS L I D E R I S K R E D U CT I O N 37
(continued)
CHAPTER COVERAGE OUTPUT
3. Understand-ing Landslide Hazard
1. Gain familiarity of different landslide types and how to identify those which may be addressed by MoSSaiC
•Review landslide process introductory material in this book and other sources
MCU and task teams understand the types of landslide risk for which MoSSaiC is applicable
2. Gain familiarity with slope processes and slope stability variables
•Review landslide process variables as introduced in this book
MCU and task teams can identify different levels of landslide hazard and underlying physical causes
3. Gain familiarity with methods for analyzing slope stability
•Review slope stability software as introduced in this book and other sources
MCU and task teams can provide scientific rationale for landslide mitigation measures
4. Selecting Communities
1. Define the community selection process
• Identify available experts in government
•Determine availability of software and data
•Request permission to use data if necessary
•Design appropriate method for selecting communities
Agreed-upon selection method and criteria, roles and responsibili-ties, timeline
2. Assess landslide hazard
•Data acquisition: topography, soils, geology, land use, past landslides
•Data analysis: landslide susceptibility or hazard within the study area
List or map of relative landslide susceptibility of different areas
3. Assess exposure and vulnerability
•Data acquisition: community locations, building footprints, housing/population density, census data or poverty data
•Data analysis: vulnerability of exposed communities to landslide impacts in terms of physical damage, poverty, or other criteria
List or map of relative vulnerability of exposed communities
4. Assess landslide risk
•Data analysis: landslide susceptibility/hazard, exposure, and vulnerability data combined to determine overall landslide risk for study area
•Data analysis: identify communities exposed to highest levels of landslide risk
List or map plus list of most-at-risk communi-ties for possible risk reduction measures
5. Select communities
•Conduct brief site visits of short-listed communities to confirm results
•Consult community liaison task team and other relevant local stakeholders to review list
•Confirm prioritized community short list according to selection criteria
Prioritized community short list
6. Prepare site map information for selected communities
•Data acquisition: most detailed maps and aerial photos of selected communities
•Map preparation: assemble community maps/photos and print hard copies
Hard-copy map and aerial photo for use on site
5. Community-Based Mapping for Landslide Hazard Assessment
1. Identify the best form of community participation and mobilization
•Review and determine the most suitable form of community participation
• Identify available community liaison experts in government
MCU agrees on appropriate community participation strategy
2. Include key community members in the project team
• Identify existing or new community representatives
•Hold initial discussions with community representatives to brief them on mapping and project rationale
Key community members included
TABLE 1 .1 1 MoSSaiC framework (continued)
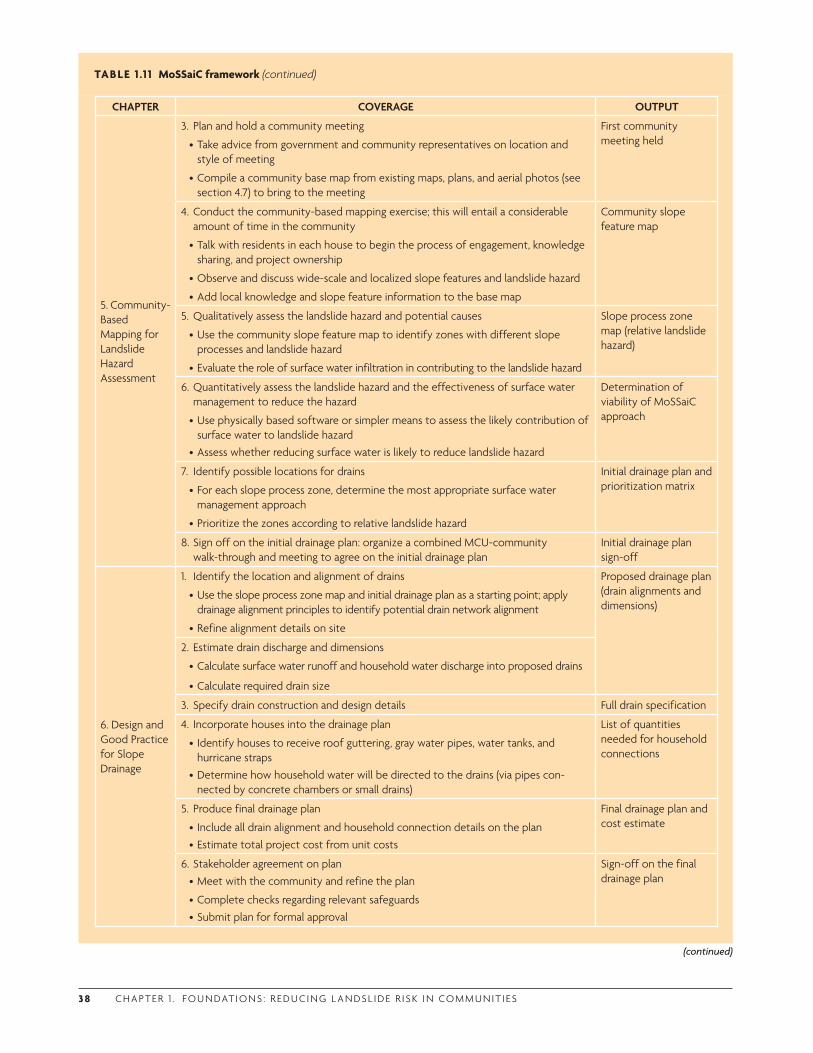
3 8 C H A P T E R 1 . F O U N DAT I O N S : R E D U C I N G L A N DS L I D E R I S K I N CO M M U N I T I ES
CHAPTER COVERAGE OUTPUT
5. Community-Based Mapping for Landslide Hazard Assessment
3. Plan and hold a community meeting
•Take advice from government and community representatives on location and style of meeting
•Compile a community base map from existing maps, plans, and aerial photos (see section 4.7) to bring to the meeting
First community meeting held
4. Conduct the community-based mapping exercise; this will entail a considerable amount of time in the community
•Talk with residents in each house to begin the process of engagement, knowledge sharing, and project ownership
•Observe and discuss wide-scale and localized slope features and landslide hazard
•Add local knowledge and slope feature information to the base map
Community slope feature map
5. Qualitatively assess the landslide hazard and potential causes
•Use the community slope feature map to identify zones with different slope processes and landslide hazard
•Evaluate the role of surface water infiltration in contributing to the landslide hazard
Slope process zone map (relative landslide hazard)
6. Quantitatively assess the landslide hazard and the effectiveness of surface water management to reduce the hazard
•Use physically based software or simpler means to assess the likely contribution of surface water to landslide hazard•Assess whether reducing surface water is likely to reduce landslide hazard
Determination of viability of MoSSaiC approach
7. Identify possible locations for drains
•For each slope process zone, determine the most appropriate surface water management approach
•Prioritize the zones according to relative landslide hazard
Initial drainage plan and prioritization matrix
8. Sign off on the initial drainage plan: organize a combined MCU-community walk-through and meeting to agree on the initial drainage plan
Initial drainage plan sign-off
6. Design and Good Practice for Slope Drainage
1. Identify the location and alignment of drains
•Use the slope process zone map and initial drainage plan as a starting point; apply drainage alignment principles to identify potential drain network alignment
•Refine alignment details on site
Proposed drainage plan (drain alignments and dimensions)
2. Estimate drain discharge and dimensions
•Calculate surface water runoff and household water discharge into proposed drains
•Calculate required drain size
3. Specify drain construction and design details Full drain specification
4. Incorporate houses into the drainage plan
• Identify houses to receive roof guttering, gray water pipes, water tanks, and hurricane straps•Determine how household water will be directed to the drains (via pipes con-
nected by concrete chambers or small drains)
List of quantities needed for household connections
5. Produce final drainage plan
• Include all drain alignment and household connection details on the plan•Estimate total project cost from unit costs
Final drainage plan and cost estimate
6. Stakeholder agreement on plan•Meet with the community and refine the plan
•Complete checks regarding relevant safeguards •Submit plan for formal approval
Sign-off on the final drainage plan
TABLE 1 .1 1 MoSSaiC framework (continued)
(continued)

CO M M U N I T Y- BA S E D L A N DS L I D E R I S K R E D U CT I O N 39
CHAPTER COVERAGE OUTPUT
7. Implement-ing the Planned Works
1. Prepare work package and request for tender documentation
•Prepare a bill of quantities for the planned works
• Incorporate appropriate contingency and any double-handling costs (i.e., where material has to be delivered to sites where access is difficult and requires the establishment of a storage site between delivery and construction site locations)
•Decide on work package size that maximizes community engagement and meets procurement requirements
•Prepare design drawings and plans to accompany each work package
• Identify an appropriate plan for procuring materials depending on the community contracting approach, community capacity, and project procurement requirements
Work packages for implementation of drainage intervention to reduce landslide hazard
2. Conduct the agreed-upon community contracting tendering process
• Identify potential contractors from the community and provide briefing on proposed works and work packages, emphasizing the need for good construction practice
• Invite tenders from contractors, providing assistance or training on how to submit a tender document
•Evaluate tenders, award contracts, and brief contractors on safeguards
Briefing meeting for contractors held; community contracts awarded
3. Implement construction
•Select experienced site supervisors
•Authorize start of construction and meet with the community to discuss the construction process and introduce site supervisors
•Closely supervise the works to ensure good construction practices; clear commu-nication among contractors, supervisors, community, and the MoSSaiC core unit; and timely disbursement of funds for procurement of materials and payment of contractors/laborers
Briefing meeting for community held; construction under way
4. Sign off on completed construction
• Identify outstanding works
•Arrange for any necessary repairs or minor modifications
•Sign off on completed construction and pay withholding payments to contractors
Construction completed and signed off on
8. Encouraging Behavioral Change
1. Understand how new practices are adopted
•Use the steps in the ladder of adoption and behavioral change model to identify communication and capacity-building needs in each community and in govern-ment
•Understand stakeholder perceptions and the role of community participation
Assessment of aspects of behavioral change to be addressed by communication and capacity-building activities
2. Design a communication strategy
•Review existing resources and methodologies for designing a communication strategy
• Identify communication purposes and audiences
•Select forms of communication and design messages
Communication strategy
3. Design a capacity-building strategy
•Review knowledge into action approaches
• Identify levels of capacity, capacity requirements, and activities for building capacity
Capacity-building strategy
4. Plan for postproject maintenance
•Understand the need for incorporating maintenance into drain design and project planning
Project maintenance options
5. Map out the complete behavioral change strategy
•Map the agreed-upon behavioral change strategies and associated actions
Map of capacity-building strategies
TABLE 1 .1 1 MoSSaiC framework (continued)
(continued)
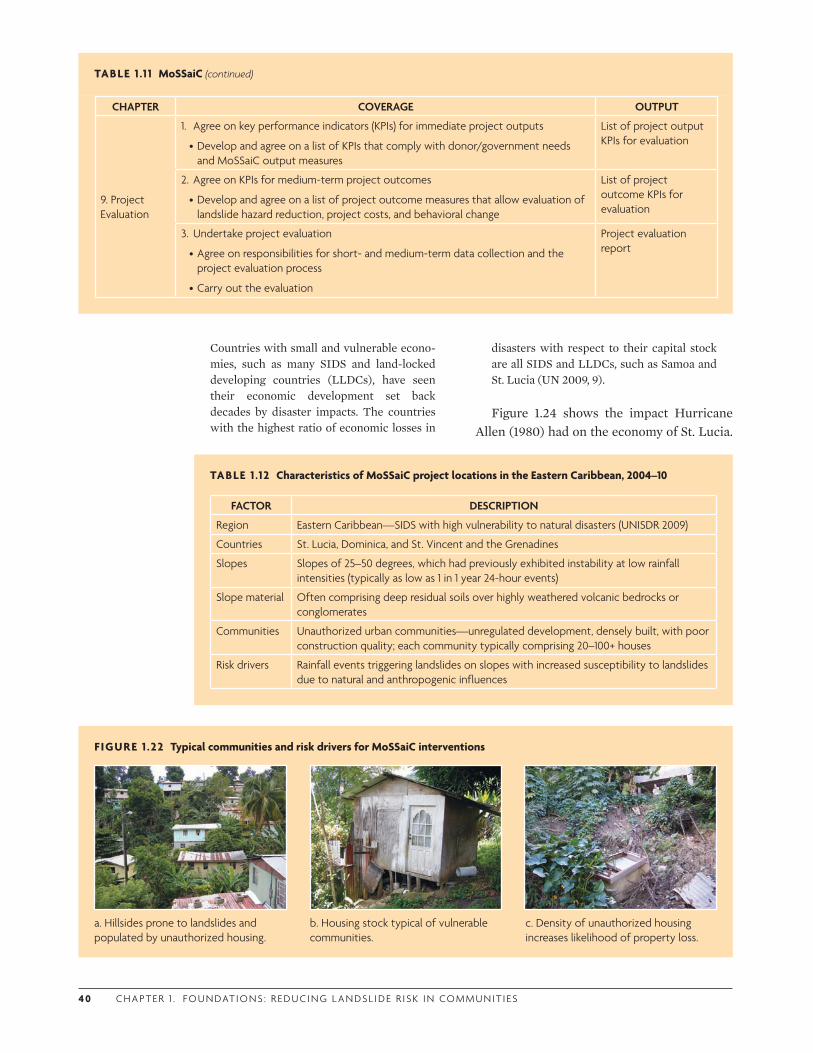
4 0 C H A P T E R 1 . F O U N DAT I O N S : R E D U C I N G L A N DS L I D E R I S K I N CO M M U N I T I ES
TABLE 1 .12 Characteristics of MoSSaiC project locations in the Eastern Caribbean, 2004–10
FACTOR DESCRIPTION
Region Eastern Caribbean—SIDS with high vulnerability to natural disasters (UNISDR 2009)
Countries St. Lucia, Dominica, and St. Vincent and the Grenadines
Slopes Slopes of 25–50 degrees, which had previously exhibited instability at low rainfall intensities (typically as low as 1 in 1 year 24-hour events)
Slope material Often comprising deep residual soils over highly weathered volcanic bedrocks or conglomerates
Communities Unauthorized urban communities—unregulated development, densely built, with poor construction quality; each community typically comprising 20–100+ houses
Risk drivers Rainfall events triggering landslides on slopes with increased susceptibility to landslides due to natural and anthropogenic influences
FIGURE 1 .22 Typical communities and risk drivers for MoSSaiC interventions
a. Hillsides prone to landslides and populated by unauthorized housing.
b. Housing stock typical of vulnerable communities.
c. Density of unauthorized housing increases likelihood of property loss.
CHAPTER COVERAGE OUTPUT
9. Project Evaluation
1. Agree on key performance indicators (KPIs) for immediate project outputs
•Develop and agree on a list of KPIs that comply with donor/government needs and MoSSaiC output measures
List of project output KPIs for evaluation
2. Agree on KPIs for medium-term project outcomes
•Develop and agree on a list of project outcome measures that allow evaluation of landslide hazard reduction, project costs, and behavioral change
List of project outcome KPIs for evaluation
3. Undertake project evaluation
•Agree on responsibilities for short- and medium-term data collection and the project evaluation process
•Carry out the evaluation
Project evaluation report
TABLE 1 .1 1 MoSSaiC (continued)
Countries with small and vulnerable econo-mies, such as many SIDS and land-locked developing countries (LLDCs), have seen their economic development set back decades by disaster impacts. The countries with the highest ratio of economic losses in
disasters with respect to their capital stock are all SIDS and LLDCs, such as Samoa and St. Lucia (UN 2009, 9).
Figure 1.24 shows the impact Hurricane Allen (1980) had on the economy of St. Lucia.
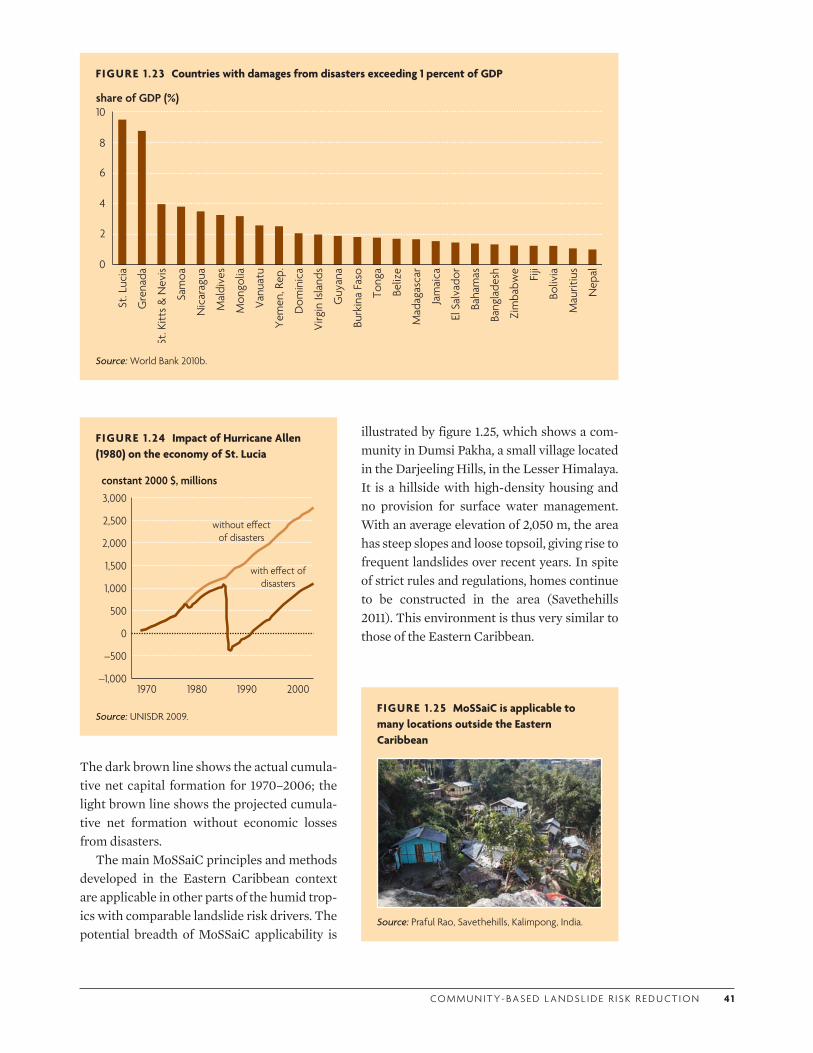
CO M M U N I T Y- BA S E D L A N DS L I D E R I S K R E D U CT I O N 4 1
F IGURE 1 .23 Countries with damages from disasters exceeding 1 percent of GDP
share of GDP (%)10
8
6
4
2
0
Nep
al
Boliv
iaFiji
Zim
babw
e
Bang
lade
sh
Baha
mas
El S
alva
dor
Jam
aica
Mad
agas
car
Beliz
e
Tong
a
Burk
ina
Faso
Guy
ana
Virg
in Is
land
s
Dom
inic
a
Yem
en, R
ep.
Vanu
atu
Mon
golia
Mal
dive
s
Nic
arag
ua
Sam
oa
St. K
itts
& N
evis
Gre
nada
St. L
ucia
Mau
ritiu
s
Source: World Bank 2010b.
FIGURE 1 .24 Impact of Hurricane Allen (1980) on the economy of St. Lucia
constant 2000 $, millions
–1,000
–500
0
500
1,000
1,500
2,000
2,500
3,000
1970 1980 1990 2000
without e ectof disasters
with e ect ofdisasters
Source: UNISDR 2009.
The dark brown line shows the actual cumula-tive net capital formation for 1970–2006; the light brown line shows the projected cumula-tive net formation without economic losses from disasters.
The main MoSSaiC principles and methods developed in the Eastern Caribbean context are applicable in other parts of the humid trop-ics with comparable landslide risk drivers. The potential breadth of MoSSaiC applicability is
illustrated by figure 1.25, which shows a com-munity in Dumsi Pakha, a small village located in the Darjeeling Hills, in the Lesser Himalaya. It is a hillside with high-density housing and no provision for surface water management. With an average elevation of 2,050 m, the area has steep slopes and loose topsoil, giving rise to frequent landslides over recent years. In spite of strict rules and regulations, homes continue to be constructed in the area (Savethehills 2011). This environment is thus very similar to those of the Eastern Caribbean.
FIGURE 1 .25 MoSSaiC is applicable to many locations outside the Eastern Caribbean
Source: Praful Rao, Savethehills, Kalimpong, India.
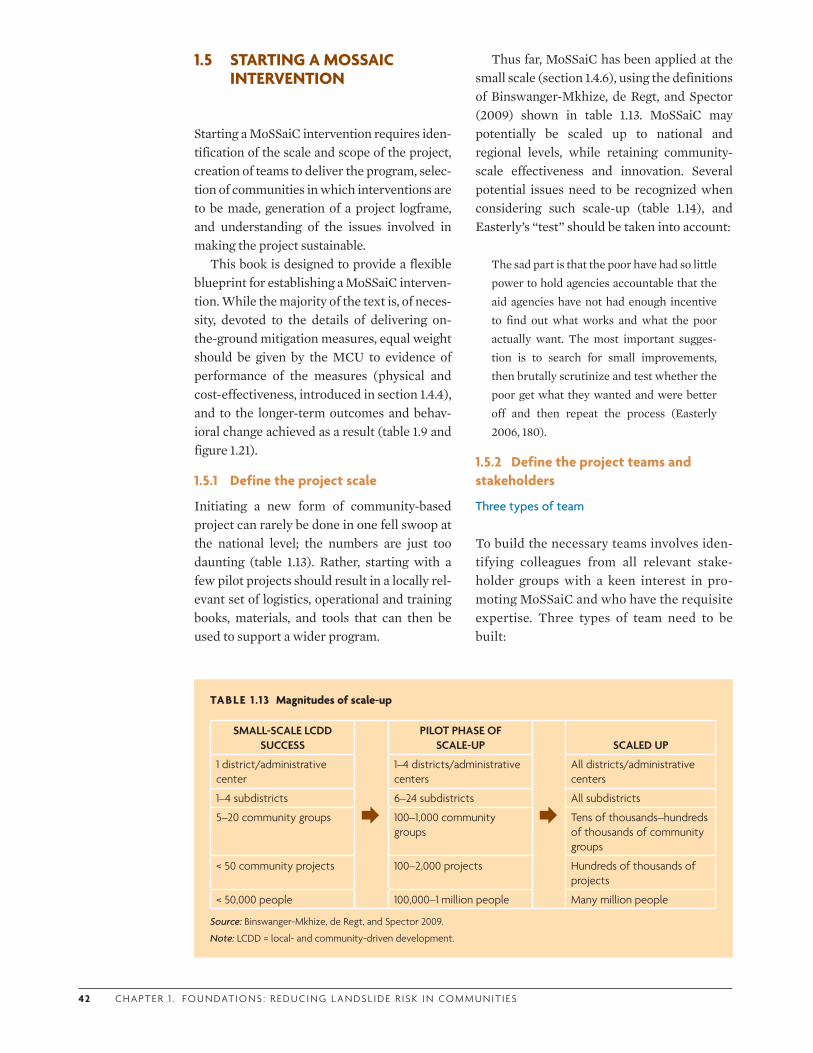
42 C H A P T E R 1 . F O U N DAT I O N S : R E D U C I N G L A N DS L I D E R I S K I N CO M M U N I T I ES
TABLE 1 .13 Magnitudes of scale-up
SMALL-SCALE LCDD SUCCESS
PILOT PHASE OF SCALE-UP
SCALED UP
1 district/administrative center
1–4 districts/administrative centers
All districts/administrative centers
1–4 subdistricts 6–24 subdistricts All subdistricts
5–20 community groups 100–1,000 community groups
Tens of thousands–hundreds of thousands of community groups
< 50 community projects 100–2,000 projects Hundreds of thousands of projects
< 50,000 people 100,000–1 million people Many million people
Source: Binswanger-Mkhize, de Regt, and Spector 2009.
Note: LCDD = local- and community-driven development.
1.5 STARTING A MOSSAIC INTERVENTION
Starting a MoSSaiC intervention requires iden-tification of the scale and scope of the project, creation of teams to deliver the program, selec-tion of communities in which interventions are to be made, generation of a project logframe, and understanding of the issues involved in making the project sustainable.
This book is designed to provide a flexible blueprint for establishing a MoSSaiC interven-tion. While the majority of the text is, of neces-sity, devoted to the details of delivering on-the-ground mitigation measures, equal weight should be given by the MCU to evidence of performance of the measures (physical and cost-effectiveness, introduced in section 1.4.4), and to the longer-term outcomes and behav-ioral change achieved as a result (table 1.9 and figure 1.21).
1.5.1 Define the project scale
Initiating a new form of community-based project can rarely be done in one fell swoop at the national level; the numbers are just too daunting (table 1.13). Rather, starting with a few pilot projects should result in a locally rel-evant set of logistics, operational and training books, materials, and tools that can then be used to support a wider program.
Thus far, MoSSaiC has been applied at the small scale (section 1.4.6), using the definitions of Binswanger-Mkhize, de Regt, and Spector (2009) shown in table 1.13. MoSSaiC may potentially be scaled up to national and regional levels, while retaining community-scale effectiveness and innovation. Several potential issues need to be recognized when considering such scale-up (table 1.14), and Easterly’s “test” should be taken into account:
The sad part is that the poor have had so little power to hold agencies accountable that the aid agencies have not had enough incentive to find out what works and what the poor actually want. The most important sugges-tion is to search for small improvements, then brutally scrutinize and test whether the poor get what they wanted and were better off and then repeat the process (Easterly 2006, 180).
1.5.2 Define the project teams and stakeholders
Three types of team
To build the necessary teams involves iden-tifying colleagues from all relevant stake-holder groups with a keen interest in pro-moting MoSSaiC and who have the requisite expertise. Three types of team need to be built:
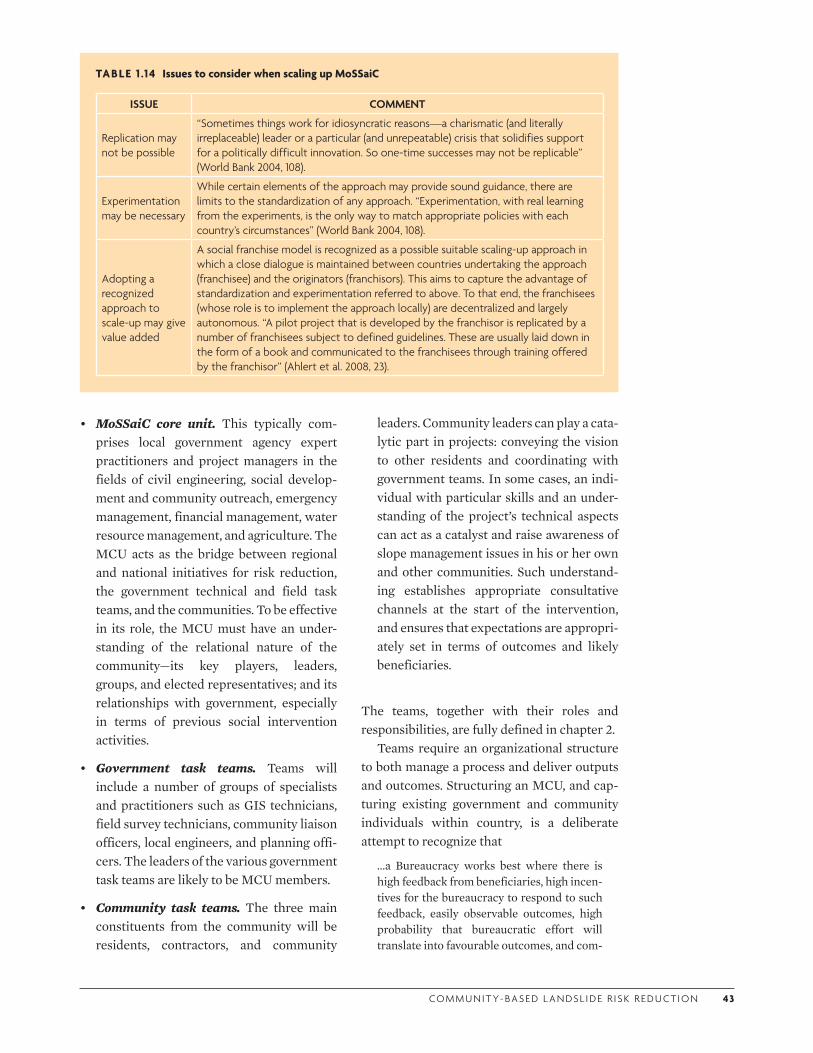
CO M M U N I T Y- BA S E D L A N DS L I D E R I S K R E D U CT I O N 43
• MoSSaiC core unit. This typically com-prises local government agency expert practitioners and project managers in the fields of civil engineering, social develop-ment and community outreach, emergency management, financial management, water resource management, and agriculture. The MCU acts as the bridge between regional and national initiatives for risk reduction, the government technical and field task teams, and the communities. To be effective in its role, the MCU must have an under-standing of the relational nature of the community—its key players, leaders, groups, and elected representatives; and its relationships with government, especially in terms of previous social intervention activities.
• Government task teams. Teams will include a number of groups of specialists and practitioners such as GIS technicians, field survey technicians, community liaison officers, local engineers, and planning offi-cers. The leaders of the various government task teams are likely to be MCU members.
• Community task teams. The three main constituents from the community will be residents, contractors, and community
leaders. Community leaders can play a cata-lytic part in projects: conveying the vision to other residents and coordinating with government teams. In some cases, an indi-vidual with particular skills and an under-standing of the project’s technical aspects can act as a catalyst and raise awareness of slope management issues in his or her own and other communities. Such understand-ing establishes appropriate consultative channels at the start of the intervention, and ensures that expectations are appropri-ately set in terms of outcomes and likely beneficiaries.
The teams, together with their roles and responsibilities, are fully defined in chapter 2.
Teams require an organizational structure to both manage a process and deliver outputs and outcomes. Structuring an MCU, and cap-turing existing government and community individuals within country, is a deliberate attempt to recognize that
…a Bureaucracy works best where there is high feedback from beneficiaries, high incen-tives for the bureaucracy to respond to such feedback, easily observable outcomes, high probability that bureaucratic effort will translate into favourable outcomes, and com-
TABLE 1 .14 Issues to consider when scaling up MoSSaiC
ISSUE COMMENT
Replication may not be possible
“Sometimes things work for idiosyncratic reasons—a charismatic (and literally irreplaceable) leader or a particular (and unrepeatable) crisis that solidifies support for a politically difficult innovation. So one-time successes may not be replicable” (World Bank 2004, 108).
Experimentation may be necessary
While certain elements of the approach may provide sound guidance, there are limits to the standardization of any approach. “Experimentation, with real learning from the experiments, is the only way to match appropriate policies with each country’s circumstances” (World Bank 2004, 108).
Adopting a recognized approach to scale-up may give value added
A social franchise model is recognized as a possible suitable scaling-up approach in which a close dialogue is maintained between countries undertaking the approach (franchisee) and the originators (franchisors). This aims to capture the advantage of standardization and experimentation referred to above. To that end, the franchisees (whose role is to implement the approach locally) are decentralized and largely autonomous. “A pilot project that is developed by the franchisor is replicated by a number of franchisees subject to defined guidelines. These are usually laid down in the form of a book and communicated to the franchisees through training offered by the franchisor” (Ahlert et al. 2008, 23).
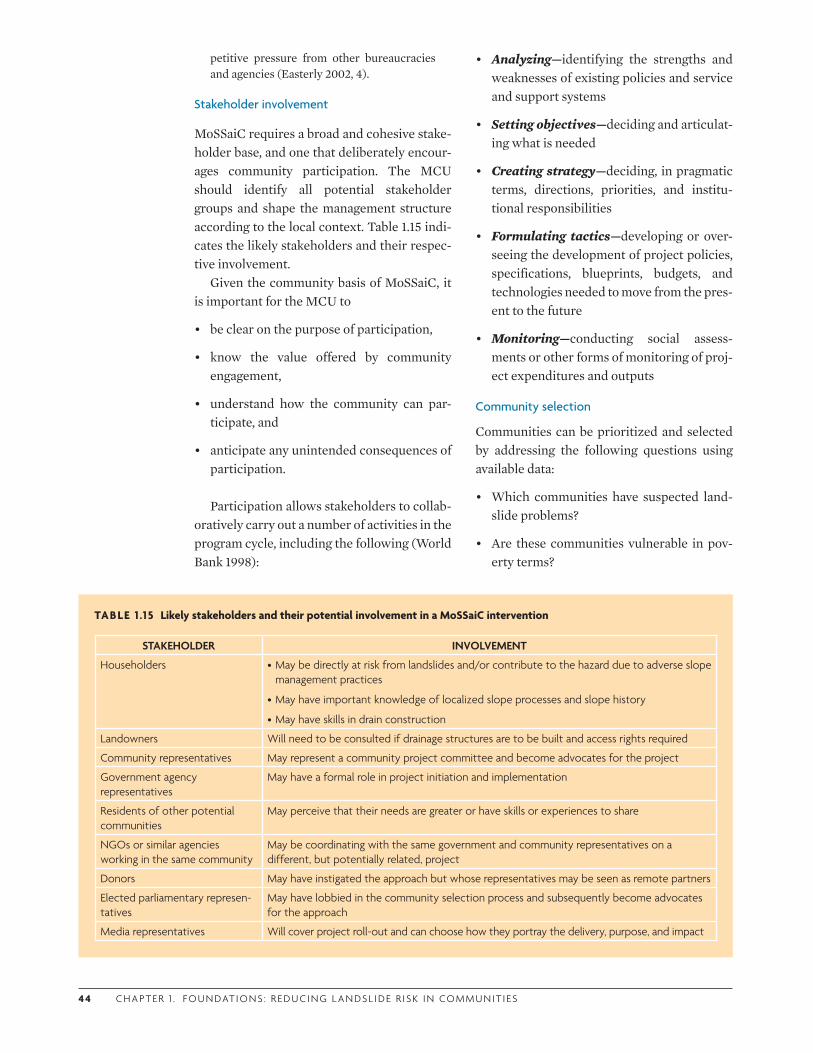
4 4 C H A P T E R 1 . F O U N DAT I O N S : R E D U C I N G L A N DS L I D E R I S K I N CO M M U N I T I ES
TABLE 1 .15 Likely stakeholders and their potential involvement in a MoSSaiC intervention
STAKEHOLDER INVOLVEMENT
Householders •May be directly at risk from landslides and/or contribute to the hazard due to adverse slope management practices
•May have important knowledge of localized slope processes and slope history
•May have skills in drain construction
Landowners Will need to be consulted if drainage structures are to be built and access rights required
Community representatives May represent a community project committee and become advocates for the project
Government agency representatives
May have a formal role in project initiation and implementation
Residents of other potential communities
May perceive that their needs are greater or have skills or experiences to share
NGOs or similar agencies working in the same community
May be coordinating with the same government and community representatives on a different, but potentially related, project
Donors May have instigated the approach but whose representatives may be seen as remote partners
Elected parliamentary represen-tatives
May have lobbied in the community selection process and subsequently become advocates for the approach
Media representatives Will cover project roll-out and can choose how they portray the delivery, purpose, and impact
petitive pressure from other bureaucracies and agencies (Easterly 2002, 4).
Stakeholder involvement
MoSSaiC requires a broad and cohesive stake-holder base, and one that deliberately encour-ages community participation. The MCU should identify all potential stakeholder groups and shape the management structure according to the local context. Table 1.15 indi-cates the likely stakeholders and their respec-tive involvement.
Given the community basis of MoSSaiC, it is important for the MCU to
• be clear on the purpose of participation,
• know the value offered by community engagement,
• understand how the community can par-ticipate, and
• anticipate any unintended consequences of participation.
Participation allows stakeholders to collab-oratively carry out a number of activities in the program cycle, including the following (World Bank 1998):
• Analyzing—identifying the strengths and weaknesses of existing policies and service and support systems
• Setting objectives—deciding and articulat-ing what is needed
• Creating strategy—deciding, in pragmatic terms, directions, priorities, and institu-tional responsibilities
• Formulating tactics—developing or over-seeing the development of project policies, specifications, blueprints, budgets, and technologies needed to move from the pres-ent to the future
• Monitoring—conducting social assess-ments or other forms of monitoring of proj-ect expenditures and outputs
Community selection
Communities can be prioritized and selected by addressing the following questions using available data:
• Which communities have suspected land-slide problems?
• Are these communities vulnerable in pov-erty terms?
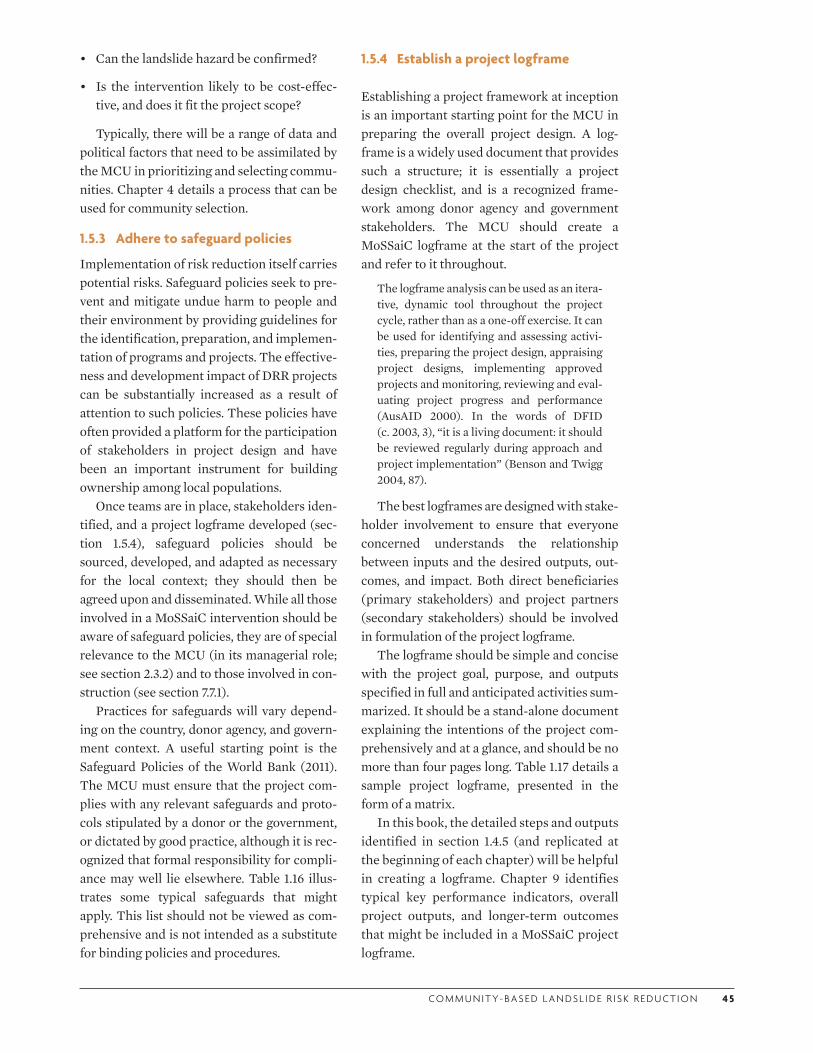
CO M M U N I T Y- BA S E D L A N DS L I D E R I S K R E D U CT I O N 4 5
• Can the landslide hazard be confirmed?
• Is the intervention likely to be cost-effec-tive, and does it fit the project scope?
Typically, there will be a range of data and political factors that need to be assimilated by the MCU in prioritizing and selecting commu-nities. Chapter 4 details a process that can be used for community selection.
1.5.3 Adhere to safeguard policies
Implementation of risk reduction itself carries potential risks. Safeguard policies seek to pre-vent and mitigate undue harm to people and their environment by providing guidelines for the identification, preparation, and implemen-tation of programs and projects. The effective-ness and development impact of DRR projects can be substantially increased as a result of attention to such policies. These policies have often provided a platform for the participation of stakeholders in project design and have been an important instrument for building ownership among local populations.
Once teams are in place, stakeholders iden-tified, and a project logframe developed (sec-tion 1.5.4), safeguard policies should be sourced, developed, and adapted as necessary for the local context; they should then be agreed upon and disseminated. While all those involved in a MoSSaiC intervention should be aware of safeguard policies, they are of special relevance to the MCU (in its managerial role; see section 2.3.2) and to those involved in con-struction (see section 7.7.1).
Practices for safeguards will vary depend-ing on the country, donor agency, and govern-ment context. A useful starting point is the Safeguard Policies of the World Bank (2011). The MCU must ensure that the project com-plies with any relevant safeguards and proto-cols stipulated by a donor or the government, or dictated by good practice, although it is rec-ognized that formal responsibility for compli-ance may well lie elsewhere. Table 1.16 illus-trates some typical safeguards that might apply. This list should not be viewed as com-prehensive and is not intended as a substitute for binding policies and procedures.
1.5.4 Establish a project logframe
Establishing a project framework at inception is an important starting point for the MCU in preparing the overall project design. A log-frame is a widely used document that provides such a structure; it is essentially a project design checklist, and is a recognized frame-work among donor agency and government stakeholders. The MCU should create a MoSSaiC logframe at the start of the project and refer to it throughout.
The logframe analysis can be used as an itera-tive, dynamic tool throughout the project cycle, rather than as a one-off exercise. It can be used for identifying and assessing activi-ties, preparing the project design, appraising project designs, implementing approved projects and monitoring, reviewing and eval-uating project progress and performance (AusAID 2000). In the words of DFID (c. 2003, 3), “it is a living document: it should be reviewed regularly during approach and project implementation” (Benson and Twigg 2004, 87).
The best logframes are designed with stake-holder involvement to ensure that everyone concerned understands the relationship between inputs and the desired outputs, out-comes, and impact. Both direct beneficiaries (primary stakeholders) and project partners (secondary stakeholders) should be involved in formulation of the project logframe.
The logframe should be simple and concise with the project goal, purpose, and outputs specified in full and anticipated activities sum-marized. It should be a stand-alone document explaining the intentions of the project com-prehensively and at a glance, and should be no more than four pages long. Table 1.17 details a sample project logframe, presented in the form of a matrix.
In this book, the detailed steps and outputs identified in section 1.4.5 (and replicated at the beginning of each chapter) will be helpful in creating a logframe. Chapter 9 identifies typical key performance indicators, overall project outputs, and longer-term outcomes that might be included in a MoSSaiC project logframe.
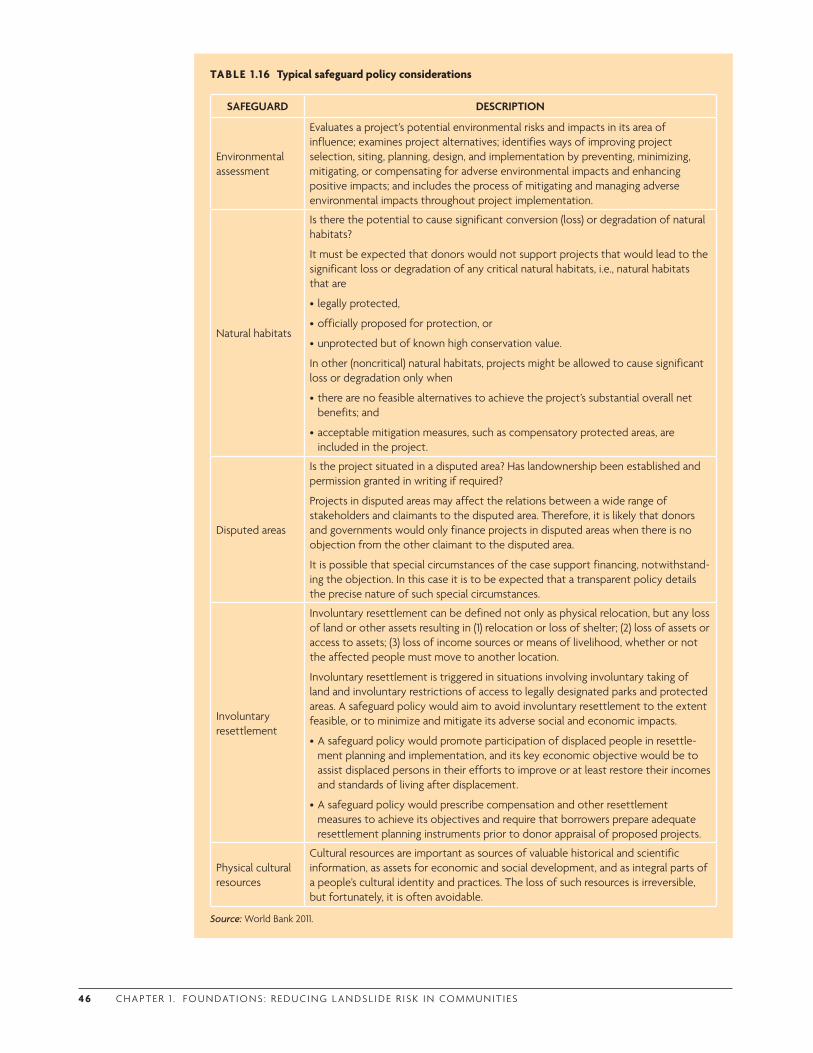
4 6 C H A P T E R 1 . F O U N DAT I O N S : R E D U C I N G L A N DS L I D E R I S K I N CO M M U N I T I ES
TABLE 1 .16 Typical safeguard policy considerations
SAFEGUARD DESCRIPTION
Environmental assessment
Evaluates a project’s potential environmental risks and impacts in its area of influence; examines project alternatives; identifies ways of improving project selection, siting, planning, design, and implementation by preventing, minimizing, mitigating, or compensating for adverse environmental impacts and enhancing positive impacts; and includes the process of mitigating and managing adverse environmental impacts throughout project implementation.
Natural habitats
Is there the potential to cause significant conversion (loss) or degradation of natural habitats?
It must be expected that donors would not support projects that would lead to the significant loss or degradation of any critical natural habitats, i.e., natural habitats that are
• legally protected,
•officially proposed for protection, or
•unprotected but of known high conservation value.
In other (noncritical) natural habitats, projects might be allowed to cause significant loss or degradation only when
•there are no feasible alternatives to achieve the project’s substantial overall net benefits; and
•acceptable mitigation measures, such as compensatory protected areas, are included in the project.
Disputed areas
Is the project situated in a disputed area? Has landownership been established and permission granted in writing if required?
Projects in disputed areas may affect the relations between a wide range of stakeholders and claimants to the disputed area. Therefore, it is likely that donors and governments would only finance projects in disputed areas when there is no objection from the other claimant to the disputed area.
It is possible that special circumstances of the case support financing, notwithstand-ing the objection. In this case it is to be expected that a transparent policy details the precise nature of such special circumstances.
Involuntary resettlement
Involuntary resettlement can be defined not only as physical relocation, but any loss of land or other assets resulting in (1) relocation or loss of shelter; (2) loss of assets or access to assets; (3) loss of income sources or means of livelihood, whether or not the affected people must move to another location.
Involuntary resettlement is triggered in situations involving involuntary taking of land and involuntary restrictions of access to legally designated parks and protected areas. A safeguard policy would aim to avoid involuntary resettlement to the extent feasible, or to minimize and mitigate its adverse social and economic impacts.
•A safeguard policy would promote participation of displaced people in resettle-ment planning and implementation, and its key economic objective would be to assist displaced persons in their efforts to improve or at least restore their incomes and standards of living after displacement.
•A safeguard policy would prescribe compensation and other resettlement measures to achieve its objectives and require that borrowers prepare adequate resettlement planning instruments prior to donor appraisal of proposed projects.
Physical cultural resources
Cultural resources are important as sources of valuable historical and scientific information, as assets for economic and social development, and as integral parts of a people’s cultural identity and practices. The loss of such resources is irreversible, but fortunately, it is often avoidable.
Source: World Bank 2011.
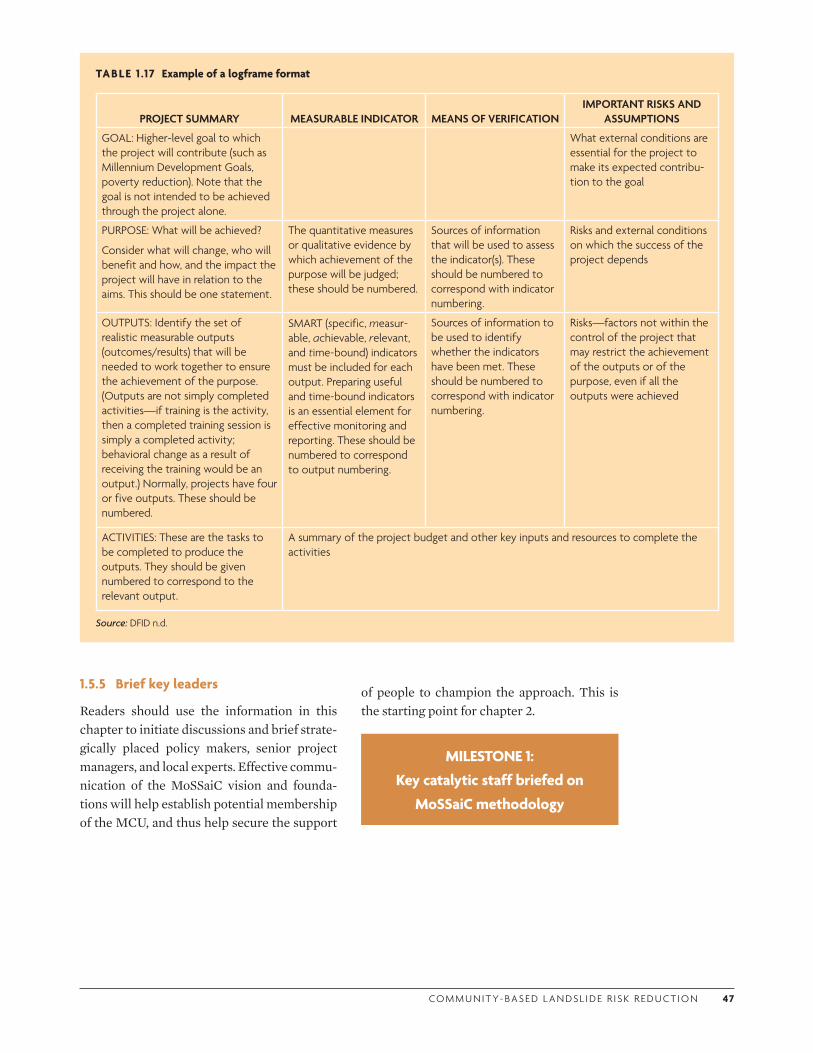
CO M M U N I T Y- BA S E D L A N DS L I D E R I S K R E D U CT I O N 47
1.5.5 Brief key leaders
Readers should use the information in this chapter to initiate discussions and brief strate-gically placed policy makers, senior project managers, and local experts. Effective commu-nication of the MoSSaiC vision and founda-tions will help establish potential membership of the MCU, and thus help secure the support
TABLE 1 .17 Example of a logframe format
PROJECT SUMMARY MEASURABLE INDICATOR MEANS OF VERIFICATION IMPORTANT RISKS AND
ASSUMPTIONS
GOAL: Higher-level goal to which the project will contribute (such as Millennium Development Goals, poverty reduction). Note that the goal is not intended to be achieved through the project alone.
What external conditions are essential for the project to make its expected contribu-tion to the goal
PURPOSE: What will be achieved?
Consider what will change, who will benefit and how, and the impact the project will have in relation to the aims. This should be one statement.
The quantitative measures or qualitative evidence by which achievement of the purpose will be judged; these should be numbered.
Sources of information that will be used to assess the indicator(s). These should be numbered to correspond with indicator numbering.
Risks and external conditions on which the success of the project depends
OUTPUTS: Identify the set of realistic measurable outputs (outcomes/results) that will be needed to work together to ensure the achievement of the purpose. (Outputs are not simply completed activities—if training is the activity, then a completed training session is simply a completed activity; behavioral change as a result of receiving the training would be an output.) Normally, projects have four or five outputs. These should be numbered.
SMART (specific, measur-able, achievable, relevant, and time-bound) indicators must be included for each output. Preparing useful and time-bound indicators is an essential element for effective monitoring and reporting. These should be numbered to correspond to output numbering.
Sources of information to be used to identify whether the indicators have been met. These should be numbered to correspond with indicator numbering.
Risks—factors not within the control of the project that may restrict the achievement of the outputs or of the purpose, even if all the outputs were achieved
ACTIVITIES: These are the tasks to be completed to produce the outputs. They should be given numbered to correspond to the relevant output.
A summary of the project budget and other key inputs and resources to complete the activities
Source: DFID n.d.
MILESTONE 1: Key catalytic staff briefed on
MoSSaiC methodology
of people to champion the approach. This is the starting point for chapter 2.
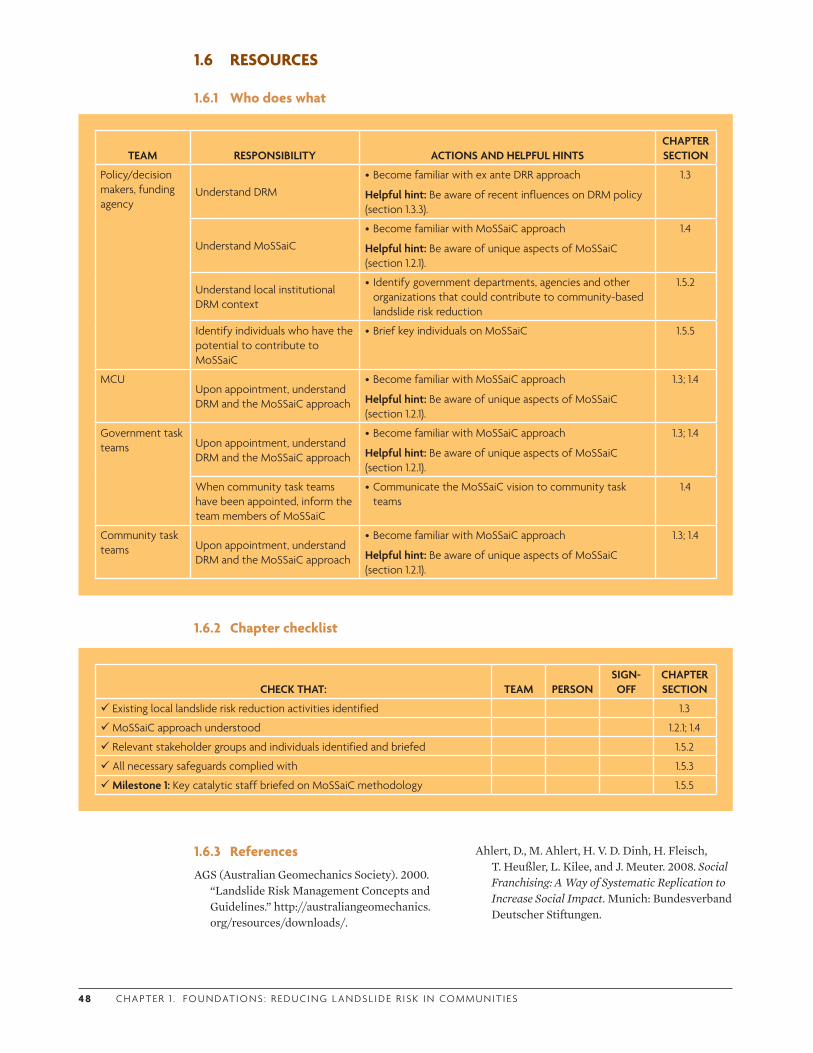
4 8 C H A P T E R 1 . F O U N DAT I O N S : R E D U C I N G L A N DS L I D E R I S K I N CO M M U N I T I ES
TEAM RESPONSIBILITY ACTIONS AND HELPFUL HINTSCHAPTER SECTION
Policy/decision makers, funding agency
Understand DRM•Become familiar with ex ante DRR approach
Helpful hint: Be aware of recent influences on DRM policy (section 1.3.3).
1.3
Understand MoSSaiC•Become familiar with MoSSaiC approach
Helpful hint: Be aware of unique aspects of MoSSaiC (section 1.2.1).
1.4
Understand local institutional DRM context
• Identify government departments, agencies and other organizations that could contribute to community-based landslide risk reduction
1.5.2
Identify individuals who have the potential to contribute to MoSSaiC
•Brief key individuals on MoSSaiC 1.5.5
MCUUpon appointment, understand DRM and the MoSSaiC approach
•Become familiar with MoSSaiC approach
Helpful hint: Be aware of unique aspects of MoSSaiC (section 1.2.1).
1.3; 1.4
Government task teams Upon appointment, understand
DRM and the MoSSaiC approach
•Become familiar with MoSSaiC approach
Helpful hint: Be aware of unique aspects of MoSSaiC (section 1.2.1).
1.3; 1.4
When community task teams have been appointed, inform the team members of MoSSaiC
•Communicate the MoSSaiC vision to community task teams
1.4
Community task teams Upon appointment, understand
DRM and the MoSSaiC approach
•Become familiar with MoSSaiC approach
Helpful hint: Be aware of unique aspects of MoSSaiC (section 1.2.1).
1.3; 1.4
CHECK THAT: TEAM PERSONSIGN-OFF
CHAPTER SECTION
Existing local landslide risk reduction activities identified 1.3
MoSSaiC approach understood 1.2.1; 1.4
Relevant stakeholder groups and individuals identified and briefed 1.5.2
All necessary safeguards complied with 1.5.3
Milestone 1: Key catalytic staff briefed on MoSSaiC methodology 1.5.5
1.6 RESOURCES
1.6.1 Who does what
1.6.2 Chapter checklist
1.6.3 References
AGS (Australian Geomechanics Society). 2000. “Landslide Risk Management Concepts and Guidelines.” http://australiangeomechanics.org/resources/downloads/.
Ahlert, D., M. Ahlert, H. V. D. Dinh, H. Fleisch, T. Heußler, L. Kilee, and J. Meuter. 2008. Social Franchising: A Way of Systematic Replication to Increase Social Impact. Munich: Bundesverband Deutscher Stiftungen.
CO M M U N I T Y- BA S E D L A N DS L I D E R I S K R E D U CT I O N 4 9
Alcántara-Ayala, I. 2002. “Geomorphology, Natural Hazards, Vulnerability and Prevention of Natural Disasters in Developing Countries.” Geomorphology 47: 107–24.
Anderson, M. G., and E. A. Holcombe. 2006. “Sustainable Landslide Risk Reduction in Poorer Countries.” Proceedings of the Institution of Civil Engineers—Engineering Sustainability 159: 23–30.
Anderson, M. G., E. A. Holcombe, M. Esquivel, J. Toro, and F. Ghesquiere. 2010. “The Efficacy of a Programme of Landslide Risk Reduction in Areas of Unplanned Housing in the Eastern Caribbean.” Environmental Management 45 (4): 807–21.
Angel, S. 2000. Housing Policy Matters. Oxford: Oxford University Press.
Annan, K. A. 1999. “UN Report of the Secretary-General on the Work of the Organization General.” Assembly Official Records Fifty-Fourth Session Supplement No. 1 (A/54/1). http://www.un.org/Docs/SG/Report99/intro99.htm.
AusAID (Australian Agency for International Development). 2000. “The Logical Framework Approach.” AusGUIDElines 1, AusAID. Cited in Benson and Twigg (2004).
Benson, C., and J. Twigg. 2004. “Measuring Mitigation Methodologies for Assessing Natural Hazard Risks and the Net Benefits of Mitigation—A Scoping Study.” ProVention Consortium, Geneva.
—. 2007. “Tools for Mainstreaming Disaster Risk Reduction: Guidance Notes for Development Organisations.” ProVention Consortium, Geneva.
Binswanger-Mkhize, H. P., J. P. de Regt, and S. Spector, eds. 2009. Scaling Up Local & Community Driven Development (LCDD): A Real World Guide to Its Theory and Practice. Washington, DC: World Bank.
Blaikie, P., T. Cannon, I. Davis, and B. Wisner. 1994. At Risk: Natural Hazards, People’s Vulnerability, and Disasters. 1st ed. London: Routledge.
Bloom, D. E., and T. Khanna. 2007. “The Urban Revolution.” Finance & Development 9. http://www.imf.org/external/pubs/ft/fandd/2007/09/pdf/bloom.pdf.
Board on Natural Disasters. 1999. “Mitigation Emerges as Major Strategy for Reducing Losses
Caused by Natural Disasters.” Science 284: 1943–47.
Bull-Kamanga, L., K. Diagne, A. Lavell, E. Leon, F. Lerise, H. MacGregor, A. Maskrey, M. Meshack, M. Pelling, H. Reid, D. Satterthwaite, J. Songsore, K. Westgate, and A. Yitambe. 2003. “From Everyday Hazards to Disasters: The Accumulation of Risk in Urban Areas.” Environment and Urbanization 15 (1): 193–203.
Bunce, C. M., D. M. Cruden, and N. R. Morgenstern. 1995. “Hazard Assessment for Rock Fall on a Highway.” In Proceedings of the 48th Canadian Geotechnical Conference, 449–508. Vancouver.
CCRIF (Caribbean Catastrophe Risk Insurance Facility). 2012. “The Caribbean Catastrophe Risk Insurance Facility.” http://www.ccrif.org/content/about-us.
Charveriat, C. 2000. “Natural Disasters in Latin America and the Caribbean: An Overview of Risk.” Working Paper No. 434, Inter-American Development Bank, Washington, DC.
Crompton, R. P., and K. J. McAneney. 2008. “Normalised Australian Insured Losses from Meteorological Hazards: 1967–2006.” Environmental Science & Policy 11: 371–78.
Crompton, R. P., K. J. McAneney, K. Chen, R. A. Pielke Jr., and K. Haynes. 2010. “Influence of Location, Population and Climate on Building Damage and Fatalities due to Australian Bushfire: 1925–2009.” Weather, Climate and Society 2: 300–10.
Crozier, M., and T. Glade. 2005. “Landslide Hazard and Risk: Issues, Concepts and Approach.” In Landslide Hazard and Risk, ed. T. Glade, M. G. Anderson, and M. Crozier, 1–40. Chichester, UK: Wiley.
Curtis, D. 2004. “How We Think They Think: Thought Styles in the Management of International Aid.” Policy Administration and Development 24: 415–23.
Dai, F. C., C. F. Lee, and Y. Y. Ngai. 2002. “Landslide Risk Assessment and Management: An Overview.” Engineering Geology 64: 65–87.
de Silva, S., and J. W. Sum. 2008. “Social Funds as an Instrument of Social Protection: Analysis of Lending Trends.” HNPSP Paper, World Bank, Washington, DC. http://documents.worldbank.org/curated/en/2008/07/9806577/social-funds-instrument-social-protection-analysis-lending-trends-fy2000-2007.
5 0 C H A P T E R 1 . F O U N DAT I O N S : R E D U C I N G L A N DS L I D E R I S K I N CO M M U N I T I ES
DFID (Department for International Development). n.d. “CSCF Monitoring, Evaluation and Lesson Learning Guidelines.” http://www.dfid.gov.uk/Documents/funding/civilsocietycf-lesson-guidelines.pdf.
—. 2003. “Logical Frameworks.” In Tools for Development: A Handbook for Those Engaged in Development Activity. London: DFID. Cited in Benson and Twigg (2004).
—. 2004. Disaster Risk Reduction: A Development Concern. London: DFID.
Easterly, W. 2002. “The Cartel of Good Intentions: The Problem of Bureaucracy in Foreign Aid Cartel of Good intentions.” Working Paper 4, Center for Global Development, Washington, DC. http://papers.ssrn.com/sol3/papers.cfm?abstract_id=999981.
—. 2006. The White Man’s Burden. Oxford: Oxford University Press.
Glade, T., and M. J. Crozier. 2005. “A Review of Scale Dependency in Landslide Hazard and Risk Analysis.” In Landslide Hazard and Risk, ed. T. Glade, M. G. Anderson, and M. J. Crozier, 75–138. Chichester, UK: Wiley.
Green, R., S. Miles, and W. Svekla. 2009. “Situation Assessment in Villa Nueva Prospects for an Urban Disaster Risk Reduction Program in Guatemala City’s Precarious Settlements.” Institute Working Paper 2009, 1, Western Washington University, Bellingham, WA.
Ho, K. K. S., E. Leroi, and W. J. Roberds. 2000. “Quantitative Risk Assessment—Application, Myths and Future Directions. In Proceedings of the International Conference on Geotechnical & Geological Engineering (GeoEng 2000), vol. 1, 269–312. Melbourne.
Hochrainer-Stigler, S., H. Kunreuther, J. Linnerooth-Bayer, R. Mechler, E. Michel-Kerjan, R. Muir-Wood, N. Ranger, P. Vaziri, and M. Young. 2010. “The Costs and Benefits of Reducing Risk from Natural Hazards to Residential Structures in Developing Countries.” Working Paper 2011-01, Wharton Risk Management and Decision Process Center, University of Pennsylvania, Philadelphia.
Holcombe, E. A., S. Smith, E. Wright, and M. G. Anderson. 2011. “An Integrated Approach for Evaluating the Effectiveness of Landslide Hazard Reduction in Vulnerable Communities in the Caribbean.” Natural Hazards. doi:10.1007/s11069-011-9920-7.
Hong, Y., R. Adler, and G. Huffman. 2006. “Evaluation of the Potential of NASA Multi-Satellite Precipitation Analysis in Global Landslide Hazard Assessment.” Geophysical Research Letters 33: L22402. doi:10.1029/2006GL028010.
IDB (Inter-American Development Bank). 2005. “Preliminary Companion Paper to the Draft Disaster Risk Management Policy.” IDB, Washington, DC.
IEG (Independent Evaluation Group). 2006. Hazards of Nature, Risks to Development: World Bank Assistance for Natural Disasters. Washington, DC: World Bank.
IFRC (International Federation of Red Cross and Red Crescent Societies). 2004. World Disasters Report. http://www.ifrc.org/en/publications-and-reports/world-disasters-report/previous-issues/.
Knutson, T. R., J. L. McBride, J. Chan, K. Emanuel, G. Holland, C. Landsea, I. Held, J. P. Kossin, A. K. Srivastava, and M. Sugi. 2010. “Tropical Cyclones and Climate Change.” Nature Geosciences 3: 157–63.
Kunreuther, H. 2009. “At War with the Weather and Other Extreme Events: Managing Large-Scale Risks in a New Era of Catastrophes.” Presentation made at the London School of Economics. http://www.cccep.ac.uk/Events/Past/2009/MunichReEvents2009/Seminar_Kunreuther_Oct10.pdf.
Kunreuther, H., R. Meyer, and M. E. Kerjan. Forthcoming. “Overcoming Decision Biases to Reduce Losses from Natural Catastrophes.” In Behavioral Foundations of Policy, ed. E. Shafir. Princeton: Princeton University Press.
Lee, E. M., and D. K. C. Jones. 2004. Landslide Risk Assessment. London: Thomas Telford Publishing.
Lloyd-Jones, T. 2006. Mind the Gap! Post-Disaster Reconstruction and the Transition from Humanitarian Relief. London: Royal Institute of Chartered Surveyors. http://www.rics.org/site/download_feed.aspx?fileID=2263&fileExtension=PDF.
Lumb, P. 1975. “Slope Failures in Hong Kong.” Quarterly Journal of Engineering Geology 8: 31–65.
Lynn, Jonathan. 2009. “World ‘Sleepwalking’ into Disasters: U.N. Aid Chief.” Reuters. http://www.reuters.com/article/worldNews/idUSTRE55F3Z320090616.
CO M M U N I T Y- BA S E D L A N DS L I D E R I S K R E D U CT I O N 5 1
Mann, M. E., and A. E. Kerry. 2006. “Atlantic Hurricane Trends Linked to Climate Change.” EOS 87: 233–44.
Maskrey, A. 1989. Disaster Mitigation: A Community Based Approach. Development Guidelines No. 3. Oxford: Oxfam.
—. 1992. “Defining the Community’s Role in Disaster Mitigation.” Appropriate Technology Magazine 19 (3). http://practicalaction.org/practicalanswers/product_info.php?products_id=214.
Mechler, R., J. Linnerooth-Bayer, and D. Peppiatt. 2006. Disaster Insurance for the Poor? A Review of Microinsurance for Natural Disaster Risk in Developing Countries. Geneva: ProVention Consortium/International Institute for Applied Systems Analysis.
Mechler, R., S. Hochrainer, G. Pflug, A. Lotsch, and K. Williges. 2010. “Assessing the Financial Vulnerability to Climate-Related Natural Hazards: Background Paper for the World Development Report 2010 ‘Development and Climate Change.’” Policy Research Working Paper 5232, World Bank, Washington, DC.
Meyer, R. J. 2005. “Why We Under-Prepare for Hazards.” The Wharton School, University of Pennsylvania, Philadelphia.
Moench, M., R. Mechler, and S. Stapleton. 2007. “Guidance Note on the Costs and Benefits of Disaster Risk Reduction.” Prepared for UNISDR Global Platform on Disaster Risk Reduction High Level Dialogue, June 4–7.
OAS (Organization of American States). 2004. “Managing Natural Hazard Risk.” Policy Series #4. OAS, Washington, DC.
Olshansky, R. B. 1996. “Planning for Hillside Development.” Planning Advisory Service Report 466, American Planning Association.
Opadeyi, S., S. Ali, and F. Chin. 2005. “Status of Hazard Maps, Vulnerability Assessments and Digital Maps in the Caribbean.” Final report. Caribbean Disaster Emergency Response Agency.
Ostrom, E., C. Gibson, S. Shivakumar, and K. Andersson. 2001. “Aid, Incentives, and Sustainability: An Institutional Analysis of Development Cooperation.” Sida Studies in Evaluation Report 02/01, Stockholm.
Ou-Yang, C. 2010. “Mitigating Losses from Climate Change through Insurance.” The Wharton School, University of Pennsylvania,
Philadelphia. http://rmi.gsu.edu/Research/downloads/2010/Chieh_Mitigating_Losses_Climate_Change_070810.pdf.
Pelling, M., and C. High. 2005. “Understanding Adaptation: What Can Social Capital Offer Assessments of Adaptive Capacity?” Global Environmental Change 15 (4): 308–19.
Pelling, M., and J. L. Uitto. 2001. “Small Island Developing States: Natural Disaster Vulnerability and Global Change.” Global Environmental Change Part B: Environmental Hazards 3: 49–62.
Pielke Jr., R. A., J. Gratz, C. W. Landsea, D. Collins, M. Saunders, and R. Musulin. 2008. “Normalized Hurricane Damages in the United States: 1900–2005.” Natural Hazards Review 9 (1): 29–42.
Rasmussen, T. N. 2004. “Macro Economic Impacts of Natural Disasters in the Caribbean.” Working Paper WP/04/224, International Monetary Fund, Washington, DC.
Savethehills. 2011. “Working with the Communities 2011—Dumsi Pakha Village, Kalimpong.” Blog entry January 9. http://savethehills.blogspot.com/2011/01/working-with-communities-2011-dumsi.html.
Schuster, R. L., and L. M. Highland. 2007. “The Third Hans Cloos Lecture. Urban Landslides: Socioeconomic Impacts and Overview of Mitigative Strategies.” Bulletin of Engineering Geology and the Environment 66: 1–27.
Siri, G. 2006. “Targeting Assistance toward Those Most Affected by Disasters: The Role of Social Investment Funds.” Draft, Disaster Management Facility, World Bank, Washington, DC.
Soubbotina, T. P. 2004. Beyond Economic Growth: Meeting the Challenges of Global Development. WBI Learning Resources Series. Washington, DC: World Bank.
Spence, M. 2011. The Next Convergence: The Future of Economic Growth in a Multispeed World. New York: Farrar, Straus and Giroux.
Sweikar, M., I. Mandadjiev, K. McCann, and G. Wikel. 2006. “Disaster Risk Reduction: Mapping the Advocacy Landscape.” Center for Public Policy Research, College of William and Mary, Williamsburg, VA. http://www.wm.edu/as/publicpolicy/documents/prs/care.pdf.
Twigg, J. 2001. Corporate Social Responsibility and Disaster Reduction: A Global Overview. London: Hazard Research Centre, University College.
52 C H A P T E R 1 . F O U N DAT I O N S : R E D U C I N G L A N DS L I D E R I S K I N CO M M U N I T I ES
—. 2004. “Disaster Risk Reduction: Mitigation and Preparedness.” Development and Emergency Programming Good Practice Review 9.
UN (United Nations). 2007. World Population Prospects: The 2006 Revision. New York: UN. Cited in Bloom and Khanna (2007).
UN (United Nations). 2009. “Summary and Recommendations: Global Assessment Report on Disaster Risk Reduction: Risk and Poverty in a Changing Climate.” http://www.preventionweb.net/files/9414_GARsummary.pdf.
UN-Habitat. 2005. Global Urban Observatory database. Cited in Bloom and Khanna (2007).
UNDP (United Nations Development Programme). 2004. Reducing Disaster Risk: A Challenge for Development. New York: UNDP Bureau for Crisis Prevention and Recovery.
—. 2008. “A Guide to the Vulnerability Reduction Assessment.” UNDP Working Paper.
UNISDR (United Nations Office for Disaster Risk Reduction). 2009. “Chapter 2. Global Disaster Risk: Patterns, Trends and Drivers.” In Global Assessment Report on Disaster Risk Reduction. http://www.preventionweb.net/english/hyogo/gar/report/documents/GAR_Chapter_2_2009_eng.pdf.
—. 2012. “United Nations International Strategy for Disaster Reduction, Climate Change.” www.unisdr.org/we/advocate/climate-change.
UNU (United Nations University). 2006. “Landslides. Asia Has the Most; Americas, the Deadliest; Europe, the Costliest; Experts Seek Ways to Mitigate Landslide Losses; Danger Said Growing Due To Climate Change, Other Causes.” News Release MR/E01/06/rev1.
USGS (U.S. Geological Survey). 2003. National Landslide Hazards Mitigation Strategy—A Framework for Loss Reduction. Washington, DC: USGS.
Wamsler, C. 2006. “Mainstreaming Risk Reduction in Urban Planning and Housing: A Challenge for International Aid Organizations.” Disaster 30: 151–77.
—. 2007. “Bridging the Gaps: Stakeholder-Based Strategies for Risk Reduction and Financing for the Urban Poor.” Environment and Urbanization 19: 115.
Wharton School. 2008. Managing Large-Scale Risks in a New Era of Catastrophes: Insuring, Mitigating and Financing Recovery from Natural Disasters in the United States. http://opim.wharton.upenn.edu/risk/library/Wharton_LargeScaleRisks_FullReport_2008.pdf.
World Bank. 1998. Participation and Social Assessment: Tools and Techniques. Washington, DC: World Bank.
—. 2004. Making Services Work for Poor People. World Development Report. Washington, DC: World Bank.
—. 2005. Grenada: A Nation Rebuilding. An Assessment of Reconstruction and Economic Recovery One Year after Hurricane Ivan. Washington, DC: World Bank.
—. 2007. Community Based Disaster Risk Management, India. http://go.worldbank.org/0A4B712DW0.
—. 2009. Urbanization and Growth: Commission on Growth and Development. Washington, DC: World Bank.
—. 2010a. Development and Climate Change. World Development Report. Washington, DC: World Bank.
—. 2010b. Natural Hazards Unnatural Disasters: The Economics of Effective Prevention. Washington, DC: World Bank.
—. 2010c. Safer Homes, Stronger Communities. A Handbook for Reconstructing after Natural Disasters. Washington, DC: World Bank.
—. 2011. “Safeguard Policies.” http://go.worldbank.org/WTA1ODE7T0.
Zaitchik, B. F., and H. M. van Es. 2003. “Applying a GIS Slope-Stability Model to Site-Specific Landslide Prevention in Honduras.” Journal of Soil and Water Conservation 58: 45–53.

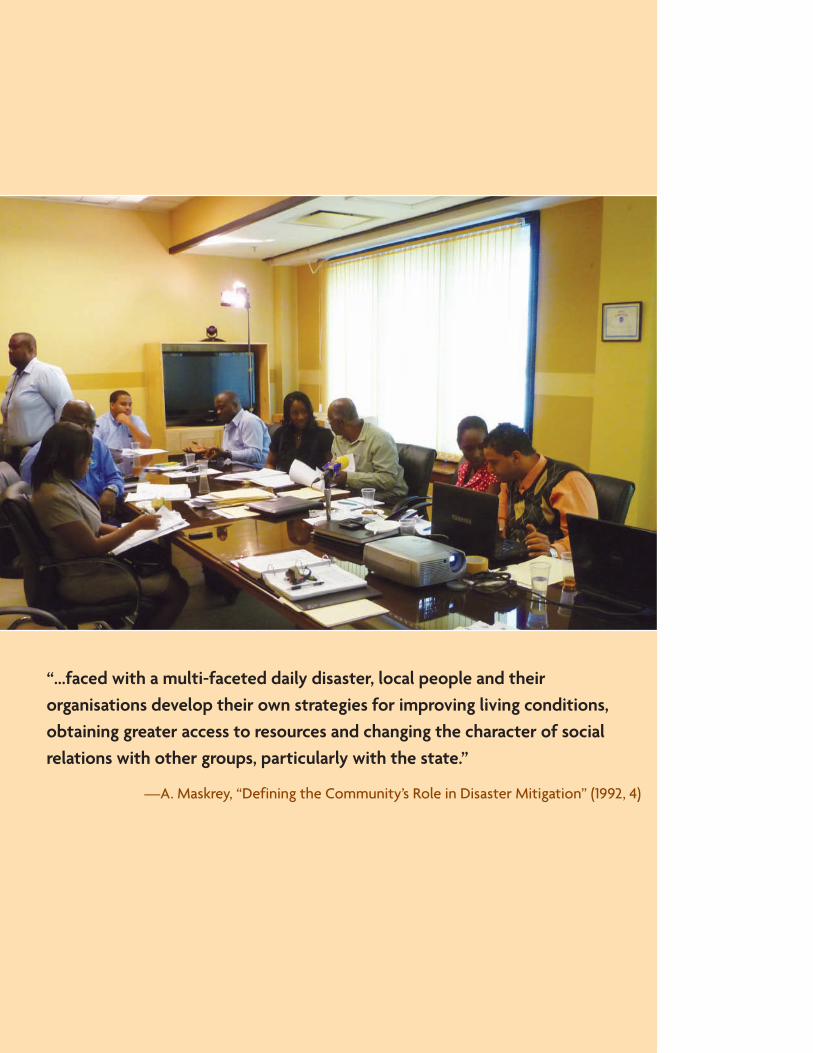
“…faced with a multi-faceted daily disaster, local people and their organisations develop their own strategies for improving living conditions, obtaining greater access to resources and changing the character of social relations with other groups, particularly with the state.”
—A. Maskrey, “Defining the Community’s Role in Disaster Mitigation” (1992, 4)
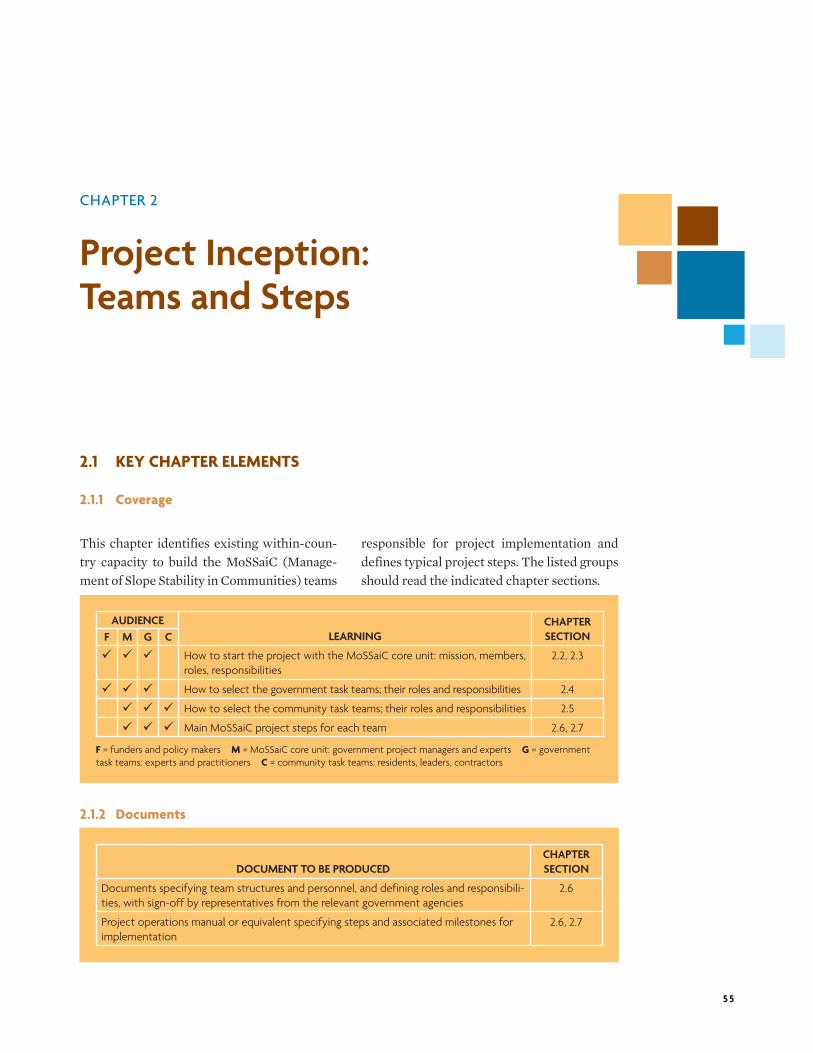
5 5
CHAPTER 2
Project Inception: Teams and Steps
2.1 KEY CHAPTER ELEMENTS
2.1.1 Coverage
This chapter identifies existing within-coun-try capacity to build the MoSSaiC (Manage-ment of Slope Stability in Communities) teams
responsible for project implementation and defines typical project steps. The listed groups should read the indicated chapter sections.
AUDIENCELEARNING
CHAPTER SECTIONF M G C
How to start the project with the MoSSaiC core unit: mission, members, roles, responsibilities
2.2, 2.3
How to select the government task teams; their roles and responsibilities 2.4
How to select the community task teams; their roles and responsibilities 2.5
Main MoSSaiC project steps for each team 2.6, 2.7
F = funders and policy makers M = MoSSaiC core unit: government project managers and experts G = government task teams: experts and practitioners C = community task teams: residents, leaders, contractors
2.1.2 Documents
DOCUMENT TO BE PRODUCEDCHAPTER SECTION
Documents specifying team structures and personnel, and defining roles and responsibili-ties, with sign-off by representatives from the relevant government agencies
2.6
Project operations manual or equivalent specifying steps and associated milestones for implementation
2.6, 2.7
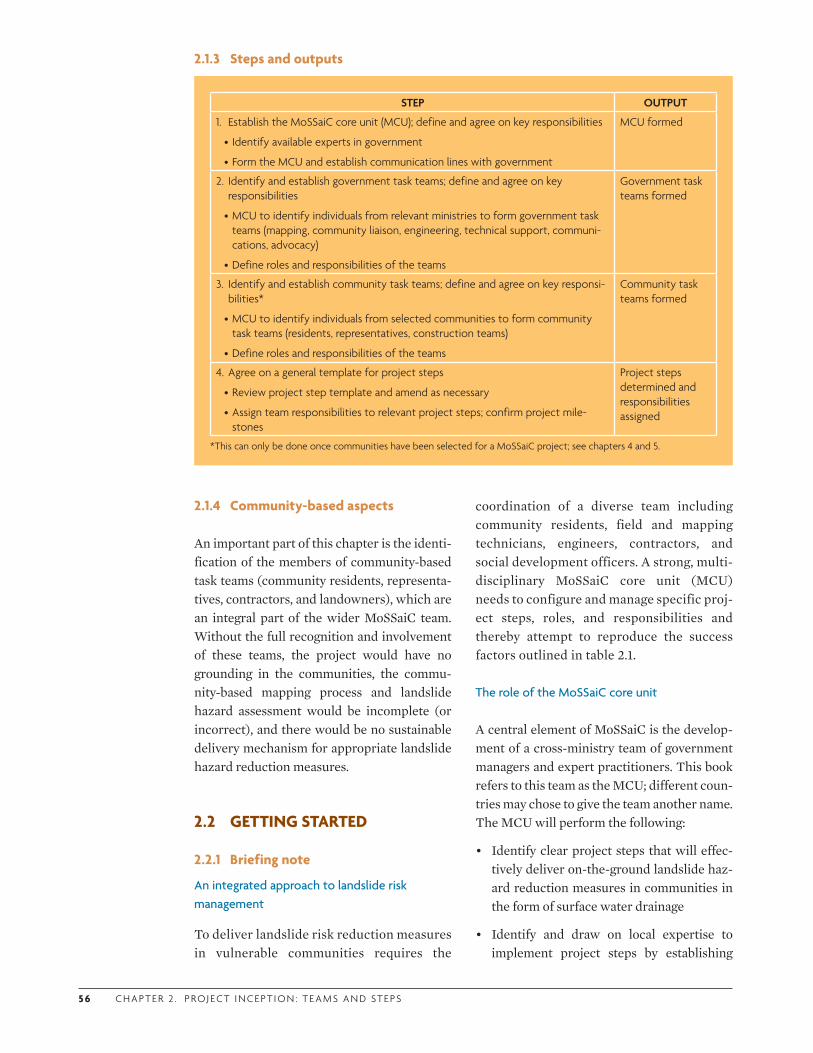
5 6 C H A P T E R 2 . P RO J E CT I N C E P T I O N : T E A M S A N D ST E PS
2.1.3 Steps and outputs
2.1.4 Community-based aspects
An important part of this chapter is the identi-fication of the members of community-based task teams (community residents, representa-tives, contractors, and landowners), which are an integral part of the wider MoSSaiC team. Without the full recognition and involvement of these teams, the project would have no grounding in the communities, the commu-nity-based mapping process and landslide hazard assessment would be incomplete (or incorrect), and there would be no sustainable delivery mechanism for appropriate landslide hazard reduction measures.
2.2 GETTING STARTED
2.2.1 Briefing note
An integrated approach to landslide risk management
To deliver landslide risk reduction measures in vulnerable communities requires the
coordination of a diverse team including community residents, field and mapping technicians, engineers, contractors, and social development officers. A strong, multi-disciplinary MoSSaiC core unit (MCU) needs to configure and manage specific proj-ect steps, roles, and responsibilities and thereby attempt to reproduce the success factors outlined in table 2.1.
The role of the MoSSaiC core unit
A central element of MoSSaiC is the develop-ment of a cross-ministry team of government managers and expert practitioners. This book refers to this team as the MCU; different coun-tries may chose to give the team another name. The MCU will perform the following:
• Identify clear project steps that will effec-tively deliver on-the-ground landslide haz-ard reduction measures in communities in the form of surface water drainage
• Identify and draw on local expertise to implement project steps by establishing
STEP OUTPUT
1. Establish the MoSSaiC core unit (MCU); define and agree on key responsibilities
• Identify available experts in government
•Form the MCU and establish communication lines with government
MCU formed
2. Identify and establish government task teams; define and agree on key responsibilities
•MCU to identify individuals from relevant ministries to form government task teams (mapping, community liaison, engineering, technical support, communi-cations, advocacy)
•Define roles and responsibilities of the teams
Government task teams formed
3. Identify and establish community task teams; define and agree on key responsi-bilities*
•MCU to identify individuals from selected communities to form community task teams (residents, representatives, construction teams)
•Define roles and responsibilities of the teams
Community task teams formed
4. Agree on a general template for project steps
•Review project step template and amend as necessary
•Assign team responsibilities to relevant project steps; confirm project mile-stones
Project steps determined and responsibilities assigned
*This can only be done once communities have been selected for a MoSSaiC project; see chapters 4 and 5.
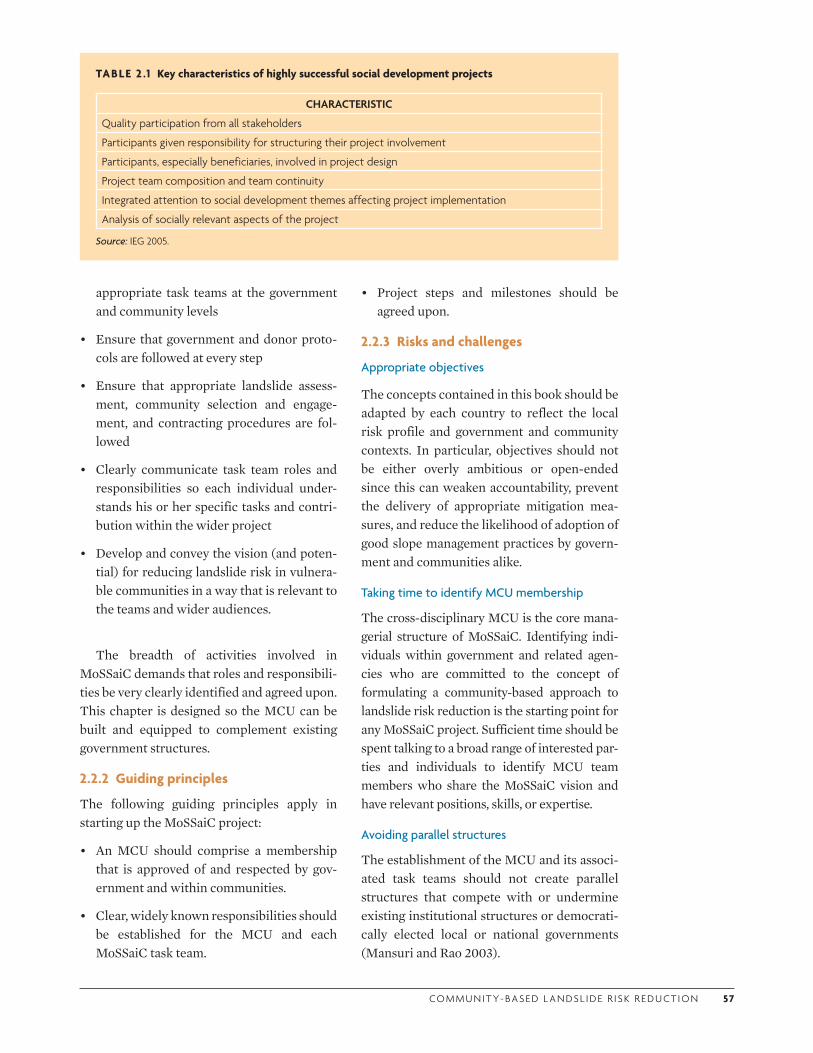
CO M M U N I T Y- BA S E D L A N DS L I D E R I S K R E D U CT I O N 57
TABLE 2 .1 Key characteristics of highly successful social development projects
CHARACTERISTIC
Quality participation from all stakeholders
Participants given responsibility for structuring their project involvement
Participants, especially beneficiaries, involved in project design
Project team composition and team continuity
Integrated attention to social development themes affecting project implementation
Analysis of socially relevant aspects of the project
Source: IEG 2005.
appropriate task teams at the government and community levels
• Ensure that government and donor proto-cols are followed at every step
• Ensure that appropriate landslide assess-ment, community selection and engage-ment, and contracting procedures are fol-lowed
• Clearly communicate task team roles and responsibilities so each individual under-stands his or her specific tasks and contri-bution within the wider project
• Develop and convey the vision (and poten-tial) for reducing landslide risk in vulnera-ble communities in a way that is relevant to the teams and wider audiences.
The breadth of activities involved in MoSSaiC demands that roles and responsibili-ties be very clearly identified and agreed upon. This chapter is designed so the MCU can be built and equipped to complement existing government structures.
2.2.2 Guiding principles
The following guiding principles apply in starting up the MoSSaiC project:
• An MCU should comprise a membership that is approved of and respected by gov-ernment and within communities.
• Clear, widely known responsibilities should be established for the MCU and each MoSSaiC task team.
• Project steps and milestones should be agreed upon.
2.2.3 Risks and challenges
Appropriate objectives
The concepts contained in this book should be adapted by each country to reflect the local risk profile and government and community contexts. In particular, objectives should not be either overly ambitious or open-ended since this can weaken accountability, prevent the delivery of appropriate mitigation mea-sures, and reduce the likelihood of adoption of good slope management practices by govern-ment and communities alike.
Taking time to identify MCU membership
The cross-disciplinary MCU is the core mana-gerial structure of MoSSaiC. Identifying indi-viduals within government and related agen-cies who are committed to the concept of formulating a community-based approach to landslide risk reduction is the starting point for any MoSSaiC project. Sufficient time should be spent talking to a broad range of interested par-ties and individuals to identify MCU team members who share the MoSSaiC vision and have relevant positions, skills, or expertise.
Avoiding parallel structures
The establishment of the MCU and its associ-ated task teams should not create parallel structures that compete with or undermine existing institutional structures or democrati-cally elected local or national governments (Mansuri and Rao 2003).

5 8 C H A P T E R 2 . P RO J E CT I N C E P T I O N : T E A M S A N D ST E PS
Fully developing and engaging with all task teams
Task teams should be identified and appropri-ately staffed for each project step to ensure that no individual or group is overburdened or required to take on tasks exceeding expertise.
Clear, consistent, and frequent communica-tion will maintain momentum and commit-ment from individuals who may have other responsibilities. The form this communication takes needs to be agreed upon at the start of the project. Whether regular communication is by e-mail or briefing meetings, for example, will very much depend on local practices.
Realistic project time frames
Project initiators are frequently overly opti-mistic about the schedule for implementing multidisciplinary projects (see, e.g., IEG 2000). Because MoSSaiC integrates govern-ment and community, and focuses on delivery of physical landslide reduction measures in communities, it is particularly important that expectations of project timing and outcomes are set realistically. This is not just to avoid unrealized expectations and having to deal with the consequences (particularly in com-munities), but for the more positive reason that being seen to deliver the project on time and on budget is likely to encourage behavioral change. Small successes build confidence and lead to wider uptake.
Quality of project management
A lack good quality project management can lead to a variety of poor outcomes:
• Inadequate project conceptualization and design (potentially resulting in loss of finan-cial or decision-making transparency, poor scientific justification of hazard reduction measures, and inadequate design or con-struction of hazard reduction measures)
• Poor quality construction (if site supervision is not scheduled sufficiently frequently)
• Project interruptions and contractors not getting paid on time (if the funding stream is not adequately managed)
• Inadequate attention to project safeguards (especially if there are issues of landowner-ship relevant to any proposed construction or required access)
Relevance of project documents
Avoid producing documents that are unlikely to be used and read. Instead, focus on develop-ing a suite of documents that provide sound records for subsequent project impact analy-sis, enable teams to undertake their tasks, and serve public awareness and media initiatives.
Creating a platform for behavioral change
Urban development can generate landslide risk; conversely, landslide risk can affect devel-opment. At a community level, each household can inadvertently contribute to landslide risk or, with good slope management practices, play an important role in its mitigation. Gov-ernment projects and policies can also either increase or reduce landslide risk at the com-munity, municipal, or national scale. Creating a platform for behavioral change in communi-ties and governments is an important part of the MoSSaiC vision, and it is best achieved by engaging with the community from start to finish and by using existing government staff to form the MCU. In this way, landslide hazard reduction measures can be delivered on the ground, and behavioral changes be achieved as the community and government teams learn by doing.
2.2.4 Adapting the chapter blueprint to existing capacity
This chapter provides a flexible blueprint for MoSSaiC project inception. Funders and pol-icy makers, in conjunction with the MCU, should adapt this blueprint to suit local capac-ity and institutional structures.
Use the matrix opposite to determine exist-ing capacity to configure multidisciplinary community-based projects, and hence the likely capacity for forming MoSSaiC teams.
1. Assign a capacity score from 1 to 3 (low to high) to reflect existing capacity for each element in the matrix’s left-hand column.
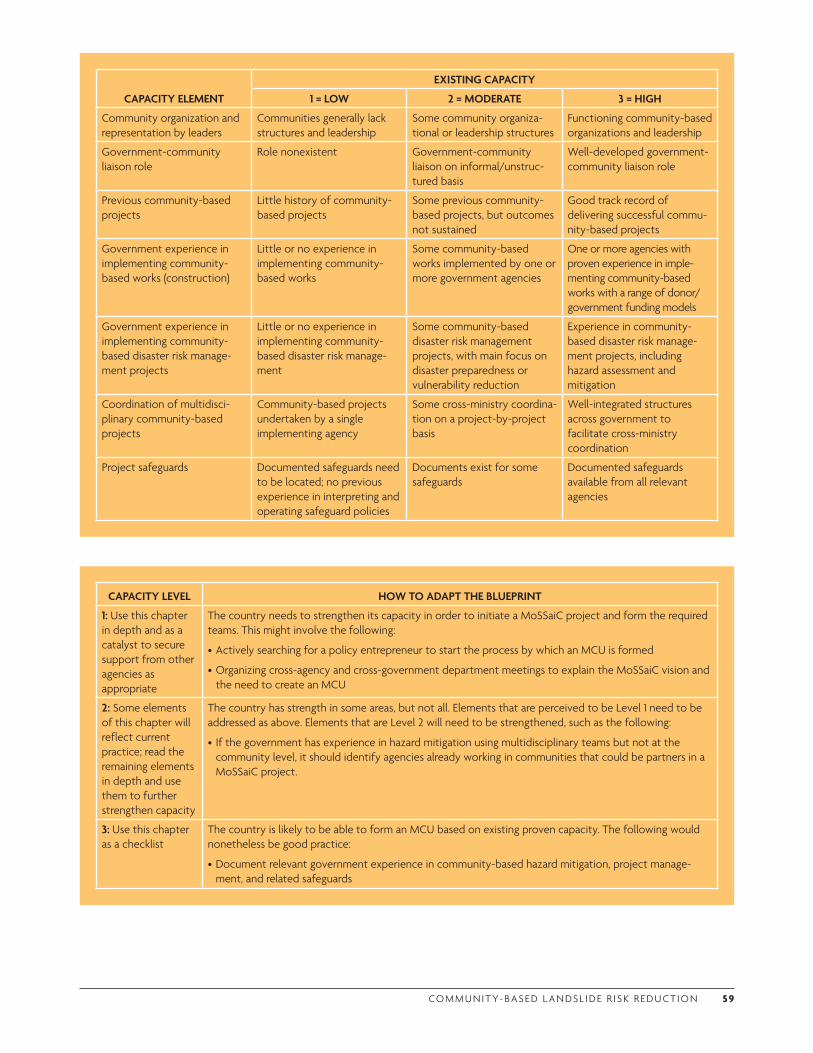
CO M M U N I T Y- BA S E D L A N DS L I D E R I S K R E D U CT I O N 59
CAPACITY ELEMENT
EXISTING CAPACITY
1 = LOW 2 = MODERATE 3 = HIGH
Community organization and representation by leaders
Communities generally lack structures and leadership
Some community organiza-tional or leadership structures
Functioning community-based organizations and leadership
Government-community liaison role
Role nonexistent Government-community liaison on informal/unstruc-tured basis
Well-developed government-community liaison role
Previous community-based projects
Little history of community-based projects
Some previous community-based projects, but outcomes not sustained
Good track record of delivering successful commu-nity-based projects
Government experience in implementing community-based works (construction)
Little or no experience in implementing community-based works
Some community-based works implemented by one or more government agencies
One or more agencies with proven experience in imple-menting community-based works with a range of donor/government funding models
Government experience in implementing community-based disaster risk manage-ment projects
Little or no experience in implementing community-based disaster risk manage-ment
Some community-based disaster risk management projects, with main focus on disaster preparedness or vulnerability reduction
Experience in community-based disaster risk manage-ment projects, including hazard assessment and mitigation
Coordination of multidisci-plinary community-based projects
Community-based projects undertaken by a single implementing agency
Some cross-ministry coordina-tion on a project-by-project basis
Well-integrated structures across government to facilitate cross-ministry coordination
Project safeguards Documented safeguards need to be located; no previous experience in interpreting and operating safeguard policies
Documents exist for some safeguards
Documented safeguards available from all relevant agencies
CAPACITY LEVEL HOW TO ADAPT THE BLUEPRINT
1: Use this chapter in depth and as a catalyst to secure support from other agencies as appropriate
The country needs to strengthen its capacity in order to initiate a MoSSaiC project and form the required teams. This might involve the following:
•Actively searching for a policy entrepreneur to start the process by which an MCU is formed
•Organizing cross-agency and cross-government department meetings to explain the MoSSaiC vision and the need to create an MCU
2: Some elements of this chapter will reflect current practice; read the remaining elements in depth and use them to further strengthen capacity
The country has strength in some areas, but not all. Elements that are perceived to be Level 1 need to be addressed as above. Elements that are Level 2 will need to be strengthened, such as the following:
• If the government has experience in hazard mitigation using multidisciplinary teams but not at the community level, it should identify agencies already working in communities that could be partners in a MoSSaiC project.
3: Use this chapter as a checklist
The country is likely to be able to form an MCU based on existing proven capacity. The following would nonetheless be good practice:
•Document relevant government experience in community-based hazard mitigation, project manage-ment, and related safeguards

6 0 C H A P T E R 2 . P RO J E CT I N C E P T I O N : T E A M S A N D ST E PS
2. Identify the most common capacity score as an indicator of the overall capacity level.
3. Adapt the blueprint in this chapter in accor-dance with the overall capacity level (see guide at the bottom of the previous page).
A review of selected capacity assessment methodologies can be found in UNDP (2006), and Venture Philanthropy Partners (2001, 84) provides an example of a detailed capacity assessment framework for nonprofit organiza-tions.
2.3 ESTABLISHING THE MoSSaiC CORE UNIT
2.3.1 Rationale
Integrated approach to a multidisciplinary problem
Typically, the management of landslide risk involves assessment of the risk, evaluation of
risk reduction options, and then treatment of the risk. This requires the coordination of experts in the areas (and order) shown in table 2.2.
A new way of building capacity
Forming the MCU from existing staff within governments and agencies is a sound way of seeking to build capacity within government. Initially, capacity is enhanced simply by pro-viding the opportunity for government staff to exercise their expertise in an innovative way and as part of a multidisciplinary team. This expertise is developed and increased through hands-on experience as the project progresses. Successful implementation of landslide risk reduction measures in the first few communi-ties encourages behavioral and policy changes within government.
The MCU thus becomes both a focus for building capacity and the means of building capacity in other teams, as it can provide the following:
TABLE 2 .2 Typical landslide risk management project cycle
TYPICAL PHASE REQUIRED SKILLS/EXPERTISE
Landslide risk management project preparation
Identify the project: Determine the need for and interest in a landslide risk reduction project
Management, financial, donor agency, engineering/scientificFormulate the project: Define the project scope, budget, aims,
objectives, and feasibility
Landslide risk assessment
Identify the broad landslide risk: Identify the relative landslide susceptibility or hazard of different areas to different landslide types, and the relative vulnerability of the exposed communities
Local community knowledge, mapping, data management, engineering/scientific
Understand and estimate the specific landslide risk: For a specific community and hillside, identify the underlying landslide hazard drivers and confirm the level of the hazard; confirm the relative exposure and vulnerability of the community
Mapping, engineering/scientific, social science, economic
Evaluate the risk: Compare with other risks and decide whether to accept or treat the risk Management, financial, engineering/
scientific
Landslide risk reduction
Identify disaster risk reduction options: Typical options are to avoid or reduce the hazard, reduce vulnerability, or transfer the risk
Plan the risk mitigation: Design the landslide hazard reduction measures (drainage to capture surface water and household water)
Engineering/scientific
Implement risk mitigation: Issue and manage contracts and construc-tion, raise public awareness
Financial/contracting, community liaison, engineering, supervision, construction
Monitor and evaluate: Check project progress, problems, solutions, sustainability, impact
Management, community liaison, engineering
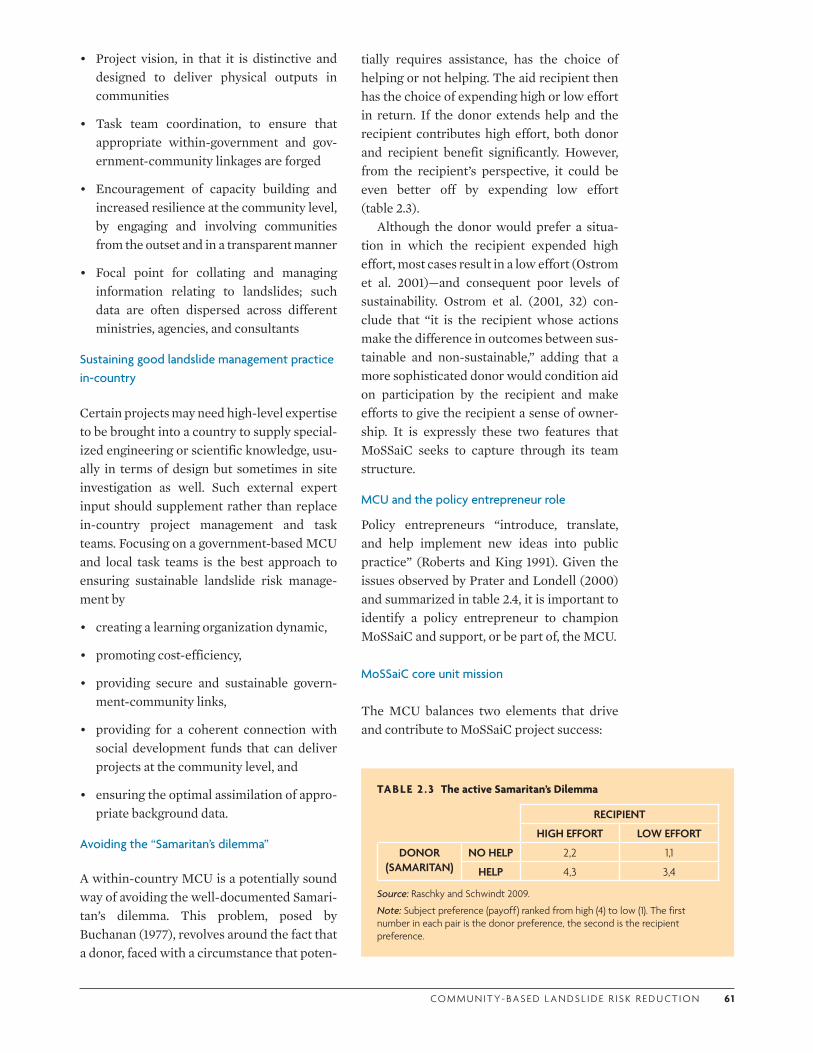
CO M M U N I T Y- BA S E D L A N DS L I D E R I S K R E D U CT I O N 61
• Project vision, in that it is distinctive and designed to deliver physical outputs in communities
• Task team coordination, to ensure that appropriate within-government and gov-ernment-community linkages are forged
• Encouragement of capacity building and increased resilience at the community level, by engaging and involving communities from the outset and in a transparent manner
• Focal point for collating and managing information relating to landslides; such data are often dispersed across different ministries, agencies, and consultants
Sustaining good landslide management practice in-country
Certain projects may need high-level expertise to be brought into a country to supply special-ized engineering or scientific knowledge, usu-ally in terms of design but sometimes in site investigation as well. Such external expert input should supplement rather than replace in-country project management and task teams. Focusing on a government-based MCU and local task teams is the best approach to ensuring sustainable landslide risk manage-ment by
• creating a learning organization dynamic,
• promoting cost-efficiency,
• providing secure and sustainable govern-ment-community links,
• providing for a coherent connection with social development funds that can deliver projects at the community level, and
• ensuring the optimal assimilation of appro-priate background data.
Avoiding the “Samaritan’s dilemma”
A within-country MCU is a potentially sound way of avoiding the well-documented Samari-tan’s dilemma. This problem, posed by Buchanan (1977), revolves around the fact that a donor, faced with a circumstance that poten-
tially requires assistance, has the choice of helping or not helping. The aid recipient then has the choice of expending high or low effort in return. If the donor extends help and the recipient contributes high effort, both donor and recipient benefit significantly. However, from the recipient’s perspective, it could be even better off by expending low effort (table 2.3).
Although the donor would prefer a situa-tion in which the recipient expended high effort, most cases result in a low effort (Ostrom et al. 2001)—and consequent poor levels of sustainability. Ostrom et al. (2001, 32) con-clude that “it is the recipient whose actions make the difference in outcomes between sus-tainable and non-sustainable,” adding that a more sophisticated donor would condition aid on participation by the recipient and make efforts to give the recipient a sense of owner-ship. It is expressly these two features that MoSSaiC seeks to capture through its team structure.
MCU and the policy entrepreneur role
Policy entrepreneurs “introduce, translate, and help implement new ideas into public practice” (Roberts and King 1991). Given the issues observed by Prater and Londell (2000) and summarized in table 2.4, it is important to identify a policy entrepreneur to champion MoSSaiC and support, or be part of, the MCU.
MoSSaiC core unit mission
The MCU balances two elements that drive and contribute to MoSSaiC project success:
TABLE 2 .3 The active Samaritan’s Dilemma
RECIPIENT
HIGH EFFORT LOW EFFORT
DONOR (SAMARITAN)
NO HELP 2,2 1,1
HELP 4,3 3,4
Source: Raschky and Schwindt 2009.
Note: Subject preference (payoff) ranked from high (4) to low (1). The first number in each pair is the donor preference, the second is the recipient preference.
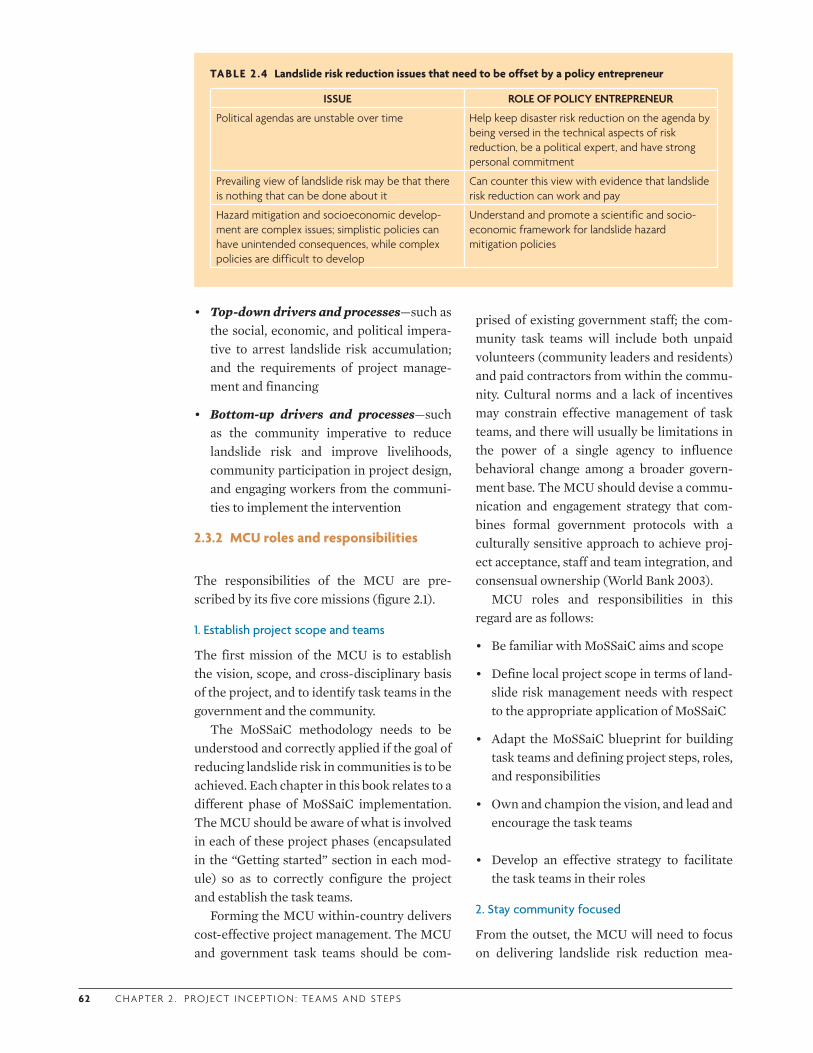
62 C H A P T E R 2 . P RO J E CT I N C E P T I O N : T E A M S A N D ST E PS
• Top-down drivers and processes—such as the social, economic, and political impera-tive to arrest landslide risk accumulation; and the requirements of project manage-ment and financing
• Bottom-up drivers and processes—such as the community imperative to reduce landslide risk and improve livelihoods, community participation in project design, and engaging workers from the communi-ties to implement the intervention
2.3.2 MCU roles and responsibilities
The responsibilities of the MCU are pre-scribed by its five core missions (figure 2.1).
1. Establish project scope and teams
The first mission of the MCU is to establish the vision, scope, and cross-disciplinary basis of the project, and to identify task teams in the government and the community.
The MoSSaiC methodology needs to be understood and correctly applied if the goal of reducing landslide risk in communities is to be achieved. Each chapter in this book relates to a different phase of MoSSaiC implementation. The MCU should be aware of what is involved in each of these project phases (encapsulated in the “Getting started” section in each mod-ule) so as to correctly configure the project and establish the task teams.
Forming the MCU within-country delivers cost-effective project management. The MCU and government task teams should be com-
TABLE 2 .4 Landslide risk reduction issues that need to be offset by a policy entrepreneur
ISSUE ROLE OF POLICY ENTREPRENEUR
Political agendas are unstable over time Help keep disaster risk reduction on the agenda by being versed in the technical aspects of risk reduction, be a political expert, and have strong personal commitment
Prevailing view of landslide risk may be that there is nothing that can be done about it
Can counter this view with evidence that landslide risk reduction can work and pay
Hazard mitigation and socioeconomic develop-ment are complex issues; simplistic policies can have unintended consequences, while complex policies are difficult to develop
Understand and promote a scientific and socio-economic framework for landslide hazard mitigation policies
prised of existing government staff; the com-munity task teams will include both unpaid volunteers (community leaders and residents) and paid contractors from within the commu-nity. Cultural norms and a lack of incentives may constrain effective management of task teams, and there will usually be limitations in the power of a single agency to influence behavioral change among a broader govern-ment base. The MCU should devise a commu-nication and engagement strategy that com-bines formal government protocols with a culturally sensitive approach to achieve proj-ect acceptance, staff and team integration, and consensual ownership (World Bank 2003).
MCU roles and responsibilities in this regard are as follows:
• Be familiar with MoSSaiC aims and scope
• Define local project scope in terms of land-slide risk management needs with respect to the appropriate application of MoSSaiC
• Adapt the MoSSaiC blueprint for building task teams and defining project steps, roles, and responsibilities
• Own and champion the vision, and lead and encourage the task teams
• Develop an effective strategy to facilitate the task teams in their roles
2. Stay community focused
From the outset, the MCU will need to focus on delivering landslide risk reduction mea-

CO M M U N I T Y- BA S E D L A N DS L I D E R I S K R E D U CT I O N 63
FIGURE 2 .1 Five missions of the MoSSaiC core unit
a. Mission 1: Establish the vision, scope, and cross-disciplinary basis of the project and identify task teams in government and communities.
b. Mission 2: Ground the project in communities throughout the process to create a platform for behavioral change in both government and communities.
c. Mission 3: Ensure good design of landslide hazard reduction measures, and the quality and completion of construction.
d. Mission 4: Create a culture of good slope management practice, and evaluate project impact and sustainability in partnership with communities and funding agencies.
e. Mission 5: Identify project safeguard requirements (relating to issues such as the potential for involuntary resettlement following slope failure and house destruction or for resolving landownership for drainage lines).
sures in vulnerable communities. This focus will require the development of strategies to engage the community from the start and to maintain that engagement during landslide hazard mapping and assessment, through the design process, during implementation, and in the follow-up phases.
The government task teams should be encouraged to work with community mem-bers both formally and informally in order to benefit from community knowledge of local slope processes and relevant community social structures. The community thus becomes the locus both of activities and of hands-on expe-rience for the government and community task teams.
The MCU roles and responsibilities in this regard are as follows:
• Develop a community selection process that is justifiable in terms of susceptibility
of slopes to landslides and vulnerability of communities to the impact of landslides
• Ensure that the selected communities are consulted on their priorities and the poten-tial for implementing landslide hazard reduction measures
• Ensure that appropriate community par-ticipation approaches are used in selecting community task teams, mapping landslide hazards and drainage issues, designing a drainage intervention, and conducting liai-son with residents during and after the project
• Establish a realistic community contracting process by which contracting and procure-ment are undertaken on behalf of or by the community
• Ensure that contractors from the commu-nity are engaged and supervised in the con-
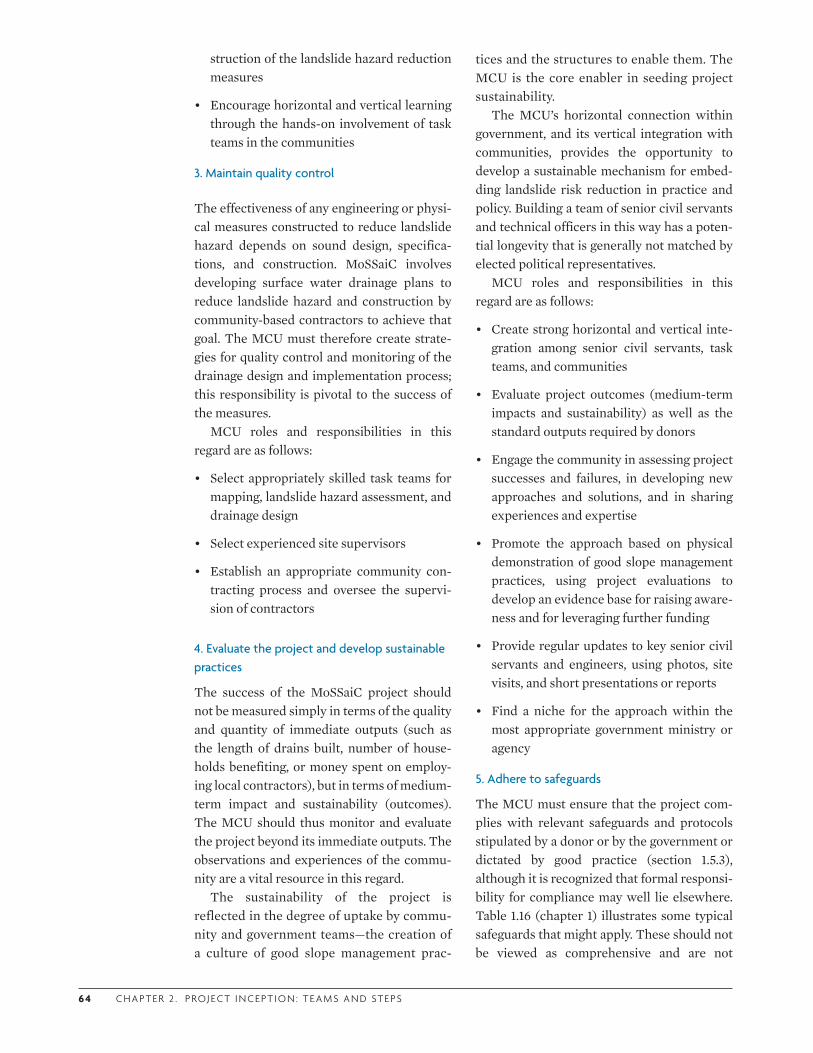
6 4 C H A P T E R 2 . P RO J E CT I N C E P T I O N : T E A M S A N D ST E PS
struction of the landslide hazard reduction measures
• Encourage horizontal and vertical learning through the hands-on involvement of task teams in the communities
3. Maintain quality control
The effectiveness of any engineering or physi-cal measures constructed to reduce landslide hazard depends on sound design, specifica-tions, and construction. MoSSaiC involves developing surface water drainage plans to reduce landslide hazard and construction by community-based contractors to achieve that goal. The MCU must therefore create strate-gies for quality control and monitoring of the drainage design and implementation process; this responsibility is pivotal to the success of the measures.
MCU roles and responsibilities in this regard are as follows:
• Select appropriately skilled task teams for mapping, landslide hazard assessment, and drainage design
• Select experienced site supervisors
• Establish an appropriate community con-tracting process and oversee the supervi-sion of contractors
4. Evaluate the project and develop sustainable practices
The success of the MoSSaiC project should not be measured simply in terms of the quality and quantity of immediate outputs (such as the length of drains built, number of house-holds benefiting, or money spent on employ-ing local contractors), but in terms of medium-term impact and sustainability (outcomes). The MCU should thus monitor and evaluate the project beyond its immediate outputs. The observations and experiences of the commu-nity are a vital resource in this regard.
The sustainability of the project is reflected in the degree of uptake by commu-nity and government teams—the creation of a culture of good slope management prac-
tices and the structures to enable them. The MCU is the core enabler in seeding project sustainability.
The MCU’s horizontal connection within government, and its vertical integration with communities, provides the opportunity to develop a sustainable mechanism for embed-ding landslide risk reduction in practice and policy. Building a team of senior civil servants and technical officers in this way has a poten-tial longevity that is generally not matched by elected political representatives.
MCU roles and responsibilities in this regard are as follows:
• Create strong horizontal and vertical inte-gration among senior civil servants, task teams, and communities
• Evaluate project outcomes (medium-term impacts and sustainability) as well as the standard outputs required by donors
• Engage the community in assessing project successes and failures, in developing new approaches and solutions, and in sharing experiences and expertise
• Promote the approach based on physical demonstration of good slope management practices, using project evaluations to develop an evidence base for raising aware-ness and for leveraging further funding
• Provide regular updates to key senior civil servants and engineers, using photos, site visits, and short presentations or reports
• Find a niche for the approach within the most appropriate government ministry or agency
5. Adhere to safeguards
The MCU must ensure that the project com-plies with relevant safeguards and protocols stipulated by a donor or by the government or dictated by good practice (section 1.5.3), although it is recognized that formal responsi-bility for compliance may well lie elsewhere. Table 1.16 (chapter 1) illustrates some typical safeguards that might apply. These should not be viewed as comprehensive and are not
CO M M U N I T Y- BA S E D L A N DS L I D E R I S K R E D U CT I O N 6 5
intended to be a substitute for binding policies and procedures.
MCU roles and responsibilities in this regard are as follows:
• Be fully conversant with the safeguards that apply to the project
• Communicate safeguards and processes for compliance to relevant stakeholders
• Keep a record of compliance
2.3.3 MCU membership
MCUs will vary in structure from country to country. Typically, members might be drawn from the following government departments, ministries, and agencies:
• Public works• Social development• Planning• Finance• National emergency organization • Statistics and census• Agriculture • Water and sewerage company
Higher education and community colleges (where there is relevant technical expertise that would be of value) may also contribute MCU members.
Members selected should be fully conver-sant with and supportive of the MCU mis-sions, roles, and responsibilities as outlined above. They should be committed to deliver-ing landslide risk reduction measures using an interdisciplinary, community-based approach. MCU members need to be able to command respect from the communities, government, donors, and media (Anderson and Holcombe 2004, 2006a, 2006b; Anderson, Holcombe, and Williams 2007).
MCU members need to stay fully engaged throughout the project; if they do not, believ-ing that the project has been established and is to some degree running itself, project outputs will suffer as a consequence.
Qualitative evidence suggests that the role of project facilitators (MCU members in this case) is key to the success of community-based
projects. In a survey of the World Bank Devel-opment Research Group, Mansuri and Rao (2003) found that projects are often under-taken with young, inexperienced facilitators whose incentives are not aligned with the best interests of the community. This finding rein-forces the critical role of the MCU and the nature of its membership.
MILESTONE 2: MoSSaiC core unit formed; key responsibilities agreed on and
defined
2.4 IDENTIFYING THE GOVERNMENT TASK TEAMS
Part of the MCU’s first mission is to develop teams dedicated to specific project tasks that will ensure the delivery of appropriate physi-cal measures to reduce the landslide hazard.
Identification and initial engagement of task team members will probably be an itera-tive and consultative process in conjunction with the development of specific project steps. In many cases, MCU members themselves may be the most appropriate people to con-tribute to or lead a particular task team.
Each MCU member will need to identify and consult with expert practitioners (engi-neers, officials, and technicians) in their respective ministries to
• identify motivated, knowledgeable, and skilled individuals who want to contribute to the overall vision of achieving landslide hazard reduction in communities; and
• consult with these individuals to identify cross-ministry collaborations and specific steps that they (as part of the ministry or agency) would need to undertake for proj-ect success.
Table 2.5 provides guidance on factors rele-vant to the team selection process.
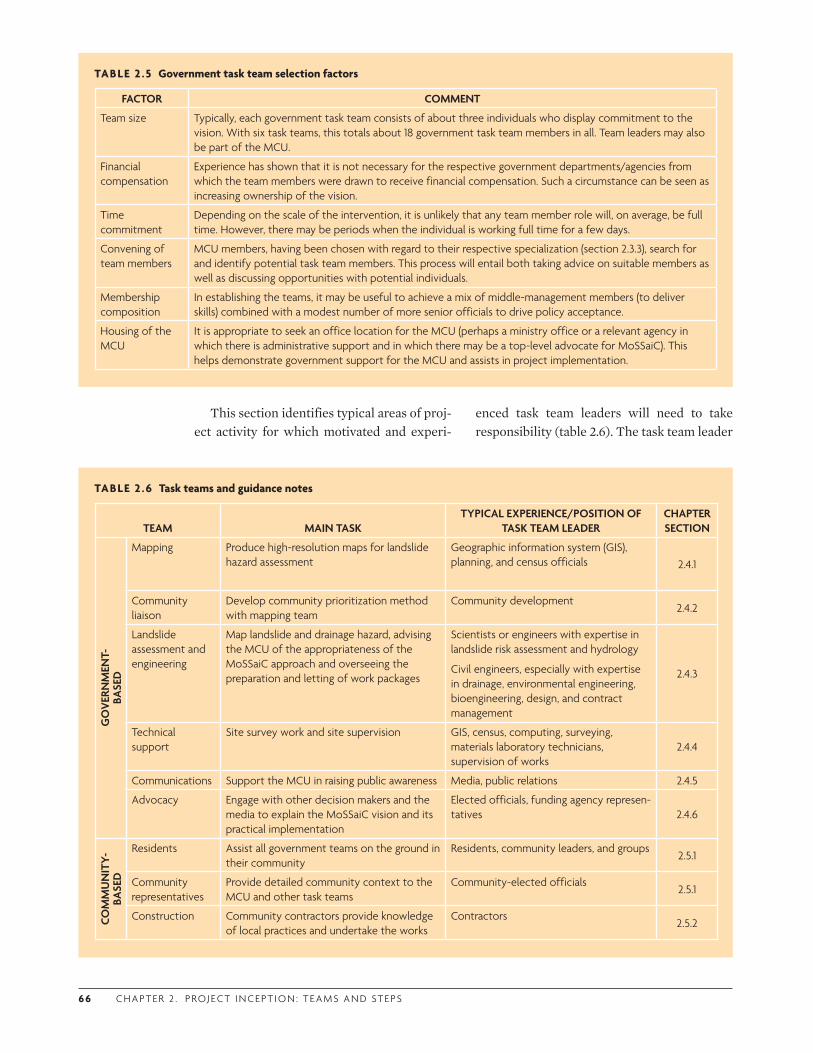
6 6 C H A P T E R 2 . P RO J E CT I N C E P T I O N : T E A M S A N D ST E PS
This section identifies typical areas of proj-ect activity for which motivated and experi-
TABLE 2 .5 Government task team selection factors
FACTOR COMMENT
Team size Typically, each government task team consists of about three individuals who display commitment to the vision. With six task teams, this totals about 18 government task team members in all. Team leaders may also be part of the MCU.
Financial compensation
Experience has shown that it is not necessary for the respective government departments/agencies from which the team members were drawn to receive financial compensation. Such a circumstance can be seen as increasing ownership of the vision.
Time commitment
Depending on the scale of the intervention, it is unlikely that any team member role will, on average, be full time. However, there may be periods when the individual is working full time for a few days.
Convening of team members
MCU members, having been chosen with regard to their respective specialization (section 2.3.3), search for and identify potential task team members. This process will entail both taking advice on suitable members as well as discussing opportunities with potential individuals.
Membership composition
In establishing the teams, it may be useful to achieve a mix of middle-management members (to deliver skills) combined with a modest number of more senior officials to drive policy acceptance.
Housing of the MCU
It is appropriate to seek an office location for the MCU (perhaps a ministry office or a relevant agency in which there is administrative support and in which there may be a top-level advocate for MoSSaiC). This helps demonstrate government support for the MCU and assists in project implementation.
enced task team leaders will need to take responsibility (table 2.6). The task team leader
TABLE 2 .6 Task teams and guidance notes
TEAM MAIN TASKTYPICAL EXPERIENCE/POSITION OF
TASK TEAM LEADERCHAPTER SECTION
GO
VERN
MEN
T-BA
SED
Mapping Produce high-resolution maps for landslide hazard assessment
Geographic information system (GIS), planning, and census officials 2.4.1
Community liaison
Develop community prioritization method with mapping team
Community development2.4.2
Landslide assessment and engineering
Map landslide and drainage hazard, advising the MCU of the appropriateness of the MoSSaiC approach and overseeing the preparation and letting of work packages
Scientists or engineers with expertise in landslide risk assessment and hydrology
Civil engineers, especially with expertise in drainage, environmental engineering, bioengineering, design, and contract management
2.4.3
Technical support
Site survey work and site supervision GIS, census, computing, surveying, materials laboratory technicians, supervision of works
2.4.4
Communications Support the MCU in raising public awareness Media, public relations 2.4.5
Advocacy Engage with other decision makers and the media to explain the MoSSaiC vision and its practical implementation
Elected officials, funding agency represen-tatives 2.4.6
COM
MU
NIT
Y-BA
SED
Residents Assist all government teams on the ground in their community
Residents, community leaders, and groups2.5.1
Community representatives
Provide detailed community context to the MCU and other task teams
Community-elected officials2.5.1
Construction Community contractors provide knowledge of local practices and undertake the works
Contractors2.5.2
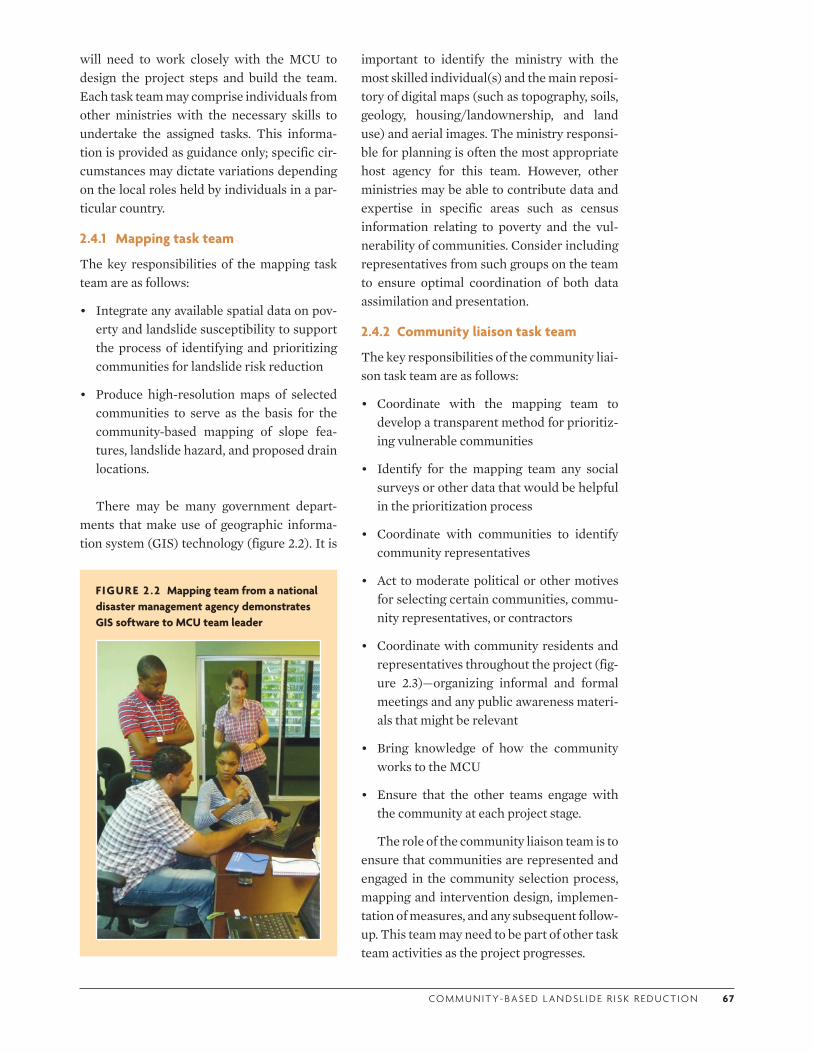
CO M M U N I T Y- BA S E D L A N DS L I D E R I S K R E D U CT I O N 67
will need to work closely with the MCU to design the project steps and build the team. Each task team may comprise individuals from other ministries with the necessary skills to undertake the assigned tasks. This informa-tion is provided as guidance only; specific cir-cumstances may dictate variations depending on the local roles held by individuals in a par-ticular country.
2.4.1 Mapping task team
The key responsibilities of the mapping task team are as follows:
• Integrate any available spatial data on pov-erty and landslide susceptibility to support the process of identifying and prioritizing communities for landslide risk reduction
• Produce high-resolution maps of selected communities to serve as the basis for the community-based mapping of slope fea-tures, landslide hazard, and proposed drain locations.
There may be many government depart-ments that make use of geographic informa-tion system (GIS) technology (figure 2.2). It is
FIGURE 2 .2 Mapping team from a national disaster management agency demonstrates GIS software to MCU team leader
important to identify the ministry with the most skilled individual(s) and the main reposi-tory of digital maps (such as topography, soils, geology, housing/landownership, and land use) and aerial images. The ministry responsi-ble for planning is often the most appropriate host agency for this team. However, other ministries may be able to contribute data and expertise in specific areas such as census information relating to poverty and the vul-nerability of communities. Consider including representatives from such groups on the team to ensure optimal coordination of both data assimilation and presentation.
2.4.2 Community liaison task team
The key responsibilities of the community liai-son task team are as follows:
• Coordinate with the mapping team to develop a transparent method for prioritiz-ing vulnerable communities
• Identify for the mapping team any social surveys or other data that would be helpful in the prioritization process
• Coordinate with communities to identify community representatives
• Act to moderate political or other motives for selecting certain communities, commu-nity representatives, or contractors
• Coordinate with community residents and representatives throughout the project (fig-ure 2.3)—organizing informal and formal meetings and any public awareness materi-als that might be relevant
• Bring knowledge of how the community works to the MCU
• Ensure that the other teams engage with the community at each project stage.
The role of the community liaison team is to ensure that communities are represented and engaged in the community selection process, mapping and intervention design, implemen-tation of measures, and any subsequent follow-up. This team may need to be part of other task team activities as the project progresses.
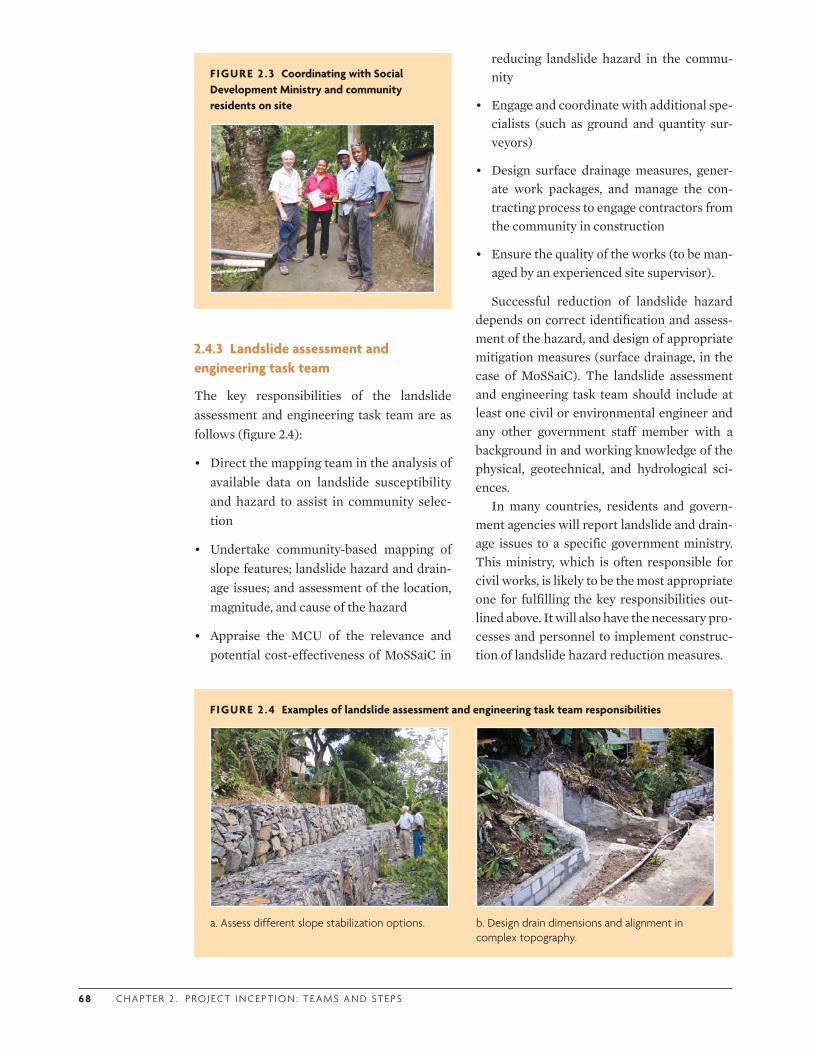
6 8 C H A P T E R 2 . P RO J E CT I N C E P T I O N : T E A M S A N D ST E PS
2.4.3 Landslide assessment and engineering task team
The key responsibilities of the landslide assessment and engineering task team are as follows (figure 2.4):
• Direct the mapping team in the analysis of available data on landslide susceptibility and hazard to assist in community selec-tion
• Undertake community-based mapping of slope features; landslide hazard and drain-age issues; and assessment of the location, magnitude, and cause of the hazard
• Appraise the MCU of the relevance and potential cost-effectiveness of MoSSaiC in
reducing landslide hazard in the commu-nity
• Engage and coordinate with additional spe-cialists (such as ground and quantity sur-veyors)
• Design surface drainage measures, gener-ate work packages, and manage the con-tracting process to engage contractors from the community in construction
• Ensure the quality of the works (to be man-aged by an experienced site supervisor).
Successful reduction of landslide hazard depends on correct identification and assess-ment of the hazard, and design of appropriate mitigation measures (surface drainage, in the case of MoSSaiC). The landslide assessment and engineering task team should include at least one civil or environmental engineer and any other government staff member with a background in and working knowledge of the physical, geotechnical, and hydrological sci-ences.
In many countries, residents and govern-ment agencies will report landslide and drain-age issues to a specific government ministry. This ministry, which is often responsible for civil works, is likely to be the most appropriate one for fulfilling the key responsibilities out-lined above. It will also have the necessary pro-cesses and personnel to implement construc-tion of landslide hazard reduction measures.
FIGURE 2 .3 Coordinating with Social Development Ministry and community residents on site
FIGURE 2 .4 Examples of landslide assessment and engineering task team responsibilities
a. Assess different slope stabilization options. b. Design drain dimensions and alignment in complex topography.
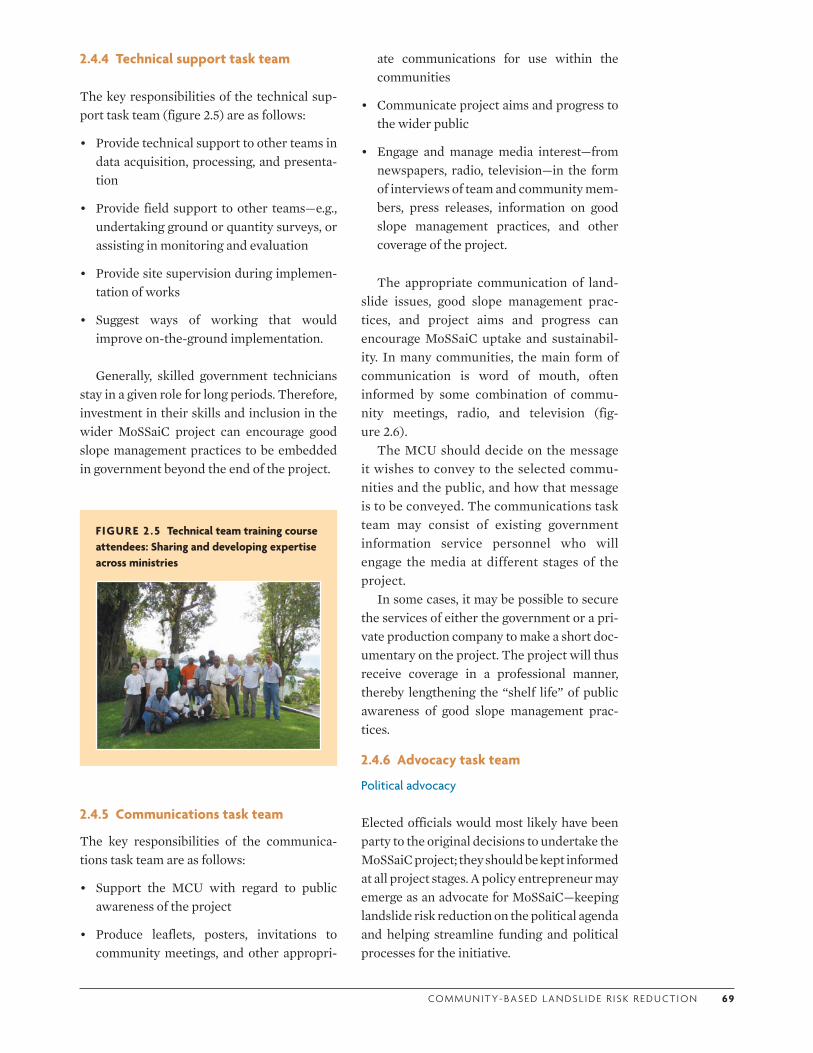
CO M M U N I T Y- BA S E D L A N DS L I D E R I S K R E D U CT I O N 69
2.4.4 Technical support task team
The key responsibilities of the technical sup-port task team (figure 2.5) are as follows:
• Provide technical support to other teams in data acquisition, processing, and presenta-tion
• Provide field support to other teams—e.g., undertaking ground or quantity surveys, or assisting in monitoring and evaluation
• Provide site supervision during implemen-tation of works
• Suggest ways of working that would improve on-the-ground implementation.
Generally, skilled government technicians stay in a given role for long periods. Therefore, investment in their skills and inclusion in the wider MoSSaiC project can encourage good slope management practices to be embedded in government beyond the end of the project.
ate communications for use within the communities
• Communicate project aims and progress to the wider public
• Engage and manage media interest—from newspapers, radio, television—in the form of interviews of team and community mem-bers, press releases, information on good slope management practices, and other coverage of the project.
The appropriate communication of land-slide issues, good slope management prac-tices, and project aims and progress can encourage MoSSaiC uptake and sustainabil-ity. In many communities, the main form of communication is word of mouth, often informed by some combination of commu-nity meetings, radio, and television (fig-ure 2.6).
The MCU should decide on the message it wishes to convey to the selected commu-nities and the public, and how that message is to be conveyed. The communications task team may consist of existing government information service personnel who will engage the media at different stages of the project.
In some cases, it may be possible to secure the services of either the government or a pri-vate production company to make a short doc-umentary on the project. The project will thus receive coverage in a professional manner, thereby lengthening the “shelf life” of public awareness of good slope management prac-tices.
2.4.6 Advocacy task team
Political advocacy
Elected officials would most likely have been party to the original decisions to undertake the MoSSaiC project; they should be kept informed at all project stages. A policy entrepreneur may emerge as an advocate for MoSSaiC—keeping landslide risk reduction on the political agenda and helping streamline funding and political processes for the initiative.
FIGURE 2 .5 Technical team training course attendees: Sharing and developing expertise across ministries
2.4.5 Communications task team
The key responsibilities of the communica-tions task team are as follows:
• Support the MCU with regard to public awareness of the project
• Produce leaflets, posters, invitations to community meetings, and other appropri-
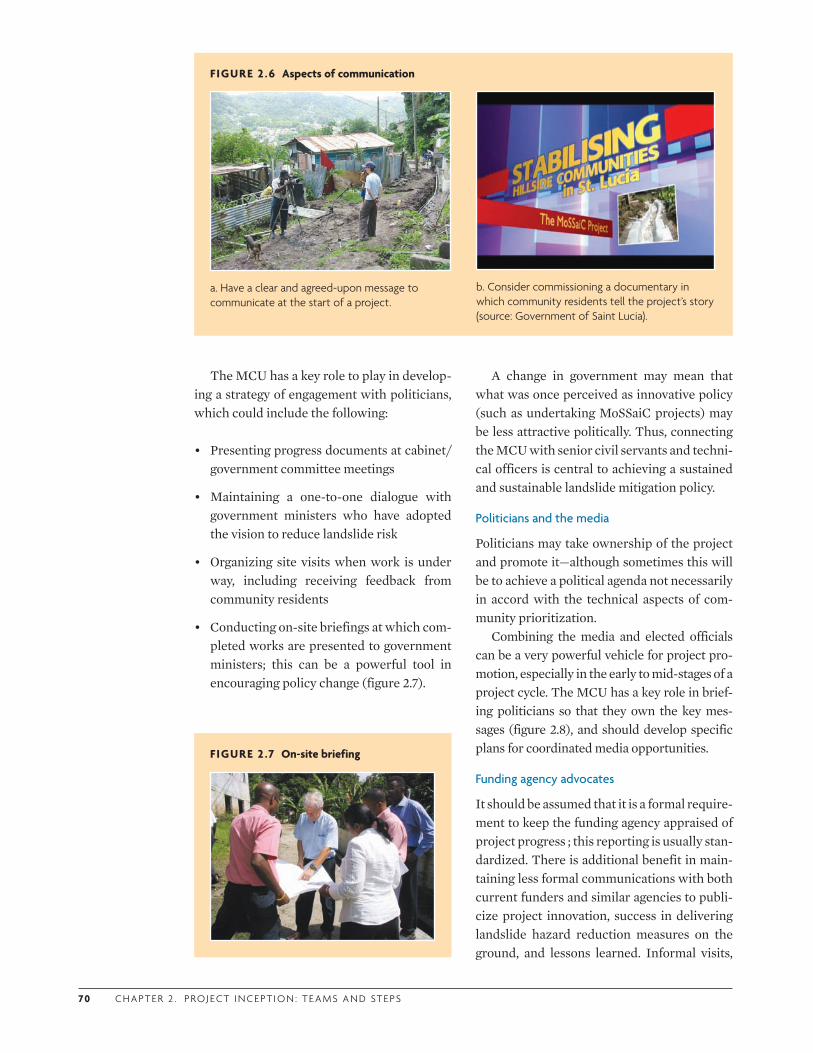
70 C H A P T E R 2 . P RO J E CT I N C E P T I O N : T E A M S A N D ST E PS
The MCU has a key role to play in develop-ing a strategy of engagement with politicians, which could include the following:
• Presenting progress documents at cabinet/government committee meetings
• Maintaining a one-to-one dialogue with government ministers who have adopted the vision to reduce landslide risk
• Organizing site visits when work is under way, including receiving feedback from community residents
• Conducting on-site briefings at which com-pleted works are presented to government ministers; this can be a powerful tool in encouraging policy change (figure 2.7).
A change in government may mean that what was once perceived as innovative policy (such as undertaking MoSSaiC projects) may be less attractive politically. Thus, connecting the MCU with senior civil servants and techni-cal officers is central to achieving a sustained and sustainable landslide mitigation policy.
Politicians and the media
Politicians may take ownership of the project and promote it—although sometimes this will be to achieve a political agenda not necessarily in accord with the technical aspects of com-munity prioritization.
Combining the media and elected officials can be a very powerful vehicle for project pro-motion, especially in the early to mid-stages of a project cycle. The MCU has a key role in brief-ing politicians so that they own the key mes-sages (figure 2.8), and should develop specific plans for coordinated media opportunities.
Funding agency advocates
It should be assumed that it is a formal require-ment to keep the funding agency appraised of project progress ; this reporting is usually stan-dardized. There is additional benefit in main-taining less formal communications with both current funders and similar agencies to publi-cize project innovation, success in delivering landslide hazard reduction measures on the ground, and lessons learned. Informal visits,
FIGURE 2 .6 Aspects of communication
a. Have a clear and agreed-upon message to communicate at the start of a project.
b. Consider commissioning a documentary in which community residents tell the project’s story (source: Government of Saint Lucia).
FIGURE 2 .7 On-site briefing

CO M M U N I T Y- BA S E D L A N DS L I D E R I S K R E D U CT I O N 7 1
possibly with a media component (figure 2.9), can help maintain a funding agency’s advocacy of MoSSaiC, especially if funding agency staff turnover is significant.
The MCU should create and encourage links with funding agency staff in order to
• raise international awareness of a country program,
• potentially provide links to other funding sources,
• provide an opportunity to exchange best practices, and
• build self-esteem among those engaged in MoSSaiC at the community level—residents and team members alike would not other-wise gain exposure to such groups or be able to express their perceptions and first-hand project knowledge to them.
2.5 IDENTIFYING THE COMMUNITY TASK TEAMS
2.5.1 Community residents
The key responsibilities of community resi-dents with regard to MoSSaiC are as follows:
• Discuss and influence project conceptual design—the specific form of community participation and community contracting processes will vary depending on local community structures
• Provide detailed local knowledge on past landslides, slope features and processes, rainfall impacts, and drainage issues
• Select representatives from the community to interface with the government task teams
• Make in-kind contributions to project implementation, or earn money as part of a contractors’ team
• Learn about good slope management prac-tices and put them in use wherever possi-ble.
Frequently, the first engagement of com-munity residents in the project will be infor-mal as part of initial government task team site visits to confirm the selection of commu-nities for the project. These initial visits are good for opening up discussions with resi-dents in a nonthreatening way, but formal communication with the community should also occur early on. It is important to identify existing community-based organizations and formal community leadership structures that may be required to endorse (or facilitate) a MoSSaiC project. Having established an appropriate means for engaging with the community, a meeting should be held to pres-ent and discuss the proposed project (fig-ure 2.10a). This meeting will often be a multi-purpose event, with media and local government representatives also in atten-dance. These formal and informal occasions give residents the opportunity to express their views and begin to select a group of commu-nity representatives for the project.
FIGURE 2 .8 Media film elected officials during a MoSSaiC project
FIGURE 2 .9 Funding agency staff on site at initial stage of MoSSaiC project
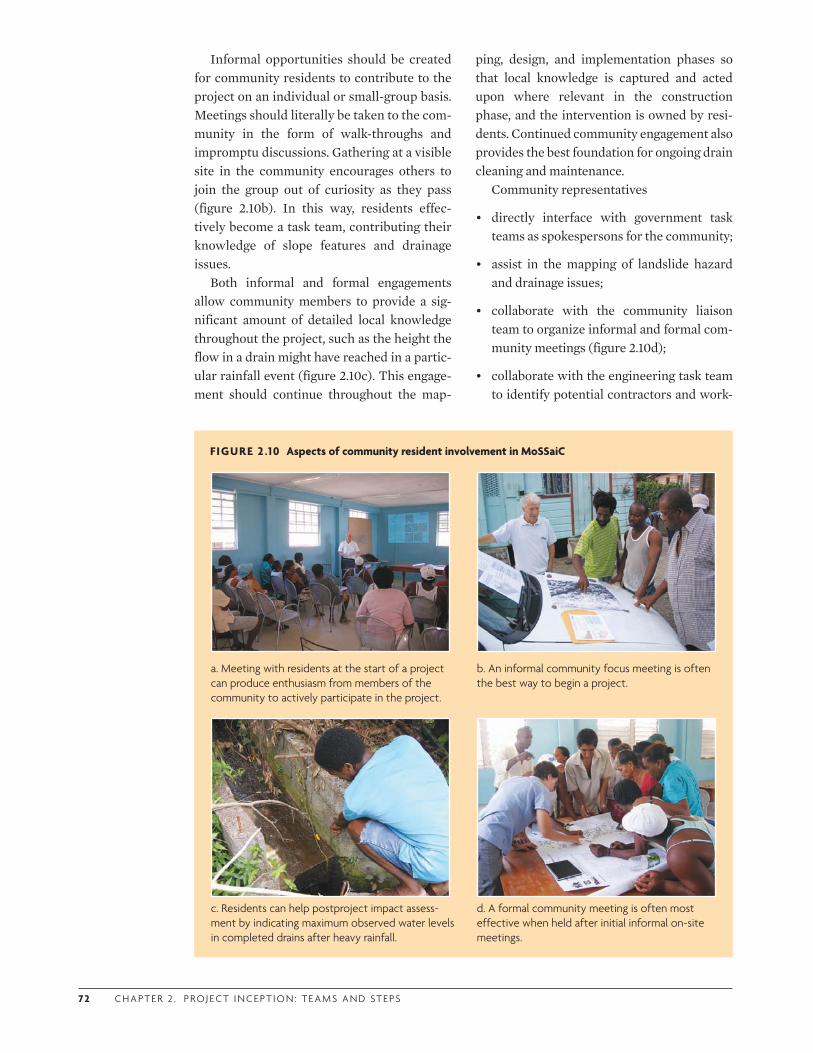
72 C H A P T E R 2 . P RO J E CT I N C E P T I O N : T E A M S A N D ST E PS
Informal opportunities should be created for community residents to contribute to the project on an individual or small-group basis. Meetings should literally be taken to the com-munity in the form of walk-throughs and impromptu discussions. Gathering at a visible site in the community encourages others to join the group out of curiosity as they pass (figure 2.10b). In this way, residents effec-tively become a task team, contributing their knowledge of slope features and drainage issues.
Both informal and formal engagements allow community members to provide a sig-nificant amount of detailed local knowledge throughout the project, such as the height the flow in a drain might have reached in a partic-ular rainfall event (figure 2.10c). This engage-ment should continue throughout the map-
ping, design, and implementation phases so that local knowledge is captured and acted upon where relevant in the construction phase, and the intervention is owned by resi-dents. Continued community engagement also provides the best foundation for ongoing drain cleaning and maintenance.
Community representatives
• directly interface with government task teams as spokespersons for the community;
• assist in the mapping of landslide hazard and drainage issues;
• collaborate with the community liaison team to organize informal and formal com-munity meetings (figure 2.10d);
• collaborate with the engineering task team to identify potential contractors and work-
FIGURE 2 .10 Aspects of community resident involvement in MoSSaiC
a. Meeting with residents at the start of a project can produce enthusiasm from members of the community to actively participate in the project.
b. An informal community focus meeting is often the best way to begin a project.
c. Residents can help postproject impact assess-ment by indicating maximum observed water levels in completed drains after heavy rainfall.
d. A formal community meeting is often most effective when held after initial informal on-site meetings.
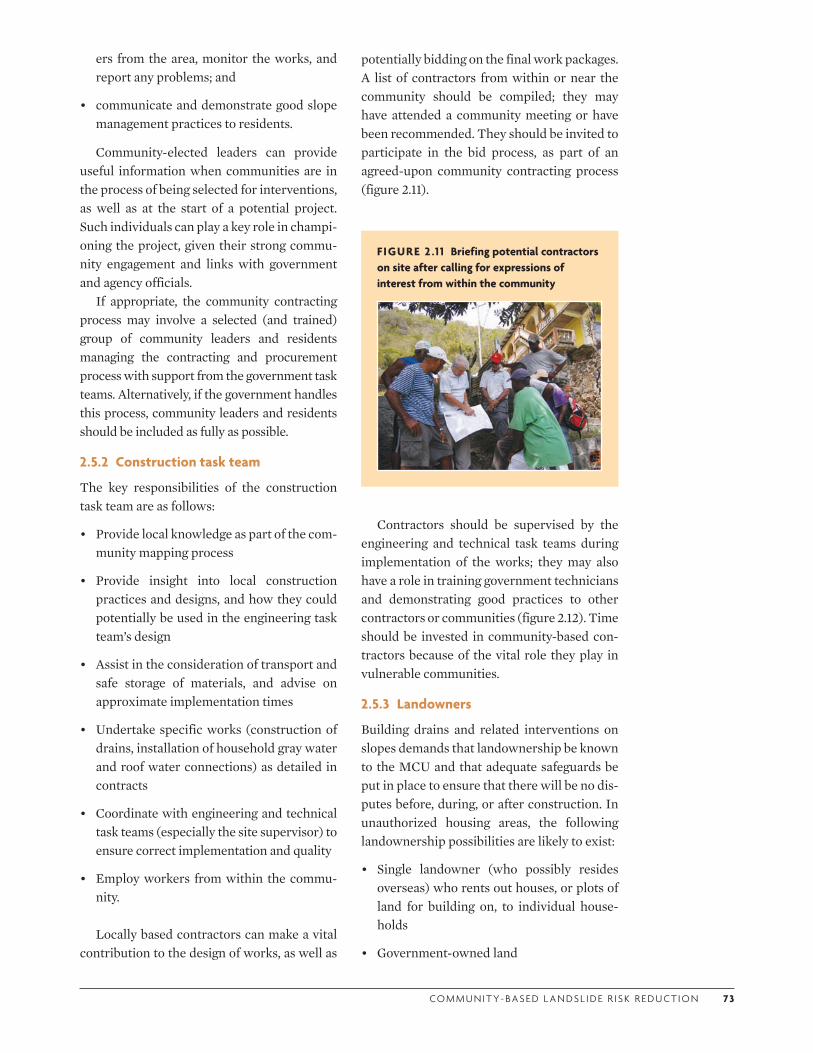
CO M M U N I T Y- BA S E D L A N DS L I D E R I S K R E D U CT I O N 73
ers from the area, monitor the works, and report any problems; and
• communicate and demonstrate good slope management practices to residents.
Community-elected leaders can provide useful information when communities are in the process of being selected for interventions, as well as at the start of a potential project. Such individuals can play a key role in champi-oning the project, given their strong commu-nity engagement and links with government and agency officials.
If appropriate, the community contracting process may involve a selected (and trained) group of community leaders and residents managing the contracting and procurement process with support from the government task teams. Alternatively, if the government handles this process, community leaders and residents should be included as fully as possible.
2.5.2 Construction task team
The key responsibilities of the construction task team are as follows:
• Provide local knowledge as part of the com-munity mapping process
• Provide insight into local construction practices and designs, and how they could potentially be used in the engineering task team’s design
• Assist in the consideration of transport and safe storage of materials, and advise on approximate implementation times
• Undertake specific works (construction of drains, installation of household gray water and roof water connections) as detailed in contracts
• Coordinate with engineering and technical task teams (especially the site supervisor) to ensure correct implementation and quality
• Employ workers from within the commu-nity.
Locally based contractors can make a vital contribution to the design of works, as well as
potentially bidding on the final work packages. A list of contractors from within or near the community should be compiled; they may have attended a community meeting or have been recommended. They should be invited to participate in the bid process, as part of an agreed-upon community contracting process (figure 2.11).
FIGURE 2 .1 1 Briefing potential contractors on site after calling for expressions of interest from within the community
Contractors should be supervised by the engineering and technical task teams during implementation of the works; they may also have a role in training government technicians and demonstrating good practices to other contractors or communities (figure 2.12). Time should be invested in community-based con-tractors because of the vital role they play in vulnerable communities.
2.5.3 Landowners
Building drains and related interventions on slopes demands that landownership be known to the MCU and that adequate safeguards be put in place to ensure that there will be no dis-putes before, during, or after construction. In unauthorized housing areas, the following landownership possibilities are likely to exist:
• Single landowner (who possibly resides overseas) who rents out houses, or plots of land for building on, to individual house-holds
• Government-owned land
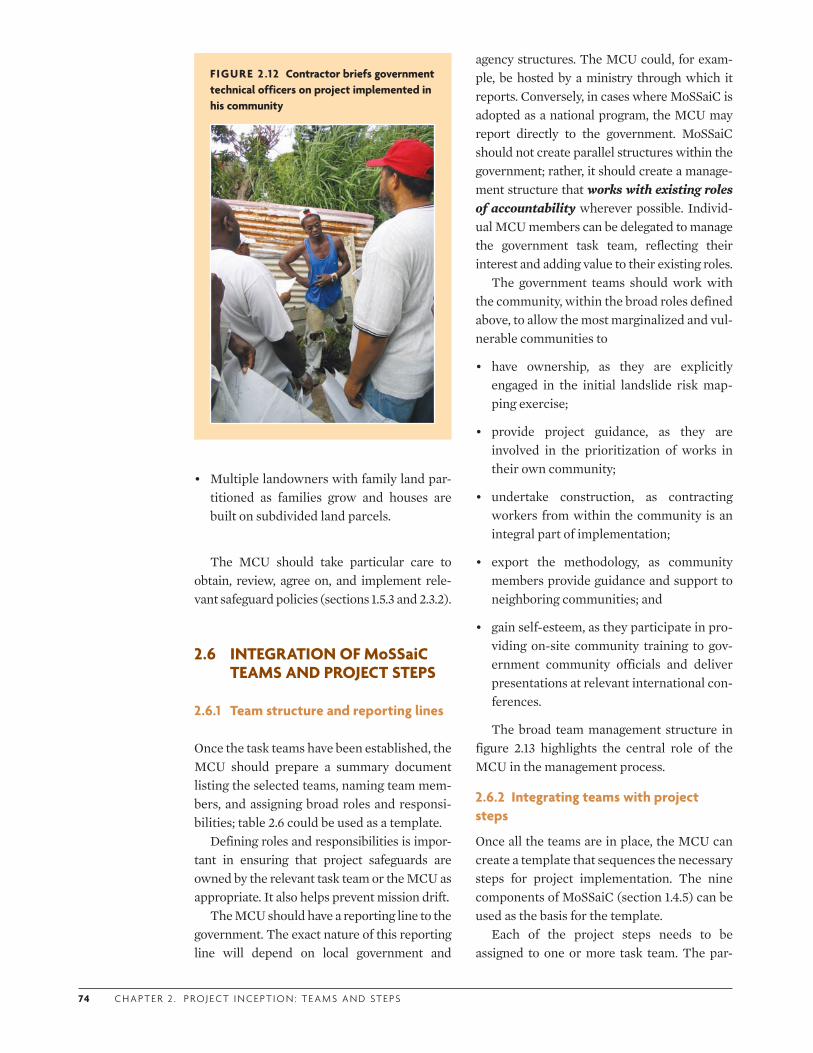
74 C H A P T E R 2 . P RO J E CT I N C E P T I O N : T E A M S A N D ST E PS
• Multiple landowners with family land par-titioned as families grow and houses are built on subdivided land parcels.
The MCU should take particular care to obtain, review, agree on, and implement rele-vant safeguard policies (sections 1.5.3 and 2.3.2).
2.6 INTEGRATION OF MoSSaiC TEAMS AND PROJECT STEPS
2.6.1 Team structure and reporting lines
Once the task teams have been established, the MCU should prepare a summary document listing the selected teams, naming team mem-bers, and assigning broad roles and responsi-bilities; table 2.6 could be used as a template.
Defining roles and responsibilities is impor-tant in ensuring that project safeguards are owned by the relevant task team or the MCU as appropriate. It also helps prevent mission drift.
The MCU should have a reporting line to the government. The exact nature of this reporting line will depend on local government and
agency structures. The MCU could, for exam-ple, be hosted by a ministry through which it reports. Conversely, in cases where MoSSaiC is adopted as a national program, the MCU may report directly to the government. MoSSaiC should not create parallel structures within the government; rather, it should create a manage-ment structure that works with existing roles of accountability wherever possible. Individ-ual MCU members can be delegated to manage the government task team, reflecting their interest and adding value to their existing roles.
The government teams should work with the community, within the broad roles defined above, to allow the most marginalized and vul-nerable communities to
• have ownership, as they are explicitly engaged in the initial landslide risk map-ping exercise;
• provide project guidance, as they are involved in the prioritization of works in their own community;
• undertake construction, as contracting workers from within the community is an integral part of implementation;
• export the methodology, as community members provide guidance and support to neighboring communities; and
• gain self-esteem, as they participate in pro-viding on-site community training to gov-ernment community officials and deliver presentations at relevant international con-ferences.
The broad team management structure in figure 2.13 highlights the central role of the MCU in the management process.
2.6.2 Integrating teams with project steps
Once all the teams are in place, the MCU can create a template that sequences the necessary steps for project implementation. The nine components of MoSSaiC (section 1.4.5) can be used as the basis for the template.
Each of the project steps needs to be assigned to one or more task team. The par-
FIGURE 2 .12 Contractor briefs government technical officers on project implemented in his community
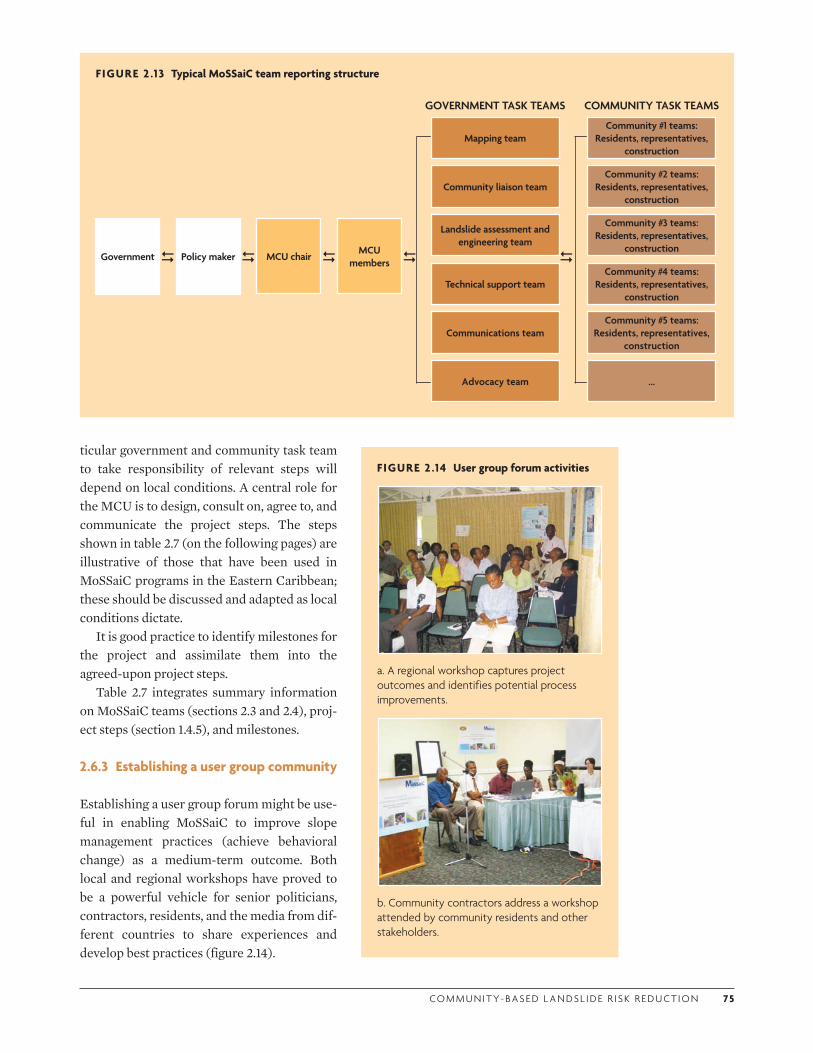
CO M M U N I T Y- BA S E D L A N DS L I D E R I S K R E D U CT I O N 75
ticular government and community task team to take responsibility of relevant steps will depend on local conditions. A central role for the MCU is to design, consult on, agree to, and communicate the project steps. The steps shown in table 2.7 (on the following pages) are illustrative of those that have been used in MoSSaiC programs in the Eastern Caribbean; these should be discussed and adapted as local conditions dictate.
It is good practice to identify milestones for the project and assimilate them into the agreed-upon project steps.
Table 2.7 integrates summary information on MoSSaiC teams (sections 2.3 and 2.4), proj-ect steps (section 1.4.5), and milestones.
2.6.3 Establishing a user group community
Establishing a user group forum might be use-ful in enabling MoSSaiC to improve slope management practices (achieve behavioral change) as a medium-term outcome. Both local and regional workshops have proved to be a powerful vehicle for senior politicians, contractors, residents, and the media from dif-ferent countries to share experiences and develop best practices (figure 2.14).
FIGURE 2 .13 Typical MoSSaiC team reporting structure
COMMUNITY TASK TEAMS
Government Policy maker MCU chair MCU members
Community #1 teams:Residents, representatives,
construction
Community #2 teams:Residents, representatives,
construction
Community #3 teams:Residents, representatives,
construction
Community #4 teams:Residents, representatives,
construction
Community #5 teams:Residents, representatives,
construction
…
Mapping team
Community liaison team
Landslide assessment and engineering team
Technical support team
Communications team
Advocacy team
GOVERNMENT TASK TEAMS
FIGURE 2 .14 User group forum activities
a. A regional workshop captures project outcomes and identifies potential process improvements.
b. Community contractors address a workshop attended by community residents and other stakeholders.
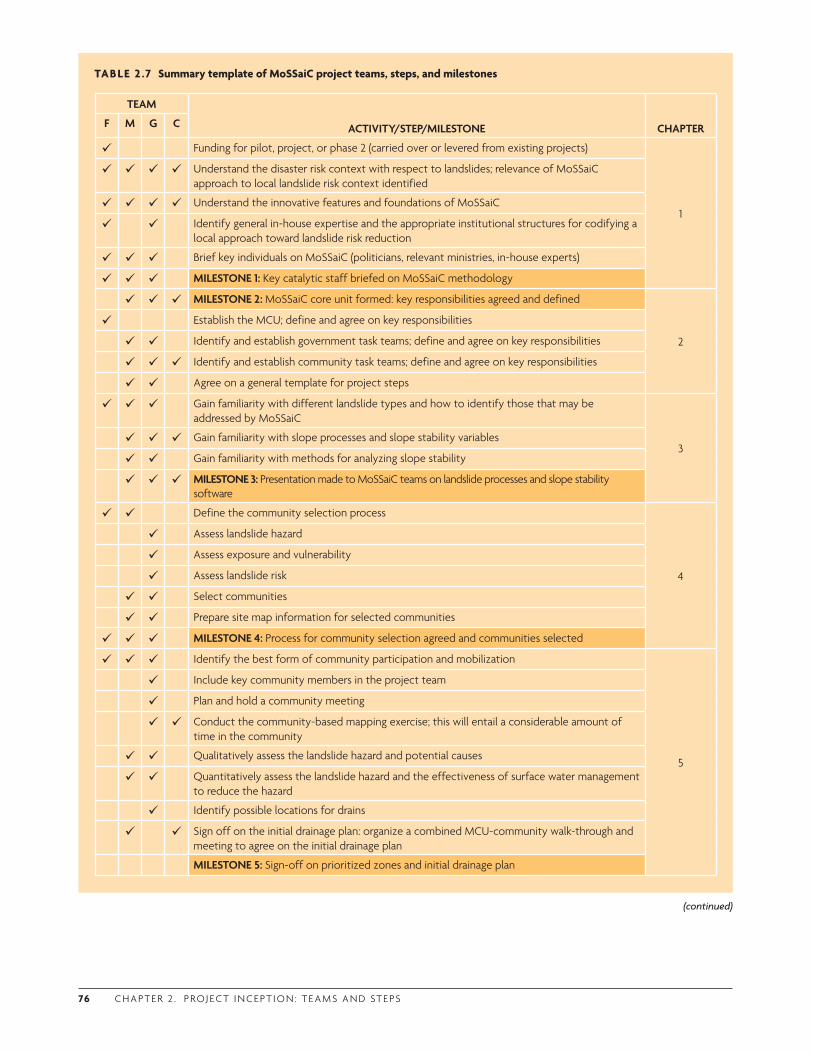
76 C H A P T E R 2 . P RO J E CT I N C E P T I O N : T E A M S A N D ST E PS
TABLE 2 .7 Summary template of MoSSaiC project teams, steps, and milestones
TEAM
ACTIVITY/STEP/MILESTONE CHAPTERF M G C
Funding for pilot, project, or phase 2 (carried over or levered from existing projects)
1
Understand the disaster risk context with respect to landslides; relevance of MoSSaiC approach to local landslide risk context identified
Understand the innovative features and foundations of MoSSaiC
Identify general in-house expertise and the appropriate institutional structures for codifying a local approach toward landslide risk reduction
Brief key individuals on MoSSaiC (politicians, relevant ministries, in-house experts)
MILESTONE 1: Key catalytic staff briefed on MoSSaiC methodology
MILESTONE 2: MoSSaiC core unit formed: key responsibilities agreed and defined
2
Establish the MCU; define and agree on key responsibilities
Identify and establish government task teams; define and agree on key responsibilities
Identify and establish community task teams; define and agree on key responsibilities
Agree on a general template for project steps
Gain familiarity with different landslide types and how to identify those that may be addressed by MoSSaiC
3 Gain familiarity with slope processes and slope stability variables
Gain familiarity with methods for analyzing slope stability
MILESTONE 3: Presentation made to MoSSaiC teams on landslide processes and slope stability software
Define the community selection process
4
Assess landslide hazard
Assess exposure and vulnerability
Assess landslide risk
Select communities
Prepare site map information for selected communities
MILESTONE 4: Process for community selection agreed and communities selected
Identify the best form of community participation and mobilization
5
Include key community members in the project team
Plan and hold a community meeting
Conduct the community-based mapping exercise; this will entail a considerable amount of time in the community
Qualitatively assess the landslide hazard and potential causes
Quantitatively assess the landslide hazard and the effectiveness of surface water management to reduce the hazard
Identify possible locations for drains
Sign off on the initial drainage plan: organize a combined MCU-community walk-through and meeting to agree on the initial drainage plan
MILESTONE 5: Sign-off on prioritized zones and initial drainage plan
(continued)
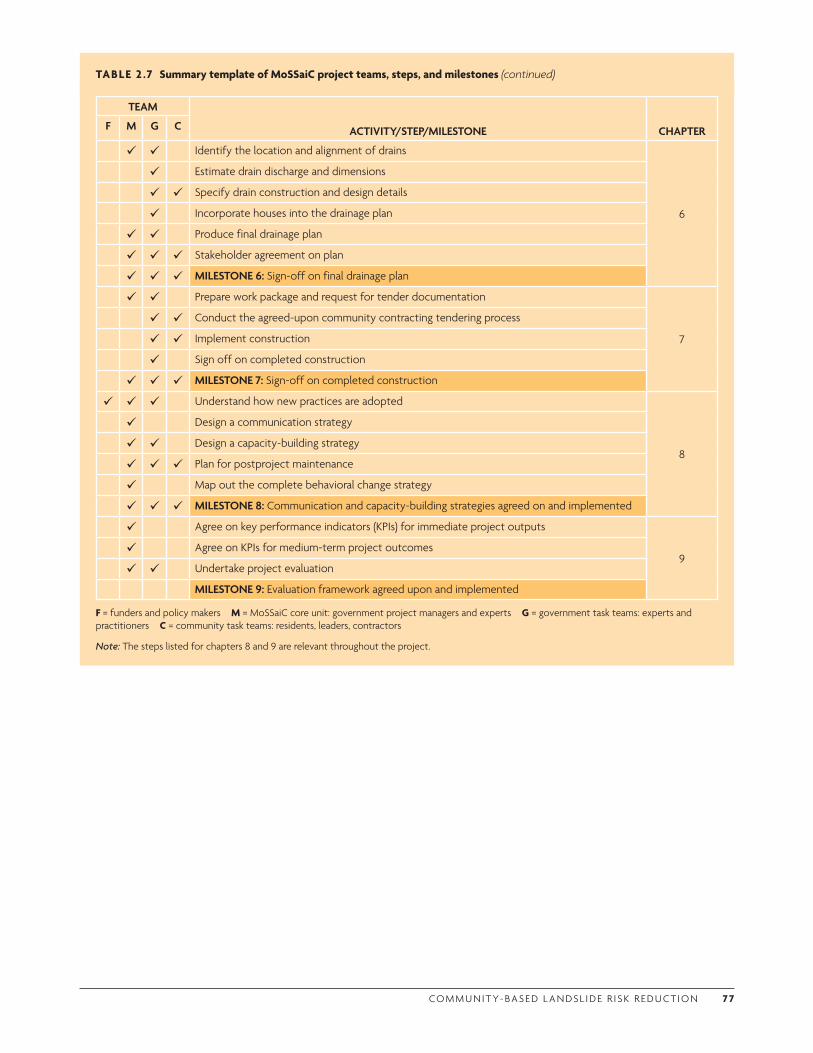
CO M M U N I T Y- BA S E D L A N DS L I D E R I S K R E D U CT I O N 7 7
TEAM
ACTIVITY/STEP/MILESTONE CHAPTERF M G C
Identify the location and alignment of drains
6
Estimate drain discharge and dimensions
Specify drain construction and design details
Incorporate houses into the drainage plan
Produce final drainage plan
Stakeholder agreement on plan
MILESTONE 6: Sign-off on final drainage plan
Prepare work package and request for tender documentation
7
Conduct the agreed-upon community contracting tendering process
Implement construction
Sign off on completed construction
MILESTONE 7: Sign-off on completed construction
Understand how new practices are adopted
8
Design a communication strategy
Design a capacity-building strategy
Plan for postproject maintenance
Map out the complete behavioral change strategy
MILESTONE 8: Communication and capacity-building strategies agreed on and implemented
Agree on key performance indicators (KPIs) for immediate project outputs
9 Agree on KPIs for medium-term project outcomes
Undertake project evaluation
MILESTONE 9: Evaluation framework agreed upon and implemented
F = funders and policy makers M = MoSSaiC core unit: government project managers and experts G = government task teams: experts and practitioners C = community task teams: residents, leaders, contractors
Note: The steps listed for chapters 8 and 9 are relevant throughout the project.
TABLE 2 .7 Summary template of MoSSaiC project teams, steps, and milestones (continued)
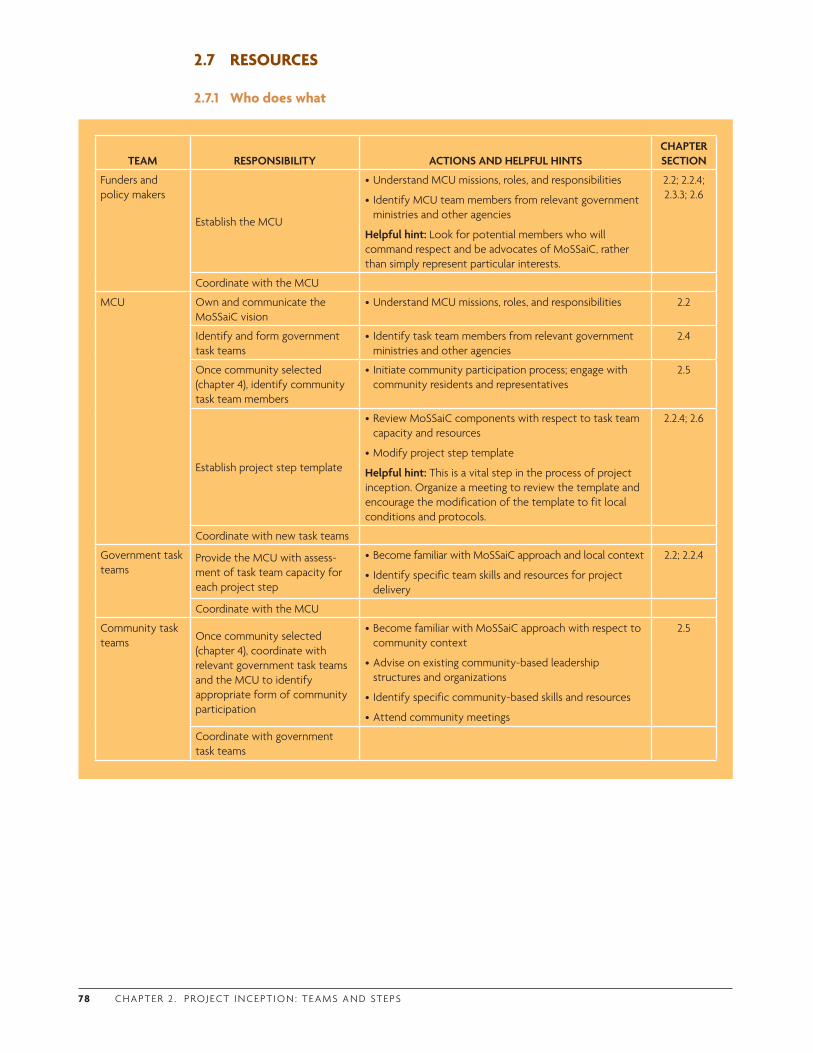
78 C H A P T E R 2 . P RO J E CT I N C E P T I O N : T E A M S A N D ST E PS
TEAM RESPONSIBILITY ACTIONS AND HELPFUL HINTSCHAPTER SECTION
Funders and policy makers
Establish the MCU
•Understand MCU missions, roles, and responsibilities
• Identify MCU team members from relevant government ministries and other agencies
Helpful hint: Look for potential members who will command respect and be advocates of MoSSaiC, rather than simply represent particular interests.
2.2; 2.2.4; 2.3.3; 2.6
Coordinate with the MCU
MCU Own and communicate the MoSSaiC vision
•Understand MCU missions, roles, and responsibilities 2.2
Identify and form government task teams
• Identify task team members from relevant government ministries and other agencies
2.4
Once community selected (chapter 4), identify community task team members
• Initiate community participation process; engage with community residents and representatives
2.5
Establish project step template
•Review MoSSaiC components with respect to task team capacity and resources
•Modify project step template
Helpful hint: This is a vital step in the process of project inception. Organize a meeting to review the template and encourage the modification of the template to fit local conditions and protocols.
2.2.4; 2.6
Coordinate with new task teams
Government task teams
Provide the MCU with assess-ment of task team capacity for each project step
•Become familiar with MoSSaiC approach and local context
• Identify specific team skills and resources for project delivery
2.2; 2.2.4
Coordinate with the MCU
Community task teams Once community selected
(chapter 4), coordinate with relevant government task teams and the MCU to identify appropriate form of community participation
•Become familiar with MoSSaiC approach with respect to community context
•Advise on existing community-based leadership structures and organizations
• Identify specific community-based skills and resources
•Attend community meetings
2.5
Coordinate with government task teams
2.7 RESOURCES
2.7.1 Who does what

CO M M U N I T Y- BA S E D L A N DS L I D E R I S K R E D U CT I O N 79
2.7.2 Chapter checklist
2.7.3 References
Anderson, M. G., and E. A. Holcombe. 2004. “Management of Slope Stability in Communities.” Insight 1: 15–17.
—. 2006a. “Purpose Driven Public Sector Reform: The Need for within-Government Capacity Build for the Management of Slope Stability in Communities (MoSSaiC) in the Caribbean.” Environmental Management 37: 5–29.
—. 2006b. “Sustainable Landslide Risk Reduction in Poorer Countries.” Proceedings of the Institution of Civil Engineers—Engineering Sustainability 159: 23–30.
Anderson, M. G., E. A. Holcombe, and D. Williams. 2007. “Reducing Landslide Risk in Poor Housing Areas of the Caribbean—Developing a New Government-Community Partnership Model. Journal of International Development 19: 205–21.
Buchanan, J. M. 1977. “The Samaritans’ Dilemma.” In Freedom in Constitutional Contract, ed. J. M. Buchanan. College Station, TX: Texas A & M University Press.
IEG (Independent Evaluation Group). 2000. “IEG Report on Project ID P003985 Indonesia.” World Bank, Washington, DC.
—. 2005. Putting Social Development to Work for the Poor: An OED Review of World Bank Activities. Washington, DC: World Bank.
Mansuri, G., and V. Rao. 2003. Evaluating Community-Based and Community-Driven Development: A Critical Review of the Evidence. Development Research Group. Washington, DC: World Bank.
Maskrey, A. 1992. “Defining the Community’s Role in Disaster Mitigation.” Appropriate Technology
CHECK THAT: TEAM PERSONSIGN-OFF
CHAPTER SECTION
List compiled of individuals supportive of MoSSaiC across government/agencies 2.3.3
Milestone 2: MCU formed
MCU has identified individuals for government task teams 2.4
MCU and appropriate government task teams have identified individuals for community task teams
2.5
MCU has established clear line of responsibility to a specific government entity 2.6
All necessary safeguards complied with 1.5.3; 2.3.2
Magazine 19 (3). http://practicalaction.org/practicalanswers/product_info.php?products_id=214.
Ostrom, E., C. Gibson, S. Shivakumar, and K. Andersson. 2001. “Aid, Incentives, and Sustainability: An Institutional Analysis of Development Cooperation.” Sida Studies in Evaluation Report 02/01, Stockholm.
Prater, C. S., and M. K. Londell. 2000. “Politics of Natural Hazards.” Natural Hazards Review 1 (2): 73–82.
Raschky, P. A., and M. Schwindt. 2009. “Aid, Natural Disasters and the Samaritan’s Dilemma.” Policy Research Working Paper 4952, World Bank, Washington, DC.
Roberts, N. C., and P. J. King. 1991. “Policy Entrepreneurs: Their Activity Structure and Function in the Policy Process.” Journal of Public Administration Research and Theory 1 (2): 147–75.
UNDP (United Nations Development Programme). 2006. “A Review of Selected Capacity Assessment Methodologies.” http://lencd.com/data/docs/242-A%20Review%20of%20Selected%20Capacity%20Assessment%20Methodologies.pdf.
Venture Philanthropy Partners. 2001. Effective Capacity Building in Nonprofit Organizations. http://www.vppartners.org/sites/default/files/reports/full_rpt.pdf.
—. 2003. Strategic Communication for Development Projects: A Toolkit for Task Team Leaders. http://siteresources.worldbank.org/EXTDEVCOMMENG/Resources/toolkitwebjan2004.pdf.

“A failure to address the underlying risk drivers will result in dramatic increases in disaster risk and associated poverty outcomes. In contrast, if addressing these drivers is given priority, risk can be reduced…”
—United Nations, “Global Assessment Report on Disaster Risk Reduction” (2009, 4)
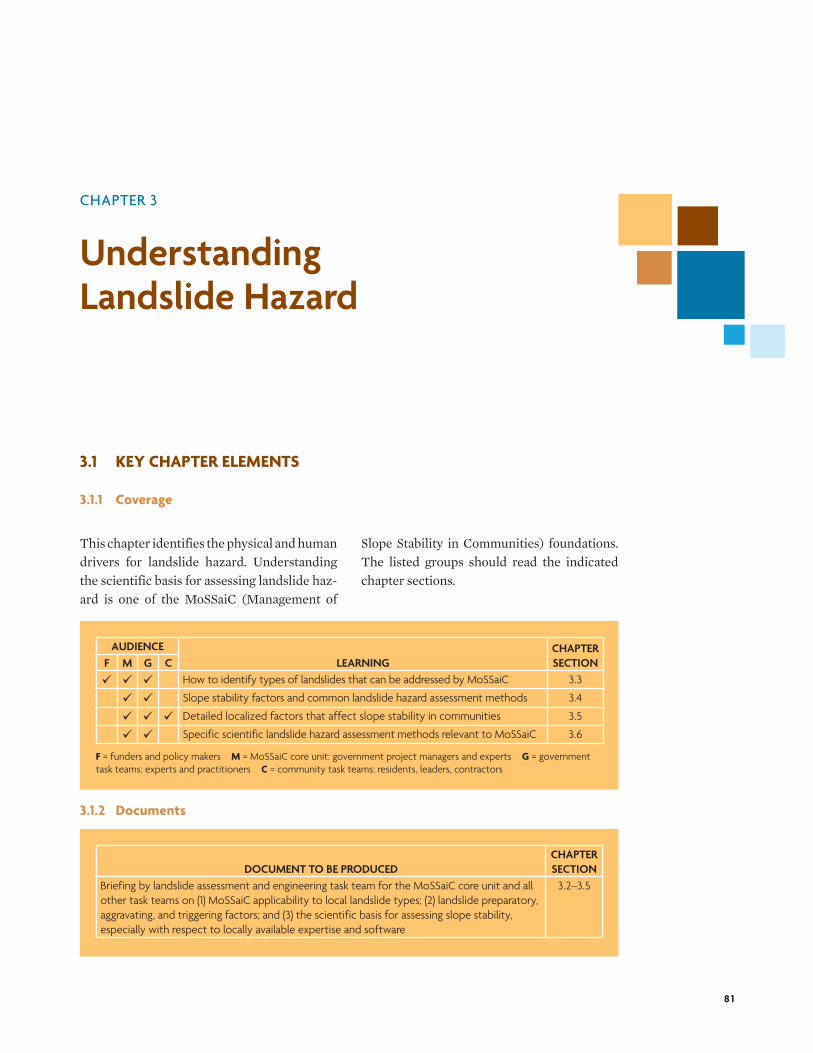
8 1
CHAPTER 3
Understanding Landslide Hazard
3.1 KEY CHAPTER ELEMENTS
3.1.1 Coverage
This chapter identifies the physical and human drivers for landslide hazard. Understanding the scientific basis for assessing landslide haz-ard is one of the MoSSaiC (Management of
Slope Stability in Communities) foundations. The listed groups should read the indicated chapter sections.
AUDIENCELEARNING
CHAPTER SECTIONF M G C
How to identify types of landslides that can be addressed by MoSSaiC 3.3
Slope stability factors and common landslide hazard assessment methods 3.4
Detailed localized factors that affect slope stability in communities 3.5
Specific scientific landslide hazard assessment methods relevant to MoSSaiC 3.6
F = funders and policy makers M = MoSSaiC core unit: government project managers and experts G = government task teams: experts and practitioners C = community task teams: residents, leaders, contractors
3.1.2 Documents
DOCUMENT TO BE PRODUCEDCHAPTER SECTION
Briefing by landslide assessment and engineering task team for the MoSSaiC core unit and all other task teams on (1) MoSSaiC applicability to local landslide types; (2) landslide preparatory, aggravating, and triggering factors; and (3) the scientific basis for assessing slope stability, especially with respect to locally available expertise and software
3.2–3.5
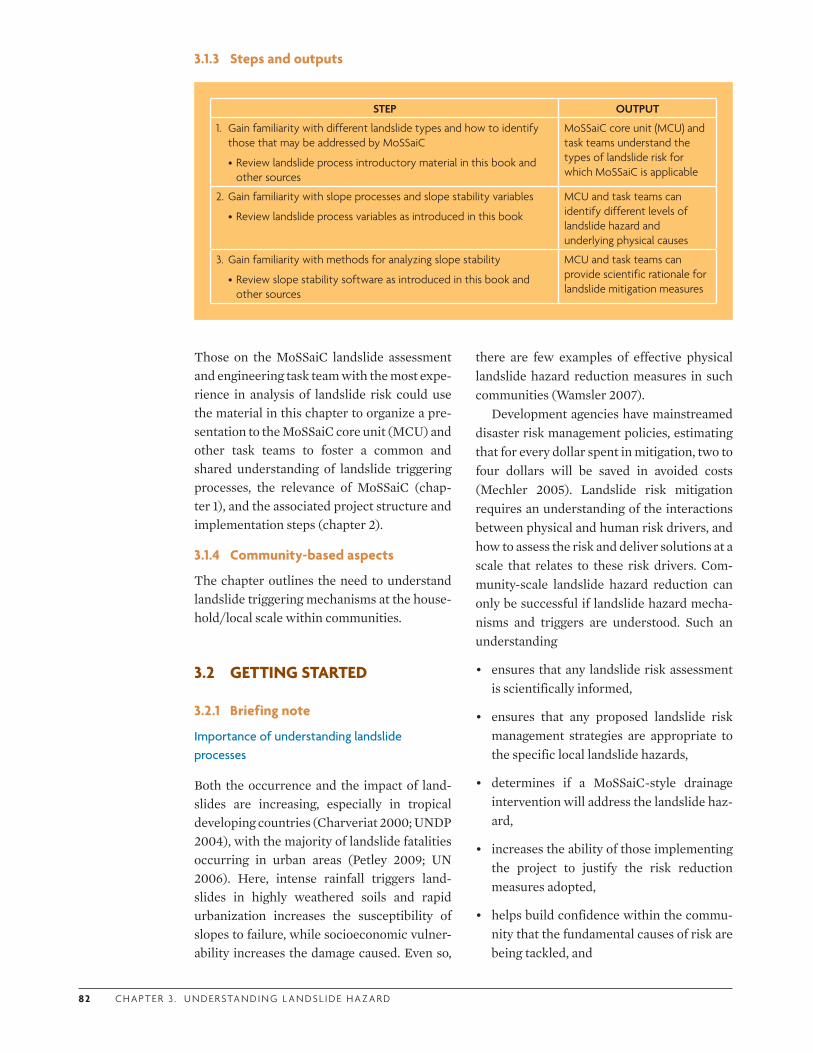
82 C H A P T E R 3 . U N D E R STA N D I N G L A N DS L I D E H A Z A R D
3.1.3 Steps and outputs
Those on the MoSSaiC landslide assessment and engineering task team with the most expe-rience in analysis of landslide risk could use the material in this chapter to organize a pre-sentation to the MoSSaiC core unit (MCU) and other task teams to foster a common and shared understanding of landslide triggering processes, the relevance of MoSSaiC (chap-ter 1), and the associated project structure and implementation steps (chapter 2).
3.1.4 Community-based aspects
The chapter outlines the need to understand landslide triggering mechanisms at the house-hold/local scale within communities.
3.2 GETTING STARTED
3.2.1 Briefing note
Importance of understanding landslide processes
Both the occurrence and the impact of land-slides are increasing, especially in tropical developing countries (Charveriat 2000; UNDP 2004), with the majority of landslide fatalities occurring in urban areas (Petley 2009; UN 2006). Here, intense rainfall triggers land-slides in highly weathered soils and rapid urbanization increases the susceptibility of slopes to failure, while socioeconomic vulner-ability increases the damage caused. Even so,
there are few examples of effective physical landslide hazard reduction measures in such communities (Wamsler 2007).
Development agencies have mainstreamed disaster risk management policies, estimating that for every dollar spent in mitigation, two to four dollars will be saved in avoided costs (Mechler 2005). Landslide risk mitigation requires an understanding of the interactions between physical and human risk drivers, and how to assess the risk and deliver solutions at a scale that relates to these risk drivers. Com-munity-scale landslide hazard reduction can only be successful if landslide hazard mecha-nisms and triggers are understood. Such an understanding
• ensures that any landslide risk assessment is scientifically informed,
• ensures that any proposed landslide risk management strategies are appropriate to the specific local landslide hazards,
• determines if a MoSSaiC-style drainage intervention will address the landslide haz-ard,
• increases the ability of those implementing the project to justify the risk reduction measures adopted,
• helps build confidence within the commu-nity that the fundamental causes of risk are being tackled, and
STEP OUTPUT
1. Gain familiarity with different landslide types and how to identify those that may be addressed by MoSSaiC
•Review landslide process introductory material in this book and other sources
MoSSaiC core unit (MCU) and task teams understand the types of landslide risk for which MoSSaiC is applicable
2. Gain familiarity with slope processes and slope stability variables
•Review landslide process variables as introduced in this book
MCU and task teams can identify different levels of landslide hazard and underlying physical causes
3. Gain familiarity with methods for analyzing slope stability
•Review slope stability software as introduced in this book and other sources
MCU and task teams can provide scientific rationale for landslide mitigation measures
CO M M U N I T Y- BA S E D L A N DS L I D E R I S K R E D U CT I O N 83
• encourages a holistic and strategic approach to implementation of landslide risk reduc-tion measures among all stakeholders.
Landslide hazard as a component of landslide risk
Three components contribute to landslide risk: the physical landslide hazard (its likeli-hood, location, and magnitude), the exposure of different elements (such as people, build-ings, public utilities, economic infrastructure, or the environment) to that hazard, and the vulnerability of those elements to damage by the hazard.
• Landslide hazard is defined in terms of its frequency (e.g., an annual probability of 0.1, meaning a 1-in-10-year landslide event), magnitude, and type at a particular location or within a wider region. When the likeli-hood of a particular landslide hazard is expressed in relative or qualitative terms rather than as a probability, it is more appropriate to refer to susceptibility (more versus less susceptible to landslides).
• The exposure of people, structures, ser-vices, or the environment to a specific land-slide hazard is determined by the spatial and temporal location of those elements with respect to the landslide.
• Vulnerability is an expression of the poten-tial of the exposed elements to suffer harm or loss. Thus, exposure and vulnerability relate to the consequences or results of the landslide, and not to the landslide process itself (Crozier and Glade 2005). In many cases, exposure is treated as an implicit part of vulnerability assessment. Vulnerability is related to the capacity to anticipate a land-slide hazard, cope with it, resist it, and recover from its impact. A combination of physical, environmental, social, economic, political, cultural, and institutional factors determine vulnerability (Benson and Twigg 2007).
To understand landslide risk, it is necessary to understand the nature and causes of the hazard. Many development studies and pro-
grams focus on assessing vulnerability and exposure to landslide hazards; relatively few look at the physical causes of the hazard at the highly localized scales at which they occur. Various natural and human preparatory and aggravating factors can reduce slope stability and trigger landslides. By understanding these driving factors and identifying the dominant landslide mechanisms, it is often possible to address the root causes of landslides and thus reduce the hazard (the frequency or magni-tude of the event).
One of the main premises of MoSSaiC is that rainfall-triggered landslide hazards can often be reduced in vulnerable communities in developing countries. This is because a com-mon driver for such landslide hazards is poor slope drainage and surface water infiltration into weathered slope materials on densely populated urban slopes. Scientific principles and methods can be used to confirm the role of surface water infiltration and therefore indi-cate a potential solution—the construction of appropriately located surface water drains.
Science as part of the landslide risk management process
A typical disaster risk management process was introduced in section 1.3.2. Table 3.1 pres-ents the scientific basis of each step in this pro-cess with particular reference to landslide risk management and the MoSSaiC approach.
3.2.2 Guiding principles
The following guiding principles apply in understanding landslide hazard:
• Develop a shared understanding of land-slide processes within the MCU
• Identify and collate data on past, existing, or predicted landslide hazards in the proj-ect area and on physical and human factors relating to slope stability
• Explain and explore the scientific ratio-nale for landslide hazard reduction in a way that is accessible to residents in vul-nerable communities; assure residents that the local landslide processes are
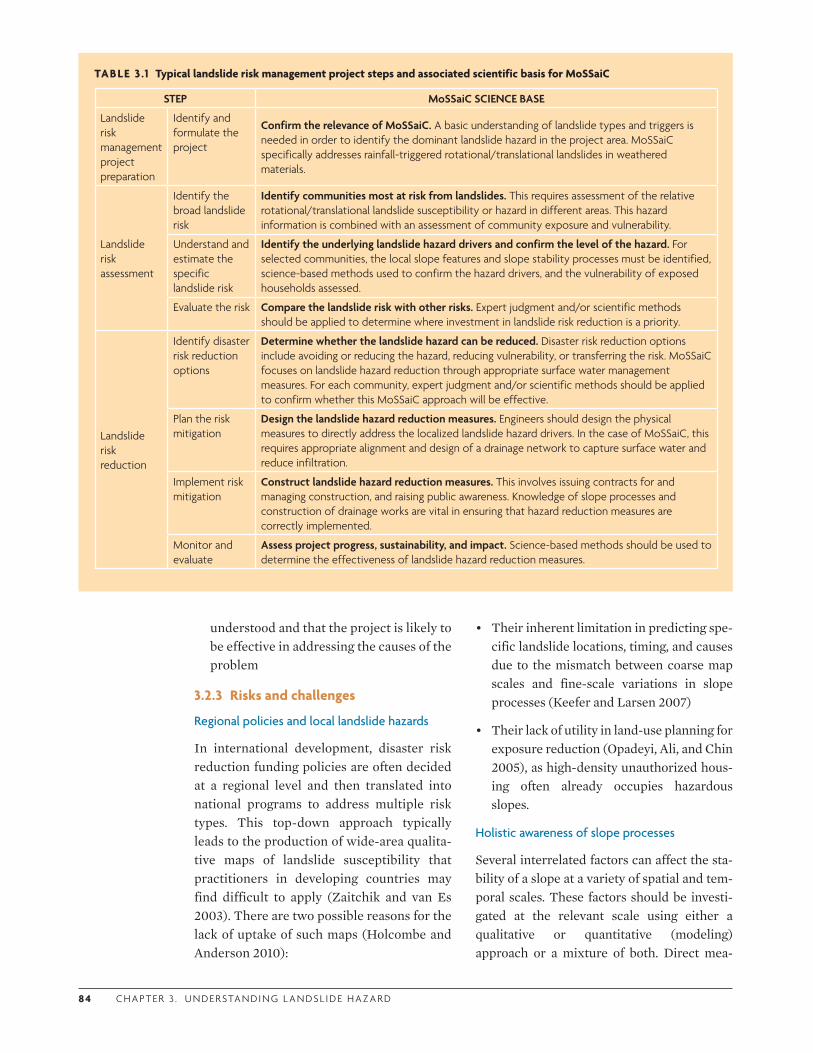
8 4 C H A P T E R 3 . U N D E R STA N D I N G L A N DS L I D E H A Z A R D
understood and that the project is likely to be effective in addressing the causes of the problem
3.2.3 Risks and challenges
Regional policies and local landslide hazards
In international development, disaster risk reduction funding policies are often decided at a regional level and then translated into national programs to address multiple risk types. This top-down approach typically leads to the production of wide-area qualita-tive maps of landslide susceptibility that practitioners in developing countries may find difficult to apply (Zaitchik and van Es 2003). There are two possible reasons for the lack of uptake of such maps (Holcombe and Anderson 2010):
• Their inherent limitation in predicting spe-cific landslide locations, timing, and causes due to the mismatch between coarse map scales and fine-scale variations in slope processes (Keefer and Larsen 2007)
• Their lack of utility in land-use planning for exposure reduction (Opadeyi, Ali, and Chin 2005), as high-density unauthorized hous-ing often already occupies hazardous slopes.
Holistic awareness of slope processes
Several interrelated factors can affect the sta-bility of a slope at a variety of spatial and tem-poral scales. These factors should be investi-gated at the relevant scale using either a qualitative or quantitative (modeling) approach or a mixture of both. Direct mea-
TABLE 3 .1 Typical landslide risk management project steps and associated scientific basis for MoSSaiC
STEP MoSSaiC SCIENCE BASE
Landslide risk management project preparation
Identify and formulate the project
Confirm the relevance of MoSSaiC. A basic understanding of landslide types and triggers is needed in order to identify the dominant landslide hazard in the project area. MoSSaiC specifically addresses rainfall-triggered rotational/translational landslides in weathered materials.
Landslide risk assessment
Identify the broad landslide risk
Identify communities most at risk from landslides. This requires assessment of the relative rotational/translational landslide susceptibility or hazard in different areas. This hazard information is combined with an assessment of community exposure and vulnerability.
Understand and estimate the specific landslide risk
Identify the underlying landslide hazard drivers and confirm the level of the hazard. For selected communities, the local slope features and slope stability processes must be identified, science-based methods used to confirm the hazard drivers, and the vulnerability of exposed households assessed.
Evaluate the risk Compare the landslide risk with other risks. Expert judgment and/or scientific methods should be applied to determine where investment in landslide risk reduction is a priority.
Landslide risk reduction
Identify disaster risk reduction options
Determine whether the landslide hazard can be reduced. Disaster risk reduction options include avoiding or reducing the hazard, reducing vulnerability, or transferring the risk. MoSSaiC focuses on landslide hazard reduction through appropriate surface water management measures. For each community, expert judgment and/or scientific methods should be applied to confirm whether this MoSSaiC approach will be effective.
Plan the risk mitigation
Design the landslide hazard reduction measures. Engineers should design the physical measures to directly address the localized landslide hazard drivers. In the case of MoSSaiC, this requires appropriate alignment and design of a drainage network to capture surface water and reduce infiltration.
Implement risk mitigation
Construct landslide hazard reduction measures. This involves issuing contracts for and managing construction, and raising public awareness. Knowledge of slope processes and construction of drainage works are vital in ensuring that hazard reduction measures are correctly implemented.
Monitor and evaluate
Assess project progress, sustainability, and impact. Science-based methods should be used to determine the effectiveness of landslide hazard reduction measures.
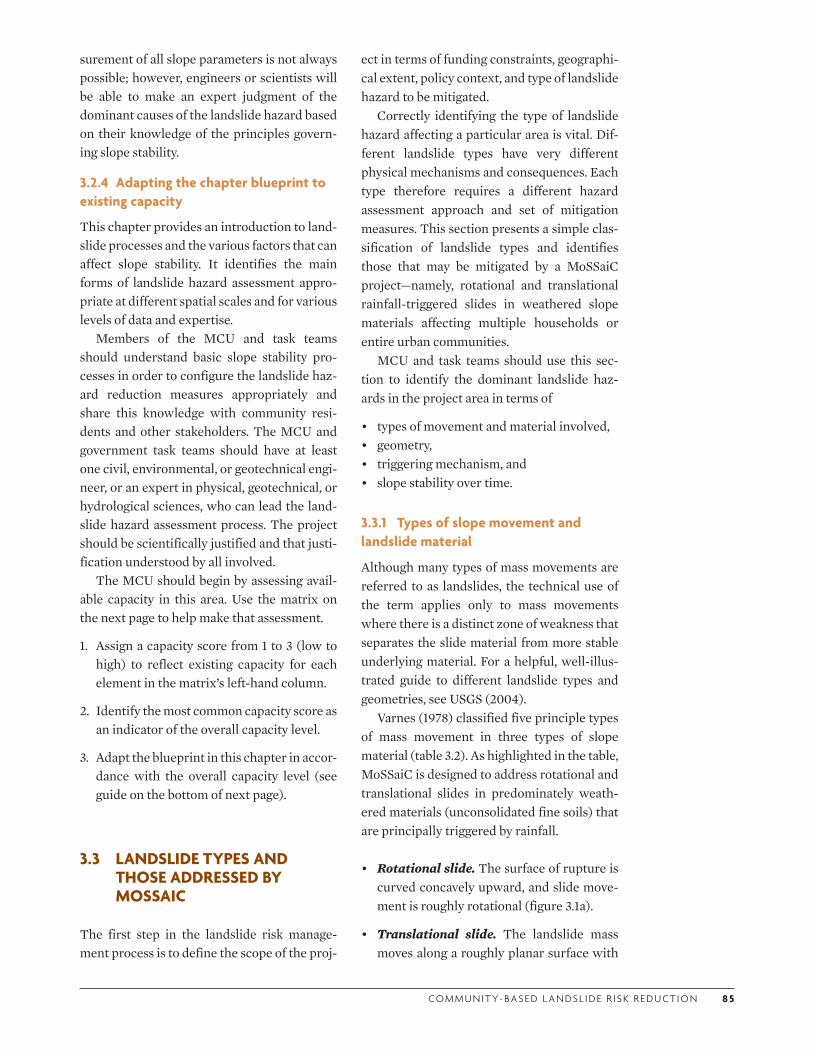
CO M M U N I T Y- BA S E D L A N DS L I D E R I S K R E D U CT I O N 8 5
surement of all slope parameters is not always possible; however, engineers or scientists will be able to make an expert judgment of the dominant causes of the landslide hazard based on their knowledge of the principles govern-ing slope stability.
3.2.4 Adapting the chapter blueprint to existing capacity
This chapter provides an introduction to land-slide processes and the various factors that can affect slope stability. It identifies the main forms of landslide hazard assessment appro-priate at different spatial scales and for various levels of data and expertise.
Members of the MCU and task teams should understand basic slope stability pro-cesses in order to configure the landslide haz-ard reduction measures appropriately and share this knowledge with community resi-dents and other stakeholders. The MCU and government task teams should have at least one civil, environmental, or geotechnical engi-neer, or an expert in physical, geotechnical, or hydrological sciences, who can lead the land-slide hazard assessment process. The project should be scientifically justified and that justi-fication understood by all involved.
The MCU should begin by assessing avail-able capacity in this area. Use the matrix on the next page to help make that assessment.
1. Assign a capacity score from 1 to 3 (low to high) to reflect existing capacity for each element in the matrix’s left-hand column.
2. Identify the most common capacity score as an indicator of the overall capacity level.
3. Adapt the blueprint in this chapter in accor-dance with the overall capacity level (see guide on the bottom of next page).
3.3 LANDSLIDE TYPES AND THOSE ADDRESSED BY MOSSAIC
The first step in the landslide risk manage-ment process is to define the scope of the proj-
ect in terms of funding constraints, geographi-cal extent, policy context, and type of landslide hazard to be mitigated.
Correctly identifying the type of landslide hazard affecting a particular area is vital. Dif-ferent landslide types have very different physical mechanisms and consequences. Each type therefore requires a different hazard assessment approach and set of mitigation measures. This section presents a simple clas-sification of landslide types and identifies those that may be mitigated by a MoSSaiC project—namely, rotational and translational rainfall-triggered slides in weathered slope materials affecting multiple households or entire urban communities.
MCU and task teams should use this sec-tion to identify the dominant landslide haz-ards in the project area in terms of
• types of movement and material involved,• geometry,• triggering mechanism, and• slope stability over time.
3.3.1 Types of slope movement and landslide material
Although many types of mass movements are referred to as landslides, the technical use of the term applies only to mass movements where there is a distinct zone of weakness that separates the slide material from more stable underlying material. For a helpful, well-illus-trated guide to different landslide types and geometries, see USGS (2004).
Varnes (1978) classified five principle types of mass movement in three types of slope material (table 3.2). As highlighted in the table, MoSSaiC is designed to address rotational and translational slides in predominately weath-ered materials (unconsolidated fine soils) that are principally triggered by rainfall.
• Rotational slide. The surface of rupture is curved concavely upward, and slide move-ment is roughly rotational (figure 3.1a).
• Translational slide. The landslide mass moves along a roughly planar surface with
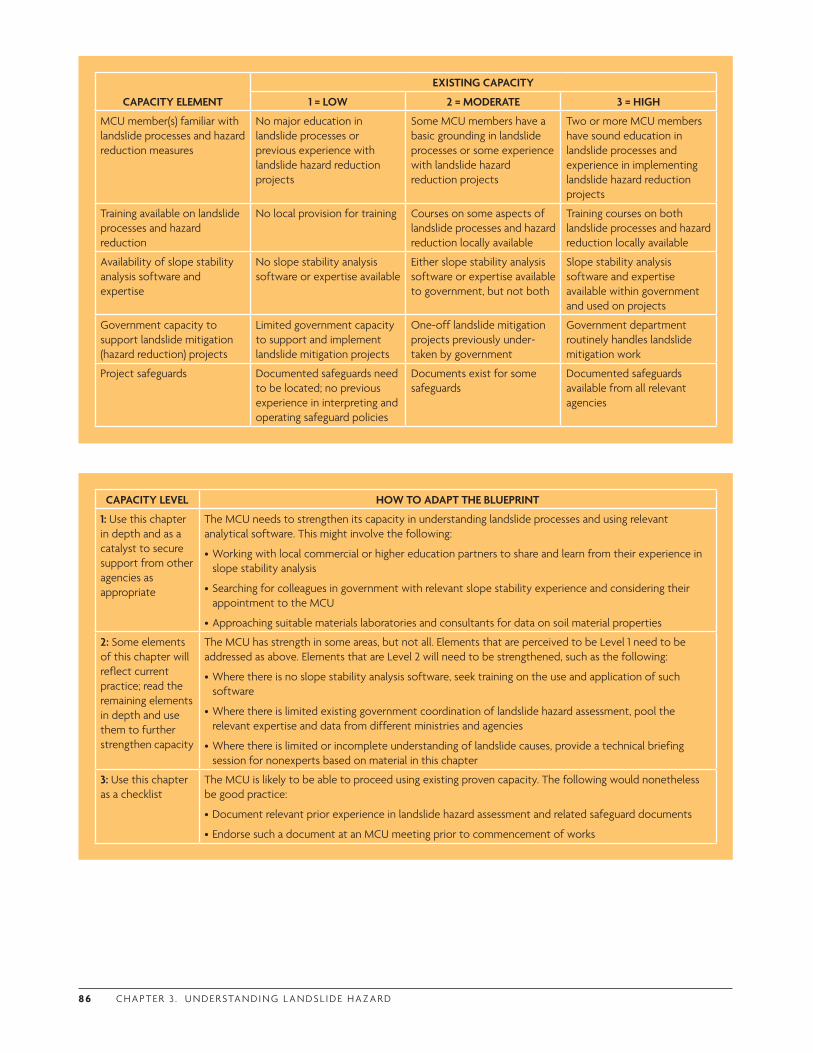
8 6 C H A P T E R 3 . U N D E R STA N D I N G L A N DS L I D E H A Z A R D
CAPACITY LEVEL HOW TO ADAPT THE BLUEPRINT
1: Use this chapter in depth and as a catalyst to secure support from other agencies as appropriate
The MCU needs to strengthen its capacity in understanding landslide processes and using relevant analytical software. This might involve the following:
•Working with local commercial or higher education partners to share and learn from their experience in slope stability analysis
•Searching for colleagues in government with relevant slope stability experience and considering their appointment to the MCU
•Approaching suitable materials laboratories and consultants for data on soil material properties
2: Some elements of this chapter will reflect current practice; read the remaining elements in depth and use them to further strengthen capacity
The MCU has strength in some areas, but not all. Elements that are perceived to be Level 1 need to be addressed as above. Elements that are Level 2 will need to be strengthened, such as the following:
•Where there is no slope stability analysis software, seek training on the use and application of such software
•Where there is limited existing government coordination of landslide hazard assessment, pool the relevant expertise and data from different ministries and agencies
•Where there is limited or incomplete understanding of landslide causes, provide a technical briefing session for nonexperts based on material in this chapter
3: Use this chapter as a checklist
The MCU is likely to be able to proceed using existing proven capacity. The following would nonetheless be good practice:
•Document relevant prior experience in landslide hazard assessment and related safeguard documents
•Endorse such a document at an MCU meeting prior to commencement of works
CAPACITY ELEMENT
EXISTING CAPACITY
1 = LOW 2 = MODERATE 3 = HIGH
MCU member(s) familiar with landslide processes and hazard reduction measures
No major education in landslide processes or previous experience with landslide hazard reduction projects
Some MCU members have a basic grounding in landslide processes or some experience with landslide hazard reduction projects
Two or more MCU members have sound education in landslide processes and experience in implementing landslide hazard reduction projects
Training available on landslide processes and hazard reduction
No local provision for training Courses on some aspects of landslide processes and hazard reduction locally available
Training courses on both landslide processes and hazard reduction locally available
Availability of slope stability analysis software and expertise
No slope stability analysis software or expertise available
Either slope stability analysis software or expertise available to government, but not both
Slope stability analysis software and expertise available within government and used on projects
Government capacity to support landslide mitigation (hazard reduction) projects
Limited government capacity to support and implement landslide mitigation projects
One-off landslide mitigation projects previously under-taken by government
Government department routinely handles landslide mitigation work
Project safeguards Documented safeguards need to be located; no previous experience in interpreting and operating safeguard policies
Documents exist for some safeguards
Documented safeguards available from all relevant agencies
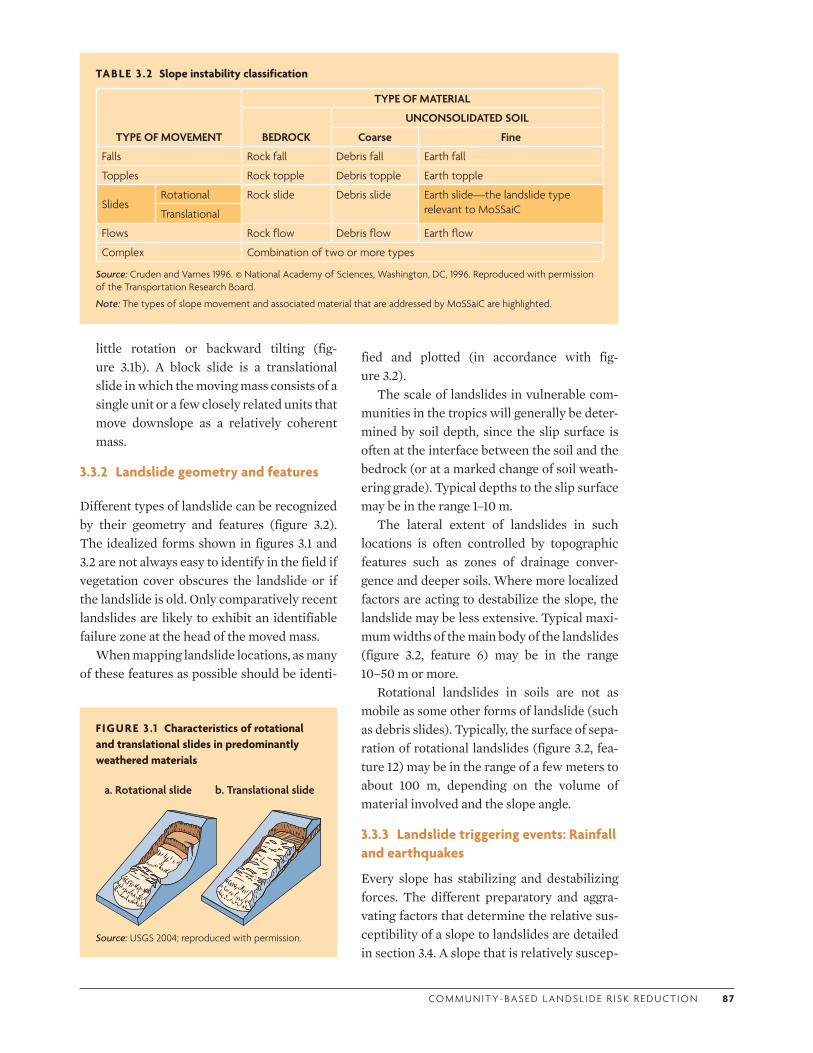
CO M M U N I T Y- BA S E D L A N DS L I D E R I S K R E D U CT I O N 87
TABLE 3 .2 Slope instability classification
TYPE OF MOVEMENT
TYPE OF MATERIAL
BEDROCK
UNCONSOLIDATED SOIL
Coarse Fine
Falls Rock fall Debris fall Earth fall
Topples Rock topple Debris topple Earth topple
SlidesRotational Rock slide Debris slide Earth slide—the landslide type
relevant to MoSSaiCTranslational
Flows Rock flow Debris flow Earth flow
Complex Combination of two or more types
Source: Cruden and Varnes 1996. © National Academy of Sciences, Washington, DC, 1996. Reproduced with permission of the Transportation Research Board.
Note: The types of slope movement and associated material that are addressed by MoSSaiC are highlighted.
FIGURE 3 .1 Characteristics of rotational and translational slides in predominantly weathered materials
a. Rotational slide b. Translational slide
Source: USGS 2004; reproduced with permission.
fied and plotted (in accordance with fig-ure 3.2).
The scale of landslides in vulnerable com-munities in the tropics will generally be deter-mined by soil depth, since the slip surface is often at the interface between the soil and the bedrock (or at a marked change of soil weath-ering grade). Typical depths to the slip surface may be in the range 1–10 m.
The lateral extent of landslides in such locations is often controlled by topographic features such as zones of drainage conver-gence and deeper soils. Where more localized factors are acting to destabilize the slope, the landslide may be less extensive. Typical maxi-mum widths of the main body of the landslides (figure 3.2, feature 6) may be in the range 10–50 m or more.
Rotational landslides in soils are not as mobile as some other forms of landslide (such as debris slides). Typically, the surface of sepa-ration of rotational landslides (figure 3.2, fea-ture 12) may be in the range of a few meters to about 100 m, depending on the volume of material involved and the slope angle.
3.3.3 Landslide triggering events: Rainfall and earthquakes
Every slope has stabilizing and destabilizing forces. The different preparatory and aggra-vating factors that determine the relative sus-ceptibility of a slope to landslides are detailed in section 3.4. A slope that is relatively suscep-
little rotation or backward tilting (fig-ure 3.1b). A block slide is a translational slide in which the moving mass consists of a single unit or a few closely related units that move downslope as a relatively coherent mass.
3.3.2 Landslide geometry and features
Different types of landslide can be recognized by their geometry and features (figure 3.2). The idealized forms shown in figures 3.1 and 3.2 are not always easy to identify in the field if vegetation cover obscures the landslide or if the landslide is old. Only comparatively recent landslides are likely to exhibit an identifiable failure zone at the head of the moved mass.
When mapping landslide locations, as many of these features as possible should be identi-
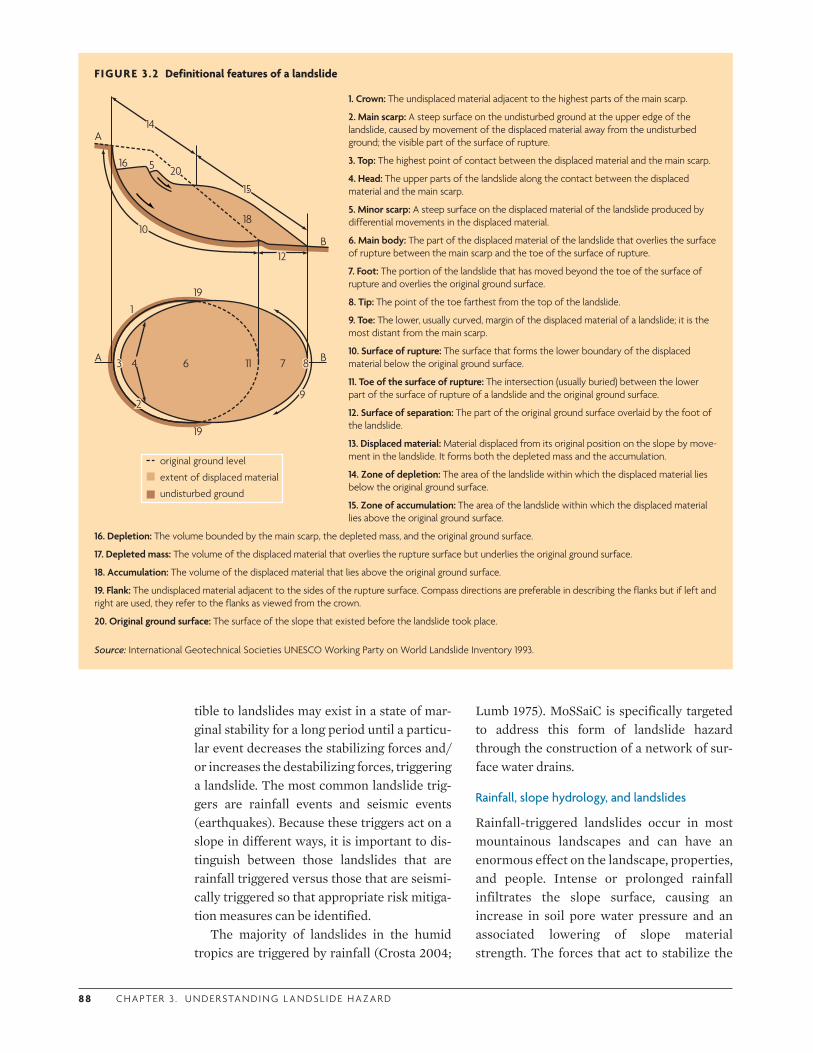
8 8 C H A P T E R 3 . U N D E R STA N D I N G L A N DS L I D E H A Z A R D
FIGURE 3 .2 Definitional features of a landslide
1. Crown: The undisplaced material adjacent to the highest parts of the main scarp.
2. Main scarp: A steep surface on the undisturbed ground at the upper edge of the landslide, caused by movement of the displaced material away from the undisturbed ground; the visible part of the surface of rupture.
3. Top: The highest point of contact between the displaced material and the main scarp.
4. Head: The upper parts of the landslide along the contact between the displaced material and the main scarp.
5. Minor scarp: A steep surface on the displaced material of the landslide produced by differential movements in the displaced material.
6. Main body: The part of the displaced material of the landslide that overlies the surface of rupture between the main scarp and the toe of the surface of rupture.
7. Foot: The portion of the landslide that has moved beyond the toe of the surface of rupture and overlies the original ground surface.
8. Tip: The point of the toe farthest from the top of the landslide.
9. Toe: The lower, usually curved, margin of the displaced material of a landslide; it is the most distant from the main scarp.
10. Surface of rupture: The surface that forms the lower boundary of the displaced material below the original ground surface.
11. Toe of the surface of rupture: The intersection (usually buried) between the lower part of the surface of rupture of a landslide and the original ground surface.
12. Surface of separation: The part of the original ground surface overlaid by the foot of the landslide.
13. Displaced material: Material displaced from its original position on the slope by move-ment in the landslide. It forms both the depleted mass and the accumulation.
14. Zone of depletion: The area of the landslide within which the displaced material lies below the original ground surface.
15. Zone of accumulation: The area of the landslide within which the displaced material lies above the original ground surface.
16. Depletion: The volume bounded by the main scarp, the depleted mass, and the original ground surface.
17. Depleted mass: The volume of the displaced material that overlies the rupture surface but underlies the original ground surface.
18. Accumulation: The volume of the displaced material that lies above the original ground surface.
19. Flank: The undisplaced material adjacent to the sides of the rupture surface. Compass directions are preferable in describing the flanks but if left and right are used, they refer to the flanks as viewed from the crown.
20. Original ground surface: The surface of the slope that existed before the landslide took place.
Source: International Geotechnical Societies UNESCO Working Party on World Landslide Inventory 1993.
tible to landslides may exist in a state of mar-ginal stability for a long period until a particu-lar event decreases the stabilizing forces and/or increases the destabilizing forces, triggering a landslide. The most common landslide trig-gers are rainfall events and seismic events (earthquakes). Because these triggers act on a slope in different ways, it is important to dis-tinguish between those landslides that are rainfall triggered versus those that are seismi-cally triggered so that appropriate risk mitiga-tion measures can be identified.
The majority of landslides in the humid tropics are triggered by rainfall (Crosta 2004;
Lumb 1975). MoSSaiC is specifically targeted to address this form of landslide hazard through the construction of a network of sur-face water drains.
Rainfall, slope hydrology, and landslides
Rainfall-triggered landslides occur in most mountainous landscapes and can have an enormous effect on the landscape, properties, and people. Intense or prolonged rainfall infiltrates the slope surface, causing an increase in soil pore water pressure and an associated lowering of slope material strength. The forces that act to stabilize the
1
22
33 4
5
6 7 88
99
1010
11
1212
1414
1515
16
18
19
19
2020
A B
A
B
undisturbed ground
original ground level
extent of displaced material
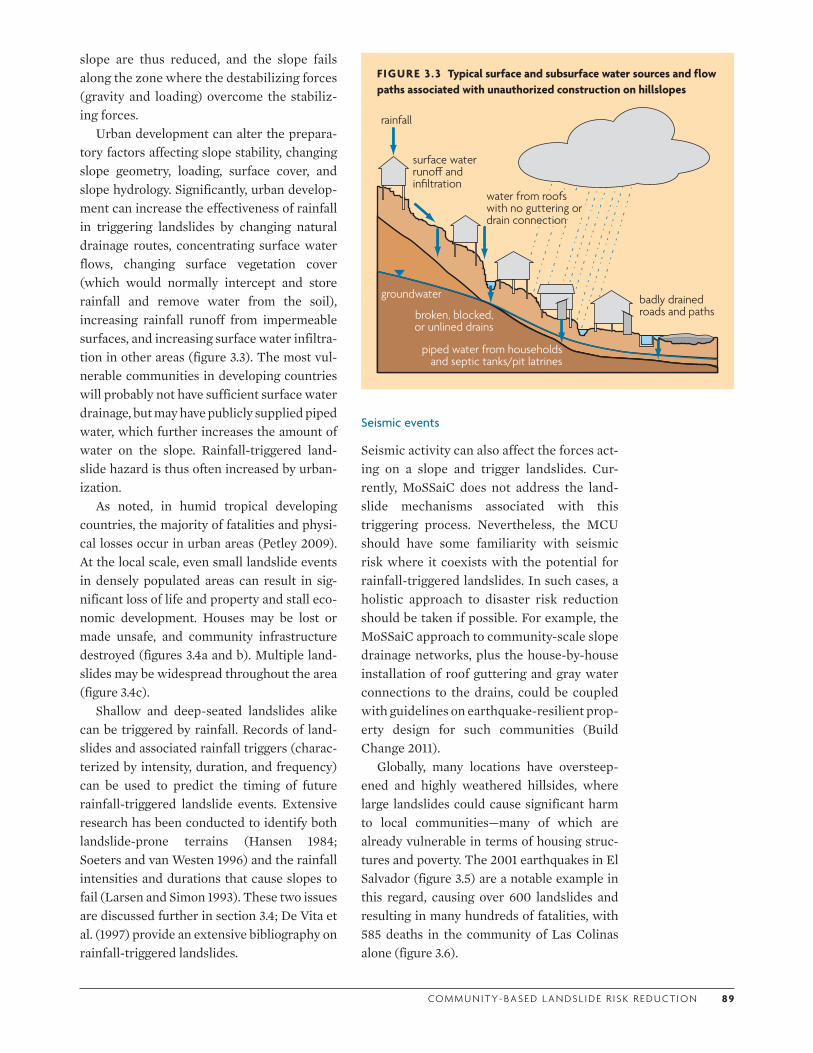
CO M M U N I T Y- BA S E D L A N DS L I D E R I S K R E D U CT I O N 89
slope are thus reduced, and the slope fails along the zone where the destabilizing forces (gravity and loading) overcome the stabiliz-ing forces.
Urban development can alter the prepara-tory factors affecting slope stability, changing slope geometry, loading, surface cover, and slope hydrology. Significantly, urban develop-ment can increase the effectiveness of rainfall in triggering landslides by changing natural drainage routes, concentrating surface water flows, changing surface vegetation cover (which would normally intercept and store rainfall and remove water from the soil), increasing rainfall runoff from impermeable surfaces, and increasing surface water infiltra-tion in other areas (figure 3.3). The most vul-nerable communities in developing countries will probably not have sufficient surface water drainage, but may have publicly supplied piped water, which further increases the amount of water on the slope. Rainfall-triggered land-slide hazard is thus often increased by urban-ization.
As noted, in humid tropical developing countries, the majority of fatalities and physi-cal losses occur in urban areas (Petley 2009). At the local scale, even small landslide events in densely populated areas can result in sig-nificant loss of life and property and stall eco-nomic development. Houses may be lost or made unsafe, and community infrastructure destroyed (figures 3.4a and b). Multiple land-slides may be widespread throughout the area (figure 3.4c).
Shallow and deep-seated landslides alike can be triggered by rainfall. Records of land-slides and associated rainfall triggers (charac-terized by intensity, duration, and frequency) can be used to predict the timing of future rainfall-triggered landslide events. Extensive research has been conducted to identify both landslide-prone terrains (Hansen 1984; Soeters and van Westen 1996) and the rainfall intensities and durations that cause slopes to fail (Larsen and Simon 1993). These two issues are discussed further in section 3.4; De Vita et al. (1997) provide an extensive bibliography on rainfall-triggered landslides.
FIGURE 3 .3 Typical surface and subsurface water sources and flow paths associated with unauthorized construction on hillslopes
groundwater
broken, blocked, or unlined drains
piped water from households and septic tanks/pit latrines
surface water runo� and infiltration
rainfall
badly drained roads and paths
water from roofs with no guttering or drain connection
Seismic events
Seismic activity can also affect the forces act-ing on a slope and trigger landslides. Cur-rently, MoSSaiC does not address the land-slide mechanisms associated with this triggering process. Nevertheless, the MCU should have some familiarity with seismic risk where it coexists with the potential for rainfall-triggered landslides. In such cases, a holistic approach to disaster risk reduction should be taken if possible. For example, the MoSSaiC approach to community-scale slope drainage networks, plus the house-by-house installation of roof guttering and gray water connections to the drains, could be coupled with guidelines on earthquake-resilient prop-erty design for such communities (Build Change 2011).
Globally, many locations have oversteep-ened and highly weathered hillsides, where large landslides could cause significant harm to local communities—many of which are already vulnerable in terms of housing struc-tures and poverty. The 2001 earthquakes in El Salvador (figure 3.5) are a notable example in this regard, causing over 600 landslides and resulting in many hundreds of fatalities, with 585 deaths in the community of Las Colinas alone (figure 3.6).
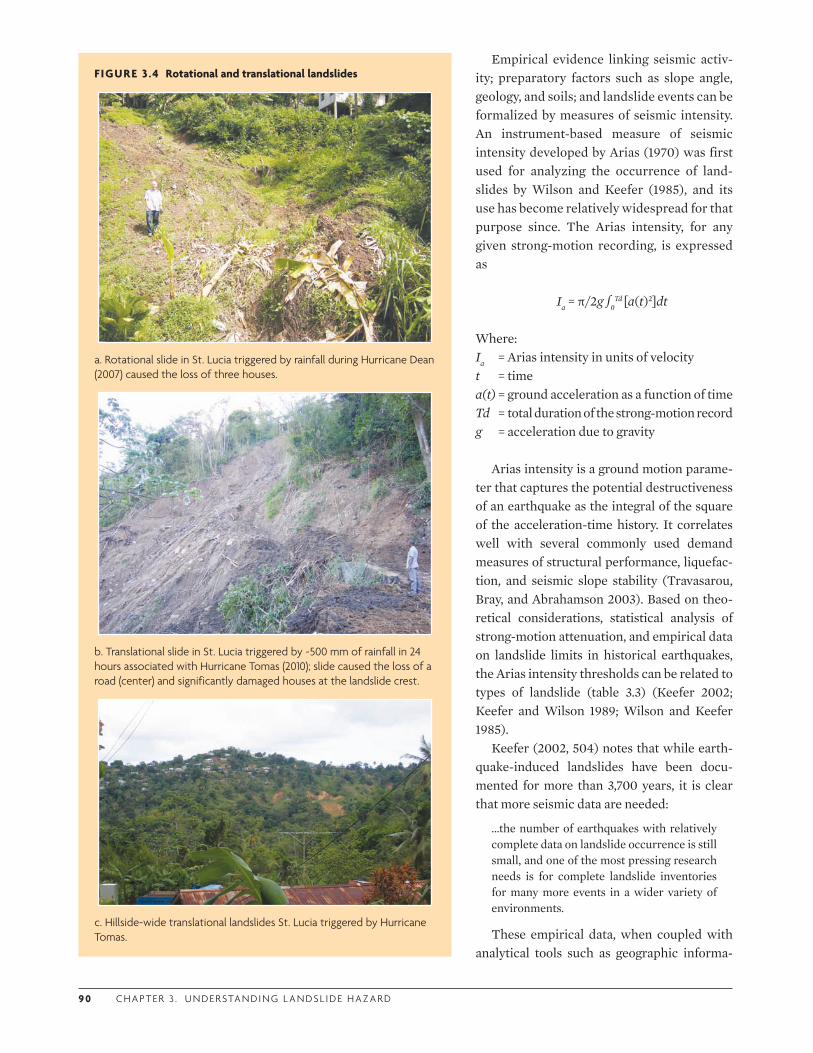
9 0 C H A P T E R 3 . U N D E R STA N D I N G L A N DS L I D E H A Z A R D
Empirical evidence linking seismic activ-ity; preparatory factors such as slope angle, geology, and soils; and landslide events can be formalized by measures of seismic intensity. An instrument-based measure of seismic intensity developed by Arias (1970) was first used for analyzing the occurrence of land-slides by Wilson and Keefer (1985), and its use has become relatively widespread for that purpose since. The Arias intensity, for any given strong-motion recording, is expressed as
Ia = π/2g ∫0Td [a(t)2]dt
Where:Ia = Arias intensity in units of velocityt = timea(t) = ground acceleration as a function of timeTd = total duration of the strong-motion recordg = acceleration due to gravity
Arias intensity is a ground motion parame-ter that captures the potential destructiveness of an earthquake as the integral of the square of the acceleration-time history. It correlates well with several commonly used demand measures of structural performance, liquefac-tion, and seismic slope stability (Travasarou, Bray, and Abrahamson 2003). Based on theo-retical considerations, statistical analysis of strong-motion attenuation, and empirical data on landslide limits in historical earthquakes, the Arias intensity thresholds can be related to types of landslide (table 3.3) (Keefer 2002; Keefer and Wilson 1989; Wilson and Keefer 1985).
Keefer (2002, 504) notes that while earth-quake-induced landslides have been docu-mented for more than 3,700 years, it is clear that more seismic data are needed:
…the number of earthquakes with relatively complete data on landslide occurrence is still small, and one of the most pressing research needs is for complete landslide inventories for many more events in a wider variety of environments.
These empirical data, when coupled with analytical tools such as geographic informa-
FIGURE 3 .4 Rotational and translational landslides
a. Rotational slide in St. Lucia triggered by rainfall during Hurricane Dean (2007) caused the loss of three houses.
b. Translational slide in St. Lucia triggered by ~500 mm of rainfall in 24 hours associated with Hurricane Tomas (2010); slide caused the loss of a road (center) and significantly damaged houses at the landslide crest.
c. Hillside-wide translational landslides St. Lucia triggered by Hurricane Tomas.
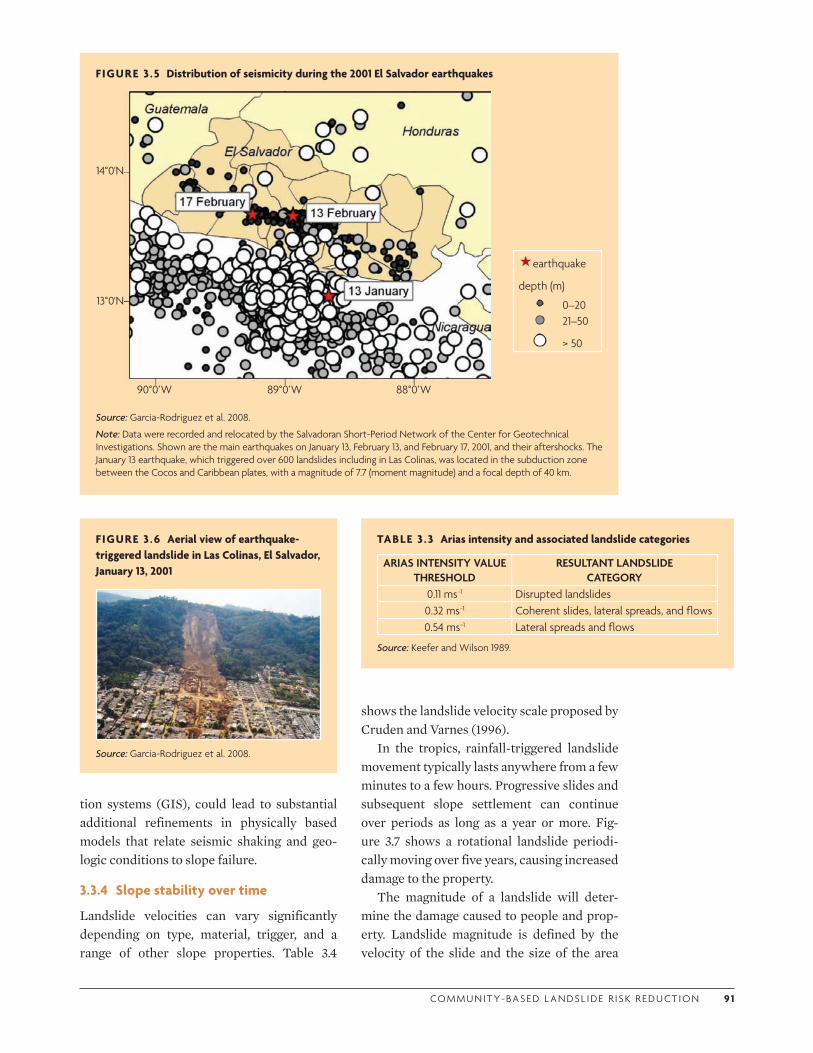
CO M M U N I T Y- BA S E D L A N DS L I D E R I S K R E D U CT I O N 9 1
tion systems (GIS), could lead to substantial additional refinements in physically based models that relate seismic shaking and geo-logic conditions to slope failure.
3.3.4 Slope stability over time
Landslide velocities can vary significantly depending on type, material, trigger, and a range of other slope properties. Table 3.4
FIGURE 3 .6 Aerial view of earthquake-triggered landslide in Las Colinas, El Salvador, January 13, 2001
Source: Garcia-Rodriguez et al. 2008.
TABLE 3 .3 Arias intensity and associated landslide categories
ARIAS INTENSITY VALUE THRESHOLD
RESULTANT LANDSLIDE CATEGORY
0.11 ms−1 Disrupted landslides0.32 ms−1 Coherent slides, lateral spreads, and flows0.54 ms−1 Lateral spreads and flows
Source: Keefer and Wilson 1989.
shows the landslide velocity scale proposed by Cruden and Varnes (1996).
In the tropics, rainfall-triggered landslide movement typically lasts anywhere from a few minutes to a few hours. Progressive slides and subsequent slope settlement can continue over periods as long as a year or more. Fig-ure 3.7 shows a rotational landslide periodi-cally moving over five years, causing increased damage to the property.
The magnitude of a landslide will deter-mine the damage caused to people and prop-erty. Landslide magnitude is defined by the velocity of the slide and the size of the area
FIGURE 3 .5 Distribution of seismicity during the 2001 El Salvador earthquakes
90°0’W 89°0’W 88°0’W
Source: Garcia-Rodriguez et al. 2008.
Note: Data were recorded and relocated by the Salvadoran Short-Period Network of the Center for Geotechnical Investigations. Shown are the main earthquakes on January 13, February 13, and February 17, 2001, and their aftershocks. The January 13 earthquake, which triggered over 600 landslides including in Las Colinas, was located in the subduction zone between the Cocos and Caribbean plates, with a magnitude of 7.7 (moment magnitude) and a focal depth of 40 km.
14°0'N
13°0'N
earthquake
depth (m)
0–20 21–50
> 50

92 C H A P T E R 3 . U N D E R STA N D I N G L A N DS L I D E H A Z A R D
TABLE 3 .4 Landslide velocity scale
VELOCITY CLASS DESCRIPTION
VELOCITY (mm/s)
TYPICAL VELOCITY PROBABLE DESTRUCTIVE SIGNIFICANCE
7 Extremely rapid
5 × 10³ 5 m/s
Catastrophe of major violence; buildings destroyed by impact of displaced material; many deaths; escape unlikely
6 Very rapid
5 × 101 3 m/min
Some lives lost; velocity too great to permit all persons to escape
5 Rapid
5 × 101 1.8 m/h
Escape evacuation possible; structures, possessions, and equipment destroyed
4 Moderate
5 × 10³ 13 m/month
Some temporary and insensitive structures can be temporarily maintained
3 Slow
5 × 10⁵ 1.6 m/year
Remedial construction can be undertaken during movement; insensi-tive structures can be maintained with frequent maintenance work if total movement is not large during a particular acceleration phase
2 Very slow
5 × 10⁷ 15 mm/year
Some permanent structures undamaged by movement
Extremely slowImperceptible without instruments; construction possible with precautions
Source: Cruden and Varnes 1996. © National Academy of Sciences, Washington, DC, 1996. Reproduced with permission of the Transportation Research Board.
FIGURE 3 .7 Progressive landslide
a. In 2005, rainfall triggered a progressive rotational landslide in a vulnerable community in St. Lucia.
b. The same house in 2008 shows the slow progressive movement of the rotational failure.
c. The same house in 2010 shows the structure’s near collapse after five years of very slow progressive slope failure.
affected, in terms of both the actual failed area and the travel distance of the displaced mate-rial (the accumulation zone).
The slope’s postfailure stability can also contribute to overall landslide impact. Depending on the geometry of the slide and the resulting geometry of the slope, there may be either a relative increase in overall stability
(reduction in hazard) or a decrease in stability due to the slide’s creating an unstable scarp (figure 3.8).
In an area of existing landslides, postfailure stability should be carefully assessed to iden-tify possible future hazard, since this may be either increased or decreased by occurrence of a slope failure.
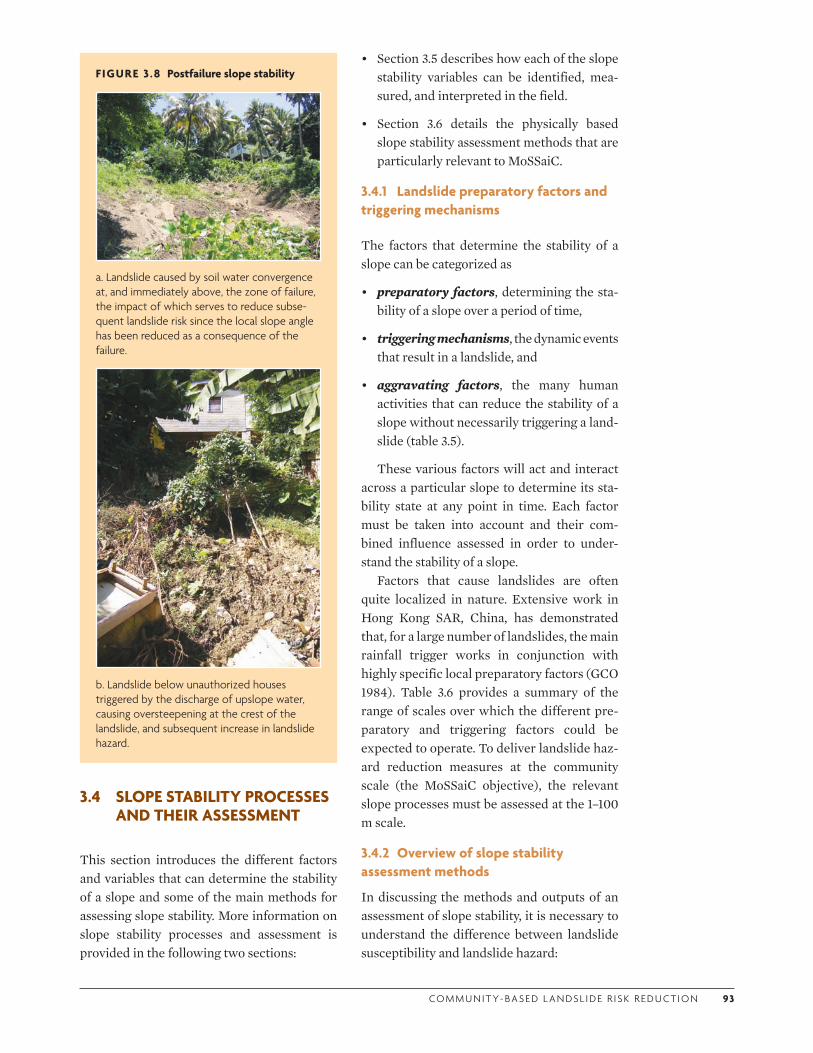
CO M M U N I T Y- BA S E D L A N DS L I D E R I S K R E D U CT I O N 93
FIGURE 3 .8 Postfailure slope stability
a. Landslide caused by soil water convergence at, and immediately above, the zone of failure, the impact of which serves to reduce subse-quent landslide risk since the local slope angle has been reduced as a consequence of the failure.
b. Landslide below unauthorized houses triggered by the discharge of upslope water, causing oversteepening at the crest of the landslide, and subsequent increase in landslide hazard.
3.4 SLOPE STABILITY PROCESSES AND THEIR ASSESSMENT
This section introduces the different factors and variables that can determine the stability of a slope and some of the main methods for assessing slope stability. More information on slope stability processes and assessment is provided in the following two sections:
• Section 3.5 describes how each of the slope stability variables can be identified, mea-sured, and interpreted in the field.
• Section 3.6 details the physically based slope stability assessment methods that are particularly relevant to MoSSaiC.
3.4.1 Landslide preparatory factors and triggering mechanisms
The factors that determine the stability of a slope can be categorized as
• preparatory factors, determining the sta-bility of a slope over a period of time,
• triggering mechanisms, the dynamic events that result in a landslide, and
• aggravating factors, the many human activities that can reduce the stability of a slope without necessarily triggering a land-slide (table 3.5).
These various factors will act and interact across a particular slope to determine its sta-bility state at any point in time. Each factor must be taken into account and their com-bined influence assessed in order to under-stand the stability of a slope.
Factors that cause landslides are often quite localized in nature. Extensive work in Hong Kong SAR, China, has demonstrated that, for a large number of landslides, the main rainfall trigger works in conjunction with highly specific local preparatory factors (GCO 1984). Table 3.6 provides a summary of the range of scales over which the different pre-paratory and triggering factors could be expected to operate. To deliver landslide haz-ard reduction measures at the community scale (the MoSSaiC objective), the relevant slope processes must be assessed at the 1–100 m scale.
3.4.2 Overview of slope stability assessment methods
In discussing the methods and outputs of an assessment of slope stability, it is necessary to understand the difference between landslide susceptibility and landslide hazard:
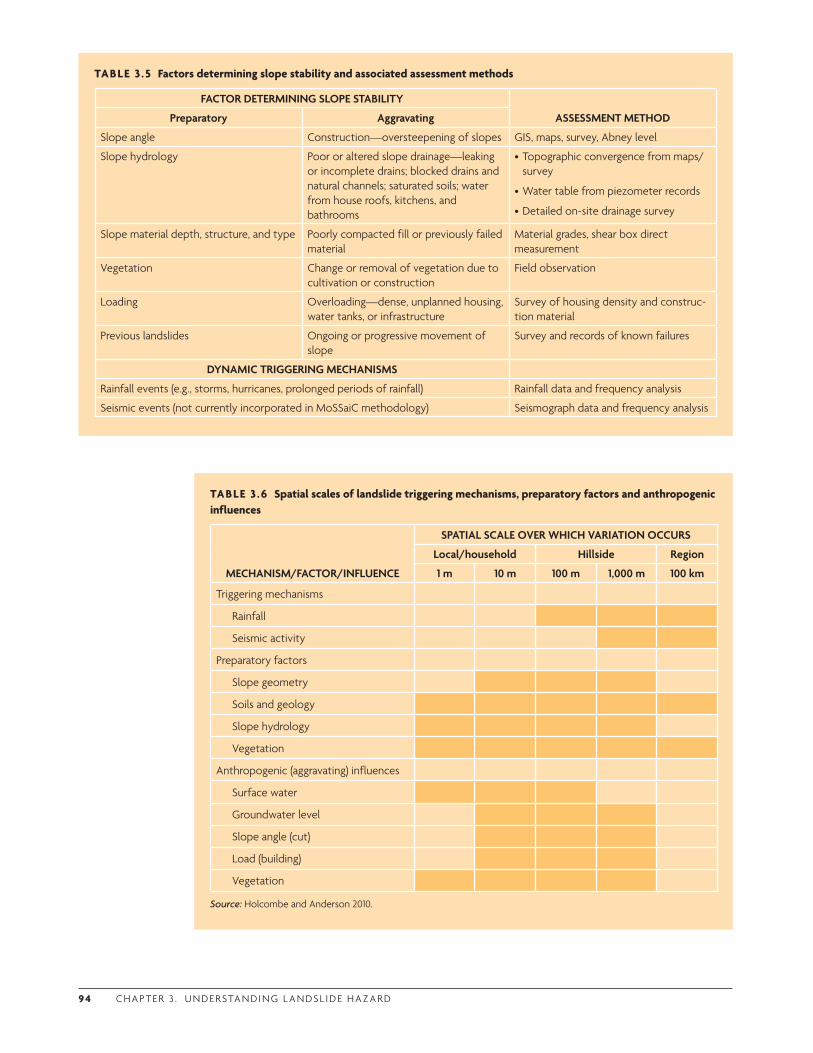
9 4 C H A P T E R 3 . U N D E R STA N D I N G L A N DS L I D E H A Z A R D
TABLE 3 .6 Spatial scales of landslide triggering mechanisms, preparatory factors and anthropogenic influences
MECHANISM/FACTOR/INFLUENCE
SPATIAL SCALE OVER WHICH VARIATION OCCURS
Local/household Hillside Region
1 m 10 m 100 m 1,000 m 100 km
Triggering mechanisms
Rainfall
Seismic activity
Preparatory factors
Slope geometry
Soils and geology
Slope hydrology
Vegetation
Anthropogenic (aggravating) influences
Surface water
Groundwater level
Slope angle (cut)
Load (building)
Vegetation
Source: Holcombe and Anderson 2010.
TABLE 3 .5 Factors determining slope stability and associated assessment methods
FACTOR DETERMINING SLOPE STABILITY
ASSESSMENT METHODPreparatory Aggravating
Slope angle Construction—oversteepening of slopes GIS, maps, survey, Abney level
Slope hydrology Poor or altered slope drainage—leaking or incomplete drains; blocked drains and natural channels; saturated soils; water from house roofs, kitchens, and bathrooms
•Topographic convergence from maps/survey
•Water table from piezometer records
•Detailed on-site drainage survey
Slope material depth, structure, and type Poorly compacted fill or previously failed material
Material grades, shear box direct measurement
Vegetation Change or removal of vegetation due to cultivation or construction
Field observation
Loading Overloading—dense, unplanned housing, water tanks, or infrastructure
Survey of housing density and construc-tion material
Previous landslides Ongoing or progressive movement of slope
Survey and records of known failures
DYNAMIC TRIGGERING MECHANISMS
Rainfall events (e.g., storms, hurricanes, prolonged periods of rainfall) Rainfall data and frequency analysis
Seismic events (not currently incorporated in MoSSaiC methodology) Seismograph data and frequency analysis
CO M M U N I T Y- BA S E D L A N DS L I D E R I S K R E D U CT I O N 9 5
• Landslide susceptibility relates to the type and spatial distribution of existing or poten-tial landslides in an area. Susceptibility assessment is based on the qualitative or quantitative assessment of the role of pre-paratory factors in determining the rela-tive stability of different slopes or zones. The magnitude and velocity of existing or potential landslides may be taken into account, but the frequency or timing will not be specified.
• Landslide hazard is the probability of a landslide (qualitatively or quantitatively assessed) of a certain type, magnitude, and velocity occurring at a specific location. Quantitative hazard assessment takes into account the role of the triggering event (of a known probability) causing the landslide.
Several different approaches can be used to assess landslide susceptibility and hazard, including direct geomorphologic mapping, index-based mapping and heuristic (expert) assessment, inventory-based empirical and statistical modeling of slope parameters, and deterministic (physically based) and probabi-listic modeling of slope processes (Aleotti and Chowdhury 1999; Dai, Lee, and Ngai 2002; and Huabin et al. 2005; these also contain summa-ries of these methods). Table 3.7 outlines the respective advantages and disadvantages of the principal approaches.
Selection of the most suitable approach for a given study must consider the spatial scale for which it is most appropriate, the data requirements, and the level of quantification it affords (van Westen et al. 2006; van Westen et al. 2008). Four methods of relevance to MoSSaiC are briefly reviewed in sections 3.4.3–3.4.6:
• Spatially distributed landslide susceptibil-ity mapping using GIS-based methods—useful for the initial identification and pri-oritization of areas with relatively high landslide susceptibility (as described in chapter 4)
• Direct landslide hazard mapping—also use-ful for identification of areas of existing
slope instability and for confirmation of the type of landslide hazard
• Empirical rainfall threshold modeling—if sufficient empirical data are available, this method can be used in conjunction with susceptibility maps to indicate the potential timing and spatial distribution of multiple landslide events
• Physically based slope stability modeling—the most relevant approach for MoSSaiC, as it allows investigation of the slope stability processes and landslide trigger at a scale enabling the identification of appropriate hazard reduction measures (1–100 m2).
3.4.3 GIS-based landslide susceptibility mapping
Many wide-area and spatially distributed landslide assessments use GIS software as the platform for assembling digital maps of prepa-ratory variables such as topography, soils and geology, drainage patterns, and land use. The data can be augmented and the analysis extended if there is a record of the locations of past landslides. Landslide inventories allow the identification of precedents in which the influence of each preparatory variable is deter-mined with respect to slope stability and assigned a weighting. Alternatively, experts may assign weights based on their judgment and experience. The resulting index overlay maps define the landslide susceptibility for each terrain unit. On their own, these GIS-based susceptibility maps cannot be used to predict the exact timing and location of indi-vidual landslides, but they do provide a vital tool for planning and management in terms of broad zones of relative landslide susceptibility.
An example of GIS capability for develop-ing landslide susceptibility maps is given by Nandi and Shakoor (2010). They developed relationships between landslides and various instability factors contributing to their occur-rence using GIS. A landslide inventory map was prepared using landslide locations identi-fied from aerial photographs, field checks, and existing literature. Seven instability factors were then selected—slope angle, soil type, soil
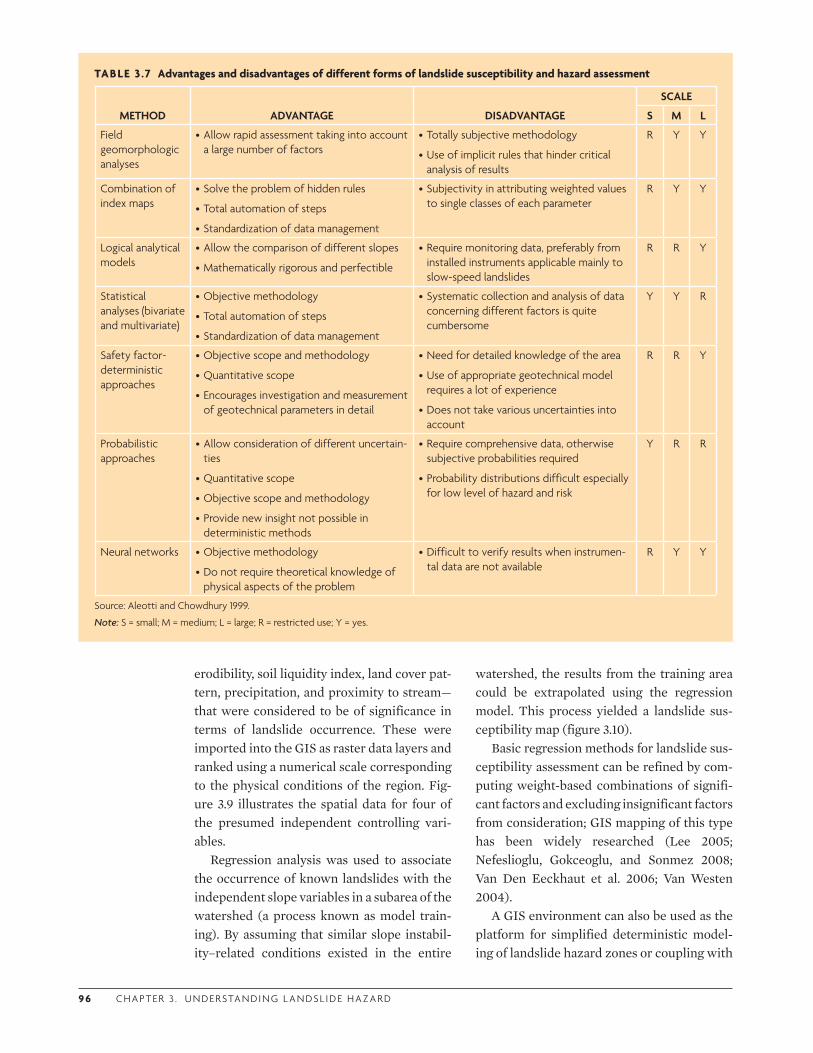
9 6 C H A P T E R 3 . U N D E R STA N D I N G L A N DS L I D E H A Z A R D
erodibility, soil liquidity index, land cover pat-tern, precipitation, and proximity to stream—that were considered to be of significance in terms of landslide occurrence. These were imported into the GIS as raster data layers and ranked using a numerical scale corresponding to the physical conditions of the region. Fig-ure 3.9 illustrates the spatial data for four of the presumed independent controlling vari-ables.
Regression analysis was used to associate the occurrence of known landslides with the independent slope variables in a subarea of the watershed (a process known as model train-ing). By assuming that similar slope instabil-ity–related conditions existed in the entire
watershed, the results from the training area could be extrapolated using the regression model. This process yielded a landslide sus-ceptibility map (figure 3.10).
Basic regression methods for landslide sus-ceptibility assessment can be refined by com-puting weight-based combinations of signifi-cant factors and excluding insignificant factors from consideration; GIS mapping of this type has been widely researched (Lee 2005; Nefeslioglu, Gokceoglu, and Sonmez 2008; Van Den Eeckhaut et al. 2006; Van Westen 2004).
A GIS environment can also be used as the platform for simplified deterministic model-ing of landslide hazard zones or coupling with
TABLE 3 .7 Advantages and disadvantages of different forms of landslide susceptibility and hazard assessment
METHOD ADVANTAGE DISADVANTAGE
SCALE
S M L
Field geomorphologic analyses
•Allow rapid assessment taking into account a large number of factors
•Totally subjective methodology
•Use of implicit rules that hinder critical analysis of results
R Y Y
Combination of index maps
•Solve the problem of hidden rules
•Total automation of steps
•Standardization of data management
•Subjectivity in attributing weighted values to single classes of each parameter
R Y Y
Logical analytical models
•Allow the comparison of different slopes
•Mathematically rigorous and perfectible
•Require monitoring data, preferably from installed instruments applicable mainly to slow-speed landslides
R R Y
Statistical analyses (bivariate and multivariate)
•Objective methodology
•Total automation of steps
•Standardization of data management
•Systematic collection and analysis of data concerning different factors is quite cumbersome
Y Y R
Safety factor- deterministic approaches
•Objective scope and methodology
•Quantitative scope
•Encourages investigation and measurement of geotechnical parameters in detail
•Need for detailed knowledge of the area
•Use of appropriate geotechnical model requires a lot of experience
•Does not take various uncertainties into account
R R Y
Probabilistic approaches
•Allow consideration of different uncertain-ties
•Quantitative scope
•Objective scope and methodology
•Provide new insight not possible in deterministic methods
•Require comprehensive data, otherwise subjective probabilities required
•Probability distributions difficult especially for low level of hazard and risk
Y R R
Neural networks •Objective methodology
•Do not require theoretical knowledge of physical aspects of the problem
•Difficult to verify results when instrumen-tal data are not available
R Y Y
Source: Aleotti and Chowdhury 1999.
Note: S = small; M = medium; L = large; R = restricted use; Y = yes.
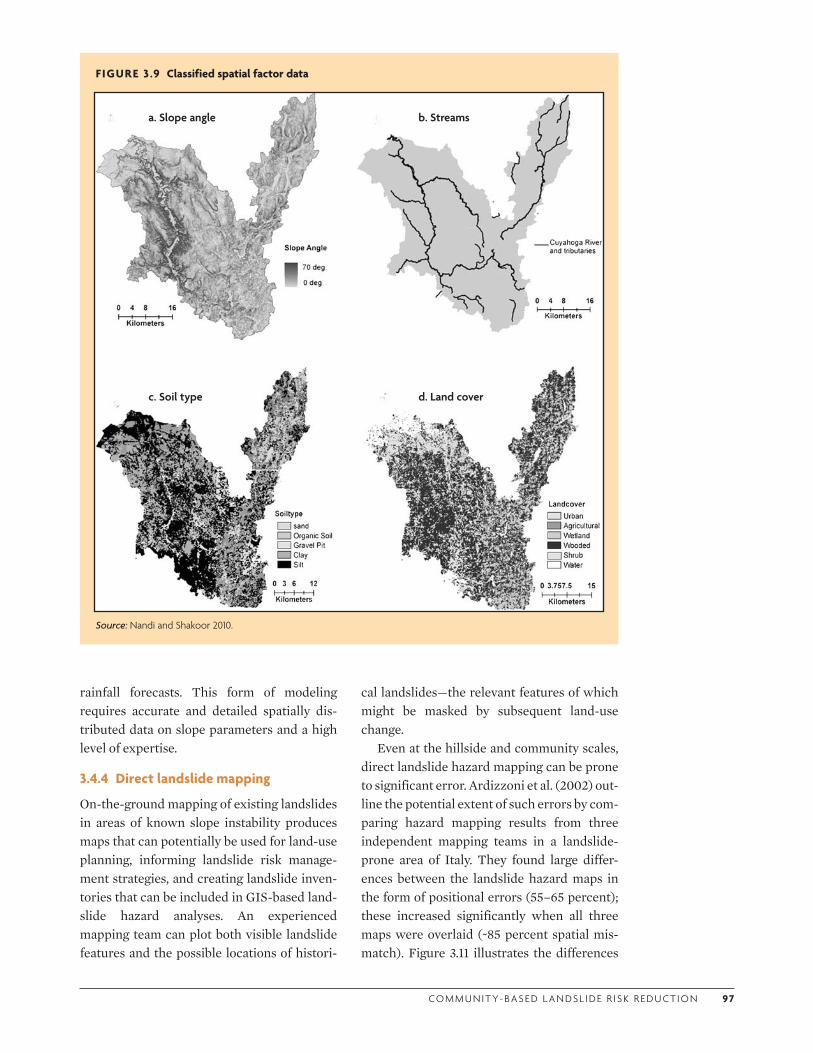
CO M M U N I T Y- BA S E D L A N DS L I D E R I S K R E D U CT I O N 9 7
rainfall forecasts. This form of modeling requires accurate and detailed spatially dis-tributed data on slope parameters and a high level of expertise.
3.4.4 Direct landslide mapping
On-the-ground mapping of existing landslides in areas of known slope instability produces maps that can potentially be used for land-use planning, informing landslide risk manage-ment strategies, and creating landslide inven-tories that can be included in GIS-based land-slide hazard analyses. An experienced mapping team can plot both visible landslide features and the possible locations of histori-
cal landslides—the relevant features of which might be masked by subsequent land-use change.
Even at the hillside and community scales, direct landslide hazard mapping can be prone to significant error. Ardizzoni et al. (2002) out-line the potential extent of such errors by com-paring hazard mapping results from three independent mapping teams in a landslide-prone area of Italy. They found large differ-ences between the landslide hazard maps in the form of positional errors (55–65 percent); these increased significantly when all three maps were overlaid (~85 percent spatial mis-match). Figure 3.11 illustrates the differences
FIGURE 3 .9 Classified spatial factor data
Source: Nandi and Shakoor 2010.
a. Slope angle b. Streams
c. Soil type d. Land cover
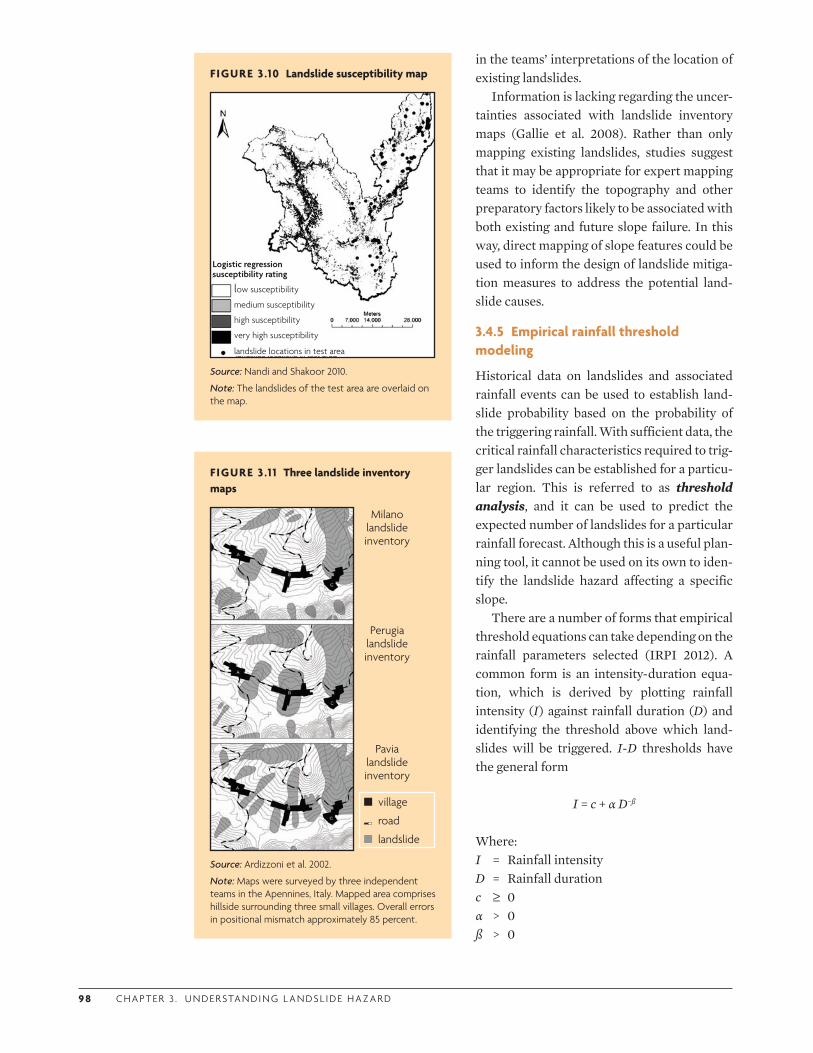
9 8 C H A P T E R 3 . U N D E R STA N D I N G L A N DS L I D E H A Z A R D
in the teams’ interpretations of the location of existing landslides.
Information is lacking regarding the uncer-tainties associated with landslide inventory maps (Gallie et al. 2008). Rather than only mapping existing landslides, studies suggest that it may be appropriate for expert mapping teams to identify the topography and other preparatory factors likely to be associated with both existing and future slope failure. In this way, direct mapping of slope features could be used to inform the design of landslide mitiga-tion measures to address the potential land-slide causes.
3.4.5 Empirical rainfall threshold modeling
Historical data on landslides and associated rainfall events can be used to establish land-slide probability based on the probability of the triggering rainfall. With sufficient data, the critical rainfall characteristics required to trig-ger landslides can be established for a particu-lar region. This is referred to as threshold analysis, and it can be used to predict the expected number of landslides for a particular rainfall forecast. Although this is a useful plan-ning tool, it cannot be used on its own to iden-tify the landslide hazard affecting a specific slope.
There are a number of forms that empirical threshold equations can take depending on the rainfall parameters selected (IRPI 2012). A common form is an intensity-duration equa-tion, which is derived by plotting rainfall intensity (I) against rainfall duration (D) and identifying the threshold above which land-slides will be triggered. I-D thresholds have the general form
I = c + α D−ß
Where: I = Rainfall intensityD = Rainfall durationc ≥ 0α > 0ß > 0
FIGURE 3 .1 1 Three landslide inventory maps
Source: Ardizzoni et al. 2002.
Note: Maps were surveyed by three independent teams in the Apennines, Italy. Mapped area comprises hillside surrounding three small villages. Overall errors in positional mismatch approximately 85 percent.
Milano landslide inventory
Perugia landslide inventory
Pavia landslide inventory
village
road
landslide
FIGURE 3 .10 Landslide susceptibility map
Source: Nandi and Shakoor 2010.
Note: The landslides of the test area are overlaid on the map.
low susceptibility
medium susceptibility
high susceptibility
very high susceptibility
landslide locations in test area
Logistic regression susceptibility rating
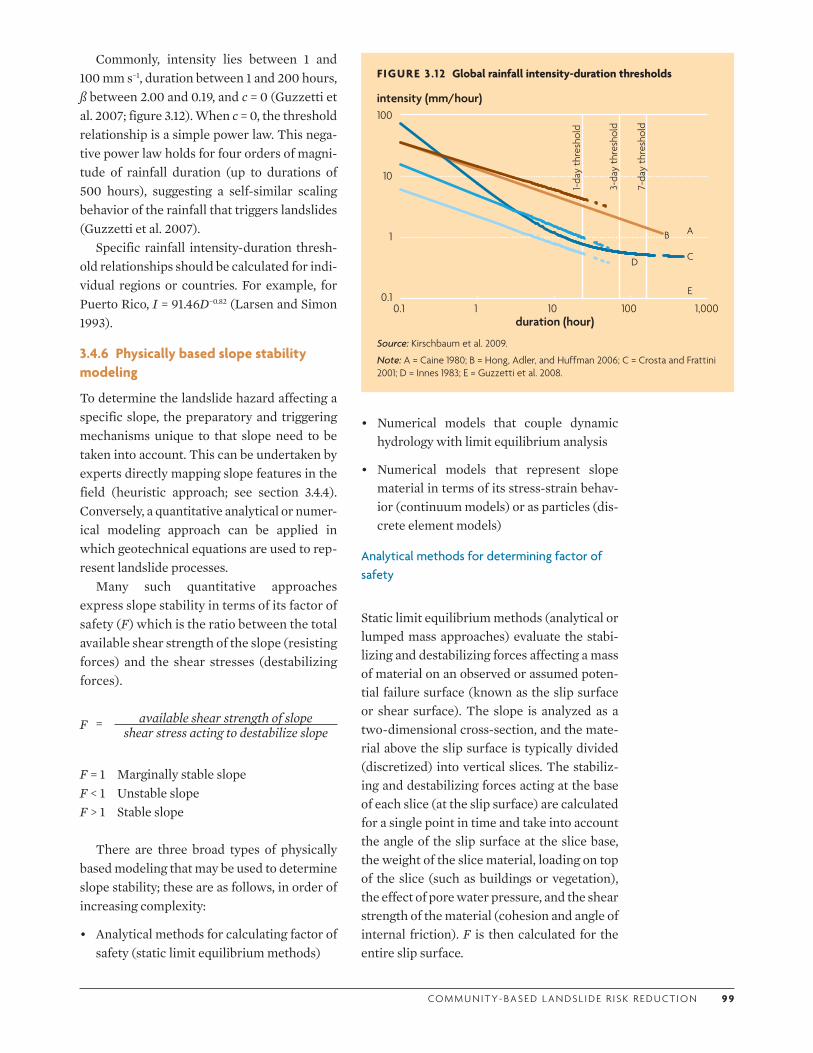
CO M M U N I T Y- BA S E D L A N DS L I D E R I S K R E D U CT I O N 9 9
FIGURE 3 .12 Global rainfall intensity-duration thresholds
duration (hour)
intensity (mm/hour)
0.1
1
10
100
10010 1,00010.1
1-day
thre
shol
d
3-da
y th
resh
old
7-da
y th
resh
old
AB
CD
E
Source: Kirschbaum et al. 2009.
Note: A = Caine 1980; B = Hong, Adler, and Huffman 2006; C = Crosta and Frattini 2001; D = Innes 1983; E = Guzzetti et al. 2008.
Commonly, intensity lies between 1 and 100 mm s−1, duration between 1 and 200 hours, ß between 2.00 and 0.19, and c = 0 (Guzzetti et al. 2007; figure 3.12). When c = 0, the threshold relationship is a simple power law. This nega-tive power law holds for four orders of magni-tude of rainfall duration (up to durations of 500 hours), suggesting a self-similar scaling behavior of the rainfall that triggers landslides (Guzzetti et al. 2007).
Specific rainfall intensity-duration thresh-old relationships should be calculated for indi-vidual regions or countries. For example, for Puerto Rico, I = 91.46D−0.82 (Larsen and Simon 1993).
3.4.6 Physically based slope stability modeling
To determine the landslide hazard affecting a specific slope, the preparatory and triggering mechanisms unique to that slope need to be taken into account. This can be undertaken by experts directly mapping slope features in the field (heuristic approach; see section 3.4.4). Conversely, a quantitative analytical or numer-ical modeling approach can be applied in which geotechnical equations are used to rep-resent landslide processes.
Many such quantitative approaches express slope stability in terms of its factor of safety (F) which is the ratio between the total available shear strength of the slope (resisting forces) and the shear stresses (destabilizing forces).
F = available shear strength of slopeshear stress acting to destabilize slope
F = 1 Marginally stable slopeF < 1 Unstable slopeF > 1 Stable slope
There are three broad types of physically based modeling that may be used to determine slope stability; these are as follows, in order of increasing complexity:
• Analytical methods for calculating factor of safety (static limit equilibrium methods)
• Numerical models that couple dynamic hydrology with limit equilibrium analysis
• Numerical models that represent slope material in terms of its stress-strain behav-ior (continuum models) or as particles (dis-crete element models)
Analytical methods for determining factor of safety
Static limit equilibrium methods (analytical or lumped mass approaches) evaluate the stabi-lizing and destabilizing forces affecting a mass of material on an observed or assumed poten-tial failure surface (known as the slip surface or shear surface). The slope is analyzed as a two-dimensional cross-section, and the mate-rial above the slip surface is typically divided (discretized) into vertical slices. The stabiliz-ing and destabilizing forces acting at the base of each slice (at the slip surface) are calculated for a single point in time and take into account the angle of the slip surface at the slice base, the weight of the slice material, loading on top of the slice (such as buildings or vegetation), the effect of pore water pressure, and the shear strength of the material (cohesion and angle of internal friction). F is then calculated for the entire slip surface.
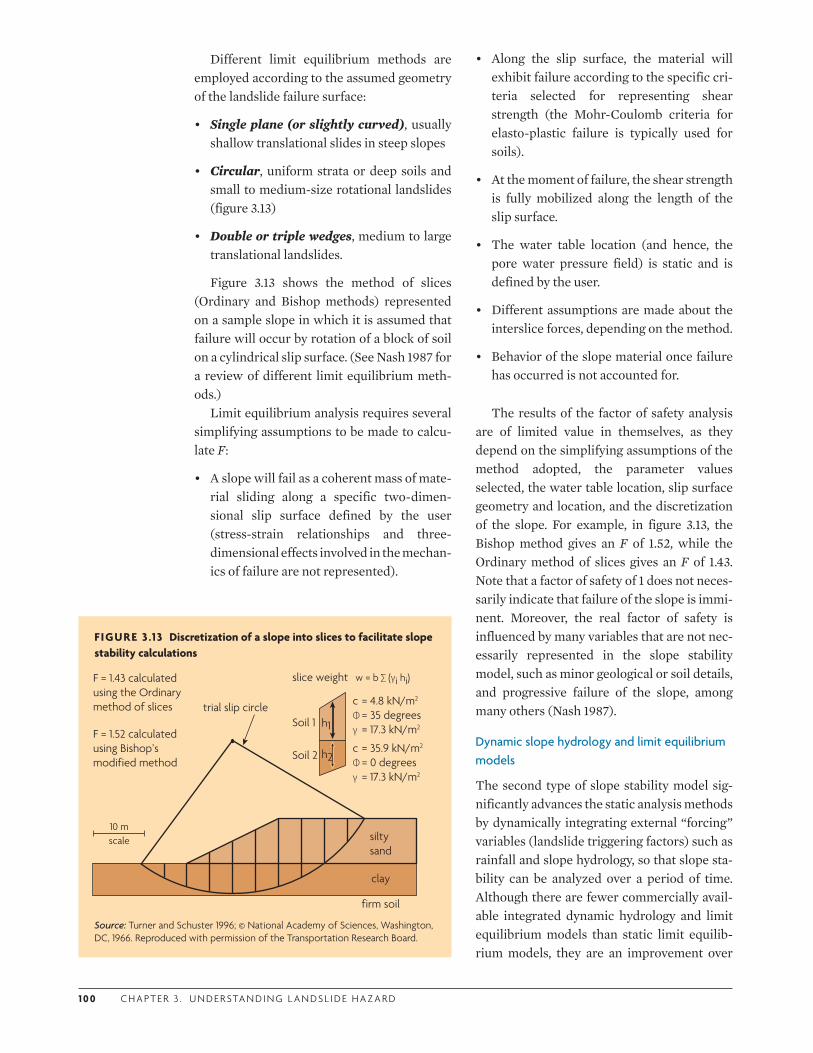
1 0 0 C H A P T E R 3 . U N D E R STA N D I N G L A N DS L I D E H A Z A R D
Different limit equilibrium methods are employed according to the assumed geometry of the landslide failure surface:
• Single plane (or slightly curved), usually shallow translational slides in steep slopes
• Circular, uniform strata or deep soils and small to medium-size rotational landslides (figure 3.13)
• Double or triple wedges, medium to large translational landslides.
Figure 3.13 shows the method of slices (Ordinary and Bishop methods) represented on a sample slope in which it is assumed that failure will occur by rotation of a block of soil on a cylindrical slip surface. (See Nash 1987 for a review of different limit equilibrium meth-ods.)
Limit equilibrium analysis requires several simplifying assumptions to be made to calcu-late F:
• A slope will fail as a coherent mass of mate-rial sliding along a specific two-dimen-sional slip surface defined by the user (stress-strain relationships and three-dimensional effects involved in the mechan-ics of failure are not represented).
• Along the slip surface, the material will exhibit failure according to the specific cri-teria selected for representing shear strength (the Mohr-Coulomb criteria for elasto-plastic failure is typically used for soils).
• At the moment of failure, the shear strength is fully mobilized along the length of the slip surface.
• The water table location (and hence, the pore water pressure field) is static and is defined by the user.
• Different assumptions are made about the interslice forces, depending on the method.
• Behavior of the slope material once failure has occurred is not accounted for.
The results of the factor of safety analysis are of limited value in themselves, as they depend on the simplifying assumptions of the method adopted, the parameter values selected, the water table location, slip surface geometry and location, and the discretization of the slope. For example, in figure 3.13, the Bishop method gives an F of 1.52, while the Ordinary method of slices gives an F of 1.43. Note that a factor of safety of 1 does not neces-sarily indicate that failure of the slope is immi-nent. Moreover, the real factor of safety is influenced by many variables that are not nec-essarily represented in the slope stability model, such as minor geological or soil details, and progressive failure of the slope, among many others (Nash 1987).
Dynamic slope hydrology and limit equilibrium models
The second type of slope stability model sig-nificantly advances the static analysis methods by dynamically integrating external “forcing” variables (landslide triggering factors) such as rainfall and slope hydrology, so that slope sta-bility can be analyzed over a period of time. Although there are fewer commercially avail-able integrated dynamic hydrology and limit equilibrium models than static limit equilib-rium models, they are an improvement over
FIGURE 3 .13 Discretization of a slope into slices to facilitate slope stability calculations
w = b ∑ (γi hi)
silty sand
clay
firm soil
F = 1.43 calculated using the Ordinary method of slices
F = 1.52 calculated using Bishop’s modified method
slice weight
Soil 1
Soil 2
h1
h2
= 4.8 kN/m2
= 35 degrees= 17.3 kN/m2
c Φ γ
= 35.9 kN/m2
= 0 degrees= 17.3 kN/m2
c Φ γ
10 mscale
trial slip circle
Source: Turner and Schuster 1996; © National Academy of Sciences, Washington, DC, 1966. Reproduced with permission of the Transportation Research Board.
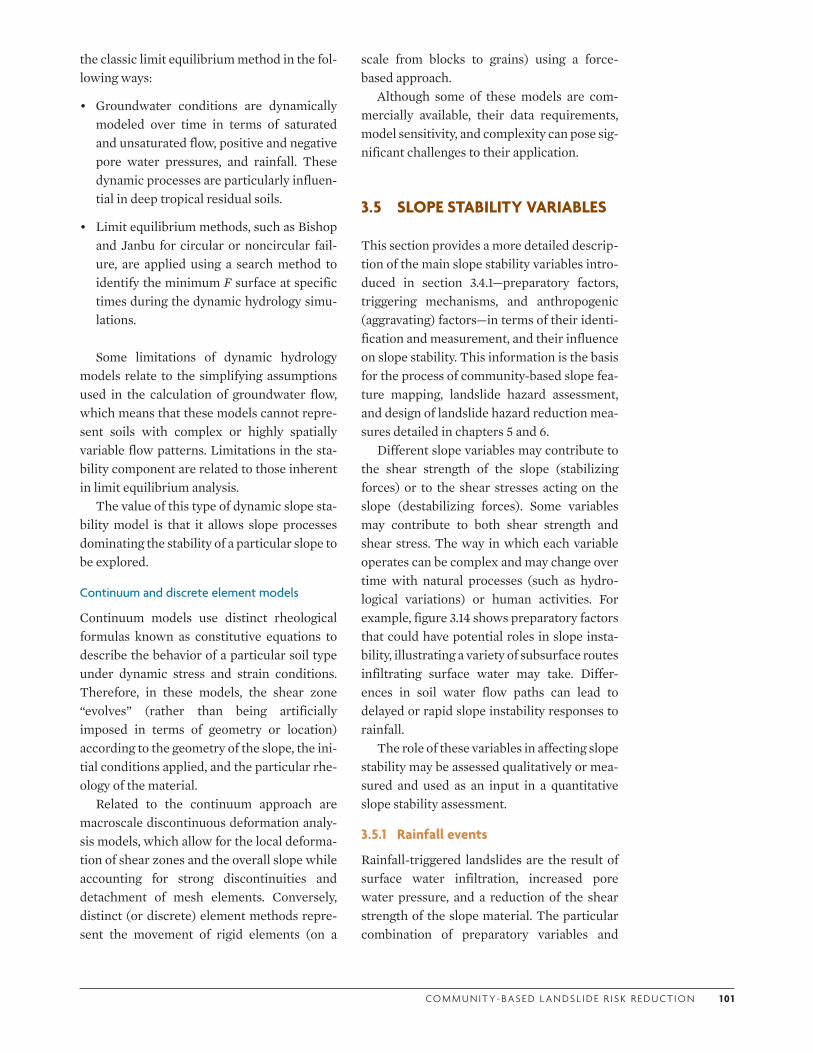
CO M M U N I T Y- BA S E D L A N DS L I D E R I S K R E D U CT I O N 1 0 1
the classic limit equilibrium method in the fol-lowing ways:
• Groundwater conditions are dynamically modeled over time in terms of saturated and unsaturated flow, positive and negative pore water pressures, and rainfall. These dynamic processes are particularly influen-tial in deep tropical residual soils.
• Limit equilibrium methods, such as Bishop and Janbu for circular or noncircular fail-ure, are applied using a search method to identify the minimum F surface at specific times during the dynamic hydrology simu-lations.
Some limitations of dynamic hydrology models relate to the simplifying assumptions used in the calculation of groundwater flow, which means that these models cannot repre-sent soils with complex or highly spatially variable flow patterns. Limitations in the sta-bility component are related to those inherent in limit equilibrium analysis.
The value of this type of dynamic slope sta-bility model is that it allows slope processes dominating the stability of a particular slope to be explored.
Continuum and discrete element models
Continuum models use distinct rheological formulas known as constitutive equations to describe the behavior of a particular soil type under dynamic stress and strain conditions. Therefore, in these models, the shear zone “evolves” (rather than being artificially imposed in terms of geometry or location) according to the geometry of the slope, the ini-tial conditions applied, and the particular rhe-ology of the material.
Related to the continuum approach are macroscale discontinuous deformation analy-sis models, which allow for the local deforma-tion of shear zones and the overall slope while accounting for strong discontinuities and detachment of mesh elements. Conversely, distinct (or discrete) element methods repre-sent the movement of rigid elements (on a
scale from blocks to grains) using a force-based approach.
Although some of these models are com-mercially available, their data requirements, model sensitivity, and complexity can pose sig-nificant challenges to their application.
3.5 SLOPE STABILITY VARIABLES
This section provides a more detailed descrip-tion of the main slope stability variables intro-duced in section 3.4.1—preparatory factors, triggering mechanisms, and anthropogenic (aggravating) factors—in terms of their identi-fication and measurement, and their influence on slope stability. This information is the basis for the process of community-based slope fea-ture mapping, landslide hazard assessment, and design of landslide hazard reduction mea-sures detailed in chapters 5 and 6.
Different slope variables may contribute to the shear strength of the slope (stabilizing forces) or to the shear stresses acting on the slope (destabilizing forces). Some variables may contribute to both shear strength and shear stress. The way in which each variable operates can be complex and may change over time with natural processes (such as hydro-logical variations) or human activities. For example, figure 3.14 shows preparatory factors that could have potential roles in slope insta-bility, illustrating a variety of subsurface routes infiltrating surface water may take. Differ-ences in soil water flow paths can lead to delayed or rapid slope instability responses to rainfall.
The role of these variables in affecting slope stability may be assessed qualitatively or mea-sured and used as an input in a quantitative slope stability assessment.
3.5.1 Rainfall events
Rainfall-triggered landslides are the result of surface water infiltration, increased pore water pressure, and a reduction of the shear strength of the slope material. The particular combination of preparatory variables and
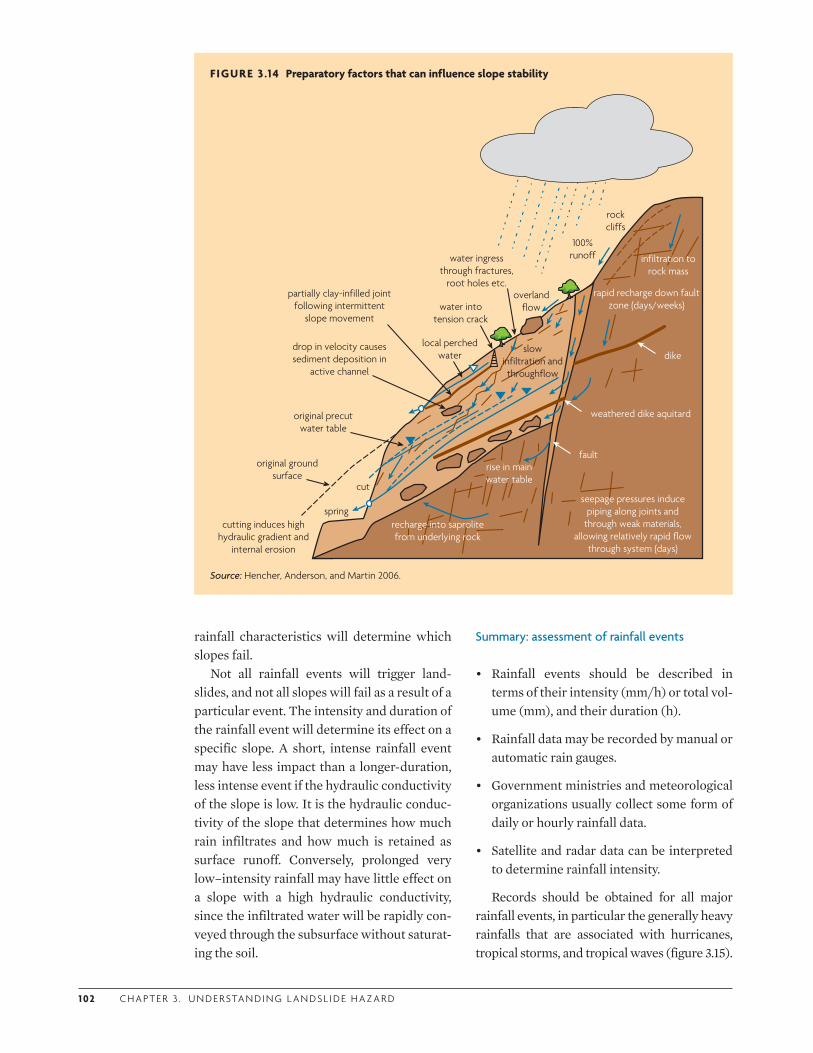
1 02 C H A P T E R 3 . U N D E R STA N D I N G L A N DS L I D E H A Z A R D
FIGURE 3 .14 Preparatory factors that can influence slope stability
partially clay-infilled joint following intermittent
slope movement
drop in velocity causes sediment deposition in
active channel
original precut water table
original ground surface
cut
spring
local perched water
water into tension crack
water ingress through fractures,
root holes etc.overland
flow
100% runoff
rock cliffs
cutting induces high hydraulic gradient and
internal erosion
recharge into saprolite from underlying rock
rise in main water table
seepage pressures induce piping along joints and
through weak materials, allowing relatively rapid flow
through system (days)
slow infiltration and throughflow
weathered dike aquitard
rapid recharge down fault zone (days/weeks)
infiltration to rock mass
dike
fault
Source: Hencher, Anderson, and Martin 2006.
rainfall characteristics will determine which slopes fail.
Not all rainfall events will trigger land-slides, and not all slopes will fail as a result of a particular event. The intensity and duration of the rainfall event will determine its effect on a specific slope. A short, intense rainfall event may have less impact than a longer-duration, less intense event if the hydraulic conductivity of the slope is low. It is the hydraulic conduc-tivity of the slope that determines how much rain infiltrates and how much is retained as surface runoff. Conversely, prolonged very low–intensity rainfall may have little effect on a slope with a high hydraulic conductivity, since the infiltrated water will be rapidly con-veyed through the subsurface without saturat-ing the soil.
Summary: assessment of rainfall events
• Rainfall events should be described in terms of their intensity (mm/h) or total vol-ume (mm), and their duration (h).
• Rainfall data may be recorded by manual or automatic rain gauges.
• Government ministries and meteorological organizations usually collect some form of daily or hourly rainfall data.
• Satellite and radar data can be interpreted to determine rainfall intensity.
Records should be obtained for all major rainfall events, in particular the generally heavy rainfalls that are associated with hurricanes, tropical storms, and tropical waves (figure 3.15).
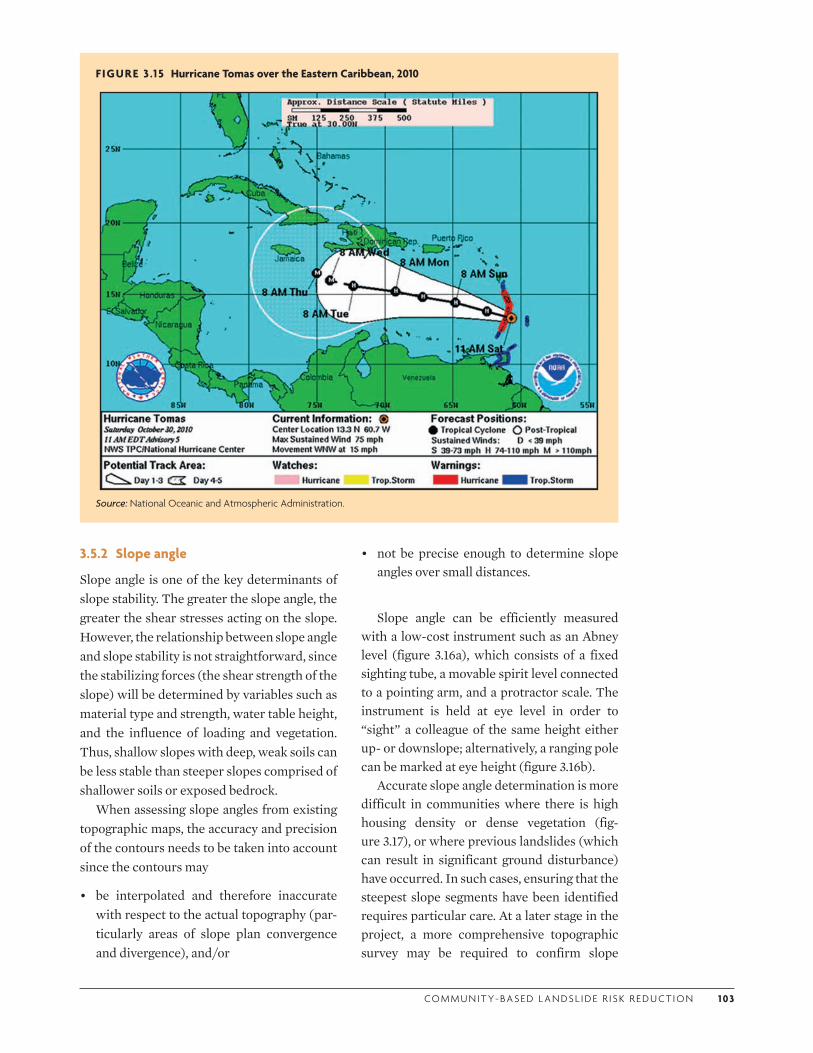
CO M M U N I T Y- BA S E D L A N DS L I D E R I S K R E D U CT I O N 1 03
FIGURE 3 .15 Hurricane Tomas over the Eastern Caribbean, 2010
Source: National Oceanic and Atmospheric Administration.
• not be precise enough to determine slope angles over small distances.
Slope angle can be efficiently measured with a low-cost instrument such as an Abney level (figure 3.16a), which consists of a fixed sighting tube, a movable spirit level connected to a pointing arm, and a protractor scale. The instrument is held at eye level in order to “sight” a colleague of the same height either up- or downslope; alternatively, a ranging pole can be marked at eye height (figure 3.16b).
Accurate slope angle determination is more difficult in communities where there is high housing density or dense vegetation (fig-ure 3.17), or where previous landslides (which can result in significant ground disturbance) have occurred. In such cases, ensuring that the steepest slope segments have been identified requires particular care. At a later stage in the project, a more comprehensive topographic survey may be required to confirm slope
3.5.2 Slope angle
Slope angle is one of the key determinants of slope stability. The greater the slope angle, the greater the shear stresses acting on the slope. However, the relationship between slope angle and slope stability is not straightforward, since the stabilizing forces (the shear strength of the slope) will be determined by variables such as material type and strength, water table height, and the influence of loading and vegetation. Thus, shallow slopes with deep, weak soils can be less stable than steeper slopes comprised of shallower soils or exposed bedrock.
When assessing slope angles from existing topographic maps, the accuracy and precision of the contours needs to be taken into account since the contours may
• be interpolated and therefore inaccurate with respect to the actual topography (par-ticularly areas of slope plan convergence and divergence), and/or
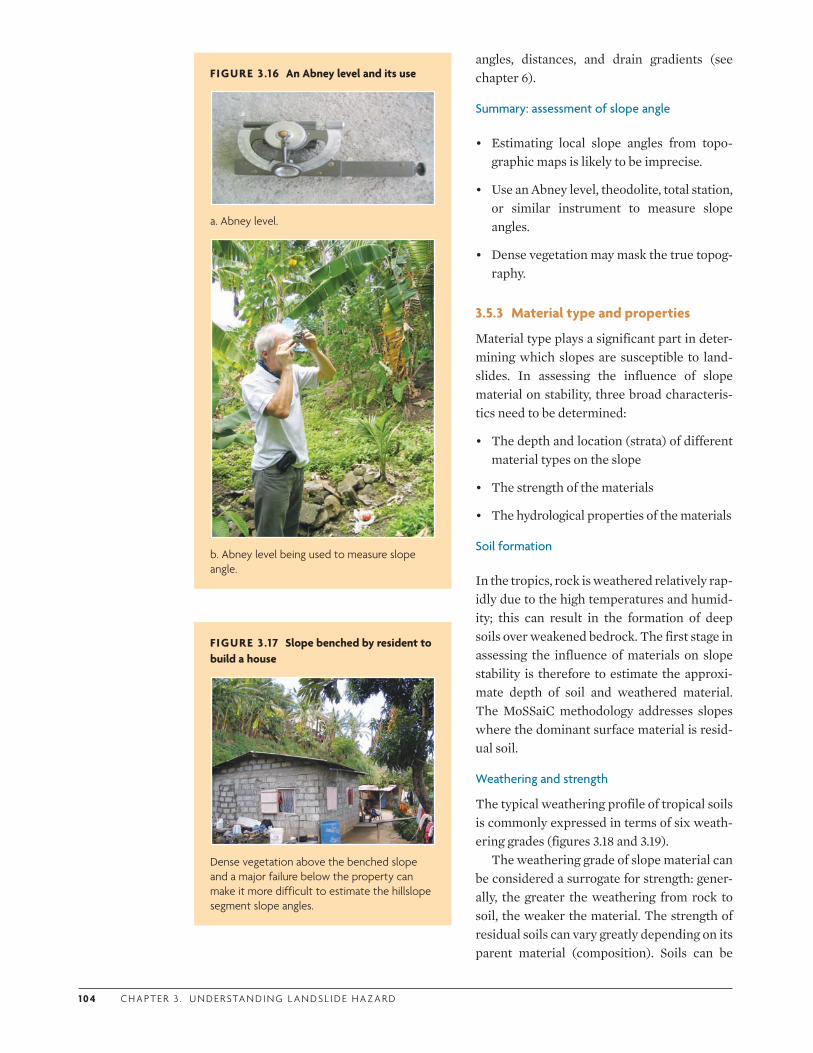
1 0 4 C H A P T E R 3 . U N D E R STA N D I N G L A N DS L I D E H A Z A R D
angles, distances, and drain gradients (see chapter 6).
Summary: assessment of slope angle
• Estimating local slope angles from topo-graphic maps is likely to be imprecise.
• Use an Abney level, theodolite, total station, or similar instrument to measure slope angles.
• Dense vegetation may mask the true topog-raphy.
3.5.3 Material type and properties
Material type plays a significant part in deter-mining which slopes are susceptible to land-slides. In assessing the influence of slope material on stability, three broad characteris-tics need to be determined:
• The depth and location (strata) of different material types on the slope
• The strength of the materials
• The hydrological properties of the materials
Soil formation
In the tropics, rock is weathered relatively rap-idly due to the high temperatures and humid-ity; this can result in the formation of deep soils over weakened bedrock. The first stage in assessing the influence of materials on slope stability is therefore to estimate the approxi-mate depth of soil and weathered material. The MoSSaiC methodology addresses slopes where the dominant surface material is resid-ual soil.
Weathering and strength
The typical weathering profile of tropical soils is commonly expressed in terms of six weath-ering grades (figures 3.18 and 3.19).
The weathering grade of slope material can be considered a surrogate for strength: gener-ally, the greater the weathering from rock to soil, the weaker the material. The strength of residual soils can vary greatly depending on its parent material (composition). Soils can be
FIGURE 3 .16 An Abney level and its use
a. Abney level.
b. Abney level being used to measure slope angle.
FIGURE 3 .17 Slope benched by resident to build a house
Dense vegetation above the benched slope and a major failure below the property can make it more difficult to estimate the hillslope segment slope angles.

CO M M U N I T Y- BA S E D L A N DS L I D E R I S K R E D U CT I O N 1 0 5
characterized in terms of particle size distri-bution and structure; bulk density; the ratio of sand, silt, and clays; and the chemical compo-sition of the clay. These characteristics can be used as proxies for strength and hydrological properties based on empirical relationships (Carter and Bentley 1991).
For slope stability analysis, a more precise measure of soil strength entails laboratory assessment of the geotechnical properties of slope soil samples (figure 3.20). The shear strength of a specific soil can then be described in terms of soil cohesion (c, kPa) and angle of internal friction (Φ, degrees), which are the parameters that need to be specified in ana-lytical and numerical slope stability models (Nash 1987).
In areas where landslides have already occurred, the slope material will have a much lower strength than its original intact strength; this is its residual strength.
Hydrological properties
The strength of soils and weathered materials will be affected by moisture content. Increased moisture content of slope material causes increases in pore pressure, which reduces shear strength. Conversely, the drying of slope material can cause negative pore pressures (matric suction), which increase shear strength (Fredlund 1980; Fredlund and Rahardjo 1993). The magnitude of pore pres-sures associated with wetting and drying are dictated by material properties such as pore size and chemistry. For instance, clay particles carry a negative charge, which influences the retention of moisture in the pores. Thus, sandy porous soils may experience little variation in strength, while the strength of clay soils can vary significantly with moisture content.
The deep residual soils of the humid tropics can often have relatively high hydraulic con-ductivities, allowing rainfall to infiltrate rap-
FIGURE 3 .18 Typical weathering profiles of tropical soils
Residual soil
Completely weathered
Highly weathered
Moderately weathered
Slightly weathered
Faintly weatheredFresh
VI
V
IV
III
II
IB
IA
Humus/topsoil
All rock material converted to soil; mass structure and material fabric destroyed. Significant change in volume.
All rock material decomposed and/or disintegrated to soil. Original mass structure still largely intact.
More than 50% of rock material decomposed and/or disintegrated to soil. Fresh/discolored rock present as discontinuous framework or corestones.
Less than 50% of rock material decomposed and/or disintegrated to soil. Fresh/discolored rock present as continuous framework or corestones.
Discoloration indicates weathering of rock material and discontinuity surfaces. All rock material may be discolored and weaker than its fresh condition.
Discoloration on major discontinuity surfaces.
No visible sign of rock material weathering.
Rock decomposed to soilWeathered/disintegrated rockRock discolored by weatheringFresh rock
Idealized weathering profiles - without corestones (left) and
with corestones (right)
Source: Fookes 1997, reproduced with permission of the Geological Society, London. Weathering grades are based on the commonly used classification of Fookes 1997, Komoo and Mogana 1988, and Little 1969.
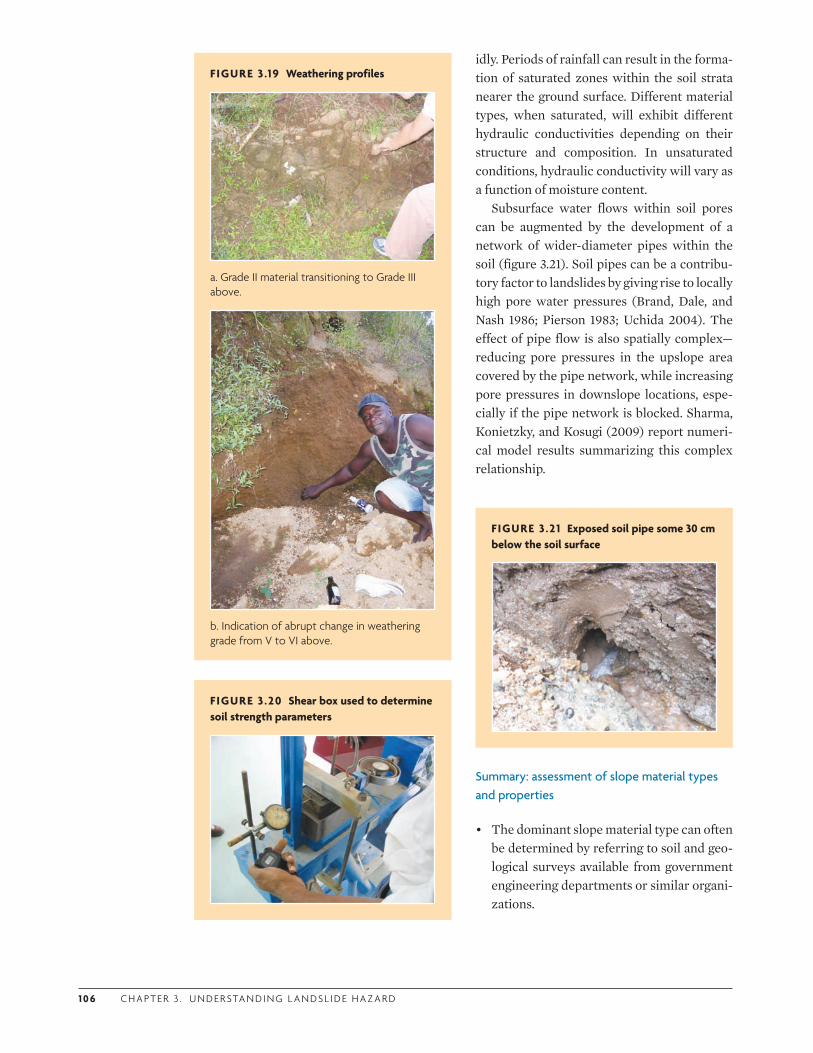
1 0 6 C H A P T E R 3 . U N D E R STA N D I N G L A N DS L I D E H A Z A R D
FIGURE 3 .20 Shear box used to determine soil strength parameters
FIGURE 3 .21 Exposed soil pipe some 30 cm below the soil surface
idly. Periods of rainfall can result in the forma-tion of saturated zones within the soil strata nearer the ground surface. Different material types, when saturated, will exhibit different hydraulic conductivities depending on their structure and composition. In unsaturated conditions, hydraulic conductivity will vary as a function of moisture content.
Subsurface water flows within soil pores can be augmented by the development of a network of wider-diameter pipes within the soil (figure 3.21). Soil pipes can be a contribu-tory factor to landslides by giving rise to locally high pore water pressures (Brand, Dale, and Nash 1986; Pierson 1983; Uchida 2004). The effect of pipe flow is also spatially complex—reducing pore pressures in the upslope area covered by the pipe network, while increasing pore pressures in downslope locations, espe-cially if the pipe network is blocked. Sharma, Konietzky, and Kosugi (2009) report numeri-cal model results summarizing this complex relationship.
FIGURE 3 .19 Weathering profiles
a. Grade II material transitioning to Grade III above.
b. Indication of abrupt change in weathering grade from V to VI above.
Summary: assessment of slope material types and properties
• The dominant slope material type can often be determined by referring to soil and geo-logical surveys available from government engineering departments or similar organi-zations.
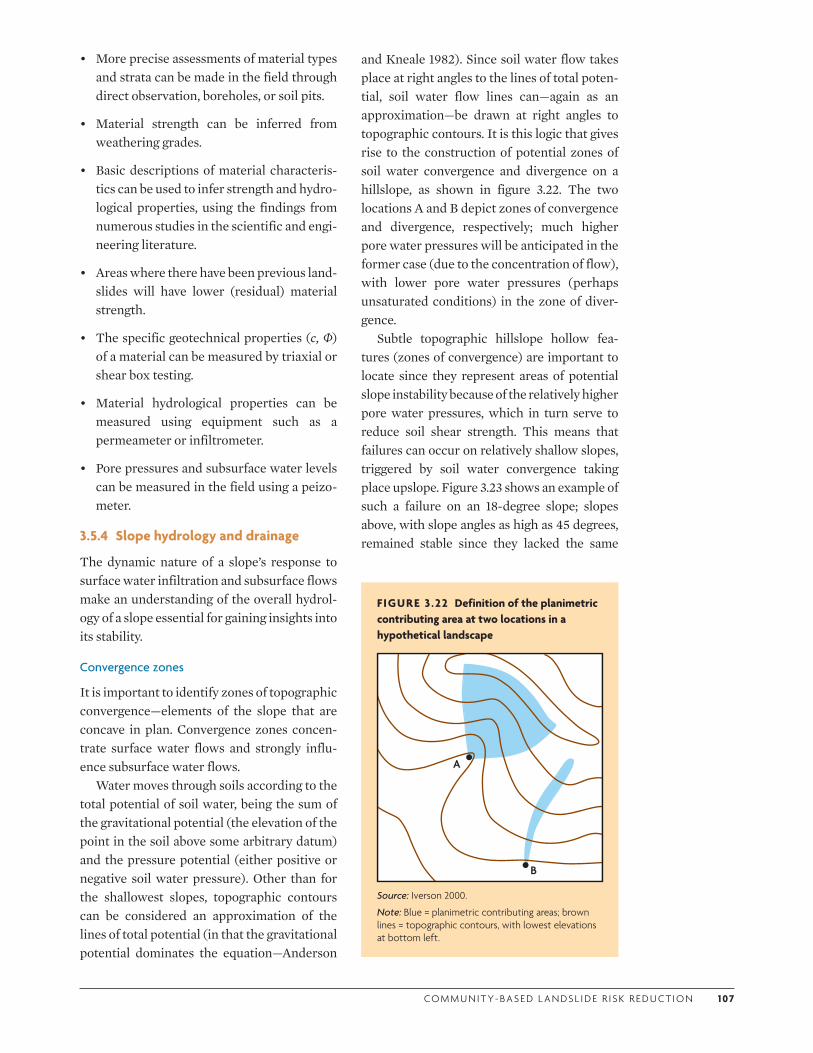
CO M M U N I T Y- BA S E D L A N DS L I D E R I S K R E D U CT I O N 1 0 7
• More precise assessments of material types and strata can be made in the field through direct observation, boreholes, or soil pits.
• Material strength can be inferred from weathering grades.
• Basic descriptions of material characteris-tics can be used to infer strength and hydro-logical properties, using the findings from numerous studies in the scientific and engi-neering literature.
• Areas where there have been previous land-slides will have lower (residual) material strength.
• The specific geotechnical properties (c, Φ) of a material can be measured by triaxial or shear box testing.
• Material hydrological properties can be measured using equipment such as a permeameter or infiltrometer.
• Pore pressures and subsurface water levels can be measured in the field using a peizo-meter.
3.5.4 Slope hydrology and drainage
The dynamic nature of a slope’s response to surface water infiltration and subsurface flows make an understanding of the overall hydrol-ogy of a slope essential for gaining insights into its stability.
Convergence zones
It is important to identify zones of topographic convergence—elements of the slope that are concave in plan. Convergence zones concen-trate surface water flows and strongly influ-ence subsurface water flows.
Water moves through soils according to the total potential of soil water, being the sum of the gravitational potential (the elevation of the point in the soil above some arbitrary datum) and the pressure potential (either positive or negative soil water pressure). Other than for the shallowest slopes, topographic contours can be considered an approximation of the lines of total potential (in that the gravitational potential dominates the equation—Anderson
and Kneale 1982). Since soil water flow takes place at right angles to the lines of total poten-tial, soil water flow lines can—again as an approximation—be drawn at right angles to topographic contours. It is this logic that gives rise to the construction of potential zones of soil water convergence and divergence on a hillslope, as shown in figure 3.22. The two locations A and B depict zones of convergence and divergence, respectively; much higher pore water pressures will be anticipated in the former case (due to the concentration of flow), with lower pore water pressures (perhaps unsaturated conditions) in the zone of diver-gence.
Subtle topographic hillslope hollow fea-tures (zones of convergence) are important to locate since they represent areas of potential slope instability because of the relatively higher pore water pressures, which in turn serve to reduce soil shear strength. This means that failures can occur on relatively shallow slopes, triggered by soil water convergence taking place upslope. Figure 3.23 shows an example of such a failure on an 18-degree slope; slopes above, with slope angles as high as 45 degrees, remained stable since they lacked the same
FIGURE 3 .22 Definition of the planimetric contributing area at two locations in a hypothetical landscape
A
B
Source: Iverson 2000.
Note: Blue = planimetric contributing areas; brown lines = topographic contours, with lowest elevations at bottom left.
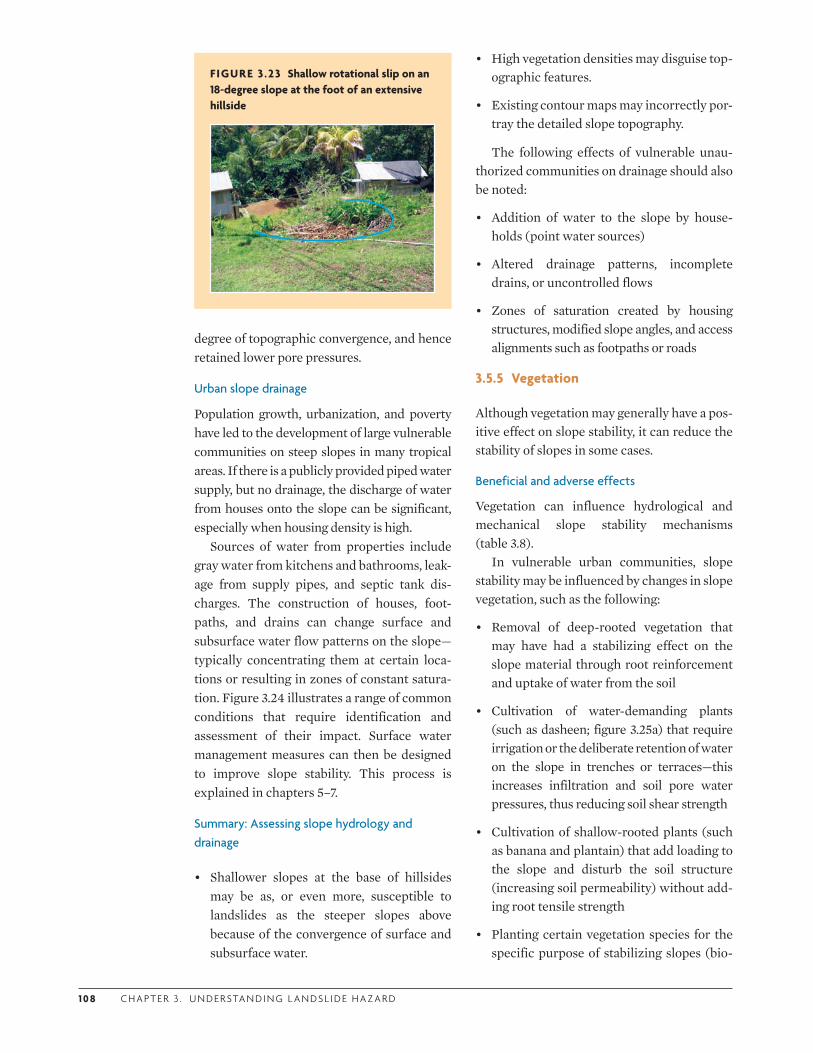
1 0 8 C H A P T E R 3 . U N D E R STA N D I N G L A N DS L I D E H A Z A R D
degree of topographic convergence, and hence retained lower pore pressures.
Urban slope drainage
Population growth, urbanization, and poverty have led to the development of large vulnerable communities on steep slopes in many tropical areas. If there is a publicly provided piped water supply, but no drainage, the discharge of water from houses onto the slope can be significant, especially when housing density is high.
Sources of water from properties include gray water from kitchens and bathrooms, leak-age from supply pipes, and septic tank dis-charges. The construction of houses, foot-paths, and drains can change surface and subsurface water flow patterns on the slope—typically concentrating them at certain loca-tions or resulting in zones of constant satura-tion. Figure 3.24 illustrates a range of common conditions that require identification and assessment of their impact. Surface water management measures can then be designed to improve slope stability. This process is explained in chapters 5–7.
Summary: Assessing slope hydrology and drainage
• Shallower slopes at the base of hillsides may be as, or even more, susceptible to landslides as the steeper slopes above because of the convergence of surface and subsurface water.
• High vegetation densities may disguise top-ographic features.
• Existing contour maps may incorrectly por-tray the detailed slope topography.
The following effects of vulnerable unau-thorized communities on drainage should also be noted:
• Addition of water to the slope by house-holds (point water sources)
• Altered drainage patterns, incomplete drains, or uncontrolled flows
• Zones of saturation created by housing structures, modified slope angles, and access alignments such as footpaths or roads
3.5.5 Vegetation
Although vegetation may generally have a pos-itive effect on slope stability, it can reduce the stability of slopes in some cases.
Beneficial and adverse effects
Vegetation can influence hydrological and mechanical slope stability mechanisms (table 3.8).
In vulnerable urban communities, slope stability may be influenced by changes in slope vegetation, such as the following:
• Removal of deep-rooted vegetation that may have had a stabilizing effect on the slope material through root reinforcement and uptake of water from the soil
• Cultivation of water-demanding plants (such as dasheen; figure 3.25a) that require irrigation or the deliberate retention of water on the slope in trenches or terraces—this increases infiltration and soil pore water pressures, thus reducing soil shear strength
• Cultivation of shallow-rooted plants (such as banana and plantain) that add loading to the slope and disturb the soil structure (increasing soil permeability) without add-ing root tensile strength
• Planting certain vegetation species for the specific purpose of stabilizing slopes (bio-
FIGURE 3 .23 Shallow rotational slip on an 18-degree slope at the foot of an extensive hillside
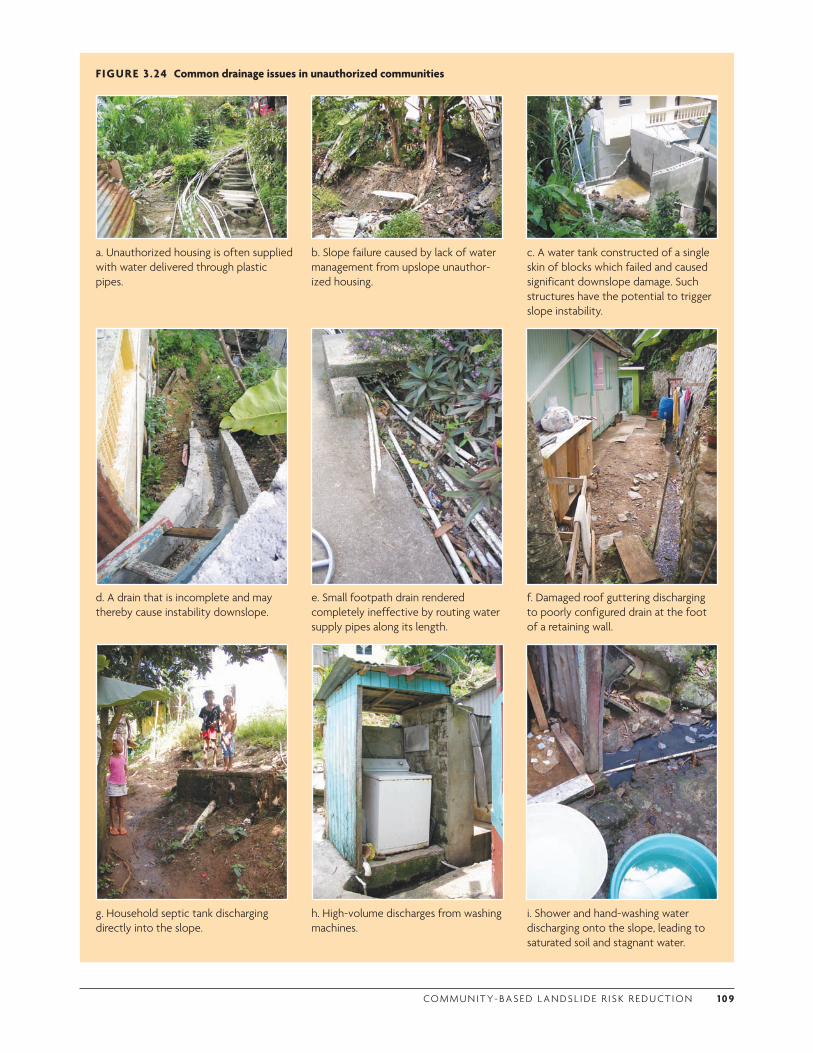
CO M M U N I T Y- BA S E D L A N DS L I D E R I S K R E D U CT I O N 1 0 9
FIGURE 3 .24 Common drainage issues in unauthorized communities
a. Unauthorized housing is often supplied with water delivered through plastic pipes.
b. Slope failure caused by lack of water management from upslope unauthor-ized housing.
c. A water tank constructed of a single skin of blocks which failed and caused significant downslope damage. Such structures have the potential to trigger slope instability.
d. A drain that is incomplete and may thereby cause instability downslope.
e. Small footpath drain rendered completely ineffective by routing water supply pipes along its length.
f. Damaged roof guttering discharging to poorly configured drain at the foot of a retaining wall.
g. Household septic tank discharging directly into the slope.
h. High-volume discharges from washing machines.
i. Shower and hand-washing water discharging onto the slope, leading to saturated soil and stagnant water.
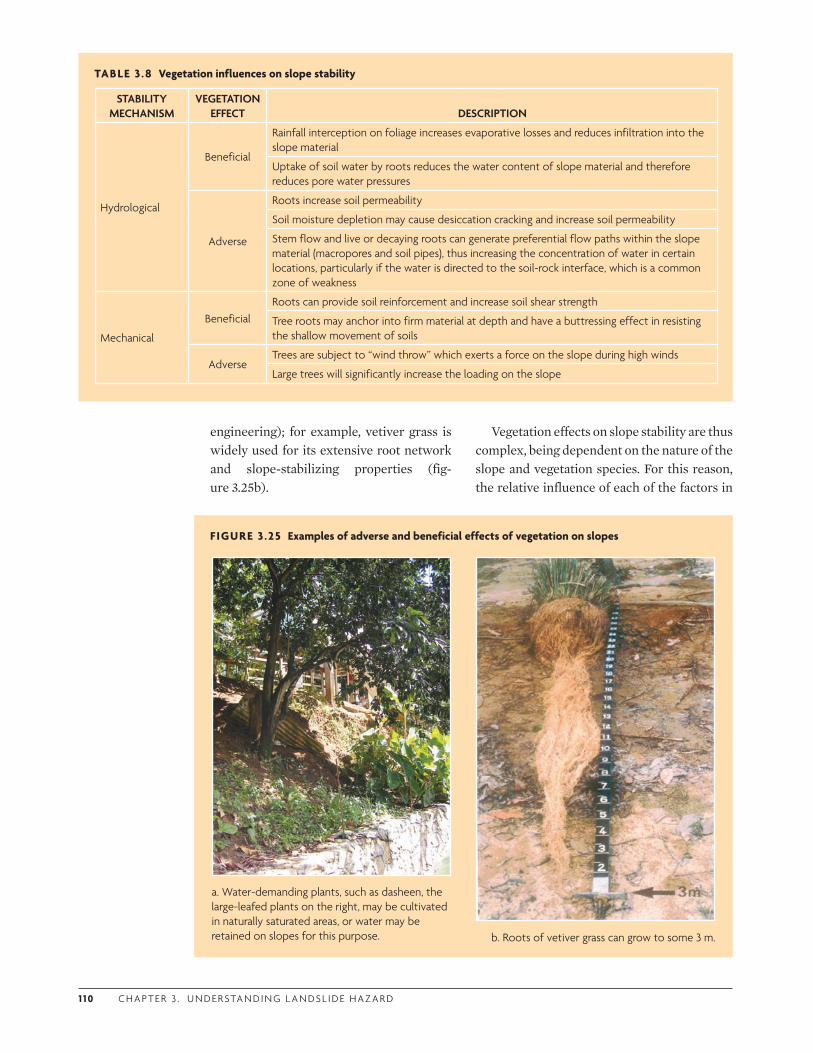
1 1 0 C H A P T E R 3 . U N D E R STA N D I N G L A N DS L I D E H A Z A R D
engineering); for example, vetiver grass is widely used for its extensive root network and slope-stabilizing properties (fig-ure 3.25b).
Vegetation effects on slope stability are thus complex, being dependent on the nature of the slope and vegetation species. For this reason, the relative influence of each of the factors in
TABLE 3 .8 Vegetation influences on slope stability
STABILITY MECHANISM
VEGETATION EFFECT DESCRIPTION
Hydrological
Beneficial
Rainfall interception on foliage increases evaporative losses and reduces infiltration into the slope material
Uptake of soil water by roots reduces the water content of slope material and therefore reduces pore water pressures
Adverse
Roots increase soil permeability
Soil moisture depletion may cause desiccation cracking and increase soil permeability
Stem flow and live or decaying roots can generate preferential flow paths within the slope material (macropores and soil pipes), thus increasing the concentration of water in certain locations, particularly if the water is directed to the soil-rock interface, which is a common zone of weakness
Mechanical
BeneficialRoots can provide soil reinforcement and increase soil shear strength
Tree roots may anchor into firm material at depth and have a buttressing effect in resisting the shallow movement of soils
AdverseTrees are subject to “wind throw” which exerts a force on the slope during high winds
Large trees will significantly increase the loading on the slope
FIGURE 3 .25 Examples of adverse and beneficial effects of vegetation on slopes
a. Water-demanding plants, such as dasheen, the large-leafed plants on the right, may be cultivated in naturally saturated areas, or water may be retained on slopes for this purpose. b. Roots of vetiver grass can grow to some 3 m.
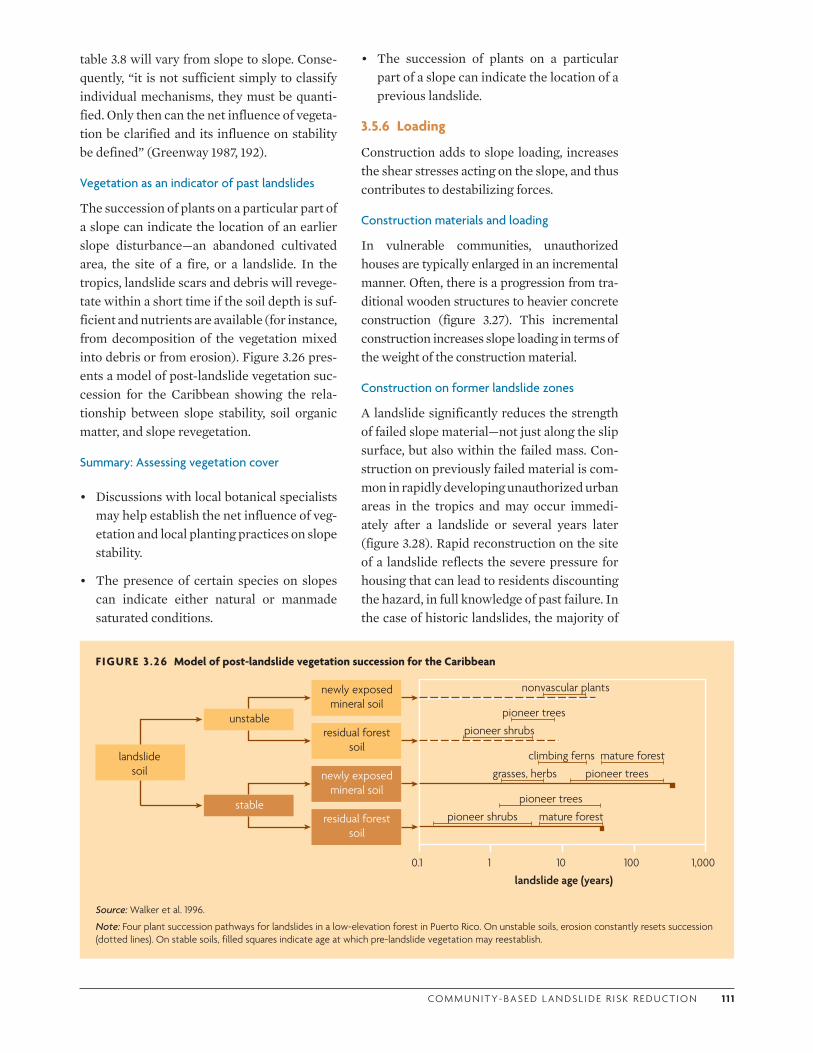
CO M M U N I T Y- BA S E D L A N DS L I D E R I S K R E D U CT I O N 1 1 1
table 3.8 will vary from slope to slope. Conse-quently, “it is not sufficient simply to classify individual mechanisms, they must be quanti-fied. Only then can the net influence of vegeta-tion be clarified and its influence on stability be defined” (Greenway 1987, 192).
Vegetation as an indicator of past landslides
The succession of plants on a particular part of a slope can indicate the location of an earlier slope disturbance—an abandoned cultivated area, the site of a fire, or a landslide. In the tropics, landslide scars and debris will revege-tate within a short time if the soil depth is suf-ficient and nutrients are available (for instance, from decomposition of the vegetation mixed into debris or from erosion). Figure 3.26 pres-ents a model of post-landslide vegetation suc-cession for the Caribbean showing the rela-tionship between slope stability, soil organic matter, and slope revegetation.
Summary: Assessing vegetation cover
• Discussions with local botanical specialists may help establish the net influence of veg-etation and local planting practices on slope stability.
• The presence of certain species on slopes can indicate either natural or manmade saturated conditions.
• The succession of plants on a particular part of a slope can indicate the location of a previous landslide.
3.5.6 Loading
Construction adds to slope loading, increases the shear stresses acting on the slope, and thus contributes to destabilizing forces.
Construction materials and loading
In vulnerable communities, unauthorized houses are typically enlarged in an incremental manner. Often, there is a progression from tra-ditional wooden structures to heavier concrete construction (figure 3.27). This incremental construction increases slope loading in terms of the weight of the construction material.
Construction on former landslide zones
A landslide significantly reduces the strength of failed slope material—not just along the slip surface, but also within the failed mass. Con-struction on previously failed material is com-mon in rapidly developing unauthorized urban areas in the tropics and may occur immedi-ately after a landslide or several years later (figure 3.28). Rapid reconstruction on the site of a landslide reflects the severe pressure for housing that can lead to residents discounting the hazard, in full knowledge of past failure. In the case of historic landslides, the majority of
FIGURE 3 .26 Model of post-landslide vegetation succession for the Caribbean
0.1 1 10 100 1,000landslide age (years)
landslide soil
stable
unstable
newly exposed mineral soil
residual forest soil
newly exposed mineral soil
residual forest soil
nonvascular plants
pioneer trees
pioneer shrubs
climbing fernsgrasses, herbs
mature forest
pioneer trees
pioneer shrubs mature forestpioneer trees
Source: Walker et al. 1996.
Note: Four plant succession pathways for landslides in a low-elevation forest in Puerto Rico. On unstable soils, erosion constantly resets succession (dotted lines). On stable soils, filled squares indicate age at which pre-landslide vegetation may reestablish.
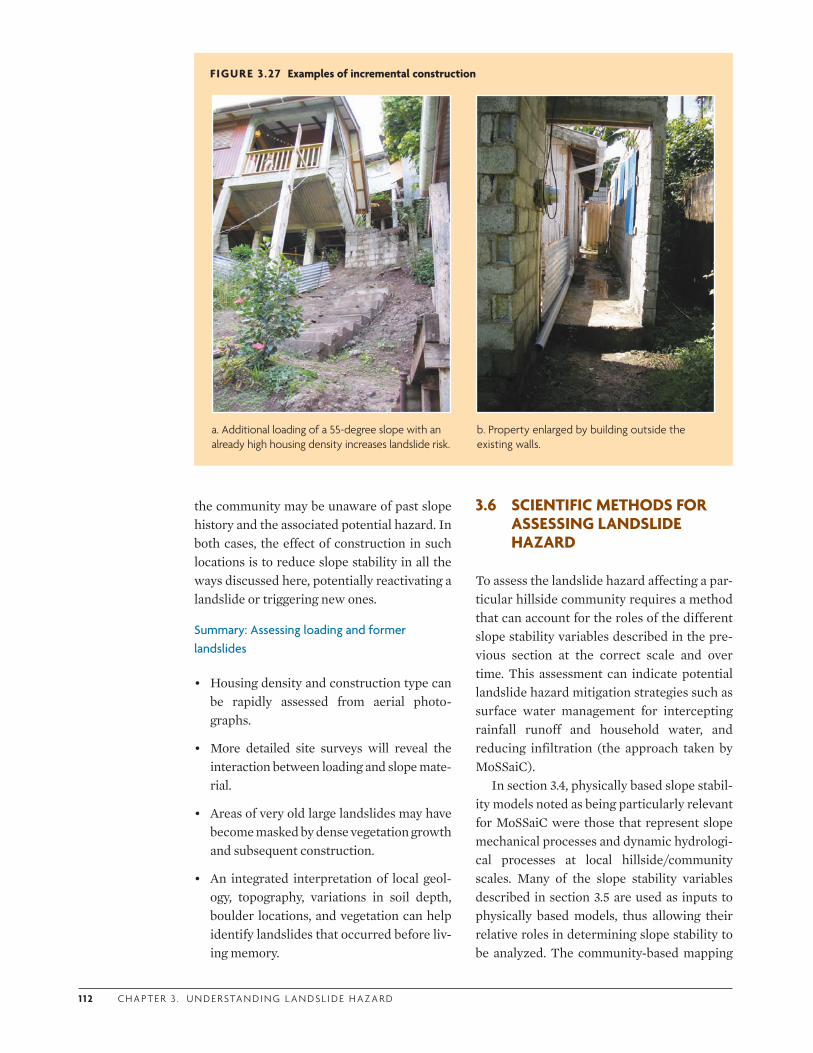
1 1 2 C H A P T E R 3 . U N D E R STA N D I N G L A N DS L I D E H A Z A R D
the community may be unaware of past slope history and the associated potential hazard. In both cases, the effect of construction in such locations is to reduce slope stability in all the ways discussed here, potentially reactivating a landslide or triggering new ones.
Summary: Assessing loading and former landslides
• Housing density and construction type can be rapidly assessed from aerial photo-graphs.
• More detailed site surveys will reveal the interaction between loading and slope mate-rial.
• Areas of very old large landslides may have become masked by dense vegetation growth and subsequent construction.
• An integrated interpretation of local geol-ogy, topography, variations in soil depth, boulder locations, and vegetation can help identify landslides that occurred before liv-ing memory.
3.6 SCIENTIFIC METHODS FOR ASSESSING LANDSLIDE HAZARD
To assess the landslide hazard affecting a par-ticular hillside community requires a method that can account for the roles of the different slope stability variables described in the pre-vious section at the correct scale and over time. This assessment can indicate potential landslide hazard mitigation strategies such as surface water management for intercepting rainfall runoff and household water, and reducing infiltration (the approach taken by MoSSaiC).
In section 3.4, physically based slope stabil-ity models noted as being particularly relevant for MoSSaiC were those that represent slope mechanical processes and dynamic hydrologi-cal processes at local hillside/community scales. Many of the slope stability variables described in section 3.5 are used as inputs to physically based models, thus allowing their relative roles in determining slope stability to be analyzed. The community-based mapping
FIGURE 3 .27 Examples of incremental construction
a. Additional loading of a 55-degree slope with an already high housing density increases landslide risk.
b. Property enlarged by building outside the existing walls.
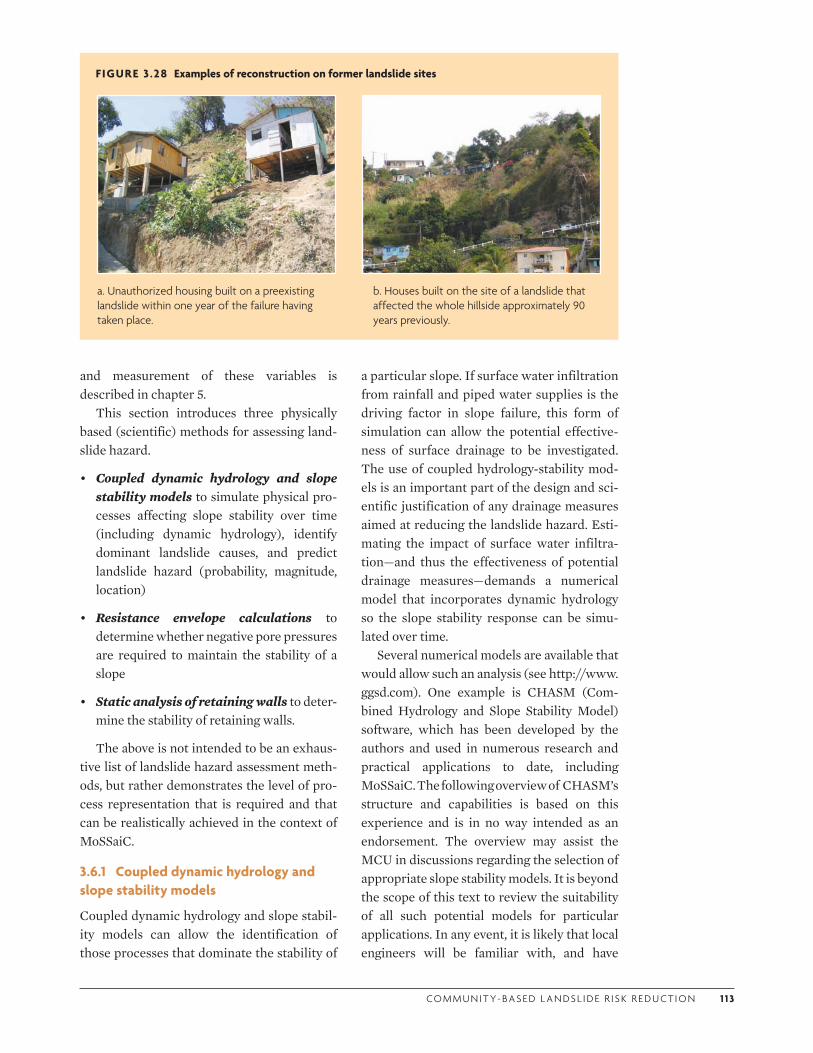
CO M M U N I T Y- BA S E D L A N DS L I D E R I S K R E D U CT I O N 1 1 3
F IGURE 3 .28 Examples of reconstruction on former landslide sites
a. Unauthorized housing built on a preexisting landslide within one year of the failure having taken place.
b. Houses built on the site of a landslide that affected the whole hillside approximately 90 years previously.
and measurement of these variables is described in chapter 5.
This section introduces three physically based (scientific) methods for assessing land-slide hazard.
• Coupled dynamic hydrology and slope stability models to simulate physical pro-cesses affecting slope stability over time (including dynamic hydrology), identify dominant landslide causes, and predict landslide hazard (probability, magnitude, location)
• Resistance envelope calculations to determine whether negative pore pressures are required to maintain the stability of a slope
• Static analysis of retaining walls to deter-mine the stability of retaining walls.
The above is not intended to be an exhaus-tive list of landslide hazard assessment meth-ods, but rather demonstrates the level of pro-cess representation that is required and that can be realistically achieved in the context of MoSSaiC.
3.6.1 Coupled dynamic hydrology and slope stability models
Coupled dynamic hydrology and slope stabil-ity models can allow the identification of those processes that dominate the stability of
a particular slope. If surface water infiltration from rainfall and piped water supplies is the driving factor in slope failure, this form of simulation can allow the potential effective-ness of surface drainage to be investigated. The use of coupled hydrology-stability mod-els is an important part of the design and sci-entific justification of any drainage measures aimed at reducing the landslide hazard. Esti-mating the impact of surface water infiltra-tion—and thus the effectiveness of potential drainage measures—demands a numerical model that incorporates dynamic hydrology so the slope stability response can be simu-lated over time.
Several numerical models are available that would allow such an analysis (see http://www.ggsd.com). One example is CHASM (Com-bined Hydrology and Slope Stability Model) software, which has been developed by the authors and used in numerous research and practical applications to date, including MoSSaiC. The following overview of CHASM’s structure and capabilities is based on this experience and is in no way intended as an endorsement. The overview may assist the MCU in discussions regarding the selection of appropriate slope stability models. It is beyond the scope of this text to review the suitability of all such potential models for particular applications. In any event, it is likely that local engineers will be familiar with, and have
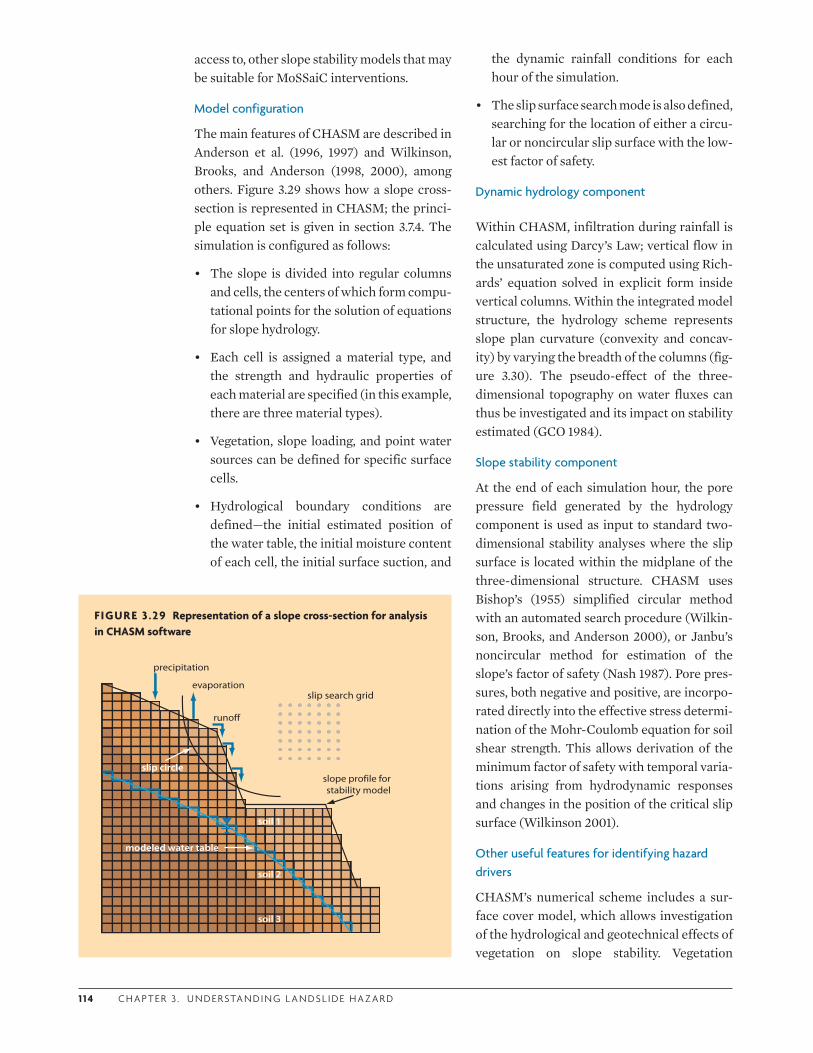
1 1 4 C H A P T E R 3 . U N D E R STA N D I N G L A N DS L I D E H A Z A R D
access to, other slope stability models that may be suitable for MoSSaiC interventions.
Model configuration
The main features of CHASM are described in Anderson et al. (1996, 1997) and Wilkinson, Brooks, and Anderson (1998, 2000), among others. Figure 3.29 shows how a slope cross-section is represented in CHASM; the princi-ple equation set is given in section 3.7.4. The simulation is configured as follows:
• The slope is divided into regular columns and cells, the centers of which form compu-tational points for the solution of equations for slope hydrology.
• Each cell is assigned a material type, and the strength and hydraulic properties of each material are specified (in this example, there are three material types).
• Vegetation, slope loading, and point water sources can be defined for specific surface cells.
• Hydrological boundary conditions are defined—the initial estimated position of the water table, the initial moisture content of each cell, the initial surface suction, and
the dynamic rainfall conditions for each hour of the simulation.
• The slip surface search mode is also defined, searching for the location of either a circu-lar or noncircular slip surface with the low-est factor of safety.
Dynamic hydrology component
Within CHASM, infiltration during rainfall is calculated using Darcy’s Law; vertical flow in the unsaturated zone is computed using Rich-ards’ equation solved in explicit form inside vertical columns. Within the integrated model structure, the hydrology scheme represents slope plan curvature (convexity and concav-ity) by varying the breadth of the columns (fig-ure 3.30). The pseudo-effect of the three-dimensional topography on water fluxes can thus be investigated and its impact on stability estimated (GCO 1984).
Slope stability component
At the end of each simulation hour, the pore pressure field generated by the hydrology component is used as input to standard two-dimensional stability analyses where the slip surface is located within the midplane of the three-dimensional structure. CHASM uses Bishop’s (1955) simplified circular method with an automated search procedure (Wilkin-son, Brooks, and Anderson 2000), or Janbu’s noncircular method for estimation of the slope’s factor of safety (Nash 1987). Pore pres-sures, both negative and positive, are incorpo-rated directly into the effective stress determi-nation of the Mohr-Coulomb equation for soil shear strength. This allows derivation of the minimum factor of safety with temporal varia-tions arising from hydrodynamic responses and changes in the position of the critical slip surface (Wilkinson 2001).
Other useful features for identifying hazard drivers
CHASM’s numerical scheme includes a sur-face cover model, which allows investigation of the hydrological and geotechnical effects of vegetation on slope stability. Vegetation
FIGURE 3 .29 Representation of a slope cross-section for analysis in CHASM software
modeled water table
slope profile for stability model
slip circle
runoff
evaporation
precipitation
soil 3
soil 2
soil 1
slip search grid
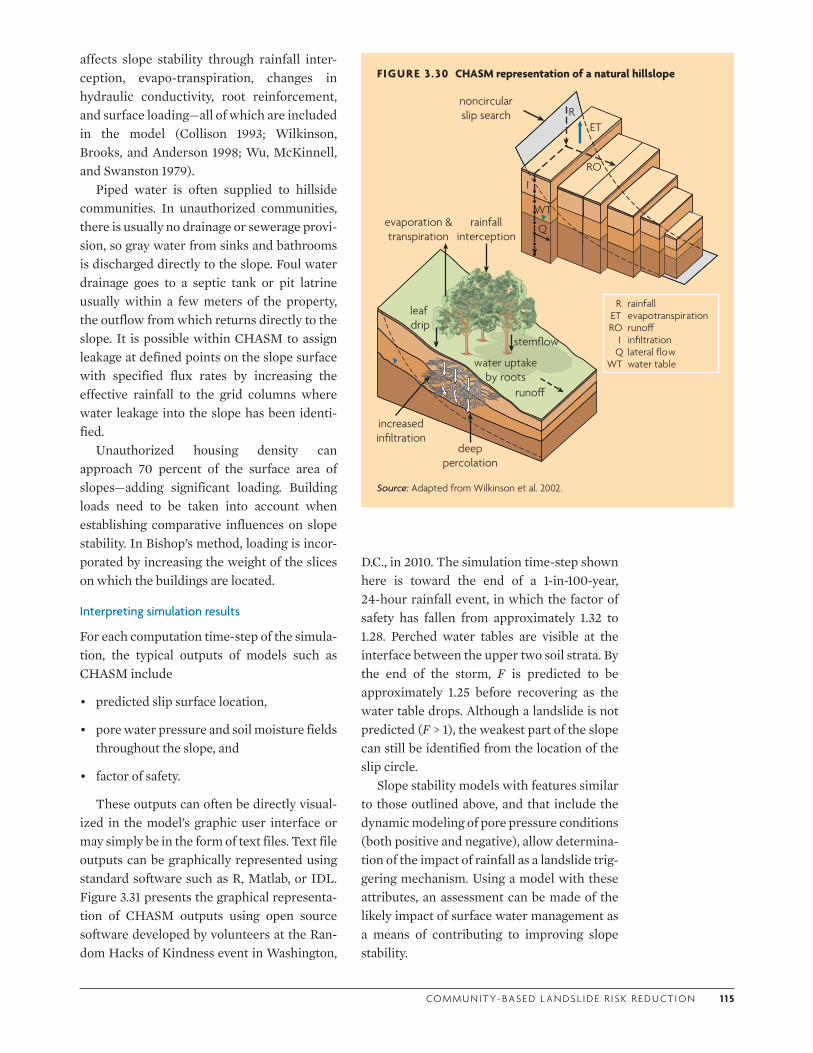
CO M M U N I T Y- BA S E D L A N DS L I D E R I S K R E D U CT I O N 1 1 5
affects slope stability through rainfall inter-ception, evapo-transpiration, changes in hydraulic conductivity, root reinforcement, and surface loading—all of which are included in the model (Collison 1993; Wilkinson, Brooks, and Anderson 1998; Wu, McKinnell, and Swanston 1979).
Piped water is often supplied to hillside communities. In unauthorized communities, there is usually no drainage or sewerage provi-sion, so gray water from sinks and bathrooms is discharged directly to the slope. Foul water drainage goes to a septic tank or pit latrine usually within a few meters of the property, the outflow from which returns directly to the slope. It is possible within CHASM to assign leakage at defined points on the slope surface with specified flux rates by increasing the effective rainfall to the grid columns where water leakage into the slope has been identi-fied.
Unauthorized housing density can approach 70 percent of the surface area of slopes—adding significant loading. Building loads need to be taken into account when establishing comparative influences on slope stability. In Bishop’s method, loading is incor-porated by increasing the weight of the slices on which the buildings are located.
Interpreting simulation results
For each computation time-step of the simula-tion, the typical outputs of models such as CHASM include
• predicted slip surface location,
• pore water pressure and soil moisture fields throughout the slope, and
• factor of safety.
These outputs can often be directly visual-ized in the model’s graphic user interface or may simply be in the form of text files. Text file outputs can be graphically represented using standard software such as R, Matlab, or IDL. Figure 3.31 presents the graphical representa-tion of CHASM outputs using open source software developed by volunteers at the Ran-dom Hacks of Kindness event in Washington,
D.C., in 2010. The simulation time-step shown here is toward the end of a 1-in-100-year, 24-hour rainfall event, in which the factor of safety has fallen from approximately 1.32 to 1.28. Perched water tables are visible at the interface between the upper two soil strata. By the end of the storm, F is predicted to be approximately 1.25 before recovering as the water table drops. Although a landslide is not predicted (F > 1), the weakest part of the slope can still be identified from the location of the slip circle.
Slope stability models with features similar to those outlined above, and that include the dynamic modeling of pore pressure conditions (both positive and negative), allow determina-tion of the impact of rainfall as a landslide trig-gering mechanism. Using a model with these attributes, an assessment can be made of the likely impact of surface water management as a means of contributing to improving slope stability.
FIGURE 3 .30 CHASM representation of a natural hillslope
RET
IQ
WT
rainfallevapotranspirationruno�infiltrationlateral flowwater table
RO
rainfallinterception
leaf drip
stemflow
increasedinfiltration
deeppercolation
evaporation &transpiration
water uptakeby roots
runo�
RET
noncircularslip search
RO
Q
I
WT
Source: Adapted from Wilkinson et al. 2002.

1 1 6 C H A P T E R 3 . U N D E R STA N D I N G L A N DS L I D E H A Z A R D
3.6.2 Resistance envelope method for determining suction control
The resistance envelope method can be used to determine whether negative pore pressures are required to maintain the stability of a slope. The apparent significance of slope drainage can be corroborated using resistance enve-lopes to identify the controls on slope stability (Chowdhury, Flentje, and Bhattacharya 2010; Fredlund 1980; Janbu 1977; Kenny 1967). Resistance envelope calculations can be used to show either the average negative pore pres-sure required for the maintenance of stability or, conversely, the saturated conditions under
which the slope may be expected to remain stable (Anderson, Kemp, and Shen 1987).
In the resistance envelope method, several slip surfaces are assumed and the average shear strength required for equilibrium is determined (using an appropriate method of analysis, such as Bishop 1955) along each of the surfaces, together with the corresponding average normal stress. The average mobilized shear strength is then plotted against the aver-age effective normal stress, with each point on the plot representing a critical slip surface. Joining all these points together forms the resistance envelope, onto which the plot of the
FIGURE 3 .31 Outputs from a CHASM simulation
0
2
4
6
8
10
12
14
16
1.1
1.12
1.14
1.16
1.18
1.2
1.22
1.24
1.26
0 50 100 150 200 250 300 350
prec
ipita
tion
mm
h−1
fact
or o
f saf
ety
hours
Slope Factor of Safety and Precipitation
Source: Prototype visualization software created at Random Hacks of Kindness event 2010.
PHYSICALLY BASED SLOPE STABILITY MODELS
USAGE•Simulation of the physical processes affecting slope stability• Identification of dominant landslide causes•Landslide hazard prediction (probability, magnitude, location)
SOURCE See http://www.ggsd.com for a comprehensive listing of slope stability software
FURTHER DISCUSSION
See section 5.6.3 for CHASM application
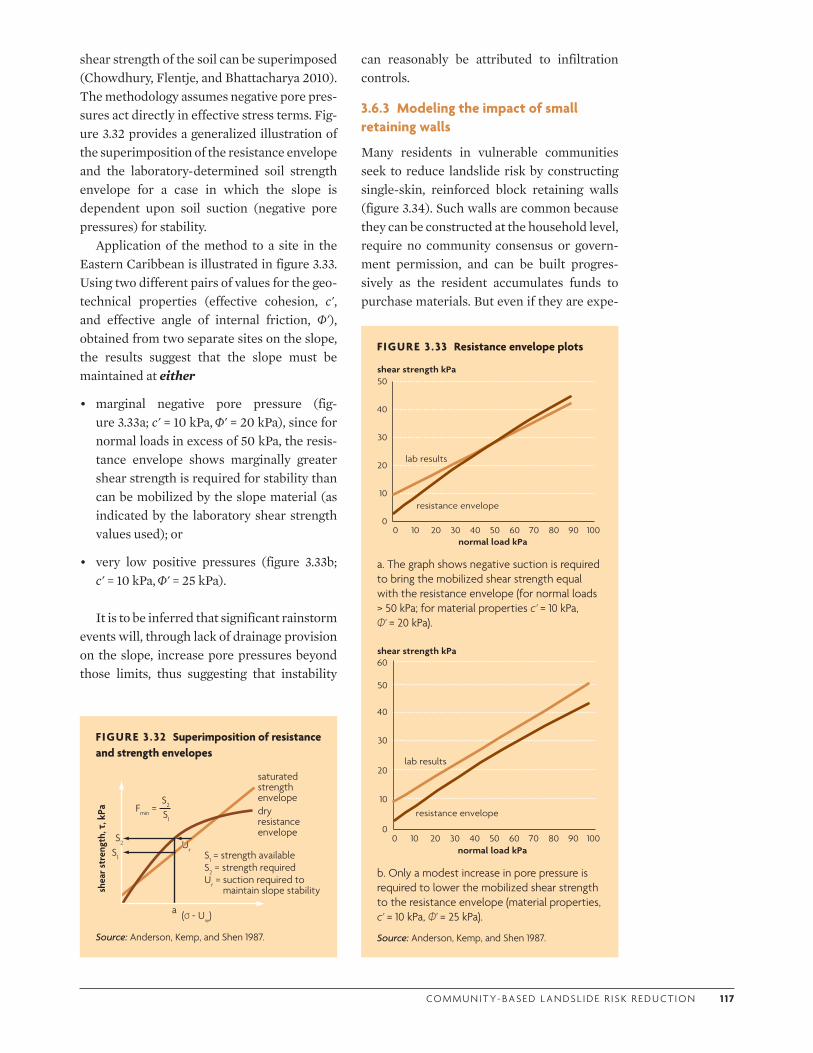
CO M M U N I T Y- BA S E D L A N DS L I D E R I S K R E D U CT I O N 1 1 7
shear strength of the soil can be superimposed (Chowdhury, Flentje, and Bhattacharya 2010). The methodology assumes negative pore pres-sures act directly in effective stress terms. Fig-ure 3.32 provides a generalized illustration of the superimposition of the resistance envelope and the laboratory-determined soil strength envelope for a case in which the slope is dependent upon soil suction (negative pore pressures) for stability.
Application of the method to a site in the Eastern Caribbean is illustrated in figure 3.33. Using two different pairs of values for the geo-technical properties (effective cohesion, c', and effective angle of internal friction, Φ'), obtained from two separate sites on the slope, the results suggest that the slope must be maintained at either
• marginal negative pore pressure (fig-ure 3.33a; c' = 10 kPa, Φ' = 20 kPa), since for normal loads in excess of 50 kPa, the resis-tance envelope shows marginally greater shear strength is required for stability than can be mobilized by the slope material (as indicated by the laboratory shear strength values used); or
• very low positive pressures (figure 3.33b; c' = 10 kPa, Φ' = 25 kPa).
It is to be inferred that significant rainstorm events will, through lack of drainage provision on the slope, increase pore pressures beyond those limits, thus suggesting that instability
can reasonably be attributed to infiltration controls.
3.6.3 Modeling the impact of small retaining walls
Many residents in vulnerable communities seek to reduce landslide risk by constructing single-skin, reinforced block retaining walls (figure 3.34). Such walls are common because they can be constructed at the household level, require no community consensus or govern-ment permission, and can be built progres-sively as the resident accumulates funds to purchase materials. But even if they are expe-
FIGURE 3 .32 Superimposition of resistance and strength envelopes
shea
r str
engt
h, τ
, kPa
saturated strength envelopedry resistance envelope
S1 = strength availableS2 = strength requiredUr = suction required to
maintain slope stability
S1
a
S2
S1
(σ - Uw)
UUr
Fmin =
S2
Source: Anderson, Kemp, and Shen 1987.
FIGURE 3 .33 Resistance envelope plots
0
10
20
30
40
50
0 10 20 30 40 50 60 70 80 90 100
shear strength kPa
normal load kPa
lab results
resistance envelope
a. The graph shows negative suction is required to bring the mobilized shear strength equal with the resistance envelope (for normal loads > 50 kPa; for material properties c' = 10 kPa, Φ' = 20 kPa).
0
10
20
30
40
50
0 10 20 30 40 50 60 70 80 90 100
shear strength kPa
normal load kPa
lab results
resistance envelope
60
b. Only a modest increase in pore pressure is required to lower the mobilized shear strength to the resistance envelope (material properties, c' = 10 kPa, Φ' = 25 kPa).
Source: Anderson, Kemp, and Shen 1987.
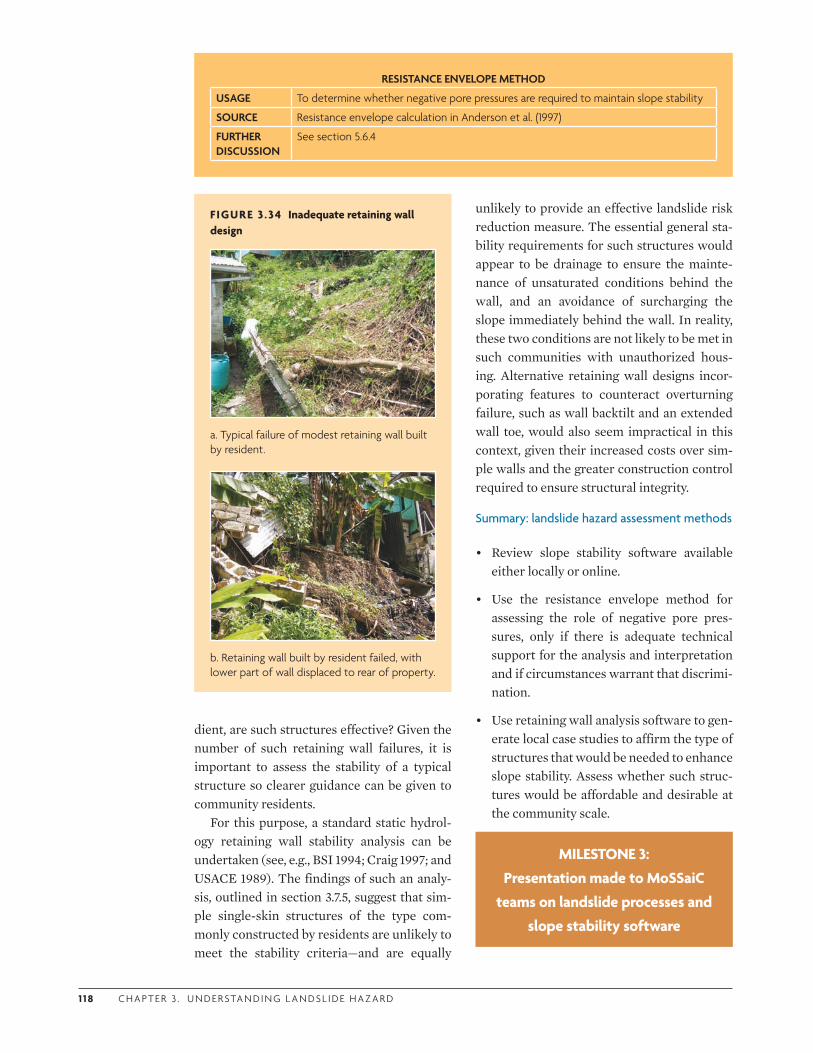
1 1 8 C H A P T E R 3 . U N D E R STA N D I N G L A N DS L I D E H A Z A R D
dient, are such structures effective? Given the number of such retaining wall failures, it is important to assess the stability of a typical structure so clearer guidance can be given to community residents.
For this purpose, a standard static hydrol-ogy retaining wall stability analysis can be undertaken (see, e.g., BSI 1994; Craig 1997; and USACE 1989). The findings of such an analy-sis, outlined in section 3.7.5, suggest that sim-ple single-skin structures of the type com-monly constructed by residents are unlikely to meet the stability criteria—and are equally
unlikely to provide an effective landslide risk reduction measure. The essential general sta-bility requirements for such structures would appear to be drainage to ensure the mainte-nance of unsaturated conditions behind the wall, and an avoidance of surcharging the slope immediately behind the wall. In reality, these two conditions are not likely to be met in such communities with unauthorized hous-ing. Alternative retaining wall designs incor-porating features to counteract overturning failure, such as wall backtilt and an extended wall toe, would also seem impractical in this context, given their increased costs over sim-ple walls and the greater construction control required to ensure structural integrity.
Summary: landslide hazard assessment methods
• Review slope stability software available either locally or online.
• Use the resistance envelope method for assessing the role of negative pore pres-sures, only if there is adequate technical support for the analysis and interpretation and if circumstances warrant that discrimi-nation.
• Use retaining wall analysis software to gen-erate local case studies to affirm the type of structures that would be needed to enhance slope stability. Assess whether such struc-tures would be affordable and desirable at the community scale.
MILESTONE 3: Presentation made to MoSSaiC
teams on landslide processes and slope stability software
RESISTANCE ENVELOPE METHOD
USAGE To determine whether negative pore pressures are required to maintain slope stability
SOURCE Resistance envelope calculation in Anderson et al. (1997)
FURTHER DISCUSSION
See section 5.6.4
FIGURE 3 .34 Inadequate retaining wall design
a. Typical failure of modest retaining wall built by resident.
b. Retaining wall built by resident failed, with lower part of wall displaced to rear of property.
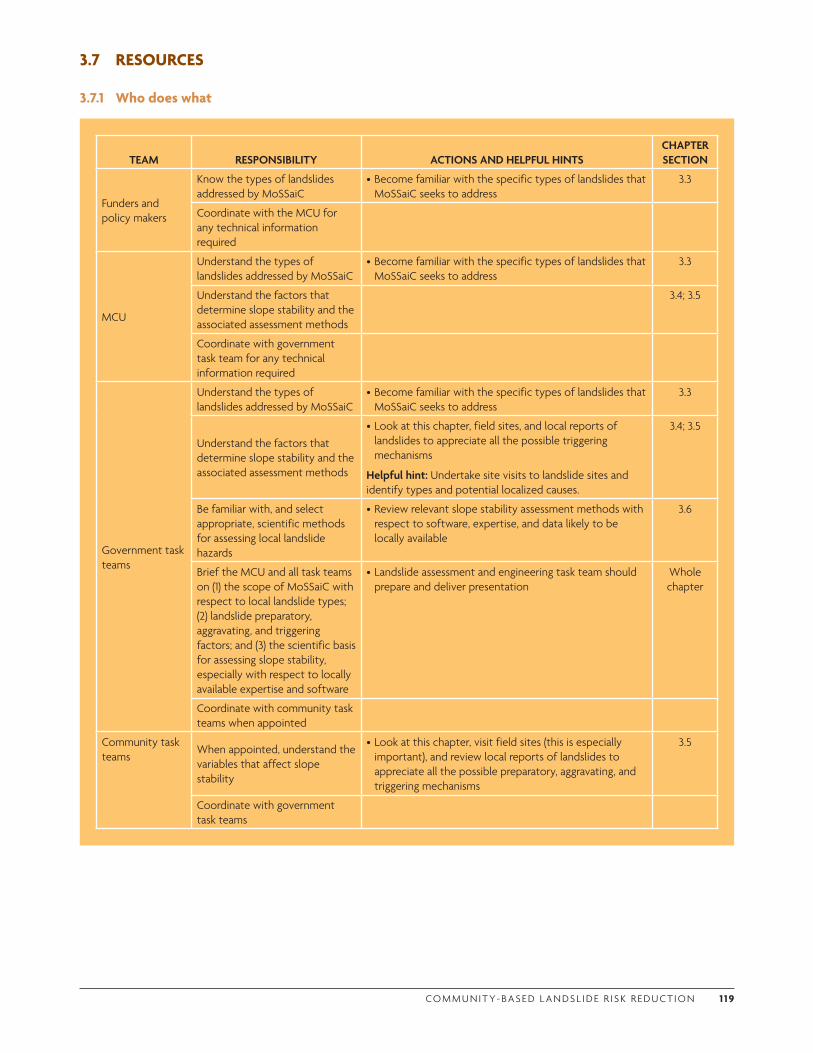
CO M M U N I T Y- BA S E D L A N DS L I D E R I S K R E D U CT I O N 1 1 9
3.7 RESOURCES
3.7.1 Who does what
TEAM RESPONSIBILITY ACTIONS AND HELPFUL HINTSCHAPTER SECTION
Funders and policy makers
Know the types of landslides addressed by MoSSaiC
•Become familiar with the specific types of landslides that MoSSaiC seeks to address
3.3
Coordinate with the MCU for any technical information required
MCU
Understand the types of landslides addressed by MoSSaiC
•Become familiar with the specific types of landslides that MoSSaiC seeks to address
3.3
Understand the factors that determine slope stability and the associated assessment methods
3.4; 3.5
Coordinate with government task team for any technical information required
Government task teams
Understand the types of landslides addressed by MoSSaiC
•Become familiar with the specific types of landslides that MoSSaiC seeks to address
3.3
Understand the factors that determine slope stability and the associated assessment methods
•Look at this chapter, field sites, and local reports of landslides to appreciate all the possible triggering mechanisms
Helpful hint: Undertake site visits to landslide sites and identify types and potential localized causes.
3.4; 3.5
Be familiar with, and select appropriate, scientific methods for assessing local landslide hazards
•Review relevant slope stability assessment methods with respect to software, expertise, and data likely to be locally available
3.6
Brief the MCU and all task teams on (1) the scope of MoSSaiC with respect to local landslide types; (2) landslide preparatory, aggravating, and triggering factors; and (3) the scientific basis for assessing slope stability, especially with respect to locally available expertise and software
•Landslide assessment and engineering task team should prepare and deliver presentation
Whole chapter
Coordinate with community task teams when appointed
Community task teams
When appointed, understand the variables that affect slope stability
•Look at this chapter, visit field sites (this is especially important), and review local reports of landslides to appreciate all the possible preparatory, aggravating, and triggering mechanisms
3.5
Coordinate with government task teams
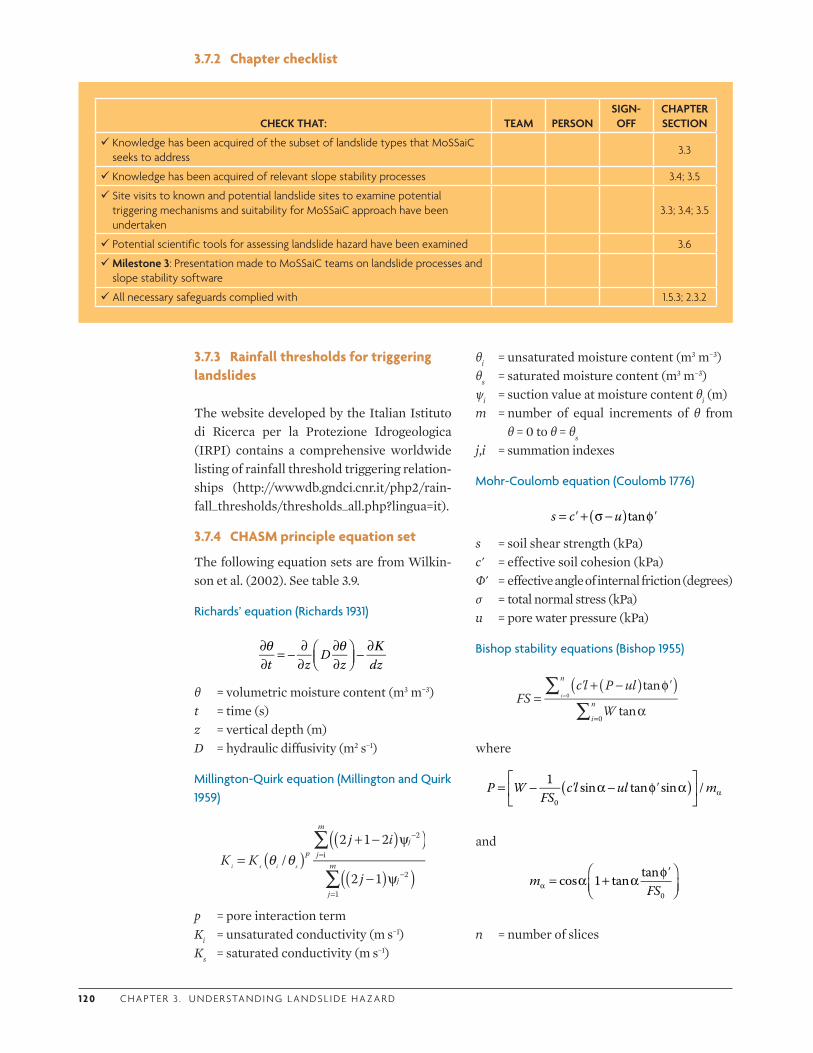
1 2 0 C H A P T E R 3 . U N D E R STA N D I N G L A N DS L I D E H A Z A R D
3.7.2 Chapter checklist
3.7.3 Rainfall thresholds for triggering landslides
The website developed by the Italian Istituto di Ricerca per la Protezione Idrogeologica (IRPI) contains a comprehensive worldwide listing of rainfall threshold triggering relation-ships (http://wwwdb.gndci.cnr.it/php2/rain-fall_thresholds/thresholds_all.php?lingua=it).
3.7.4 CHASM principle equation set
The following equation sets are from Wilkin-son et al. (2002). See table 3.9.
Richards’ equation (Richards 1931)
t zD
z dzθ θ Κ∂
∂= − ∂
∂∂∂
− ∂
θ = volumetric moisture content (m3 m−3)t = time (s)z = vertical depth (m)D = hydraulic diffusivity (m2 s−1)
Millington-Quirk equation (Millington and Quirk 1959)
K Kj i
j/
2 1 2
2 1
pj
j
m
j
j
m
2
i
2
1
i s i s
∑
∑θ θ
( )
( )( )
( )
( )=
+ − ψ
− ψ
−
=
−
=
p = pore interaction termKi = unsaturated conductivity (m s−1)Ks = saturated conductivity (m s−1)
CHECK THAT: TEAM PERSONSIGN-OFF
CHAPTER SECTION
Knowledge has been acquired of the subset of landslide types that MoSSaiC seeks to address
3.3
Knowledge has been acquired of relevant slope stability processes 3.4; 3.5
Site visits to known and potential landslide sites to examine potential triggering mechanisms and suitability for MoSSaiC approach have been undertaken
3.3; 3.4; 3.5
Potential scientific tools for assessing landslide hazard have been examined 3.6
Milestone 3: Presentation made to MoSSaiC teams on landslide processes and slope stability software
All necessary safeguards complied with 1.5.3; 2.3.2
θi = unsaturated moisture content (m3 m−3)θs = saturated moisture content (m3 m−3)ψi = suction value at moisture content θi (m)m = number of equal increments of θ from
θ = 0 to θ = θs
j,i = summation indexes
Mohr-Coulomb equation (Coulomb 1776)
s c' u 'tan( )= + σ − φ
s = soil shear strength (kPa)c' = effective soil cohesion (kPa)Φ' = effective angle of internal friction (degrees)σ = total normal stress (kPa)u = pore water pressure (kPa)
Bishop stability equations (Bishop 1955)
FSc'l P ul '
W
tan
tan
n
i
n
0
i 0∑
∑( )( )
=+ − φ
α=
=
where
P WFS
c'l ul ' m1 sin tan sin /0
( )= − α − φ α
α
and
m 'FS
cos 1 tan tan
0
= α + α φ
α
n = number of slices
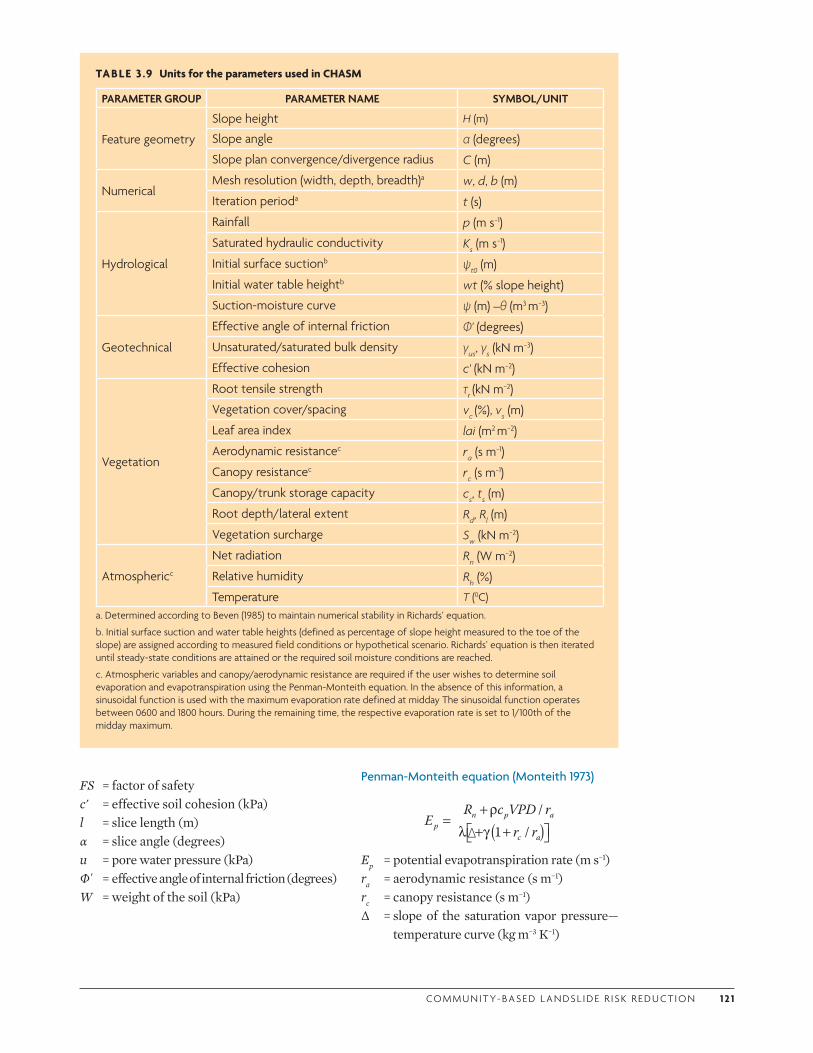
CO M M U N I T Y- BA S E D L A N DS L I D E R I S K R E D U CT I O N 1 2 1
FS = factor of safetyc' = effective soil cohesion (kPa)l = slice length (m)α = slice angle (degrees)u = pore water pressure (kPa)Φ' = effective angle of internal friction (degrees)W = weight of the soil (kPa)
Penman-Monteith equation (Monteith 1973)
Ep = potential evapotranspiration rate (m s−1)ra = aerodynamic resistance (s m−1)rc = canopy resistance (s m−1)Δ = slope of the saturation vapor pressure—
temperature curve (kg m−3 K−1)
TABLE 3 .9 Units for the parameters used in CHASM
PARAMETER GROUP PARAMETER NAME SYMBOL/UNIT
Feature geometry
Slope height H (m)
Slope angle α (degrees)
Slope plan convergence/divergence radius C (m)
Numerical Mesh resolution (width, depth, breadth)a w, d, b (m)
Iteration perioda t (s)
Hydrological
Rainfall p (m s−1)
Saturated hydraulic conductivity Ks (m s−1)
Initial surface suctionb ψt0 (m)
Initial water table heightb wt (% slope height)
Suction-moisture curve ψ (m) –θ (m3 m−3)
Geotechnical
Effective angle of internal friction Φ' (degrees)
Unsaturated/saturated bulk density γus, γs (kN m−3)
Effective cohesion c' (kN m−2)
Vegetation
Root tensile strength τr (kN m−2)
Vegetation cover/spacing vc (%), vs (m)
Leaf area index lai (m2 m−2)
Aerodynamic resistancec ra (s m−1)
Canopy resistancec rc (s m−1)
Canopy/trunk storage capacity cs, ts (m)
Root depth/lateral extent Rd, Rl (m)
Vegetation surcharge Sw (kN m−2)
Atmosphericc
Net radiation Rn (W m−2)
Relative humidity Rh (%)
Temperature T (0C)a. Determined according to Beven (1985) to maintain numerical stability in Richards’ equation.
b. Initial surface suction and water table heights (defined as percentage of slope height measured to the toe of the slope) are assigned according to measured field conditions or hypothetical scenario. Richards’ equation is then iterated until steady-state conditions are attained or the required soil moisture conditions are reached.
c. Atmospheric variables and canopy/aerodynamic resistance are required if the user wishes to determine soil evaporation and evapotranspiration using the Penman-Monteith equation. In the absence of this information, a sinusoidal function is used with the maximum evaporation rate defined at midday The sinusoidal function operates between 0600 and 1800 hours. During the remaining time, the respective evaporation rate is set to 1/100th of the midday maximum.
ER c VPD r
r r/
1 /pn p a
c a( )=+ρ
λ γ + Δ+
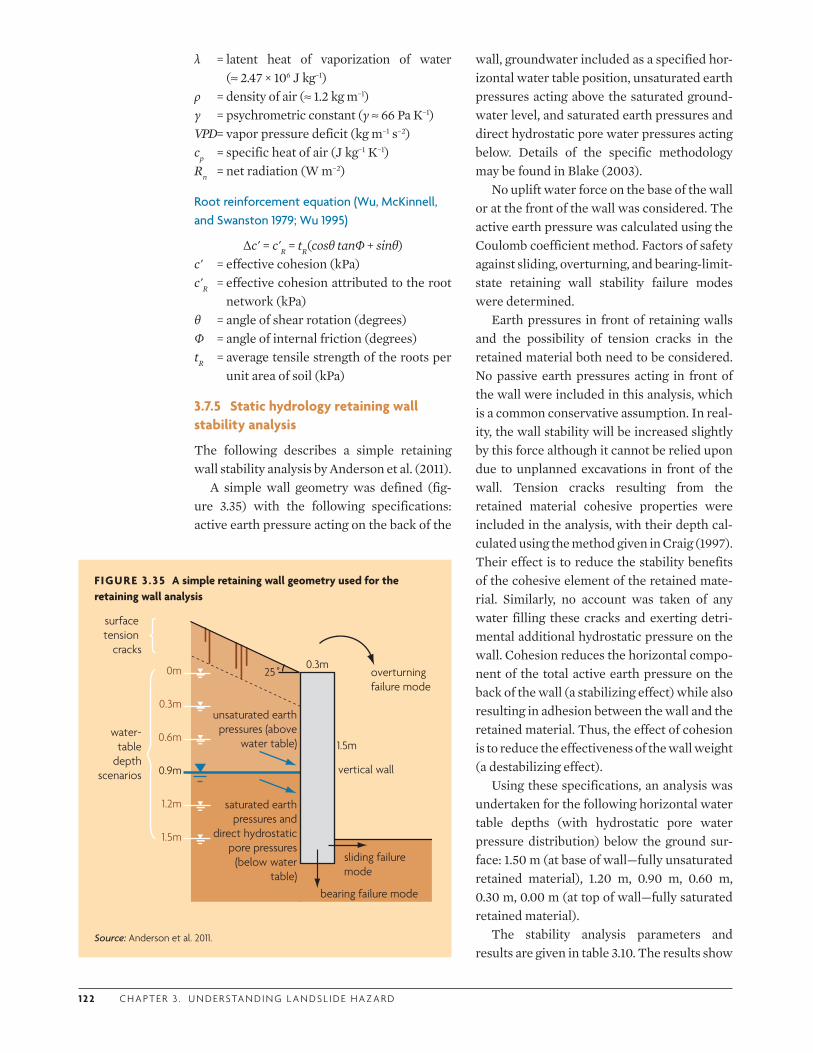
1 2 2 C H A P T E R 3 . U N D E R STA N D I N G L A N DS L I D E H A Z A R D
λ = latent heat of vaporization of water (≈ 2.47 × 10⁶ J kg−1)
ρ = density of air (≈ 1.2 kg m−1)γ = psychrometric constant (γ ≈ 66 Pa K−1)VPD = vapor pressure deficit (kg m−1 s−2)cp = specific heat of air (J kg−1 K−1)Rn = net radiation (W m−2)
Root reinforcement equation (Wu, McKinnell, and Swanston 1979; Wu 1995)
Δc' = c'R = tR(cosθ tanΦ + sinθ)c' = effective cohesion (kPa)c'R = effective cohesion attributed to the root
network (kPa)θ = angle of shear rotation (degrees)Φ = angle of internal friction (degrees)tR = average tensile strength of the roots per
unit area of soil (kPa)
3.7.5 Static hydrology retaining wall stability analysis
The following describes a simple retaining wall stability analysis by Anderson et al. (2011).
A simple wall geometry was defined (fig-ure 3.35) with the following specifications: active earth pressure acting on the back of the
wall, groundwater included as a specified hor-izontal water table position, unsaturated earth pressures acting above the saturated ground-water level, and saturated earth pressures and direct hydrostatic pore water pressures acting below. Details of the specific methodology may be found in Blake (2003).
No uplift water force on the base of the wall or at the front of the wall was considered. The active earth pressure was calculated using the Coulomb coefficient method. Factors of safety against sliding, overturning, and bearing-limit-state retaining wall stability failure modes were determined.
Earth pressures in front of retaining walls and the possibility of tension cracks in the retained material both need to be considered. No passive earth pressures acting in front of the wall were included in this analysis, which is a common conservative assumption. In real-ity, the wall stability will be increased slightly by this force although it cannot be relied upon due to unplanned excavations in front of the wall. Tension cracks resulting from the retained material cohesive properties were included in the analysis, with their depth cal-culated using the method given in Craig (1997). Their effect is to reduce the stability benefits of the cohesive element of the retained mate-rial. Similarly, no account was taken of any water filling these cracks and exerting detri-mental additional hydrostatic pressure on the wall. Cohesion reduces the horizontal compo-nent of the total active earth pressure on the back of the wall (a stabilizing effect) while also resulting in adhesion between the wall and the retained material. Thus, the effect of cohesion is to reduce the effectiveness of the wall weight (a destabilizing effect).
Using these specifications, an analysis was undertaken for the following horizontal water table depths (with hydrostatic pore water pressure distribution) below the ground sur-face: 1.50 m (at base of wall—fully unsaturated retained material), 1.20 m, 0.90 m, 0.60 m, 0.30 m, 0.00 m (at top of wall—fully saturated retained material).
The stability analysis parameters and results are given in table 3.10. The results show
FIGURE 3 .35 A simple retaining wall geometry used for the retaining wall analysis
25˚
1.5m
0.3moverturning failure mode
sliding failure mode
bearing failure mode
1.2m
0.9m
0.6m
0.3m
0m
1.5m
unsaturated earth pressures (above
water table)
saturated earth pressures and
direct hydrostatic pore pressures
(below water table)
water-table
depthscenarios
surface tension
cracks
vertical wall
Source: Anderson et al. 2011.
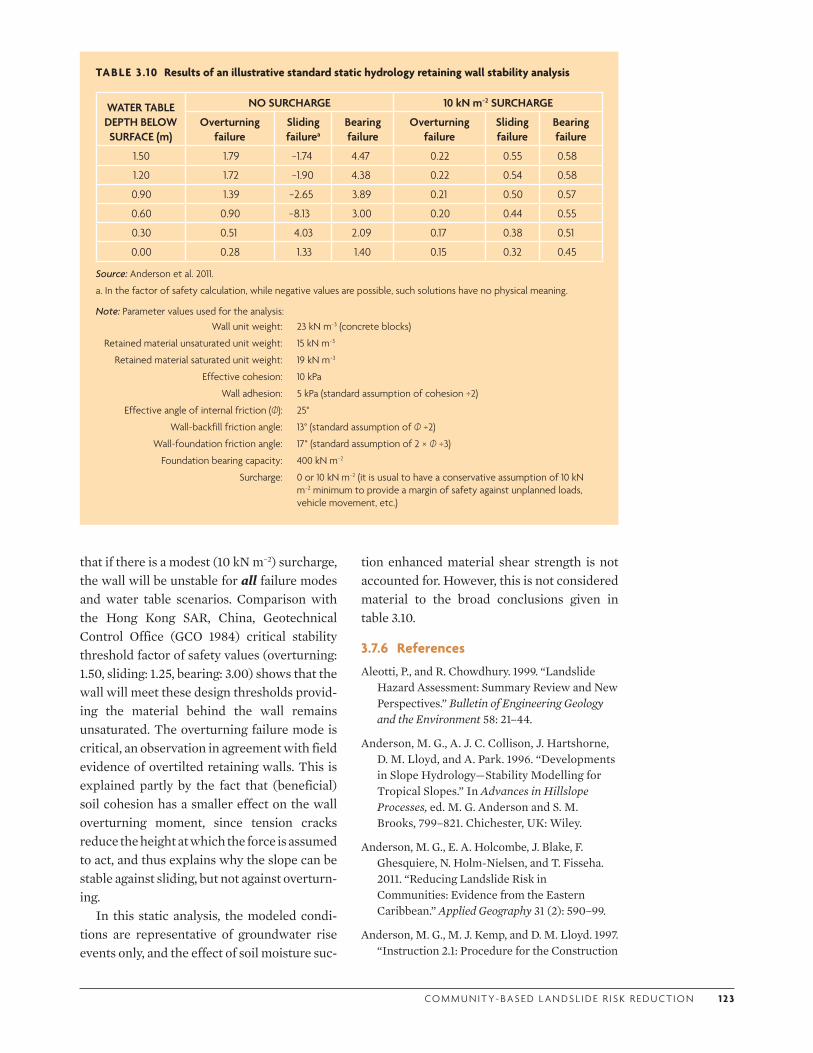
CO M M U N I T Y- BA S E D L A N DS L I D E R I S K R E D U CT I O N 1 2 3
that if there is a modest (10 kN m−2) surcharge, the wall will be unstable for all failure modes and water table scenarios. Comparison with the Hong Kong SAR, China, Geotechnical Control Office (GCO 1984) critical stability threshold factor of safety values (overturning: 1.50, sliding: 1.25, bearing: 3.00) shows that the wall will meet these design thresholds provid-ing the material behind the wall remains unsaturated. The overturning failure mode is critical, an observation in agreement with field evidence of overtilted retaining walls. This is explained partly by the fact that (beneficial) soil cohesion has a smaller effect on the wall overturning moment, since tension cracks reduce the height at which the force is assumed to act, and thus explains why the slope can be stable against sliding, but not against overturn-ing.
In this static analysis, the modeled condi-tions are representative of groundwater rise events only, and the effect of soil moisture suc-
tion enhanced material shear strength is not accounted for. However, this is not considered material to the broad conclusions given in table 3.10.
3.7.6 References
Aleotti, P., and R. Chowdhury. 1999. “Landslide Hazard Assessment: Summary Review and New Perspectives.” Bulletin of Engineering Geology and the Environment 58: 21–44.
Anderson, M. G., A. J. C. Collison, J. Hartshorne, D. M. Lloyd, and A. Park. 1996. “Developments in Slope Hydrology—Stability Modelling for Tropical Slopes.” In Advances in Hillslope Processes, ed. M. G. Anderson and S. M. Brooks, 799–821. Chichester, UK: Wiley.
Anderson, M. G., E. A. Holcombe, J. Blake, F. Ghesquiere, N. Holm-Nielsen, and T. Fisseha. 2011. “Reducing Landslide Risk in Communities: Evidence from the Eastern Caribbean.” Applied Geography 31 (2): 590–99.
Anderson, M. G., M. J. Kemp, and D. M. Lloyd. 1997. “Instruction 2.1: Procedure for the Construction
TABLE 3 .10 Results of an illustrative standard static hydrology retaining wall stability analysis
WATER TABLE DEPTH BELOW SURFACE (m)
NO SURCHARGE 10 kN m−2 SURCHARGE
Overturning failure
Sliding failurea
Bearing failure
Overturning failure
Sliding failure
Bearing failure
1.50 1.79 −1.74 4.47 0.22 0.55 0.58
1.20 1.72 −1.90 4.38 0.22 0.54 0.58
0.90 1.39 −2.65 3.89 0.21 0.50 0.57
0.60 0.90 −8.13 3.00 0.20 0.44 0.55
0.30 0.51 4.03 2.09 0.17 0.38 0.51
0.00 0.28 1.33 1.40 0.15 0.32 0.45
Source: Anderson et al. 2011.
a. In the factor of safety calculation, while negative values are possible, such solutions have no physical meaning.
Note: Parameter values used for the analysis:Wall unit weight:
Retained material unsaturated unit weight:
Retained material saturated unit weight:
Effective cohesion:
Wall adhesion:
Effective angle of internal friction (Φ):
Wall-backfill friction angle:
Wall-foundation friction angle:
Foundation bearing capacity:
Surcharge:
23 kN m−3 (concrete blocks)
15 kN m−3
19 kN m−3
10 kPa
5 kPa (standard assumption of cohesion ÷2)
25°
13° (standard assumption of Φ ÷2)
17° (standard assumption of 2 × Φ ÷3)
400 kN m−2
0 or 10 kN m−2 (it is usual to have a conservative assumption of 10 kN m−2 minimum to provide a margin of safety against unplanned loads, vehicle movement, etc.)

1 24 C H A P T E R 3 . U N D E R STA N D I N G L A N DS L I D E H A Z A R D
of a Resistance Envelope for a Slope.” In Hydrological Design Manual for Slope Stability in the Tropics, 14–20. Crowthorne, UK: Transport Research Laboratory. http://www.transport-links.org/transport_links/filearea/publications/1_711_ORN%2014.pdf.
Anderson, M. G., M. J. Kemp, and M. Shen. 1987. “On the Use of Resistance Envelopes to Identify the Controls on Slope Stability in the Tropics.” Earth Surface Processes and Landforms 12 (6): 637–48.
Anderson, M. G., and P. E. Kneale. 1982. “The Influence of Low-Angled Topography on Hillslope Soil-Water Convergence and Stream Discharge.” Journal of Hydrology 57 (1–2): 65–80
Ardizzone, F., M. Cardinali, A. Carrara, F. Guzzetti, and P. Reichenbach. 2002. “Impact of Mapping Errors on the Reliability of Landslide Hazard Maps.” Natural Hazards and Earth System Sciences 2 (1–2): 3–14.
Arias, A. 1970. “A Measure of Earthquake Intensity.” Seismic Design for Nuclear Powerplants, ed. R. J. Hansen, 438–83. Cambridge, MA: MIT Press.
Benson, C., and J. Twigg. 2007. “Tools for Mainstreaming Disaster Risk Reduction: Guidance Notes for Development Organisations.” ProVention Consortium, Geneva.
Beven, K. J. 1985. “Distributed Models.” In Hydrological Forecasting, ed. M. G. Anderson and T. B. Burt, 405–35. New York: Wiley.
Bishop, A. W. 1955. “The Use of the Slip Circle in the Stability analysis of Slopes.” Geotechnique 5 (1): 7–77.
Blake, J. R. 2003. “Modelling the Dynamic Interaction between Hillslope Hydrology and Retaining Structures (Hydrology and Retaining Walls Model: HYDRET).” PhD thesis, University of Bristol.
Brand, E. W., M. J. Dale, and J. M. Nash. 1986. “Soil Pipes and Slope Stability in Hong Kong.” Quarterly Journal of Engineering Geology and Hydrogeology 19 (3): 301–03.
BSI (British Standards Institution). 1994. BS8002: Code of Practice for Earth Retaining Structures. London: BSI.
Build Change. 2009. “You Can Keep Your Family Safe from Earthquakes—How to Build Strong and Sturdy Homes.” http://www.buildchange.org/resources.php.
Caine, N. 1980. “The Rainfall Intensity Duration Control of Shallow Landslides and Debris Flows.” Geographisca Annaler 62 (1): 23–27.
Carter, M., and S. P. Bentley. 1991. Correlations of Soil Properties. Chichester, UK: Wiley.
Charveriat, C. 2000. “Natural Disasters in Latin America and the Caribbean: An Overview of Risk.” Working Paper No. 434, Inter-American Development Bank, Washington, DC.
Chowdhury, R., P. Flentje, and G. Bhattacharya. 2010. Geotechnical Slope Analysis. New York: CRC Press.
Collison, A. 1993. “Assessing the Influence of Vegetation on Slope Stability in the Tropics.” PhD thesis, University of Bristol.
Cooper, R. G. 2007. Mass Movements in Great Britain. Geological Conservation Review Series 33. Peterborough, UK: Joint Nature Conservation Committee.
Coulomb, C. A. 1776. “Essai sur une application des règles des maximis à quelques problèmes de statique relatifs à l’architecture.” Memorandum Académie de Royal des Sciences par divers Savans 7, 343–82.
Craig, R. F. 1997. Soil Mechanics. 6th ed. London: E & FN Spon.
Crosta, G. B. 2004. “Introduction to the Special Issue on Rainfall-Triggered Landslides and Debris Flows.” Engineering Geology 73: 191–92.
Crosta, G. B., and P. Frattini. 2001. “Rainfall Thresholds for Triggering Soil Slips and Debris Flow.” Mediterranean Storms 2000, ed. A. Mugnai, F. Guzzetti, and G. Roth. Proceedings of the 2nd EGS Plinius Conference on Mediterranean Storms, 2000. Siena, Italy.
Crozier, M., and T. Glade. 2005. “Landslide Hazard and Risk: Issues, Concepts and Approach.” In Landslide Hazard and Risk, ed. T. Glade, M. G. Anderson, and M. Crozier, 1–40. Chichester, UK: Wiley.
Cruden, D. M., and D. J. Varnes. 1996. “Landslide Types and Processes.” In Landslides: Investigation and Mitigation, Transportation Research Board Special Report 247, ed. A. K. Turner and R. L. Shuster, 36–75. Washington, DC: National Academies Press.
Dai, F. C., C. F. Lee, and Y. Y. Ngai. 2002. “Landslide Risk Assessment and Management: An Overview.” Engineering Geology 64: 65–87.
De Vita, P., P. Reichenbach, J. C. Bathurst, M. Borga, G. Crosta, M. Crozier, T. F. Glade, A.
CO M M U N I T Y- BA S E D L A N DS L I D E R I S K R E D U CT I O N 1 2 5
Hansen, and J. Wasowski. 1997. “Rainfall-Triggered Landslides: A Reference List.” Environmental Geology 35: 219–33.
Fookes, P. G. 1997. Tropical Residual Soils. London: Geological Society.
Fredlund, D. G. 1980. “The Shear Strength of Unsaturated Soil and Its Relationship to Slope Stability Problems in Hong Kong.” Hong Kong Engineer 8: 57–59.
Fredlund, D. G., and H. Rahardjo. 1993. Soil Mechanics for Unsaturated Soils. Chichester, UK: Wiley.
Galli, M., F. Ardizzone, M. Cardinali, F. Guzzetti, and P. Reichenbach. 2008. “Comparing Landslide Inventory Maps.” Geomorphology 94: 268–89.
Garcia-Rodriguez, M. J., J. A. Malpica, B. Benito, and M. Diaz. 2008. “Susceptibility Assessment of Earthquake-Triggered Landslides in El Salvador Using Logistic Regression.” Geomorphology 95 (3–4): 175–91.
GCO (Geotechnical Control Office). 1984. Geotechnical Manual for Slopes. 2nd ed. Government of Hong Kong Special Administrative Region.
Greenway, D. R. 1987. “Vegetation and Slope Stability.” In Slope Stability: Geotechnical Engineering and Geomorphology, ed. M. G. Anderson and K. S. Richards, 187–230. Chichester: Wiley.
Guzzetti, F., S. Peruccacci, M. Rossi, and C. P. Stark. 2007. “Rainfall Thresholds for the Initiation of Landslides in Central and Southern Europe.” Meteorology and Atmospheric Physics 98: 239–67.
—. 2008. “The Rainfall Intensity-Duration Control of Shallow Landslides and Debris Flows: An Update.” Landslides 5: 3–8.
Hansen, A. 1984. “Landslide Hazard Analysis.” In Slope Instability, ed. D. Brunsden and D. B. Prior, 523–604. New York: Wiley.
Hencher, S. R., M. G. Anderson, and R. P. Martin. 2006. “Hydrogeology of Landslides in Weathered Profiles.” In Proceedings of the International Conference on Slopes, 463–74. Kuala Lumpur.
Holcombe, E. A., and M. G. Anderson. 2010. “Implementation of Community-Based Landslide Hazard Mitigation Measures: The Role of Stakeholder Engagement in Sustainable
Project Scale-Up.” Sustainable Development 18 (6): 331–49.
Hong, Y., R. Adler, and G. Huffman. 2006. “Evaluation of the Potential of NASA Multi-Satellite Precipitation Analysis in Global Landslide Hazard Assessment.” Geophysical Research Letters 33: L22402. doi:10.1029/2006GL028010.
Huabin, W., L. Gangjun, X. Weiya, and W. Conghu. 2005. “GIS-Based Landslide Hazard Assessment: An Overview.” Progress in Physical Geography 29: 548–67. doi:10.1191/0309133305pp462ra.
Innes, J. L. 1983. “Debris Flows.” Progress in Physical Geography 7: 469–501.
International Geotechnical Societies UNESCO Working Party on World Landslide Inventory. 1993. “A Suggested Method for Describing the Activity of a Landslide.” Bulletin of the International Association of Engineering Geology 47: 53–57.
IRPI (Istituto di Ricerca per la Protezione Idrogeologica). 2012. “Rainfall Thresholds for the Initiation of Landslides.” http://rainfallthresholds.irpi.cnr.it/.
Iverson, R. M. 2000. “Landslide Triggering by Rain Infiltration.” Water Resources Research 36 (7): 1897–1910.
Janbu, N. 1977. “Slope and Excavations in Normally and Lightly Consolidated Clays.” In Proceedings of the Ninth International Conference on Soil Mechanics and Foundation Engineering, vol. 2, 549–66. Tokyo.
Keefer, D. K. 2002. “Investigating Landslides Caused by Earthquakes—A Historical Review.” Surveys in Geophysics 23 (6): 473–510.
Keefer, D. K., and M. C. Larsen. 2007. “Assessing Landslide Hazards.” Science 316: 1136–38.
Keefer, D. K., and R. C. Wilson. 1989. “Predicting Earthquake-induced Landslides, with Emphasis on Arid and Semi-Arid Environments.” In Landslides in a Semiarid Environment, vol. 2, ed. P. M. Sadler and D. M. Morton, 118–49. Riverside, CA: Inland Geological Society of Southern California Publications.
Kenny, T. C. 1967. “Slide Behaviour and Shear Resistance of a Quick Clay Determined from a Study of the Landslide at Selnes, Norway.” In Proceedings of the Geotechnical Conference on Shear Strength Properties of Natural Soils and Rock, vol. 1, 57–64. Oslo.
1 2 6 C H A P T E R 3 . U N D E R STA N D I N G L A N DS L I D E H A Z A R D
Kirschbaum, D. B., R. Adler, Y. Hong, and A. Lerner-Lam. 2009. “Evaluation of a Preliminary Satellite-Based Landslide Hazard Algorithm Using Global Landslide Inventories.” Natural Hazards Earth System Science 9: 673–86.
Komoo, I., and S. N. Mogana. 1988. “Physical Characterization of Weathering Profiles of Clastic Metasediments in Peninsular Malaysia.” In Proceedings of the 2nd Conference on Geomechanics in Tropical Soils, Singapore 1, 37–42.
Larsen, M. C., and A. Simon. 1993. “A Rainfall Intensity-Duration Threshold for Landslides in a Humid-Tropical Environment, Puerto Rico.” Geografiska Annaler Series A-Physical Geography 75 (1–2): 13–23.
Lee, S. 2005. “Application of Logistic Regression Model and Its Validation for Landslide Susceptibility Mapping Using GIS and Remote Sensing Data.” International Journal of Remote Sensing 26 (7): 1477–91.
Little, A. L. 1969. “The Engineering Classification of Residual Tropical Soils.” In Proceedings of the 7th International Conference on Soil Mechanics and Foundation Engineering, Mexico. 1, 1 10.
Lumb, P. 1975. “Slope Failures in Hong Kong.” Quarterly Journal of Engineering Geology 8: 31–65.
Mechler, R. 2005. Cost-Benefit Analysis of Natural Disaster Risk Management in Developing Countries: Manual. Bonn: Deutsche Gesellschaft fuer Technische Zusammenarbeit (GTZ) GmbH.
Millington, R. J., and J. P. Quirk. 1959. “Permeability of Porous Media.” Nature 183: 387–88.
Monteith, J. L. 1973. Principles of Environmental Physics. London: Edward Arnold.
Nandi, A., and A. Shakoor. 2010. “A GIS-Based Landslide Susceptibility Evaluation Using Bivariate and Multivariate Statistical Analyses.” Engineering Geology 110 (1–2): 11–20.
Nash, D. 1987. “A Comparative Review of Limit Equilibrium Methods of Stability Analysis.” In Slope Stability, Geotechnical Engineering and Geomorphology, ed. M. G. Anderson and K. S. Richards, 11–73. Chichester, UK: Wiley.
Nefeslioglu, H. A., C. Gokceoglu, and H. Sonmez. 2008. “An Assessment on the Use of Logistic Regression and Artificial Neural Networks with Different Sampling Strategies for the
Preparation of Landslide Susceptibility Maps.” Engineering Geology 97: 171–91.
Opadeyi, S., S. Ali, and F. Chin. 2005. “Status of Hazard Maps, Vulnerability Assessments and Digital Maps in the Caribbean.” Final report. Caribbean Disaster Emergency Response Agency.
Petley, D. N. 2009. “On the Impact of Urban Landslides.” Geological Society Engineering Geology Special Publications 22: 83–99.
Pierson, T. C. 1983. “Soil Pipes and Slope Stability.” Quarterly Journal of Engineering Geology 16: 1–11.
Richards, L. A. 1931. “Capillary Conduction of Liquids in Porous Mediums.” Physics 1: 318–33.
Sharma, R. H., H. Konietzky, and K. Kosugi. 2009. “Numerical Analysis of Soil Pipe Effects on Hillslope Water Dynamics.” Acta Gepotechnica 5 (1): 33–42.
Soeters, R., and C. J. van Westen. 1996. “Slope Instability Recognition, Analysis and Zonation.” In Landslides: Investigation and Mitigation, Transportation Research Board Special Report 247, ed. A. K. Turner and R. L. Shuster, 129–77. Washington, DC: National Academies Press.
Travasarou, T., J. D. Bray, and N. A. Abrahamson. 2003. “Empirical Attenuation Relationship for Arias Intensity.” Earthquake Engineering and Structural Dynamics 32: 1133–55.
Turner, A. K., and R. L. Schuster, eds. 1996. Landslides: Investigation and Mitigation, Transportation Research Board Special Report 247. Washington, DC: National Academies Press.
Uchida, T. 2004. “Clarifying the Role of Pipe Flow on Shallow Landslide Initiation.” Hydrological Processes 18: 375–78.
United Nations. 2006. “State of the World’s Cities 2006/7.” United Nations Human Settlement Programme (UN-Habitat), Nairobi, Kenya.
–. 2009. “Making Disaster Risk Reduction Gender-Sensitive: Policy and Practical Guidelines.” Geneva: UN.
UNDP (United Nations Development Programme). 2004. Reducing Disaster Risk: A Challenge for Development. New York: UNDP Bureau for Crisis Prevention and Recovery.
USACE (U.S. Army Corps of Engineers). 1989. U.S. Army Corps of Engineers Engineering Manual: Engineering and Design - Retaining and Flood Walls. http://140.194.76.129/publications/eng-manuals/em1110-2-2502/toc.htm.
CO M M U N I T Y- BA S E D L A N DS L I D E R I S K R E D U CT I O N 1 2 7
USGS (U.S. Geological Survey). 2004. “Landslide Types and Processes.” Fact sheet 2004-3072. http://pubs.usgs.gov/fs/2004/3072/.
Van Den Eeckhaut, M., T. Vanwalleghem, J. Poesen, G. Govers, G. Verstraeten, and L. Vanderkerckhove. 2006. “Prediction of Landslide Susceptibility Using Rare Events Logistic Regression: A Case-Study in Flemish Ardennes (Belgium).” Geomorphology 76: 392–410.
Van Westen, C. J. 2004. “Geo-Information Tools for Landslide Risk Assessment: An Overview of Recent Developments.” In Landslide Evaluation and Stabilization, ed. W. A. Lacerda, M. Ehrlich, S. A. B. Fountoura, and A. S. F. Sayao, 39–56. Rotterdam: Balkema.
Varnes, D. J. 1978. “Slope Movement Types and Processes.” In Landslides: Analysis and Control, Transportation Research Board Special Report 176, ed. R. L. Schuster and R. J. Krizek, 11–33. Washington, DC: National Academies Press.
Walker, L. R., D. J. Zarin, N. Fetcher, R. W. Myster, and A. H. Johnson. 1996. “Ecosystem Development and Plant Succession on Landslides in the Caribbean.” Biotropica 28: 566–76.
Wamsler, C. 2007. “Bridging the Gaps: Stakeholder-Based Strategies for Risk Reduction and Financing for the Urban Poor.” Environment and Urbanization 19: 115.
Wilkinson, P. L. 2001. “Investigating the Hydrological and Geotechnical Effects of Vegetation on Slope Stability: Development of a Fully Integrated Numerical Model.” PhD thesis, University of Bristol.
Wilkinson, P. L., M. G. Anderson, D. M. Lloyd, and J. P. Renaud. 2002. “Landslide Hazard and
Bioengineering: Towards Providing Improved Decision Support through Integrated Model Development.” Environmental Modelling and Software 7: 333–44.
Wilkinson, P. L., S. M. Brooks, and M. G. Anderson. 1998. “Investigating the Effect of Moisture Extraction by Vegetation upon Slope Stability: Further Developments of a Combined Hydrology and Stability Model (CHASM).” In Hydrology in a Changing Environment, ed. H. Wheater and C. Kirby, 165–78. Proceedings of the British Hydrological Society International Symposium, Exeter, UK, July 6–10.
—. 2000. “Design and Application of an Automated Non-Circular Slip Surface Search within a Combined Hydrology and Stability Model (CHASM).” Hydrological Processes 14: 2003–17.
Wilson, R. C., and D. K. Keefer. 1985. “Predicting Areal Limits of Earthquake-Induced Landsliding.” In Earthquake Hazards in the Los Angeles Region—An Earth-Science Perspective, U.S. Geological Survey Professional Paper 1360. Washington, DC: Government Printing Office.
Wu, W., and R. C. Sidle. 1995. “A Distributed Slope Stability Model for Steep Forested Basins.” Water Resources Research 31: 2097–110.
Wu, T. H., W. P. McKinnell, and D. N. Swanston. 1979. “Strength of Tree Roots and Landslides on Prince of Wales Island, Alaska.” Canadian Geotechnical Journal 16: 19–33.
Zaitchik, B. F., and H. M. van Es. 2003. “Applying a GIS Slope-Stability Model to Site-Specific Landslide Prevention in Honduras.” Journal of Soil and Water Conservation 58: 45–53.
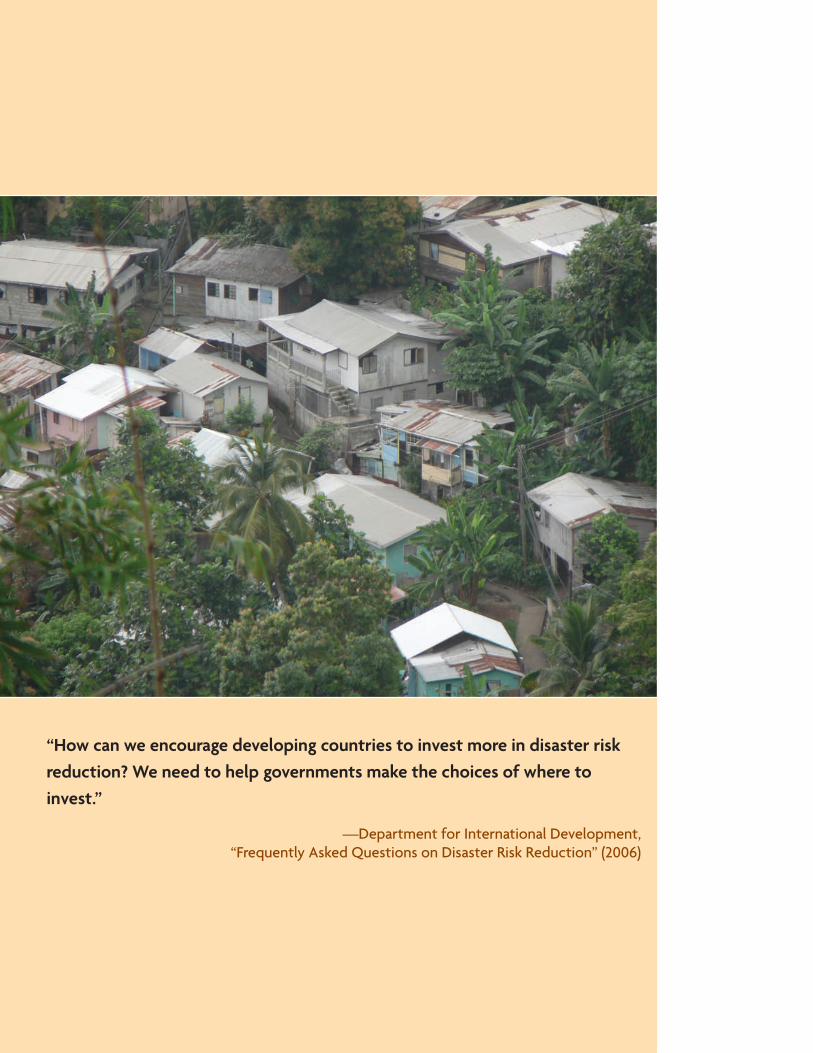
“How can we encourage developing countries to invest more in disaster risk reduction? We need to help governments make the choices of where to invest.”
—Department for International Development, “Frequently Asked Questions on Disaster Risk Reduction” (2006)
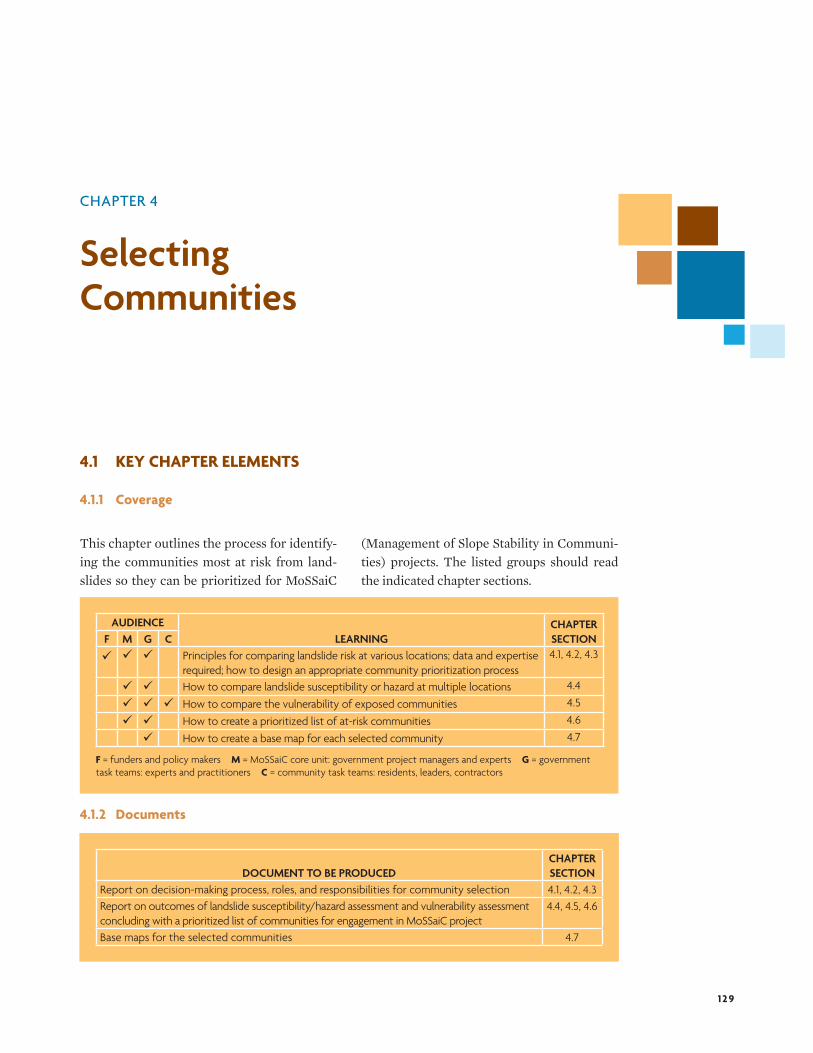
1 2 9
CHAPTER 4
Selecting Communities
4.1 KEY CHAPTER ELEMENTS
4.1.1 Coverage
This chapter outlines the process for identify-ing the communities most at risk from land-slides so they can be prioritized for MoSSaiC
(Management of Slope Stability in Communi-ties) projects. The listed groups should read the indicated chapter sections.
AUDIENCELEARNING
CHAPTER SECTIONF M G C
Principles for comparing landslide risk at various locations; data and expertise required; how to design an appropriate community prioritization process
4.1, 4.2, 4.3
How to compare landslide susceptibility or hazard at multiple locations 4.4
How to compare the vulnerability of exposed communities 4.5
How to create a prioritized list of at-risk communities 4.6
How to create a base map for each selected community 4.7
F = funders and policy makers M = MoSSaiC core unit: government project managers and experts G = government task teams: experts and practitioners C = community task teams: residents, leaders, contractors
4.1.2 Documents
DOCUMENT TO BE PRODUCEDCHAPTER SECTION
Report on decision-making process, roles, and responsibilities for community selection 4.1, 4.2, 4.3Report on outcomes of landslide susceptibility/hazard assessment and vulnerability assessment concluding with a prioritized list of communities for engagement in MoSSaiC project
4.4, 4.5, 4.6
Base maps for the selected communities 4.7
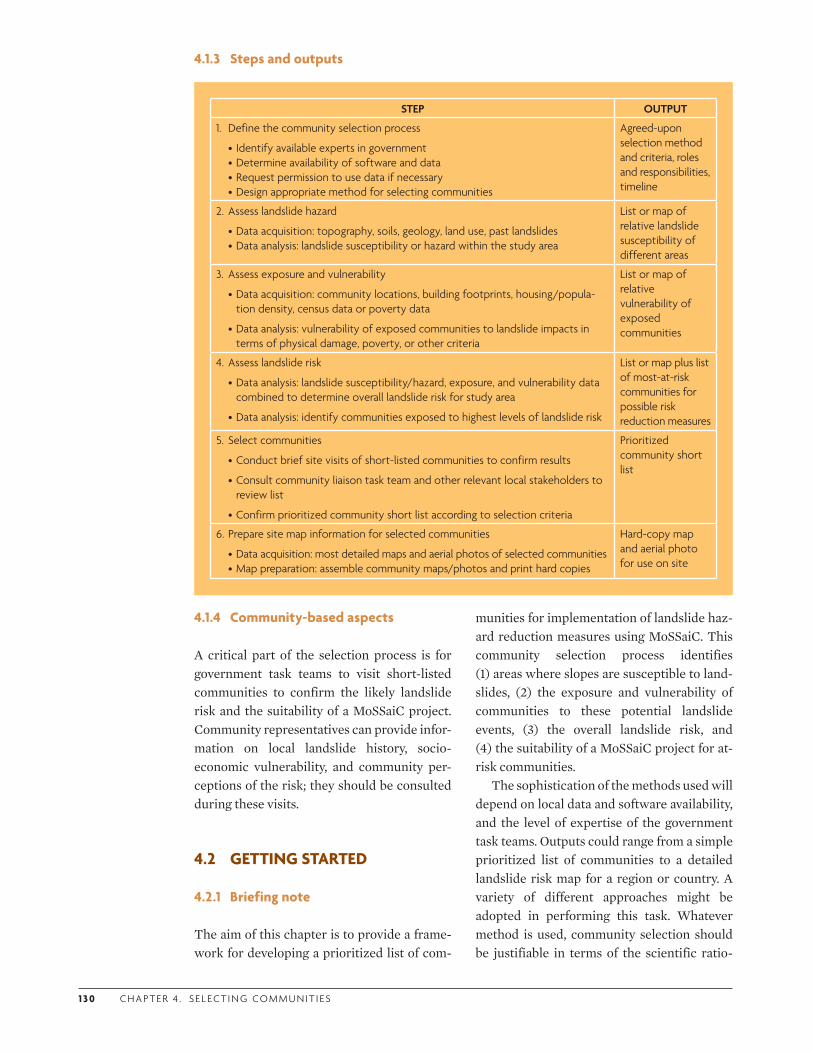
1 3 0 C H A P T E R 4 . S E L E CT I N G CO M M U N I T I ES
4.1.3 Steps and outputs
4.1.4 Community-based aspects
A critical part of the selection process is for government task teams to visit short-listed communities to confirm the likely landslide risk and the suitability of a MoSSaiC project. Community representatives can provide infor-mation on local landslide history, socio-economic vulnerability, and community per-ceptions of the risk; they should be consulted during these visits.
4.2 GETTING STARTED
4.2.1 Briefing note
The aim of this chapter is to provide a frame-work for developing a prioritized list of com-
munities for implementation of landslide haz-ard reduction measures using MoSSaiC. This community selection process identifies (1) areas where slopes are susceptible to land-slides, (2) the exposure and vulnerability of communities to these potential landslide events, (3) the overall landslide risk, and (4) the suitability of a MoSSaiC project for at-risk communities.
The sophistication of the methods used will depend on local data and software availability, and the level of expertise of the government task teams. Outputs could range from a simple prioritized list of communities to a detailed landslide risk map for a region or country. A variety of different approaches might be adopted in performing this task. Whatever method is used, community selection should be justifiable in terms of the scientific ratio-
STEP OUTPUT
1. Define the community selection process
• Identify available experts in government•Determine availability of software and data•Request permission to use data if necessary •Design appropriate method for selecting communities
Agreed-upon selection method and criteria, roles and responsibilities, timeline
2. Assess landslide hazard
•Data acquisition: topography, soils, geology, land use, past landslides•Data analysis: landslide susceptibility or hazard within the study area
List or map of relative landslide susceptibility of different areas
3. Assess exposure and vulnerability
•Data acquisition: community locations, building footprints, housing/popula-tion density, census data or poverty data
•Data analysis: vulnerability of exposed communities to landslide impacts in terms of physical damage, poverty, or other criteria
List or map of relative vulnerability of exposed communities
4. Assess landslide risk
•Data analysis: landslide susceptibility/hazard, exposure, and vulnerability data combined to determine overall landslide risk for study area
•Data analysis: identify communities exposed to highest levels of landslide risk
List or map plus list of most-at-risk communities for possible risk reduction measures
5. Select communities
•Conduct brief site visits of short-listed communities to confirm results
•Consult community liaison task team and other relevant local stakeholders to review list
•Confirm prioritized community short list according to selection criteria
Prioritized community short list
6. Prepare site map information for selected communities
•Data acquisition: most detailed maps and aerial photos of selected communities•Map preparation: assemble community maps/photos and print hard copies
Hard-copy map and aerial photo for use on site
CO M M U N I T Y- BA S E D L A N DS L I D E R I S K R E D U CT I O N 1 3 1
nale underpinning the landslide risk assess-ment.
Once the communities have been selected, the mapping task team assembles the most-detailed maps available for these communi-ties. These maps form the basis for the com-munity-based landslide hazard and drainage mapping exercise (described in chapter 5) and subsequent implementation of appropriate hazard reduction measures.
Why a community selection process is needed
The aim of a MoSSaiC intervention is to reduce landslide hazard in the most vulnerable com-munities.
In any country or region, there may be many communities at risk, and government awareness of these communities will vary. The MoSSaiC core unit (MCU) should agree on a process by which communities are selected for this type of landslide risk reduction project.
Having a structured approach to commu-nity selection also ensures that community inclusion, exclusion, and prioritization can be justified to the communities, the government, and donor agencies. Therefore, the selection process should make use of any relevant quan-titative data relating to landslide susceptibil-ity/hazard and community vulnerability. It should also be able to incorporate qualitative data such as local knowledge, reports from communities, and information from govern-ment ministries (such as public works, social development, and emergency management).
Key activities, resources, and teams
The community selection process primarily involves data acquisition and analysis. Data may be in the form of maps and lists of known or suspected landslides; digital maps of land use, topography, drainage, soil, and geology; and data relating to vulnerability (such as cen-sus data at enumeration district level or bet-ter). Depending on the scope of the study and the available data and expertise, the analysis may be carried out using spreadsheet or data-base software (to compile and compare data on a list of communities), or a geographic information system (GIS) (for mapping and
spatially distributed analysis of risk over wide areas).
The MCU should oversee the development of the method for community selection and be responsible for deciding the final list of prior-ity communities. A lead investigator should be selected to coordinate the multidisciplinary process of data acquisition and analysis. Dif-ferent task teams should work together to combine their understanding of slope pro-cesses and landslide hazard, technical exper-tise in data management and/or GIS mapping, and experience in vulnerability or poverty assessment.
4.2.2 Guiding principles
The following guiding principles apply in selecting communities for MoSSaiC project interventions:
• Be realistic about the data, time, and exper-tise available for the community selection process. It is better to design a simple, low-tech, but achievable decision-making pro-cess than to attempt to use software and techniques for which there is insufficient expertise or poor quality data.
• The community selection process should be transparent, regardless of the quality of the data or the sophistication of the land-slide hazard and vulnerability assessment methods, so that priorities and decisions can be justified to all stakeholders. This transparency assists in explaining decisions to residents in communities that may sub-sequently not be selected, avoiding bias toward particular individuals or agendas in decision making, and enabling the project to be more easily audited and evaluated.
4.2.3 Risks and challenges
Limited available data
The community selection process requires the comparison of the landslide risk affecting mul-tiple communities. This may be done as a search for at-risk communities over a wide area (with no prior knowledge of which com-

1 32 C H A P T E R 4 . S E L E CT I N G CO M M U N I T I ES
munities may be identified), or may involve comparing known at-risk communities. Both approaches require data—the type, quality, and availability of which will determine the community selection method used.
Whatever data are used in the community selection process, be transparent about their source and quality when presenting results to decision makers and communities.
Interpreting landslide hazard maps
When using preexisting landslide hazard maps be aware how they were generated because this affects how they should be inter-preted.
As described in chapter 3, several different factors can act together to cause landslides. These factors can vary over very short dis-tances and also over time. The best landslide hazard maps are based on a combination of accurate, high-resolution digital maps of these factors and records of past landslides. Devel-oping such maps requires a good understand-ing of the processes that cause landslides and experience in using GIS and spatial data sets. A landslide hazard map based on inaccurate, incomplete, or low-resolution data, or on faulty scientific assumptions, can be mislead-ing.
Assess the provenance and utility of preex-isting landslide hazard maps in terms of the following:
• The data used to compile the map, and its quality and resolution—These data can include environmental (preparatory) fac-tors, triggering factors, and past landslides
• The type of landslide represented—MoSSaiC is directed toward rotational and translational slides in weathered materials
• The expertise of the map maker and the method used—Methods include direct landslide mapping, semi-quantitative index overlay methods, and spatially distributed modeling of slope factor of safety
• The slope stability information conveyed by the map—Landslide susceptibility maps show the relative spatial likelihood of land-
slide initiation; hazard maps additionally convey the temporal probability of land-slide initiation.
Test the provenance and utility of other types of data, such as community vulnerability information, in a similar manner before including it in the risk analysis.
4.2.4 Adapting the chapter blueprint to existing capacity
Use the matrix opposite below to determine the availability of physical data (relating to landslides), vulnerability data, software, and the expertise of the government team.
1. Assign a capacity score from 1 to 3 (low to high) to reflect existing capacity for each element in the matrix’s left-hand column.
2. Identify the most common capacity score as an indicator of the overall capacity level.
3. Adapt the blueprint in this chapter in accor-dance with the overall capacity level (see guide at the bottom of the opposite page).
4.3 DEFINING THE COMMUNITY SELECTION PROCESS
The community selection process comprises two integrated methods—a landslide risk assessment at multiple locations and the appli-cation of decision-making criteria for selecting communities. The selection process will be constrained by the technical capacity for land-slide risk assessment and the scope of the proj-ect as defined by funders and government.
For a given technical capacity and project scope, use the guidance in this section to iden-tify the following:
• A suitable approach to comparing levels of landslide risk at multiple locations
• The criteria for community selection
• The data requirements for the community selection process
• The roles of the MCU and task teams

CO M M U N I T Y- BA S E D L A N DS L I D E R I S K R E D U CT I O N 1 33
CAPACITY ELEMENT
EXISTING CAPACITY
1 = LOW 2 = MODERATE 3 = HIGH
Local geotechnical expertise No local geotechnical experts and no local knowledge of landslide processes or hazard assessment
Geotechnical engineers or academics with some experience of landslide hazard assessment in the field or in using GIS
Geotechnical engineers or academics with expertise in landslide hazard assessment in the field and in using GIS
Digital map availability No digital maps Some digital maps available or at low resolution
High-resolution digital maps available
Preexisting landslide suscepti-bility, hazard, or risk maps
No (or poor quality) landslide susceptibility/hazard maps
Relevant landslide susceptibil-ity map available, sufficient resolution and quality
Good quality, high-resolution, relevant landslide susceptibil-ity/hazard map available
GIS software expertise No software or trained staff GIS software available and experience with simple GIS analysis
GIS software and experienced staff
Landslide records No landslide records Some landslide records kept separately by different agencies in different formats for different purposes
Comprehensive, geo-refer-enced landslide records integrated and accessible across multiple agencies
Vulnerability data availability No data on community vulnerability
Data on proxies for vulnerabil-ity (e.g., census data for calculating poverty indicators)
Vulnerability assessment methods and data established
Project safeguards Documented safeguards need to be located; no previous experience in interpreting and operating safeguard policies
Documents exist for some safeguards
Documented safeguards available from all relevant agencies
CAPACITY LEVEL HOW TO ADAPT THE BLUEPRINT
1: Use this chapter in depth and as a catalyst to secure support from other agencies as appropriate
Unless outside GIS expertise and data can be obtained, the community selection process should be based on reports and local knowledge (word of mouth) of landslide-prone areas and vulnerable communities. The output will be a refined list of communities based on qualitative information sources only. The MCU needs to strengthen its capacity for community selection; this might involve the following:
•Using this book/chapter to gain an understanding of types of available community selection methods
• Identifying colleagues in government or higher education with knowledge of landslides and community vulnerability assessment and considering their appointment as the lead investigator in the community selection process
•Working with local commercial or higher education partners to access digital maps or GIS expertise
2: Some elements of this chapter will reflect current practice; read the remaining elements in depth and use them to further strengthen capacity
It might be possible to use GIS data to indicate relative risk across a wide area; this can be refined with local knowledge. The expected output at this level will be a low-resolution risk map and a list of priority communities. The MCU has strength in some areas, but not all. Elements that are perceived to be Level 1 need to be addressed as above. Elements that are Level 2 will need to be strengthened, such as the following:
•Receiving assistance or training in the use and application of GIS software
• Integrating such data and knowledge across ministries
3: Use this chapter as a checklist
The MCU can likely produce and implement community selection using existing capacity. Detailed GIS-based landslide risk mapping is possible without any additional training and can be refined with data on past landslides. The expected output will be a high-resolution landslide risk map and a community short list verified through field visits. The following would nonetheless be good practice:
•Document the community selection methodology for future reference
•Establish a landslide risk database and risk management planning tool
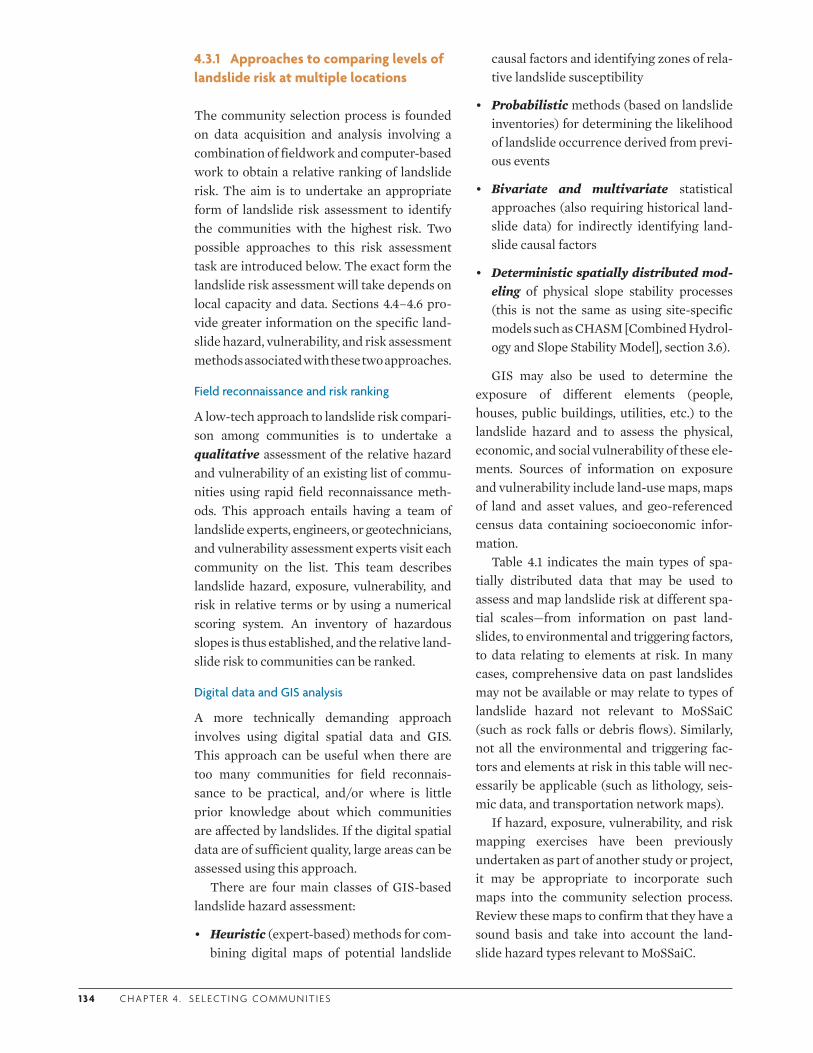
1 3 4 C H A P T E R 4 . S E L E CT I N G CO M M U N I T I ES
4.3.1 Approaches to comparing levels of landslide risk at multiple locations
The community selection process is founded on data acquisition and analysis involving a combination of fieldwork and computer-based work to obtain a relative ranking of landslide risk. The aim is to undertake an appropriate form of landslide risk assessment to identify the communities with the highest risk. Two possible approaches to this risk assessment task are introduced below. The exact form the landslide risk assessment will take depends on local capacity and data. Sections 4.4–4.6 pro-vide greater information on the specific land-slide hazard, vulnerability, and risk assessment methods associated with these two approaches.
Field reconnaissance and risk ranking
A low-tech approach to landslide risk compari-son among communities is to undertake a qualitative assessment of the relative hazard and vulnerability of an existing list of commu-nities using rapid field reconnaissance meth-ods. This approach entails having a team of landslide experts, engineers, or geotechnicians, and vulnerability assessment experts visit each community on the list. This team describes landslide hazard, exposure, vulnerability, and risk in relative terms or by using a numerical scoring system. An inventory of hazardous slopes is thus established, and the relative land-slide risk to communities can be ranked.
Digital data and GIS analysis
A more technically demanding approach involves using digital spatial data and GIS. This approach can be useful when there are too many communities for field reconnais-sance to be practical, and/or where is little prior knowledge about which communities are affected by landslides. If the digital spatial data are of sufficient quality, large areas can be assessed using this approach.
There are four main classes of GIS-based landslide hazard assessment:
• Heuristic (expert-based) methods for com-bining digital maps of potential landslide
causal factors and identifying zones of rela-tive landslide susceptibility
• Probabilistic methods (based on landslide inventories) for determining the likelihood of landslide occurrence derived from previ-ous events
• Bivariate and multivariate statistical approaches (also requiring historical land-slide data) for indirectly identifying land-slide causal factors
• Deterministic spatially distributed mod-eling of physical slope stability processes (this is not the same as using site-specific models such as CHASM [Combined Hydrol-ogy and Slope Stability Model], section 3.6).
GIS may also be used to determine the exposure of different elements (people, houses, public buildings, utilities, etc.) to the landslide hazard and to assess the physical, economic, and social vulnerability of these ele-ments. Sources of information on exposure and vulnerability include land-use maps, maps of land and asset values, and geo-referenced census data containing socioeconomic infor-mation.
Table 4.1 indicates the main types of spa-tially distributed data that may be used to assess and map landslide risk at different spa-tial scales—from information on past land-slides, to environmental and triggering factors, to data relating to elements at risk. In many cases, comprehensive data on past landslides may not be available or may relate to types of landslide hazard not relevant to MoSSaiC (such as rock falls or debris flows). Similarly, not all the environmental and triggering fac-tors and elements at risk in this table will nec-essarily be applicable (such as lithology, seis-mic data, and transportation network maps).
If hazard, exposure, vulnerability, and risk mapping exercises have been previously undertaken as part of another study or project, it may be appropriate to incorporate such maps into the community selection process. Review these maps to confirm that they have a sound basis and take into account the land-slide hazard types relevant to MoSSaiC.
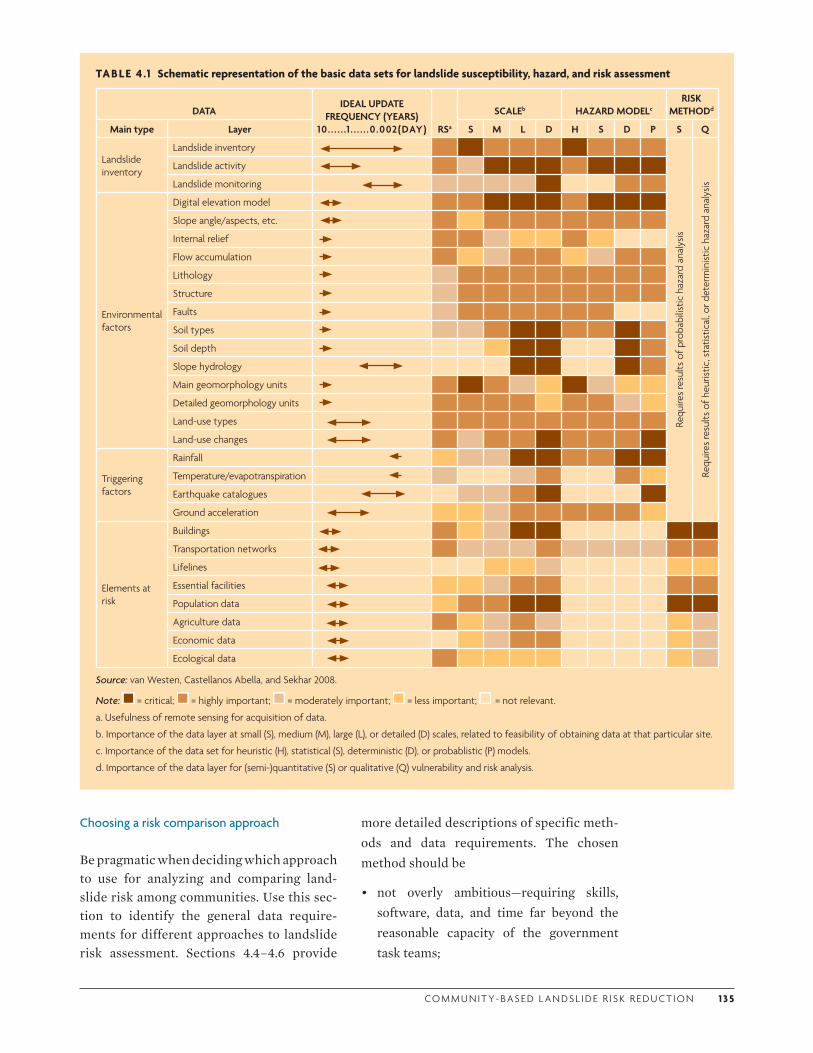
CO M M U N I T Y- BA S E D L A N DS L I D E R I S K R E D U CT I O N 1 3 5
Choosing a risk comparison approach
Be pragmatic when deciding which approach to use for analyzing and comparing land-slide risk among communities. Use this sec-tion to identify the general data require-ments for different approaches to landslide risk assessment. Sections 4.4–4.6 provide
more detailed descriptions of specific meth-ods and data requirements. The chosen method should be
• not overly ambitious—requiring skills, software, data, and time far beyond the reasonable capacity of the government task teams;
TABLE 4 .1 Schematic representation of the basic data sets for landslide susceptibility, hazard, and risk assessment
DATAIDEAL UPDATE
FREQUENCY (YEARS)10. . . . . .1 . . . . . .0 .002(DAY) RSa
SCALEb HAZARD MODELcRISK
METHODd
Main type Layer S M L D H S D P S Q
Landslide inventory
Landslide inventory
Requ
ires
resu
lts o
f pro
babi
listic
haz
ard
anal
ysis
Requ
ires
resu
lts o
f heu
ristic
, sta
tistic
al, o
r det
erm
inist
ic h
azar
d an
alys
is
Landslide activity
Landslide monitoring
Environmental factors
Digital elevation model
Slope angle/aspects, etc.
Internal relief
Flow accumulation
Lithology
Structure
Faults
Soil types
Soil depth
Slope hydrology
Main geomorphology units
Detailed geomorphology units
Land-use types
Land-use changes
Triggering factors
Rainfall
Temperature/evapotranspiration
Earthquake catalogues
Ground acceleration
Elements at risk
Buildings
Transportation networks
Lifelines
Essential facilities
Population data
Agriculture data
Economic data
Ecological data
Source: van Westen, Castellanos Abella, and Sekhar 2008.
Note: = critical; = highly important; = moderately important; = less important; = not relevant.
a. Usefulness of remote sensing for acquisition of data.
b. Importance of the data layer at small (S), medium (M), large (L), or detailed (D) scales, related to feasibility of obtaining data at that particular site.
c. Importance of the data set for heuristic (H), statistical (S), deterministic (D), or probablistic (P) models.
d. Importance of the data layer for (semi-)quantitative (S) or qualitative (Q) vulnerability and risk analysis.
1 3 6 C H A P T E R 4 . S E L E CT I N G CO M M U N I T I ES
• designed to provide enough information for the purpose of the project, but not necessar-ily a comprehensive quantitative analysis of risk—in many cases, decision makers will simply need a screening process for identi-fying and prioritizing communities; and
• rigorous, in that, regardless of the govern-ment’s technical capacity, there should be a transparent method for community selec-tion that provides the basis for justifying selections.
4.3.2 Methods for community selection
To create an integrated community selection process, combine the chosen landslide risk assessment approach with project-specific criteria for selecting communities.
When choosing the landslide risk assess-ment approach and defining the community selection criteria, take the following influences into account:
• Obligations under the funding loan or grant contracts to work in specific locations or meet certain criteria and safeguards
• Community-driven demands for solutions to landslide issues
• Scientific/technical interest in using cer-tain risk assessment methods
• Awareness and availability (or lack thereof ) of digital data, GIS, or mapping methods
• Political agendas
Selection criteria
Begin by defining the questions that, when answered, will become the selection criteria. Each country will ask these questions and define their criteria differently depending on their expertise, priorities, and approach to the task. However, two broad criteria for community selection should always be met: the high level of landslide risk to a commu-nity (hazard, exposure, and vulnerability) relative to other communities, and the appro-priateness of MoSSaiC as a means of address-ing that risk.
If there is no regular use of wide-area data for landslide risk mapping, or if there is already a long list of communities requesting help, then a bottom-up or list-driven approach may be appropriate. This approach could be vul-nerable to political agendas to include certain communities on the list. On the other hand, experienced users of wide-area digital maps and GIS software might formulate questions in a top-down manner to derive a list of com-munities. Such an approach is perhaps more politically objective, but requires considerable technical expertise and a good data set. In real-ity, a combination of the two methods may be used to confirm the communities on the list.
• Example 1: A priori list-driven questions for bottom-up selection
1. Where have landslides already occurred?
2. How many houses are exposed, and is housing density moderate to high?
3. Are the exposed households physically and socioeconomically vulnerable?
4. Based on the above, which communities are at greatest risk from landslides?
5. Would an intervention be cost-effective, and does it fit the project scope?
• Example 2: GIS-based approach for wide-area or top-down selection
1. Where are the areas with the highest landslide susceptibility or hazard?
2. Within these landslide areas, where are the most-exposed communities?
3. Within these exposed communities, where is the greatest physical and socio-economic vulnerability?
4. Based on the above, which communities are at greatest risk from landslides?
5. Where would an intervention be most cost-effective and appropriate?
Figure 4.1 illustrates how these two types of approach may be used individually or in con-junction.
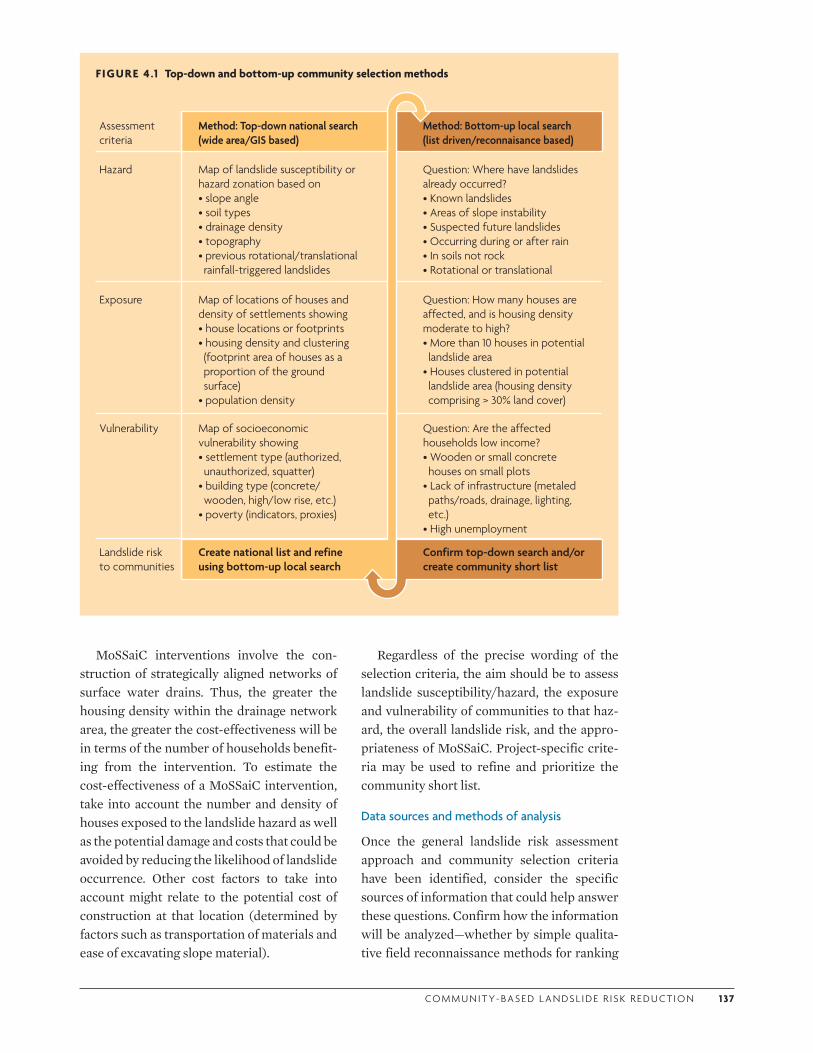
CO M M U N I T Y- BA S E D L A N DS L I D E R I S K R E D U CT I O N 1 37
MoSSaiC interventions involve the con-struction of strategically aligned networks of surface water drains. Thus, the greater the housing density within the drainage network area, the greater the cost-effectiveness will be in terms of the number of households benefit-ing from the intervention. To estimate the cost-effectiveness of a MoSSaiC intervention, take into account the number and density of houses exposed to the landslide hazard as well as the potential damage and costs that could be avoided by reducing the likelihood of landslide occurrence. Other cost factors to take into account might relate to the potential cost of construction at that location (determined by factors such as transportation of materials and ease of excavating slope material).
FIGURE 4 .1 Top-down and bottom-up community selection methods
Map of landslide susceptibility or hazard zonation based on• slope angle• soil types• drainage density• topography• previous rotational/translational rainfall-triggered landslides
Question: Where have landslides already occurred? • Known landslides• Areas of slope instability• Suspected future landslides• Occurring during or after rain• In soils not rock• Rotational or translational
Hazard
Map of locations of houses and density of settlements showing• house locations or footprints• housing density and clustering (footprint area of houses as a proportion of the ground surface)
• population density
Question: How many houses are affected, and is housing density moderate to high?• More than 10 houses in potential landslide area
• Houses clustered in potential landslide area (housing density comprising > 30% land cover)
Exposure
Map of socioeconomic vulnerability showing• settlement type (authorized, unauthorized, squatter)
• building type (concrete/ wooden, high/low rise, etc.)
• poverty (indicators, proxies)
Question: Are the affected households low income?• Wooden or small concrete houses on small plots
• Lack of infrastructure (metaled paths/roads, drainage, lighting, etc.)
• High unemployment
Vulnerability
Method: Top-down national search (wide area/GIS based)
Method: Bottom-up local search(list driven/reconnaisance based)
Create national list and refine using bottom-up local search
Confirm top-down search and/or create community short list
Landslide risk to communities
Assessment criteria
Regardless of the precise wording of the selection criteria, the aim should be to assess landslide susceptibility/hazard, the exposure and vulnerability of communities to that haz-ard, the overall landslide risk, and the appro-priateness of MoSSaiC. Project-specific crite-ria may be used to refine and prioritize the community short list.
Data sources and methods of analysis
Once the general landslide risk assessment approach and community selection criteria have been identified, consider the specific sources of information that could help answer these questions. Confirm how the information will be analyzed—whether by simple qualita-tive field reconnaissance methods for ranking
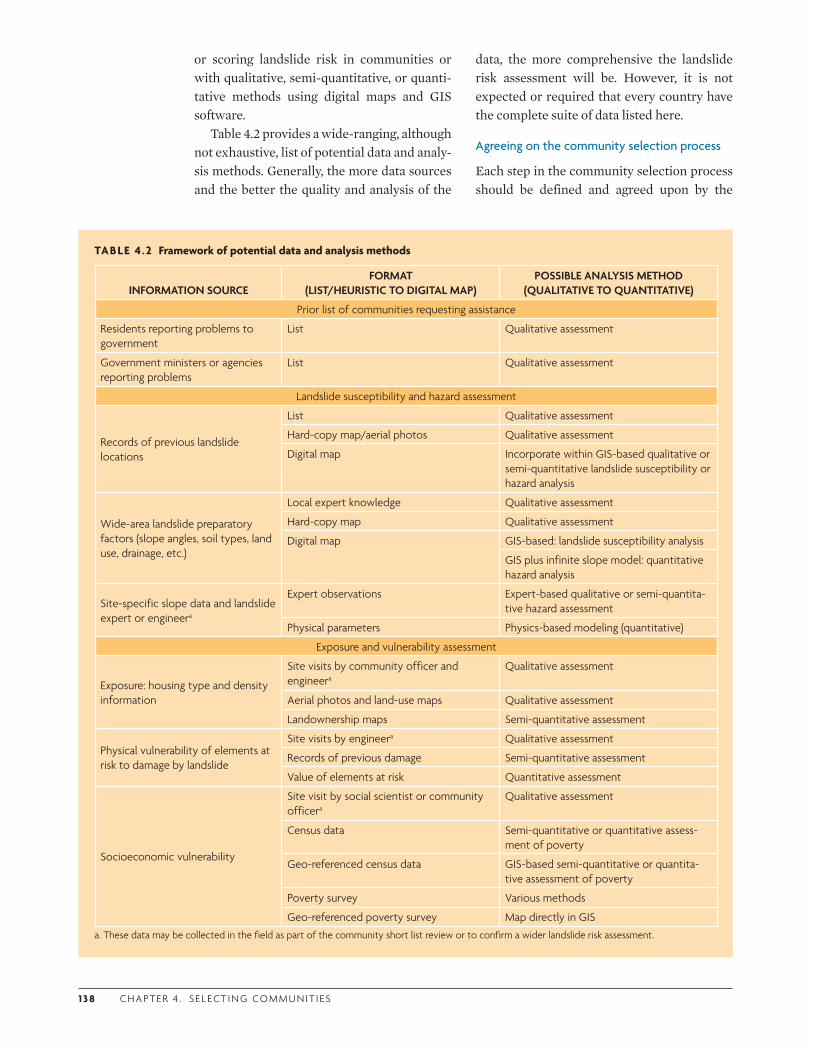
1 3 8 C H A P T E R 4 . S E L E CT I N G CO M M U N I T I ES
or scoring landslide risk in communities or with qualitative, semi-quantitative, or quanti-tative methods using digital maps and GIS software.
Table 4.2 provides a wide-ranging, although not exhaustive, list of potential data and analy-sis methods. Generally, the more data sources and the better the quality and analysis of the
data, the more comprehensive the landslide risk assessment will be. However, it is not expected or required that every country have the complete suite of data listed here.
Agreeing on the community selection process
Each step in the community selection process should be defined and agreed upon by the
TABLE 4 .2 Framework of potential data and analysis methods
INFORMATION SOURCEFORMAT
(LIST/HEURISTIC TO DIGITAL MAP)POSSIBLE ANALYSIS METHOD
(QUALITATIVE TO QUANTITATIVE)
Prior list of communities requesting assistance
Residents reporting problems to government
List Qualitative assessment
Government ministers or agencies reporting problems
List Qualitative assessment
Landslide susceptibility and hazard assessment
Records of previous landslide locations
List Qualitative assessment
Hard-copy map/aerial photos Qualitative assessment
Digital map Incorporate within GIS-based qualitative or semi-quantitative landslide susceptibility or hazard analysis
Wide-area landslide preparatory factors (slope angles, soil types, land use, drainage, etc.)
Local expert knowledge Qualitative assessment
Hard-copy map Qualitative assessment
Digital map GIS-based: landslide susceptibility analysis
GIS plus infinite slope model: quantitative hazard analysis
Site-specific slope data and landslide expert or engineera
Expert observations Expert-based qualitative or semi-quantita-tive hazard assessment
Physical parameters Physics-based modeling (quantitative)
Exposure and vulnerability assessment
Exposure: housing type and density information
Site visits by community officer and engineera
Qualitative assessment
Aerial photos and land-use maps Qualitative assessment
Landownership maps Semi-quantitative assessment
Physical vulnerability of elements at risk to damage by landslide
Site visits by engineera Qualitative assessment
Records of previous damage Semi-quantitative assessment
Value of elements at risk Quantitative assessment
Socioeconomic vulnerability
Site visit by social scientist or community officera
Qualitative assessment
Census data Semi-quantitative or quantitative assess-ment of poverty
Geo-referenced census data GIS-based semi-quantitative or quantita-tive assessment of poverty
Poverty survey Various methods
Geo-referenced poverty survey Map directly in GISa. These data may be collected in the field as part of the community short list review or to confirm a wider landslide risk assessment.
CO M M U N I T Y- BA S E D L A N DS L I D E R I S K R E D U CT I O N 1 39
MCU. The timeline, roles, and responsibilities for undertaking the analysis should then be set.
For the examples given above, the main steps in the community selection process could be defined as follows.
• Example 1: A priori list-driven process for bottom-up selection
— Main data format: Soft data comprising lists of known landslide hotspots and areas of concern (requiring input from engineers, field technicians, community development officers, census officers)
— Main steps:
1. Conduct reconnaissance of listed com-munities, completing slope inventory forms to capture landslide hazard, exposure, and vulnerability factors.
2. Rank landslide hazard, exposure, and vulnerability qualitatively using terms such as low, medium, or high; or use a numerical scoring system.
3. Confirm rankings using any available secondary sources of hazard data (knowledge of previous slides, aerial photos, maps relating to slope fea-tures), exposure (housing density and construction type), and vulnerability information (poverty surveys, census data).
4. Prioritize communities on basis of risk ranking or score.
• Example 2: GIS-based process for wide-area or top-down selection
— Main data format: Digital spatial data relating to landslide preparatory and triggering factors, past landslides, and exposure/vulnerability of communities
— Main steps:
1. Conduct GIS analysis of landslide risk:
a. Using basic semi-quantitative GIS map analysis and index overlay to
indicate areas of relative landslide susceptibility, exposure, vulnera-bility, and risk (undertaken by GIS technicians and engineers/geo-technicians) or
b. Using advanced quantitative GIS map analysis in conjunction with spatially distributed numerical slope stability models to quantify landslide hazard, exposure, vul-nerability, and risk affecting differ-ent areas (requiring experienced GIS analysts and specialists in numerical landslide modeling)
2. Compare the results obtained with an ex ante list of at-risk communities, or generate a new list.
3. Confirm the community short list and priorities for intervention using field-based reconnaissance methods as per Example 1, based on expert judgment.
Agree on the method by which relative landslide risk will be assessed, then agree on any further criteria for community selection. Such criteria should answer questions relating to whether a MoSSaiC-type intervention would be appropriate, whether it would fit the project scope or specific requirements from funders or the government, and whether it would be cost-effective. To make the decision-making process transparent, these criteria should be set before generating the prioritized list of communities.
Once the list of eligible communities has been generated and confirmed via brief reconnaissance of the sites, the task teams will need to carry out detailed mapping in each community to identify the specific causes of landslides. These specific slope pro-cesses cannot be identified remotely from maps since they typically occur on scales of 1–10 m, and are affected by human activity (construction, farming, etc.). The detailed community-based mapping method is the subject of chapter 5 and is the basis for the design of the physical landslide risk reduc-tion measures in chapter 6.
1 4 0 C H A P T E R 4 . S E L E CT I N G CO M M U N I T I ES
4.3.3 Roles and responsibilities in community selection
The community selection process encom-passes a wide range of disciplines and stake-holder interests. Use the following overviews of roles and responsibilities to ensure the pro-cess is scientifically grounded, rigorous, and transparent.
MoSSaiC core unit
The MCU has the following responsibilities:
• Agree on the process for community selec-tion, who will be involved in decision mak-ing, and how the process will be run
• Agree on the criteria or thresholds for inclusion of communities
• Identify a lead investigator for the task of landslide risk data acquisition and analy-sis
• Ensure that existing government proce-dures and protocols are followed (e.g., with regard to access to and sharing of sensitive data)
• Review the outcomes of the data acquisi-tion and landslide risk analysis process
• Agree on a prioritized list of communities for detailed mapping and MoSSaiC proj-ects.
For the purposes of community selection, the MCU could be augmented to include land-slide risk assessment experts from local higher education institutions, and representatives from ministries and agencies responsible for utilities (water, electricity) and census data. These stakeholders should perform the fol-lowing:
• Advise on the technical aspects of landslide risk assessment
• Provide data held by their institutions or ministries
• Advise on the reliability of data
• Contribute to the decision-making process
Task teams
Members of the landslide hazard assessment and engineering team, mapping team, commu-nity liaison team, and technical support team may all be involved in landslide risk data acquisition and analysis. Typical tasks include the following:
• Review the data acquired and handle pre-liminary error checking
• Process data into appropriate formats
• Conduct field reconnaissance or data analy-sis to determine landslide hazard, and the exposure and vulnerability of communities
• Combine the results of hazard and vulner-ability assessments to determine overall landslide risk
• Present the risk comparison results in a for-mat that is accessible for decision-making purposes
• Maintain and update hazard, exposure, vul-nerability, and risk data for future use (if required as part of the project)
• For selected communities, generate base maps for use in detailed community-based landslide hazard and drainage mapping (see chapter 5)
4.4 LANDSLIDE SUSCEPTIBILITY AND HAZARD ASSESSMENT METHODS
Different approaches can be used to assess relative landslide susceptibility or hazard depending on the data, expertise, and resources available (see above and sec-tion 3.4). Following is a brief overview of some commonly used assessment methods; these are presented in order of increasing data requirements, complexity, and level of quantification:
• Field-based reconnaissance and heuristic (expert) ranking/scoring of landslide haz-ard (qualitative results at a detailed scale)
CO M M U N I T Y- BA S E D L A N DS L I D E R I S K R E D U CT I O N 1 4 1
• GIS-based index overlay of digital maps using a heuristic approach to give landslide susceptibility (qualitative results over medium to regional scales)
• GIS-based landslide susceptibility and hazard assessment using probabilistic, sta-tistical, or deterministic methods (semi-quantitative and quantitative results par-ticularly suited to large and medium scales).
Regardless of whether a simple qualitative or in-depth quantitative method is used, it is important to distinguish between landslide susceptibility and landslide hazard:
• Landslide susceptibility relates to the type and spatial distribution of existing or poten-tial landslides in an area. Susceptibility assessment is based on the qualitative or quantitative assessment of the role of pre-paratory factors in determining the relative stability of different slopes or zones. The magnitude and velocity of existing or poten-tial landslides may be taken into account, but the frequency or timing will not be specified.
• Landslide hazard is the probability of a landslide (qualitatively or quantitatively assessed) of a certain type, magnitude, and velocity occurring at a specific location. Quantitative hazard assessment takes into account the role of the triggering event (of a known probability) causing the landslide.
A comprehensive list of all the potential data on environmental factors related to slope stability is given in table 4.3. The relevance of these data to landslide susceptibility and haz-ard assessment is described, and their applica-bility at different scales is indicated. It is not expected that all of these data are available for—or even relevant to—the community selection process.
Most of the methods introduced in this sec-tion can be applied to both landslide suscepti-bility and landslide hazard assessment; the main difference is whether the landslide prob-ability is estimated for a specific location.
4.4.1 Qualitative landslide hazard assessment: Field reconnaissance and hazard ranking methods
Qualitative slope stability assessment methods involve the systematic classification of slopes in relative terms such as high, medium, or low landslide hazard or using a relative rating derived from a numerical scoring system. These methods are usually based on a combi-nation of expert judgment and empirical evi-dence (local knowledge or records of past landslides). They can be used as a means of initial assessment of slope stability in the field or in combination with remote sensing, GIS, and mapping methods.
Field reconnaissance and hazard ranking methods can be used for community selection in one of two ways:
• As the primary method in a bottom-up (list-driven) approach, where communities have been listed by government agencies and/or community representatives as requiring assistance, and where there are insufficient digital map data for a top-down/wide-area assessment of landslide susceptibility or hazard
• As the second stage in a top-down approach, as a means of verifying and prioritizing the communities identified via wide-area GIS-based susceptibility or hazard mapping.
Similar methods are used for detailed com-munity-based slope feature mapping once a community has been selected for a MoSSaiC intervention. This in-depth mapping process is fully described in chapter 5.
These methods are usually applied in com-bination with an assessment of the exposure and vulnerability of the elements at risk (see section 4.5) in order to arrive at an overall landslide risk rating (section 4.6). Field recon-naissance and hazard ranking methods are also used in the development of a national slope stability database (or risk register) for use in landslide management.
One limitation of this type of approach is the difficultly in achieving consistent evalua-
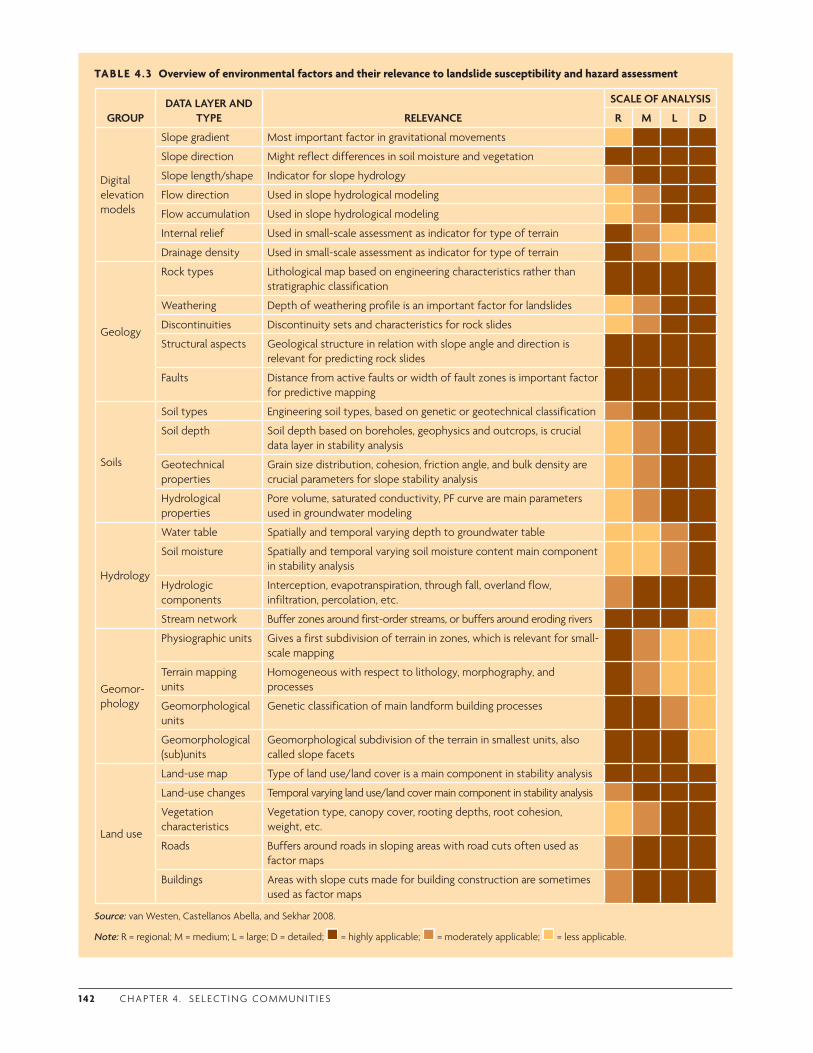
1 42 C H A P T E R 4 . S E L E CT I N G CO M M U N I T I ES
TABLE 4 .3 Overview of environmental factors and their relevance to landslide susceptibility and hazard assessment
GROUPDATA LAYER AND
TYPE RELEVANCE
SCALE OF ANALYSIS
R M L D
Digital elevation models
Slope gradient Most important factor in gravitational movements
Slope direction Might reflect differences in soil moisture and vegetation
Slope length/shape Indicator for slope hydrology
Flow direction Used in slope hydrological modeling
Flow accumulation Used in slope hydrological modeling
Internal relief Used in small-scale assessment as indicator for type of terrain
Drainage density Used in small-scale assessment as indicator for type of terrain
Geology
Rock types Lithological map based on engineering characteristics rather than stratigraphic classification
Weathering Depth of weathering profile is an important factor for landslides
Discontinuities Discontinuity sets and characteristics for rock slides
Structural aspects Geological structure in relation with slope angle and direction is relevant for predicting rock slides
Faults Distance from active faults or width of fault zones is important factor for predictive mapping
Soils
Soil types Engineering soil types, based on genetic or geotechnical classification
Soil depth Soil depth based on boreholes, geophysics and outcrops, is crucial data layer in stability analysis
Geotechnical properties
Grain size distribution, cohesion, friction angle, and bulk density are crucial parameters for slope stability analysis
Hydrological properties
Pore volume, saturated conductivity, PF curve are main parameters used in groundwater modeling
Hydrology
Water table Spatially and temporal varying depth to groundwater table
Soil moisture Spatially and temporal varying soil moisture content main component in stability analysis
Hydrologic components
Interception, evapotranspiration, through fall, overland flow, infiltration, percolation, etc.
Stream network Buffer zones around first-order streams, or buffers around eroding rivers
Geomor-phology
Physiographic units Gives a first subdivision of terrain in zones, which is relevant for small-scale mapping
Terrain mapping units
Homogeneous with respect to lithology, morphography, and processes
Geomorphological units
Genetic classification of main landform building processes
Geomorphological (sub)units
Geomorphological subdivision of the terrain in smallest units, also called slope facets
Land use
Land-use map Type of land use/land cover is a main component in stability analysis
Land-use changes Temporal varying land use/land cover main component in stability analysis
Vegetation characteristics
Vegetation type, canopy cover, rooting depths, root cohesion, weight, etc.
Roads Buffers around roads in sloping areas with road cuts often used as factor maps
Buildings Areas with slope cuts made for building construction are sometimes used as factor maps
Source: van Westen, Castellanos Abella, and Sekhar 2008.
Note: R = regional; M = medium; L = large; D = detailed; = highly applicable; = moderately applicable; = less applicable.
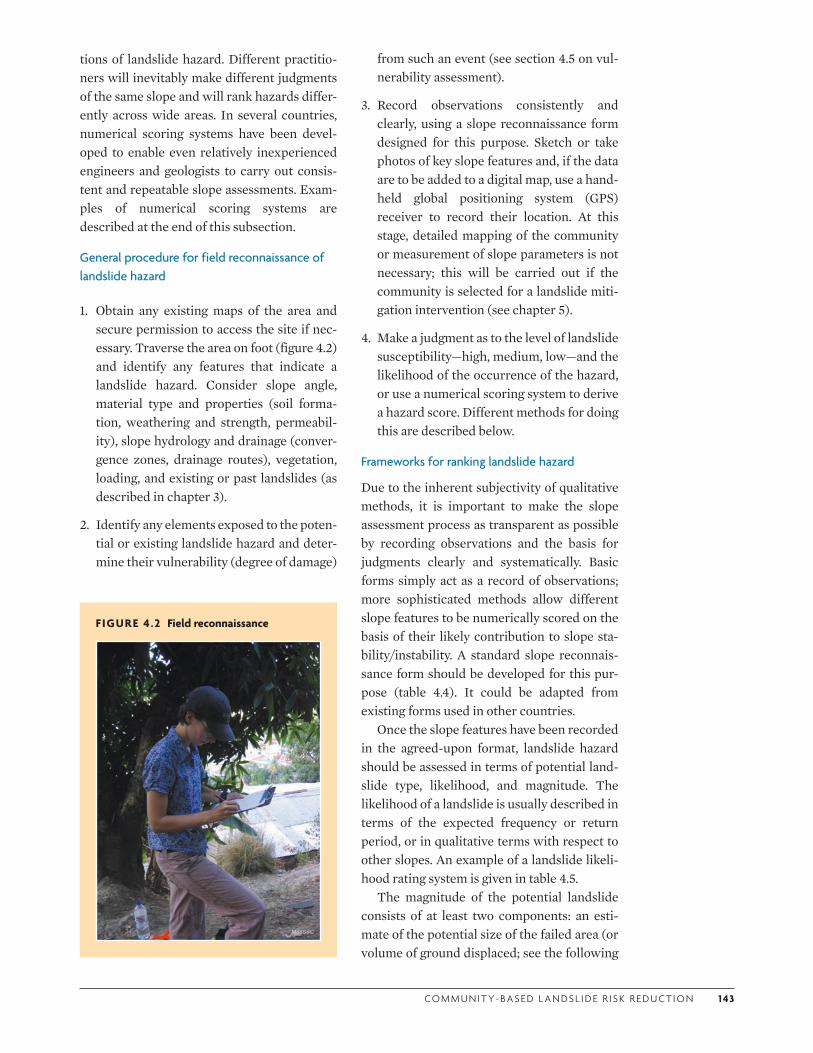
CO M M U N I T Y- BA S E D L A N DS L I D E R I S K R E D U CT I O N 1 43
tions of landslide hazard. Different practitio-ners will inevitably make different judgments of the same slope and will rank hazards differ-ently across wide areas. In several countries, numerical scoring systems have been devel-oped to enable even relatively inexperienced engineers and geologists to carry out consis-tent and repeatable slope assessments. Exam-ples of numerical scoring systems are described at the end of this subsection.
General procedure for field reconnaissance of landslide hazard
1. Obtain any existing maps of the area and secure permission to access the site if nec-essary. Traverse the area on foot (figure 4.2) and identify any features that indicate a landslide hazard. Consider slope angle, material type and properties (soil forma-tion, weathering and strength, permeabil-ity), slope hydrology and drainage (conver-gence zones, drainage routes), vegetation, loading, and existing or past landslides (as described in chapter 3).
2. Identify any elements exposed to the poten-tial or existing landslide hazard and deter-mine their vulnerability (degree of damage)
from such an event (see section 4.5 on vul-nerability assessment).
3. Record observations consistently and clearly, using a slope reconnaissance form designed for this purpose. Sketch or take photos of key slope features and, if the data are to be added to a digital map, use a hand-held global positioning system (GPS) receiver to record their location. At this stage, detailed mapping of the community or measurement of slope parameters is not necessary; this will be carried out if the community is selected for a landslide miti-gation intervention (see chapter 5).
4. Make a judgment as to the level of landslide susceptibility—high, medium, low—and the likelihood of the occurrence of the hazard, or use a numerical scoring system to derive a hazard score. Different methods for doing this are described below.
Frameworks for ranking landslide hazard
Due to the inherent subjectivity of qualitative methods, it is important to make the slope assessment process as transparent as possible by recording observations and the basis for judgments clearly and systematically. Basic forms simply act as a record of observations; more sophisticated methods allow different slope features to be numerically scored on the basis of their likely contribution to slope sta-bility/instability. A standard slope reconnais-sance form should be developed for this pur-pose (table 4.4). It could be adapted from existing forms used in other countries.
Once the slope features have been recorded in the agreed-upon format, landslide hazard should be assessed in terms of potential land-slide type, likelihood, and magnitude. The likelihood of a landslide is usually described in terms of the expected frequency or return period, or in qualitative terms with respect to other slopes. An example of a landslide likeli-hood rating system is given in table 4.5.
The magnitude of the potential landslide consists of at least two components: an esti-mate of the potential size of the failed area (or volume of ground displaced; see the following
FIGURE 4 .2 Field reconnaissance

1 4 4 C H A P T E R 4 . S E L E CT I N G CO M M U N I T I ES
TABLE 4 .4 Typical sections of a slope reconnaissance form
SLOPE FEATURE DESCRIPTION
Slope angle •Gently sloping (< 15°) to very steep (> 45°)
Topography •Concave/convex/planar/hummocky/complex/terraced
Slope-forming material
•Degree of weathering as indicator of strength (from bedrock to residual soils and colluvium)
•Depth of soil to bedrock
Erosion •Type: indistinct/rill/gully/piping/washout
•Extent: isolated or small areas/multiple features/almost continuous area
Geological features
•Outcropping of bedrock
•Presence of joints
• Joint spacing: wide (massive)/medium (blocky)/close (fractured)
Ground moisture
•Extent: isolated/substantial
•Location: base of slope/midslope/convergence zone/strata interface/other
•Occurrence: only after rainy/wet season/all year
Seepage •Extent: isolated/substantial
•Location: bedding planes/joints/shear zone/strata interface/other
•Water: clear/muddy
Vegetation •Type (%): grass/shrub/forested/cultivated/other
•Density: sparse/moderate/dense
Site stability •Known: past landslide activity/landslide-prone area
• Indicators: tilting of trees or structures/hummocky ground/tension cracks/other
Adverse human impact
•Slope excavation/loading/removal of vegetation/irrigation/mining/water leakage/drainage failure
Sketch •Slope cross-section indicating geometry, strata, geological features, seepage, ground moisture, vegetation, site stability indicators, adverse human impacts, and location of any elements at risk
•Slope plan indicating the above features and location of previous landslides
Landslide hazard (see chapter 3)
•Landslide type: fall/topple/slide/flow/complex
•Slope material: bedrock/unconsolidated material
•Landslide likelihood (see table 4.5)
•Landslide magnitude: estimate size of potential failure and potential distance of runout (Finlay, Mostyn, and Fell 1999)
•Hazard score (if using numerical scoring system)
equation given by Cruden and Varnes 1996), and some description of what will happen to the failed material such as the distance/depth/speed/volume of runout.
Volume of ground displaced = 1/6π × D × W × L
Where: D = Maximum depth to slip surface below
original ground surface
W = Maximum width between flanks of land-slide perpendicular to length, L
L = Minimum distance from landslide crown to toe
Empirical methods for estimating the travel distance and depth of failed material require few measurable parameters. If the landslide type is properly identified and the relevant equations used, Wong and Ho (1996, 419)
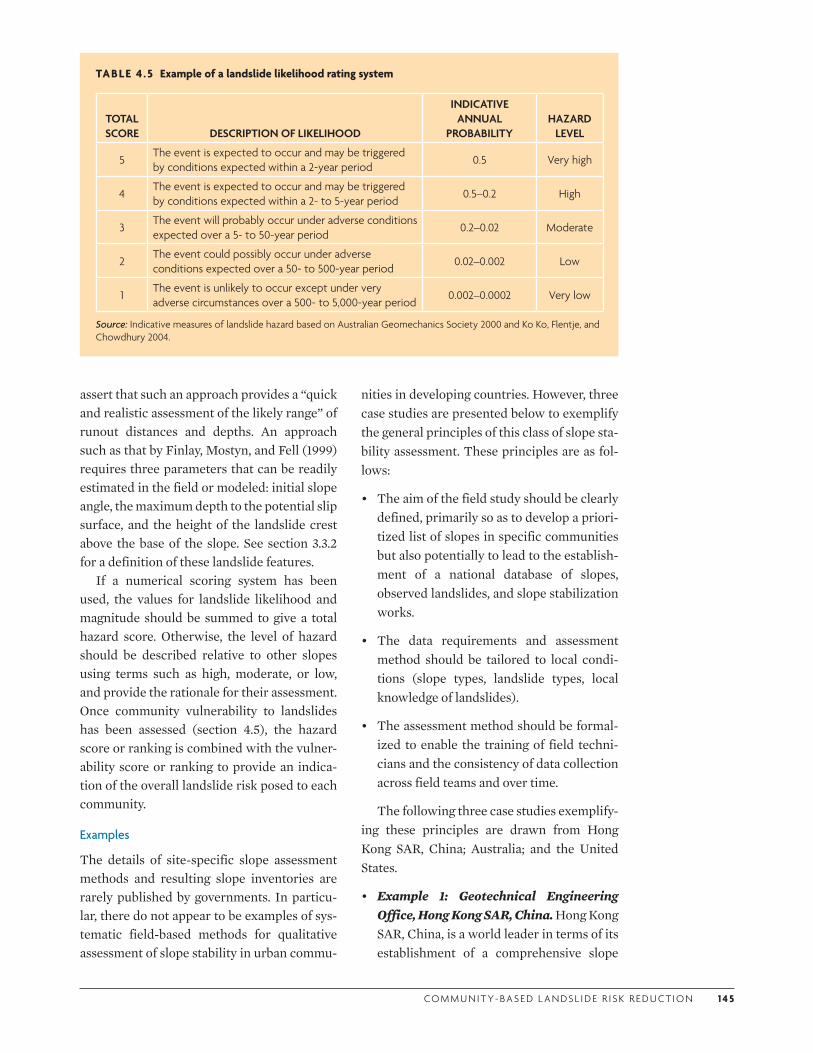
CO M M U N I T Y- BA S E D L A N DS L I D E R I S K R E D U CT I O N 1 4 5
TABLE 4 .5 Example of a landslide likelihood rating system
TOTAL SCORE DESCRIPTION OF LIKELIHOOD
INDICATIVE ANNUAL
PROBABILITYHAZARD
LEVEL
5The event is expected to occur and may be triggered by conditions expected within a 2-year period
0.5 Very high
4The event is expected to occur and may be triggered by conditions expected within a 2- to 5-year period
0.5–0.2 High
3The event will probably occur under adverse conditions expected over a 5- to 50-year period
0.2–0.02 Moderate
2The event could possibly occur under adverse conditions expected over a 50- to 500-year period
0.02–0.002 Low
1The event is unlikely to occur except under very adverse circumstances over a 500- to 5,000-year period
0.002–0.0002 Very low
Source: Indicative measures of landslide hazard based on Australian Geomechanics Society 2000 and Ko Ko, Flentje, and Chowdhury 2004.
assert that such an approach provides a “quick and realistic assessment of the likely range” of runout distances and depths. An approach such as that by Finlay, Mostyn, and Fell (1999) requires three parameters that can be readily estimated in the field or modeled: initial slope angle, the maximum depth to the potential slip surface, and the height of the landslide crest above the base of the slope. See section 3.3.2 for a definition of these landslide features.
If a numerical scoring system has been used, the values for landslide likelihood and magnitude should be summed to give a total hazard score. Otherwise, the level of hazard should be described relative to other slopes using terms such as high, moderate, or low, and provide the rationale for their assessment. Once community vulnerability to landslides has been assessed (section 4.5), the hazard score or ranking is combined with the vulner-ability score or ranking to provide an indica-tion of the overall landslide risk posed to each community.
Examples
The details of site-specific slope assessment methods and resulting slope inventories are rarely published by governments. In particu-lar, there do not appear to be examples of sys-tematic field-based methods for qualitative assessment of slope stability in urban commu-
nities in developing countries. However, three case studies are presented below to exemplify the general principles of this class of slope sta-bility assessment. These principles are as fol-lows:
• The aim of the field study should be clearly defined, primarily so as to develop a priori-tized list of slopes in specific communities but also potentially to lead to the establish-ment of a national database of slopes, observed landslides, and slope stabilization works.
• The data requirements and assessment method should be tailored to local condi-tions (slope types, landslide types, local knowledge of landslides).
• The assessment method should be formal-ized to enable the training of field techni-cians and the consistency of data collection across field teams and over time.
The following three case studies exemplify-ing these principles are drawn from Hong Kong SAR, China; Australia; and the United States.
• Example 1: Geotechnical Engineering Office, Hong Kong SAR, China. Hong Kong SAR, China, is a world leader in terms of its establishment of a comprehensive slope

1 4 6 C H A P T E R 4 . S E L E CT I N G CO M M U N I T I ES
and landslide database, the assessment of landslide hazard and risk, and management of manmade and natural slopes. The New Priority Ranking System is used for assess-ment of soil cut slopes, rock cut slopes, retaining walls, and fill slopes. For each slope type, a field team records the detailed slope geometry, exposed slope materials, slope protection and drainage, signs of instability, engineering judgment as to the hazard posed, and the location of facilities (buildings and roads) with respect to the slope. Technicians and engineers use com-putation sheets to assign numeric scores to each slope characteristic and derive insta-bility and consequence scores. Slopes can then be prioritized for remediation mea-sures, maintenance, or monitoring (Cheng 2009).
• Example 2: University of Wollongong, Australia. Ko Ko, Flentje, and Chowdhury (2004) report on a method for assessing the stability of four classes of slopes: natural slopes, embankments, rock slopes or rock cuttings, and soil cuttings. They include a sample field data sheet for recording the characteristics of natural slopes and assign-ing numeric scores to describe their influ-ence on landslide hazard. Five categories of relative hazard are defined (from very high to very low) which relate to the total score. A nominal landslide probability is then identified based on the score and expert judgment. This hazard rating can then be combined with a consequence (vulnerabil-ity) score (also described in the paper) to give an indication of the relative landslide risk associated with a particular slope. The authors conclude that, by using this method, the careful observation and expert judg-ment of slope characteristics can provide a rapid means for prioritizing slopes for more detailed landslide assessment and risk reduction.
• Example 3: U.S. Federal Highway Admin-istration. Several U.S. states have devel-oped field-based slope assessment methods focusing on the risk to roads and road users.
Liang (2007) provides a helpful review of several of these methods, and of the slope management framework developed in Hong Kong SAR, China (see above). Included in the report’s appendixes are landslide hazard reconnaissance forms used by the Ohio Department of Transpor-tation. While not directly applicable to urban landslides in developing countries, this report demonstrates the principles of site-based assessment of slopes and the use of this information in prioritizing expendi-ture on landslide risk reduction.
4.4.2 Qualitative landslide susceptibility mapping: GIS index overlay methods
The stability of a slope is related to environ-mental factors such as slope angle, topogra-phy, drainage (on the surface and in the ground), soil type, geological characteristics, land use, and vegetation cover. In many coun-tries, there are digitized maps of these envi-ronmental factors available at small (regional) scales of 1:250,000 to 1:100,000, medium scales of 1:50,000 to 1:25,000, and—some-times—at large scales of 1:10,000. If GIS soft-ware and expertise are also available, it is pos-sible to analyze digital maps and produce landslide susceptibility, hazard, or risk maps at these scales. The four main classes of GIS-based landslide assessment are heuristic (expert-based), probabilistic, statistical, and deterministic.
This subsection outlines the basic princi-ples of GIS-based heuristic landslide suscepti-bility mapping methods and presents related case studies. These methods are closely related to the numerical scoring approach often used in field reconnaissance in that scores (an index) are assigned to different slope, soil, geology, drainage, and land cover characteris-tics. These layers are then overlaid, and the influence of the various environmental factors weighted to reflect their importance in deter-mining slope stability. This procedure is com-monly called index-overlay analysis. GIS map-ping approaches enable the assessment of slope stability over continuous large areas,
CO M M U N I T Y- BA S E D L A N DS L I D E R I S K R E D U CT I O N 1 47
rather than just considering individual sites. Because the GIS environment allows many layers of information to be added, a landslide susceptibility/hazard map can be added to a vulnerability map to derive an overall risk map.
With heuristic mapping approaches, expert knowledge of the local environmental factors for landslides is essential. Ideally, if the locations and types of previous landslides are known and mapped, this information can be used directly to derive appropriate weights for the different environmental factors on each layer of the landslide hazard map. In many countries, a record of landslides is not always kept or may be incomplete. In the absence of a landslide inventory, the analyst must apply local knowledge and expert judg-ment in assigning weights to the various envi-ronmental factors. This results in a qualita-tive map indicating relative landslide susceptibility.
Limitations of GIS-based approaches are related to the availability, quality, and scale of the digital data and the expertise of the ana-lyst. Keep in mind that landslide processes tend to be highly localized and cannot usually be captured at the wide-area scale.
Note that a landslide susceptibility map simply identifies the spatial variation of differ-ent ensembles of slope characteristics and how landslide prone these slopes are in rela-tion to each other. A landslide hazard map contains more information by indicating both the spatial and temporal likelihood of land-slide occurrence—that is, the location and tim-ing of potential landslide events.
General procedure for GIS index overlay
1. Acquire any available digital data relating to the environmental factors associated with slope stability, including elevation data (e.g., contour maps), geology, soil, and land-use maps. If important data relating to a partic-ular environmental factor are not available in a digital format but do exist in hard copy, these may need to be digitized. Numerous field-based and remote-sensing methods exist for generating digital spatial data;
these are not reviewed here, as they can represent a significant financial or time investment which may not be within the scope of the project.
2. Convert the digital data layers into the cor-rect format for the chosen GIS platform. It may be necessary to geo-reference, trans-form, or reproject the data so that all the layers are in the same coordinate system and geographical projection. Verify the accuracy and completeness of the data, and make any necessary corrections.
3. Use the elevation data to generate a digital elevation model in raster or vector format (grid-based or triangular irregular net-work). Use tools within the GIS environ-ment to derive key slope stability factors from the digital elevation model such as slope angle, aspect, and length; internal relief; and drainage routing.
4. Process other map layers to derive useful information. Geology maps can be reinter-preted in terms of engineering geological classifications (relating to rock composition and strength). Soil depths and strengths can sometimes be inferred or approximated from maps of soil erosion and soil type. Despite the importance of soil properties for predicting slope stability, there are often very little direct data on soil strength, hydrology, or depth over wide areas. In many cases, the limited data on soils will need to be augmented by local knowledge and by verifying soil characteristics at selected sites.
5. For each environmental factor, convert the range of values of the data in that layer into an index that describes the relative contri-bution to slope stability. Low index values may be assigned where the characteristic of the environmental variable is associated with stable slopes (such as a strong soil or bedrock); high index values indicate an association with less stable slopes (e.g., weak soils). Index each factor (GIS layer) in this way—from flat land to steep slopes, shallow soils to deep soils, strong soils to
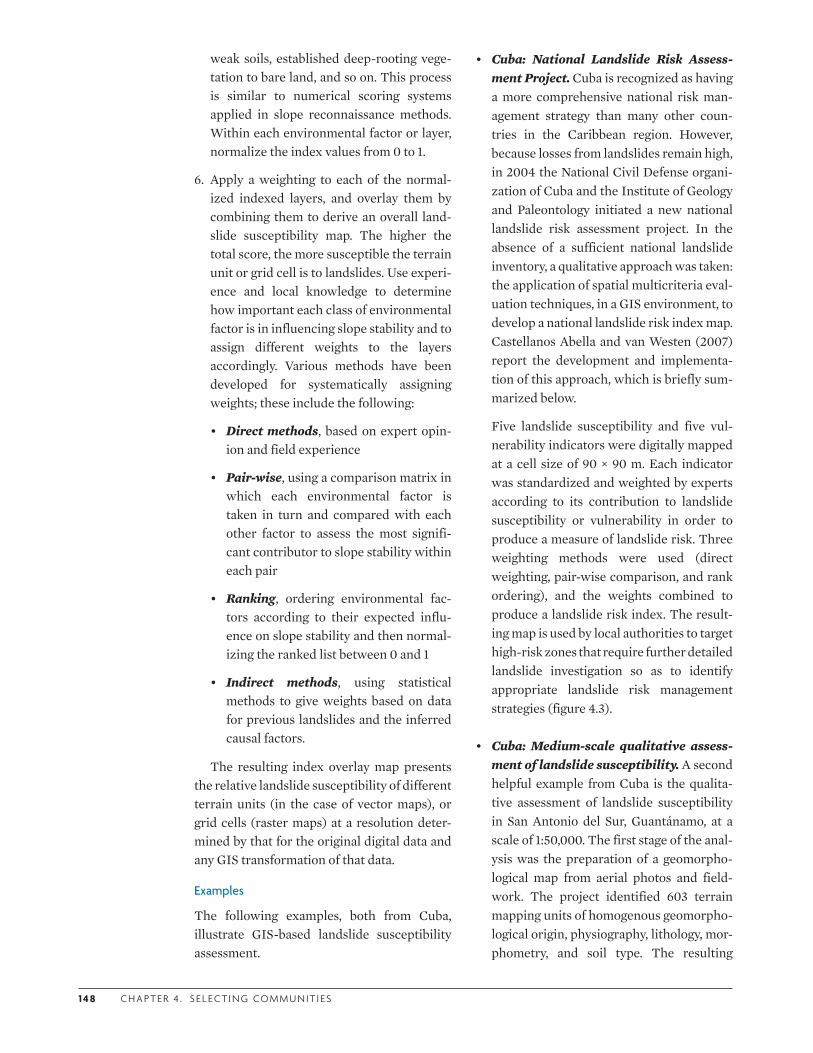
1 4 8 C H A P T E R 4 . S E L E CT I N G CO M M U N I T I ES
weak soils, established deep-rooting vege-tation to bare land, and so on. This process is similar to numerical scoring systems applied in slope reconnaissance methods. Within each environmental factor or layer, normalize the index values from 0 to 1.
6. Apply a weighting to each of the normal-ized indexed layers, and overlay them by combining them to derive an overall land-slide susceptibility map. The higher the total score, the more susceptible the terrain unit or grid cell is to landslides. Use experi-ence and local knowledge to determine how important each class of environmental factor is in influencing slope stability and to assign different weights to the layers accordingly. Various methods have been developed for systematically assigning weights; these include the following:
• Direct methods, based on expert opin-ion and field experience
• Pair-wise, using a comparison matrix in which each environmental factor is taken in turn and compared with each other factor to assess the most signifi-cant contributor to slope stability within each pair
• Ranking, ordering environmental fac-tors according to their expected influ-ence on slope stability and then normal-izing the ranked list between 0 and 1
• Indirect methods, using statistical methods to give weights based on data for previous landslides and the inferred causal factors.
The resulting index overlay map presents the relative landslide susceptibility of different terrain units (in the case of vector maps), or grid cells (raster maps) at a resolution deter-mined by that for the original digital data and any GIS transformation of that data.
Examples
The following examples, both from Cuba, illustrate GIS-based landslide susceptibility assessment.
• Cuba: National Landslide Risk Assess-ment Project. Cuba is recognized as having a more comprehensive national risk man-agement strategy than many other coun-tries in the Caribbean region. However, because losses from landslides remain high, in 2004 the National Civil Defense organi-zation of Cuba and the Institute of Geology and Paleontology initiated a new national landslide risk assessment project. In the absence of a sufficient national landslide inventory, a qualitative approach was taken: the application of spatial multicriteria eval-uation techniques, in a GIS environment, to develop a national landslide risk index map. Castellanos Abella and van Westen (2007) report the development and implementa-tion of this approach, which is briefly sum-marized below.
Five landslide susceptibility and five vul-nerability indicators were digitally mapped at a cell size of 90 × 90 m. Each indicator was standardized and weighted by experts according to its contribution to landslide susceptibility or vulnerability in order to produce a measure of landslide risk. Three weighting methods were used (direct weighting, pair-wise comparison, and rank ordering), and the weights combined to produce a landslide risk index. The result-ing map is used by local authorities to target high-risk zones that require further detailed landslide investigation so as to identify appropriate landslide risk management strategies (figure 4.3).
• Cuba: Medium-scale qualitative assess-ment of landslide susceptibility. A second helpful example from Cuba is the qualita-tive assessment of landslide susceptibility in San Antonio del Sur, Guantánamo, at a scale of 1:50,000. The first stage of the anal-ysis was the preparation of a geomorpho-logical map from aerial photos and field-work. The project identified 603 terrain mapping units of homogenous geomorpho-logical origin, physiography, lithology, mor-phometry, and soil type. The resulting
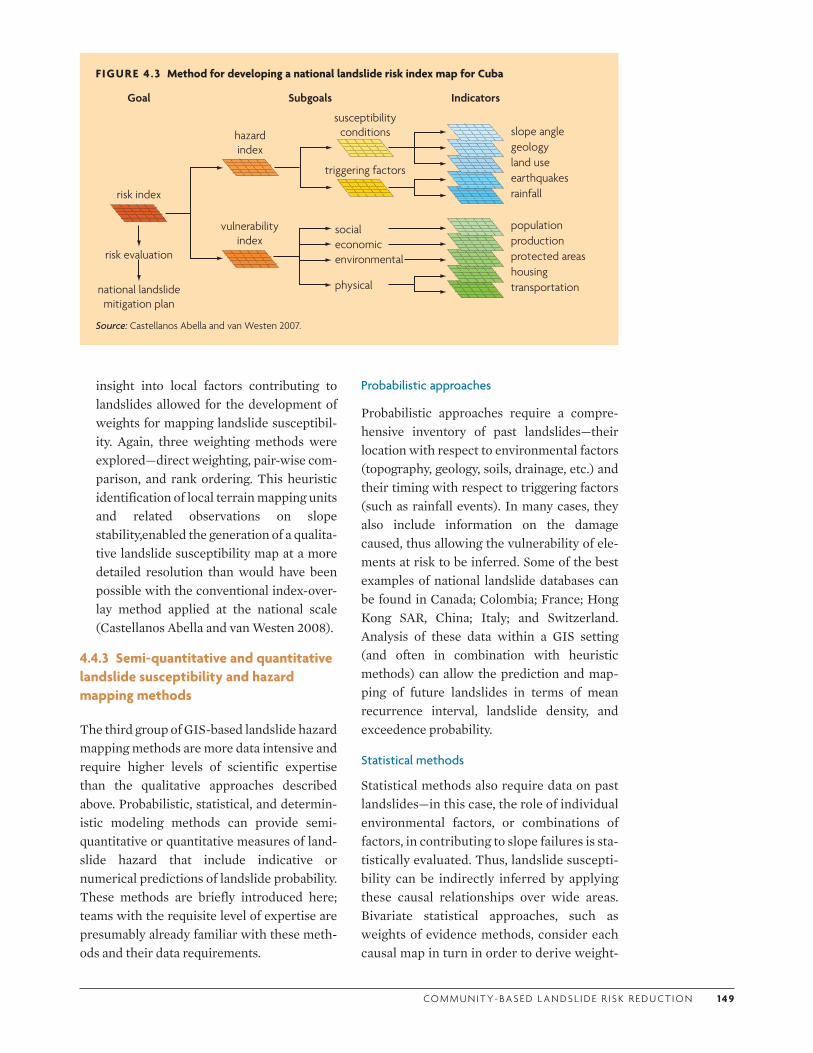
CO M M U N I T Y- BA S E D L A N DS L I D E R I S K R E D U CT I O N 1 4 9
insight into local factors contributing to landslides allowed for the development of weights for mapping landslide susceptibil-ity. Again, three weighting methods were explored—direct weighting, pair-wise com-parison, and rank ordering. This heuristic identification of local terrain mapping units and related observations on slope stability,enabled the generation of a qualita-tive landslide susceptibility map at a more detailed resolution than would have been possible with the conventional index-over-lay method applied at the national scale (Castellanos Abella and van Westen 2008).
4.4.3 Semi-quantitative and quantitative landslide susceptibility and hazard mapping methods
The third group of GIS-based landslide hazard mapping methods are more data intensive and require higher levels of scientific expertise than the qualitative approaches described above. Probabilistic, statistical, and determin-istic modeling methods can provide semi-quantitative or quantitative measures of land-slide hazard that include indicative or numerical predictions of landslide probability. These methods are briefly introduced here; teams with the requisite level of expertise are presumably already familiar with these meth-ods and their data requirements.
Probabilistic approaches
Probabilistic approaches require a compre-hensive inventory of past landslides—their location with respect to environmental factors (topography, geology, soils, drainage, etc.) and their timing with respect to triggering factors (such as rainfall events). In many cases, they also include information on the damage caused, thus allowing the vulnerability of ele-ments at risk to be inferred. Some of the best examples of national landslide databases can be found in Canada; Colombia; France; Hong Kong SAR, China; Italy; and Switzerland. Analysis of these data within a GIS setting (and often in combination with heuristic methods) can allow the prediction and map-ping of future landslides in terms of mean recurrence interval, landslide density, and exceedence probability.
Statistical methods
Statistical methods also require data on past landslides—in this case, the role of individual environmental factors, or combinations of factors, in contributing to slope failures is sta-tistically evaluated. Thus, landslide suscepti-bility can be indirectly inferred by applying these causal relationships over wide areas. Bivariate statistical approaches, such as weights of evidence methods, consider each causal map in turn in order to derive weight-
FIGURE 4 .3 Method for developing a national landslide risk index map for Cuba
Indicators
population productionprotected areashousingtransportation
slope anglegeologyland useearthquakesrainfall
triggering factors
susceptibility conditionshazard
index
vulnerability index
risk index
SubgoalsGoal
risk evaluation
national landslide mitigation plan
social
environmentaleconomic
physical
Source: Castellanos Abella and van Westen 2007.

1 5 0 C H A P T E R 4 . S E L E CT I N G CO M M U N I T I ES
ing values for that environmental factor. These methods are widely employed in con-junction with heuristic methods. Multivari-ate approaches use methods such as logistic regression, artificial neural networks, and fuzzy logic to determine the relative contri-bution of all the causative environmental fac-tors in determining the landslide hazard for a defined land unit.
Limitations of statistical methods include the inherent generalization of landslide caus-ative factors—the assumption that the same combination of factors will cause landslides throughout the study area. This limitation is magnified if the data on past landslides do not differentiate between landslide types, if the landslide data are incomplete, or if the envi-ronmental factor maps are not sufficiently detailed to capture localized variations.
Deterministic approaches
Deterministic approaches address landslide hazard in terms of underlying physical pro-cesses. For engineering and geotechnical applications, deterministic modeling is usually undertaken at the scale of individual slope cross-sections. However, in a GIS environ-ment, the ability to represent slope parameters over a wide area allows spatially distributed
deterministic modeling of slope stability. These methods are most appropriately applied over small areas, such as river catchments or subcatchments; and at detailed scales, since they require large amounts of good quality spatially distributed data relating to topogra-phy, soil depth and strength, and hydrological properties. A digital elevation model is used to determine rainfall and surface water infiltra-tion, groundwater levels, and pore water pres-sures. A typical distributed deterministic model uses a simple infinite slope stability equation in conjunction with the two-dimen-sional hillslope hydrology calculations to determine the factor of safety for each map-ping unit or grid cell.
Examples of deterministic models include the shallow landsliding model (SHALSTAB) developed by Montgomery and Dietrich (1994) and available as an ArcScript for use in ArcView GIS; and the Stability Index Mapping (SINMAP) model developed by Pack, Tarbo-ton, and Goodwin (1998), which is also avail-able as an ArcView GIS extension.
Figure 4.4 shows the results of such an anal-ysis for the assessment of debris flow hazard in Tegucigalpa, Honduras. The spatial data for this study by Harp et al. (2009) included a dig-ital elevation model (for deriving slope angle),
FIGURE 4 .4 Quantitative GIS-based hazard map for Tegucigalpa, Honduras
Source: Harp et al. 2009.
CO M M U N I T Y- BA S E D L A N DS L I D E R I S K R E D U CT I O N 1 5 1
a geological map (for deriving material strength), and an inventory of debris flows triggered by Hurricane Mitch in 1998. An infi-nite slope stability model (based on the limit equilibrium approach described in chapter 3) was used to predict the slope factor of safety and hence determine the debris flow hazard for different hillslopes.
Deterministic methods can also be applied in the prediction of landslide runout—travel distance, velocity, and depth of landslide debris. The development and application of such approaches require extensive data and significant expertise, and are therefore not necessarily appropriate for use in community selection.
4.5 ASSESSING COMMUNITY VULNERABILITY TO LANDSLIDES
Having identified the landslide susceptibility or hazard for a list of communities, or on a wider spatial scale using GIS-based methods, the next stage is to consider what the conse-quences of a landslide event would be in terms of the exposure and vulnerability of different elements (people and property) to that hazard. The overall landslide risk is the combination of hazard, exposure, and vulnerability.
Exposure describes the location of a par-ticular element with respect to the potential landslide—whether it is on the upper or side margins of the slide, within the failed mass, or in the path of the debris. In selecting commu-nities for potential MoSSaiC interventions, both the number of houses exposed to each particular landslide hazard and the density of housing within that hazard zone (often expressed as the proportion of land coverage by houses) must be noted. Housing density is particularly significant, because MoSSaiC projects involve the construction of a network of surface water drains to improve slope stabil-ity and reduce the hazard to multiple house-holds. The greater the housing density, the more households will benefit from the drain-age intervention.
The vulnerability of exposed elements is expressed in terms of the potential degree of damage (or loss) with respect to the magni-tude (or intensity) of a given landslide. MoSSaiC projects are intended for the most- physically and -socioeconomically vulnerable communities. As with landslide hazard assess-ment, the scale of this assessment can vary from regional to detailed household level, and the data requirements, methodology, and out-puts will vary accordingly. Exposure is often considered in conjunction with, or as an inte-gral part of, vulnerability (Crozier and Glade 2005).
Table 4.6 identifies the ways in which the exposure and vulnerability of different ele-ments at risk may be represented at different spatial scales. Of particular relevance to MoSSaiC are data on buildings, population, and economic factors that describe the physi-cal and socioeconomic exposure and vulnera-bility of urban communities to landslides.
At medium mapping scales, the physical exposure and vulnerability of the community can be described simply in terms of how many buildings (houses) might be affected by a landslide event. At a more detailed scale, for a given landslide location and magnitude, the physical exposure and vulnerability of a house may be described in terms of how eas-ily it could be damaged. For example, if hit by a small landslide, a concrete house with good foundations may be less likely to collapse than a wooden structure with poor founda-tions. The physical vulnerability of people within a community relates to the level of injury or loss of life; this is a very difficult aspect of vulnerability to assess since it requires the combined spatial and temporal prediction of both the landslide event and the exposure of people to that event.
The socioeconomic vulnerability of a com-munity to landslides is related to the ability of households to recover from a landslide. This recovery might involve rebuilding part or all of a house, replacing possessions, finding a dif-ferent means of income (if tools or stock have been lost), or moving to a different location. While not synonymous with poverty, socio-
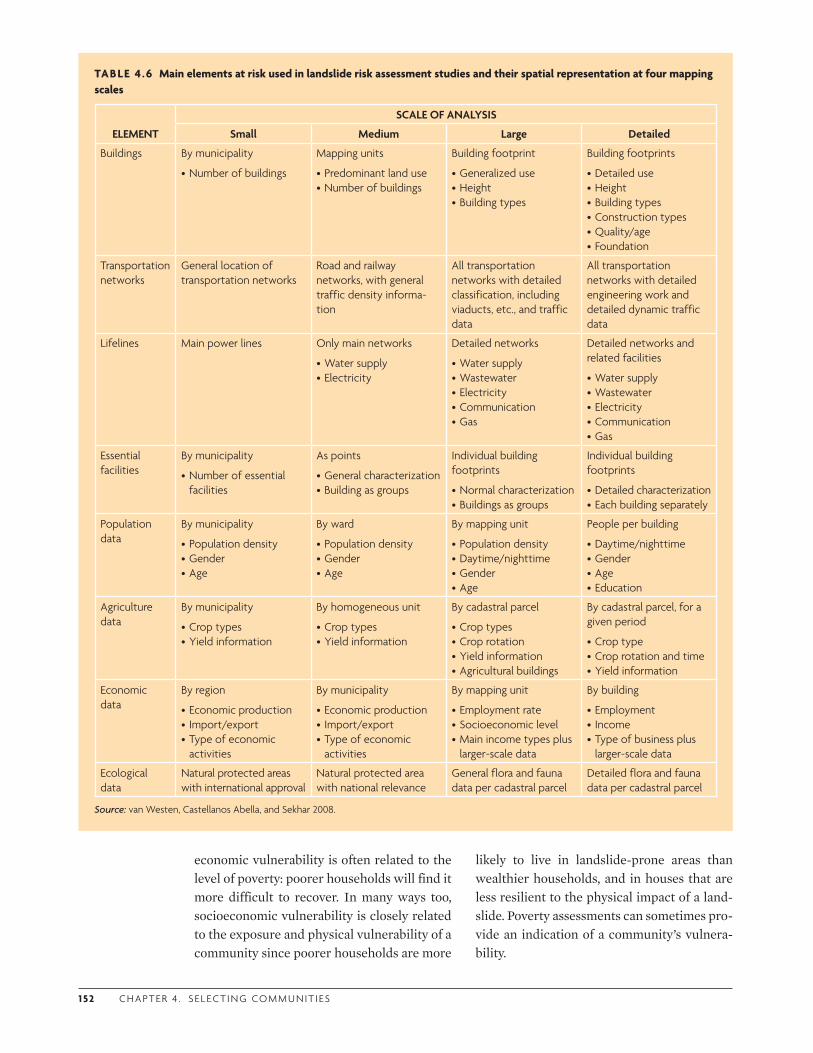
1 52 C H A P T E R 4 . S E L E CT I N G CO M M U N I T I ES
economic vulnerability is often related to the level of poverty: poorer households will find it more difficult to recover. In many ways too, socioeconomic vulnerability is closely related to the exposure and physical vulnerability of a community since poorer households are more
likely to live in landslide-prone areas than wealthier households, and in houses that are less resilient to the physical impact of a land-slide. Poverty assessments can sometimes pro-vide an indication of a community’s vulnera-bility.
TABLE 4 .6 Main elements at risk used in landslide risk assessment studies and their spatial representation at four mapping scales
ELEMENT
SCALE OF ANALYSIS
Small Medium Large Detailed
Buildings By municipality
•Number of buildings
Mapping units
•Predominant land use•Number of buildings
Building footprint
•Generalized use•Height•Building types
Building footprints
•Detailed use•Height•Building types•Construction types•Quality/age•Foundation
Transportation networks
General location of transportation networks
Road and railway networks, with general traffic density informa-tion
All transportation networks with detailed classification, including viaducts, etc., and traffic data
All transportation networks with detailed engineering work and detailed dynamic traffic data
Lifelines Main power lines Only main networks
•Water supply•Electricity
Detailed networks
•Water supply•Wastewater•Electricity•Communication•Gas
Detailed networks and related facilities
•Water supply•Wastewater•Electricity•Communication•Gas
Essential facilities
By municipality
•Number of essential facilities
As points
•General characterization•Building as groups
Individual building footprints
•Normal characterization•Buildings as groups
Individual building footprints
•Detailed characterization•Each building separately
Population data
By municipality
•Population density•Gender•Age
By ward
•Population density•Gender•Age
By mapping unit
•Population density•Daytime/nighttime•Gender•Age
People per building
•Daytime/nighttime•Gender•Age•Education
Agriculture data
By municipality
•Crop types•Yield information
By homogeneous unit
•Crop types•Yield information
By cadastral parcel
•Crop types•Crop rotation•Yield information•Agricultural buildings
By cadastral parcel, for a given period
•Crop type•Crop rotation and time•Yield information
Economic data
By region
•Economic production• Import/export•Type of economic
activities
By municipality
•Economic production• Import/export•Type of economic
activities
By mapping unit
•Employment rate•Socioeconomic level•Main income types plus
larger-scale data
By building
•Employment• Income•Type of business plus
larger-scale data
Ecological data
Natural protected areas with international approval
Natural protected area with national relevance
General flora and fauna data per cadastral parcel
Detailed flora and fauna data per cadastral parcel
Source: van Westen, Castellanos Abella, and Sekhar 2008.

CO M M U N I T Y- BA S E D L A N DS L I D E R I S K R E D U CT I O N 1 53
The following subsections outline two broad approaches to assessing the potential consequences of landslides with a view to determining which communities have the greatest exposure and vulnerability.
• Field reconnaissance and heuristic (expert-based) ranking/scoring of community and household exposure and vulnerability to landslides
• GIS-based methods using land-use maps to determine community exposure, and cen-sus data to assess vulnerability (qualitative to semi-qualitative results over medium to regional scales).
Use these guidelines to identify a method-ology compatible with available data and expertise, and that can be interfaced with landslide hazard information in terms of its format (list or map) and spatial scale.
4.5.1 Field reconnaissance and vulnerability ranking methods
Field reconnaissance and ranking methods were introduced in section 4.4.1 as a means for rapid assessment of landslide hazard by a team of experts. Similar methods can be applied to assess community exposure and vulnerabil-ity—either qualitatively (e.g., as high, moder-ate, or low), or quantitatively (using a numeri-cal scoring system). Hazard, exposure, and vulnerability measures can be combined to rank overall landslide risk.
General procedure for field reconnaissance of vulnerability
Specific procedures relating to the assessment of community exposure and vulnerability to landslide hazards are highlighted here; see section 4.4.1 for the general procedure for field reconnaissance.
If a landslide hazard has been identified, the team should have already estimated the spatial extent of the landslide-prone area and the potential downslope extent of the failed material. On the basis of this assessment, esti-mate the physical exposure and vulnerability in terms of the following:
• The number of houses and people likely to be exposed to the landslide and debris
• The housing density (this helps with the assessment of the possible cost-effective-ness of constructing a drainage network)
• The potential physical damage to individ-ual houses based on their construction type (if there is sufficient knowledge of past landslide impacts and the resilience of structures to such impacts; figure 4.5)
• The cost of the potential landslide damage (if the approximate value of the elements at risk is known).
FIGURE 4 .5 Resilience of structures depending on construction type
a. Minor landslide where the impact of the debris has damaged a concrete home.
b. Minor landslide where the impact of the debris has destroyed a wooden home.
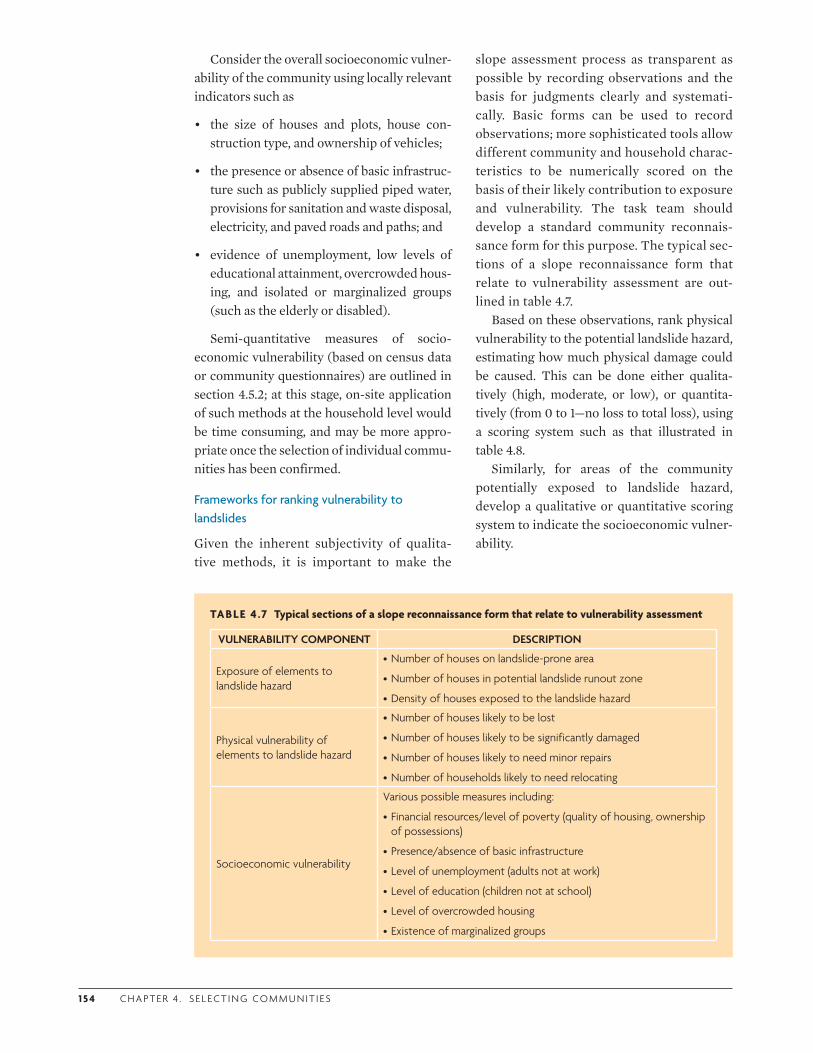
1 5 4 C H A P T E R 4 . S E L E CT I N G CO M M U N I T I ES
Consider the overall socioeconomic vulner-ability of the community using locally relevant indicators such as
• the size of houses and plots, house con-struction type, and ownership of vehicles;
• the presence or absence of basic infrastruc-ture such as publicly supplied piped water, provisions for sanitation and waste disposal, electricity, and paved roads and paths; and
• evidence of unemployment, low levels of educational attainment, overcrowded hous-ing, and isolated or marginalized groups (such as the elderly or disabled).
Semi-quantitative measures of socio-economic vulnerability (based on census data or community questionnaires) are outlined in section 4.5.2; at this stage, on-site application of such methods at the household level would be time consuming, and may be more appro-priate once the selection of individual commu-nities has been confirmed.
Frameworks for ranking vulnerability to landslides
Given the inherent subjectivity of qualita-tive methods, it is important to make the
slope assessment process as transparent as possible by recording observations and the basis for judgments clearly and systemati-cally. Basic forms can be used to record observations; more sophisticated tools allow different community and household charac-teristics to be numerically scored on the basis of their likely contribution to exposure and vulnerability. The task team should develop a standard community reconnais-sance form for this purpose. The typical sec-tions of a slope reconnaissance form that relate to vulnerability assessment are out-lined in table 4.7.
Based on these observations, rank physical vulnerability to the potential landslide hazard, estimating how much physical damage could be caused. This can be done either qualita-tively (high, moderate, or low), or quantita-tively (from 0 to 1—no loss to total loss), using a scoring system such as that illustrated in table 4.8.
Similarly, for areas of the community potentially exposed to landslide hazard, develop a qualitative or quantitative scoring system to indicate the socioeconomic vulner-ability.
TABLE 4 .7 Typical sections of a slope reconnaissance form that relate to vulnerability assessment
VULNERABILITY COMPONENT DESCRIPTION
Exposure of elements to landslide hazard
•Number of houses on landslide-prone area
•Number of houses in potential landslide runout zone
•Density of houses exposed to the landslide hazard
Physical vulnerability of elements to landslide hazard
•Number of houses likely to be lost
•Number of houses likely to be significantly damaged
•Number of houses likely to need minor repairs
•Number of households likely to need relocating
Socioeconomic vulnerability
Various possible measures including:
•Financial resources/level of poverty (quality of housing, ownership of possessions)
•Presence/absence of basic infrastructure
•Level of unemployment (adults not at work)
•Level of education (children not at school)
•Level of overcrowded housing
•Existence of marginalized groups
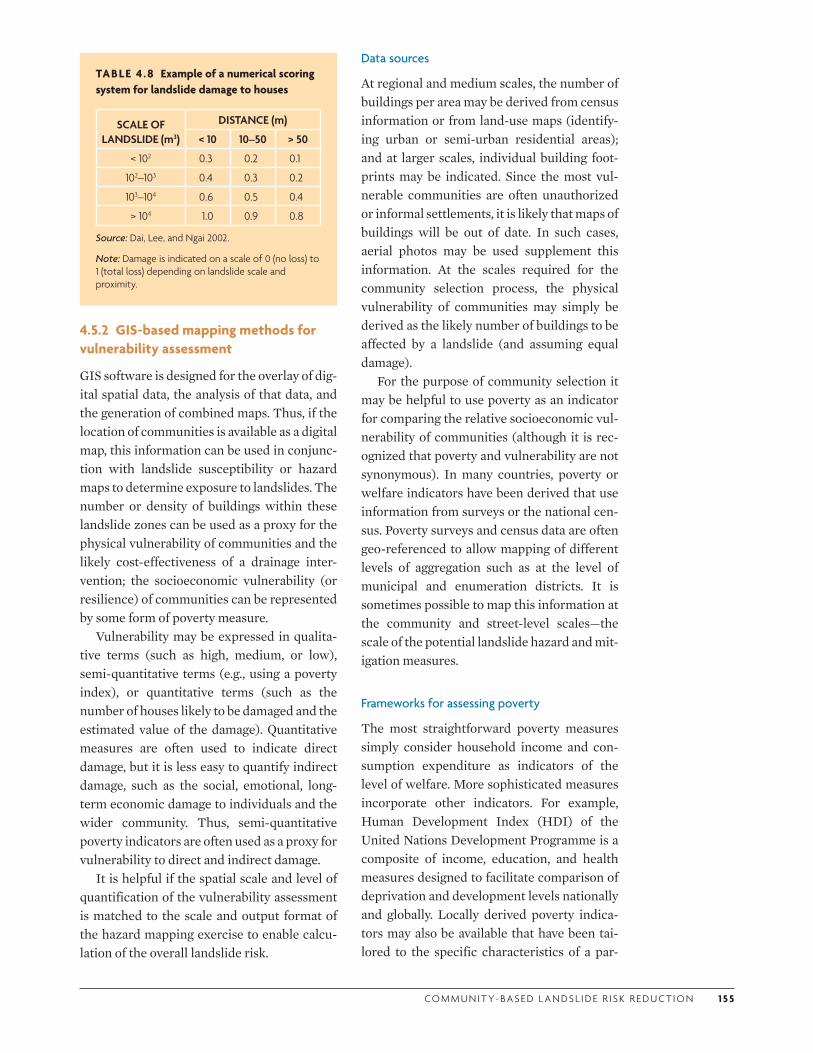
CO M M U N I T Y- BA S E D L A N DS L I D E R I S K R E D U CT I O N 1 5 5
TABLE 4 .8 Example of a numerical scoring system for landslide damage to houses
SCALE OF LANDSLIDE (m3)
DISTANCE (m)
< 10 10–50 > 50
< 102 0.3 0.2 0.1
102–103 0.4 0.3 0.2
103–104 0.6 0.5 0.4
> 104 1.0 0.9 0.8
Source: Dai, Lee, and Ngai 2002.
Note: Damage is indicated on a scale of 0 (no loss) to 1 (total loss) depending on landslide scale and proximity.
Data sources
At regional and medium scales, the number of buildings per area may be derived from census information or from land-use maps (identify-ing urban or semi-urban residential areas); and at larger scales, individual building foot-prints may be indicated. Since the most vul-nerable communities are often unauthorized or informal settlements, it is likely that maps of buildings will be out of date. In such cases, aerial photos may be used supplement this information. At the scales required for the community selection process, the physical vulnerability of communities may simply be derived as the likely number of buildings to be affected by a landslide (and assuming equal damage).
For the purpose of community selection it may be helpful to use poverty as an indicator for comparing the relative socioeconomic vul-nerability of communities (although it is rec-ognized that poverty and vulnerability are not synonymous). In many countries, poverty or welfare indicators have been derived that use information from surveys or the national cen-sus. Poverty surveys and census data are often geo-referenced to allow mapping of different levels of aggregation such as at the level of municipal and enumeration districts. It is sometimes possible to map this information at the community and street-level scales—the scale of the potential landslide hazard and mit-igation measures.
Frameworks for assessing poverty
The most straightforward poverty measures simply consider household income and con-sumption expenditure as indicators of the level of welfare. More sophisticated measures incorporate other indicators. For example, Human Development Index (HDI) of the United Nations Development Programme is a composite of income, education, and health measures designed to facilitate comparison of deprivation and development levels nationally and globally. Locally derived poverty indica-tors may also be available that have been tai-lored to the specific characteristics of a par-
4.5.2 GIS-based mapping methods for vulnerability assessment
GIS software is designed for the overlay of dig-ital spatial data, the analysis of that data, and the generation of combined maps. Thus, if the location of communities is available as a digital map, this information can be used in conjunc-tion with landslide susceptibility or hazard maps to determine exposure to landslides. The number or density of buildings within these landslide zones can be used as a proxy for the physical vulnerability of communities and the likely cost-effectiveness of a drainage inter-vention; the socioeconomic vulnerability (or resilience) of communities can be represented by some form of poverty measure.
Vulnerability may be expressed in qualita-tive terms (such as high, medium, or low), semi-quantitative terms (e.g., using a poverty index), or quantitative terms (such as the number of houses likely to be damaged and the estimated value of the damage). Quantitative measures are often used to indicate direct damage, but it is less easy to quantify indirect damage, such as the social, emotional, long-term economic damage to individuals and the wider community. Thus, semi-quantitative poverty indicators are often used as a proxy for vulnerability to direct and indirect damage.
It is helpful if the spatial scale and level of quantification of the vulnerability assessment is matched to the scale and output format of the hazard mapping exercise to enable calcu-lation of the overall landslide risk.

1 5 6 C H A P T E R 4 . S E L E CT I N G CO M M U N I T I ES
ticular region or country. Table 4.9 illustrates the typical components of a locally derived poverty index.
These measures can be applied both in the field (using a household questionnaire), or using GIS (by acquiring geo-referenced cen-sus data at the least aggregated, most detailed, level possible). The required census variables may initially be processed in the census data-base software using available search and query protocols. For more complex analysis, export the data to a spreadsheet. Finally, sort the list of communities according to socio-economic vulnerability (poverty in this case)
and present either as a list or import into GIS to create a map.
4.6 ASSESSING LANDSLIDE RISK AND CONFIRMING COMMUNITY SELECTION
Landslide risk is a product of the level of land-slide susceptibility or hazard and the vulnera-bility of the elements exposed to damage by that hazard (the potential landslide conse-quences). The previous two sections have out-lined a range of methods for deriving landslide
TABLE 4 .9 Typical components of a locally derived poverty index
ITEM CLASSIFICATION SCOREMAXIMUM
SCORE FOR ITEM
Wall type Brick/block/concrete 3
3Wood and concrete 2
Wood 1
Wattle/tapia/makeshift 0
Toilet type WC to sewer/cess pit 11
Pit latrine/none 0
Light source Electricity/gas 11
Kerosene/none 0
Possessions TV, telephone, video, stove, refrigerator, washing machine
0.5 each4
Car/pick-up 1
No. persons per bedroom
< 1 3
31–1.99 2
2–3 1
3.01 or more 0
Education of head of household
Tertiary/university 5
5
Secondary complete 4
Secondary incomplete 3
Primary complete 2
Primary incomplete 1
None 0
No. of employed to total no. of persons
1 3
30.49–1 2
0.25–0.5 1
< 0.25 0
Maximum total score: 20
Source: Government of St. Lucia 2004.

CO M M U N I T Y- BA S E D L A N DS L I D E R I S K R E D U CT I O N 1 57
TABLE 4 .10 Example of a risk rating matrix
HAZARD RATING
OVERALL PHYSICAL AND SOCIOECONOMIC VULNERABILITY RATING
Very high High Medium Low Very low
Very high 5 5 4 3 2
High 5 4 4 3 2
Medium 4 4 3 2 1
Low 3 3 2 1 1
Very low 2 2 1 1 1
susceptibility or hazard, exposure and vulner-ability in qualitative, semi-quantitative, and quantitative terms; in list or map-based for-mats; and using field reconnaissance or GIS processing of digital spatial data. This section brings these outputs together to derive an assessment of landslide risk to enable selec-tion of the most appropriate communities in which to initiate MoSSaiC projects.
4.6.1 Combining the hazard and vulnerability information
Depending on the approach taken for assess-ing landslide hazard, expose and vulnerability, use one of the following methods to combine these assessments and derive the overall land-slide risk to communities.
Field reconnaissance methods
Complete the reconnaissance forms and assess the overall landslide risk when on site in each community—assigning both hazard and vul-nerability ratings in qualitative terms or according to a numerical scoring system. Com-bine these ratings or scores to give the land-slide risk rating using a matrix such as that in table 4.10.
Once all the communities on the list have been visited and assessed in this way, review the completed reconnaissance forms and rank the communities in order of landslide risk.
GIS-based methods
An alternative to a risk rating matrix is to overlay GIS-generated hazard and vulnera-bility maps to produce a composite landslide risk map. Different weights may be assigned to the hazard and vulnerability maps accord-ing to the agreed-upon community selection criteria.
To identify a community short list, review the attributes of the risk map and sort the com-munities by overall risk. Compare the risk assessment with local knowledge, known landslides, and past events and ask whether the results are realistic and reasonable or whether the method needs refining. Abstract a short list of high-risk communities from the GIS for final verification.
A team of landslide experts/engineers or geotechnicians and a social scientist or com-munity development practitioner should visit each of the short-listed communities and use rapid field reconnaissance to confirm the selection.
4.6.2 Confirming selected communities
The task team should present the results of the risk comparison and analysis to the MCU along with the following information to sup-port the decision-making process:
• Executive summary
— A list or table of the communities in rank order of landslide risk together with the hazard, exposure, and vulnerability rat-ings or scores (derived from field recon-naissance results or GIS maps)
— Maps of the landslide hazard, exposure, vulnerability, and risk assessments if GIS methods have been applied
• Appendixes
— Supporting materials detailing the data acquisition and analysis process and pro-viding the rationale behind qualitative heuristic (expert-based) judgments
— Key reconnaissance data sheets or sub-sidiary maps developed as part of the risk assessment process
The MCU should review the list and decide how well each of the priority communities meets the selection criteria and whether they
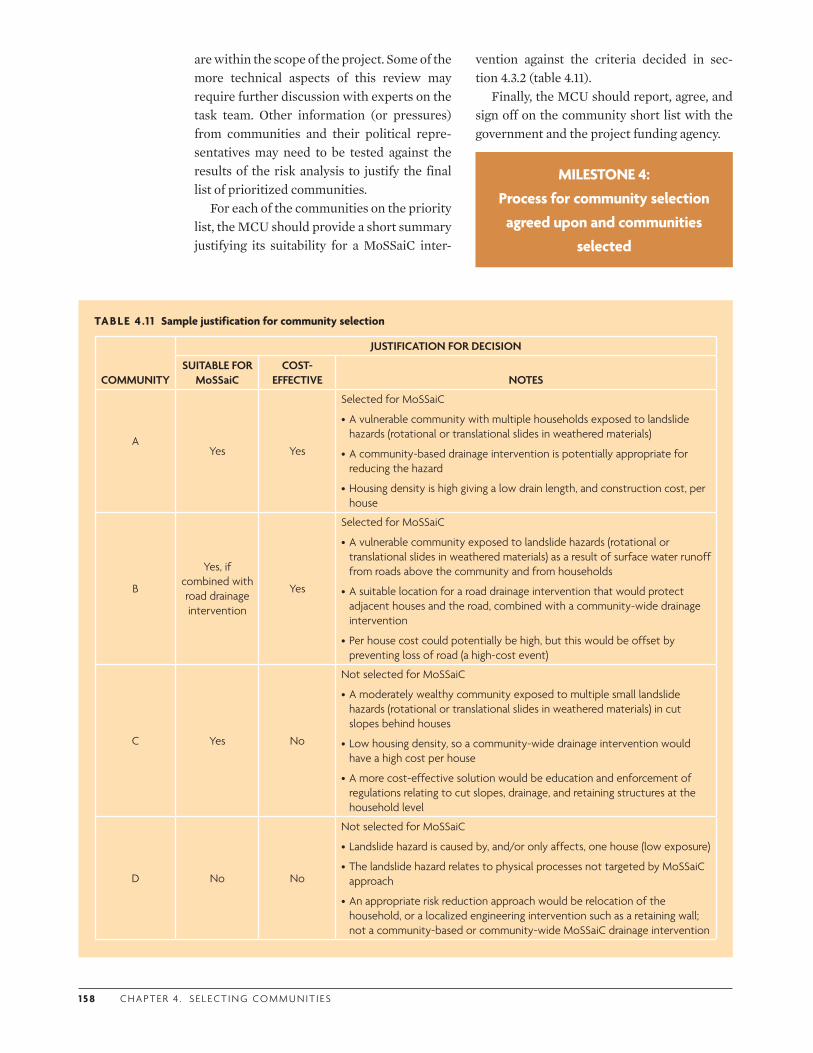
1 5 8 C H A P T E R 4 . S E L E CT I N G CO M M U N I T I ES
are within the scope of the project. Some of the more technical aspects of this review may require further discussion with experts on the task team. Other information (or pressures) from communities and their political repre-sentatives may need to be tested against the results of the risk analysis to justify the final list of prioritized communities.
For each of the communities on the priority list, the MCU should provide a short summary justifying its suitability for a MoSSaiC inter-
vention against the criteria decided in sec-tion 4.3.2 (table 4.11).
Finally, the MCU should report, agree, and sign off on the community short list with the government and the project funding agency.
MILESTONE 4: Process for community selection
agreed upon and communities selected
TABLE 4 .1 1 Sample justification for community selection
COMMUNITY
JUSTIFICATION FOR DECISION
SUITABLE FOR MoSSaiC
COST-EFFECTIVE NOTES
AYes Yes
Selected for MoSSaiC
•A vulnerable community with multiple households exposed to landslide hazards (rotational or translational slides in weathered materials)
•A community-based drainage intervention is potentially appropriate for reducing the hazard
•Housing density is high giving a low drain length, and construction cost, per house
B
Yes, if combined with road drainage intervention
Yes
Selected for MoSSaiC
•A vulnerable community exposed to landslide hazards (rotational or translational slides in weathered materials) as a result of surface water runoff from roads above the community and from households
•A suitable location for a road drainage intervention that would protect adjacent houses and the road, combined with a community-wide drainage intervention
•Per house cost could potentially be high, but this would be offset by preventing loss of road (a high-cost event)
C Yes No
Not selected for MoSSaiC
•A moderately wealthy community exposed to multiple small landslide hazards (rotational or translational slides in weathered materials) in cut slopes behind houses
•Low housing density, so a community-wide drainage intervention would have a high cost per house
•A more cost-effective solution would be education and enforcement of regulations relating to cut slopes, drainage, and retaining structures at the household level
D No No
Not selected for MoSSaiC
•Landslide hazard is caused by, and/or only affects, one house (low exposure)
•The landslide hazard relates to physical processes not targeted by MoSSaiC approach
•An appropriate risk reduction approach would be relocation of the household, or a localized engineering intervention such as a retaining wall; not a community-based or community-wide MoSSaiC drainage intervention
CO M M U N I T Y- BA S E D L A N DS L I D E R I S K R E D U CT I O N 1 59
4.7 PREPARING A BASE MAP FOR DETAILED COMMUNITY MAPPING
Once the list of prioritized communities has been confirmed, the mapping task team should compile all the spatial data available to pro-duce a composite base map for each commu-nity. These maps will be used to identify the precise localized slope processes and trigger-ing mechanisms that contribute to the land-slide hazard in each community. This detailed community mapping is undertaken in the next stage of the project (chapter 5).
The base map is used both as a guide in locating and understanding these slope pro-cesses, and as a template to which detailed observations can be added by the community mapping team and the residents. The anno-tated base map is thus a working document in the identification of landslide causes and potential solutions. It may be used as an input for physically based analysis of slope stability and to communicate slope stability concepts and project aims to the community. And, after many revisions, it will provide the template for the detailed drainage design and work pack-ages for construction.
4.7.1 Useful features
It is useful to work from a geo-referenced map of the community. Such a map will make it easier to analyze the cause/effect relationships between slope features, processes, and land-slide triggering mechanisms, and will allow measurements to be made, other maps to be overlaid, and GPS locations to be identified.
Base maps should be at the most detailed resolution possible to permit identification (or, later, addition) of individual features such as houses, paths, and drainage patterns (fig-ure 4.6a). The area covered by each base map should encompass the topographic unit within which the community resides (i.e., the hillside or drainage subcatchment), since this is the greatest area over which potential landslide mechanisms and associated environmental factors may operate.
Topographic, or contour, maps provide a useful starting point for preparing the base map, since the scale and coordinate system are known and topographic units can be recog-nized. Many topographic maps also include land-use information and the locations of houses, roads, paths, and drainage lines—thus providing a head start in the detailed mapping of a community (figure 4.6b). A base map that includes these features as vectors (points, lines, and polygons) is usually quite clear and easy to interpret; such a document is also very easy to annotate.
4.7.2 Supporting data
Maps of geology, lithology, and soils can pro-vide useful supplementary data in support of field observations and slope stability calcula-tions. In general, however, they should not be included in the base map owing to the sheer volume of information they would add. Aerial and satellite photos can similarly supplement the base map, providing information on the location of houses, paths, and—sometimes—drainage routes; but the density of their infor-mation and the solid coloration of these raster images can make annotation difficult (fig-ure 4.6c). On the other hand, aerial photos are a very useful tool for engaging residents in dis-cussing landslide and drainage issues.
If field reconnaissance forms have been used in the rapid assessment of landslide haz-ard and vulnerability (as described in this chapter), this information should be added to the base map or included in the supplemen-tary material.
4.7.3 Sources of spatial data
If field reconnaissance was the main method-ology for community selection and there are no digital maps, photocopy and scale up any available hard-copy maps of each community as necessary.
Where GIS-based mapping was used in the community selection, print out a high-resolution base map of each community. Ide-ally, the base map should comprise GIS layers with vector data (points, lines, and polygons) showing contours, roads, paths, drains, and

1 6 0 C H A P T E R 4 . S E L E CT I N G CO M M U N I T I ES
houses. Try not to include raster layers, such as aerial photographs or digital elevation models, or layers with soils, geology, and lithology; these data can be provided as sup-plementary maps.
A final source of information for the base map may be surveys and plans generated for previous community projects, such as the con-struction of paths and other infrastructure.
Depending on the quality of the survey con-ducted and whether the plans are geo-refer-enced, such information can be a useful part of the base map. However, maps and information consolidated from government or other sources may not be up to date. Before these can be added, significant on-site verification and further relevant detail may be needed; this process is outlined in section 5.4.
FIGURE 4 .6 Generating the base map from a topography map and an aerial photo
a. A community base map prepared from the original topographic map (b) and updated using an aerial photo (c).
b. A topographic map may be available. In this example, the main roads and some of the houses in the community are also shown.
c. An aerial photograph of the community can be used in updating existing digital maps to create the base map and as a supplementary resource for the community mapping process.
Source: Reproduced with permission of the Chief Surveyor, Ministry of Physical Planning, St. Lucia.
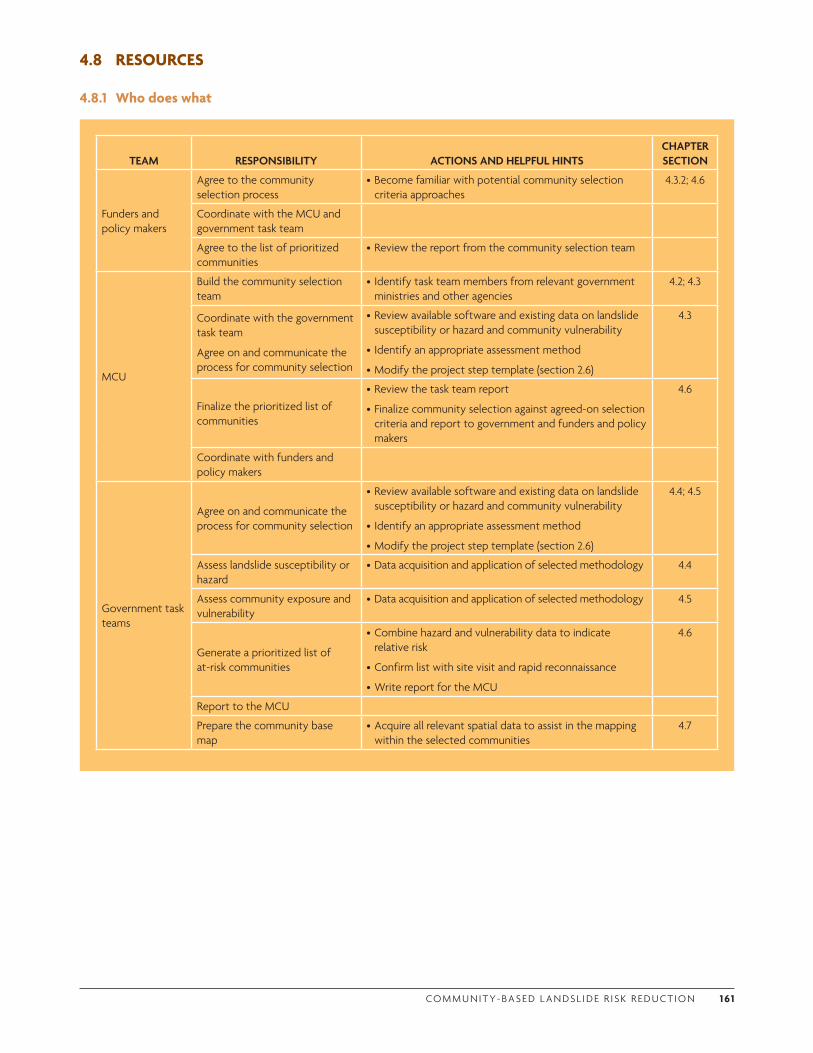
CO M M U N I T Y- BA S E D L A N DS L I D E R I S K R E D U CT I O N 1 61
4.8 RESOURCES
4.8.1 Who does what
TEAM RESPONSIBILITY ACTIONS AND HELPFUL HINTSCHAPTER SECTION
Funders and policy makers
Agree to the community selection process
•Become familiar with potential community selection criteria approaches
4.3.2; 4.6
Coordinate with the MCU and government task team
Agree to the list of prioritized communities
•Review the report from the community selection team
MCU
Build the community selection team
• Identify task team members from relevant government ministries and other agencies
4.2; 4.3
Coordinate with the government task team
Agree on and communicate the process for community selection
•Review available software and existing data on landslide susceptibility or hazard and community vulnerability
• Identify an appropriate assessment method
•Modify the project step template (section 2.6)
4.3
Finalize the prioritized list of communities
•Review the task team report
•Finalize community selection against agreed-on selection criteria and report to government and funders and policy makers
4.6
Coordinate with funders and policy makers
Government task teams
Agree on and communicate the process for community selection
•Review available software and existing data on landslide susceptibility or hazard and community vulnerability
• Identify an appropriate assessment method
•Modify the project step template (section 2.6)
4.4; 4.5
Assess landslide susceptibility or hazard
•Data acquisition and application of selected methodology 4.4
Assess community exposure and vulnerability
•Data acquisition and application of selected methodology 4.5
Generate a prioritized list of at-risk communities
•Combine hazard and vulnerability data to indicate relative risk
•Confirm list with site visit and rapid reconnaissance
•Write report for the MCU
4.6
Report to the MCU
Prepare the community base map
•Acquire all relevant spatial data to assist in the mapping within the selected communities
4.7

1 62 C H A P T E R 4 . S E L E CT I N G CO M M U N I T I ES
CHECK THAT: TEAM PERSONSIGN-OFF
CHAPTER SECTION
Capabilities, personnel, data, and software identified 4.3
Appropriate method specified for selecting communities 4.3.2
Areas of landslide hazard identified and ranked 4.4
Most vulnerable communities identified and ranked 4.5
Overall landslide risk to communities determined and priority communities identified
4.6
Milestone 4: Process for community selection agreed upon and communities selected
4.3.2; 4.6.2
Base maps for the short-listed communities prepared 4.7
All necessary safeguards complied with 1.5.3; 2.3.2
4.8.2 Chapter checklist
4.8.3 References
Australian Geomechanics Society. 2000. “Landslide Risk Management Concepts and Guidelines.” http://australiangeomechanics.org/admin/wp-content/uploads/2010/11/LRM2000-Concepts.pdf.
Castellanos Abella, E. A., and C. J. van Westen. 2007. “Generation of a Landslide Risk Index Map for Cuba Using Spatial Multi-Criteria Evaluation.” Landslides 4: 311–25.
—. 2008. “Qualitative Landslide Susceptibility Assessment by Multicriteria Analysis: A Case Study from San Antonio del Sur, Guantánamo, Cuba.” Geomorphology 94 (3–4): 453–66.
Cheng, P. F. K. 2009. “The New Priority Ranking System for Man-Made Slopes and Retaining Walls.” Special Project Report SPR4/2009, Geotechnical Engineering Office, Government of Hong Kong Special Administrative Region. http://hkss.cedd.gov.hk/hkss/eng/download/SIS/cnprs/SPR%204_2009.pdf.
Crozier, M., and T. Glade. 2005. “Landslide Hazard and Risk: Issues, Concepts and Approach.” In Landslide Hazard and Risk, ed. T. Glade, M. G. Anderson, and M. Crozier, 1–40. Chichester, UK: Wiley.
Cruden, D. M., and D. J. Varnes. 1996. “Landslide Types and Processes.” In Landslides: Investigation and Mitigation, Transportation Research Board Special Report 247, ed. A. K. Turner and R. L. Shuster, 36–75. Washington, DC: National Academies Press.
Dai, F. C., C. F. Lee, and Y. Y. Ngai. 2002. “Landslide Risk Assessment and Management: An Overview.” Engineering Geology 64: 65–87.
Department for International Development. 2006. “Frequently Asked Questions on Disaster Risk Reduction.” http://webarchive.nationalarchives.gov.uk/+/http://www.dfid.gov.uk/Media-Room/News-Stories/2006-to-do/Frequently-Asked-Questions-on-Disaster-Risk-Reduction-/.
Finlay, P. J., G. R. Mostyn, and R. Fell. 1999. “Landslide Risk Assessment: Prediction of Travel Distance.” Canadian Geotechnical Journal 36 (3): 556–62.
Harp, E. L., M. E. Reid, J. P. McKenna, and J. A. Michael. 2009. “Mapping of Hazard from Rainfall-Triggered Landslides in Developing Countries: Examples from Honduras and Micronesia.” Engineering Geology 104 (3–4): 295–311.
Ko Ko, C., P. Flentje, and F. Chowdhury. 2004. “Landslides Qualitative Hazard and Risk Assessment Method and Its Reliability.” Bulletin of Engineering Geology and the Environment 63: 149–65. DOI 10.1007/s10064-004-0231-z http://www.springerlink.com/content/eqa4jf2jq95p7mfa/fulltext.pdf.
Liang, R. Y., 2007. “Landslide Hazard Rating Matrix and Database.” Final report, FHWA/OH-2007/18, U.S. Federal Highways Administration and Ohio Department of Transportation.

CO M M U N I T Y- BA S E D L A N DS L I D E R I S K R E D U CT I O N 1 63
Montgomery, D. R., and W. E. Dietrich. 1994. “A Physically-Based Model for the Topographic Control on Shallow Landsliding.” Water Resources Research 30: 1153–71.
Pack, R. T., D. G. Tarboton, and C. N. Goodwin. 1998. “The SINMAP Approach to Terrain Stability Mapping.” Paper submitted to 8th Congress of the International Association of Engineering Geology, Vancouver, September 21–25. http://hydrology.usu.edu/sinmap/.
van Westen, C. J., E. A. Abella, and L. K. Sekhar. 2008. “Spatial Data for Landslide Susceptibility, Hazards and Vulnerability Assessment: An Overview.” Engineering Geology 102 (3–4): 112–31.
Wong, H. N., and K. K. S. Ho. 1996. “Travel Distance of Landslide Debris.” In Landslides, vol. 1, ed. K. Sennest, 417–22. Rotterdam: Balkema.
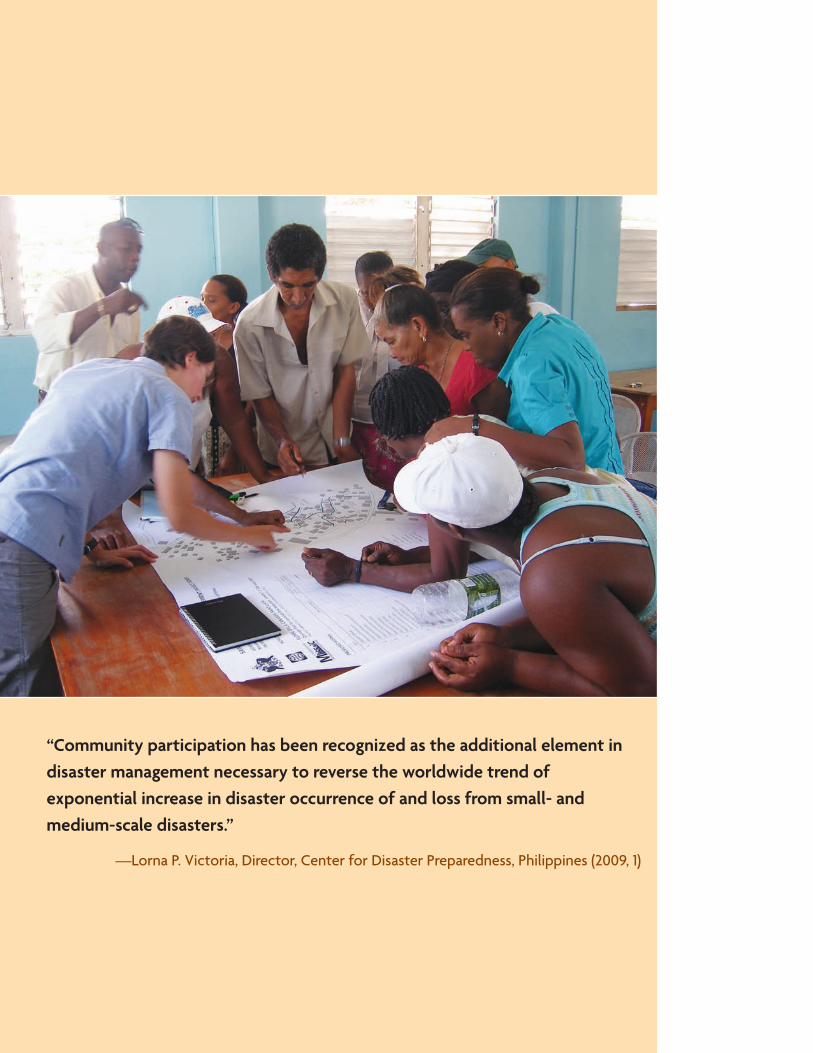
“Community participation has been recognized as the additional element in disaster management necessary to reverse the worldwide trend of exponential increase in disaster occurrence of and loss from small- and medium-scale disasters.”
—Lorna P. Victoria, Director, Center for Disaster Preparedness, Philippines (2009, 1)

1 6 5
CHAPTER 5
Community-Based Mapping for Landslide Hazard Assessment
5.1 KEY CHAPTER ELEMENTS
5.1.1 Coverage
This chapter illustrates how to work with communities to develop a map of slope drain-age and landslide hazard for use in the
MoSSaiC (Management of Slope Stability in Communities) process. The listed groups should read the indicated chapter sections.
AUDIENCELEARNING
CHAPTER SECTIONF M G C
The community mapping process 5.4
How to assess if a MoSSaiC intervention is suitable 5.5, 5.6
How to develop an initial drainage plan for landslide hazard reduction 5.7
F = funders and policy makers M = MoSSaiC core unit: government project managers and experts G = government task teams: experts and practitioners C = community task teams: residents, leaders, contractors
5.1.2 Documents
DOCUMENT TO BE PRODUCEDCHAPTER SECTION
Community slope feature map 5.4
Slope process zone map 5.5
Initial drainage plan 5.7
Priority matrix of slope zones and proposed drainage interventions 5.7
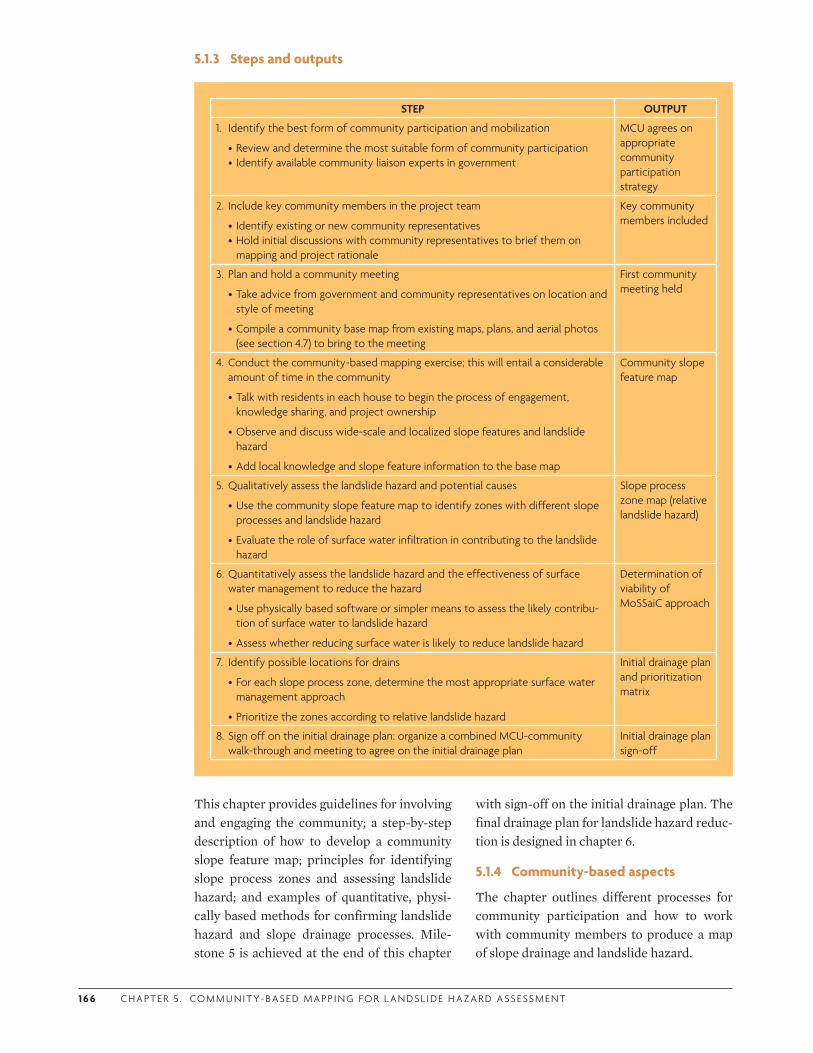
1 6 6 C H A P T E R 5 . COM M U N I T Y- BA S E D M A P P I N G F O R L A N DS L I D E H A Z A R D A SS ESS M E N T
5.1.3 Steps and outputs
This chapter provides guidelines for involving and engaging the community; a step-by-step description of how to develop a community slope feature map; principles for identifying slope process zones and assessing landslide hazard; and examples of quantitative, physi-cally based methods for confirming landslide hazard and slope drainage processes. Mile-stone 5 is achieved at the end of this chapter
with sign-off on the initial drainage plan. The final drainage plan for landslide hazard reduc-tion is designed in chapter 6.
5.1.4 Community-based aspects
The chapter outlines different processes for community participation and how to work with community members to produce a map of slope drainage and landslide hazard.
STEP OUTPUT
1. Identify the best form of community participation and mobilization
•Review and determine the most suitable form of community participation• Identify available community liaison experts in government
MCU agrees on appropriate community participation strategy
2. Include key community members in the project team
• Identify existing or new community representatives•Hold initial discussions with community representatives to brief them on
mapping and project rationale
Key community members included
3. Plan and hold a community meeting
•Take advice from government and community representatives on location and style of meeting
•Compile a community base map from existing maps, plans, and aerial photos (see section 4.7) to bring to the meeting
First community meeting held
4. Conduct the community-based mapping exercise; this will entail a considerable amount of time in the community
•Talk with residents in each house to begin the process of engagement, knowledge sharing, and project ownership
•Observe and discuss wide-scale and localized slope features and landslide hazard
•Add local knowledge and slope feature information to the base map
Community slope feature map
5. Qualitatively assess the landslide hazard and potential causes
•Use the community slope feature map to identify zones with different slope processes and landslide hazard
•Evaluate the role of surface water infiltration in contributing to the landslide hazard
Slope process zone map (relative landslide hazard)
6. Quantitatively assess the landslide hazard and the effectiveness of surface water management to reduce the hazard
•Use physically based software or simpler means to assess the likely contribu-tion of surface water to landslide hazard
•Assess whether reducing surface water is likely to reduce landslide hazard
Determination of viability of MoSSaiC approach
7. Identify possible locations for drains
•For each slope process zone, determine the most appropriate surface water management approach
•Prioritize the zones according to relative landslide hazard
Initial drainage plan and prioritization matrix
8. Sign off on the initial drainage plan: organize a combined MCU-community walk-through and meeting to agree on the initial drainage plan
Initial drainage plan sign-off
CO M M U N I T Y- BA S E D L A N DS L I D E R I S K R E D U CT I O N 1 67
5.2 GETTING STARTED
5.2.1 Briefing note
What is community-based mapping for landslide hazard assessment?
Community-based mapping is a central ele-ment of MoSSaiC. It allows identification of the natural and human causes of slope insta-bility at a sufficiently detailed scale for poten-tial landslide hazard reduction measures to be determined.
The starting point is the mapping of detailed slope features (at scales of 10–50 m) and stabil-ity history based on community residents’ knowledge and careful observations by engi-neers or landslide experts. By mapping slope features at this scale, zones of different slope stability processes and relative landslide haz-ard can be identified. An initial assessment is then made of the role of surface water infiltra-tion in contributing to the landslide hazard, allowing the potential effectiveness of surface water drainage in reducing the landslide haz-ard to be evaluated. Scientific methods are used to confirm and refine the landslide haz-ard assessment. Finally, possible locations of new surface drains are discussed with the community, and an authorized stakeholder signs off on the prioritized zones and initial drainage plan.
Community-based landslide hazard map-ping is a two-way learning process. Engaging with individuals in the community enables the synthesis of their detailed local knowledge of the slope with scientific and engineering knowledge of slope processes. During these discussions, community awareness of slope processes and of good and bad slope manage-ment practices is also likely to be raised.
Why is such a detailed map necessary?
Mapping landslide hazard at the community level is a vital component of the overall land-slide hazard reduction process described in section 1.2.
Community-based mapping is very much the start of the MoSSaiC process in a particu-lar community, and an input to the develop-
ment of landslide hazard reduction measures. The initial community slope feature map is eventually developed into a formal drainage plan (chapter 6) detailing drain alignments, household connections, and other related works for reducing landslide hazard.
In contrast, traditional community-based (participatory) landslide hazard mapping approaches are typically used to provide infor-mation to residents and authorities so that construction can be limited in hazardous loca-tions, disaster preparedness improved, and vulnerability reduced. These landslide hazard maps are usually seen as an output from the exercise rather than an input for designing hazard reduction measures.
Similarly, wide-scale (regional or country-based) landslide hazard maps usually deliver information that provides only general guid-ance as to areas of landslide susceptibility or hazard. Such maps do have a role to play in MoSSaiC, and chapter 4 reviews how they can be generated and used in selecting communi-ties where MoSSaiC projects might be rele-vant. However, the information contained in these maps is not resolved at a sufficiently fine scale to capture the detailed physical causes or triggers of potential landslides (as described in chapter 3). They thus cannot provide enough information to design physical landslide haz-ard mitigation measures in communities.
Landslide processes at the community scale
Understanding the mechanisms that trigger landslides, and the scale at which they operate, provides the scientific basis for mitigating landslide hazard. As outlined in chapter 3, landslide hazard results from a combination of preparatory factors relating to slope geometry, soil and geology, vegetation, surface water and groundwater regimes; and triggering mecha-nisms such as rainfall and seismic events. Tropical regions are especially susceptible to landslides because of high-intensity and high-duration rainfall events, the rapid rate of weathering, and resulting deep soils (often on steep slopes). Rainfall is the main landslide trigger in the tropics, and preliminary evi-dence suggests that climate change could pro-
1 6 8 C H A P T E R 5 . COM M U N I T Y- BA S E D M A P P I N G F O R L A N DS L I D E H A Z A R D A SS ESS M E N T
duce more intense precipitation events in regions such as the Caribbean, thus increasing the probability of landslides (Knutson et al. 2010).
Even without climate change, anthropo-genic activities are increasing landslide risk in some of the most vulnerable communities. These activities include altering slope geome-try with earthworks (cut and fill), changing slope vegetation, loading slopes with buildings and infrastructure; all of which can cause vari-ations in surface water and groundwater regimes. The pressure of development on both land and population results in the poorer, most vulnerable sections of society living on the most-marginal, landslide-prone hillsides.
The scales at which the preparatory and anthropogenic factors operate were summa-rized in chapter 3 (table 3.6). At the hillside scale (100–1,000 m), geographic information system– (GIS-) based mapping techniques can be used to identify zones of increased landslide hazard or susceptibility by overlay-ing and indexing topographic, soil/geology, and vegetation maps. But to predict landslide hazard so as to inform a community-based landslide risk reduction strategy requires that certain parameters be resolved at the house-hold scale (1–10 m). In densely populated communities, it is vital to identify the effects of highly localized surface water regimes, manmade structures, and cut slopes. The sur-face- and groundwater regimes in such loca-tions will vary over short time scales in response to rainfall events and the addition of household water to the slope. These physical parameters need to be modeled in a fully dynamic way (i.e., over time) to reveal the precise mechanisms determining the stability of the slope, and hence how slope stability can be improved.
What information should be on the map?
Detailed community-based mapping of slope features provides information for determining the local slope destabilizing mechanisms and the potential for rainfall-triggered landslides. A well-constructed community slope feature map will
• identify zones of past, present, and poten-tial future landslide hazard;
• provide information about the local topog-raphy (~30 m scale) and mechanisms con-tributing to slope instability such as drain-age and poor construction practices (~10 m scale);
• contain sufficient information to allow a scientific assessment of landslide hazard (using data such as slope angle, basic soil characteristics, vegetation cover, and sources of household water as inputs to slope stability models);
• be sufficiently accurate to allow the provi-sional alignment of new drains to be plotted;
• be comprehensive, incorporating informa-tion from residents and measurements made on the ground; and
• be clear, so that residents, engineers, and decision makers can understand and cor-rectly interpret it.
To meet these criteria, community-based mapping and landslide hazard assessment must be carried out carefully and rigorously.
5.2.2 Guiding principles
The following guiding principles apply in community-based mapping and landslide haz-ard assessment:
• Recognize the importance of full and repeated consultation and discussion with community residents; recognize the value of their knowledge of slope features and processes, and be aware of different con-cerns, perceptions of risk, and competing agendas.
• Ensure that the wider topographic controls on drainage, soil depth, and slope stability are identified; be aware of potential con-nections between features in one part of the slope and the related landslide hazard in another.
• When considering small-scale instability affecting individual houses, be alert to
CO M M U N I T Y- BA S E D L A N DS L I D E R I S K R E D U CT I O N 1 69
potential pressure from owners to solve their specific problems; do not neglect look-ing for wider causes and solutions.
• Construct maps carefully and clearly to ensure all relevant information is captured and available for future reference. Each mapping stage builds on the information from the previous map to develop an accu-rate drainage plan and work packages for construction.
• Undertake repeated community walk-throughs to ensure adherence to all of the above principles.
• Ensure that all relevant safeguards are addressed.
5.2.3 Risks and challenges
Mapping topographic features at the necessary resolution
Identifying major topographic features is a critical element of the walk-through and field survey processes. It is likely that the existing plans and maps incorporated in the commu-nity base map (as described in section 4.7) will not be resolved at sufficient detail to reliably indicate zones of water convergence or diver-gence on the slope. Identification of topo-graphic hollows at a scale of ~30 m is integral to the MoSSaiC mapping process, and time must be spent in carefully identifying such fea-tures, since they are likely to control soil water flow and pore pressure changes, and thus landslide hazard.
Spending sufficient time with the community
Community members can provide a signifi-cant amount of information regarding the drainage conditions that prevail on the slope during heavy rain. Repeated efforts should be made to talk to as many residents as possible. Choose times when the majority of residents are at home, such as early evenings, weekends, and public holidays. Try to visit the commu-nity during heavy rainfall to observe drainage patterns and issues, and to discuss these with residents.
Engage the community in the science of landslide risk reduction from the very begin-ning of the project, using illustrations to help explain slope processes and good slope man-agement practices. This builds trust and encourages those within the community to bid on the possible works.
The slope feature map should be the prod-uct of several visits to the community, not just a single two- to three-day mission. Repeated visits test initial thoughts, encourage the maxi-mum number of community residents to par-ticipate, and provide the best opportunity for securing information critical to the formula-tion of landslide mitigation measures.
Learning by doing
The community-based mapping process is an integral part of community and government training in good practice for landslide risk reduction. The government task teams will need to be open to what they can learn from community residents and from one another. Team members with technical or engineering backgrounds will have to adapt their typical data acquisition and mapping approaches to incorporate community knowledge. Project managers and supervisors of construction works might need to identify new ways to involve community residents and contractors. Conversely, team members with roles in com-munity development will need to familiarize themselves with some of the more technical aspects of the mapping process.
Connecting with key community members
Spending time in the community throughout the process encourages key members of the community to own the project—and, more importantly, to own the methodology. Their engagement thus becomes a significant train-ing opportunity, in that they may thus become advocates for MoSSaiC and potential trainers themselves. Identify respected residents in the community to champion MoSSaiC.
Challenges of community engagement
Communities should not be seen as idealized entities with homogenous views, abilities, or

1 70 C H A P T E R 5 . COM M U N I T Y- BA S E D M A P P I N G F O R L A N DS L I D E H A Z A R D A SS ESS M E N T
vulnerabilities. Recognize that some residents may have diverging agendas.
Residents’ attitudes toward participating in a community-based hazard mapping exercise are likely to be influenced by their perception of risk (chapter 8). In communities where landslides have occurred, residents may some-times be less receptive to mitigation measures than the general public since they are likely to have a sense of powerlessness (Lin et al. 2008).
Although residents may correctly identify slope surface processes and features, their interpretation of the importance of these in determining slope stability may be incomplete. Local knowledge thus must be integrated with scientific and expert knowledge.
5.2.4 Adapting the chapter blueprint to existing capacity
Use the matrix opposite to assess the quality of core mapping data (the base map) for each community, and government capacity to com-bine scientific and community-based knowl-edge of local landslide processes. This informa-tion will guide the process of community-based mapping for landslide hazard assessment.
1. Assign a capacity score from 1 to 3 (low to high) to reflect existing capacity for each element in the matrix’s left-hand column.
2. Identify the most common capacity score as an indicator of the overall capacity level.
3. Adapt the blueprint in this chapter in accor-dance with the overall capacity level (see guide at the bottom of the opposite page).
5.3 DECIDING ON HOW TO WORK WITHIN A COMMUNITY
Before community engagement is instigated, the MoSSaiC core unit (MCU) and the govern-ment task teams should understand different forms of community participation and the community-based foundation for MoSSaiC projects (section 1.4.3).
This section introduces some general com-munity participation principles and identifies specific principles and practices related to MoSSaiC. Comprehensive guidelines on com-munity participation for development and disaster risk reduction are often available from international development agencies and prac-titioners such as nongovernmental organiza-tions (NGOs).
5.3.1 Community participation: Principles
An important MoSSaiC project objective is to achieve behavioral change among all stake-holders regarding landslide risk reduction in communities. To this end, community resi-dents should be enabled to participate in the complete process of mapping, drainage design, contracting, construction, and main-tenance; and government task teams should be prepared to spend significant time on site with the community. MoSSaiC project steps and expenditure profiles should demonstrate government commitment to a high level of community engagement. Previous experi-ence shows that the majority of total project expenditure can be within the community in the form of construction materials and labor costs.
Determine the most appropriate form of participation
Approaches to community participation can be defined as instrumental, collaborative, or supportive. The Active Learning Network for Accountability and Performance in Humani-tarian Action describes these approaches as follows (ALNAP 2003):
• Instrumental approaches regard commu-nity participation as a means of achieving project objectives; while these approaches can build community capacity, this is not a project objective in itself.
• Collaborative approaches are based on exchange of resources throughout the proj-ect cycle in order to achieve a shared objec-tive. With this type of approach, the govern-
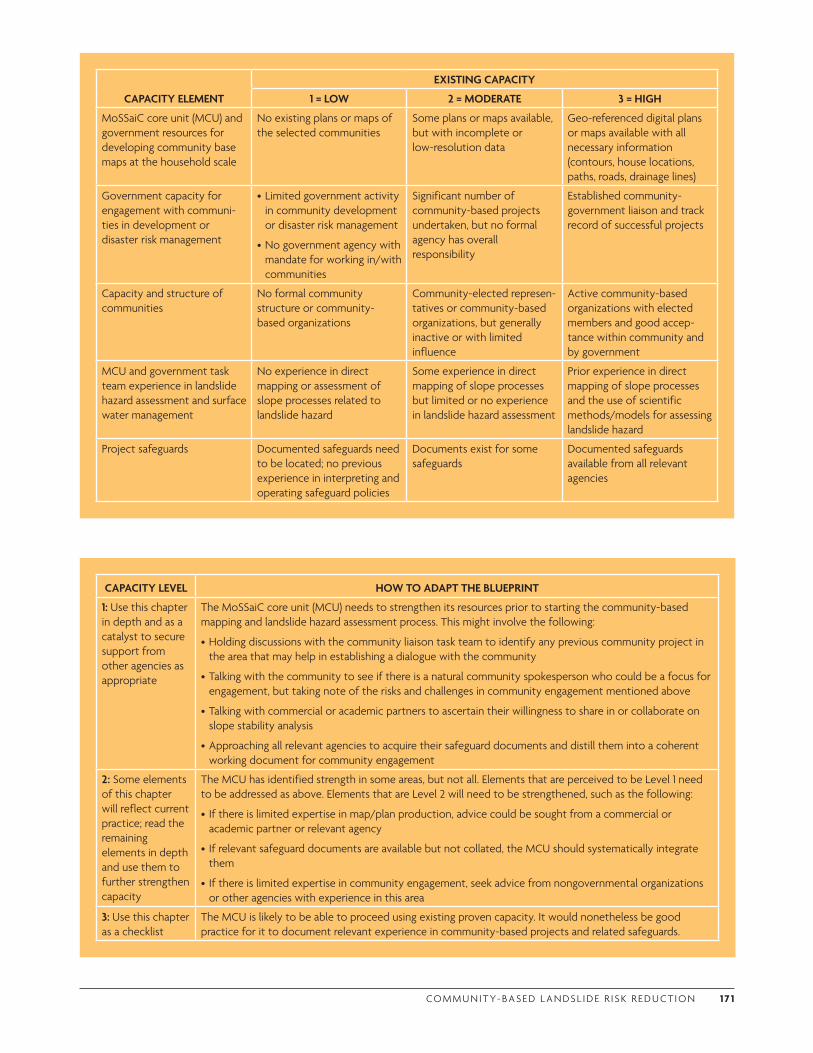
CO M M U N I T Y- BA S E D L A N DS L I D E R I S K R E D U CT I O N 1 7 1
CAPACITY LEVEL HOW TO ADAPT THE BLUEPRINT
1: Use this chapter in depth and as a catalyst to secure support from other agencies as appropriate
The MoSSaiC core unit (MCU) needs to strengthen its resources prior to starting the community-based mapping and landslide hazard assessment process. This might involve the following:
•Holding discussions with the community liaison task team to identify any previous community project in the area that may help in establishing a dialogue with the community
•Talking with the community to see if there is a natural community spokesperson who could be a focus for engagement, but taking note of the risks and challenges in community engagement mentioned above
•Talking with commercial or academic partners to ascertain their willingness to share in or collaborate on slope stability analysis
•Approaching all relevant agencies to acquire their safeguard documents and distill them into a coherent working document for community engagement
2: Some elements of this chapter will reflect current practice; read the remaining elements in depth and use them to further strengthen capacity
The MCU has identified strength in some areas, but not all. Elements that are perceived to be Level 1 need to be addressed as above. Elements that are Level 2 will need to be strengthened, such as the following:
• If there is limited expertise in map/plan production, advice could be sought from a commercial or academic partner or relevant agency
• If relevant safeguard documents are available but not collated, the MCU should systematically integrate them
• If there is limited expertise in community engagement, seek advice from nongovernmental organizations or other agencies with experience in this area
3: Use this chapter as a checklist
The MCU is likely to be able to proceed using existing proven capacity. It would nonetheless be good practice for it to document relevant experience in community-based projects and related safeguards.
CAPACITY ELEMENT
EXISTING CAPACITY
1 = LOW 2 = MODERATE 3 = HIGH
MoSSaiC core unit (MCU) and government resources for developing community base maps at the household scale
No existing plans or maps of the selected communities
Some plans or maps available, but with incomplete or low-resolution data
Geo-referenced digital plans or maps available with all necessary information (contours, house locations, paths, roads, drainage lines)
Government capacity for engagement with communi-ties in development or disaster risk management
•Limited government activity in community development or disaster risk management
•No government agency with mandate for working in/with communities
Significant number of community-based projects undertaken, but no formal agency has overall responsibility
Established community-government liaison and track record of successful projects
Capacity and structure of communities
No formal community structure or community-based organizations
Community-elected represen-tatives or community-based organizations, but generally inactive or with limited influence
Active community-based organizations with elected members and good accep-tance within community and by government
MCU and government task team experience in landslide hazard assessment and surface water management
No experience in direct mapping or assessment of slope processes related to landslide hazard
Some experience in direct mapping of slope processes but limited or no experience in landslide hazard assessment
Prior experience in direct mapping of slope processes and the use of scientific methods/models for assessing landslide hazard
Project safeguards Documented safeguards need to be located; no previous experience in interpreting and operating safeguard policies
Documents exist for some safeguards
Documented safeguards available from all relevant agencies
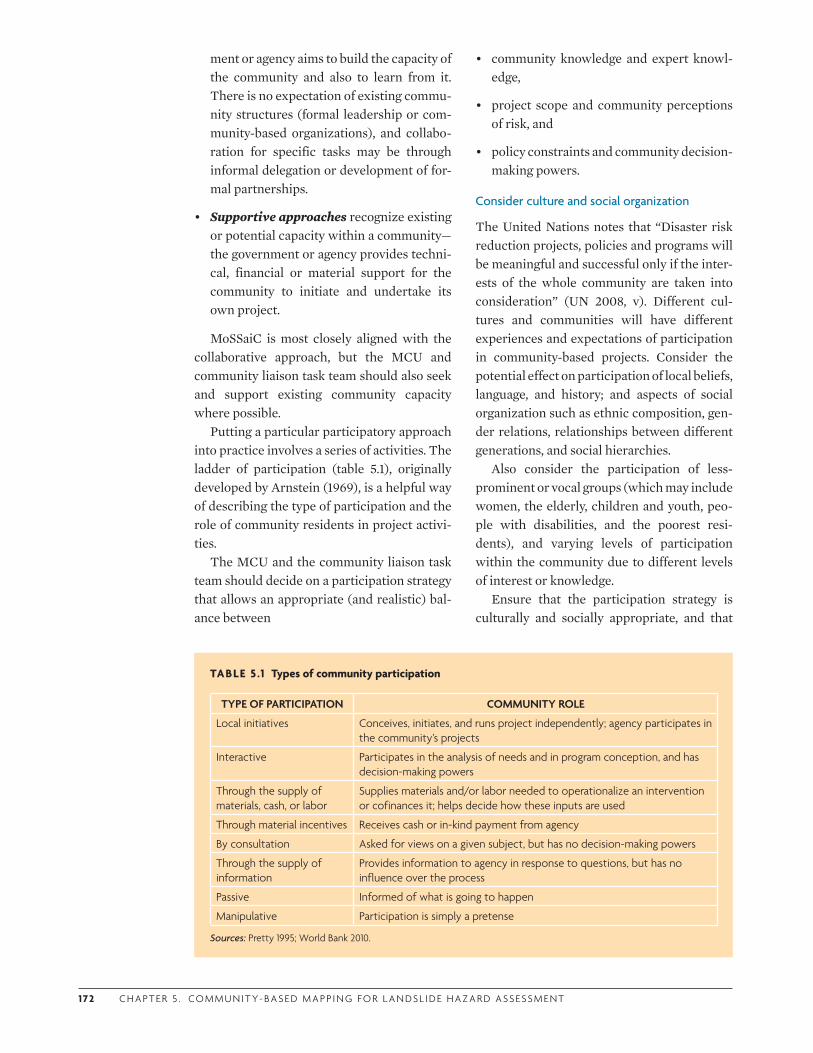
1 72 C H A P T E R 5 . COM M U N I T Y- BA S E D M A P P I N G F O R L A N DS L I D E H A Z A R D A SS ESS M E N T
ment or agency aims to build the capacity of the community and also to learn from it. There is no expectation of existing commu-nity structures (formal leadership or com-munity-based organizations), and collabo-ration for specific tasks may be through informal delegation or development of for-mal partnerships.
• Supportive approaches recognize existing or potential capacity within a community—the government or agency provides techni-cal, financial or material support for the community to initiate and undertake its own project.
MoSSaiC is most closely aligned with the collaborative approach, but the MCU and community liaison task team should also seek and support existing community capacity where possible.
Putting a particular participatory approach into practice involves a series of activities. The ladder of participation (table 5.1), originally developed by Arnstein (1969), is a helpful way of describing the type of participation and the role of community residents in project activi-ties.
The MCU and the community liaison task team should decide on a participation strategy that allows an appropriate (and realistic) bal-ance between
• community knowledge and expert knowl-edge,
• project scope and community perceptions of risk, and
• policy constraints and community decision-making powers.
Consider culture and social organization
The United Nations notes that “Disaster risk reduction projects, policies and programs will be meaningful and successful only if the inter-ests of the whole community are taken into consideration” (UN 2008, v). Different cul-tures and communities will have different experiences and expectations of participation in community-based projects. Consider the potential effect on participation of local beliefs, language, and history; and aspects of social organization such as ethnic composition, gen-der relations, relationships between different generations, and social hierarchies.
Also consider the participation of less-prominent or vocal groups (which may include women, the elderly, children and youth, peo-ple with disabilities, and the poorest resi-dents), and varying levels of participation within the community due to different levels of interest or knowledge.
Ensure that the participation strategy is culturally and socially appropriate, and that
TABLE 5 .1 Types of community participation
TYPE OF PARTICIPATION COMMUNITY ROLE
Local initiatives Conceives, initiates, and runs project independently; agency participates in the community’s projects
Interactive Participates in the analysis of needs and in program conception, and has decision-making powers
Through the supply of materials, cash, or labor
Supplies materials and/or labor needed to operationalize an intervention or cofinances it; helps decide how these inputs are used
Through material incentives Receives cash or in-kind payment from agency
By consultation Asked for views on a given subject, but has no decision-making powers
Through the supply of information
Provides information to agency in response to questions, but has no influence over the process
Passive Informed of what is going to happen
Manipulative Participation is simply a pretense
Sources: Pretty 1995; World Bank 2010.
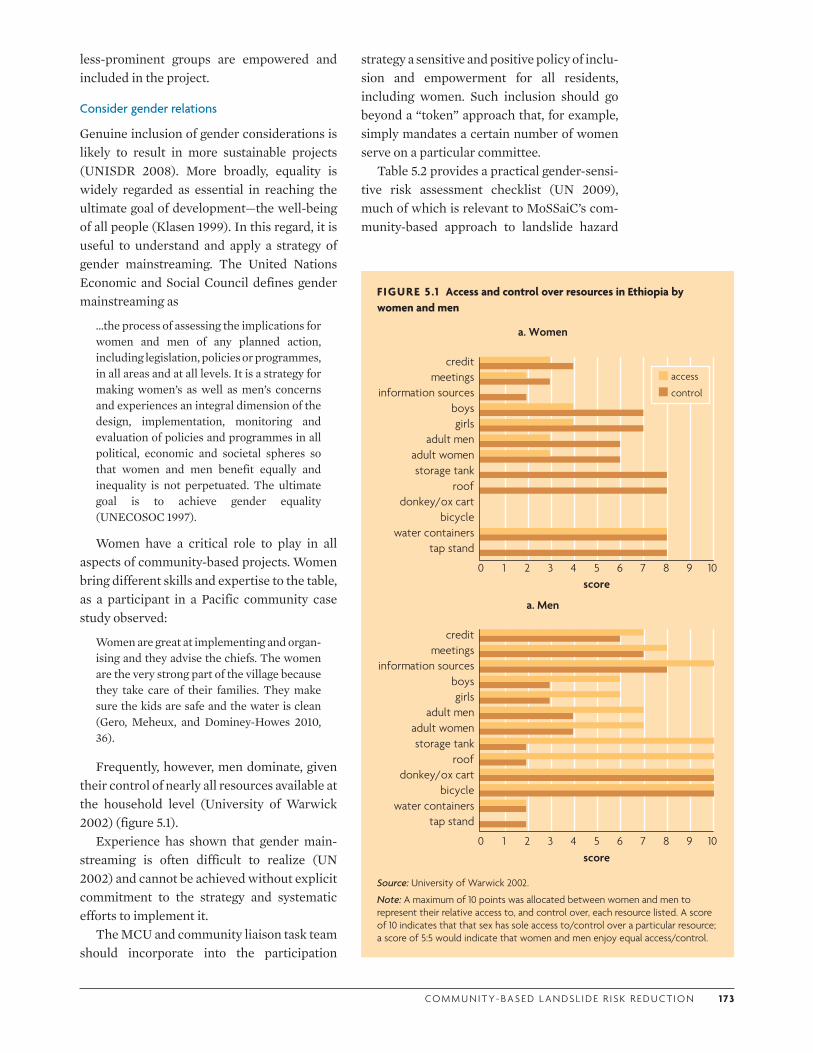
CO M M U N I T Y- BA S E D L A N DS L I D E R I S K R E D U CT I O N 1 73
less-prominent groups are empowered and included in the project.
Consider gender relations
Genuine inclusion of gender considerations is likely to result in more sustainable projects (UNISDR 2008). More broadly, equality is widely regarded as essential in reaching the ultimate goal of development—the well-being of all people (Klasen 1999). In this regard, it is useful to understand and apply a strategy of gender mainstreaming. The United Nations Economic and Social Council defines gender mainstreaming as
…the process of assessing the implications for women and men of any planned action, including legislation, policies or programmes, in all areas and at all levels. It is a strategy for making women’s as well as men’s concerns and experiences an integral dimension of the design, implementation, monitoring and evaluation of policies and programmes in all political, economic and societal spheres so that women and men benefit equally and inequality is not perpetuated. The ultimate goal is to achieve gender equality (UNECOSOC 1997).
Women have a critical role to play in all aspects of community-based projects. Women bring different skills and expertise to the table, as a participant in a Pacific community case study observed:
Women are great at implementing and organ-ising and they advise the chiefs. The women are the very strong part of the village because they take care of their families. They make sure the kids are safe and the water is clean (Gero, Meheux, and Dominey-Howes 2010, 36).
Frequently, however, men dominate, given their control of nearly all resources available at the household level (University of Warwick 2002) (figure 5.1).
Experience has shown that gender main-streaming is often difficult to realize (UN 2002) and cannot be achieved without explicit commitment to the strategy and systematic efforts to implement it.
The MCU and community liaison task team should incorporate into the participation
strategy a sensitive and positive policy of inclu-sion and empowerment for all residents, including women. Such inclusion should go beyond a “token” approach that, for example, simply mandates a certain number of women serve on a particular committee.
Table 5.2 provides a practical gender-sensi-tive risk assessment checklist (UN 2009), much of which is relevant to MoSSaiC’s com-munity-based approach to landslide hazard
FIGURE 5 .1 Access and control over resources in Ethiopia by women and men
2 4 6 8 100
a. Women
tap standwater containers
bicycledonkey/ox cart
roofstorage tank
adult womenadult men
girlsboys
information sourcesmeetings
credit
1 3 5 7 9
2 4 6 8 100
a. Men
tap standwater containers
bicycledonkey/ox cart
roofstorage tank
adult womenadult men
girlsboys
information sourcesmeetings
credit
1 3 5 7 9
score
score
access
control
Source: University of Warwick 2002.
Note: A maximum of 10 points was allocated between women and men to represent their relative access to, and control over, each resource listed. A score of 10 indicates that that sex has sole access to/control over a particular resource; a score of 5:5 would indicate that women and men enjoy equal access/control.
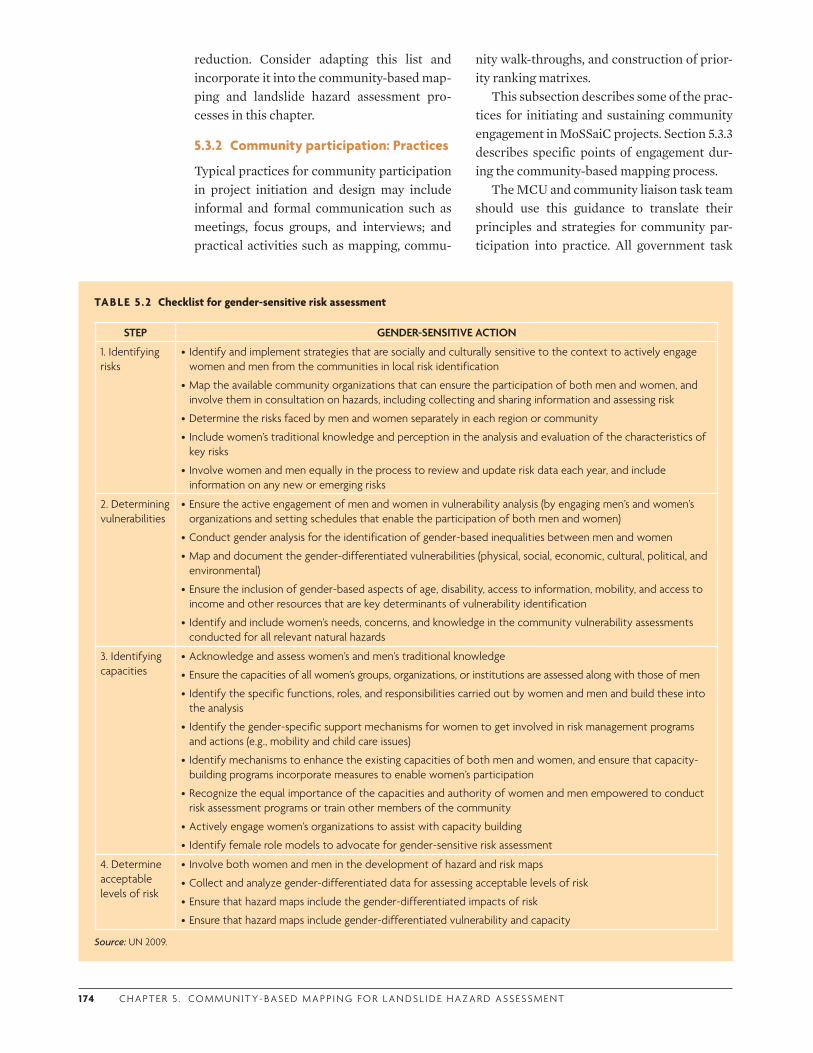
1 74 C H A P T E R 5 . COM M U N I T Y- BA S E D M A P P I N G F O R L A N DS L I D E H A Z A R D A SS ESS M E N T
reduction. Consider adapting this list and incorporate it into the community-based map-ping and landslide hazard assessment pro-cesses in this chapter.
5.3.2 Community participation: Practices
Typical practices for community participation in project initiation and design may include informal and formal communication such as meetings, focus groups, and interviews; and practical activities such as mapping, commu-
TABLE 5 .2 Checklist for gender-sensitive risk assessment
STEP GENDER-SENSITIVE ACTION
1. Identifying risks
• Identify and implement strategies that are socially and culturally sensitive to the context to actively engage women and men from the communities in local risk identification
•Map the available community organizations that can ensure the participation of both men and women, and involve them in consultation on hazards, including collecting and sharing information and assessing risk
•Determine the risks faced by men and women separately in each region or community
• Include women’s traditional knowledge and perception in the analysis and evaluation of the characteristics of key risks
• Involve women and men equally in the process to review and update risk data each year, and include information on any new or emerging risks
2. Determining vulnerabilities
•Ensure the active engagement of men and women in vulnerability analysis (by engaging men’s and women’s organizations and setting schedules that enable the participation of both men and women)
•Conduct gender analysis for the identification of gender-based inequalities between men and women
•Map and document the gender-differentiated vulnerabilities (physical, social, economic, cultural, political, and environmental)
•Ensure the inclusion of gender-based aspects of age, disability, access to information, mobility, and access to income and other resources that are key determinants of vulnerability identification
• Identify and include women’s needs, concerns, and knowledge in the community vulnerability assessments conducted for all relevant natural hazards
3. Identifying capacities
•Acknowledge and assess women’s and men’s traditional knowledge
•Ensure the capacities of all women’s groups, organizations, or institutions are assessed along with those of men
• Identify the specific functions, roles, and responsibilities carried out by women and men and build these into the analysis
• Identify the gender-specific support mechanisms for women to get involved in risk management programs and actions (e.g., mobility and child care issues)
• Identify mechanisms to enhance the existing capacities of both men and women, and ensure that capacity-building programs incorporate measures to enable women’s participation
•Recognize the equal importance of the capacities and authority of women and men empowered to conduct risk assessment programs or train other members of the community
•Actively engage women’s organizations to assist with capacity building
• Identify female role models to advocate for gender-sensitive risk assessment
4. Determine acceptable levels of risk
• Involve both women and men in the development of hazard and risk maps
•Collect and analyze gender-differentiated data for assessing acceptable levels of risk
•Ensure that hazard maps include the gender-differentiated impacts of risk
•Ensure that hazard maps include gender-differentiated vulnerability and capacity
Source: UN 2009.
nity walk-throughs, and construction of prior-ity ranking matrixes.
This subsection describes some of the prac-tices for initiating and sustaining community engagement in MoSSaiC projects. Section 5.3.3 describes specific points of engagement dur-ing the community-based mapping process.
The MCU and community liaison task team should use this guidance to translate their principles and strategies for community par-ticipation into practice. All government task
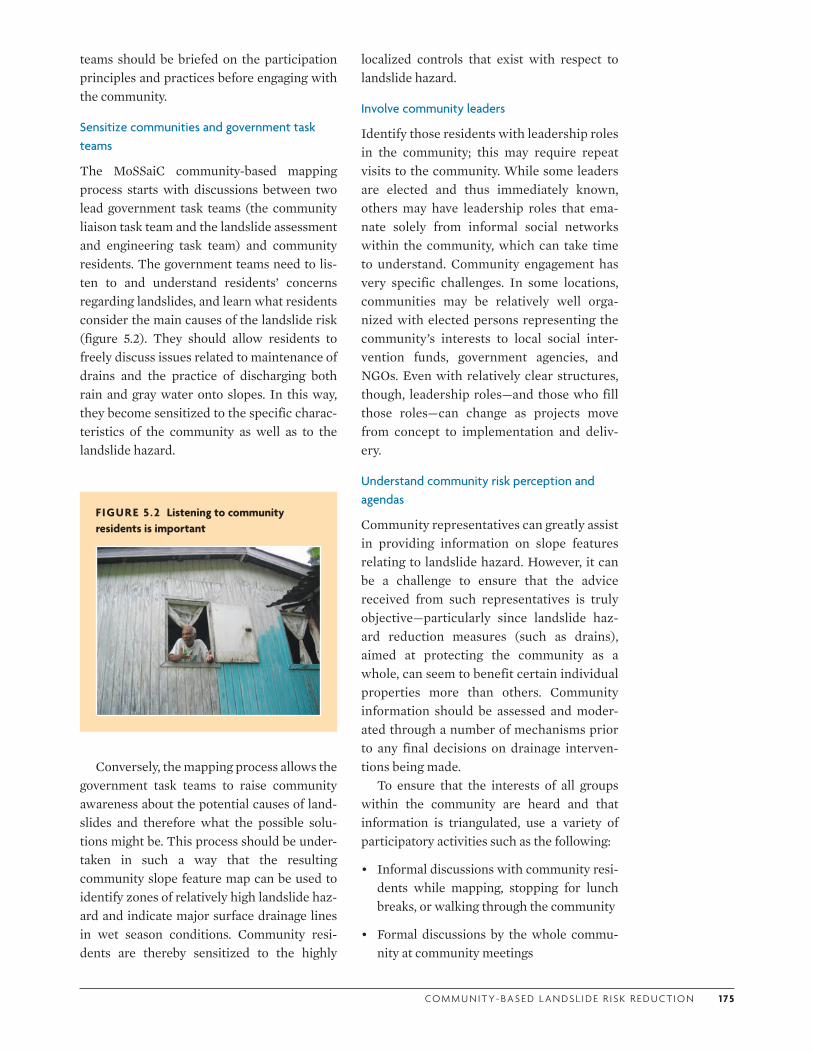
CO M M U N I T Y- BA S E D L A N DS L I D E R I S K R E D U CT I O N 1 75
teams should be briefed on the participation principles and practices before engaging with the community.
Sensitize communities and government task teams
The MoSSaiC community-based mapping process starts with discussions between two lead government task teams (the community liaison task team and the landslide assessment and engineering task team) and community residents. The government teams need to lis-ten to and understand residents’ concerns regarding landslides, and learn what residents consider the main causes of the landslide risk (figure 5.2). They should allow residents to freely discuss issues related to maintenance of drains and the practice of discharging both rain and gray water onto slopes. In this way, they become sensitized to the specific charac-teristics of the community as well as to the landslide hazard.
localized controls that exist with respect to landslide hazard.
Involve community leaders
Identify those residents with leadership roles in the community; this may require repeat visits to the community. While some leaders are elected and thus immediately known, others may have leadership roles that ema-nate solely from informal social networks within the community, which can take time to understand. Community engagement has very specific challenges. In some locations, communities may be relatively well orga-nized with elected persons representing the community’s interests to local social inter-vention funds, government agencies, and NGOs. Even with relatively clear structures, though, leadership roles—and those who fill those roles—can change as projects move from concept to implementation and deliv-ery.
Understand community risk perception and agendas
Community representatives can greatly assist in providing information on slope features relating to landslide hazard. However, it can be a challenge to ensure that the advice received from such representatives is truly objective—particularly since landslide haz-ard reduction measures (such as drains), aimed at protecting the community as a whole, can seem to benefit certain individual properties more than others. Community information should be assessed and moder-ated through a number of mechanisms prior to any final decisions on drainage interven-tions being made.
To ensure that the interests of all groups within the community are heard and that information is triangulated, use a variety of participatory activities such as the following:
• Informal discussions with community resi-dents while mapping, stopping for lunch breaks, or walking through the community
• Formal discussions by the whole commu-nity at community meetings
FIGURE 5 .2 Listening to community residents is important
Conversely, the mapping process allows the government task teams to raise community awareness about the potential causes of land-slides and therefore what the possible solu-tions might be. This process should be under-taken in such a way that the resulting community slope feature map can be used to identify zones of relatively high landslide haz-ard and indicate major surface drainage lines in wet season conditions. Community resi-dents are thereby sensitized to the highly
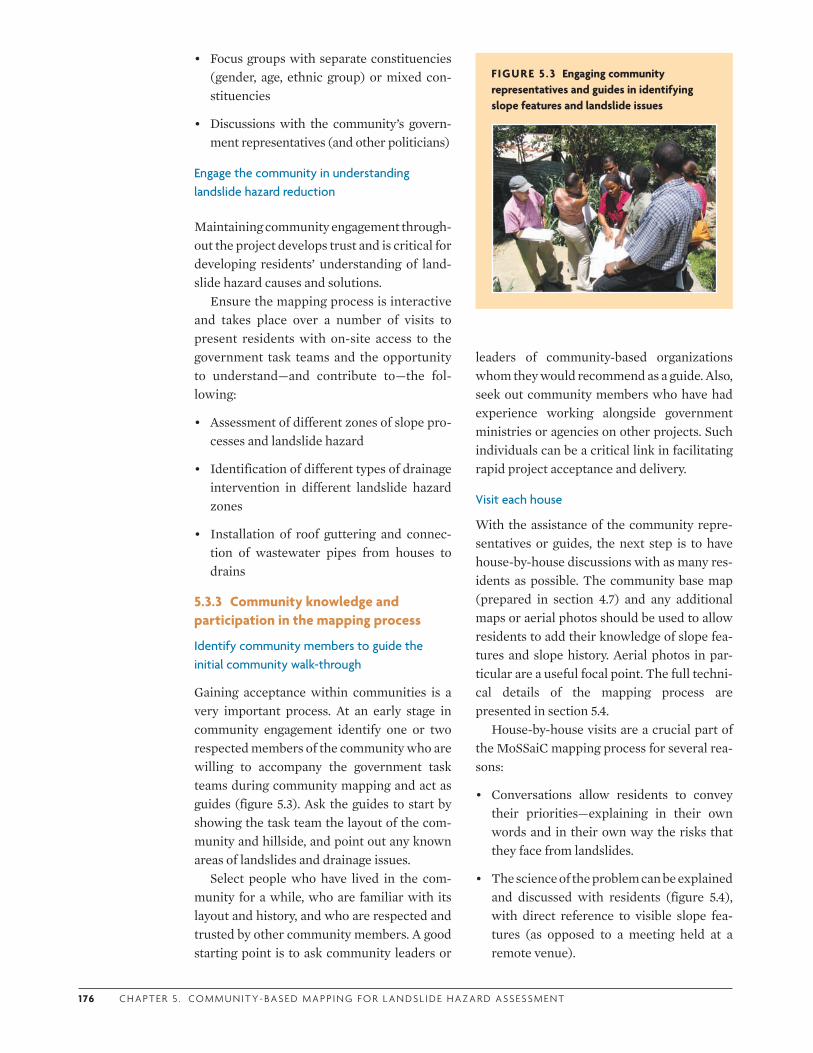
1 76 C H A P T E R 5 . COM M U N I T Y- BA S E D M A P P I N G F O R L A N DS L I D E H A Z A R D A SS ESS M E N T
• Focus groups with separate constituencies (gender, age, ethnic group) or mixed con-stituencies
• Discussions with the community’s govern-ment representatives (and other politicians)
Engage the community in understanding landslide hazard reduction
Maintaining community engagement through-out the project develops trust and is critical for developing residents’ understanding of land-slide hazard causes and solutions.
Ensure the mapping process is interactive and takes place over a number of visits to present residents with on-site access to the government task teams and the opportunity to understand—and contribute to—the fol-lowing:
• Assessment of different zones of slope pro-cesses and landslide hazard
• Identification of different types of drainage intervention in different landslide hazard zones
• Installation of roof guttering and connec-tion of wastewater pipes from houses to drains
5.3.3 Community knowledge and participation in the mapping process
Identify community members to guide the initial community walk-through
Gaining acceptance within communities is a very important process. At an early stage in community engagement identify one or two respected members of the community who are willing to accompany the government task teams during community mapping and act as guides (figure 5.3). Ask the guides to start by showing the task team the layout of the com-munity and hillside, and point out any known areas of landslides and drainage issues.
Select people who have lived in the com-munity for a while, who are familiar with its layout and history, and who are respected and trusted by other community members. A good starting point is to ask community leaders or
leaders of community-based organizations whom they would recommend as a guide. Also, seek out community members who have had experience working alongside government ministries or agencies on other projects. Such individuals can be a critical link in facilitating rapid project acceptance and delivery.
Visit each house
With the assistance of the community repre-sentatives or guides, the next step is to have house-by-house discussions with as many res-idents as possible. The community base map (prepared in section 4.7) and any additional maps or aerial photos should be used to allow residents to add their knowledge of slope fea-tures and slope history. Aerial photos in par-ticular are a useful focal point. The full techni-cal details of the mapping process are presented in section 5.4.
House-by-house visits are a crucial part of the MoSSaiC mapping process for several rea-sons:
• Conversations allow residents to convey their priorities—explaining in their own words and in their own way the risks that they face from landslides.
• The science of the problem can be explained and discussed with residents (figure 5.4), with direct reference to visible slope fea-tures (as opposed to a meeting held at a remote venue).
FIGURE 5 .3 Engaging community representatives and guides in identifying slope features and landslide issues
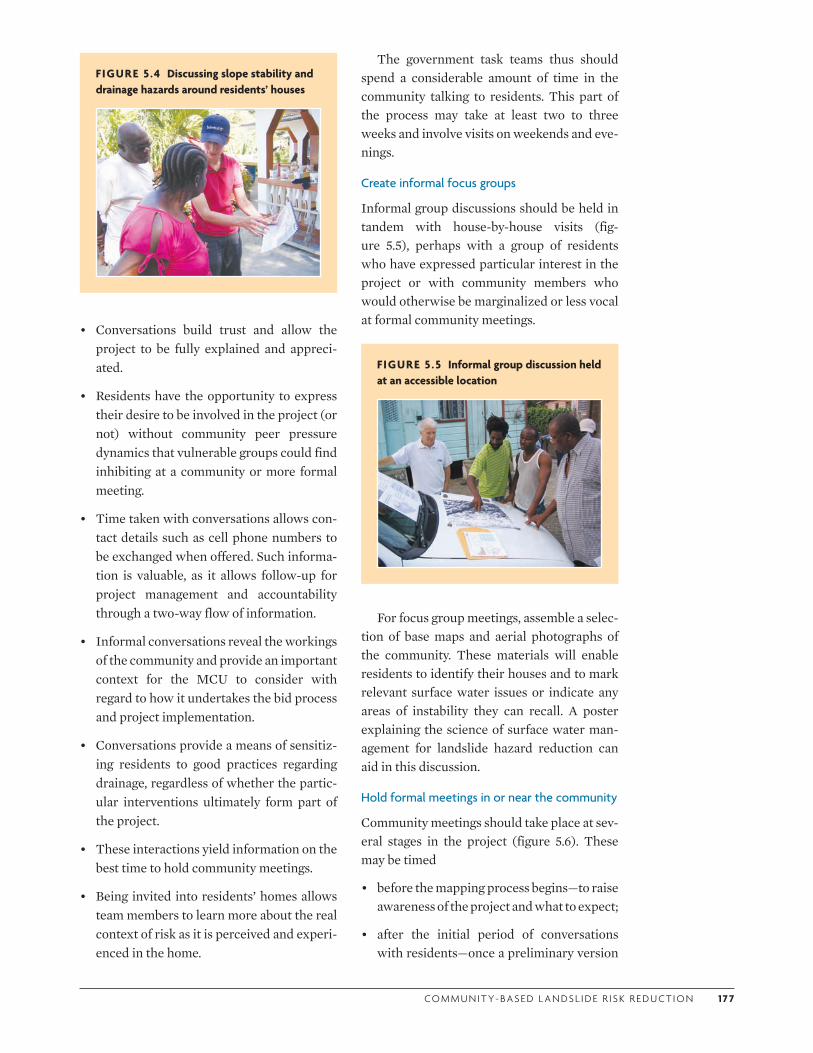
CO M M U N I T Y- BA S E D L A N DS L I D E R I S K R E D U CT I O N 1 7 7
• Conversations build trust and allow the project to be fully explained and appreci-ated.
• Residents have the opportunity to express their desire to be involved in the project (or not) without community peer pressure dynamics that vulnerable groups could find inhibiting at a community or more formal meeting.
• Time taken with conversations allows con-tact details such as cell phone numbers to be exchanged when offered. Such informa-tion is valuable, as it allows follow-up for project management and accountability through a two-way flow of information.
• Informal conversations reveal the workings of the community and provide an important context for the MCU to consider with regard to how it undertakes the bid process and project implementation.
• Conversations provide a means of sensitiz-ing residents to good practices regarding drainage, regardless of whether the partic-ular interventions ultimately form part of the project.
• These interactions yield information on the best time to hold community meetings.
• Being invited into residents’ homes allows team members to learn more about the real context of risk as it is perceived and experi-enced in the home.
The government task teams thus should spend a considerable amount of time in the community talking to residents. This part of the process may take at least two to three weeks and involve visits on weekends and eve-nings.
Create informal focus groups
Informal group discussions should be held in tandem with house-by-house visits (fig-ure 5.5), perhaps with a group of residents who have expressed particular interest in the project or with community members who would otherwise be marginalized or less vocal at formal community meetings.
For focus group meetings, assemble a selec-tion of base maps and aerial photographs of the community. These materials will enable residents to identify their houses and to mark relevant surface water issues or indicate any areas of instability they can recall. A poster explaining the science of surface water man-agement for landslide hazard reduction can aid in this discussion.
Hold formal meetings in or near the community
Community meetings should take place at sev-eral stages in the project (figure 5.6). These may be timed
• before the mapping process begins—to raise awareness of the project and what to expect;
• after the initial period of conversations with residents—once a preliminary version
FIGURE 5 .4 Discussing slope stability and drainage hazards around residents’ houses
FIGURE 5 .5 Informal group discussion held at an accessible location
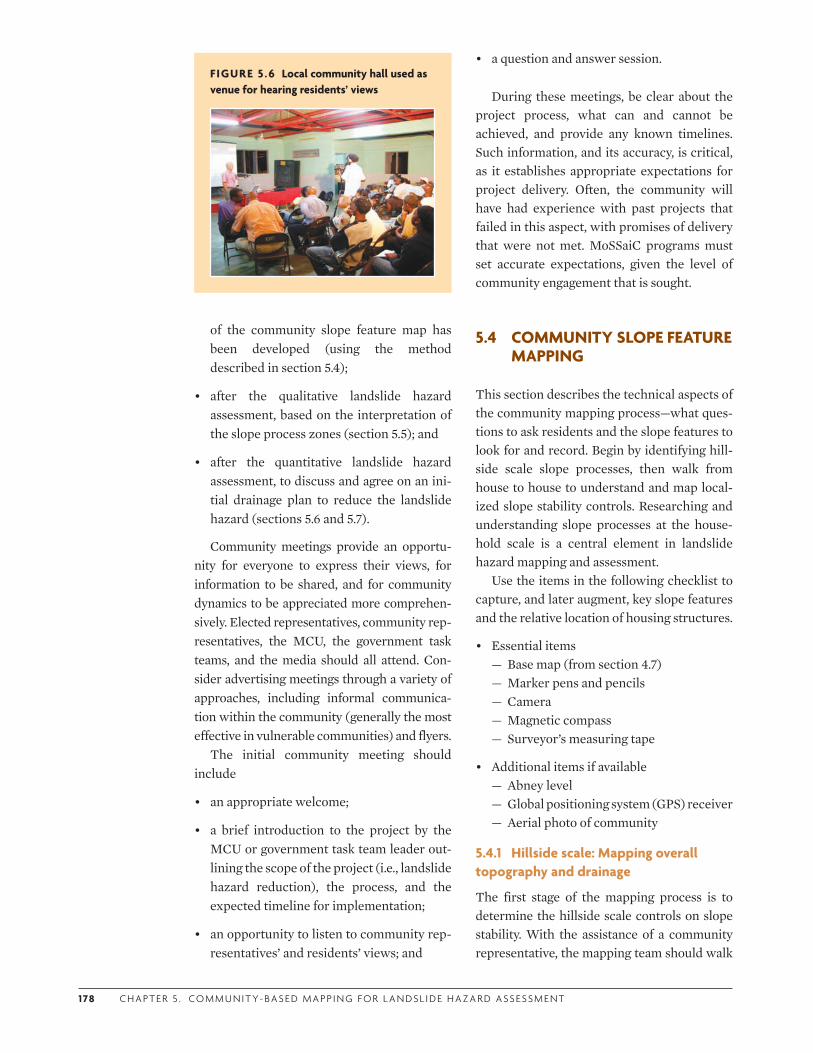
1 78 C H A P T E R 5 . COM M U N I T Y- BA S E D M A P P I N G F O R L A N DS L I D E H A Z A R D A SS ESS M E N T
of the community slope feature map has been developed (using the method described in section 5.4);
• after the qualitative landslide hazard assessment, based on the interpretation of the slope process zones (section 5.5); and
• after the quantitative landslide hazard assessment, to discuss and agree on an ini-tial drainage plan to reduce the landslide hazard (sections 5.6 and 5.7).
Community meetings provide an opportu-nity for everyone to express their views, for information to be shared, and for community dynamics to be appreciated more comprehen-sively. Elected representatives, community rep-resentatives, the MCU, the government task teams, and the media should all attend. Con-sider advertising meetings through a variety of approaches, including informal communica-tion within the community (generally the most effective in vulnerable communities) and flyers.
The initial community meeting should include
• an appropriate welcome;
• a brief introduction to the project by the MCU or government task team leader out-lining the scope of the project (i.e., landslide hazard reduction), the process, and the expected timeline for implementation;
• an opportunity to listen to community rep-resentatives’ and residents’ views; and
FIGURE 5 .6 Local community hall used as venue for hearing residents’ views
• a question and answer session.
During these meetings, be clear about the project process, what can and cannot be achieved, and provide any known timelines. Such information, and its accuracy, is critical, as it establishes appropriate expectations for project delivery. Often, the community will have had experience with past projects that failed in this aspect, with promises of delivery that were not met. MoSSaiC programs must set accurate expectations, given the level of community engagement that is sought.
5.4 COMMUNITY SLOPE FEATURE MAPPING
This section describes the technical aspects of the community mapping process—what ques-tions to ask residents and the slope features to look for and record. Begin by identifying hill-side scale slope processes, then walk from house to house to understand and map local-ized slope stability controls. Researching and understanding slope processes at the house-hold scale is a central element in landslide hazard mapping and assessment.
Use the items in the following checklist to capture, and later augment, key slope features and the relative location of housing structures.
• Essential items — Base map (from section 4.7) — Marker pens and pencils — Camera — Magnetic compass — Surveyor’s measuring tape
• Additional items if available — Abney level — Global positioning system (GPS) receiver — Aerial photo of community
5.4.1 Hillside scale: Mapping overall topography and drainage
The first stage of the mapping process is to determine the hillside scale controls on slope stability. With the assistance of a community representative, the mapping team should walk

CO M M U N I T Y- BA S E D L A N DS L I D E R I S K R E D U CT I O N 1 79
through the community to become familiar with the overall topography, main patterns of water movement, and any variations in slope angle and material. Mark these features on the base map (generated in section 4.7; see fig-ure 5.7a) and add, confirm, or correct the posi-tions of houses, paths, drainage lines, and other key structures. Use a compass to take bearings or a GPS receiver to record coordinates; if available, use an aerial photograph (figure 5.7b) to help with navigation and mapping.
Topography and natural drainage
Topography affects drainage, soil formation, and slope stability over scales as localized as 20–50 m. It can be difficult to recognize topo-graphic features at this scale for several rea-sons:
• Vegetation can mask the view over even very short distances.
• Unauthorized housing can give a false impression of the topography.
• Contours on topographic maps may be interpolated from coarser resolution sur-veys, thus smoothing out these features (note the relatively straight and evenly spaced contours depicted in figure 5.7a).
The topography of a slope should be described in terms of its constituent convex, concave, or planar (straight) elements, in plan and section (figure 5.8) at a scale of ~20–50 m. In particular, the mapping team should be careful to identify concave topographic ele-ments and associated slope processes.
• Concave downslope profile (concave in section). Soil depth is often related to topography. Where the slope profile is con-cave in section (types 7, 8, and 9 in fig-ure 5.8), it is common for soil depth to increase downslope (figure 5.9). This is due to the erosion or mass wasting of soils from upper slope sections and the deposition of this material on lower slopes. The depth and relative lack of strength of accumulated soils (colluvium) makes them particularly prone to landslides (section 3.5.3).
FIGURE 5 .7 Community base map and supplementary aerial photograph
a. A typical community base map compiled from existing contour data and building footprints extracted from a recent aerial photo. Contours may be interpolated and are best used as a general guide to topographic variations (convergent/divergent zones and drainage patterns). See figure 5.18 for an example of this map with slope process features added.
b. An aerial photograph of the community can help with identifying structures and other landmarks.
Source: Reproduced with permission of the Chief Surveyor, Ministry of Physical Planning, St. Lucia.
A downslope increase in soil depth can have a broadly counterintuitive effect: steeper slopes, higher up the hillside, can exhibit stability because of their shallower soils or exposed rock (figure 5.10a), while relatively shallow slopes further downslope may, in certain circumstances, prove less stable due to the accumulation of deeper soils (fig-ure 5.10b).
• Topographic convergence zones (concave in plan). Areas of the hillside that are con-
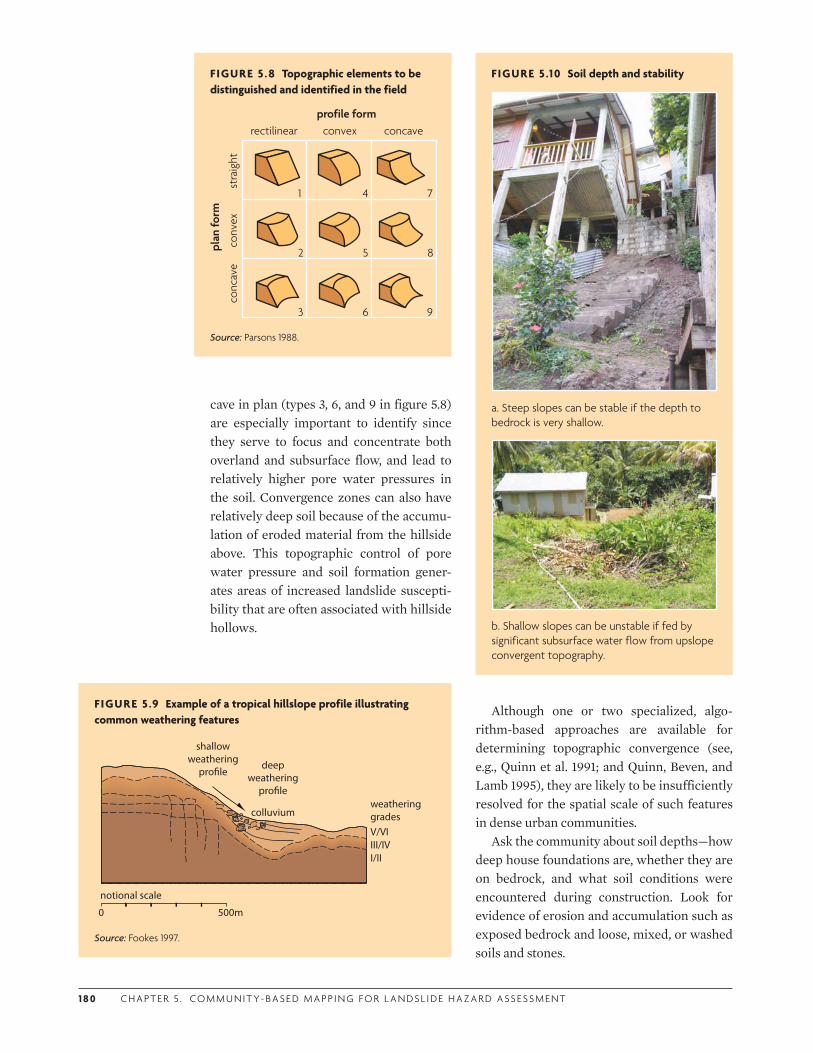
1 8 0 C H A P T E R 5 . COM M U N I T Y- BA S E D M A P P I N G F O R L A N DS L I D E H A Z A R D A SS ESS M E N T
cave in plan (types 3, 6, and 9 in figure 5.8) are especially important to identify since they serve to focus and concentrate both overland and subsurface flow, and lead to relatively higher pore water pressures in the soil. Convergence zones can also have relatively deep soil because of the accumu-lation of eroded material from the hillside above. This topographic control of pore water pressure and soil formation gener-ates areas of increased landslide suscepti-bility that are often associated with hillside hollows.
FIGURE 5 .8 Topographic elements to be distinguished and identified in the field
rectilinear convex concave
conc
ave
conv
exst
raig
ht
profile form
plan
form
1 4 7
2 5 8
3 6 9
Source: Parsons 1988.
Although one or two specialized, algo-rithm-based approaches are available for determining topographic convergence (see, e.g., Quinn et al. 1991; and Quinn, Beven, and Lamb 1995), they are likely to be insufficiently resolved for the spatial scale of such features in dense urban communities.
Ask the community about soil depths—how deep house foundations are, whether they are on bedrock, and what soil conditions were encountered during construction. Look for evidence of erosion and accumulation such as exposed bedrock and loose, mixed, or washed soils and stones.
FIGURE 5 .9 Example of a tropical hillslope profile illustrating common weathering features
V/VIIII/IVI/II
colluviumweathering grades
deep weathering
pro�le
shallow weathering
pro�le
notional scale
500m0
Source: Fookes 1997.
FIGURE 5 .10 Soil depth and stability
a. Steep slopes can be stable if the depth to bedrock is very shallow.
b. Shallow slopes can be unstable if fed by significant subsurface water flow from upslope convergent topography.
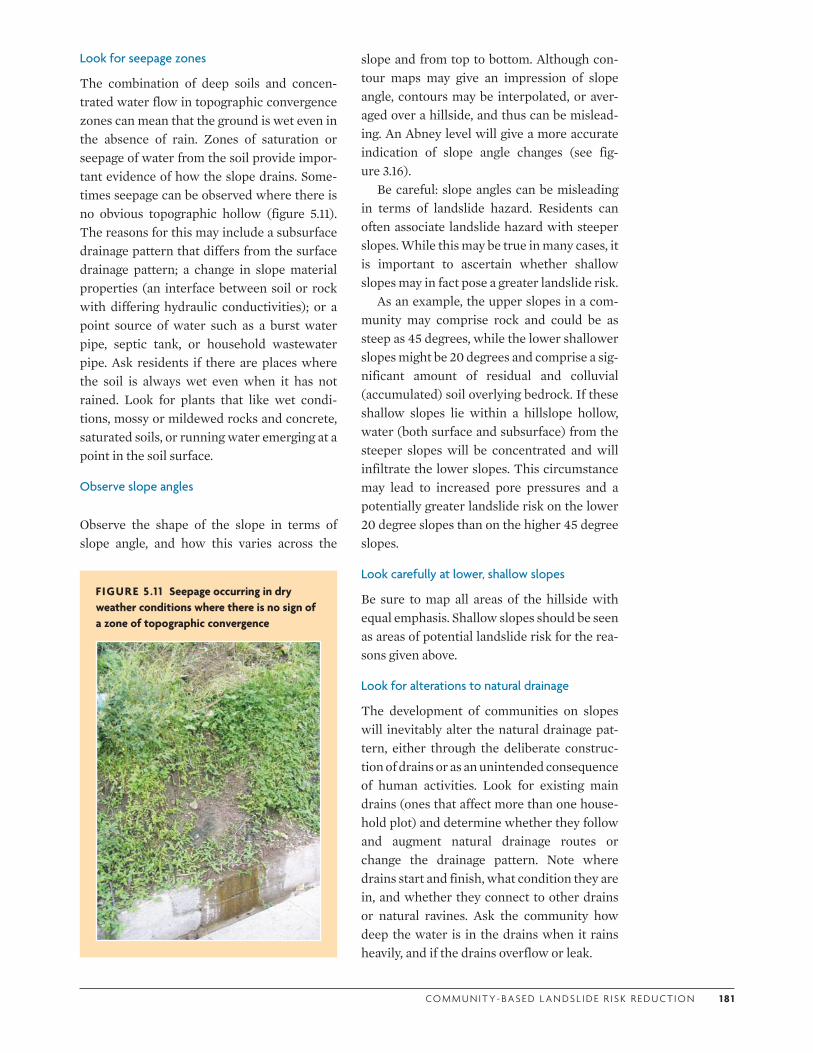
CO M M U N I T Y- BA S E D L A N DS L I D E R I S K R E D U CT I O N 1 8 1
Look for seepage zones
The combination of deep soils and concen-trated water flow in topographic convergence zones can mean that the ground is wet even in the absence of rain. Zones of saturation or seepage of water from the soil provide impor-tant evidence of how the slope drains. Some-times seepage can be observed where there is no obvious topographic hollow (figure 5.11). The reasons for this may include a subsurface drainage pattern that differs from the surface drainage pattern; a change in slope material properties (an interface between soil or rock with differing hydraulic conductivities); or a point source of water such as a burst water pipe, septic tank, or household wastewater pipe. Ask residents if there are places where the soil is always wet even when it has not rained. Look for plants that like wet condi-tions, mossy or mildewed rocks and concrete, saturated soils, or running water emerging at a point in the soil surface.
Observe slope angles
Observe the shape of the slope in terms of slope angle, and how this varies across the
slope and from top to bottom. Although con-tour maps may give an impression of slope angle, contours may be interpolated, or aver-aged over a hillside, and thus can be mislead-ing. An Abney level will give a more accurate indication of slope angle changes (see fig-ure 3.16).
Be careful: slope angles can be misleading in terms of landslide hazard. Residents can often associate landslide hazard with steeper slopes. While this may be true in many cases, it is important to ascertain whether shallow slopes may in fact pose a greater landslide risk.
As an example, the upper slopes in a com-munity may comprise rock and could be as steep as 45 degrees, while the lower shallower slopes might be 20 degrees and comprise a sig-nificant amount of residual and colluvial (accumulated) soil overlying bedrock. If these shallow slopes lie within a hillslope hollow, water (both surface and subsurface) from the steeper slopes will be concentrated and will infiltrate the lower slopes. This circumstance may lead to increased pore pressures and a potentially greater landslide risk on the lower 20 degree slopes than on the higher 45 degree slopes.
Look carefully at lower, shallow slopes
Be sure to map all areas of the hillside with equal emphasis. Shallow slopes should be seen as areas of potential landslide risk for the rea-sons given above.
Look for alterations to natural drainage
The development of communities on slopes will inevitably alter the natural drainage pat-tern, either through the deliberate construc-tion of drains or as an unintended consequence of human activities. Look for existing main drains (ones that affect more than one house-hold plot) and determine whether they follow and augment natural drainage routes or change the drainage pattern. Note where drains start and finish, what condition they are in, and whether they connect to other drains or natural ravines. Ask the community how deep the water is in the drains when it rains heavily, and if the drains overflow or leak.
FIGURE 5 .1 1 Seepage occurring in dry weather conditions where there is no sign of a zone of topographic convergence
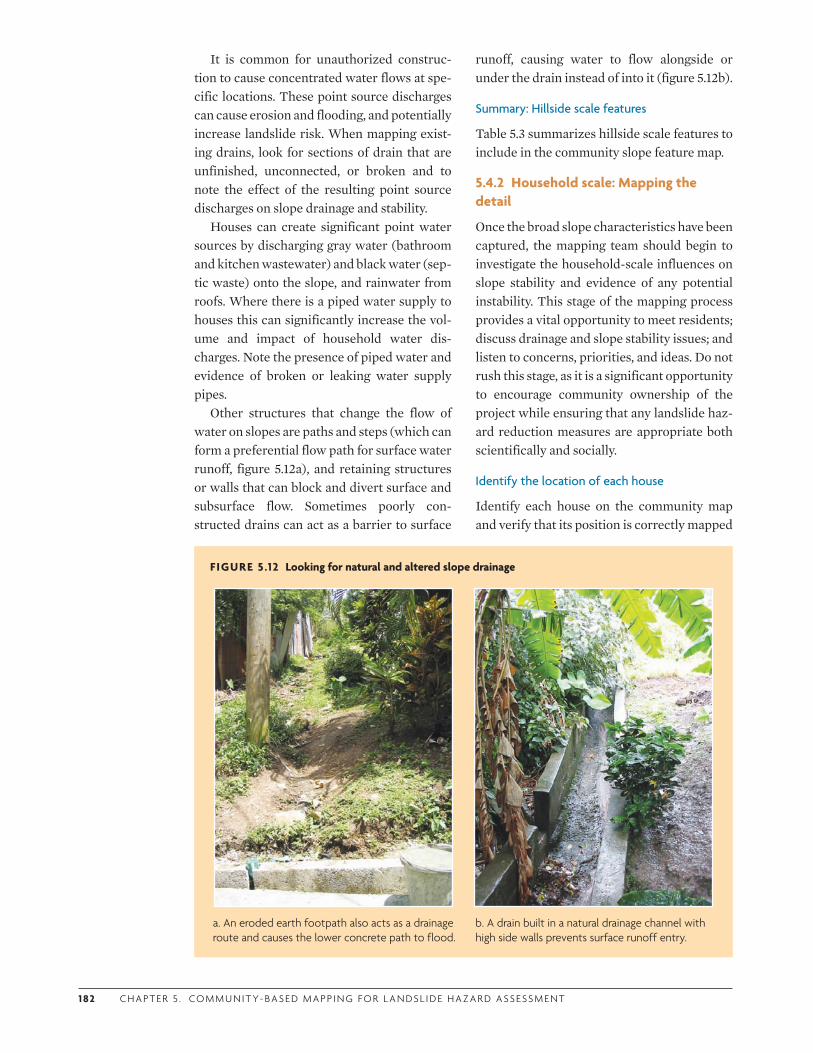
1 82 C H A P T E R 5 . COM M U N I T Y- BA S E D M A P P I N G F O R L A N DS L I D E H A Z A R D A SS ESS M E N T
It is common for unauthorized construc-tion to cause concentrated water flows at spe-cific locations. These point source discharges can cause erosion and flooding, and potentially increase landslide risk. When mapping exist-ing drains, look for sections of drain that are unfinished, unconnected, or broken and to note the effect of the resulting point source discharges on slope drainage and stability.
Houses can create significant point water sources by discharging gray water (bathroom and kitchen wastewater) and black water (sep-tic waste) onto the slope, and rainwater from roofs. Where there is a piped water supply to houses this can significantly increase the vol-ume and impact of household water dis-charges. Note the presence of piped water and evidence of broken or leaking water supply pipes.
Other structures that change the flow of water on slopes are paths and steps (which can form a preferential flow path for surface water runoff, figure 5.12a), and retaining structures or walls that can block and divert surface and subsurface flow. Sometimes poorly con-structed drains can act as a barrier to surface
runoff, causing water to flow alongside or under the drain instead of into it (figure 5.12b).
Summary: Hillside scale features
Table 5.3 summarizes hillside scale features to include in the community slope feature map.
5.4.2 Household scale: Mapping the detail
Once the broad slope characteristics have been captured, the mapping team should begin to investigate the household-scale influences on slope stability and evidence of any potential instability. This stage of the mapping process provides a vital opportunity to meet residents; discuss drainage and slope stability issues; and listen to concerns, priorities, and ideas. Do not rush this stage, as it is a significant opportunity to encourage community ownership of the project while ensuring that any landslide haz-ard reduction measures are appropriate both scientifically and socially.
Identify the location of each house
Identify each house on the community map and verify that its position is correctly mapped
FIGURE 5 .12 Looking for natural and altered slope drainage
a. An eroded earth footpath also acts as a drainage route and causes the lower concrete path to flood.
b. A drain built in a natural drainage channel with high side walls prevents surface runoff entry.
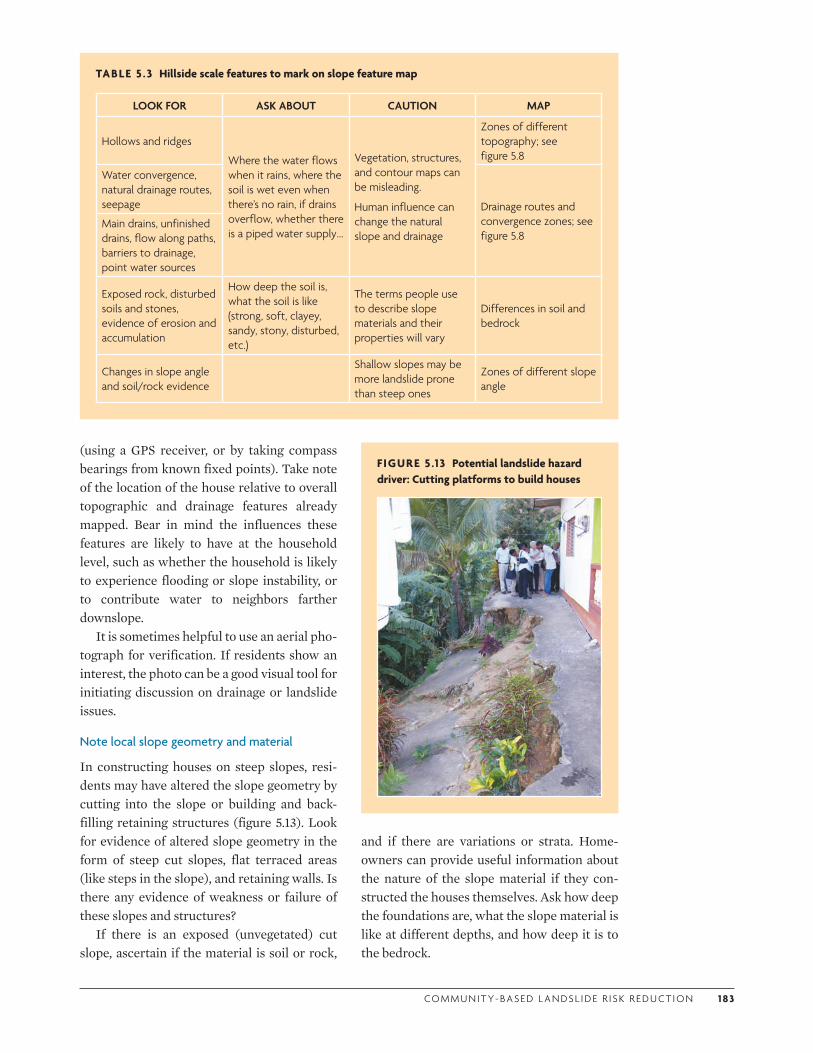
CO M M U N I T Y- BA S E D L A N DS L I D E R I S K R E D U CT I O N 1 83
TABLE 5 .3 Hillside scale features to mark on slope feature map
LOOK FOR ASK ABOUT CAUTION MAP
Hollows and ridges
Where the water flows when it rains, where the soil is wet even when there’s no rain, if drains overflow, whether there is a piped water supply…
Vegetation, structures, and contour maps can be misleading.
Human influence can change the natural slope and drainage
Zones of different topography; see figure 5.8
Water convergence, natural drainage routes, seepage Drainage routes and
convergence zones; see figure 5.8
Main drains, unfinished drains, flow along paths, barriers to drainage, point water sources
Exposed rock, disturbed soils and stones, evidence of erosion and accumulation
How deep the soil is, what the soil is like (strong, soft, clayey, sandy, stony, disturbed, etc.)
The terms people use to describe slope materials and their properties will vary
Differences in soil and bedrock
Changes in slope angle and soil/rock evidence
Shallow slopes may be more landslide prone than steep ones
Zones of different slope angle
(using a GPS receiver, or by taking compass bearings from known fixed points). Take note of the location of the house relative to overall topographic and drainage features already mapped. Bear in mind the influences these features are likely to have at the household level, such as whether the household is likely to experience flooding or slope instability, or to contribute water to neighbors farther downslope.
It is sometimes helpful to use an aerial pho-tograph for verification. If residents show an interest, the photo can be a good visual tool for initiating discussion on drainage or landslide issues.
Note local slope geometry and material
In constructing houses on steep slopes, resi-dents may have altered the slope geometry by cutting into the slope or building and back-filling retaining structures (figure 5.13). Look for evidence of altered slope geometry in the form of steep cut slopes, flat terraced areas (like steps in the slope), and retaining walls. Is there any evidence of weakness or failure of these slopes and structures?
If there is an exposed (unvegetated) cut slope, ascertain if the material is soil or rock,
and if there are variations or strata. Home-owners can provide useful information about the nature of the slope material if they con-structed the houses themselves. Ask how deep the foundations are, what the slope material is like at different depths, and how deep it is to the bedrock.
FIGURE 5 .13 Potential landslide hazard driver: Cutting platforms to build houses
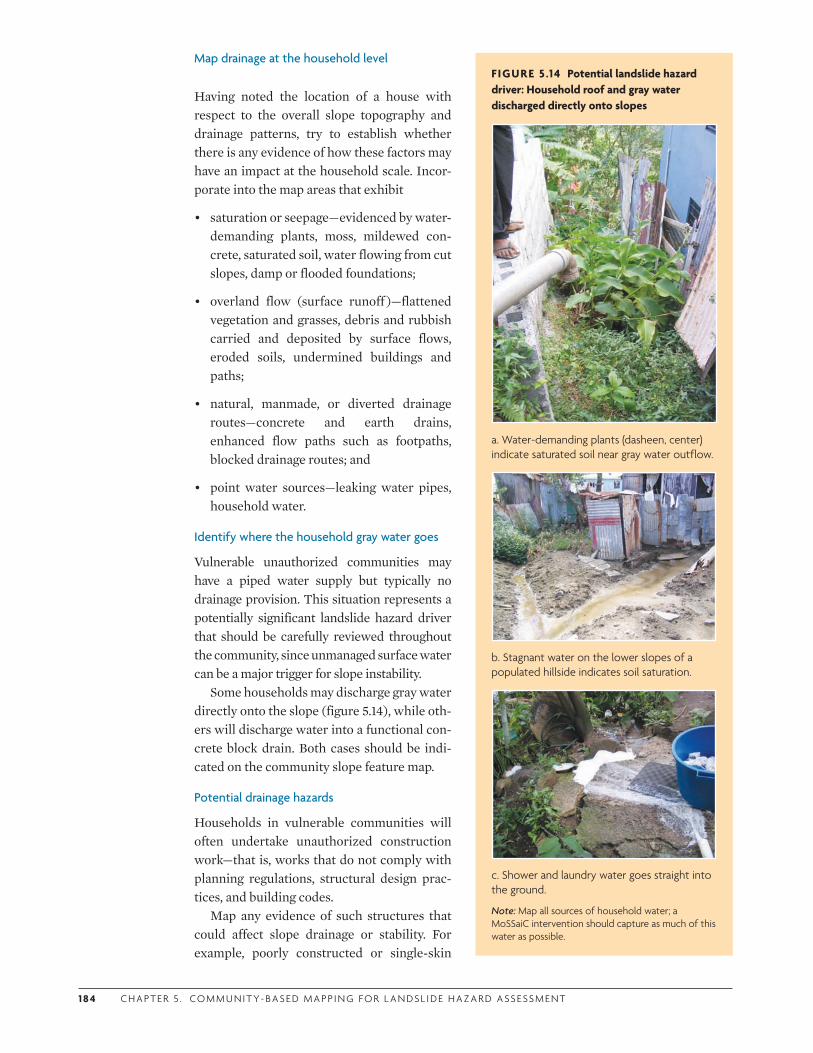
1 8 4 C H A P T E R 5 . COM M U N I T Y- BA S E D M A P P I N G F O R L A N DS L I D E H A Z A R D A SS ESS M E N T
Map drainage at the household level
Having noted the location of a house with respect to the overall slope topography and drainage patterns, try to establish whether there is any evidence of how these factors may have an impact at the household scale. Incor-porate into the map areas that exhibit
• saturation or seepage—evidenced by water-demanding plants, moss, mildewed con-crete, saturated soil, water flowing from cut slopes, damp or flooded foundations;
• overland flow (surface runoff )—flattened vegetation and grasses, debris and rubbish carried and deposited by surface flows, eroded soils, undermined buildings and paths;
• natural, manmade, or diverted drainage routes—concrete and earth drains, enhanced flow paths such as footpaths, blocked drainage routes; and
• point water sources—leaking water pipes, household water.
Identify where the household gray water goes
Vulnerable unauthorized communities may have a piped water supply but typically no drainage provision. This situation represents a potentially significant landslide hazard driver that should be carefully reviewed throughout the community, since unmanaged surface water can be a major trigger for slope instability.
Some households may discharge gray water directly onto the slope (figure 5.14), while oth-ers will discharge water into a functional con-crete block drain. Both cases should be indi-cated on the community slope feature map.
Potential drainage hazards
Households in vulnerable communities will often undertake unauthorized construction work—that is, works that do not comply with planning regulations, structural design prac-tices, and building codes.
Map any evidence of such structures that could affect slope drainage or stability. For example, poorly constructed or single-skin
FIGURE 5 .14 Potential landslide hazard driver: Household roof and gray water discharged directly onto slopes
a. Water-demanding plants (dasheen, center) indicate saturated soil near gray water outflow.
b. Stagnant water on the lower slopes of a populated hillside indicates soil saturation.
c. Shower and laundry water goes straight into the ground.
Note: Map all sources of household water; a MoSSaiC intervention should capture as much of this water as possible.
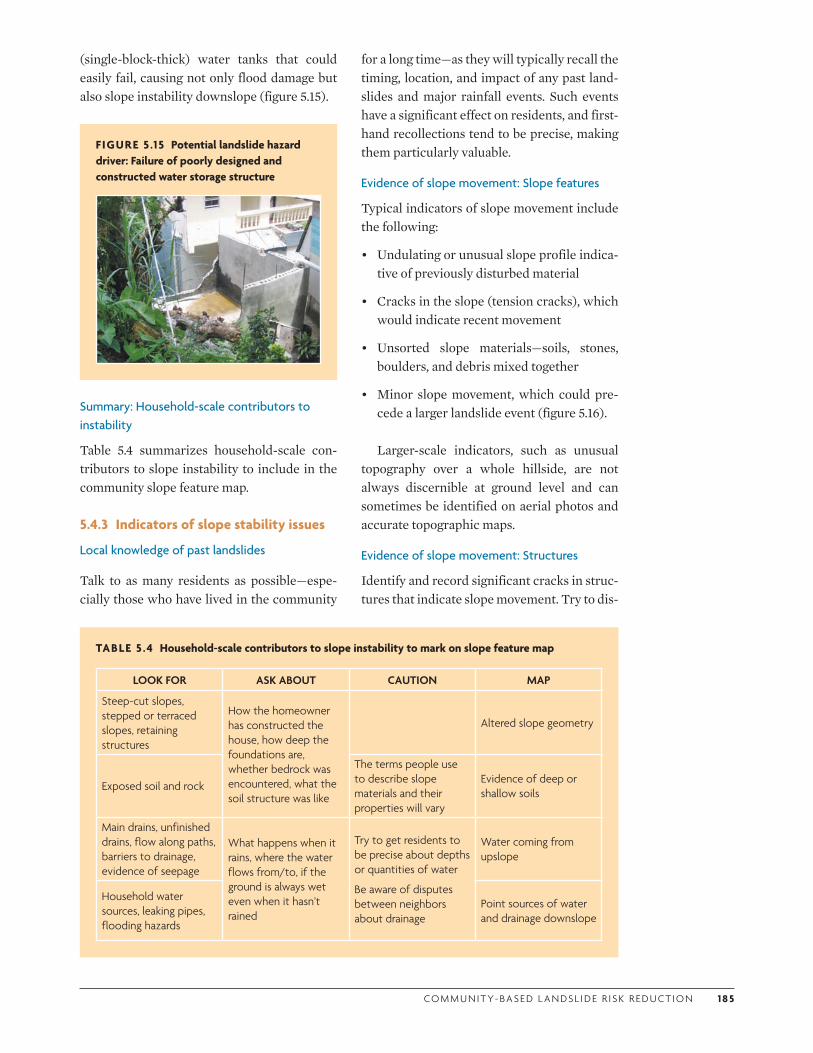
CO M M U N I T Y- BA S E D L A N DS L I D E R I S K R E D U CT I O N 1 8 5
(single-block-thick) water tanks that could easily fail, causing not only flood damage but also slope instability downslope (figure 5.15).
Summary: Household-scale contributors to instability
Table 5.4 summarizes household-scale con-tributors to slope instability to include in the community slope feature map.
5.4.3 Indicators of slope stability issues
Local knowledge of past landslides
Talk to as many residents as possible—espe-cially those who have lived in the community
FIGURE 5 .15 Potential landslide hazard driver: Failure of poorly designed and constructed water storage structure
TABLE 5 .4 Household-scale contributors to slope instability to mark on slope feature map
LOOK FOR ASK ABOUT CAUTION MAP
Steep-cut slopes, stepped or terraced slopes, retaining structures
How the homeowner has constructed the house, how deep the foundations are, whether bedrock was encountered, what the soil structure was like
Altered slope geometry
Exposed soil and rock
The terms people use to describe slope materials and their properties will vary
Evidence of deep or shallow soils
Main drains, unfinished drains, flow along paths, barriers to drainage, evidence of seepage
What happens when it rains, where the water flows from/to, if the ground is always wet even when it hasn’t rained
Try to get residents to be precise about depths or quantities of water
Be aware of disputes between neighbors about drainage
Water coming from upslope
Household water sources, leaking pipes, flooding hazards
Point sources of water and drainage downslope
for a long time—as they will typically recall the timing, location, and impact of any past land-slides and major rainfall events. Such events have a significant effect on residents, and first-hand recollections tend to be precise, making them particularly valuable.
Evidence of slope movement: Slope features
Typical indicators of slope movement include the following:
• Undulating or unusual slope profile indica-tive of previously disturbed material
• Cracks in the slope (tension cracks), which would indicate recent movement
• Unsorted slope materials—soils, stones, boulders, and debris mixed together
• Minor slope movement, which could pre-cede a larger landslide event (figure 5.16).
Larger-scale indicators, such as unusual topography over a whole hillside, are not always discernible at ground level and can sometimes be identified on aerial photos and accurate topographic maps.
Evidence of slope movement: Structures
Identify and record significant cracks in struc-tures that indicate slope movement. Try to dis-
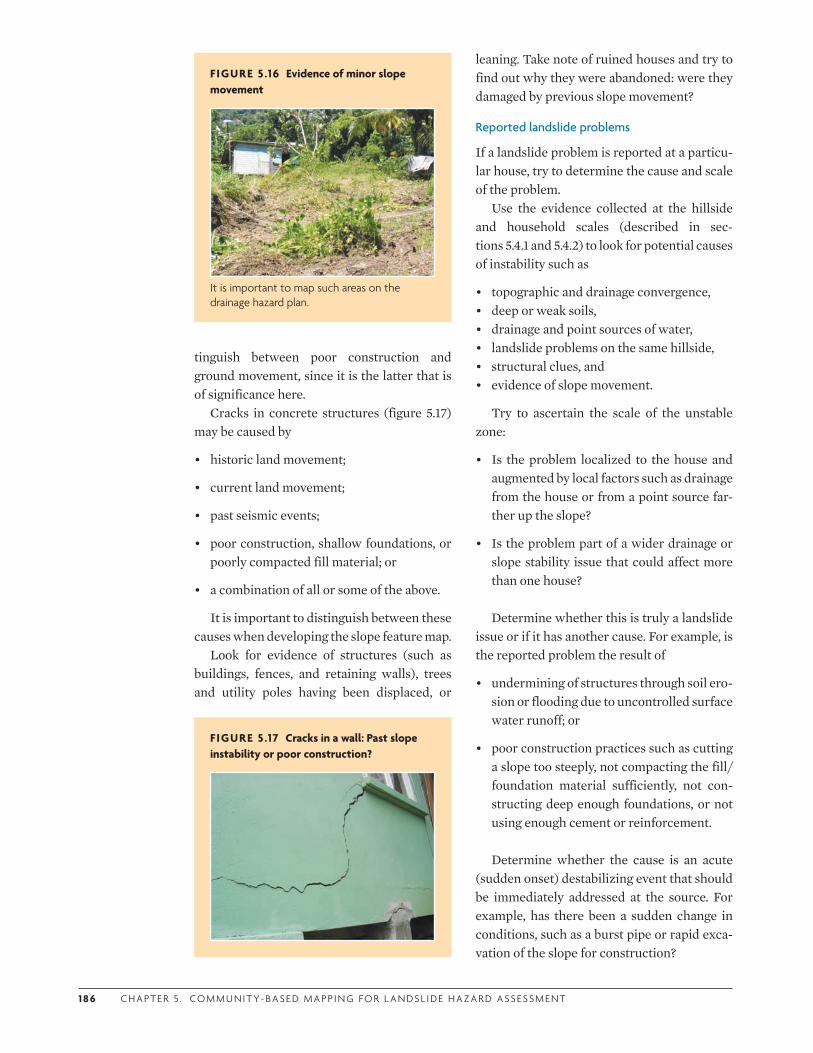
1 8 6 C H A P T E R 5 . COM M U N I T Y- BA S E D M A P P I N G F O R L A N DS L I D E H A Z A R D A SS ESS M E N T
tinguish between poor construction and ground movement, since it is the latter that is of significance here.
Cracks in concrete structures (figure 5.17)may be caused by
• historic land movement;
• current land movement;
• past seismic events;
• poor construction, shallow foundations, or poorly compacted fill material; or
• a combination of all or some of the above.
It is important to distinguish between these causes when developing the slope feature map.
Look for evidence of structures (such as buildings, fences, and retaining walls), trees and utility poles having been displaced, or
FIGURE 5 .16 Evidence of minor slope movement
It is important to map such areas on the drainage hazard plan.
leaning. Take note of ruined houses and try to find out why they were abandoned: were they damaged by previous slope movement?
Reported landslide problems
If a landslide problem is reported at a particu-lar house, try to determine the cause and scale of the problem.
Use the evidence collected at the hillside and household scales (described in sec-tions 5.4.1 and 5.4.2) to look for potential causes of instability such as
• topographic and drainage convergence,• deep or weak soils,• drainage and point sources of water,• landslide problems on the same hillside,• structural clues, and• evidence of slope movement.
Try to ascertain the scale of the unstable zone:
• Is the problem localized to the house and augmented by local factors such as drainage from the house or from a point source far-ther up the slope?
• Is the problem part of a wider drainage or slope stability issue that could affect more than one house?
Determine whether this is truly a landslide issue or if it has another cause. For example, is the reported problem the result of
• undermining of structures through soil ero-sion or flooding due to uncontrolled surface water runoff; or
• poor construction practices such as cutting a slope too steeply, not compacting the fill/foundation material sufficiently, not con-structing deep enough foundations, or not using enough cement or reinforcement.
Determine whether the cause is an acute (sudden onset) destabilizing event that should be immediately addressed at the source. For example, has there been a sudden change in conditions, such as a burst pipe or rapid exca-vation of the slope for construction?
FIGURE 5 .17 Cracks in a wall: Past slope instability or poor construction?
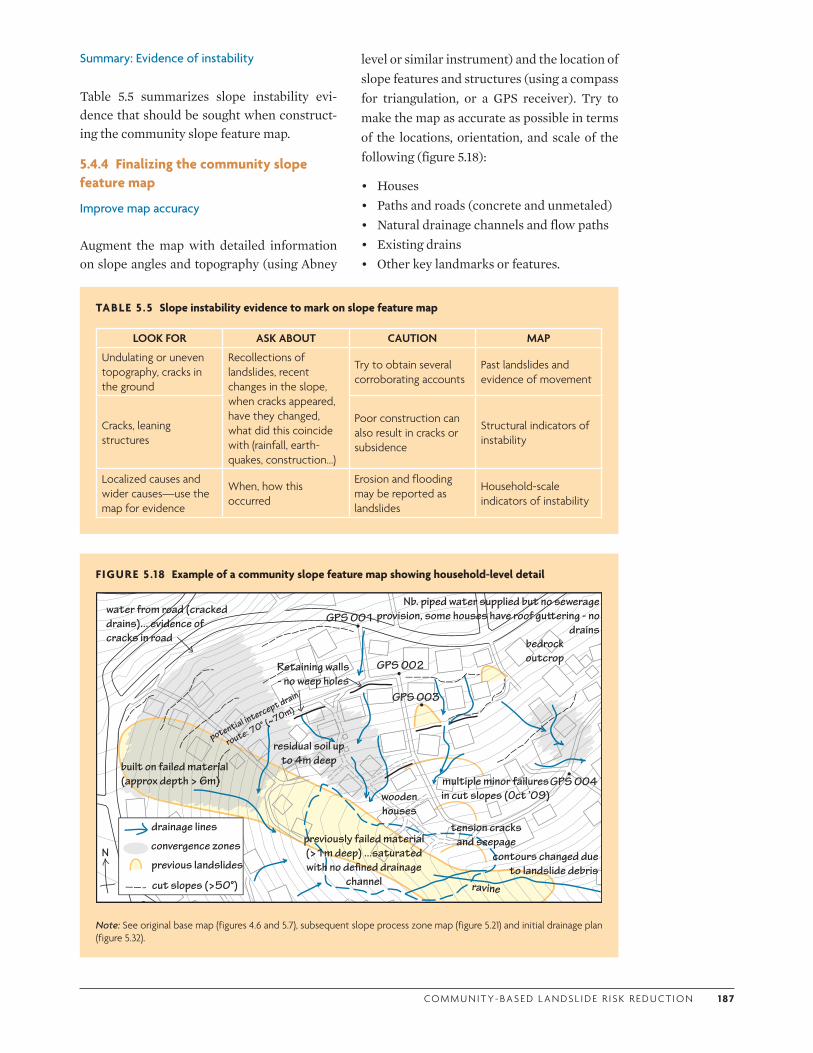
CO M M U N I T Y- BA S E D L A N DS L I D E R I S K R E D U CT I O N 1 87
Summary: Evidence of instability
Table 5.5 summarizes slope instability evi-dence that should be sought when construct-ing the community slope feature map.
5.4.4 Finalizing the community slope feature map
Improve map accuracy
Augment the map with detailed information on slope angles and topography (using Abney
level or similar instrument) and the location of slope features and structures (using a compass for triangulation, or a GPS receiver). Try to make the map as accurate as possible in terms of the locations, orientation, and scale of the following (figure 5.18):
• Houses• Paths and roads (concrete and unmetaled)• Natural drainage channels and flow paths• Existing drains• Other key landmarks or features.
TABLE 5 .5 Slope instability evidence to mark on slope feature map
LOOK FOR ASK ABOUT CAUTION MAP
Undulating or uneven topography, cracks in the ground
Recollections of landslides, recent changes in the slope, when cracks appeared, have they changed, what did this coincide with (rainfall, earth-quakes, construction…)
Try to obtain several corroborating accounts
Past landslides and evidence of movement
Cracks, leaning structures
Poor construction can also result in cracks or subsidence
Structural indicators of instability
Localized causes and wider causes—use the map for evidence
When, how this occurred
Erosion and flooding may be reported as landslides
Household-scale indicators of instability
FIGURE 5 .18 Example of a community slope feature map showing household-level detail
previously failed material (>1m deep) ...saturated with no de�ned drainage
channel
multiple minor failures in cut slopes (Oct ’09)
tension cracks and seepage
water from road (cracked drains)... evidence of cracks in road
wooden houses
Retaining walls - no weep holes
built on failed material (approx depth > 6m)
Nb. piped water supplied but no sewerage provision, some houses have roof gu�ering - no
drains
ravine
bedrock outcrop
residual soil up to 4m deep
contours changed due to landslide debris
GPS 001
GPS 002
GPS 004
GPS 003
N
potential intercept drain
route: 70° (~70m)
previous landslides
convergence zones
drainage lines
cut slopes (>50°)
Note: See original base map (figures 4.6 and 5.7), subsequent slope process zone map (figure 5.21) and initial drainage plan (figure 5.32).
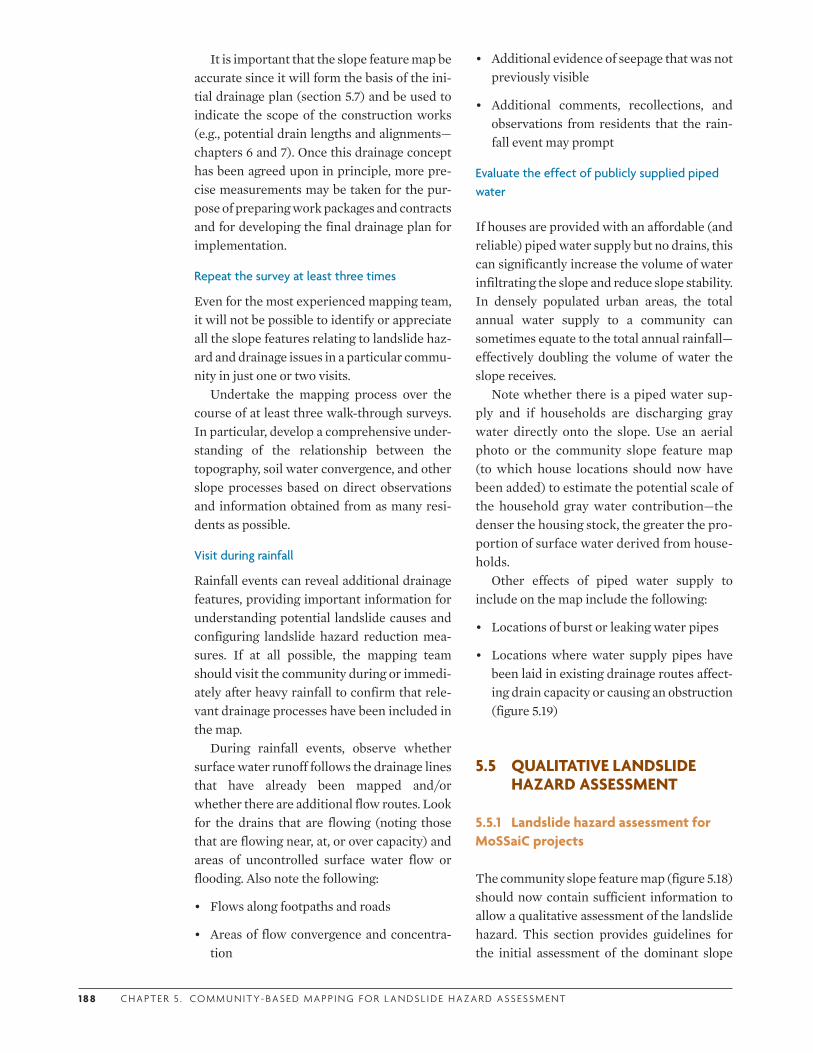
1 8 8 C H A P T E R 5 . COM M U N I T Y- BA S E D M A P P I N G F O R L A N DS L I D E H A Z A R D A SS ESS M E N T
It is important that the slope feature map be accurate since it will form the basis of the ini-tial drainage plan (section 5.7) and be used to indicate the scope of the construction works (e.g., potential drain lengths and alignments—chapters 6 and 7). Once this drainage concept has been agreed upon in principle, more pre-cise measurements may be taken for the pur-pose of preparing work packages and contracts and for developing the final drainage plan for implementation.
Repeat the survey at least three times
Even for the most experienced mapping team, it will not be possible to identify or appreciate all the slope features relating to landslide haz-ard and drainage issues in a particular commu-nity in just one or two visits.
Undertake the mapping process over the course of at least three walk-through surveys. In particular, develop a comprehensive under-standing of the relationship between the topography, soil water convergence, and other slope processes based on direct observations and information obtained from as many resi-dents as possible.
Visit during rainfall
Rainfall events can reveal additional drainage features, providing important information for understanding potential landslide causes and configuring landslide hazard reduction mea-sures. If at all possible, the mapping team should visit the community during or immedi-ately after heavy rainfall to confirm that rele-vant drainage processes have been included in the map.
During rainfall events, observe whether surface water runoff follows the drainage lines that have already been mapped and/or whether there are additional flow routes. Look for the drains that are flowing (noting those that are flowing near, at, or over capacity) and areas of uncontrolled surface water flow or flooding. Also note the following:
• Flows along footpaths and roads
• Areas of flow convergence and concentra-tion
• Additional evidence of seepage that was not previously visible
• Additional comments, recollections, and observations from residents that the rain-fall event may prompt
Evaluate the effect of publicly supplied piped water
If houses are provided with an affordable (and reliable) piped water supply but no drains, this can significantly increase the volume of water infiltrating the slope and reduce slope stability. In densely populated urban areas, the total annual water supply to a community can sometimes equate to the total annual rainfall—effectively doubling the volume of water the slope receives.
Note whether there is a piped water sup-ply and if households are discharging gray water directly onto the slope. Use an aerial photo or the community slope feature map (to which house locations should now have been added) to estimate the potential scale of the household gray water contribution—the denser the housing stock, the greater the pro-portion of surface water derived from house-holds.
Other effects of piped water supply to include on the map include the following:
• Locations of burst or leaking water pipes
• Locations where water supply pipes have been laid in existing drainage routes affect-ing drain capacity or causing an obstruction (figure 5.19)
5.5 QUALITATIVE LANDSLIDE HAZARD ASSESSMENT
5.5.1 Landslide hazard assessment for MoSSaiC projects
The community slope feature map (figure 5.18) should now contain sufficient information to allow a qualitative assessment of the landslide hazard. This section provides guidelines for the initial assessment of the dominant slope

CO M M U N I T Y- BA S E D L A N DS L I D E R I S K R E D U CT I O N 1 89
stability controls within a community. In par-ticular, the landslide assessment and engineer-ing task team should evaluate the extent to which slope instability is dominated by sur-face water infiltration. This will indicate whether a MoSSaiC project to improve surface water management might be effective in improving slope stability. Section 5.6 provides scientifically based tools and methods to assist in making this assessment.
Importance of justifiable measures
Providing a scientifically based justification for landslide hazard reduction measures is important for several reasons:
• Any physical works claiming to reduce landslide hazard (i.e., reduce the likelihood of landslide occurrence) should be targeted at the specific causes of the landslide haz-ard.
• To facilitate community participation, there should be an explanation of the sci-ence behind the proposed intervention.
FIGURE 5 .19 Piped water supplied to unauthorized communities
a. Water meters allow an estimation of the volume supplied to the community.
b. Water supply pipes may have been laid in drains for ease of installation, thus reducing drain capacity.
• Engineers, works supervisors, and contrac-tors will need a basis for understanding the design and specification of the works.
• Decision makers involved in funding proj-ects and government agencies will have to be able to justify community activities and expenditures.
The qualitative landslide hazard assessment process
Figure 5.20 illustrates a typical workflow and related decisions in the interpretation of the community slope feature map. The aim is to evaluate the relative degree of landslide haz-ard and the potential causes and solutions, thus allowing identification of cases where MoSSaiC interventions are likely to be appro-priate.
5.5.2 Identify landslide hazard zones
Begin by identifying the various slope pro-cesses, landslide hazards, and drainage zones within the community. From this, produce a
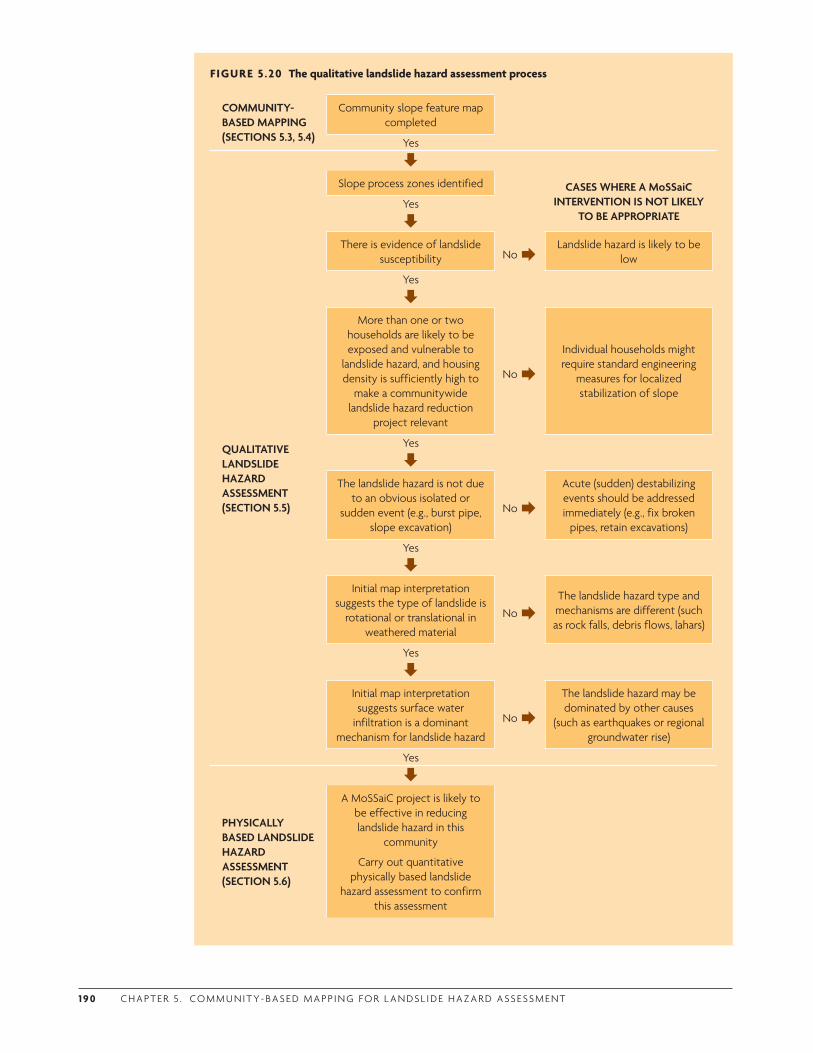
1 9 0 C H A P T E R 5 . COM M U N I T Y- BA S E D M A P P I N G F O R L A N DS L I D E H A Z A R D A SS ESS M E N T
FIGURE 5 .20 The qualitative landslide hazard assessment process
COMMUNITY-BASED MAPPING (SECTIONS 5.3, 5.4)
Community slope feature map completed
Yes
QUALITATIVE LANDSLIDE HAZARD ASSESSMENT(SECTION 5.5)
Slope process zones identified CASES WHERE A MoSSaiC INTERVENTION IS NOT LIKELY
TO BE APPROPRIATEYes
There is evidence of landslide
susceptibility No Landslide hazard is likely to be
low
Yes
More than one or two
households are likely to be exposed and vulnerable to
landslide hazard, and housing density is sufficiently high to
make a communitywide landslide hazard reduction
project relevant
No
Individual households might require standard engineering
measures for localized stabilization of slope
Yes
The landslide hazard is not due
to an obvious isolated or sudden event (e.g., burst pipe,
slope excavation)
No
Acute (sudden) destabilizing events should be addressed immediately (e.g., fix broken
pipes, retain excavations)
Yes
Initial map interpretation
suggests the type of landslide is rotational or translational in
weathered material
No The landslide hazard type and mechanisms are different (such as rock falls, debris flows, lahars)
Yes
Initial map interpretation suggests surface water
infiltration is a dominant mechanism for landslide hazard
No
The landslide hazard may be dominated by other causes
(such as earthquakes or regional groundwater rise)
Yes
PHYSICALLY BASED LANDSLIDE HAZARD ASSESSMENT (SECTION 5.6)
A MoSSaiC project is likely to be effective in reducing landslide hazard in this
community
Carry out quantitative physically based landslide
hazard assessment to confirm this assessment
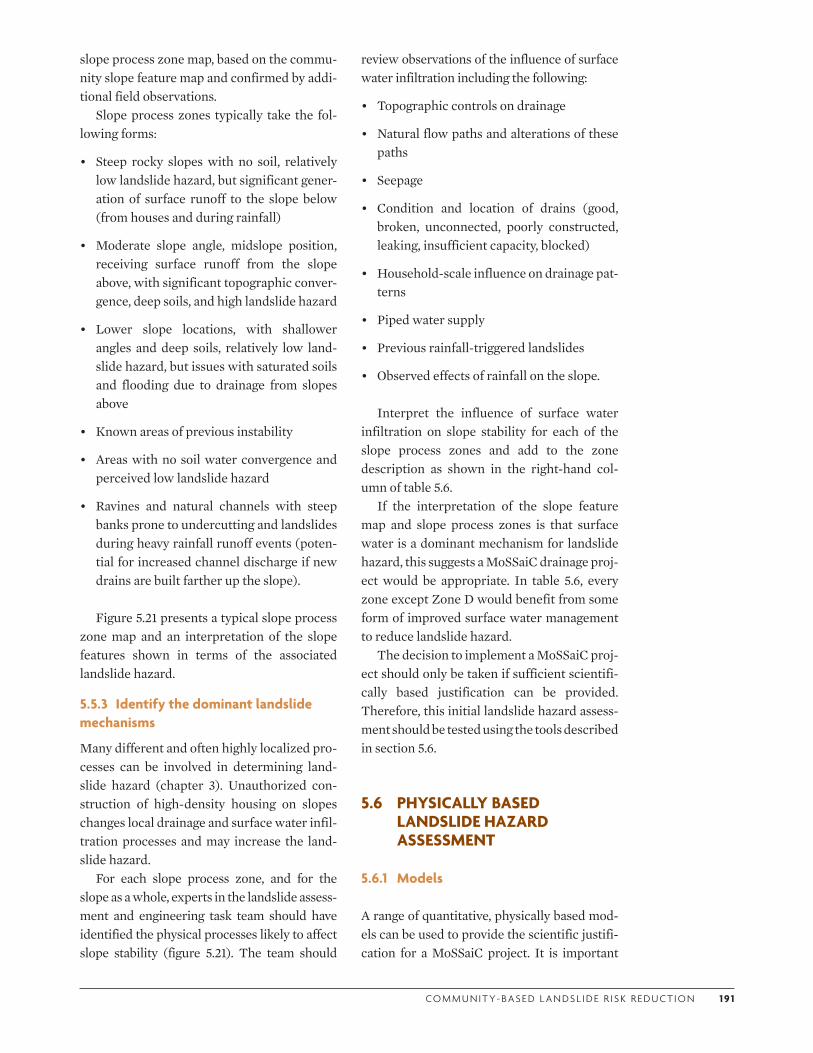
CO M M U N I T Y- BA S E D L A N DS L I D E R I S K R E D U CT I O N 1 9 1
slope process zone map, based on the commu-nity slope feature map and confirmed by addi-tional field observations.
Slope process zones typically take the fol-lowing forms:
• Steep rocky slopes with no soil, relatively low landslide hazard, but significant gener-ation of surface runoff to the slope below (from houses and during rainfall)
• Moderate slope angle, midslope position, receiving surface runoff from the slope above, with significant topographic conver-gence, deep soils, and high landslide hazard
• Lower slope locations, with shallower angles and deep soils, relatively low land-slide hazard, but issues with saturated soils and flooding due to drainage from slopes above
• Known areas of previous instability
• Areas with no soil water convergence and perceived low landslide hazard
• Ravines and natural channels with steep banks prone to undercutting and landslides during heavy rainfall runoff events (poten-tial for increased channel discharge if new drains are built farther up the slope).
Figure 5.21 presents a typical slope process zone map and an interpretation of the slope features shown in terms of the associated landslide hazard.
5.5.3 Identify the dominant landslide mechanisms
Many different and often highly localized pro-cesses can be involved in determining land-slide hazard (chapter 3). Unauthorized con-struction of high-density housing on slopes changes local drainage and surface water infil-tration processes and may increase the land-slide hazard.
For each slope process zone, and for the slope as a whole, experts in the landslide assess-ment and engineering task team should have identified the physical processes likely to affect slope stability (figure 5.21). The team should
review observations of the influence of surface water infiltration including the following:
• Topographic controls on drainage
• Natural flow paths and alterations of these paths
• Seepage
• Condition and location of drains (good, broken, unconnected, poorly constructed, leaking, insufficient capacity, blocked)
• Household-scale influence on drainage pat-terns
• Piped water supply
• Previous rainfall-triggered landslides
• Observed effects of rainfall on the slope.
Interpret the influence of surface water infiltration on slope stability for each of the slope process zones and add to the zone description as shown in the right-hand col-umn of table 5.6.
If the interpretation of the slope feature map and slope process zones is that surface water is a dominant mechanism for landslide hazard, this suggests a MoSSaiC drainage proj-ect would be appropriate. In table 5.6, every zone except Zone D would benefit from some form of improved surface water management to reduce landslide hazard.
The decision to implement a MoSSaiC proj-ect should only be taken if sufficient scientifi-cally based justification can be provided. Therefore, this initial landslide hazard assess-ment should be tested using the tools described in section 5.6.
5.6 PHYSICALLY BASED LANDSLIDE HAZARD ASSESSMENT
5.6.1 Models
A range of quantitative, physically based mod-els can be used to provide the scientific justifi-cation for a MoSSaiC project. It is important
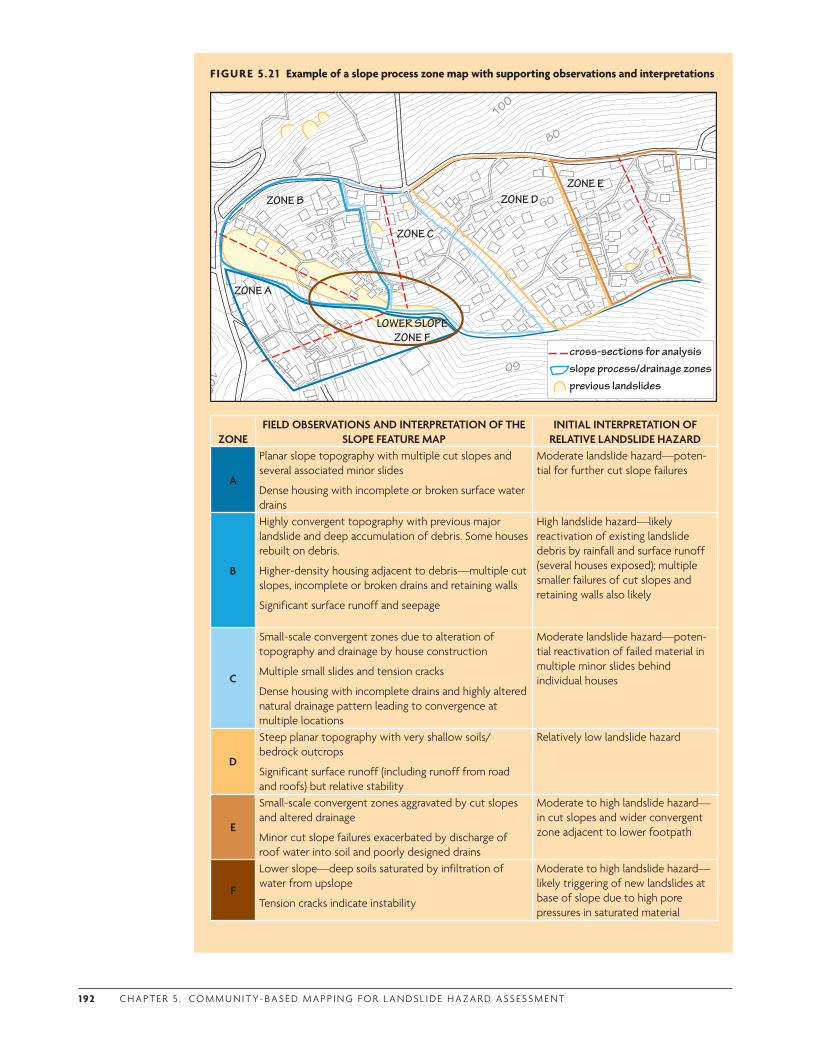
1 92 C H A P T E R 5 . COM M U N I T Y- BA S E D M A P P I N G F O R L A N DS L I D E H A Z A R D A SS ESS M E N T
FIGURE 5 .21 Example of a slope process zone map with supporting observations and interpretations
10
0
60
80
100 1
60
previous landslidesslope process/drainage zonescross-sections for analysis
ZONE DZONE B
ZONE A
ZONE C
ZONE E
LOWER SLOPE ZONE F
ZONEFIELD OBSERVATIONS AND INTERPRETATION OF THE
SLOPE FEATURE MAPINITIAL INTERPRETATION OF
RELATIVE LANDSLIDE HAZARD
A
Planar slope topography with multiple cut slopes and several associated minor slides
Dense housing with incomplete or broken surface water drains
Moderate landslide hazard—poten-tial for further cut slope failures
B
Highly convergent topography with previous major landslide and deep accumulation of debris. Some houses rebuilt on debris.
Higher-density housing adjacent to debris—multiple cut slopes, incomplete or broken drains and retaining walls
Significant surface runoff and seepage
High landslide hazard—likely reactivation of existing landslide debris by rainfall and surface runoff (several houses exposed); multiple smaller failures of cut slopes and retaining walls also likely
C
Small-scale convergent zones due to alteration of topography and drainage by house construction
Multiple small slides and tension cracks
Dense housing with incomplete drains and highly altered natural drainage pattern leading to convergence at multiple locations
Moderate landslide hazard—poten-tial reactivation of failed material in multiple minor slides behind individual houses
D
Steep planar topography with very shallow soils/bedrock outcrops
Significant surface runoff (including runoff from road and roofs) but relative stability
Relatively low landslide hazard
E
Small-scale convergent zones aggravated by cut slopes and altered drainage
Minor cut slope failures exacerbated by discharge of roof water into soil and poorly designed drains
Moderate to high landslide hazard—in cut slopes and wider convergent zone adjacent to lower footpath
F
Lower slope—deep soils saturated by infiltration of water from upslope
Tension cracks indicate instability
Moderate to high landslide hazard—likely triggering of new landslides at base of slope due to high pore pressures in saturated material
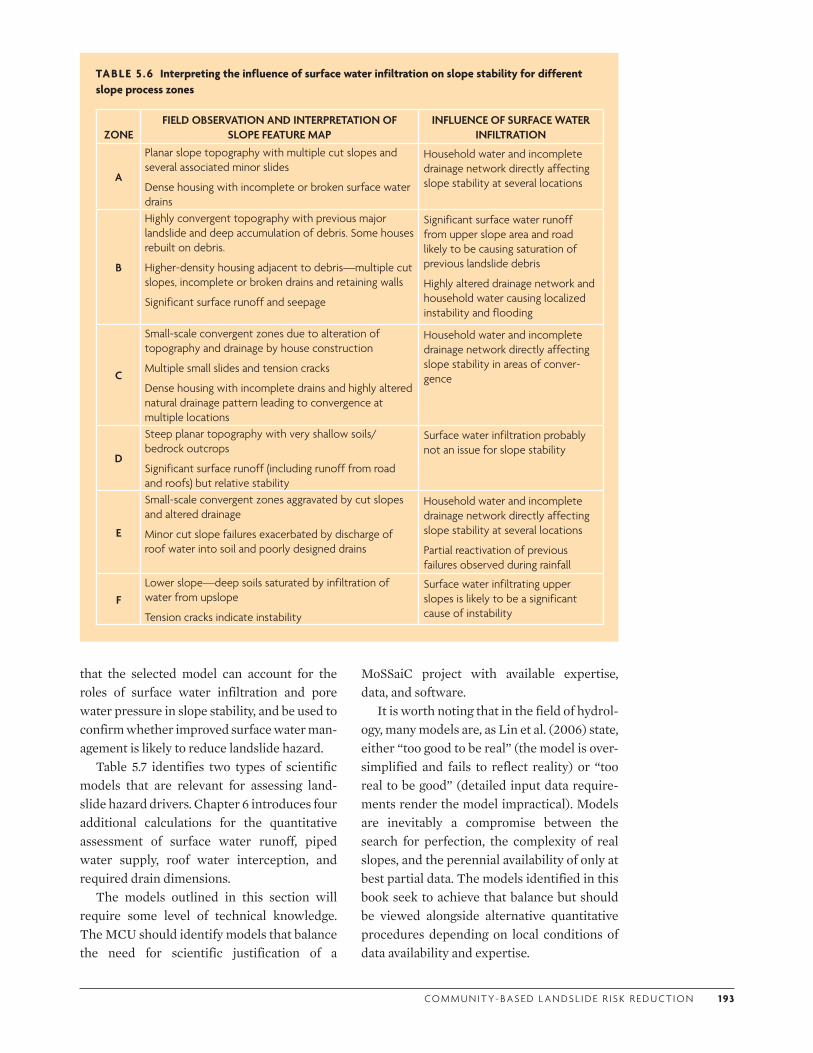
CO M M U N I T Y- BA S E D L A N DS L I D E R I S K R E D U CT I O N 1 93
that the selected model can account for the roles of surface water infiltration and pore water pressure in slope stability, and be used to confirm whether improved surface water man-agement is likely to reduce landslide hazard.
Table 5.7 identifies two types of scientific models that are relevant for assessing land-slide hazard drivers. Chapter 6 introduces four additional calculations for the quantitative assessment of surface water runoff, piped water supply, roof water interception, and required drain dimensions.
The models outlined in this section will require some level of technical knowledge. The MCU should identify models that balance the need for scientific justification of a
MoSSaiC project with available expertise, data, and software.
It is worth noting that in the field of hydrol-ogy, many models are, as Lin et al. (2006) state, either “too good to be real” (the model is over-simplified and fails to reflect reality) or “too real to be good” (detailed input data require-ments render the model impractical). Models are inevitably a compromise between the search for perfection, the complexity of real slopes, and the perennial availability of only at best partial data. The models identified in this book seek to achieve that balance but should be viewed alongside alternative quantitative procedures depending on local conditions of data availability and expertise.
TABLE 5 .6 Interpreting the influence of surface water infiltration on slope stability for different slope process zones
ZONEFIELD OBSERVATION AND INTERPRETATION OF
SLOPE FEATURE MAPINFLUENCE OF SURFACE WATER
INFILTRATION
A
Planar slope topography with multiple cut slopes and several associated minor slides
Dense housing with incomplete or broken surface water drains
Household water and incomplete drainage network directly affecting slope stability at several locations
B
Highly convergent topography with previous major landslide and deep accumulation of debris. Some houses rebuilt on debris.
Higher-density housing adjacent to debris—multiple cut slopes, incomplete or broken drains and retaining walls
Significant surface runoff and seepage
Significant surface water runoff from upper slope area and road likely to be causing saturation of previous landslide debris
Highly altered drainage network and household water causing localized instability and flooding
C
Small-scale convergent zones due to alteration of topography and drainage by house construction
Multiple small slides and tension cracks
Dense housing with incomplete drains and highly altered natural drainage pattern leading to convergence at multiple locations
Household water and incomplete drainage network directly affecting slope stability in areas of conver-gence
D
Steep planar topography with very shallow soils/bedrock outcrops
Significant surface runoff (including runoff from road and roofs) but relative stability
Surface water infiltration probably not an issue for slope stability
E
Small-scale convergent zones aggravated by cut slopes and altered drainage
Minor cut slope failures exacerbated by discharge of roof water into soil and poorly designed drains
Household water and incomplete drainage network directly affecting slope stability at several locations
Partial reactivation of previous failures observed during rainfall
FLower slope—deep soils saturated by infiltration of water from upslope
Tension cracks indicate instability
Surface water infiltrating upper slopes is likely to be a significant cause of instability
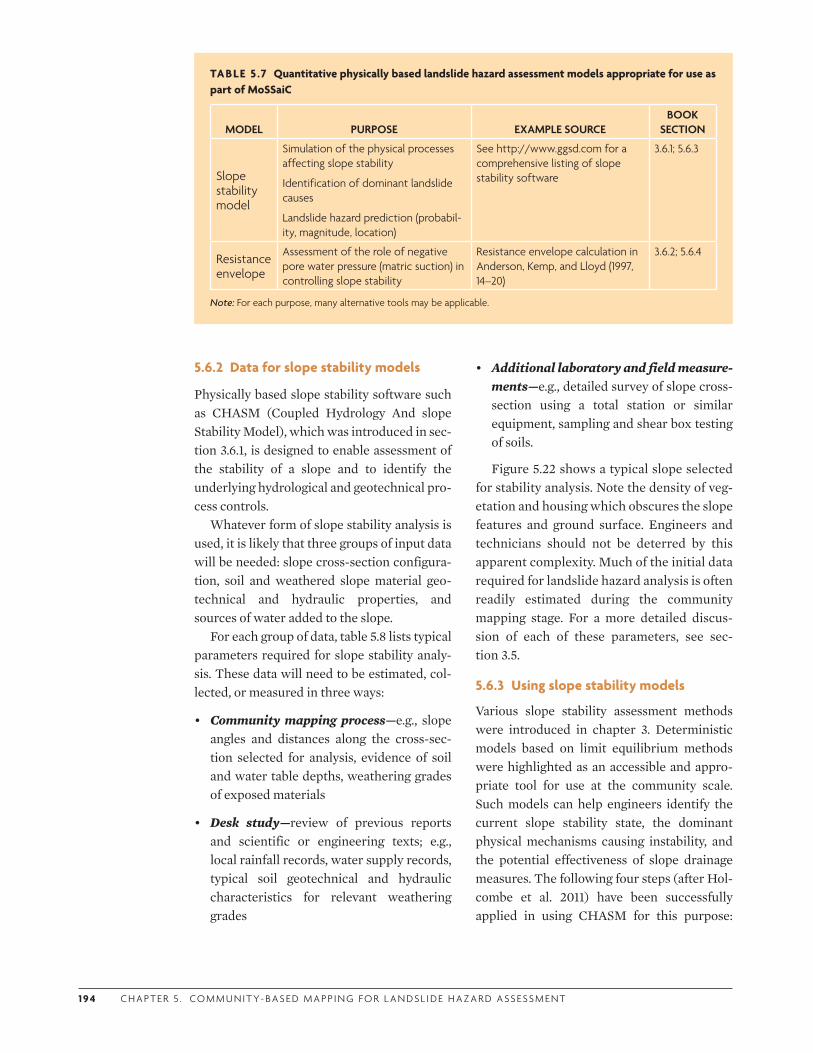
1 9 4 C H A P T E R 5 . COM M U N I T Y- BA S E D M A P P I N G F O R L A N DS L I D E H A Z A R D A SS ESS M E N T
5.6.2 Data for slope stability models
Physically based slope stability software such as CHASM (Coupled Hydrology And slope Stability Model), which was introduced in sec-tion 3.6.1, is designed to enable assessment of the stability of a slope and to identify the underlying hydrological and geotechnical pro-cess controls.
Whatever form of slope stability analysis is used, it is likely that three groups of input data will be needed: slope cross-section configura-tion, soil and weathered slope material geo-technical and hydraulic properties, and sources of water added to the slope.
For each group of data, table 5.8 lists typical parameters required for slope stability analy-sis. These data will need to be estimated, col-lected, or measured in three ways:
• Community mapping process—e.g., slope angles and distances along the cross-sec-tion selected for analysis, evidence of soil and water table depths, weathering grades of exposed materials
• Desk study—review of previous reports and scientific or engineering texts; e.g., local rainfall records, water supply records, typical soil geotechnical and hydraulic characteristics for relevant weathering grades
• Additional laboratory and field measure-ments—e.g., detailed survey of slope cross-section using a total station or similar equipment, sampling and shear box testing of soils.
Figure 5.22 shows a typical slope selected for stability analysis. Note the density of veg-etation and housing which obscures the slope features and ground surface. Engineers and technicians should not be deterred by this apparent complexity. Much of the initial data required for landslide hazard analysis is often readily estimated during the community mapping stage. For a more detailed discus-sion of each of these parameters, see sec-tion 3.5.
5.6.3 Using slope stability models
Various slope stability assessment methods were introduced in chapter 3. Deterministic models based on limit equilibrium methods were highlighted as an accessible and appro-priate tool for use at the community scale. Such models can help engineers identify the current slope stability state, the dominant physical mechanisms causing instability, and the potential effectiveness of slope drainage measures. The following four steps (after Hol-combe et al. 2011) have been successfully applied in using CHASM for this purpose:
TABLE 5 .7 Quantitative physically based landslide hazard assessment models appropriate for use as part of MoSSaiC
MODEL PURPOSE EXAMPLE SOURCEBOOK
SECTION
Slope stability model
Simulation of the physical processes affecting slope stability
Identification of dominant landslide causes
Landslide hazard prediction (probabil-ity, magnitude, location)
See http://www.ggsd.com for a comprehensive listing of slope stability software
3.6.1; 5.6.3
Resistance envelope
Assessment of the role of negative pore water pressure (matric suction) in controlling slope stability
Resistance envelope calculation in Anderson, Kemp, and Lloyd (1997, 14–20)
3.6.2; 5.6.4
Note: For each purpose, many alternative tools may be applicable.
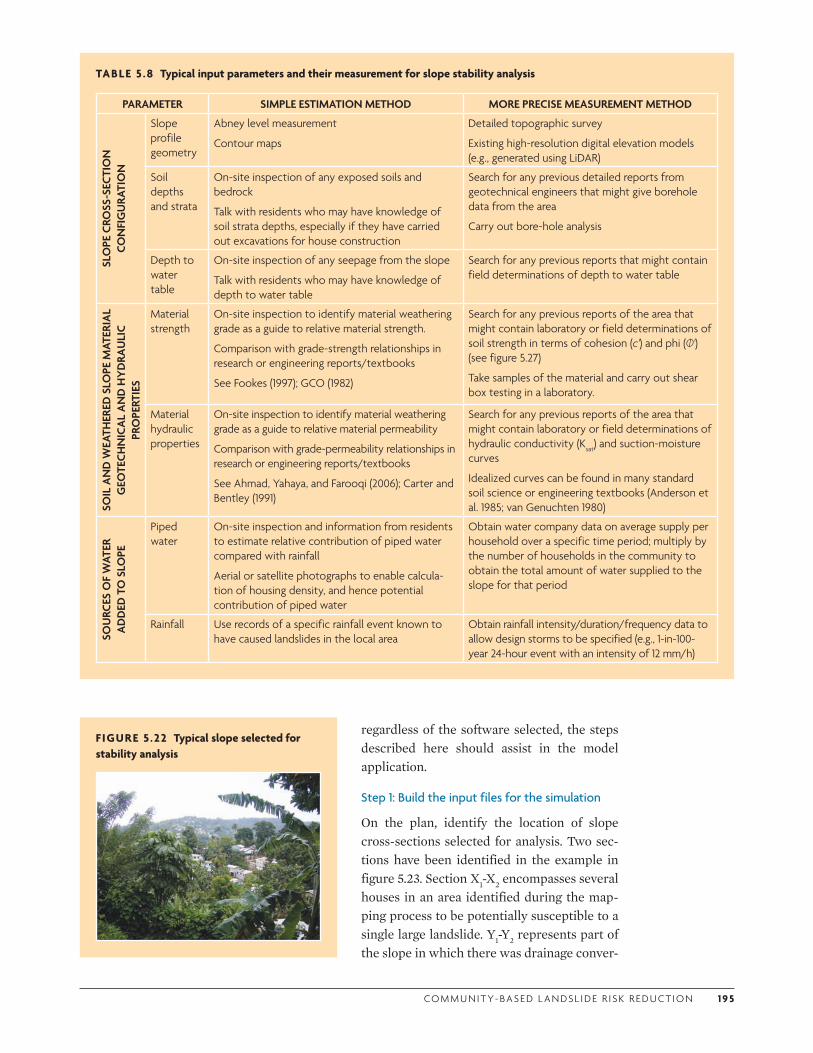
CO M M U N I T Y- BA S E D L A N DS L I D E R I S K R E D U CT I O N 1 9 5
regardless of the software selected, the steps described here should assist in the model application.
Step 1: Build the input files for the simulation
On the plan, identify the location of slope cross-sections selected for analysis. Two sec-tions have been identified in the example in figure 5.23. Section X1-X2 encompasses several houses in an area identified during the map-ping process to be potentially susceptible to a single large landslide. Y1-Y2 represents part of the slope in which there was drainage conver-
TABLE 5 .8 Typical input parameters and their measurement for slope stability analysis
PARAMETER SIMPLE ESTIMATION METHOD MORE PRECISE MEASUREMENT METHODSL
OPE
CRO
SS-S
ECTI
ON
CO
NFI
GU
RATI
ON
Slope profile geometry
Abney level measurement
Contour maps
Detailed topographic survey
Existing high-resolution digital elevation models (e.g., generated using LiDAR)
Soil depths and strata
On-site inspection of any exposed soils and bedrock
Talk with residents who may have knowledge of soil strata depths, especially if they have carried out excavations for house construction
Search for any previous detailed reports from geotechnical engineers that might give borehole data from the area
Carry out bore-hole analysis
Depth to water table
On-site inspection of any seepage from the slope
Talk with residents who may have knowledge of depth to water table
Search for any previous reports that might contain field determinations of depth to water table
SOIL
AN
D W
EATH
ERED
SLO
PE M
ATER
IAL
GEO
TECH
NIC
AL
AN
D H
YD
RAU
LIC
PRO
PERT
IES
Material strength
On-site inspection to identify material weathering grade as a guide to relative material strength.
Comparison with grade-strength relationships in research or engineering reports/textbooks
See Fookes (1997); GCO (1982)
Search for any previous reports of the area that might contain laboratory or field determinations of soil strength in terms of cohesion (c') and phi (Φ') (see figure 5.27)
Take samples of the material and carry out shear box testing in a laboratory.
Material hydraulic properties
On-site inspection to identify material weathering grade as a guide to relative material permeability
Comparison with grade-permeability relationships in research or engineering reports/textbooks
See Ahmad, Yahaya, and Farooqi (2006); Carter and Bentley (1991)
Search for any previous reports of the area that might contain laboratory or field determinations of hydraulic conductivity (Ksat) and suction-moisture curves
Idealized curves can be found in many standard soil science or engineering textbooks (Anderson et al. 1985; van Genuchten 1980)
SOU
RCES
OF
WAT
ER
AD
DED
TO
SLO
PE
Piped water
On-site inspection and information from residents to estimate relative contribution of piped water compared with rainfall
Aerial or satellite photographs to enable calcula-tion of housing density, and hence potential contribution of piped water
Obtain water company data on average supply per household over a specific time period; multiply by the number of households in the community to obtain the total amount of water supplied to the slope for that period
Rainfall Use records of a specific rainfall event known to have caused landslides in the local area
Obtain rainfall intensity/duration/frequency data to allow design storms to be specified (e.g., 1-in-100-year 24-hour event with an intensity of 12 mm/h)
FIGURE 5 .22 Typical slope selected for stability analysis

1 9 6 C H A P T E R 5 . COM M U N I T Y- BA S E D M A P P I N G F O R L A N DS L I D E H A Z A R D A SS ESS M E N T
gence and several cut slopes that showed signs of instability. The following considers the example of section X1-X2.
a. Draw the slope cross-section.
— Draw the slope cross-section to scale by reading contours from an accurate topography map or by using field mea-surements and applying trigonometry.
— Identify how many material types are present (ranging from weathering grade VI to grade I material—i.e., residual soils to bedrock, figure 3.18) based on observations, residents’ knowledge, local expert knowledge, and previous reports.
— Estimate the depth and angle of the dif-ferent material strata—again using observations, residents’ knowledge, local expert knowledge, and previous reports. Draw the strata on the cross-section.
— Estimate the depth to the water table in a similar way and add to the cross-sec-tion.
— If CHASM software is used, these data are encapsulated in the geometry input file.
b. Define the material geotechnical and hydraulic properties.
— Define the properties required by the model for each of the material types identified in the slope cross-section.
— If CHASM software is used, the data requirements are as follows: saturated and unsaturated bulk density, saturated moisture content, cohesion, angle of internal friction, and suction-moisture curve coordinates. These data are encap-sulated in the soil input file.
c. Define the boundary conditions.
— In dynamic hydrology models, the hydrological boundary conditions rep-resent the initial conditions and the behavior of the water at the edge of the model domain. Boundary conditions can include initial surface suction con-ditions, rainfall, point water sources,
FIGURE 5 .23 Zone E of the example community with two slope cross-sections marked for analysis
road
ravine
Y2
Y1
X2
X1
roads, paths, or steps
concrete house
concrete + wooden house
wooden house
existing landslides
approx 50 m
cross-sections for analysis
N
Note: See figure 5.21.
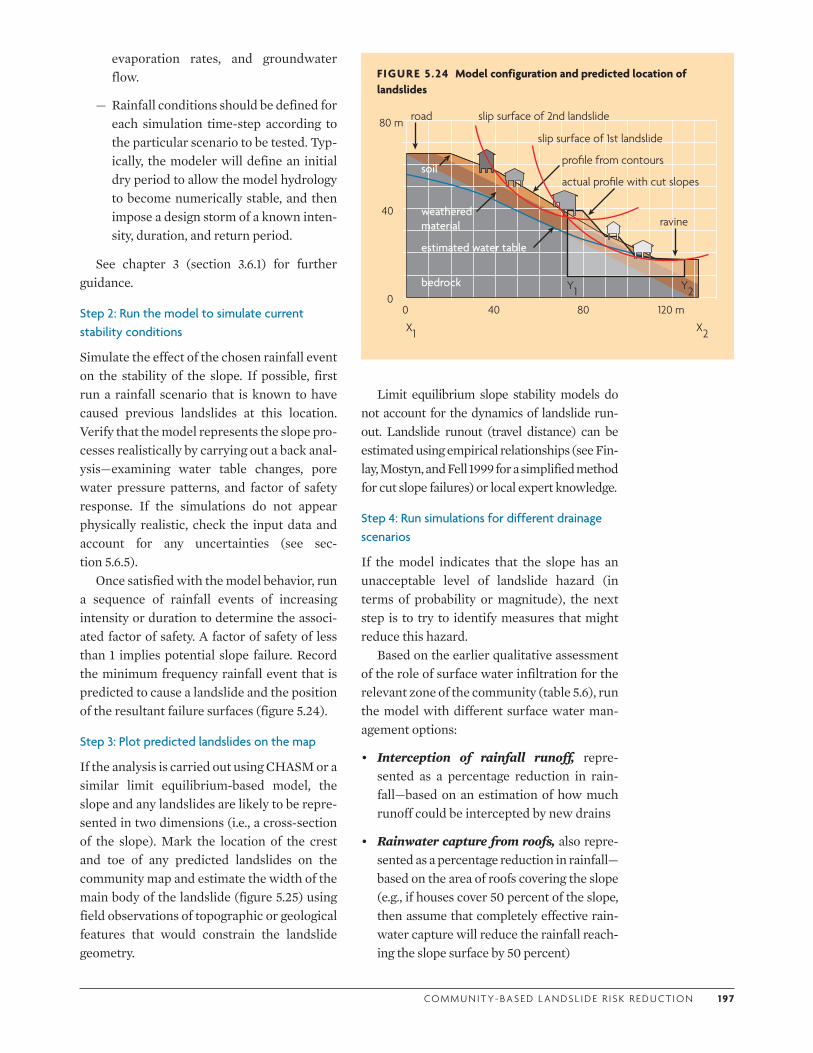
CO M M U N I T Y- BA S E D L A N DS L I D E R I S K R E D U CT I O N 1 9 7
evaporation rates, and groundwater flow.
— Rainfall conditions should be defined for each simulation time-step according to the particular scenario to be tested. Typ-ically, the modeler will define an initial dry period to allow the model hydrology to become numerically stable, and then impose a design storm of a known inten-sity, duration, and return period.
See chapter 3 (section 3.6.1) for further guidance.
Step 2: Run the model to simulate current stability conditions
Simulate the effect of the chosen rainfall event on the stability of the slope. If possible, first run a rainfall scenario that is known to have caused previous landslides at this location. Verify that the model represents the slope pro-cesses realistically by carrying out a back anal-ysis—examining water table changes, pore water pressure patterns, and factor of safety response. If the simulations do not appear physically realistic, check the input data and account for any uncertainties (see sec-tion 5.6.5).
Once satisfied with the model behavior, run a sequence of rainfall events of increasing intensity or duration to determine the associ-ated factor of safety. A factor of safety of less than 1 implies potential slope failure. Record the minimum frequency rainfall event that is predicted to cause a landslide and the position of the resultant failure surfaces (figure 5.24).
Step 3: Plot predicted landslides on the map
If the analysis is carried out using CHASM or a similar limit equilibrium-based model, the slope and any landslides are likely to be repre-sented in two dimensions (i.e., a cross-section of the slope). Mark the location of the crest and toe of any predicted landslides on the community map and estimate the width of the main body of the landslide (figure 5.25) using field observations of topographic or geological features that would constrain the landslide geometry.
Limit equilibrium slope stability models do not account for the dynamics of landslide run-out. Landslide runout (travel distance) can be estimated using empirical relationships (see Fin-lay, Mostyn, and Fell 1999 for a simplified method for cut slope failures) or local expert knowledge.
Step 4: Run simulations for different drainage scenarios
If the model indicates that the slope has an unacceptable level of landslide hazard (in terms of probability or magnitude), the next step is to try to identify measures that might reduce this hazard.
Based on the earlier qualitative assessment of the role of surface water infiltration for the relevant zone of the community (table 5.6), run the model with different surface water man-agement options:
• Interception of rainfall runoff, repre-sented as a percentage reduction in rain-fall—based on an estimation of how much runoff could be intercepted by new drains
• Rainwater capture from roofs, also repre-sented as a percentage reduction in rainfall—based on the area of roofs covering the slope (e.g., if houses cover 50 percent of the slope, then assume that completely effective rain-water capture will reduce the rainfall reach-ing the slope surface by 50 percent)
FIGURE 5 .24 Model configuration and predicted location of landslides
road
ravine
slip surface of 2nd landslide
slip surface of 1st landslide
soil
weathered material
bedrock
actual profile with cut slopes
profile from contours
estimated water table
0
40
80 m
8040 120 m0X1 X2
Y1 Y2
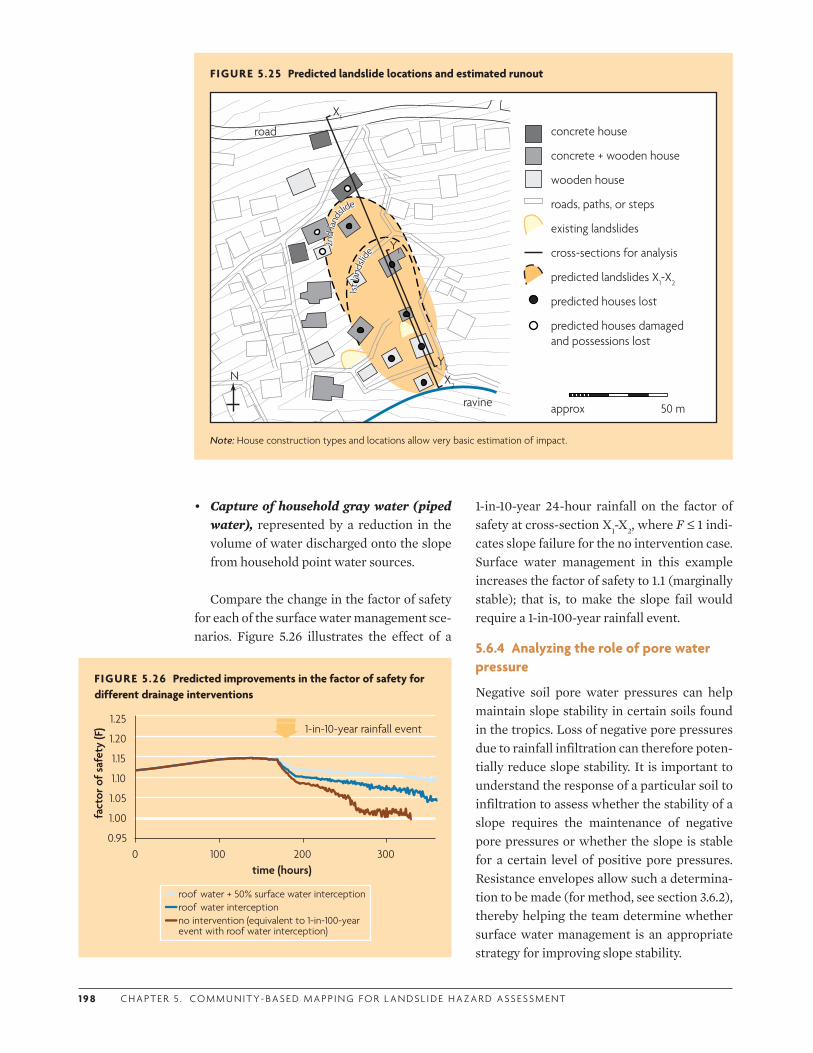
1 9 8 C H A P T E R 5 . COM M U N I T Y- BA S E D M A P P I N G F O R L A N DS L I D E H A Z A R D A SS ESS M E N T
• Capture of household gray water (piped water), represented by a reduction in the volume of water discharged onto the slope from household point water sources.
Compare the change in the factor of safety for each of the surface water management sce-narios. Figure 5.26 illustrates the effect of a
1-in-10-year 24-hour rainfall on the factor of safety at cross-section X1-X2, where F ≤ 1 indi-cates slope failure for the no intervention case. Surface water management in this example increases the factor of safety to 1.1 (marginally stable); that is, to make the slope fail would require a 1-in-100-year rainfall event.
5.6.4 Analyzing the role of pore water pressure
Negative soil pore water pressures can help maintain slope stability in certain soils found in the tropics. Loss of negative pore pressures due to rainfall infiltration can therefore poten-tially reduce slope stability. It is important to understand the response of a particular soil to infiltration to assess whether the stability of a slope requires the maintenance of negative pore pressures or whether the slope is stable for a certain level of positive pore pressures. Resistance envelopes allow such a determina-tion to be made (for method, see section 3.6.2), thereby helping the team determine whether surface water management is an appropriate strategy for improving slope stability.
FIGURE 5 .25 Predicted landslide locations and estimated runout
road
ravine
Y2
Y1
X2
X1
roads, paths, or steps
concrete house
concrete + wooden house
wooden house
existing landslides
approx 50 m
cross-sections for analysis
N
predicted houses lost
predicted houses damaged and possessions lost
predicted landslides X1-X2
2nd
lands
lide
1st l
ands
lid
e
2nd
lands
lide
1st l
ands
lid
e
Note: House construction types and locations allow very basic estimation of impact.
FIGURE 5 .26 Predicted improvements in the factor of safety for different drainage interventions
0.95
1.00
1.05
1.10
1.15
1.20
1.25
0 100 200 300
fact
or o
f saf
ety
(F)
time (hours)
1-in-10-year rainfall event
roof water + 50% surface water interception roof water interceptionno intervention (equivalent to 1-in-100-year event with roof water interception)
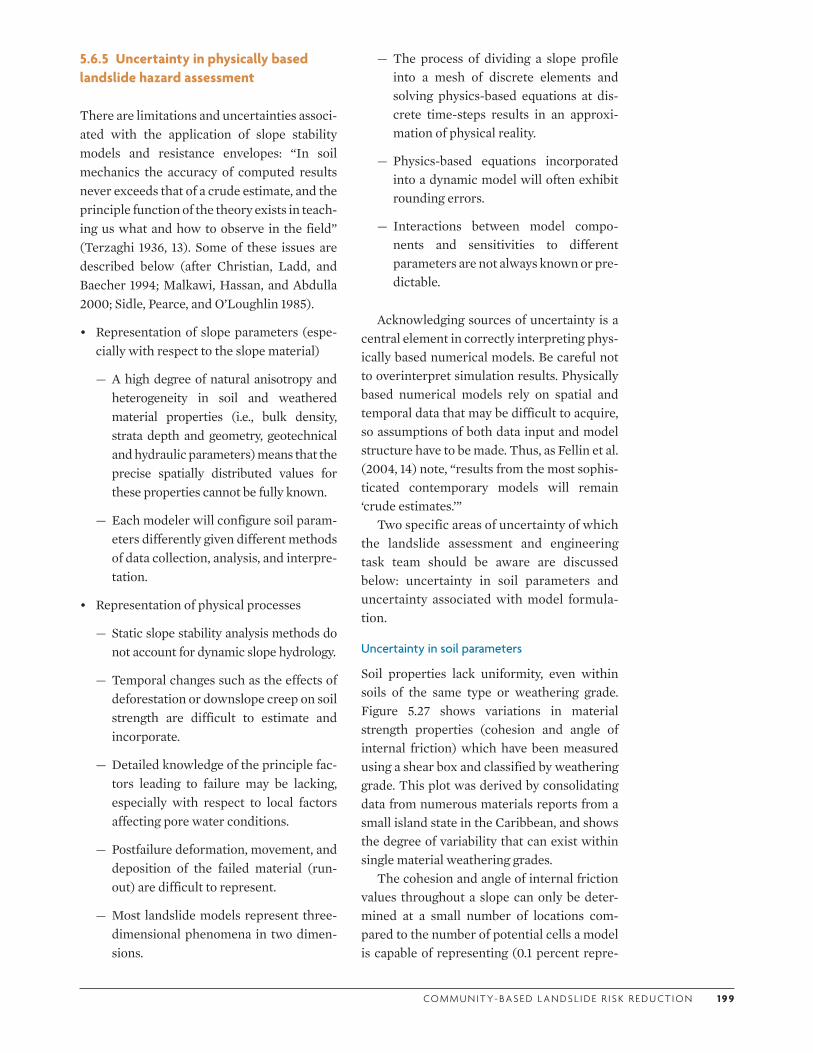
CO M M U N I T Y- BA S E D L A N DS L I D E R I S K R E D U CT I O N 1 9 9
5.6.5 Uncertainty in physically based landslide hazard assessment
There are limitations and uncertainties associ-ated with the application of slope stability models and resistance envelopes: “In soil mechanics the accuracy of computed results never exceeds that of a crude estimate, and the principle function of the theory exists in teach-ing us what and how to observe in the field” (Terzaghi 1936, 13). Some of these issues are described below (after Christian, Ladd, and Baecher 1994; Malkawi, Hassan, and Abdulla 2000; Sidle, Pearce, and O’Loughlin 1985).
• Representation of slope parameters (espe-cially with respect to the slope material)
— A high degree of natural anisotropy and heterogeneity in soil and weathered material properties (i.e., bulk density, strata depth and geometry, geotechnical and hydraulic parameters) means that the precise spatially distributed values for these properties cannot be fully known.
— Each modeler will configure soil param-eters differently given different methods of data collection, analysis, and interpre-tation.
• Representation of physical processes
— Static slope stability analysis methods do not account for dynamic slope hydrology.
— Temporal changes such as the effects of deforestation or downslope creep on soil strength are difficult to estimate and incorporate.
— Detailed knowledge of the principle fac-tors leading to failure may be lacking, especially with respect to local factors affecting pore water conditions.
— Postfailure deformation, movement, and deposition of the failed material (run-out) are difficult to represent.
— Most landslide models represent three-dimensional phenomena in two dimen-sions.
— The process of dividing a slope profile into a mesh of discrete elements and solving physics-based equations at dis-crete time-steps results in an approxi-mation of physical reality.
— Physics-based equations incorporated into a dynamic model will often exhibit rounding errors.
— Interactions between model compo-nents and sensitivities to different parameters are not always known or pre-dictable.
Acknowledging sources of uncertainty is a central element in correctly interpreting phys-ically based numerical models. Be careful not to overinterpret simulation results. Physically based numerical models rely on spatial and temporal data that may be difficult to acquire, so assumptions of both data input and model structure have to be made. Thus, as Fellin et al. (2004, 14) note, “results from the most sophis-ticated contemporary models will remain ‘crude estimates.’”
Two specific areas of uncertainty of which the landslide assessment and engineering task team should be aware are discussed below: uncertainty in soil parameters and uncertainty associated with model formula-tion.
Uncertainty in soil parameters
Soil properties lack uniformity, even within soils of the same type or weathering grade. Figure 5.27 shows variations in material strength properties (cohesion and angle of internal friction) which have been measured using a shear box and classified by weathering grade. This plot was derived by consolidating data from numerous materials reports from a small island state in the Caribbean, and shows the degree of variability that can exist within single material weathering grades.
The cohesion and angle of internal friction values throughout a slope can only be deter-mined at a small number of locations com-pared to the number of potential cells a model is capable of representing (0.1 percent repre-
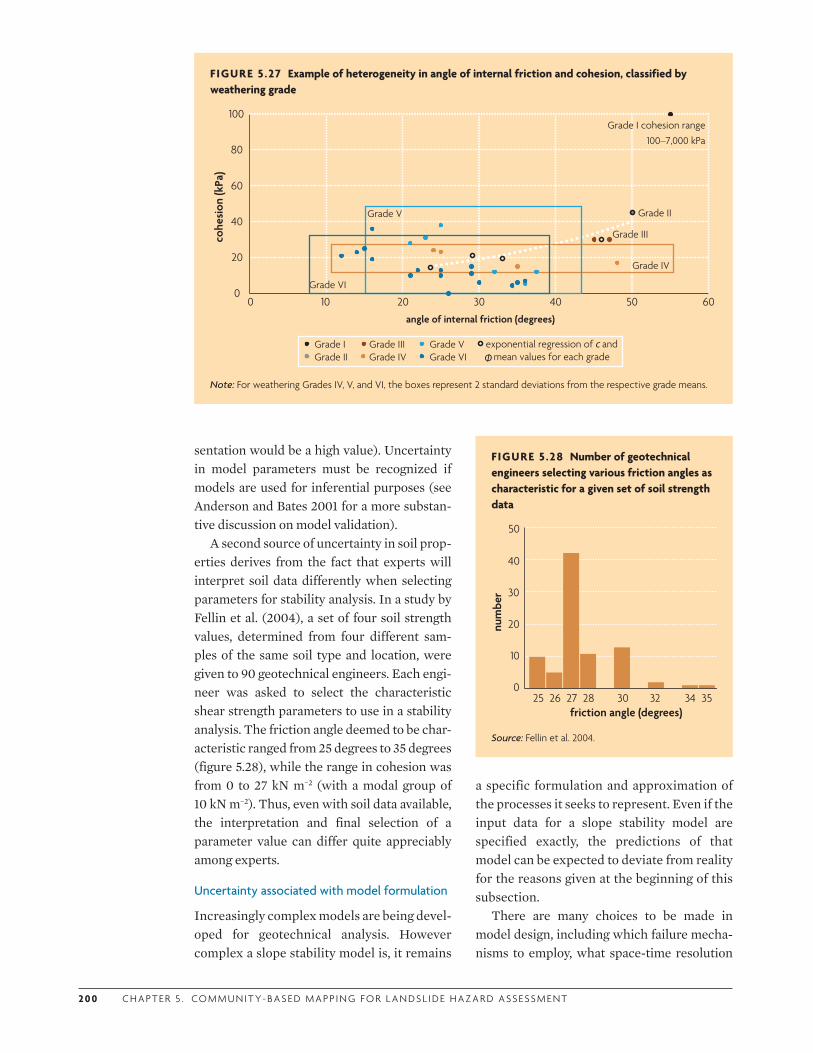
2 0 0 C H A P T E R 5 . COM M U N I T Y- BA S E D M A P P I N G F O R L A N DS L I D E H A Z A R D A SS ESS M E N T
sentation would be a high value). Uncertainty in model parameters must be recognized if models are used for inferential purposes (see Anderson and Bates 2001 for a more substan-tive discussion on model validation).
A second source of uncertainty in soil prop-erties derives from the fact that experts will interpret soil data differently when selecting parameters for stability analysis. In a study by Fellin et al. (2004), a set of four soil strength values, determined from four different sam-ples of the same soil type and location, were given to 90 geotechnical engineers. Each engi-neer was asked to select the characteristic shear strength parameters to use in a stability analysis. The friction angle deemed to be char-acteristic ranged from 25 degrees to 35 degrees (figure 5.28), while the range in cohesion was from 0 to 27 kN m−2 (with a modal group of 10 kN m−2). Thus, even with soil data available, the interpretation and final selection of a parameter value can differ quite appreciably among experts.
Uncertainty associated with model formulation
Increasingly complex models are being devel-oped for geotechnical analysis. However complex a slope stability model is, it remains
a specific formulation and approximation of the processes it seeks to represent. Even if the input data for a slope stability model are specified exactly, the predictions of that model can be expected to deviate from reality for the reasons given at the beginning of this subsection.
There are many choices to be made in model design, including which failure mecha-nisms to employ, what space-time resolution
FIGURE 5 .27 Example of heterogeneity in angle of internal friction and cohesion, classified by weathering grade
0
20
40
60
80
100
602010 30 40 500angle of internal friction (degrees)
cohe
sion
(kPa
)
Grade I cohesion range100–7,000 kPa
Grade II
Grade III
Grade IV
Grade V
Grade VI
exponential regression of c and mean values for each grade
Grade VGrade VI
Grade IGrade II
Grade IIIGrade IV
Note: For weathering Grades IV, V, and VI, the boxes represent 2 standard deviations from the respective grade means.
FIGURE 5 .28 Number of geotechnical engineers selecting various friction angles as characteristic for a given set of soil strength data
40
30
20
10
025 26 28 32 3427 30 35
friction angle (degrees)
num
ber
50
Source: Fellin et al. 2004.
Ф
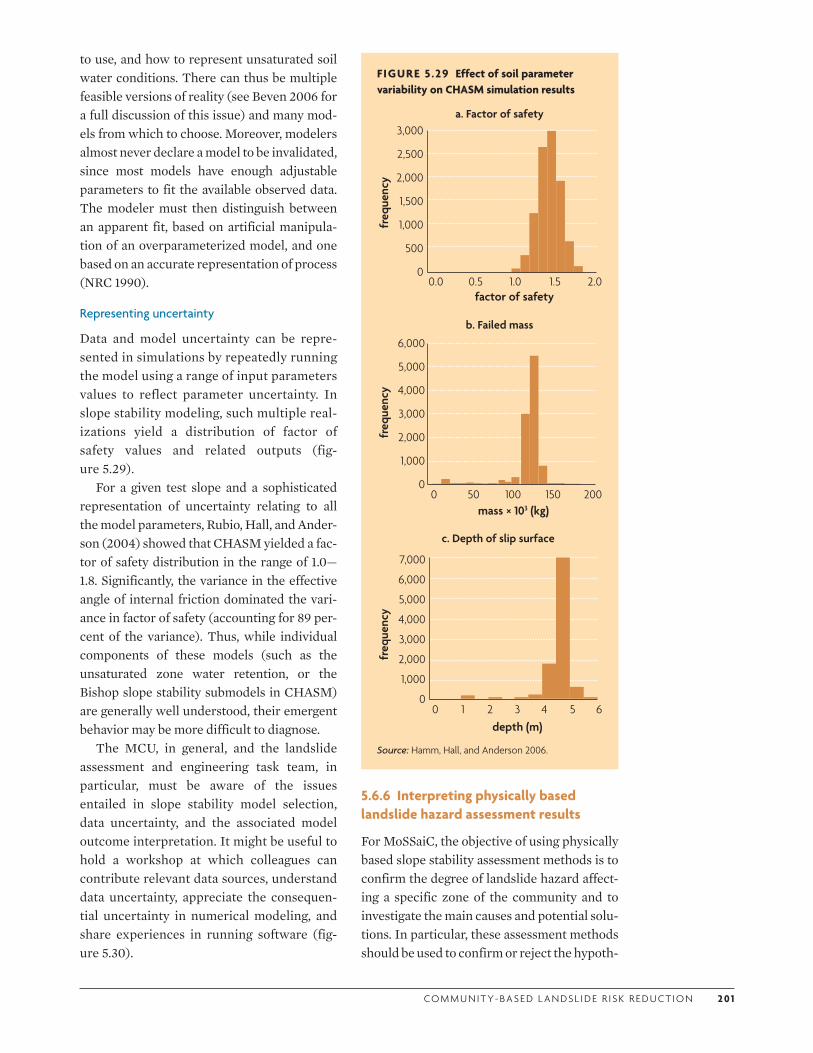
CO M M U N I T Y- BA S E D L A N DS L I D E R I S K R E D U CT I O N 2 0 1
to use, and how to represent unsaturated soil water conditions. There can thus be multiple feasible versions of reality (see Beven 2006 for a full discussion of this issue) and many mod-els from which to choose. Moreover, modelers almost never declare a model to be invalidated, since most models have enough adjustable parameters to fit the available observed data. The modeler must then distinguish between an apparent fit, based on artificial manipula-tion of an overparameterized model, and one based on an accurate representation of process (NRC 1990).
Representing uncertainty
Data and model uncertainty can be repre-sented in simulations by repeatedly running the model using a range of input parameters values to reflect parameter uncertainty. In slope stability modeling, such multiple real-izations yield a distribution of factor of safety values and related outputs (fig-ure 5.29).
For a given test slope and a sophisticated representation of uncertainty relating to all the model parameters, Rubio, Hall, and Ander-son (2004) showed that CHASM yielded a fac-tor of safety distribution in the range of 1.0—1.8. Significantly, the variance in the effective angle of internal friction dominated the vari-ance in factor of safety (accounting for 89 per-cent of the variance). Thus, while individual components of these models (such as the unsaturated zone water retention, or the Bishop slope stability submodels in CHASM) are generally well understood, their emergent behavior may be more difficult to diagnose.
The MCU, in general, and the landslide assessment and engineering task team, in particular, must be aware of the issues entailed in slope stability model selection, data uncertainty, and the associated model outcome interpretation. It might be useful to hold a workshop at which colleagues can contribute relevant data sources, understand data uncertainty, appreciate the consequen-tial uncertainty in numerical modeling, and share experiences in running software (fig-ure 5.30).
FIGURE 5 .29 Effect of soil parameter variability on CHASM simulation results
b. Failed mass
c. Depth of slip surface
depth (m)0 1 2 6543
freq
uenc
y
7,000
6,000
5,000
4,000
3,000
2,000
1,000
0
mass × 103 (kg)
freq
uenc
y
0 50 100 200150
6,000
5,000
4,000
3,000
2,000
1,000
0
a. Factor of safety
factor of safety
freq
uenc
y
0.0 0.5 1.0 2.01.5
3,000
2,500
2,000
1,500
1,000
500
0
Source: Hamm, Hall, and Anderson 2006.
5.6.6 Interpreting physically based landslide hazard assessment results
For MoSSaiC, the objective of using physically based slope stability assessment methods is to confirm the degree of landslide hazard affect-ing a specific zone of the community and to investigate the main causes and potential solu-tions. In particular, these assessment methods should be used to confirm or reject the hypoth-
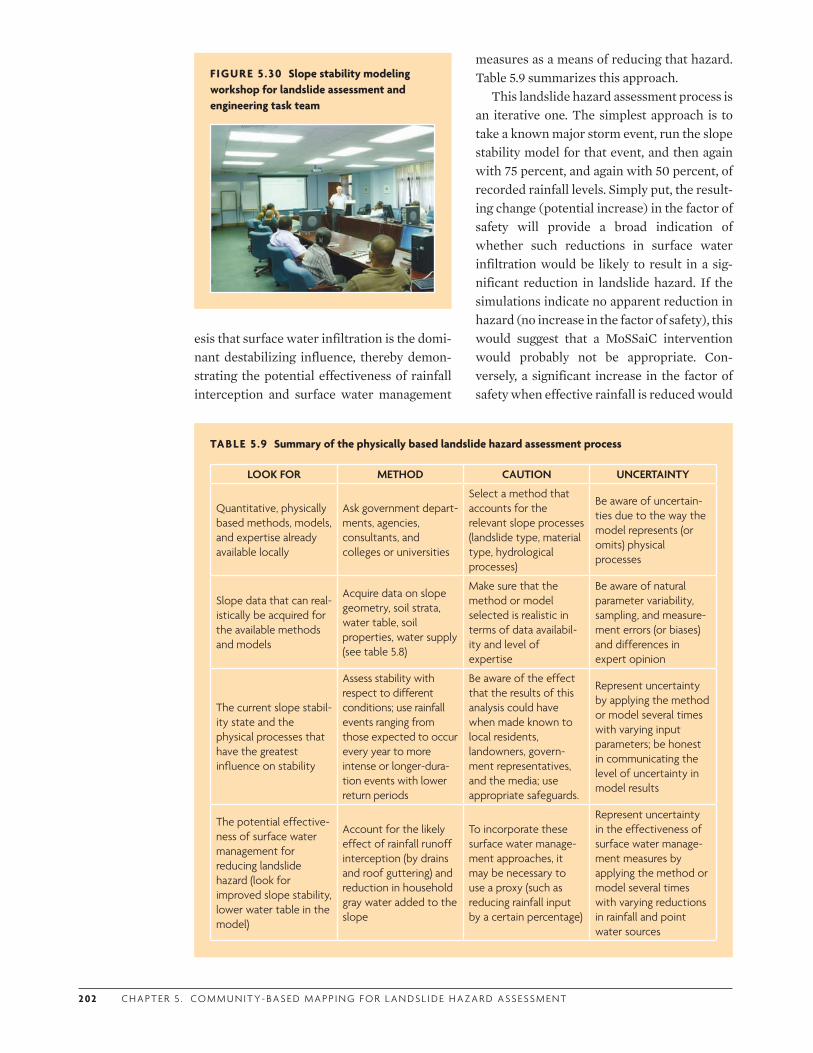
2 02 C H A P T E R 5 . COM M U N I T Y- BA S E D M A P P I N G F O R L A N DS L I D E H A Z A R D A SS ESS M E N T
esis that surface water infiltration is the domi-nant destabilizing influence, thereby demon-strating the potential effectiveness of rainfall interception and surface water management
measures as a means of reducing that hazard. Table 5.9 summarizes this approach.
This landslide hazard assessment process is an iterative one. The simplest approach is to take a known major storm event, run the slope stability model for that event, and then again with 75 percent, and again with 50 percent, of recorded rainfall levels. Simply put, the result-ing change (potential increase) in the factor of safety will provide a broad indication of whether such reductions in surface water infiltration would be likely to result in a sig-nificant reduction in landslide hazard. If the simulations indicate no apparent reduction in hazard (no increase in the factor of safety), this would suggest that a MoSSaiC intervention would probably not be appropriate. Con-versely, a significant increase in the factor of safety when effective rainfall is reduced would
TABLE 5 .9 Summary of the physically based landslide hazard assessment process
LOOK FOR METHOD CAUTION UNCERTAINTY
Quantitative, physically based methods, models, and expertise already available locally
Ask government depart-ments, agencies, consultants, and colleges or universities
Select a method that accounts for the relevant slope processes (landslide type, material type, hydrological processes)
Be aware of uncertain-ties due to the way the model represents (or omits) physical processes
Slope data that can real-istically be acquired for the available methods and models
Acquire data on slope geometry, soil strata, water table, soil properties, water supply (see table 5.8)
Make sure that the method or model selected is realistic in terms of data availabil-ity and level of expertise
Be aware of natural parameter variability, sampling, and measure-ment errors (or biases) and differences in expert opinion
The current slope stabil-ity state and the physical processes that have the greatest influence on stability
Assess stability with respect to different conditions; use rainfall events ranging from those expected to occur every year to more intense or longer-dura-tion events with lower return periods
Be aware of the effect that the results of this analysis could have when made known to local residents, landowners, govern-ment representatives, and the media; use appropriate safeguards.
Represent uncertainty by applying the method or model several times with varying input parameters; be honest in communicating the level of uncertainty in model results
The potential effective-ness of surface water management for reducing landslide hazard (look for improved slope stability, lower water table in the model)
Account for the likely effect of rainfall runoff interception (by drains and roof guttering) and reduction in household gray water added to the slope
To incorporate these surface water manage-ment approaches, it may be necessary to use a proxy (such as reducing rainfall input by a certain percentage)
Represent uncertainty in the effectiveness of surface water manage-ment measures by applying the method or model several times with varying reductions in rainfall and point water sources
FIGURE 5 .30 Slope stability modeling workshop for landslide assessment and engineering task team

CO M M U N I T Y- BA S E D L A N DS L I D E R I S K R E D U CT I O N 2 03
indicate that a MoSSaiC intervention could be appropriate.
The landslide assessment and engineering task team should communicate the results of the quantitative landslide hazard assessment clearly to the MCU so that nonexperts can understand and make decisions about the project. Be transparent about uncertainties in the specific values of slope factor of safety or percentage changes in stability for different drainage interventions. Importantly, identify the overall trends in the model results to con-vey whether surface water infiltration is a sig-nificant driver for the landslide hazard, and whether drains would be likely to improve slope stability.
If physically based simulations support a MoSSaiC intervention, continue to use the model to determine the specific impact of sur-face water management. Chapter 6 details the components of such an intervention: the vari-ous configurations of contour (intercept) drains and downslope drains; and the installa-tion of downpipes, guttering, gray water drain pipes, and related infrastructure. Once a detailed drainage design has been undertaken, the simulations can be rerun with more pre-cise rainfall reduction figures that reflect anticipated rainfall capture data.
5.7 PRIORITIZE ZONES FOR DRAINAGE INTERVENTIONS
If the quantitative, physically based landslide hazard analysis indicates that a MoSSaiC proj-ect is appropriate, the next step is to prioritize zones of the community for specific drainage measures. The landslide assessment and engi-neering task team should integrate all the information generated by the mapping and modeling processes described in this chapter:
• Hillside-scale slope features and processes (topography, slope angles, locations of deeper soils versus bedrock, convergence zones, major natural and altered drainage lines, evidence of past or potential land-slides)
• Household-scale features and influences on slope processes (local slope geometry—cuts, fills, and retaining structures, house-hold-scale drainage lines and point water sources, evidence of previous or potential landslides)
• Quantitative landslide hazard assessments (slope stability modeling, analysis of the effect of piped water and rainfall, assess-ment of suction control).
Building on the initial qualitative landslide hazard assessment process outlined in fig-ure 5.20, figure 5.31 consolidates and presents the complete landslide hazard assessment and decision-making process described in this chapter.
The final phase of the community-based landslide hazard mapping process described in this subsection entails the following:
• For each of the slope process and landslide hazard zones in the community, confirming the potential surface water management option likely to be most effective in improv-ing the slope stability and drainage issues within each hillside zone
• Sketching potential new drain locations on an initial drainage plan and taking photos of these locations
• Assigning priorities to the various drainage interventions based on relative landslide hazard and likely effectiveness
• Gaining consensus from all stakeholders on the initial drainage plan.
5.7.1 Assign a potential drainage intervention to each zone
Each landslide hazard and drainage zone will require a slightly different intervention to reduce landslide hazard; some zones may not need any intervention at all.
The community needs to understand the rationale behind the identification of the dif-ferent zones, and therefore the purpose and suitability of the different categories of inter-vention proposed for each zone. Some areas of

2 0 4 C H A P T E R 5 . COM M U N I T Y- BA S E D M A P P I N G F O R L A N DS L I D E H A Z A R D A SS ESS M E N T
FIGURE 5 .31 Complete community-based landslide hazard assessment process for MoSSaiC interventions
COMMUNITY-BASED MAPPING (SECTION 5.3, 5.4)
Community slope feature map completed
Yes
QUALITATIVE LANDSLIDE HAZARD ASSESSMENT(SECTION 5.5)
Slope process zones identified
Yes
CASES WHERE A MoSSaiC INTERVENTION IS NOT LIKELY TO BE APPROPRIATE
There is evidence of landslide susceptibility No Landslide hazard is likely to be low
Yes
More than one or two households are likely to be exposed and vulnerable to landslide hazard, and housing
density is sufficiently high to make a communitywide landslide hazard reduction project relevant
No
Individual households might require standard engineering measures for localized stabilization of
slope
Yes
The landslide hazard is not due to an obvious isolated or sudden event (e.g., burst pipe, slope excavation) No
Acute (sudden) destabilizing events should be addressed immediately (e.g., fix broken pipes,
retain excavations)
Yes
Initial map interpretation suggests the type of landslide is rotational or translational in weathered material No
The landslide hazard type and mechanisms are different (such as rock falls, debris flows, lahars)
Yes
Initial map interpretation suggests surface water infiltration is a dominant mechanism for landslide hazard No
The landslide hazard may be dominated by other causes (such as earthquakes or regional groundwa-
ter rise)
Yes
PHYSICALLY BASED LANDSLIDE HAZARD ASSESSMENT (SECTION 5.6)
Slope stability and pore water pressure analysis confirms that surface water infiltration is a dominant mechanism
for landslide hazardNo
The landslide hazard may be complicated by multiple aggravating factors (human influences,
previous earthquakes, groundwater change, deforestation, construction)
Yes
INITIAL ASSESSMENT OF SLOPE DRAINAGE FEASIBILITY (SECTION 5.7)
Possible locations for intercept and down-slope drains can be identified and an initial drainage plan agreed with
the communityNo
Constructing new surface water drains is not likely to be feasible in this community
Yes
Milestone 5
DRAINAGE DESIGN (CHAPTER 6)
Calculations confirm the effectiveness of new drains to intercept surface water runoff and convey runoff,
roof-water and household water off the slopeNo
The landslide hazard may not be addressed by surface water management alone
Yes
A MoSSaiC project is likely to be effective in reducing landslide hazard in this community
Final drainage plan agreed upon
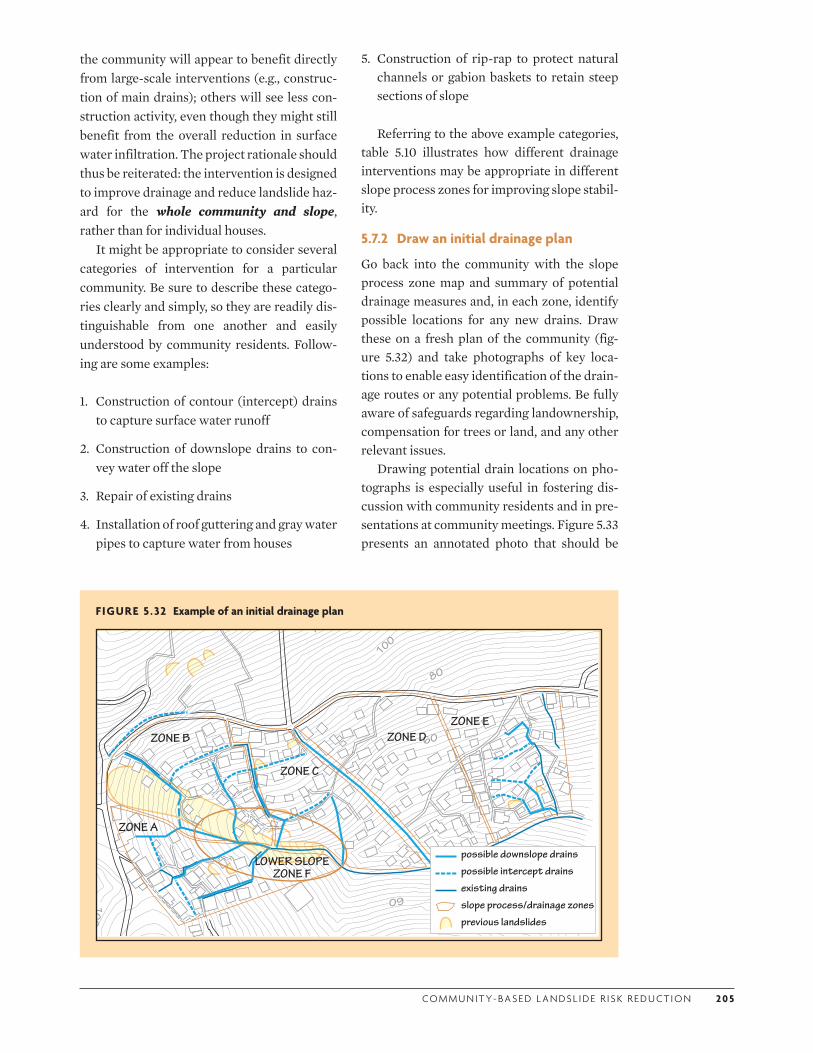
CO M M U N I T Y- BA S E D L A N DS L I D E R I S K R E D U CT I O N 2 0 5
the community will appear to benefit directly from large-scale interventions (e.g., construc-tion of main drains); others will see less con-struction activity, even though they might still benefit from the overall reduction in surface water infiltration. The project rationale should thus be reiterated: the intervention is designed to improve drainage and reduce landslide haz-ard for the whole community and slope, rather than for individual houses.
It might be appropriate to consider several categories of intervention for a particular community. Be sure to describe these catego-ries clearly and simply, so they are readily dis-tinguishable from one another and easily understood by community residents. Follow-ing are some examples:
1. Construction of contour (intercept) drains to capture surface water runoff
2. Construction of downslope drains to con-vey water off the slope
3. Repair of existing drains
4. Installation of roof guttering and gray water pipes to capture water from houses
5. Construction of rip-rap to protect natural channels or gabion baskets to retain steep sections of slope
Referring to the above example categories, table 5.10 illustrates how different drainage interventions may be appropriate in different slope process zones for improving slope stabil-ity.
5.7.2 Draw an initial drainage plan
Go back into the community with the slope process zone map and summary of potential drainage measures and, in each zone, identify possible locations for any new drains. Draw these on a fresh plan of the community (fig-ure 5.32) and take photographs of key loca-tions to enable easy identification of the drain-age routes or any potential problems. Be fully aware of safeguards regarding landownership, compensation for trees or land, and any other relevant issues.
Drawing potential drain locations on pho-tographs is especially useful in fostering dis-cussion with community residents and in pre-sentations at community meetings. Figure 5.33 presents an annotated photo that should be
FIGURE 5 .32 Example of an initial drainage plan
100
60
80
100 120
60
ZONE DZONE B
ZONE A
ZONE C
ZONE E
LOWER SLOPE ZONE F
previous landslides
slope process/drainage zones
existing drains
possible intercept drains
possible downslope drains
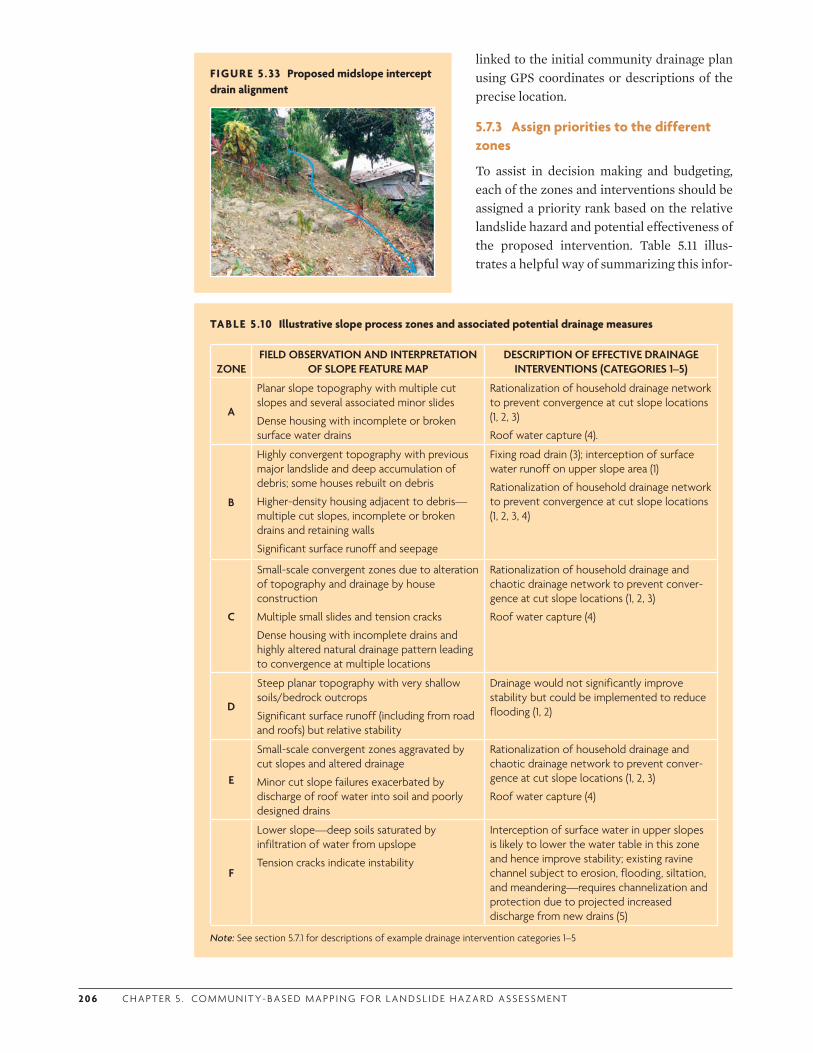
2 0 6 C H A P T E R 5 . COM M U N I T Y- BA S E D M A P P I N G F O R L A N DS L I D E H A Z A R D A SS ESS M E N T
linked to the initial community drainage plan using GPS coordinates or descriptions of the precise location.
5.7.3 Assign priorities to the different zones
To assist in decision making and budgeting, each of the zones and interventions should be assigned a priority rank based on the relative landslide hazard and potential effectiveness of the proposed intervention. Table 5.11 illus-trates a helpful way of summarizing this infor-
TABLE 5 .10 Illustrative slope process zones and associated potential drainage measures
ZONEFIELD OBSERVATION AND INTERPRETATION
OF SLOPE FEATURE MAPDESCRIPTION OF EFFECTIVE DRAINAGE
INTERVENTIONS (CATEGORIES 1–5)
A
Planar slope topography with multiple cut slopes and several associated minor slides
Dense housing with incomplete or broken surface water drains
Rationalization of household drainage network to prevent convergence at cut slope locations (1, 2, 3)
Roof water capture (4).
B
Highly convergent topography with previous major landslide and deep accumulation of debris; some houses rebuilt on debris
Higher-density housing adjacent to debris—multiple cut slopes, incomplete or broken drains and retaining walls
Significant surface runoff and seepage
Fixing road drain (3); interception of surface water runoff on upper slope area (1)
Rationalization of household drainage network to prevent convergence at cut slope locations (1, 2, 3, 4)
C
Small-scale convergent zones due to alteration of topography and drainage by house construction
Multiple small slides and tension cracks
Dense housing with incomplete drains and highly altered natural drainage pattern leading to convergence at multiple locations
Rationalization of household drainage and chaotic drainage network to prevent conver-gence at cut slope locations (1, 2, 3)
Roof water capture (4)
D
Steep planar topography with very shallow soils/bedrock outcrops
Significant surface runoff (including from road and roofs) but relative stability
Drainage would not significantly improve stability but could be implemented to reduce flooding (1, 2)
E
Small-scale convergent zones aggravated by cut slopes and altered drainage
Minor cut slope failures exacerbated by discharge of roof water into soil and poorly designed drains
Rationalization of household drainage and chaotic drainage network to prevent conver-gence at cut slope locations (1, 2, 3)
Roof water capture (4)
F
Lower slope—deep soils saturated by infiltration of water from upslope
Tension cracks indicate instability
Interception of surface water in upper slopes is likely to lower the water table in this zone and hence improve stability; existing ravine channel subject to erosion, flooding, siltation, and meandering—requires channelization and protection due to projected increased discharge from new drains (5)
Note: See section 5.7.1 for descriptions of example drainage intervention categories 1–5
FIGURE 5 .33 Proposed midslope intercept drain alignment
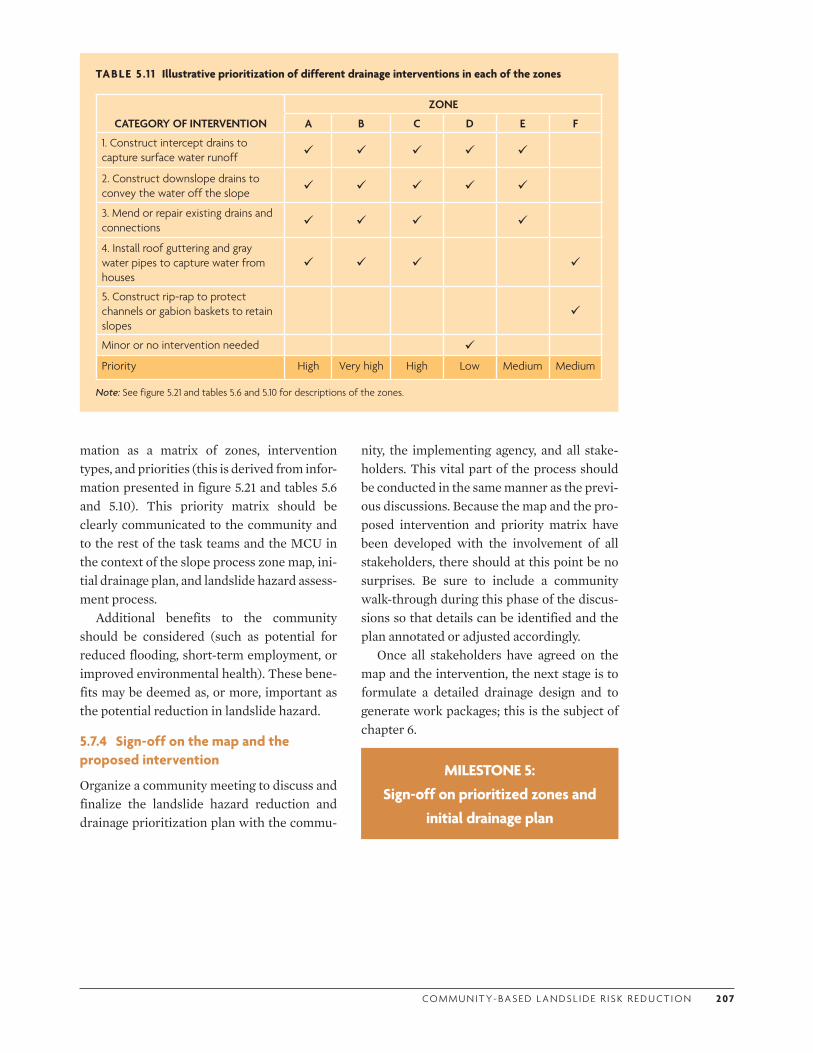
CO M M U N I T Y- BA S E D L A N DS L I D E R I S K R E D U CT I O N 2 0 7
mation as a matrix of zones, intervention types, and priorities (this is derived from infor-mation presented in figure 5.21 and tables 5.6 and 5.10). This priority matrix should be clearly communicated to the community and to the rest of the task teams and the MCU in the context of the slope process zone map, ini-tial drainage plan, and landslide hazard assess-ment process.
Additional benefits to the community should be considered (such as potential for reduced flooding, short-term employment, or improved environmental health). These bene-fits may be deemed as, or more, important as the potential reduction in landslide hazard.
5.7.4 Sign-off on the map and the proposed intervention
Organize a community meeting to discuss and finalize the landslide hazard reduction and drainage prioritization plan with the commu-
nity, the implementing agency, and all stake-holders. This vital part of the process should be conducted in the same manner as the previ-ous discussions. Because the map and the pro-posed intervention and priority matrix have been developed with the involvement of all stakeholders, there should at this point be no surprises. Be sure to include a community walk-through during this phase of the discus-sions so that details can be identified and the plan annotated or adjusted accordingly.
Once all stakeholders have agreed on the map and the intervention, the next stage is to formulate a detailed drainage design and to generate work packages; this is the subject of chapter 6.
MILESTONE 5: Sign-off on prioritized zones and
initial drainage plan
TABLE 5 .1 1 Illustrative prioritization of different drainage interventions in each of the zones
CATEGORY OF INTERVENTION
ZONE
A B C D E F
1. Construct intercept drains to capture surface water runoff
2. Construct downslope drains to convey the water off the slope
3. Mend or repair existing drains and connections
4. Install roof guttering and gray water pipes to capture water from houses
5. Construct rip-rap to protect channels or gabion baskets to retain slopes
Minor or no intervention needed
Priority High Very high High Low Medium Medium
Note: See figure 5.21 and tables 5.6 and 5.10 for descriptions of the zones.
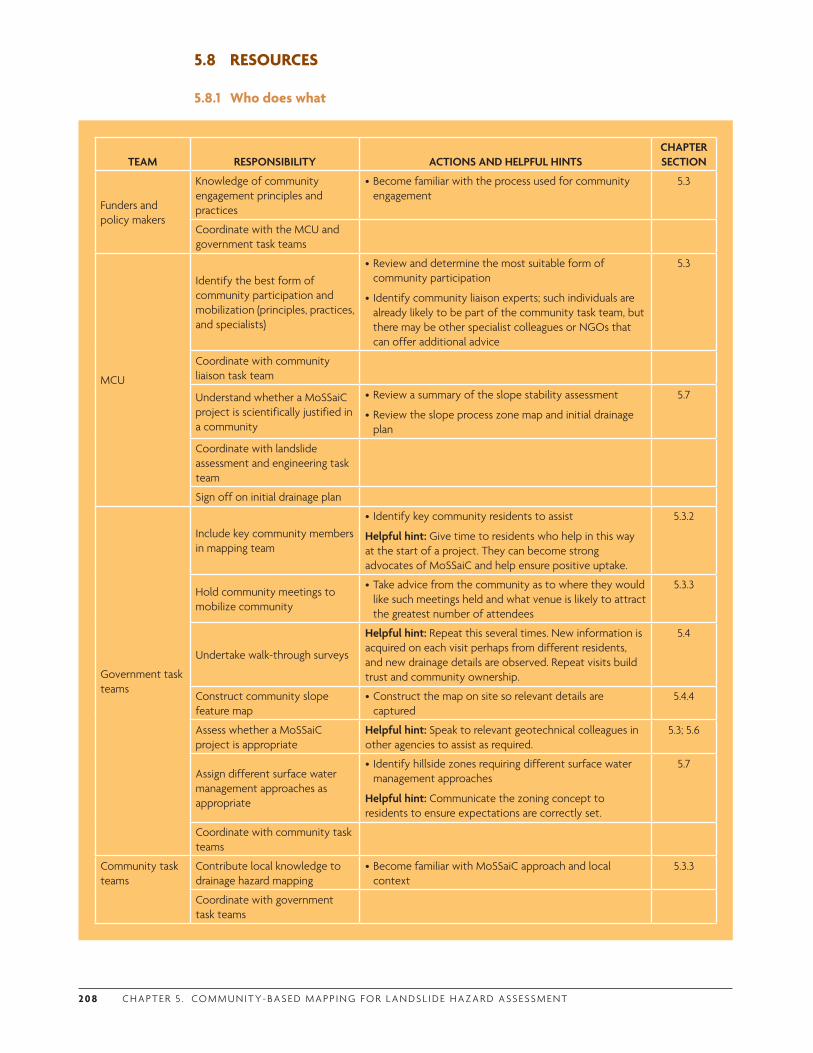
2 0 8 C H A P T E R 5 . COM M U N I T Y- BA S E D M A P P I N G F O R L A N DS L I D E H A Z A R D A SS ESS M E N T
5.8 RESOURCES
5.8.1 Who does what
TEAM RESPONSIBILITY ACTIONS AND HELPFUL HINTSCHAPTER SECTION
Funders and policy makers
Knowledge of community engagement principles and practices
•Become familiar with the process used for community engagement
5.3
Coordinate with the MCU and government task teams
MCU
Identify the best form of community participation and mobilization (principles, practices, and specialists)
•Review and determine the most suitable form of community participation
• Identify community liaison experts; such individuals are already likely to be part of the community task team, but there may be other specialist colleagues or NGOs that can offer additional advice
5.3
Coordinate with community liaison task team
Understand whether a MoSSaiC project is scientifically justified in a community
•Review a summary of the slope stability assessment
•Review the slope process zone map and initial drainage plan
5.7
Coordinate with landslide assessment and engineering task team
Sign off on initial drainage plan
Government task teams
Include key community members in mapping team
• Identify key community residents to assist
Helpful hint: Give time to residents who help in this way at the start of a project. They can become strong advocates of MoSSaiC and help ensure positive uptake.
5.3.2
Hold community meetings to mobilize community
•Take advice from the community as to where they would like such meetings held and what venue is likely to attract the greatest number of attendees
5.3.3
Undertake walk-through surveys
Helpful hint: Repeat this several times. New information is acquired on each visit perhaps from different residents, and new drainage details are observed. Repeat visits build trust and community ownership.
5.4
Construct community slope feature map
•Construct the map on site so relevant details are captured
5.4.4
Assess whether a MoSSaiC project is appropriate
Helpful hint: Speak to relevant geotechnical colleagues in other agencies to assist as required.
5.3; 5.6
Assign different surface water management approaches as appropriate
• Identify hillside zones requiring different surface water management approaches
Helpful hint: Communicate the zoning concept to residents to ensure expectations are correctly set.
5.7
Coordinate with community task teams
Community task teams
Contribute local knowledge to drainage hazard mapping
•Become familiar with MoSSaiC approach and local context
5.3.3
Coordinate with government task teams
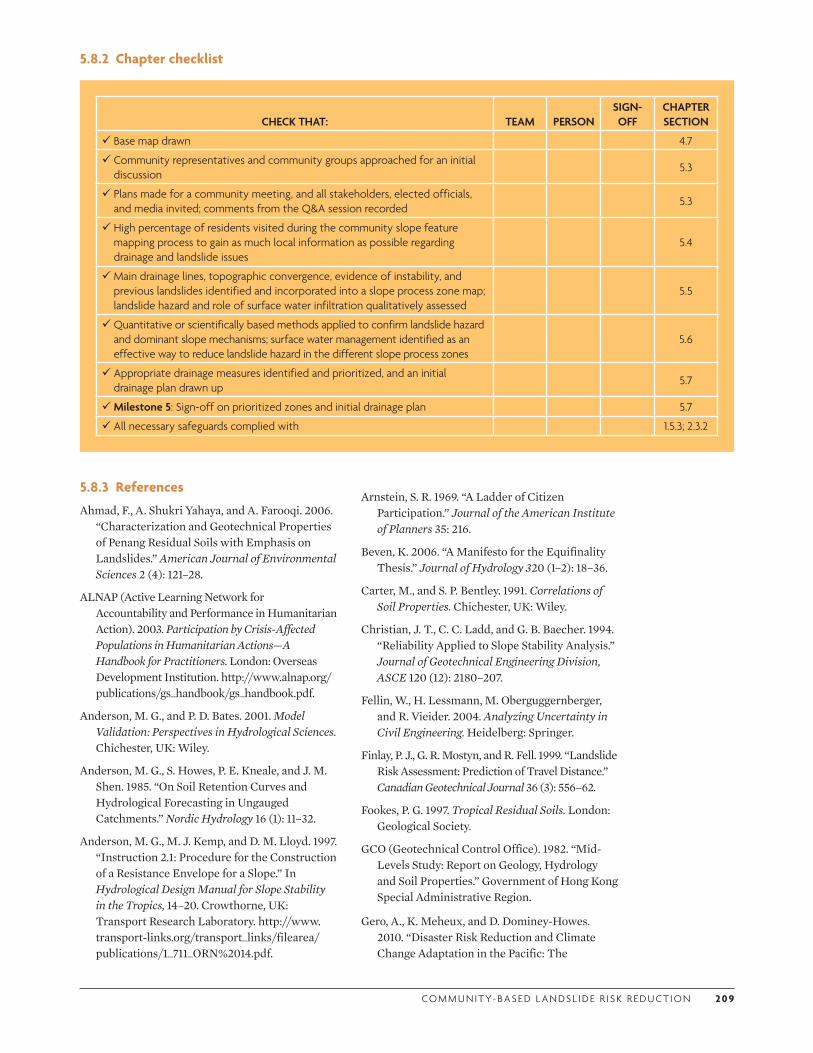
CO M M U N I T Y- BA S E D L A N DS L I D E R I S K R E D U CT I O N 2 0 9
5.8.2 Chapter checklist
5.8.3 References
Ahmad, F., A. Shukri Yahaya, and A. Farooqi. 2006. “Characterization and Geotechnical Properties of Penang Residual Soils with Emphasis on Landslides.” American Journal of Environmental Sciences 2 (4): 121–28.
ALNAP (Active Learning Network for Accountability and Performance in Humanitarian Action). 2003. Participation by Crisis-Affected Populations in Humanitarian Actions—A Handbook for Practitioners. London: Overseas Development Institution. http://www.alnap.org/publications/gs_handbook/gs_handbook.pdf.
Anderson, M. G., and P. D. Bates. 2001. Model Validation: Perspectives in Hydrological Sciences. Chichester, UK: Wiley.
Anderson, M. G., S. Howes, P. E. Kneale, and J. M. Shen. 1985. “On Soil Retention Curves and Hydrological Forecasting in Ungauged Catchments.” Nordic Hydrology 16 (1): 11–32.
Anderson, M. G., M. J. Kemp, and D. M. Lloyd. 1997. “Instruction 2.1: Procedure for the Construction of a Resistance Envelope for a Slope.” In Hydrological Design Manual for Slope Stability in the Tropics, 14–20. Crowthorne, UK: Transport Research Laboratory. http://www.transport-links.org/transport_links/filearea/publications/1_711_ORN%2014.pdf.
CHECK THAT: TEAM PERSONSIGN-OFF
CHAPTER SECTION
Base map drawn 4.7
Community representatives and community groups approached for an initial discussion
5.3
Plans made for a community meeting, and all stakeholders, elected officials, and media invited; comments from the Q&A session recorded
5.3
High percentage of residents visited during the community slope feature mapping process to gain as much local information as possible regarding drainage and landslide issues
5.4
Main drainage lines, topographic convergence, evidence of instability, and previous landslides identified and incorporated into a slope process zone map; landslide hazard and role of surface water infiltration qualitatively assessed
5.5
Quantitative or scientifically based methods applied to confirm landslide hazard and dominant slope mechanisms; surface water management identified as an effective way to reduce landslide hazard in the different slope process zones
5.6
Appropriate drainage measures identified and prioritized, and an initial drainage plan drawn up
5.7
Milestone 5: Sign-off on prioritized zones and initial drainage plan 5.7
All necessary safeguards complied with 1.5.3; 2.3.2
Arnstein, S. R. 1969. “A Ladder of Citizen Participation.” Journal of the American Institute of Planners 35: 216.
Beven, K. 2006. “A Manifesto for the Equifinality Thesis.” Journal of Hydrology 320 (1–2): 18–36.
Carter, M., and S. P. Bentley. 1991. Correlations of Soil Properties. Chichester, UK: Wiley.
Christian, J. T., C. C. Ladd, and G. B. Baecher. 1994. “Reliability Applied to Slope Stability Analysis.” Journal of Geotechnical Engineering Division, ASCE 120 (12): 2180–207.
Fellin, W., H. Lessmann, M. Oberguggernberger, and R. Vieider. 2004. Analyzing Uncertainty in Civil Engineering. Heidelberg: Springer.
Finlay, P. J., G. R. Mostyn, and R. Fell. 1999. “Landslide Risk Assessment: Prediction of Travel Distance.” Canadian Geotechnical Journal 36 (3): 556–62.
Fookes, P. G. 1997. Tropical Residual Soils. London: Geological Society.
GCO (Geotechnical Control Office). 1982. “Mid-Levels Study: Report on Geology, Hydrology and Soil Properties.” Government of Hong Kong Special Administrative Region.
Gero, A., K. Meheux, and D. Dominey-Howes. 2010. “Disaster Risk Reduction and Climate Change Adaptation in the Pacific: The
2 1 0 C H A P T E R 5 . COM M U N I T Y- BA S E D M A P P I N G F O R L A N DS L I D E H A Z A R D A SS ESS M E N T
Challenge of Integration.” Miscellaneous Report 4, Australia-Pacific Tsunami Research Centre Natural Hazards Research Laboratory, University of New South Wales.
Hamm, N. A. S., J. W. Hall, and M. G. Anderson. 2006. “Variance-Based Sensitivity Analysis of the Probability of Hydrologically Induced Slope Stability.” Computers and Geosciences 32 (6): 803–17.
Klasen, S. 1999. Does Gender Inequality Reduce Growth and Development? Evidence from Cross-Country Regressions. Washington, DC: World Bank.
Knutson, T. R., J. L. McBride, J. Chan, K. Emanuel, G. Holland, C. Landsea, I. Held, J. P. Kossin, A. K. Srivastava, and M. Sugi. 2010. “Tropical Cyclones and Climate Change.” Nature Geosciences 3: 157–63.
Lin, H., J. Bouma, Y. Pachepsky, A. Western, J. Thompson, R. van Genuchten, H.-J. Vogel, and A. Lilly. 2006. “Hydropedology: Synergistic Integration of Pedology and Hydrology.” Water Resources Research 42: W05301.
Lin, S., D. Shaw, M.-C. Ho, and S. Lin. 2008. “Why Are Flood and Landslide Victims Less Willing to Take Mitigation Measures Than the Public? Natural Hazards 44: 305–14.
Malkawi, A. I., W. F. Hassan, and F. A. Abdulla. 2000. “Uncertainty and Reliability Analysis Applied to Slope Stability.” Structural Safety 22 (2): 161–87.
National Research Council. 1990. Groundwater Models, Scientific and Regulatory Applications. Washington, DC: National Academy Press.
Parsons, A. J. 1988. Hillslope Form and Process. London: Routledge.
Pretty, J. 1995. “Participatory Learning for Sustainable Agriculture.” World Development 23: 1247–263.
Quinn, P. F., K. Beven, P. Chevallier, and O. Planchon. 1991. “The Prediction of Hillslope Flow Paths for Distributed Hydrological Modeling Using Digital Terrain Models.” Hydrological Processes 5: 59–79.
Quinn, P. F., K. J. Beven, and R. Lamb. 1995. “The ln (a/tan beta) Index: How to Calculate It and How to Use It within the TOPMODEL Framework.” Hydrological Processes 9: 161–82.
Rubio, E., J. W. Hall, and M. G. Anderson. 2004. “Uncertainty Analysis in a Slope Hydrology and Stability Model Using Probabilistic and Imprecise Information.” Computers and Geotechnics 31 (7): 529–36.
Sidle, R. C., A. J. Pearce, and C. L. O’Loughlin. 1985. “Hillslope Stability and Land Use.” Water Resource Monograph 11, American Geophysical Union.
Terzaghi, K. 1936. “Relation between Soil Mechanics and Foundation Engineering.” Presidential address. In Proceedings of the First International Conference on Soil Mechanics and Foundation Engineering, vol. 3, 13–18.
UN (United Nations). 2002. Gender Mainstreaming: An Overview. www.un.org/womenwatch/osagi/pdf/e65237.pdf.
—. 2008. “Gender Perspectives—Integrating Disaster Risk Reduction and Climate Change Adaptation. Good Practice and Lessons Learned.” http://www.un.org/waterforlifedecade/pdf/2008_isdr_gender_perspectives_disaster_risk_reduction_cc_eng.pdf.
—. 2009. “Making Disaster Risk Reduction Gender-Sensitive: Policy and Practical Guidelines.” http://www.preventionweb.net/files/9922_MakingDisasterRiskReduction GenderSe.pdf.
UNECOSOC (United Nations Economic and Social Council). 1997. UN Economic and Social Council Resolution 1992/2: Agreed Conclusions 1997/2. http://www.unhcr.org/refworld/docid/ 4652c9fc2.html.
UNISDR (United Nations Office for Disaster Risk Reduction). 2008. Gender Perspectives: Integrating Disaster Risk Reduction into Climate Change Adaptation. www.unisdr.org/we/inform/publications/3391.
University of Warwick. 2002. “Very Low-Cost Domestic Roofwater Harvesting in the Humid Tropics: Existing Practice.” School of Engineering, University of Warwick, Warwick, UK.
van Genuchten, M. Th. 1980. “A Closed-Form Equation for Predicting the Hydraulic Conductivity of Unsaturated Soils.” Soil Science Society of America Journal 44: 892–98.
Victoria, L. P. 2009. “Community Based Approaches to Disaster Mitigation.” Document UNPAN009661, UN Public Administration Network. http://unpan1.un.org/intradoc/groups/public/documents/APCITY/UNPAN009661.pdf.
World Bank. 2010. Safer Homes, Stronger Communities. A Handbook for Reconstructing after Natural Disasters. Washington, DC: World Bank.


“During the past three decades policy statements by all major agencies have included risk reduction as a pre-condition and an integrated aspect of sustainable development… but when it comes to practical implementation, comparatively little has been done.”
— C. Wamsler, “Mainstreaming Risk Reduction in Urban Planning and Housing: A Challenge for International Aid Organizations” (2006, 159)
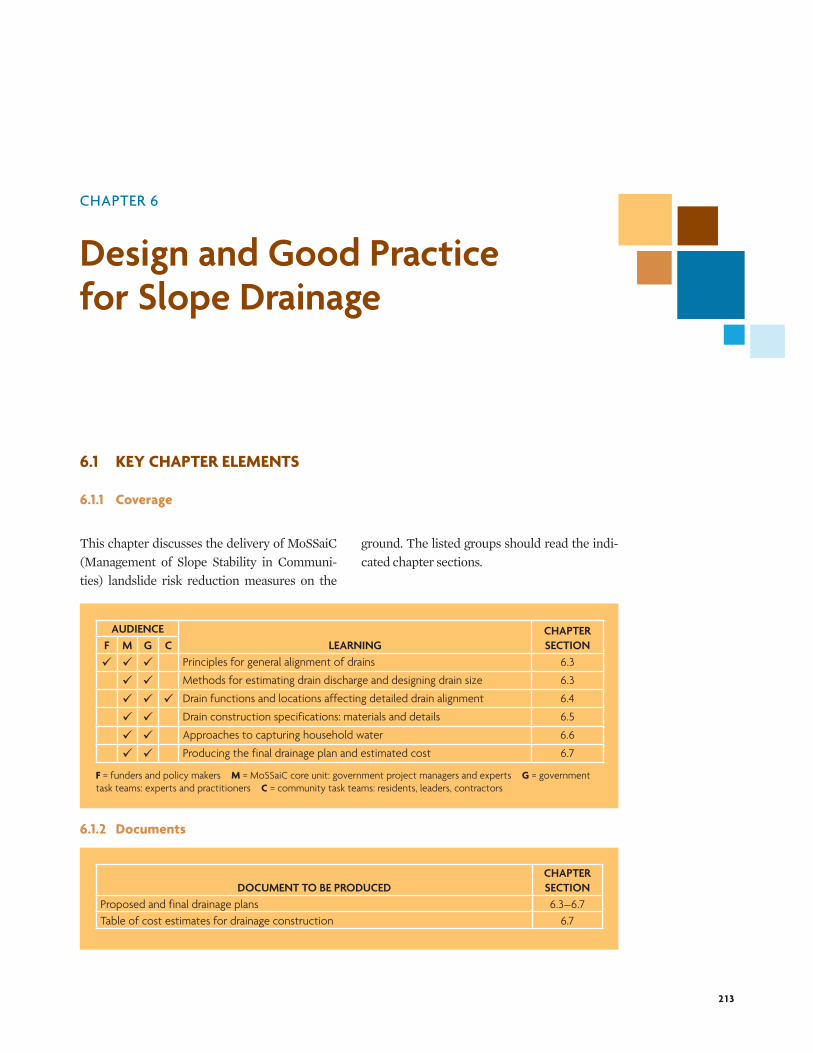
2 1 3
CHAPTER 6
Design and Good Practice for Slope Drainage
6.1 KEY CHAPTER ELEMENTS
6.1.1 Coverage
This chapter discusses the delivery of MoSSaiC (Management of Slope Stability in Communi-ties) landslide risk reduction measures on the
ground. The listed groups should read the indi-cated chapter sections.
AUDIENCELEARNING
CHAPTER SECTIONF M G C
Principles for general alignment of drains 6.3
Methods for estimating drain discharge and designing drain size 6.3
Drain functions and locations affecting detailed drain alignment 6.4
Drain construction specifications: materials and details 6.5
Approaches to capturing household water 6.6
Producing the final drainage plan and estimated cost 6.7
F = funders and policy makers M = MoSSaiC core unit: government project managers and experts G = government task teams: experts and practitioners C = community task teams: residents, leaders, contractors
6.1.2 Documents
DOCUMENT TO BE PRODUCEDCHAPTER SECTION
Proposed and final drainage plans 6.3–6.7Table of cost estimates for drainage construction 6.7
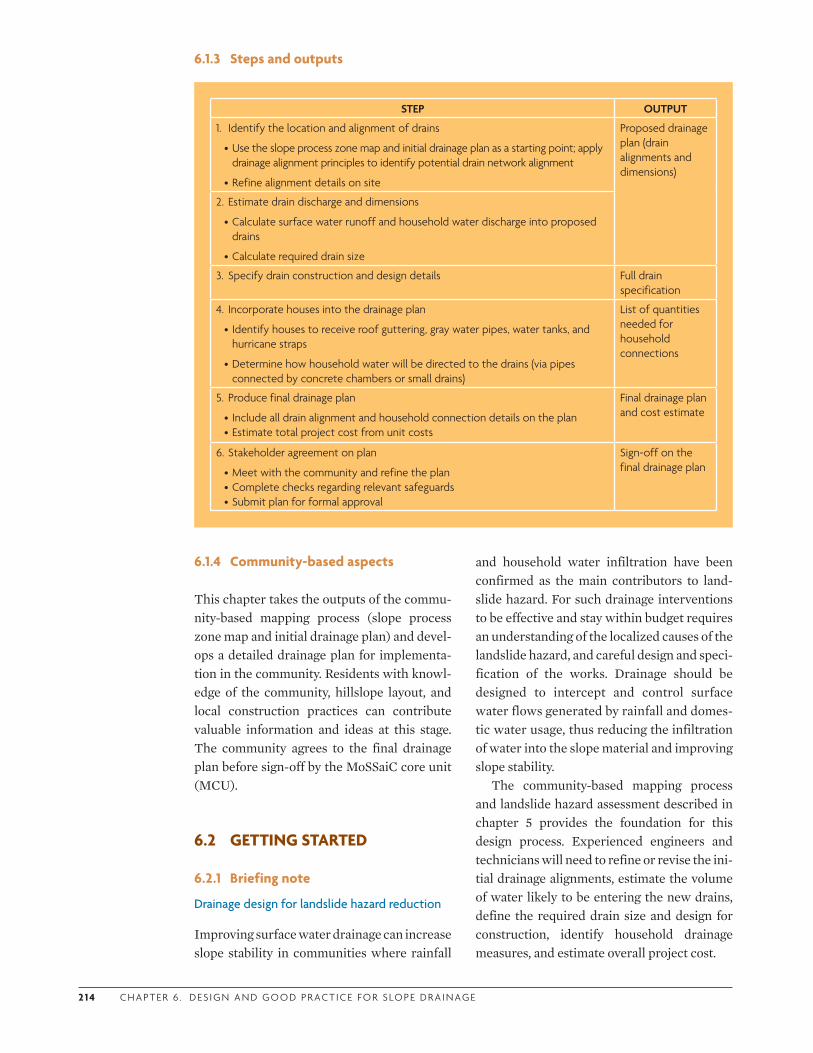
2 1 4 C H A P T E R 6 . D ES I G N A N D G O O D P R ACT I C E F O R S LO P E D R A I N AG E
6.1.3 Steps and outputs
6.1.4 Community-based aspects
This chapter takes the outputs of the commu-nity-based mapping process (slope process zone map and initial drainage plan) and devel-ops a detailed drainage plan for implementa-tion in the community. Residents with knowl-edge of the community, hillslope layout, and local construction practices can contribute valuable information and ideas at this stage. The community agrees to the final drainage plan before sign-off by the MoSSaiC core unit (MCU).
6.2 GETTING STARTED
6.2.1 Briefing note
Drainage design for landslide hazard reduction
Improving surface water drainage can increase slope stability in communities where rainfall
and household water infiltration have been confirmed as the main contributors to land-slide hazard. For such drainage interventions to be effective and stay within budget requires an understanding of the localized causes of the landslide hazard, and careful design and speci-fication of the works. Drainage should be designed to intercept and control surface water flows generated by rainfall and domes-tic water usage, thus reducing the infiltration of water into the slope material and improving slope stability.
The community-based mapping process and landslide hazard assessment described in chapter 5 provides the foundation for this design process. Experienced engineers and technicians will need to refine or revise the ini-tial drainage alignments, estimate the volume of water likely to be entering the new drains, define the required drain size and design for construction, identify household drainage measures, and estimate overall project cost.
STEP OUTPUT
1. Identify the location and alignment of drains
•Use the slope process zone map and initial drainage plan as a starting point; apply drainage alignment principles to identify potential drain network alignment
•Refine alignment details on site
Proposed drainage plan (drain alignments and dimensions)
2. Estimate drain discharge and dimensions
•Calculate surface water runoff and household water discharge into proposed drains
•Calculate required drain size
3. Specify drain construction and design details Full drain specification
4. Incorporate houses into the drainage plan
• Identify houses to receive roof guttering, gray water pipes, water tanks, and hurricane straps
•Determine how household water will be directed to the drains (via pipes connected by concrete chambers or small drains)
List of quantities needed for household connections
5. Produce final drainage plan
• Include all drain alignment and household connection details on the plan•Estimate total project cost from unit costs
Final drainage plan and cost estimate
6. Stakeholder agreement on plan
•Meet with the community and refine the plan•Complete checks regarding relevant safeguards •Submit plan for formal approval
Sign-off on the final drainage plan
CO M M U N I T Y- BA S E D L A N DS L I D E R I S K R E D U CT I O N 2 1 5
The importance of good design
A good drainage design will achieve the fol-lowing:
• Interception of rainfall runoff from the slope surface and roofs
• Capture of gray water from houses
• Controlled flow of all intercepted/captured surface water in a network of drains
• Reduced landslide hazard.
Good design will also minimize the need for land-take, the potential for drain obstruction by debris, and ongoing maintenance.
Even if the government has little experi-ence in designing and implementing drainage works in vulnerable unauthorized communi-ties, there are likely to be relevant local design and construction standards or specifications for drains. Entities such as nongovernmental organizations (NGOs), local contractors, and community residents with construction skills also may be able to identify examples of good practices in drainage design. These sources of information should be reviewed by the land-slide assessment and engineering task team, and appropriate standards and specifications selected. Drain effectiveness in reducing land-slide hazard depends on adhering to such standards and specifications. Accurate specifi-cation of these details also ensures accurate estimates of the total project budget for deci-sion-making, financial, and management pur-poses. The final drainage plan will need to meet appropriate standards, provide adequate construction specifications and cost estimates, and be approved before work packages can be drawn up and contracts awarded.
Additional benefits
Besides reducing landslide hazard in a tar-geted and cost-effective manner, a commu-nity-based program of surface water manage-ment can
• reduce localized flooding and soil erosion;
• improve the community’s environment;
• inform residents of good slope manage-ment and landslide hazard reduction prac-tices;
• be the focal point of a holistic approach to landslide risk reduction for governments and international development agencies; and
• be included in broader poverty reduction, disaster risk reduction, and climate change adaptation programs.
6.2.2 Guiding principles
The following guiding principles apply in slope drainage design:
• Be as precise as possible in specifying drain-age alignment and design in terms of type, size, and materials. Conduct supplemen-tary surveys of any complicated drainage lines within the community as necessary.
• Apply relevant engineering and construc-tion standards and protocols.
• Be as precise and realistic as possible in the initial estimate of quantities so the overall project budget can be estimated.
• Deliver a holistic presentation of the proj-ect (plan and budget) for approval by the MCU and the government agency in charge of implementation.
• Ensure that all relevant safeguards are addressed, especially regarding drain align-ment, with both landowners and commu-nity residents.
6.2.3 Risks and challenges
Design for easy drain maintenance
Although the importance of drain mainte-nance is widely recognized by funders, gov-ernments, and communities, it is rarely under-taken. The need for cleaning and structural maintenance should be explicitly factored into drainage design and on-site construction deci-sions. Drains can, to some extent, be designed to be self-cleaning and therefore easier to maintain. In particular, shallow flow gradients should be avoided, and contour (intercept)
2 1 6 C H A P T E R 6 . D ES I G N A N D G O O D P R ACT I C E F O R S LO P E D R A I N AG E
drains should be designed to keep flow veloci-ties generally high (to limit sediment deposi-tion). Areas of drain constriction, such as nar-row culverts or abrupt changes in alignment, should be avoided so debris does not accumu-late and cause the drain to overflow. Well-designed drains that have been constructed and finished to a good standard, kept clear of debris, and regularly inspected for damage will afford a greater level of protection to com-munities and have a longer design life than poorly designed and constructed drains.
Prioritizing locations for drain construction to reduce landslide hazard
Donors and governments cannot build drains for all houses in all communities. Even in the vulnerable landslide-prone communities selected for MoSSaiC projects, it is not possi-ble from a budgetary or political standpoint to fund every drainage intervention that might be beneficial. For each of these communities, the slope process zone map, initial drainage plan, and drainage prioritization matrix developed in chapter 5 should enable broad priorities to be established. Once the design and specifica-tion of the drainage plan is complete, the cost of these interventions can be estimated. Deci-sion makers should use this information—along with the relevant local safeguards and protocols—to allocate the project budget in a transparent and justifiable way.
Household rainwater and gray water management
In unauthorized communities and among the wider public, there may be little awareness of how simple, low-cost improvements in house-hold drainage can reduce landslide hazard. Yet the adoption of such drainage and slope man-agement practices can ensure the sustainabil-ity of MoSSaiC projects and be highly cost-effective. One means of encouraging adoption is to demonstrate simple household-scale sur-face water management practices that can be used in conjunction with standard drain con-struction methods.
Throughout the project, residents should be made aware of the need for roof guttering
and downpipes that should be connected directly to lined drains,or to properly covered containers for rainwater harvesting (with overflow pipes into drains). Gray water outlets (e.g., sinks and showers) should also be con-nected to the drainage network if there is no other provision for household drainage. Soak-aways should be avoided if possible since they act as a point water source by directly adding water to the slope material.
If there are no new drains adjacent to a house, connections can be made using readily available materials and appropriate technol-ogy, such as wide diameter plastic pipes con-nected by a sequence of concrete chambers. MoSSaiC has also developed a type of drain suitable for use in locations where a shallow trench can be excavated in the soil. The trench is lined with sturdy polythene sheeting (such as sunlight-stable greenhouse polythene sheeting) held in place by a wire mesh. The mesh is formed to the shape of the drain by hand and secured with U-shaped pegs made from steel reinforcing rods. These materials can be purchased for less than 10 percent the cost of similarly sized concrete drains; are much cheaper to transport and easy to carry; and, apart from some short instruction in their assembly, require no previous construction experience.
In some high-priority zones of the commu-nity, these household-level drainage measures may be included as part of the project. Because it is not feasible or affordable to provide such measures for every house, including examples of these methods in the final drainage plan will encourage residents to adopt low-cost or other appropriate technology solutions on a self-help basis. Such solutions offer certain techni-cal, political, and financial advantages, and play a role in the overall improvement of sur-face water management.
6.2.4 Adapting the chapter blueprint to existing capacity
Use the matrix opposite to assess the capac-ity of the MCU and the government task teams (or collaborating government agency) to deliver a final drainage plan at a profes-
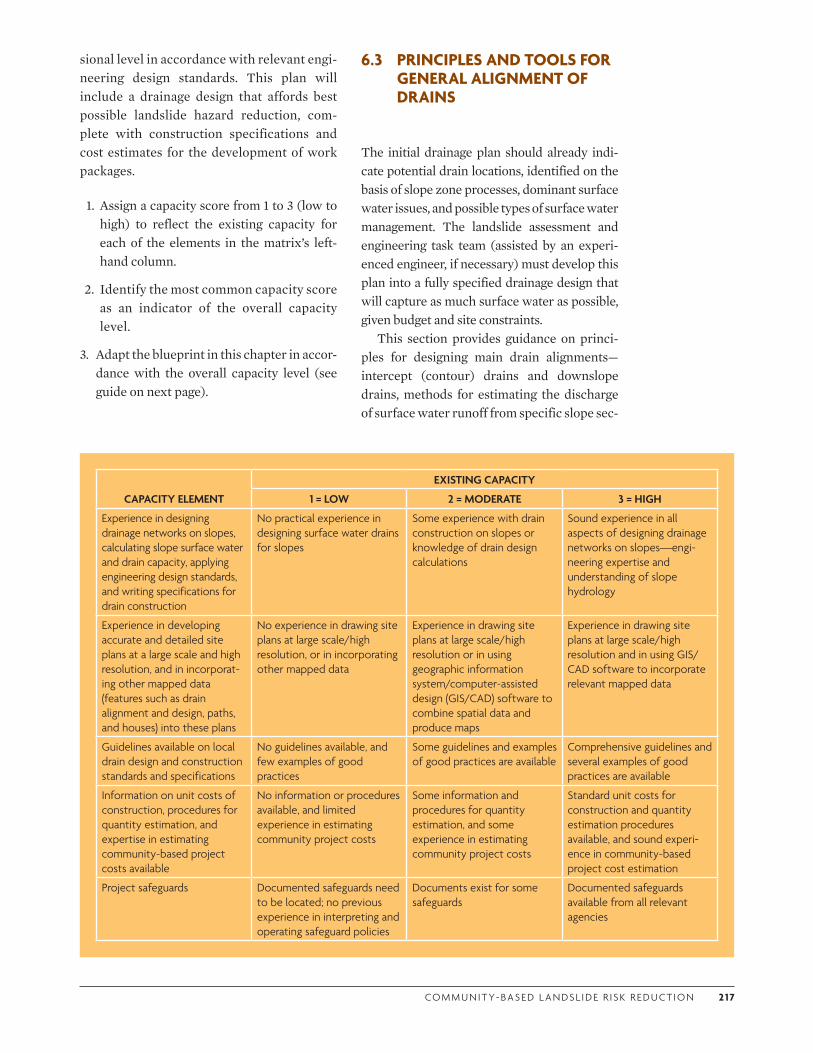
CO M M U N I T Y- BA S E D L A N DS L I D E R I S K R E D U CT I O N 2 1 7
sional level in accordance with relevant engi-neering design standards. This plan will include a drainage design that affords best possible landslide hazard reduction, com-plete with construction specifications and cost estimates for the development of work packages.
1. Assign a capacity score from 1 to 3 (low to high) to reflect the existing capacity for each of the elements in the matrix’s left-hand column.
2. Identify the most common capacity score as an indicator of the overall capacity level.
3. Adapt the blueprint in this chapter in accor-dance with the overall capacity level (see guide on next page).
6.3 PRINCIPLES AND TOOLS FOR GENERAL ALIGNMENT OF DRAINS
The initial drainage plan should already indi-cate potential drain locations, identified on the basis of slope zone processes, dominant surface water issues, and possible types of surface water management. The landslide assessment and engineering task team (assisted by an experi-enced engineer, if necessary) must develop this plan into a fully specified drainage design that will capture as much surface water as possible, given budget and site constraints.
This section provides guidance on princi-ples for designing main drain alignments—intercept (contour) drains and downslope drains, methods for estimating the discharge of surface water runoff from specific slope sec-
CAPACITY ELEMENT
EXISTING CAPACITY
1 = LOW 2 = MODERATE 3 = HIGH
Experience in designing drainage networks on slopes, calculating slope surface water and drain capacity, applying engineering design standards, and writing specifications for drain construction
No practical experience in designing surface water drains for slopes
Some experience with drain construction on slopes or knowledge of drain design calculations
Sound experience in all aspects of designing drainage networks on slopes—engi-neering expertise and understanding of slope hydrology
Experience in developing accurate and detailed site plans at a large scale and high resolution, and in incorporat-ing other mapped data (features such as drain alignment and design, paths, and houses) into these plans
No experience in drawing site plans at large scale/high resolution, or in incorporating other mapped data
Experience in drawing site plans at large scale/high resolution or in using geographic information system/computer-assisted design (GIS/CAD) software to combine spatial data and produce maps
Experience in drawing site plans at large scale/high resolution and in using GIS/CAD software to incorporate relevant mapped data
Guidelines available on local drain design and construction standards and specifications
No guidelines available, and few examples of good practices
Some guidelines and examples of good practices are available
Comprehensive guidelines and several examples of good practices are available
Information on unit costs of construction, procedures for quantity estimation, and expertise in estimating community-based project costs available
No information or procedures available, and limited experience in estimating community project costs
Some information and procedures for quantity estimation, and some experience in estimating community project costs
Standard unit costs for construction and quantity estimation procedures available, and sound experi-ence in community-based project cost estimation
Project safeguards Documented safeguards need to be located; no previous experience in interpreting and operating safeguard policies
Documents exist for some safeguards
Documented safeguards available from all relevant agencies
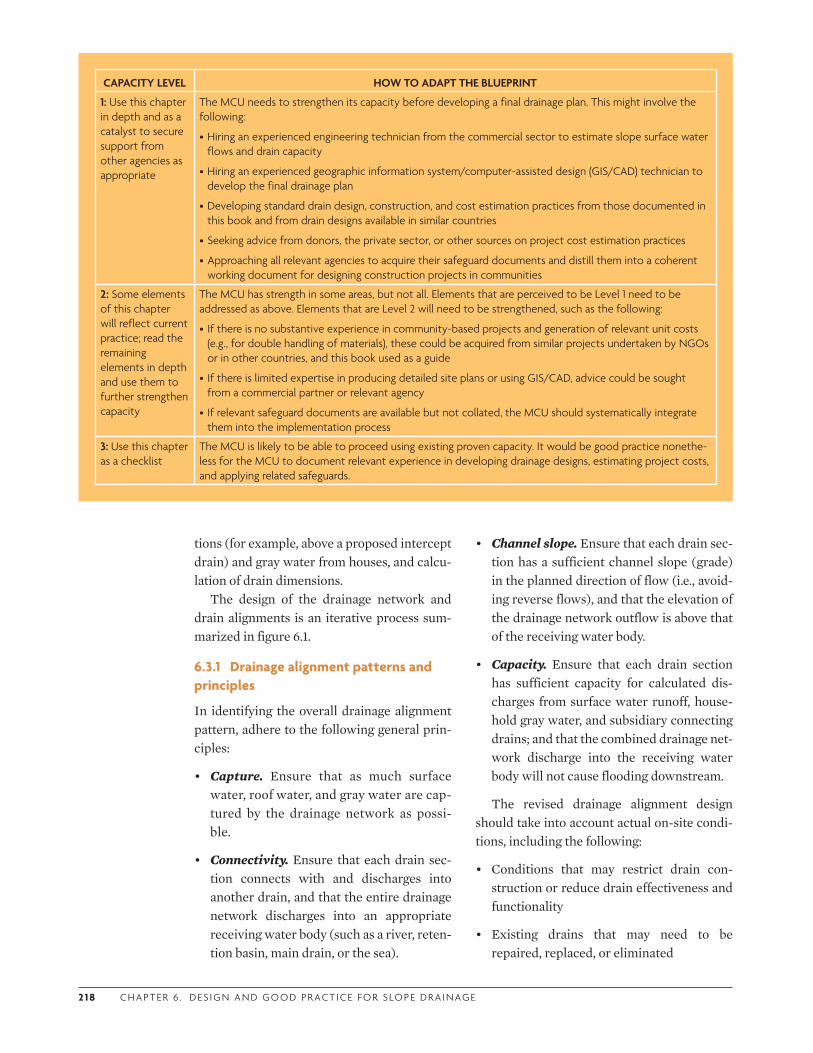
2 1 8 C H A P T E R 6 . D ES I G N A N D G O O D P R ACT I C E F O R S LO P E D R A I N AG E
tions (for example, above a proposed intercept drain) and gray water from houses, and calcu-lation of drain dimensions.
The design of the drainage network and drain alignments is an iterative process sum-marized in figure 6.1.
6.3.1 Drainage alignment patterns and principles
In identifying the overall drainage alignment pattern, adhere to the following general prin-ciples:
• Capture. Ensure that as much surface water, roof water, and gray water are cap-tured by the drainage network as possi-ble.
• Connectivity. Ensure that each drain sec-tion connects with and discharges into another drain, and that the entire drainage network discharges into an appropriate receiving water body (such as a river, reten-tion basin, main drain, or the sea).
• Channel slope. Ensure that each drain sec-tion has a sufficient channel slope (grade) in the planned direction of flow (i.e., avoid-ing reverse flows), and that the elevation of the drainage network outflow is above that of the receiving water body.
• Capacity. Ensure that each drain section has sufficient capacity for calculated dis-charges from surface water runoff, house-hold gray water, and subsidiary connecting drains; and that the combined drainage net-work discharge into the receiving water body will not cause flooding downstream.
The revised drainage alignment design should take into account actual on-site condi-tions, including the following:
• Conditions that may restrict drain con-struction or reduce drain effectiveness and functionality
• Existing drains that may need to be repaired, replaced, or eliminated
CAPACITY LEVEL HOW TO ADAPT THE BLUEPRINT
1: Use this chapter in depth and as a catalyst to secure support from other agencies as appropriate
The MCU needs to strengthen its capacity before developing a final drainage plan. This might involve the following:
•Hiring an experienced engineering technician from the commercial sector to estimate slope surface water flows and drain capacity
•Hiring an experienced geographic information system/computer-assisted design (GIS/CAD) technician to develop the final drainage plan
•Developing standard drain design, construction, and cost estimation practices from those documented in this book and from drain designs available in similar countries
•Seeking advice from donors, the private sector, or other sources on project cost estimation practices
•Approaching all relevant agencies to acquire their safeguard documents and distill them into a coherent working document for designing construction projects in communities
2: Some elements of this chapter will reflect current practice; read the remaining elements in depth and use them to further strengthen capacity
The MCU has strength in some areas, but not all. Elements that are perceived to be Level 1 need to be addressed as above. Elements that are Level 2 will need to be strengthened, such as the following:
• If there is no substantive experience in community-based projects and generation of relevant unit costs (e.g., for double handling of materials), these could be acquired from similar projects undertaken by NGOs or in other countries, and this book used as a guide
• If there is limited expertise in producing detailed site plans or using GIS/CAD, advice could be sought from a commercial partner or relevant agency
• If relevant safeguard documents are available but not collated, the MCU should systematically integrate them into the implementation process
3: Use this chapter as a checklist
The MCU is likely to be able to proceed using existing proven capacity. It would be good practice nonethe-less for the MCU to document relevant experience in developing drainage designs, estimating project costs, and applying related safeguards.
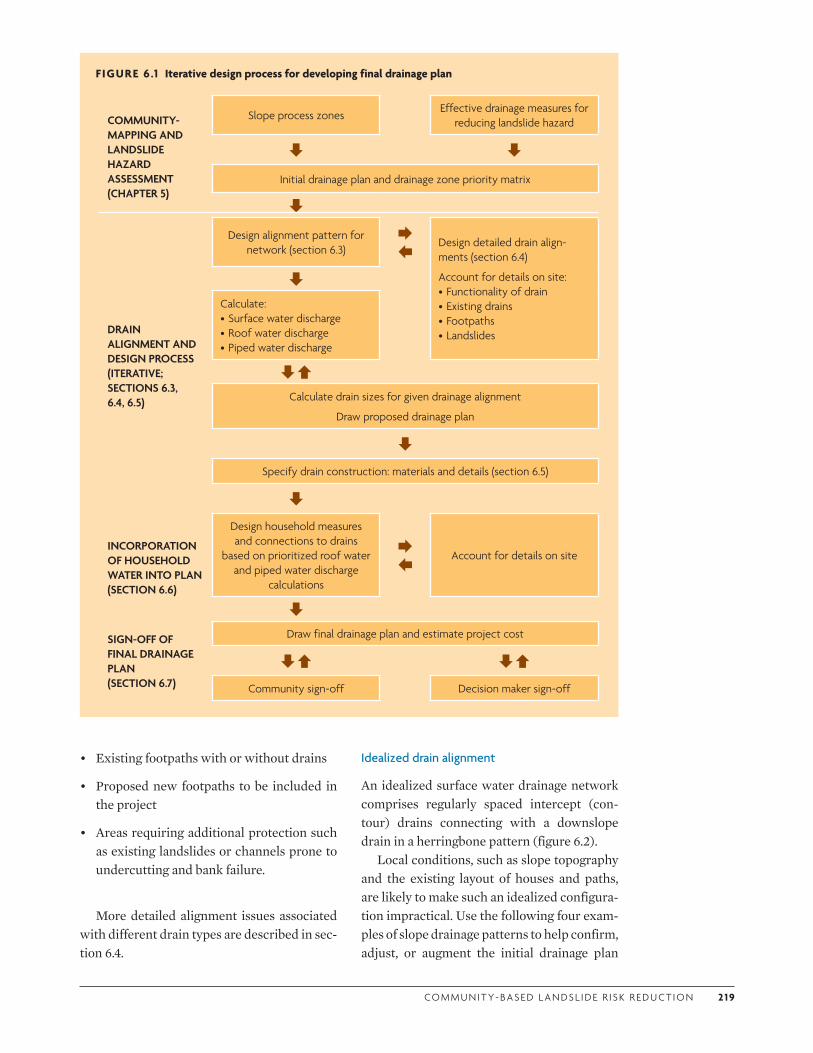
CO M M U N I T Y- BA S E D L A N DS L I D E R I S K R E D U CT I O N 2 1 9
• Existing footpaths with or without drains
• Proposed new footpaths to be included in the project
• Areas requiring additional protection such as existing landslides or channels prone to undercutting and bank failure.
More detailed alignment issues associated with different drain types are described in sec-tion 6.4.
Idealized drain alignment
An idealized surface water drainage network comprises regularly spaced intercept (con-tour) drains connecting with a downslope drain in a herringbone pattern (figure 6.2).
Local conditions, such as slope topography and the existing layout of houses and paths, are likely to make such an idealized configura-tion impractical. Use the following four exam-ples of slope drainage patterns to help confirm, adjust, or augment the initial drainage plan
FIGURE 6.1 Iterative design process for developing final drainage plan
COMMUNITY-MAPPING AND LANDSLIDE HAZARD ASSESSMENT (CHAPTER 5)
Slope process zonesEffective drainage measures for
reducing landslide hazard
Initial drainage plan and drainage zone priority matrix
DRAIN ALIGNMENT AND DESIGN PROCESS (ITERATIVE; SECTIONS 6.3, 6.4, 6.5)
Design alignment pattern for network (section 6.3)
Design detailed drain align-ments (section 6.4)
Account for details on site:•Functionality of drain•Existing drains•Footpaths•Landslides
Calculate:•Surface water discharge•Roof water discharge •Piped water discharge
Calculate drain sizes for given drainage alignment
Draw proposed drainage plan
Specify drain construction: materials and details (section 6.5)
INCORPORATION OF HOUSEHOLD WATER INTO PLAN (SECTION 6.6)
Design household measures and connections to drains
based on prioritized roof water and piped water discharge
calculations
Account for details on site
SIGN-OFF OF FINAL DRAINAGE PLAN (SECTION 6.7)
Draw final drainage plan and estimate project cost
Community sign-off Decision maker sign-off
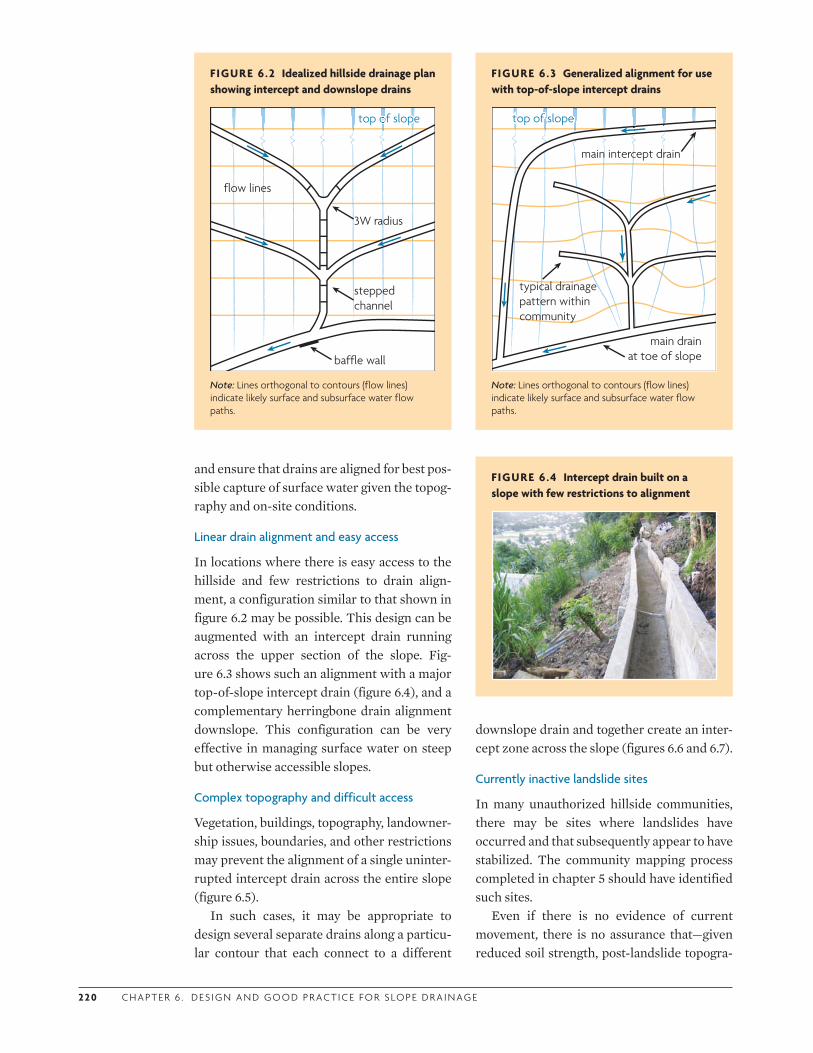
2 2 0 C H A P T E R 6 . D ES I G N A N D G O O D P R ACT I C E F O R S LO P E D R A I N AG E
and ensure that drains are aligned for best pos-sible capture of surface water given the topog-raphy and on-site conditions.
Linear drain alignment and easy access
In locations where there is easy access to the hillside and few restrictions to drain align-ment, a configuration similar to that shown in figure 6.2 may be possible. This design can be augmented with an intercept drain running across the upper section of the slope. Fig-ure 6.3 shows such an alignment with a major top-of-slope intercept drain (figure 6.4), and a complementary herringbone drain alignment downslope. This configuration can be very effective in managing surface water on steep but otherwise accessible slopes.
Complex topography and difficult access
Vegetation, buildings, topography, landowner-ship issues, boundaries, and other restrictions may prevent the alignment of a single uninter-rupted intercept drain across the entire slope (figure 6.5).
In such cases, it may be appropriate to design several separate drains along a particu-lar contour that each connect to a different
downslope drain and together create an inter-cept zone across the slope (figures 6.6 and 6.7).
Currently inactive landslide sites
In many unauthorized hillside communities, there may be sites where landslides have occurred and that subsequently appear to have stabilized. The community mapping process completed in chapter 5 should have identified such sites.
Even if there is no evidence of current movement, there is no assurance that—given reduced soil strength, post-landslide topogra-
FIGURE 6.2 Idealized hillside drainage plan showing intercept and downslope drains
3W radius
stepped channel
flow lines
baffle wall
top of slopetop of slope
Note: Lines orthogonal to contours (flow lines) indicate likely surface and subsurface water flow paths.
FIGURE 6.3 Generalized alignment for use with top-of-slope intercept drains
top of slopetop of slope
main intercept drain
typical drainage pattern within community
main drainat toe of slope
Note: Lines orthogonal to contours (flow lines) indicate likely surface and subsurface water flow paths.
FIGURE 6.4 Intercept drain built on a slope with few restrictions to alignment

CO M M U N I T Y- BA S E D L A N DS L I D E R I S K R E D U CT I O N 2 2 1
phy, and associated subsurface flow patterns (such as soil pipes)—the landslide will not be reactivated by future rainfall events. It is thus important to align drains to minimize water inflow to these failed sites. The alignment shown in figure 6.8 can be used to good effect in such circumstances (figure 6.9).
Currently active landslide sites (progressive failure)
Some hillsides exhibit progressive failures—the continued, imperceptibly slow movement of material following a landslide-triggering event. Progressive failures are commonly asso-ciated with, but not restricted to, slope materi-als with high clay content.
The community mapping process should have identified sites of progressive slope fail-ure and noted observations from residents about periods of slope movement. Ascertain-ing that a landslide is still active is important,
since this can affect the alignment of main drains around the unstable area and may also require well-maintained minor drains to drain the slide itself. Main drains should not be built on or across progressive landslides or unstable
FIGURE 6.5 Drain alignment complexities
a. Vegetation, a previously built footbath (with underdesigned slip drain) and topography restrict the alignment of a new intercept drain.
b. Undulating topography needs to be carefully surveyed, especially when aligning an intercept drain, so as to achieve self-cleaning gradients.
FIGURE 6.6 Network of small intercept drains intercepting surface water along entire uppermost contour of slope
exist
ing
river
cha
nnel
top of slope multiple intercept
drains
FIGURE 6.7 Downslope drain
This drain is designed to receive water from the main intercept drain, and a minor intercept drain (center right) under construction.

2 2 2 C H A P T E R 6 . D ES I G N A N D G O O D P R ACT I C E F O R S LO P E D R A I N AG E
material, since slope movement could cause cracking and leakage—potentially discharging drain water into the unstable material. How-ever, minor drains that start within the failed mass and remove water from the area can be used to good effect. Low-cost drains made of flexible materials, such as those introduced in sections 6.5.2 and 6.5.3, might be appropriate.
Figure 6.10 illustrates a drain alignment designed to prevent water flow into the slide area (to the left of the drain) from upslope, and drain the progressive slide material at the mid-point of the slide as well as immediately downslope.
6.3.2 Calculating drain flow and drain dimensions
Estimate the potential volumes of surface water runoff, roof water, and gray water that will be discharged into the new drains. Use local engineering protocols to select an appro-priate design rainfall intensity (i.e., with a specified probability or return period) to esti-mate surface water and roof water runoff. From these estimations, determine the required drain capacities and dimensions. This drain alignment-dimension design pro-cess is iterative and involves the steps described in figure 6.11.
Methods that may be used to calculate the discharge into drains, and hence the required drain size, are summarized in the following sections; see table 6.1.
FIGURE 6.8 Drain alignment to minimize surface and immediate subsurface water flow into previously failed material
landslide
top of slopetop of slope
align drain to intercept surface runoff above landslide
original drainage route
Note: Lines orthogonal to contours indicate likely surface and subsurface water flow paths and emphasize the importance of the drain in preventing increased pore water pressures within the landslide.
FIGURE 6.9 Drain aligned to intercept surface water and routed around a major preexisting landslide
Crest of preexisting landslide is toward upper center.
FIGURE 6.10 Drain alignment for site of progressive failure
landslide zone
main intercept drain
intercept drain to protect landslide zone
main drainat toe of slope
main drainat toe of slope
minor drain to reduce saturation of landslide zone
top of slopetop of slope
Note: Lines orthogonal to contours (flow lines) indicate likely surface and subsurface water flow paths. A comparatively high-density drain network can help prevent downslope water ingress to a failed site; consider aligning drains above, within, and immediately downslope of the failed material.
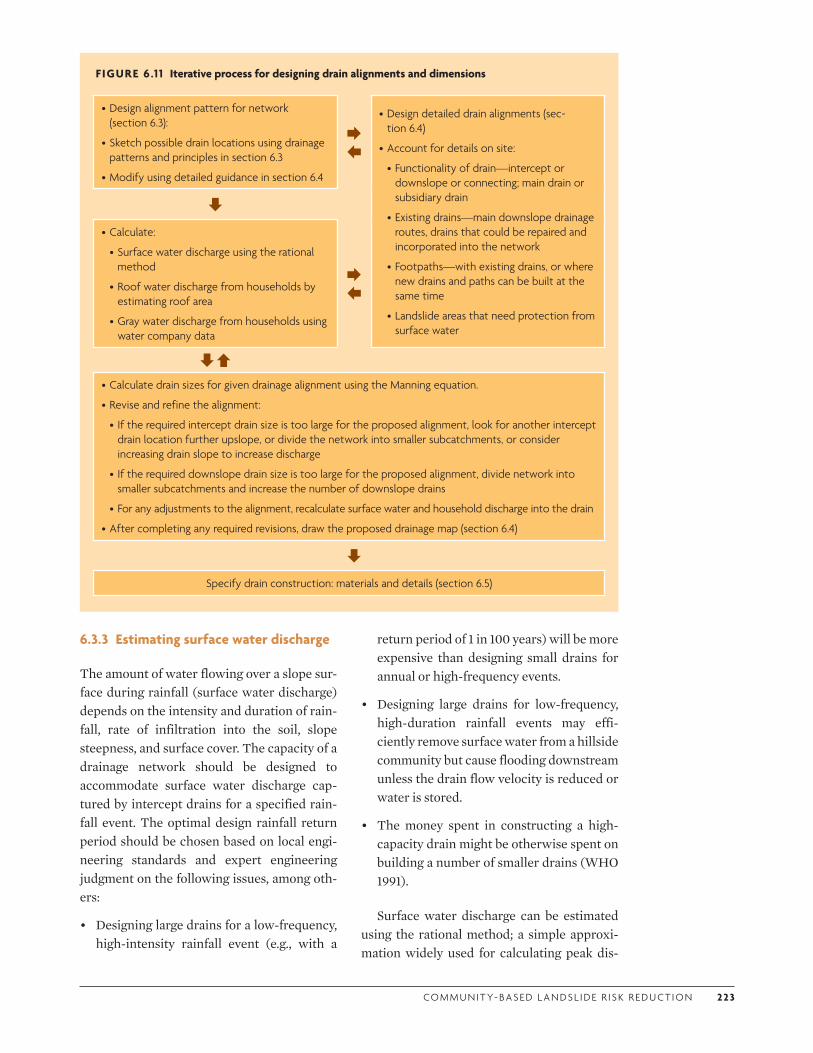
CO M M U N I T Y- BA S E D L A N DS L I D E R I S K R E D U CT I O N 2 2 3
6.3.3 Estimating surface water discharge
The amount of water flowing over a slope sur-face during rainfall (surface water discharge) depends on the intensity and duration of rain-fall, rate of infiltration into the soil, slope steepness, and surface cover. The capacity of a drainage network should be designed to accommodate surface water discharge cap-tured by intercept drains for a specified rain-fall event. The optimal design rainfall return period should be chosen based on local engi-neering standards and expert engineering judgment on the following issues, among oth-ers:
• Designing large drains for a low-frequency, high-intensity rainfall event (e.g., with a
return period of 1 in 100 years) will be more expensive than designing small drains for annual or high-frequency events.
• Designing large drains for low-frequency, high-duration rainfall events may effi-ciently remove surface water from a hillside community but cause flooding downstream unless the drain flow velocity is reduced or water is stored.
• The money spent in constructing a high-capacity drain might be otherwise spent on building a number of smaller drains (WHO 1991).
Surface water discharge can be estimated using the rational method; a simple approxi-mation widely used for calculating peak dis-
FIGURE 6.1 1 Iterative process for designing drain alignments and dimensions
•Design alignment pattern for network (section 6.3):
•Sketch possible drain locations using drainage patterns and principles in section 6.3
•Modify using detailed guidance in section 6.4
•Design detailed drain alignments (sec-tion 6.4)
•Account for details on site:
•Functionality of drain—intercept or downslope or connecting; main drain or subsidiary drain
•Existing drains—main downslope drainage routes, drains that could be repaired and incorporated into the network
•Footpaths—with existing drains, or where new drains and paths can be built at the same time
•Landslide areas that need protection from surface water
•Calculate:
•Surface water discharge using the rational method
•Roof water discharge from households by estimating roof area
•Gray water discharge from households using water company data
•Calculate drain sizes for given drainage alignment using the Manning equation.
•Revise and refine the alignment:
• If the required intercept drain size is too large for the proposed alignment, look for another intercept drain location further upslope, or divide the network into smaller subcatchments, or consider increasing drain slope to increase discharge
• If the required downslope drain size is too large for the proposed alignment, divide network into smaller subcatchments and increase the number of downslope drains
•For any adjustments to the alignment, recalculate surface water and household discharge into the drain
•After completing any required revisions, draw the proposed drainage map (section 6.4)
Specify drain construction: materials and details (section 6.5)
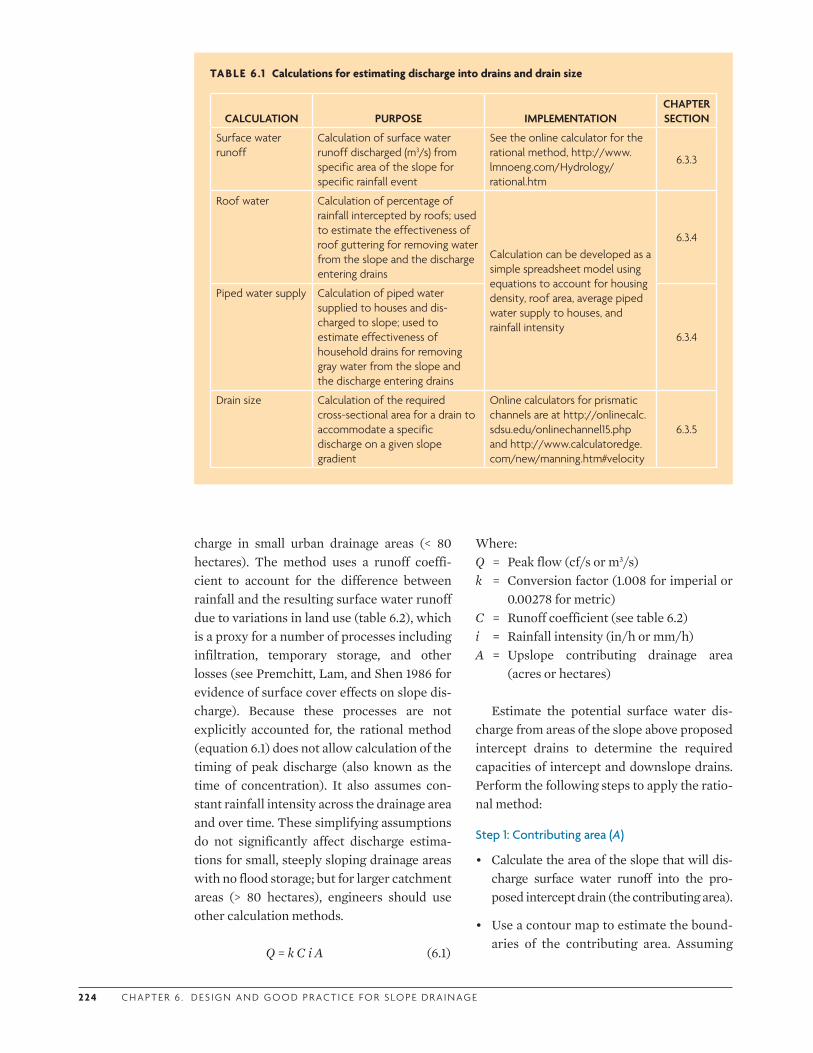
2 24 C H A P T E R 6 . D ES I G N A N D G O O D P R ACT I C E F O R S LO P E D R A I N AG E
charge in small urban drainage areas (< 80 hectares). The method uses a runoff coeffi-cient to account for the difference between rainfall and the resulting surface water runoff due to variations in land use (table 6.2), which is a proxy for a number of processes including infiltration, temporary storage, and other losses (see Premchitt, Lam, and Shen 1986 for evidence of surface cover effects on slope dis-charge). Because these processes are not explicitly accounted for, the rational method (equation 6.1) does not allow calculation of the timing of peak discharge (also known as the time of concentration). It also assumes con-stant rainfall intensity across the drainage area and over time. These simplifying assumptions do not significantly affect discharge estima-tions for small, steeply sloping drainage areas with no flood storage; but for larger catchment areas (> 80 hectares), engineers should use other calculation methods.
Q = k C i A (6.1)
Where: Q = Peak flow (cf/s or m3/s)k = Conversion factor (1.008 for imperial or
0.00278 for metric)C = Runoff coefficient (see table 6.2)i = Rainfall intensity (in/h or mm/h)A = Upslope contributing drainage area
(acres or hectares)
Estimate the potential surface water dis-charge from areas of the slope above proposed intercept drains to determine the required capacities of intercept and downslope drains. Perform the following steps to apply the ratio-nal method:
Step 1: Contributing area (A)
• Calculate the area of the slope that will dis-charge surface water runoff into the pro-posed intercept drain (the contributing area).
• Use a contour map to estimate the bound-aries of the contributing area. Assuming
TABLE 6 .1 Calculations for estimating discharge into drains and drain size
CALCULATION PURPOSE IMPLEMENTATIONCHAPTER SECTION
Surface water runoff
Calculation of surface water runoff discharged (m3/s) from specific area of the slope for specific rainfall event
See the online calculator for the rational method, http://www.lmnoeng.com/Hydrology/rational.htm
6.3.3
Roof water Calculation of percentage of rainfall intercepted by roofs; used to estimate the effectiveness of roof guttering for removing water from the slope and the discharge entering drains
Calculation can be developed as a simple spreadsheet model using equations to account for housing density, roof area, average piped water supply to houses, and rainfall intensity
6.3.4
Piped water supply Calculation of piped water supplied to houses and dis-charged to slope; used to estimate effectiveness of household drains for removing gray water from the slope and the discharge entering drains
6.3.4
Drain size Calculation of the required cross-sectional area for a drain to accommodate a specific discharge on a given slope gradient
Online calculators for prismatic channels are at http://onlinecalc.sdsu.edu/onlinechannel15.php and http://www.calculatoredge.com/new/manning.htm#velocity
6.3.5
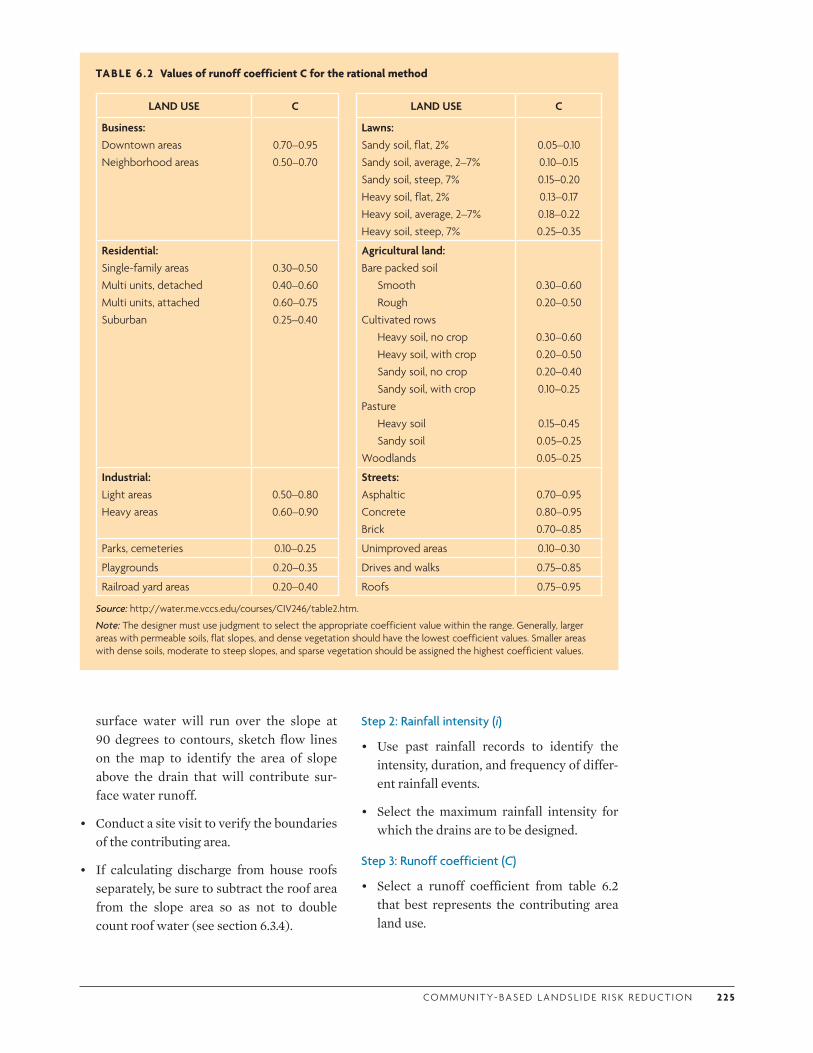
CO M M U N I T Y- BA S E D L A N DS L I D E R I S K R E D U CT I O N 2 2 5
surface water will run over the slope at 90 degrees to contours, sketch flow lines on the map to identify the area of slope above the drain that will contribute sur-face water runoff.
• Conduct a site visit to verify the boundaries of the contributing area.
• If calculating discharge from house roofs separately, be sure to subtract the roof area from the slope area so as not to double count roof water (see section 6.3.4).
Step 2: Rainfall intensity (i)
• Use past rainfall records to identify the intensity, duration, and frequency of differ-ent rainfall events.
• Select the maximum rainfall intensity for which the drains are to be designed.
Step 3: Runoff coefficient (C)
• Select a runoff coefficient from table 6.2 that best represents the contributing area land use.
TABLE 6 .2 Values of runoff coefficient C for the rational method
LAND USE C LAND USE C
Business: Downtown areas Neighborhood areas
0.70–0.95 0.50–0.70
Lawns: Sandy soil, flat, 2% Sandy soil, average, 2–7% Sandy soil, steep, 7% Heavy soil, flat, 2% Heavy soil, average, 2–7% Heavy soil, steep, 7%
0.05–0.10 0.10–0.15 0.15–0.20 0.13–0.17 0.18–0.22 0.25–0.35
Residential: Single-family areas Multi units, detached Multi units, attached Suburban
0.30–0.50 0.40–0.60 0.60–0.75 0.25–0.40
Agricultural land: Bare packed soil
Smooth Rough
Cultivated rows Heavy soil, no crop Heavy soil, with crop Sandy soil, no crop Sandy soil, with crop
Pasture Heavy soil Sandy soil
Woodlands
0.30–0.60 0.20–0.50
0.30–0.60 0.20–0.50 0.20–0.40 0.10–0.25
0.15–0.45 0.05–0.25 0.05–0.25
Industrial: Light areas Heavy areas
0.50–0.80 0.60–0.90
Streets: Asphaltic Concrete Brick
0.70–0.95 0.80–0.95 0.70–0.85
Parks, cemeteries 0.10–0.25 Unimproved areas 0.10–0.30
Playgrounds 0.20–0.35 Drives and walks 0.75–0.85
Railroad yard areas 0.20–0.40 Roofs 0.75–0.95
Source: http://water.me.vccs.edu/courses/CIV246/table2.htm.
Note: The designer must use judgment to select the appropriate coefficient value within the range. Generally, larger areas with permeable soils, flat slopes, and dense vegetation should have the lowest coefficient values. Smaller areas with dense soils, moderate to steep slopes, and sparse vegetation should be assigned the highest coefficient values.
2 2 6 C H A P T E R 6 . D ES I G N A N D G O O D P R ACT I C E F O R S LO P E D R A I N AG E
• If there is more than one distinct type of land use, subdivide the area accordingly and assign appropriate values of C to each subarea.
• If the area has been subdivided according to different values of C, recalculate A for each area. Multiply A and C for each subarea, add the results together, and divide by the total area to obtain a weighted value of C for the entire contributing area.
Step 4: Peak discharge (Q)
Use the rational method to calculate peak sur-face water discharge from the contributing area.
6.3.4 Estimating the discharge from houses
Each household can affect the amount of surface water on a slope in two ways: (1) by intercepting rainfall on roofs and either dis-charging it directly onto the slope, collecting it, or directing it into drains; and (2) by dis-charging gray water and septic waste onto the slope.
If the housing density is high, the propor-tion of rainfall intercepted by roofs will be cor-respondingly high. If there is piped water sup-ply, this can result in a significant increase in surface water discharge—in some cases, amounting to as much as that generated by rainfall.
If the project scope includes installing roof guttering, gray water pipes, and connections to the new drains, the resulting discharge should be accounted for in drain capacity calcula-tions. The importance of household water capture also needs to be established both as part of the justification for the intervention and as a way of changing slope management perceptions and practices.
Use the following steps to estimate house-hold water contributions to surface water. This method can be applied to the whole com-munity to estimate an average discharge for the area or specific contributing area dis-charges into different drains.
Step 1: Proportion of rainfall intercepted by roofs
• Calculate the total contributing area of the slope that will discharge water into the pro-posed drain.
• Estimate the area of the slope covered by houses by using geographic information system/computer-assisted design (GIS/CAD) to directly measure the building foot-prints, or estimating the average house size and multiplying this by the number of houses on the slope.
• Divide the total house footprint area by the slope area to obtain the proportion of the slope over which houses directly intercept rainfall on their roofs.
• Multiply the result by the rainfall for the chosen design event (see section 6.3.3) to calculate the potential maximum roof water capture and subsequent discharge into drains.
• Be careful not to double count the roof water contribution in estimating surface water discharge (section 6.3.3).
Step 2: Water supply
• Obtain water company data on average sup-ply per household over a specific time period.
• Multiply the average supply by the number of households in the community to obtain the total amount of water supplied to the slope for that period.
• Convert from volume to equivalent depth (e.g., mm/day), and compare with the aver-age rainfall rate for the equivalent time period to determine the significance of piped water supply in adding water to the slope.
• Estimate how much water is lost from pipes through leakage and how much will be added to the slope as septic waste. (The water company should be able to provide an estimate of these figures.) The remain-ing supply represents the maximum vol-

CO M M U N I T Y- BA S E D L A N DS L I D E R I S K R E D U CT I O N 2 2 7
ume that could be captured from houses as gray water and discharged into the drains.
6.3.5 Estimating dimensions for main drains
Use the predicted surface water discharge and, if relevant, the estimated household water discharge to determine appropriate dimen-sions (cross-sectional areas) for the main intercept and downslope drains. Typically, the dimensions of the smaller subsidiary or house-hold drains can be determined by rule of thumb, experience, or local knowledge. How-ever, if drain size calculations are needed in order to conform with local engineering design standards or building codes, then these protocols should be followed.
The Manning equation (6.2) is a semi-empirical equation that is the most commonly used to calculate uniform steady-state flow of water in open channels.
V = (k/n) × R2/3 × S1/2 (6.2)
Where: V = Velocity (ft/s or m/s)k = Constant (1.485 for imperial units, or 1.0
for metric)R = Hydraulic radius (ft or m)S = Channel slope (ft/ft or m/m)n = Manning’s constant defined for different
channel materials
Drain discharge can be calculated using equation (6.3), in which flow velocity is esti-mated by the Manning equation (6.2).
Q = A × V (6.3)
Where: Q = Discharge (ft3s−1 or m3s−1)A = Channel cross-sectional area (ft2 or m2)V = Flow velocity (ft s−1 or m s−1)
This calculation can be applied iteratively to identify the drain cross-sectional area required to accommodate a specified dis-charge. A number of online calculators are available for this calculation. Alternatively, the
sequence of calculations can be entered into a spreadsheet to allow multiple iterations to be carried out until the correct drain size is iden-tified. A typical sequence of steps using an online calculator is as follows.
Step 1: Define an initial trial drain size and channel slope
• Select a channel width and flow depth and assume a vertical side slope for a typical open box drain.
• Define the channel slope based on the pro-posed drain alignment identified in the field (channel slope = vertical channel rise/horizontal channel run).
Step 2: Select a value for Manning’s constant (n)
Typical values of finished and unfinished con-crete channels are 0.012 and 0.014, respectively.
Step 3: Use an online calculator to determine the maximum drain discharge
• Enter the values from Steps 1 and 2 into an online calculator.
• Calculate maximum drain discharge Q.
Step 4: Identify the required drain size
• Compare the maximum drain discharge with the estimated discharge from slope surface runoff and from households (sec-tions 6.3.3 and 6.3.4) and the flow entering from any other drains.
• Repeat the process with different realistic drain sizes and gradients until the required discharge can be accommodated by the drain.
6.3.6 Example to demonstrate intercept drain effectiveness
In this example, the rational method was used to calculate surface water discharge upslope of a proposed intercept drain location. The drain was subsequently constructed (figure 6.12a). Several households adjacent to the drain then connected their downpipes and gray water to the drain. During a storm event, a resident noted the flow depth in the drain and observed the
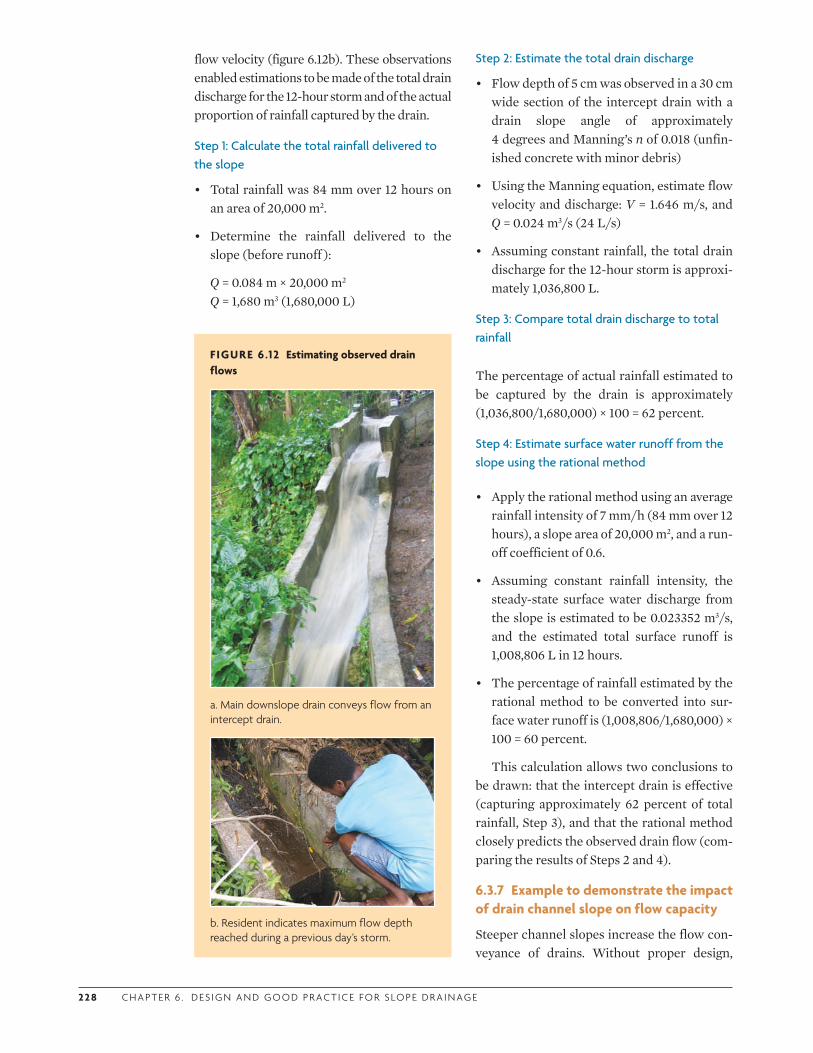
2 2 8 C H A P T E R 6 . D ES I G N A N D G O O D P R ACT I C E F O R S LO P E D R A I N AG E
flow velocity (figure 6.12b). These observations enabled estimations to be made of the total drain discharge for the 12-hour storm and of the actual proportion of rainfall captured by the drain.
Step 1: Calculate the total rainfall delivered to the slope
• Total rainfall was 84 mm over 12 hours on an area of 20,000 m2.
• Determine the rainfall delivered to the slope (before runoff ):
Q = 0.084 m × 20,000 m2
Q = 1,680 m3 (1,680,000 L)
Step 2: Estimate the total drain discharge
• Flow depth of 5 cm was observed in a 30 cm wide section of the intercept drain with a drain slope angle of approximately 4 degrees and Manning’s n of 0.018 (unfin-ished concrete with minor debris)
• Using the Manning equation, estimate flow velocity and discharge: V = 1.646 m/s, and Q = 0.024 m3/s (24 L/s)
• Assuming constant rainfall, the total drain discharge for the 12-hour storm is approxi-mately 1,036,800 L.
Step 3: Compare total drain discharge to total rainfall
The percentage of actual rainfall estimated to be captured by the drain is approximately (1,036,800/1,680,000) × 100 = 62 percent.
Step 4: Estimate surface water runoff from the slope using the rational method
• Apply the rational method using an average rainfall intensity of 7 mm/h (84 mm over 12 hours), a slope area of 20,000 m2, and a run-off coefficient of 0.6.
• Assuming constant rainfall intensity, the steady-state surface water discharge from the slope is estimated to be 0.023352 m3/s, and the estimated total surface runoff is 1,008,806 L in 12 hours.
• The percentage of rainfall estimated by the rational method to be converted into sur-face water runoff is (1,008,806/1,680,000) × 100 = 60 percent.
This calculation allows two conclusions to be drawn: that the intercept drain is effective (capturing approximately 62 percent of total rainfall, Step 3), and that the rational method closely predicts the observed drain flow (com-paring the results of Steps 2 and 4).
6.3.7 Example to demonstrate the impact of drain channel slope on flow capacity
Steeper channel slopes increase the flow con-veyance of drains. Without proper design,
FIGURE 6.12 Estimating observed drain flows
a. Main downslope drain conveys flow from an intercept drain.
b. Resident indicates maximum flow depth reached during a previous day’s storm.
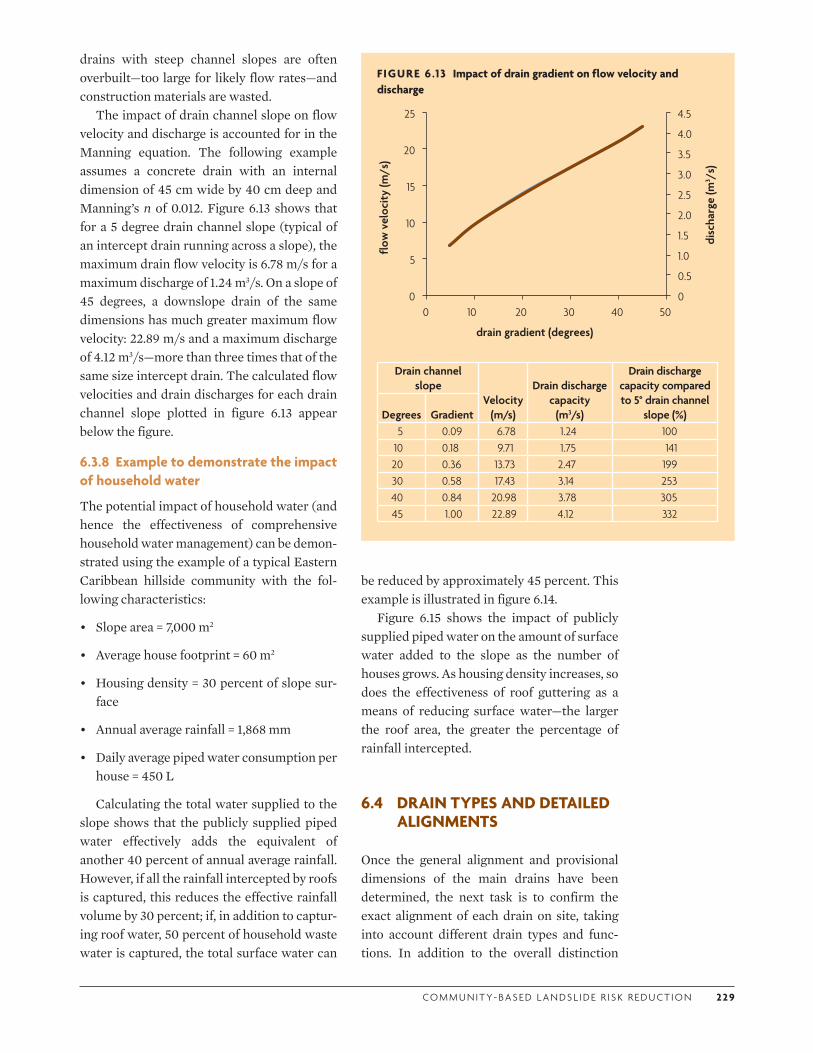
CO M M U N I T Y- BA S E D L A N DS L I D E R I S K R E D U CT I O N 2 2 9
drains with steep channel slopes are often overbuilt—too large for likely flow rates—and construction materials are wasted.
The impact of drain channel slope on flow velocity and discharge is accounted for in the Manning equation. The following example assumes a concrete drain with an internal dimension of 45 cm wide by 40 cm deep and Manning’s n of 0.012. Figure 6.13 shows that for a 5 degree drain channel slope (typical of an intercept drain running across a slope), the maximum drain flow velocity is 6.78 m/s for a maximum discharge of 1.24 m3/s. On a slope of 45 degrees, a downslope drain of the same dimensions has much greater maximum flow velocity: 22.89 m/s and a maximum discharge of 4.12 m3/s—more than three times that of the same size intercept drain. The calculated flow velocities and drain discharges for each drain channel slope plotted in figure 6.13 appear below the figure.
6.3.8 Example to demonstrate the impact of household water
The potential impact of household water (and hence the effectiveness of comprehensive household water management) can be demon-strated using the example of a typical Eastern Caribbean hillside community with the fol-lowing characteristics:
• Slope area = 7,000 m2
• Average house footprint = 60 m2
• Housing density = 30 percent of slope sur-face
• Annual average rainfall = 1,868 mm
• Daily average piped water consumption per house = 450 L
Calculating the total water supplied to the slope shows that the publicly supplied piped water effectively adds the equivalent of another 40 percent of annual average rainfall. However, if all the rainfall intercepted by roofs is captured, this reduces the effective rainfall volume by 30 percent; if, in addition to captur-ing roof water, 50 percent of household waste water is captured, the total surface water can
be reduced by approximately 45 percent. This example is illustrated in figure 6.14.
Figure 6.15 shows the impact of publicly supplied piped water on the amount of surface water added to the slope as the number of houses grows. As housing density increases, so does the effectiveness of roof guttering as a means of reducing surface water—the larger the roof area, the greater the percentage of rainfall intercepted.
6.4 DRAIN TYPES AND DETAILED ALIGNMENTS
Once the general alignment and provisional dimensions of the main drains have been determined, the next task is to confirm the exact alignment of each drain on site, taking into account different drain types and func-tions. In addition to the overall distinction
FIGURE 6.13 Impact of drain gradient on flow velocity and discharge
0
0.5
1.0
1.5
2.0
2.5
3.0
3.5
4.0
4.5
0
5
10
15
20
25
0 10 20 30 40 50
disc
harg
e (m
3 /s)
flow
vel
ocit
y (m
/s)
drain gradient (degrees)
Drain channel slope
Velocity (m/s)
Drain discharge capacity
(m3/s)
Drain discharge capacity compared to 5° drain channel
slope (%)Degrees Gradient5 0.09 6.78 1.24 100
10 0.18 9.71 1.75 14120 0.36 13.73 2.47 19930 0.58 17.43 3.14 25340 0.84 20.98 3.78 30545 1.00 22.89 4.12 332
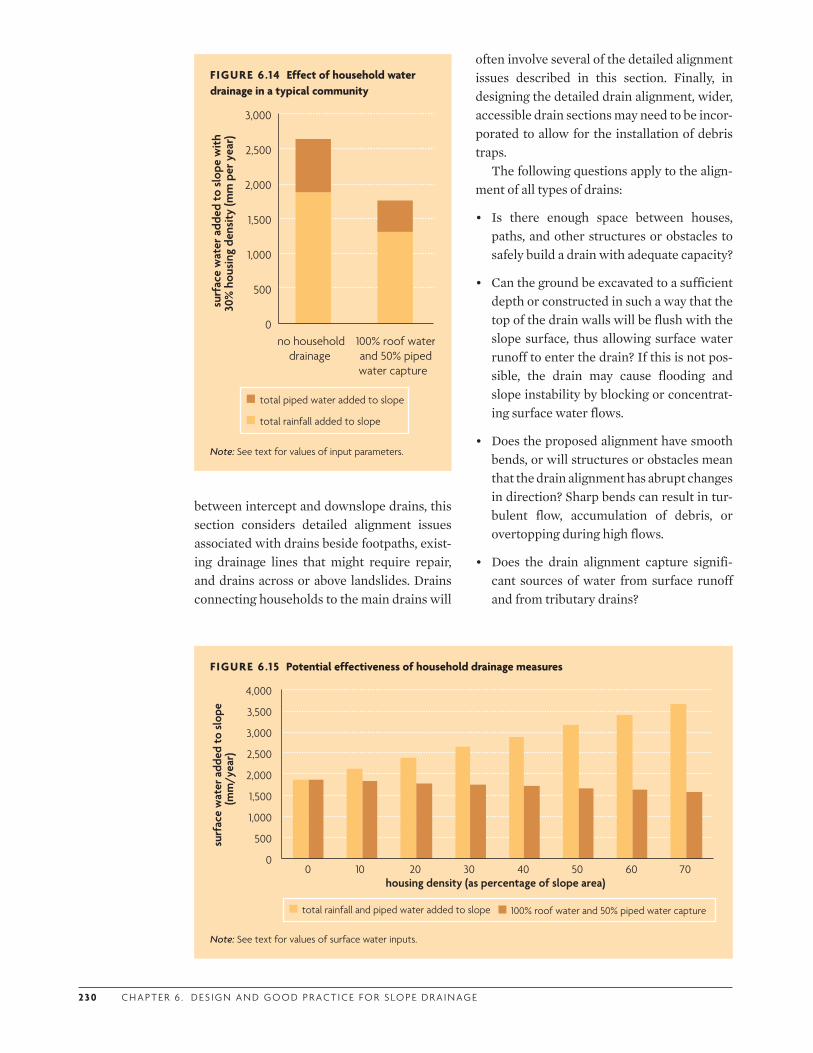
2 3 0 C H A P T E R 6 . D ES I G N A N D G O O D P R ACT I C E F O R S LO P E D R A I N AG E
between intercept and downslope drains, this section considers detailed alignment issues associated with drains beside footpaths, exist-ing drainage lines that might require repair, and drains across or above landslides. Drains connecting households to the main drains will
often involve several of the detailed alignment issues described in this section. Finally, in designing the detailed drain alignment, wider, accessible drain sections may need to be incor-porated to allow for the installation of debris traps.
The following questions apply to the align-ment of all types of drains:
• Is there enough space between houses, paths, and other structures or obstacles to safely build a drain with adequate capacity?
• Can the ground be excavated to a sufficient depth or constructed in such a way that the top of the drain walls will be flush with the slope surface, thus allowing surface water runoff to enter the drain? If this is not pos-sible, the drain may cause flooding and slope instability by blocking or concentrat-ing surface water flows.
• Does the proposed alignment have smooth bends, or will structures or obstacles mean that the drain alignment has abrupt changes in direction? Sharp bends can result in tur-bulent flow, accumulation of debris, or overtopping during high flows.
• Does the drain alignment capture signifi-cant sources of water from surface runoff and from tributary drains?
FIGURE 6.14 Effect of household water drainage in a typical community
0
500
1,000
1,500
2,000
2,500
3,000
no householddrainage
100% roof waterand 50% pipedwater capture
surf
ace
wat
er a
dded
to s
lope
wit
h 30
% h
ousi
ng d
ensi
ty (m
m p
er y
ear)
total piped water added to slope
total rainfall added to slope
Note: See text for values of input parameters.
FIGURE 6.15 Potential effectiveness of household drainage measures
surf
ace
wat
er a
dded
to s
lope
(mm
/yea
r)
total rainfall and piped water added to slope 100% roof water and 50% piped water capture
0
500
1,000
1,500
2,000
2,500
3,000
3,500
4,000
0 10 20 30 40 50 60 70 housing density (as percentage of slope area)
Note: See text for values of surface water inputs.
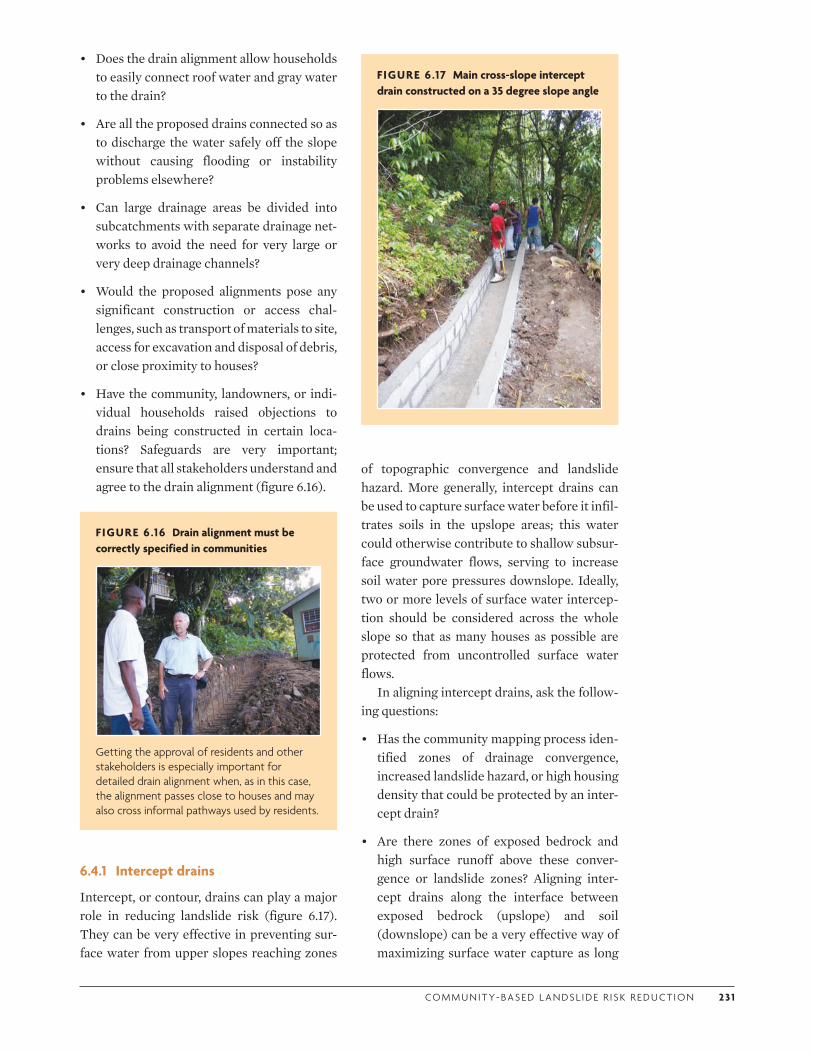
CO M M U N I T Y- BA S E D L A N DS L I D E R I S K R E D U CT I O N 2 3 1
• Does the drain alignment allow households to easily connect roof water and gray water to the drain?
• Are all the proposed drains connected so as to discharge the water safely off the slope without causing flooding or instability problems elsewhere?
• Can large drainage areas be divided into subcatchments with separate drainage net-works to avoid the need for very large or very deep drainage channels?
• Would the proposed alignments pose any significant construction or access chal-lenges, such as transport of materials to site, access for excavation and disposal of debris, or close proximity to houses?
• Have the community, landowners, or indi-vidual households raised objections to drains being constructed in certain loca-tions? Safeguards are very important; ensure that all stakeholders understand and agree to the drain alignment (figure 6.16).
6.4.1 Intercept drains
Intercept, or contour, drains can play a major role in reducing landslide risk (figure 6.17). They can be very effective in preventing sur-face water from upper slopes reaching zones
of topographic convergence and landslide hazard. More generally, intercept drains can be used to capture surface water before it infil-trates soils in the upslope areas; this water could otherwise contribute to shallow subsur-face groundwater flows, serving to increase soil water pore pressures downslope. Ideally, two or more levels of surface water intercep-tion should be considered across the whole slope so that as many houses as possible are protected from uncontrolled surface water flows.
In aligning intercept drains, ask the follow-ing questions:
• Has the community mapping process iden-tified zones of drainage convergence, increased landslide hazard, or high housing density that could be protected by an inter-cept drain?
• Are there zones of exposed bedrock and high surface runoff above these conver-gence or landslide zones? Aligning inter-cept drains along the interface between exposed bedrock (upslope) and soil (downslope) can be a very effective way of maximizing surface water capture as long
FIGURE 6.16 Drain alignment must be correctly specified in communities
Getting the approval of residents and other stakeholders is especially important for detailed drain alignment when, as in this case, the alignment passes close to houses and may also cross informal pathways used by residents.
FIGURE 6.17 Main cross-slope intercept drain constructed on a 35 degree slope angle
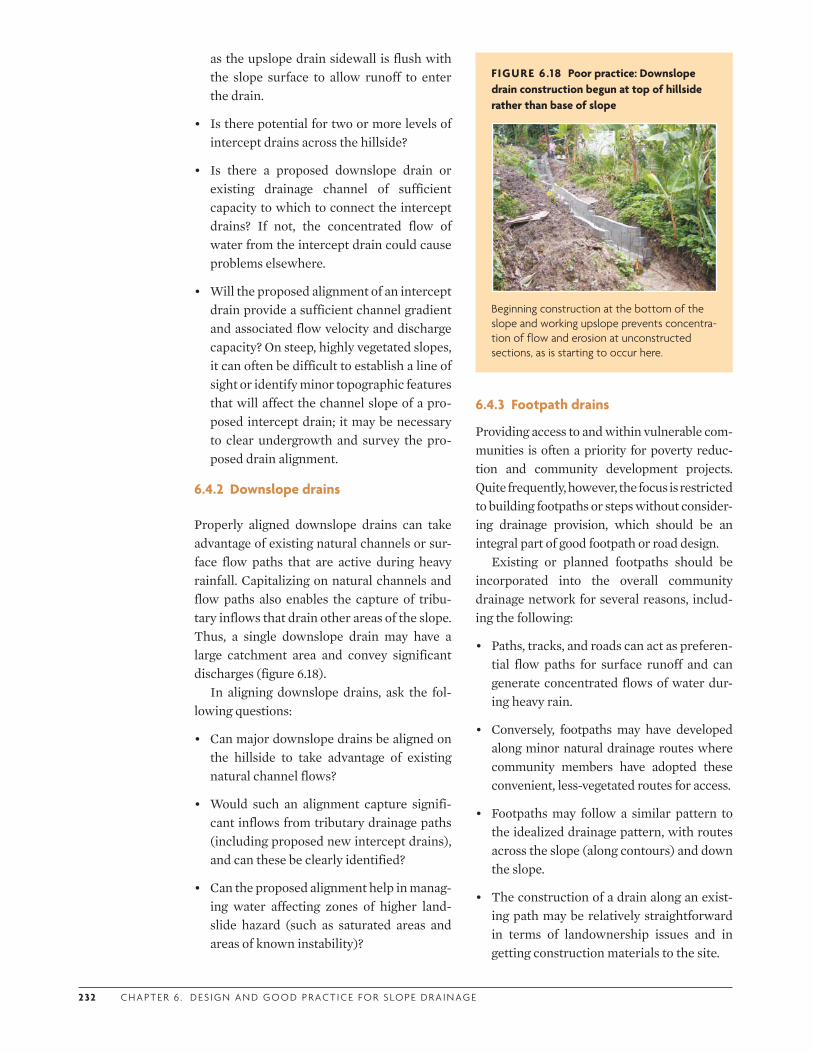
2 32 C H A P T E R 6 . D ES I G N A N D G O O D P R ACT I C E F O R S LO P E D R A I N AG E
as the upslope drain sidewall is flush with the slope surface to allow runoff to enter the drain.
• Is there potential for two or more levels of intercept drains across the hillside?
• Is there a proposed downslope drain or existing drainage channel of sufficient capacity to which to connect the intercept drains? If not, the concentrated flow of water from the intercept drain could cause problems elsewhere.
• Will the proposed alignment of an intercept drain provide a sufficient channel gradient and associated flow velocity and discharge capacity? On steep, highly vegetated slopes, it can often be difficult to establish a line of sight or identify minor topographic features that will affect the channel slope of a pro-posed intercept drain; it may be necessary to clear undergrowth and survey the pro-posed drain alignment.
6.4.2 Downslope drains
Properly aligned downslope drains can take advantage of existing natural channels or sur-face flow paths that are active during heavy rainfall. Capitalizing on natural channels and flow paths also enables the capture of tribu-tary inflows that drain other areas of the slope. Thus, a single downslope drain may have a large catchment area and convey significant discharges (figure 6.18).
In aligning downslope drains, ask the fol-lowing questions:
• Can major downslope drains be aligned on the hillside to take advantage of existing natural channel flows?
• Would such an alignment capture signifi-cant inflows from tributary drainage paths (including proposed new intercept drains), and can these be clearly identified?
• Can the proposed alignment help in manag-ing water affecting zones of higher land-slide hazard (such as saturated areas and areas of known instability)?
6.4.3 Footpath drains
Providing access to and within vulnerable com-munities is often a priority for poverty reduc-tion and community development projects. Quite frequently, however, the focus is restricted to building footpaths or steps without consider-ing drainage provision, which should be an integral part of good footpath or road design.
Existing or planned footpaths should be incorporated into the overall community drainage network for several reasons, includ-ing the following:
• Paths, tracks, and roads can act as preferen-tial flow paths for surface runoff and can generate concentrated flows of water dur-ing heavy rain.
• Conversely, footpaths may have developed along minor natural drainage routes where community members have adopted these convenient, less-vegetated routes for access.
• Footpaths may follow a similar pattern to the idealized drainage pattern, with routes across the slope (along contours) and down the slope.
• The construction of a drain along an exist-ing path may be relatively straightforward in terms of landownership issues and in getting construction materials to the site.
FIGURE 6.18 Poor practice: Downslope drain construction begun at top of hillside rather than base of slope
Beginning construction at the bottom of the slope and working upslope prevents concentra-tion of flow and erosion at unconstructed sections, as is starting to occur here.
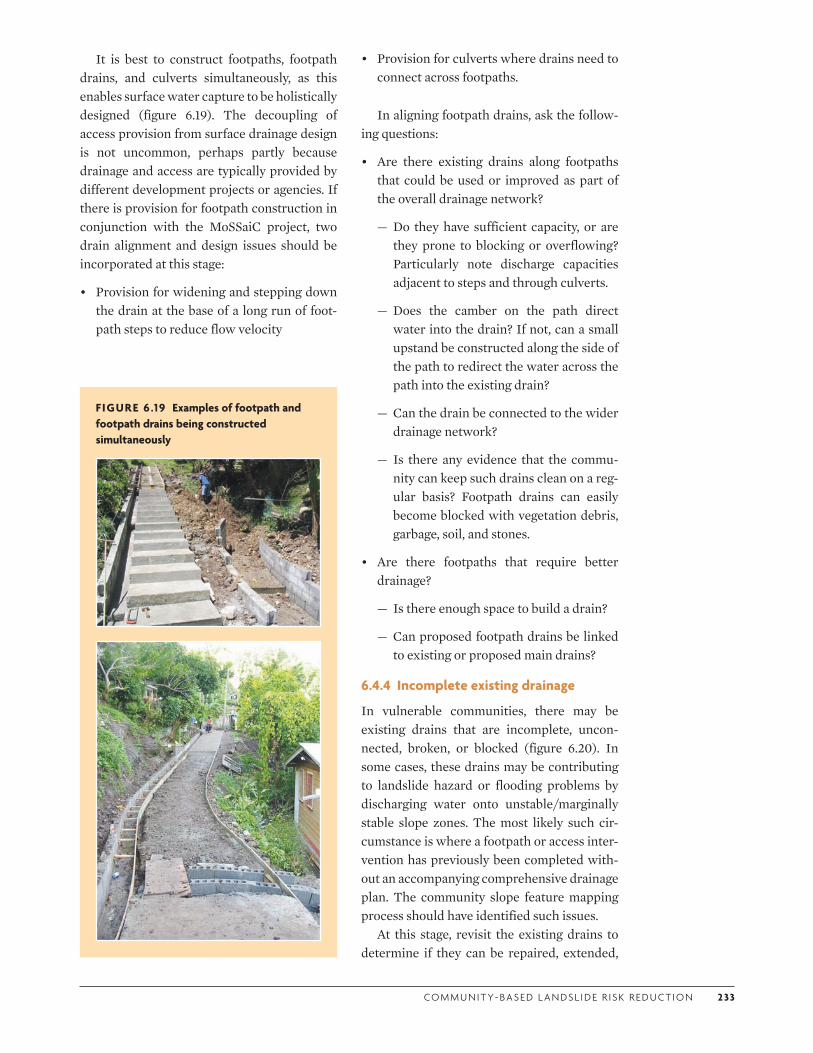
CO M M U N I T Y- BA S E D L A N DS L I D E R I S K R E D U CT I O N 2 33
It is best to construct footpaths, footpath drains, and culverts simultaneously, as this enables surface water capture to be holistically designed (figure 6.19). The decoupling of access provision from surface drainage design is not uncommon, perhaps partly because drainage and access are typically provided by different development projects or agencies. If there is provision for footpath construction in conjunction with the MoSSaiC project, two drain alignment and design issues should be incorporated at this stage:
• Provision for widening and stepping down the drain at the base of a long run of foot-path steps to reduce flow velocity
• Provision for culverts where drains need to connect across footpaths.
In aligning footpath drains, ask the follow-ing questions:
• Are there existing drains along footpaths that could be used or improved as part of the overall drainage network?
— Do they have sufficient capacity, or are they prone to blocking or overflowing? Particularly note discharge capacities adjacent to steps and through culverts.
— Does the camber on the path direct water into the drain? If not, can a small upstand be constructed along the side of the path to redirect the water across the path into the existing drain?
— Can the drain be connected to the wider drainage network?
— Is there any evidence that the commu-nity can keep such drains clean on a reg-ular basis? Footpath drains can easily become blocked with vegetation debris, garbage, soil, and stones.
• Are there footpaths that require better drainage?
— Is there enough space to build a drain?
— Can proposed footpath drains be linked to existing or proposed main drains?
6.4.4 Incomplete existing drainage
In vulnerable communities, there may be existing drains that are incomplete, uncon-nected, broken, or blocked (figure 6.20). In some cases, these drains may be contributing to landslide hazard or flooding problems by discharging water onto unstable/marginally stable slope zones. The most likely such cir-cumstance is where a footpath or access inter-vention has previously been completed with-out an accompanying comprehensive drainage plan. The community slope feature mapping process should have identified such issues.
At this stage, revisit the existing drains to determine if they can be repaired, extended,
FIGURE 6.19 Examples of footpath and footpath drains being constructed simultaneously
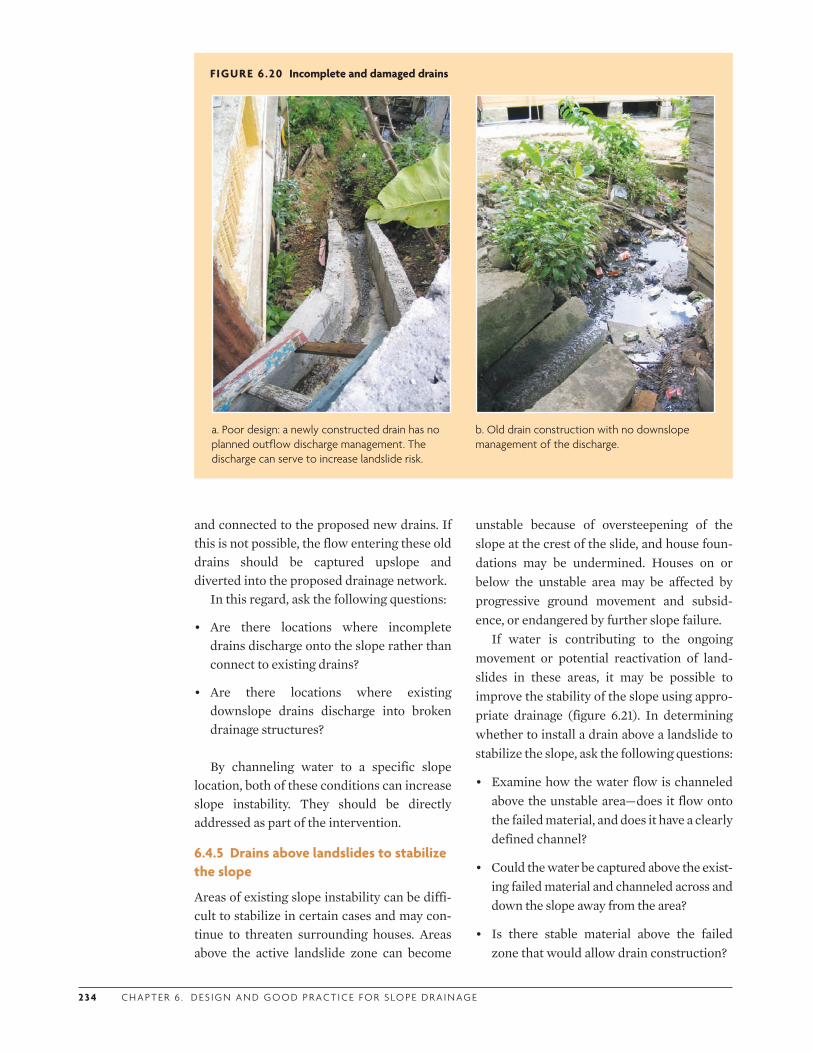
2 3 4 C H A P T E R 6 . D ES I G N A N D G O O D P R ACT I C E F O R S LO P E D R A I N AG E
and connected to the proposed new drains. If this is not possible, the flow entering these old drains should be captured upslope and diverted into the proposed drainage network.
In this regard, ask the following questions:
• Are there locations where incomplete drains discharge onto the slope rather than connect to existing drains?
• Are there locations where existing downslope drains discharge into broken drainage structures?
By channeling water to a specific slope location, both of these conditions can increase slope instability. They should be directly addressed as part of the intervention.
6.4.5 Drains above landslides to stabilize the slope
Areas of existing slope instability can be diffi-cult to stabilize in certain cases and may con-tinue to threaten surrounding houses. Areas above the active landslide zone can become
unstable because of oversteepening of the slope at the crest of the slide, and house foun-dations may be undermined. Houses on or below the unstable area may be affected by progressive ground movement and subsid-ence, or endangered by further slope failure.
If water is contributing to the ongoing movement or potential reactivation of land-slides in these areas, it may be possible to improve the stability of the slope using appro-priate drainage (figure 6.21). In determining whether to install a drain above a landslide to stabilize the slope, ask the following questions:
• Examine how the water flow is channeled above the unstable area—does it flow onto the failed material, and does it have a clearly defined channel?
• Could the water be captured above the exist-ing failed material and channeled across and down the slope away from the area?
• Is there stable material above the failed zone that would allow drain construction?
FIGURE 6.20 Incomplete and damaged drains
a. Poor design: a newly constructed drain has no planned outflow discharge management. The discharge can serve to increase landslide risk.
b. Old drain construction with no downslope management of the discharge.
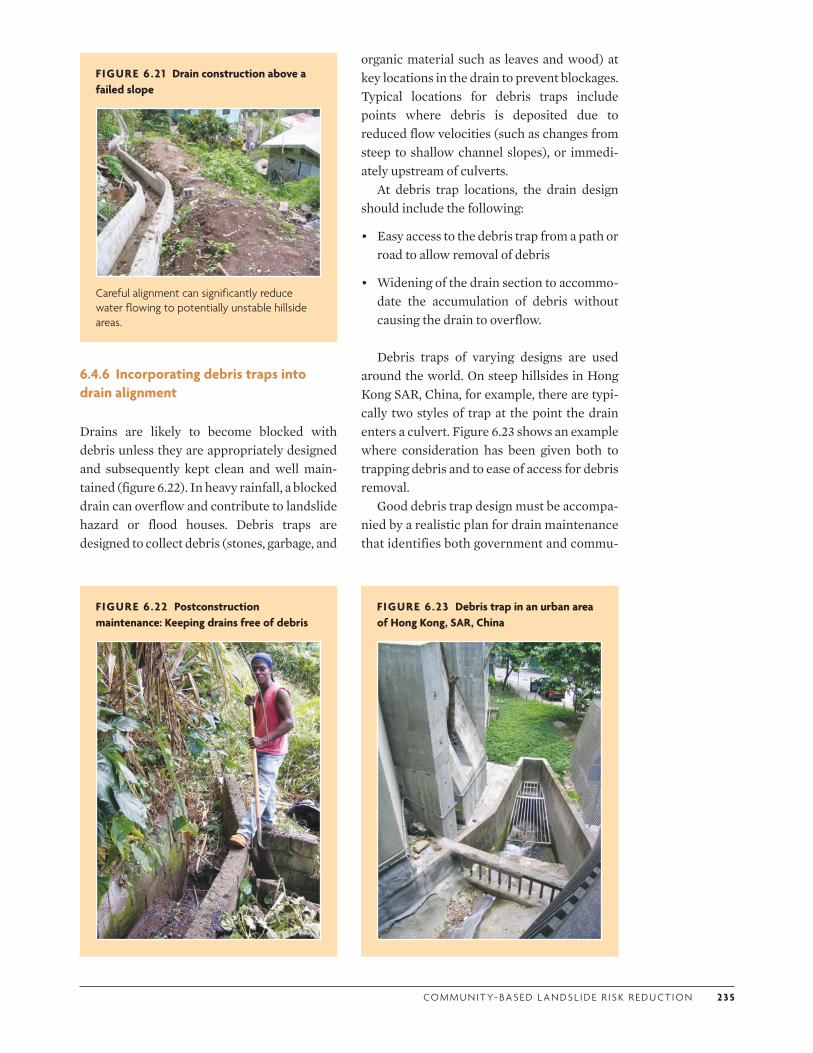
CO M M U N I T Y- BA S E D L A N DS L I D E R I S K R E D U CT I O N 2 3 5
FIGURE 6.21 Drain construction above a failed slope
Careful alignment can significantly reduce water flowing to potentially unstable hillside areas.
FIGURE 6.22 Postconstruction maintenance: Keeping drains free of debris
FIGURE 6.23 Debris trap in an urban area of Hong Kong, SAR, China
6.4.6 Incorporating debris traps into drain alignment
Drains are likely to become blocked with debris unless they are appropriately designed and subsequently kept clean and well main-tained (figure 6.22). In heavy rainfall, a blocked drain can overflow and contribute to landslide hazard or flood houses. Debris traps are designed to collect debris (stones, garbage, and
organic material such as leaves and wood) at key locations in the drain to prevent blockages. Typical locations for debris traps include points where debris is deposited due to reduced flow velocities (such as changes from steep to shallow channel slopes), or immedi-ately upstream of culverts.
At debris trap locations, the drain design should include the following:
• Easy access to the debris trap from a path or road to allow removal of debris
• Widening of the drain section to accommo-date the accumulation of debris without causing the drain to overflow.
Debris traps of varying designs are used around the world. On steep hillsides in Hong Kong SAR, China, for example, there are typi-cally two styles of trap at the point the drain enters a culvert. Figure 6.23 shows an example where consideration has been given both to trapping debris and to ease of access for debris removal.
Good debris trap design must be accompa-nied by a realistic plan for drain maintenance that identifies both government and commu-
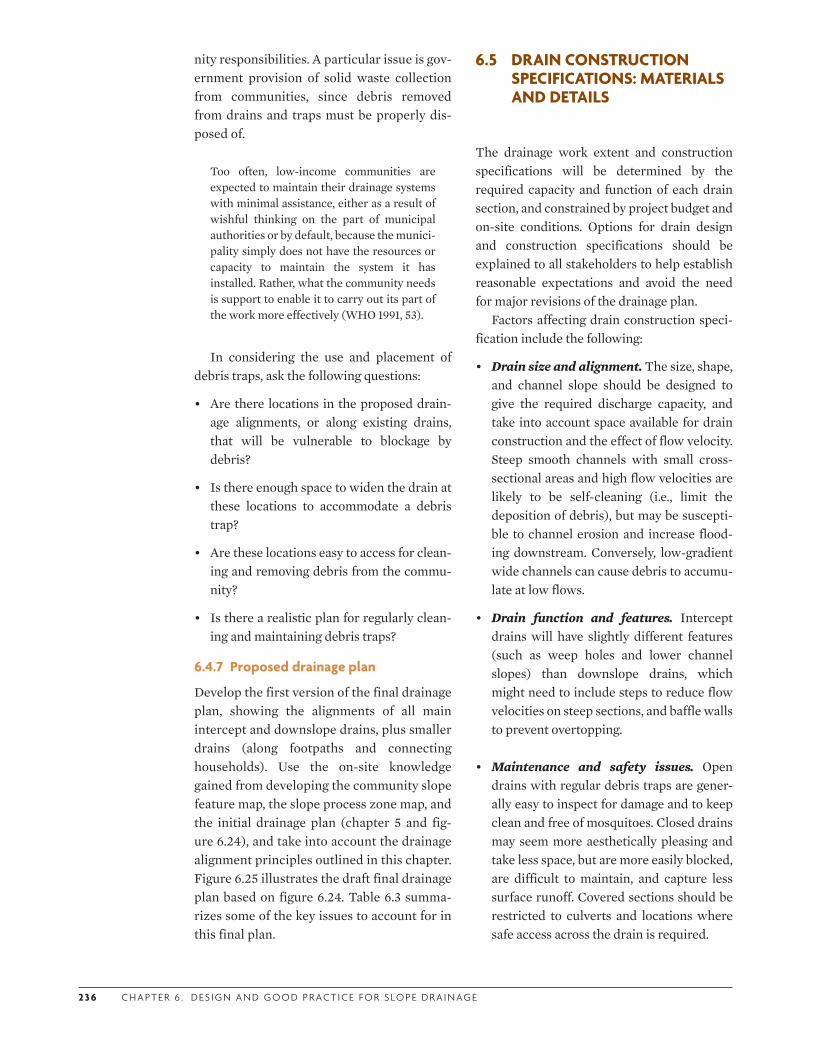
2 3 6 C H A P T E R 6 . D ES I G N A N D G O O D P R ACT I C E F O R S LO P E D R A I N AG E
nity responsibilities. A particular issue is gov-ernment provision of solid waste collection from communities, since debris removed from drains and traps must be properly dis-posed of.
Too often, low-income communities are expected to maintain their drainage systems with minimal assistance, either as a result of wishful thinking on the part of municipal authorities or by default, because the munici-pality simply does not have the resources or capacity to maintain the system it has installed. Rather, what the community needs is support to enable it to carry out its part of the work more effectively (WHO 1991, 53).
In considering the use and placement of debris traps, ask the following questions:
• Are there locations in the proposed drain-age alignments, or along existing drains, that will be vulnerable to blockage by debris?
• Is there enough space to widen the drain at these locations to accommodate a debris trap?
• Are these locations easy to access for clean-ing and removing debris from the commu-nity?
• Is there a realistic plan for regularly clean-ing and maintaining debris traps?
6.4.7 Proposed drainage plan
Develop the first version of the final drainage plan, showing the alignments of all main intercept and downslope drains, plus smaller drains (along footpaths and connecting households). Use the on-site knowledge gained from developing the community slope feature map, the slope process zone map, and the initial drainage plan (chapter 5 and fig-ure 6.24), and take into account the drainage alignment principles outlined in this chapter. Figure 6.25 illustrates the draft final drainage plan based on figure 6.24. Table 6.3 summa-rizes some of the key issues to account for in this final plan.
6.5 DRAIN CONSTRUCTION SPECIFICATIONS: MATERIALS AND DETAILS
The drainage work extent and construction specifications will be determined by the required capacity and function of each drain section, and constrained by project budget and on-site conditions. Options for drain design and construction specifications should be explained to all stakeholders to help establish reasonable expectations and avoid the need for major revisions of the drainage plan.
Factors affecting drain construction speci-fication include the following:
• Drain size and alignment. The size, shape, and channel slope should be designed to give the required discharge capacity, and take into account space available for drain construction and the effect of flow velocity. Steep smooth channels with small cross-sectional areas and high flow velocities are likely to be self-cleaning (i.e., limit the deposition of debris), but may be suscepti-ble to channel erosion and increase flood-ing downstream. Conversely, low-gradient wide channels can cause debris to accumu-late at low flows.
• Drain function and features. Intercept drains will have slightly different features (such as weep holes and lower channel slopes) than downslope drains, which might need to include steps to reduce flow velocities on steep sections, and baffle walls to prevent overtopping.
• Maintenance and safety issues. Open drains with regular debris traps are gener-ally easy to inspect for damage and to keep clean and free of mosquitoes. Closed drains may seem more aesthetically pleasing and take less space, but are more easily blocked, are difficult to maintain, and capture less surface runoff. Covered sections should be restricted to culverts and locations where safe access across the drain is required.
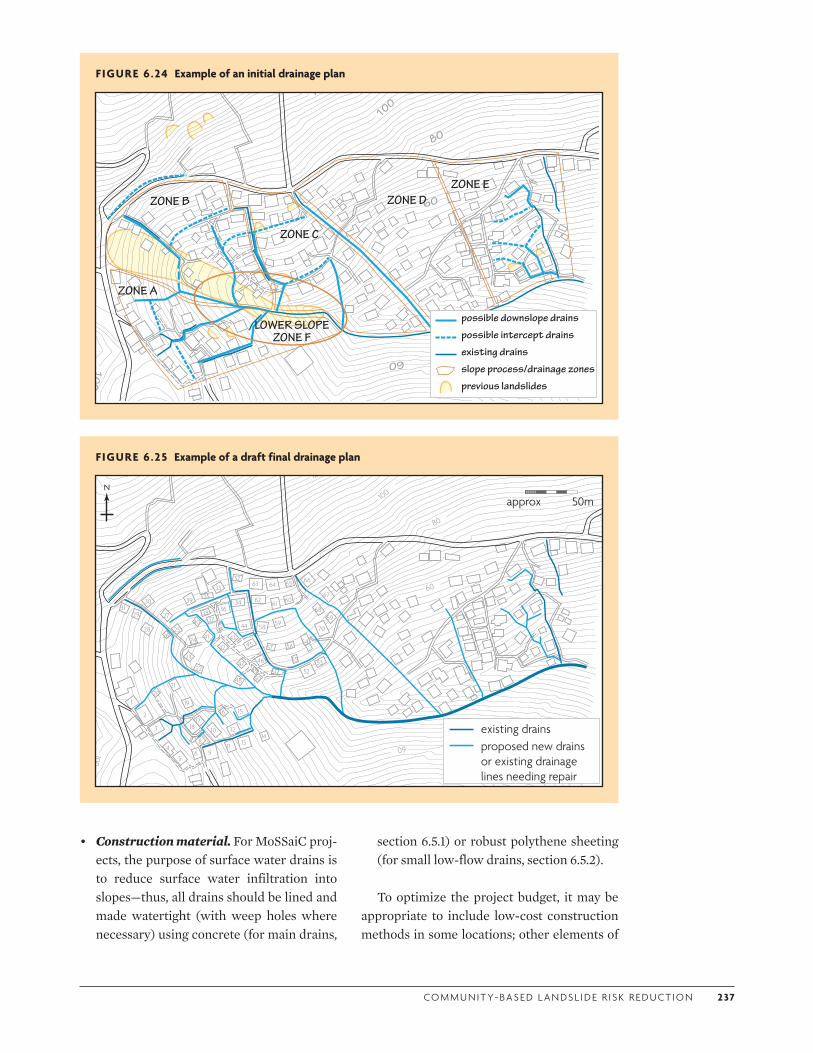
CO M M U N I T Y- BA S E D L A N DS L I D E R I S K R E D U CT I O N 2 37
• Construction material. For MoSSaiC proj-ects, the purpose of surface water drains is to reduce surface water infiltration into slopes—thus, all drains should be lined and made watertight (with weep holes where necessary) using concrete (for main drains,
section 6.5.1) or robust polythene sheeting (for small low-flow drains, section 6.5.2).
To optimize the project budget, it may be appropriate to include low-cost construction methods in some locations; other elements of
FIGURE 6.24 Example of an initial drainage plan
100
60
80
100 120
60
ZONE DZONE B
ZONE A
ZONE C
ZONE E
LOWER SLOPE ZONE F
previous landslides
slope process/drainage zones
existing drains
possible intercept drains
possible downslope drains
FIGURE 6.25 Example of a draft final drainage plan
100
60
80
100
120
60
1
2
3
4
56
7 8
9
10
2426
23
22
48
2019
18
21
16 15
1413
12
11
17
3129
28 25
27
30
3233
363840 37
39 3534
44
4341
42 45
47 46
5049 51 52
53
54
55
5657
58 59
606162
63 64 65 66
68
67
69
70
approx 50mN
existing drainsproposed new drains or existing drainage lines needing repair
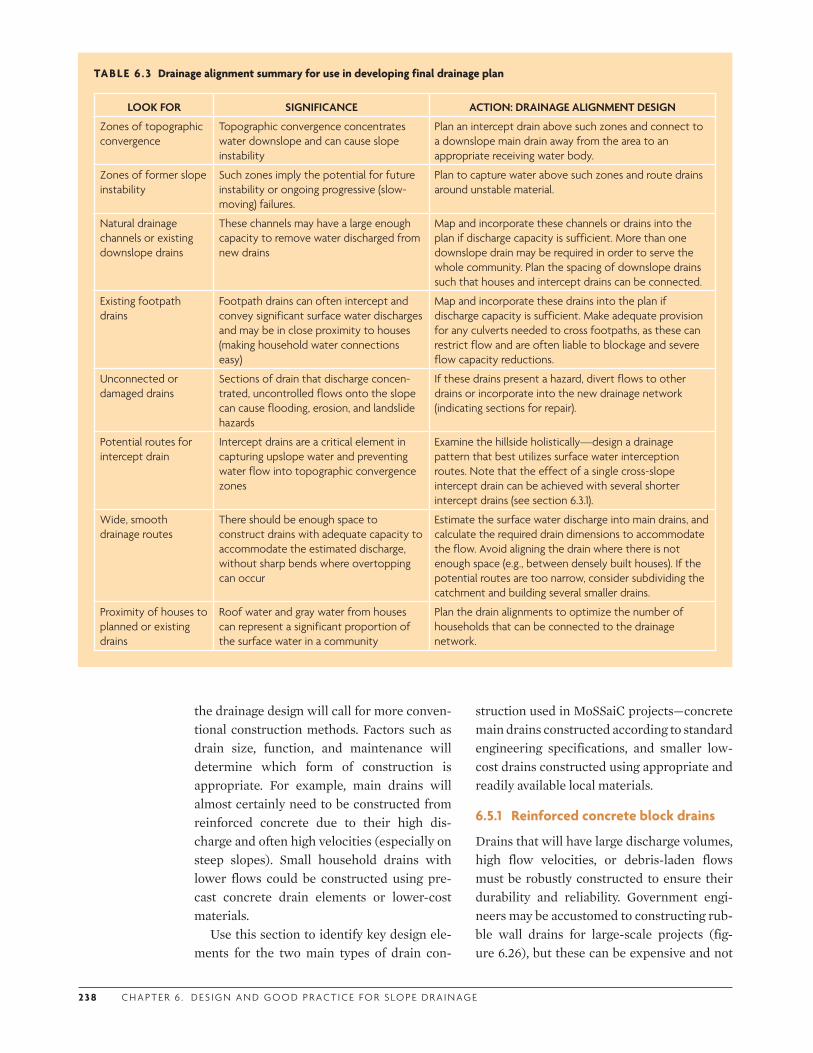
2 3 8 C H A P T E R 6 . D ES I G N A N D G O O D P R ACT I C E F O R S LO P E D R A I N AG E
the drainage design will call for more conven-tional construction methods. Factors such as drain size, function, and maintenance will determine which form of construction is appropriate. For example, main drains will almost certainly need to be constructed from reinforced concrete due to their high dis-charge and often high velocities (especially on steep slopes). Small household drains with lower flows could be constructed using pre-cast concrete drain elements or lower-cost materials.
Use this section to identify key design ele-ments for the two main types of drain con-
struction used in MoSSaiC projects—concrete main drains constructed according to standard engineering specifications, and smaller low-cost drains constructed using appropriate and readily available local materials.
6.5.1 Reinforced concrete block drains
Drains that will have large discharge volumes, high flow velocities, or debris-laden flows must be robustly constructed to ensure their durability and reliability. Government engi-neers may be accustomed to constructing rub-ble wall drains for large-scale projects (fig-ure 6.26), but these can be expensive and not
TABLE 6 .3 Drainage alignment summary for use in developing final drainage plan
LOOK FOR SIGNIFICANCE ACTION: DRAINAGE ALIGNMENT DESIGN
Zones of topographic convergence
Topographic convergence concentrates water downslope and can cause slope instability
Plan an intercept drain above such zones and connect to a downslope main drain away from the area to an appropriate receiving water body.
Zones of former slope instability
Such zones imply the potential for future instability or ongoing progressive (slow-moving) failures.
Plan to capture water above such zones and route drains around unstable material.
Natural drainage channels or existing downslope drains
These channels may have a large enough capacity to remove water discharged from new drains
Map and incorporate these channels or drains into the plan if discharge capacity is sufficient. More than one downslope drain may be required in order to serve the whole community. Plan the spacing of downslope drains such that houses and intercept drains can be connected.
Existing footpath drains
Footpath drains can often intercept and convey significant surface water discharges and may be in close proximity to houses (making household water connections easy)
Map and incorporate these drains into the plan if discharge capacity is sufficient. Make adequate provision for any culverts needed to cross footpaths, as these can restrict flow and are often liable to blockage and severe flow capacity reductions.
Unconnected or damaged drains
Sections of drain that discharge concen-trated, uncontrolled flows onto the slope can cause flooding, erosion, and landslide hazards
If these drains present a hazard, divert flows to other drains or incorporate into the new drainage network (indicating sections for repair).
Potential routes for intercept drain
Intercept drains are a critical element in capturing upslope water and preventing water flow into topographic convergence zones
Examine the hillside holistically—design a drainage pattern that best utilizes surface water interception routes. Note that the effect of a single cross-slope intercept drain can be achieved with several shorter intercept drains (see section 6.3.1).
Wide, smooth drainage routes
There should be enough space to construct drains with adequate capacity to accommodate the estimated discharge, without sharp bends where overtopping can occur
Estimate the surface water discharge into main drains, and calculate the required drain dimensions to accommodate the flow. Avoid aligning the drain where there is not enough space (e.g., between densely built houses). If the potential routes are too narrow, consider subdividing the catchment and building several smaller drains.
Proximity of houses to planned or existing drains
Roof water and gray water from houses can represent a significant proportion of the surface water in a community
Plan the drain alignments to optimize the number of households that can be connected to the drainage network.
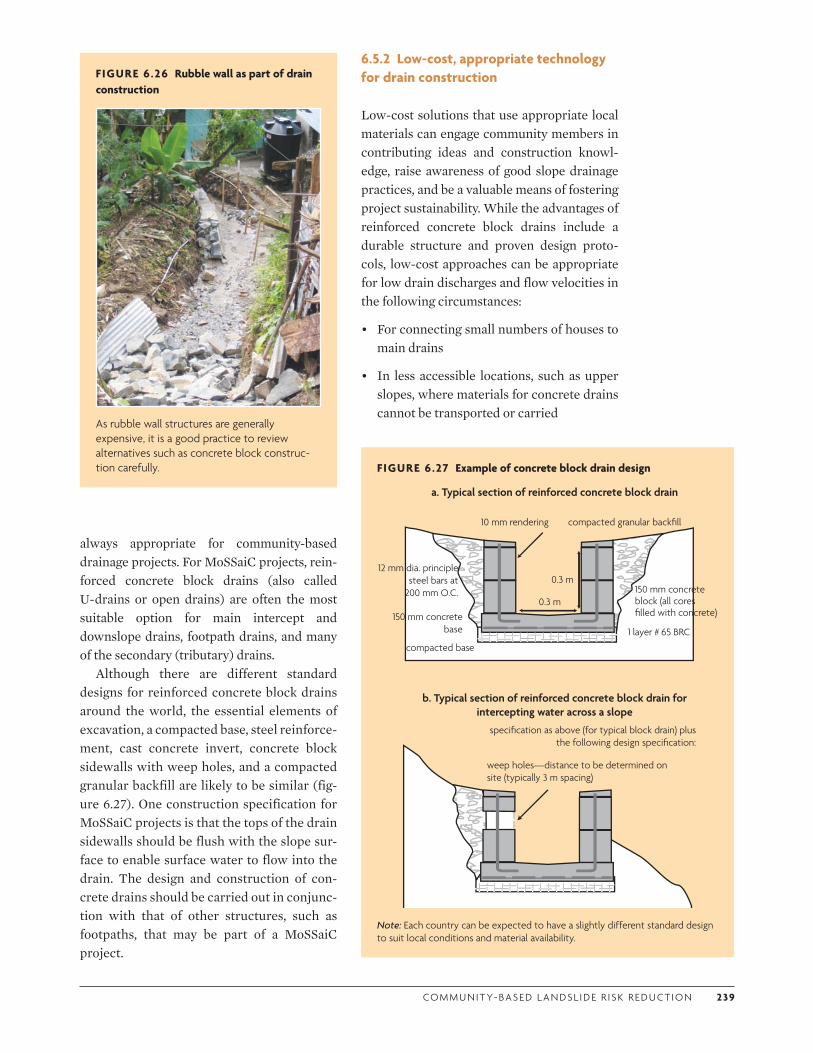
CO M M U N I T Y- BA S E D L A N DS L I D E R I S K R E D U CT I O N 2 39
always appropriate for community-based drainage projects. For MoSSaiC projects, rein-forced concrete block drains (also called U-drains or open drains) are often the most suitable option for main intercept and downslope drains, footpath drains, and many of the secondary (tributary) drains.
Although there are different standard designs for reinforced concrete block drains around the world, the essential elements of excavation, a compacted base, steel reinforce-ment, cast concrete invert, concrete block sidewalls with weep holes, and a compacted granular backfill are likely to be similar (fig-ure 6.27). One construction specification for MoSSaiC projects is that the tops of the drain sidewalls should be flush with the slope sur-face to enable surface water to flow into the drain. The design and construction of con-crete drains should be carried out in conjunc-tion with that of other structures, such as footpaths, that may be part of a MoSSaiC project.
6.5.2 Low-cost, appropriate technology for drain construction
Low-cost solutions that use appropriate local materials can engage community members in contributing ideas and construction knowl-edge, raise awareness of good slope drainage practices, and be a valuable means of fostering project sustainability. While the advantages of reinforced concrete block drains include a durable structure and proven design proto-cols, low-cost approaches can be appropriate for low drain discharges and flow velocities in the following circumstances:
• For connecting small numbers of houses to main drains
• In less accessible locations, such as upper slopes, where materials for concrete drains cannot be transported or carried
FIGURE 6.26 Rubble wall as part of drain construction
As rubble wall structures are generally expensive, it is a good practice to review alternatives such as concrete block construc-tion carefully. FIGURE 6.27 Example of concrete block drain design
compacted granular backfill
150 mm concrete block (all cores filled with concrete)
12 mm dia. principle steel bars at
200 mm O.C.
1 layer # 65 BRC150 mm concrete
base
compacted base
10 mm rendering
0.3 m
0.3 m
specification as above (for typical block drain) plus the following design specification:
weep holes—distance to be determined on site (typically 3 m spacing)
a. Typical section of reinforced concrete block drain
b. Typical section of reinforced concrete block drain for intercepting water across a slope
Note: Each country can be expected to have a slightly different standard design to suit local conditions and material availability.

24 0 C H A P T E R 6 . D ES I G N A N D G O O D P R ACT I C E F O R S LO P E D R A I N AG E
• On unstable slope sections that need sur-face drainage but where slope movement may be reactivated.
A low-cost, appropriate technology drain construction method was developed by govern-ment task teams and community residents dur-ing a MoSSaiC project in St. Lucia. The drain consists of a shallow trench lined with durable polythene sheeting (typically sunlight-stable polythene) which makes the drain water tight and prevents infiltration. To keep it in place, the polythene is overlaid with a light-weight steel-wire mesh molded to the shape of the drain and anchored to the ground with U-shaped pegs made by bending lengths of reinforcing rod. These materials cost considerably less than those required for constructing a reinforced concrete block drain of equivalent size.
Beyond its cost-effectiveness, some of the advantages of this drain construction method include the following:
• Ease of transport. Materials can readily be carried to sites that are difficult or prohibi-tively expensive to transport materials to for concrete block drain construction (fig-ure 6.28).
• Rapid uptake. Low cost, and the ease of transport of materials, means that such
drain construction methods are more likely to be adopted as a self-help measure by individual households.
• Speed and flexibility of construction. Unlike concrete block drains, the plastic-lined drains can be quickly constructed or dismantled. New drains can be installed relatively easily to accommodate slope movement on progressive slides or the con-struction of new houses or paths (fig-ure 6.29).
Certain communities in the Eastern Carib-bean have been sufficiently engaged with MoSSaiC projects to use their own initiative
FIGURE 6.28 Shipping construction material to site can be expensive
Shipping sand and cement can add significantly to the cost of conventional drain construction in more remote island locations. Here, material is being shipped some 18 miles on an inter-island ferry to reach the community.
FIGURE 6.29 Installation of plastic-lined drain
a. Low-cost drain being installed by residents.
b. Completed drain, with household gray water connections.
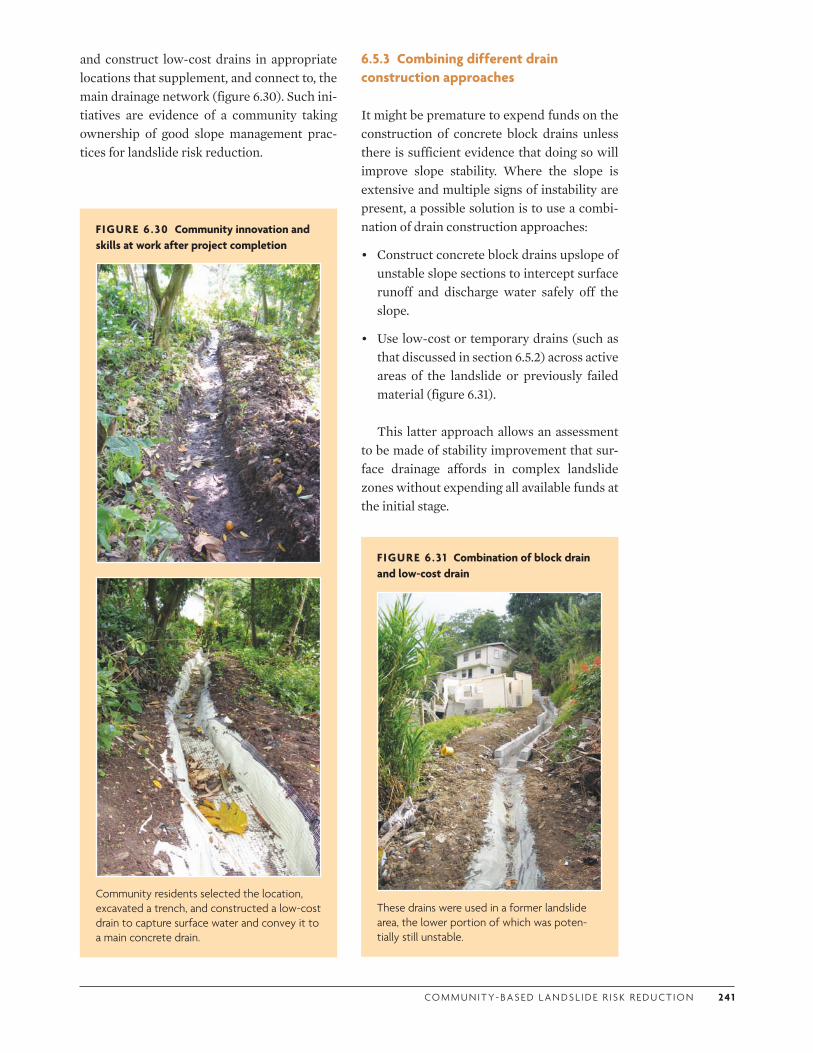
CO M M U N I T Y- BA S E D L A N DS L I D E R I S K R E D U CT I O N 24 1
and construct low-cost drains in appropriate locations that supplement, and connect to, the main drainage network (figure 6.30). Such ini-tiatives are evidence of a community taking ownership of good slope management prac-tices for landslide risk reduction.
6.5.3 Combining different drain construction approaches
It might be premature to expend funds on the construction of concrete block drains unless there is sufficient evidence that doing so will improve slope stability. Where the slope is extensive and multiple signs of instability are present, a possible solution is to use a combi-nation of drain construction approaches:
• Construct concrete block drains upslope of unstable slope sections to intercept surface runoff and discharge water safely off the slope.
• Use low-cost or temporary drains (such as that discussed in section 6.5.2) across active areas of the landslide or previously failed material (figure 6.31).
This latter approach allows an assessment to be made of stability improvement that sur-face drainage affords in complex landslide zones without expending all available funds at the initial stage.
FIGURE 6.30 Community innovation and skills at work after project completion
Community residents selected the location, excavated a trench, and constructed a low-cost drain to capture surface water and convey it to a main concrete drain.
FIGURE 6.31 Combination of block drain and low-cost drain
These drains were used in a former landslide area, the lower portion of which was poten-tially still unstable.
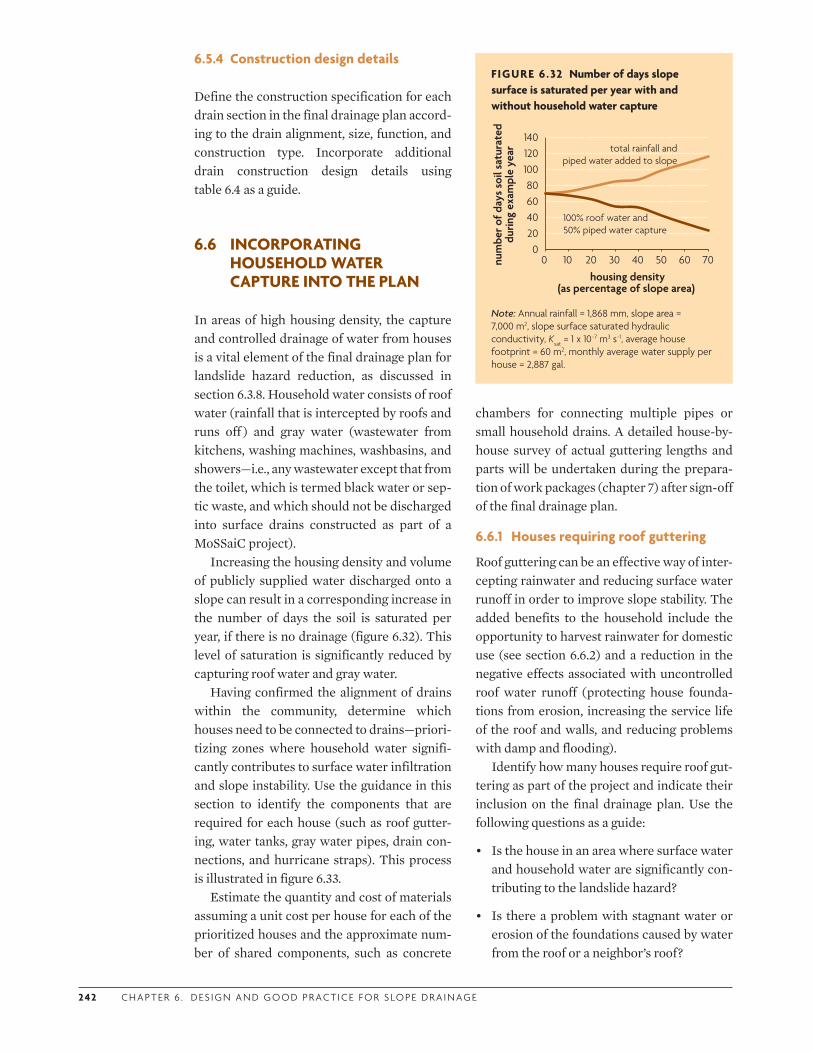
242 C H A P T E R 6 . D ES I G N A N D G O O D P R ACT I C E F O R S LO P E D R A I N AG E
6.5.4 Construction design details
Define the construction specification for each drain section in the final drainage plan accord-ing to the drain alignment, size, function, and construction type. Incorporate additional drain construction design details using table 6.4 as a guide.
6.6 INCORPORATING HOUSEHOLD WATER CAPTURE INTO THE PLAN
In areas of high housing density, the capture and controlled drainage of water from houses is a vital element of the final drainage plan for landslide hazard reduction, as discussed in section 6.3.8. Household water consists of roof water (rainfall that is intercepted by roofs and runs off ) and gray water (wastewater from kitchens, washing machines, washbasins, and showers—i.e., any wastewater except that from the toilet, which is termed black water or sep-tic waste, and which should not be discharged into surface drains constructed as part of a MoSSaiC project).
Increasing the housing density and volume of publicly supplied water discharged onto a slope can result in a corresponding increase in the number of days the soil is saturated per year, if there is no drainage (figure 6.32). This level of saturation is significantly reduced by capturing roof water and gray water.
Having confirmed the alignment of drains within the community, determine which houses need to be connected to drains—priori-tizing zones where household water signifi-cantly contributes to surface water infiltration and slope instability. Use the guidance in this section to identify the components that are required for each house (such as roof gutter-ing, water tanks, gray water pipes, drain con-nections, and hurricane straps). This process is illustrated in figure 6.33.
Estimate the quantity and cost of materials assuming a unit cost per house for each of the prioritized houses and the approximate num-ber of shared components, such as concrete
chambers for connecting multiple pipes or small household drains. A detailed house-by-house survey of actual guttering lengths and parts will be undertaken during the prepara-tion of work packages (chapter 7) after sign-off of the final drainage plan.
6.6.1 Houses requiring roof guttering
Roof guttering can be an effective way of inter-cepting rainwater and reducing surface water runoff in order to improve slope stability. The added benefits to the household include the opportunity to harvest rainwater for domestic use (see section 6.6.2) and a reduction in the negative effects associated with uncontrolled roof water runoff (protecting house founda-tions from erosion, increasing the service life of the roof and walls, and reducing problems with damp and flooding).
Identify how many houses require roof gut-tering as part of the project and indicate their inclusion on the final drainage plan. Use the following questions as a guide:
• Is the house in an area where surface water and household water are significantly con-tributing to the landslide hazard?
• Is there a problem with stagnant water or erosion of the foundations caused by water from the roof or a neighbor’s roof?
FIGURE 6.32 Number of days slope surface is saturated per year with and without household water capture
0 20 40 60 80
100 120 140
0 10 20 30 40 50 60 70 num
ber o
f day
s so
il sa
tura
ted
durin
g ex
ampl
e ye
ar
housing density(as percentage of slope area)
total rainfall and piped water added to slope
100% roof water and50% piped water capture
Note: Annual rainfall = 1,868 mm, slope area = 7,000 m2, slope surface saturated hydraulic conductivity, Ksat = 1 x 10⁻⁷ m3 s−1, average house footprint = 60 m2, monthly average water supply per house = 2,887 gal.
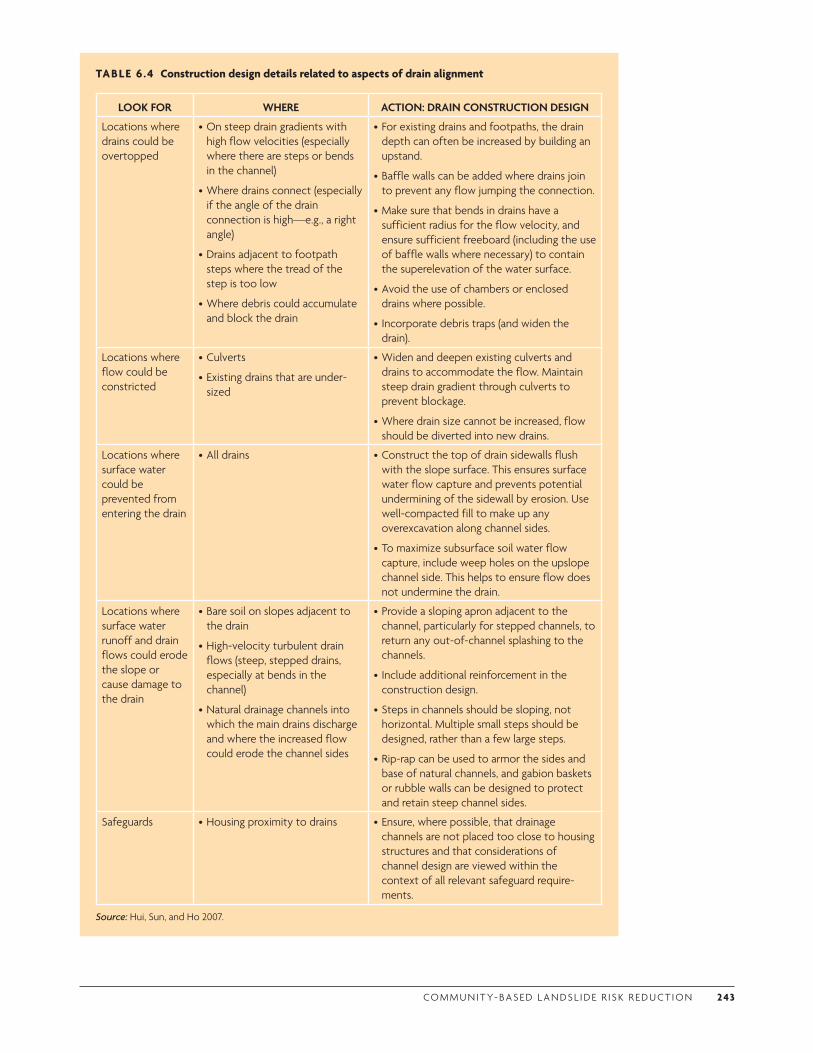
CO M M U N I T Y- BA S E D L A N DS L I D E R I S K R E D U CT I O N 243
TABLE 6 .4 Construction design details related to aspects of drain alignment
LOOK FOR WHERE ACTION: DRAIN CONSTRUCTION DESIGN
Locations where drains could be overtopped
•On steep drain gradients with high flow velocities (especially where there are steps or bends in the channel)
•Where drains connect (especially if the angle of the drain connection is high—e.g., a right angle)
•Drains adjacent to footpath steps where the tread of the step is too low
•Where debris could accumulate and block the drain
•For existing drains and footpaths, the drain depth can often be increased by building an upstand.
•Baffle walls can be added where drains join to prevent any flow jumping the connection.
•Make sure that bends in drains have a sufficient radius for the flow velocity, and ensure sufficient freeboard (including the use of baffle walls where necessary) to contain the superelevation of the water surface.
•Avoid the use of chambers or enclosed drains where possible.
• Incorporate debris traps (and widen the drain).
Locations where flow could be constricted
•Culverts
•Existing drains that are under-sized
•Widen and deepen existing culverts and drains to accommodate the flow. Maintain steep drain gradient through culverts to prevent blockage.
•Where drain size cannot be increased, flow should be diverted into new drains.
Locations where surface water could be prevented from entering the drain
•All drains •Construct the top of drain sidewalls flush with the slope surface. This ensures surface water flow capture and prevents potential undermining of the sidewall by erosion. Use well-compacted fill to make up any overexcavation along channel sides.
•To maximize subsurface soil water flow capture, include weep holes on the upslope channel side. This helps to ensure flow does not undermine the drain.
Locations where surface water runoff and drain flows could erode the slope or cause damage to the drain
•Bare soil on slopes adjacent to the drain
•High-velocity turbulent drain flows (steep, stepped drains, especially at bends in the channel)
•Natural drainage channels into which the main drains discharge and where the increased flow could erode the channel sides
•Provide a sloping apron adjacent to the channel, particularly for stepped channels, to return any out-of-channel splashing to the channels.
• Include additional reinforcement in the construction design.
•Steps in channels should be sloping, not horizontal. Multiple small steps should be designed, rather than a few large steps.
•Rip-rap can be used to armor the sides and base of natural channels, and gabion baskets or rubble walls can be designed to protect and retain steep channel sides.
Safeguards •Housing proximity to drains •Ensure, where possible, that drainage channels are not placed too close to housing structures and that considerations of channel design are viewed within the context of all relevant safeguard require-ments.
Source: Hui, Sun, and Ho 2007.
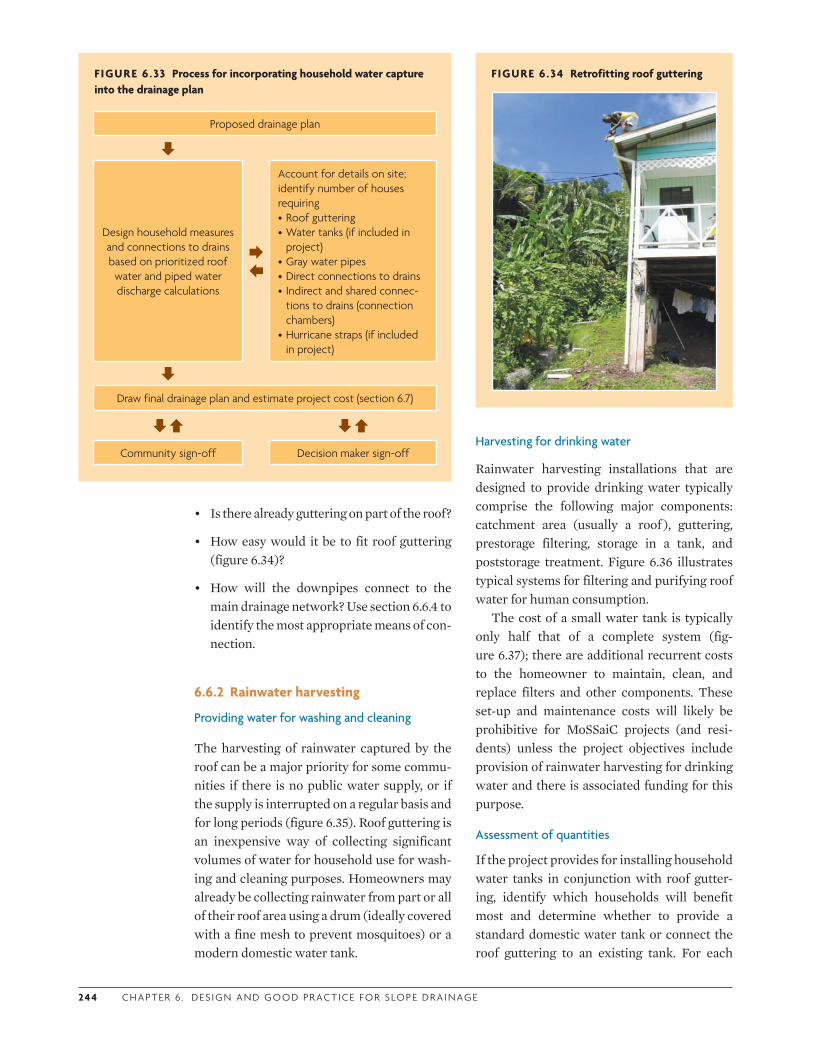
24 4 C H A P T E R 6 . D ES I G N A N D G O O D P R ACT I C E F O R S LO P E D R A I N AG E
• Is there already guttering on part of the roof?
• How easy would it be to fit roof guttering (figure 6.34)?
• How will the downpipes connect to the main drainage network? Use section 6.6.4 to identify the most appropriate means of con-nection.
6.6.2 Rainwater harvesting
Providing water for washing and cleaning
The harvesting of rainwater captured by the roof can be a major priority for some commu-nities if there is no public water supply, or if the supply is interrupted on a regular basis and for long periods (figure 6.35). Roof guttering is an inexpensive way of collecting significant volumes of water for household use for wash-ing and cleaning purposes. Homeowners may already be collecting rainwater from part or all of their roof area using a drum (ideally covered with a fine mesh to prevent mosquitoes) or a modern domestic water tank.
Harvesting for drinking water
Rainwater harvesting installations that are designed to provide drinking water typically comprise the following major components: catchment area (usually a roof ), guttering, prestorage filtering, storage in a tank, and poststorage treatment. Figure 6.36 illustrates typical systems for filtering and purifying roof water for human consumption.
The cost of a small water tank is typically only half that of a complete system (fig-ure 6.37); there are additional recurrent costs to the homeowner to maintain, clean, and replace filters and other components. These set-up and maintenance costs will likely be prohibitive for MoSSaiC projects (and resi-dents) unless the project objectives include provision of rainwater harvesting for drinking water and there is associated funding for this purpose.
Assessment of quantities
If the project provides for installing household water tanks in conjunction with roof gutter-ing, identify which households will benefit most and determine whether to provide a standard domestic water tank or connect the roof guttering to an existing tank. For each
FIGURE 6.33 Process for incorporating household water capture into the drainage plan
Proposed drainage plan
Design household measures and connections to drains based on prioritized roof
water and piped water discharge calculations
Account for details on site; identify number of houses requiring•Roof guttering•Water tanks (if included in
project)•Gray water pipes•Direct connections to drains• Indirect and shared connec-
tions to drains (connection chambers)•Hurricane straps (if included
in project)
Draw final drainage plan and estimate project cost (section 6.7)
Community sign-off Decision maker sign-off
FIGURE 6.34 Retrofitting roof guttering
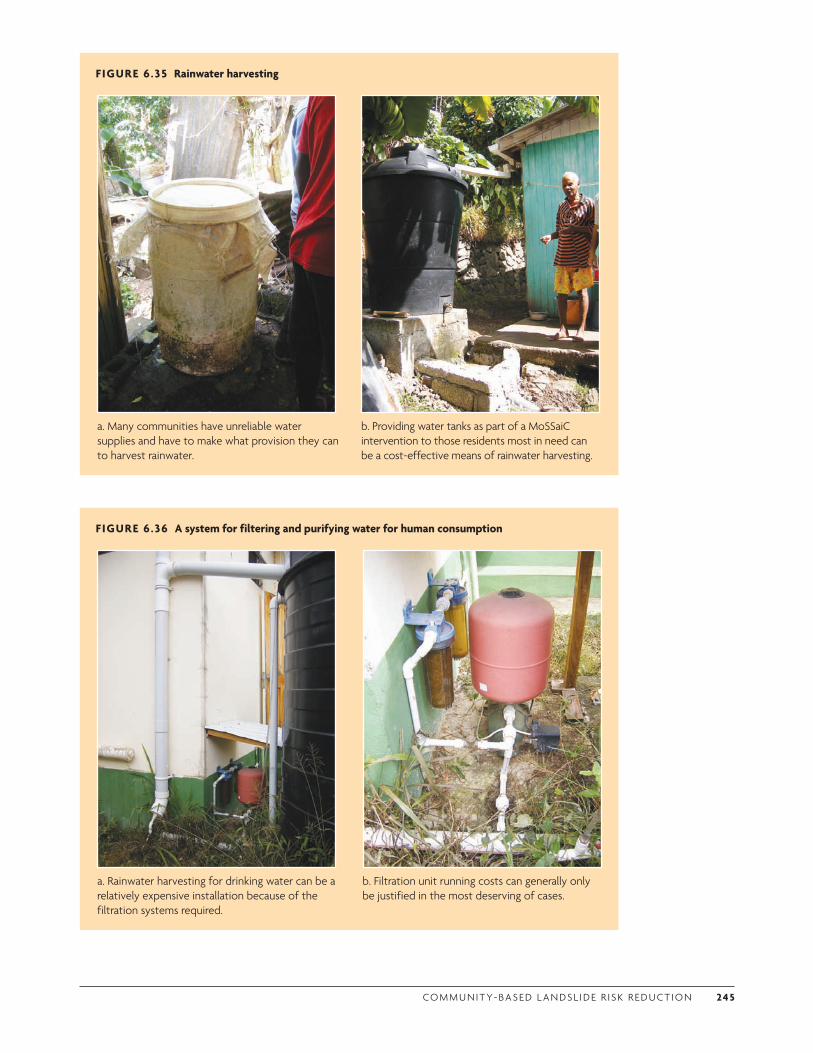
CO M M U N I T Y- BA S E D L A N DS L I D E R I S K R E D U CT I O N 24 5
FIGURE 6.35 Rainwater harvesting
a. Many communities have unreliable water supplies and have to make what provision they can to harvest rainwater.
b. Providing water tanks as part of a MoSSaiC intervention to those residents most in need can be a cost-effective means of rainwater harvesting.
FIGURE 6.36 A system for filtering and purifying water for human consumption
a. Rainwater harvesting for drinking water can be a relatively expensive installation because of the filtration systems required.
b. Filtration unit running costs can generally only be justified in the most deserving of cases.
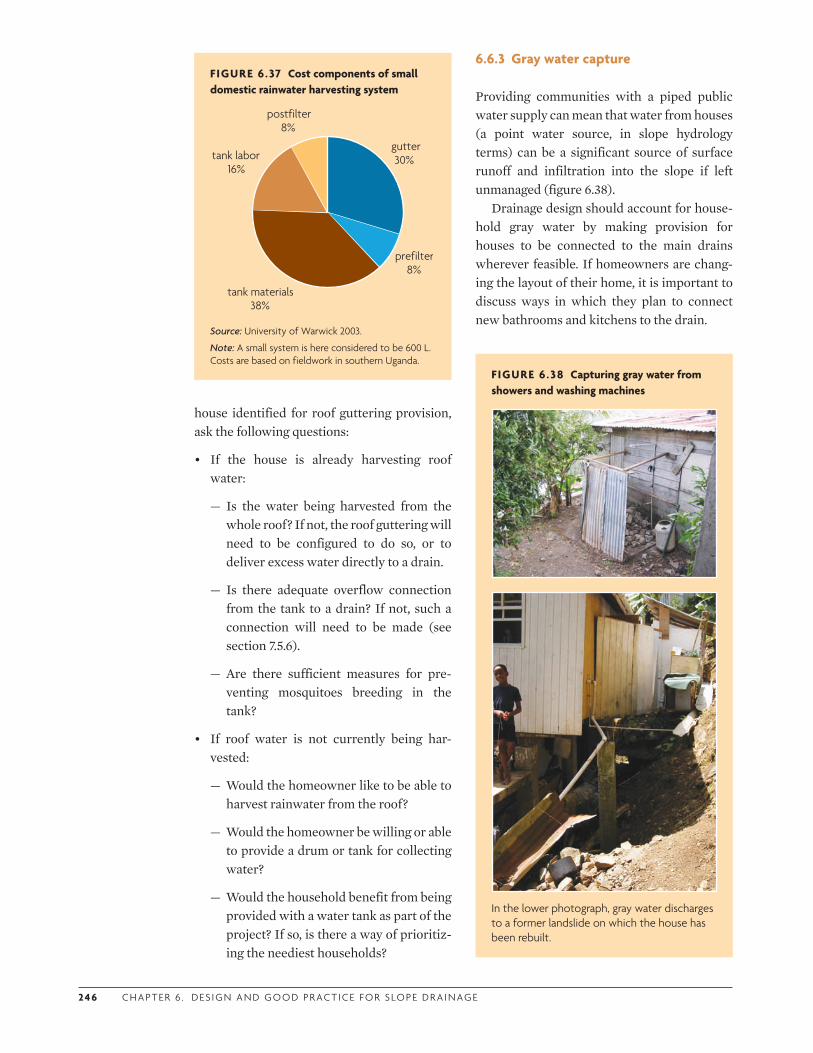
24 6 C H A P T E R 6 . D ES I G N A N D G O O D P R ACT I C E F O R S LO P E D R A I N AG E
house identified for roof guttering provision, ask the following questions:
• If the house is already harvesting roof water:
— Is the water being harvested from the whole roof? If not, the roof guttering will need to be configured to do so, or to deliver excess water directly to a drain.
— Is there adequate overflow connection from the tank to a drain? If not, such a connection will need to be made (see section 7.5.6).
— Are there sufficient measures for pre-venting mosquitoes breeding in the tank?
• If roof water is not currently being har-vested:
— Would the homeowner like to be able to harvest rainwater from the roof?
— Would the homeowner be willing or able to provide a drum or tank for collecting water?
— Would the household benefit from being provided with a water tank as part of the project? If so, is there a way of prioritiz-ing the neediest households?
6.6.3 Gray water capture
Providing communities with a piped public water supply can mean that water from houses (a point water source, in slope hydrology terms) can be a significant source of surface runoff and infiltration into the slope if left unmanaged (figure 6.38).
Drainage design should account for house-hold gray water by making provision for houses to be connected to the main drains wherever feasible. If homeowners are chang-ing the layout of their home, it is important to discuss ways in which they plan to connect new bathrooms and kitchens to the drain.
FIGURE 6.37 Cost components of small domestic rainwater harvesting system
gutter30%
prefilter8%
tank materials38%
tank labor16%
postfilter8%
Source: University of Warwick 2003.
Note: A small system is here considered to be 600 L. Costs are based on fieldwork in southern Uganda.
FIGURE 6.38 Capturing gray water from showers and washing machines
In the lower photograph, gray water discharges to a former landslide on which the house has been rebuilt.
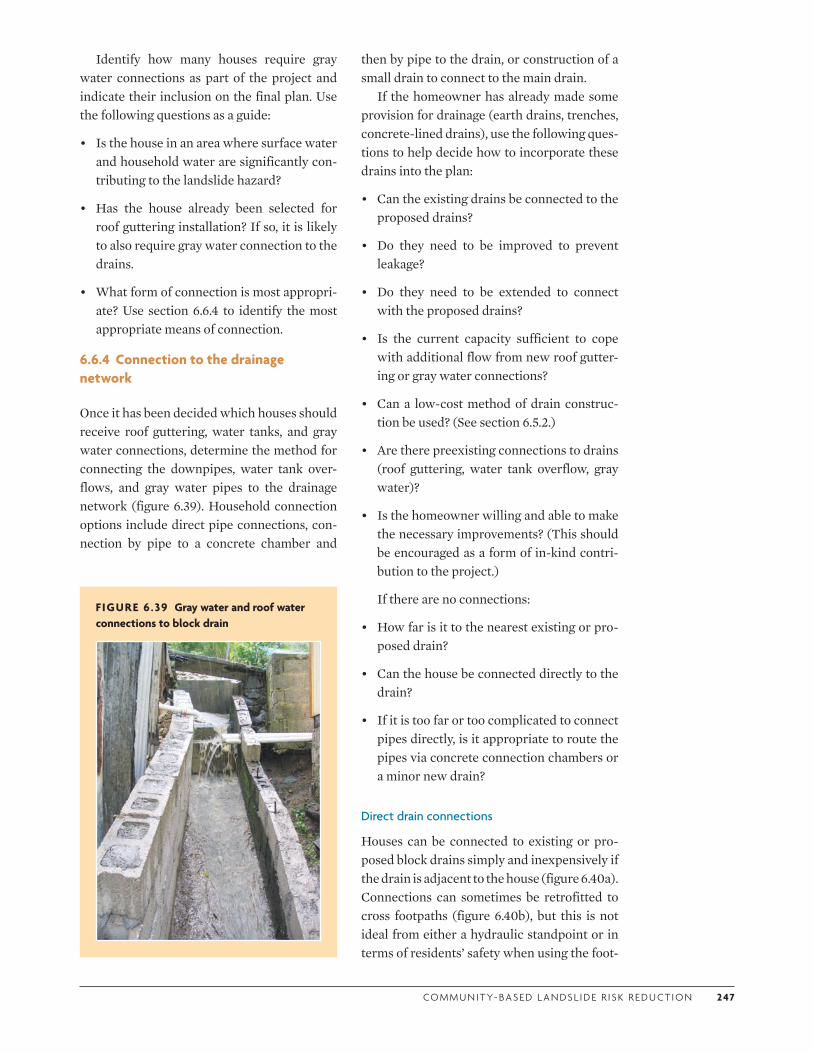
CO M M U N I T Y- BA S E D L A N DS L I D E R I S K R E D U CT I O N 247
Identify how many houses require gray water connections as part of the project and indicate their inclusion on the final plan. Use the following questions as a guide:
• Is the house in an area where surface water and household water are significantly con-tributing to the landslide hazard?
• Has the house already been selected for roof guttering installation? If so, it is likely to also require gray water connection to the drains.
• What form of connection is most appropri-ate? Use section 6.6.4 to identify the most appropriate means of connection.
6.6.4 Connection to the drainage network
Once it has been decided which houses should receive roof guttering, water tanks, and gray water connections, determine the method for connecting the downpipes, water tank over-flows, and gray water pipes to the drainage network (figure 6.39). Household connection options include direct pipe connections, con-nection by pipe to a concrete chamber and
then by pipe to the drain, or construction of a small drain to connect to the main drain.
If the homeowner has already made some provision for drainage (earth drains, trenches, concrete-lined drains), use the following ques-tions to help decide how to incorporate these drains into the plan:
• Can the existing drains be connected to the proposed drains?
• Do they need to be improved to prevent leakage?
• Do they need to be extended to connect with the proposed drains?
• Is the current capacity sufficient to cope with additional flow from new roof gutter-ing or gray water connections?
• Can a low-cost method of drain construc-tion be used? (See section 6.5.2.)
• Are there preexisting connections to drains (roof guttering, water tank overflow, gray water)?
• Is the homeowner willing and able to make the necessary improvements? (This should be encouraged as a form of in-kind contri-bution to the project.)
If there are no connections:
• How far is it to the nearest existing or pro-posed drain?
• Can the house be connected directly to the drain?
• If it is too far or too complicated to connect pipes directly, is it appropriate to route the pipes via concrete connection chambers or a minor new drain?
Direct drain connections
Houses can be connected to existing or pro-posed block drains simply and inexpensively if the drain is adjacent to the house (figure 6.40a). Connections can sometimes be retrofitted to cross footpaths (figure 6.40b), but this is not ideal from either a hydraulic standpoint or in terms of residents’ safety when using the foot-
FIGURE 6.39 Gray water and roof water connections to block drain
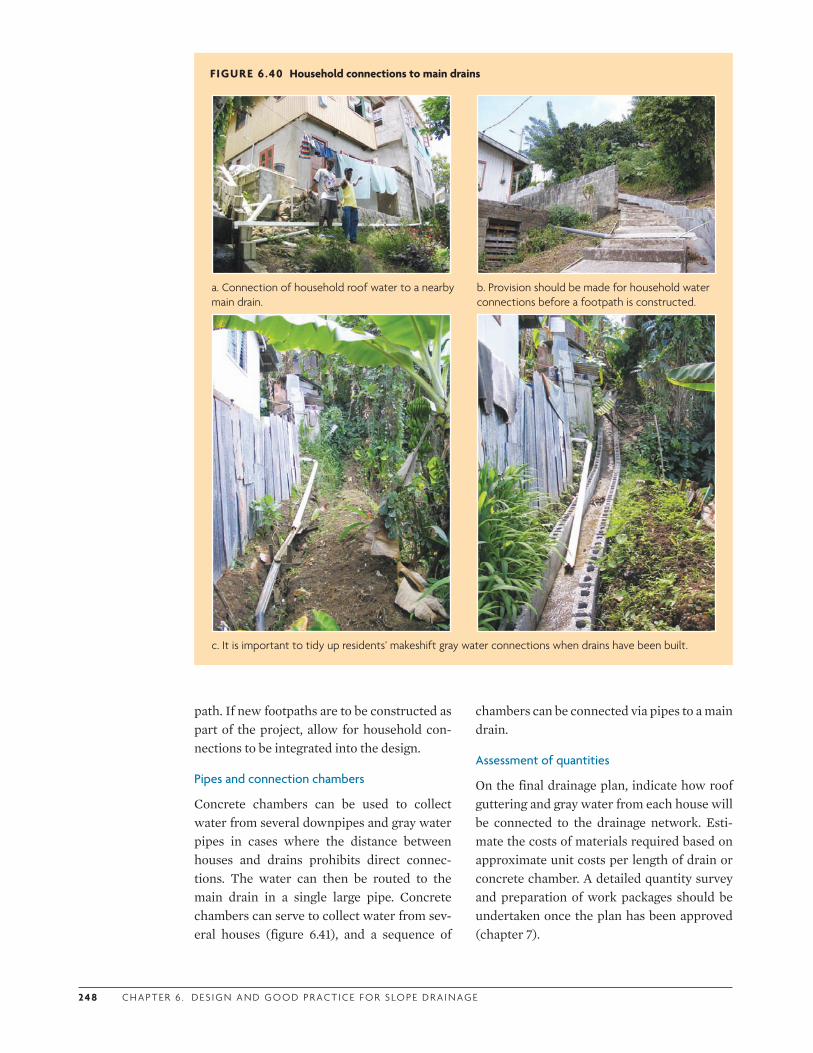
24 8 C H A P T E R 6 . D ES I G N A N D G O O D P R ACT I C E F O R S LO P E D R A I N AG E
path. If new footpaths are to be constructed as part of the project, allow for household con-nections to be integrated into the design.
Pipes and connection chambers
Concrete chambers can be used to collect water from several downpipes and gray water pipes in cases where the distance between houses and drains prohibits direct connec-tions. The water can then be routed to the main drain in a single large pipe. Concrete chambers can serve to collect water from sev-eral houses (figure 6.41), and a sequence of
chambers can be connected via pipes to a main drain.
Assessment of quantities
On the final drainage plan, indicate how roof guttering and gray water from each house will be connected to the drainage network. Esti-mate the costs of materials required based on approximate unit costs per length of drain or concrete chamber. A detailed quantity survey and preparation of work packages should be undertaken once the plan has been approved (chapter 7).
FIGURE 6.40 Household connections to main drains
a. Connection of household roof water to a nearby main drain.
b. Provision should be made for household water connections before a footpath is constructed.
c. It is important to tidy up residents’ makeshift gray water connections when drains have been built.
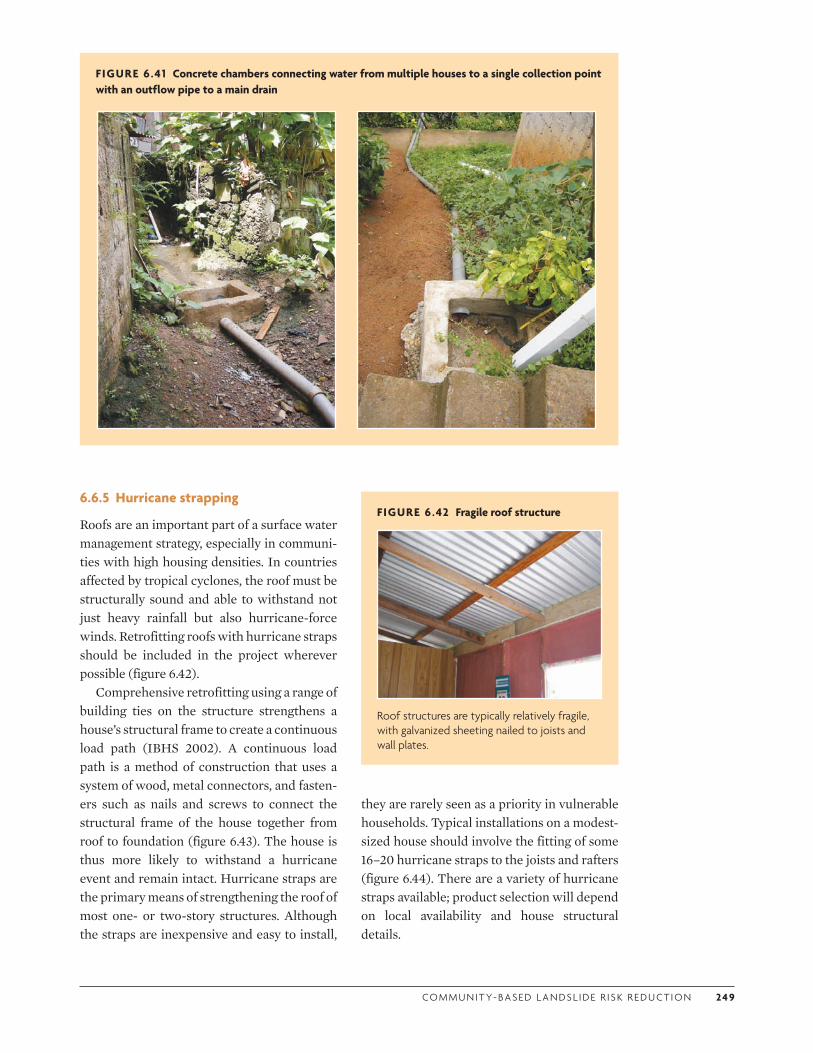
CO M M U N I T Y- BA S E D L A N DS L I D E R I S K R E D U CT I O N 24 9
FIGURE 6.41 Concrete chambers connecting water from multiple houses to a single collection point with an outflow pipe to a main drain
FIGURE 6.42 Fragile roof structure
Roof structures are typically relatively fragile, with galvanized sheeting nailed to joists and wall plates.
6.6.5 Hurricane strapping
Roofs are an important part of a surface water management strategy, especially in communi-ties with high housing densities. In countries affected by tropical cyclones, the roof must be structurally sound and able to withstand not just heavy rainfall but also hurricane-force winds. Retrofitting roofs with hurricane straps should be included in the project wherever possible (figure 6.42).
Comprehensive retrofitting using a range of building ties on the structure strengthens a house’s structural frame to create a continuous load path (IBHS 2002). A continuous load path is a method of construction that uses a system of wood, metal connectors, and fasten-ers such as nails and screws to connect the structural frame of the house together from roof to foundation (figure 6.43). The house is thus more likely to withstand a hurricane event and remain intact. Hurricane straps are the primary means of strengthening the roof of most one- or two-story structures. Although the straps are inexpensive and easy to install,
they are rarely seen as a priority in vulnerable households. Typical installations on a modest-sized house should involve the fitting of some 16–20 hurricane straps to the joists and rafters (figure 6.44). There are a variety of hurricane straps available; product selection will depend on local availability and house structural details.
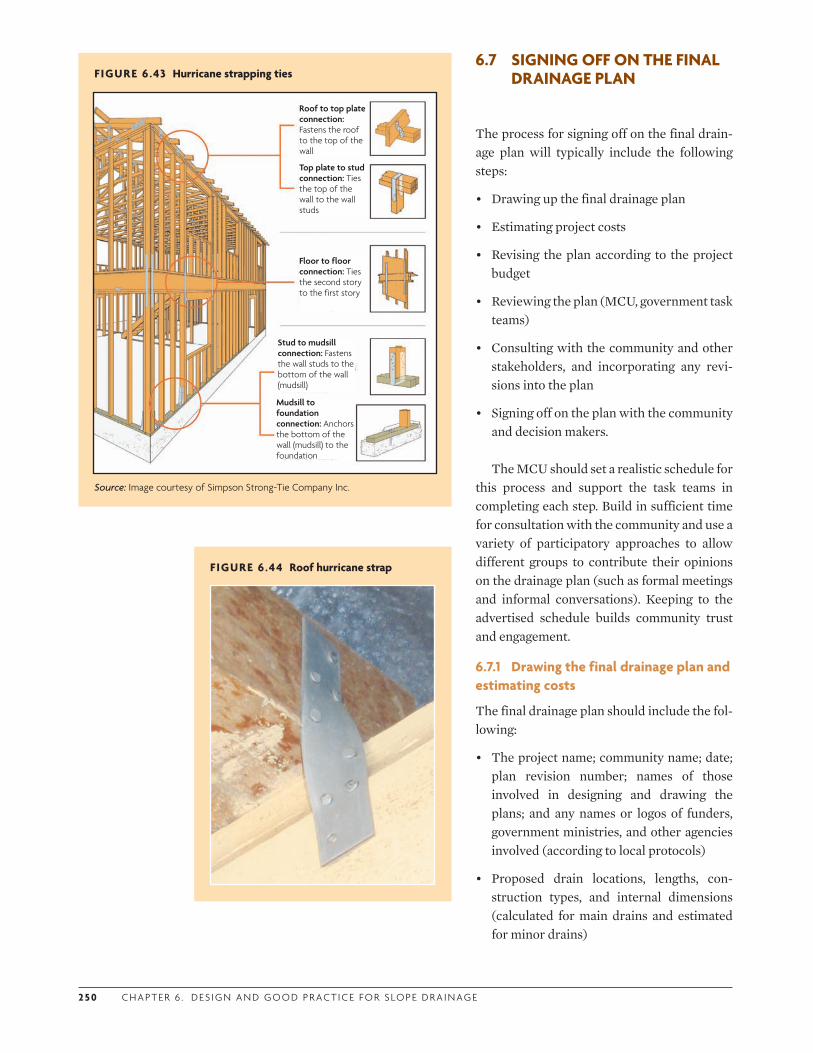
2 5 0 C H A P T E R 6 . D ES I G N A N D G O O D P R ACT I C E F O R S LO P E D R A I N AG E
6.7 SIGNING OFF ON THE FINAL DRAINAGE PLAN
The process for signing off on the final drain-age plan will typically include the following steps:
• Drawing up the final drainage plan
• Estimating project costs
• Revising the plan according to the project budget
• Reviewing the plan (MCU, government task teams)
• Consulting with the community and other stakeholders, and incorporating any revi-sions into the plan
• Signing off on the plan with the community and decision makers.
The MCU should set a realistic schedule for this process and support the task teams in completing each step. Build in sufficient time for consultation with the community and use a variety of participatory approaches to allow different groups to contribute their opinions on the drainage plan (such as formal meetings and informal conversations). Keeping to the advertised schedule builds community trust and engagement.
6.7.1 Drawing the final drainage plan and estimating costs
The final drainage plan should include the fol-lowing:
• The project name; community name; date; plan revision number; names of those involved in designing and drawing the plans; and any names or logos of funders, government ministries, and other agencies involved (according to local protocols)
• Proposed drain locations, lengths, con-struction types, and internal dimensions (calculated for main drains and estimated for minor drains)
FIGURE 6.44 Roof hurricane strap
FIGURE 6.43 Hurricane strapping ties
Source: Image courtesy of Simpson Strong-Tie Company Inc.
Floor to floor connection: Ties the second story to the first story
Stud to mudsill connection: Fastens the wall studs to the bottom of the wall (mudsill)
Mudsill to foundation connection: Anchors the bottom of the wall (mudsill) to the foundation
Roof to top plate connection: Fastens the roof to the top of the wall
Top plate to stud connection: Ties the top of the wall to the wall studs
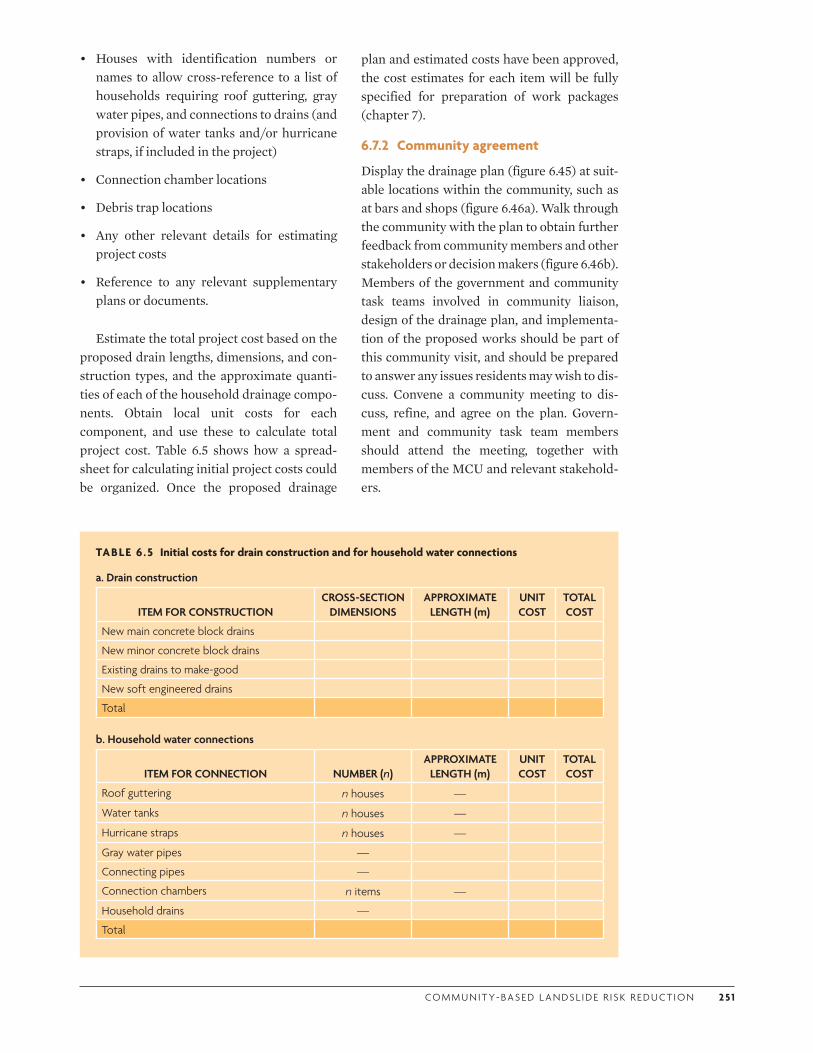
CO M M U N I T Y- BA S E D L A N DS L I D E R I S K R E D U CT I O N 2 51
• Houses with identification numbers or names to allow cross-reference to a list of households requiring roof guttering, gray water pipes, and connections to drains (and provision of water tanks and/or hurricane straps, if included in the project)
• Connection chamber locations
• Debris trap locations
• Any other relevant details for estimating project costs
• Reference to any relevant supplementary plans or documents.
Estimate the total project cost based on the proposed drain lengths, dimensions, and con-struction types, and the approximate quanti-ties of each of the household drainage compo-nents. Obtain local unit costs for each component, and use these to calculate total project cost. Table 6.5 shows how a spread-sheet for calculating initial project costs could be organized. Once the proposed drainage
plan and estimated costs have been approved, the cost estimates for each item will be fully specified for preparation of work packages (chapter 7).
6.7.2 Community agreement
Display the drainage plan (figure 6.45) at suit-able locations within the community, such as at bars and shops (figure 6.46a). Walk through the community with the plan to obtain further feedback from community members and other stakeholders or decision makers (figure 6.46b). Members of the government and community task teams involved in community liaison, design of the drainage plan, and implementa-tion of the proposed works should be part of this community visit, and should be prepared to answer any issues residents may wish to dis-cuss. Convene a community meeting to dis-cuss, refine, and agree on the plan. Govern-ment and community task team members should attend the meeting, together with members of the MCU and relevant stakehold-ers.
TABLE 6 .5 Initial costs for drain construction and for household water connections
a. Drain construction
ITEM FOR CONSTRUCTIONCROSS-SECTION
DIMENSIONSAPPROXIMATE
LENGTH (m)UNIT COST
TOTAL COST
New main concrete block drains
New minor concrete block drains
Existing drains to make-good
New soft engineered drains
Total
b. Household water connections
ITEM FOR CONNECTION NUMBER (n)APPROXIMATE
LENGTH (m)UNIT COST
TOTAL COST
Roof guttering n houses —
Water tanks n houses —
Hurricane straps n houses —
Gray water pipes —
Connecting pipes —
Connection chambers n items —
Household drains —
Total
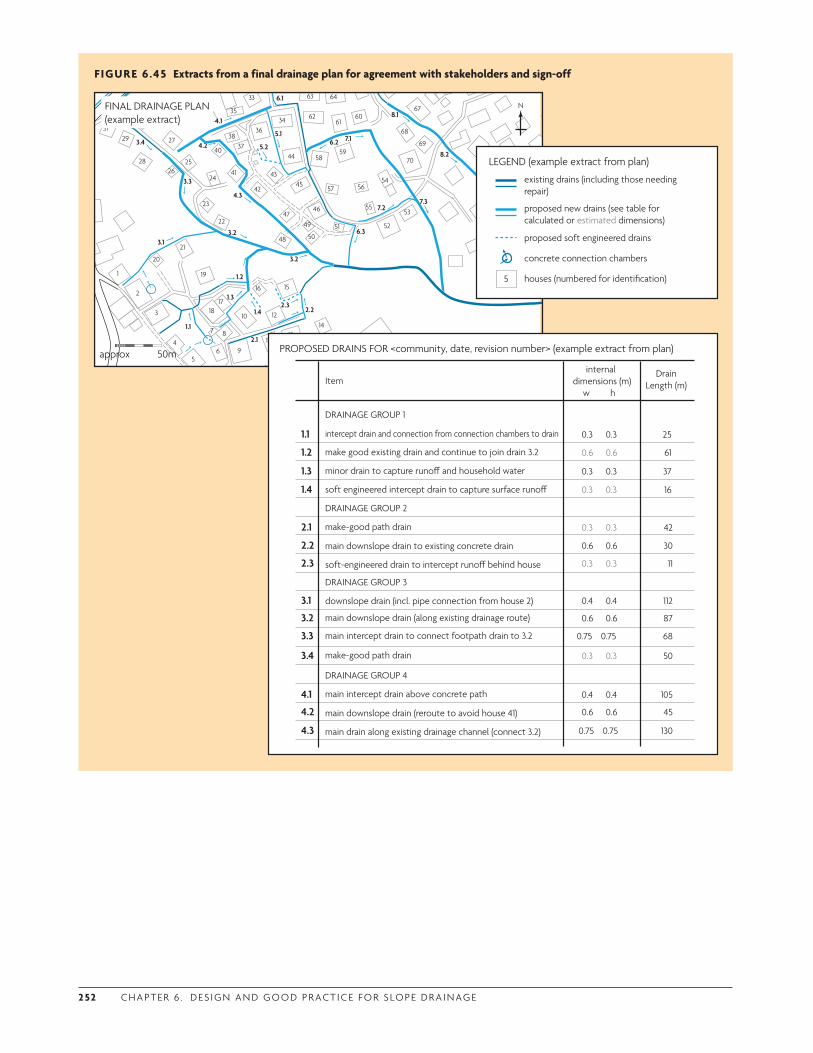
2 52 C H A P T E R 6 . D ES I G N A N D G O O D P R ACT I C E F O R S LO P E D R A I N AG E
FIGURE 6.45 Extracts from a final drainage plan for agreement with stakeholders and sign-off
1.1
1.2
1.3
1.4
2.1
2.22.3
3.1
3.4
3.2
3.3
3.2
4.1
4.2
4.3
5.1
5.2
6.1
6.2
6.3
7.1
7.27.3
8.1
8.2
1
2
3
4
56
7 8
9
10
2426
23
22
48
20
19
18
21
16 15
1413
12
11
17
3129
28 25
27
30
33
3638
40 37
3935
34
44
4341
4245
4746
50
49 51 52
53
54
55
5657
5859
6061
62
63 64
68
67
69
70
approx 50m
NFINAL DRAINAGE PLAN (example extract)
PROPOSED DRAINS FOR <community, date, revision number> (example extract from plan)
DrainLength (m)Item
DRAINAGE GROUP 1
soft-engineered drain to intercept runo� behind house
make-good path drain
intercept drain and connection from connection chambers to drain
make good existing drain and continue to join drain 3.2
minor drain to capture runo� and household water
downslope drain (incl. pipe connection from house 2)
soft engineered intercept drain to capture surface runo�
main downslope drain to existing concrete drain
DRAINAGE GROUP 2
DRAINAGE GROUP 3
main downslope drain (along existing drainage route)
main intercept drain to connect footpath drain to 3.2
make-good path drain
main drain along existing drainage channel (connect 3.2)
main intercept drain above concrete path
main downslope drain (reroute to avoid house 41)
DRAINAGE GROUP 4
w h
internal dimensions (m)
0.3 0.3
0.3 0.3
0.6 0.6
0.3 0.3
0.3 0.3
0.6 0.6
0.3 0.3
0.4 0.4
0.6 0.6
0.75 0.75
0.3 0.3
0.4 0.4
0.6 0.6
1.3
1.1
1.2
1.4
2.1
2.2
2.3
3.1
3.2
3.3
3.4
4.1
4.2
4.3 0.75 0.75
25
61
37
16
42
30
11
112
87
68
50
105
45
130
LEGEND (example extract from plan)
5
existing drains (including those needing repair)
proposed new drains (see table for calculated or estimated dimensions)
houses (numbered for identification)
concrete connection chambers
proposed soft engineered drains
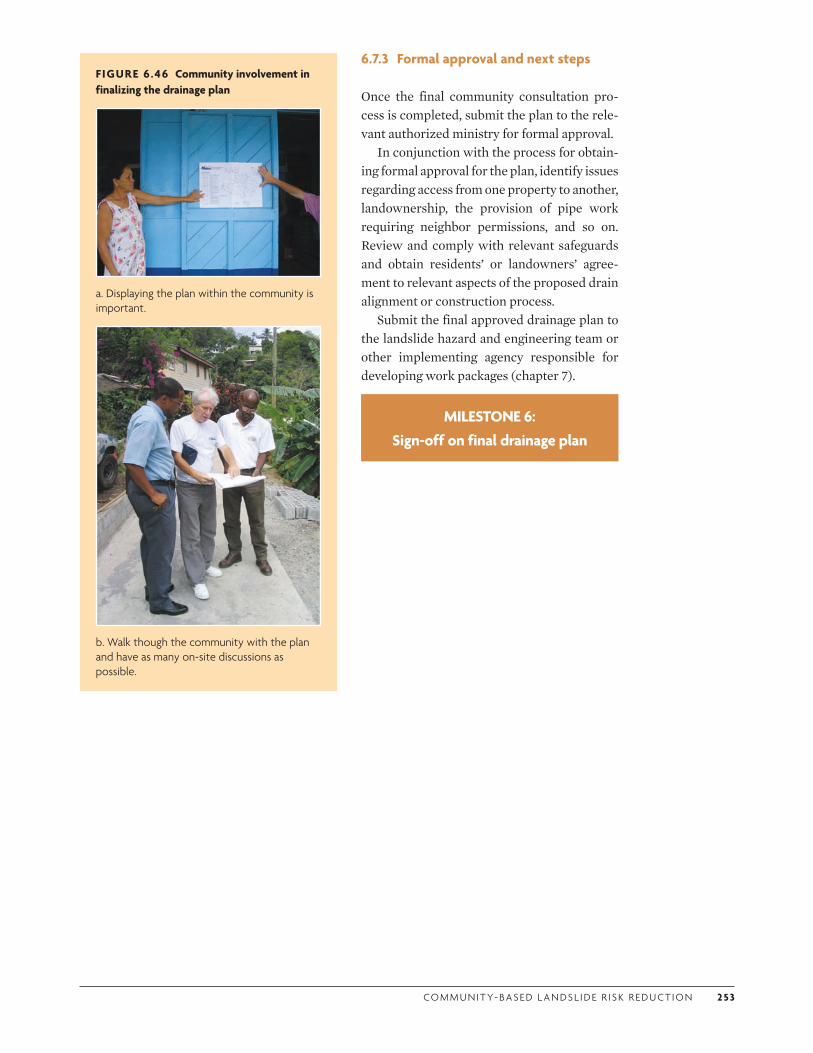
CO M M U N I T Y- BA S E D L A N DS L I D E R I S K R E D U CT I O N 2 53
6.7.3 Formal approval and next steps
Once the final community consultation pro-cess is completed, submit the plan to the rele-vant authorized ministry for formal approval.
In conjunction with the process for obtain-ing formal approval for the plan, identify issues regarding access from one property to another, landownership, the provision of pipe work requiring neighbor permissions, and so on. Review and comply with relevant safeguards and obtain residents’ or landowners’ agree-ment to relevant aspects of the proposed drain alignment or construction process.
Submit the final approved drainage plan to the landslide hazard and engineering team or other implementing agency responsible for developing work packages (chapter 7).
MILESTONE 6: Sign-off on final drainage plan
FIGURE 6.46 Community involvement in finalizing the drainage plan
a. Displaying the plan within the community is important.
b. Walk though the community with the plan and have as many on-site discussions as possible.
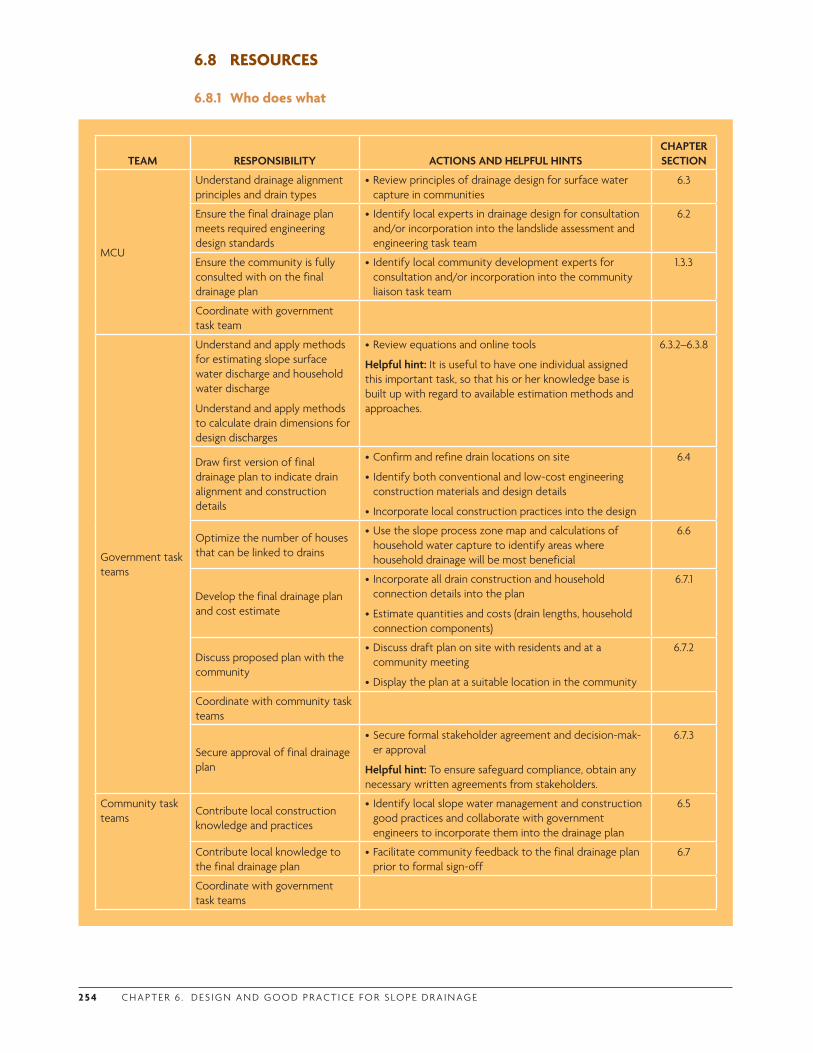
2 5 4 C H A P T E R 6 . D ES I G N A N D G O O D P R ACT I C E F O R S LO P E D R A I N AG E
6.8 RESOURCES
6.8.1 Who does what
TEAM RESPONSIBILITY ACTIONS AND HELPFUL HINTSCHAPTER SECTION
MCU
Understand drainage alignment principles and drain types
•Review principles of drainage design for surface water capture in communities
6.3
Ensure the final drainage plan meets required engineering design standards
• Identify local experts in drainage design for consultation and/or incorporation into the landslide assessment and engineering task team
6.2
Ensure the community is fully consulted with on the final drainage plan
• Identify local community development experts for consultation and/or incorporation into the community liaison task team
1.3.3
Coordinate with government task team
Government task teams
Understand and apply methods for estimating slope surface water discharge and household water discharge
Understand and apply methods to calculate drain dimensions for design discharges
•Review equations and online tools
Helpful hint: It is useful to have one individual assigned this important task, so that his or her knowledge base is built up with regard to available estimation methods and approaches.
6.3.2–6.3.8
Draw first version of final drainage plan to indicate drain alignment and construction details
•Confirm and refine drain locations on site
• Identify both conventional and low-cost engineering construction materials and design details
• Incorporate local construction practices into the design
6.4
Optimize the number of houses that can be linked to drains
•Use the slope process zone map and calculations of household water capture to identify areas where household drainage will be most beneficial
6.6
Develop the final drainage plan and cost estimate
• Incorporate all drain construction and household connection details into the plan
•Estimate quantities and costs (drain lengths, household connection components)
6.7.1
Discuss proposed plan with the community
•Discuss draft plan on site with residents and at a community meeting
•Display the plan at a suitable location in the community
6.7.2
Coordinate with community task teams
Secure approval of final drainage plan
•Secure formal stakeholder agreement and decision-mak-er approval
Helpful hint: To ensure safeguard compliance, obtain any necessary written agreements from stakeholders.
6.7.3
Community task teams
Contribute local construction knowledge and practices
• Identify local slope water management and construction good practices and collaborate with government engineers to incorporate them into the drainage plan
6.5
Contribute local knowledge to the final drainage plan
•Facilitate community feedback to the final drainage plan prior to formal sign-off
6.7
Coordinate with government task teams
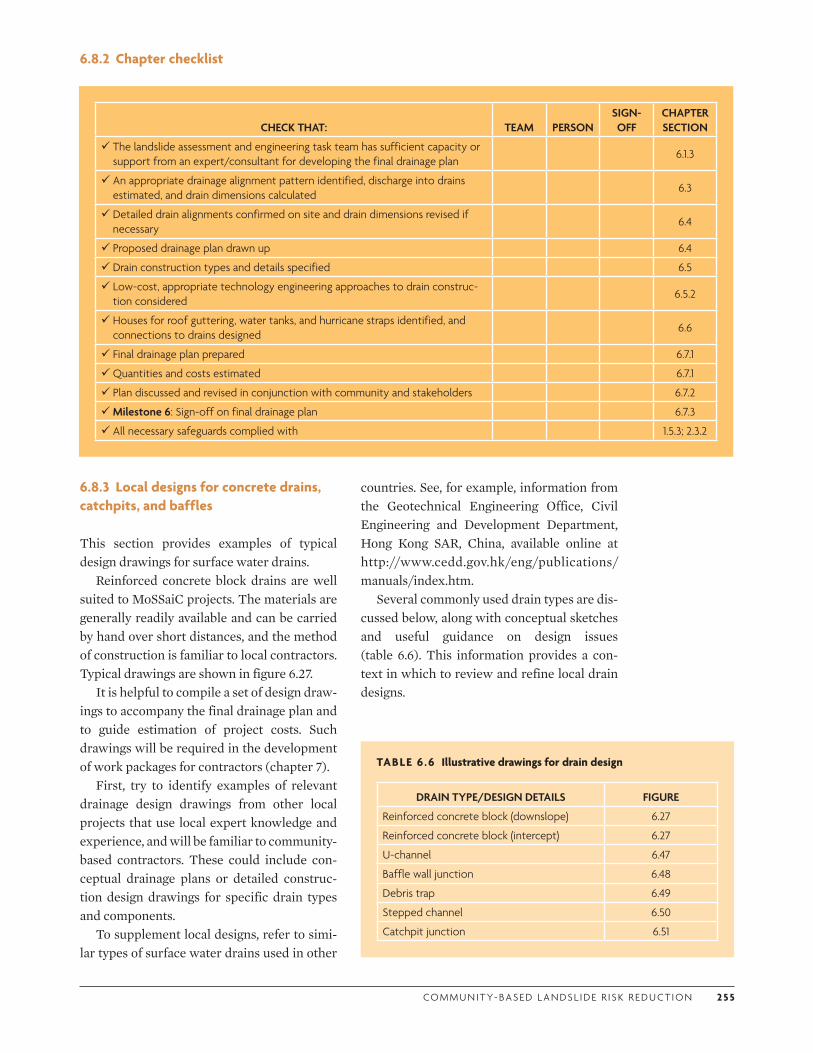
CO M M U N I T Y- BA S E D L A N DS L I D E R I S K R E D U CT I O N 2 5 5
CHECK THAT: TEAM PERSONSIGN-OFF
CHAPTER SECTION
The landslide assessment and engineering task team has sufficient capacity or support from an expert/consultant for developing the final drainage plan
6.1.3
An appropriate drainage alignment pattern identified, discharge into drains estimated, and drain dimensions calculated
6.3
Detailed drain alignments confirmed on site and drain dimensions revised if necessary
6.4
Proposed drainage plan drawn up 6.4
Drain construction types and details specified 6.5
Low-cost, appropriate technology engineering approaches to drain construc-tion considered
6.5.2
Houses for roof guttering, water tanks, and hurricane straps identified, and connections to drains designed
6.6
Final drainage plan prepared 6.7.1
Quantities and costs estimated 6.7.1
Plan discussed and revised in conjunction with community and stakeholders 6.7.2
Milestone 6: Sign-off on final drainage plan 6.7.3
All necessary safeguards complied with 1.5.3; 2.3.2
TABLE 6 .6 Illustrative drawings for drain design
DRAIN TYPE/DESIGN DETAILS FIGURE
Reinforced concrete block (downslope) 6.27
Reinforced concrete block (intercept) 6.27
U-channel 6.47
Baffle wall junction 6.48
Debris trap 6.49
Stepped channel 6.50
Catchpit junction 6.51
6.8.2 Chapter checklist
6.8.3 Local designs for concrete drains, catchpits, and baffles
This section provides examples of typical design drawings for surface water drains.
Reinforced concrete block drains are well suited to MoSSaiC projects. The materials are generally readily available and can be carried by hand over short distances, and the method of construction is familiar to local contractors. Typical drawings are shown in figure 6.27.
It is helpful to compile a set of design draw-ings to accompany the final drainage plan and to guide estimation of project costs. Such drawings will be required in the development of work packages for contractors (chapter 7).
First, try to identify examples of relevant drainage design drawings from other local projects that use local expert knowledge and experience, and will be familiar to community-based contractors. These could include con-ceptual drainage plans or detailed construc-tion design drawings for specific drain types and components.
To supplement local designs, refer to simi-lar types of surface water drains used in other
countries. See, for example, information from the Geotechnical Engineering Office, Civil Engineering and Development Department, Hong Kong SAR, China, available online at http://www.cedd.gov.hk/eng/publications/manuals/index.htm.
Several commonly used drain types are dis-cussed below, along with conceptual sketches and useful guidance on design issues (table 6.6). This information provides a con-text in which to review and refine local drain designs.
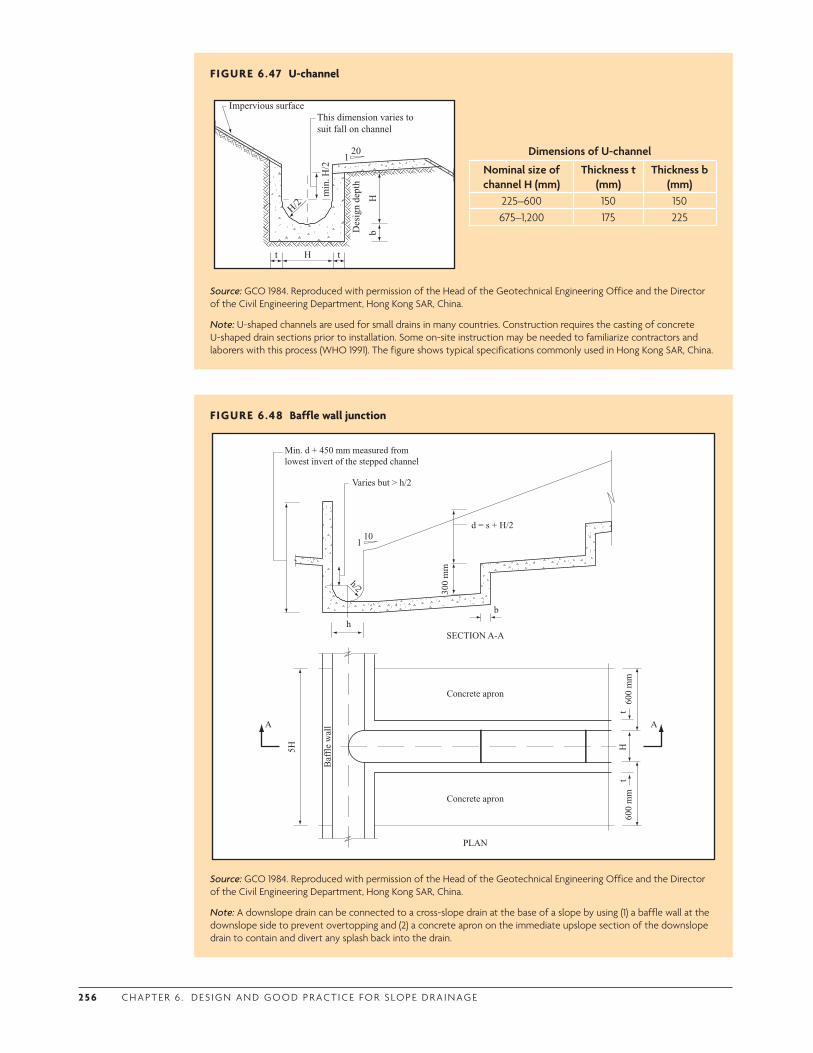
2 5 6 C H A P T E R 6 . D ES I G N A N D G O O D P R ACT I C E F O R S LO P E D R A I N AG E
FIGURE 6.47 U-channel
This dimension varies to suit fall on channel
Impervious surface
H tt
min
. H/2
HbD
esig
n de
pth
201
H/2
Dimensions of U-channel
Nominal size of channel H (mm)
Thickness t (mm)
Thickness b (mm)
225–600 150 150675–1,200 175 225
Source: GCO 1984. Reproduced with permission of the Head of the Geotechnical Engineering Office and the Director of the Civil Engineering Department, Hong Kong SAR, China.
Note: U-shaped channels are used for small drains in many countries. Construction requires the casting of concrete U-shaped drain sections prior to installation. Some on-site instruction may be needed to familiarize contractors and laborers with this process (WHO 1991). The figure shows typical specifications commonly used in Hong Kong SAR, China.
FIGURE 6.48 Baffle wall junction
b
d = s + H/2
Varies but > h/2
101
h/230
0 m
m
h
Min. d + 450 mm measured from lowest invert of the stepped channel
SECTION A-A
Concrete apron
Concrete apron
Baf
fle
wal
l
H60
0 m
m60
0 m
mt
t
5H
PLAN
A A
Source: GCO 1984. Reproduced with permission of the Head of the Geotechnical Engineering Office and the Director of the Civil Engineering Department, Hong Kong SAR, China.
Note: A downslope drain can be connected to a cross-slope drain at the base of a slope by using (1) a baffle wall at the downslope side to prevent overtopping and (2) a concrete apron on the immediate upslope section of the downslope drain to contain and divert any splash back into the drain.

CO M M U N I T Y- BA S E D L A N DS L I D E R I S K R E D U CT I O N 2 57
FIGURE 6.49 Typical debris/sand trap
Cover slabs if required
Max. design water level 300 min.
300
min
.
300
375 min.0.25D
Dh
375
min
.0.
25DFall
1 in 40
D +
150
min
.
Inlet1 in F
Outlet
50 thick perforated face slab Graded stone filter lower layer size 150 mm,upper layer size 40-75 mm
L 750 min.
A
SECTIONAL ELEVATION
A
B W
SECTIONAL PLAN
25 x 16 m.s. flat bar
16 dia. m.s. bar at 100 c/c
150 dia. holes
W
SECTION A-A
Note : (1) All dimensions in millimetres.(2) Normally for drains of 900 mm dia. and below. For bigger drains and steep terrain, sand trap should be
specially designed.(3) Size Depth : < 750 Width : > 3B Length : L = 4.8D0.67 h0.5 F-0.5 > 4B(4) Graded stone filter should be crusher run granite aggregate.(5) Capacity DWL to be according to size and nature of catchment, providing detention time not less than
5 minutes for max. design flow of inlet.
Source: GCO 1984. Reproduced with permission of the Head of the Geotechnical Engineering Office and the Director of the Civil Engineering Department, Hong Kong SAR, China.
Note: Debris traps can be combined with a catchpit and sand/sediment trap.
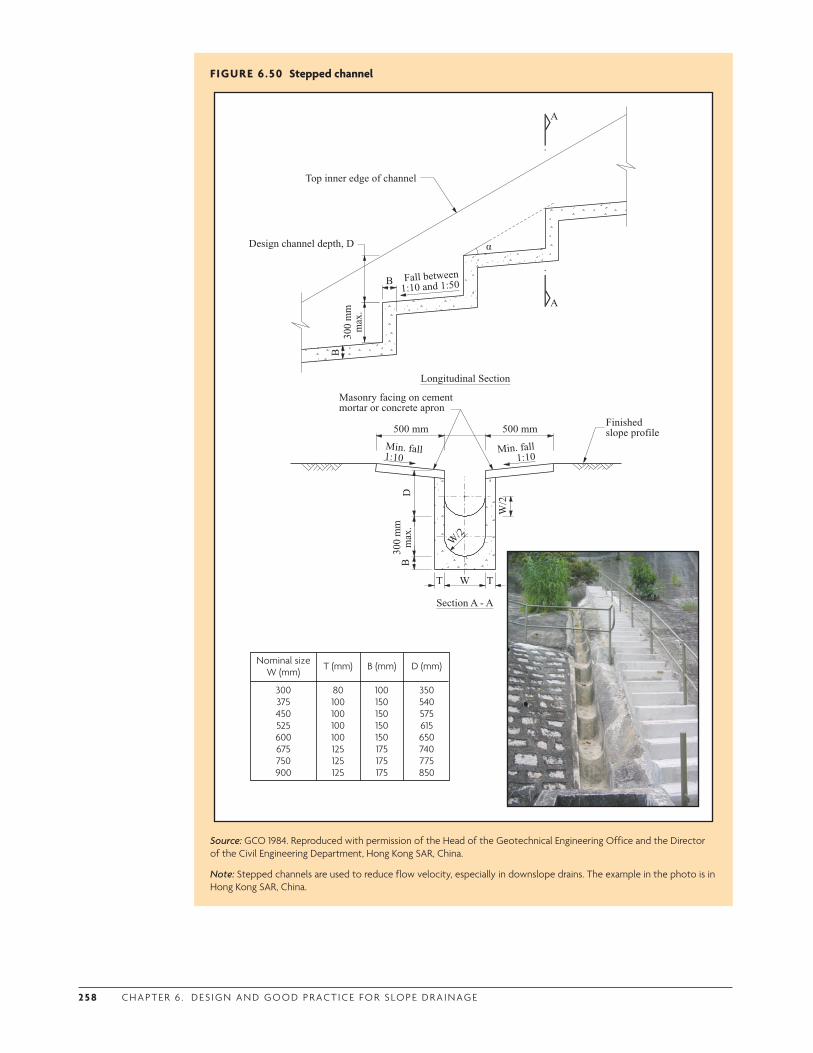
2 5 8 C H A P T E R 6 . D ES I G N A N D G O O D P R ACT I C E F O R S LO P E D R A I N AG E
FIGURE 6.50 Stepped channel
Design channel depth, D
Top inner edge of channel
Masonry facing on cement mortar or concrete apron
500 mm500 mm
T TW
BD
W/2
W/2
300
mm
max
.
300
mm
max
.
B
B
A
A
Finished slope profile
Min. fall1:10
Min. fall1:10
Fall between1:10 and 1:50
Longitudinal Section
Section A - A
80100100100100125125125
T (mm)
100150150150150175175175
B (mm)
350540575615650740775850
D (mm)
300375450525600675750900
Nominal sizeW (mm)
Source: GCO 1984. Reproduced with permission of the Head of the Geotechnical Engineering Office and the Director of the Civil Engineering Department, Hong Kong SAR, China.
Note: Stepped channels are used to reduce flow velocity, especially in downslope drains. The example in the photo is in Hong Kong SAR, China.
α
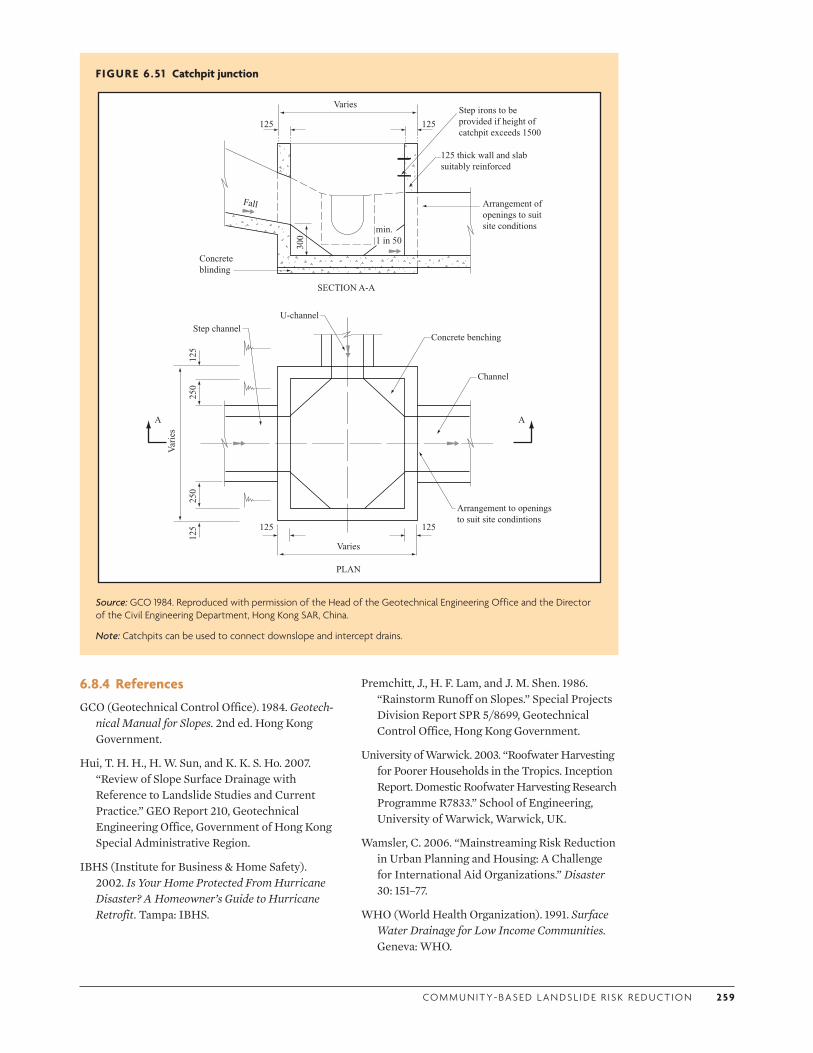
CO M M U N I T Y- BA S E D L A N DS L I D E R I S K R E D U CT I O N 2 59
FIGURE 6.51 Catchpit junction
A A
U-channel
Varies
PLAN
Concrete benching
Channel
Arrangement to openings to suit site condintions
Step channel
125
125
250
250
Var
ies
125 125
125 125
Varies
min.1 in 50
300
Fall Arrangement of openings to suit site conditions
125 thick wall and slab suitably reinforced
Step irons to be provided if height of catchpit exceeds 1500
Concrete blinding
SECTION A-A
Source: GCO 1984. Reproduced with permission of the Head of the Geotechnical Engineering Office and the Director of the Civil Engineering Department, Hong Kong SAR, China.
Note: Catchpits can be used to connect downslope and intercept drains.
6.8.4 References
GCO (Geotechnical Control Office). 1984. Geotech-nical Manual for Slopes. 2nd ed. Hong Kong Government.
Hui, T. H. H., H. W. Sun, and K. K. S. Ho. 2007. “Review of Slope Surface Drainage with Reference to Landslide Studies and Current Practice.” GEO Report 210, Geotechnical Engineering Office, Government of Hong Kong Special Administrative Region.
IBHS (Institute for Business & Home Safety). 2002. Is Your Home Protected From Hurricane Disaster? A Homeowner’s Guide to Hurricane Retrofit. Tampa: IBHS.
Premchitt, J., H. F. Lam, and J. M. Shen. 1986. “Rainstorm Runoff on Slopes.” Special Projects Division Report SPR 5/8699, Geotechnical Control Office, Hong Kong Government.
University of Warwick. 2003. “Roofwater Harvesting for Poorer Households in the Tropics. Inception Report. Domestic Roofwater Harvesting Research Programme R7833.” School of Engineering, University of Warwick, Warwick, UK.
Wamsler, C. 2006. “Mainstreaming Risk Reduction in Urban Planning and Housing: A Challenge for International Aid Organizations.” Disaster 30: 151–77.
WHO (World Health Organization). 1991. Surface Water Drainage for Low Income Communities. Geneva: WHO.
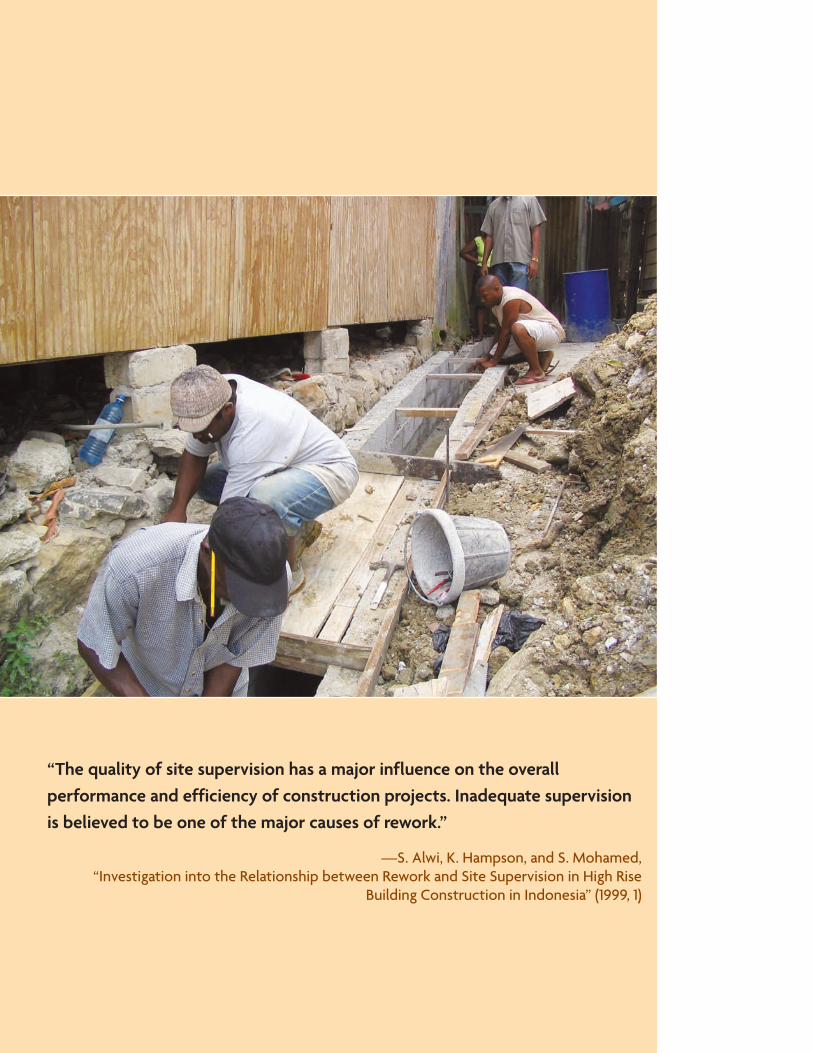
“The quality of site supervision has a major influence on the overall performance and efficiency of construction projects. Inadequate supervision is believed to be one of the major causes of rework.”
—S. Alwi, K. Hampson, and S. Mohamed, “Investigation into the Relationship between Rework and Site Supervision in High Rise
Building Construction in Indonesia” (1999, 1)
2 61
CHAPTER 7
Implementing the Planned Works
7.1 KEY CHAPTER ELEMENTS
7.1.1 Coverage
This chapter provides guidance on contracting and constructing MoSSaiC (Management of Slope Stability in Communities) drainage works in communities to improve slope stability.
Emphasis is placed on the critical role of site supervisors, working in partnership with com-munity contractors. The listed groups should read the indicated chapter sections.
AUDIENCE
LEARNINGCHAPTER SECTIONF M G C
How to prepare work packages 7.3
Importance of site supervision during construction 7.5.1
Good practices in construction 7.6
Practices to be avoided in construction 7.7
Ensuring works are completed to the required standard 7.8
F = funders and policy makers M = MoSSaiC core unit: government project managers and experts G = government task teams: experts and practitioners C = community task teams: residents, leaders, contractors
7.1.2 Documents
DOCUMENT TO BE PRODUCEDCHAPTER SECTION
Bill of quantities 7.3.1Work packages 7.3.2Materials procurement plan 7.3.3Schedules of construction defects and outstanding works 7.8
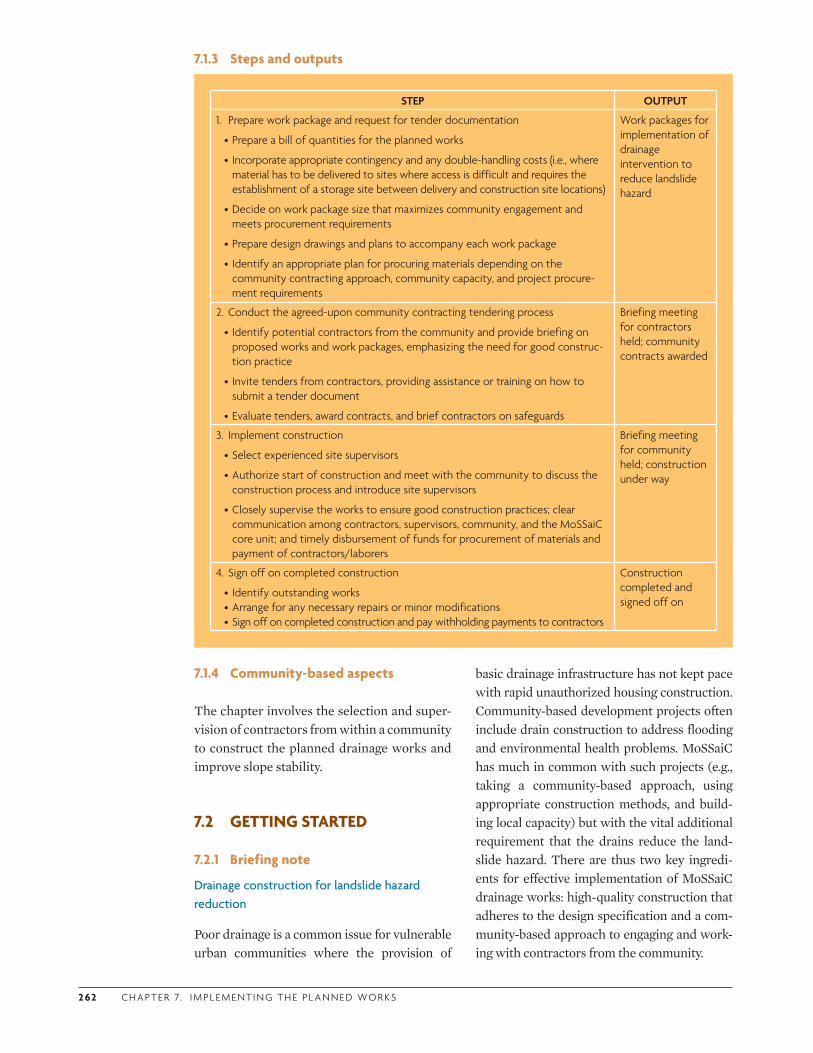
2 62 C H A P T E R 7. I M P L E M E N T I N G T H E P L A N N E D WO R K S
7.1.3 Steps and outputs
7.1.4 Community-based aspects
The chapter involves the selection and super-vision of contractors from within a community to construct the planned drainage works and improve slope stability.
7.2 GETTING STARTED
7.2.1 Briefing note
Drainage construction for landslide hazard reduction
Poor drainage is a common issue for vulnerable urban communities where the provision of
basic drainage infrastructure has not kept pace with rapid unauthorized housing construction. Community-based development projects often include drain construction to address flooding and environmental health problems. MoSSaiC has much in common with such projects (e.g., taking a community-based approach, using appropriate construction methods, and build-ing local capacity) but with the vital additional requirement that the drains reduce the land-slide hazard. There are thus two key ingredi-ents for effective implementation of MoSSaiC drainage works: high-quality construction that adheres to the design specification and a com-munity-based approach to engaging and work-ing with contractors from the community.
STEP OUTPUT
1. Prepare work package and request for tender documentation
•Prepare a bill of quantities for the planned works
• Incorporate appropriate contingency and any double-handling costs (i.e., where material has to be delivered to sites where access is difficult and requires the establishment of a storage site between delivery and construction site locations)
•Decide on work package size that maximizes community engagement and meets procurement requirements
•Prepare design drawings and plans to accompany each work package
• Identify an appropriate plan for procuring materials depending on the community contracting approach, community capacity, and project procure-ment requirements
Work packages for implementation of drainage intervention to reduce landslide hazard
2. Conduct the agreed-upon community contracting tendering process
• Identify potential contractors from the community and provide briefing on proposed works and work packages, emphasizing the need for good construc-tion practice
• Invite tenders from contractors, providing assistance or training on how to submit a tender document
•Evaluate tenders, award contracts, and brief contractors on safeguards
Briefing meeting for contractors held; community contracts awarded
3. Implement construction
•Select experienced site supervisors
•Authorize start of construction and meet with the community to discuss the construction process and introduce site supervisors
•Closely supervise the works to ensure good construction practices; clear communication among contractors, supervisors, community, and the MoSSaiC core unit; and timely disbursement of funds for procurement of materials and payment of contractors/laborers
Briefing meeting for community held; construction under way
4. Sign off on completed construction
• Identify outstanding works•Arrange for any necessary repairs or minor modifications•Sign off on completed construction and pay withholding payments to contractors
Construction completed and signed off on
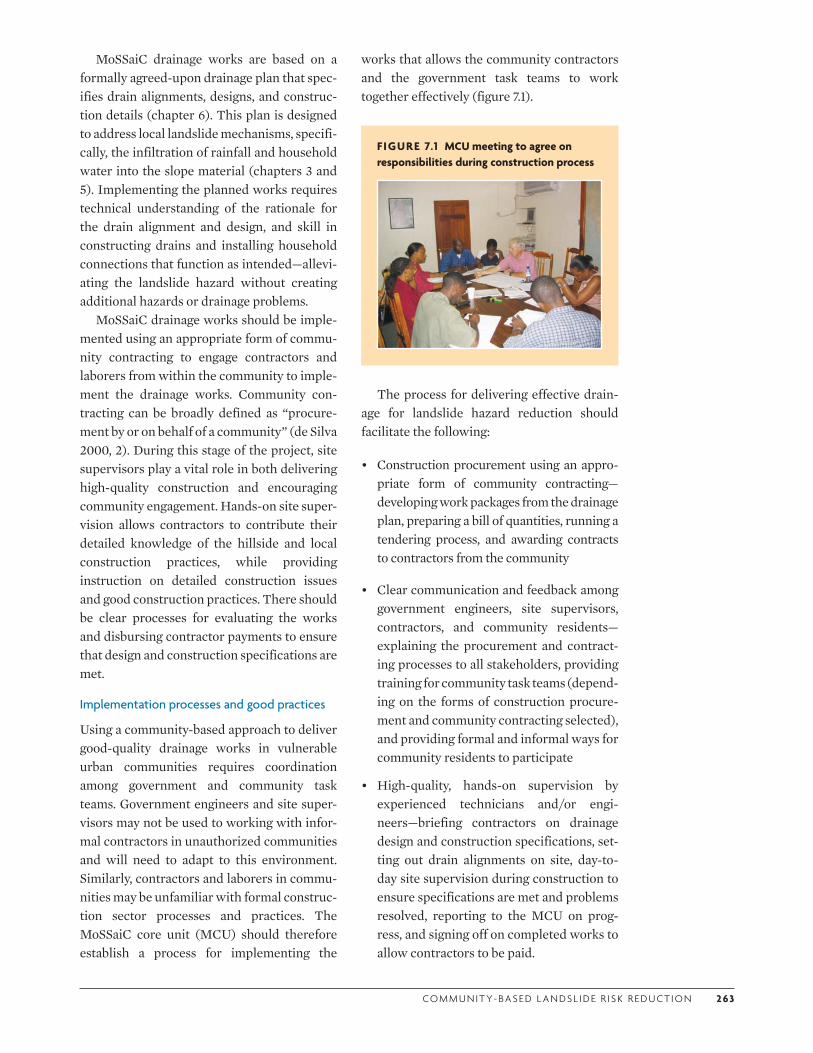
CO M M U N I T Y- BA S E D L A N DS L I D E R I S K R E D U CT I O N 2 63
MoSSaiC drainage works are based on a formally agreed-upon drainage plan that spec-ifies drain alignments, designs, and construc-tion details (chapter 6). This plan is designed to address local landslide mechanisms, specifi-cally, the infiltration of rainfall and household water into the slope material (chapters 3 and 5). Implementing the planned works requires technical understanding of the rationale for the drain alignment and design, and skill in constructing drains and installing household connections that function as intended—allevi-ating the landslide hazard without creating additional hazards or drainage problems.
MoSSaiC drainage works should be imple-mented using an appropriate form of commu-nity contracting to engage contractors and laborers from within the community to imple-ment the drainage works. Community con-tracting can be broadly defined as “procure-ment by or on behalf of a community” (de Silva 2000, 2). During this stage of the project, site supervisors play a vital role in both delivering high-quality construction and encouraging community engagement. Hands-on site super-vision allows contractors to contribute their detailed knowledge of the hillside and local construction practices, while providing instruction on detailed construction issues and good construction practices. There should be clear processes for evaluating the works and disbursing contractor payments to ensure that design and construction specifications are met.
Implementation processes and good practices
Using a community-based approach to deliver good-quality drainage works in vulnerable urban communities requires coordination among government and community task teams. Government engineers and site super-visors may not be used to working with infor-mal contractors in unauthorized communities and will need to adapt to this environment. Similarly, contractors and laborers in commu-nities may be unfamiliar with formal construc-tion sector processes and practices. The MoSSaiC core unit (MCU) should therefore establish a process for implementing the
works that allows the community contractors and the government task teams to work together effectively (figure 7.1).
FIGURE 7.1 MCU meeting to agree on responsibilities during construction process
The process for delivering effective drain-age for landslide hazard reduction should facilitate the following:
• Construction procurement using an appro-priate form of community contracting—developing work packages from the drainage plan, preparing a bill of quantities, running a tendering process, and awarding contracts to contractors from the community
• Clear communication and feedback among government engineers, site supervisors, contractors, and community residents—explaining the procurement and contract-ing processes to all stakeholders, providing training for community task teams (depend-ing on the forms of construction procure-ment and community contracting selected), and providing formal and informal ways for community residents to participate
• High-quality, hands-on supervision by experienced technicians and/or engi-neers—briefing contractors on drainage design and construction specifications, set-ting out drain alignments on site, day-to-day site supervision during construction to ensure specifications are met and problems resolved, reporting to the MCU on prog-ress, and signing off on completed works to allow contractors to be paid.
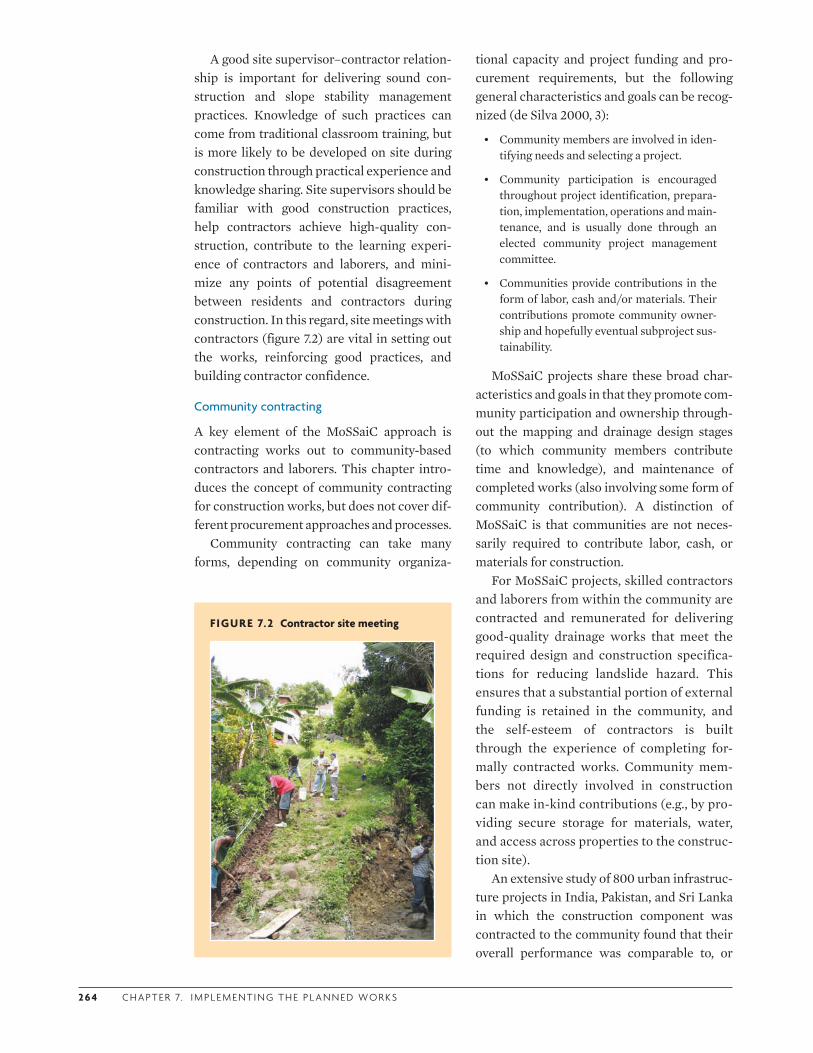
2 6 4 C H A P T E R 7. I M P L E M E N T I N G T H E P L A N N E D WO R K S
A good site supervisor–contractor relation-ship is important for delivering sound con-struction and slope stability management practices. Knowledge of such practices can come from traditional classroom training, but is more likely to be developed on site during construction through practical experience and knowledge sharing. Site supervisors should be familiar with good construction practices, help contractors achieve high-quality con-struction, contribute to the learning experi-ence of contractors and laborers, and mini-mize any points of potential disagreement between residents and contractors during construction. In this regard, site meetings with contractors (figure 7.2) are vital in setting out the works, reinforcing good practices, and building contractor confidence.
Community contracting
A key element of the MoSSaiC approach is contracting works out to community-based contractors and laborers. This chapter intro-duces the concept of community contracting for construction works, but does not cover dif-ferent procurement approaches and processes.
Community contracting can take many forms, depending on community organiza-
tional capacity and project funding and pro-curement requirements, but the following general characteristics and goals can be recog-nized (de Silva 2000, 3):
• Community members are involved in iden-tifying needs and selecting a project.
• Community participation is encouraged throughout project identification, prepara-tion, implementation, operations and main-tenance, and is usually done through an elected community project management committee.
• Communities provide contributions in the form of labor, cash and/or materials. Their contributions promote community owner-ship and hopefully eventual subproject sus-tainability.
MoSSaiC projects share these broad char-acteristics and goals in that they promote com-munity participation and ownership through-out the mapping and drainage design stages (to which community members contribute time and knowledge), and maintenance of completed works (also involving some form of community contribution). A distinction of MoSSaiC is that communities are not neces-sarily required to contribute labor, cash, or materials for construction.
For MoSSaiC projects, skilled contractors and laborers from within the community are contracted and remunerated for delivering good-quality drainage works that meet the required design and construction specifica-tions for reducing landslide hazard. This ensures that a substantial portion of external funding is retained in the community, and the self-esteem of contractors is built through the experience of completing for-mally contracted works. Community mem-bers not directly involved in construction can make in-kind contributions (e.g., by pro-viding secure storage for materials, water, and access across properties to the construc-tion site).
An extensive study of 800 urban infrastruc-ture projects in India, Pakistan, and Sri Lanka in which the construction component was contracted to the community found that their overall performance was comparable to, or
FIGURE 7.2 Contractor site meeting
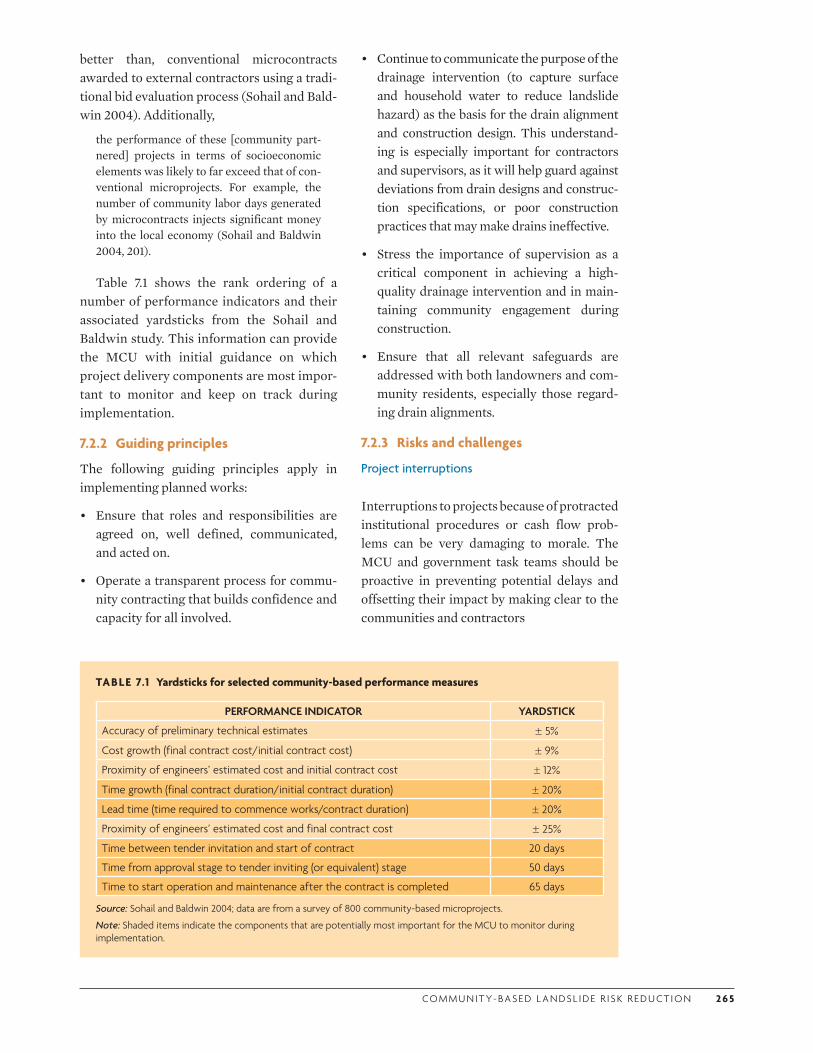
CO M M U N I T Y- BA S E D L A N DS L I D E R I S K R E D U CT I O N 2 6 5
TABLE 7.1 Yardsticks for selected community-based performance measures
PERFORMANCE INDICATOR YARDSTICK
Accuracy of preliminary technical estimates ± 5%
Cost growth (final contract cost/initial contract cost) ± 9%
Proximity of engineers’ estimated cost and initial contract cost ± 12%
Time growth (final contract duration/initial contract duration) ± 20%
Lead time (time required to commence works/contract duration) ± 20%
Proximity of engineers’ estimated cost and final contract cost ± 25%
Time between tender invitation and start of contract 20 days
Time from approval stage to tender inviting (or equivalent) stage 50 days
Time to start operation and maintenance after the contract is completed 65 days
Source: Sohail and Baldwin 2004; data are from a survey of 800 community-based microprojects.
Note: Shaded items indicate the components that are potentially most important for the MCU to monitor during implementation.
better than, conventional microcontracts awarded to external contractors using a tradi-tional bid evaluation process (Sohail and Bald-win 2004). Additionally,
the performance of these [community part-nered] projects in terms of socioeconomic elements was likely to far exceed that of con-ventional microprojects. For example, the number of community labor days generated by microcontracts injects significant money into the local economy (Sohail and Baldwin 2004, 201).
Table 7.1 shows the rank ordering of a number of performance indicators and their associated yardsticks from the Sohail and Baldwin study. This information can provide the MCU with initial guidance on which project delivery components are most impor-tant to monitor and keep on track during implementation.
7.2.2 Guiding principles
The following guiding principles apply in implementing planned works:
• Ensure that roles and responsibilities are agreed on, well defined, communicated, and acted on.
• Operate a transparent process for commu-nity contracting that builds confidence and capacity for all involved.
• Continue to communicate the purpose of the drainage intervention (to capture surface and household water to reduce landslide hazard) as the basis for the drain alignment and construction design. This understand-ing is especially important for contractors and supervisors, as it will help guard against deviations from drain designs and construc-tion specifications, or poor construction practices that may make drains ineffective.
• Stress the importance of supervision as a critical component in achieving a high-quality drainage intervention and in main-taining community engagement during construction.
• Ensure that all relevant safeguards are addressed with both landowners and com-munity residents, especially those regard-ing drain alignments.
7.2.3 Risks and challenges
Project interruptions
Interruptions to projects because of protracted institutional procedures or cash flow prob-lems can be very damaging to morale. The MCU and government task teams should be proactive in preventing potential delays and offsetting their impact by making clear to the communities and contractors
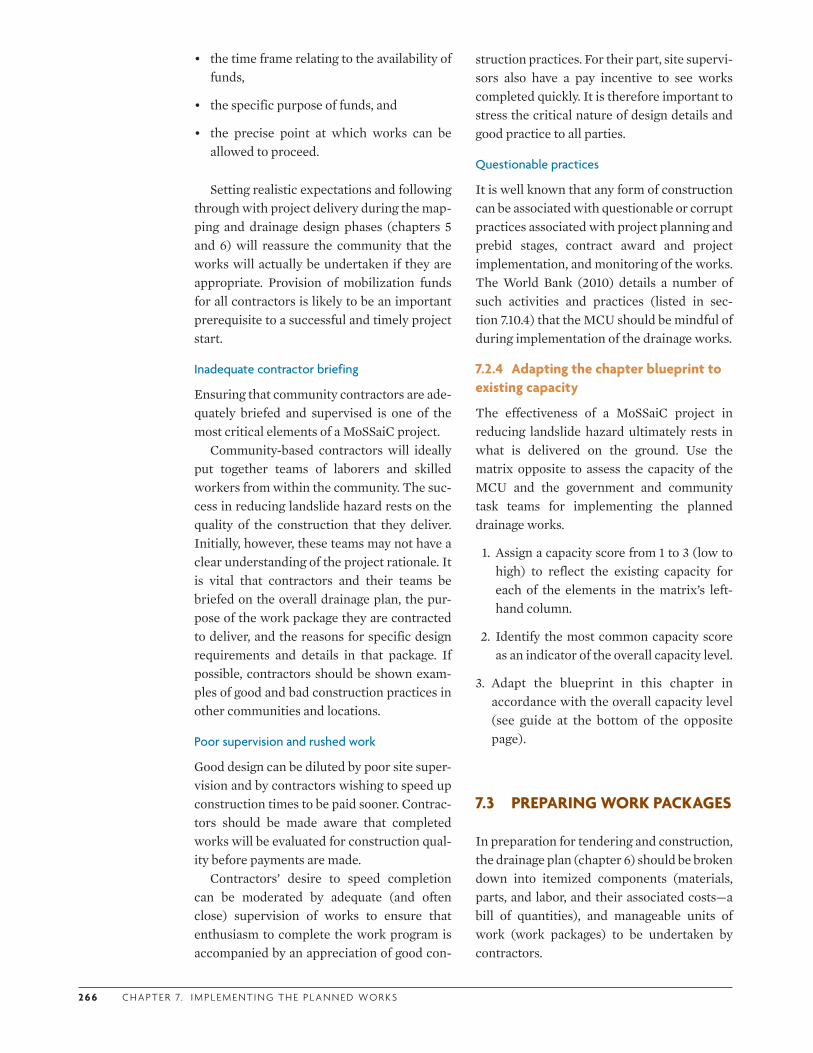
2 6 6 C H A P T E R 7. I M P L E M E N T I N G T H E P L A N N E D WO R K S
• the time frame relating to the availability of funds,
• the specific purpose of funds, and
• the precise point at which works can be allowed to proceed.
Setting realistic expectations and following through with project delivery during the map-ping and drainage design phases (chapters 5 and 6) will reassure the community that the works will actually be undertaken if they are appropriate. Provision of mobilization funds for all contractors is likely to be an important prerequisite to a successful and timely project start.
Inadequate contractor briefing
Ensuring that community contractors are ade-quately briefed and supervised is one of the most critical elements of a MoSSaiC project.
Community-based contractors will ideally put together teams of laborers and skilled workers from within the community. The suc-cess in reducing landslide hazard rests on the quality of the construction that they deliver. Initially, however, these teams may not have a clear understanding of the project rationale. It is vital that contractors and their teams be briefed on the overall drainage plan, the pur-pose of the work package they are contracted to deliver, and the reasons for specific design requirements and details in that package. If possible, contractors should be shown exam-ples of good and bad construction practices in other communities and locations.
Poor supervision and rushed work
Good design can be diluted by poor site super-vision and by contractors wishing to speed up construction times to be paid sooner. Contrac-tors should be made aware that completed works will be evaluated for construction qual-ity before payments are made.
Contractors’ desire to speed completion can be moderated by adequate (and often close) supervision of works to ensure that enthusiasm to complete the work program is accompanied by an appreciation of good con-
struction practices. For their part, site supervi-sors also have a pay incentive to see works completed quickly. It is therefore important to stress the critical nature of design details and good practice to all parties.
Questionable practices
It is well known that any form of construction can be associated with questionable or corrupt practices associated with project planning and prebid stages, contract award and project implementation, and monitoring of the works. The World Bank (2010) details a number of such activities and practices (listed in sec-tion 7.10.4) that the MCU should be mindful of during implementation of the drainage works.
7.2.4 Adapting the chapter blueprint to existing capacity
The effectiveness of a MoSSaiC project in reducing landslide hazard ultimately rests in what is delivered on the ground. Use the matrix opposite to assess the capacity of the MCU and the government and community task teams for implementing the planned drainage works.
1. Assign a capacity score from 1 to 3 (low to high) to reflect the existing capacity for each of the elements in the matrix’s left-hand column.
2. Identify the most common capacity score as an indicator of the overall capacity level.
3. Adapt the blueprint in this chapter in accordance with the overall capacity level (see guide at the bottom of the opposite page).
7.3 PREPARING WORK PACKAGES
In preparation for tendering and construction, the drainage plan (chapter 6) should be broken down into itemized components (materials, parts, and labor, and their associated costs—a bill of quantities), and manageable units of work (work packages) to be undertaken by contractors.
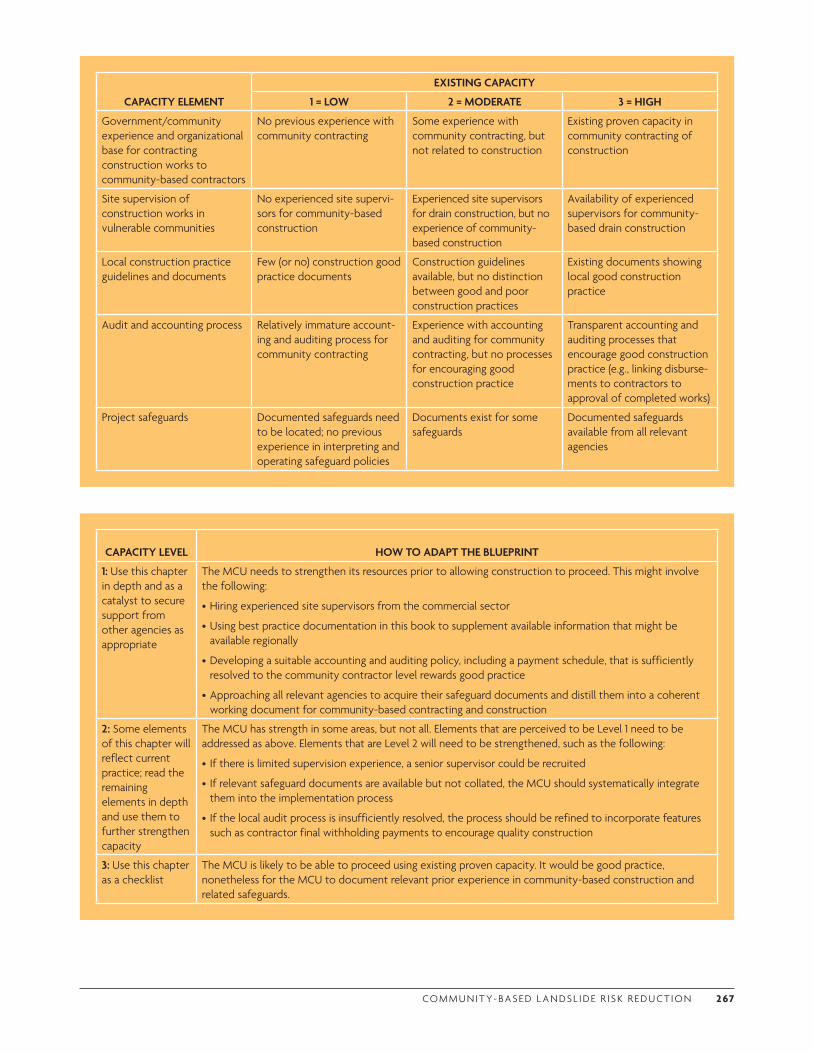
CO M M U N I T Y- BA S E D L A N DS L I D E R I S K R E D U CT I O N 2 67
CAPACITY ELEMENT
EXISTING CAPACITY
1 = LOW 2 = MODERATE 3 = HIGH
Government/community experience and organizational base for contracting construction works to community-based contractors
No previous experience with community contracting
Some experience with community contracting, but not related to construction
Existing proven capacity in community contracting of construction
Site supervision of construction works in vulnerable communities
No experienced site supervi-sors for community-based construction
Experienced site supervisors for drain construction, but no experience of community-based construction
Availability of experienced supervisors for community-based drain construction
Local construction practice guidelines and documents
Few (or no) construction good practice documents
Construction guidelines available, but no distinction between good and poor construction practices
Existing documents showing local good construction practice
Audit and accounting process Relatively immature account-ing and auditing process for community contracting
Experience with accounting and auditing for community contracting, but no processes for encouraging good construction practice
Transparent accounting and auditing processes that encourage good construction practice (e.g., linking disburse-ments to contractors to approval of completed works)
Project safeguards Documented safeguards need to be located; no previous experience in interpreting and operating safeguard policies
Documents exist for some safeguards
Documented safeguards available from all relevant agencies
CAPACITY LEVEL HOW TO ADAPT THE BLUEPRINT
1: Use this chapter in depth and as a catalyst to secure support from other agencies as appropriate
The MCU needs to strengthen its resources prior to allowing construction to proceed. This might involve the following:
•Hiring experienced site supervisors from the commercial sector
•Using best practice documentation in this book to supplement available information that might be available regionally
•Developing a suitable accounting and auditing policy, including a payment schedule, that is sufficiently resolved to the community contractor level rewards good practice
•Approaching all relevant agencies to acquire their safeguard documents and distill them into a coherent working document for community-based contracting and construction
2: Some elements of this chapter will reflect current practice; read the remaining elements in depth and use them to further strengthen capacity
The MCU has strength in some areas, but not all. Elements that are perceived to be Level 1 need to be addressed as above. Elements that are Level 2 will need to be strengthened, such as the following:
• If there is limited supervision experience, a senior supervisor could be recruited
• If relevant safeguard documents are available but not collated, the MCU should systematically integrate them into the implementation process
• If the local audit process is insufficiently resolved, the process should be refined to incorporate features such as contractor final withholding payments to encourage quality construction
3: Use this chapter as a checklist
The MCU is likely to be able to proceed using existing proven capacity. It would be good practice, nonetheless for the MCU to document relevant prior experience in community-based construction and related safeguards.
2 6 8 C H A P T E R 7. I M P L E M E N T I N G T H E P L A N N E D WO R K S
A work package should have the following characteristics (based on Wideman 2012):
• Have a defined size and duration, limited to relatively short periods of time
• Be able to be realistically estimated in terms of quantities and costs of works
• Produce measurable outputs (deliverables)
• Entail a large enough scope of work that could be competitively bid for and con-tracted for by itself (the test of reasonable-ness)
• Be distinguishable from, but integrate with, other work packages.
Work packages should be prepared by an engineer or quantity surveyor who is part of the landslide assessment and engineering or technical task team, or who has been appointed by the MCU for this task.
The engineer or quantity surveyor should use this section to guide the preparation of work packages and request for tender (RFT) documents—preparing a bill of quantities, identifying work packages, and preparing detailed construction design requirements for each work package. This process should be undertaken in accordance with the cho-sen form of construction procurement and community contracting for the project, which affects the size (value) of contracts; the tendering process; and roles/responsi-bilities of the government, community, and contractors.
7.3.1 Prepare a bill of quantities
The bill of quantities is a document containing an itemized breakdown of the quantity and costs of materials, parts, and labor required for a construction project. Costs are estimated based on approximate local costs for deliver-ing a unit of a certain type of work, such as constructing a meter of reinforced concrete block drain.
The bill of quantities serves two purposes—it provides a detailed breakdown of project costs for the MCU (against which the project budget and progress can be managed), and
forms the basis for the specification of the works in the work package RFT documents and contracts.
To create work package RFT documents, the information from a bill of quantities is combined with detailed construction specifi-cations (a specified bill of quantities), and terms and conditions for construction. Con-tractors use these specified quantity estimates and associated construction activities to price the work for which they are bidding.
Estimate quantities
The final drainage plan includes an estimate of the total project cost based on approximate drain lengths and the number of houses for roof water and gray water capture (chapter 6). To create a detailed bill of quantities, the drainage plan needs to be further broken down into appropriate component parts (units) for construction.
Measure and record the lengths of each type of new drain section, culvert, and repairs to existing drains (distinguished by drain size, design, and construction specifications), and itemize drain components such as debris traps.
To obtain a bill of quantities for the capture of household roof and gray water, complete a detailed survey of each house selected in the drainage design phase (section 6.6). This task should be performed by a surveyor or some-one familiar with the MoSSaiC methodology to ensure that proper connections are made between houses and existing or proposed drains. Table 7.2 lists the main items to include in the survey of each house. Ideally, the sur-veyor should also sketch a plan view of each house and mark details such as where the roof might need preparation for the works (fig-ure 7.3); the length of guttering; and the loca-tions of downpipes, water tanks, and drain connections.
Obtain accurate estimates of all the compo-nents needed for roof water management, including brackets, connectors, and other fix-ings (figures 7.4 and 7.5). Underestimation of quantities can result in work delays and loss of project momentum (figure 7.6).

CO M M U N I T Y- BA S E D L A N DS L I D E R I S K R E D U CT I O N 2 69
TABLE 7.2 Items to include when surveying houses identified for household water capture
COMPONENT ITEM DISCUSS WITH HOUSEHOLD, MEASURE, AND RECORD
Preparation of roof
Galvanized roofing Time allowances for trimming irregular galvanized roofing
Replacement joists Lengths of joists to be repaired or replaced to allow fitting of facia boards and guttering
Facia boards Lengths of facia board to be repaired or replaced prior to affixing roof guttering
Roof water capture
Guttering and downpipes
•Lengths required
•Estimated number of connectors and brackets to support gutters and downpipes during heavy rainfall events.
•Where downpipes will be located in order to connect with water-tanks and drains
•Connections to existing rainwater drums or tanks, and make the necessary provision for overflow into the nearest drain
Water tanks (if allocated to this house)
•Water tank locations
•Connections to downpipes
•How overflows will be connected to drains
Gray water capture
Pipes from kitchen and bathroom
Length of piping required to capture gray water from kitchen sinks, washing machines, bathroom washbasins, and showers
Drain connections
Pipes and connection chambers or small drains
Confirm form of connection, quantity of parts, and location (ensure that connections are of sufficient gradient to maximize flow rates)
Hurricane strapping
Roof to top plate connections
Ideally, enough straps should be included to allow the roofing material to be attached at every joist
FIGURE 7.4 Downpipe installation detail
F IGURE 7.3 Modifications to roof structure for roof guttering installation
Develop a spreadsheet with a page for every house to detail the quantities of each item required (figure 7.7); include a master sheet that sums the quantities for all the houses. Add a contingency (usually 10 percent) to allow for unforeseen additional works or costs.
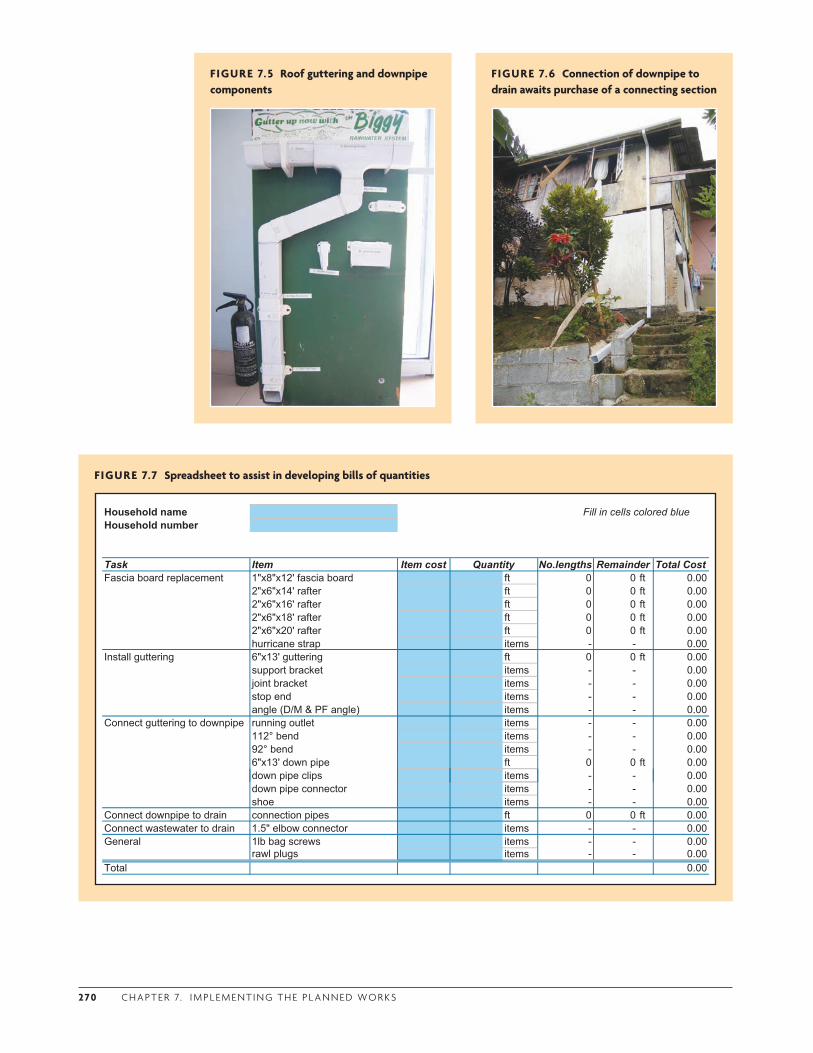
2 70 C H A P T E R 7. I M P L E M E N T I N G T H E P L A N N E D WO R K S
FIGURE 7.5 Roof guttering and downpipe components
FIGURE 7.6 Connection of downpipe to drain awaits purchase of a connecting section
FIGURE 7.7 Spreadsheet to assist in developing bills of quantities
Household name Fill in cells colored blueHousehold number
Task Item Item cost Quantity No.lengths Total CostRemainderFascia board replacement 1"x8"x12' fascia board ft 0 0 ft 0.00
2"x6"x14' rafter ft 0 0 ft 0.002"x6"x16' rafter ft 0 0 ft 0.002"x6"x18' rafter ft 0 0 ft 0.002"x6"x20' rafter ft 0 0 ft 0.00hurricane strap items - - 0.00
Install guttering 6"x13' guttering ft 0 0 ft 0.00support bracket items - - 0.00joint bracket items - - 0.00stop end items - - 0.00angle (D/M & PF angle) items - - 0.00
Connect guttering to downpipe running outlet items - - 0.00112° bend items - - 0.0092° bend items - - 0.006"x13' down pipe ft 0 0 ft 0.00down pipe clips items - - 0.00down pipe connector items - - 0.00shoe items - - 0.00
Connect downpipe to drain connection pipes ft 0 0 ft 0.00Connect wastewater to drain 1.5" elbow connector items - - 0.00General 1lb bag screws items - - 0.00
rawl plugs items - - 0.00Total 0.00
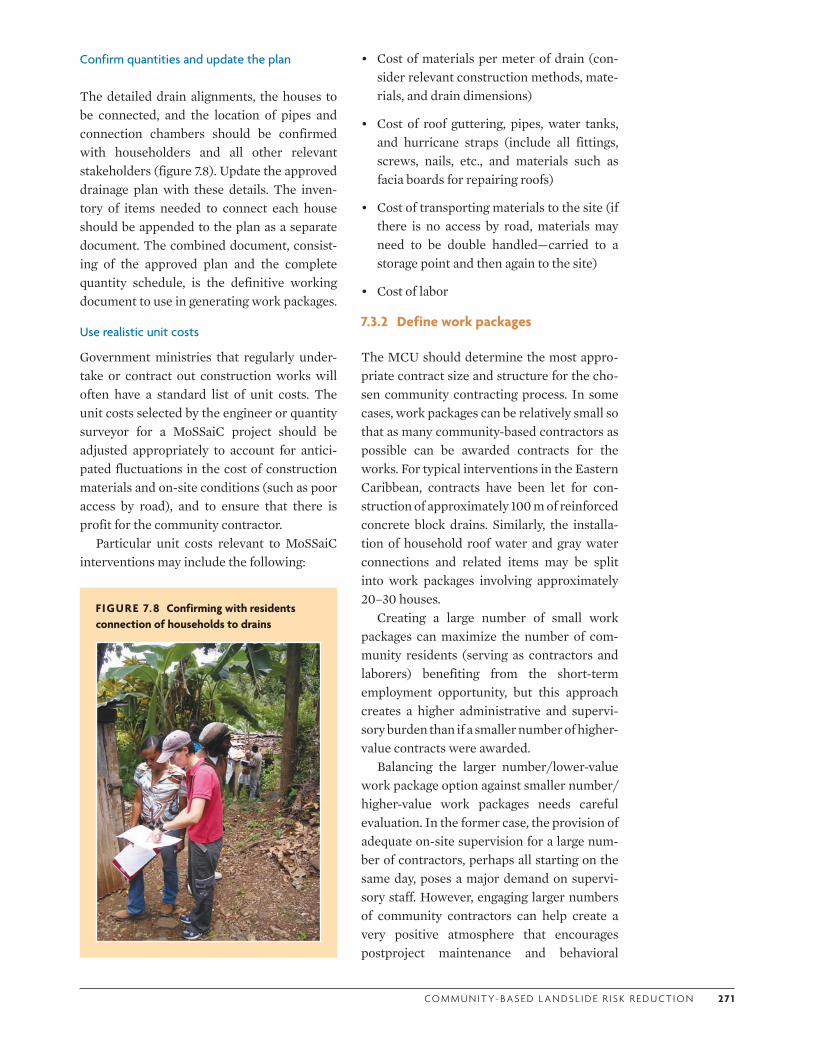
CO M M U N I T Y- BA S E D L A N DS L I D E R I S K R E D U CT I O N 2 7 1
Confirm quantities and update the plan
The detailed drain alignments, the houses to be connected, and the location of pipes and connection chambers should be confirmed with householders and all other relevant stakeholders (figure 7.8). Update the approved drainage plan with these details. The inven-tory of items needed to connect each house should be appended to the plan as a separate document. The combined document, consist-ing of the approved plan and the complete quantity schedule, is the definitive working document to use in generating work packages.
Use realistic unit costs
Government ministries that regularly under-take or contract out construction works will often have a standard list of unit costs. The unit costs selected by the engineer or quantity surveyor for a MoSSaiC project should be adjusted appropriately to account for antici-pated fluctuations in the cost of construction materials and on-site conditions (such as poor access by road), and to ensure that there is profit for the community contractor.
Particular unit costs relevant to MoSSaiC interventions may include the following:
FIGURE 7.8 Confirming with residents connection of households to drains
• Cost of materials per meter of drain (con-sider relevant construction methods, mate-rials, and drain dimensions)
• Cost of roof guttering, pipes, water tanks, and hurricane straps (include all fittings, screws, nails, etc., and materials such as facia boards for repairing roofs)
• Cost of transporting materials to the site (if there is no access by road, materials may need to be double handled—carried to a storage point and then again to the site)
• Cost of labor
7.3.2 Define work packages
The MCU should determine the most appro-priate contract size and structure for the cho-sen community contracting process. In some cases, work packages can be relatively small so that as many community-based contractors as possible can be awarded contracts for the works. For typical interventions in the Eastern Caribbean, contracts have been let for con-struction of approximately 100 m of reinforced concrete block drains. Similarly, the installa-tion of household roof water and gray water connections and related items may be split into work packages involving approximately 20–30 houses.
Creating a large number of small work packages can maximize the number of com-munity residents (serving as contractors and laborers) benefiting from the short-term employment opportunity, but this approach creates a higher administrative and supervi-sory burden than if a smaller number of higher-value contracts were awarded.
Balancing the larger number/lower-value work package option against smaller number/higher-value work packages needs careful evaluation. In the former case, the provision of adequate on-site supervision for a large num-ber of contractors, perhaps all starting on the same day, poses a major demand on supervi-sory staff. However, engaging larger numbers of community contractors can help create a very positive atmosphere that encourages postproject maintenance and behavioral
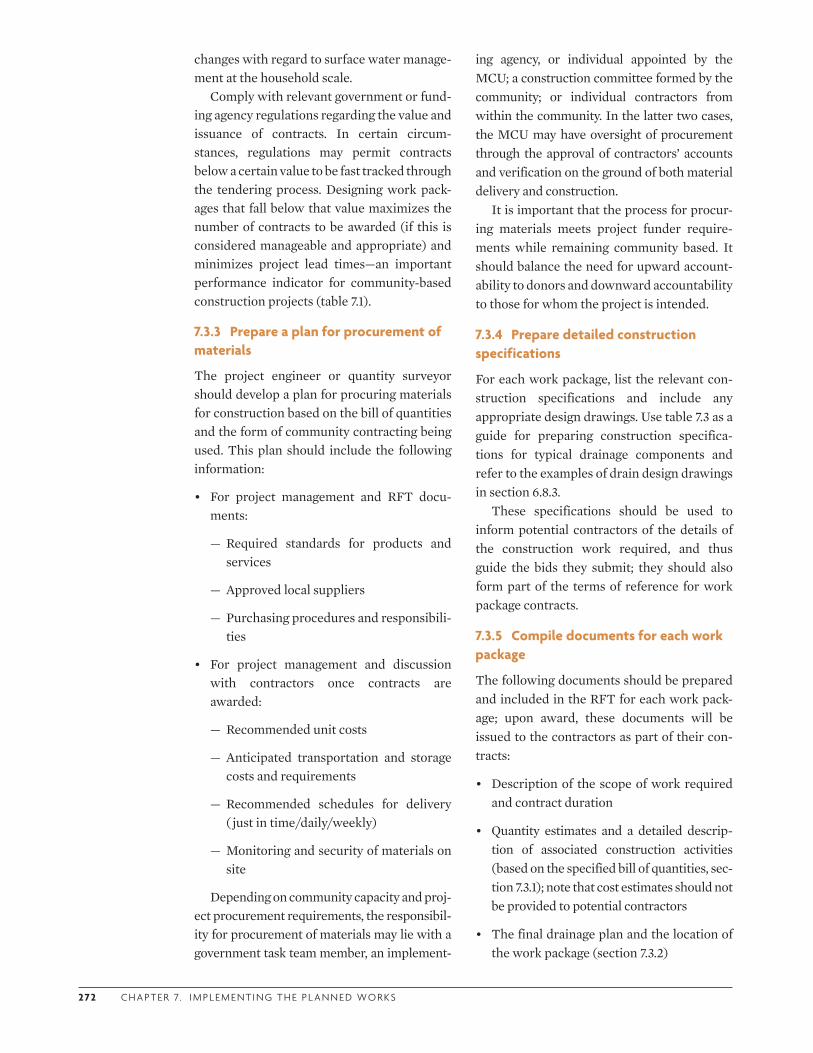
2 72 C H A P T E R 7. I M P L E M E N T I N G T H E P L A N N E D WO R K S
changes with regard to surface water manage-ment at the household scale.
Comply with relevant government or fund-ing agency regulations regarding the value and issuance of contracts. In certain circum-stances, regulations may permit contracts below a certain value to be fast tracked through the tendering process. Designing work pack-ages that fall below that value maximizes the number of contracts to be awarded (if this is considered manageable and appropriate) and minimizes project lead times—an important performance indicator for community-based construction projects (table 7.1).
7.3.3 Prepare a plan for procurement of materials
The project engineer or quantity surveyor should develop a plan for procuring materials for construction based on the bill of quantities and the form of community contracting being used. This plan should include the following information:
• For project management and RFT docu-ments:
— Required standards for products and services
— Approved local suppliers
— Purchasing procedures and responsibili-ties
• For project management and discussion with contractors once contracts are awarded:
— Recommended unit costs
— Anticipated transportation and storage costs and requirements
— Recommended schedules for delivery ( just in time/daily/weekly)
— Monitoring and security of materials on site
Depending on community capacity and proj-ect procurement requirements, the responsibil-ity for procurement of materials may lie with a government task team member, an implement-
ing agency, or individual appointed by the MCU; a construction committee formed by the community; or individual contractors from within the community. In the latter two cases, the MCU may have oversight of procurement through the approval of contractors’ accounts and verification on the ground of both material delivery and construction.
It is important that the process for procur-ing materials meets project funder require-ments while remaining community based. It should balance the need for upward account-ability to donors and downward accountability to those for whom the project is intended.
7.3.4 Prepare detailed construction specifications
For each work package, list the relevant con-struction specifications and include any appropriate design drawings. Use table 7.3 as a guide for preparing construction specifica-tions for typical drainage components and refer to the examples of drain design drawings in section 6.8.3.
These specifications should be used to inform potential contractors of the details of the construction work required, and thus guide the bids they submit; they should also form part of the terms of reference for work package contracts.
7.3.5 Compile documents for each work package
The following documents should be prepared and included in the RFT for each work pack-age; upon award, these documents will be issued to the contractors as part of their con-tracts:
• Description of the scope of work required and contract duration
• Quantity estimates and a detailed descrip-tion of associated construction activities (based on the specified bill of quantities, sec-tion 7.3.1); note that cost estimates should not be provided to potential contractors
• The final drainage plan and the location of the work package (section 7.3.2)
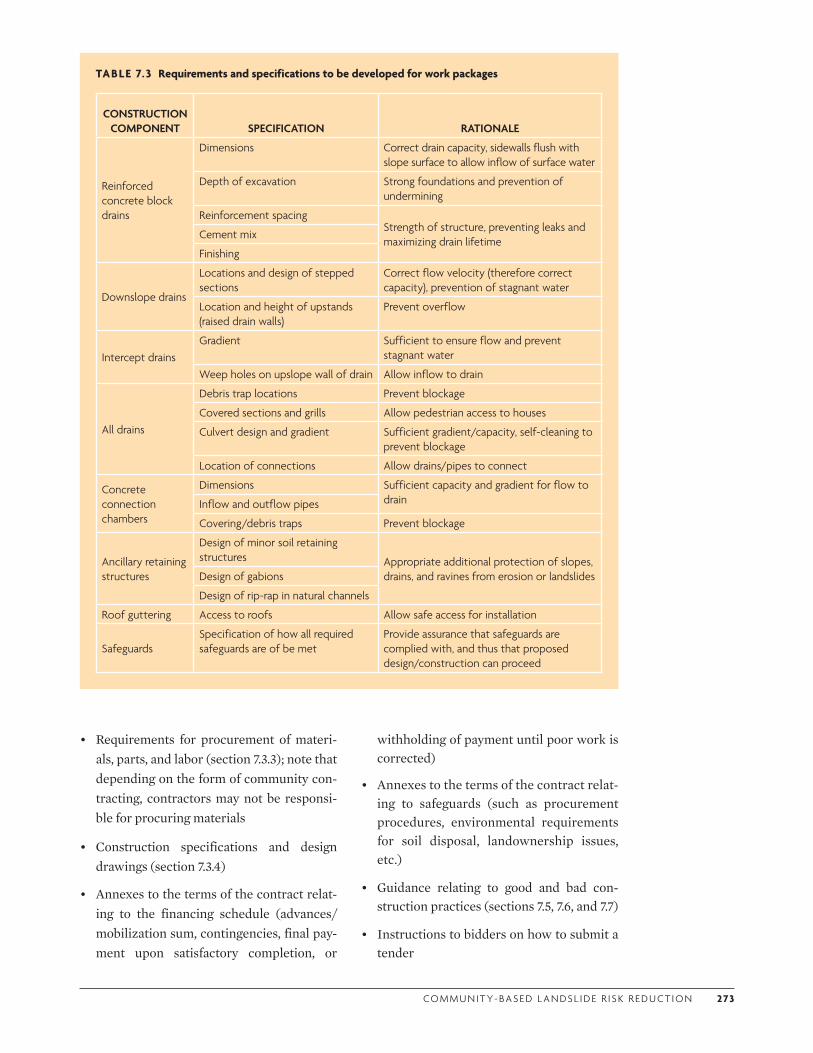
CO M M U N I T Y- BA S E D L A N DS L I D E R I S K R E D U CT I O N 2 73
TABLE 7.3 Requirements and specifications to be developed for work packages
CONSTRUCTION COMPONENT SPECIFICATION RATIONALE
Reinforced concrete block drains
Dimensions Correct drain capacity, sidewalls flush with slope surface to allow inflow of surface water
Depth of excavation Strong foundations and prevention of undermining
Reinforcement spacingStrength of structure, preventing leaks and maximizing drain lifetime
Cement mix
Finishing
Downslope drains
Locations and design of stepped sections
Correct flow velocity (therefore correct capacity), prevention of stagnant water
Location and height of upstands (raised drain walls)
Prevent overflow
Intercept drainsGradient Sufficient to ensure flow and prevent
stagnant water
Weep holes on upslope wall of drain Allow inflow to drain
All drains
Debris trap locations Prevent blockage
Covered sections and grills Allow pedestrian access to houses
Culvert design and gradient Sufficient gradient/capacity, self-cleaning to prevent blockage
Location of connections Allow drains/pipes to connect
Concrete connection chambers
Dimensions Sufficient capacity and gradient for flow to drainInflow and outflow pipes
Covering/debris traps Prevent blockage
Ancillary retaining structures
Design of minor soil retaining structures Appropriate additional protection of slopes,
drains, and ravines from erosion or landslidesDesign of gabions
Design of rip-rap in natural channels
Roof guttering Access to roofs Allow safe access for installation
SafeguardsSpecification of how all required safeguards are of be met
Provide assurance that safeguards are complied with, and thus that proposed design/construction can proceed
• Requirements for procurement of materi-als, parts, and labor (section 7.3.3); note that depending on the form of community con-tracting, contractors may not be responsi-ble for procuring materials
• Construction specifications and design drawings (section 7.3.4)
• Annexes to the terms of the contract relat-ing to the financing schedule (advances/mobilization sum, contingencies, final pay-ment upon satisfactory completion, or
withholding of payment until poor work is corrected)
• Annexes to the terms of the contract relat-ing to safeguards (such as procurement procedures, environmental requirements for soil disposal, landownership issues, etc.)
• Guidance relating to good and bad con-struction practices (sections 7.5, 7.6, and 7.7)
• Instructions to bidders on how to submit a tender
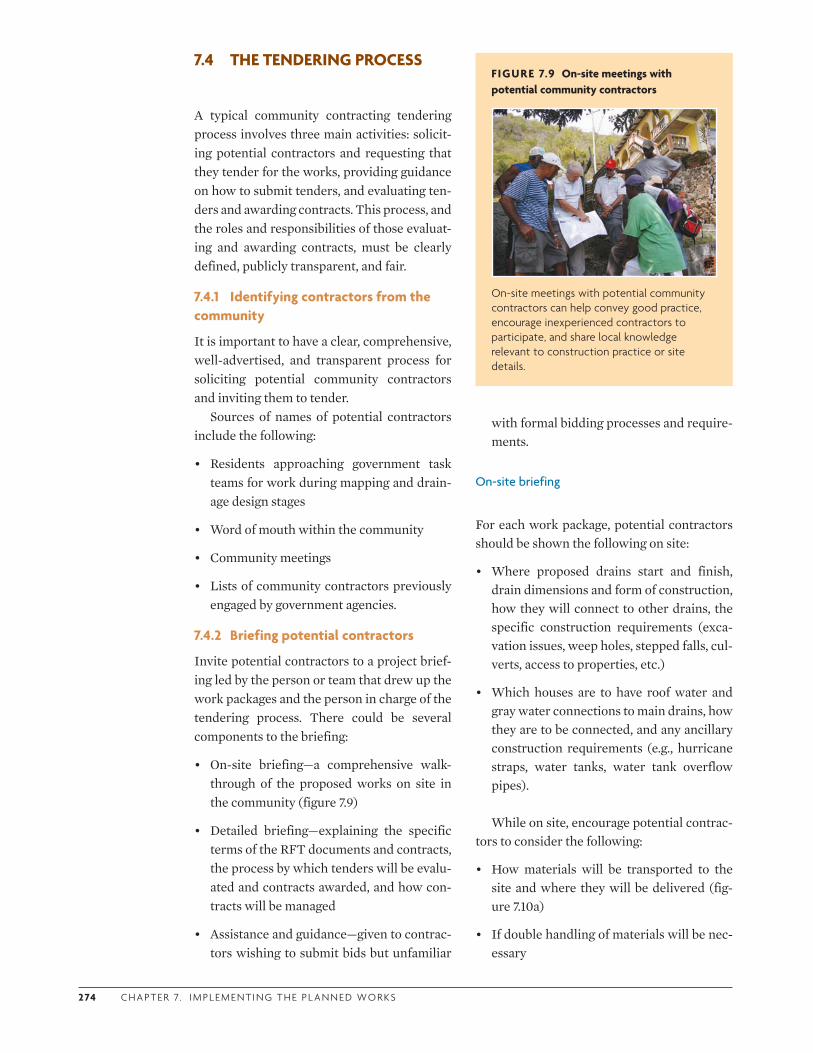
2 74 C H A P T E R 7. I M P L E M E N T I N G T H E P L A N N E D WO R K S
7.4 THE TENDERING PROCESS
A typical community contracting tendering process involves three main activities: solicit-ing potential contractors and requesting that they tender for the works, providing guidance on how to submit tenders, and evaluating ten-ders and awarding contracts. This process, and the roles and responsibilities of those evaluat-ing and awarding contracts, must be clearly defined, publicly transparent, and fair.
7.4.1 Identifying contractors from the community
It is important to have a clear, comprehensive, well-advertised, and transparent process for soliciting potential community contractors and inviting them to tender.
Sources of names of potential contractors include the following:
• Residents approaching government task teams for work during mapping and drain-age design stages
• Word of mouth within the community
• Community meetings
• Lists of community contractors previously engaged by government agencies.
7.4.2 Briefing potential contractors
Invite potential contractors to a project brief-ing led by the person or team that drew up the work packages and the person in charge of the tendering process. There could be several components to the briefing:
• On-site briefing—a comprehensive walk-through of the proposed works on site in the community (figure 7.9)
• Detailed briefing—explaining the specific terms of the RFT documents and contracts, the process by which tenders will be evalu-ated and contracts awarded, and how con-tracts will be managed
• Assistance and guidance—given to contrac-tors wishing to submit bids but unfamiliar
with formal bidding processes and require-ments.
On-site briefing
For each work package, potential contractors should be shown the following on site:
• Where proposed drains start and finish, drain dimensions and form of construction, how they will connect to other drains, the specific construction requirements (exca-vation issues, weep holes, stepped falls, cul-verts, access to properties, etc.)
• Which houses are to have roof water and gray water connections to main drains, how they are to be connected, and any ancillary construction requirements (e.g., hurricane straps, water tanks, water tank overflow pipes).
While on site, encourage potential contrac-tors to consider the following:
• How materials will be transported to the site and where they will be delivered (fig-ure 7.10a)
• If double handling of materials will be nec-essary
FIGURE 7.9 On-site meetings with potential community contractors
On-site meetings with potential community contractors can help convey good practice, encourage inexperienced contractors to participate, and share local knowledge relevant to construction practice or site details.
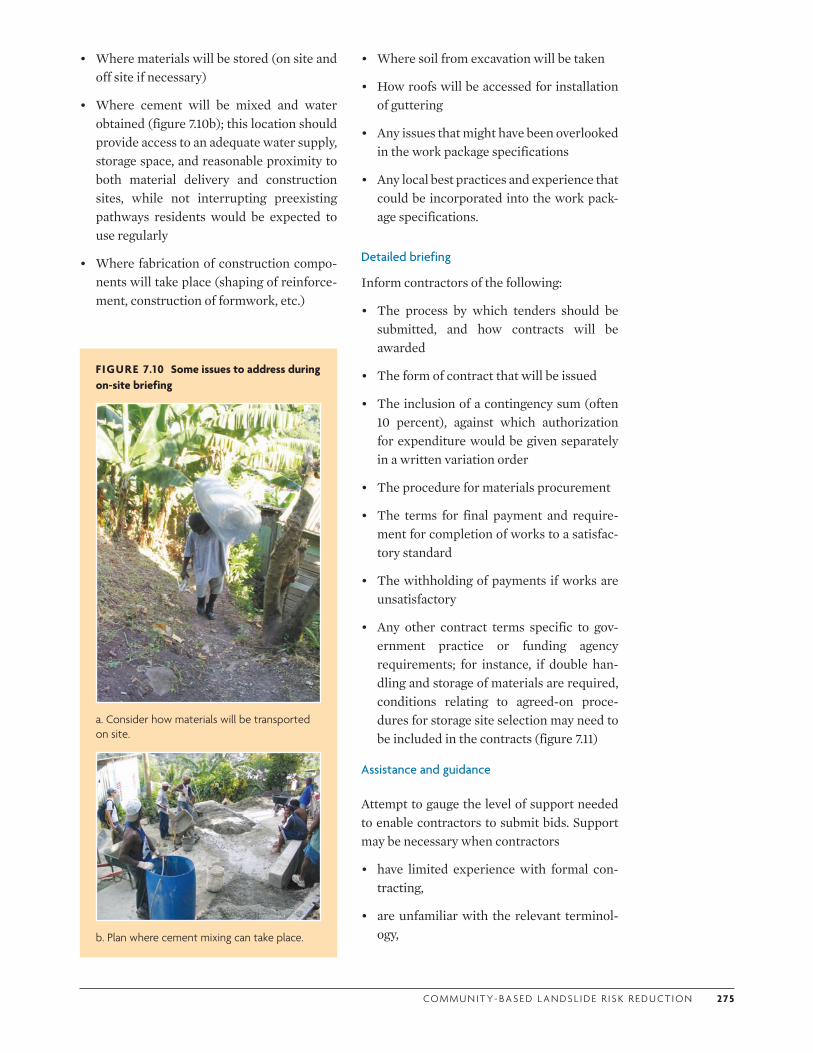
CO M M U N I T Y- BA S E D L A N DS L I D E R I S K R E D U CT I O N 2 75
• Where materials will be stored (on site and off site if necessary)
• Where cement will be mixed and water obtained (figure 7.10b); this location should provide access to an adequate water supply, storage space, and reasonable proximity to both material delivery and construction sites, while not interrupting preexisting pathways residents would be expected to use regularly
• Where fabrication of construction compo-nents will take place (shaping of reinforce-ment, construction of formwork, etc.)
FIGURE 7.10 Some issues to address during on-site briefing
a. Consider how materials will be transported on site.
b. Plan where cement mixing can take place.
• Where soil from excavation will be taken
• How roofs will be accessed for installation of guttering
• Any issues that might have been overlooked in the work package specifications
• Any local best practices and experience that could be incorporated into the work pack-age specifications.
Detailed briefing
Inform contractors of the following:
• The process by which tenders should be submitted, and how contracts will be awarded
• The form of contract that will be issued
• The inclusion of a contingency sum (often 10 percent), against which authorization for expenditure would be given separately in a written variation order
• The procedure for materials procurement
• The terms for final payment and require-ment for completion of works to a satisfac-tory standard
• The withholding of payments if works are unsatisfactory
• Any other contract terms specific to gov-ernment practice or funding agency requirements; for instance, if double han-dling and storage of materials are required, conditions relating to agreed-on proce-dures for storage site selection may need to be included in the contracts (figure 7.11)
Assistance and guidance
Attempt to gauge the level of support needed to enable contractors to submit bids. Support may be necessary when contractors
• have limited experience with formal con-tracting,
• are unfamiliar with the relevant terminol-ogy,

2 76 C H A P T E R 7. I M P L E M E N T I N G T H E P L A N N E D WO R K S
FIGURE 7.1 1 Double handling of materials can require temporary storage
• need help in completing the required ten-der documents,
• require assistance in interpreting an awarded contract, or
• are not able to read or write.
Assess the level of assistance needed during the contractor briefing process. The process of offering assistance and guidance should be transparent, open to all potential contractors, and without breaching any contracting and procurement protocols. The process should avoid the perception that one contractor is being favored over another.
While there can be many benefits in using small-scale community-based contractors, small contracting enterprises have certain lim-itations such as their ability to obtain credit and financial resources (Larcher 1999). In many cases, a contractor’s size and turnover may be below the level required for achieving a credit rating, thus preventing access to loans for construction mobilization (i.e., procuring materials and employing laborers at the start of construction, before receiving any pay-ments for completed works). This is often
compounded by the fact that the institutional framework that supports the construction industry in the majority of developing coun-tries is very weak and underdeveloped.
For the above reasons, the project procure-ment plan may allow the disbursement of start-up (mobilization) funds to contractors. Additionally, contractors may wish to assist each other by pooling resources for common tasks such as purchasing materials and pay-ing for laborers to manually transport materi-als on site. Contractor collaboration is a potentially powerful process in facilitating capacity building among community mem-bers in project initiation, delivery, and imple-mentation.
If the procurement of materials is to be the responsibility of the contractors (rather than an agency or individual appointed by the MCU, or a community construction committee) guidance should be provided on cost and price structures. In preparing tenders, potential contractors will need to consider the price they are likely to pay for materials and there-fore likely costs for construction work (Ogun-lana and Butt 2000). Cost estimates should also account for potential fluctuations in mate-rial prices due to factors such as material shortages, charges for transportation to the site, or changes in supplier (typically, some 60 percent of construction materials are imported in the developing world—Nordberg 1999) Ide-ally, the contractor needs to have an integrated view of the relationship between estimating, tendering, budgeting, and cost control.
7.4.3 Evaluating tenders and awarding contracts
The process for evaluating tenders and awarding contracts will vary from project to project depending on government and fund-ing agency requirements, the form of com-munity contracting chosen, and the value (or size) of the contracts. In most cases, submit-ted tenders will be evaluated by a tenders board on the basis of proposed costs and the technical skill or expertise of the contractors. The evaluation may also take into account wider project objectives such as building
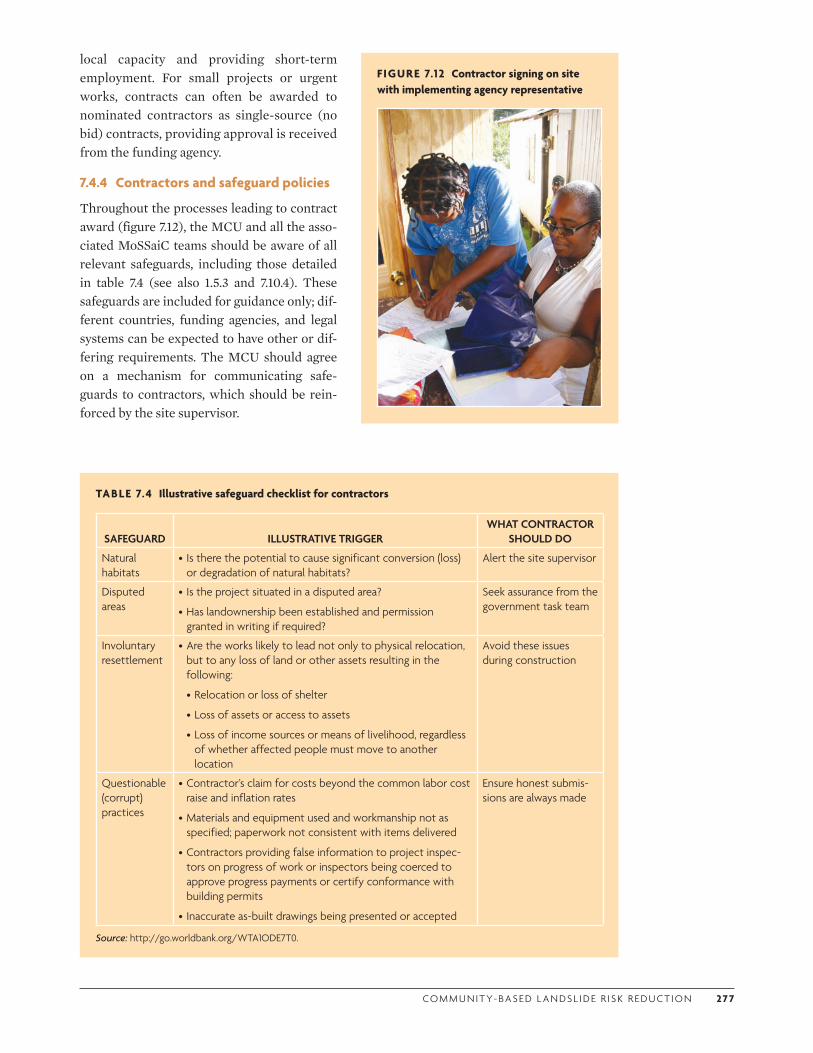
CO M M U N I T Y- BA S E D L A N DS L I D E R I S K R E D U CT I O N 2 7 7
local capacity and providing short-term employment. For small projects or urgent works, contracts can often be awarded to nominated contractors as single-source (no bid) contracts, providing approval is received from the funding agency.
7.4.4 Contractors and safeguard policies
Throughout the processes leading to contract award (figure 7.12), the MCU and all the asso-ciated MoSSaiC teams should be aware of all relevant safeguards, including those detailed in table 7.4 (see also 1.5.3 and 7.10.4). These safeguards are included for guidance only; dif-ferent countries, funding agencies, and legal systems can be expected to have other or dif-fering requirements. The MCU should agree on a mechanism for communicating safe-guards to contractors, which should be rein-forced by the site supervisor.
TABLE 7.4 Illustrative safeguard checklist for contractors
SAFEGUARD ILLUSTRATIVE TRIGGERWHAT CONTRACTOR
SHOULD DO
Natural habitats
• Is there the potential to cause significant conversion (loss) or degradation of natural habitats?
Alert the site supervisor
Disputed areas
• Is the project situated in a disputed area?
•Has landownership been established and permission granted in writing if required?
Seek assurance from the government task team
Involuntary resettlement
•Are the works likely to lead not only to physical relocation, but to any loss of land or other assets resulting in the following:
•Relocation or loss of shelter
•Loss of assets or access to assets
•Loss of income sources or means of livelihood, regardless of whether affected people must move to another location
Avoid these issues during construction
Questionable (corrupt) practices
•Contractor’s claim for costs beyond the common labor cost raise and inflation rates
•Materials and equipment used and workmanship not as specified; paperwork not consistent with items delivered
•Contractors providing false information to project inspec-tors on progress of work or inspectors being coerced to approve progress payments or certify conformance with building permits
• Inaccurate as-built drawings being presented or accepted
Ensure honest submis-sions are always made
Source: http://go.worldbank.org/WTA1ODE7T0.
FIGURE 7.12 Contractor signing on site with implementing agency representative
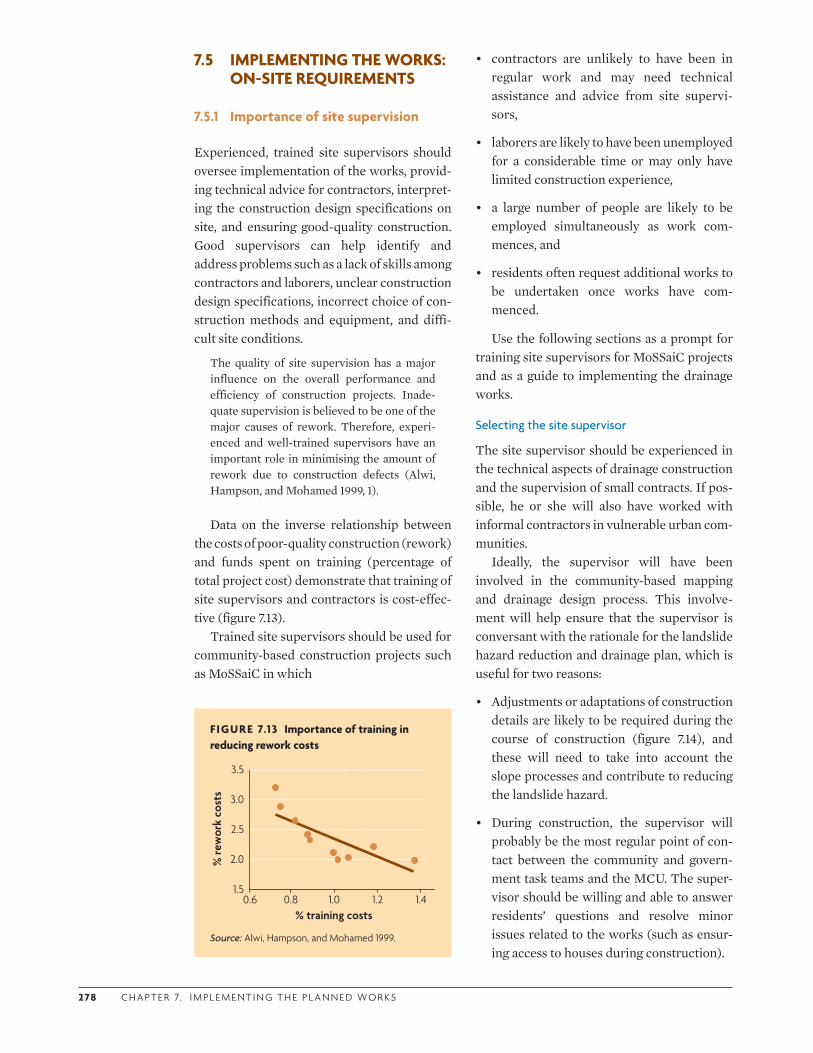
2 78 C H A P T E R 7. I M P L E M E N T I N G T H E P L A N N E D WO R K S
7.5 IMPLEMENTING THE WORKS: ON-SITE REQUIREMENTS
7.5.1 Importance of site supervision
Experienced, trained site supervisors should oversee implementation of the works, provid-ing technical advice for contractors, interpret-ing the construction design specifications on site, and ensuring good-quality construction. Good supervisors can help identify and address problems such as a lack of skills among contractors and laborers, unclear construction design specifications, incorrect choice of con-struction methods and equipment, and diffi-cult site conditions.
The quality of site supervision has a major influence on the overall performance and efficiency of construction projects. Inade-quate supervision is believed to be one of the major causes of rework. Therefore, experi-enced and well-trained supervisors have an important role in minimising the amount of rework due to construction defects (Alwi, Hampson, and Mohamed 1999, 1).
Data on the inverse relationship between the costs of poor-quality construction (rework) and funds spent on training (percentage of total project cost) demonstrate that training of site supervisors and contractors is cost-effec-tive (figure 7.13).
Trained site supervisors should be used for community-based construction projects such as MoSSaiC in which
FIGURE 7.13 Importance of training in reducing rework costs
1.5
2.0
2.5
3.0
3.5
% training costs
% re
wor
k co
sts
0.6 0.8 1.0 1.2 1.4
Source: Alwi, Hampson, and Mohamed 1999.
• contractors are unlikely to have been in regular work and may need technical assistance and advice from site supervi-sors,
• laborers are likely to have been unemployed for a considerable time or may only have limited construction experience,
• a large number of people are likely to be employed simultaneously as work com-mences, and
• residents often request additional works to be undertaken once works have com-menced.
Use the following sections as a prompt for training site supervisors for MoSSaiC projects and as a guide to implementing the drainage works.
Selecting the site supervisor
The site supervisor should be experienced in the technical aspects of drainage construction and the supervision of small contracts. If pos-sible, he or she will also have worked with informal contractors in vulnerable urban com-munities.
Ideally, the supervisor will have been involved in the community-based mapping and drainage design process. This involve-ment will help ensure that the supervisor is conversant with the rationale for the landslide hazard reduction and drainage plan, which is useful for two reasons:
• Adjustments or adaptations of construction details are likely to be required during the course of construction (figure 7.14), and these will need to take into account the slope processes and contribute to reducing the landslide hazard.
• During construction, the supervisor will probably be the most regular point of con-tact between the community and govern-ment task teams and the MCU. The super-visor should be willing and able to answer residents’ questions and resolve minor issues related to the works (such as ensur-ing access to houses during construction).
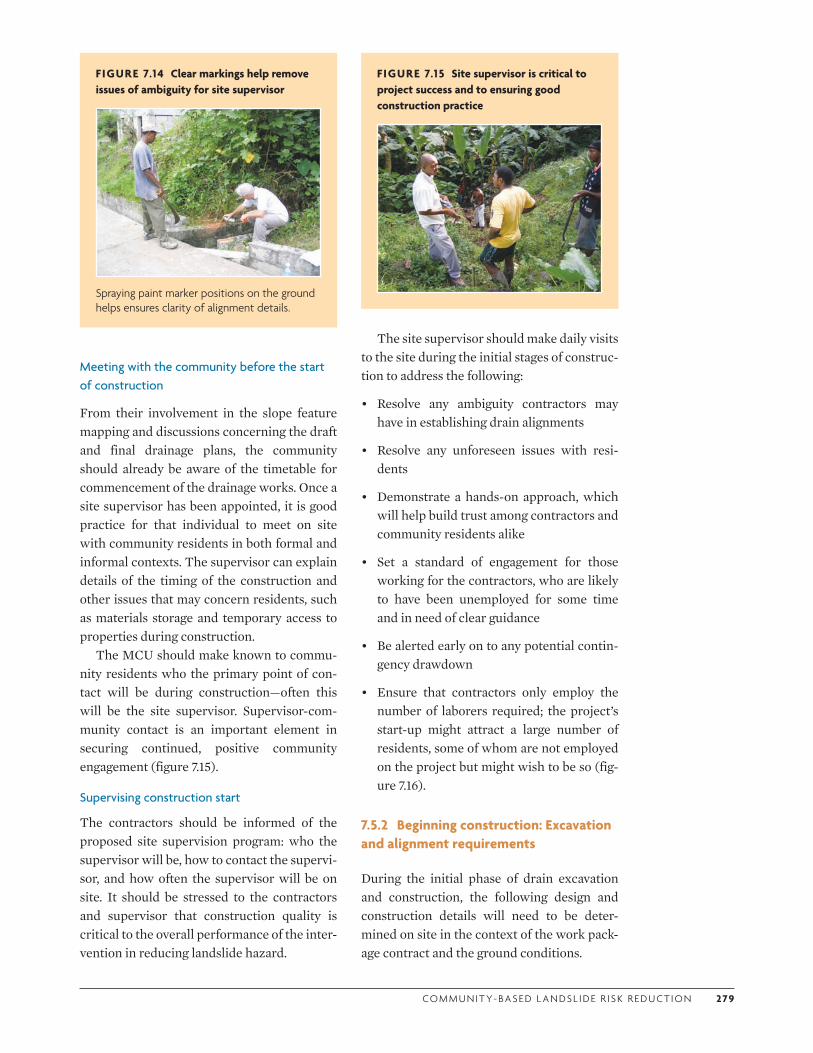
CO M M U N I T Y- BA S E D L A N DS L I D E R I S K R E D U CT I O N 2 79
FIGURE 7.14 Clear markings help remove issues of ambiguity for site supervisor
Spraying paint marker positions on the ground helps ensures clarity of alignment details.
Meeting with the community before the start of construction
From their involvement in the slope feature mapping and discussions concerning the draft and final drainage plans, the community should already be aware of the timetable for commencement of the drainage works. Once a site supervisor has been appointed, it is good practice for that individual to meet on site with community residents in both formal and informal contexts. The supervisor can explain details of the timing of the construction and other issues that may concern residents, such as materials storage and temporary access to properties during construction.
The MCU should make known to commu-nity residents who the primary point of con-tact will be during construction—often this will be the site supervisor. Supervisor-com-munity contact is an important element in securing continued, positive community engagement (figure 7.15).
Supervising construction start
The contractors should be informed of the proposed site supervision program: who the supervisor will be, how to contact the supervi-sor, and how often the supervisor will be on site. It should be stressed to the contractors and supervisor that construction quality is critical to the overall performance of the inter-vention in reducing landslide hazard.
The site supervisor should make daily visits to the site during the initial stages of construc-tion to address the following:
• Resolve any ambiguity contractors may have in establishing drain alignments
• Resolve any unforeseen issues with resi-dents
• Demonstrate a hands-on approach, which will help build trust among contractors and community residents alike
• Set a standard of engagement for those working for the contractors, who are likely to have been unemployed for some time and in need of clear guidance
• Be alerted early on to any potential contin-gency drawdown
• Ensure that contractors only employ the number of laborers required; the project’s start-up might attract a large number of residents, some of whom are not employed on the project but might wish to be so (fig-ure 7.16).
7.5.2 Beginning construction: Excavation and alignment requirements
During the initial phase of drain excavation and construction, the following design and construction details will need to be deter-mined on site in the context of the work pack-age contract and the ground conditions.
FIGURE 7.15 Site supervisor is critical to project success and to ensuring good construction practice
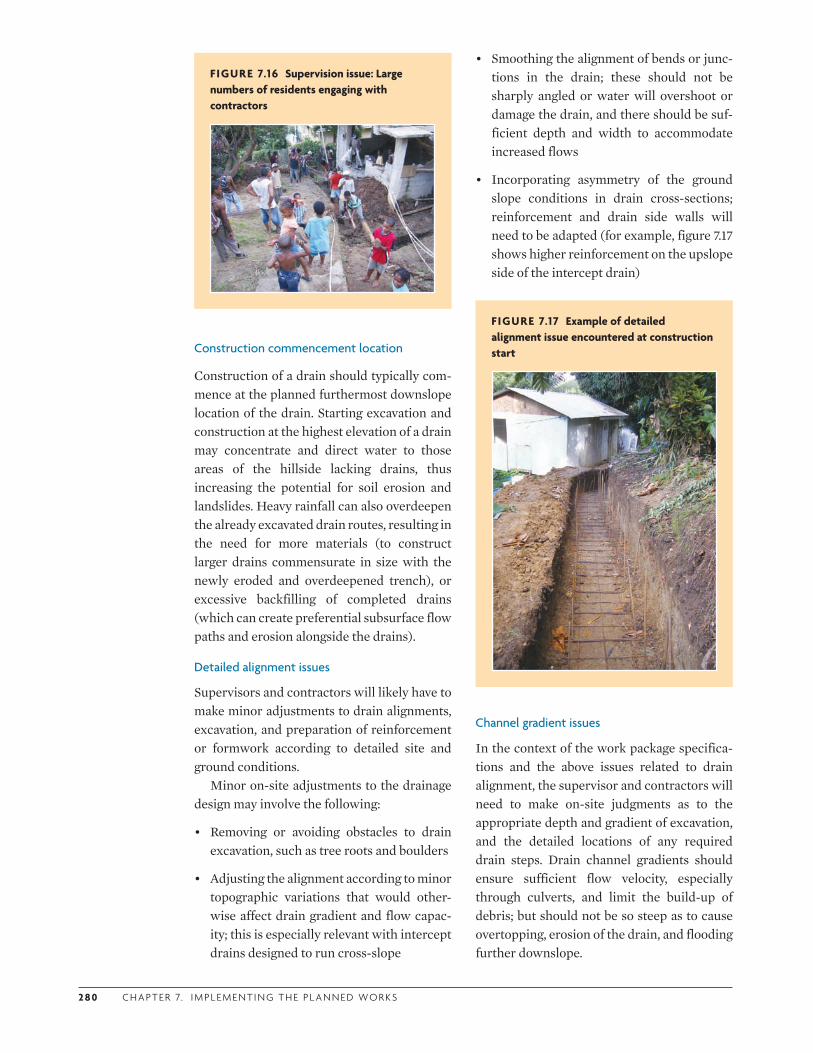
2 8 0 C H A P T E R 7. I M P L E M E N T I N G T H E P L A N N E D WO R K S
Construction commencement location
Construction of a drain should typically com-mence at the planned furthermost downslope location of the drain. Starting excavation and construction at the highest elevation of a drain may concentrate and direct water to those areas of the hillside lacking drains, thus increasing the potential for soil erosion and landslides. Heavy rainfall can also overdeepen the already excavated drain routes, resulting in the need for more materials (to construct larger drains commensurate in size with the newly eroded and overdeepened trench), or excessive backfilling of completed drains (which can create preferential subsurface flow paths and erosion alongside the drains).
Detailed alignment issues
Supervisors and contractors will likely have to make minor adjustments to drain alignments, excavation, and preparation of reinforcement or formwork according to detailed site and ground conditions.
Minor on-site adjustments to the drainage design may involve the following:
• Removing or avoiding obstacles to drain excavation, such as tree roots and boulders
• Adjusting the alignment according to minor topographic variations that would other-wise affect drain gradient and flow capac-ity; this is especially relevant with intercept drains designed to run cross-slope
FIGURE 7.16 Supervision issue: Large numbers of residents engaging with contractors
• Smoothing the alignment of bends or junc-tions in the drain; these should not be sharply angled or water will overshoot or damage the drain, and there should be suf-ficient depth and width to accommodate increased flows
• Incorporating asymmetry of the ground slope conditions in drain cross-sections; reinforcement and drain side walls will need to be adapted (for example, figure 7.17 shows higher reinforcement on the upslope side of the intercept drain)
FIGURE 7.17 Example of detailed alignment issue encountered at construction start
Channel gradient issues
In the context of the work package specifica-tions and the above issues related to drain alignment, the supervisor and contractors will need to make on-site judgments as to the appropriate depth and gradient of excavation, and the detailed locations of any required drain steps. Drain channel gradients should ensure sufficient flow velocity, especially through culverts, and limit the build-up of debris; but should not be so steep as to cause overtopping, erosion of the drain, and flooding further downslope.

CO M M U N I T Y- BA S E D L A N DS L I D E R I S K R E D U CT I O N 2 8 1
Specific on-site requirements relating to drain channel gradient include the following:
• Creating steps in the drains with steep channel gradients to slow flow velocity especially where the drain changes direc-tion or where two drains join (steps reduce the risk of overtopping due to excess flow velocity)
• Making intercept and downslope drains self-cleaning by establishing drain channel gradients that maintain adequate flow velocity and thus reduce the deposition of debris (figure 7.18)
• Ensuring that finished invert levels will prevent standing water or an incorrect flow direction
7.5.3 Ensure that water can enter drains
Casting of the base of the drains and construc-tion of block work side walls is a critical phase of drain construction. If construction is too hasty or poorly supervised, the result can be an ineffective drain that fails to capture surface runoff—and therefore to reduce landslide haz-ard. Ineffective drain construction can be avoided by the contractor adhering to the fol-lowing construction guidance.
FIGURE 7.18 Self-cleaning stepped drains
Ensuring stepped drains that self-clean is a vital element of good practice and needs to be carefully supervised on site because ground conditions may not always make that easy to achieve.
Drain wall
Construct the top of drain side walls flush with the ground surface (on both sides of downslope drains and on the upslope side of intercept drains) (figure 7.19). This construction detail needs to be stressed to residents and contrac-tors. Where there is inadequate design and site supervision, it is not uncommon for sidewalls to be constructed above ground level, thereby preventing surface water from entering the drain.
Incorporate weep holes
Weep holes allow water to enter drains by cap-turing subsurface (infiltrated) water from the uppermost soil horizons. Weep holes on the upslope sidewall of an intercept drain are especially important. If they are excluded, subsurface flow may, as a consequence, pass under the drain base and erode drain founda-tions on the downslope side.
Discuss weep hole provision with the con-tractor since the spacing of vertical reinforce-ment rods needs to be accommodated at the start of drain construction.
Weep holes can be formed in several ways, the most common of which are by leaving gaps in block construction (figure 7.20a), using a
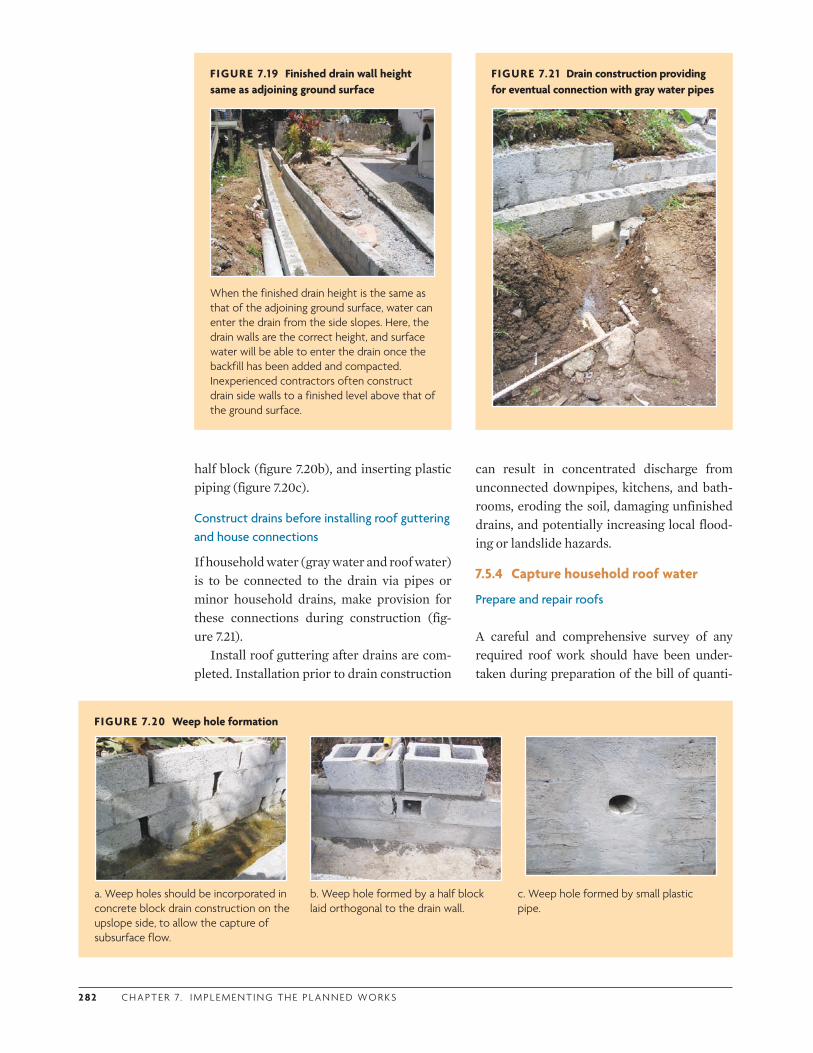
2 82 C H A P T E R 7. I M P L E M E N T I N G T H E P L A N N E D WO R K S
FIGURE 7.19 Finished drain wall height same as adjoining ground surface
When the finished drain height is the same as that of the adjoining ground surface, water can enter the drain from the side slopes. Here, the drain walls are the correct height, and surface water will be able to enter the drain once the backfill has been added and compacted. Inexperienced contractors often construct drain side walls to a finished level above that of the ground surface.
half block (figure 7.20b), and inserting plastic piping (figure 7.20c).
Construct drains before installing roof guttering and house connections
If household water (gray water and roof water) is to be connected to the drain via pipes or minor household drains, make provision for these connections during construction (fig-ure 7.21).
Install roof guttering after drains are com-pleted. Installation prior to drain construction
FIGURE 7.20 Weep hole formation
a. Weep holes should be incorporated in concrete block drain construction on the upslope side, to allow the capture of subsurface flow.
b. Weep hole formed by a half block laid orthogonal to the drain wall.
c. Weep hole formed by small plastic pipe.
can result in concentrated discharge from unconnected downpipes, kitchens, and bath-rooms, eroding the soil, damaging unfinished drains, and potentially increasing local flood-ing or landslide hazards.
7.5.4 Capture household roof water
Prepare and repair roofs
A careful and comprehensive survey of any required roof work should have been under-taken during preparation of the bill of quanti-
FIGURE 7.21 Drain construction providing for eventual connection with gray water pipes
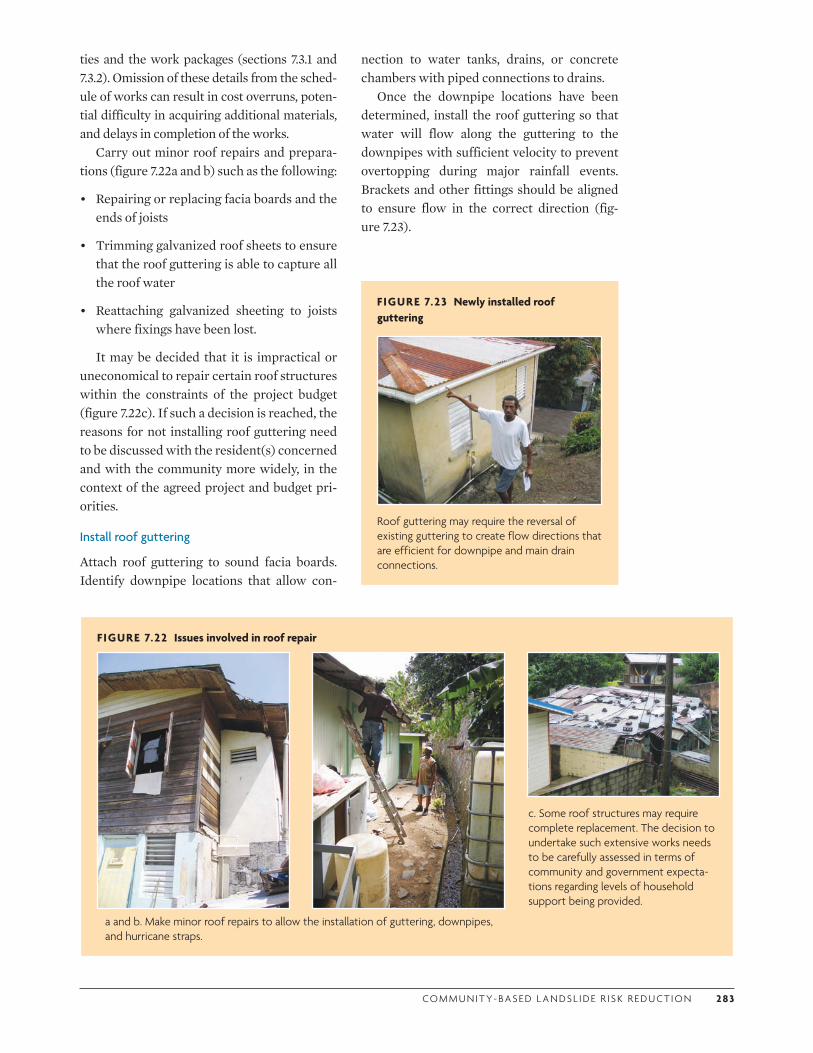
CO M M U N I T Y- BA S E D L A N DS L I D E R I S K R E D U CT I O N 2 83
ties and the work packages (sections 7.3.1 and 7.3.2). Omission of these details from the sched-ule of works can result in cost overruns, poten-tial difficulty in acquiring additional materials, and delays in completion of the works.
Carry out minor roof repairs and prepara-tions (figure 7.22a and b) such as the following:
• Repairing or replacing facia boards and the ends of joists
• Trimming galvanized roof sheets to ensure that the roof guttering is able to capture all the roof water
• Reattaching galvanized sheeting to joists where fixings have been lost.
It may be decided that it is impractical or uneconomical to repair certain roof structures within the constraints of the project budget (figure 7.22c). If such a decision is reached, the reasons for not installing roof guttering need to be discussed with the resident(s) concerned and with the community more widely, in the context of the agreed project and budget pri-orities.
Install roof guttering
Attach roof guttering to sound facia boards. Identify downpipe locations that allow con-
nection to water tanks, drains, or concrete chambers with piped connections to drains.
Once the downpipe locations have been determined, install the roof guttering so that water will flow along the guttering to the downpipes with sufficient velocity to prevent overtopping during major rainfall events. Brackets and other fittings should be aligned to ensure flow in the correct direction (fig-ure 7.23).
FIGURE 7.22 Issues involved in roof repair
c. Some roof structures may require complete replacement. The decision to undertake such extensive works needs to be carefully assessed in terms of community and government expecta-tions regarding levels of household support being provided.
a and b. Make minor roof repairs to allow the installation of guttering, downpipes, and hurricane straps.
FIGURE 7.23 Newly installed roof guttering
Roof guttering may require the reversal of existing guttering to create flow directions that are efficient for downpipe and main drain connections.
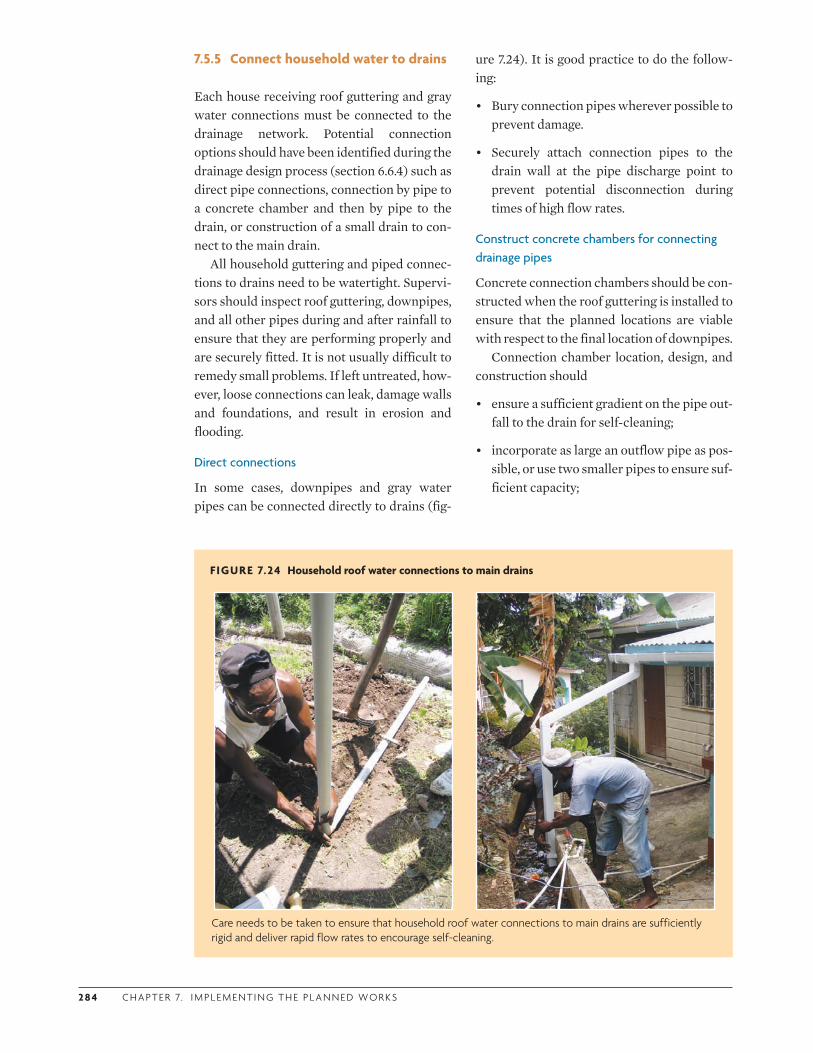
2 8 4 C H A P T E R 7. I M P L E M E N T I N G T H E P L A N N E D WO R K S
7.5.5 Connect household water to drains
Each house receiving roof guttering and gray water connections must be connected to the drainage network. Potential connection options should have been identified during the drainage design process (section 6.6.4) such as direct pipe connections, connection by pipe to a concrete chamber and then by pipe to the drain, or construction of a small drain to con-nect to the main drain.
All household guttering and piped connec-tions to drains need to be watertight. Supervi-sors should inspect roof guttering, downpipes, and all other pipes during and after rainfall to ensure that they are performing properly and are securely fitted. It is not usually difficult to remedy small problems. If left untreated, how-ever, loose connections can leak, damage walls and foundations, and result in erosion and flooding.
Direct connections
In some cases, downpipes and gray water pipes can be connected directly to drains (fig-
ure 7.24). It is good practice to do the follow-ing:
• Bury connection pipes wherever possible to prevent damage.
• Securely attach connection pipes to the drain wall at the pipe discharge point to prevent potential disconnection during times of high flow rates.
Construct concrete chambers for connecting drainage pipes
Concrete connection chambers should be con-structed when the roof guttering is installed to ensure that the planned locations are viable with respect to the final location of downpipes.
Connection chamber location, design, and construction should
• ensure a sufficient gradient on the pipe out-fall to the drain for self-cleaning;
• incorporate as large an outflow pipe as pos-sible, or use two smaller pipes to ensure suf-ficient capacity;
FIGURE 7.24 Household roof water connections to main drains
Care needs to be taken to ensure that household roof water connections to main drains are sufficiently rigid and deliver rapid flow rates to encourage self-cleaning.
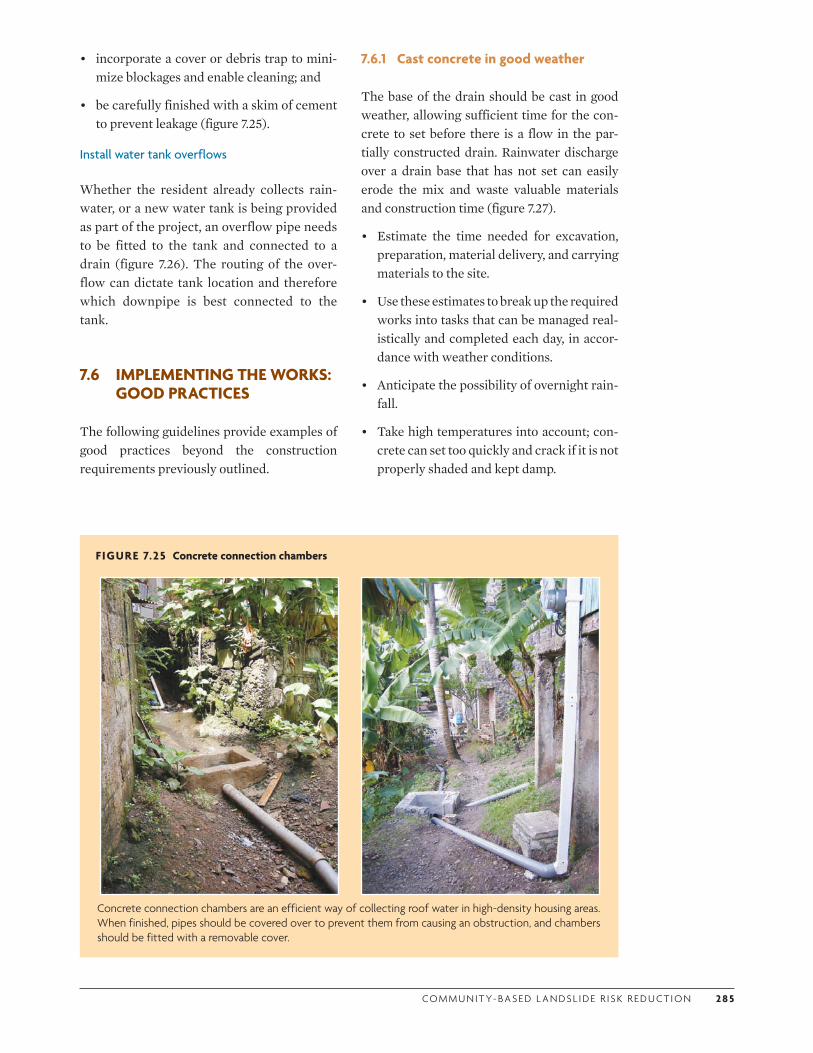
CO M M U N I T Y- BA S E D L A N DS L I D E R I S K R E D U CT I O N 2 8 5
• incorporate a cover or debris trap to mini-mize blockages and enable cleaning; and
• be carefully finished with a skim of cement to prevent leakage (figure 7.25).
Install water tank overflows
Whether the resident already collects rain-water, or a new water tank is being provided as part of the project, an overflow pipe needs to be fitted to the tank and connected to a drain (figure 7.26). The routing of the over-flow can dictate tank location and therefore which downpipe is best connected to the tank.
7.6 IMPLEMENTING THE WORKS: GOOD PRACTICES
The following guidelines provide examples of good practices beyond the construction requirements previously outlined.
7.6.1 Cast concrete in good weather
The base of the drain should be cast in good weather, allowing sufficient time for the con-crete to set before there is a flow in the par-tially constructed drain. Rainwater discharge over a drain base that has not set can easily erode the mix and waste valuable materials and construction time (figure 7.27).
• Estimate the time needed for excavation, preparation, material delivery, and carrying materials to the site.
• Use these estimates to break up the required works into tasks that can be managed real-istically and completed each day, in accor-dance with weather conditions.
• Anticipate the possibility of overnight rain-fall.
• Take high temperatures into account; con-crete can set too quickly and crack if it is not properly shaded and kept damp.
FIGURE 7.25 Concrete connection chambers
Concrete connection chambers are an efficient way of collecting roof water in high-density housing areas. When finished, pipes should be covered over to prevent them from causing an obstruction, and chambers should be fitted with a removable cover.
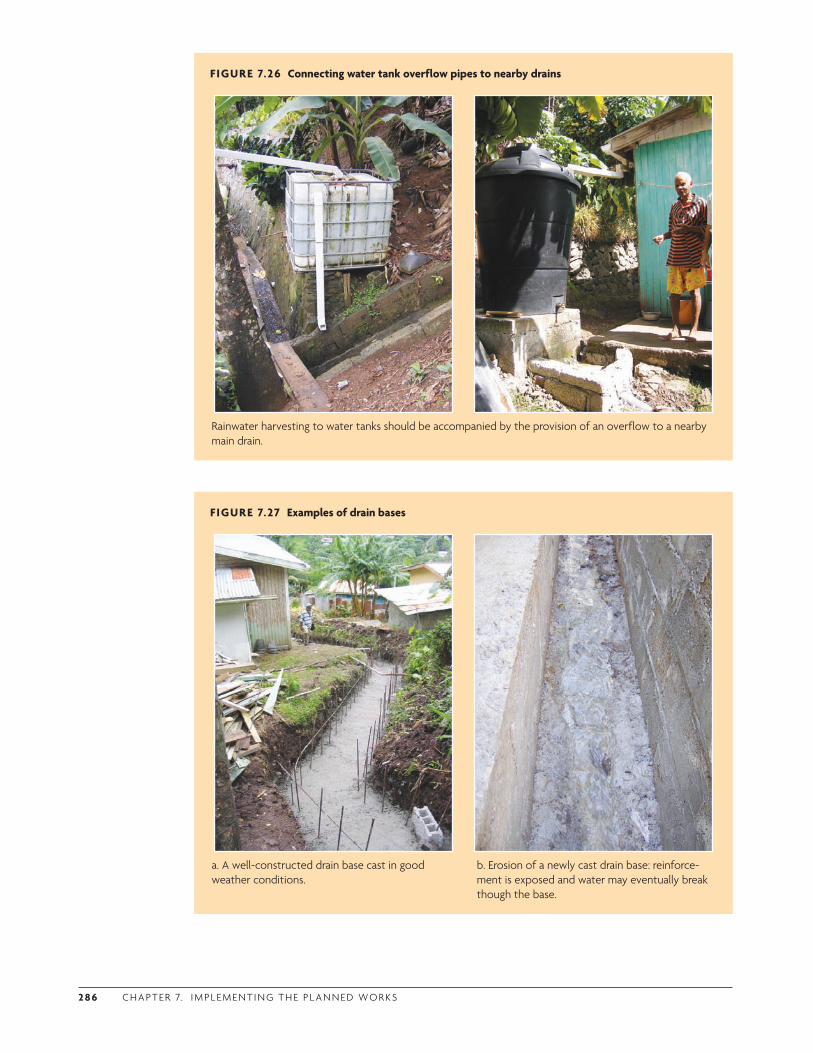
2 8 6 C H A P T E R 7. I M P L E M E N T I N G T H E P L A N N E D WO R K S
FIGURE 7.26 Connecting water tank overflow pipes to nearby drains
Rainwater harvesting to water tanks should be accompanied by the provision of an overflow to a nearby main drain.
FIGURE 7.27 Examples of drain bases
a. A well-constructed drain base cast in good weather conditions.
b. Erosion of a newly cast drain base: reinforce-ment is exposed and water may eventually break though the base.
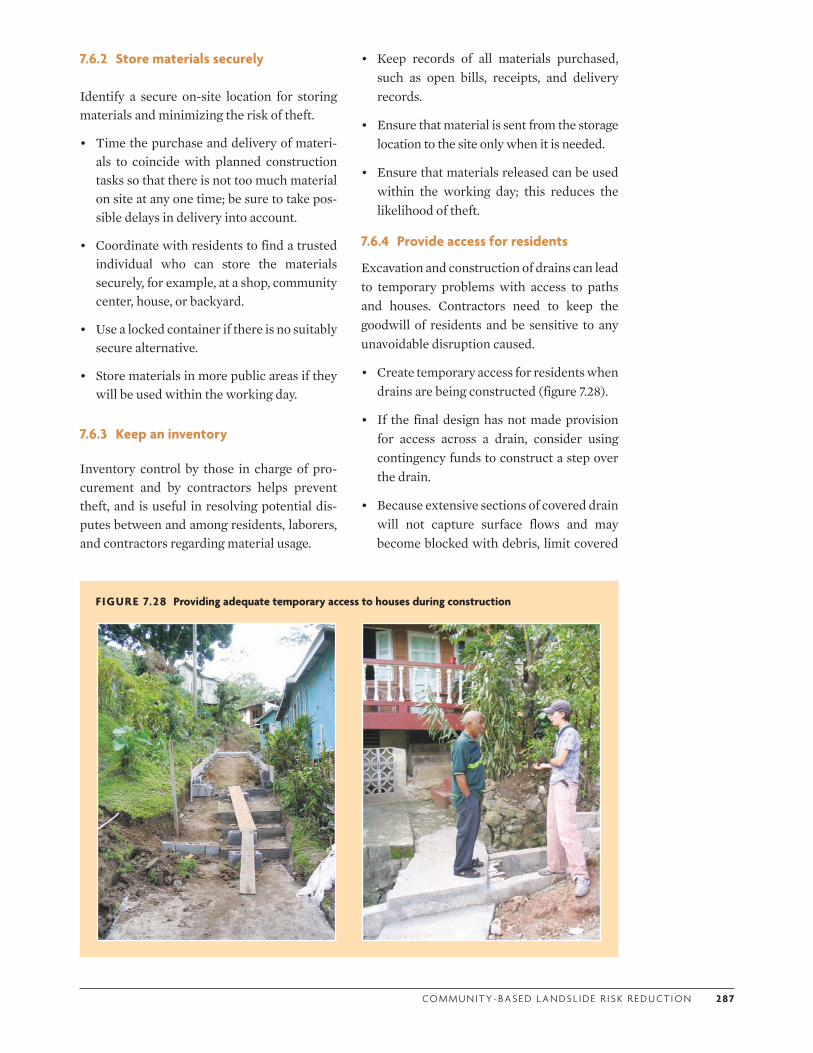
CO M M U N I T Y- BA S E D L A N DS L I D E R I S K R E D U CT I O N 2 87
7.6.2 Store materials securely
Identify a secure on-site location for storing materials and minimizing the risk of theft.
• Time the purchase and delivery of materi-als to coincide with planned construction tasks so that there is not too much material on site at any one time; be sure to take pos-sible delays in delivery into account.
• Coordinate with residents to find a trusted individual who can store the materials securely, for example, at a shop, community center, house, or backyard.
• Use a locked container if there is no suitably secure alternative.
• Store materials in more public areas if they will be used within the working day.
7.6.3 Keep an inventory
Inventory control by those in charge of pro-curement and by contractors helps prevent theft, and is useful in resolving potential dis-putes between and among residents, laborers, and contractors regarding material usage.
• Keep records of all materials purchased, such as open bills, receipts, and delivery records.
• Ensure that material is sent from the storage location to the site only when it is needed.
• Ensure that materials released can be used within the working day; this reduces the likelihood of theft.
7.6.4 Provide access for residents
Excavation and construction of drains can lead to temporary problems with access to paths and houses. Contractors need to keep the goodwill of residents and be sensitive to any unavoidable disruption caused.
• Create temporary access for residents when drains are being constructed (figure 7.28).
• If the final design has not made provision for access across a drain, consider using contingency funds to construct a step over the drain.
• Because extensive sections of covered drain will not capture surface flows and may become blocked with debris, limit covered
FIGURE 7.28 Providing adequate temporary access to houses during construction
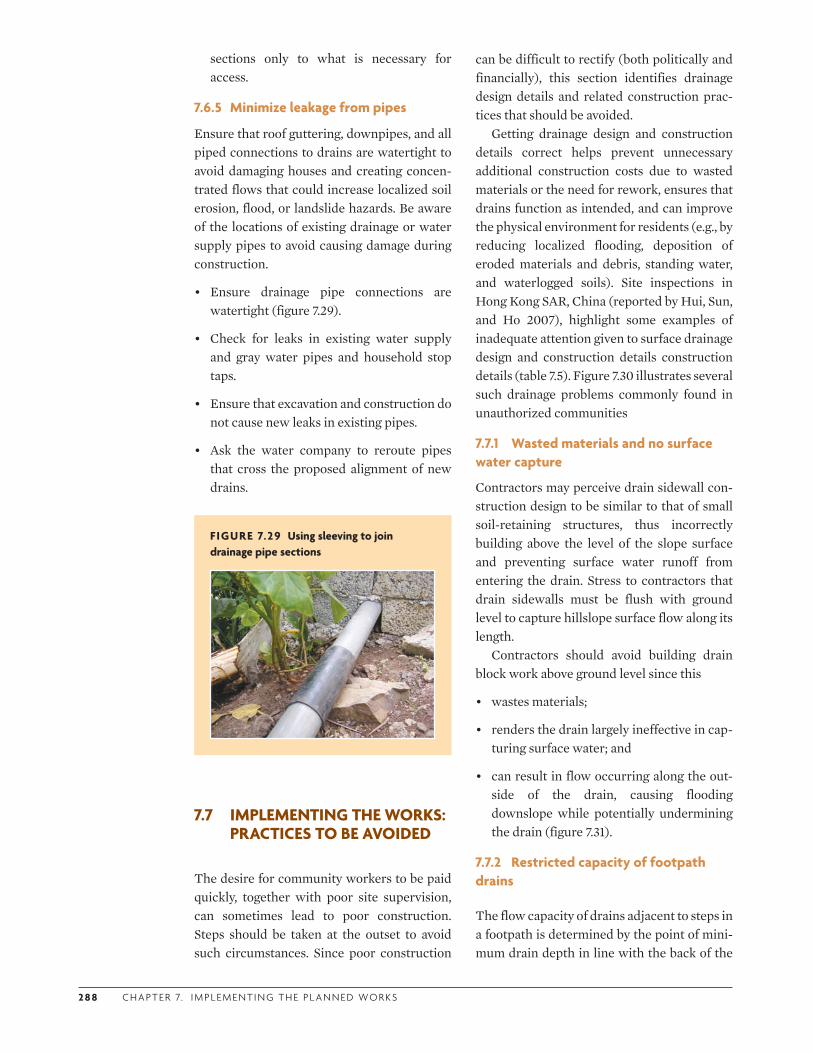
2 8 8 C H A P T E R 7. I M P L E M E N T I N G T H E P L A N N E D WO R K S
sections only to what is necessary for access.
7.6.5 Minimize leakage from pipes
Ensure that roof guttering, downpipes, and all piped connections to drains are watertight to avoid damaging houses and creating concen-trated flows that could increase localized soil erosion, flood, or landslide hazards. Be aware of the locations of existing drainage or water supply pipes to avoid causing damage during construction.
• Ensure drainage pipe connections are watertight (figure 7.29).
• Check for leaks in existing water supply and gray water pipes and household stop taps.
• Ensure that excavation and construction do not cause new leaks in existing pipes.
• Ask the water company to reroute pipes that cross the proposed alignment of new drains.
FIGURE 7.29 Using sleeving to join drainage pipe sections
7.7 IMPLEMENTING THE WORKS: PRACTICES TO BE AVOIDED
The desire for community workers to be paid quickly, together with poor site supervision, can sometimes lead to poor construction. Steps should be taken at the outset to avoid such circumstances. Since poor construction
can be difficult to rectify (both politically and financially), this section identifies drainage design details and related construction prac-tices that should be avoided.
Getting drainage design and construction details correct helps prevent unnecessary additional construction costs due to wasted materials or the need for rework, ensures that drains function as intended, and can improve the physical environment for residents (e.g., by reducing localized flooding, deposition of eroded materials and debris, standing water, and waterlogged soils). Site inspections in Hong Kong SAR, China (reported by Hui, Sun, and Ho 2007), highlight some examples of inadequate attention given to surface drainage design and construction details construction details (table 7.5). Figure 7.30 illustrates several such drainage problems commonly found in unauthorized communities
7.7.1 Wasted materials and no surface water capture
Contractors may perceive drain sidewall con-struction design to be similar to that of small soil-retaining structures, thus incorrectly building above the level of the slope surface and preventing surface water runoff from entering the drain. Stress to contractors that drain sidewalls must be flush with ground level to capture hillslope surface flow along its length.
Contractors should avoid building drain block work above ground level since this
• wastes materials;
• renders the drain largely ineffective in cap-turing surface water; and
• can result in flow occurring along the out-side of the drain, causing flooding downslope while potentially undermining the drain (figure 7.31).
7.7.2 Restricted capacity of footpath drains
The flow capacity of drains adjacent to steps in a footpath is determined by the point of mini-mum drain depth in line with the back of the
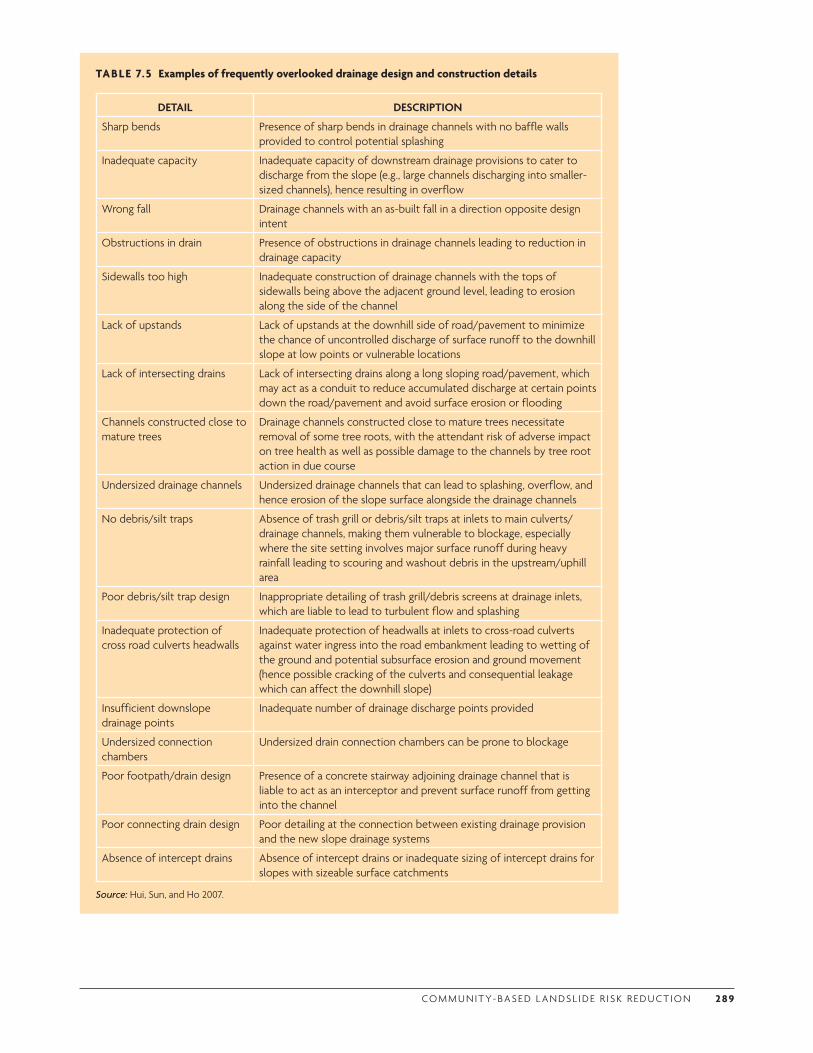
CO M M U N I T Y- BA S E D L A N DS L I D E R I S K R E D U CT I O N 2 89
TABLE 7.5 Examples of frequently overlooked drainage design and construction details
DETAIL DESCRIPTION
Sharp bends Presence of sharp bends in drainage channels with no baffle walls provided to control potential splashing
Inadequate capacity Inadequate capacity of downstream drainage provisions to cater to discharge from the slope (e.g., large channels discharging into smaller-sized channels), hence resulting in overflow
Wrong fall Drainage channels with an as-built fall in a direction opposite design intent
Obstructions in drain Presence of obstructions in drainage channels leading to reduction in drainage capacity
Sidewalls too high Inadequate construction of drainage channels with the tops of sidewalls being above the adjacent ground level, leading to erosion along the side of the channel
Lack of upstands Lack of upstands at the downhill side of road/pavement to minimize the chance of uncontrolled discharge of surface runoff to the downhill slope at low points or vulnerable locations
Lack of intersecting drains Lack of intersecting drains along a long sloping road/pavement, which may act as a conduit to reduce accumulated discharge at certain points down the road/pavement and avoid surface erosion or flooding
Channels constructed close to mature trees
Drainage channels constructed close to mature trees necessitate removal of some tree roots, with the attendant risk of adverse impact on tree health as well as possible damage to the channels by tree root action in due course
Undersized drainage channels Undersized drainage channels that can lead to splashing, overflow, and hence erosion of the slope surface alongside the drainage channels
No debris/silt traps Absence of trash grill or debris/silt traps at inlets to main culverts/drainage channels, making them vulnerable to blockage, especially where the site setting involves major surface runoff during heavy rainfall leading to scouring and washout debris in the upstream/uphill area
Poor debris/silt trap design Inappropriate detailing of trash grill/debris screens at drainage inlets, which are liable to lead to turbulent flow and splashing
Inadequate protection of cross road culverts headwalls
Inadequate protection of headwalls at inlets to cross-road culverts against water ingress into the road embankment leading to wetting of the ground and potential subsurface erosion and ground movement (hence possible cracking of the culverts and consequential leakage which can affect the downhill slope)
Insufficient downslope drainage points
Inadequate number of drainage discharge points provided
Undersized connection chambers
Undersized drain connection chambers can be prone to blockage
Poor footpath/drain design Presence of a concrete stairway adjoining drainage channel that is liable to act as an interceptor and prevent surface runoff from getting into the channel
Poor connecting drain design Poor detailing at the connection between existing drainage provision and the new slope drainage systems
Absence of intercept drains Absence of intercept drains or inadequate sizing of intercept drains for slopes with sizeable surface catchments
Source: Hui, Sun, and Ho 2007.
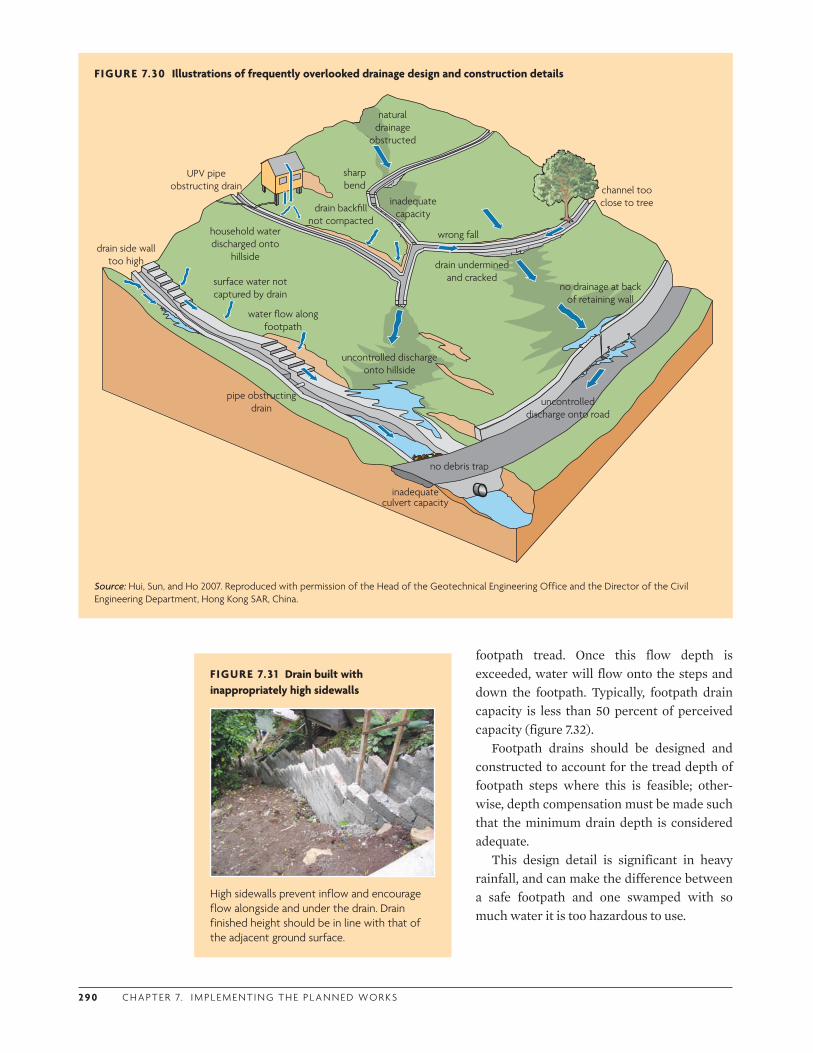
2 9 0 C H A P T E R 7. I M P L E M E N T I N G T H E P L A N N E D WO R K S
FIGURE 7.31 Drain built with inappropriately high sidewalls
High sidewalls prevent inflow and encourage flow alongside and under the drain. Drain finished height should be in line with that of the adjacent ground surface.
footpath tread. Once this flow depth is exceeded, water will flow onto the steps and down the footpath. Typically, footpath drain capacity is less than 50 percent of perceived capacity (figure 7.32).
Footpath drains should be designed and constructed to account for the tread depth of footpath steps where this is feasible; other-wise, depth compensation must be made such that the minimum drain depth is considered adequate.
This design detail is significant in heavy rainfall, and can make the difference between a safe footpath and one swamped with so much water it is too hazardous to use.
FIGURE 7.30 Illustrations of frequently overlooked drainage design and construction details
sharp bend
inadequate capacity
wrong fall
inadequate culvert capacity
drain side wall too high
channel too close to tree
no debris trap
UPV pipe obstructing drain
water flow along footpath
surface water not captured by drain
natural drainage
obstructed
uncontrolled discharge onto road
no drainage at back of retaining wall
uncontrolled discharge onto hillside
drain undermined and cracked
household water discharged onto
hillside
drain backfill not compacted
pipe obstructing drain
Source: Hui, Sun, and Ho 2007. Reproduced with permission of the Head of the Geotechnical Engineering Office and the Director of the Civil Engineering Department, Hong Kong SAR, China.
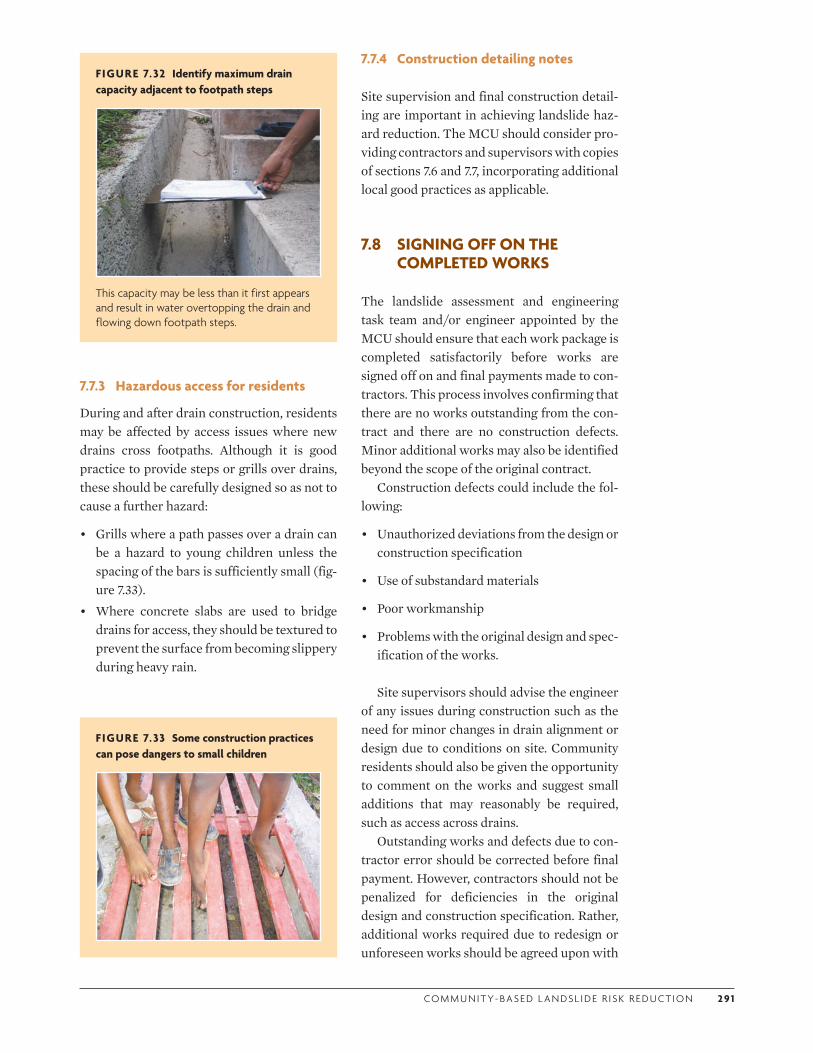
CO M M U N I T Y- BA S E D L A N DS L I D E R I S K R E D U CT I O N 2 9 1
F IGURE 7.32 Identify maximum drain capacity adjacent to footpath steps
This capacity may be less than it first appears and result in water overtopping the drain and flowing down footpath steps.
7.7.4 Construction detailing notes
Site supervision and final construction detail-ing are important in achieving landslide haz-ard reduction. The MCU should consider pro-viding contractors and supervisors with copies of sections 7.6 and 7.7, incorporating additional local good practices as applicable.
7.8 SIGNING OFF ON THE COMPLETED WORKS
The landslide assessment and engineering task team and/or engineer appointed by the MCU should ensure that each work package is completed satisfactorily before works are signed off on and final payments made to con-tractors. This process involves confirming that there are no works outstanding from the con-tract and there are no construction defects. Minor additional works may also be identified beyond the scope of the original contract.
Construction defects could include the fol-lowing:
• Unauthorized deviations from the design or construction specification
• Use of substandard materials
• Poor workmanship
• Problems with the original design and spec-ification of the works.
Site supervisors should advise the engineer of any issues during construction such as the need for minor changes in drain alignment or design due to conditions on site. Community residents should also be given the opportunity to comment on the works and suggest small additions that may reasonably be required, such as access across drains.
Outstanding works and defects due to con-tractor error should be corrected before final payment. However, contractors should not be penalized for deficiencies in the original design and construction specification. Rather, additional works required due to redesign or unforeseen works should be agreed upon with
7.7.3 Hazardous access for residents
During and after drain construction, residents may be affected by access issues where new drains cross footpaths. Although it is good practice to provide steps or grills over drains, these should be carefully designed so as not to cause a further hazard:
• Grills where a path passes over a drain can be a hazard to young children unless the spacing of the bars is sufficiently small (fig-ure 7.33).
• Where concrete slabs are used to bridge drains for access, they should be textured to prevent the surface from becoming slippery during heavy rain.
FIGURE 7.33 Some construction practices can pose dangers to small children
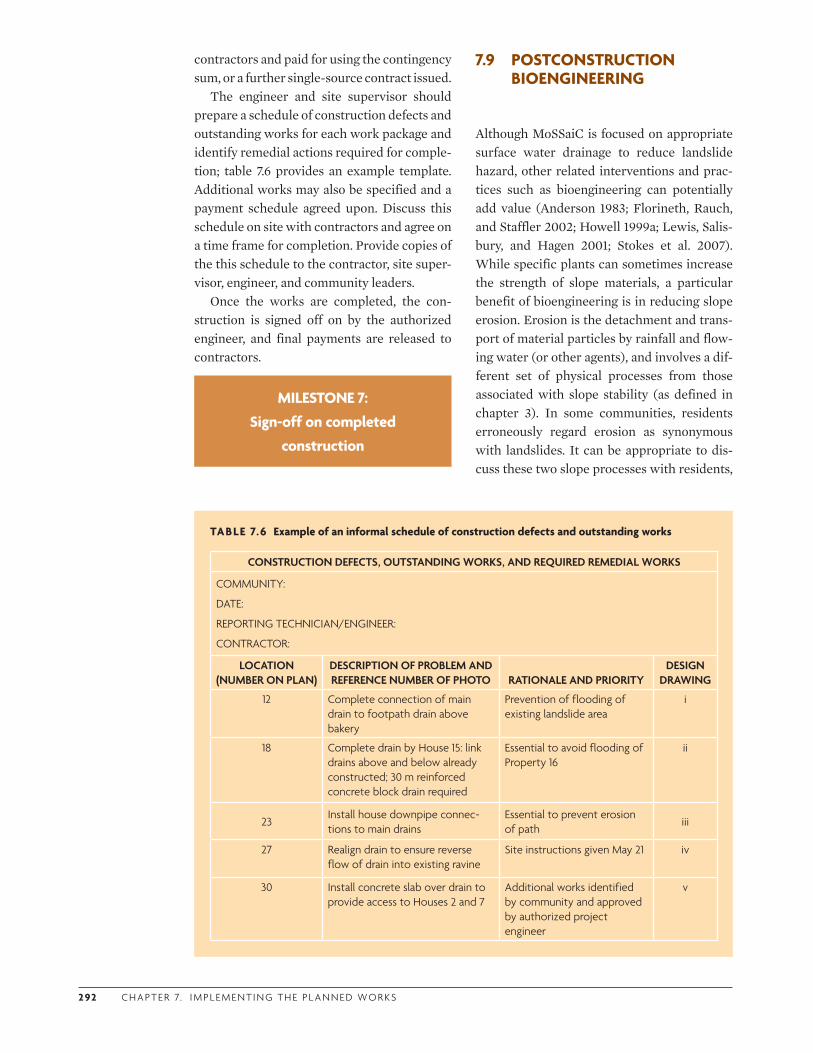
2 92 C H A P T E R 7. I M P L E M E N T I N G T H E P L A N N E D WO R K S
contractors and paid for using the contingency sum, or a further single-source contract issued.
The engineer and site supervisor should prepare a schedule of construction defects and outstanding works for each work package and identify remedial actions required for comple-tion; table 7.6 provides an example template. Additional works may also be specified and a payment schedule agreed upon. Discuss this schedule on site with contractors and agree on a time frame for completion. Provide copies of the this schedule to the contractor, site super-visor, engineer, and community leaders.
Once the works are completed, the con-struction is signed off on by the authorized engineer, and final payments are released to contractors.
MILESTONE 7: Sign-off on completed
construction
7.9 POSTCONSTRUCTION BIOENGINEERING
Although MoSSaiC is focused on appropriate surface water drainage to reduce landslide hazard, other related interventions and prac-tices such as bioengineering can potentially add value (Anderson 1983; Florineth, Rauch, and Staffler 2002; Howell 1999a; Lewis, Salis-bury, and Hagen 2001; Stokes et al. 2007). While specific plants can sometimes increase the strength of slope materials, a particular benefit of bioengineering is in reducing slope erosion. Erosion is the detachment and trans-port of material particles by rainfall and flow-ing water (or other agents), and involves a dif-ferent set of physical processes from those associated with slope stability (as defined in chapter 3). In some communities, residents erroneously regard erosion as synonymous with landslides. It can be appropriate to dis-cuss these two slope processes with residents,
TABLE 7.6 Example of an informal schedule of construction defects and outstanding works
CONSTRUCTION DEFECTS, OUTSTANDING WORKS, AND REQUIRED REMEDIAL WORKS
COMMUNITY:
DATE:
REPORTING TECHNICIAN/ENGINEER:
CONTRACTOR:
LOCATION(NUMBER ON PLAN)
DESCRIPTION OF PROBLEM AND REFERENCE NUMBER OF PHOTO RATIONALE AND PRIORITY
DESIGN DRAWING
12 Complete connection of main drain to footpath drain above bakery
Prevention of flooding of existing landslide area
i
18 Complete drain by House 15: link drains above and below already constructed; 30 m reinforced concrete block drain required
Essential to avoid flooding of Property 16
ii
23Install house downpipe connec-tions to main drains
Essential to prevent erosion of path
iii
27 Realign drain to ensure reverse flow of drain into existing ravine
Site instructions given May 21 iv
30 Install concrete slab over drain to provide access to Houses 2 and 7
Additional works identified by community and approved by authorized project engineer
v
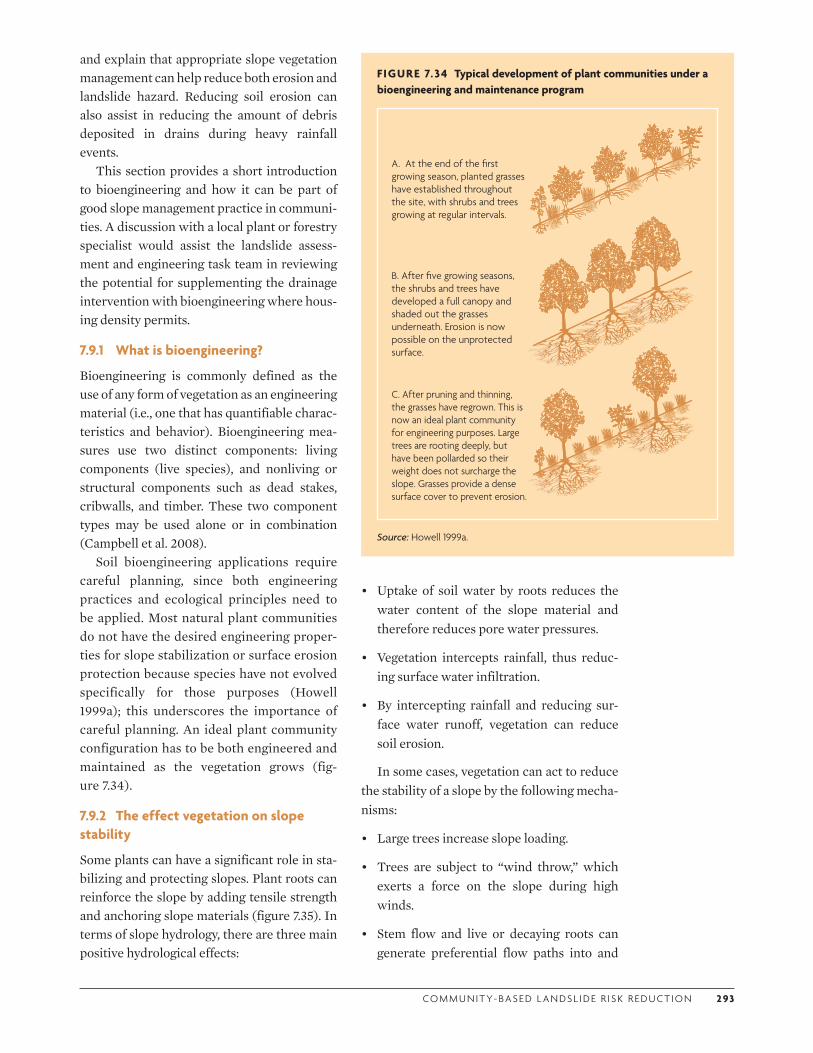
CO M M U N I T Y- BA S E D L A N DS L I D E R I S K R E D U CT I O N 2 93
and explain that appropriate slope vegetation management can help reduce both erosion and landslide hazard. Reducing soil erosion can also assist in reducing the amount of debris deposited in drains during heavy rainfall events.
This section provides a short introduction to bioengineering and how it can be part of good slope management practice in communi-ties. A discussion with a local plant or forestry specialist would assist the landslide assess-ment and engineering task team in reviewing the potential for supplementing the drainage intervention with bioengineering where hous-ing density permits.
7.9.1 What is bioengineering?
Bioengineering is commonly defined as the use of any form of vegetation as an engineering material (i.e., one that has quantifiable charac-teristics and behavior). Bioengineering mea-sures use two distinct components: living components (live species), and nonliving or structural components such as dead stakes, cribwalls, and timber. These two component types may be used alone or in combination (Campbell et al. 2008).
Soil bioengineering applications require careful planning, since both engineering practices and ecological principles need to be applied. Most natural plant communities do not have the desired engineering proper-ties for slope stabilization or surface erosion protection because species have not evolved specifically for those purposes (Howell 1999a); this underscores the importance of careful planning. An ideal plant community configuration has to be both engineered and maintained as the vegetation grows (fig-ure 7.34).
7.9.2 The effect vegetation on slope stability
Some plants can have a significant role in sta-bilizing and protecting slopes. Plant roots can reinforce the slope by adding tensile strength and anchoring slope materials (figure 7.35). In terms of slope hydrology, there are three main positive hydrological effects:
FIGURE 7.34 Typical development of plant communities under a bioengineering and maintenance program
A. At the end of the first growing season, planted grasses have established throughout the site, with shrubs and trees growing at regular intervals.
B. After five growing seasons, the shrubs and trees have developed a full canopy and shaded out the grasses underneath. Erosion is now possible on the unprotected surface.
C. After pruning and thinning, the grasses have regrown. This is now an ideal plant community for engineering purposes. Large trees are rooting deeply, but have been pollarded so their weight does not surcharge the slope. Grasses provide a dense surface cover to prevent erosion.
Source: Howell 1999a.
• Uptake of soil water by roots reduces the water content of the slope material and therefore reduces pore water pressures.
• Vegetation intercepts rainfall, thus reduc-ing surface water infiltration.
• By intercepting rainfall and reducing sur-face water runoff, vegetation can reduce soil erosion.
In some cases, vegetation can act to reduce the stability of a slope by the following mecha-nisms:
• Large trees increase slope loading.
• Trees are subject to “wind throw,” which exerts a force on the slope during high winds.
• Stem flow and live or decaying roots can generate preferential flow paths into and

2 9 4 C H A P T E R 7. I M P L E M E N T I N G T H E P L A N N E D WO R K S
within slope material (macropores), increasing the concentration of water in certain locations.
• Some cultivated species, such as banana and plantain, contribute to slope loading while developing only very limited root sys-tems.
There are acknowledged limitations to bio-engineering. Campbell et al. (2008, 13) sum-marize these: “although the benefits of vegeta-tion to prevent soil erosion are well established, its ability to stabilise slopes subject to shallow failures is less well proven, and certainly less well quantified.”
7.9.3 Vegetation and urban slope management
In areas of unauthorized housing, vegetation is commonly removed for house construction, potentially increasing landslide hazard and soil erosion. The slope may subsequently be kept clear of vegetation or planted with crops
that do not provide adequate stabilization or surface protection.
When considering bioengineering to sup-plement a MoSSaiC drainage intervention, talk to community residents about local vege-tation management practices, the removal of vegetation from slopes, whether they grow subsistence crops or crops to sell, and the ben-efits and disadvantages of different planting schemes. Involve local plant experts and engi-neers in identifying plants that have a positive effect on slope stability and provide protection from soil erosion.
Refer to studies and guidance notes on bio-engineering to inform the discussion on the most appropriate planting scheme for the community. Comprehensive processes for selecting bioengineering approaches are given by Howell (1999b; see table 7.7) and Campbell et al. (2008); major reviews of bioengineering practice can be found in Barker (1995), Camp-bell et al. (2008), Coppin and Richards (1990), and Gray and Sotir (1996); Wilkinson et al. (2002) provide modeling evidence of slope types for which vegetation increases or decreases landslide risk. It is beyond the scope of this book to provide species information or specific planting guidance, as local climatic conditions will play a significant role in this regard.
In many cases, grasses and shrubs may pro-vide a good bioengineering solution for com-munities. Some grass species, such as vetiver, have extensive root networks and can provide both soil strength and surface protection. They can also trap loose slope material and reduce sedimentation in surface drains. Grasses need significant sunlight to become established and will not easily survive in a community of other plants, so any shrubs and trees should be kept thinned and pruned for the grasses to continue to thrive. Because long grass can provide an ideal environment for insects, rats, and other pests in urban areas, due care and consider-ation are needed in planning their use in any community bioengineering intervention.
Figure 7.36 illustrates different vegetation covers for four slopes. Vegetation manage-
FIGURE 7.35 Lateral root spread
The extent of lateral root spread in this red cedar can help reinforce upper soil layers; species with a larger tap root would reinforce the slope at depth.
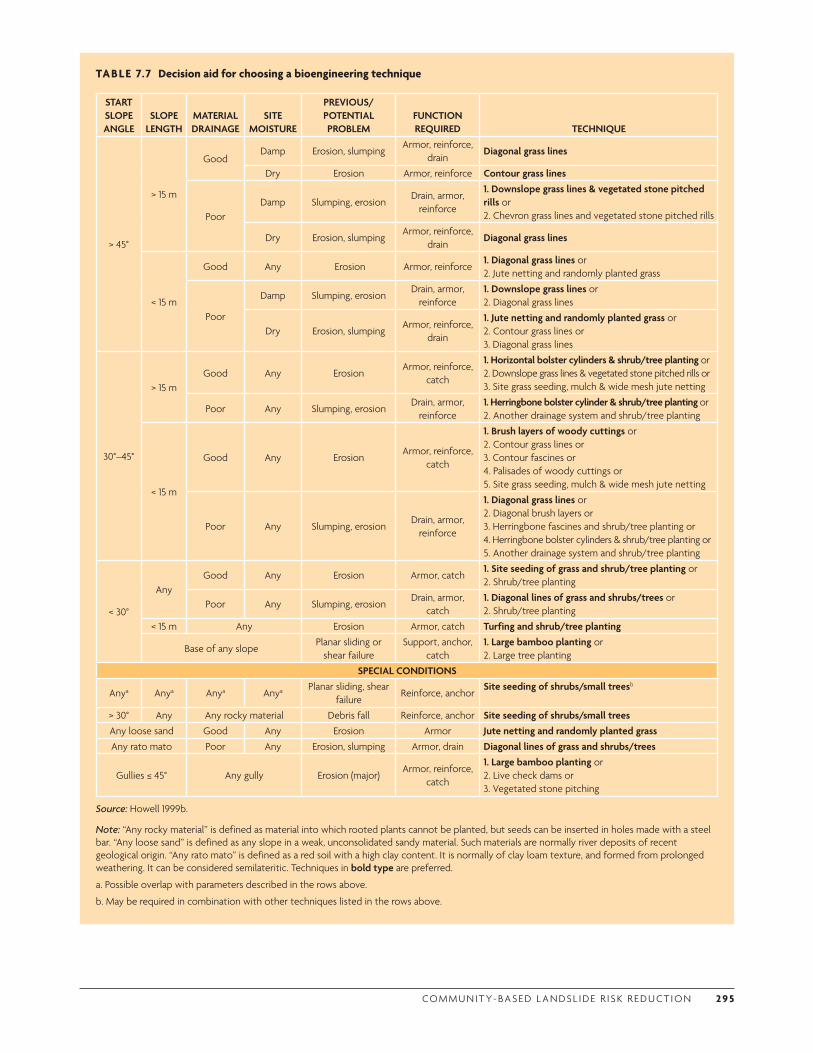
CO M M U N I T Y- BA S E D L A N DS L I D E R I S K R E D U CT I O N 2 9 5
TABLE 7.7 Decision aid for choosing a bioengineering technique
START SLOPE ANGLE
SLOPE LENGTH
MATERIAL DRAINAGE
SITE MOISTURE
PREVIOUS/POTENTIAL PROBLEM
FUNCTION REQUIRED TECHNIQUE
> 45°
> 15 m
GoodDamp Erosion, slumping
Armor, reinforce, drain
Diagonal grass lines
Dry Erosion Armor, reinforce Contour grass lines
PoorDamp Slumping, erosion
Drain, armor, reinforce
1. Downslope grass lines & vegetated stone pitched rills or 2. Chevron grass lines and vegetated stone pitched rills
Dry Erosion, slumpingArmor, reinforce,
drainDiagonal grass lines
< 15 m
Good Any Erosion Armor, reinforce1. Diagonal grass lines or2. Jute netting and randomly planted grass
Poor
Damp Slumping, erosionDrain, armor,
reinforce1. Downslope grass lines or 2. Diagonal grass lines
Dry Erosion, slumpingArmor, reinforce,
drain
1. Jute netting and randomly planted grass or2. Contour grass lines or3. Diagonal grass lines
30°–45°
> 15 mGood Any Erosion
Armor, reinforce, catch
1. Horizontal bolster cylinders & shrub/tree planting or2. Downslope grass lines & vegetated stone pitched rills or3. Site grass seeding, mulch & wide mesh jute netting
Poor Any Slumping, erosionDrain, armor,
reinforce1. Herringbone bolster cylinder & shrub/tree planting or2. Another drainage system and shrub/tree planting
< 15 m
Good Any ErosionArmor, reinforce,
catch
1. Brush layers of woody cuttings or2. Contour grass lines or3. Contour fascines or4. Palisades of woody cuttings or5. Site grass seeding, mulch & wide mesh jute netting
Poor Any Slumping, erosionDrain, armor,
reinforce
1. Diagonal grass lines or 2. Diagonal brush layers or3. Herringbone fascines and shrub/tree planting or4. Herringbone bolster cylinders & shrub/tree planting or5. Another drainage system and shrub/tree planting
< 30°
AnyGood Any Erosion Armor, catch
1. Site seeding of grass and shrub/tree planting or2. Shrub/tree planting
Poor Any Slumping, erosionDrain, armor,
catch1. Diagonal lines of grass and shrubs/trees or2. Shrub/tree planting
< 15 m Any Erosion Armor, catch Turfing and shrub/tree planting
Base of any slopePlanar sliding or
shear failureSupport, anchor,
catch1. Large bamboo planting or2. Large tree planting
SPECIAL CONDITIONS
Anya Anya Anya Anya Planar sliding, shear failure
Reinforce, anchorSite seeding of shrubs/small treesb
> 30° Any Any rocky material Debris fall Reinforce, anchor Site seeding of shrubs/small treesAny loose sand Good Any Erosion Armor Jute netting and randomly planted grassAny rato mato Poor Any Erosion, slumping Armor, drain Diagonal lines of grass and shrubs/trees
Gullies ≤ 45° Any gully Erosion (major)Armor, reinforce,
catch
1. Large bamboo planting or2. Live check dams or3. Vegetated stone pitching
Source: Howell 1999b.
Note: “Any rocky material” is defined as material into which rooted plants cannot be planted, but seeds can be inserted in holes made with a steel bar. “Any loose sand” is defined as any slope in a weak, unconsolidated sandy material. Such materials are normally river deposits of recent geological origin. “Any rato mato” is defined as a red soil with a high clay content. It is normally of clay loam texture, and formed from prolonged weathering. It can be considered semilateritic. Techniques in bold type are preferred.
a. Possible overlap with parameters described in the rows above.
b. May be required in combination with other techniques listed in the rows above.
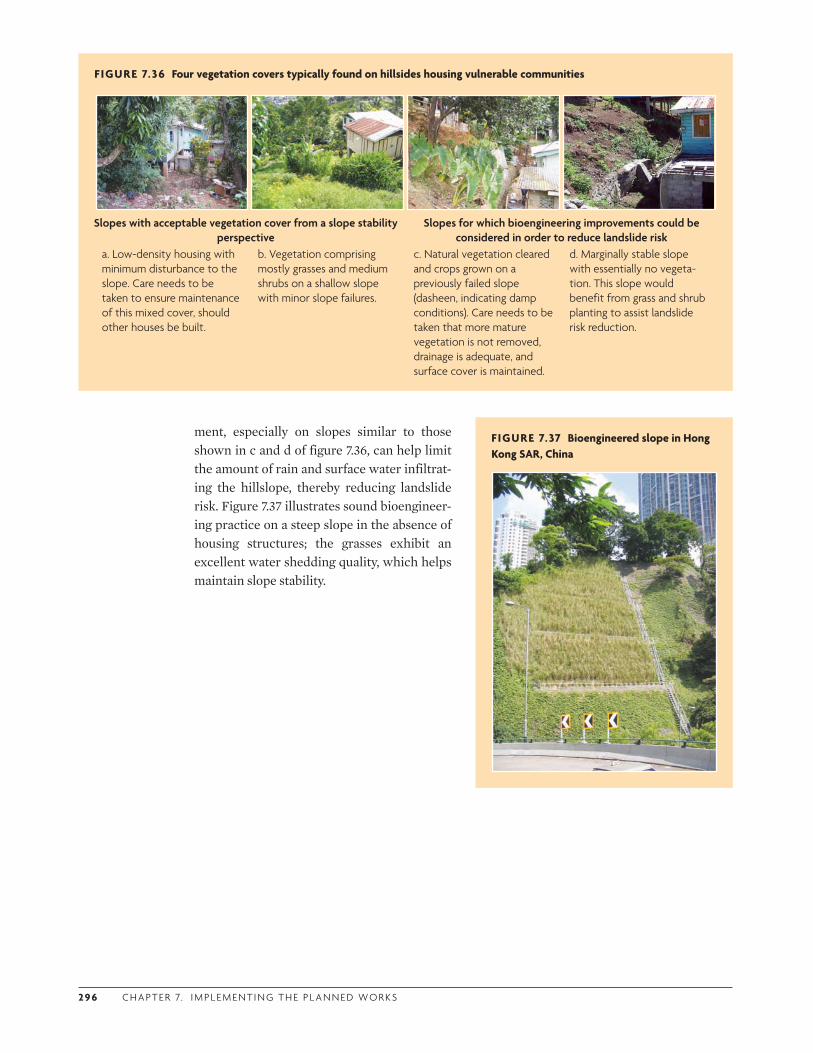
2 9 6 C H A P T E R 7. I M P L E M E N T I N G T H E P L A N N E D WO R K S
FIGURE 7.37 Bioengineered slope in Hong Kong SAR, China
ment, especially on slopes similar to those shown in c and d of figure 7.36, can help limit the amount of rain and surface water infiltrat-ing the hillslope, thereby reducing landslide risk. Figure 7.37 illustrates sound bioengineer-ing practice on a steep slope in the absence of housing structures; the grasses exhibit an excellent water shedding quality, which helps maintain slope stability.
FIGURE 7.36 Four vegetation covers typically found on hillsides housing vulnerable communities
Slopes with acceptable vegetation cover from a slope stability perspective
Slopes for which bioengineering improvements could be considered in order to reduce landslide risk
a. Low-density housing with minimum disturbance to the slope. Care needs to be taken to ensure maintenance of this mixed cover, should other houses be built.
b. Vegetation comprising mostly grasses and medium shrubs on a shallow slope with minor slope failures.
c. Natural vegetation cleared and crops grown on a previously failed slope (dasheen, indicating damp conditions). Care needs to be taken that more mature vegetation is not removed, drainage is adequate, and surface cover is maintained.
d. Marginally stable slope with essentially no vegeta-tion. This slope would benefit from grass and shrub planting to assist landslide risk reduction.

CO M M U N I T Y- BA S E D L A N DS L I D E R I S K R E D U CT I O N 2 9 7
TEAM RESPONSIBILITY ACTIONS AND HELPFUL HINTSCHAPTER SECTION
MCU
Confirm community contracting approach for implementation of the drainage works
•Define and facilitate an appropriate contracting approach in accordance with funder/government procurement requirements and government/community capacity
7.2
Ensure that processes for procure-ment of works and materials and standards for construction meet funder/government requirements
•Define and facilitate the tendering process • Identify appropriate work package size (value) •Authorize an engineer and/or quantity surveyor to prepare work
package specifications and be responsible for signing off on completed works
7.3; 7.4; 7.8
Ensure that adequate site supervision processes are in place
• Select a committed site supervisorHelpful hint: This is a pivotal role in construction quality, so choose a committed person is likely to be respected by contractors and community/government task team members.
7.5.1
Coordinate with government task teams
Government task teams
Prepare work packages
• Prepare a specified bill of quantities for the planned works and a plan for procurement of materials• Identify work packages according to contract size and number
agreed with the MCU•Create RFT documents
7.3
Issue RFTs and brief potential contractors on required works, good practices, and safeguards
•Hold briefing meeting with potential contractors and provide guidance and assistance with tendering process
7.4.1; 7.4.2
Facilitate the tender evaluation and contract award in accordance with selected community contracting approach
•Adhere to tendering procedures, ensuring transparencyHelpful hint: Typically, more contractors will want work than can be employed. Try to ensure that the contracting process is as positive as possible for all potential contractors.
7.4.3
Facilitate site supervision and communication among community residents, contractors, and government task teams
• Provide training for site supervisors • Ensure day-to-day presence of supervisor on site to deliver
good-quality works
7.5; 7.6; 7.7
Coordinate with community task teams
Sign off on completed construction
• Ensure comprehensive snagging is recorded and completed prior to sign-off
Helpful hint: Spend time on site with government task team members and key residents to ensure, as far as possible, that all snagging is identified and competed. Once the project has been closed, contractor remobilization even for small tasks can be time consuming.
7.8
Community task teams
Coordinate with the MCU and government task teams on the community contracting process
• Participate in agreed-upon community contracting process 7.2
Understand the planned works, good construction practices, appropriate safeguards, and tender for works
•Attend briefing by government task teams on scope of work packages, good construction practices, and safeguards • Submit tenders for work packages
7.4
Implement contracted works
•Construct drains and install household roof water and gray water connections•Adhere to site supervision and good practice guidelinesHelpful hint: Avoid material waste (and consequent income loss) by following design specifications and not overconstructing—seek advice from the site supervisor on details that require on-site design decisions.
7.5; 7.6; 7.7
Complete construction to required specifications
•Address construction defects and complete any outstanding works to the satisfaction of the authorized project engineer
7.8
Coordinate with government task teams
7.10 RESOURCES
7.10.1 Who does what

2 9 8 C H A P T E R 7. I M P L E M E N T I N G T H E P L A N N E D WO R K S
FIGURE 7.38 Choosing a debris trap location
7.10.2 Chapter checklist
7.10.3 Low-cost appropriate construction methods
Debris trap construction
The following method can be used to con-struct a low-cost debris trap suitable for instal-lation in modest-sized, well-maintained drains in vulnerable communities.
1. Choose a location for the debris trap that can be easily accessed for debris removal (figure 7.38).
2. Acquire reinforcing rods, an angle iron, and all necessary welding equipment.
3. Mark the location and angle of the trap against the drain side walls; measure and cut the angle iron on which the trap grill will rest.
4. Drill holes in the drain sidewalls to place reinforcing rods that will support the angle iron.
5. Cut the reinforcing rods to fit the depth of the holes and the angle iron width. Cut vertical and horizontal reinforcement bars to length.
6. Position all vertical reinforcement bars and weld in position (figure 7.39). Weld the handle so the finished trap can be easily removed by sliding up the angle iron; this will make it easier to maintain the drain not just upstream of the trap, but also in the culvert under the footpath as necessary.
CHECK THAT: TEAM PERSONSIGN-OFF
CHAPTER SECTION
A specified bill of quantities and a plan for procurement of materials have been completed
7.2; 7.3.3
A specified bill of quantities and a plan for procurement of materials have been completed
7.3
Work packages and request for tender documents have been drawn up and potential contractors briefed on how to tender
7.3.5; 7.4
Contract details include construction specifications and design drawings, and adequate provision for mobilization and contingencies
7.3
A site supervisor has been selected and trained, and contractors briefed on good construction practice
7.5; 7.6; 7.7
A schedule of construction defects and outstanding works has been drawn up and acted on
7.8
Milestone 7: Sign-off on completed construction 7.8
All necessary safeguards complied with1.5.3; 2.3.2,
7.10.4
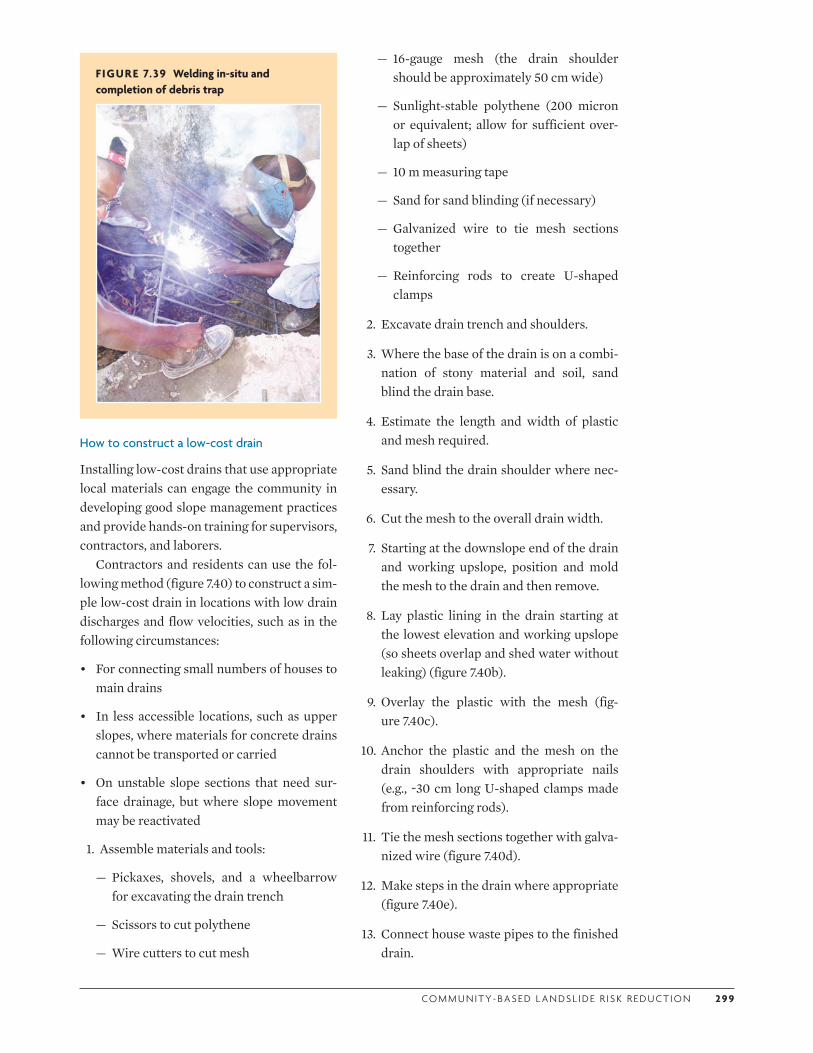
CO M M U N I T Y- BA S E D L A N DS L I D E R I S K R E D U CT I O N 2 9 9
— 16-gauge mesh (the drain shoulder should be approximately 50 cm wide)
— Sunlight-stable polythene (200 micron or equivalent; allow for sufficient over-lap of sheets)
— 10 m measuring tape
— Sand for sand blinding (if necessary)
— Galvanized wire to tie mesh sections together
— Reinforcing rods to create U-shaped clamps
2. Excavate drain trench and shoulders.
3. Where the base of the drain is on a combi-nation of stony material and soil, sand blind the drain base.
4. Estimate the length and width of plastic and mesh required.
5. Sand blind the drain shoulder where nec-essary.
6. Cut the mesh to the overall drain width.
7. Starting at the downslope end of the drain and working upslope, position and mold the mesh to the drain and then remove.
8. Lay plastic lining in the drain starting at the lowest elevation and working upslope (so sheets overlap and shed water without leaking) (figure 7.40b).
9. Overlay the plastic with the mesh (fig-ure 7.40c).
10. Anchor the plastic and the mesh on the drain shoulders with appropriate nails (e.g., ~30 cm long U-shaped clamps made from reinforcing rods).
11. Tie the mesh sections together with galva-nized wire (figure 7.40d).
12. Make steps in the drain where appropriate (figure 7.40e).
13. Connect house waste pipes to the finished drain.
How to construct a low-cost drain
Installing low-cost drains that use appropriate local materials can engage the community in developing good slope management practices and provide hands-on training for supervisors, contractors, and laborers.
Contractors and residents can use the fol-lowing method (figure 7.40) to construct a sim-ple low-cost drain in locations with low drain discharges and flow velocities, such as in the following circumstances:
• For connecting small numbers of houses to main drains
• In less accessible locations, such as upper slopes, where materials for concrete drains cannot be transported or carried
• On unstable slope sections that need sur-face drainage, but where slope movement may be reactivated
1. Assemble materials and tools:
— Pickaxes, shovels, and a wheelbarrow for excavating the drain trench
— Scissors to cut polythene
— Wire cutters to cut mesh
FIGURE 7.39 Welding in-situ and completion of debris trap
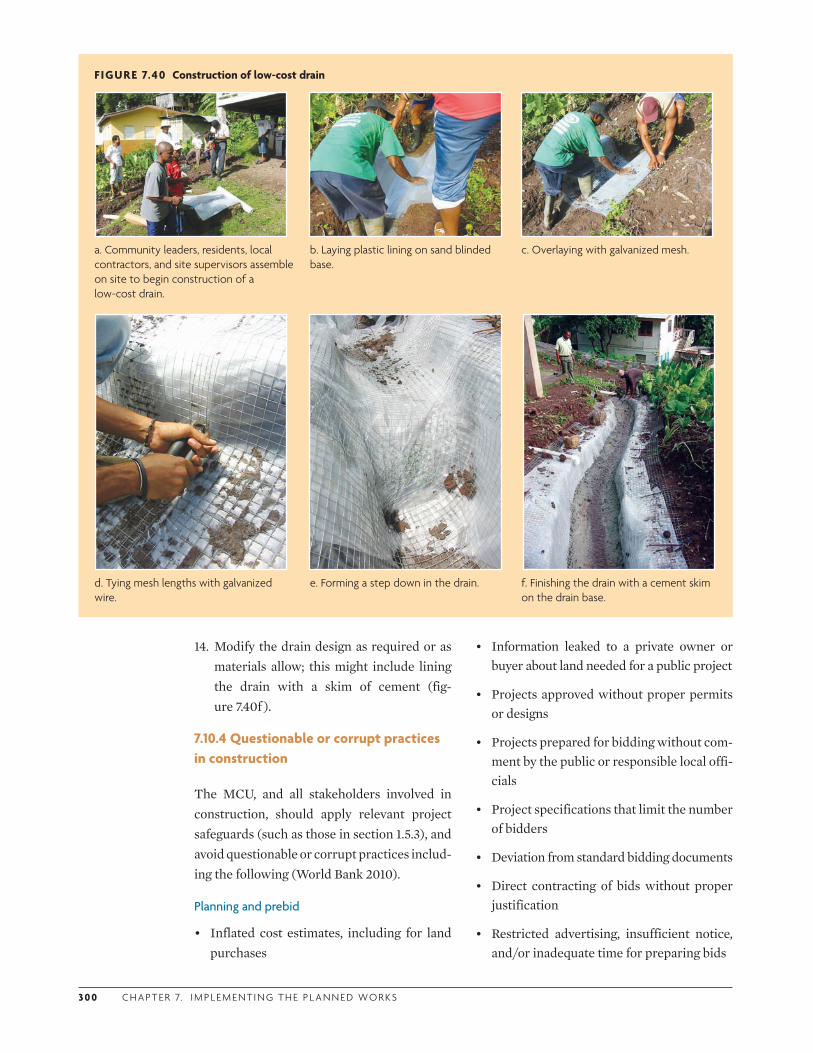
3 0 0 C H A P T E R 7. I M P L E M E N T I N G T H E P L A N N E D WO R K S
14. Modify the drain design as required or as materials allow; this might include lining the drain with a skim of cement (fig-ure 7.40f ).
7.10.4 Questionable or corrupt practices in construction
The MCU, and all stakeholders involved in construction, should apply relevant project safeguards (such as those in section 1.5.3), and avoid questionable or corrupt practices includ-ing the following (World Bank 2010).
Planning and prebid
• Inflated cost estimates, including for land purchases
• Information leaked to a private owner or buyer about land needed for a public project
• Projects approved without proper permits or designs
• Projects prepared for bidding without com-ment by the public or responsible local offi-cials
• Project specifications that limit the number of bidders
• Deviation from standard bidding documents
• Direct contracting of bids without proper justification
• Restricted advertising, insufficient notice, and/or inadequate time for preparing bids
FIGURE 7.40 Construction of low-cost drain
a. Community leaders, residents, local contractors, and site supervisors assemble on site to begin construction of a low-cost drain.
b. Laying plastic lining on sand blinded base.
c. Overlaying with galvanized mesh.
d. Tying mesh lengths with galvanized wire.
e. Forming a step down in the drain. f. Finishing the drain with a cement skim on the drain base.
CO M M U N I T Y- BA S E D L A N DS L I D E R I S K R E D U CT I O N 3 0 1
• Advance release of bid information to one bidder
• Bids accepted after the submission deadline
Contract award and project implementation
• Bid evaluation committee has conflict-of-interest ties with bidders
• Amending evaluation criteria after receipt of bids
• Company presenting competing bids
• Government allowing bid evaluation report to be revised or reissued
• Government imposing subcontracting requirements on prime contractor
• Staff members involved in contract award participating in contract supervision
• Contract variations and change orders approved without proper verification
• Contractor claims for costs beyond the common labor cost raise and inflation rates
• Materials and equipment used and work-manship not as specified; paperwork not consistent with items delivered
• Contractors providing false information to project inspectors on progress of work, or inspectors coerced to approve progress payments or certify compliance with build-ing permits
• Inaccurate as-built drawings presented or accepted
Monitoring
• Staff responsible for oversight have con-flicts of interest
• Control systems are inadequate, unreliable, or inconsistently applied
• No follow-up undertaken regarding indica-tions, suspicion, or accusations of corrup-tion
• Lack of confidentiality on accusations of corruption
• Delayed or superficial evaluation; delayed publication of evaluation report
• Failure to disqualify companies impugned in evaluation reports
7.10.5 References
Alwi, S., K. Hampson, and S. Mohamed. 1999. “Investigation into the Relationship between Rework and Site Supervision in High Rise Building Construction in Indonesia.” In Proceedings of the 2nd International Conference on Construction Process Reengineering, 189–95. July, Sydney. http://eprints.qut.edu.au/4161/1/4161_1.pdf.
Anderson, M. G. 1983. “The Prediction of Soil Suction for Slopes in Hong Kong.” CE3/81, Geotechnical Control Office, Hong Kong Government.
Barker, D. H., ed. 1995. Vegetation and Slopes: Stabilisation, Protection and Ecology. London: Thomas Telford Publishing.
Campbell, S. D. G., R. Shaw, R. J. Sewell, and J. C. F. Wong. 2008. “Guidelines for Soil Bioengineering Applications on Natural Terrain Landslide Scars.” GEO Report 227, Geotechnical Engineering Office, Government of Hong Kong Special Administrative Region.
Coppin, N. J., and I. G. Richards. 1990. Use of Vegetation in Civil Engineering. London: CIRIA/Butterworths.
de Silva, S., 2000. Community-Based Contracting: A Review of Stakeholder Experience. Washington, DC: World Bank.
Florineth, F., H. P. Rauch, and H. P. Staffler. 2002. “Stabilization of Landslides with Bio-Engineering Measures in South Tyrol/Italy and Thankot/Nepal.” In INTERPRAEVENT 2002 in the Pacific Rim, 2002, Matsumoto/Japan, vol. 2, 827–37. Matsumoto, Japan.
Gray, D. H., and R. B. Sotir. 1996. Biotechnical and Bioengineering Slope Stabilisation: A Practical Guide for Erosion Control. New York: Wiley.
Howell, J. 1999a. “Roadside Bio-Engineering—Reference Manual.” Department of Roads, Government of Nepal.
Howell, J. 1999b. “Roadside Bio-Engineering—Site Handbook.” Department of Roads, Government of Nepal.
Hui, T. H. H., H. W. Sun, and K. K. S. Ho. 2007. “Review of Slope Surface Drainage with
3 02 C H A P T E R 7. I M P L E M E N T I N G T H E P L A N N E D WO R K S
Reference to Landslide Studies and Current Practice.” GEO Report 210, Geotechnical Engineering Office, Government of Hong Kong Special Administrative Region.
Larcher, P. 1999. “Construction: Is There a Place for Small-Scale Contracting Enterprises?” Urban Forum 10: 75–89.
Lewis, L., S. L. Salisbury, and S. Hagen. 2001. “Soil Bioengineering for Upland Slope Stabilization.” Washington State Transportation Center, University of Washington. http://www.wsdot.wa.gov/eesc/cae/design/roadside/rm.htm.
Nordberg, R. 1999. “Building Sustainable Cities.” International Union for Housing Finance. http://www.housingfinance.org/publications/others-publications.
Ogunlana, S. O., and K. Butt. 2000. “Construction Project Cost Feedback in Developing Economies: The Case of Pakistan.” http://www.irb.fraunhofer.de/CIBlibrary/search-quick-result-list.jsp?A&idSuche=CIB+DC8938.
Sohail, M., and A. N. Baldwin. 2004. “Community-Partnered Contracts in Developing Countries.” Proceedings of the Institution of Civil
Engineers—Engineering Sustainability 157(4): 193 –201.
Stokes, A., J. Spanos, J. E. Norris, and E. Cammeratt, eds. 2007. Eco- and Ground Bio-Engineering: The Use of Vegetation to Improve Slope Stability. Proceedings of the First International Conference on Eco-Engineering. Developments in Plant and Soil Science vol. 103. Dordrecht, the Netherlands: Springer. http://www.springerlink.com/content/978-1-4020-5592-8/#section=291629&page=1.
Wideman, M. 2012. “Project Management of Capital Projects—An Overview.” http://www.maxwideman.com/papers/capitalprojects/breakdown.htm.
Wilkinson, P. L., M. G. Anderson, D. M. Lloyd, and J. P. Renaud. 2002. “Landslide Hazard and Bioengineering: Towards Providing Improved Decision Support through Integrated Model Development.” Environmental Modelling and Software 7: 333–44.
World Bank. 2010. Safer Homes, Stronger Communities. A Handbook for Reconstructing after Natural Disasters. Washington, DC: World Bank.

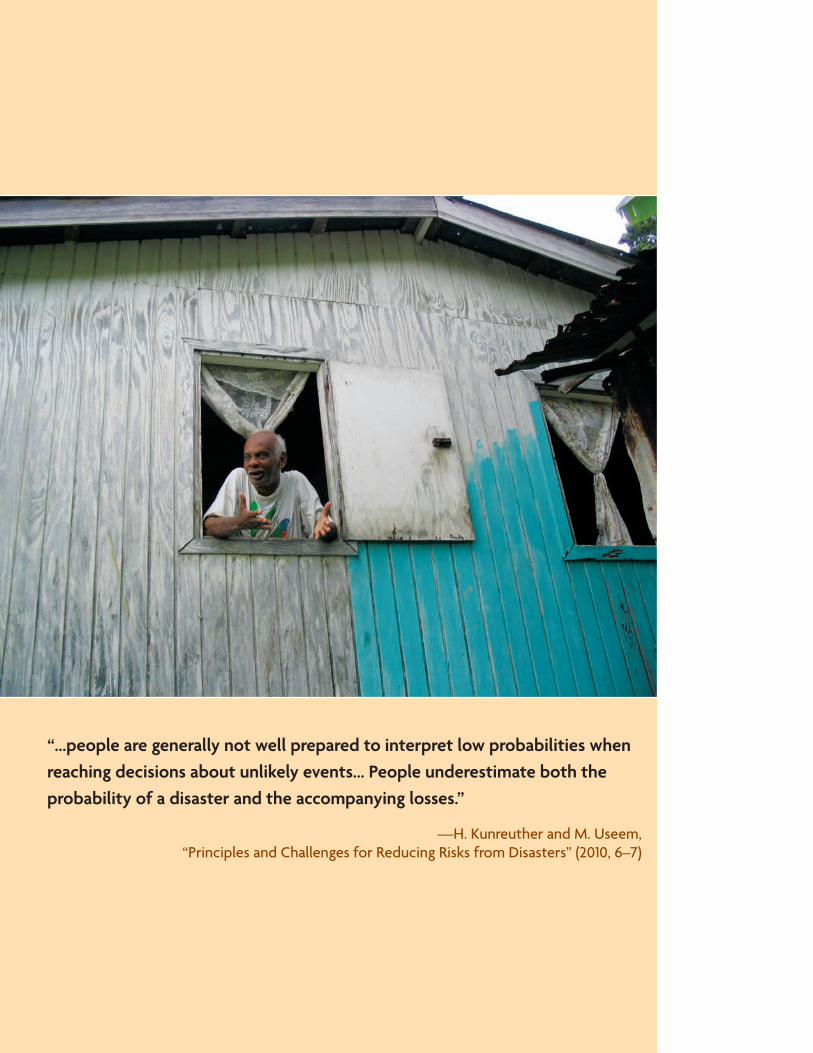
“…people are generally not well prepared to interpret low probabilities when reaching decisions about unlikely events… People underestimate both the probability of a disaster and the accompanying losses.”
—H. Kunreuther and M. Useem, “Principles and Challenges for Reducing Risks from Disasters” (2010, 6–7)

3 0 5
CHAPTER 8
Encouraging Behavioral Change
8.1 KEY CHAPTER ELEMENTS
8.1.1 Coverage
This chapter presents communication and capacity-building strategies for achieving behav-ioral change in MoSSaiC (Management of Slope
Stability in Communities) landslide hazard reduction practice and policy. The listed groups should read the indicated chapter sections.
AUDIENCE
LEARNINGCHAPTER SECTIONF M G C
Steps involved in behavioral change 8.3
How learning by doing can build capacity 8.3
Ways to communicate 8.4; 8.5
Ways of building local capacity 8.6
Postproject maintenance options 8.7.1
Mapping the behavioral change strategy 8.7.2
F = funders and policy makers M = MoSSaiC core unit: government project managers and experts G = government task teams: experts and practitioners C = community task teams: residents, leaders, contractors
8.1.2 Documents
DOCUMENT TO BE PRODUCEDCHAPTER SECTION
Communication strategy 8.5
Capacity-building strategy 8.6
Behavioral change strategy 8.7.2
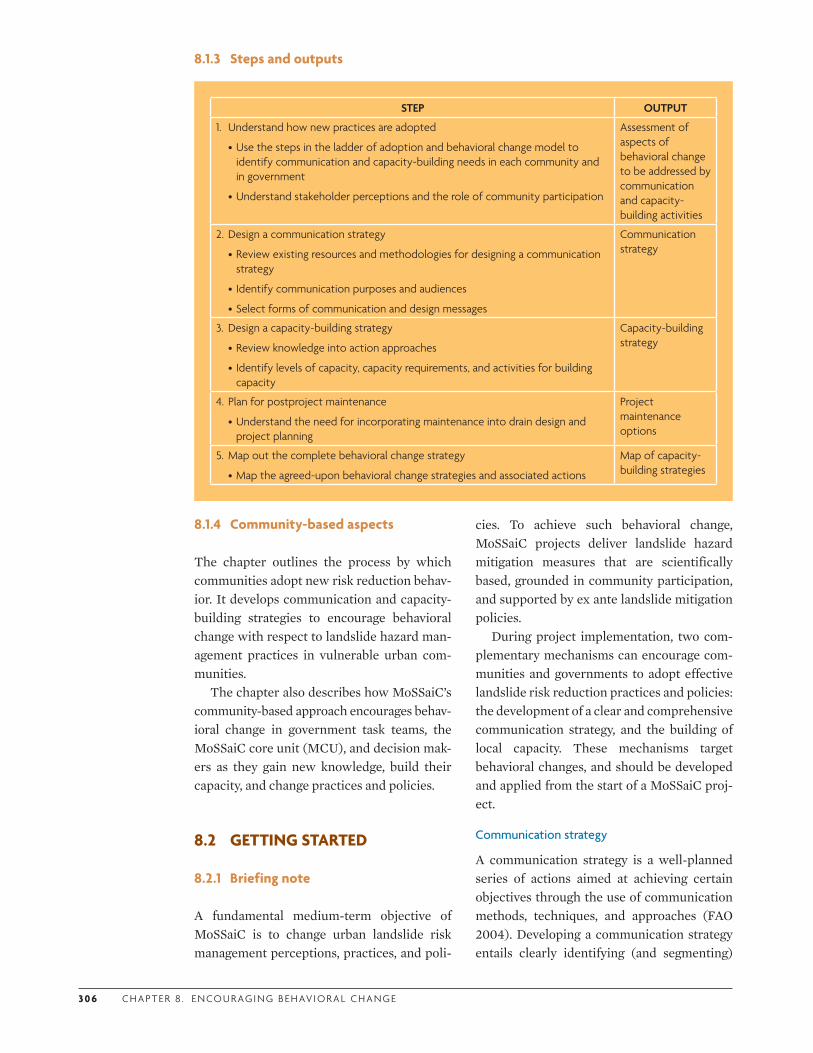
3 0 6 C H A P T E R 8 . E N CO U R AG I N G B E H AV I O R A L C H A N G E
8.1.3 Steps and outputs
8.1.4 Community-based aspects
The chapter outlines the process by which communities adopt new risk reduction behav-ior. It develops communication and capacity-building strategies to encourage behavioral change with respect to landslide hazard man-agement practices in vulnerable urban com-munities.
The chapter also describes how MoSSaiC’s community-based approach encourages behav-ioral change in government task teams, the MoSSaiC core unit (MCU), and decision mak-ers as they gain new knowledge, build their capacity, and change practices and policies.
8.2 GETTING STARTED
8.2.1 Briefing note
A fundamental medium-term objective of MoSSaiC is to change urban landslide risk management perceptions, practices, and poli-
cies. To achieve such behavioral change, MoSSaiC projects deliver landslide hazard mitigation measures that are scientifically based, grounded in community participation, and supported by ex ante landslide mitigation policies.
During project implementation, two com-plementary mechanisms can encourage com-munities and governments to adopt effective landslide risk reduction practices and policies: the development of a clear and comprehensive communication strategy, and the building of local capacity. These mechanisms target behavioral changes, and should be developed and applied from the start of a MoSSaiC proj-ect.
Communication strategy
A communication strategy is a well-planned series of actions aimed at achieving certain objectives through the use of communication methods, techniques, and approaches (FAO 2004). Developing a communication strategy entails clearly identifying (and segmenting)
STEP OUTPUT
1. Understand how new practices are adopted
•Use the steps in the ladder of adoption and behavioral change model to identify communication and capacity-building needs in each community and in government
•Understand stakeholder perceptions and the role of community participation
Assessment of aspects of behavioral change to be addressed by communication and capacity-building activities
2. Design a communication strategy
•Review existing resources and methodologies for designing a communication strategy
• Identify communication purposes and audiences
•Select forms of communication and design messages
Communication strategy
3. Design a capacity-building strategy
•Review knowledge into action approaches
• Identify levels of capacity, capacity requirements, and activities for building capacity
Capacity-building strategy
4. Plan for postproject maintenance
•Understand the need for incorporating maintenance into drain design and project planning
Project maintenance options
5. Map out the complete behavioral change strategy
•Map the agreed-upon behavioral change strategies and associated actions
Map of capacity-building strategies
CO M M U N I T Y- BA S E D L A N DS L I D E R I S K R E D U CT I O N 3 0 7
audiences, defining messages, determining the means of communication best suited to the local context, and integrating the strategy into the process of project implementation.
Communication strategies for disaster risk reduction (DRR) may explicitly address risk perception and understanding in order to encourage a change in risk reduction behavior. However, “concern does not mean under-standing, and under standing does not neces-sarily lead to action” (World Bank 2010). Com-munication strategies should thus be developed and applied in conjunction with other behavioral change strategies such as community participation and empowerment (Paton 2003). In community participatory projects such as MoSSaiC, the communication strategy facilitates interaction among stake-holders and provides the common ground by which project objectives can be achieved (Bes-sette 2004).
Building capacity
DRR capacity building refers to actions that develop the skills and societal infrastructures within communities or organizations to reduce the level of disaster risk. These actions include training and education, public information, transferring technology or technical expertise, strengthening infrastructure, and enhancing organizational abilities (UNISDR 2004).
Capacity building and communication overlap in their aim to increase knowledge and change behavior. However, as already noted, DRR knowledge and technology do not auto-matically translate into action or increased capacity (Paton 2003). Capacity building should go beyond traditional approaches that emphasize education and training in the class-room, and include on-the-job learning and informal knowledge sharing (CADRI 2011).
MoSSaiC encourages a learning-by-doing approach to build the capacity of individuals, communities, and governments to understand and address rainfall-triggered landslide haz-ards. Learning by doing enables community and government teams to develop new knowl-edge, skills, and expertise as they implement the project.
8.2.2 Guiding principles
The following guiding principles apply in encouraging behavioral change:
• Recognize that it takes time and strategic implementation of MoSSaiC projects to start to change the landslide risk reduction behavior of communities and governments. Behavioral change involves changing per-ceptions, motivations, capabilities, and actions to enable new practices to be adopted. Communication and capacity-building strategies are an important part of the behavioral change process.
• Clearly communicate project messages to set expectations about the project scope, process, and outputs. These messages should be backed up by timely project deliv-ery to maintain trust among project stake-holders.
• Incorporate the communication strategy into the community participation process. The MCU and the government task teams should be aware of local social and cultural conditions and how their interactions with the community will be interpreted.
• Plan capacity-building activities that both translate new knowledge into action and action into new knowledge (learning by doing). This second, less formal, aspect of capacity building is a key part of MoSSaiC projects for communities and government teams.
• Project messages and new capabilities for landslide risk reduction can be lost with government staff turnover. The MCU should develop communication and capac-ity-building strategies for government task teams (as well as communities) to avoid project disruption due to staff turnover and to sustain new capacities over the long term.
• Policy champions are important in keeping landslide hazard mitigation on the govern-ment agenda. This support can provide a policy and funding environment for longer-
3 0 8 C H A P T E R 8 . E N CO U R AG I N G B E H AV I O R A L C H A N G E
term project continuity and behavioral change at both the community and govern-ment levels.
8.2.3 Risks and challenges
Risk perception
People generally underestimate the probabil-ity of disasters, the associated risks, and the accompanying losses. They also have a ten-dency to estimate risks based on their own experience rather than on information con-veyed by experts. One outcome is an overin-vestment in prevention after a disaster has occurred—prevention is then undertaken too late (Kunreuther and Useem 2010). Defining a sound communication strategy therefore requires an understanding of people’s percep-tions and behavioral biases.
Clear project messages
Having a clear set of project messages for stakeholders is essential. Community resi-dents, government task teams, decision mak-ers, funders, and the wider public will need to know about the MoSSaiC approach and proj-ect implementation process (such as project steps, time frames, roles and responsibilities, procurement, training, and maintenance) in varying levels of detail.
Messages for each audience need to be developed and delivered ahead of the time they will be needed so that they influence, rather than simply record, events. A lack of harmonized and clear communication may mean projects exhibit poor coordination, insufficient lesson learning, high rates of duplication, and poor integration with related projects in communities.
Timing of media reports
The local media can want a project news item before there is anything of substance to report. Additionally, unless there is clear communica-tion, expectations among those who pick up on project news items could run ahead of proj-ect delivery. It is critical to ensure that reported timelines are as accurate as possible when communicating with the media; correctly
answering such questions as “When is the project going to start?” is key.
Relevant forms of communication and capacity building
In reaching community residents and the wider public with project messages,
project managers should be wary of “one-size-fits-all” solutions that appear to solve all problems by using media products. Past experience indicates that unless such instru-ments are used in connection with other approaches and based on proper research, they seldom deliver the intended results (Mefalopulos 2008, 20).
Media such as TV, radio, newspaper articles, and static forms of awareness raising (posters, leaflets, and displays) should thus be com-bined with personal contact and community participation in a way that is locally appropri-ate.
Similarly, DRR capacity-building activities should be case specific and adapted to local conditions at three interrelated levels: individ-ual, organizational, and institutional/societal (the enabling environment) (CADRI 2011). For MoSSaiC projects, a combination of formal and informal activities should be designed to equip individuals, communities, government task teams, and the MCU to deliver landslide hazard reduction measures. At the level of the societal/institutional enabling environment, the aim should be to show that such measures both work and pay so as to provide an evidence base for changing broader landslide risk reduction practices and policies.
High staff turnover
While the MCU may interface with key gov-ernment officials and elected officials at the time of project initiation, there is every pros-pect that, through the project period, there could be significant turnover among the staff responsible for project delivery and those sup-porting the project indirectly. Personnel changes can result in loss of project owner-ship, understanding, and capacity as well as potentially delaying project delivery. The MCU should develop clear project messages
CO M M U N I T Y- BA S E D L A N DS L I D E R I S K R E D U CT I O N 3 0 9
and mechanisms for bringing new staff onboard and up to speed.
8.2.4 Adapting the chapter blueprint to existing capacity
Successful communication and capacity- building strategies for landslide hazard reduc-tion do not follow an easily specified formula but should be developed according to local conditions. Use the capacity guides from pre-vious chapters (each relating to a MoSSaiC project step) to identify the following:
• Critical points for communication among stakeholders during project implementa-tion
• Areas that need capacity building in order to deliver effective landslide hazard reduc-tion measures.
Use the matrix on the next page to assess existing capacity for delivering the necessary communication and capacity-building activi-ties.
1. Assign a capacity score from 1 to 3 (low to high) to reflect the existing capacity for each of the elements in the matrix’s left-hand column.
2. Identify the most common capacity score as an indicator of the overall capacity level.
3. Adapt the blueprint in this chapter in accor-dance with the overall capacity level (see guide on page 311).
8.3 ADOPTION OF CHANGE: FROM RISK PERCEPTION TO BEHAVIORAL CHANGE
MoSSaiC uses a combination of community and government teamwork, scientific meth-ods, and the delivery of hazard reduction mea-sures on the ground to reduce urban landslide risk (chapters 2–7). If it is to be sustainable, landslide risk reduction needs to be embedded in urban slope management practice and pol-icy by communities and governments. The
outcome should be reduced landslide hazard (physical mitigation measures) and increased resilience to landslide risk (awareness and avoidance, or mitigation, of future landslide hazards). Some specific aspects of behavior change associated with MoSSaiC follow.
• At the household level. Residents have greater confidence in adapting how they build on, drain, bioengineer, and maintain their part of the hillside, dedicating money and time to appropriate landslide mitiga-tion measures and slope management.
• At the community level. Communities rec-ognize the importance of drain mainte-nance in reducing landslide risk, and act on that recognition by advocating for, and becoming involved in, a postproject main-tenance strategy (section 8.7.1).
• At the government level. Practitioners and policy makers have a greater ability to address small-scale everyday landslide haz-ards, which reflect an accumulation of disaster risk, and anticipate the capacity to deal with medium- and large-scale land-slide events (Bull-Kamanga et al. 2003).
Use this section to understand how people adopt new risk reduction behavior and how two crosscutting issues—risk perception and the knowledge into action learning process—affect communication and capacity-building strategies for behavioral change.
8.3.1 The behavioral change process
UNICEF (2008, 1) notes
The global experience of the development community has demonstrated that Commu-nity-based Disaster Risk Reduction (CBDRR) efforts approached from a social and behav-iour change perspective ensure that the poorest, most vulnerable and marginalised communities understand the simple and practical actions required to protect lives and personal assets in the case of natural disas-ters.
The process of adopting innovation (behav-ioral change) can be seen as a series of steps in a “ladder of adoption” (Mefalopulos and Kam-
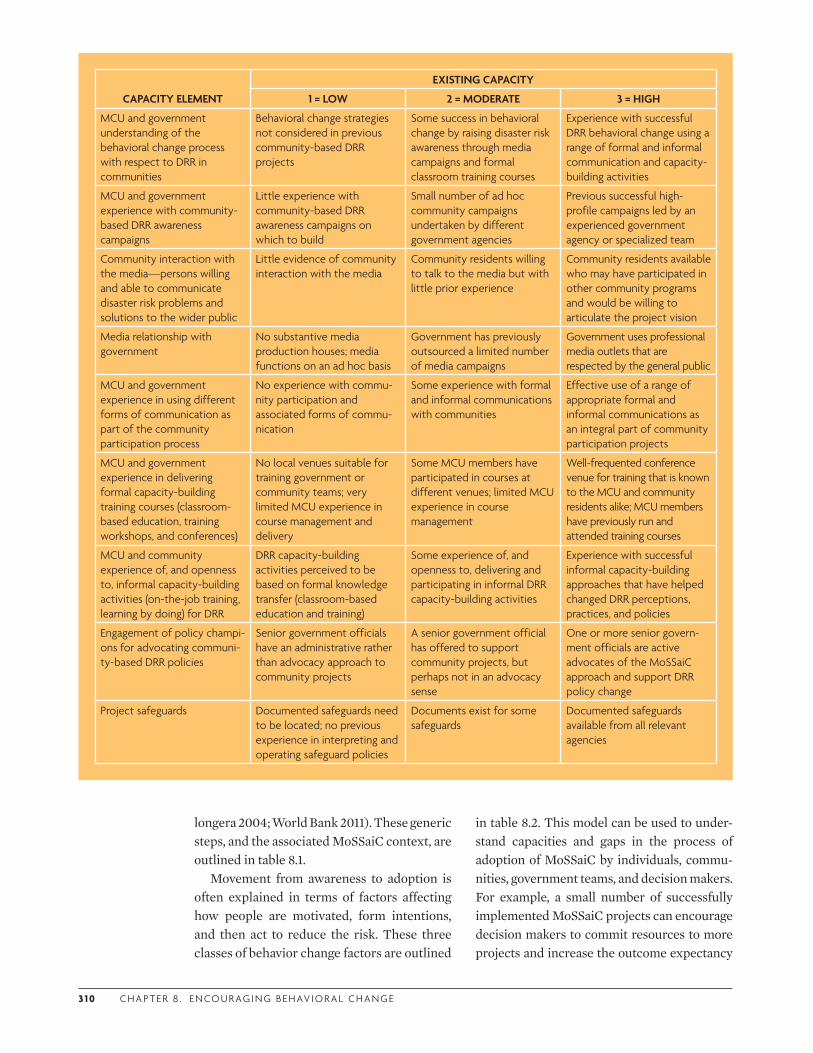
3 1 0 C H A P T E R 8 . E N CO U R AG I N G B E H AV I O R A L C H A N G E
longera 2004; World Bank 2011). These generic steps, and the associated MoSSaiC context, are outlined in table 8.1.
Movement from awareness to adoption is often explained in terms of factors affecting how people are motivated, form intentions, and then act to reduce the risk. These three classes of behavior change factors are outlined
in table 8.2. This model can be used to under-stand capacities and gaps in the process of adoption of MoSSaiC by individuals, commu-nities, government teams, and decision makers. For example, a small number of successfully implemented MoSSaiC projects can encourage decision makers to commit resources to more projects and increase the outcome expectancy
CAPACITY ELEMENT
EXISTING CAPACITY
1 = LOW 2 = MODERATE 3 = HIGH
MCU and government understanding of the behavioral change process with respect to DRR in communities
Behavioral change strategies not considered in previous community-based DRR projects
Some success in behavioral change by raising disaster risk awareness through media campaigns and formal classroom training courses
Experience with successful DRR behavioral change using a range of formal and informal communication and capacity-building activities
MCU and government experience with community-based DRR awareness campaigns
Little experience with community-based DRR awareness campaigns on which to build
Small number of ad hoc community campaigns undertaken by different government agencies
Previous successful high-profile campaigns led by an experienced government agency or specialized team
Community interaction with the media—persons willing and able to communicate disaster risk problems and solutions to the wider public
Little evidence of community interaction with the media
Community residents willing to talk to the media but with little prior experience
Community residents available who may have participated in other community programs and would be willing to articulate the project vision
Media relationship with government
No substantive media production houses; media functions on an ad hoc basis
Government has previously outsourced a limited number of media campaigns
Government uses professional media outlets that are respected by the general public
MCU and government experience in using different forms of communication as part of the community participation process
No experience with commu-nity participation and associated forms of commu-nication
Some experience with formal and informal communications with communities
Effective use of a range of appropriate formal and informal communications as an integral part of community participation projects
MCU and government experience in delivering formal capacity-building training courses (classroom-based education, training workshops, and conferences)
No local venues suitable for training government or community teams; very limited MCU experience in course management and delivery
Some MCU members have participated in courses at different venues; limited MCU experience in course management
Well-frequented conference venue for training that is known to the MCU and community residents alike; MCU members have previously run and attended training courses
MCU and community experience of, and openness to, informal capacity-building activities (on-the-job training, learning by doing) for DRR
DRR capacity-building activities perceived to be based on formal knowledge transfer (classroom-based education and training)
Some experience of, and openness to, delivering and participating in informal DRR capacity-building activities
Experience with successful informal capacity-building approaches that have helped changed DRR perceptions, practices, and policies
Engagement of policy champi-ons for advocating communi-ty-based DRR policies
Senior government officials have an administrative rather than advocacy approach to community projects
A senior government official has offered to support community projects, but perhaps not in an advocacy sense
One or more senior govern-ment officials are active advocates of the MoSSaiC approach and support DRR policy change
Project safeguards Documented safeguards need to be located; no previous experience in interpreting and operating safeguard policies
Documents exist for some safeguards
Documented safeguards available from all relevant agencies
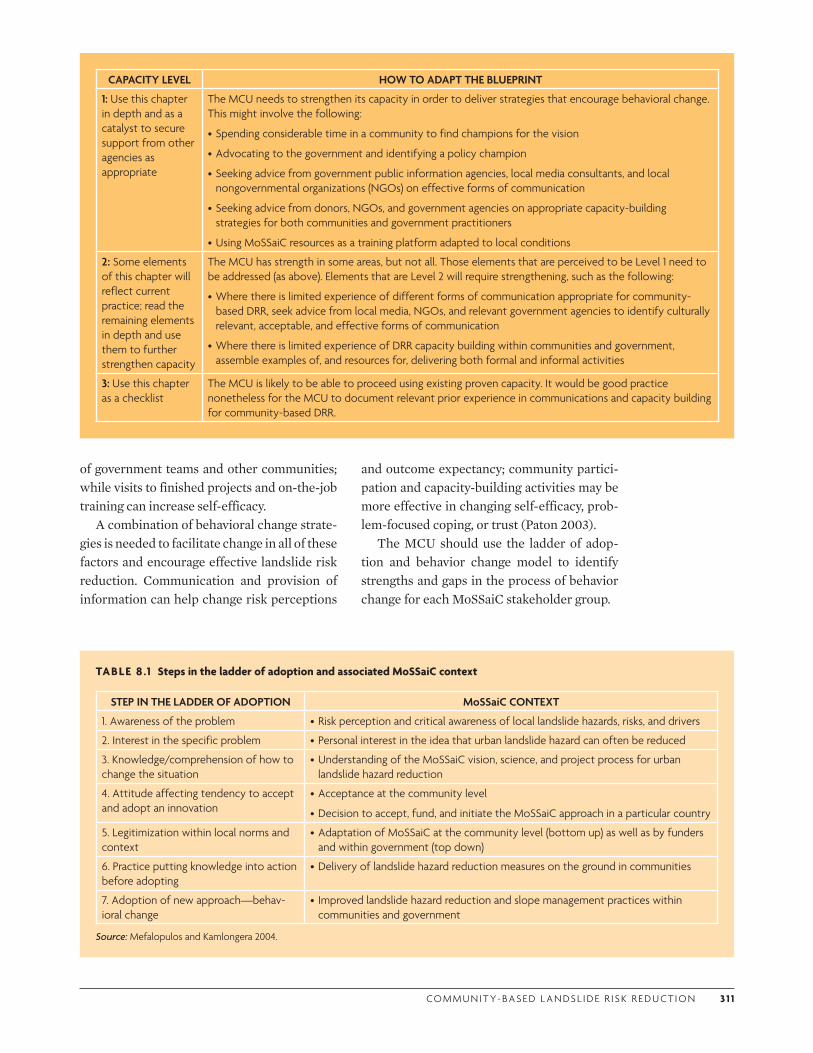
CO M M U N I T Y- BA S E D L A N DS L I D E R I S K R E D U CT I O N 3 1 1
CAPACITY LEVEL HOW TO ADAPT THE BLUEPRINT
1: Use this chapter in depth and as a catalyst to secure support from other agencies as appropriate
The MCU needs to strengthen its capacity in order to deliver strategies that encourage behavioral change. This might involve the following:
•Spending considerable time in a community to find champions for the vision
•Advocating to the government and identifying a policy champion
•Seeking advice from government public information agencies, local media consultants, and local nongovernmental organizations (NGOs) on effective forms of communication
•Seeking advice from donors, NGOs, and government agencies on appropriate capacity-building strategies for both communities and government practitioners
•Using MoSSaiC resources as a training platform adapted to local conditions
2: Some elements of this chapter will reflect current practice; read the remaining elements in depth and use them to further strengthen capacity
The MCU has strength in some areas, but not all. Those elements that are perceived to be Level 1 need to be addressed (as above). Elements that are Level 2 will require strengthening, such as the following:
•Where there is limited experience of different forms of communication appropriate for community-based DRR, seek advice from local media, NGOs, and relevant government agencies to identify culturally relevant, acceptable, and effective forms of communication
•Where there is limited experience of DRR capacity building within communities and government, assemble examples of, and resources for, delivering both formal and informal activities
3: Use this chapter as a checklist
The MCU is likely to be able to proceed using existing proven capacity. It would be good practice nonetheless for the MCU to document relevant prior experience in communications and capacity building for community-based DRR.
of government teams and other communities; while visits to finished projects and on-the-job training can increase self-efficacy.
A combination of behavioral change strate-gies is needed to facilitate change in all of these factors and encourage effective landslide risk reduction. Communication and provision of information can help change risk perceptions
and outcome expectancy; community partici-pation and capacity-building activities may be more effective in changing self-efficacy, prob-lem-focused coping, or trust (Paton 2003).
The MCU should use the ladder of adop-tion and behavior change model to identify strengths and gaps in the process of behavior change for each MoSSaiC stakeholder group.
TABLE 8 .1 Steps in the ladder of adoption and associated MoSSaiC context
STEP IN THE LADDER OF ADOPTION MoSSaiC CONTEXT
1. Awareness of the problem •Risk perception and critical awareness of local landslide hazards, risks, and drivers
2. Interest in the specific problem •Personal interest in the idea that urban landslide hazard can often be reduced
3. Knowledge/comprehension of how to change the situation
•Understanding of the MoSSaiC vision, science, and project process for urban landslide hazard reduction
4. Attitude affecting tendency to accept and adopt an innovation
•Acceptance at the community level
•Decision to accept, fund, and initiate the MoSSaiC approach in a particular country
5. Legitimization within local norms and context
•Adaptation of MoSSaiC at the community level (bottom up) as well as by funders and within government (top down)
6. Practice putting knowledge into action before adopting
•Delivery of landslide hazard reduction measures on the ground in communities
7. Adoption of new approach—behav-ioral change
• Improved landslide hazard reduction and slope management practices within communities and government
Source: Mefalopulos and Kamlongera 2004.
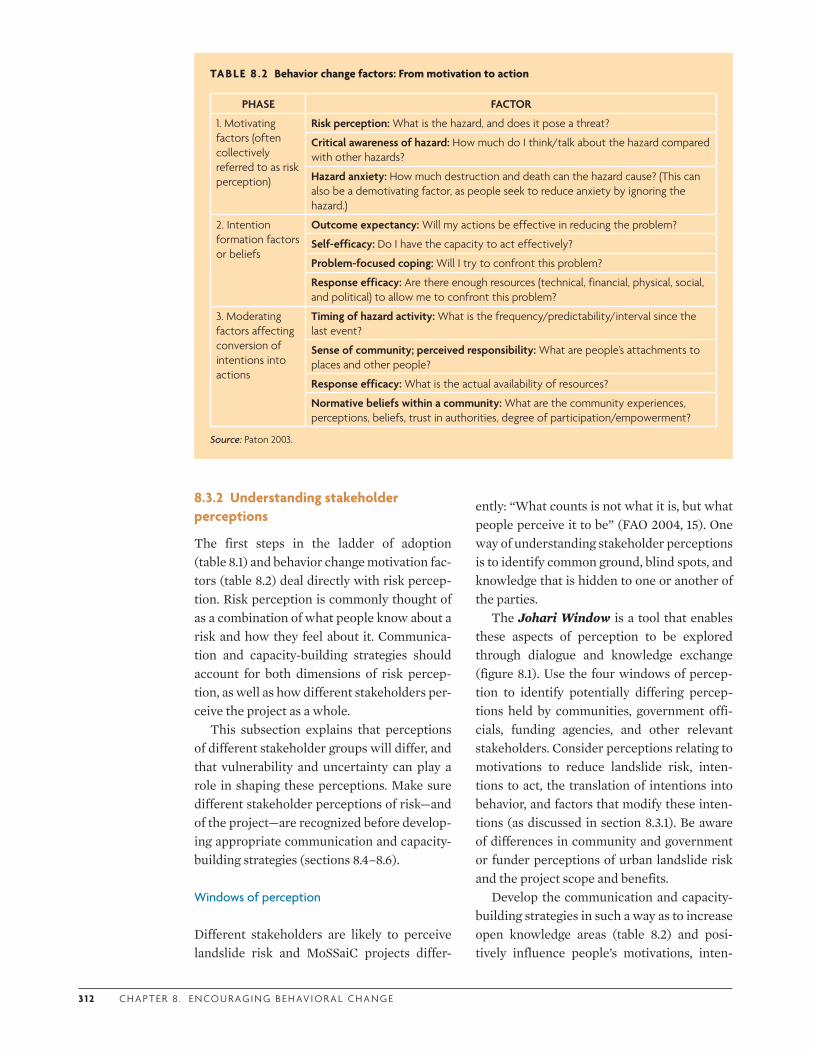
3 1 2 C H A P T E R 8 . E N CO U R AG I N G B E H AV I O R A L C H A N G E
8.3.2 Understanding stakeholder perceptions
The first steps in the ladder of adoption (table 8.1) and behavior change motivation fac-tors (table 8.2) deal directly with risk percep-tion. Risk perception is commonly thought of as a combination of what people know about a risk and how they feel about it. Communica-tion and capacity-building strategies should account for both dimensions of risk percep-tion, as well as how different stakeholders per-ceive the project as a whole.
This subsection explains that perceptions of different stakeholder groups will differ, and that vulnerability and uncertainty can play a role in shaping these perceptions. Make sure different stakeholder perceptions of risk—and of the project—are recognized before develop-ing appropriate communication and capacity-building strategies (sections 8.4–8.6).
Windows of perception
Different stakeholders are likely to perceive landslide risk and MoSSaiC projects differ-
TABLE 8 .2 Behavior change factors: From motivation to action
PHASE FACTOR
1. Motivating factors (often collectively referred to as risk perception)
Risk perception: What is the hazard, and does it pose a threat?
Critical awareness of hazard: How much do I think/talk about the hazard compared with other hazards?
Hazard anxiety: How much destruction and death can the hazard cause? (This can also be a demotivating factor, as people seek to reduce anxiety by ignoring the hazard.)
2. Intention formation factors or beliefs
Outcome expectancy: Will my actions be effective in reducing the problem?
Self-efficacy: Do I have the capacity to act effectively?
Problem-focused coping: Will I try to confront this problem?
Response efficacy: Are there enough resources (technical, financial, physical, social, and political) to allow me to confront this problem?
3. Moderating factors affecting conversion of intentions into actions
Timing of hazard activity: What is the frequency/predictability/interval since the last event?
Sense of community; perceived responsibility: What are people’s attachments to places and other people?
Response efficacy: What is the actual availability of resources?
Normative beliefs within a community: What are the community experiences, perceptions, beliefs, trust in authorities, degree of participation/empowerment?
Source: Paton 2003.
ently: “What counts is not what it is, but what people perceive it to be” (FAO 2004, 15). One way of understanding stakeholder perceptions is to identify common ground, blind spots, and knowledge that is hidden to one or another of the parties.
The Johari Window is a tool that enables these aspects of perception to be explored through dialogue and knowledge exchange (figure 8.1). Use the four windows of percep-tion to identify potentially differing percep-tions held by communities, government offi-cials, funding agencies, and other relevant stakeholders. Consider perceptions relating to motivations to reduce landslide risk, inten-tions to act, the translation of intentions into behavior, and factors that modify these inten-tions (as discussed in section 8.3.1). Be aware of differences in community and government or funder perceptions of urban landslide risk and the project scope and benefits.
Develop the communication and capacity-building strategies in such a way as to increase open knowledge areas (table 8.2) and posi-tively influence people’s motivations, inten-
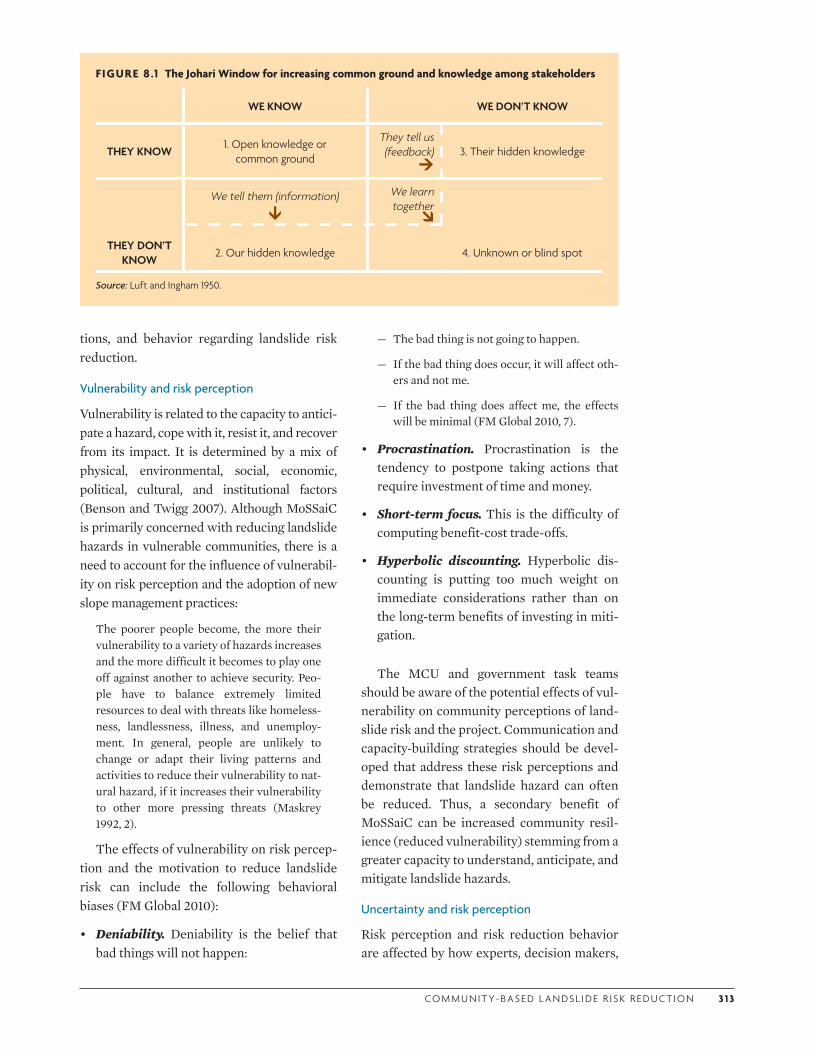
CO M M U N I T Y- BA S E D L A N DS L I D E R I S K R E D U CT I O N 3 1 3
tions, and behavior regarding landslide risk reduction.
Vulnerability and risk perception
Vulnerability is related to the capacity to antici-pate a hazard, cope with it, resist it, and recover from its impact. It is determined by a mix of physical, environmental, social, economic, political, cultural, and institutional factors (Benson and Twigg 2007). Although MoSSaiC is primarily concerned with reducing landslide hazards in vulnerable communities, there is a need to account for the influence of vulnerabil-ity on risk perception and the adoption of new slope management practices:
The poorer people become, the more their vulnerability to a variety of hazards increases and the more difficult it becomes to play one off against another to achieve security. Peo-ple have to balance extremely limited resources to deal with threats like homeless-ness, landlessness, illness, and unemploy-ment. In general, people are unlikely to change or adapt their living patterns and activities to reduce their vulnerability to nat-ural hazard, if it increases their vulnerability to other more pressing threats (Maskrey 1992, 2).
The effects of vulnerability on risk percep-tion and the motivation to reduce landslide risk can include the following behavioral biases (FM Global 2010):
• Deniability. Deniability is the belief that bad things will not happen:
FIGURE 8.1 The Johari Window for increasing common ground and knowledge among stakeholders
WE KNOW WE DON’T KNOW
THEY KNOW1. Open knowledge or
common ground
They tell us (feedback)
3. Their hidden knowledge
We tell them (information)
We learn together
THEY DON’T KNOW
2. Our hidden knowledge 4. Unknown or blind spot
Source: Luft and Ingham 1950.
— The bad thing is not going to happen.
— If the bad thing does occur, it will affect oth-ers and not me.
— If the bad thing does affect me, the effects will be minimal (FM Global 2010, 7).
• Procrastination. Procrastination is the tendency to postpone taking actions that require investment of time and money.
• Short-term focus. This is the difficulty of computing benefit-cost trade-offs.
• Hyperbolic discounting. Hyperbolic dis-counting is putting too much weight on immediate considerations rather than on the long-term benefits of investing in miti-gation.
The MCU and government task teams should be aware of the potential effects of vul-nerability on community perceptions of land-slide risk and the project. Communication and capacity-building strategies should be devel-oped that address these risk perceptions and demonstrate that landslide hazard can often be reduced. Thus, a secondary benefit of MoSSaiC can be increased community resil-ience (reduced vulnerability) stemming from a greater capacity to understand, anticipate, and mitigate landslide hazards.
Uncertainty and risk perception
Risk perception and risk reduction behavior are affected by how experts, decision makers,
3 1 4 C H A P T E R 8 . E N CO U R AG I N G B E H AV I O R A L C H A N G E
and those at risk (in this case, communities) interpret uncertainty about that risk. A grow-ing source of uncertainty is arguably a shared, common uncertainty about the results of haz-ard and risk modeling predictions, leading to a hesitation to invest in ex ante DRR.
Increasingly complex hazard and risk mod-els, combined with uncertainty in model parameters, have resulted in disaster risk pre-dictions with greater and greater uncertainty bounds. A consequence is that decision mak-ers and the public may learn from one expert that there is little to be concerned about for a particular risk, and from another that the very same risk is of major significance (Kunreuther and Useem 2010). Seemingly conflicting mes-sages are compounded by the fact that
the concepts, nature and implications of sci-entific uncertainty are not well understood by policymakers and/or society… This causes confusion when it comes to confidence in the work that physical scientists produce (Mal-amud and Petley 2009, 167)
and further uncertainty when deciding how to act.
These messages and associated uncertain-ties will be processed in different ways by each stakeholder—ignoring the message, trying to find more information to reduce their uncer-tainty, or accepting the message that is most compatible with existing risk perceptions or biases.
For example, among decision makers and politicians, uncertainty can generate a falsely optimistic (biased) confidence that a cata-strophic event will “not happen in my term of office” (Kunreuther and Useem 2010). Vulner-able communities may discount messages about uncertain disaster risks in light of their experience of more pressing threats such as unemployment or illness (Maskrey 1992). Such interpretations of risk are perhaps most important for low-probability uncertain events because, unlike high-probability events, personal experience is likely to be absent (McNabb and Pearson 2010).
The MCU and government task teams should be aware of uncertainties in model pre-dictions and how these uncertainties might be
interpreted. Encourage transparency in com-munication between experts and other stake-holders so that the possibilities of over- or underprediction of landslide risk can be accounted for in community selection and the design of landslide mitigation measures.
8.3.3 Combining knowledge and action
Traditional risk communication and capacity-building strategies both tend to emphasize transfer of knowledge from experts or deci-sion makers to laypeople. However, as the lad-der of adoption (steps 3–6) and behavior change factors in section 8.3.1 indicate, knowl-edge must be combined with action in order to change stakeholder perceptions and practices. It is now well known that traditional knowl-edge transfer approaches can be ineffective unless balanced by other forms of communica-tion and capacity-building activities (CADRI 2011; World Bank 2010). Dialogue-based com-munication and learning by doing or action learning are thus a fundamental part of com-munity participatory approaches such as MoSSaiC.
Use this subsection to understand how knowledge and action can be combined to encourage behavioral change and to guide the inclusion of learning by doing in project com-munication and capacity-building strategies.
Conventional knowledge transfer and disaster risk reduction
Gaillard and Mercer (2012, 2) note that “the field of DRR is a battlefield of knowledge and action, which often results in poor outcomes in terms of actual reduction of disaster risk for those most vulnerable.” Conventional West-ern-style education emphasizes written knowledge as the precursor and only effective basis for action (Crookall and Thorngate 2009). The one-way transfer of knowledge is evident in top-down DRR policies that focus on classroom-based training, education, and public awareness campaigns to increase knowledge and encourage behavioral change. Yet it is understandably difficult for local deci-sion makers, practitioners, and community residents to turn scientific knowledge into
CO M M U N I T Y- BA S E D L A N DS L I D E R I S K R E D U CT I O N 3 1 5
hazard reduction actions (GNDR 2011). The knowledge and practices identified at interna-tional and national scales are simply not trick-ling down fast enough to achieve DRR on the ground (Wisner 2009).
Community-based DRR has, in part, emerged as a response to conventional top-down approaches—focusing on vulnerability rather than hazard reduction and emphasiz-ing community participation, local knowl-edge, appropriate technologies, and practical actions. This approach addresses many of the limitations of top-down national DRR poli-cies, but usually cannot address the hazard component of landslide risk. Even at the local government level, “the knowledge base required to identify landslide prone areas is often either nonexistent or fragmentary” (UNU 2006).
Given the limitations of either purely top-down or bottom-up approaches in addressing urban landslide risk, it is now recognized that a combination of these approaches is required. Landslide risk reduction necessitates the inte-gration of different disciplines so that scien-tific knowledge of the hazard is combined with local knowledge and appropriate actions (Malamud and Petley 2009); “we must avoid romanticising indigenous knowledge, and combine it with scientific knowledge” (Pelling 2007, 16). Similarly, conventional top-down communication and capacity development methods should be balanced by more informal dialogue and participatory-based methods.
Learning by doing
“Knowledge and action are closely inter-twined,” note Crookall and Thorngate (2009, 17), and the process of adopting new DRR behavior requires both to be present. Learning by doing integrates learning, action, and reflec-tion; and is carried out during, rather than prior to, project implementation (IFRC 2008). Learning by doing goes beyond conventional classroom-based knowledge into action activi-ties and public awareness education by empha-sizing action as a means for learning and gen-erating new knowledge.
MoSSaiC projects involve learning by doing: combining local and scientific knowl-edge about slope stability; encouraging funders, governments, and communities to develop and apply MoSSaiC in the context of local expertise, practices, and policies; and generating new knowledge through the pro-cess of putting MoSSaiC into action (table 8.3).
MoSSaiC communication and capacity-building strategies should include activities designed to enable or encourage participants to do the following (Crookall and Thorngate 2009, 19):
• “[A]pply new knowledge to a practical situ-ation” (knowledge into action)
• “[G]enerate understanding, learn new skills, and gain new knowledge from a con-crete experience” (action into knowledge)
• “[M]ake connections between actions and related knowledge” (integrating action and knowledge).
Use table 8.3 as a guide to review for each stakeholder group what works locally in terms of knowledge into action and action into knowledge activities. Use this review to inform the development of communication and capacity-building strategies.
8.4 COMMUNICATION PURPOSE AND AUDIENCE
A communication strategy is typically devel-oped by defining the purpose of communica-tion and identifying audiences, messages, and appropriate forms of communication.
Designing the strategy is an art, not a sci-ence, and there are many ways of approaching the task. Table 8.4 presents five questions that can help the MCU and communications task team in organizing the necessary information and developing a strategy.
Use this section to identify the purposes and key audiences of the communication strat-egy; use section 8.5 to help identify specific communication tools and messages.

3 1 6 C H A P T E R 8 . E N CO U R AG I N G B E H AV I O R A L C H A N G E
TABLE 8 .3 Knowledge and action as part of the adoption of the MoSSaiC process
STAKEHOLDER KNOWLEDGE INTO ACTION ACTION INTO KNOWLEDGE
Community task teams—residents, leaders, and local contractors
•Detailed knowledge of slope history and features (drainage, cuts/fills, soil depth, signs of instability) contributes to mapping and landslide hazard reduction design process
•New information about slope stability is provided by government
•Contractors from within the community are engaged and apply existing skills
•Residents involved in the process see the direct results of good slope management practices and simple measures in their own households
•Good construction practices and new skills are generated and shared among site supervisors, engineers, and contractors
MCU and government task teams—engineering and science practitioners
•Engineering and technical knowledge is increased and applied to design of landslide hazard reduction measures
•Site supervisors are briefed and oversee delivery of physical mitigation works
•Government team members develop new local knowledge and practices while working on site and with local contractors in the communities
MCU and government task teams—community development practitioners
•Knowledge of community context and dynam-ics is applied to enable community participa-tion in the project
•Learning the science from other team members and integrating community mobilization skills with hazard reduction agenda
MCU, politicians, and funding agencies
•Decision makers, funders, and MCU briefed on MoSSaiC vision and the science of landslide hazard reduction
•Existing project management skills employed in new ways
•Project reports provide new evidence base for policy change and innovation for adopting the approach more widely
Academic researchers and private sector consultants
•Application and development of landslide theory in the field
•Refinement of approach to landslide re-search—experience of working with end users results in new priorities, scientific methods, and ways of communicating
TABLE 8 .4 Questions to guide the design of a MoSSaiC communication strategy
QUESTION ACTION
Are there resources already available for communication?
Review existing methods and toolkits for communication in a development, DRR, or community participation context (e.g., IFRC 2010; Mefalopulos 2008; UNICEF 2008)
What are the purposes or functions of the communication strategy?
Review the MoSSaiC vision and foundations (chapter 1) and behavior change process (section 8.3.1), and identify communica-tion requirements (see section 8.4.1)
Who are the audiences and messengers?
Identify MoSSaiC stakeholders (table 1.16 and chapter 2); identify communication requirements and strength, frequency, and directions of communication flows (see section 8.4.2)
How and when can these audiences be best engaged?
Based on communication purposes and audiences, identify appropriate modes (written/verbal/visual, and one-/two-way), channels (face to face or mediated), tools, and timing (see section 8.5)
What are the key messages for each audience?
Based on communication purposes and audiences, design messages with appropriate content, language, and presentation style (see section 8.5).
CO M M U N I T Y- BA S E D L A N DS L I D E R I S K R E D U CT I O N 3 1 7
8.4.1 Defining communication purposes and functions
For MoSSaiC projects, the communication strategy serves the following purposes:
• Raising awareness and changing percep-tions about urban landslide hazard risk
• Facilitating community participation, understanding, interaction, and trust among stakeholders
• Providing information and managing expectations about project implementation and outcomes
• Generating new knowledge as part of a learning-by-doing approach
• Encouraging the adoption of new landslide risk management behavior.
As the World Bank (2010, 327) notes,
Well-designed communication cam paigns that address individuals as members of a local community—and not as power less members of an unmanageably large group—can empower them to act. This treatment can help make a global phenom enon personally rele-vant and immediate, and accentuate the local and individual ownership of the solutions.
The MCU should review the purposes that communication will serve and use these pur-poses to guide the development of the commu-nication strategy.
8.4.2 Identifying audiences
MoSSaiC stakeholders include the following:
• Project funders
• Politicians and government decision makers
• MCU and government task teams
• Community task teams (including individ-ual residents)
• Landowners.
Additional audiences may include the gen-eral public, regional MoSSaiC user groups, and the scientific community.
Each stakeholder can act as a messenger or audience (or both) in a communication net-work with information flowing in one or many directions at different times during the proj-ect. The characteristics of each audience should determine the form of communication selected to suit the purpose of that communi-cation:
The importance of defining your target groups cannot be overstated. Knowledge, beliefs, and customs often vary widely from one group to another and the ways in which knowledge is acquired are not the same in each community. Even within a given target group, it’s important to learn how to segment (IDRC 2012, 2).
The MCU should compile a list or commu-nication network diagram of audiences and messengers. For each audience, consider per-ceptions, motivations, and intentions regard-ing landslide risk and the potential for adopt-ing new risk reduction behavior (section 8.3.1); the cultural, political, and social con-text; and local factors that might affect com-munication and limit behavior change (table 8.5). Use tools like the Johari Window (fig-ure 8.1) and baseline studies to help under-stand stakeholder (audience and messenger) perceptions. This analysis will help identify communication requirements in terms of appropriate forms of communication and messages (section 8.5).
8.5 FORMS OF COMMUNICATION AND PROJECT MESSAGES
Forms of communication can be classified in terms of modes, channels, and tools:
• The basic modes of communication are written, verbal, and visual; and one way (information transfer) or two way (consul-tation or dialogue).
• Communication channels are either face-to-face (direct) or mediated (indirect), and either target specific individuals or groups, or diffuse audiences.

3 1 8 C H A P T E R 8 . E N CO U R AG I N G B E H AV I O R A L C H A N G E
• Different communication tools are appro-priate for different modes and channels of communication as illustrated in table 8.6.
MoSSaiC projects need to use a wide range of communication modes, channels, and tools
TABLE 8 .5 Examples of local factors affecting communication
FACTOR EFFECT ON COMMUNICATION
Community perceptions
•There may be views regarding who should have assistance that are embedded within social groups and not in accord with likely project recommendations
•Perceptions regarding landslide risk and mitigation measures may vary from one community to another, thus requiring different messages
•Government agencies and staff may not initially be seen as trustworthy
Social behavior •Where a community is highly polarized by criminality or other factors; this situation could make project acceptance difficult to achieve
Perceptions of timing
•Cultural differences in the perception of time could affect project time frames (e.g., where a laissez faire attitude is prevalent)
Government messages
•Different parts of established government bureaucracies may send different messages regarding DRR priorities and practices
Political agendas
•Communities might move faster than government in recognizing the need for DRR
•DRR may be low on the current government agenda, but high on that of the political opposition parties
History •Project fatigue among residents may mean that motivational messages need to be stronger than simply justifying the science of the intervention
Gender •Women may be the day-to-day decision makers in the household, but have less exposure to certain communication methods
Landownership •Project messages need to take into account local landownership protocols
Meetings •Views expressed in meetings may reflect dominant rather than majority views and could reflect special, undeclared, interests
Stakeholder availability
•Critical stakeholders may not be reached by some forms of communication (e.g., landlord residing overseas)
to achieve project objectives and encourage behavioral change. Communication tools should be used as part of the overall project process rather than as stand-alone outputs (e.g., landslide maps, posters, leaflets, or a TV documentary).
TABLE 8 .6 Examples of communication tools by mode, channel, and purpose
MODE, CHANNEL, PURPOSE TOOL
One-way communication to provide information indirectly with no feedback mechanism
•Leaflets, posters, information packs•Newsletters, project updates•Reports, documents, protocols•Exhibitions, demonstration of technologies•Mass media (TV, radio, newspapers)
Two-way communication to seek information and feedback indirectly or face to face
•Site visits•Consultation documents, surveys•Formal public meetings, presentations
Two-way communication and dialogue to facilitate mutual exchange, understanding, and stakeholder participation
• Interactive mapping, workshops, and training activities•Consensus-building meetings, mediation•Various community participatory tools
Source: Burgess and Chilvers 2006.
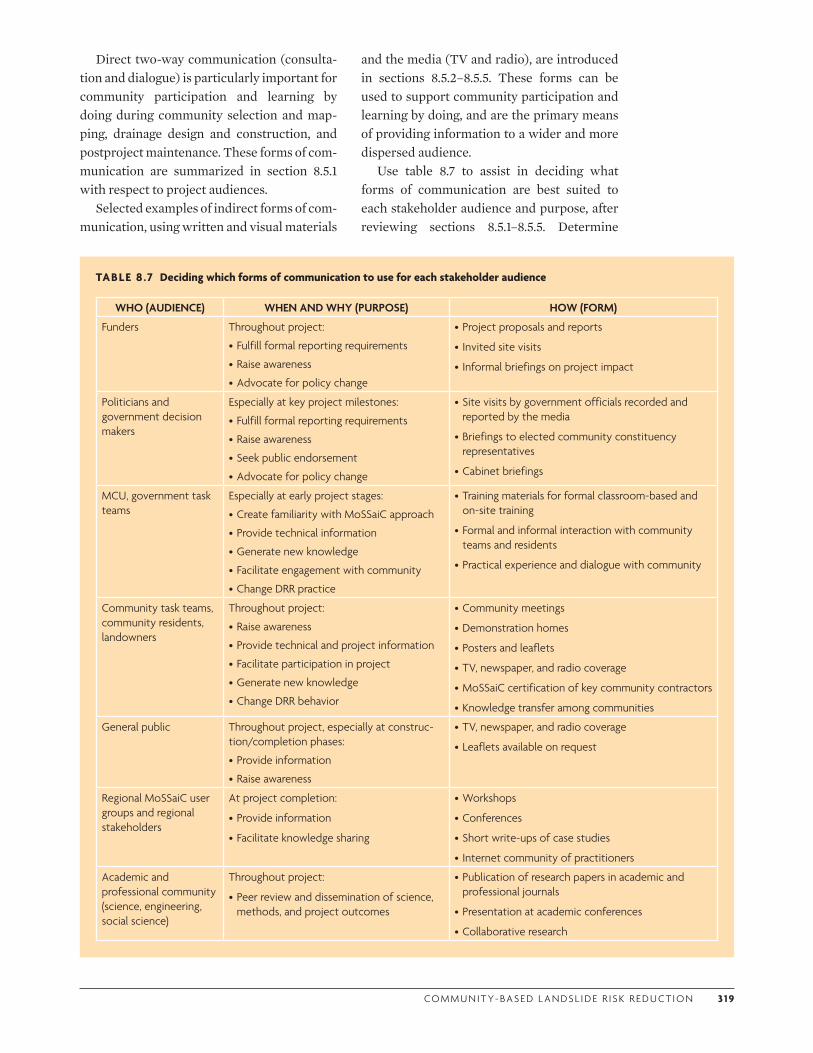
CO M M U N I T Y- BA S E D L A N DS L I D E R I S K R E D U CT I O N 3 1 9
Direct two-way communication (consulta-tion and dialogue) is particularly important for community participation and learning by doing during community selection and map-ping, drainage design and construction, and postproject maintenance. These forms of com-munication are summarized in section 8.5.1 with respect to project audiences.
Selected examples of indirect forms of com-munication, using written and visual materials
and the media (TV and radio), are introduced in sections 8.5.2–8.5.5. These forms can be used to support community participation and learning by doing, and are the primary means of providing information to a wider and more dispersed audience.
Use table 8.7 to assist in deciding what forms of communication are best suited to each stakeholder audience and purpose, after reviewing sections 8.5.1–8.5.5. Determine
TABLE 8 .7 Deciding which forms of communication to use for each stakeholder audience
WHO (AUDIENCE) WHEN AND WHY (PURPOSE) HOW (FORM)
Funders Throughout project:
•Fulfill formal reporting requirements
•Raise awareness
•Advocate for policy change
•Project proposals and reports
• Invited site visits
• Informal briefings on project impact
Politicians and government decision makers
Especially at key project milestones:
•Fulfill formal reporting requirements
•Raise awareness
•Seek public endorsement
•Advocate for policy change
•Site visits by government officials recorded and reported by the media
•Briefings to elected community constituency representatives
•Cabinet briefings
MCU, government task teams
Especially at early project stages:
•Create familiarity with MoSSaiC approach
•Provide technical information
•Generate new knowledge
•Facilitate engagement with community
•Change DRR practice
•Training materials for formal classroom-based and on-site training
•Formal and informal interaction with community teams and residents
•Practical experience and dialogue with community
Community task teams, community residents, landowners
Throughout project:
•Raise awareness
•Provide technical and project information
•Facilitate participation in project
•Generate new knowledge
•Change DRR behavior
•Community meetings
•Demonstration homes
•Posters and leaflets
•TV, newspaper, and radio coverage
•MoSSaiC certification of key community contractors
•Knowledge transfer among communities
General public Throughout project, especially at construc-tion/completion phases:
•Provide information
•Raise awareness
•TV, newspaper, and radio coverage
•Leaflets available on request
Regional MoSSaiC user groups and regional stakeholders
At project completion:
•Provide information
•Facilitate knowledge sharing
•Workshops
•Conferences
•Short write-ups of case studies
• Internet community of practitioners
Academic and professional community (science, engineering, social science)
Throughout project:
•Peer review and dissemination of science, methods, and project outcomes
•Publication of research papers in academic and professional journals
•Presentation at academic conferences
•Collaborative research
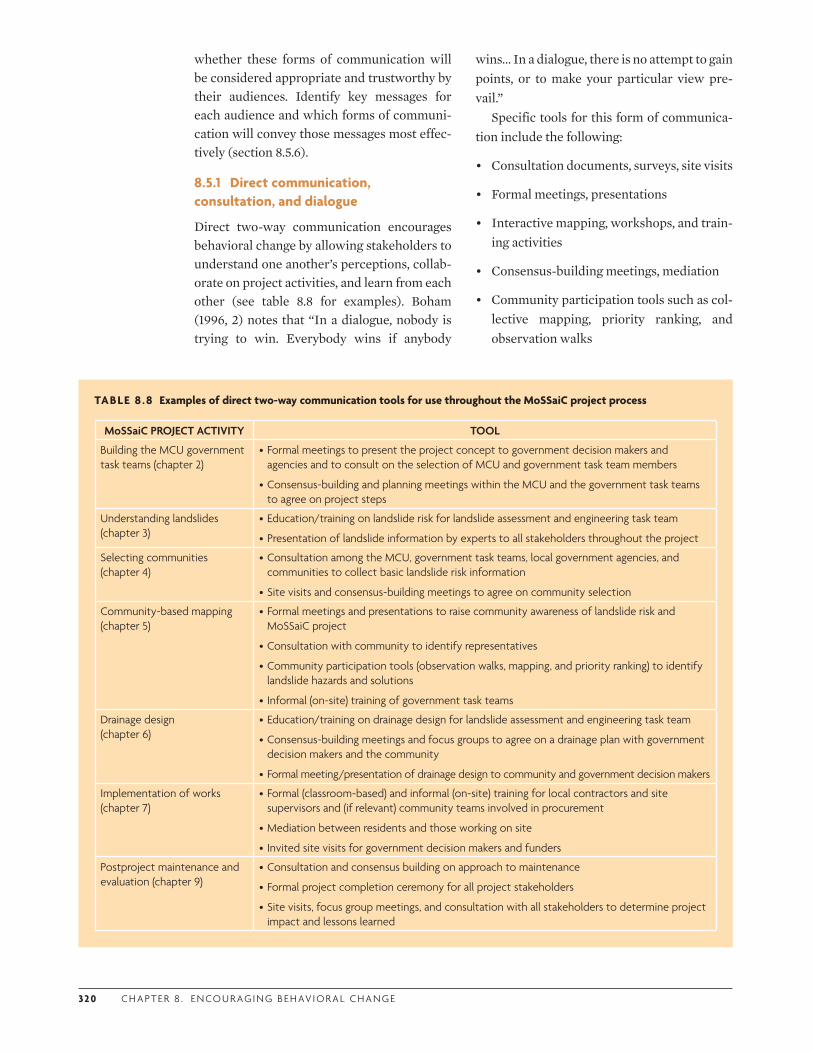
32 0 C H A P T E R 8 . E N CO U R AG I N G B E H AV I O R A L C H A N G E
whether these forms of communication will be considered appropriate and trustworthy by their audiences. Identify key messages for each audience and which forms of communi-cation will convey those messages most effec-tively (section 8.5.6).
8.5.1 Direct communication, consultation, and dialogue
Direct two-way communication encourages behavioral change by allowing stakeholders to understand one another’s perceptions, collab-orate on project activities, and learn from each other (see table 8.8 for examples). Boham (1996, 2) notes that “In a dialogue, nobody is trying to win. Everybody wins if anybody
wins… In a dialogue, there is no attempt to gain points, or to make your particular view pre-vail.”
Specific tools for this form of communica-tion include the following:
• Consultation documents, surveys, site visits
• Formal meetings, presentations
• Interactive mapping, workshops, and train-ing activities
• Consensus-building meetings, mediation
• Community participation tools such as col-lective mapping, priority ranking, and observation walks
TABLE 8 .8 Examples of direct two-way communication tools for use throughout the MoSSaiC project process
MoSSaiC PROJECT ACTIVITY TOOL
Building the MCU government task teams (chapter 2)
•Formal meetings to present the project concept to government decision makers and agencies and to consult on the selection of MCU and government task team members
•Consensus-building and planning meetings within the MCU and the government task teams to agree on project steps
Understanding landslides (chapter 3)
•Education/training on landslide risk for landslide assessment and engineering task team
•Presentation of landslide information by experts to all stakeholders throughout the project
Selecting communities (chapter 4)
•Consultation among the MCU, government task teams, local government agencies, and communities to collect basic landslide risk information
•Site visits and consensus-building meetings to agree on community selection
Community-based mapping (chapter 5)
•Formal meetings and presentations to raise community awareness of landslide risk and MoSSaiC project
•Consultation with community to identify representatives
•Community participation tools (observation walks, mapping, and priority ranking) to identify landslide hazards and solutions
• Informal (on-site) training of government task teams
Drainage design (chapter 6)
•Education/training on drainage design for landslide assessment and engineering task team
•Consensus-building meetings and focus groups to agree on a drainage plan with government decision makers and the community
•Formal meeting/presentation of drainage design to community and government decision makers
Implementation of works (chapter 7)
•Formal (classroom-based) and informal (on-site) training for local contractors and site supervisors and (if relevant) community teams involved in procurement
•Mediation between residents and those working on site
• Invited site visits for government decision makers and funders
Postproject maintenance and evaluation (chapter 9)
•Consultation and consensus building on approach to maintenance
•Formal project completion ceremony for all project stakeholders
•Site visits, focus group meetings, and consultation with all stakeholders to determine project impact and lessons learned
CO M M U N I T Y- BA S E D L A N DS L I D E R I S K R E D U CT I O N 32 1
Using direct two-way communication for MoSSaiC projects
These communication tools are used through-out the MoSSaiC project to facilitate collabo-ration among key government and community stakeholders. To understand and apply these tools, the MCU and government task teams should review their use in the context of their specific purpose for MoSSaiC; see table 8.8 as a guide.
Delivering project messages
The approach that the MCU and the govern-ment task teams adopt for communicating with communities will determine the extent to which they are accepted and trusted by them and how effective project messages will be in encouraging behavioral change:
Any strategy intended to effect change in a community should be discussed with, under-stood and agreed upon by the community, since the primary decision-makers about what and how to change are the very people who are going to be affected by the change (FAO 2004, B1).
Consider local customs, norms, and resources that will guide the approach to two-way communication in communities. Take guidance from the community liaison task team and community representatives to iden-tify ground rules for government task teams engaging with communities. In this regard, note the following (IFRC 2008 and Mefalopu-los 2008):
• Agree on the timing, location, and purpose of meetings and site visits with community representatives beforehand
• Chose meeting venues that are accessible to the community
• Start and finish meetings and site visits promptly
• Respect cultural formalities and language in addressing individuals and groups
• Be aware of unspoken messages conveyed by body language and conduct
• Turn off mobile phones and stay present throughout meetings
• Respect opinions and include all partici-pants
• Remember that active listening can be as important as speaking
• Be frank and answer questions honestly
• Keep explanations brief and easy to under-stand
• Provide practical guidance on community actions
• Use flipcharts, maps, leaflets, and other visual interactive tools as a means of shar-ing information.
Identify the best means of notifying com-munities about project meetings and site vis-its—e.g., word of mouth, communication via a community leader or representative or by an individual who is paid to make community announcements.
8.5.2 Community demonstration sites and show homes
In many vulnerable communities, the best form of communication is highly visual and based on demonstration. Visits to sites of past hazard events and demonstration of successful hazard mitigation measures is a powerful way of changing perceptions about how to tackle hazards effectively. Demonstration sites, example infrastructure, and show homes in communities provide tangible evidence that can help governments and communities envis-age what they might have the capacity to do in similar situations (self-efficacy). Combining demonstration sites with information materi-als and training allows people to understand and adopt risk reduction behavior.
MoSSaiC demonstration sites and show homes
Completed MoSSaiC projects provide the context for demonstrating urban landslide hazard solutions such as surface water drain-age networks, houses with roof guttering,
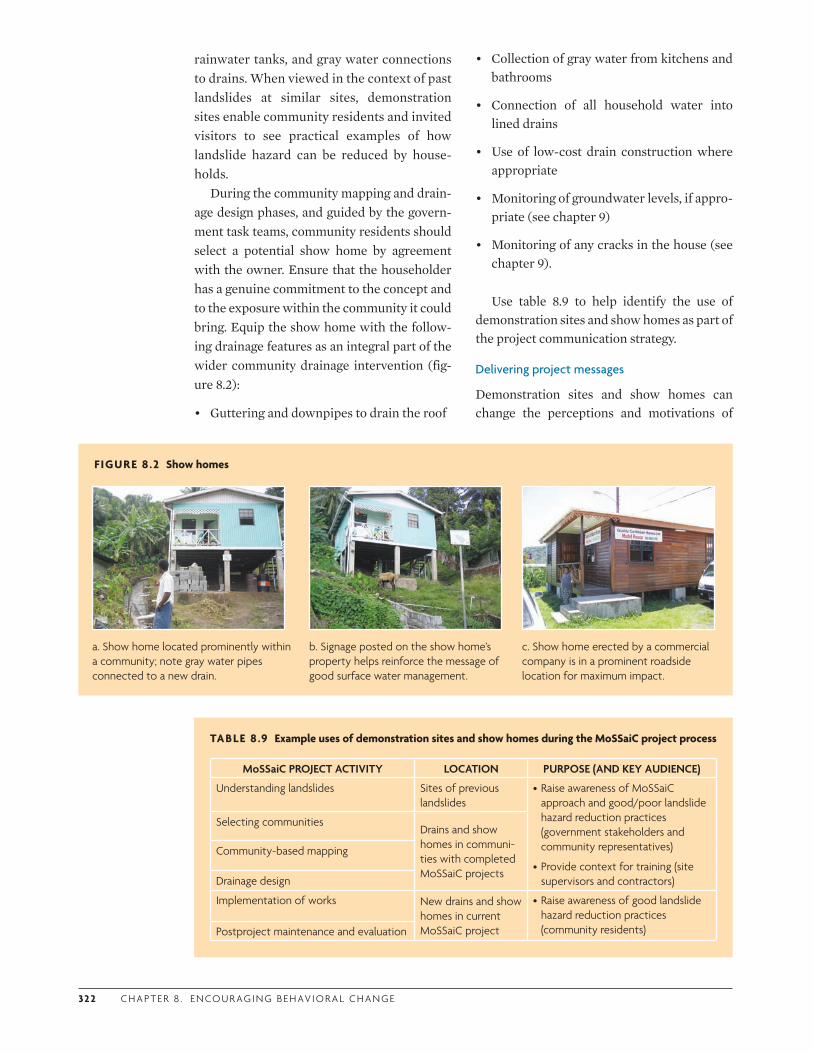
32 2 C H A P T E R 8 . E N CO U R AG I N G B E H AV I O R A L C H A N G E
rainwater tanks, and gray water connections to drains. When viewed in the context of past landslides at similar sites, demonstration sites enable community residents and invited visitors to see practical examples of how landslide hazard can be reduced by house-holds.
During the community mapping and drain-age design phases, and guided by the govern-ment task teams, community residents should select a potential show home by agreement with the owner. Ensure that the householder has a genuine commitment to the concept and to the exposure within the community it could bring. Equip the show home with the follow-ing drainage features as an integral part of the wider community drainage intervention (fig-ure 8.2):
• Guttering and downpipes to drain the roof
• Collection of gray water from kitchens and bathrooms
• Connection of all household water into lined drains
• Use of low-cost drain construction where appropriate
• Monitoring of groundwater levels, if appro-priate (see chapter 9)
• Monitoring of any cracks in the house (see chapter 9).
Use table 8.9 to help identify the use of demonstration sites and show homes as part of the project communication strategy.
Delivering project messages
Demonstration sites and show homes can change the perceptions and motivations of
TABLE 8 .9 Example uses of demonstration sites and show homes during the MoSSaiC project process
MoSSaiC PROJECT ACTIVITY LOCATION PURPOSE (AND KEY AUDIENCE)
Understanding landslides Sites of previous landslides
•Raise awareness of MoSSaiC approach and good/poor landslide hazard reduction practices (government stakeholders and community representatives)
•Provide context for training (site supervisors and contractors)
Selecting communitiesDrains and show homes in communi-ties with completed MoSSaiC projects
Community-based mapping
Drainage design
Implementation of works New drains and show homes in current MoSSaiC project
•Raise awareness of good landslide hazard reduction practices (community residents)Postproject maintenance and evaluation
FIGURE 8.2 Show homes
a. Show home located prominently within a community; note gray water pipes connected to a new drain.
b. Signage posted on the show home’s property helps reinforce the message of good surface water management.
c. Show home erected by a commercial company is in a prominent roadside location for maximum impact.
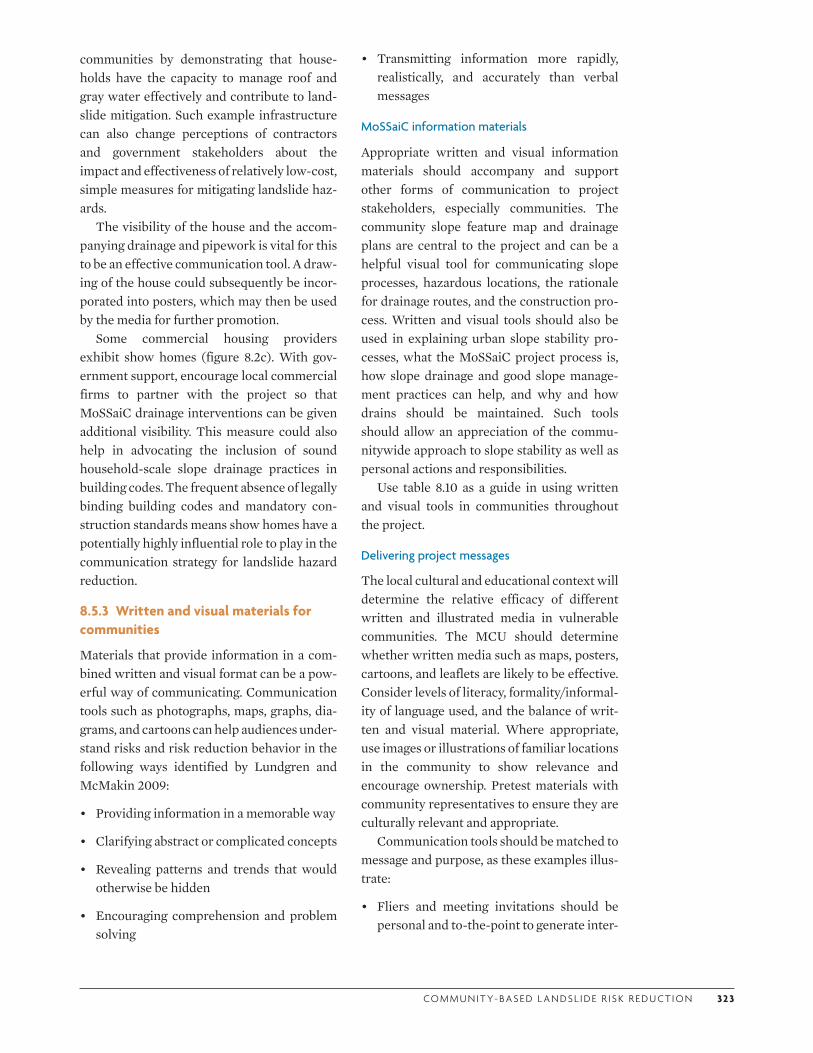
CO M M U N I T Y- BA S E D L A N DS L I D E R I S K R E D U CT I O N 32 3
communities by demonstrating that house-holds have the capacity to manage roof and gray water effectively and contribute to land-slide mitigation. Such example infrastructure can also change perceptions of contractors and government stakeholders about the impact and effectiveness of relatively low-cost, simple measures for mitigating landslide haz-ards.
The visibility of the house and the accom-panying drainage and pipework is vital for this to be an effective communication tool. A draw-ing of the house could subsequently be incor-porated into posters, which may then be used by the media for further promotion.
Some commercial housing providers exhibit show homes (figure 8.2c). With gov-ernment support, encourage local commercial firms to partner with the project so that MoSSaiC drainage interventions can be given additional visibility. This measure could also help in advocating the inclusion of sound household-scale slope drainage practices in building codes. The frequent absence of legally binding building codes and mandatory con-struction standards means show homes have a potentially highly influential role to play in the communication strategy for landslide hazard reduction.
8.5.3 Written and visual materials for communities
Materials that provide information in a com-bined written and visual format can be a pow-erful way of communicating. Communication tools such as photographs, maps, graphs, dia-grams, and cartoons can help audiences under-stand risks and risk reduction behavior in the following ways identified by Lundgren and McMakin 2009:
• Providing information in a memorable way
• Clarifying abstract or complicated concepts
• Revealing patterns and trends that would otherwise be hidden
• Encouraging comprehension and problem solving
• Transmitting information more rapidly, realistically, and accurately than verbal messages
MoSSaiC information materials
Appropriate written and visual information materials should accompany and support other forms of communication to project stakeholders, especially communities. The community slope feature map and drainage plans are central to the project and can be a helpful visual tool for communicating slope processes, hazardous locations, the rationale for drainage routes, and the construction pro-cess. Written and visual tools should also be used in explaining urban slope stability pro-cesses, what the MoSSaiC project process is, how slope drainage and good slope manage-ment practices can help, and why and how drains should be maintained. Such tools should allow an appreciation of the commu-nitywide approach to slope stability as well as personal actions and responsibilities.
Use table 8.10 as a guide in using written and visual tools in communities throughout the project.
Delivering project messages
The local cultural and educational context will determine the relative efficacy of different written and illustrated media in vulnerable communities. The MCU should determine whether written media such as maps, posters, cartoons, and leaflets are likely to be effective. Consider levels of literacy, formality/informal-ity of language used, and the balance of writ-ten and visual material. Where appropriate, use images or illustrations of familiar locations in the community to show relevance and encourage ownership. Pretest materials with community representatives to ensure they are culturally relevant and appropriate.
Communication tools should be matched to message and purpose, as these examples illus-trate:
• Fliers and meeting invitations should be personal and to-the-point to generate inter-
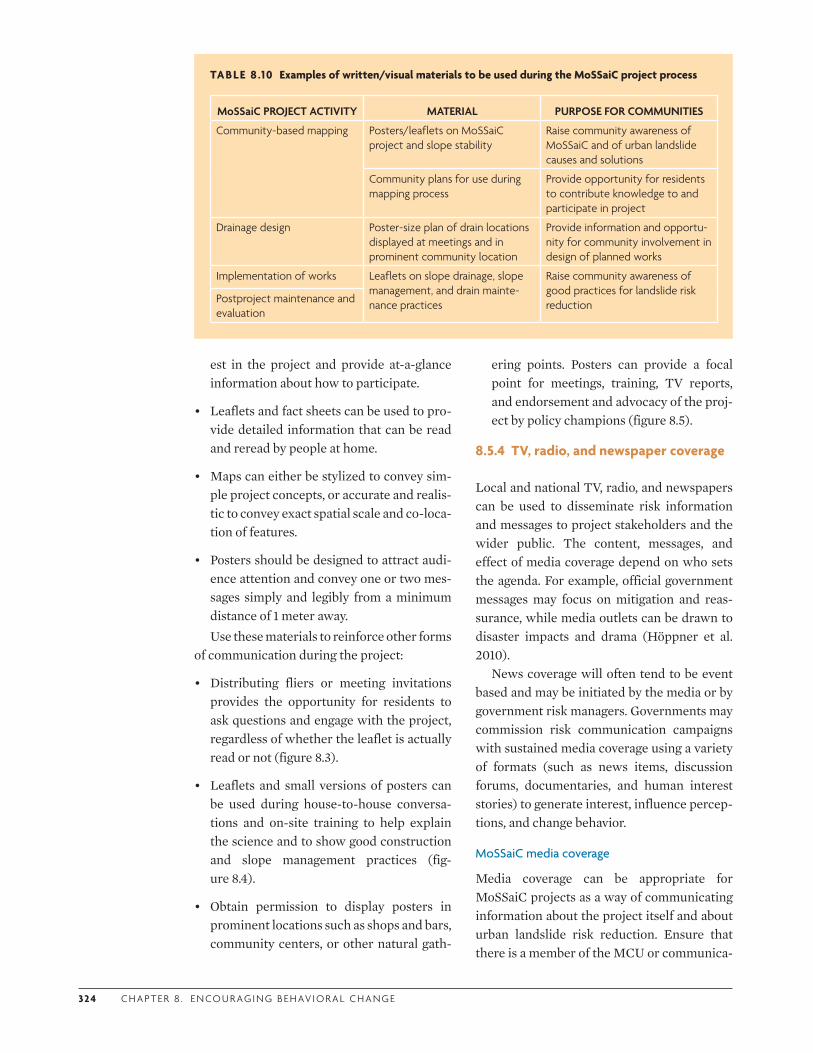
324 C H A P T E R 8 . E N CO U R AG I N G B E H AV I O R A L C H A N G E
est in the project and provide at-a-glance information about how to participate.
• Leaflets and fact sheets can be used to pro-vide detailed information that can be read and reread by people at home.
• Maps can either be stylized to convey sim-ple project concepts, or accurate and realis-tic to convey exact spatial scale and co-loca-tion of features.
• Posters should be designed to attract audi-ence attention and convey one or two mes-sages simply and legibly from a minimum distance of 1 meter away.Use these materials to reinforce other forms
of communication during the project:
• Distributing fliers or meeting invitations provides the opportunity for residents to ask questions and engage with the project, regardless of whether the leaflet is actually read or not (figure 8.3).
• Leaflets and small versions of posters can be used during house-to-house conversa-tions and on-site training to help explain the science and to show good construction and slope management practices (fig-ure 8.4).
• Obtain permission to display posters in prominent locations such as shops and bars, community centers, or other natural gath-
ering points. Posters can provide a focal point for meetings, training, TV reports, and endorsement and advocacy of the proj-ect by policy champions (figure 8.5).
8.5.4 TV, radio, and newspaper coverage
Local and national TV, radio, and newspapers can be used to disseminate risk information and messages to project stakeholders and the wider public. The content, messages, and effect of media coverage depend on who sets the agenda. For example, official government messages may focus on mitigation and reas-surance, while media outlets can be drawn to disaster impacts and drama (Höppner et al. 2010).
News coverage will often tend to be event based and may be initiated by the media or by government risk managers. Governments may commission risk communication campaigns with sustained media coverage using a variety of formats (such as news items, discussion forums, documentaries, and human interest stories) to generate interest, influence percep-tions, and change behavior.
MoSSaiC media coverage
Media coverage can be appropriate for MoSSaiC projects as a way of communicating information about the project itself and about urban landslide risk reduction. Ensure that there is a member of the MCU or communica-
TABLE 8 .10 Examples of written/visual materials to be used during the MoSSaiC project process
MoSSaiC PROJECT ACTIVITY MATERIAL PURPOSE FOR COMMUNITIES
Community-based mapping Posters/leaflets on MoSSaiC project and slope stability
Raise community awareness of MoSSaiC and of urban landslide causes and solutions
Community plans for use during mapping process
Provide opportunity for residents to contribute knowledge to and participate in project
Drainage design Poster-size plan of drain locations displayed at meetings and in prominent community location
Provide information and opportu-nity for community involvement in design of planned works
Implementation of works Leaflets on slope drainage, slope management, and drain mainte-nance practices
Raise community awareness of good practices for landslide risk reductionPostproject maintenance and
evaluation
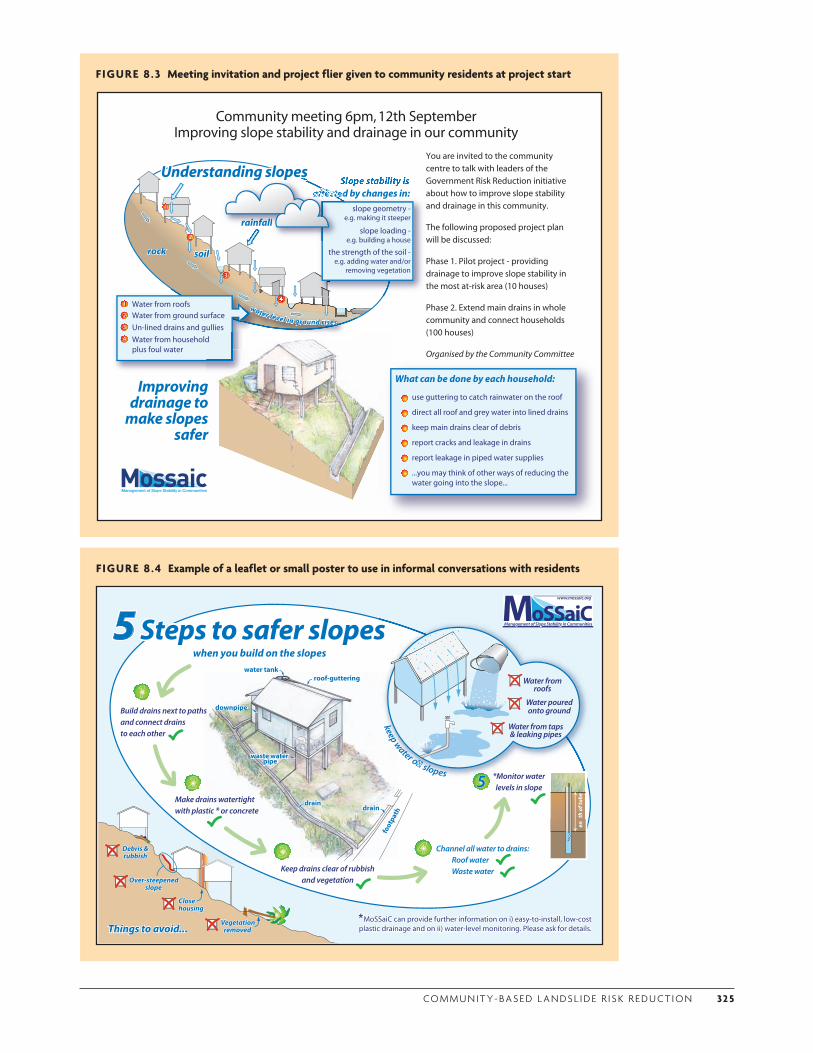
CO M M U N I T Y- BA S E D L A N DS L I D E R I S K R E D U CT I O N 32 5
FIGURE 8.4 Example of a leaflet or small poster to use in informal conversations with residents
Closehousing
Debris & rubbish
Over-steepenedslope
Vegetationremoved
Closehousing
Debris & rubbish
Over-steepenedslope
Vegetationremoved
foot
path
roof-guttering
waste water pipe
draindrain
water tank
downpipe
roof-guttering
waste water pipe
draindrain
water tank
downpipe
when you build on the slopes
keep water o� slopes
Water from taps& leaking pipes
Water poured onto ground
Water fromroofs
5 Steps to safer slopes5 Steps to safer slopesMoSSaiC
Management of Slope Stability in CommunitiesManagement of Slope Stability in Communities
www.mossaic.orgwww.mossaic.org
enth
oft
ub
e
Things to avoid...Things to avoid...
Channel all water to drains: Roof waterWaste water
Make drains watertight with plastic * or concrete
Build drains next to paths and connect drains to each other
Keep drains clear of rubbish and vegetation
*MoSSaiC can provide further information on i) easy-to-install, low-cost plastic drainage and on ii) water-level monitoring. Please ask for details.*MoSSaiC can provide further information on i) easy-to-install, low-cost plastic drainage and on ii) water-level monitoring. Please ask for details.
*Monitor waterlevels in slope5
FIGURE 8.3 Meeting invitation and project flier given to community residents at project start
Understanding slopesUnderstanding slopes
rainfall
Improving drainage to
make slopes safer
Water from household plus foul water
44
Un-lined drains and gullies33
Water from ground surface22
Water from roofs11
33
22
11
water level in ground rises
water level in ground rises
soilsoilrockrock
affected by changes in:affected by changes in:
slope geometry - e.g. making it steeper
slope loading - e.g. building a house
the strength of the soil - e.g. adding water and/or
removing vegetation
What can be done by each household:
use guttering to catch rainwater on the roof
direct all roof and grey water into lined drains
keep main drains clear of debris
report cracks and leakage in drains
report leakage in piped water supplies
...you may think of other ways of reducing the water going into the slope...
pessanding slooanding slopes
iirai ffnfallllll
a ecccffeaffecttedctecafaa tttttteeeefefefefeccccccccaaaa fffeffffffffffffaa tteeaffeeectedecffaffected
Community meeting 6pm, 12th SeptemberImproving slope stability and drainage in our community
You are invited to the community
centre to talk with leaders of the
Government Risk Reduction initiative
about how to improve slope stability
and drainage in this community.
The following proposed project plan
will be discussed:
Phase 1. Pilot project - providing
drainage to improve slope stability in
the most at-risk area (10 houses)
Phase 2. Extend main drains in whole
community and connect households
(100 houses)
Organised by the Community Committee
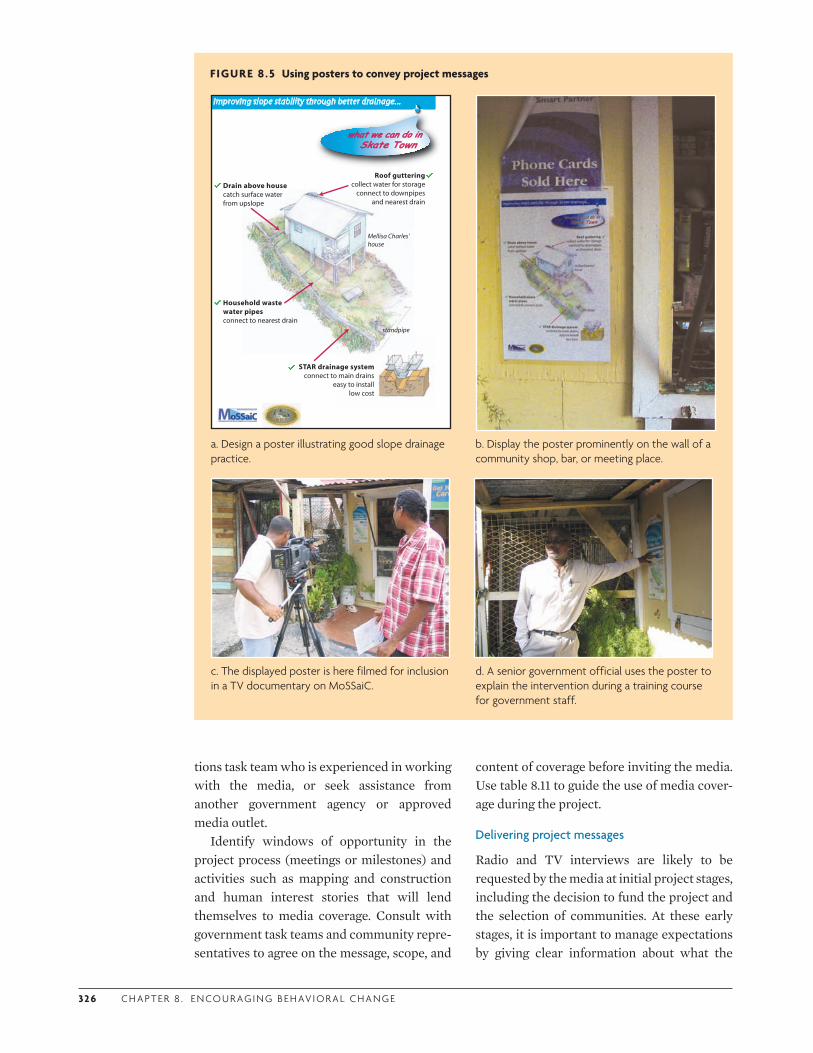
32 6 C H A P T E R 8 . E N CO U R AG I N G B E H AV I O R A L C H A N G E
FIGURE 8.5 Using posters to convey project messages
STAR drainage system connect to main drains
easy to installlow cost
Drain above housecatch surface water from upslope
Household waste water pipesconnect to nearest drain
Roof guttering collect water for storage
connect to downpipes and nearest drain
Improving slope stability through better drainage...
standpipe
Mellisa Charles' house
a. Design a poster illustrating good slope drainage practice.
b. Display the poster prominently on the wall of a community shop, bar, or meeting place.
c. The displayed poster is here filmed for inclusion in a TV documentary on MoSSaiC.
d. A senior government official uses the poster to explain the intervention during a training course for government staff.
tions task team who is experienced in working with the media, or seek assistance from another government agency or approved media outlet.
Identify windows of opportunity in the project process (meetings or milestones) and activities such as mapping and construction and human interest stories that will lend themselves to media coverage. Consult with government task teams and community repre-sentatives to agree on the message, scope, and
content of coverage before inviting the media. Use table 8.11 to guide the use of media cover-age during the project.
Delivering project messages
Radio and TV interviews are likely to be requested by the media at initial project stages, including the decision to fund the project and the selection of communities. At these early stages, it is important to manage expectations by giving clear information about what the
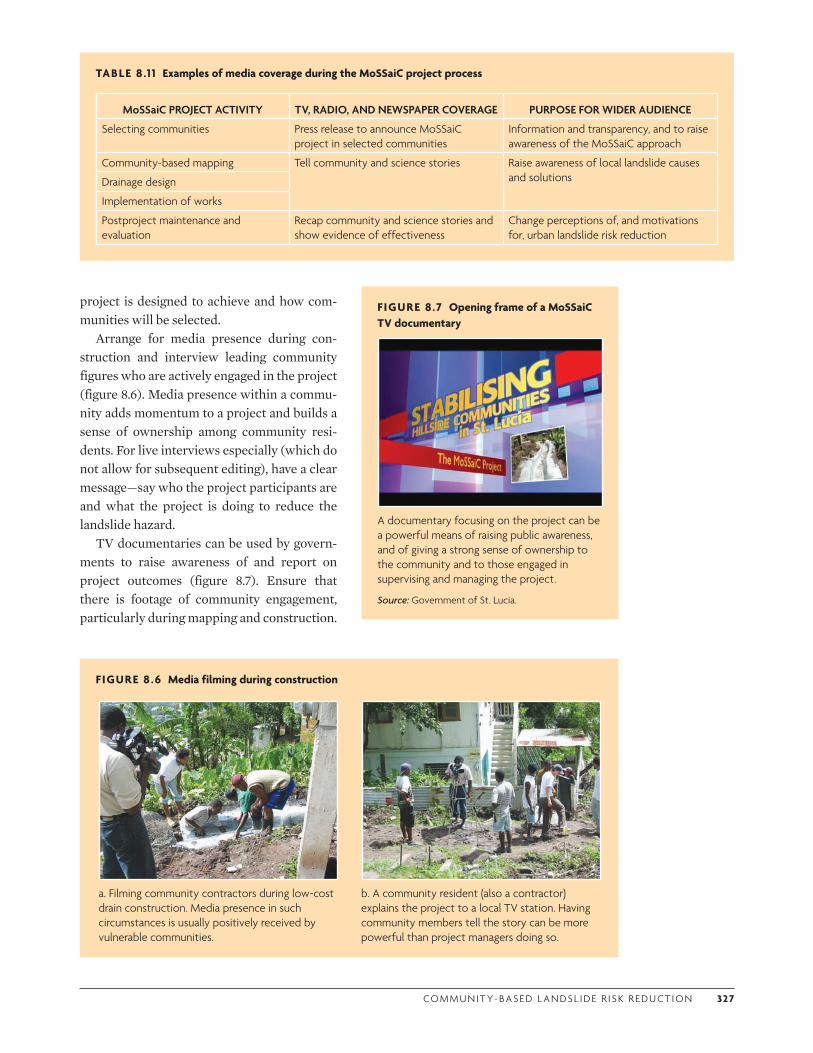
CO M M U N I T Y- BA S E D L A N DS L I D E R I S K R E D U CT I O N 32 7
project is designed to achieve and how com-munities will be selected.
Arrange for media presence during con-struction and interview leading community figures who are actively engaged in the project (figure 8.6). Media presence within a commu-nity adds momentum to a project and builds a sense of ownership among community resi-dents. For live interviews especially (which do not allow for subsequent editing), have a clear message—say who the project participants are and what the project is doing to reduce the landslide hazard.
TV documentaries can be used by govern-ments to raise awareness of and report on project outcomes (figure 8.7). Ensure that there is footage of community engagement, particularly during mapping and construction.
TABLE 8 .1 1 Examples of media coverage during the MoSSaiC project process
MoSSaiC PROJECT ACTIVITY TV, RADIO, AND NEWSPAPER COVERAGE PURPOSE FOR WIDER AUDIENCE
Selecting communities Press release to announce MoSSaiC project in selected communities
Information and transparency, and to raise awareness of the MoSSaiC approach
Community-based mapping Tell community and science stories Raise awareness of local landslide causes and solutionsDrainage design
Implementation of works
Postproject maintenance and evaluation
Recap community and science stories and show evidence of effectiveness
Change perceptions of, and motivations for, urban landslide risk reduction
FIGURE 8.6 Media filming during construction
a. Filming community contractors during low-cost drain construction. Media presence in such circumstances is usually positively received by vulnerable communities.
b. A community resident (also a contractor) explains the project to a local TV station. Having community members tell the story can be more powerful than project managers doing so.
FIGURE 8.7 Opening frame of a MoSSaiC TV documentary
A documentary focusing on the project can be a powerful means of raising public awareness, and of giving a strong sense of ownership to the community and to those engaged in supervising and managing the project.
Source: Government of St. Lucia.

32 8 C H A P T E R 8 . E N CO U R AG I N G B E H AV I O R A L C H A N G E
The TV program can be repeated when subse-quent MoSSaiC projects start in new commu-nities. The advantages and associated risks of this programming style should be reviewed before a program is commissioned (table 8.12). General guidelines for imparting messages to the media include the following:
• Keep it simple; use words people under-stand.
• Be clear and avoid detailed explanations.
• Describe, simply, what the project does, not how it works.
• Describe the differences the project will make to the local community.
• Give a human story—explain what the proj-ect will do for an individual.
Many organizations provide comprehen-sive media guidelines for community develop-ment and DRR projects—see, e.g., UNDP (2012)
8.5.5 Scientific and professional publications
There is a gap between DRR knowledge and action—and between researchers, policy mak-ers, different academic disciplines, and related professions such as engineering (Gaillard and Mercer 2012). Efforts are being made to
TABLE 8 .12 Factors for the MCU to consider when commissioning a TV documentary
ADVANTAGE RISK
•Very much a “gold standard” as far as media recognition is concerned
•Likely to have a long shelf life
•Professionally produced
•By being filmed in a familiar location/context, a locally produced documentary can raise awareness that landslide hazard can be addressed in similar communities
•Could attract the attention and endorsement of a prominent and respected person
•Can be used in subsequent team training
•Another organization may be in charge of the overall message sent
•There is no guarantee that all elements of MoSSaiC will be covered
•Production costs for a professional media house can be high
• It may not be possible to capture the full impact of the intervention, e.g., drains flowing during major storm events
•Dominant, rather than representative, views may be expressed by those community residents who volunteer to participate
address the communication gaps between these various actors. Potential solutions include adopting new paradigms to combine hazard and vulnerability reduction approaches and developing new knowledge exchange mechanisms, ways of communicating scien-tific information and uncertainty, multidisci-plinary collaborations, and action-research approaches (Malamud and Petley 2009).
MoSSaiC takes a multidisciplinary approach to delivering community-based, sci-ence-based, and evidence-based landslide risk reduction measures. This specific collabora-tion of DRR researchers, practitioners, and policy makers lends itself to dissemination of project research and results in professional and academic circles.
Publishing an article in a local professional magazine or academic journal, with key proj-ect participants as coauthors, can be a good communication channel for the following rea-sons:
• Academic journals require papers to be peer reviewed, thus providing feedback and critical evaluation of the project, opportu-nities to learn, and subsequent credibility once accepted for publication.
• Articles in local publications will be read by colleagues in government and private com-panies who may be participants in deci-sions relating to MoSSaiC.
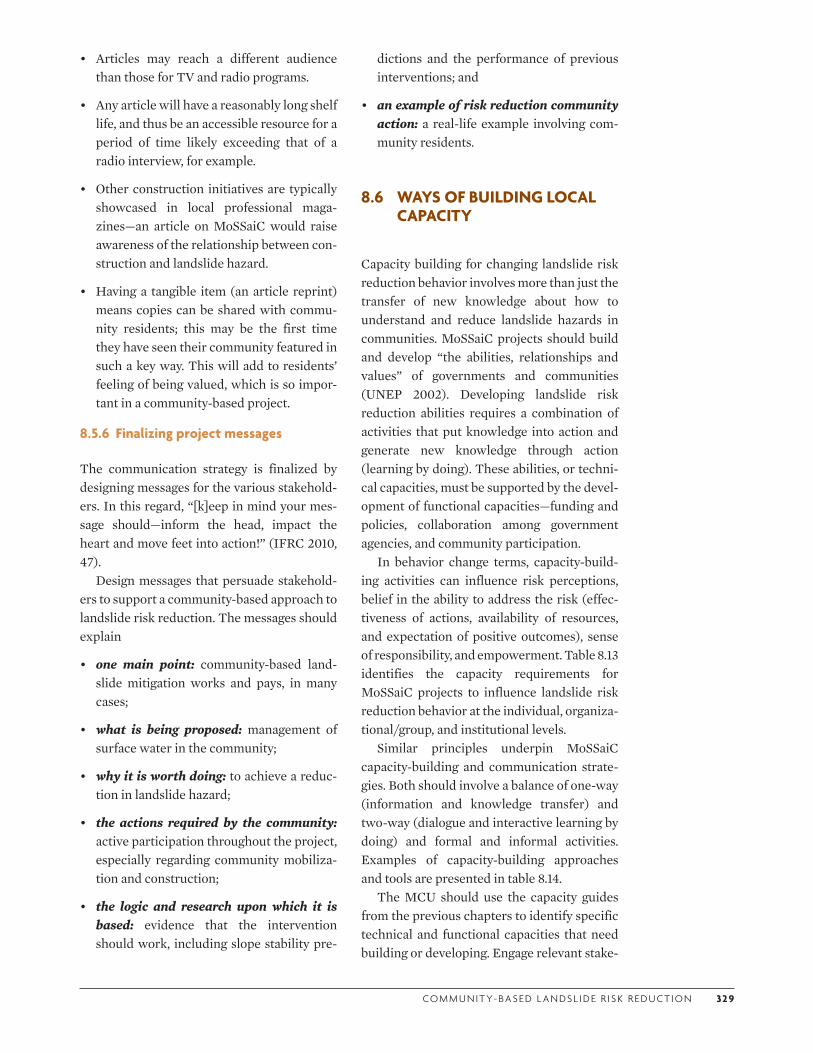
CO M M U N I T Y- BA S E D L A N DS L I D E R I S K R E D U CT I O N 32 9
• Articles may reach a different audience than those for TV and radio programs.
• Any article will have a reasonably long shelf life, and thus be an accessible resource for a period of time likely exceeding that of a radio interview, for example.
• Other construction initiatives are typically showcased in local professional maga-zines—an article on MoSSaiC would raise awareness of the relationship between con-struction and landslide hazard.
• Having a tangible item (an article reprint) means copies can be shared with commu-nity residents; this may be the first time they have seen their community featured in such a key way. This will add to residents’ feeling of being valued, which is so impor-tant in a community-based project.
8.5.6 Finalizing project messages
The communication strategy is finalized by designing messages for the various stakehold-ers. In this regard, “[k]eep in mind your mes-sage should—inform the head, impact the heart and move feet into action!” (IFRC 2010, 47).
Design messages that persuade stakehold-ers to support a community-based approach to landslide risk reduction. The messages should explain
• one main point: community-based land-slide mitigation works and pays, in many cases;
• what is being proposed: management of surface water in the community;
• why it is worth doing: to achieve a reduc-tion in landslide hazard;
• the actions required by the community: active participation throughout the project, especially regarding community mobiliza-tion and construction;
• the logic and research upon which it is based: evidence that the intervention should work, including slope stability pre-
dictions and the performance of previous interventions; and
• an example of risk reduction community action: a real-life example involving com-munity residents.
8.6 WAYS OF BUILDING LOCAL CAPACITY
Capacity building for changing landslide risk reduction behavior involves more than just the transfer of new knowledge about how to understand and reduce landslide hazards in communities. MoSSaiC projects should build and develop “the abilities, relationships and values” of governments and communities (UNEP 2002). Developing landslide risk reduction abilities requires a combination of activities that put knowledge into action and generate new knowledge through action (learning by doing). These abilities, or techni-cal capacities, must be supported by the devel-opment of functional capacities—funding and policies, collaboration among government agencies, and community participation.
In behavior change terms, capacity-build-ing activities can influence risk perceptions, belief in the ability to address the risk (effec-tiveness of actions, availability of resources, and expectation of positive outcomes), sense of responsibility, and empowerment. Table 8.13 identifies the capacity requirements for MoSSaiC projects to influence landslide risk reduction behavior at the individual, organiza-tional/group, and institutional levels.
Similar principles underpin MoSSaiC capacity-building and communication strate-gies. Both should involve a balance of one-way (information and knowledge transfer) and two-way (dialogue and interactive learning by doing) and formal and informal activities. Examples of capacity-building approaches and tools are presented in table 8.14.
The MCU should use the capacity guides from the previous chapters to identify specific technical and functional capacities that need building or developing. Engage relevant stake-
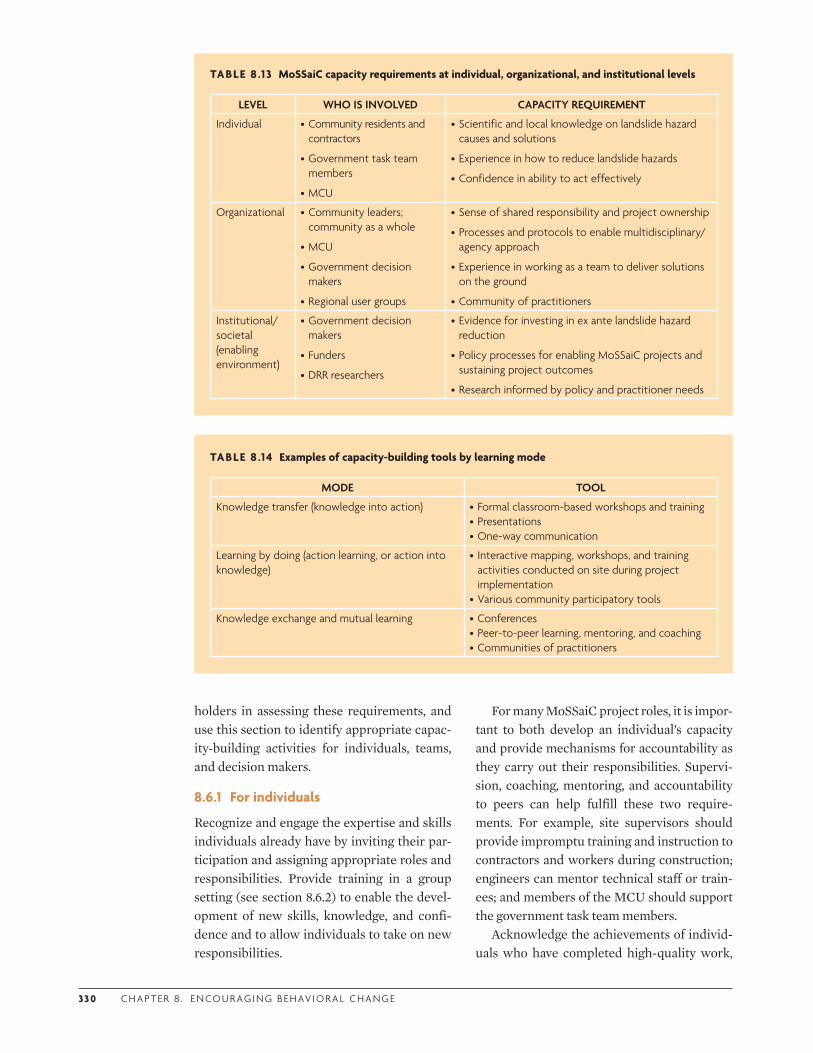
33 0 C H A P T E R 8 . E N CO U R AG I N G B E H AV I O R A L C H A N G E
holders in assessing these requirements, and use this section to identify appropriate capac-ity-building activities for individuals, teams, and decision makers.
8.6.1 For individuals
Recognize and engage the expertise and skills individuals already have by inviting their par-ticipation and assigning appropriate roles and responsibilities. Provide training in a group setting (see section 8.6.2) to enable the devel-opment of new skills, knowledge, and confi-dence and to allow individuals to take on new responsibilities.
For many MoSSaiC project roles, it is impor-tant to both develop an individual’s capacity and provide mechanisms for accountability as they carry out their responsibilities. Supervi-sion, coaching, mentoring, and accountability to peers can help fulfill these two require-ments. For example, site supervisors should provide impromptu training and instruction to contractors and workers during construction; engineers can mentor technical staff or train-ees; and members of the MCU should support the government task team members.
Acknowledge the achievements of individ-uals who have completed high-quality work,
TABLE 8 .14 Examples of capacity-building tools by learning mode
MODE TOOL
Knowledge transfer (knowledge into action) •Formal classroom-based workshops and training•Presentations•One-way communication
Learning by doing (action learning, or action into knowledge)
• Interactive mapping, workshops, and training activities conducted on site during project implementation•Various community participatory tools
Knowledge exchange and mutual learning •Conferences•Peer-to-peer learning, mentoring, and coaching•Communities of practitioners
TABLE 8 .13 MoSSaiC capacity requirements at individual, organizational, and institutional levels
LEVEL WHO IS INVOLVED CAPACITY REQUIREMENT
Individual •Community residents and contractors
•Government task team members
•MCU
•Scientific and local knowledge on landslide hazard causes and solutions
•Experience in how to reduce landslide hazards
•Confidence in ability to act effectively
Organizational •Community leaders; community as a whole
•MCU
•Government decision makers
•Regional user groups
•Sense of shared responsibility and project ownership
•Processes and protocols to enable multidisciplinary/agency approach
•Experience in working as a team to deliver solutions on the ground
•Community of practitioners
Institutional/societal (enabling environment)
•Government decision makers
•Funders
•DRR researchers
•Evidence for investing in ex ante landslide hazard reduction
•Policy processes for enabling MoSSaiC projects and sustaining project outcomes
•Research informed by policy and practitioner needs
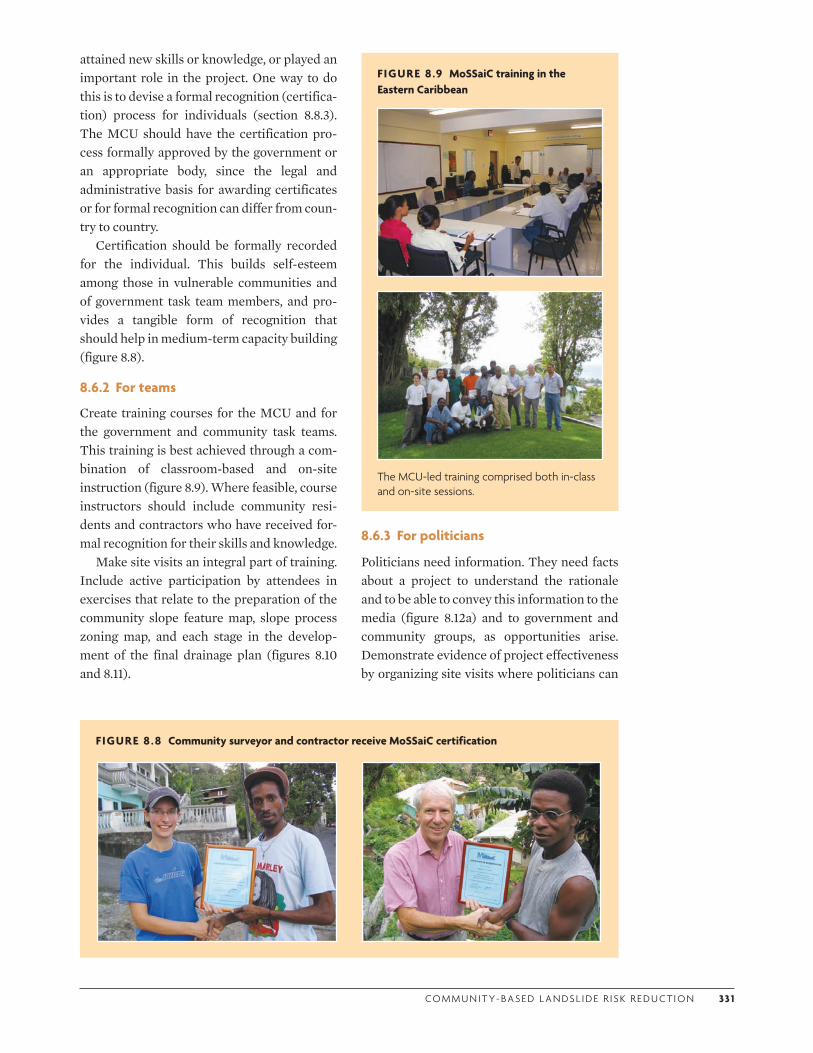
CO M M U N I T Y- BA S E D L A N DS L I D E R I S K R E D U CT I O N 33 1
attained new skills or knowledge, or played an important role in the project. One way to do this is to devise a formal recognition (certifica-tion) process for individuals (section 8.8.3). The MCU should have the certification pro-cess formally approved by the government or an appropriate body, since the legal and administrative basis for awarding certificates or for formal recognition can differ from coun-try to country.
Certification should be formally recorded for the individual. This builds self-esteem among those in vulnerable communities and of government task team members, and pro-vides a tangible form of recognition that should help in medium-term capacity building (figure 8.8).
8.6.2 For teams
Create training courses for the MCU and for the government and community task teams. This training is best achieved through a com-bination of classroom-based and on-site instruction (figure 8.9). Where feasible, course instructors should include community resi-dents and contractors who have received for-mal recognition for their skills and knowledge.
Make site visits an integral part of training. Include active participation by attendees in exercises that relate to the preparation of the community slope feature map, slope process zoning map, and each stage in the develop-ment of the final drainage plan (figures 8.10 and 8.11).
8.6.3 For politicians
Politicians need information. They need facts about a project to understand the rationale and to be able to convey this information to the media (figure 8.12a) and to government and community groups, as opportunities arise. Demonstrate evidence of project effectiveness by organizing site visits where politicians can
FIGURE 8.8 Community surveyor and contractor receive MoSSaiC certification
FIGURE 8.9 MoSSaiC training in the Eastern Caribbean
The MCU-led training comprised both in-class and on-site sessions.
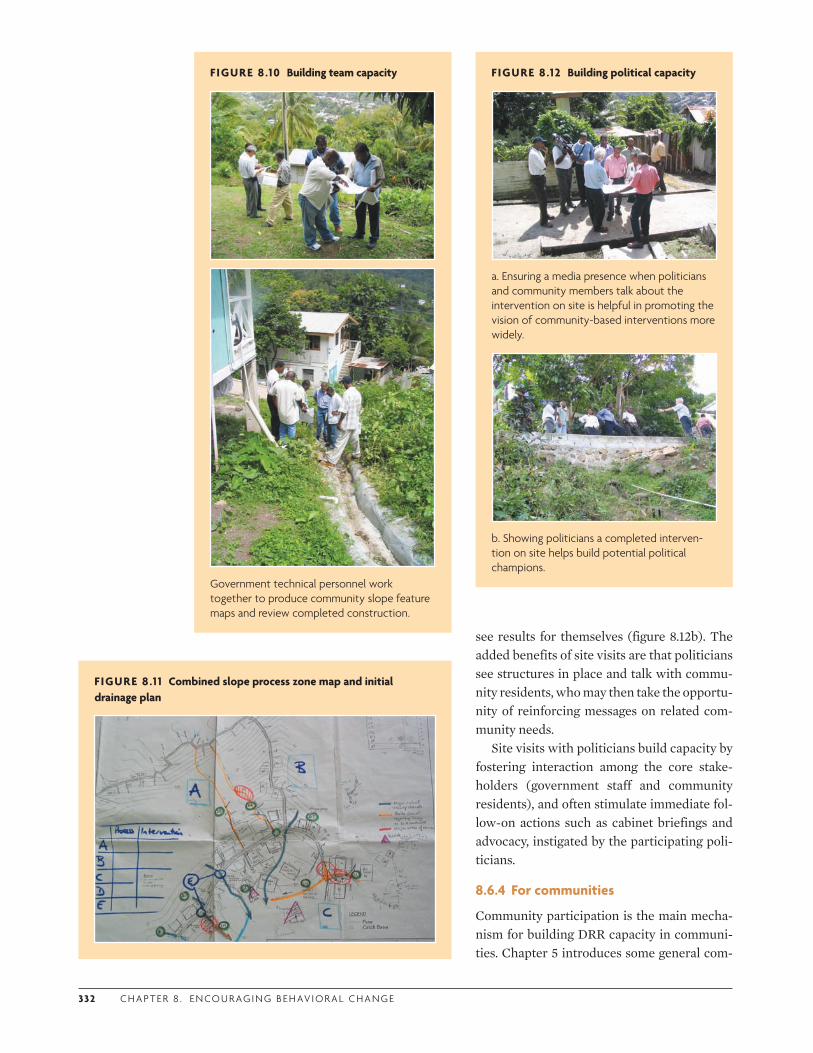
332 C H A P T E R 8 . E N CO U R AG I N G B E H AV I O R A L C H A N G E
see results for themselves (figure 8.12b). The added benefits of site visits are that politicians see structures in place and talk with commu-nity residents, who may then take the opportu-nity of reinforcing messages on related com-munity needs.
Site visits with politicians build capacity by fostering interaction among the core stake-holders (government staff and community residents), and often stimulate immediate fol-low-on actions such as cabinet briefings and advocacy, instigated by the participating poli-ticians.
8.6.4 For communities
Community participation is the main mecha-nism for building DRR capacity in communi-ties. Chapter 5 introduces some general com-
FIGURE 8.10 Building team capacity
Government technical personnel work together to produce community slope feature maps and review completed construction.
FIGURE 8.12 Building political capacity
a. Ensuring a media presence when politicians and community members talk about the intervention on site is helpful in promoting the vision of community-based interventions more widely.
b. Showing politicians a completed interven-tion on site helps build potential political champions.
FIGURE 8.1 1 Combined slope process zone map and initial drainage plan
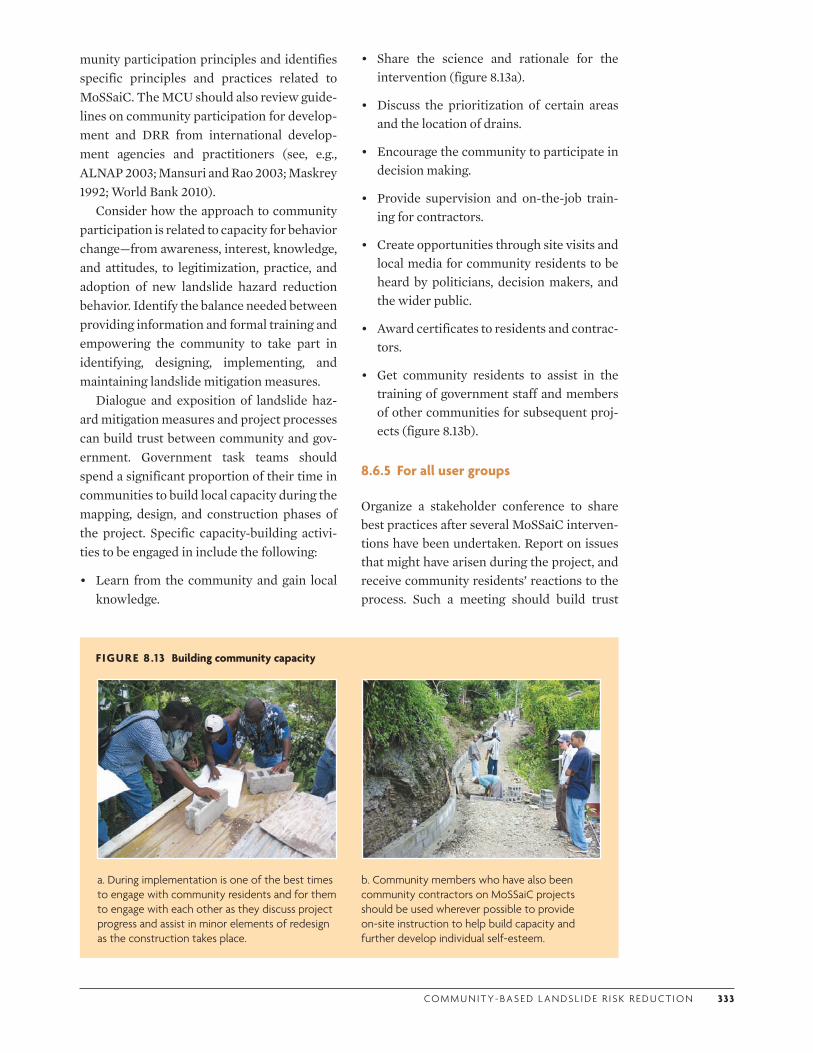
CO M M U N I T Y- BA S E D L A N DS L I D E R I S K R E D U CT I O N 333
munity participation principles and identifies specific principles and practices related to MoSSaiC. The MCU should also review guide-lines on community participation for develop-ment and DRR from international develop-ment agencies and practitioners (see, e.g., ALNAP 2003; Mansuri and Rao 2003; Maskrey 1992; World Bank 2010).
Consider how the approach to community participation is related to capacity for behavior change—from awareness, interest, knowledge, and attitudes, to legitimization, practice, and adoption of new landslide hazard reduction behavior. Identify the balance needed between providing information and formal training and empowering the community to take part in identifying, designing, implementing, and maintaining landslide mitigation measures.
Dialogue and exposition of landslide haz-ard mitigation measures and project processes can build trust between community and gov-ernment. Government task teams should spend a significant proportion of their time in communities to build local capacity during the mapping, design, and construction phases of the project. Specific capacity-building activi-ties to be engaged in include the following:
• Learn from the community and gain local knowledge.
• Share the science and rationale for the intervention (figure 8.13a).
• Discuss the prioritization of certain areas and the location of drains.
• Encourage the community to participate in decision making.
• Provide supervision and on-the-job train-ing for contractors.
• Create opportunities through site visits and local media for community residents to be heard by politicians, decision makers, and the wider public.
• Award certificates to residents and contrac-tors.
• Get community residents to assist in the training of government staff and members of other communities for subsequent proj-ects (figure 8.13b).
8.6.5 For all user groups
Organize a stakeholder conference to share best practices after several MoSSaiC interven-tions have been undertaken. Report on issues that might have arisen during the project, and receive community residents’ reactions to the process. Such a meeting should build trust
FIGURE 8.13 Building community capacity
a. During implementation is one of the best times to engage with community residents and for them to engage with each other as they discuss project progress and assist in minor elements of redesign as the construction takes place.
b. Community members who have also been community contractors on MoSSaiC projects should be used wherever possible to provide on-site instruction to help build capacity and further develop individual self-esteem.
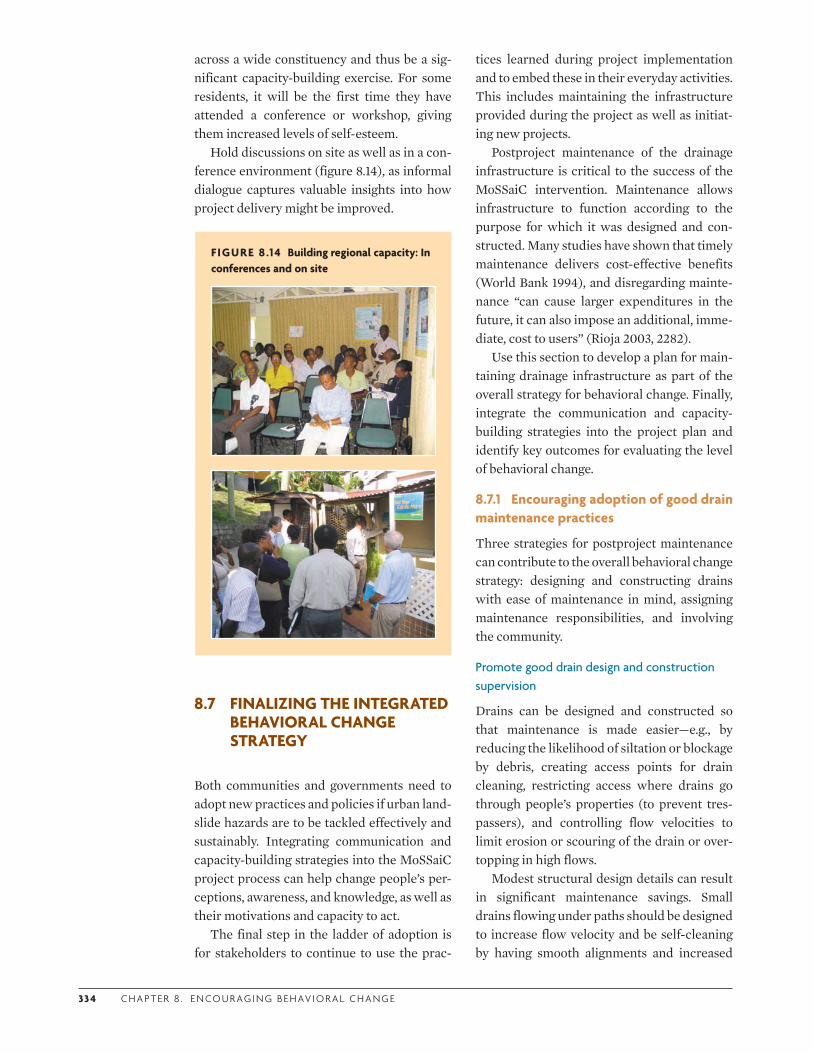
33 4 C H A P T E R 8 . E N CO U R AG I N G B E H AV I O R A L C H A N G E
across a wide constituency and thus be a sig-nificant capacity-building exercise. For some residents, it will be the first time they have attended a conference or workshop, giving them increased levels of self-esteem.
Hold discussions on site as well as in a con-ference environment (figure 8.14), as informal dialogue captures valuable insights into how project delivery might be improved.
tices learned during project implementation and to embed these in their everyday activities. This includes maintaining the infrastructure provided during the project as well as initiat-ing new projects.
Postproject maintenance of the drainage infrastructure is critical to the success of the MoSSaiC intervention. Maintenance allows infrastructure to function according to the purpose for which it was designed and con-structed. Many studies have shown that timely maintenance delivers cost-effective benefits (World Bank 1994), and disregarding mainte-nance “can cause larger expenditures in the future, it can also impose an additional, imme-diate, cost to users” (Rioja 2003, 2282).
Use this section to develop a plan for main-taining drainage infrastructure as part of the overall strategy for behavioral change. Finally, integrate the communication and capacity-building strategies into the project plan and identify key outcomes for evaluating the level of behavioral change.
8.7.1 Encouraging adoption of good drain maintenance practices
Three strategies for postproject maintenance can contribute to the overall behavioral change strategy: designing and constructing drains with ease of maintenance in mind, assigning maintenance responsibilities, and involving the community.
Promote good drain design and construction supervision
Drains can be designed and constructed so that maintenance is made easier—e.g., by reducing the likelihood of siltation or blockage by debris, creating access points for drain cleaning, restricting access where drains go through people’s properties (to prevent tres-passers), and controlling flow velocities to limit erosion or scouring of the drain or over-topping in high flows.
Modest structural design details can result in significant maintenance savings. Small drains flowing under paths should be designed to increase flow velocity and be self-cleaning by having smooth alignments and increased
FIGURE 8.14 Building regional capacity: In conferences and on site
8.7 FINALIZING THE INTEGRATED BEHAVIORAL CHANGE STRATEGY
Both communities and governments need to adopt new practices and policies if urban land-slide hazards are to be tackled effectively and sustainably. Integrating communication and capacity-building strategies into the MoSSaiC project process can help change people’s per-ceptions, awareness, and knowledge, as well as their motivations and capacity to act.
The final step in the ladder of adoption is for stakeholders to continue to use the prac-
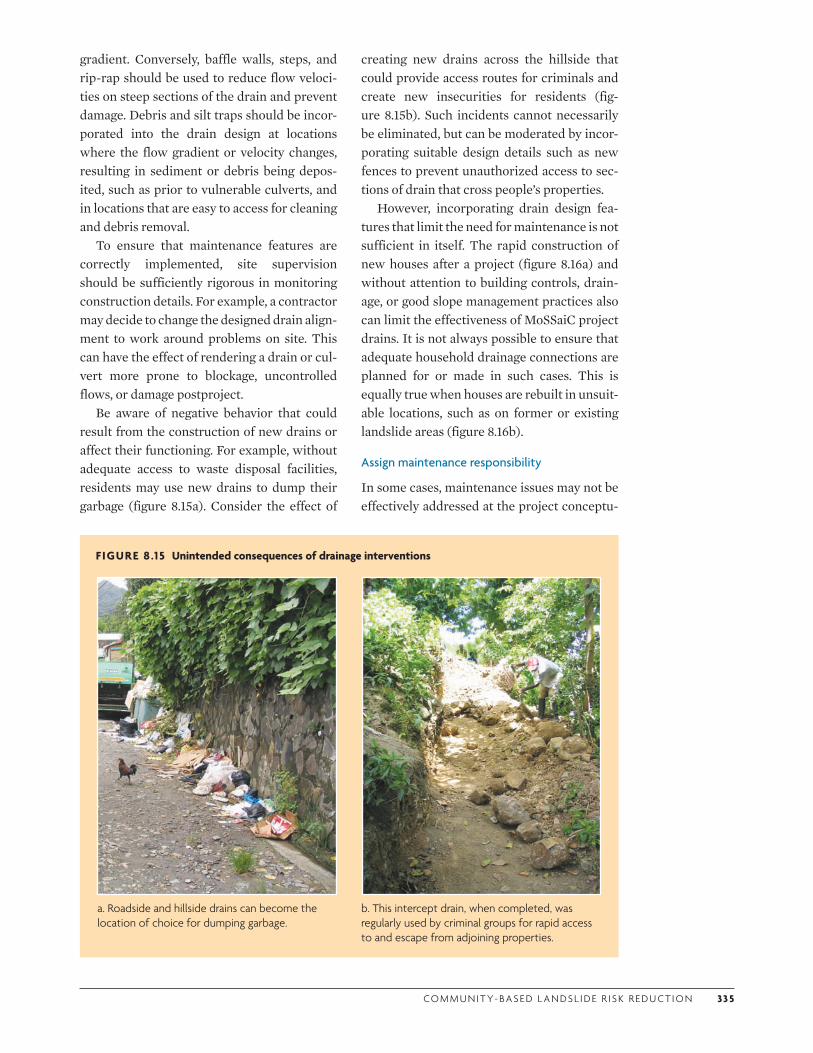
CO M M U N I T Y- BA S E D L A N DS L I D E R I S K R E D U CT I O N 33 5
gradient. Conversely, baffle walls, steps, and rip-rap should be used to reduce flow veloci-ties on steep sections of the drain and prevent damage. Debris and silt traps should be incor-porated into the drain design at locations where the flow gradient or velocity changes, resulting in sediment or debris being depos-ited, such as prior to vulnerable culverts, and in locations that are easy to access for cleaning and debris removal.
To ensure that maintenance features are correctly implemented, site supervision should be sufficiently rigorous in monitoring construction details. For example, a contractor may decide to change the designed drain align-ment to work around problems on site. This can have the effect of rendering a drain or cul-vert more prone to blockage, uncontrolled flows, or damage postproject.
Be aware of negative behavior that could result from the construction of new drains or affect their functioning. For example, without adequate access to waste disposal facilities, residents may use new drains to dump their garbage (figure 8.15a). Consider the effect of
creating new drains across the hillside that could provide access routes for criminals and create new insecurities for residents (fig-ure 8.15b). Such incidents cannot necessarily be eliminated, but can be moderated by incor-porating suitable design details such as new fences to prevent unauthorized access to sec-tions of drain that cross people’s properties.
However, incorporating drain design fea-tures that limit the need for maintenance is not sufficient in itself. The rapid construction of new houses after a project (figure 8.16a) and without attention to building controls, drain-age, or good slope management practices also can limit the effectiveness of MoSSaiC project drains. It is not always possible to ensure that adequate household drainage connections are planned for or made in such cases. This is equally true when houses are rebuilt in unsuit-able locations, such as on former or existing landslide areas (figure 8.16b).
Assign maintenance responsibility
In some cases, maintenance issues may not be effectively addressed at the project conceptu-
FIGURE 8.15 Unintended consequences of drainage interventions
a. Roadside and hillside drains can become the location of choice for dumping garbage.
b. This intercept drain, when completed, was regularly used by criminal groups for rapid access to and escape from adjoining properties.
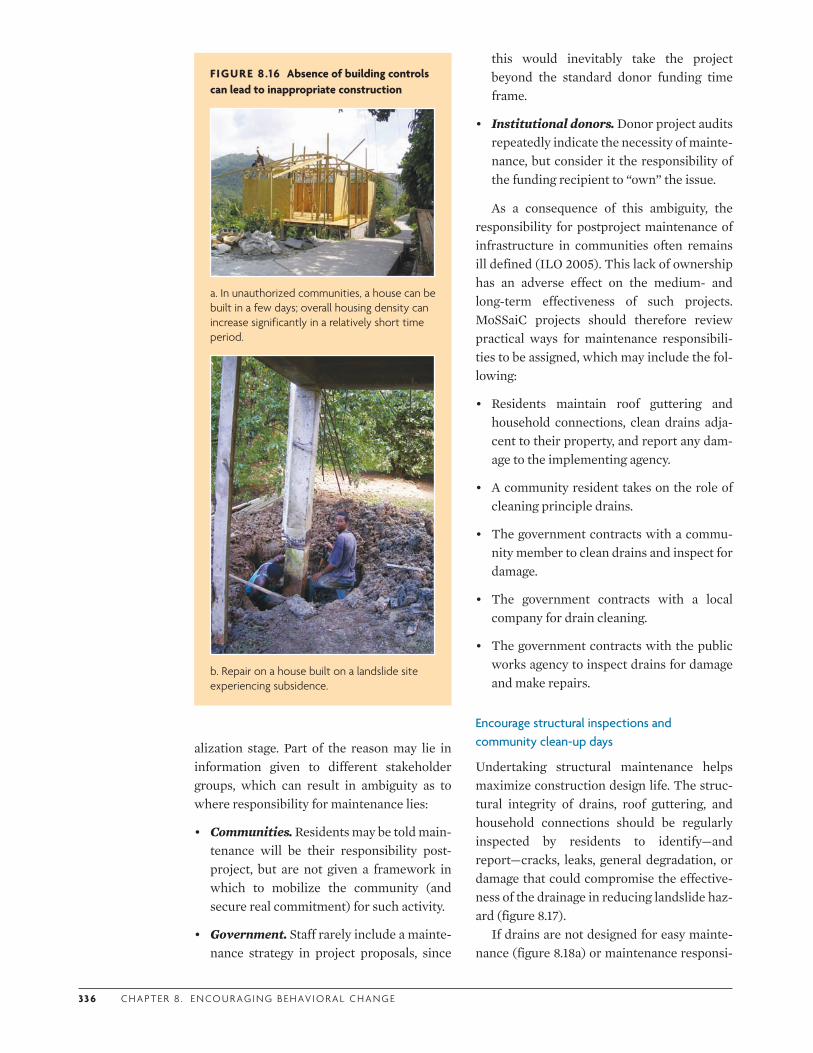
33 6 C H A P T E R 8 . E N CO U R AG I N G B E H AV I O R A L C H A N G E
alization stage. Part of the reason may lie in information given to different stakeholder groups, which can result in ambiguity as to where responsibility for maintenance lies:
• Communities. Residents may be told main-tenance will be their responsibility post-project, but are not given a framework in which to mobilize the community (and secure real commitment) for such activity.
• Government. Staff rarely include a mainte-nance strategy in project proposals, since
this would inevitably take the project beyond the standard donor funding time frame.
• Institutional donors. Donor project audits repeatedly indicate the necessity of mainte-nance, but consider it the responsibility of the funding recipient to “own” the issue.
As a consequence of this ambiguity, the responsibility for postproject maintenance of infrastructure in communities often remains ill defined (ILO 2005). This lack of ownership has an adverse effect on the medium- and long-term effectiveness of such projects. MoSSaiC projects should therefore review practical ways for maintenance responsibili-ties to be assigned, which may include the fol-lowing:
• Residents maintain roof guttering and household connections, clean drains adja-cent to their property, and report any dam-age to the implementing agency.
• A community resident takes on the role of cleaning principle drains.
• The government contracts with a commu-nity member to clean drains and inspect for damage.
• The government contracts with a local company for drain cleaning.
• The government contracts with the public works agency to inspect drains for damage and make repairs.
Encourage structural inspections and community clean-up days
Undertaking structural maintenance helps maximize construction design life. The struc-tural integrity of drains, roof guttering, and household connections should be regularly inspected by residents to identify—and report—cracks, leaks, general degradation, or damage that could compromise the effective-ness of the drainage in reducing landslide haz-ard (figure 8.17).
If drains are not designed for easy mainte-nance (figure 8.18a) or maintenance responsi-
FIGURE 8.16 Absence of building controls can lead to inappropriate construction
a. In unauthorized communities, a house can be built in a few days; overall housing density can increase significantly in a relatively short time period.
b. Repair on a house built on a landslide site experiencing subsidence.
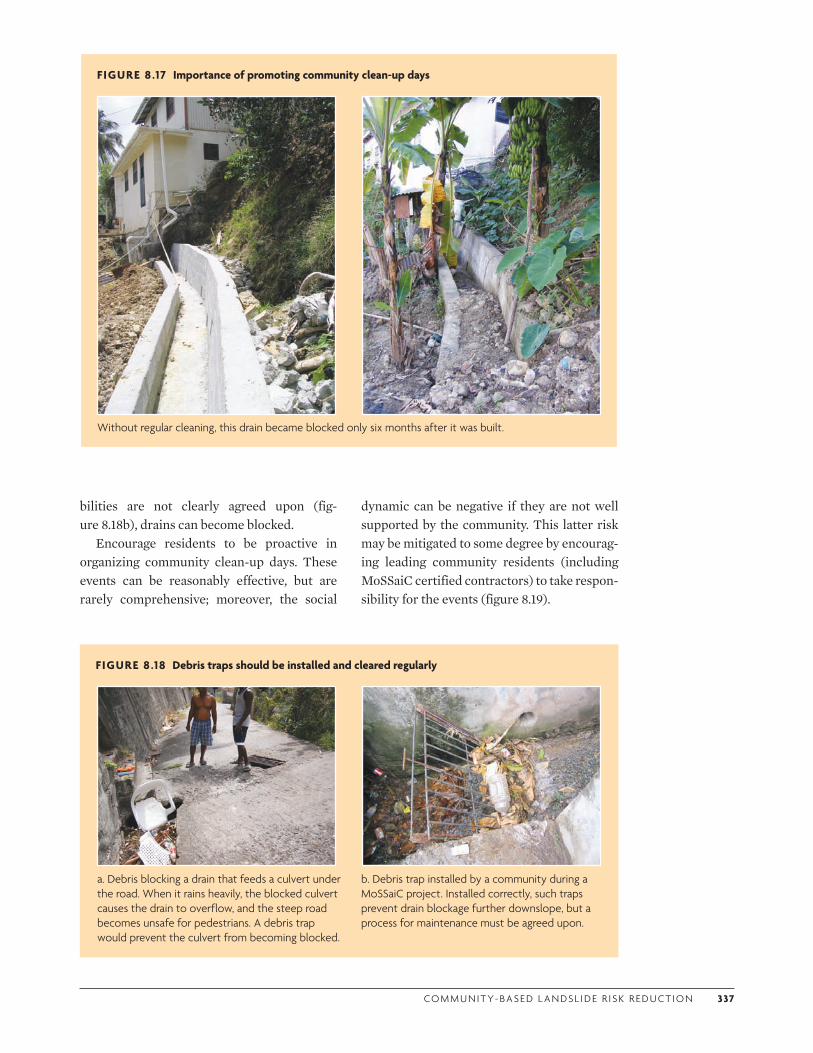
CO M M U N I T Y- BA S E D L A N DS L I D E R I S K R E D U CT I O N 337
bilities are not clearly agreed upon (fig-ure 8.18b), drains can become blocked.
Encourage residents to be proactive in organizing community clean-up days. These events can be reasonably effective, but are rarely comprehensive; moreover, the social
dynamic can be negative if they are not well supported by the community. This latter risk may be mitigated to some degree by encourag-ing leading community residents (including MoSSaiC certified contractors) to take respon-sibility for the events (figure 8.19).
FIGURE 8.17 Importance of promoting community clean-up days
Without regular cleaning, this drain became blocked only six months after it was built.
FIGURE 8.18 Debris traps should be installed and cleared regularly
a. Debris blocking a drain that feeds a culvert under the road. When it rains heavily, the blocked culvert causes the drain to overflow, and the steep road becomes unsafe for pedestrians. A debris trap would prevent the culvert from becoming blocked.
b. Debris trap installed by a community during a MoSSaiC project. Installed correctly, such traps prevent drain blockage further downslope, but a process for maintenance must be agreed upon.
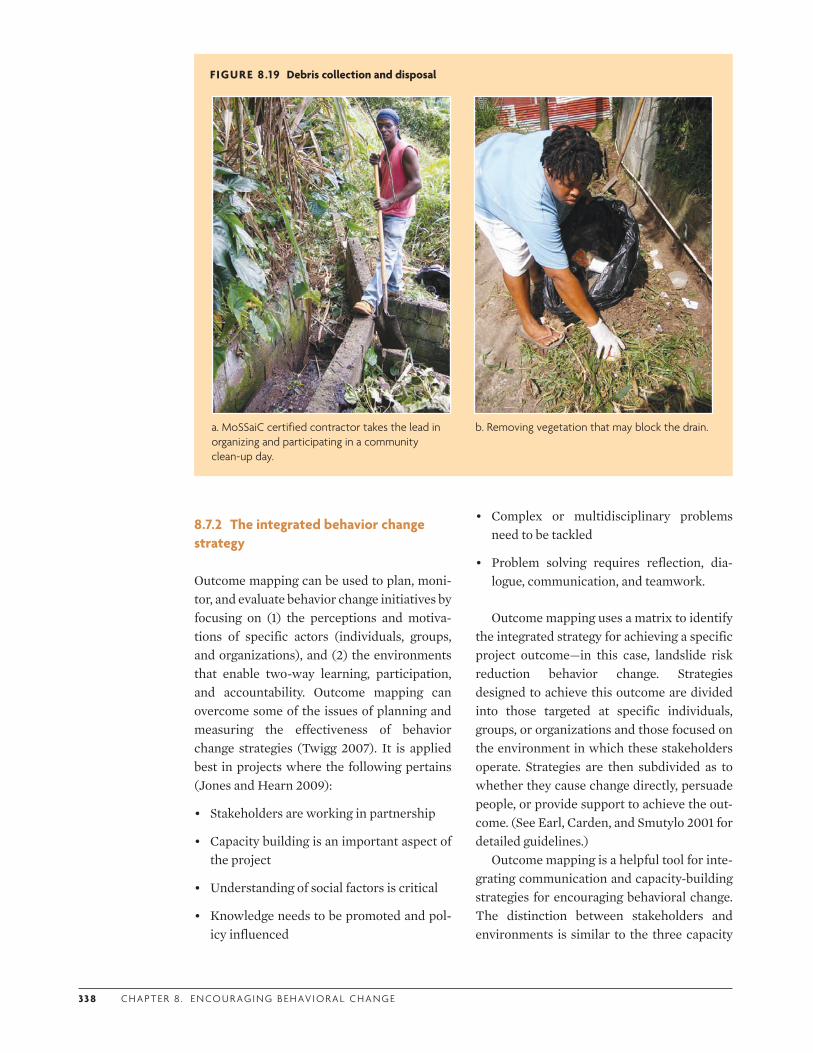
33 8 C H A P T E R 8 . E N CO U R AG I N G B E H AV I O R A L C H A N G E
8.7.2 The integrated behavior change strategy
Outcome mapping can be used to plan, moni-tor, and evaluate behavior change initiatives by focusing on (1) the perceptions and motiva-tions of specific actors (individuals, groups, and organizations), and (2) the environments that enable two-way learning, participation, and accountability. Outcome mapping can overcome some of the issues of planning and measuring the effectiveness of behavior change strategies (Twigg 2007). It is applied best in projects where the following pertains (Jones and Hearn 2009):
• Stakeholders are working in partnership
• Capacity building is an important aspect of the project
• Understanding of social factors is critical
• Knowledge needs to be promoted and pol-icy influenced
• Complex or multidisciplinary problems need to be tackled
• Problem solving requires reflection, dia-logue, communication, and teamwork.
Outcome mapping uses a matrix to identify the integrated strategy for achieving a specific project outcome—in this case, landslide risk reduction behavior change. Strategies designed to achieve this outcome are divided into those targeted at specific individuals, groups, or organizations and those focused on the environment in which these stakeholders operate. Strategies are then subdivided as to whether they cause change directly, persuade people, or provide support to achieve the out-come. (See Earl, Carden, and Smutylo 2001 for detailed guidelines.)
Outcome mapping is a helpful tool for inte-grating communication and capacity-building strategies for encouraging behavioral change. The distinction between stakeholders and environments is similar to the three capacity
FIGURE 8.19 Debris collection and disposal
a. MoSSaiC certified contractor takes the lead in organizing and participating in a community clean-up day.
b. Removing vegetation that may block the drain.
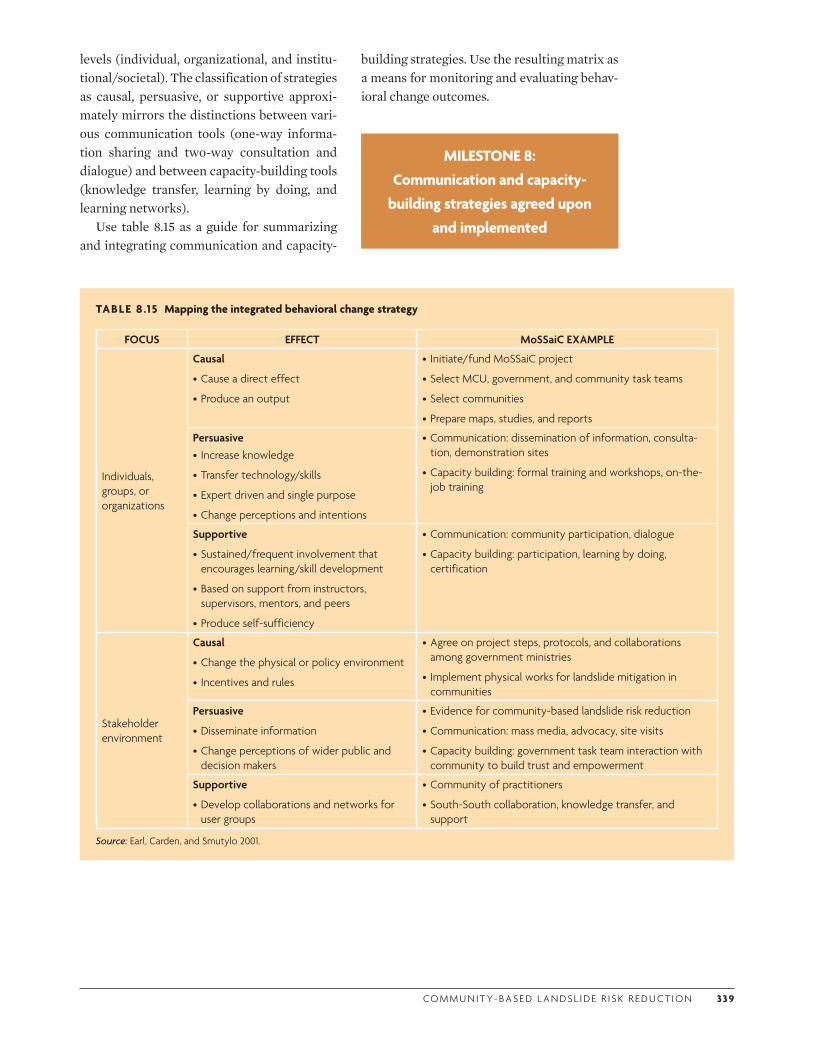
CO M M U N I T Y- BA S E D L A N DS L I D E R I S K R E D U CT I O N 339
levels (individual, organizational, and institu-tional/societal). The classification of strategies as causal, persuasive, or supportive approxi-mately mirrors the distinctions between vari-ous communication tools (one-way informa-tion sharing and two-way consultation and dialogue) and between capacity-building tools (knowledge transfer, learning by doing, and learning networks).
Use table 8.15 as a guide for summarizing and integrating communication and capacity-
building strategies. Use the resulting matrix as a means for monitoring and evaluating behav-ioral change outcomes.
MILESTONE 8: Communication and capacity-
building strategies agreed upon and implemented
TABLE 8 .15 Mapping the integrated behavioral change strategy
FOCUS EFFECT MoSSaiC EXAMPLE
Individuals, groups, or organizations
Causal
•Cause a direct effect
•Produce an output
• Initiate/fund MoSSaiC project
•Select MCU, government, and community task teams
•Select communities
•Prepare maps, studies, and reports
Persuasive• Increase knowledge
•Transfer technology/skills
•Expert driven and single purpose
•Change perceptions and intentions
•Communication: dissemination of information, consulta-tion, demonstration sites
•Capacity building: formal training and workshops, on-the-job training
Supportive
•Sustained/frequent involvement that encourages learning/skill development
•Based on support from instructors, supervisors, mentors, and peers
•Produce self-sufficiency
•Communication: community participation, dialogue
•Capacity building: participation, learning by doing, certification
Stakeholder environment
Causal
•Change the physical or policy environment
• Incentives and rules
•Agree on project steps, protocols, and collaborations among government ministries
• Implement physical works for landslide mitigation in communities
Persuasive
•Disseminate information
•Change perceptions of wider public and decision makers
•Evidence for community-based landslide risk reduction
•Communication: mass media, advocacy, site visits
•Capacity building: government task team interaction with community to build trust and empowerment
Supportive
•Develop collaborations and networks for user groups
•Community of practitioners
•South-South collaboration, knowledge transfer, and support
Source: Earl, Carden, and Smutylo 2001.
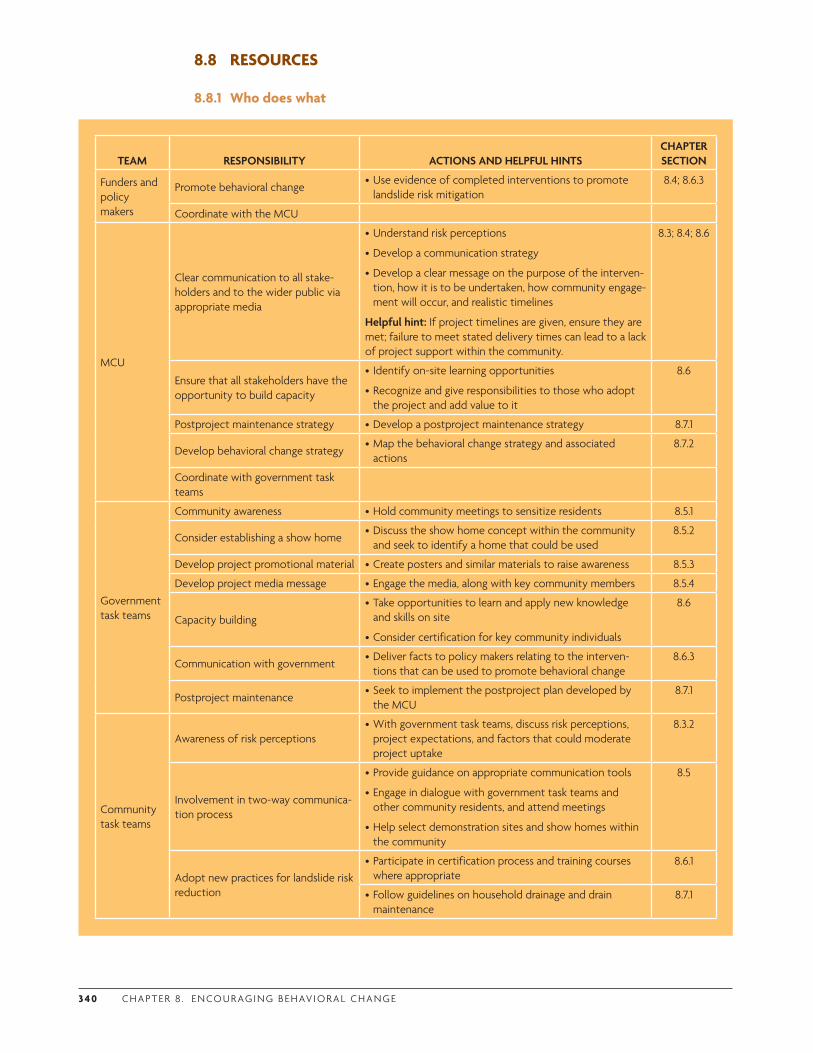
3 4 0 C H A P T E R 8 . E N CO U R AG I N G B E H AV I O R A L C H A N G E
8.8 RESOURCES
8.8.1 Who does what
TEAM RESPONSIBILITY ACTIONS AND HELPFUL HINTSCHAPTER SECTION
Funders and policy makers
Promote behavioral change•Use evidence of completed interventions to promote
landslide risk mitigation8.4; 8.6.3
Coordinate with the MCU
MCU
Clear communication to all stake-holders and to the wider public via appropriate media
•Understand risk perceptions
•Develop a communication strategy
•Develop a clear message on the purpose of the interven-tion, how it is to be undertaken, how community engage-ment will occur, and realistic timelines
Helpful hint: If project timelines are given, ensure they are met; failure to meet stated delivery times can lead to a lack of project support within the community.
8.3; 8.4; 8.6
Ensure that all stakeholders have the opportunity to build capacity
• Identify on-site learning opportunities
•Recognize and give responsibilities to those who adopt the project and add value to it
8.6
Postproject maintenance strategy •Develop a postproject maintenance strategy 8.7.1
Develop behavioral change strategy•Map the behavioral change strategy and associated
actions8.7.2
Coordinate with government task teams
Government task teams
Community awareness •Hold community meetings to sensitize residents 8.5.1
Consider establishing a show home•Discuss the show home concept within the community
and seek to identify a home that could be used8.5.2
Develop project promotional material •Create posters and similar materials to raise awareness 8.5.3
Develop project media message •Engage the media, along with key community members 8.5.4
Capacity building•Take opportunities to learn and apply new knowledge
and skills on site
•Consider certification for key community individuals
8.6
Communication with government•Deliver facts to policy makers relating to the interven-
tions that can be used to promote behavioral change8.6.3
Postproject maintenance•Seek to implement the postproject plan developed by
the MCU8.7.1
Community task teams
Awareness of risk perceptions•With government task teams, discuss risk perceptions,
project expectations, and factors that could moderate project uptake
8.3.2
Involvement in two-way communica-tion process
•Provide guidance on appropriate communication tools
•Engage in dialogue with government task teams and other community residents, and attend meetings
•Help select demonstration sites and show homes within the community
8.5
Adopt new practices for landslide risk reduction
•Participate in certification process and training courses where appropriate
8.6.1
•Follow guidelines on household drainage and drain maintenance
8.7.1
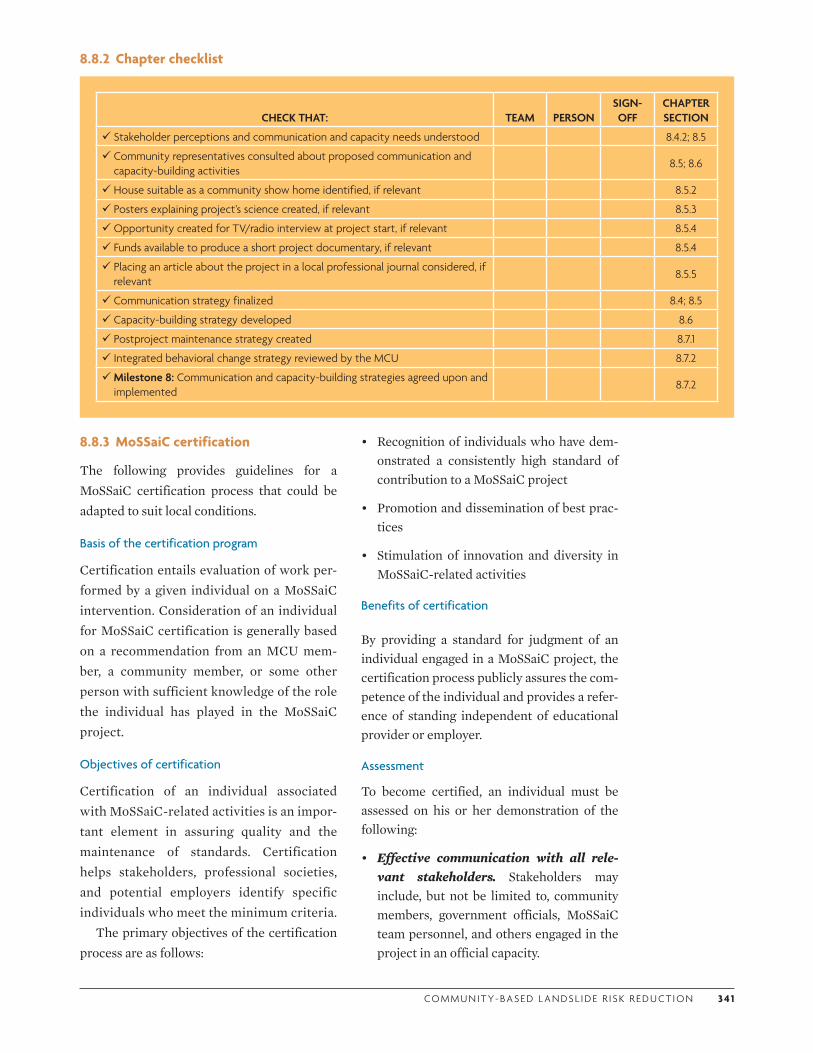
CO M M U N I T Y- BA S E D L A N DS L I D E R I S K R E D U CT I O N 3 4 1
8.8.2 Chapter checklist
8.8.3 MoSSaiC certification
The following provides guidelines for a MoSSaiC certification process that could be adapted to suit local conditions.
Basis of the certification program
Certification entails evaluation of work per-formed by a given individual on a MoSSaiC intervention. Consideration of an individual for MoSSaiC certification is generally based on a recommendation from an MCU mem-ber, a community member, or some other person with sufficient knowledge of the role the individual has played in the MoSSaiC project.
Objectives of certification
Certification of an individual associated with MoSSaiC-related activities is an impor-tant element in assuring quality and the maintenance of standards. Certification helps stakeholders, professional societies, and potential employers identify specific individuals who meet the minimum criteria.
The primary objectives of the certification process are as follows:
CHECK THAT: TEAM PERSONSIGN-OFF
CHAPTER SECTION
Stakeholder perceptions and communication and capacity needs understood 8.4.2; 8.5
Community representatives consulted about proposed communication and capacity-building activities
8.5; 8.6
House suitable as a community show home identified, if relevant 8.5.2
Posters explaining project’s science created, if relevant 8.5.3
Opportunity created for TV/radio interview at project start, if relevant 8.5.4
Funds available to produce a short project documentary, if relevant 8.5.4
Placing an article about the project in a local professional journal considered, if relevant
8.5.5
Communication strategy finalized 8.4; 8.5
Capacity-building strategy developed 8.6
Postproject maintenance strategy created 8.7.1
Integrated behavioral change strategy reviewed by the MCU 8.7.2
Milestone 8: Communication and capacity-building strategies agreed upon and implemented
8.7.2
• Recognition of individuals who have dem-onstrated a consistently high standard of contribution to a MoSSaiC project
• Promotion and dissemination of best prac-tices
• Stimulation of innovation and diversity in MoSSaiC-related activities
Benefits of certification
By providing a standard for judgment of an individual engaged in a MoSSaiC project, the certification process publicly assures the com-petence of the individual and provides a refer-ence of standing independent of educational provider or employer.
Assessment
To become certified, an individual must be assessed on his or her demonstration of the following:
• Effective communication with all rele-vant stakeholders. Stakeholders may include, but not be limited to, community members, government officials, MoSSaiC team personnel, and others engaged in the project in an official capacity.
3 42 C H A P T E R 8 . E N CO U R AG I N G B E H AV I O R A L C H A N G E
• Understanding of the impact of low-cost community-based landslide risk reduc-tion within his or her particular spe-cialty. Examples of such specialties are low-cost drain construction, site survey work, site construction, and supervision.
• Delivery of high-quality work.
• Taking the initiative in his or her area of specialization.
• Consistency of performance and commit-ment throughout the project.
The above generic attributes recognize the broad nature of the potential skills an individ-ual may possess and practice on a MoSSaiC activity.
8.8.4 References
ALNAP (Active Learning Network for Accountability and Performance in Humanitarian Action). 2003. Participation by Crisis-Affected Populations in Humanitarian Actions—A Handbook for Practitioners. London: Overseas Development Institution. http://www.alnap.org/publications/gs_handbook/gs_handbook.pdf.
Benson, C., and J. Twigg. 2007. “Tools for Mainstreaming Disaster Risk Reduction: Guidance Notes for Development Organisations.” ProVention Consortium, Geneva.
Bessette, G. 2004. “Involving the Community: A Guide to Participatory Development Communication.” Southbound in association with the International Development Research Centre, Penang, Malaysia.
Bohm, D. 1996. “On Dialogue.” Schouten & Nelissen, Zaltbommel, the Netherlands. http://sprott.physics.wisc.edu/chaos-complexity....../dialogue.pdf.
Bull-Kamanga, L., K. Diagne, A. Lavell, E. Leon, F. Lerise, H. MacGregor, A. Maskrey, M. Meshack, M. Pelling, H. Reid, D. Satterthwaite, J. Songsore, K. Westgate, and A. Yitambe. 2003. “From Everyday Hazards to Disasters: The Accumulation of Risk in Urban Areas.” Environment and Urbanization 15 (1): 193–203.
Burgess, J., and J. Chilvers. 2006. “Upping the Ante: A Conceptual Framework for Designing and Evaluating Participatory Technology
Assessments.” Science and Public Policy 33 (10): 713–28.
CADRI (Capacity for Disaster Reduction Initiative). 2011. “Basics of Capacity Development for Disaster Risk Reduction.” United Nations, Geneva.
Crookall, D., and W. Thorngate. 2009. “Acting, Knowing, Learning, Simulating, Gaming.” Simulation Gaming 40: 8–26.
Earl, S., F. Carden, and T. Smutylo. 2001. Outcome Mapping: Building Learning and Reflection into Development Programs. Ottawa: International Development Research Centre. http://web.idrc.ca/openebooks/959-3/.
FAO (Food and Agriculture Organization of the United Nations). 2004. “Participatory Communication Strategy Design.” Document ID 188865. http://www.fao.org/docrep/008/y5794e/y5794e00.htm.
FM Global. 2010. “Flirting with Disasters: Why Companies Risk It All.” http://www.fmglobal.com/assets/pdf/P10168.pdf.
Gaillard, J. C., and J. Mercer. 2012. “From Knowledge to Action: Bridging Gaps in Disaster Risk Reduction.” Progress in Human Geography doi:10.1177/0309132512446717.
GNDR (Global Network of Civil Society Organizations for Disaster Reduction). 2011. If We Do Not Join Hands: Views from the Frontline—Local Reports of Progress on Implementing the Hyogo Framework for Action, with Strategic Recommendations for More Effective Implementation. Teddington, UK: GNDR.
Höppner, C., M. Buchecker, and M. Bründl. 2010. “Risk Communication and Natural Hazards.” Cap Haz-Net. WP5 Report, Berne, Switzerland.
IDRC (International Development Research Centre). 2012. “Developing a Communications Strategy.” http://web.idrc.ca/uploads/user-S/11606746331Sheet01_CommStrategy.pdf.
IFRC (International Federation of Red Cross and Red Crescent Societies). 2008. “VCA Training Guide: Classroom Training and Learning-by-Doing.” IFRC, Geneva.
—. 2010. Advocacy for Disaster Risk Reduction Training Course: Facilitator’s Guide. http://drrinsouthasia.net/downloads/Publications_Case_Studies/IFRC/Advocacy%20for%20DRR%20Trg.%20Kit/Facilitators%20Guide%20Advocacy%20Trg.%20Kit.pdf.

CO M M U N I T Y- BA S E D L A N DS L I D E R I S K R E D U CT I O N 3 43
ILO (International Labour Organization). 2005 “Community Contracting and Organisational Practices in Rural Areas: A Case Study of Malawi.” http://www.ilo.org/wcmsp5/groups/public/@ed_emp/@emp_policy/@invest/documents/publication/wcms_asist_8030.pdf.
Jones, H., and S. Hearn. 2009. “Outcome Mapping: A Realistic Alternative for Planning, Monitoring and Evaluation.” Overseas Development Institute, UK. http://www.odi.org.uk/resources/docs/5058.pdf.
Kunreuther, H., and M. Useem. 2010. “Principles and Challenges for Reducing Risks from Disasters.” In Learning from Catastrophes, ed. H. Kunreuther and M. Useem. Upper Saddle River, NJ: Wharton School Publishing.
Luft, J., and H. Ingham. 1950. “The Johari Window, a Graphic Model of Interpersonal Awareness.” In Proceedings of the Western Training Laboratory in Group Development. Los Angeles.
Lundgren, R. E., and A. H. McMakin. 2009. Risk Communication—A Handbook for Communicating Environmental, Safety, and Health Risks. Hoboken, NJ: Wiley.
Malamud, B. D., and D. Petley. 2009. “Lost in Translation.” Public Service Review: Science and Technology 2: 164–67.
Mansuri, G., and V. Rao. 2003. Evaluating Community-Based and Community-Driven Development: A Critical Review of the Evidence. Development Research Group. Washington, DC: World Bank.
Maskrey, A. 1992. “Defining the Community’s Role in Disaster Mitigation.” Appropriate Technology Magazine 19 (3). http://practicalaction.org/practicalanswers/product_info.php?products_id=214.
McNabb, M., and K. Pearson. 2010. “Can Poor Countries Afford to Prepare for Low-Probability Events?” In Learning from Catastrophes, ed. H. Kunreuther and M. Useem. Upper Saddle River, NJ: Wharton School Publishing.
Mefalopulos, P. 2008. Development Communication Sourcebook—Broadening the Boundaries of Communication. Washington, DC: World Bank.
Mefalopulos, P., and C. Kamlongera. 2004. Participatory Communication Strategy Design: A Handbook. Southern African Development Community, Centre of Communication for Development. Rome: Food and Agriculture Organization of the United Nations.
Paton, D. 2003. “Disaster Preparedness: A Social-Cognitive Perspective.” Disaster Prevention and Management 12: 210–16.
Rioja, F. K. 2003. “Filling Potholes: Macroeconomic Effects of Maintenance versus New Investments in Public Infrastructure.” Journal of Public Economics 87 (9–10): 2281–304.
Twigg, J. 2007. “Characteristics of a Disaster Resilient Community: A Guidance Note.” https://practicalaction.org/docs/ia1/community-characteristics-en-lowres.pdf.
UNU (United Nations University). 2006. “Landslides. Asia Has the Most; Americas, the Deadliest; Europe, the Costliest; Experts Seek Ways to Mitigate Landslide Losses; Danger Said Growing Due To Climate Change, Other Causes.” News Release MR/E01/06/rev1.
UNDP (United Nations Development Programme). 2012. Communicating for Results: Reaching the Outside World. http://web.undp.org/comtoolkit/reaching-the-outside-world/outside-world-tools.shtml.
UNEP (United Nations Environment Programme). 2002. Capacity Building for Sustainable Development: An Overview of UNEP Environmental Capacity Development Activities. www.unep.org/Pdf/Capacity_building.pdf.
UNICEF. 2008. “Conference on Community-based Disaster Risk Reduction.” November 26–28, Kolkata. www.unicef.org/india/Conference CommunitybasedDisasterRiskReductionreport.pdf.
UNISDR (United Nations Office for Disaster Risk Reduction). 2004. “Hyogo Framework for Action 2005–2015: Building the Resilience of Nations and Communities to Disasters.” UNISDR, Geneva. http://www.unisdr.org/wcdr.
Wisner, B. 2009. “Local Knowledge and Disaster Risk Reduction.” Keynote presentation at the Side Meeting on Indigenous Knowledge, “Global Platform for Disaster Reduction,” Geneva, June 17.
World Bank. 2010. Development and Climate Change. World Development Report. Washington, DC: World Bank.
—. 2011. “Mainstreaming Adaptation to Climate Change in Agriculture and Natural Resources Management Projects. Engaging Local Communities and Increasing Adaptive Capacity.” Guidance Note 2 http://siteresources.worldbank.org/EXTTOOLKIT3/Resources/3646250-1250715327143/GN2.pdf.
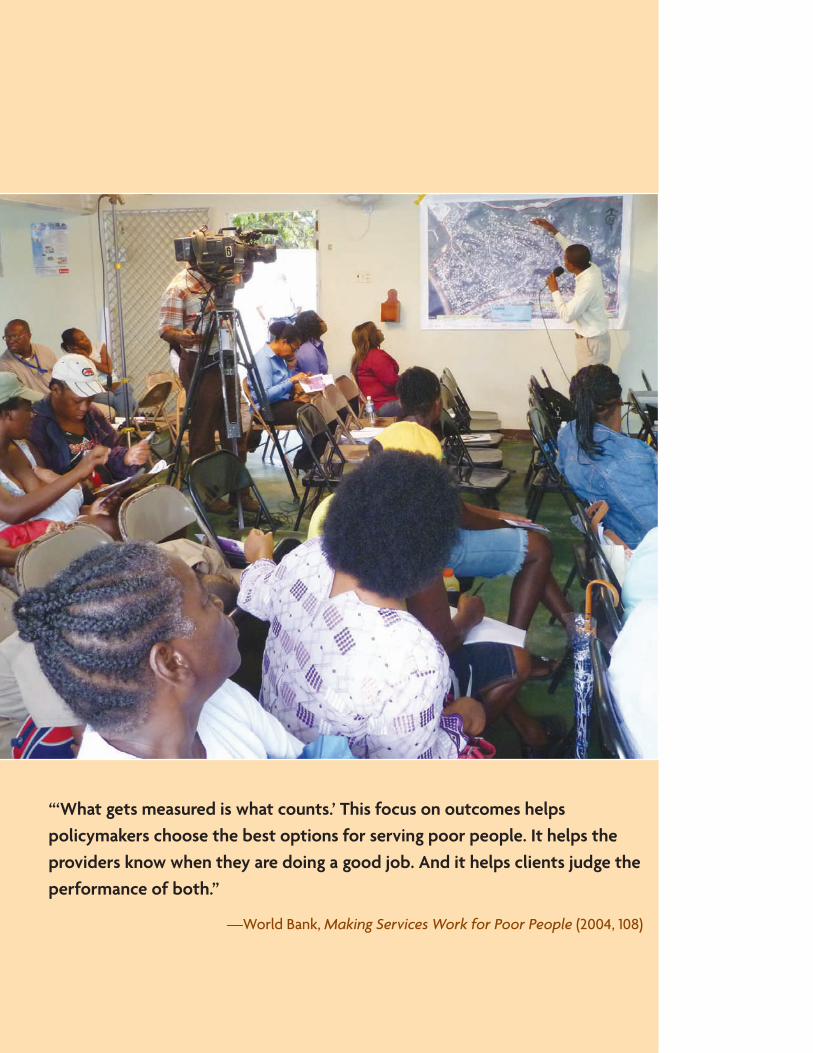
“‘What gets measured is what counts.’ This focus on outcomes helps policymakers choose the best options for serving poor people. It helps the providers know when they are doing a good job. And it helps clients judge the performance of both.”
—World Bank, Making Services Work for Poor People (2004, 108)
3 4 5
CHAPTER 9
Project Evaluation
9.1 KEY CHAPTER ELEMENTS
9.1.1 Coverage
This chapter provides a framework for MoSSaiC (Management of Slope Stability in Communi-ties) project evaluation and highlights the need
for an evidence base for ex ante landslide risk reduction. The listed groups should read the indicated chapter sections.
AUDIENCE
LEARNINGCHAPTER SECTIONF M G C
Importance of project evaluation 9.2
Development of key performance indicators 9.4–9.5
F = funders and policy makers M = MoSSaiC core unit: government project managers and experts G = government task teams: experts and practitioners C = community task teams: residents, leaders, contractors
9.1.2 Documents
DOCUMENT TO BE PRODUCEDCHAPTER SECTION
Key performance indicator list for immediate project outputs 9.4
Key performance indicator list for medium-term project outcomes 9.5
An agreed-upon evaluation framework 9.4, 9.5
3 4 6 C H A P T E R 9. P RO J E CT E VA L U AT I O N
9.1.3 Steps and outputs
9.1.4 Community-based aspects
The chapter outlines how community mem-bers can contribute to postproject evaluation and the evidence base for community-based landslide hazard reduction.
9.2 GETTING STARTED
9.2.1 Briefing note
Evaluation aims
Project evaluation aims to “determine the rel-evance and fulfillment of objectives, develop-ment efficiency, effectiveness, impact and sus-tainability” (OECD 2002, 21). Evaluation is carried out both during and after projects (for-matively and summatively, respectively) as fol-lows (World Bank 2007):
• Formative evaluations focus on project implementation and improvements, regard-less of whether the assumed operational logic corresponds to actual operations and what immediate consequences each imple-mentation stage produces.
• Summative evaluations focus on out-comes and impacts at the end of the proj-ect (or after a particular project stage) to determine the extent to which antici-pated outcomes were produced (the con-sequences and results of the project)—enabling an assessment of the creation,
continuation, or scaling-up of a given project or policy.
Evaluation of a MoSSaiC project provides the evidence base for ex ante landslide risk reduction (which is one of the three founda-tions of MoSSaiC) by demonstrating whether community-based landslide risk reduction works and pays, and what the most appropri-ate practices and policies are. This evidence base comprises three levels and time frames of project evaluation information:
• Standard key performance indicators (KPIs). Have the requirements of the funders and other stakeholders been met?
• Short-term MoSSaiC outputs and KPIs. Have MoSSaiC milestones been met using appropriate community- and science-based methods?
• Medium- and longer-term MoSSaiC out-comes. Are there continuing benefits from the project in terms of reduced landslide hazard and adoption of effective urban landslide risk reduction practices and poli-cies by communities and government (i.e., behavioral change)?
In addition to these three levels or time frames, MoSSaiC project evaluations should consider three categories of effectiveness—technical and physical (reducing the hazard), cost, and behavioral change (including risk reduction awareness and capacity).
STEP OUTPUT
1. Agree on key performance indicators (KPIs) for immediate project outputs
•Develop and agree on a list of KPIs that comply with donor/government needs and MoSSaiC output measures
List of project output KPIs for evaluation
2. Agree on KPIs for medium-term project outcomes
•Develop and agree on a list of project outcome measures that allow evalua-tion of landslide hazard reduction, project costs, and behavioral change
List of project outcome KPIs for evaluation
3. Undertake project evaluation
•Agree on responsibilities for short- and medium-term data collection and the project evaluation process
•Carry out the evaluation
Project evaluation report
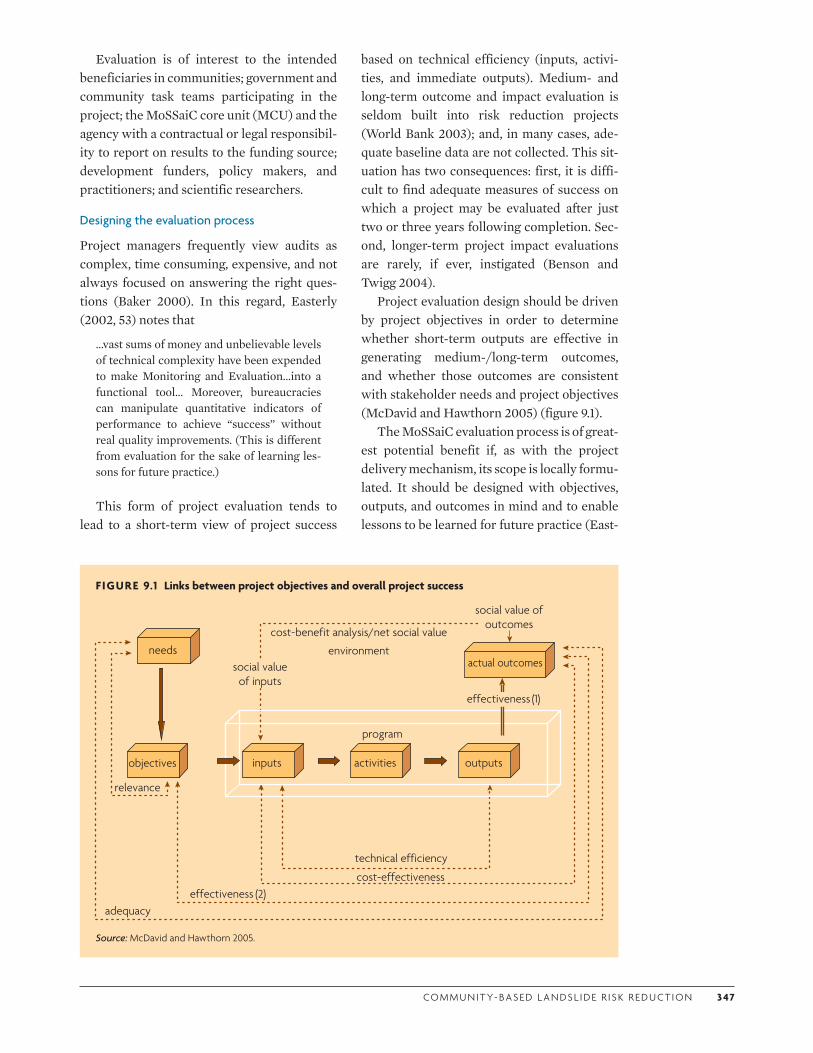
CO M M U N I T Y- BA S E D L A N DS L I D E R I S K R E D U CT I O N 3 47
Evaluation is of interest to the intended beneficiaries in communities; government and community task teams participating in the project; the MoSSaiC core unit (MCU) and the agency with a contractual or legal responsibil-ity to report on results to the funding source; development funders, policy makers, and practitioners; and scientific researchers.
Designing the evaluation process
Project managers frequently view audits as complex, time consuming, expensive, and not always focused on answering the right ques-tions (Baker 2000). In this regard, Easterly (2002, 53) notes that
…vast sums of money and unbelievable levels of technical complexity have been expended to make Monitoring and Evaluation…into a functional tool… Moreover, bureaucracies can manipulate quantitative indicators of performance to achieve “success” without real quality improvements. (This is different from evaluation for the sake of learning les-sons for future practice.)
This form of project evaluation tends to lead to a short-term view of project success
based on technical efficiency (inputs, activi-ties, and immediate outputs). Medium- and long-term outcome and impact evaluation is seldom built into risk reduction projects (World Bank 2003); and, in many cases, ade-quate baseline data are not collected. This sit-uation has two consequences: first, it is diffi-cult to find adequate measures of success on which a project may be evaluated after just two or three years following completion. Sec-ond, longer-term project impact evaluations are rarely, if ever, instigated (Benson and Twigg 2004).
Project evaluation design should be driven by project objectives in order to determine whether short-term outputs are effective in generating medium-/long-term outcomes, and whether those outcomes are consistent with stakeholder needs and project objectives (McDavid and Hawthorn 2005) (figure 9.1).
The MoSSaiC evaluation process is of great-est potential benefit if, as with the project delivery mechanism, its scope is locally formu-lated. It should be designed with objectives, outputs, and outcomes in mind and to enable lessons to be learned for future practice (East-
FIGURE 9.1 Links between project objectives and overall project success
actual outcomesneeds
social value ofoutcomes
objectives activities
program
relevance
(2)
technical efficiency
adequacy
social valueof inputs
effectiveness (1)
outputsinputs
effectivenesscost-effectiveness
cost-benefit analysis/net social value
environment
Source: McDavid and Hawthorn 2005.
3 4 8 C H A P T E R 9. P RO J E CT E VA L U AT I O N
erly 2002). This evidence base is important if the perceptions of individuals, governments, and major international funding agencies are to be changed regarding community-based landslide risk reduction.
Evaluating technical and physical effectiveness (landslide hazard reduction)
MoSSaiC employs scientific methods to assess landslide hazard and drainage issues affecting communities and to determine if improved drainage will increase slope stabil-ity. Drainage interventions are then designed on this basis. An evaluation of a MoSSaiC intervention should demonstrate the level to which landslide hazard has potentially been reduced. Hazard reduction can be deter-mined through
• the use of slope stability calculations and models,
• observations relating to rainfall events and the effectiveness of drains,
• observations relating to subsequent slope stability, and
• comments from residents.
Evaluating cost-effectiveness
A central premise of MoSSaiC is that it is often more cost-effective to reduce landslide hazard in communities than it is for a government to respond to a landslide and for the community to recover from one (Anderson and Holcombe 2006). This cost-effectiveness extends to the method of landslide hazard reduction—the appropriate use of slope surface drainage to reduce the landslide hazard for as many house-holds as possible. The use of existing govern-ment personnel and the engagement of con-tractors from the community should maximize the proportion of project money spent on the ground.
Evaluation of the cost-effectiveness of a MoSSaiC intervention involves monetizing all the costs and benefits associated with the proj-ect. In that context, three core costs are to be determined:
• Costs incurred in reducing the landslide hazard (in conjunction with the outcomes of the technical/physical evaluation)
• Costs of not undertaking the intervention (potential cost of a landslide)
• Proportion of project money spent on con-struction materials and labor.
Evaluation of capacity-building, awareness, and behavioral change
The emphasis on community engagement and the development of a government team to design and implement landslide risk reduction means that MoSSaiC can build capacity. This capacity building may occur through hands-on experience, the use and development of existing skills, or some form of training. Addi-tionally, the project may employ (or attract) the media and demonstrate good slope man-agement practices to the wider public. The aim is to generate a culture of awareness of landslide causes and of appropriate measures that can reduce this hazard. Over time, with the ongoing implementation of projects in dif-ferent communities, a degree of behavioral change will become embedded in the approach to landslide risk.
To evaluate the capacity-building and behavioral change achievements of a MoSSaiC project, the following indicators are relevant:
• Involvement of key government technical and managerial staff
• Involvement of community contractors, residents, and leaders
• Training of government staff, contractors, or community leaders on site and in the classroom
• Adoption of good slope management and landslide hazard reduction practices and policies by government in subsequent inter-ventions
• Adoption of good slope management and landslide hazard reduction practices by communities and contractors after the project is completed

CO M M U N I T Y- BA S E D L A N DS L I D E R I S K R E D U CT I O N 3 4 9
• Media uptake and presentation of the approach
• Comments from project participants.
9.2.2 Guiding principles
The following guiding principles apply in proj-ect evaluation:
• Agree on MoSSaiC project evaluation objectives with stakeholders at the start of the project. Make sure KPIs directly relate to these objectives over short, medium, and longer time frames.
• Where possible, integrate the collection of project performance data into the project process rather than creating separate (or duplicate) activities. For example, data collected during community selection, detailed community mapping, landslide hazard assessment, and drainage design (landslide hazard, exposure, and vulnera-bility) can also be used as baseline data for evaluating postproject changes in land-slide risk and surface water flows. Simi-larly, capacity assessments, studies of risk perception, and the behavior change strat-egy map (discussed in chapter 8) can be revisited after the project to evaluate changes.
• Establish responsibilities for project evalu-ation both during and after the project. The responsibility for medium- and long-term postproject evaluation (or monitoring) may need to reside with a local agency that already has a mandate or research program for disaster risk assessment and manage-ment.
• Ensure the collection and evaluation of project performance data are transparent and open to independent or external audit-ing. Adhere to funder and government safe-guards for evaluation and monitoring. Invite independent review of the project evidence base to establish credibility and learn lessons for future practice.
9.2.3 Risks and challenges
Evaluation seen as low priority
Project evaluation is rarely seen as a priority during project implementation, and record-keeping for KPIs or evaluation purposes fre-quently takes a backseat to more immediate and pressing issues. But without project evalu-ation, performance and progress cannot be measured; data collection to this end is vital. A member of the government task teams must be given responsibility for coordinating project evaluation in terms of securing agreement on KPIs, developing a template for recording rel-evant data, and recording the data in a timely manner.
Sustaining project data capture over the medium term is another challenging issue, and must be addressed so that the true project impact can be demonstrated. It may be appro-priate to initiate a formal assessment of ongo-ing impact on government capacity and the extent of behavioral change. Other data relat-ing to the physical effectiveness of the mitiga-tion measures should be collected as and when major rainfall events occur months—or even years—after project completion.
Responsibility for acquiring and maintain-ing postproject evaluation data might best be given to and overseen by an agency with an existing mandate for disaster risk manage-ment, community vulnerability reduction, or geological and geotechnical surveys, or with a local university research program.
Top-down evaluation
Development and disaster risk reduction (DRR) project evaluations remain predomi-nantly top down, designed to provide informa-tion to headquarters staff and donors. What is certain is that
evaluations need to go far beyond “bureau-cratic” reports presenting financial accounts and “physical” achievements of projects, such as those required by many funding orga-nizations. In fact, this kind of reporting tends to encourage and allow precisely the dis-
3 5 0 C H A P T E R 9. P RO J E CT E VA L U AT I O N
torted presentations of achievements that emphasize successes and minimize failures (Platteau 2004, 243).
Impediments to data collection
The time and resources allocated to project evaluations are usually very limited, leading to overemphasis on selective field evidence. Data can be further skewed by the methods used and perceptions of those involved in both acquiring and providing the data. For example, “agency evaluation teams dominated by exter-nal specialists—often men—appear to be com-mon” (Benson and Twigg 2004, 115).
Organizations may not want to provide infor-mation that shows that a program was ineffec-tive. Nonetheless, the MCU should promote the importance of evaluation regardless of potential outcome; as the World Bank (2004, 106) notes:
There are impediments to collecting such information [data and information to facili-tate the evaluation]. Provider organizations often do not want to acknowledge their lack of impact (even if it does not affect their pay directly), but knowing when things are not working is essential for improvements. Fur-ther, it is necessary to know not just what works but also why—to replicate the program and increase the scale of coverage.
9.2.4 Adapting the chapter blueprint to existing capacity
Use the capacity scoring matrix opposite to assess the capacity of the MCU and govern-ment task teams to carry out evaluation during and immediately after the project. Identify potential capacity for medium- to long-term postproject evaluation of outcomes.
1. Assign a capacity score from 1 to 3 (low to high) to reflect existing capacity for each of the elements in the matrix’s left-hand col-umn.
2. Identify the most common capacity score as the overall capacity level.
3. Adapt the chapter blueprint in accordance with this overall capacity level (see guide at the bottom of the opposite page).
9.3 DATA REQUIREMENTS FOR PROJECT EVALUATION
KPIs are metrics, or data, used for project eval-uation that relate project objectives and inputs to the resulting outputs and outcomes.
• Inputs. Inputs are the funds, time, and resources required for the project.
• Outputs. Outputs are the immediate results of project implementation such as number of persons employed, meters of drain con-structed, or number of houses with roof guttering installed.
• Outcomes. Outcomes are the longer-term results of the project such as reduction in landslide probability, reduced cost of land-slides, or improvements in slope manage-ment practice.
9.3.1 MoSSaiC project evaluation data
To achieve a holistic evaluation of the MoSSaiC program, the MCU should develop a plan for acquiring KPI data and evidence relating to three categories—technical/physical effective-ness, cost-effectiveness, and behavioral change (including risk reduction awareness and capacity)—over two postproject time frames:
• At project completion (outputs)
• Over the medium term—three to five years after project completion (outcomes).
Data within these categories (table 9.1) facilitate construction of three KPI clusters, introduced in sections 9.4 and 9.5:
• Typical donor-focused KPIs. The MCU should ascertain if there are any donor KPI requirements for the MoSSaiC project (table 9.2).
• Detailed MoSSaiC KPIs for project out-puts. The MCU should create an agreed-upon list of output KPIs relevant to the spe-cific project (table 9.3).
• KPIs for MoSSaiC project outcomes. The MCU should create a list of outcome KPIs
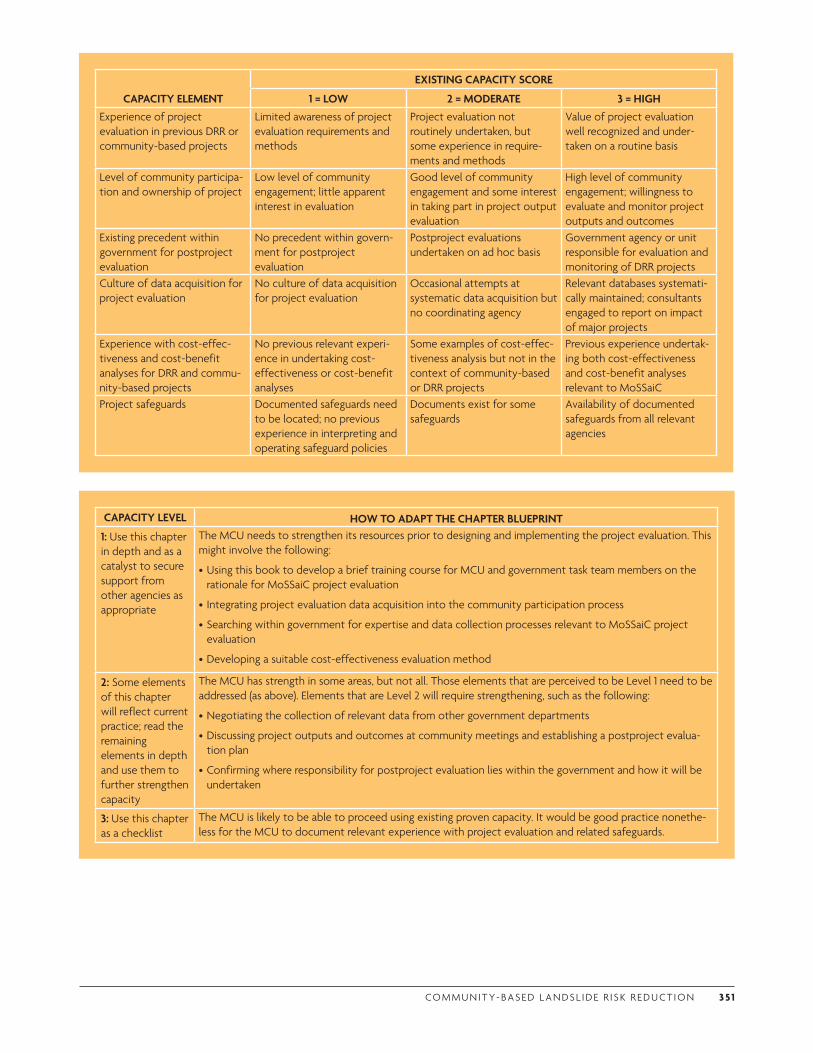
CO M M U N I T Y- BA S E D L A N DS L I D E R I S K R E D U CT I O N 3 51
CAPACITY ELEMENT
EXISTING CAPACITY SCORE
1 = LOW 2 = MODERATE 3 = HIGHExperience of project evaluation in previous DRR or community-based projects
Limited awareness of project evaluation requirements and methods
Project evaluation not routinely undertaken, but some experience in require-ments and methods
Value of project evaluation well recognized and under-taken on a routine basis
Level of community participa-tion and ownership of project
Low level of community engagement; little apparent interest in evaluation
Good level of community engagement and some interest in taking part in project output evaluation
High level of community engagement; willingness to evaluate and monitor project outputs and outcomes
Existing precedent within government for postproject evaluation
No precedent within govern-ment for postproject evaluation
Postproject evaluations undertaken on ad hoc basis
Government agency or unit responsible for evaluation and monitoring of DRR projects
Culture of data acquisition for project evaluation
No culture of data acquisition for project evaluation
Occasional attempts at systematic data acquisition but no coordinating agency
Relevant databases systemati-cally maintained; consultants engaged to report on impact of major projects
Experience with cost-effec-tiveness and cost-benefit analyses for DRR and commu-nity-based projects
No previous relevant experi-ence in undertaking cost-effectiveness or cost-benefit analyses
Some examples of cost-effec-tiveness analysis but not in the context of community-based or DRR projects
Previous experience undertak-ing both cost-effectiveness and cost-benefit analyses relevant to MoSSaiC
Project safeguards Documented safeguards need to be located; no previous experience in interpreting and operating safeguard policies
Documents exist for some safeguards
Availability of documented safeguards from all relevant agencies
CAPACITY LEVEL HOW TO ADAPT THE CHAPTER BLUEPRINT1: Use this chapter in depth and as a catalyst to secure support from other agencies as appropriate
The MCU needs to strengthen its resources prior to designing and implementing the project evaluation. This might involve the following:
•Using this book to develop a brief training course for MCU and government task team members on the rationale for MoSSaiC project evaluation
• Integrating project evaluation data acquisition into the community participation process
•Searching within government for expertise and data collection processes relevant to MoSSaiC project evaluation
•Developing a suitable cost-effectiveness evaluation method
2: Some elements of this chapter will reflect current practice; read the remaining elements in depth and use them to further strengthen capacity
The MCU has strength in some areas, but not all. Those elements that are perceived to be Level 1 need to be addressed (as above). Elements that are Level 2 will require strengthening, such as the following:
•Negotiating the collection of relevant data from other government departments
•Discussing project outputs and outcomes at community meetings and establishing a postproject evalua-tion plan
•Confirming where responsibility for postproject evaluation lies within the government and how it will be undertaken
3: Use this chapter as a checklist
The MCU is likely to be able to proceed using existing proven capacity. It would be good practice nonethe-less for the MCU to document relevant experience with project evaluation and related safeguards.
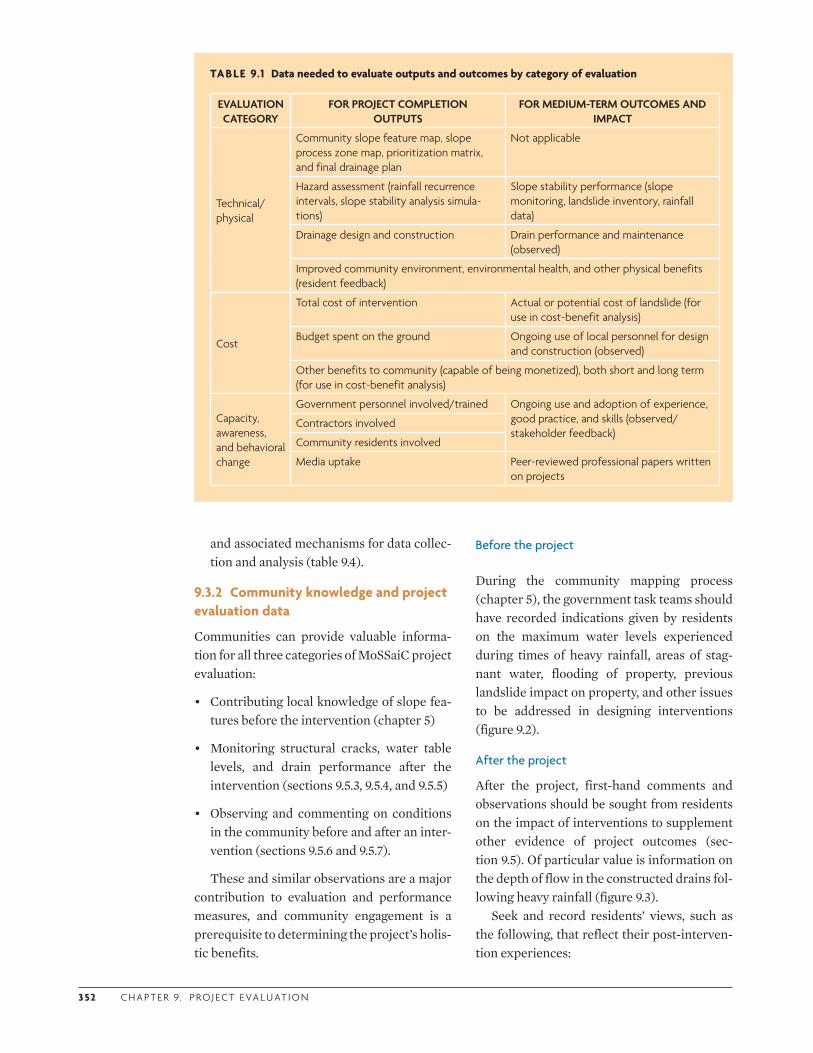
3 52 C H A P T E R 9. P RO J E CT E VA L U AT I O N
TABLE 9.1 Data needed to evaluate outputs and outcomes by category of evaluation
EVALUATION CATEGORY
FOR PROJECT COMPLETION OUTPUTS
FOR MEDIUM-TERM OUTCOMES AND IMPACT
Technical/physical
Community slope feature map, slope process zone map, prioritization matrix, and final drainage plan
Not applicable
Hazard assessment (rainfall recurrence intervals, slope stability analysis simula-tions)
Slope stability performance (slope monitoring, landslide inventory, rainfall data)
Drainage design and construction Drain performance and maintenance (observed)
Improved community environment, environmental health, and other physical benefits (resident feedback)
Cost
Total cost of intervention Actual or potential cost of landslide (for use in cost-benefit analysis)
Budget spent on the ground Ongoing use of local personnel for design and construction (observed)
Other benefits to community (capable of being monetized), both short and long term (for use in cost-benefit analysis)
Capacity, awareness, and behavioral change
Government personnel involved/trained Ongoing use and adoption of experience, good practice, and skills (observed/stakeholder feedback)
Contractors involved
Community residents involved
Media uptake Peer-reviewed professional papers written on projects
and associated mechanisms for data collec-tion and analysis (table 9.4).
9.3.2 Community knowledge and project evaluation data
Communities can provide valuable informa-tion for all three categories of MoSSaiC project evaluation:
• Contributing local knowledge of slope fea-tures before the intervention (chapter 5)
• Monitoring structural cracks, water table levels, and drain performance after the intervention (sections 9.5.3, 9.5.4, and 9.5.5)
• Observing and commenting on conditions in the community before and after an inter-vention (sections 9.5.6 and 9.5.7).
These and similar observations are a major contribution to evaluation and performance measures, and community engagement is a prerequisite to determining the project’s holis-tic benefits.
Before the project
During the community mapping process (chapter 5), the government task teams should have recorded indications given by residents on the maximum water levels experienced during times of heavy rainfall, areas of stag-nant water, flooding of property, previous landslide impact on property, and other issues to be addressed in designing interventions (figure 9.2).
After the project
After the project, first-hand comments and observations should be sought from residents on the impact of interventions to supplement other evidence of project outcomes (sec-tion 9.5). Of particular value is information on the depth of flow in the constructed drains fol-lowing heavy rainfall (figure 9.3).
Seek and record residents’ views, such as the following, that reflect their post-interven-tion experiences:
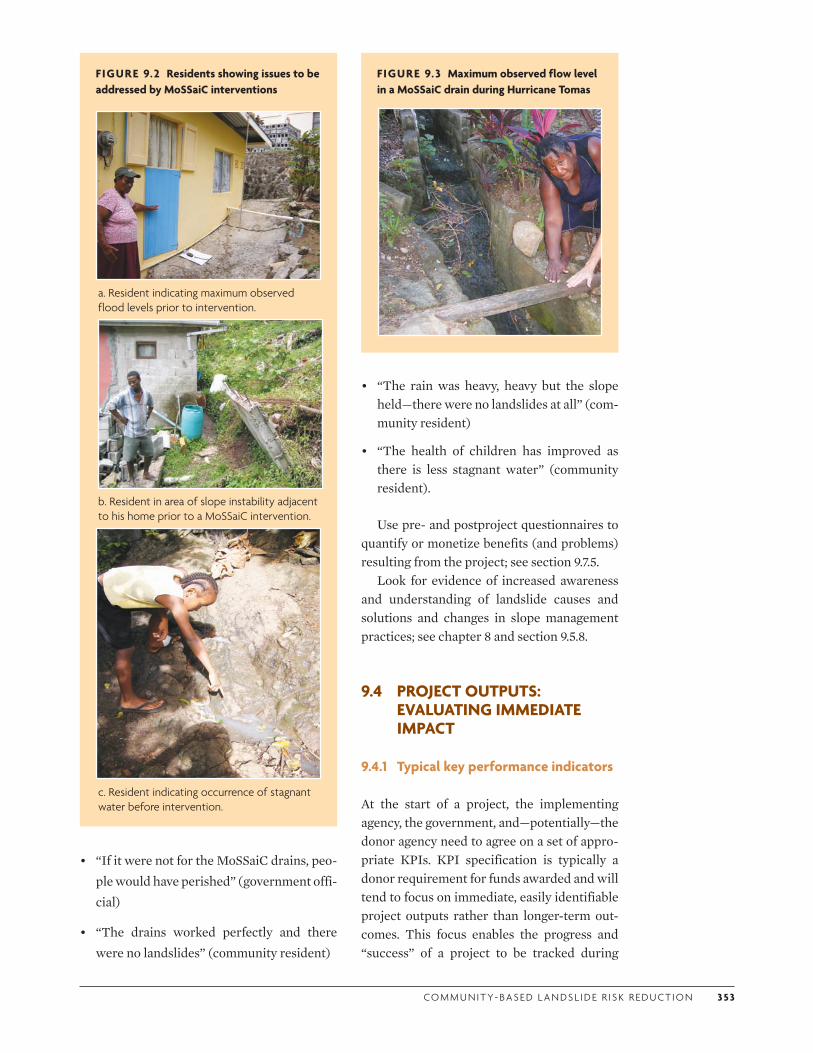
CO M M U N I T Y- BA S E D L A N DS L I D E R I S K R E D U CT I O N 3 53
FIGURE 9.2 Residents showing issues to be addressed by MoSSaiC interventions
a. Resident indicating maximum observed flood levels prior to intervention.
b. Resident in area of slope instability adjacent to his home prior to a MoSSaiC intervention.
c. Resident indicating occurrence of stagnant water before intervention.
FIGURE 9.3 Maximum observed flow level in a MoSSaiC drain during Hurricane Tomas
• “The rain was heavy, heavy but the slope held—there were no landslides at all” (com-munity resident)
• “The health of children has improved as there is less stagnant water” (community resident).
Use pre- and postproject questionnaires to quantify or monetize benefits (and problems) resulting from the project; see section 9.7.5.
Look for evidence of increased awareness and understanding of landslide causes and solutions and changes in slope management practices; see chapter 8 and section 9.5.8.
9.4 PROJECT OUTPUTS: EVALUATING IMMEDIATE IMPACT
9.4.1 Typical key performance indicators
At the start of a project, the implementing agency, the government, and—potentially—the donor agency need to agree on a set of appro-priate KPIs. KPI specification is typically a donor requirement for funds awarded and will tend to focus on immediate, easily identifiable project outputs rather than longer-term out-comes. This focus enables the progress and “success” of a project to be tracked during
• “If it were not for the MoSSaiC drains, peo-ple would have perished” (government offi-cial)
• “The drains worked perfectly and there were no landslides” (community resident)
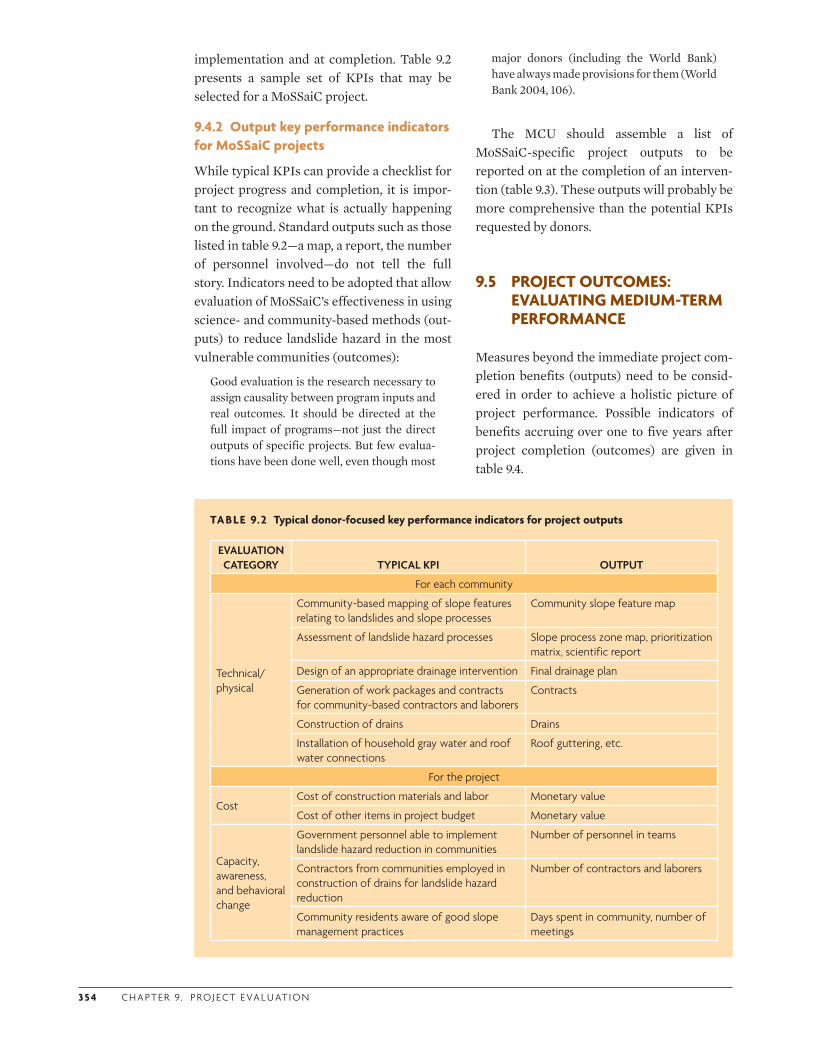
3 5 4 C H A P T E R 9. P RO J E CT E VA L U AT I O N
implementation and at completion. Table 9.2 presents a sample set of KPIs that may be selected for a MoSSaiC project.
9.4.2 Output key performance indicators for MoSSaiC projects
While typical KPIs can provide a checklist for project progress and completion, it is impor-tant to recognize what is actually happening on the ground. Standard outputs such as those listed in table 9.2—a map, a report, the number of personnel involved—do not tell the full story. Indicators need to be adopted that allow evaluation of MoSSaiC’s effectiveness in using science- and community-based methods (out-puts) to reduce landslide hazard in the most vulnerable communities (outcomes):
Good evaluation is the research necessary to assign causality between program inputs and real outcomes. It should be directed at the full impact of programs—not just the direct outputs of specific projects. But few evalua-tions have been done well, even though most
major donors (including the World Bank) have always made provisions for them (World Bank 2004, 106).
The MCU should assemble a list of MoSSaiC-specific project outputs to be reported on at the completion of an interven-tion (table 9.3). These outputs will probably be more comprehensive than the potential KPIs requested by donors.
9.5 PROJECT OUTCOMES: EVALUATING MEDIUM-TERM PERFORMANCE
Measures beyond the immediate project com-pletion benefits (outputs) need to be consid-ered in order to achieve a holistic picture of project performance. Possible indicators of benefits accruing over one to five years after project completion (outcomes) are given in table 9.4.
TABLE 9.2 Typical donor-focused key performance indicators for project outputs
EVALUATION CATEGORY TYPICAL KPI OUTPUT
For each community
Technical/physical
Community-based mapping of slope features relating to landslides and slope processes
Community slope feature map
Assessment of landslide hazard processes Slope process zone map, prioritization matrix, scientific report
Design of an appropriate drainage intervention Final drainage plan
Generation of work packages and contracts for community-based contractors and laborers
Contracts
Construction of drains Drains
Installation of household gray water and roof water connections
Roof guttering, etc.
For the project
CostCost of construction materials and labor Monetary value
Cost of other items in project budget Monetary value
Capacity, awareness, and behavioral change
Government personnel able to implement landslide hazard reduction in communities
Number of personnel in teams
Contractors from communities employed in construction of drains for landslide hazard reduction
Number of contractors and laborers
Community residents aware of good slope management practices
Days spent in community, number of meetings
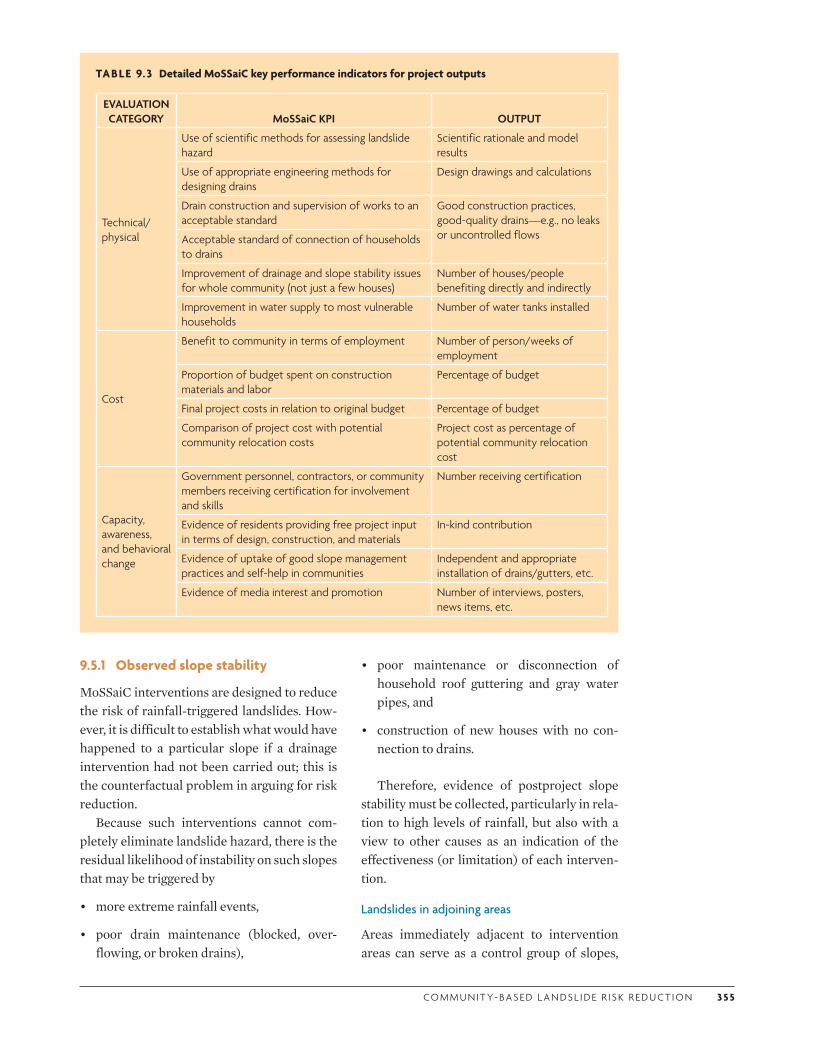
CO M M U N I T Y- BA S E D L A N DS L I D E R I S K R E D U CT I O N 3 5 5
9.5.1 Observed slope stability
MoSSaiC interventions are designed to reduce the risk of rainfall-triggered landslides. How-ever, it is difficult to establish what would have happened to a particular slope if a drainage intervention had not been carried out; this is the counterfactual problem in arguing for risk reduction.
Because such interventions cannot com-pletely eliminate landslide hazard, there is the residual likelihood of instability on such slopes that may be triggered by
• more extreme rainfall events,
• poor drain maintenance (blocked, over-flowing, or broken drains),
TABLE 9.3 Detailed MoSSaiC key performance indicators for project outputs
EVALUATION CATEGORY MoSSaiC KPI OUTPUT
Technical/physical
Use of scientific methods for assessing landslide hazard
Scientific rationale and model results
Use of appropriate engineering methods for designing drains
Design drawings and calculations
Drain construction and supervision of works to an acceptable standard
Good construction practices, good-quality drains—e.g., no leaks or uncontrolled flowsAcceptable standard of connection of households
to drains
Improvement of drainage and slope stability issues for whole community (not just a few houses)
Number of houses/people benefiting directly and indirectly
Improvement in water supply to most vulnerable households
Number of water tanks installed
Cost
Benefit to community in terms of employment Number of person/weeks of employment
Proportion of budget spent on construction materials and labor
Percentage of budget
Final project costs in relation to original budget Percentage of budget
Comparison of project cost with potential community relocation costs
Project cost as percentage of potential community relocation cost
Capacity, awareness, and behavioral change
Government personnel, contractors, or community members receiving certification for involvement and skills
Number receiving certification
Evidence of residents providing free project input in terms of design, construction, and materials
In-kind contribution
Evidence of uptake of good slope management practices and self-help in communities
Independent and appropriate installation of drains/gutters, etc.
Evidence of media interest and promotion Number of interviews, posters, news items, etc.
• poor maintenance or disconnection of household roof guttering and gray water pipes, and
• construction of new houses with no con-nection to drains.
Therefore, evidence of postproject slope stability must be collected, particularly in rela-tion to high levels of rainfall, but also with a view to other causes as an indication of the effectiveness (or limitation) of each interven-tion.
Landslides in adjoining areas
Areas immediately adjacent to intervention areas can serve as a control group of slopes,
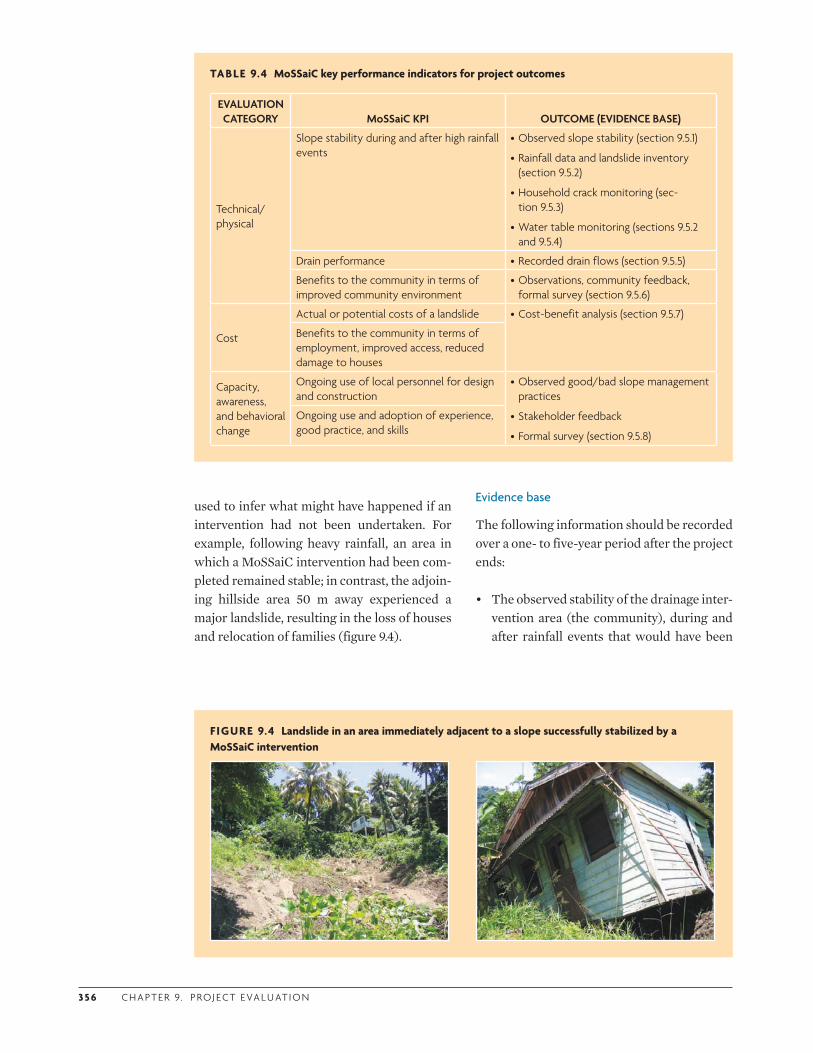
3 5 6 C H A P T E R 9. P RO J E CT E VA L U AT I O N
TABLE 9.4 MoSSaiC key performance indicators for project outcomes
EVALUATION CATEGORY MoSSaiC KPI OUTCOME (EVIDENCE BASE)
Technical/physical
Slope stability during and after high rainfall events
•Observed slope stability (section 9.5.1)
•Rainfall data and landslide inventory (section 9.5.2)
•Household crack monitoring (sec-tion 9.5.3)
•Water table monitoring (sections 9.5.2 and 9.5.4)
Drain performance •Recorded drain flows (section 9.5.5)
Benefits to the community in terms of improved community environment
•Observations, community feedback, formal survey (section 9.5.6)
Cost
Actual or potential costs of a landslide •Cost-benefit analysis (section 9.5.7)
Benefits to the community in terms of employment, improved access, reduced damage to houses
Capacity, awareness, and behavioral change
Ongoing use of local personnel for design and construction
•Observed good/bad slope management practices
•Stakeholder feedback
•Formal survey (section 9.5.8)
Ongoing use and adoption of experience, good practice, and skills
used to infer what might have happened if an intervention had not been undertaken. For example, following heavy rainfall, an area in which a MoSSaiC intervention had been com-pleted remained stable; in contrast, the adjoin-ing hillside area 50 m away experienced a major landslide, resulting in the loss of houses and relocation of families (figure 9.4).
Evidence base
The following information should be recorded over a one- to five-year period after the project ends:
• The observed stability of the drainage inter-vention area (the community), during and after rainfall events that would have been
FIGURE 9.4 Landslide in an area immediately adjacent to a slope successfully stabilized by a MoSSaiC intervention
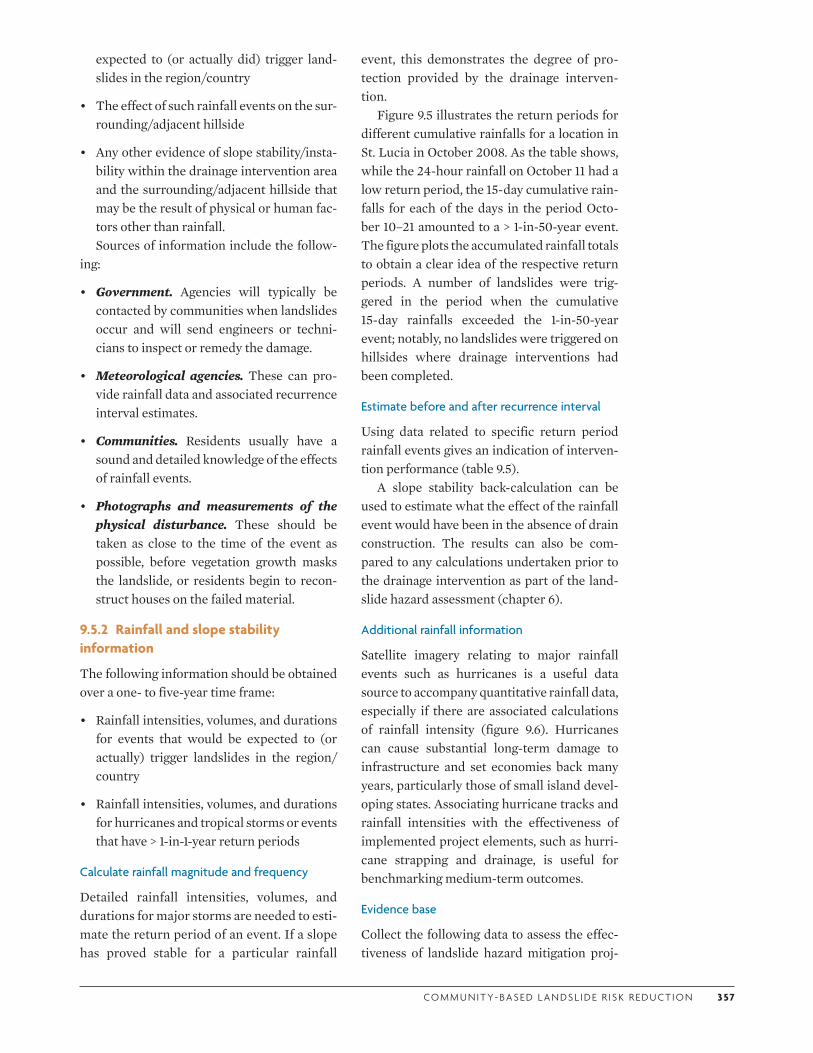
CO M M U N I T Y- BA S E D L A N DS L I D E R I S K R E D U CT I O N 3 57
expected to (or actually did) trigger land-slides in the region/country
• The effect of such rainfall events on the sur-rounding/adjacent hillside
• Any other evidence of slope stability/insta-bility within the drainage intervention area and the surrounding/adjacent hillside that may be the result of physical or human fac-tors other than rainfall.Sources of information include the follow-
ing:
• Government. Agencies will typically be contacted by communities when landslides occur and will send engineers or techni-cians to inspect or remedy the damage.
• Meteorological agencies. These can pro-vide rainfall data and associated recurrence interval estimates.
• Communities. Residents usually have a sound and detailed knowledge of the effects of rainfall events.
• Photographs and measurements of the physical disturbance. These should be taken as close to the time of the event as possible, before vegetation growth masks the landslide, or residents begin to recon-struct houses on the failed material.
9.5.2 Rainfall and slope stability information
The following information should be obtained over a one- to five-year time frame:
• Rainfall intensities, volumes, and durations for events that would be expected to (or actually) trigger landslides in the region/country
• Rainfall intensities, volumes, and durations for hurricanes and tropical storms or events that have > 1-in-1-year return periods
Calculate rainfall magnitude and frequency
Detailed rainfall intensities, volumes, and durations for major storms are needed to esti-mate the return period of an event. If a slope has proved stable for a particular rainfall
event, this demonstrates the degree of pro-tection provided by the drainage interven-tion.
Figure 9.5 illustrates the return periods for different cumulative rainfalls for a location in St. Lucia in October 2008. As the table shows, while the 24-hour rainfall on October 11 had a low return period, the 15-day cumulative rain-falls for each of the days in the period Octo-ber 10–21 amounted to a > 1-in-50-year event. The figure plots the accumulated rainfall totals to obtain a clear idea of the respective return periods. A number of landslides were trig-gered in the period when the cumulative 15-day rainfalls exceeded the 1-in-50-year event; notably, no landslides were triggered on hillsides where drainage interventions had been completed.
Estimate before and after recurrence interval
Using data related to specific return period rainfall events gives an indication of interven-tion performance (table 9.5).
A slope stability back-calculation can be used to estimate what the effect of the rainfall event would have been in the absence of drain construction. The results can also be com-pared to any calculations undertaken prior to the drainage intervention as part of the land-slide hazard assessment (chapter 6).
Additional rainfall information
Satellite imagery relating to major rainfall events such as hurricanes is a useful data source to accompany quantitative rainfall data, especially if there are associated calculations of rainfall intensity (figure 9.6). Hurricanes can cause substantial long-term damage to infrastructure and set economies back many years, particularly those of small island devel-oping states. Associating hurricane tracks and rainfall intensities with the effectiveness of implemented project elements, such as hurri-cane strapping and drainage, is useful for benchmarking medium-term outcomes.
Evidence base
Collect the following data to assess the effec-tiveness of landslide hazard mitigation proj-
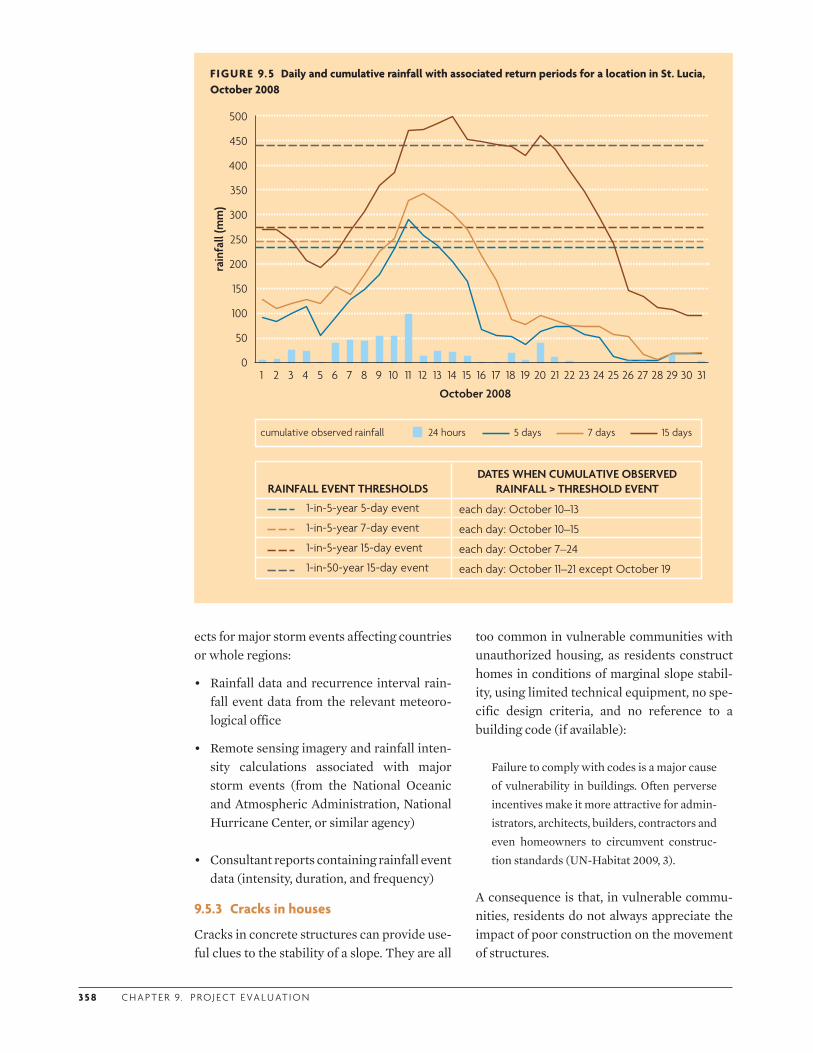
3 5 8 C H A P T E R 9. P RO J E CT E VA L U AT I O N
FIGURE 9.5 Daily and cumulative rainfall with associated return periods for a location in St. Lucia, October 2008
rain
fall
(mm
)
October 2008
0
50
100
150
200
250
300
350
400
450
500
1 2 3 4 5 6 7 8 9 10 11 12 13 14 15 16 17 18 19 20 21 22 23 24 25 26 27 28 29 30 31
15 days7 days5 days24 hourscumulative observed rainfall
RAINFALL EVENT THRESHOLDSDATES WHEN CUMULATIVE OBSERVED
RAINFALL > THRESHOLD EVENT
each day: October 10–13
each day: October 10–15
each day: October 7–24
each day: October 11–21 except October 19
1-in-5-year 5-day event
1-in-5-year 7-day event
1-in-5-year 15-day event
1-in-50-year 15-day event
ects for major storm events affecting countries or whole regions:
• Rainfall data and recurrence interval rain-fall event data from the relevant meteoro-logical office
• Remote sensing imagery and rainfall inten-sity calculations associated with major storm events (from the National Oceanic and Atmospheric Administration, National Hurricane Center, or similar agency)
• Consultant reports containing rainfall event data (intensity, duration, and frequency)
9.5.3 Cracks in houses
Cracks in concrete structures can provide use-ful clues to the stability of a slope. They are all
too common in vulnerable communities with unauthorized housing, as residents construct homes in conditions of marginal slope stabil-ity, using limited technical equipment, no spe-cific design criteria, and no reference to a building code (if available):
Failure to comply with codes is a major cause of vulnerability in buildings. Often perverse incentives make it more attractive for admin-istrators, architects, builders, contractors and even homeowners to circumvent construc-tion standards (UN-Habitat 2009, 3).
A consequence is that, in vulnerable commu-nities, residents do not always appreciate the impact of poor construction on the movement of structures.
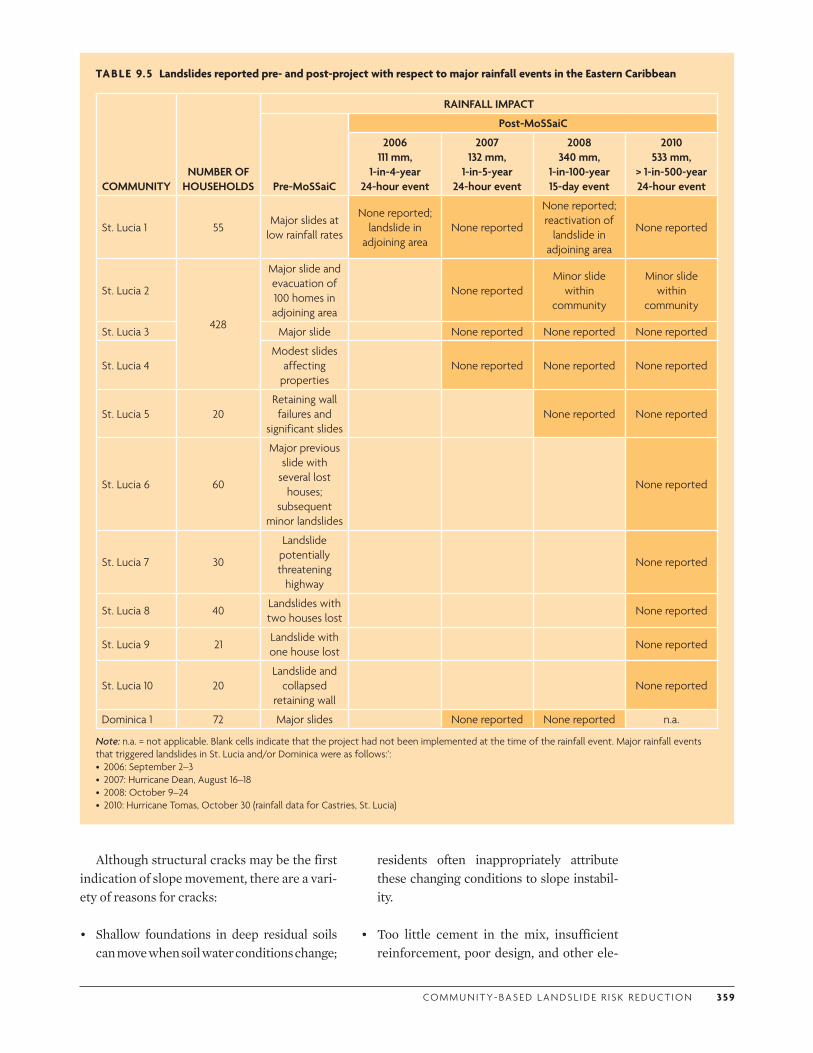
CO M M U N I T Y- BA S E D L A N DS L I D E R I S K R E D U CT I O N 3 59
TABLE 9.5 Landslides reported pre- and post-project with respect to major rainfall events in the Eastern Caribbean
COMMUNITYNUMBER OF
HOUSEHOLDS
RAINFALL IMPACT
Pre-MoSSaiC
Post-MoSSaiC
2006 111 mm,
1-in-4-year 24-hour event
2007 132 mm,
1-in-5-year 24-hour event
2008 340 mm,
1-in-100-year 15-day event
2010 533 mm,
> 1-in-500-year 24-hour event
St. Lucia 1 55Major slides at
low rainfall rates
None reported; landslide in
adjoining areaNone reported
None reported; reactivation of
landslide in adjoining area
None reported
St. Lucia 2
428
Major slide and evacuation of 100 homes in adjoining area
None reportedMinor slide
within community
Minor slide within
community
St. Lucia 3 Major slide None reported None reported None reported
St. Lucia 4Modest slides
affecting properties
None reported None reported None reported
St. Lucia 5 20Retaining wall failures and
significant slidesNone reported None reported
St. Lucia 6 60
Major previous slide with
several lost houses;
subsequent minor landslides
None reported
St. Lucia 7 30
Landslide potentially threatening
highway
None reported
St. Lucia 8 40Landslides with two houses lost
None reported
St. Lucia 9 21Landslide with one house lost
None reported
St. Lucia 10 20Landslide and
collapsed retaining wall
None reported
Dominica 1 72 Major slides None reported None reported n.a.
Note: n.a. = not applicable. Blank cells indicate that the project had not been implemented at the time of the rainfall event. Major rainfall events that triggered landslides in St. Lucia and/or Dominica were as follows:’:• 2006: September 2–3• 2007: Hurricane Dean, August 16–18 • 2008: October 9–24• 2010: Hurricane Tomas, October 30 (rainfall data for Castries, St. Lucia)
Although structural cracks may be the first indication of slope movement, there are a vari-ety of reasons for cracks:
• Shallow foundations in deep residual soils can move when soil water conditions change;
residents often inappropriately attribute these changing conditions to slope instabil-ity.
• Too little cement in the mix, insufficient reinforcement, poor design, and other ele-
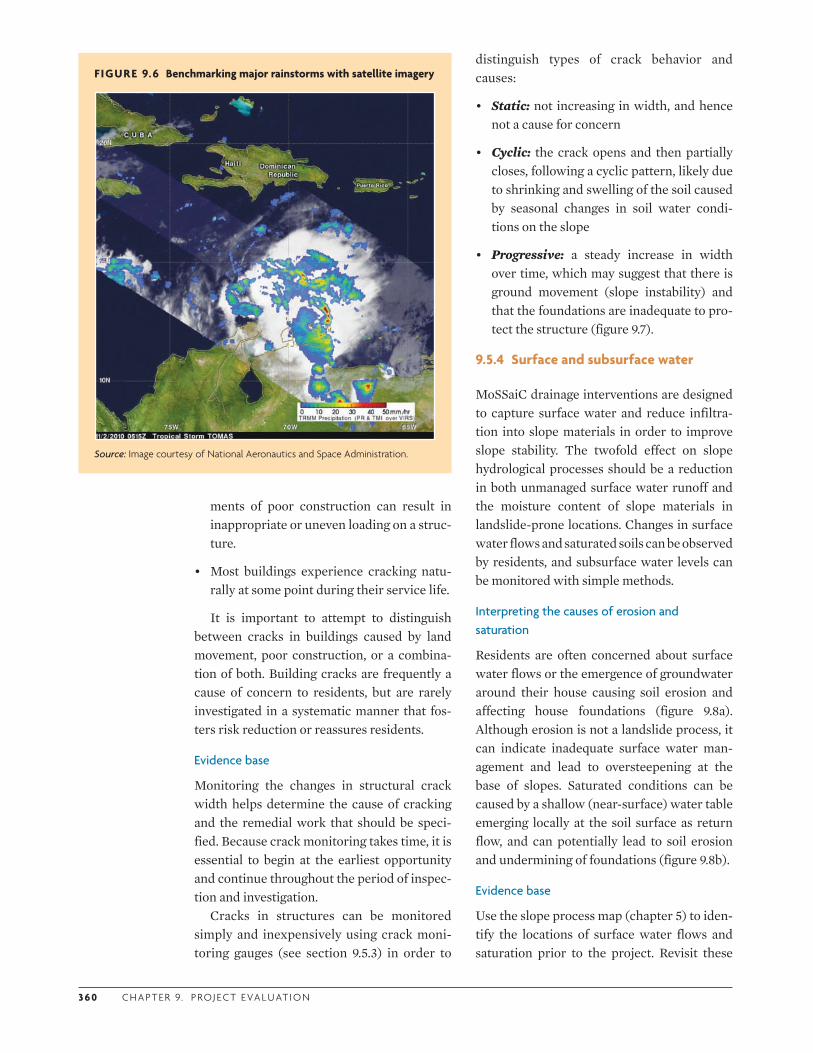
3 6 0 C H A P T E R 9. P RO J E CT E VA L U AT I O N
FIGURE 9.6 Benchmarking major rainstorms with satellite imagery
Source: Image courtesy of National Aeronautics and Space Administration.
ments of poor construction can result in inappropriate or uneven loading on a struc-ture.
• Most buildings experience cracking natu-rally at some point during their service life.
It is important to attempt to distinguish between cracks in buildings caused by land movement, poor construction, or a combina-tion of both. Building cracks are frequently a cause of concern to residents, but are rarely investigated in a systematic manner that fos-ters risk reduction or reassures residents.
Evidence base
Monitoring the changes in structural crack width helps determine the cause of cracking and the remedial work that should be speci-fied. Because crack monitoring takes time, it is essential to begin at the earliest opportunity and continue throughout the period of inspec-tion and investigation.
Cracks in structures can be monitored simply and inexpensively using crack moni-toring gauges (see section 9.5.3) in order to
distinguish types of crack behavior and causes:
• Static: not increasing in width, and hence not a cause for concern
• Cyclic: the crack opens and then partially closes, following a cyclic pattern, likely due to shrinking and swelling of the soil caused by seasonal changes in soil water condi-tions on the slope
• Progressive: a steady increase in width over time, which may suggest that there is ground movement (slope instability) and that the foundations are inadequate to pro-tect the structure (figure 9.7).
9.5.4 Surface and subsurface water
MoSSaiC drainage interventions are designed to capture surface water and reduce infiltra-tion into slope materials in order to improve slope stability. The twofold effect on slope hydrological processes should be a reduction in both unmanaged surface water runoff and the moisture content of slope materials in landslide-prone locations. Changes in surface water flows and saturated soils can be observed by residents, and subsurface water levels can be monitored with simple methods.
Interpreting the causes of erosion and saturation
Residents are often concerned about surface water flows or the emergence of groundwater around their house causing soil erosion and affecting house foundations (figure 9.8a). Although erosion is not a landslide process, it can indicate inadequate surface water man-agement and lead to oversteepening at the base of slopes. Saturated conditions can be caused by a shallow (near-surface) water table emerging locally at the soil surface as return flow, and can potentially lead to soil erosion and undermining of foundations (figure 9.8b).
Evidence base
Use the slope process map (chapter 5) to iden-tify the locations of surface water flows and saturation prior to the project. Revisit these
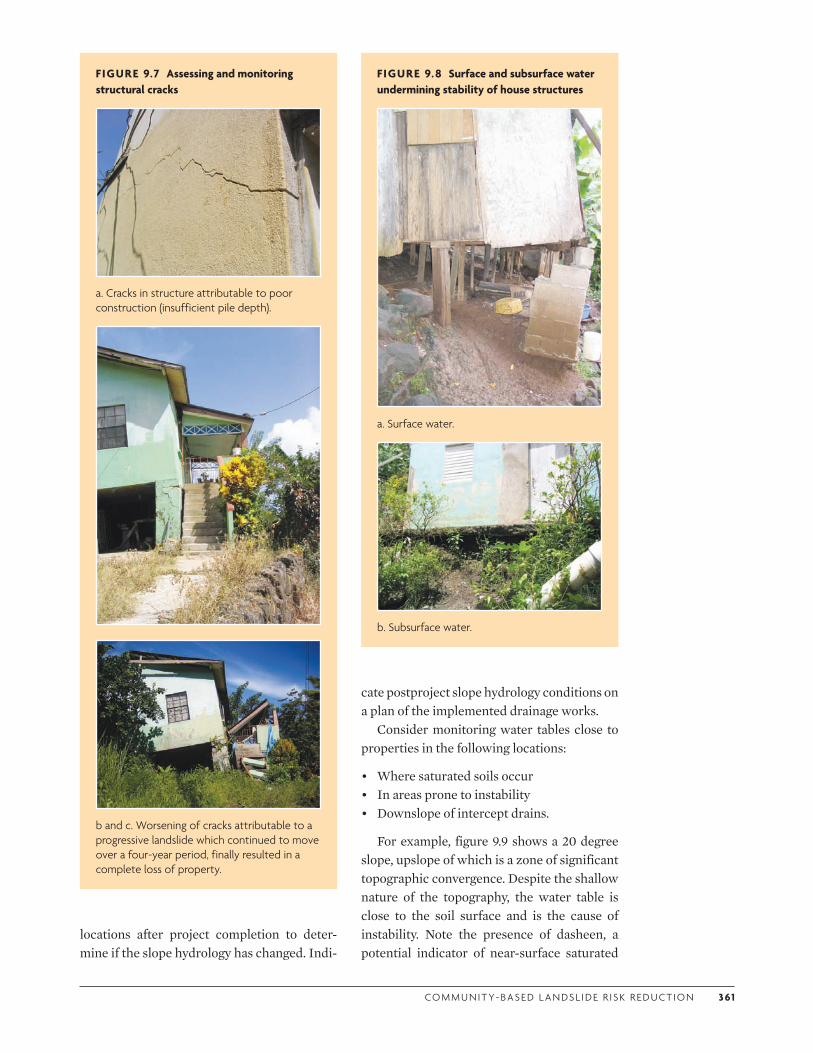
CO M M U N I T Y- BA S E D L A N DS L I D E R I S K R E D U CT I O N 3 61
F IGURE 9.7 Assessing and monitoring structural cracks
a. Cracks in structure attributable to poor construction (insufficient pile depth).
b and c. Worsening of cracks attributable to a progressive landslide which continued to move over a four-year period, finally resulted in a complete loss of property.
FIGURE 9.8 Surface and subsurface water undermining stability of house structures
a. Surface water.
b. Subsurface water.
cate postproject slope hydrology conditions on a plan of the implemented drainage works.
Consider monitoring water tables close to properties in the following locations:
• Where saturated soils occur • In areas prone to instability• Downslope of intercept drains.
For example, figure 9.9 shows a 20 degree slope, upslope of which is a zone of significant topographic convergence. Despite the shallow nature of the topography, the water table is close to the soil surface and is the cause of instability. Note the presence of dasheen, a potential indicator of near-surface saturated
locations after project completion to deter-mine if the slope hydrology has changed. Indi-
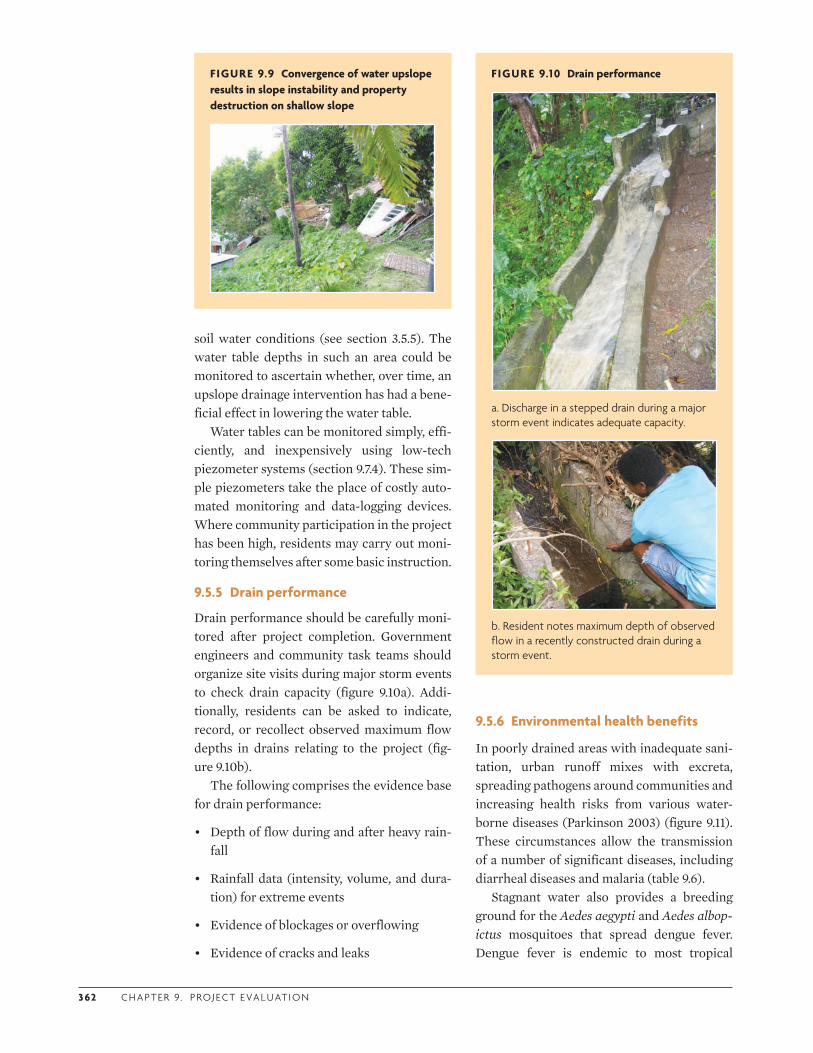
3 62 C H A P T E R 9. P RO J E CT E VA L U AT I O N
soil water conditions (see section 3.5.5). The water table depths in such an area could be monitored to ascertain whether, over time, an upslope drainage intervention has had a bene-ficial effect in lowering the water table.
Water tables can be monitored simply, effi-ciently, and inexpensively using low-tech piezometer systems (section 9.7.4). These sim-ple piezometers take the place of costly auto-mated monitoring and data-logging devices. Where community participation in the project has been high, residents may carry out moni-toring themselves after some basic instruction.
9.5.5 Drain performance
Drain performance should be carefully moni-tored after project completion. Government engineers and community task teams should organize site visits during major storm events to check drain capacity (figure 9.10a). Addi-tionally, residents can be asked to indicate, record, or recollect observed maximum flow depths in drains relating to the project (fig-ure 9.10b).
The following comprises the evidence base for drain performance:
• Depth of flow during and after heavy rain-fall
• Rainfall data (intensity, volume, and dura-tion) for extreme events
• Evidence of blockages or overflowing
• Evidence of cracks and leaks
FIGURE 9.9 Convergence of water upslope results in slope instability and property destruction on shallow slope
9.5.6 Environmental health benefits
In poorly drained areas with inadequate sani-tation, urban runoff mixes with excreta, spreading pathogens around communities and increasing health risks from various water-borne diseases (Parkinson 2003) (figure 9.11). These circumstances allow the transmission of a number of significant diseases, including diarrheal diseases and malaria (table 9.6).
Stagnant water also provides a breeding ground for the Aedes aegypti and Aedes albop-ictus mosquitoes that spread dengue fever. Dengue fever is endemic to most tropical
FIGURE 9.10 Drain performance
a. Discharge in a stepped drain during a major storm event indicates adequate capacity.
b. Resident notes maximum depth of observed flow in a recently constructed drain during a storm event.
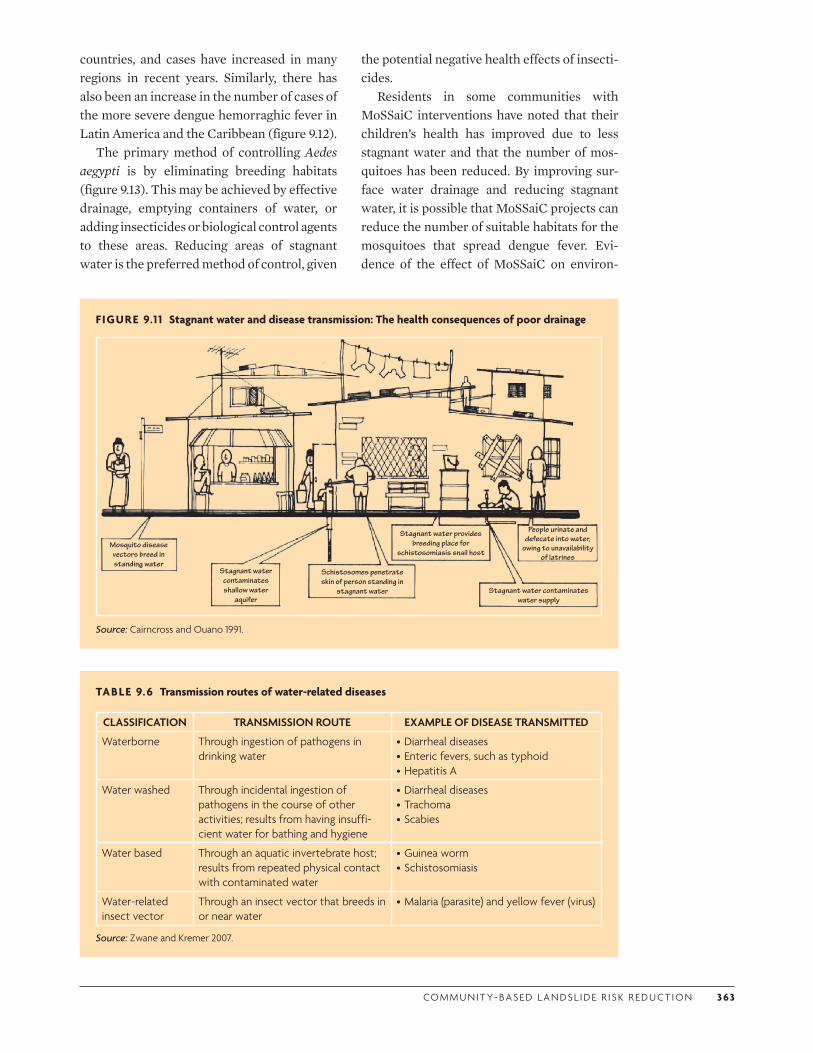
CO M M U N I T Y- BA S E D L A N DS L I D E R I S K R E D U CT I O N 3 63
countries, and cases have increased in many regions in recent years. Similarly, there has also been an increase in the number of cases of the more severe dengue hemorraghic fever in Latin America and the Caribbean (figure 9.12).
The primary method of controlling Aedes aegypti is by eliminating breeding habitats (figure 9.13). This may be achieved by effective drainage, emptying containers of water, or adding insecticides or biological control agents to these areas. Reducing areas of stagnant water is the preferred method of control, given
TABLE 9.6 Transmission routes of water-related diseases
CLASSIFICATION TRANSMISSION ROUTE EXAMPLE OF DISEASE TRANSMITTED
Waterborne Through ingestion of pathogens in drinking water
•Diarrheal diseases•Enteric fevers, such as typhoid•Hepatitis A
Water washed Through incidental ingestion of pathogens in the course of other activities; results from having insuffi-cient water for bathing and hygiene
•Diarrheal diseases•Trachoma•Scabies
Water based Through an aquatic invertebrate host; results from repeated physical contact with contaminated water
•Guinea worm•Schistosomiasis
Water-related insect vector
Through an insect vector that breeds in or near water
•Malaria (parasite) and yellow fever (virus)
Source: Zwane and Kremer 2007.
the potential negative health effects of insecti-cides.
Residents in some communities with MoSSaiC interventions have noted that their children’s health has improved due to less stagnant water and that the number of mos-quitoes has been reduced. By improving sur-face water drainage and reducing stagnant water, it is possible that MoSSaiC projects can reduce the number of suitable habitats for the mosquitoes that spread dengue fever. Evi-dence of the effect of MoSSaiC on environ-
FIGURE 9.1 1 Stagnant water and disease transmission: The health consequences of poor drainage
Source: Cairncross and Ouano 1991.
Mosquito disease vectors breed in standing water
Stagnant water contaminates shallow water
aquifer
Schistosomes penetrate skin of person standing in
stagnant water
Stagnant water provides breeding place for
schistosomiasis snail host
People urinate and defecate into water,
owing to unavailability of latrines
Stagnant water contaminates water supply
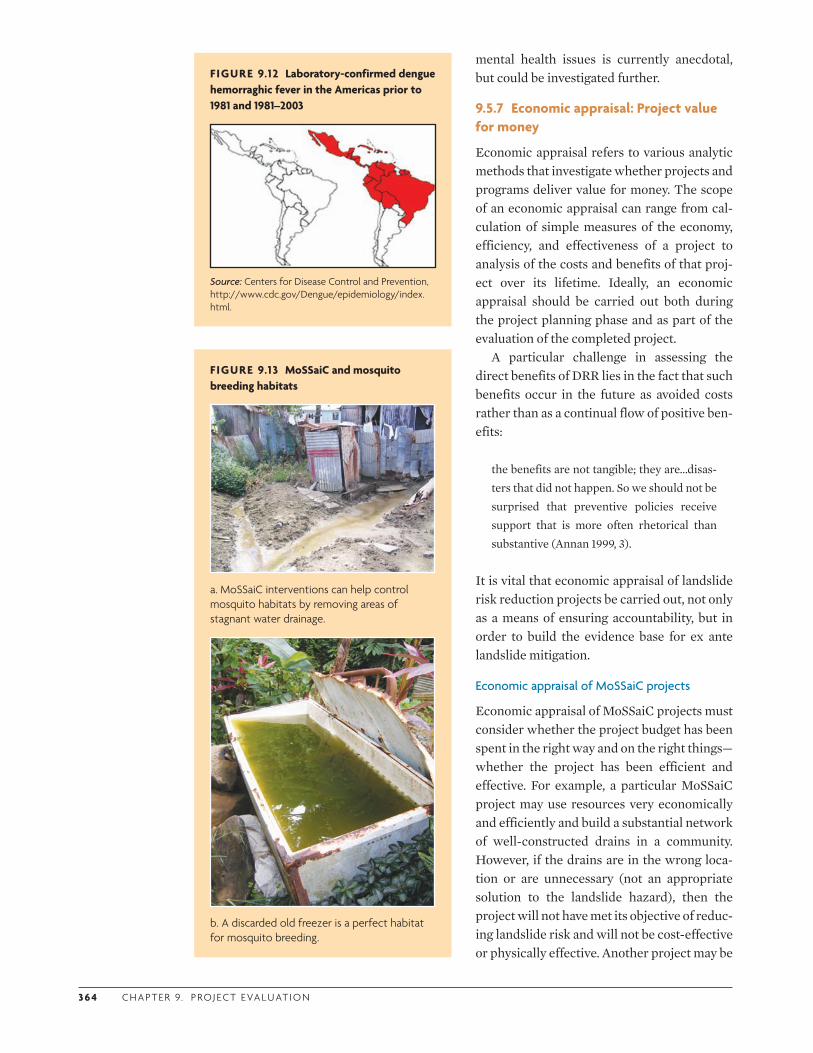
3 6 4 C H A P T E R 9. P RO J E CT E VA L U AT I O N
mental health issues is currently anecdotal, but could be investigated further.
9.5.7 Economic appraisal: Project value for money
Economic appraisal refers to various analytic methods that investigate whether projects and programs deliver value for money. The scope of an economic appraisal can range from cal-culation of simple measures of the economy, efficiency, and effectiveness of a project to analysis of the costs and benefits of that proj-ect over its lifetime. Ideally, an economic appraisal should be carried out both during the project planning phase and as part of the evaluation of the completed project.
A particular challenge in assessing the direct benefits of DRR lies in the fact that such benefits occur in the future as avoided costs rather than as a continual flow of positive ben-efits:
the benefits are not tangible; they are…disas-ters that did not happen. So we should not be surprised that preventive policies receive support that is more often rhetorical than substantive (Annan 1999, 3).
It is vital that economic appraisal of landslide risk reduction projects be carried out, not only as a means of ensuring accountability, but in order to build the evidence base for ex ante landslide mitigation.
Economic appraisal of MoSSaiC projects
Economic appraisal of MoSSaiC projects must consider whether the project budget has been spent in the right way and on the right things—whether the project has been efficient and effective. For example, a particular MoSSaiC project may use resources very economically and efficiently and build a substantial network of well-constructed drains in a community. However, if the drains are in the wrong loca-tion or are unnecessary (not an appropriate solution to the landslide hazard), then the project will not have met its objective of reduc-ing landslide risk and will not be cost-effective or physically effective. Another project may be
FIGURE 9.12 Laboratory-confirmed dengue hemorraghic fever in the Americas prior to 1981 and 1981–2003
Source: Centers for Disease Control and Prevention, http://www.cdc.gov/Dengue/epidemiology/index.html.
FIGURE 9.13 MoSSaiC and mosquito breeding habitats
a. MoSSaiC interventions can help control mosquito habitats by removing areas of stagnant water drainage.
b. A discarded old freezer is a perfect habitat for mosquito breeding.
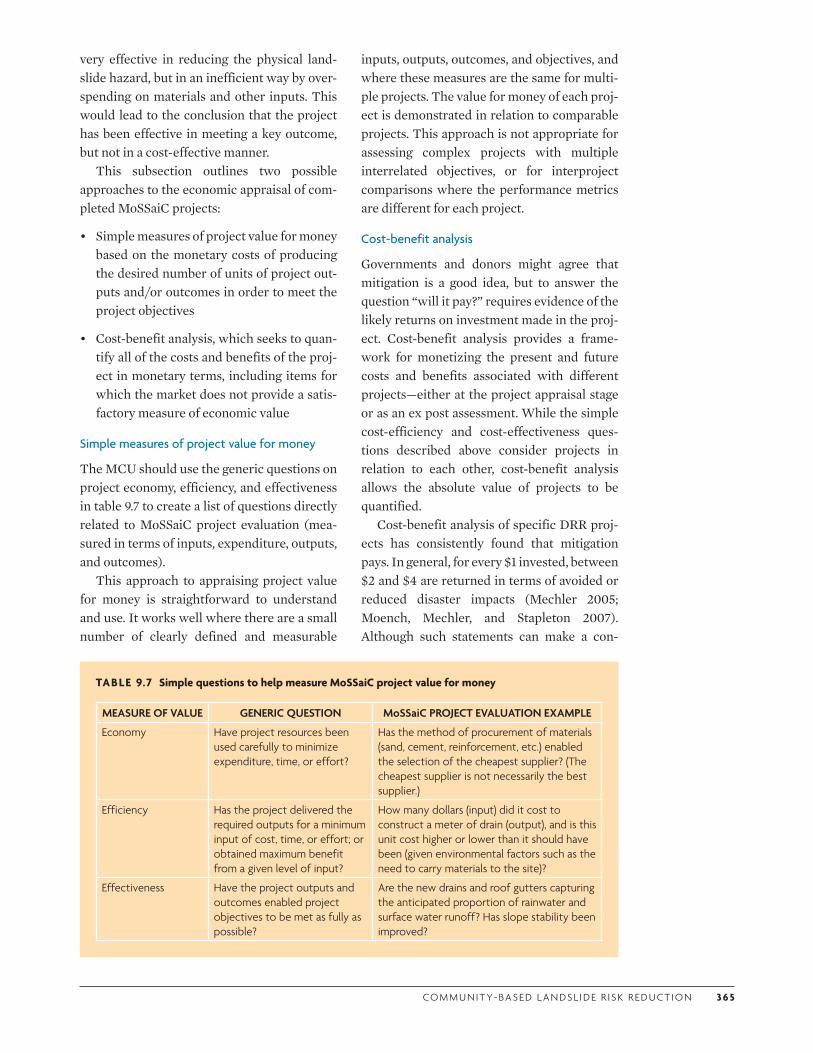
CO M M U N I T Y- BA S E D L A N DS L I D E R I S K R E D U CT I O N 3 6 5
very effective in reducing the physical land-slide hazard, but in an inefficient way by over-spending on materials and other inputs. This would lead to the conclusion that the project has been effective in meeting a key outcome, but not in a cost-effective manner.
This subsection outlines two possible approaches to the economic appraisal of com-pleted MoSSaiC projects:
• Simple measures of project value for money based on the monetary costs of producing the desired number of units of project out-puts and/or outcomes in order to meet the project objectives
• Cost-benefit analysis, which seeks to quan-tify all of the costs and benefits of the proj-ect in monetary terms, including items for which the market does not provide a satis-factory measure of economic value
Simple measures of project value for money
The MCU should use the generic questions on project economy, efficiency, and effectiveness in table 9.7 to create a list of questions directly related to MoSSaiC project evaluation (mea-sured in terms of inputs, expenditure, outputs, and outcomes).
This approach to appraising project value for money is straightforward to understand and use. It works well where there are a small number of clearly defined and measurable
inputs, outputs, outcomes, and objectives, and where these measures are the same for multi-ple projects. The value for money of each proj-ect is demonstrated in relation to comparable projects. This approach is not appropriate for assessing complex projects with multiple interrelated objectives, or for interproject comparisons where the performance metrics are different for each project.
Cost-benefit analysis
Governments and donors might agree that mitigation is a good idea, but to answer the question “will it pay?” requires evidence of the likely returns on investment made in the proj-ect. Cost-benefit analysis provides a frame-work for monetizing the present and future costs and benefits associated with different projects—either at the project appraisal stage or as an ex post assessment. While the simple cost-efficiency and cost-effectiveness ques-tions described above consider projects in relation to each other, cost-benefit analysis allows the absolute value of projects to be quantified.
Cost-benefit analysis of specific DRR proj-ects has consistently found that mitigation pays. In general, for every $1 invested, between $2 and $4 are returned in terms of avoided or reduced disaster impacts (Mechler 2005; Moench, Mechler, and Stapleton 2007). Although such statements can make a con-
TABLE 9.7 Simple questions to help measure MoSSaiC project value for money
MEASURE OF VALUE GENERIC QUESTION MoSSaiC PROJECT EVALUATION EXAMPLE
Economy Have project resources been used carefully to minimize expenditure, time, or effort?
Has the method of procurement of materials (sand, cement, reinforcement, etc.) enabled the selection of the cheapest supplier? (The cheapest supplier is not necessarily the best supplier.)
Efficiency Has the project delivered the required outputs for a minimum input of cost, time, or effort; or obtained maximum benefit from a given level of input?
How many dollars (input) did it cost to construct a meter of drain (output), and is this unit cost higher or lower than it should have been (given environmental factors such as the need to carry materials to the site)?
Effectiveness Have the project outputs and outcomes enabled project objectives to be met as fully as possible?
Are the new drains and roof gutters capturing the anticipated proportion of rainwater and surface water runoff? Has slope stability been improved?
3 6 6 C H A P T E R 9. P RO J E CT E VA L U AT I O N
vincing case for risk reduction, they should be treated with caution (Twigg 2004), as studies are few and far between—at least in the pub-lished literature—and are usually presented as statements of fact without explaining how the calculations were made. As Twigg (2004, 358) notes, “The readiness with which publications on disasters repeat such assertions should per-haps be worrying, as it suggests that little sub-stantiated data is available.”
Because such studies are relatively scarce, especially in developing countries and with respect to landslide risk reduction, investment in DRR remains low in the face of numerous competing development opportunities (Ben-son and Twigg 2004).
Use the following steps as a guide in under-taking a cost-benefit analysis of a MoSSaiC project.
1. Monetize the costs and benefits of the project. If these are given in physical or welfare terms, different methods can be used to convert them to monetary values. For DRR projects, the main physical bene-fits are the avoided future disaster costs (rebuilding, relocating, and replacing pos-sessions). Thus, the cost of landslides with and without the project, and the difference between the two scenarios, should be cal-culated. To determine these costs, the nature of the anticipated landslide hazard (type and magnitude) needs to be known at a spatial scale relating to the landslide haz-ard reduction project. This allows identifi-cation of elements exposed to the hazard (such as houses) and estimation of the likely damage caused (the landslide cost). There may also be less tangible environmental, welfare, and social benefits to the commu-nity. In some analyses, a value of life assumption is made to account for potential loss of life; assigning such values can be controversial, and they are generally uti-lized in wide-area studies where multiple hazards and risk reduction projects are being compared.
2. Estimate the probability of landslide costs occurring in the future. In the case
of landslide hazard reduction, this requires calculation of the probability of landslide occurrence with and without intervention. These calculations can be made using a physically based slope stability model to determine the rainfall return frequency required to trigger a landslide.
3. Discount all expected future landslide costs into present values according to how far into the future they are expected to occur. The present value depends on the discount rate and project lifetime specified (i.e., how long the project infrastructure will continue to provide a reduction in landslide hazard).
4. Use cost-benefit analysis decision crite-ria to determine project value for money. Standard criteria include the benefit-cost ratio, the net expected present value of the project, and the internal rate of return. The benefit-cost ratio of a landslide risk reduction project is the ratio of the cost of the initial investment in hazard reduction to the difference in the net expected value of landslide costs before and after the proj-ect (the benefit in terms of avoided costs). The net expected present value is simply the project benefits minus the costs. It is positive where the project results in a reduction in future landslide costs (and potential additional benefits to the com-munity) that outweigh the cost of the intervention. Conversely, the net expected present value could be negative if the proj-ect has the effect of increasing the land-slide hazard or if a landslide destroys part of the project.
An example of a MoSSaiC project cost-benefit analysis is given in section 9.7.5. A helpful review of general cost-benefit analysis tools and resources can be found at the ProVention Consortium website (http://www.preventionweb.net/files/8088_WP1highres1.pdf ).
The results of cost-benefit analysis should be used in the context of other project infor-mation when evaluating the project as a whole:
CO M M U N I T Y- BA S E D L A N DS L I D E R I S K R E D U CT I O N 3 67
The question often left for us to ponder when reviewing Cost-benefit Analysis (CBA) on a particular hazard mitigation project is not what values we place on the moneterized impacts but rather how large or small are these compared to the “value” of the non-monetized impacts. CBA alone cannot answer this question, but human experience and reflection can (Ganderton 2005).
9.5.8 Adoption of good landslide risk reduction practices
One of the key objectives of MoSSaiC is to encourage individuals, communities, and gov-ernments to adopt practices that reduce urban landslide hazards. Chapter 8 outlined the pro-cess of behavioral change in terms of a ladder of adoption (from perception and awareness, to knowledge and action, and finally to adop-tion of MoSSaiC), factors affecting motiva-tions and intentions to act, and strategies for communicating and capacity building. The resulting behavioral change strategy was sum-marized in the form of an outcome map (sec-tion 8.7.2).
Use this outcome map to evaluate whether the planned outputs (communication, capac-ity-building activities) have been delivered. To evaluate the effectiveness of the behavioral change strategy, look for evidence of adoption of good landslide risk reduction practices (dis-cussed in this section) and policies (sec-tion 9.5.9) during and after the project.
Community evidence
Evidence of communities adopting good land-slide risk reduction practices might typically involve the following:
• Installation of drains around houses using the residents’ own resources
• Installation of roof guttering and adoption of roof water harvesting by residents
• Reduction in the dumping of garbage in drains
• Maintenance and cleaning of drains around homes and, more widely, during commu-
nity-organized events to clear the drainage network and debris traps
• Fewer cut slopes excavated at the rear of properties
• An increased general awareness among the majority of residents of the need for good drainage practices, such as the prompt reporting of leaking water supply pipes to the water company
Government evidence
At the government level, decision makers should seek to embed the above practices into larger-scale infrastructure and community development projects. Evidence of adoption can include the following:
• Using appropriate scientific methods for assessing slope stability prior to construc-tion on landslide-prone slopes
• Including the provision of adequate drain-age in road and footpath construction proj-ects on slopes
• Including specific contractual require-ments for drain cleaning and maintenance when new infrastructure is constructed
• Incorporating slope stability assessment and drainage standards into planning pro-tocols and other policy instruments
• Generating awareness and providing train-ing for government practitioners involved in activities that may affect slope stability.
9.5.9 Development of new landslide risk reduction policies
Evidence-based policy making is becoming more central to development funding and poli-cies. Policy makers are increasingly asked “to explain not just what policy options they pro-pose, and why they consider them appropri-ate, but also their understanding of their likely effectiveness” (Segone 2008, 28). This approach requires a move from opinions (which rely on ideals, speculation, or the selec-tive use of evidence) to evidence from project
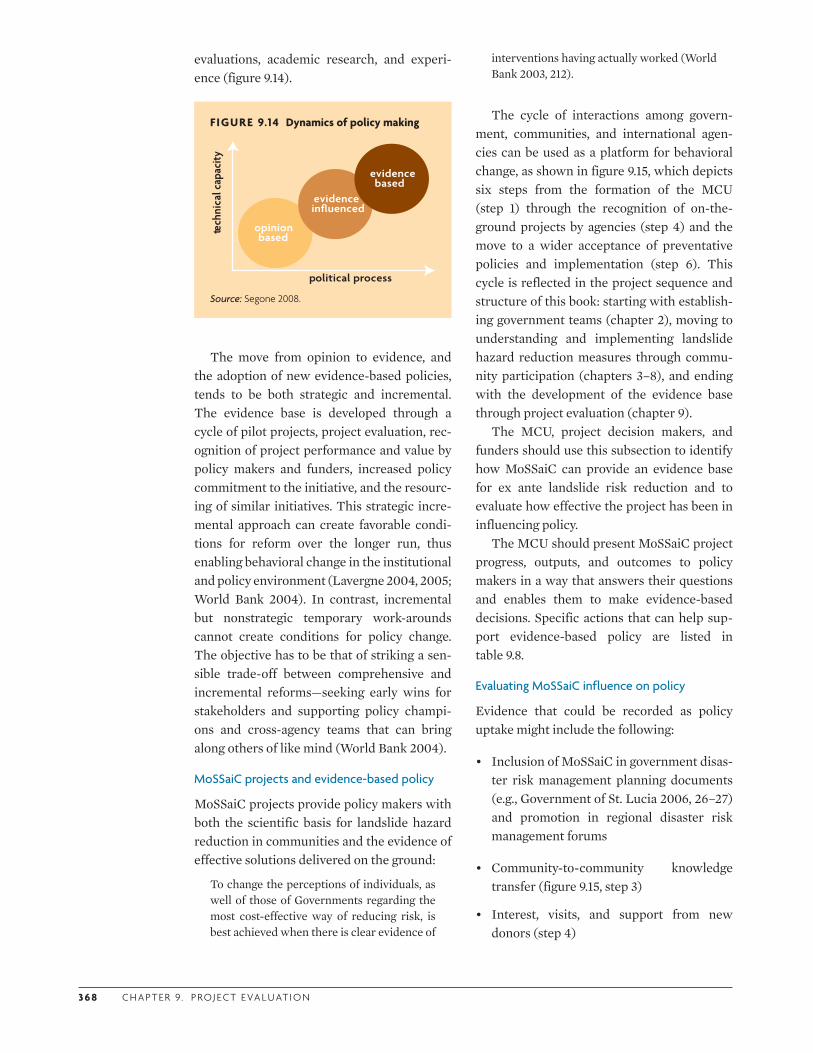
3 6 8 C H A P T E R 9. P RO J E CT E VA L U AT I O N
evaluations, academic research, and experi-ence (figure 9.14).
interventions having actually worked (World Bank 2003, 212).
The cycle of interactions among govern-ment, communities, and international agen-cies can be used as a platform for behavioral change, as shown in figure 9.15, which depicts six steps from the formation of the MCU (step 1) through the recognition of on-the-ground projects by agencies (step 4) and the move to a wider acceptance of preventative policies and implementation (step 6). This cycle is reflected in the project sequence and structure of this book: starting with establish-ing government teams (chapter 2), moving to understanding and implementing landslide hazard reduction measures through commu-nity participation (chapters 3–8), and ending with the development of the evidence base through project evaluation (chapter 9).
The MCU, project decision makers, and funders should use this subsection to identify how MoSSaiC can provide an evidence base for ex ante landslide risk reduction and to evaluate how effective the project has been in influencing policy.
The MCU should present MoSSaiC project progress, outputs, and outcomes to policy makers in a way that answers their questions and enables them to make evidence-based decisions. Specific actions that can help sup-port evidence-based policy are listed in table 9.8.
Evaluating MoSSaiC influence on policy
Evidence that could be recorded as policy uptake might include the following:
• Inclusion of MoSSaiC in government disas-ter risk management planning documents (e.g., Government of St. Lucia 2006, 26–27) and promotion in regional disaster risk management forums
• Community-to-community knowledge transfer (figure 9.15, step 3)
• Interest, visits, and support from new donors (step 4)
FIGURE 9.14 Dynamics of policy making
opinion based
political process
tech
nica
l cap
acity
evidenceinfluenced
evidencebased
Source: Segone 2008.
The move from opinion to evidence, and the adoption of new evidence-based policies, tends to be both strategic and incremental. The evidence base is developed through a cycle of pilot projects, project evaluation, rec-ognition of project performance and value by policy makers and funders, increased policy commitment to the initiative, and the resourc-ing of similar initiatives. This strategic incre-mental approach can create favorable condi-tions for reform over the longer run, thus enabling behavioral change in the institutional and policy environment (Lavergne 2004, 2005; World Bank 2004). In contrast, incremental but nonstrategic temporary work-arounds cannot create conditions for policy change. The objective has to be that of striking a sen-sible trade-off between comprehensive and incremental reforms—seeking early wins for stakeholders and supporting policy champi-ons and cross-agency teams that can bring along others of like mind (World Bank 2004).
MoSSaiC projects and evidence-based policy
MoSSaiC projects provide policy makers with both the scientific basis for landslide hazard reduction in communities and the evidence of effective solutions delivered on the ground:
To change the perceptions of individuals, as well of those of Governments regarding the most cost-effective way of reducing risk, is best achieved when there is clear evidence of
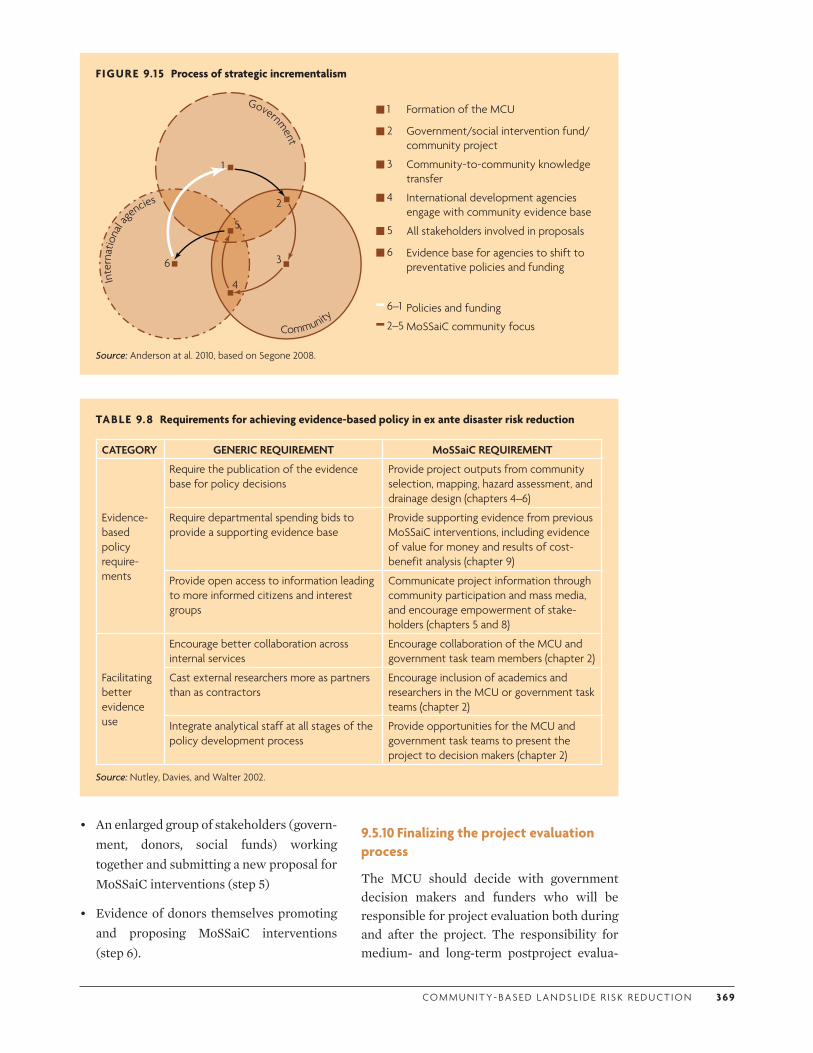
CO M M U N I T Y- BA S E D L A N DS L I D E R I S K R E D U CT I O N 3 69
FIGURE 9.15 Process of strategic incrementalism
1
2
3
4
5
6
Government
Inte
rnat
iona
l a
gencies
Community
2
3
4
5
6
1 Formation of the MCU
Government/social intervention fund/ community project
Community-to-community knowledge transfer
International development agencies engage with community evidence base
All stakeholders involved in proposals
Evidence base for agencies to shift to preventative policies and funding
6–1 Policies and funding2–5 MoSSaiC community focus
Source: Anderson at al. 2010, based on Segone 2008.
• An enlarged group of stakeholders (govern-ment, donors, social funds) working together and submitting a new proposal for MoSSaiC interventions (step 5)
• Evidence of donors themselves promoting and proposing MoSSaiC interventions (step 6).
9.5.10 Finalizing the project evaluation process
The MCU should decide with government decision makers and funders who will be responsible for project evaluation both during and after the project. The responsibility for medium- and long-term postproject evalua-
TABLE 9.8 Requirements for achieving evidence-based policy in ex ante disaster risk reduction
CATEGORY GENERIC REQUIREMENT MoSSaiC REQUIREMENT
Evidence-based policy require-ments
Require the publication of the evidence base for policy decisions
Provide project outputs from community selection, mapping, hazard assessment, and drainage design (chapters 4–6)
Require departmental spending bids to provide a supporting evidence base
Provide supporting evidence from previous MoSSaiC interventions, including evidence of value for money and results of cost-benefit analysis (chapter 9)
Provide open access to information leading to more informed citizens and interest groups
Communicate project information through community participation and mass media, and encourage empowerment of stake-holders (chapters 5 and 8)
Facilitating better evidence use
Encourage better collaboration across internal services
Encourage collaboration of the MCU and government task team members (chapter 2)
Cast external researchers more as partners than as contractors
Encourage inclusion of academics and researchers in the MCU or government task teams (chapter 2)
Integrate analytical staff at all stages of the policy development process
Provide opportunities for the MCU and government task teams to present the project to decision makers (chapter 2)
Source: Nutley, Davies, and Walter 2002.

370 C H A P T E R 9. P RO J E CT E VA L U AT I O N
tion (or monitoring) may need to reside with a local agency that already has a mandate, or research program, for disaster risk assessment and management.
MILESTONE 9: Evaluation framework agreed
upon and implemented
9.6 ADDRESSING LANDSLIDE RISK DRIVERS OVER THE LONGER TERM
The drivers of landslide risk relate to the hazard (the landslide event) and the vulnerability of exposed elements (such as people, communi-ties, and infrastructure) to damage by that haz-ard event. Since the primary aim of MoSSaiC is to identify and reduce physical landslide hazard drivers affecting the most vulnerable urban communities, the evaluation process (sections 9.3–9.5) is concerned with project effectiveness in reducing landslide hazard and improving slope management practices over short- and medium-scale time frames.
This section considers MoSSaiC as a poten-tial contributor to holistic policy responses to landslide risk and trends in landslide risk driv-ers (both physical and societal) over longer time scales:
• DRR under present and future climate sce-narios
• Risk transfer through insurance at individ-ual and national scales
• “No regrets” landslide risk management given uncertain trends in risk drivers.
9.6.1 Disaster risk reduction and climate proofing
DRR and climate change adaptation policies are, to some extent, complementary even though they have been evolving independently until recently:
DRR can deal with current climate variability and be the first line defence against climate change, being therefore an essential part of adaptation. Conversely, for DRR to be suc-cessful, account needs to be taken of the shifting risks associated with climate change, and ensure that measures do not increase vulnerability to climate change in the medium to long-term (Mitchell and van Aalst 2008, 1).
“Climate proofing” is shorthand for the identification and reduction of risks posed to development projects by climate variability and change. Today the need for climate proof-ing is greater than ever as risk drivers change (see section 9.6.3) and increase the hazard, exposure, and vulnerability of communities and regions to climate-related disasters.
Climate proofing in the most vulnerable communities requires urgent attention because the destruction of, or damage to, unauthorized housing is one of the most com-mon and serious impacts of many extreme-weather events (Parry et al. 2009). Unauthor-ized housing is often not constructed to withstand such events even under current cli-matic conditions:
…property is built at a substandard level and does not conform even to minimal building codes and standards. This widespread failure to build enough weather resistance into existing and expanding human settlements is the main reason for the existence of an adap-tation deficit… The evidence suggests strongly that the adaptation deficit continues to increase because losses from extreme events continue to increase. In other words, societies are becoming less well adapted to current climate. Such a process of develop-ment has been called “maladaptation” (UNFCCC 2007, 99).
MoSSaiC can contribute to a planned har-monization and alignment of incentives of cli-mate change adaptation in developing coun-tries. Table 9.9 sets out key elements of MoSSaiC that can be regarded as contributing to climate proofing in vulnerable communi-ties.
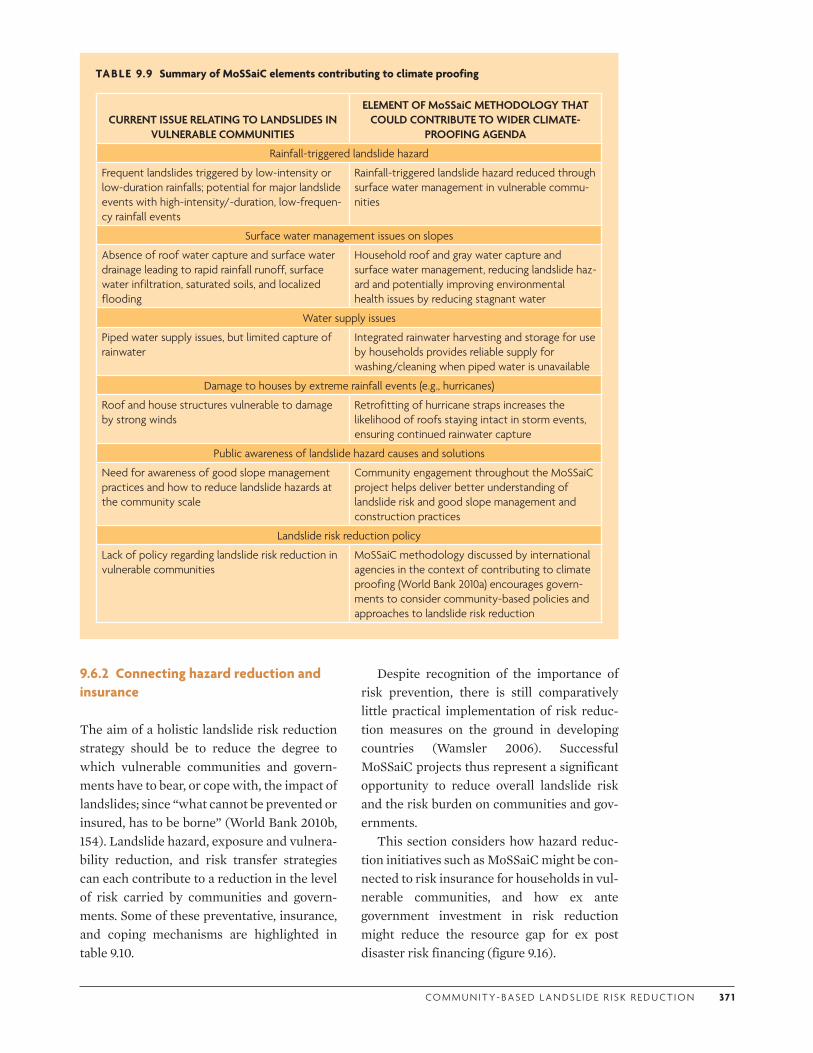
CO M M U N I T Y- BA S E D L A N DS L I D E R I S K R E D U CT I O N 37 1
9.6.2 Connecting hazard reduction and insurance
The aim of a holistic landslide risk reduction strategy should be to reduce the degree to which vulnerable communities and govern-ments have to bear, or cope with, the impact of landslides; since “what cannot be prevented or insured, has to be borne” (World Bank 2010b, 154). Landslide hazard, exposure and vulnera-bility reduction, and risk transfer strategies can each contribute to a reduction in the level of risk carried by communities and govern-ments. Some of these preventative, insurance, and coping mechanisms are highlighted in table 9.10.
Despite recognition of the importance of risk prevention, there is still comparatively little practical implementation of risk reduc-tion measures on the ground in developing countries (Wamsler 2006). Successful MoSSaiC projects thus represent a significant opportunity to reduce overall landslide risk and the risk burden on communities and gov-ernments.
This section considers how hazard reduc-tion initiatives such as MoSSaiC might be con-nected to risk insurance for households in vul-nerable communities, and how ex ante government investment in risk reduction might reduce the resource gap for ex post disaster risk financing (figure 9.16).
TABLE 9.9 Summary of MoSSaiC elements contributing to climate proofing
CURRENT ISSUE RELATING TO LANDSLIDES IN VULNERABLE COMMUNITIES
ELEMENT OF MoSSaiC METHODOLOGY THAT COULD CONTRIBUTE TO WIDER CLIMATE-
PROOFING AGENDA
Rainfall-triggered landslide hazard
Frequent landslides triggered by low-intensity or low-duration rainfalls; potential for major landslide events with high-intensity/-duration, low-frequen-cy rainfall events
Rainfall-triggered landslide hazard reduced through surface water management in vulnerable commu-nities
Surface water management issues on slopes
Absence of roof water capture and surface water drainage leading to rapid rainfall runoff, surface water infiltration, saturated soils, and localized flooding
Household roof and gray water capture and surface water management, reducing landslide haz-ard and potentially improving environmental health issues by reducing stagnant water
Water supply issues
Piped water supply issues, but limited capture of rainwater
Integrated rainwater harvesting and storage for use by households provides reliable supply for washing/cleaning when piped water is unavailable
Damage to houses by extreme rainfall events (e.g., hurricanes)
Roof and house structures vulnerable to damage by strong winds
Retrofitting of hurricane straps increases the likelihood of roofs staying intact in storm events, ensuring continued rainwater capture
Public awareness of landslide hazard causes and solutions
Need for awareness of good slope management practices and how to reduce landslide hazards at the community scale
Community engagement throughout the MoSSaiC project helps deliver better understanding of landslide risk and good slope management and construction practices
Landslide risk reduction policy
Lack of policy regarding landslide risk reduction in vulnerable communities
MoSSaiC methodology discussed by international agencies in the context of contributing to climate proofing (World Bank 2010a) encourages govern-ments to consider community-based policies and approaches to landslide risk reduction
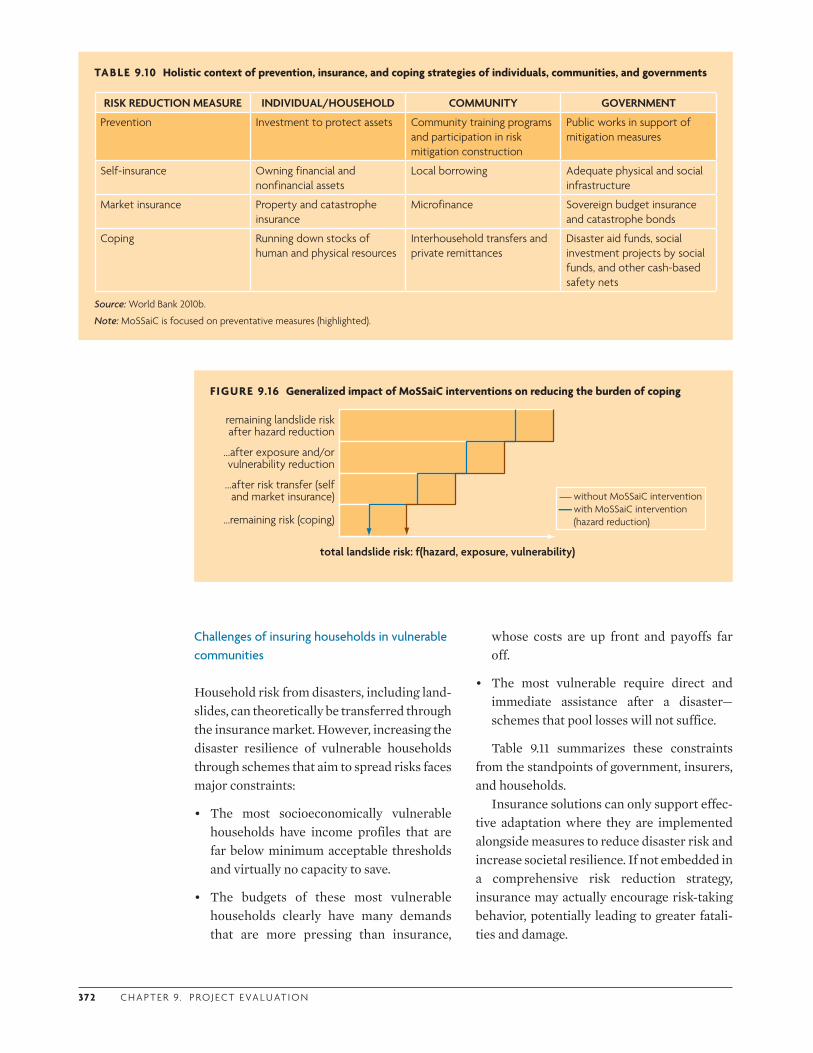
372 C H A P T E R 9. P RO J E CT E VA L U AT I O N
FIGURE 9.16 Generalized impact of MoSSaiC interventions on reducing the burden of coping
remaining landslide risk after hazard reduction
…remaining risk (coping)
…after exposure and/or vulnerability reduction
…after risk transfer (self and market insurance)
total landslide risk: f(hazard, exposure, vulnerability)
without MoSSaiC interventionwith MoSSaiC intervention (hazard reduction)
TABLE 9.10 Holistic context of prevention, insurance, and coping strategies of individuals, communities, and governments
RISK REDUCTION MEASURE INDIVIDUAL/HOUSEHOLD COMMUNITY GOVERNMENT
Prevention Investment to protect assets Community training programs and participation in risk mitigation construction
Public works in support of mitigation measures
Self-insurance Owning financial and nonfinancial assets
Local borrowing Adequate physical and social infrastructure
Market insurance Property and catastrophe insurance
Microfinance Sovereign budget insurance and catastrophe bonds
Coping Running down stocks of human and physical resources
Interhousehold transfers and private remittances
Disaster aid funds, social investment projects by social funds, and other cash-based safety nets
Source: World Bank 2010b.
Note: MoSSaiC is focused on preventative measures (highlighted).
Challenges of insuring households in vulnerable communities
Household risk from disasters, including land-slides, can theoretically be transferred through the insurance market. However, increasing the disaster resilience of vulnerable households through schemes that aim to spread risks faces major constraints:
• The most socioeconomically vulnerable households have income profiles that are far below minimum acceptable thresholds and virtually no capacity to save.
• The budgets of these most vulnerable households clearly have many demands that are more pressing than insurance,
whose costs are up front and payoffs far off.
• The most vulnerable require direct and immediate assistance after a disaster—schemes that pool losses will not suffice.
Table 9.11 summarizes these constraints from the standpoints of government, insurers, and households.
Insurance solutions can only support effec-tive adaptation where they are implemented alongside measures to reduce disaster risk and increase societal resilience. If not embedded in a comprehensive risk reduction strategy, insurance may actually encourage risk-taking behavior, potentially leading to greater fatali-ties and damage.
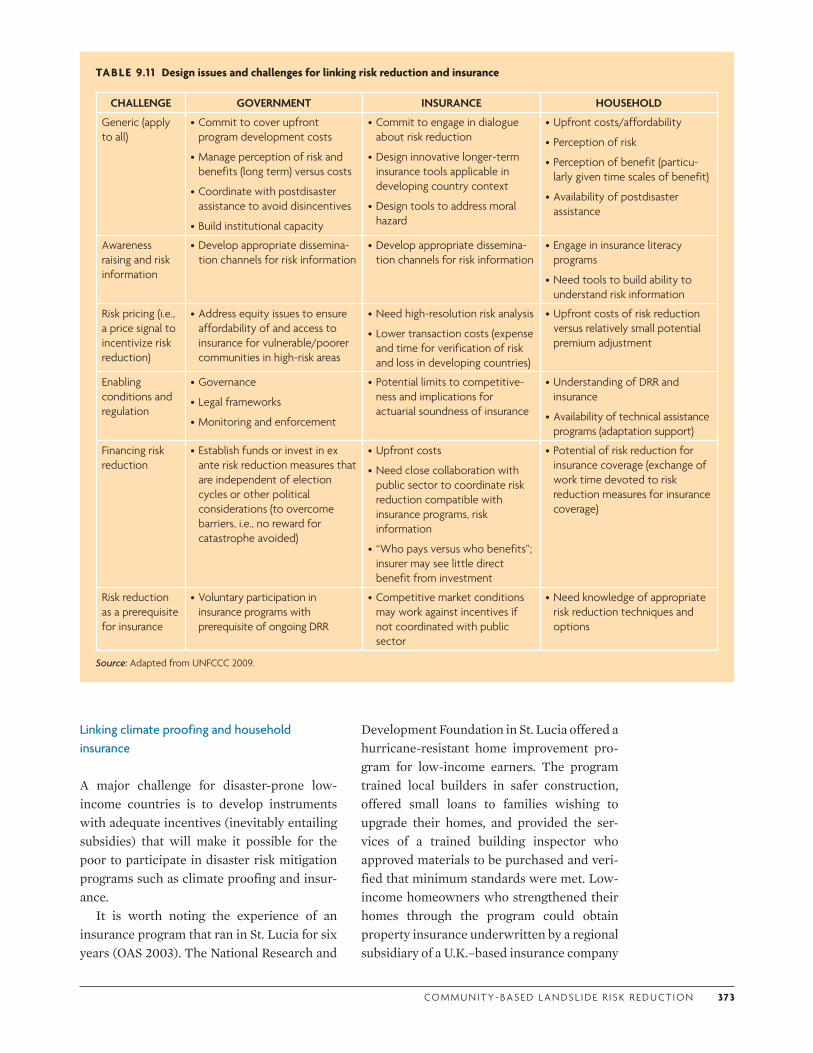
CO M M U N I T Y- BA S E D L A N DS L I D E R I S K R E D U CT I O N 373
TABLE 9.1 1 Design issues and challenges for linking risk reduction and insurance
CHALLENGE GOVERNMENT INSURANCE HOUSEHOLD
Generic (apply to all)
•Commit to cover upfront program development costs
•Manage perception of risk and benefits (long term) versus costs
•Coordinate with postdisaster assistance to avoid disincentives
•Build institutional capacity
•Commit to engage in dialogue about risk reduction
•Design innovative longer-term insurance tools applicable in developing country context
•Design tools to address moral hazard
•Upfront costs/affordability
•Perception of risk
•Perception of benefit (particu-larly given time scales of benefit)
•Availability of postdisaster assistance
Awareness raising and risk information
•Develop appropriate dissemina-tion channels for risk information
•Develop appropriate dissemina-tion channels for risk information
•Engage in insurance literacy programs
•Need tools to build ability to understand risk information
Risk pricing (i.e., a price signal to incentivize risk reduction)
•Address equity issues to ensure affordability of and access to insurance for vulnerable/poorer communities in high-risk areas
•Need high-resolution risk analysis
•Lower transaction costs (expense and time for verification of risk and loss in developing countries)
•Upfront costs of risk reduction versus relatively small potential premium adjustment
Enabling conditions and regulation
•Governance
•Legal frameworks
•Monitoring and enforcement
•Potential limits to competitive-ness and implications for actuarial soundness of insurance
•Understanding of DRR and insurance
•Availability of technical assistance programs (adaptation support)
Financing risk reduction
•Establish funds or invest in ex ante risk reduction measures that are independent of election cycles or other political considerations (to overcome barriers, i.e., no reward for catastrophe avoided)
•Upfront costs
•Need close collaboration with public sector to coordinate risk reduction compatible with insurance programs, risk information
•“Who pays versus who benefits”; insurer may see little direct benefit from investment
•Potential of risk reduction for insurance coverage (exchange of work time devoted to risk reduction measures for insurance coverage)
Risk reduction as a prerequisite for insurance
•Voluntary participation in insurance programs with prerequisite of ongoing DRR
•Competitive market conditions may work against incentives if not coordinated with public sector
•Need knowledge of appropriate risk reduction techniques and options
Source: Adapted from UNFCCC 2009.
Linking climate proofing and household insurance
A major challenge for disaster-prone low-income countries is to develop instruments with adequate incentives (inevitably entailing subsidies) that will make it possible for the poor to participate in disaster risk mitigation programs such as climate proofing and insur-ance.
It is worth noting the experience of an insurance program that ran in St. Lucia for six years (OAS 2003). The National Research and
Development Foundation in St. Lucia offered a hurricane-resistant home improvement pro-gram for low-income earners. The program trained local builders in safer construction, offered small loans to families wishing to upgrade their homes, and provided the ser-vices of a trained building inspector who approved materials to be purchased and veri-fied that minimum standards were met. Low-income homeowners who strengthened their homes through the program could obtain property insurance underwritten by a regional subsidiary of a U.K.–based insurance company
374 C H A P T E R 9. P RO J E CT E VA L U AT I O N
and established through a local broker. The insurance plan covered major natural disas-ters. Figure 9.17 shows the management struc-ture of the loan process and associated insur-ance scheme.
The insurance scheme was mandatory for recipients of the home improvement loans. Full coverage with a 2 percent deductible was specified in the policies. Premium rates ranged from 0.60 percent for concrete block homes to 1.05 percent for homes made of timber. Between 1996 and November 2002, 345 loans were disbursed within this program, with an average loan size of approximately $4,100 (in 2002 dollars) (OAS 2003).
The program is noteworthy because it is a rare example of targeting insurance to the most vulnerable households, coupling home improvement for natural hazard mitigation with property insurance cover. The home improvement conditionality of the scheme off-set the reported “catch-22” insurance position for natural hazard cover alone—namely, that natural hazard insurance premiums are usu-ally very high, as only those likely to make fre-quent claims consider insuring themselves against them. High premiums associated with hazard cover alone lead to one of two possi-bilities: the customer decides that the insur-ance is too expensive and does not insure the property, or the insurance companies decide there will be no profit in underwriting hurri-cane damage at a premium customers are will-ing to pay and decline to offer the business.
Being mindful of the possible constraints mentioned above, funders and governments could consider combining an insurance scheme with MoSSaiC projects to create a comprehensive landslide risk management plan in which
• preventative measures are provided (or encouraged) through MoSSaiC projects;
• insurance is available for participating households, assuming a model analogous to that outlined in figure 9.17; and
• should a landslide occur, the government would manage a damage repair program.
Landslide risk reduction and macrofinancing disasters
Insurance is just one of several financial instruments used by governments to fund disaster relief and recovery. Table 9.12 lists a variety of other ex ante and postdisaster financing instruments available to govern-ments. Disaster financing is especially demanding for developing countries because there can be a shortfall, known as a resource gap, between the disaster costs and the funds available to the government to rebuild and provide relief and assistance with the recovery efforts (Mechler et al. 2010). These resource gaps are often greatest immediately after a disaster when funding needs are urgent and high, but funds and financial assistance have not yet been mobilized (Ghesquiere and Mahul 2007).
A country’s resource gap is calculated by identifying the probability (or annual recur-rence interval) of a disaster event in which net losses exceed all available financial resources (figure 9.18). For some developing countries, a resource gap can be created by a disaster event with as high a probability of occurrence as 1 in 15 years (Mechler et al. 2010).
The frequency and impact of disaster events determine whether it is more effective for gov-ernments to invest in risk reduction or risk financing. Generally, risk prevention is more cost-effective for high-probability events with low to medium-size losses, while risk financ-ing targets less frequent, higher-impact events (Mechler et al. 2010). For countries prone to rainfall-triggered landslides and where high-frequency events can trigger a resource gap, it is conceivable that a national program on MoSSaiC projects could contribute to disaster resilience at a national scale.
9.6.3 Anticipating future disaster risk scenarios
In chapter 1, a number of policy issues and trends were identified that affect urban land-slide risk in developing countries, including the speed of conventional DRR uptake, the rate of societal change and urbanization, and

CO M M U N I T Y- BA S E D L A N DS L I D E R I S K R E D U CT I O N 375
FIGURE 9.17 Model used in St. Lucia for hurricane-resistant home improvement program for low-income earners
Inte
rvie
w a
nd lo
an a
pplic
atio
nInitial contact(receptionist)
First interview(loans/building officers)
Site visit(loans/building officers)
Environmental guidelines Siting criteria
Construction detailsSelect builder and prepare drawings
(building officer)
Minimum building standardsDesign standards
Review file(unit head)
Loan approval(unit head, executive director, loan
committee or board, depending on size of loan)
Cons
truc
tion
phas
e
Loan disbursement
Disbursements(accountant)
Site visits(building officer)�
Loan
com
plet
ion
Certification of completion(building officer)
Minimum building standardsand environmental guidelines
Standards met
Insurance coverage(accountant)
Loan payment(accountant/loan officer)
Closure of loan(accountant)
Min
imum
bui
ldin
g st
anda
rds
and
envi
ronm
enta
l gui
delin
esSt
anda
rds m
et
�
�
Source: OAS 2003; reproduced with permission of the OAS General Secretariat.
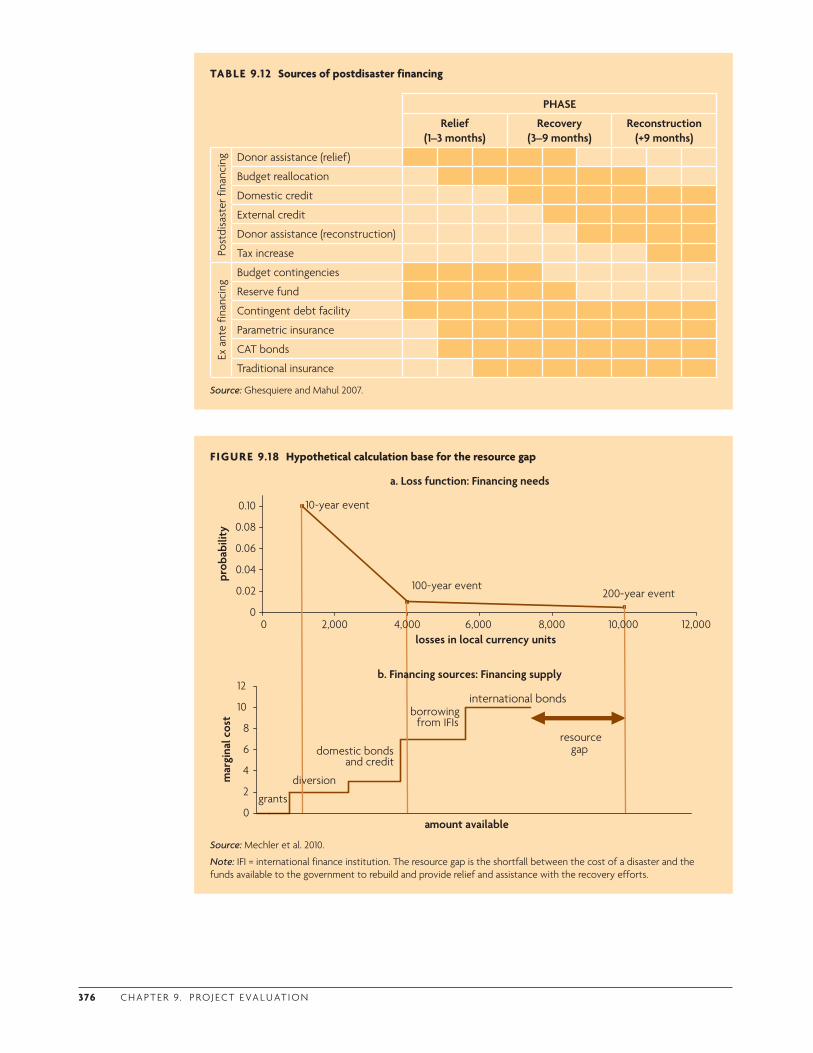
376 C H A P T E R 9. P RO J E CT E VA L U AT I O N
TABLE 9.12 Sources of postdisaster financing
PHASE
Relief (1–3 months)
Recovery (3–9 months)
Reconstruction (+9 months)
Post
disa
ster
fina
ncin
g Donor assistance (relief)
Budget reallocation
Domestic credit
External credit
Donor assistance (reconstruction)
Tax increase
Ex a
nte
finan
cing
Budget contingencies
Reserve fund
Contingent debt facility
Parametric insurance
CAT bonds
Traditional insurance
Source: Ghesquiere and Mahul 2007.
FIGURE 9.18 Hypothetical calculation base for the resource gap
0
2
4
6
8
10
12
amount available
mar
gina
l cos
t
international bonds
domestic bonds and credit
borrowing from IFIs
grants
a. Loss function: Financing needs
200-year event100-year event
10-year event
0
0.02
0.04
0.06
0.08
0.10
losses in local currency units
prob
abili
ty
resourcegap
0 2,000 6,000 12,0008,000
b. Financing sources: Financing supply
diversion
4,000 10,000
Source: Mechler et al. 2010.
Note: IFI = international finance institution. The resource gap is the shortfall between the cost of a disaster and the funds available to the government to rebuild and provide relief and assistance with the recovery efforts.
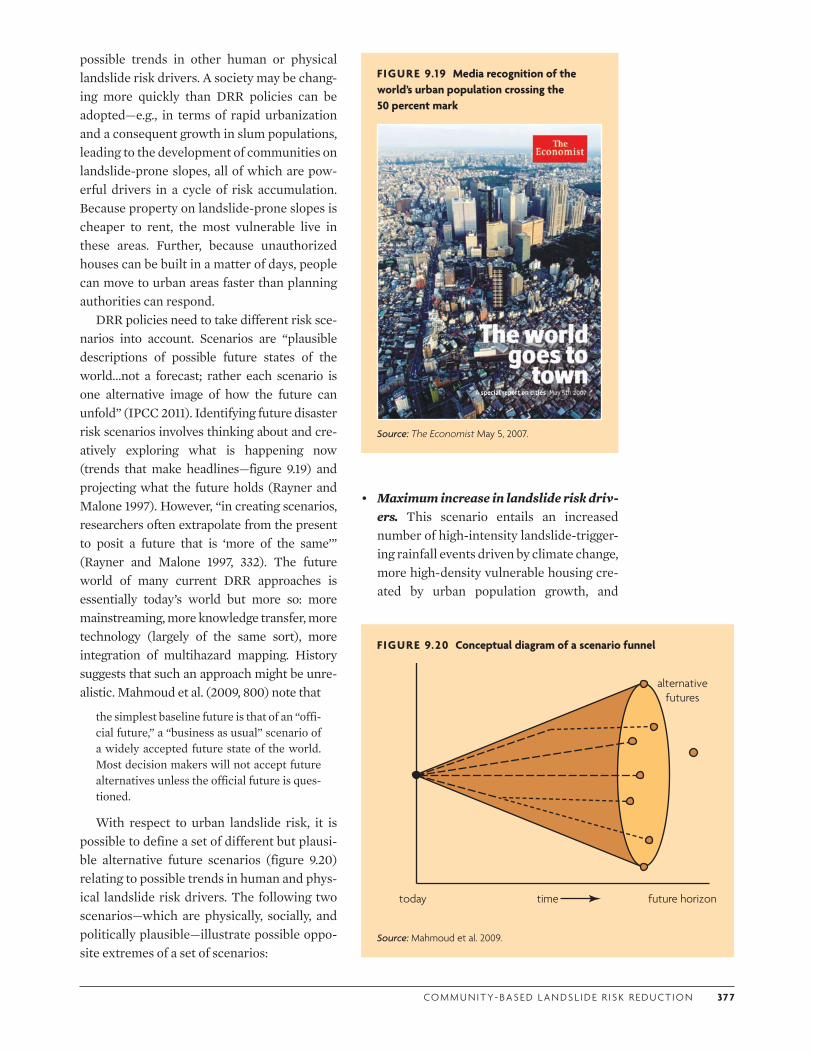
CO M M U N I T Y- BA S E D L A N DS L I D E R I S K R E D U CT I O N 37 7
• Maximum increase in landslide risk driv-ers. This scenario entails an increased number of high-intensity landslide-trigger-ing rainfall events driven by climate change, more high-density vulnerable housing cre-ated by urban population growth, and
FIGURE 9.19 Media recognition of the world’s urban population crossing the 50 percent mark
Source: The Economist May 5, 2007.
possible trends in other human or physical landslide risk drivers. A society may be chang-ing more quickly than DRR policies can be adopted—e.g., in terms of rapid urbanization and a consequent growth in slum populations, leading to the development of communities on landslide-prone slopes, all of which are pow-erful drivers in a cycle of risk accumulation. Because property on landslide-prone slopes is cheaper to rent, the most vulnerable live in these areas. Further, because unauthorized houses can be built in a matter of days, people can move to urban areas faster than planning authorities can respond.
DRR policies need to take different risk sce-narios into account. Scenarios are “plausible descriptions of possible future states of the world…not a forecast; rather each scenario is one alternative image of how the future can unfold” (IPCC 2011). Identifying future disaster risk scenarios involves thinking about and cre-atively exploring what is happening now (trends that make headlines—figure 9.19) and projecting what the future holds (Rayner and Malone 1997). However, “in creating scenarios, researchers often extrapolate from the present to posit a future that is ‘more of the same’” (Rayner and Malone 1997, 332). The future world of many current DRR approaches is essentially today’s world but more so: more mainstreaming, more knowledge transfer, more technology (largely of the same sort), more integration of multihazard mapping. History suggests that such an approach might be unre-alistic. Mahmoud et al. (2009, 800) note that
the simplest baseline future is that of an “offi-cial future,” a “business as usual” scenario of a widely accepted future state of the world. Most decision makers will not accept future alternatives unless the official future is ques-tioned.
With respect to urban landslide risk, it is possible to define a set of different but plausi-ble alternative future scenarios (figure 9.20) relating to possible trends in human and phys-ical landslide risk drivers. The following two scenarios—which are physically, socially, and politically plausible—illustrate possible oppo-site extremes of a set of scenarios:
FIGURE 9.20 Conceptual diagram of a scenario funnel
alternative futures
future horizontoday time
Source: Mahmoud et al. 2009.
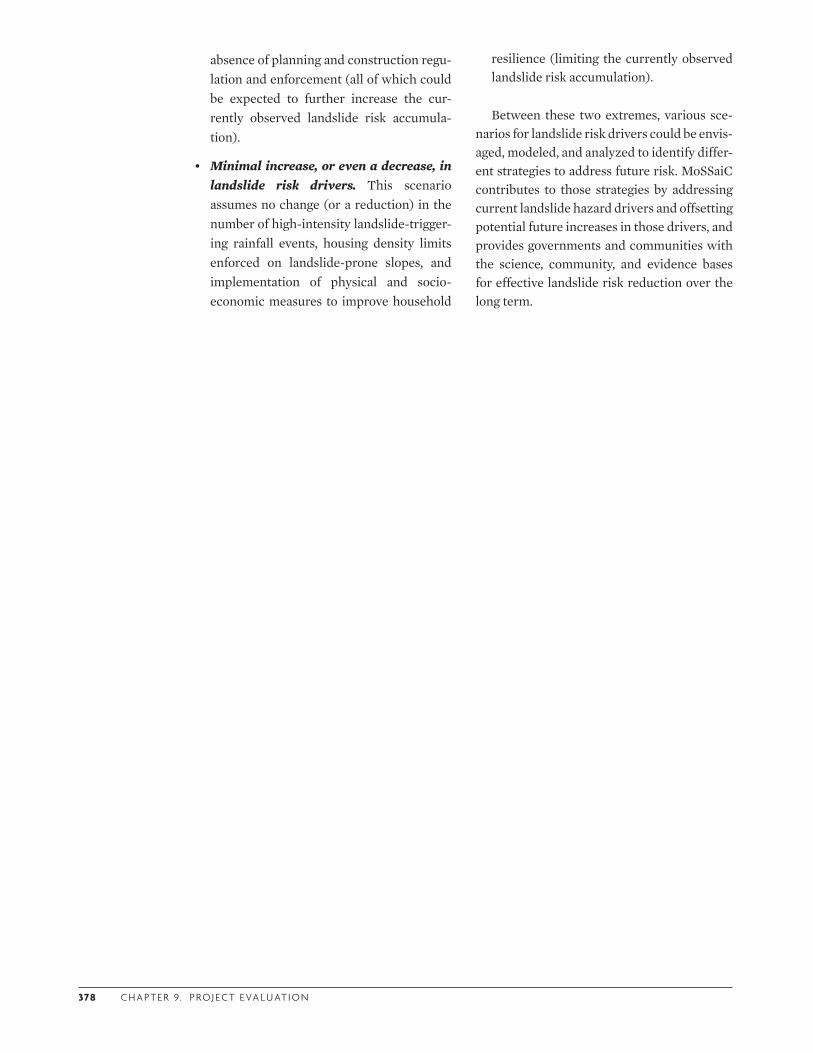
378 C H A P T E R 9. P RO J E CT E VA L U AT I O N
absence of planning and construction regu-lation and enforcement (all of which could be expected to further increase the cur-rently observed landslide risk accumula-tion).
• Minimal increase, or even a decrease, in landslide risk drivers. This scenario assumes no change (or a reduction) in the number of high-intensity landslide-trigger-ing rainfall events, housing density limits enforced on landslide-prone slopes, and implementation of physical and socio-economic measures to improve household
resilience (limiting the currently observed landslide risk accumulation).
Between these two extremes, various sce-narios for landslide risk drivers could be envis-aged, modeled, and analyzed to identify differ-ent strategies to address future risk. MoSSaiC contributes to those strategies by addressing current landslide hazard drivers and offsetting potential future increases in those drivers, and provides governments and communities with the science, community, and evidence bases for effective landslide risk reduction over the long term.
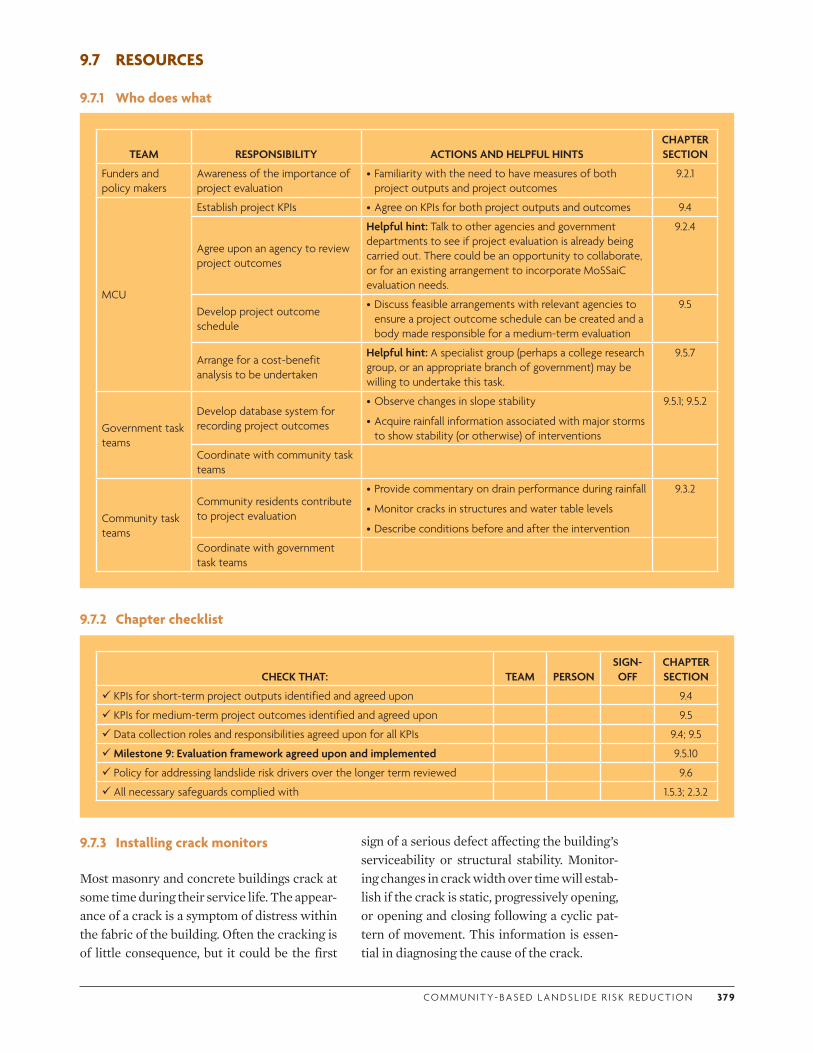
CO M M U N I T Y- BA S E D L A N DS L I D E R I S K R E D U CT I O N 379
TEAM RESPONSIBILITY ACTIONS AND HELPFUL HINTSCHAPTER SECTION
Funders and policy makers
Awareness of the importance of project evaluation
•Familiarity with the need to have measures of both project outputs and project outcomes
9.2.1
MCU
Establish project KPIs •Agree on KPIs for both project outputs and outcomes 9.4
Agree upon an agency to review project outcomes
Helpful hint: Talk to other agencies and government departments to see if project evaluation is already being carried out. There could be an opportunity to collaborate, or for an existing arrangement to incorporate MoSSaiC evaluation needs.
9.2.4
Develop project outcome schedule
•Discuss feasible arrangements with relevant agencies to ensure a project outcome schedule can be created and a body made responsible for a medium-term evaluation
9.5
Arrange for a cost-benefit analysis to be undertaken
Helpful hint: A specialist group (perhaps a college research group, or an appropriate branch of government) may be willing to undertake this task.
9.5.7
Government task teams
Develop database system for recording project outcomes
•Observe changes in slope stability
•Acquire rainfall information associated with major storms to show stability (or otherwise) of interventions
9.5.1; 9.5.2
Coordinate with community task teams
Community task teams
Community residents contribute to project evaluation
•Provide commentary on drain performance during rainfall
•Monitor cracks in structures and water table levels
•Describe conditions before and after the intervention
9.3.2
Coordinate with government task teams
CHECK THAT: TEAM PERSONSIGN-OFF
CHAPTER SECTION
KPIs for short-term project outputs identified and agreed upon 9.4
KPIs for medium-term project outcomes identified and agreed upon 9.5
Data collection roles and responsibilities agreed upon for all KPIs 9.4; 9.5
Milestone 9: Evaluation framework agreed upon and implemented 9.5.10
Policy for addressing landslide risk drivers over the longer term reviewed 9.6
All necessary safeguards complied with 1.5.3; 2.3.2
9.7 RESOURCES
9.7.1 Who does what
9.7.2 Chapter checklist
9.7.3 Installing crack monitors
Most masonry and concrete buildings crack at some time during their service life. The appear-ance of a crack is a symptom of distress within the fabric of the building. Often the cracking is of little consequence, but it could be the first
sign of a serious defect affecting the building’s serviceability or structural stability. Monitor-ing changes in crack width over time will estab-lish if the crack is static, progressively opening, or opening and closing following a cyclic pat-tern of movement. This information is essen-tial in diagnosing the cause of the crack.
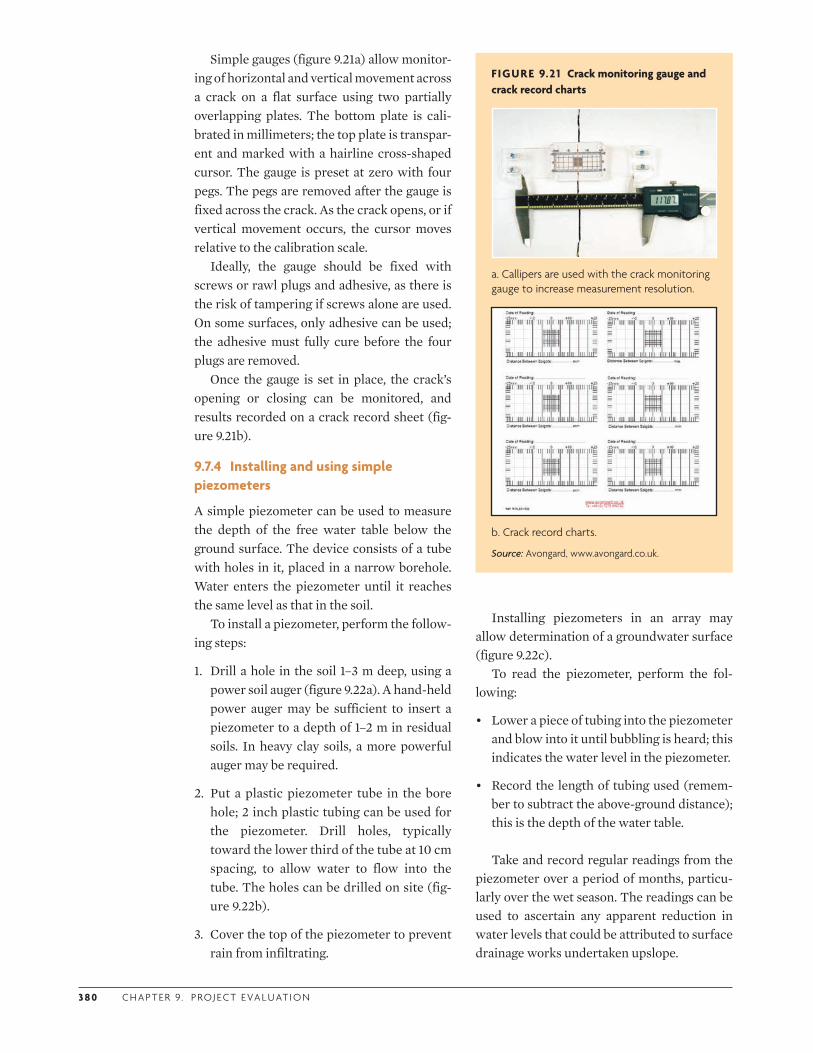
3 8 0 C H A P T E R 9. P RO J E CT E VA L U AT I O N
Simple gauges (figure 9.21a) allow monitor-ing of horizontal and vertical movement across a crack on a flat surface using two partially overlapping plates. The bottom plate is cali-brated in millimeters; the top plate is transpar-ent and marked with a hairline cross-shaped cursor. The gauge is preset at zero with four pegs. The pegs are removed after the gauge is fixed across the crack. As the crack opens, or if vertical movement occurs, the cursor moves relative to the calibration scale.
Ideally, the gauge should be fixed with screws or rawl plugs and adhesive, as there is the risk of tampering if screws alone are used. On some surfaces, only adhesive can be used; the adhesive must fully cure before the four plugs are removed.
Once the gauge is set in place, the crack’s opening or closing can be monitored, and results recorded on a crack record sheet (fig-ure 9.21b).
9.7.4 Installing and using simple piezometers
A simple piezometer can be used to measure the depth of the free water table below the ground surface. The device consists of a tube with holes in it, placed in a narrow borehole. Water enters the piezometer until it reaches the same level as that in the soil.
To install a piezometer, perform the follow-ing steps:
1. Drill a hole in the soil 1–3 m deep, using a power soil auger (figure 9.22a). A hand-held power auger may be sufficient to insert a piezometer to a depth of 1–2 m in residual soils. In heavy clay soils, a more powerful auger may be required.
2. Put a plastic piezometer tube in the bore hole; 2 inch plastic tubing can be used for the piezometer. Drill holes, typically toward the lower third of the tube at 10 cm spacing, to allow water to flow into the tube. The holes can be drilled on site (fig-ure 9.22b).
3. Cover the top of the piezometer to prevent rain from infiltrating.
FIGURE 9.21 Crack monitoring gauge and crack record charts
a. Callipers are used with the crack monitoring gauge to increase measurement resolution.
b. Crack record charts.
Source: Avongard, www.avongard.co.uk.
Installing piezometers in an array may allow determination of a groundwater surface (figure 9.22c).
To read the piezometer, perform the fol-lowing:
• Lower a piece of tubing into the piezometer and blow into it until bubbling is heard; this indicates the water level in the piezometer.
• Record the length of tubing used (remem-ber to subtract the above-ground distance); this is the depth of the water table.
Take and record regular readings from the piezometer over a period of months, particu-larly over the wet season. The readings can be used to ascertain any apparent reduction in water levels that could be attributed to surface drainage works undertaken upslope.
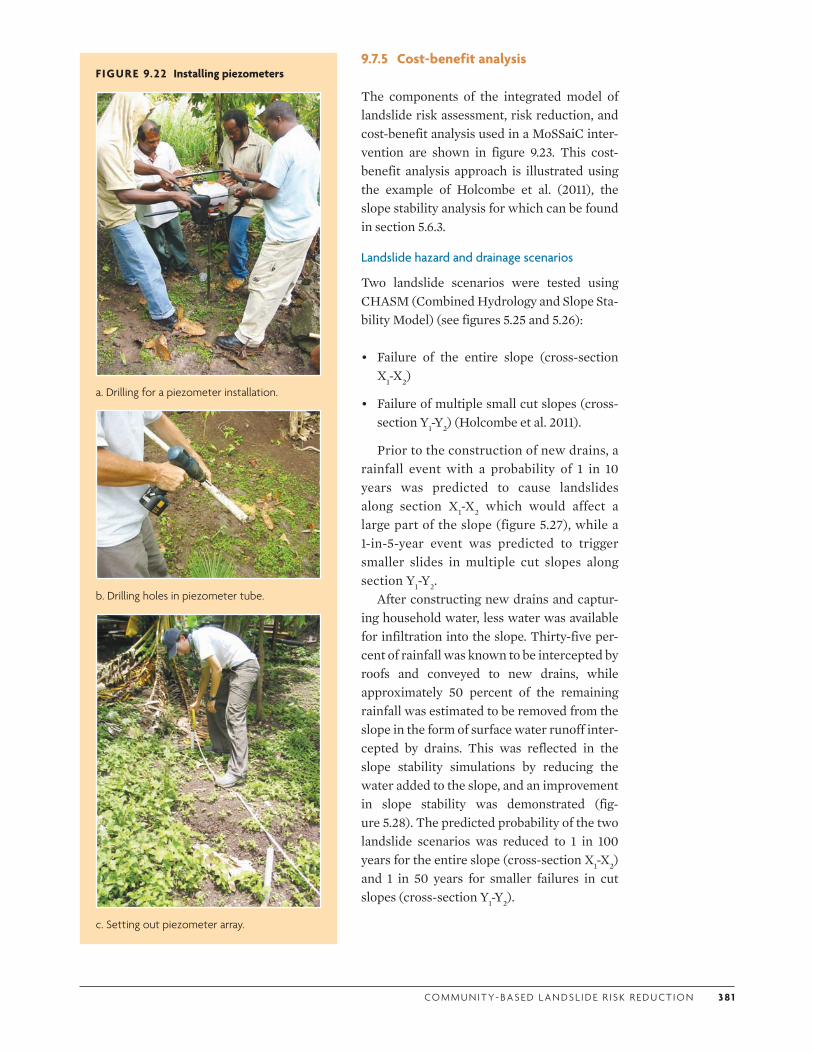
CO M M U N I T Y- BA S E D L A N DS L I D E R I S K R E D U CT I O N 3 8 1
F IGURE 9.22 Installing piezometers
a. Drilling for a piezometer installation.
b. Drilling holes in piezometer tube.
c. Setting out piezometer array.
9.7.5 Cost-benefit analysis
The components of the integrated model of landslide risk assessment, risk reduction, and cost-benefit analysis used in a MoSSaiC inter-vention are shown in figure 9.23. This cost-benefit analysis approach is illustrated using the example of Holcombe et al. (2011), the slope stability analysis for which can be found in section 5.6.3.
Landslide hazard and drainage scenarios
Two landslide scenarios were tested using CHASM (Combined Hydrology and Slope Sta-bility Model) (see figures 5.25 and 5.26):
• Failure of the entire slope (cross-section X1-X2)
• Failure of multiple small cut slopes (cross-section Y1-Y2) (Holcombe et al. 2011).
Prior to the construction of new drains, a rainfall event with a probability of 1 in 10 years was predicted to cause landslides along section X1-X2 which would affect a large part of the slope (figure 5.27), while a 1-in-5-year event was predicted to trigger smaller slides in multiple cut slopes along section Y1-Y2.
After constructing new drains and captur-ing household water, less water was available for infiltration into the slope. Thirty-five per-cent of rainfall was known to be intercepted by roofs and conveyed to new drains, while approximately 50 percent of the remaining rainfall was estimated to be removed from the slope in the form of surface water runoff inter-cepted by drains. This was reflected in the slope stability simulations by reducing the water added to the slope, and an improvement in slope stability was demonstrated (fig-ure 5.28). The predicted probability of the two landslide scenarios was reduced to 1 in 100 years for the entire slope (cross-section X1-X2) and 1 in 50 years for smaller failures in cut slopes (cross-section Y1-Y2).
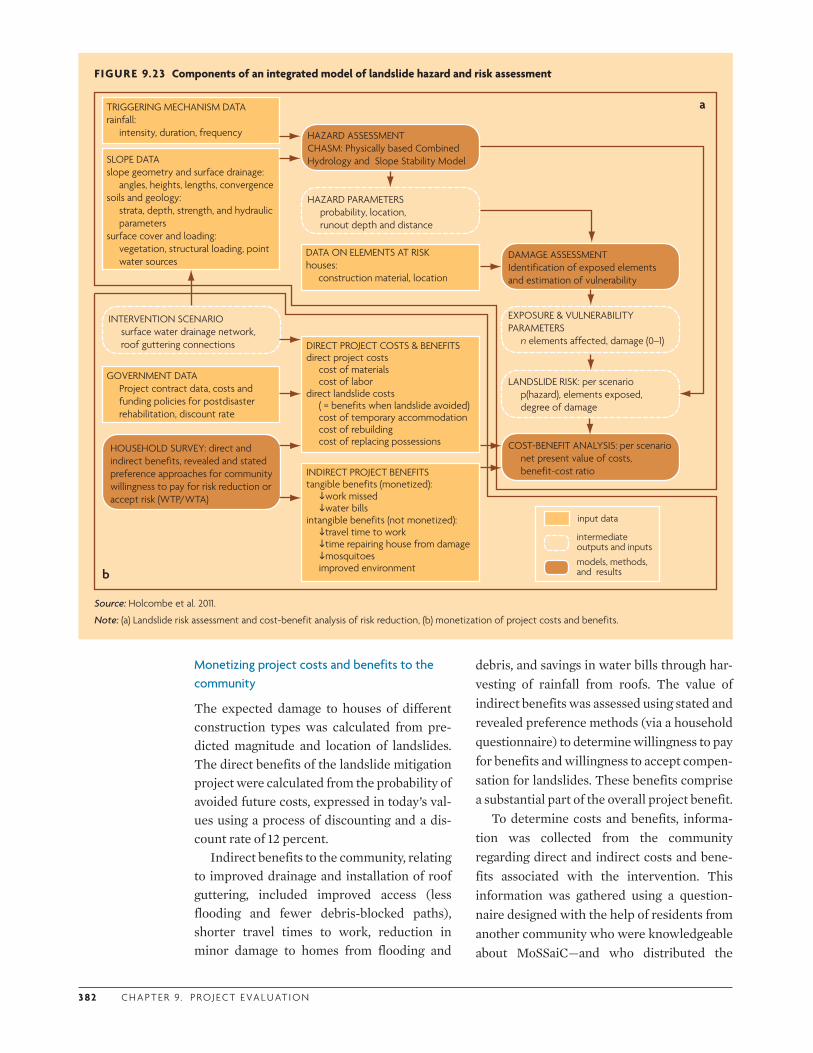
3 82 C H A P T E R 9. P RO J E CT E VA L U AT I O N
FIGURE 9.23 Components of an integrated model of landslide hazard and risk assessment
b
a
SLOPE DATAslope geometry and surface drainage:
angles, heights, lengths, convergencesoils and geology:
strata, depth, strength, and hydraulic parameters
surface cover and loading: vegetation, structural loading, point water sources
TRIGGERING MECHANISM DATArainfall:
intensity, duration, frequency
DATA ON ELEMENTS AT RISKhouses:
construction material, location
HAZARD ASSESSMENTCHASM: Physically based Combined Hydrology and Slope Stability Model
DAMAGE ASSESSMENTIdentification of exposed elements and estimation of vulnerability
HAZARD PARAMETERSprobability, location, runout depth and distance
EXPOSURE & VULNERABILITY PARAMETERS
n elements affected, damage (0–1)
LANDSLIDE RISK: per scenariop(hazard), elements exposed, degree of damage
DIRECT PROJECT COSTS & BENEFITSdirect project costs
cost of materialscost of labor
direct landslide costs( = benefits when landslide avoided)cost of temporary accommodationcost of rebuildingcost of replacing possessions
INDIRECT PROJECT BENEFITStangible benefits (monetized):
�work missed�water bills
intangible benefits (not monetized):�travel time to work�time repairing house from damage�mosquitoesimproved environment
GOVERNMENT DATAProject contract data, costs and funding policies for postdisaster rehabilitation, discount rate
INTERVENTION SCENARIOsurface water drainage network, roof guttering connections
COST-BENEFIT ANALYSIS: per scenarionet present value of costs, benefit-cost ratio
HOUSEHOLD SURVEY: direct and indirect benefits, revealed and stated preference approaches for community willingness to pay for risk reduction or accept risk (WTP/WTA)
intermediate outputs and inputs
input data
models, methods,and results
Source: Holcombe et al. 2011.
Note: (a) Landslide risk assessment and cost-benefit analysis of risk reduction, (b) monetization of project costs and benefits.
Monetizing project costs and benefits to the community
The expected damage to houses of different construction types was calculated from pre-dicted magnitude and location of landslides. The direct benefits of the landslide mitigation project were calculated from the probability of avoided future costs, expressed in today’s val-ues using a process of discounting and a dis-count rate of 12 percent.
Indirect benefits to the community, relating to improved drainage and installation of roof guttering, included improved access (less flooding and fewer debris-blocked paths), shorter travel times to work, reduction in minor damage to homes from flooding and
debris, and savings in water bills through har-vesting of rainfall from roofs. The value of indirect benefits was assessed using stated and revealed preference methods (via a household questionnaire) to determine willingness to pay for benefits and willingness to accept compen-sation for landslides. These benefits comprise a substantial part of the overall project benefit.
To determine costs and benefits, informa-tion was collected from the community regarding direct and indirect costs and bene-fits associated with the intervention. This information was gathered using a question-naire designed with the help of residents from another community who were knowledgeable about MoSSaiC—and who distributed the
CO M M U N I T Y- BA S E D L A N DS L I D E R I S K R E D U CT I O N 3 83
questionnaires and helped residents to com-plete them.
A sample questionnaire that may be adapted can be found in Holcombe et al. (2011). The specific information that needs to be captured by the questionnaire will depend on the cost-benefit analysis method used. Seek expert guidance from those knowledge-able in this field to guide the design of a cost-benefit model appropriate to the local cir-cumstances and likely data availability. It is outside the scope of this book to provide guidance beyond illustrating the potential outcomes of a cost-benefit analysis (section 9.5.7); for more information on a MoSSaiC application of cost-benefit analysis, see Hol-combe et al. (2011).
Results and discussion
The resulting benefit-cost ratio of the land-slide hazard reduction project was estimated to be 1.7:1 without drain maintenance (assum-ing a seven-year drain design life), rising to 2.7:1 with proper maintenance (conservatively assuming a 20-year design life).
The findings of this study should be taken only as a basis for encouraging further design of appropriate cost-benefit analysis models for this type of project, and not as a general confir-mation of any specific form of intervention. The findings are based on a study undertaken in a small community of 25 houses in the East-ern Caribbean. The hope is that by illustrating these results from a single small-scale proto-type cost-benefit analysis, the MCU is encour-aged to consider cost-benefit analysis of fur-ther MoSSaiC projects.
9.7.6 References
Anderson, M. G., and E. A. Holcombe. 2006. “Sustainable Landslide Risk Reduction in Poorer Countries.” Proceedings of the Institution of Civil Engineers—Engineering Sustainability 159: 23–30.
Annan, K. A. 1999. “UN Report of the Secretary-General on the Work of the Organization General.” Assembly Official Records Fifty-Fourth Session Supplement No. 1 (A/54/1). http://www.un.org/Docs/SG/Report99/intro99.htm.
Baker, J. L. 2000. Evaluating the Impact of Development Projects on Poverty: A Handbook for Practitioners. Washington, DC: World Bank. http://siteresources.worldbank.org/INTISPMA/Resources/Impact-Evaluation-Handbook--English-/impact1.pdf.
Benson, C., and J. Twigg. 2004. “Measuring Mitigation Methodologies for Assessing Natural Hazard Risks and the Net Benefits of Mitigation—A Scoping Study.” ProVention Consortium, Geneva.
Cairncross, S., and E. A. R. Ouano. 1991. Surface Water Drainage for Low-income Communities. Geneva: World Health Organization and United Nations Environment Programme. Cited in Parkinson 2003.
Easterly, W. 2002. “The Cartel of Good Intentions: The Problem of Bureaucracy in Foreign Aid Cartel of Good intentions.” Working Paper 4, Center for Global Development, Washington, DC. http://papers.ssrn.com/sol3/papers.cfm?abstract_id=999981.
Ganderton, P. 2005. “Benefit–Cost Analysis of Disaster Mitigation: Application as a Policy and Decision-Making Tool.” Mitigation and Adaptation Strategies for Global Change 10: 445–65.
Ghesquiere, F., and O. Mahul. 2007. “Sovereign Natural Disaster Insurance for Developing Countries: A Paradigm Shift in Catastrophe Risk Financing.” Policy Research Working Paper 4345. World Bank, Washington, DC.
Government of St. Lucia. 2006. “Landslide Response Plan.” http://web.stlucia.gov.lc/nemp/plans/LandslidePlan.pdf.
Holcombe, E. A., S. Smith, E. Wright, and M. G. Anderson. 2011. “An Integrated Approach for Evaluating the Effectiveness of Landslide Hazard Reduction in Vulnerable Communities in the Caribbean.” Natural Hazards. doi:10.1007/s11069-011-9920-7.
IPCC (Intergovernmental Panel on Climate Change). 2011. “Definition of Terms Used within the DDC Pages.” http://www.ipcc-data.org/ddc_definitions.html.
Lavergne, R. 2004. “Debrief—Tokyo Symposium on Capacity Development, February 4–6, 2004.” Presentation prepared for Canadian International Development Agency staff.
—. 2005. “Capacity Development under Program-Based Approaches: Results from the LENPA Forum of April 2005.”
3 8 4 C H A P T E R 9. P RO J E CT E VA L U AT I O N
Mahmoud, M., Y. Liu, H. Hartmann, S. Stewart, T. Wagener, D. Semmens, R. Stewart, H. Gupta, D. Dominguez, F. Dominguez, D. Hulse, R. Letcher, B. Rashleigh, C. Smith, R. Street, J. Ticehurs, M. Twery, H. van Delden, R. Waldick, D. White, and L. Winter. 2009. “A Formal Framework for Scenario Development in Support of Environmental Decision-Making.” Environmental Modelling and Software 24: 798–808.
McDavid, J. C., and L. R. L. Hawthorn. 2005. Program Evaluation Performance Measurement: An Introduction to Practice. Thousand Oaks, CA: Sage Publications.
Mechler, R. 2005. Cost-Benefit Analysis of Natural Disaster Risk Management in Developing Countries: Manual. Bonn: Deutsche Gesellschaft fuer Technische Zusammenarbeit (GTZ) GmbH.
Mechler, R., S. Hochrainer, G. Pflug, A. Lotsch, and K. Williges. 2010. “Assessing the Financial Vulnerability to Climate-Related Natural Hazards: Background Paper for the World Development Report 2010 ‘Development and Climate Change.’” Policy Research Working Paper 5232, World Bank, Washington, DC.
Mitchell, T., and M. van Aalst. 2008. “Convergence of Disaster Risk Reduction and Climate Change Adaptation: A Review Paper for DFID.” UK Department for International Development, London. http://www.preventionweb.net/files/7853_ConvergenceofDRRandCCA1.pdf.
Moench, M., R. Mechler, and S. Stapleton. 2007. “Guidance Note on the Costs and Benefits of Disaster Risk Reduction.” Prepared for UNISDR Global Platform on Disaster Risk Reduction High Level Dialogue, June 4–7.
Nutley, S., H. Davies, and I. Walter. 2002. “Evidence Based Policy and Practice: Cross Sector Lessons from the UK.” Working Paper 9, Economic and Social Research Council, UK Centre for Evidence Based Policy.
OAS (Organization of American States). 2003. “Safer and Environmentally Sustainable Low-Income Housing in the OECS through Property Insurance and Home Retrofit Programs.” World Bank Contract #7122427, OAS, Washington, DC.
OECD (Organisation for Economic Co-operation and Development). 2002. Glossary of Key Terms in Evaluation and Results Based Management. Paris: OECD.
Parkinson, J. 2003. “Drainage and Stormwater Management Strategies for Low-Income Urban Communities.” Environment and Urbanization 15: 115.
Parry, M., N. Arnell, P. Berry, D. Dodman, S. Fankhauser, C. Hope, S. Kovats, R. Nicholls, D. Satterthwaite, R. Tiffin, and T. Wheeler. 2009. Assessing the Costs of Adaptation to Climate Change: A Review of the UNFCCC and Other Recent Estimates. London: International Institute for Environment and Development and Grantham Institute for Climate Change.
Platteau, J.-P. 2004. “Monitoring Elite Capture in Community Driven Development.” Development and Change 35: 223–46.
Rayner, S., and E. L. Malone. 1997. “Zen and the Art of Climate Maintenance.” Nature 390: 332–34
Segone, M. 2008. “Evidence-Based Policy Making and the Role of Monitoring and Evaluation within the New Aid Environment.” In Bridging the Gap: The Role of Monitoring and Evaluation in Evidence-Based Policy Making, ed. M. Segone, 16–45. UNICEF. http://www.unicef.org/ceecis/evidence_based_policy_making.pdf.
Twigg, J. 2004. “Disaster Risk Reduction: Mitigation and Preparedness.” Development and Emergency Programming Good Practice Review 9.
UNFCCC (United Nations Framework Convention on Climate Change). 2007. “Investment and Financial Flows to Address Climate Change.” http://unfccc.int/resource/docs/publications/financial_flows.pdf.
—. 2009. “Adaptation to Climate Change: Linking Disaster Risk Reduction and Insurance.” Paper submitted to the UNFCCC for the 6th Session of the Ad Hoc Working Group on Long-Term Cooperative Action under the Convention, Bonn, June 1–12. http://unfccc.int/resource/docs/2009/smsn/ngo/163.pdf.
UN-Habitat. 2009. Planning Sustainable Cites: Global Report on Human Settlements 2009. http://www.unhabitat.org/documents/GRHS09/FS5.pdf.
Wamsler, C. 2006. “Mainstreaming Risk Reduction in Urban Planning and Housing: A Challenge for International Aid Organizations.” Disaster 30: 151–77.
World Bank. 2003. Strategic Communication for Development Projects: A Toolkit for Task Team Leaders. http://siteresources.worldbank.org/EXTDEVCOMMENG/Resources/toolkitwebjan2004.pdf.

CO M M U N I T Y- BA S E D L A N DS L I D E R I S K R E D U CT I O N 3 8 5
—. 2004. Making Services Work for Poor People. World Development Report. Washington, DC: World Bank.
—. 2007. Introduction to Development Evaluation. International Program for Development Evaluation Training. http://www.worldbank.org/oed/ipdet/modules/M_01-na.pdf.
—. 2010a. Natural Hazards Unnatural Disasters: The Economics of Effective Prevention. Washington, DC: World Bank.
—. 2010b. Safer Homes, Stronger Communities. A Handbook for Reconstructing after Natural Disasters. Washington, DC: World Bank.
Zwane, A. P., and M. Kremer. 2007. “What Works in Fighting Diarrheal Diseases in Developing Countries? A Critical Review.” World Bank Research Observer 22 (1): 1–24.

3 87
Glossary
Abney level. A low-cost instrument used in topographic surveying to measure slope angle in degrees and percentage of grade. The instru-ment consists of a fixed sighting tube, a mov-able spirit level connected to a pointing arm, and a protractor scale.
Acceptable risk. The level of risk loss a soci-ety or community considers acceptable given existing social, economic, political, cultural, technical, and environmental conditions.
Anisotropy. Variation of a physical property depending on the direction in which it is mea-sured.
As Low As Reasonably Practicable (ALARP). ALARP risks are those in which the cost of further risk reduction measures would be grossly disproportionate to the benefits they would deliver.
Baffle. An upstand in the drain intended to reduce flow velocity and water surface super-elevation on drain bends (likely overtopping).
Behavioral change. A change in attitudes and practices of individuals and groups (in the case of MoSSaiC, the desired behavioral change is the adoption of good slope management prac-tices and policies by communities and govern-ments alike).
Bill of quantities. Document containing an itemized breakdown of the works to be carried out in a unit price contract, indicating a quan-tity for each item and the corresponding unit price.
Building code. A set of standards that specify the minimum acceptable level of safety for buildings or structures.
Capacity building. A complex concept that conveys the process by which individuals, groups, and organizations build their knowl-edge, abilities, relationships, and values in order to solve problems and achieve develop-ment objectives. The impact of capacity build-ing may thus be seen at different scales—in individuals, households, communities, and governments.
Catchpit. A structure linking inflow and out-flow drains (similar to connection chambers).
Catalytic people. In the context of MoSSaiC, existing staff working in government or rele-vant local agencies who understand the MoSSaiC vision and show an aptitude and a willingness to participate in its delivery.
Certification. The achievement by an indi-vidual against a previously agreed schedule of performance, signed off on by government
3 8 8 G LOSS A RY
representatives. The term may be varied in dif-ferent countries for legal or other reasons.
Community. A group of households that iden-tify themselves in some way as having a com-mon interest or needs as well as physical space. A social group that resides in a specific locality.
Community engagement. Informing, collab-orating with, involving, consulting, and empowering community members.
Community meeting. Meeting of community residents to discuss any aspect relating to a project. Such meetings can be formal or infor-mal, depending on the nature of the commu-nity and what works best for the residents in terms of timing and venue.
Community contracting. Procurement by or on behalf of a community. While there are many different models of community con-tracting, a common feature is that they seek to give the community varying degrees of control over investment and implementation, which it is hoped will encourage ownership and sus-tainability.
Connection chamber. A reinforced concrete vault (with height, width, and depth of between 300–500 mm each) allowing inflow from one or more pipes carrying household gray water and roof water, and outflow via a single pipe to a nearby main drain or another connection chamber. The top of the chamber is usually flush with the ground surface and covered with a concrete slab that can be removed to allow access for maintenance and cleaning.
Consequences. The outcome of an event such as a landslide hazard occurring. Dependent on the exposure and vulnerability of the elements at risk (e.g., people, houses, infrastructure).
Convergence (of a slope). When viewed in plan, orthogonals to the ground contours con-verge in the downslope direction. This situa-tion is conducive to the concentration of sub-
surface and surface water, and thus to higher downslope pore water pressures.
Cost-benefit analysis. A systematic calcula-tion of project cost-effectiveness in terms of the balance between the net present value of project costs and project benefits (discounted over the project lifetime). Project costs and benefits must be “monetized” (assigned a mon-etary value) for inclusion in the calculation.
Direct shear test. A widely used method for determining the shear strength of soils (in terms of cohesion and angle of internal fric-tion), first used by Coulomb in 1776.
Disaster risk management. An understand-ing of what processes and factors contribute to risk, sufficient that management of the risks can be undertaken.
Divergence (of a slope). When viewed in plan, orthogonals to the ground contours diverge in the downslope direction. This situa-tion is conducive to the divergence of subsur-face and surface water, and thus to lower downslope pore water pressures.
Double-handling costs. Additional costs incurred when construction materials cannot be delivered directly to site due to limited access. The material is instead manually trans-ported between the point of delivery, an inter-mediate storage site, and the construction site.
Elements at risk. Such as people, communi-ties, agricultural areas, roads, facilities (e.g., hospitals, schools), utilities (e.g., water mains, power lines, power stations), economic/indus-trial infrastructure (factories, mines).
Erosion (soil). The gradual wearing away of soil by an agent such as water or wind, and its loss, particle by particle.
Evidence-based policy. A policy process that helps make better-informed decisions by put-ting the best available evidence at the center of the policy process.
CO M M U N I T Y- BA S E D L A N DS L I D E R I S K R E D U CT I O N 3 89
Exposure. The location of elements at risk with respect to a specific hazard.
Ex ante measures. Measures taken before a disaster in the expectation that they will either prevent, or significantly reduce the impact of, a possible disaster.
Ex post measures. Measures taken after a disaster has occurred to seek to make good all related damage caused by the disaster.
Factor of safety. The ratio of shear strength (acting so as to resist slope failure) of a soil to the shearing force (tending to induce slope fail-ure) experienced by slope material. A factor of safety < 1 indicates potential slope instability.
Focus group. A small number (typically around 10) of individuals who provide infor-mation during a directed and moderated inter-active group discussion. The purpose is to sub-ject ideas to review by the group in order to determine the viability of those ideas.
Geographic information system (GIS). Any system that captures, stores, analyzes, man-ages, and presents data that are linked to their geographical location.
Gray water. Gray water is all nonseptic waste from houses, typically including water from washing machines, showers, and kitchen sinks.
Hazard. A process that has the potential to cause damage (e.g., landslide).
Hazard map. A map showing areas affected by a particular hazard, such as landslides.
Herringbone drainage. A drainage pattern that is frequently used to drain hillsides, most commonly for cut-slopes in highways. It com-prises a central downslope drain with feeder intercept drains running to either side.
Heterogeneity. Exhibiting diverse (non-homogeneous) properties.
Hurricane strapping. Typically, galvanized strapping bars of various shapes to affix roof timbers to wall plates to ensure the stability of the entire roof structure during high winds.
Intercept drain. A drain running almost par-allel to slope contours (but with a slight down-slope gradient) to capture water flowing down the slope.
Key performance indicators (KPIs). Quan-titative and qualitative measures of project outputs and outcomes used to evaluate the progress of success of the project.
Landowners. Those who “own” the land upon which MoSSaiC project construction takes place. Note that landownership may be difficult to establish, landowners may not reside within country, and landownership may be disputed—refer to any relevant safeguards.
Landslide hazard. The probability of occur-rence of a landslide of a specific type and mag-nitude in a particular location.
Landslide risk. A function of landslide haz-ard, exposure, and vulnerability—communi-ties with relatively high landslide risk will be those where high landslide hazard coincides with high-level exposure (e.g., dense housing) and high socioeconomic vulnerability.
Landslide susceptibility. The propensity of an area to experience landslides—the inherent instability of a slope.
Low-cost drain. Non–concrete block drains constructed using polythene and galvanized mesh for lining an excavated drain trench. Espe-cially useful for small drains conveying low-vol-ume or low-velocity flows, and where the deliv-ery of cement and blocks may be difficult.
MoSSaiC core unit (MCU). The main man-agement coordinating body for MoSSaiC interventions, comprising within-country “catalytic” individuals from different govern-ment ministries, agencies, and related bodies.

39 0 G LOSS A RY
Mitigation. The lessening of the adverse impact of hazards or disasters.
Point sources. Sources of water that have a specific point of discharge onto a hillslope, such as gray water discharge from a house or an unlined drain.
Preparatory factors. Factors that can have a potential role in slope instability.
Project outcomes. Medium-term, post-implementation results of a project.
Project outputs. Results of a project that are measurable at the immediate point of project completion.
Project step template. The document that sets out the initial project steps for a MoSSaiC inter-vention and which the MCU has the responsi-bility of refining to suit local conditions.
Rainfall threshold. A threshold measure of rain-fall (typically duration and depth or intensity) that, if exceeded, has been shown empirically to be associated with the occurrence of landslides.
Rational method. A widely used equation to estimate water discharge, being a product of rainfall intensity, hillslope contributing area, and a runoff coefficient.
Recurrence interval. Time between hazard events of similar size in a given location based on the probability that the event will be equaled or exceeded in a given period (typi-cally a year). Thus a 30-year event is one that is likely to occur once every 30 years.
Reporting lines. The way people participat-ing in a project are organized. Individuals responsible for a specific aspect of project delivery should be assigned to a supervisor or line manager to ensure that they are fully sup-ported (technically and operationally) and accountable in their role. Clear reporting lines are particularly important for community-based projects. Community residents will
interact with different government team members over the course of a MoSSaiC project and should be able to identify “who is respon-sible for whom about what.”
Resilience. The ability of a community or society potentially exposed to hazards to resist, absorb, adapt to, and recover from the stresses of the hazard event. Often referred to as the converse of vulnerability.
Resistance envelope. A means of assessing the threshold soil water conditions for stabil-ity, typically used to determine whether the maintenance of negative pore pressures is required for a slope to remain stable. This technique also enables the likely slope failure depth to be identified.
Resolution. The accuracy at which a given map scale can depict the location and shape of map features; the larger the map scale, the higher the possible resolution. As map scale decreases, res-olution diminishes and feature boundaries must be smoothed, simplified, or not shown at all. It is the size of the smallest feature that can be repre-sented in a surface. For example, small areas may have to be represented as points.
Retrofitting. Reinforcement or upgrading of existing structures to make them more resis-tant and resilient to hazards.
Risk. With respect to disasters, a function of the hazard, exposure, and vulnerability. A measure of the likelihood of damage.
Risk analysis. The process of hazard, expo-sure, and vulnerability identification and risk estimation. This may be qualitative—landslide probability, exposure, and vulnerability of exposed elements expressed in relative terms; semi-quantitative—indicative probability or relative vulnerability; or quantitative—numer-ical probability and loss measures.
Risk drivers. Factors that serve to promote a potential increase in the level of risk (e.g., rain-fall, discharge of water onto hillslopes).
CO M M U N I T Y- BA S E D L A N DS L I D E R I S K R E D U CT I O N 39 1
Scale (of maps and plans). The scale of a map or plan is defined as the ratio of a distance on the map to the corresponding distance on the ground. Scales are often qualified as small scale, typically for large regional maps, or large scale, typically for county maps or town plans.
Safeguards. Requirements, protocols, guid-ance notes, etc., from funding agencies, gov-ernments, and other such bodies that define ways of working that the MCU, and all con-cerned with a MoSSaiC intervention, should both take note of and adhere to wherever they are deemed or shown to be relevant.
Shear strength. The resistance to deforma-tion by continuous shear displacement of soil particles along a surface of rupture.
Show home. A home within a community in which drainage provision is configured to pro-vide an example of good practice to the rest of the community.
Squatter housing. Housing occupying land illegally.
Stakeholders. Groups who have any direct or indirect interest in the MoSSaiC intervention, or who can affect or be affected by the imple-mentation and outcomes, including such groups as those undertaking, managing, reporting on, affected by, promoting, and fund-ing the interventions.
Strategic incrementalism. An approach to changing practice and policy that is incremental.
Tolerable risk. A risk that society is willing to live with so as to secure certain benefits in the confidence that it is being properly controlled, kept under review, and further reduced as and when possible.
Triggering event. A natural (e.g., rainfall, seismic, volcanic) or human-induced (e.g. slope loading, slope cutting) event that results in the occurrence of a landslide.
Unacceptable risk. The level of risk that soci-ety is not prepared to accept.
Unauthorized housing. Housing not in com-pliance with current regulations concerning landownership, land-use and planning zones, or construction.
Vulnerability. The potential degree of dam-age or loss experienced by the exposed ele-ments for a given landslide event, usually expressed on a scale of 0–1 (no damage to total loss). With respect to urban landslides, dam-age can be thought of as direct or indirect, physical (loss of life, homes, or property), or socioeconomic (loss of livelihoods, loss of assets).
Vulnerable community. With respect to MoSSaiC, a community that can be considered likely to be significantly physically and socio-economically damaged by a landslide. It will have low resilience to such an event and will find it difficult to recover. Poverty may be used as an indicator of vulnerability and resilience. Different countries will be expected to apply different measures to assess vulnerability to identify and prioritize communities for MoSSaiC projects.
Weathering. The physical and chemical alter-ation of minerals into other minerals by the action of heat, water, and air.
Weathering grades. A scale describing the level of weathering of a rock mass, typically divided into six classes (fresh rock being grade I; fully weathered soil being grade VI).
Work package. The complete specification of works to be completed by a contractor. This should specify the detailed nature of the works to be undertaken with clear indication of extent marked on the ground on site, as well as on the drainage plan. Design drawings and similar specifications should be included as part of the package.

393
Index
Figures and tables are indicated by f and t, fol-lowing the page numbers.
AAbney level, 103, 104f, 387“acceptable risk,” 13–14, 15f, 387accumulation of risk, 10Active Learning Network for Accountability and
Performance in Humanitarian Action, 170
adapting the MoSSaiC blueprint to existing capacity
behavioral change, 309, 311 community-based mapping, 170, 171 drainage design, 216–17 implementation of planned works, 266, 267 landslide hazards, 85, 86 prioritizing of communities at risk, 132, 133 project evaluation, 350, 351 project inception, 58–60advocacy task team, 69–71, 71fAlwi, S., 260 Anderson, M. G., 114angle of internal friction, 99-100, 105, 117, 120-23,
195t. See also shear strengthanisotropy, 199, 387anthropogenic contributors to landslide risk,
27–28, 28f, 168Ardizzone, F., 97Arias, A., 90, 91tArnstein, S. R., 172As Low As Reasonably Practicable (ALARP), 14,
387
Bbaffles, 255, 255–59f, 387Barker, D. H., 294base map, 140, 159-60, 160f, 169, 178. See also
community-based mappingbehavioral change, xxviii, 305–43
adapting the MoSSaiC blueprint to existing capacity, 309, 311
adoption of change, 309–15, 311t behavioral change process, 309–11, 312f combining knowledge and action, 314–25 learning by doing, 315, 316t stakeholder perceptions, 312–14 vulnerability and risk perception, 313 briefing note, 306–7 building local capacity, 307, 329–34, 330t communities, 332–33, 333f examples by learning mode, 330t individual expertise and skills, 330–31,
331f politicians, 331–32, 332f teams, 331, 332f user groups, 333–34, 334f communication forms and project messages,
317–29. See also communication communication strategy, 306–7, 315–17, 316t community-based aspects, 306 defined, 387 finalizing integrated strategy, 334–39 adoption of good drain maintenance
practices, 334–35 assignment of maintenance responsibility,
335–36, 336f integration of strategy, 338–39, 339t structural inspections and community
clean-up days, 336–37, 337f guiding principles, 307–8 high staff turnover, 308–9 key elements, 305–6 project inception creating platform for, 58 risks and challenges, 308–9 who does what, 340benefit-cost ratio 18f, 19f 27f, 353, 382f. See also
cost-benefit analysisbill of quantities, 268–69, 269–70f, 269t, 387bioengineering 292-294, 295t, 296fBinswanger-Mkhize, H. P., 42

39 4 I N D E X
Bishop, A. W., 101, 114, 116Bishop method, 100Bishop stability equation, 120black water. See septic wasteBlake, J. R., 122Brooks, S. M., 114Buchanan, J. M., 61budget constraints, 7building code, 227, 323, 370, 387
CCampbell, S., 294capacity building. See also adapting the MoSSaiC
blueprint to existing capacity defined, 387 government capacity, 34 local capacity, 309, 329–34Caracas, República Bolivariana de Venezuela,
unauthorized housing in, 25Caribbean. See Latin America and the CaribbeanCaribbean Catastrophe Risk Insurance Facility, 19catalytic people, xxv, 4, 43, 387catchpits, 255, 255–59f, 387categories of disasters, 9, 9tcertification process for MoSSaiC, 341–42, 387CHASM (Combined Hydrology and Slope
Stability Model), 113–15, 114–16f, 120, 121t, 134, 194, 196, 201, 201f
Chowdhury, F., 146clean-up days, 336–37, 337fclimate change, 23climate proofing, 370, 371t, 373cohesion, 99-100, 105, 117, 120-23, 195t. See also
shear strengthcommunication briefing key leaders about MoSSaiC, 47 clear project messages for stakeholders, 308 community demonstration sites and show
homes, 321–23, 322f, 322t, 391 community involvement methods, 174–75 defining communication purposes and
functions, 317 delivering project messages, 322–24, 325f direct communications, 320–21, 320t examples of communication mode, channel,
and purpose, 318t finalizing project messages, 329 focus groups, 177, 177f, 389 forms and project messages, 317–29 in government-community partnerships, 34 identifying audiences, 317, 318t, 319t meetings. See community meetings MoSSaiC information materials, 323 relevance, 308 scientific and professional publications, 328–
29 timing of media reports, 308 TV, radio, and newspaper coverage, 324–28,
327–28t, 327f written and visual materials for communities,
323–24, 324t, 326fcommunications task team, 69, 70fcommunities at risk, prioritizing of, 2, 3f, 129–63
adapting the MoSSaiC blueprint to existing capacity, 132, 133
base map preparation for detailed community mapping, 159–60, 160f
briefing note, 130–31 combining hazard and vulnerability
information, 157 community-based aspects, 130 confirming selection, 156–58, 157t guiding principles, 131 interpreting landslide hazard maps, 132 key elements, 129–30 landslide susceptibility and hazard
assessment methods, 140–51, 142t deterministic methods, 150–51 field reconnaissance and hazard ranking
methods, 141–46, 143f, 144–45t GIS-based qualitative landslide
susceptibility mapping, 146–49, 155–56
probabilistic approaches, 149 semi-quantitative and quantitative, 149–51 statistical methods, 149–50 psychological barriers of, 6–7 risks and challenges, 131–32 selection process, xxvi, xxix, 44–45, 132–40,
135t bivariate and multivariate statistical
approaches, 134 choice of risk comparison approach, 135–
36 comparison of risk at multiple locations,
134–36 data and analysis methods for, 137–38, 138t deterministic spatially distributed
modeling, 134 digital data and GIS analysis, 132, 134 field reconnaissance and risk ranking, 134 heuristic methods, 134 MCU agreement to, 138–39 methods for, 136–39, 137f probabilistic methods, 134 short-term planning of, 7 situational barriers of, 6–7 size of cities and, xxiii vulnerability assessment, 151–56, 152t defined, 12 exposure, 151 field reconnaissance and vulnerability
ranking methods, 153–54, 154–55t
GIS-based mapping for, 155–56 who does what, 161community-based approach, 3, 4f, 26t, 29–34. See
also community engagement; specific topics
behavioral change, 306 communities at risk, prioritizing of, 130 community-based mapping, 166, 169–70 coping mechanisms, 30, 31t definition of community, xxiii, 388 drainage design and good practice, 214 government-community partnerships, 34
CO M M U N I T Y- BA S E D L A N DS L I D E R I S K R E D U CT I O N 39 5
implementation of planned works, 262 landslides as community issue, 4, 23 mapping. See community-based mapping MoSSaiC’s approach to, 5–6, 32–33 teams. See community task teamscommunity-based mapping, xxvi–xxvii, 165–210,
204f adapting the MoSSaiC blueprint to existing
capacity, 170, 171 base map preparation for detailed mapping,
159–60 briefing note, 167–68 community-based aspects, 166, 169–70. See
also community engagement community knowledge and gaining
acceptance, 176–78 connecting with key community members,
169, 175 defined, 167 guiding principles, 168–69 identification of landslide hazard zones, 189–
91, 192f, 193t information to be included, 168 key elements, 165–66 physically based landslide hazard assessment,
191–93, 194t, 202t pore water pressure, 88, 99-101, 105-108, 114-
20, 198 purpose of, 167, 168 qualitative landslide hazard assessment, 188–
91, 190f repeating survey, 188 risks and challenges, 169–70 scientifically based justification, 189 slope features, 178–88, 187f accuracy of map, 187–88 alterations to natural drainage, 181–82, 182f evidence of slope movement, 185–87, 186f hillside scale, 178–82, 179f, 183t household drainage, 184–85, 184–85f household-scale contributors, 182–85,
185t, 187f local knowledge of past landslides, 185 local slope geometry and material, 183–84,
183f seepage zones, 181, 181f slope angle. See slope angle slope stability issues, 185–87, 187t slope stability models, 194–98, 195–98f,
195t. See also CHASM (Combined Hydrology and Slope Stability Model)
topography and natural drainage, 169, 179, 179–80f
timing of visits and meetings with residents, 169, 188
topographic features to be identified at necessary resolution, 169
zones for drainage interventions, 203community clean-up days, 336–37, 337fcommunity contracting, 264–65, 264f, 265t, 388community engagement benefits of, xxi–xxii, 2, 4, 4f, 32–34, 33t
collaborative approaches, 170, 172 community-based mapping requiring, 166,
169–70 defined, 388 how to work within a community, 170–78 avoiding bias and considering interests of
all groups, 175–76 community leaders’ involvement, 47, 175 culture and diversity, 172–73 formal meetings, 177–78, 178f gender relations, 173–74, 173f, 174t house-by-house discussions, 176–77, 177f informal focus groups, 177, 177f interactive process, 176 listening to residents, 175 practices and communication methods,
174–75 types of participation, 170, 172, 172t instrumental approaches, 170 mapping. See community-based mapping practices, 174–76 principles, 170–74 selection of community. See communities at
risk, prioritizing of stakeholders, 44, 44t supportive approaches, 172community leaders’ involvement, 47, 175community liaison task team, 67, 68f, 140, 174community meetings, 177–78, 178f, 388community task teams, xxx–xxxi, 5t, 43, 71–74, 75fconcave downslope profile, 179, 180fconcrete drains. See drainage design and good
practiceconnection chambers, 248, 249f, 284, 285f, 388consequences, 388. See also cost-benefit analysis;
fatalities and losses damages exceeding 1 percent of GDP, 41f outputs and outcomes as evidence of
effectiveness, 34, 35t, 390 unintended, 335, 335fconstruction task team, 73, 73–74fcontracts, tendering process, 276–77convergence zones, 179–80, 180f, 388Coppin, N. J., 294corruption, 300–301cost-benefit analysis, 18–19, 18–19f, 365–67, 381–83,
382f, 388Craig, R. F., 122Crozier, M. J., 21Cruden, D. M., 91Cuba’s National Landslide Risk Assessment
Project, 148–49, 149fcultural differences, 172–73
Ddebris traps, 235–36, 235f, 335 clearing, 336–37, 337–38f construction, 298–99, 298–300fdemonstration sites and show homes, 321–23,
322f, 322t, 391Department for International Development (UK),
128de Regt, J. P., 42
39 6 I N D E X
desk studies, 194Dietrich, W. E., 150disaster risk, 7–25 “acceptable risk,” 13–14, 15f categories of disasters, 9, 9t definition of risk, 11–14 future scenarios 374, 376-78, 377f increases in costs of, 8, 8–9f increases in number of, 7–8, 8f insurance, 19–20, 19f landslide risk, 9–10. See also landslide hazards management. See disaster risk management
(DRM) records of disasters, 9disaster risk management (DRM), 11–14, 14f assessment, 12. See also science-based approach benefits of, xxi, 2, 18 catastrophe risk models, 18 definition of, 11–12, 388 disaster risk insurance, 19–20, 19f evidence of project’s effectiveness. See
evidence base of effectiveness exposure, defined, 12 hazard, defined, 11–12 influences on, 14–23 international advocacy groups, 15f national and local studies, 21 social funds, 21–23, 22f UN disaster response organizational
framework, 16f process and steps involved, 12–13, 13t recent influences on, 14–23 reduction (DRR), 13, 307. See also disaster risk
mitigation top-down evaluation, 349–50 science-based approach. See science-based
approach shift from ex post to ex ante policies, 14–17 vulnerability, defined, 12disaster risk mitigation benefits of, 2, 3f, 18–19, 18–19f definition of mitigation, 390 need for evidence of benefits of, 17–19. See also
evidence base of effectiveness psychological barriers to, 6–7 scope of, 13 situational barriers to, 6–7divergence of a slope, 388. See also slope angleDominica, impacts of community-based risk
reduction program in, 34, 35tdouble-handling costs, 226, 271, 274, 275, 388double or triple wedge analysis, 100downslope concave downslope profile, 179, 180f drains, 232, 232fdrainage design and good practice, xxvii, 213–59 adapting the MoSSaiC blueprint to existing
capacity, 216–17 alignment of drains, 217–29, 219f calculation of drain flow and dimensions,
222, 223f, 224t complex topography and difficult access,
220, 221f
currently active landslide sites, 221–22, 222f
currently inactive landslide sites, 220–21, 222f
estimation of house discharge, 226–29 estimation of main drain dimensions, 227 estimation of surface water discharge,
223–26, 225t idealized alignment, 219–20, 220f impact of household water, 229, 230f intercept drain effectiveness, 227–29,
228–29f linear drain alignment and easy access,
220, 220f patterns and principles, 218–22 alterations to natural drainage, 181–82, 182f assignment of maintenance responsibility,
335–36, 336f briefing note, 214–15 capacity, 218 channel slope, 218 community-based aspects, 214 community slope feature map as part of, 167 connectivity, 218 drain specifications, 236–42, 240–42f, 243t drain performance, 362, 362f drain types, 229–36, 231f downslope drains, 232, 232f footpath drains, 232–33, 233f incomplete existing drains, 233–34, 234f incorporating debris traps, 235–36, 235f intercept drains, 227–29, 228–29f, 231–32,
231f, 389 placement above landslides to stabilize
slope, 234, 235f easy drain maintenance, 215–16, 334–35 effectiveness of drains, xxv gray water management, 216, 246–47, 246f.
See also gray water management guiding principles, 215 household water capture, 218, 242–50, 282–84 connection to drainage network, 247–48,
247–49f hurricane strapping, 249, 250f, 389 rainwater harvesting, 244–47, 245–46f roof guttering, 242, 244, 244f, 282, 283f importance of good design, 215 key elements, 213–14 local designs for concrete drains, catchpits,
and baffles, 255, 255–59f locations chosen to reduce landslide hazard, 216 low-cost drains, 298–301, 389 proposed drainage plan, 236, 237f, 238t reinforced concrete block drains, 238–39, 239f risks and challenges, 215–16 signing off on final drainage plan, 250-51 community agreement, 251, 252–53f formal approval, 253 slope stability and, 107–8 who does what, 254 zones for interventions, 203–7 assigning intervention to each zone, 203,
205
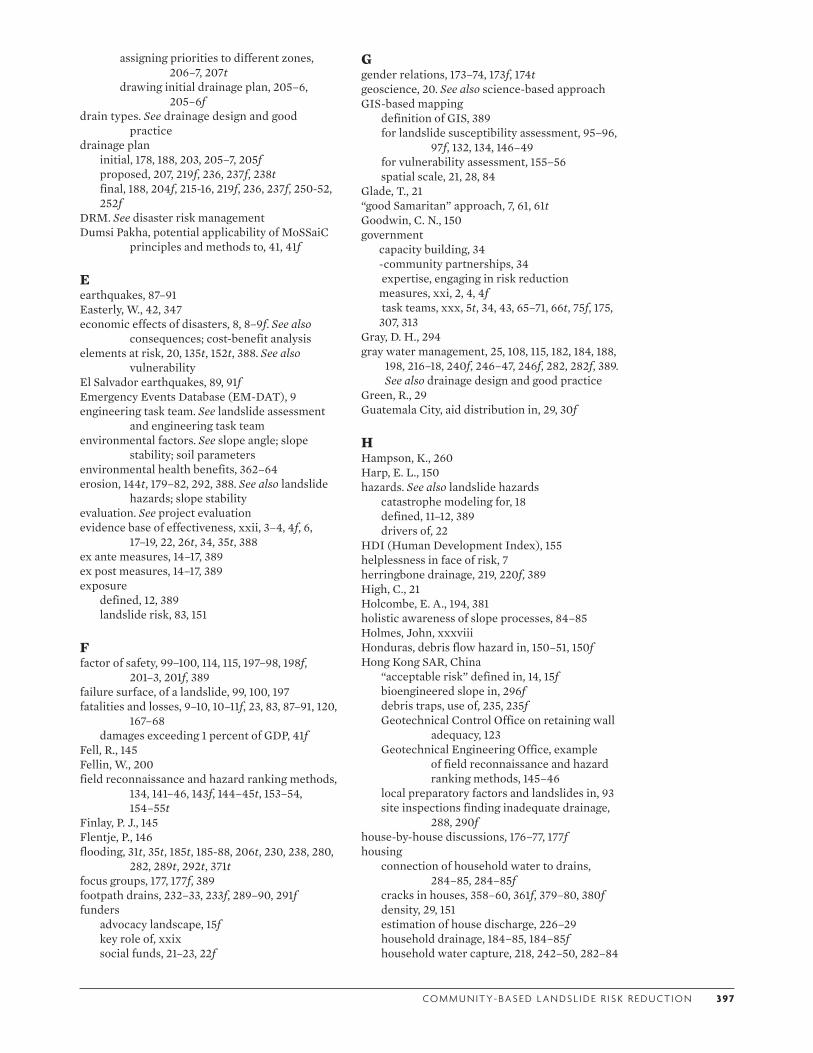
CO M M U N I T Y- BA S E D L A N DS L I D E R I S K R E D U CT I O N 39 7
assigning priorities to different zones, 206–7, 207t
drawing initial drainage plan, 205–6, 205–6f
drain types. See drainage design and good practice
drainage plan initial, 178, 188, 203, 205–7, 205f
proposed, 207, 219f, 236, 237f, 238tfinal, 188, 204f, 215-16, 219f, 236, 237f, 250-52, 252f
DRM. See disaster risk managementDumsi Pakha, potential applicability of MoSSaiC
principles and methods to, 41, 41f
Eearthquakes, 87–91Easterly, W., 42, 347economic effects of disasters, 8, 8–9f. See also
consequences; cost-benefit analysiselements at risk, 20, 135t, 152t, 388. See also
vulnerabilityEl Salvador earthquakes, 89, 91fEmergency Events Database (EM-DAT), 9engineering task team. See landslide assessment
and engineering task teamenvironmental factors. See slope angle; slope
stability; soil parametersenvironmental health benefits, 362–64erosion, 144t, 179–82, 292, 388. See also landslide
hazards; slope stabilityevaluation. See project evaluationevidence base of effectiveness, xxii, 3–4, 4f, 6,
17–19, 22, 26t, 34, 35t, 388ex ante measures, 14–17, 389ex post measures, 14–17, 389exposure defined, 12, 389 landslide risk, 83, 151
Ffactor of safety, 99–100, 114, 115, 197–98, 198f,
201–3, 201f, 389failure surface, of a landslide, 99, 100, 197fatalities and losses, 9–10, 10–11f, 23, 83, 87–91, 120,
167–68 damages exceeding 1 percent of GDP, 41fFell, R., 145Fellin, W., 200field reconnaissance and hazard ranking methods,
134, 141–46, 143f, 144–45t, 153–54, 154–55t
Finlay, P. J., 145Flentje, P., 146flooding, 31t, 35t, 185t, 185-88, 206t, 230, 238, 280,
282, 289t, 292t, 371tfocus groups, 177, 177f, 389footpath drains, 232–33, 233f, 289–90, 291ffunders advocacy landscape, 15f key role of, xxix social funds, 21–23, 22f
Ggender relations, 173–74, 173f, 174tgeoscience, 20. See also science-based approachGIS-based mapping definition of GIS, 389 for landslide susceptibility assessment, 95–96,
97f, 132, 134, 146–49 for vulnerability assessment, 155–56
spatial scale, 21, 28, 84 Glade, T., 21“good Samaritan” approach, 7, 61, 61tGoodwin, C. N., 150government capacity building, 34 -community partnerships, 34 expertise, engaging in risk reduction
measures, xxi, 2, 4, 4f task teams, xxx, 5t, 34, 43, 65–71, 66t, 75f, 175,
307, 313Gray, D. H., 294gray water management, 25, 108, 115, 182, 184, 188,
198, 216–18, 240f, 246–47, 246f, 282, 282f, 389. See also drainage design and good practice
Green, R., 29Guatemala City, aid distribution in, 29, 30f
HHampson, K., 260Harp, E. L., 150hazards. See also landslide hazards catastrophe modeling for, 18 defined, 11–12, 389 drivers of, 22HDI (Human Development Index), 155helplessness in face of risk, 7herringbone drainage, 219, 220f, 389High, C., 21Holcombe, E. A., 194, 381holistic awareness of slope processes, 84–85Holmes, John, xxxviiiHonduras, debris flow hazard in, 150–51, 150fHong Kong SAR, China “acceptable risk” defined in, 14, 15f bioengineered slope in, 296f debris traps, use of, 235, 235f Geotechnical Control Office on retaining wall
adequacy, 123 Geotechnical Engineering Office, example
of field reconnaissance and hazard ranking methods, 145–46
local preparatory factors and landslides in, 93 site inspections finding inadequate drainage,
288, 290fhouse-by-house discussions, 176–77, 177fhousing connection of household water to drains,
284–85, 284–85f cracks in houses, 358–60, 361f, 379–80, 380f density, 29, 151 estimation of house discharge, 226–29 household drainage, 184–85, 184–85f household water capture, 218, 242–50, 282–84
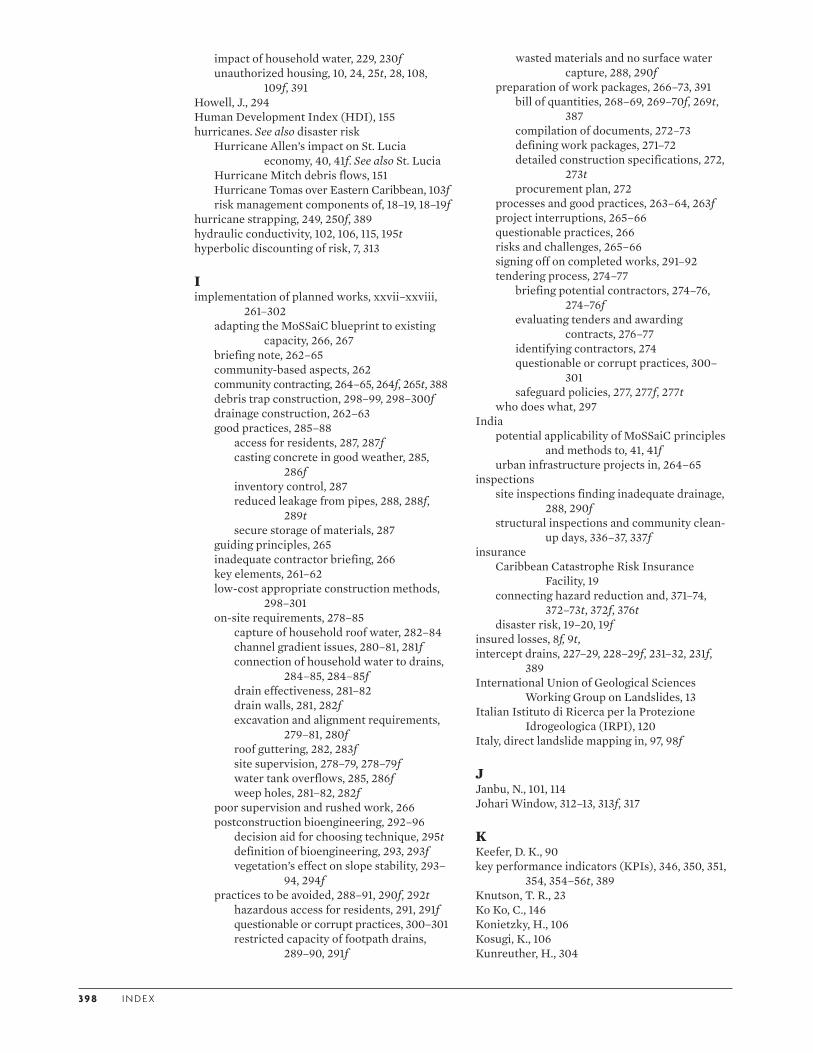
39 8 I N D E X
impact of household water, 229, 230f unauthorized housing, 10, 24, 25t, 28, 108,
109f, 391Howell, J., 294Human Development Index (HDI), 155hurricanes. See also disaster risk Hurricane Allen’s impact on St. Lucia
economy, 40, 41f. See also St. Lucia Hurricane Mitch debris flows, 151 Hurricane Tomas over Eastern Caribbean, 103f risk management components of, 18–19, 18–19fhurricane strapping, 249, 250f, 389hydraulic conductivity, 102, 106, 115, 195thyperbolic discounting of risk, 7, 313
Iimplementation of planned works, xxvii–xxviii,
261–302 adapting the MoSSaiC blueprint to existing
capacity, 266, 267 briefing note, 262–65 community-based aspects, 262 community contracting, 264–65, 264f, 265t, 388 debris trap construction, 298–99, 298–300f drainage construction, 262–63 good practices, 285–88 access for residents, 287, 287f casting concrete in good weather, 285,
286f inventory control, 287 reduced leakage from pipes, 288, 288f,
289t secure storage of materials, 287 guiding principles, 265 inadequate contractor briefing, 266 key elements, 261–62 low-cost appropriate construction methods,
298–301 on-site requirements, 278–85 capture of household roof water, 282–84 channel gradient issues, 280–81, 281f connection of household water to drains,
284–85, 284–85f drain effectiveness, 281–82 drain walls, 281, 282f excavation and alignment requirements,
279–81, 280f roof guttering, 282, 283f site supervision, 278–79, 278–79f water tank overflows, 285, 286f weep holes, 281–82, 282f poor supervision and rushed work, 266 postconstruction bioengineering, 292–96 decision aid for choosing technique, 295t definition of bioengineering, 293, 293f vegetation’s effect on slope stability, 293–
94, 294f practices to be avoided, 288–91, 290f, 292t hazardous access for residents, 291, 291f questionable or corrupt practices, 300–301 restricted capacity of footpath drains,
289–90, 291f
wasted materials and no surface water capture, 288, 290f
preparation of work packages, 266–73, 391 bill of quantities, 268–69, 269–70f, 269t,
387 compilation of documents, 272–73 defining work packages, 271–72 detailed construction specifications, 272,
273t procurement plan, 272 processes and good practices, 263–64, 263f project interruptions, 265–66 questionable practices, 266 risks and challenges, 265–66 signing off on completed works, 291–92 tendering process, 274–77 briefing potential contractors, 274–76,
274–76f evaluating tenders and awarding
contracts, 276–77 identifying contractors, 274 questionable or corrupt practices, 300–
301 safeguard policies, 277, 277f, 277t who does what, 297India potential applicability of MoSSaiC principles
and methods to, 41, 41f urban infrastructure projects in, 264–65inspections site inspections finding inadequate drainage,
288, 290f structural inspections and community clean-
up days, 336–37, 337finsurance Caribbean Catastrophe Risk Insurance
Facility, 19 connecting hazard reduction and, 371–74,
372–73t, 372f, 376t disaster risk, 19–20, 19finsured losses, 8f, 9t, intercept drains, 227–29, 228–29f, 231–32, 231f,
389International Union of Geological Sciences
Working Group on Landslides, 13Italian Istituto di Ricerca per la Protezione
Idrogeologica (IRPI), 120Italy, direct landslide mapping in, 97, 98f
JJanbu, N., 101, 114Johari Window, 312–13, 313f, 317
KKeefer, D. K., 90key performance indicators (KPIs), 346, 350, 351,
354, 354–56t, 389Knutson, T. R., 23Ko Ko, C., 146Konietzky, H., 106Kosugi, K., 106Kunreuther, H., 304

CO M M U N I T Y- BA S E D L A N DS L I D E R I S K R E D U CT I O N 39 9
Llaboratory and field measurements, 194land-locked developing countries, 40landowners, 73–74, 389landslide assessment and engineering task team,
68, 68f, 140, 201–2, 202f, 203, 291landslide hazards, xxv–xxvi, 81–127, 141 accumulation of risk, 10 adapting the MoSSaiC blueprint to existing
capacity, 85, 86t aggravating factors, 93, 94t assessment of, xxvi community-based mapping for. See
community-based mapping scientific methods for, 112–18 briefing note, 82–83 community-based aspects, 82 as community issue, 4. See also communities
at risk, prioritizing of; community-based approach
as component of landslide risk, 83 construction on former landslide zones, 111,
113f coupled dynamic hydrology and slope
stability models, 113–15 dynamic hydrology component, 114 interpreting simulation results, 115 model configuration, 114 slope stability component, 114 defined, 389 direct landslide mapping, 97–98 empirical rainfall threshold modeling, 98–99,
99f fatalities and losses associated with, 9–10,
10–11f, 23, 83, 87–91, 120, 167–68 geometry and features of landslides, 87, 88f GIS-based susceptibility mapping, 95–96, 97f,
132, 134 guiding principles, 83–84 holistic awareness of slope processes, 84–85 identifying, xxvi, 10–11, 84–85 instability and. See slope stability key elements, 81–82 lack of awareness of risk, 7 as management issue, 4 mapping of. See community-based mapping;
mapping physically based slope stability modeling,
99–101 preparatory factors and triggering
mechanisms, 87–91, 93, 94t, 102f, 390
probability, 95 rainfall and earthquakes, 87–91 reduction practices, 367–69 regional policies and, 84 risks and challenges, 84–85 science-based approach, 20, 83, 84t, 112–18. See
also CHASM (Combined Hydrology and Slope Stability Model)
resistance envelope method for determining suction control, 116–17, 117f
small retaining walls, inadequacy of, 117–18, 118f, 122–23, 122f
seismic events, 89–91, 91f slope movement and landslide material, 85–87 slope stability and. See slope stability susceptibility, 95, 96t, 140, 141 types of landslides, 85–92. See also rotational
slides; translational slides understanding landslide processes, 82–83 who does what, 119landslide risk drivers definition of landslide risk, 389 Eastern Caribbean, 35–36, 40f longer term, 370–78 MoSSaiC targeting, 23–25, 40f physical, 22, 26-27 science-based approach, 28 urbanization, 2, 10, 23-25, 89, 108, 374 vulnerability and, 22Latin America and the Caribbean. See also specific
countries Caribbean Catastrophe Risk Insurance
Facility, 19 Caribbean regions vulnerable to natural
disasters, 36, 41f Eastern Caribbean typical communities and
risk drivers, 35–36, 40f housing density in, 29 La Red studies of disasters, 9 MoSSaiC development in, 10–11 pilots, 35–41, 40t rainfall-triggered landslide risk in, 9learning by doing, xxiii, 169, 307, 314-17, 319, 329,
330t, 339tlessons learned in disaster risk management, xxv failure to apply from past disasters, 7 from World Bank natural disaster projects,
17–18, 17tlimit equilibrium method, 99-101loading and slope stability, 111–12, 112flogframe format, 45, 47tLondell, M. K., 61low-cost drains, 298–301, 389Lundgren, R. E., 323
Mmacrofinancing disasters, 374, 376fMahmoud, M., 377Malone, E. L., 30management issue, landslide hazards as, 4. See
also government expertise, engaging in risk reduction measures
mapping community-based. See community-based
mapping direct landslide mapping, 97–98 GIS-based landslide susceptibility mapping,
95–96, 97f, 132, 134, 146–49 landslide hazard map, 147, 389 national risk maps, 21 resolution of maps, 21, 67, 132, 149, 169, 390 task team, 67, 67f, 140, 159, 178
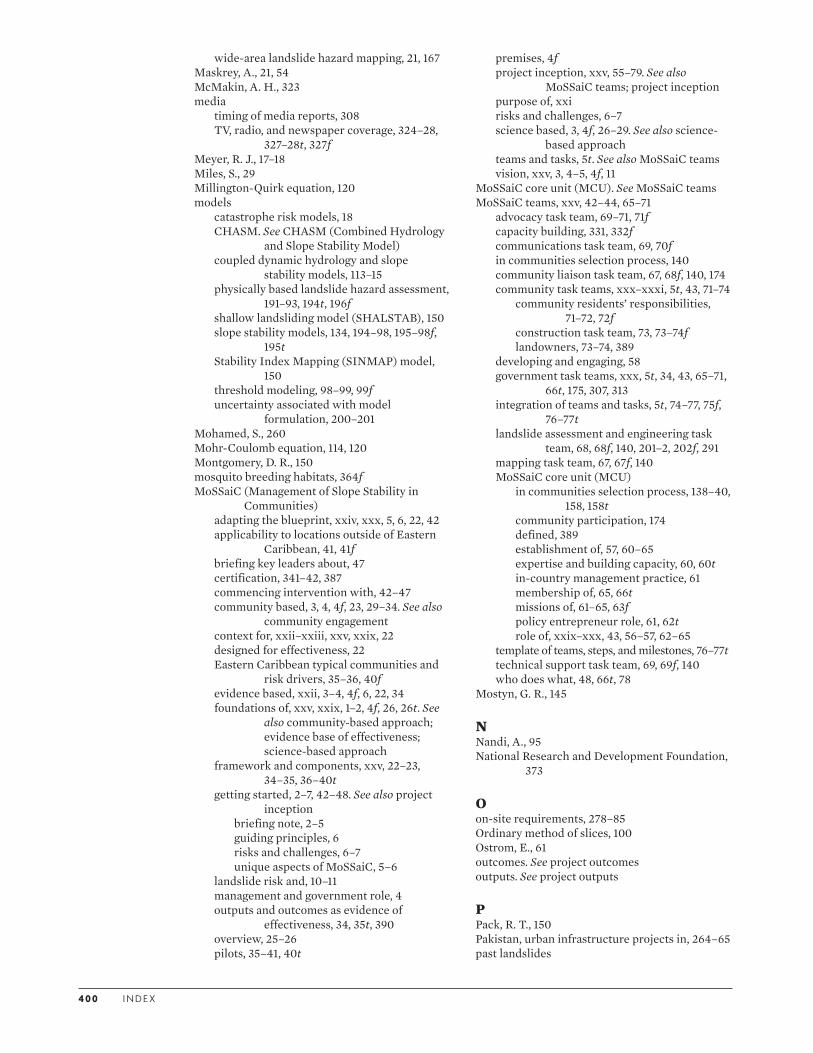
4 0 0 I N D E X
wide-area landslide hazard mapping, 21, 167Maskrey, A., 21, 54McMakin, A. H., 323media timing of media reports, 308 TV, radio, and newspaper coverage, 324–28,
327–28t, 327fMeyer, R. J., 17–18Miles, S., 29Millington-Quirk equation, 120models catastrophe risk models, 18 CHASM. See CHASM (Combined Hydrology
and Slope Stability Model) coupled dynamic hydrology and slope
stability models, 113–15 physically based landslide hazard assessment,
191–93, 194t, 196f shallow landsliding model (SHALSTAB), 150 slope stability models, 134, 194–98, 195–98f,
195t Stability Index Mapping (SINMAP) model,
150 threshold modeling, 98–99, 99f uncertainty associated with model
formulation, 200–201Mohamed, S., 260Mohr-Coulomb equation, 114, 120Montgomery, D. R., 150mosquito breeding habitats, 364fMoSSaiC (Management of Slope Stability in
Communities) adapting the blueprint, xxiv, xxx, 5, 6, 22, 42 applicability to locations outside of Eastern
Caribbean, 41, 41f briefing key leaders about, 47 certification, 341–42, 387 commencing intervention with, 42–47 community based, 3, 4, 4f, 23, 29–34. See also
community engagement context for, xxii–xxiii, xxv, xxix, 22 designed for effectiveness, 22 Eastern Caribbean typical communities and
risk drivers, 35–36, 40f evidence based, xxii, 3–4, 4f, 6, 22, 34 foundations of, xxv, xxix, 1–2, 4f, 26, 26t. See
also community-based approach; evidence base of effectiveness; science-based approach
framework and components, xxv, 22–23, 34–35, 36–40t
getting started, 2–7, 42–48. See also project inception
briefing note, 2–5 guiding principles, 6 risks and challenges, 6–7 unique aspects of MoSSaiC, 5–6 landslide risk and, 10–11 management and government role, 4 outputs and outcomes as evidence of
effectiveness, 34, 35t, 390 overview, 25–26 pilots, 35–41, 40t
premises, 4f project inception, xxv, 55–79. See also
MoSSaiC teams; project inception purpose of, xxi risks and challenges, 6–7 science based, 3, 4f, 26–29. See also science-
based approach teams and tasks, 5t. See also MoSSaiC teams vision, xxv, 3, 4–5, 4f, 11MoSSaiC core unit (MCU). See MoSSaiC teamsMoSSaiC teams, xxv, 42–44, 65–71 advocacy task team, 69–71, 71f capacity building, 331, 332f communications task team, 69, 70f in communities selection process, 140 community liaison task team, 67, 68f, 140, 174 community task teams, xxx–xxxi, 5t, 43, 71–74 community residents’ responsibilities,
71–72, 72f construction task team, 73, 73–74f landowners, 73–74, 389 developing and engaging, 58 government task teams, xxx, 5t, 34, 43, 65–71,
66t, 175, 307, 313 integration of teams and tasks, 5t, 74–77, 75f,
76–77t landslide assessment and engineering task
team, 68, 68f, 140, 201–2, 202f, 291 mapping task team, 67, 67f, 140 MoSSaiC core unit (MCU) in communities selection process, 138–40,
158, 158t community participation, 174 defined, 389 establishment of, 57, 60–65 expertise and building capacity, 60, 60t in-country management practice, 61 membership of, 65, 66t missions of, 61–65, 63f policy entrepreneur role, 61, 62t role of, xxix–xxx, 43, 56–57, 62–65 template of teams, steps, and milestones, 76–77t technical support task team, 69, 69f, 140 who does what, 48, 66t, 78Mostyn, G. R., 145
NNandi, A., 95National Research and Development Foundation,
373
Oon-site requirements, 278–85Ordinary method of slices, 100Ostrom, E., 61outcomes. See project outcomesoutputs. See project outputs
PPack, R. T., 150Pakistan, urban infrastructure projects in, 264–65past landslides
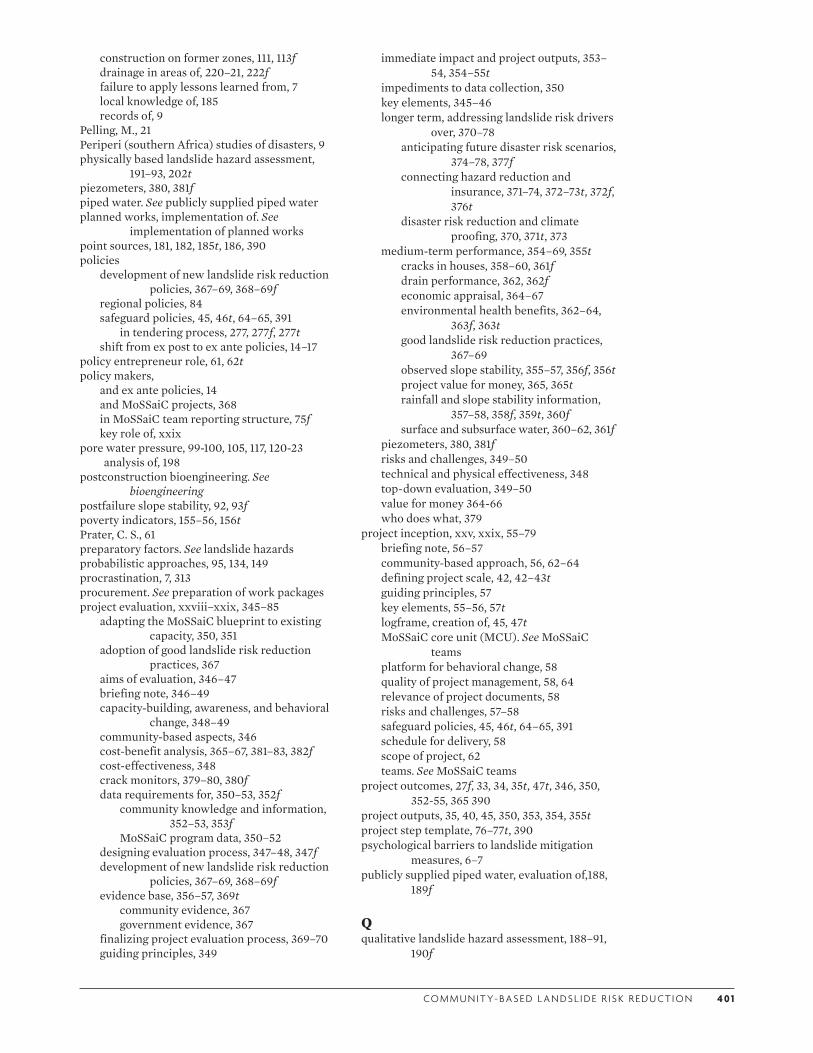
CO M M U N I T Y- BA S E D L A N DS L I D E R I S K R E D U CT I O N 4 0 1
construction on former zones, 111, 113f drainage in areas of, 220–21, 222f failure to apply lessons learned from, 7 local knowledge of, 185 records of, 9Pelling, M., 21Periperi (southern Africa) studies of disasters, 9physically based landslide hazard assessment,
191–93, 202tpiezometers, 380, 381fpiped water. See publicly supplied piped waterplanned works, implementation of. See
implementation of planned workspoint sources, 181, 182, 185t, 186, 390policies development of new landslide risk reduction
policies, 367–69, 368–69f regional policies, 84 safeguard policies, 45, 46t, 64–65, 391 in tendering process, 277, 277f, 277t shift from ex post to ex ante policies, 14–17policy entrepreneur role, 61, 62tpolicy makers, and ex ante policies, 14 and MoSSaiC projects, 368 in MoSSaiC team reporting structure, 75f key role of, xxixpore water pressure, 99-100, 105, 117, 120-23 analysis of, 198postconstruction bioengineering. See
bioengineering postfailure slope stability, 92, 93fpoverty indicators, 155–56, 156tPrater, C. S., 61preparatory factors. See landslide hazardsprobabilistic approaches, 95, 134, 149procrastination, 7, 313procurement. See preparation of work packagesproject evaluation, xxviii–xxix, 345–85 adapting the MoSSaiC blueprint to existing
capacity, 350, 351 adoption of good landslide risk reduction
practices, 367 aims of evaluation, 346–47 briefing note, 346–49 capacity-building, awareness, and behavioral
change, 348–49 community-based aspects, 346 cost-benefit analysis, 365–67, 381–83, 382f cost-effectiveness, 348 crack monitors, 379–80, 380f data requirements for, 350–53, 352f community knowledge and information,
352–53, 353f MoSSaiC program data, 350–52 designing evaluation process, 347–48, 347f development of new landslide risk reduction
policies, 367–69, 368–69f evidence base, 356–57, 369t community evidence, 367 government evidence, 367 finalizing project evaluation process, 369–70 guiding principles, 349
immediate impact and project outputs, 353–54, 354–55t
impediments to data collection, 350 key elements, 345–46 longer term, addressing landslide risk drivers
over, 370–78 anticipating future disaster risk scenarios,
374–78, 377f connecting hazard reduction and
insurance, 371–74, 372–73t, 372f, 376t
disaster risk reduction and climate proofing, 370, 371t, 373
medium-term performance, 354–69, 355t cracks in houses, 358–60, 361f drain performance, 362, 362f economic appraisal, 364–67 environmental health benefits, 362–64,
363f, 363t good landslide risk reduction practices,
367–69 observed slope stability, 355–57, 356f, 356t project value for money, 365, 365t rainfall and slope stability information,
357–58, 358f, 359t, 360f surface and subsurface water, 360–62, 361f piezometers, 380, 381f risks and challenges, 349–50 technical and physical effectiveness, 348 top-down evaluation, 349–50 value for money 364-66 who does what, 379project inception, xxv, xxix, 55–79 briefing note, 56–57 community-based approach, 56, 62–64 defining project scale, 42, 42–43t guiding principles, 57 key elements, 55–56, 57t logframe, creation of, 45, 47t MoSSaiC core unit (MCU). See MoSSaiC
teams platform for behavioral change, 58 quality of project management, 58, 64 relevance of project documents, 58 risks and challenges, 57–58 safeguard policies, 45, 46t, 64–65, 391 schedule for delivery, 58 scope of project, 62 teams. See MoSSaiC teamsproject outcomes, 27f, 33, 34, 35t, 47t, 346, 350,
352-55, 365 390project outputs, 35, 40, 45, 350, 353, 354, 355tproject step template, 76–77t, 390psychological barriers to landslide mitigation
measures, 6–7publicly supplied piped water, evaluation of,188,
189f
Qqualitative landslide hazard assessment, 188–91,
190f
4 02 I N D E X
Rrainfall slope stability and, 101–2, 357–58 assessment of rainfall events, 102 empirical rainfall threshold modeling. See
rainfall threshold triggering landslide disasters and fatalities,
9–10, 10–11f, 23, 83, 87–91, 120, 167–68
rainfall threshold, 95, 98–99, 120, 390rainwater harvesting, 244–47, 245–46fRandom Hacks of Kindness event (Washington,
D.C.), 115rational method, 223, 224, 225t, 227, 228, 390Rayner, S., 30records of disasters, 9regression methods, 96reporting lines, 74, 75f, 390resilience of structures, 153, 153f, 390resistance envelope method, 116–17, 117f, 198, 390resolution of maps, 21, 67, 132, 149, 169, 390resource gap, 371. 374, 376fretaining walls, 117–18, 118f, 122–23, 122fretrofitting, 244f, 247, 249, 390Richards, I. G., 294risk, definition of, 11–14, 390risk drivers. See landslide risk driversrisk management. See disaster risk management
(DRM)roof guttering, 242, 244, 244f, 282, 283froot reinforcement equation, 122rotational slides, 27, 84t, 85, 87, 87f, 87t, 90f, 91, 92,
108f, 100, 108, 137t, 158t, 190t, 204t
Ssafeguards, 45, 46t, 64-5, 73, 74, 136, 205, 215, 231,
243t, 273t, 277, 300, 391St. Lucia drain construction method in, 240–41, 240–
41f economic losses from disasters in, 40 hurricane damage in, 18–19, 18–19f, 40, 41f hurricane-resistant home improvement
program, 373, 375f impacts of community-based risk reduction
program in, 34, 35t progressive slides in, 92f rotational slides in, 90f translational slides in, 90f“Samaritan’s dilemma,” 7, 61, 61tSamoa, economic losses in disasters in, 40San Salvador and coping with disasters, 29–30scale of maps and plans, 391. See also community-
based mappingscience-based landslide risk assessment, xxi, 4f,
20–21, 26–29, 26t, 27f anthropogenic contributors to risk, 27–28, 28f landslide hazard, 112–18 in landslide risk management, 20, 83, 84t local risk drivers, 28 mapping for. See community-based mappingscientific and professional publications, 328–29
seepage zones, 181, 181fseismic events, 89–91, 91fseptic waste, 182, 226, 242Shakoor, A., 95shallow landsliding model (SHALSTAB), 150Sharma, R. H., 106shear box, 94t, 106f 107, 194, 195, 199shear strength, 99-100, 114, 120, 391shear surface. See slip surfaceshow homes, 321–23, 322f, 322tsite supervision, 278–79, 278–79f, 291situational factors as barriers to landslide mitigation measures,
6–7 as determinants of vulnerability, 12slip surface, 99slope angle, 103–4, 104f, 144t, 181slope drainage. See drainage design and good
practiceslope hydrology, 88–89, 107–8slope instability classification, 87tslope stability calculations, 100, 100f CHASM. See CHASM (Combined Hydrology
and Slope Stability Model) community-based mapping, 178–88. See also
community-based mapping continuum and discrete element models, 101 direct landslide mapping, 97–98 GIS-based landslide susceptibility mapping,
95–96, 97f, 132, 134, 146–49 loading, 111–12, 112f material types and properties, 104–7 hydrological properties, 105–7, 106f
geotechnical properties, 99-101, 105. 117, 120
soil formation, 104, 105f weathering and strength, 104–5, 106f medium-term performance, 355–57 models, 134, 194–98, 195t observed slope stability, 355–57, 356f, 356t over time, 91–92, 92t overview of assessment methods, 93–95, 94t physically based modeling, 99–101 postfailure, 92, 93f processes and their assessment, 93–101, 94t project evaluation, 357–58 rainfall and, 101–2 empirical rainfall threshold modeling,
98–99 slope angle and, 103–4, 104f, 144t, 181 slope hydrology and drainage, 100–101, 107–8,
107–8f urban slope drainage, 108 variables, 101–12 vegetation and, 108–11, 110f, 110t, 114–15slums. See urbanizationsmall island developing states (SIDS), 8, 36, 40social funds, role of, 21–23, 22fsocioeconomic vulnerability, 12, 151–52, 155–56,
156tsoil parameters. See also cohesion; angle of
internal friction.

CO M M U N I T Y- BA S E D L A N DS L I D E R I S K R E D U CT I O N 4 03
Mohr-Coulomb equation for soil shear strength, 114, 120
slope stability, 104, 105f uncertainty in, 199–200, 200fSotir, R. B., 294Southeast Asia, rainfall-triggered landslide risk
in, 9Spector, S., 42squatter housing, 391Sri Lanka, urban infrastructure projects in,
264–65Stability Index Mapping (SINMAP) model, 150stakeholders, 44, 44t, 308, 312–14, 391. See
also communication; community engagement
statistical methods, 149–50strategic incrementalism, 368-69, 369f, 391supervision. See site supervisionsurface and subsurface water, 29, 89f, 360–62. See
also drainage design and good practice; gray water management
estimation of surface water discharge, 223–26susceptibility, 95, 96t, 140–51, 142t defined, 389 GIS-based landslide susceptibility mapping,
95–96, 97f, 98f, 132, 134, 146–49 hazard assessment methods, 140–51, 142tsustainability of MoSSaiC projects, xxii–xxiii, 64Svekla, W., 29
TTarboton, D. G., 150Task teams. See advocacy task team;
communications task team; community liaison task team; community task teams; government task teams; landslide assessment and engineering task team;
mapping team; technical support task teamtechnical support task team, 69, 69f, 140Tegucigalpa, Honduras, debris flow hazard in,
150–51, 150ftemporal vulnerability, 12threshold modeling, 98–99, 99ftolerable risk, 391top-down approach, 25 balancing with bottom-up approach, 61–62 negative aspects of, 17topography alignment of drains in complex topography,
220, 221f convergence zones, 179-80f mapping features, 169, 179, 179–80f slope reconnaissance form, 144ttranslational slides, 27, 84t, 85–86, 87f, 87t, 90f.
100, 132, 137t, 158t, 190t, 204ttriggering events, 135t, 391. See also rainfallTwigg, J., 21, 366
U“unacceptable risk,” 391. See also “acceptable risk”unauthorized housing. See housinguncertainty
in model formulation, 200–201 in physically based landslide hazard
assessment, 199–200 in soil parameters, 199–200, 200f risk perception and, 313–14United Nations capacity assessment methodologies of UNDP,
60 on culture and community interests as
elements of project success, 172 disaster response organizational framework,
16f Economic and Social Council’s definition of
gender mainstreaming, 173 “Global Assessment Report on Disaster Risk
Reduction,” 80 Human Development Index (HDI), 155 International Strategy for Disaster Reduction,
23 risk assessment recommendations from,
20–21 UNICEF on behavioral change process in
Community-based Disaster Risk Reduction, 309
on vulnerability of Eastern Caribbean, 36, 40University of Wollongong, Australia, example of
field reconnaissance and hazard ranking methods, 145–46
urbanization, 23–25, 24f, 374 slope drainage and, 108, 109f vegetation and slope management, 294–96,
296fU.S. Federal Highway Administration, example of
field reconnaissance and hazard ranking methods, 146
Useem, M., 304user groups, 75–76, 75f, 333–34, 334f
VVarnes, D. J., 85, 91value for money, in projects. See project evaluation vegetation restricting alignment of drains, 220, 221f slope stability and, 108–11, 110–11f, 110t, 114–15,
144t, 293–94, 294f urban slope management and, 294–96, 296fVenture Philanthropy Partners, 60Victoria, Lorna P., 164vulnerability of community to landslides, 151–56, 391.
See also communities at risk, prioritizing of
defined, 12, 83, 391 drivers of landslide risk, 22 unauthorized housing, 24, 25t
WWamsler, C., 16, 212weathering features, 104–5, 106f, 179–80, 180f, 391Wharton School of the University of
Pennsylvania, 18wide-area landslide hazard mapping, 21, 167

4 0 4 I N D E X
Wilkinson, P. L., 114, 120, 294women. See gender relationswork packages. See preparation of work packagesWorld Bank assessment of economic impact of natural
disasters, 36 on communication campaigns, 317 on housing tenure in low-income countries, 24
Making Services Work for Poor People, 344 natural disaster projects, 17, 17t Safeguard Policies, 45World Development Report’s overview of
MoSSaiC, 25–26
YYunus, M., xxix


ECO-AUDIT
Environmental Benefits Statement
The World Bank is committed to preserving endangered forests and natural resources. To reduce our carbon footprint, the Office of the Publisher follows the recommended standards for paper usage set by the Green Press Initiative, a nonprofit program supporting publishers in using fiber that is not from endangered forests.
In the printing of Community-Based Landslide Risk Reduction, we took the following mea-sures:
•We used paper containing 25 percent recycled fiber made from postconsumer waste; each pound of postconsumer recycled fiber that replaces a ton of virgin fiber prevents the release of 2,108 pounds of greenhouse gas emissions and lessens the burden on landfills.
•We used paper that is chlorine-free and acid-free.
•We printed with vegetable-based inks made from renewable sources and easier to remove in the recycling process.
These measures in printing Community-Based Landslide Risk Reduction saved the following:
•18 trees
•11 million BTUs of total energy
•7,125 lbs. of CO2 equivalent of greenhouse gases
•26,901 gals. of wastewater
•2,412 lbs. of solid waste
For more information, visit www.greenpressinitiative.org.