Classification of residential areas according to physical vulnerability to natural hazards: a case...
25
Classification of residential areas according to physical vulnerability to natural hazards: a case study of Çanakkale, Turkey Arzu Başaran-Uysal, Funda Sezen, Süha Özden, and Öznur Karaca 1 The selection of new settlement areas and the construction of safe buildings, as well as rendering built-up areas safe, are of great importance in mitigating the damage caused by natural disasters. Most cities in Turkey are unprepared for natural hazards. In this paper, Çanakkale, located in a first-degree seismic zone and sprawled around the Sarıçay Delta, is examined in terms of its physical vulnerability to natural hazards. Residential areas are analysed using GIS (geographic information system) and remote-sensing technologies in relation to selected indicators. Residential areas of the city are divided into zones according to an evaluation of geological characteristics, the built-up area’s features, and urban infrastructure, and four risk zones are determined. The results of the analysis show that the areas of the city suitable for housing are very limited. In addition, the historical centre and the housing areas near Sarıçay stream are shown to be most problematic in terms of natural disasters and sustainability. Keywords: Çanakkale city, disaster risk analysis, geographic information system (GIS), physical vulnerability, sustainable community, Turkey Introduction Natural disasters pose a risk to the vast majority of cities in Turkey owing to rapid population growth, unplanned development, and poor monitoring and enforce- ment of disaster risk reduction laws and regulations. Two earthquakes occurred in the Marmara Region—the most developed part of the country—in 1999 (on 17 August and 12 November), spawning an intense discussion of the relationship between earth- quakes and urban planning (Sengezer and Koç, 2005). For the first time in Turkey, attention centred on the question of why the housing inspections performed before the disaster were inadequate rather than on what to do following the disaster (Ersoy, 2001). A number of fundamental changes were made to the building inspection system and to development legislation after 1999 (Can, 2001). Research to identify long-term solutions to natural disaster risk (Ulusal Deprem Konseyi, 2002) and to improve and strengthen built-up urban areas ( İstanbul Deprem Master Planı, 2003) gained momentum. In recent years, natural hazards, such as floods and landslides, in metropolitan areas have exposed the reality that ecology-compatible urbanisation has not occurred. Residential areas with low-quality houses and an inadequate physical environment suffer most in such events (White et al., 2004; Wamsler, 2006). In sum, doi:10.1111/disa.12037 Disasters, 2014, 38(1): 202−226. © 2014 The Author(s). Disasters © Overseas Development Institute, 2014 Published by John Wiley & Sons Ltd, 9600 Garsington Road, Oxford, OX4 2DQ, UK and 350 Main Street, Malden, MA 02148, USA
-
Upload
independent -
Category
Documents
-
view
1 -
download
0
Transcript of Classification of residential areas according to physical vulnerability to natural hazards: a case...

Classification of residential areas according to physical vulnerability to natural hazards: a case study of Çanakkale, Turkey
Arzu Başaran-Uysal, Funda Sezen, Süha Özden, and Öznur Karaca1
The selection of new settlement areas and the construction of safe buildings, as well as rendering built-up areas safe, are of great importance in mitigating the damage caused by natural disasters. Most cities in Turkey are unprepared for natural hazards. In this paper, Çanakkale, located in a first-degree seismic zone and sprawled around the Sarıçay Delta, is examined in terms of its physical vulnerability to natural hazards. Residential areas are analysed using GIS (geographic information system) and remote-sensing technologies in relation to selected indicators. Residential areas of the city are divided into zones according to an evaluation of geological characteristics, the built-up area’s features, and urban infrastructure, and four risk zones are determined. The results of the analysis show that the areas of the city suitable for housing are very limited. In addition, the historical centre and the housing areas near Sarıçay stream are shown to be most problematic in terms of natural disasters and sustainability.
Keywords: Çanakkale city, disaster risk analysis, geographic information system (GIS), physical vulnerability, sustainable community, Turkey
IntroductionNatural disasters pose a risk to the vast majority of cities in Turkey owing to rapid population growth, unplanned development, and poor monitoring and enforce-ment of disaster risk reduction laws and regulations. Two earthquakes occurred in the Marmara Region—the most developed part of the country—in 1999 (on 17 August and 12 November), spawning an intense discussion of the relationship between earth-quakes and urban planning (Sengezer and Koç, 2005). For the first time in Turkey, attention centred on the question of why the housing inspections performed before the disaster were inadequate rather than on what to do following the disaster (Ersoy, 2001). A number of fundamental changes were made to the building inspection system and to development legislation after 1999 (Can, 2001). Research to identify long-term solutions to natural disaster risk (Ulusal Deprem Konseyi, 2002) and to improve and strengthen built-up urban areas (İstanbul Deprem Master Planı, 2003) gained momentum. In recent years, natural hazards, such as floods and landslides, in metropolitan areas have exposed the reality that ecology-compatible urbanisation has not occurred. Residential areas with low-quality houses and an inadequate physical environment suffer most in such events (White et al., 2004; Wamsler, 2006). In sum,
doi:10.1111/disa.12037
Disasters, 2014, 38(1): 202−226. © 2014 The Author(s). Disasters © Overseas Development Institute, 2014Published by John Wiley & Sons Ltd, 9600 Garsington Road, Oxford, OX4 2DQ, UK and 350 Main Street, Malden, MA 02148, USA
Classification of residential areas according to physical vulnerability to natural hazards 203
there is a close relationship between natural disasters and sustainable urban develop-ment (Ayala-Carcedo, 2004; Wisner et al., 2004). Many governments and national and international organisations have acknowl-edged that land-use planning is a significant tool with which to prepare cities for natural disasters (Alexander, 1991; Burby et al., 2000; Menoni, 2004). Natural disaster risks can be mitigated by suitable site selection, housing appropriate for the ground, and planned development. However, renovation of existing building stock is needed in many residential areas to prevent damage by natural hazards. A determination of the degree of natural disaster risk and vulnerability in built-up areas is of utmost importance for hazard mitigation (Solway, 2004; Bayındırlık ve İskan Bakanlığı, 2009). In this study, residential areas of Çanakkale—a small-scale city located in a first-degree seismic zone—are assessed and classified according to their physical vulnera-bility to natural hazards (earthquakes, landslides, and stream floods). Some sustainable urban development indicators are evaluated spatially, aided by remote sensing tech-niques and geographic information systems (GIS), and housing areas are grouped into four risk zones according to their physical vulnerability to natural hazards. The results of the study are important in determining sustainable urban development and disaster risk mitigation strategies.
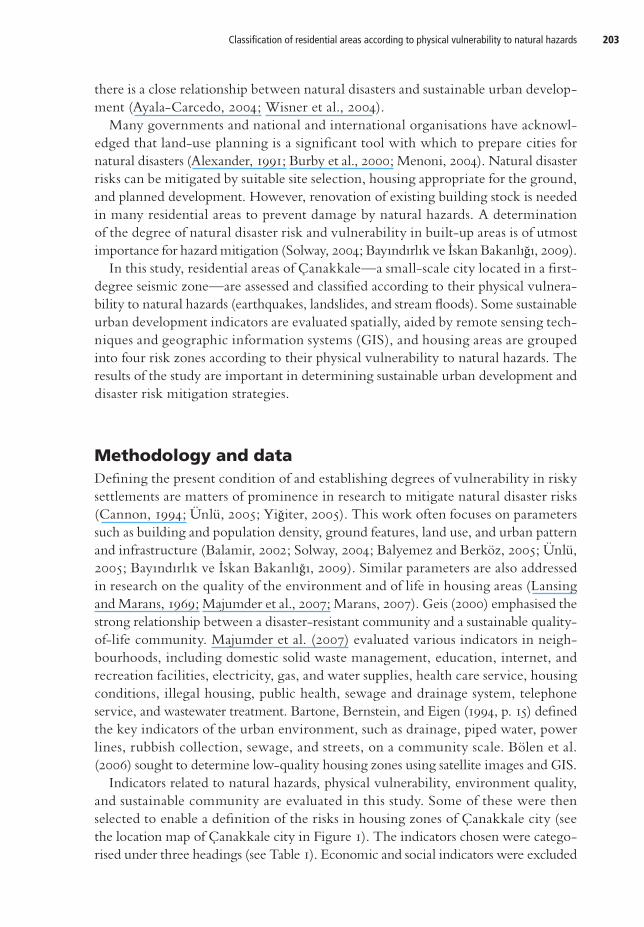
Methodology and dataDefining the present condition of and establishing degrees of vulnerability in risky settlements are matters of prominence in research to mitigate natural disaster risks (Cannon, 1994; Ünlü, 2005; Yiğiter, 2005). This work often focuses on parameters such as building and population density, ground features, land use, and urban pattern and infrastructure (Balamir, 2002; Solway, 2004; Balyemez and Berköz, 2005; Ünlü, 2005; Bayındırlık ve İskan Bakanlığı, 2009). Similar parameters are also addressed in research on the quality of the environment and of life in housing areas (Lansing and Marans, 1969; Majumder et al., 2007; Marans, 2007). Geis (2000) emphasised the strong relationship between a disaster-resistant community and a sustainable quality-of-life community. Majumder et al. (2007) evaluated various indicators in neigh-bourhoods, including domestic solid waste management, education, internet, and recreation facilities, electricity, gas, and water supplies, health care service, housing conditions, illegal housing, public health, sewage and drainage system, telephone service, and wastewater treatment. Bartone, Bernstein, and Eigen (1994, p. 15) defined the key indicators of the urban environment, such as drainage, piped water, power lines, rubbish collection, sewage, and streets, on a community scale. Bölen et al. (2006) sought to determine low-quality housing zones using satellite images and GIS. Indicators related to natural hazards, physical vulnerability, environment quality, and sustainable community are evaluated in this study. Some of these were then selected to enable a definition of the risks in housing zones of Çanakkale city (see the location map of Çanakkale city in Figure 1). The indicators chosen were catego-rised under three headings (see Table 1). Economic and social indicators were excluded
Arzu Başaran-Uysal, Funda Sezen, Süha Özden, and Öznur Karaca204
Figure 1. Location map of the study area
Source: authors.
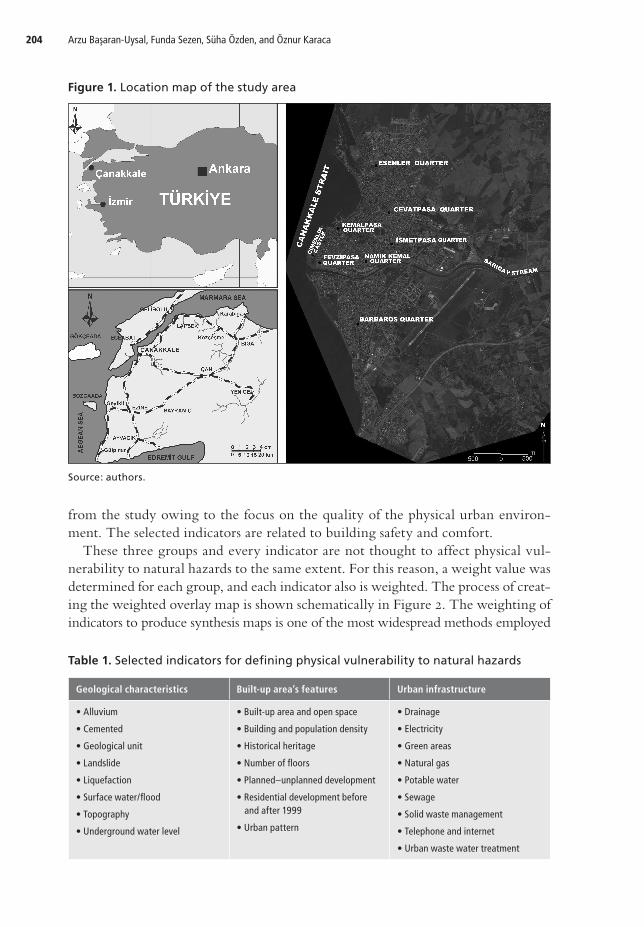
from the study owing to the focus on the quality of the physical urban environ-ment. The selected indicators are related to building safety and comfort. These three groups and every indicator are not thought to affect physical vul-nerability to natural hazards to the same extent. For this reason, a weight value was determined for each group, and each indicator also is weighted. The process of creat-ing the weighted overlay map is shown schematically in Figure 2. The weighting of indicators to produce synthesis maps is one of the most widespread methods employed
Table 1. Selected indicators for defining physical vulnerability to natural hazards
Geological characteristics Built-up area’s features Urban infrastructure
• Alluvium
• Cemented
• Geological unit
• Landslide
• Liquefaction
• Surface water/flood
• Topography
• Underground water level
• Built-up area and open space
• Building and population density
• Historical heritage
• Number of floors
• Planned–unplanned development
• Residential development before and after 1999
• Urban pattern
• Drainage
• Electricity
• Green areas
• Natural gas
• Potable water
• Sewage
• Solid waste management
• Telephone and internet
• Urban waste water treatment
Classification of residential areas according to physical vulnerability to natural hazards 205
Figure 2. The process of creating the weighted overlay map
• Selection of indicators and their categorisation under the three headings
• Determination of weight value factors for each issue
• Determination of weight values for each indicator
• Determination of criteria for each indicator
• Determination of suitability values for each criteria
• Constitution of maps for each indicator
• Constitution of three main synthesis maps
• Overlay of three main synthesis maps
• Determination of risk levels
• Constitution of weighted overlay map
Source: authors.
Literature review
Observation
Evaluation
Helping with GIS
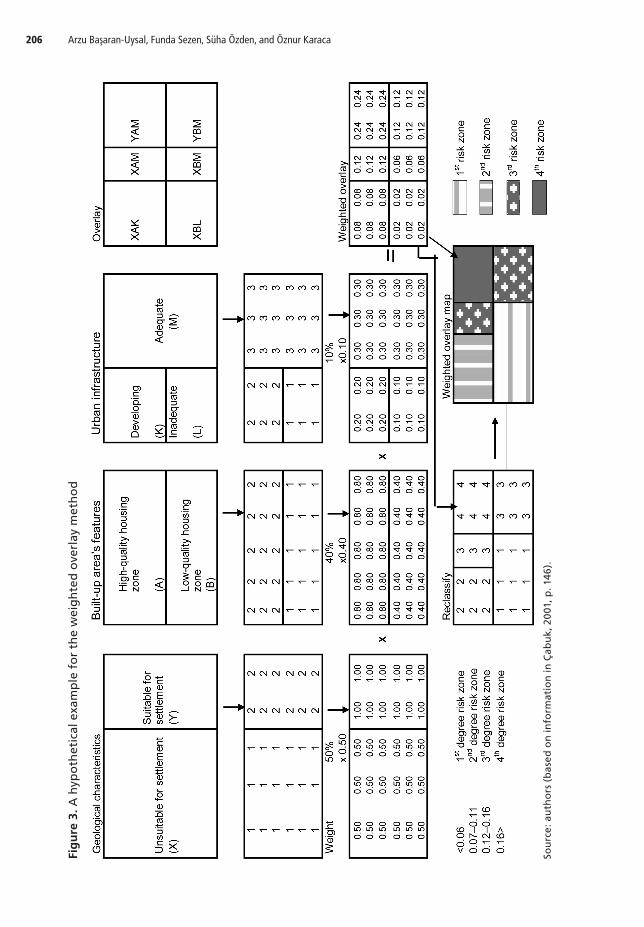
in GIS practice (Jankowski and Richard, 1994; Malczewski, 1999; Nath et al., 2000; Çabuk, 2001; Cengiz and Akbulak, 2009). Criteria are defined for each indicator. Indicators are weighted according to their degree of importance, and suitability values between zero and two are given. After all of the indicators were entered into the GIS environment and expressed spatially, three main synthesis maps were output:
• a map showing zones suitable and unsuitable for settlement on the basis of geo-logical characteristics;
• a map showing high- and low-quality housing zones; and • a map showing the quality of urban infrastructure (inadequate, developing, and
adequate).
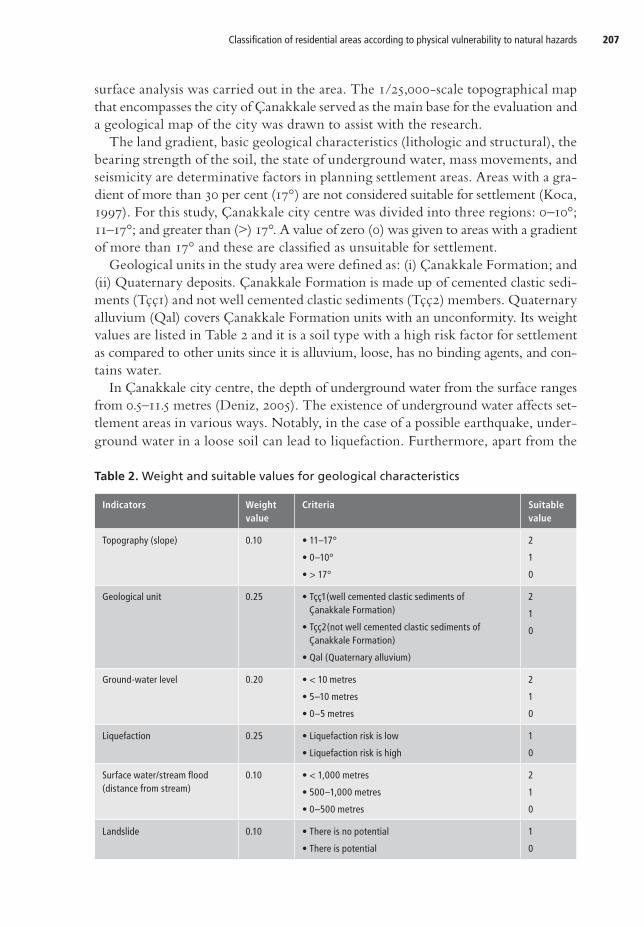
These three selected indicators were then weighted separately. Geological char-acteristics are the most important element in increasing the risk of natural disaster whereas built-up features are the second most important element affecting physical vulnerability. Consequently, the weight values were determined as 50 per cent for geological characteristics, 40 per cent for built-up area’s features, and 10 per cent for urban infrastructure. A ‘weighted overlay map’ is constructed by superimposing the three synthesis maps (see Figure 3). In defining geological characteristics, we took account of the three most impor-tant hazards that the built-up areas of Çanakkale can experience: earthquakes, floods, and landslides. Table 2 shows the weight values determined for geological character-istic indicators and the suitability values determined for related criteria. Previous research on the geology and morphology of the city of Çanakkale and data from bore-holes and geological mapping studies were included in the present study (Önem, 1974; Şentürk and Karaköse, 1987; Yaltırak and Okay, 2004; Deniz, 2005). Furthermore,
Arzu Başaran-Uysal, Funda Sezen, Süha Özden, and Öznur Karaca206
Fig
ure
3. A
hyp
oth
etic
al e
xam
ple
fo
r th
e w
eig
hte
d o
verl
ay m
eth
od
Sou
rce
: au
tho
rs (
bas
ed o
n in
form
atio
n in
Çab
uk,
20
01, p
. 146
).
Classification of residential areas according to physical vulnerability to natural hazards 207
surface analysis was carried out in the area. The 1/25,000-scale topographical map that encompasses the city of Çanakkale served as the main base for the evaluation and a geological map of the city was drawn to assist with the research. The land gradient, basic geological characteristics (lithologic and structural), the bearing strength of the soil, the state of underground water, mass movements, and seismicity are determinative factors in planning settlement areas. Areas with a gra-dient of more than 30 per cent (17°) are not considered suitable for settlement (Koca, 1997). For this study, Çanakkale city centre was divided into three regions: 0–10°; 11–17°; and greater than (>) 17°. A value of zero (0) was given to areas with a gradient of more than 17° and these are classified as unsuitable for settlement. Geological units in the study area were defined as: (i) Çanakkale Formation; and (ii) Quaternary deposits. Çanakkale Formation is made up of cemented clastic sedi-ments (Tçç1) and not well cemented clastic sediments (Tçç2) members. Quaternary alluvium (Qal) covers Çanakkale Formation units with an unconformity. Its weight values are listed in Table 2 and it is a soil type with a high risk factor for settlement as compared to other units since it is alluvium, loose, has no binding agents, and con-tains water. In Çanakkale city centre, the depth of underground water from the surface ranges from 0.5–11.5 metres (Deniz, 2005). The existence of underground water affects set-tlement areas in various ways. Notably, in the case of a possible earthquake, under-ground water in a loose soil can lead to liquefaction. Furthermore, apart from the
Table 2. Weight and suitable values for geological characteristics
Indicators Weight value
Criteria Suitable value
Topography (slope) 0.10 • 11–17°
• 0–10°
• > 17°
2
1
0
Geological unit 0.25 • Tçç1(well cemented clastic sediments of Çanakkale Formation)
• Tçç2(not well cemented clastic sediments of Çanakkale Formation)
• Qal (Quaternary alluvium)
2
1
0
Ground-water level 0.20 • < 10 metres
• 5–10 metres
• 0–5 metres
2
1
0
Liquefaction 0.25 • Liquefaction risk is low
• Liquefaction risk is high
1
0
Surface water/stream flood(distance from stream)
0.10 • < 1,000 metres
• 500–1,000 metres
• 0–500 metres
2
1
0
Landslide 0.10 • There is no potential
• There is potential
1
0
Arzu Başaran-Uysal, Funda Sezen, Süha Özden, and Öznur Karaca208
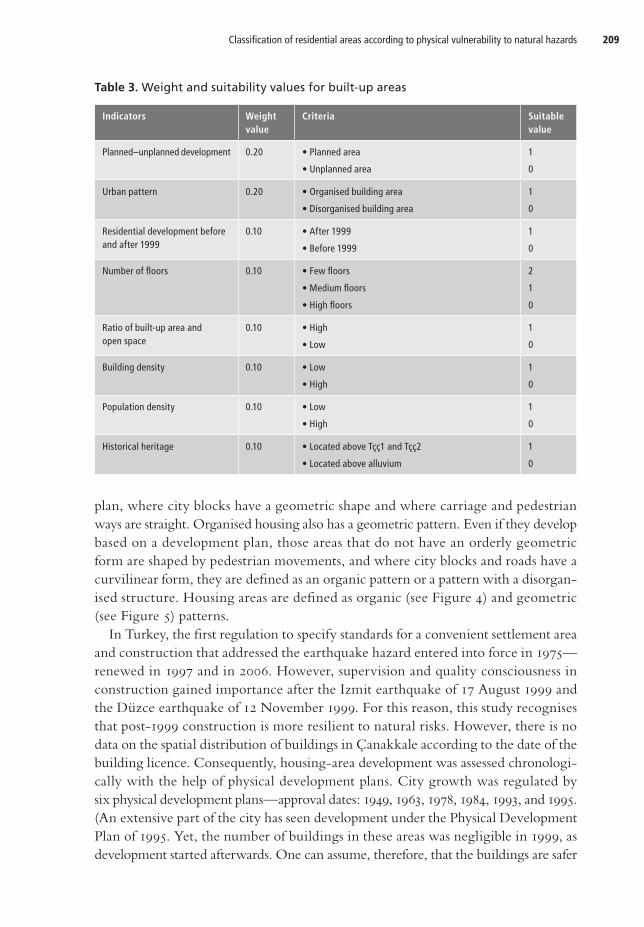
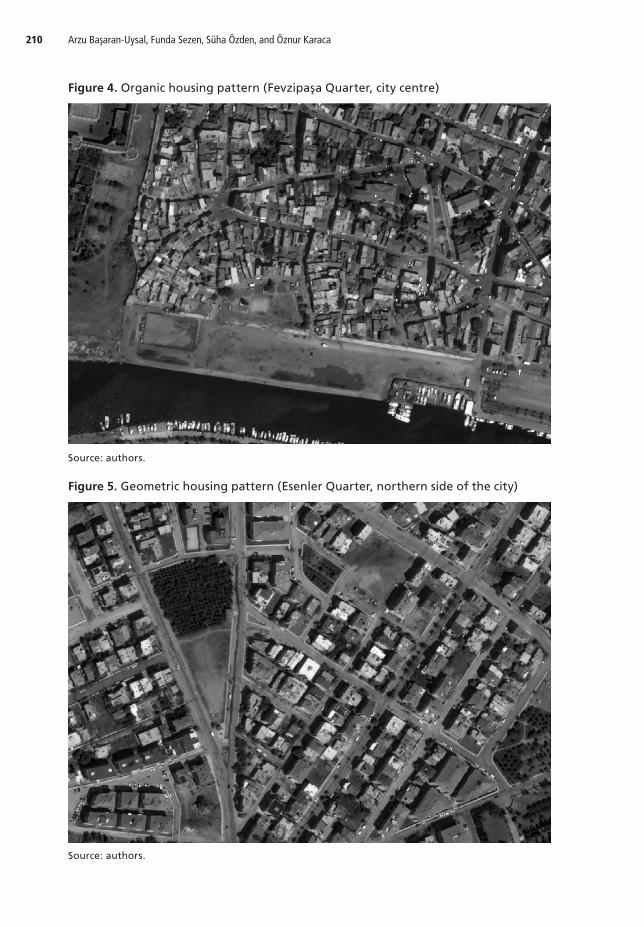
working challenge during construction, the existence of underground water at the foundation level in a large part of the settlement area presents water–concrete inter-action and bearing-strength problems. The places where the underground water level is between zero and five metres are defined as areas unsuitable for settlement. Waterlogged soils composed of loose sand tend to compress and the volume tends to shrink with the effect of repeated loads, increasing pore-water pressure in the absence of drainage. When repeated loads support rising pore-water pressure in the sand layer, total normal tension can reach a value equivalent to the pore-water pres-sure. In this case, a non-cohesive soil loses its sliding resistance and undergoes major transpositions by behaving like a liquid, and so the liquefaction phase begins (Das, 1983, pp. 353–374). When waterlogged sandy soil liquefies, it can behave like a liquid instead of like a solid material. The soil can go down, and sand slides and sand volca-noes can be observed. Given the soil characteristics and the underground water depth in the Çanakkale settlement area, there is a high risk of liquefaction. Here, the phenom-enon of liquefaction comes to the fore when questioning the suitability of Çanakkale city for settlement. The weight value, therefore, is set as 0.25 (see Table 2). Settlement areas were classified as areas with high liquefaction risk (0) and areas with low lique-faction risk (1) by taking soil characteristics and underground water levels into account. Sarıçay stream and its branches have caused significant floods on Çanakkale plain in the past. During the event of 3 October 1962 (due to heavy rain), Sarıçay stream flooded the vegetable and fruit orchards in the vicinity and led to pecuniary loss. On 27–28 December 1964, flood water, owing to heavy rainfall, covered three-quarters of the city again. As a result, 106 buildings suffered severe damage, 44 experi-enced moderate damage, and 11,490 were submerged (Devlet Su İşleri, 1966). For this reason, stream flood is defined as an indicator. Suitability points were given taking the distances between settlement areas and Sarıçay stream into consideration. Unhardened units throughout the city of Çanakkale and the Strait of Çanakkale, which become unstable in the event of excessive rain, lead to landslides occasionally in regions where the slope gradient increases. There is a high risk of a landslide in the southern part of the city where block and villa-type collective housing developments are widespread. For this study, the suitability points were designated as areas with and without landslide potential. A general framework is established for resilience of settlement area while built-up area indicators and weight values are determined. It is acknowledged that the areas where housing has developed in an unplanned manner and where a disorganised urban pattern is formed are those that are at the greatest risk when exposed to danger. Satellite images—coloured QuickBird Satellite archive footage of 13 August 2008—and a 1/5000-scale land-use plan of the city of Çanakkale were employed in urban pattern analyses. Those areas that developed in a planned and unplanned manner are exposed by comparing satellite images and plans from the 1950s. Table 3 lists the weight and suitability values set for built-up areas. Organised and disorganised housing areas serve as criteria in an urban pattern analysis. Organised housing refers to areas that are in conformity with the development
Classification of residential areas according to physical vulnerability to natural hazards 209
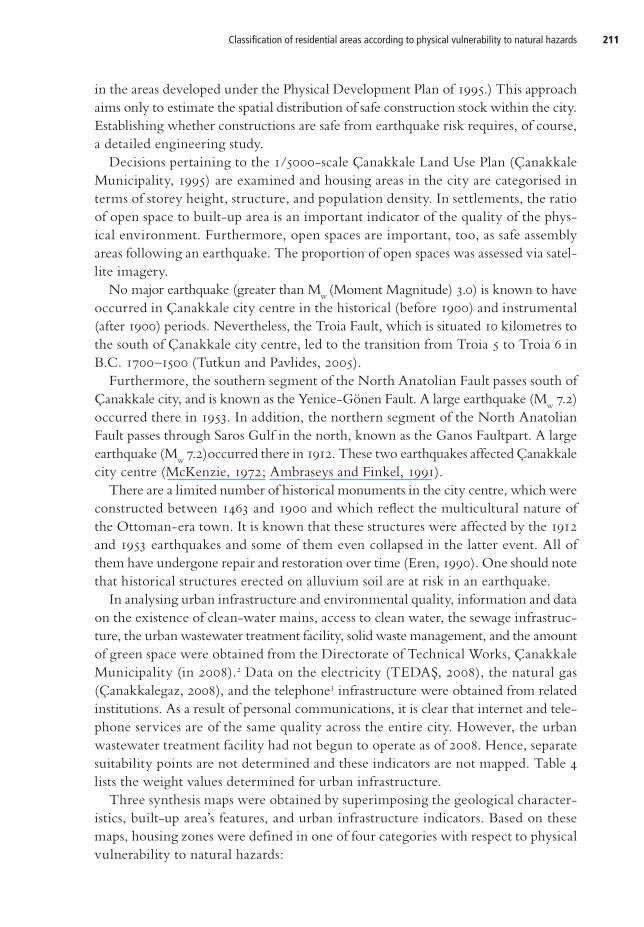
plan, where city blocks have a geometric shape and where carriage and pedestrian ways are straight. Organised housing also has a geometric pattern. Even if they develop based on a development plan, those areas that do not have an orderly geometric form are shaped by pedestrian movements, and where city blocks and roads have a curvilinear form, they are defined as an organic pattern or a pattern with a disorgan-ised structure. Housing areas are defined as organic (see Figure 4) and geometric (see Figure 5) patterns. In Turkey, the first regulation to specify standards for a convenient settlement area and construction that addressed the earthquake hazard entered into force in 1975—renewed in 1997 and in 2006. However, supervision and quality consciousness in construction gained importance after the Izmit earthquake of 17 August 1999 and the Düzce earthquake of 12 November 1999. For this reason, this study recognises that post-1999 construction is more resilient to natural risks. However, there is no data on the spatial distribution of buildings in Çanakkale according to the date of the building licence. Consequently, housing-area development was assessed chronologi-cally with the help of physical development plans. City growth was regulated by six physical development plans—approval dates: 1949, 1963, 1978, 1984, 1993, and 1995. (An extensive part of the city has seen development under the Physical Development Plan of 1995. Yet, the number of buildings in these areas was negligible in 1999, as development started afterwards. One can assume, therefore, that the buildings are safer
Table 3. Weight and suitability values for built-up areas
Indicators Weight value
Criteria Suitable value
Planned–unplanned development 0.20 • Planned area
• Unplanned area
1
0
Urban pattern 0.20 • Organised building area
• Disorganised building area
1
0
Residential development before and after 1999
0.10 • After 1999
• Before 1999
1
0
Number of floors 0.10 • Few floors
• Medium floors
• High floors
2
1
0
Ratio of built-up area and open space
0.10 • High
• Low
1
0
Building density 0.10 • Low
• High
1
0
Population density 0.10 • Low
• High
1
0
Historical heritage 0.10 • Located above Tçç1 and Tçç2
• Located above alluvium
1
0
Arzu Başaran-Uysal, Funda Sezen, Süha Özden, and Öznur Karaca210
Figure 4. Organic housing pattern (Fevzipaşa Quarter, city centre)
Figure 5. Geometric housing pattern (Esenler Quarter, northern side of the city)
Source: authors.
Source: authors.
Classification of residential areas according to physical vulnerability to natural hazards 211
in the areas developed under the Physical Development Plan of 1995.) This approach aims only to estimate the spatial distribution of safe construction stock within the city. Establishing whether constructions are safe from earthquake risk requires, of course, a detailed engineering study. Decisions pertaining to the 1/5000-scale Çanakkale Land Use Plan (Çanakkale Municipality, 1995) are examined and housing areas in the city are categorised in terms of storey height, structure, and population density. In settlements, the ratio of open space to built-up area is an important indicator of the quality of the phys-ical environment. Furthermore, open spaces are important, too, as safe assembly areas following an earthquake. The proportion of open spaces was assessed via satel-lite imagery. No major earthquake (greater than M
w (Moment Magnitude) 3.0) is known to have
occurred in Çanakkale city centre in the historical (before 1900) and instrumental (after 1900) periods. Nevertheless, the Troia Fault, which is situated 10 kilometres to the south of Çanakkale city centre, led to the transition from Troia 5 to Troia 6 in B.C. 1700–1500 (Tutkun and Pavlides, 2005). Furthermore, the southern segment of the North Anatolian Fault passes south of Çanakkale city, and is known as the Yenice-Gönen Fault. A large earthquake (M
w 7.2)
occurred there in 1953. In addition, the northern segment of the North Anatolian Fault passes through Saros Gulf in the north, known as the Ganos Faultpart. A large earthquake (M
w 7.2)occurred there in 1912. These two earthquakes affected Çanakkale
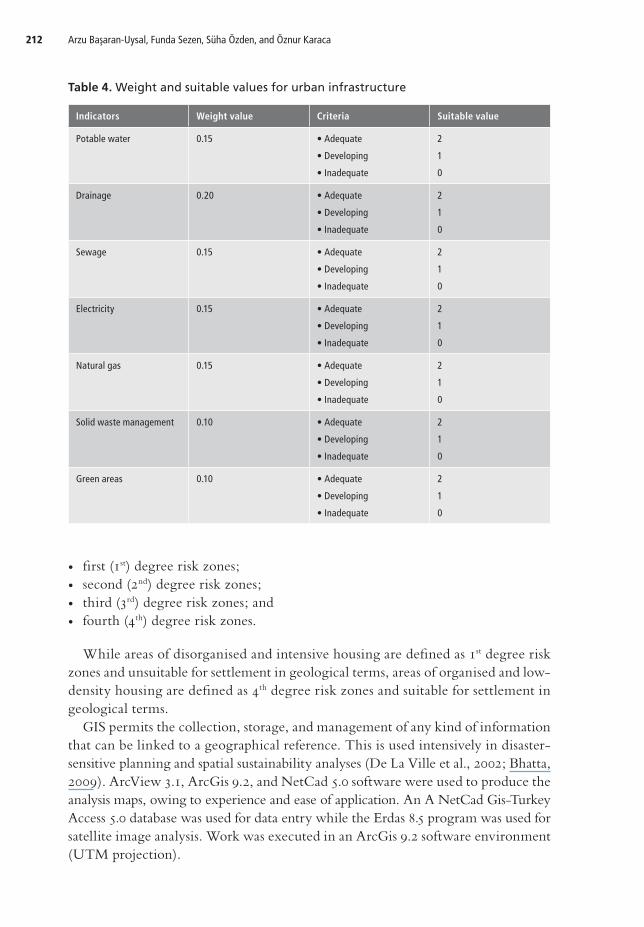
city centre (McKenzie, 1972; Ambraseys and Finkel, 1991). There are a limited number of historical monuments in the city centre, which were constructed between 1463 and 1900 and which reflect the multicultural nature of the Ottoman-era town. It is known that these structures were affected by the 1912 and 1953 earthquakes and some of them even collapsed in the latter event. All of them have undergone repair and restoration over time (Eren, 1990). One should note that historical structures erected on alluvium soil are at risk in an earthquake. In analysing urban infrastructure and environmental quality, information and data on the existence of clean-water mains, access to clean water, the sewage infrastruc-ture, the urban wastewater treatment facility, solid waste management, and the amount of green space were obtained from the Directorate of Technical Works, Çanakkale Municipality (in 2008).2 Data on the electricity (TEDAŞ, 2008), the natural gas (Çanakkalegaz, 2008), and the telephone3 infrastructure were obtained from related institutions. As a result of personal communications, it is clear that internet and tele-phone services are of the same quality across the entire city. However, the urban wastewater treatment facility had not begun to operate as of 2008. Hence, separate suitability points are not determined and these indicators are not mapped. Table 4 lists the weight values determined for urban infrastructure. Three synthesis maps were obtained by superimposing the geological character-istics, built-up area’s features, and urban infrastructure indicators. Based on these maps, housing zones were defined in one of four categories with respect to physical vulnerability to natural hazards:
Arzu Başaran-Uysal, Funda Sezen, Süha Özden, and Öznur Karaca212
• first (1st) degree risk zones; • second (2nd) degree risk zones; • third (3rd) degree risk zones; and • fourth (4th) degree risk zones.
While areas of disorganised and intensive housing are defined as 1st degree risk zones and unsuitable for settlement in geological terms, areas of organised and low-density housing are defined as 4th degree risk zones and suitable for settlement in geological terms. GIS permits the collection, storage, and management of any kind of information that can be linked to a geographical reference. This is used intensively in disaster-sensitive planning and spatial sustainability analyses (De La Ville et al., 2002; Bhatta, 2009). ArcView 3.1, ArcGis 9.2, and NetCad 5.0 software were used to produce the analysis maps, owing to experience and ease of application. An A NetCad Gis-Turkey Access 5.0 database was used for data entry while the Erdas 8.5 program was used for satellite image analysis. Work was executed in an ArcGis 9.2 software environment (UTM projection).
Table 4. Weight and suitable values for urban infrastructure
Indicators Weight value Criteria Suitable value
Potable water 0.15 • Adequate
• Developing
• Inadequate
2
1
0
Drainage 0.20 • Adequate
• Developing
• Inadequate
2
1
0
Sewage 0.15 • Adequate
• Developing
• Inadequate
2
1
0
Electricity 0.15 • Adequate
• Developing
• Inadequate
2
1
0
Natural gas 0.15 • Adequate
• Developing
• Inadequate
2
1
0
Solid waste management 0.10 • Adequate
• Developing
• Inadequate
2
1
0
Green areas 0.10 • Adequate
• Developing
• Inadequate
2
1
0
Classification of residential areas according to physical vulnerability to natural hazards 213
Case study and results Geological characteristics
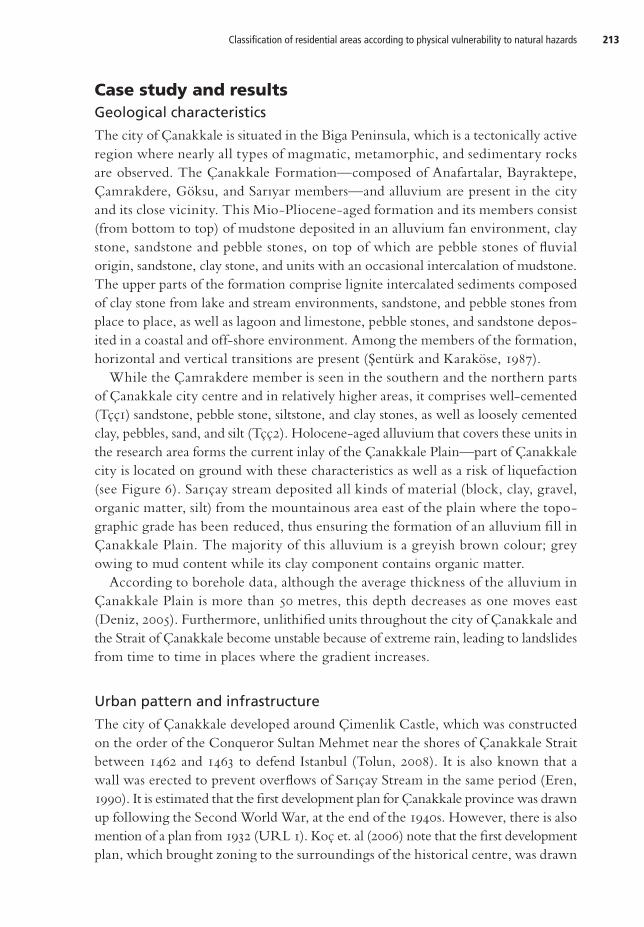
The city of Çanakkale is situated in the Biga Peninsula, which is a tectonically active region where nearly all types of magmatic, metamorphic, and sedimentary rocks are observed. The Çanakkale Formation—composed of Anafartalar, Bayraktepe, Çamrakdere, Göksu, and Sarıyar members—and alluvium are present in the city and its close vicinity. This Mio-Pliocene-aged formation and its members consist (from bottom to top) of mudstone deposited in an alluvium fan environment, clay stone, sandstone and pebble stones, on top of which are pebble stones of fluvial origin, sandstone, clay stone, and units with an occasional intercalation of mudstone. The upper parts of the formation comprise lignite intercalated sediments composed of clay stone from lake and stream environments, sandstone, and pebble stones from place to place, as well as lagoon and limestone, pebble stones, and sandstone depos-ited in a coastal and off-shore environment. Among the members of the formation, horizontal and vertical transitions are present (Şentürk and Karaköse, 1987). While the Çamrakdere member is seen in the southern and the northern parts of Çanakkale city centre and in relatively higher areas, it comprises well-cemented (Tçç1) sandstone, pebble stone, siltstone, and clay stones, as well as loosely cemented clay, pebbles, sand, and silt (Tçç2). Holocene-aged alluvium that covers these units in the research area forms the current inlay of the Çanakkale Plain—part of Çanakkale city is located on ground with these characteristics as well as a risk of liquefaction (see Figure 6). Sarıçay stream deposited all kinds of material (block, clay, gravel, organic matter, silt) from the mountainous area east of the plain where the topo-graphic grade has been reduced, thus ensuring the formation of an alluvium fill in Çanakkale Plain. The majority of this alluvium is a greyish brown colour; grey owing to mud content while its clay component contains organic matter. According to borehole data, although the average thickness of the alluvium in Çanakkale Plain is more than 50 metres, this depth decreases as one moves east (Deniz, 2005). Furthermore, unlithified units throughout the city of Çanakkale and the Strait of Çanakkale become unstable because of extreme rain, leading to landslides from time to time in places where the gradient increases.
Urban pattern and infrastructure
The city of Çanakkale developed around Çimenlik Castle, which was constructed on the order of the Conqueror Sultan Mehmet near the shores of Çanakkale Strait between 1462 and 1463 to defend Istanbul (Tolun, 2008). It is also known that a wall was erected to prevent overflows of Sarıçay Stream in the same period (Eren, 1990). It is estimated that the first development plan for Çanakkale province was drawn up following the Second World War, at the end of the 1940s. However, there is also mention of a plan from 1932 (URL 1). Koç et. al (2006) note that the first development plan, which brought zoning to the surroundings of the historical centre, was drawn

Arzu Başaran-Uysal, Funda Sezen, Süha Özden, and Öznur Karaca214
Figure 6. 1/25000 scale geological map of Çanakkale city
Source: Sezen, 2010.
up in 1949. The development plans of 1963, 1978, 1984, 1993, and 1995 ensured the growth of the city (see Figure 7). The inner city has an organic urban form owing to its development before 1949. All of the areas that developed after 1949 were built up using the development plan. There are areas, though, that, despite having a
Classification of residential areas according to physical vulnerability to natural hazards 215
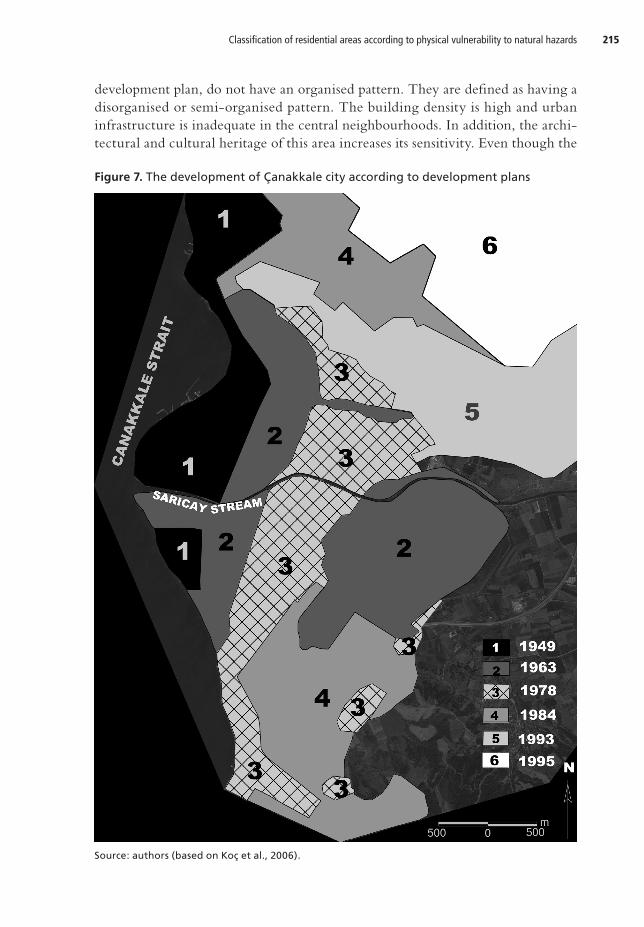
Figure 7. The development of Çanakkale city according to development plans
Source: authors (based on Koç et al., 2006).
development plan, do not have an organised pattern. They are defined as having a disorganised or semi-organised pattern. The building density is high and urban infrastructure is inadequate in the central neighbourhoods. In addition, the archi-tectural and cultural heritage of this area increases its sensitivity. Even though the
Arzu Başaran-Uysal, Funda Sezen, Süha Özden, and Öznur Karaca216
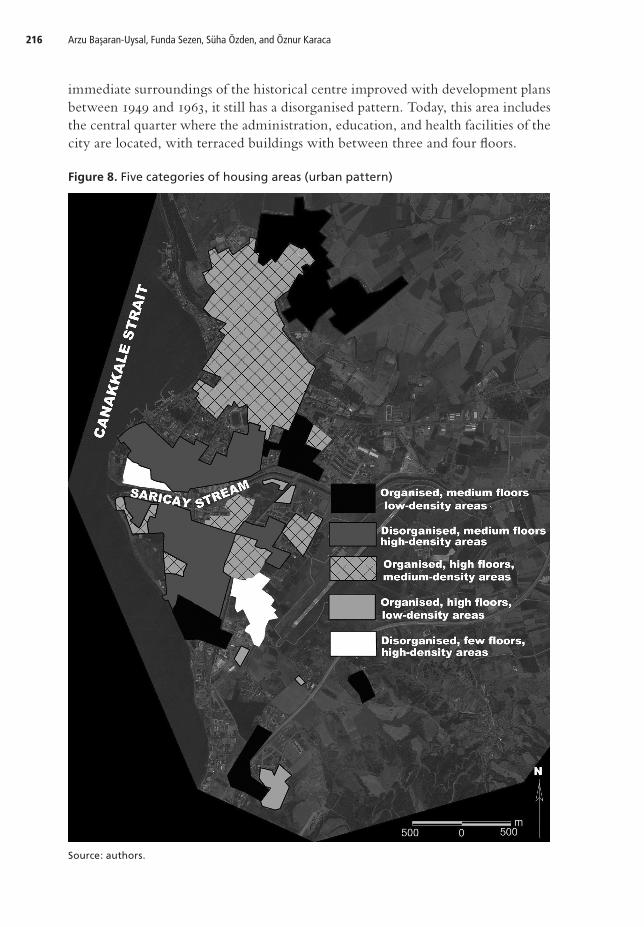
Figure 8. Five categories of housing areas (urban pattern)
Source: authors.
immediate surroundings of the historical centre improved with development plans between 1949 and 1963, it still has a disorganised pattern. Today, this area includes the central quarter where the administration, education, and health facilities of the city are located, with terraced buildings with between three and four floors.

Classification of residential areas according to physical vulnerability to natural hazards 217
The city continued to sprawl to the east along both sides of Sarıçay stream in a disorganised and semi-organised manner between 1963 and 1978. During this period, a new development axis formed along the shores of the strait to the south of the city. While semi-organised and medium-density housing developed to the south of Sarıçay stream, organised, multi-storey housing remained to the north. Between 1984 and 1993, the north–northeast and coastal shore of the city was opened for construction. As of late 2013, there is planned urban development in these areas. In 1992, the demand for housing increased with the establishment of a university in the city. Mostly mass housing was seen in areas opened for development subsequently, a fact that can be interpreted as satisfying housing demand quickly. A development plan was prepared for a fairly large area in 1995, but not all of these areas have been opened for construction yet. As a result of the built-up area analysis conducted to iden-tify the urban pattern, housing areas were evaluated in five categories (see Figure 8). Electricity, potable water, sewage, and transport infrastructure reach all dwellings in the city. As for internet and telephone subscriptions, all areas can be offered the services on request. However, there are areas where urban infrastructure is inadequate. The city’s sewage system was designed in 1976 and construction was completed in 1989. Yet it does not have a waste-water treatment system. Domestic waste-water is released to the strait through a deep-sea discharge. In summer, there is a stench and hygiene problems along the shore. Site selection for an urban waste-water treat-ment plant has been finalised and the system is at the design stage. There is major air pollution in winter owing to the use of coal for heating. Natural gas began to be used in the city in 2007, but infrastructure works continue—Figure 9 shows the areas where infrastructure is in place. North of the city, work is continuing to move the electric infrastructure underground and to rebuild it—Figure 10 shows the areas where it has been moved underground. The rubbish dump site to the south of the city became surrounded by housing areas over time. The solid waste storage prob-lem, the most important urban infrastructure issue facing the city for a long time, was solved when the Solid Waste Sanitary Landfill entered into service in 2010. What is more, rehabilitation of the old rubbish dump site has begun (Çanakkale Municipality, 2008). The areas with identified urban infrastructure problems are the city centre and along the shores of Sarıçay stream where there is unplanned or disorganised and high-density building. There are frequent sewer blockages in these areas and many drainage problems in the housing areas along the Sarıçay stream bank (Çanakkale Municipality, 2008). In seasons when it rains a lot, there is flooding; the fact that the underground water level is high increases this risk. On Sarıçay riverbank, the areas in the historical city centre are also the settlements where poverty is most intense. Here, where construction quality is quite low, housing flows over to the roads in some places. For this reason, it becomes harder in these areas to renew such infrastructure as sewage and potable water. Natural gas infrastructure has not been developed in these areas to date either. Disorganised housing areas are, at the same time, substandard housing areas in the
Arzu Başaran-Uysal, Funda Sezen, Süha Özden, and Öznur Karaca218
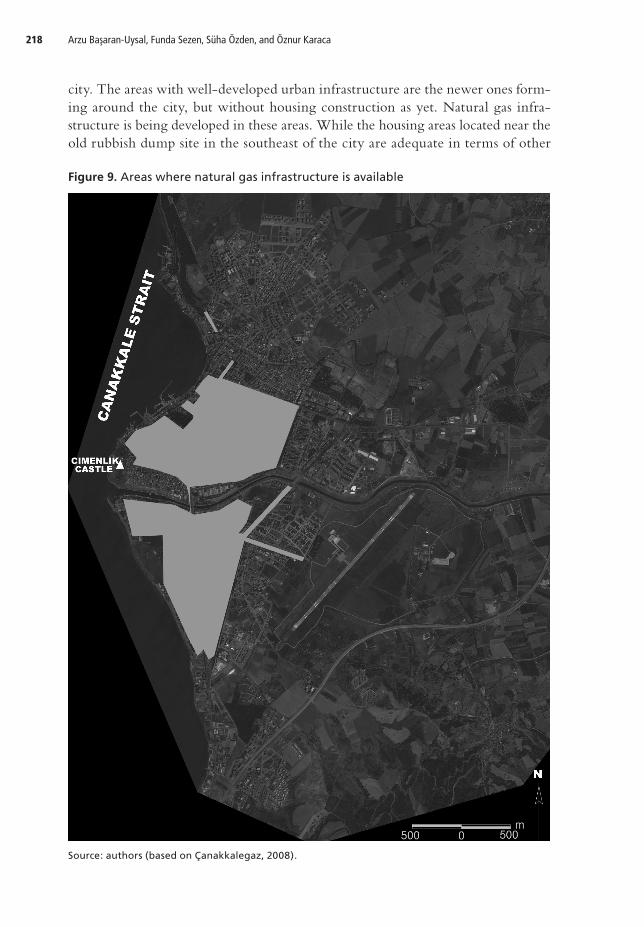
Figure 9. Areas where natural gas infrastructure is available
Source: authors (based on Çanakkalegaz, 2008).
city. The areas with well-developed urban infrastructure are the newer ones form-ing around the city, but without housing construction as yet. Natural gas infra-structure is being developed in these areas. While the housing areas located near the old rubbish dump site in the southeast of the city are adequate in terms of other
Classification of residential areas according to physical vulnerability to natural hazards 219
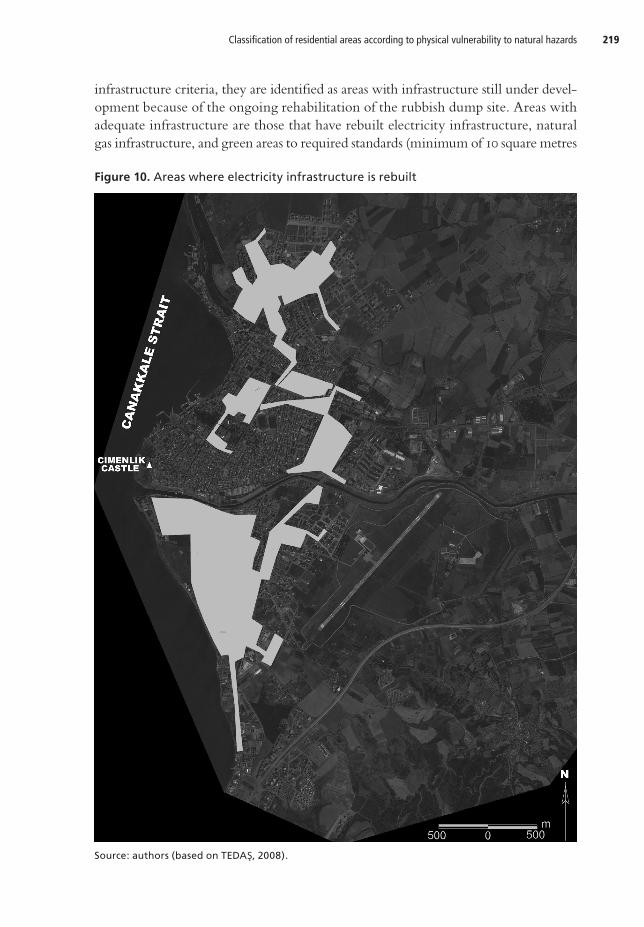
Figure 10. Areas where electricity infrastructure is rebuilt
Source: authors (based on TEDAŞ, 2008).
infrastructure criteria, they are identified as areas with infrastructure still under devel-opment because of the ongoing rehabilitation of the rubbish dump site. Areas with adequate infrastructure are those that have rebuilt electricity infrastructure, natural gas infrastructure, and green areas to required standards (minimum of 10 square metres

Arzu Başaran-Uysal, Funda Sezen, Süha Özden, and Öznur Karaca220
per person). Residential areas are evaluated in three groups in terms of their urban infrastructure possibilities:
• areas with problematic infrastructure; • areas with infrastructure under development; and • areas with adequate infrastructure.
Determining the risky zones
In terms of geological characteristics, the important thing to note is that the soil structure of the whole city does not reside on sound basement rock. The city devel-oped on an alluvium delta created by the Sarıçay stream. In terms of earthquake hazard, the key point is that the entire city faces a natural disaster risk. The city centre and both sides of Sarıçay stream, especially, are areas where liquefaction and flood risks are high. Furthermore, these areas have a disorganised urban pattern and high-density building stock and most constructions have aged. They are defined as housing areas that are unsuitable for settlement from a geological standpoint and are of low quality. As seen, the housing developing in the east and the northeast of the city is on the Çanakkale Formation (Tçç2), which is partially suitable in geological terms in gen-eral. As these areas were opened to housing after 1999, they have a safer construction stock compared to the city centre and do not face flood, landslide, or liquefaction hazards. Urban infrastructure is renewed here. These areas, which cover a spatially significant part of the city, are defined as unsuitable for settlement in geological terms. However, the quality of building and urban infrastructure in these areas is better than that in the inner city. There are planned, developed areas in the south of the city where the quality of housing and urban infrastructure is high but earthquake and landslide hazards are present. Covering a smaller area in comparison to other categories, these areas are defined as not suitable for settlement owing to inappropriate geological criteria, but these areas have high-quality and safer buildings. In the north of the city there is an area that exhibits better geological character-istics. This also has developed with planning and has new building stock. For this reason, it is defined as suitable for settlement in geological terms and has a high-quality built environment. Consequently, following the superimposing of geological characteristics, built-up area’s features, and urban infrastructure on to the synthesis maps (see Figure 11), the housing areas of Çanakkale city are evaluated according to four risk categories (vis-à-vis physical vulnerability to earthquakes, floods, and landslides):
• First (1st) degree risk zone. Substandard housing areas not suitable for settlement geologically are evaluated in this category. The historical centre of the city and both sides of Sarıçay stream are most vulnerable to natural hazards. These areas need to be improved and prepared for natural hazards immediately and as a top

Classification of residential areas according to physical vulnerability to natural hazards 221
Figure 11. Risky zones according to physical vulnerability to natural hazards
Source: authors.
priority. Furthermore, Sarıçay stream is an important part of the urban ecosystem: a natural resource with landscape value. This area is sensitive and needs to be protected to ensure environmental sustainability. In addition, many structures that are important from the perspective of architectural and cultural heritage (such as

Arzu Başaran-Uysal, Funda Sezen, Süha Özden, and Öznur Karaca222
the Armenian Church, Çimenlik Castle, Fatih Mosque, and the Synagogue) are located in the first degree risk zone. The historical city centre, which is defined as a first degree risk area, was declared an urban protected site in 1995. Monuments and historical structures were restored, yet many of the houses with a civil archi-tectural heritage require restoration and reinforcement. There are occasional prob-lems with dilapidation in an area where commerce and housing functions coexist.
• Second (2nd) degree risk zone. Housing areas not suitable for settlement geo-logically but whose urban infrastructure is being improved are evaluated in this category. Covering a significant portion of the city, these areas are of medium den-sity and demonstrate a planned housing pattern. Developed after 1999, it has (safer) mass housing of between four and five storeys. In addition, urban infrastructure is still being developed here. Even though it is not suitable for settlement from a geological viewpoint, therefore, the damage that could be caused by earthquake and floods will be less than that in first degree risk zones. Long-term improvement methods can be designed for this area to mitigate hazards related to natural disasters.
• Third (3rd) degree risk zone. High-quality housing areas not suitable for settle-ment geologically are evaluated in this category. They cover a very small area south of the city. While there is no flooding hazard here, earthquake and landslide hazards are present. However, it is of low density and demonstrates an organised housing pattern, and has developed, quality infrastructure and new buildings. It is developing owing to the panorama of the straits and its proximity to the university campus.
• Fourth (4th) degree risk zone. High-quality housing areas suitable for settle-ment geologically are evaluated in this category. This area is defined as safer in terms of earthquake risk because there is no underground water in the soil. There is also no risk of landsides and overflows. This area has the least physical vulnerabil-ity due to its organised, developed building stock and its sufficient urban infra-structure. While it faces no risk of natural hazards, such as landslides, liquefaction, and overflows, the risk of a natural disaster is not completely absent because it is located in the first degree earthquake risk zone
Conclusion The matter of dealing with natural disaster risks in urban planning not only involves site selection and safe building, but also determining the risks posed by natural haz-ards, performing physical renovation, improving urban infrastructure, enhancing the quality of life, and making decisions about the protection of cultural, historical, and natural heritage. In dealing with mitigation of the damage caused by natural disasters in built-up areas, there is a need to evaluate different parameters in the selec-tion of new housing areas. Identifying areas at risk of natural hazards in built-up areas is the first step in making cities resilient. The areas on which Çanakkale was founded and developed are on alluvium soil, which is very sensitive to natural hazards. The results of the analysis reveal that there are very limited parts of the city suitable for housing. This fact increases the impor-tance of improving the standards of housing and neighbourhoods in the city. The

Classification of residential areas according to physical vulnerability to natural hazards 223
whole city must be re-planned using a new approach that integrates physical vul-nerability to natural hazards in the long term, and improvement strategies should be developed. This study presents a general framework for evaluating the entire city’s physical vulnerability to natural hazards. While it offers observations and more detailed geological maps (1/1000; 1/500), opening boreholes very frequently, soil analysis experimental evaluations, and other detailed research to measure building quality are also required. Nonetheless, this study is important in showing that the city is very vulnerable to natural hazards. The historical city centre and the housing areas near Sarıçay stream have been highlighted as most problematic in terms of disaster risk and sustainability. Immediate and short-term improvement strategies need to be developed for these areas. For the first degree risk zones, more than one urban regeneration model is needed, such as renewal, rehabilitation, strengthening, or improvement strategies. These areas face numerous problems, such as an historic building stock, intense commercial functions, dilapidation, and poverty. Creating and implementing such models for the whole city requires cooperation between organisations. Implementation requires appro-priate budgets and authority—local administrations cannot handle this on their own. Cooperation between the local administration and landlords, public institutions, and the real-estate sector is necessary for successful urban regeneration. The regenera-tion of areas with a disaster risk is on the agenda of the Ministry of Environment and Urbanism and it is preparing a ‘Law Concerning the Transformation of Areas under Disaster Risk’ (URL 2). Following the introduction of such legal regulations, it may be possible to improve and renew the historical city centre and both banks of Sarıçay stream in particular. Since areas suitable for settlement are quite limited in the city, the best approach is to enhance the building quality and the physical environment in vicinities with second and third degree risk. These are the areas where the new housing needs of the city are met. As seen, the buildings in these areas are renovated by landlords and contractors on a parcel-by-parcel basis. A master renovation decision should be taken to direct building improvements on such a scale. Urban renovation strategies, though, will need to increase the resilience of these areas in the long run.
AcknowledgementsThis research was supported by the Scientific Research Projects Commission (project number: 2009/60) at Çanakkale Onsekiz Mart University. Part of the study was adapted from the Master of Science thesis of Funda Sezen (2010), the second author.
CorrespondenceArzu Başaran Uysal, Department of Urban and Regional Planning, Architecture and Design Faculty, Çanakkale Onsekiz Mart University, Terzioglu Campus, 120, 1700 Çanakkale, Turkey. Telephone: +90 286 2180018-3092; e-mail: [email protected]
Arzu Başaran-Uysal, Funda Sezen, Süha Özden, and Öznur Karaca224
Endnotes1 Arzu Başaran-Uysal is an Assistant Professor in the Department of Urban and Regional Planning,
Architecture and Design Faculty, Çanakkale Onsekiz Mart University, Turkey; Funda Sezen, MSc is a Geological Engineer in the Department of Geology Engineering, Engineering Faculty, Çanakkale Onsekiz Mart University, Turkey; Süha Özden is a Professor in the Department of Geology Engineering, Engineering Faculty, Çanakkale Onsekiz Mart University, Turkey; and Öznur Karaca
is an Assistant Professor in the Department of Geology Engineering, Engineering Faculty, Çanakkale Onsekiz Mart University, Turkey.
2 Personal communication with the authors, 2008. 3 Personal communication with the authors, 2008.
ReferencesAlexander, D. (1991) ‘Applied geomorphology and the impact of natural hazards on the built envi-
ronment’. Natural Hazards. 4(1). pp. 57–80. Ambraseys, N.N. and C.F. Finkel (1991) ‘Long-term seismicity of Istanbul and of the Marmara Region’.
Terra Nova. 3(5). pp. 527–539.Ayala-Carcedo, F.J. (2004) ‘A risk analysis and sustainability approach to natural disaster assessment
and mitigation philosophy in the world’. In R. Casale and C. Margottini (eds.) Natural Disaster and Sustainable Development. Springer-Verlag, Berlin. pp. 271–295.
Balamir, M. (2002) ‘Kentsel risk yönetimi: Depremlere karsi güvenli kent tasarimi icin yöntem ve araclar’ [‘Urban risk management: method and tools for safe urban design against earthquakes’]. In E.M. Komut (ed.) Doğal Afetler: Güvenlik için Tasarlama. UIA – Türkiye Mimarlar Odası, Kardelen Ofset, Ankara. pp. 26–54.
Balyemez, S. and L. Berköz (2005) ‘Hasar görebilirlik ve kentsel deprem davranisi’ [‘Vulnerability and urban earthquake behaviour’]. ITÜ Dergisi/A Mimarlik, Panlama, Tasarim. 4(1). pp. 3–14.
Bartone, C., J. Bernstein, and J. Eigen (1994) Toward Environmental Strategies for Cities. Urban Manage-ment Programme 18. The World Bank, Washington, DC.
Bayındırlık ve İskan Bakanlığı (2009) Afetlere hazırlık ve kentsel risk yönetimi raporu [Preparation for Disasters and Urban Risk Management Commission Report. http://www.deprem.gov.tr/sarbis/DDK/Belgeler/Kentlesme_surasi.../kitap4.pdf (accessed on 6 November 2013).
Bhatta, B. (2009) ‘Analysis of urban growth pattern using remote sensing and GIS: a case study of Kolkata, India’. International Journal of Remote Sensing. 30(18). pp. 4733–4746.
Bölen, F. et al. (2006) Istanbul’da konut alanlarında fiziksel çevre kalitesi analizi [Analysis of Housing Areas and the Quality of Life in Istanbul]. Konut ve Yaşam Kalitesi Grubu Raporu, Istanbul Büyükşehir Belediyesi, Istanbul Metropoliten Planlama ve Kentsel Tasarım Merkezi, Istanbul.
Burby R.J., R. Deyle, D. Godschalk, and R. Olshansky (2000) ‘Creating hazard resilient communi-ties through land-use planning’. Natural Hazard Review. 1(2). pp. 99–106.
Çabuk, A. (2001) ‘A proposal for a method to establish natural-hazard-based land-use planning: the Adapazarı case study’. Turkish Journal of Earth Sciences. 10. pp. 43–152.
Can, N. (2001) ‘Dogu Marmara depremi sonrasinda imara yönelik hukuki düzenlemeler’ [‘Legal arrangement after the east Marmara earthquake in Turkey’]. Planlama Dergisi, 3. pp. 41–49.
Çanakkale Municipality (1995) 1/5000 Land Use Plan. Çanakkale Municipality, Çanakkale.Çanakkalegaz (2008) Natural Gas Infrastructure Plan. Çanakkalegaz, Çanakkale.Cannon, T. (1994) ‘Introduction: vulnerability analysis and the explanation of “natural” disasters’.
In A. Varley (ed.) Disasters, Development and Environments. John Wiley and Sons Ltd., London. pp. 13–30. Cengiz, T. and C. Akbulak (2009) ‘Application of analytical hierarchy process and geographic infor-
mation systems in land-use suitability evaluation: a case study of Dümrek village (Çanakkale, Turkey)’. International Journal of Sustainable Development and World Ecology. 16(4). pp. 286–294.

Classification of residential areas according to physical vulnerability to natural hazards 225
Das, B.M. (1983) Fundamentals of Soil Dynamics. Elsevier Science Publishing Co., New York, NY.De La Ville, N., A.C. Diaz, and D. Ramirez (2002) ‘Remote sensing and GIS technologies as tools
to support sustainable management of areas devastated by landslides’. Environment, Development and Sustainability. 4. pp. 221–229.
Deniz, O. (2005) Çanakkale Yerleşim Alanının Yeraltısuyu Kalitesinin İncelenmesi [Research on the Quality of Underground Water in the Çanakkale Residential Area]. Yüksek Lisans Tezi, Fen Bilimleri Enstitüsü, Çanakkale Onsekiz Mart Üniversitesi, Çanakkale.
Devlet Su İşleri (1966) Çanakkale Projesi İstikşaf Raporu. 25. Şube Müdürlüğü, Çanakkale.Eren, R. (1990) Çanakkale ve Yöresi Türk Devri Eserleri. Çanakkale Seramik Fabrikaları A.Ş. Yayını,
Çanakkale.Ersoy, M. (2001) ‘Fiziksel planlama sistemimiz ve dogal afetler’ [‘Physical planning system and natural
disasters in Turkey’]. Planlama Dergisi. 3. pp. 16–23.Geis, D. (2000) ‘By design: the disaster resistant and quality-of-life community’. Natural Hazards Review.
August. pp. 151–160.Jankowski, P. and L. Richard (1994) ‘Integration of GIS-based suitability analysis and multicriteria
evaluation in a spatial decision support system for route selection’. Environment and Planning B: Planning and Design. 21. pp. 323–340.
Koç, T. et al. (2006) Çanakkale´nin Kentsel Gelisimi (1462–2006) ile Fiziki Cografya Iliskisi [The Relation-ship between the Urban Sprawl of Çanakkale (1462–2006) and Physical Geography]. Çanakkale Kent Konseyi Yayinlari, Çanakkale.
Koca, M.Y. (1997) Eğim Haritaları ve Uygulamadaki Önemi [Slope Maps and their Importance for Imple-mentation]. TMMOB Jeoloji Mühendisleri Odası İzmir Şubesi Yayını, İzmir.
Lansing, J.B. and R.W. Marans (1969) ‘Evaluation of neighbourhood quality’. Journal of the American Planning Association. 35(3). pp. 195–199.
Majumder A.K., E. Hossain, N. Islam, andd I. Sarwar (2007) ‘Urban environmental quality mapping: a perception study on Chittagong Metropolitan City’. Kathmandu University Journal of Science, Engineering and Technology. 1(4). http://www.ku.edu.np/kuset/fourth_issue/orginal/6%20A.Kamruzzaman-Edited.pdf (accessed on 30 October 2013).
Malczewski, J. (1999) GIS and Multicriteria Decision Analysis. John Wiley and Sons Inc., New York, NY. Marans, R. (2007) ‘Kentsel yaşam kalitesinin ölçülmesi’ [‘Measuring the quality of urban life’].
Mimarlık. 335. http://mo.org.tr/mimarlikdergisi/index.cfm?sayfa=mimarlik&DergiSayi=53&RecID=1326 (accessed on 30 October 2013).
McKenzie D.P. (1972) ‘Active tectonics of the Mediterranean region’. Geophysical Journal of the Royal Astronomical Society. 30(2). pp. 109–185.
Menoni, S. (2004) ‘Land use planning in hazard mitigation: intervening in social and systemic vul-nerabilities – An application to seismic risk prevention’. In R. Casale, and C. Margottini (eds.) Natural Disaster and Sustainable Development. Springer Berlin Heidelberg. Chapter 10. pp. 165–182.
Nath, S.S., J.P. Bolte, G.L. Ross, and J. Aguilar-Manjarrez (2000) ‘Applications of geographical information systems (GIS) for spatial decision support in aquaculture’. Aquacultural Engineering. 23(1–3). pp. 233–278.
Önem Y. (1974) Gelibolu Yarımadası ve Çanakkale Dolayının Jeolojisi [Geology of Gallipoli Peninsula and Çanakkale]. TPAO Report 877. TPAO Press, Ankara.
Sengezer, B. and E. Koç (2005) ‘A critical analysis of earthquakes and urban planning in Turkey’. Disasters. 29(2). pp. 171–194.
Sezen, F. (2010) Çanakkale Kenti Konut Alanlarında Jeolojik Altyapı ve Çevre Kalitesi [Geological Infra-structure and Environmental Quality in the Residential Areas of Çanakkale]. Yüksek Lisans Tezi, Fen Bilimleri Enstitüsü, Çanakkale Onsekiz Mart Üniversitesi, Çanakkale
Şentürk, K. and C. Karaköse (1987) Çanakkale Boğazı ve Dolayının Jeolojisi [Geology of the Çanakkale Strait]. Maden Teknik Arama Genel Müdürlüğü, Ankara.
Arzu Başaran-Uysal, Funda Sezen, Süha Özden, and Öznur Karaca226
Solway, L. (2004) ‘Reducing the effect of natural hazards on urban areas’. In R. Casale and C. Margottini (eds.) Natural Disaster and Sustainable Development. Springer, Berlin. Chapter 19. pp. 303–338.
TEDAŞ (2008) Electricity Infrastructure Plan. TEDAŞ, ÇanakkaleTolun, V. (ed.) (2008) Çanakkale City Guide. Çanakkale Municipality, Çanakkale.Tutkun, S. Z. and S.B. Pavlides (2005) ‘The Troy Fault’. Bulletin of the Geological Society of Greece. 37.
pp. 194–200. Ulusal Deprem Konseyi (2002) Ulusal Deprem Konseyi Stratejik Raporu [National Earthquake Council
Strategy Report]. http://www.imo.org.tr/resimler/dosya_ekler/940fb8395012661_ek.doc, (accessed on 5 November 2013).
Ünlü, A. (2005) ‘Risk değerlendirme yöntemi olarak yerleşme ünitesi analizi (Town-Watching)’ [‘Town-watching analysis as a risk evaluation method’]. In M. Kadıoğlu and E. Özdamar (eds.) Afet Yönetiminin Temel İlkeleri. JICA Türkiye Ofisi, Ankara. Chapter 1. pp. 53–58.
Wamsler, C. (2006) ‘Mainstreaming risk reduction in urban planning and housing: a challenge for international aid organizations’. Disasters. 30(2). pp. 15−177.
White, P. et al. (2004) Disaster Risk Reduction: A Development Concern. Department for International Development, London.
Wisner, B., P. Blaikie, T. Cannon, and I. Davis (2004) At Risk: Natural Hazards, People’s Vulnerability and Disasters. Second edition. Taylor and Francis, London.
Yaltırak, C. and A.I. Okay (2004) ‘Edremit Körfezi kuzeyi paleotetis birimlerinin jeolojisi’ [‘Geology of the Paleotethys units at the northern part of Edremit Bay’]. ITU Dergisi/D. 3(1). pp. 67–79.
Yiğiter, G.R. (2005) ‘Kentsel yerleşmeleri afetlere hazırlama odaklı kent planlaması’ [‘Urban plan-ning to prepare for disaster and hazard mitigation’]. In M. Kadıoğlu and E. Özdamar (eds.) Afet Yönetiminin Temel İlkeleri. JICA Türkiye Ofisi, Ankara. Chapter 1. pp. 59–66.