Unravelling hazards of nanoparticles to earthworms, from ...
192
Unravelling hazards of nanoparticles to earthworms, from gene to population Merel van der Ploeg
-
Upload
khangminh22 -
Category
Documents
-
view
1 -
download
0
Transcript of Unravelling hazards of nanoparticles to earthworms, from ...

Unravelling hazards of nanoparticles to
earthworms, from gene to population
Merel van der Ploeg

Thesis committee
Promotor
Prof. dr. ir. I.M.C.M. Rietjens
Professor of Toxicology
Co-promotor
Dr. ir. N.W. van den Brink
Senior Scientist Ecotoxicology
Alterra
Other members
Dr. ir. C.A.M. van Gestel, VU University Amsterdam
Prof. dr. A.A. Koelmans, Wageningen University
Prof. dr. ir. W.J.G.M. Peijnenburg, Leiden University
Dr. C. Svendsen, Centre for Ecology and Hydrology, Wallingford, United Kingdom
This research was conducted under the auspices of the Graduate School for Socio-
Economic and Natural Sciences of the Environment (SENSE)

Unravelling hazards of nanoparticles to
earthworms, from gene to population
Merel van der Ploeg
Thesis
submitted in fulfilment of the requirements for the degree of doctor
at Wageningen University
by the authority of the Rector Magnificus
Prof. dr. M.J. Kropff,
in the presence of the
Thesis Committee appointed by the Academic Board
to be defended in public
on Wednesday January 30 2012
at 4 p.m. in the Aula.

Merel van der Ploeg
Unravelling hazards of nanoparticles to earthworms, from gene to population
PhD Thesis Wageningen University, Wageningen, NL (2012)
With references, with summaries in Dutch and English
ISBN 978-94-6173-444-0

Er bestaat materie die nooit verbruikt en/of toxisch zal worden
(Nano, Brugge, 2010)


Table of contents
Chapter 1 General introduction 9
Chapter 2 Effects of C60 nanoparticle exposure on earthworms (Lumbricus
rubellus) and implications for population dynamics 29
Chapter 3 C60 exposure induced tissue damage and gene expression alterations in
the earthworm Lumbricus rubellus 49
Chapter 4 In vitro nanoparticle toxicity to rat alveolar cells and coelomocytes
from the earthworm Lumbricus rubellus 73
Chapter 5 Effects of silver nanoparticles on Lumbricus rubellus earthworms and
particle characterisation in relevant test matrices, including soil 95
Chapter 6 General discussion and future perspectives 133
Summary 145
Samenvatting 151
List of references 159
Acknowledgements 181
About the author 187


9
Chapter 1
General introduction

Chapter 1
10
Nanotechnology
Nanotechnology is a novel technology, which is said to herald a new era or even the next
industrial revolution (Hansen et al. 2008). This technology involves research and
technological development at the atomic, molecular and macromolecular levels, creating
and using structures, devices and systems at the scale of nanometers (Mason 2009;
Miyazaki and Islam 2007; the Woodrow Wilson institute; Wijnhoven et al. 2010).
Properties of the engineered nanoscale materials may be modified towards defined
technological requirements. Nanomaterials tend to be more chemically reactive, have
different strengths or electrical properties and are generally more mobile than similar
materials at larger scales. In some cases, simply making things smaller changes the
properties of materials, such as for example, exhibiting a different colour or starting to
conduct electricity at the nanoscale (Mason 2009; the Woodrow Wilson institute). The
definition of nanomaterials has been under debate, due to the criteria for defining a
substance as a nanomaterial (Maynard 2011). On 18 October 2011, the European
Commission recommended the following definition for a nanomaterial: “a natural,
incidental or manufactured material containing particles, in an unbound state or as an
aggregate or as an agglomerate and where, for 50% or more of the particles in the number
size distribution, one or more external dimensions is in the size range 1 nm – 100 nm”
(European Union 2011). The term nanomaterials includes nano-objects (two dimensions
less than 100 nanometer) and nanoparticles (three dimensions of 100 nanometer or smaller),
but also fullerenes, graphene flakes and single wall carbon nanotubes with one or more
dimensions below 1 nm (the Woodrow Wilson institute; Wijnhoven et al. 2010).
Although nanotechnology is said to have enormous potential to change society and daily
life as we know it, it is just beginning to deliver on its promises. The number of products
containing engineered nanomaterials is steadily growing and for the near future a further
increase is expected (Gottschalk and Nowack 2011). From 2006 to 2011, the number of
listed consumer products containing engineered nanomaterials increased worldwide from
212 to 1317 (the Woodrow Wilson institute). For the European market, the number of
consumer products with a ‘nanoclaim’ (the claim that the product contains engineered
nanomaterials), increased from 143 in 2007 to 858 in 2010 (Wijnhoven et al. 2010). The

General introduction
11
type of products listed are diverse and include sunscreens, shampoos, toothpastes, vitamin
sprays, sport-rackets, golf bats, clothes, food packaging and even food products, such as
coffee creamer and instant noodles (Dekkers et al. 2011; the Woodrow Wilson institute;
Wijnhoven et al. 2010). Apart from consumer products, engineered nanomaterials are also
being used and studied for medical applications, such as drug delivery, bioseparation,
wound dressing, contraceptive devices, coating of surgical instruments and orthopedic
prostheses, nanorobots for surgery, imaging with nanoparticle contrast materials and
nanobiosensors (Chen and Schluesener 2008; Ito et al. 2005; Jain 2008). Other fields where
nanotechnology is used and tested are soil remediation (Andreescu et al. 2009; Tratnyek
and Johnson 2006), environmental monitoring (Rogers 2006; Andreescu et al. 2009),
energy generation and storage (Khodadadi and Hosseinizadeh 2007; Arico et al. 2005;
Vaseashta and Mihailescu 2008) and drinking- and waste water-treatment (Savage and
Diallo 2005; Vaseashta and Mihailescu 2008). By 2014, it is expected that 15% of the total
global output of manufactured goods will have incorporated nanotechnology (Pilkington et
al. 2009).
Hazard considerations
However, the same characteristics which make engineered nanomaterials useful in many
products, such as chemical reactivity and persistence, cause concern about their potential
adverse effects on humans (Rushton et al. 2010; Warheit et al. 2008). To examine the
probability that engineered nanomaterials cause adverse effects to human health, proper
risk assessments are essential (Hagens et al. 2007; Klaine et al. 2008; Navarro et al. 2008a;
Tiede et al. 2009). The risk of a compound depends on the exposure and the potential to
cause harm (the hazard) to an organism (Klaassen and Watkins 2003). The expected
exposure routes associated with engineered nanomaterial production and use, which arise as
a consequence of their diverse applications, include inhalation, ingestion injection and
dermal routes (Casals et al. 2008; Oberdörster et al. 2005; Stone et al. 2007; Stebounova et
al. 2011). Environmental exposure of humans through inhalation of nanoparticles
(previously called ultrafine particles) associated with health effects has been studied most
and started already more than twenty years ago (Oberdörster et al. 2007). Higher levels of

Chapter 1
12
ultrafine particles (10 to 100 nm) were noted in urban areas compared with rural areas and
exposure to these ultrafine particles was positively associated with symptoms of respiratory
and cardiovascular diseases and even increased mortality (Brand et al. 1991; Clancy et al.
2002; Dockery et al. 1993; Donaldson and Stone 2003; Peters et al. 1997; Pope et al. 1991;
Renwick et al. 2004; Stone et al. 2007).
These air pollution studies have contributed to the understanding of nanoparticle exposure
and hazards (Oberdörster et al. 2005). In the last few years, research has resulted in a
considerable amount of information on the hazards of nanoparticles to mammals (including
humans), proceeding from toxicity studies using mammalian cells in vitro and as well as in
vivo studies with different mammals (Ariano et al. 2011; Bhattacharjee et al. 2010; Fujita et
al. 2009; Hansen et al. 2008; Hussain et al. 2005; Shvedova et al. 2005). Overall, the
studies demonstrated that nanoparticles can enter cells by diffusing through cell
membranes, but also by active uptake, such as endocytosis (Barillet et al. 2010;
Bhattacharjee et al. 2011; Johnston et al. 2010). Within cells, nanoparticles may accumulate
and cause toxicity (Bullard-Dillard et al. 1996). Many studies have demonstrated the
formation of reactive oxygen species (ROS) (Barillet et al. 2010; Bhattacharjee et al. 2010;
Foldbjerg et al. 2009; Hsin et al. 2008; Li et al. 2008; Park et al. 2011). Intracellular
accumulation of ROS may either come from direct ROS production on the surface of
nanoparticles, from indirect generation of ROS in cells due to interruption of the
mitochondrial electron transport chain, or from destabilization of cellular ROS elimination
pathways (AshaRani et al. 2008; Bhattacharjee et al. 2011; Hsin et al. 2008; Li et al. 2008;
Ma et al. 2011; Pan et al. 2009). Other toxic effects associated with nanoparticle exposure
and often associated with the ROS formation, are damage to membrane integrity,
inflammation, DNA damage, perturbation of cellular calcium homeostasis and apoptosis
(Ariano et al. 2011; Arora et al. 2008; Green and Howman 2005; Park et al. 2011; Xia et al.
2008; Zhao et al. 2011).
Nanoparticles in the environment
As the toxicity data obtained in mammalian test systems suggest that nanoparticles may
affect human health, the question also arises if engineered nanoparticles have the potential

General introduction
13
to become hazardous pollutants affecting the environment (Farré et al. 2011; Klaine et al.
2008). Due to the steady increase of production and use of engineered nanoparticles,
discharge into the environment (intentionally or unintentionally) during production,
transport, use and disposal is inevitable (Gottschalk and Nowack 2011; Lin et al. 2010;
Oberdörster et al. 2005), Therefore the environmental discharge, exposure and effects are
becoming an increasing concern and need to be addressed (Klaine et al. 2008).
Ecotoxicology of engineered nanoparticles (nanoecotoxicology) is not in its infancy
anymore, but still has an explorative character (Nowack 2009; Kahru and Dubourguier
2010). The risk of a substance depends both on exposure and hazards. For engineered
nanoparticles there is little knowledge about exposure, as the real concentrations of these
particles present in the environment are hardly characterized (Gottschalk and Nowack
2011; Handy et al. 2008a; Paterson et al. 2011; Vonk et al. 2009). It is not yet possible to
monitor engineered nanoparticle concentrations in the environment, due to the lack of
standard analytical methods for the analysis of environmentally relevant concentrations
(Handy et al. 2008a; Nowack 2009; Paterson et al. 2011; Tiede et al. 2008). At the moment
only few studies report on detecting engineered nanoparticle discharge into the environment
(Farré et al. 2010; Hsu and Chein 2007; Kaegi et al. 2008; Kiser et al. 2009), investigating
engineered nanoparticle release from paints used on exterior surfaces into waste waters
(Kaegi et al. 2008) or engineered nanoparticle concentrations and fate in waste water
treatment plants (Farré et al. 2010; Hsu and Chein 2007; Kiser et al. 2009;). The
environmental samples in these studies were analysed using electron microscopy
(transmission electron microscopy (TEM) and scanning electron microscopy (SEM))
mostly in combination with electron dispersive X-ray microanalysis (EDX), inductively
coupled plasma optical emission spectroscopy (ICP-OES) and mass spectrometry (ICP-
MS), and liquid chromatography–quadrupole linear ion trap–mass spectrometry (LC–
QqLIT–MS). Limitations of these studies are that they only represent a small part of the
potential environmental release situations and products, and are often not repeated enough
to get a good statistical evaluation. Furthermore, a combination of methods is needed,
which makes analysis expensive and the interpretation difficult. Therefore, these
experimental methods used are often not suitable for large scale measurements of

Chapter 1
14
environmental concentrations of engineered nanoparticles (Gottschalk and Nowack 2011).
Even though interpretation of these studies on engineered nanoparticles discharge and other
studies on exposure modelling should be treated cautiously, these studies indicate that
increasing concentrations of engineered nanoparticles are present in the environment
(Gottschalk and Nowack 2011; Mueller and Nowack 2008). Predicted environmental
concentrations of engineered nanoparticles approach the milligram per kilogram level (0.5
mg/kg soil for TiO2 nanoparticles in soil treated with sludge from wastewater treatment
plants; Gottschalk et al. 2009).
Once in the environment, engineered nanoparticles can go through different behavioural
changes, including aggregation, adsorption and dissolution (Farré et al. 2011; Klaine et al.
2008; Lin et al. 2010; Paterson et al. 2011). Behaviour of engineered nanoparticles in the
environment depends on their characteristics, among which are size (distribution),
composition, possible contaminants, shape, zeta potential and photoactivation (Paterson et
al. 2011; Vonk et al. 2009). Once released into the environment, the characteristics and thus
the behaviour of engineered nanoparticles will be modified by parameters such as pH, ionic
strength and natural organic matter (Handy et al. 2008b; Lin et al. 2010). Depending on
their behaviour, engineered nanoparticles may interact with chemicals, macromolecules,
other nanoparticles and organisms in the environment in different ways. Animals may be
exposed to engineered nanoparticles via skin contact, oral uptake through the
gastrointestinal tract or through inhalation (Fujita et al. 2009; Handy et al. 2008b; Klaassen
and Watkins 2003; Klaine et al. 2008; Scott-Fordsmand et al. 2008a; Shvedova et al. 2008;
Smith et al. 2007; van Ravenzwaay et al. 2009).
So far, nanoecotoxicological research has focussed mostly on aquatic test organisms,
including water fleas (Daphnia magna) and various species of algae and fish (Fabrega et al.
2011; Kahru and Dubourguier 2010; Navarro et al. 2008b). Compared with studies on the
possible adverse effects of engineered nanoparticles in aquatic test organisms, effects on
soil organisms were less frequently included in environmental hazard identification studies
(Crane et al. 2008; Handy et al. 2008c; Shoults-Wilson et al. 2011a). However, engineered

General introduction
15
nanoparticles may accumulate in soils through the application of sewage sludge, accidental
spills, deposition from the air, agrochemicals or soil remediation (Cornelis et al. 2010).
Furthermore, soil has been indicated as a sink for many (conventional) pollutants and
therefore, long-term exposure of soil organisms is plausible (Rodriguez-Castellanos and
Sanchez-Hernandez 2007). These perceptions make soil organisms a target to be taken into
account. And more recently, attention for the possible adverse effects of engineered
nanoparticles on soil organisms is increasing.
Aim of the thesis study
Given the need for better characterization of hazards of engineered nanoparticles to the
environment and soil organisms in particular, the aim of the present thesis was to
investigate effects of nanoparticle exposure on the earthworm Lumbricus rubellus, as a
model organism for soil ecotoxicology, and to contribute to the development of effect
markers for engineered nanoparticle exposure in this model.
The following sections present in some more detail the model system selected, endpoints of
interest and the nanoparticles chosen for the studies described in the subsequent chapters of
the present thesis.
Model organism: the earthworm
Earthworms (from the Lumbricidae family) were selected as one of the key indicator
organisms for ecotoxicological testing of industrial chemicals by organisations dealing with
environmental pollution and pesticides, including the European Community, the global
Organization for Economic Co-operation and Development (OECD) and the Food and
Agriculture Organization of the United Nations (FAO) (Edwards and Bater 1992). At
present, earthworms are one of the most common organisms used in soil toxicity testing
(Spurgeon et al. 2003; Rodriguez-Castellanos and Sanchez-Hernandez 2007). Earthworms
are excellent subjects for toxicological research, for several reasons. One reason is that
working with these animals is relatively easy, because common expertise about how to
handle them is increasing, standardized guidelines have been developed, identification keys

Chapter 1
16
are available and there is a vast and growing body of knowledge on their biology and
ecology (Spurgeon et al. 2003; Römbke et al. 2005). A second reason is that there are few
ethical objections to the use of these non-controversial experimental organisms (Römbke et
al. 2005; Stenersen et al. 1992). Earthworms are also excellent subjects for ecotoxicological
research, because of their different ways of potential exposure. Earthworms are
continuously exposed both via their exterior epidermis, but also via their intestinal tract,
because they ingest soil (Sanchez-Hernandez et al. 2006; Vijver et al. 2003). In addition, in
the soil, earthworms are in contact with both the aqueous and the solid phase of the
substrate (Römbke et al. 2005). Their reactions to exposure are detectable at various levels
of biological organisation varying from gene expression at the cellular level, to population
dynamics (Spurgeon et al. 2004; Stenersen et al. 1992). Furthermore, although the
complexity of earthworms is low compared with vertebrates, they have highly
differentiated organs and tissues, and possess an immune system that is comparable to that
of vertebrates (Chen et al. 1991; Stenersen et al. 1992). In addition, earthworms are the
common prey of many vertebrates. Therefore, they play a key role in the biomagnification
process of several soil pollutants and in the occurrence of indirect effects of soil pollution
on terrestrial vertebrates (Rodriguez-Castellanos and Sanchez-Hernandez 2007;
Roodbergen et al. 2008).
The earthworm species Eisenia fetida and Eisenia andrei, from the family Lumbricidae, are
the model species used in many studies and the species for which the OECD guidelines are
designed (OECD 207:1984; OECD 222: 2004). These species are recommended because of
their rapid life cycle and ease of culturing in laboratories (Edwards and Bohlen 1996).
However, these are not the ideal species for extrapolation of laboratory data to field
conditions, because these species are limited to sites rich in organic matter, such as compost
and manure (Ma 1984; Tiunov et al. 2006; Lapied et al. 2010) and generally less sensitive
to chemical exposure through the soil, compared with other Lumbricidae species (Dean-
Ross 1983; Frampton et al. 2006; Ma 1984; Ma and Bodt 1993). For the studies described
in the present thesis, another earthworm species from the family Lumbricidae was selected,
e.g. L. rubellus. This is an epi-endogeic and abundant earthworm species, found in
General introduction
17
temperate regions all over the world (Frampton et al. 2006; Ma and Bodt 1993; Sims and
Gerard 1985; Tiunov et al. 2006).
The endpoints of interest
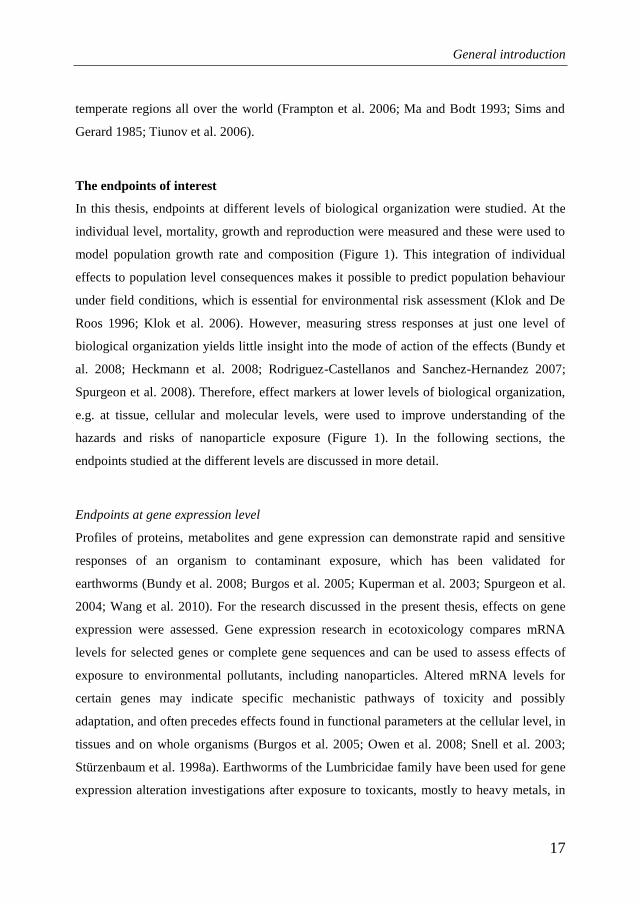
In this thesis, endpoints at different levels of biological organization were studied. At the
individual level, mortality, growth and reproduction were measured and these were used to
model population growth rate and composition (Figure 1). This integration of individual
effects to population level consequences makes it possible to predict population behaviour
under field conditions, which is essential for environmental risk assessment (Klok and De
Roos 1996; Klok et al. 2006). However, measuring stress responses at just one level of
biological organization yields little insight into the mode of action of the effects (Bundy et
al. 2008; Heckmann et al. 2008; Rodriguez-Castellanos and Sanchez-Hernandez 2007;
Spurgeon et al. 2008). Therefore, effect markers at lower levels of biological organization,
e.g. at tissue, cellular and molecular levels, were used to improve understanding of the
hazards and risks of nanoparticle exposure (Figure 1). In the following sections, the
endpoints studied at the different levels are discussed in more detail.
Endpoints at gene expression level
Profiles of proteins, metabolites and gene expression can demonstrate rapid and sensitive
responses of an organism to contaminant exposure, which has been validated for
earthworms (Bundy et al. 2008; Burgos et al. 2005; Kuperman et al. 2003; Spurgeon et al.
2004; Wang et al. 2010). For the research discussed in the present thesis, effects on gene
expression were assessed. Gene expression research in ecotoxicology compares mRNA
levels for selected genes or complete gene sequences and can be used to assess effects of
exposure to environmental pollutants, including nanoparticles. Altered mRNA levels for
certain genes may indicate specific mechanistic pathways of toxicity and possibly
adaptation, and often precedes effects found in functional parameters at the cellular level, in
tissues and on whole organisms (Burgos et al. 2005; Owen et al. 2008; Snell et al. 2003;
Stürzenbaum et al. 1998a). Earthworms of the Lumbricidae family have been used for gene
expression alteration investigations after exposure to toxicants, mostly to heavy metals, in

Chapter 1
18
several studies (Burgos et al. 2005; Homa et al. 2005; Owen et al. 2008; Ricketts et al.
2004; Spurgeon et al. 2004; Stürzenbaum et al. 1998b). Within these studies, alterations
were studied for effects on gene expression for the functioning of proteins for detoxification
(such as metallothionein and lysosomal glycoprotein), general and oxidative stress
(including heat shock protein 70 (HSP70) and glutathione S-transferase (GST)) and
reproduction (annetocin).
Figure 1. Schematic overview of the endpoints studied in the present thesis, at different levels of biological
organization, which provides the possibility to study toxic mode of action at lower levels, as well as exemplify
more about the ecological relevance of demonstrated effects, using the endpoints at higher levels.
Endpoints at cellular level
Using in vitro models, a wide variety of endpoints may be employed to study the cellular
effects of nanoparticles. Endpoints studied and shown to be affected by nanoparticle
exposure include intracellular production of ROS, disturbance of the mitochondrial
membrane potential, reduction in cellular ATP levels, increased cytoplasmic calcium levels,
induction of apoptosis, impairment of cell proliferation and reduced viability (Bhattacharjee
et al. 2011; Pan et al. 2009; Park et al. 2011; Schaeublin et al 2011; Xia et al. 2008).
Cellular models have also been used to study endpoints related to the immune system
specifically, such as production of cytokines and changes in phagocytic activity

General introduction
19
(Bhattacharjee et al. 2011; Nguyen et al. 2012). Since immune cells deal with invasive
particles, including bacteria, viruses and nanoparticles, these cells may be a specific target
for nanoparticle toxicity. For the immune system of earthworms, the free circulating
immune cells present in the coelomic fluid, called coelomocytes, play an important role
(Hayashi et al. 2012; Stein et al. 1977). The earthworm phagocytic assay, using such
coelomocytes, may be considered equivalent to phagocytic assays using vertebrate cells,
because phagocytosis is phylogenetically conserved within the animal kingdom as a first-
line non-specific immune defence against microbial invaders (Burch et al. 1999; Fournier et
al. 2000). Coelomocytes have already been used in several ecotoxicology studies to
demonstrate effects of conventional toxic compounds, and these studies demonstrated that
the model provides a simple, rapid and sensitive tool to assess immunotoxicological
hazards of environmental exposure at the cellular level (Adamowicz 2005; Bilej et al. 1990;
Bilej et al. 1992; Brousseau et al. 1997; Burch et al. 1999; Engelmann et al. 2005;
Massicotte et al. 2004; Ville et al. 1995).
Endpoints at tissue level
Histology is the study of cells, tissues, and organs as seen with a microscope (Sharma and
Satyanarayan 2011). Histological changes in the tissues can be used to determine
modifications and damaging effects on tissues and cells, caused by prior or on-going
exposure to contaminants (Muthukaruppan et al. 2005; Sharma and Satyanarayan 2011).
The changes observed depend on the exposure and on the ability of the organisms to repair
the injury (Muthukaruppan et al. 2005). Histological observations of tissues and cells are
valuable tools to evaluate toxic effects of contaminants, which have been illustrated in
several ecotoxicological studies with different species of Lumbricidae earthworms (Amaral
et al. 2006; Amaral and Rodrigues 2005; Fischer and Molnar 1992; Giovanetti et al. 2010;
Kiliç 2011; Morgan and Turner 2005; Muthukaruppan and Paramasamy 2010).
Endpoints at individual level
The most generally used effect markers in ecotoxicological studies with earthworms are
survival, growth and reproduction. These endpoints are broadly accepted as

Chapter 1
20
ecotoxicological endpoints, because they have been demonstrated as reliable and sensitive
indicators of toxicity (Roh et al. 2007). There are two OECD guidelines for
ecotoxicological studies with earthworms. The first and oldest is the acute toxicity test,
OECD207 (OECD 1984), assessing survival only. The second is the four week
reproduction test, OECD222 (OECD 2004), which also includes observations on growth,
cocoon production and hatchability. Survival is a less sensitive endpoint and from an
ecological point of view less relevant, compared to growth and reproduction (van Gestel et
al. 1992). Therefore the four week reproduction test was used in this study. The offspring of
the earthworms were also exposed and observed until adulthood, considering the potential
prolonged availability of nanoparticles and the potentially higher sensitivity of juveniles
compared with adults for exposure (Booth and O’Halloran 2001; Nielsen et al. 2008;
Widarto et al. 2004).
Endpoints at population level
To assess the ecological impact of nanoparticle exposure, consequences at the population
level may be more relevant than effects observed at the individual level and may thus be
better predictors of hazards that nanoparticle exposure may pose to earthworm populations
under field conditions (Klok et al. 2006; Widarto et al. 2004). For L. rubellus earthworms,
observations made at the organismal level (on survival, growth and cocoon production)
have been used to demonstrate effects of heavy metal and pesticide exposure on growth and
development of earthworm populations in the field, with various population models
(Baveco and de Roos 1996; Klok et al. 2006; Spurgeon et al. 2003). In the present study, a
continuous-time life-history model (Baveco and De Roos, 1996; De Roos, 2008) was used
to integrate effects of nanoparticle exposure on organismal endpoints into effects on
population growth rate and stage distribution, i.e. the composition of the population in the
different life stages of cocoon, juvenile, subadult and adult.
The nanoparticles tested
The nanoparticles used in the in vivo and most in vitro experiments of the present thesis are
from the category of the carbon and silver nanoparticles. These two categories of

General introduction
21
nanoparticles were selected because they are much employed in consumer products and
investigated for various applications (Gelderman et al. 2008; Klaine et al. 2008; Stone et al.
2010; the Woodrow Wilson Institute).
Carbon nanoparticles
Carbon nanoparticles can originate from natural origin or (intentional and unintentional)
anthropogenic sources. Exposure of organisms to carbon nanoparticles with a natural origin
can occur due to volcano eruptions and forest fires, and it has taken place since organisms
live on the earth (Bastús et al. 2008). Exposure to carbon nanoparticles has increased over
the last century due to anthropogenic sources, including the large scale use of internal
combustion engines and, later on, the intentional production of engineered carbon
nanoparticles for consumer products and medical applications (Gelderman et al. 2008; the
Woodrow Wilson institute). The carbon nanoparticle studied in the present thesis is the
fullerene C60, which has a size of approximately 0.7 nm (Goel et al. 2004). As pristine C60
is extremely insoluble in water and very stable, soils are likely to serve as a sink for C60 (Li
and Alvarez 2011; Nielsen et al. 2008). In soil, these nanoparticles are expected to form
clusters together (agglomerates and/or aggregates) and to bind to compounds present in the
soil, including clay and organic matter, as shown in figure 2 (Ben-Moshe et al. 2010; Brant
et al. 2005; Chen and Elimelech 2006).
At the time the present thesis study started, one study on earthworms exposed to
nanoparticles was published, by Scott-Fordsmand et al. (2008a). This study demonstrated
effects of C60, applied through the food, on the reproduction of the earthworm E. veneta.
During the last four years, only one other ecotoxicology study on effects of C60 exposure
has been conducted with earthworms (see table 1). Apart from effect studies, a
bioaccumulation study was performed by Li et al. (2010), which demonstrated the
bioaccumulation of (radiolabelled) C60 added to the soil by E. fetida earthworms.

Chapter 1
22
Figure 2. Schematic overview of the behaviour of C60 in the soil, with clustering of the single particles (nC60) and
the binding of single particles (C60) and nC60 to compounds present in the soil.
Table 1. Studies demonstrating toxic effects of C60 nanoparticle exposure on earthworms. The exposure is
presented as nominal concentrations, added to food or soil. Reproduction was quantified as the cocoon production,
and the effects are calculated as compared with control (100%).
Species Exposure Effect Reference
E. veneta 1 g/kg food ↓ reproduction (to 22%) Scott-Fordsmand et al. 2008a
E. fetida 2 and 10 g/kg soil No avoidance of the C60
amended soil
Li and Alvarez 2011
5 to 50 g/kg soil ↓ reproduction (to 40%)
at 50 g/kg soil
Silver nanoparticles
The second type of nanoparticles investigated in this study are silver nanoparticles (AgNP).
The AgNP used in this thesis had an average size of 15 nm (as stated by the manufacturer)
and have been chosen by the European Commission’s Joint Research Centre (JRC) as a

General introduction
23
representative as-produced commercial nanomaterial. JRC is of the opinion that
“representative nanomaterials are of utmost importance to be made available to the
international scientific community to enable innovation and development of safe materials
and products” (JRC 2011).
Silver (Ag) is a rare but naturally occurring element. Exposure of Ag to humans and the
environment has already taken place for many centuries, because Ag has been used in many
applications, including photography, jewellery and as an antimicrobial (Atkins and Jones
2000; Rai et al. 2009; Wijnhoven et al. 2009). These days Ag is applied to many products
as AgNP, including personal care products and textiles. Several studies have investigated
the release of AgNP from textiles during washing and demonstrated release of Ag (both
ionic Ag and AgNP) up to 377 μg/g product per washing (Benn and Westerhoff 2008; Benn
et al. 2010; Geranio et al. 2009). However, results depended on the type of AgNP, the
product and the washing conditions (Gottschalk and Nowack 2011). Due to the use of
AgNP in textiles and other consumer products, wastewater and eventually sewage sludge
are likely places for AgNP to be found (Cornelis et al. 2010; Mitrano et al. 2012). Sewage
sludge application may be one of the ways AgNP is discharged to the soil. AgNP may be
present in the soil as single particles, dissolve to silver ions or cluster together, and all these
forms may bind to compounds present in the soil (Figure 3; Stebounova et al. 2011;
Tourinho et al. 2012). Conditions under which these nanoparticles dissolve or cluster and
the extent to which these changes occur, depend on the characteristics of the nanoparticles,
including size, coating, surface charge, possible contaminants and shape (Coutris et al.
2012; Park et al. 2011; Vonk et al. 2009). In addition, the type of soil is an important factor
influencing nanoparticle behaviour and therewith toxicity (Cornelis et al. 2010; Shoults-
Wilson et al. 2011a).

Chapter 1
24
Figure 3. Schematic overview of the behaviour of silver nanoparticles (AgNP) in the soil, showing potential
clustering and dissolution of AgNP, and the binding of these Ag forms to soil compounds (including organic
matter, chloride and sulphide).
The mechanisms underlying the toxicity of AgNP have not been fully elucidated, but there
are indications that the toxicity not only depends on ionic Ag, but also on nanoparticle
specific effects (Demir et al. 2011; Hayashi et al. 2012; Kawata et al. 2009; Park et al.
2011). A few studies have indicated that bioaccumulation of AgNP is low in earthworms
(Coutris et al. 2012; Shoults-Wilson et al. 2011a, 2011c). However, toxic effects have been
observed in earthworms exposed to AgNP (Table 2).

General introduction
25
Table 2. Toxic effects observed in earthworms (Lumbricus terrestris and E. fetida) after exposure to AgNP, which
were uncoated, colloid or coated with polyvinyl pyrolidone (PVP) or oleic acid (OA). Reproduction was
quantified as cocoon production of the earthworms. The exposure is given as nominal concentrations and the %
effects are compared with the control (=100%).
Species Exposure Effect Reference
L. terrestris 8.8 nm; colloid ↑ apoptotic activity (to 500%) from 4 mg/kg Lapied et al. 2010
0.4 to 8 mg/kg soil
20 nm; uncoated
↑ apoptotic activity (to 400%) at 100
mg/kg
1 to 100 mg/kg soil
E. fetida 10 nm; PVP-coated ↓ reproduction (to 55%) at 1000 mg/kg
Shoults-Wilson et al. 2011a
10 to 1000 mg/kg soil
30-50 nm; PVP-coated
↓ reproduction (to 40%) from 1000
mg/kg
10 to 1000 mg/kg soil
E. fetida 10 and 30-50 nm; PVP-coated Avoidance from 7 mg/kg Shoults-Wilson et al. 2011b
0.3 to 54 mg/kg soil
E. fetida 30-50 nm; PVP-coated ↓ reproduction (to 40%) from 1000
mg/kg
Shoults-Wilson et al.
2011c
10 to 1000 mg/kg soil
30-50 nm; OA-coated
↓ reproduction (to 40%) from 1000 mg/kg
10 to 1000 mg/kg soil
E. fetida 30-50 nm; PVP-coated ↓ growth (to 73%) Heckmann et al. 2011a
1000 mg/kg soil Total reproductive failure
E. fetida 10 and 80 nm; OA-coated ↓ enzymatic activities from 100
mg/kg Hu et al. 2012
20 to 500 mg/kg soil

Chapter 1
26
Outline of the thesis
Given the need for better characterization of hazards of engineered nanoparticles to soil
organisms, the present thesis investigated effects of nanoparticle exposure on the
earthworm L. rubellus and contributed to the development of effect markers for engineered
nanoparticle exposure in this model soil organism for soil ecotoxicological studies. This
work is presented in six chapters. The present chapter 1 provides an introduction and
background information on the work discussed in this thesis. In order to investigate effects
of C60 exposure at the population level, Chapter 2 presents results from in vivo
experiments in which earthworms were exposed to C60, spiked to the soil in different
concentrations. From these experiments, individual endpoints were deployed to model
population level effects. Chapter 3 and chapter 4 complement the observations made in
chapter 2, studying cellular and molecular responses of earthworms to exposure to C60.
These responses may inform on the toxic mechanisms of C60 exposure and may also
contribute to the development of additional effect markers for C60 exposure. In chapter 3,
histopathology and gene expression analysis of earthworms exposed in vivo to C60 were
investigated. Chapter 4 presents results of experiments using immune cells (coelomocytes)
extracted from earthworms and exposed in vitro to nanoparticles. This test system was used
to study possible effects of C60 exposure on important cells for the immune response in
earthworms. Chapter 5 describes similar experiments as presented in Chapter 2-4, but
performed for AgNP. In vivo and in vitro experiments are discussed, exposing earthworms
and coelomocytes to AgNP. Finally, chapter 6 discusses the findings described in the
thesis and presents suggestions for future research.

General introduction
27

Chapter 1
28

29
Chapter 2
Effects of C60 nanoparticle exposure on
earthworms (Lumbricus rubellus) and
implications for population dynamics
Based on:
MJC van der Ploeg, JM Baveco, A van der Hout, R Bakker, IMCM Rietjens, NW van den
Brink. 2011. Effects of C60 nanoparticle exposure on earthworms (Lumbricus rubellus) and
implications for population dynamics. Environmental Pollution 159: 198-203.

Chapter 2
30
Abstract
Effects of C60 nanoparticles (nominal concentrations 0, 15.4 and 154 mg/kg soil) on
mortality, growth and reproduction of Lumbricus rubellus earthworms were assessed. C60
exposure had a significant effect on cocoon production, juvenile growth rate and mortality.
These endpoints were used to model effects on the population level. This demonstrated
reduced population growth rate with increasing C60 concentrations. Furthermore, a shift in
stage structure was shown for C60 exposed populations, i.e. a larger proportion of juveniles.
This result implies that the lower juvenile growth rate due to exposure to C60 resulted in a
larger proportion of juveniles, despite increased mortality among juveniles. Overall, this
study indicates that C60 exposure may seriously affect earthworm populations. Furthermore,
it was demonstrated that juveniles were more sensitive to C60 exposure than adults.

Effects of C60 on individual and population level
31
Introduction
The production and use of nanoparticles, such as fullerenes and quantum dots, have
increased for several decades and are expected to increase dramatically in the near future
(Navarro et al. 2008a; Nowack and Bucheli 2007). Therefore, exposure of humans and the
environment to these particles seems inevitable (Handy et al. 2008c) and evaluation of
potential impact of engineered nanoparticles on human and environmental health requires
attention (Baun et al. 2008; Nel et al. 2006; Nowack and Bucheli 2007; Scott-Fordsmand et
al. 2008a; Usenko et al. 2008).
In spite of their increased use and development for several decades (Navarro et al. 2008a),
interest in the possible negative effects of nanoparticles was only instigated a decade ago
(Kamat et al. 1998; Li et al. 1996; Sera et al. 1996; Stone et al. 1998). At present, possible
hazards and risks are still mostly unknown (Baun et al. 2008; Handy et al. 2008b). So far,
environmental hazards of nanoparticles have mainly been studied in aquatic organisms
(Baun et al. 2008; Handy et al. 2008b; Isaacson et al. 2007; Moore 2006; Oberdörster 2004;
Oberdörster et al. 2006; Smith et al. 2007; Usenko et al. 2008; Zhu et al. 2006) and
relatively little is known about possible effects on soil organisms and ecosystems (Handy et
al. 2008a; Navarro et al. 2008a; Scott-Fordsmand et al. 2008a). However, well-functioning
soils are the basis of terrestrial ecosystems and essential for the society. Since soil may
serve as a sink for many pollutants (Rodriguez-Castellanos and Sanchez-Hernandez 2007),
including nanoparticles, long-term exposure to nanoparticles is plausible. This demands
detailed ecotoxicological studies on hazards and risks that nanoparticles may pose to soil
organisms. Earthworms, abundant soil organisms, have been used in many conventional
soil ecotoxicology studies, because they are in close contact with the soil and thus good
indicators for risks of soil contaminants (Rodriguez-Castellanos and Sanchez-Hernandez
2007; Spurgeon et al. 2003).
The objective of the present study was to investigate the potential impacts of fullerene
nanoparticles (C60) on earthworms. Effects of C60 exposure on growth, mortality and
reproduction were studied during different life stages of Lumbricus rubellus (cocoon,
juvenile, subadult and adult). These important individual endpoints for population
dynamics (Baveco and De Roos 1996) were used in a continuous-time life-history model

Chapter 2
32
(De Roos 2008). In this way, effects of C60 exposure on the individual endpoints could be
integrated into effects on population growth rate and stage distribution, i.e. the development
of the population in terms of composition and number of individuals. Consequences at the
population level may be more relevant for ecological impact of C60 than endpoints at the
individual level (Klok et al. 2006; Widarto et al. 2004) and may thus be better predictors of
hazards that C60 exposure may pose to earthworm populations under field conditions.
Materials and Methods
Earthworms
Adult (clitellated) individuals of L. rubellus were obtained from an uncontaminated
location in the Netherlands (Nijkerkerveen). The earthworms ranged in weight from 1415
to 1950 mg. Prior to the experiment, they were maintained for two weeks under constant
conditions (24 hrs light, 15°C, 61% relative humidity) in uncontaminated soil, similar to the
experimental soil.
Soil preparation
Experiments were performed using clean soil with 4.3% organic matter and soil pH was 5.0
(Proefboerderij Kooijenburg, Marwijksoord, the Netherlands). A week before the start of
the experiment, the soil was sifted through a 5 mm sieve and transferred to glass containers
(650 gram per container). Containers were kept under the same conditions as during the
acclimatisation period.
C60 was obtained from SES Research (99.5+%, Houston USA). Metal impurities in the C60
were measured by ICP-AES (Table 1), after destruction with aqua regia (NEN 6465, 1992).
As the maximum additional concentrations of metals from C60 when added to the soil, were
far below threshold levels (Abdul Rida 1996; Klok et al. 2006; Scott-Fordsmand et al.
2008a), potential side effects of metals were not considered in further evaluation of the
data.

Effects of C60 on individual and population level
33
Table 1. Measured concentrations of different metals detected in C60 powder, and concentrations added to the soil
at an exposure level of 154 mg C60/kg soil.
Compound Fe Ni Zn Cd Co Cu Pb
mg/kg C60 14.3 0.02 1.5 0.0 0.0 1.2 0.05
mg/kg soil 2.2 0.002 0.2 0.0 0.0 0.2 0.008
To obtain a stable C60 stock solution, C60 was dissolved in an aqueous soil extract. This
extract was obtained by stirring control soil in ultrapure water (0.4 g/mL) for one hour and
then filtering it (Whatman filters type 597, Fisher Scientific). After filtering, C60 was added
to a part of the extract, to a final nominal concentration of 2 g/L. The suspension thus
obtained was stirred for three days, in order to acquire an even suspension. Nominal soil
concentrations were set at 0, 15.4 and 154 mg C60/kg soil (dry weight) and a moisture
content of 17.2% (dry weight). Concentrations were selected based on Scott-Fordsmand et
al. (2008a). For the control (0 mg/kg) and the high exposure (154 mg/kg), 50 mL of soil
suspension without and with C60, respectively, was added to every container with 650 g
soil. For the 15.4 mg/kg soil exposure, 5 mL suspension with and 45 mL suspension
without C60 was added to the soil. Subsequently, the soil was mixed thoroughly. Worms
were added immediately after preparation of the soil.
Characterisation of actual exposure is important in ecotoxicology (Spurgeon et al. 2003;
Scott-Fordsmand et al. 2008b). Therefore, in the present study, appearance and aggregation
of C60 particles in the soil extract were characterised using transmission electron
microscopy (TEM), and concentrations of C60 in the soil were determined by
spectrophotometry. C60 nanoparticles were visualized by a TEM (JEOL JEM 1011) as well
as a high resolution TEM (HRTEM; JEOL JEM 2100), operated at 60 kV and 200 kV,
respectively. Samples were taken from freshly made stocks of ultrapure water with C60 and
soil extract with and without C60. These samples were dropped on a 400 mesh copper
Formvar/carbon grid and left to dry, before examination with the TEM or HRTEM.
Spectrophotometry (Aquamate from Thermo Electron Corporation) was used to determine
actual concentrations of C60, for the control and 154 mg C60/kg exposure soil. Per treatment
five soil samples were collected. C60 was extracted from the soil using toluene and

Chapter 2
34
concentrations were quantified spectrophotometrically (wavelength: 335 nm and extinction
coefficient: 0.072 L/cm/mg; Bensasson et al. 1994; Çiçek et al. 2001). In earthworms it was
not possible to quantify C60 concentrations due to interference of the matrix with the
measurements.
Experimental design
Experiments were conducted conform ISO guidelines 11268-2 :1998, with minor
modifications in exposure scenarios (see above) and use of another species (L. rubellus).
Two experiments were carried out. The first experiment was conducted with adult
earthworms and the second experiment was performed with offspring from the first
experiment. To assess effects on growth rate at different life stages, experimental data on
adult and juvenile growth were analyzed separately.
Adult growth, mortality and reproduction
This experiment consisted of three exposure levels, with nominal concentrations of 0 mg/kg
(n = 8), 15.4 mg/kg (n = 6) and 154 mg/kg (n = 6). Each container housed five earthworms
and the containers were considered to be the experimental units. At the start of the
experiment the worms were weighted and randomly assigned to a container and treatment
(weights did not differ significantly between treatments, α = 0.05). Every week the worms
were fed dried alder leaves (Alnus glutinosa), from an uncontaminated location
(Vossemeerdijk, Dronten, the Netherlands), ad libitum. Before placing the leaves on top of
the soil, they were moistened with demineralised water for at least an hour. After four
weeks, the experiment was terminated and the worms were counted and weighted again.
The number of produced cocoons was determined per container by wet-sieving and hand-
sorting.
Offspring growth and mortality
Ten cocoons (if possible) were taken from each container and were incubated in a large
Petri dish with soil of the corresponding treatment of their parent earthworms. After

Effects of C60 on individual and population level
35
hatching, juveniles were weighted and kept in a glass container with soil under the same
exposure as their parents. Earthworms were sorted monthly from the soil over a period of
326 days, to determine weight and life stage. They were considered subadult when the
tubercula pubertatis was present, but before the clitellum had reached its full development.
Clitellated worms were indicated as adults (Sims and Gerard 1985).
Population model
The population model is based on a simple Dynamic Energy Budget (DEB) model
(Kooijman and Metz 1984). This DEB model assumes that a fixed fraction of the incoming
energy is spend on respiration, for maintenance and growth, and the remainder is invested
in reproduction. Under constant environmental conditions the age-dependent individual
growth with age is defined by the DEB model as
a
a ellll )( bmm)( equation 1
where size l(a) equals the weight to the power of one-third (mg1/3
) of an individual of age a
(in days), lm the maximum attainable size (mg1/3
), lb the size (mg1/3
) at hatching and γ the
individual growth rate constant (mg1/3
/mg1/3
/day) (Klok and Roos 1996).
Following the DEB model, reproduction is proportional to surface area (mg2/3
)
2bmmm)( )( a
a elllrm for ad)( ll a equation 2
with m(a) as the reproduction rate of an individual of age a (cocoons/day), rm the maximum
reproduction rate (calculated from the number of cocoons/worm/day divided by (l(a))2).
Maturation and reaching the subadult stage are assumed to be determined by size. Thus, lad
is the size (mg1/3
) at which individuals become mature.

Chapter 2
36
In contrast to the experimental data, in which growth rate was analyzed for the different
stages separately, for modelling purposes growth rate γ was calculated for the entire life of
the earthworms, integrating the growth rates of the different life stages. For each container,
a growth curve was obtained (more details are discussed in the supplementary data) and all
curves were highly significant (p < 0.05). Growth rate γ was adjusted for the number of
earthworms per container, because Faber et al. (2004) demonstrated under similar
experimental conditions, that growth rate of earthworms correlates negatively with worm
density. The reduction in growth rate due to worm density as determined by Faber et al.
(2004), was used to adjust γ, with a density of 5 worms per container set as the reference.
For the population parameters, averages and standard deviations were calculated per
treatment group. These parameters were used in a continuous-time life-history model (De
Roos 2008). Population growth rate was determined by solving Lotka’s integral equation:
mA
ra daaFame0
)()(1 equation 3
in which r represents population growth rate, m(a) is the individual fecundity at age a (see
above) and F(a) the survival probability up to age a.
Survival function F(a) under natural conditions was derived from field data for a related
species, Lumbricus terrestris (Lakhani and Satchell 1970), and scaled to the shorter lifespan
of L. rubellus. Following the same procedure as Klok and De Roos (1996), we estimated
stage-specific constant mortality rates (c, j, s, a, for cocoons, juveniles, subadults and
adults, respectively) separately from the continuous survival curve. This enabled us to
include additional toxicant-induced stage-specific mortality into the model, as derived from
the experiments. This additional mortality was only included for the juvenile stage, because
this was the only stage in which we found a significantly increased mortality in the high
exposure group.

Effects of C60 on individual and population level
37
Under constant conditions, the population will grow with fixed rate r . The associated
stable stage distribution is given by:
)()( aFeaS r equation 4
in which S(a) represents the density of individuals with age a in the exponentially growing
population relative to the density of newborn individuals (De Roos 2008).
For the stage distribution this implies that fractions of cocoons, juveniles, subadults and
adults are given by:
equation 5
mA
r
r
daaFe
daaFe
C
0
0
)(
)(0
m
s
A
r
A
r
daaFe
daaFe
J
0
)(
)(
0
m
ad
s
A
r
A
A
r
daaFe
daaFe
S
0
)(
)(
m
m
ad
A
r
A
A
r
daaFe
daaFe
A
0
)(
)(
Here 0, As, Aad and Am represent the duration of the cocoon stage, the age at becoming
subadult and adult, and the maximum age, respectively. Note that these thresholds, except
for the cocoon stage duration, are defined by size and can be determined by solving
equation 1 for age at a specified size.
All the parameters used for the different treatments are given in table 2.
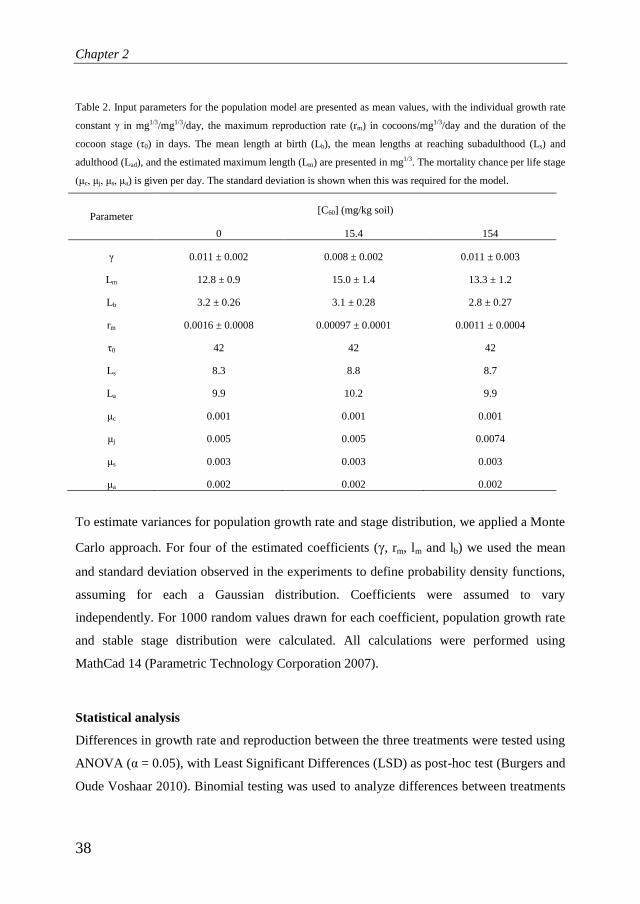
Chapter 2
38
Table 2. Input parameters for the population model are presented as mean values, with the individual growth rate
constant γ in mg1/3/mg1/3/day, the maximum reproduction rate (rm) in cocoons/mg1/3/day and the duration of the
cocoon stage (τ0) in days. The mean length at birth (Lb), the mean lengths at reaching subadulthood (Ls) and
adulthood (Lad), and the estimated maximum length (Lm) are presented in mg1/3. The mortality chance per life stage
(μc, μj, μs, μa) is given per day. The standard deviation is shown when this was required for the model.
Parameter [C60] (mg/kg soil)
0 15.4 154
γ 0.011 ± 0.002 0.008 ± 0.002 0.011 ± 0.003
Lm 12.8 ± 0.9 15.0 ± 1.4 13.3 ± 1.2
Lb 3.2 ± 0.26 3.1 ± 0.28 2.8 ± 0.27
rm 0.0016 ± 0.0008 0.00097 ± 0.0001 0.0011 ± 0.0004
τ0 42 42 42
Ls 8.3 8.8 8.7
La 9.9 10.2 9.9
μc 0.001 0.001 0.001
μj 0.005 0.005 0.0074
μs 0.003 0.003 0.003
μa 0.002 0.002 0.002
To estimate variances for population growth rate and stage distribution, we applied a Monte
Carlo approach. For four of the estimated coefficients (, rm, lm and lb) we used the mean
and standard deviation observed in the experiments to define probability density functions,
assuming for each a Gaussian distribution. Coefficients were assumed to vary
independently. For 1000 random values drawn for each coefficient, population growth rate
and stable stage distribution were calculated. All calculations were performed using
MathCad 14 (Parametric Technology Corporation 2007).
Statistical analysis
Differences in growth rate and reproduction between the three treatments were tested using
ANOVA (α = 0.05), with Least Significant Differences (LSD) as post-hoc test (Burgers and
Oude Voshaar 2010). Binomial testing was used to analyze differences between treatments

Effects of C60 on individual and population level
39
for juvenile mortality and for population stable stage distribution (Burgers and Oude
Voshaar 2010). Since juvenile earthworms are relatively fast growing, an exponential
growth curve was assumed for this life stage, while for adult earthworms the growth rate
was assumed to be linear (Burgers and Oude Voshaar 2010). All statistics were conducted
using GENstat (12th
Edition, VSN International Ltd.).
Results
Characterisation of exposure media
The TEM images shown in figure 1 demonstrate that soilextract only does not contain C60
aggregates (Fig. 1A), but these aggregates are present in the soilextract with C60 (Fig. 1B).
C60 appears to form aggregates of 10-15 nm in size, in soilextract (Fig. 1B) as well as in
demineralised water (Fig. 1C), and these aggregates form loose clusters with each other.
The HRTEM image of soilextract with C60 (Fig. 1D) shows the crystal structure of the
aggregated C60 nanoparticles, demonstrated for these particles in other studies as well
(Fujita et al. 2009; Goel et al. 2004). This indicates that the structures visualized in figure
1B and 1C indeed consist of C60.
Figure 1. TEM images of soilextract without C60 (A) and with C60 (2 mg/mL) (B), and demineralised water with
C60 (1 mg/mL freshly made stocks) (C). HRTEM image of the soilextract with C60 (D), showing the crystal
structure of the C60 nanoparticles in the aggregates.
Spectrophotometry was used to estimate concentrations of C60 in the soil. In the control soil
a concentration of 6.6 ± 0.9 mg/kg soil (mean ± S.E.) was measured and in the high
exposure soil (with nominal concentration of 154 mg C60/kg soil) the measured C60

Chapter 2
40
concentration was 125.2 ± 3.3 mg/kg soil. We assume that the 6.6 mg C60/kg soil in the
control soil (nominal C60 concentration of 0 mg/kg) is a natural background of unknown
carbon particles. This could consist of C60 particles, but also of other carbon particles,
because the method is not size selective. The measured concentration at the high exposure
could then be adjusted to (125.2–6.6=) 118.6 mg/kg soil. Measured concentrations are in
the range of the expected/nominal levels (with ~75% of nominal concentration for the
measured high concentration), so we assume that nominal levels approach actual levels of
C60. Furthermore, the small standard errors indicate that the C60 is well mixed through the
soil.
Adult mortality, growth rate and cocoon production
No significant differences were observed between treatments for survival and growth rate
of adult earthworms (Table 3), but cocoon production was significantly affected by C60
exposure (p=0.011). Earthworms exposed to nominal C60 concentrations of 154 mg/kg soil
produced significantly fewer cocoons than the control (~60% of control). Cocoon
production of the earthworms in the group exposed to nominal C60 concentrations of 15.4
mg/kg soil did not differ significantly from either the control or the high exposure group.
Table 3. Average mortality (%/day), growth rate (mg/worm/day) and cocoon production (number of
cocoons/worm/day) for adult L. rubellus earthworms in the different treatment groups, exposed for four weeks.
Capitals A and B indicate significant differences within a column (α = 0.05). Mean values ± S.E.
[C60] mg/kg soil Mortality Growth rate Cocoon production N
0 0.1 ± 0.09 A 12.8 ± 1.9 A 0.25 ± 0.01 A 8
15.4 0.2 ± 0.24 A 11.4 ± 2.7 A 0.21 ± 0.02 AB 6
154 0.1 ± 0.12 A 8.5 ± 3.8 A 0.15 ± 0.03 B 6
Juvenile growth rate and mortality
Mortality among juveniles exposed to nominal C60 concentrations of 154 mg/kg soil was
significantly higher than the control group (p=0.002), while exposure to nominal C60

Effects of C60 on individual and population level
41
concentrations of 15.4 mg/kg soil did not significantly affect juvenile mortality (figure 2;
p=0.363).
Figure 2. Juvenile mortality (percentage dead juveniles of the total number of hatched juveniles) for L. rubellus
earthworms per treatment. Capital A and B indicate significant differences (α = 0.05). Mean values ± S.E.
Table 4 shows that exposure to nominal C60 concentrations of 15.4 mg/kg soil resulted in a
significantly reduced growth rate for juveniles, compared to the control group. No
significant difference was demonstrated between the growth rates of the juveniles exposed
to nominal C60 concentrations of 154 mg/kg soil and the control.
The size at which individuals developed from juvenile to subadult tended to increase with
higher exposure level, but this effect was not significant (0 mg/kg: 8.5 ± 0.46 cm; 15.4
mg/kg: 8.9 ± 0.66 cm; 154mg/kg: 9.0 ± 0.46 cm; mean ± S.E.).
Table 4. Growth rate (R; within regression used: A+B*(RX)) for juvenile L. rubellus earthworms per treatment.
Capitals (A or B) describe significant differences (α = 0.05). Mean values ± S.E.
[C60] mg/kg soil Growth rate N
0 1.007 ± 0.002 C 8
5.4 0.998 ± 0.003 D 6
154 1.007 ± 0.004 C 5
Chapter 2
42
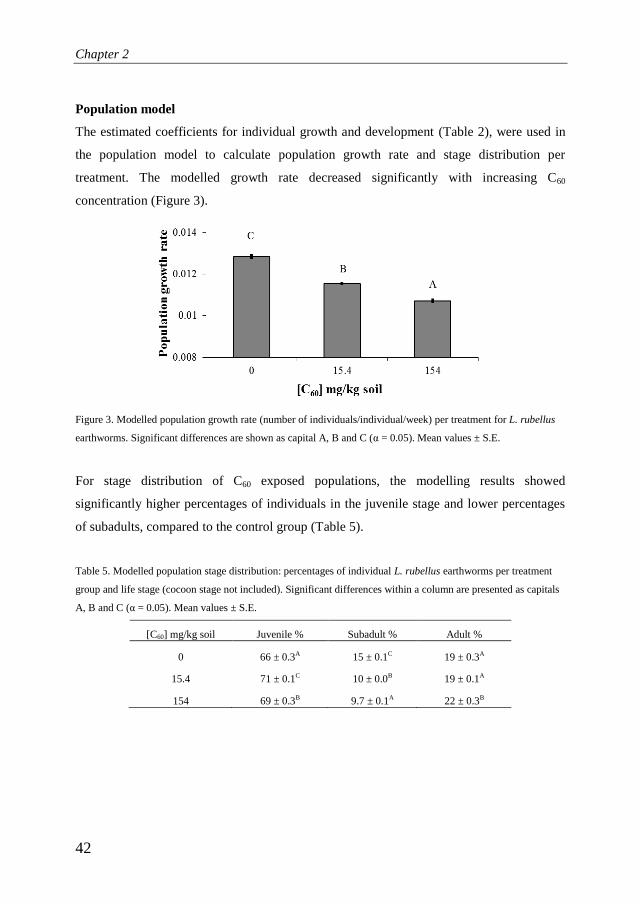
Population model
The estimated coefficients for individual growth and development (Table 2), were used in
the population model to calculate population growth rate and stage distribution per
treatment. The modelled growth rate decreased significantly with increasing C60
concentration (Figure 3).
Figure 3. Modelled population growth rate (number of individuals/individual/week) per treatment for L. rubellus
earthworms. Significant differences are shown as capital A, B and C (α = 0.05). Mean values ± S.E.
For stage distribution of C60 exposed populations, the modelling results showed
significantly higher percentages of individuals in the juvenile stage and lower percentages
of subadults, compared to the control group (Table 5).
Table 5. Modelled population stage distribution: percentages of individual L. rubellus earthworms per treatment
group and life stage (cocoon stage not included). Significant differences within a column are presented as capitals
A, B and C (α = 0.05). Mean values ± S.E.
[C60] mg/kg soil Juvenile % Subadult % Adult %
0 66 ± 0.3A 15 ± 0.1C 19 ± 0.3A
15.4 71 ± 0.1C 10 ± 0.0B 19 ± 0.1A
154 69 ± 0.3B 9.7 ± 0.1A 22 ± 0.3B

Effects of C60 on individual and population level
43
Discussion
Exposure scenario
An important issue when performing ecotoxicity experiments is the exposure scenario
(Scott-Fordsmand et al. 2008b). For this scenario, the addition of the potential toxic
compound to the soil is a significant aspect. Nanoparticles are generally applied to the soil
in a suspension. Such a suspension can be produced by prolonged stirring of the
nanoparticles in water, sonication of the nanoparticle solution or dissolving the
nanoparticles in a carrier solvent, such as THF (Oberdörster 2004; Scott-Fordsmand et al.
2008a; Zhu et al. 2006). However, these dissolving methods can have an effect on the
toxicity of nanoparticles (Henry et al. 2007; Oberdörster et al. 2006; Spohn et al. 2009; Zhu
et al. 2006). Furthermore, such exposure may not mimic ecologically relevant exposure
scenarios. To avoid this possible drawback, we dissolved C60 in an aqueous solution
containing extracted organic material from the experimental soil, before adding it to the
soil. In this way, no additional compounds or co-solvents were required.
Another aspect of the exposure scenario is characterization of the potential toxic compound
in the soil. We characterized aggregation status and estimated particle size distribution of
C60 in the soil using (HR-)TEM. As demonstrated in figure 1, the crystal structure
characteristic for nanoparticles was only visible in the soil extract with C60 and not in the
soil extract only. Also, soilextract with C60 nanoparticles appeared to contain similar
nanoparticle aggregates as the solution of C60 in demineralised water (which contains no
other particles than the C60 nanoparticles). These samples demonstrated C60 particles in
aggregates within the size range of 10-15 nm and these tight aggregates appeared to form
loose clusters with other C60 aggregates. When total C60 concentrations were measured in
the soil, using spectrophotometry, this demonstrated that measured C60 concentrations in
the high treatment group were in the same range as the nominal concentrations (with an
extraction efficiency of ~75%). This indicates that nominal concentrations of C60 appeared
to be similar to actual concentrations.

Chapter 2
44
Experimental endpoints
Adult cocoon production
Cocoon production of adult earthworms decreased with increasing C60 concentrations
(Table 3), which is consistent with a study by Scott-Fordsmand et al. (2008a). Although
there were differences between the experimental methods of Scott-Fordsmand et al. (2008a)
and our study, for example the use of a different earthworm species (Eisenia veneta) and a
different exposure route of C60 (through food), effects on cocoon production were similar
between the studies.
Juvenile growth rate and mortality
The severity of the effects of C60 on the juvenile earthworms increased with the exposure
level. At the low exposure level non-lethal effects were visible on growth rates (Table 4),
but at the high exposure level lethality increased significantly (Figure 2). Lower juvenile
growth rate combined with an increased size needed to develop to subadult (demonstrated
as a trend in the current study), leads to a higher fraction of the population remaining in the
juvenile stage. At a nominal C60 exposure level of 154 mg/kg soil, juveniles demonstrated a
similar growth rate as the control group, which was unexpected. However, this treatment
group showed a high mortality level (~40%). Two hypotheses can be postulated for the
mechanism that could overshadow possible effects on growth rate in the 154 mg/kg
exposure group. The first hypothesis is that C60 exposure caused slow-growing juveniles to
die, resulting in a selection towards individuals with a normal growth rate. A second
hypothesis may be related to a density-dependent growth rate under the experimental
conditions, which was demonstrated by Faber et al. (2004). Due to the induced mortality,
density decreased for the 154 mg/kg soil treatment. Hence, earthworms that survived C60
exposure could have had a density advantage. This latter hypothesis was assumed to be the
most important mechanism and therefore the growth rates used in the population modelling
were adjusted for the earthworm densities (see supplementary data).

Effects of C60 on individual and population level
45
Population model
When applying the experimental data in the population model (with correction for
density), the population growth rate was found to be reduced significantly with
increasing C60 concentrations (figure 3). The model also demonstrated effects of C60
exposure on the stage distribution of the populations, with increased percentages of
C60 exposed individuals in the juvenile stage (Table 5). Experimental data on
reduced juvenile growth rate (Table 4), combined with a longer length needed to
reach subadulthood, confirm that exposed earthworms may stay longer in the
juvenile stage. However, this effect is not detectable at the adult stage, likely due to
a faster development through the subadult stage, as demonstrated by the smaller
fraction of earthworms in this stage (Table 5).
Juvenile sensitivity
Both the individual and the modelled data demonstrate effects of C60 on the juvenile stage.
Similar to these results, other studies using annelids have also demonstrated the juvenile
stage as most sensitive to toxic compounds (Booth and O’Halloran 2001; Levin et al. 1996;
Widarto et al. 2004). The studies of Booth and O’Halloran (2001) and Widarto et al. (2004)
found that juvenile growth rate was more reduced than adult growth rate, upon exposure to
pesticides and nonylphenol, respectively. These two studies and the study by Levin et al.
(1996) also showed that time to maturity was affected by exposure to the toxic compounds.
Responses of juveniles may predict long-term impact of exposure to toxic compounds on
populations better than responses in adults (Booth and O’Halloran 2001), especially when
effects demonstrated under laboratory conditions are extrapolated to the field situation. In
the field, the lifespan of earthworms is generally shorter than under laboratory conditions
(Edwards and Bohlen 1996), because earthworms are not only exposed to the studied toxic
compound but also to other stress factors, including seasonal variation, predation,
competition, parasites, water motion and other pollutants (Klok et al. 2006; Levin et al.
2006). When the juvenile growth rate is reduced, this results in a prolonged juvenile stage
and thus in shorter subadult and adult stages under field conditions. Some juveniles might
not even reach adulthood within their lifespan (Klok and De Roos 1996). Lower number of

Chapter 2
46
earthworms growing to adulthood in combination with reduced fertility, would then
aggravate the negative effects of C60 on cocoon production.
Conclusions
This study shows that C60 exposure affects L. rubellus in a dose-dependent way, both at
individual and at population level. Data at the individual level demonstrated reduced
cocoon production and juvenile growth rate, and a higher juvenile mortality for the exposed
earthworms. When these observed effects were extrapolated to the population level, this
resulted in a lower growth rate and a stage distribution shift towards a larger proportion of
juveniles, for C60 exposed populations. Hence, we conclude that exposure to C60 may pose a
hazard to earthworm populations. The present study also suggests that earthworms in the
juvenile stage represent a more sensitive target for long-term effects on populations than
adult earthworms.
Acknowledgements
The authors would like to thank Joost van der Pol for his work during the early stage of the
experiments. Also, we would like to show our gratitude to Jack Faber for sharing his
earthworm knowledge with us. Furthermore, Gerrit Alink, Hans Bouwmeester and Sourav
Bhattacharjee are acknowledged for the useful discussions about nanoparticle toxicology.
Furthermore, we would like to thank Hans Zweers, Ruud Peters and Bert Brouwer for their
help with the C60 measurements, in soil and earthworms. This research project was
supported by Wageningen UR strategic research program BioNanotechnology 2007-2011
and research school WIMEK.
Supplementary data
To obtain averages of the parameters for the population model per treatment, we used a
Gompertz curve to describe the growth of the earthworms. This curve provided us with
information about the rate constant (γ), maximum length (Lm) and weight at hatching (Lb)

Effects of C60 on individual and population level
47
for every container (Table S1). All regressions were (highly) significant, as is demonstrated
by the Fprob in table S1 and is illustrated for two examples in figures S1A and S1B.
Table S1: Per container γ, Lm, Lb and Fprob were obtained by fitting the data on a growth curve.
pot # [C60] γ estimated γ adjusted Lm Lb
Fprob (mg/kg soil) (mg1/3/mg1/3/day) (mg1/3/mg1/3/day) (mg1/3) (mg1/3)
1 0 0.01 0.014 9.79 3.25 < 0.001
2 0 0.01 0.012 13.48 3.57 < 0.001
3 0 0.013 0.012 12.04 2.78 < 0.001
4 0 0.011 0.011 13.85 3.22 < 0.001
7 0 0.009 0.007 13.22 3.32 < 0.001
8 0 0.013 0.012 14.5 3.2 0.031
9 15 0.012 0.009 14.85 2.73 < 0.001
11 15 0.007 0.006 16.86 3.4 < 0.001
13 15 0.009 0.008 14.96 3.01 < 0.001
14 15 0.009 0.01 13.48 3.14 < 0.001
15 154 0.009 0.007 14.12 3.06 < 0.001
16 154 0.017 0.015 11.77 2.8 < 0.001
17 154 0.013 0.012 13 2.88 < 0.001
19 154 0.015 0.011 14.33 2.41 0.008
Figure S1. Individual L. rubellus earthworms with measured data (black line) and modelled data (dotted line) from
container 8 (A) and 16 (B), with length in mg1/3 plotted against age (# days after hatching).

Chapter 2
48

49
Chapter 3
C60 exposure induced tissue damage and
gene expression alterations in the
earthworm Lumbricus rubellus
Based on:
MJC van der Ploeg, RD Handy, L-H Heckmann, A van der Hout, NW van den Brink. 2012.
C60 exposure induced tissue damage and gene expression alterations in the earthworm
Lumbricus rubellus. Nanotoxicology, in press, DOI: 10.3109/17435390.2012.668569.

Chapter 3
50
Abstract
Effects of C60 exposure (0, 15.4 or 154 mg/kg soil) on the earthworm Lumbricus rubellus
were assessed at the tissue and molecular level, in two experiments. In the first experiment
earthworms were exposed for four weeks, and in the second lifelong. In both experiments
gene expression of heat shock protein 70 (HSP70) decreased. For catalase and glutathione-
S-transferase (GST) no significant trends in gene expression or enzyme activity were
observed. Gene expression of coelomic cytolytic factor-1 (CCF-1) did not alter in
earthworms exposed for four weeks, but was significantly down-regulated in the lifelong
exposure. Histology of earthworms exposed to C60 in both experiments showed a damaged
cuticle, with underlying pathologies of epidermis and muscles, as well as effects on the gut
barrier. However, tissue repair was also observed in these earthworms. Overall, these data
show that sub-lethal C60 exposure to earthworms via the soil affects gene expression and
causes tissue pathologies.

Effects of C60 on gene expression and tissues
51
Introduction
The field of nanotechnology is rapidly expanding and carbon-based nanomaterials represent
the second largest category of nanomaterials (second only to silver; as discussed in the
Nanotechnology Project of the Woodrow Wilson International Centre for Scholars).
Carbon-based nanomaterials, which include fullerenes, are used in health and fitness
products, electronic goods, medical technology, and to encapsulate active ingredients for
bioremediation (Cheng et al. 2004; Aitken et al. 2006). It is therefore inevitable that
fullerenes, such as C60, will be released into the environment (Gottschalk et al. 2009). C60
exposure can be toxic to animals (Handy et al. 2008a; Klaine et al. 2008; Kahru and
Dubourguier 2010), including earthworms (Scott-Fordsmand et al. 2008a; Chapter 2).
Environmental risk assessments typically use survival, growth and reproductive success to
predict population level responses to chemicals (Roh et al. 2007). For earthworms, reduced
survival, growth and reproduction have been described for C60 exposure in the soil (Scott-
Fordsmand et al. 2008a; Chapter 2), including their consequences for the population
growth rate. However, effects of C60 exposure on earthworms below the whole organism
level are much less clear and studies on the possible target tissues, biological processes as
well as modes of action underlying the toxicity of these nanoparticles are needed.
Research on the sub-lethal effects of C60 has been driven partly by the chemistry of C60,
with a focus on the ability of C60 to generate reactive oxygen species (ROS) (Taylor and
Walton 1993; Kamat et al. 2000). Evidence for the oxidative stress hypothesis arises from
studies on mammalian cells exposed to C60, where antioxidants (such as ascorbic acid and
alpha-tocopherol) protected against membrane damage and the activity of antioxidant
enzymes (e.g., catalase and superoxide dismutase) was altered (Kamat et al. 2000; Usenko
et al. 2008). Moreover, other mammalian studies demonstrate evidence of inflammatory
responses (Fujita et al. 2009; Mühlfeld et al. 2008) and alterations of macrophage immune
function (Hamilton et al. 2007), due to C60 exposure. However, toxic mechanisms and
stress responses of earthworms to C60 exposure remain to be investigated.
The overall aim of the present study was to investigate cellular and molecular responses of
earthworms to C60 exposure, to complement the observations already made on survival,
growth and reproduction (Chapter 2). The secondary objective was to contribute to the

Chapter 3
52
development of effect markers for C60 exposure, by using a set of established effect markers
which reflect the different levels of biological organisation in the earthworm and may also
inform on the toxic mechanism of C60 exposure (Handy et al. 2002a; Heckmann et al.
2008). At the molecular level, four specific effect markers were selected; heat shock
protein 70 (HSP70) as a well-known effect marker of generic stress (van Straalen and
Roelofs 2006), catalase and glutathione-S-transferase (GST) as effect markers for oxidative
stress (Kohen and Nyska 2002), and coelomic cytolytic factor-1 (CCF-1) as an immune
response effect marker (Olivares Fontt et al. 2002). At the cellular and tissue level,
histological analyses were used to identify pathology and evidence of inflammation in the
tissue. Finally, the molecular and tissue level effects were interpreted in the context of
effects on mortality, growth and reproduction observed in the same experiments, as
reported in chapter 2.
Materials and Methods
Soil preparations and C60 characterisation
The earthworms investigated in this study are from the same experiments as described in
chapter 2, where details about soil preparations and C60 characterisation are described. In
short, the experiments were carried out with clean soil, consisting of 4.3% organic matter
and the pH was 5.0 (Proefboerderij Kooijenburg, Marwijksoord, the Netherlands). The
containers, with soil and earthworms, were maintained under constant conditions (24 hours
light, 15°C, 61% relative humidity) throughout the experiments. C60 was obtained as a dry
powder from SES Research (99.5+%, Houston USA). To be able to get an indication of
metal impurities in the C60, a chemical analysis on the C60 powder was performed, by
inductively coupled plasma-atomic emission spectroscopy (ICP-AES). As shown in table 1,
metal levels were well below threshold levels for toxic effects, even with maximum
addition of C60 to the soil (Neuhauser et al. 1984; Abdul Rida 1996; Scott-Fordsmand et al.
1998; Klok et al. 2006).

Effects of C60 on gene expression and tissues
53
Table 1. Overview of measured concentrations of different metals detected in C60 (mg/kg C60) and nominal
concentrations of the metals (mg/kg soil) for the highest exposure level of C60 (154 mg C60/kg soil). Threshold
levels, or no effect levels, for earthworms (at mg/kg soil) from the literature are also given (Neuhauser et al. 1984;
Abdul Rida, 1996; Scott-Fordsmand et al. 1998; Klok et al. 2006).
Metal (mg/kg) Cd Co Cu Fe Ni Pb Zn
In C60 >0.0001 >0.0001 1.2 14 0.016 0.05 1.48
In soil with C60 >0.0001 >0.0001 0.18 2.2 0.002 0.008 0.23
Threshold level 1.6 26 22 28495 80 52 85
To obtain a stable C60 stock solution, C60 was dissolved in an aqueous soil extract (as also
described in Chapter 2). This extract was obtained by stirring control soil in ultrapure
water (0.4 g soil/mL) for one hour at 180 rpm, after which it was filtered (Whatman filters
type 597, Fisher Scientific). After filtering, C60 was added to a part of the soil extract, to a
final nominal concentration of 2 g/L. The C60 suspension thus obtained was stirred for three
days. Nominal soil concentrations were set at 0 (control), 15.4 and 154 mg C60/kg soil (dry
weight), with a moisture content of 17.2% (dry weight). To obtain these concentrations in
the soil, 650 gram soil was mixed with soil extract for two minutes (Hobart mixer, speed 2),
for every container separately. For the control and the 154 mg/kg exposure 50 mL of soil
extract, without and with C60 respectively, was added to every container. For the 15.4
mg/kg soil exposure, the soil extract added to each container consisted of 5 mL soil extract
with C60 and 45 mL soil extract without C60. Earthworms were added to the containers
immediately after preparation of the soil.
Size and aggregation of C60 particles in the soil extract were characterised using both
transmission electron microscopy (TEM) (JEOL JEM 1011) and high resolution TEM
(HRTEM; JEOL JEM 2100), operated at 60 kV and 200 kV, respectively. Samples of C60
in the soil extracts demonstrated that C60 appeared to form aggregates of 10-15 nm in size,
which clustered together loosely (as also discussed in chapter 2). The HRTEM image of
the soil extract with C60 showed the normal crystal structure of the aggregated C60, as
observed in other studies also (Fujita et al. 2009; Goel et al. 2004).
Concentrations of C60 in the soil were determined with a toluene extraction method and
followed by spectrophotometry (Aquamate from Thermo Electron Corporation), for five

Chapter 3
54
samples per treatment (as described in chapter 2). Measured concentrations of C60 were in
the range of the nominal levels (125.2 ± 3.3 mg/kg soil (n=5) for the high nominal
concentration of 154 mg/kg soil), suggesting that nominal levels approached actual levels
of C60. Furthermore, the small standard errors between replicate soil samples indicated that
the C60 was well mixed throughout the soil. For earthworms, it was not technically possible
to quantify C60 concentrations in the tissues, due to interference from the organic matrix of
the tissues.
Experimental designs
Two experiments were carried out. In the first experiment healthy adult earthworms
(Lumbricus rubellus), ranging in weight from 1241 to 1663 mg, were exposed to soil with
nominal concentrations of 0, 15.4 or 154 mg C60/kg soil for four weeks. Eight containers
were used for each treatment and each container housed five earthworms. The containers
were considered to be the experimental units for replicates, so there were eight replicates
and 40 earthworms per treatment. Every week the earthworms were fed alder leaves (Alnus
glutinosa), from an uncontaminated location (Vossemeerdijk, Dronten, the Netherlands), ad
libitum. In the second experiment offspring, from parent earthworms exposed to the same
C60 treatment as above, were exposed from hatching up to adulthood (approximately 350
days; ‘lifelong’). The number of replicates was eight for the control treatment and six for
both 15.4 and 154 mg C60/kg soil. Earthworms were fed alder leaves as discussed above
and the containers were checked every four weeks, to monitor the survival and body weight
of the earthworms. At the end of each of the experiments, earthworms were washed in cold
demineralized water, weighed and then randomly allocated for histological examination
(two earthworms per container) or for gene expression and enzyme activity analysis (one
earthworm per container).
Gene expression analysis
Earthworms used for gene expression analysis were washed in cold demineralized water,
weighed and then immediately snap frozen in liquid nitrogen and stored at -80°C.
Earthworms were transported on dry ice to the National Environmental Research Institute
Effects of C60 on gene expression and tissues
55
(NERI) in Silkeborg Denmark, where gene expression measurements were performed. For
these measurements, earthworms from four replicates were used per exposure group (n = 4
containers per treatment), but for the earthworms exposed lifelong to 154 mg C60/kg soil
only earthworms from three containers were available due to high mortality at this
treatment level (n = 3). Individual whole earthworms were taken from the -80°C freezer
and immediately ground to a fine powder, under liquid nitrogen, using a pestal and mortar.
The resulting powder was mixed thoroughly to ensure that a representative sub-sample
(approximately 20 mg tissue) could be used for gene expression analysis. Total RNA was
extracted using the NucleoSpin RNA II kit from Macherey-Nagel (Germany). RNA
concentrations were determined by spectrophotometry using an Implen Nanophotometer
(AH Diagnostics, Denmark) and the integrity of the RNA was verified by 1% agarose gel
electrophoresis. For each sample 2 μg of DNAse-treated total RNA was reverse transcribed
to cDNA using anchored oligo(dT)20 primers (Invitrogen, Denmark) and the Omniscript
Reverse Transcription kit (Qiagen, Germany). cDNA samples were diluted in RNAse free
water to a concentration of 4 ng/μL. Expressed Sequence Tags (ESTs) for the seven
investigated genes were obtained from Lumbribase (Lumbribase homepage) and NCBI
websites (NCBI homepage), and verified by BLASTX analysis (NCBI homepage). Forward
and backward primers for these ESTs were designed using Primer3 (Rozen and Skaletsky
1999) and synthesized by Eurofins (Ebersberg, Germany). EST number, gene ontology and
primer sequences of the investigated genes are shown in table 2.

Chapter 3
56
Table 2. EST number, gene ontology and primer sequences of the investigated genes.
Gene name Lumbribase
EST no. Gene ontology Forward primer (5'-3') Reverse primer (5'-3')
Amplicon
size (bp)
HSP70 LRC01283 General stress protein TTGCATATGGAGCTGCTGTC GAGGAGTCACGTCGAGAAGC 106
Catalase LRC01429 Anti-oxidant enzyme ACATGAACGGATACGGAAGC ATTCTTGATGCCTTGGTTCG 120
GST-pi LRC06119 Anti-oxidant enzyme CACTTGGCAACACTGGAGAA CTGACCTTGTCACCAACGAA 93
SOD LRC09106 Anti-oxidant enzyme CCACGTTCACACATCTGGAG GCGATTATGCGGATTGAAGT 92
CCF-1 LRC00385 Cytokine GTACGTGACAGCCTTGCAGA GGCATTGTTGTCTCCCTCAT 101
GAPDH LRC07381 Glycolytic enzyme TGTCTCGACCGACTTCAACA GTGATCATTGAGGGCGATTC 95
PFK-1 LRC00993 Glycolytic enzyme TACGTCGCTGAATGAGATCG CTTGGGTCTCGATGACGAAT 111
Ch
ap
ter 3
56

Effects of C60 on gene expression and tissues
57
Real-time quantitative polymerase chain reaction (qPCR) was conducted using Brilliant II
SYBR Green qPCR Master. Each sample was run in duplicate and each well contained a 5
μL sample (equivalent to 20 ng total RNA) along with 900 nM of each primer, in a total
volume of 25 μL. The plate was shaken and centrifuged for one minute (at 4600 g), to
ensure a homogenous mixture on the bottom of the plate without bubbles. The cycling
program was started at 95°C for ten minutes to activate the DNA polymerase, then 40
cycles of 95°C for ten seconds and 60°C for sixty seconds. Subsequently, melting curves
were performed by Stratagene MxPro Software 4.1 (Agilent Technologies, Denmark), to
validate that only one target had been amplified. Threshold cycles and amplification
efficiencies were calculated for each sample using Data Analysis for Real-Time PCR
(DART-PCR) version 1.0 (Peirson et al. 2003). Outliers identified by DART-PCR and
samples diverging from the dissociation curve were omitted from further analysis.
NORMA-Gene was used to normalize the relative expression of the samples calculated by
DART-PCR (Heckmann et al. 2011b).
Enzyme activity assays
Total protein concentrations were estimated using the Pierce BCA protein assay kit
(Thermo Scientific, Rockford, US). The activity of two antioxidant enzymes, catalase and
GST, was determined using commercially available assay kits from Cayman Chemical
(Ann Arbor, Michigan, US), with item numbers 707002 and 703302, respectively. Samples
were taken from the same earthworms used for gene expression quantification. For the
catalase assay, a 50 mg sample was homogenized in 40 mL of a catalase assay buffer (50
mM potassium phosphate buffer, prepared with 0.07 g/mL KH2PO4 and 0.11 g/mL
K2HPO4*3H2O; 0.3 mg/mL EDTA; pH 7.0; (Sambrook and Russell 2001)). The
homogenate was centrifuged (10,000 g for 15 minutes) and the supernatant was used for
further analysis. CAT activity was determined using H2O2 as the substrate and the
formaldehyde produced was measured at 540 nm. For the GST, 50 mg sample was
homogenized in 400 μL of GST assay buffer (100 mM potassium phosphate buffer,
prepared with 0.14 g/mL KH2PO4 and 0.23 g/mL K2HPO4*3H2O; 0.6 mg/mL EDTA; pH
7.0; (Sambrook and Russell 2001)) and centrifuged for 15 minutes at 10,000 g. The

Chapter 3
58
supernatant was used for the GST activity determination. Activities of total GST were
determined using 1-chloro-2,4-dinitrobenzene (CDNB) as substrate and absorbance was
measured at 340 nm. Enzyme activities were related to the protein content (determined at
562 nm) of the sample. All samples were analysed at least as duplicates and as described by
the assay kit supplier. C60 interference with the kits for gene expression and biochemistry is
not expected, because the high ionic strengths of the salines used to make the tissue
homogenates would rapidly precipitate the C60, which is then lost in the pellet at the
centrifugation steps, leaving a clean supernatant for biochemistry (Hou et al. 2009).
Histological observations
Earthworms were carefully collected, washed in cold demineralized water and weighed.
Subsequently, segments were carefully cut from the clitellum (covering the region
approximately one centimetre anterior and posterior to the clitellum), using a sharp scalpel
blade, and were placed immediately into buffered 4 % formal saline to fix the specimens
(Handy et al. 2002b). Fixed samples were sent to the University of Plymouth for processing
of routine wax histology (Handy et al. 2002b). For the first experiment two earthworms
from every replicate (sixteen earthworms per treatment) were processed. For the second
lifelong experiment five adult earthworms per treatment, all from different containers, were
processed for histology. Earthworms from both experiments were processed into wax
blocks and 8 µm sections were cut from each earthworm. Sections were stained with
haematoxylin and eosin for general structural observations or with Mallory’s trichrome to
reveal additional details of connective tissues. All tissues were prepared simultaneously in
batches containing tissues from control earthworms and the C60 treatments at the same time
point, in order to eliminate differences in fixation or staining artefacts between treatments.
Tissues were examined under an Olympus Vanox-T microscope and photographs were
produced using an Olympus digital camera (C-2020 Z). The thickness of each layer of
tissue from the ectoderm (cuticle, epidermis, circular muscle and longitudinal muscle when
intact, and clitellum parenchyma when present) were measured manually for each slide to
analyse morphometrics.
Effects of C60 on gene expression and tissues
59
Statistics
Differences in gene expression and enzyme activity between the three treatments were
analyzed using analysis of variance (ANOVA, with α = 0.05), with Least Significant
Differences (LSD) as the post-hoc test (Burgers and Oude Voshaar 2010). Histological
observations on cuticle loss were statistically tested for differences between exposure levels
and between exposure periods, using a binomial regression analysis. These statistical
analysis were carried out with GENstat (13th Edition, VSN International Ltd.). For other
histological observations, data were similarly analysed by StatGraphics Plus version 5.1.
No container effects were observed, so data was pooled by treatment for ANOVA (after
checking for kurtosis, skewedness, and unequal variance with Bartlett’s test). In cases
where data transformation was not effective, the Kruskal–Wallis test was used and
differences were located by notched box and whisker plots. Results are presented as mean ±
standard error of the mean (SEM) unless otherwise specified.
Results
Gene expression analysis
For the adult earthworms exposed to C60 for four weeks, only one of the genes examined
(HSP70) showed a clear concentration-dependent change of expression in whole tissue
homogenates (Figure 1). HSP70 gene expression in both the 15.4 and 154 mg C60/kg soil
treatments decreased significantly (ANOVA; p=0.018) compared with the control (Figure
1A). In the 154 mg C60/kg treatment group, the HSP70 expression had decreased down to
34% of the control value. For catalase, GST and CCF-1 gene expressions (Figures 1B-1D)
there were no statistical differences noted due to C60 exposure. The gene expression of
glyceraldehyde 3-phosphate dehydrogenase (GAPDH), an enzyme involved in the citric
acid cycle, did not differ between the three treatments as well (as shown in Supplementary
Table S1).
In the lifelong experiment the HSP70 gene expression was also down-regulated with
increasing C60 concentration, to 60% of the control level (Figure 1A), but this trend was
only statistically significant at the 10% rejection level (ANOVA; p = 0.1). The gene

Chapter 3
60
expressions of the antioxidant enzymes catalase and GST did not change significantly due
to C60 exposure (Figures 1B and 1C). However, unlike the four weeks experiment, the
CCF-1 gene expression of earthworms exposed lifelong to both C60 concentrations showed
a statistically significant decrease (ANOVA; p=0.04) compared to the control treatment
(Figure 1D). In the 154 mg C60/kg soil treatment group the CCF-1 expression had decreased
down to 12% of the control value. Gene expressions of superoxide dismutase (SOD),
GAPDH and phosphofructokinase-1 (PFK-1) did not demonstrate differences between the
treatments (see Supplementary Table S1).
Figure 1. Relative gene expression levels (compared with average of the control) of (A) heat shock protein 70
(HSP70), (B) catalase, (C) glutathione S-transferase (GST) and (D) coelomic cytolytic factor 1 (CCF-1), for the
four weeks (light grey) and for the lifelong (dark grey) exposed L. rubellus earthworms. Data are shown per
exposure group (0, 15.4 and 154 mg C60/kg soil), as mean values ± SEM. Significant differences demonstrated are
compared to control, *p<0.05 and **p<0.01.

Effects of C60 on gene expression and tissues
61
Enzyme activity assays
Table 3 shows that the enzyme activity for catalase and GST did not differ significantly
between treatments for the four weeks experiment. In the lifelong exposed earthworms also
no treatment-dependent changes in catalase and GST activity were noted (Table 3).
Table 3. Measured levels of catalase and glutathione-S-transferase for L rubellus earthworms in the different
treatment groups, exposed to C60 for four weeks or lifelong. Mean values ± SEM. No significant differences were
demonstrated between treatments, within the assays (α = 0.05).
Exposure period [C60] Catalase GST
(mg/kg soil) (nmol/min/mg protein) (nmol/min/mg protein)
Four weeks 0 295 ± 32 184 ± 53
15.4 318 ± 48 154 ± 62
154 327 ± 67 158 ± 49
Lifelong 0 394 ± 38 212 ± 89
15.4 464 ± 51 133 ± 56
154 298 ± 48 148 ± 40
Histological observations
In the four week experiment quantitative histological analysis of the thickness of cuticle,
epidermis and the circular muscles of the ectoderm showed no significant differences
between treatments, for any of the segments (see Supplementary Table S2). Further
histological examination demonstrated changes in the tissue of adult earthworms after four
weeks of exposure to C60 (Figure 2). Control earthworms showed normal structure of the
ectoderm, without epithelial lifting or necrosis (Figure 2A). The underlying circular and
longitudinal muscles were normal for all control earthworms, and pathologies such as
fibrosis, hydropic change or atrophy were absent. There was also no evidence of
coelomocyte infiltration in any of the tissues, which renders the absence of an inflammatory
response of the cells.
In the tissues of earthworms exposed to 15.4 mg C60/kg soil for four weeks, some
histological changes were observed. Eleven out of the sixteen earthworms showed an intact

Chapter 3
62
cuticle, but the staining was more basophilic than for the controls. Three out of the five
earthworms with damaged cuticle also showed enlarged mucocytes and a fine basophilic
granular deposit in some epithelial cells. This indicates an increase in negatively charged
material in the epidermis. Earthworms with a damaged cuticle also demonstrated some
hyperplasia of the epidermal and basal cells, as well as granular lipofuscin-like deposits in
the circular muscle layer (Figure 2B) in combination with mild fibrosis. Some loss of
architecture and oedema in the longitudinal muscle was also observed (Figure 2B). The gut
epithelium of all the earthworms in this group showed hyperplasia of the sub-mucosa and
epithelium, accompanied by necrosis. In six out of the sixteen earthworms, the changes to
the gut were so severe that the normal architecture was no longer evident. The clitellum
segments of the earthworms exposed to 15.4 mg C60/kg soil were comparable to the
controls, except for one earthworm with damaged cuticle and eosinophilic epidermal cells.
This earthworm also had eosinophilic granular deposits in the damaged parenchyma of the
clitellum.
In earthworms exposed for four weeks to 154 mg C60/kg soil, cuticle damage was similar to
that observed at the lower C60 concentration (observed in five of the sixteen earthworms),
but three earthworms also showed areas of thickened and very basophilic cuticles. For all
sixteen earthworms, mild hydropic changes in the epidermis were noted, which was not
observed for the 0 and 15.4 mg C60/kg soil treatment groups. Three earthworms with a
damaged cuticle also showed some erosion of the epidermal cells, lipofuscin-like deposits
and fibrosis in the circular muscle (Figure 2C), as well as oedema in the longitudinal
muscle. Two earthworms with a damaged cuticle, demonstrated severe erosion of the
longitudinal muscle with loss of architecture (Figure 2C). In the gut sections of the
earthworms in this exposure group, injuries to the intestinal cells were similar to those in
the 15.4 mg C60/kg soil exposure group. All sixteen earthworms showed hyperplasia and
necrosis and in nine earthworms this resulted in complete loss of the normal architecture of
the gut epithelium. The clitellum segment from earthworms exposed to 154 mg C60/kg soil
were normal, except for one earthworm with diffuse parenchyma.

Effects of C60 on gene expression and tissues
63
Figure 2. Transverse sections of segments from the anterior region of earthworms exposed to (A) control, (B) 15.4
and (C) 154 mg/kg of C60 nanoparticles. Controls show normal morphology of the epidermis with an intact cuticle
on the surface and undischarged mucous cells. The circular (CM) and longitudinal muscle (LM) layers are normal.
Panel B and C demonstrate the erosion of the epithelium, with loss of the cuticle and discharge of mucous cells for
both C60 concentrations. For these earthworms granulation in the circular muscle was observed (panel B, white
arrows), as well as fibrosis of the circular muscle and some loss of integrity of the longitudinal muscle (panel C).
The magnification was X400. Sections were cut 8 µm thick and stained with Mallory’s trichrome.

Chapter 3
64
Lifelong exposure also caused no notable changes in the thicknesses of the tissue layers in
the ectoderm (see Supplementary Table S2). Further examination of the tissues of the
control earthworms demonstrated normal histology, as also described above for the four
weeks exposed control group.
Tissues of earthworms exposed to 15.4 mg C60/kg soil showed some loss of the cuticle,
which was accompanied by enlarged mucocytes and some hyperplasia of the epidermal
cells. In four earthworms the circular muscle also demonstrated mild atrophy, and for two
earthworms mild fibrosis and granular lipofuscin-like deposits was noted. The gut epithelial
cells of these earthworms were thinner and showed more elongated nuclei than the cells of
the control earthworms. This demonstrates that these cells have increased their metabolic
activity.
Segments from earthworms after lifelong exposure to 154 mg C60/kg soil showed loss of
the cuticle in three out of the five earthworms examined. In the earthworms with damaged
cuticles effects were similar to the four week experiment, except for one lifelong exposed
earthworm which also showed atrophy of the longitudinal muscles. Changes in the gut
epithelium were similar to the changes of the earthworms exposed lifelong to 15.4 mg
C60/kg soil. However, the earthworms in the highest exposure group also showed areas of
necrotic epithelium, where all cells showed extensive vacuoles. The clitellum of three out
of the five earthworms exposed to 154 mg C60/kg soil was different from the controls. For
one earthworm depletion of the parenchyma of the clitellum was observed and in two other
earthworms severe erosion of the parenchyma had occurred.
Statistical tests of the above described effects on the cuticle showed that exposed
earthworms experienced significantly more cuticle loss (binomial regression analysis; p <
0.001). Also, the cuticle damage was more severe in the earthworms exposed to C60 lifelong
than in the adults exposed for four weeks (binomial regression analysis; p = 0.039).

Effects of C60 on gene expression and tissues
65
Discussion
This study shows that earthworms exposed to C60 in soil can suffer adverse sub-lethal
effects, which include loss of integrity of the protective cuticle, pathology of the ectoderm,
intestinal erosion and altered gene expression in the whole organism. These changes occur
against a background of increased juvenile mortality and decreases in reproductive success
and juvenile growth, reported in a previous ecotoxicological study on earthworms exposed
to C60 under the same conditions (discussed in Chapter 2). In that study it was
demonstrated that reproductive success decreased with increasing C60 concentration, down
to 60% of the control level at the highest concentration of 154 mg C60/kg soil. Effects on
juvenile earthworms also increased with the C60 exposure level. At the sub-lethal exposure
level of 15.4 mg C60/kg soil, growth rate was significantly reduced. At the highest exposure
level mortality was the dominant effect, with 40% of the juvenile earthworms passing away
after hatching.
Gene expression of HSP70 was down-regulated with increasing C60 concentration, for both
exposure periods. Such down-regulation is not unique to C60 exposed earthworms and has
been demonstrated for other compounds and organisms as well, such as for cadmium
exposed mussels (Brown et al. 1995), for amphipods exposed to dieldrin and fluoranthene
(Werner and Nagel 1997), and for isopoda species exposed to several toxic metals (Eckwert
et al. 1997). The down-regulation of HSP70 expression could be explained by emerging
tolerance for C60 exposure (Eckwert and Köhler 1997; Croute et al. 2000) and by the up-
regulation of another member of the HSP family. HSP70 is part of a family of heat shock
proteins, which respond in a dynamic way to exposure, and therefore other members of the
HSP family may have been up-regulated to protect the earthworms instead (Werner and
Nagel 1997; Bierkens 2000). Lower HSP70 expression levels could also be explained by
tissue repair, which is indicated by the histology, e.g. hyperplasia and the presence of
thinner cells with elongated nuclei in the gut epithelium, and also observed in fish epithelia
due to carbon nanotube exposure (Smith et al. 2007). HSP70 is known to inhibit global
protein synthesis (van Straalen and Roelofs 2006). During tissue repair, protein synthesis

Chapter 3
66
will be increased in the tissue and this is usually accompanied by low HSP70 expression
(Feder 1999; Bierkens 2000).
In the present study, no statistically significant effects of C60 exposure on antioxidant
enzyme expression and activity were observed, in either the four week or the lifelong
experiment. Numerous other nanotoxicology studies suggest oxidative stress as a likely
mechanism of C60 toxicity (Kamat et al. 1998; Sayes et al. 2005; Usenko et al. 2008; Klaper
et al. 2009; Barillet et al. 2010). However, these studies have used short, acute exposures
and/or in vitro studies on cells. The lack of clear dose-response relationships between C60
exposure and oxidative stress may be explained by different phenomena. Earthworms may
adapt to oxidative stress associated with sub-lethal pollutant exposure quickly (Maity et al.
2008) and effects may have only been detectable a couple of days after the start of the C60
exposure, rather than 4 weeks later. Furthermore, the oxidative stress response usually
involves a cascade, including various chemical antioxidants and antioxidant enzymes, and it
may not be necessary to induce all of the antioxidant enzymes. In addition, the
concentrations of antioxidant enzymes are known to vary across different tissues, and a
whole body measurement may not detect fine changes in individual tissues (Korsloot et al.
2004; Kohen and Nyska 2002; Smith et al. 2007; Barillet et al. 2010). The tissue repair
demonstrated with the histological observations could also affect antioxidant enzyme
activity.
There are some concerns that C60 could produce inflammation and may be immunotoxic
(Fujita et al. 2009; Hamilton et al. 2007). However, in the histological analysis of this study
no inflammation response in the tissues was observed (no coelomocyte infiltration into the
tissues) and also gene expression of the cytokine-like protein CCF-1 did not increase.
Tissue injury in the absence of an immune response can be explained by (i) death of the
coelomocytes or (ii) immunosuppression (Stebbing 1981; van Straalen and Roelofs 2006).
The latter seems most likely, as the lifelong exposed earthworms demonstrated a
statistically significant down-regulation of CCF-1 expression (to < 20% compared to the
control). Immunosuppression due to chronic exposure has also been demonstrated for

Effects of C60 on gene expression and tissues
67
Lumbricus terrestris earthworms exposed to the polychlorinated biphenyl (PCB) Aroclor
1254 (Goven et al. 1993).
Reliable measurements or visualization of C60 in the internal tissues of earthworms are not
feasible without fluorescent or radio-active labelling of the nanoparticle. So, in the absence
of routine analytical methods to measure C60 in the tissues of earthworms, target organs for
C60 can only be inferred from biological effects and the integrity of the external barriers on
the animal at the moment. In both the four weeks and lifelong C60 exposed earthworms
damaged cuticles were observed, accompanied by underlying pathology in the rest of the
ectoderm. This suggests that C60 would have direct access to the internal tissues of the
earthworms. For the life time exposure study, the incidence of cuticle pathology was higher
(> 60%) than for the four weeks exposure (around 30%), suggesting a cumulative effect
over time. In both experiments the gut barrier was also compromised by C60 exposure,
indicating that any C60 in ingested soil would also be able to access the body. Unlike the
cuticle, the gut showed an adaptive response with evidence of tissue repair. The four week
exposed earthworms demonstrated loss of gut epithelial architecture in both the 15.4 and
154 mg C60/kg soil exposure groups. However, the situation was less severe for the lifelong
exposed earthworms, which showed only patches of necrotic gut epithelial cells mainly in
the 154 mg C60/kg soil exposure group. This indicates that the repair mechanisms of the
lifelong exposed earthworms may have been active, but nonetheless the gut barrier was not
fully intact. Overall, the incidence of tissue injuries was broadly the same at the two C60
concentrations, suggesting that even the lowest C60 concentration tested was well above the
exposure threshold.
Tissue injury has consequences for the bioenergetics of earthworms. The tissue injury and
repair observed in the present study would inevitably increase the body maintenance
component of the overall energy budget, leaving less energy for other processes like growth
and reproduction (Kooijman 2000). The earthworms examined in this study were from the
same experiments as discussed in chapter 2, which demonstrated that C60 exposure can
indeed reduce reproduction (in a concentration-dependent way) and juvenile growth (as a

Chapter 3
68
sub-lethal effect, at the exposure level of 15.4 mg C60/kg soil). The decrease in reproductive
success may also be explained by a direct effect of C60 exposure on the reproductive
organs. Histological observations of the clitellum, an important part of the earthworm
reproductive system, showed a damaged parenchyma of the clitellum in C60 exposed
earthworms.
The mg/kg concentrations used in the present study demonstrate toxic effects due to four
weeks up to lifelong exposure. A no observable adverse effect level (NOAEL) could be
established. Verified measurements of actual soil C60 concentrations present in the
environment are lacking. However, modelled environmental concentrations of C60 predict
an annual increase of C60 concentrations in the soil at the ng/kg level (Gottschalk et al.
2009). C60 is very stable, so persistence of these nanoparticles can be expected (Nielsen et
al. 2008). Furthermore, the predicted values for C60 in sewage sludge are approaching the
mg/kg range (Gottschalk et al. 2009) and this waste is often applied to agricultural soils.
The commercial production of C60 is also expected to increase in the coming decades
(Nielsen et al. 2008). Taken together, these observations suggest that the exposures in the
present study are 1000 fold higher than modelled environmental C60 concentrations in soils
at the moment, but only a lowest observed adverse effect level (LOAEL) was established in
the present study and environmental concentration are likely to increase with a growing
production and the environmental persistence of C60.
In conclusion, this study demonstrates sub-lethal effects of C60 exposure at the level of gene
expression and tissue integrity on earthworms. The gene expression data demonstrated
down-regulation of some stress and immune-related genes, but no response of antioxidant
enzyme expression or activity was observed. Histological observations confirmed tissue
injuries and showed that the external barriers (cuticle and gut epithelium) of the C60
exposed earthworms were partly damaged. The surviving earthworms appeared to cope
with the injuries during their life time and even showed evidence of tissue repair. However,
these sub-lethal changes resulted in effects on growth and reproduction, as shown in an
earlier study on the same experiments (Chapter 2). This indicates that repair of effects at a

Effects of C60 on gene expression and tissues
69
lower level of biological integrity may result in effects at higher levels of biological
organisation. Further research is needed to identify the precise mode of action of (chronic)
C60 exposure to earthworms, with emphasis on the time-sequence of expression of genomic
effect markers and the appearance of (tissue) pathology, reproductive failure, growth
retardation and finally death of the earthworms. Also, a range of concentrations below 15.4
mg C60/kg soil needs to be studied to assess the NOAEL for C60 exposure to earthworms.
Acknowledgements
The authors would like to thank prof. dr. ir. Ivonne M.C.M. Rietjens of the Division of
Toxicology of the Wageningen University for her valuable scientific input in this study.
Laura de Haan, also from the Division of Toxicology of the Wageningen University, is
kindly acknowledged for her technical support. We would like to thank Yuya Hayashi
(Interdisciplinary Nanoscience Centre (iNANO) and National Environmental Research
Institute (NERI) Aarhus University) for his help with the gene expression measurements
and Michael Hockings (School of Biomedical and Biological Sciences, University of
Plymouth) is thanked for histological technical support. Ivo Laros, from Alterra
Wageningen UR, is acknowledged for the useful discussions about enzyme expression and
activity. This research project was supported by Wageningen UR strategic research
program BioNanotechnology 2007-2011 and research school WIMEK.

Chapter 3
70
Supplementary data
Table S1. Relative gene expression levels (compared to the average of the control) of superoxide dismutase
(SOD), glyceraldehyde 3-phosphate dehydrogenase (GAPDH) and phosphofructokinase-1 (PFK-1) for the four
weeks and for the lifelong treated L rubellus earthworms, exposed to different concentrations of C60 in the soil. No
significant differences were demonstrated between treatments, within the assays (α = 0.05). Data are shown per
exposure group (0, 15.4 and 154 mg C60/kg soil), as mean values ± S.E.
Exposure period [C60] (mg/kg soil) SOD GAPDH PFK1
Four weeks 0 - 1.0 ± 0.35 -
Four weeks 15.4 - 0.8 ± 0.44 -
Four weeks 154 - 0.8 ± 0.37 -
Lifelong 0 1.0 ± 0.27 1.0 ± 0.26 1.0 ± 0.10
Lifelong 15.4 1.1 ± 0.07 1.8 ± 0.39 0.8 ± 0.11
Lifelong 154 0.54 ± 0.29 0.7 ± 0.05 0.8 ± 0.18

Effects of C60 on gene expression and tissues
71
Table S2. Quantitative histology of the ectodermal layers (cuticle, epidermis and the circular and longitudinal
muscles) of L. rubellus earthworms, showing either the thickness of each tissue layer in the ectoderm (μm,
ectoderm thickness) for the four weeks exposure or the percentage thickness of each tissue layer (% of ectoderm
thickness) for the lifelong exposed earthworms. Data are means ± S.E. and data are only given where tissue
structure enabled accurate measurements to be made. *p<0.05 compared to the control. **Tissue injury prevented
measurements on more than one earthworm.
[C60] (mg/kg
soil)
Exposure
period Cuticle Epidermis Parenchyma
Circular
muscle
Longitudinal
muscle
Anterior segments
0 4 weeks 0.32 ± 0.10 7.89 ± 2.43 - 5.53 ± 0.73 -
15 4 weeks 0.77 ± 0.41 4.36 ± 1.51 - 6.04 ± 0.54 -
154 4 weeks 0.28 ± 0.04 2.93 ± 0.38 - 5.42 ± 0.76 -
Anterior segments
0 Lifelong 0.7 ± 0.3 15.5 ± 3.2 - 13.3 ± 2.5 58.4 ± 18.6
15 Lifelong 0.1 ± 0.1 17.9 ± 2.9 - 14.7 ± 2.8 64.2± 1.3 *
154 Lifelong 0.4 ± 0.26 9.7 ± 3.0 - 11.4 ± 7.4 73.6 ± 1.5
Clitellum segments
0 Lifelong - 10.41** 43.1 ± 16.5 3.1 ± 1.0 37.5 ± 20.0
15 Lifelong 0.1 ± 0.1 16.0 ± 1.0 39.5 ± 15.9 9.2 ± 2.8 45.0 ± 9.4
154 Lifelong 0.5 ± 0.26 14.8 ± 7.8 18.0 ± 9.0 7.5 ± 1.5 43.2 ± 18.0
Posterior segments
0 Lifelong 0.4 ± 0.2 20.2 ± 6.7 - 14.3 ± 4.4 59.6 ± 9.1
15 Lifelong 1.0 ± 0.2 11.0 ± 2.1 - 11.5 ± 1.7 74.9 ± 2.4
154 Lifelong 0.5 ± 0.5 20.7 ± 6.7 - 7.69** 63.6 ± 5.9

Chapter 3
72

73
Chapter 4
In vitro nanoparticle toxicity to rat
alveolar cells and coelomocytes from the
earthworm Lumbricus rubellus
Based on:
MJC van der Ploeg, JHJ van den Berg, S Bhattacharjee, LHJ de Haan, DS Ershov, RG
Fokkink, H Zuilhof, IMCM Rietjens, NW van den Brink. In vitro nanoparticle toxicity to
rat alveolar cells and coelomocytes from the earthworm Lumbricus rubellus.
Nanotoxicicology, in press, DOI: 10.3109/17435390.2012.744857.

Chapter 4
74
Abstract
Sensitivity of immune cells (coelomocytes) of Lumbricus rubellus earthworms was
investigated for exposure to selected nanoparticles, in order to obtain further insight in
mechanisms of effects observed after in vivo C60 exposure. In the in vivo study, tissue
damage appeared to occur without accompanying increased immune responses.
Coelomocytes exposed in vitro to C60 showed no decrease of their cellular viability, but
demonstrated a decrease in gene expression of the cytokine-like protein CCF-1, indicating
immunosuppression. Experiments with NR8383 rat macrophage cells and tri-block
copolymer nanoparticles were used to compare sensitivity and to demonstrate the
usefulness of coelomocytes as a test system for nano-immunotoxicity, respectively. Overall,
the results imply that sensitivity towards nanoparticles differs between cell types and
nanoparticles. Moreover, this study indicates that injuries in absence of an immune
response, observed after in vivo C60 exposure in chapter 3, are caused by
immunosuppression rather than coelomocyte mortality.

Cellular uptake and cytotoxicity of nanoparticles
75
Introduction
Due to the rapid increase of nanoparticle production, these particles are expected to end up
in the environment (Kahru and Dubourguier 2010; Nowack 2009). The possible
environmental hazards of nanoparticles are not well known and nanoecotoxicological data
should be obtained with high priority (Handy et al. 2008a; Stone et al. 2010). In our
previous work (Chapter 2 and 3) we have shown that fullerene (C60) exposure can affect
the earthworm Lumbricus rubellus. In chapter 2 it was demonstrated that in vivo exposure
of these earthworms to C60 in the soil caused a reduction of cocoon production and juvenile
survival and growth. Investigation at the molecular level (Chapter 3) demonstrated a
concentration-dependent down-regulation of the gene expression of heat shock protein 70
(HSP70), a well-known effect marker for generic stress (van Straalen and Roelofs 2006),
and of coelomic cytolytic factor-1 (CCF-1), a cytokine-like protein in earthworms with
similar functions as the mammalian tumor necrosis factor-alpha (TNF-α) (Bilej et al. 1995;
Olivares Fontt et al. 2002). This down-regulation instead of up-regulation of CCF-1
indicated a reduced instead of an increased immune response in earthworms upon C60
exposure. The exact mode of action underlying this effect, immunosuppression or mortality
of immune cells, remained to be elucidated. Additionally, histological observations of the
C60 exposed earthworms demonstrated damage to the external barriers (cuticle and gut
epithelium), in combination with strong effects on the structure of muscle tissues (Chapter
3). In general, tissue injury is associated with an inflammatory response of the
coelomocytes, as part of tissue repair (Cikutovic et al. 1999; Goven et al. 1994). However,
no inflammatory response was observed in our previous study described in Chapter 3.
Perceiving such injuries in the absence of an expected immune response may be explained
by either immunosuppression or mortality of the coelomocytes, important cells in the
earthworm immune system (Stebbing 1981; van Straalen and Roelofs 2006).
Coelomocytes are free flowing cells, present in the coelomic cavity of earthworms. These
cells are responsible for cellular immune functions, including phagocytosis and release of
cytokine-like proteins to stimulate immune responses (Adamowicz and Wojtaszek 2001;
Adamowicz 2005; Bilej et al. 1990; Diogéne et al. 1997; Hrženjak et al. 1992; Engelmann
et al. 2005; Kauschke et al. 2007; Ville et al., 1995; Weeks and Svendsen 1996).

Chapter 4
76
Coelomocytes have already been used in several ecotoxicology studies to demonstrate
effects of conventional toxic compounds, and these studies demonstrated that the model
provides a simple, rapid and sensitive tool to assess immunotoxicological hazards (Burch et
al. 1999; Calisi et al. 2009; Massicotte et al. 2004; Sauvé et al. 2002; Sauvé and Fournier
2005; Scott-Fordsmand et al. 1998; Ville et al. 1995).
In order to address the impact of nanoparticle exposure on the immune cells of earthworms
in more detail, coelomocytes were isolated from the earthworm L. rubellus and exposed to
C60 in vitro. These coelomocytes were analyzed for their viability, phagocytic activity and
CCF-1 gene expression levels. Coelomocytes were also exposed to tri-block copolymer
nanoparticles (Bhattacharjee et al. 2011), in order to validate the use of coelomocytes as a
test system for immunotoxicity of nanoparticles. Finally, for comparison, mammalian rat
lung macrophage NR8383 cells were also exposed to the same nanoparticles, characterizing
their effects on cell viability, phagocytosis and production of TNF-α.
Materials and methods
Nanoparticles and characterization
Positively (with an amine terminal group; PNP-NH2) and negatively (with a carboxylic acid
terminal group; PNP-COOH) charged tri-block copolymer nanoparticles, with and without
fluorescent probe, were prepared as described by Bhattacharjee et al. (2011). The stock
consisted of polymer nanoparticles suspended in nanopure water. For the experiments,
serial dilutions of exposure medium were made in ultrapure water, and for all
concentrations the same amount (20%) of Ham’s F-12K (Kaighn’s) medium (culture
medium; from Invitrogen/Life Technologies Ltd, UK) containing 10% heat-inactivated
fetal calf serum (FCS; from PAA Laboratories GmbH, Germany) was added. C60
nanoparticle powder was obtained from SES Research (99.5+%, Houston USA). As
discussed in chapter 2, an analysis with inductively coupled plasma-atomic emission
spectroscopy (ICP-AES) on the C60 powder demonstrated that metal impurities in the C60
did not pose any risk. For the experiments, a stock of 8 mg/ml C60 powder in culture
medium supplemented with 10% FCS was made, which was stirred overnight to obtain an

Cellular uptake and cytotoxicity of nanoparticles
77
even suspension. Serial dilutions of exposure medium were made with the culture medium
containing 10% FCS. The size distribution of the nanoparticles was determined by dynamic
light scattering (DLS), using a Cobolt Samba 300mW DPSS laser at a wavelength of 532
nm. For each sample, the mean diameter of the peaks with the associated polydispersity
index (PDI), an indication of the width of the diameter peak, was determined for twenty
measurements. Due to the presence of more than one peak for the C60 samples, the PDI was
established by determining the width of each peak at half-height and using that width in the
equation PDI = [width/radius]2. The polymer nanoparticles were characterized in ultrapure
water as well as in culture medium containing 10% FCS, at a concentration of 0.1 μg/ml.
C60 characterization was only performed in culture medium supplemented with 10% FCS.
Two C60 concentrations (10 and 100 μg/ml) were tested, to study possible changes in
aggregation with an increase in C60 concentration. The zeta potential was analyzed using a
Malvern ZetaSizer 2000. Suspensions were similar to the ones used for the DLS analysis.
Data were processed with Zeta mode V1.51 software (Chen et al. 2004). Five
measurements were used to establish average and SEM for each sample. Aqueous
dispersions of the polymer nanoparticles were also examined using a field emission
scanning electron microscope, as reported by Bhattacharjee et al. (2011). C60 was viewed
by transmission electron microscopy (TEM), at a concentration of 10 μg C60/ml culture
medium. A drop of sample was deposited on a copper grid coated with formvar and carbon.
After an incubation of two minutes, excess suspension was carefully removed with a filter
paper and the grid was allowed to dry at room temperature. The grids were observed in a
JEOL 2100 TEM (Jeol, Japan), operating at 200 kV. Micrographs were taken with a
GATAN US4000 4K digital camera.
Cell types
Coelomocytes
Primary immune cells (coelomocytes) in the coelomic fluid were extruded from unexposed
adult L. rubellus earthworms. Coelomocyte extrusion was performed using a modification
of the extrusion method as described by Eyambe et al. (1991). 24 Hours before extrusion,
earthworms were rinsed in demineralized water, placed in a petri dish on a moist filter

Chapter 4
78
paper (Whatman filters type 597, Fisher Scientific) and incubated in a climate room at
15°C. After 24 hours, the earthworms were rinsed again, placed on paper towel and
massaged to expel the contents from the gut. 24 hour starvation and the massage were
performed in order to prevent fecal contamination of the extrusion medium upon collection
of the coelomocytes in a subsequent step. Subsequently, individual earthworms were placed
in 10 ml tubes and 3 ml extrusion medium was added. The extrusion medium consisted of
95% phosphate-buffered saline (PBS), supplemented with 2 mg/ml ethylene-
diaminetetraacetic acid (EDTA, 99% purified grade; from Sigma-Aldrich, St Louis, USA)
and 4 mg/ml guaiacol glycerol ether (GGE, >98%; from Sigma-Aldrich, St Louis, USA),
adjusted to pH 7.3 with sodium hydroxide. Just before extrusion, 5% (of final volume) of
96%-ethanol was added to the medium. The earthworms were incubated in the extrusion
medium for three minutes, during which they excreted coelomocytes into the medium.
After three minutes the earthworms were removed from the medium, rinsed in
demineralized water and released in soil. The tubes with the coelomocyte suspensions were
put on ice and 5 ml of culture medium containing 10% FCS was added to each tube. The
coelomocytes were centrifuged (at 200 g for 10 minutes) and washed with culture medium
to remove the extrusion medium. Subsequently, the coelomocytes were resuspended in 200
μl culture medium containing 10% FCS and the coelomocyte suspensions from the
different earthworms were combined. Cells were counted using a Bϋrker bright line
counting chamber and cell number was adjusted to approximately 4 x 10⁶ cells/ml.
Thereafter, 50 μl or 150 μl of the adjusted cell suspension was added to each well of a 96-
well or a 48-well plate (with a flat-bottom; from Greiner Bio-One, Germany), respectively,
and directly used in the experiments.
NR8383 cells
NR8383 rat macrophage cells (ATCC, Manassas, USA) were cultured and obtained
according to the procedure described by Bhattacharjee et al. (2011). For exposure, 50 μl of
a cell suspension (of approximately 4 x 10⁶ cells/ml) was added to each well of a 96-well
plate and directly used in the experiments.

Cellular uptake and cytotoxicity of nanoparticles
79
Cellular uptake of nanoparticles by coelomocytes
For studying effects of inhibition of clathrin-mediated and caveolin-mediated endocytosis,
sucrose and MβCD pre-incubations were carried out. The procedure has been described in
detail by Bhattacharjee et al. (2011), who studied the same nanoparticles in NR8383 cells.
After pre-incubation with the inhibitors, the cells were plated, exposed to the fluorescent
polymer nanoparticles (at 1 μg/ml) and incubated at 15°C overnight. After the incubation,
coelomocytes were studied with a confocal laser scanning microscope (CLSM; Zeiss 200M
Axiovert). Details on the CLSM procedure can be found in Bhattacharjee et al. (2011). Z-
stack imaging of coelomocytes was performed, to ascertain that the particles were inside
the coelomocytes and not on the surface (Cartiera et al. 2009). Samples with coelomocytes
exposed to PNP-NH2 or PNP-COOH in the absence of inhibitors were also analyzed, for
comparison.
Cell survival and phagocytic activity
To quantify cell survival and phagocytic activity, serial dilutions of exposure medium were
made as discussed before. Subsequently, 50 μl of exposure medium was added to 50 μl of
cell suspension, to obtain the acquired final concentrations and expose the cells. The
polymer nanoparticles used in these experiments were non-fluorescent, to avoid
interference with the fluorescent beads used in the phagocytosis assay. Culture medium
supplemented with 10% FCS only and culture medium containing 10% FCS as well as
CuSO4 (100 μM for the NR8383 cells and 300 μM for the coelomocytes) were used as
negative and positive control, respectively. Fluorescent beads (size 1 um, L-1030 latex
beads; from Sigma-Aldrich, St Louis, USA) were added to the wells at a cell to bead ratio
of 1:50. For the coelomocytes, the beads were added before overnight incubation and for
the NR8383 cells the beads were added only four hours before scoring the phagocytosis,
because coelomocytes have a lower uptake rate than NR8383 cells (Brousseau et al. 1997).
The cells were incubated overnight at 37°C (NR8383 cells) or 15°C (coelomocytes). To test
for viability of the cells, a trypan blue solution (in PBS) was added to each well (final
concentration 0.05%). From each well, a sample was taken for quantification of the cell
viability and the phagocytic activity, using a light microscope (Olympus CK2) and a

Chapter 4
80
fluorescent microscope (Olympus T2) with fluorescent light (Olympus BH2-RFL-T2),
respectively. For each sample the number of blue cells per 100 cells was counted randomly
to assess viability of the cells. Quantification of the phagocytic activity was achieved using
the procedure discussed by Bhattacharjee et al. (2011).
Cytokine (-like) assays
Measurement of CCF-1 gene expression in coelomocytes
Coelomocytes (150 μl/well) were seeded in a 48-well plate and 150 μl of serial dilutions of
the C60 exposure medium were added to each well, to obtain the acquired final exposure
concentrations. Exposing cells to culture medium containing 10% FCS only was tested as a
negative control. The coelomocytes were exposed overnight and then RNA was extracted,
using a Qiashreddar and a RNeasy kit (Qiagen GmbH, Germany). RNA concentrations
were determined by a Nanodrop spectrophotometer (ND-1000 Spectrophotometer, from
Thermo Scientific, USA). For each sample, 300 ng total RNA (15 ng/μl as final
concentration) was reverse transcribed to cDNA using iScript Reverse Transcription
Supermix (Bio-rad Laboratories, USA). Expressed Sequence Tags (ESTs), and forward and
backward primers for the target gene CCF-1 and the reference gene (glyceraldehyde-3-
phosphate dehydrogenase (GAPDH)) were verified and designed as discussed in chapter 3.
The primers were obtained from Biolegio (the Netherlands). Using these primers, real-time
quantitative polymerase chain reaction (qPCR) was conducted with iQ Sybr Green
Supermix (Bio-rad Laboratories, USA). All samples were diluted 40 times and a dilution
series of a mix of all the samples was also tested. This dilution series was used to make a
dissociation curve afterwards, to be able to eliminate outliers. Each well of a 96-well plate
contained 5 μl of a sample (equivalent to 15 ng cDNA) along with 400 nM of each primer,
in a total volume of 25 μl. The plate was centrifuged for one minute (at 120 g), to ensure a
homogenous mixture on the bottom of the plate without bubbles. The cycling program was
started at 95°C for fifteen minutes to activate the DNA polymerase, followed by 45 cycles
of 95°C for 30 seconds, 55°C for 30 seconds and 72°C for 30 seconds. The program was
completed with 72°C for five minutes and 95°C for one minute. Thereafter melting curves
were performed by iCycle (Bio-rad Laboratories, USA) to validate that only one target had

Cellular uptake and cytotoxicity of nanoparticles
81
been amplified. With this program, threshold cycles and amplification efficiencies were
also calculated for each sample. Samples with distinct divergence from the dissociation
curve were omitted from further analysis (Heckmann et al. 2006). The induction factor was
calculated for each sample, using the reference gene to normalize for reverse transcription
efficiency (Pfaffl 2001).
Measurement of TNF-α produced by NR8383 cells.
The NR8383 cells were seeded in a 96-well plate (final concentration of 2 x 10⁵ cells/well)
and serial dilutions of the exposure medium were added to obtain the acquired final C60
concentrations. Exposure of the cells to culture medium containing 10% FCS only was used
as a negative control. After 24 hours, 50 μl was taken from each sample and added to the
anti-rat TNF-α antibody pre-coated 96-well plate of a commercially available rat TNF-α
ELISA kit (Thermo Fisher Scientific, Rockford, USA). TNF-α levels were analysed
according to the protocol described by the ELISA kit manufacturer.
Statistics
All experiments were performed in triplicate. The results were calculated as % of the
respective negative control and are presented as mean of the replicates ± standard error of
the mean (SEM). Data were analyzed in GENstat (14th
Edition, VSN International Ltd.).
Differences between treatments were analyzed using analysis of variance (ANOVA, with α
= 0.05), with Least Significant Differences (LSD) as the post-hoc test (Burgers and Oude
Voshaar 2010). α = 0.05 is considered to be the level of significance and marked with an
asterisk sign (٭). In specific cases a trend at the level of α = 0.10 was determined and noted
by a hashtag (#). When possible, concentration response curves were generated, by
applying logistic nonlinear regression analysis. EC50 was defined as the concentration of the
nanoparticle exposure that led to an effect of 50%, compared with the negative control, of
the recorded response.

Chapter 4
82
Results
Characterization of the nanoparticles
In the present study two types of nanoparticles were applied: C60 and tri-block copolymer
nanoparticles. C60 was already studied previously in an in vivo toxicity study with L.
rubellus earthworms (Chapter 2 and 3). The polymer nanoparticles were used because
they enabled uptake studies in our in vitro cellular system, given the fact that they can be
prepared containing a fluorescent label.
The synthesis and characterization of the polymer nanoparticles was described in detail
before by Bhattacharjee et al. (2011). In short, the size distribution of both PNP-NH2 and
PNP-COOH as analyzed by DLS, was 45 ± 5 nm when dispersed in ultrapure water.
Scanning electron microscope imaging confirmed the presence of particles of this size in
the dispersions. In culture medium supplemented with 10% FCS, however, PNP-NH2
showed a size distribution of 106 ± 5 nm and PNP-COOH of 67 ± 5 nm. The zeta potential
in water was +20 mV for PNP-NH2 and -22 mV for PNP-COOH. In culture medium
containing 10% FCS though, the zeta potential was -12 mV and -35 mV for PNP-NH2 and
PNP-COOH, respectively.
For C60 in culture medium supplemented with 10% FCS, analysis by DLS demonstrated
that a prominent component was approximately 200 nm in size for both examined
concentrations. Lower peaks were also observed, indicating the presence of much smaller
(26 and 5 nm) and larger (~10 μm) particles, in addition to the prominent 200 nm particles.
The zeta potential of C60 in culture medium supplemented with 10% FCS was -14 mV at 10
μg/ml and -13 mV at 100 μg/ml. In the TEM images, C60 clusters (nC60) with a size
between 100 and 200 nm were observed (Figure 1A), which contained the crystalline
structure of C60 (Figure 1B). Furthermore, the electron diffraction demonstrated discrete
spots (not shown), suggesting a crystalline structure pattern (Bokare and Patnaik 2005;
Deguchi et al. 2001).

Cellular uptake and cytotoxicity of nanoparticles
83
Figure 1. TEM images of (A) a C60 cluster (nC60) in culture medium and (B) a close up of the C60 cluster showing
the crystalline structure known for C60 nanoparticles (Bokare and Patnaik 2005; Deguchi et al. 2001).
Cellular uptake of nanoparticles
Significant cellular uptake of the polymer nanoparticles by coelomocytes could be detected,
after incubation with the fluorescent polymer nanoparticles, using Z-stack imaging of
coelomocytes (Figure 2). These images indicated that PNP-COOH were more clustered and
that the PNP-NH2 nanoparticles were spread more diffusely in the cytoplasm of the
coelomocytes. The overall uptake did not differ significantly between PNP-NH2 and PNP-
COOH.
After inhibition of the specific endocytosis pathways, cellular uptake of PNP-COOH was
affected for both the caveolin- and clathrin-mediated pathways, to 56% and 65% compared
to the control, respectively (Figure 3A). For PNP-NH2, cellular uptake was especially
reduced after inhibition of the clathrin-mediated endocytosis pathway, to 59% of the control
(Figure 3B). Together these data reveal that the coelomocytes, in analogy with rat
macrophage NR8383 cells studied before, are able to internalize nanoparticles of different
charges by several active uptake mechanisms.

Chapter 4
84
Figure 2. CLSM images of cross sections of a coelomocyte after overnight exposure to PNP-NH2 (top) or PNP-
COOH (bottom). The results are shown as z-stack images, where slice 1 demonstrates the bottom and slice 6 the
top part of the cell.
Figure 3. Fluorescent intensity of (A) PNP-COOH and (B) PNP-NH2 internalized by coelomocytes, for control
(black) and for specific inhibition of the clathrin- (white) or caveolin-mediated (grey) endocytosis pathways.
Values are shown as mean % of the respective control ± SEM and statistical different values from the respective
control are marked with an asterisk (*).

Cellular uptake and cytotoxicity of nanoparticles
85
Cell survival and phagocytic activity
For the coelomocytes exposed to PNP-COOH, no clear concentration-dependent decrease
for viability as well as phagocytic activity was observed (Figure 4A and 4C). The results
presented in figures 4B and 4D show that PNP-NH2 did induce a concentration-dependent
reduction of the viability and phagocytic activity of the coelomocytes. EC50 values of 45
μg/ml for the effects of PNP-NH2 exposure on cell viability (Figure 4B), and of 7.8 μg/ml
for the effects on phagocytic activity (Figure 4D) were derived. For comparison, the effects
of PNP-NH2 on viability and phagocytosis of NR8383 are also displayed (Figure 4) and
these data reveal that these cells also only demonstrated adverse effects on cell viability and
phagocytic activity after exposure to PNP-NH2, with EC50 values of 31 μg/ml and 64 μg/ml,
respectively.
As shown in figure 5A, C60 exposed coelomocytes demonstrated no decrease in cell
viability. However, a concentration-dependent decrease of the phagocytic activity was
observed for these cells, with an EC50 value of 2000 μg/ml (Figure 5B). For comparison,
the effect of increasing C60 concentrations on viability and phagocytic activity of NR8383
macrophage cells was also tested (Figure 5). For these cells, exposure to C60 resulted in a
concentration-dependent decrease of cell viability as well as of the phagocytic activity. The
EC50 values for these effects of C60 exposure were 1.04 μg/ml and 1.87 μg/ml, respectively.
Cytokine (-like) assays
CCF-1 gene expression in coelomocytes (Figure 6A) decreased at lower concentrations, but
an increase was observed from 4000 μg C60/ml culture medium onwards, which is just
above the EC50 of phagocytic activity. An EC50 for the effect of C60 on CCF-1 activity
could not be derived, but the lowest observable effect concentration (LOEC) was 100
μg/ml.
In addition, a considerable increase of TNF-α levels produced by the NR8383 cells was
observed with increasing C60 concentrations, starting from a concentration around the EC50
for phagocytic activity (Figure 6B). At the highest C60 concentration of 400 μg/ml, the
TNF-α level was seven times higher compared to the negative control. As the effect curve

Chapter 4
86
was still in the exponential stage at the highest concentration tested, no EC50 could be
established. The LOEC could be derived, which was 1 μg C60/ml culture medium.
Figure 4. Viability (A and B) and phagocytic activity (C and D) of NR8383 cells (triangles) and coelomocytes
(circles), compared to the respective unexposed control (= 100%), after exposure to increasing PNP-COOH (open,
A and C) and PNP-NH2 (filled, B and D). Values are presented in mean ± SEM, with an asterisk (*) indicating
statistical difference from the control. Only significant regression curves are displayed (coelomocytes normal line
and NR8383 cells dashed line).

Cellular uptake and cytotoxicity of nanoparticles
87
Figure 5. Viability (A) and phagocytic activity (B) of NR8383 cells (triangle) and coelomocytes (round) after
exposure to increasing C60 concentrations. Values are expressed compared to the control (= 100%) and are shown
in mean ± SEM. An asterisk (٭) indicates a statistically significant difference compared with the respective control
at the level of α=0.05 and hashtag (#) indicates a significant difference with α=0.10. Only significant regression
curves for the coelomocytes (normal line) and the NR8383 cells (dashed line) are displayed.
Figure 6. CCF-1 gene expression levels of coelomocytes (A) and TNF-α levels in NR8383 cells (B) exposed to
increasing C60 concentrations. Values are shown in mean ± SEM. Statistical differences compared to the respective
control are marked with an asterisk (*) for α=0.05 and with a hashtag (#) at the level of α=0.10. The arrow
indicates the EC50 value of the phagocytic activity.

Chapter 4
88
Discussion and conclusions
Our previous work (Chapter 2 and 3) has demonstrated toxic effects of in vivo C60
exposure on L. rubellus earthworms, as reflected by adverse effects on reproduction,
juvenile survival and growth, tissue integrity and by altered gene expression of HSP70 and
CCF-1. In the present study we investigated the impact of nanoparticle exposure, including
C60, towards isolated coelomocytes of the earthworm L. rubellus. These investigations were
performed in order to obtain insight into the sensitivity of these important cells of the
earthworm’s immune system to nanoparticle exposure.
For the polymer nanoparticles, it is reported that they do not have a strong tendency to
aggregate (Bhattacharjee et al. 2011). The hydrodynamic diameter of the polymer
nanoparticles, analyzed by DLS, was larger in culture medium containing 10% FCS
compared with water. This difference was especially observed for PNP-NH2 and may be
due to negatively charged proteins present in the medium, which have a preference for
adsorption on positive nanoparticles (Cherng et al. 1996; Montes-Burgos et al. 2010).
Adsorption of (negatively charged) proteins on the polymer nanoparticles was illustrated by
the zeta potential data of the polymer nanoparticles measured in culture medium containing
10% FCS. These data demonstrate a weak negative charge for PNP-NH2 and a stronger
negative charge for PNP-COOH, as compared with the zeta potential in water. Even though
the PNP-NH2 were coated with a protein corona and their zeta potential had changed, they
were readily taken up by the coelomocytes, which was also observed in other studies
investigating the uptake of positively charged nanoparticles (Asati et al. 2010;
Bhattacharjee et al. 2011; Chen et al. 2011). Studies by Lesniak et al. (2010) and Maiorano
et al. (2010) have demonstrated that the stability of the protein corona may vary and does
not always oppose the uptake of nanoparticles. Therefore, the protein corona of the PNP-
NH2 may have been quite unstable, not hindering cellular uptake and subsequent adverse
effects on the cells.
C60 size distribution and aggregation in culture medium supplemented with 10% FCS was
assessed using DLS. The prominent size distribution was about 200 nm, for both

Cellular uptake and cytotoxicity of nanoparticles
89
concentrations analyzed. TEM imaging also demonstrated clusters within this size range
and moreover, the observed crystalline structure pattern indicates that they contained C60.
The large clusters observed, may be due to aggregates of C60 (Gelderman et al. 2008).
Measurements of C60 in culture medium containing 10% FCS showed low negative zeta
potential values, which is in line with observations reported for C60 solutions in other
studies (Chen and Elimelech 2006; Spohn et al. 2009; Han and Karim 2008). These slightly
negative zeta potentials were not strong enough to cause electrostatic repulsion of the
particles, suggesting that the system was not stable and agglomeration of particles was to be
expected (Berg et al. 2009; Jiang et al. 2009; Xu et al. 2007).
The CLSM observations for cellular uptake of the fluorescent polymer nanoparticles,
demonstrated that both PNP-NH2 and PNP-COOH were internalized. However, these
observations indicated that PNP-COOH were clustered, most likely in lysosomes, but PNP-
NH2 were distributed more diffusely throughout the coelomocytes. This difference was also
noted for NR8383 cells, by Bhattacharjee et al. (2011). When observing the inhibition of
the specific pathways, the CLSM data indicate that for the positively charged nanoparticles
only inhibition of the clathrin-mediated endocytosis had a significant effect on the uptake.
Bhattacharjee et al. (2011), using NR8383 cells, also observed the clathrin-dependent
endocytosis to be of importance for the cellular uptake of especially PNP-NH2. This finding
indicates that endocytosis through the clathrin-mediated pathway is a possible mechanism
of internalization for PNP-NH2, for both NR8383 cells and coelomocytes. Other studies
(Harush-Frenkel et al. 2007; Ma and Lim 2003), using various cultured cells, also
demonstrated that clathrin-mediated endocytosis was mainly involved in the uptake of
positively charged nanoparticles. Uptake of PNP-COOH was significantly reduced after
inhibition of both the caveolin- and clathrin-mediated endocytosis pathways. This differs
from the expectations, because Bhattacharjee et al. (2011) found that the caveolin-mediated
endocytosis was a more important pathway for uptake of PNP-COOH by the NR8383 cells,
than the clathrin-mediated pathway. Overall, the data on the cellular uptake of the polymer
nanoparticles demonstrate that both nanoparticles were internalized by the coelomocytes,
and that the caveolin- and clathrin-mediated pathways were involved. The CLSM data also

Chapter 4
90
indicate that distribution within the coelomocytes differed between PNP-NH2 and PNP-
COOH, e.g. PNP-NH2 were more present in the cytosol of the cells.
Even though no evident difference was noted between the total uptake levels of the
differently charged polymer nanoparticles, they induced different toxicity to the
coelomocytes. PNP-COOH induced no clear cytotoxicity, but exposure of the coelomocytes
to PNP-NH2 caused significantly lower cell viability and phagocytic activity. Bhattacharjee
et al. (2011) observed similar effects for NR8383 cells, showing cytotoxicity for PNP-NH2
but not for PNP-COOH. PNP-NH2 may be more cytotoxic due to their more diffuse
distribution. These nanoparticles may instigate production of reactive oxygen species
(ROS) and interact with mitochondria, thereby hampering normal mitochondrial
functioning and causing depletion of the high energy substrate adenosine-5'-triphosphate
(ATP) (AshaRani et al. 2008; Bhattacharjee et al. 2011; Karatas et al. 2009; Pan et al. 2009;
Xia et al. 2008).
Several in vitro studies have demonstrated toxicity due to C60 exposure in mammalian cells
(Gelderman et al. 2008; Jacobsen et al. 2008; Jia et al. 2005). In these studies, DNA
damage, loss of phagocytic ability, cell cycle arrest and increased influx of calcium were
detected. To the knowledge of the authors, this is the first study discussing in vitro C60
exposure of earthworm coelomocytes. The results demonstrate hardly any effect of C60
exposure on coelomocyte survival. The phagocytic activity was affected at high
concentrations, with significantly decreased activity from 2000 μg C60/ml culture medium
onwards, down to 13% phagocytic activity compared with the control at 8000 μg C60/ml
culture medium. CCF-1 gene expression of coelomocytes appeared to be a more sensitive
parameter, showing a statistically significant decrease already at the lowest tested C60
concentration of 100 μg/ml. Decreased CCF-1 expression was also observed in the
earthworms exposed in vivo in our previous study (Chapter 3). This demonstrates that, at
relatively low concentrations, C60 exposure may suppress an inflammatory reaction of the
coelomocytes. Other studies have also demonstrated decreases in phagocytic activity in
combination with a reduction in cytokine release, after exposure to magnetic and cadmium

Cellular uptake and cytotoxicity of nanoparticles
91
quantum dot (CdTe-QD) nanoparticles (Hsiao et al. 2009; Nguyen et al. 2012). Moreover,
Nguyen et al. (2012) demonstrated that CdTe-QD nanoparticles, by lowering cytokine
levels, could make the cells more sensitive to a bacterial infection. Such reduced resistance
to opportunistic infections, in combination with the inability of the coelomocytes to induce
adequate tissue repair (Goven et al. 1994; Napolitano et al. 1996), may explain the tissue
injuries previously observed (Chapter 3).
At very high C60 concentrations, above the EC50 for phagocytosis, the measured CCF-1
expression increased again. For the NR8383 cells, the cytokine (TNF-α) level also showed
an increase after phagocytic activity had decreased below 50%. However, NR8383 cells
demonstrated a clear concentration-dependent cytotoxicity and inflammatory response
(TNF-α increase), already at 1 μg/ml (close to the EC50 for phagocytosis which is 1.87
μg/ml). These differences between the cell types demonstrate that for viability and
phagocytic activity, the coelomocytes appear to be less sensitive to C60 exposure than the
NR8383 cells. However, the CCF-1 gene expression data and the data on the polymer
nanoparticle exposure demonstrate that coelomocytes are a sensitive test system for
determining immunotoxicity of nanoparticles.
Differences in sensitivity and intracellular processing between cell types after exposure to
the same type of nanoparticle, has been demonstrated in other studies as well. Xia et al.
(2008) observed that mouse macrophage (RAW 264.7) and human lung epithelial (BEAS-
2B) cultured cells were more sensitive to cationic polystyrene nanosphere exposure, than
human microvascular endothelial (HMEC), mouse hepatoma (HEPA-1), rat
pheochromocytoma (PC-12) cells. However, only the BEAS-2B cells were found to
internalize more nanoparticles than the other cell types. Nguyen et al. (2012) found that
mouse macrophage cells (J774A.1) were more sensitive to CdTe-QD exposure than human
colonic epithelial cells (HT29), in terms of metabolism loss, changes in morphology and
rate of QD internalization. Differences in sensitivity and uptake of nanoparticles were also
found between coelomocytes and a cultured cell line, in a study by Hayashi et al. (2012).
This study demonstrated that coelomocytes from the earthworm Eisenia fetida were more

Chapter 4
92
sensitive to silver nanoparticle exposure than the cultured human leukemia (THP-1) cell
line and also accumulated more silver nanoparticles.
In conclusion, the results of this study demonstrate that earthworm immune cells can be a
target for nanoparticles. The present study also shows the usefulness of primary immune
cells, from L. rubellus earthworms, as a test system to determine immunotoxicity of
nanoparticles on these earthworms.
For C60 nanoparticles, tissue injuries were demonstrated in the absence of an immune
response, and this was ascribed to immunosuppression or mortality of immune cells
(Chapter 3). The present in vitro study indicates that C60 does not affect the viability of the
coelomocytes. However, C60 exposure reduced CCF-1 gene expression levels in in vitro
exposed coelomocytes, similar to the effect after exposure to earthworms in vivo. Although
in vivo observations are difficult to compare with in vitro effects and a relationship between
coelomic fluid concentrations and body burden of C60 could not be established, the results
of the present study suggest that similar mechanisms of action may apply to in vitro
exposed cells and in vivo exposed organisms. In both studies, levels of CCF-1 were reduced
due to C60 exposure, indicating that the tissue injuries at the organismal level may be
associated with immunosuppression rather than mortality of the coelomocytes.
Acknowledgements
The authors would like to thank dr. Antonius TM Marcelis and dr. Gerrit M Alink for their
valuable advices. Anton J Korteweg, from the division of Physical Chemistry and Colloid
Science, is acknowledged for technical support with the zeta potential analyses. This
research project was supported by Wageningen UR strategic research program
BioNanotechnology 2007-2011 and research school WIMEK.

Cellular uptake and cytotoxicity of nanoparticles
93
Chapter 4
94

95
Chapter 5
Effects of silver nanoparticles on
Lumbricus rubellus earthworms and
particle characterisation in relevant test
matrices, including soil
Submitted for publication

Chapter 5
96
Abstract
The impact of silver nanoparticles (AgNP) and silver nitrate (AgNO3) on Lumbricus
rubellus earthworms was assessed. Four week exposure to the highest AgNP treatment (154
mg Ag/kg) reduced growth and reproduction, compared with the control. AgNO3 exposure
also caused lowered reproduction, but not as much as the equivalent AgNP treatment.
Lifelong exposure to the highest AgNP treatment caused complete juvenile mortality. All
AgNP treatments induced tissue pathology. Population modelling demonstrated reduced
population growth rates for the AgNP and AgNO3 treatments, and no growth at the highest
AgNP treatment, due to juvenile mortality. Analysis of AgNP treated soil samples revealed
that single AgNP and AgNP clusters were present in the soil, and that total Ag in soil pore
water remained high throughout the lifelong experiment. Overall, this study indicates that
AgNP exposure may affect earthworm populations and that the exposure may be prolonged,
due to continuous release of Ag to the soil pore water.
Effects and characterization of AgNP exposure
97
Introduction
Nanotechnology has an increasing societal impact, with great expectations for the use of
nanoparticles in a wide range of applications including food additives, medical devices and
soil remediation (Andreescu et al. 2009; Calzolai et al. 2012; Dekkers et al. 2011). Silver
nanoparticles (AgNP) are among the most widely used nanoparticles in consumer products
and inevitably, the unintended exposure of humans and the environment is of concern
(Calzolai et al. 2012; Wijnhoven et al. 2010). Consequently, there have been efforts to
collect data on the environmental hazards and behaviour of AgNP (Arnaout and Gunsch
2012; Stone et al. 2010; Wijnhoven et al. 2010). Kahru and Dubourguier (2010) evaluated
the toxicity of nanoparticles on species from different levels in the aquatic ecosystem
(including bacteria, algae, yeast, ciliates, crustaceans, nematodes and fish) from 77 studies,
and classified AgNP as “extremely toxic”. Several studies suggest that the toxicity of AgNP
to the environment may be derived from the release of silver (Ag) ions, because ionic Ag is
known as one of the most toxic heavy metal species, but the hazards of AgNP may not be
completely explained by ionic Ag toxicity (Arnaout and Gunsch 2012; Colman et al. 2012;
Griffitt et al. 2009; Mitrano et al. 2012; Ratte 1999).
The risks of AgNP exposure to terrestrial ecosystems and especially soil organisms is still
poorly understood (Shoults-Wilson et al. 2011c). However, the antimicrobial properties of
AgNP have raised concerns that soil microbial communities may be disturbed, with
deleterious consequences for important ecosystem functions, including decomposition and
nutrient cycling (Colman et al. 2012; Rai et al. 2009). In addition, direct AgNP toxicity to
other soil organisms is also of concern (Tourinho et al. 2012).
A limited number of studies have investigated the impact of AgNP exposure to earthworms,
quantifying effects on survival, growth, avoidance, inhibition of the Na+, K+ ATPase and
apoptotic activity in tissues, for Eisenia fetida and Lumbricus terrestris earthworms
(Heckmann et al. 2011a; Hu et al. 2012; Lapied et al. 2010; Shoults-Wilson et al. 2011a,
2011b and 2011c). The toxicity of metal nanoparticles to soil organisms has been
tentatively associated with ionic metal fractions appearing in the soil pore water (Kool et al.
2011; Shoults-Wilson et al. 2011a). Furthermore, the behaviour of AgNP may be modified
by interactions of these nanoparticles with soil components, such as organic matter and

Chapter 5
98
clay, and by soil characteristics, including ionic strength and pH (Cornelis et al. 2010;
Coutris et al. 2012; Lapied et al. 2010; Shoults-Wilson et al. 2011a; Stebounova et al. 2011;
Tourinho et al. 2012). Therefore, for good interpretation of soil toxicity experiments,
characterisation of the nanoparticles in different soil compartments (e.g. soil and soil pore
water) is required (Cornelis et al. 2010; Jiang et al. 2009; Montes-Burgos et al. 2010; Stone
et al. 2010).
Our previous work on C60 exposure to earthworms highlighted some important timescale
issues in nanoparticle toxicity. In vivo experiments demonstrated lower reproduction after
four week C60 exposure, and reduced survival and growth after lifelong C60 exposure,
which are all critical endpoints for population dynamics (Chapter 2). For these C60
exposed earthworms, tissue pathology and genomic responses were observed as well, as
discussed in Chapter 3. Additional in vitro experiments, using earthworm immune cells
(coelomocytes), demonstrated effects of exposure to C60 and polymer nanoparticles, which
implicated the immunotoxic potential of nanoparticles (Chapter 4). In the present study a
similar approach was employed, using Lumbricus rubellus earthworms exposed to AgNP in
vivo for four weeks with a subsequent lifelong exposure of the offspring and the assessment
of a range of endpoints (survival, growth, reproduction and histopathology). A population
model was used to quantify the potential impact of AgNP induced changes of these
individual endpoints on L. rubellus populations. In an attempt to link exposure to effects,
Ag concentrations were characterized in different test matrices, using several independent
analytical techniques. In addition, given our previous observations of immunotoxicity of
nanoparticles, an in vitro experiment with coelomocytes was performed to give insight in
possible modes of action of AgNP toxicity.
Materials and Methods
Three experiments were conducted, two in vivo experiments and one in vitro experiment.
The first in vivo experiment encompassed the four week exposure of adult earthworms, and
the assessment of their survival, growth and reproduction. In the second in vivo experiment,
offspring from the first experiment were monitored lifelong for survival and growth. In
addition, an in vitro experiment was conducted, to assess the possible immunotoxic effects

Effects and characterization of AgNP exposure
99
of AgNP. In the latter experiment, earthworm coelomocytes were exposed overnight and
cell survival was determined.
Test compounds
Commercially available NM-300K silver nanoparticles (AgNP) were obtained from
Mercator GmbH (Germany), with a mean reported particle diameter of 15 nm (90% < 20
nm). These nanoparticles have been selected as a representative nanomaterial by the OECD
Working Party on Manufactured Nanomaterials (WPMN) international testing program
(OECD 2010). The stock suspension of AgNP contained 10.16% Ag (w/w) dispersed in a
stabilizing vehicle material, consisting of polyoxyethylene glycerol trioleate (4%; w/w) and
polyoxyethylene (20) sorbitan mono-laurat (Tween 20) (4%; w/w) (manufacturer’s
information). The vehicle material without AgNP was also purchased from Mercator as
NM-300K DIS Ag-dispersant, and used as a control. Silver nitrate (AgNO3) was obtained
from Merck KGaA (Germany), as a powder with a purity of 99.8% (w/w), and used to
benchmark the AgNP effects against Ag salt.
Metal impurities in the AgNP stock suspension and the AgNO3 powder were measured by
an Element 2 high resolution inductively coupled plasma-mass spectrometry (HR-ICP-MS;
Element 2; Thermo Scientific, Germany), after dissolving in 0.14M HNO3 (1/1000). The
levels of metal impurities were very low (as shown in Table S1 of the Supplementary Data)
and therefore, no additional risks were expected from these impurities.
In vivo experiments
Experimental design
The in vivo experiments were conducted following ISO guidelines 11268-2: 1998, with
minor adjustments in exposure scenarios and using the earthworm species L. rubellus. For
the four week exposure experiment, adult (clitellated) earthworms were acquired
(Nijkerkerveen, the Netherlands). The average weight of the earthworms was 1373 ± 33 mg
(mean ± SEM; n = 180) and the weights did not differ significantly between exposure
groups (p > 0.05). Prior to the experiment, the earthworms were acclimatized for two weeks

Chapter 5
100
under constant conditions (24 hours light, 15°C and 61% relative humidity) in
uncontaminated sandy test soil, with 1.6% clay, 4.3% organic matter and a pH-H2O of 5.96.
For the in vivo experiments, the soil was prepared as described in chapter 2, using a wet-
spiking procedure with a soil extract. For each treatment, six glass containers were used (n
= 6), each housing five earthworms. Different soil exposure concentrations of Ag in the
form of AgNP and AgNO3 were used. Three nominal exposure concentrations of AgNP
were tested: 1.5 (low), 15.4 (medium) and 154 (high) mg Ag/kg soil. Due to limitations in
the experimental logistics of the in vivo experiments, only one concentration of AgNO3 was
tested, at 15.4 mg Ag/kg soil, to compare the Ag salt with the highest AgNP treatment. In
addition, soil without Ag and soil with vehicle material were used as controls. The soil
extract used to spike the soil, was obtained by addition of soil to ultrapure water, after
which the suspension was shaken and filtrated. Subsequently, the soil extract was spiked
with AgNP (2.0 Ag/l), AgNO3 (0.2 g Ag/l), vehicle material (20 g/l; as a control for AgNP)
or without any addition (control for AgNO3) and added to the soil. The soil was mixed
thoroughly and added to the container, after which the earthworms were placed in the
container immediately. In the materials and methods section of the Supplementary Data,
further details about the soil and the spiking procedure are provided.
For the four week experiment the endpoints included survival, growth (weight gain
compared between beginning and end of experiment) and reproduction (the cocoon
production per container at the end of the experiment, converted to the average number of
cocoons produced per earthworm per day). Furthermore, at the end of the experiment,
histological observations of different tissues were made and total Ag concentrations were
analysed in tissues. In addition, imaging of Ag particle uptake (only for the high AgNP
treatment) was conducted at the end of the experiment, to underpin the analytical results. In
the lifelong experiment earthworms were checked monthly, over a period of ten months, for
survival and growth. Furthermore, histological examinations were made at the end of the
lifelong experiment (after ten months).

Effects and characterization of AgNP exposure
101
Table 1. Overview of the different analytical techniques used to characterize in vivo exposure. The exposure was assessed in soil extract (SE) and
ultrapure water (UPW) by asymmetric flow field flow fractionation system (AF4) to determine the size of AgNP, and in soil (S) and earthworms (E)
to quantify total Ag and Ag particle diameter and concentrations using inductively coupled plasma mass spectrometry (ICP-MS) and single particle
ICP-MS (SP-ICP-MS). Furthermore, soil pore water was analysed by flame atomic absorption spectrometry (F-AAS) to measure total Ag
concentratis present in the soil pore water samples. Samples for the analyses were freshly made (t = 0) or taken at the end of the four week (t = 1
month) or the lifelong experiment (t = 10 or 11 months). In addition, freshly made samples of soil extract (SE), as well as samples from soil (S) and
earthworms (E) taken at the end of the four week experiment were analysed by field emission gun scanning electron microscopy in combination
with energy dispersive analysis of X-rays (SEM/EDX). The abbreviation n.a. means not applicable.
Matrix SE and UPW Soil Soil pore water Earthworm SE, Soil, Earthworms
Endpoint Size Total Ag and Ag
particle (>30 nm) conc. Total Ag conc.
Total Ag and Ag particle
(>30 nm) conc. Imaging of Ag particles
Method AF4 ICP-MS, SP-ICP-MS F-AAS ICP-MS, SP-ICP-MS SEM/EDX
Time point t=0 t=1 and t=10 t=1 and t=11 t=1 t=0 (SE), t=1 (S, E)
Treatment
unit analysed n.a.
All AgNP and AgNO3
treatments
All AgNP and
AgNO3
treatments
All AgNP and AgNO3
treatments
High AgNP and AgNO3
(S), high AgNP (E)
Effects a
nd
cha
racteriza
tion
of A
gN
P exp
osu
re
101

Chapter 5
102
Exposure characterisation
In this section, an overview of the methods used to characterise the in vivo exposure will be
presented. Due to the extent of the methods, details are provided in the materials and
methods section of the Supplementary Data.
Characterisation of the AgNP and total Ag concentrations was performed in the soil extract
(used for addition of AgNP, AgNO3 and vehicle material to the soil), the soil, the soil pore
water and the earthworms, where technically possible. An overview of the in vivo exposure
characterisation is presented in table 1 and the results are discussed in the results section.
For analysis of the soil extract, which was used for spiking the soil, a freshly made stock of
AgNP in the soil extract was diluted with clean soil extract before determination of the
particle diameter of AgNP with asymmetric flow field flow fractionation (AF4). An
accompanying experiment was performed with the soil extract, during which the ionic
strength of the soil extract was increased. This experiment was performed because of the
idea that the ionic strength of the soil pore water during the in vivo experiments was
probably (much) higher than of the soil extract (Houba et al. 2000) and therefore AgNP
aggregation is expected when adding the soil extract to the soil (Cornelis et al. 2010;
Tourinho et al. 2012).
For analysis of the soil, soil samples were taken at the end of the four week and lifelong
experiments (after ten months). After acid digestion of the soil, inductively coupled plasma
mass spectrometry (ICP-MS) was used to measure total Ag concentrations. In addition, a
novel method for quantification of relative particle size distribution and particle number
concentrations of Ag particles was applied, using single particle ICP-MS (SP-ICP-MS).
Similar soil samples as used for the ICP-MS measurements were analysed after water
extraction, in order to preserve the structural integrity of the Ag particles.
For analysis of total Ag in the soil pore water, samples were obtained after saturation and
centrifugation of soil samples taken at the end of the four week and lifelong experiments
(after eleven months). Subsequently, total Ag concentrations in the soil pore water samples
were directly measured with flame atomic absorption spectrometry (F-AAS).

Effects and characterization of AgNP exposure
103
For the earthworm analysis, whole earthworm samples were collected at the end of the four
week experiment and analysed to assess the uptake of Ag. Measurements by ICP-MS were
performed to determine total Ag concentrations in the earthworm samples, after acid
digestion of whole earthworms. In addition, particle size distribution and particle number
concentration of Ag particles were measured by SP-ICP-MS, in water extracts of the
earthworms.
Furthermore, in almost all matrices of the in vivo experiment (soil extract, soil and
earthworm) the presence of Ag particles was qualitatively assessed by field emission gun
scanning electron microscopy in combination with energy dispersive analysis of X-rays
(SEM/EDX). SEM/EDX provides information about the Ag particle size and composition,
and the elements associated with these particles.
Effect assessment: Individual and population endpoints
At the start of the four week experiment, the earthworms were weighted and added to the
containers. Earthworms were fed alder leaves (Alnus glutinosa) from an uncontaminated
location (Vossemeerdijk, Dronten, the Netherlands), ad libitum. After four weeks, the
experiment was terminated and the earthworms were counted and weighted again. One
earthworm per container was stored in 4% buffered formal saline for histological
examination (Handy et al. 2002b), after segments were carefully cut with a sharp scalpel
blade, covering the region approximately one centimetre anterior and posterior to the
clitellum. The other earthworms were put in liquid nitrogen and stored at -80°C, until
further analysis. Subsequently, the number of cocoons present per container was
determined by wet-sieving and hand-sorting.
For the consecutive lifelong experiment, the cocoons from the first experiment were
incubated in petri dishes with soil of the corresponding treatment of their parent
earthworms. After hatching, juveniles were transferred to containers with soil of the same
exposure as their parents, again with six containers per treatment (n = 6) and five
earthworms per container. Earthworms were checked monthly over a period of ten months,
to determine weight and life stage: juvenile, subadult (showing a tubercula pubertatis, but
before the clitellum has fully developed) or adult (with a fully developed clitellum) (Sims

Chapter 5
104
and Gerard 1985). At the end of the experiment, earthworms were counted and weighted.
For histological examination, one earthworm was randomly chosen from each container,
carefully cut and then immediately fixed in 4% buffered formal saline. The other
earthworms were put in liquid nitrogen and stored at -80°C, until further analysis.
The individual effect markers on adult reproduction and offspring survival and growth,
were integrated to assess consequences at the population level, using a continuous-time life-
history model as described in chapter 2. Within this model, several parameters were taken
from the literature (Klok and De Roos 1996), including the duration of the cocoon stage (τ0;
42 days), and the mortality chance per day (with 1 = 100% mortality at day 1) for the
cocoon stage (μc; 0.001) and the adult life stage (μad; 0.0027).
Effect assessment: Histological observations
For the histological examinations, the fixed segments were processed into wax blocks and
transverse sections of 7 µm were cut from each segment. The staining of these sections was
performed using Mallory’s trichrome. All sections were prepared simultaneously, in
batches containing both samples from earthworms of the control, AgNP and AgNO3
treatments, in order to eliminate differences in fixation or staining artefacts between
treatments. Sections were examined with an Olympus Vanox-T microscope and
photographs were obtained using an Olympus digital camera (C-2020 Z). Eventually, not
all earthworms were examined, due to some preservation artefacts, which made the
histological observations semi-quantitative.
In vitro experiment
Exposure characterization
Dynamic light scattering (DLS) and Zetasizer analyses were applied on freshly made stocks
of AgNP and AgNO3 (10 μg/ml) in ultrapure water and Ham’s F-12K (Kaighn’s) medium
(cell culture medium; from Invitrogen/Life Technologies Ltd, UK) containing 10% fetal
calf serum (FCS), to measure particle size distribution and zeta potential for AgNP and

Effects and characterization of AgNP exposure
105
AgNO3 (results are presented in the Results section). Furthermore, the presence of Ag
particles was qualitatively established using SEM/EDX.
Effect assessment: Coelomocyte viability
Primary immune cells from the coelomic fluid (coelomocytes) were exposed to AgNP and
AgNO3 in vitro. Coelomocytes were extruded from unexposed adult L. rubellus earthworms
as described in chapter 4. Serial dilutions of AgNP and AgNO3 in cell culture medium
containing 10% FCS were made, to obtain a concentration range of exposure medium from
0 to 2000 μg Ag/ml cell culture medium, for AgNP as well as AgNO3. In addition, serial
dilutions of vehicle material without AgNP were prepared and used as negative control for
AgNP exposure. Subsequently, 50 μl of exposure medium was added to 50 μl of
coelomocytes suspension (with approximately 5 x 10⁶ coelomocytes/ml) in a 96 well-plate,
to obtain the acquired final concentrations of AgNP and AgNO3 from 0 to 1000 μg Ag/ml
cell culture medium. The coelomocytes were incubated overnight, at 15°C. Hereafter, cell
viability was assessed using 0.05% trypan blue (final concentration), as described in
chapter 4.
Statistical analyses
Differences between treatments were analysed using analysis of variance (ANOVA, with α
= 0.05), with least significant differences (LSD) as the post-hoc test (Burgers and Oude
Voshaar 2010). The ANOVA tests were carried out using GENstat (14th
Edition, VSN
International Ltd.). Results are presented relative to the corresponding control (= 100%), as
mean ± standard error of the mean (SEM) per treatment, unless otherwise specified.

Chapter 5
106
Results
In vivo experiments
Exposure characterisation
The particle diameter of AgNP in the soil extract (used for spiking the soil) was determined
by AF4, which demonstrated a clear peak with a maximum absorption at a particle diameter
of 16 nm (Supplementary Data Figure S1). Integration of the fractograms with total Ag
measurements in the eluent fractions demonstrated that more than 90% of the total Ag
amount in the soil extract had a particle diameter < 32 nm (Figure S2). The addition of
calcium to the soil extract with AgNP at a concentration of 5 mM and higher, caused
complete destabilization of the colloidal AgNP suspension (Figure S3), suggesting
clustering and settling of the AgNP.
SEM/EDX analysis of the soil extract containing AgNP demonstrated the presence of
single Ag particles, with a particle diameter of approximately 20 nm. Some larger structures
(50 to 250 nm) of Ag were also present, consisting of Ag only or Ag in combination with
carbon, chloride and sulfide. In the soil extract with AgNO3, large Ag flake-like structures
(≥ 1 μm) were formed, which also contained chloride and carbon.
Soil samples were taken at the end of the four week and the lifelong (ten months) in vivo
experiments. For the four week experiment, the total Ag concentrations were 1.2 ± 0.03,
10.5 ± 0.2 and 118 ± 4 mg Ag/kg for the low, medium and high AgNP treatments,
respectively (Table 2). Hence, 68 to 80% of the nominal AgNP soil exposure concentration
was extracted from the soil samples, with the acid digestion method. After ten months the
low, medium and high AgNP treatments demonstrated total Ag concentrations of 1.3 ± 0.3,
8.3 ± 0.3 and 104 ± 4 mg Ag/kg soil, respectively. The AgNO3 treatment showed a total Ag
concentration of 11.5 ± 0.1 mg Ag/kg after four weeks (Table 2) and a concentration of 6.3
± 0.01 mg Ag/kg soil after ten months. A novel method for SP-ICP-MS analysis of soil was
applied, with which a water extractable fraction of 10 to 27% was detected. Furthermore,
due to the instrumental parameters used for the SP-ICP-MS, it was only feasible to detect
particles larger than 30-40 nm. Consequently, the present results are semi-quantitative and
Effects and characterization of AgNP exposure
107
provide insight into the occurrence of particles larger than 30 nm, excluding the single
AgNP used in this study. Ag particle concentrations for the low AgNP and the AgNO3
treatments were below the detection limit of the SP-ICP-MS (< 0.10 mg Ag/kg soil) for all
samples. Soil samples taken after four weeks from the medium AgNP treatment showed an
Ag particle concentration of 0.13 ± 0.02 mg Ag/kg and for the high AgNP exposure soil
this concentration was 5.5 ± 0.9 mg Ag/kg soil (Figure S4), with average Ag particle sizes
of 42 nm and 46 nm, respectively. After ten months, the Ag particle concentration for
medium AgNP soil was below the detection limit. The high AgNP treatment showed a
concentration of 1.9 ± 0.3 mg Ag/kg soil, with Ag particles of 48 nm, at this time point.
SEM/EDX imaging of the soil samples taken at the end of the four week experiment
indicated the presence of AgNP in the soil in three different forms: (1) single AgNP of
approximately 20 nm in size, which were most abundant, (2) larger spherical structures
with a size of 50 to 250 nm, containing only Ag (Figure S6A), and (3) structures of
approximately 500 nm in the shape of a star (Figure S6B). These star shaped structures
consisted of Ag particles of 50 to 100 nm, in combination with carbon and chloride. In the
soil samples treated with AgNO3 no Ag structures were visible.
Analyses of the soil pore water samples were carried out at the end of the four week and the
lifelong in vivo experiments, in order to assess whether any changes of the total Ag levels in
the soil pore water occurred over time. Total Ag concentrations in the soil pore water
samples from the low and medium AgNP treatments were below the detection limit of the
F-AAS (< 3 μg Ag/l). Soil pore water samples from the high AgNP treatment showed a
total Ag concentration of 96 ± 6 μg Ag/l after four weeks (Table 2) and after eleven months
the total Ag concentration had increased to 260 ± 21 μg Ag/l. For the AgNO3 treatment,
total Ag could only be detected in soil pore water samples after four weeks, with an Ag
concentration of 16 ± 7 μg Ag/l (Table 2).
Using ICP-MS, total Ag concentrations were measured in earthworms exposed in vivo for
four weeks and the uptake ratio of the total Ag concentration in the earthworm to the total
Ag concentration in the soil could be established. Ag concentrations of the earthworms

Chapter 5
108
sampled from the low AgNP treatment did not exceed the detection limit for the ICP-MS (<
1 mg Ag/kg earthworm) and the SP-ICP-MS (< 0.2 μg Ag/g earthworm). Earthworms from
the medium AgNP treatment group showed a total Ag concentration of 4.5 ± 0.5 μg Ag/g
earthworm (Table 2), which indicates a corresponding uptake ratio of 0.43. In earthworms
from the high AgNP treatment, the total Ag concentration was 2.7 ± 0.3 μg Ag/g earthworm
(Table 2), suggesting an uptake ratio of 0.02. For AgNO3 exposed earthworms, total Ag
concentration and the corresponding uptake ratio were 2.3 ± 0.7 μg Ag/g earthworm (Table
2) and 0.2, respectively. The SP-ICP-MS analysis of earthworms from the medium AgNP,
high AgNP and AgNO3 treatments showed Ag particle concentrations of 0.3 ± 0.16 μg
Ag/g earthworm (average size 47 nm), 1.2 ± 0.97 μg Ag/g earthworms, with an average
size of 51 nm (Figure S5), and particles of 49 nm at a concentration of 2.2 ± 0.8 μg Ag/g
earthworm, respectively.
Table 2. Exposure characterisation of the four week experiment presented with the nominal concentrations (mg
Ag/kg soil) for the AgNP and AgNO3 treatments, as well as the total Ag concentrations measured in soil (mg
Ag/kg soil). Furthermore, total Ag concentration in the soil pore water (μg Ag/l soil pore water) and the
earthworms (μg Ag/g earthworm) are demonstrated. In addition, effects of four week exposure to AgNP and
AgNO3 on relative weight gain and cocoon production of the L. rubellus earthworms (n = 6 containers) are shown.
Values are presented as mean ± SEM. For the effects, values are compared with the corresponding control (=
100%), between vehicle material control (V. control) and AgNP treatments or control and AgNO3 treatments, and
for these data an asterisk sign (*) shows an assessed significant difference.
Treatment Nominal
[Ag] Total Ag in soil
Total Ag in soil
pore water
Total Ag in
earthworms
Relative
weight gain
Relative #
cocoons
V. control 0 < 1 < 3 < 1 100 ± 12 100 ± 4
AgNP 1.5 1.2 ± 0.03 < 3 < 1 121 ± 17 103 ± 5
15.4 10.5 ± 0.2 < 3 4.5 ± 0.5 136 ± 4 91 ± 11
154 118 ± 4 96 ± 6 2.7 ± 0.3 44 ± 12 * 18 ± 3 *
Control 0 < 1 < 3 < 1 100 ± 17 100 ± 8
AgNO3 15.4 11.5 ± 0.1 16 ± 7 2.3 ± 0.7 118 ± 14 60 ± 10 *
SEM/EDX analysis of the earthworm slices from the high AgNP treatment of the four week
experiment demonstrated the presence of Ag particles in the intestine, consisting of Ag only

Effects and characterization of AgNP exposure
109
(Figure 1A) or along with sulfide and chloride. When focussing on the dermis of the
earthworms, Ag particles were found within the layer of epithelial cells. These were single
AgNP with a size of approximately 20 nm (Figure 1B), but also larger particles (≤ 100 nm)
consisting mainly of Ag.
Figure 1. SEM/EDX images and EDX spectrum analyses obtained from a L. rubellus earthworm exposed to the
high AgNP treatment for four weeks, indicating the presence of an Ag only structure in the intestine (A) and a
single AgNP in the dermis (B). The grey oval line in the EDX spectrum encircles the Ag element peak.
Effect assessment: Individual and population endpoints
All adult earthworms survived the four week exposure. Table 2 shows that the adult weight
gain in the high AgNP treatment group was significantly reduced (down to 44%), compared

Chapter 5
110
with the vehicle material control group, as was the reproduction (down to 18%). AgNO3
exposure did not reduce weight gain, but a significant reduction in cocoon production down
to 60% was observed, as compared with the unexposed control treatment (Table 2).
In the lifelong experiment the hatchability of the offspring was only significantly affected
in the high AgNP treatment (ANOVA, p=0.001), where only two cocoons hatched and the
hatched juveniles died shortly afterwards.
Table 3 shows the parameters used in the continuous-time life-history model for the
different treatments, which were estimated from the individual endpoints, e.g. adult
reproduction, and survival and growth of the offspring. The low and medium AgNP
treatments caused significantly reduced population growth rates (ANOVA; p < 0.001),
decreasing down to 95% and 89%, respectively, compared with the vehicle material
control. For the high AgNP, no population growth calculation was possible, due to the
100% mortality shortly after hatching. The population growth rate of the AgNO3 treatment
was significantly reduced compared with the corresponding unexposed control (87%;
ANOVA; p < 0.001) and slightly, but significantly, lower than the medium AgNP
treatment. The life stage distribution of the populations did not show significant differences
between treatments, aside from the high AgNP treatment with the 100% juvenile mortality.

Effects and characterization of AgNP exposure
111
Table 3. Input parameters for the population model, estimated from the four week and lifelong in vivo experiments, are presented per treatment group. The
growth rate constant for the individual earthworms (γ) is given in mg1/3/mg1/3/day and the maximum reproduction rate (Rm) per treatment group is presented
as cocoons/mg1/3/day. Earthworm length at birth (Lb), the lengths at reaching subadulthood (Ls) and adulthood (Lad), and the estimated maximum length of
the earthworms (Lm) are displayed as mg1/3. In addition, the mortality chance for the juveniles (μj) and subadults (μs) are given per day (with 1 = 100%
mortality at day 1). For all data, the mean values are presented and the standard deviation (SD) is displayed when this was required for the model.
Significant differences between vehicle material control and AgNP treatments or control and AgNO3 treatments are displayed with an asterisk sign (*).
Treatment
Input parameters
γ Rm Lb Ls Lad Lm μj μs
Vehicle control 0.022 ± 0.005 0.0033 ± 0.0005 2.49 ± 0.3 10.5 11.2 13.3 ± 0.8 0.005 0.0043
Low AgNP 0.023 ± 0.005 0.0039 ± 0.0003 2.426 ± 0.1 9.93 11.2 12.5 ± 0.6 0.0051 0.0043
Medium AgNP 0.021 ± 0.006 0.0027 ± 0.0004* 2.46 ± 0.2 10.4 11.8 14.0 ± 0.1 0.0061 0.0059
Control 0.021 ± 0.004 0.0032 ± 0.0005 2.68 ± 0.1 9.9 11.4 13.4 ± 1.0 0.0047 0.0043
AgNO3 0.021 ± 0.005 0.0018 ± 0.0002* 2.69 ± 0.2 10.2 11.5 13.9 ± 0.9 0.0053 0.0043
Effects a
nd
cha
racterisa
tion
of A
gN
P in
vivo a
nd
in vitro
expo
sure
111

Chapter 5
112
Effect assessment: Histological observations
For the four week experiment, observations of the tissue segments anterior to the clitellum
and of the clitellum region from the control and the vehicle material control earthworms
showed a normal histology. The tissue segments anterior to the clitellum of these
earthworms showed an epithelium consisting of columnar epithelial cells, some mucous
and basal cells, and normal looking underlying circular and longitudinal muscles (Figure
2A and 2B). One of the four vehicle material control earthworms, showed some slight
eosinophilic granular material in the epithelium of these segments. The clitellum region of
the control and vehicle control earthworms showed a pseudostratified epithelium with soft
parenchyma underneath and normal circular and longitudinal muscle layers.
The AgNP treatments caused mild or moderate erosion in parts of the epithelium of the
tissue anterior to the clitellum (Figure 2C, 2D and 2E), for three of the four low AgNP
treated earthworms and two of the four medium AgNP and high AgNP examined
earthworms, respectively. Mild fibrosis was noted in the circular muscles of these
earthworms as well. The tissues of the clitellum region were also affected by four week
exposure to AgNP. Exposure to the low and medium AgNP treatment caused granular
lipofuscin-like deposits in the clitellum tissue and epidermis, and mild fibrosis of the
circular muscle, in two of six (low) and two of three (medium) examined earthworms. For
the high AgNP treatment, only tissue from one earthworm, with normal histology, was
examined. Earthworms from the AgNO3 treatment showed some hyperplasia in the
epidermis and some granular lipofuscin-like deposits in the circular muscle (2 of 3
earthworms), in the tissue anterior to the clitellum (Figure 2F). In addition, in the clitellum
region of one of the three AgNO3 exposed earthworms some hyperplasia of the
pseudostratisfied epithelium was noted.
For the lifelong experiment, examination of the segments of the clitellum region and the
tissue anterior to the clitellum of the control and the vehicle material control earthworms
showed normal histology.
The tissue anterior to the clitellum of earthworms from the low and medium AgNP
treatments showed some erosion of the epithelium. In addition, one earthworm from the

Effects and characterization of AgNP exposure
113
medium AgNP treatment showed excessive hyperplasia of mucus cells in the epidermis,
which suggests increased mucus production (a defence mechanism). When looking at the
clitellum region, low AgNP treatment resulted in hyperplasia of mucus cells in the
epidermis and some loss of the clitellum tissue thickness in one of the five earthworms. All
four earthworms from the medium AgNP treatment demonstrated slight or moderate loss of
architecture for the epithelial cells of the clitellum region, and one earthworm showed
additional fibrosis and lipofuscin-like deposits in the circular muscle, as well as some
damage to the longitudinal muscle. For the AgNO3 treatment, slight erosion of epithelial
cells (with otherwise intact epithelium) and some thickening of the circular muscle were
noted in tissue anterior to the clitellum of two of the three earthworms. In the clitellum
region, AgNO3 treatment had less effect than the AgNP treatments, causing some erosion of
the epithelium, and some thickening of the circular muscle in two of the three earthworms.
The in vitro experiment
Exposure characterisation
For the in vitro experiment, Ag exposure was analysed using SEM/EDX, DLS and zeta
potential. SEM/EDX analysis of cell culture medium with AgNP demonstrated single Ag
particles of approximately 20 nm (most abundant) and some larger Ag structures (50-250
nm), which appeared to include chloride and sometimes sulfide. DLS analysis of AgNP in
the ultrapure water demonstrated particles with a hydrodynamic diameter of 50 nm (Figure
3) and a zeta potential of -25 ± 1. When AgNP was analysed in the cell culture medium, the
particle hydrodynamic diameter became slightly larger (58 nm; Figure 3) and the zeta
potential became less negative (-11 ± 1 mV). SEM/EDX imaging of AgNO3 in the cell
culture medium showed large structures of Ag (≥ 1 μm), which were associated with
chloride. No consistent results were obtained for DLS measurements of AgNO3 in ultrapure
water and the cell culture medium. Zeta potential measurements of AgNO3 showed a
slightly positive zeta potential in ultrapure water (1.6 ± 0.4 mV) and a zeta potential of -12
± 0.3 mV in the cell culture medium.
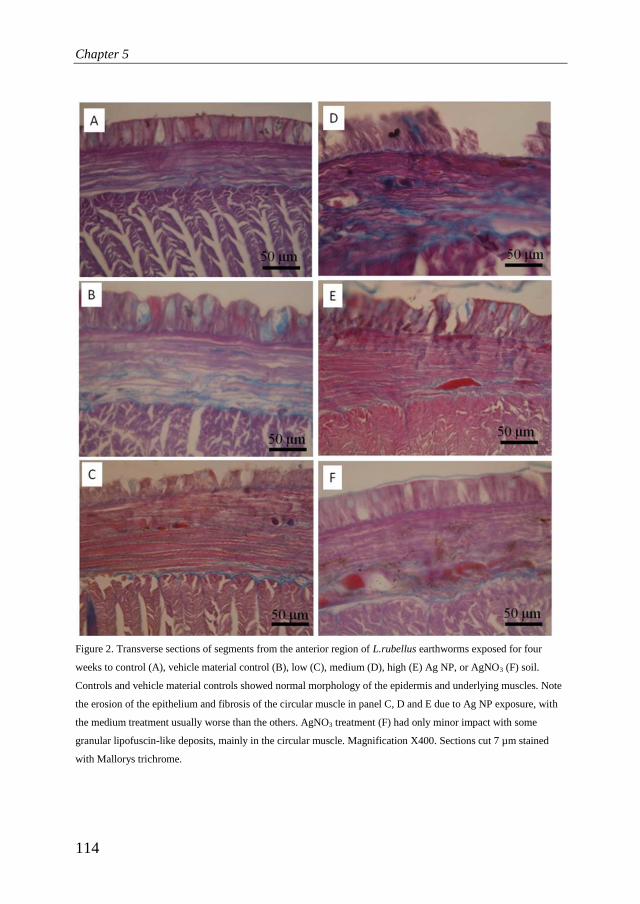
Chapter 5
114
Figure 2. Transverse sections of segments from the anterior region of L.rubellus earthworms exposed for four
weeks to control (A), vehicle material control (B), low (C), medium (D), high (E) Ag NP, or AgNO3 (F) soil.
Controls and vehicle material controls showed normal morphology of the epidermis and underlying muscles. Note
the erosion of the epithelium and fibrosis of the circular muscle in panel C, D and E due to Ag NP exposure, with
the medium treatment usually worse than the others. AgNO3 treatment (F) had only minor impact with some
granular lipofuscin-like deposits, mainly in the circular muscle. Magnification X400. Sections cut 7 µm stained
with Mallorys trichrome.

Effects and characterization of AgNP exposure
115
Figure 3. Hydrodynamic diameters of AgNP in ultrapure water (black dotted line) and cell culture medium with
10% FCS (grey line), measured with DLS at t = 0.
Effect assessment: Coelomocyte viability
Figure 4 shows that viability of the coelomocytes decreased with increasing AgNP
concentrations, demonstrating an EC50 of 290 μg Ag/ml cell culture medium. Viability of
the coelomocytes was affected more by AgNO3 exposure, with an EC50 of 21 μg Ag/ml cell
culture medium (Figure 4).
Figure 4. Viability of the coelomocytes exposed to increasing concentrations of AgNP (black open circle) or
AgNO3 (grey cross). Values are compared with the control (=100%) and are shown as mean ± SEM (N=3). An
asterisk sign (٭) indicates a statistically significant difference compared with the control. The regression curves for
AgNP (continuous black line) and AgNO3 (dashed grey line) exposure are displayed.

Chapter 5
116
Discussion
The present study has investigated the effects of in vivo exposure of earthworms to AgNP
through the soil. Effects of AgNP exposure were not only observed in a four week exposure
experiment on growth, reproduction and histopathology, but also after lifelong exposure on
survival, growth and histopathology. The modelling approach made it possible to observe
effects of AgNP exposure on L. rubellus population growth rate, even at the lowest AgNP
concentration (1.5 mg Ag/kg soil) tested. Furthermore, the in vitro assay showed the
potential immunotoxicity of AgNP exposure to coelomocytes, which may have implications
on whole body functioning. Exposure characterization indicated that the soil extract (used
for spiking the soil) contained many single AgNP, but addition of the soil extract with
AgNP to the soil led to formation of larger Ag structures, in addition to the single AgNP.
Furthermore, total Ag levels in the soil pore water of the AgNP exposure soil remained
high during the lifelong experiment, which was not observed for soil spiked with AgNO3.
This suggests differences in the behaviour of the nano form compared with the metal salt in
the soil.
Exposure characterisation
In this study, several analytical techniques were used to characterize the exposure of
earthworms in vivo. With these different techniques a thorough characterization of AgNP
was established, before addition of AgNP to the soils (using the soil extract), and during
exposure of the earthworms in the soil and in the soil pore water. In addition, uptake of
AgNP by the earthworms was analysed.
Analysis of AgNP in the soil extract by AF4 showed a peak diameter at 16 nm, which is in
good agreement with Klein et al. (2011) for the same NM-300K AgNP, who reported a
particle diameter varying from 14 to 17 nm using transmission electron microscopy. The
ionic strength of the soil extract was rather low (2.3 mM), while the ionic strength in the
soil pore water during the in vivo experiment may have been much higher (Houba et al.
2000). This higher ionic strength may have led to clustering of AgNP after the soil extract
was added to the soil (Cumberland and Lead 2009; Delay et al. 2011; Stebounova et al.
2011). This phenomenon may explain the presence of larger Ag structures within the solid

Effects and characterization of AgNP exposure
117
phase of the soil, as indicated by SEM/EDX and SP-ICP-MS analyses, in addition to the
single AgNP also observed in the soil by SEM/EDX. These larger Ag structures consisted
of AgNP clusters (Figure S6A) or of AgCl and Ag2S heteroaggregates (Figure S6B),
possibly with ionic silver adsorbed to the AgNP surfaces and ‘nanobridges’ of AgCl or
Ag2S heteroaggregates between the AgNP (Levard et al. 2011; Li et al. 2010; Liu and Hurt
2010; Walczak et al. 2012). Furthermore, the results of the soil pore water from the high
AgNP exposure soil suggest that Ag particles and structures provided continuous release of
Ag to the soil pore water. This suggestion is in line with Coutris et al. (2012), who also
observed a long-term release of (dissolved) Ag in their study using uncoated AgNP of 20
nm. In the SEM/EDX imaging and SP-ICP-MS analysis of soil with AgNO3, no Ag
particles and structures were detected. This indicates that AgNO3 remained dissolved in the
soil, as is also known and demonstrated for this metal salt (Atkins and Jones 2000; Coutris
et al. 2012; Ratte 1999). The Ag from AgNO3 may have undergone rapid fixation in the
soil, binding to chloride, sulfide and soil organic matter, without forming large and
detectable amounts of insoluble Ag heteroaggregates (Alberts and Filip 1998; Coutris et al.
2012; Kerndorff and Schnitzer 1980; Murray and Linder 1984). Hence, these results
suggest that exposure of organisms to AgNP in soils has a more dynamic character than
exposure to AgNO3, because AgNP continuously release Ag to the soil pore water, unlike
AgNO3.
The uptake of Ag by four week exposed earthworms demonstrated that, even though the
total Ag and nominal AgNP concentrations in the soil increased, the total Ag concentration
in the earthworms was not affected. This was also observed by Shoults-Wilson et al.
(2011c) for E. fetida earthworms exposed to polyvinylpyrrolidone (PVP)-coated or oleic
acid (OA)-coated AgNP through the soil, and this indicates that accumulation of Ag by
earthworms may not be directly related to the total Ag and nominal AgNP concentrations in
the soil. In this study, only total Ag concentrations in the soil pore water were measured,
but other studies on nanometals (Kool et al. 2011; Shoults-Wilson et al. 2011a) suggest that
the bioavailability and uptake of Ag may be more directly linked to the ionic fraction
present in the soil pore water.

Chapter 5
118
The ICP-MS and SEM/EDX data of the earthworms exposed to AgNP and AgNO3 for four
weeks provide evidence that Ag particles were taken up by the earthworms (Figure 1) and
that these particles were in close contact with the earthworm tissues, especially the external
barriers. As we were not able to distinguish between adsorption on the outside and true
uptake (on the inside), it is not known to what extent the earthworms were accumulating
Ag. For AgNP exposed earthworms, the Ag particles which were taken up were single
AgNP or AgNP clusters, but also consisted of AgCl or Ag2S heteroaggregates. AgCl and
Ag2S heteroaggregate formation has been observed and discussed in studies for in vivo oral
exposure to AgNP and Ag ions, added as AgNO3 or Ag acetate, and may also explain the
presence of Ag particles in earthworms exposed to AgNO3 (Danscher and Stoltenberg
2006; Loeschner et al. 2011; Walczak et al. 2012).
In vivo effect assessment
The four week experiment demonstrated effects of exposure to the high AgNP (154 mg
Ag/kg soil) and the AgNO3 (15 mg Ag/kg soil) treatments. Other four week reproduction
studies exposing earthworms to AgNP also demonstrated effects of AgNO3 at lower Ag
concentrations than AgNP (Heckmann et al. 2011a; Shoults-Wilson 2011c). This indicates
that the effects of ionic Ag are important for the toxicity effects observed in four week
exposure experiments. Within the lifelong experiment with the offspring, the effects for
AgNP were more striking than for AgNO3, because medium AgNP caused a reduction in
juvenile and subadult survival to a higher extent than the AgNO3 treatment, and high AgNP
treatment resulted in complete mortality during the cocoon and juvenile stages. These
results also indicate that juveniles may be more sensitive to (chronic) AgNP exposure than
adults, as was also observed for C60 (chapter 2).
The effects on growth and reproduction after four week exposure to AgNP in this study
(Table 2), were observed at lower concentrations that in other studies. Shoults-Wilson et al.
(2011c) noted a decrease in reproduction for E. fetida earthworms of 40% at 1000 mg
Ag/kg soil after four week exposure to PVP-coated or OA-coated AgNP, with a size of 30
to 50 nm. Heckmann et al. (2011) tested the effect of PVP-coated AgNP (30 - 50 nm) on E.
fetida earthworms only at 1000 mg Ag/kg soil for four weeks, and the exposed earthworms

Effects and characterization of AgNP exposure
119
responded with a reduced growth (down to 73% compared with the control) and did not
reproduce. The earthworms of the present study demonstrated a reduction in growth down
to 44% and a very low reproduction (down to 18%) already after four week exposure to the
‘high AgNP treatment’ of 154 mg Ag/kg (Table 2). These differences may be explained by
the use of a different AgNP. For example, toxicity of citrate-coated AgNP of 10 nm and
PVP-coated AgNP of 20 nm to the bacteria Nitrosomonas europaea depended on coating
and/or size of the AgNP (Arnaout and Gunsch 2012). Other factors explaining differences
between toxicity studies are the characteristics of the soil. This was demonstrated by
Shoults-Wilson et al. (2011a), who observed more effects of AgNP exposure to E. fetida
earthworms when using sandy loam soil compared with artificial soil, with the first type of
soil comprising lower levels of clay and organic matter, and a lower pH. In addition,
sensitivity to exposure may differ between earthworm species, as was discussed by
Frampton et al (2006) for different pesticides. In that study, the sensitivity varied between
earthworm species and types of pesticide.
Adult reproduction and offspring survival and growth were integrated in the population
model, to assess population level consequences. The resulting population growth rates were
slightly higher than the data demonstrated in chapter 2 for C60 exposure, which indicates
that differences may be apparent between experiments and that caution should be taken
when comparing between different experiments. Furthermore, all AgNP and AgNO3
treatments in the present study showed a reduction in population growth rate. This indicates
that the lowest adverse effect level (LOAEL) for AgNP exposure is 1.5 mg/kg and that
even without observing significant effects for the individual endpoints of survival, growth
and reproduction, population growth rate may be affected.
The histological examinations and SEM/EDX analysis of AgNP exposed earthworms
indicate that AgNP may affect the external barriers, but are not expected to penetrate far
into the earthworm body. Lapied et al. (2010) also demonstrated that the external barriers of
the earthworm L. terrestris were affected most by AgNP exposure. Damage to the outer
skin and the intestine may seriously affect the health of earthworms, because this damage
Chapter 5
120
interferes with the correct functioning of these tissues and potentially the homeostasis of the
earthworms (Lapied et al. 2010). In addition, when looking at the lifelong experiment,
tissue injuries were more severe for the medium AgNP treatment, compared with the
AgNO3 treatment. This complements the idea indicated by the juvenile mortality data, that
chronic AgNP treatment was more harmful for the earthworms than chronic AgNO3
treatment. This difference may be explained by the exposure characterisation data, which
suggest that AgNP may prolong the presence of a bioavailable fraction of Ag.
In vitro experiment
Analysis of AgNP in the cell culture medium by DLS showed particles of 58 nm (Figure 3),
which is in good agreement with DLS results presented by Klein et al. (2011) for the same
NM-300K AgNP. Furthermore, characterisation of the in vitro exposure by SEM/EDX and
DLS suggests that the coelomocytes were exposed in vitro mainly to single AgNP, or two
clustered AgNP. The AgNP were presumably kept stable in this state due to a protein
corona (Hayashi et al. 2012; Lundqvist et al. 2008; Murdock et al. 2008), which caused the
zeta potential to become less negative in cell culture medium when compared with
ultrapure water.
When comparing the AgNP EC50 with the EC50 for AgNO3, within the in vitro experiment,
a 14-fold difference is observed. The soluble Ag fraction was not measured in the present
study, but Hayashi et al. (2012) demonstrated an ionic Ag fraction between 2 and 8% for
the AgNP in cell culture medium after incubation for 24 hours. If this is similar for the
AgNP used in the present study, the toxicity of ionic Ag may explain a large portion of the
effects of AgNP exposure. Overall, this in vitro experiment indicates that AgNP exposure
may impair functioning of the coelomocytes, including immune responses against
pathogens and tissue repair (as also discussed for C60 in chapter 4), possibly mainly
through the ionic Ag fraction. These effects on immune functioning and tissue repair may
have had consequences for the bioenergetics of the exposed earthworms, increasing the
body maintenance and leaving less energy for other processes (Kooijman 2000), as is
demonstrated by the reduced growth and reproduction of the earthworms exposed to AgNP
in vivo (Table 2).

Effects and characterization of AgNP exposure
121
In conclusion, AgNP exposure may impact earthworm populations, by affecting growth,
reproduction, juvenile survival, tissue integrity and immune cell viability of the
earthworms. Chronic effects of AgNP exposure are readily observed at 1.5 mg Ag/kg soil,
hence the no observed adverse effect level (NOAEL) is below that concentration. The
expected environmental concentrations of AgNP in soil are modelled at the ng Ag/kg level,
although sewage sludge is expected to contain concentrations of milligrams Ag/kg
(Gottschalk et al. 2009) and the deposited AgNP may accumulate in the top layer of the
soil, as is also demonstrated for conventional pollutants (Hou et al. 2005; Mikkelsen et al.
1996). In this way, organisms living in the upper soil layer, including L. rubellus
earthworms, may be at risk of chronic exposure to Ag.
Acknowledgements
The authors would like to thank Annemariet van der Hout for her work on the in vivo
experiments, at Alterra (WUR). Remco Fokkink and Anton Korteweg, from the WUR
division of Physical Chemistry and Colloid Science, are acknowledged for technical
support with the DLS and zeta potential analyses. Michael Hockings is thanked for support
with the histological observations at Plymouth University. This research project was
supported by Wageningen UR strategic research program BioNanotechnology 2007-2011
and research school WIMEK.

Chapter 5
122
Supplementary data
Details on materials and methods
Soil preparation for the in vivo experiments
Sandy, moderately humic, loamy soil (1.6% clay, 4.3% organic matter, pH-H2O 5.96) was
collected from an experimental organic farm in the Netherlands (Kooijenburg,
Marwijksoord, the Netherlands). This location has a long history of organic farming and the
soil contains only background levels of heavy metals (Lahr et al. 2008). After sampling, the
soil was air-dried at room temperature. A week before the start of the experiment, the soil
was sifted through a 5 mm sieve and glass containers (with a lid) were filled with 650 gram
of the sieved soil. Moisture content of the soil was determined by overnight drying at
105°C and the soil in the containers was amended with the amount of water needed to
obtain a final moisture content of 15% (based on dry weight) during the experiments. These
containers were kept under the same constant conditions as during the acclimatisation
period of the earthworms.
The earthworms were exposed to three different AgNP treatments of 1.5 (low AgNP
treatment), 15.4 (medium AgNP treatment) and 154 mg Ag/kg soil (high AgNP treatment)
and compared with the vehicle material. As reference, Ag salt was added as AgNO3 at 15.4
mg Ag/kg soil, with an appropriate control where no Ag salt was added. All these soil
exposure concentrations are expressed as Ag content/kg dry weight of soil. The test
substances and the vehicle material were added to the soil containers using an aqueous soil
extract, to ensure uniform additions to the soil. This soil extract was prepared by gently
shaking soil in ultrapure water (Millipore; resistivity = 18.2 mΩ cm-1
), at a soil to water
ratio of 1/2.5 (g/v) for one hour, followed by filtration over a 4-7 μm filter (Whatmann
filters type 597, Fisher Scientific). The pH of the soil extract was 6.2 and the ionic strength
was equivalent to 2.3 mM. After filtration of the soil extract, AgNP and AgNO3 were added
at nominal concentrations of 2 g Ag/l and 0.2 g Ag/l, respectively. In addition, a soil extract
was prepared with only the vehicle material, at a concentration of 20 g NM-300K DIS/l.
After addition of the AgNP, AgNO3 or vehicle material, the soil extracts were gently
shaken for one hour, immediately followed by addition of the soil extracts to the soil in the

Effects and characterization of AgNP exposure
123
containers. Soils were dosed carefully with 0.5, 5.0 and 50 ml of the soil extract spiked with
AgNP (2.0 Ag/l), using glass pipettes, to realize nominal soil exposure concentrations of
1.5, 15.4 and 154 mg Ag/kg soil, respectively. The 15.4 mg Ag/kg soil for the AgNO3
treatment was prepared by spiking the soil with 50 ml of soil extract with AgNO3 (0.2 g
Ag/l). For the controls, soil was amended with 50 ml soil extract without any addition as a
control for AgNO3 or 50 ml soil extract with the vehicle material (20 g/l) as a control for
AgNP, to obtain a vehicle concentration similar to the vehicle concentration in the high
AgNP treatment. After application of the soil extracts, the soil was mixed thoroughly for
two minutes (Hobart mixer; speed 2), followed by the immediate addition of the
earthworms.
Soil extract analysis with AF4
The hydrodynamic diameter of the AgNP present in the soil extract was determined within
48 hours after preparation, by an Asymmetric Flow Field Flow Fractionation system (AF4;
Postnova Analytics, Munich Germany). For this purpose, the soil extract with AgNP, at a
concentration of 2 g/l, was further diluted in clean soil extract to reach an actual Ag
concentration of 7.8 ± 0.2 mg Ag/l. To verify if any changes in particle diameter had
occurred after diluting the AgNP in the soil extract, an aliquot of the AgNP stock was
diluted in ultrapure water (8.6 ± 0.3 mg Ag/l) to reach a similar Ag concentration as in the
diluted soil extract with AgNP. The runs with the AF4 were performed in duplicate, with an
injection volume of 100 µl. The accumulation wall of the AF4 consisted of a 1 kDa
polyether sulfone membrane (Postnova Analytics, Munich, Germany) and the spacer
thickness of the AF4 channel was 350 µm. The carrier consisted of a 0.01% (w/v) sodium
dodecyl sulphate (SDS) solution at pH 8 in ultrapure water (Bolea et al. 2011). During the
focusing step of twelve minutes, the channel flow was 0.02 ml/min, while the cross flow
and detector flow were 0.4 and 1.0 ml/min, respectively. A transition time of one minute
was used to separate the elution step from the focusing step. During the elution step, the
channel flow was 1.4 ml/min, while the cross flow was 0.4 ml/min for 25 minutes.
Afterwards, the cross flow was decreased in a linear fashion to 0 ml/min in one minute.
Subsequently, the elution step was maintained for an additional ten minutes, with the cross

Chapter 5
124
flow field turned off. The detector flow was interfaced online to an ultraviolet diode-array-
detection detector (Postnova Analytics, Germany), which measured the UV-VIS spectrum
each 0.6 seconds during the elution step. Hereafter, AF4 theory was used to calculate the
hydrodynamic diameter of the AgNP eluted during the first 25 minutes of the elution step
(Litzén 1993). This theory is based on ideal behaviour of spherical particles, which is the
case for the majority of the Ag present in the NM-300K AgNP (Klein et al. 2011).
For the off-line collection of the AF4 eluate, the detector outflow of the AF4 system was
connected to a fraction collector (Retriever IV, Teledyne Isco, USA) to take samples over
an interval of two minutes (2 ml) during the elution step of the AF4 runs. These samples
correspond to an interval in particle diameter size of about 7 nm. After sampling, 0.2 ml of
65% (v/v) HNO3 was added to each sample for 24 hours, for digestion of AgNP, after
which the Ag concentration was measured using a high resolution-inductively coupled
plasma-mass spectrometer (Thermo Element 2, Thermo Scientific). The recovery of AgNP
after AF4 separation was calculated by dividing the total amount of Ag measured in all
fractions collected during the elution step of an AF4 run, by the amount of Ag injected with
the sample into the AF4 system, multiplied by 100%.
In addition, an accompanying experiment was performed, to investigate the stability and
possible aggregation of AgNP in the soil, as compared with the soil extract. For this
experiment, the soil extract containing AgNP was spiked with calcium nitrate (Ca(NO3)2),
which was prepared in clean soil extract, to reach a final nominal Ca concentration of 5, 10,
25, or 50 mM. Calcium was selected, because this is generally the most important cation in
soil pore water (Koopmans et al. 2006). Also, treatments consisting of the soil extract with
and without AgNP, to which no calcium was added, were included in the experiment. The
suspensions were shaken for 24 hours. Subsequently, the UV-vis absorption spectra of the
suspensions were measured, using a Genesys 10S UV-VIS spectrophotometer (Thermo
Scientific). The instrument was referenced with ultrapure water.
ICP-MS methods for soil and earthworm characterization
Total Ag concentrations were determined for soil and earthworms, from the four week and
the lifelong (ten months) in vivo experiments, using ICP-MS. For this purpose, 0.5 gram per

Effects and characterization of AgNP exposure
125
soil sample or whole earthworms were taken (triplicates per treatment) and put into a
microwave digestion vessel. Samples were digested with 6 ml of 37% (v/v) HCl and 2 ml
of 70% (v/v) HNO3. The vessels were microwaved at 1600 W, to 140°C with 20°/min and
to 180°C with 15°/min, which was held for 60 minutes. Following digestion, the digests
were transferred to 50 ml polypropylene tubes and 42 ml of ultrapure water was added to
each tube. An aliquot of 1 ml was taken from each tube and diluted 6 times. Hereafter the
samples were measured with an ICP-MS (Thermo Scientific X-series 2), equipped with a
Burgener PEEK Mira Mist type nebulizer and a quartz impact bead spray chamber. The
forward RF-power was 1400 W and the gas flows were 13 l/min for the plasma, 1.0 l/min
for the nebulizer and 0.7 l/min for the auxiliary. The sample flow rate to the nebulizer was
set at 0.5 ml/min, using an integrated peristaltic pump. The ICP-MS instrument was
operated in the continuous analysis mode.
For the characterisation of Ag particles in soil, 1 gram of soil (from the four week and the
lifelong in vivo experiments) was extracted with ultrapure water, at a soil to solution ratio
of 1/25 (w/v). The soil was not pre-treated prior to this soil extraction. The extracts were
shaken in a head-over-head apparatus for 16 hours. After settling for 15 minutes, an aliquot
of 2 ml was collected and filtered through a 5 µm filter. The filtrate was diluted with
ultrapure water at a ratio of 1/1000 and analysed with single particle inductively coupled
plasma mass spectrometry (SP-ICP-MS). Triplicates were measured for soil from each
treatment. In case of the earthworms, 5 ml of ultrapure water was added to the whole
earthworm (stored at -80°C beforehand) and the vial was placed in an ultrasonic bath for 30
minutes. Hereafter, the entire sample was transferred into a 50 ml polypropylene tube.
Subsequently, 10 ml ultrapure water was added to the tube and the sample was sonicated
for 3 minutes. Following sonication, another 10 ml of ultrapure water was added and the
sample was extracted in a head-over-head apparatus for 16 hours. An aliquot of 2 mL was
collected from the tube and filtered through a 5 µm filter. The filtrate was diluted 1000
times and analysed by SP-ICP-MS. Three earthworms per treatments were analysed.
The SP-ICP-MS measurements were performed using the ICP-MS instrument and
instrumental settings similar as for the ICP-MS, however, in this case the ICP-MS was
operated in the time resolved mode (TRA) with a dwell time of 3 milliseconds and a typical

Chapter 5
126
run time of 60 seconds per measurement. During SP-ICP-MS analysis, an Ag particle
generates a pulse of ions, which results in a signal which is greater than the background.
The intensity readings can be collected as a function of time, where pulses above the
background represent the measurement of an individual nanoparticle (Mitrano et al. 2012).
The Ag particle diameter size is determined from the intensity of the pulses, while the Ag
particle size distribution is determined from the normalized frequency of all pulses. With
the SP-ICP-MS analysis used, only particles > 30-40 nm could be detected.
Soil pore water analysis using F-AAS
Flame atomic absorption spectrometry (F-AAS) was used to determine the total Ag
concentrations in the soil pore water samples. Soil samples (50 gram per sample; triplicates
per treatment soil) were collected for the soil pore water measurements at two time points,
e.g. at the end of the four week experiment and after the lifelong experiment (eleven
months). Soil pore water samples were obtained after equilibration of the soil samples,
which were saturated with ultrapure water (at a moisture content of 100% instead of 15%),
for one week. Subsequently, the samples were centrifuged for 45 minutes (centrifuge
Falcon 6/300 series, CFC Free) at 2000 g over two round filters with a pore size of 11 μm
(Schleicher &Schuell) and a 0.45 μm membrane filter (Schleicher &Schuell), placed inside
the centrifuge tubes (Hobbelen et al. 2004). All filters were pre-treated and saturated with a
Cu(NO3)2 solution to prevent Ag loss, resulting from Ag binding to the filter material.
Approximately 5 ml of soil pore water was collected for each soil, to perform analysis of
the total Ag levels in the soil pore water by F-AAS (Perkin Elmer 1100B).
In vitro characterization by DLS and ZetaSizer
The particle size distribution of particles present in cell culture medium spiked with AgNP
or AgNO3 was performed by dynamic light scattering (DLS), using a Cobolt Samba
300mW DPSS laser at a wavelength of 532 nm as a light source. In addition, suspensions in
ultrapure water were made, to verify if any changes in particle diameter had occurred after
dilution in cell culture medium. The (nominal) concentration of AgNP stock and AgNO3
powder in ultrapure water or cell culture medium containing 10% FCS was 10 μg Ag/ml.

Effects and characterization of AgNP exposure
127
For each sample, twenty measurements were made and the detector intensity data
(measured with an ALV/SO SIPD Single Photon Detector with ALV Static and Dynamic
Fiber optics) were processed with an ALV5000/60X0 external correlator and ALV-5000/E
software (all from ALV-GmbH, Germany). The average autocorrelation data (g2) were
analysed using AfterALV software (Dullware, the Netherlands), which uses the CONTIN
algorithm as developed by Stephen Provencher (Provencher 1982). For each sample, the
mean diameter of the peaks with the associated polydispersity index (PDI), an indication of
the width of the diameter peak, was determined.
In addition, the zeta potential for the same samples as used for DLS measurements was
analysed, using a Malvern ZetaSizer 2000 (Malvern Instruments, UK). Data were processed
with Zeta mode V1.51 software (Chen et al. 2004). Five measurements were used to
establish average and SEM for each sample.
SEM/EDX methods for Ag particle analysis
The presence of Ag particles in different sample types was visualized and qualitatively
determined, shortly after preparation of the media, by field emission gun scanning electron
microscopy (SEM). This technique was applied in combination with energy dispersive
analysis of X-rays (EDX), which provides information about the elements associated with
the Ag particles present in the samples. In case of soil, samples were dried at 40°C, placed
on aluminium specimen holders with double sided adhesive carbon tape, and coated with a
5-10 nm layer of chromium, using an Emitech K575X turbo sputter coater. In case of the
earthworms, earthworms (from -80°C) were fixated with glutardialdehyde in a solution of
phosphate buffered saline (PBS). Subsequently, the earthworms were dehydrated with
ethanol and xylene, using a vacuum infiltrating processor (VIP). These dehydrated samples
were soaked in molten paraffin and then 4 micrometre-thick sections of the paraffin
embedded material were produced, using a microtome. These sections were mounted on
glass microscope slides and washed with xylene and ethanol for deparaffinization.
Thereafter, the sections were dried at room temperature and coated with the chromium. In
case of the soil extract and cell culture medium, samples (10 μg Ag/ml) of 1 to 2 ml were
filtered over an Anopore aluminium oxide filter with a pore size of 20 nm (type Anodisc,
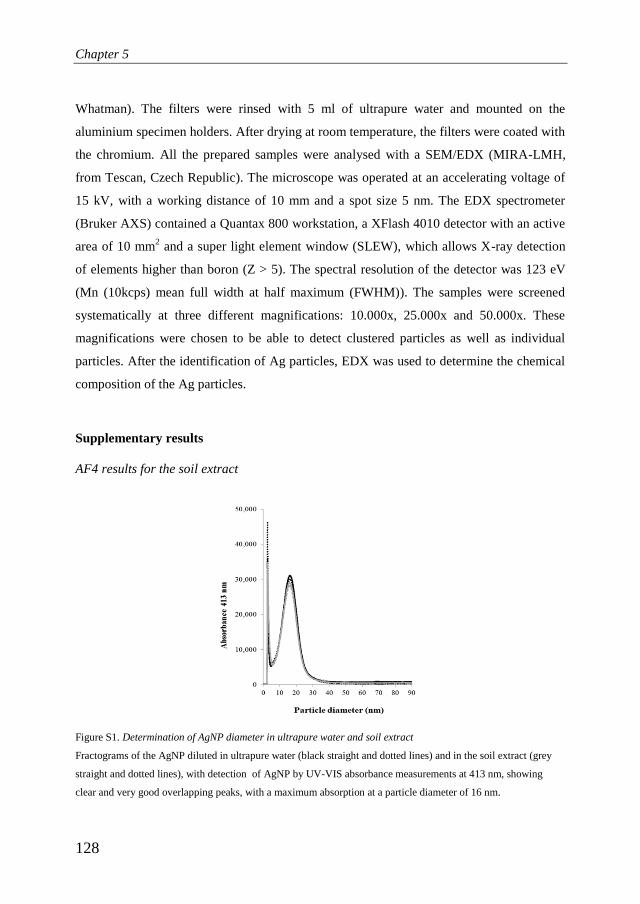
Chapter 5
128
Whatman). The filters were rinsed with 5 ml of ultrapure water and mounted on the
aluminium specimen holders. After drying at room temperature, the filters were coated with
the chromium. All the prepared samples were analysed with a SEM/EDX (MIRA-LMH,
from Tescan, Czech Republic). The microscope was operated at an accelerating voltage of
15 kV, with a working distance of 10 mm and a spot size 5 nm. The EDX spectrometer
(Bruker AXS) contained a Quantax 800 workstation, a XFlash 4010 detector with an active
area of 10 mm2 and a super light element window (SLEW), which allows X-ray detection
of elements higher than boron (Z > 5). The spectral resolution of the detector was 123 eV
(Mn (10kcps) mean full width at half maximum (FWHM)). The samples were screened
systematically at three different magnifications: 10.000x, 25.000x and 50.000x. These
magnifications were chosen to be able to detect clustered particles as well as individual
particles. After the identification of Ag particles, EDX was used to determine the chemical
composition of the Ag particles.
Supplementary results
AF4 results for the soil extract
Figure S1. Determination of AgNP diameter in ultrapure water and soil extract
Fractograms of the AgNP diluted in ultrapure water (black straight and dotted lines) and in the soil extract (grey
straight and dotted lines), with detection of AgNP by UV-VIS absorbance measurements at 413 nm, showing
clear and very good overlapping peaks, with a maximum absorption at a particle diameter of 16 nm.

Effects and characterization of AgNP exposure
129
Figure S2. Analysis of the fraction of Ag for each particle diameter interval
The AF4 fractogram of one of the duplicate runs of soil extract with AgNP (straight line), with detection by UV-
vis absorbance measurements, in combination with the results of the Ag concentration measurements in the eluent
fractions collected during the AF4 run (dotted line), presented as a percentage of the total amount of Ag injected
with the sample into the AF4 system.
Figure S3. The impact of ionic strength on AgNP clustering
The UV-vis absorption spectra of the AgNP in the soil extract at different Ca concentrations. The particle diameter
of AgNP was unaffected while diluted in the soil extract (black line). After addition of Ca (at 5mM Ca (black not-
extended line), 10 mM Ca (black dotted line), 25 mM Ca (grey line) and 50 mM Ca (grey dotted line)), the
absorption peaks were lost from the UV-vis absorption spectra, shown by the lines near and on the X-axes. This
indicates that the colloidal AgNP suspension was destabilized.

Chapter 5
130
SP-ICP-MS data
Figure S4. Ag particles in soil
SP-ICP-MS analysis for soil from the four weeks high AgNP treatment, showing the pulses (or signals) generated
in time (A) and the particle size (nm) distribution calculated from the SP-ICP-MS data (B).
Figure S5. Ag particles in earthworm
The pulses generated in time (in ms) during the SP-ICP-MS analysis (A) and the size (nm) distribution of the Ag
particles as calculated from the SP-ICP-MS data (B), for an L. rubellus earthworm sample from the four weeks
exposure to the high AgNP treatment.

Effects and characterization of AgNP exposure
131
SEM/EDX imaging of Ag in soil
Figure S6. SEM images of Ag particles present in soil from the high AgNP treatment of the four week experiment,
with an Ag only aggregate (A) and a star structure (B), which seemed to consist of Ag aggregates of 50 to 100 nm
in combination with carbon and chloride.
Metal impurities in stocks
Table S1. Concentrations of different metals measured in the AgNP-stock suspension and for the AgNO3 powder,
analysed by HR-ICP-MS and converted to mg Ag/kg soil, to present the data as possible metal impurity
concentrations for the soil at the highest exposure treatments tested (154 mgAg/kg or 15.4 mg Ag/kg,
respectively).
Material Cd Cr Cu Ni Pb Zn
AgNP 0.11 0.11 0.01 0.12 0.01 0.0
AgNO3 0.03 0.004 0.0 0.07 0.04 0.0

Chapter 5
132

133
Chapter 6
General discussion and future perspectives

Chapter 6
134
General discussion
The production and use of nanoparticles have increased for several decades and the number
of products with engineered nanoparticles incorporated is steadily growing (Gottschalk and
Nowack 2011; Wijnhoven et al. 2010; Woodrow Wilson institute). The fields of application
of nanoparticles are diverse and wide, including food, personal care, sports gear, medical
applications, as well as devices for environmental monitoring and waste water treatment
(Andreescu et al. 2009; Dekkers et al. 2011; Jain 2008; Savage and Diallo 2005). Due to
this dramatic increase in production and applications of engineered nanoparticles, exposure
of humans and the environment to these materials seems inevitable (Handy et al. 2008a;
Oberdörster et al. 2005). And unfortunately, the same characteristics which make
nanoparticles useful in many products, such as chemical reactivity and persistence, cause
concern about their potential adverse health effects (Warheit et al. 2008; Farré et al. 2011).
A considerable number of studies has investigated the hazards of nanoparticles on
mammals (including humans) and has demonstrated uptake, bioaccumulation and toxicity
of different types of nanoparticles (Ariano et al. 2011; Bhattacharjee et al. 2010; Fujita et
al. 2009; Hsin et al. 2008; Hussain et al. 2005; Park et al. 2011; Schaeublin et al. 2011;
Shvedova et al. 2005; Xia et al. 2008). Discharge of nanoparticles into the environment,
during production, transport, use and disposal, is expected (Gottschalk and Nowack 2011;
Lin et al. 2010) and possible environmental exposure, hazards and risks need to be
addressed (Baun et al. 2008a; Handy et al. 2008c; Nel et al. 2006; Nowack and Bucheli
2007; Stone et al. 2010). Research on the impact of nanoparticles on the environment has
mainly focussed on aquatic organisms (Handy et al. 2008c; Kahru and Dubourguier 2010;
Navarro et al. 2008; Shoults-Wilson et al. 2011c) and information on effects of nanoparticle
exposure on soil organisms and ecosystems is scarce.
Given the need for better characterization of hazards of engineered nanoparticles to the
environment and soil organisms in particular, the aim of the present thesis was to
investigate effects of nanoparticle exposure on the earthworm Lumbricus rubellus, as a
model organism for soil ecotoxicology, and to contribute to the development of effect
markers for engineered nanoparticle exposure in this model.

General discussion and future perspectives
135
The nanoparticles investigated in the studies described in the present thesis were fullerene
(C60) and silver nanoparticles (AgNP). These nanoparticles were selected because they are
among the most widely used types of nanoparticles in consumer products and are deemed
suitable as reference material (Gelderman et al. 2008; Klaine et al. 2008; Stone et al. 2010;
Woodrow Wilson Institute). C60 was also chosen because of its known stability and very
low solubility, which indicate that soil may serve as a sink for these nanoparticles (Li and
Alvarez 2011; Nielsen et al. 2008). The type of AgNP selected for the experiments
discussed in the present thesis were designated as a representative nanomaterial by the
European Commission’s Joint Research Centre (JRC), which means that this specific type
of nanomaterial will be tested by different laboratories within Europe and the results can be
compared more easily than for other types of AgNP. In the present thesis, effects of the
selected nanoparticles on gene expression, tissue integrity, individual health and population
growth were investigated after in vivo exposure. In addition, in vitro experiments were
carried out using earthworm immune cells, to evaluate possible immunotoxic effects of the
nanoparticles. By studying effects at different levels of biological integration further insight
in the mode of action was obtained and a contribution to the development of effect markers
for nanoparticle exposure was made. Furthermore, effects of nanoparticle exposure at the
individual level were translated to the population level, in order to predict effects possibly
occurring for earthworm populations in the field upon nanoparticle exposure.
Taken together, the results of the present thesis reveal that C60 and AgNP exposure affect L.
rubellus earthworms in a dose dependent way, at different levels of biological organization.
The histopathological observations made in the studies discussed in the present thesis
provided insight in possible causes of effects. The observations on tissues of exposed
earthworms showed damage to the external barriers, e.g. cuticle and gut epithelium
(chapter 3 and 5), an effect which may seriously affect the health of earthworms (Lapied
et al. 2010). For C60 exposure, the effects on underlying tissues were more visible than for
the AgNP exposure. This indicates that at the dose levels tested, C60 may have had more
effect on the external barriers and/or that C60 infiltrated into the earthworms to a higher
extent than AgNP. In this way, C60 interfered more with the functioning of the external

Chapter 6
136
barriers and the homeostasis of the earthworms, and may have made the underlying tissues
more vulnerable (Lapied et al. 2010).
The decrease in growth and cocoon production observed upon C60 and AgNP exposure
(chapter 2 and 5) may have occurred due to the effects of tissue injury and repair on the
bioenergetics of the exposed earthworms, leaving less energy for growth and reproduction
(Kooijman 2000). However, the decrease in reproductive success may also be explained by
a direct effect of nanoparticle exposure on the reproductive organs. This applies at least for
C60 exposure, because damage to the parenchyma of the clitellum (an important part of the
earthworm reproductive system) was observed in C60 exposed earthworms. For the AgNP
exposed earthworms no clear effects on the parenchyma were observed and the
bioenergetics explanation seems most likely for reduced reproductive output in AgNP
exposed earthworms, however, definite conclusions on the effects of AgNP on the
reproductive system requires further future histopathological examinations.
Oxidative stress is a mode of action which has been much discussed and demonstrated for
nanoparticle toxicity (Barillet et al. 2010; Bhattacharjee et al. 2011; Johnston et al. 2010;
Klaper et al. 2009; Li et al. 2008; Oberdörster et al. 2005). However, L. rubellus
earthworms exposed to C60 in vivo did not demonstrate an increase in antioxidant enzyme
expression and activity (Chapter 3). This lack of a significant effect on oxidative stress
marker enzymes may be explained by the experimental set-up, which may have masked the
occurrence of oxidative stress (Johnston et al. 2010). An important factor of the
experimental set-up in this case is the in vivo and relatively long lasting exposure, which
differs from most nanotoxicology studies reporting on nanoparticle induced oxidative stress
that have used short, acute and/or in vitro exposures. As effects may only be noticeable
shortly after the start of the C60 exposure rather than four weeks or even several months
later, due to feedback processes (Maity et al. 2008; Oberdörster et al. 2004), they may not
have been noticed in the experiments discussed in the present thesis. The use of only a
small set of antioxidant enzymes may be an additional masking factor, because it may not
be necessary for the earthworms to induce all of the antioxidant enzymes present in the

General discussion and future perspectives
137
earthworm body (Kohen and Nyska 2002; Martindale and Holbrook 2002). Furthermore,
the use of whole body measurements may have masked the occurrence of oxidative stress,
because this may impede the detection of subtle changes in individual tissues as
concentrations of antioxidant enzymes may vary between different tissues (Barillet et al.
2010; Korsloot et al. 2004; Oberdörster et al. 2004; Smith et al. 2007).
The results from the in vitro experiments on C60 toxicity were not unambiguous. In vitro
exposure of rat macrophage NR8383 cells to C60 demonstrated a reduction in cell survival
and phagocytic activity, already at low μg/ml concentrations with EC50 values of 1.04 and
1.87 μg/ml, respectively (chapter 4). The coelomocytes, on the other hand, were much less
sensitive and the survival and phagocytic activity of these cells seemed unaffected by C60
exposure until the mg/ml level. In contrast to this, the coelomocytes and NR8383 cells
demonstrated similar responses to tri-block polymer nanoparticle exposure, indicating the
usefulness of the coelomocytes for nanotoxicity testing. The cell culture media used in the
C60 experiments were the same for both cell types and could not explain the demonstrated
difference in effects to C60 exposure between the cell types. The most plausible explanation
is the difference in sensitivity between the cell types. This phenomenon has been
demonstrated in other studies testing nanoparticle exposure in vitro as well (Hayashi et al.
2012; Nguyen et al. 2012; Xia et al. 2008). For rat NR8383 cells C60 exposure may cause
damage to cells, affecting cell viability and phagocytic activity, and C60 exposure to
earthworm coelomocytes may merely cause suppression of the inflammatory response (as
demonstrated by lowered CCF-1 levels).
Reliable, extensive and repeated measurements of actual soil nanoparticle concentrations
are lacking, but modelled environmental concentrations of nanoparticles in the soil are
close to the μg/kg level (Gottschalk et al. 2009). The nanoparticle concentrations applied in
the experiments discussed in the present thesis are more than three orders of magnitude
above these currently expected environmental concentrations. However, nanoparticle
exposure may pose a threat to soil ecosystems in the near future, due to the expected
prolonged presence of some types of nanoparticles (Coutris et al. 2012; Li et al. 2010;

Chapter 6
138
Nielsen et al. 2008). In addition, in the experiments discussed in the present thesis only
lowest observed adverse effect levels (LOAELs) could be determined and the no observed
adverse effect levels (NOAELs) may be at much lower concentrations. Furthermore, the
earthworms are used as model organisms for soil ecotoxicology and the impact of
nanoparticles on the earthworms need to be extrapolated to other soil organisms, which
may be more sensitive to nanoparticle exposure.
Future perspectives
The introduction of nanotechnology offered tremendous opportunities for all sorts of nano-
applications in different fields, including medicines, foods, electronics, alternative energy
and water remediation. During the production, use and disposal of a nanoproduct, it is
likely that nanoparticles will eventually enter the soil environment. Currently, effects of
exposure of nanoparticles on soil ecosystems are still largely unknown, but efforts are being
made, including the present thesis. Even though the present thesis has shed some light on
possible effects and modes of action of nanoparticle toxicity towards earthworms, ample
questions remain for future research. The two main topics for environmental risk
assessment of engineered nanoparticles in the soil are (1) the hazard assessment of
nanoparticles to soil organisms, including characterisation of (1a) bioavailability and (1b)
adverse effects and sensitive endpoints, and (2) the assessment of the actual exposure and
behaviour of nanoparticles under field conditions.
1a. Characterisation of bioavalibility
If nanoparticles are discharged to the soil, soil organisms may be exposed and may
accumulate the nanoparticles. Several studies have investigated the bioaccumulation
of nanoparticles in soil organisms, but many questions remain (Hu et al. 2010; Kim
et al. 2011; Lapied et al. 2011; Li et al. 2010; Shoults-Wilson et al. 2011c).
Therefore, bioaccumulation should be considered for future research, especially in
combination with the impact on the organisms, because studies on bioaccumulation
and effects do not demonstrate a clear correlation. For example, the research by
Shoults-Wilson et al. (2011c) on bioaccumulation of polyvinylpyrrolidon (PVP)
and/or oleic acid (OA) coated AgNP by Eisenia fetida earthworms as well as the

General discussion and future perspectives
139
AgNP bioaccumulation by L. rubellus earthworms discussed in chapter 5 of the
present thesis do not indicate a clear dose-dependent bioaccumulation. However,
both studies demonstrated (nominal) concentration dependent effects of AgNP. One
explanation for this discrepancy of bioaccumulation and effects may be that AgNP
affects earthworms also without being taken up. The histopathology data (chapter
5) may suggest this, because the effects are mostly observed on the external barriers.
Another explanation may be that earthworms accumulate Ag particles as well as Ag
ions (Unrine et al. 2010). As it has been suggested that the particles may not
contribute substantially to toxicity and merely increase the tissue Ag concentrations,
the toxicity of AgNP may be primarily related to the fraction of Ag ions present in
the earthworms (Kool et al. 2011; Shoults-Wilson et al. 2011c). Therefore, future
research should account for the oxidation and dissolution of metal nanoparticles in
order to explain potential accumulation and toxicity of metal nanoparticles and their
ions for earthworms.
Furthermore, if nanoparticles are accumulated by soil organisms, these materials
may be transferred within food chains. Holbrook et al. (2008) demonstrated the
transfer of quantum dots in a simplified aquatic food chain, from ciliated protozoans
to rotifers. Nanoparticle transfer may also occur in terrestrial food chains.
Earthworms are considered to be very important for biomagnification of
conventional pollutants in terrestrial ecosystems (Rogival et al. 2007; Roodbergen et
al. 2008; Rozema et al. 2008; VandeCasteele et al. 2004) and may have the same
role for nanoparticle biomagnification. Hence, possible biomagnification is an issue
future research should deal with.
In addition to bioaccumulation of nanoparticles themselves, the impact of
nanoparticles on bioaccumulation and toxicity of other environmental pollutants
requires future investigation. Nanoparticles may influence bioaccumulation and
toxicity of other environmental pollutants when they affect the external barriers, as
observed in chapter 3 and 5 for C60 and AgNP, enabling other compounds to enter
the body more easily. In addition, nanoparticles may enhance the bioaccumulation of
other compounds through adsorption, as was observed for C60 and TiO2
Chapter 6
140
nanoparticles by Baun et al. (2008b) and Zhang et al. (2007), respectively. These
nanoparticles demonstrated strong adsorption capacities for other toxic compounds,
e.g. the polycyclic aromatic hydrocarbon phenanthrene and the heavy metal
cadmium, respectively, which enhanced the availability and bioaccumulation of
phenanthrene and cadmium in aquatic organisms (Baun et al. 2008b; Zhang et al.
2007). The same phenomenon may occur in soil ecosystems, and for other
nanoparticles and other environmental pollutants as well.
1b. Characterisation of adverse effects and sensitive endpoints
As soil organisms are and will be exposed to nanoparticles in the field, reliable and
sensitive test systems are important to establish the relevant endpoints. The currently
used toxicity tests may need modifications. The standard OECD toxicity test
systems for exposure of earthworms encompass acute (48 hours) or four week
exposure of adult earthworms (OECD 207:1984 and OECD 222: 2004). Both the C60
and the AgNP experiments discussed in the present thesis indicate that juveniles are
more sensitive to the nanoparticle exposure and this can have adverse effects on
earthworm populations. Therefore, experiments with earthworms from different life
stages or lifelong exposure experiments may be useful in future research to better
predict the impact of nanoparticle exposure under field conditions. Furthermore, the
standard OECD toxicity test systems investigate mortality, growth and reproduction,
using adult earthworms. These individual endpoints are very relevant to assess
possible effects at the population level. However, they are usually affected at
relatively high concentrations and additional endpoints are useful to inform about
the mode of action of the toxicity (Lapied et al. 2010). In the present thesis, gene
expression analysis was employed (chapter 3), which proved its usefulness to
demonstrate toxicity of the C60 already from the lowest concentration examined.
Gene expression of a small set of genes was studied, but profiling based techniques
(including genomics, proteomics and metabolomics) are advancing and have been
proven of use for earthworm research as well (Bundy et al. 2008; Gong et al. 2007;
Guo et al. 2009; Kuperman et al. 2003; Wang et al. 2010). Therefore, the use of

General discussion and future perspectives
141
these techniques at larger scale in future research studies may be helpful in
unravelling the mode of action of nanoparticle toxicity.
Instead of in vivo experiments, the use of simple in vitro models using endpoints
which may reveal general mechanisms of toxicity, may be a basis for further
assessing the potential hazards of nanoparticle exposure and possibly in the future
replace, reduce and refine in vivo experiments. For the most useful translation of the
in vitro results to the in vivo situation, preferably a suitable and comparable in vitro
system should be used. For example, as the results presented in chapter 3 and 5
demonstrate the effects of C60 and AgNP on the external barriers, e.g. cuticle and gut
epithelium, epithelial cells may be selected as an in vitro system for studying the
mechanisms of this toxicity. Furthermore, in future research cultured cell types (such
as NR8383 cells) may be used for large scale screening and the search for the
mechanisms underlying the effects. In addition, primary cells (including earthworm
coelomocytes), which are not easy to obtain and culture, may be used to ascertain
the obtained results and to facilitate the translation of the in vitro to the in vivo
situation. However, before (large scale) screening of in vitro nanotoxicity is
possible, in vitro assays will need to be further developed, validated and
standardized. One matter which needs further investigation is the best general theory
behind cellular toxicity of nanoparticles. Oxidative stress, with the formation of
reactive oxygen species (ROS), is considered as an important mode of action for
nanoparticle induced cytotoxicity (Bhattacharjee et al. 2010; Li et al. 2008;
Marambio-Jones and Hoek 2010; Stone and Donaldson 2006). However, findings
differ between experimental set-ups and several studies indicate that the generation
of ROS may be a secondary effect rather than causing the onset of toxicity
(Bhattacharjee et al. 2011; Johnston et al. 2010; Park et al. 2011). Another important
matter for in vitro assays is the selection of in vitro methods with endpoints that are
not affected themselves by the nanoparticles. During our in vitro investigations
interference of C60 and AgNP with the MTT and resazurin assays was observed
(data not shown). This phenomenon has been demonstrated and discussed in other
studies as well (Klaine et al. 2008; Kroll et al. 2009).

Chapter 6
142
2. Exposure and behaviour of nanoparticles under field conditions
Apart from information on hazards, actual exposure levels under field conditions are also
required for risk assessment. At the moment, information on release of nanoparticles into
the environment is largely unknown and only small scale studies have investigated actual
nanoparticle release into the environment (Farré et al. 2010; Hsu and Chein 2007; Kaegi et
al. 2008; Kiser et al. 2009). Furthermore, standard analytical methods for the analysis of
environmental concentrations of nanoparticles are lacking and actual exposure levels are
still very difficult to determine (Handy et al. 2008a; Nowack 2009; Paterson et al. 2011;
Vonk et al. 2009). Measuring nanoparticles in the soil is especially complicated because of
the complex matrix (Gimbert et al. 2007). The nanoparticles may be present in the soil as
single nanoparticles or as aggregates, or they may be dissolved or bound to soil compounds
(including organic matter). These aspects seem to depend on the properties of the
nanoparticle itself, including size, shape, charge, concentration and surface and core
chemistry, as well as on the composition of the soil, e.g. content of organic matter and clay
(Ben-Moshe et al. 2010; Cornelis et al. 2010; Darlington et al. 2009; Lapied et al. 2011;
Stone et al. 2010; Zook et al. 2011). One of the biggest challenges for detection and
characterisation of nanoparticles in soil is their separation from solid compounds naturally
present in the soil without modifying the nanoparticles (Klaine et al. 2008). Here, the
distinction between bioavailable and inaccessible nanoparticles (and their derivatives) also
provides an analytical challenge for future research.
Furthermore, research on the perseverance and bioavailability of nanoparticles over time is
needed, for a better understanding of exposure under field conditions. For example, the
experiments discussed in chapter 5 demonstrated more striking deviation in effects
between AgNP and AgNO3 for the long-term than for the four week experiment, because
AgNP seemed able to provide prolonged exposure to dissolved Ag. In addition to the longer
duration of the experiment, the use of ‘aged’ forms of nanoparticles may also be useful in
future research to provide information on bioactivity, stability and prolonged presence or
persistence of nanoparticles. ‘Aged’ and weathered nanoparticles may be the form in which
nanoparticles are present in the environment rather than as the freshly suspended or
synthesized nanoparticles generally used in experiments. ‘Aged’ nanoparticles may contain

General discussion and future perspectives
143
modified or lost surface coatings, affecting nanoparticle properties (such as size, charge and
surface chemistry) and behaviour (including clustering and dissolution) (Bastús et al. 2008;
Zook et al. 2011).
In conclusion, the present thesis demonstrated hazards of exposure of the earthworm L.
rubellus to the nanoparticles C60 and AgNP at different levels of biological organisation,
which provided insight into possible modes of action of the nanoparticle toxicity as well as
implications for earthworm populations. A valid translation of these results to the situation
of populations of earthworms and other soil organisms under field conditions is not yet
possible, because methods for reliable determination of nanoparticle levels in soil are
lacking. The expected concentrations in the field are more than three orders of magnitude
below the concentrations used in the experiments discussed in this thesis. However, due to
expected and observed prolonged bioavailability of some nanoparticle species and the high
levels of nanoparticles in sewage sludge, concentrations in the field may develop towards
the levels of the experiments discussed in the present thesis in the near future. Furthermore,
when focusing on the risk assessment procedure, it should be pointed out that in the
experiments discussed in the present thesis effects were already observed at the lowest
concentration used, for both C60 and AgNP. This implies that the NOAELs are below those
concentrations. In addition, the experiments were performed using a single soil (model)
species and assessment factors are needed to extrapolate to other soil organisms with
unknown sensitivity. When taking these matters in consideration, the assessed levels
discussed in the present thesis may be relevant for nanoparticle exposure to soil organisms
in the near future. Therefore this work has contributed to understanding the potential
hazards of nanoparticle addition (accidental or intentional) to the soil environment. Even
though, as the future perspectives demonstrate, a lot of questions and challenges remain for
future research.

Chapter 6
144

145
Summary

Summary
146
Summary
Nanotechnology is an expeditiously growing field, where engineered nanoparticles are
being incorporated in many different applications, from food to waste water treatment
(Dekkers et al. 2011; Gottschalk and Nowack 2011; Savage and Diallo 2005). Due to this
large scale production and use of nanoparticles, their release into the environment seems
inevitable (Crane et al. 2008; Handy et al. 2008a; Oberdörster et al. 2005). Actual exposure
levels of nanoparticles under field conditions and the hazards of nanoparticle exposure to
the environment are poorly understood, especially for the soil environment (Kahru and
Dubourguier 2010; Navarro et al. 2008; Shoults-Wilson et al. 2011a).
Given the need for better characterization of hazards of engineered nanoparticles to the
environment and soil organisms in particular, the aim of the present thesis was to
investigate effects of nanoparticle exposure on the earthworm Lumbricus rubellus, as a
model organism for soil ecotoxicology, and to contribute to the development of effect
markers for engineered nanoparticle exposure in this model.
The present thesis was divided in different chapters. Chapter 1 provides an introduction to
the topic and discusses the importance of research on the hazards of exposure to engineered
nanoparticles. Furthermore, the aim and outline of the thesis are presented, with
background information on the model organism, effect markers and nanoparticles.
In chapter 2 effects of exposure to the fullerene C60 (nominal concentrations 0, 15.4 and
154 mg C60/kg soil) on survival and growth during the different life stages of L. rubellus
(cocoon, juvenile, subadult and adult), as well as reproduction were quantified. These
important individual endpoints for population dynamics were incorporated in a continuous-
time life-history model (Baveco and De Roos 1996; De Roos 2008). In this way, effects of
C60 exposure on the individual endpoints could be extrapolated to implications for
population growth rate and life stage distribution, i.e. the development of the population in
terms of number of individuals in the different life stages. These implications at the
population level may be more relevant for the ecological impact of C60 than effects on

Summary
147
endpoints at the individual level (Klok et al. 2006; Widarto et al. 2004). At the individual
level C60 exposure caused significant adverse effects on cocoon production, juvenile growth
rate and survival. When these endpoints were used to model effects on the population level,
reduced population growth rates with increasing C60 concentrations were observed.
Furthermore, a shift in life stage structure was shown for C60 exposed populations, towards
a larger proportion of juveniles. This result implies that the lower juvenile growth rate
induced by C60 exposure resulted in a larger proportion of juveniles, despite increased
mortality among juveniles. Overall, this study implied serious consequences of C60
exposure for L. rubellus earthworm populations, even at the lowest level of exposure tested.
Furthermore, it showed that juveniles were more sensitive to C60 exposure than adults.
To complement the observations made on survival, growth and reproduction described in
chapter 2, subsequent investigations on cellular and molecular responses of the
earthworms to C60 exposure were performed (chapter 3). A set of established effect
markers was used, which reflect different levels of biological organisation in the earthworm
and may inform on the toxic mechanisms of adverse effects induced by C60 exposure
(Handy et al. 2002; Heckmann et al. 2008). At the molecular level, four specific effect
markers were selected, including markers for generic stress (heat shock protein 70 (HSP70)
(van Straalen and Roelofs 2006), for oxidative stress (catalase and glutathione-S-transferase
(GST) (Kohen and Nyska 2002) and for an immune response (coelomic cytolytic factor-1
(CCF-1) (Olivares Fontt et al. 2002). At the tissue level, histological analyses were used to
identify damage to cells and tissues, and indications of inflammation in the tissues. In these
investigations, exposure to C60 (0, 15 or 154 mg C60/kg soil) affected gene expression of
HSP70 significantly. Gene expression of CCF-1 did not alter in adult earthworms exposed
for four weeks, but was significantly down-regulated after lifelong exposure (from cocoon
stage to adulthood) of earthworms, already to the lowest C60 exposure level. No significant
trends were noted for catalase and glutathione-S-transferase (GST) gene expression or
enzyme activity. Tissue samples of the C60 exposed earthworms from both experiments and
exposure levels, showed a damaged cuticle with underlying pathologies of epidermis and
muscles. Additionally, the gut barrier was not fully intact. However, tissue repair was also

Summary
148
observed in these earthworms. In conclusion, this study demonstrated effects of sub-lethal
C60 exposure on L. rubellus earthworms, at the level of gene expression and tissue integrity.
Although tissue injury is generally associated with an inflammatory response, as part of
tissue repair (Cikutovic et al. 1999; Goven et al. 1994), the tissue damage observed for the
in vivo C60 exposed earthworms in chapter 3 appeareded to occur without accompanying
induced immune responses. The CCF-1 gene expression level was reduced in the C60
exposed earthworms, and histological observations did not show infiltration of damaged
tissues by immune cells. In order to obtain further insight in mechanisms of effects
observed at the molecular and tissue level on immune related parameters, the sensitivity of
immune cells (coelomocytes) of L. rubellus earthworms towards exposure to selected
nanoparticles was investigated in vitro (chapter 4). To this end, coelomocytes were
isolated from unexposed adult L. rubellus earthworms and exposed to C60 in vitro. After
exposure, these coelomocytes were tested for cellular viability, phagocytic activity and
CCF-1 gene expression levels. The gene expression of CCF-1 was most affected,
demonstrating a strong reduction, which indicated immunosuppression. Experiments with
NR8383 rat macrophage cells and tri-block copolymer nanoparticles were used to compare
sensitivity of the cell types and showed the usefulness of coelomocytes as a test system for
nano-immunotoxicity in general. Overall, this study indicated that the absence of an
immune response, in case of tissue injuries observed after in vivo C60 exposure, is likely
caused by immunosuppression rather than coelomocyte mortality.
In subsequent investigations, the experiments performed for C60 were also carried out with
silver nanoparticles (AgNP), both in vivo and in vitro (chapter 5). Effects of AgNP were
assessed in vivo at nominal concentrations of 0, 1.5 (low), 15.4 (medium) and 154 (high)
mg Ag/kg soil and compared to effects of silver ions, added as AgNO3 (nominal
concentration 15.4 mg Ag/kg soil). In a four week reproduction assay, the high AgNP and
AgNO3 treatments had a significant effect on cocoon production and high AgNP exposure
also caused a reduction in weight gain of the adult earthworms. No juveniles survived the
high AgNP treatment, therefore only F1 earthworms from the other exposure treatments

Summary
149
were monitored for survival and growth, until adulthood. These individual endpoints were
used to model effects on the population level. The low and medium AgNP as well as the
AgNO3 treatments significantly reduced the population growth rate. The high AgNP
treatment caused complete failure of the population growth. Furthermore, histological
examination of the earthworms from all AgNP exposure treatments demonstrated tissue
damage, with injuries mainly at the external barriers, e.g. the cuticle and the gut epithelium.
In addition, effects of AgNP exposure were assessed in vitro and a reduction of
coelomocyte viability was observed in a concentration-dependent manner, although the
EC50 was fourteen times higher compared with that for Ag ions, added as AgNO3.
Furthermore, characterisation of the in vivo exposure media implied that AgNP remained
present in the soil in single and aggregated state, releasing Ag to the soil pore water up to at
least eleven months. The ionic fraction of Ag in soils has been suggested to be bioavailable
to organisms and (largely) responsible for the observed AgNP toxicity (Coutris et al. 2012;
Koo, et al. 2011; Shoults-Wilson et al. 2011b). In comparison, the AgNO3 seemed to
dissolve rapidly, as is also known for this metal salt, and fixation of Ag ions by the soil
presumably led to a quick reduction of Ag bioavailability (Atkins and Jones 2000; Coutris
et al. 2012; Ratte 1999). This is in line with the observation that effects were more
prolonged in the AgNP treatments in comparison with the AgNO3 exposed animals. In
conclusion, this study indicated that AgNP exposure may seriously affect earthworm
populations, with the ability to cause immunotoxicity, injury to the external barriers of the
earthworm body and a reduction in growth, reproduction and juvenile survival.
Finally, chapter 6 presents a discussion on the findings of the present thesis and provides
suggestions for future research.

Summary
150

151
Samenvatting

Samenvatting
152
Samenvatting
Nanotechnologie is een snel groeiende technologie waarbij kunstmatige, door de mens
ontworpen deeltjes, zogeheten nanodeeltjes, worden gebruikt voor veel verschillende
soorten toepassingen (Gottschalk and Nowack 2011; Wijnhoven et al. 2010; Woodrow
Wilson institute). De manieren waarop nanodeeltjes worden toegepast zijn divers en breed;
van voedsel, sportartikelen, verzorgingsproducten, medische applicaties, tot apparatuur
voor rioolwaterzuivering en monitoring van het milieu (Andreescu et al. 2009; Dekkers et
al. 2011; Gottschalk and Nowack 2011; Jain 2008; Savage and Diallo 2005). Gezien de
grootschalige productie en toepassing van nanodeeltjes, lijkt het onvermijdelijk dat deze
deeltjes vrijkomen in het milieu en dat mensen en andere organismen eraan worden
blootgesteld (Crane et al. 2008; Handy et al. 2008a; Oberdörster et al. 2005). Helaas geven
sommige eigenschappen die nanodeeltjes nuttig maken voor veel toepassingen, zoals
chemische reactiviteit en persistentie, ook reden tot zorgen over de mogelijke negatieve
effecten voor mens en milieu (Warheit et al. 2008; Farré et al. 2011). Over de concentraties
van nanodeeltjes in het milieu en de gevaren voor het milieu van blootstelling aan
nanodeeltjes, is nog onvoldoende bekend. Dit geldt vooral voor de bodem (Kahru and
Dubourguier 2010; Navarro et al. 2008; Shoults-Wilson et al. 2011a).
Inspelend op de behoefte om de gevaren van kunstmatige nanodeeltjes voor het milieu in
het algemeen en voor bodemorganismen in het bijzonder beter in kaart te brengen, was het
doel van de studies beschreven in dit proefschrift om de effecten van de blootstelling van
nanodeeltjes op de regenworm Lumbricus rubellus te onderzoeken. Deze wormensoort
diende als modelorganisme voor bodem ecotoxicologie. Daarnaast waren de studies ook
opgezet om bij te dragen aan de ontwikkeling van effect-indicatoren voor de blootstelling
aan kunstmatige nanodeeltjes in dit onderzoeksmodel.
Het proefschrift is opgedeeld in zes hoofdstukken. Hoofdstuk 1 geeft een introductie in het
onderwerp en beschrijft het nut van onderzoek naar de gevaren van blootstelling aan
kunstmatige nanodeeltjes. Verder bespreekt het hoofdstuk het doel van de studies

Samenvatting
153
beschreven in het proefschrift, met achtergrond-informatie over het modelorganisme L.
rubellus, effect-indicatoren en nanodeeltjes.
In hoofdstuk 2 werd onderzocht welke effecten de blootstelling aan het koolstofnanodeeltje
C60 (met nominale concentraties van 0, 15.4, 154 mg C60/kg grond) heeft op de
voortplanting van L. rubellus regenwormen en op de overleving en groei van de
regenwormen tijdens verschillende levensfasen (cocon, juveniel, subadult en volwassen).
Deze kenmerken of parameters van de individuele regenwormen zijn belangrijk in de
populatie dynamica en werden opgenomen in een ‘continuous-time life-history’ model
(Baveco and De Roos 1996; De Roos 2008). Dit model maakte het mogelijk om de effecten
van blootstelling aan C60 op de individuele parameters te vertalen naar gevolgen voor
populatie-groeisnelheid en levensfase-verdeling. De levensfase-verdeling laat de
ontwikkeling van de populatie zien voor het aantal individuen per levensfase. Deze
gevolgen op populatie niveau kunnen relevanter zijn voor het ecologische effect van C60
dan effecten op de individuele parameters (Klok et al. 2006; Widarto et al. 2004).
Op het individuele niveau werden bij de regenwormen significant nadelige effecten van
blootstelling aan C60 vastgesteld voor de cocon-productie, en de juveniele groei en
overleving. Vertaling van deze parameters naar het populatieniveau liet zien dat de
populatie-groeisnelheid afnam naarmate de C60 testconcentraties werden verhoogd.
Daarnaast was de levensfase-verdeling voor de populaties van de aan C60 blootgestelde
regenwormen verschoven, want er was een relatief grotere groep van regenwormen in de
juveniele fase. De lagere juveniele groeisnelheid, veroorzaakt door C60 blootstelling, zorgde
voor een grotere groep regenwormen in de juveniele fase, ondanks de grotere sterfte onder
juvenielen. Uit dit experiment werd geconcludeerd dat blootstelling aan C60, bij de
concentraties die gebruikt zijn in dit experiment, ernstige gevolgen kan hebben voor
populaties van regenwormen, en dat juveniele regenwormen gevoeliger zijn voor deze
blootstelling dan volwassen regenwormen.
In aanvulling op het experiment in hoofdstuk 2, zijn er in hoofdstuk 3 ook op cellulair en
moleculair niveau testen uitgevoerd met de aan C60 blootgestelde regenwormen. Hiervoor is

Samenvatting
154
een set van bestaande effect-indicatoren gebruikt. Deze indicatoren geven informatie over
de effecten van blootstelling aan C60 op verschillende niveaus van de biologische
organisatie van de regenworm en over de toxische mechanismen van deze effecten (Handy
et al. 2002; Heckmann et al. 2008). Op moleculair niveau werden enkele effect indicatoren
geselecteerd, waaronder indicatoren voor algemene stress (heat shock protein 70, HSP70)
(van Straalen and Roelofs 2006), voor oxidatieve stress (catalase and glutathione-S-
transferase, GST) (Kohen and Nyska 2002) en een indicator voor een immuun-reactie
(coelomic cytolytic factor-1, CCF-1) (Olivares Fontt et al. 2002). Op het cellulaire weefsel-
niveau zijn histologische analyses uitgevoerd, waarbij gekeken is naar beschadigingen aan
cellen en weefsels, en naar ontstekingen in de weefsels.
De testen op moleculair niveau lieten zien dat blootstelling aan C60 (0, 15 of 154 mg C60/kg
grond) een significant effect had op de genexpressie van de algemene stress-indicator
HSP70. Bij de genexpressie van CCF-1 was geen effect te zien voor de regenwormen die
vier weken waren blootgesteld. De levenslang blootgestelde regenwormen hadden, bij
beide C60 concentraties, echter een significant lagere genexpressie van deze immuun-reactie
indicator ten opzichte van de controle-groep. Voor catalase en GST, indicatoren voor
oxidatieve stress, werden geen significante effecten op de genexpressie vastgesteld. De
histologische analyse van de weefselmonsters lieten een beschadigde cuticula (buitenste
huidlaag) zien, met schade aan onderliggende epidermis en spieren, voor regenwormen van
beide C60 concentraties en experimenten. Daarnaast was de darmwand van deze wormen
beschadigd. Tegelijkertijd was er echter herstel van de darmwandweefsels te zien. Op basis
van de resultaten uit dit hoofdstuk werd geconcludeerd dat effecten van niet-dodelijke
blootstelling van regenwormen aan C60 ook op het niveau van genexpressie en
weefselstructuur te bepalen is.
Over het algemeen gaat weefselschade gepaard met ontsteking als onderdeel van
weefselherstel (Cikutovic et al. 1999; Goven et al. 1994). Echter, in de beschadigde
weefsels van de regenwormen die in vivo waren blootgesteld aan C60 , zoals beschreven in
hoofdstuk 3, werden geen ontstekingen waargenomen. Deze regenwormen lieten namelijk

Samenvatting
155
een verlaagde CCF-1 genexpressie zien en bovendien werd tijdens de histologische analyse
van de weefsels geen infiltratie geobserveerd van beschadigde weefsels met immuuncellen.
Om meer inzicht te krijgen in de mechanismen van de aan het immuunsysteem-gerelateerde
effecten die zijn waargenomen op moleculair en weefsel-niveau, zijn in hoofdstuk 4
immuuncellen (coelomocyten) van niet-blootgestelde L. rubellus regenwormen geïsoleerd
en in vitro getest op gevoeligheid voor blootstelling aan C60. De coelomocyten werden
getest op cellulaire overleving, fagocytische activiteit en CCF-1 genexpressie. Uit deze
experimenten bleek dat CCF-1 genexpressie de meest gevoelige parameter was voor C60
blootstelling, aangezien deze een sterke reductie liet zien bij toenemende C60 concentraties.
Dit resultaat suggereert een onderdrukking van de immuunreactie. Verder werden ook in
vitro experimenten uitgevoerd met NR8383 rat macrofaag cellen en tri-block copolymeer
nanodeeltjes, om de gevoeligheid van verschillende celtypen te vergelijken en om de
bruikbaarheid van coelomocyten als testsysteem voor nano-immunotoxiciteit aan te tonen.
Uit de in vitro experimenten beschreven in dit hoofdstuk werd geconcludeerd dat de
afwezigheid van een immuunreactie, zoals geobserveerd in hoofdstuk 3, eerder werd
veroorzaakt door onderdrukking van het immuunsysteem dan door verhoogde mortaliteit
van coelomocyten.
De experimenten die werden uitgevoerd met C60, werden in hoofdstuk 5 herhaald met
zilver nanodeeltjes (AgNP), zowel in vivo als in vitro. Effecten van in vivo blootstelling aan
AgNP werden vastgesteld bij nominale concentraties van 0, 1.5 (laag), 15.4 (midden) en
154 (hoog) mg Ag/kg grond, en vergeleken met effecten na blootstelling aan zilvernitraat
(AgNO3), bij een nominale concentratie van 15.4 mg Ag/kg grond.
In een vier weken durend reproductie-experiment met volwassen regenwormen
produceerden de regenwormen die blootgesteld waren aan de AgNO3 en de hoge AgNP
grond significant minder cocons. Daarnaast hadden de regenwormen van de hoge AgNP
blootstellingsgroep een lagere gewichtstoename. Bij het monitoren van de nakomelingen
van de blootgestelde regenwormen, blootgesteld aan dezelfde concentraties als hun ouders,
kwamen bij de hoge AgNP blootstellingsgroep maar twee juvenielen uit hun cocon en die
stierven snel. Om deze reden werden alleen de nakomelingen van de andere

Samenvatting
156
blootstellingsgroepen gemonitord op overleving en groei, totdat ze volwassen waren. De
individuele parameters van de reproductie- en de nakomelingenexperimenten werden
gebruikt om effecten op populatie niveau vast te stellen. Deze analyse liet significant lagere
populatie groeisnelheden zien voor de lage en midden AgNP blootstellingsgroepen en de
AgNO3 blootstellingsgroep. De hoge AgNP blootstelling zorgde ervoor dat de populatie
helemaal niet groeide. De blootgestelde regenwormen, van zowel het reproductie-
experiment als van het nakomelingenexperiment, werden ook gebruikt voor een
histologische analyse van het weefsel. Uit deze analyse kwam naar voren dat alle AgNP
blootstellingen (laag, middel en hoog) weefselschade veroorzaakten, waarbij de schade
vooral geobserveerd werd aan de zogeheten ‘externe barrières’, de cuticula en de
darmwand.
Daarnaast werd er ook een in vitro experiment uitgevoerd, waarbij een verminderde
overleving van de coelomocyten werd vastgesteld bij toenemende AgNP concentraties.
Voor AgNP lag de EC50 (de concentratie waarbij de overleving van de coelomocyten 50%
lager was dan de controle) wel veertien keer hoger dan de EC50 voor zilverionen,
toegevoegd als AgNO3.
Verder werd in hoofstuk 5 ook de aanwezigheid en mogelijke in vivo blootstelling aan
AgNP en AgNO3 geanalyseerd. De resultaten van deze analyse gaven aan dat AgNP zowel
afzonderlijk als geaggregeerd in de grond aanwezig waren, en ertoe in staat zijn om voor
tenminste elf maanden Ag (ionen en wellicht kleine Ag aggregaten) vrij te laten in het
poriewater van de grond. De ionenfractie van Ag in de grond wordt wel gezien als het deel
dat (meest) beschikbaar is voor organismen en (grotendeels) verantwoordelijk is voor de
geobserveerde toxiciteit van AgNP op bodemorganismen (Coutris et al. 2012; Kool et al.
2011; Shoults-Wilson et al. 2011b). Ter vergelijking werd de aanwezigheid van AgNO3 in
de grond ook geanalyseerd en dit metaalzout leek snel op te lossen, zoals wel bekend voor
AgNO3 (Ratte 1999). Deze analyse van aanwezigheid en mogelijke blootstelling van AgNP
en AgNO3 in de grond was in overeenstemming met de effecten van in vivo blootstelling op
de regenwormen, waarbij de blootstelling aan AgNP een duidelijker effect van langdurige
blootstelling liet zien dan AgNO3. Uit de resultaten van dit hoofdstuk werd geconcludeerd
dat blootstelling aan AgNP ernstige gevolgen kan hebben voor populaties van

Samenvatting
157
regenwormen, met de mogelijkheid op immunotoxiciteit, schade aan externe barrières van
het lichaam van de regenwormen en een vermindering van groei, reproductie en overleving
van juvenielen te veroorzaken.
Tenslotte werden in hoofdstuk 6 de bevindingen van het huidige proefschrift
bediscussieerd en werden suggesties voor toekomstig onderzoek besproken.

Samenvatting
158

159
List of references

List of references
160
Abdul Rida AMM. 1996. Effet des lombriciens sur l'absorption du potassium par le ray-grass dans des sols
contaminés par CINQ elements traces. Soil Biology and Biochemistry 28: 1045-1051.
Adamowicz A and Wojtaszek J. 2001. Morphology and phagocytotic activity of coelomocytes in Dendrobaena
veneta (Lumbricidae). Zoologica Poloniae 46: 91-104.
Adamowicz A. 2005. Morphology and ultrastructure of the earthworm Dendrobaena veneta (Lumbricidae)
coelomocytes. Tissue and Cell 37: 125-133.
Aitken RJ, Chaudhry MQ, Boxall ABA, Hull M. 2006. Manufacture and use of nanomaterials: current status in the
UK and global trends. Occupational Medicine 56: 300-306.
Alberts JJ, Filip Z. 1998. Metal binding in estuarine humic and fulvic acids: FTIR analysis of humic acid-metal
complexes. Environmental Technology 19: 923-931.
Amaral AFS, Soto M, Cunha R, Mari, Marigómez I, Rodrigues AS. 2006. Bioavailability and cellular effects of
metals on Lumbricus terrestris inhabiting volcanic soils. Environmental Pollution 142: 103-108.
Amaral FS, Rodrigues AS. 2005. Metal accumulation and apoptosis in the alimentary canal of Lumbricus
terrestris as a metal biomarker. Biometals 18: 199-206.
Andreescu S, Njagi J, Ispas C, Ravalli MT. 2009. JEM Spotlight: Applications of advanced nanomaterials for
environmental monitoring. Journal of Environmental Monitoring 11: 27-40.
Ariano P, Zamburlin P, Gilardino A, Mortera R, Onida B, Tomatis M, Ghiazza M, Fubini B, Lovisolo D. 2011.
Interaction of spherical silica nanoparticles with neuronal cells: size-dependent toxicity and perturbation
of calcium homeostasis. Small 7: 766-774.
Arico AS, Bruce P, Scrosati B, Tarascon J-M, van Schalkwijk W. 2005. Nanostructured materials for advanced
energy conversion and storage devices. Nature Materials 4: 366-377.
Arnaout CL, Gunsch CK. 2012. Impacts of silver nanoparticle coating on the nitrification potential of
Nitrosomonas europaea. Environmental Science and Technology 46: 5387-5395.
Arora S, Jain J, Rajwade JM, Paknikar KM. 2008. Cellular responses induced by silver nanoparticles: In vitro
studies. Toxicology Letters 179: 93-100.
Asati A, Santra S, Kaittanis C, Perez JM. 2010. Surface-charge-dependent cell localization and cytotoxicity of
cerium oxide nanoparticles. ACS Nano 4: 5321-5331.
AshaRani PV, Low Kah Mun G, Hande MP, Valiyaveettil S. 2008. Cytotoxicity and genotoxicity of silver
nanoparticles in human cells. ACS Nano 3: 279-290.
Atkins P, Jones L. 2000. Chemical principles, The quest for insight. New York, USA: WH Freeman and
Company.
Barillet S, Jugan ML, Laye M, Leconte Y, Herlin-Boime N, Reynaud C, Carrière, M. 2010. In vitro evaluation of
SiC nanoparticles impact on A549 pulmonary cells: Cyto-, genotoxicity and oxidative stress. Toxicology
Letters 198: 324-330.
Bastús NG, Casals E, Vázquez-Campos S, Puntes V. 2008. Reactivity of engineered inorganic nanoparticles and
carbon nanostructures in biological media. Nanotoxicology 2: 99-112.
Baun A, Hartmann NB, Grieger K, Kusk KO. 2008a. Ecotoxicity of engineered nanoparticles to aquatic
invertebrates: a brief review and recommendations for future toxicity testing. Ecotoxicology 17: 387-395.
List of references
161
Baun A, Sørensen SN, Rasmussen RF, Hartmann NB, Koch CB. 2008b. Toxicity and biobioaccumulation of
xenobiotic organic compounds in the presence of aqueous suspensions of aggregates of nano-C60. Aquatic
Toxicology 86: 379-387.
Baveco JM, De Roos AM. 1996. Assessing the impact of pesticides on Lumbricid populations: an individual-
based modeling approach. The Journal of Applied Ecology 33: 1451-1468.
Ben-Moshe T, Dror I, Berkowitz B. 2010. Transport of metal oxide nanoparticles in saturated porous media.
Chemosphere 81: 387-393.
Benn TM, Cavanagh B, Hristovski K, Posner JD, Westerhoff P. 2010. The release of nanosilver from consumer
products used in the home. Journal of Environmental Quality 39: 1875-1882.
Benn TM, Westerhoff P. 2008. Nanoparticle silver released into water from commercially available sock fabrics.
Environmental Science and Technology 42: 4133-4139.
Bensasson RV, Bienvenue E, Dellinger M, Leach S, Seta P. 1994. C60 in model biological systems. A visible-UV
absorption study of solvent-dependent parameters and solute aggregation. The Journal of Physical
Chemistry 98: 3492-3500.
Berg JM, Romoser A, Banerjee N, Zebda R, Sayes CM. 2009. The relationship between pH and zeta potential of ∼
30 nm metal oxide nanoparticle suspensions relevant to in vitro toxicological evaluations.
Nanotoxicology 3: 276-283.
Bhattacharjee S, De Haan LHJ, Evers NM, Jiang X, Marcelis ATM, Zuilhof H, Rietjens IMCM, Alink GM. 2010.
Role of surface charge and oxidative stress in cytotoxicity of organic monolayer-coated silicon
nanoparticles towards macrophage NR8383 cells. Particle and Fibre Toxicology 7: 25.
Bhattacharjee S, Ershov D, van der Gucht J, Alink GM, Rietjens IMCM, Marcelis ATM, Zuilhof H. 2011. Surface
charge-specific cytotoxicity and cellular uptake of tri-block copolymer nanoparticles. Nanotoxicology,
DOI:10.3109/17435390. 2011.633714.
Bierkens JGEA. 2000. Applications and pitfalls of stress-proteins in biomonitoring. Toxicology 153:61-72.
Bilej M, Brys L, Beschin A, Lucas R, Vercauteren E, Hanusová R, De Baetselier P. 1995. Identification of a
cytolytic protein in the coelomic fluid of Eisenia foetida earthworms. Immunology Letters 45: 123-128.
Bilej M, Scheerlinck J-P, VandenDriessche T, De Baetselier P, Vetvicka V. 1990. The flow cytometric analysis of
in vitro phagocytic activity of earthworm coelomocytes (Eisenia foetida; Annelida). Cell Biology
International Reports 14: 831-837.
Bilej M, Síma P, Slípka J. 1992. Repeated antigenic challenge induces earthworm coelomocyte proliferation.
Immunology Letter 32: 181-184.
Bokare AD, Patnaik A. 2005. C60 aggregate structure and geometry in nonpolar o-xylene. The Journal of Physical
Chemistry B 109: 87-92.
Bolea E, Jiménez-Lamana J, Laborda F, Castillo J. 2011. Size characterization and quantification of silver
nanoparticles by asymmetric flow field-flow fractionation coupled with inductively coupled plasma mass
spectrometry. Analytical and Bioanalytical Chemistry 401: 2723-2732.

List of references
162
Booth LH, O’Halloran K. 2001. A comparison of biomarker responses in the earthworm Aporrectodea caliginosa
to the organophosphorus insecticides Diazinon and Chlorpyrifos. Environmental Toxicology and
Chemistry 20: 2494-2502.
Brand P, Gebhart J, Below M, Georgi B, Heyder J. 1991. Characterization of environmental aerosols on
heligoland island. Atmospheric Environment Part A General Topics 25: 581-585.
Brant J, Lecoanet H, Wiesner MR. 2005. Aggregation and deposition characteristics of fullerene nanoparticles in
aqueous systems. Journal of Nanoparticle Research 7: 545-553.
Brousseau P, Fugère N, Bernier J, Coderre D, Nadeau D, Poirier G, Fournier M. 1997. Evaluation of earthworm
exposure to contaminated soil by cytometric assay of coelomocytes phagocytosis in Lumbricus terrestris
(Oligochaeta). Soil Biology and Biochemistry 29: 681-684.
Brown DC, Bradley BP, Tedengren M. 1995. Genetic and environmental regulation of HSP70 expression. Marine
Environmental Research 39:181-184.
Bullard-Dillard R, Creek KE, Scrivens WA, Tour JM. 1996. Tissue Sites of Uptake of 14C-Labeled C60.
Bioorganic Chemistry 24: 376-385.
Bundy J, Sidhu J, Rana F, Spurgeon DJ, Svendsen C, Wren J, Stürzenbaum SR, Morgan AJ, Kille P. 2008.
'Systems toxicology' approach identifies coordinated metabolic responses to copper in a terrestrial non-
model invertebrate, the earthworm Lumbricus rubellus. BMC Biology 6: 25.
Burch SW, Fitzpatrick LC, Goven AJ, Venables BJ, Giggleman MA. 1999. In vitro earthworm Lumbricus
terrestris coelomocyte assay for use in terrestrial toxicity identification evaluation. Bulletin of
Environmental Contamination and Toxicology 62: 547-554.
Burgers SLGE, Oude Voshaar JH. 2010. Statistiek voor onderzoekers. Met voorbeelden uit de landbouw en
milieuwetenschappen, third edition. Wageningen, The Netherlands: Wageningen Academic Publishers.
Burgos M, Winters C, Stürzenbaum SR, Randerson P, Kille P, Morgan AJ. 2005. Cu and Cd effects on the
earthworm Lumbricus rubellus in the laboratory: Multivariate statistical analysis of relationships between
exposure, biomarkers, and ecologically relevant parameters. Environmental Science and Technology 39:
1757-1763.
Calisi A, Lionetto MG, Schettino T. 2009. Pollutant-induced alterations of granulocyte morphology in the
earthworm Eisenia foetida. Ecotoxicology and Environmental Safety 72: 1369-1377.
Cartiera MS, Johnson KM, Rajendran V, Caplan MJ, Saltzman WM. 2009. The uptake and intracellular fate of
PLGA nanoparticles in epithelial cells. Biomaterials 30: 2790-2798.
Casals E, Vázques-Campos S, Bastús NS, Puntes V. 2008. Distribution and potential toxicity of engineered
inorganic nanoparticles and carbon nanostructures in biological systems. Trends in Analytical Chemistry
27: 672-683.
Chen KL, Elimelech M. 2006. Aggregation and deposition kinetics of fullerene (C60) nanoparticles. Langmuir 22:
10994-11001.
Chen L, Mccrate JM, Lee JCM, Li H. 2011. The role of surface charge on the uptake and biocompatibility of
hydroxyapatite nanoparticles with osteoblast cells. Nanotechnology 22: 105708.
List of references
163
Chen SC, Fitzpatrick LC, Goven AJ, Venables BJ, Cooper EL. 1991. Nitroblue tetrazolium dye reduction by
earthworm (Lumbricus terrestris) coelomocytes: An enzyme assay for nonspecific immunotoxicity of
xenobiotics. Environmental Toxicology and Chemistry 10: 1037-1043.
Chen X, Schluesener HJ. 2008. Nanosilver: A nanoproduct in medical application. Toxicology Letters 176: 1-12.
Chen XY, Armes SP, Greaves SJ, Watts JF. 2004. Synthesis of hydrophilic polymer-grafted ultrafine inorganic
oxide particles in protic media at ambient temperature via atom transfer radical polymerization: use of an
electrostatically adsorbed polyelectrolytic macroinitiator. Langmuir 20: 587-595.
Cheng X, Kan AT, Tomson MB. 2004. Naphthalene adsorption and desorption from aqueous C60 fullerene.
Journal of Chemical and Engineering Data 49:675-683.
Cherng J-Y, van de Wetering P, Talsma H, Crommelin DJA, Hennink WE. 1996. Effect of size and serum proteins
on transfection efficiency of poly ((2-dimethylamino)ethyl methacrylate)-plasmid nanoparticles.
Pharmaceutical Research 13: 1038-1042.
Çiçek B, Kenar A, Nazir H. 2001. Simultaneous determination of C60 and C70 fullerenes by a spectrophotometric
method. Fullerene Science and Technology 9: 103-111.
Cikutovic MA, Fitzpatrick LC, Goven AJ, Venables BJ, Giggleman MA, Cooper EL. 1999. Wound healing in
earthworms Lumbricus terrestris; A cellular-based biomarker for assessing sublethal chemical toxicity.
Bulletin of Environmental Contamination and Toxicology 62: 508-514.
Clancy L, Goodman P, Sinclair H, Dockery DW. 2002. Effect of air-pollution control on death rates in Dublin,
Ireland: an intervention study. The Lancet 360: 1210-1214.
Colman B, Wang S-Y, Auffan M, Wiesner M, Bernhardt E. 2012. Antimicrobial effects of commercial silver
nanoparticles are attenuated in natural streamwater and sediment. Ecotoxicology 21: 1867-1877.
Cornelis G, Kirby JK, Beak D, Chittleborough D, McLaughlin MJ. 2010. A method for determination of retention
of silver and cerium oxide manufactured nanoparticles in soils. Environmental Chemistry 7: 298-308.
Coutris C, Joner EJ, Oughton DH. 2012. Aging and soil organic matter content affect the fate of silver
nanoparticles in soil. Science of the Total Environment 420: 327-333.
Crane M, Handy RD, Garrod J, Owen R. 2008. Ecotoxicity test methods and environmental hazard assessment for
engineered nanoparticles. Ecotoxicology 17: 421-437.
Croute F, Beau B, Arrabit C, Gaubin Y, Delmas F, Murat JC, Soleilhavoup JP. 2000. Pattern of stress protein
expression in human lung cell-line A549 after short- or long-term exposure to cadmium. Environmental
Health Perspectives 108:55-60.
Cumberland SA, Lead JR. 2009. Particle size distributions of silver nanoparticles at environmentally relevant
conditions. Journal of Chromatography A 1216: 9099-9105.
Danscher G, Stoltenberg M. 2006. Silver enhancement of quantum dots resulting from (1) metabolism of toxic
metals in animals and humans, (2) in vivo, in vitro and immersion created zinc–sulphur/zinc–selenium
nanocrystals, (3) metal ions liberated from metal implants and particles. Progress in Histochemistry and
Cytochemistry 41: 57-139.
De Roos AM. 2008. Demographic analysis of continuous-time life-history models. Ecology Letters 11: 1-15.

List of references
164
Dean-Ross D. 1983. Methods for the assessment of the toxicity of environmental chemicals to earthworms.
Regulatory Toxicology and Pharmacology 3: 48-59.
Deguchi S, Alargova RG, Tsujii K. 2001. Stable dispersions of fullerenes, C60 and C70, in water. Preparation and
characterization. Langmuir 17: 6013-6017.
Dekkers S, Krystek P, Peters RJB, Lankveld DPK, Bokkers BGH, van Hoeven-Arentzen PH, Bouwmeester H,
Oomen AG. 2011. Presence and risks of nanosilica in food products. Nanotoxicology 5: 393-405.
Delay M, Dolt T, Woellhaf A, Sembritzki R, Frimmel FH. 2011. Interactions and stability of silver nanoparticles
in the aqueous phase: Influence of natural organic matter (NOM) and ionic strength. Journal of
Chromatography A 1218: 4206-4212.
Demir E, Vales G, Kaya B, Creus A, Marcos R. 2011. Genotoxic analysis of silver nanoparticles in Drosophila.
Nanotoxicology 5: 417-424.
Diogéne J, Dufour M, Poirier GG, Nadeau D. 1997. Extrusion of earthworm coelomocytes: comparison of the cell
populations recovered from the species Lumbricus terrestris, Eisenia fetida and Octolasion tyrtaeum.
Laboratory Animals 31: 326-336.
Dockery DW, Pope CA, Xu X, Spengler JD, Ware JH, Fay ME, Ferris BG, Speizer FE. 1993. An association
between air pollution and mortality in six U.S. cities. New England Journal of Medicine 329: 1753-1759.
Donaldson K, Stone V. 2003. Current hypotheses on the mechanisms of toxicity of ultrafine particles. Annali
dell'Istituto Superiore di Sanità 39: 405-410.
Eckwert H, Alberti G, Köhler H-R. 1997. The induction of stress proteins (hsp) in Oniscus asellus (Isopoda) as a
molecular marker of multiple heavy metal exposure: I. Principles and toxicological assessment.
Ecotoxicology 6:249-262.
Eckwert H, Köhler H-R. 1997. The indicative value of the hsp70 stress response as a marker for metal effects in
Oniscus asellus (Isopoda) field populations: variability between populations from metal-polluted and
uncontaminated sites. Applied Soil Ecology 6:275-282.
Edwards CA, Bater JE. 1992. The use of earthworms in environmental management. Soil Biology and
Biochemistry 24: 1683-1689.
Edwards CA, Bohlen PJ. 1996. Biology and ecology of earthworms. Third Edition. London, UK: Chapman and
Hall.
Engelmann P, Pálinkás L, Cooper EL, Németh P. 2005. Monoclonal antibodies identify four distinct annelid
leukocyte markers. Developmental and Comparative Immunology 29: 599-614.
European Union. 2011. Official Journal of the European Union L275; European Commission Recommendation of
18 October 2011 on the definition of nanomaterial.
Eyambe GS, Goven AJ, Fitzpatrick LC, Venables BJ, Cooper EL. 1991. A non-invasive technique for sequential
collection of earthworm (Lumbricus terrestris) leukocytes during subchronic immunotoxicity studies.
Laboratory Animals 25: 61-67.
Faber JH, van der Hout A, Martakis GFP. 2004. Earthworm functioning in soils in relation to population densities.
XIVth international colloquium on soil zoology and ecology. Abstract book 96.

List of references
165
Fabrega J, Fawcett SR, Renshaw JC, Lead JR. 2009. Silver nanoparticle impact on bacterial growth: Effect of pH,
concentration, and organic matter. Environmental Science and Technology 43: 7285-7290.
Fabrega J, Luoma SN, Tyler CR, Galloway TS, Lead JR. 2011. Silver nanoparticles: Behaviour and effects in the
aquatic environment. Environment International 37: 517-531.
Farré M, Pérez S, Gajda-Schrantz K, Osorio V, Kantiani L, Ginebreda A, Barceló D. 2010. First determination of
C60 and C70 fullerenes and N-methylfulleropyrrolidine C60 on the suspended material of wastewater
effluents by liquid chromatography hybrid quadrupole linear ion trap tandem mass spectrometry. Journal
of Hydrology 383: 44-51.
Farré M, Sanchís J, Barceló D. 2011. Analysis and assessment of the occurrence, the fate and the behavior of
nanomaterials in the environment. TrAC Trends in Analytical Chemistry 30: 517-527.
Feder ME. 1999. Organismal, ecological, and evolutionary aspects of heat-shock proteins and the stress response:
Established conclusions and unresolved issues. American Zoologist 39:857-864.
Fischer E, Molnár L. 1992. Environmental aspects of the chloragogenous tissue of earthworms. Soil Biology and
Biochemistry 24: 1723-1727.
Foldbjerg R, Olesen P, Hougaard M, Dang DA, Hoffmann HJ, Autrup H. 2009. PVP-coated silver nanoparticles
and silver ions induce reactive oxygen species, apoptosis and necrosis in THP-1 monocytes. Toxicology
Letters 190: 156-162.
Fournier M, Cyr D, Blakley B, Boermans H, Brousseau P. 2000. Phagocytosis as a biomarker of immunotoxicity
in wildlife species exposed to environmental xenobiotics. American Zoologist 40: 412-420.
Frampton G, Jaensch S, Scott Fordsmand JJ, Roembke J, Van den Brink P. 2006. Effects of pesticides on soil
invertebrates in laboratory studies: A review and analysis using species sensitivity distributions.
Environmental Toxicology and Chemistry 25: 2480-2489.
Fujita K, Morimoto Y, Ogami A, Myojyo T, Tanaka I, Shimada M, Wang W-N, Endoh S, Uchida K, Nakazato T,
Yamamoto K, Fukui H, Horie M, Yoshida Y, Iwahashi H, Nakanishi J. 2009. Gene expression profiles in
rat lung after inhalation exposure to C60 fullerene particles. Toxicology 258: 47-55.
Gelderman MP, Simakova O, Clogston JD, Patri AK, Siddiqui SF, Vostal AC, Simak J. 2008. Adverse effects of
fullerenes on endothelial cells: Fullerenol C60(OH)24 induced tissue factor and ICAM-I membrane
expression and apoptosis in vitro. International Journal of Nanomedicine 3: 59-68.
Geranio L, Heuberger M, Nowack B. 2009. The behavior of silver nanotextiles during washing. Environmental
Science and Technology 43: 8113-8118.
Gimbert LJ, Hamon RE, Casey PS, Worsfold PJ. 2007. Partitioning and stability of engineered ZnO nanoparticles
in soil suspensions using flow field-flow fractionation. Environmental Chemistry 4: 8-10.
Giovanetti A, Fesenko S, Cozzella ML, Asencio LD, Sansone U. 2010. Bioaccumulation and biological effects in
the earthworm Eisenia fetida exposed to natural and depleted uranium. Journal of Environmental
Radioactivity 101: 509-516.
Goel A, Howard JB, Vander Sande JB. 2004. Size analysis of single fullerene molecules by electron microscopy.
Carbon 42: 1907-1915.

List of references
166
Gong P, Guan X, Inouye LS, Pirooznia M, Indest KJ, Athow RS, Deng Y, Perkins EJ. 2007. Toxicogenomic
Analysis Provides New Insights into Molecular Mechanisms of the Sublethal Toxicity of 2,4,6-
Trinitrotoluene in Eisenia fetida. Environmental Science and Technology 41: 8195-8202.
Gottschalk F, Nowack B. 2011. The release of engineered nanomaterials to the environment. Journal of
Environmental Monitoring 13: 1145-1155.
Gottschalk F, Sonderer T, Scholz RW, Nowack B 2009. Modeled environmental concentrations of manufactured
nanomaterials (TiO2, ZnO, Ag, CNT, fullerenes) for different regions. Environmental Science and
Technology 43: 9216-9222.
Goven AJ, Chen SC, Fitzpatrick LC, Venables BJ. 1994. Lysozyme activity in earthworm (Lumbricus terrestris)
coelomic fluid and coelomocytes: enzyme assay for immunotoxicity of xenobiotics. Environmental
Toxicology and Chemistry 13: 607-614.
Goven AJ, Eyambe GS, Fitzpatrick LC, Venables BJ, Cooper EL. 1993. Cellular biomarkers for measuring
toxicity of xenobiotics: effects of polychlorinated biphenyls on earthworm Lumbricus terrestris
coelomocytes. Environmental Toxicology and Chemistry 12: 863-870.
Green M, Howman E. 2005. Semiconductor quantum dots and free radical induced DNA nicking. Chemical
Communications 121-123.
Griffitt RJ, Hyndman K, Denslow ND, Barber DS. 2009. Comparison of molecular and histological changes in
zebrafish gills exposed to metallic nanoparticles. Toxicological Sciences 107: 404-415.
Guo Q, Sidhu J, Ebbels T, Rana F, Spurgeon DJ, Svendsen C, Stürzenbaum S, Kille P, Morgan AJ, Bundy J. 2009.
Validation of metabolomics for toxic mechanism of action screening with the earthworm Lumbricus
rubellus. Metabolomics 5: 72-83.
Hagens WI, Oomen AG, de Jong WH, Cassee FR, Sips AJAM. 2007. What do we (need to) know about the
kinetic properties of nanoparticles in the body? Regulatory Toxicology and Pharmacology 49: 217-229.
Hamilton RF, Buford MC, Wood MB, Arnone B, Morandi M, Holian A. 2007. Engineered carbon nanoparticles
alter macrophage immune function and initiate airway hyper-responsiveness in the BALB/c mouse
model. Nanotoxicology 1: 104-117.
Han B, Karim NM. 2008. Cytotoxicity of aggregated fullerene C60 particles on CHO and MDCK cells. Scanning
30: 213-220.
Handy RD, Jha AN, Depledge MH. 2002a. Biomarker approaches for ecotoxicological biomonitoring at different
levels of biological organisation. In: Burden K, McKelvie I, Förstner U, Guenther A, eds. Handbook of
Environmental Monitoring. New York, US: McGraw Hill, pp. 9.1-9.32.
Handy RD, Runnalls T, Russell PM. 2002b. Histopathologic biomarkers in three spined sticklebacks, Gasterosteus
aculeatus, from several rivers in southern England that meet the Freshwater Fisheries Directive.
Ecotoxicology 11: 467-479.
Handy RD, von der Kammer F, Lead JR, Hassellov M, Owen R, Crane M. 2008a. The ecotoxicology and
chemistry of manufactured nanoparticles. Ecotoxicology 17: 287-314.
Handy RD, Henry TB, Scown TM, Johnston BD, Tyler CR. 2008b. Manufactured nanoparticles: their uptake and
effects on fish—a mechanistic analysis. Ecotoxicology 17: 396-409.

List of references
167
Handy RD, Owen R, Valsami-Jones E. 2008c. The ecotoxicology of nanoparticles and nanomaterials: current
status, knowledge gaps, challenges, and future needs. Ecotoxicology 17: 315-325.
Hansen S, Michelson E, Kamper A, Borling P, Stuer-Lauridsen F, Baun A. 2008. Categorization framework to aid
exposure assessment of nanomaterials in consumer products. Ecotoxicology 17: 438-447.
Harush-Frenkel O, Debotton N, Benita S, Altschuler Y. 2007. Targeting of nanoparticles to the clathrin-mediated
endocytic pathway. Biochemical and Biophysical Research Communications 353: 26-32.
Hayashi Y, Engelmann P, Foldbjerg R, Szabó M, Somogyi I, Pollák E, Molnár L, Autrup H, Sutherland DS, Scott-
Fordsmand JJ, Heckmann L-H. 2012. Earthworms and humans in vitro: Characterizing evolutionarily
conserved stress and immune responses to silver nanoparticles. Environmental Science and Technology
46: 4166-4173.
Heckmann L-H, Connon R, Hutchinson T, Maund S, Sibly R, Callaghan A. 2006. Expression of target and
reference genes in Daphnia magna exposed to ibuprofen. BMC Genomics 7: 175.
Heckmann L-H, Hovgaard M, Sutherland D, Autrup H, Besenbacher F, Scott-Fordsmand JJ. 2011a. Limit-test
toxicity screening of selected inorganic nanoparticles to the earthworm Eisenia fetida. Ecotoxicology 20:
226-233.
Heckmann LH, Krogh PH, Sørensen PB, Sørensen JG. 2011b. NORMA-Gene: A simple and robust method for
QPCR normalisation based on target gene data. BMC Bioinformatics 12: 250.
Heckmann L-H, Sibly R, Connon R, Hooper H, Hutchinson T, Maund S, Hill C, Bouetard A, Callaghan A. 2008.
Systems biology meets stress ecology: linking molecular and organismal stress responses in Daphnia
magna. Genome Biology 9: R40.
Henry TB, Menn F-M, Fleming JT, Wilgus J, Compton RN, Sayler GS. 2007. Attributing effects of aqueous C60
nano-aggregates to tetrahydrofuran decomposition products in larval zebrafish by assessment of gene
expression. Environmental Health Perspectives 115: 1059-1065.
Hobbelen PHF, Koolhaas JE, van Gestel CAM. 2004. Risk assessment of heavy metal pollution for detritivores in
floodplain soils in the Biesbosch, The Netherlands, taking bioavailability into account. Environmental
Pollution 129: 409-419.
Holbrook RD, Murphy KE, Morrow JB, Cole KD. 2008. Trophic transfer of nanoparticles in a simplified
invertebrate food web. Nature Nanotechnology 3: 352-355.
Homa J, Olchawa E, Stürzenbaum SR, Morgan AJ, Plytycz B. 2005. Early-phase immunodetection of
metallothionein and heat shock proteins in extruded earthworm coelomocytes after dermal exposure to
metal ions. Environmental Pollution 135: 275-280.
Hou H, Takamatsu T, Koshikawa MK, Hosomi M. 2005. Migration of silver, indium, tin, antimony, and bismuth
and variations in their chemical fractions on addition to uncontaminated soils. Soil Science 170: 624-639.
Hou W-C, Jafvert CT. 2009. Photochemical transformation of aqueous C60 clusters in sunlight. Environmental
Science and Technology 43: 362-367.
Houba VJG, Temminghoff EJM, Gaikhorst GA, van Vark W. 2000. Soil analysis procedures using 0.01 M
calcium chloride as extraction reagent. Communications in Soil Science and Plant Analysis 31:
1299-1396.

List of references
168
Hrženjak T, Hrženjak M, Kašuba V, Efenberger-Marinculic P, Levanat S. 1992. A new source of biologically
active compounds-earthworm tissue (Eisenia foetida, Lumbricus rubellus). Comparative Biochemistry
and Physiology Part A: Physiology 102: 441-447.
Hsiao JK, Weng TI, Tai MF, Chen YF, Wang YH, Yang CY, Wang JL, Liu HM. 2009. Cellular behavior change
of macrophage after exposure to nanoparticles. Journal of Nanoscience and Nanotechnology 9:
1388-1393.
Hsin Y-H, Chen C-F, Huang S, Shih T-S, Lai P-S, Chueh PJ. 2008. The apoptotic effect of nanosilver is mediated
by a ROS- and JNK-dependent mechanism involving the mitochondrial pathway in NIH3T3 cells.
Toxicology Letters 179: 130-139.
Hsu L-Y, Chein H-M. 2007. Evaluation of nanoparticle emission for TiO2 nanopowder coating materials. Journal
of Nanoparticle Research 9: 157-163.
Hu C, Li M, Wang W, Cui Y, Chen J, Yang L. 2012. Ecotoxicity of silver nanoparticles on earthworm Eisenia
fetida: responses of the antioxidant system, acid phosphatase and ATPase. Toxicological and
Environmental Chemistry 94: 732-741.
Hussain SM, Hess KL, Gearhart JM, Geiss KT, Schlager JJ. 2005. In vitro toxicity of nanoparticles in BRL 3A rat
liver cells. Toxicology in Vitro 19: 975-983.
Isaacson CW, Usenko CY, Tanguay RL, Field JA. 2007. Quantification of fullerenes by LC/ESI-MS and its
application to in vivo toxicity assays. Analytical Chemistry 79: 9091-9097.
ISO, the International Organization for Standardization. 1998. Soil quality – Effects of pollutants on earthworms
(Eisenia fetida) – Part 2: Determination of effects on reproduction. 11268-2: 1998. Geneva, Switzerland.
Ito A, Shinkai M, Honda H, Kobayashi T. 2005. Medical application of functionalized magnetic nanoparticles.
Journal of Bioscience and Bioengineering 100: 1-11.
Jacobsen NR, Pojana G, White P, Møller P, Cohn CA, Korsholm KS, Vogel U, Marcomini A, Loft S, Wallin H.
2008. Genotoxicity, cytotoxicity, and reactive oxygen species induced by single-walled carbon nanotubes
and C60 fullerenes in the FE1-MutaTMMouse lung epithelial cells. Environmental and Molecular
Mutagenesis 49: 476-487.
Jain KK. 2008. Nanomedicine: Application of nanobiotechnology in medical practice. Medical Principles and
Practice 17: 89-101.
Jia G, Wang H, Yan L, Wang X, Pei R, Yan T, Zhao Y, Guo X. 2005. Cytotoxicity of carbon nanomaterials:
single-wall nanotube, multi-wall nanotube, and fullerene. Environmental Science and Technology 39:
1378-1383.
Jiang J, Oberdörster G, Biswas P. 2009. Characterization of size, surface charge, and agglomeration state of
nanoparticle dispersions for toxicological studies. Journal of Nanoparticle Research 11: 77-89.
Johnston HJ, Hutchison GR, Christensen FM, Aschberger K, Stone V. 2010. The biological mechanisms and
physicochemical characteristics responsible for driving fullerene toxicity. Toxicological Sciences 114:
162-182.
JRC; European commission Joint Research Centre. 2011. NM-Series of Representative Manufactured
Nanomaterials. NM-300 Silver: characterisation, stability, homogeneity. EUR 24693 EN-2011.

List of references
169
Kaegi R, Ulrich A, Sinnet B, Vonbank R, Wichser A, Zuleeg S, Simmler H, Brunner S, Vonmont H, Burkhardt M,
Boller M. 2008. Synthetic TiO2 nanoparticle emission from exterior facades into the aquatic environment.
Environmental Pollution 156: 233-239.
Kahru A, Dubourguier H-C. 2010. From ecotoxicology to nanoecotoxicology. Toxicology 269: 105-119.
Kamat JP, Devasagayam TPA, Priyadarsini KI, Mohan H, Mittal JP. 1998. Oxidative damage induced by the
fullerene C60 on photosensitization in rat liver microsomes. Chemico-Biological Interactions 114:
145-159.
Kamat JP, Devasagayam TPA, Priyadarsini KI, Mohan H. 2000. Reactive oxygen species mediated membrane
damage induced by fullerene derivatives and its possible biological implications. Toxicology 155: 55-61.
Karatas OF, Sezgin E, Aydin O, Culha M. 2009. Interaction of gold nanoparticles with mitochondria. Colloids and
Surfaces B 71: 315–318.
Kauschke E, Mohrig W, Cooper EL. 2007. Coelomic fluid proteins as basic components of innate immunity in
earthworms. European Journal of Soil Biology 43: S110-S115.
Kawata K, Osawa M, Okabe S. 2009. In Vitro toxicity of silver nanoparticles at noncytotoxic doses to HepG2
human hepatoma cells. Environmental Science and Technology 43: 6046-6051.
Kerndorff H, Schnitzer M. 1980. Sorption of metals on humic acid. Geochimica et Cosmochimica Acta 44: 1701-
1708.
Khodadadi JM, Hosseinizadeh SF. 2007. Nanoparticle-enhanced phase change materials (NEPCM) with great
potential for improved thermal energy storage. International Communications in Heat and Mass Transfer
34: 534-543.
Kiliç GA. 2011. Histopathological and biochemical alterations of the earthworm (Lumbricus Terrestris) as
biomarker of soil pollution along Porsuk river basin (Turkey). Chemosphere 83: 1175-1180.
Kim S, Kim J, Lee I. 2011. Effects of Zn and ZnO nanoparticles and Zn2+ on soil enzyme activity and
biobioaccumulation of Zn in Cucumis sativus. Chemistry and Ecology 27: 49-55.
Kiser MA, Westerhoff P, Benn T, Wang , Pérez-Rivera J, Hristovski K. 2009. Titanium nanomaterial removal
and release from wastewater treatment plants. Environmental Science and Technology 43: 6757-6763.
Klaassen CD, Watkins III JB. 2003. Casarett and Doull’s Essentials of Toxicology. New ork, USA: The Mc-
Graw-Hill Companies Inc.
Klaine SJ, Alvarez PJJ, Batley GE, Fernandes TF, Handy RD, Lyon DY, Mahendra S, McLaughlin MJ, Lead JR.
2008. Nanomaterials in the environment: Behavior, fate, bioavailability, and effects. Environmental
Toxicology and Chemistry 27: 1825-1851.
Klaper R, Crago J, Barr J, Arndt D, Setyowati K, Chen J. 2009. Toxicity biomarker expression in daphnids
exposed to manufactured nanoparticles: Changes in toxicity with functionalization. Environmental
Pollution 157: 1152-1156.
Klein CL, Comero S, Stahlmecke B, Romazanov J, Kuhlbusch TAJ, van Doren E, De Temmerman P-J, Mast J,
Wick P, Krug H, Locoro G, Hund-Rinke K, Kördel W, Friedrichs S, Maier G, Werner J, Linsinger Th,
Gawlik BM. 2011. NM-Series of representative manufactured nanomaterials. NM-300 silver.

List of references
170
Characterisation, stability, homogeneity. Joint Research Centre, Institute for Health and Consumer
Protection, European Commission, DOI: 10.2788/23079.
Klok C, De Roos AM. 1996. Population level consequences of toxicological influences on individual growth and
reproduction in Lumbricus rubellus (Lumbricidae, Oligochaeta). Ecotoxicology and Environmental
Safety 33: 118-127.
Klok C, van der Hout A, Bodt J. 2006. Population growth and development of the earthworm Lumbricus rubellus
in a polluted field soil: possible consequences for the godwit (Limosa limosa). Environmental Toxicology
and Chemistry 25: 213-219.
Kohen R, Nyska A. 2002. Invited review: Oxidation of biological systems: Oxidative stress phenomena,
antioxidants, redox reactions, and methods for their quantification. Toxicologic Pathology 30: 620-650.
Kooijman SALM. 2000. Dynamic energy and mass budgets in biological systems. Cambridge, UK: Cambridge
University Press.
Kooijman SALM., Metz JAJ. 1984. On the dynamics of chemically stressed populations: The deduction of
population consequences from effects on individuals. Ecotoxicology and Environmental Safety 8:
254-274.
Kool PL, Ortiz MD, van Gestel CAM. 2011. Chronic toxicity of ZnO nanoparticles, non-nano ZnO and ZnCl2 to
Folsomia candida (Collembola) in relation to bioavailability in soil. Environmental Pollution 159:
2713-2719.
Koopmans GF, Chardon WJ, Dekker PHM, Römkens PFAM, Schoumans OF. 2006. Comparing different
extraction methods for estimating phosphorus solubility in various soil types. Soil Science 171: 103-116.
Korsloot A, van Gestel CAM, van Straalen NM. 2004. Environmental stress and cellular response in arthropods.
Boca Raton, US: CRC Press LLC.
Kroll A, Pillukat MH, Hahn D, Schnekenburger J. 2009. Current in vitro methods in nanoparticle risk assessment:
Limitations and challenges. European Journal of Pharmaceutics and Biopharmaceutics 72: 370-377.
Kuperman RG, Checkai RT, Ruth LM, Henry T, Simini M, Kimmel DG, Phillips CT, Bradley BP. 2003. A
proteome-based assessment of the earthworm Eisenia fetida: response to chemical warfare agents in a
sandy loam soil: The 7th international symposium on earthworm ecology, Cardiff Wales 2002.
Pedobiologia 47: 617-621.
Lahr J, Kools SAE, van der Hout A, Faber JH. 2008. Combined effects of zinc and earthworm density on soil
ecosystem functioning. Soil Biology and Biochemistry 40: 334-341.
Lakhani KH, Satchell JE. 1970. Production by Lumbricus terrestris. The Journal of Animal Ecology 39: 473-492.
Lapied E, Moudilou E, Exbrayat J-M, Oughton DH, Joner EJ. 2010. Silver nanoparticle exposure causes apoptotic
response in the earthworm Lumbricus terrestris (Oligochaeta). Nanomedicine 5: 975-984.
Lapied E, Nahmani JY, Moudilou E, Chaurand P, Labille J, Rose J, Exbrayat J-M, Oughton DH, Joner EJ. 2011.
Ecotoxicological effects of an aged TiO2 nanocomposite measured as apoptosis in the anecic earthworm
Lumbricus terrestris after exposure through water, food and soil. Environment International 37:
1105-1110.

List of references
171
Lesniak A, Campbell A, Monopoli MP, Lynch I, Salvati A, Dawson KA. 2010. Serum heat inactivation affects
protein corona composition and nanoparticle uptake. Biomaterials 31: 9511-9518.
Levard C, Reinsch BC, Michel FM, Oumahi C, Lowry GV, Brown GE. 2011. Sulfidation processes of PVP-coated
silver nanoparticles in aqueous solution: Impact on dissolution rate. Environmental Science and
Technology 45: 5260-5266.
Levin L, Caswell H, Bridges T, DiBacco C, Cabrera D, Plaia G. 1996. Demographic responses of estuarine
polychaetes to pollutants: life table response experiments. Ecological Applications 6: 1295-1313.
Li D, Alvarez PJJ. 2011. Avoidance, weight loss, and cocoon production assessment for Eisenia fetida exposed to
C60 in soil. Environmental Toxicology and Chemistry 30: 2542-2545.
Li D, Fortner JD, Johnson DR, Chen C, Li Q, Alvarez PJJ. 2010. Bioaccumulation of 14C60 by the Earthworm
Eisenia fetida. Environmental Science and Technology 44: 9170-9175.
Li N, Xia T, Nel AE. 2008. The role of oxidative stress in ambient particulate matter-induced lung diseases and its
implications in the toxicity of engineered nanoparticles. Free Radical Biology and Medicine 44:
1689-1699.
Li X, Lenhart JJ, Walker HW. 2010. Dissolution-accompanied aggregation kinetics of silver nanoparticles.
Langmuir 16690-16698.
Li XY, Gilmour PS, Donaldson K, MacNee W. 1996. Free radical activity and pro-inflammatory effects of
particulate air pollution (PM10) in vitro and in vivo. Thorax 51: 1216-1222.
Lin D, Tian X, Wu F, Xing B. 2010. Fate and transport of engineered nanomaterials in the environment. Journal of
Environmental Quality 36: 1896-1908.
Liu J, Hurt RH. 2010. Ion release kinetics and particle persistence in aqueous nano-silver colloids. Environmental
Science and Technology 44: 2169-2175.
Loeschner K, Hadrup N, Qvortrup K, Larsen A, Gao X, Vogel U, Mortensen A, Lam HR, Larsen EH. 2011.
Distribution of silver in rats following 28 days of repeated oral exposure to silver nanoparticles or silver
acetate. Particle and Fibre Toxicology 8: 18.
Lumbribase homepage. Accessed from the website:
http://xyala.cap.ed.ac.uk/Lumbribase/lumbribase_php/lumbribase.shtmland. Accessed on 2 August 2010.
Lundqvist M, Stigler J, Elia G, Lynch I, Cedervall T, Dawson KA. 2008. Nanoparticle size and surface properties
determine the protein corona with possible implications for biological impacts. Proceedings of the
National Academy of Sciences of the United States of America 105: 14265-14270.
Ma J, Lü X, Huang Y. 2011. Genomic Analysis of Cytotoxicity Response to Nanosilver in Human Dermal
Fibroblasts. Journal of Biomedical Nanotechnology 7: 263-275.
Ma W-C, Bodt J. 1993. Differences in toxicity of the insecticide chlorpyrifos to six species of earthworms
(Oligochaeta, Lumbricidae) in standardized soil tests. Bulletin of Environmental Contamination and
Toxicology 50: 864-870.
Ma W-C. 1984. Sublethal toxic effects of copper on growth, reproduction and litter breakdown activity in the
earthworm Lumbricus rubellus, with observations on the influence of temperature and soil pH.
Environmental Pollution Series A, Ecological and Biological 33: 207-219.

List of references
172
Ma Z, Lim L-Y. 2003. Uptake of chitosan and associated insulin in caco-2 cell monolayers: A comparison
between chitosan molecules and chitosan nanoparticles. Pharmaceutical Research 20: 1812-1819.
Maiorano G, Sabella S, Sorce B, Brunetti V, Malvindi MA, Cingolani R, Pompa PP. 2010. Effects of cell culture
media on the dynamic formation of protein-nanoparticle complexes and influence on the cellular
response. ACS Nano 4: 7481-7491.
Maity S, Roy S, Chaudhury S, Bhattacharya S. 2008. Antioxidant responses of the earthworm Lampito mauritii
exposed to Pb and Zn contaminated soil. Environmental Pollution 151: 1-7.
Manzo S, Rocco A, Carotenuto R, De Luca Picione F, Miglietta M, Rametta G, Di Francia G. 2011. Investigation
of ZnO nanoparticles’ ecotoxicological effects towards different soil organisms. Environmental Science
and Pollution Research 18: 756-763.
Marambio-Jones C, Hoek E. 2010. A review of the antibacterial effects of silver nanomaterials and potential
implications for human health and the environment. Journal of Nanoparticle Research 12: 1531-1551.
Mason EF. 2009. Nanotechnology, nanomaterials, and the potential for regulatory action by USEPA.
Environmental Claims Journal 21: 200-210.
Massicotte R, Robidoux PY, Sauvé S, Flipo D, Mathiot A, Fournier M, Trottier B. 2004. Immunotoxicological
response of the earthworm Lumbricus terrestris following exposure to cement kiln dusts. Ecotoxicology
and Environmental Safety 59: 10-16.
Maynard AD. 2011. Don't define nanomaterials. Nature 475: 31.
Mikkelsen PS, Häfliger M, Ochs M, Tjell JC, Jacobsen P, Boller M. 1996. Experimental assessment of soil and
groundwater contamination from two old infiltration systems for road run-off in Switzerland. Science of
the Total Environment 189-190: 341-347.
Mitrano DM, Lesher EK, Bednar A, Monserud J, Higgins CP, Ranville JF. 2012. Detecting nanoparticulate silver
using single-particle inductively coupled plasma–mass spectrometry. Environmental Toxicology and
Chemistry 31: 115-121.
Miyazaki K, Islam N. 2007. Nanotechnology systems of innovation—An analysis of industry and academia
research activities. Technovation 27: 661-675.
Montes-Burgos I, Walczyk D, Hole P, Smith J, Lynch I, Dawson K. 2010. Characterisation of nanoparticle size
and state prior to nanotoxicological studies. Journal of Nanoparticle Research 12: 47-53.
Moore MN. 2006. Do nanoparticles present ecotoxicological risks for the health of the aquatic environment?
Environment International 32: 967-976.
Morgan AJ, Turner MP. 2005. Quantitative ultrastructure of metal-sequestering cells reflects intersite and
interspecies differences in earthworm metal burdens. Archives of Environmental Contamination and
Toxicology 49: 45-52.
Mueller NC, Nowack B. 2008. Exposure modeling of engineered nanoparticles in the environment. Environmental
Science and Technology 42: 4447-4453.
Mühlfeld C, Rothen-Rutishauser B, Blank F, Vanhecke D, Ochs M, Gehr P. 2008. Interactions of nanoparticles
with pulmonary structures and cellular responses. American Journal of Physiology: Lung Cellular and
Molecular Physiology 294: 817-829.

List of references
173
Murdock RC, Braydich-Stolle L, Schrand AM, Schlager JJ, Hussain SM. 2008. Characterization of nanomaterial
dispersion in solution prior to in vitro exposure using dynamic light scattering technique. Toxicological
Sciences 101: 239-253.
Murray K, Linder PW. 1984. Fulvic acids: structure and metal binding. Journal of Soil Science 35: 217-222.
Muthukaruppan G, Paramasamy G. 2010. Effect of Butachlor herbicide on earthworm Eisenia fetida - Its
histological perspicuity. Applied and Environmental Soil Science 1-4.
Muthukaruppan G, Jjanardhanan S, Vijayalakshmi GS. 2005. Sublethal toxicity of the herbicide Butachlor on the
earthworm Perionyx sansibaricus and its histological changes. Journal of Soils and Sediments 5: 82-86.
Napolitano LM, Koruda MJ, Meyer AA, Baker CC. 1996. The impact of femur fracture with associated soft tissue
injury on immune function and intestinal permeability. Shock 5: 202-207.
Navarro E, Baun A, Behra R, Hartmann NB, Filser J, Miao A-J, Quigg A, Santschi PH, Sigg L. 2008a.
Environmental behaviour and ecotoxicity of engineered nanoparticles to algae, plants, and fungi.
Ecotoxicology 17: 372-386.
Navarro E, Piccapietra F, Wagner B, Marconi F, Kaegi R, Odzak N, Sigg L, Behra R. 2008b. Toxicity of silver
nanoparticles to Chlamydomonas reinhardtii. Environmental Science and Technology 42: 8959-8964.
Navarro E, Baun A, Behra R, Hartmann N, Filser J, Miao A-J, Quigg A, Santschi P, Sigg L. 2008. Environmental
behavior and ecotoxicity of engineered nanoparticles to algae, plants and fungi. Ecotoxicology 17:
372-386.
NCBI homepage. Accessed from the website: http://www.ncbi.nlm.nih.gov/. Accessed on 2 August 2010.
Nel A, Xia T, Mädler L, Li N. 2006. Toxic potential of materials at the nanolevel. Science 311: 622-627.
Neuhauser EF, Meyer JA, Malecki MR, Thomas JM. 1984. Dietary cobalt supplements and the growth and
reproduction of the earthworm Eisenia foetida. Soil Biology and Biochemistry 16: 521-523.
Nguyen KC, Seligy VL, Tayabali AF. 2012. Cadmium telluride quantum dot nanoparticle cytotoxicity and effects
on model immune responses to Pseudomonas aeruginosa. Nanotoxicology, DOI:
10.3109/17435390.2011.648667.
Nielsen DG, Roursgaard M, Alstrup K, Steen J, Poulsen S. 2008. In vivo biology and toxicology of fullerenes and
their derivatives. Basic and Clinical Pharmacology and Toxicology 103: 197-208.
Nowack B, Bucheli TD. 2007. Occurrence, behavior and effects of nanoparticles in the environment.
Environmental Pollution 150: 5-22.
Nowack B. 2009. The behavior and effects of nanoparticles in the environment. Environmental Pollution 157:
1063-1064.
Oberdörster G, Oberdörster E, Oberdörster J. 2005. Nanotoxicology: An emerging discipline evolving from
studies on ultrafine particles. Environmental Health Perspectives 113: 823-839.
Oberdörster G, Stone V, Donaldson K. 2007. Toxicology of nanoparticles: A historical perspective.
Nanotoxicology 1: 2-25.
Oberdörster E. 2004. Manufactured nanomaterials (Fullerenes, C60) induce oxidative stress in the brain of juvenile
largemouth bass. Environmental Health Perspectives 112: 1058-1062.

List of references
174
Oberdörster E, Zhu S, Blickley TM, McClellan-Green P, Haasch ML. 2006. Ecotoxicology of carbon-based
engineered nanoparticles: Effects of fullerene (C60) on aquatic organisms. Carbon 44: 1112-1120.
OECD, Organization for Economic Cooperation and Development. 1984. Earthworms, Acute toxicity tests. OECD
Guideline for Testing Chemicals no. 207. Paris, France.
OECD, Organization for Economic Cooperation and Development. 2004. Earthworm reproduction test. OECD
Guideline for Testing Chemicals no. 222. Paris, France.
OECD, Organization for Economic Cooperation and Development. 2010. ENV-JM-MONO(2009)20-ENG-
Guidance Manual for Sponsors. Guidance Manual for the Testing of Manufactured Nanomaterials:
OECD's Sponsorship Programme.
http://www.oecd.org/officialdocuments/displaydocumentpdf/?cote=env/jm/mono(2010)25&doclanguage
=en.
Olivares Fontt E, Beschin A, Van Dijck E, Vercruysse V, Bilej M, Lucas R, De Baetselier P, Vray B. 2002.
Trypanosoma cruzi is lysed by coelomic cytolytic factor-1, an invertebrate analogue of tumor necrosis
factor, and induces phenoloxidase activity in the coelomic fluid of Eisenia foetida foetida. Developmental
and Comparative Immunology 26: 27-34.
Owen J, Hedley BA, Svendsen C, Wren J, Jonker M, Hankard P, Lister L, Stürzenbaum SR, Morgan AJ, Spurgeon
D, Blaxter M, Kille P. 2008. Transcriptome profiling of developmental and xenobiotic responses in a
keystone soil animal, the oligochaete annelid Lumbricus rubellus. BMC Genomics 9: 266.
Pan Y, Leifert A, Ruau D, Neuss S, Bornemann J, Schmid G Brandau W, Ulrich S, Jahnen-Dechent W. 2009.
Gold nanoparticles of diameter 1.4 nm trigger necrosis by oxidative stress and mitochondrial damage.
Small 5: 2067–2076.
Park MVDZ, Neigh AM, Vermeulen JP, de la Fonteyne LJJ, Verharen HW, Briedé JJ, van Loveren H, de Jong
WH. 2011. The effect of particle size on the cytotoxicity, inflammation, developmental toxicity and
genotoxicity of silver nanoparticles. Biomaterials 32: 9810-9817.
Paterson G, Macken A, Thomas KV. 2011. The need for standardized methods and environmental monitoring
programs for anthropogenic nanoparticles. Analytical Methods 3: 1461-1467.
Peirson SN, Butler JN, Foster RG. 2003. Experimental validation of novel and conventional approaches to
quantitative real-time PCR data analysis. Nucleic Acids Research 31: e73.
Peters A, Wichmann HE, Tuch T, Heinrich J, Heyder J. 1997. Respiratory effects are associated with the number
of ultrafine particles. American Journal of Respiratory and Critical Care Medicine 155: 1376-83.
Pfaffl MW. 2001. A new mathematical model for relative quantification in real-time RT–PCR. Nucleic Acids
Research 29: 2002-2007.
Pilkington A, Lee LL, Chan CK, Ramakrishna S. 2009. Defining key inventors: A comparison of fuel cell and
nanotechnology industries. Technological Forecasting and Social Change 76: 118-127.
Pope CA, Dockery DW, Spengler JD, Raizenne ME. 1991. Respiratory health and PM10 pollution: A daily time
series analysis. American Journal of Respiratory and Critical Care Medicine 144: 668-674.
Provencher SW. 1982. CONTIN: A general purpose constrained regularization program for inverting noisy linear
algebraic and integral equations. Computer Physics Communications 27: 229-242.

List of references
175
Rai M, Yadav A, Gade A. 2009. Silver nanoparticles as a new generation of antimicrobials. Biotechnology
Advances 27: 76-83.
Ratte HT. 1999. Bioaccumulation and toxicity of silver compounds: A review. Environmental Toxicology and
Chemistry 18: 89-108.
Renwick LC, Brown D, Clouter A, Donaldson K. 2004. Increased inflammation and altered macrophage
chemotactic responses caused by two ultrafine particle types. Occupational and Environmental Medicine
61: 442-447.
Ricketts HJ, Morgan AJ, Spurgeon DJ, Kille P. 2004. Measurement of annetocin gene expression: a new
reproductive biomarker in earthworm ecotoxicology. Ecotoxicology and Environmental Safety 57: 4-10.
Rodriguez-Castellanos L, Sanchez-Hernandez J. 2007. Earthworm biomarkers of pesticide contamination: Current
status and perspectives. Journal of Pesticide Science 32: 360-371.
Rogers KR. 2006. Recent advances in biosensor techniques for environmental monitoring. Analytica Chimica
Acta 568: 222-231.
Roh J-Y, Jung I-H, Lee J-Y, Choi J. 2007. Toxic effects of di(2-ethylhexyl)phthalate on mortality, growth,
reproduction and stress-related gene expression in the soil nematode Caenorhabditis elegans. Toxicology
237: 126-133.
Römbke J, Jänsch S, Didden W. 2005. The use of earthworms in ecological soil classification and assessment
concepts. Ecotoxicology and Environmental Safety 62: 249-265.
Roodbergen M, Klok C, van der Hout A. 2008. Transfer of heavy metals in the food chain earthworm black-tailed
godwit (Limosa limosa): Comparison of a polluted and a reference site in the Netherlands. Science of the
Total Environment 406: 407-412.
Rozen S, Skaletsky H. 1999. Primer3 on the WWW for General Users and for Biologist Programmers. In: Misener
S, Krawetz SA, eds. Bioinformatics Methods and Protocols: Methods in Molecular Biology. Totowa, US:
Humana Press Inc. pp: 365-386.
Rushton EK, Jiang J, Leonard SS, Eberly S, Castranova V, Biswas P, Elder A, Han X, Gelein R, Finkelstein J,
Oberdörster G. 2010. Concept of assessing nanoparticle hazards considering nanoparticle dosemetric and
chemical/biological response metrics. Journal of Toxicology and Environmental Health Part A 73:
445-461.
Sambrook J, Russell DW. 2001. Molecular Cloning: a laboratory manual, third edition. Cold Spring Harbor, US:
Cold Spring Harbor Laboratory Press, A1.5.
Sanchez-Hernandez JC. 2006. Earthworm biomarkers in ecological risk assessment. Reviews of Environmental
Contamination and Toxicology 188: 85–126.
Sauvé S, Fournier M. 2005. Age-specific immunocompetence of the earthworm Eisenia andrei: exposure to
methylmercury chloride. Ecotoxicology and Environmental Safety 60: 67-72.
Sauvé S, Hendawi M, Brousseau P, Fournier M. 2002. Phagocytic response of terrestrial and aquatic invertebrates
following in vitro exposure to trace elements. Ecotoxicology and Environmental Safety 52: 21-29.
Savage N, Diallo MS. 2005. Nanomaterials and water purification: Opportunities and challenges. Journal of
Nanoparticle Research 7: 331-342.

List of references
176
Sayes CM, Gobin AM, Ausman KD, Mendez J, West JL, Colin JL. 2005. Nano-C60 cytotoxicity is due to lipid
peroxidation. Biomaterials 26: 7587-7595.
Schaeublin NM, Braydich-Stolle LK, Schrand AM, Miller JM, Hutchison J, Schlager JJ, Hussain SM. 2011.
Surface charge of gold nanoparticles mediates mechanism of toxicity. Nanoscale 3:410-420.
Scott-Fordsmand JJ, Weeks JM, Hopkin SP. 1998. Toxicity of nickel to the earthworm and the applicability of the
neutral red retention assay. Ecotoxicology 7: 291-295.
Scott-Fordsmand JJ, Krogh PH, Schaefer M, Johansen A. 2008a. The toxicity testing of double-walled nanotubes-
contaminated food to Eisenia veneta earthworms. Ecotoxicology and Environmental Safety 71: 616-619.
Scott-Fordsmand JJ, Krogh PH, Lead J. 2008b. Nanomaterials in ecotoxicology. Integrated Environmental
Assessment and Management 4: 126-128.
Sera N, Tokiwa H, Miyata N. 1996. Mutagenicity of the fullerene C60-generated singlet oxygen dependent
formation of lipid peroxides. Carcinogenesis 17: 2163-2169.
Sharma V, Satyanarayan S. 2011. Effect of selected heavy metals on the histopathology of different tissues of
earthworm Eudrillus eugeniae. Environmental Monitoring and Assessment 180: 57-267.
Shoults-Wilson WA, Reinsch BC, Tsyusko OV, Bertsch PM, Lowry GV, Unrine JM. 2011a. Role of particle size
and soil type in toxicity of silver nanoparticles to earthworms. Soil Science Society of America Journal
75: 365-377.
Shoults-Wilson WA, Zhurbich O, McNear D, Tsyusko O, Bertsch P, Unrine J. 2011b. Evidence for avoidance of
Ag nanoparticles by earthworms (Eisenia fetida). Ecotoxicology 20: 385-396.
Shoults-Wilson WA, Reinsch BC, Tsyusko OV, Bertsch PM, Lowry GV, Unrine JM. 2011c. Effect of silver
nanoparticle surface coating on bioaccumulation and reproductive toxicity in earthworms (Eisenia fetida).
Nanotoxicology 5: 432-444.
Shvedova AA, Kisin E, Murray AR, Johnson VJ, Gorelik O, Arepalli S, Hubbs AF, Mercer RR, Keohavong P,
Sussman N, Jin J, Yin J, Stone S, Chen BT, Deye G, Maynard A, Castranova V, Baron PA, Kagan VE.
2008. Inhalation vs. aspiration of single-walled carbon nanotubes in C57BL/6 mice: inflammation,
fibrosis, oxidative stress, and mutagenesis. American Journal of Physiology - Lung Cellular and
Molecular Physiology 295: L552-L565.
Shvedova AA, Kisin ER, Mercer R, Murray AR, Johnson VJ, Potapovich , Tyurina YY, Gorelik O, Arepalli S,
Schwegler-Berry D, Hubbs AF, Antonini J, Evans DE, Ku B-K, Ramsey D, Maynard A, Kagan VE,
Castranova V, Baron P. 2005. Unusual inflammatory and fibrogenic pulmonary responses to single-
walled carbon nanotubes in mice. American Journal of Physiology - Lung Cellular and Molecular
Physiology 289: L698-L708.
Sims RW, Gerard BM. 1985. Earthworms: Keys and notes for the identification and study of the species, volume
31. London, UK: The Linnean Society of London and The estuarine and Brackish-Water Sciences
Association.
Smith CJ, Shaw BJ, Handy RD. 2007. Toxicity of single walled carbon nanotubes on rainbow trout,
(Oncorhynchus mykiss): Respiratory toxicity, organ pathologies, and other physiological effects. Aquatic
Toxicology 82: 94-109.
List of references
177
Snell TW, Brogdon SE, Morgan MB. 2003. Gene expression profiling in ecotoxicology. Ecotoxicology 12:
475-483.
Spohn P, Hirsch C, Hasler F, Bruinink A, Krug HF, Wick P. 2009. C60 fullerene: A powerful antioxidant or a
damaging agent? The importance of an in-depth material characterization prior to toxicity assays.
Environmental Pollution 157: 1134-1139.
Spurgeon DJ, Weeks JM, Van Gestel CAM. 2003. A summary of eleven years progress in earthworm
ecotoxicology: The 7th international symposium on earthworm ecology-Cardiff-Wales-2002.
Pedobiologia 47: 588-606.
Spurgeon DJ, Stürzenbaum SR, Svendsen C, Hankard PK, Morgan AJ, Weeks JM, Kille P. 2004. Toxicological,
cellular and gene expression responses in earthworms exposed to copper and cadmium. Comparative
Biochemistry and Physiology Part C: Toxicology and Pharmacology 138: 11-21.
Spurgeon DJ, Morgan AJ, Kille P. 2008. Current research in soil invertebrate ecotoxicogenomics. In:
Comparative Toxicogenomics; Hogstrand C, Kille P. Amsterdam, The Netherlands: Elsevier.
Pp: 133-164.
Stebbing ARD. 1981. Stress, health and homeostasis. Marine Pollution Bulletin 12: 326-329.
Stebounova LV, Guio E, Grassian VH. 2011. Silver nanoparticles in simulated biological media: a study of
aggregation, sedimentation, and dissolution. Journal of Nanoparticle Research 13: 233-244.
Stein E, Avtalion RR, Cooper EL. 1977. The coelomocytes of the earthworm Lumbricus terrestris: morphology
and phagocytic properties. Journal of Morphology 153: 467-477.
Stenersen J, Brekke E, Engelstad F. 1992. Earthworms for toxicity testing; species differences in response towards
cholinesterase inhibiting insecticides. Soil Biology and Biochemistry 24: 1761-1764.
Stone V, Donaldson K. 2006. Nanotoxicology: Signs of stress. Nature Nanotechnology 1: 23-24.
Stone V, Johnston H, Clift MJD. 2007. Air pollution, ultrafine and nanoparticle toxicology: Cellular and molecular
interactions. IEEE Transactions on NanoBioscience 6: 331-340.
Stone V, Nowack B, Baun A, van den Brink N, von der Kammer F, Dusinska M, Handy R, Hankin S, Hassellöv
M, Joner E, Fernandes TF. 2010. Nanomaterials for environmental studies: Classification, reference
material issues, and strategies for physico-chemical characterisation. Science of the Total Environment
408: 1745-1754.
Stone V, Shaw J, Brown DM, MacNee W, Faux S.P, Donaldson K. 1998. The role of oxidative stress in the
prolonged inhibitory effect of ultrafine carbon black on epithelial cell function. Toxicology in Vitro 12:
649-659.
Stürzenbaum SR, Kille P, Morgan AJ. 1998a. Heavy metal-induced molecular responses in the earthworm,
Lumbricus rubellus genetic fingerprinting by directed differential display. Applied Soil Ecology 9:
495-500.
Stürzenbaum SR, Kille P, Morgan AJ. 1998b. Identification of heavy metal induced changes in the expression
patterns of the translationally controlled tumour protein (TCTP) in the earthworm Lumbricus rubellus.
Biochimica et Biophysica Acta (BBA) - Gene Structure and Expression 1398: 294-304.
Taylor R, Walton DRM. 1993. The chemistry of fullerenes. Nature 363:685-693.

List of references
178
Tiede K, Boxall ABA, Tear SP, Lewis J, David H, Hassellöv M. 2008. Detection and characterization of
engineered nanoparticles in food and the environment. Food Additives and Contaminants: Part A 25:
795-821.
Tiede K, Hassellöv M, Breitbarth E, Chaudhry Q, Boxall ABA. 2009. Considerations for environmental fate and
ecotoxicity testing to support environmental risk assessments for engineered nanoparticles. Journal of
Chromatography A 1216: 503-509
Tiunov AV, Hale CM, Holdsworth AR, Vsevolodova-Perel TS, Hendrit PF. 2006. Invasion patterns of
Lumbricidae into the previously earthworm-free areas of northeastern Europe and the western Great
Lakes region of North America. Biological Invasions 8: 1223-1234.
Tourinho PS, van Gestel CAM, Lofts S, Svendsen C, Soares AMVM, Loureiro S. 2012. Metal-based nanoparticles
in soil: fate, behavior, and effects on soil invertebrates. Environmental Toxicology and Chemistry 31:
1679-1692.
Tratnyek PG, Johnson RL. 2006. Nanotechnologies for environmental cleanup. Nano Today 1: 44-48
Unrine JM, Hunyadi SE, Tsyusko OV, Rao W, Shoults-Wilson WA, Bertsch PM. 2010b. Evidence for
bioavailability of Au nanoparticles from soil and biodistribution within earthworms (Eisenia fetida).
Environmental Science and Technology 44: 8308-8318.
Usenko CY, Harper SL, Tanguay RL. 2008. Fullerene C60 exposure elicits an oxidative stress response in
embryonic zebrafish. Toxicology and Applied Pharmacology 229: 44-55.
Van der Ploeg MJC, Baveco JM, van der Hout A, Bakker R, Rietjens IMCM, van den Bink NW. 2011. Effects of
C60 nanoparticle exposure on earthworms (Lumbricus rubellus) and implications for population dynamics.
Environmental Pollution 159: 198-203.
Van der Ploeg MJC, Handy RD, Heckmann L-H, van der Hout A, van den Brink NW. 2012. C60 exposure induced
tissue damage and gene expression alterations in the earthworm Lumbricus rubellus. Nanotoxicology,
DOI: 10.3109/17435390.2012.668569.
Van Gestel CAM, Dirven-Van Breemen EM, Baerselman R, Emans HJB, Janssen JAM, Postuma R, Van Vliet
PJM. 1992. Comparison of sublethal and lethal criteria for nine different chemicals in standardized
toxicity tests using the earthworm Eisenia andrei. Ecotoxicology and Environmental Safety 23: 206-220.
Van Ravenzwaay B, Landsiedel R, Fabian E, Burkhardt S, Strauss V, Ma-Hock L. 2009. Comparing fate and
effects of three particles of different surface properties: Nano-TiO2, pigmentary TiO2 and quartz.
Toxicology Letters 186: 152-159.
Van Straalen NM, Roelofs D. 2006. An introduction to ecological genomics. Oxford, UK: Oxford University
Press.
Vaseashta A, Mihailescu IN. 2008. Nanoscale materials, devices, and systems for chem.-bio sensors, photonics,
and energy generation and storage. In: Functionalized Nanoscale Materials, Devices and Systems.
Dordrecht, the Netherlands: Springer
Vijver MG, Vink JPM, Miermans CJH, van Gestel CAM. 2003. Oral sealing using glue: a new method to
distinguish between intestinal and dermal uptake of metals in earthworms. Soil Biology and Biochemistry
35: 125-132.

List of references
179
Ville P, Roch P, Cooper EL, Masson P, Narbonne J-F. 1995. PCBs increase molecular-related activities
(lysozyme, antibacterial, hemolysis, proteases) but inhibit macrophage-related functions (phagocytosis,
wound healing) in earthworms. Journal of Invertebrate Pathology 65: 217-224.
Vonk JA, Struijs J, van de Meent D, Peijnenburg WJGM. 2009. Nanomaterials in the auqatic environment:
toxicity, exposure and risk assessment. RIVM report 607794001.
Walczak AP, Fokkink R, Peters R, Tromp P, Herrera Rivera ZE, Rietjens IMCM, Hendriksen PJM, Bouwmeester
H. 2012. Behavior of silver nanoparticles and silver ions in an in vitro human gastrointestinal digestion
model. Nanotoxicology, DOI: 10.3109/17435390.2012.726382.
Wang X, Chang L, Wang G, Sun Z, Ma H, Sun Q, Li J. 2010. Protein extraction from the earthworm Eisenia
fetida for 2-DE. Proteomics 10: 1095-1099.
Warheit DB, Sayes CM, Reed KL, Swain KA. 2008. Health effects related to nanoparticle exposures:
Environmental, health and safety considerations for assessing hazards and risks. Pharmacology and
Therapeutics 120: 35-42.
Weeks JM, Svendsen C. 1996. Neutral red retention by lysosomes from earthworm (Lumbricus rubellus)
coelomocytes: A simple biomarker of exposure to soil copper. Environmental Toxicology and Chemistry
15: 1801-1805.
Werner I, Nagel R. 1997. Stress proteins HSP60 and HSP70 in three species of amphipods exposed to cadmium,
diazinon, dieldrin and fluoranthene. Environmental Toxicology and Chemistry 16: 2393-2403.
Widarto TH, Homstrup M, Forbes VE. 2004. The influence of nonylphenol on life-history of the earthworm
Dendrobaena octaedra Savigny: linking effects from the individual- to the population-level.
Ecotoxicology and Environmental Safety 58: 147-159.
Wijnhoven SWP, Dekkers S, Kooi M, Jongeneel WP, de Jong WH. 2010. Nanomaterials in consumer products;
update of products on the European market in 2010. RIVM Report 340370003/2010.
Wijnhoven SWP, Peijnenburg WJGM, Herberts CA, Hagens WI, Oomen AG, Heugens EHW, Roszek B,
Bisschops J, Gosens J, van de Meent D, Dekkers S, de Jong WH, van Zijverden M, Sips AJAM,
Geertsma RE. 2009. Nano-silver – a review of available data and knowledge gaps in human and
environmental risk assessment. Nanotoxicology 3: 109-138.
Woodrow Wilson International Centre for Scholars. 2007. Project on Emerging Nanotechnologies. Consumer
Products Inventory of Nanotechnology Products. Accessed from the website
http://www.nanotechproject.org/. Accessed on 8 October 2012.
Xia T, Kovochich M, Liong M, Zink JI, Nel AE. 2008. Cationic polystyrene nanosphere toxicity depends on cell-
specific endocytic and mitochondrial injury pathways. ACS Nano 2: 85-96.
Xu H-Y, Zou J-W, Yu Q-S, Wang Y-H, Zhang J-Y, Jin H-X. 2007. QSPR/QSAR models for prediction of the
physicochemical properties and biological activity of polybrominated diphenyl ethers. Chemosphere 66:
1998-2010.
Xu R, Wu C, Xu H. 2007. Particle size and zeta potential of carbon black in liquid media. Carbon 45: 2806-2809.
Zhang X, Sun H, Zhang Z, Niu Q, Chen Y, Crittenden JC. 2007. Enhanced bioaccumulation of cadmium in carp in
the presence of titanium dioxide nanoparticles. Chemosphere 67: 160-166.

List of references
180
Zhao F, Zhao Y, Liu Y, Chang X, Chen C, Zhao Y. 2011. Cellular uptake, intracellular trafficking, and
cytotoxicity of nanomaterials. Small 7: 1322-1337.
Zhao YH, Le J, Abraham MH, Hersey A, Eddershaw PJ, Luscombe CN, Boutina D, Beck G, Sherborne B, Cooper
I, Platts JA. 2001. Evaluation of human intestinal absorption data and subsequent derivation of a
quantitative structure–activity relationship (QSAR) with the Abraham descriptors. Journal of
Pharmaceutical Sciences 90: 749-784.
Zhu S, Oberdörster E, Haasch ML. 2006. Toxicity of an engineered nanoparticle (fullerene, C60) in two aquatic
species, Daphnia and fathead minnow. Marine Environmental Research 62: S5-S9.
Zhu X, Zhu L, Li Y, Duan Z, Chen W, Alvarez PJJ. 2007. Developmental toxicity in zebrafish (Danio rerio)
embryos after exposure to manufactured nanomaterials : buckminsterfullerene aggregates (nC60) and
fullerol. Environmental Toxicology and Chemistry 26: 976-979.
Zook J, Long S, Cleveland D, Geronimo C, MacCuspie R. 2011. Measuring silver nanoparticle dissolution in
complex biological and environmental matrices using UV–visible absorbance. Analytical and
Bioanalytical Chemistry 401: 1993-2002.

181
Acknowledgements

Acknowledgements
182
Er is een jiddisch gezegde “Worms eat you up dead and worries eat you up alive”. De
afgelopen vier jaar heb ik een combinatie hiervan meegemaakt: wormen-zorgen die
aan me vraten. Toch heb ik een goede tijd gehad en heel veel geleerd. In dit
hoofdstuk wil ik alle mensen bedanken die hebben bijgedragen aan dit proefschrift
en die onmisbaar waren op professioneel en persoonlijk vlak.
Supervisors…altijd even vragen hoe het gaat; de planning in de gaten houden;
manuscripten en abstracts doornemen; resultaten bespreken; een goede en
constructieve combinatie. Nico, duizendmaal dank voor jouw enthousiasme,
motivatie en het vertrouwen in het project en in mij. Het was heel fijn dat ik altijd bij
je kon binnenwandelen en veel met je kon bespreken en discussiëren. Ivonne, ik heb
veel van je geleerd over presenteren, plannen en discipline. Jouw snelle feedback en
kritische blik waren zeer waardevol voor het project en leerzaam voor mij.
Co-authors and accompanying scientific and technical support….help out in the lab; give
support and mental coaching; check manuscripts. Annemariet, hoewel ik jouw lab
niet altijd netjes achterliet, was je toch altijd erg behulpzaam, enthousiast en heel fijn
om mee te werken. Jouw kennis over de in vivo proeven was erg waardevol voor
mijn project. Hans, bedankt voor je inzet en alle hulp in het lab en erbuiten. Het was
jammer dat je pas laat bij mijn project betrokken werd, want het was fijn om met je
te werken (de ‘anaconda’ wormen zullen niet snel worden vergeten) en ik heb veel
van je geleerd. Jan, bedankt voor alle steun en gezelligheid. Je bent er 1-uit-
duizenden. Laura, bedankt voor al je steun, inzet, enthousiasme en gezelligheid. Het
was heel fijn om met jou te sparren en om met je samen te werken in het lab en
tijdens practica. Hans Baveco, bedankt voor het opzetten van het populatiemodel en
voor het ‘on-demand troubleshooten’. Lars, thank you for giving me the opportunity
to work in your lab. It was hard work, but I learned a lot and I also had a very nice
time. Thanks for sharing your knowledge and also for the (mental) support. Yuya,
thank you too, for making my stay at NERI nice and interesting. Pauline, het was
fijn om met jou samen te werken, en om van jou en van jouw werkwijze te leren.
Bedankt voor de mogelijkheid om in jullie lab te werken. Richard Handy, your
critical view on the manuscripts, and your great contribution and enthusiasm were

Acknowledgements
183
very valuable for the work. It was very interesting and instructive working with you.
Sourav, thank you for your enthusiasm and willingness to make ‘endless amounts’
of your nanoparticles. It was nice to work with you and learn from you. Dmitry,
thank you for your CLSM-wisdom and your help with the work on and
interpretation of the results. Remco Fokkink, je was altijd erg aardig en behulpzaam,
en bereid om uitleg te geven over de DLS en alle mysteries eromheen. Bedankt. The
RIKILT-people (Ruud Peters, Zahira Herrera Rivera, Rob Bakker, Bert Brouwer en
Hans Bouwmeester), thanks for analysing lots and lots of samples for me, for nano-
discussions and for answering my many questions. Gerwin en Bastiaan, bedankt
voor alle hulp met het ‘zilver-probleem’. Ik heb heel veel van jullie geleerd en de
samenwerking was erg prettig. Het is leuk om te weten dat de samenwerking met
Nico doorgaat. Peter Tromp, bedankt voor het monnikenwerk met onze samples en
voor de mooie SEM-plaatjes. Gerrit Alink, bedankt voor de bijdrage aan mijn
onderzoek en voor de Groningse gezelligheid. Jack Faber wil ik bedanken voor zijn
bijdrage aan het eerste artikel en voor zijn steun aan mijn project. Han Zuilhof en
Ton Marcelis, bedankt voor jullie chemische inbreng, in discussies en het artikel.
Verder wil ik Anton Korteweg, Jan van Lent en Hans Zweers nog bedanken voor het
werk dat ik met hen heb kunnen uitvoeren, met respectievelijk Zetasizer, TEM en
soxtherm.
TOX-colleagues...very helpful in the lab; always in for a joke, a drink or a nice chat; a good
distraction from the work; a nice lunch date. Thanks to everyone at the Toxicology
department, including Agata (for nice lunch dates and sharing nano-wisdom),
Alexandros, Ala, Ana, Ans, Ans, Arif, Barae, Bert, David, Elise, Erryana, Gre,
Henrique, Hequn, Irene (voor alle vraagjes die ik mocht stellen), Jac, Jaime, Jochem,
Jonathan, Judith, Justine, Karsten, Letty, Marelle, Marije, Myrthe, Niek, Reiko,
Rungnapa, Samantha (voor het delen van nano-wijsheid en de DLS), Si, Tinka,
Walter, Wasma et al.
Die-hard TOX-ladies…TOX-ladies movie night and dinners; fun and GG; great organizers
of PhD- and lab trips. Alicia, Linda, Nynke and Suzanne, thanks for all the fun time
and keep in touch.

Acknowledgements
184
Alterra-collega’s….gezellige kamergenoten; een goede afleiding van het werk; staan altijd
net voor je bij het koffie/thee apparaat; erg behulpzaam in het lab. Bedankt Alex,
Arjen, Bart, David, Dennis, Dick, Geert, Gerard, Ivo, Jack, Jeroen, Joost, Hugh,
Leen, Marieke, Ruud en Wim. Sunday, good luck with your project. I hope you
(also) have a great time and learn a lot.
Vrienden en familie….erg belangrijk voor afleiding en gezelligheid; om van te leren over
studie, carrière en over het leven in het algemeen.
Barbies….roze; prettig gestoord; gek op waterdieren. Baywatch en Shelly, bedankt voor de
leuke ‘roze’ avondjes en uitjes, en de nodige opbeurende woorden.
Bioloogjes... wat ver weg maar gelukkig steeds dichterbij. Anneke, Deanna en Rosa, dank
voor de gezelligheid, via de mail of als we afspreken face-to-face.
Gooise meiden...the good old times; getuigen van veel van mijn ‘groeistuipen’. Milena,
Nienke en Wendy, de laatste jaren zien we elkaar nog maar weinig, maar het contact
is (en blijft hopelijk) leuk en waardevol voor me.
Exseptioneel…voor de nodige (carnaval-, nieuwjaars-, promotie-)feestjes en leuke etentjes.
Francien, Leonie, Marloes, Martine en Mirjam, bedankt voor jullie gezelligheid,
interesse en goede raad.
Myrte en Jauk….s’avonds even langsgaan; wijn drinken; spelletjes spelen; thee drinken;
samen eten; Dasja dishen. Myrte en Jauk, bedankt dat ik zo vaak bij jullie kon
binnenvallen. Jullie gastvrijheid, warmte en gekheid waren erg fijn en nodig.
Phd-family and –friends….nice drinks and dinners; moral support; great distraction. I have
learned a lot from all of you, about my professional and personal life. Ana, Marie,
Mazhar, Pilar and Rozelin, thank you for all the nice times together. Keep in tough.
Paranimfen...onmisbaar; heel goede en lieve vriendinnen; thee; een luisterend oor voor al
het gezwam en geklaag over het (AIO-)leven; opbeurend; thee; een leuk weekendje
Groningen of een paar weken Amerika; margarita’s; chai latte. Shibby en dude,
jullie zijn geweldige vriendinnen, die me goede raad geven en waarmee ik lief en
leed kan delen. Straks hebben we voor de derde keer een promotie, en ik ben heel
blij met jullie als mijn paranimfen!

Acknowledgements
185
Niet-officiële schoonfamilie…extra feest en gezelligheid, bij sinterklaas, kerst en
verjaardagen; erg handig tijdens verhuizingen; fijne yogalessen; leuke en spannende
uitjes. Peter, Josje, Kristel, Lotte en Vera bedankt voor alle leuke afleiding,
betrokkenheid en interesse.
Ouders...stimulerend; ‘bubbels’ en bossche bollen; staan altijd klaar met liefde, raad en
daad. Pap en mam, duizendmaal dank voor jullie liefde, interesse, vertrouwen en alle
mogelijkheden die jullie voor me hebben gecreëerd.
Broer, zussen en aanhang…lief; gezellig; geinterresseerd; klankbord; betrokken. As,
bedankt voor je creatieve bijdrage aan mijn proefschrift. Sig, bedankt voor het
checken van de samenvatting. Ro, Leonieke en Laurens, bedankt voor jullie support
en luisterende oren.
Liefde is…..een bad klaarmaken; handige dingen voor mij in elkaar klussen; een mental
coach (ook al is het midden in de nacht); kinderlijk gek doen; samen naar
begrafenissen; reizen; het S-woord en wellicht nog meer in de toekomst. Jeroen, je
kent mij beter dan ik mezelf ken, dus je weet allang dat ik niet zonder jou kan. Het is
ontzettend fijn om jou als steun en stimulans te hebben, en het is bijzonder om
toekomstplannen met jou te maken. Ik ben benieuwd waar het leven ons brengt,
samen!

Acknowledgements
186

187
About the author

About the author
188
Curriculum vitae
Merel van der Ploeg was born September 27 1982 in Bussum. After attending the ‘Goois
Lyceum’ secondary school in Bussum, she started a study Biology at the University of
Groningen in 2000. After two years of study, she took a gap year, to backpack through New
Zealand and Australia. After this year, she returned to the study Biology, motivated. During
her Msc in Marine Biology, she conducted three research projects. The first project was at
the Department of Animal Ecology of the University of Groningen, where she studied the
trade-off between secondary sexual traits and the immune system of cichlid fish.
Subsequently, she did her second research project at the seal rehabilitation centre Lenie ‘t
Hart in Pieterburen, on the transfer of antibodies against morbilli and herpes virus from
mother to pup, in common and grey seals. For her third research project she went to the
Institute of Ocean Sciences of the Environment Canada in Sydney, Canada, where she
studied the effects of natural factors on biomarkers (vitamin A and thyroid hormones) in
blood and blubber of seal pups. During her Msc, she also followed courses on ‘Science in
Business and Policy’ and communication skills. After finishing her Msc in 2007, she
wanted to gain more knowledge in the field of ecotoxicology, and therefore she started a
PhD project on ‘Environmental risks of nanoparticles to soil organisms (NanoSoil)’ at the
department of Toxicology of the Wageningen University in cooperation with Alterra
Wageningen UR, in 2008. This project was conducted under the supervision of Prof. dr. ir.
Ivonne M.C.M. Rietjens and dr. ir. Nico W. van den Brink and resulted in this thesis.
During her PhD she followed postgraduate courses in Toxicology, in order to register as a
Toxicologist with the Dutch Society for Toxicology (NVT). She was also involved in
several extra-curricular activities at the Wageningen University, including her
chairwomanship of the PhD council of the researchschool WIMEK/SENSE (SPC), for three
years, and the co-organization of the 2011 PhD study trip of the department of Toxicology,
to Switzerland and Italy.

About the author
189
List of publications
MJC van der Ploeg, JM Baveco, A van der Hout, R Bakker, IMCM Rietjens, NW van den
Brink. 2011. Effects of C60 nanoparticle exposure on earthworms (Lumbricus rubellus) and
implications for population dynamics. Environmental Pollution 159: 198-203
MJC van der Ploeg, RD Handy, L-H Heckmann, A van der Hout, NW van den Brink.
2012. C60 exposure induced tissue damage and gene expression alterations in the earthworm
Lumbricus rubellus. Nanotoxicology, in press DOI:10.3109/17435390.2012.668569
MJC van der Ploeg, Johannes HJ van den Berg, Sourav Bhattacharjee, Laura HJ de Haan,
Dmitry S Ershov, Remco G Fokkink, Han Zuilhof, Ivonne MCM Rietjens, Nico W van den
Brink. 2012. In vitro nanoparticle toxicity to rat alveolar cells and coelomocytes from the
earthworm Lumbricus rubellus. Nanotoxicology,in press DOI:10.3109/17435390.2012.744857
MJC van der Ploeg, RD Handy, PL Waalewijn-Kool, JHJ van den Berg, ZE Herrera
Rivera, J Bovenschen, B Molleman, JM Baveco, P Tromp, RJB Peters, GF Koopmans,
IMCM Rietjens, NW van den Brink. Effects of silver nanoparticles on Lumbricus rubellus
earthworms and particle characterisation in relevant test matrices, including soil. Submitted

About the author
190
Overview of completed training activities

About the author
191
About the author
192
The research described in the present thesis was financially supported by graduate school
WIMEK and Wageningen UR strategic research program BioNanotechnology 2007-2011
(IPOP/BioNano)
Financial support from Alterra (WUR) and Wageningen University for printing of this
thesis is gratefully acknowledged
The thesis was printed by GVO drukkers en vormgevers B.V./Ponsen&Looijen, Ede, the
Netherlands
Cover design: Aster van der Ploeg
Thesis layout: Jeroen Verhallen, Merel van der Ploeg and Communication Services,
afdeling vormgeving (WUR)