thesis_hum_2016_ferreira_nicole.pdf - University of Cape Town
Upload
khangminh22Category
view
1download
0
2019/2020 INVEST IN CAPE TOWN | 1 WWW.INVESTCAPETOWN.COM
INVEST IN CAPE TOWNREGIONAL MARKET ANALYSIS ANDINTELLIGENCE REPORT 2019/2020
MIR-2019-2020FA grant v2.indd 1 2020/07/14 14:48

2 | 2019/2020 INVEST IN CAPE TOWN
INTRODUCTION 3
FOREWORD 4
1. SOUTH AFRICA AT A GLANCE 9 Competitiveness 9
2. CAPE TOWN: A WORLD CLASS CITY 10
3 CAPE TOWN AT A GLANCE 11 3.1 Education and Skills 11 3.2 EmploymentProfile 13 3.3 Cape Town’s Economy 15 3.4 Doing Business 17 3.5 TradeandForeignDirectInvestmentProfile 19 3.6 Good Governance 25 3.7 Business Enabling Initiatives 25 3.8 Boat Building Industry 26 3.9 Infrastructure and Cost 27 3.10 Cape Town Accolades 34
4. SECTORAL POCKETS OF EXCELLENCE 35 4.1 Business Services 35 4.1.1 Business Process Outsourcing 36 4.1.2 Information Communication Technology 38 4.2 Financial Services 40 4.3 Film and Multimedia 41 4.4 Tourism 45 4.5 Green Technology 50 4.6 Electronics 55 4.7 Food and Beverages 56 4.8 Clothing and Textiles 58
5. WORKING TOGETHER TO BUILD A RESILIENT INVESTMENT DESTINATION 60
6. REGULATIONS & LEGISLATION 61
7. ACCESS TO INTERNATIONAL MARKETS 62
8. KEY INCENTIVES 64
9. KEY CONTACTS 66
10. ACKNOWLEDGEMENTS 70TABL
E O
F C
ON
TEN
TSPAGE
MIR-2019-2020FA grant v2.indd 2 2020/07/14 14:48
2019/2020 INVEST IN CAPE TOWN | 3
This document has been developed to showcase the current investment climate within Cape Town for potential investors. This will enable more enlightened business decisions.
Thedocumentidentifiestheopportunitiesaffordedtobusinesses;andprovidesinformationoneightidentifiedsectorsoftheeconomythatpresenthighgrowthsectors for investment. Facilitated by the combined efforts of the general public, privateandpublicsectors;theseincentives,developmentsandeconomicgrowthsectors essentially present current and future investors with a growing business and investor friendly environment in which to operate.
2019/2020 INVEST IN CAPE TOWN | 3
INTR
OD
UC
TIO
N
MIR-2019-2020FA grant v2.indd 3 2020/07/14 14:48

4 | 2019/2020 INVEST IN CAPE TOWN
Executive Mayor of the City of Cape Town, Dan Plato
Having long been recognised as one of the top tourist destinations in the world with titles like ‘world’s friendliest city’ and ‘world’s leading festival and events capital,’ we are proud that in recent years we have been receiving recognition for the hard work we have put in to make Cape Town the most attractive city for investment on the Africa Continent.
With our focus now on fighting the COVID-19 global pandemic, and the impact that this will have on economies around the world, we will need to find new and innovative ways to celebrate the natural beauty of our city and support the hard work of our local tourism sector for earning us titles such
as being named Africa’s leading digital city, leading festival and events destination, and annually being recognised as a top global city by various organisations and publications.
These accolades are, a reflection of the hard work that this administration has put in to make sure we continue to attract investment and that we have the right infrastructure and systems in place to ensure ease of doing business for global companies looking for a home in Africa.
Amazon, textile manufacturer PFnonwovens and digital consulting agency Capita are just some of the major corporations who have set up shop in our beautiful city.
Despite these achievements, we cannot ignore the prevailing circumstances and all our efforts must be geared towards addressing and overcoming this pandemic.
A common theme comes to mind when thinking of what we are living through: resilience. Just two years ago we called on our residents to assist us in overcoming one of the worst droughts we have ever faced. By working together, we kept Cape Town’s taps running. Lessons from this challenging period helped formulate the city’s resilience strategy, part of which is adapting to acute shocks such as disease outbreaks, much like the COVID-19 pandemic we are currently facing. Acute shocks brought on by climate change, disease and other events, are linked to chronic stressors such as high unemployment – which is increasing across the world as a result of the outbreak.
FORE
WO
RD
MIR-2019-2020FA grant v2.indd 4 2020/07/14 14:48
2019/2020 INVEST IN CAPE TOWN | 5
We are Africa’s leading digital city,
leading festival and events destination,
and annually are recognised as a top
global city in accolades bestowed by various
organisations and publications.
Relating to energy resilience, we are one of the most energy secure cities in the country and are actively looking to reduce our reliance on Eskom so that we can stay open for business without having to worry about shortcomings that are beyond our control.
We are working hard to adequately respond to this pandemic on a local government level through comprehensive testing, awareness and food relief, while at the same time actively preparing for the recovery period
The City’s Economic Action Plan has highlighted three stages of intervention in response to the crisis. The following is part of the overall plan to assist business in Cape Town.
- providing support to the BPO (call centres) sector by helping to equip their staff to work from home. - Successfully lobbying national government to amend certain restrictive regulations, relating to the unbanning of the e-commerce sector, to protect both lives and livelihoods. - We have helped companies re-purpose manufacturing towards the manufacture of Personal Protective Equipment. - The City’s Finance Directorate has made relief measures available to guest houses and certain B&Bs, which could cut rates bills in half. - The City has also started the SMME COVID-19 Toolkit initiative, which is available to SMMEs in Cape Town, and aims to supply thousands of toolkits to get businesses back to work safely as soon as they are allowed to do so.
With the resilience and commitment our residents have already demonstrated, I am confident we can make it through these difficult times.
We look forward to again working with our very capable partners, including Wesgro, Cape Town Tourism and Cape Town International Airport who work with the City’s Economic Opportunities and Asset Management Directorate through Invest Cape Town. This city works because we work together.
MIR-2019-2020FA grant v2.indd 5 2020/07/14 14:48
6 | 2019/2020 INVEST IN CAPE TOWN
FORE
WO
RDMMC for Economic Opportunit ies and Asset Management, James Vos
The impact of Covid-19 has made its presence felt on the economy and local businesses. My team in the City’s Enterprise and Investment Department have been working hard to find ways to mitigate the economic impact and the corresponding lockdown has had on so many sectors of our economy.
I am fully aware that many businesses in Cape Town have been pushed to the brink. That is why we are exploring measures to ensure that we not only minimise the effects of this crisis – but build a stronger, more resilient future for our businesses and ultimately the residents of Cape Town.
I therefore established early on in this crisis an Economic Task Team tasked with formulating the City’s Economic Action Plan which identifies three stages of intervention in response to the crisis. These stages are - respond, adapt and recover, and stabilise.
This plan can be found on our Invest Cape Town website, which is also frequently updated with the latest and most accurate information available to give businesses access to vital resources on ongoing interventions and assistance available from national, provincial and local government.
In the midst of this crisis, we have seen some remarkable examples of adaptation and innovation and I am proud of the work done by the various officials to assist businesses in this regard. The ‘Women in Business programme’ is inspiring example of adapting to a new way of working by embracing technology. In response to the COVID-19 pandemic, the programme has been adapted to enable successful delivery and engagement on an exclusively online basis. Participants will also have access to additional online learning components.
I am also particularly proud of the SMME COVID-19 Toolkit initiative, which targets SMMEs in Cape Town, providing thousands of toolkits with essentials to help get businesses back to work safely. Likewise, the support given to small businesses through The Business Hub, an initiative of the City’s Enterprise and Investment Department that functions as an one-stop shop with various units on hand to assist SMMEs with business rescue initiatives, red tape reduction and enterprise and supplier development.
MIR-2019-2020FA grant v2.indd 6 2020/07/14 14:48

2019/2020 INVEST IN CAPE TOWN | 7
The City of Cape Town and our official Destination Marketing Organisation, Cape Town Tourism, have formulated plans, embracing technology and using research as a strategic guide, to plot a sustainable future for the City’s vital and vibrant tourism sector. If you fail to plan, you plan to fail and I am proud of the work that has gone into helping the tourism industry on the road to readiness and recovery.
The COVID pandemic and associated preventative measures has fundamentally changed the way we work. The City continues to work through our Strategic Business Partners to look at equipping businesses for new ways of working.
In every crisis, there is an opportunity and the City is actively working to identify and exploit new sectoral opportunities that are emerging.
That is why we are exploring measures
to ensure that we not only minimise the
effects of this crisis – but build a stronger, more resilient future
for our businesses and ultimately the residents
of Cape Town.
MIR-2019-2020FA grant v2.indd 7 2020/07/14 14:48

8 | 2019/2020 INVEST IN CAPE TOWN
A green tech industry with opportunities in wind, solar PV, smart meters, batteries, waste, water
tech, gas and chemicals value chains.
Best city in South Africa in getting electricity to investors
and granting construction permits – World Bank Ease
of Doing Business 2018.
The tech hub of Africa with the most tech
start-ups of any city on the continent. Home to Amazon, DHL and
Naspers.
World-class infrastructure, sound governance, and four top African
universities providing a skilled workforce.
To date, Cape Town Air Access has helped land 15 new routes, and 20 route expansions, resulting in over 1.5 million two-way seats being added into
Cape Town.
www.investcapetown.com
@InvestCapeTown
+27 21 417 4043
WHERE BIG IDEAS AND INNOVATION MEET.Cape Town is a forward-looking city with a range of exciting
business opportunities for investors.
AFRICA’SHIGH-PERFORMANCE
BUSINESS HUB
MIR-2019-2020FA grant v2.indd 8 2020/07/14 14:48

2019/2020 INVEST IN CAPE TOWN | 9
A green tech industry with opportunities in wind, solar PV, smart meters, batteries, waste, water
tech, gas and chemicals value chains.
Best city in South Africa in getting electricity to investors
and granting construction permits – World Bank Ease
of Doing Business 2018.
The tech hub of Africa with the most tech
start-ups of any city on the continent. Home to Amazon, DHL and
Naspers.
World-class infrastructure, sound governance, and four top African
universities providing a skilled workforce.
To date, Cape Town Air Access has helped land 15 new routes, and 20 route expansions, resulting in over 1.5 million two-way seats being added into
Cape Town.
www.investcapetown.com
@InvestCapeTown
+27 21 417 4043
WHERE BIG IDEAS AND INNOVATION MEET.Cape Town is a forward-looking city with a range of exciting
business opportunities for investors.
AFRICA’SHIGH-PERFORMANCE
BUSINESS HUB
1
Sources: International Monetary Fund World Data (2019), The Global Competitiveness Report 2019, and CIA World Factbook (2019)
KEY COMPETITIVE INDICATORS, 2019
INDICATOR SOUTH AFRICA
55.3864.1
27.5%
767.2 billion
13,6000.5717.916.1
5.3
6061
89
6994
BRAZIL
208.8574.3
12.8%
3.24 trillion
15,600 2.4
15.415
3.4
7132
67
7892
CHINA
1 384.6875.8
3.9%
23.21 trillion
16,70019.244.8 45.8
1.6
2813
18
3696
INDIA
1 296.8369.1
8.5%
9.47 trillion
7,2008.0
31.3 28.8
3.6
6834
120
7071
RUSSIA
142.1271.3
5.2%
4.02 trillion
27,9003.0722.7 26.5
3.7
4339
22
5099.7
DEMOGRAPHICSPopulation (millions)Life Expectancy at birth (years) 2018Unemployment rate (%) 2017
THE ECONOMYGross Domestic Purchasing Power Parity (USD PPP)GDP per capita (USD PPP) GDP (PPP) as share (%) of world total Total Investment (% of GDP) Gross national savings (% of GDP) Average Inflation rate (%)
COMPETITIVENESSGlobal Competitiveness ranking (/141) Travel and Tourism Competitiveness (/140) Information Communications Technology Adoption ranking (/141) Quality of overall infrastructure (/141) Literacy rate (%)
Competitiveness
In 2018, South Africa was the 39th largest global destination market for greenfield investment out of 109 countries. The country was the largest destination and source market for greenfield investment on the African continent (FDI Markets, 2019).
In terms of global competitiveness, South Africa fared better than Brazil and India, ranking 60th out of 141 countries. Furthermore, the quality of overall infrastructure in South Africa was on par with its fellow BRIC partners. South Africa’s literacy rate is particularly high, achieving a higher ranking than that of Brazil and India.
SOUTH AFRICA AT A GLANCE
MIR-2019-2020FA grant v2.indd 9 2020/07/14 14:48
10 | 2019/2020 INVEST IN CAPE TOWN
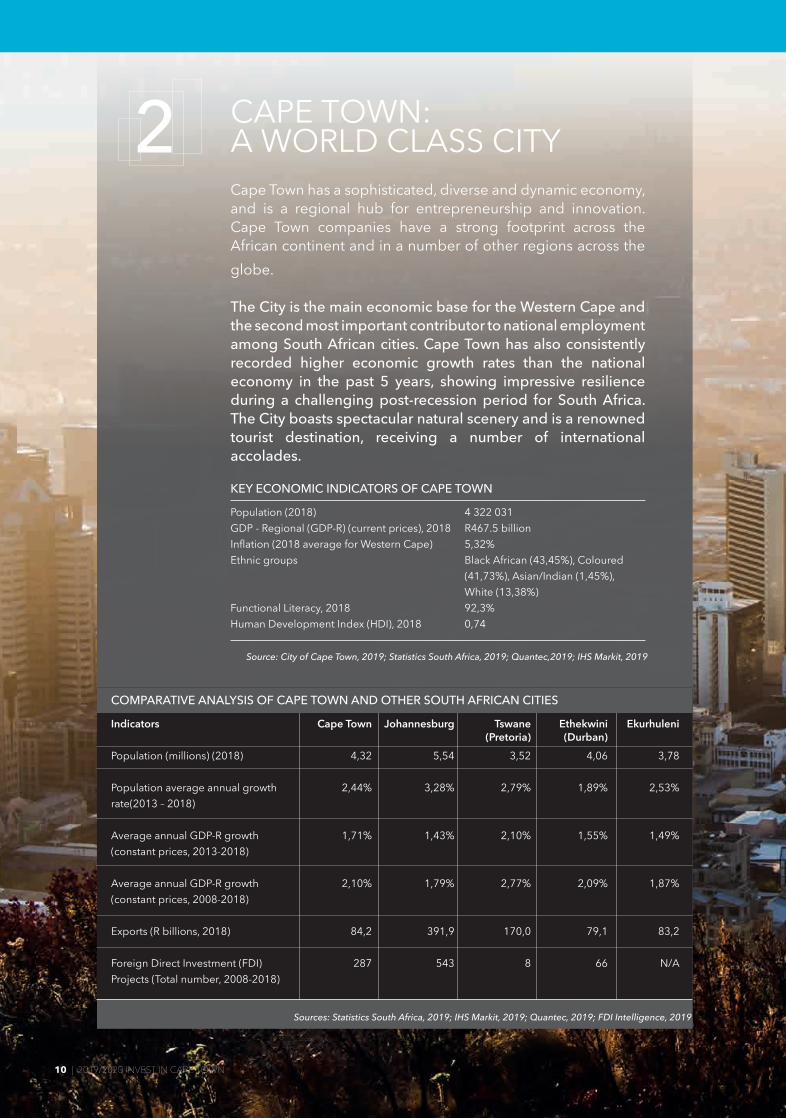
2 CAPE TOWN: A WORLD CLASS CITYCape Town has a sophisticated, diverse and dynamic economy, and is a regional hub for entrepreneurship and innovation. Cape Town companies have a strong footprint across the African continent and in a number of other regions across the globe.
The City is the main economic base for the Western Cape and the second most important contributor to national employment among South African cities. Cape Town has also consistently recorded higher economic growth rates than the national economy in the past 5 years, showing impressive resilience during a challenging post-recession period for South Africa. The City boasts spectacular natural scenery and is a renowned tourist destination, receiving a number of international accolades.
KEY ECONOMIC INDICATORS OF CAPE TOWN
10 | 2019/2020 INVEST IN CAPE TOWN
Population (2018) 4 322 031GDP - Regional (GDP-R) (current prices), 2018 R467.5 billionInflation (2018 average for Western Cape) 5,32%Ethnic groups Black African (43,45%), Coloured (41,73%), Asian/Indian (1,45%), White (13,38%)Functional Literacy, 2018 92,3%Human Development Index (HDI), 2018 0,74
Source: City of Cape Town, 2019; Statistics South Africa, 2019; Quantec,2019; IHS Markit, 2019
Sources: Statistics South Africa, 2019; IHS Markit, 2019; Quantec, 2019; FDI Intelligence, 2019
COMPARATIVE ANALYSIS OF CAPE TOWN AND OTHER SOUTH AFRICAN CITIES
Indicators
Population (millions) (2018)
Population average annual growth rate(2013 – 2018)
Average annual GDP-R growth(constant prices, 2013-2018)
Average annual GDP-R growth(constant prices, 2008-2018)
Exports (R billions, 2018)
Foreign Direct Investment (FDI) Projects (Total number, 2008-2018)
Cape Town
4,32
2,44%
1,71%
2,10%
84,2
287
Johannesburg
5,54
3,28%
1,43%
1,79%
391,9
543
Tswane (Pretoria)
3,52
2,79%
2,10%
2,77%
170,0
8
Ethekwini (Durban)
4,06
1,89%
1,55%
2,09%
79,1
66
Ekurhuleni
3,78
2,53%
1,49%
1,87%
83,2
N/A
MIR-2019-2020FA grant v2.indd 10 2020/07/14 14:48
2019/2020 INVEST IN CAPE TOWN | 11
3 CAPE TOWN AT A GLANCE
3.1 Education and skills
Cape Town has four tertiary education institutions: • University of Cape Town (highest QS World Ranking amongst African universities);• University of Stellenbosch Business School; • University of the Western Cape; and, • Cape Peninsula University of Technology.
In addition, the University of Stellenbosch (second highest QS World Ranking amongst South African universities) is located just outside of the city’s boundaries.
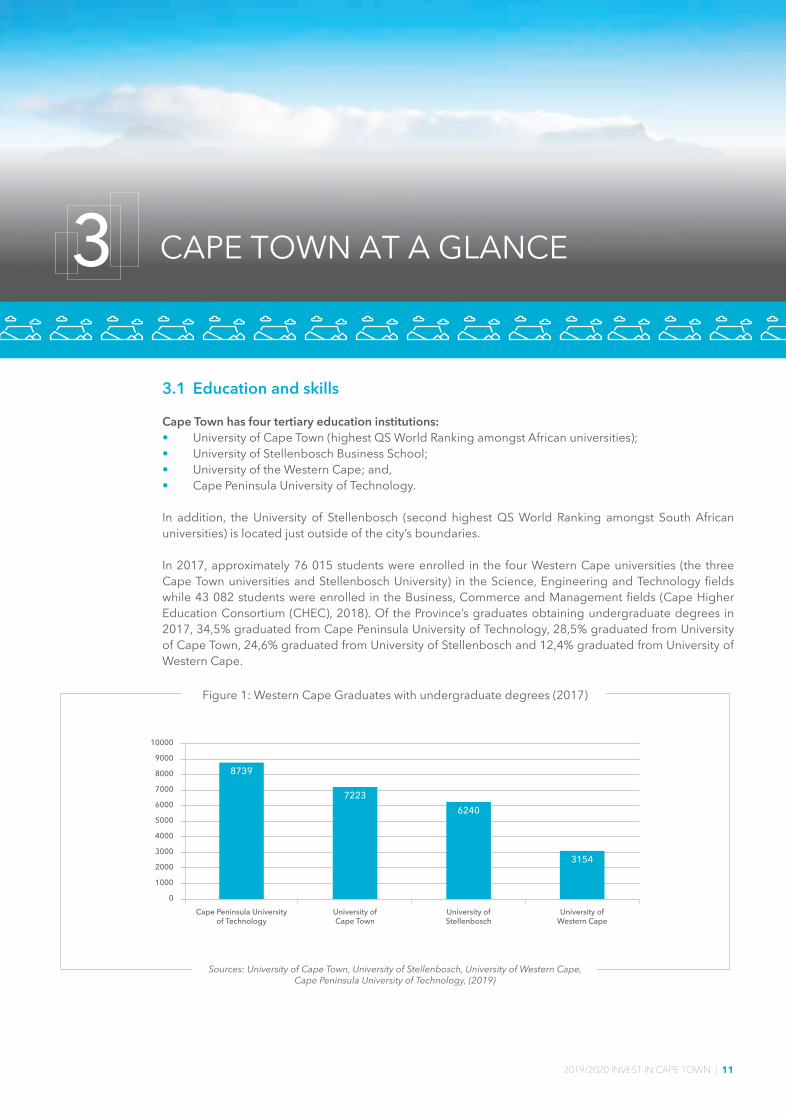
In 2017, approximately 76 015 students were enrolled in the four Western Cape universities (the three Cape Town universities and Stellenbosch University) in the Science, Engineering and Technology fields while 43 082 students were enrolled in the Business, Commerce and Management fields (Cape Higher Education Consortium (CHEC), 2018). Of the Province’s graduates obtaining undergraduate degrees in 2017, 34,5% graduated from Cape Peninsula University of Technology, 28,5% graduated from University of Cape Town, 24,6% graduated from University of Stellenbosch and 12,4% graduated from University of Western Cape.
8739
Cape Peninsula Universityof Technology
University ofCape Town
University ofStellenbosch
University ofWestern Cape
72236240
3154
10000
9000
8000
7000
6000
5000
4000
3000
2000
1000
0
Sources: University of Cape Town, University of Stellenbosch, University of Western Cape,Cape Peninsula University of Technology, (2019)
Figure 1: Western Cape Graduates with undergraduate degrees (2017)
Source: CHEC Standardized Regional Statistics (2019)
Figure 2: Western Cape Graduates byClassification of Educational Subject
Material (CESM), 2015
ScienceEngineeringTechnology
41%
OtherHumanities
23%
Education8%
Business /Commerce /Management
28%
MIR-2019-2020FA grant v2.indd 11 2020/07/14 14:48

12 | 2019/2020 INVEST IN CAPE TOWN
Skills Development
The City of Cape Town collaborates with the private and public sectors’ stakeholders to ensure a steady supply of skills needed by industry. Key stakeholders include national, provincial and private strategic partners, including non-profit organisations. This collaboration ensures impactful skills training for unemployed young people in Cape Town. Skills development training programs implemented by these key stakeholders are geared towards fulfilling industry demand and beneficiaries of the development programs often end up in internships and permanent employment.
Current skills development programs undertaken through the City of Cape Town include Business Process Out-sourcing entry level agent training, supervisor and team leader training, software and business analysis training in IT, digital training, clothing, textile and fashion training as well as green economy related training interventions.
Cape Skills Accelerator ProjectThe Cape Skills Accelerator Project seeks to create 3300 employment opportunities for youth and women in marginalised communities.
The project is aligned to the Integrated Development Plan (IDP) that proclaims “the City will drive economic inclusion to improve citizens’ quality of life and levels of self-determination, and create an enabling environment for economic growth by working with its partners to support skills development initiatives in high growth sectors."
This project will be undertaken in order to address the youth unemployment challenge.
8739
Cape Peninsula Universityof Technology
University ofCape Town
University ofStellenbosch
University ofWestern Cape
72236240
3154
10000
9000
8000
7000
6000
5000
4000
3000
2000
1000
0
Sources: University of Cape Town, University of Stellenbosch, University of Western Cape,Cape Peninsula University of Technology, (2019)
Figure 1: Western Cape Graduates with undergraduate degrees (2017)
Source: CHEC Standardized Regional Statistics (2019)
Figure 2: Western Cape Graduates byClassification of Educational Subject
Material (CESM), 2015
ScienceEngineeringTechnology
41%
OtherHumanities
23%
Education8%
Business /Commerce /Management
28%
MIR-2019-2020FA grant v2.indd 12 2020/07/14 14:48

2019/2020 INVEST IN CAPE TOWN | 13
1 The strict definition of unemployment considers a person to be unemployed only if they have “taken active steps to look for work or to start some form of self-employment in the four weeks prior to the interview”. They are sometimes referred to as the “searching unemployed”.2 A person is considered to be economically inactive if they were able and available to work in the week prior to the survey but did not work, did not look for work and did not try to start their own business. 3 Broad definition of unemployment includes discouraged job-seekers: those that want to work but are not actively searching for a job as they have lost hope, wanted to work but there are no jobs in the area or were unable to find work that required their skills. They are sometimes referred to as the “non-searching unemployed”
Cape Town’s top employing sectors were the finance, community and social services, and trade sectors. The finance and business services sector employed the largest number of skilled individuals in 2018 (276 917) and the construction sector employed the largest number of semi-skilled and unskilled individuals (99 959).
3.2 Employment profile
CAPE TOWN’S EMPLOYMENT INDICATORS, 2018Population aged 15-64 years 2 905 239Labour Force Participation Rate 70%Employed 1 599 119Strictly Unemployed1 437 662Not Economically Active2 868 457Strict unemployment rate 22%
Source: Statistics South Africa, 2019
Source: Statistics South Africa (2019)
Figure 3: Sectoral employment split in Cape Town (2018)
0 50 000 150 000 250 000 350 000100 000 200 000 300 000 400 000
Trade
Finance
Community andsocial sciencesManufacturing
Construction
Transport
Private households
Agriculture
Utilities
Mining
Number of employed people
Formal skilled labour Informal labourFormal semi-skilled and un-skilled labour
A challenging macroeconomic climate at a national level, has seen a steady increase in the unemployment rate over the past two years. Cape Town has, nevertheless, maintained a strict unemployment rate which is slightly below the national strict rate, and a broad unemployment rate which is over 14 percentage points lower than the comparable national rate. The reason for Cape Town’s comparatively low broad unemployment rate, both compared to the country as a whole and the other metros (see Figures 4 and 5), lies in the relatively small number of discouraged work-seekers in the City. This reflects on a labour market which, while not always providing sufficient employment opportunities to absorb new labour entrants, continues to sustain a strong level of participation and active job seeking.
MIR-2019-2020FA grant v2.indd 13 2020/07/14 14:48

14 | 2019/2020 INVEST IN CAPE TOWN
Source: Statistics South Africa (2019)
Figure 5: Strict versus broad unemployment rate trend across South African cities (2018)
Tshwane 33,90%
36,06%35,93%
31,23%28,85%
35,85%31,60%
27,95%19,90%
23,13%21,49%
28,02%
Nelson Mandele Bay
City of Johannesburg
Ekhurhuleni
eThekweni
Cape Town
Broad Strict
Source: Statistics South Africa (2019)
Figure 4: Unemployment rate trends in Cape Town relative to the national average (2013-2018)
40%
35%
30%
25%
20%Q1 Q2 Q3 Q4 Q1 Q2 Q3 Q4 Q1 Q2 Q3 Q4 Q1 Q2 Q3 Q4 Q1 Q2 Q3 Q4 Q1 Q2 Q3 Q4
2013 2014 2015 2016 2017 2018
SA strict unemployment
CT strict unemployment
SA broad unemployment
CT broad unemployment
Source: Statistics South Africa (2019)
Figure 5: Strict versus broad unemployment rate trend across South African cities (2018)
Tshwane 33,90%
36,06%35,93%
31,23%28,85%
35,85%31,60%
27,95%19,90%
23,13%21,49%
28,02%
Nelson Mandele Bay
City of Johannesburg
Ekhurhuleni
eThekweni
Cape Town
Broad Strict
Source: Statistics South Africa (2019)
Figure 4: Unemployment rate trends in Cape Town relative to the national average (2013-2018)
40%
35%
30%
25%
20%Q1 Q2 Q3 Q4 Q1 Q2 Q3 Q4 Q1 Q2 Q3 Q4 Q1 Q2 Q3 Q4 Q1 Q2 Q3 Q4 Q1 Q2 Q3 Q4
2013 2014 2015 2016 2017 2018
SA strict unemployment
CT strict unemployment
SA broad unemployment
CT broad unemployment
MIR-2019-2020FA grant v2.indd 14 2020/07/14 14:48

2019/2020 INVEST IN CAPE TOWN | 15
3.3 Cape Town’s economy
As a global mid-sized developing city, Cape Town acts as a magnet for talent, investment and production, utilising economies of scale to grow faster than the broader region in which it is located. The city, nevertheless, as shown in Figure 6 below, finds itself affected by economic shocks to the national economy. The City’s GDP-R grew by an average of 1,54% between 2014 and 2018, on average growing 0,41 percentage points faster than the national economy during this time.
The biggest economic sector, by value, in Cape Town in 2018 was the finance and business services sector, contributing R100,7 billion (35% of GDP-R at constant 2010 prices), while community services contributed R48 billion (17%), and trade contributed R45,7 billion (16%).
Strong growth was demonstrated between 2013 and 2018 by the finance and agriculture sectors with average annual growth rates of 2,6% and 2,4%, respectively. Following closely were the construction and community service sectors with average annual growth of 2,0% and 1,8% respectively. The electricity sector below includes generation, distribution, gas manufacture and water collection and distribution which was negatively impacted by the drought.
SECTOR BREAKDOWN OF GVA FOR CAPE TOWN (2013 – 2018, R millions)
Source: IHS Markit, 2019
Source: IHS Markit (2018)
Figure 6: Growth in GDP-R at constant 2010 prices in Cape Town (%) (2008-2018)
South Africa
Cape Town
3,19%
4,27%
-1,54%
-1,22%
3,04%
2,66%
3,28%
4,14%
2,21%
2,99%
2,49%
2,55%
1,85%
2,20%
1,19%
1,66%
0,40%
1,69%
1,41%
0,90%
0,79%
1,25%
2008 2009 2010 2011 2012 2013 2014 2015 2016 2017 2018
5,00%
4,00%
3,00%
2,00%
1,00%
0,00%
-1,00%
-2,00%
Gro
th in
GD
P-R
(200
8-20
18)
Broad economic sector 2013 2014 2015 2016 2017 2018 % Share, 2018
Agriculture 2 420 2 572 2 566 2 488 2 761 2 649 1%Mining 422 449 461 463 462 457 0%Manufacturing 40 397 40 359 40 204 40 695 40 523 40 718 14%Electricity 4 026 3 997 3 866 4 303 3 773 3 771 1%Construction 9 705 10 072 10 338 10 533 10 482 10 376 4%Trade 42 777 43 598 44 661 45 669 45 423 45 686 16%Transport 28 999 29 991 30 265 30 681 31 059 31 473 11%Finance and business services 88 994 91 381 94 175 96 176 98 564 100 749 35%Community services 44 895 46 177 46501 46 983 47 380 47 969 17%Total Industries 262 635 268 599 273 038 277 990 280 427 283 848 100%
MIR-2019-2020FA grant v2.indd 15 2020/07/14 14:48

16 | 2019/2020 INVEST IN CAPE TOWN
Detailed sectoral breakdowns
In terms of gross value added, Cape Town’s food, beverages and tobacco products (27%) and fuel, petroleum, chemical and rubber products (25%) sub-sectors were the largest contributors to the manufacturing sector.
The largest sub-sectors of tertiary activities were finance and insurance (19%), real estate activities (16%) and retail trade and repairs of goods (10%).
1,8%
2,6%
1,8%
1,5%
2,0%
0,3%
1,6%
2,4%
Community services
Finance
Transport
Trade
Construction
Electricity
Manufacturing
Mining
Agriculture
-2,6%
-3,0% 3,0%-2,0% 2,0%-1,0% 1,0%0,0%
Source: IHS Markit (2019)
Figure 7: GDP-R growth performance of sectors in Cape Town (2013-2018)
Other non-metallicmineral products
Electrical machineryand apparatus
Electronic, sound/vision,medical & other appliances
Food, beverages andtobacco products
Fuel, petroleum, chemicaland rubber products
Transport equipment
Textiles, clothing andleather goods
Furniture and other itemsNEC and recycling
Wood and wood products
Metal products, machineryand household appliances
2%2%
5%
6%
8%
10%
11%
25%
27%
4%
Source: IHS Markit (2019)
Figure 8: Sub-sectoral breakdown of manufacturing sector GVA (2018)
1,8%
2,6%
1,8%
1,5%
2,0%
0,3%
1,6%
2,4%
Community services
Finance
Transport
Trade
Construction
Electricity
Manufacturing
Mining
Agriculture
-2,6%
-3,0% 3,0%-2,0% 2,0%-1,0% 1,0%0,0%
Source: IHS Markit (2019)
Figure 7: GDP-R growth performance of sectors in Cape Town (2013-2018)
Other non-metallicmineral products
Electrical machineryand apparatus
Electronic, sound/vision,medical & other appliances
Food, beverages andtobacco products
Fuel, petroleum, chemicaland rubber products
Transport equipment
Textiles, clothing andleather goods
Furniture and other itemsNEC and recycling
Wood and wood products
Metal products, machineryand household appliances
2%2%
5%
6%
8%
10%
11%
25%
27%
4%
Source: IHS Markit (2019)
Figure 8: Sub-sectoral breakdown of manufacturing sector GVA (2018)
MIR-2019-2020FA grant v2.indd 16 2020/07/14 14:48

2019/2020 INVEST IN CAPE TOWN | 17
Finance and Insurance
Real estate activities
Retail trade and repairs of goods
Other business activitiesHealth and social work
Wholesale and commission trade
Land and Water transport
Air transport and transportsupporting activities
Sale and repairs of motorvehicles, sale of fuel
Hotels and restaurants
Public administration anddefence activities
Post and telecommunication
EducationOther service activities
1%
4%
5%
19%
16%
10%
9%7%
3% 3%
4%
6%
6%
7%
Source: IHS Markit (2019)
Figure 9: Sub-sectoral breakdown of the tertiary sector (2018)
3.4 Doing Business
The 2018 Doing Business report found that South Africa ranked 84th globally amongst the 190 countries reviewed (World Bank, 2019). South Africa fared better in terms of paying taxes and protecting minority investors in terms of its distance to the frontier score (DTF)4 when measured against China, Tunisia, Botswana and Turkey5. South Africa also fared relatively well in the categories of resolving insolvency and getting credit.
Cape Town fared better than other South African metropolitan municipalities in terms of dealing with construction permits and getting electricity.
4 The distance to frontier (DTF) score helps assess the absolute level of regulatory performance over time. It measures the distance of each economy to the “frontier,” which represents the best performance observed on each of the indicators across all economies in the Doing Business sample since 2005. An economy’s distance to frontier is reflected on a scale from 0 to 100, where 0 represents the lowest performance and 100 represents the frontier.
5 These countries were chosen as a comparison to South Africa as they rank close to South Africa’s total 2017 DTF score of 65.2. Botswana’s DTF score is 65.55; China (64.28 DTF); Tunisia (64.89 DTF) and Turkey (67.19 DTF).
MIR-2019-2020FA grant v2.indd 17 2020/07/14 14:48

18 | 2019/2020 INVEST IN CAPE TOWN
Buffalo City
Cape Town
Ekurhuleni
eThekwini
Johannesburg
Mangaung
Msunduzi
Nelson Mandela Bay
Other
90
80
70
60
50
40
30
20
10
0Dealing with
construction permitsGetting electricity Registering property Enforcing contacts
100908070605040302010
0Doi
ng B
usin
ess 2
019
Scor
e
Starting aBusiness
GettingCredit
ProtectingMinority
PayingTaxes
Tradingacross
Borders
EnforcingContracts
ResolvingInsolvency
Dealing withConstruction
GettingElectricity
RegistrationProperty
South Africa China Tunisia Botswana Turkey
Source: The World Bank (2019)
Figure 10: South Africa’s ‘Doing Business’ Performance (2018)
Source: The World Bank (2019)
Figure 11: South African Cities - Doing Business Relative Performance (2018)
MIR-2019-2020FA grant v2.indd 18 2020/07/14 14:48
2019/2020 INVEST IN CAPE TOWN | 19
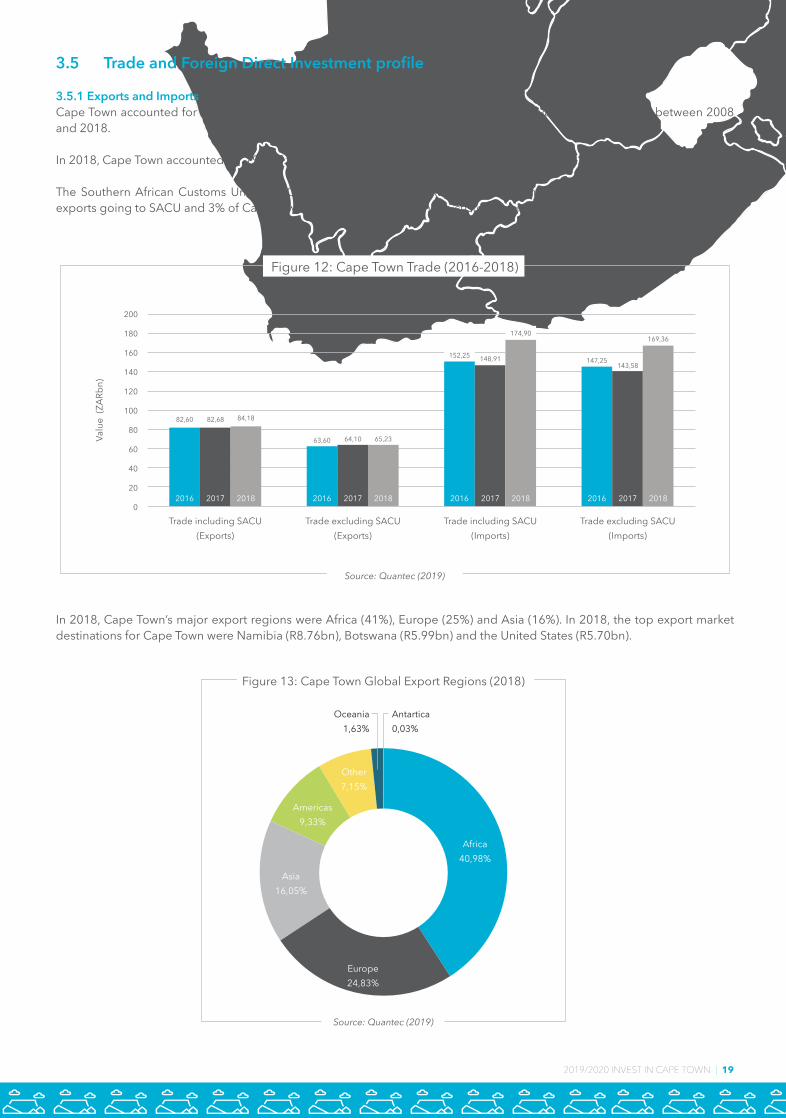
3.5 Trade and Foreign Direct Investment profile
3.5.1 Exports and ImportsCape Town accounted for 65% of the Western Cape’s exports in 2018, with annual rand value growth of 10% between 2008 and 2018.
In 2018, Cape Town accounted for 79% of the Western Cape’s imports.
The Southern African Customs Union (SACU) countries make up a key regional trading partner with 23% of Cape Town’s exports going to SACU and 3% of Cape Town’s imports sourced from the customs union.
In 2018, Cape Town’s major export regions were Africa (41%), Europe (25%) and Asia (16%). In 2018, the top export market destinations for Cape Town were Namibia (R8.76bn), Botswana (R5.99bn) and the United States (R5.70bn).
2016 2017 2018 2016 2017 2018 2016 2017 2018 2016 2017 2018
82,60 82,68 84,18
63,60 64,10 65,23
152,25 148,91
174,90
147,25143,58
169,36
Trade including SACU(Exports)
Trade including SACU(Imports)
Trade excluding SACU(Exports)
Trade excluding SACU(Imports)
200
180
160
140
120
100
80
60
40
20
0
Valu
e (Z
ARbn
)
Source: Quantec (2019)
Figure 12: Cape Town Trade (2016-2018)
Source: Quantec (2019)
Figure 13: Cape Town Global Export Regions (2018)
Americas9,33%
Other7,15%
Asia16,05%
Europe24,83%
Antartica0,03%
Oceania1,63%
Africa40,98%
2008 2009 2010 2011 2012 2013 2014 2015 2016 2017 2018
35%
30%
25%
20%
15%
10%
5%
0%
-5%
-10%
-15%
Growth (%) Average (%)
Source: Quantec (2019)
Figure 14: Cape Town's Annual Growth in Exports (2008-2018)
MIR-2019-2020FA grant v2.indd 19 2020/07/14 14:48

20 | 2019/2020 INVEST IN CAPE TOWN
The graph below shows Cape Town’s annual export growth over a 10-year period.
Note: the average growth in exports measured in USD was 4.2% from 2008-2018.
In 2018, refined petroleum was the largest exported product from Cape Town valued at R14,3bn, followed by citrus fruit and apples, pears and quinces valued at R6,2bn and R3.7bn respectively.
Approximately 38% of all exports from Cape Town are from the agriculture and fishing sector.
Source: Quantec (2019)
Figure 13: Cape Town Global Export Regions (2018)
Americas9,33%
Other7,15%
Asia16,05%
Europe24,83%
Antartica0,03%
Oceania1,63%
Africa40,98%
2008 2009 2010 2011 2012 2013 2014 2015 2016 2017 2018
35%
30%
25%
20%
15%
10%
5%
0%
-5%
-10%
-15%
Growth (%) Average (%)
Source: Quantec (2019)
Figure 14: Cape Town's Annual Growth in Exports (2008-2018)
Source: Quantec (2019)
Figure 15: Cape Town’s Top Traded Products (2016-2018)
Refinedpetroleum
Citrusfruit
Apples, pears& quinces
Grapes Wine offresh grapes
Engineparts
Fishfillests
Yachts& boats
Make-uppreparations
Oils & otherproducts
14,371
6,175
3,702 3,1832,031 1,917 1,766 1,727 1,646 1,510
16,000
14,000
12,000
10,000
8,000
6,000
4,000
2,000
0
Valu
e (R
m)
MIR-2019-2020FA grant v2.indd 20 2020/07/14 14:48

2019/2020 INVEST IN CAPE TOWN | 21
In 2018, Cape Town exported almost 86% of South Africa’s ships, boats and floating structures and 82% of South African tobacco. Cape Town imports 75% of South Africa’s fish and crustaceans and 52% of beverages, spirits and vinegar.
Note: products in the table above are categorized according to the Harmonised System with 2 digits
KEY COMMODITIES TRADED BY CAPE TOWN AND SOUTH AFRICA, 2018
Source: Quantec (2019)
TOP 10 EXPORTS (Rm) CAPE TOWN SOUTH AFRICA % OF SOUTH AFRICA
Mineral fuels and mineral oils 16 652 131 518 12.66%Edible fruit and nuts 14 271 48 734 29.28%Nuclear reactors, machinery and mechanical appliances 5 634 76 959 7.32%Fish and crustaceans 5 304 7 150 74.18%Beverages, spirits and vinegar 2 773 18 836 14.72%Tobacco and manufactured tobacco substitutes 2 313 2 837 81.52%Ships, boats and floating structures 2 157 2 508 85.99%Pearls, precious or semi-precious stones 2 119 219 628 0.96%Essential oils and resinoids 2 029 8 210 24.72%Electrical machinery and equipment 1 975 23 883 8.27%TOP 10 IMPORTS (Rm) CAPE TOWN SOUTH AFRICA % OF SOUTH AFRICA
Mineral fuels and mineral oils 82 076 227 212 36.12%Nuclear reactors, machinery and mechanical appliances 9 697 152 306 6.37%Electrical machinery and equipment 6 483 107 701 6.02%Articles of apparel and clothing accessories, not knitted or crocheted 4 750 13 317 35.67%Plastics and articles thereof 4 392 35 130 12.50%Articles of apparel and clothing accessories, knitted or crocheted 4 246 11 117 38.20%Beverages, spirits and vinegar 4 199 8 058 52.11%Fish and crustaceans 3 189 4 260 74.86%Optical, photographic, cinematographic 3 160 29 927 10.56%Footwear, gaiters and the like; parts of such articles 3 140 12 284 25.56%%
3.5.2 Foreign Direct Investment
Between January 2003 and December 2018, a total of 344 FDI projects were recorded into Cape Town. These projects represent an estimated total capital investment of R110.31billion which is an average investment of R319.4million per project. During the period, an estimated 24 446 jobs were created (FDI Intelligence, 2019).6
More than 60 percent of the interviewed companies cited the growth in the domestic market as the top motive for companies investing in Cape Town followed by proximity to markets or customers with 24% and third was the regulatory environment with 17.3% (FDI Intelligence, 2019).
Further, Cape Town has positioned itself to be one of the leading ICT investment destinations in Africa. Between 2003 and December 2018, Cape Town’s ICT sector ranked third in terms of capital expenditure in the said sector. According to Team Support CEO Robert C. Johnson, “Cape Town has become one of the leading technology cities in the Southern Hemisphere and it is full of talented individuals with expertise in customer support.” (FDI Intelligence, 2019).
6 The Financial Times data used to quantify these total figures include estimated project information. In these instances, capex and job creation figures are based on similar projects in the same sub-sector.
MIR-2019-2020FA grant v2.indd 21 2020/07/14 14:48

22 | 2019/2020 INVEST IN CAPE TOWN
The top source markets for FDI into Cape Town from 2003 to 2018, were as follows:• United Kingdom (26.4% of projects and 20% of capex).• United States (23.5% of projects and 28.5% of capex).• Germany (7.3% of projects and 7.3% of capex).• China (4.6% of projects and 7.0% of capex)
Source: FDI Intelligence (2019)
Figure 16: FDI inflows to Cape Town, January 2003 - December 2018
Capex
Projects
5,707 3,005 2,546 7,223 3,711 16,33 7,020 11,28 2011 6,939 9,015 4,634 4,980 4,969 9,510 6,002
11 8 10 14 14 18 23 26 29 31 38 34 29 23 20 16
Valu
e (Z
ARm
)
2003 2004 2005 2006 2007 2008 2009 2010 2011 2012 2013 2014 2015 2016 2017 2018
18000
16000
14000
12000
10000
8000
6000
4000
2000
0
40
35
30
25
20
15
10
5
Projects
Selected companies that have invested in Cape Town over the past 10 years include:
GlaxoSmithKline GlaxoSmithKline (UK) invested in Epping Industrial into a pharmaceuticals manufacturing project in 2010.
Gestamp Gestamp Renewable Industries (Spain), the wind industrial division of Gestamp established a new wind tower manufacturing facility in Atlantis in 2012.
Burger King Burger King (United States) opened a new meat production facility in Elsies River in 2014. The USD4.72m facility was opened through a joint venture with Excellent Meat.
Pegas Pegas Nonwovens (Luxembourg) invested in a manufacturing site in Atlantis (2017) for the production of synthetic nonwoven textiles.
Capita Capita (UK) acquired Full Circle to initially set up in the BPO industry in 2012 in Maitland. Capita expanded in 2017, adding 1000 jobs.
Hisense Hisense (China) opened a mega manufacturing plant in Atlantis in 2013 that expanded in 2017. The plant manufactures FMCG products and mobile devices.
Converse Converse (United States) invested in a retail store in Canal Walk (Century City) in 2018.
Hurricane Electric US-based Hurricane Electric, a co-location and web hosting specialist, set up a point of presence in Rondebosch in 2018.
Lufthansa Technik Lufthansa Technik (Germany) invested in the Aerospace sector in a maintenance & servicing project in 2019.
Huawei Technologies Huawei Technologies, a provider of retail and marketing services in Plattekloof, and a subsidiary of China-based Huawei, increased its staff members in 2019 by 50% in order to support a growing demand within the ICT sector.
Source: FDI Intelligence, (2019)
MIR-2019-2020FA grant v2.indd 22 2020/07/14 14:48

2019/2020 INVEST IN CAPE TOWN | 23
The top six destination markets for FDI from Cape Town between 2003 and 2018 were Nigeria, the United Kingdom, Kenya, Zambia, Angola and the United Arab Emirates. African markets made up seven of the top 10 destination markets for FDI from Cape Town between 2003 and 2018. These African markets were Nigeria, Kenya, Zambia, Angola, Mozambique, Ghana, and Uganda.
#6: Ghana7 projects (5.22%)
#1: Nigeria30 projects (22.39%)
#4: Angola10 projects (7.46%)
#10: Botswana5 projects (3.73%)
#7: Uganda7 projects (5.22%)
#2: Kenya20 projects (14.93%)
#9: Tanzania6 projects (4.48%)
#5: Mozambique58 projects (5.97%)
#3: Zambia13 projects (9.70%)
#8: Mauritius6 projects (4.48%)
Source: FDI Intelligence, (2019)
Figure 17: FDI from Cape Town into African Markets, 2003-2018
MIR-2019-2020FA grant v2.indd 23 2020/07/14 14:48

24 | 2019/2020 INVEST IN CAPE TOWN
www.wesgro.co.za | [email protected] | +27 (0) 21 487 8600
Wesgro @wesgro Wesgro
Cape Town and the Western Cape – A Place of More
We are a region of unlimited potential. And this translates into unlimited opportunity. Whether you’re interested in travel, investment, film or exporting, we have something for you.
Our destination is also a resilient one. We work with all levels of government and the private sector to ensure that we meet the needs of industry. As an economic powerhouse on the African continent, Cape Town and the Western Cape boasts a world of opportunities in a variety of sectors.
As the official tourism, trade and investment promotion agency for Cape Town and the Western Cape - we can help you uncover more, in a place of more.
3157 Wesgro Generic AD.indd 1 2020/04/28 16:59MIR-2019-2020FA grant v2.indd 24 2020/07/14 14:48
2019/2020 INVEST IN CAPE TOWN | 25
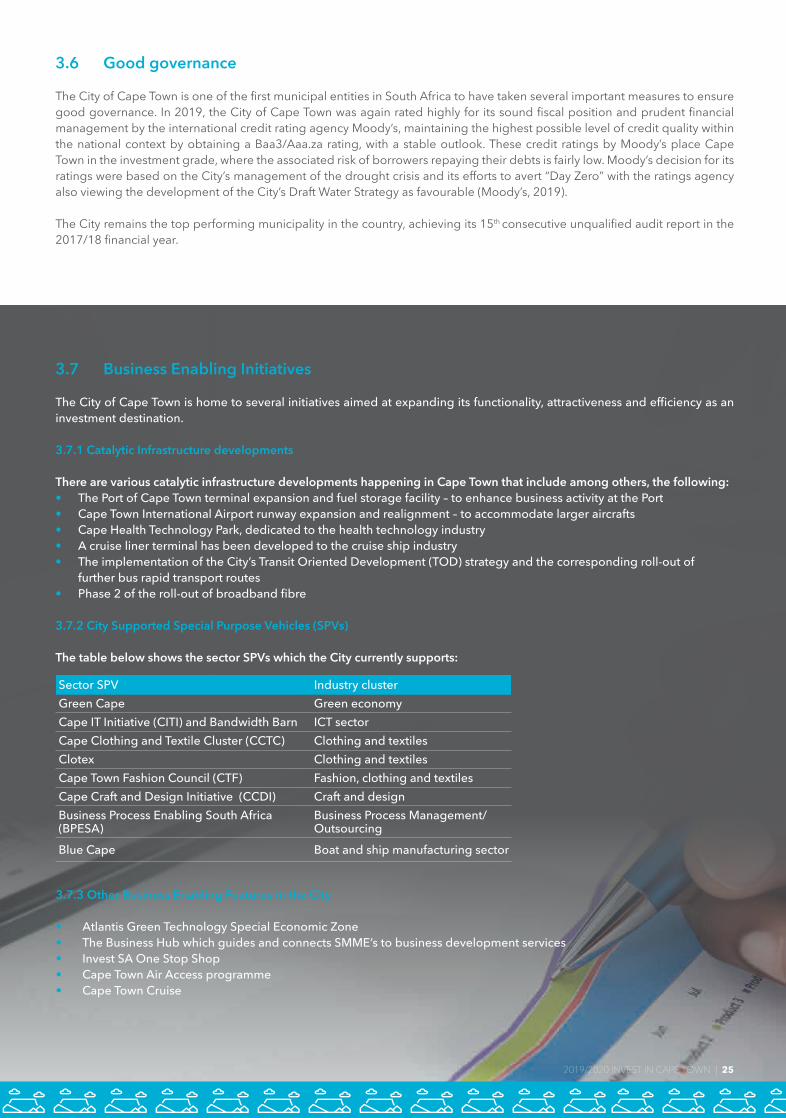
3.7 Business Enabling Initiatives
TheCityofCapeTownishometoseveralinitiativesaimedatexpandingitsfunctionality,attractivenessandefficiencyasaninvestment destination.
3.7.1 Catalytic Infrastructure developments
There are various catalytic infrastructure developments happening in Cape Town that include among others, the following:• The Port of Cape Town terminal expansion and fuel storage facility – to enhance business activity at the Port• Cape Town International Airport runway expansion and realignment – to accommodate larger aircrafts• Cape Health Technology Park, dedicated to the health technology industry• A cruise liner terminal has been developed to the cruise ship industry• The implementation of the City’s Transit Oriented Development (TOD) strategy and the corresponding roll-out of further bus rapid transport routes• Phase2oftheroll-outofbroadbandfibre
3.7.2 City Supported Special Purpose Vehicles (SPVs)
The table below shows the sector SPVs which the City currently supports:
3.7.3 Other Business Enabling Features in the City
• Atlantis Green Technology Special Economic Zone• The Business Hub which guides and connects SMME’s to business development services• Invest SA One Stop Shop• Cape Town Air Access programme• Cape Town Cruise
Sector SPV Industry clusterGreen Cape Green economyCape IT Initiative (CITI) and Bandwidth Barn ICT sectorCape Clothing and Textile Cluster (CCTC) Clothing and textilesClotex Clothing and textilesCape Town Fashion Council (CTF) Fashion, clothing and textilesCape Craft and Design Initiative (CCDI) Craft and designBusiness Process Enabling South Africa Business Process Management/(BPESA) Outsourcing
Blue Cape Boat and ship manufacturing sector
3.6 Good governance
The City of Cape Town is one of the first municipal entities in South Africa to have taken several important measures to ensure good governance. In 2019, the City of Cape Town was again rated highly for its sound fiscal position and prudent financial management by the international credit rating agency Moody’s, maintaining the highest possible level of credit quality within the national context by obtaining a Baa3/Aaa.za rating, with a stable outlook. These credit ratings by Moody’s place Cape Town in the investment grade, where the associated risk of borrowers repaying their debts is fairly low. Moody’s decision for its ratings were based on the City’s management of the drought crisis and its efforts to avert “Day Zero” with the ratings agency also viewing the development of the City’s Draft Water Strategy as favourable (Moody’s, 2019).
The City remains the top performing municipality in the country, achieving its 15th consecutive unqualified audit report in the 2017/18 financial year.
www.wesgro.co.za | [email protected] | +27 (0) 21 487 8600
Wesgro @wesgro Wesgro
Cape Town and the Western Cape – A Place of More
We are a region of unlimited potential. And this translates into unlimited opportunity. Whether you’re interested in travel, investment, film or exporting, we have something for you.
Our destination is also a resilient one. We work with all levels of government and the private sector to ensure that we meet the needs of industry. As an economic powerhouse on the African continent, Cape Town and the Western Cape boasts a world of opportunities in a variety of sectors.
As the official tourism, trade and investment promotion agency for Cape Town and the Western Cape - we can help you uncover more, in a place of more.
3157 Wesgro Generic AD.indd 1 2020/04/28 16:59
2019/2020 INVEST IN CAPE TOWN | 25
MIR-2019-2020FA grant v2.indd 25 2020/07/14 14:49

26 | 2019/2020 INVEST IN CAPE TOWN
3.8 Boat Building Industry
The Cape Boat Building industry is well established and has a good global reputation, regularly being nominated for, or winning, international awards. The largest number of boats manufactured are luxury recreational catamarans and South Africa is ranked globally as number 2 in the world after France in terms of catamaran units produced Cape Town-based Robertson and Caine, which is the second-largest sail catamaran manufacturer in the world and the world leader in power catamarans, supplies the world’s largest charter boat operation, Tui Marine.
The Western Cape is the largest marine manufacturing centre within South Africa, generating over R2,3 billion in 2018 in exports revenue (Quantec, 2019), and houses approximately 45% of boat builders.Cape Town’s boatbuilding exports have grown by ±20,5% year-on-year since 2014 (Quantec, 2019) and exports 80% of its produced items. This has ultimately attracted a positive trade balance of around US$73m annually.
Since 2014, the boat building industry, including commercial and ocean sports has secured investments worth over R25 billion and created over 4 500 direct jobs and 7 000 indirect jobs.
26 | 2019/2020 INVEST IN CAPE TOWN
source: InvestCapeTown website, May 2020
The industry’s strengths include: • Expertise in building sailing catamarans suitable for cruising and charter work• Good work force• Strong support value chain• The South African government, through Operation Phakisa, has earmarked the sector for development• Local boat builders have internationally recognized design capabilities, a reputation for excellence and quality, with a particular strength in multihull production• Proximity to developing markets in sub-Saharan Africa• Cape Town a popular port for international cruising yachts
MIR-2019-2020FA grant v2.indd 26 2020/07/14 14:49

2019/2020 INVEST IN CAPE TOWN | 27
3.9 Infrastructure and Costs
3.9.1 Transport Infrastructure: Road, Railway, Airport and Port
The City of Cape Town provides a well-connected transport infrastructure system and is prioritizing extensive upgrades and investment in the improvement of public transport systems and transport linkages to increase the economic and social functionality of the city.
Airport
The Cape Town International Airport (CTIA) is a world-class airport, it is the second largest in South Africa and the third largest in Africa. In 2019, the airport was awarded the Best Airport in Africa by Skytrax and retained its rating as the 22nd best airport in the world by Skytrax (Skytrax, 2019). CTIA was also named Africa’s Leading Airport by the World Travel Awards (World Travel Awards, 2019). Key infrastructure projects including refurbishment and expansions of terminals as well as new runway realignment are set to be completed in 2023.
Windhoek, NamibiaOranjemund, Namibia
Hong Kong, ChinaGaborone, Botswana
Lianda, Angola
Addis Ababa, Ethiopian Kigali, RwandaHarare, Zimbabwe
Frankfurt, Germany Winhoek, NaamibiaWalvis Bay, Namibia
Singapore, Singapore Doha, Qatar
Vienna, Astria
Zurich, Switzerland Walvis Bay, Namibia
Neark, New York
Port Louis, Mauritius Dubai, UAE
Windhoek, NamibiaMaun, Botswana
Victoria Falls, ZimbabweSt Helena*
Nairobi, KenyaLivingston, Zambia
Victoria Falls, Zimbabwe
Istanbul, TurkeyMunich*, GermanyFrankfort, Germany
Amsterdam,Netherlands
Paris, France London Heathrow, UKLondon Gatwick, UK
Cape Town International Route Network 2019Cape Town International Route Network 2019
MIR-2019-2020FA grant v2.indd 27 2020/07/14 14:49

28 | 2019/2020 INVEST IN CAPE TOWN
Cape Town Air Access is the focal point for international air route development to the Western Cape Province in South Africa and signifies an impressive collaboration between the Western Cape Provincial Government, the City of Cape Town, Airports Company South Africa, Cape Town Tourism, South African Tourism, Wesgro and private sector partners.
The primary mandate of the air access team is to promote, develop and maintain international air routes in and out of Cape Town International Airport through:
• Route retention (ensuring the success of existing routes), • Route expansion (increasing frequencies and capacity on existing routes), and • New route establishment (facilitating the establishment of new routes).
Our contact details:tel: +27 21 487 8600e-mail: [email protected]
www.wesgro.co.za
Wesgro @wesgro Wesgro Promoting direct flights to Cape Town
3157 CTAA AD.indd 3 2020/04/28 16:53MIR-2019-2020FA grant v2.indd 28 2020/07/14 14:49
2019/2020 INVEST IN CAPE TOWN | 29
Cape Town Air Access is the focal point for international air route development to the Western Cape Province in South Africa and signifies an impressive collaboration between the Western Cape Provincial Government, the City of Cape Town, Airports Company South Africa, Cape Town Tourism, South African Tourism, Wesgro and private sector partners.
The primary mandate of the air access team is to promote, develop and maintain international air routes in and out of Cape Town International Airport through:
• Route retention (ensuring the success of existing routes), • Route expansion (increasing frequencies and capacity on existing routes), and • New route establishment (facilitating the establishment of new routes).
Our contact details:tel: +27 21 487 8600e-mail: [email protected]
www.wesgro.co.za
Wesgro @wesgro Wesgro Promoting direct flights to Cape Town
3157 CTAA AD.indd 3 2020/04/28 16:53
Located approximately 12 miles (20 km) from the city centre of Cape Town, the CPT Airport operates with international and domestic flights. It is the only airport in the Cape Town metropolitan area that offers scheduled passenger services (Cape Town International Airport, 2017). The airport had total passenger traffic of 10.8 million in 2018 (City of Cape Town, 2018).
The airport has domestic and international terminals, connected by a central terminal (Brand South Africa, 2017). Several international airlines offer direct flights to Cape Town, including from London, Amsterdam and Windhoek. All of South Africa’s airlines fly to Cape Town, with the route between Cape Town and Johannesburg particularly well served (ibid, 2017).
Air Access
Cape Town Air Access is the focal point for international air route development in the Western Cape and signifies an impressive collaboration between the Western Cape Provincial Government (WCG), the City of Cape Town (CCT), Airports Company South Africa (ACSA), Cape Town Tourism (CTT), South African Tourism (SAT), Wesgro and private sector partners.
The primary mandate of the air access team is to promote, develop and maintain international air routes in and out of Cape Town International Airport through: • Route retention (ensuring the success of existing routes), • Route expansion (increasing frequencies and capacity on existing routes), and • New route establishment (facilitating the establishment of new routes).
3.9.2 Information Technology Infrastructure
Information technology (IT) infrastructure is well established in the City of Cape Town with the City having invested R950.5 million (including phase 1 pilot) on its capital broadband infrastructure at end of July 2017 (estimated to be R1 989 million by 2021). This includes the proof of concept (phase 1) which occurred from 01 July 2009 to 30 June 2014) as part of its broadband infrastructure project. This city owned network increases the City’s bandwidth by approximately 3000 times at current connected sites.
The following impact was made by the project to date: • Over 950 kilometers of fibre-optic cable installed and owned by the City (planned 1 827 kilometers by 2021) • 475 buildings in total connected on the Metro Area Network (MAN) • Free Wi-Fi installed at 715 access points at 225 locations • 30 MyCiTi stations connected (three depots, 27 stations) • 10 MyCiTi buses connected with free high-speed Wi-Fi • 135 Metro Police cameras connected in (Athlone, Manenberg, Bellville, Francie van Zijl, Parow, Hans Strijdom, Robert Sobukwe, Silverton and Wynberg)
The resultant financial benefits are already evident in that a cost saving of R418 million was made by the City installing its own broadband links. Further, R307 million in costs were saved by cancelling rented broadband links and R58.4 million in revenue was generated through the leasing of spare capacity in the City’s lines to commercial operators. This constitutes a Return on Investment of 63%.
This improvement of IT infrastructure, can be used to catalyse the development of the rapidly growing ICT sector in the city, as well as helping to support entrepreneurial growth through providing citizens with increased access to the internet.
In 2018, the City signed an agreement with Cell C to provide public connectivity using street light poles, city building and public transport infrastructure to ensure better connectivity across the city (CCID, 2019). In 2019, Cape Town was the only African city to make it on to Savills Tech Cities Index, making Cape Town Africa’s leading digital city (Savills, 2019). This success is driven by the presence of widely available information and communication technology (ICT) skills and an entrepreneurial culture in this city (CCID, 2019).
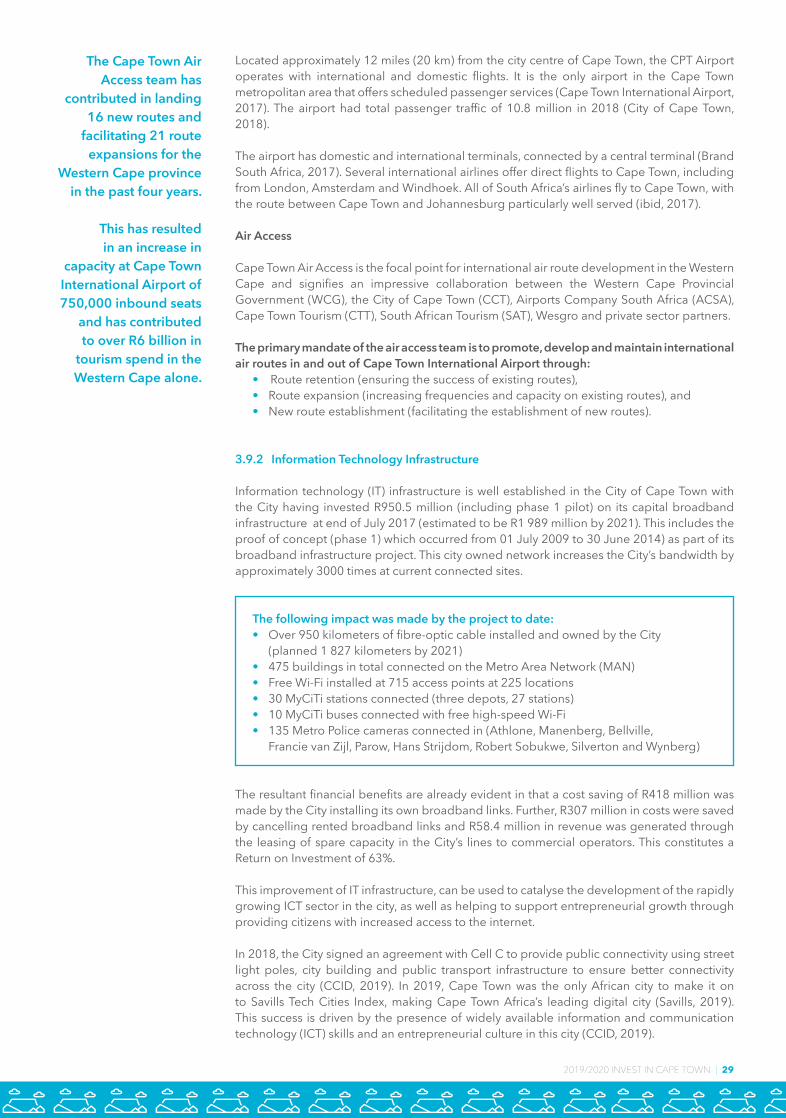
The Cape Town Air Access team has
contributed in landing 16 new routes and
facilitating 21 route expansions for the
Western Cape province in the past four years.
This has resulted in an increase in
capacity at Cape Town International Airport of 750,000 inbound seats
and has contributed to over R6 billion in
tourism spend in the Western Cape alone.
MIR-2019-2020FA grant v2.indd 29 2020/07/14 14:49
30 | 2019/2020 INVEST IN CAPE TOWN
3.9.3 Electricity and Water
Extensive investment in electricity infrastructure across the country is apparent, whereby a large proportion of the focus is on renewables. Although electricity costs in South Africa are increasing with Eskom granted approval to raise its prices by 25% over the next three years, the country still retains a relatively low position in terms of global electricity pricing.
Cape Town’s energy supply is mostly provided by the national grid, with energy demands set at approximately 2 400MW. Two thirds of residents are serviced by the City, with the remaining 25% served by Eskom. A large proportion of Cape Town’s electricity is supplied by Koeberg power station, a nuclear power station located approximately 36km north of the city centre. There are plans to diversify the forms of energy provision to Cape Town and initiatives have arisen which will enhance the use of renewable energy (through the Atlantis Green Technology Special Economic Zone) to take advantage of the growing oil and gas opportunities.
GLOBAL ELECTRICITY PRICES, 2018Country US dollar per kWh Germany 0,33Belgium 0,28Italy 0,27Portugal 0,26Spain 0,24United Kingdom 0,22France 0,19United States 0,13South Africa 0,09
Source: Business Tech, 2019
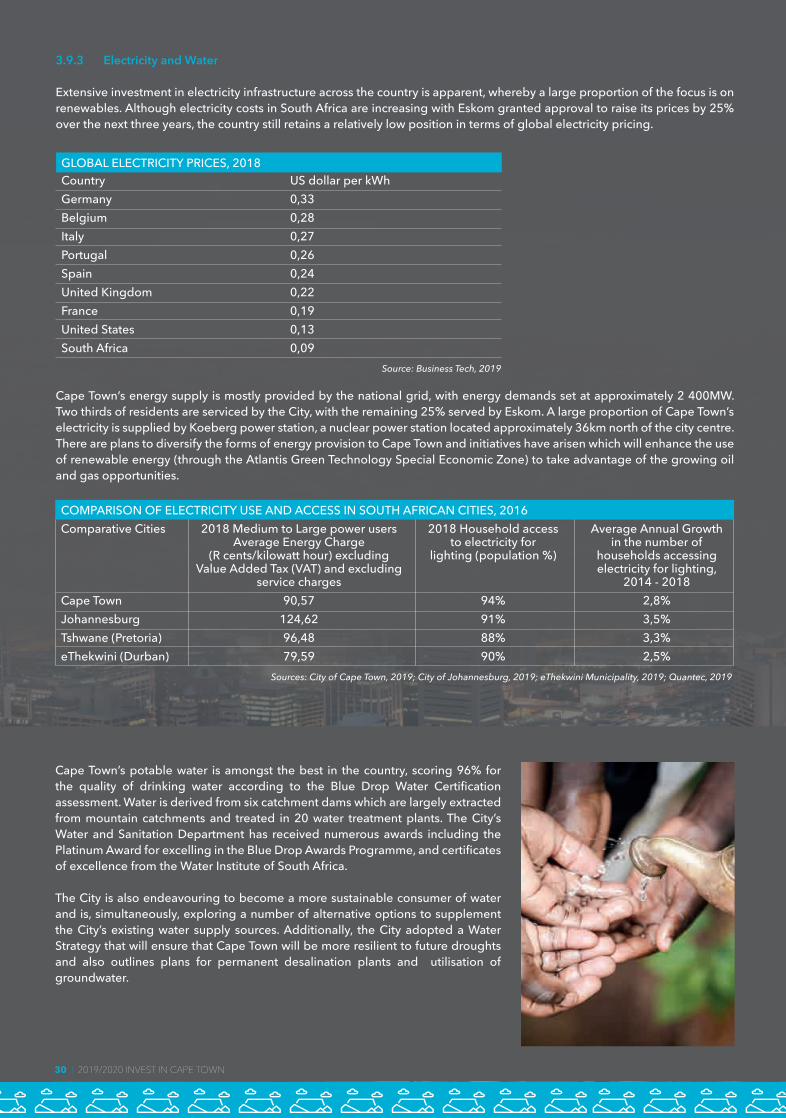
Cape Town’s potable water is amongst the best in the country, scoring 96% for the quality of drinking water according to the Blue Drop Water Certificationassessment. Water is derived from six catchment dams which are largely extracted from mountain catchments and treated in 20 water treatment plants. The City’s Water and Sanitation Department has received numerous awards including the PlatinumAwardforexcellingintheBlueDropAwardsProgramme,andcertificatesof excellence from the Water Institute of South Africa.
The City is also endeavouring to become a more sustainable consumer of water and is, simultaneously, exploring a number of alternative options to supplement the City’s existing water supply sources. Additionally, the City adopted a Water Strategy that will ensure that Cape Town will be more resilient to future droughts and also outlines plans for permanent desalination plants and utilisation of groundwater.
COMPARISON OF ELECTRICITY USE AND ACCESS IN SOUTH AFRICAN CITIES, 2016Comparative Cities 2018 Medium to Large power users 2018 Household access Average Annual Growth Average Energy Charge to electricity for in the number of (R cents/kilowatt hour) excluding lighting (population %) households accessing Value Added Tax (VAT) and excluding electricity for lighting, service charges 2014 - 2018Cape Town 90,57 94% 2,8%Johannesburg 124,62 91% 3,5%Tshwane (Pretoria) 96,48 88% 3,3%eThekwini (Durban) 79,59 90% 2,5%
Sources: City of Cape Town, 2019; City of Johannesburg, 2019; eThekwini Municipality, 2019; Quantec, 2019
30 | 2019/2020 INVEST IN CAPE TOWN
MIR-2019-2020FA grant v2.indd 30 2020/07/14 14:49

2019/2020 INVEST IN CAPE TOWN | 31
Source: Rode (pp. 57) ( 2019)
Figure 18: Cape Town office stock (m2)*
CBD Cape Town
Bellville
Century City
Pinelands
Claremont
Rondebosch/Newlands
V&A Waterfront
0 200000 400000 600000 800000 1000000
941269
542038
355739
309716
113922
102531
126853
*Grades A+, A & B
3.9.4 Prime Office Space and Industrial Space
Cape Town has evolved into a world-class business destination offering a quality and modern environment for business and innovation. The total current value of property in the Central Business District (CBD) amounts to more than R43 billion (Cape Town Central City Improvement District, 2019) and is set to increase. 2018 saw the completion of approximately 52,600m2 of large-scale buildings, including the construction of a new office block for KPMG in the CBD (16,000 m2) and Waterway House at the V&A Waterfront (15,000 m2) (Jones Lang Lasalle, 2018). Other new developments constructed in 2018 include Sable Park in Century City (16,000 m2) and Springfield Office Park (5,600 m2) (Baker street properties, 2018).
Cape Town's office vacancies within the CBD have remained stable relative to 2017, at 7,3% in December 2018. In 2018, Cape Town retained the lowest vacancy rate among the five largest metropolitan municipalities, while eThekwini, the City of Johannesburg, Nelson Mandela Bay, and the City of Tshwane CBD’s recorded vacancy rates of 13,9%; 12,3%, 11,2% and 8,9%, respectively (SAPOA, 2018:9). The majority of offices within the CBD consist of AAA, A, and B-grade office space, marking the CBD one of the most dynamic and sought-after locations for office rentals (Rode Report, 2018:45).
Fast growing office locations in the City include the CBD, Bellville and Century City. Century City houses some of the most modern and exciting office space which is centered on “green” building and innovative design. Similarly, Claremont, an upmarket suburb, is a prominent node for offices and businesses, with a large presence of smaller businesses in the specialist sectors.
KeyOfficeMarketIndicators 2018Prime Gross Rent (ZAR/m2 pm) 205Prime Yield (%) 8,8Cape Town Vacancies (%) 7Total Gross Leasable Area (GLA) (‘000m2) 2 607
Sources: Rode, 2019 (page 53) and JLL, 2019
MIR-2019-2020FA grant v2.indd 31 2020/07/14 14:49

32 | 2019/2020 INVEST IN CAPE TOWN
3.9.5 Industrial Land
The city plays host to a number of industrial activities in different areas including the Atlantis zoned industrial area which has been delineated a key development node offering an expanse of 1,000 hectares of land. This includes a zone for noxious industry as well as an identified hub for manufacturing green technologies (Atlantis Green Technology Special Economic Zone).
Source: City of Cape Town (2019)
Figure 19: Percentage of industrial businesses in each sector across Cape Town (2016)
Human health and socialwork activities 1%
Financial and insurance activities 1%
Information and communication 1%
Water supply, sewerage,waste management and
remediation activities 1%
Electricity, gas, steam andair conditioning supply 1%
Accommodation and foodservice activities 3%
Other service activities 2%
Administrative and supportservice activities 4%
Professional, scientific andtechnical activities 4%
Construction 7%
Transportation and storage 8%
Manufacturing 28%
Wholesale and retail trade,repair of motor vehiclesand motorcycles 35%
Agriculture, forestry and fishing 0,1%
Mining and quarrying 0.0%
Public administration and defence,compulsory social security 0,3%
Real estate activities 0,3%
Arts, entertainment and recreation 1%
Education 1%
The graph above depicts the split of industrial businesses by sector within the industrial areas in Cape Town. Businesses specialising in the wholesale and retail trade sector are predominant in industrial areas (36%), while the manufacturing sector closely follows at 28%.
Land parcels within the industrial area boundaries that are not economically active either consist of vacant land, vacant buildings, road reserves or wetlands. The vacant land within the industrial area boundaries amounts to 459 land parcels whereas the vacant building amounts to only 114 land parcels.
In addition to Atlantis, key industrial areas include Epping, Montague Gardens, Ndabeni, Paarden Island and Airport Industria, as well as other outlying areas along the N2, N1 and R300 highways. According to Rode (2017), the Cape Peninsula has relatively low vacancy factors7 in its industrial areas (Figure 19), suggesting a promising return on industrial property rentals (Rode, 2018: 4). A number of City incentive schemes for the growth of industry operations are available, as outlined in Section 8.
7 These industrial vacancy factors are not to be interpreted as actual vacancy percentages which indicate the floor area available for leasing at any given time, but rather as graduations on a 0-9 vacancy scale, where 0 equates to no vacancy and 9 equates to substantial vacancy. These factors are for all unit sizes (250 m², 500 m², 1.000 m², 2.500 m² and 5.000 m²) combined, as surveyed by Rode. Vacancies could however, differ across the different-sized units (Rode, 2017: 59).
MIR-2019-2020FA grant v2.indd 32 2020/07/14 14:49

2019/2020 INVEST IN CAPE TOWN | 33
Source: Rode (2019)
Figure 20: Vacancy factors of industrial areas in Cape Town, Quarter 3 (2018)
Retreat/Steenberg
Racing Park
Kuils River
Capricorn Park
Bellville South/Sacks Circle
Killarney Gardens
Saxenburg Industrial Park
Blackheath
Parow Beaconvale
Epping 1 & 2
Parow Industria
Montague gardens
Brackenfell Industria
Elsies River
Okavango
Everite Brackenfell
Kraaifontein
Bellville Oakdale
Maitland
Ottery Sunset
Ottery Hillstar
Lansdowne Nerissa
Woodstock/Salt River/Observatory
Tygerberg Business Parl
Bellville triangle
Airport Industria
Viking place
Parow East
Diep River
Marconi Beam
Bellville Stikland/Kaymore
Ndabeni
Paarden Eiland
WP Park
Sand Industria
0,0 0,5 1,0 1,5 2,0 2,5 3,0 3,5 4,0 4,5
MIR-2019-2020FA grant v2.indd 33 2020/07/14 14:49
34 | 2019/2020 INVEST IN CAPE TOWN
3.10 Cape Town Accolades
Cape Town is undoubtedly one of the most internationally recognised cities.
A variety of activities are within a 20-minute drive from the CBD including hiking, beaches, internationally acclaimed restaurants and bars, vineyards and wine tasting, national reserves, and cultural landmarks such as Robben Island and Table Mountain, a 7th Wonder of Nature.
Cape Town receives regular accolades which are related to lifestyle, opportunities, service offerings and overall living standards. Year after year Cape Town continues to receive accolades for being a destination of choice, these include amongst others:
• In December 2019, Cape Town was recognised as one the Top 10 Long-Haul CityBreakforUKTravellers;• In the same month Cape Town was listed in the Top Ten Global List of Best PlacestoCelebrateNewYear’s;• In November 2019, Cape Town was voted the Best City in the World in the TelegraphTravelAwardsforsevenconsecutiveyears;• In October 2019, Cape Town International Airport was named Africa’s Leading Airport–WorldTravelAwards;• In the same month, Cape Town was named Africa’s Leading Festival & Events Destination–WorldTravelAwards;• Table Mountain was also named Africa’s Leading Tourist Destination – World TravelAwards;• In August 2019, Cape Town voted as one of the World’s Friendliest Cities - Big 7Travel;• In July 2019, Cape Town Scored Top Ten Spot In Global Bucket List of Places ToVisit-Big7Travel;• Cape Town was named Best African & Middle Eastern City in Travel + Leisure World’sBestAwards-Travel+Leisure;• In 2019 the Cape Town International Airport was voted Best in Africa in 2019 - SkytraxWorldAirport;• CapeTownwasthefirstAfricancitytoevertowintheUNESCOCityofDesign Award;• According to Savills Tech Cities Cape Town was rated as one of the top 30 tech cities on the planet• Western Cape was voted Golf Destination of the Year in 2017, Africa and Gulf States-IAGTO–InternationalAssociationofGolfTourOperators;• Cape Town ranked number 8 on Top 50 Bucket list destinations in the world - Big7Travel,2019;• Blouberg Strand (Cape Town) ranked (number 1) as the most Instagrammable location in South Africa.• Two Oceans Aquarium was recognized as the Most Responsible Tourism attractioninAfrica-2019,ResponsibleTourismAwardsAfrica;• Zeitz Mocaa – outstanding contribution to the Promotion and Preservation of ContemporaryArtsfromAfrica-2019CulturalAffairs;• Zeitz Mocaa - 5 Art and Design Destinations for 2019 on Culture Trip Wish List -2019 Culture Trip and • Cape Town was voted Best African Business Tourism Event Destination in 2018 - International Congress and Convention Association, ICCA, 2018.
The private health sector is world-class and offers leading teaching hospitals.
There are numerous public and private top schools including international German, Italian and French schools. Top tertiary education institutions are available within the city and host a vast number of international students.
34 | 2019/2020 INVEST IN CAPE TOWN
MIR-2019-2020FA grant v2.indd 34 2020/07/14 14:49
2019/2020 INVEST IN CAPE TOWN | 35
4 SECTORAL POCKETS OF EXCELLENCE
4.1 Business Services
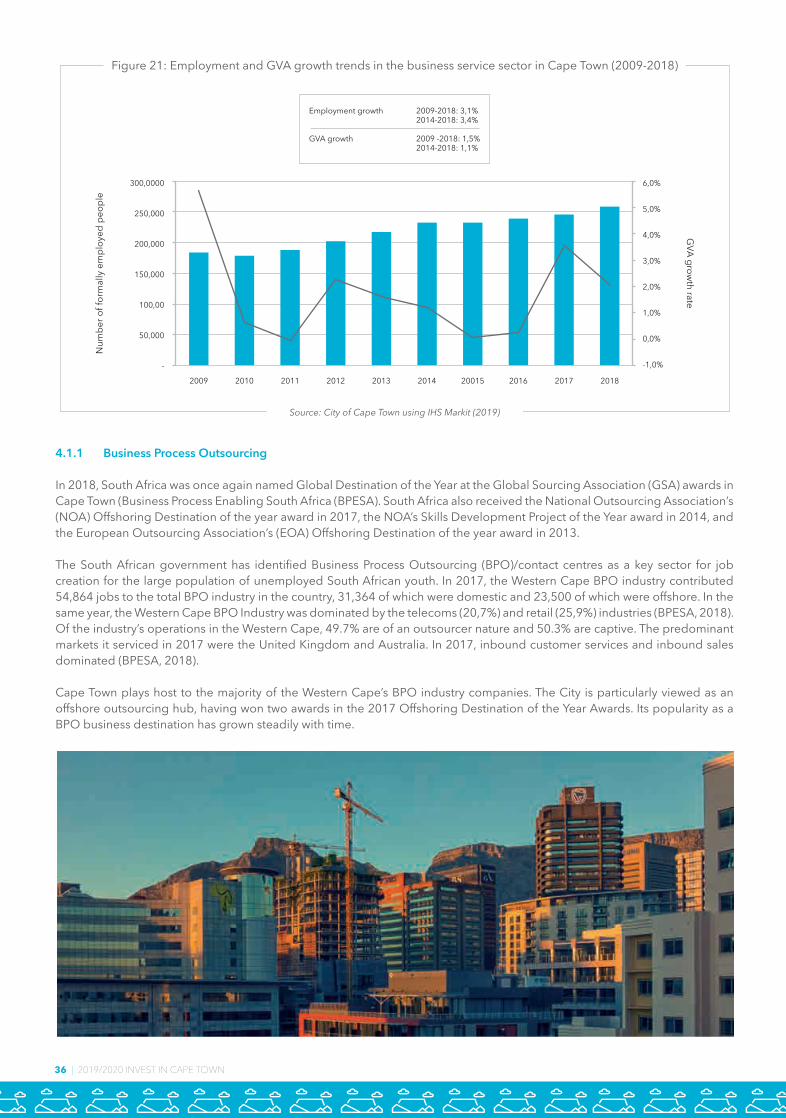
The business service sector, including Business Process Outsourcing (BPO) and Information Technology (IT), has been the largest contributor to employment growth in Cape Town over the last 10 years.
The City has attracted a number of foreign companies into its business services sector, with 111 investment projects being funded from 2009 to 2018. The top two business services subsectors attracting FDI during this time were professional services (23 projects) and creative industries (17 projects) (FDI Intelligence, 2018).
8 This indicator provides an indication of Cape Town’s comparative advantages as compared to the rest of South Africa’s metropolitan municipalities. A location quotient value of greater than one indicates that a sector has a comparative advantage.
Key Indicator Table, 2018
Gross Value Added (GVA) / share of Cape Town GVA R 21 008 million / 7,04%Location quotient 8 0,99Ten-year Foreign Direct Investment (FDI) value R10 618 millionTen-year GVA Growth contribution (2009-2018) 1,5%Formal employment 257 392Contribution to employment creation in Cape Town between 2009-2018 (%) 37,51%
Sources: IHS Markit (2019), FDI Intelligence (2019)
MIR-2019-2020FA grant v2.indd 35 2020/07/14 14:49
36 | 2019/2020 INVEST IN CAPE TOWN
4.1.1 Business Process Outsourcing
In 2018, South Africa was once again named Global Destination of the Year at the Global Sourcing Association (GSA) awards in Cape Town (Business Process Enabling South Africa (BPESA). South Africa also received the National Outsourcing Association’s (NOA) Offshoring Destination of the year award in 2017, the NOA’s Skills Development Project of the Year award in 2014, and the European Outsourcing Association’s (EOA) Offshoring Destination of the year award in 2013.
The South African government has identified Business Process Outsourcing (BPO)/contact centres as a key sector for job creation for the large population of unemployed South African youth. In 2017, the Western Cape BPO industry contributed 54,864 jobs to the total BPO industry in the country, 31,364 of which were domestic and 23,500 of which were offshore. In the same year, the Western Cape BPO Industry was dominated by the telecoms (20,7%) and retail (25,9%) industries (BPESA, 2018). Of the industry’s operations in the Western Cape, 49.7% are of an outsourcer nature and 50.3% are captive. The predominant markets it serviced in 2017 were the United Kingdom and Australia. In 2017, inbound customer services and inbound sales dominated (BPESA, 2018).
Cape Town plays host to the majority of the Western Cape’s BPO industry companies. The City is particularly viewed as an offshore outsourcing hub, having won two awards in the 2017 Offshoring Destination of the Year Awards. Its popularity as a BPO business destination has grown steadily with time.
Source: City of Cape Town using IHS Markit (2019)
Figure 21: Employment and GVA growth trends in the business service sector in Cape Town (2009-2018)
Employment growth 2009-2018: 3,1% 2014-2018: 3,4%
GVA growth 2009 -2018: 1,5% 2014-2018: 1,1%
300,0000
250,000
200,000
150,000
100,00
50,000
-
6,0%
5,0%
4,0%
3,0%
2,0%
1,0%
0,0%
-1,0%
2009 2010 2011 2012 2013 2014 20015 2016 2017 2018
Num
ber o
f for
mal
ly e
mpl
oyed
peo
ple
GVA grow
th rate
MIR-2019-2020FA grant v2.indd 36 2020/07/14 14:49
2019/2020 INVEST IN CAPE TOWN | 37
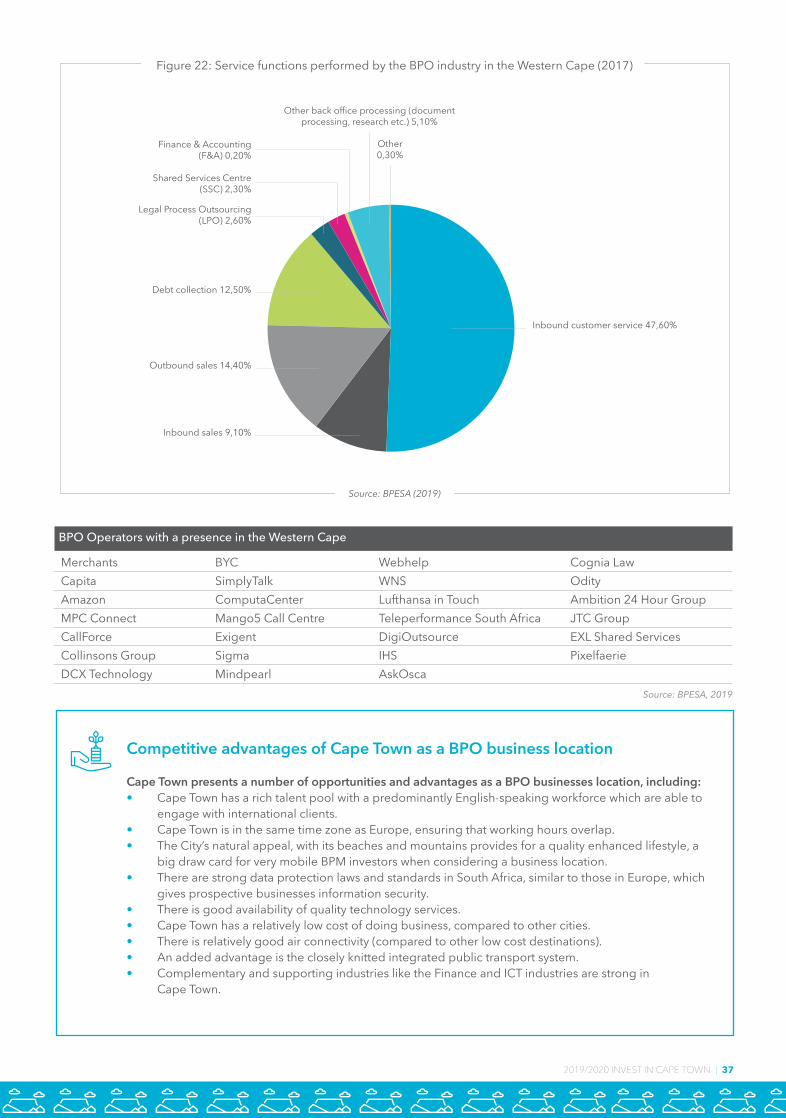
Competitive advantages of Cape Town as a BPO business location
Cape Town presents a number of opportunities and advantages as a BPO businesses location, including: • Cape Town has a rich talent pool with a predominantly English-speaking workforce which are able to engage with international clients.• Cape Town is in the same time zone as Europe, ensuring that working hours overlap.• The City’s natural appeal, with its beaches and mountains provides for a quality enhanced lifestyle, a big draw card for very mobile BPM investors when considering a business location. • There are strong data protection laws and standards in South Africa, similar to those in Europe, which gives prospective businesses information security.• There is good availability of quality technology services.• Cape Town has a relatively low cost of doing business, compared to other cities.• There is relatively good air connectivity (compared to other low cost destinations).• An added advantage is the closely knitted integrated public transport system.• Complementary and supporting industries like the Finance and ICT industries are strong in Cape Town.
Source: BPESA (2019)
Figure 22: Service functions performed by the BPO industry in the Western Cape (2017)
Outbound sales 14,40%
Inbound customer service 47,60%
Shared Services Centre(SSC) 2,30%
Finance & Accounting(F&A) 0,20%
Other0,30%
Other back office processing (documentprocessing, research etc.) 5,10%
Debt collection 12,50%
Legal Process Outsourcing(LPO) 2,60%
Inbound sales 9,10%
Figure 9: Sub-sectoral breakdown of the tertiary sector (2018)BPO Operators with a presence in the Western Cape
Merchants BYC Webhelp Cognia LawCapita SimplyTalk WNS OdityAmazon ComputaCenter Lufthansa in Touch Ambition 24 Hour GroupMPC Connect Mango5 Call Centre Teleperformance South Africa JTC GroupCallForce Exigent DigiOutsource EXL Shared ServicesCollinsons Group Sigma IHS PixelfaerieDCX Technology Mindpearl AskOsca
Source: BPESA, 2019
MIR-2019-2020FA grant v2.indd 37 2020/07/14 14:49

38 | 2019/2020 INVEST IN CAPE TOWN
4.1.2 Information Communication Technology
Cape Town is the leading location in the country for technology start-ups and venture capital deals (Price Waterhouse Coopers (PWC)), South African Venture Capital and Private Equity Association (SAVCA, 2015). The City has also been a technology leader in the domains of mobile software, revenue management and payment processes. The value of FDI over the last 10 years in the Software & IT services is R5 324 million (15,7% of total FDI into Cape Town over that period).
According to PWC (2018) 58% of the 742 emerging tech or tech-enabled companies they surveyed as part of their 2015 study, were headquartered in the Western Cape, of which the majority can be assumed to be based in Cape Town. The 2018 Ventureburn Survey (2018) found that 37% of start-ups are based in the Western Cape. The favourable conditions for tech startups in the Western Cape and Cape Town is also reflected in the fact that 52,6% of venture capital deals in 2017 were headquartered in the Province.
Emergence of the ecommerce industry in Cape Town
The ongoing advancement of Information Technology infrastructure and innovative software developments has allowed the e-commerce industry to grow at a rapid pace within the City. Currently Cape Town based companies account for the ten most visited e-commerce websites in the country (Effective Measure, 2014). In an industry that is strongly reliant on supply side factors like the availability of ICT skills, and the prevalence of entrepreneurship, Cape Town has been able to carve out a competitive niche despite having physical access to a much smaller market than the metros in Gauteng. So successful has the City been in carving out this niche, that it is now widely considered to be a tech and e-commerce hub within South Africa.
The diagram overleaf depicts the e-commerce landscape in Cape Town. It distinguishes between companies with a strong e-commerce presence and those which are often referred to as ‘e-tailers,’ companies that would be classified as exclusively e-commerce by Statistics South Africa. While the e-commerce industry could be categorised under the retail sector, its existence and growth is strongly predicated on the broader technology system in Cape Town and as such supporting industries and industry bodies are critical to the e-commerce industries success in the City.
Source: City of Cape Town (2019) adapted from the SAVCA 2018 Venture Capital Survey
Figure 23: Share of venture capital deals headquarters by South African province
Gauteng KwaZulu-Natal Western Cape Rest of SA Non 0 South Africa
32%34,6%
6% 4,3%3% 2,3%3%
6,2%
56%52,6%
60%
50%
40%
30%
20%
10%
0%
2016 2017
MIR-2019-2020FA grant v2.indd 38 2020/07/14 14:49

2019/2020 INVEST IN CAPE TOWN | 39
ONLINE TRAFFIC MARKETING
Quirk, Glow, Liquorice, IncuBeta
LOGISTICS
In-house:• Mr Delivery (Takealot)
Outsourced:• On the dot• RAM• ARAMEX
INDUSTRY BODIES• Cape IT Intiative (Capaciti, Bandwidth Barn)• Silicon Cape• Ecommerce Forum Africa• CodeX• Launch lab
E-COMMERCE AWARDS 2016
TakealotSA’s favourite e-commerewebsite, best mobile store
YuppiechefBest e-commere store, bestshopping process
Diagram 2: The e-commerce ecosystem in Cape Town
SOFTWARE & APP DEVELOPMENT
Fontera, Alacrity, Peruzal, Refresh,Creative Media, Realm Digital
PAYMENTS GATEWAYS
Pay U, Payfast, PayGate, Peach Payments
TRADITIONAL RETAILERS C2C E-COMMERCE
Online classifieds:• Gumtree (1)*• OLX (2)
B2C AND B2B E-COMMERCE
General retail:• Takealot (4&6)†
Clothing and accessories:• Zando (8)• Spree (7)• Superbalist (9)• Ruby Box
E-goods:• Quicket
Niche retail:• Yuppiechef (7)• NetFlorist• Seeds for Africa
Travel and hospitality:• SafariNow• TravelGround• Lekkerslaap
Price comparisons:• Price Check (5)• Travelstart
Companies in Cape Town with a strong e-commerce presence:• Woolworths• Pick n Pay• Clicks
*Numbers in brackets indicate the company’s ranking among the most-visited-e-commerce websites in South Africa.† Prior to the Takealot/Kalahari merger, Kalahari’s website was ranked 4th, and Takealot’s 6th.
Source: City of Cape Town (2019)
Competitive advantages of Cape Town as an IT location
Cape Town represents a number of opportunities and advantages to IT businesses locating in it, including: • The industry is largely supply driven and the availability of ICT skills and, the prevalence of an entrepreneurial culture, are key aspects in this regard.• There is better availability of venture capital in Cape Town (SAVCA, 2015).• There are benefits of agglomeration. Cape Town has established itself as a key technology hub in South Africa with a number of major companies launching their head offices in the City. This is, in turn, attracting other tech companies.• In a highly mobile sector, Cape Town’s natural beauty which allows for a better working environment and lifestyle, is a strong pull factor to skilled employees.• The diverse eco-system of companies across the value chain and, a strong presence of supporting institutions, provide for ease of business operations.
MIR-2019-2020FA grant v2.indd 39 2020/07/14 14:49

40 | 2019/2020 INVEST IN CAPE TOWN
4.2 Financial services
Cape Town’s financial services sector was the largest contributor to GDP in 2018, contributing R43 billion, having grown by 1,3%, on average, over the period 2014 to 2018. A large proportion of private investment and asset management services, as well as insurance and personal service companies are located in Cape Town. Cape Town is emerging as a significant financial services hub in the country.
Top insurance companies such as Old Mutual Africa, Santam, Direct Axis, Metropolitan, and Sanlam are headquartered in Cape Town and renowned investment and financial advisors such as Allan Gray, Price Waterhouse Coopers and Investec are also based in the city.
Five major South African banks (First National Bank, ABSA, Standard Bank, Nedbank and Capitec) have offices within the city, and have extensive services located throughout the metropolitan.
Cape Town Financial Industry Indicators
Indicators ValueGVA (R‘000) (2018) R 43 112 946Contribution to GVA of national finance industry (2018) 13%Average annual growth rate (2014 – 2018) 1,3%Inward FDI into Cape Town’s financial services (number of projects) (2009-2018) 17 projectsFormal employment (Finance sector) (2018) 58 356Cape Town’s % of total national employment in the finance sector (2018) 16%
Sources:IHS Markit (2019), FDI Intelligence (2019)
MIR-2019-2020FA grant v2.indd 40 2020/07/14 14:49

2019/2020 INVEST IN CAPE TOWN | 41
4.3 Film and Multimedia
Cape Town is an internationally competitive film and media destination, with a growing number of international film makers making use of the destination’s locations, facilities and services.
During 2018 City of Cape Town in partnership with the Cape Town film and media industry launched Film Cape Town to promote the City as a premier film and media destination while also providing prospective clients with tools to make their production in Cape Town a success.
It is premised on providing destination marketing support to the Cape Town film and media industry and being a catalyst for growth of the local industry. This would go hand-in-hand with driving transformation for a more inclusive and demographically representative industry, adopting more water-wise methods for productions taking into account residents and the environment.
Members of the film industry committed to these principles by signing a pledge which would be the guideline for the Cape Town market. The pledge is aimed at creating an industry community where competition is encouraged and bigger production companies are able to lend a helping hand to young filmmakers.
The City has a variety of world-class locations, studios, facilitation companies and specialised crew. In addition to being the country’s leading feature film production destination, Cape Town is also South Africa’s ‘new media’ hub, with 57% of all South African gaming studios being located in the City as well as a large proportion of the country’s animation studios. There are approximately 5 000 identified City of Cape Town locations (Wesgro, 2016) and countless privately owned locations available to the Film and Media Sector. These locations vary from city centre locations to mountainous and nature based locations, providing flexibility for filmmakers wishing to shoot a multitude of locations in one destination.
A number of architectural styles also exist in the City. The Cape Town International Convention Centre (CTICC) – which expanded in 2018 - the Cape Town Stadium, and Cape Town Civic Centre are all popular locations. The V&A Waterfront has its own permit office. Cape Nature and SANParks locations are also in close proximity to the City. Between 2017 and 2018, a total of 11 377 locations were booked with 7 061 location permits issued during the period. The number of permits issued on an annual basis in Cape Town puts the city on track with the number of permits issued in other major film destinations like Toronto.
2019/2020 INVEST IN CAPE TOWN | 41
MIR-2019-2020FA grant v2.indd 41 2020/07/14 14:49
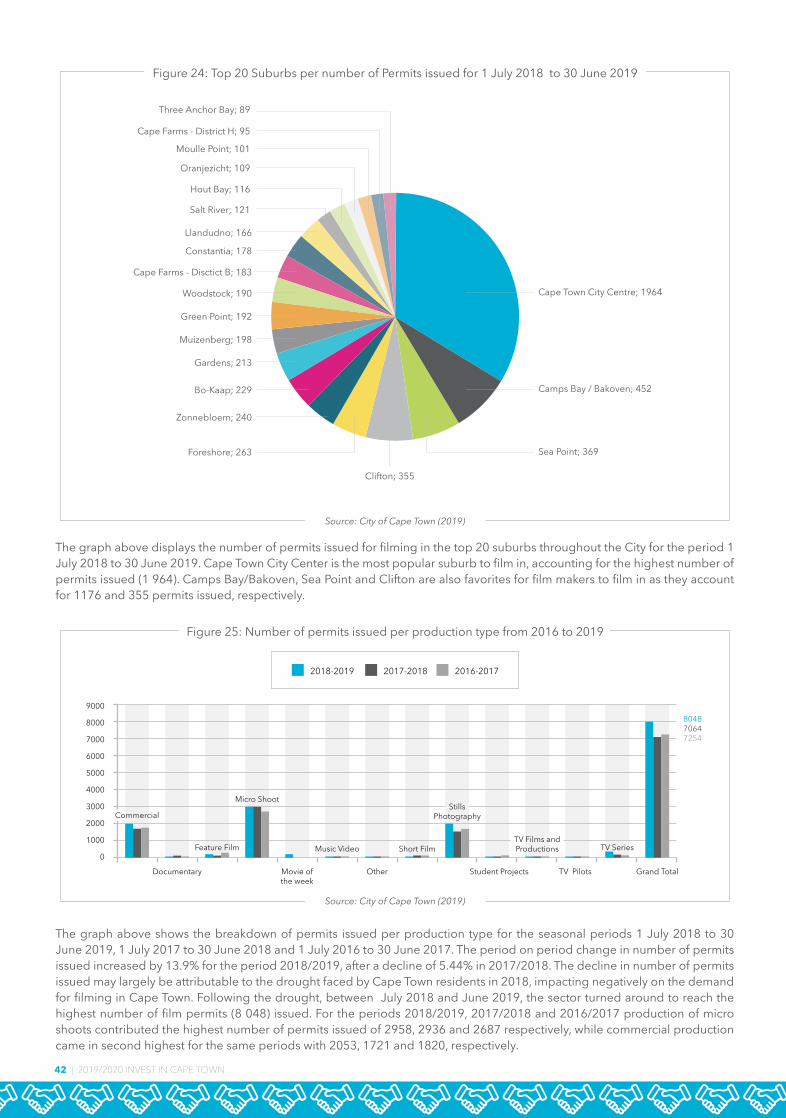
42 | 2019/2020 INVEST IN CAPE TOWN
Oranjezicht; 109
Moulle Point; 101
Cape Farms - District H; 95
Hout Bay; 116
Salt River; 121
Llandudno; 166
Constantia; 178
Cape Farms - Disctict B; 183
Woodstock; 190
Green Point; 192
Muizenberg; 198
Gardens; 213
Bo-Kaap; 229
Zonnebloem; 240
Foreshore; 263
Cape Town City Centre; 1964
Camps Bay / Bakoven; 452
Sea Point; 369
Clifton; 355
Three Anchor Bay; 89
Source: City of Cape Town (2019)
Figure 24: Top 20 Suburbs per number of Permits issued for 1 July 2018 to 30 June 2019
Source: City of Cape Town (2019)
Figure 25: Number of permits issued per production type from 2016 to 2019
2018-2019 2017-2018 2016-2017
Feature Film
Movie ofthe week
Other
TV Series
Documentary
Micro Shoot
Music Video Short Film
Student Projects TV Pilots Grand Total
TV Films andProductions
CommercialStills
Photography
804870647254
9000
8000
7000
6000
5000
4000
3000
2000
1000
0
The graph above displays the number of permits issued for filming in the top 20 suburbs throughout the City for the period 1 July 2018 to 30 June 2019. Cape Town City Center is the most popular suburb to film in, accounting for the highest number of permits issued (1 964). Camps Bay/Bakoven, Sea Point and Clifton are also favorites for film makers to film in as they account for 1176 and 355 permits issued, respectively.
The graph above shows the breakdown of permits issued per production type for the seasonal periods 1 July 2018 to 30 June 2019, 1 July 2017 to 30 June 2018 and 1 July 2016 to 30 June 2017. The period on period change in number of permits issued increased by 13.9% for the period 2018/2019, after a decline of 5.44% in 2017/2018. The decline in number of permits issued may largely be attributable to the drought faced by Cape Town residents in 2018, impacting negatively on the demand for filming in Cape Town. Following the drought, between July 2018 and June 2019, the sector turned around to reach the highest number of film permits (8 048) issued. For the periods 2018/2019, 2017/2018 and 2016/2017 production of micro shoots contributed the highest number of permits issued of 2958, 2936 and 2687 respectively, while commercial production came in second highest for the same periods with 2053, 1721 and 1820, respectively.
MIR-2019-2020FA grant v2.indd 42 2020/07/14 14:49

2019/2020 INVEST IN CAPE TOWN | 43
While Cape Town has always been a relatively popular shooting location for feature films, the development of the Cape Town Film Studios (CTFS) served as the catalyst for the change in perceptions about Cape Town as a film destination. This in turn, gained the confidence of the international industry which has led to numerous high profile international productions being shot at the studio. In the past five years, the CTFS has hosted more than 20 productions (refer to the table below), creating approximately 70 000 annualised Full Time Equivalent (“FTE”) jobs (CTFS, 2016).
Foreign Production South African Production Company Production Year Company
Black Sails Season 1, 2,3,4 Platinum Dunes, Starz Entertainment, Quaker Moving Pictures Film Afrika 2012-2016Darktowers : Gunslinger Sony Pictures Entertainment, Media Rights Capital, Imagine Entertainment, Weed Road Pictures Moonlighting 2016The Empty Man Twentieth Century Fox , Boom! Studios Out of Africa 2016Blood Drive NBC Universal, Universal Cable Productions, Strong & Dobbs Productions -Syfy Channel Film Afrika 2014Love Jacked Inner City Films, Butinox Spier Films 2016Tomb Raider MGM Moonlighting 2016Outlander Sony Pictures Television, Left Bank Pictures Film Afrika 2016-2017Deep Blue Sea 2 Warner Brothers, Syfy Channel Film Afrika 2017Escape Room 1 & 2 Columbia Pictures, Original Film Moonlighting 2017 & 2019Red Sea Diving Resort Bron Studios, EMJAG Productions Out of Africa 2017Samson The Movie Pure Flix Entertainment Fabulous Boomtown Boys 2017Warrior Season 1 and 2 HBO Moonlighting 2017-2019Origin Google, Youtube Red, Left Bank Pictures Moonlighting 2018Doctor Who BBC Out of Africa 2018Good Omens Amazon Studios, BBC Studios, BBC Worldwide. Blank Coropation Out of Africa 2018Bloodshot Sony Pictures Entertainment Moonlighting 2018Monster Hunter Capcom Company, Impact Pictures Moonlighting 2018Inside Man 2 Universal Pictures Moonlighting 2017Raised by Wolves Scott Free Productions Film Afrika 2018-2019Poppie Nongena Helena Spring 2018Riding with Sugar Helena Spring 2018Jim Button Malao Film, Rat Pack Filmproduktion, Studio Babelsberg, Warner Bros Moonlighting 2018Vagrant Queen Blue Ice Pictures Blue Ice Films 2019The Watch Film Afrika 2019Deep Blue Sea 3 Film Afrika 2019
Source: Cape Town Film Studio, 2019
Sources: City of Cape Town (2019), NFVF (2019) and Wesgro (2019)
Key Indicators for the Film and Media Industry in Cape Town
Indicators ValueImpact of the Film and Media Industry on Cape Town’s EconomyCape Town Film and Media GVA (direct) R1 375 millionCape Film and Media GGP (direct & indirect) R2 632 millionDirect jobs (FTE) in Film and Media in Cape Town 6 550Total jobs (FTE) in Film and Media in Cape Town 9 490Inward FDI into Cape Town Film sector (2003-2016) 3 projects valued ZAR2.1 billion (94% of SA cities)
General statistics for the Film and Media Industry in Cape TownCape Town gaming studio (2017) 17 studios (57% of SA)Cape Town co-productions projects (2010-2014) 18.5 co-productions (55% of SA cities)Number of registered production companies in SA 150Number of Screens in South Africa +-800 screens available over 125 cinemas
MIR-2019-2020FA grant v2.indd 43 2020/07/14 14:49

44 | 2019/2020 INVEST IN CAPE TOWN
Competitive advantages of the Film and Media Industry in Cape Town
• Cape Town has the lowest annual operating costs when benchmarked against other film cities such as Auckland, Madrid, Rio de Janeiro, Beijing, London, New York, Paris and Toronto (FDI Benchmark, 2018).• South Africa has 9 co-production treaties with Germany, United Kingdom, Canada, Italy, New Zealand, Australia, France, Netherlands and Ireland. Germany has been the leading co- producing partner.• Cape Town Film Studios has been rated as the best film studio complex of its kind, in the developing world by international production executives (CTFS 2017).• The film industry has local skills across facilitation, production, technical services and the creative arena boasting over 2 500 direct service providers. • The industry is further supported by select film and media education and training institutions located in the Cape Town. These include Big Fish School
of Digital Filmmaking, the University of Cape Town Film and Media Department, AFDA, City Varsity, Red and Yellow, AAA Cape Town, Vega, The Animation School, SAE and False Bay College to name a few
• The City’s expanding broadband infrastructure will gradually remove internet connectivity constraints sometimes faced by the industry.
The list below shows the commercials that were shot in Cape Town.
Commercials Shot at CTFS/Good Hope Centre
Source: Wesgro, 2019
Commercial Name Production CompanySky The Farm ProductionsCell C Egg FilmsCell C Film MachineFacebook Platypus ProductionsCastle Lite Plank FilmsNetflix AFS ProductionsHenkel Giant FilmsE-Trader AFS ProductionsEsprit Cape DirectATU Cyclone FilmsKohl Monkey FilmsKubus Atomic PicturesSears Moonlighting FilmsMaltina Cab FilmsKohls Summer Monkey FilmsVW Amarok Velocity FilmsSky Vodka Egg FilmsCelebrex AFS ProductionsDHL Egg FilmsGlow Exite WishbonesNissan Leaf Farm FilmsIBM Gatehouse CommercialsCTM Moonlighting CommercialHeineken Monkey FilmsKlipdrift Carbon FilmsLoveables Navigator FilmsRenault Lobster TreeTangerine Moonlighting CommercialRight to play Moonlighting CommercialGlo commercial x2 WishbonesGatehouse EmiratesThe Lifesaver CV AfricaMTN Darling FilmsSoweto 1960 Kinder Joy Atomik PicturesNaai is n lekker ding Orange FilmsInstaslave Stories Moonlighting Commercial
MIR-2019-2020FA grant v2.indd 44 2020/07/14 14:49
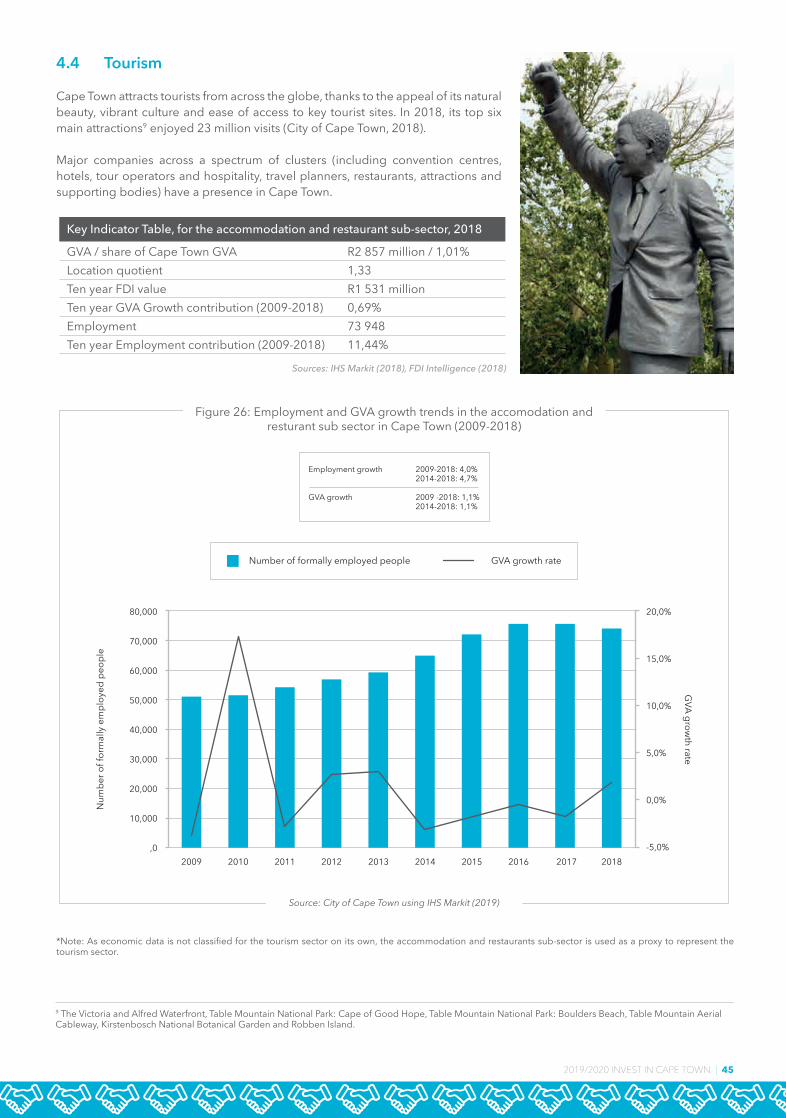
2019/2020 INVEST IN CAPE TOWN | 45
4.4 Tourism
Cape Town attracts tourists from across the globe, thanks to the appeal of its natural beauty, vibrant culture and ease of access to key tourist sites. In 2018, its top six main attractions9 enjoyed 23 million visits (City of Cape Town, 2018).
Major companies across a spectrum of clusters (including convention centres, hotels, tour operators and hospitality, travel planners, restaurants, attractions and supporting bodies) have a presence in Cape Town.
Key Indicator Table, for the accommodation and restaurant sub-sector, 2018
GVA / share of Cape Town GVA R2 857 million / 1,01%Location quotient 1,33Ten year FDI value R1 531 millionTen year GVA Growth contribution (2009-2018) 0,69%Employment 73 948Ten year Employment contribution (2009-2018) 11,44%
2009 2010 2011 2012 2013 2014 2015 2016 20182017
80,000
70,000
60,000
50,000
40,000
30,000
20,000
10,000
,0
20,0%
15,0%
10,0%
5,0%
0,0%
-5,0%
GVA grow
th rateN
umbe
r of f
orm
ally
em
ploy
ed p
eopl
e
Source: City of Cape Town using IHS Markit (2019)
Figure 26: Employment and GVA growth trends in the accomodation andresturant sub sector in Cape Town (2009-2018)
Employment growth 2009-2018: 4,0% 2014-2018: 4,7%
GVA growth 2009 -2018: 1,1% 2014-2018: 1,1%
Number of formally employed people GVA growth rate
9 The Victoria and Alfred Waterfront, Table Mountain National Park: Cape of Good Hope, Table Mountain National Park: Boulders Beach, Table Mountain Aerial Cableway, Kirstenbosch National Botanical Garden and Robben Island.
*Note: As economic data is not classified for the tourism sector on its own, the accommodation and restaurants sub-sector is used as a proxy to represent the tourism sector.
Sources: IHS Markit (2018), FDI Intelligence (2018)
MIR-2019-2020FA grant v2.indd 45 2020/07/14 14:49
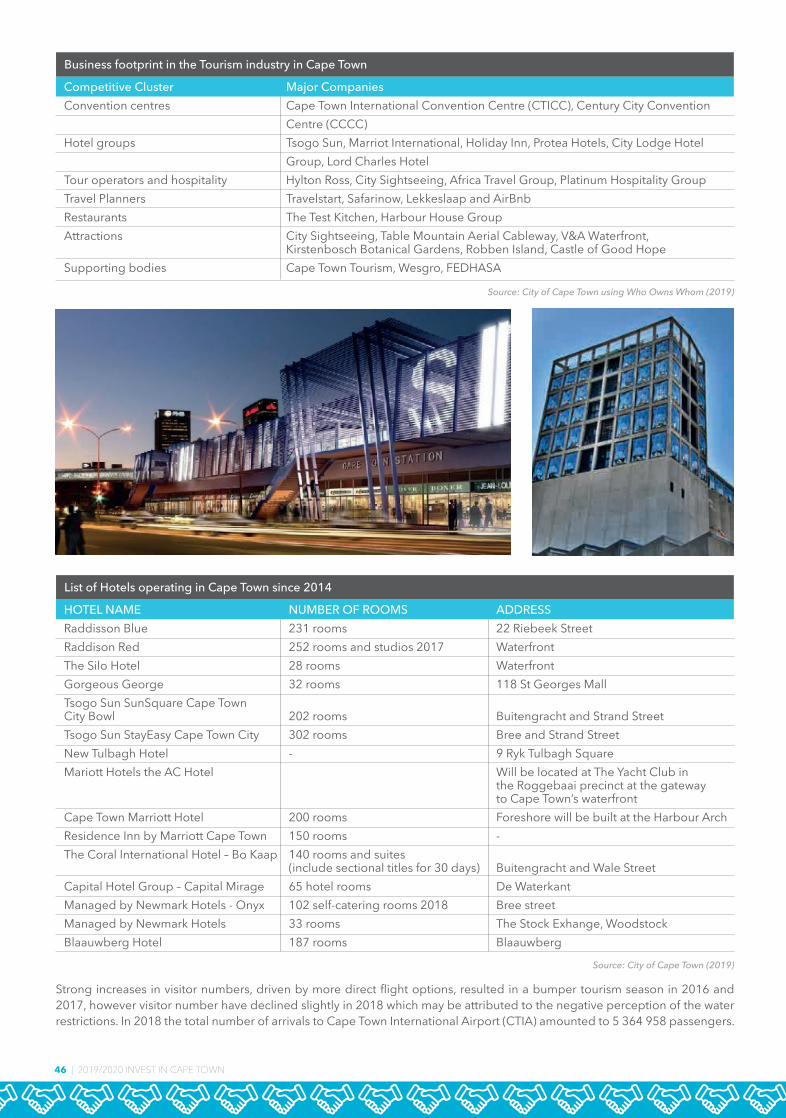
46 | 2019/2020 INVEST IN CAPE TOWN
Business footprint in the Tourism industry in Cape Town
List of Hotels operating in Cape Town since 2014
Competitive Cluster Major CompaniesConvention centres Cape Town International Convention Centre (CTICC), Century City Convention Centre (CCCC)Hotel groups Tsogo Sun, Marriot International, Holiday Inn, Protea Hotels, City Lodge Hotel Group, Lord Charles HotelTour operators and hospitality Hylton Ross, City Sightseeing, Africa Travel Group, Platinum Hospitality GroupTravel Planners Travelstart, Safarinow, Lekkeslaap and AirBnbRestaurants The Test Kitchen, Harbour House Group Attractions City Sightseeing, Table Mountain Aerial Cableway, V&A Waterfront, Kirstenbosch Botanical Gardens, Robben Island, Castle of Good HopeSupporting bodies Cape Town Tourism, Wesgro, FEDHASA
HOTEL NAME NUMBER OF ROOMS ADDRESSRaddisson Blue 231 rooms 22 Riebeek StreetRaddison Red 252 rooms and studios 2017 WaterfrontThe Silo Hotel 28 rooms WaterfrontGorgeous George 32 rooms 118 St Georges MallTsogo Sun SunSquare Cape TownCity Bowl 202 rooms Buitengracht and Strand StreetTsogo Sun StayEasy Cape Town City 302 rooms Bree and Strand StreetNew Tulbagh Hotel - 9 Ryk Tulbagh SquareMariott Hotels the AC Hotel Will be located at The Yacht Club in the Roggebaai precinct at the gateway to Cape Town’s waterfrontCape Town Marriott Hotel 200 rooms Foreshore will be built at the Harbour ArchResidence Inn by Marriott Cape Town 150 rooms -The Coral International Hotel – Bo Kaap 140 rooms and suites (include sectional titles for 30 days) Buitengracht and Wale StreetCapital Hotel Group – Capital Mirage 65 hotel rooms De WaterkantManaged by Newmark Hotels - Onyx 102 self-catering rooms 2018 Bree streetManaged by Newmark Hotels 33 rooms The Stock Exhange, WoodstockBlaauwberg Hotel 187 rooms Blaauwberg
Source: City of Cape Town using Who Owns Whom (2019)
Source: City of Cape Town (2019)
Strong increases in visitor numbers, driven by more direct flight options, resulted in a bumper tourism season in 2016 and 2017, however visitor number have declined slightly in 2018 which may be attributed to the negative perception of the water restrictions. In 2018 the total number of arrivals to Cape Town International Airport (CTIA) amounted to 5 364 958 passengers.
MIR-2019-2020FA grant v2.indd 46 2020/07/14 14:49

2019/2020 INVEST IN CAPE TOWN | 47
Tourism Indicators, 2017
Foreign Arrivals Source ValueTotal Foreign Arrivals to South Africa Cape Town Tourism 10 285 197Share of Foreign Arrivals to the Western Cape Cape Town Tourism 16,8%Number of Foreign Arrivals to the Western Cape Cape Town Tourism 1 727 913Share of Foreign Arrivals to Cape Town Cape Town Tourism 95,8%Number of Foreign Arrivals to Cape Town Cape Town Tourism 1 655 341Domestic Tourism Overnight Trips ValueTotal number of domestic trips taken in South Africa Cape Town Tourism 17 168 000Share of domestic trips taken to the Western Cape Cape Town Tourism 8,5%Number of domestic trips taken to the Western Cape Cape Town Tourism 1 463 000Share of domestic trips taken to Cape Town Cape Town Tourism 32,0%Number of domestic trips taken to Cape Town Cape Town Tourism 468 160
Source: Cape Town Tourism, 2019, I and M Futureneer Advisor Pty Ltd 2019
The graph below shows Cape Town’s occupancy rates for the period July 2018 to June 2019. Between November 2018 and January 2020 the district witnessed a declined in the occupancy rate. According to Cape Tourism this can be attributed to a number of factors which include an oversupply of rooms, safety concerns and perceived political instability.
90%
89%
70%
60%
50%
40%
30%
20%
10%
0%Jul-18 Aug-18 Sep-18 Oct-18 Jul-18 Nov-18 Jan-19 Feb-19 Mar-19 Apr-19 May-19 Jun-19
50,6%56,7%
63,60% 68,5%
76,10%69,10% 66,10%
77,90%71,90%
60,8%53,0%
51,3%
5,4%
12,1%12,2%
7,7%11,1%
-9,2% -4,3%
17,9%-7,7%
-15,4%
-12,8% -3,2%
Source: Cape Town Tourism (2019)
Figure 27: Occupancy Rate Performance in Cape Town
Average Occupancy Rate % Growth
MIR-2019-2020FA grant v2.indd 47 2020/07/14 14:49

48 | 2019/2020 INVEST IN CAPE TOWN
www.atlantissez.com
The Atlantis Special Economic Zone (SEZ) for Green Technologies is located on the West Coast of South Africa, in the Cape Town Metro. The zone is dedicated to the manufacturing and provision of services in the green tech space. Wind turbines, solar panels, insulation, biofuels, electric vehicles, materials recycling and green building materials are examples of green tech that are welcomed.
If you are a manufacturer, service provider or supplier to green tech value chains, the SEZ may be a great place to locate. It offers the benefits of co-location, access to strong markets, a development-ready area, great support and incentives, and an attractive skills base to recruit from.
A great location for green tech manufacturing
To find our more, contact Jarrod Lyons, Investment Facilitator, [email protected].
3157 ATLANTIS Advertorial final.indd 1 2020/05/14 09:10
The graph below shows the average room rate and RevPAR10 performance in Cape Town for the period July 2018 to June 2019.
Competitive advantages for the Tourism industry in Cape Town
• Cape Town has a natural scenic appeal, in part owing to it having Table Mountain, one of the new seven Wonders of Nature.• The City has received numerous accolades since 2011, as showcased in Section 3. • The natural attractions of Cape Town contribute to the City being viewed as a destination where tourists do not have to spend a lot of money to have a good holiday.• The City provides first world infrastructure and tourist facilities, including conference facilities.• Cape Town has the country’s second largest airport, which makes the destination more accessible than others in Africa.• Cape Town’s tourism brand has become self-sustaining, with the City regularly making it onto top ten lists globally. • Some of the best restaurants in the world are located in Cape Town, helping to establish Cape Town as a major gastronomic destination on the continent.• There is a strong perception that Cape Town is a safer travel destination than other cities in the country.• The relatively weak exchange rate also works in favour of international tourists.
10 RevPAR is the Revenue per available room, it is the conceptual link between average occupancy rates and average room rates. It measures the net accommodation revenue per day, per available room.
R2,500
R2,000
R1,500
R1,000
R,500
R,0
Jul-18 Aug-18 Sep-18 Oct-18 Jul-18 Nov-18 Jan-19 Feb-19 Mar-19 Apr-19 May-19 Jun-19
Source: Cape Town Tourism (2019)
Figure 28: Average Room Rate (ARR) and Revenue per Room Performance in Cape Town
Average room rate Revenue per room
MIR-2019-2020FA grant v2.indd 48 2020/07/14 14:49
2019/2020 INVEST IN CAPE TOWN | 49
www.atlantissez.com
The Atlantis Special Economic Zone (SEZ) for Green Technologies is located on the West Coast of South Africa, in the Cape Town Metro. The zone is dedicated to the manufacturing and provision of services in the green tech space. Wind turbines, solar panels, insulation, biofuels, electric vehicles, materials recycling and green building materials are examples of green tech that are welcomed.
If you are a manufacturer, service provider or supplier to green tech value chains, the SEZ may be a great place to locate. It offers the benefits of co-location, access to strong markets, a development-ready area, great support and incentives, and an attractive skills base to recruit from.
A great location for green tech manufacturing
To find our more, contact Jarrod Lyons, Investment Facilitator, [email protected].
3157 ATLANTIS Advertorial final.indd 1 2020/05/14 09:10MIR-2019-2020FA grant v2.indd 49 2020/07/14 14:49

50 | 2019/2020 INVEST IN CAPE TOWN
4.5 Green Technology
South Africa’s utility-scale Renewable Energy Independent Power Producer Procurement Programme (REI4P) is worth R200 billion, with a local content requirement of R67.1 billion (City of Cape Town and GreenCape, 2019). The value of Western Cape REI4P projects is R36.2 billion (ibid). REI4P requirements for local content procurement range between 40-65%, providing significant local manufacturing opportunities (ibid).
Cape Town has positioned itself as the focal point for Green Technology in South Africa, with the successful designation of the Atlantis Special Economic Zone (ASEZ) and its official launch on 6 December 2018 as presided over by the President of South Africa, His Excellency Cyril Ramaphosa. Being located in the Western Cape means Cape Town has access to prime locations, modern infrastructure, a skilled workforce, low operational costs and an abundance of natural resources (GreenCape, 2019a: 44).
A number of Renewable Energy companies have their headquarters in Cape Town across the economic clusters of solar photovoltaic manufacturing, wind turbine-related, electrical manufacturing, fuel supply, professional services and supporting bodies. Foreign direct investment in the renewable energy sector amounted to R5 billion between 2008 and 2017, corresponding to 18 new projects (FDI Intelligence, 2019). This investment came predominantly through the electricity (54,2%), sales, marketing and support (21,4%) and manufacturing (20,6%) sub-sectors, with a marginal share attributable to logistics, distribution and transportation (3,2%) during this period (ibid).
Eletricity54,2%
Manufacturing20,6%
Logistics, Distribution& Transportation
3,2%
Sales, Marketing& Support
21,4%
Source: FDI Intelligence (2019)
Figure 29: FDI inflows into the Renewable Energy Sector between 2008-2017Distinguished by industry activity classification
MIR-2019-2020FA grant v2.indd 50 2020/07/14 14:49

2019/2020 INVEST IN CAPE TOWN | 51
Business footprint in the Renewable Energy industry in Cape Town
Major Companies Solar panels InvertersIBC Solar Jinko solar Siemens Suntech Power Holdings Hanwha SolarOne SMA Solar TechnologySunpower Yingli Solar BonfiglioliExosun SunPower (acquired Tenesol) AEGJinkoSolar Solar Direct MLT DriversSMA Solar Technology SetSolar MicrocareReneSola Canadian Solar TUB Znshine Group Foundations RWW Engineering PROINSO Aveng InvertersFirst Solar Murray and Roberts Siemens TerniEnergia Group 5 SMA Solar TechnologyAEG Power Solutions Trackers BonfiglioliART Solar (Durban) Tenesol AEGIBC Solar/ILB Helios PIA Solar MLT DriversCanadian solar PowerWay Microcare Reutech TUB RWW Engineering Major Companies Turbines BladesJuwi Suzlon Suzlon Wind Prospect Acciona VestasGestamp Renewable Industries (GRI) Sinovel NordexMainstream Renewable Power Vestas SiemensVestas Guodian United Power Towers Nordex Nordex GRI TowersSiemens Siemens Concrete UnitsEnercon Internals CablingResolux Group Resolux ResoluxFoundations Steel Structrures Aveng ArceloMittal (announced closure) Murray and Roberts Group 5 Major CompaniesAdenco Construction E-Lek Engineering Major Companies FFS Refiners Bio Green Major Companies Kaytech (Geotextiles) Skyward (double glazed window & door manufacturer) Major CompaniesMainstream Renewable Power G7 Energies ACWA PowerAfrican Infrastructure InvestmentManagers (AIIM) Windlab Aurora Power SolutionsMulilo Renewable Energy Building Energy AccionaUmoya Energy ACED (African Clean Energy Devn) GlobeleqBioTherm Energy RedCap Scatec Solar Skypower Pele Green Veld Renewables Enel Green Power Innowind GreenCape South African Renewable Energy Business Incubator (SAREBI) Wesgro South African Renewable Energy Technology Centre (SARETEC)
Competitive ClusterSolar photovoltaic manufacturing
Wind turbine-relatedmanufacturing
Electrical manufacturing
Fuel supply
Other green technologies
Professional services
Supporting bodies
Sources: City of Cape Town using FDI Intelligence (2020)
MIR-2019-2020FA grant v2.indd 51 2020/07/14 14:49
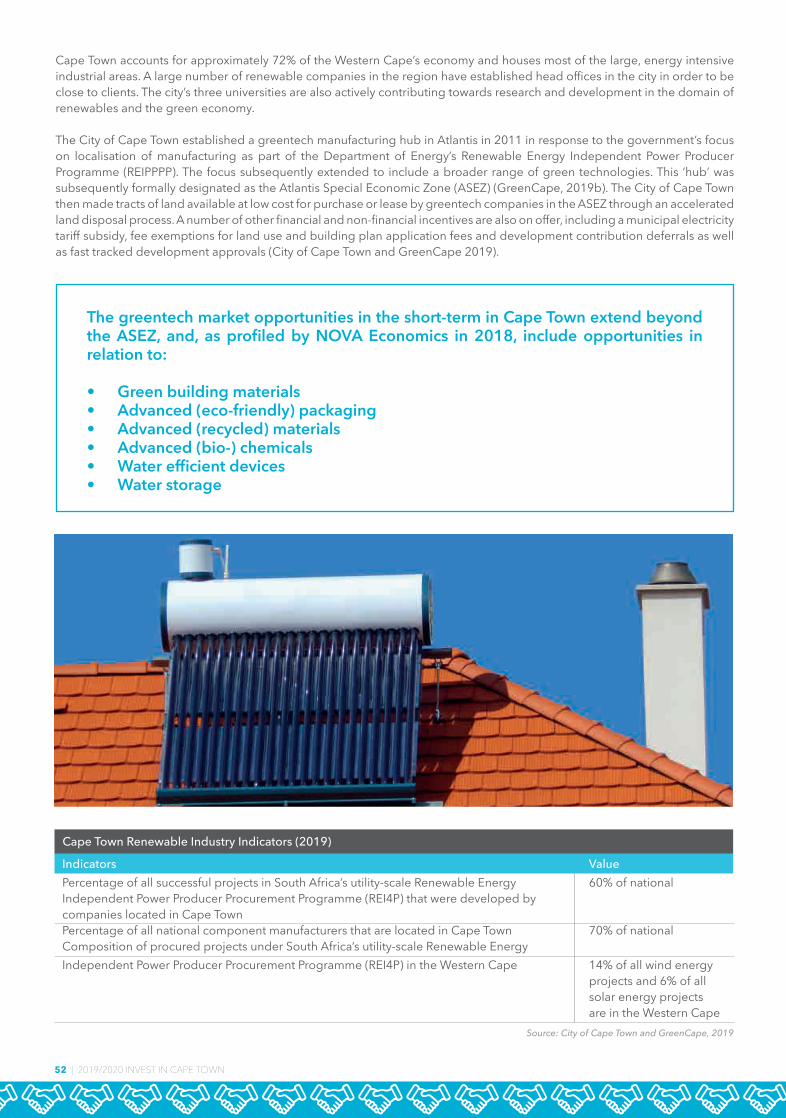
52 | 2019/2020 INVEST IN CAPE TOWN
Cape Town accounts for approximately 72% of the Western Cape’s economy and houses most of the large, energy intensive industrial areas. A large number of renewable companies in the region have established head offices in the city in order to be close to clients. The city’s three universities are also actively contributing towards research and development in the domain of renewables and the green economy.
The City of Cape Town established a greentech manufacturing hub in Atlantis in 2011 in response to the government’s focus on localisation of manufacturing as part of the Department of Energy’s Renewable Energy Independent Power Producer Programme (REIPPPP). The focus subsequently extended to include a broader range of green technologies. This ‘hub’ was subsequently formally designated as the Atlantis Special Economic Zone (ASEZ) (GreenCape, 2019b). The City of Cape Town then made tracts of land available at low cost for purchase or lease by greentech companies in the ASEZ through an accelerated land disposal process. A number of other financial and non-financial incentives are also on offer, including a municipal electricity tariff subsidy, fee exemptions for land use and building plan application fees and development contribution deferrals as well as fast tracked development approvals (City of Cape Town and GreenCape 2019).
Cape Town Renewable Industry Indicators (2019)
Indicators ValuePercentage of all successful projects in South Africa’s utility-scale Renewable Energy 60% of nationalIndependent Power Producer Procurement Programme (REI4P) that were developed by companies located in Cape Town Percentage of all national component manufacturers that are located in Cape Town 70% of nationalComposition of procured projects under South Africa’s utility-scale Renewable Energy Independent Power Producer Procurement Programme (REI4P) in the Western Cape 14% of all wind energy projects and 6% of all solar energy projects are in the Western Cape
Source: City of Cape Town and GreenCape, 2019
The greentech market opportunities in the short-term in Cape Town extend beyond the ASEZ, and, as profiled by NOVA Economics in 2018, include opportunities in relation to:
• Green building materials• Advanced (eco-friendly) packaging• Advanced (recycled) materials• Advanced (bio-) chemicals• Water efficient devices• Water storage
MIR-2019-2020FA grant v2.indd 52 2020/07/14 14:50

2019/2020 INVEST IN CAPE TOWN | 53
Competitive advantages of the Renewable Energy industry in Cape Town
Being located in the Western Cape means that Cape Town forms part of a Province which GreenCape deems ‘Africa’s renewable energy and cleantech hub’ (GreenCape, 2019: 44), with:• A critical mass of renewable component manufacturers and renewable project developers in Cape Town. • Access to funding, with a number of foremost professional servicesandfinancierslocatedinCapeTown.• A concentration of high-skilled talent with four universities with established Research and Development capacity and dedicated streams of study in the realm of the green economy. • An attractive lifestyle appeal which draws and retains high skilled labour.• Notable market opportunities for businesses and investors across the agriculture, energy services, utility scale solar and wind,waste,water,bio-economyandresourceefficiency streams. • An ease of doing business, with the City of Cape Town leading the national ranks in terms of dealing with construction permits and in providing electricity according to the World Bank’s Doing Business in South Africa publication (World Bank, 2018). • Investment incentives from the City of Cape Town in the Atlantis Green Technology Special Economic Zone. A rollout of these incentives to other industrial areas across the city is under consideration.• Strong and growing South African and African markets for Greentech.• An Innovative Greentech Ecosystem which includes the likes of GreenCapeandscientificknowledgeinstitutionsinthe province.• Investors have access to extensive investment support through the Invest SA One Stop Shop, Wesgro, GreenCape and the City ofCapeTown’sInvestmentFacilitationOffices.
2019/2020 INVEST IN CAPE TOWN | 53
MIR-2019-2020FA grant v2.indd 53 2020/07/14 14:50

54 | 2019/2020 INVEST IN CAPE TOWN
STREAMLINEDINVESTMENT SERVICES
Welcome to the InvestSA One Stop ShopThanks to the InvestSA One Stop Shop (OSS) it’s never been easier or faster to invest in Cape Town, the Western Cape and South Africa.
The OSS cuts through red tape and streamlines the investment value chain for medium to large sized companies looking to invest in South Africa.
Making business a pleasure in South AfricaFor the ease and convenience of doing business, the OSS is located in one building. Which means we act as your centralised contact point, as opposed to you dealing with a multitude of government departments in different locations. The OSS has made great strides in fostering a better business environment in Cape Town and the Western Cape, helping to make the investment process here as seamless as possible.
Investment facilitation servicesThe OSS acts as your investment home away from home by facilitating meetings with governmental stakeholders and providing access to investor resources. Further to this it also offers:
• The provision of facilities and departmental representatives to assist investors with business registration
• Intellectual property protection, applications for national and local incentives, applications for work visas
• Temporary and permanent residence, registration for tax purposes, and any other regulatory requirements (licenses, authorisations, registrations, etc.) to do business in South Africa and the Western Cape.
• A front desk, centre manager and office management service.
• High-end, accessible facilities where investors can meet relevant stakeholders to discuss investment opportunities and plans.
• Information on trade and investment in the Western Cape, South Africa and Africa.
• A lead-tracking system to ensure that prospective investors receive quality services until their respective projects reach the point of commercialisation.
• An entry point for investors in need of regulatory compliance.
• The provision of pre-approval information to investors (i.e. market data, costs, incentives, project approval, visits, local partners, etc.)
• The provision of facilitation services to investors (i.e. permits, approvals, import equipment & raw materials, work permits, etc.)
• Incentive facilitation.
• Participation in regulatory reform.
• A collaborative interface between senior-level government agents and investors.
Contact UsFor more seamless investment help, contact:
[email protected] • 021 023 090046 Street Georges Mall, Cape Sun Corner, Strand Street 8001
2701 InvestSA AD.indd 1 2019/02/19 2:17 PMMIR-2019-2020FA grant v2.indd 54 2020/07/14 14:50
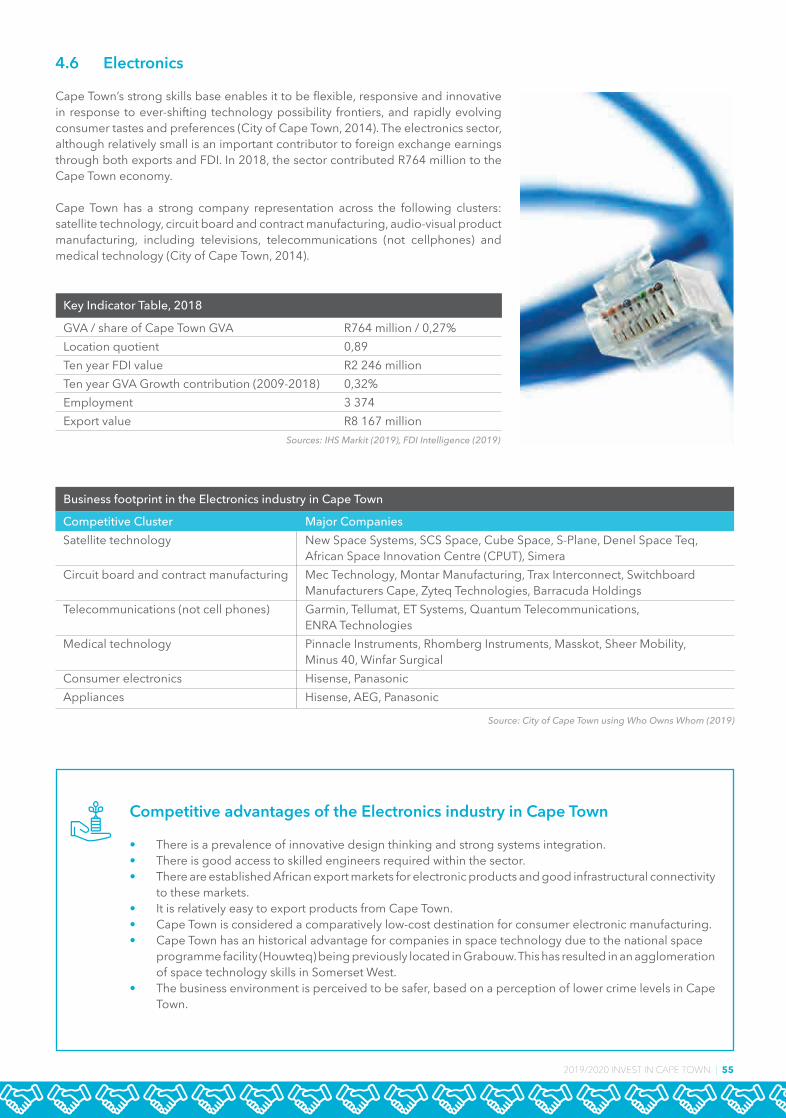
2019/2020 INVEST IN CAPE TOWN | 55
4.6 Electronics
Cape Town’s strong skills base enables it to be flexible, responsive and innovative in response to ever-shifting technology possibility frontiers, and rapidly evolving consumer tastes and preferences (City of Cape Town, 2014). The electronics sector, although relatively small is an important contributor to foreign exchange earnings through both exports and FDI. In 2018, the sector contributed R764 million to the Cape Town economy.
Cape Town has a strong company representation across the following clusters: satellite technology, circuit board and contract manufacturing, audio-visual product manufacturing, including televisions, telecommunications (not cellphones) and medical technology (City of Cape Town, 2014).
Competitive advantages of the Electronics industry in Cape Town
• There is a prevalence of innovative design thinking and strong systems integration.• There is good access to skilled engineers required within the sector.• There are established African export markets for electronic products and good infrastructural connectivity to these markets.• It is relatively easy to export products from Cape Town.• Cape Town is considered a comparatively low-cost destination for consumer electronic manufacturing.• Cape Town has an historical advantage for companies in space technology due to the national space programme facility (Houwteq) being previously located in Grabouw. This has resulted in an agglomeration of space technology skills in Somerset West.• The business environment is perceived to be safer, based on a perception of lower crime levels in Cape Town.
STREAMLINEDINVESTMENT SERVICES
Welcome to the InvestSA One Stop ShopThanks to the InvestSA One Stop Shop (OSS) it’s never been easier or faster to invest in Cape Town, the Western Cape and South Africa.
The OSS cuts through red tape and streamlines the investment value chain for medium to large sized companies looking to invest in South Africa.
Making business a pleasure in South AfricaFor the ease and convenience of doing business, the OSS is located in one building. Which means we act as your centralised contact point, as opposed to you dealing with a multitude of government departments in different locations. The OSS has made great strides in fostering a better business environment in Cape Town and the Western Cape, helping to make the investment process here as seamless as possible.
Investment facilitation servicesThe OSS acts as your investment home away from home by facilitating meetings with governmental stakeholders and providing access to investor resources. Further to this it also offers:
• The provision of facilities and departmental representatives to assist investors with business registration
• Intellectual property protection, applications for national and local incentives, applications for work visas
• Temporary and permanent residence, registration for tax purposes, and any other regulatory requirements (licenses, authorisations, registrations, etc.) to do business in South Africa and the Western Cape.
• A front desk, centre manager and office management service.
• High-end, accessible facilities where investors can meet relevant stakeholders to discuss investment opportunities and plans.
• Information on trade and investment in the Western Cape, South Africa and Africa.
• A lead-tracking system to ensure that prospective investors receive quality services until their respective projects reach the point of commercialisation.
• An entry point for investors in need of regulatory compliance.
• The provision of pre-approval information to investors (i.e. market data, costs, incentives, project approval, visits, local partners, etc.)
• The provision of facilitation services to investors (i.e. permits, approvals, import equipment & raw materials, work permits, etc.)
• Incentive facilitation.
• Participation in regulatory reform.
• A collaborative interface between senior-level government agents and investors.
Contact UsFor more seamless investment help, contact:
[email protected] • 021 023 090046 Street Georges Mall, Cape Sun Corner, Strand Street 8001
2701 InvestSA AD.indd 1 2019/02/19 2:17 PM
Business footprint in the Electronics industry in Cape Town
Competitive Cluster Major CompaniesSatellite technology New Space Systems, SCS Space, Cube Space, S-Plane, Denel Space Teq, African Space Innovation Centre (CPUT), SimeraCircuit board and contract manufacturing Mec Technology, Montar Manufacturing, Trax Interconnect, Switchboard Manufacturers Cape, Zyteq Technologies, Barracuda HoldingsTelecommunications (not cell phones) Garmin, Tellumat, ET Systems, Quantum Telecommunications, ENRA TechnologiesMedical technology Pinnacle Instruments, Rhomberg Instruments, Masskot, Sheer Mobility, Minus 40, Winfar SurgicalConsumer electronics Hisense, PanasonicAppliances Hisense, AEG, Panasonic
Source: City of Cape Town using Who Owns Whom (2019)
Key Indicator Table, 2018
GVA / share of Cape Town GVA R764 million / 0,27%Location quotient 0,89Ten year FDI value R2 246 millionTen year GVA Growth contribution (2009-2018) 0,32%Employment 3 374Export value R8 167 million
Sources: IHS Markit (2019), FDI Intelligence (2019)
MIR-2019-2020FA grant v2.indd 55 2020/07/14 14:50

56 | 2019/2020 INVEST IN CAPE TOWN
4.7 Food and Beverages
Cape Town is an established hub for food and beverage manufacturing, boasting some of the country’s largest companies in the sector. The city’s proximity to a vast and productive agricultural hinterland with distinctive agricultural yields (including grapes, deciduous fruits and ostriches), its large international port, a growing consumer population and a relatively strong skills base, makes it a very competitive location in which to base food and beverage manufacturing operations.
The industry is one of the few manufacturing industries in which Cape Town has a positive trade balance and is a very important earner of foreign exchange for the City. Recent growth in food and beverage exports provides reason to believe that the sector is well placed to realise the opportunities presented by growing demand for food and beverage products on the African continent. Cape Town hosts competitive clusters in terms of the manufacture of spice and saucing products,theprocessingoffishproducts,themanufactureofgrainmillproducts(especially cereals), beer brewing and soft drink production.
Food and beverage manufacturing is the largest of Cape Town’s manufacturing industries, contributing 3,88% of Cape Town’s GVA. The industry has a metro location quotient of 1,34, meaning that it is relatively more important to Cape Town’s economy than it is to other metros and can thus be considered a comparative advantage industry for the city.
Key Indicator Table, 2018
GVA / share of Cape Town GVA R11 001 million / 3,88%Location quotient 1,34Ten-year FDI value R824 millionTen-year GVA Growth contribution (2008-2018) 4,48%Employment 60 342Ten-year Employment contribution (2008-2018) 13,41,%Exportvalue(includingfishing) 10209million
Sources: IHS Markit (2019), FDI Intelligence (2019)
MIR-2019-2020FA grant v2.indd 56 2020/07/14 14:50
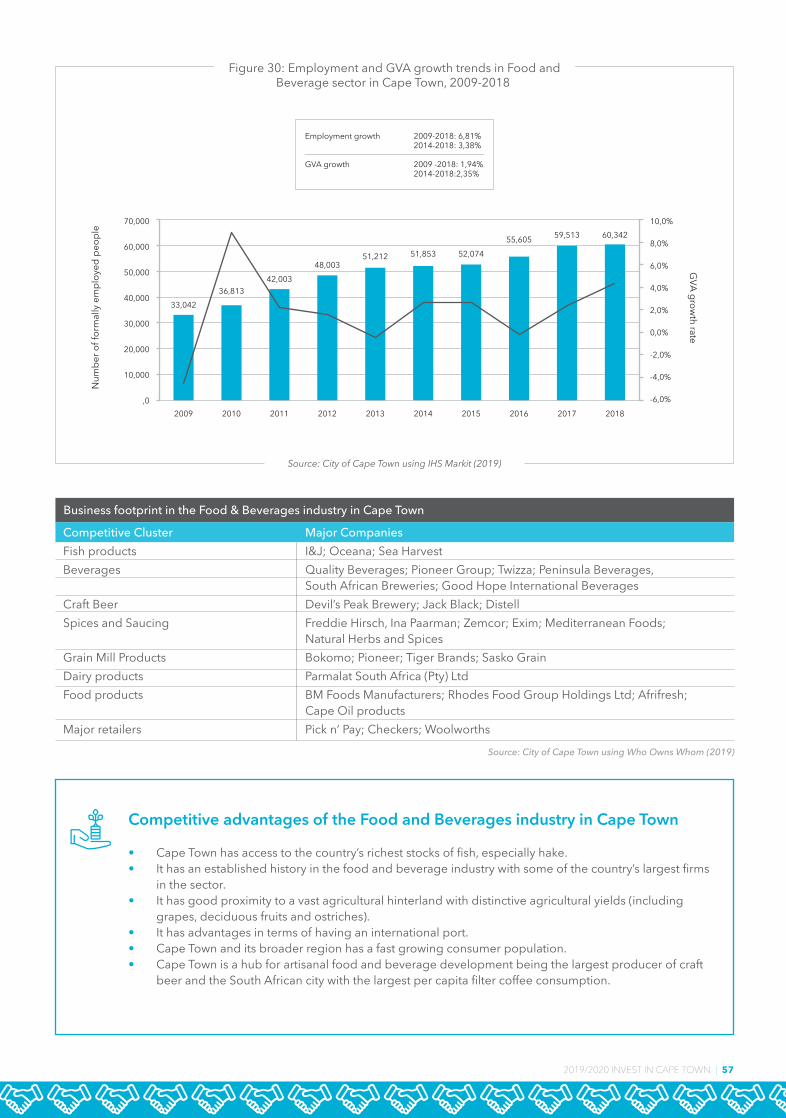
2019/2020 INVEST IN CAPE TOWN | 57
Competitive advantages of the Food and Beverages industry in Cape Town
• Cape Town has access to the country’s richest stocks of fish, especially hake.• It has an established history in the food and beverage industry with some of the country’s largest firms in the sector.• It has good proximity to a vast agricultural hinterland with distinctive agricultural yields (including grapes, deciduous fruits and ostriches).• It has advantages in terms of having an international port.• Cape Town and its broader region has a fast growing consumer population.• Cape Town is a hub for artisanal food and beverage development being the largest producer of craft beer and the South African city with the largest per capita filter coffee consumption.
2009 2010 2011 2012 2013 2014 2015 2016 2017 2018
33,04236,813
42,00348,003
51,212 51,853 52,07455,605 59,513 60,342
70,000
60,000
50,000
40,000
30,000
20,000
10,000
,0
10,0%
8,0%
6,0%
4,0%
2,0%
0,0%
-2,0%
-4,0%
-6,0%
GVA grow
th rateN
umbe
r of f
orm
ally
em
ploy
ed p
eopl
e
Source: City of Cape Town using IHS Markit (2019)
Figure 30: Employment and GVA growth trends in Food andBeverage sector in Cape Town, 2009-2018
Employment growth 2009-2018: 6,81% 2014-2018: 3,38%
GVA growth 2009 -2018: 1,94% 2014-2018:2,35%
Business footprint in the Food & Beverages industry in Cape Town
Competitive Cluster Major CompaniesFish products I&J; Oceana; Sea HarvestBeverages Quality Beverages; Pioneer Group; Twizza; Peninsula Beverages, South African Breweries; Good Hope International BeveragesCraft Beer Devil’s Peak Brewery; Jack Black; DistellSpices and Saucing Freddie Hirsch, Ina Paarman; Zemcor; Exim; Mediterranean Foods; Natural Herbs and SpicesGrain Mill Products Bokomo; Pioneer; Tiger Brands; Sasko GrainDairy products Parmalat South Africa (Pty) LtdFood products BM Foods Manufacturers; Rhodes Food Group Holdings Ltd; Afrifresh; Cape Oil products Major retailers Pick n’ Pay; Checkers; Woolworths
Source: City of Cape Town using Who Owns Whom (2019)
MIR-2019-2020FA grant v2.indd 57 2020/07/14 14:50
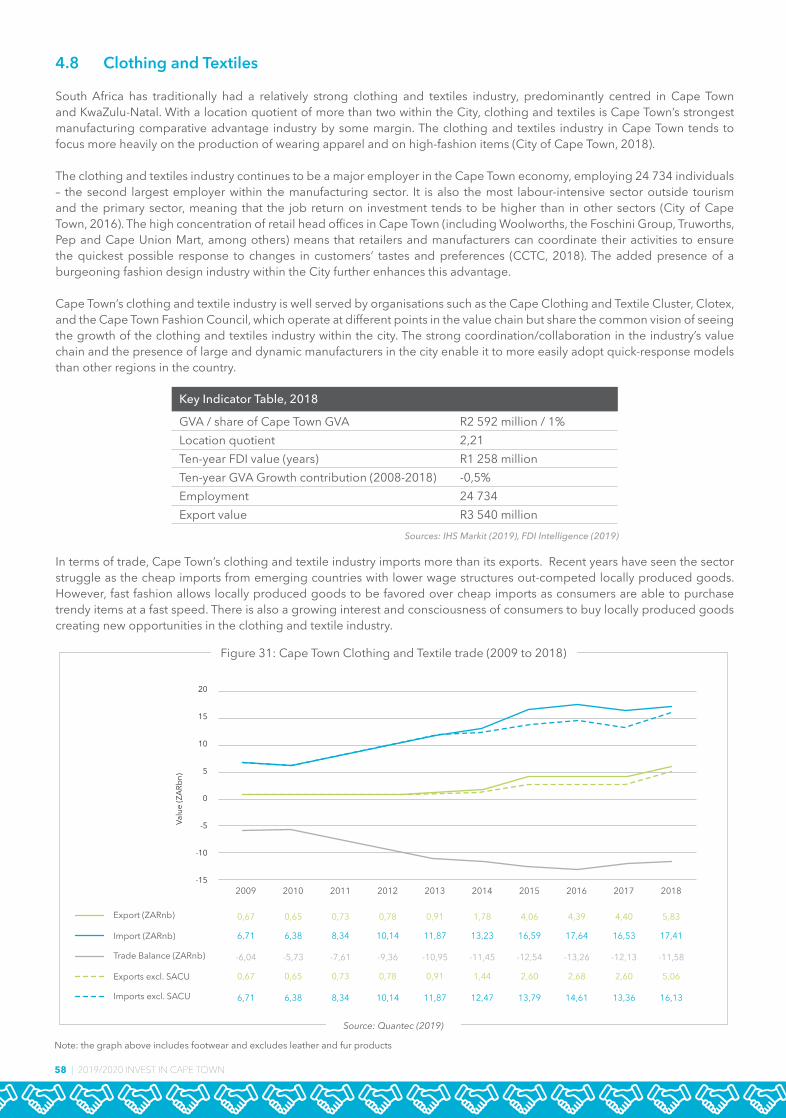
58 | 2019/2020 INVEST IN CAPE TOWN
4.8 Clothing and Textiles
South Africa has traditionally had a relatively strong clothing and textiles industry, predominantly centred in Cape Town and KwaZulu-Natal. With a location quotient of more than two within the City, clothing and textiles is Cape Town’s strongest manufacturing comparative advantage industry by some margin. The clothing and textiles industry in Cape Town tends to focus more heavily on the production of wearing apparel and on high-fashion items (City of Cape Town, 2018).
The clothing and textiles industry continues to be a major employer in the Cape Town economy, employing 24 734 individuals – the second largest employer within the manufacturing sector. It is also the most labour-intensive sector outside tourism and the primary sector, meaning that the job return on investment tends to be higher than in other sectors (City of Cape Town, 2016). The high concentration of retail head offices in Cape Town (including Woolworths, the Foschini Group, Truworths, Pep and Cape Union Mart, among others) means that retailers and manufacturers can coordinate their activities to ensure the quickest possible response to changes in customers’ tastes and preferences (CCTC, 2018). The added presence of a burgeoning fashion design industry within the City further enhances this advantage.
Cape Town’s clothing and textile industry is well served by organisations such as the Cape Clothing and Textile Cluster, Clotex, and the Cape Town Fashion Council, which operate at different points in the value chain but share the common vision of seeing the growth of the clothing and textiles industry within the city. The strong coordination/collaboration in the industry’s value chain and the presence of large and dynamic manufacturers in the city enable it to more easily adopt quick-response models than other regions in the country.
In terms of trade, Cape Town’s clothing and textile industry imports more than its exports. Recent years have seen the sector struggle as the cheap imports from emerging countries with lower wage structures out-competed locally produced goods. However, fast fashion allows locally produced goods to be favored over cheap imports as consumers are able to purchase trendy items at a fast speed. There is also a growing interest and consciousness of consumers to buy locally produced goods creating new opportunities in the clothing and textile industry.
Export (ZARnb)
Import (ZARnb)
Trade Balance (ZARnb)
Imports excl. SACU
Exports excl. SACU
0,67
6,71
-6,04
6,71
0,67
0,65
6,38
-5,73
6,38
0,65
0,73
8,34
-7,61
8,34
0,73
0,78
10,14
-9,36
10,14
0,78
0,91
11,87
-10,95
11,87
0,91
1,78
13,23
-11,45
12,47
1,44
4,06
16,59
-12,54
13,79
2,60
4,39
17,64
-13,26
14,61
2,68
4,40
16,53
-12,13
13,36
2,60
5,83
17,41
-11,58
16,13
5,06
2009 2010 2011 2012 2013 2014 2015 2016 2017 2018
20
15
10
5
0
-5
-10
-15
Valu
e (Z
ARbn
)
Source: Quantec (2019)
Figure 31: Cape Town Clothing and Textile trade (2009 to 2018)
Note: the graph above includes footwear and excludes leather and fur products
Key Indicator Table, 2018
GVA / share of Cape Town GVA R2 592 million / 1%Location quotient 2,21Ten-year FDI value (years) R1 258 millionTen-year GVA Growth contribution (2008-2018) -0,5%Employment 24 734Export value R3 540 million
Sources: IHS Markit (2019), FDI Intelligence (2019)
MIR-2019-2020FA grant v2.indd 58 2020/07/14 14:50

2019/2020 INVEST IN CAPE TOWN | 59
*Note: OTIF (on-time and in-full) is a measure of the efficiency and accuracy of delivery in the supply chain*note: average number of employees at CCTC member firms.
Competitive advantages of the Clothing and Textiles industry in Cape Town
• Its’ proximity in terms of the closeness of major retailers (with head offices in Cape Town) to local designers and manufacturers, creates a vertically integrated value chain which is better able to respond to fast changing fashion trends.• There is a strong tradition of Cut-Make-Trim (CMT)-related skills (especially seamstresses) in Cape Town• The ease of access to the port results in cheaper transportation costs for textile inputs.• The sector is well-organised and supported through a number of government-funded sector bodies.• The Department of Trade and Industry offers incentives and assistance through its Clothing and Textiles Competitiveness Programme and the Competitiveness Improvement Programme.• Cape Town is a design hub, with many of the major fashion designers basing themselves in the city.
The performance indicators for a sample of large clothing and textile manufacturers in the Western Cape (mainly from Cape Town) shown in the table below are evidence that the clothing and textiles industry has gained fresh growth impetus. The im-provement in the process indicators in the latter part of the table go a long way toward explaining why companies in the sector have been able to expand sales and employment creation and reflect concerted effort by the private sector and government to upgrade the competitiveness of the industry’s manufacturing capacity.
Business footprint in the Clothing & Textiles industry in Cape Town
Competitive Cluster Example of major businessesWearing apparel Prestige, K-Way, Pep Clothing, Jacques Hau, (including Cut Make and Trim businesses) Peter Blond, House of Monatic, GL ClothingManufacture of other textiles Falke Eurosocks, Rotex Fabrics, Hextex, Waltex(blankets, carpets, tents, knitted fabrics) Carpets, Cotton Traders, Braitex TensilonDesign Houses YDE; Reliance ClothingRetail The Foschini Group. Woolworths, Truworths, Pep Stores, Cape Union MartSupporting bodies Clotex, Cape Town Fashion Council, Cape Clothing and Textiles Cluster
Performance of the Clothing & Textiles industry in Cape Town (2015-2018)
Unit 2015 2016 2017 2018 Sales Indexed CPI adjusted manufacturing sales 116 127 127 134Employment Number (average) 310,0 334, 334 369Quality Internal rework/repair rate 4,5 4,9 4,0 3,9Reliability Customer OTIF* as a percentage 93,5 92 93,9 93,6Labour Turnover Labour turnover rate (excluding salaried staff) 9,0 8,3 5,6 6,3
Source: City of Cape Town using Who Owns Whom (2019)
MIR-2019-2020FA grant v2.indd 59 2020/07/14 14:50
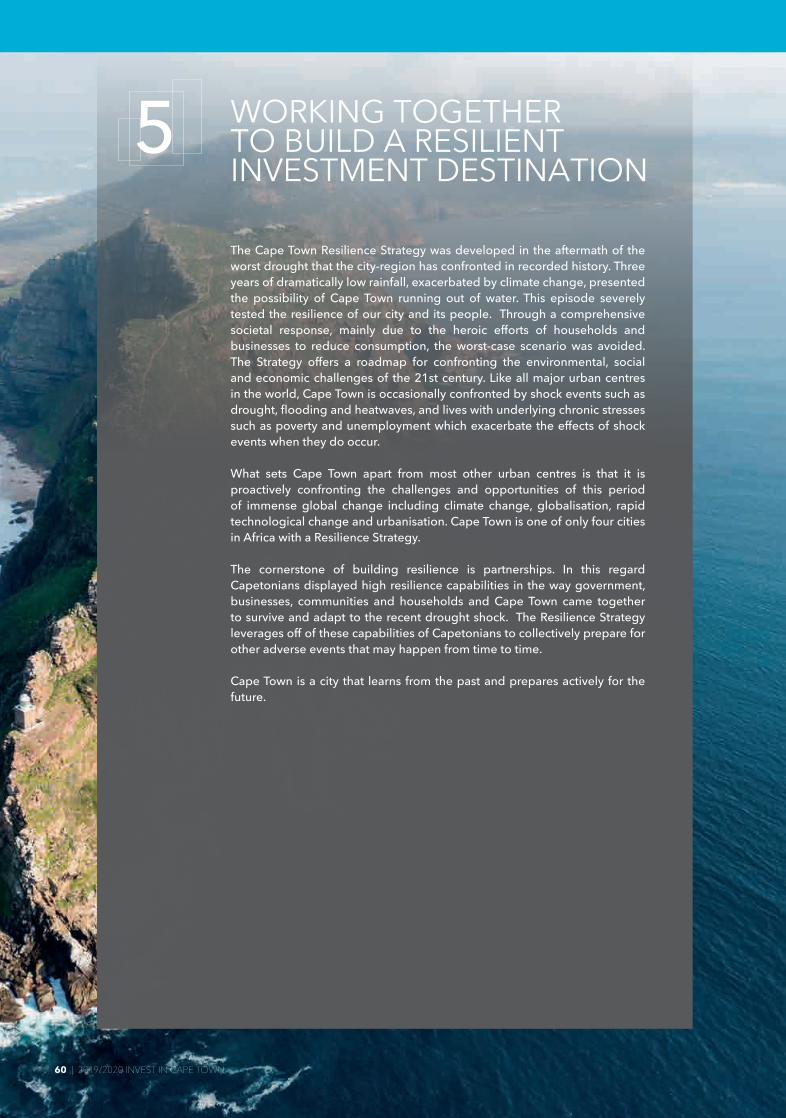
60 | 2019/2020 INVEST IN CAPE TOWN
5 WORKING TOGETHER TO BUILD A RESILIENT INVESTMENT DESTINATION
The Cape Town Resilience Strategy was developed in the aftermath of the worst drought that the city-region has confronted in recorded history. Three years of dramatically low rainfall, exacerbated by climate change, presented the possibility of Cape Town running out of water. This episode severely tested the resilience of our city and its people. Through a comprehensive societal response, mainly due to the heroic efforts of households and businesses to reduce consumption, the worst-case scenario was avoided. The Strategy offers a roadmap for confronting the environmental, social and economic challenges of the 21st century. Like all major urban centres in the world, Cape Town is occasionally confronted by shock events such as drought,floodingandheatwaves,andliveswithunderlyingchronicstressessuch as poverty and unemployment which exacerbate the effects of shock events when they do occur.
What sets Cape Town apart from most other urban centres is that it is proactively confronting the challenges and opportunities of this period of immense global change including climate change, globalisation, rapid technological change and urbanisation. Cape Town is one of only four cities in Africa with a Resilience Strategy.
The cornerstone of building resilience is partnerships. In this regard Capetonians displayed high resilience capabilities in the way government, businesses, communities and households and Cape Town came together to survive and adapt to the recent drought shock. The Resilience Strategy leverages off of these capabilities of Capetonians to collectively prepare for other adverse events that may happen from time to time.
Cape Town is a city that learns from the past and prepares actively for the future.
60 | 2019/2020 INVEST IN CAPE TOWN
MIR-2019-2020FA grant v2.indd 60 2020/07/14 14:50

2019/2020 INVEST IN CAPE TOWN | 61
6 REGULATIONS & LEGISLATION
South Africa actively encourages foreign investment in all sectors of the economy, and there are consequently few restrictions on investment. Factors which potential investors should take into account on exploring investment in the city include:
Company registration and administrationThe six principal methods of doing business in South Africa are registering as a; 1) Company (public or private) incorporated under the Companies Act 71 of 2008, 2) Personal Liability Company,3) Partnership, 4) Business trust, 5) Sole Proprietorship, or 6) External Company (branch of a foreign company).
Duty Drawback Scheme Duty Drawback schemes provide refunds for import duties paid on the materials used in the production of goods that are exported. Drawbacks are administered by the International Trade Administration Commission of South Africa, and manufacturers may apply for refunds after the final product is exported.
Exchange and remittance of fundsExchange controls on South African residents are enforced by the South African Reserve Bank (SARB). Exchange controls are only exercised on residents and the transactions in foreign exchange entered in between non-residents and residents. There are no restrictions on foreign investors to acquire companies or businesses in South Africa, and additionally, the acquisition of shares or introduction of capital does not require SARB approval.
Land and buildings There is no restriction on foreign investors in acquiring property in the country. In order for foreign companies to acquire property, they must register as an external company in terms of the Companies Act 71 of 2008.
Employment and labour relationsThe employment sector within South Africa is regulated by statute, common law and contract. The main legislature regulating the employer/employee relationship can be found on the department of labour website http://www.labour.gov.za/DOL/Foreigners must obtain a work permit before they are legally entitled to work in South Africa.
Taxation and Double Taxation AgreementsSouth Africa has a highly regarded tax system that is over-seen by the South African Revenue Services. The tax system is a residence-based system. Concerning non-residents, they are taxed on their income sourced from South Africa. For a status overview of DTA’s (Double Taxation Agreement) with other nations, visit: www.sars.gov.za
Access to Finance To open a bank account, foreigners must be in the possession of a valid work or residency permit. Additionally, by law banks have to request identity and a proof of residence. The limit placed on borrowing by foreign-owned companies is based on a pre-determined formula. Considering 100% foreign-owned companies, the local borrowing limit is 100% of the effective capital of the South African company.
•
•
•
•
•
•
•
MIR-2019-2020FA grant v2.indd 61 2020/07/14 14:50

62 | 2019/2020 INVEST IN CAPE TOWN
7 ACCESS TO INTERNATIONAL MARKETS
South Africa’s has signed multiple free-trade and bilateral agreements: Southern African Customs Union (SACU), Southern African Development Community (SADC) FTA, Africa Growth and Opportunity Act (AGOA) and the Economic Partnership Agreement (EPA). Available www.thedti,gov.za.
MAIN TRADE AGREEMENTS BETWEEN SOUTH AFRICA AND OTHER COUNTRIES
Southern African Customs Union (SACU)
Southern African Development Community (SADC)
SACU – Economic Partnership Agreement (EPA)
SACU – Southern Common Market (Mercusor)
Customs Union
Free Trade Agreement (FTA)
Free Trade Agreement
Preferential Trade Agreement (PTA) with the aim of becoming a customs union
South Africa, Botswana, Lesotho, Namibia, Swaziland
Angola, Botswana, DRC, Lesotho, Madagascar, Malawi, Mozambique, Mauritius, Namibia, Seychelles, South Africa, Tanzania, Zambia, Zimbabwe and the Comoro.Botswana, Lesotho, Mozambique, Namibia, South Africa and Eswatini. Angola has an option to join the agreement in future
SACU; and Brazil, Argentina, Paraguay and Uruguay
SACU’s objectives include to, inter alia, facilitate cross-border movement of goods between member states; promote integration of member states into the global economy through trade and investment.Market integration accompanied by cross-border infrastructural Swaziland development and sectoral co-operation.
EPA gives asymmetric access to the partners in the SADC-EPA group. The agreement also contains a chapter on sustainable development which covers social and environmental matters.
Promote bilateral trade flows by means of mutual concessions, tariff preferences and other agreed trade conditions by member states. The agreement also aims to strengthen cooperation in the areas of animal health and plant protection, standards, technical regulations and conformity assessment, food safety and mutual recognition of sanitary and phytosanitary measures.
Tariffs have largely been abolished on goods traded between member states, and a common external tariff is applied to imports from third country parties.
Most products
The EU guarantees Botswana, Lesotho, Mozambique, Namibia, and eSwatini 100% free access to its market and has also fully or partially removed customs duties on 98.7% of imports from South Africa.About 1,000 product lines on each side of the border.
Trade Agreement Type of Agreement Participating Nations Main terms Products Involved
MIR-2019-2020FA grant v2.indd 62 2020/07/14 14:50

2019/2020 INVEST IN CAPE TOWN | 63
In addition, South Africa signed DTA with a number of countries to eliminate double taxation. For a list of the double taxation agreements please see the link below: http://www.sars.gov.za/AllDocs/LegalDoclib/Agreements/LAPD-IntA-DTA-2013-01%20-%20Status%20Overview%20of%20All%20DTAs%20and%20Protocols.pdf
Trade Agreement Type of Agreement Participating Nations Main terms Products Involved
Tripartite Free Trade Agreement (T-FTA)
Generalized System of Preferences (GSP)
African Continental Free Agreement Area
LegislationAfrican Growth and Opportunity Act (AGOA)
FTA
Unilateral preferences granted under the enabling clause of the World Trade Organization
FTA
Part of Trade and Development Act (2000)
Member states of Southern African Development Community, East African Community and Common Market for Eastern & Southern Africa
South Africa – EU, Norway, Switzerland, Russia, Turkey, US, Canada and Japan
To date the agreement has been ratified by 28 countries.
US, 39 sub-Saharan African countries (South Africa included)
A tripartite initiative: harmonisation of trade regimes, free movement of business persons, joint implementation of regional infrastructure projects and programmes, development of regional value chains and legal and institutional arrangements for regional cooperation among the 26 member states. A non-reciprocal trade agreement. Preferential market access was granted to South Africa as it is a developing country.
Create a single continental market for goods and services, with free movement of business persons and investments, and thus pave the way for accelerating the establishment of the Customs Union.
Provides duty-free access to 98% of US imports for AGOA members.
Phase 1 covers only trade in goods and core areas necessary to support that.
In the HTSUS, GSP-eligible products are identified by a Special Program Indicator (SPI). The SPI code “A” in the “Special” tariff column next to an HTSUS subheading identifies that the product is GSP-eligible for all BDCs. The code “A+” indicates that the product is eligible only from least-developed BDCs. The code “A*” identifies that the product is not eligible to be imported under the program from one or more BDCs. The SPI must be indicated on the appropriate CBP forms when importers claim duty-free status.Not yet operational as a tariff
Over 7,000 products are covered.
MIR-2019-2020FA grant v2.indd 63 2020/07/14 14:50

64 | 2019/2020 INVEST IN CAPE TOWN
Cape Town aims to position itself as a globally competitive city and considering that numerous cities across the globe utilise incentives to attract investment, the City of Cape Town offers a suite of incentives for new investment and the expansion of existing investment in its key industries and spatial nodes.
The City Council approved the extension of investment incentives in October 2019 to six of Cape Town’s industrial areas, namely:
• Atlantis Industria;• Triangle Farm/Stikland;• Parow Industria;• Sacks Circle;• Lansdowne Industrial; and• Elsies River
8 KEY INCENTIVES
Urban Development Zone (UDZ) tax incentive
City of Cape Town Investment Incentives
To encourage private sector-led residential and commercial development in inner-city areas with developed public transport facilities.
To stimulate job creating investment in either the manufacturing sector or prioritized tertiary sector industries in Cape Town.
Eligibility for the City’s investment incentives depends on investors meeting certain pre-defined criteria as spelt out in the Investment Incentives Policy.
The Urban Development Zone (UDZ) is a tax incentive administered by SARS. The UDZ allows businesses which fall within its area (the demarcations of which are determined by the City) to benefit from significant tax savings for building development.Non-financial incentives include: • Fast-tracked development applications• A dedicated investment facilitation service
Financial incentives include:• Development application fee waivers• Reduced development charges• Special electricity tariff
1
2
Incentive schemes Focus of scheme Nature of incentives
MIR-2019-2020FA grant v2.indd 64 2020/07/14 14:50

2019/2020 INVEST IN CAPE TOWN | 65
The national Department of Trade and Industry (the dti), in collaboration with other public and private sector entities have also developed a number incentive schemes to assist with the growth of certain sectors. These national incentives schemes are listed below.
The scheme seeks to accelerate the quantitative and qualitative increase and participation of Black Industrialists in the national economy, selected industrial sectors and value chains, as reflected by their contribution to growth, investment, exports and employment.Non-profit business organizations in sectors and sub-sectors of industries prioritized by the dti. Manufacturers and other areas of the apparel value chain in South Africa. Personnel Related Costs; Travel Expenses; Direct Material; Capital Items and Tooling; Software; Documentation; Testing and Trials; Licensing Costs; Quality Assurance and Certification; Patent Costs; and Subcontracting and Consulting.Local and foreign-owned manufacturers who wish to establish a new production facility; expand an existing production facility; or upgrade an existing facility in the clothing and textiles sector. Improvement of capital stock in manufacturing sector including tobacco, alcoholic beverages, arms and ammunition, etc. Automotive sector through investment in new and/or replacement models and components.People-carrier vehicles through investment in new and/or replacement models and components.Transport systems, Electricity and distribution systems, Telecommunications systems, Transmission systems, Sewage systems, Waste storage, disposal and treatment systems, Fuel supply systems.Stimulation of investment in aquaculture to increase production, create jobs, encourage geographical spread and broaden participation.Create employment through offshore servicing.Feature films, Telemovies, Television drama series or miniseries, Documentary or documentary miniseries, or documentary feature, Animation, Digital content and Video gaming.Large-budget films and television productions and post-production work.Attract big-budget overseas film and television productions.
1
2
3
45
6
7
8
9
10
11
12
13
14
Incentive scheme Focus of scheme
Black Industrialist Scheme (BIS)
Sector Specific Assistance Scheme (SSAS)
Clothing and Textile Competitiveness Improvement Programme (CTCIP)Support Programme for Industrial Innovation (SPII)
Manufacturing Investment Programme (MIP)
12i Tax Incentive
Automotive Investment Scheme (AIS)
People-carrier Automotive Investment Scheme (P-AIS)
Critical Infrastructure Programme (CIP)
Aquaculture Development and Enhancement Programme (ADEP)
Business Growth ServicesSouth Africa Film and Television Production and Co-production Incentive
Foreign Film and Television production and Post-production IncentiveThe Location Film and Television Production Incentive
Source: the dti, 2019
“I am proud that these incentives add another real mechanism to ensure Cape Town remains regionally and globally competitive, can attract more investment and increase job creation in the metro.”
Ald James Vos, Mayoral Committee Member for Economic Opportunities and Asset Management
MIR-2019-2020FA grant v2.indd 65 2020/07/14 14:50
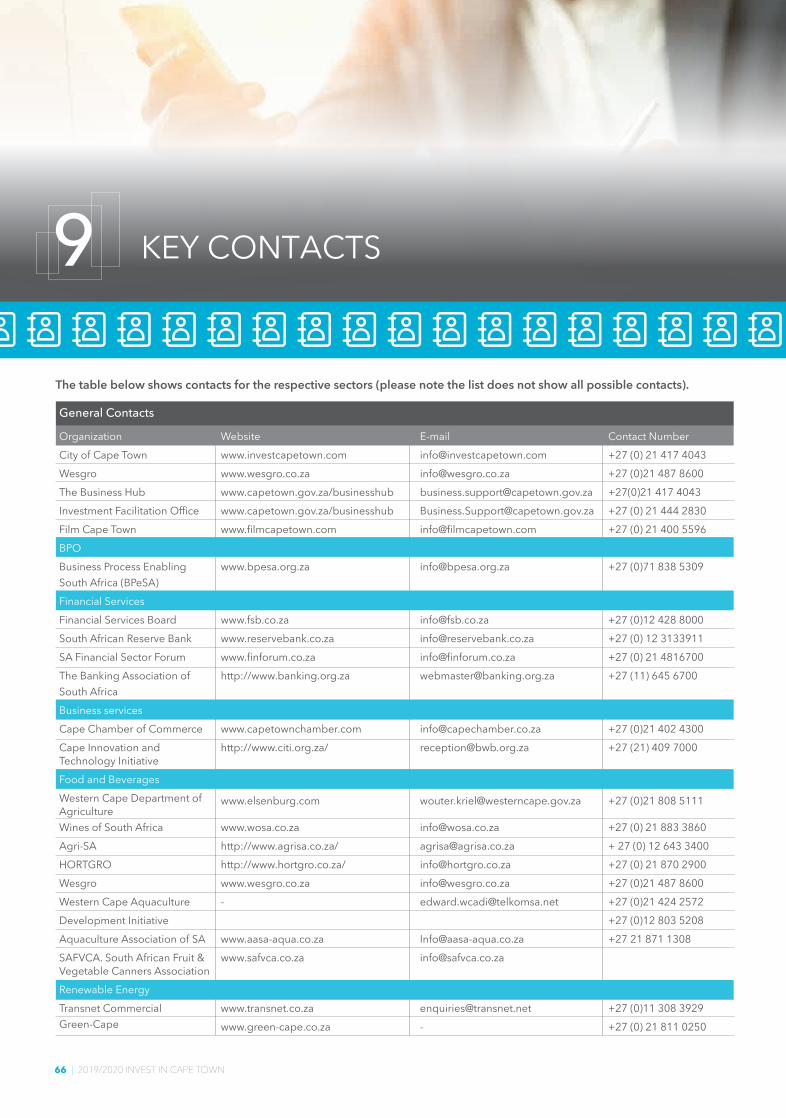
66 | 2019/2020 INVEST IN CAPE TOWN
The table below shows contacts for the respective sectors (please note the list does not show all possible contacts).
9 KEY CONTACTS
General Contacts
OrganizationCity of Cape TownWesgroThe Business HubInvestment Facilitation OfficeFilm Cape TownBPOBusiness Process Enabling South Africa (BPeSA)Financial ServicesFinancial Services Board South African Reserve Bank SA Financial Sector Forum The Banking Association of South AfricaBusiness servicesCape Chamber of CommerceCape Innovation and Technology InitiativeFood and BeveragesWestern Cape Department of AgricultureWines of South AfricaAgri-SA HORTGROWesgroWestern Cape Aquaculture Development InitiativeAquaculture Association of SASAFVCA. South African Fruit & Vegetable Canners AssociationRenewable EnergyTransnet CommercialGreen-Cape
Websitewww.investcapetown.comwww.wesgro.co.zawww.capetown.gov.za/businesshubwww.capetown.gov.za/businesshubwww.filmcapetown.com
www.bpesa.org.za
www.fsb.co.zawww.reservebank.co.zawww.finforum.co.zahttp://www.banking.org.za
www.capetownchamber.comhttp://www.citi.org.za/
www.elsenburg.com
www.wosa.co.zahttp://www.agrisa.co.za/http://www.hortgro.co.za/www.wesgro.co.za-
www.aasa-aqua.co.zawww.safvca.co.za
www.transnet.co.zawww.green-cape.co.za
[email protected] [email protected]@capetown.gov.za [email protected] [email protected]
[email protected]@[email protected]@banking.org.za
[email protected]@bwb.org.za
[email protected]@[email protected]@[email protected]
[email protected]@safvca.co.za
Contact Number+27 (0) 21 417 4043+27 (0)21 487 8600+27(0)21 417 4043+27 (0) 21 444 2830+27 (0) 21 400 5596
+27 (0)71 838 5309
+27 (0)12 428 8000+27 (0) 12 3133911 +27 (0) 21 4816700+27 (11) 645 6700
+27 (0)21 402 4300+27 (21) 409 7000
+27 (0)21 808 5111
+27 (0) 21 883 3860+ 27 (0) 12 643 3400+27 (0) 21 870 2900 +27 (0)21 487 8600+27 (0)21 424 2572+27 (0)12 803 5208+27 21 871 1308
+27 (0)11 308 3929+27 (0) 21 811 0250
MIR-2019-2020FA grant v2.indd 66 2020/07/14 14:50
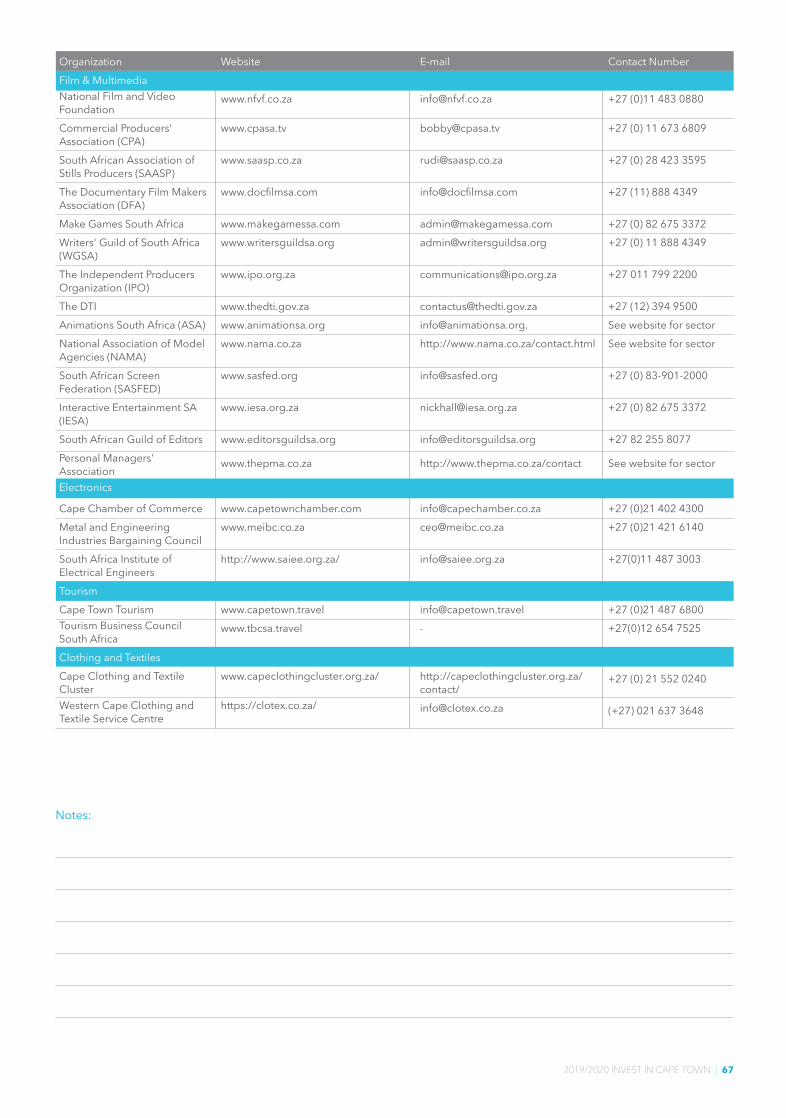
2019/2020 INVEST IN CAPE TOWN | 67
Notes:
OrganizationFilm & MultimediaNational Film and Video FoundationCommercial Producers’ Association (CPA) South African Association of Stills Producers (SAASP)The Documentary Film Makers Association (DFA)Make Games South AfricaWriters' Guild of South Africa (WGSA)The Independent Producers Organization (IPO)The DTIAnimations South Africa (ASA)National Association of Model Agencies (NAMA)South African Screen Federation (SASFED)Interactive Entertainment SA (IESA)South African Guild of EditorsPersonal Managers' AssociationElectronics
Cape Chamber of CommerceMetal and Engineering Industries Bargaining Council South Africa Institute of Electrical EngineersTourismCape Town TourismTourism Business Council South AfricaClothing and TextilesCape Clothing and Textile ClusterWestern Cape Clothing and Textile Service Centre
Website
www.nfvf.co.za
www.cpasa.tv
www.saasp.co.za
www.docfilmsa.com
www.makegamessa.comwww.writersguildsa.org
www.ipo.org.za
www.thedti.gov.zawww.animationsa.orgwww.nama.co.za
www.sasfed.org
www.iesa.org.za
www.editorsguildsa.org
www.thepma.co.za
www.capetownchamber.comwww.meibc.co.za
http://www.saiee.org.za/
www.capetown.travelwww.tbcsa.travel
www.capeclothingcluster.org.za/
https://clotex.co.za/
[email protected]@writersguildsa.org
[email protected]@animationsa.org.http://www.nama.co.za/contact.html
http://www.thepma.co.za/contact
[email protected]@meibc.co.za
http://capeclothingcluster.org.za/contact/[email protected]
Contact Number
+27 (0)11 483 0880
+27 (0) 11 673 6809
+27 (0) 28 423 3595
+27 (11) 888 4349
+27 (0) 82 675 3372+27 (0) 11 888 4349
+27 011 799 2200
+27 (12) 394 9500See website for sectorSee website for sector
+27 (0) 83-901-2000
+27 (0) 82 675 3372
+27 82 255 8077
See website for sector
+27 (0)21 402 4300+27 (0)21 421 6140
+27(0)11 487 3003
+27 (0)21 487 6800+27(0)12 654 7525
+27 (0) 21 552 0240
(+27) 021 637 3648
MIR-2019-2020FA grant v2.indd 67 2020/07/14 14:50

68 | 2019/2020 INVEST IN CAPE TOWN
Airports Company South Africa (ACSA), 2019, Passenger movements.
Baker Street Properties, 2019, Office Insights, December 2018.
Business Process Enabling South Africa (BEPESA), 2019, Key Indicator Report 2018.
Business Tech, 2019, South Africa’s petrol and electricity prices vs the world, 24 March 2019, https://businesstech.co.za/news/energy/306592/south-africas-petrol-and-electricity-prices-vs-the-world/ [2019, October 14].Cape Town Central City Improvement District (CCID), 2019, The State of Cape Town Central City Report 2018, page 16-17,The Digital City.
Cape Clothing and Textile Cluster, 2019, Annual Report 2018
Cape Higher Education Consortium (CHEC), 2017, Standardized Regional Statistics 2017
Cape Town Tourism, 2019, Tourism Indicators 2018.
City of Cape Town and GreenCape, 2019, Why you should invest in the Atlantis Special Economic Zone for Green Technologies City of Cape Town, 2017 and 2018 Economic Performance Indicators for Cape Town: Various quarters
City of Cape Town, 2019, City of Cape Town Water Strategy 2019
City of Cape Town, 2017, Industrial Survey
City Power, 2018, Tariffs and Charges 2018-2019
Company and Intellectual Property Commission (CIPC), 2017
10 REFERENCE LIST
Cape Penisula University of Technology, 2019, Annual Report 2018
Department of Trade and Industry (DTI), 2018, Trade Agreements, 2018
Department of Labour, 2018, Labour Regulations, 2018
De Villiers, J., 2019, This is what Cape Town airport will look like in 2023 – after R7 billion goes into new runways and departure lounges, Business Insider, 6 February, https://www.businessinsider.co.za/cape-town-international-airport-r7-billion-expansion-2019-2.
Effective Measure, 2014, Top 30 Ecommerce Websites Visited by South Africans – April 2014
Eskom, 2019, Tariffs and Charges 2018-2019
eThekwini municipality, 2019, Electricity Tariffs, 2018-2019
Foreign Direct Investment, FDIIntelligence, 2019
GreenCape, 2019a, Utility-scale renewable energy – 2019 Market Intelligence Report
GreenCape, 2019b, Atlantis Special Economic Zone, Cape Town – Annual Report 2018/19
I and M Futureneer Advisor Pty Ltd, 2018
IHS Markit, 2019, ReX Regional Explorer
International Monetary Fund, IMF, (2019), World Economic Outlook Database, 2019
IOL,2019, City receives its 15th unqualified audit, https://www.iol.co.za/capetimes/news/city-receives-its-15th-unqualified-audit-18909212 [2019, October 9].
MIR-2019-2020FA grant v2.indd 68 2020/07/14 14:50
2019/2020 INVEST IN CAPE TOWN | 69
IOL, 2019, Mayor hails Cape Town’s status as Africa’s leading digital city, https://www.iol.co.za/capeargus/news/mayor-hails-cape-towns-status-as-africas-leading-digital-city-30864519 [2019, October 10].
IOL, 2019, Unpacking City of Cape Town’s R49 billion draft budget, https://www.iol.co.za/capeargus/news/unpacking-c i ty -of -cape-towns-r49-bi l l ion-draft -budget-20134624 [2019, October 9].
ITWeb, 2019, Cape Town among the top tech cities in the world, https://www.itweb.co.za/content/JN1gP7O1D1WqjL6m [2019, October 10].
ITWeb, 2019, Cape Town municipality opens business hub, https://www.itweb.co.za/content/6GxRKMY8xDO7b3Wj [2019, October 9].
Jones Lang LaSalle (JLL), 2018, Cape Town City Report, 2018 and Cape Town Office Market Outlook, Quarter 4, 2018
Moody’s, 2019. Moody’s changes Cape Town municipal rating from negative to stable. https://www.fin24.com/Economy/moodys-changes-cape-town-municipal-rating-from-negative-to-stable-20190318
MyCiTi, 2017, Connect to free Wi-Fi on these buses, Media Release, 22 June 2017, https://www.myciti.org.za/en/contact/media-releases/connect-to-free-wifi-on-these-buses/ [2019, October 11].
National Energy Regulator of South Africa (NERSA), 2019, Approved Municipal Electricity Tariffs, Gauteng province, 2018-2019
NOVA Economics, 2018, Review and update of the strategy for the Atlantis greentech SEZ
Quantec, 2019, EasyData
Rode property publication, 2018, Rode’s Report on the South African Property Market, Quarter 3, 2018
Skytrax, 2019, World’s Top 100 Airports 2019, https://www.worldairportawards.com/worlds-top-100-airports-2019/ [2019, October 8].
South African Property Owners Association (SAPOA), 2018, Industrial Vacancy Report 2018 and Office Vacancy Report 2018.
Statistics South Africa, 2018, Domestic Tourism Survey 2018, Quarterly Labour Force Survey 2018 and South African population estimates 2018
South Africa Revenue Service, (2017), Taxation information, 2017
South African Reserve Bank, (2017)
Statista, 2019, Global electricity prices in 2018, by select country (in U.S. dollars per kilowatt hour), https://www.statista.com/statistics/263492/electricity-prices-in-selected-countries/ [2019, October 14].
Stellenbosch University, 2019, Annual Report 2018
University of Cape Town. 2019, Teaching and Learning Report 2018.
University of Western Cape, 2019, Annual Report 2018
Wesgro, 2018, Air Access Unit Information, 2018
Wesgro, 2018, Convention Bureau Unit Information, 2018
World Bank, 2019, Doing Business in South Africa, 2018 and Global Competitiveness Report 2018
World Fact-Book, 2018, Central Intelligence Agency database, 2018
World Travel Awards (WTA), 2019b, World Travel Awards Africa and Indian Ocean 2019 winners revealed in Mauritius, World Travel Awards (WTA), 1 June 2019, Available: https://www.worldtravelawards.com/winners/2019/africa [2019, August 5].
Notes:
MIR-2019-2020FA grant v2.indd 69 2020/07/14 14:50

70 | 2019/2020 INVEST IN CAPE TOWN
11 ACKNOWLEDGEMENTS
City of Cape Town Investment Promotion Lean Muller Tel: +27 21 444 9351 Email: [email protected]
Catalytic Sectors Faith Kolala Tel: +27 21 417 4020 Email: [email protected]
Atlantis Investment Facilitation Office Timothy Hadingham Tel: +27 21 417 0518Email: [email protected]
Research Paul Court, Layarn Booley, Meagan Jooste Upadhyaya, Yoliswa Tiwe and Jodie Posen
Project ManagementTarryn Voigt-Mallum (City Project Manager)
WesgroInvestment Promotion James Milne Tel: +27 21 487 8679Email: [email protected]
Research Lona Tshongweni
We would like to acknowledge the contribution of City of Cape Town officials: Lance Greyling, Rory Viljoen, Pauline van der Spuy, Nazli Laatoe, Charnelle Dunn, Robin Jutzen, Clayton Barnes and Rowelna Williams.
We would also like to acknowledge the contribution of: Cornelis Van de Waal, Monica Rorvik, Inge Dykman, Desrie Govender and Vanessa Davidson from BlueCape.
MIR-2019-2020FA grant v2.indd 70 2020/07/14 14:50

2019/2020 INVEST IN CAPE TOWN | 71
MIR-2019-2020FA grant v2.indd 71 2020/07/14 14:50

72 | 2019/2020 INVEST IN CAPE TOWNwww.investcapetown.com
CAPE TOWN, CONNECTING AFRICA TO THE WORLD.Perfectly positioned as a springboard into the rest of Africa, Cape Town has welcomed four new African airlines to the city since 2015.
YOUR INVESTMENT CONNECTION
TO AFRICA
10032644JB/HFCB_10873 InvestCT_A4 Print Ad_01.indd 1 2020/05/08 10:19MIR-2019-2020FA grant v2.indd 72 2020/07/14 14:50
Copyright © 2022 FDOKUMEN