
Software Quality Assurance in Scrum - University of Cape Town
Upload
khangminh22Category
view
1download
0
Univers
ity of
Cap
e Tow
n
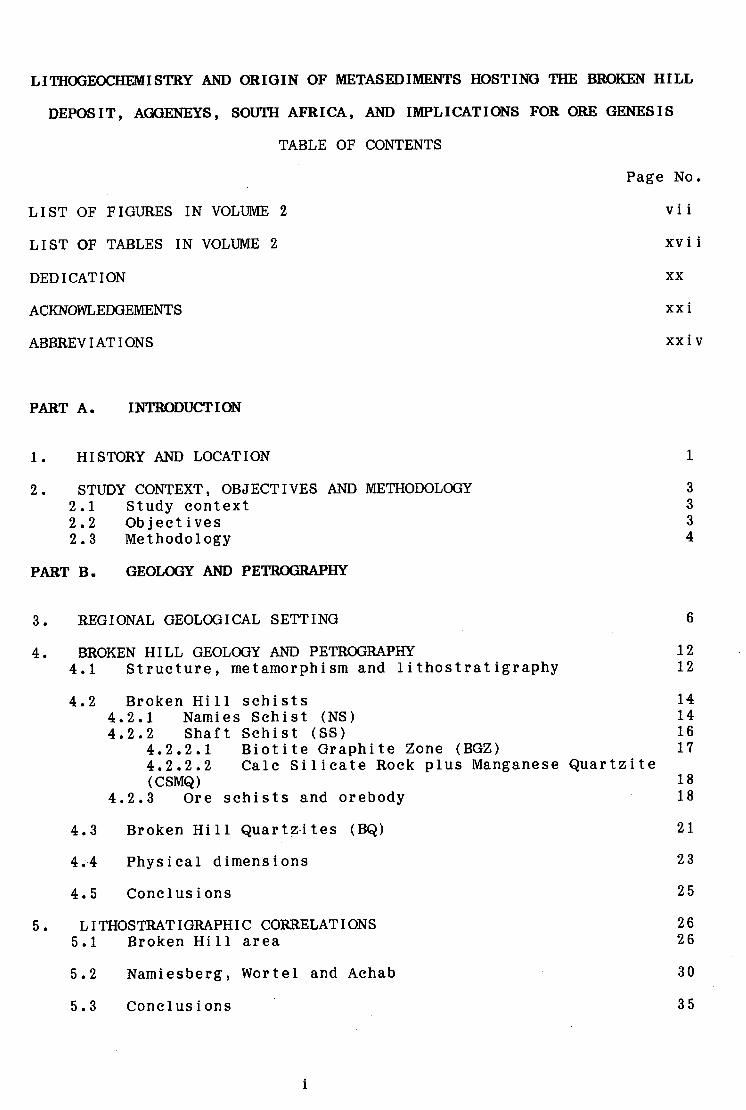
LITHOOEOCHEMISTRY AND ORIGIN OF METASEDIMENTS HOSTING
THE BROKEN HILL DEPOSIT, AGGENEYS, SOUTH AFRICA,
AND IMPLICATIONS FOR ORE GENESIS
by
RAEL DESMOND LIPSON
DOCTOR OF PHILOSOPHY
IN THE DEPARTMENT OF GEOCHEMISTRY
FACULTY OF SCIENCE
UNIVERSITY OF CAPE TOWN
APRIL 1990 The University of Cape Town has been given the right to reproduce this thesis in whole ' or kl part. Copyright is held by the author.
I
Univers
ity of
Cap
e Tow
n
The copyright of this thesis vests in the author. No quotation from it or information derived from it is to be published without full acknowledgement of the source. The thesis is to be used for private study or non-commercial research purposes only.
Published by the University of Cape Town (UCT) in terms of the non-exclusive license granted to UCT by the author.

ABSTRACT
The thin metasedimentary suite (< 1 OOOm) of supracrustal schist and
quartzite at Broken Hill, Aggeneys, forms part of the Proterozoic
Aggeneys Subgroup within the Namaqua Province of South Africa. The
structural succession at Broken Hill comprises gneisses (not
investigated in this thesis), which overlie red-coloured, nodular
magnetite-bearing Namies Schist that grades downwards into mature
Broken Hill Quartzites. The latter host heavy mineral layers
containing detritally rounded zircons. Ore Schist lying below Broken
Hill Quartzites, has similar characteristics to Namies Schist, and
hosts the banded iron formation-associated Broken Hill Pb-Ag-Zn-Cu
orebody. Biotite garnet schist and stringers of Garnet Quartzite
within Ore Schist represent an Ore Equivalent Horizon at the same
stratigraphic level as the two superposed lenses comprising the Broken
Hill orebody. A Biotite Graphite Zone marks the sharp contact between
Ore Schist and the green-coloured, pyrite- and graphite- bearing Shaft
Schist. Lenses of Cale Silicate Rock plus Manganese Quartzite within
Shaft Schist lie close to the Biotite Graphite Zone. Analyses of an
extensive suite of spatially and lithologically controlled borehole
core and surface outcrop samples by X-ray fluorescence spectrometry
reveals a contrast between sporadically high base metal values in
Namies Schist, and Shaft Schist which is chemically anomalous only in
its elevated Pb content. Namies Schist at Broken Hill is therefore
interpreted as predating the orebody, whereas Shaft Schist postdated
the deposit. An overturned sequence is thus inferred at Broken Hill,
and it can be correlated unit-for-unit with sequences at Namiesberg
and Wortel (termed regional rocks) lying 25 - 30km to the east and
north. A voluminous basement of potassic, siliceous, biotite gneisses
underlie the supracrustal rocks.

The low MnO and high S content of the homogeneous Shaft Schist stand
in contrast to the high MnO and low S character of the chemically
variable Namies Schist, and viewed together with rock colour and
absence or presence of magnetite, indicate that Namies Schist and the
related, detrital Broken Hill Quartzites, formed in oxygenated,
agitated, aqueous conditions whereas Shaft Schist developed as a black
shale in an anoxic, meromictic, lagoon-like environment. Lenses of
Cale Silicate Rock plus Manganese Quartzite primarily represent the
precipitates from elements which had accumulated at the thermocline
boundary prior to destabilization of the quiet, lagoonal cond}tions.
The high S content of Shaft Schist and negative Ce anomaly of Cale
Silicate Rock plus Manganese Quartzite show that Shaft Schist formed
beneath sea water. A passive continental margin environment may be
deduced from the extreme silica purity and sheet-like morphology of
the quartz arenitic Broken Hill Quartzites, and from the elevated
alumina concentrations of Namies Schist and Shaft Schist. Shaft
Schist and Broken Hill Quartzites were probably the lagoon and beach
barrier sediments, respectively, of a prograding beach barrier system,
and the upward coarsening Namies Schist represents the shoreface
pelites. Ore Schist probably formed as washover sediments derived
from Namies Schist. The tendancy for quartzite to thin southwards
through Aggeneys is matched by progressively cleaner separation in
that direction, of silica in quartzite from alumina in schist,
indicating south-directed progradation over tens of kilometres.
Shapes of rare earth element patterns, Eu/Eu* ratios from Namies
Schist, Broken Hill Quartzites and Shaft Schist, and major and trace
element modelling suggest that the metasediments were derived from a
weathered, granodioritic provenance. Ca removed during early
provenance weathering was probably precipitated distally to form the
calcic rocks south and east of Aggeneys, while removed Na remained in

solution. Detrital transport of the granodioritic residuum caused the
formation of Ca- and Na- depleted, and K-, Al- and total rare earth
element-enriched shales and sandstones. Ion microprobe Pb isotope
dating of detrital zircons from Broken Hill Quartzites return maximum
ages of 2.0Ga which confirm the post-Archaean signatures given by low
La/Th ratios and negative Eu anomalies of the metasediments. The age
constraints and oxygen isotope composition of Broken Hill Quartzites
are compatible with a provenance of Vioolsdrif granitoids, which crop
out to the north and north-west of Aggeneys.
The average base metal and associated element concentrations of Namies
Schist and Broken Hill Quartzites at Broken Hill are greater than for
their correlative regional rocks, indicating the presence of a
geochemical halo around the orebody. The Ore Equivalent Horizon
displays a localized primary geochemical halo measureable for up to
lOkm distance, and most clearly defined by increasing Zn and Ba
concentrations progressively nearer the orebody. "Ore Factor" scores
from the Factor Analysis of Ore Schist, also increase progressively
nearer ore. Together with positive heavy rare earth element anomalies
of many Ore Equivalent Horizon samples, and their unusual petrography,
these observations suggest that many component elements of the Ore
Equivalent Horizon were of exhalative origin. Within the Ore
Equivalent Horizon, higher concentrations of base metals and related
elements on the west side of the Broken Hill orebody relative to the
east side, and a maximum MnO concentration lying some 300m east of the
orebody, suggest that the hydrothermal fluid from which ore formed
moved eastwards along the sea floor.
Thermochemical modelling of Zn/Cu and Pb/Cu ratios of hydrothermal
solutions in equilibrium with sphalerite, galena and chalcocite shows
that higher solution pH favours greater relative Cu concentrations in

the ore fluid. Whereas the higher temperature fluids (> 150°C) have
relatively low Zn/Cu ratios, maximum relative Zn concentrations occur
in the lowest pH and lowest temperature fluids. The four orebodies in
the Aggeneys-Gamsberg area were likely to have had similar metal
ratios to those present in their parent hydrothermal fluids. Using
the gross Zn/Pb, Zn/Cu and Pb/Cu ratios of each deposits and
thermochemical data from both this investigation and from Huston and
Large (1987), it is shown that the Pb-Zn-Cu-rich Broken Hill deposit
formed from fluids at ca. 280°C and a pH of 4.7 - 5.4. The Zn-rich
Gamsberg deposit formed from fluids at 100 - 150°C and a pH of 4.0 -
4.5. The acidic and reduced, S-bearing waters in the enclosed \
Gamsberg basin are contrasted with the oxidizing, SO,-bearing and more
alkaline environment in which the Broken Hill (and Black Mountain)
orebodies formed. The nature of individual basin sea water which was
convected kilometres down into the crust, as well as the depth of
convection, ultimately determined the proportions of metals leached
from a basement which probably becomes more maf ic at depth. The
higher temperature, more deeply circulating, alkaline fluids which
gave rise to the Black Mountain and Broken Hill deposits, leached
relatively more Cu, whereas low temperature, shallowly circulating, l
more acidic and HiS-rich fluids generated the Gamsberg and Big
Syncline orebodies. Unrealistically large volumes of illite would be
required at Aggeneys to produce a deposit of the size of Broken Hill,
solely by the dehydration of sediment.
Localization of ore to the general Aggeneys-Gamsberg area where
amphibolite bodies and wedges of elastic conglomerates occur, point to
the likely existence of synsedimentary rift processes. Such rift
faults probably focussed fluids on their return journey from depth,
and sulphur and metals precipitated at or near the vents in response
to falling temperature, to form stratiform orebodies on the sea floor.

The passage of hydrothermal fluid caused slight metal contamination of
Namies Schist and Broken Hill Quartzites immediately below the ore
time horizon. The Broken Hill orebody and geochemical halo were
preserved by progradational deposition of the overlying Shaft Schist.
LITHOGEOCHEMISTRY AND ORIGIN OF METASEDIMENTS HOSTING THE BROKEN HILL
DEPOSIT, AGGENEYS, SOUTH AFRICA, AND IMPLICATIONS FOR ORE GENESIS
TABLE OF CONTENTS
LIST OF FIGURES IN VOLUME 2
LIST OF TABLES IN VOLUME 2
DEDICATION
ACKNOWLEOOEMENTS
ABBREVIATIONS
PART A. INTRODUCTION
1. HISTORY AND LOCATION
2. STUDY CONTEXT, OBJECTIVES AND METHODOLOGY 2.1 Study context 2.2 Objectives 2.3 Methodology
PART B. GEOLOGY AND PETROGRAPHY
3. REGIONAL GEOLOGICAL SETTING
4. BROKEN HILL GEOLOGY AND PETROGRAPHY 4.1 Structure, metamorphism and lithostratigraphy
4.2 Broken Hill schists 4.2.1 Namies Schist (NS) 4.2.2 Shaft Schist (SS)
4.2.2.1 Biotite Graphite Zone (BGZ) 4.2.2.2 Cale Silicate Rock plus Manganese (CSMQ)
4.2.3 Ore schists and orebody
4. 3 Broken Hi 11 Quar tz-ites ( BQ)
4~4 Physical dimensions
4.5 Conclusions
5. LITHOSTRATIGRAPHIC CORRELATIONS 5.1 Broken Hill area
5.2 Namiesberg, Wortel and Achab
5.3 Conclusions
i
Page No.
Quartzite
vii
xvii
xx
xxi
xx iv
1
3 3 3 4
6
12 12
14 14 16 17
18 18
21
23
25
26 26
30
35

PART C. GEOCHEMISTRY
6. BROKEN HILL GEOCHEMISTRY 37 6.1 Element redistributions 37
6.1.1 Introduction 38 6.1.2 Constraints on rigorous modelling of element mobility during metamorphism 39 6.1.3 Non-rigorous modelling of element mobility during metamorphism 39
6.1.3.1 Major elements 39 6.1.3.2 K/Rb ratios 40 6.1.3.3 Pegmatite and host schist 41
6.1.3.3.1 Physical evidence 41 6.1.3.3.2 Geochemical evidence 42
6.1.3.4 Pyrite to pyrrhotite transitions 43 6.1.3.5 Oxygen isotopes 44
6.1.4 Element mobility during weathering 44 6.1.4.1 Comparison between specific selected samples (orientation study) 45 6.1.4.2 Comparison between sample groups 46
6.1.5 Discussion and conclusions 46
6.2 Namies Schist and Shaft Schist 48 6.2.1 Direct geochemical contrast between NS and SS 48 6.2.2 Element variability 49 6.2.3 R-mode factor analysis 49 6.2.4 Discriminant function analysis (DFA) 51 6.2.5 Rare earth elements (REE) 52 6.2.6 Contrasted behaviour of base metals in NS and SS 53 6.2.7 Minor lithologies and special samples 53
6.2.7.1 Cale Silicate Rock plus Manganese Quartzite (CSMQ) 53 6.2.7.2 Biotite Graphite Zone (BGZ) 54 6.2.7.3 Geochemistry of ALP054 54 6.2.7.4 Tank Hill samples 55
6.3 Ore Equivalent Horizon and Orebody 56
6.4
6.3.1 Schists 56 6.3.1.1 Geochemical characteristics 56 6.3.1.2 R-mode factor analysis 57 6.3.1.3 Discriminant function analysis 58 6.3.1.4 Rare earth elements 60 6.3.1.5 OS correlations 60 6.3.1.6 OS geochemical variations at Broken Hill 61
6.3.2 Ore Schist plus Garnet Quartzite (OS+GQ), Ore Equivalent Garnet Quartzite (OEGQ), Garnet Quartzite (GQ) and Orebody 62
6.3.2.1 Geochemical characteristics 62 6.3.2.2 Rare earth elements 64 6.3.2.3 Garnet Quartzite (GQ), Ore Equivalent Garnet Quartzite (OEGQ) and Ore Schist plus Garnet Quartzite (OS+GQ) geochemical variations at Broken Hill 65
6.3.3 Comparison with mineralized sequences 66
Broken 6.4.1 6.4.2 6.4.3 6.4.4
Hill Quartzites (BQ) Geochemical characteristics R-mode factor analysis Discriminant function analysis Rare earth elements
i i
(DFA)
67 67 69 69 69
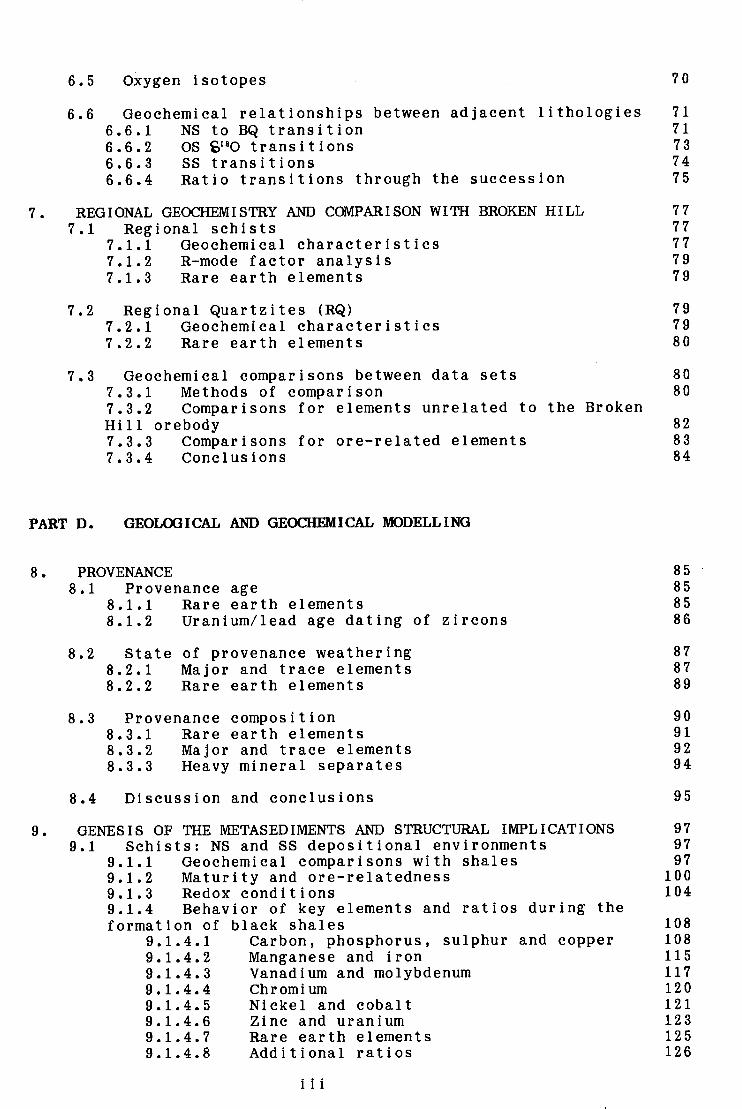
6.5 Oxygen isotopes 70
6.6 Geochemical relationships between adjacent lithologies 71 6.6.1 NS to BQ transition 71 6.6.2 OS ~80 transitions 73 6.6.3 SS transitions 74 6.6.4 Ratio transitions through the succession 75
7. REGIONAL GEOCHEMISTRY AND COMPARISON WITH BROKEN HILL 77 77 77 79 79
7.1 Regional schists 7.1.1 Geochemical characteristics 7.1.2 R-mode factor analysis 7.1.3 Rare earth elements
7.2 Regional Quartzites (RQ) 79 79 80
7.2.1 Geochemical characteristics 7.2.2 Rare earth elements
7.3 Geochemical comparisons between data sets 80 7.3.1 Methods of comparison 80 7.3.2 Comparisons for elements unrelated to the Broken Hill orebody 82 7.3.3 Comparisons for ore-related elements 83 7.3.4 Conclusions 84
PART D. GEOLOGICAL AND GEOCHEMICAL MODELLING
8 • PROVENANCE 85 85 85 86
8.1 Provenance age 8.1.1 Rare earth elements 8.1.2 Uranium/lead age dating of zircons
8.2 State of provenance weathering 8.2.1 Major and trace elements 8.2.2 Rare earth elements
8.3 Provenance composition 8.3.1 Rare earth elements 8.3.2 Major and trace elements 8.3.3 Heavy mineral separates
8.4 Discussion and conclusions
87 87 89
90 91 92 94
95
9. GENESIS OF THE METASEDIMENTS AND STRUCTURAL IMPLICATIONS 97 9.1 Schists: NS and SS depositional environments 97
9.1.1 Geochemical comparisons with shales 97 9.1.2 Maturity and ore-relatedness 100 9.1.3 Redox conditions 104 9.1.4 Behavior of key elements and ratios during the formation of black shales 108
9.1.4.1 Carbon, phosphorus, sulphur and copper 108 9.1.4.2 Manganese and iron 115 9.1.4.3 Vanadium and molybdenum 117 9.1.4.4 Chromium 120 9.1.4.5 Nickel and cobalt 121 9.1.4.6 Zinc and uranium 123 9.1.4.7 Rare earth elements 125 9.1.4.8 Additional ratios 126
i i i
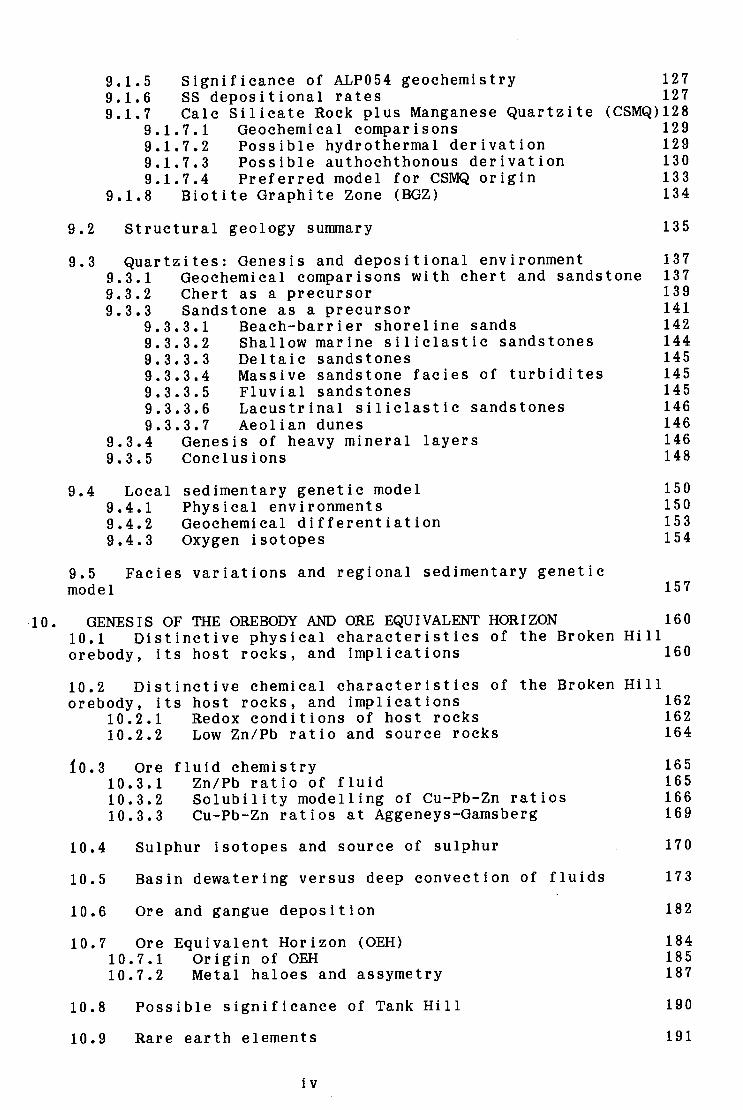
9.1.5 Significance of ALP054 geochemistry 9.1.6 SS depositional rates
127 127
9.1.7 Cale Silicate Rock plus Manganese Quartzite 9.1.7.1 Geochemical comparisons
(CSMQ)128 129 129 130 133 134
9.1.7.2 Possible hydrothermal derivation 9.1.7.3 Possible authochthonous derivation 9.1.7.4 Preferred model for CSMQ origin
9.1.8 Biotite Graphite Zone (BGZ)
9.2 Structural geology summary 135
9.3 Quartzites: Genesis and depositional environment 137
9.4
9.3.1 Geochemical comparisons with chert and sandstone 137 9.3.2 Chert as a precursor 139 9.3.3 Sandstone as a precursor 141
9.3.3.1 Beach-barrier shoreline sands 142 9.3.3.2 Shallow marine siliclastic sandstones 144 9.3.3.3 Deltaic sandstones 145 9.3.3.4 Massive sandstone facies of turbidites 145 9.3.3.5 Pluvial sandstones 145 9.3.3.6 Lacustrinal siliclastic sandstones 146 9.3.3.7 Aeolian dunes 146
9.3.4 Genesis of heavy mineral layers 146 9.3.5 Conclusions 148
Local 9.4.1 9.4.2 9.4.3
sedimentary genetic model Physical environments Geochemical differentiation Oxygen isotopes
150 150 153 154
9.5 Facies variations and regional sedimentary genetic model 157
·10. GENESIS OF THE OREBODY AND ORE EQUIVALENT HORIZON 160 10.1 Distinctive physical characteristics of the Broken Hill orebody, its host rocks, and implications 160
10.2 Distinctive chemical characteristics of the Broken orebody, its host rocks, and implications
10.2.1 Redox conditions of host rocks 10.2.2 Low Zn/Pb ratio and source rocks
!o.3 ore 10.3.1 10.3.2 10.3.3
fluid chemistry Zn/Pb ratio of fluid Solubility modelling of cu-Pb-Zn ratios Cu-Pb-Zn ratios at Aggeneys-Gamsberg
10.4
10.5
10.6
Sulphur isotopes and source of sulphur
Basin dewatering versus deep convection of fluids
Ore and gangue deposition
10.7 Ore Equivalent Horizon (OEH) 10.7.1 Origin of OEH 10.7.2 Metal haloes and assymetry
10.8 Possible significance of Tank Hill
10.9 Rare earth elements
iv
Hill 162 162 164
165 165 166 169
170
173
182
184 185 187
190
191
11.
10.10 Genetic model for Aggeneys-Gamsberg orebodies and OEH 194
CONCLUSIONS 202
202
205
11. l Stratigr•phy and sedimentology
11. 2 Ore genesis and local tectonics
11. 3 Ore halo and exploration 208
11.4 Geotectonic setting 209
PART E. APPENDICES AND REFERENCES
12. APPENDICES 213
APPENDIX A SAMPLING AND ANALYTICAL TECHNIQUES 213 A.1 Sampling rationale and technique 213
A.1.1 Parameters common to borehole core and surface outcrop sampling 213 A.1.2 Borehole core samples 213 A.1.3 Surface outcrop samples 213
A.2 Analytical methods 213 A.2.1 Sample preparation 213 A.2.2 X-ray fluorescence spectrometry (XRF) 214 A.2.3 Volatile-free recalculation 214 A.2.4 Gas chromatography 215 A.2.5 Comparison between XRF and Instrumental Neutron Activation Analysis (INAA) results for rare earth elements 215
APPENDIX B STATISTICAL TECHNIQUES B.1 Correlation
217 217
B.2 Factor analysis
B. 3 Discriminant function analysis (DFA)
APPENDIX C ADDITIONAL PETROGRAPHIC DESCRIPTIONS C.1 Namies Schist (NS)
C.2 Shaft c.2.1 c.2.2 (CSMQ)
Schist (SS) Biotite Graphite Zone (BGZ) Cale Silicate Rock plus Manganese Quartzite
217
217
219 219
219 219
220
C.3 Ore Schist (OS) and Orebody 221
C.4 Broken Hill Quartzites (BQ) 222
C.5 Namies-type Schist (NTS) 223 C.5.1 NTS at Namiesberg 223 C.5.2 NTS in Achab borehole 223
C.6 Shaft-type Schist (STS) 224 C.6.1 Massive Sillimanite 224 C.6.2 Cale Silicate-type Rock plus Manganese Quartzite 224
v

C.7 Regional Quartzite (RQ)
APPENDIX D METAMORPHISM
APPENDIX E RELATIONSHIPS BETWEEN MAJOR LITHOLCXJIES E.1 Gneisses through NS to WQ
225
226
227 227
E.2 OS through SS to Plant Quartzite (PQ) 227
APPENDIX F ORE SCHIST FACTOR SCORES RELATED TO THE OREBODY 228
APPENDIX G LITHCXJEOCHEMICAL EXPLORATION STRATEGY 229
APPENDIX H CALCULATION OF LIMITING CASES FOR PRE-METAMORPHIC CARBON AND SULPHUR CONTENTS OF SS 230
APPENDIX I CALCULATION OF PB/CU AND ZN/CU RATIOS IN FLUIDS 232
APPENDIX J MASS BALANCE FOR GENERATING BROKEN HILL OREBODY USING LYDON'S DEWATERING MODEL 234
APPENDIX K SUNDRY TABLES REFERRED TO IN THE TEXT
1.2. REFERENCES
vi
234
235

LIST OF FIGURES IN VOLUME 2
Fig. 1.1 Major Proterozoic tectonic provinces and subprovinces of southern Africa (after Hartnady et al., 1985). Box covers Aggeneys area shown in Fig. 1.4. SCCB = Southern Cape Conductive Belt; + = Beattie magnetic anomaly (after de Beer and Meyer, 1983)
Fig. 1.2 Aerial photograph of Broken Hill mine, looking west. The Black Mountain orebody is seen in the far distance. Photograph courtesy A. Lanham
Fig. 1.3 Panoramic view of Broken Hill looking east. Maanhaarkop is seen in the middle distance and Gamsberg (flat-topped mountain) in the far distance
Fig. 1.4 Locality map of southern Africa showing position of inselbergs in the Aggeneys area within the Namaqua Province. Position of Groothoek Thrust after Blignault et al. (1983, Fig. 14). BH =Broken Hill; MK= Maanhaarkop; FK = Froneman se Kop; BM =Black Mountain; PH= Plant Hill; TH= Tank Hill. Inset shows Aggeneys area relative to political boundaries
Fig. 2.1 Conceptual representation of an orebody enveloped by its lithogeochemical halo. On the top surface are shown two idealized lithogeochemical sampling profiles for an element of interest with concentration intensity (here shown as positive) increasing both towards the centre of each profile and with proximity to the orebody. Similar profiles could be drawn down the borehole (BH) depicted, with increased geochemical response where the borehole intersects the halo. The Broken Hill orebody only measures 1 OOOm by lOOm in outcrop. Prior knowledge of a halo which envelopes Broken Hill-type mineralization would indicate a buried deposit, or alert the explorationist when a borehole had narrowly missed the orebody
Fig. 3.1 Map showing Subgroups of the Bushmanland Group, and Subgroups of the Okiep Group which are similar to the Aggeneys and Pella Subgroups. Modified after SACS (1980, Figs. 5.1.5 and 5.1.6)
Fig. 3.2 Map showing the Aggeneys Subgroup and all possible correlative supracrustal successions in the Namaqua Province, and the distribution of the Little Namaqualand Suite, from Bitterfontein to Prieska (based on Blignault et al., 1983, Fig. 14; Joubert, 1986; SACS, Fig. 5.1.1 and Moore, 1986, Fig. 1.1)
Fig. 4.1 Map of the Aggeneys area showing gross similarity of the geology between Broken Hill, Klein Kop, Maanhaarkop and Froneman se Kop. Locality plan shows relationship of Broken Hill (BH), Maanhaarkop (MK) and Froneman se Kop (FK) forming the southern limb of the Black Mountain (BM) synclinorium. Also indicated are Plant Hill (PH) and Tank Hill (TH).
Fig. 4.2 Structural succession at Broken Hill: the idealized borehole intersection
Fig. 4.3 Regional north south section through Broken Hill, Aggeneysberge and Black Mountain showing fold closure positions for Aggeneysberge and Black mountain projected down plunge from surface (after Lipson, 1978, Fig. 87). Location of cross section shown in Fig. 5.3
Fig. 4.4 Structural interpretation along a section through Broken Hill and Plant Hill
Fig. 4.5 Idealized structural section through Maanhaarkop and borehole TSll
Fig. 4.6 Working stratigraphic column at Broken Hill Fig. 4.7 Photograph of NS core showing pink hue and common nodular
texture
vii

Fig. 4.8 NS (ALP063) showing undeformed muscovite as an alteration product after folded sillimanite. Note also simplectic quartz. intergrowths (dark zones in muscovite). Highly birefringent inclusion in quartz is zircon. Crossed nichols. (lcm = 100 micron)
Fig. 4.9 Photograph of SS core showing bottle-green hue and uniformly banded texture. Note green colour of pegmatite at bottom centre
Fig. 4.10 SS (ALP186) showing muscovite as an alteration product after biotite. Plain polarized light. (lcm = 100 micron)
Fig. 4.11 Photograph of conglomerate at Maanhaarkop Fig. 4.12 Photograph of folded OEGQ layer in OS on west side of
Broken Hill orebody. Note pegmatite formed between OEGQ boudins in upper limb of fold
Fig. 4.13 Photograph of IS showing pseudo-pebbles in schist matrix. Note quartzitic band in bottom left, which has started to boudinage
Fig. 4.14 Photograph of OES+GQ core from borehole BH112 beyond the eastern fold closure of ~he orebody. Note garnet-biotite composition of OES, and the intense refoliation present in the top piece of core
Fig. 4.15 Quartzite with heavy mineral layers showing possible foreset between two subparallel bands
Fig. 4.16 Stereoscopic X-ray radiographs of quartzite. Heavy mineral layers show ripple-like features with cusps pointing southward. Detail also shows apparent foreset "F" being truncated by apparent topset "T" at "X"
Fig. 4.17 Stereoscopic X-ray radiographs of quartzite showing detail of possible raindrop feature located at "Z"
Fig. 4.18 Photomicrograph of well rounded zircon concentrates from BQ (ALP227). Photograph courtesy of G. Martin
Fig. 4.19 Heavy mineral layer in quartzite with rounded zircon (Z) the dominant mineral. (R = rutile; Ln = limonite). Photograph courtesy of G. Martin
Fig. 5.1 Generalized geological map of Black Mountain, Tank Hill and Broken Hill
Fig. 5.2 Photograph of Tank Hill looking south west. Note the unusual rock-types Garnet Quartzite, Green Quartzite, Massive Magnetite and Barite Magnetite Rock, all lying within the dip slope of a single stratigraphic horizon between the quartzite which forms the ridge of Tank Hill, and gneiss underlying the sand-covered flats. Quartzites in the far distance are separated from Tank Hill by a valley
Fig. 5.3 Generalized geological map of the Aggeneys area with some selected inselbergs. Indicated are section lines through Broken Hill-Aggeneysberge (Fig. 4.3), Namiesberg (Fig. 5.4) and Wortel (Fig. 5.6)
Fig. 5.4 Cross section through Namiesberg and borehole VGl. Abbreviations as in list at start of thesis
Fig. 5.5 Photograph of southern limb of Namiesberg syncline showing Dark-type Quartzite overlying White-type Quartzite
Fig. 5.6 Cross section through Wortel and borehole WTL4. Abbreviations as in list at start of thesis
Fig. 5.7 Generalized comparative stratigraphic successions from Broken Hill, Gamsberg, Namiesberg and Wortel. Abbreviations as in list at start of thesis
Fig. 6.1 NS and SS K vs Rb concentrations compared with various shales. See legend for shale codes
Fig. 6.2 Photograph of schist from borehole core (touching pencil) and surface outcrop, used to test the chemical effects of surface weathering
v i i i

Fig. 6.3 Surface schist weathering orientation study. Percent variation (positive or negative) in element content is with respect to sample ALP163
Fig. 6.4 NS and SS Zr vs Si02 concentrations Fig. 6.5 NS and SS element variations vs Al20a: (a) Zr; (b) Ba; (c)
Zn; ( d) Cu; ( e) Ni ; ( f) MnO; ( g) Pb; ( h) Co Fig. 6.6 NS factor analysis: (a) loadings on the six factors which
cumulatively explain 93.6 % of the variance; (b) geometric representation of Factors 1, 3 and 4 which account for 64.7 % of the total variance. For purposes of clarity the elements Co, Ni, Sc, P105, V, MgO, Ti02, Nb and Fe20a have been omitted as they may be effectively represented by the elements AlsOa, KsO and Rb, as seen in Fig. 6.6 (a) above. The REE's and certain other elements are also omitted in the interests of clarity; (c) 3-D conceptual representation of the major NS factors shown in Fig. 6.6 (b) above.
Fig. 6.7 SS factor analysis: (a) loadings on the five factors which cumulatively explain 82.6 % of the variance; (b) geometric representation of Factors 1, 3 and 4 which account for 65.6 % of the total variance. For purposes of clarity the elements Co, Ni, Sc, V, MgO, Cr and FesOa have been omitted as they may be effectively represented by the elements AlsOa, KsO and Ba, as seen in Fig. 6.7 (a) above. The REE's and certain other elements are also omitted in the interests of clarity; (c) 3-D conceptual representation of the major NS factors shown in Fig. 6.7 (b) above.
Fig. 6.8 Shale-normalized REE patterns using the INAA analytical method: (a) NS; (b) SS. ALP057, 184 and 059 are USS; ALP158 is LSS. Average shale after Piper (1974)
Fig. 6.9 Shale-normalized schist REE patterns, using the XRF analytical method: (a) NS from borehole BH123; (b) USS from borehole BH123; (c) LSS from boreholes BH164 and 156. Estimated Ho (Ho est.) = Y*0.0272 (see Appendix A.2.5).
Fig. 6.10 Average shale-normalized REE patterns for the rock-types NS, USS and LSS for XRF-derived data
Fig. 6.11 Shale-normalized REE patterns using the method: (a) CS; (b) MnQ (s = surface samples;
Fig. 6.12 Shale-normalized REE patterns using the sample ALP213
Fig. 6.13 NS, SS and BGZ Zr vs Si02 concentrations
XRF analytical c = borehole core)
INAA method for MnQ
Fig. 6.14 Shale-normalized BGZ REE patterns: (a) XRF data; (b) INAA data
Fig. 6.15 Shale-normalized REE patterns for the Tank Hill rocks using XRF-derived data. Surface NS (NSS) and SS (SSS) are shown for comparison
Fig. 6.16 OS factor analysis: (a) including REE, with loadings on the seven factors which cumulatively explain 89.6 % of the variance; (b) excluding REE, with loadings on the 6 factors which cumulatively explain 80.9 % of the variance; (c) geometric representation of Factors 1, 2 and 3 (excluding REE) which account for 52.6 % of the total variance. For purposes of clarity the elements Rb, Cr, Co, Sc and Ti02 have been omitted as all except Co may be effectively represented by K20, as seen in Fig. 6.16 (b) above. Co was omitted because it displays poor correlation with all elements (Table 6.19) and falls in Factor 6 (Fig. 6.16 (b)). The REE's are also omitted in the interests of clarity; (d) 3-D conceptual representation of the major NS factors shown in Fig. 6.16 (c)) above
ix

Fig. 6.17 Shale-normalized INAA REE profiles of Ore Schists: (a) UFS (ALP052) and IS (ALP147); (b) HS; (c) OS surface samples west of orebody; (d) OS surface samples east of orebody, with ALP219 and ALP225 from Maanhaarkop
Fig. 6.18 OS borehole core element variations versus distance from the orebody: (a) Zn; (b) Mn; (c) Ba
Fig. 6.19 OS surface outcrop element and ratio variations versus distance from the orebody: (a) Zn; (b) Ba; (c) Pb; (d) Mn; (e) Mn/Mn+Fe
Fig. 6.20 Average K/Rb and Ca/Sr (ppm/ppm) ratios for ore- and nonore- related rocks
Fig. 6.21 Shale-normalized INAA and XRF REE profiles for various orerelated rocks: (a) Massive Sulphide and Quartz Magnetite Rock from the Broken Hill orebody; (b) Magnetite-rich rocks from the Broken Hill orebody compared with Froneman se Kop Quartz Magnetite Rock; (c) Lower Orebody Garnet Quartzite; (d) Ore Equivalent Garnet Quartzite (ALP130 and ALP132 from Maanhaarkop); (e) Ore Schist plus Garnet Quartzite (ALP128 and ALP129 from Maanhaarkop. INAA data in (a) ; XRF data in ( b) to ( e)
Fig. 6.22 OS+GQ and GQ element and inter-element ratio variations versus distance from the orebody: (a) Zn; (b) Pb; (c) Zn/Zn+Al; (d) Pb/Pb+K
Fig. 6.23 Plot of Fe/Ti vs Al/(Al+Fe+Mn) ratios after Bostrom (1973). All data other than Aggeneys samples from Marchig at al. (1982). (b) is an enlargement of the area in (a) centered on average crust
Fig. 6.24 Shale-normalized INAA and XRF REE profiles for various orerelated rocks at Aggeneys compared with metalliferous hydrothermal sediments from the Santorini caldera (1), Atlantis II Deep (2), Galapagos islands (3) and nontronite encrusting basalt on the Juan de Puca Ridge (4). Comparisons are (a) massive sulphide (5 = ALP081, 6 = ALPllO); (b) schists (5 =NS, ALP030; 6 =SS, ALP057; 7 =OS, ALP225; 8 =OS, ALP052). Profiles 1, 2 and 3 from Fleet (1984); profile 4 from Murnane and Clague (1983, sample llb).
Fig. 6.25 BQ element variations vs AlsOa: (a) Ba; (b) Pb; (c) Zn Fig. 6.26 Combined factor analysis for WQ and DQ: (a) excluding REE,
with loadings on the five factors which cumulatively explain 92,2 % of the variance; (b) including REE with loadings on the four factors which cumulatively explain 100 % of the variance
Fig. 6.27 Shale-normalized BQ REE patterns: (a) INAA analysis for a WQ sample; (b) XRF analyses of WQ (ALP040), DQ (ALP042) and MDS (ALP041) from borehole BH123, and MDS from Maanhaarkop (ALP125)
Fig. 6.28 6 180 (SMOW) ratios of quartz grains from different parts of the structural succession. Most samples come from borehole BH123 hence all samples have been fitted into their approximate positions within the borehole lithological column. Within the Ore and Equivalent Horizons the following infrequently used abbreviations are: UOB = Upper Orebody; LOB = Lower Orebody; QM =Quartz Magnetite; MS =Massive Sulphide
Fig. 6.29 NS element variations down borehole BH123: (a) Si01, Cr and Zr; (b) AlsOa, KsO, TiO, and CaO; (c) Ni, Nb and Co; (d) V, Rb, Sr and Sc. All elements reported in ppm except SiO,, Al 10 3 ,
K,O, TiOs and Cao which are in percent. X-axis represents depth in metres down the borehole. ~ample numbers and rock types are shown. Zr and Cr are the only elements which do not grade smoothly across the NS-WQ boundary
Fig. 6.30 Shale-normalized XRF-derived REE analyses from borehole BH166. Samples 1 to 5 of NS are taken progressively nearer WQ (sample 6).
Fig. 6.31 NS Zr vs SiOs concentrations
x

Fig. 6.32 Plots of average element concentrations of NS against MDS and DQ for each of three boreholes: (a) Si02; (b) Ce; (c) Zr
Fig. 6.33 Zones over which geochemical transitions are considered in SS. Zones a. to e. referred to in the text are highlighted.
Fig. 6.34 SS element variations down boreholes. Elements in percent are Si02, MnO, Na20, Cao, Al20a, P206 and s. All other elements in ppm. X-axis represents depth in metres down the sub-vertical borehole. Sample numbers, rock types and contacts referred to in the text, are shown. Boreholes are (a) BH123; (b) BH156; (c) BH164
Fig. 6.35 Inter-element ratios versus distance down borehole BH123: (a) Ba/Ba+Sr; (b) Rb/Rb+Sr
Fig. 6.36 Inter-element ratios versus distance down borehole BH156: (a) Ba/Ba+Sr; (b) Rb/Rb+Sr
Fig. 7.1 Comparison between element concentrations in Broken Hill bore ho 1 e BH 12 3 and W or t e 1 ho 1 e s WTL 3 & 4 : ( a ) Zr ; ( b ) S i 02 ; ( c ) Zn; (d) MnO. X-axis represents consecutive rock types down the holes plotted at equally spaced intervals. NS and SS = Broken Hill and Wortel Namies and Shaft Schists; Q = Broken Hill and Wortel quartzites; OEH = Broken Hill OEH and approximate equivalent stratigraphic schist at Wortel; CSMQ =Broken Hill CSMQ and Wortel CTSMQ
Fig. 7.2 Shale normalized REE patterns for regional rocks compared with Broken Hill analogues, using the XRF analytical method: (a) NS compared with Wortel and Achab NTS; (b) SS compared with Wortel and Namiesberg STS; (c) CSMQ compared with Wortel CTSMQ; (d) WQ compared with Wortel WTQ; (e) MDS compared with Wortel MDTS
Fig. 7.3 Delta diagrams showing the log ratios of mean element concentration of Broken Hill rock-types to Regional rock-types for borehole core only: (a) NS/NTS (Achab); (b) NS/NTS (Wort el); (c) SS/STS (Namiesberg); (d) SS/STS (Wortel); (e) WQ/WTQ (Wortel); (f) DQ/DTQ (Wortel); (g) DQ/DTQ (Namiesberg). Elements are those less obviously related to the orebody
Fig. 7.4 Ratio-ratio diagrams showing the log ratios of the mean concentrations of 3 elements plotted against the log Si ratios for various suites of rocks shown: (a) Al; (b)K; (c) Fe. Legend appears with Fig. 7.5
Fig~ 7.5 Log[Al(bh)/Al(reg)] ratio plotted against the Si02 content of the regional rock, for the rock-types shown
Fig. 7.6 Delta diagrams showing the log ratios of mean ore-related element concentration of Broken Hill rock-types to regional rocktypes for both borehole core and surface samples: (a) NS/NTS (core); (b) NS/NTS (surface); (c) SS/STS (core); (d) MDS/MDTS (surface and core); (e) WQ/WTQ (core); (f) DQ/DTQ (core)
Fig. 8.1 (a) Chondrite normalised NS (ALP028), SS (ALP057), and WQ (ALP067) INAA REE patterns compared with those of Australian Archaean shales (AAS) and post-Archaean Australian shales (PAAS). Chondrite values used for normalization are from Taylor and Gorton (1977). AAS analysis is from Taylor and McLennan (1981), while PAAS values come from Nance and Taylor (1976)
Fig. 8.2 NS and SS La vs Th concentrations on plots after McLennan et al. (1983)
Fig. 8.3 NS and SS Co/Th vs La/Sc concentrations on plots after McLennan et al. (1983). M =average Archaean mafic volcanic rocks; F = average Archaean felsic volcanic rocks
Fig. 8.4 Concordia diagram of ion microprobe results from single zircons from WQ (after Armstrong et al., 1988)
xi

Fig. 8.5 Chondrite normalised BS (ALP028) REE patterns compared with those of siliceous to intermediate rocks and to PAAS. Chondrite values used for normalization are from Taylor and Gorton (1977). Granite and intermediate rock REE values are taken from Haskin et al. (1968), while PAAS values come from Nance and Taylor (1976)
Fig. 8.6 Estimates of average crust which produced BS, using plots of: (a) K/Rb vs K; (b) Si/Al vs Al; (c) Ti vs Zr; (d) Zr vs Cr. Average rock-types annotated thus: n = NS; s = SS; N and H = calculated crust which produced NS and SS, respectively; v = data from Vinogradov (1962); k =data from Krauskopf (1979); t =data from Turekian (1972); y =data from Taylor (1964); s =shale average; c = crustal average; M = maf ic rocks; I = intermediate rocks (Si02 < 60%); G = granite (SiO: > 60%)
Fig. 9.1 Fields of NS and SS relative to sedimentary and igneous fields defined by de la Roche (1966) in the ternary diagram Fe 20s (total)+Ti02 +CaO - Si0:*0.73 - Al20s• Solid line passing through gabbro and granite defines the igneous trend. Terna~y diagram represents the subset shown in the locality figure
Fig. 9.2 Fields of NS and SS relative to sedimentary and igneous fields defined by de la Roche (1966) in the ternary diagram MgO -K20 - Na20. Solid line passing through gabbro and granite defines the igneous trend. Ternary diagram represents the full field shown in the locality figure
Fig. 9.3 Fields of NS and SS in the binary diagram (Al-K)+(Fe-Mg)-4Ca vs (Al-K)-(Fe-Mg)-2Na of de la Roche (1978) which shows progressive chemical changes that accompany the transformation of igneous rocks to various types of highly mature sediment
Fig. 9.4 Fields of NS and SS relative to sedimentary and igneous fields defined by Garrels and MacKenzie (1971) in the binary diagram log(SiOz/Al20a) vs log( (CaO+Na20)/K20)
Fig. 9.5 Fields of NS and SS relative to progressively more mature pelitic rocks in the ternary diagram KzO+Na:O+CaO - MgO+FeO(total) - Al:Oa from Englund and Jorgensen (1973). Ternary diagram represents the full field shown in the locality figure
Fig. 9.6 Fields of NS and SS in binary diagram of Niggli al-alk vs Al:Os
~ Fig. 9.7 Fields of NS and SS in binary diagrams of trace elements vs Niggli al~alk: (a) Zr; (b) Ba; (c) Zn; (d) Ni; (e) Co
Fig. 9.8 Fields of NS and SS in binary diagrams of major elements vs Niggli al-alk: (a) MnO; (b) Cao; (c) Fe:03 ; (d) MgO; (e) TiOz; ( f) Na20; (g) KxO
Fig. 9.9 Fields of NS and SS in binary diagram of P20s vs C Fig. 9.10 Histograms of SIC ratios: (a) USS; (b) LSS; (c) NS Fig. 9.11 S vs C plots relating to SS: (a) SS S vs C raw data; (b)
Graphic representation of the conditions bounding the premetamorphic S and C concentrations in SS (see Appendix H for details); (c) SSS vs C curves relative to sediments deposited below various water types. Black Sea sediments from Levjnthal (1983); sediments from below normal oxidizing sea water taken from Levinthal (1983) and Berner (1984); modern fresh water lake sediments from Berner (1984)
xii
Fig. 9.12 Stability relations in Eh-pH space between some Fe and Mn compounds in water at 25°C and 1 atmosphere total pressure. Dark and light lines mark the Mn and Fe fields, respectively. The Fez-, Fe2+ and Mnz. fields are aqueous, of which the Mns. field is by far the largest. Activity of total dissolved S = 10-1m. At lower S concentrations the fields of sulphides shrink markedly. Activity for total dissolved C02 = 10-'m for Mn, and 0 for Fe. The field of siderite virtually disappears for total dissolved C02 < 10-am. Modified after Garrels and Christ (1965, pp221, 243 and 381). Also plotted are fields of various naturally occurring waters taken from Baas Becking et al. (1960). The arrow from A to B marks the change in conditions when fresh water mixes with sea water ·
Fig. 9.13 Profiles of total Mn in Laurentian Trough sediments (from Sundby et al., 1981)
Fig. 9.14 Co-precipitation of Mo by Mn and Fe oxides under varying pH conditions, after Evans et al. (1974-1978). Curves as follows: a. from Chan and Riley (1966); b. and d. Ishibashi et al. (1962); c. Kim and Zeitlin (1968)
Fig. 9.15 Fields of NS and SS in binary diagram of Cr versus various e 1 emen ts : (a) Cr vs C; ( b) Cr vs Al 20a; ( c) Cr vs Si 0 1 ; ( d) Cr vs Zr
Fig. 9.16 Fields of NS and SS in binary diagram of Ni versus various e 1 eme n t s : ( a ) Ni v s Pa Os ; ( b ) Ni v s Zr
Fig. 9.17 Stability relations for Ce in Eh-pH space, at 25°C and 1 bar pressure. Activities of ions are Mz., M1 • and M" = 10-6 ; total COa = 10-a (after Brookins, 1983). Water fields after Baas Becking et al. (1960). The line joining A to B represents the approximate redox change encountered when particles pass from river water into the sea.
Fig. 9.18 Variations in rare earth concentrations during weathering of granodiorite (after Nesbitt, 1979).
Fig. 9.19 Fields of NS and SS in binary diagram of Cr/(Cr+V) versus various elements: (a) C; (b) S; (c) Ni
Fig. 9.20 Fields of NS and SS in binary diagram of Cu/(Cu+(Mn0/20)) versus Cu I (Cu+ ( Fe aOa I 14 0 0 ) )
Fig. 9.21 The dependence of Pb concentrations on aITTs for galena saturated solutions at 50°C and 100°C (after Giordano and Barnes, 1979)
Fig. 9.22 Activities of the complexes Pb(HS) 2 and Pb(HS) 1·: (a) 30°C; (b) 1oo~c. Total s activity = 1 for heavy line and 0.1 for light line. After Giordano and Barnes (1979)
Fig. 9.23 Stability relations in Eh-pH space between various Pb compounds in water at 25°C and 1 atmosphere total pressure. Aqueous Pb covers a wide field in the absence of dissolved S, and this field shrinks to be restricted to the strongly acid range with increase in S content to 10- 1 m. Dark lines represent fields for conditions of Pco2 = 10-4m and Ps = 10-1m; 1 ight 1 ines for Pco2 = 10-'m and Ps = Om. After Garrels and Christ (1965, pp234 and 237)
Fig. 9.24 Schematic model of basin geometry control on distribution of CSMQ lenses: (a) BGZ forms above Broken Hill orebody and beneath stable thermocline at time To; (b) after disruption of the thermocline, CSMQ precipitates (time T1 ); (c) below the newly established thermocline (T2 ) in the deepest part of the basin, CSMQ goes back into solution, leaving lenses of CSMQ on the flanks of the basin above the Ts line; (d) the thermocline at time Ta is re-established at the approximate position of the T0 thermocline level, with dep~sition of SS preserving the CSMQ lenses
Fig. 9.25 NS Zn variations for surface outcrop and borehole core samples versus distance from the Broken Hill orebody
xiii

Fig. 9.26 Chondrite normalized WQ REE pattern (ALP067) compared with those from basalt associated deep ocean chert of Crerar et al. (1982)
Fig. 9.27 Fields of WQ, DQ, NS and MDS relative to the sandstone fields of Pettijohn et al. (1972, p62) in the binary diagram log(NasO/KsO) versus log(SiOs/AlsOa). c = core; s = surface
Fig. 9.28 Fields of WQ, DQ, NS and MDS relative to fields of quartz arenite and high silica chert in the binary diagram SiO: versus CaO+MgO.
Fig. 9.29 Fields of WQ, DQ, NS and MDS relative to the sandstonequartzi te field of Garrels and MacKenzie (1971) in the binary diagram of log(SiOa/Al:Oa) versus log((CaO+Na20)/K20). Heavy line from granite to basalt defines the igneous trend
Fig. 9.38 Model showing paleo-geographical relationships between provenance, proximal and distal environments during sedimentation of the Aggeneys Subgroup
Fig. 10.1 Effects of temperature on the lOO*Zn/(Zn + Pb) ratio for salinities of 0.5, 1.0 and 1.5m NaCl (after Huston and Large, 1987)
Fig. 10.2 PbS solubility at 150°C in 3m NaCl solutions. Lines with negative slopes on the left side of the diagram are dominated by chloride complexes, and those with positive slopes by sulphide complexes (after Giordano and Barnes, 1979)
Fig. 10.3 Concentration of metals in solution in equilibrium with various minerals: Ba with barite; Cu with chalcopyrite or bornite; Zn with sphalerite (after Ohmoto et al., 1983)
Fig. 10.4 Effect of pH, temperature and salinity on the Zn/Cu and Pb/Cu ratios: (a) effect of pH on the lOO*Zn/(Zn + Cu) ratio at I = 1.0m; (b) effect of temperature on the lOO*Zn/(Zn +Cu) ratio at pH= 6; (c) effect of salinity on the lOO*Zn/(Zn + Cu) ratio at pH = 6; (d) effect of pH on the lOO*Pb/(Pb + Cu) ratio at I = 1.0m; (e) effect of temperature on the lOO*Pb/(Pb + Cu) ratio at pH= 6; (f) effect of salinity on the lOO*Pb/(Pb +Cu) ratio at pH = 6
Fig. 10.5 S"S values for Aggeneys-Gamsberg ore deposits. Values are for sulphides above and barite below the line (after von Gehlen et al. (1983)
Fig. 10.6 Relationship between potential sulphide mass producible (including Fe sulphide) and time for (a) various cross sectional areas of downf low, and (b) various geothermal gradients (after Strens et al., 1987)
Fig. 10.7 Temperature-concentration relationships for total sulphide mass producible in hydrothermal brine (after Strens et al., 1987)
Fig. 10.8 Changes in the saturation indices of minerals during cooling from a 300°C Kuroko fluid on mixing with sea water. Sp = sphalerite; Ba = barite; Cp = chalcopyrite; Py = pyrite; Hm = hematite. The saturation indices of minerals are dependent on fluid redox conditions in (b) but not in (a) (after Ohmoto et al., 1983)
Fig. 10.9 Changes in the saturation indices of minerals during cooling from a 200°c Kuroko fluid. Abbreviations as for Fig. 10.8 (after Ohmoto et al., 1983)
Fig. 10.10 Solubility of amorphous silica in water between 25 and 250°C (after Holland and Mallinin, 1979)
Fig. 10.11 Relationship between proximal ores and exhalites shown in f02 - temperature space for pH between 5 at 350°C and 7 at 50°C with total S = 10-sm and lm NaCl. Modified after R. R. Large (1977)
xiv
Fig. 10.12 (a) Schematic positioning of Aggeneys-Gamsberg orebodies relative to each other within the prograding beach-barrier sedimentary model; (b) Schematic diagrams contrasting the orerock relationships and depth of convective fluid passage in generating the Gamsberg and Broken Hill orebodies. Note that diagrams are not to scale, and (a) should not be viewed as a cross section
Fig. 11.1 Schematic representation of tectonic regime envisaged before, during and after deposition of the Aggeneys orebodies: (a) Basement thinning and rift development; (b) Southerly progradation of beach-barrier setting over the the rift environment; (c) Detail of the syn-sedimentary graben and yoked basin settings for the three Aggeneys ore deposits, also showing thinning of quartzites to the south and maximum development of NS in the rifted blocks; (d) Right lateral simple shear couple which acted on the rift zone; (e) Response of rift zone sediments to earliest phase of deformation, with thrusting on the south limbs of synclines and accentuation of normal displacements on the north limbs. For the sake of clarity only three marker horizons are shown; (f) Schematic plan of Aggeneys area after open folding event, showing proposed locations of reactivated normal faults; (g) Schematic cross-section through the plan in (f) above
Fig. 11.2 Schematic representation of geotectonic model for development of the Namaqualand Metamorphic Complex as it affects the Bushmanland Group: (a) Generation of Vioolsdrif Suite and basement to the Bushmanland Group, resulting from south-directed subduction; (b) Sedimentation of Bushmanland Group above rifted passive margin against marginal basin. Simultaneous northdirected, shallow dipping subduction along SCCB, with generation of volcanic arc, and sedimentation of both mature passive margin and immature volcanic arc detritus; (c) Collision of continents causing south vergence and reactivation of normal faults in the Aggeneys area
Fig. A.1 Cross section through sampled boreholes showing sample numbers and lithologies: (a) Section through TSll at Maanhaarkop; (b) Section through BH163 at Broken Hill; (c) Fence diagram through BH123 to BH164 at Broken Hill; (d) Section through WTL3 and 4 at Wortel; (e) Section through AC2 at Achab; (f) Section through VGl at Namiesberg. Locations of Broken Hill and Maanhaarkop boreholes are shown in the locality plan with Fig. A.le. while locations of the Achab and Namiesberg boreholes appear in Fig. A.2c. The locations of the Wortel boreholes appear in Fig. 5.3
Fig. A.2 Geological maps showing locations of surface s.amples: (a) Broken Hill - Klein Kop; (b) Tank Hill, Maanhaarkop, Froneman se Kop; (c) Namiesberg
Fig. A.3 Comparison betwe~n volatile-included and volatile-free trace element data (left hand side and right hand sides, respectively), when plotted against volatile-free AlsOa• Differences between the two pairs of diagrams are negligible except where high AlsOa concentrations coincide with elevated trace element values. Diamond = NS; Plus = LSS; Box = USS
Fig. A.4 Comparison between XRF-derived rare earth element analyses and INAA data for the same samples: (a) La; (b) Ce; (c) Nd
Fig. A.5 REE analyses of four samples by (a) INAA and (b) XRF analytical techniques, illustrating the applicability of the XRFderived Ho estimate as an indication of relative HREE concentration
Fig. C.1 Photomicrograph of BGZ (ALP235) showing extensive brecciation and rounding of quartz grains in a clay and sericite matrix. Crossed nicols. (lcm = 400 micron)
xv

Fig. C.2 Photomicrograph of CS (ALP188) showing mineral banded nature, with garnet-dominated band below, followed by a biotiterich band and then a quartz-rich band above. Plain polarized light. (lcm = 400 micron)
Fig. C.3 Photomicrograph of DQ (ALP239) showing severely strained quirtz grain surrounded by a mortar texture of polygonized quartz grains. Muscovite appears near the top right-hand corner. Crossed nicols. (lcm = 400 micron)
Fig. c.4 Photomicrograph of DQ (ALP126) showing sheared. wispy muscovite in a matrix of recrystallized quartz grains. Crossed nicols. (lcm = 400 micron)
Fig. E.1 Photograph of amphibolite xenoliths intruded by augen gneiss in quarry south of Broken Hill. Main xenolith is approximately lOcm wide
Fig. E.2 Schematic structural borehole intersection through the contact zone between Basal Gneiss and Namies Schist
Fig. E.3 Schematic cross section through Shaft Schist showing position of Grey Granoblastic Leucocratic Gneiss (GGLG) as well as the contact between USS and LSS
Fig. F.1 OS "ore factor" score variations with distance from the orebody: (a) OS borehole core Factor 2; (b) OS borehole core Factor 3; (c) OS surface outcrop Factor 3
Fig. G.1 Flow chart displaying the regional scale lithogeochemical exploration strategy for locating ore deposits of the Broken Hilltype in the north west Cape
Fig. G.2 Flow chart displaying the local scale lithogeochemical exploration strategy for locating ore deposits of the Broken Hilltype in the north west Cape
xvi
LIST OF TABLES IN VOLUME 2
Table 1.1 Table 3.1
Groups south
Published ore reserves for the Aggeneys-Gamsberg deposits SACS (1980) lithostratigraphy of the Bushmanland and Okiep in a generalized structural succession from north (top) to
Table 3.2 Chronology of the major events in the western Namaqua Province
Table 4.1 Zircon grain sizes in Namies Schist and Shaft Schist Table 4.2 Zircon grain sizes in Broken Hill Quartzites and Median
Schist Table 4.3 Stratigraphic thicknesses (m) of rock types at Broken Hill Table 4.4 Physical dimensions of Broken Hill Quartzites Table 4.5 Physical dimensions of Namies Schist and Shaft Schist Table 4.6 Physical dimensions of Biotite Graphite Zone (BGZ) and Cale
Silicate Rock plus Manganese Quartzite (CSMQ) Table 4.7 Physical dimensions of the Broken Hill orebody and Ore
Schists Table 6.1 Percentage pegmatite in zones of homogeneous schist Table 6.2 Host rock element enrichments and depletions resulting from
pegmatites extraction Table 6.3 Ratios between surface outcrop (s) and borehole core (c)
element mean concentrations of NS, USS and OS as an indication of effect of surface weathering on element distribution
Table 6.4 NS and SS average element concentrations and coefficients of variation (S.D./Mean)
Table 6.5 SS element concentrations relative to NS Table 6.6 Tests for normality and tests for equality of means for the
rock-types NS and SS Table 6.7 NS correlation matrix Table 6.8 SS correlation matrix Table 6.9 Average coefficients of variation for NS and SS Table 6.10 NS and SS factor analysis parameters: (a) variances
explained by each factor, and cumulative variances; (b) communalities for each element.
Table 6.11 CS and MnQ average element concentrations for core and surface samples combined
Table 6.12 cs element concentrations relative to USS Table 6.13 MnQ element concentrations relative to USS Table 6.14 BGZ average element concentrations and standard Table 6.15 BGZ element concentrations relative to USS: (a)
BGZ/USS on a per element basis; (b) Ca/Sr C/S and K/Na BGZ and USS
deviations ratios of ratios of
Table 6.16 Tank Hill Schist (THS) and Green Quartzite (GrQ) element concentrations
Table 6.17 Tests for Normality and tests for the equality of means for the rock-types NS, SS and OS
Table 6.18 OEH average element concentrations and coefficients of variation (S.D./Mean)
Table 6.19 OS correlation matrix Table 6.20 OS factor analysis parameters; (a) OS variances explained
by each Factor, and cumulative variances; (b) communalities for each element
Table 6.21 Some orebody average element concentrations Table 6.22 Broken Hill Quartzite (BQ) average element concentrations
and standard deviations Table 6.23 BQ correlation matrix Table 6.24 BQ factor analysis parameters: (a) variances explained by
each factor, and cumulative variances; (b) communalities for each element
xvii

Table 6.25 Relative element abundances and variations in specific zones of SS
Table 7.1 NTS and STS average element concentrations and coefficients of variation (S.D./Mean)
Table 7.2 NTS correlation matrix Table 7.3 STS correlation matrix Table 7.4 Wortel CTSMQ element concentrations and comparative rock-
types from Broken Hill Table 7.5 Regional Quartzite element concentrations Table 7.6 Regional Quartzite correlation matrix Table 8.1 BS CIA values relative to various rock-types and clays Table 9.1 Average Shale composition and comparison with average NS
and SS: (a) Average Shale, average NS and.SS; (b) Ratio between average element concentration of NS and average shale; (c) Ratio between average element concentrations of SS and average shale
Table 9.2 Analyses of NS and SS and various shales for comparison Table 9.3 Ratios of BGZ to various black shales Table 9.4 Estimated SS original clay composition compared with illite
and montmorillonite Table 9.5 MnO/(MnO+Fe203 ) ratios for NS and SS compared with various
shales Table 9.6 CS average composition, comparative rocks and ratios Table 9.7 MnQ average composition, comparative cherts and ratios Table 10.1 Average base metal contents of some common crustal rocks Table 10.2 Equilibrium constants used in the Cu-Pb-Zn ratio
calculations Table 10.3 Zinc/copper and lead/copper ratios of saturated solutions
at varying temperatures, salinities and pH's as calculated from thermochemical data
Table 10.4 Zinc/lead, zinc/copper and lead/copper ratios of the Aggeneys-Gamsberg orebodies
Table 10.5 6 84S values for sulphide and sulphate (barite) from the Aggeneys-Gamsberg area
Table 10.6 Summary of conditions which obtained to produce the Aggeneys-Gamsberg orebodies
Table A.1 Instrumental conditions adopted for major and trace element analyses using XRF spectrometers in the laboratories of the University of Cape Town Geochemistry Department
Table A.2 Typical lower limits of detection (LLD) and absolute errors (1 standard deviation) for Bushmanland schists from this study analysed by the XRF technique. Since quartzite samples have lower mass absorption coefficients, their LLD and error values are approximately 1/3 lower than for schist
Table A.3 Analytical data including volatiles Table A.4 Additional analyses: INAA and fire assay analytical data Table A.5 Analytical data recalculated volatile-free Table A.6 Analyses of three aliquots of one sample for C, H and N
using gas chromatography Table A.7 Three duplicate INAA REE analyses (ppm) of sample ALP190 Table C.1 List of mineralogical abbreviations used Table C.2 Estimated Namies Schist modal percentages Table C.3 Estimated Shaft Schist modal percentages Table C.4 Estimated Biotite Graphite Zone modal percentages Table C.5 Estimated Cale Silicate Rock plus Manganese Quartzite modal
percentages Table C.6 Estimated Hangingwall Schist modal percentages Table C.7 Estimated Ore Equivalent Schist modal percentages Table C.8 Estimated Ore Equivalent Schist plus Garnet Quartzite modal
percentages Table C.9 Estimated Upper Footwall Schist modal percentages Table C.10 Estimated Orebody silicate assemblage modal percentages
xviii

Table C.11 Estimated Garnet Quartzite modal percentages Table C.12 Estimated Broken Hill Quartzite modal percentages Table C.13 Estimated Namies-type Schist modal percentages Table C.14 Estimated Shaft-type Schist modal percentages Table C.15 Estimated Cale-type Silicate plus Manganese Quartzite
modal percentages Table C.16 Estimated Regional Quartzite modal percentages Table F.1 Factor loadings for OS "ore factors" Table K.1 Comparison between Namies Schist at Gamsberg and at Broken
Hill Table K.2 Comparison between Quartzite descriptions at Gamsberg and
at Broken Hill Table K.3 Broken Hill oxygen isotope data (permil) from Reid et al.
(1987) Table K.4 U, Th and Pb ion microprobe analyses on zircons from White
Quartzite at Froneman se Kop. (Analyst: R. A. Armstrong)
xix

DEDICATION
To Eddie, my dear father-in-law,
who would have loved to peruse
this completed work
xx
ACKNOWLEDGEMENTS
Completion of so large a part-time thesis over a period of 8 years
would have proved impossible without the aid of numerous people, to
whom I am indebted. This is particularly true considering that the
University of Cape Town is separated from Krugersdorp by 1 500km.
In suggesting the project, Ben Weilers and Rennie Blignault rekindled
my zest for earth sciences. My thanks are extended to Gold Fields of
South Africa who, guided by Ben Weilers, Richard Viljoen and Erhart
Kostlin, provided finances for transport, Cape Town accomodation,
analytical- and publication- fees.
Both Dave Reid and Andy Duncan painstakingly introduced me to the
world of computers and the workings of computer-controlled XRF
spectrometers. As my supervisors, their patience at the early stages
of the thesis will remain to their credit and my benefit. Informative
discussions held with them, as well as their continuous, incisive
guidance, helped mold the thesis. I also benefited from technical
discussions with Bob Winter, Mike Watkeys, Julian Hobbs, Pete Smith,
Tony Erlank, James Willis and John Moore. James Willis and Anton le
Roux rendered backup assistance with analytical work and data
reduction.
Thanks go to Graham Kletz, Mark Clarke and Dave Richardson for their
aid in using the BMDP statistical package, while Christine Stock and
Fatima Ferraz guided me out of problem areas encountered in PC
software. Richard Johnson is thanked for giving of his valuable time
translating a data file from mainframe to PC. Computers played so
central a role in data- and word- processing of this thesis, that I
xxi

would like to place on record my gratitude to the developers of PC's
and the writers of user-friendly software!
The late Hans Welke readily undertook the separation of quartzite
hosted zircons. Ion microprobe analyses of these were later supplied
by Richard Armstrong, with whom informative discussions were held on
the topic of isotope systematics. Garth Eagle made an invaluable
contribution by assisting with the acquisition of carbon analyses on
CSIR gas ·chromatographs. In providing INAA analyses of rare earth
elements for a number of ALP samples, Dave Reid again injected
stimulation and a more rigorous foundation to the thesis. I am most
appreciative of this and his willing sharing of data pertinent to the
current study. The section on thermochemistry was only possible after
discussions with Mike Meyer and Dave Richardson, and a written
communication from Dave Huston in Australia.
Logistical support was cheerfully provided at Aggeneys by Ivo Chunnett
and later by Dave Mourant. Joseph Afrikaner rendered much appreciated
physical help in the field, while Shereen Abrams did a sterling job
with sample preparation at UCT. The draughting services rendered by
Les Hill, Lesley Kemmish and staff at Gold Fields have enhanced the
quality of the diagrams, and all the above are thanked for their
assistance, as is Gavin Martin for his photomicrographic aid.
My parents are thanked for making it possible for me to pursue a
career in earth sciences. My appreciation is extended to the late
Sophie and Eddie Walder for accomodation, sustenance and encouragement
during numerous sojourns in Cape Town.
xxii

My wife, Lorraine, maintained her unswerving confidence, encouragement
and love during this study, which proved so supportive. Her willing
sacrifice of holidays and time together, for the sake of the thesis,
is appreciated. Tashi and Elan showed understanding beyond their
years in not having ready access to their father.
xxiii
ABBREVIATIONS
Rock - types Inselbergs ------------ ----------AM Amphibole Magnetite rock AC Achab BGZ Biotlte Graphite Zone BH Broken Hi 11 BQ Broken Hill Quartzite (= WQ t DQ +- MDS) BM Black Mountain BS Broken Hill Schists (=NS t SS t OS) FK Froneman se Kop cs Cale Silicate Rock KK Klein Kop CSMQ Cale Silicate Rock plus Manganese Quartzite MK Maanhaarkop CTS Cale-type Silicate Rock NB Namiesberg CTSMQ Cale-type Silicate Rock plus Manganese Quartzite PH Plant Hill DQ Dark Quartzite TH Tank Hill DTQ Dark-type Quartzite WTL Wortel GGLG Grey Granoblastic Leucocratic Gneiss GQ Garnet Quartzite Measures GRQ Green Quartzite (from Tank Hill) --------GTQ Garnet-type Quartzite a activity HS Hangingwall Schist 0 angstrom a HS+GQ Hangingwall Schist plus Garnet Quartzite cm centermetres IS Intermediate Schist g activity coefficient
. IS+GQ Intermediate Schist plus Garnet Quartzite km kilometres LGQ Lower Orebody Garnet Quartzite m metres LMAtGQ Lower Orebody Amphibole Magnetite rock mm mill !metres LOB Lower orebody mt million tonnes LOEStGQ Lower Ore Equivalent Schist plus Garnet Quartzite m(italics) molality LSS Lower Shaft Schist MDS Median Schist Other MOTS Median-type Schist MNQ Manganese Quartzite ALP Aggeneys LithogeochemicaI Project MQ Quartz Magnetite Rock ( = QM) ASG Aggeneys Subgroup MS Massive Sulfide BG Bushmanland Group NS Namies Schist BIF Banded Iron Formation NTS Namies-type Schist BSP Bushmanland Subprovinee · OEGQ Ore Equivalent Garnet Quartzite GFSA Gold Fields of South Atrica Ltd OES Ore Equivalent Schist HREE Heavy rare earth elements OESP Pegmatite in Ore Equivalent Schist INAA Instrumental neutron activation analysis OESP+GQ Pegmatite in Ore Equivalent Schist t GQ LREE Light me earth elements OEStGQ Ore Equivalent Schist plus Garnet Quartzite NP Namaqua Province OS Ore Schist (= OES t HS t IS t UFS) 00 Okiep Group p Pegmatite (massive) ORG Orange River Group PHS Pegmatite in Hangingwall Schist PD Phelps Dodge Corporation PNS Pegmatite In Namies Schist REE Rare earth elements PSS Pegmatite in Shaft Schist RSP Richtersveld Subprovince PSTS Pegmatite in Shaft-type Schist SCCB Southern Cape Conductive Belt PUFS Pegmatite in Upper Footwall Schist XRF X-ray f luorescenee spectrometry Q Quartzite (undefined) QM Quartz Magnetite rock (= MQ) Rock - types (continued) RQ Regional Quartzite (= WTQ t DTQ) ------------------------s Schist (undefined) UMQ Upper Orebody Quartz Magnetite roek SS Shaft Schist UOB Upper orebody STS Shatt-type Schist UOES+GQ Upper Ore Equivalent Schist + C~ STS+Q Shaft-type Schist t Quartzite USS Upper Shaft Schist S(ACH) Schist at Achab (= NTSJ WQ White Quartzite UPS Upper Footwall Schist WTQ White-type Quartzite
xx iv

PART.A. . \
INTRODUCTION

PART A. INTRODUCTION
1. HISTORY AND LOCATION
The distinctive, black, malachite-stained banded iron formation of the
Swartberg inselberg (now Black Mountain), drew the attention of many
prospectors and geologists to the Aggeneys area in Bushmanland (Figs.
1.1 and 1.2). In 1929 a 25m deep shaft sunk into the footwall
siliceous zone of the Black Mountain orebody, narrowly missed high
grade mineralization. Since that time options to mineral rights over
the farms zuurwater and Aggeneys in the magisterial district of
Namaqualand had been held and allowed to lapse by numerous companies.
In mid-1971 Phelps Dodge Corporation (PD) sank the first borehole on
the properties, and intersected the Black Mountain orebody below the
gossan capping. Immediately following this discovery, gossans were
recognised at Noeniepoort se Kop (now Broken Hill), Big Syncline and
Gamsberg, lying some 6km south-east, 3km east and 24km east of Black
Mountain, respectively (Fig. 1.2, 1.3 and 1.4). An aggressive
program of base metal exploration by multi-national corporations
commenced in the north-west Cape Province of South Africa. The
techniques of field mapping, ground and airborne geophysics and soil
and stream sediment geochemical sampling were employed, yet no
additional significant base metal deposits have since been discovered.
The need for more sophisticated exploration techniques became obvious
in order to discover buried deposits, and in 1982 Mr B. F. Weilers and
Dr. H. J. Blignault of Gold Fields of South Africa Ltd (GFSA)
suggested that the author research the effectiveness of whole rock
sampling as a means of locating Aggeneys-type orebodies, which
stimulated the current investigation.
In 1977 PD entered into a joint venture with GFSA, and 1979 saw the
opening of the Broken Hill mine (Fig. 1.2). Today the town of
Aggeneys, situated 60km west of Pofadder and lOOkm north-east of
1

Springbok, serves the mine and any further development which may take
place on these world class sized deposits measuring 10 1 - 10 8 million
tonnes (Table 1.1). Feasibility studies continue to test the
viability of the Black Mountain and Gamsberg orebodies, however, the
Big Syncline deposit with its low grade Zn-Pb mineralization does not
warrant further investigation at present. All four ore deposits now
fall under the management control of GFSA.
2
2. STUDY CONTEXT, OBJECTIVES AND METHODOLOGY
2.1 Study context
Previous geological investigations in the Bushmanland area of the
Namaqua Province (Fig. 1.1) have tended to be either of a regional
nature (Gevers, 1937; Joubert, 1974; Paizes, 1975; Blignault et al.,
1983; Moore, 1986), or localized to a specific inselberg of the semi
desert environment (Moore, 1977; Lipson, 1978; Rozendaal, 1978;
Stedman, 1980). The present study lies part-way between these two
extremes, examining in detail metasediments from the Broken Hill,
Maanhaarkop and Froneman se Kop chain of inselbergs (Fig. 1.4), and
then extending the investigation to similar rocks in outlying
inselbergs up to 35km from Broken Hill. The study is restricted to
the clearly metasedimentary rocks, leaving well alone the
controversial quartzo-feldspathic gneisses, or so-called "floor"
rocks, components of which are basement, intrusives and supracrustal
rocks (Watkeys, 1986).
2.2 Objectives
In approximately decreasing order of priority, this thesis has the
following objectives:
(a) Determine the likely precursor rocks and the depositional
environments to the metasediments hosting the Broken Hill orebody at
Aggeneys.
(b) Characterize lithotypes as an aid to lithostratigraphic mapping
in the Aggeneys area.
(c) Define the type of provenance which on weathering gave rise to
the sediments which were subsequently metamorphosed.
(d) Assess the genesis of the orebody and ore-associated rocks in the
light of sedimentological analysis and thermochemical modelling.
(e) Identify the likely sources for the metals and sulphur which
comprise the Aggeneys-Gamsberg orebodies.
3

(f) Assess the existence of geochemical haloes surrounding the
orebody at both local and regional scales, since haloes enlarge the
exploration target size (Fig. 2.1).
2.3 Methodology
At an early stage of the thesis, constraints are placed on element
mobility due to weathering, and to both prograde and retrograde
metamorphism. Thereafter, surface and borehole core samples are
treated separately, where practical.
Rocks at Broken Hill are characterized by making use of stratigraphy,
petrography and the application of statistical techniques on the
geochemistry of these units in the Broken Hill area. The structural
or stratigraphic nature of the succession at Broken Hill is assessed
prior to attempting genetic modelling. Reference is made to the
literature in order to examine possible pre-metamorphic precursor
rock-types and their depositional environments. The likely provenance
and state of provenance weathering is also assessed in terms of the
characteristics deduced for the Broken Hill lithotypes. Correlation
between Broken Hill rocks with those from the outlying areas of Achab,
Vogelstruishoek (Namiesberg) and Wortel (Fig. 1.4), are made on the
basis of sequence repetition, texture and petrography. The
geochemical changes between correlated lithotypes then provide a basis
for regional sedimentological modelling.
Few samples from the orebody are analysed. Thermochemical modelling
founded upon base metal contents of the four orebodies in the
Aggeneys-Gamsberg area, is used together with conclusions drawn from
detailed work on the metasediments, to derive constraints on the
genesis of the ore deposits and their source of metals and sulphur.
4

Plotting of elements and element ratios against distance from the
Broken Hill orebody is used to investigate the presence of a local ore
halo. The emphasis is placed on rocks lying at the same stratigraphic
horizon as the orebody. The correlative Bushmanland rocks which were
unaffected by base metal mineralization provide regional background
element and element ratio levels for comparison with units near the
orebody.
5

PART B.
GEOLOGY AND PETROGRAPHY

PART B. GEOLOGY AND PETROGRAPHY
3. REGIONAL GEOLOGICAL SETTING
The schist and quartzite successions and lesser amphibolites in the
Aggeneys area of Namaqualand form a part of the gneiss- and granite
dominated Bushmanland Subprovince (BSP) of the mid-Proterozoic Namaqua
Province (NP) (Fig. 1.1). The metasedimentary schists and quartzites
lie close to the south eastern boundary of the early- to mid
Proterozoic meta-igneous Richtersveld Subprovince (RSP). The Gordonia
Subprovince to the north and east of Aggeneys is largely metapelitic
in the north west, giving way to Ca-dominated metasediments and
metavolcanics immediately east of Aggeneys. A distinctive Bouguer
gravity anomaly which coincides with the surface expression of the
Namaqua Front and Tugela Thrust Zone, marks the northern limit of the
NP. The late-Proterozoic Gariep and Saldania Subprovinces,
respectively, bound the BSP to the west and south. The latter
boundary is taken at the Southern Cape Conductive Belt (SCCB) and
coincident Beattie magnetic anomaly (Fig. 1.1). These subcontinental
wide geophysical features, buried below Paleozoic Karoo cover, were
interpreted by de Beer and Meyer (1983) as resulting from oceanic
serpentinized basalt above a north-dipping subduction zone.
The clearly metasedimentary and lesser metavolcanic rocks preserved in
the north west corner of the BSP (Fig. 1.1), and collectively termed
"supracrustal" rocks, have been divided by SACS (1980) into the Okiep
Group (OG) to the west, and the Bushmanland Group (BG) in the east
(Fig. 3.1). The schists, quartzites, banded iron formations (BIF) and
amphibolites of the Aggeneys area, collectively form the Aggeneys
Subgroup (ASG) within the BG. The thinness of the ASG was noted by
Rozendaal (1982) who measured a 1 500m thick succession at Gamsberg.
In contrast, the tectonically overlying felsic metavolcanic Hom
Subgroup measures at least 2 OOOm in thickness (Blignault et al.,
6

1983), and is structurally overlain by the Guadom Subgroup of biotite
hornblende gneisses and schist. The Pella Subgroup of schist and
quartzite which bears a strong similarity to rocks at Aggeneys, lies
directly above the Guadom Subgroup (Table 3.1). Within the OG,
schists and quartzites of the Khurisberg, Aardvark and Eenriet
Subgroups (Fig. 3.1) also bear a striking resemblance to the ASG.
Blignault et al. (1983) therefore correlated these similar-looking
schist and quartzite Subgroups, but suggested that the Hom and Guadom
Subgroups form an eastern extension of the metavolcanic Orange River
Group (ORG) component of the Richtersveld Subprovince.
The ASG age is bracketed by the uppermost amphibolites at Gamsberg
which yield a Sm-Nd whole-rock isochron age of 1 649 .. ~.90Ma (Reid et
al., 1987), and the basement of Achab Gneiss in the Aggeneys (Watkeys,
1986) and Namiesberg (Moore, 1977) areas which yield whole rock Pb-Pb
ages of 2020_~)50Ma (Welke and Smith, 1984). The strati form Aggeneys-
Gamsberg orebodies within the ASG, return anomalously younger ages of
between 1 200 - 1 500Ma (Koeppel, 1980).
Previous workers agree that the ASG formed in shallow water, but
whereas Rozendaal (1982) and Blignault et al. (1983) envisaged a
continental edge or shoreline environment, Moore (1986) proposed a
marginal, continental basin environment having had little access to
the sea. Rozendaal (1982) concluded that a transgression caused
deposition of fluvial feldspathic sandstones (now feldspathic
quartzites) in the Wortel area which graded upwards through shale (now
Namies Schist as defined later in section 5.1) into marine sandstones
(now quartzites). Development of the ore-associated iron formation
which overlies the quartzites, was related to fluids exhaled up growth
faults, and derived from basaltic magma. After a regression and
transgression which lead to deposition of conglomerates and shales,
7

the sequence at Gamsberg was capped by basaltic, shallow water
extrusions (now amphibolites) (Rozendaal, 1982). The role played by
lithospheric rifting in controlling sedimentology in the BG, was
stressed by both Rozendaal (1982) and Moore (1986). Moore (1986)
envisaged that many gneisses belong to the supracrustal suite and were
derived from K-rich rhyolitic and rhyodacitic caldera ejecta. Water
reworking of this volcanic debris resulted in siliclastic
sedimentation, with the quartzites representing metacherts derived
from subaerial acid volcanism. Metals leached from the volcanic pile
precipitated as iron formation and massive sulphide in restricted
anaerobic sub-basins (Moore, 1986).
The Ca-rich supracrustal rocks in the Gordonia Subprovince east of
Aggeneys were called the Korannaland Sequence by SACS (1980), and
comprise aluminous schists, quartzo-feldspathic gneisses, calc
silicate rock, marble, leucogneiss, amphibolite, quartzite and
conglomerate. The Jannelsepan Formation of amphibolitic gneisses,
schists and calc-silicate rock occur in a belt near the eastern edge
of the NP, and yield a maximum Rb/Sr age of 1,5Ga at the Copperton
volcanogenic cu-Zn deposit (Cornell, 1978) (Table 3.2) (Fig. 3.2).
The OG extends as far south as Bitterfontein, where, as the
supracrustal rocks in closest proximity to the SCCB, they comprise
feldspathic quartzite, schists and aluminous gneisses. Moore (1986)
recognised a series of east-west trending belts of meta-volcano
sedimentary rocks between Bitterfontein and Okiep (Fig. 3.2). The
only available radiometric dates on the OG come from cordierite
orthopyroxene rocks in the Springbok-Komaggas area which yield U-Pb
zircon dates of older than 1 700Ma for the inherited age, and a
1 200Ma age for the high-grade metamorphic event (Clifford et al.,
1981).
8
Rocks which may be near- or actual- age equivalents of the ASG are
therefore sporadically developed over a vast tract of the NP (Fig.
3.2). The SACS (1980) separation of similar packages of rock suites
into different Groups based purely on geographic grounds, is probably
not warranted.
The +2.0Ga old mafic and ultramafic bodies which define the Groothoek
Thrust and the boundary between the BSP and RSP in the Wortel area
(Fig. 1.4), are the oldest known intrusives in these subprovinces, and
are roughly contemporaneous with the Aggeneys basement. The
Vioolsdrif Suite (VS) of granodiorite and diorite, represent new
crustal material derived from mantle differentiation, and they
intruded their co-magmatic 2.0Ga calc-alkali ORO volcanic rocks at
about 1.9Ga (Reid and Barton, 1983). The RSP was reintruded by more
acidic phases of VS some 1.73Ga ago. The Little Namaqualand Suite
(1.0 - 1.2Ga) of siliceous augen granite-gneisses (Blignault et al.,
1983) (Table 3.2), is the most regionally developed of the later
phases intrusive into the BSP, with extensive occurrences in both the
Springbok and Pella-Aggeneys areas (Fig. 3.2). The Aroams Gneiss,
which is located between Aggeneys and Pella, is the largest locally
developed member of the Little Namaqualand Suite.
Blignault et al. (1983) recognised two major structural episodes which
deformed the BSP and RSP. The earlier Eburnian (2.0Ga) orogeny which
deformed the ORO, was limited to the RSP. The younger Kibaran
orogeny, pervasive in the BSP, caused the dominant east west fabric
and isoclinal folds, and their related prograde metamorphic event,
dated at 1.2Ga (Clifford et al., 1981). Blignault et al. (1983)
interpreted the Groothoek Thrust (Fig. 1.4) as one of two late Kibaran
SSW-verging thrusts in and immediately south of the RSP, along which
9

over 75km movement occurred. Moore (1986) suggested rather that the
Groothoek Thrust marked the suture zone between the microcontinent on
which the BG formed, and a super continent to the north. He cited as
evidence the different basement types on either side of the Groothoek
Thrust, and the ophiolite-like nature of the intrusive bodies along
the Thrust. Joubert (1986) proposed rather that the Tantalite Valley
Line (Fig. 3.2) of mafic intrusives and amphibolites (1.73Ga maximum
age) marks the suture along which the RSP and BSP microcontinent in
the south was accreted to the Gordonia Subprovince in the north (Fig.
1.1). This was followed at 1.3Ga with the accretion of the entire NP
against the Kaapvaal Province.
From the greenschist facies, actinolite-hornblende dominated center of
the RSP, the metamorphic grade increases both to the south and north.
South of the RSP metamorphic isograds of the NP display the east-west
elongation of the metasedimentary belts, the major thrust zones and
the SCCB, with the highest grade metamorphic parageneses found around
Garies-Kliprand (hercynite +quartz assemblage). Both the Springbok
Nababeep and Bitterfontein areas fall in the slightly lower grade
garnet + cordierite + K-feldspar assemblage zones (Waters, 1986). To
the north the isograds parallel the Namaqua Front where Blignault et
al. (1983) showed a belt of granulite facies metamorphism extending
through Grunau and Warmbad in Namibia and on to a point east of
Kenhardt in South Africa. Symmetrically placed south of
Bitterfontein and north of Springbok is the amphibolite facies grade
assemblage of biotite + sillimanite + quartz into which the Aggeneys
area falls (see Fig. 1 of Waters, 1986). The hercynite +quartz
assemblage suggests maximum prograde conditions of +800°c at 5Kb,
corresponding to the unusually high thermal gradient of 50°C/Km
(Waters, 1986), and corresponding well with the 45°C/Km gradient
calculated for the Aggeneys area (Lipson, 1978). Based on the high
10
thermal gradient and isobaric cooling history in western Namaqualand,
Waters (1986) concluded that metamorphism resulted from convection
caused by the ascension of dry, charnockitic magmas to levels above
those presently exposed, and noted that such high heat flow acid magma
provinces commonly occur in extensional regimes.
11

4. BROKEN HILL GEOLOGY AND PETROGRAPHY
The component rocks of the Aggeneys Subgroup (section 3) at each of
the inselbergs stretching from Broken Hill through Maanhaarkop to
Froneman se Kap are grossly similar (Fig. 4.1), hence the geology of
only Broken Hill will be discussed in detail. Surface mapping of the
area includes the work of J.M. Moore and K. Holliman (Broken Hill),
J. D. Wilson (Maanhaarkop), and R. D.·Lipson (Maanhaarkop and Froneman
se Kop).
The ASG at Broken Hill is divided into the four formations, Namies
Schist, Broken Hill Quartzite, Ore Schist and Shaft Schist. The name
Namies Schist is retained from earlier workers, while introduction of
the new names is justified in sections 4 and 5. Sediment-hosted,
massive sulphide deposits commonly have associated a number of rock
types of limited lateral extent (often < 200m strike length and < 2m
width), and Broken Hill is no exception. Consequently, these rocks
have been given informal, descriptive names (Fig. 4.6) many of which
have long been in use by mine staff. Several units, such as those
equivalent to the ore time horizon, had not been recognised and were
therefore un-named. In this thesis, rocks comprising a mixture of two
components unfortunately bear clumsy, dualistic names, e.g.
Hangingwall Schist and Garnet Quartzite, abbreviated to HS+GQ. As
will be shown (section 5), formations may be correlated over a wide
areal extent, and these formation names are formally proposed for the
ASG. It is unlikely, however, that within the formations, the names
of individual rock-types which have limited distribution, will have
application beyond the immediate Broken Hill area.
4.1 Structure, metamorphism and lithostratigraphy
At least four tectonic phases plastically deformed rocks in the
Aggeneys area. F2 folds (sensu Joubert, 1971) cause the major gneiss
12

and schist fabric, the prominent L2 lineations which plunge at 25 - 30°
along an east-north-east bearing, and control the plunge of the Broken
Hill orebody~ In the steeply north-dipping strata of Broken Hill, the
prominent mineral lineations other than L2 are sub-horizontal. The
right-lateral Z-shape of the Broken Hill inselberg (Fig. 4.1) results
from the Fa deformation episode. Inselbergs stretching from Froneman
se Kop in the east through Maanhaarkop to Broken Hill in the west,
were referred to by the author (Lipson, 1978) as Fa megaboudins
developed along the southern limb of the Black Mountain Synclinorium.
The metamorphic peak associated with F2 folding has been estimated at
630 - 670°C and 2,8 - 4,5Kb at Gamsberg (Rozendaal, 1978), or 670 -
690°C and 3,4 - 4,5Kb in the Aggeneysberge (Lipson, 1978), i.e. upper
amphibolite facies bordering on granulite facies. Various
retrogressive episodes followed to produce mineral assemblages ranging
to and below 350°C (Lipson, 1978).
Due to the intense deformation at Aggeneys the rocks are first
described in their structural succession and inferences will be made
throughout the thesis, based on geological and geochemical arguments,
as to the original younging directions. In an idealized surface
borehole at Broken Hill drilled perpendicular to dip (Fig. 4.2), first
the gneisses of the ''floor" rocks are intersected, followed by the
supracrustal rocks investigated in this study. The latter comprise
some 64% schist (506m) in the 793m thick structural succession with
interspersed quartzite, ore, calc silicate rock and gneiss. Below the
supracrustal rocks lie gneisses having minor amphibolite and quartzite
developed.
The regional occurrence of leucocratic gneisses found underlying the
schist-quartzite belts lead the author (Lipson, 1978) to propose that
part of the succession at Broken Hill is overturned (Fig. 4.3). If
13

this interpretation is correct then the overturned succession youngs
all the way from the gneisses north of Broken Hill, southwards to the
grey granoblastic leucocratic gneiss (GGLG) (Fig. 4.4), a rock so
named to distinguish it from mafic grey gneiss, and from the common
Pink Gneiss found in Bushmanland. The GGLG forms the core of a south
verging, isoclinal syncline, whereafter the schist and quartzite south
of the fold axis define the "right-way-up" limb of the fold. The
cross section through Maanhaarkop (Fig. 4.5) reveals the same gross
structural succession as at Broken Hill, but lack of outcrop to the
south of Maanhaarkop and insufficient borehole coverage leave a gap in
the stratigraphic information available in the equivalent position of
the Plant Hill quartzite shown in Fig. 4.4 • The stratigraphic column
derived as a working model, and referred to hereafter as a working
stratigraphic column, starts with Namies schist at the base and ends
with GGLG at the top, thus placing the orebody stratigraphically above ,
the quartzites (Fig. 4.6). The supracrustal succession in the working
stratigraphic column at Broken Hill comprises only 459m (excluding
GGLG) compared with the 793m long structural succession.
4.2 Broken Hill schists
4.2.1 Namies Schist (NS)
The rationale for naming the schist lying between gneiss and
quartzite, Namies Schist, is presented in Section 5.1. The rock is
afforded formation status as indicated in Fig. 4.6. Namies Schist
(NS) is a strongly foliated, coarse-grained, quartzitic schist which
displays textural variations from nodular to mottled (Fig. 4.7). The
nodules, comprising a quartz-muscovite-sillimanite assemblage, are
most common at, but not restricted to, the zone closest to the
gneisses. Rarely are banded or massive varieties of NS found. The
colour of fresh rock varies from grey-green to pink, although wet
pieces of borehole core of both the schist and enclosed pegmatites
14

always display a reddish colour. In outcrop the schists weather dark
brown to grey where relatively quartz-poor, and lighter grey in the
more quartz- and muscovite- rich areas. NS occasionally hosts one
metre thick amphibolite bands and chlorite-rich schists, as well as
quartzite and Garnet Quartzite bands of up to half a metre thick.
NS displays a wide modal variation, with essential minerals consisting
of quartz, biotite, sillimanite, muscovite and opaque minerals. The
subparallel arrangement of elongated quartz, sillimanite and the micas
define the rock's well developed foliation. Close to the basal
gneisses, quartz comprises some 40 - 50% of the rock, with biotite (15
- 25%) in excess of muscovite (5 - 10%) (Appendix C.l, Table C.2).
Nearer the quartzites not only do the number of quartzite interbands
increase, but there is also an increase in quartz content (estimated
50 - 60%) and muscovite (estimated 10 - 25%), at the expense of
biotite (estimated <5%). The occurrence of both plagioclase and
microperthite (20 - 40%) is restricted to the zone adjacent to basal
gneisses. An important feature of NS, however, is that irrespective
of relative mica content, the primary (deformed) muscovite is
frequently in stable contact with biotite. In both borehole core and
surface samples, much coarser-grained, secondary (undeformed)
muscovite occurs as an alteration product after sillimanite (Fig. 4.8)
(Appendix C.1), while chlorite represents the major secondary product
after biotite. This contrasts strongly with Shaft Schist discussed
below in which muscovite forms the major alteration product after
biotite.
Of the minor minerals, zircon is ubiquitous, while coarse-grained
garnet, tourmaline and fine-grained sphene occur sporadically. Zircon
displays a slightly elongated, but rounded form, and most commonly
occurs as an interstitial mineral. No zircon overgrowths have been
15

noted, and metamict varieties are rare. Magnetite commonly comprises
up to 5% of NS, with accessory chalcopyrite occurring as irregular
blebs or streaks parallel to the foliation. Pyrite and pyrrhotite are
more rarely developed. The opaque mineral content of NS does not vary
systematically through the succession.
4.2.2 Shaft Schist (SS)
Shaft Schist (SS) forms a distinct horizon in the footwall of the
Broken Hill orebody through which both the Broken Hill decline- and
vertical- shafts were sunk. Although comprising approximately one
fifth of the supracrustal sequence, SS rarely crops out due to its
soft nature and negative weathering characteristic, thus borehole core
and underground development of fer the best exposure of this horizon.
The rock-type is referred to by local mine geologists as Lower
Footwall Schist, and by Lipson (1978) as Spring Schist, after the
tentative correlation between it and the Spring Schist in the
Aggeneysberge. SS may be further subdivided into structurally Upper
and Lower horizons (USS and LSS) separated by GGLG near surface, and
distinguishable from each other down dip when GGLG is no longer
present, by the more siliceous character of LSS (Figs. 4.2 and 4.4).
As with NS, SS should be afforded the rank of formation (Fig. 4.6).
The Biotite Graphite Zone and Cale Silicate Rock plus Manganese
Quartzite comprise two subunits of SS, and are described below in
sections 4.2.2.1 and 4.2.2.2 •
SS is also a strongly foliated, coarse-grained rock, but unlike NS,
hand specimens display relative homogeneity with little textural or
mineralogical variation. Amongst the borehole cores examined, no
amphibolite bands were noted. Fresh core specimens of SS and its
enclosed pegmatites display a green-grey colour when both wet and dry
(Fig. 4.9), although w'ithin a month of exposure to rain, oxidation of
16
the contained iron sulphides produces a distinctive yellow-coloured
staining. In the rare outcrops of SS, the breakdown of iron sulphides
and consequent generation of sulphuric acid produce alteration colours
ranging through white, yellow, red and black.
The well foliated texture of SS is defined by oriented, strongly
elongated quartz, sillimanite, micas, iron sulphides and graphite.
Additional petrographic descriptions and estimated modal percentages
appear in Appendix C.2 and Table C.3). In contrast to NS, the
muscovite content never exceeds that of biotite, and virtually all
muscovite is an alteration product of biotite (Fig. 4.10) or
sillimanite. Only trace amounts of chlorite alteration after biotite
are present.
Rounded zircon occurs in all thin sections examined, but appears
finer-grained and more frequently enclosed in biotite in SS than in NS
(Table 4.1). Minor exceptions exist to the above generalizations
(Appendix C.2). The opaque minerals consist of pyrite and pyrrhotite,
with minor graphite, but magnetite is absent. Samples with > 5%
pyrit~ and pyrrhotite occur within 80m of the Broken Hill orebody.
4.2.2.1 Biotite Graphite Zone (BGZ)
Ryan et al. (1982) called this rock the pyritic graphitic biotite
schist, while the term Weak Zone used by mine personnel aptly
describes the poor support conditions which obtain where mining
development proceeds through this incompetent horizon. The term
Biotite Graphite Zone is suggested here since the unit forms a
distinctive zone, though not a separate rock-type, of relative
enrichment in biotite and graphite within SS. BGZ marks the
structural top of SS, separating Ore Schist above from SS below (Fig.
4.2), and appears to be a stratigraphic horizon due to its persistent
17

and concordant nature. The green-grey coloured BGZ is a strongly
foliated schist comprising millimetre thick, slickensided graphite
layers in a matrix of clay and biotite-rich SS (Appendix C.2.1; Table
C.4; Fig. C.l) suggesting a concentration of shear deformation at this
stratigraphic level. The Zone frequently contains green-coloured
pegmatites and lensoid bands of pyritic Garnet Quartzite.
4.2.2.2 Cale Silicate Rock plus Manganese Quartzite (CSMQ)
CSMQ occurs as lenses approximately lOm structurally below BGZ, with
dimensions shown in Table 4.6, and has not previously been described
in the literature. The two components of CSMQ are intimately
interbanded, green to pink rocks, and exhibit fine to coarse-grained
textures. individual bands of the two rocks vary in size from 2 -
lOOcm. Within 200m south-east of the Broken Hill orebody the
manganese quartzite predominates, and this displays yellow to orange
boxworks after sulphides. While the Cale Silicate Rock comprises
garnet, quartz, a pyroxene-amphibole mixture and sulphides including
dominant pyrrhotite, and lesser disseminated galena and sphalerite,
the Manganese Quartzite consists of quartz, garnet, biotite and
sulphides (Appendix C.2~2; Table C.5; Fig. C.2).
At Maanhaarkop CSMQ thickens to nearly 2m and carries up to 7% Pb as
cerrusite and galena in surface samples. No CSMQ samples from Broken
Hill have returned such high Pb values. Also found in a 2m2 outcrop
associated with CSMQ on Maanhaarkop is the only unequivocal
conglomerate (Fig. 4.11) found along the entire outcrop chain
stretching from Broken Hill to Froneman se Kop.
4.2.3 Ore schists and orebody
The detailed geology in and immediately adjacent to the orebody is
complicated both by lensoid development of the orebody and associated
18
rocks, as well as by later deformation causing high amplitude folds
(Fig. 4.12) which juxtapose sequences of similar looking schists. The
schist zone hosting the orebody and lying between the quartzites above
and BGZ below, is therefore called Ore Schist (OS) (the nomenclature
is further justified in section 5.2) and can be subdivided purely on
structural positioning into Hangingwall Schist (HS) above the Upper
Orebody (UOB), Intermediate Schist (IS) which separates UOB from the
Lower Orebody (LOB), and Upper Footwall Schist (UFS) which lies
between LOB and BGZ (Fig. 4.2). The Ore Equivalent Schist (OES) is
defined as the lateral equivalent (both to the west and east) of the
zone comprising UOB+IS+LOB (Fig. 4.6). Except in UFS which is
noticeably feldspar rich, thin bands of Garnet Quartzite frequently
occur in Ore Schist. The rock is then referred to as Hangingwall
Schist plus Garnet Quartzite (HS+GQ), or Ore Equivalent Schist plus
Garnet Quartzite (OES+GQ). Where these Garnet Quartzites are
sufficiently thickly developed, they are referred to as Ore Equivalent
Garnet Quartzite (OEGQ). HS displays strongly developed compositional
banding. OES is most easily recognised where it comprises a massive
biotite and garnet rock with minor quartz and muscovite. The biotite
{lakes vary up to 15mm in size and host garnets of up to 8mm diameter.
Parts of IS have identical mineralogy to OES.
The term Garnet Quartzite as commonly used by mine staff is retained
instead of the term garnet-quartz rock suggested by Spry and Wonder
(1989), who pointed out that garnet quartzite implies that the rock
was formed by metamorphism of a sandstone or chert. No misnomer is
apparent in view of the wide definition of chert, which includes
silica of organic, inorganic and replacement origin.
In general terms the two lenses comprising the Broken Hill orebody
have separate lithologies. An abrupt increase in the quartz and
19

magnetite contents of OS marks the top of UOB which consists of a
magnetite-bearing quartzite that grades downwards with increasing
magnetite content into a quartz magnetite rock (QM) clearly belong;ing
to the oxide facies of banded iron formations (BIF). QM grades
downwards into an amphibole magnetite rock (AM) which hosts the WE!ll
defined, partly baritic massive sulphide lenses of UOB. The footwall
to UOB comprises either QM or GQ, and both display sharp contacts with
IS. LOB generally has the same form as UOB except that the quartz;
magnetite rock is absent, and sulphide mineralization in the amphibole
magnetite rock is finer-grained and of a higher tenor than in the
corresponding rock of UOB. LOB is sheathed in GQ. In places along
the LOB upper contact GQ displays a conglomeratic appearance with a
biotite garnet matrix wrapped around the quartzite "pebbles" (Fig.
4.13). The matrix consists of garnet, quartz, biotite, opaque
minerals, muscovite and gahnite (Appendix C.3; Table C.11). Although
quartz dominated, the ''clast" comprises the same minerals except for
muscovite.
Of all OS samples examined (Appendix C.3; Tables C.6 - C.9), only
those from the intensely refoliated zone of an Fa fold (Fig. 4.14) in
BH112 (samples ALP172, 174 and 176) display such severe alteration
that even quartz has participated in the reactions generating
sericite. Coarse-grained biotite has retrograded to sericite around
the fold axes. In ALP174, sericite occupies large areas of the thin
section with muscovite having crystallized from the sericitic mass.
Biotite is preserved at the terminations of elongated garnet, but
passes rapidly into sericite away from the garnet.
The tenor of mineralization in both UOB and LOB increases
progressively towards the central massive sulphide lenses. Although
estimates of the orebody assemblages appear in Table C.10, detailed
20

descriptions of UOB and LOB fall outside the scope of this thesis, and
the reader is referred to Ryan et al. (1982) for more information. "'.;:
Zircon concentrations decrease from HS or UPS into OES and further
into GQ and the orebody. In some of the OES samples zircon is
preserved entirely as fine crystals in biotite, showing pleochroic
haloes. Gahnite is limited to rocks of the orebody and their adjacent
Garnet Quartzites, and to one sample of surface OES (ALP198) located
some 20m from the orebody. The lack of heavy minerals other than
magnetite in ALP075, a quartz magnetite rock from the Broken Hill
orebody, contrasts strongly with the abundant apatite, sphene and
coarse-grained, rounded zircon found in ALP228, a quartz magnetite
lens from the south slopes of Froneman se Kop (Table C.10). Magnetite
comprises in excess of 90% of the minerals listed under the column
"Op" (opaque minerals) in Tables C.10 and C.11.
4.3 Broken Hill Quartzites (BQ)
The massive, white to glassy quartzites at Broken Hill, Maanhaarkop
and Froneman se Kop, form the prominent ridges responsible for the
inselberg landscape at Aggeneys. At all three hills the two distinct
quartzites referred to by mine geologists as Upper Quartzite and Lower
Quartzite according to their structural superposition, are separated
by a Median Schist horizon (MDS) which frequently encloses dark
quartzite lenses. The Lower Quartzite is generally darker coloured
than the Upper Quartzite, particularly so in weathered outcrops, and
the terms Dark Quartzite (DQ) and White Quartzite (WQ) introduced by
Rozendaal (1982) are adopted (see section 5.1 below for justification
of the formation name Broken Hill Quartzites). In total the two
quartzit~s, measuring some 88m in true thickness, comprise an
important component of the supracrustal succession at Broken Hill, and
lie between the schist horizons NS and OS (Figs. 4.2 and 4.6).
21

Until Mr. J. Hobbs drew the author's attention to faint heavy minE!ral
layering in the steeply north-dipping WQ at Froneman se Kop, no
pristine sedimentary structures had been recognised in BQ. The
dominant features of the layers is that they remain subparallel over
the few metres of continuous outcrop in which they can be traced, with
the occasional development of a low angle band linking two adjacent
layers (Fig. 4.15). Radiographic stereo pairs from an oriented sample
of one such occurrence reveals ripple-like features measuring up to
2cm across which display both concavity and pointed cusps to the south
(Fig. 4.16). The apparent truncation of 11 foreset X" by "topset Y"
(Fig. 4.16) also suggests southward younging, as does the possible
"rain-drop" feature located at Z (Fig. 4.17). These features are,
however, open to different sedimentological interpretations.
Furthermore, though suggestive of primary sedimentary structures, the
cusps and truncations may have developed during the four major phases
of structural deformation (Ryan et. al., 1982). Assuming that the
sample collected is representative of the attitude of the entire hill
and was not affected by local small-scale isoclinal folding, then the
rocks at Froneman se Kop are overturned.
Although WQ and DQ generally have similar mineralogies, there is a
tendency for DQ to contain more mica and accessory minerals than WQ
(Table C.12), which accounts for the darker colour of DQ. In both WQ
and DQ, quartz comprises in excess of 80% of the mode, with muscovite
the next most important mineral. Heavy mineral layers continue
through and not around quartz grains, which indicates extensive
recrystallization of quartz, and prevents any genetic connotations
being placed on quartz grain morphologies (Lipson et al., 1986).
Additional BQ petrographic descriptions appear in Appendix C.4.
22

Ubiquitous zircon displays a well rounded and slightly elongated
morphology (Fig. 4.18) with a long axis dimension averaging 80 - 95
microns (Table 4.2). Rounded grains of zircon measuring 30 - 50
microns dominate the mineralogy nf the heavy mineral layers (Fig.
4.19) with lesser, rounded to idioblastic grains of hematite/ilmenite
intergrowths, and red rutile. In hand specimens of both WQ and DQ,
sporadic pyrite and chalcopyrite grains concentrate along bands and
zones slightly enriched in magnetite. Heavy mineral layer thickness
is restricted to the width of one or two mineral grains (Fig. 4.19),
hence no graded bedding is discernible (Lipson et al., 1986).
MDS displays wide variations in mineralogical proportions and is both
foliated and banded. Major minerals comprise quartz, biotite,
muscovite and sillimanite (Table C.12), while garnet and magnetite in
quantities of between 3 and 10% each, characterize this rock and are
frequently associated with small amounts of disseminated pyrite and
chalcopyrite.
4.4 Physical dimensions
The stratigraphic thicknesses of each rock type measured in the
sampled boreholes is given in Table 4.3 • Also included are average,
total and range of thickness.
At Broken Hill, WQ can be traced along the entire 3 300m length of the
inselberg, while DQ continues for only 900m, although it is inferred
to extend over a similar strike length to WQ (Fig. A.2a). Remnants of
both quartzites are recognised between the 6km separating Broken Hill
and Froneman se Kop. Drilling at Broken Hill shows that the
quartzites continue down-dip for over 750m, and for over lOkm in the
preferred structural interpretation of macroscopic isoclinal fold
duplication of the entire succession (Fig. 4.3). WQ and DQ average
23
65m and 23m in true thickness, respectively (Fig. 4.4 and Table 4.4),
while MOS averages 17m.
Both NS and SS display similar strike dimensions to those of the
quartzites. Without exception, every borehole drilled into the 3 300m
long Broken Hill inselberg has intersected the two schist horizons at
their anticipated relative positions. From sporadic surface and
borehole information between Broken Hill and Maanhaarkop, a strike
extent of over 5km can be inferred for both schists. The lack of
positive identification of SS at Froneman se Kop precludes the
inference of its presence east of Maanhaarkop. While the preferred
structural interpretation suggests a down-dip continuation of SS for
well over lOkm (Fig. 4.3), NS lacks a similar dip extent since it is
not developed at Plant Hill. With reference to Fig. 4.3 it appears
that NS was thinned as an incompetent layer along the sheared limb of
the isoclinal fold.
An average thickness dimension of 96m for SS (Table 4.5) is based at
Broken Hill on an average between the thickness from BGZ to GGLG, and
from GGLG to the Plant Hill quartzite (PQ) (Fig. 4.4). No other
complete borehole intersections exist on which to base this
calculation. The average of 104m for NS thickness includes the thin
Maanhaarkop intersection in borehole TSll (Fig. 4.5).
The 1 - lOm wide BGZ (Table 4.6) occurs both structurally below the
Broken Hill orebody, and also in percussion boreholes drilled for
water near Klein Kop (Fig. 4.1). Whether BGZ exists on Maanhaarkop
remains unknown as no boreholes have penetrated its anticipated
stratigraphic level in that area. In contrast, folded, 1 - 7m wide
lenses of CSMQ (Table 4.6) lie at a constant stratigraphic level both
at Broken Hill and at Maanhaarkop. These lenses seldom occur in the
24

immediate structural footwall of the Broken Hill orebody, but rather
structurally below, and peripherally to the orebody.
OS may be traced for the entire length of both Broken Hill and
Maanhaarkop, and down dip for > 800m to the deepest borehole
intersections at these hills, maintaining a width of approximately
llOm (Table 4.7). Where the orebody is present, HS averages some 2lm
in thickness, IS llm and UFS some 21m. Away from the orebody, OES
measures up to 40m in thickness with the massive biotite garnet rock
component of OES not exceeding lOm in width. The lensoid UOB and LOB
measure 40 - 60m and 30 - 40m, respectively, over the bulk of their
lengths. Ryan et al. (1982) quote a strike extent to the orebody of
600m and down plunge extent of over 1 200m. The relationships between
major lithologies are described in Appendix E.
4.5 Conclusions
The general setting of a schist and quartzite succession with
associated conglomerates and calc silicate rocks clearly suggests that
the package of rocks which host the Broken Hill orebody, is
metasedimentary. The likely precursors to the major schist
(metapelite) and quartzite (metapsammite or metachert) units will be
examined in section 9. The particularly well developed metatholeites
(now amphibolites), near the top of the succession at Gamsberg and
Aggeneysberge, in which amygdales are preserved (Rozendaal, 1978; Ryan
et al., 1982; Reid et al., 1987) reflect volcanic input at specific
times during development of the basin (see also Fig. 5.3).
25

5. LITHOSTRATIGRAPHIC CORRELATIONS
5.1 Broken Hill area
In an environment as structurally deformed as the NP, the possibility
exists that large-scale dislocations have occurred, fortuitously
juxtaposing on individual inselbergs, similar-looking but
stratigraphically unrelated rock successions. Therefore in studying
spatial distribution of lithogeochemical signatures in the Broken Hill
area, the structural succession must be examined for the presence of
large-scale, low angle (thrust) and high angle faults. If individual
metasediments and their order of occurrence are correlatable between,
for example, Broken Hill and Maanhaarkop (Fig. 4.1), then continuity
probably existed at sometime between these two inselbergs.
The structural successions at Broken Hill and Maanhaarkop are grossly
similar with the nodular to mottled, magnetite-bearing, quartz- and
zircon- rich NS on the north side of both hills structurally overlying
the whiter, thicker WQ, and then the darker, thinner DQ. Between the
two quartzites is sandwiched the magnetite-bearing MDS that in places
at both localities exhibits traces of Cu mineralization in the form of
malachite staining on outcrops and chalcopyrite in borehole core. At
Broken Hill MDS also hosts a stratabound and stratif~rm gossan lying
directly structurally above the orebody. The strike extent of the
gossan is restricted to the general region of the Broken Hill orebody.
The schists immediately below DQ contain 5 - 15cm wide bands of Garnet
Quartzite. In borehole BH123 the two distinct Garnet Quartzite-rich
zones within these schists reflect the down-plunge extremities of the
Broken Hill UOB (ALP047) and LOB (ALP049), and may be correlated with
two Garnet Quartzite-rich zones in borahole TSll at Maanhaarkop
(ALP130 and 132). In both boreholes BH123 and TSll, Garnet Quartzite
layers are rarely found in the schist below the lower of the two major
26
Garnet Quartzite zones. Surface outcrops at Maanhaarkop show CSMQ and
occasional outcrops of SS in the same relative structural positions as
at Broken Hill. Even the percussion boreholes drilled for water
between Klein Kop and Maanhaarkop intersected graphite at the depth
expected for BGZ, confirming the continuity of many of the
supracrustal rock-types below surface cover. Although BH123 continued
through schist to intersect BGZ, CSMQ and SS, TSll stopped short in
schist below the lower Garnet Quartzite, but before testing either BGZ
or CSMQ horizons (Fig. 4.5). On simple petrographic grounds,
therefore, rocks at Broken Hill and Maanhaarkop may be correlated with
a high degree of certainty.
Schists occupying a position between gneiss and quartzite at Gamsberg
(Rozendaal, 1978) and Namiesberg are referred to by SACS (1980) as
Namies Schist, with the rank of formation. In gross appearance,
included lithologies and mineralogy, NS at Broken Hill is similar to
that described by Rozendaal (1982) at Gamsberg (Table K.1), thus
justifying the correlation between these schist horizons from the two
inselbergs.
In detail, good correlation also exists between the quartzite members
at Broken Hill and those described at Gamsberg by Rozendaal (1978)
(Table K.2), with White Quartzite at Broken Hill the equivalent of the
White Quartzite Member at Gamsberg, Dark Quartzite at Broken Hill the
equivalent of the Dark Quartzite Member at Gamsberg, and MDS at Broken
Hill the equivalent of the Pelitic Schist Member at Gamsberg •.
Although Rozendaal 1 s (1982) quartzite nomenclature is adopted, the
specific name Median Schist is preferred to his general term Peli tic
Schist. Both SACS (1980) and Rozendaal (1982) express doubts about
correlations between the supracrustal successions at Aggeneys-Gamsberg
and at Pella, hence the term Pella Quartzite Formation which
27
collectively includes the Aggeneys and Gamsberg units (Rozendaal,
1978) is inappropriate. Rozendaal (1982) later suggested calling the
unit the Zuurwater Quartzite Formation after the farm Zuurwater at
Aggeneys. Moore (1977) simply used the word Quartzite to describe
this suite of rocks at Namiesberg, while SACS (1980) preferred the
term Metaquartzite unit. The name White Quartzite Formation used by
Ryan et al. (1982) does not accurately reflect the presence of colour
variations between white and dark members. In proposing here the term
Broken Hill Quartzite Formation (BQ) for WQ, MDS and DQ, cognizance is
taken of the good quartzite exposures which exist on surface, in
borehole cores, and in underground workings at Broken Hill.
Maanhaarkop, Klein Kop and Froneman se Kop differ from Broken Hill
chiefly in the lack of an orebody and in the thinner supracrustal
successions at the former locations. The succession is so thin at
Froneman se Kop that no NS separates gneisses from WQ on its north
slope (Fig. 4.1). Neither OES nor SS could be positively identified
on the south slope of Froneman se Kop, although the presence of SS
beneath the sand cover south of Froneman se Kop is considered likely.
The two garnetiferous schist samples from the south slopes of Froneman
se Kop (ALP229 and 230, Fig. A.2b), are correlated with OS because of
their similar petrographies (Table C.6) and similar locations within
the metasedimentary succession.
The conglomerate-like GQ of the Lower Orebody (section 4.2.3) is
unlikely to have gained its elastic appearance in the sedimentary
environment since the unusual garnet+gahnite mineralogy is preserved
in both clasts and matrix. It would be fortuitous for Fe-Zn-rich
quartz pebbles to be deposited in an Fe-Zn-rich pelite. The necking
evident in the more continuous, quartzitic layers (Fig. 4.13)
indicates that the clasts are probably boudinaged remnants of quartz-
28

rich layers in a meta-pelitic matrix. Such rocks are therefore
referred to as pseudo-conglomerates, and there can be no justification
in correlating them with the less equivocal meta-diamictites
recognised by Strydom (pers.comm., 1983) from Black Mountain and the
Aggeneysberge, or the meta-conglomerate in the eastern Aggeneysberge
(Ryan et al., 1982).
Problems have long existed in correlating the north-west dipping Tank
Hill succession with rocks at Broken Hill and Black Mountain.
Although gneiss occurs on the northwestern slope of Tank Hill (Fig.
5.1), the schist lying between gneiss and quartzite in the expected
position of NS, has a gossan-like appearance with black, Mn-Fe
surf icial staining and occasional veins which cross-cut the foliation.
Dark alteration extends into the host rock for 2cm on either side of
the veins. A thin(< lOOcm thick), unmineralized band of massive
magnetite and barite extends for approximately lOOm strike length in
the schist (Figs. 5.1 and 5.2). Part of the schist grades into a
Garnet Quartzite, while an isolated (lOm x lOm) patch of green,
fuchsitic quartzite occurs close to the quartzite contact (Fig. 5.2).
Estimated modal percentages appear in Table C.2 for the schist
(ALP243) and Green Quartzite (ALP244X and Y). Extensive shearing in
the area precludes recognition of two distinct quartzite horizons
within the quartzite zone (Fig. 5.1), but a gossanous Pb-Zn
mineralized schist similar in character to Spring Schist in the
Aggeneysberge, structurally underlies these quartzites.
29

Tentative correlations between rock types at Tank Hill with Black
Mountain to the northwest and Broken Hill to the southeast, 'are as
follows:
1. The veined schist at Tank Hill is a type of NS which hosts the
three unusual rock types, massive magnetite and barite, Garnet
Quartzite and green quartzite.
2. The quartzite zone structurally below NS correlates with BQ and can
also be traced to Black Mountain where it lies both above and below
the orebody due to isoclinal fold duplication (Fig. 4.3).
3. The mineralized schist at Tank Hill has been traced into the Lower
Orebody pelitic horizon at Black Mountain by integration of detailed
surface mapping results with those from a line of boreholes drilled
between the two inselbergs. Towards the east the mineralized schist
at Tank Hill is correlated with either the Broken Hill Orebody or with
SS as a mineralized portion thereof.
The dire~t correlation of rocks at Broken Hill with those at Klein
Kap, Maanhaarkop and Froneman se Kap appears straightforward, although
correlation with Tank Hill is more tenuous.
5.2 Namiesberg, Wortel and Achab
Both Namiesberg and Wortel localities have a similar-looking gneiss
schist-quartzite suite of rocks to those described at Broken Hill. In
contrast, no rock-types other than schist were intersected in borehole
AC2 from Achab, and no outcrops occur within 1 OOOm of the borehole
site.
In comparing rocks outside of the inunediate Aggeneys area (regional
rocks) with those at Broken Hill (local rocks), the names used at
Broken Hill have been favoured. To distinguish both clearly and
simply between local rocks and their likely regional counterparts, the
30
suffix "type" is added to the Broken Hill rock name for the
corresponding regional rock. Thus for example, Namies Schist (NS) at
Broken Hill becomes Namies-type Schist (NTS) at Wortel.
Similarly to Broken Hill, the major quartzite and schist horizons at
both Namiesberg and Wortel may be traced along strike for several
kilometers, and the packages of metasediments measure tens to hundreds
of metres in thickness. The Namiesberg structural succession
approximates that at Gamsberg (Rozendaal, 1982), with gneiss overlain
by schist and then by a quartzite zone (Fig. 5.4). At Namiesberg this
schist has a variable, foliated and banded character, with interlayers
of orange-coloured muscovite gneiss (confined to the northern slopes),
pink-coloured pegmatites (ALP433), and occasional dark-weathering
quartzites. On both the north and south sides of Namiesberg, black
Fe-Mn stained vugs in places present a slightly gossanous appearance.
Moore (1977) reported thin lenses of calc silicate rock, aluminous
rich rock and amphibolites within the schist. The massive sillimanite
pods in the schist have been mined as a refractory product. Both at
Namiesberg and Wortel, schist lying between gneiss and quartzite
becomes more feldspathic away from the quartzites. Gneiss, pegmatite
and gossanous parts were excluded from all samples.
Based on the nodular texture, variability, included quartzites,
adjacent rock types, the pink colour of included pegmatites, and
mineralogy (Appendix C.5 and Table C.13), the schists lying between
gneiss and quartzite at Namiesberg are correlated with NS. Moore
(1977) proposed that the quartzite zone at Namiesberg marked the top
of the stratigraphic succession, implying that schists found
structurally above the quartzites are a duplication of those below.
Selected traverses carried out during the sample collection program at
Namiesberg showed, however, that the quartzites comprise a lower white
31

variety separated from a darker, pyrite-bearing type, by a banded and
foliated schist horizon, in exactly the same sequence as found at
Gamsberg, and reversed to the structural order at Broken Hill.
Quartzites along the subvertical northern limb of the Namiesberg
synclinorium can be traced around the closure into the north-dipping
southern limb (Figs. 5.3 - 5.5). The whiter of these quartzites is
therefore termed White-type Quartzite (WTQ) and the darker, Dark-type
Quartzite (DTQ), with the schist called Median-type Schist (MDTS).
These quartzites contain heavy mineral layers similar to those found
in BQ. At Wortel the structure is not as clearly defined, but the
north fiide of the Wortel mountains in the vicinity of boreholes WTL3
and WLT4 (Figs. 5.3 and 5.6) have a broadly similar structural
sequence to that at Broken Hill. The quartzites are overlain firstly
by a thin, light grey to pink coloured, magnetite-bearing schist (NTS)
which hosts pink coloured pegmatites, and then by gneiss. The
textural and mineralogical descriptions of the Regional Quartzites
(RQ) are presented in Appendix C.7 and Table C.16.
At both Namiesberg and Wortel, borehole samples of schist lying on the
side of the quartzites opposite to that of the gneiss, display the
bottle green colour, foliated pyrite, and monotonous, unbanded
character of Broken Hill SS, and are termed STS. Pale green-coloured
pegmatites usually comprise in excess of 10% of the rock, by volume.
At Wortel this schist hosts both the massive sillimanite pods
exploited as a source of refractory ore (Appendix C.6.1) as well as
the thin banded iron formation/calc silicate rock/Garnet Quartzite
gossans investigated by exploration companies. Comparisons between
the Broken Hill and Wortel calc silicate rocks reveal petrographic
similarities except for olivine found at Wortel (Appendix C.6.2; Table
C.15). In that respect the Wortel CTS has an affinity with AM at
Broken Hill. The recognition that massive sillimanite pods occur in
32

both NTS and STS is in conflict with Rozendaal's (1982) assertion that
these bodies are restricted to NS, and suggests an age of formation
which possibly post-dates that of NS.
The structural geology at Wortel may be interpreted as an inclined
isoclinal syncline which passes outwards into gneiss in both right
way-up and overturned limbs (Fig. 5.6). Quartzites adjacent to STS
are thus correlated, and named DTQ, while those nearest the gneisses
are called WTQ. At Namiesberg borehole VGl was sited inside the
synclinal structure and was not drilled sufficiently deep to intersect
NTS rimming the structure (Fig. 5.4). Thus only surface samples of
NTS were collected from Namiesberg while both surface and core samples
of quartzites were obtained from there (Figs. A.lf and A.2c). No
surface samples were collected from Wortel, and the data from two
boreholes there were merged to produce one composite borehole
(Appendix A.1.2; Fig. A.ld).
The light grey schists in borehole AC2 from Achab frequently display a
nodular to blotchy texture. Interbands of feldspathic quartzite in
the ratio of six schist to one quartzite occur for over 150m of the
borehole core. Small, pink coloured pegmatites commonly invade the
schist. Well rounded zircons of variable sizes are common (Appendix
C.5.2) and schist mineralogy (Table C.13) is similar to that of NS.
The opaque minerals consist mainly of magnetite, with pyrite and
pyrrhotite being present in trace quantities only. All these
attributes suggest a correlation between the Achab schist and NS,
hence these rocks are also called NTS.
If the northernmost half of the Wortel structural succession is
inverted to produce a working stratigraphic column as constructed at
Broken Hill, then comparison between Broken Hill, Namiesberg and
33

Wortel reveal gross similarities, with basal gneisses overlain by NS
and NTS, followed by the quartzite zone, and capped by SS and STS
(Fig. 5.7). The major differences between the above areas and
Gamsberg is that no Shaft-type Schist is found towards the top of the
succession at Gamsberg unless the pelitic parts of the Gamsberg
orebody represent mineralized STS. A conglomerate-muscovite schist
and amphibolite suite (Nousees Mafic Gneiss, Rozendaal, 1982; Koeris
Formation, Reid et al., 1987) cap the succession at Gamsberg.
Rozendaal (1982) did suggest that part of the stratigraphy above the
Gamsberg orebody was removed during the hiatus which existed prior to
deposition ot the unconformably overlying conglomerates. This could
account for the lack of unmineralized STS at Gamsberg. In summary, it
is clear that from the gneisses to DQ, good lithological correlations
exist between Broken Hill, Namiesberg, Wortel and Gamsberg, while
above DQ the correlation applies in the first three areas only.
Schists lying between DTQ and STS at both Namiesberg and Wortel, but
not clearly looking like STS, have been designated Schist (S) and
treated separately (Figs. 5.4, A.ld and A.lf). Their stratigraphic
position suggests a possible correlation with OS at Broken Hill.
Praekelt et al. (1983) correlated the rocks at Gamsberg with those in
the Namiesberg, calling the package from Namies Schist at the base
through Dark Quartzite at the top, the Achab Formation; the schist and
Banded Iron Formation directly above the quartzites, the Garns
Formation; and the amphibolite, schist and conglomerate previously
called Nousees Maf ic Gneiss, the Bloemhoek Formation. Distinctive
marker units in the ASG are so infrequently developed that the
grouping of schist and quartzite by Praekelt et al. (1983) into the
Achab Formation tends to blur the fundamental geology recognised by
SACS (1980), to whose definition of Namies Schist, it is therefore
34
reverted. On the basis of their paper it is not possible to ascertain
whether Praekelt et al. (1983) correlated the banded iron formation at
Gamsberg with that at Broken Hill. Also, in defining the Aggeneys Ore
Formation, Ryan et al. (1982) did not separate OS from SS. For these
reasons the new term Ore Schist has been introduced for the package of
rocks constrained between BQ and SS, which host the Broken Hill
orebody. The term Koeris Formation proposed by Reid et al. (1987) is
preferred to Bloemhoek Formation for the muscovite schist, amphibolite
and metaconglomerate horizons which overlie the Gamsberg orebody and
probably form the stratigraphic capping to SS, since Koeris is one of
the type areas for this suite of rocks.
Praekelt et al. (1983) correlated a zone of muscovite enrichment at
the base of their Achab Formation (i.e. base of NS) with the top of
the succession at Wortel such that virtually all the quartzites and
schists at Wortel would lie stratigraphically below NS. Thus in the
Aggeneys area, Praekelt et al. (1983) deduce a supracrustal succession
exceeding 3 OOOm in thickness. None of the other workers in the area
(e.g. Moore, 1977, 1986; Rozendaal, 1978, 1982; Lipson, 1978, and this
thesis) have, however, found evidence for stratigraphic successions
exceeding 1 500m in thickness at any one locality.
5.3 Conclusions
The similar stratigraphic successions at Broken Hill, Gamsberg,
Namiesberg and Wortel (Fig. 5.7) clearly suggest that correlation of
the major lithostratigraphic units is both realistic and desirable,
and that the use of small variations such as muscovite enrichment
cannot be used as a foundation for correlation purposes. The major
features of the broad correlations between these inselbergs include
nodular, magnetite-bearing quartz-muscovite schists lying between
basal gneisses and quartzites.; a whiter quartzite overlain by a darker
35

quartzite; and then a monotonous bottle-green pyritic schist above the
quartzites. The name Pella Quartzite Formation is replaced by Broken
Hill Quartzite Formation as explained above (section 5.1), while the
Aggeneys Ore Formation of Ryan et al. (1982) is here separated into
Ore Schist and Shaft Schist Formations. Within the ASG the following
formation names are therefore proposed (Fig. 4.6), of which the top
three are new, viz.:
Shaft Schist
Ore Schist
Broken Hill Quartzite
Namies Schist
(Base)
The association of Shaft-type Schist with feldspar-free quartzites has
been observed at many places in Bushmanland, including borehole cores
from Annakoppies near Pella, at Hartebeestvlei south east of Pofadder
and from Koeris north of Aggeneys. The suggested stratigraphic
succession therefore assumes regional significance.
36

PART C.
GEOCHEMISTRY

PART C. GEOCHEMISTRY
Sampling techniques and analytical methods employed are reviewed in
Appendix A. Sample locations appear in Figs. Al and A2. Instrumental
conditions, detection limits and error values are presented in Tables
Al and A2, and Figs. A3 - A5, while the analytical data may be found
in Tables A3 - A5.
6. BROKEN HILL GEOCHEMISTRY
6.1 Element redistributions
6.1.1 Introduction
Metamorphism can significantly change the pre-metamorphic rock
composition (e-.g. MacRae and Nesbitt, 1980; Barby and Cuney, 1982),
and the presence of pegmatites in the Broken Hill succession suggests
that a degree of partial melting may have occurred. Along the
boundary of amphibolite facies transition to granulite facies in
southern Namaqualand, Waters and Whales (1984) showed that such
melting need not necessarily result in the complete loss of elements
from the rocks, since all three ~f the components which participated
in the melting process, viz. paleosome, restite and neosome, are
present within a few centimetres of each other.
The existence of later retrogressive metamorphic fluids which may have
also introduced or removed elements in the Broken Hill rocks, is
inferred from sericite in borehole core, and low temperature, water
rich fluid inclusions from quartz grains in gneisses throughout the
Namaqualand-Bushmanland area (Schoch, 1983, pers.comm.). Such water
may have been locally derived since Lipson (1978) showed an example of
probable rehydration of sillimanite by the water originally produced
during the transformation of muscovite +quartz to K-feldspar +
sillimanite. Leaching of surface outcrops, particularly in rocks
37

containing sulphides, is a further process which may have changed the
original composition of the metasediments. In studying element
redistributions, the Broken Hill schists (BS) are the rocks chosen
because they contain quartz-feldspar assemblages which would have
facilitated melting; their fissility offered possible avenues for
movement of retrogressive fluids; and schists are among the most
susceptible of the local rock-types to weathering.
6.1.2 Constraints on rigorous modelling of element mobility during
metamorphism
The geographic distribution of samples collected during the current
investigation is too restricted to attempt analyzing the same rock at
progressively higher metamorphic grades along strike (e.g. Evans,
1964), which would give an empirical estimate of element mobility due
to prograde metamorphism. The rigorous theoretical approach requires
identification of each component in the general reaction
original rock =melt + restite + vapour,
and the mineral assemblages present in each of the participating solid
phases. The values of partition coefficients (D 1 ) for elements (i) ~
are needed between the mineral phases in the original rock and the
melt. Further, the bulk composition of the original rock is required
since D, varies for different rock-types (Shaw, 1977). The likely
non-modal melting steps should be known because the minerals
participating in the melting process will change as individual phases
are exhausted (Hertogen and Gijbels, 1976) •. The generalized equation
38

for determining the behaviour of an element during the melting process
(Shaw, 1977), would have the form
P 1 •-1 = p.c D1£- 1 + pii D1Jl- 1 + ••••• • = ~pc D1 E:-l
where
p 1s- 1 =non-modal melting bulk distribution coefficient for element (i)
between solid (s) and liquid (1)
p~ =proportion of mineral (~) which melts
D1l-1 = distributiofi coefficient between mineral (e:) and liquid (1)
Clements and Wall (1981) showed that the liquid produced from melting
of biotite-bearing metapelites does not usually have a minimum melt
composition. Shaw (1977) demonstrated that in the case of
granodiorite the water content of the melt will determine whether
biotite or K-feldspar melts first. These are important considerations
because, for example, in rhyolitic rocks DRbK!-1 = 0.34, while ~bs1-1 =
2.24 (Arth, 1976), showing that Rb preferentially partitions into the
first-formed liquid if K-feldspar remains in the restite and biotite
me 1 t s f i rs t. S inc e 0 1 s-1 v a 1 u es do not ex i st for a number of the
minerals, such as sillimanite and muscovite, in the BS metamorphic
assemblages, and the composition of the vapour, if present, is not
known, it would be impossible to rigorously assess the partitioning of
any element during the melting process. The methods emp,loyed to
assess element mobility during metamorphism are therefore not well
constrained.
6.1.3 Non-rigorous modelling of element mobility during metamorphism
6.1.3.1 Major elements
During prograde metamorphism of BS, the quantity of major elements
lost to the melt is loosely constrained by Nesbitt 1 s (1980) work which
showed that even when metapelites are metamorphosed to granulite
39
facies and produce 30% melt, K20 and Si02 in the residue decrease by
29% and 6.7% respectively, while MgO content increases by 42%, Ti02 by
37%, Cao by 33% and total Fe as Fe20a by 32% (percentage changes
calculated by the present author from the data of Nesbitt, 1980). In
the case of the upper amphibolite facies metamorphism present at
Broken Hill (section 4.1), major element changes are permissible only
at levels somewhat below.these figures.
6.1.3.2 K/Rb ratios
The K/Rb ratios of metamorphic rocks during melting is primarily
controlled by the Kand Rb partition coefficients of K-feldspar and
biotite, relative to the liquid (Barbey and Cuney, 1982). The high
DRbs1-
1 values in rhyolitic (2.24) and dacitic (3.26) rocks (Arth, 1976)
suggests that only when large volumes of biotite participate in the
melting process during the transformation from amphibolite to
granulite facies, will significant amounts of Rb be lost from the
residue. The abundance of biotite and the high Rb concentrations of
BS relative to various average shale and metapelite analyses (Fig.
6.1) confirm that no significant losses of Rb occurred. In absolute
terms, the K content of BS overlaps that of the shale averages,
whereas the Rb concentrations extend to relatively higher levels than
their shale counterparts. Consequently the relatively low BS K/Rb
ratio of < 200 compared with values equal to or exceeding 200 for
pelitic rocks (Fig. 6.1) shows that BS is relatively richer in Rb,
with NS (lower K/Rb ratio) more so than SS (higher K/Rb ratio).
Introduction of Rb would be taken up by existing minerals according to
the mineral-fluid partition coefficients (DRb€.-r), with biotite (and
muscovite) being the likely recipients of most Rb. In NS, the
constant K/Rb ratio over a wide range of Rb (Fig. 6.1) could therefore
40

reflect Rb addition. Rb enrichment of SS is unlikely because the more
Rb-rich USS has a higher K/Rb ratio than LSS.
6.1.3.3 Pegmatite and host schist
6.1.3.3.1 Physical evidence
The mineralogy of pegmatites (particularly those of less than one
metre in thickness) tends to mimic that of the host rock. Pegmatites
in garnet-, tourmaline- or sulphide-bearing BS contain garnet,
tourmaline or sulphide, respectively; and pegmatites in galena-bearing
pelitic rocks frequently contain the Pb-bearing feldspar, amazonite.
Lipson (1978) showed evidence for in-situ pegmatite generation in the
Aggeneysberge, where a fracture contained within schist (i.e. not
extending outside of the schist) opens up into a zone filled by
pegmatite. Fig. 4.12 provides a similar example of local pegmatite
derivation. If the pegmatites have a local origin, as opposed to
having had some extraneous, deeper source, then a constant proportion
of pegmatite to host rock would be anticipated, provided that the host
was homogeneous, including volatiles, and that there are no
indications of nearby shear zones which could have introduced water
into the system. Such lengths of borehole core schist, homogeneous
except for sporadic pegmatites, were selected and the cumulative
pegmatite length within any one sample was measured and expressed in
Table 6.1 as a percentage of the total sample interval. This method
provides an approximate volumetric proportion of pegmatite in schist.
Measurements taken along the length of core from a single borehole
display small absolute variation relative to each other. In
particular, Zone 1 from borehole BH123, predominantly consisting of
homogeneous SS (Table 6.1), displays a virtually constant pegmatite
content of 14% for all seven intervals assessed. From the foregoing,
41

it appears that partial melting did not lead to significant removal of
liquid from its source.
6.1.3.3.2 Geochemical evidence
Within each core sample of NS, SS and OS, the corresponding pegmatites
were removed and bulked to provide matching pairs of schist and
pegmatite. The indications that thin pegmatites are locally derived
permits an exercise of adding back to the host schist, the component
of contained pegmatite in the volumetric proportion measured, and then
comparing the recalculated host composition with that of the host
rock, and expressing this difference as a percentage, viz.
%VARN = '(RECALC HOST-HOST)* 100/HOST
where
RECALC HOST = (1-%PEG/100)*HOST + %PEG/100*PEG;
%PEG
and
= the measured volumetric pegmatite content of the rock;
HOST and PEG are respectively the concentrations per element of the
schist and pegmatite pair.
Negative values of "%VARN" indicate that the host rock (restite) has
higher concentrations of the particular element, while positive values
reflect host rock depletion at the expense of pegmatite. A summary
of these variations in Table 6.2 shows three distinct categories i.e.
elements partitioned into the pegmatites of both NS and SS (Na, Sr,
Ca(?)); elements restricted to SS which show large values of "%VARN 11
(U and Y); and those elements in OS displaying large "%VARN" which may
reflect the nearby presence of an orebody (K,Ba,Pb(?)). Only the
behavior of Na, Sr and Ca will be examined here, while elements of
importance to SS and OS are reviewed later in sections 9 and 10.
42
For all three pegmatite-SS pairs, the higher Na content of pegmatite
is excessive, with "%VARN" values of between 28 and 184. Only one of
these pairs has much higher Sr in the pegmati te (ALP 141; "%VARN" =
62), while higher Ca values in SS pegmatites is not consistent. Both
Kand Rb display small "%VARN" values, and in respect of Rb, this
confirms that little biotite participated in the melting process.
6.1.3.4 Pyrite to pyrrhotite transitions
In the iron sulphide-bearing, carbonaceous SS, the pyrite-pyrrhotite
transition may be used to assess the role of fluid movement through BS
in general, during its metamorphic evolution. Ferry (1981) showed
that few sulphide-rich schists which have been metamorphosed to
sillimanite grades, still contain pyrite, due to the reactions
2FeS2 + 2H20 + C = 2FeS + 2H2S + C02 ( 1)
2FeS2 + CH, = 2FeS + 2H2S + C. ( 2)
The passage of water through C-bearing rocks, or of methane, thus
leads to the conversion of pyrite to pyrrhotite. Elevated
temperatures up to sillimanite grades of metamorphism will be
insufficient to convert all pyrite to pyrrhotite without large
fluid/rock ratios. In fact the reaction proceeds to completion at
chlorite grades of metamorphism if fluid/rock ratios are of the order
of two to five (Ferry, 1981).
Pyrite is the dominant SS sulphide, although pyrrhotite has been
positively identified in hand specimen, thus the inferred low
fluid/rock ratio in SS limits the element mobility which could have
resulted from fluid movement. Ferry (1981) postulated that the fluids
driving the reactions are derived from an unknown source external to
the black shales undergoing metamorphism. In the Broken Hill area
there are no known C-bearing rocks either structurally above or below
SS which were capable of generating a CH,-rich fluid, thus only
43

equation (1) appears likely in which free carbon in the form of
graphite, is readily available in SS. This reaction relies on the
presence of an HaO-rich fluid phase, which might have been derived
from metamorphic dehydration of NS and quartzites (making use of the
working stratigraphic column); to the low temperature water soaking
phase recognised in fluid inclusions (Schoch, 1983, pers.comm.); or
merely to local water generated during the transformation of muscovite
+quartz to sillimanite + K-feldspar (section 6.1.1).
6.1.3.5 Oxygen isotopes
Although oxygen isotope analytical data from quartz grains will be
fully presented in section 6.5, certain results are relevant to the
present discussion. 6 180 values range from as low as 5.7°/oo in NS,
through ratios of the order of 9°/oo in BQ to values of 14.l°loo in SS.
As pointed out by Reid et al. (1987), the lack of isotopic
homogenization across lithological boundaries, severely limits the
quantity of pervasive metamorphic fluid which may have passed through
the Broken Hill sequence.
6 .1. 4 Element mobility during weathering
The effects that surface weathering have on schist geochemistry are
particularly important for establishing whether surface outcrop and
borehole core sample data may be combined, or must be treated
separately. In the two approaches adopted, firstly a specific
orientation study was designed to test the effects on element mobility
due to surface weathering, and secondly in a more general way, the
mean element concentrations of surface outcrop samples are compared
with those of their borehole core counterparts.
44 ----- -------------------------~-------------------------------------------~

6.1.4.1
study)
Comparison between specific selected samples (orientation
The geochemistry of distinctively banded hangingwall schist (ALP165)
from a depth of 46m in borehole BH112 situated 300m east of the Broken
Hill orebody, was compared with that of a similar rock-type situated
near the surface position of the borehole (ALP163) (Fig. 6.2).
Calculations based on the hill slope and core foliation angles
confirmed the approximate location of the correlative rock-type on
surface. A second surface sample (ALP164), less banded than the
first, was selected from lm higher up the hill slope to test chemical
variability over a short distance, and a second core sample (ALP166)
was similarly selected from a depth of 61m in the borehole.
In Fig. 6.3 where ALP163 is used as the standard of comparison, schist
geochemistry varies greatly even between two virtually contiguous
surface outcrop samples, with major element chemistry differences of
up to 65% for MgO, and up to 100% in the case of the trace element Cu.
The two borehole core samples display slightly less element variation.
Only where complete separation occurs between element values from
surface outcrop and borehole core samples (Fig. 6.3) may definitive
conclusions be drawn. The elements Fe20i, MnO, S and possibly C
display slightly higher values on surface, but the opposite applies to
K20, Rb, Pb, Zn, Nb and Zr. Cu displays too wide a variation to allow
definitive conclusions. It is impossible to assert with 100%
certainty that the core and surface sample element variations are
merely a function of surface weathering, particularly since the
concentrations of Zr, a relatively immobile element, differ between
the two environments. These inherent variations are exemplified by
the differences between the two surface samples and the two samples of
borehole core.
45

6.1.4.2 Comparison between sample groups
When the ratios of surface outcrop samples to borehole core samples
are taken for mean element concentrations of NS, USS and OS (Table
6.3), the lower values displayed by K20, Rb, Zn and Pb in surface
samples are confirmed. Although NS and OS surface samples have
relatively lower Nb and Zr values as seen in the orientation study,
the two USS surface samples display slightly higher Nb and Zr
concentrations than the average for USS borehole core. The relatively
higher FeaOi and MnO contents of surface samples deduced from the
specific orientation study cannot be substantiated by comparing their
mean values in surface and core samples. The extremely low
concentrations of S in surface samples (Table 6.3) disagrees with the
evidence from the orientation study. The sulphuric acid created
during weathering of the pyritic SS is the likely cause of the far
lower concentrations of Cao, Na20, K20, S, Cu, Zn, Pb, V and Sr, and
probable residual enrichment in Zr and Nb, in outcrop samples of SS.
6 .1. 5 Discussions and conclusions
Although a non-rigorous approach was adopted for determining the
effects which metamorphism had on element distribution, constraints
have nevertheless been established. NS and SS have lower K/Rb ratios
than comparative pelites with similar K concentrations, with NS
showing relatively higher values of Rb than SS. While Rb enrichment
of NS appears likely, the same cannot be deduced for SS. Rb- and
biotite- rich schists in which pegmatites occur suggest that biotite
probably did not participate in the melting process. It may be
speculated that the higher maximum Rb content of NS relative to SS was
a result of either Rb-bearing fluids being blocked by an impervious
layer e.g. the quartzites, or to the timing of Rb addition predating
deposition of SS. Evidence of fluid damming should be preserved in
the rock record as a zone of Rb enrichment along the base of the
46

impervious layer, yet no such zone has been identified, since the
highest Rb content of 398 ppm occurs in schist spatially associated
with the orebody. The alternative option is therefore favoured i.e.
that NS predates SS, and was to some extent enriched in Rb prior to SS
deposition.
The presence of pegmatites in discrete tension zones and the constant
proportion of pegmatites in homogeneous schist suggest the local
derivation of melts. Recalculation of original rock composition by
adding back to schist the appropriate pegmatite component in the
correct proportion, shows that Na in particular, and Sr to a lesser
extent, were lost to the pegmatite. Ferry (1981) showed that Na is
the oniy major element which suffers significant losses in Fe
sulphide- and C- rich metamorphic rocks (originally black shales) at
the boundary between chlorite and sillimanite grades of metamorphism.
In the case of SS, adding back the Na and Sr contents of pegmatites to
the schist increases the host rock concentration from an average of
0.181% to 0.321% Na, and 33 ppm to 39 ppm Sr, representing increases
of 77% and 18%, respectively. For NS the respective increases in Na
and Sr are 19% and 12% • Care will therefore be exercised with these
elements when comparing BS geochemistry with that of other pelitic
rocks.
The lack of ubiquitous transition of pyrite to pyrrhotite in SS
severely constrains the amount of pervasive fluid which passed through
these rocks, and is corroborated by the lack of oxygen isotope
homogenization between different schists. Intense retrogression
associated with the F2 refoliation zone around the eastern end of the
Broken Hill orebody (section 4.2.3) suggests that the passage of non
pervasive, low-temperature fluid was restricted to tectonically
prepared zones.
47

The study on the effects of weathering shows that significant changes
probably occur in the element concentrations of outcropping schists.
Separate treatment of surface outcrop and core samples is therefore
necessary.
6.2 Namies Schist and Shaft Schist
Throughout this section the compositional characteristics of NS and SS
are compared with each other, while comparisons with published pelite
data are made in section 9. The discussion is restricted to borehole
core unless surface samples are specifically mentioned. The effects
of weathering on element mobility show that the two data sets must
where possible be treated separately (section 6.1.4).
6.2.1 Direct geochemical contrast between NS and SS
Mineralogical differences between NS and SS (section 4.2) are
reflected in certain key elements. Whereas the carbon (C) content of
the more siliceous NS never exceeds 500ppm, SS consistently comprises
> 1 OOOppm c (excluding one sample), and has a higher LOI (Table 6.4).
Ratios of average SS/NS on a per element basis reveal major
dissimilarities where this ratio has values much greater than or less
than 1 (Table 6. 5). SS has more S < .. ?.. 1 OOOppm) but less MnO
(< 1 OOOppm) and P206 (< 800ppm) than NS. The Ba content of SS is less
than half that of NS, while V and Ni contents of SS are double those
of average NS (Table 6.5). Chi-squared and t-Tests performed on the
data show that most elements follow a log-normal distribution, and
most element means in NS and SS may be considered different at the 95%
confidence limits of the one tailed Chi-squared and Student's t
distributions (Table 6.6).
48

An obvious difference between NS and SS geochemistry is the far higher
degree of inter-element correlation in SS (compare Tables 6.7 and
6.8). For example, the elements Cu, Zn, Ba, Fe20a, K20, Rb, Al20a,
Ti02, Sc, Ni, MgO, V, Co and Cr correlate strongly with each other,
whereas for NS, only the elements K20, Rb, Al20a, Ti02, Nb, Sc, Ni, MgO
and V do so. In both NS and SS, Si02 and Zr are strongly correlated,
with SS defining the lower Si02 and Zr end of the spectrum (Fig. 6.4),
but these elements correlate negatively with most other elements.
6.2.2 Element variability
When compared with SS, NS displays a more variable geochemical
composition shown by the relat.ively large coefficients of variation
for each element (Table 6.4). The contrast is accentuated when USS
and LSS are treated separately (Table 6.9). The greater element
variability in many elements of NS compared to SS is illustrated in
Fig. 6.5a-h. The highest Zn (391ppm) and Ni (45ppm) values in SS,
both from ALP183 (Fig. 6.5c and e), can be attributed to the corrosive
weathering of pyritic SS causing contamination from the galvanized
iron core holding tray left exposed to wind and rain for an unusually
long period of time. Of the remaining SS samples, only ALP054, lying
structurally above CSMQ, displays distinctively higher concentrations
in any elements (i.e. MnO, Pb, and Co; Fig. 6.5f-h). Special
significance is attached to the chemistry of ALP054, which is
discussed in sections 6.2.7.3 and 9.1.5.
6. 2. 3 R-mode factor analysis
R-mode factor analysis is used as a convenient way of highlighting
interrelationships between variables (such as geochemical elements),
whereas Q-mode factor analysis addresses the correlatedness between
samples. Due to problems of closure and to certain philosophical
objections to the application of the varimax rotation to geochemical
49

data (Appendix B.2), element relatedness as shown by factor analysis
will be continually assessed in terms of geological feasibility.
Both NS and SS factor analysis reveal the dichotomy between the
detritally-related elements, Si02 and Zr, versus a suite of elements
related to Al20a and K20. This emerges from the high negative loadings
on Si02 and Zr and positive loadings on Al20a and K20 in Factor 1 of
both rock types (Figs. 6.6a and 6.7a), as noted previously from the
correlation matrices. The high communalities for these elements
(Table 6.10) indicate reliable results. The first factor accounts for
approximately 40% of the total group variances (Table 6.10), and the
antipodal geometric representation of silica versus alumina suggest a
closure-related interdependence (Figs. 6.6 and 6.7). The separation
of the rare earth elements (REE) into Factor 2 of both schists
reflects the similar chemical behaviour of the REE's as a result of
the addition of electrons to the inner 4f orbitals rather than the
outer shells (Herrman, 1970). Factor 2 is therefore omitted from
Figs. 6.6b and 6.7b in preference to Factor 4. Y serves as an
indication of heavy rare earth elements (HREE) (Herrmann, 1970). In
SS there exists a strong relationship between the light rare earth
elements (LREE) and Y, whereas in NS, Y shows only a subdued
connection with the LREE 1 s (Figs. 6.6 and 6.7; Tables 6.7 and 6.8).
In NS, Y is grouped with Pb, Zn and Ba in Factor 4, and with MnO in
Factor 6. Factor 3 may be considered an alkali and alkali earth
element group, except that in SS K20 and Rb do not contribute to
Factor 3. This separation of K20 and Rb from Cao, Na20 and Sr in. SS is
inherent in the correlation matrix (Table 6.8).
The major difference between NS and SS, as emphasized by factor
analysis, is the NS Factors 4 and 5 which comprise the ore elements
Ba, Pb, Zn, Sand Cu (Fig. 6.6). In SS all these elements, excluding
50

Pb, have high loadings in Factor 1, related to Al 20a and KaO, and
display positive correlation at the 99% confidence level (Table 6.8).
SS Pb has an enigmatic association with MnO, P205 and possibly Y (Fig.
6.7). The major features and differences between NS and SS factor
analysis calculations are conceptually depicted in Figs. 6.6c and
6.7c. The low communalities shown by Th in both schists and Cu in SS,
indicates that care should generally be taken in interpreting Th and
Cu behaviour. The unpredictable nature of Cu is a problem common to
pelites (e.g. Senior and Leake, 1978).
6.2.4 Discriminant function analysis (DFA)
Reliable classification of schist and quartzite successions within the
Bushmanland Group is essential to successful structural-stratigraphic
mapping, and forms a prerequisite to exploration geology. In the
Broken Hill area, NS and SS comprise the two most voluminous
stratigraphic members, yet hand specimen distinction between these
rock-types sometimes proves difficult. Discriminating petrographic
features above (section 4.2) are now augmented by the more rigorous
lithogeochemical characterization technique of DFA (Appendix B.3). A
suite of six "immobile" elements (Al20a, Zr, Nb, TiOa, Th and Sc) are
used for discrimination purposes (Appendix B.3). Discrimination
between NS and SS on the basis of REE's is discussed below (section
6.2.5).
The BMDP DFA output for borehole core samples of NS and SS in the
Broken Hill area provides moderate separation between the two
populations, with one SS sample (ALP141) and two NS samples (ALP028
and ALP029) being misclassified. The elements Nb and Sc provide 91.7%
correct classification (U-statistic = 0.3244; see Appendix B.3) when
combined in the linear functions:
51

NS 539.5*Nb - 139.5*Sc - 250.2
SS 478.l*Nb - 102.3*Sc - 219.1
These functions may be used by inserting for any unknown sample, the
two variables and classifying the sample as NS or SS depending upon
which linear function gives the greater score. The relatively poor
"immobile" element DFA distinction between NS and SS indicates that
additional criteria, such as petrography (section 4.2) and possibly
rare earth elements (examined below in section 6.2.5) must be used in
conjunction with DFA.
6.2.5 Rare earth elements (REE)
Both XRF and INAA techniques have been used to determine REE
concentrations in the schists and other rocks, and although absolute
concentrations for the two techniques are at different levels, the
shapes of the REE patterns should retain their integrity irrespective
of the technique used (Appendix A.2.5). Only three NS and four SS
samples have been analysed by the INAA technique (Fig. 6.8) while a
selection of NS and SS XRF-derived REE analyses are presented in Fig.
6.9. The Y concentration provides an estimate of the Ho content of
the rock (Appendix A.2.5). It is common practice to plot on a per
element basis, normalized instead of absolute REE data, and the
standard used most frequently in this thesis is Piper's (1974) average
shale, instead of chondrite. Key features of the shale-normalized REE
patterns depicted in Fig. 6.8 and 6.9 are:
(a) their relatively elevated light REE (LREE) nature;
(b) the distinctive positive Ce and negative Nd anomalies of LSS,
relative to most USS and NS samples;
(c) the relative Nd peak in NS; and
(d) the higher concentration of REE in NS than in SS (Fig. 6.10).
52

6.2.6 Contrasted behaviour of base metals in NS and SS
In contrast to SS, NS displays variable Ba, Zn and Cu concentrations
(section 6.2.1). Also, NS contains more Ba, Pb, Zn and Cu than SS
(Table 6.5). Lastly, NS has Ba, Pb, Zn, Cu and S separated from
Factor 1, and Y separated from the LREE's (section 6.2.3), unlike the
behaviour of these elements in the factor analysis of SS.
6.2.7 Minor lithologies and special samples
6.2.7.1 Cale Silicate Rock plus Manganese Quartzite (CSMQ)
Three Cale Silicate Rock (CS) and four Manganese Quartzite (MnQ)
samples were analysed from this distinctive horizon within USS in the
Broken Hill - Maanhaarkop area. Of these, one MnQ and two CS samples
represent fresh borehole core. Due to the inherent heterogeneiety of
these rocks, the surface and borehole core samples were combined for
averaging purposes (Table 6.11). Relative to the enclosing USS, CS
shows significantly higher concentrations in the elements Cao, MnO,
P20 5 , Pb and Zn, and in the Ca/Sr ratio (i.e. 485 vs 28), and to a
lesser extent in MgO, Ba and Sr. The CS elements showing slightly
lower concentrations than USS include KzO, Rb and V (Table 6.12). MnQ
also shows far higher concentrations in MnO, P20s, Pb and Zn, as well
as in Cu, with less marked concentrations of Cao, when compared with
USS. Relative to USS, MnQ has far lower concentrations in most other
elements (Table 6.13). Though the base metal content of CS and MnQ
are much higher than those of USS, their S concentrations are of
similar magnitude. A notable feature of MnQ is the sporadically high
concentration of U, As and Sb (29, 279 and 9ppm respectively) in
ALP213 as determined by INAA. Although Ag-bearing (28ppm), ALP213
carries no Au (< 50ppb).
The three shale-normalized CS REE patterns are fairly variable, but in
contrast to SS they display a negative Ce anomaly most distinctly
53
developed in sample ALP055 (Fig. 6.lla). The shale-normalized REE
patterns for MnQ show no consistent trends between samples. Of the
four MnQ samples analysed, two display positive slopes towards in the
estimated Ho position, while ALP213, a strongly weathered surface
sample with boxworks after pyrite, shows very low concentrations in
estimated Ho (Y <LLD) (Fig. 6.llb). Depletion in HREE is a feature
common to rocks undergoing extreme surface weathering (Nesbitt, 1979),
as would result from the generation of sulphuric acid from pyrite.
Only one CSMQ sample, the same ALP213, was analysed for REE by the
INAA method, and the negative slope towards the heavy REE (HREE) side
of the diagram is still apparent, with Lu <LLD (Fig. 6.12).
6.2.7.2 Biotite Graphite Zone (BGZ)
Mean BGZ chemical composition is so similar to that of USS (Table
6.14) that only three elements, viz. MnO, Pb and Zn show more than
twice the USS concentration, while Cao, P205, C and Cu have slightly
lower contents (Table 6.15a). Only Na20, Sr and S show significantly
lower concentrations, as highlighted by comparing the Ca/Sr, C/S and
K/Na ratios in the two rock types (Table 6.15b). The Zr-Si02
relationship of BGZ accords well with USS (Fig. 6.13).
The BGZ REE patterns have similar shapes to those of USS, although
showing a greater range in total REE (compare Figs. 6.14a with 6.9b
and 6.8c, and Fig. 6.14b with 6.8b). The INAA data suggests that BGZ
has the well developed positive Ce anomaly of LSS.
6.2.7.3 Geochemistry of ALP054
In borehole BH123, ALP054 is the schist sample 'lying between BGZ
structurally above and CSMQ below. Classification of this sample as
SS follows from its physical appearance, position in the sequence, and
C concentration in excess of 0.1% (C = 0.12%). Attention has been
54

drawn in sections 6.2.1 and 6.2.2 to the unusual geochemistry of this
sample. Relative to SS, ALP054 displays higher values of Mn, Pb, Co
(Fig. 6.5f-h) and Fe, and lower concentrations of C, V, Mo and S. The
high Co value of 41ppm is nearly double the figure in both SS and in
schists lying immediately adjacent to the Broken Hill orebody.
6.2.7.4 Tank Hill samples
The hypothesis that the gossanous schist on the northern flank of Tank
Hill may correlate with NS (section 5.1) is examined in the light of
available geochemical data. The excessively high Ba, Pb, Zn and S
content of Tank Hill Schist (THS) (Table 6.16) reflects the gossan
producing mineralization, and cannot be used for discriminating
purposes. THS and Green Quartzite (GrQ) are tested against NS and SS,
these being the two thickest schist horizons at Broken Hill.
The discriminant function derived for differentiating between borehole
core samples of NS and SS (section 6.2.4) was used on THS, and returns
a higher score for NS than for SS (6429 vs 5998), also indicating
classification as NS. The REE patterns of both THS and GrQ have the
general shape of the NS surface samples, and lack the slightly
positive Ce anomaly of surface SS samples (Fig. 6.15). The steep fall
of THS to the estimated Ho composition is probably caused by HREE
leaching in this sulphide-rich rock as explained for ALP213 (section
6.2.7.1). Compared with NS and SS surface samples, THS has MgO, Ni
and Th abundances more similar to NS than to SS (Table 6.16). It is
only the high Ti02 content of THS that suggests an SS classification,
but correlation with NS cannot be excluded since the average Ti02
content of surface NS is almost half that of cored NS, and Ti02 should
be one of the least mobile elements in the weathering environment
(Fig. 6.3).
55

Despite the large Si02 content of GrQ (97%, Table 6.16), the rock
contains excessive amounts of Ba, Pb and Cr (561ppm, 57ppm and 64ppm,
respectively). The high Cr content suggests fuchsite as the green
mica responsible for the rock's colour, while Pb and Ba reflect the
mineralizing event seen in the adjacent schist. As with THS, the REE
pattern of GrQ accords more closely with NS than with SS (Fig. 6.15),
though at low concentrations.
6.3 Ore Equivalent Horizon and Orebody
The Ore Equivalent Horizon (OEH) comprises the variety of schists and
quartzites, Hangingwall Schist (HS), Intermediate Schist (IS), Upper
Footwall Schist (UFS), Ore Schist plus Garnet Quartzite (OS+GQ), Ore
Equivalent Garnet Quartzite (OEGQ), Garnet Quartzite (GQ) and the two
separate data sets of surface and borehole core Ore Equivalent Schist
(OES). The limited orebody samples taken include Upper Orebody Quartz
Magnetite Rock (QM), Lower Orebody Garnet Quartzite (LGQ), Lower
Orebody Amphibole Magnetite Rock (AM) and Massive Sulphide (MS).
6.3.1 Schists
Most of the statistical work performed on Ore Schists (OS) applies to
the 31 sample borehole core data set comprising HS + IS + UFS + OES.
XRF-derived La, Ce and Nd analyses were only performed on 19 of these
samples. As done previously, the geochemistry of OS will be examined
in comparison with NS and SS, whereafter comparisons will be made with
various published mineralized sequences.
6 • 3 • 1 • 1 Geochemical characteristics
Most of the OS elements follow a log-normal distribution as revealed
by Chi-squared tests (Table 6.17). Of. the key elements C and S, both
have concentrations more closely allied to the low levels of NS than
to SS. OS has less Si02 and more Al20a than NS, but with
56

concentrations similar to those of SS, as shown by t-Tests (Table
6.17). Use of the t-Test on the other elements fails to show
consistently whether OS correlates with NS or with SS. Whereas the
REE's of OS have similar concentrations to those of NS and not SS, the
Zr, Cr, V, Sc and Ni contents are similar to those of SS (Table 6.17).
The coefficients of variation for each element tend to lie between
those of NS and SS, although variations in the elements Pb, Cu ands
greatly exceed those of NS (compare Table 6.18 with 6.4). It is only
the correlation matrices which suggest a closer affinity of OS with NS
than with SS, since SS shows far greater inter-element correlation
than either NS or OS (compare Table 6.19 with 6.7 and 6.8). In
particular, those elements directly or indirectly related to the ore
forming event, such as Y, P, Cu, Pb, Zn, S, Ba, Fe and Mn show poor
correlation with elements outside of that group, contrasting markedly
with SS. In the correlation matrix (Table 6.19), only er suggests an
affinity of OS for SS since OS Cr is strongly correlated with a series
of elements such as Al and K whereas NS Cr is not. A noteworthy
feature of OS is the sporadically developed high concentrations of Mo
(see footnote to Table 6.18).
6.3.1.2 R-mode factor analysis
Two sets of factor analysis were performed on OS borehole core, viz.
all 31 samples but excluding La, Ce and Nd, and the 19 samples which
contain the light REE's (Figs. 6.16a and b). The first analysis is
used for most evaluations, while the second aids the examination of
the relationship between the light REE 1 s and other elements. The high
communalities for each element (Table 6.20) indicate reliable results.
Because La, Ce and Nd tend to form a grouping on their own (Fig. 6.16)
they are omitted from Figs. 6.16c and d in the interests of clarity.
A separate factor analysis computation was performed on OS surface
57

data excluding REE's, with the object of using scores for plotting
ore-related factor(s) (section 6.3.1.6 and Appendix F).
As with NS and SS (section 6.2.3), Factor 1 of OS shows the strong
separation of Si02 and Zr from a suite of elements including Al20a and
K20. The lower loadings on Factor 1 (when compared with NS or SS)
suggests the presence of additional influences. With reference to
Figs. 6.16a and b it appears that Factors 2 and 3 largely comprise the
ore related elements Cu, S, Fe20a, Pb, Zn, Ba, MnO and Y. In Fig.
6.16b, Cao also falls into Factor 3, and the relatively close
association of Cao and P205 with Pb, Y and MnO in Fig. 6.16c suggests
that they too may be incorporated with the ore-related elements, even
though only Cao correlates with Pb, Cu and Y in Table 6.19. The
factor analysis grouping of Cao and P205 may .reflect the presence of
apatite.
In common with NS (section 6.2.3) the HR.EE indicator element Y is
completely divorced from the LREE 1 s, and falls within the ore-related
Factors. Factor 4 represents the Na20, Cao and Sr grouping which is
separated from K20. The poor individual loadings, particularly on
Factors 5, 6 and 7, and the lack of simple geological explanation for
these element groupings, precludes further interpretation of the OS
factor analysis. As summarized in Fig. 6.16d, factor analysis of OS
highlights the separate grouping of ore related elements (including
Y), much as seen in NS, and in contrast to SS.
6.3.1.3 Discriminant function analysis (DFA)
Though the mineralogical characteristics of OS, NS and SS have been
discussed (section 4.2.3), DFA is now applied to the geochemistry of
these three rock-types to aid distinction between them. In addition,
the success with which OS is discriminated from NS and from SS may
58

indicate with which rock type OS more closely correlates. Ultimately,
the combined use of petrography, DFA and REE patterns should be made
in order to effect classification.
For the computation of DFA, the same six "immobile" elements used in
the earlier DFA (section 6.2.4) are applied. In all, four separate
analyses were performed, viz. NS vs OS, SS vs OS, NS + SS vs OS and NS
vs SS vs OS. The discrimination between SS and OS is far better that
between NS and OS, as revealed by the lower U-statistic in the former
(0.2738 vs 0.5257). The SS vs OS DFA provides 94.6% correct
classification with two SS samples (ALP056 and ALP057) and one OS
sample (ALP119) being misclassified. In contrast, the NS vs OS DFA
results in only an 83.3% correct classification with five NS (ALP028,
ALP029, ALP061, ALP062 and ALP063) and two OS samples (ALP103 and
ALP127) being misclassified. For SS, the three elements Als03 , Zr and
Nb help define the classification function, whereas for NS only Zr and
Nb are incorporated as shown below:
OS 5234.1 AlsOa + 3078.9 Zr - 2734.0 Nb - 15720.2
SS 5306.3 AlzOa + 3121.0 Zr - 2811.6 Nb - 16106.2
and
OS 321. 2 Zr + 346.8 Nb - 615.8
NS 335.3 Zr + 331. 2 Nb - 631. 9
The distinction between NS + SS vs OS at 85.1% correct classification
is also poor (U-statistic = 0.5119), whereas the discrimination
between all three rock-types provides a 92.5% separation (U-statistic
= 0.1723). Only Nb goes into the classification function of the
former , v i z • :
OS 301.8 Nb - 197.6
NS + SS 272.4 Nb - 161.2
whereas four elements contribute to separating all three rock-types:
59

OS -3758.7 Ti02 + 7639.4 Al20a + 3353.3 Zr - 1409.8 Nb - 15881.4
SS -3794.9 Ti02 + 7742.6 Al20a + 3395.6 Zr - 1476.6 Nb - 16303.8
NS -3841.1 Ti02 + 7723.9 Al20a + 3394.6 Zr - 1417.3 Nb - 16097.7
Classifications are effected as described in section 6.2.3.
The low percentage correct classification evident in DFA computations
including OS and NS is a reflection of close chemical similarity
between these two rock-types. In contrast, the much better separation
between OS and SS shows that OS is chemically distinct from SS.
6.3.1.4 Rare earth elements
The OS samples display REE patterns intermediate between NS and SS,
with less strongly defined positive Ce anomalies than SS (compare Fig.
6.17 with Fig. 6.8b). In addition, a number of OS surface and core
samples from both BH and MK display a marked positive HREE anomaly
(Fig. 6.17).
6.3.1.5 OS correlations
The weight of evidence suggests a closer affinity of OS with NS than
with SS. The sporadically high concentrations and groupings. of the
ore-related elements (and Y) in both rock-types contrasts strongly
with SS where most ore-related elements correlate with K20 and Al 20 2 ,
and Y with REE. The total REE concentrations of OS are more similar
to NS than to SS, though the shapes of the OS REE patterns appear
intermediate between NS and SS. It is noteworthy, however, that
certain elements which distinguish SS from NS, viz. Cr, Ni and V, have
concentrations in OS similar to those in SS, possibly suggesting that
OS represents a transition from NS chemistry, with which it is more
closely allied, to that of SS.
60

6.3.1.6 OS geochemical variations at Broken Hill
Key element and inter-element ratios of OS are examined to determine
their three-dimensional spatial abundances with respect to the Broken
Hill orebody. These include the elements exploited at Broken Hill,
such as Pb, Zn and Cu, as well as associated elements found at
relatively high concentrations, such as Ba, Mn and Fe. Si has also
been included in the investigation because of the siliceous nature of
some parts of OS. Both manganese and iron are sensitive to redox
changes, hence the Mn/Mn+Fe ratio has been selected to enhance the
signature of metasediments which may have formed under oxidizing
conditions (high ratio). In all binary diagrams the logarithmic
distance from the orebody is plotted along the X-axis in order to
better define element concentrations near the orebody, while the
element or ratio appears along a linear or logarithmic Y-axis.
Surface outcrop and borehole core samples are treated separately.
Core samples of OS only come from the east side of the orebody,
whereas samples of outcropping OS comprise rocks from both west and
east of the orebody (Fig. A.2a). To the east, samples were taken as
far afield as Froneman se Kop (nearly lOkm away from the orebody),
while the presence of Tank Hill mineralization and the Black Mountain
orebody west of Broken Hill necessitated that sampling not extend west
beyond the Broken Hill inselberg, a distance of some 200m.
Geochemical trends deduced for surface samples initially apply to data
sets both west and east of the orebody combined, whereafter results
from the two localities are contrasted.
In borehole core samples, the elements Zn, Mn, Ba (Figs. 6.18a-c) and
to a lesser extent Cu and the Mn/Mn+Fe ratio, show wide zones of
scatter about broadly defined increases in concentration towards the
orebody. Outcrop samples similarly display broadly increasing
concentrations of Zn, Ba and Pb towards the orebody (Figs. 6.19a-c),
61

but no meaningful trend is evident for Cu. The complicated Mn and
Mn/Mn+Fe trends (Figs. 6.19d and e) are discussed later (section
10.7). When the "ore factor" scores from R-mode factor analysis of OS
are plotted against distance from the orebody, broadly defined
increasing trends towards the orebody are evident (Appendix F).
In contrasting elements and inter-element ratios of OS surface samples
from west of the orebody with those located east of the deposit,
different absolute values and trends are evident (Fig. 6.19a-e). The
general pattern is that OS within 200m of the orebody contains higher
base metal and .silica concentrations to the west of the orebody than
to the east. Mn and the Mn/Mn+Fe ratio attain similar concentrations
on both sides of the orebody, but whereas the maximum values are
obtained at approximately 60m distance from the western extremity of
the orebody, the maximum to the east of the deposit is reached at a
distance of 300m.
6.3.2 Ore Schist plus Garnet Quartzite (OS+GQ), Ore Equivalent
Garnet Quartzite (OEGQ), Garnet Quartzite (GQ) and Orebody
The small number of samples within these individual rock types
precludes a rigorous statistical assessment of their geochemistry.
Only the salient features will therefore be highlighted.
6.3.2.1 Geochemical characteristics
Chemically, the orebody iron formations Quartz Magnetite (Q.Vl) and
Amphibole Magnetite (AM) consist mainly of SiOz and Fe20a, and in the
case of AM, the elevated Al 20a (5.4%) and MnO (7.8%) contents (Table
6.21) reflect the presence of manganiferous grunerite/cummingtonite
and spessartitic garnet (Ryan et al., 1982). The iron formations also
contain detectable Mo (up to 9ppm). Being part of the orebody, the
elements Pb, Zn, Cu, S and in the case of AM, Ba as well, are
62

elevated. QM is Ba deficient (60ppm) relative to all other ore
related rocks, as discussed later in section 10.7.2.
A comparison between the ore-associated QM at Broken Hill and QM at
Froneman se Kop, which although lying at the same stratigraphic level,
bears no spatial relationship to ore, reveals that although both have
similar Si02 and FesOa concentrations, the latter has distinctly higher
Ti02, Al20a and Na20, and lower MgO concentrations than the former
(Table 6.21). Of the base metals and related elements, the Froneman
se Kop QM contains little Pb, Zn, Cu or S, but has more than double
the Ba content of Broken Hill QM. The Froneman se Kop Sr
concentration of 266ppm is excessive compared with its low Cao content
of only 0.225%. These differences will be interpreted in section
10.7.2.
The siliceous (87% Si02) Lower Orebody GQ (Table 6.21) has Fe 20a and
Al20a as additional important major elements, and high levels of MnO
(0.35%). The base metal and related elements Pb, Zn, Cu, Sand Ba all
occur at elevated concentrations despite their high silica content.
OS+GQ represents a rock type gradational between OS and GQ, as
evidenced by its intermediate concentrations of all major elements
(Table 6.18). Although OEGQ is.expected to be rich in Si02 (by
definition), the major elements Fe20a, MnO, Cao and P20s are also at
levels higher than in OS. In contrast, NS and SS display strong
antipathetic relationships between Si02 on the one hand, and Fe20a and
P20s on the other (Tables 6.7 and 6.8). For MnO and Cao, NS also shows
a strongly negative correlation with Si02•
As expected, most trace elements decrease from OS through OS+GQ to
OEGQ. Ore-related elements are among the notable exceptions. The Ba
63

and Zn contents attain maximum concentrations in OS+GQ, with average
values of 813ppm and 591ppm respectively, while Pb, Cu, S and Y reach
their maxima in OEGQ with average values of 203, 121, 1622 and 73ppm,
respectively. Following Cao, Sr is also most concentrated in OEGQ
(18ppm), yet the increase in average Zr from OS to OEGQ (267ppm to
355ppm) is an unexpected (and unexplained) result. Mo attains
sporadically high values in OS+GQ and OEGQ, with a maximum
concentration of 64ppm coming from one Maanhaarkop sample of OEGQ.
The relatively elevated levels of Cao (or depressed Sr concentrations)
associated with the orebody, as noted above, is depicted in a plot of
the Ca/Sr ratio from rocks bearing various geographical and possible
genetic relationships to the orebody. Fig. 6.20 shows that while SS
has the lowest ratio of all rocks, AM, OEGQ, OS+GQ and Broken Hill QM
have the highest. In contrast, the K/Rb ratio remains relatively
constant, with only Froneman se Kop QM having an unusually high ratio.
6.3.2.2 Rare earth elements
Of the suite of rocks comprising the orebody, orebody GQ, OEGQ and
OS+GQ, INAA analyses are only available for the orebody. REE data for
the additional rock-types will be taken from XRF analyses.
A strongly positive Eu anomaly characterizes the massive sulphide (MS)
samples (Fig. 6.21a), in contrast to all other REE patterns seen from
the Aggeneys area. MS also displays a negative Nd anomaly,
particularly in the most sulphide rich sample (ALPllO). Although the
QM sample shows a slightly positive HR.EE anomaly, MS samples do not.
The absolute concentrations of REE's in the orebody samples are
somewhat less than in average shale. A comparison between the ore
enclosing magnetite-rich rocks and QM from Froneman se Kop show not
only the higher total REE concentrations in the latter, but also that
64
the REE pattern peaks at Nd and not at the HREE's (Fig. 6.21b). The
Nd peak is a characteristic established previously for NS.
No consistent shapes can be established for the REE patterns from
orebody GQ samples. While ALP077 shows relatively high La
concentrations, ALP149 has a slightly positive HR.EE signature (Fig.
6.21c). Both show small negative Ce anomalies. In contrast the OEGQ
samples from both surface and core show a consistent and strongly
developed positive slope towards the HREE's (Fig. 6.21d). The 1:1
correspondence between the REE compositions of ALP172G at Broken Hill
and ALP130 at Maanhaarkop underscores the correlation between OEGQ
from the two areas. OS+GQ samples show REE patterns with shapes which
mainly peak at Nd, similarly to OS and NS, and the occasional sample
which displays a relatively high estimated Ho composition (Fig.
6.21e).
6.3.2.3 Garnet Quartzite (GQ), Ore Equivalent Garnet Quartzite
(OEGQ) and Ore Schist plus Garnet Quartzite (OS+GQ) geochemical
variations at Broken Hill
The rocks included in this section are GQ which sheaths the LOB, OEGQ
at tens to thousands of metres from the orebody, as well as the mixed
rock OS+GQ located at variable distances from the deposit. For the
sake of graphical simplicity these rocks are divided into the two
categories GQ and OS+GQ. In so small and heterogeneous a data set,
ratios are of more significance than individual element variations,
nevertheless it is worth noting the general increase in Zn and Pb
concentrations towards the orebody (Fig. 6.22a and b).
The similar ionic radii of K• and Pb 2• results in the substitution of
the former by the latter in K-feldspar and in potassic mica (Sahl et
al., 1974). Plotting of the calculated Pb/Pb+K ratio is therefore
65
employed to trace possible precipitates from Pb-rich hydrothermal
fluids. Zn resides primarily in biotite in sulphide- and oxide- poor
metapelites (Brehler and Wedepohl, 1972). In order to determine
anomalously high concentrations of Zn beyond those caused by an
increase in Al-bearing minerals such as biotite, Zn is normalized to
Al in the ratio Zn/Zn+Al. Plotting of the ratios Pb/Pb+K and Zn/Zn+Al
reveals well defined increases towards the orebody, especially when
the two rock categories are viewed independently (Figs. 6.22c and d).
6.3.3 Comparison with mineralized sequences
With reference to Fig. 6.23, Bostrom (1973) showed that oceanic
sediments lie on a mixing line between the two end members of Fe-Mn
rich active ridge sediments (A), and terrigenous average continental
crust (C). Both Bostrom (1973) and Marchig et al. (1982) used the
Fe/Ti vs Al/Al+Fe+Mn plot to demonstrate that as the hydrothermal
metalliferous component increases, so the rock falls progressively
nearer the Al and Ti deficient, Fe and Mn enriched, left hand part of
the graph. The hydrothermal sediments of Marchig et al. (1982)
correspond well with "Ore" samples from Broken Hill (comprising QM,
AM, Lower Orebody GQ, and the OS+GQ extensions of LOB and UOB), and
lie on a continuum through OS and NS into SS. OS and NS clearly show
the closest resemblance to the ore samples, while SS lies even further
removed from an ore signature than average continental crust (C).
The REE's of Broken Hill ore-related rocks are compared with four
Recent ore sediments taken from the literature (Fig. 6.24). The two
Broken Hill massive sulphide samples have total REE concentrations in
excess of basalt-related Galapagos and Atlantis II hydrothermal
sediments, but of a similar order of magnitude to that of the
Santorini calc-alkaline (Smith and Cronen, 1983) caldera-related
hydrothermal ores (Fig. 6.24a). Whereas the metalliferous sediments
66

from the literature all display positive HREE anomalies, the Broken
Hill ores maintain a relatively flat profile. The strongly developed
positive La and Eu anomalies of the basalt-related hydrothermal ores
are present in weaker form in the Broken Hill ores. Only the
Santorini sample displays a negative Eu anomaly (Fig. 6.24a). Broken
Hill schists show higher REE concentrations than the basalt-related
ores, and selected OS samples (e.g. ALP225) do display a positive HREE
anomaly (Fig. 6.24b).
6.4 Broken Hill Quartzites (BQ)
Differing quartzite sampling techniques have generated two
geochemically distinct data sets since core samples comprise a
composite of the entire quartzite intersection iricluding slightly more
micaceous parts, while surface samples consist of a limited composite
of the exposure biased towards the more siliceous parts of the horizon
which form prominent outcrops. This, and minor surface leaching,
result in the more representative core samples having higher values in
virtually all elements other than Si02 (Table 6.22), thus core samples
are used for comparative purposes. Of the MOS samples, only one
surface and three borehole core analyses are available, and other than
a lower Zn concentration in the surface sample (Table A.3), there are
no obvious weathering effects. An average of all four MOS samples is
therefore used.
6.4.1 Geochemical characteristics
The most notable geochemical features of BQ is its highly siliceous
character (96.2% Si02); the high Zr content of 129ppm, considering the
silica purity of these rocks; and the lack of detectable carbon (Table
6.22). Many elements are present at levels below XRF detection limits
(Th, U, Mo, Ni, Sc, Co, S, C and Sr), and for the purposes of
statistical treatment, samples with major element concentrations below
67

detection limits are given a value of 0.001%, and lppm for trace
elements below detection limits. Of interest are the elevated
concentrations at Maanhaarkop of Zn in ALP124 (WQ), and Cu and Sin
ALP126 (DQ), together with the presence of chalcopyrite in adjacent
MDS (ALP125). BQ cannot be correlated with MnQ since in comparison
the latter has relatively high concentrations of many elements
(particularly MnO, Cao, P205, Sr, V, Sand the base metals), but low
abundances of Zr and K20 (Table 6.11).
The BQ correlation matrix reveals only a few well defined correlations
(Table 6.23). Si02 displays the expected antipathetic relationship
with Al20a, while Zn, MnO and Fe20a are positively correlated with each
other. The ore-related elements Cu, Pb, Zn, Ba and Fe 20 3 fail to form
a definable group of positively correlated elements, but their their
concentrations do generally increase with increasing Al 20 3 (e.g. Fig.
6.25).
Compared with WQ, the slightly higher content of minerals other than
quartz in DQ (section 4.3), is also evident in the marginally
increased concentrations of Al20a, Fe20a, Zr and particularly in REE
(Table 6.22). The mineralogy and geochemistry of MDS and NS are
similar. Both schists have high Fe20a contents considering their
elevated Si02 composition. The feature of high MnO coupled with low
MgO, which aids in distinguishing NS from SS, is repeated in MDS. As
with NS, MDS displays sporadically high Zr concentrations (419ppm in
ALP041; Table A.3), and elevated Zn averaging 209ppm (vs 194ppm Zn in
NS). Only the Ba content of MDS (313ppm) differs markedly from that
of NS (1253ppm), while average Cu concentrations of MDS (90ppm) exceed
those of NS (37ppm).
68

6.4.2 R-mode factor analysis
The R-mode factor analysis is based on 8 samples (for the data set
excluding REE), and five samples for the set which includes REE, thus
Fig. 6.26b is used only when assessing elements in relation to REE.
Notwithstanding the high communalities (Table 6.24), the analysis
fails to define many easily interpretable factors. Factor 1 shows the
closure-dominated relationship between Si02 on the one hand, and Cao,
Rb, Al20a, MgO, Fe20a, K20 and MnO, as wel 1 as the ore-related elements
Pb and Zn, on the other. The well defined positive correlation
between Si02 and Zr in schists (sections 6.2 and 6.3), does not apply
to BQ (Fig. 6.26), and Zr has a high loading in Factor 2 together with
Cr, Nb, Ti02 and REE. Y displays a strongly antipathetic relationship
with REE in Factor 2 (Fig. 6.26b), and with Cu in Factor 4, but Factor
4 also reveals a sympathetic relationship between Y, MnO and Fe 20a•
6.4.3 Discriminant function analysis (DFA)
Of the six "immobile" elements used in the schist DFA analyses, Th and
Sc fall mainly below detection limits so the analysis may only be
performed using the remaining four elements, Al20a, Zr, Nb and Ti02.
The differences between "immobile" element concentrations in WQ and DQ
are so slight that no element has an F-statistic which exceeds the F
to-enter level of 1.5 (specially reduced from the value of 4.0 used in
the schist analyses).
6.4.4 Rare earth elements
The single INAA analysis performed on a quartzite sample (WQ) reveals
concentrations substantially lower than in schists, and a pattern
having closer affinity to SS than to NS, as deduced from the positive
Ce anomaly (compare Fig. 6.27 with Figs. 6.8a and b). This feature,
though more common to SS, is occasionally found in NS (ALP122, Fig.
6.8a). The negative Eu anomaly is more strongly defined than in
either NS or SS. REE XRF results from WQ (ALP040) and DQ (ALP042)
69

show slightly positive Nd anomalies similar to those displayed by NS.
The difference in REE concentrations and pattern shapes for WQ and DQ
(Fig. 6.27b) suggest a non-equivalence of the two rock-types unless a
substantial facies change had been structurally juxtaposed. The MDS
sample which contains traces of chalcopyrite (ALP125) bears a strongly
positive slope towards the HREE's (Fig. 6.27b), while the second MDS
sample (ALP041) has a pattern very similar to that of NS (Fig. 6.9a).
MDS has too high absolute REE concentrations and lacks the fall-off to
the estimated Ho position, to be equated with SS (Figs. 9b and c).
6.5 Oxygen isotopes
Analyses of oxygen isotopes were performed mainly on quartz grains at
the University of Cape Town by Reid et al. (1987), in order to augment
the major and trace element data of the ALP collection. The common
representation is applied i.e. comparing the 180/ 160 ratio of the sample
with that of Standard Mean Ocean Water (SMOW) to produce the 8 180 ratio
(Faure, 1986). The samples come from both borehole core and the
surface outcrops (Table K.3), and the data are plotted along the
horizontal depth scale applicable in borehole BH123, from which most
of the samples were selected (Fig. 6.28). A number of features emerge
whose possible significance will be interpreted in appropriate
sections later on in the thesis.
With reference to Fig. 6.28, there is a marked variation in 6180 values
in quartz grains from different rock types. As noted with the major
and trace elements, the variation between 6180 in quartz grains from NS
appears far greater that in SS (ranges of 0.66 vs 0.20°/oo'
respectively). The 8 80 values of BQ quartz (8.9 - 9.7°/oo) lie between
those of NS (5.7 - 6.4°/ 00 ) and SS (13.9 - 14.l°/00), while the orebody
and ore-related rocks display quartz grain 6180 values ranging between
6.6 and 9.7 (with a single sample of UFS having a value of 12.9°/00 ).
70
\

Therefore a progression exists through the structural sequence from
low &80 values above to high values below.
6.6 Geochemical relationships between adjacent lithologies
Geochemical variations perpendicular to strike are assessed by
plotting the concentration of each element separately for each sample
down the surface boreholes. Gradational, .Yet consistent geochemical
patterns are then sought between comparable lithological intersections
from appropriate boreholes. Since the schists immediately hosting the
Broken Hill orebody (i.e. within 10-20m) are of variable composition
and display elevated concentrations of ore-related elements such as
Cu, Pb, Zn and Ba, only the 180 information from OS will be used.
For the three boreholes sampled continuously from NS to DQ, a single
composite of MDS for each borehole was taken, thus the sampling
technique prevents a rigorous assessment of elemental variations from
WQ through MDS to DQ. In the case of SS, core from four boreholes is
used to define trends.
6.6.1 NS to BQ transition
When considering geochemical variations through NS to WQ, clearly
defined examples from borehole BH123 are illustrated in Figs. 6.29a-c.
The elements may be divided into four categories:
(a) Elements which increase through NS into WQ. Si02 is the only
member of this class;
(b) Elements· which decrease through NS into WQ. All the major
elements excluding SiOa, fall into this category, examples of which
are shown in Figs. 6.29b. The trace elements Sc, Th, Nb, Co, V, Ni,
Sr, Rb and Ba also decrease into WQ, examples of which are shown in
Fig. 6.29c;
71

(c) Elements which increase along with Si02 up to the WQ boundary, but
then decrease in WQ. Only Zr and Cr display these spatial
relationships (Fig. 6.29a); and
(d) Elements which do not display consistent behaviour progressively
closer to WQ, or for which insufficient data is available. The
elements Y, S, Cu, Pb, Zn, U, Mo and C fall into this class.
XRF-derived REE data from BH166 reveals transitional REE patterns
across NS. Except for the sample furthest from WQ (curve 1 in Fig.
6.30), NS REE patterns are all similar to each other, showing slightly
positive Nd anomalies, but a systematic decrease in shale-normalized
total REE values towards WQ (curve 6). Although total REE
concentrations in WQ are substantially lower than in NS, a similar
shape of the REE pattern is still preserved (Fig. 6.30).
The systematic increase in Si02 through NS into WQ (Fig. 6.29a)
provides quantitative confirmation of the mineralogical gradations
noted in section 4.2.1. The remarkable decrease in all other major
elements and many trace elements, towards and across the NS/WQ
boundary (Fig. 6.29b and c), probably reflect the effect of "closure"
(Butler, 1982) resulting from the progressive Si02 increase. The
behaviour of these elements nevertheless confirm the gradational
nature of the transition through NS to WQ. The progressive increase
in Zr and Cr contents of NS together with Si02 (Figs. 6.29a and 6.31),
but lack of continuation of these trends across the boundary with WQ,
probably result from specific sedimentological controls, to be
discussed in section 9.3.4, and do not detract from the evidence for a
continuum existing between NS and WQ.
Due to the sampling constraint mentioned, a different technique is
required to examine whether the geochemical gradations continue
72

through to DQ. For comparative purposes, the mean element
concentrations of NS for each borehole are plotted along the abscissa
against the ordinate representing the element concentration of MDS and
DQ in the same borehole. The three boreholes BH123, BH166 and TSll,
separated by 800m and 4 800m, respectively, provide sufficient spread
between profiles to test whether the geochemistry of NS in one
borehole has any bearing on the geochemistry of MDS and DQ in the same
borehole. For the elements Si02, Al 20a and REE considered as
relatively "immobile", MDS and DQ display a marked dependence on the
corresponding element concentrations in NS results for Si02 and Ce
shown in (Fig. 6.32a and b). Th and Vin MDS and DQ show a similar
dependency on their NS concentrations. All three of the elements
Ti02, Zr and Cr display non-positive but nevertheless similar shapes
for their plots of NS versus both MDS and DQ (results for Zr plotted
in Fig. 6.32c), showing that although apparently independent of NS
concentrations for these three elements, the DQ concentrations of
Ti02, Zr and Cr are mutually dependent with those of MDS. DQ but not
MDS displays positive correlation with the corresponding Nb and Sc
concentrations of NS. As would be anticipated of both the more mobile
and the "ore-related" elements, including MnO, Rb, Pb, Fe, P20 5 , Co, Y,
Ni, Zn, Cu, S, MgO, Cao, Na20, Sr, K20 and Ba, they show no clear-cut
dependence between element concentrations in NS and in the
corresponding DQ and MDS samples. The evidence presented above is
consistent with the existence of a continuous stratigraphic succession
between NS and DQ.
6.6.2 OS &80 transitions
With reference to Fig. 6.28 it is evident that quartz grain 0180 values
from OS are of comparable levels with those of WQ and DQ. A
substantial increase in 8180 values occurs at the base of OES, with the
UFS 0180 ratio of 12.9°/00 lying close to that of SS (-14°/ 00 ).
73

Significantly, the break in increasing &80 values does not occur at
BGZ, along which shear deformation is evident (section 4.2.2.1), hence
a degree of geochemicar continuity may be inferred between UFS and ss.
6.6.3 SS transitions
Unlike NS, five individual transitions in SS must be taken into
account. These comprise element variations (a) directly below BGZ;
(b) in the structural hanging wall of CSMQ; (c) in the footwall of
CSMQ; (d) across the USS-LSS boundary; and (e) towards the quartzite
at Plant Hill (PQ) (Fig. 6.33). Plots of the most significant
elements from borehole cores which traverse SS are presented in Fig.
6.34.
Below BGZ the elements Th, Pb, Nb, and REE increase; while LOI, Mo,
Cu, Rb and particularly Cao, P20s, C, Ba, V, Cr, Zn, Ni and MgO
decrease (Figs. 6.34a and c; Table 6.25). Only one sample of SS
(ALP054) is available from between BGZ and CSMQ and relative to SS in
the remainder of borehole BH123, this sample in the hanging wall to
CSMQ displays notable concentrations of Pb, Fe20a, MnO, Co and Cao, and
low MgO, P20s, C, S, V, Ni, Ba and Zn contents (Fig. 6.34a).
Structurally below CSMQ, MnO, Zr, Cr, Th, Pb and Zn decrease strongly,
while Si02, P20s, Fe20a and Co increase (Fig. 6.34a). On moving from
USS to LSS, a consistent increase in Si02 and Zr is accompanied by a
marked decrease in V and Ni (Figs. 6.34a and c). Less severe
decreases occur for Al20a, Fe 20a, MgO, K20, LOI, C, Rb, Ba, (Mo), Zn, Cu
and Cr. Towards PQ, LSS displays weak increases in Cao, Na20, Ba and
Sr. The elements Al20a, Ti02, MnO, MgO, Ni, Zn and Cu, decrease
towards PQ, except for the one or two samples immediately adjacent to
PQ in which these elements increase slightly (Fig. 6.34b).
74

6.6.4 Ratio transitions through the succession
The wide variation in Si02 content of rocks through the stratigraphy
at Broken Hill, suggests that it may be useful to monitor key element
changes across strike with proximity to the orebody, by using inter
element ratios. Adoption of this method follows a study by Plimer and
Elliott (1979) of such variations associated with the Broken Hill
(Australia) deposit. Plimer and Elliott (1979) outlined the atomic
properties of the element pairs K-Rb and Ca-Sr, which respectively
have similar ionic radii, electronegativities and ionization
potentials, causing Rb• to substitute for K• in minerals and Sr 2 • for
ca2•. Since Rb• has a slightly larger ionic radius than K•, Rb
concentrates in hydrothermal phases relative to K, whereas Sr 2• being
slightly smaller than cas., is preferentially incorporated in minerals.
The ratios Ca/Sr and Rb/K tend to increase progressively as
hydrothermal fluids rise in the crust. Precipitates from these fluids
at or near the surface of the earth should therefore retain some of
the fluid's chemical composition, and the indicator used to monitor
these elements in hydrothermal precipitates is the ratio Rb/Rb+Sr (or
Rb/Sr ratio; Plimer and Elliott, 1979).
Sr substitutes for the important ore-related element Ba, particularly
in barite precipitated directly from sea water, due to the inherently
high Sr content of the oceans (Hanor, 1969). In cases where
hydrothermal Ba is introduced into sea water, the resulting Ba/Sr
ratio of barite and of the bulk rock, increases (Hanor, 1969). In
addition, hydrothermal solutions become progressively depleted in Sr
as discussed above, thus high Ba/Ba+Sr rock ratios should indicate the
presence of precipitates from Ba-bearing hydrothermal fluids.
Borehole BH123 covers the succession from NS in the structural hanging
wall, through OEH (OS+GQ and OEGQ in Fig. 6.35) into the SS footwall,
75

while BH156 only reflects the transition from OS and LGQ into SS (Fig.
6.36). It is evident from Figs. 6.35 and 6.36 that there is a general
increase towards OEH in the ratios Ba/Ba+Sr and Rb/Rb+Sr in both
boreholes, from both the structural hangingwall and footwall sides.
The ratio values in the structural hangingwall exceed those in the
footwall, and the increases in the ratio towards OEH in the
hangingwall is better defined than in SS.
76

7. REGIONAL GEOCHEMISTRY AND COMPARISON WITH BROKEN HILL
Samples collected from the farms Achab, Vogelstruishoek (Namiesberg)
and Wortel are used to determine geochemical background levels for
various rock-types lying well removed from known mineralization and if
possible to provide the compositional data required for regional
sedimentological modelling. In this section the lithogeochemistry of
the regional rock-types is described, and compared with appropriate
units at Broken Hill. Since the schist and quartzite data sets are
small, rigorous statistical testing of element distribution type is
inappropriate, and the log transformations applied to the Broken Hill
data are used as a matter of course.
A series of elements are plotted for boreholes BH123 (Broken Hill) and
WTL3&4 (Wortel), to provide an indication of the degree of geochemical
similarity between the correlated rock-types plotted along the X-axis
of Figs. 7.la-d. Zr, as one of the least-mobile elements, shows
remarkably similar behaviour from the two localities, with the NS (and
NTS) samples having elevated Zr concentrations relative to the SS (and
STS) samples, and the quartzite and CSMQ Zr values being depressed
(Fig. 7.la). Si02 also shows general similarity between correlated
rocks from the 2 areas, although Wortel STS is slightly elevated in
silica relative to SS (Fig. 7.lb). In contrast, the Zn concentrations
of BH123 rocks exceed those in comparative rock-types from WTL3&4
(Fig. 7.lc), as does the MnO concentration of all rocks excepting SS
(Fig. 7.ld).
7.1 Regional schists
7.1.1 Geochemical characteristics
As with NS and SS, NTS is more silica-rich than STS, but both have
less Si02 than their counterparts at Broken Hill, and thus contain
more alumina (Table 7.1). NTS contains more Cao (0.52%) and Na20
77

(0.72%) than NS (0.17% and 0.16%, respectively). The c, v ands
contents of STS exceed those of NTS, but are substantially less than
in SS. Base metal concentrations of NS tend to be distinctly higher
than in NTS as discussed later (section 7.3.3), but this does not hold
true when comparing SS with STS. In common with SS, many STS samples
have U and Mo concentrations in excess of the lower limit of
detection, while NTS, like NS, does not. In general, and in keeping
with the SS versus NS relationships, STS displays less major element
variability than NTS, as measured by the coefficient of variation
(Table 7.1), but the trace elements generally display more
variability.
In contrast with NS, NTS displays far greater inter-element
correlation, particularly so for the ore-related elements (compare
Tables 7.2 and 6.7). There exists an enigmatic positive Pb
correlation with Zr and negative Pb correlation with K20, Ba and Rb,
but as with NS, Cu remains uncorrelated with virtually all elements in
NTS. Both STS and SS show Cu positively correlated with most elements
(Tables 7.3 and 6.8), and the STS correlation matrix is similar to
that of SS except that Ba and Th are uncorrelated with most elements.
The Wortel CTS has the distinctive geochemical composition of low Si02
(39%) coupled with high Fe20a (45%), MnO (3.7%) and P20 6 (0.8%) which
characterizes the Amphibole Magnetite rock of Broken Hill, and
distinguishes it from CS (Table 7.4). Additional distinctive features
of CTS include elevated Mo, Co, S and Y, and these considerations
suggest that CTS correlates far more closely with AM than with CS.
The distinctive geochemical characteristics of GTQ include a
relatively low Si02 content (66%) coupled with high concentrations of
Ti02 (0.4%), Al110a (9.5%), Fe20a (19.6%), MgO (3.0%) and Co (42 ppm)
(Table 7.4). Comparisons between GTQ with both LGQ and MnQ from
78
Broken Hill reveal so wide a discrepancy in the above elements as to
preclude correlation. GTQ cannot be called a calc silicate rock since
it has more than double the iron and less than one tenth the calcium
of CS (Table 7.4), and therefore emerges as an uncorrelated iron
silicate rock.
7.1.2 R-mode factor analysis
Factor analysis computations for both NTS and STS failed to reveal any
specific ore-related factors. Few geologically interpretable factors
emerged, and the study was not pursued.
7.1.3 Rare earth elements
NTS sample REE patterns display similar shapes and concentrations to
those of NS, but with Achab NTS showing a relatively low estimated Ho
concentrations (Fig. 7.2a). The shapes of STS REE patterns vary from
having the positive Ce anomaly common to LSS, to having negative Ce
anomalies and REE concentrations well in excess of those in SS (Fig.
7.2b). In comparing calc silicate rocks from Wortel and Broken Hill,
the notable REE difference is the positive and negative Ce anomalies,
respectively, and positive estimated Ho concentration of CTS (Fig.
7.2c). The Wortel GTQ also displays the positive Ce anomaly of CTS,
but without the dramatic increase towards the estimated Ho values
shown by both Wortel CTS and Broken Hill MnQ. Although AM at Broken
Hill has a relatively elevated estimated Ho concentration, the
positive Ce anomaly of CTS is not reflected in AM.
7.2 Regional Quartzites (RQ)
7.2.1 Geochemical characteristics
Similar sampling and detection limit constraints apply to RQ as they
do to BQ (section 6.4), hence again the borehole core samples are used
for comparisons, while in the case of MOTS a single surface sample is
79

included with the Broken Hill core samples. As with BQ, WTQ contains
more Si02 and less Al20a, KzO, Fe20a and REE than DTQ (Table 7. 5), while
the elevated S content of DTQ (783 ppm) reflects the pyrite frequently
seen in hand specimens (Appendix C.7 and Table C.16). In comparison
with BQ (Table 6.22), RQ has a far higher Na20 content, but the two
rock suites have Zr concentrations of similar magnitude. Whereas the
Ba concentration of MDTS is slightly higher than in MDS, the Mno, Cu,
Pb and Zn contents are substantially lower.
The RQ correlation matrix displays far more inter-element correlations
than does the BQ matrix (compare Tables 7.6 and 6.23). Ba, Fe20 2 , K20,
Rb, Al20a, Ti02 and Nb are all mutually correlated, and these display a
far stronger negative correlation with Si02 than in BQ.
7.2.2 Rare earth elements
Variation in RQ REE patterns is wide with no consistent shapes
apparent. Positive estimated Ho anomalies are not confined to BQ, and
both positive and negative Ce anomalies are observed (Fig. 7.2d).
MDTS displays similar shapes to the REE patterns of MDS, with one of
the Wortel samples (ALP449) also displaying a positive anomaly for
estimated Ho (Fig. 7.2e).
7.3 Geochemical comparisons between data sets
Only correlated rock-types from Broken Hill and the regional areas are
compared. OEH and the orebody therefore cannot be included in the
investigation below, except when comparing AM at Broken Hill with CTS
at Wortel.
7 • 3 • 1 Methods of comparison
In Figs. 7.3a-g, grouping of the elements partly follows results from
the correlation matrices (Table 7.2 and 7.3), with Si02 and Zr on the
80

one hand, contrasted with the elements with which they are negatively
correlated (Al20a, Ti02, K20, Na20, Sc, Rb and Sr). The results of
Table 6.5 showed that at Broken Hill the elements Fe20 3 , MnO, S and V
display moderate to strong concentration differences between NS and
SS, and this grouping is therefore also adopted for comparing Broken
Hill with regional rocks. In section 7.3.3, the elements most likely
to be related to the presence of the Broken Hill orebody are grouped,
and the relative behaviour of Si02, Al20a and K20 are also plotted in
order to monitor the effects of closure.
Delta diagrams compare the mean element concentrations for NS, SS, WQ
and DQ at Broken Hill against the appropriate mean element
concentrations from the three regional areas Achab, Wortel and
Namiesberg, by taking their log ratio (Figs. 7.3 and 7.6). Where the
corresponding Broken Hill and regional rocks have an element of equal
concentration, the log ratio is zero, but the ratio plots above the
zero line when the Broken Hill rocks have a relative excess of that
element, and vice versa. For the purposes of comparing non-ore
related elements, only core samples are used, whereas in section
7.3.3, certain surface sample suites will also be examined since
practical applications of these techniques cannot be restricted to
borehole core.
The ratio vs ratio diagram (Figs. 7.4) documents the change in the
ratio of one element in Broken Hill rocks relative to their regional
counterparts, as a function of the change in the ratio of another
element. For example, as the Si content of Broken Hill rocks (bh)
decrease relative to the equivalent regional rocks (reg), the relative
Al content increases as a result of closure. In the quartzite/schist
ratio part of Fig. 7.4a, the Si variation in BQ is so small that it
may effectively be considered constant, thus as Si in the regional
81

schists increases, the log[Si(bh)/Si(reg)] ratio decreases, moving to
the left, and the log[Al(bh)/Al(reg)] ratio increases. Fig. 7.5
confirms that the Al ratio variation is just a function of the
regional schist Si02 content. At relatively high regional rock Si02
concentrations (i.e. in the BQ/RQ field), a small increase in RQ Si02
content drastically increases the BQ/RQ Al ratio, causing the curve to
become virtually asymptotic.
7.3.2 Comparisons for elements unrelated to the Broken Hill orebody
The two data sets comprising the ratios Broken Hill Quartzite/Regional
Schist (BQ/RS) and Broken Hill Quartzite/Regional Quartzite (BQ/RQ)
appear to form a continuum when the ratios of the major elements Al, K
and Fe are plotted against the Si ratio (Fig. 7.4). The Si02
concentration of the regional rocks is the single most important
variable controlling the ratios Al(bh)/Al(reg), K(bh)/K(reg) and
Fe(bh)/Fe(reg) ratios for BQ/RQ and BQ/RS, as explained above, and
with reference to Fig. 7.5). The BS/RS Al ratios form a well defined
curve passing through the origin, but in the case of K and Fe, the
curves pass just above the origin, indicating relatively higher levels
of these elements at Broken Hill.
Figs. 7.3a and b reveal that Broken Hill has NS with intermediate
concentrations of Si and Zr, with relatively higher Si and Zr than
Achab NTS, and lower Si and Zr than Wortel NTS. Consequently, Achab
NTS has higher concentrations in the elements Al, Ti, K, Na, Sc, Rb,
Sr, S and V than their Broken Hill counterparts, and Wortel NTS has
lower concentrations in these elements, excepting for Na and Sr. It
is noteworthy that Na and Sr are the elements displaying the lowest
NS/NTS ratios, suggesting that Na and Sr in NS at Broken Hill have
unusually low concentrations. Mn shows significantly higher
82

concentrations in NS relative to both Achab and Wortel NTS, as to a
lesser extent does Fe.
In the case of SS (Figs. 7.6c and d), Broken Hill is again
intermediate in Si and Al composition with Namiesberg STS having
relatively higher Si and lower Al than Broken Hill SS, in agreement
with findings for the NS/NTS ratios. Broken Hill SS is also
intermediate in concentration for the elements Na, Sr, Fe and Mn.
Only S and V are consistently higher in Broken Hill SS.
For the quartzites, the Wortel and Namiesberg relative Si and Al
concentrations are opposite to those in the schists, with Wortel
quartzites having more Al and less Si than BQ, and Namiesberg
quartzites having less Al and more Si than BQ (Fig. 7.3e-g). BQ shows
conspicuously lower Sr concentrations and relatively more Fe and Mn
than Wortel and Namiesberg quartzites, irrespective of the
corresponding Al behaviour.
7.3.3 Comparisons for ore-related elements
The average concentrations of both core and surface NS samples from
Broken Hill are relatively elevated in the elements Pb, Zn, Ba, (Mn),
Fe, P and Y compared with the average regional NTS samples (from Achab
and Wortel), notwithstanding the higher Si and lower .Al contents of NS
(Figs. 7.6a and b). In strong contrast to NS, Broken Hill SS ore
related elements with the exception of Pb, are at relatively lower
concentrations when compared with regional STS (Namiesberg and Wortel)
(Figs. 7.6c and d). The average Pb content of SS at 42ppm is higher
than the maximum STS Pb value of 32ppm, and the highest SS Pb value of
128ppm occurs 150m into the structural footwall of the orebody. Even
though average MOS and MOTS have equal Si concentrations, the ore
related elements with the exception of Ba display considerably higher
83

values in MDS than in MDTS, and lower Na and Sr (Fig. 7.6d), similar
to the pattern seen in NS. The two Wortel MDTS samples with Ba in
excess of 600ppm are responsible for the Ba anomaly.
Delta diagrams comparing element concentrations of borehole core
samples of BQ to those of RQ, display relatively higher base metal and
associated elements in the case of BQ (Figs. 7.6e and f). The lower
Na and Sr content of BQ relative to RQ is again evident. These
features are not well defined in the ratios of the surface samples of
BQ relative to RQ.
7.3.4 Conclusions
There is a progressively clearer separation of Si02 in quartzite from
Al20a in schist, moving from Wortel through Broken Hill to Namiesberg.
An additional geochemical difference is that NS and BQ at Broken Hill
relative to NTS and RQ, have higher levels of base metal and related
elements, while Na and Sr concentrations are lower. No simple
distinction can be drawn between SS and STS, however, the elevated
concentrations of Pb in SS appears to be a useful indication of the
nearby orebody. The existence of regional and local indicators of
mineralization forms the basis of the lithogeochemical exploration
strategy for locating Broken Hill-type deposits in the North West Cape
(Appendix G, Figs. G.1 and G.2). This strategy would be ineffective
unless combined with geological and geophysical techniques in the
search for more ore.
84

PART D ..
GEOLOGICAL AND GEOCHEMICAL MODELLING

\
\
PART D. GEOLOGICAL AND GEOCHEMICAL MODELLING
8. PROVENANCE
The chemical and mineralogical signatures of sediments are to some
extent derived from the provenance area (e.g. Taylor, 1979; McLennan
et al., 1983). Relative to BQ, the schists with their higher element
concentrations other than SiOg, provide better information for the
purposes of provenance modelling. U-Pb age patterns from detrital
zircon grains in the quartzites (which are conformable with NS;
section 6.6.1) will be assessed for provenance geochronlogical
constraints.
8.1 Provenance age
8.1.1 Rare earth elements
BS chondrite-normalized REE patterns display the strongly negative Eu
anomaly definitive of sediments derived from a post-Archaean
provenance since, as shown in Fig. 8.1, the Archaean rocks have no Eu
depletion. Taylor (1979) and McLennan et al. (1980) argued that the
major batholith generation event which marked the close of the
Archaean at ~2.5Ga, fractionated Eu into early formed calcic-
plagioclase, leaving the voluminous felsic fraction Eu deficient.
Sediments derived from the more felsic, post-Archaean crust therefore-
have a negative Eu anomaly.
La and Th contents vary dramatically with the degree of igneous
differentiation, thus in general terms sediments derived from more
maf ic Archaean crust may be distinguished from those having a
relatively felsic post-Archaean provenance. From basalt to granite,
La concentration varies between 16.7 and lOlppm, while Th varies from
1.12 to 50ppm. The La/Th ratio decreases from 8.8 in basalt to 2.0 in
granite, hence sediments derived from the more mafic average Archaean
crust have La/Th ratios of 3.6, while sediments from a younger, more
85

felsic provenance have ratios of approximately 2.7 (McLennan et al.,
1980). The very low BS La/Th ratio of 1.8 (Fig. 8.2) suggests a
strongly fractionated and hence felsic provenance of post-Archaean
character. Comparing La/Th ratios of metapelites with pelites is
justifiable since both La and Th are relatively insoluble, and also
immobile during metamorphism (McLennan and Taylor, 1980; Cullers et
al., 1974). The relatively high Th content of BS is responsible for
producing a low Co/Th ratio, causing BS to plot well below the mixing
curve between Archaean maf ic (M) and felsic (F) volcanic rocks along
which most Archaean sediments lie (McLennan et al., 1983) (Fig. 8.3).
8 .1. 2 Uranium/lead age dating of zircons
Individual zircons separated from the WQ outcrop at Froneman se Kop in
which cross-bedded heavy mineral layers are located (section 4.3),
were individually analysed on the ion microprobe at the Australian
National University by Dr R. A. Armstrong. All analysed zircons
display the characteristic detrital rounding described earlier
(section 4.3), with two analyses being performed on zircon rims.
Plotting of the results on a conventional concordia diagram (Fig. 8.4)
reveals a range of discordant age patterns but with an upper age
intercept of 1 800 - 2 OOOMa which approximates the calculated
207 Pb/ 206Pb ages (Table K.4). The scatter of results below the concordia
fail to define any obvious discordia, indicating episodic Pb-loss
(Faure, 1986). Almost total Pb-loss in the most U-rich zircons (Table
K.4) occurred between 1 000 - 1 200Ma which is a metamorphic age
common in the 2 OOOMa Achab Gneiss, and which corresponds with the age
of intrusion of the granite precursor to the Aroams Gneiss (Armstrong
et al., 1988). The zircon rims plot furthest removed from concordia,
suggesting that these zircons suffered the most recent and the
greatest total loss of Pb.
86

The data clearly suggest that the age of the provenance area for BQ
does not exceed 2 OOOMa, which corresponds to the interpreted age of
the Achab Gneiss. As suggested by Moore (1977), Watkeys (1986) and
Armstrong et al. (1988), the Achab Gneiss acted as a basement and in
part possibly also as a provenance area to the Bushmanland Sequence.
8.2 State of provenance weathering
8.2.1 Major and trace elements
Relative to the average of average shale compositions given by
Vinogradov (1962), Krauskopf (1979) and Turekian (1972), the most
notable major element characteristics of BS are their higher K20
content (higher by .:~:_1.25 times); and lower Na20, Cao and MgO
composition (by ,;,,0.21, 0.04 and 0.48 times, respectively). The Cao
deficiency can in part be attributed to the lack of Precambrian
crustacea remains, when compared with shale averages which include
post-Proterozoic lithologies. The relative intensities of the Na20,
Cao and MgO deficiencies juxtaposed with the high K20 contents is,
however, similar to the weathering scheme proposed by Nesbitt et al.
(1980). Continental weathering is characterised by losses to the
oceans of the elements Na 20, CaO, MgO and under extreme conditions of
weathering, by K20 (Nesbitt and Young, 1984; Bjo~lykke, 1974). Four
tests utilizing major and trace elements are employed to assess the
provenance state of weathering. The first three ratios were used by
Dypvik (1979), while CIA was devised by Nesbitt and Young (1982).
a. K20/Na20. Relative to average shale ratios of between 2.5 - 3.0, BS
have high K20/Na20 ratios (meanss = 15; meanNs = 28). The high BS
K20/Na20 ratio is emphasized when compared with a ratio of 8.2 for
Andaya (Norway), Ramsa Formation shales, which directly overlie their
deeply weathered granite provenance. The relatively low Na20 content
87

of BS is the main reason for their high K20/Na20 values. Adding back
the 77% and 19% Na20 lost to pegmatites from SS and NS, respectively
(section 6.1.5), decreases the K20/NazO ratio of SS to 8.7, i.e.
broadly agreeing with Dypvik's (1979) values for pelites derived from
granite, while the NS ratio decreases to 23.6, which is still high,
thus emphasizing the suggestion of unusual processes which generated
NS.
b. Rb/K20. The BS average Rb/KzO ratio of 55 - 57 falls well within
the average shale compositions listed by Vinogradov (1962) and
Krauskopf (1979) of between 47 - 73. The Broken Hill values are
considerably lower than the average of 172 for Dypvik's (1979) Ramsa
Formation. The Norwegian granite provenance has proceeded to the
kaolinite stage of weathering (Dypvik, 1979). Nesbitt et al. (1980)
confirmed that although Rb/KzO ratios decrease during initial stages
of weathering of granitic rocks, the ultimate product of weathering,
i.e. kaolinite, displays a marked increase of Rb/K20 (relative to
parent rock). Such behaviour of the Rb/KzO ratio results from the
preferential hydration and removal of the smaller K· cation and
retention of Rb• on developing clays (Nesbitt et al., 1980) which are
later physically removed to the depository to form shales.
c. Maturity Index (AlzOa + K20)/(MgO + Na20). Bjorlykke (1974) derived
this ratio as an index of sediment maturity, based on the relatively
immobile low temperature behavior of Al and K, compared with Mg and Na
which are rapidly removed to the oceans. The Maturity Index for
average shale varies between 5.8 - 7.2 which is considerably less than
the range of 13.0 - 21.6 for BS. Even adding back the 77% and 19%
Na20 lost to pegmatites from SS and NS respectively, causes a
negligible decrease in the Index (from 21.6 to 20.9 for NS and 13.0 to
11.6 for SS) since the NazO contribution is substantially smaller than
88

that of MgO. Bjorlykke (1974) found that the most mature Lower
Paleozoic sediments of Norway attain a maximum ratio of 12, and
suggested that the Index reflects both the type and degree of
provenance weathering. In a separate study on the Mesozoic sediments
of Andoya, Dypvik (1979) ascertained that the Maturity Index for the
Ramsa Formation averages 57. Higher up in the succession (i.e.
further removed from the provenance), the Maturity Index does not
exceed a value of 10.
d. Chemical Index of Alteration - CIA.
[ (Al20a * lOO)/(Al20a + Cao + Na20 + K20)] (expressed in molecular
proportions)
The CIA appears less dependent on provenance type than do the other
three indices, as Nesbitt and Young (1982) have shown that both
granite and basalt yield similar CIA values for their weathered end
products. Comparison between CIA ranges (Table 8.1) for BS and
various rocks and minerals given by Nesbitt and Young (1982), reveal
that BS have slightly higher CIA values than average shale, and fall
!n the range of montmorillonite and illite, without attaining the
kaolinite/chlorite degree of maturity. As shown for the Maturity
Index above, adding back the proportion of Na20 lost to pegmatites
will not materially affect the CIA because of the small Na 20
contribution to the denominator.
8.2.2 Ra+e earth elements
Nesbitt (1979) showed that weathering of rocks can drastically affect
their total REE concentrations by factors of 2.5 for moderately
weathered granodiorite and of 0.4 for residual products i.e. kaolinite
and illite, which form in fractures between less weathered parts of
the granodiorite. The latter degree of alteration is restricted to
rocks attacked by humic acids resulting from organic decay (Burkov and
89

Podporina, 1967; Nesbitt et al., 1980), a factor of little consequence
during the Precambrian. Thus the likely bulk product of Precambrian
weathering would be the "disintegrated zone" (Burkov and Podporina,
1967), and "altered rock" (Nesbitt, 1979), which are REE enriched.
Compared with Post Archaean Australian Shales (PAAS), BS display
higher REE patterns (Fig. 8.5), which probably reflect such
intermediate stages of weathering. Calculations by the present author
on Nesbitt's (1979) data reveal that the Eu/Eu* ratio remains
virtually unaffected by the weathering process (Eu/Eu* of parent rock
= 0.74; of moderately weathered rock = 0.73; of residual products =
0.76), hence the ratio in pelites should reflect the provenance
composition.
8.3 Provenance composition
An assessment of provenance would be considerably simplified if a
single source to Broken Hill schists (BS) could be established. Reid
et al. (1987) argued that the variation in oxygen isotope ratios
across stratigraphic boundaries (section 6.5) precluded a simple and
single provenance for elastic quartz, however, it will be shown later
(section 9.4.3) that the isotopic signature of quartz from a single
source may be modified in the depository by interaction with both pore
and hydrothermal fluids. The gradational relationship between NS and
WQ (section 6.6.1) suggests that the chemical and mineralogical
differences between these two rock-types reflect sedimentological
differentiation (discussed more fully in section 9.4 below) rather
than from erosion of different provenances. The fundamental chemical
and mineralogical differences between NS and SS may have resulted from
erosion of different provenances, and/or from depositional environment
factors. The REE evidence is examined to provide clarity on this
point.
90

8.3.1 Rare Earth Elements
Cullers et al. (1975) argued that the REE signature of clays and
particularly of illite, is retained during transportation of clays
from the provenance to the depository. The similar shapes to WQ and
BS REE patterns, but far lower total REE concentration in WQ (Fig.
8.5) indicate that the bulk of the REE 1 s are not contained in quartz,
but in the mica, sillimanite and feldspar components of the schists.
These aluminium silicates will therefore largely reflect the REE
characteristics of the inherited clays since metamorphism does not
significantly change the total REE content, pattern shape or Eu/Eu*
ratios of shales during metamorphism (Cullers et al., 1974). BS
displays a pattern of strong total REE enrichment compared with
siliceous to intermediate igneous rock data from Haskin et al. (1968)
(Fig. 8.5). The increase in total REE with increasing Si02 content of
igneous rocks is apparent from Fig. 8.5, suggesting a highly felsic
provenance to BS. In view of the weathered nature of the provenance
(section 8.2) the total REE concentration and patterns of BS may over
estimate the siliceous nature of provenance rock composition.
The Eu/Eu* ratio, which is unaffected by weathering (section 8.2.2),
can provide an idea of provenance composition. With reference to data
by Haskin et al. (1968), Cullers et al. (1975) pointed out that Eu/Eu*
becomes progressively smaller (i.e. increasingly large negative Eu
anomaly) with increase in Si02 content (Fig. 8.5). Granite with Si02 =
60 - 70% has Eu/Eu* = 0.79, and 0.42 for granite with Si02 > 70%. The
three NS samples average Eu/Eu* = 0.59, the single WQ sample has· a
value of 0.58, while the four SS samples average 0.52. The small
range in Eu/Eu* ratios between NS, WQ and SS which display such a wide
silica variation (68.7 - 96.3% Si02) do not support a contention of
recognizably different provenances, but are indicative of detrital
contribution to all three rock-types from similar or a single
91

provenance. Furthermore, the Eu/Eu* ratio of the metasediments
provides an estimate of the provenance silica composition of
approximately 70% Si02. The low La/Th ratio of BS (section 8.1.1)
supports the indications of a relatively felsic provenance.
Cullers et al. (1975) identified six factors which could affect the
REE patterns of shales, viz. source rock inheritance; weathering of
source rock; exchange reactions during transport and deposition;
diagenesis; contamination with allanite/monazite-type heavy minerals;
and metamorphic changes. They suggested that source rock inheritance
is the major factor controlling pelite REE patterns, which becomes
modified by the intensity of provenance weathering. In the foregoing
discussion, source rock composition and the effects of provenance
weathering have been assessed, while metamorphic changes to REE
patterns seem unlikely (Cullers et al., 1974). Neither monazite nor
allanite were identified in samples of BS. Fleet (1984) indicated
that diagenesis probably has little effect on the REE content of
sediments, and there is no reason to suspect that exchange reactions
during transport and deposition would be any different during the
formation of North American Shales, and BS.
8.3.2 Major and trace elements
The original chlorite content of shales may provide an estimate of the
mafic component of the provenance. The Maturity Index (Al20a +
K20)/(Mg0 + Na20) derived by Bjorlykke (1974) varies inversely with
detrital chlorite content, largely because of MgO in the denominator.
The most chlorite deficient Lower Paleozoic sediments of Norway
analysed by Bjorlykke (1974) have a maximum Maturity Index of 12,
while the BS Index varies between 11.8 and 21.6, suggesting that
chlorite, and hence mafic rock, was not an important component of the
provenance.
92

Plotting of NS (n) and SS (s) relative to the fields of granitic to
intermediate rocks, and to mafic rocks (Fig. 8.6), shows that BS falls
far closer to the former than to the latter. The transformation from
average crust cited by one author to average shale of the same author
may provide an indication of the gross relationship which ties a
specific shale to its provenance. Using the formula
P = S * (Ca/Sa), where
P =Provenance composition;
S =Known shale composition;
Ca =Average crust composition from one author; and
Sa= Average shale composition from the same author, shows that the
calculated provenance (Fig. 8.6, letters in boxes) lies closer to the
field defined by granitic to intermediate rocks than to that of maf ic
rocks.
The relationships between the elements K, Rb, Si, Al, Ti, Zr and Cr
have been chosen as they include the major and trace elements which
display the least mobility during weathering (Nesbitt et al., 1980;
Minarik et al., 1983; Kronberg et al., 1979). A major proportion of
these elements will be transferred in detrital form from provenance to
sediment. Only the data of Krauskopf (1979) and Vinogradov (1962) is
used for calculating the ratio Ca/Sa, although various averages from
Taylor (1964) and Turekian (1972) appear in Fig. 8.6 for reference.
The transformation of average crust to average shale (Cv and Ck to Sv
and Sk, respectively; Fig. 8.6) causes a consistent pattern of K/Rb
depletion in the residual crust as explained in section 8.2. The
calculated K/Rb ratios for the provenance to NS and SS are 213 and 222
respectively, using the data of Vinogradov (1962); and 191 and 199
93

using Krauskopf 1s (1979) values, which both correspond fairly closely
to average granite and intermediate rocks (Fig. 8.6a).
As crust is reworked and transformed to produce sedimentary rocks, the
separation of quartz on the one hand from clays and micas in the other
leads to the development of quartzites and shales, respectively. The
Al content of the developing shale increases (Garrels and Mackenzie,
1971), thus the strongly decreasing Si/Al ratio seen in Fig. 8.6b is
anticipated. Whereas granitic and mafic rocks have similar Al
compositions (Fig. 8.6b), their Si contents differ sufficiently to
conclude that the SS provenance had a granitic nature. The high Si
content of NS and resultant low Al concentration, cause the NS
provenance to plot in the extremely siliceous part of Fig. 8.6b.
The behaviour of Ti and Zr in BS is assessed since maf ic rocks are
richer in Zr and poorer in Ti than granites (Fig. 8.6c); and Zr- and
Ti- bearing minerals tend to move together during sedimentary
processes (e.g. Chandler, 1988). NS and SS both have relatively high
Zr compared with average shale, but the vectors towards their
precursors point in the direction of the granitic field, rather than
towards that of mafic rock (Fig. 8.6c). The Cr content of the
estimated NS and SS provenance also tends towards that of an
intermediate rock composition (Fig. 8.6d). In pointing towards a
granitic to intermediate provenance for BS rather than to a mafic one,
the major and trace element data are compatible with the REE
indications of a provenance having a composition of approximately 70%
Si02•
8.3.3 Heavy mineral separates
A study of heavy mineral separates and heavy mineral layers in
quartzites (section 4.3) failed to reveal any detritally rounded
94
garnet, kyanite, pyroxene, hornblende or staurolite. Such indicator
metamorphic minerals form common detrital components of sediments
derived from denudation of metamorphic rocks (e.g. Flores and
Shideler, 1982; Trimonis et al., 1978), and some trace of these
minerals should survive the weathering and transportation process had
the quartzites been der~ved from a metamorphic provenance.
8.4 Discussion and conclusions
NS and SS were most likely derived from a common provenance, which the
well defined negative Eu anomaly of BS suggests was felsic and hence
of post-Archaean age, a result supported by the relatively high Th
content of BS. The strongly negative Eu anomaly of BS also suggests
that the provenance had relatively low concentrations of Ca
plagioclase. The provenance age is well constrained since the
basement to BS has been dated at 2.0Ga (Armstrong, et al., 1988), and
zircons inherited from the provenance give the same age. The lack of
inherited metamorphic heavy minerals in the Aggeneys quartzites
suggests that the provenance area was not metamorphosed.
The low Eu/Eu* ratio of BS strongly favours a felsic provenance of ca.
70% SiOz composition, and this conclusion is supported by the
relatively elevated total REE content of both NS and SS; by La/Th
ratios of -2; and by a variety of major and trace indicator elements
suggestive of a granitic precursor. The maturity index clearly shows
that chlorite, and hence basalt, was not a major component of the
provenance. The well rounded zircons preserved in WQ could not have
originally crystallized in a mafic rock since Poldervaart (1956)
showed that in high temperature rocks, zircon is one of the last
minerals to form, occupying and adopting the irregular shapes
remaining just before solidification. Such zircons have little
95
preservation potential during detrital transport. The provenance to
BS was therefore a felsic- igneous or -sedimentary rock.
It was suggested previously (Lipson, 1980) that basal gneisses in the
Aggeneys area were metamorphosed rapakivi granites. Pristine rocks of
this type are characterized by concentrations in the elements Si02 and
K20, corresponding to some of the features of BS. REE data from the
Laitila rapakivi granite (Vorma, 1976) reveals a ratio of Eu/Eu* =
0.08 which is far lower than the ratio of 0.52 - 0.59 of BS. The
known preservation of the Eu/Eu* ratio from provenance to sediment
discounts the likelihood of a rapakivi granite provenance. Similarly,
although the Laitila massif contains high concentrations of LREE (La =
lOOppm vs BS average= 55ppm), the HREE are also present at high
levels (Lu= 1.17ppm) relative to BS (average Lu= 0.55ppm). A
provenance of rapakivi granite would therefore not lead to the
development of the observed shapes of BS REE patterns.
The high degree of sediment maturity was largely inherited from in
situ provenance weathering, as revealed by total REE contents; by
Eu/Eu* ratios; by the Maturity Index; and by the Chemical Index of
Alteration. The latter two Indices suggest that the degree of
weathering did not proceed to the kaolin stage, as exemplified by the
thick lateritic profiles of Brazil where most K20 contents are < 0.15
(Kronberg et al., 1979). Similarly, although the Rb/K20 ratio of BS
exceeds that of average shale, it is not as high as in kaolinite.
96

9. GENESIS OF THE METASEDIMENTS AND STRUCTURAL IMPLICATIONS
9.1 Schists: NS and SS depositional environments
The extensive areal development of both NS and SS is a constraint in
that neither schist is likely to have formed in a fluvial environment,
particularly during the ~recambrian when there was insufficient plant
life available to trap large quantities of clay and mica before they
reached either a lake or the coast (Prof. N. Smith, pers.comm., 1989).
Comparisons with analyses from the literature, as well as indications
of sediment maturity and likely redox conditions, are assessed
together with the behavior of key elements, in order to establish
possible marine or lacustrine environments in which these rocks
formed.
9 .1.1 Geochemical comparisons with shales
A comparison between NS and SS on the one hand, and average shale on
the other reveals considerable gross geochemical similarities, with
only the elements Cao, Na20, Sr, Ni and S occurring at considerably
lower concentrations in NS, and Cao and Sr at considerably lower
levels in SS (Table 9.1). The elements MgO, P205 and V are present at
not quite such low levels in NS, and similarly for MnO, Na20, P205 and
Ni in SS. Relative to average shale, NS shows twice the Zr, Pb and Zn
concentrations, and SS twice the Pb and S content.
The common feature of low Cao, Sr and P205 in both NS and SS probably
reflects a lack of metazoan remains prior to approximately 680Ma
(Cloud, 1981). The low Ca-plagioclase content of the provenance
(section 8.4) may also have contributed to a Cao deficiency of BS.
Taking into account the NS and SS Na losses due to metamorphism
(section 6.1) results in recalculated, average shale normalized ratios
(NaNs/NaAv.Shale and Nass/NaAv.Shale) of 0.17 and 0.28 respectively,
suggesting that low Na concentrations are an inherent characteristic
97

of the Broken Hill schists. The high Zr content (particularly in NS)
can be related to the abundant zircon identified (section 4.2.1).
The elevated Pb concentrations in both rock-types, and high Zn in NS,
reflect the presence of the nearby orebody. The low Ni content of
both NS and SS is not readily explained.
A comparison between both NS and SS with pelagic sediments of similar
Si02 content shows wide element concentration differences in the key
elements MnO, MgO, Na20, Zr, Mo, V, Ni, Co and REE (Table 9.2). Since
no correlation with such pelagic sediments could be entertained,
shales from the near-shore environment are therefore examined.
The unusually high Si02 content of NS limits the number of pelite
analyses available for comparison. In a suite of shales and
sandstones from the Mesozoic sediments of Andaya, northern Norway, the
Upper Jurassic Dragneset Formation has been singled out for comparison
since, similarly to NS, it contains a high proportion of both Si02 and
muscovite (Dalland, 1975, p.280). Specifically, sample A103
(Breisanden Member), with Si02 = 77.4% (LOI < 5%) (Dypvik, 1979) bears
the closest geochemical similarity to average NS (Table 9.2). The
most notable differences between NS and sample A103 are the far higher
Ca, P, and C in the latter (due to fossil remains); higher Na20, Cr,
V, Ni and S; and significantly lower MnO and Ba. The elements Si02,
Ti02, Al20a, K20, Sc, Co, and Zn have similar concentrations in sample
Al03 and in NS, and the first five elements represent some of the
generally accepted least mobile elements, while Zr is not
substantially higher in NS than in sample A103. Both Dal land (1975)
and Dypvik (1979) concluded that the Breisanden Member formed under
oxidizing conditions in an open marine environment, whereas much of
the enclosing sediment formed in a reducing environment under
conditions of restricted water circulation.
98

Since MnO is known to be a sensitive redox indicator (e.g. Krauskopf,
1979, p216), the literature was scanned to try and match the elevated
MnO content of NS with rocks of similarly elevated Si02
concentrations. The Recent sands and muds from the Gulf of Paria off
the Venezuelan coast (Hirst, 1962a,b) offer two samples (BV592 and
525) which may be compared with ALP028 which has a similar Si02
content, and sample Sl52 for comparison with ALP030 (Table 9.2).
Hirst (1962a) showed that the Paria sediments have the bulk of their
iron in the ferric state. Most elements in the ALP028 comparison show
remarkably similar concentration levels, with the exception of the
elevated Paria Cao, Sr and Na20, and lower K20 and Rb. While the Cao
and Sr content probably reflect the presence of organic remains (see
above), the elevated Na20, and depressed K20 and Rb nature of the Paria
sediments is explained by Hirst (1962a) as resulting from a condition
not present during the Precambrian, that is, excessive vegetation
along the Orinoco River system, which absorbs K20 (and presumably Rb
as well), and therefore creates a K20 deficiency in developing illites
in the depository. The illites then degrade and absorb seawater Na20
instead of K20.
In the case of SS there is a gross similarity to those black shales
which have relatively low S and C concentrations. Ferry (1981)
concluded that pre-metamorphic protoliths of graphitic sulphur-rich
schists were almost certainly black shales, thus SS may be compared
with the Jurassic Kullgrofta Member black shales of the Ramsa
Formation (Dypvik, 1979); Recent Black Sea sediment (Calvert and
Batchelor, 1978); and average Black Shale (Vine and Tourtelot, 1970)
(Table 9.2). Noteworthy similarities include the low MnO content of
black shales and SS, the high K20 and V contents, and similar ranges
of Ba. The Kullgrofta Member (KM) in particular bears a remarkable
99

geochemical similarity to SS, and is described by Dypvik (1979) as a
non-marine bituminous shale having formed under reducing conditions.
Attention is drawn to the low Na20 contents of KM and USS (0.30%).
BGZ, as part of SS, is also compared with black shale, and shows good
agreement (Table 9.3), with only MnO, Pb and Zn displaying
consistently higher values in BGZ. An explanation for these
enrichments will be discussed in section 9.1.8.
In summary, it is shown that Phanerozoic geochemical analogues exist
for NS, as exemplified by the Dragneset and Paria sediments; and for
SS as indicated by black shales from Norway and the Black Sea, and by
average black shale. Whereas the Dragneset and Paria sediments formed
under oxidizing conditions in an open sea shelf environment, the black
shales formed under reducing conditions. A detailed examination of
the environments in which NS and SS developed follows.
9.1.2 Maturity and ore relatedness
In order to broadly define the processes which produced the Broken
Hill Schists (BS), their geochemistry is plotted on a series of
appropriate diagrams. The ternary diagram (Fe20a (total) + Ti02 + CaO)
- (Si02 * 0.73) - (Ala03 ) of de la Roche (1966) (Fig. 9.1) explores the
geochemical trends resulting from the erosion and reworking of various
igneous rocks to sediments. SS data points lie well removed from the
igneous trend, and close to, but at somewhat higher AlaOa
concentrations than shale, whereas NS samples plot within both igneous
and sedimentary rock fields. A companion ternary diagram (MgO - K20 -
Na 20), however, shows notably less NaaO and a slightly higher KaO
content in BS relative to igneous rocks (especially) and to shales
(Fig. 9.2). In Fig. 9.1 BS overlap the compositional field of
beidillite (a Na-Ca-rich, Mg-Fe-poor montmorillonite), and lie
adjacent to the illite field, whereas the high K - low Na content of
100

the rocks reveals in Fig. 9.2 that illitic clays were a probable
component of these rocks.
the montmorillonite field.
In neither diagram do the schists·plot near
More recently de la Roche (1978) used the
element combinations displayed in Fig. 9.3, which also portray the
chemical effects of igneous rocks being progressively reworked by
sedimentary processes to form a variety of end-member sediments such
as evaporites and laterites. SS samples fall within the peraluminous
field (argillaceous rocks), and lie along a trend of increasing Al
enrichment and Na + Ca depletion, which occurs well removed from, and
orthogonal to, the igneous trend. NS data points lie partially within
the shale field, somewhat closer to, but wholly outside of, the
igneous field. The trends defined by both schists indicate mature
aluminous shales which formed along a continental margin environment.
The clustering of a series of elements together with Al 20 2 in the
factor analyses of SS, NS and OS (sections 6.2.3 and 6.3.1.2; Figs.
6.6, 6.7 and 6.16) may therefore be interpreted as reflecting the
contribution of clays, micas and possibly some feldspar.
The antipodal distributions of Si02 and Zr from the Al20a component in
factor analysis Figs. 6.6, 6.7 and 6.16 indicate that quartz sand and
zircon were moving together in the sedimentary environment as detrital
minerals. The increase in Zr concentration in NS up to the boundary
with, but not into WQ (section 6.6.1), while all major and many trace
elements show gradational changes through NS into WQ, suggests that
the NS contact with WQ marks the sedimentological horizon at which
heavy mineral concentrations reached a maximum. Additional water
winnowing of the sediment lead to the development of mature, quartz
rich sediment with zircon preserved mainly along single-grain-thick
heavy mineral layers (section 4.3). The similar distribution that Cr
shows to Zr in the transition from NS to WQ (section 6.6), suggests
101
the likely presence of detrital chromite or chrome-bearing magnetite,
particularly in NS.
The binary plot of Garrels and MacKenzie (1971) (Fig. 9.4) also shows
chemical changes which accompany the transformation of igneous rocks
to sediment. NS and SS plot even further removed from the igneous
trend than Precambrian slate, a feature governed by the higher K20 and
lower Na20 and Cao contents of BS, which suggests maturity of
sediment. Contrary to Fig. 9.1, BS plot well removed from either
illite or montmorillonite fields.
In the ternary diagram of Englund and Jorgensen (1973) SS and NS fall
between the fields defined ·by black shale and pelagic pelites on the
one hand, and flint clay on the other (Fig. 9.5). Englund and
Jorgensen (1973) concluded that of the pelites considered, flint clay
represents the most mature sediment, while the greywacke-associated
pelites are the least mature. Conclusions drawn from Fig. 9.5
therefore corroborate earlier evidence suggesting that NS and SS
represent mature, Al-rich metapelites.
Both detrital feldspar and platey minerals (micas and clay) will have
contributed to the Al and alkali concentration of the BS precursors.
The Niggli al-alk parameter remains close to zero for Na- and K
feldspar (Senior and Leake, 1978), while the low Ca concentrations of
both NS and SS indicate that the detrital anorthite contribution must
have been negligible. If Al20a variation was predominantly due to
detrital feldspar addition, the al-alk parameter would remain
virtually constant. In Fig. 9.6 SS displays a clear decrease in al
alk values with increasing Al20a hence the alumina concentration of SS
is controlled by varying mica content (mainly biotite; section 4.2.2).
Using MgO as an indication of the biotite content of SS, it is
102

apparent that while the al-alk parameter decreases with an increase in
biotite content, the AlzOa content increases (compare Figs. 9.6 and
9.8a). Unlike SS, NS displays virtually its full al-alk range at both
9% and 17% Al 20 3 (Fig. 9.6). Effectively, the al-alk variation in NS
may be viewed as varying between constant limits over the wide NS Al20a
range, suggesting that NS alumina content is to some extent controlled
by detrital feldspar, in contrast to the exclusive control of alumina
in SS by platey minerals. It is apparent from Fig. 9.7a that the al
alk parameter and Zr in SS behave sympathetically, and taking
cognizance of the relationships established in Figs. 9.6 and 9.8a,
these suggest that the bulk of the Zr in SS is inversely related to
biotite concentration and is therefore likely to be controlled by
detrital zircon grains.
The well defined antipath~tic relationship between al-alk and Ba, Zn,
Ni and Co in SS (Figs. 9.7b-e) as well as the dependence of base
metals, excluding Pb, on the major elements such as K, Al, Mg and Fe
(Table 6.8), clearly indicates that the micas (mainly biotite) control
these elements with positive correlation, and that the Zn-Ba-Cu
concentration decrease with distance from the orebody (Fig. 6.34a) is
not primarily related to the presence of the orebody. In contrast,
MnO behaviour in SS is unrelated to the al-alk, and hence the mica
content (Fig. 9.8a). The Pb scatter in SS (Fig. 6.5g) is unlikely to
be pristine because of a lack of correlation with any other base
metals, and the elevated Pb concentrations in SS pegmatites (196, 121
and 72ppm for ALP087P, ALP141P and ALP059P, respectively), suggest
that Pb migration may have taken place from the orebody during
formation of pegmatite •
A technique developed by Senior and Leake (1978) is applied to
establishing rough estimates of the original clay composition of SS by
103

noting the major element concentration of the most Al 20 3-rich SS end
member, i.e. at the lowest al-alk values (Figs. 9.8c-g). Data in
Figs. 9.1 and 9.2 showed that the two clays having analyses most
similar to the resulting BS clay component are illite and
montmorillonite. The estimated clay precursor to SS is shown in Table
9.4 to compare far more closely with illite than with montmorillonite,
based particularly on the higher Fe20a, Na20 and K20 components of
illite, and lower MgO.
The evidence presented suggests that Broken Hill schists originally
had a significant illite component, and their geochemical displacement
from igneous rocks is too great to classify them as either distally
reworked intrusive or extrusive rocks. Further, there are indications
that these schists formed in a continental margin environment. The
possibility that their high degree of maturity i.e. elevated Al202 and
K20 contents, and lower concentrations of Cao and Na20, could result
from massive element leaching (of Ca, Na20 and MgO), and addition (of
K20) due to the ore-forming process, is unlikely since schists lying
both structurally above and below the Broken Hill orebody generally
display similar levels of concentrations in these elements.
9 .1. 3 Redox conditions
The preservation of prograde muscovite in'equilibrium with biotite
(section 4.2.1) suggests an oxidizing environment at some point in
time during the pre-metamorphic history of NS since Dapples (1967)
showed that muscovite forms (from an illitic parent) in preference to
biotite, at high Eh during both early diagenesis and later burial.
This oxidizing environment must have been restricted to NS through
upper amphibolite facies metamorphism since the stable muscovite
biotite paragenesis occurs in NS but not in SS. Retrograde production
of chlorite and muscovite from biotite in both schists indicates that
104
higher oxygen fugacities were widespread (Dapples, 1967) during the
later metamorphic history of BS. Petrographic indicators suggesting
originally reducing conditions under which SS formed, include the
presence of biotite as the dominant mica, and the ubiquitous presence
of Fe sulphide but absence of magnetite. Canfield and Berner (1987)
showed that magnetite is dissolved in anoxic sediments. The formation
of biotite at the expense of muscovite and hematite (or muscovite and
chlorite) is empirically observed to be an indication of reducing
conditions (Dapples, 1967).
The generally red colour of NS and the common occurrence of magnetite
(FesO,) (section 4.2.1) suggest that oxidizing conditions dominated
some stage of NS development. Dapples (1967) stated that the bulk
colour of a rock is determined by the oxidation state of Fe, and once
Fett has been ox i d i zed t o Fe 3 • , " t he r e i s much 1 e s s t end ency t o r eve r s e
the equilibrium during the later history of the rock" (p.97). This
oxidation of Fe is partly controlled by pH, with the slightly acidic
stream environment maintaining iron as Fe 2•. The slightly alkaline
conditions of playa lakes or the sea promote Fea. formation. The
monotonous, bottle-green to grey colour of SS (section 4.2.2) is a
well substantiated characteristic of anoxic sediments and results from
the reduced state of Fe. As long as C is available, the generation of
C02 provides electrons to drive Fe 3• to Fe2• (Dapples, 1967) which leads
to the production of pyrite and/or pyrrhotite instead of hematite
and/or magnetite. Fairbridge (1967) showed the equations governing
the reduction of Fe as
FeO(OH) + CH. + 2H20 ----> Fe(OH)2 + C02 + 7H
or
FeO(OH) + l/6C2HaOs + H20 ----> Fe(OH)2 + C02 + 3H.
105

The paucity of C in NS but its presence in SS (section 6.2.1) shows
that the reduced state of SS Fe cannot be solely attributed to
metamorphism, but must have existed during deposition and/or
diagenesis. During the period 1.6 to 2.0Ga which brackets the BS
depositional age (Reid and Welke, 1988), the atmosphere was already
oxidizing (Cloud, 1976). Oxidizing marine conditions are largely
restricted to either nearshore, agitated environments in which there
exists mixing with atmospheric oxygen (Hirst, 1962a), or to pelagic
environments (Gundlach and Marchig, 1982; El Wakeel and Riley, 1961).
The variability of NS geochemistry (section 6.2.2) suggests formation
in an agitated, relatively energetic environment of the shoreface
type, which has fluctuations in sedimentary input and chemical
gradients (Skei, 1983, p.141) unlike conditions obtaining in the
pelagic or estuarine regime. This NS inhornogeneiety is also reflected
in Figs. 9.3 and 9.5 where NS plots between igneous rocks and/or
immature sediments on the one hand, and the more mature SS on the
other. Comparison of NS whole rock geochemistry with a variety of
Phanerozoic pelites reveals analogous sediments which formed in an
open sea, oxidizing, continental shelf environment and not under
pelagic conditions (section 9.1.1). The frequent occurrence of large
detrital zircon grains in NS also suggests a proximal rather than a
pelagic depository.
The evenly distributed non-carbonate C in SS (0.1% < C < 1.0%) far
exceeds the maximum of 0.05% C in NS (section 6.2.1), but falls short
of the black shale average organic C content of 3% (versus 0.65% for
average shale; Vine and Tourtelot, 1970, p 257). Good agreement
exists, however, between the chemistry of SS and those black shales
with relatively low Sand C contents (section 9.1.1). Furthermore,
minor losses of C02, and s as S02 or H2S during metamorphism (section
6.1; and see below) might have lowered the C and S contents of SS.
106

Additional chemical parameters which distinguish black shales from
non-black shales include higher concentrations in Mo, Ni, V, U, Cu, Zn
(Holland, 1979) and Cr (Matzat and Shiraki, 1972-1978); and lower MnO
contents (Vine and Tourtelot, 1970). Relative to NS, SS contains more
Mo, Ni and Cr and far less MnO (Tables 6.4 and 6.5), while Cu and Zn
concentrations in NS exceed those in SS. SS displays V and Cr
concentrations comparable to average black shale, but has relatively
lower Mo, Ni and Cu contents (Table 9.2). The low MnO concentrations
of SS relative to black shale and average shale is marked. Many of
the available indicator trace elements therefore suggest some form of
black shale precursor to SS.
Extensive research on C-rich shales has established that the chemical
and physical parameters of the basinal waters determine what type of
black shale forms (e.g. Vine and Tourtelot, 1970; Tourtelot, 1979).
The post-depositional chemistry of these sediments is preserved
relatively efficiently because their erodibility decreases with
increasing organic c content. The high electrostatic attraction of
the commonly associated clays can prevent transportation by currents
sufficiently energetic to move fine sands (Hatcher and Segar, 1976).
Black shale was defined by Tourtelot (1979) as a dark coloured mudrock
containing organic matter. Black shales have formed throughout the
Earth's history and result when enough organic matter is present to
exhaust the environmental oxygen supply. A restricted water
circulation, in which oxygen content of water is not renewed, promotes
the development of black shale (Tourtelot, 1979).
107

9.1.4 Behaviour of key elements and ratios during the formation of
.black shales
In this section, those critical elements are examined which
characterize black shales. SS geochemistry is again contrasted with
that of NS and inferences drawn will contribute towards constructing a
basin depositional model.
9 • 1 • 4 • 1 Carbon, phosphorus, sulphur and copper
Individual assessments follow of the three primary sources of C in
shales, viz. C component of carbonates (mineral C); hydrothermally
introduced C; and biogenically produced C (organic C). A petrographic
study of 12 SS samples failed to reveal the presence of any carbonate.
Had carbonate existed, it must have disappeared during either
diagenesis or metamorphism. Though solution of Ca into pore waters
occurs during diagenesis (Sharma, 1971, p 171, quoting Friedman et
al., 1968), Mg is at the same time removed from the pore waters and
incorporated into the developing sediment, thus dolomite and/or
magnesite would form at low temperatures, while at metamorphic grades
at the boundary of granulite facies metamorphism to which the Aggeneys
area was subjected (Lipson, 1978), minerals such as wollastonite (from
calcite and quartz), or diopside and fosterite (from a dolomite
precursor; Winkler, 1976), would be preserved in SS. The lack of any
of the above indicator minerals shows that C in SS was unlikely to
have formed from mineral carbonate.
108

C can form as one of the exhaled components from sub-sea floor
convective systems during water movement and heating of COz, viz.
C02 + ferrous silicates ---->magnetite + c
(Hutchinson et al., 1980). Were the C in SS generated in this manner,
then the maximum C content should be associated with periods of
maximum exhalation, i.e. with the Broken Hill orebody (discussed in
detail in section 10). All check analyses for C in the Broken Hill
orebody and its Ore Equivalent Horizon have failed to detect
concentrations in excess of 0.05%. C02 could have been lost during
diageneses and metamorphism, yet the Ore Equivalent Horizon lying 95m
from the orebody, which contains no magnetite (but some pyrite, e.g.
ALP 174 and 175), comprises a maximum of 0.02% c. An exhalative
source for the C is therefore also unlikely.
If the graphite of SS were biogenically derived then the
concentrations of some of the additional nutrient elements viz. 02, N2
and P (Turekian, 1968) should covary with c. Only the variation of P
with respect to C is examined since 02 and Nz are gases. The fairly
good positive correlation between P and C (r = 0.61; n = 16; Fig. 9.9)
is consistent with a common origin for both elements. A strong
correlation between C and any elements is unlikely because during
diagenesis, a certain percentage of organic C is hydrolized and lost
to the sea water, e.g. Hatcher and Segar (1976, p471) quote an
absolute loss of 0.3% C from a silt-clay in Recent Bearing Sea
sediments, which contained 1.38% organic c.
Since particulate phosphate rapidly dissolves on entering strongly
reducinJ waters (Skei and Melsom, 1982), the gently increasing P205
content of SS with increasing C (Fig. 9.9) confirms that waters
109
immediately overlying SS were probably anoxic. The corollary holds
that if oxygenated water extended down to the sea floor, i.e. no
halocline existed, then most of the P206 would accumulate in the
sediment. Assuming similar diagenetic losses of P205 in accumulating
sediments irrespective of whether the overlying waters are oxidizing
or reducing (probably less loss if oxidizing), and a loss of most of
the C as C02 because of the oxidizing water, then P205 vs C plots for
sediments formed beneath oxidized waters should be steep. In NS, the
low C content ensures that this slope is almost vertical.
An organic C precursor to SS graphite has important genetic
implications. Phytoplanktonic blue-green algae were the most highly
developed photosynthesising organisms alive during the period 1 600 -
2 OOOMa (Cloud, 1981; Plumstead, 1969) in which the Aggeneys sediments
formed (Armstrong et al., 1988). Plumstead (1969) suggests that the
lack of a protective ozone layer shielding ultra-violet radiation on
the Earth's surface during Transvaal dolomite times of ca. 2.2Ga,
restricted the blue-green algae to living subaqueously. These algae
required light for photosyntheses, and Klein et al. (1987) have
estimated that the maximum water depths under which the Transvaal
Supergroup Campbell Rand carbonaceous shales formed was between 40 -
45m. Photosynthetic accumulation of 02 in the atmosphere was so slow
that by the start of the Phanerozoic, 02 comprised only 1% of the
atmosphere (Plumstead, 1969). Environmental constraints applicable
during Transvaal times, in which algae developed on either the near
shore slope or in the intertidal zones, would therefore not have
changed radically by the time SS started developing. Even today
phytoplanktonic activity is greater nearer the coasts of continents
than in the open ocean (Strickland, 1965).
110

Observations from a number of partly silled basins e.g. Lake McKerrow,
New Zealand (Pickrill et al., 1981) and Elliot Bay, Seattle (Baker et
al., 1983), show that most river water and its load has a short
residence time in estuaries, and that the major source of
sedimentation is from the sea. Proterozoic phytoplankton which grew
and died in shallow water on the seaward side of a sill, could have
been swept into the deeper estuary by the entering sea water, and
fallen to the floor. Therefore, as long as Proterozoic organic C was
produced in a nearby shallow water environment, the site of the C
accumulation could have been in slightly deeper reducing water. A
shallow water sedimentary environment is confirmed by the SS Ba
content of 350 - 530ppm which compares with the empirically determined
near shore shelf environment black shale Ba concentrations of 200 -
500ppm (Vine, 1966). This contrasts with deep water black shales
which contain approximately 1 OOOppm Ba (Vine, 1966).
s in SS may have been derived from either a hydrothermal source or by
local evaporative and/or biogenic processes. The lack of any base
metal concentrations (other than in CSMQ) in SS at Broken Hill,
suggests no hydrothermal input to SS. (The mineralized CSMQ is
examined in detail in section 9.1.7). Williams (1978) suggested that
anoxic sediments associated with mineralization have positively skewed
SIC ratios, owing to additionally derived hydrothermal s. The
frequency distribution plots of SIC (Fig. 9.10), show a normal
distribution for USS, and strong positive skewness for both LSS and
NS. The skewness in all cases results from extremely low C
concentrations, rather than S excesses. The lack of skewness in USS,
the most C-rich of the three schists, coupled with its relative
proximity to the Broken Hill orebody, again suggests that no
significant hydrothermal S contributed to SS. No S isotope data is
available from SS.
111

The positively correlated s-c relationship in SS (Fig. 9.lla) is
typical of black shales which have formed world-wide since the late
Archaean (Tourtelot, 1979), and sulphate reducing organisms, as the
generator of S, have existed since the middle Archaean (Monster et
al., 1979). Sulphate reduction by anaerobic bacteria is a
characteristic feature of most anoxic basins (Trudinger, 1981, p.280).
The model of in-situ S production requires that so, 2 - is reduced either
in the water column and in the sediment (under anoxic water
conditions), or in the sediment alone (Leventhal, 1983). Oxygen
deficient conditions cause first nitrate, and then sulphate to be
turned to by bacteria as sources of 0 2 for catabolism (destructive
metabolism) of organic C (Richards, 1971, p.203). In all cases, the S
and C contents of the sedimentary rock record will increase linearly.
The reduced S first forms Hs- by the reaction
where R represents the organic residue not metabolised. Desulfovibrio
desulfuricans is the micro-organism which accomplishes the so, 2 -
reduction (Leventhal, 1983). The Hs- combines with available Fe in
. minerals (Berner, 1971, p.202) to form FeS (mackinawite), which
converts during diagenesis through greigite (Fe 3S,) and/or pyrrhotite
(FenSn+1) to pyrite (FeSz), the stable iron sulphide (Berner, 1971,
p205).
Some of the HS· which does not form iron sulphide, can eventually be
lost from the rock record due to its conversion back to so, 2 - (Berner,
112

1972). This only occurs if the environment becomes more oxidizing
i . e.
HS + 202 ----> so,2- + H• (Riley and Chester, 1971).
Thus in a basin which remains anoxic over a long period of time,
little Swill be lost to basin waters, and the same argument will hold
for organic c. According to Leventhal (1983) a positive intercept on
the S axis of a S vs c plot, as in Fig. 9.lla confirms that the waters
were stratified into anoxic water below and oxic water above. He
explained that in addition to sulphide formation in the sediments,
some insoluble sulphide forms within the reducing waters and
precipitates to the sea floor, "but the usual complement of associated
organic matter (R, in the equation) does not necessarily reach, and
therefore is not preserved in, the sediment" (Leventhal, 1983, p134).
In strongly reduced waters such as in deep fjords having a sill depth
of only 2m, H2S concentrations attain levels of up to 175 ml/I (Skei,
1983).
On oxidation during metamorphism both S and C may be lost as gases.
Ferry (1981) found that the pyrite/pyrite + pyrrhotite ratio of black
shales decreases along stringent lines with increased metamorphic
grade (p919). Of the two reactions suggested by Ferry (1981), the one
in which H20 fluxing drives the reaction is preferred (section
6.1.3.4), viz.:
2FeS2 + 2H20 + C = 2FeS + 2H2S + C02. ---- ( 1)
pyrite pyrrhotite
Note that although both Sand Care lost as a fluid phase, the rate of
loss is in the proportion of 2*S to l*C. Not until all pyrite is
113

consumed do additional minerals participate in hydrogen sulphide
forming reactions, such as
KAlSiaOa + 3FeS + 4H20 = KFeaAlSia01o(OH)2 + 3H2S ----(2)
K-feldspar pyrrhotite biotite
leading to an increase in the Fe/Fe+Mg ratio of biotite. Once
reaction (2) proceeds, the 2:1 loss of S:C no longer applies.
Both pyrite and pyrrhotite are present in SS thus equation (1) was
still operative when metamorphically induced desulphidation and
decarbonation ceased. An estimation of the premetamorphic S and C
contents of SS, assuming 50% conversion of pyrite to pyrrhotite, is
therefore possible (Appendix H), leading to the calculated ranges X-X'
in Fig. 9.llb, viz.:
0 • 11 % c j 0 • 6 3% s
and
1.18% C; 2.16% S.
In addition, the premetamorphic positive S intercept at 0% C increases
from 0.42% to 0.47% S (Fig. 9.llb), confirming the anoxic nature of
basin water conditions during SS times. A useful criterion for
distinguishing between sediments formed under sea water or fresh water
is that of Berner (1984) who showed that the low so, 2- content of fresh
water prevents any appreciable S concentration in sediments formed in
lakes. Jones and Bowser (1978) confirmed that rarely is pyrite or any
other sulphide found in lacustrinal sediments due to the environmental
s deficiency. In a plot of organic C vs S, fresh water pelites have a
small S increment per unit increment of C (shallow slope), while the S
content of sediments formed under sea water increase rapidly with C
(steeper slope). SS has far too steep a slope due to high S content
(Fig. 9.llc; line A-B) to have formed in fresh water. Line X-X',
114

shown for reference purposes, represents the maximum possible
premetamorphic S and C concentrations in SS.
Cu, similarly to S, remains soluble in the oxygenated environment, but
precipitates as a sulphide under anoxic conditions (Goldberg, 1965;
Heggie and Lewis, 1984). The good correlations exhibited between Cu
and most other elements in SS and STS (Tables 6.8 and 7.3), but lack
of correlation in either NS or NTS (Tables 6.7 and 7.2) also confirms
the oxidizing and reducing nature, respectively, of NS-NTS, and SS
STS.
9.1.4.2 Manganese and iron
SS is characterized by both constant and low MnO concentrations
(section 6.2.2; Table 6.4). Though constant, the Fe20a content of SS
tends to be higher than average shale (section 9.1.1; Table 9.lc).
The theoretical behaviours of MnO and Fe20a in a variety of aqueous and
diagenetic environments are therefore examined to explain these
features.
The interface between fresh and saline water represents a zone where
significant chemical change takes place. In the superimposed Eh-pH
diagrams for Mn and Fe, the field of soluble Mn 2• is far more extensive
than that of Fe2•. The mixing of fresh and sea water would follow a
path approximating that from A to B in Fig. 9.12. Whereas Fe
precipitates rapidly, Mn remains largely in solution. When river
water enters the estuarine environment the ionic sea water (with
cations of Na·, Ca2• and Mg2•) oxidizes the introduced, negatively
charged Fe-bearing colloids (Boyle et al., 1977), which also contain
lesser amounts of Mn, Al and P, and the increasingly saline water
extends the flocculation process. In addition to such inorganic
colloids, Sholkovitz (1976) showed that flocculation of dissolved
115
organic matter represents an effective mechanism for removing Fe, Mn,
Al and P from river water when it mixes with sea water. Massive
flocculation of colloids on encountering sea water is the major
process of Fe removal in estuaries. Bewers and Yeats (1977)
calculated that 89% of the river-introduced Fe remains in the st.
Lawrence estuary, while under laboratory conditions, the comparable
figures produced by Sholkovitz (1978) and Salamons (1980) are 95% and
90% respectively. The comparative values for Mn are 47%, 25 - 45% and
50%, respectively. Colloidally held elements will accumulate at the
sediment-water interface provided that no major physico-chemical
boundaries in the water are encountered. If the oxidized colloids
pass through a theromocline below which anoxic conditions prevail,
then Mn" is reduced to the soluble form of Mnz- (Goldberg, 1965, p183),
thus limiting the the amount of Mn which reaches the sediment. Far
more acidic and anoxic conditions are required for the reduction of
insoluble Fe 2• compounds to soluble Feh, than for the reduction of Mn'•
compounds to Mn 2• (Fig. 9.12). Only extreme variations in fugacities
of S (from 10-sm to 10·1m) would materially change the gross Eh-pH
stability fields for Mn and Fe shown in Fig. 9.12. Thus under
constant conditions of anoxia, less Mn than Fe reaches the sediment
water interface. The formation of insoluble FeS particles within
anoxic waters (e.g. Skei and Melsom, 1981) further accentuates the
separation of Fe from Mn in the developing sediment.
During the diagenesis of sediments, reducing conditions also result in
the formation of Mn 2• which diffuses upwards (Hatcher and Segar, 1976,
p471), as confirmed by Riley and Chester (1971, p408) who showed that
the enrichment of Mn in pore waters occurs at the expense of the host
sediment. The presence of organic matter in the sediment further aids
solution of Mn as an organic chelate (amino acid complex) (Riley and
Chester, 1971, p405). The anticipated concentration of Mn just above
116

reducing sediments is found in the St. Lawrence estuary (Bewers and
Yeats, 1979). Sundby et al. (1981) showed that Mn is enriched to
between 1 000 - 5 OOOppm within only the top 20mm of oxidized pelitic
sediments forming in the Gulf of St. Lawrence. Below this level the
reduced nature of the sediment causes the Mn content to drop to
between 450 - 1 OOOppm (i.e. MnO = 580 - 1 290ppm). Individual
profiles to depths of 30cm in the sediments show that below the zone
of surface sediment oxidation, Mn contents remain virtually constant
(Fig. 9.13). This profile may be compared with the constant Mn
content of SS (Fig. 6.34a).
Redissolution experiments by Boyle et al. (1977) showed that little Fe
goes back into solution in the estuarine environment, which confirms
observations by Bewers and Yeats (1979) and by Duinker and Nolting
(1978) that in waters directly overlying the bottoms of estuaries,
only Mn (and not Fe) concentrations are increased. The ratio
MnO/(MnO+Fe20a) of sediment should therefore provide a sensitive redox
indicator. The SS average ratio of 0.006 agrees well with world black
shale averages of 0.007 (Table 9.5), suggesting development of SS
under the reducing conditions necessary for the development of black
shales. The ratio is approximately quarter the NS average of 0.023
which falls between the two world average shale values of 0.016 and
0.123. SS MnO concentrations averaging 500ppm are so low compared
with the St. Lawrence sediments as to suggest that not only was SS
formed as a reduced sediment, but that the waters overlying SS were
also anoxic.
9.1.4.3 Vanadium and molybdenum
The V content of USS, averaging 183ppm, is much higher that that of
average shale (V = 130ppm) or NS (V = 46ppm), and it compares
favourably with the average black shale V concentration of 150ppm
117

quoted by Vine and Tourtelot (1970). USS, with Mo= 3.4ppm, displays
slightly higher Mo concentrations than the average shale values of 2.0
- 2.6. The Mo concentration of USS nevertheless lies well below the
black shale average of lOppm. LSS averages 78ppm V which is somewhat
less than the average shale value of 130ppm V (Vine and Tourtelot,
1970). Few LSS and NS samples analysed contain Mo in concentrations
in excess of the lower limit of detection (- 1.5ppm), therefore the
higher Mo and V contents of USS only, will be examined in the three
environments of oxidizing and reducing waters, and reducing sediments.
Under oxidizing, aqueous, low temperature and neutral pH conditions,
the major mechanism of Mo removal from solution is by coprecipitation
with MnOz and Fe(OH)3. Similarly, virtually all non-detritally bound V
coprecipitates with Fe(OH)2 between a pH range of 8.5 to < 4.0 (Fig.
9.14). Flocculation of Fe and Mn colloids associated with the mixing
of fresh and sea water (section 9.1.4.2) will therefore remove large
proportions of the available Mo and V from surface waters in the
nearshore environment.
When Mo which is bound with Fe(OH) 3 passes downwards into reducing
waters, the entire colloid continues to fall to the sediment-water
interface. Mo and V also precipitate with fine-grained iron sulphides
(Bertine, 1972), which are common in the stagnant water layer of
stratified water bodies (e.g. Lake Kivu, Degens et al., 1972).
Reducing waters are slightly acidic due to the reaction
(Turekian, 1968), and at pH= 6 - 7, a series of thiomolybdates form
( [Mo02S2P- ----> [MoOSa] 2- ----> [Mos,p-) which in the presence of Fe
cause the precipitation of the trisulphide MoS 2 (Evans et al., 1974-
118

1978). By contrast, the orthomolybdate [Moo,p- is very soluble in
alkaline solutions. Acidity also enhances the fixation of Mo and Von
organic matter (Coveny and Martin, 1983). Contreras et al. (1978)
speculated that the diagenetic conversion of mackinawite/greigite to
pyrite (i.e. FeS ----> FeS2) leads to the expulsion of Mo due to the
large difference in ionic radii between Mo 6• and Fez., and the loss of
Mo to interstitial pore water was empirically confirmed by Holland
(1979). Mo and V enrichment nevertheless represents a characteristic
of black shales (Krauskopf, 1967).
Bertine and Turekian (1973) suggested that oceanic sediments which
form under oxidizing conditions are Fe-Mn oxide rich with a Mo/U ratio
= 3, while reducing sediments have Mo/U = 1, this feature being
largely governed by U solubility in the oxidizing environment. Only
four SS samples have both Mo and U in excess of the lower limits of
detection (- 1.5ppm and 3.5ppm, respectively), and these average Mo/U
= 0.8 (s.d. = 0.2).
In summary it is suggested that in the case of USS, the soluble
[Moo,p- anion available in surficial, oxygenated waters,
coprecipitated with Mn02 and Fe(OH) 3 • On passing downwards into
reducing, acidic waters, only that Mo bound with the Fe floccules
continued to fall to the sea floor and formed insoluble MoS 3 • Soluble
(MoS,) 2- coprecipitated with either organic Corwith fine-grained
sulphides. During diagenetic transformation of Fe sulphide to pyrite,
some of the originally precipitated Mo, but not V, was probably lost.
The direct proportionality of Mo solubility to temperature (Evans et
al., 1974-1978), will have resulted in further Mo escaping during
metamorphic losses of water or volatiles from SS.
119

9.1.4.4 Chromium
Average black shale tends to be slightly richer in Cr than average
shale (lOOppm vs 90 - lOOppm) (Vine and Tourtelot, 1970; Vinogradov,
1962; Turekian, 1972; Krauskopf, 1979). USS, with 109ppm Cr, has a
higher Cr content than both black shale and NS (72ppm). The behavior
of Cr in the sedimentary environment is, however, complicated by its
presence both in detrital minerals such as chromite and magnetite, as
well as in clay minerals which derive a component of their metals from
overlying and interstitial water (called the hydrogenous component by
Goldberg (1954) and Piper (1971) due to derivation of material from
the hydrosphere, and in contrast to biogenous, lithogenous and
cosmogenous components). The clays later convert to micas where Cr
substitutes extensively for Al (Matzat and Shiraki, 1972-1978). This
dual mode of occurrence has lead Holland (1979, p.1679) to attribute
the relative enrichment of Cr over the elements Cu, Ni, V and Zn in
some black shales, to addition of detrital chromite.
The low temperature aqueous behavior of Cr has not received extensive
attention in the literature, leading to inconsistent conclusions.
Matzat and Shiraki (1972-1978) claim that progressive oxidation causes
the insoluble era. cation to be oxidized to Cr 6• (in the form of the
soluble anion (Cr04) 2-). In evidence they quote the depleted Cr
content of oxidized, deep sea Fe-Mn nodules. Although the equation
governing this behavior of Cr, as given by Piper (1971), viz.
( CrO,) 2 - + 5H' + 3 e- = Cr (OH) a + HaO
shows that acidic (H•), reducing (e-) environments lead to the
precipita~ion of Cr (as Cr(OH)a), yet Piper's (1971) data from the
Framvaren fjord in Norway reveals that in the extremely anoxic waters
·~
120 (
developed below the well defined pycnocline, suspended Cr goes into
solution.
In SS, the good positive correlation between Cr and both C and Al202
(Table 6.8; Figs. 9.15a and b) suggests Cr fixation in SS by both
biogenic and hydrogenous processes, while the antipathetic
relationship of Cr with Si02 and Zr (Table 6.8; Figs. 9.15c and d)
suggests non-detritally derived Cr. The behaviour of Cr in SS
supports a model of a reducing environment fixing Cr on developing
clays, and also suggests that the waters overlying SS, never attained
the degree of extreme anoxia present in the Framvaren fjord. In
contrast, NS Cr displays negative correlation with C and Al202, and
positive correlation with Si02 (Figs. 9.15a-c). Notwithstanding the
approximately constant Cr concentration over a wide range of Zr
concentrations (Fig. 9.15d), the opposite behaviour of Cr in NS
relative to SS suggests a component of detritally contained Cr as
chromite or chrome-bearing magnetite in NS (see also section 9.1.2).
9.1.4.5 Nickel and cobalt
The Ni content of SS averaging 22 - 34ppm, by far exceeds the 12ppm
average of NS. These values are, however, lower than average shale
(68 - 95ppm; Vinogradov, 1962; Turekian, 1972; Krauskopf, 1979),
average black shale (50ppm, Vine and Turekian, 1970), and world
averages of 80 - 320ppm Ni quoted by Turekian (1968-1978) for deep sea
pelagic sediments. Fresh water pelites and nearshore clays average
between 25 - 52ppm Ni (Turekian, 1968-1978), thus absolute Ni
concentrations also discount the possibility that either SS or NS
formed in the pelagic environment.
During continental weathering, Ni and Co are rapidly adsorbed onto
suspended particulate matter (mainly illite and montmorillonite) and
121

remain in suspension until reaching sea water at the interface with
the estuarine environment (Turekian, 1971). Here, Co in particular
goes into solution, with Sholkovitz (1978) showing that Co forms
extremely stable complexes with the c1- anion of sea water. Therefore
whereas 40% of the Ni in river water is flocculated on encountering
sea water at salinities of 0 - 18°/oo, only 10% of the Co is. The
efficient removal of Ni and Co by organic material reaches a maximum
under alkaline conditions, but as the pH drops to between 7 and 4,
lesser Ni and Co remain adhered to organic C (Coveney and Martin,
1983). An additional method of Ni and Co removal from aerated
solutions is by co-precipitation with Fe and Mn oxides (Turekian,
1968-1978; Murray and Brewer, 1977), while under anoxic conditions,
anions of sulphide cause the precipitation of Ni (Turekian, 1968-1978)
and Co (Piper, 1971). The sulphide-rich bottom waters of the Black
Sea contain more Ni than the overlying aerated waters (Burns et al.,
1973-1978) thus reflecting the sulphide influence on Ni. Measurements
by Bewers and Yeats (1977) showed that some 12% of the Ni entering the
St. Lawrence estuary from the continent, fails to escape to the ocean.
These considerations have lead Turekian (1971) and Vine (1966) to the
conclusion that the reducing environment represents a major site for
Ni accumulation.
In reducing sediments, Heggie and Lewis (1984) found that Co behaves
almost identically to Mn i.e. Co, and to a lesser extent Ni, go into
the pore waters, leaving the sediments Co depleted. The Ni/Co ratio
may therefore act as a redox indicator, with high ratios indicating
anoxic conditions of deposition. The Ni/Co ratio in SS far exceeds
that in NS {Ni/COuss = 2.1; Ni/COLss = 1.8; Ni/CONs = 1.1), suggesting a
more oxidizing environment for NS than for SS. The Ni/Co ratio of
both SS and NS is, however, far less than the ratios in both average
black shale and average shale (5.0 and> 3.4 , respectively).
122
The positive correlation of P205, one of the nutrient elements, with Ni
in both SS and NS (Fig. 9.16a), suggests that Ni could not have been
of detrital origin as might be anticipated for nickeliferous, detrital
chromite (Holland, 1979, p.1678). This conclusion is supported by the
lack of positive correlation between Ni and Zr in either of the
schists (Fig. 9.16b).
It may be concluded that Ni and Co adsorbed onto suspended particle
matter entered an estuarine environment via rivers, and during the
mixing of fresh and sea water, more Ni was flocculated than Co.
Available organic matter and precipitating Fe-Mn oxides adsorbed both
Ni and Co and facilitated their removal from the oxidizing zone.
Within reducing waters, adsorption of Ni and Co onto precipitating
sulphides further depleted the waters of these elements, yet during
the diagenetic stages, more Co than Ni went back into solution under
the reducing conditions obtaining in SS. Relative to NS, SS has the
higher Ni/Co ratio. That this ratio is still considerably less than
that of average black shale might be the result of a slightly less
reducing environment for SS than for average black shale, as supported
by the lower C content of SS. No significant detrital contribution of
Ni was made to either SS or NS.
9.1.4.6 Zinc and uranium
According to Wedepohl (1972), the major mechanism for both transport
and deposition of Zn is along with the detrital minerals chromite,
magnetite, colloidal iron oxide, and iron oxide coatings on other
minerals. Of the adsorbing minerals, only montmorillonite, peat moss
and precipitated Fe oxides are significant Zn retainers (up to 2% Zn;
Wedepohl, 1972) while illite, the predominant clay precursor to both
SS and NS (section 9.1.2), and kaolinite adsorb an order of magnitude
123
less Zn from a sea water solution. The most important characteristic
of the low temperature aqueous behavior of Zn is that extremely little
Zn is trapped in the estuarine environment, as long as the sill level
is not unusually high. Of the Zn entering the St. Lawrence estuary
from the continent, only 0.1% is trapped in the estuarine sediment
(Bewers and Yeats, 1977). In contrast, the Framvaren Fjord anoxic
waters of Norway, which are dammed by a sill lying only two metres
below water level, have suspended Zn particles and framboidal pyrite
forming, and the sediments contain 1 OOOppm Zn (Skei, 1983). In the
St. Lawrence estuary, Zn behaves similarly to Mn in that the bulk of
the Zn which does precipitate and reaches the sediment, goes back into
solution, thus greatly increasing the Zn content of bottom waters
(Bewers and Yeats, 1979). The relative Zn deficiency of SS (106ppm;
excluding ALP183 with Zn = 391ppm; section 6.2.2) confirms the
reducing, estuarinal environment of SS formation, when compared with
the relatively Zn rich NS (194ppm).
The solubility of U is largely controlled by its oxidation state, with
reducing conditions favouring U fixation in developing sediment
(Pertlik et al., 1978). Insufficient u analyses above XRF detection
limits of approximately 4.5ppm are available from SS and NS for a
comprehensive assessment of U distribution in these schists.
Partial melting of BS has produced pegmatites in SS (section 6.1.5)
with marked enrichments of U <..~. 65ppm), while NS pegmatites are not
uraniferous. Dostal and Capedri (1978) showed that at the upper
limits of medium grade metamorphism, U is lost from the fractures and
cleavage planes of ferromagnesian minerals, especially from biotite.
Metamorphism does not mobilize U from the major U-bearing accessory
minerals such as zircon, magnetite-ilmenite, sphene, rutile and
apatite. Dostal and Capedri (1978) calculated that 60 - 70% of U in
124

metapelites at medium grade metamorphism occurs along cleavage and
fracture planes, while the remainder is locked up in accessory
minerals. Though absolute U contents of both NS and SS are very low,
the marked U concentration of SS-related pegmatites suggests that U
was more readily accessible to metamorphic fluids in SS than in NS.
Whereas most U in NS is probably tied up in the accessory minerals
zircon, sphene and magnetite, and was therefore detritally introduced,
a proportion of the U in SS is held in biotite and might have been
adsorbed from the waters onto the reducing C and clay surfaces of the
developing SS sediment. Such a hydrogenous origin for U is common to
fine-grained carbonaceous sediments (Pertlik et al., 1978).
9.1.4.7 Rare earth elements
The lower total REE content of SS relative to NS, and the small but
frequently developed positive Ce anomaly in SS may result from one or
both of two controlling factors. Firstly the lowered total REE
concentrations of coal-hosting rocks is attributed by Herrman (1970)
to the low pH conditions known to promote the solution and removal of
REE. Soluble cea. is oxidized to insoluble Ce"• when river water first
encounters sea water (e.g. Piper, 1974), hence Ce has quarter the
residence time in sea water of the other light REE 1 s, i.e. 50 years
versus 200 years (Wildeman and Haskin, 1965). Theoretically, Ce,
being the only REE with a different solubility distribution in Eh-pH
space, may be fractionated from the other REE 1 s when subjected to
increasing pH and/or Eh (Fig. 9.17), whereas the remaining REE 1 s and Y
start to precipitate only when the pH exceeds approximately 7.5
(Brookins, 1983). Ce tends to become strongly bound with clays
measuring between 0.02 - 0.1 micron in diameter (Carpenter and Grant,
1967).
125

Secondly, the clay-rich residual products of a weathered granodiorite
are strongly and preferentially enriched in Ce relative to La and Nd
when normalized to the parent rock REE composition (Fig. 9.18), and
the total REE concentrations of such clays are also depleted (Nesbitt,
1979). Relative to NS, the more Al-rich SS may therefore have
inherited its positive Ce anomaly directly from the weathered
provenance. Similarly, the lower total REE concentration of SS
relative to NS, may also have been inherited from the weathered
source.
9.1.4.8 Additional ratios
The fixing of V by organic C, as promoted by increased acidity (e.g.
Coveney and Martin, 1983) has lead both Dypvik (1979) and Large
(1981a) to use the Cr/V ratio as a measure of reducing conditions,
with the lowest ratio signifying the most reducing and acidic
environments. Furthermore C, S and Ni are all fixed in sediments
formed in reducing environments (sections 9.1.4.1 and 9.1.4.5) thus,
combining these elements in plots of Cr/(Cr+V) vs C, S and Ni produces
sensitive redox indicators. When applied to NS and SS there is a
clear progression from NS through LSS to USS at the high C, Ni and S
ends of the plots which coincides with the low Cr/(Cr+V) ends of the
spectrum, thus showing that USS was formed in the most reducing and
acidic environment of the three rock types, while NS formed under the
most oxidizing conditions (Figs. 9.19a-c).
As outlined in section 9.1.4.2, oxidizing waters promote the fixing of
both Mn and Fe in developing sediments, while reducing conditions lead
to Mn, only, returning to solution. In contrast, Cu precipitates in
reducing waters (Heggie and Lewis, 1984) but remains in solution under
oxidizing conditions (section 9.1.4.1). The Cu/Mn ratio is therefore
expected to be higher than that of Cu/Fe, in reducing sediments, and
126

vice versa in oxidizing sediments. Combining both parameters in one
plot (Fig. 9.20) clearly shows the separation of NS from SS as
expected of sediments formed in oxidizing and reducing environments
respectively. As in Figs. 6.5f-h, sample ALP054 again plots as an
outlier.
9 .1. 5 Significance of ALP054 geochemistry
Although easily classified as SS, sample ALP054, lying in the
immediate structural hanging wall of CSMQ in borehole BH123, has a
series of unusual geochemical characteristics outlined in section
6.2.7.3 and in Figs. 6.34a and 9.20. The elements MnO, Co and Fe20a
have all been shown to concentrate in sediments which form under
oxidizing conditions (sections 9.1.4.1 and 9.1.4.5), while in a
similar environment, C, V, Mo and S are lost as gases or go into
solution (sections 9.1.4.1 and 9.1.4.3). The geochemical composition
of ALP054 suggests that although the schist was originally deposited
in reducing waters to form SS, waters overlying the developing
sediment changed from strongly reducing to strongly oxidizing for a
relatively brief period of time. Additional sampling would be
required to support this conclusion.
9 .1. 6 SS depositional rates
Formation of the homogeneous SS must have occurred in an environment
of prolonged quiescence, as with other black shales. This may be
contrasted with near shore (shoreface) marine environments which are
normally unstable, with fluctuations in circulation, sediment input
and chemical gradient (Skei, 1983). Using a rate of 3mm per year for
sedimentation of Framvaren fjord black shales (Skei, 1983, p141), it
would take approximately 80Ma of persistent, quiet, stratified water
conditions for the lOOm of SS to form. This figure is calculated as
follows:
127
Framvaren sediments comprise 96% H20 and 4% solid matter; SS consists
of 6% H20 and 94% solid matter. Therefore in one year, the amount of
SS produced is
[4/100 + (6/100 * 4/100)) * 3mm/y
sediment contribution water contribution
i.e. 0.13mm/y of SS.
At this rate it would take 79Ma (say 80Ma) for the lOOm of SS to form.
Jefferson et al. (1983) accurately calculated accumulation rates of
between 0.5 and 4.0m per million years for grey shales associated with
the Cirque Pb-Zn-Ag-Ba deposit of British Columbia. These rates
translate to between 25 and 200Ma per lOOm of shale developed, thus
bracketing the 80Ma estimate derived from Skei 1 s (1983) data. These
sedimentation rates would fit well within the c.a. 400Ma time span
between the 2 OOOMa old basement to the Bushmanland Sequence
(Armstrong, et al., 1988), and the 1 600Ma old amphibolites (Reid, et
al., 1987) which post-date SS.
9 .1. 7 Cale Silicate Rock plus Manganese Quartzite (CSMQ)
Any model proposed for the formation of Cale Silicate Rock (CS) must
account for the negative Ce anomaly and the high MnO, P206 and base
metal contents of this unit (section 6.2.7.1). The mineralization
displayed by CSMQ might simply be explained as another pulse of
hydrothermal activity similar to that responsible for the two Broken
Hill ore lenses. Alternative methods of forming CSMQ will also be
examined.
128

9.1.7.1 Geochemical comparisons
No calcic rock analyses could be found in the literature which
approximate cs. Because the Scandanavian shales used above (section
9.1.1) host calcic rocks, analyses of the latter rocks are used for
comparison with cs. Also chosen are the calc silicate rocks found in
the Broken Hill Australia area as a Proterozoic analogue associated
with an orebody. Compared with the Scandanavian shallow marine calc
silicate rocks, CS displays extremely high MnO and base metal values,
and lower alkali metals and Zr contents (Table 9.6). The MnO-rich
nature of CS is confirmed when compared to the Australian calc
silicate rocks. CS also contains consistently more P20 5 than the other
comparative calcic rocks.
The general appearance of Manganese Quartzite (MnQ), its association
with CS, and its low Zr content suggest some form of chert precursor
to these rocks, and since MnQ cannot be correlated with BQ (section
6.4.1), chert analyses from the literature are used for comparison
purposes. As with cs, no obvious analogues could be found. Compared
with massive chert overlying volcanogenic manganese ores in Japan, MnQ
contains significantly more MnO, in addition to AlsOa, Fe20a, Cao, K20
and P20 5 , and shows a relative deficiency in only MgO (Table 9.7). The
MnO- and P20 5 - rich nature of MnQ also preclude simple comparisons with
cherts derived from organic or volcanic processes (Table 9.7).
9.1.7.2 Possible hydrothermal derivation
The chemical compositions of CS and of MnQ differ markedly from those
of possible correlatives within the Broken Hill (Aggeneys) deposit.
Compared with Amphibole Magnetite Rock, CS has an order of magnitude
more Cao and less than a quarter the MnO and Fe20a contents (compare
Table 6.11 with Table 6.21). MnQ has an order of magnitude more P20s
than Garnet Quartzite, five times its Cao and double its MnO contents.
129

It could be argued that the chemistry of the hydrothermal solutions
responsible for generating the Broken Hill deposit changed in CSMQ
times to approximate that responsible for causing parts of the
Australian Broken Hill deposit, in which the base metal sulphides
display a direct relationship with Cao, MnO and P20s (Stanton et al.,
1978). In this model, the negative Ce anomaly displayed by cs would
have been inherited from sea water, either in its recirculated,
hydrothermal form, or from sea water in the depository.
9.1.7.3 Possible authochthonous derivation
The formation of SS beneath a shallow, stratified, sea water column
which was strongly reducing and slightly acidic just above the
sediment-water interface (section 9.1.3), may have contributed to the
unusual geochemistry of CSMQ. An examination of conditions which
exist in stratified water columns shows that the interface between
overlying oxidizing and underlying reducing waters frequently also
marks a rapid change in temperature, from warm above to cold below
(thermocline) (Riley and Chester, 1971; Piper, 1971); in salinity to
more saline below (halocline, Pickrill el al., 1981) and thus more
dense (pycnocline, Piper, 1971); and frequently from alkaline above to
acidic below (Degens and Staffers, 1976; Riley and Chester, 1971).
Because. of the rapid variation in physical conditions across a
thermocline, a number of elements behave differently on either side of
the· boundary. Mhh and Fe2• concentrate in solution just below
thermoclines, due to an equilibrium established by the process of
their upward diffusion through the thermocline, oxidation, and
subsequent precipitation and downward return through the thermocline
(Degens and Staffers, 1976). These authors further suggested that
during the Precambrian, water below the thermoclines was nearly
saturated with silica since no silica-secreting organisms had yet
evolved, and due to the lower pH in anoxic basins, carbonates did not
130

precipitate. The concentration of soluble P20& reaches a maximum just
below the thermocline (Piper, 1971; Skei and Melsom, 1982), while Al 20 3
concentrations are far greater above than below the thermocline (Skei,
1983). As mentioned earlier (section 9.1.4.6), the anoxic H2S-rich
water lying below the thermocline in the Framvaren Fjord contains
suspended framboidal pyrite and sphalerite (Skei, 1983).
Some form of thermocline disruption must have occurred for a short
period during SS times to have allowed the formation of the carbonate
precursors to the calcic pyroxenes and amphiboles of CSMQ (Table C.5).
Degens and Stoffers (1976) suggested that a drop or break-up of a
thermocline causes the destabilization and precipitation of the
elements Mn (Mn 2• --->Mn" + 2e-), Fe (Fe2• ---> Fea. + e-), Mg,
carbonates, P, Si, and the minerals pyrite and sphalerite. At Lake
Kivu, (FeMn)COa and MgCOa rapidly precipitate when the thermocline
drops, such that stacked layers of manganosiderite reflect an
oscillating thermocline. The dissociation of soluble phosphoric acid
(HPo, 2-) to insoluble P0, 2- requires an increase in pH (Sheu and Burkart,
1982). The rapid decrease in Al content below the thermocline (Skei,
1983) suggests that a drop or breakup of the thermocline would
increase the amount of Al in solution and therefore decrease the
quantity of hydrogenous Al reaching the sea bed.
Thermodynamic modelling by Giordano and Barnes (1979) of Pb behaviour
in aqueous solutions at low temperatures has shown a strongly positive
increase in Pb solubility as a function of aH2s (Fig. 9.21). At 30°C
and total sulphur activity < 0.1, the Pb concentrations are maximized
and constant at pH< 6, while at higher sulphur activities a Pb
maximum is achieved at pH= 7 (Fig. 9.22a). With an increase in
temperature to l00°c, the soluble Pb maximum increases by an order of
magnitude and occurs at pH< 6 (Fig. 9.22b). At 30°C (Fig. 9.22a) a
131

decrease in the S activity and/or increase in pH due to a disrupted
thermocline would lead to Pb precipitation as cerussite or anglesite
(Fig. 9.23).
A strongly negative Ce anomaly such as that developed in CS (section
6.2.7.1) may be directly inherited from sea water (Tlig and M'~abat,
1985) and these authors showed that such depletions are common to
Tunisian Cretaceous carbonates formed beneath sea water in a variety
of environments, thus if CSMQ precipitated rapidly, it is likely that
the water signature would be reflected in the rock. In addition to
the positive Ce anomaly inherited by some SS samples from the
weathered provenance (section 8), the developing SS may have
preferentially accumulated the Ce lost from sea water. Reid et al.
(1987) found that the Big Syncline marbles at Aggeneys have 13C ratios
compatible with sea water derivation, and they suggested that certain
low 180 values usually indicative of a non~marine origin may have
resulted from metamorphic exchange. Most of the geochemical
characteristics of CSMQ viz. unusually high concentrations in P205,
MnO, Pb, MgO, Cao, Si02, Zn and S; depletions in AlaOa; and a negative
Ce anomaly, are therefore accounted for in the model of a dropped or
disrupted thermocline.
The control which physical properties had on the basin water chemistry
provides an explanation to the factor grouping of P205, MnO and Pb in
SS (Factor 5; Fig. 6.7). During times of basin stagnation, these
elements remained largely in solution but concentrated at the
thermocline boundary, while during the period of thermocline
disruption, the complexes of P, Mn and Pb precipitated to be
incorporated into CSMQ.
132

In seeking mechanisms to explain the thermocline destabilization, it
is noteworthy that the only unequivocal conglomerate recognised by the
author in the Broken Hill-Maanhaarkop area occurs as a 2m2 outcrop
adjacent to CSMQ (section 4.2.2.2). An inrush of pebbles into a
' stratified, partially enclosed, stagnant basin must have been
triggered by a storm or earthquake. The net effect of such violent
changes would be to temporarily destroy any water stratification,
particularly around the edges of a micro-basin, and to increase the pH
due to an inrush of fresh water together with pebbles. Concentrations
in the elements U, As, Sb and Ag are· not, however, accounted for in
such a model.
The distribution of SS and CSMQ shows that the postulated thermocline
extended from at least Broken Hill to Maanhaarkop, a strike distance
of 5km. Reasons for the lensoid nature of CSMQ might reflect basin
geometry. Initial disruption of the thermocline would have led to
CSMQ precipitation over the entire basin, but re-establishment of the
thermocline initially in the deepest parts of the basin would have
caused rapid re-dissolution, leaving lenses of CSMQ preserved
peripherally to the basin depocentre. By the time the thermocline was
established back to its original level, these lenses may have been
partially buried by sedimentation and hehce rendered less prone to
acid attack, analogous to the manganosiderite lenses in Lake Kivu
(Degens and Staffers, 1976).
9.1.7.4 Preferred model for CSMQ origin
Neither of the sugges~ed models for CSMQ derivation completely satisfy
all the relevant facts. Whereas the geochemical differences between
CS and MnQ on the one hand, with rocks of the Broken Hill (Aggeneys)
deposit ori the other, suggest different modes of formation for CSMQ
relative to the orebody, the elevated concentrations of U, Sb, As and
133

Ag in MnQ favour derivation from some hydrothermal source. Both
processes may well have operated simultaneously. The thinness of CSMQ
and its location within the reduced SS indicate that irrespective of
whether the hydrothermal or disrupted thermocline process was
dominant, the basin geometry and chemical conditions of basin waters
both above and below the thermocline would still have caused
precipitation of most of the elements comprising CSMQ, and would have
constrained preservation of that rock. It is suggested that fault
related, ~ydrothermal activity which produced the elements U, As, Sb
and Ag, as well as a possible component of the MnQ silica, much like
the volcanogenic or exhalative source of the massive Japanese cherts
(Watanabe et al., 1970), was associated with earthquakes which
triggered the discharge of conglomerate into the basin. In general,
it is likely that the more violent dicharges of metalliferous
hydrothermal fluid into a meromictic basin, will trigger the
precipitation of the elements Mn, Fe, P and Si as a result of
disruption of the thermocline, and these elements will accumulate as
gangue components of ores formed on the sea floor in developing black
shale environments.
9.1.8 Biotite Graphite Zone (BGZ)
The similarity between BGZ and USS established in section 6.2.7.2
indicates that the former is also a type of black shale. The lower
Si02 and Zr content of BGZ (Fig. 6.13) suggests that BGZ is comprised
of more hydrogenous/biogenous, and less lithogenous (or elastic)
material than USS. BGZ compares even more favourably with black
shales than does SS in view of its higher concentrations of Mo, V, Ni
and C (Table 9.3). With regard to the relatively elevated
concentrations of MnO, Pb, Zn and cu, and depressed Na 20, S and Sr in
BGZ (section 9.1.1), a likely cause is the passageway created by BGZ
134
for Recent oxidizing and acidic meteoric waters, as revealed in
underground exposures, from the structurally overlying strata which
include the Broken Hill orebody. Such Recent contamination may also
account for the decreasing Zn concentrations found in SS progressively
further from the orebody (Fig~ 6.34a).
The high clay content of BGZ is the likely reason for its elevated C
concentration since C adsorption increases with decreasing clay grain
size (Sharma, 1971). In order for the clay- and c- rich BGZ to have
formed, less detritus contributed to BGZ development than to that of
SS. The formation of BGZ and SS under such quiet conditions
effectively capped and preserved the Broken Hill orebody.
9.2 Structural geology summary
On the basis of physical evidence it was shown that the rock-types at
Broken Hill may be correlated directly with those at Maanhaarkop
(section 5.1), hence continuity of strata along strike exists for over
5km. It is also necessary to establish to what extent the structural
superposition of rocks across strike at Broken Hill may be considered
a stratigraphic succession, and what their facing direction is.
Conclusions will be drawn from evidence presented earlier.
At Broken Hill the interfaces between lithologies of contrasting
competency, such as between schist and quartzite, and along BGZ, would
be the planes most likely to act as zones of structural dislocation.
NS and WQ form a single continuous succession (sections 4.2.1 and
6.6.1), while continuity exists between NS, MDS and DQ without much
lateral movement having occurred (section 6.6.1). Localization of the
MDS gossan to the immediate vicinity of the Broken Hill orebody in a
tectonic environment in which subhorizontal lineations and
slickensides predominate (section 5.1), also militates against the
135
gossan forming part of a thrust slice off the Broken Hill orebody
since sub-vertical slickensides would have resulted. The unusually
high Y concentrations in MOS (74pprn) and OEGQ (103ppm) from a borehole
through the succession at Maanhaarkop confirm that little structural
dislocation exists between these two rock-types. The regional
recurrence of the WQ-MDS-DQ succession from Broken Hill to Namiesberg
to Wortel, and the different shapes of the WQ and DQ REE patterns
(section 6.4.4) indicate that these quartzites could not originally
have formed a single horizon duplicated by thrusting or folding. The
Zn concentrations of both surface outcrop and borehole core samples of
NS, which is separated from the orebody and OEH by BQ, increase
progressively nearer the orebody, from as far away as 5km (Fig. 9.25).
It is unlikely that the Broken Hill deposit could fortuitously have
been structurally juxtaposed with the maximum Zn concentration in NS.
The anomalously high Pb content of SS (Fig. 7.6c) strongly suggests
that if any major dislocation occurred along the slickensided BGZ,
then this post-dated the pegmatite-forming event to which the SS Pb
anomaly was probably causally related (section 9.1.2). The geometric
location of CSMQ peripherally to, but seldom lying directly
structurally below the orebody, is suggestive of the orebody occupying
the deepest part of the basin (section 9.1.7), and renders improbable
the likelihood that significant displacement occurred along BGZ.
Whether the entire metasedimentary succession is allochthonous with
respect to the gneisses, as proposed by Watkeys (1986), lies outside
the scope of this thesis.
Regionally, the gneisses occur below the metasediments, while at
Broken Hill gneiss overlies the schist-quartzite-orebody succession
(section 4.1). Additional physical evidence which suggests
overturning of the succession along the Broken Hill line of outcrops
136

is inversion of the cross-bedding in X-Ray radiographs of orientated
quart~ite from Froneman se Kop (section 4.3). Examination of many
more samples would be required before placing much reliance on this
single observation. The geochemical data has, however, shown that in
contrast to SS, NS bears the signature of the Broken Hill orebody in
respect of base metals, Ba and REE concentrations (section 6.2.6).
This NS characteristic does not persist away from the Broken Hill area
since both NTS and.STS fail to show the ore-related signatures. The
oxidizing environment to which the SS sample ALP054 was clearly
subjected (section ·9.1.5), must have immediately predated deposition
of CSMQ as explained in section 9.1.7.3, thus supporting the
interpretation of the Broken Hill succession as overturned.
9.3 Quartzites: Genesis and depositional environment
9.3.1 Geochemical comparisons with chert and sandstone
Comparisons of geochemical analyses from Broken Hill Quartzites (BQ)
with those of highly siliceous cherts and elastic quartzites, reveals
that of the analysed elements, only the Zr content of BQ is
significantly higher than that of chert. The oxides and elements MnO,
MgO, Cao, Na20, Ba, Sr, Mo, Cr, Ni and Co in BQ are all at lower
levels of concentration than in chert (Table 9.8). No trace element
analyses for quartz arenites were located, but their major element
contents are of similar magnitude to those of BQ. In chert, the
higher content of a number of the above oxides and elements such as
MgO, Cao, Sr, Cr, Ni and Co probably reflect the influence of the
genetically related maf ic and felsic volcanics. A comparison between
the shapes of REE patterns from deep oceanic chert associated with
basaltic volcanism, and a sample of WQ (ALP067) reveal a clear
distinction based on the marked negative Eu anomaly of the BQ sample,
and its relatively higher LREE content (Fig. 9.26). Such features
137

typify felsic rocks (section 8), whereas the chert REE patterns shown
are inherited from their mafic source rock (Crerar et al., 1982).
The extremely high Si02 content of BQ results in most samples plotting
in the quartz arenite field of Pettijohn et al. (1972) (Fig. 9.27).
BQ lie within the high Si02 range of quartz arenites, and importantly,
MgO, Cao, NaaO and KaO levels are generally as low as those of quart.z
arenites, in contrast to the relative alkali- and alkali earth- rich
cherts. In a binary plot of Si02 vs Cao + MgO, BQ fall within and
close to the field defined by four of the five quartz arenite
analyses, and all except one analysis (ALP124) fall well outside of
the high-silica chert field. Rather, BQ lies along a mixing line
between NS and pure Si02 (Fig. 9.28) as also defined in Figs. 9.27 and
9.29 where the orientations of the four BQ subsets all extend towards
NS. Attention is drawn to the Maanhaarkop samples of WQ and MDS
(ALP124 and ALP125, respectively) in Figs. 9.28 and 9.29 since they
frequently fall outside of the fields defined by the remaining WQ and
MDS analyses. These two samples have elevated base metal contents as
discussed later (section 9.3.5), which may have a bearing on their
unusual geochemistry.
BQ displays a (CaO+Na20}/K20 ratio even lower than that of average
sandstone and quartzite (Fig. 9.29), and geochemical comparison with
quartz arenites (Table 9.8) indicates that this may be attributed to
BQ having a higher K20 and lower Cao content than quartz arenite. The
high Si02/Al 20a ratio of BQ borehole core compares well with the
average quartzite Si02/Al20a ratio of Garre1s·and McKenzie (1971) (Fig.
9.29), while the BQ surface samples fall higher up on the plot due to
the previously mentioned surface sampling bias towards the most
quartz-rich rocks. The entire linear trend from NS to BQ lies
parallel to, but displaced towards a lower (Cao + Na20)/K20 value, than
138
the sandstone to quartzite trend shown by Garrels and McKenzie (1971)
(Fig. 9.29).
Erlank et al. (1978) suggested an average of 19ppm Zr for flint and
chert from various locations, while Maxwell (1953) failed to even
detect Zr in 24 samples of chert flint, ranging in age from
Precambrian to Recent, and having a wide geographic distribution. The
higher Zr content of BQ (108 - 149ppm; Table 9.8) therefore suggests a
detrital, terrigenous, rather than a chert origin, and the morphology
of heavy minerals (section 4.3) corroborates this interpretation.
Since NS formed from detritus deposited in an agitated environment,
and strong genetic links exist between NS and WQ, MOS and DQ (sections
4.2.1 and 6.6.1), placer processes apparently led to the formation of
BQ. Notwithstanding this evidence, the pos~ibility of a chert
precursor to BQ as proposed by Moore (1986), will still be examined
prior to comparing BQ with various sandstones.
9.3.2 Chert as a precursor
Krauskopf (1959) suggested that some form of subaqueous volcanic or
exhalative Si input is necessary to produce the vast quantity of Si
contained in chert. This Si later accumulates by inorganic or
organically-assisted processes in a series of environments which
include deep water siliceous ooze both associated and not associated
with pillow lavas and serpentinites (Thurston, 1972; Grunau, 1965;
Crerar et al., 1982; Gundlach and Marchig, 1982), and the shallow to
intermediate water cherts of Bramlette (1946) and Hughes (1976).
Various chert-types are examined below, and their characteristics then
compared with those of BQ. The organically derived cherts are of no
further consequence to this study since silica-secreting organisms had
not developed prior to 1.3Ga (Cloud, 1981, p13).
139

The Caballos Formation of western Texas has similar geometric
dimensions to BQ, extending for over 30km with a 45m thick lower
novaculite (massive, milky white chert) and upper 120m thick
novaculite being underlain, overlain and separated by interbedded
chert and shale (Folk and McBride, 1976). McBride and Folk (1977)
found numerous shallow water- to subareal- indicating structures
including sand pockets within novaculite, petrified logs, evaporite
pseudomorphs and paleosoil features. The accessory minerals and
inclusions comprise illite, carbonate minerals, radiolaria, spores,
organic matter and pyrite.
The Strelley Pool chert of the Archaean Pilbara block, Western
Australia (Lowe, 1983), formed in a large (120km diameter),
restricted, hypersaline basin. The chert is 25m thick, continuous
over tens of kilometers and lies near the top of a volcanic greenstone
belt. Evidence of abundant biogenic activity includes organic
laminite, stromatolites, carbonaceous mats and oncoliths, and the lack
of shale suggests low detrital input. One-to-fifteen centimetre thick
layers of laminated and cross-laminated "wind-blown" sand, containing
up to 5% zircon plus opaque minerals, fill cavities in underlying
dessicated quartzite. The preservation of silicif ied evaporites is
widespread.
The shallow water cherts from marine and lacustrinal environments
outlined above display the important common parameters of widespread
evaporites and carbonates, both of which are lacking in BQ. Since
pyritic quartzites on the adjacent farm of Koeris still contain
visible graphite, the argument could not be used that all C in
quartzite at Broken Hill may have been lost under diagenesis and/or
metamorphism. The lack of volcaniclastic rock fragments or feldspar
phenocrysts further preclude comparison of BQ with Conception Group
140

cherts, while the Strelley Pool chert has no greenstone counterpart in
the shale- and felsic gneiss- dominated environment of Aggeneys. With
regard to the development of subparallel, single-grain-thick heavy
mineral layers of BQ, such concentrations are either lacking in
shallow to intermediate water cherts, or are present together with
sand in pockets or as fillings in dessicated chert surfaces.
The 128 million tonne Beowawe siliceous sinter in Nevada (Rimstidt and
Cole, 1983) comprises a delta shaped mound (65m thick; l,6km long)
which formed from geothermal solutions that welled up the Malpais
graben-bounding fault. Though silica composition of this deposit is
not available, elements of interest include Na (0,28 - 0,49%), Ca
(0,23 - 0,25%) and Sr (82 - 18lppm). The limited lateral extent of
the mound shaped siliceous sinter contrasts with the tabular habit of
BQ. Additionally, the elements Na, Ca and Sr in which sinter is
enriched, are strongly depleted in BQ.
9.3.3 Sandstone as a precursor
Horne (1979) suggested that there exist only three ways of producing
clean quartz arenites viz. by diagenetic overgrowths on sand grains;
by erosion of a pure quartz provenance; and where sands have been
winnowed of finer-grained and less stable minerals. Silicified soils
are rarely developed (Horne, 1979), and the regular geochemical
gradations from NS into WQ effectively discount either silicified
soils or a pure quartz provenance as precursors to BQ. Beach-barrier
shorelines, as well as additional environments in which quartz-rich
elastic sediments form, are now examined for their applicability to BQ
genesis.
141

9.3.3.1 Beach-barrier shoreline sands
A beach-barrier island system has three components which are a
subaerial, sandy barrier island chain; an enclosed body of water
(lagoon or estuary) lying behind it on the landward side; and tidal
inlets which join the estuary to the sea (Reinson, 1979). Barrier
islands form along continental' margins where an abundant sediment
supply is fed to a low gradient, continental shelf lying adjacent to a
low relief coastal plain. Tidal ranges must also be as low as 4m
otherwise barrier islands cannot form. Tidal ranges of between 2 - 4m
produce short, stunted barrier islands whereas areas of microtidal
variation (< 2m) produce long, linear barrier islands with
insignificant tidal inlets or deltas. The shoreface (seaward side)
acts as a major source of sediment for the barrier island. The lower
shoreface (most seaward side) comprises fine to very fine-grained
sands interlayered with silty mud, while the middle shoreface contains
sandbars comprising clean sands with minor silt. The cleanest sands
lie in the intertidal zone i.e. the foreshore. Laminations are mainly
planar (sub-parallel). Backshore dunes are wind generated while
further landward, washover deposits comprising back-barrier sand
flats, are formed. The lagoonal facies of interbedded sandstone,
shale, siltstone and organic matter, reflect the most landward of the
barrier island components. According to Reinson (1979, p70),
regressive, or prograding beach-barrier sequences coarsen upwards
whereas transgressive sequences show neither upward-coarsening nor
upward-fining features. The transgressive sequences are well
preserved only if there is a rapid rise in sea level. In contrast,
regressive sequences have much greater preservation potential.
The Late Miocene Cohansey quartz arenite of Southern Jersey (Carter,
1978), displays all the features of a barrier island system as
described above. The quartz arenite attains a maximum thickness of
142
30m, although Carter (1978) suggested that a slow regression or a
number of regressive-transgressive phases would cause thicker sand
deposits. Heavy mineral layers of between < lcm to 30cm thick occur
in various laminated sand facies, with the well sorted foreshore sands
containing laminations continuous for over !Om, with bases sometimes
defined by heavy minerals. In the Cohansey sandstones the
carbonaceous remains of abundant burrowing animals are still
preserved.
The beach-barrier shoreline sand model could adequately account for
all the physical and chemical features of BQ. Though the thickness of
BQ is somewhat greater than, for example, the Cohansey quartzites, it
is feasible that a persistent regression, effected by a constant rate
of basin subsidence or a constant rate of provenance uplift, possibly
with minor transgressive phases, could lead to development of the 80m
thick WQ. Jurassic barrier sandstones up to 47m thick have been
documented in southern England by Davies et al. (1971). The strike
extent of over 50km for the Carter Caves sandstone of Kentucky
(Reinson, 1979), testifies to the extreme lateral continuity of
microtidal beach-barriers, while the down-dip extent is a function of
the time span over which progradation continued. In BQ the presence
of heavy mineral layers having a predominantly planar habit is
consistent with intertidal foreshore sedimentation. The extensive
carbon remains in the Miocene Cohansey sandstone which are attributed
to burrowing animals (Carter, 1978), had not yet evolved during the
mid-Proterozoic, thus the lack of carbon in BQ does not detract from
the beach-barrier model.
The only components of the beach-barrier system missing from BQ are
the tidal inlets, washover deposits and backshore dunes. Tidal inlets
would be poorly developed in conditions of microtidal variation, which
143

would also promote the development of persistent barrier islands. At
Broken Hill the pelitic and psammitic rock types MDS, DQ, HS and UFS
could conceivably represent washover deposits and backshore dunes
(although no specific evidence is led to support the possibility),
since they lie between the postulated beach-barrier, WQ, to the north,
and the estuarinal SS (section 9.1.4) to the south.
9.3.3.2 Shallow marine siliclastic sandstones
Shallow marine siliclastic sandstones consist of sand blankets and
minor shelf sand bars. Sand blankets comprising enormous volumes of
silica, extend for hundreds of kilometres. The Jura quartzite
sequence of Scotland is some 5 OOOm thick, with individual sandstones
up to 350m thick. Off the Oregon coast (on the continental shelf) the
sand facies occurs at depths of 50 - lOOm and comprises sands,
gravels, quartz, feldspar and rock fragments (Johnson, 1978, p223).
Blanket ~andstones are typically cross-bedded. Winnowing of light
material (Johnson, 1978, p232) could conceivably lead to heavy mineral
concentrations.
Minor shelf sand bars range in size from 3 - lOm in height, 1 000 -
2 OOOm in width and tens of kilometres in length. They display sharp
contacts with their underlying muddy sediments (Johnson, 1978, p226).
Blanket sandstones are far too thick, and too immature to be compared
with BQ. The cross-bedded nature of blanket sandstones is not
reflected in the planar to low angle bedding found in WQ. By
contrast, the 80m thick WQ is too thick and extensively developed to
be compared with the lOm high shelf sand bars, which are only 1 - 2km
wide. Similarly, their sharp contact with muddy sediments differs
markedly from the gradational contact of WQ with NS.
144

9.3.3.3 Deltaic sandstones
Deltas are composed of a number of different rock types, but three
factors tell forcefully against BQ having originated as deltaic
deposits. These are that deltas as a whole form discrete shoreline
protruberances, although wave-dominated deltas may have linear fronts
(Miall, 1984); deltas tend to form exceptionally thick sedimentary
successions (Elliot, 1978, p97); and the active river courses in a
delta produce distinctive bar finger sands which have a linear, rather
than planar geometry (Pettijohn et al., 1972, p467). BQ have a
tabular form, and the entire Aggeneys supracrustal succession is less
than 1 OOOm in thi-0kness. Furthermore, deltaic sandstones have high
angle cross-beds (Miall, 1979, p48), versus planar bedded to low angle
cross-beds in the Aggeneys heavy mineral layers. The planar bedding
which is the dominant bedform of the quartzites, in no way resembles
the typical convolute bedding produced in deltas due to rapid loading
of sand onto unconsolidated mud.
9.3.3.4 Massive sandstone facies of turbidites
The massive sandstone facies of deep water turbidites comprise a
series of thick, graded beds which are rapidly deposited (Walker,
1979, p92). Besides the graded beds and concave-up fluid escape
features, these rocks contain no sedimentgry structures. It is
doubtful whether such rapid dumping could lead to the SiOz purity of
BQ.
9.3.3.5 Pluvial sandstones
The extensive nature of BQ, lack of channels and lag deposits (Walker
and Cant, 1979), and their extreme silica purity, are not consistent
with fluvial sandstones. Pluvial conditions are unlikely to produce
quartz arenites, no matter how prolonged the river transport
(Pettijohn et al., 1972, p224).
145

9.3.3.6 Lacustrinal siliclastic sandstones
Although in general, sediment types in lakes differ little from their
marine counterparts, the lower wave energy and common fluctuation of
water level result in compositionally less mature sediments than are
produced in the marine environment (Collinson, 1978, p65). The
extreme silica purity of BQ is therefore unlikely to have been
produced by lacustrinal conditions.
9.3.3.7 Aeolian dunes
Although aeolian sandstones are characterised by a lack of clays,
micas or gravels (Collinson, 1978, p92), their large scale cross
bedding at relatively high angles (Walker & Middleton, 1979, p33),
differs from the frequency and attitude of heavy mineral laminations
in WQ. Furthermore the strongly developed geochemical gradation from
NS into WQ could not be explained by aeolian processes, as no
preferred vertical variation has been documented from dunes (Walker
and Middleton, 1979, p40), however, as long as the BQ-NS contact was
developed subaqueously, a component of BQ could have developed
subareally as dunes. The average maximum thickness of aeolian dunes
of >> lOOm, greatly exceeds average BQ thicknesses. Beach foreshores
have a higher mica content than dunes (Shepard and Young, 1961) since
wind winnowing deflation processes effectively remove all the micas
(Krynine, 1942)1
• The presence of muscovite as the next most abundant
mineral after quartz in BQ (section 4.3) tells against an aeolian
origin for the major portion of BQ.
9.3.4 Genesis of heavy mineral layers
The common methods of producing heavy mineral layers in sandstones are
water winnowed residues and aeolian deflation residues. Authigenic
and metamorphic generation of zircon is also possible.
146

The most common current environment for the development of heavy
mineral layers is along submerged beaches (Mitchell and Reading, 1978,
p453). Carter (1978) attributed the heavy mineral layers of the
Cohansey barrier sand.deposit to water winnowing of low density grains
from fine, high density ones. Aeolian deflation residues can
concentrate heavy minerals when windstorms remove silt and less dense
material from bedloads (Collinson, 1978), and this process may have
been responsible for generating a small proportion of the heavy
mineral layers in BQ, i.e. in that part of BQ which is of possible
aeolian origin. In addition to the heavy mineral layers, the common
dissemination of heavy minerals throughout BQ, however, suggests that
little of the heavy mineral concentrations are of aeolian origin.
Water as opposed to wind winnowing was therefore probably responsible
for generating most of the BQ heavy mineral layers.
Having already demonstrated the gradational nature of NS into BQ and
MDS, it can be seen in Fig. 9.30 that heavy minerals, as indicated by
Zr content, were optimally concentrated at a whole rock composition of
approximately 82% Si02• At higher Si02 levels, the sheer silica purity
of the rock caused the Zr content to decrease markedly.
Saxena (1966) showed that zircons are neither as resistant to chemical
and physical breakdown as commonly thought, nor are zircons solely a
high temperature, igneous mineral. Authigenic zircons frequently
comprise up to 90% of the zircons contained in a sediment, having
formed from a fine-grained "brown mass" comprising rutile, ilmenite
and zircon. Metamorphic zircons formed in this manner tend towards
euhedralism. Saxena (1966) stressed that little if any authigenic
zircon will form around zircons hosted by clean sediments which lack
the "brown mass". The rounded zircons located in the clean BQ matrix
147

suggests that except for rare idioblastic zircon overgrowths on
rounded zircon grains, no authigenic or metamorphic zircon growth
occurred in BQ. Rounded rims on zircon which return 2,0Ga old ages
(section 8.1.2) attest to overgrowths having been produced in the
provenance. Rounding is the frequently observed morphology of zircons
in beach sand environments (e.g. Shepard and Young, 1961), and must
have resulted from abrasion during elastic travel, as suggested by
Pettijohn et al. (1972).
9.3.5 Conclusions
Examination of the physical and geochemical attributes of silica-rich
rocks reveals that no chert could have acted as a precursor to BQ.
Moore (1986) argued that the presence in Namaqualand quartzites, of
(a) minor ferruginous units; (b) widespread S enrichment; (c) local B,
Zn and Pb rich units; and (d) ca- and Mg- rich bands,· indicate that
the quartzites themselves were cherts. While it is agreed that iron
and base metal- rich units within the quartzites are probably of
chemogenic origin, the lenticular shape of these units and their
mineralogy resemble, at a smaller scale, those of the Aggeneys
Gamsberg orebodies. These thin units were probably formed by
processes which gave rise to the orebodies (discussed later in section
10), and therefore do not reflect on the genesis of their enclosing
quartz host rocks. The widespread S referred to by Moore (1986) is
preferentially concentrated as pyrite in the stratigraphically higher
DQ at Broken Hill, Namiesberg and Wortel, and is interpreted as
reflecting the change from oxidizing conditions under which NS and WQ
formed, to the reducing environment in which SS developed. The Ca
and Mg- rich bands referred to by Moore (1986), are not found in the
current study area, and cannot be commented upon here.
148

The evidence presented suggests that BQ represents a metamorphosed,
highly mature detrital sandstone or quartz arenite which, due to the
lack of carbonate cement, can be further classified as alkaline-earth
poor quartz arenite (Pettijohn et al., 1972, p62). Quartz arenites
form at craton margins (Pettijohn et al., 1972, pp224 and 547; Potter,
1984). The microtidal, partially submerged beach-barrier along a
continental margin is suggested as the most likely environment in
which BQ formed, and the relatively thick development of quartzite
suggests a constant rate of subsidence and/or provenance uplift.
Following from the beach-barrier model and the gradational link with
NS is the assertion that the shoreline prograded. Furthermore, the
upward coarsening successions typical of beach-barrier facies agrees
with the interpretation that NS lies stratigraphically below BQ
(section 9.2).
The majority of the BQ zircon grains are of detrital origin, as are
the rounded rutile grains and hematite-ilmenite intergrowths,
testifying to the high preservation potential of zircon up to the
border of granulite facies metamorphism. A percentage of the
muscovite contained in BQ may also be of direct detrital origin,
however, the quartz grain morphologies do not reveal any information
regarding their detrital history due to extensive recrystallization.
The presence in DQ of gahnite on Klein Kap, and vein-bounded
tourmaline on Maanhaarkop possibly testify to the presence of
mineralizing processes, as does the Pb value of 47ppm in the Klein Kap
sample and 67ppm Zn in a DQ sample on Broken Hill. Highly anomalous
values of Cu, Zn, S and Y from borehole intersections of WQ, MDS and
DQ (ALP124, 125 and 126) on Maanhaarkop deserve exploration follow-up
work.
149

9.4 Local sedimentary genetic model
9.4.1 Physical environments
Of the four metasedimentary formations defined at Broken Hill, OS is
not directly used for modelling purposes because of geochemical
complications resulting from the presence of the orebody. It was
shown that NS developed in an oxidizing, agitated environment of the
shoreface type from detrital, terrigenous sediment, whereas SS is a
metamorphosed black shale partly of hydrogenous origin, having formed
in a quiet, meromictic, reducing, estuarinal or lagoonal basin which
prevailed for some 80Ma (section 9.1.6). The thermocline was
disrupted once, leading to precipitation of CSMQ and to oxidation of
SS in the immediate stratigraphic footwall of CSMQ. Structurally
sandwiched between NS and SS the metamorphosed quartz arenitic BQ
formed as a beach-barrier along a continental margin in a microtidal
environment (section 9.3). Although now complicated by structural
disturbances, strong indications exist that the three units NS, BQ and
SS were spatially related in the depository, since NS grades into WQ,
and both of these rock-types display physical and geochemical links
with MDS and DQ (section 6.6.1). NS and the detrital component of SS
were probably derived from a similar provenance (section 8). The
geometric positioning of the orebody with respect to CSMQ (section
9.1.5) suggests little movement along BGZ. Justification therefore
exists for seeking a simple, unifying sedimentary model for the
genesis of NS, BQ and SS.
It was shown that SS and BQ were generated in sea water a~d under the
influence of coastal processes (sections 9.1 and 9.3.5). The
estuarinal, beach-barrier and shoreface environments were shown in
sections 9.1.2, 9.1.4 and 9.3 to accord well with the physical and
geochemical constraints imposed by SS, BQ and NS respectively, whereas
pelagic sedimentation can be discounted on the grounds that, inter
150

alia, an agitated shoreline environment was necessary for the
development of BQ (section 9.3).
Only at the interface of continental and oceanic environments are the
divergent parameters of shallow, agitated and quiet sea water
conditions fulfilled. The beach-barrier model offers the three major
components sought i.e. foreshore (NS), beach-barrier sands (BQ) and
estuary/lagoon (SS). It follows from the evidence for an inverted
stratigraphic succession (section 9.1.5 and 9.2) that NS
stratigraphically underlies and coarsens upwards to WQ, which accords
well with the high preservation potential of a prograding beach
barrier system (section 9.3.3.1). Reinson (1979) showed that in this
progradational environment, the beach-barrier sandstone is then
overlain by the reducing beds (Fig. 9.31) with which SS may be
equated. These factors suggest that SS prograded over BQ which in
turn prograded seawards over NS. Discriminant function analysis
indicates that NS and OS, as opposed to SS, were probably very similar
rock types, suggesting that NS-type sedimentation persisted landwards
beyond the quartzites. In the beach-barrier model this implies that
OS was largely a washover deposit comprising redistributed NS
shoreface sediments. The major change in sedimentary conditions
therefore occurred somewhere near BGZ, and not at the quartzites.
The paleogeography and sedimentology of the Mississippi River coastal
area offers an analogy with the Broken Hill metasediments. A Late
Jurassic shoreline straddled the Arkansas-Louisiana State boundary,
with sediments of the Cotton Valley Group being deposited as
terrestrial coastal plain red beds to the north, followed
progressively southwards by lagoonal black pelites (Hico Shale),
barrier island psammite (Terryville Sandstone), and open marine
pelites (Bossier Formation) (Thomas and Mann, 1966). As the shoreline
151

prograded southwards, and the basin deepened in that direction, the
marine shales were sequentially overlain by the beach-barrier
sandstone and the lagoonal pelites (Fig. 9.32). All contacts between
different lithologies are gradational. Maximum documented thicknesses
for the units are 610m (Hico Shale), 426m (Terryville Sandstone) and
200m (Bossier Formation). The entire sequence extends laterally for
well over 160km, and continues down dip for in excess of lOkm.
Knowles Limestone overlies the complete succession, and thickens
towards the south. The lithological analogies drawn are that SS
equates with Hico Shale, BQ with Terryville Sandstone and NS with
Bossier Formation. In this dynamic model any one stratigraphic
horizon is diachronous (Figs. 9.32 and 9.33), thus all three rock
types formed synchronously, with BQ and then SS progressively building
out seawards over earlier formed NS. Deeper parts of the basin, as
defined by sea floor topography, would then have preserved thicker
successions of NS.
There are certain fundamental similarities between the host rocks to
the Broken Hill (Aggeneys) deposit, and to the Broken Hill (Australia)
orebody in an environment at somewhat higher metamorphic grades.
Although the nature of premetamorphic rocks at the stratigraphic base
of the sequence in Australia (Suites 1 to 3) are still hotly debated
(e.g. Wright et al. (1987) claim these are metasediments while Stevens
and Stroud (1983), Plimer and Lottermoser (1988) and Willis et al.
(1988) interpret these as metavolcanic rocks), Suite 4, the Mine
Sequence, and younger rocks, are interpreted as predominantly of
metasedimentary origin by all workers. The Broken Hill (Australia)
orebody lies within a 1 500m-thick pelitic-to-psammitic suite of rocks
(Suite 4) which are in turn overlain by 700m of graphite-bearing,
pelitic and psammitic rock which hosts lenses of calc silicate rock
(Stevens and Stroud, 1983).
152
The Broken Hill Quartzites (BQ), as metamorphosed quartz arenites,
offer valuable information regarding the tectonic setting of the
depository. Due to the extreme maturity of quartz arenites, they must
have formed along a cratonic margin (Pettijohn et al., 1972, pp.224
and 547) where sedimentary working and reworking is most effective.
Dickenson et al. (1983) showed that the most quartz-rich sands are
derived from stable craton interiors having low relief (p223), with
progressively less mature sediments being derived from more
tectonically active areas such as magmatic arcs. Potter (1984) tested
the Dickenson et al. (1983) hypothesis by sampling beach sands around
the entire South American continent, and found that the most mature
beach sands, corresponding to quartz arenite, are forming along the
tectonically passive or trailing east coast, having derived their
sediment from the Guyana and Brazilian shields. A plot of both Broken
Hill and Regional Quartzites on the discriminant diagram of Bhatia
(1983) clearly classifies all quartzites as having formed along a
passive margin (Fig. 9.34). The extreme purity of BQ and their likely
derivation along a craton margin strongly suggest a cratonic interior
provenance. In addition, the maturity of BS (section 9.1.2) and the
lack of a basaltic to andesitic provenance (section 8) militate
against a fore arc basin setting since these tend to accumulate
immature greywacke-type sediments (Bhatia and Taylor, 1981).
9.4.2 Geochemical differentiation
It is proposed that a provenance of granodioritic composition (section
8.3) represents the starting point for the geochemical sedimentary
differentiation process which led to the Broken Hill metasediments.
According to various weathering schemes (e.g. Garrels and McKenzie,
1971) Ca, along with Na would rapidly be removed from the provenance
to the sea. Though Na remains largely soluble, Ca is precipitated as
153

carbonate minerals at some distance well removed from the provenance.
Except for CSMQ, the entire suite of Broken Hill metasediments is Ca
poor, thus the calc silicate metasediments found both to the south and
east of Aggeneys (Paizes, 1975) might represent the missing Ca which
accumulated in a more distally removed, stable shelf environment. It
is suggested that the granodioritic source first underwent residual Al
enrichment towards an SS type composition (Fig. 9.35) before the
process of sedimentary differentiation took place. This is
represented in Fig. 9.36 by the granodioritic composition shifting
first to the left in the direction of SS and the base of NS, solely
due to in-situ weathering. This residuum would then have been
transported to the depository. During shoreface deposition and
reworking of such detritus, the NS chemical composition was then
enriched in silica and depleted in alumina, reflecting progressive
removal of micaceous minerals and clays from disintegrated feldspars.
The physical and geochemical differentiation reached a boundary
condition with the development of BQ (Figs. 9.35 and 9.36). The
entire process may be schematically represented by granodiorite first
undergoing residual Al enrichment due to weathering, whereafter these
residual products were subjected to different depositional histories,
with SS formation being more dominated by clay deposition, as opposed
to the largely quartz and heavy mineral concentrating processes which
led to the development of NS and BQ (Fig. 9.37).
9.4.3 Oxygen isotopes
The wide variation in quartz oxygen isotopes between NS and SS
(section 6.5), yet their likely common provenance (section 8)
indicates retention of a complex historical record in these rocks.
The sedimentological model outlined above is thus tested against the
oxygen isotope data.
154
Seeing that BQ is comprised almost entirely of quartz, it is
reasonable to assume that little isotopic shift as a result of either
diagenesis or metamorphism could occur in this rock and it should
therefore most closely preserve the provenance b180 ratio. As shown by
Reid et al. (1987), the oxygen isotope signature of BQ is similar to
that of Vioolsdrif granite, a nearby composite batholithic body
predominantly composed of tonalite and granodiorite (Reid, 1979),
which acted as a possible contributor of detritus to the Bushmanland
Group. NS and OS oxygen isotopic ratios are depleted in 180 relative
to BQ, while the SS ratios are relatively heavy (Fig. 6.28). With
reference to the latter, it was asserted in sections 9.1.4 and 9.1.6
that SS formed slowly within a partly closed basin, with significant
hydrogenous input. Although such basins preferentially lose 160 to
evaporation, leaving the basin waters 180 enriched (Faure, 1986, pp 432
- 435), the 5 180 shift is only of the order of 2°/ 00 and would hardly
affect the developing sediment. Berner (1971) showed that although
most quartz is of detrital origin, "a considerable proportion is also
formed in sediments during diagenesis as chert and silica cement"
(p158). Both quartz and opaline silica (a predecessor to quartz)
form authigenically. In sea water the electrolytes and the relatively
high pH range of 7.5 to 8.3 result in rapid precipitation of amorphous
silica into a gel which in hardening into opaline silica, encloses
some sea water (Berner, 1971, pp 158 - 161). Blatt (1987) estimated
that up t o 1 5 % o f the qua r t z i n sh a 1 e s may be o f such or i g i n • 180 i s
strongly fractionated into silica relative to water with which it
equilibrates, such that at 0°C the &so difference is +42, and this
decreases linearly with temperature to +36 at 20°C (Faure, 1986, Fig.
24.12). In addition, the eso composition of clays is determined by
the water and temperature conditions obtaining at the time of clay
formation, with higher temperature waters in warm climates resulting
in clays with &so values in excess of +20°/~ (Faure, 1986, Fig. 25.8).
155

The S 80 ratio also increases with decrease in grain size (Blatt,
1987). Compared with the agitated and detrital dominated environment
in which NS formed, the restricted SS basin environment would have
promoted both a higher clay content as well as a significant
hydrogenous silica component which may have resulted in the positive
'0180 sh i f t f r om that of BQ ( + 8 , 9 to + 9 , 7 ) to that of SS ( + 1 3 , 9 ° I 00 to
+14,1°/ 00 ). A simple weighting calculation shows that only a 10%
quartz contribution with ?:>180 of +40°/ 00 , and 90% quartz with 5180 of
+10°/oo produces average quartz with <0 180 of +13°/oo• The high 8 180
ratio of hydrogenous clays may have also contributed to the "heavy"
S180 signature of SS quartz due to re-equilibration of detrital quartz
with clay during metamorphism.
Standard Mean Ocean Water ( SMOW) has a 6180 ratio of zero, hence
sedimentary and metamorphic rocks with positive ~180 values which
interact with large quantities of sea water during convection in the
earth's crust, experience a depletion in their 180 composition. Higher
temperatures promote water-rock interaction and isotopic exchange, as
does a vein networking (Faure, 1986), and the country rock effectively
suffers a form of contact metamorphism. The low 6180 values of NS are
therefore entirely compatible with the indication that NS was affected
by the ore-forming process (section 9.2), and suggests that
hydrothermal fluid passed through NS on its passage towards deposition
of the orebody and related rocks. As noted in section 6.5, the most
dramatic jump in £ 180 ratios occurs not at any obvious structural
boundary, but in the immediate structural footwall of the orebody.
Since the Broken Hill succession is overturned (section 9.2) and the
low 6180 signature of the orebody is attributed to the ore forming
process, it appears that the younger successions unaffected by any
hydrothermal event were able to retain their pristine b180 signatures.
156

9.5 Facies variations and regional sedimentary genetic model
In the ratio-ratio diagrams (Figs. 7.4a-c) the continuum seen between
the BQ/RQ and BQ/RS data sets when Al, Kand Fe ratios are plotted
against their respective Si ratios, and the fact that Si is the most
important single element controlling the ratios, suggests that the
schists were variably swamped by silica sand, producing progressively
more silica-rich rocks up to the sandstone (now quartzite) end-member.
The decrease in Al, K, and Fe results from the effects of closure,
since each element ratio plots on a continuum through the X-Y origins.
The variations in Si and Al content of Broken Hill core samples and of
Regional rocks (Fig. 7.4a and Table 9.9) shows that schists at Achab
and Namiesberg (NTS and STS) are both more Al-rich and Si-deficient
than their Broken Hill counterparts, while Namiesberg quartzites (WTQ
and DTQ) are more Si-rich and Al-deficient than at Broken Hill. This
relationship indicates a cleaner separation at Namiesberg and Achab
areas between Si and Al, than found at Broken Hill. It is therefore
interpreted that maturity of sedimentation at Achab-Namiesberg had
reached a more advanced stage than at Broken Hill. In contrast,
Wortel displays poorer separation between Al and Si than at Broken
Hill. Prolonged water working of sediment in the Namiesberg-Achab
area should have resulted in maximum release to the sea water of the
Na, Ca and Sr components of the detritus. Namiesberg SS does show the
maximum deficiency in Na and Sr (and Ca) relative to Broken Hill and
Wortel (Figs. 7.3c and d) in a relationship antipathetic to that of Al
and K. A reason for Broken Hill NS, rather than NTS and RQ at Achab
and Namiesberg having the lowest Na and Sr concentrations, will be
examined in section 10.7.2. The implication is that although all
three components of the beach-barrier environment are found at Wortel,
Broken Hill and Achab-Namiesberg, Wortel is the most proximal and
Achab-Namiesberg the most distal of the three areas, suggesting a
157

south-easterly progradation of the shoreline from a provenance lying
somewhat to the north-west in the direction of the most prominently
developed part of the Vioolsdrif batholith (Fig. 9.38). As pointed
out by D. A. Richardson (pers.comm., 1989) these variations could also
be interpreted as a slowing down in the rate of progradation, with
deposition in the Namiesberg-Achab area occurring over a longer period
of time than in the Wortel area. Notwithstanding the more Al-rich
nature of STS at Namiesberg, the Broken Hill V, C and S SS
concentrations far exceed those at Namiesberg (section 7.1.1),
suggesting possible quieter and a slightly deeper water lagoonal
environment at Broken Hill than at Namiesberg.
Of the minor rock-types from the Regional areas, the well defined
geochemical correlation between CTS and AM, but not with CS (section
7.1.1), suggests possible ore association characteristics of the
Wortel CTS, as does its relatively elevated estimated Ho content
(section 7.1.3). The relatively high estimated Ho concentrations of
Wortel WTQ and MDTS (Figs. 7.2d and e) may also reflect some
hydrothermal component. The pod-like form of massive sillimanite
bodies as well as their occurrence in different parts of the
succession (in STS at Wortel and in NTS at Namiesberg, section 5.2)
indicates that their time of formation post-dated the depositional age
of their host rocks.
It was suggested by the author (Lipson, 1981a) that the massive white
quartzites of the Bushmanland Group generally thin from Pella through
Aggeneys, some 45km to the south, until thin, metre-wide remnants only
are covered by the younger Karoo sediments and Kalahari sands some 10
- 30km to the south of Aggeneys. Along the same traverse, the calc
silicate horizons become more prominent. In equating Bushmanland calc
silicate horizons with Knowles Limestone, in the analogy of the Cotton
158

Valley Group (Fig. 9.33), then a northerly provenance to the
Bushmanland Group at Aggeneys is also suggested, with a shoreline
which prograded in a southerly direction (Fig. 9.38). It is
noteworthy that Colliston (1983, pllO) similarly proposed mature
linear shoreline sands as opposed to deltaic distributary sands in the
Pella-Dabenoris area, on the basis of a transitional lower contact
into immature sandstones.
From Fig. 9.33 it is clear that although red beds are developed
closest to the provenance, only during transgressive cycles will they
be preserved at the base of the succession. Shoreline progradation
results in red beds overlying the black shale. Laminated feldspathic
quartzites have been mapped by the author (unpub. work) below NS near
the gneiss contact at Wortel, and interpreted as arkosic sediments by
Rozendaal (1982, Table 90, p282) who refers to these rocks as the
Beenbreek Formation. These feldspathic quartzites are not found at
the base of the supracrustal succession in the Aggeneys area
suggesting that during progradation, the red beds were either not
locally developed or were deposited at the top of the succession, and
have subsequently been eroded in most places. Only in the Eastern
Aggeneysberge, preserved in a synclinal structure, are numerous
quartzo-feldspathic gneisses found which may represent such
feldspathic quartzites.
159

10. GENESIS OF THE OREBODY AND ORE EQUIVALENT HORIZON
The problems caused by dynamothermal metamorphism apply equally to
establishing the genesis of the Broken Hill orebody as they do to the
origin of the host rocks. The interpretations made regarding the
latter will now be used as a framework to help solve questions about
the former. In general terms the Broken Hill orebody lies within
similar rock-types and at approximately the same stratigraphic level
as the Gamsberg, Black Mountain and Big Syncline orebodies (Figs. 4.3
and 5.7). The four deposits display so many physical similarities
(Ryan et al., 1982; Rozendaal, 1982), that their geneses can
reasonably be assumed to be linked. Consequent modelling and
discussion, using data from all four orebodies as well as from similar
deposits found elsewhere, will explore boundary conditions limiting
the possible source of the metals, S and Ba, the likely mineralizing
fluid physical properties, and the ore depositional environments.
10.1 Distinctive physical characteristics of the Broken Hill
ore body, its host rocks, and implications
The upper amphibolite facies grade of both host rocks and ore bodies
in the Aggeneys-Gamsberg area (Ryan et al., 1982; Rozendaal, 1982),
indicate that the orebodies were already emplaced at the time of
metamorphic onset, hence the mineralizing fluids could not have been
derived by metamorphic fluid expulsion at a greater depth. The Broken
Hill orebody is unlikely to be of replacement origin since the
stratigraphic column taken through the deposit is increased by the
thickness <i 40m) of the deposit.
At Black Mountain it has been personally observed that gradationally
cross-cutting, large-scale silicification of schist, coincident with
the development of garnets, chalcopyrite and pyrite to form a Garnet
Quartzite, is geographically limited to an area adjacent to the
160

maximum development of Pb-Cu-Zn ore in banded iron formation. The ore
and Garnet Quartzite occur along the axis of an isoclinal fold which
plunges for well over 2km, and in which significant refoliation has
occurred. The well constrained location of silicification suggests
that development of the Black Mountain Garnet Quartzite is likely to
have formed as part of the mineralizing process. These factors are
therefore consistent with the view of Ryan et al. (1982) that the
Black Mountain Garnet Quartzite represents a footwall alteration zone.
Broken Hill lacks these epigenetic characteristics. While the Black
Mountain orebody probably overlies its feeder zone much like the
Sullivan deposit (Ethier et al., 1976), Broken Hill thus appears more
distal in nature.
The only direct indications of possible syn-sedimentary volcanic
activity are the thin (< 5m wide) amphibolites at the base of the
Black Mountain succession, and the amygdaloidal amphibolites which
occur at the top of the metasedimentary successions at Gamsberg
(Rozendaal, 1982) and in the eastern Aggeneysberge (Ryan et al.,
1982). Otherwise the orebodies lie within a continental to
continental margin sediment package of metamorphosed shales and
sandstones (section 9.4), and are unrelated to any lava domes or .local
subvolcanic intrusives which characterize volcanogenic deposits (Sato,
1972; Campbell et al., 1981). The local syngenetic, shale- or
elastic- hosted massive sulphide orebodies may be classified as
sedimentary exhalative (sedex) deposits, along with the Mt Isa Pb-Zn
lenses and the Sullivan deposit.
In contrast to the Mississippi Valley type (MVT) deposits which form
in carbonates by a process of subsurface cavity filling and
replacement (Rhodes et al., 1984) over an extended period of time of
up to 50Ma (Cathles and Smith, 1983), the sedex orebodies develop at
161

the sea water-sediment interface, thus any cessations of sulphide
generation will result in dilution of the orebody by the OS
sedimentary gangue. NS and OS, as elastic sediments, probably formed
far more quickly than the SS rate of 1.2m per million years (section
9.1.6), thus the Broken Hill massive sulphide must have developed
rapidly, and Finlow-Bates (1979) estimated that for the Mount Isa
sulphide lenses, up to lcm of ore carrying 25% Pb would form in
approximately five weeks.
10.2 Distinctive chemical characteristics of the Broken Hill
orebody, its host rocks, and implications
10.2.1 Redox conditions of host rocks
It was shown that during deposition of SS, the sediments formed
beneath a water column open to the sea (sections 9.1.4.1 and 9.1.7),
and that BQ probably formed in a coastal setting (section 9.3.5),
hence it is likely that OS also formed beneath sea water. Total
dissolved s concentrations in sea water fall between 10-1m to 10-2m
(Krauskopf, 1979), thus Fig. 9.12 is appropriate. Though iron
sulphides are stable over a wide range in pH conditions, in sea water
the Eh needs to drop from +0 .• 3 volts to -0.2 volts at a constant pH of
8 (Fig. 9.12) in order for sulphides to form, otherwise hematite is
the likely stable iron mineral. Magnetite occupies a very restricted
field in Eh-pH space, and would form in the depository only if the
dual unusual conditions were met of high pH(> 9) and low Eh (< -0.4)
(Fig. 9.12). Away from the orebody where precipitation rates were
probably much slower, such strongly reducing conditions would be
manifest by the preservation of carbon (C). The predominance of Fe
oxide, as opposed to Fe sulphide, along the orebody time horizon in OS
(section 4.2.3) is therefore consistent with the low C content of OS.
Berner (1971, p203) considered a lack of C the most important limiting
factor in the reduction of so,2- to H2S, which is necessary for the
162

production of sedimentary Fe sulphide. The inference is that Fe
incorporated into the developing OS outside of the orebody,
precipitated as hematite under oxidizing conditions, and was later
converted to magnetite during metamorphic recrystallization. The
unusually high Mo content of 19ppm in ALP212, a sample of OES situated
740m east of the orebody, coincides with the elevated MnO
concentration of 0.8%, and independently emphasizes the strongly
oxidizing environment under which OES formed, since the aqueous
behaviour of Mo is Eh dependent, and Mo only coprecipitates with
manganese oxide under oxidizing conditions (Contreras et al., 1978).
In contrast to the Broken Hill environment, the iron formation
immediately associated with the Sullivan deposit predominantly
consists of pyrrhotite, and classifies as sulphide facies, while the
host rocks comprise grey-green, thinly bedded quartzites, siltstones
and argillite with ubiquitous pyrrhotite and very minor magnetite
(Sangster, 1972). The Sullivan iron formation clearly developed in an
environment which was already reducing, whereas it is proposed that
the Broken Hill orebody created a reducing sub-environment (massive
sulphide) within an oxidizing environment, similar to the model
suggested by Stanton (1972) for the Australian Broken Hill deposit.
Had the Broken Hill Quartzites acted as a sandstone aquifer for
introduction of epigenetic, oxidizing waters into reducing shales, it
is unlikely that the oxidation of Fe would have taken place in rocks
both above and below the aquifer (OS and NS). In the case of OS, the
sharp and consistent cut-off in oxide Fe at BGZ could not readily be
explained by this model, and neither could the massive, and
individually restricted nature of the UOB and LOB lenses.
163
10.2.2 Low Zn/Pb ratio and source rocks
The unusually low Zn/Pb ratios at Black Mountain and Broken Hill
relative to other sedex·deposits were highlighted by Lydon (1983).
When considering a possible source of Pb, only felsic rocks display
relatively elevated Pb and Ba contents (Table 10.1), while Cu and Zn
concentrations are highest in basalts. Graf (1977, p544) sketched the
general empirical variation in orebody metal content as a function of
the likely source rock chemical composition, from the Cu-Zn Cyprus
deposits which overlie basalt, through the Cu-Pb-Zn Kuroko deposits
formed in a mixed felsic to mafic volcanic suite, to the K-feldspar-
rich New Brunswick deposits which are Pb-rich relative to the Kuroko
deposits. As far as the source of Fe is concerned, Graf (1977)
pointed out that even in felsic rocks, the Fe content is over 100
times that of their base metals, so there is no lack of Fe
availability for producing the iron sulphides (or oxides) of the
orebody.
A Rb rich ore-forming fluid may be deduced at Broken Hill from the
increase in the Rb/Rb+Sr ratio progressively nearer the orebody
(section 6.6.4; Fig. 6.35b). Ellis (1979, p648) showed that in order
to enrich geothermal waters in the rarer alkalies such as Rb, the
rocks being leached are likely to have had a composition varying from
andesitic to rhyolitic. The sporadically high base metal content of
NS (sections 4.2.1 and 6.2.6) suggests that the mineralizing fluid
originated at greater depth below the orebody than at the
stratigraphic level of NS. The felsic (K-feldspar-rich) basal
gneisses which underlie the orebodies, and constitute by far the most
abundant rock type of the Namaqua Province (Lipson, 1980; Watkeys, '
1986) are thus a possible source of metals for the Aggeneys-Gamsberg
deposits.
164

10.3 Ore fluid chemistry
10.3.1 Zn/Pb ratio of fluid
In order to evaluate the causes of unusually low Zn/Pb ratios in ore,
it is necessary to examine the behaviour of this ratio in the fluid
which generates a deposit. The Zn/Pb ratio of the eventual
precipitate will equal that of the causative hydrothermal fluid,
provided that 111i128 > 1Drota1 metu in the fluid (Ohmoto et al., 1983). A
sulphur deficient fluid (Jllius < 1Drota1meta1) at 200°C tends to deposit one
metal only, while a S-rich fluid at 250°C will produce polymetallic
deposits (Ohmoto et al., 1983). In thermochemical modelling of the
Zn/Pb ratio in fluids at moderate temperatures, Huston and Large
(1987) showed that provided all metals in solution are transported as
chloride complexes, and that either lllim > 1Drota1meta1 or that the metals
are close to saturation, then only temperature and NaCl content of the
hydrothermal solutions significantly affect the ratio. Under these
circumstances, the hotter solutions are more Pb-r~ch while the more
saline ones are relatively Zn-rich (Fig. 10.1). Huston and Large
(1987) expected that bedrock composition influences the Zn/Pb ratio of
ore forming fluids only in the extreme cases such as where the Pb-
def icient basaltic source to Archaean deposits or to black smokers
results in total undersaturation of the fluid with respect to Pb.
The applicability of Huston and Large 1 s (1987) work and subsequent
thermochemical modelling (section 10.3.2) depends on whether the
conditions outlined are fulfilled. The activities of the ligands c1-,
HS-, H2S and OH- in solution, rather than the concentrations of metals
in rocks, control the ore-carrying capacity of fluids (Barnes, 1979).
c1- represents by far the most important ligand which complexes with
the saline, slightly acid solutions typically responsible for
generating massive sulphide deposits (Large, 1977). At 200°c, c1-
complexing of Zn and of Pb is eight orders of magnitude greater that s
165

complexing (Barnes, 1979). At lower temperatures the transport of Zn
by bisulphide complexes becomes important in neutral to alkaline
solutions with unusually high S contents (> O.lm ~ 32 OOOppm) (Large,
1977; Bourcier and Barnes, 1987). Pb transportation by S complexes
over a variety of temperatures is extremely poor below reduced S
concentrations of approximately 2.5m (Fig. 10.2) (Giordano and Barnes,
1979). It is therefore evident that at temperatures of less than
-200°C the S-ligand transport of Zn (but not Pb) becomes important in
solutions rich in reduced s. Sulphate plays very little part in
transporting ore metals since barite is much less soluble in
hydrothermal sulphate-rich waters than in sulphide waters yet barium
is carried in the ore solutions (Barnes, 1979). The Ba concentration
of hydrothermal fluids varies as a function of a80,2- and is independent
of both aH2s (Fig. 10.3) and of temperature (Ohmoto et al., 1983) such
that at a 80,2- = 10-•m, the Ba concentration is -10-5m. At similar levels
of aH28 , the Zn concentration is -10- 2m, and is independent of a 80,2-.
From the foregoing it therefore appears likely that c1- complexes were
the major ligands responsible for metal transport in the Aggeneys
Gamsberg deposits. As regards the S content of the ore fluid relative
to its contained metal, the great volume of iron sulphide in the
Aggeneys-Gamsberg deposits (Ryan et al., 1982; Rozendaal, 1982), much
of which is pyrite, suggests that the ore-forming solutions were S-
ri ch (ffl1us > IDrotal metal) •
10.3.2 Solubility modelling of Cu-Pb-Zn ratios
Although many similarities exist between the four deposits in the
Aggeneys area, the two major differences are
(a) their wide variation in Cu-Pb-Zn ratios, from the Cu-rich and Zn
deficient Black Mountain orebody to the Zn-rich and Cu-deficient
Gamsberg orebody, and
166

(b) the local depositional environments as deduced from the rocks
directly hosting the orebodies.
Examination of theoretical factors controlling the Cu-Pb-Zn ratios are
a prerequisite for evaluating whether the depositional environments in
any way influenced the metal ratios of the enclosed deposits. In
order to apply the models of Ohmoto et al. (1983) and Huston and Large
(1987), the requirement of 111ii:2s > IDrou1 m .. ta1 in ore forming fluids
responsible for ore generation is reasonable in the Aggeneys-Gamsberg
deposits (section 10.3.1). For the purposes of metal element ratio
modelling which includes Cu, the simplest Cu sulphide for which data
is available, i.e. chalcocite (Cu2S) is used as a first approximation
of insoluble Cu minerals. The equations for the lOO*Pb/(Pb+Cu) and
lOO*Zn/(Zn+Cu) ratios are based on Huston and Large (1987) for the
lOO*Zn/(Zn+Pb) ratio (hereafter referred to as the Pb/Cu, Zn/Cu and
Zn/Pb ratios respectively). Unlike the Zn/Pb ratio, however, the
derived equations for the Pb/Cu and Zn/Cu ratios, viz:
[ IDrot cu] / [ IDrot Pb] =
[ { (ac1·)/( (g<cuc121")*(Ki)o.s*aH+)} + { (a2c1·)/(gtcuc1a12
)
* ( Kz ) 0 •
5 * aH+ ) } +
{1/(g(CuCl)+)*(Ka) 0 • 5 } + {(ac1·)/(K,)o.5} + {(a 2c1·)/(g(CUCl3)-) *(Ks)0
•5
+
{ (a 3c1·)/(g<cucu1 2"*(Ks) 0•
5] I
[ { 1 I ( ( g Pbc1 + ) * ( KPbc1 + ) } + { ( ac1 - ) I ( KPbc12 ° ) }
+ { (a2c1·)/(g(PbCl3)-*KPbCl3"} + { (a 8c1·)/( (gPbcu 2")*(KPbc1'2") 1
and
[ .IDrot cu J / [ IDrot Zn J =
[ { ( ac1 - ) I ( ( g (cue! 2) - ) * ( K1 ) 0. 5 * aH+ ) } + { ( a 2 Cl - ) I ( g ( CuCI a) 2• * ( K2 ) 0. 5 * aH+ ) } +
{1/(g(CUCl)+)*(Ka) 0' 5} + {(ac1·)/(K,) 0·5} + {(a2c1·)/(g(CUCl3)-*(K5)0
·5
+
{ (a8c1·)/(g(cucu1 2"*(K&) 0·5 ] I
[ {1/( (gznc1+)*(Kznc1+)} + { (ac1·)/(Kzncu0 )}
+ { (a2c1·)/(g(zncu1"*Kzncu·} + { (a3c1·)/( (gzncu 2-)*(Kznc1/")]
167

are pH dependent with the relative Cu concentration increasing with pH
(Appendix I). The ratios are still independent of f02 and activity of
dissolved s. From sets of simultaneous equations the equilibrium
constants (K) were calculated between 25 and 300°C (Table 10.2) while
the activity coefficients for the various Cu complexes were calculated
over salinities ranging between 0.25 and 3.0m NaCl (Appendix I), from
the modified Debye-Huckel equation (Helgeson, 1969). KNac1 values were
taken from Huston and Large (1987), while a value of one was used for
the activity coefficients of uncharged species (Helgeson et al.,
1981). A subset of values in the matrices for the Pb/Cu and Zn/Cu
ratios over varying temperatures, salinities and pH's (Table 10.3) are
graphically plotted in Figs. 10.4a-f.
By far the most important ~arameter influencing the Pb/Cu and Zn/Cu
ratios is the variation in pH, with the ratios stretching between 100%
(at pH = 4) and 0% (at pH = 8) for both ratios over virtually all
temperature and salinity ranges (Figs. 10.4a and d). As noted from
the equations for the ratios, the relative Cu content of the ore fluid
increases (ratio decrease) with pH, with the most dramatic ratio
changes occurring over the pH range of 5 - 6.5 for the Pb/Cu ratio,
and 5.5 - 7 for the Zn/Cu ratio.
As far as temperature is concerned, the Pb/Cu ratios display maximum
relative Cu enrichment between temperatures of 100 - 180°C over all pH
and salinity ranges (Fig. 10.4d). The Zn/Cu ratio shows greater
complexity, with the relative Zn content decreasing up to 200°C
whereafter at higher temperatures the ratio increases and then
decreases (Fig. 10.4b). The common assumption that with a decrease in
temperature Cu precipitates first is thus not always true. For the
Pb/Cu ratio, relative Cu solubility first increases with decreasing
temperature, and only decreases at temperatures below -140°C.
168

Salinity has little effect on the Pb/Cu ratio except at molalities
below 1, where a further decrease in ionic strength of the solution
results in a rapid rise in the relative Pb concentration, and applies
over all pH ranges (Fig. 10.4f). The Zn/Cu ratio also shows a rapid
relative Zn increase below mrac1 = 1, but contrary to the Pb/Cu ratio
the Zn/Cu ratio increases as the molality increases above a value of
1. Clearly, ore fluids with mrac1 = 1 are those most relatively
enriched in Cu, and most relatively depleted in Zn (Fig. 10.4c).
10.3.3 Cu-Pb-Zn ratios at Aggeneys-Gamsberg
Use of the metal contents published in Ryan et al. (1982) for
calculation of metal ratios, results in simplifications since each
orebody comprises a number of physically and chemically distinct
layers or lenses. Only gross ore fluid chemistry may thus be inferred
for each deposit.
The metal ratios of the four orebodies vary widely (Table 10.4).
Reading off the data of Huston and Large (1987) shown in Fig. 10.1,
the approximate mineralizing temperatures for the various deposits
are:
Gamsberg Big Syncline Broken Hill
Temperature 100 - 150 180 for al 1 mrac1 280
( oc) 220 or 260 for 1. 5mrac1
Black Mountain
300
Approximate salinity boundaries of 0.5 - 2.0mrac1 may be inferred from
the literature based on measured fluid inclusion salinities in Kuroko
fluids with 0.6 - 1.37mrac1 (Ohmoto et al., 1983); general estimates of
approximately 1.6mrac1 (Barnes, 1979); 1.5mrac1 for the elastic-hosted
Jason deposit (Gardner and Hutcheon, 1985); and 1.4 - 2.6mrac1 for the
169

high temperature fluid inclusions at the carbonate-hosted Silvermines
deposit (Samson and Russell, 1987).
Utilizing the data in Figs. 10.4a-f, Table 10.3, and the temperature
and salinity constraints above, estimates may be made of the ore
solution pH variations for the individual Aggeneys-Gamsberg ore
deposits from the Zn/Cu and Pb/Cu ratios, viz:
Gamsberg
pH (Zn/Cu) 4.0 - 4.5
pH (Pb/Cu) 4.0 - 4.3
Big Syncline
4.1 - 4.3
4.2 - 4.6
Broken Hi 11
4.9 - 5.4
4.7 - 5.2
Black Mountain
5.9 - 6.2
5.6 - 5.8
The two sets of estimates independently read off the Zn/Cu and Pb/Cu
plots produce remarkably similar pH values which show a consistent
increase in estimated ore fluid pH from Gamsberg through Big Syncline
and Broken Hill to Black Mountain.
By re-applying the pH and temperature constraints gained above and
reading off from Figs. 10.4a-f and Table 10.4, it is possible to
estimate the salinities (.111Naci> for the ore fluids responsible for the
four orebodies, viz:
Gamsberg
.111Nac1 ( Zn I Cu) 0 • 2 5 - 0 • 3
.111Nac1 (Pb/Cu) 0.4
Big Syncline
0.5 - -1.5
0.3 - 0.8
Broken Hill
0.4 - -1.2
0.5 - 0.7
10.4 Sulphur isotopes and source of sulphur
Black Mountain
0.8 - 1.2
1.0 - -2
The S isotope compositions in the Aggeneys-Gamsberg area cover a wide
range, with the lowest 6 3'S from sulphide and sulphate found at Black
Mountain and the most positive at Gamsberg (von Gehlen et al., 1983)
(Table 10.5; Fig. 10.5). The systematic variation through time of sea
170

water and ore sulphide isotopic compositions led Sangster (1976) to
conclude that sea water sulphate is the ultimate source of most s in
ore deposits, hence organic and inorganic mechanisms of so, 2 - reduction
are examined.
' The metabolic activi1y of oceanic anaerobic bacteria, notably
Desulphovibrio desulphuricans, act as a catalyst for the reduction of
sulphate to sulphide. In the process the lighter 32S isotope is more
commonly reduced (Sangster, 1976), hence the 8 84S values in such
biogenically derived sulphides which are incorporated into sedimentary
rocks, range from -5 to -30°/oo (Ohmoto and Rye, 1979). The residual
sulphate in the water becomes enriched in 34 S, and as long as the
system remains closed to sulphur such as in a lagoon, then any
evaporites formed from this water will bear the signature of
isotopically heavy s (Sangster, 1976).
Analytical data from various geothermal fields reveal that at
temperatures around 250°C the H2S and HS- contents of the solutions
increase at the expense of so, 2- (Ellis, 1979), and Nielsen (1979) and
Ohmoto and Rye (1979) agree that inorganic reduction of so, 2- only
begins above -250°C. Under these conditions the sea water 5us value
of 20°/oo is lowered to produce sulphides with 8 34S of +5 to +20°/ 00
(Ohmoto and Rye, 1979). In contrast, igneous rocks have t)34S values of
-0°/oo' hence ore deposits having sulphides with 0°/00 'Q34S values are
interpreted as having been derived from fluids of magmatic origin
(Ohmoto and Rye, 1979).
In the Aggeneys-Gamsberg area, von Gehlen et al. (1983) viewed the
strongly positive ~84S of barite as indicative of a restricted basin or
lagoonal environment. They interpreted the increase of sulphide and
sulphate ~348 values from west to east as reflecting the mixing of two
171

sulphur sources, viz. magmatic-exhalative S ('0348 - 0°/00) from the
Black Mountain area with local evaporite derived S ('i)34S .. ::. +30°/oo) from
the Gamsberg area. The positiveS34S sulphide value in the Broken Hill
deposit, however, is unlikely to have resulted from the mixing of two
fluids above the sediment-water interface, with one having ~'S values
near zero and another with strongly positive 6 34 8 va 1 ue s, tie cause the
Broken Hill orebody formed in an environment which had little or no
restricted water circulation. It is therefore suggested that the
positive 8348 ratio of Broken Hill sulphides was established before
exhalation, and that reduction of so,2- occurred in the crust at
temperatures of > 250°C. The same reasoning applies to the magnetite-
rich and carbon-deficient Black Mountain orebody. The lowest sulphate
g's value of the Black Mountain area probably reflects the contribution
of normal sea water so,2-, since barite, in deriving its so,2- from sea
water, precipitates rapidly when Ba is exhaled, and adopts
approximately the local aqueous 't> 34S of so,2- (Sangster, 1976). None of
the Aggeneys-Gamsberg deposits could have formed in inland basins
since freshwater has sulphur ~'S values of zero (Sangster, 1976).
As suggested by von Gehlen et al. (1983), the highest &'S sulphate
ratios in the east indicate that Gamsberg ore formed in the most
restrictive of the Aggeneys-Gamsberg depositional environments. This
interpretation is supported by the common presence of graphite in the
Gamsberg orebody (Rozendaal, 1982). The local sea water in the
Gamsberg basin therefore probably had a positive 834S signature caused
by bacterial reduction of S~2-, both prior to and during ore
deposition, whereas prior to exhalation, sea water in the Black
Mountain and Broken Hill depositories had relatively unmodified &'S
ratios.
172

The layered amphibolite near the base of the Black Mountain succession
along the contact between gneiss and schist possibly contributed a
minor amount of magmatic S there. The decrease in sus sulphide from
Gamsberg to Black Mountain may also reflect an increase in f02 and/or
pH since a positive shift in the f02 value by 1 log unit or in pH by 1
unit results in a 8us decrease in sulphides by up to 20°/oa (Ohmoto,
1972).
10.5 Basin dewatering versus deep convection of fluids
The two proponents of contrasting, current models for the generation
of the sedex deposits (Lydon, 1983, 1986; and Russell, 1983, 1986)
find common ground in the envisaged extensional tectonic environments
of 2nd and 3rd order fault-bounded basins as ore depocentres. The
models differ in the explanations of the source of the metals and
fluids responsible for generation of these deposits.
Lydon (1983, 1986) envisaged a finite source fluid derived from
shallow depths due to the metamorphic release of connate water from
sediments when clays transform to micas. The sedimentary successions
with thicker source beds will generate the larger ore deposits. The
s-0urce of heat required to drive the metamorphism and fluid expulsion
is seen as elevated heat flow related to faulting and incipient
magmatic activity (Lydon, 1986). An essential component of the model
is a thick (few lOOm), thermally insulating and hydraulically sealing
shaley rock which allows geopressuring of an underlying aquifer where
the mineral transformations take place.
In contrast, Russell (1983, 1986) proposed that the fluids which
generate the ore deposits represent the infinitely rechargeable source
of overlying sea water which permeates the crust via ever deepening
convective cells in areas of extensional tectonics~ The fluids
173

progress downwards into the baseme·nt to depths of as much as 15km,
being limited only by the deformation change from brittle to ductile
failure. Sea water becomes modified on its downward journey,
increasing in acidity and attacking feldspars which release a series
of elements including base metals. These fluids are focused in their
upward journey along the master faults, to be exhaled on the sea
floor.
Strens et al. (1987) and Samson and Russell (1987) argued that the
sedex temperatures of ore fluid formation lie between the high
temperatures related to a magmatic source, and the temperatures of 100
- 150°C (maximum of 200°C) associated with Mississippi Valley-type •
deposits (Cathles and Smith, 1983). The latter authors showed that it
is only under the most exacting conditions of rapid and episodic
connate water expulsion from a basin that fluid temperatures of 150°C
may be brought to within lkm of the surface. Temperatures deduced
for fluids responsible for generating the Aggeneys-Gamsberg deposits,
ranging from 300 - 150°C (section 10.3.3), bracket the fluid inclusion
homogenization temperatures of -250°C deduced from the Jason Pb-Zn
sedex deposit in Canada (Gardner and Hutcheon, 1985), and the 50 -
260°C homogenization temperatures (mode at 190°C) deduced for the
carbonate-hosted Pb-Zn-barite Silvermines deposit in Ireland (Samson
and Russell, 1987).
It is unlikely that the Lydon (1983, 1986) model of normal dewatering
alone could produce either the volume of sulphide or the 250°C
temperatures associated with the sedex deposits. Strens et al. (1987)
showed by rigorous quantitative modelling of geothermal gradients of
as low as 30°C/km that a single-pass, single-fluid convective cell of
hypersaline seawater penetrating through basin sediments and into the
basement is capable of producing sizable lead-zinc deposits. These
174

cells deepen with time by a process of crack propagation to the
maximum temperature constraint of -250°C, representing the transition
between brittle and ductile failure (White and White, 1983).
Strens et al. (1987) modeled the circulation as two phases, viz.
downward recharge through a porous (fractured) rock and an upflow
cycle of turbulent, focused and rapidly discharged fluids. They
estimated the maximum amount of potential sulphide mass which can be
transported to the depositional site, requires an optimal permeability
of -l0-16m2 in the recharge cycle. At higher permeability, such as
would be anticipated in unconsolidated sediments or volcaniclastics,
Strens et al. (1987) found that the flow is controlled by the upflow
characteristics, and the potential sulphide mass drops slightly, while
at lower permeability, the low flow rate limits the volume of fluid
which can pass through the system.
In the absence of intrusives, the potential sulphide mass will depend
on the size of the recharge cell (Fig. 10.6) thus for a geologically
reasonable cross-sectional area of say 80km2 (i.e. lOkm * 8km), some
nine million tonnes (mt) of sulphide may be produced, approximately
equivalent to the 40mt of ore grading say 25% total sulphide found at
Broken Hill. The additional 12mt of Fe contained in magnetite is not
yet accounted for. Viewing the deposit as comprising the two lenses
Upper Orebody (UOB) and Lower Orebody (LOB), each with its own
distinct lithology and Cu/Pb+Zn ratio (Ryan et al., 1982; Wilson,
1981), and using a UOB:LOB contained S +metal ratio of say 2:1, then
some 14mt contained S + metal exist in the UOB and 7mt in the LOB.
Though Strens et al. (1987) have modeled up to a maximum of only 9mt
contained sulphide, Figs. 10.6a and b suggest that additional metal
leaching would be promoted, possibly up to and beyond the required
14mt of contained S + metal in the UOB, if any of the following
175

conditions were met, viz. (a) a greater cross-sectional area of
downflow (exceeding 80km2); (b) a higher geothermal gradient
(exceeding 30°C/km); or (c) an increase in the time span over which
the cell exists (beyond 50 000 years). Clearly the Strens et al.
(1987) model produces tonnage figures of a similar order of magnitude
to the Broken Hill orebody.
Once the hydrothermal cell has worked its way down to the zone of
brittle-ductile transition in the crust, ore deposition will terminate
as access to additional geothermal energy ceases and the fluid
temperature drops due to the ingress of cool sea water (Strens et al.,
1987). These authors calculated that some 106 years pass before the
rocks re-equilibrate to the ambient geothermal gradient and are able
to once again crack at the onset of the next tectonic pulse. This
sets in motion an entirely new convective cell which would be capable
of producing a separate orebody having its own distinctive
characteristics, much as the upper and lower lenses of the Broken Hill
orebody.
Lydon's (1983, 1986) finite ore-fluid model can be tested by simple
mass balance. A 40mt orebody such as Broken Hill (excluding the Fe
contained in magnetite) comprising say 21mt contained S +metals or
approximately 18.8mt metals, would require a pure illite source region
of lOkm * lOkm * 1.34km (Appendix J). Using more realistic parameters
of only a maximum of 50% of the source region being illite; that the
thickness of the protore could not exceed 0.5km (at Broken Hill this
would include the schist and Pink Gneiss stratigraphically below the
orebody); and that the extraction/concentration efficiency at the
point of discharge had been say 50%, then only 2mt or 11% of the
required metal could have been produced. As Lydon's (1983, 1986)
model stipulates that the fluid is non-renewable, the UOB and LOB
176

cannot be treated separately as done above for the Strens et al.
(1987) model. Lydon's (1983) model is virtually incapable of
producing sufficient fluid for a large sedex deposit (i.e. in excess
of say 5mt contained metal in the Aggeneys area. Considering the size
of the Aggeneys-Gamsberg deposits (Gamsberg is in excess of 150mt),
Lydon's (1986) belief that the maximum size of the deposit will be
limited by the thickness of the underlying argillaceous rocks, does
not appear to be valid.
The Lydon (1983, 1986) model fails to explain the high heat flows
required, since both at Aggeneys and in the case of the Irish
deposits, the available cover rocks are relatively thin, and little
evidence exists for nearby intrusions. The heat contributed from the
thin amphibolite at the base of the Black Mountain succession (section
10.1) would be minimal. The amphibolites at the top of the Big
Syncline and Gamsberg successions probably reflect later stages of
rifting, and Reid et al. (1987) concluded that the mantle source to
the amphibolites display subduction-related metasomatic
characteristics similar to those found in active continental margins
and island arcs, including those of the back arc environment. The
local geothermal gradient was therefore probably increasing during the
time of ore deposition, but the levels of heat flux must have been
well below those required to satisfy the Lydon (1986) model.
As a variation on the Lydon (1983, 1986) model, Moore (1986) also
proposed that the metals were leached from the near surface
environment. He suggested that weathering or hydrothermal processes
acted on Pink Gneiss which stratigraphically immediately underlies NS,
and which Moore (1986) interpreted to have been acid volcanics still
in an unconsolidited state during the time of ore formation. The
metals were then concentrated in highly restricted anaerobic sub-
177

basins where they precipitated as base metal sulphide deposits.
Problems with this model include the calculation that unrealistically
high heat flows (ca. 600°C/km) would be required to produce the low
Zn/Pb ratios observed at Black Mountain, which are estimated to have
formed from solutions at temperatures of ca. 300°C (section 10.3.3).
Moore's (1986) leaching model cannot account for the well defined,
distinct metal ratios at each of the Aggeneys-Gamsberg deposits, and
it has been shown (section 10.2.1) that not all the local basins in
which ore is found, were reducing when the metals were deposited. The
metasediments are also shown to be so mature that it is highly
unlikely that they were derived from proximal, contemporaneous,
unconsolidated volcanics which are a necessary condition for Moore's
(1986) model.
Due to the thin available cover rocks in the Irish midlands, Lydon
(1986) was forced to conclude that dehydration of the Old Red
Sandstone (ORS) produced the metal-rich ore fluids which gave rise to
the Irish deposits. LeHuray et al. (1987) showed, however, that the
ORS underlies only a few of the Irish deposits, and there exists a
one-to-one correspondence between individual deposit Pb isotope ratios
and the underlying basement of Lewisian gneisses, thus linking the
origin of Pb in the orebodies directly to their basements, and
supporting the models of Russell (1986) and Strens et al. (1987). In
similar Pb isotope studies on Swedish Phanerozoic and Proterozoic
strata-bound sulphide ore deposits, Johansson and Rickard (1984) and
Johansson and Rickard (1985) also found that the Pb was derived from
the well homogenized, pre-existing basements.
Lydon (1986) argued that so large a volume of water would be required
to alter crystalline basement to liberate metals, that insufficient
178

metal concentrations could be achieved to form an orebody, based on
hydrolysis reactions of the type
KAlSiaOa + H• + 0.5*Ha0 = 0.5*Al2Si20dOH), + Si02 + K•
K-feldspar Kaolinite Quartz
which require lO'kg of reactant solution at a pH= 4 to alter 1 mole
of K-feldspar. Kaolinite is, however, the end stage product of acid
reaction with K-feldspar. K-mica represents an intermediate stage of
alteration which in fact buffers solutions passing through granitic
rocks to becoming progressively more acidic at higher temperatures
(Barnes, 1979), via reactions of the type
(Ellis, 1979). Large (1977) also showed that K-feldspar may be
altered by reactions which do not consume H', but do consume water,
e.g.
2KA.1Sia0a + 3Fes. + 2Mgz. + 14H20 = Mg2FeaAl2Sia01o(OH) 8 + 2K' +
3H,S i O, + 8H'
Chlorite
whereaf ter
Depending on the Mg and Fe concentration of the solute, metals
liberated from K-feldspar could be concentrated in a relatively
limited volume of solution. Beach (1980) quoted similar reactions
e.g.
179

KAlSiaOs + 2NaA1SiaOs + 4.5(Mg,Fe) 2• + K• + 2C02 + 8H20 = K2Al,Si 6Al 20 20 (0H),
+ KdMg,Fe),,sAlSiaAl202o(OH), + 2Na• + 2CaCOa + 7Si02 +SH•
and
and suggested further that one way proton generating reactions which
also consume HaO, such as
must exist in order to remove and precipitate elsewhere the Si02
generated at the site of K-feldspar destruction. The rapid
destruction of biotite even under conditions of surface weathering
would provide the required Fe and Mg (Minarik et al., 1983; Nesbitt
and Young, 1984). The critical role played by Mg in solution was
emphasized in the experimental results of Bischoff et al. (1981) who
reacted sea water and brine with greywacke. They found that at
temperatures of 200°C and 350°C the seawater pH drops dramatically to
5.2 and 4.8 respectively, and in the case of K-feldspar, and with Mg 2•
sourced from seawater or dolomite, they envisaged that the responsible
proton generating reaction is
5Mg2• + 2K-feldspar + 8Ha0 = cl inochlore + 2K• + 8H' + 3Si0s•
The reactions above involving Fe-Mg-bearing micas, show that solutions
buffered by the more maf ic rocks have a higher pH than fluids in
contact with granitic rocks (Barnes, short course, 1990).
Berner and Holdren (1977) showed that K-feldspar breakdown occurs
mainly on fracture surfaces and not by diffusion processes, therefore
models involving crack propagation in basement will be conducive to K-
180

feldspar destruction. Infiltration of surface waters to depths of
-12km have long been postulated, and Ferry (1986) argued that
multipass circulation of metamorphic fluids, rather than continual
recharge, could be an important feature of regional metamorphism which
allows for high fluid/rock ratios. These systems would also help
concentrate base metals. Russell (1986) showed from physical tests
carried out at Camborne that water pumped into boreholes drilled to
depths of 2km infiltrates the basement down to depths of -4.8km.
Strens et al. (1987) acknowledged that the type of fluid flow
envisaged in their and Russell's (1986) model is not ideal for
scavenging metals, and not as theoretically effective as connate
fluids released during metamorphic dewatering, however they argued
that if only 10% of the lOppm Pb contained in a rock volume measuring
20km * 15km * lOkm were stripped, a total of 5mt of Pb would be
removed. If all the metal is precipitated at the point of exhalation,
this could produce an orebody of 50mt grading 10% Pb i.e. roughly the
same order of magnitude as Broken Hill. To emphasize the principle of
metals being stripped from basement rocks, Strens et al. (1987) quoted
zones of impermeable, but Cu depleted epidosite below Cyprus
volcanogenic orebodies which appear to have acted in a porous manner
to the fluids. While Barnes (1979) suggested that metal
concentrations of at least lOppm in solution are necessary for the
generation of base metal deposits, Barrett and Anderson (1988) pointed
out that the metal concentration~ of fluids exhaling to produce the
potential Cu-Zn orebodies at the East Pacific Rise and in the Guaymas
Basin are 1 000 times lower than lOppm. They suggested that a
combination of high fluid flow rate over a prolonged period, and an
excess of reduced S over metals, will cause the efficient
precipitation of all transported metals on discharge. Barrett and
Anderson's (1988) work therefore casts doubt on the necessity for a
181

connate water source of ore-forming fluid. The heat requirement is
still essential since the capacity for hydrothermal brines to
concentrate metals increases exponentially with temperature, as
indicated by Strens et al. (1987) (Fig. 10.7) and Ohmoto et al. (1983)
who showed that the Pb, Zn and Ag content increase dramatically in
fluid from 200 - 300°C. Crust heated by intrusions, or areas of
elevated geothermal gradient, will thus have the greatest capacity for
generating fluids which may carry sufficient metals for producing
large orebodies.
10.6 Ore and gangue deposition
The relatively shallow water depths of 45m (section 9.1.4.1) under
which Broken Hill ore deposition probably occurred would not inhibit
the development of a sedex deposit. The curves of Haas (1971) show
that boiling takes place at shallow depths (low hydrostatic head),
with associated precipitation of some mineral phases due both to
supersaturation and to cooling. In the Red Sea Atlantis II deposit,
Zierenberg and Shanks (1986) determined that below the sediment-water
interface, the ore-forming brines are heated to 255°C. It is evident
from high temperature (> 334°C) cubanite + chalcopyrite + pyrite
assemblages found in the deposit (Pottorf and Barnes, 1983), that
earlier formed crystallized solid phases are bodily transported up the
focused fluid channelways, thus subsurface boiling would not prevent
the formation of ore at the sediment-water interface. The
sporadically high Mo values in OEH (Table 6.18) suggest that boiling
may have occurred prior to exhalation, since Arnorsson and Ivarsson
(1985) found in Iceland geothermal waters that boiling and mixing with
cold sea water leads to molybdenite undersaturation, and these
processes favour leaching of Mo from the country rock. Localized
showings of molybdenum were noted by the writer in the basal gneisses
at both the Aggeneys township and the quarry near the mine's reduction
182

plant, and these occurrences demonstrate the potential for the
basement to have supplied Mo to leaching hydrothermal fluids. Hemley
et al. (1986) showed that pressure release along gently decreasing
temperature gradients leads to greater (and not less) fluid capacity
for carrying the elements Fe, Zn and Pb, again indicating that boiling
would have little effect on the capacity for the metal-bearing
solution to produce a sedex deposit. Both Large (1983) and Plimer
(1981) recognised that the cross-cutting, epigenetic components of
stratiform orebodies may increase at shallower depths, but without
preventing the formation of major, layered sedex deposits.
By far the most important parameter responsible for precipitation of
sulphides is temperature drop. The Kuroko ores formed within a 50°C
drop in the initial ore fluid temperature after only 10% mixing with
cold sea water (Ohmoto et al., 1983, p589}. These authors used plots
of Saturation Index (SI} vs temperature to assess the depositional
characteristics of cooling hydrothermal fluids, where
and where Kaphaier1te is the equilibrium constant for the reaction
ZnS + 2H• + nc1- = ZnCl 02
-0 + H2 S.
Fig. 10.8 shows that cooling from high temperature (300°C) fluids
saturated in sphalerite, galena, chalcopyrite and barite will promote
chalcopyrite precipitation as well as that of sphalerite, galena and
barite (SI> 1), whereas cooling from lower temperature solutions
(200°C) (Fig. 10.9) leads to precipitation of the latter three
minerals, but chalcopyrite goes into solution. Virtually all the Ba
will precipitate on entering seawater because SI continues to increase
183
with a drop in temperature, and there is more Total so,2- in sea water
than in ore fluids (Ohmoto et al., 1983). The SI > 1 requirement is a
necessary but not sufficient condition for mineral precipitation,
especially in the case of silica, as discussed in section 10.7.1
below.
10.7 Ore Equivalent Horizon (OEH)
Components of OEH which formed at the same time as the orebody, carry
the signature of mineralization (section 6.3). Biotite-garnet-rich
schist, or bands of garnetiferous quartz-rich rock, are features
commonly associated with massive sulphide ore deposits. In the Gossan
Lead district of Virginia, Gair and Slack (1984) described biotite-,
chlorite- and garnet- rich rocks occurring as lenses within !Om of the
hangingwall or footwall of the orebody, and interpreted these as
metamorphosed alteration zones or intermixed chemical and elastic
sediments, while chloritite exhalites (Bernard et al., 1982) and
chlorite schist (Graf, 1977, p535) have been described from the
Spanish Huelva Province and the New Brunswick area of Canada,
' respectively. McLeod and Stanton (1984) recognised phyllosilicate
layers associated with stratiform sulphide deposits of south eastern
Australia with the biotite-rich horizons representing metamorphism of
hydrothermally derived nontronite which precipitated as aprons to the
orebodies. The siliceous exhalite (tetsusekiei) developed over a
considerable areal extent both surrounding the Kuroko orebodies and
occurring in their immediate hangingwalls (Ohmoto et al., 1983;
Kalogeropoulos and Scott, 1983), can probably be equated with the
layers of Ore Equivalent Garnet Quartzite at Broken Hill.
Factors to be considered in this section will be the reasons for
formation of OEH, and the physico-chemical controls which resulted in
different element distributions east and west of the orebody. The
184

increase in certain elements nearer the orebody, as well as the
behaviour of REE will also be examined. The general lack of
metamorphic element migration in the Broken Hill area (section 6.1)
suggests that the defined geochemical signatures of ore-related
elements were present, at the latest, once diagenesis had ceased.
10.7.1 Origin of OEH
The paucity of zircon in OES, GQ and the orebody (section 4.2.3)
suggests that these rocks were largely of chemogenic origin. The
source of silica for GQ both surrounding the orebody as well as for
the layers found in OEH, may be sought in the ore fluids. In
solution, silica occurs in the form of monomers such as Si02.nH20 and
is neither influenced by ionic strength of the solution nor pH near
the neutral range (Holland and Malinin, 1979). Temperature is the
major control on silica solubility and deposition. A saturated water
solution at 250°C contains 1 OOOppm amorphous silica, but a
temperature drop to 25°C will cause precipitation of some 900ppm (Fig.
10.10).
The ratio A/M of surface area available for precipitation (A) to the
mass of water (M) also has a pronounced effect on silica precipitation
(Rimstidt and Barnes, 1980). Within fractured rocks the combined
effect of slow cooling and a high A/M ratio promotes Si precipitation,
producing the siliceous footwall stockworks (e.g. the Black Mountain
Garnet Quartzite), whereas the A/M ratio is close to zero when hot
fluid mixes with cold sea water above the sea floor, and though base
metals precipitate, Si precipitation is relatively inhibited. Ohmoto
et al. (1983) suggested that the relat.ively low Si content of many
massive sulphide deposits is strong evidence that these deposits
formed above the sea floor. Had Si precipitated together with
precipitatian of sulphides, the deposits would not be economical. The
185

location of GQ surrounding but not contained within the LOB, and as
stringers in OES, might well reflect the continued movement in
solution of Si relative to the base metals; due to the low A/M ratio
in sea water.
The biotite in OES was probably derived from a combination of two
sources. Terrigenous, illitic clays are thought to have provided the
Al and some of the K, while K, Fe and Mg were supplied by the
exhalative fluids which passed through the potassic, biotite-bearing
basement rocks (Lipson, 1980) from which components of the ore-forming
fluids were derived (section 10.5). Ellis (1979) stated that the most
important equation governing reaction between Kand Na in the
hydrothermal environment is
= xNa• + yCa2 • + K-feldspar.
With higher temperature, and independent of pH variation, the K/Na
ratio in the fluid increases i.e. the equation moves to the left,
thus any rapidly exhaled fluids will be K-enriched relative to Na. As
such fluids cool on moving vertically up towards the lower temperature
environment, they normally exchange some K for Na in the solid phases
encountered (White, 1965). Mg2+ (and Fe 2+) may be liberated from Mg
silicate under conditions where acidic solutions attack relatively Ca
silicate-poor rocks (Ellis, 1979).
As described above, temperature drop is the major factor responsible
for silica precipitation, but the oxidation state of Fe will vary.
Any hydrothermal fluid starting from a point corresponding to A in
Fig. 10.11 will follow a path roughly from A to B as it nears the
surface and cools, with base metal sulphides precipitating (Large,
1977). In Large 1 s (1977) terminology these form the proximal ores,
186

but the ratio oxidized S/reduced s (So/Sr) of the environment which
the remaining hydrothermal fluid encounters will determine the form of
Fe which precipitates. For So/Sr < 1, Fe sulphide forms whereas for
So/Sr >> 1, magnetite precipitates to the left of B. If during
cooling and equilibration of the fluid to the sea water f02 value of
10"62atm (Large, 1977, p562), the environment is sufficiently
oxidizing, then hematite will form. The UOB, and later on the LOB,
formed as minerals precipated when hydrothermal solutions passed
between points A and C as shown in Fig. 10.11. The complex redox
conditions obtaining in specific subenvironments within which
components of the ore lenses formed, and the order and mechanism of
precipitation, lie beyond the scope of this thesis. Away from the
orebody, the Ore Equivalent Garnet Quartzite and some of the elements
incorporated into OS, formed as exhalites as the fluids passed from C
to D (Fig. 10.11), with progressively less volume of precipitate being
formed.
10.7.2 Metal haloes and assymetry
The high KzO/Na20 ratio of 39 for borehole core OS samples (calculated
from Table 6.18) might be attributed to the K-metasomatism experienced
during hydrothermal alteration associated with falling temperatures
after exhalation (section 10.7.1). Plimer and Elliot (1979) listed a
series of deposits for which Na and Ca losses and K gains have been
documented in strata stratigraphically equivalent to orebodies, which
they attributed to slight alteration associated with ore deposition.
In the case of the ore equivalent tetsusekiei, Kalogeropoulos and
Scott (1983) considered that similar chemical alteration resulted from
a thermal event which post-dated the blanket-like deposition of
tetsusekiei. In the Broken Hill area it is likely that OEH was
forming over the entire life-span of the orebody, thus each new layer
of depositing OEH would provide heat to the unconsolidated precipitate
187

on the sea floor, and allow additional alteration of the type
documented by Kalogeropoulos and Scott (1983), viz. albite to chlorite
to sericite. The relatively high K20/Na20 value of 28 (23.6 after Na20
recalculation) for NS, versus an average of 15 (8.7 after Na 20
recalculation) for SS, again reflects the.NS association with ore
forming processes, and may be the reason for NS and BQ at Broken Hill
having lower Sr contents, and in most cases lower Na as well, than in
the Achab-Namiesberg area (section 7).
Reasons for the increasing Ca/Sr ratio progressively closer to the
more highly mineralized parts of the orebody (Fig. 6.20) may be sought
in the differential behaviour of Ca and Sr in hydrothermal solutions.
Though the solubility of celestite (SrSO,) is smaller by an order of
magnitude than that of anhydrite (CaSO,), the strontianite '<srC03 )
solubility is greater than that of calcite (CaCOa) above 200°c. All
four minerals become progressively less ·soluble at higher temperature
(Holland and Malinin, 1979). The increasing Ca/Sr ratio closer to QM
and AM may therefore indicate that once deposited, the central
portions of the orebody remained above 200°C sufficiently long for
preferential calcite rather than strontianite deposition, with QM
(highest Ca/Sr ratio) at the base of the orebody remaining hotter for
longer. Metamorphic recrystallization later led to the destruction of
calcite during the development of silicates (Lipson, 1978; Rozendaal,
1982). Higher temperatures in QM were possibly also partly
responsible for the lower Ba concentration there since barite
solubility increases at higher temperature (Holland and Malinin,
1979).
Rocks such as Amphibole Magnetite which are part of the orebody,
contain MnO contents of up to 7.8% (Table A.3). Outside of the
complex redox subenvironments in which ore was forming, however, the
188

maximum MnO concentration lies at some distance from the orebody
(section 6.3.1.6), and this is not a feature unique to Broken Hill.
Smith and Cronen (1983) showed that in sediments surrounding the
Santorini caldera and hydrothermal centre, Mn content actually
increases away from the vent area. This phenomenon may be examined by
contrasting the redox behaviours of Fe and Mn, since although Fe 2• and
Mnz. have simUar ionic potentials (IP= 2.7 vs IP = 2.5) and are
soluble, Mnh (IP= 6.7) has a far greater IP than Fea. (IP= 4.7) thus
requiring considerably higher oxidizing conditions before Mn moves
from the field of soluble cations to the field of insoluble
hydrolysates (Mason, 1958; and section 9.1.4.2). The reducing sea
water associated with the immediate environs of the Broken Hill
orebody (section 10.2.1 and above) would prevent large scale Mn
precipitation until the more.normal redox sea water conditions were
encountered, and the observed assymetry to the location of the maximum
Mn concentrations at 60m from the western closure of the orebody, but
300m from the eastern extremity (section 6.3.1.6), suggests that the
packets of reduced water drifted from west to east. The lack of
mixing with sea water may also be deduced from the notable difference
in Ba concentration between QM (60ppm), AM (1 273ppm) and GQ (2
435ppm) which suggests that lower in the orebody stratigraphy, Ba in
the ore fluid had little contact with sea water so,a- as explained
above (section 10.6), but higher up and further out, increased mixing
resulted in progressively more barite precipitation.
The higher Cu-Si and Ba-Pb signature of OS immediately west relative
to the signature east of the orebody (section 6.3.1.6) also indicates
that the ore fluid flowed in an easterly direction with the west side
of the orebody lying closest to the hydrothermal vent. At
temperatures of below 50°C such as would be expected of sea water into
which the hydrothermal fluid was introduced, the Zn/Pb and Zn/Cu
189

ratios of the solution are extremely high (Figs. 10.1 and 10.4b),
suggesting that in the cool environment, temperature is the dominant
parameter controlling relative cu, Pb and Zn concentrations. Cu and
Pb would preferentially precipitate near the vent, while Zn should
remain in solution for a longer period of time, as suggested by the
shallow drop-off in Zn concentration east of the orebody (Fig. 6.19a).
The high Zn concentrations west of the orebody may be attributed to
co-precipitation with the other metals. Si will also precipitate
nearer the vent in response to falling temperature (Fig. 10.10), as
will Ba (Figs. 10.8a and 10.9a). This evidence as well as the
observation that the highest NS surface sample base metal
concentrations occur in the west of Broken Hill (ALP205), clearly
suggest that the vent from which the Broken Hill ores were exhaled,
lies either at the western extremity of the orebody, or possibly even
further west than that. Both Lydon (1983) and Large (1977) have
remarked on the evidence suggesting that exhaled hydrothermal fluid is
capable of flowing down a paleoslope until being trapped in a sub
basin. Seeing that aqueous sulphate and sulphide species do not
readily equilibrate during rapid temperature changes below 200°c,
exhaled solutions have the opportunity to move away from the vent and
cool rapidly (Large, 1977).
10.8 Possible significance of Tank Hill
A number of unique features displayed by NS at Tank Hill are
suggestive of proximity to a hydrothermal vent (sections 5.1 and
6.2.7.4). These include the gossan-like appearance and slight
mineralization of NS there; the occasional cross-cutting veinlets; the
bands of magnetite and barite; the presence and lensoid occurrence of
·Green Quartzite (GrQ) and Garnet Quartzite (GQ) hosted by NS; and the
relatively high base metal content of samples of the latter and of NS.
The fuchsitic GrQ comprises 97% SiOz, yet it contains 561ppm Ba, 57ppm
190

Pb and 64ppm Cr (Table 6.16). In comparison, BQ with similar silica
levels has < lOppm Cr or Pb, and< 50ppm Ba (Table 6.22). Schreyer et
al. (1981) described fuchsitic corundum rocks and fuchsite quartzites,
albeit in greenstone settings from the southern African Archaean, as
residual end members resulting from post-volcanic exhalative
alteration of komatiitic lavas. Ba substitutes for K in the lattice
of fuchsite in these rocks. Surface outcrop NS samples with Cr levels
of 114ppm already show a degree of Cr enrichment over their borehole
core counterparts (Cr= 72ppm), thus the possibility exists at Tank
Hill that the leaching of NS of most elements by hydrothermal
solutions led to the relative residual enrichment of Cr there. The
high Ba and Pb contents of GrQ testify to the mineralizing event, and
silicification (or residual Si enrichment) to produce the restricted
occurrences of GrQ and GQ, add weight to the hypothesis that Tank Hill
represented a hydrothermal centre in the Aggeneys area. The localized
barite and magnetite bodies could represent the near-vent, possibly
subsurface, stratiform deposition of Ba and Fe in the oxidizing NS
environment.
Nowhere on the Broken Hill inselberg do there exist similar features
suggestive of proximity to a hydrothermal conduit. In section 10.10
below, a model will be detailed in which Tank Hill is proposed as a
possible source from which emanated the ore-bearing fluids that
ultimately flowed to form the Broken Hill orebody.
10.9 Rare earth elements
Aspects of REE patterns which reveal petrogenetic information include
the absolute REE concentrations; the nature of the Ce and Eu anomalies
since these two REE elements are more readily oxidized and reduced,
respectively, than the other REE's; and the slope of the REE profile
towards the HREE's. Sea water, as a common component of fluid which
191

interacts with solid phases to form sedimentary host rocks and
orebodies, is often found to impart to these rocks its strongly
negative Ce anomaly (low Ce residence time), and positive slope
towards the HREE 1 s (HREE have a higher residen~e time than LREE)
(Herrmann, 1970). Currently forming ores to a large extent display
these features (Fig. 6.24), even though sea water has absolute REE
levels of the order of 10-7 those of shale.
A feature of the Broken Hill ores and ore related rocks is their
narrow range of normalized REE concentrations which is of similar
magnitude to that of the Broken Hill schists, but contrasts markedly
with the wide variations displayed by the presently forming ores (Fig.
6.24). Either the Broken Hill ores contain significant proportions of
their host rocks, or both rock-types ultimately originated from a
common source. The two Garnet Quartzites and one of the two Massive
Sulphide samples analysed, display a weakly developed negative Ce
anomaly (Fig. 6.21). Only the magnetite-rich parts of the orebody and
some of the ore-associated schists display relative enrichments in
HREE. Accepting that rocks at Broken Hill formed below sea water
(sections 9.1.4.1, 9.1.7 and 10.4), then very little time elapsed
between sulphide deposition and burial since Fleet (1984) and Ruhlin
and OWen (1986) convincingly showed that hydrothermal sediments adopt
the sea water REE signatures given sufficient exposure time.
The high total REE content of the ores probably reflects a felsic
source since granitic rock has some three times the REE content of
basalt (Herrmann, 1970), and the Broken Hill ores compare far more
favourably in their total REE concentrations with the intermediate
caldera-related (Smith and Cronen, 1983) Santorini ores than with the
basalt-related Atlantis II and Galapagos deposits (Fig. 6.24).
Michard and Albarede (1986) concluded that the fluid characteristics
192

determine the Eu concentration of hydrothermal sediments since acidic,
reduced waters at > 250°C are required to convert Eu3 • to the more
soluble EuS+, and both Alderton et al. (1980) and Strong (1984) found
that in the case of REE 1 s, sericitic alteration of feldspar, as
envisaged for the basal gneisses at Aggeneys, leads to a selective
loss of Eu. Graf (1977) noted that it is the Eus. ion which
fractionates into baritic rocks to form EuSO,, thus explaining the
most strongly defined positive Eu anomaly in Massive Sulphide sample
ALPllO which contains 2% barite.
Seeing that the orebody itself fails to show HREE enrichments suggests
that the positive HREE patterns seen in sporadic samples of OS, OEGQ
and NS (sections 6.3.1.4 and 6.2.5) may not be a direct consequence of
mineralization. Furthermore, mobilization of HREE requires strongly
alkaline solutions (McLennan and Taylor, 1979; Michard and Albarede,
1986; Michard et al., 1987), conditions which were not likely to have
produced the Aggeneys-Gamsberg deposits (section 10.3.3). HREE
preferentially partition into chlorite (Alderton et al., 1980) and
garnet (Graf, 1977), hence it is likely that the HREE signatures of
some of the schists and Garnet Quartzites were inherited from the
overlying sea water by the exhalative components of precursors to
biotite and garnet, during periods of sufficient quiescence. The
relatively elevated HREE patterns from a few NS samples may represent
the preferred accomodation of the smaller HREE ions (Alderton et al.,
1980) in the pre-biotite, chlorite-glauconite lattice during passage
of some mineralizing fluids through NS. The NS signature is possibly
akin to that in the Kidd Creek footwall alteration zone (Campbell et
al., 1984). The relative HREE enrichment of some Aggeneys samples
compared with NTS samples from Achab suggest that analysis of REE 1 s
still offer exploration application, similar to the advantages
suggested by Campbell et al. (1982) for distinguishing between
193

pregnant versus barren felsic volcanics in the Canadian greenstone
belts.
Compared with the magnetite-rich rocks associated with Broken Hill
mineralization, the magnetite ironstone ALP228 from Froneman se Kop
has a much higher total REE content and is relatively depleted in
HREE. Elevations in the elements Th, U, Zr, Y and REE together with
the high Ti levels suggest that ALP228 is predominantly of detrital
placer origin and is unrelated to mineralization.
The lack of an elevated HREE signature in the Tank Hill samples (all
taken from Tank Hill surface outcrop) may be attributed to extreme
weathering accentuated by sulphuric acid gained from sulphides in
these rocks, which resulted in preferential removal of HREE (Nesbitt,
1979). A similar explanation was proposed for the low HREE content of
MnQ (section 6.2.7.1).
10.10 Genetic model for Aggeneys-Gamsberg orebodies and OEH
Application of Cu-Pb-Zn ratio modelling to the Aggeneys-Gamsberg
deposits (section 10.3.3) showed that the four orebodies were probably
generated by independently operating convecting systems which gained
their metals by circulating deep into the basement (section 10.5).
The possibility that fluids migrated laterally along an aquifer and
selectively deposited their metals, has already been discounted in
section 10.1 and 10.2.1. An alternative hypothesis of a single
convective cell which exhaled hydrothermal fluid at a point source, is
highly unlikely because the fluid would have had to migrate over tens
of kilometres, progressively and selectively precipitating out
different elements. The deposits should then be continuous, ·instead
of only having possible OEH linking them. If the fluid reached the
surface in the Black Mountain-Tank Hill area, these being chosen
194

because of their hydrothermal alteration features (section 10.1 and
10.8), then the barite at Gamsberg must have had a source independent
from that of the sulphide orebody since the instability of Ba in
contact with sea water (sections 10.4 and 10.6) would preclude its
migration beyond the limits of the reducing hydrothermal packet of
solution. A dual source model for Zn and Ba at Gamsberg would be
highly fortuitous. The convective system responsible for generating
the Cu-rich Black Mountain orebody must have been more. alkaline (Figs.
10.4a and d) than systems at the other deposits. If these fluids then
migrated eastwards precipitating the bulk of the Pb in the Broken Hill
area and then most of the Zn in the Big Syncline and Gamsberg areas,
the fluids would have had to evolve to progressively more acidic
compositions in order to preferentially retain Pb and then Zn in
solution (see 50°C curves in Figs. 10.4a and d). Such a model is
untenable because mixing with normal seawater (pH = 8.1 - 8.3;
Krauskopf, 1979, p46) in the zones between the different basins, would
have kept the solutions alkaline. Furthermore, the temperature drop
encountered on exhalation (section 10.6) would have precluded
migration of metal-charged fluids over the required distances.
In reviewing the genesis of the orebodies it is pertinent to summarize
some of the key limiting factors present in the Aggeneys-Gamsberg
area. These include the fact that the supracrustal rocks are
unusually thin, in total measuring < 1 OOOm , of which only some 60%
of the succession occurs below the orebodies, thus metal leaching of
the basement is likely. The Bushmanland Subprovince is so dominated
by exposures of highly siliceous and potassic gneisses and granites,
including those which definitely predate the orebodies (i.e. Achab
Gneiss), that even had major thrust-type dislocations taken place, all
four orebodies would effectively still lie on a common felsic
basement, yet each deposit has unique metal ratios. There are no
195

gross intrusions underlying the ore horizon which could have
stimulated convection, thus geothermal energy was the most likely
source of heat. The thin amphibolite layer at the boundary between
gneiss and NS below the Black Mountain orebody, and the minor lenses
of amphibolite within NS at Broken Hill, could have contributed only
small quantities of thermal energy. The presence of rifting in the
Aggeneys-Gamsberg area was likely (Lipson, 1981a; Rozendaal, 1982), as
suggested by the amphibolites (tholeiitic meta-basalts; Reid et al.,
1987) at Koeris, Aggeneysberge and Gamsberg, and the elastic wedges of
conglomerate and diamictite at Black Mountain and Aggeneysberge (Ryan
et al., 1982; Strydom, pers.comm., 1982). The higher heat flow
associated with these rift faults which separated the individual
basins, could therefore have set convection in motion, and helped
focus fluids during exhalations.
At the time of ore deposition, the Broken Hill basin was at least
partly open to the sea (sections 9.1.4.1, 9.1.7 and 10.4) and the same
may be deduced for the basin at Black Mountain since similar
oxygenated rocks which lack graphite, predominate there. In contrast,
the Gamsberg basin was enclosed (section 10.4), and the accumulation
of organic remains on the sea floor would have consumed Oz during
conversion to C02, resulting in increased H• concentration (Grasshoff,
1975). Such falls in pH below thermoclines are recorded from Lake
Kivu (Degens and Staffers, 1976) and Framvaren Fjord (Piper, 1971)
hence on a regional basis, sea water pH at the time of ore deposition
must have decreased towards the east, as corroborated by the more
positive 6 24S ratio being located in that direction (section 10.4).
The lowest Sus ratios from the Black Mountain area suggest that this
basin was even more open to the sea than Broken Hill. The Cu-Pb-Zn
ratio modelling independently showed that ore solutions became
progressively more acidic towards the east (section 10.3.3). Von
196

Gehlen et al. (1983) suggested that bacterial reduction of sulphate in
the enclosed Gamsberg basin caused an enrichment of 3'S in the basin
waters. This fluid thus already had the attributes of low pH (section
10.3.3) and reduced S (section 10.4), most significant for generating
solutions with high Zn/Pb and Zn/Cu ratios, before being convected
down into the basement to later re-emerge as the metalliferous
hydrothermal solutions having positive b34S ratios. Not only Zn but
also Ba concentrations would be enhanced in these solutions, while the
more oxidizing, S-def icient waters would carry more Pb but far less Ba
(section 10.3.1). The low temperature (< 200°C) fluids rich in
reduced S would be dominantly Zn-rich - Pb-poor (section 10.3.1),
while similar fluids rich in c1- (and not in reduced S) would be
relatively Pb enriched. Thus the Zn and Ba in the Gamsberg deposit
are readily explained, while circulation of more oxidizing and higher
temperature water led to the Broken Hill orebody being Pb-rich, but
relatively Ba-poor. Clearly these are not the only reasons for the
difference between the Gamsberg and Broken Hill deposits since Black
Mountain has substantial Pb as well as an associated 8mt barite
deposit. The highest temperature fluids which formed the Black
Mountain deposit (section 10.3.3), had similar surface water f02
concentrations to those at Broken Hill, but would have nevertheless
promoted Ba extraction in the Black Mountain hydrothermal cell because
the solubility of Ba increases with temperature up to at least 300°C
if the NaCl content is .. ?.. lm (Holland and Malinin, 1979), conditions
which were probably met at Black Mountain but not at Broken Hill
(section 10.3.3).
It is therefore suggested from the discussion above that while the
source and isotopic character of S for the orebody sulphides is
envisaged as circulated sea water derived partly or wholly from the
same local basin into which the ore fluids would ultimately be
197

debouched, cold sea water sulphate was the source of sulphur for
barite precipitation when the hydrothermal Ba reached the basin.
Inherent in the proposed model of circulating convective cells which
leached the basement, is that large quantities of fluid must have been
pumped through the basement (high fluid/rock ratios), as also proposed
by LeHuray et al. (1987) for the formation of the Irish deposits.
The Gamsberg orebody probably formed from fluids which penetrated to
relatively shallow crustal levels, as deduced from the low fluid
temperatures. The felsic and potassic nature of the crust encountered
enhanced the fluid's acidity (section 10.5). Exhalation back into the
enclosed basin further lowered the pH so that with time, the fluid
system became more efficient at leaching Zn from the crust. This
resulted in the observed increasing Zn concentrations found
stratigraphically higher up in the Gamsberg orebody (Martin, 1989).
As fluids reached the sediment-water interface, no metals would have
escaped due to the enclosed nature of the basin, hence confirming that
the Gamsberg ore fluid must have contained Zn to the virtual exclusion
of Cu and Pb.
Of the Aggeneys-Gamsberg deposits, Black Mountain had the highest
temperature fluid as deduced from thermochemical modelling (section
10.3.3) and from the maximum temperature drop (Fig. 10.10) indicated
at Black Mountain by the large quantity of silicif ication in the form
of Garnet Quartzite replacement of schist there. Small zones
containing chalcopyrite and pyrite in .basal gneisses at Black Mountain
have not been documented from any of the other deposits, and suggest
that not only did fluids pass through the gneisses in the
stratigraphic footwall of the Black Mountain deposit, but that these
solutions at Black Mountain were also at higher temperatures than
elsewhere. These indications of high temperature fluids suggest that
198

fluids penetrated to the greatest depth at Black Mountain. During the
convective flow of oceanic water in the Black Mountain area through
the felsic rock of the exposed crust, the fluid pH would decrease
(section 10.5). The Cu-rich nature of Black Mountain indicates that
the fluid composition was in fact less acidic than for any of the
other deposits. It is therefore suggested that the more deeply
penetrating Black Mountain convective cell reacted extensively with
crust of a more maf ic composition at depth in order to have buffered
the fl~id to the high estimated pH values. The slightly more acidic
character of the Broken Hill convective cell fluids, and the lower
estimated fluid temperatures, suggest that in the case of Broken Hill,
the fluids did not penetrate to the same depth as those of Black
Mountain, and reacted only to a limited extent with the proposed more
maf ic crust.
The relative positioning of the Aggeneys-Gamsberg deposits with
respect to the prograding beach-barrier sedimentary system is
schematically shown in Fig. 10.12a in which Black Mountain and Broken
Hill formed in the more oxidizing washover deposit zone which was in
communication with the open sea (probably via inlets not shown in the
illustration), while Big Syncline and Gamsberg developed in what was a
more restricted part of the estuarinal environment where reducing
conditions predominated. The details of ore in relation to host
rocks, and of convective cells, are contrasted between Gamsberg and
Broken Hill in Fig. 10.12b.
It was suggested in section 10.5 that successive cycles of convecting
fluid could result in the formation of ore lenses with distinct metal
characteristics. If tectonic activity occurred before restoration of
the rocks to the ambient geothermal gradient, then subsequent
convective cells would be shorter lived, resulting in the younger ore
199

lens being smaller, as found at Broken Hill. The Intermediate Schist
would represent sedimentation which occurred during the period between
hydrothermal exhalations.
Once deposited, the orebodies would represent easily erodible soft
sediments, and it is envisaged that the slow formation of the
stratigraphically overlying BGZ and SS in the quiet, prograding,
restricted environment (sections 9.1.6 and 9.5), ensured preservation
of the Broken Hill deposit. Large (1981b) concluded similarly that
quiet (graphitic) conditions are necessary for the preservation of
sedex deposits.
In summary, the salient points envisaged for the genesis of the
orebodies and OEH follow below. Each of the four Aggeneys-Gamsberg
deposits developed from independent hydrothermal fluid convecting
cells with the composition of the water in the overlying rift-bounded
basin to some extent determining the physical properties of the
circulating fluids (Table 10.6). The deeply circulating fluids at
Black Mountain and the Cu-rich nature of that orebody, suggest that
the basement is probably more maf ic at depth. Both the depth of fluid
circulation which controlled fluid temperature and pH, as well as the
initial fluid properties prior to convective circulation, ultimately
determined the proportions of metals leached from the basement.
Consequent orebodies largely retained the metallic ratios of the fluid
since the condition Inrota1 s >> Inrou1 meta1 was met. A high fluid/rock ratio
obtained throughout the mineralizing events which tapped the renewable
source of overlying sea water. Metals were deposited within a few
kilometres of the individual conduits, mainly due to temperature loss.
The driving force for convection was probably geothermal energy, which
requires that the fluids propagated progressively deeper with time.
In the case of Broken Hill, this process may have continued until the
200

brittle-ductile boundary was encountered, at which point the
mineralizing process for the UOB lens ceased. Following a period of
sedimentation during which time IS was deposited, generation of a
shorter-Lived convective cell resulted in LOB being formed.
Although focused at specific centres along faults, the exhaled fluids
also leaked through the footwall rocks such as NS and basal gneisses,
depositing sporadic, disseminated base metal sulphides in both, and
minor Garnet Quartzite lenses in NS. Rocks stratigraphically
overlying the Broken Hill orebody remained unaffected by the
mineralizing event. As the Broken Hill ore fluid moved down the
paleoslope in an easterly direction from its vent at Tank Hill, minor
amounts of exhalative components were deposited to form OEH. The bulk
of the mineralizing fluids probably came to rest in the deepest part
of the Broken Hill basin, which was oxidizing except for that part
affected by the highly reducing hydrothermal fluids. Small parcels of
the fluid continued eastwards to produce OEH as far away as
Maanhaarkop.
201

11. CONCLUSIONS
11.1 Stratigraphy and sedimentology
In the study of rocks around Aggeneys, use has been made of field
relationships, petrography, and lithogeochemistry, with emphasis on
the latter because of the degree of metamorphic alteration and
structural complexity. An investigation into the degree of element
mobilization due to metamorphism has revealed that care need be taken
only with the elements Na and and to a lesser extent Sr, which were
lost to pegmatites.
Along the line of inselbergs stretching from Broken Hill to
Maanhaarkop and underlying a suite of felsic gneisses, three major
litho-types exist, namely the structurally overlying Namies Schist
(NS), Broken Hill Quartzite (BQ) and then Shaft Schist (SS). Both the
petrography and lithogeochemistry reveal that NS and BQ are linked by
gradational variations, while SS is likely to have formed a
conformable part of the succession. Between BQ and SS occurs a mixed
suite predominantly comprising schist (most similar in character to
NS), which hosts the Broken Hill orebody as well as Ore Equivalent
Schist and Garnet Quartzite. The unit as a whole is called Ore
Equivalent Horizon (OEH). Geochemical evidence suggests that OEH has
also maintained its continuity in the rock succession. Within SS but
near the contact with OEH, are found thin lenses of Cale Silicate Rock
plus Manganese Quartzite (CSMQ).
Physical characteristics as well as lithogeochemistry reveal that
whereas NS formed in an agitated, oxidizing environment, with
deposition of detrital quartzites as an end member, SS formed as a
black shale in a shallow water lagoonal or estuarinal environment with
CSMQ representing the only temporary reversion to oxidizing
conditions. The high S content of SS and the negative Ce anomaly of
202

CSMQ indicate that these rocks formed beneath sea water. Sporadically
high base metal values in NS indicate that the chemistry of NS was
affected by the mineralizing event, and this interpretation is
consistent with the lower S180 values in NS than in SS. The Broken
Hill succession as seen today is therefore interpreted as overturned,
based on the above evidence; on the inverted cross-bedding in
quartzites; on the observation that SS in the immediate hangingwall of
CSMQ was also oxidized; and on the regional presence of gneiss at the
base of metasedimentary successions in Bushmanland.
The triad NS, BQ and SS emerge as metasediments of high chemical
maturity, and together with their low Eu/Eu* ratio suggest that their
deposition occurred along a passive continental margin se~ting. The
order of occurrence from NS through BQ to SS conforms well with linear
beach-barriers with NS representing the seaward shoreface sediments,
BQ the quartz arenite beach and dune environment, and SS the sediments
formed in the partly enclosed basin nearer the continent. Large
components of OEH probably represent washover deposits sourced from
NS. Such continental margin sequences are dynamic systems which
commonly prograde with the shoreface sediments coarsening upwards to
the quartz arenites, and in turn being overlain by the black shale.
Mapping, petrographic work and lithogeochemistry have confirmed both
the presence and polarity of the triad of rocks in the Namiesberg
Achab and Wortel areas, hence it is suggested that progradation
extended from well to the north of Aggeneys to some point south of the
area. The Late Jurassic Cotton Valley Group straddling the Gulf of
Mexico represents an analogous model in which the same triad of rocks
give way closer to the provenance to arkosic red beds, which both
underlie and overlie the succession. In Bushmanland, such
metasediments may be present in the form of the Beenbreek Formation,
203

the feldspathic quartzites in places at the base of the succession at
Wortel, and in the feldspathic quartzites or quartzitic gneisses at
the top of the succession in the Aggeneysberge. Recognition of the
regional nature of the metasedimentary triad considerably simplifies
stratigraphy in the schist and quartzite belts of the Aggeneys
Subgroup.
Comparisons between the chemistry of rocks from Aggeneys, Namiesberg
Achab and Wortel indicates that variable sand input was the dominant
factor controlling regional facies variation. Progressively cleaner
separation of Al from Si in the schists and quartzites further south
suggest progradation in a southerly direction away from a northerly
provenance. The thickening of quartzite to the north of Aggeneys
supports this contention. The REE patterns amongst other evidence
show that a weathered granodioritic parent probably contributed its
detritus to forming the Aggeneys Subgroup, and both the Pb isotope and
oxygen isotope data are compatible with a provenance of granodioritic
rocks of the Vioolsdrif Suite. Ca removed from the provenance during
early stages of weathering was probably precipitated in a distal
environment to form the calcic rocks south and east of Aggeneys, while
the Na remained in solution. Detrital transport of the granodioritic
residuum lead to the generation of Ca- and Na- depleted shales and
sandstones.
The chemistry of Cale Silicate Rock and of Manganese Quartzite differ
significantly from that of possible correlative rocks in the Broken
Hill orebody, yet the elevated concentrations of base metals and U,
Sb, As and Ag in CSMQ certainly suggest a hydrothermal component. It
is suggested that the fairly violent introduction of metal-bearing,
hydrothermal fluids into the meromictic basin caused disruption of the
thermocline beneath which SS was forming. The elements and oxides
204

P205 , MnO, Fe20a, MgO, Cao and Si02 at the thermocline boundary, as well
as the introduced metals, then precipitated to form CSMQ, while Al20a
remained soluble. As acidic conditions re-established in the deepest
part of the basin, CSMQ dissolved, leaving peripheral lenses of the
rock. The lack of CSMQ in the immediate stratigraphic hangingwall of
the orebody therefore suggests that ore was deposited in the deepest
part of the local basin.
From the foregoing, there appears to be little sedimentological
control on the location of the Broken Hill orebody within the
prograding shoreline, save that progradation of SS almost immediately
above the deposit helped in its preservation. Possibly the regional
occurrences of small sulphide deposits within NS (Rozendaal, 1982}
reflect the vestiges of deposits largely destroyed by the subsequent
high energy style of sedimentation.
11.2 Ore genesis and local tectonics
The higher heat flow normally associated with rift environments, as
alluded to in section 10.10, would have promoted the leaching of
metals by convecting fluids, and as envisaged by Rozendaal (1982),
these structures would focus the flow of returning hydrothermal
solutions. The germain features envisaged for localizing the
orebodies are represented schematically in Figs. 11.la-c, and depict
the most likely, though unproven, tectonic controls on the
mineralization process. East-north-east trending continental margin
rift faults developed in the basement before or during early
sedimentation of the Aggeneys Subgroup (Fig. 11.la) over which the
beach-barrier system prograded to the south, producing the thickest
development of NS in the Aggeneys-Gamsberg area and a thinning of BQ
towards the south (Fig. 11.lb). Tilted, fault-bounded rift blocks are
envisaged as having created the sub-basins necessary for the
205

development and trapping of the individual ore deposits (Fig. 11.lc).
Periodic mineralization in the Aggeneys area over such stationary "hot
spots" is manifest by minor sulphide mineralization in NS at the
western closure of the Aggeneysberge (Lipson, 1978) and in the eastern
Aggeneysberge, and possibly at Tank Hill as well, while small lenses
of sulphide occur at Broken Hill within MOS. The two superposed
lenses comprising the Broken Hill orebody also represent a stationary
source generating mineralization in successively higher layers of the
stratigraphy.
The synsedimentary growth faults in the Aggeneys area produced
individual yoked basins of which that at Black Mountain was the
deepest and hottest and probably overlaid the master faults "a" and
"b" in the rift system (Fig. 11.lc). Fault "b" fed the fluids to the
proximal Black Mountain orebody, while fault "a" which had its surface
expression at Tank Hill, fed the more distal Broken Hill orebody. The
onset of a right-lateral simple shear couple (Fig. 11.ld) initiated
synclinal formation at Black Mountain (Fig. 11.le), being the hottest
and deepest of the sub-basins, and this earliest deformation at
Aggeneys caused reactivation of the normal faults into either reverse
faults (thrusts) on the southern limbs of synclinal structures, or
greatly exaggerated the throw on the normal faults, causing major
"losses" of supracrustal rocks between the inselbergs. Measurement of
lineations at Broken Hill suggest subhorizontal movement, thus instead
of movement from north to south as indicated by the northerly dip in
Bushmanland, the movement direction probably had a strong westerly
component. The later, open folding in the Aggeneys area produced the
configuration seen today, with folding of the postulated reactivated
growth faults which cross-cut the strata at shallow angles (Figs.
11.lf and g). It is of note that a structure conforming to fault "a"
bringing quartzite and ore progressively into contact with gneiss, has
206

been located in drill hole intersections between Black Mountain and
Tank Hill (Stedman, 1980).
Modelling of processes responsible for the generation of deposits with
such widely varying metal ratios over so thin a supracrustal
succession has shown that independent cells of convecting fluid must
have leached many kilometres down into the basement. Selective
stripping by solutions, of radiogenic Pb from basement feldspars
commonly results in syngenetic ore deposits returning Pb-Pb ages
younger than their host rocks (Prof. H. Barnes, 1990, pers.comm.), and
may account for the anomalous 1 200 - 1 500Ma ages determined for the
Aggeneys-Gamsberg orebodies by Koeppel (1980). The combined effects
of utilization by the convective systems of the physically and
chemically different waters from the individual basins, and the depth
of fluid penetration into a basement which probably becomes more maf ic
at depth, were responsible for the differential leaching of metals.
In the case of Broken Hill, once the fluids were focused up the major
faults and exhaled onto the sea floor, the sulphide load was deposited
rapidly in the nearby Broken Hill basin, mainly in response to falling
temperature. The layered Garnet Quartzite and biotite-garnet schist
lying along the time horizon of the orebody represent a combination of
exhalite not incorporated into the orebody and terriginous clays.
Some of this material may have emanated from subsidiary cracks in the
sea floor at varying distances from the major faults, thus
contaminating strata stratigraphically below the ore time horizon.
Certain elements and inter-element ratios in both OEH and NS could
therefore be used at local and regional scales to guide the
explorationist towards a potential orebody.
207

11.3 Ore halo and exploration
It is shown that NS near the Broken Hill orebody has higher
concentrations in the elements Pb, Zn, Ba, Fe, P and Y than in
regionally developed NS unrelated to known mineralization. This
observation holds notwithstanding the more Si-rich and Al-poor nature
of NS samples from Broken Hill. Broken Hill Quartzites near the
orebody also have elevated concentrations of the elements Cu, Pb, Zn,
Mn and Fe, and lower Na and Sr, than their regional counterparts. For
SS, only the element Pb is significantly higher near the orebody.
The mineralization halo along the Ore Equivalent Horizon extends for
up to lOkm from the Broken Hill orebody. Samples of Ore Schist from
borehole core reveal increases in the elements Zn, Mn and Ba towards
the orebody, while for outcrop samples of that rock, the elements Zn,
Ba and Pb show a general increase nearer the orebody. When the "Ore
Factor" scores from Factor Analysis of Ore Schist from both borehole
core and outcrop samples are plotted against distance, there is also a
general increase in scores towards the orebody. · For the rock-type
Garnet Quartzite, and the mixed rock Ore Schist and Garnet Quartzite,
both the Zn and Pb contents increase towards the orebody, as do the
Pb/Pb+K and Zn/Zn+Al ratios.
The geochemical trends described in the Ore Equivalent Horizon are
defined by broad scatter about the generally increasing values of
indicator elements and inter-element ratios progressively nearer the
Broken Hill orebody. Numerous samples are required for confident
application of the technique to the search for more ore.
208

11.4 Geotectonic setting
The Groothoek Thrust (Fig. 1.4) was viewed by Moore (1986) as the
suture zone between the northerly subducting ''Namaqualand
microcontinent" on which is located the Bushmanland Group, and the
Vioolsdrif Suite to the north. He stressed the role which subduction
had on lithospheric evolution of the area, since not only were the
calc-alkaline volcanics of the Orange River Group attributed to
melting above the subduction zone, but acid volcanism which post-dated
the continent-continent collision event, was also indicated just to
the north of the envisaged suture zone. It is these late volcanics
whic.h Moore (1986) proposed were feeding the "Namaqualand peripheral
basin" in which the Bushmanland Group was developing. Joubert (1986)
has, however, called into question the likelihood that the Groothoek
Thrust marks a suture since the maf ic intrusives which help define the
thrust zone are definitely not abducted oceanic crust, but probably
represent the mafic to ultramafic base or subvolcanic complex part of
the Orange River Group. The possibility that south of Vioolsdrif the
Thrust cuts rocks of the Vioolsdrif Suite also suggests that the
Thrust is not a cryptic suture. Blignault et al. (1983) interpreted
the Groothoek Thrust as just one of a number of thrusts. Gravity
profiles from de Beer and Meyer (1983) do not detect the Groothoek
Thrust and show rather that the Namaqua Front Zone (Fig. 1.1) is the
northern boundary to the craton. To the north and south of the
Groothoek Thrust the basements of Orange River Group-Vioolsdrif Suite
and Achab Gneiss, respectively, have approximately the same ages of
2.0Ga (Reid and Barton, 1983; Welk~ and Smith, 1984; Armstrong et al.,
1988), and remarkably similar metasediments occur on both sides of the
Thrust. The quartzites in the Pella and Dabenoris areas look the same
as those at Aggeneys and both contain heavy mineral layers. Fresh
schist borehole core examined from the Pella area has all the
attributes. of SS, while the quartzite-banded iron formation-muscovite
209

schist-conglomerate suite occurring in the Dabenoris area has the same
characteristics and stratigraphic polarity as found at Gamsberg.
Since both basement and cover rocks to the north and south of the
Groothoek Thrust have such similar properties, there is little reason
to deduce that separate continents originally existed on either side.
The dating of 2.0Ga detrital zircons from BQ renders unlikely Moore's
(1986) model of 1.6Ga acid volcanics syncronously feeding detritus to
the developing Bushmanland basin. The present study has also shown
that weathering of a continental granodioritic provenance was required
to generate the metasediments at Aggeneys, therefore rocks of the
Vioolsdrif Suite, which probably formed the interior when the
siliclastic Bushmanland Group was developing along the continental
margin, remains a likely provenance. The Pink Gneiss which underlies
the metasediments and falls outside the scope of this study, may well
represent a composite felsic rock of both igneous origin (intrusive or
extrusive) or reworked igneous rock, as proposed by Moore (1986). The
sedimentary components thereof, which were derived from the youngest
and most felsic part of the Vioolsdrif Suite, probably formed red bed
deposits.
Early (2.0Ga) subduction from the north (Fig. ll.2a) probably
generated the calc-alkaline Vioolsdrif Igneous Suite (Joubert, 1986),
followed by deep weathering of this predominantly granodioritic
terrain. The Namaqua Front represents the suture zone once continent
continent collision eventually occurred (Fig. ll.2b). Although Stowe
(1986) suggested that subduction along the Southern Cape Conductivity
Belt (SCCB) (Fig. 1.1) in the Vanrhynsdorp area started at only
-1.0Ga, it is suggested here that subduction may have commenced at an
earlier date (1.7 - 1.8Ga) which generated a second granitoid and
volcanic belt. The Bushmanland basin formed on the passive margin
210

adjacent to a marginal basin (Fig. ll.2b), and east-west rifting there
might have been influenced by SCCB subduction. The weathered
Vioolsdrif provenance contributed sediments along the passive northern
margin. Immature detritus was fed into the Bitterfontein area from
the volcanic arc to the immediate north and from the continent to the
south, to produce the feldspathic quartzites and metapsammitic
gneisses mapped by Moore (1986). "A-subduction"-type megasuture
tectonics (Mitchell and Reading, 1986, p513) which followed the
continent-continent collision in the south, may have caused thrusting
with a south-west vergence (Fig. ll.2c) which reactivated normal
faults in the Bushmanland basin. The geotectonic model favoured
therefore comprises three continents and two subduction zones, with
the Bushmanland and Richtersveld Subprovinces representing a single
micro-continent (Fig. ll.2b).
The major zones of rifting in the Aggeneys area are probably analagous
to those found along passive continental margins as shown by Falvey
and Mutter (1981) over which sediments typically prograde. These
Australian examples refer to continental breakup with sea floor
spreading, causing basins having up to 6km of sediment. In contrast
the thin <i lkm thick) Aggeneys Subgroup is here envisaged as having
formed along the passive margin side of a shallow marginal basin (Fig.
ll.2b) which, as shown in Fig. 11.67E of Mitchell and Reading (1986),
are commonly high heat flow regimes. The increased geothermal
gradients in the Aggeneys-Gamsberg area during the time of ore
deposition probably heralded the transition of the Aggeneys
environment from one of passive continental margin as deduced from the
lowermost part 6f the supracrustal succession, to that of a back arc
basin (Reid et al., 1987) as suggested by the amphibolites and
conglomerates at the top of the succession. The combination of
passive margin rifting, thick felsic basement and local areas of
211

elevated temperature were probably the key factors leading to
generation of the Aggeneys-Gamsberg Pb-Zn-Cu sedex deposits.
Progradation of SS at Broken Hill ensured preservation of the deposit.
212

PART E.
APPENDICES AND REFERENCES

12. APPENDICES
APPENDIX A SAMPLING AND ANALYTICAL TECHNIQUES
A.1 Sampling rationale and techniques A.1.1 Parameters common to borehole core and surface outcrop sampling
A previous orientation study on MnO distribution surrounding the Broken Hill and Big Syncline orebodies (Lipson, 1981b) showed an exponential increase in MnO concentrations with decreasing distance from each deposit. Samples for the current study were therefore collected more frequently progressively closer to the orebody in order to detail the geochemical character of the rocks over the zone of most rapid chemical change (Figs. A.1 and A.2).
No samples were taken across major lithological contacts. Bands of < 2m (usually pegmatite or quartzite) were omitted except for interbedded OES and GQ where a combination of the two were taken, and the sample called OES+qQ. All weathered or fractured pieces of rock were omitted from samples.
A.1.2 Borehole core samples Most sampled core taken was of BX diameter < .. :::.43mm). Five to ten centimetre pieces of homogeneous core were taken at intervals of .: .. 1.5m, and accumulated over the sampled width of up to 90m for some quartzites.
Two Wortel boreholes were sampled because neither was adequate for sampling of complete stratigraphic successions. WTL4, which contains the most complete stratigraphic succession, is too veined and fractured at shallow depths (< 372m from surface) to be sampled for lithogeochemical purposes. The supracrustal succession in WTL3 was therefore sampled from 261m down to 470m, whereafter sampling continued from the same stratigraphic horizon at a depth of 394.9m in WTL4 to the end of the hole (Fig. A.ld).
A.1.3 Surface outcrop samples Along the strike of specific lithologies, a bulk sample was collected from an area measuring up to lOm * lOm. All obvious weathered portions of the rock were removed in the field.
A.2 Analytical methods A.2.1 Sample preparation All external surfaces of borehole core were sanded down using emery paper. Where possible, any signs of weathering, veining or fracturing were separated from the main sample using a manual or hydraulic splitter. In the case of sample ALP183, selection of recently weathered borehole core from a rusted core tray could not be avoided. The standard techniques employed by the Geochemistry Department of the University of Cape Town (Duncan et al., 1984) were used for analyzing the Bushmanland rocks. The fresh chips of sample were then cleaned in
213

distilled water by ultrasonic agitation for 10 - 20 minutes, followed by drying at 110°c for +4 hours. A jaw crusher fitted with Mn-lined, carbon steel jaws, was used to reduce the sample to +lOmm chips. All apparatus in the crusher with which the sample comes into contact was carefully cleaned and off-cuts from the spiitting phase was crushed as a precontaminant, prior to crushing the next sample. The crushed sample was coned and a representative 60g aliquot extracted for pulverizing for 25 minutes in an agate Siebtechnik vessel. Cleaning and precontamination of the vessel followed the procedure outlined for the jaw crusher. Some 6g of the pulverized sample was compressed into a pellet, using 2% mowiol solution as binder, a die to shape the pellet, boric acid as a backing, and a hydraulic press which subjected the pellet to seven tonnes pressure. Trace element and Na20 analyses were performed on these briquettes. The H2o- and loss on ignition (LOI) were determined by weight loss on heating a 1.5gm aliquot of pulverized sample to ll0°C and 1 000°c, respectively. The major rockforming oxides excluding Na20 were determined on duplicate glass disks fused at 1 000°C and comprising 0.28g of ashed sample, 1.5g of flux (Spectroflux 105) and 0.02g of NaNOa as outlined by Norrish and Hutton (1969). Fusion was performed in a Pt-Au crucible and the bead cast in a carbon mould.
A.2.2 X-ray fluorescence spectrometry (XRF) Virtually all analyses excluding that of carbon, were performed on the Siemens SRS-1 and Phillips PW1400 wavelength dispersive XRF spectrometers, with the K-alpha line being measured for all major and most trace elements (Table A.1). Blanks and standards were measured and all the data corrected via programmes on the HP 1 000 minicomputer, for background, spectral line interference, dead-time, instrumental drift and position in the sample holder carousel. Standards utilized included rocks from the USOS and South African NIMROC collections. The lower limits of detection (LLD) and counting errors for all elements deduced by XRF are given in Table A.2. A number of quartzite samples for which the elements Na 20, MgO, and MnO fall below the LLD, were analysed at the ppm level by Gold Fields Laboratories using the Atomic Absorption Spectroscopic (AAS) technique. All AAS analyses were run in duplicate with blanks being measured to monitor background, and pure elements diluted in 10% HCl, used as standards. Silicates were dissolved in HF and all solutions were measured at 10% HCl dilution. In order to integrate the low level AAS data with the XRF analyses, a reduced major axis linear regression was performed on duplicate AAS- and XRF- derived analyses which fall above the XRF lower limit of detection, and the AAS analyses were adjusted using the regression equations.
A.2.3 Volatile-free recalculation In Tables A.3 and A.5 are presented the uncorrected and volatile-free data, respectively. For all statistical calculations and all graphical representations of the analytical data, the volatile-free major elements are used together with the original, uncorrected trace element data, since volatile-free recalculation of trace elements result in negligible changes. The difference between plotting
214

volatile-included and volatile-free trace elements against volatilefree major elements may be graphically seen in Fig. A.3, chosen as an extract from Fig. 6.5, for which there exists a wide variation in LOI and H2o- concentrations. It is only at the high Al20a end of the spectrum, where their contributions to the total major element analyses become significant, that the difference between the trace element concentrations on a volatile-included- and volatile-freebasis can actually be recognised, such as the change from 45ppm to 47ppm Ni at 20.7% Al20a, and 272ppm to 281ppm Pb at 20.4% Al20ao
A. 2. 4 Gas chromatography Carbon analyses were conducted on 50 aliquots of pulverized sample, using a Carlo Erba Strumentazione Gas Chromatograph Element Analyzer (model 1106) housed in the National Research Institute for Oceanography in the CSIR Stellenbosch Laboratories. The instrument utilizes the thermal conduction principle of detection. Empty crimped tin boats acted as blanks, while two different standards were inserted at intervals throughout the runs and comprised acetanilide ( CsHsNHCOCHa) and eye 1 ohexanone din it rophenyl hydrazone ( C12H12N20z) • Lower limits of detection are approximately 0.01% C. Previous carbon analyses on McArthur River samples by Lambert and Scott (1975) had shown that at high S concentrations, S overloading of the instrument traps had resulted in S being read as C in the detection chamber. In order to test for this problem in the current study, three different weight aliquots of a pulverized C- and s- bearing sample were analysed (Table A.6) and showed that increased sample weight does not lead to an increase in the C content, thus S overloading at S concentrations of 1.4% does not constitute a problem. Furthermore, Table A.6 also shows that samples in excess of 5mg sample weight may be considered homogeneous.
A.2.5 Comparison between XRF and Instrumental Neutron Activation Analysis (INAA) results for rare earth elements
Most ALP samples were analysed for the three light REE's (LREE), La, Ce and Nd using the XRF techniques outlined above. An estimate of the chondrite-normalized Ho concentration was obtained by multiplying Y by 0.5 (Hanson, 1980), and since
HOaample/HOchondrlte .. :::. Ysample/ 2, HOsample .. ::. (Ysample * Hochondrlte) /2' therefore
HOaamp1e/HOshale -:: .... (Yeample/ 2) * (HOchondrltefHOehale} - Y * 0.0272 for
Hoohoncsrite = 0.0730 (Taylor and Gorton, 1977) and Hoshe.1e = 1.34 (Piper, 1974). Thus the shale-normalized Ho estimate may be gained by multiplying Y by 0.0272. A total of 23 samples were analysed by kind courtesy of D. L. Reid for a range of REE 1 s, as well as a series of additional elements using the INAA technique (Jacobs et al., 1977) and resulting data processed using the Teabags program (Lindstrom and Korotev, 1982) at the New Mexico Institute of Mining and Technology. Table A.7 shows the high precision of the INAA data. The counting errors for individual sample measurements are less than the standard
215

deviations of three replicate analyses, thus the latter are used for quoting two sigma errors for La, Ce and Nd of 4.9, 11.3 and 7.6, respectively. Comparisons between La, Ce and Nd analyses by the two techniques performed on the same samples reveal that the INAA values are usually higher than those obtained by XRF, with the relative deviation at a maximum in the middle XRF value range (at approximately 30ppm for La and Nd, and 6Sppm for Ce; Fig. A.4). Thus although a discrepancy exists in the absolute concentrations of the LREE's, the shapes of the REE profiles should be fairly consistent and comparable between samples analysed by the two techniques.
The accuracy of the Ho estimate can only be indirectly assessed by comparing the shapes of INAA and XRF derived REE patterns, since Ho was not analysed by INAA. Fig. A.Sa displays INAA data for samples with a range in heavy REE (HREE) values, while Fig. A.Sb shows the corresponding XRF derived REE patterns with the Ho estimate. The shapes of both INAA and XRF REE patterns at the HREE end of the spectrum are sufficiently similar, albeit at different absolute concentrations, to justify using XRF data with recalculated Y as a Ho estimator for interpr_etive purposes in samples where INAA data are not available.
216

APPENDIX B STATISTICAL TECHNIQUES
B.1 Correlation The Pearson correlation matrix is calculated from log10 transformed data within BMDP program P4M (factor analysis). For SS the data set is 23 samples because REE data is not available for the remaining two samples. c analyses were run on 16 samples including the two for which REE are outstanding.
B.2 Factor analysis Davis (1973, p412-413) suggests that many of the multivariate statistical methods do not have as rigorous a theoretical background as univariate data analysis. Also many of the multivariate techniques have been worked out only for the most restrictive assumptions. The more general assumptions are inadequately known for many real world problems. Temple (1978) criticized the use of factor analysis in geology on the grounds that the hypotheses are complex since they consist of believing in (i) a small number of factors, and in (ii) partitioning the variances into "uniquenesses" and "communalities", terms which have never really been defined. Temple (ibid.) asserted that the varimax rotation does not really improve the meaningfulness of the factors, thus he advocates the use of the unrotated (principal) components since in addition they do not rely on complex hypotheses. Chayes and Trochimczyk (1978), however, even questioned the use of principal component analysis (and hence factor analysis) on closed arrays. From the foregoing it is clear that problems abound in applying factor analysis to closed arrays. Davis (1973) nevertheless asserted the proved empirical usefulness of factor analysis in a geological context. In this thesis, careful application of R-mode factor analysis is ensured by using mainly high factor loadings before accepting that the elements contribute to a factor; by checking element associations back with the correlation matrix; by noting those factors for which closure is clearly operating; and by only accepting geologically reasonable associations.
. All correlation matrices and hence factor analyses are performed on log10 transformed data, with major elements first being converted to ppm as suggested by Le Maitre (1982, pllO). The data is standardized to ensure equal means and variances before performing factor analyses. The elements C, U and Mo are omitted from all factor analysis calculations due to their levels of concentration falling below the lower detection limits.
B.3 Discriminant function analysis (DFA) DFA is a multivariate statistical technique used to distinguish between defined groups using measured variables. The method serves to weigh and linearly combine the discriminating variables such that the statistical definition of the groups is optimized. Although a basic assumption of DFA is that the variables are normally distributed, departures from normality are not too serious (Le Maitre, 1982). All DFA computer runs are therefore performed on log10 transformed data, which provides a reasonably close approximation to normality (section
217

6.2.1). BIVIDP program P7M (Dixon, 1983) offers variable selection in a stepwise manner, successively incorporating the element with the next highest "F" statistic into the discrimination function. The procedure continues with inclusion and expulsion of variables until no additional variables provide improved discrimination. The summary statistics generated by the program include a parameter known as the Wilke's Lambda or U-statistic which is an inverse measure of the effectiveness of the discriminant function. The default "F-to-enter" of four was accepted in the case of schist discrimination, but was lowered to 1.5 for quartzite due to the low "F'' statistics caused by fairly similar group means.
Selection of elements to be used in discriminating between various schists and quartzites has been limited to less mobile elements because not only has the Bushmanland Group been subjected to non-i sochemical metamorphism (section 6.1), but at Aggeneys the presence of four orebodies might have left some base metal-related imprint on the host rocks. In studies on hydrothermally altered rhyolite associated with the Phelps Dodge massive sulphide deposit in Quebec, Maclean and Kronidiotis (1987) found that the elements Al, Zr, Nb, Ti and Y show the least mobility. The factor analysis evidence that Y displays similarities to the base metals (section 6.2.3), precludes its use as an "immobile" element, but necessitates its inclusion as one of the ore-related elements. Th and Sc are used since Th is far less mobile than uranium, and tends to become residually enriched in resistate minerals such as zircon, or in clays, during weathering and alteration (Pertlik et al., 1978), and Floyd and Winchester (1978) found that Sc is also relatively immobile during metamorphism and hydrothermal activity. Finlow-Bates and Stumpfl (1981) showed that Sc is mobilized in the most intensely altered and sulphidized portions of rocks hosting volcanogenic massive sulphide deposits, but no samples included in the present DFA runs showed indications of intense alteration or sulphidation.
218

APPENDIX C ADDITIONAL PETROGRAPHIC DESCRIPTIONS
C.l Namies Schist (NS) In NS, sillimanite and its alteration products of muscovite and sericite comprise some 5 - 20% of the rock, with only a fraction of the sillimanite being completely fresh. Tourmaline is pleochroic from deep- to light- green. For estimated modal percentages see Table C.2.
C.2 Shaft Schist (SS) Intense sericitization of feldspars in SS is not limited to surface samples, and gridiron twinning of coarser-grained microcline was recognised only in a few thin sections. The common presence of sericite masses pseudomorphing a finer-grained, polygonal mineral suggests the original presence of plagioclase, although no polysynthetic twinning was recognised in thin section. Much of the sillimanite has also been altered to sericite. The only discernable differences between the degree of alteration of SS on surface and in borehole core lies in the darker colour and dustier appearance of surface biotite, and the complete sericitization of surface sillimanite.
A variety of accessory minerals occur in SS. Most zircons occur as fine-grained inclusions in biotite, with occasional zircon grains included in quartz and rarely showing overgrowths. Tourmaline (pleochroic from deep yellow to pale green) is sporadically developed (found in three SS samples only). Apatite occurs in the form of medium-grained, interstitial, elongated prisms, while rare garnet occurs as fine-grained (8 micron) equant grains enclosed in quartz, or 40 micron grains showing an intergrown contact with biotite.
Oval-shaped pegmatitic neosomes within SS measuring 2cm x lcm, comprise coarse-grained quartz and strongly sericitized feldspar. Pyrite and/or pyrrhotite rim the entire neosome. Estimated modal percentages of SS appear in Table C.3.
c.2.1 Biotite Graphite Zone (BGZ) In certain thin sections BGZ shows evidence of severe deformation (Fig. C.1), with rounded and sometimes brecciated quartz grains in an anastomosing matrix of clay and sericite.
BGZ has a comparable mineral assemblage to SS, including high biotite to muscovite proportions (Table C.4), lack of pristine muscovite, presence of graphite and sulphides, and the absence of magnetite. In thin section the higher content of sericite and clay in BGZ distinguish it from SS. Neither tourmaline nor plagioclase are recognised, although some felted masses of sericite may pseudomorph plagioclase. As in SS, zircons appear to have a bimodal size distribution, with most being extremely fine-grained and rounded, while a significant proportion display coarse and broken habits. An associated quartzite horizon comprises some 5 - 8% garnet, K-feldspar, some sulphide, but neither magnetite nor zircon. Due to its thinness
219
and discontinuous nature, no geochemical analyses were performed on this rock.
c.2.2 Cale Silicate Rock plus Manganese Quartzite (CSMQ) Individual bands comprising the Cale Silicate Rock have a decussate texture. Banding in ALP188 is defined by alternating garnet- and quartz- rich layers (Fig. C.2). Grain sizes, shape and mineralogy (Table C.5) vary considerably, with ubiquitously present garnet ranging in diameter and shape from 40 micron with xenoblastic habit (ALP055), to idioblastically developed, 3mm porphyroblasts (ALP188). Coarse-grained (5mm) clinopyroxene which dominates ALP055, is not present in any other thin sections of Cale Silicate Rock.
Garnet displays varying degrees of alteration to chlorite, ranging from minor chloritization of garnet edges, to equant grains in a felted chloritic mass. All garnet grains contain inclusions predominantly of quartz. The diopside of ALP055 is pleochroic from pale pink to pale green, displays twinning, and contains lamellae inclusions of an amphibole which is pleochroic from colourless to pale yellow. Micro shear zones in pyroxene are retrograded to fibrous amphibole. Minor coarse-grained (2mm long) amphibole prisms lie in stable contact with pyroxene. Some of the chlorite of ALP121c probably pseudomorphs pyroxene since a faint orthogonal relic cleavage is visible.
Quartz appears as unstrained, coarse-grained (up to 3,5mm diameter) interstitial filling between the mafic minerals of pyroxene and garnet. Abundant sericite is present in only ALP188 where it is pseudomorphous, probably after plagioclase. The same rock contains biotite flakes which are partially altered to chlorite, and interstitial epidote. The rare apatite of ALP121c displays a coarsegrained (lmm diameter) xenoblastic habit, while zircon, with long axes measuring 20 micron to lmm, mainly displays an idioblastic shape. Positively identified opaque minerals ar~ pyrite, pyrrhotite, sphalerite and galena, which occur both interstitially to the silicates as well as included in pyroxene.
Banding in the Manganese Quartzite is defined by layers of opaque minerals, comprising iron sulphide, sphalerite and galena. These rocks vary from being equigranular with recrystallized unstrained quartz grains measuring 20 micron in diameter, and meeting in well defined triple junctions, to showing intense undulose extinction in grains measuring 3mm. Only in ALP213 are shear zones developed within the quartzite. Garnet, which is scattered throughout the rock, varies in habit from idioblastic to equant, and averages 15 - 50 micron in diameter. Neither biotite nor the rare tourmaline (pleochroic from colourless to deep blue, and measuring five micron on the long axis), display obvious preferred orientation. Inclusion-free gahnite displays a rounded habit and measures 15 micron in diameter. Clays develop after iron sulphides in surface samples of manganese quartzite.
220

c.3 Ore Schists (OS) and Orebody The component schists of OS generally display similar mineralogies, but differ widely in their modal proportions (Tables C.6 - C.9). The common petrographic characteristics are therefore described, with reference being made to features limited to specific samples.
All OS samples display a well developed foliation defined by biotite, elongated, strained quartz, sillimanite, elongated garnet, and Kfeldspar porphyroblasts. On a microscopic scale folding of biotite and muscovite flakes reflect deformation seen in outcrop. The rocks are generally coarse-grained with the individual minerals quartz, muscovite, biotite, garnet, sillimanite and feldspar commonly of the order of lmm along the long axis. Specific porphyroblasts of garnet and K-feldspar measure up to 8mm. Many schist specimens display compositional banding at the cm scale, with more quartz-rich portions forming quartzite layers, trains of sillimanite nodules defining aluminous-rich bands, and garnet-biotite concentrations constituting the mafic layers. The latter assemblage typifies the silicate mineralogy of the immediate orebody environment and ore-related rocks. The same garnet-biotite pairing as found in ALP047 and ALP049, which are the direct down-plunge continuations of UOB and LOB, respectively, is also found in OES both close to and far removed from the orebody.
Of the two forms of garnet present, the massive variety is most common and displays alteration along cracks to chlorite plus opaque mineral dusting. The bulk of the chlorite present, however, replaces biotite. Biotite concentrically rims the skeletal and possibly younger variety of garnet which poikiloblastically encloses quartz, biotite and occasionally sillimanite. The presence of this second type of garnet seems to be restricted to rocks which have undergone a large degree of sericitic alteration.
K-feldspar appears prominently in hand specimens and thin sections of UFS, but microscope examination reveals that HS and OES may also contain up to 10% of the mineral (Tables C.6, C.7 and C.9), while OES+GQ commonly carries large (up to 8mm across) K-feldspar porphyroblasts which poikiloblastically include quartz, biotite and garnet (e.g. ALP049). K-feldspar occasionally displays perthitic intergrowths and more rarely gridiron twinning. Sillimanite and Kfeldspar seldom touch, and the zone separating the two minerals frequently comprises simplectic intergrowths of undeformed muscovite and quartz. Only in ALP047, a strikingly unaltered sample, are folded trains of helicitically preserved sillimanite found in K-feldspar. The bulk of the muscovite and sericite in the schists occurs as a retrograde product after biotite, K-feldspar and sillimanite. Although the prismatic faces of biotite and muscovite appear to lie in stable contact, the basal terminations of one mineral against the other commonly reveal a reactionary boundary. In rocks displaying a large degree of folding the hinge zones of folded sillimanite are retrograded to muscovite. Only in the massive sulphide sample of the orebody (ALP081) is there no indication of a precursor to muscovite.
221

The presence of sericite is only documented in Tables C.6 - C.11 where the original mineral can no longer still be distinguished.
Comparing OS surface samples with borehole core does not reveal great changes due to weathering. The major alteration effects are opaque dusting of the biotites and garnets, and a greater degree of feldspar sericitization.
Zircon which occurs in quartz almost invariably displays rounded terminations similar to the detrital zircons found in the quartzites. ALP114, a GQ from BH114 represents one exception to the above general rule, with zircon being abundant and associated both with gahnite and with biotite. Unusually long zircon grains are present, also showing rounded terminations, and rounded zircon cores are overgrown by crystalline zircon.
Gahnite has a subidioblastic form, becoming prismatic in the one schist sample (ALP198). The tourmaline of ALP102 has an idioblastic, coarse-grained habit with minor fine-grained tourmaline crystals scattered throughout the rock. Apatite displays subidioblastic, hexagonal form and commonly occurs as fine-grained inclusions in quartz, but rate fine-grained sphene and rutile are xenoblastic.
The well banded OES+GQ continuation of UOB (ALP047) requires special mention as four distinct units are discernable. ALP047A consists of a quartz magnetite rock in which magnetite grades over the length .of the thin section, from constituting 35% of the rock and averaging 0.5mm in grain size, to 60% of the rock and averaging 3mm. Both quartz and garnet concentrations behave antipathetically to magnetite, while gahnite content increases with that of magnetite. Only in the most magnetite-rich portion do chalcopyrite and pyrite appear. ALP047C contains the three distinct bands noted in Table C.8. The quartz- and zircon- deficient garnet-biotite band measures 2mm across. The two remaining bands each measure lOmm across, but in neither is zircon prominently developed.
Judging from the geographical location of ALP190 and the amount of contained K-feldspar, this sample would more accurately classifies as UFS rather than OES. It is therefore treated as UFS throughout the thesis.
C.4 Broken Hill Quartzites (BQ) In BQ quartz grain sizes and shapes reflect the local strain history. They vary from coarse grains showing undulose extinction measuring in excess of lcm in diameter, and separated from other grains by mortar textured quartz (Fig. C.3), to totally polygonized, recrystallized, unstrained, fine-grained quartz. Muscovite grains are distributed evenly throughout the quartzite, with grain sizes ranging between 140 - 2 000 micron in long dimension within a single thin section (Fig. C.4). Muscovite morphology provides indications of different muscovite ages, with undeformed, simplectic intergrowths with quartz post-dating severely deformed and sheared grains. No firm
222

petrogenetic connotations may be attached to muscovite due to the simplicity of mineral parageneses present in quartzites.
Biotite occurs at various stages of alteration to chlorite in laths measuring between 130 and 1 100 micron in long axis. Rare garnets occur skeletally enclose in quartz (Table C.12). Idioblastic zircon overgrowths on rounded zircon inclusions are also rare. The zircon grains occur both concentrated along the heavy mineral layers as well as scattered throughout the quartzite, and lie between various mineral grains, or enclosed in quartz or in mica. Where hosted by muscovite or biotite/chlorite, the zircons display radioactive-damage haloes.
Tourmaline is restricted to a sample of DQ on Maanhaarkop (Table C.12), which is the equivalent rock type to the tourmaline-bearing quartzite at Gamsberg (Rozendaal, 1978). The coarse-grained (300 x 2 000 micron) idioblastic tourmaline lies within or closely related to a vein which cross-cuts at low angles, the rock foliation as defined by oriented muscovite. Gahnite has only been identified in one specimen (ALP240 from DQ on Klein Kop) where it occurs as small (80 micron) rounded grains in quartz, or associated with biotite. Sphene is equally rarely developed (ALP240), and occurs in quartz unrelated to any specific bands. The opaque minerals tend to be larger (40 - 80 micron) than the associated zircon grains. Bright red rutile similarly occurs as rounded to subrounded grains measuring 75 to 100 micron.
The garnets in MOS measure up to 3 500 micron and poikiloblastically enclose quartz grains. The green spine! found in ALP125 from Maanhaarkop is probably gahnite rather than hercynite since the whole rock averages 308ppm Zn. Abundantly developed zircon grains display a well rounded habit and vary from much finer-grained (10 to 40 micron) than in the adjacent quartzites, to long dimensions similar to the quartzite zircons (i.e. 70 to 100 micron; Table C.12).
C.5 Namies-type Schist (NTS) C.5.1 NTS at Namiesberg Banding on the microscopic scale is reflected by 2mm wide layers of feldspathic quartzite and quartzite. Sericitization of K-feldspar is insufficient to obliterate the common gridiron twinning observed, and plagioclase grains are occasionally recognised. As with other schist samples from surface exposures, the biotite flakes from Namiesberg NTS are strongly weathered with the production of large quantities of opaque dust. None of the remaining opaque minerals comprise pyrite or pyrrhotite. The bulk of the zircons found in NTS are elongated with rounded terminations, have variable grain sizes, and occur in quartz, K-feldspar and micas.
C.5.2 NTS in Achab borehole The coarse-grained schist (up to 8mm long porphyroblasts) comprises quartz, biotite, sillimanite, feldspar and muscovite. Gridiron
223

twinning, and the habit of filling gaps between quartz and plagioclase, commonly distinguishes K-feldspar. Zircons occur mainly in the leucocratic minerals as coarse- (200 micron) and fine- grained, well rounded crystals. Estimated modal percentages appear in Table C.13.
C.6 Shaft-type Schist (STS) Under crossed nicols STS from both Namiesberg and Wortel display a distinctive ''furry" appearance due to the high content of fresh and altered, coarse-grained sillimanite, measuring up to 8mm in length. Although sericitized K-feldspar is a common component of the rock, gridiron twinning can seldom be identified, and no plagioclase has been recognised (Table C.14). Muscovite always occurs in quantities subordinate to biotite and is clearly a retrograde product after sillimanite, K-feldspar and biotite.
Of all the NTS and STS samples examined, garnet occurs in the thin section of only ALP430, an STS sample from Wortel. The garnet poikiloblastically encloses fine-grained, elongated quartz trains which lie sub-parallel to the surrounding foliation. Only the immediately adjacent biotite concentrically surrounds the garnet.
The opaque minerals in STS always comprise pyrite and less commonly pyrrhotite, and no magnetite has been recognised. The sulphides adopt either a foliated form or the pyrite occurs as cubes.
Zircons occur differently in STS relative to NTS. They are always found as fine specks with large pleochroic haloes in biotite, and when coarser-grained, the frequently metamict zircons adopt irregular to angular shapes, and produce wide pleochroic halos in biotite.
C.6.1 Massive Sillimanite While the massive sillimanite bodies which are being exploited measure tens of metres in width, borehole WTL3 intersected only 1.5m of the rock type. Contacts with the surrounding STS are sharp, although the sillimanite content of the schist does increase nearer the massive sillimanite. Essential minerals of the rock comprise sillimanite extensively altered to muscovite, lesser quartz, non-sulphide opaque minerals associated with accessory sphene and rutile, and elongated zircons with ragged terminations.
C.6.2 Cale Silicate-type Rock plus Manganese Quartzite The above field name encompasses the two separate rock-types, Garnettype Quartzite (GTQ} and Cale silicate-type rock (CTS). Borehole WTL4 intersected some 13m of CTS, with the GTQ mainly flanking the central CTS. The CTS is a massive to slightly foliated, dark green rock with grain sizes of individual pyroxene grains of up to 12mm. The dark pink coloured interbands of weakly foliated GTQ have maximum biotite grain sizes ranging up to only lmm.
GTQ displays a simple mineralogical assemblage of quartz, garnet and biotite (Table C.15), with alignment of the latter mineral imparting
224

the weak foliation seen in hand specimen. The equant garnet contains minor quartz inclusions. Apatite commonly preserved in quartz and biotite displays a subidioblastic, hexagonal shape. Zircon grains occur only as fine specks showing pleochroic halos in biotite.
CTS is a heterogeneous rock with two thin sections displaying completely different mineralogies (Table C.15). In ALP446CY 50% of the rock comprises orthoferrosilite (biaxial positive; high relief), while 50% of ALP446CX is composed of fayalite (biaxial negative; 2V = 30 - 40°) (Table C.15). In both rocks grunerite forms the alteration product after the major components and garnet, while biotite and apatite represent prograde minerals.
c.7 Regional Quartzites (RQ) In thin section a clear distinction exists between the quartzites from Wortel, which comprise at least 20% feldspar, and those from Namiesberg which are feldspar-free (Table C.16). Plagioclase in Wortel WTQ has the composition of andesine, and together with Kfeldspar it is slightly sericitized. Heavy mineral layers (HMLs) defined by trains of zircon grains and opaque minerals, occur in both WTQ and DTQ from Wortel, with biotite and/or chlorite forming an important related mineral. The associated garnet and epidote-group minerals in ALP437 are clearly non-detrital as they display scalloped contacts with quartz. Zircon grain sizes in the HMLs vary up to 170 micron, but in the host quartzite these range up to 300 micron. The zircons display oval to elongated shapes with rounded terminations, and slight metamorphic overgrowths on the terminations. Pyrite occurs in both cubic and rounded form of which the latter may be detrital.
MDTS is a foliated and banded rock being similar in appearance to NTS, with pink-coloured enclosed pegmatites. Magnetite comprises one of the rock forming minerals. The banded variety of MDTS (ALP426; Table C.16) has quartz-rich layers of 7mm width separated by sillimanitebiotite rich layers of 2mm width. The included, rounded, coarsegrained (180 micron) zircons in the quartz-biotite layers near the contact with the sillimanite layer may reflect the base of a graded bed.
225

APPENDIX D METAMORPHISM
The best available indicators of prograde metamorphism are the rare sillimanite-K-feldspar intergrowths in ALP047 and ALP438. Abundant evidence exists for the retrograde reaction K-feldspar + Sillimanite + HzO --> Muscovite + Quartz as follows: a. simplectic intergrowths of muscovite and quartz are· common in NTS and STS from both Namiesberg and Wortel b. ALP415 has virtually no sillimanite but abundant K-feldspar and the simplectic intergrowth, suggesting that the retrograde reaction was arrested at the point of sillimanite consumption c. in ALP438 (STS from Wortel) the contact between sillimanite and Kfeldspar is preserved, with some of the sillimanite dissolving into a simplectic intergrowth of muscovite + quartz.
In a single thin section of OS, non-pervasive retrograde metamorphism may be deduced from zones displaying extreme biotite sericitization occurring near areas of fresh biotite. It appears that the reaction froze when all available water had been consumed as also suggested by the partial retrogression of feldspar to sericite. The extensive and severe alteration observed in the samples from borehole BH112 is a localized phenomenon suggesting that retrogressive fluids were focused along specific zones within the schists. The prograde peak of metamorphism was attained just after F2 deformation (Joubert, 1971; Lipson, 1978), thus such extensive retrogression associated with F2 folding was unexpected. Perhaps the S2 refoliation presented more open channelways for retrogressive fluid movement later in the history of these rocks. The evidence of biotite preservation at the terminations of elongated garnet suggests that the fluid flow was in the plane of the foliation. The fact that chlorite generation after biotite and opaque minerals occurs in both surface and borehole core shows that such retogression predates the alteration due to current weathering.
Metamorphic conditions appear similar between Broken Hill, Wortel and Namiesberg, but a more intensive study would be needed to show whether or not any metamorphic gradients exist. Because of these uncertainties, it was decided to normalize all geochemical major element data to 100% before comparing the chemistry of rocks at Broken Hill with those from the other areas (see also Appendix A.2.3)~
226
APPENDIX E RELATIONSHIPS BETWEEN MAJOR LITHOLOGIES
E.1 Gneisses through NS to WQ From Broken Hill to Froneman se Kop the only exposed contact between NS and gneisses is found at Maanhaarkop, where the interface is sharp. Borehole cores from the vicinity of Broken Hill reveal the detailed complexity of this contact zone. Near NS the gneisses comprise components of both the granoblastic pink variety and inequigranular augen gneiss. Similar looking augen gneiss in the Aggeneys quarry is clearly of intrusive origin (intrusive into an amphibolite; Fig. E.1). As a generalization, the gneisses pass structurally downwards first through a thin (1 - 2m wide) chorite-biotit~!feldspar/quartz rock, (contact A, Fig. E.2) into a schist of up to 15m width. The schist passes back into a 6 - 30m wide gneiss, with the interface zone (contact B; Fig. E.2) sometimes being interbanded over 6m in a gradational-like relationship, while the actual contact is interpreted at a thin (< lm wide) chlorite-amphibole rock. The contact between the interlayered gneiss and NS (contact C: Fig. E.2) varies from being interbanded (gradational?) over 2m, to sharp. The last appearance of gneiss is marked by either an associated pegmatite or a 0.5m wide layer of biotite-chlorite schist.
E.2 OS through SS to Plant Quartzite (PQ) The contact between structurally overlying OS and the graphitic BGZ can be accurately defined by the garnet-out and graphite-in criterion. With the diminution of clay content, BGZ grades downwards into SS. SS displays sharp though interbanded contacts with lenses of CSMQ, which it hosts. The contact between silica-poor Upper Shaft Schist (USS) and siliceous Lower Shaft Schist (LSS) (contact C; Fig. E.3) is defined on chemical grounds, as it was not originally visually recognised. LSS displays a sharp contact with GGLG in borehole BH164 (contact B; Fig. E.3), while the contact between USS and GGLG is not exposed. LSS displays a sharp contact with the underlying quartzite (PQ). Minor quartz interbands and extensive pegmatites (neosomes?) are developed over the last !Om of SS.
227

APPENDIX F ORE SCHIST FACTOR SCORES RELATED TO THE OREBODY
R-mode factor analysis computed on borehole core samples of OS, reveal primary (lower factor number) and secondary "ore factors" (section 6.3.1.2). For surface outcrop OS samples, a single "ore factor" emerged, which incorporates strongly positive loadings on the elements Zn, Cu and Pb, and negative loadings on MgO, Ni, Y and Cao (Table F.1). Plotting of the factor scores for each sample as a function of distance from the orebody shows broadly defined increasing trends towards the orebody (Fig. F.1). West of the orebody the surface OS factor scores are higher than to the east.
228

APPENDIX G LITHOGEOCHEMICAL EXPLORATION STRATEGY
Both regional- and local- scale lithogeochemical exploration techniques indicating the presence of Broken Hill-type ore in the north west Cape have been examined. The former will aid in identifying areas at the scale of tens of kilometres which hold potential for mineralization, while the latter pertains to areas smaller than lOkm where an ore centre is being sought.
In both flow charts which detail exploration strategies (Figs. G.l and G.2), an attempt should be made to identify the stratigraphic succession in order to apply the appropriate lithogeochemical techniques. If distinctions, particularly between schists, cannot be made on the basis of geology and petrography (section 4.2), then the discriminating lithogeochemical statistical parameters examined in section 6.2, are suggested for this purpose. Generalized tests only, shown on the left-hand side of Figs. G.l and G.2, may be used failing the confident separation of rock-types. Where successful separation has taken place, then in the regional flow chart, the delta diagrams (section 7.3.3) are used to distinguish fertile from barren target areas. For local exploration, monitoring of the concentrations and values of specific elements and ratios as applicable to OEH (section 6.3.1.6 and 6.3.2.3), is advocated to lead the explorationist through the ore halo to the orebody.
Irrespective of whether or not the stratigraphic succession is defined, the potential for the presence of base metal sulphides may be tested for as advocated at the base of Figs. G.l and G.2. Whereas at the regional scale this consists of factor analysis (Appendix F), for localized exploration, two ratios are suggested which increase towards mineralization across stratigraphic boundaries (Figs. 6.35 and 6.36). The successful definition of a prospective regional area naturally leads to work at the local scale.
Broad scatter about the generally increasing trends of indicator elements and inter-element ratios progressively nearer the Broken Hill orebody, define the geochemical vectors towards ore. The practical application of these techniques should rely on trends defined by numerous samples. Misleading interpretations could result from small data sets.
229

APPENDIX H CALCULATION OF LIMITING CASES FOR PRE-METAMORPHIC CARBON AND SULPHUR CONTENTS OF SS
Using the fluid-fluxing equation of Ferry (1981) (section 9.1.4.1), viz. :
2FeS2 + 2H20 + C = 2FeS + 2H2S + C02, ---- ( 1) pyrite pyrrhotite
an estimate of the premetamorphic S and C content of SS is possible, since both pyrite and pyrrhotite are still present. Had devolatilization ceased at the point of final pyrite conversion, then a maximum, limiting case can be calculated for the S and C loss due to reaction (1). Using the Son C regression equation (r = 0.77; n = 16)
of
y = 1.24x + 0.42 ----(3)
as the best estimate of present day relationships between S and C, then the equation
y = 2x + 0.42 ----(4)
defines the locus of points along which the minimum pre-metamorphic S and C concentrations could have existed, for a 2:1 loss of S:C. To generate the equation of the line defining the locus of points along which the maximum S and C contents could have existed, first the maximum present day S content must be calculated by substituting the highest SS carbon content of 0.82% for x in equation (3), giving S = 1.44% (Fig. 9.llb, pt. B). The slope of the required line is also 2, and solving as before produces the equation
y = 2x - 0.20 ----(5)
In order to smooth out variability in S concentrations, the highest and lowest C values viz. 0.0 and 0.82% are substituted into equation (3) and produce minimum and maximum s contents of 0.42 and 1.44%. There is no petrographic evidence to suggest that S exists in any form other than sulphide in SS (section 4.2.2), thus if 100% of the pyrite were consumed but no further desulphidation occurred, then the maximum possible S concentration of the rock would have been twice the present S content (equation (1)). Equations (4) and (5) can therefore be solved for the maximum possible C contents of SS, using twice the current lowest and highest calculated S concentrations, i.e. 0.84 and 2.88% S respectively. The corresponding C values are 0.21 and 1.54% (Fig. 9.llb, pts. A' and B1 ). The line joining points A' and B' in Fig. 9.llb define the limiting, maximum possible Sand C contents for the pre-metamorphic SS. The equation of the line passing through these co-ordinates can be solved for
Therefore
m = (2.88 - 0.84)/(1.54 - 0.21) = 1.53.
y = 1.53x + c. ----(6)
230
Substituting the co-ordinates for point A' into equation (6) solves for c, hence the equation of the line limiting the maximum C and S concentrations of SS is:
y = 1.53x + 0.52 ----(7)
Relatively little pyrrhotite has been identified in SS, so a maximum of 50% conversion of pyrite to pyrrhotite can safely be used to calculate maximum possible C and S concentrations of the premetamorphic SS. Instead of doubling the current S content of SS, as in the case of 100% pyrite conversion to pyrrhotite, only 50% of the current value is added to the current S content, giving maximum and minimum S ordinate values of 0.63 and 2.16% respectively. Corresponding C abscissa values, calculated as before, give 0.11 and 1.18% (Fig. 9.llb, pts. X and X1 ). The slope of the line defining the locus of points along which 50% conversion of pyrite to pyrrhotite has occurred, is calculated as before, generating the equation
y = 1.43x + 0.47----(8).
In summary, the calculated range of C and S values for pre-metamorphic SS is:
0.11% c ; 0.63% s and
1.18% c ; 2.16% s.
231

APPENDIX I CALCULATION OF PB/CU AND ZN/CU RATIOS IN FLUIDS
The method used for calculating the Pb/Cu and Zn/Cu ratios follows that outlined by Huston (1988, pers.comm.), for the Zn/Pb ratio i.e. first determine the ionic strength of the solution and then calculate the Pb/Cu and Zn/Cu ratios. The ionic strengths were given by Huston (1988, pers.comm.) for the temperature range 25 - 300°C and over NaCltatar molalities of 0.25 - 3.0, as follows:
Calculated ionic strength (I .::::. ffic 1- ) ( mNac1 ) t o t a 1 25°C 50°C 100°C 150°C 200°c 250°C 300°C
.25 .246 .247 .247 .246 .241 .233 .210
.50 .486 .489 .489 .485 .470 .451 .396
1.0 .949 .959 .958 .947 .908 .859 .739
1. 5 1. 388 1. 407 1.407 1. 387 1. 317 1. 241 1.058
2.0 1. 802 1. 831 1. 832 1. 803 1. 699 1. 602 1. 360
3.0 2.553 2.601 2.604 2.560 2.392 2.273 1. 932
Calculation of the individual CuCl species equilibrium constants (K .. q)
with Cu2S as the insoluble sulphide, was performed in the standard manner by solving sets of simultaneous equations all taken from Helgeson (1969), and adding up the K .. q values.
Since the total molality of any species is the sum of molalities of all species containing the element (Garrels and Christ, 1965, p56), the term mtotal cufmtotal Pb may be Writ ten aS
-----------------------------------------------------------{ mPbCl. + mPbCl 2 + mPbCl 3 - + mPbCl 'a- }
where fficuc12· = (a 2c1- * aa•)/(gcuc12- * K1°' 6) fficucra 2- = (a2c1- * aa•) I (gcucl32
- * K2°' 6 * a0'6a2s)
fficucH = (ac1- * a 3a•)/(gcuc1f * Ka0' 5 * a 0·6a2s * a 006a2) fficuc12 = (a2c1- * a 3a•)/(gcucu * K,0·5 * a0'6a2s * a0' 5a2) fficuc13- = (a3c1- * a 3a•)/(gcuCl3- * K6° 06 * a0'6a2s * a0' 5a2) fficuc14 2- = (a'c1- * a 3a•)/(gcucu2· * Ks0'6 * a0'6a2s * a 0
'5a2)
and where gcuci· is the activity coefficient of the CuCl ... complex. Substituting activities, activity coefficients and equilibrium constants for concentrations, and simplifying, the equation may be expressed as: [mTot cul/[mTot Pb] = [ { (ac1·)1( (g(cuc12i-)*(K1) 0·5 *aa•)} + { (a 2c1-)/(g<cucui 2-*(K2) 0·5*aa•)} +
{l/(g(cucl)•)*(K2) 0·5} + { (ac1·)/(K,) 0·5} + { (a2c1·)/(g<cuc12i-*(K5) 0·5
+
{ ( & 3c1-) I ( g(CUC1') 2-* (Ks) o.s] I [ { 1 I ( ( g PbCJ • ) * ( KPbCJ • ) } + { ( Rei - ) I (KP be I 2 ) } + { (a2c1·)/(g(PbCJ3)-*KPbCJ3-1 + { (a2c1•)/( (gPbC1'2-)*(KPbCJ4 2
-)]
The equation for mtotal culmtotal Zn is similarly derived.
232

The following constants were applied in calculating individual activity coefficients using the Debye-Huckel equation a 0 = 3. 5*10- 9 cm for C 1-a 0 = 4.0*l0-8 cm for singly charged species a 0 = 5.0*l0- 8 cm for doubly charged species b = 0.04 The values for A and B at varying temperatures were taken from Helgeson et al. (1981). All Pb and Zn equilibrium constants omitted in Table 4 of Huston and Large (1987) were calculated by this author using linear extrapolation of the existing data. This assumption is reasonable as shown by fitting linear regressions to the complete data sets which all reveal correlation coefficients in excess of 0.99 •
As with the calculation of the Zn/Pb ratio, first the product mtota1 cufmtotal Pb and mtotal cufmtotal Zn are Calculated before SUbStitUtiOn into the equations 100 Zn/(Zn +Cu)= 100/(1 + (mtou1culmtota1Pb)(at.wt.cu/at.wt.Pb)], and 100 Pb/ (Pb + Cu) = 100/ [ 1 + (mtota1 culmtotal zn) (at .wt •cu/at .wt •zn)] •
The values from these final equations are used for creating the graphs showing the inter-relationships existing between temperature, pH and salinity in controlling the Cu-Pb-Zn ratios.
233

APPENDIX J MASS BALANCE FOR GENERATING BROKEN HILL OREBODY USING LYDON'S DEWATERING MODEL
Lydon (1986, p 565) showed that conversion of 1 mole illite to muscovite produces 11.6 g solution at a concentration of 1 638ppm trace metal, assuming an initial 50ppm metal concentration in the illite. In round terms 384g illite produces 11.6g solution i.e. lkg illite produces say 3g solution, or 1 tonne produces say 30kg solution which carries 0.05Kg, or 5*10-5 tonnes metal. In order to produce 18.8 * 10 6 tonnes metal, then (18.8 * 10 6 )/(5 * 10-5
) = 3.76 * 10 11 tonnes illite are required. For a theoretical illite source region measuring lOkm * lOkm in surface area, and having an SO of 2.8, the thickness of the illite sheet can be calculated i.e.
10 000 * 10 000 * x * 2.8 = 3.76 * 10 11 tonnes
where x = thickness in m.
Therefore x = 1 340m, or 1.34km.
Thus in order to produce the 18.8 mt total metal contained in the Broken Hill orebody, Lydon's (1986) model would require a pure illite source region measuring lOkm * lOkm * 1.34km.
APPENDIX K SUNDRY TABLES REFERRED TO IN THE TEXT
Table K.1 Comparison between Namies Schist at Gamsberg and at Broken Hi 11
Table K.2 Comparison between Quartzite descriptions at Gamsberg and at Broken Hill
Table K.3 Broken Hill oxygen isotopes Table K.4 U, Th and Pb ion microprobe analyses on zircons from White
Quartzite at Froneman se Kop
234

1 3 . REFERENCES
Adachi, M., Yamamoto, K. and Sugisaki, R. (1986). Hydrothermal chert and associated siliceous rocks from the morthern Pacific: their geological significance as indication of ocean ridge activity. Sedim. Geol., 47, 125-148.
Alderton, D. H. M., Pearce, J. A., and Potts, P. J. (1980). Rare earth element mobility during granite alteration: evidence from southwest England. Earth Planet. Sc. Lett., 49, 149-165.
Armstrong, R. A., Reid, D. L., Watkeys, M. K., Welke, H. J., Lipson, R. D. and Compston, w. (1988). Zircon U-Pb ages from the Aggeneys area, Central Bushmanland. Abs., geol. Soc. s. A. Geocongress 88, Univ. Natal, Durban, 493-496.
Arnorsson, s. and Ivarsson, G. (1985). Molybdenum in Iceland geothermal waters. Contr. Miner. Petrol., 90, 179-189.
Arth, J. G. (1976). Behaviour of trace elements during magmatic processes - a summary of theoretical models and their applications. J. res. U.S. geol. Surv., 4, 41-47.
Baas Becking, L. G. M., Kaplan, I. R. and Moore, D. (1960). Limits of the natural environment in terms of pH and oxidation - reduction potentials. J. Geol., 68, 243-284.
Baker, E.T., Cannon, G. A. and Herbert, c. c. Jnr. (1983). Particle transport processes in a small marine bay. J. Geophys. Res., 88, 9661-9669.
Barbey, P. and Cuney, M. (1982). K, Rb, Sr, Ba, U and Th geochemistry of the Lapland granulites (Fennoscandia). LILE fractionation controlling factors. Contr. Miner. Petrol., 81, 304-316.
Barnes, H. L. (1979). Solubilities of ore minerals, 404-460. In: Barnes, H. L., Ed., Geochemistry of hydrothermal ore deposits. John Wiley & Sons, New York, 798pp.
Barrett, T. J. and Anderson, G. M. (1988). The solubility of sphalerite and galena in 1-5 m NaCl solutions to 300°C. Geochim. Cosmochim. Acta, 52, 813-820.
Beach, A. (1980). Retrogressive metamorphic processes in shear zones with special reference to the Lewisian complex. J. struct. Geol., 2, 257-263.
Bernard, A. J., Dagallier, G., and Soler, E. (1982). The exhalative sediments linked to the volcanic exhalative massive sulphide deposits: a case study of European occurrences, 553-564. In: Amstutz, G. c., El Goresy, A., Frenzel, G., Kluth, c., Moh, G., Wauschkuhn, A. and Zimmerman, R. A. Eds., Ore genesis: The state of the art. Spec. Pub. Soc. Geol. appl. Miner. Deps., 2. Springer Verlag, Heidelberg, 804pp.
Bernard, H. A., Leblanc, R. J. and Major, c. F. (1962). Recent and Pleistocene geology of southeast Texas, 175-205. In: Geology of the Gulf Coast and central Texas and guidebook of excursions: Houston Geol. Soc., Geol. Soc. Amer. Annual Meeting, Houston, Texas
Berner, R. A. (1971). Principles of chemical sedimentology. McGrawHill Book Co., New York, 240pp.
Berner, R. A. (1972). Sulfate reduction, pyrite formation, and the oceanic sulfur budget, 347-364. In: Dyrssen, D. and Jagner, D. Eds., The changing chemistry of the oceans, Wiley Interscience, Stockholm.
Berner, R. A. (1984). Sedimentary pyrite formation: an update. Geochim. Cosmochim. Acta, 48, 605-615.
Berner, R. A., and Holdren, G. R. (1977). Mechanisms of feldspar weathering: some observational evidence. Geology, 5, 369-372.
Bertine, K. K. (1972). The deposition of molybdenum in anoxic waters. Mar. Chemistry, 1, 43-53.
235

Bertine, K. K. and Turekian, K. K. (1973). Molybdenum in marine deposits. Geochim. Cosmochim. Acta, 37, 1415-1434.
Betton, P.J., (1984). Nd and Sr isotopic evidence for the evolution of the Namaqualand Mobile Belt, Southern Africa. Abs., Conference on Middle to Late Proterozoic lithosphere evolution, Precambr. Res. Unit, Univ. Cape Town, p.7. ·
Bewers, J.M. and Yeats, P.A. (1977). Oceanic residence times of trace metals. Nature, 268, 595~598.
Bewers, J.M. and Yeats, P. A. (1979). The behaviour of trace metals in estuaries of the St. Lawrence basin. Naturaliste Can., 106, 149-161.
Bhatia, M. R. (1983). Plate tectonics and geochemical composition of sandstones. J. Geol., 91, 611-627.
Bhatia, M. R. (1985). Rare earth element geochemistry of Australian Paleozoic graywackes and mudrocks: provenance and tectonic control. Sedim. Geol., 45, 97-113.
Bhatia, M. R. and Taylor, S. R. (1981). Trace element geochemistry and sedimentary provinces: a study from the Tasman Geosyncline, Australia. Chem. Geol., 33, 115-125.
Bischoff, J. L., Radke, A. s. and Rosenbauer, R. J. (1981). Hydrothermal alteration of greywacke by brine and seawater: roles of alteration and chloride complexing on metal solubilization at 200° and 350°C. Econ. Geol., 76, 659-676.
Bjorlykke, K. (1974). Geochemical and mineralogical influence of Ordovician island arcs on epicontinental elastic sedimentation. A study of Lower Palaeozoic sedimentation in the Oslo region, Norway. Sedimentology, 21, 251-272.
Blatt, H. (1987). Oxygen isotopes and the origin of quartz. J. sedim. Petro 1 • , 5 7 , 3 7 3-3 7 7.
Blignault, H.J., van Aswegen, G., van der Merwe, s.w., and Colliston, W.P. (1983). The Namaqualand geotraverse and environs: part of the Proterozoic Namaqua Mobile Belt. Spec. Publ. geol. Soc. S. Afr. , 10, 1-2 9.
Bostrom, K. (1973). The origin and fate of ferromanganoan active ridge sediments. Stockholm Contr. Geol., 27, 149-243.
Bourcier, w. L. and Barnes, H. L. (1987). Ore solution chemistry-VII. Stabilities of chloride and bisulfide complexes of zinc to 350°C. Econ. Geol., 82, 1839-1863.
Boyle, E. A., Edmond, J.M. and Sholkovitz, E. R. (1977). The mechanism of iron removal in estuaries. Geochim. Cosmochim. Acta, 41, 1313-1324.
Bramlette, M. N. (1946). The Monterey Formation of California and the origin of its siliceous rocks. Prof. Pap., U. s. geol. Surv., 212, 57pp.
Brehler, B. and Wedepohl, K. H. (1972). Zinc. In: Wedepohl, K. H., Ed., Handbook of Geochemistry, Springer-Verlag Publishing Company, Berlin, 30-A-1 - 30-H-3.
Brookins, D. G. (1983). Eh-pH diagrams for the rare earth elements at 25°C and one bar pressure. Geochem. J., 17, 223-229.
Burkov, v. V. and Podporina, Y. K. (1967). Rare earths in granitoid residuum. Dokl. Acad. Nauk. SSSR., 177, 214-216.
Burns, R. G., Burns, V. M. and Turekian, K. K. (1973-1978). Nickel. In: Wedepohl, K. H., Ed., Handbook of Geochemistry, SpringerVerlag Publishing Company, Berlin, 28-A-1 - 28-0-2.
Burns, R. G., Burns, v. M. and Turekian, K. K. (1974-1978). Cobalt. In: Wedepohl, K. H., Ed., Handbook of Geochemistry, SpringerVerlag Publishing Company, Berlin, 27-A-1 - 27-0-1.
Butler, J.C. (1982). The closure problem as reflected in discriminant function analysis. Chem. Geol., 37, 367-375.
236

Calvert, s. E. and Batchelor, c. H. (1978). In: Ross, D. A. and Neprochnov, Y. P., Eds., Initial reports of the deep sea drilling project, 42, Part 2, u. s. Government printing off ice, Washington.
Cameron, E. M. and Garrels, R. M. (1980). Geochemical composition of some Precambrian shales from the Canadian Shield. Chem. Geol., 28, 181-197.
Campbell, I. H., Franklin, J.M., Gorton, M. P., Hart, T. R. and Scott, s. D. (1981). The role of subvolcanic sills in the generation of massive sulfide deposits. Econ. Geol., 76, 2248-2253.
Campbell, I. H., Coad, P., Franklin, J.M., Gorton, M. P., Scott, s. D., Sowa, J., and Thurston, P. c. (1982). Rare earth elements in volcanic rocks associated with Cu-Zn massive sulphide mineralization: a preliminary report. Can. J. Earth Sci., 19, 619-623.
Campbell, I. H., Lesher, c. M., Coad, P., Franklin, J.M., Gorton, M. P., and Thurston, P. c. (1984). Rare-earth element mobility in alteration pipes below massive Cu-Zn-sulfide deposits. Chem. Geol., 45, 181-202.
Canfield, D. E. and Berner, R. A. (1987). Dissolution and pyritization of magnetite in anoxic marine sediments. Geochim. Cosmochim. Acta, 51, 645-659.
Carpenter, J. H. and Grant, V. E. (1967). Concentration and state of cerium in coastal waters. J. mar. Res., 25, 228-238.
Carter, C. H. (1978). A regressive barrier and barrier-protected deposit: depositional environments and geographic setting of the Late Tertiary Cohansey sand. J. sedim. Petrol., 48, 933-950.
Cathles, L. M., and Smith, A. T. (1983). Thermal constraints on the formation of Mississippi Valley-type lead-zinc deposits and their implications for eposidic basin dewatering and deposit genesis. Econ. Geol., 78, 983-1002.
Chan, K. M. and Riley, J.P. (1966). The determination of molybdenum in natural waters, silicates, and biological materials. Analyt. Chim. Acta, 36, 220-.
Chandler, F. w. (1988). Quartz arenites: review and interpretation. Sedim. Geol., 58, 105-126.
Chayes, F. and Trochimczyk, J. (1978). An effect of closure on the structure of principal components. Mathl. Geol., 4, 323-3337.
Clemens, J. D. and Wall, V. J. (1981). Origin and crystallization of some peraluminous (S-Type) granitic magmas. Can. Miner., 19, 111-131.
Clifford, T.N., Stumpfl, E.S., Mciver, J.R., Burger, A.J., McCarthy, T.S., and Rex, D.C. (1981). Mineral-chemical and isotopic studies of Namaqualand granulites, South Africa: a Grenville analogue. Contr. Miner. Petrol., 77, 225-250.
Cloud, P. (1976). Major features of crustal evolution. Annex. Trans. geol. Soc. s. Afr., 74, Alex du Tait Mem. Leet., 14, 33pp.
Cloud, P. (1981). Evolution of ecosystems, 6-18. In: Skinner, B. J., Ed., paleontology and paleoenvironments. William Kaufmann, Inc., Los Altos.
Collinson, J. D. (1978). Alluvial sediments, 15-60. In: Reading, H. G., Ed., Sedimentary environments and facies. Blackwell, Oxford, 569pp.
Colliston, W. P. (1983). Stratigraphic and depositional aspects of the Proterozoic metasediments of the Aggeneys Subgroup at Pella and Dabenoris. Spec. Publ. geol. Soc. s. Afr., 10, 101-110.
Contreras, R., Fogg, T. R., Chasteen, N., Gaudette, H. E. and Lyons, W. B. (1978). Molybdenum in pore waters of anoxic marine sediments by electron paramagnetic resonance spectroscopy. Mar. Chemistry, 6, 365-373.
237
Cornell, D.H. (1978). Age and metamorphism of the Copperton Formation, Prieska District. In: Verwoerd, W.J. (ed.). Mineralization in metamorphic terrains. Spec. Publ. geol. Soc. s. Afr., 4, 223-234.
Coveney, R. M. and Martin, s. (1983). Molybdenum and other heavy metals of the Mecca Quarry and Logan Quarry Shales. Econ. Geol., 78, 132-149.
Crerar, D. A., Namson, J., So Chyi, M., Williams, L. and Feigenson, M. D. (1982). Manganiferous cherts of the Franciscan assemblage: I. General geology, ancient and modern analogues, and implications for hydrothermal convection at oceanic spreading centers. Econ. Geo 1 • , 7 7 , 51 9- 5 4 0 •
Cullers, R. L., Yeh, L., Chaudhuri, s. and Guidotti, c. v. (1974). Rare earth elements in Silurian pelitic schists from N. w. Maine. Geochim. Cosmochim. Acta, 38, 389-400.
Cullers, R. L., Chaudhuri, s., Arnold, B., Lee, M. and Wolf, W. Jr. (1975). Rare earth distribution in clay minerals and in the claysized fraction of the Lower Permian Havensville and Eskridge shales of Kansas and Oklahoma. Geochim. Cosmochim. Acta, 39, 1691-1703.
Dalland, A. (1975). The Mesozoic rocks of Andoy, northern Norway. Norges geol. Unders., 316, 271-287.
Dapples, E. c. (1967). Diagenesis of sandstones, 91-125. In: Larsen, G. and Chilingar, G. v. Eds., Diagenesis in sediments. Elsevier Publishing Company, Amsterdam.
Davies, D. K., Ethridge, F. G. and Berg, R.R. (1971). Recognition of barrier environments. Bull. Am. Ass. Petrol. Geol., 55, 550-565.
Davis, J. c. (1973). Statistics and data analysis in geology. John Wiley & Sons, Inc., New York, 534pp.
de Beer, J.H. and Meyer, R. (1983). Geoelectrical and gravitational characteristics of the Mamaqua-Natal Mobile Belt and its boundaries. Spec. Publ. geol. Soc. s. Afr., 10, 91-100.
Degens, E.T. Okada, H., Honjo, s. and Hathaway, J. c. (1972). Microcrystalline sphalerite in resin globules suspended in Lake Kivu, East Africa. Miner. Deposita, 1, 1-12.
Degens, E.T., and Stoffers, P. (1976). Stratified waters as a key to the past. Nature, Lond., 263, 22-27.
de la Roche, H. (1966). Sur !'existence de plusieurs facies geochimiques dans las schistes Paleozoiques des Pyrenees Luchonnaises. Geol. Rdsch., 55, 274-301.
de la Roche, H. (1978). La chimie des roches presentee et interpretee d 1 apres la structure de leur facies mineral dans 1 1 espace des variables chimiques: fonctions specifiques et diagrammes qui s 1 en deduisent- application aux roches ignees. Chem. Geol., 21, 63-87.
Dickinson, w. R., Beard, L. s., Brackenridge, G. R., Erjavec, J. L., Ferguson, R. c., Inman, K. F., Knepp, R. A., Lindberg, F. A. and Ryberg, P. T. (1983). Provenance to North American Phanerozoic sandstones in relation to tectonic setting. Bull. geol. Soc. Am., 94, 222-235.
Dixon, w. J. (1983). BMDP statistical software. University of California Press, Berkeley, 734pp.
Dostal, J. and Capedri, s. (1978). Uranium in metamorphic rocks. Contr. Miner. Petrol., 66, 409-414.
Duinker, J. c. and Nolting, R. F. (1978). Mixing, removal and mobilization of trace metals in the Rhine estuary. Ned. J. Sea Res., 12, 205-223.
Duncan, A. R., Erlank, A. J. and Betton, P. J. (1984). Analytical techniques and database descriptions. Spec. Publ. geol. Soc. S. Afr., 13, 389-395.
Dypvik, H. (1979). Mineralogy and chemistry of the Mesozoic sediments of Andaya, northern Norway. Sedim. Geol., 24, 45-67.
238

Elliot, T. (1978). Deltas, 97-142. In: Reading, H. G., Ed., Sedimentary environments and facies. Blackwell, Oxford, 569pp.
Ellis, A. J. (1979). Explored geothermal systems, 632-683. In: Barnes, H. L., Ed., Geochemistry of hydrothermal ore deposits. John Wiley & Sons, New York, 798pp.
El Wakeel, S.K. and Riley, J. P. (1961). Chemical and mineralogical studies of deep-sea sediments. Geochim. Cosmochim. Acta, 25, 110-146.
Englund, J. and Jorgensen, P. (1973). A chemical classification system for argillaceous sediments and factors affection their composition. Geol. Forenin. Stockholm, Forh., 95, 87-97.
Erlank, A. J., Smith, H. s., Marchant, J. w., Cardoso, M. P. and Ahrens, L. H. (1978). Zirconium. In: Wedepohl, K. H., Ed., Handbook of Geochemistry, Springer-Verlag Publishing Company, Berlin, B-0.
Ethier, v. G., Campbell, F. A., Both, R. A. and Krouse, H. R. (1976). Geological setting of the Sullivan orebody and estimates of temperatures and pressure of metamorphism. Econ. Geol., 71, 1570-1588.
Evans, B. w. (1964). Fractionation of elements in the pelitic hornfelses of the Cashel-Lough Wheelaun intrusion, Connemara, Eire. Geochim. Cosmochim. Acta, 28, 127-156.
Evans, H. T., Manheim, F. T. and Landergren, s. (1974-1978). Molybdenum. In: Wedepohl, K. H•, Ed., Handbook of Geochemistry, Springer-Verlag Publishing Company, Berlin, 42-A-1 to 42-0-2.
Fairbridge, R. w. (1967). Phases of diagenesis and authigenesis, 19-89. In: Larsen, G. and Chilingar, G. v. Eds., Diagenesis in sediments. Elsevier Publishing Company, Amsterdam.
Falvey, D. A. and Mutter, J.C. (1981). Regional plate tectonics and the evolution of Australia's passive continental margins. Bull. Aust. Bur. Miner. Resour. Geol. Geophys., 6, 1-29.
Faure, G. (1986). Principles of isotope geology. John Wiley and Sons, New York, 587pp.
Ferry, J.M. (1981). Petrology of graphitic sulfide-rich schists from south-central Maine: an example of desulf idation during prograde regional metamorphism. Am. Miner., 66, 908-930.
Ferry, J.M. (1986). Infiltration of aqueous fluid and high f luid:rock ratios during greenschist facies metamorphism: a reply. J. Petrology, 27, 695-714.
Finlow-Bates, T. (1979). Cyclicity in the lead-zinc-silver - bearing sediments at Mount Isa Mine, Queensland, Australia, and rates of sulfide accumulation. Econ. Geol., 74, 1408-1419.
Finlow-Bates, T. and Stumpf!, E. F. (1981). The behaviour of socalled immobile elements in hydrothermally altered rocks associated with volcanogenic submarine-exhalative ore deposits. Miner. Deposita, 16, 319-328.
Fleet, A J. (1984). Aqueous and sedimentary geochemistry of the Rare Earth Elements, 343-373. In: Henderson, P., Ed., Rare earth element geochemistry. Elsivier Science Publishers, Amsterdam.
Flores, R. M. and Shideler, G. L. (1982). Discriminant analyses of heavy minerals in beach and dune sediments of the Outer Banks barrier, North Carolina. Bull. geol. Soc. Am., 93, 409-413.
Floyd, P.A., and Winchester, J. A. (1978). Identification and discrimination of altered and metamorphosed volcanic rocks using immobile elements. Chem. Geol., 21, 291-306.
Folk, R. L. and McBride, E. F. (1976). The Caballos novaculite ·revisited Part I: origin of novaculite members. J. sedim. Petrol., 46, 659-669.
Gair, J.E., and Slack, J. F. (1984). Deformation, geochemistry, and origin of massive sulfide deposits, Gossan Lead District, Virginia. Econ. Geol., 79, 1483-1520.
239
Gardner, H. D., and Hutcheon, I. (1985). Geochemistry, mineralogy, and geology of the Jason Pb-Zn deposits, Macmillan Pass, Yukon, Canada. Econ. Geol., 80, 1257-1276.
Garrels, R. M., and Christ, c. L. (1965). Solutions, minerals, and equilibria. Harper and Row, and John Weatherhill, Inc., Tokyo, 450pp.
Garrels, R. M. and MacKenzie, F. T. (1971). Evolution of sedimentary rocks. Norton, New York, 397pp.
Gevers, T. w., Partridge, F. c. and Joubert, G. K. (1937). The pegmatite area south of the Orange River in Namaqualand. Mem. geol. Surv. Un. S. Afr., 31, 180pp.
Giordano, T. H., and Barnes, H. L. (1979). Ore solution chemistry VI. PbS solubility in bisulfide solutions to 300°C. Econ. Geol., 74, 1637-1646.
Goldberg, E. D. (1954). Marine geochemistry 1. Chemical scavengers of the sea. J. Geol., 62, 249-265.
Goldberg, E. D. (1965). Minor elements in sea water, 163-196. In: Riley, J.P. and Skirrow, G., Eds., Chemical oceanography, Academic Press, London, 712pp.
Graf, J. L. (1977). Rare earth elements as hydrothermal tracers during the formation of massive sulfide deposits in volcanic rocks. Econ. Geol., 12, 527-548.
Grasshoff, K. (1975). The hydrochemistry of landlocked basins and fjords, 455-597. In: Riley, J.P., and Skirrow, G., Eds., Chemical oceanography. Academic Press, London.
Grunau, H. R. (1965). Radiolarian cherts and associated rocks in space and time. Eclogae Geol. Helv., 58, 157-208.
Gundlach, H. and Marchig, v. (1982). Ocean floor "metalliferous sediments" - two possibilities for genesis, 200-210. In: Amstutz, G. c., El Goresy, A., and Frenzel, G., Kluth, c., Moh, G., Wauschkuhn, A. and Zimmerman, R. A. Eds., Ore genesis: The state of the art. Spec. Pub. Soc. Geol. appl. Miner. Deps., 2. Springer Verlag, Heidelberg, 804pp.
Haas, J. L. (1971). The effect of salinity on the maximum thermal gradient of a hydrothermal system at hydrostatic pressure. Econ. Geol., 66, 940-946.
Hanor, J. S. (1969). Barite saturation in sea water. Geochim. Cosmochim. Acta, 33, 894-898.
Hanson, G. N. (1980). Rare earth elements in petrogenetic studies of igneous systems. Ann. Rev. Earth Planet. Sc., 8, 371-406.
Hartnady, c., Joubert, P. and Stowe, c. (1985). Proterozoic crustal evolution in southwestern Africa. Episodes, 8, 236-244.
Haskin, L.A., Haskin, M.A., Frey, F. A. and Wildeman, T. R. (1968), 889-912. In: Ahrens, L, H. Ed., Origin and distribution of the elements. Pergamon Press.
Hatcher, P. G. and Segar, D. A. (1976). Chemistry and continental margin sedimentation, 461-477. In: Stanley, D. J. and Swift, D. J. P. Eds., Marine sediment transport and environmental management. John Wiley.
Heggie, D. and Lewis, T. (1984). Cobalt in pore waters of marine sediments. Nature, 311, 453-455.
Helgeson, H. c. (1969). Thermodynamics of hydrothermal systems at elevated temperatures and pressures. Am. J. Sc., 267, 729-804.
Helgeson, H. c., Kirkham, D. H., and Flowers, G. c. (1981). Theoretical prediction of the thermodynamic behavior of aqueous electrolytes at high pressures and temperatures: IV. Calculation of activity coefficients, osmotic coefficients, and apparent molal and standard and relative partial molal properties to 600°C and 5 kb. Am. J. Sc., 281, 1249-1516.
240

Hemley, J. J., Cygan, G. L. and d'Angelo, W. M. (1986). Effect of pressure on ore mineral solubilities under hydrothermal conditions. Geology, 14, 377-379.
Herrmann, A.G. (1970). Yttrium and lanthanides. In: Wedepohl, K. H., Ed., Handbook of Geochemistry, Springer-Verlag Publishing Company, Berlin, 39,57-71-B - 39,57-71-0.
Hertogen, J. and Gijbels, R. (1976). Calculation of trace element fractionation during partial melting. Geochim. Cosmochim. Acta, 40' 313-322.
Hirst, D. M. (1962a). The geochemistry of modern sediments from the Gulf of Paria - I: The relationship between the mineralogy and thedistribution of major elements. Geochim. Cosmochim. Acta, 26, 309-334.
Hirst, D. M. (1962b). The geochemistry of modern sediments from the Gulf of Paria - II: The location and distribution of trace elements. Geochim. Cosmochim. Acta, 26, 1147-1187.
Holland, H. D., (1979). Metals in black shales - a reassessment. Econ. Geol., 74, 1676-1680.
Holland, H. D., and Malinin, S. D. (1979). The solubility and occurrence of mon-ore minerals, 461-508. In: Barnes, H. L., Ed., Geochemistry of hydrothermal ore deposits. John Wiley & Sons, New York, 798pp.
Horne, J. c. (1979). The orthoquartzite problem, p370. In: Ferm, J. c. and Horne, J. c., Eds., Carboniferous depositional environments in the Appalachian region. Univ. s. Carolina, Columbia.
Hughes, c. J. (1976). Volcanogenic cherts in the late Precambrian Conception Group, Avalon Peninsula, Newfoundland. Can. J. Earth Sci., 13, 512-519.
Huston, D. L., and Large, R.R. (1987). Genetic and exploration significance of the Zinc Ratio (100Zn/(Zn +Pb)) in massive sulfide systems. Econ. Geol., 82, 1521-1539.
Hutchinson, R. W., Fyfe, W. S. and Kerrich, R. (1980). Deep fluid penetration and ore deposition. Miner. Sci. Engng., 12, 107-120.
Ishibashi, M., Fujinaga, T. and Kawamoto, T. (1962). Fundamental investigation on the dissolution and deposition of molybdenum, tungsten and vanadium in the sea. Rec. Oceanogr. Wks. Japan, spec. 6, 215-.
Jacobs, J. W., Korotev, R. L., Blanchard, D. P. and Haskin, L.A. (1977). A well tested procedure for instrumental neutron activation analysis of silicate rocks and minerals. J. Radioanalytical chem., 40, 93-114.
James, H. L. (1954). Sedimentary facies of iron-formation. Econ. Geol., 49, 235-285.
Jefferson, C. W., Kilby, D. B., Pigage, L. c. and Roberts, W. J. (1983). The Cirque barite-lead-zinc deposits, northeastern British Columbia, 121-140. In: Sangster, D. F., Ed., Short course in sediment-hosted lead-zinc deposits. Mineralogical association of Canada, Victoria, 309 pp.
Johansson, A., and Rickard, D. (1984). Isotopic composition of Phanerozoic ore leads form·the Swedish segment of the Fennoscandian Shield. Miner. Deposita, 19, 249-255.
Johansson, A., and Rickard, D. (1985). Some new lead isotope determinations from the Proterozoic sulfide ores of central Sweden. Miner. Deposita, 20, 1-7.
Johnson, H. D. (1978). Shallow siliclastic seas, 207-258. In: Reading, H. G., Ed., Sedimentary environments and facies. Blackwell, Oxford, 569pp.
Jones, B. F. and Bowser, c. J. (1978). The mineralogy and related chemistry of lake sediments, 179-235. In: Lerman, A. Ed., Lakes. Chemistry, geology and physics. Springer-Verlag, New York, 363pp.
241

Joubert, P. (1971). The regional tectonism of the gneisses of part of Mamaqualand. Bull. Precambr. Res. Unit, Univ. Cape Town, 10, 220pp.
Joubert, P. (1974). The gneisses of Namaqualand and their deformation. Trans. geol. Soc. s. Afr., 77, 339-345.
Joubert, P. (1986). Namaqualand - a model of Proterozoic accretion? Trans. geol. Soc. s. Afr., 89, 79-96.
Kalogeropoulos, s. I. and Scott, s. D. (1983). Mineralogy and geochemistry of tuffaceous exhalites (tetsusekiei) of the Fukazawa Mine, Hokuroku District, Japan. Econ. Geol., Monogr. 5, 412-432.
Kim, Y. A. and Zeitlin, H. (1968). The determination of molybdenum in seawater. Limnol. Oceanogr., 13, 534-.
Klein, c., Beukes, N. J. and Schopf, J. w. (1987). Filamentous microfossils in the Early Proterozoic Transvaal Supergroup: their morphology, significance, and paleoenvironmental setting. Precambr. Res., 36, 81-94.
Koeppel, v. (1980). Lead isotope studies of stratiform ore deposits of the Namaqualand, N. w. Cape Province, South Africa, and their implications on the age of the Bushmanland Sequence. Proc. 5th IAGOD Symp., 1, 195-207.
Krauskopf, K. B. (1959). The geochemistry of silica in sedimentary environments. Soc. econ. palaeont. Miner. spec. Publn., 7, 4-19.
Krauskopf, K. B. (1967). Source rocks for metal-bearing fluids, 1-33. In: Barnes, H. L. Ed., Geochemistry of hydrothermal ore deposits. Holt, Rinehart and Winston Inc., New York.
Krauskopf, K. B. (1979). Introduction to geochemistry. McGraw-Hill, Inc., Tokyo, 617pp.
Kronberg, B. I., Fyfe, w. s., Leonardos, o. H. Jr. and Santos, A. M. (1979). The chemistry of some Brazilian soils: element mobility during intense weathering. Chem. Geol., 24, 211-229.
Krynine, P. D. (1942). Differential sedimentation and its products during one complete geosynclinal cycle. Anales 1 st Congreso Panamerican Ingenieria de Minas y Geologia, 2, 537-561.
Lambert, I. B. and Scott, K. M. (1975). Carbon contents of sedimentary rocks within and around the McArthur zinc-lead-silver deposit, Northern Territory. J. geochem. Explor., 4, 365-369.
Large, D. E. (1981). Sediment-hosted submarine exhalative lead-zinc deposits - review of their geological characteristics and genesis, 469-507. In: Wolf, K. H. Ed., Handbook of strata-bound and stratiform ore deposits, 9. Elsevier Publishing Company, Amsterdam.
Large, D. E. (1981). The geochemistry of the sedimentary rocks in the vicinity of the Tom Pb-Zn-Ba deposit, Yukon Territory, Canada. J. geochem. Explor., 15, 203-217.
Large, D. E. (1983). Sediment-hosted massive sulphide lead-zinc deposits: an empirical model. In: Sangster, D. F., Ed., Short course in sediment-hosted lesd-zinc deposits. Mineralogical association of Canada, Victoria, 309 pp.
Large, R.R. (1977). Chemical evolution and zonation of massive sulfide deposits in volcanic terrains. Econ. Geol., 12, 549-572.
LeHuray, A. P., Caulfield, J. B. D., Rye, D. M., and Dixon, P.R. (1987). Basement controls on sediment-hosted Zn-Pb deposits: a Pb isotope study of carboniferous mineralization in Central Ireland. Econ. Geol., 82, 1695-1709.
Le Maitre, R. W. (1982). Numerical petrology. Elsevier Scientific Publishing Co.,New York, 281pp.
Leventhal, J. S. (1983). An interpretation of carbon and sulfur relationships in Black Sea sediments as indicators of environments of deposition. Geochim. Cosmochim. Acta, 47, 133-137.
242

Lindstrom, D. J. and Korotev, R. L. (1982). TEABAGS: Computer programs for instrumental neutron activation analysis. J. Radioanalytical chem., 70, 439-458.
Lipson, R. D. (1978). Some aspects of the geology of part of the Aggeneysberge and surrounding gneisses Namaqualand. M.Sc. thesis (unpubl.), Univ. Witwatersrand, 100 pp.
Lipson, R. D. (1980). The granitic rocks surrounding the Aggeneysberge: a metamorphosed rapakivi suite? Trans. geol. Soc. S. Afr., 83, 179-192.
Lipson, R. D. (1981a). North west Cape aeromagnetic coverage -interpretation of linears and high - low pair anomalies. Internal GFSA Co. Rep. (unpubl.), llpp.
Lipson, R. D. (1981b). Manganese dispersion around the Broken Hill and Big Syncline orebodies, Aggeneys. Internal GFSA Co. Rep. ( unpub 1 • ) , 7pp.
Lipson, R. D., Martin, G. J., and Hobbs, J.B. M. (1986). Heavy mineral layers: evidence of a elastic origin for Bushmanland quartzite genesis at Aggeneys. Trans. geol. Soc. s. Afr., 89, 367-372.
Lowe, D.R. (1983). Restricted shallow-water sedimentation of early Archean stromatolitic and evaporitic strata of the Strelley Pool Chert, Pilbara Block, Western Australia. Precambr. Res., 19, 239-283.
Lydon, J. w. (1983). Chemical parameters controlling the origin and deposition of sediment-hosted stratiform lead-zinc deposits, 175-250. In: Sangster, D. F., Ed., Short course in sediment-hosted lesd-zinc deposits. Mineralogical association of Canada, Victoria, 309 pp.
Lydon, J. W. (1986). Models for the generation of metalliferous hydrothermal systems within sedimentary rocks and their applicability to the Irish Carboniferous Zn-Pb deposits, 555-577. In: Andrew, c. J., Crowe, R. W. A., Finlay, s., Pennell, W. M, and Pyne, J. F., Ed., Geology and genesis of mineral deposits in Ireland. Irish association for economic geology, Dublin, 711pp.
MacLean, W. H. and Kranidiotis, P. (1987). Immobile elements as monitors of mass transfer in Hydrothermal alteration: Phelps Dodge massive sulfide deposit, Matagami, Quebec. Econ. Geol., 82, 951-962.
MacRae, N.D. and Nesbitt, H.W. (1980). Partial melting in common sedimentary rocks: a mass balance approach. Contr. Miner. Petrol., 75, 21-26.
Marchig, v., Gundlach, H., Moller, P. and Schley, F. (1982). Some geochemical indicators for discrimination between diagenetic and hydrothermal metalliferous sediments. Mar. Geol., 50, 241-256.
Martin, G. J. (1989). The mineralogical investigation of borecore samples from the Gamsberg zinc deposit, north west Cape. Gold Fields Laboratories Report (unpubl.), Gam/2, 15pp.
Mason, B. (1958). Principles of geochemistry. John Wiley and Son, New York, 310pp.
Matzat, E. and Shiraki, K. (1972-1978). Chrome. In: Wedepohl, K. H., Ed., Handbook of Geochemistry, Springer-Verlag Publishing Company, Berlin, 24-A-1 - 24-0-1.
Maxwell, J. A. (1953). Geochemical study of chert and related deposits. Geol. Soc. Am. Bull. Abstr., 64, p1452.
McBride, E. F. and Folk, R. L. (1977). The Caballos novaculite revisited Part II: chert and shale members and synthesis. J. sedim. Petrol., 47, 1261-1286.
McLennan, s. M., and Taylor, s. R. (1979). Rare earth element mobility associated with uranium mineralisation. Nature, 282, 247-250.
243

McLennan, s. M., and Taylor, S. R. (1980). Th and U in sedimentary rocks: crustal evolution and sedimentary recycling. Nature, 285, 621-624.
McLennan, s. M., Nance, w. B. and Taylor, s. R. (1980). Rare earth element-thorium correlations in sedimentary rocks, and the composition of the continental crust. Geochim. Cosmochim. Acta, 44, 1833-1839.
McLennan, S. M., Taylor, s. R. and Eriksson, K. A. (1983). Geochemistry of Archean shales from the Pilbara Supergroup, Western Australia. Geochim. Cosmochim. Acta, 41, 1211-1222.
McLeod, R. L., and Stanton, R. L. (1984). Phyllosilicates and associated minerals in some Paleozoic stratiform sulfide deposits of southeastern Australia. Econ. Geol., 19, 1-22.
Miall, A. D. (1979). Deltas, 43-56. In: Walker, R. G., Ed., Facies models. Ainsworth Press, Ontario, 211pp.
Miall, A. D. (1984). Deltas, 105-118. In: Walker, R. G., Ed., Facies models, second edition. Ainsworth Press, Ontario, 317pp.
Michard, A., and Albarede, F. (1986). The REE content of some hydrothermal fluids. Chem. Geol., 55, 51-60.
Michard, A., Beaucaire, C., and Michard, G. (1987). Uranium and rare earth elements in COz-rich waters fromVals-les-Bains (France). Geochim. Cosmochim. Acta, 51, 901-909.
Minarik, L., Absalon, K., Kollnerova, z., and Klecka, M. (1983). Chemical changes of granite during its weathering, 293-306. In: Augustithis, s. s., Ed., Leaching and diffusion in rocks and their weathering products. Theophrastus Publications S.A., Athens.
Mitchell, A. H. G. and Reading, H. G. (1978). Sedimentation and tectonics, 439-476. In: Reading, H. G., Ed., Sedimentary environments and facies. Blackwell, Oxford.
Mitchell, A.H. G. and Reading, H. G. (1986). Sedimentation and tectonics, 471-591. In: Reading, H. G., Ed., Sedimentary environments and facies. Blackwell, Oxford, 615pp.
Monster, J., Appel, P. w. u., Thode, H. G., Schidlowski, M., Carmichael, C. M. and Bridgwater, D. (1979). Sulfur isotope studies in early Archaean sediments from Isua, West Greenland: implications for the antiquity of bacterial sulfate reduction. Geochim. Cosmochim. Acta, 43, 405-413.
Moore, J.M. (1977). The geology of Namiesberg, northern Cape. Bull. Precambr. Res. Unit, Univ. Cape Town, 20, 69pp.
Moore, J.M. (1986). A comparative study of metamorphosed supracrustal rocks from the western Mamaqualand Metamorphic Complex. Ph.D. thesis (unpubl.), Univ. Cape Town, 370 pp.
Murnane, R., and Clague, D. A. (1983). Nontronite from a low temperature hydrothermal system on the Juan de Fuca Ridge. Earth Planet. Sc. Lett., 65, 343-352.
Murray, J. W. and Brewer, P. G. (1977). Mechanisms of removal of manganese, iron and other trace metals from sea water, 292-325. In: Glasby, G. P., Ed., Marine manganese deposits. Elsevier Publishing Company, Amsterdam.
Nance, W. B. and Taylor, s. R. (1976). Rare earth element patterns and crustal evolution - I. Australian post-Archaean sedimentary rocks. Geochim. Cosmochim. Acta, 40, 1539-1552.
Nesbitt, H. w. (1979). Mobility and fractionation of rare earth elements during weathering of a granodiorite. Nature, 219, 206-21 o.
Nesbitt, H. W. (1980). Genesis of the New Quebec and Adirondack granulites: evidence for their production by partial melting. Contr. Miner. Petrol., 72, 303-310.
Nesbitt, H. W., Markovics, G. and Price, R. C. (1980). Chemical processes affecting alkalis and alkaline earths during continental weathering. Geochim. Cosmochim. Acta, 44, 1659-1666.
244

Nesbitt, H. w., and Young, G. M. (1982). Early Proterozoic climates and plate motions inferred from major element chemistry of lutites. Nature, 299, 715-717.
Nesbitt, H. w., and Young, o. M. (1984). Prediction of some weathering trends of plutonic and volcanic rocks based on thermodynamic and kinetic considerations. Geochim. Cosmochim. Acta, 48, 1523-1534.
Nielsen, H. (1979). Sulfur isotopes, 283-312. In: Jager, E., and Hunziker, J. C.,Ed., Lectures in isotope geology. Springer-Verlag, Berlin.
Norrish, K. and Hutton, J. T. (1969). An accurate X-ray fluorescence spectrographic method for the analysis of a wide range of geological samples. Geochim. Cosmochim. Acta, 33, 431-453.
Ohmoto, H. (1972). Systematics of sulfur and carbon isotopes in hydrothermal ore deposits. Econ. Geol., 67, 551-578.
Ohmoto, H., and Rye, R. o. (1979). Isotopes of sulfur and carbon, 509-567. In: Barnes, H. L., Ed., Geochemistry of hydrothermal ore deposits. John Wiley & Sons, New York, 798pp.
Ohmoto, H., Mizukami, M., Drummond, s. E., Eldridge, c. s., PisuthaArnond, V., and Lenagh, T. c. (1983). Chemical processes of Kuroko formation. Econ. Geol., Monogr. 5, 570-604.
Paizes, P. E. (1975). The geology of an area between Vaalkop and Aggeneys in the vicinity of Pofadder, north-western Cape Province. M.Sc, thesis (unpubl.) Univ. Witwatersrand, 220pp.
Pertlik, F., Rogers, J. J. w., Adams, J. A. s., and Haack, u. K. (1978). Uranium. In: Wedepohl, K. H., Ed., Handbook of Geochemistry, Springer-Verlag Publishing Company, Berlin, 92-A-1 -92-0-1.
Pettijohn, F. J., Potter, P. E. and Siever, R. (1972). Sand and sandstone. Springer-Verlag, Berlin, 618pp.
Pickrill, R. A., Irwin, J. and Shakespeare, B. s. (1981). Circulation and sedimentation in a tidal-influenced fjord lake: Lake McKerrow, New Zealand. Est. Coastal Shelf Sci., 12, 23-27.
Piper, D. z. (1971). The distribution of Co, Cr, Cu, Fe, Mn, Ni and Zn in Framvaren, a Norwegian anoxic fjord. Geochim. Cosmochim. Acta, 35, 531-550.
Piper, D. z. (1974). Rare earth elements in the sedimentary cycle: a summary. Chem. Geol., 14, 285-304.
Plimer, I. R. (1981). Water depth - a critical factor for exhalative ore deposits. Bull. Aust. Bur. Miner. Resour. Geol. Geophys., 6, 293-300.
Plimer, I. R. and Eliott, S.' M. (1979). The use of Rb/Sr ratios as a guide to mineralization. J. geochem. Explor., 12, 21-34.
Plimer, I. R. and Lottermoser, B. G. (1988). Comments and replies on "Sedimentary model for the giant Broken Hill Pb-Zn deposit, Australia". Geology, 16, 564-565.
Plumstead, E. P. (1969). Three thousand million years of plant life in Afriqa. Annex. Trans. geol. Soc. s. Afr., 72, Alex du Toit Mem. Leet., 11, 72pp.
Poldervaart, A. (1956). Zircon in rocks. 2. Igneous rocks. Am. J. Sc., 254, 521-554.
Potter, P. E. (1984). South American modern beach sand and plate tectonics. Nature, 311, 645-648.
Pottorf, R. J., and Barnes, H. L. (1983). Mineralogy, geochemistry, and ore genesis of hydrothermal sediments from the Atlantis II Deep, Red Sea. Econ. Geol., Monogr. 5, 198-223.
Praekelt, H.E., Colliston, W.P., and Schoch, A.E. (1983). The stratigraphic interpretation of a highly deformed Proterozoic region in central Bushmanland, South Africa: first correlation of structurally separated metasediments of the Aggeneys Subgroup. Precambr. Res., 23, 177-185.
245
Reid, D. L. (1979). Age relationships within the mid-Proterozoic Vioolsdrif Batholith, lower Orange River region. Trans. geol. Soc. S.Afr., 82, 305-311.
Reid, D.L. and Barton, E.S. (1983). Geochemical characterization of granitoids in the Namaqualand geotraverse. Spec. Publ. geol. Soc. S. Afr., 10, 67-82.
Reid, D. L., Welke, H. J., Erlank, A. J., and Betton, P. J. (1987). Composition, age and tectonic setting of amphibolites in the central Bushmanland Group, western Mamaqua Province, southern Africa. Precambr. Res., 36, 99-126.
Reid, D. L., Erlank, A. J., Waters, D. J. and Moore, J.M. (1987). Isotopic and trace element characterisation of the Aggeneys-type metal sulphide deposits and host rocks. C.S.I.R. N.G.P. Annual Prog. Rep. (unpubl.), 8pp.
Reid, D. L. and Welke, H. J. (1988). Radiogenic and stable isotope characteristics of the Aggeneys-Gams ore deposits, central Bushmanland. Abs., geol. Soc. s. A. Geocongress 88, Univ. Natal, Durban, 497-499.
Reinson, G. E. (1979). Barrier island systems, 57-74. In: Walker, R. G., Ed., Facies models. Ainsworth Press, Ontario, 2llpp.
Rhodes, D., Lantos, E. A., Lantos, H. A., Webb, R., J. and Owens, D. c. (1984). Pine Point orebodies and their relationship to the stratigraphy, structure, dolomitization, and karstification of the Middle Devonian Barrier. Complex. Econ. Geol., 79, 991-1055.
Richards, F. A. (1971). Anoxic versus oxic environments, 201-217. In: Hood, D. Ed., Impingement of man on the oceans. WileyInterscience, New York.
Riley, J.P. and Chester, R. (1971). Introduction to marine chemistry. Academic Press, London, 465pp.
Rimstidt, J. D., and Barnes, H. L. (1980). The kinetics of silicawater reactions. Geochim. Cosmochim. Acta, 44, 1683-1699.
Rimstidt, J. D. and Cole, D.R. (1983). Geothermal mineralization I: the mechanism of formation of the Beowawe, Nevada, siliceous sinter deposit. Am. J. Sc., 283, 861-875.
Rozendaal, A. (1978). The Gamsberg zinc deposit, Namaqualand. In: Verwoerd, W.J. (ed.). Mineralization in metamorphic terrains. Spec. Publ. geol. Soc. s. Afr., 4, 235-265.
Rozendaal, A. (1982). The petrology of the Gamsberg zinc deposit and the Bushmanland iron formations with special reference to their relationships and genesis. Ph.D. thesis (unpubl.), Univ. Stellenbosch, 363 pp.
Ruhlin, D. E., and OWen, R. M. (1986). The rare earth element geochemistry of hydrothermal sediments from the East Pacific Rise: examination of a seawater scavenging mechanism. Geochim. Cosmochim. Acta, 50, 393-400.
Russell, M. J. (1983). Major sediment-hosted exhalative zinc + lead deposits: formation from hydrothermal convection cells that deepen during crustal extension, 251-282. In: Sangster, D. F., Ed., Short course in sediment-hosted lesd-zinc deposits. Mineralogical association of Canada, Victoria, 309 pp.
Russell, M. J. (1986). Extension and convection: a genetic model for the Irish Carboniferous base metal and barite deposits, 545-554. In: Andrew, c. J., Crowe, R. W. A., Finlay, s., Pennell, W. M, and Pyne, J. F., Ed., Geology and genesis of mineral deposits in Ireland. Irish association for economic geology, Dublin, 711pp.
Ryan, P.J., Lawrence, A.L., Lipson, R.D., Moore, J.M., Paterson, A., Stedman, D.P., and van Zyl, D. (1982). The Aggeneys base metal sulphide deposits, Namaqualand, South Africa. Econ. Geol. Res. Unit, Univ. Witwatersrand, Inf. Circ., 160, 33p.
SACS (1980). (Compiler, L.E. Kent) Stratigraphy of South Africa, Part I. Handb. geol. Soc. S. Afr., 8, 690pp.
246

Sahl, K., Doe, B. R. and Wedepohl, K. H. (1974). Lead. In: Wedepohl, K. H., Ed., Handbook of Geochemistry, Springer-Verlag Publishing Company, Berlin, 82-B-1 - 82-0-1.
Salamons, W. (1980). Adsorption processes and hydrodynamic conditions in estuaries. Envir. TechnoJ. Lett., 1, 356-365.
Samson, I. M., and Russell, M. J. (1987). Genesis of the Silvermines zinc-lead -barite deposit, Ireland: fluid inclusion and stable isotope evidence. Econ. Geol., 82, 371-394.
Sangster, D. F. (1972). Precambrian volcanogenic massive sulphide deposits in Canada: a review. Can. geol. Surv. Pap., 72-22, 44pp.
Sangster, D. F. (1976). Sulphur and lead isotopes in strata-bound deposits, 219-265. In: Wolf, K. H., Ed., Handbook of strata-bound and stratiform ore deposits, 2, Elsevier Publishing Company, Amsterdam.
Sato, T. (1972). Behaviors of ore-forming solutions in seawater. Min. Geo 1 . , 2 2 , 31 -4 2 •
Saxena, s. K. (1966). Evolution of zircons in sedimentary and metamorphic rocks. Sedimentology, 6, 1-33.
Schreyer, W., Werding, G. and Abraham, K. (1981). Corundum-fuchsite rocks in greenstone belts of southern Africa: petrology, geochemistry, and possible origin. J. Petrology, 22, 191-231.
Senior, A. and Leake, B.E. (1978). Regional metasomatism and the geochemistry of the Dalradian metasediments of Connemara, western Ireland. J. Petrology, 19, 585-623.
Sharma, G.D. (1971). Sediments, 169-188. In: Hood, D. Ed., Impingement of man on the oceans. Wiley-Interscience, New York. ·
Shaw, D. M. (1977). Trace element behaviour during anatexis. In: Proc. Chapman Conference on partial melting in the earth's upper mantle, 96, Bull. Dept. Geol. mineral. Industr. Portland, Oregon, 189-283.
Shaw, D. M. (1979). Trace element melting models. Phys. chem. earth, 11, 577-586.
Shepard, F. P. and Young, R. (1961). Distinguishing between beach and dune sands. J. sedim. Petrol., 31, 196-214.
Sheu, D. and Burkart, B. (1982). Inferred paleosalinity and phosphate content of carbonate rocks from a cyclic evaporite-carbonate rock sequence. J. sedim. Petrol., 52, 897-903.
Sholkovitz, E. R. (1976). Flocculation of dissolved organic and inorganic matter during the mixing of river water and seawater. Geochim. Cosmochim. Acta, 40, 831-845.
Sholkovitz, E. R. (1978). The flocculation of dissolved Fe, Mn, Al, Cu, Ni, Co and Cd during estuarine mixing. Earth Planet. Sc. Lett., 41, 77-86.
Skei, J. (1983). Geochemical and sedimentological considerations of a permanently anoxic fjord - Framvaren, south Norway. Sedim. Geol., 36, 131-145.
Skei, J.M. and Melsom, s. (1982). Seasonal and vertical variations in the chemical composition of suspended particulate matter in an oxygen-deficient fjord. Est. Coastal Shelf Sci., 14, 61-78.
Smith, P.A., and Cronen, D.S. (1983). The geochemistry of metalliferous sediments and waters associated with shallow submarine hydrothermal activity (Santorini, Aegean Sea). Chem. Geol., 39, 241-262.
Spry, P. G. and Wonder, J. D. (1989). Manganese-rich garnet rocks associated with the Broken Hill Lead-Zinc deposit, New South Wales, Australia. Can. Mineral., 21, 275-292.
Stanton, R. L. (1972). A preliminary account of chemical relationships between sulf ied lode and "banded iron formation" at Broken Hill, New South Wales. Econ. Geol., 67, 1128-1145.
247

Stanton, R. L., Roberts, w. P.H. and Chant, R. A. (1978). Petrochemical studies of the ore environment at Broken Hill, New South Wales: 5 - Major element constitution of the load and its interpretation. Proc. Australas. Inst. Min. Metall., 266, 51-77.
Stedman, D. P. (1980). The structural geology and metamorphic petrology of Black Mountain, Namaqualand. M.Sc. thesis (unpubl.), Univ. Witwatersrand.
Stevens, B. P. J. and Stroud, W. J. (1983). Rocks of the Broken Hill Block: their classification, nature, stratigraphic distribution, and origin. Rec. geol. Surv. New South Wales, 21, 323pp.
Stowe, C. w. (1986). Synthesis and interpretation of structures along the north-eastern boundary of the Namaqua Tectonic Province, South Africa. Trans. geol. Soc. s. Afr., 89, 185-198.
Strens, M. R., Cann, D. L., and Cann, J. R. (1987). A thermal balance model of the formation of sedimentary-exhalative lead-zinc deposits. Econ. Geol., 82, 1192-1203.
Strickland, J. D. H. (1965). Organic productivity, 478-610. In: Riley, J.P., and Skirrow, G., Eds., Chemical oceanography. Academic Press, London, 712pp.
Strong, D. F. (1984). Rare earth elements in volcanic rocks of the Buchans area, Newfoundland. Can. J. Earth Sci., 21, 775-780.
Stroud, W. J., Willis, I. L., Bradley, G. M., Brown, R. E., Stevens, B. P. J. and Barnes, R. G. (1983). Amphibole or pyroxene-bearing rocks, 227-287. In: Stevens, B. P. J. and Stroud, w. J., Eds., Rocks of the Broken Hill block: their classification, mature, stratigraphic distribution, and origin. Record geol. Surv. New South Wales, 21.
Sugisaki, R., Yamamoto, K. and Adachi, M. (1982). Triassic bedded cherts in central Japan are not pelagic. Nature, 298, 644-647.
Sundby, B., Silverberg, N. and Chesselet, R. (1981). Geochim. Cosmochim. Acta, 45, 293-307.
Taylor, s. R. (1964). Abundance of chemical elements in the continental crust: a new table. Geochim. Cosmochim. Acta, 28, 1273-1285.
Taylor, S. R. (1979). Chemical composition and evolution of the continental crust: the rare earth element evidence, 353-376. In: Mc Elhinny, W. M., Ed., The earth: its origin, structure adn evolution. Academic Press, London.
Taylor, s. R. and Gorton, M. P. (1977). Geochemical applicatiori of spark source mass spectrography - III. Element sensitivity, precision and accuracy. Geochim. Cosmochim. Acta, 41, 1375-1380.
Taylor, S. R. and McLennan, s. M. (1981). The rare earth element evidence in Precambrian sedimentary rocks: implications for crustal evolution, 527-548. In: Kroner, A. Ed., Precambrian plate tectonics. Elsevier Publishing Company, Amsterdam, 781pp.
Temple, J. T. (1978). The use of factor analysis in geology. Mathl. Geo 1 • , 4 , 3 7 9- 3 8 7 .
Thomas, W. A. and Mann, c. J. (1966). Late Jurassic depositional environments, Lousiana and Arkansas. Bull. Am. Ass. Petrol. Geol., 50, 178-182.
Thurston, D.R. (1972). Studies on bedded cherts. Contr. Miner. Petrol., 36, 329-334.
Tlig, S. and M1Rabet, A. (1985). A comparative study of the rare earth element (REE) distributions within the Lower Cretaceous dolomites and limestones of Central Tunisia. Sedimentology, 32, 897-907.
Tourtelot, H. A. (1979). Black Shale - its deposition and diagenesis. Clays Clay Miner., 27, 313-321.
248

Trimonis, E. s., Shimkis, P. P. and Ross, D. A. (1978). Mineral composition of coarse-silt fraction of the Black Sea Late Cenozoic sediments, 413-426. In: Usher, J. L. and Supko, L., Eds., Initial Reports of the Deep Sea Drilling Project, 42 (2), Washington U. s. Govt, Printing Office.
Trudinger, P.A. (1981). Origins of sulphide in sediments. Bull. Aust. Bur. Miner. Resour. Geol. Geophys., 6, 279-285.
Turekian, K. K. (1968). Oceans. Prentice Hall, New Jearsey, 120pp. Turekian, K. K. (1968-1978). Nickel. In: Wedepohl, K. H., Ed.,
Handbook of Geochemistry, Springer-Verlag Publishing Company, Berlin, 28-B-1 - 28-0-2.
Turekian, K. K. (1971). Rivers, tributaries and estuaries, 9-73. In: Hood, D. Ed., Impingement of man on the oceans. WileyInterscience, New York.
Turekian, K. K. (1972). Chemistry of the earth. Holt, Rinehart and Winston, Inc., New York, 131pp.
van de Kamp, P. c., Leake, B. E. and Senior, A. (1976). The petrography and geochemistry of some Californian arkoses with application to identifying gneisses of metasedimentary origin. J. Geo 1 • , 8 4 , 1 9 5 - 21 2 .
Vine, J. D. (1966). Element distribution in some shelf and eugeosynclinal black shales. Bull. U.S. geol. Surv., 1214E, E1-E31.
Vine, J. D. and Tourtelot, E. B. (1970). Geochemistry of black shale deposits - a summary report. Econ. Geol., 65, 253-272.
Vinogradov, A. P. (1962). Average contents of chemical elements in the principal types of igneous rocks of the earth's crust. Geochemistry, 7, 641-664.
von Gehlen, K., Nielsen, H., Chunnett, I., and Rozendaal, A. (1983). Sulphur isotopes in metamorphosed Precambrian Fe-Pb-Zn-Cu sulphides and baryte at Aggeneys and Gamsberg, South Africa. Mineralog. Mag., 47, 481-486.
Verma, A. (1976). On the petrochemistry of rapakivi granites with special reference to the Laitila Massif, southwestern Finland. Bull. geol. Surv. Finland, 285, 98pp.
Walker, R. G. (1979). Turbidites and associated coarse elastic deposits, 91-104. In: Walker, R. G., Ed., Facies models. Ainsworth Press, Ontario, 211pp. '
Walker, R. G. and Cant, D. J. (1979). Sandy fluvial systems, 23-31. In: Walker, R. G., Ed., Facies models. Ainsworth Press, Ontario, 211pp.
Walker, R. G. and Middelton (1979). Eolian sands, 33-41. In: Walker, R. G., Ed., Facies models. Ainsworth Press, Ontario, 211pp.
Watanabe, T., Yui, s, and Kato, A. (1970). Metamorphosed bedded manganese deposits of the Noda-Tamagawa mine. In: Tatsumi, T., Ed., Volcanism and ore genesis, University Tokyo Press, Tokyo, 143-152.
Waters, D. J. (1986). Metamorphic zonation and thermal history of pelitic gneisses from western Namaqualand, South Africa. Trans. geol. Soc. s. Afr., 89, 97-102.
Waters, D. J. and Whales, c. J. (1984). Dehydration melting and the granulite transition in metapelites from southern Namaqualand, s. Africa. Contr. Miner. Petrol., 88, 269-275.
Watkeys, M. K. (1986). The Achab Gneiss: a "floor" in Bushmanland or a flaw in Namaqualand? Trans. geol. Soc. s. Afr., 89, 103-116.
Wedepohl, K. H. (1972). Zinc. In: Wedepohl, K. H., Ed., Handbook of Geochemistry, Springer-Verlag Publishing Company, Berlin, 30-B-1 -30-H-3.
249

Welke, H.J. and Smith, c. B., (1984). Lead isotope characterization of the Aggeneys-Gamsberg ore bodies in relation to possible source rocks, with implications for Bushmanland metallogenesis. Abs., Conference on Middle to Late Proterozoic lithosphere evolution, Precambr. Res. Unit, Univ. Cape Town, p.8-9.
White, D. E. (1965). Saline waters of sedimentary rocks. Am. Ass. Petrol. Geologists, Mem. 4, 342-366.
White, J. c., and White, s. H. (1983). Semi-brittle deformation within the Alpine fault zone, New Zealand. J. struct. Geol., 5, 579-589.
Wildeman, T. R. and Haskin, L. (1965). Rare-earth elements in ocean sediments. J. Geophys. Res., 70, 2905-2910.
Williams, N. (1978). Studies of the base metal sulfide deposits at McArthur River, Northern Territory, Australia: II. The sulfide-S and organic-C relationships of the concordant deposits and their significance. Econ. Geol., 73, 1036-1056.
Willis, I. L., Barnes, R. G., Stevens, B. P. J., Stroud, w. J. and Brown, R. E. (1988). Comments and replies on "Sedimentary model for the giant Broken Hill Pb-Zn deposit, Australia". Geology, 16, 567.
Wilson, J. D. (1981). The geology of the Broken Hill deposit, Aggeneys, north west Cape. Abs., South African geodynamics symposium, Geocongress 181, 231-233.
Winkler, H. J. F. (1976). Petrogenesis of metamorphic rocks. Springer-Verlag, New York, 334pp.
Wright, J. v., Haydon, R. c. and McConachy, G. w. (1987). Sedimentary model for the giant Broken Hill Pb-Zn deposit, Australia. Geology, 15, 598-602.
Zierenberg, R. A. and Shanks, w. c. III, (1986). Isotopic constraints on the origin of the Atlantis II, Suakin and Valdivia brines, Red Sea. Geochim. Cosmochim. Acta, 50, 2205-2214.
250
Copyright © 2022 FDOKUMEN