AN ANALYSIS OF CASE RECORDS - University of Cape Town
93
CHANGES IN CLIENT FUNCTIONING DURING TREATMENT AT A SECONDARY STAGE ADDICTION FACILITY: AN ANALYSIS OF CASE RECORDS Nic Hazell HZLNIC001 A minor dissertation submitted in partial fulfillment of the requirements for the award of the degree of Master of Arts (Clinical Psychology) Department of Psychology Faculty of the Humanities University of Cape Town Supervisor: Dr. Debbie Kaminer 2014 University of Cape Town
-
Upload
khangminh22 -
Category
Documents
-
view
2 -
download
0
Transcript of AN ANALYSIS OF CASE RECORDS - University of Cape Town
CHANGES IN CLIENT FUNCTIONING DURING TREATMENT AT A
SECONDARY STAGE ADDICTION FACILITY: AN ANALYSIS OF CASE
RECORDS
Nic Hazell
HZLNIC001
A minor dissertation submitted in partial fulfillment of the requirements for the award
of the degree of Master of Arts (Clinical Psychology)
Department of Psychology
Faculty of the Humanities
University of Cape Town
Supervisor: Dr. Debbie Kaminer
2014
Univers
ity of
Cap
e Tow
n

The copyright of this thesis vests in the author. No quotation from it or information derived from it is to be published without full acknowledgement of the source. The thesis is to be used for private study or non-commercial research purposes only.
Published by the University of Cape Town (UCT) in terms of the non-exclusive license granted to UCT by the author.
Univers
ity of
Cap
e Tow
n

i
Declaration
This work has not been previously submitted in whole, or in part, for the award of any
degree. It is my own work. Each significant contribution to, and quotation in, this
dissertation from the work, or works, of other people has been attributed, and has
been cited and referenced.
Signature:
Date:
(Williams, et al., 2008) (Stein, et al., 2008) (Moore, Seavey, Ritter, McNulty, Gordon, & Stuart, 2013) (Dutra, Stathopoulou, Basden, Leyro, Powers, & Otto, 2008) (Rawson, et al., 1995) (Miller & Rose, 2009) (Rawson, et al., 2004) (Gossop M. , 2006) (National Treatment Agency, 2006) (Paddock, Edelen, Wenzel, Ebener, Mandell, & Dahl, 2007) (Pos, Greenberg, & Warwar, 2009) (VanWynsberghe & Khan, 2007) (Harker, Kader, Myers, Fakier, Parry, & Flisher, 2010) (ASAM, 2006) (Rollnick & Miller, 1995) (Myers, Harker, Fakier, Kader, & Mazok, 2008) (Cameron & Wolfe, 2009) (American Psychiatric Association, 2013) (American Psychiatric Association, 2013) (American Psychiatric Association, 2013) (May, et al., 2007) (Alcoholics Anonymous World Services, 2001) (Witbrodt, et al., 2007) (American Psychological Association, 2010)
ii
Acknowledgements
Thank you so much Dr Debbie Kaminer, for your advice and guidance, for your
clarity of mind, your thoroughness, and most of all, your patience. Thank you for
maintaining a smile in spite of it all.
Tonya and Leah for sticking with an absentee for all this time and for making me feel
complete while completion evaded me elsewhere, thank you. I love you both.
Thank you to the addiction treatment facility (the location of this study) staff for your
willingness and cooperation, and thanks to all those who agreed to participate in this
study.
And thanks to family and friends who have also endured me MIA. See you all soon.
iii
Abstract
Background and Aims: Recent findings indicate that South Africa and, in particular,
the Western Cape have some of the highest prevalences of substance use disorders
and substance related problems in the world. Further, in the past decade, the
prevalence of poly-substance use in South Africa has grown considerably. The high
prevalence of substance use disorders and related problems in the Western Cape
relative to an already significant national problem highlights the importance of local
research on the effective treatment of substance use disorders. While there are
outcome studies supporting the effectiveness of various addiction treatment models,
and much is known about the various stages of intervention at addiction treatment
facilities, little is known about the processes and mechanisms of addiction treatment
and recovery. Various authors have proposed that researching patient progress
through treatment is essential to growing our knowledge, improving treatments and
generalising them to other settings. This study aimed to investigate client case files at
a secondary stage addiction treatment facility in Cape Town to explore whether there
were any discernable patterns in clients’ functioning across different stages of
treatment. Method: The research took the form of a case study that used thematic
analysis to discern patterns in qualitative data regarding reported observations of
client’s behaviors, cognitions, affects and physical states at different stages of
addiction treatment. Comparisons were also made between the observations of clients
with Axis II personality traits and those without Axis II personality traits, and
between clients recovering from stimulant addiction and those recovering from non-
stimulant addiction. The participants comprised a sample of 33 clients of a secondary
stage addiction treatment facility in Cape Town, South Africa. Conclusions: Analysis
yielded a number of possible patterns in the distribution of themes across time-points,
some of which resonated with previous research, particularly regarding second order
change, but also regarding Protracted Withdrawal Syndrome and ‘The Wall’. The
comparative analysis indicated that there might be both similarities and differences
between subgroups of clients that may shed light on the use of matching hypotheses
in the context of addiction treatment.
iv
Table of Contents
Declaration i
Acknowledgements ii
Abstract iii
List of Tables vi
Chapter One: Introduction 1
1.1 Research Aims 4
1.2 Dissertation Structure 5
Chapter Two: Literature Review 6
2.1 Definitions of Addiction 6
2.1.1 DSM IV-TR 7
2.1.2 WHO and the ICD-10 9
2.1.3 American Society of Addiction Medicine 10
2.2 Approaches to Addiction Treatment 11
2.2.1 Alcoholics Anonymous and the Twelve-step Program 11
2.2.2 The Minnesota Model 14
2.2.3 Specific Treatment Techniques 16
2.2.3.1 Cognitive Behavioral Therapy 16
2.2.3.2 Contingency Management and Community
Reinforcement Approaches 18
2.2.3.3 Relapse Prevention 19
2.2.3.4 Motivational Enhancement Therapy 20
2.2.3.5 The Matrix Model 20
2.2.3.6 Medication 22
2.2.3.7 Aftercare 22
2.2.3.8 Matching individuals with treatments 22
2.2.4 Summary of Treatment Literature 23
2.3 The Process of Addiction Treatment 24
2.3.1 The Transtheoretical Model 24
2.3.2 Social Control 25
2.3.3 The Process of Change and Addiction Treatment Communities 26
2.3.4 Second Order Change 26
v
2.3.5 Emotional Processing as Core Change 27
2.3.6 Protracted Withdrawal Syndrome and ‘The Wall’ 27
2.4 Chapter Summary 28
Chapter 3: Method 30
3.1 Research Aims 30
3.2 Design 30
3.3 Setting 31
3.4 Participants 32
3.5 Data Collection 32
3.6 Data Analysis 34
3.7 Ethical Considerations 35
Chapter 4: Analysis and Discussion 39
4.1 Themes 39
4.2 Frequency of Positive, Negative and Neutral categories across time-points
for total sample 42
4.3 Frequency of specific themes by stage of treatment 47
4.3.1 Week 1 47
4.3.2 Week 4 48
4.3.3 Week 6 50
4.3.4 Week 8 52
4.4 Comparison between Axis II and non-Axis II subgroups 53
4.5 Comparison between Stimulant and Non-stimulant user subgroups 61
4.6 Chapter Summary 67
Chapter 5: Conclusion 68
5.1 Summary of findings and integration with literature 68
5.2 Limitations 73
5.3 Recommendations for future research 75
5.3 Chapter Summary 76
References 78
Appendix
vi
List of Tables
Table 3.1: Participant Profiles 33
Table 3.2: Sample grid matrix 37
Table 3.3: Examples of codes 38
Table 4.1 Themes with examples of the codes that comprise them 40
Table 4.2 Frequencies of themes at each week sampled 41
Table 4.3 Number of clients presenting with each theme per week sampled 43
Table 4.4 Number of Axis II clients presenting with each theme per week
sampled 54
Table 4.5 Number of non-Axis II clients presenting with each theme per week
sampled 55
Table 4.6 Number of stimulant clients presenting with each theme per week
sampled 62
Table 4.7 Number of non-stimulant clients presenting with each theme per
week sampled 63
1
CHAPTER ONE: INTRODUCTION
During an address in 2009, Helen Zille stated her opinion that the problem of
substance abuse in the Western Cape and South Africa as a whole was a problem
more pressing than HIV/AIDS, and that addressing this ought to be a public health
priority. Indeed, prevalence data indicate that South Africa has high rates of substance
abuse compared to many other countries.
In 2010 the World Health Organisation (WHO) launched the ATLAS on Substance
Use (2010) - Resources for the prevention and treatment of substance use disorders.
It contains information collected from 147 countries, including South Africa,
representing 88% of the world’s population (World Health Organisation, 2011).
According to the ATLAS, in 2004, 7.6% of the global burden of disease (time of life
lost to pre-mature death or ill-health) in men. In women in was 1.4%.
The highest prevalence rates of alcohol use disorders as defined by the DSM IV-TR
and ICD-10 are to be found in parts of Eastern and Central Europe (up to 16%), in the
Americas1 (up to 10%), in South East Asia (up to 10%) and in some countries in the
Western Pacific (up to 13%) (2010). WHO claims that there is a gap in knowledge
about specific illicit drug use disorders regionally and globally, which it believes may
be due to a combination of differences in the understanding of and willingness to
report on drug use in surveys.
In another survey, between 2001-2003, WHO conducted interviews with 60463
individuals across 14 countries in the Americas, Europe, the Middle East, Africa and
Asia, using the WMH-CIDI, a structured psychiatric diagnostic interview, to assess
the prevalence, severity and unmet need for treatment of Mental Disorders (World
Mental Health Survey Consortium, 2004). Substance use disorders, which included
both alcohol and illicit drug use, were found to be consistently less prevalent than
other mental disorders like anxiety disorders and mood disorders. Substance use
disorders were found to have a 12-month point prevalence of between 0.1% and
6.4%, with the Ukraine having the highest prevalence at 6.4% (World Mental Health
1 The Americas in this instance include the United States, Canada, Mexico and several South American countries.

2
Survey Consortium, 2004). The global average point prevalence of substance use
disorders across all counties sampled was 1.92%. The lower numbers in this survey
relative to the ATLAS survey reflects the fact that the global prevalence rates of drug
use disorders are estimated to be far lower than those for alcohol use disorders at 0-
3% as against 0-16% (World Health Organisation, 2010). WHO estimates that global
illicit drug use prevalence rates are highest in parts of the Americas, certain countries
in Africa, the Eastern Mediterranean, Europe and the Western Pacific (World Health
Organisation, 2010).
South Africa has one of the highest substance use, substance abuse and substance
dependence rates in the world. Studies have reported that as many as 13% of South
Africans suffer from untreated substance use disorders which, amongst other things,
places a great burden on the legal and health care sectors (Myers, Louw, & Pasche,
2010) and is considerable next to an estimated global maximum prevalence of 16%
(World Health Organisation, 2010). Deputy Trade and Industry Minister Elizabeth
Thabethe announced on the 5th September 2011 that alcohol abuse costs the South
African economy R9 billion per year through absenteeism, poor productivity, high job
turnover, interpersonal conflict, injuries and damage to property (Sunday Tribune,
2011).
Furthermore, poly-substance use has become prevalent in South Africa in the last
decade, especially in the light of the growing prevalence of methamphetamine (MA)
or ‘Tik’ (Harker, N., Kader, R., Myers, B., Fakier, N., Parry, C., & Flisher, A. J.,
2010). Drugs like heroin, Mandrax and cannabis, which have a sedative effect, are
used to counter-act the effects of, or ‘come down’ from, MA, which is a powerful
stimulant (Harker et al., 2010).
The South African Stress and Health Study (SASH), surveying 12-month prevalences
of DSM-IV disorders using the WMH-CIDI, indicated that substance use disorders
were the second most prevalent category of mental disorders in the country after
anxiety disorders (Williams, D. R., Herman, A., Stein, D., Heeringa, S. G., Jackson,
P. B., Moomal, H., et al., (2008). They were also the most prevalent of disorders
classified as serious, with alcohol dependence comprising 94.8%, and drug
dependence 81.8%, of such disorders (Williams et al., 2008). This stands in contrast

3
to the global study where substance use disorders were amongst the least prevalent
categories of disorder. Following global trends, South African males were found to be
at higher risk for substance use disorders than females and the younger cohorts were
at higher risk than the older cohorts (Williams et al., 2008).
In terms of lifetime prevalences, at 11.4%, alcohol abuse was the most prevalent
lifetime mental disorder in South Africa and at 13.3% substance use disorders were
the most prevalent class of disorder (Stein, D. J., Seedat, S., Herman, A., Moomal, H.,
Heeringa, S., Kessler, R., et al., 2008). Drug dependence was found to be rising,
especially amongst the youth (Stein et al., 2008). This mirrors the rising prevalence of
substance use disorders as a global trend (World Mental Health Survey Consortium,
2004). Substance use disorders in South Africa were found to have an early average
age of onset (21 years) when compared to many other countries (Stein et al., 2008),
although average ages of onset for such countries were not cited.
The SASH study estimated that the prevalence of substance abuse in South Africa is
at least twice that of other WHO World Mental Health Survey countries (Williams et
al., 2008). Such results highlight the importance of local research on substance use
treatment. However, in comparing South African and international prevalences, it is
important to note that, although the CIDI 3.0 was used in twenty countries around the
world including in the study in South Africa, it has not been validated for use in South
Africa (Williams et al., 2008).
Within South Africa, the Western Cape has the highest 12-month and lifetime
prevalence for alcohol use, and the highest lifetime and second highest 12-month
prevalence of substance use disorder (Harker et al., 2010). The Western Cape also has
the highest rates of alcohol related trauma and deaths, and the highest rate of arrestees
intoxicated on illicit drugs in the country (Harker et al., 2010). The Cape Town
Metropole has a higher prevalence of risky drinking and alcohol or drug related
traumatic injuries and arrests than other region in South Africa (Myers, Louw, &
Fakier, 2008).
The prevalence of Fetal Alcohol Spectrum Disorders (FASD) in the Western Cape is
one of the highest in the world, with some communities having rates as high as 8.9%
4
(May, P., Gossage, P., Marais, A.S., Adnams, C., Hoyme, H., Jones, K., et al. 2007).
This is extremely high considering that a series of global studies sourced in 1995
showed an average across studies of 1.4 cases of FASD per 1000 or 0.14% (May &
Gossage, 2011).
There has been a dramatic increase in the number of MA users in the treatment
population in the Western Cape from 6.3% in 2002 to 49% in 2007 (Harker et al.,
2010). MA abuse carries a large burden of risk, including sexual risk, mental health
problems and violence (Harker et al., 2010). As mentioned, MA use is correlated with
the use of other drugs, like heroin which further exacerbates the risk of HIV and
Hepatitis C already inherent in the sexual risk associated with MA use alone (Harker
et al., 2010).
The high prevalence of substance use disorders and related problems in the Western
Cape relative to an already significant national problem highlights the importance of
local research on the effective treatment of substance use disorders.
There is, however, a need to understand more about addiction treatment. While there
are outcome studies supporting the effectiveness of addiction treatment models like
the Minnesota Model and Alcoholics Anonymous, De Leon (1993) points out that no
theory of recovery has been sufficiently researched; the literature on the subject
remains thin. Although much is known about the various stages of intervention at
addiction treatment facilities, little is known about the processes and mechanisms of
addiction treatment and recovery, that is the intrapsychic, physiological, cognitive and
emotional transitions the recovering addict might go through. Various authors (to be
discussed in the next chapter) have highlighted the limits to our understanding of the
processes that underlie effective addiction treatment, and have proposed that
researching patient progress through treatment is essential to building this
understanding, improving treatments, and generalizing treatments to new settings. It is
this that informs and motivates the current study.
1.1 Research Aims The current study aimed to systematically investigate client case files at a secondary
stage addiction treatment facility in Cape Town to explore whether there were any

5
discernable patterns in clients’ functioning across different stages of treatment that
might inform an understanding, or further study, of the processes underlying addiction
treatment. The study aimed specifically to identify possible patterns in the frequency
of reported observations regarding client’s behaviors, cognitions, affects and physical
states at different stages of secondary stage addiction treatment. It further aimed to
compare such patterns between clients with Axis II personality traits and clients
without Axis II personality traits, and to make a similar comparison between clients
recovering from stimulant addiction and clients recovering from non-stimulant
addiction.
1.2 Dissertation Structure This dissertation comprises five chapters. Chapter One has introduced the topic,
rationale and aims of the study. Chapter Two first reviews literature defining
addiction and outlining evidence based approaches to addiction treatment, and then
reviews literature on the process of addiction treatment. Chapter Three describes
methodology, looking at the research design, the setting, the participants, and data
analysis, and then explores some ethical considerations. Chapter Four describes the
analysis, and presents and discusses the main findings. Chapter Five summarises these
findings and integrates them with the literature, offers some tentative conclusions, and
then considers limitations of the study and suggestions for future research.

6
CHAPTER TWO: LITERATURE REVIEW
The aim of this literature view is firstly to contextualise this study within the field of
addiction treatment and then to look at what has been covered in the literature
regarding the process of addiction treatment. In terms of the context of addiction
treatment, the review will cover definitions of addiction and evidence based treatment
models for addiction. With regard to the process of addiction treatment, studies of
treatment processes and of patient progress and change through treatment will be
reviewed.
2.1 Definitions of Addiction There are several definitions of addiction, and there are also a number of disorders
that, although not defined as addictions, are treated as addictions within the
Minnesota Model2 globally. There remains disagreement amongst professionals,
disciplines and organisations regarding how to define addiction (McNeece & DiNitto,
2005). Addiction has traditionally been seen as involving substance use, but there are
now also several “behavioral addictions” recognised in the addiction literature;
behavioral disorders that are treated in addiction treatment centres around the world,
for example compulsive gambling and compulsive sexual behavior (Fisher & Roget,
2009). There are also programmes within addiction treatment centres and 12-step
support groups for a construct known as co-dependency, which entails certain
personality and relational traits.
Co-dependents were historically identified as the counterparts to addicts (the spouse
for example), but co-dependency is now seen as an “illness” or syndrome in its own
right and co-dependents are seen as having several things in common with the
“alcoholic or addict personality” (Fisher & Roget, 2009). Although the term is widely
used, its definition remains vague, but includes various dysfunctional behaviors
associated with the enabling and accommodation of a chemically dependent person or
addict (McNeece & DiNitto, 2005).
The definitions of addiction as outlined by the DSM IV-TR, the WHO/ICD 10 and the
American Society of Addiction Medicine will be compared and contrasted below. 2 The Minnesota Model will be discussed in detail shortly.
7
2.1.1 DSM IV-TR The American Psychiatric Association (APA) (2000) does not list addiction as a
diagnostic category per se, but has several entries under the category Substance Use
Disorders. The DSM IV-TR (APA, 2000, p. 197) lists the following diagnostic
criteria for Substance Dependence: A maladaptive pattern of substance use, leading to clinically significant
impairment or distress, as manifested by three (or more) of the following,
occurring at any time in the same 12-month period:
1. Tolerance.
2. Withdrawal.
3. The substance is often taken in larger amounts or over a longer period than
was intended.
4. There is a persistent desire or unsuccessful efforts to cut down or control
substance use.
5. A great deal of time is spent in activities necessary to obtain the substance.
6. Important social, occupational, or recreational activities are given up or
reduced.
7. The substance use is continued despite knowledge of having a persistent or
recurrent physical or psychological problem that is likely to have been
caused or exacerbated by the substance.
The DSM IV-TR (APA, 2000, p. 199) also lists the following diagnostic criteria for
Substance Abuse:
A. A maladaptive pattern of substance use leading to clinically significant
impairment or distress, as manifested by one (or more) of the following,
occurring within a 12- month period:
1. Recurrent substance use resulting in a failure to fulfill major role
obligations at work, school, or home (e.g., repeated absences or poor work
performance related to substance use; substance-related absences.
suspensions, or expulsions from school; neglect of children or household).
2. Recurrent substance use in situations in which it is physically hazardous
(e.g.• driving an automobile or operating a machine when impaired by
substance use)
3. Recurrent substance-related legal problems (e.g., arrests for substance
8
related disorderly conduct).
4. Continued substance use despite having persistent or recurrent social or
inter-personal problems caused or exacerbated by the effects of the
substance (e.g. arguments with spouse about consequences of intoxication,
physical fights).
B. The symptoms have never met the criteria for Substance Dependence for
this class of substance.
Both the above sets of criteria involve the continued, habitual use of chemical
substances in spite of the negative consequences thereof and embody a common sense
notion of what is meant by the term addiction.
The DSM IV-TR (APA, 2000) further outlines diagnoses for substance intoxication,
substance withdrawal, and a number of specific substance use disorders like Alcohol
Dependence, Amphetamine Dependence and Cannabis Dependence.
Behavior patterns that are defined as behavioral addictions by some treatment models
were not recognized as such by the DSM IV-TR. Where the Minnesota Model
recognizes a Gambling Addiction as espoused by the 12-step support group Gamblers
Anonymous, the DSM IV-TR categorises Pathological Gambling as an impulse-
control disorder (APA, 2000). Similarly, where the Minnesota Model recognizes Sex
Addiction as espoused by Sex Addicts Anonymous and Sex and Love Addicts
Anonymous (Hazelden, Sex Addiction & Issues Links, 2009), the DSM IV-TR has
one entry under Sexual Disorder Not Otherwise Specified, namely “Distress about a
pattern of repeated sexual relationships involving a succession of lovers who are
experienced by the individual only as things to be used” (APA, 2000, p. 582). Fisher
and Roget (2009) anticipated a possible category of disorders in the DSM-5, under the
heading: Behavioral and Substance Addictions. This, however, has not happened.
Although still very new, the DSM-5 diagnostic criteria for substance use disorders are
worth noting. Under a new chapter, “Substance-Related and Addictive Disorders”, the DSM-5 combines the categories of substance abuse and substance dependence
outlined above into a single substance use disorder requiring at least two of eleven
symptoms for a diagnosis, which is rated on a continuum from mild to severe, and for
which each substance is treated as a specific disorder e.g. Alcohol Use Disorder-
9
Severe (American Psychiatric Association, 2013). “Craving, or a strong desire or urge
to use a substance” has been added as a criterion, and the recurrent legal problems
criterion has been removed. The threshold for diagnosis has been raised from one
symptom to two (American Psychiatric Association, 2013). Gambling Disorder has been
included under “Substance-Related and Addictive Disorders”, as evidence suggests
that the behavior activates the reward system in the brain in a similar way to
substances of abuse, and also because there is overlap between the criteria of
Gambling Disorder and the substance use disorders like persistent efforts to control the
behaviors (American Psychiatric Association, 2013). Sexual Disorder Not Otherwise
Specified as outlined above does not exist in the DSM-5 and no explicit equivalent is
suggested (American Psychiatric Association, 2013).
2.1.2 WHO and the ICD-10 WHO (World Health Organisation, 2011) describes addiction in terms of the repeated
and extensive use of psychoactive substances, periodic intoxication, compulsion to
take substances and great difficulty in changing this behavior. It reiterates some DSM
criteria like tolerance and withdrawal and further acknowledges the widely held belief
in addiction as a progressive illness. Similarly to the DSM, WHO promotes the use of
the term dependence over the term addiction (World Health Organisation, 2011).
The International Classification of Diseases (ICD-10), published by WHO (2010), has
a large number of classifications of ‘Mental and behavioral disorders due to
psychoactive substance use’, including acute intoxication, harmful use, withdrawal
state and dependence syndrome. Dependence syndrome is defined as:
A cluster of behavioural, cognitive, and physiological phenomena that develop
after repeated substance use and that typically include a strong desire to take the
drug, difficulties in controlling its use, persisting in its use despite harmful
consequences, a higher priority given to drug use than to other activities and
obligations, increased tolerance, and sometimes a physical withdrawal state.
(World Health Organisation, 2010, para. 3)
This clearly parallels the DSM IV-TR and DSM-5 criteria for Substance Dependence
and Abuse.
10
The ICD-10, like the DSM IV-TR and DSM-5, further defines a number of substance-
specific disorders for example ‘Mental and behavioural disorders due to use of
alcohol’ and ‘Mental and behavioural disorders due to use of opioids’. There is wide
overlap between the ICD-10 and the DSM and the two diagnostic tools can be seen as
generally equivalent. Both the ICD-10 and the DSM IV-TR have been used to define
addiction in a wide range of studies of substance use prevalence and epidemiology
globally, reviewed in Chapter One.
2.1.3 American Society of Addiction Medicine (ASAM) In April 2011, the American Society of Addiction Medicine published this definition
of addiction, which differs from the DSM IV-TR and ICD 10 in several important
respects:
Short Definition of Addiction: Addiction is a primary, chronic disease of brain
reward, motivation, memory and related circuitry. Dysfunction in these circuits
leads to characteristic biological, psychological, social and spiritual
manifestations. This is reflected in an individual pathologically pursuing reward
and/or relief by substance use and other behaviors (emphasis added).
Addiction is characterized by inability to consistently abstain, impairment in
behavioral control, craving, diminished recognition of significant problems with
one’s behaviors and interpersonal relationships, and a dysfunctional emotional
response. Like other chronic diseases, addiction often involves cycles of relapse
and remission. Without treatment or engagement in recovery activities,
addiction is progressive and can result in disability or premature death. (ASAM,
2011, para. 1)
It can be seen that ASAM is embracing a bio-medical model but, as will become
evident in the review of treatment approaches, there are also aspects of the 12-
step/Minnesota models in this definition, for example the ‘spiritual manifestations’ of
dysfunctional brain circuitry. ASAM, unlike the DSM IV-TR and ICD 10, also
recognises behavioral addictions. There seems to be an implicit assumption that the
same mechanisms underlie both chemical and behavioral addictions. The ASAM
definition differs from the DSM IV-TR with respect to the aspect of loss of control,
where it refers to ‘diminished recognition’ of consequences as opposed to ‘continued
use in spite of consequences’ (emphasis added) as in the DSM IV-TR. The DSM IV-
11
TR seems to be referring to an objectively observable behavior whereas ASAM seems
to be making an assumption about the cognitive processes behind this behavior.
It is further noted that the ASAM definition refers explicitly to a ‘dysfunctional
emotional response’, which may only be inferred from the DSM IV-TR diagnostic
criteria. ASAM describes the ‘dysfunctional emotional response’ as including an
increased sensitivity to stressors, increased anxiety, dysphoria and emotional pain,
and difficulty in identifying feelings.
It is the researchers opinion that, of the three definitions discussed, the ASAM
definition is the most appropriate to this study as it embodies the aspects of addiction
embraced by the Minnesota Model, the 12-step programme and the treatment facility
at which this research was conducted.
2.2 Approaches to Addiction Treatment There are many approaches to the treatment of addiction, ranging from the non-
clinical Alcoholics Anonymous through Cognitive Behavioral Therapy to
pharmacological interventions. What follows is a review of the most widely used of
these approaches, what they entail and what the research has indicated regarding their
effectiveness.
2.2.1 Alcoholics Anonymous and the Twelve-step Program In 1935, in Akron, Ohio, an alcoholic, now known as Bill W, asked a clergyman
where he might find another alcoholic. Bill believed that talking to another alcoholic
might help him in his long struggle to overcome his compulsion to consume alcohol
and, more specifically, with his immediate compulsion to take a drink. The clergyman
suggested a doctor who was known to him to be a chronic alcoholic. Bill met with
‘Dr. Bob’ who asserted that he could only spare about fifteen minutes of his time to
meet with Bill. Hours later, they both realized that, as well as relating to each about
their mutual affliction of alcoholism, neither had thought about having a drink since
their conversation had started, which to them seemed a miracle. They immediately
sought to find other alcoholics with whom they could share this discovery. So began
the fellowship known as Alcoholics Anonymous (AA). In 1939 a book was published,
titled Alcoholics Anonymous, which outlined a twelve-step program of recovery. The
12
current editions of the book also contain various stories of recovering alcoholics and
the traditions of the fellowship (Alcoholics Anonymous World Services, 2001). It is
noteworthy that AA influences most addiction treatment centres in the United States
today (Kelly, Magill, & Stout, 2009).
Alcoholics Anonymous embraces a disease model of alcoholism. E.M. Jellinek first
proposed the disease model in 1960, describing alcoholism as chronic, progressive
and potentially fatal (Zweben, 1993). As such, it is believed that total abstinence for
life is necessary to recover (Knack, 2009). It is in fact believed in AA and also from
the perspective of the Minnesota Model (to be discussed shortly), that the illness
progresses even when the addict is abstinent; that is, if they relapse, the addiction will
have progressed from the time they began their period of abstinence. According to
Zweben (1993), the addict/alcoholic must abstain from all mood-altering substances,
as drug substitution is common. Zweben (1993) does concede that a few addicts can
learn to use their drug of choice or another drug in moderation, but argues that the
percentage of these cases is small. Addiction is therefore seen as incurable and the
addict can only ever be ‘recovering’, that is, maintaining sobriety and managing their
illness. The disease model has proved to be very useful in the treatment of addiction
by, for example, providing a rationale for total abstinence. It has been employed by
not only Minnesota Model treatment centres, but also the National Council for
Alcoholism and the American Medical Association (Zweben, 1993).
It is perhaps supportive of AA’s notion of addiction as a disease that there is growing
evidence that addiction involves genetic factors and that there is a bio-chemical
component to addiction and possible brain differences between addicts and non-
addicts (Margolis, 1993). McGue (1999) suggests a 50%-60% genetic factor in the
risk of alcoholism, while Zweben suggests that addiction is genetic in 30% of addicts
(1993). However, she also supports the belief shared by AA and the Minnesota Model
that non-addicts, through substance abuse, can cross a line from non-addict to addict
and that once this line is crossed, there is no return (1993).
Within the disease model there is the concept of the Alcoholic or Addict Personality,
which has been described as passive-dependent, immature and having difficulty in
relating to others (Cook, 1988). Other personality traits attributed to alcoholics and
13
believed to predispose a person to drug use are impulsivity (Schuckit, 1986, as cited
in McNeece & DiNitto, 2005), being highly emotional, having low frustration
tolerance and having difficulty in expressing anger (Catanzaro, 1967, as cited in
McNeece & DiNitto, 2005). The Minnesota Multiphasic Personality Inventory does
differentiate the alcoholic from the general population, but this may only be after
years of alcoholism and the effects thereof (MacAndrew, 1979, as cited in McNeece
& DiNitto, 2005).
AA sees the twelve-step program as a spiritual path through which, among other
things, characterological problems are addressed (Morgenstern, J., Labouvie, E.,
McCrady, B. S., Kahler, C. W., & Frey, R. M., 1997). For example, step 4 calls for a
searching and fearless ‘moral inventory’ to be drawn up in which the individual looks
at acts they have committed in violation of their own values. Steps 8 and 9 require the
individual to make a list of all people they have harmed and for them to make amends
to such people wherever possible.
Zweben (1993) adds that AA entails a multi-dimensional support structure and, being
free, involves no financial barriers to membership. ‘Working the program’ involves
regular attendance of AA meetings. This is believed to help with self-regulation and
to give members a sense of relatedness and unconditional acceptance (Knack, 2009).
Further, Knack (2009) believes that AA instills hope, helps with affect tolerance and
provides an ethos of continued improvement. Members are encouraged to work the
program with the help of a ‘sponsor’, a person who has acquired a notable period of
sobriety. Such a person acts as a mentor, role model and confidante for the newcomer.
The recovering alcoholic is paradoxically urged to accept powerlessness (step one) as
part of the process of gaining control (Margolis, 1993). One of the philosophies of
AA involves the alcoholic learning to ‘live life on life’s terms’ and to ‘let go’ of self-
will (Knack, 2009). This may be part of what Morgenstern (2002) sees as AA’s
common ground with cognitive behavioral approaches to addiction treatment (to be
discussed in a subsequent section), as they involve changes in thinking about how one
interacts with people and with one’s environment (as cited in Knack, 2009). Margolis
adds that the twelve-step program teaches its adherents to access the inner drive
towards self-actualization and self-preservation within a context of caring and
understanding (1993).
14
Humphreys and Moos (2007) found that an AA participation group achieved higher
rates of abstinence and utilised fewer clinical services than did a CBT group (as cited
in Knack, 2009). Based on reviewed literature, Emrick (1987) reported that up to 50%
of long-term AA members maintained abstinence for multiple years (as cited in
(McNeece & DiNitto, 2005). Cross et al. (1990) found at a ten-year follow up to
intensive treatment that AA attendance predicted abstinence (as cited in McNeece &
DiNitto, 2005). It has also been suggested that a greater degree of involvement in AA,
rather than mere attendance, may better predict success in maintaining sobriety
(Montgomery et al., 1995 as cited in McNeece & DiNitto, 2005). 2.2.2 The Minnesota Model Between 1948 and 1950, three in-patient addiction treatment institutions were
established in the United States - Pioneer House, Willmar State Hospital and
Hazelden Addiction Treatment Centre (Cook, 1988). Although they differed
somewhat, they were all based on the AA model of alcoholism and recovery,
including the twelve-step program. A general program of treatment evolved out of
these inpatient facilities, which is now known as the Minnesota Model and is used by
most addiction treatment centres around the world (Morgenstern, Labouvie,
McCrady, Kahler, & Frey, 1997). These facilities use a multi-professional and multi-
disciplinary team to administer a holistic intervention. Such teams include
psychologists, psychiatrists, doctors, nurses and addiction counselors. Counselors are
often addicts themselves, which is believed to enhance their position as role models
and as confidantes to their clients (Cook, 1988).
Programmes include group therapy, individual counseling and lectures on various
topics including the disease model, life-skills and relapse prevention. Using elements
of cognitive behavioral theory, the Minnesota Model teaches clients to avoid people,
places and situations associated with past substance-use behaviors and promotes the
adoption of new behaviors and recreational activities (Kellogg, 1993).
Treatment facilities traditionally offer primary stage treatment, which essentially
deals with the addiction itself. Treatment at this stage involves challenging the client’s
denial, and getting the client to accept the disease model (i.e. that they have an
15
incurable illness) and the need for a life long commitment to abstinence and recovery.
Primary stage can take anywhere between three to eight weeks (Cook, 1988).
Many facilities based on the Minnesota Model also offer secondary stage treatment,
which involves further work on identified behavioral problems and maladaptive
cognitive styles, and developing life skills, including relapse prevention. This stage of
treatment also promotes healthy, stable routines, for example, eating patterns,
sleeping patterns and daily planning as opposed to impulsive decision making.
Secondary stage treatment usually lasts about eight weeks but can last longer if
deemed necessary (Cook, 1988).
Zweben (1993) states that, although AA’s twelve-step program is essential in early
recovery, it cannot supply what addiction specialists can (Zweben, 1993). In-patient
addiction treatment is therefore seen as a valuable springboard providing a solid
foundation upon which to base one’s recovery. Clients are, however, expected to
attend twelve-step meetings from the start of treatment and for the rest of their lives.
Within the Minnesota Model, clients usually reside at the treatment centre, which
provides them with a therapeutic milieu (Cook, 1988). Moos (2003) suggests that the
social environment can enhance or detract from recovery and finds that residential
treatment improves client participation and strengthens self-confidence. Across all
treatment models, group process has been found to be most critical since it involves
shared experience and hope, and enhances member’s abilities to lead abstinent,
productive lives (Borkman, Kaskutas, & Owen, 2007).
Viewed through the lens of identity theory, addicts are seen to share a common
language and internalized group norms; to recover, the addict needs to shift from an
addict identity to a non-addict identity (Kellogg, 1993). To this end, the addict needs
to recover in a new social setting and be exposed to healthy social validation
(Biernacki, 1986, as cited in Kellogg, 1993).
Another important aspect of the Minnesota Model is working with the addict’s family
(Hazelden, 2013). Addiction is seen as a family illness and families are therefore
expected to attend lectures where they learn about the disease model and the family’s
16
role in both active addiction and recovery. Specific family members are also asked to
participate in ‘conjoint’ sessions with the addict, facilitated by a clinical psychologist
and/or an addiction counselor. Families are encouraged to attend twelve-step meetings
for family members of addicts, for example Alanon. Lemieux’s (2002) view that
family can be used as a lens through which to view addiction and as a resource in
treatment supports the Minnesota Model’s focus on family (as cited in Linley, 2010).
Lemieux’s point is that addicts exist within the context of family dynamics and that
those dynamics have to be addressed in order to properly address the addiction
(Linley, 2010).
Within the Minnesota Model, depending on whether or not clients participate in
secondary stage treatment, they usually spend between one and three months in
treatment. It has been found that the duration of treatment is more highly correlated
with a successful outcome than is the amount or intensity of treatment, that is, the
number of individual or group therapy sessions (Moos, 2003). It has also been found
that success in recovery improves with duration up to two months in formal treatment
and up to a year with twelve-step support (Witbrodt et al., 2007).
There are few published reports on the effectiveness of Minnesota Model-based
treatment centres but a meta-analysis of studies indicated a 53% success rate at one-
year follow-up (Stinchfield & Owen, 1998). The National Treatment Outcome
Research Study (NTORS), a prospective study of the treatment outcome of drug
misusers in community and residential treatment programmes in the United Kingdom,
found a significant drop in behavioral problems in follow-ups with inpatients,
although less so for heavy drinkers and crack cocaine addicts (Gossop, Marsden,
Stewart, & Kidd, 2003).
2.2.3 Specific Treatment Techniques There are various evidence-based approaches to addiction treatment in use around the
world that seem to have comparable results (Kelly, Magill, & Stout, 2009). The
Minnesota Model is just one of several approaches used globally, including in South
Africa and the Western Cape. It should, however, be noted that Minnesota Model
treatment centres use a broad range of techniques in their overall programmes,
including CBT and Relapse Prevention. It is therefore important to also examine the

17
evidence supporting the effectiveness of specific techniques or models, rather than
only for Minnesota Model treatment programmes as a whole.
2.2.3.1 Cognitive Behavioral Therapy (CBT) Many approaches to substance use disorder treatment have at least some cognitive-
behavioral components. Cognitive behavioral approaches are based on the assumption
that substance-use is learned through classical and operant conditioning, and
modeling (Barry & Petry, 2009). CBT approaches can be conducted in a group or
individual format and involve working with current issues and past substance use
behavior, learning and practicing new skills and anticipating problems (Barry &
Petry, 2009). Marlatt (1985) outlines the process of examining the situational
antecedents of addictive behavior and the consequences thereof, to gain an
understanding of what is maintaining the behavior and what might inhibit it (as cited
in Fisher & Harrison, 2009). McNeece and DiNitto (2005) state that CBT views
substance use disorders as functionally related to many problems in the individual’s
life and that all problems need to be addressed in order to deal effectively with the
substance use disorder. They further emphasize the importance of developing life-
skills and working with both interpersonal and intrapersonal risk factors. Interpersonal
work might include communication exercises and intrapersonal work might include
anger management or dealing with depression.
Within CBT approaches to addiction treatment, sessions are structured and often
consist of three twenty-minute segments. The first segment is spent reviewing the
week since the last session and the second two segments are spent learning new skills
and planning how to implement and practice them in the coming week, and setting
homework tasks (Carroll, 1998, as cited in Barry & Petry, 2009).
In the nineties, Maude-Griffin, P. M., Hohenstein, J. M., Humfleet, G. L., Reilly, P.
M., Tusel, D. J., & Hall, S. M. et al., (1998) reported that, although findings were
mixed, studies had indicated that CBT was superior to other interventions in the
treatment of substance use disorders. They further stated that CBT was comparable to
the 12-step self-help groups that had shown positive outcomes in numerous studies.
Other studies have indicated no significant, or minimal, differences between CBT and
other approaches immediately after treatment, but that CBT’s efficacy seems to
18
improve at one-year follow-up. This suggests that the practice of skills over time
improves efficacy (Barry & Petry, 2009). Roberts and McCrady (2003) claim that
CBT has been empirically proven to be effective (as cited in Fisher & Harrison,
2009).
2.2.3.2 Contingency Management and Community Reinforcement Approaches Contingency Management approaches are theoretically based mainly on operant
conditioning and the assumption that substance use disorders fall along a continuum
of normal learned behavior (Higgins & Rogers, 2009). These approaches involve a
system of materially rewarding participants for drug-free urine samples and treatment
compliance (NIDA, 2011). Contingency Management involves the issuing of
vouchers for clean urine samples. Vouchers can be exchanged for retail goods, and
the value of vouchers increases with consecutive clean samples (Higgins & Rogers,
2009).
Community Reinforcement approaches involve teaching patients to recognise the
antecedents and consequences of substance use and to alter their life-styles to avoid
antecedents and find positive reinforcers as alternatives to substance use (Higgins &
Rogers, 2009).
Contingency Management and Community Reinforcement approaches can include
counselling sessions, promotion of safe recreational activities, social networks and
employment, the submission of urine samples and Disulfiram therapy for alcohol
abuse (Myers, Harker, Fakier, Kader, & Mazok, 2008). Disulfiram is a drug causing
hypersensitivity to alcohol, leading to unpleasant symptoms after alcohol
consumption.
Joining self-help groups like AA is encouraged in both approaches, as they are
believed to help in the development of new social networks and pro-recovery
activities like meeting for coffee as opposed to meeting for drinks.
The first study of Community Reinforcement approaches was done nearly forty years
ago on alcoholic hospital inpatients, where it was found that time spent drinking in the
six months post treatment was 14% for the CRA treatment group versus 79% for the
19
non-treatment group (Hunt & Azrin, 1973, as cited in Higgins & Rogers, 2009). Since
then many studies have been conducted to include various illicit drugs and even
cigarettes. Studies of contingency management approaches have shown effectiveness
in treatment retention and increased abstinence (NIDA, 2011). It is also believed to
have shown effectiveness in non-responsive clients in the general treatment
population if the rewards are great enough (Robles et al., 2000 as cited in Myers et al.,
2008).
These approaches are mostly used as components of other programmes and rarely as
stand-alone treatments (Myers et al., 2008).
2.2.3.3 Relapse Prevention Statistically, lapses are the most probable outcome after addiction treatment and
lapses often lead to full-blown relapses to the pre-treatment status (Marlatt, Bowen, &
Witkiewitz, 2009). Up to 50% of patients treated for substance use disorders will
relapse within 6 months (McKay & Weiss, 2001 as cited in Moore, Seavey, Ritter,
McNulty, Gordon, & Stuart, 2013) and up to 40% will present with a pattern of
recurrent relapse and admission to treatment programmes (Scott, Foss & Dennis, 2005
as cited in Moore, Seavey, Ritter, McNulty, Gordon, & Stuart, 2013). Fisher and
Harrison (2009) suggest that negative emotions like guilt and shame that may follow a
slip can themselves precipitate relapse. The Relapse Prevention approach uses
cognitive-behavioral and didactic techniques to prepare the recovering addict for high
stress and high-risk situations, both in terms of identifying such situations so that they
can be avoided, and to provide and develop strategies for dealing with them should
they arise. Other aspects of Relapse Prevention programmes might include the
development of support systems like family and 12-step groups, life style changes,
management of leisure time and the development of relationship skills (Fisher &
Harrison, 2009).
Relapse Prevention has been found to be as effective as 12-Step facilitation and
Motivational Enhancement Therapy (discussed below) (Caroll, 1996, as cited in
Myers, Harker, Fakier, Kader, & Mazok, 2008). It has also been found to be
significantly more effective than no intervention (Dutra, Stathopoulou, Basden,
Leyro, Powers, & Otto, 2008). Relapse Prevention may have long-term efficacy and
20
may limit the extent of relapse if it does occur (Center for Substance Abuse
Treatment, 2006; Gossop, 2006, as cited in Myers et al., 2008; Rawson, R. A.,
Shoptaw, S. J., Obert, J. L., McCann, M. J., Hasson, A. L., Marinelli-Casey, P. J., et
al., 1995).
2.2.3.4 Motivational Enhancement Therapy
Motivational Enhancement Therapy (MET) is based on Motivational Interviewing, a
client centred approach that sets out to highlight the negative consequences of target
behaviors and to develop future goals with the ultimate aim of developing motivation
for change. There are four principles of Motivational Interviewing: expressing
empathy, highlighting discrepancies between client behaviors and values, rolling with
resistance (avoiding arguments) and supporting self-efficacy (Glynn & Moyers,
2009). One of MET’s central techniques involves exploring and resolving
ambivalence (NIDA, 2011; Rollnick & Miller, 1995).
As a client centred approach, clients are encouraged to use their own resources to
effect change (Fisher & Harrison, 2009). It is believed that a possible mechanism of
change could be the reinforcement of ‘change talk’ in the context of an empathic
interpersonal dynamic between the client and the counselor (Miller & Rose, 2009).
MET has been adapted to deal with drug and alcohol dependence and can be used
independently or incorporated into other treatment programmes (Myers et al., 2008).
The approach usually involves an initial assessment, followed by up to four individual
therapy sessions (Myers, Harker, Fakier, Kader, & Mazok, 2008). Like Relapse
Prevention, the therapist can suggest, for discussion, strategies for dealing with high-
risk situations.
Roberts and McCrady (2003) assert that MET has been empirically proven to be
effective (as cited in Fisher & Harrison, 2009). According to Glynn and Moyers
(2009), there is evidence of the efficacy of Motivational Interviewing in the treatment
of alcohol misuse and street drug use. There is also evidence that it may be effective
in the treatment of MA dependence (Galloway et al., 2007 as cited in Myers et al.,
2008). However, research suggests that MET may be more effective at engaging
addicts in treatment than in actually producing abstinence on its own (NIDA, 2011).

21
Glynn and Moyers suggest that treatment providers use it as a tool within programmes
and that it not be seen as a “panacea” (2009, p. 181).
2.2.3.5 The Matrix Model The Matrix Model is a manualised outpatient programme that utilises various
evidence-based approaches like CBT techniques and 12- Step participation (Marlatt,
Bowen, & Witkiewitz, 2009). Adapted versions have been developed for the
adolescent, adult and criminal justice populations (Myers, Harker, Fakier, Kader, &
Mazok, 2008) The programme runs for about a year and includes relapse prevention,
psycho-education, family education and regular drug and alcohol testing. Like MET,
it is non-confrontational and aims to enhance self-esteem and self-worth (Fisher &
Harrison, 2009).
The programme is divided into an intensive sixteen week phase that includes group
sessions, individual counseling and education, and a 36 week continuing care phase
during which support group sessions allow for social networking and mentoring by
older participants (Fisher & Roget, 2009).
The Matrix Model dictates that its counselors should have a broad understanding of
cultural and socio-economic differences (Center for Substance Abuse Treatment,
2006). This aspect is of particular relevance in the South African context where such
issues may present various barriers to treatment (Myers, Louw, & Fakier, 2008). Also
of particular relevance in the local context is evidence of significant reductions in
psychological indicators3 and sexual risk behaviors related to the use of the Matrix
Model (Huber et al., 1997 as cited in Myers et al., 2008). There are currently several
Matrix clinics in Cape Town where MA use has grown dramatically in treatment
populations in the past decade.
A large, multi-site, United States study in 1999-2001 found that the Matrix Model
was superior to various other established outpatient models during treatment in terms
of attendance, duration of treatment, MA free urine samples and abstinence (Rawson
et al., 2004). At a six-month follow up, however, although treatment remained
3 According to Fisher and Roget (2009), the matrix counsellor works towards enhancing the client’self-esteem, dignity and self-worth.
22
efficacious, the Matrix Model was no longer superior to the other approaches in terms
of outcome. It is important however that this study did support the already extant
evidence that the Matrix Model is an effective approach to the treatment of stimulant
use disorders.
2.2.3.6 Medication It has been shown that treatment may be enhanced by the use of medication, both in
terms of drug substitution and for the management of psychiatric disorders (Gossop,
M., 2006; National Treatment Agency, 2006). Although Minnesota Model Treatment
facilities use psychiatric drugs like mood stabilisers, anti-depressants and anti-
psychotics to enhance treatment, the use of drug substitution would be seen as
counter-therapeutic as they are strictly abstinence based and drug substitution would
be seen as tantamount to cross-addiction. They do, however, use drugs like
methadone and benzodiazepines in detoxification regimens. In spite of the Minnesota
Model’s position on drug replacement, long-term methadone treatment has been
found to be highly effective. Ball and Ross (1991) found that 92% of methadone
maintenance clients were abstinent from other opioids at 4.5 years (as cited in Fisher
& Roget, 2009). Opioid pharmacology (like methadone) is the favoured treatment for
heroin addiction globally (World Health Organisation, 2010).
2.2.3.7 Aftercare Aftercare is widely believed to be an important follow-up to treatment as a reinforcer
to what has been gained (Myers et al., 2008). Given the chronicity of substance use
disorders, there is a trend toward the use of the term continuing care in cognisance of
an ongoing need for support and resources for the recovering addict (Fisher & Roget,
2009). Aftercare / continuing care can include elements of primary treatment like
individual and family counseling. 12-Step attendance is also promoted (Fisher &
Harrison, 2009). Through these programmes, staff members are able to assist clients
to assess their recovery and deal with obstacles (McNeece & DiNitto, 2005).
2.2.3.8 Matching individuals with treatments It has been suggested that some approaches to addiction treatment may be better
suited to certain individuals than other approaches (Maude-Griffin, Hohenstein,
Humfleet, Reilly, Tusel, & Hall, 1998). However, Project MATCH, investigating

23
matching hypotheses like this, found no significant difference in treatment outcomes
when matching individual characteristics with specific treatment approaches (Maude-
Griffin et al., 1998). Similarly, some approaches may be better suited to certain
addictions. For example, the Matrix Model was developed for treating individuals
addicted to MA and other stimulants (Rawson, R. A., Marinelli-Casey, P., Anglin, M.
D., Dickow, A., Frazier, Y., Gallagher, C., et al., 2004). It has also been found that
outpatient programmes and methadone programmes may be better suited to treating
heroin addiction than inpatient, abstinence based models (dos Santos, Rataemane,
Fourie, & Trathen, 2010).
Generally, the findings have been that different evidence-based treatment models
seem to perform equally well in spite of having different theoretical stances, which
might indicate the importance of non-specific factors like motivation, therapeutic
alliance (Barry & Petry, 2009), social support (like family and friends) and
environmental risk factors (Buhringer & Pfieffer-Gershel, 2008, as cited in Miller,
2009) in successful outcomes.
2.2.4 Summary of Treatment Literature Approaches to addiction treatment have been in existence for at least 78 years with
the founding of AA in 1935, the development of the Minnesota Model since 1948,
and the introduction or adaptation over the years of numerous other techniques
including CBT, Contingency Management, Relapse Prevention, MET, The Matrix
Model, Medication and Aftercare. Many of these approaches are utilised within
broader models like the Minnesota Model. Others, like the Matrix Model and MET,
endorse or motivate for the use of different models like the 12-step programme. The
above-mentioned models are all evidence based and have been shown to have
efficacy. They seem to have similar outcomes and are sometimes enhanced when
models are used in combination with each other, like when Minnesota Model
inpatient treatment programmes are followed up with Aftercare. It seems that no
model is particularly suited to a specific kind of patient, but that some models may be
well suited to particular addictions, like the Matrix Model that was developed for the
treatment of addiction to stimulants.
24
There has been relatively little published literature on the actual process of treatment
or of clients’ stages of progress in treatment (Edelen et al., 2007; Hawkins, Baer, &
Kivlahan, 2008; Kressel, De Leon, Palij, & Rubin, 2000). Though outcomes studies
indicate that therapies do work for many addicts (though it must be borne in mind that
attrition rates are high), there is limited knowledge about how or why they work
(Paddock, Edelen, Wenzel, Ebener, Mandell and Dahl, 2007; Pos, Greenberg, &
Warwar, 2009). Increasing our knowledge of how treatments work could enable the
improvement of treatment programmes and the possibility of adjusting them to fit
client characteristics.
2.3 The Process of Addiction Treatment A decade ago, Kressel, De Leon, Palij, and Rubin (2000) proposed that research into
client progress in substance use treatment was in the early stages and that it was
essential to the understanding of what makes for effective treatment. Similarly, Stout
(2007) underlines the importance of ‘mining’ underused information in an attempt to
understand not just what happened but why it happened. Finney (2007) too argues for
the importance of studying processes during treatment as opposed to focusing only on
outcomes, on the grounds that this would be of greater clinical importance in terms of
improving treatments and generalizing them to new settings.
Hawkins, Baer, and Kivlahan (2008) state that the literature indicates that a strategy
of assessing patient progress through addiction treatment could inform interventions
that reduce the risk of attrition. They argue that such a strategy does not yet exist in
the field of addiction treatment and suggest that patterns of recovery in addiction
treatment may differ from those in general psychotherapy.
It would seem, therefore, that there is a broad call for expanding research in the area
of client processes during addiction treatment. What follows is a review of the
research that has emerged in this area to date, what this work has entailed and, since
process implies change, what ‘change’ might mean.
2.3.1 The Transtheoretical Model Studies of multiple interventions for addiction have shown that different approaches
show very similar results (Huebner & Tonigan, 2007). This observation is neither new
nor unique to the treatment of addiction and as far back as 1979 Prochaska and
25
DiClemente were developing the Transtheoretical Model based on the implied hidden
processes that underlie observed behavior changes, both across various
psychotherapies and without therapeutic intervention (Prochaska, DiClemente, &
Norcross, 1992). The Transtheoretical Model attempts to outline the mechanisms of
change within and without treatment and includes a temporal dimension called the
stages of change and a set of processes that underlie the progression through these
stages (Prochaska, DiClemente, & Norcross, 1992). The five stages of change
outlined by Prochaska and colleagues are: pre-contemplation during which there is no
intention to change and there remains denial of the problem; contemplation in which
there is awareness of the problem and the intention to confront it; preparation which
involves both the intention to change and small steps towards implementing change;
action during which there is overt modification of behavior, experience and
environmental factors to facilitate change; and maintenance, which involves the
consolidation of what has been learned and efforts towards relapse prevention
(Prochaska, DiClemente, & Norcross, 1992). The processes of change are the
activities related to attempts to change behavior through the various stages (Fisher &
Roget, 2009). It has been found that cognitive processes like consciousness-raising
and a re-evaluation of one’s environment and oneself are more highly correlated with
the earlier stages of change like the pre-contemplative stage. Later stages like the
preparation and action stages are correlated with behavioral processes like avoiding
high-risk situations or substituting alternatives for problem behaviors (Fisher &
Roget, 2009).
It is noteworthy that Prochaska and colleagues (1992) suggest that moving from
contemplation to action is a prerequisite to success. They have found that the action
stage is particularly stressful and, during this stage, participants in their research
relied increasingly on helping relationships (Prochaska, DiClemente, & Norcross,
1992). The correlation of action with successful outcomes is further supported by later
research that indicates that those participants in the preparatory and action stages were
more likely to complete treatment at a college counseling centre, whereas those in the
pre-contemplative and contemplative stages were more likely to terminate treatment
prematurely (Smith, Subich, & Kalodner, 1995). As mentioned earlier, treatment
completion is correlated with better outcomes.

26
2.3.2 Social Control A concept related to the processes of change and applicable in the context of the
therapeutic community is social control, defined by Lewis and Rook (1999) as
referring to interactions between network members that entail regulation, influence
and constraint. According to Lewis and Rook (1999), social control is expected to
have the effect of both improving health practices and evoking psychological distress.
They believe that the mechanisms behind social control may involve the
internalization of social obligations and the direct influence of network members
encouraging health-enhancing behaviors and discouraging health-compromising
behaviors, and that it may be the latter that leads to frustration, and hence
psychological distress.
2.3.3 The Process of Change and Addiction Treatment Communities De Leon (1995) describes addiction as involving social, emotional, cognitive and
behavioral problems that both precede and are exacerbated by the abuse of substances
and suggests, therefore, that abstinence is a prerequisite to recovery rather than the
goal thereof (as cited in Kressel, De Leon, Palij, & Rubin, 2000). Kressel et al. (2000)
see the therapeutic community as comprising a facilitative context for change in
developmental, socialization and psychological status, the primary psychological goal
being a change in negative patterns of behavior, cognition and affect. Edelen et al.
(2007) go so far as to say that all interactions amongst staff and clients are the
treatment itself, seeing the treatment process as being comprised of both the
therapeutic community and the client’s personal development. They propose that
since the treatment programme cannot influence client behavior outside of treatment,
any changes in client functioning post treatment must be the result of changes in
psychological states during treatment (2007). Stout (2007) concurs with this
reasoning. Edelen et al. (2007), in line with Kressel et al. (2000), see personal
development, defined as changes in personal identity and perceptions, as essential to
successful outcomes.
2.3.4 Second Order Change A study by Hanna and Richie (1995) investigated the subjective experiences of
individuals who were identified as having undergone a ‘second order psychological

27
change’. Psychological change was defined by the researchers in terms of Corsini’s
definition as an improvement in cognitive, affective and behavioral functioning
(Corsini, 1984 as cited in Hanna & Ritchie, 1995). Second order change was
described as a deep and radical restructuring of an individual’s core self, their mode
of being and their worldview (Hanna & Ritchie, 1995). It was further suggested that
environmental stressors and great inner conflict could catalyze such change.
Participants reported that change was accompanied by negative subjective states
including confusion, fear, depression and anger, and that these were later followed by
a “pervasive sense of well-being” (Hanna & Ritchie, 1995, p. 179). This seems
reminiscent of the psychological distress mentioned by Lewis and Rook (1999)
regarding Social Control.
2.3.5 Emotional Processing as Core Change It is noted that the literature often refers to change as involving, for example,
‘negative subjective states’ (Lewis & Rook, 1999), ‘stress and the need for support’
(Prochaska, DiClemente, & Norcross, 1992), fear, anger and depression (Hanna &
Ritchie, 1995). Historically, one of the processes widely believed to be essential to
client change is the deepening of emotional processing, defined by Pos, Greenberg,
Goldman and Korman (2003) as attending to and tolerating emotional experience, and
cognitively reflecting on and making sense of it (Greenberg & Watson, 2006; Pos,
Greenberg & Elliott, 2008; Pos et al., 2003; Rogers, 1957 as cited in Pos, Greenberg
& Warwar, 2009). Pos, Greenberg and Warwar (2009) found evidence to support this,
finding a correlation between the degree to which clients used felt experience in
problem solving, and positive outcomes in both depression and general psychological
symptoms. ‘Felt experience’ in problem solving refers to the recognition and
acknowledgment of the subjective experience of emotional responses to external
events and how those responses are a part of perceived problems relating to those
external events (Pos, Greenberg, & Warwar, 2009).
2.3.6 Protracted Withdrawal Syndrome and ‘The Wall’ Along with the psychological processes involved in therapy or recovery, there are also
apparent physiological processes that have been observed in the withdrawal from
specific substances outside of the acute substance withdrawal as outlined by the DSM
IV-TR. The DSM IV-TR criteria for withdrawal include maladaptive behavior change

28
with physiological or cognitive concomitants or impairments in social, occupational
or other areas of functioning (APA, 2000).
The long term, post acute effects of withdrawal from alcohol are well known and
many findings have indicated that alcoholics undergoing long-term abstinence can
experience affective instability (Voltaire-Carlsson, Hiltunen, Koechling, & Borg,
1996). Voltaire-Carlsson et al. found significant differences between alcoholics
abstinent over a period of fifteen weeks and a control group of non-alcoholics (that is,
‘normal’ drinkers) abstinent over a period of fifteen weeks. Alcoholics showed higher
levels of sleep disturbance, concentration difficulties, anxiety, cravings, autonomic
disturbance, pessimistic thoughts and, interestingly, good humour as measured by the
Comprehensive Psychopathological Rating Scale (1996). These symptoms of
‘Protracted Withdrawal Syndrome’ are expected to set in at 28-56 days (4-8 weeks) of
abstinence (Voltaire-Carlsson et al., 1996).
‘The Wall’, also referred to as Protracted Withdrawal, is a stage of recovery from
methamphetamine addiction (Obert & Rawson, 2005). Obert and Rawson expect this
stage to occur in the period from 46 -120 days (6-17 weeks) of abstinence and to
include low energy, anhedonia, difficulty in concentrating, irritability, loss of sex
drive and insomnia (2005). They believe that ‘The Wall’ could be the result of a
“biological healing process in the brain” (Obert & Rawson, 2005, p. 15). One of the
strengths of the Matrix Model is its duration, as by the time this high-risk period sets
in, the average in-patients treatment period is over, while, as we have seen, the
sixteen-week intensive period of the Matrix programme covers ‘The Wall’ period and
attempts to provide some containment through this process.
One can see an overlap between the protracted withdrawal syndromes associated with
both alcohol and methamphetamine addiction, and it seems reasonable to assume that
there may be similar processes of adjustment associated with the withdrawal from
other substances of abuse. It is noted that the expected time periods are different
between the withdrawal syndromes associated with alcohol and with MA and were
there to be withdrawal syndromes associated with other substances there may too be
time periods specific to those substances.

29
2.4 Chapter Summary In reviewing the literature, a general consensus has emerged regarding the definition
of addiction by key interested organisations. There is evidence that various
approaches are equally effective in the treatment of addiction. It is also evident that
attrition rates in addiction treatment remain high and that there is much to be learned
in terms of improving treatment interventions.
There has recently been some limited research on the processes of addiction treatment
in an attempt to understand more about how treatments work. There has been a call
for within-treatment research, with the assumption that knowledge gained could
improve the efficacy of treatment and reduce attrition rates. The literature on client
process in treatment includes the proposal that successful treatment requires a
fundamental intrapersonal shift in the client and that such changes can involve
disturbances in affective, cognitive and behavioral functioning. It has further been
observed that this stage may be followed by a ‘pervasive sense of well being’. Stout
(2007) proposes that process researchers add a time-course dimension to the study of
process dynamics. He argues that more time-point observations are needed in order to
capture the full range of dynamic processes involved in treatment.
This study attempts to address such a time-course dimension in process dynamics by
examining reports in client case files extracted at specific time-points over the course
of secondary stage addiction treatment. It further attempts to pay heed to the issue of
matching individuals to treatments, by comparing clients with Axis II personality
traits with clients without Axis II personality traits, and clients recovering from
stimulant addiction with clients recovering from non-stimulant addiction. Given the
high prevalence of substance use disorders in the Western Cape and South Africa, and
the gap in the literature outlined above, this research may offer a valuable
contribution to our understanding of the process of addiction treatment.
30
CHAPTER THREE: METHOD
3.1 Research Aims The aim of this study was to explore whether there are any discernable patterns in
clients’ functioning across different stages of secondary care treatment for substance
abuse at a Cape Town treatment centre. The research aimed to address the following
research questions:
1. Are there any specific patterns in the frequency of reported observations
regarding clients’ behaviors, cognitions, affects and physical states at different
stages of their secondary stage addiction treatment?
2. Are there any differences in the frequency of observed behaviors,
cognitions, affects and physical states across different stages of treatment
between clients with Axis II personality traits and clients without Axis II
personality traits?
3. Are there any differences as above between clients recovering from
stimulant addiction and clients recovering from non-stimulant addiction?
3.2 Design This research project is an example of a case study, defined by Stake as “not a
methodological choice but a choice of what is to be studied” (Stake, 2000). Yin
(2003) describes a case study as an empirical investigation of a phenomenon in the
context within which it occurs (as cited in VanWynsberghe & Khan, 2007). In this
case the phenomenon to be studied is client functioning during eight weeks of
secondary stage treatment for addiction. The context is a secondary stage addiction
treatment facility in Cape Town, South Africa, between March and October 2011. A
case study is usually structured in terms of a number of research questions (Stake,
2000), the current study’s having just been outlined above. Stake claims that a case
study can be intrinsic, where the study is focused primarily on the particular case in
question, or instrumental, where the focus is on understanding a more general interest
(2000). This study straddles both, because while it is known that the results are
specific to these participants at this institution at this time, as an example of a
Minnesota model addiction treatment facility, this case study may begin to shed light
on the processes of addiction recovery for addicts at treatment centres more generally.

31
3.3 Setting The treatment facility is situated in Kommetjie in Cape Town, South Africa. It is a
private, sixteen-bed in-patient facility. The eight-week treatment programme, based
on the Minnesota Model, consists of group therapy, psycho-education and life skill
groups, Dialectical Behavior Therapy groups and individual counselling. In terms of
the evidence-based approaches discussed in the previous chapter, the programme
draws on CBT, Relapse Prevention, Medication, and Aftercare including 12-step
facilitation. Clients are expected to work through the 12-step programme, which
involves written work and consultation with both counselors and a 12-step sponsor.
Clients are further expected to attend at least two 12-step meetings per week, for
which transport is provided, and an aftercare group once a week.
At the time of the study, the treatment team comprised a psychiatric nurse who was
also a counselor and three other counselors who were also addicts in recovery. A
counselling psychologist facilitated weekly ward rounds, and two psychiatrists, a
clinical psychologist and a general medical practitioner consulted regularly. A
qualified counselor and addiction specialist co-facilitated group therapy sessions
several times per month on a freelance basis as needed. After hours and on weekends,
clients are attended to by members of staff known as ‘recovery assistants’, some of
whom are recovering addicts and familiar with the Minnesota model of addiction
treatment and/or the 12-step programme.
At the time of the study, about 80% of the clients were Dutch, with the remaining
clients coming from elsewhere in Europe, from the United Kingdom and from South
Africa. Dutch clients are commonly referred to this treatment centre because the
treatment facilities in Holland are not geared to treat addicts with dual diagnoses i.e.
addiction plus at least one other psychiatric diagnosis. The limited South African
representivity in this sample has implications for the generalisation of this study’s
findings to other substance abuse treatment facilities in South Africa, as will be
discussed in the last chapter.
32
3.4 Participants The treatment facility’s clients were approached shortly after admission to secondary
care over a period of five and a half months between February and August 2011. The
aims of the research were explained to potential participants, as were issues of
confidentiality and their right to change their minds at any point if they so chose.
Those who agreed to participate, but who then left treatment prior to eight weeks were
disqualified. In total, 35 clients agreed to participate in the study. Of these, two clients
requested discharge before 8 weeks of treatment were complete, and were therefore
disqualified, leaving a total sample of 33 participants. The participants included 24
males and 9 females aged 20 – 63 with an average age of 33 years and 11 months.
According to their clinical records, 13 participants had been diagnosed by the
consulting psychiatrist with a personality disorder or with personality disorder traits
(diagnoses were made during an assessment interview at the start of primary care
treatment) and 17 participants were non-stimulant drug users while 16 were stimulant
drug users. All participants had a substance use, abuse or dependency disorder, and 9
participants were also diagnosed with at least one other Axis I disorder, most
commonly mood and/or anxiety disorders. Of the sample, 23 participants were from
Holland, 5 from the U.K., 3 from South Africa and 2 from Zimbabwe. See Table 3.1.
3.5 Data Collection The sources of data for this study were the clinical case reports known at this facility
as ‘client reports’. These reports have a narrative structure and entries are made twice
during the day by members of the counselling team, and twice at night by ‘recovery
assistants’. Due to the limited scope of this mini-dissertation, it was not feasible to
sample each of the eight weeks of treatment. Therefore, a ‘snapshot’ was obtained at
four stages of treatment:
1. Week 1 of secondary stage treatment (7 days)
2. Week 4 of secondary stage treatment (7 days)
3. Week 6 of secondary stage treatment (7 days)
4. Week 8 of secondary stage treatment (7 days)
There are four reports for each client per day. A total of 3696 reports were therefore
included in the analysis (4 reports x 33 participants x 28 days sampled).
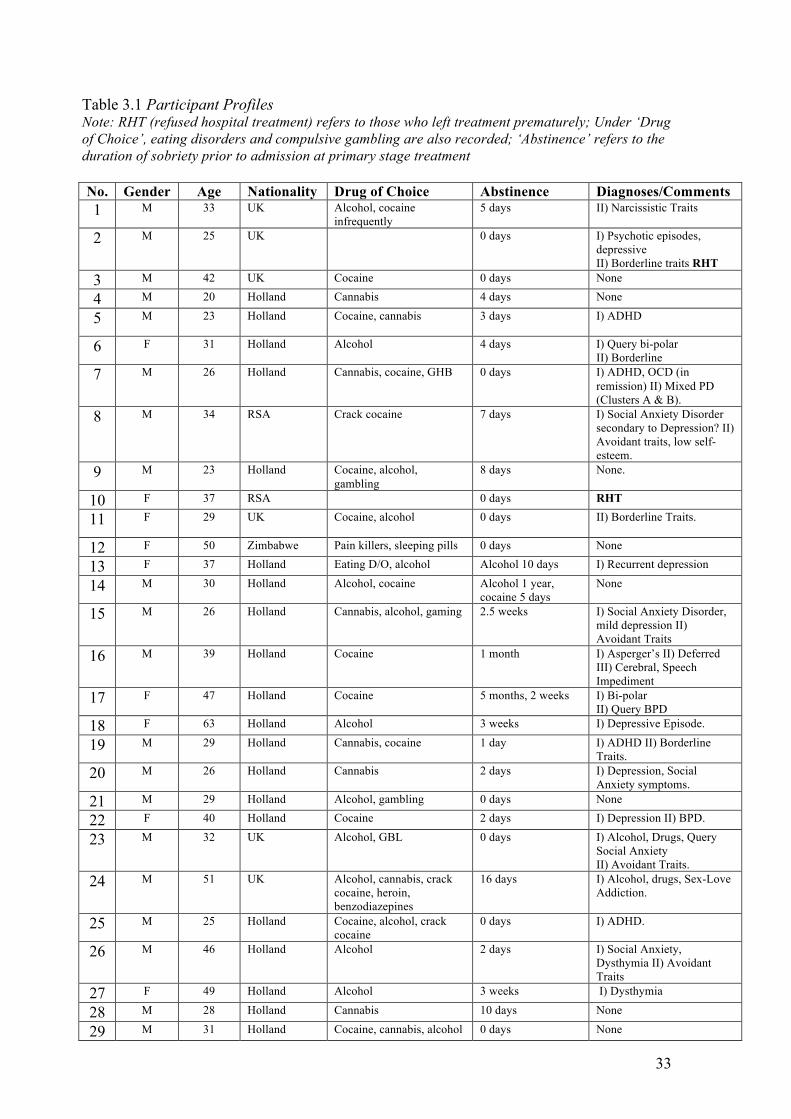
33
Table 3.1 Participant Profiles Note: RHT (refused hospital treatment) refers to those who left treatment prematurely; Under ‘Drug of Choice’, eating disorders and compulsive gambling are also recorded; ‘Abstinence’ refers to the duration of sobriety prior to admission at primary stage treatment
No. Gender Age Nationality Drug of Choice Abstinence Diagnoses/Comments 1 M 33 UK Alcohol, cocaine
infrequently 5 days II) Narcissistic Traits
2 M 25 UK 0 days I) Psychotic episodes, depressive II) Borderline traits RHT
3 M 42 UK Cocaine 0 days None
4 M 20 Holland Cannabis 4 days None
5 M 23 Holland Cocaine, cannabis 3 days I) ADHD
6 F 31 Holland Alcohol 4 days I) Query bi-polar II) Borderline
7 M 26 Holland Cannabis, cocaine, GHB 0 days I) ADHD, OCD (in remission) II) Mixed PD (Clusters A & B).
8 M 34 RSA Crack cocaine 7 days I) Social Anxiety Disorder secondary to Depression? II) Avoidant traits, low self-esteem.
9 M 23 Holland Cocaine, alcohol, gambling
8 days None.
10 F 37 RSA 0 days RHT
11 F 29 UK Cocaine, alcohol 0 days II) Borderline Traits.
12 F 50 Zimbabwe Pain killers, sleeping pills 0 days None
13 F 37 Holland Eating D/O, alcohol Alcohol 10 days I) Recurrent depression
14 M 30 Holland Alcohol, cocaine Alcohol 1 year, cocaine 5 days
None
15 M 26 Holland Cannabis, alcohol, gaming 2.5 weeks I) Social Anxiety Disorder, mild depression II) Avoidant Traits
16 M 39 Holland Cocaine 1 month I) Asperger’s II) Deferred III) Cerebral, Speech Impediment
17 F 47 Holland Cocaine 5 months, 2 weeks I) Bi-polar II) Query BPD
18 F 63 Holland Alcohol 3 weeks I) Depressive Episode.
19 M 29 Holland Cannabis, cocaine 1 day I) ADHD II) Borderline Traits.
20 M 26 Holland Cannabis 2 days I) Depression, Social Anxiety symptoms.
21 M 29 Holland Alcohol, gambling 0 days None
22 F 40 Holland Cocaine 2 days I) Depression II) BPD.
23 M 32 UK Alcohol, GBL 0 days I) Alcohol, Drugs, Query Social Anxiety II) Avoidant Traits.
24 M 51 UK Alcohol, cannabis, crack cocaine, heroin, benzodiazepines
16 days I) Alcohol, drugs, Sex-Love Addiction.
25 M 25 Holland Cocaine, alcohol, crack cocaine
0 days I) ADHD.
26 M 46 Holland Alcohol 2 days I) Social Anxiety, Dysthymia II) Avoidant Traits
27 F 49 Holland Alcohol 3 weeks I) Dysthymia
28 M 28 Holland Cannabis 10 days None
29 M 31 Holland Cocaine, cannabis, alcohol 0 days None
34
30 M 33 UK Alcohol 3 weeks I) Previous substance-related depression. II) Query Avoidant PD
31 F 50 RSA Alcohol 0 days I) Generalized Anxiety Disorder, Depression
32 M 27 Holland Cannabis 2 days I) Social Anxiety. II) Possibly Obsessive Traits
33 M 25 Zimbabwe Alcohol 1 day I) Query Dysthymia, Adjustment Disorder w/ Depressed Mood?
34 M 26 Holland Cocaine 4 days None
35 M 20 Holland Cannabis, gambling
2 days I) Anger Problem
In addition, the participants’ drugs of choice, comorbid diagnoses, ages and
nationalities were recorded from the files. Data collection began late March 2011 and
continued until early October 2011.
Participants were assigned a participant number and names were not recorded for the
analysis.
3.6 Data Analysis The method of analysis used was that of a thematic analysis, described by Braun and
Clarke as a method for identifying and analysing patterns in the form of themes
within data (2006). The process involves familiarizing oneself with a data set,
generating codes from the data relevant to the research question, and organising such
codes into themes which can then be analysed (Braun & Clarke, 2006). Thematic
analysis is flexible and allows for the coding to be driven by one’s analytic interest
(Braun & Clarke, 2006), in this case, the research questions stated.
From each of the participants’ reports, all words and phrases that referred to the
participants’ emotional states, cognitive functioning, behaviors or physical conditions
were recorded for the 1st, 4th, 6th and 8th weeks of treatment. All recorded data were
captured in a grid matrix as illustrated in Table 3.2.
After the data were captured for each of the four weeks sampled, each specific week
was examined and the words and phrases captured were grouped per week and
counted. During this phase, certain extracts were edited, to lift specific words or
phrases from these extracts that were deemed specifically appropriate to the aims of

35
the study. For example, “apologised” was extracted from “apologised for not turning
up for walk”, as it was deemed important that an apology was made and that the
specific circumstances around the apology were of secondary importance.
As the process continued, reports were combed for words and phrases identified in
previously analysed weeks and these were counted and recorded. In addition to this,
new, previously unseen words and phrases were recorded and counted and added to
the growing data set. The coding process yielded a list of 347 different words and
phrases that had been used across all participants over the four weeks sampled.
These words and phrases were then categorised under five broad categories: Affective,
Cognitive, Behavioral, Physical and then a Miscellaneous/General category that was
used to record words and phrases that did not seem to belong to the other four. Each
of these categories was in turn divided into positive, negative and neutral sub-
categories. The positive category was populated with words and phrases that appeared
to imply healthy or euthymic mood states or mental and physical well-being.
Conversely, the negative category was populated with words and phrases that seemed
to imply distress or being physically or mentally unwell or discontented. The neutral
subcategory was later added, as two themes that emerged, quiet and pensive, seemed
to fit neither the positive nor the negative sub-categories. It should be noted that the
labels positive, negative and neutral are for the utility of analysis only and are not
meant to imply a value judgement about whether a behavior or affect is “good”, “bad”
or neither. Table 3.3 contains examples of codes that emerged from the analysis,
organised according to categories, each with positive and negative sub-categories.
Emergent themes are in recorded in bold type. Note that the neutral subcategory had
not yet been created.
3.7 Ethical Considerations Given that the participants in this study were not directly involved in any way (data
were collected from reports as opposed to from the participants directly), the main
ethical considerations had to do with their rights to privacy, confidentiality, and self-
determination as outlined under Section E of the American Psychological
Association’s ‘Ethical Principles of Psychologists and Code of Conduct’ (American
Psychological Association, 2010). The participants’ anonymities were protected at all
times. Their names, personal details and details of treatment were not relevant to the
36
study and were not used in this mini-dissertation. The researcher worked alone and
had no need to share client information with any third party. No one but the
researcher knows the names and identities of the clients that the participant numbers
refer to. The participants are referred to in this study by their ascribed numbers only.
Reports were only included in the study the with the permission of the clients
concerned, that permission having been granted by means of an informed consent
form (see Appendix). Participants were verbally informed of the nature of the
research and the methods that would be used. The consent form stipulated, and the
participants were informed verbally, that they had the right to withdraw their
participation at any point before, during or after the commencement of the study.
The following chapter will outline how the words and phrases captured in the coding
process were used to derive themes, and how these themes were analysed. Findings
will be discussed.
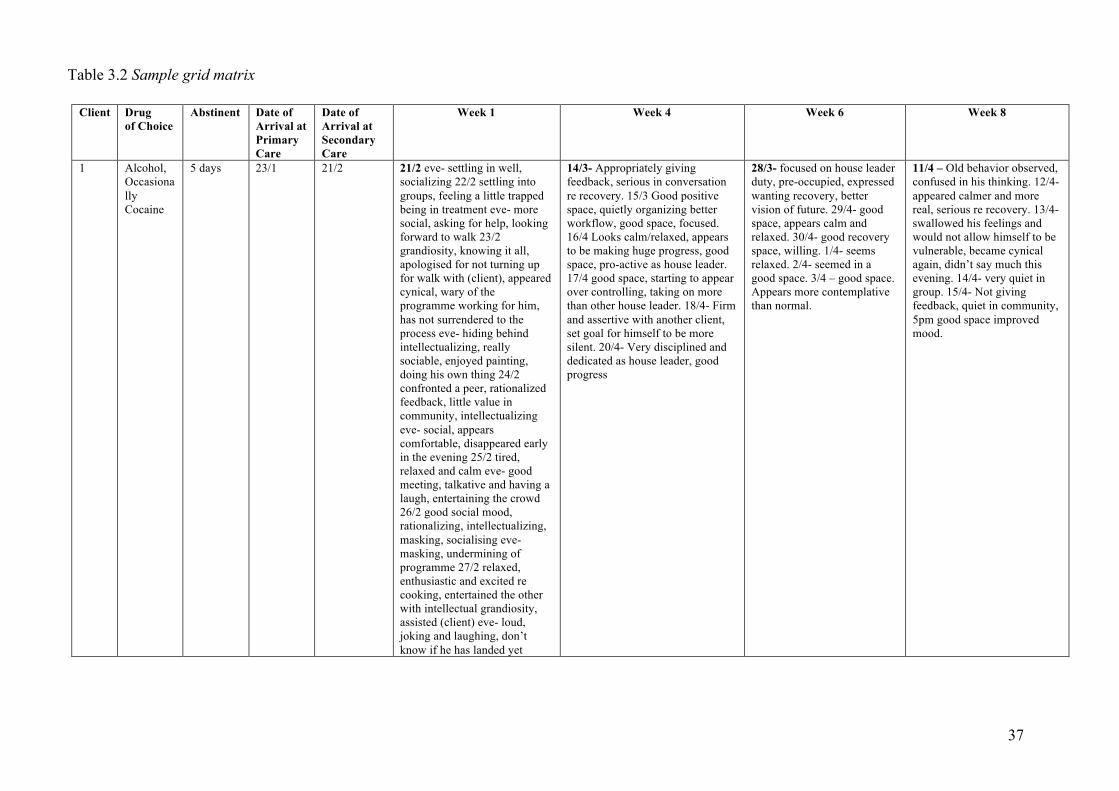
37
Table 3.2 Sample grid matrix
Client Drug of Choice
Abstinent Date of Arrival at Primary Care
Date of Arrival at Secondary Care
Week 1 Week 4 Week 6 Week 8
1 Alcohol, Occasionally Cocaine
5 days 23/1 21/2 21/2 eve- settling in well, socializing 22/2 settling into groups, feeling a little trapped being in treatment eve- more social, asking for help, looking forward to walk 23/2 grandiosity, knowing it all, apologised for not turning up for walk with (client), appeared cynical, wary of the programme working for him, has not surrendered to the process eve- hiding behind intellectualizing, really sociable, enjoyed painting, doing his own thing 24/2 confronted a peer, rationalized feedback, little value in community, intellectualizing eve- social, appears comfortable, disappeared early in the evening 25/2 tired, relaxed and calm eve- good meeting, talkative and having a laugh, entertaining the crowd 26/2 good social mood, rationalizing, intellectualizing, masking, socialising eve- masking, undermining of programme 27/2 relaxed, enthusiastic and excited re cooking, entertained the other with intellectual grandiosity, assisted (client) eve- loud, joking and laughing, don’t know if he has landed yet
14/3- Appropriately giving feedback, serious in conversation re recovery. 15/3 Good positive space, quietly organizing better workflow, good space, focused. 16/4 Looks calm/relaxed, appears to be making huge progress, good space, pro-active as house leader. 17/4 good space, starting to appear over controlling, taking on more than other house leader. 18/4- Firm and assertive with another client, set goal for himself to be more silent. 20/4- Very disciplined and dedicated as house leader, good progress
28/3- focused on house leader duty, pre-occupied, expressed wanting recovery, better vision of future. 29/4- good space, appears calm and relaxed. 30/4- good recovery space, willing. 1/4- seems relaxed. 2/4- seemed in a good space. 3/4 – good space. Appears more contemplative than normal.
11/4 – Old behavior observed, confused in his thinking. 12/4- appeared calmer and more real, serious re recovery. 13/4- swallowed his feelings and would not allow himself to be vulnerable, became cynical again, didn’t say much this evening. 14/4- very quiet in group. 15/4- Not giving feedback, quiet in community, 5pm good space improved mood.
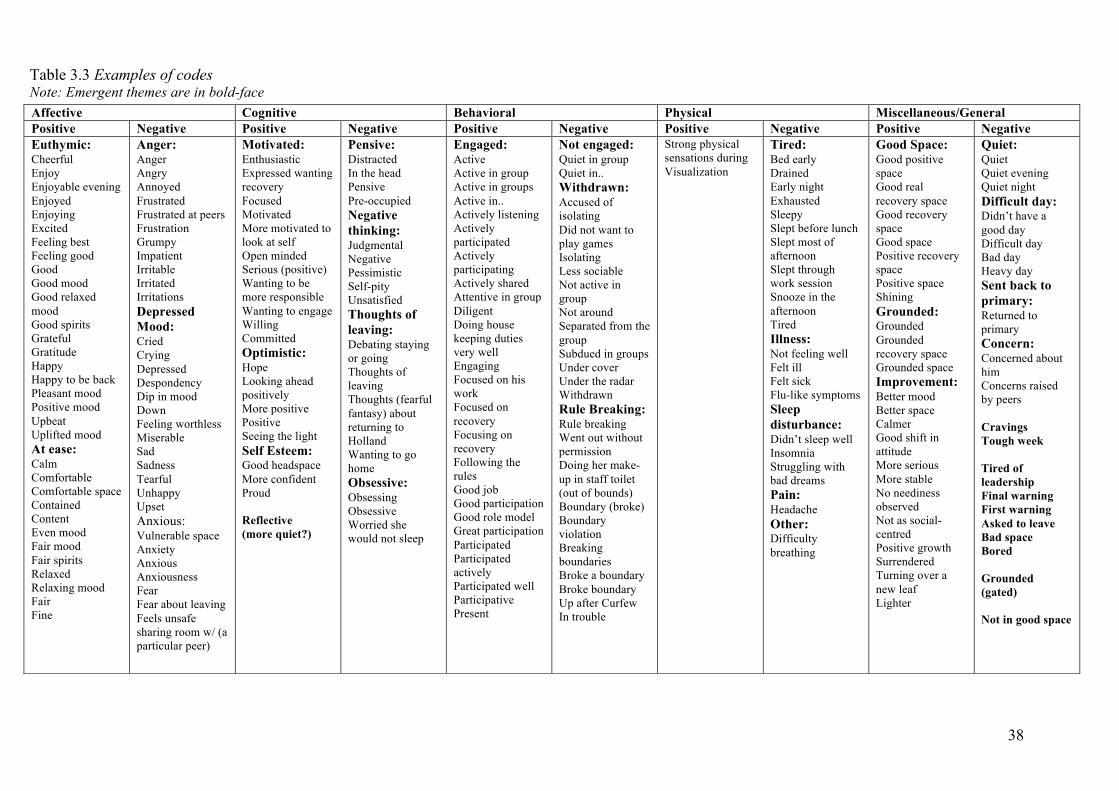
38
Table 3.3 Examples of codes Note: Emergent themes are in bold-face
Affective Cognitive Behavioral Physical Miscellaneous/General Positive Negative Positive Negative Positive Negative Positive Negative Positive Negative Euthymic: Cheerful Enjoy Enjoyable evening Enjoyed Enjoying Excited Feeling best Feeling good Good Good mood Good relaxed mood Good spirits Grateful Gratitude Happy Happy to be back Pleasant mood Positive mood Upbeat Uplifted mood At ease: Calm Comfortable Comfortable space Contained Content Even mood Fair mood Fair spirits Relaxed Relaxing mood Fair Fine
Anger: Anger Angry Annoyed Frustrated Frustrated at peers Frustration Grumpy Impatient Irritable Irritated Irritations Depressed Mood: Cried Crying Depressed Despondency Dip in mood Down Feeling worthless Miserable Sad Sadness Tearful Unhappy Upset Anxious: Vulnerable space Anxiety Anxious Anxiousness Fear Fear about leaving Feels unsafe sharing room w/ (a particular peer)
Motivated: Enthusiastic Expressed wanting recovery Focused Motivated More motivated to look at self Open minded Serious (positive) Wanting to be more responsible Wanting to engage Willing Committed Optimistic: Hope Looking ahead positively More positive Positive Seeing the light Self Esteem: Good headspace More confident Proud Reflective (more quiet?)
Pensive: Distracted In the head Pensive Pre-occupied Negative thinking: Judgmental Negative Pessimistic Self-pity Unsatisfied Thoughts of leaving: Debating staying or going Thoughts of leaving Thoughts (fearful fantasy) about returning to Holland Wanting to go home Obsessive: Obsessing Obsessive Worried she would not sleep
Engaged: Active Active in group Active in groups Active in.. Actively listening Actively participated Actively participating Actively shared Attentive in group Diligent Doing house keeping duties very well Engaging Focused on his work Focused on recovery Focusing on recovery Following the rules Good job Good participation Good role model Great participation Participated Participated actively Participated well Participative Present
Not engaged: Quiet in group Quiet in.. Withdrawn: Accused of isolating Did not want to play games Isolating Less sociable Not active in group Not around Separated from the group Subdued in groups Under cover Under the radar Withdrawn Rule Breaking: Rule breaking Went out without permission Doing her make-up in staff toilet (out of bounds) Boundary (broke) Boundary violation Breaking boundaries Broke a boundary Broke boundary Up after Curfew In trouble
Strong physical sensations during Visualization
Tired: Bed early Drained Early night Exhausted Sleepy Slept before lunch Slept most of afternoon Slept through work session Snooze in the afternoon Tired Illness: Not feeling well Felt ill Felt sick Flu-like symptoms Sleep disturbance: Didn’t sleep well Insomnia Struggling with bad dreams Pain: Headache Other: Difficulty breathing
Good Space: Good positive space Good real recovery space Good recovery space Good space Positive recovery space Positive space Shining Grounded: Grounded Grounded recovery space Grounded space Improvement: Better mood Better space Calmer Good shift in attitude More serious More stable No neediness observed Not as social-centred Positive growth Surrendered Turning over a new leaf Lighter
Quiet: Quiet Quiet evening Quiet night Difficult day: Didn’t have a good day Difficult day Bad day Heavy day Sent back to primary: Returned to primary Concern: Concerned about him Concerns raised by peers Cravings Tough week Tired of leadership Final warning First warning Asked to leave Bad space Bored Grounded (gated) Not in good space

39
CHAPTER FOUR: ANALYSIS AND DISCUSSION
This chapter will explain the process of generating themes from the data and how
these themes were analysed. The frequencies of categories and themes will be
compared and contrasted across time-points for the sample as a whole. Thereafter,
caparisons will be made between the Axis II and non-Axis II subgroups, and between
the stimulant user and non-stimulant user subgroups.
4.1 Themes Words and phrases coded from the counselors’ reported observations of clients in the
daily reports were categorised according to themes that seemed to best capture the
essence of words and phrases that described similar observations (see Table 2,
previous chapter). For example, words like cheerful, feeling best, good mood, happy
and upbeat were clustered together amongst others under a theme named Euthymic
within the Positive subcategory of the Affective category. Similarly, rule breaking,
went out without permission, boundary violation, up after curfew and in trouble were
clustered together amongst others under a theme named Rule Breaking within the
Negative subcategory of the Behavioral category. A process of further comparison led
to certain themes being collapsed into or merged with other themes. For example, the
Affective, Behavioral and Miscellaneous/General categories all had Improvement as
themes; these were then incorporated into a theme called General improvement. Some
of the theme names like Euthymic and At ease were created by the researcher to
reflect the words and phrases encompassed by that theme. Other theme names were
already in the data set, for example the terms Pensive and Motivated were frequently
reported in the case records. Good space and Under the radar could have been
incorporated into the Euthymic and Withdrawn themes respectively, but due to the
fact that each of these terms were so common in the reports they were included as
separate themes in their own right. Themes like Relapsed and Sent back to primary
(primary stage treatment) were taken directly from the reports and included as themes
because, although they did not occur often, they were seen by the researcher as fairly
severe presentations and therefore important.
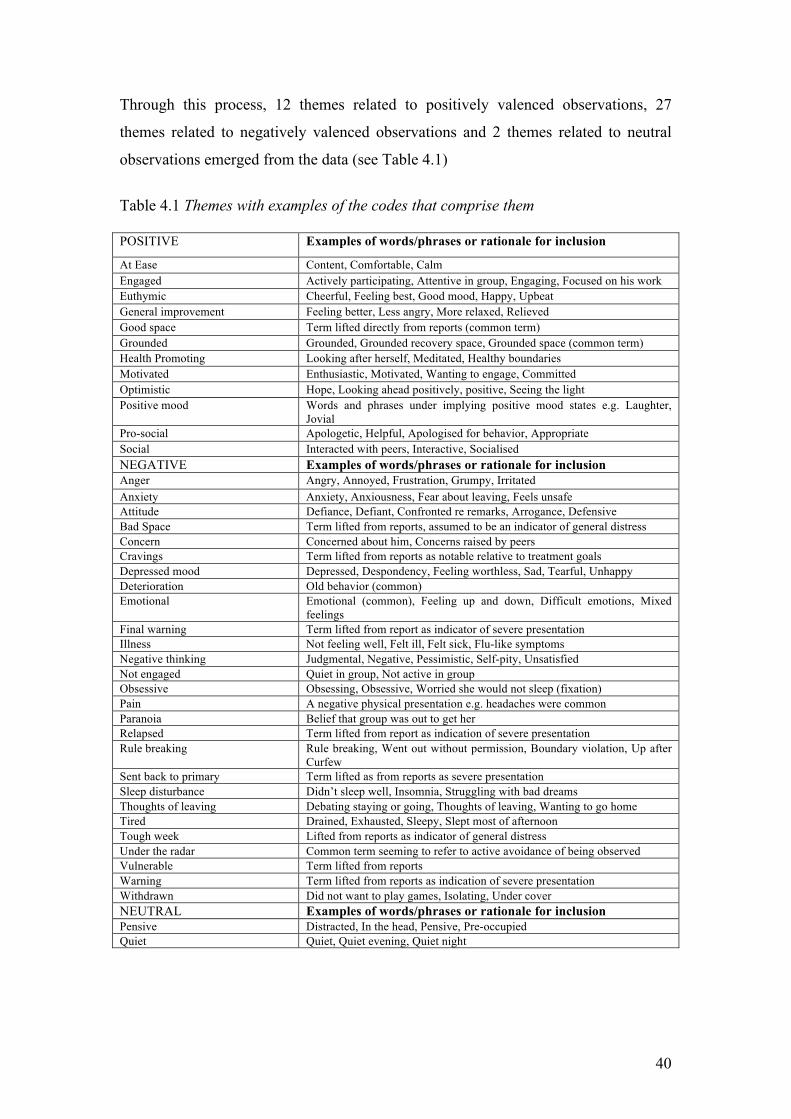
40
Through this process, 12 themes related to positively valenced observations, 27
themes related to negatively valenced observations and 2 themes related to neutral
observations emerged from the data (see Table 4.1)
Table 4.1 Themes with examples of the codes that comprise them POSITIVE Examples of words/phrases or rationale for inclusion
At Ease Content, Comfortable, Calm Engaged Actively participating, Attentive in group, Engaging, Focused on his work Euthymic Cheerful, Feeling best, Good mood, Happy, Upbeat General improvement Feeling better, Less angry, More relaxed, Relieved Good space Term lifted directly from reports (common term) Grounded Grounded, Grounded recovery space, Grounded space (common term) Health Promoting Looking after herself, Meditated, Healthy boundaries Motivated Enthusiastic, Motivated, Wanting to engage, Committed Optimistic Hope, Looking ahead positively, positive, Seeing the light Positive mood Words and phrases under implying positive mood states e.g. Laughter,
Jovial Pro-social Apologetic, Helpful, Apologised for behavior, Appropriate Social Interacted with peers, Interactive, Socialised NEGATIVE Examples of words/phrases or rationale for inclusion Anger Angry, Annoyed, Frustration, Grumpy, Irritated Anxiety Anxiety, Anxiousness, Fear about leaving, Feels unsafe Attitude Defiance, Defiant, Confronted re remarks, Arrogance, Defensive Bad Space Term lifted from reports, assumed to be an indicator of general distress Concern Concerned about him, Concerns raised by peers Cravings Term lifted from reports as notable relative to treatment goals Depressed mood Depressed, Despondency, Feeling worthless, Sad, Tearful, Unhappy Deterioration Old behavior (common) Emotional Emotional (common), Feeling up and down, Difficult emotions, Mixed
feelings Final warning Term lifted from report as indicator of severe presentation Illness Not feeling well, Felt ill, Felt sick, Flu-like symptoms Negative thinking Judgmental, Negative, Pessimistic, Self-pity, Unsatisfied Not engaged Quiet in group, Not active in group Obsessive Obsessing, Obsessive, Worried she would not sleep (fixation) Pain A negative physical presentation e.g. headaches were common Paranoia Belief that group was out to get her Relapsed Term lifted from report as indication of severe presentation Rule breaking Rule breaking, Went out without permission, Boundary violation, Up after
Curfew Sent back to primary Term lifted as from reports as severe presentation Sleep disturbance Didn’t sleep well, Insomnia, Struggling with bad dreams Thoughts of leaving Debating staying or going, Thoughts of leaving, Wanting to go home Tired Drained, Exhausted, Sleepy, Slept most of afternoon Tough week Lifted from reports as indicator of general distress Under the radar Common term seeming to refer to active avoidance of being observed Vulnerable Term lifted from reports Warning Term lifted from reports as indication of severe presentation Withdrawn Did not want to play games, Isolating, Under cover NEUTRAL Examples of words/phrases or rationale for inclusion Pensive Distracted, In the head, Pensive, Pre-occupied Quiet Quiet, Quiet evening, Quiet night
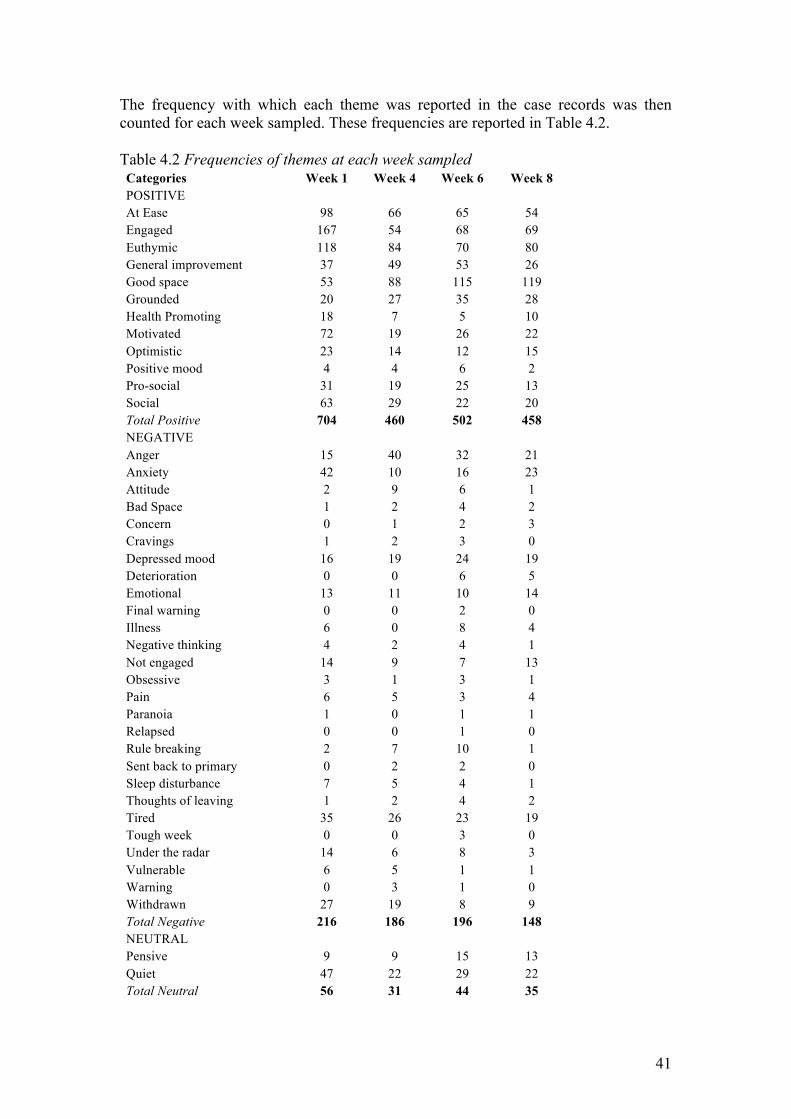
41
The frequency with which each theme was reported in the case records was then counted for each week sampled. These frequencies are reported in Table 4.2. Table 4.2 Frequencies of themes at each week sampled Categories Week 1 Week 4 Week 6 Week 8 POSITIVE At Ease 98 66 65 54 Engaged 167 54 68 69 Euthymic 118 84 70 80 General improvement 37 49 53 26 Good space 53 88 115 119 Grounded 20 27 35 28 Health Promoting 18 7 5 10 Motivated 72 19 26 22 Optimistic 23 14 12 15 Positive mood 4 4 6 2 Pro-social 31 19 25 13 Social 63 29 22 20 Total Positive 704 460 502 458 NEGATIVE Anger 15 40 32 21 Anxiety 42 10 16 23 Attitude 2 9 6 1 Bad Space 1 2 4 2 Concern 0 1 2 3 Cravings 1 2 3 0 Depressed mood 16 19 24 19 Deterioration 0 0 6 5 Emotional 13 11 10 14 Final warning 0 0 2 0 Illness 6 0 8 4 Negative thinking 4 2 4 1 Not engaged 14 9 7 13 Obsessive 3 1 3 1 Pain 6 5 3 4 Paranoia 1 0 1 1 Relapsed 0 0 1 0 Rule breaking 2 7 10 1 Sent back to primary 0 2 2 0 Sleep disturbance 7 5 4 1 Thoughts of leaving 1 2 4 2 Tired 35 26 23 19 Tough week 0 0 3 0 Under the radar 14 6 8 3 Vulnerable 6 5 1 1 Warning 0 3 1 0 Withdrawn 27 19 8 9 Total Negative 216 186 196 148 NEUTRAL Pensive 9 9 15 13 Quiet 47 22 29 22 Total Neutral 56 31 44 35
42
Because a particular participant might raise the frequency of a particular theme by
having a high number of recorded observations for that theme at a particular point in
treatment, the data were also analysed to record the number of clients that presented
with each theme per week sampled. These frequencies are reported in Table 4.3 and
expressed as percentages of the whole sample group. For example, in Week 1, 30 of
33 participants (91%) had reported observations in their files for the At ease theme
whereas in Week 4, 28 of 33 participants (85%) had recorded observations for this
theme.
First the frequencies of Positive, Negative and Neutral categories will be compared
across time-points and then the most frequent individual themes will be discussed
within each time-point. Statistical comparisons are not possible due to various data
related issues including the small sample size and the fact that comparisons are being
made across four time-points. Rather, trends will be noted.
4.2 Frequency of Positive, Negative and Neutral categories across time-points for total sample The total number of Positive themes, Negative themes and Neutral themes were
summed for each of the four time-points. The overall trend for the Positive, Negative
and Neutral categories is that the highest frequencies for each category are found in
the first week, the numbers drop quite substantially at the fourth week, increase again
slightly in the sixth week and drop again at the eighth week. The greatest difference in
frequency from one sampled week to another is in the Neutral category (comprising
only two themes) between Week 1 and Week 4. Here there is a drop from 56 overall
occurrences to 31 occurrences, a drop of 45%. We also see a large drop from Week 1
to Week 4 in the Positive category, from 704 to 460 occurrences, a drop of 35%.
Comparatively, although there is also a drop in Negative category between Weeks 1
and 4, it is only from 216 to 186, a drop of 14%. In the Negative category we see the
largest drop between Weeks 6 and 8, from 196 to 148, a drop of 24%.
The high overall frequency of Positive, Negative and Neutral themes at Week 1
relative to other sampled time-points in the treatment programme may reflect the
relative visibility or conspicuousness of in-patients at different points in treatment. If
this is true, visibility could be a function of enthusiasm on the part of participants in
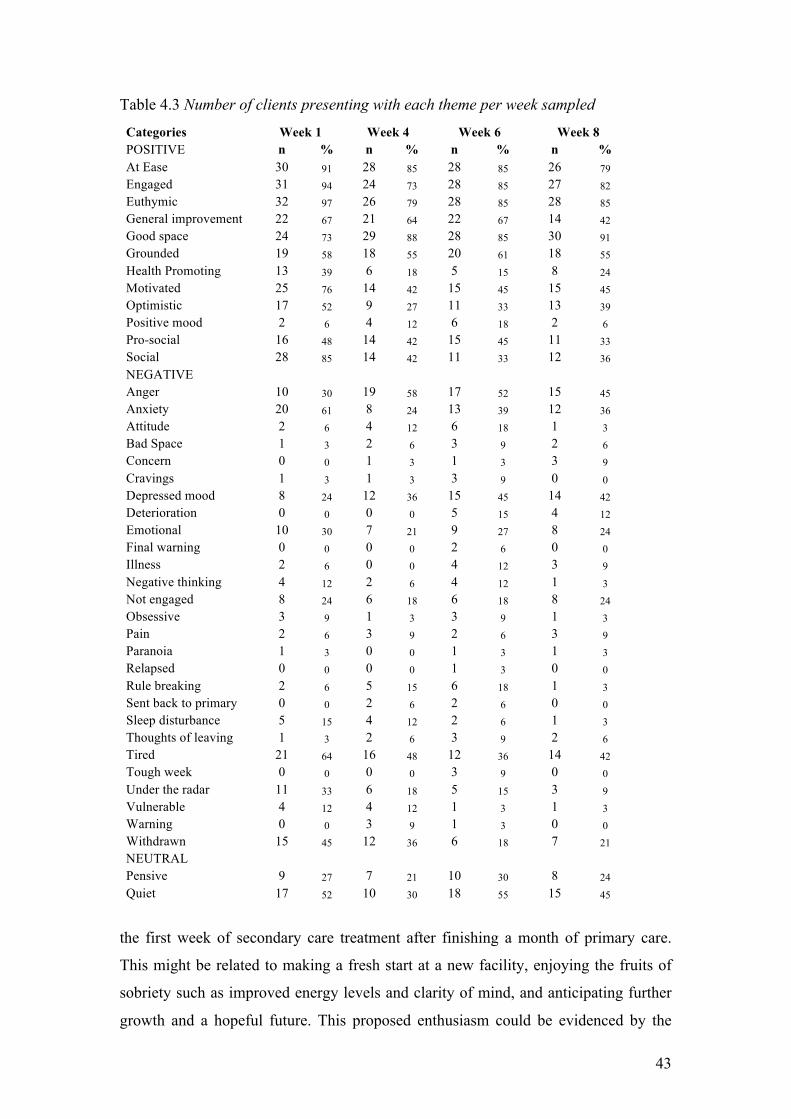
43
Table 4.3 Number of clients presenting with each theme per week sampled
Categories Week 1 Week 4 Week 6 Week 8 POSITIVE n % n % n % n % At Ease 30 91 28 85 28 85 26 79 Engaged 31 94 24 73 28 85 27 82 Euthymic 32 97 26 79 28 85 28 85 General improvement 22 67 21 64 22 67 14 42 Good space 24 73 29 88 28 85 30 91 Grounded 19 58 18 55 20 61 18 55 Health Promoting 13 39 6 18 5 15 8 24 Motivated 25 76 14 42 15 45 15 45 Optimistic 17 52 9 27 11 33 13 39 Positive mood 2 6 4 12 6 18 2 6 Pro-social 16 48 14 42 15 45 11 33 Social 28 85 14 42 11 33 12 36 NEGATIVE Anger 10 30 19 58 17 52 15 45 Anxiety 20 61 8 24 13 39 12 36 Attitude 2 6 4 12 6 18 1 3 Bad Space 1 3 2 6 3 9 2 6 Concern 0 0 1 3 1 3 3 9 Cravings 1 3 1 3 3 9 0 0 Depressed mood 8 24 12 36 15 45 14 42 Deterioration 0 0 0 0 5 15 4 12 Emotional 10 30 7 21 9 27 8 24 Final warning 0 0 0 0 2 6 0 0 Illness 2 6 0 0 4 12 3 9 Negative thinking 4 12 2 6 4 12 1 3 Not engaged 8 24 6 18 6 18 8 24 Obsessive 3 9 1 3 3 9 1 3 Pain 2 6 3 9 2 6 3 9 Paranoia 1 3 0 0 1 3 1 3 Relapsed 0 0 0 0 1 3 0 0 Rule breaking 2 6 5 15 6 18 1 3 Sent back to primary 0 0 2 6 2 6 0 0 Sleep disturbance 5 15 4 12 2 6 1 3 Thoughts of leaving 1 3 2 6 3 9 2 6 Tired 21 64 16 48 12 36 14 42 Tough week 0 0 0 0 3 9 0 0 Under the radar 11 33 6 18 5 15 3 9 Vulnerable 4 12 4 12 1 3 1 3 Warning 0 0 3 9 1 3 0 0 Withdrawn 15 45 12 36 6 18 7 21 NEUTRAL Pensive 9 27 7 21 10 30 8 24 Quiet 17 52 10 30 18 55 15 45
the first week of secondary care treatment after finishing a month of primary care.
This might be related to making a fresh start at a new facility, enjoying the fruits of
sobriety such as improved energy levels and clarity of mind, and anticipating further
growth and a hopeful future. This proposed enthusiasm could be evidenced by the

44
disproportionately high frequencies of the themes Engaged (the theme with the
highest frequency in Week 1) and Motivated (the theme with the 4th highest frequency
in Week 1). By Week 4, these themes have dropped by 68% and 74% respectively,
possibly the novelty of the fresh start having worn off, or enthusiasm having been
moderated by the challenges of a new programme not yet mastered. Another
component of visibility could be related to the Social theme, which is also prominent
in Week 1 and drops by 54% at Week 4. It seems plausible that an individual who is
being social relative to others, or relative to themselves at other times, would be more
likely to be noticed. 85% of participants presented as Social at least once in their first
week of treatment. At Week 4, this number had dropped to 42%, suggesting a
possible trend in the sample towards social withdrawal after Week 1.
The Euthymic theme had the second highest frequency at Week 1, which may be
related to the Engaged, Motivated and Social themes, as an individual who is judged
to be engaged, motivated or social might also be judged to be euthymic. Euthymic,
however, unlike Engaged, Motivated and Social, was not disproportionately high in
prevalence at Week 1 compared to later time-points. Nevertheless, the Euthymic
frequency dropped by 29% from Week 1 to Week 4 and was high in Week 1 relative
to all later frequencies of the Euthymic theme and may still possibly be related to
participant visibility.
Under the negative subcategory, Anxiety, Tired and Withdrawn account for almost
half of the total negative frequency at Week 1. These will be discussed shortly under
the next section, but where observed anxiety may possibly increase an individual’s
visibility, it may also be related to Withdrawal, as an anxious person might well be
expected to withdraw. Further, being tired and being withdrawn might appear similar
to the observer. It seems possible that both could raise visibility for the opposite
reasons to those of the positive themes like Social and Engaged. These themes in the
negative subcategory might be conspicuous by virtue of their lack of engagement,
sociability or enthusiasm.
The high frequencies in the Positive, Negative and Neutral categories at Week 1 may
also reflect the degree to which the report writers are actively observing the
participants at the beginning of treatment. It might be expected that participants in
45
their first week of secondary stage treatment would be more closely observed than
older members of the in-patient community, as the staff might have a specific interest
in how they are coping and/or settling into their new environment, what particular
strengths or weaknesses they may have and how they are interacting with others in the
in-patient community, for example. Similarly, in the interest of communicating
information about new in-patients to other staff members, report writers may be likely
to write more, and to write more descriptively, about newcomers than they would
about older in-patients.
An additional factor in the disproportionally high count of Positive themes in Week 1
may have to do with inpatients being ‘on their best behavior’. Newcomers, being
unfamiliar with the new surroundings and staff, might exercise more caution than they
might normally do. Those that are going to struggle with the rules and the structure of
the treatment environment might also take some time to feel or express distress or
resistance. This is possibly reflected in the frequencies of the Negative themes
Attitude and Rule breaking, both of which increase between Week 1 and Week 4.
Although the frequencies are low, Attitude increases from 2 to 9, and Rule breaking
from 2 to 7. These themes are both only recorded for 6% of participants in Week 1,
but at Week 4, 15% of participants are reported as Rule breaking and 12% as
displaying Attitude. However, it should be noted that the overall pattern across all
weeks makes clear the fact that high frequencies of Positive themes do not imply low
frequencies of Negative themes or vice versa. Indeed, most themes, Positive, Negative
or Neutral, follow the same overall trend. This would seem to support the idea of
fluctuating visibility of participants and/or scrutiny by report writers.
A second observation regarding the theme frequencies over the four weeks sampled is
that the overall frequencies across all these weeks are substantially higher for Positive
themes than Negative or Neutral themes. Overall, the frequency of Positive themes
was 2.3 times higher than the frequency of the Negative and Neutral themes together,
in spite of the fact that there are 2.4 times as many themes in the Negative and Neutral
categories as in the Positive category. The high frequency of instances of Positive
themes relative to Negative and Neutral themes is consistent across all time-points
and does not appear to shift across the admission, treatment and termination stages of
the programme. Some possible explanations are proposed.

46
By the time the in-patients have arrived at secondary stage treatment, they have
generally been abstinent from all substances for at least four weeks. This in itself
might have a positive physical and psychological impact on the individual’s overall
functioning and sense of wellbeing, which might in part explain the generally positive
feedback in client reports. Further, there may be a sense of mastery that comes with
the adoption of new ideas, philosophies and life-skills and the re-instillment of hope
that enhances the individual’s sense of well-being.
Given that the in-patients are being treated for addiction and that almost all of the
participants have been abstinent for at least four weeks by the start of secondary stage
treatment and 12 weeks by the end of treatment, perhaps it is to be expected that the
overall observation should be that the in-patients are doing well. According to the
DSM-IV-TR, after four weeks of abstinence, patients are in Early Full Remission;
clinically, they are no longer mentally ill. Further, if one looks at mental illness bio-
psycho-socially, there is an argument to be made for a relatively strong mental health
status by this stage of treatment: A biological component of the illness has been
contained, namely substance use, which acts and impacts on an organic level. This
should have a positive effect on general functioning as mentioned. Secondly, the
therapeutic environment is generally a containing one. Although in-patients are
expected to challenge themselves as part of the therapeutic process, which can be
distressing, this is done in a supportive environment. Further, they have been and are
removed from or buffered against the general stressors of everyday life, be they
domestic, relational, work related or environmental.
Another possible factor is that in many substance abuse programmes, a significant
number of in-patients are treated pharmacologically with antidepressants, mood-
stabilisers and/or anti-psychotics as an adjunct to addiction treatment. By the time
they reach secondary stage treatment there has been at least four weeks for such
interventions to take effect, which may also contribute to general euthymia.
In the following section, the most prominent themes recorded at each time-point will
be discussed.
47
4.3 Frequency of specific themes by stage of treatment 4.3.1 Week 1 In Week 1, the four most frequently recorded themes are, in order, Engaged (167),
Euthymic (118), At ease (98) and Motivated (72), all Positive themes. Under Negative
themes, Anxiety (42) is the most frequently observed theme in Week 1, followed by
Tired (35) and Withdrawn (27). Under the Neutral themes, Quiet is recorded 47 times
in Week 1.
As mentioned in the previous section, Engaged, Euthymic and Motivated might be
related to enthusiasm for reasons already discussed. However, one might expect that
in the first week of treatment at a new facility, with new staff and some unfamiliar in-
patients, newcomers might experience anxiety to a greater or lesser degree, possibly
alternating with more positive feelings. This, combined with the proposed visibility
factor, might explain the relatively high reported frequencies of Anxiety at Week 1. If
we examine the participant frequencies in Table 4.3, we can see that there is a degree
of overlap between clients being reported as Engaged (94%) and clients being
reported with Anxiety (61%), suggesting that these states co-exist in many participants
rather than being two distinct groups of participants (e.g. one engaged, one anxious).
A number of factors might be related to the high frequency of Tired at Week 1. Long-
term use of, or dependence on, sedative substances like opiates, benzodiazepines or
alcohol may leave such individuals dependent on these substances in order to fall
asleep at night. When these substances are no longer available to them they may
struggle to achieve normal sleep for some time, leaving them tired during the day.
Others may have had their natural sleep patterns disrupted for long periods of time
through the use of stimulants like cocaine or methamphetamine that prevent normal
sleep, or sleep at appropriate times. Such individuals may find themselves struggling
both to sleep at night and to maintain daytime wakefulness. It is noted that the
frequency of the theme Sleep Disturbance, while relatively low, is highest at Week 1
and declines over time, as does Tired.
The reported frequencies of patients being Withdrawn and Quiet are relatively high at
Week 1, which might be expected, as if one is withdrawn, one might well also be
quiet. However, where one might have expected to see high frequencies of Withdrawn
48
correlated with high levels of Depressed mood, this is not the case. In fact, when
Depressed mood does become prominent at Week 6, Withdrawn has becomes far less
prominent. The high frequencies of Withdrawn and Quiet could arguably be related to
the high levels of Tired, as those who are tired might be relatively quiet and be judged
by observers to be withdrawn. This was alluded to in the previous section.
4.3.2 Week 4 By Week 4, Good Space (88) and Euthymic (84) are the most common themes,
followed by At ease (66) and Engaged (54). There has been little change in the most
frequent themes except that Euthymic, At ease and Engaged are all reported at lower
frequencies than at Week 1, Good space has increased to become one of the most
frequent themes in Week 4, and Motivated (19) has dropped off very substantially by
53%.
It has already been noted that all theme frequencies drop between Week 1 and Week 4
and that this may be related to some general factors like scrutiny or visibility, but it is
interesting that Good space has increased by Week 4, especially since Euthymic has
dropped, and these two themes would seem to be synonymous. Perhaps the reason
Euthymic drops in frequency while Good space increases, is related to the proposed
phenomenon of scrutiny by report writers. It was suggested that report writers might
be observing in-patients more closely during their early stay than at later times. If
there were a general improvement over time while at the same time a decrease in
scrutiny of individual in-patients, then perhaps report writers were giving fewer
nuanced descriptions of individuals’ statuses and more frequently using the generic
term Good space instead. We know from looking at the overall frequencies that Good
space is being used more and more in the reports the longer an individual is in
treatment. We also know that this is a function of an individual’s stay as opposed to a
function of time per se (e.g. a drift in the report writing style), as each participant was
sampled over a seven-week period, but the data were collected from the reports of
different participants over a period of seven months. Assuming that Good space is in
fact merely another example of Euthymic then it might be interesting to combine the
frequencies of the two themes. The combined frequencies yield 171 in Week 1, 172 in
Week 4, 185 in Week 6 and 199 in Week 8. It would seem that the combined
Euthymic/Good space theme remains stable at Weeks 1 and 4, and then increases

49
slightly at Week 6 and again at Week 8. This demonstrates an increase in positive
mental status descriptors captured by the combined Euthymic/Good space theme of
16.4% between Weeks 1 and 8.
It has been suggested that Motivated and Engaged might be related via the proposed
factor of enthusiasm, which in turn could have been a function of new arrival.
Motivated has dropped very notably by Week 4 from 72 to 19, and is no longer one of
the most frequent themes. Engaged has also dropped quite substantially from 167 to
54. Although it is still amongst the most frequently recorded themes, it has dropped
from being the most frequent theme at Week 1 to the least frequent of the top four.
This mutual drop in frequency of the Motivated and Engaged themes might support
the proposed relationship between the two, and indicate that initial enthusiasm on the
part of participants declines in a notable way by Week 4 of treatment. As mentioned
in the previous section, enthusiasm might have been tempered by the difficulties and
challenges presented by the secondary stage treatment programme. Further, by Week
4, any ‘novelty factor’ might have worn off.
Under the Negative categories, Anger (40) is now the most common theme while
Anxiety (10) has dropped since Week 1. The high frequency of the Anxiety theme at
Week 1 has been tentatively explained as being a function of new arrival, amplified
like all themes by scrutiny and/or visibility. Accordingly, the drop in Anxiety at Week
4 might be expected. The increase in Anger at Week 4 could possibly, in part, be
related to the proposed phenomenon of in-patients being on their best behavior in
Week 1; patients might be less likely to express anger when trying to behave
themselves. It was also proposed that those who are going to struggle might take time
to feel distressed and therefore express emotions like anger. By Week 4, challenging
programme content may be taking its toll, provoking and eliciting anger amongst
some inpatients. Another factor could again have to do with visibility and scrutiny. It
seems likely that individuals expressing anger would be more likely to be visible to
report writers and, once anger is noted in a patient, they might be more likely to be
scrutinized.
Tired (26) and Withdrawn (19) are still common but not as frequent as they were in
Week 1. It was suggested that Tired, Withdrawn and Quiet could be related and that

50
being tired might underlie Withdrawn and Quiet. Note that, like Tired and Withdrawn,
Quiet has also dropped at Week 4 (from 47 to 22). The decrease in the recorded
frequency of the Tired theme might involve sleep hygiene. Since starting primary
stage treatment, inpatients have had a daily structure that includes mandatory lights
out at 11pm and morning waking at 7am. This may facilitate the gradual rectification
of disruptions to sleep patterns or circadian rhythms. Further, anxiety might impact
negatively on the quality of sleep and, as noted, anxiety, if measured by the Anxiety
theme, has dropped notably at Week 4.
4.3.3 Week 6 At Week 6, Good space (115), Euthymic (70), Engaged (68) and At ease (65) are
again the most frequently recorded themes, with Good space and Engaged having
both increased notably since Week 4. The increase in the frequency of Good space
might be related to the previously proposed mechanism in which report writers are
using Good space generically to refer to descriptors that would otherwise have been
captured under the Euthymic theme. We do see a drop in Euthymic from 84 to 70
between Weeks 4 and 6. By combining Good space and Euthymic, as mentioned, we
see a small increase from 172 in Week 4 to 185 in Week 6, possibly an indication that
euthymic mood states are generally increasing or in any event are not decreasing.
At Week 6 there is also a notable increase in the Engaged theme. The Engaged theme
to a large degree comprises descriptors that relate to involvement with the therapeutic
programme work (groups, lectures and therapeutic activities) including a considerable
amount of ‘homework’ to be done outside of programme time. It could be that along
with increased engagement compared with Week 4, participants are also more
reflective and thoughtful, which may present as being quieter but not necessarily more
withdrawn. This idea may be supported by the 66% increase in the frequency of
Pensive from Week 4 to Week 6.
With regard to Negative themes, although Tired has remained quite stable between
Weeks 4 and 6, Withdrawn has dropped by 58%. The decrease in Withdrawn may be
associated with the increase in reported frequency of Engaged, suggesting a possible
shift amongst participants in their overall level of active engagement with the
programme at Week 6. The 32% increase in Quiet over the same time period would

51
seem to challenge an assumption that this theme could be related to Tired and/or
Withdrawn. Quiet may refer to observations of quiet reflectiveness instead of more
active withdrawal, and its increase at Week 6 may possibly reflect an increase in
reflective processing amongst participants at this stage of treatment. The frequency of
Social drops slightly from 29 to 22 between Weeks 4 and 6, which might be related to
both the increase in the Quiet theme, and the increase in the Engaged theme, as time
spend engaging in programme material is arguably time not spent socialising.
Anger has dropped by 20% from 40 in Week 4 to 32 at Week 6. It was earlier
suggested that after some time in secondary care treatment (by four weeks) some
participants might have reached a point where they have come to feel distressed in the
context of the rules and structure of the treatment environment and that the increase in
the frequency of the Anger theme might reflect this. Similarly, the decrease in Anger
by Week 6 could reflect acclimatisation to rules and structure. The drop in Anger
could also be related to the increase in the combined Euthymic/Good space frequency,
the increase in the Engaged frequency, and the steady decrease in the Tired theme
frequency. However, Anger remains the most frequently reported Negative theme at
Week 6 (as it was at Week 4), suggesting that expressions of anger are still common
amongst patients at this stage of treatment relative to other Negative affects such as
anxiety and vulnerability. The prominence of Anger, however, could once again be a
function of visibility as mentioned, as expressions of anger might be conspicuous and
elicit the attention of report writers and therefore be more likely to be reported than
other themes.
At Week 6, the Depressed mood theme not only becomes prominent, but is at its
highest recorded frequency over the four weeks sampled. It has increased by 50%
since Week 1. If Depressed mood were a measure of clinical depression, one might
expect to find increased frequencies of Tired, Sleep disturbance and possibly
Withdrawn, yet all these themes have dropped in frequency. Negative thinking has
increased very slightly from 2 to 4 between Weeks 4 and 6, which could be related to
Depressed mood, and Anxiety, also known to be correlated with depression, has
increased by 60% between Weeks 4 and 6. It seems plausible that patients seen to be
anxious by report writers could also be perceived to have depressed mood. Possibly
related to appraisals of depressed mood is the fact that the Quiet theme has increased
52
in frequency by 32% since Week 4. Perhaps the mutual increase in Anxiety and Quiet
are related to increased interpretations of Depressed mood.
4.3.4 Week 8 At Week 8, generally the final week of treatment, the most frequently recorded
themes are Good space (119), Euthymic (80), and Engaged (69). The combined
frequency of the Euthymic/Good space themes at Week 8 is 199. This combined
frequency has increased steadily since Week 1, possibly indicating, as suggested, a
general improvement over time. It has been suggested that as time progresses,
psychopharmacological treatments have more time to take effect and the possible
benefits of abstinence have time to accumulate. These factors may contribute to the
steady increase in the Euthymic/Good space combined themes over the four weeks
sampled. This apparent improvement might also be an indication that treatment
(including counselling, group therapy, life skills etc) is working at least to the degree
that it may be contributing to the clients’ overall sense of well-being. Positive mood
states may also be related to the prospect of discharge.
At the same time, at Week 8, although much lower than in Week 1, the Anxiety theme
has increased in frequency since Week 4 by 130%. A number of references to anxiety
in the reports at Week 8 are related to the approach of discharge. As mentioned,
although treatment is in many ways challenging, being an inpatient also cocoons one
from the stresses of normal life. Work, finances, relationship difficulties, legal
challenges etc are, in a sense, temporarily suspended. The artificial environment
created by the treatment facility may come to feel not only familiar, but safe and
supportive as well. The prospect of leaving can provoke not only anxiety, but fear. It
seems possible that the increase in the frequency of the Anxiety theme towards the end
of treatment, like the positive mood states mentioned above, might also be related to
imminent departure.
The Anger theme, at a recorded frequency of 21 at Week 8, is half of what is was at
Week 4 and has dropped by 34% since Week 6. This would seem to be a notable
improvement, perhaps, as discussed, a function of acclimatisation, the general
increase in the Euthymic/Good space themes and the gradual decrease in the Tired
theme. It still, however, remains a common theme at this time-point. However, as

53
mentioned, Anger and the expression thereof, might be intrinsically more visible and
inviting of scrutiny than many of the other themes that have arisen.
Depressed mood at Week 8 is still one of the more frequent themes in the Negative
category, but far less common than reports of euthymic mood. This may indicate that
a subgroup of patients display depressed affect fairly steadily throughout treatment,
though this would require further investigation.
The Tired theme, although still prominent, has maintained a steady decline, reaching a
frequency of 19 by Week 8. This seems to support the idea of sleep hygiene having a
positive affect on quality of sleep over time. It has also been suggested that drug use
might have impacted on circadian rhythms, and perhaps the duration of abstinence has
also had a positive effect. Again, the relatively high frequency of Anxiety does not
seem to have had any notable impact on the frequency of the Tired theme. Sleep
disturbance is at its lowest frequency at this time-point and has shown a consistent
correlation with the Tired theme, which would seem to make intuitive sense. The fact
that Tired, although diminished, remains prominent, might simply be a function of the
fact that the treatment programme keeps the in-patients busy and for them to be tired
might well be expected and appropriate.
In the following section, the comparison between the Axis II and non-Axis II
subgroups will be described and discussed.
4.4 Comparison between Axis II and non-Axis II subgroups The percentage of participants in each subgroup (Axis II and non-Axis II) who were
reported to present with each theme was compared across the four time-points (see
Tables 4.4 & 4.5). For each category, differences across the two subgroups are
reported first, followed by similarities. First, the positively valenced themes are
compared.
The number of non-Axis II participants who were reported to be At Ease, Engaged,
Euthymic, in a Good Space, Optimistic and Pro-social remained quite consistent
across time periods, with no fluctuations of greater than 10% between each time-
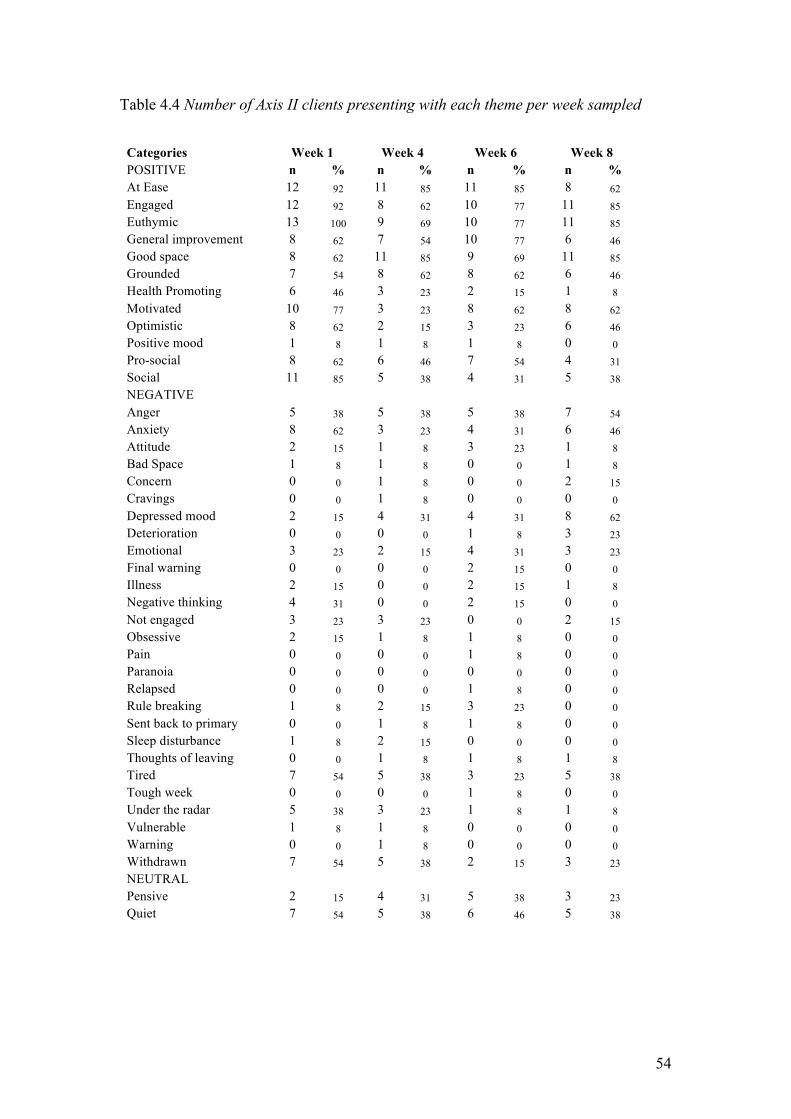
54
Table 4.4 Number of Axis II clients presenting with each theme per week sampled
Categories Week 1 Week 4 Week 6 Week 8 POSITIVE n % n % n % n % At Ease 12 92 11 85 11 85 8 62 Engaged 12 92 8 62 10 77 11 85 Euthymic 13 100 9 69 10 77 11 85 General improvement 8 62 7 54 10 77 6 46 Good space 8 62 11 85 9 69 11 85 Grounded 7 54 8 62 8 62 6 46 Health Promoting 6 46 3 23 2 15 1 8 Motivated 10 77 3 23 8 62 8 62 Optimistic 8 62 2 15 3 23 6 46 Positive mood 1 8 1 8 1 8 0 0 Pro-social 8 62 6 46 7 54 4 31 Social 11 85 5 38 4 31 5 38 NEGATIVE Anger 5 38 5 38 5 38 7 54 Anxiety 8 62 3 23 4 31 6 46 Attitude 2 15 1 8 3 23 1 8 Bad Space 1 8 1 8 0 0 1 8 Concern 0 0 1 8 0 0 2 15 Cravings 0 0 1 8 0 0 0 0 Depressed mood 2 15 4 31 4 31 8 62 Deterioration 0 0 0 0 1 8 3 23 Emotional 3 23 2 15 4 31 3 23 Final warning 0 0 0 0 2 15 0 0 Illness 2 15 0 0 2 15 1 8 Negative thinking 4 31 0 0 2 15 0 0 Not engaged 3 23 3 23 0 0 2 15 Obsessive 2 15 1 8 1 8 0 0 Pain 0 0 0 0 1 8 0 0 Paranoia 0 0 0 0 0 0 0 0 Relapsed 0 0 0 0 1 8 0 0 Rule breaking 1 8 2 15 3 23 0 0 Sent back to primary 0 0 1 8 1 8 0 0 Sleep disturbance 1 8 2 15 0 0 0 0 Thoughts of leaving 0 0 1 8 1 8 1 8 Tired 7 54 5 38 3 23 5 38 Tough week 0 0 0 0 1 8 0 0 Under the radar 5 38 3 23 1 8 1 8 Vulnerable 1 8 1 8 0 0 0 0 Warning 0 0 1 8 0 0 0 0 Withdrawn 7 54 5 38 2 15 3 23 NEUTRAL Pensive 2 15 4 31 5 38 3 23 Quiet 7 54 5 38 6 46 5 38
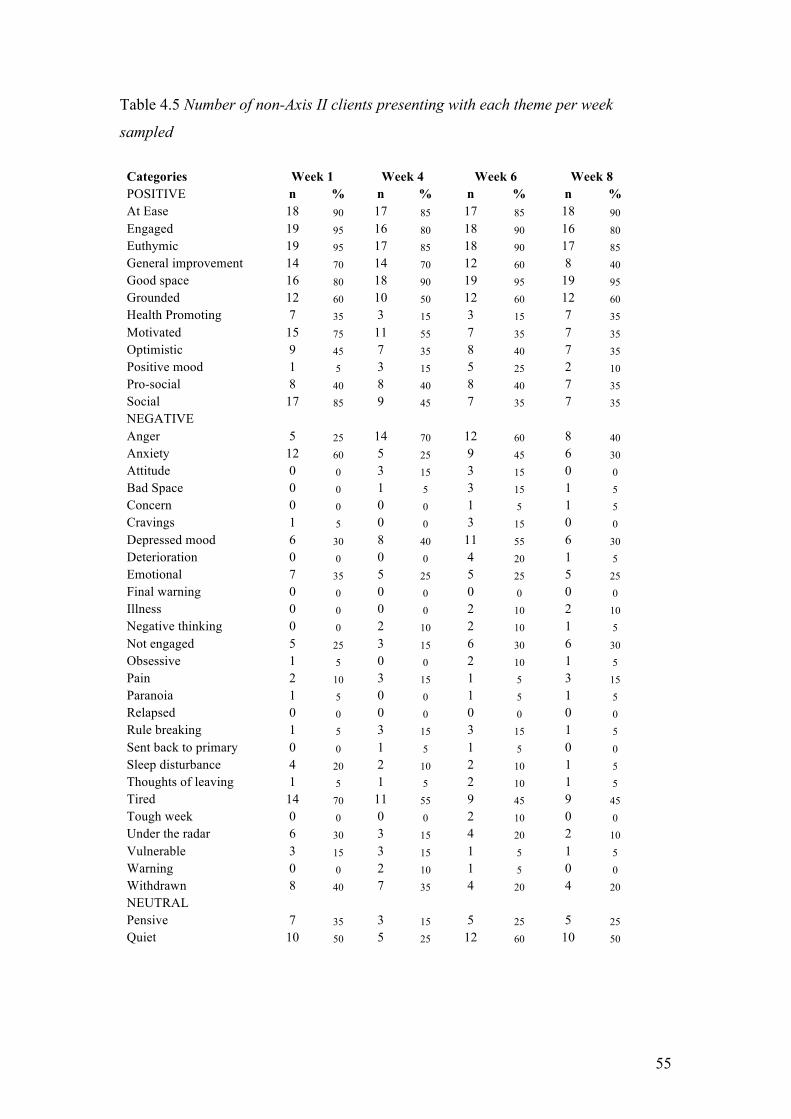
55
Table 4.5 Number of non-Axis II clients presenting with each theme per week
sampled
Categories Week 1 Week 4 Week 6 Week 8 POSITIVE n % n % n % n % At Ease 18 90 17 85 17 85 18 90 Engaged 19 95 16 80 18 90 16 80 Euthymic 19 95 17 85 18 90 17 85 General improvement 14 70 14 70 12 60 8 40 Good space 16 80 18 90 19 95 19 95 Grounded 12 60 10 50 12 60 12 60 Health Promoting 7 35 3 15 3 15 7 35 Motivated 15 75 11 55 7 35 7 35 Optimistic 9 45 7 35 8 40 7 35 Positive mood 1 5 3 15 5 25 2 10 Pro-social 8 40 8 40 8 40 7 35 Social 17 85 9 45 7 35 7 35 NEGATIVE Anger 5 25 14 70 12 60 8 40 Anxiety 12 60 5 25 9 45 6 30 Attitude 0 0 3 15 3 15 0 0 Bad Space 0 0 1 5 3 15 1 5 Concern 0 0 0 0 1 5 1 5 Cravings 1 5 0 0 3 15 0 0 Depressed mood 6 30 8 40 11 55 6 30 Deterioration 0 0 0 0 4 20 1 5 Emotional 7 35 5 25 5 25 5 25 Final warning 0 0 0 0 0 0 0 0 Illness 0 0 0 0 2 10 2 10 Negative thinking 0 0 2 10 2 10 1 5 Not engaged 5 25 3 15 6 30 6 30 Obsessive 1 5 0 0 2 10 1 5 Pain 2 10 3 15 1 5 3 15 Paranoia 1 5 0 0 1 5 1 5 Relapsed 0 0 0 0 0 0 0 0 Rule breaking 1 5 3 15 3 15 1 5 Sent back to primary 0 0 1 5 1 5 0 0 Sleep disturbance 4 20 2 10 2 10 1 5 Thoughts of leaving 1 5 1 5 2 10 1 5 Tired 14 70 11 55 9 45 9 45 Tough week 0 0 0 0 2 10 0 0 Under the radar 6 30 3 15 4 20 2 10 Vulnerable 3 15 3 15 1 5 1 5 Warning 0 0 2 10 1 5 0 0 Withdrawn 8 40 7 35 4 20 4 20 NEUTRAL Pensive 7 35 3 15 5 25 5 25 Quiet 10 50 5 25 12 60 10 50
56
point. By contrast, there was greater fluctuation across time-points for each of these
themes in the Axis II subgroup.
For example, At ease drops from 85% to 62% between Weeks 6 and 8, and Optimistic
drops from 62% to 15% between Weeks 1 and 4. These differences may possibly
indicate more variability in positive mood states in this subgroup at different points in
treatment. Reports of General Improvement also fluctuate over time for the Axis II
group but remain fairly consistent across time for the non-Axis II group, although in
Week 8 as discharge approaches the non-Axis II group has a 20% drop in reports of
General Improvement.
Reports of being Motivated decline fairly steadily for the non-Axis II group between
Weeks 1, 4 and 6, before stabilizing as discharge approaches; while reports of being
Motivated fluctuate more for the Axis II group, dropping sharply from 77% at Week 1
to 23% at Week 4, before rising again to 62% at Weeks 6 and 8. Once again, we seem
to be seeing more variability in the Axis II subgroup. Although there is change over
time for both groups, the non-Axis II group seems to show a more steady change with
less dramatic shifts between weeks. It is noted that in Weeks 6 and 8, while both
subgroups are stable, the Axis II group is considerably more motivated than the non-
Axis II subgroup. A link has been suggested between Motivated and Engaged and in
the Axis II subgroup these themes do show similar fluctuations, whereas in the non-
Axis II subgroup they are both more stable.
In contrast to the greater fluctuations reported for the Axis II group in the above
themes, reports of Health Promoting behaviors drop steadily over the course of
treatment for the Axis II subgroup, while for the non-Axis II group they drop off in
the middle of treatment (at Weeks 4 and 6) but then increase again at Week 8 to reach
the same level that they were at when treatment began. This might suggest that the
non-Axis II group found health promoting behaviors more rewarding or beneficial
than did the Axis II group, although both subgroups may have initially tried such
behaviors as may have been suggested or prescribed. Perhaps the dip in the utilization
of these behaviors by the non-Axis II subgroup reflects engagement in or distraction
by others activities, or the perceived lack of need to use these behaviors in Weeks 4
57
and 6. If the Axis II subgroup had been less rewarded by health promoting behaviors,
then this might explain the consistent drop-off over the duration of treatment.
With regard to similarities between the two subgroups, reports of Positive Mood are
low for both subgroups across all time-points, compared with the other positively
valenced categories. Although it is not immediately clear how reports of Positive
Mood might be conveying something different to Euthymic, Good Space and
Optimistic, this different pattern suggests that Positive Mood reports in the case files
may be tapping something different to these other themes. The Positive mood theme
comprises behaviors like laughter that imply positive moods. It may be that report
writers are more likely to interpret the behavior and record the interpretation e.g.
‘Good space’ than to record the specific behavior. It is also noted, however, that there
is more variability in the Positive mood theme for the non-Axis II subgroup, another
exception to the generally more variable tendencies in the Axis II subgroup. Reports
of being Grounded are consistent in both groups across time (again, suggesting that
this theme may be conveying something different to themes like At Ease or
Euthymic). Reports of being Social are highest for both groups in Week 1 and then
drop off for both groups for the remainder of treatment. This is consistent with what
was generally observed for the theme frequencies at each time-point.
In general then, the findings indicate a greater degree of fluctuation in case reports of
many (though not all) positively valenced mental states and behaviors amongst the
Axis II subgroup when compared with the Axis I subgroup.
Looking at the negatively valenced themes, the Emotional, Negative thinking, Not
engaged and Rule Breaking themes show generally more stability over time for the
non-Axis II subgroup than they do for the Axis II subgroup, similar to the general
pattern in the positive category. For example, the Emotional theme drops from 35% at
Week 1 for the Non-Axis II group to 25% at Week 4 where it remains for the duration
of the treatment period. For the Axis II subgroup, Emotional drops from 23% at Week
1 to 15% at Week 4, then rises by 16% to 31% at Week 6, dropping again at Week 8
to 23%. Rule breaking for the non-Axis II subgroup starts at 5% at Week 1, rises to
15% where it stays for Weeks 4 and 6, and then drops again to 5% at Week 8. For the
Axis II group, it starts at 8% at Week 1, increases to 15% at Week 4, then again to
58
23% at Week 6, after which it drops quite noticeably to 0% at Week 8. In contrast to
the generally more variable themes in the Axis II subgroup, Anger remains fairly
stable for the Axis II subgroup, staying at 38% for Weeks 1, 4, and 6 and rising to
54% at Week 8. For the non-Axis II subgroup, Anger starts at 25% at Week 1,
increases noticeably to 70% at Week 4 and then drops to 60% and 40% at Weeks 6
and 8 respectively. The relative stability of Anger in the Axis II group may reflect the
fact that at least half the subgroup has been identified as having Cluster B personality
traits and that the expression of anger, being a trait characteristic of this subgroup,
might therefore be expected. Conversely, Anger might be expected to be less
consistent in the alternative subgroup. However, the percentage of individuals
presenting with Anger in the non-Axis II group overall, is notably higher.
A greater percentage of participants in the non-Axis II subgroup presented with both
the Tired theme and the Sleep disturbance theme over the time of treatment than those
of the Axis II subgroup. There are also more non-Axis II participants presenting with
Not engaged over the treatment period than Axis II participants. One could perhaps
argue that tired people are less likely to engage than those who are not tired and the
percentages of both themes do seem to fluctuate similarly for both subgroups. The
Axis II group starts with 54% of participants presenting with Tired and 23% with Not
engaged. Tired then drops to 38% at Week 4 while Not engaged remains at 23%. At
Week 6, Tired drops again to 23% and Not engaged drops to 0%. At Week 8, Tired
increases again to 38% and Not engaged increases to 15%. For the non-Axis II group
we see a similar pattern with Tired moving from 70% to 55% between Weeks 1 and 4,
while Not engaged moves from 25% to 15%. Tired then increases to 45% where it
remains at Week 8, while Not engaged increases to 30% where it remains at Week 8.
One cannot, however, ignore a possible counter logic, which assumes that after a day
of engagement, one might expect to be tired. The numbers, however, do not seem to
reflect this. There seem to be no other obvious patterns that suggest differences
between theses subgroups that might explain this difference. It is possible that the
difference is merely random.
Another area of apparently marked difference between the Axis II and non-Axis II
subgroups lies with the Illness and Pain themes. While one might expect a correlation
between pain and illness, when comparing these themes, we do not see one. There
59
seems to be no relationship between these themes in terms of the number fluctuations
by week. However, nearly twice the percentage of people in the Axis II subgroup
present with Illness over the full treatment period than do those in the non-Axis II
subgroup. Conversely, more than 5 times the percentage of people in the non-Axis II
subgroup present with Pain than those in the Axis II group. Clearly pain here is not a
function of illness, but it is hard to make sense of this contrast. It may simply reflect
random coincidence. If the Axis II subgroup spent more time together, this might
explain higher numbers getting ill, but there are no data regarding this. One might
postulate that the Axis II group is generally more stressed and therefore more
susceptible to illness. They do not however present as noticeably more anxious than
the non-Axis II subgroup. Even stranger is the high presentation of Pain in the non-
Axis II subgroup. Again this could be mere co-incidence, but it may bear further
investigation.
It terms of similarities between the two subgroups, most themes other than those
discussed above seem to present similarly, possibly due to generally smaller numbers
per negatively valenced theme. There are some themes, however, that do stand out.
As already mentioned, there are similar percentages presenting with Anxiety for both
subgroups, with the Axis II and non-Axis II subgroups presenting with 62% and 60%
respectively at Week 1 and then dropping to 23% and 25% respectively at Week 4.
They then deviate from one another somewhat for Weeks 6 and 8 with both
increasing, to 31% and 45% respectively at Week 6, but then at Week 8, the Axis II
subgroup continues to increase in numbers to 46% while the non-Axis II subgroup
drops again to 30%. It has been suggested that Anxiety close to termination is high
due to impending termination. It could be that the Axis II subgroup is more distressed
by the approach of termination as a function of greater rigidity in functioning as
would be expected with an Axis II diagnosis or traits, and that the anticipation of
change provokes more anxiety in this subgroup than the other. It is perhaps not
coincidental that, at 62%, the At ease theme is lowest at this time-point for the Axis II
subgroup than for either subgroup at any other time-point.
The Tough Week and Vulnerable themes show similar fluctuations from week to week
for both subgroups. The Vulnerable theme has the Axis II and non-Axis II subgroups
presenting with 8% and 15% respectively at Weeks 1 and 4. Both subgroups then
60
drop, to 0% and %5 respectively, for Weeks 6 and 8. Similarly, Tough Week has the
Axis II and non-Axis II subgroups both presenting with 0% at Weeks 1 and 4,
presenting with 8% and 10% respectively at Week 6, and thereafter both dropping
again to 0% at Week 8.
The neutral category comprises only two themes, Pensive and Quite, that seem to
present with a similar degree of variability with neither of the two seeming
particularly stable over time. Of the two themes, Quiet presents with the most
variability in the non-Axis II subgroup. The Axis II and non-Axis II subgroups start
similarly at 54% and 50% respectively. The non-Axis II subgroup then drops quite
notably to 25% at Week 4 where the Axis II subgroup only drops to 38%. The non-
Axis II subgroup then increases dramatically to 60% at Week 6 while the Axis II
subgroup increases slightly to 46%. At Week 8, the non-Axis II subgroup has dropped
again to 50% and the Axis II subgroup has returned to 38%. It is noted that apart from
Week 1 to Week 4, the percentages for Quiet and Pensive fluctuate together with an
increase in the one being paralleled by the other for both subgroups. Quiet might
therefore be related to individuals being more reflective and thoughtful. Related to
this it was suggested that the Quiet theme may reflect engagement in programme
material. However, when comparing the Axis II and non-Axis II subgroups, while
there is more variability in the Quiet theme for the non-Axis II group, the opposite is
true for the Engaged theme.
With the positively valenced themes there are a number of quite marked differences in
fluctuation between the two subgroups. Such differences are less clear but
nevertheless present when looking at the negatively valenced themes and the neutral
themes. This smaller difference between subgroups might, as mentioned, be related to
the generally smaller numbers per theme in the negative category and the small
number of themes in the neutral category.
Overall, however, the Axis II group shows more variability over the duration of
treatment. One might conclude that this reflects something about the stability vs.
volatility or lability of the groups relative to each other. It might be expected that the
Axis II subgroup should be less stable and more volatile, labile and reactive than the
non-Axis II subgroup, particularly since at least half of the Axis II subgroup’s

61
members have Cluster B personality traits, consistent with the aforementioned
characteristics. It could perhaps be argued that the relative stability of percentages for
the negative themes as opposed to the positive themes within the Axis II subgroup
indicates that the Axis II subgroup participants are more consistently experiencing or
presenting with negative cognitions, moods and behaviors. Anger, as mentioned,
might provide a good example of this.
The following section will describe and discuss the comparison between the stimulant
and non-stimulant subgroups.
4.5 Comparison between Stimulant and Non-stimulant user subgroups The two Drug of Choice (DOC) groups were categorised as those using stimulants
(for example Cocaine and Crack Cocaine) and those using non-stimulants (for
example Alcohol, Cannabis and Heroin). The groups were of similar sizes, namely 16
stimulant users and 17 non-stimulant users. The percentage of participants in each
subgroup who were reported to present with each theme was compared across the four
time-points (see Tables 4.6 & 4.7). For each category, differences across the two
subgroups are reported first, followed by similarities. First, the positively valenced
themes are compared.
On three of the positively valenced themes, the stimulant group demonstrates
noticeably greater variability or lability than the non-stimulant subgroup. The non-
stimulant subgroup showed remarkable stability for the At ease theme, remaining at
88% at all four time-points. The stimulant subgroup’s presentation of this theme starts
at 94% and then drops to 81% where it stays for Weeks 4 and 6. At Week 8 it drops
again to 69%. Although this does not seem particularly unstable, it does contrast with
the marked stability of the alternative group. Optimistic and Pro-social are relatively
stable over the four time-points in the non-stimulant subgroup. Although Optimistic
drops by 18% between Weeks 1 and 4, this is expected given the overall tendency for
numbers to be high at Week 1. Thereafter, however, Optimistic remains at 35% at all
subsequent time-points. In the stimulant subgroup, Optimistic drops by 31% between
Weeks 1 and 4, then increases by 12% at Week 6 and again by 13% at Week 8. Pro-
social for the non-stimulant subgroup remains at 35% at Weeks 1 and 4 and then
gently increases reaching 41% and 47% at Weeks 6 and 8 respectively.
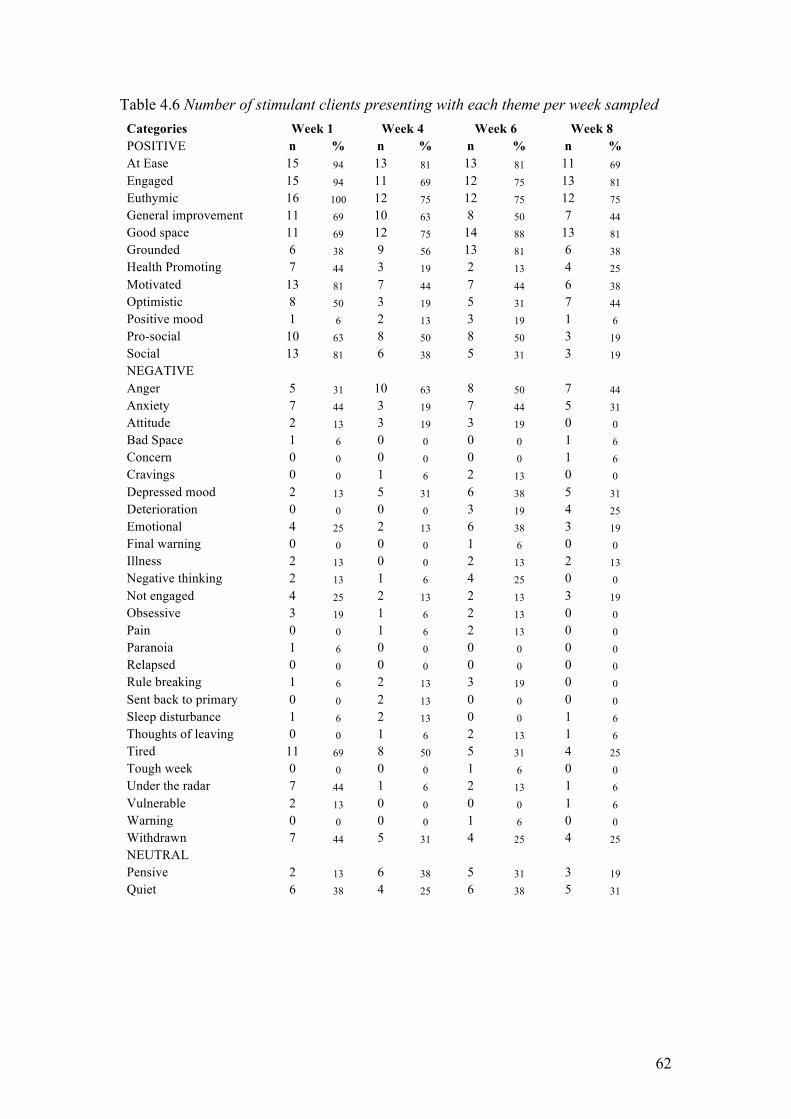
62
Table 4.6 Number of stimulant clients presenting with each theme per week sampled
Categories Week 1 Week 4 Week 6 Week 8 POSITIVE n % n % n % n % At Ease 15 94 13 81 13 81 11 69 Engaged 15 94 11 69 12 75 13 81 Euthymic 16 100 12 75 12 75 12 75 General improvement 11 69 10 63 8 50 7 44 Good space 11 69 12 75 14 88 13 81 Grounded 6 38 9 56 13 81 6 38 Health Promoting 7 44 3 19 2 13 4 25 Motivated 13 81 7 44 7 44 6 38 Optimistic 8 50 3 19 5 31 7 44 Positive mood 1 6 2 13 3 19 1 6 Pro-social 10 63 8 50 8 50 3 19 Social 13 81 6 38 5 31 3 19 NEGATIVE Anger 5 31 10 63 8 50 7 44 Anxiety 7 44 3 19 7 44 5 31 Attitude 2 13 3 19 3 19 0 0 Bad Space 1 6 0 0 0 0 1 6 Concern 0 0 0 0 0 0 1 6 Cravings 0 0 1 6 2 13 0 0 Depressed mood 2 13 5 31 6 38 5 31 Deterioration 0 0 0 0 3 19 4 25 Emotional 4 25 2 13 6 38 3 19 Final warning 0 0 0 0 1 6 0 0 Illness 2 13 0 0 2 13 2 13 Negative thinking 2 13 1 6 4 25 0 0 Not engaged 4 25 2 13 2 13 3 19 Obsessive 3 19 1 6 2 13 0 0 Pain 0 0 1 6 2 13 0 0 Paranoia 1 6 0 0 0 0 0 0 Relapsed 0 0 0 0 0 0 0 0 Rule breaking 1 6 2 13 3 19 0 0 Sent back to primary 0 0 2 13 0 0 0 0 Sleep disturbance 1 6 2 13 0 0 1 6 Thoughts of leaving 0 0 1 6 2 13 1 6 Tired 11 69 8 50 5 31 4 25 Tough week 0 0 0 0 1 6 0 0 Under the radar 7 44 1 6 2 13 1 6 Vulnerable 2 13 0 0 0 0 1 6 Warning 0 0 0 0 1 6 0 0 Withdrawn 7 44 5 31 4 25 4 25 NEUTRAL Pensive 2 13 6 38 5 31 3 19 Quiet 6 38 4 25 6 38 5 31

63
Table 4.7 Number of non-stimulant clients presenting with each theme per week sampled
Categories Week 1 Week 4 Week 6 Week 8 POSITIVE n % n % n % n % At Ease 15 88 15 88 15 88 15 88 Engaged 16 94 13 76 16 94 14 82 Euthymic 16 94 14 82 16 94 16 94 General improvement 11 65 11 65 14 82 7 41 Good space 13 76 17 100 14 82 17 100 Grounded 13 76 9 53 7 41 12 71 Health Promoting 6 35 3 18 3 18 4 24 Motivated 12 71 7 41 8 47 9 53 Optimistic 9 53 6 35 6 35 6 35 Positive mood 1 6 2 12 3 18 1 6 Pro-social 6 35 6 35 7 41 8 47 Social 15 88 8 47 6 35 9 53 NEGATIVE Anger 5 29 9 53 9 53 8 47 Anxiety 13 76 5 29 6 35 7 41 Attitude 0 0 1 6 3 18 1 6 Bad Space 0 0 2 12 3 18 1 6 Concern 0 0 1 6 1 6 2 12 Cravings 1 6 0 0 1 6 0 0 Depressed mood 6 35 7 41 9 53 9 53 Deterioration 0 0 0 0 2 12 0 0 Emotional 6 35 5 29 3 18 5 29 Final warning 0 0 0 0 1 6 0 0 Illness 0 0 0 0 2 12 1 6 Negative thinking 2 12 1 6 0 0 1 6 Not engaged 4 24 4 24 4 24 5 29 Obsessive 0 0 0 0 1 6 1 6 Pain 2 12 2 12 0 0 3 18 Paranoia 0 0 0 0 1 6 1 6 Relapsed 0 0 0 0 1 6 0 0 Rule breaking 1 6 3 18 3 18 1 6 Sent back to primary 0 0 0 0 2 12 0 0 Sleep disturbance 4 24 2 12 2 12 0 0 Thoughts of leaving 1 6 1 6 1 6 1 6 Tired 10 59 8 47 7 41 10 59 Tough week 0 0 0 0 2 12 0 0 Under the radar 4 24 5 29 3 18 2 12 Vulnerable 2 12 4 24 1 6 0 0 Warning 0 0 3 18 0 0 0 0 Withdrawn 8 47 7 41 2 12 3 18 NEUTRAL Pensive 7 41 1 6 5 29 5 29 Quiet 11 65 6 35 12 71 10 59
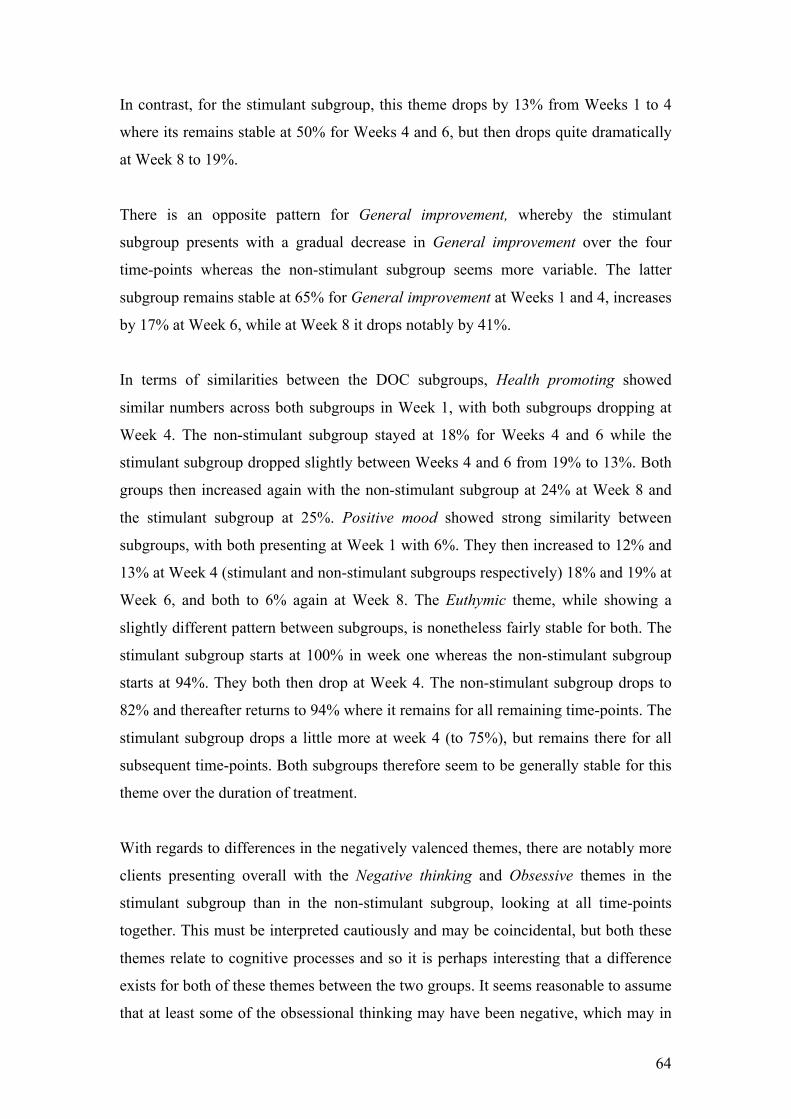
64
In contrast, for the stimulant subgroup, this theme drops by 13% from Weeks 1 to 4
where its remains stable at 50% for Weeks 4 and 6, but then drops quite dramatically
at Week 8 to 19%.
There is an opposite pattern for General improvement, whereby the stimulant
subgroup presents with a gradual decrease in General improvement over the four
time-points whereas the non-stimulant subgroup seems more variable. The latter
subgroup remains stable at 65% for General improvement at Weeks 1 and 4, increases
by 17% at Week 6, while at Week 8 it drops notably by 41%.
In terms of similarities between the DOC subgroups, Health promoting showed
similar numbers across both subgroups in Week 1, with both subgroups dropping at
Week 4. The non-stimulant subgroup stayed at 18% for Weeks 4 and 6 while the
stimulant subgroup dropped slightly between Weeks 4 and 6 from 19% to 13%. Both
groups then increased again with the non-stimulant subgroup at 24% at Week 8 and
the stimulant subgroup at 25%. Positive mood showed strong similarity between
subgroups, with both presenting at Week 1 with 6%. They then increased to 12% and
13% at Week 4 (stimulant and non-stimulant subgroups respectively) 18% and 19% at
Week 6, and both to 6% again at Week 8. The Euthymic theme, while showing a
slightly different pattern between subgroups, is nonetheless fairly stable for both. The
stimulant subgroup starts at 100% in week one whereas the non-stimulant subgroup
starts at 94%. They both then drop at Week 4. The non-stimulant subgroup drops to
82% and thereafter returns to 94% where it remains for all remaining time-points. The
stimulant subgroup drops a little more at week 4 (to 75%), but remains there for all
subsequent time-points. Both subgroups therefore seem to be generally stable for this
theme over the duration of treatment.
With regards to differences in the negatively valenced themes, there are notably more
clients presenting overall with the Negative thinking and Obsessive themes in the
stimulant subgroup than in the non-stimulant subgroup, looking at all time-points
together. This must be interpreted cautiously and may be coincidental, but both these
themes relate to cognitive processes and so it is perhaps interesting that a difference
exists for both of these themes between the two groups. It seems reasonable to assume
that at least some of the obsessional thinking may have been negative, which may in

65
part explain the similarity. It can be noted that Paranoia, also a cognitive construct, is
more prevalent in the non-stimulant group, although very weakly presented overall.
Further, Pensive, which is both cognitive and more prevalent, shows no notable
difference in presentation between the two groups. It may be that Paranoia is more a
trait characteristic, quite specific and bound to one or two individuals, and therefore
infrequently recorded. Negative thinking, on the other hand is a more generic theme
comprising various instances of similar observations and so perhaps more frequently
recorded. Pensive, a neutral theme referring to individuals seemingly engaged in
thought might be expected to be relatively evenly distributed.
In the negatively valenced themes, the Thoughts of leaving theme was very stable for
the non-stimulant subgroup, remaining at 6% at all time-points, while for the
stimulant subgroup it started at 0% at Week 1, climbed to 6% at Week 4, then again to
13% at week 6, dropping again to 6% at Week 8. Under the radar starts noticeably
higher in the stimulant subgroup at 44% vs. 24% for the non-stimulant subgroup. It
then drops dramatically at Week 4 to only 6%. At the same time, for the non-
stimulant subgroup, this theme has increased very slightly by 5%. At Week 6, the
stimulant subgroup increases to 13% while the non-stimulant subgroup drops notably
to 18%. Both subgroups then drop by 6% to 6% and 12% respectively. It seems that
one could think of both of these themes as avoidant. Thoughts of leaving would
appear to involve cognitive engagement with fantasizing about or even planning to
leave treatment. Under the radar refers more to behaviors around actively avoiding
being seen or engaged by others, particularly staff. Perhaps the greater variability in
the stimulant subgroup could reflect that, although both subgroups engage in avoidant
behaviors, for the stimulant subgroup, these behaviors are more reactive or contingent
upon internal and external cues.
With respect to similarities across subgroups in the negatively valenced themes,
Anger was reported in Week 1 at 31% and 29% for the stimulant and non-stimulant
subgroups respectively. At Week 4, the stimulant subgroup increased to 63% while
the non-stimulant subgroup increased to 53%. Week 6 saw similar numbers with the
stimulant subgroup having dropped to 50% while the non-stimulant subgroup
remained at 53%. At Week 8, both subgroups dropped slightly again to 44% and 47%
for the stimulant and non-stimulant subgroups respectively. The Final warning theme
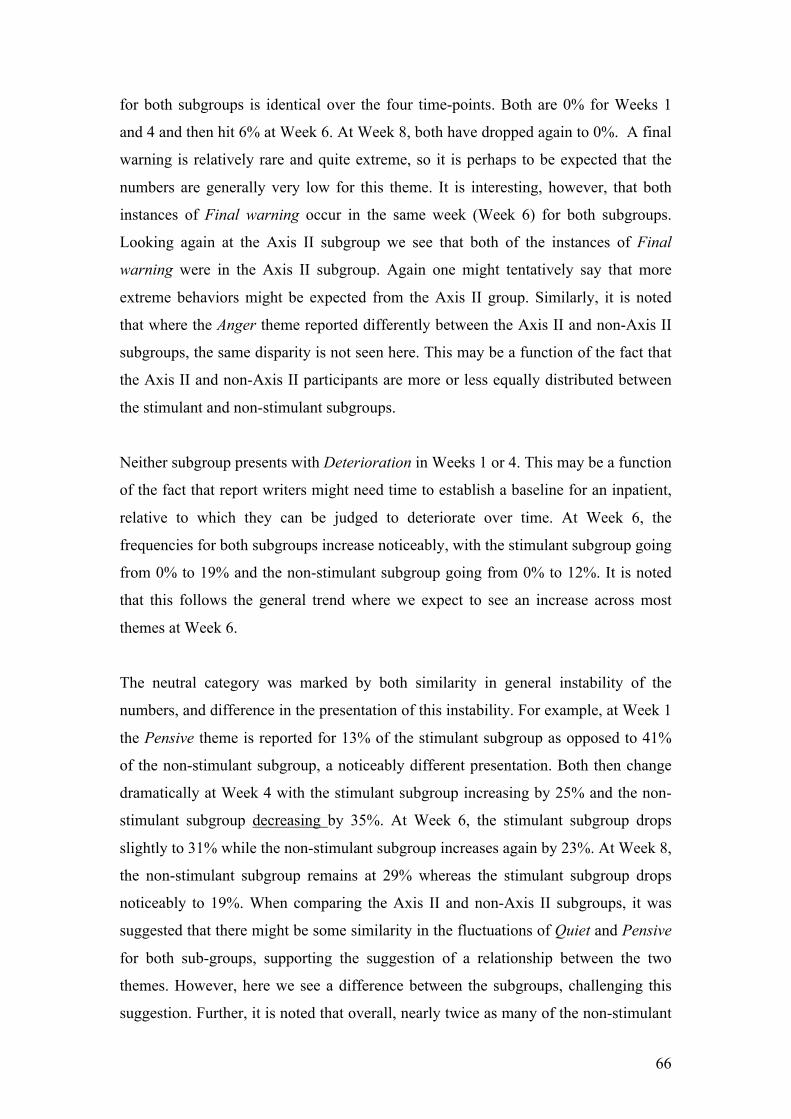
66
for both subgroups is identical over the four time-points. Both are 0% for Weeks 1
and 4 and then hit 6% at Week 6. At Week 8, both have dropped again to 0%. A final
warning is relatively rare and quite extreme, so it is perhaps to be expected that the
numbers are generally very low for this theme. It is interesting, however, that both
instances of Final warning occur in the same week (Week 6) for both subgroups.
Looking again at the Axis II subgroup we see that both of the instances of Final
warning were in the Axis II subgroup. Again one might tentatively say that more
extreme behaviors might be expected from the Axis II group. Similarly, it is noted
that where the Anger theme reported differently between the Axis II and non-Axis II
subgroups, the same disparity is not seen here. This may be a function of the fact that
the Axis II and non-Axis II participants are more or less equally distributed between
the stimulant and non-stimulant subgroups.
Neither subgroup presents with Deterioration in Weeks 1 or 4. This may be a function
of the fact that report writers might need time to establish a baseline for an inpatient,
relative to which they can be judged to deteriorate over time. At Week 6, the
frequencies for both subgroups increase noticeably, with the stimulant subgroup going
from 0% to 19% and the non-stimulant subgroup going from 0% to 12%. It is noted
that this follows the general trend where we expect to see an increase across most
themes at Week 6.
The neutral category was marked by both similarity in general instability of the
numbers, and difference in the presentation of this instability. For example, at Week 1
the Pensive theme is reported for 13% of the stimulant subgroup as opposed to 41%
of the non-stimulant subgroup, a noticeably different presentation. Both then change
dramatically at Week 4 with the stimulant subgroup increasing by 25% and the non-
stimulant subgroup decreasing by 35%. At Week 6, the stimulant subgroup drops
slightly to 31% while the non-stimulant subgroup increases again by 23%. At Week 8,
the non-stimulant subgroup remains at 29% whereas the stimulant subgroup drops
noticeably to 19%. When comparing the Axis II and non-Axis II subgroups, it was
suggested that there might be some similarity in the fluctuations of Quiet and Pensive
for both sub-groups, supporting the suggestion of a relationship between the two
themes. However, here we see a difference between the subgroups, challenging this
suggestion. Further, it is noted that overall, nearly twice as many of the non-stimulant
67
subgroup are reported as Quiet, whereas similar numbers are reported as Pensive
between both subgroups.
Comparing the two DOC subgroups, one sees a similar difference in variability in the
positive categories to what was seen between the Axis II and non-Axis II subgroups,
with the stimulant group showing more variability. Like the Axis II and non-Axis II
subgroups, there is far less difference in variability between the Negative categories
for the stimulant vs. non-stimulant subgroups, in fact even less so. Further, when
comparing the Axis II and non-Axis II subgroups it was noted that, although it might
have been expected that the Illness and Pain themes would be correlated, the opposite
was found. Here, once again, the same pattern is seen. The stimulant subgroup has
twice as many participants presenting with Illness over the sampled weeks than the
non-stimulant subgroup, while the non-stimulant subgroup has twice as many
participants presenting with Pain than the stimulant subgroup. Again an apparent
similarity is seen between the Axis II and stimulant subgroups and the non-Axis II
and non-stimulant subgroups, in spite of the overall sample being evenly represented
between subgroups, which raises the question: Are there common factors or is this
coincidental?
4.6 Chapter Summary In this chapter, the process of extracting and categorising themes from the data was
described followed by an analysis of the overall trends in the frequencies of these
categories across all time-points. The most prominent individual themes at each time-
point were then discussed, compared and contrasted. Finally, comparisons were made
between two sets of subgroups, the Axis II and non-Axis II subgroups, and the
stimulant user and non-stimulant user subgroups.
The findings will be summarised and integrated in the next chapter, and limitations
and implications of the study will be considered.

68
CHAPTER FIVE: CONCLUSION
This chapter will summarise the main findings and attempt to integrate them with the
literature where relevant, drawing tentative conclusions where possible. Some
suggestions are made as to where the findings might be relevant to the enhancement
of addiction treatment. First the findings from the analysis of frequencies of themes
and categories across time-points will be discussed, followed by a discussion
regarding the comparison of the Axis II and non-Axis II subgroups, and the stimulant
user and non-stimulant user subgroups. The limitations of the study will then be
examined, and finally, there will be some brief suggestions regarding possibilities for
further study.
5.1 Summary of findings and integration with literature An overall trend is that the highest theme frequencies across the Positive, Negative
and Neutral categories fall in Week 1. It is suggested that this might be related to the
enthusiasm of newcomers and to their possible visibility relative to later time-points.
It is further suggested that newcomers might have been more scrutinized by report
writers and that visibility and scrutiny may, in fact, be important factors in frequency
fluctuations generally.
Another trend is that the positively valenced themes are far more prominent across all
time-points than the negatively valenced and neutral themes, and noticeably so at
Week 1. It is suggested that this might be related to general euthymia as a result of
abstinence from substance use and as a result of pharmacological treatment. It is
proposed that the marked prominence of positively valenced themes in Week 1, over
and above the already mentioned possible factors around Week 1, may be related to
newcomers being on their ‘best behavior’.
Hanna and Ritchie (1995) anticipate a ‘pervasive sense of well-being’ following
second order change, and it may be that the relatively high frequency of positive
themes, both in Week 1 and in general, is a function of changes that have taken place
in primary stage treatment. The fact that the frequencies of positive themes tend to
drop off notably after Week 1 could, in part, be a function of clients having to face
new obstacles and having to work on further change. It is, however, noted that there is
69
a steady increase in the combined Euthymic/Good space theme. It is suggested that
this could be a function of abstinence, the efficacy of medication and the efficacy of
the treatment programme itself. However, it seems possible that it might also reflect a
general increase in a pervasive sense of well-being over time as a function of change;
as more clients experience second order change as a function of time in treatment,
more reports of Euthymic/Good space are made in the client case files. Although the
sum of frequencies in the Positive category is not highest at Week 8, (it is highest at
Week 1 followed by Week 6), it is noted that the negatively valenced themes are at
their lowest at Week 8, which could arguably also reflect a prevalence of a general
sense of well-being at the end of treatment. It may, however, simply indicate that
‘negative subjective states’ are declining, or being recorded less often.
Also associated with second order change, Hanna and Richie (1995) anticipate
‘negative subjective states’, namely fear, confusion, depression and anger. The data
suggests no evidence of a specific period that might reflect a pervasive sense of well-
being prior to which one might expect to see some of these negative subjective states.
Although ‘confusion’ was not reported to the degree where it emerged as, or became
associated with, a theme, ‘anger’ did emerge as a theme. Depression and fear did not
emerge per se, but Depressed mood and Anxiety did.
Anger becomes noticeably prominent at Week 4 and it is suggested that this might be
related to programme content taking its toll. This seems reminiscent of an element of
Lewis and Rook’s (1999) description of the dynamics of Social Control. Lewis and
Rook (1999) suggest that ‘frustration’ could be the outcome of being discouraged
from engaging in health-compromising behaviors. One might, therefore view this
prevalence of Anger as consistent with literature regarding change and supportive of
Lewis and Rooks (1999) assertion, that is, the prevalence of Anger at Week 4 might
be a function of change.
Anxiety, possibly synonymous with fear, is highest at Weeks 1 and 8. It is suggested
that this may be related to admission and discharge dates - that admission might
provoke anxiety for reasons around unfamiliarity with a new setting, and that
discharge might provoke anxiety around re-entering normal life. This interpretation
70
seems to make intuitive sense, but again, given the results of previous research, one
cannot ignore intrapersonal change as a factor in reported observations of Anxiety.
It is proposed that Depressed mood, most prominent at Week 6 is not a function of
clinical depression, on the grounds that expected correlates of depression like Tired,
Withdrawn and Sleep disturbance are not similarly elevated at this time-point. It
seems possible that Depressed mood might again reflect the negative subjective states
associated with second order change. Pos, Greenberg, Goldman and Korman (2003)
see tolerating and reflecting on emotional experience as essential to change. It is
proposed that at Week 6, the data, specifically the frequencies of Engaged, Quiet and
Pensive, suggest an increase in reflective processing by clients at this time-point. It
may be that Engaged, Quiet, Pensive and Depressed mood are all suggestive of,
and/or associated with, second order change as described in the literature.
Tired and Sleep disturbance gradually decease over the duration of treatment, which
may be a function of sleep hygiene, and a relationship between these themes is
suggested. The literature associates sleep disturbances with Protracted Withdrawal
Syndrome, the symptoms of which would be expected to set in at between 4-8 weeks
of abstinence. This would generally equate to Weeks 1 to 4 in the current study.
Further, insomnia is associated with ‘The Wall’, expected to set in at 6-17 weeks. The
numbers in this study suggest that, for a number of clients, both tiredness and
disturbed sleep have set in by the start of secondary stage treatment and improve
steadily from there on. Also associated with Protracted Withdrawal Syndrome, is
anxiety, which, if reflected by the Anxiety theme, is also highest at Week 1. Irritability
is further associated with ‘The Wall’ and may conceivably contribute to the high
frequency of Anger at Week 4, although ‘The Wall’ is associated with stimulant
withdrawal and the data indicate a similarity between the stimulant and non-stimulant
subgroups in the number of clients reported with Anger. Other than this, there is no
clear evidence of the other signs of Protracted Withdrawal Syndrome i.e.
concentration difficulties, cravings, autonomic disturbance or pessimistic thoughts.
Pessimistic thoughts would seemingly be embodied by Negative thinking and could
possibly be related to Thoughts of leaving, but the frequencies of both these themes
are very low. Research has associated ‘good humour’ with abstinent alcoholics
relative to abstinent non-alcoholics, and the Positive mood theme does embody
expressions of humour, but again, the frequencies are consistently low. Finally,

71
Cravings was included in this study as a theme as it seemed an important indicator in
terms of recovery from addiction. However, this theme too is reported with
consistently low frequencies.
It can tentatively be suggested that there is some evidence in the data to support
previous findings outlined in the literature regarding change, and in particular, second
order change. There may also be indications of Protracted Withdrawal Syndrome
and/or ‘The Wall’.
A better understanding of these process dynamics might be useful in enhancing
addiction treatment. For example, if evidence for the negative subjective states
associated with change were strengthened and well defined, then these might be
recognised in the future as possible indicators of client progress, whereas individuals
showing none of these indicators might raise concerns that they are not engaging with
programme material effectively or that they may need assistance or guidance. It may
also be useful if programme staff had a richer understanding of process dynamics: for
example, what they may perceive as negative presentations that might otherwise be
understood as defiance, may be interpreted as possible indications of engagement and
second order change. The results of this study also indicate a possible need for
programme staff to anticipate and address anxiety amongst patients around admission
and discharge. Further research might uncover time specific dynamics that could be
similarly useful. At the very least, a richer understanding of process dynamics might
open up the interpretive repertoire or scope of reflexivity of programme staff.
What follows is a discussion of the findings from the comparison between the Axis II
and non-Axis II subgroups, and between the stimulant user and non-stimulant user
subgroups.
When comparing the Axis II and non-Axis II subgroups, it was seen that there is more
variability or lability in percentage fluctuations in the Axis II subgroup, and that these
are most pronounced for the positively valenced themes. It is suggested that this could
be consistent with the expected characteristics of individuals with Axis II personality
traits, especially those with Cluster B traits, which are strongly represented in the
72
Axis II subgroup in this study. Anger was observed to be more stable in the Axis II
subgroup, which again is possibly consistent with what might be expected.
It is proposed that health promoting behaviors may be more rewarding to the non-
Axis II group, as the number of Axis II participants reported with Health promoting
dropped steadily and noticeably over the duration of treatment. It is asserted in
literature on the Transtheoretical Model that substituting alternatives for problem
behaviors might be indicative of the preparation and action stages of change (Fisher
& Roget, 2009). It is possible that the Health promoting theme may embody elements
of ‘substituting alternatives’, which invites the question as to whether non-Axis II
clients were more likely than Axis II clients to have moved beyond the contemplative
stage.
The Axis II subgroup appears to have been more anxious than the non-Axis II
subgroup at termination. It is proposed that this is possibly a function of greater
rigidity in personality functioning on the part of the Axis II subgroup, and that the
prospect of leaving treatment might have felt more threatening to them.
It is noted that, in these subgroups, Pain and Illness are not related to each other as
might be expected, and that far more Axis II participants were reported with Illness
whereas more non-Axis II participants were reported with Pain. This seemed both
striking and interesting. It may be coincidental, but may also bear further
investigation.
Comparing the stimulant user and non-stimulant user subgroups proved more difficult
in terms of suggesting possible explanatory factors, because while the Axis II
subgroup has a number of known possible implicit characteristics compared to the
non-Axis II subgroup, this is not true of the former subgroups. We can assume
nothing about these subgroups beyond what category of substances they were being
treated for. It is, however, suggested that the stimulant group may be more reactive in
terms of avoidant strategies and that this could be evidenced by noted differences in
the frequency patterns of Thoughts of leaving and Under the radar.
Exploring the stimulant and non-stimulant subgroups, the most striking discovery is
the apparent similarity between the stimulant user and Axis II subgroups, and the non-
73
stimulant user and non-Axis II subgroups. This is seen in the difference in variability
between subgroups, and in the distribution of the Pain and Illness themes.
Interestingly, 7 of 13 Axis II participants and 9 out of 20 non-Axis II participants
were stimulant users, so these similarities are not due to overlap between the two
subgroups, that is to say, the sample is evenly distributed amongst categories. One
tentative conclusion is that, for this sample, Axis II personality traits do not seem to
mediate drugs of choice.
The comparison of subgroups indicates that there may be both differences and
similarities between them. This requires further investigation, but if it were true that
different subgroups had predictable characteristics then this might be useful in terms
of treatment, for example with regard to the use of matching hypotheses. Although
research has indicated no benefit to matching individual characteristics to specific
treatment approaches, it may at least be of benefit if treatment staff were able to pre-
empt pitfalls by anticipating them. For example if stimulant users were more likely to
be avoidant when distressed, treatment staff might know to pay close attention to
these individuals at such times to ensure that they remained engaging with
programme material.
Overall, it would seem that there have been dynamic changes in general client
functioning over the duration of treatment, with certain themes showing marked
changes at times. Anxiety is prevalent at Weeks 1 and 8. Anger is prevalent at Week 4
and Depressed mood is prevalent at Week 6. The Euthymic/Good space theme
steadily increases over time while Tired and Sleep disturbance steadily decrease.
Developing a richer understanding of such dynamics may prove very useful in
developing our understanding of the process of recovery from addiction. Further,
there may be both similarities and differences between subgroups that may shed light
on the use of matching hypotheses in the context of addiction treatment. It would
seem therefore that this study has indicated that further research may well be
warranted and may result in a knowledge base that could enhance the treatment of
substance use disorders and possibly addictions in general.
74
5.2 Limitations There are a number of limitations that must be borne in mind while considering these
findings. It must first be acknowledged that as a case study, this research is context
specific. It is recognized that any findings in the research study pertain to the
treatment facility at which the research was conducted only and, even more
specifically, to the immediate participants. Lincoln and Guba (2002) draw attention to
the limited generalisability of case studies (as cited in VanWynsberghe & Khan,
2007). It cannot be assumed that the study’s findings can be extrapolated to outside
settings or to addicts in treatment elsewhere, in the absence of further research. The
study was motivated by the very real problems faced in this country with regards to
substance use and related issues. However, only 3 of 33 participants at the treatment
centre were South African. Further, given the cost of private addiction treatment, it is
perhaps not surprising that the 3 South Africans in the sample were at best
representative of less than 10% of the county’s population. This further limits the
degree to which extrapolations can be made in the local context. Replicating this
study at local addiction treatment centres with more South African patients would be
very valuable.
Another limitation concerns the reports themselves and the fact that they were written
by a number of different individuals. For example, it is difficult to control for
different styles of reporting or different foci of observation. Related to this, it has
been discussed that visibility and scrutiny are suggested factors that might influence
the frequencies of reported observations.
There were no statistical analyses done on the data set and as such, patterns emerged
as a function of the researcher’s judgment only. There is no way of assessing the
degree to which any perceived patterns reflected or were a function of statistically
significant changes in client functioning. Further, the small sample size made such
interpretations even more difficult. This is easily illustrated by the fact that with small
numbers, relatively minor changes translate into percentages that may subjectively
appear far more significant than they actually are.
75
It has been mentioned that the themes in this study arose as a function of the
researcher’s personal judgement. Due to the implicit subjectivity involved, I had to
attempt at all times to remain mindful of potential bias.
As an employee of the treatment facility at the time of the study I may have been
biased by preconceived ideas and knowledge of the clients, outside of what was
merely reported in the case files. Not only did I spend time interacting with and/or
observing clients, I also participated in formal and informal discourses amongst staff
in which complex co-constructions regarding clients may have been made, which
would likely have been subjective in nature and may have potentially influenced my
thinking. I also contributed to some of the client reports, which may have similarly
created some bias. During the analysis I used client numbers as opposed to names in
an attempt to disassociate data from identities. At no point during the analysis was I
aware of either the identity of participants relative to themes, or of my personal
contributions to the data set.
The processes of data collection and theme generation are long and time consuming.
Since every work session is bound to influence subsequent work sessions, I was
aware of the potential for subtle shifts in methodology to develop over time. With this
in mind, I attempted to be systematic and methodical, and attempted to regularly
cross-reference my work with previous iterations and reflect on my thinking for
consistency.
It is important to recognise that even with the best practice of reflexivity, the themes
that arose and the interpretation of the data remain a function of subjective judgment
and should be appraised as such.
5.3 Recommendations for future research This study was exploratory in the sense that it was not modeled on any previous
research on process dynamics in addiction treatment. The findings seem to indicate
that there are observable factors that may be relevant to addiction treatment. The first
recommendation for further study would be to work with a larger sample or samples,
and possibly across several settings. A larger sample could yield numbers that might
be more meaningful and lend themselves to clearer interpretation or discernment of
76
patterns in the data, and to statistical analysis. Working with multiple settings might
broaden the degree to which findings could be extrapolated to addiction treatment in
general and to general populations. Becker (2000), Smaling (1987) and (Yin) 2003
assert that comparing and contrasting multiple case studies strengthens
generalisability (as cited in VanWynsberghe & Khan, 2007).
One of the limitations regarded the personal judgments made by the researcher in
interpreting data patterns. If future research designs allow for the statistical analysis of
data this would address some of the limitations inherent in making personal
judgments regarding the significance of changes in reported observations over time or
between different categories of observation at one time.
Much of what emerged from the data seemed possibly to link to literature on various
models of change. It would be useful in future to assess the success of treatment
relative to observations of process dynamics. One way to assess success would
involve follow-ups like those conducted in outcomes based studies, of which there are
many. Certain observations have been suggested as correlates of change and if this is
so, it might be evidenced by duration of abstinence after discharge, for example.
There is evidence in the data suggesting both differences and similarities between
various subgroups. The limitations of this study make it difficult to know whether this
is random coincidence. Further investigation seems important as knowledge gained
could facilitate the implementation of matching hypotheses in the addiction treatment
setting.
5.3 Chapter Summary The analysis of frequencies of themes and categories across time-points suggests
evidence to support previous findings outlined in the literature regarding change, and
in particular, second order change. There may also be indications of Protracted
Withdrawal Syndrome and/or ‘The Wall’. It is proposed that further research may
expand our knowledge of process dynamics and that this may be useful in the
enhancement of addiction treatment. For example, process dynamics could potentially
be used as indicators of progress. Certain dynamics might prove to be time specific
and allow for anticipation and intervention by programme staff.
77
The analysis of the comparison of subgroups indicates possible differences and
similarities between them that may warrant further investigation. Future findings
could prove useful in the employment of matching hypotheses within the context of
addiction treatment if the current findings could be substantiated and/or expanded
upon. Based on the analysis of the comparison of subgroups, it is tentatively
concluded that, for this sample, Axis II personality traits do not mediate drugs of
choice.
Although the current study has yielded some potentially useful findings, it has been
limited with regard to generalisability, even to the local context. Limitations have also
been highlighted regarding potential biases, the small sample size, limited local
representivity, and the lack of a statistical analysis. It is suggested that further
research should address these limitations and that future studies include multiple local
addiction treatment settings in an attempt to increase local generalisability. It is
further suggested that future research includes an outcomes component such that
correlations between process data and efficacy of treatment can be investigated.

78
References
Alcoholics Anonymous World Services. (2001). Alcoholics Anonymous. New York
City: Alcoholics Anonymous World Services.
American Psychiatric Association. (2013). Highlights of Changes from DSM-IV-TR to
DSM-5. Retrieved from
http://www.dsm5.org/Documents/changes%20from%20dsm-iv-
tr%20to%20dsm-5.pdf on 16 January 2014
American Psychiatric Association. (2013). Diagnostic and Statistical Manual of
Mental Disorders (5th ed.). Arlinton, VA: American Psychiatric Publishing.
American Psychiatric Association. (2013). Substance-Related and Addictive
Disorders. Retrieved from
http://www.dsm5.org/Documents/Substance%20Use%20Disorder%20Fact%2
0Sheet.pdf on 16 January 2014
American Psychiatric Association. (2000). Diagnostic and Statistical Manual of
Mental Disorders (4th ed., Text Revision). Washington: Author.
American Psychological Association. (2010). Ethical Principles of Psychologists and
Code of Conduct. Retrieved from American Psychological Association:
http://www.apa.org/ethics/code/index.aspx on 15 December 2013
ASAM. (2006). Definition of addiction. Retrieved from http://www.asam.org/for-the-
public/definition-of-addiction on 13 August 2011
Barry, D., & Petry, N. (2009). Cognitive behavioral treatments for substance use
disorders. In P. M. Miller (Ed.), Evidence-based addiction treatment (pp. 159-
174). London: Academic Press.
Borkman, T., Kaskutas, L. A., & Owen, P. (2007). Contrasting and converging
philosophies of three models of alcohol/other drugs treatment: Minnesota
model, social model and addiction therapeutic communities. Alcoholism
Treatment Quarterly , 25 (3), 21-38.
Braun, V., & Clarke, V. (2006). Using thematic analysis in psychology. Qualitative
Research in Psychology , 3, 77-101.
Cameron, T., & Wolfe, J. (2009). The clinical course of addiction treatment: The role
of non-specific therapeutic factors. In P. M. Miller (Ed.), Evidence-based
addiction treatment (pp. 21-36). London: Academic Press.

79
Center for Substance Abuse Treatment. ( 2006). Counselor’s treatment manual:
Matrix intensive outpatient treatment for people with stimulant use disorders.
Rockville: Substance Abuse and Mental Health Services Administration.
Cook, C. C. (1988). The Minnesota model in the management of drug and alcohol
dependendy: Miracle, method or myth? British Journal of Addiction , 83, 625-
634.
De Leon, G. (1993). What psychologists can learn from addiction treatment research.
Psychology of Addictive Behaviors , 7 (2), 103-109.
dos Santos, M. M., Rataemane, S. T., Fourie, D., & Trathen, B. (2010). An approach
to heroin use disorder intervention within the South African context: A content
analysis study. Substance Abuse Treatment, Prevention and Policy .
Dutra, L., Stathopoulou, G., Basden, S. L., Leyro, T. M., Powers, M. B., & Otto, M.
W. (2008). A meta-analytic review of psychosocial interventions for substance
use disorders. American Journal of Psychiatry , 179-187.
Edelen, M. O., Tucker, J. S., Wenzel, S. L., Paddock, S. M., Ebener, P. A., Dahl, J., et
al. (2007). Treatment process in the therapeutic community: Associations with
retention and outcomes among adolescent residential clients. Journal of
Substance Abuse Treatment , 32, 415– 421.
Finney, J. W. (2007). Treatment processes and mediators of substance use disorders
treatment effects: The benefits of side road excursions. Alcoholism: Clinical
and Experimental Research , 31, 80s-83s.
Fisher, G. L., & Harrison, T. C. (2009). Substance abuse: Information for school
counselors, social workers, therapists, and counselors. Boston: Pearson.
Fisher, G., & Roget, N. (Eds.). (2009). Encyclopedia of substance abuse prevention,
treatment, & recovery. Los Angeles: SAGE.
Glynn, L., & Moyers, T. (2009). Motivational interviewing for addictions. In
Evidence-based addiction treatment (pp. 175-188). Boston: Academic Press.
Gossop, M., Marsden, J., Stewart, D., & Kidd, T. (2003). The national treatment
outcome research study (NTORS): 4-5 year follow-up results. Addiction , 98,
291-303.
Gossop, M. (2006). Treating drug misuse problems: evidence of effectiveness.
Retrieved from
http://www.nta.nhs.uk/uploads/nta_treat_drug_misuse_evidence_effectiveness
_2006_rb5.pdf on 28 August 2011
80
Hanna, F., & Ritchie, M. (1995). Seeking the active ingredients of psychotherapeutic
change: Within and outside the context of therapy. Professional Psychology:
Research and Practice , 26, 176-183.
Harker, N., Kader, R., Myers, B., Fakier, N., Parry, C., & Flisher, A. J. (2010).
Substance abuse trends in the Western Cape: A review of studies conducted
since 2000. Retrieved from
http://www.sahealthinfo.org/admodule/substance.pdf on 11 October 2011
Hawkins, E., Baer, J., & Kivlahan, D. (2008). Concurrent monitoring of
psychological distress and satisfaction measures as predictors of addiction
treatment retention. Journal of Substance Abuse Treatment , 35, 207–216.
Hazelden. (2013). Addiction treatment, family program. Retrieved from
http://www.hazelden.org/web/public/family.page on 16 January 2014
Hazelden. (2009). Sex addiction & issues links. Retrieved from
http://www.minnesotarecovery.info/LinksSexualAddiction.htm on 16 January
2014
Higgins, S., & Rogers, R. (2009). Contingency management and community
reinforcement approach. In P. Miller (Ed.), Evidence-based addiction
treatment (pp. 249-266). Boston: Academic Press.
Huebner, R., & Tonigan, J. (2007). The search for mechanisms of behavior change in
evidence-based behavioral treatments for alcohol use disorders: Overview.
Alcoholism: Clinical and Experimental Research , 1, 1s-3s.
Kellogg, S. (1993). Identity and recovery. Psychotherapy , 30 (2), 235-244.
Kelly, J. F., Magill, M., & Stout, R. L. (2009). How do people recover from alcohol
dependence? A systematic review of the research on mechanisms of behavior
change in alcoholics anonymous. Addicton Research and Theory , 17 (3), 236-
259.
Knack, W. A. (2009). Psychotherapy and alcoholics anonymous: An integrated
approach. Journal of Psychotherapy Integration , 19, 86-109.
Kressel, D., De Leon, ,. G., Palij, M., & Rubin, G. (2000). Measuring client clinical
progress in therapeutic community treatment The therapeutic community
client assessment inventory, client assessment summary, and staff assessment
summary. Journal of Substance Abuse Treatment , 19, 267–272.
Lewis, M., & Rook, K. (1999). Social control in personal relationships: Impact on
health behaviors and psychological distress. Health Psychology , 18, 63-71.
81
Linley, J. V. (2010). [Review of the book Offenders and substance abuse: Bringing
the family into focus, by C. Lemieux]. Journal of Social Work Practice in the
Addictions , 10 (4), 425-426.
Margolis, R. D. (1993). Recovery: Leaps of faith for addicts and psychologist.
Psychotherapy , 30 (2), 187-192.
Marlatt, G., Bowen, S., & Witkiewitz, K. (2009). Relapse prevention: Evidence base
and future directions. In P. Miller (Ed.), Evidence-based addiction treatment
(pp. 215-232). Boston: Academic Press.
Maude-Griffin, P. M., Hohenstein, J. M., Humfleet, G. L., Reilly, P. M., Tusel, D. J.,
& Hall, S. M. (1998). Superior efficacy of cognitive-behavioral therapy for
urban crack cocaine abusers: Main and matching effects. Journal of
Consulting and Clinical Psychology , 66 (5), 832-837.
May, P., Gossage, P., Marais, A.S., Adnams, C., Hoyme, H., Jones, K., et al. (2007).
The epidemiology of fetal alcohol syndrome and partial FAS in a South
African community. Drug and Alcohol Dependence , 88, 259-271.
May, P., & Gossage, P. (2011). Estimating the prevalence of fetal alcohol syndrome:
A summary. Retrieved from http://pubs.niaaa.nih.gov/publications/arh25-
3/159-167.htm on 12 October 2011
McGue, M. (1999). The behavioral genetics of alcoholism. Current Directions in
Psychological Science , 109-115.
McNeece, C. A., & DiNitto, D. M. (2005). Chemical dependency. Boston: Pearson.
Miller, W. R., & Rose, G. S. (2009). Toward a theory of motivational interviewing.
American Psychologist , 527-537.
Moore, T. M., Seavey, A., Ritter, K., McNulty, J. K., Gordon, K. C., & Stuart, G. L.
(2013, October 14). Ecological momentary assessment of the effects of
craving and affect on risk for relapse during substance abuse treatment.
Psychology of Addictive Behaviors, 1-6. doi: 10.1037/a0034127
Moos, R. H. (2003). Addictive disorders in context: principles and puzzles of
effective treatment and recovery. Psychology of Addictive Behaviors , 17 (1),
3-12.
Morgenstern, J., Labouvie, E., McCrady, B. S., Kahler, C. W., & Frey, R. M. (1997).
Affiliation with alcoholics anonymous after treatment: A study of its
therapeutic effects and mechanisms of action. Journal of Consulting and
Clinical Psychology , 65 (5), 768-777.
82
Myers, B. J., Harker, N., Fakier, N., Kader, R., & Mazok, C. (2008). A review of
evidence-based interventions of substance use disorders.
Myers, B. J., Louw, J., & Fakier, N. (2008). Alcohol and drug abuse: removing
structural barriers to treatment for historically disadvantaged communities in
Cape Town. International Journal of Social Welfare , 17, 156-165.
Myers, B. J., Louw, J., & Pasche, S. C. (2010). Inequitable access to substance abuse
treatment services in Cape Town, South Africa. Substance Abuse Treatment,
Prevention and Policy , ArtID28.
National Treatment Agency. (2006). Models of care for treatment of adult drug
misusers: Update 2006. Retrieved from
http://www.nta.nhs.uk/uploads/nta_modelsofcare_update_2006_moc3.pdf on
16 September 2011
NIDA. (2011). Principles of drug addiction treatment: A research based guide.
Retrieved from http://www.drugabuse.gov/PODAT/Evidence2.html on 13
September 2011
Obert, J., & Rawson, R. (2005). A clinician's guide to methamphetamine. Minnesota:
Hazelden.
Paddock, S. M., Edelen, M. O., Wenzel, S. L., Ebener, P., Mandell, W., & Dahl, J.
(2007). Measuring changes in client-level treatment process in the therapeutic
community (TC) with the dimensions of change instrument (DCI). The
American Journal of Drug and Alcohol Abuse , 537-546.
Pos, A., Greenberg, L., & Warwar, S. (2009). Testing a model of change in the
experiential treatment of depression. Journal of Consulting and Clinical
Psychology , 1055–1066.
Pos, A., Greenberg, L., Goldman, R., & Korman, L. (2003). Emotional processing
during experiential treatment of depression. Journal of Consulting and
Clinical Psychology, 1007-1016.
Prochaska, J., DiClemente, C., & Norcross, J. (1992). In search of how people change
applications to addictive behaviors. American Psychologist , 47, 1102-1114.
Rawson, R. A., Marinelli-Casey, P., Anglin, M. D., Dickow, A., Frazier, Y.,
Gallagher, C., et al. (2004). A multi-site comparison of psychosocial
approaches for the treatment of methamphetamine dependence. Addiction ,
708-717.
83
Rawson, R. A., Shoptaw, S. J., Obert, J. L., McCann, M. J., Hasson, A. L., Marinelli-
Casey, P. J., et al. (1995). An intensive outpatient approach for cocaine abuse
treatment: The matrix model. Journal of Substance Abuse Treatment , 117-
127.
Rollnick, S., & Miller, W. R. (1995). What is motivational interviewing? Behavioral
and Cognitive Psychotherapy , 325-334.
SAPA. (2011, September 5). Alcohol abuse costs R9bn a year. News24. Retrieved
from http://www.news24.com/SouthAfrica/Politics/Alcohol-abuse-puts-R9bn-
dent-in-economy-20110905 on 16 January 2014
Smith, K., Subich, L., & Kalodner, C. (1995). The transtheoretical model's stages and
processes of change and their relation to premature termination. Journal of
Counseling Psychology , 42, 34-39.
Stake, R. (2000). Case studies. In N. K. Denzin, & Y. S. Lincoln (Eds.), Handbook of
qualitative research (pp. 435-454). Thousand Oaks, CA: Sage.
Stein, D. J., Seedat, S., Herman, A., Moomal, H., Heeringa, S., Kessler, R., et al.
(2008). Lifetime prevalence of psychiatric disorders in South Africa. The
British Journal of Psychiatry , 112-117.
Stinchfield, R., & Owen, P. (1998). Hazelden's model of treatment and its outcome.
Addictive Behaviors , 23 (5), 669-683.
Stout, R. (2007). Advancing the analysis of treatment process. Addiction , 102, 1539–
1545.
Sunday Tribune. (2011). Alcohol Abuse Costs SA. Retrieved from Sunday Tribune:
http://www.sundaytribune.co.za/alcohol-abuse-costs-sa-1.1131798 on 6
September 2011
VanWynsberghe, R., & Khan, S. (2007). Redefining Case Study. International
Journal of Qualitative Methods , 1-10.
Voltaire-Carlsson, A., Hiltunen, A. J., Koechling, U. M., & Borg, S. (1996). Effects
of long-term abstinence on psychological functioning: A prospective
longitudinal analysis comparing alcohol- dependent patients and healthy
volunteers. Alcohol , 13, 415-42.
Williams, D. R., Herman, A., Stein, D., Heeringa, S. G., Jackson, P. B., Moomal, H.,
et al. (2008). Twelve-month mental disorders in South Africa: prevalence,
service use and demographic correlates in the population-based South African
Stress and Health Study. Psychological Medicine , 211-220.
84
Witbrodt, J., Bond, J., Kaskutas, L. A., Jaeger, J., Weisner, C., Pating, D., et al.
(2007). Day hospital and residential addiction treatment: Randomized and
nonrandomized managed care clients. Journal of Consulting and Clinical
Psychology , 75 (6), 947-959.
World Health Organisation. (2010). Mental and behavioural disorders due to
psychoactive substance use. Retrieved from
http://apps.who.int/classifications/apps/icd/icd10online on 29 November 2011
World Health Organisation. (2010). ATLAS on substance use (2010) - Resources for
the prevention and treatment of substance use disorders. Retrieved from
http://www.who.int/substance_abuse/publications/treatment/en/index.html on
29 November 2011
World Health Organisation. (2011). Lexicon of alcohol and drug terms published by
the World Health Organization. Retrieved from
http://www.who.int/substance_abuse/terminology/who_lexicon/en/ on 29
November 2011
World Health Organisation. (2011). Management of substance abuse. Retrieved from
http://www.who.int/substance_abuse/publications/Media/en/ on 29 November
2011
World Mental Health Survey Consortium. (2004). Prevalence, severity, and unmet
need for treatment of mental disorders in the World Health Organization
World Mental Health Surveys. JAMA , 2581-2590.
Zweben, J. E. (1993). Recovery oriented psychotherapy: A model for addiction
treatment. Psychotherapy , 30 (2), 259-268.
1
Appendix 1
Participant Consent Form
To whom it may concern
I am embarking on a research project to examine patterns in the recovery process of
clients at the [treatment facility] especially around the time of nine weeks into
treatment i.e. since starting primary care. To this end I would like to examine the
client reports that are updated several times daily by both the counselors and recovery
assistants (R.A.’s). The names of clients and the specific details of their treatment are
not relevant to the study and client confidentiality and anonymity will be protected at
all times before, during and after the study. Client names will not be recorded. If at
any point a client who has granted permission for their reports to be utilized in the
study changes their mind for any reason whatsoever, their wishes shall be respected
without question. Any questions regarding the study are welcome.
Yours sincerely,
Nic Hazell
I _________________________________ hereby agree and consent to my treatment
records being studied for the purposes of the above stated research project. I
understand the nature of the research and that my confidentiality and anonymity will
be protected at all times. I also understand my right to withdraw my consent at any
point.
Signed _________________________________
at ________________________________________ on the ____day____ month
__________ year.