thesis_hsf_2016_huchu_linet.pdf - University of Cape Town
223
University of Cape Town i The association between cardiorespiratory fitness and performance in a submaximal stepping test standardised for external workload. by Linet Huchu HCHLIN001 SUBMITTED TO THE UNIVERSITY OF CAPE TOWN In fulfilment of the requirements for the degree PhD Exercise Science Division of Exercise Science and Sports Medicine Department of Human Biology Faculty of Health Sciences UNIVERSITY OF CAPE TOWN August 2016
-
Upload
khangminh22 -
Category
Documents
-
view
0 -
download
0
Transcript of thesis_hsf_2016_huchu_linet.pdf - University of Cape Town

Univers
ity of
Cap
e Tow
n
i
The association between cardiorespiratory fitness and performance in a submaximal stepping test standardised for external workload.
by
Linet Huchu
HCHLIN001
SUBMITTED TO THE UNIVERSITY OF CAPE TOWN
In fulfilment of the requirements for the degree
PhD Exercise Science
Division of Exercise Science and Sports Medicine
Department of Human Biology
Faculty of Health Sciences
UNIVERSITY OF CAPE TOWN
August 2016

The copyright of this thesis vests in the author. No quotation from it or information derived from it is to be published without full acknowledgement of the source. The thesis is to be used for private study or non-commercial research purposes only.
Published by the University of Cape Town (UCT) in terms of the non-exclusive license granted to UCT by the author.
Univers
ity of
Cap
e Tow
n

ii
Abstract
Submaximal step tests are used to predict maximal oxygen consumption and work capacity.
However, if the external workload is not controlled the interpretation of the test results may
be inaccurate. The purpose of the research was to develop a submaximal test of
cardiorespiratory fitness using a novel step test designed specifically to overcome the
weaknesses of the previously published step tests.
A series of studies contributed to the theoretical development of the submaximal step
protocol, piloting the protocol, reliability studies, validation of the protocol and finally a
cross-validation of the protocol. The first study tested the hypothesis that stepping tests
configured for the same external workload, but varying in stepping frequency, elicit the same
physiological stress. Participants (n = 31) performed three step tests at 16, 20 and 24 steps per
minutes in random order. External workload was standardised at 45 kJ. Energy expenditure,
heart rate recovery, rating of perceived exertion, maximum heart rate and total heart beats
were significantly different between tests (p < 0.05) with the biggest differences occurring
between 16 and 24 steps per minute. Maximum heart rate as a percentage of age predicted
heart rate increased from 70% at 16 steps per minute to 81% at 24 steps per minute. The
study concluded that standardisation of external workload with different exercise intensities
does not result in the same physiological responses. The second study tested the reliability of
the step test. Participants (n = 34) performed a step test three times in a week at a cadence of
their choice (16, 20 or 24 steps per minute). The study showed that the step test is repeatable
for most variables measured and therefore is a reliable test of fitness.
The third study used the outcome variables measured during the step test to develop
equations which predicted VO2max measured directly in a maximal test on a treadmill. A
diverse sample of participants (n = 273), differing in sex, level of habitual physical activity
and age were recruited for the study. Several models for predicting VO2max were
determined. The most parsimonious equation was:
VO2max (ml.kg-1.min-1) = -0.10911 (age) - 0.06178 (body mass) - 0.75481 (body fat %)
+0.00208 (METS) + 0.11636 (HRR) - 0.019551 (MHR) + 0.07955 (Av HR) + 83.34846

iii
(R2 = 0.75, standard error of estimate = 5.51 ml.kg.min-1) where METS is metabolic
equivalent, HRR is heart rate recovery, MHR is maximum heart rate and Av HR is average
heart rate.
Cross validation was done (n = 50) to test the accuracy of the prediction equation. The
relationship between the predicted VO2max and the measured VO2max was r = 0.87. In
conclusion the standardised step test can predict VO2max in a heterogeneous population of
males and females, varied ages (20 to 60 years), physical activity levels and fitness levels.

iv
Acknowledgements
The PhD journey as it is known has been one long journey. In fact it has been the longest
journey I have travelled. It was not a cruise. It had winds, turns, twists, ups, downs and all. Of
course I did not travel alone. There were people who saw me through, who ensured I went
through it to the end. That was done in numerous ways: advice, encouragements, prayers,
checking on me, company, financial assistance, participation in research and lessons.
First and foremost I wish to express my profound gratitude to Professor Michael Ian Lambert,
my supervisor. He mentored me, taught me, encouraged me and provided financial
assistance.
I thank my family for allowing me to fulfil my vision, for helping out, encouraging and being
there for me.
The staff and students at the division of Exercise Science and Sports Medicine (ESSM) and
the Sports Science Institution of South Africa (SSISA) contributed immensely to the
completion of the thesis through teaching, participating, advising and encouraging me.
Participants were of crucial importance to the research. They sacrificed their precious time to
come and take part. All the studies were very demanding and needed commitment with some
requiring up to four days in a week and one hour per session. They did not falter.
Welly I thank you for editing the document. Words of encouragement were daily bread.
I thank you all from the deepest of my heart.

v
Dedication
I dedicate the thesis to my dad who departed when I was finalising and my late maternal
grandmother who made me embark on the journey.

vi
Table of Contents Abstract ................................................................................................................................................... ii
Acknowledgements ................................................................................................................................ iv
Dedication ............................................................................................................................................... v
List of Tables .......................................................................................................................................... x
List of Figures ...................................................................................................................................... xiii
List of Appendices ............................................................................................................................... xiv
CHAPTER 1 ........................................................................................................................................... 1
LITERATURE REVIEW ................................................................................................................... 1
1.1 Introduction ........................................................................................................................ 2
1.2 Measures of Cardiorespiratory Fitness ............................................................................... 2
1.2.1 Maximal Tests ............................................................................................................. 2
1.2.2 Submaximal Tests ....................................................................................................... 3
1.3 Heart Rate as a Physiological Determinant of Cardiorespiratory Fitness ........................... 5
1.3.1 Resting Heart Rate ...................................................................................................... 7
1.3.2 Heart Rate during Exercise .......................................................................................... 8
1.3.3 Effect of Endurance Training on Submaximal and Maximal Heart Rate ..................... 8
1.3.4 Factors Affecting Heart Rate during Exercise ............................................................. 8
1.3.5 Heart Rate after Exercise ............................................................................................ 9
1.3.6 Application of the Heart Rate Data ........................................................................... 10
1.4 Step Tests .......................................................................................................................... 11
1.4.1 Introduction .............................................................................................................. 11
1.4.2 Cardiovascular Efficiency Test ................................................................................... 14
1.4.3 Pulse-ratio Test ......................................................................................................... 15
1.4.4 Harvard Step Test ...................................................................................................... 18
1.4.5 Astrand-Ryhming Nomogram ................................................................................... 20
1.4.6 YMCA 3-Minute Step Test ......................................................................................... 22
1.4.7 Balke Step Test .......................................................................................................... 24
1.4.8 Queen’s College Step Test ........................................................................................ 26
1.4.9 The Canadian Home Fitness Test .............................................................................. 31
1.4.10 Chester Step Test ...................................................................................................... 36
1.4.11 Cambridge Step Test ................................................................................................. 39
1.5 Summary ........................................................................................................................... 41

vii
1.6 Clinimetrics........................................................................................................................ 45
CHAPTER 2 ......................................................................................................................................... 47
PURPOSE OF THE STUDY ............................................................................................................ 47
2.1 Introduction ...................................................................................................................... 48
2.2 Aim of the Thesis ............................................................................................................... 49
2.3 Objectives of the Thesis .................................................................................................... 49
2.4 Summary ........................................................................................................................... 49
CHAPTER 3 ......................................................................................................................................... 50
STEP TEST DEVELOPMENT ........................................................................................................ 50
3.1 Introduction ...................................................................................................................... 51
3.2 Why Step Test? ................................................................................................................. 51
3.3 Workload ........................................................................................................................... 52
3.4 Step Height ........................................................................................................................ 54
3.5 Stepping Rate .................................................................................................................... 57
3.6 Trialling and Pilot Studies .................................................................................................. 59
3.6.1 Pilot Study 1 .............................................................................................................. 60
3.6.2 Pilot Study 2 .............................................................................................................. 60
3.6.3 Pilot Study 3 .............................................................................................................. 61
3.7 Workload Determination .................................................................................................. 62
3.8 Stepping Rate Determination ........................................................................................... 63
3.9 Test Duration..................................................................................................................... 63
3.10 Summary ........................................................................................................................... 63
CHAPTER 4 ......................................................................................................................................... 65
THE ASSOCIATION BETWEEN MEASURES OF ENERGY EXPENDITURE AND HEART RATE IN THREE SUBMAXIMAL STEPPING TESTS STANDARDISED FOR EXTERNAL WORKLOAD. .................................................................................................................................. 65
4.1 Introduction ...................................................................................................................... 66
4.2 Methods ............................................................................................................................ 66
4.2.1 Participants ............................................................................................................... 66
4.2.2 Sample Size ............................................................................................................... 66
4.2.3 Pre-participation ....................................................................................................... 66
4.2.4 Anthropometric Measurements ............................................................................... 67
4.2.5 Step Test .................................................................................................................... 68

viii
4.3 Data Analysis ..................................................................................................................... 71
4.4 Results ............................................................................................................................... 71
4.5 Discussion .......................................................................................................................... 76
4.6 Conclusions ....................................................................................................................... 78
CHAPTER 5 ......................................................................................................................................... 79
THE REPEATABILITY OF THE MEASUREMENTS OF ENERGY EXPENDITURE AND HEART RATE IN A STEPPING TEST STANDARDISED FOR EXTERNAL WORKLOAD .... 79
5.1 Introduction ...................................................................................................................... 80
5.2 Methods ............................................................................................................................ 82
5.2.1 Sample ....................................................................................................................... 82
5.2.2 Pre-participation ....................................................................................................... 82
5.2.3 Anthropometric Measurements ............................................................................... 82
5.2.4 Testing ....................................................................................................................... 82
5.2.5 Physical Performance ................................................................................................ 84
5.2.6 Data Analysis ............................................................................................................. 84
5.3 Results ............................................................................................................................... 85
5.3.1 A. Whole Group ......................................................................................................... 85
5.3.2 B. Step Cadence ........................................................................................................ 92
5.3.3 Twelve Minute Motion Test ...................................................................................... 94
5.4 Discussion .......................................................................................................................... 96
5.5 Conclusions ..................................................................................................................... 100
CHAPTER 6 ....................................................................................................................................... 101
THE ASSOCIATION BETWEEN CARDIORESPIRATORY FITNESS AND PERFORMANCE IN A SUBMAXIMAL STEPPING TEST STANDARDISED FOR EXTERNAL WORKLOAD 101
6.1 Introduction .................................................................................................................... 102
6.1.1 Aim of the Study...................................................................................................... 102
6.2 Methods .......................................................................................................................... 103
6.2.1 Study Design ............................................................................................................ 103
6.2.2 Participants ............................................................................................................. 103
6.2.3 Participant Physical Characteristics ........................................................................ 104
6.2.4 Step Test .................................................................................................................. 105
6.2.5 VO2max Test ............................................................................................................ 106
6.2.6 Ethical Considerations ............................................................................................. 108

ix
6.2.7 Benefits to the Participants..................................................................................... 108
6.2.8 Statistical Analysis ................................................................................................... 108
6.3 Results ............................................................................................................................. 109
6.3.1 Physical Characteristics of Participants ................................................................... 109
6.3.2 Step Test Components ............................................................................................ 112
6.3.3 Step Test Outcome Measures ................................................................................. 113
6.3.4 VO2max Outcome Measures ................................................................................... 115
6.3.5 Relationship between VO2max, Physical Characteristics of Participants and Step
Test Measures ......................................................................................................................... 118
6.3.6 Multiple Regression Steps and Results ................................................................... 122
6.4 Discussion ........................................................................................................................ 128
6.5 Conclusions ..................................................................................................................... 131
CHAPTER 7 ....................................................................................................................................... 132
CROSS VALIDATION STUDY .................................................................................................... 132
7.1 Introduction .................................................................................................................... 133
7.2 Methods .......................................................................................................................... 133
7.2.1 Participants ............................................................................................................. 134
7.2.2 Statistical Analysis ................................................................................................... 134
7.3 Results ............................................................................................................................. 135
7.3.1 Physical Characteristics of Participants ................................................................... 135
7.3.2 Step Test Components ............................................................................................ 138
7.3.3 Outcome Measures of the Step Test ...................................................................... 139
7.3.4 Outcome Measures of the VO2max Test................................................................. 140
7.3.5 Prediction of VO2max from the Equation ............................................................... 141
7.4 Discussion ........................................................................................................................ 145
CHAPTER 8 ....................................................................................................................................... 148
SUMMARY AND CONCLUSIONS ............................................................................................. 148
8.1 Summary ......................................................................................................................... 149
8.2 Conclusions ..................................................................................................................... 152
REFERENCE LIST ............................................................................................................................ 153
APPENDICES .................................................................................................................................... 171

x
List of Tables Table 1 Brief description of step tests ........................................................................................... 13
Table 2 Basis of the Canadian home fitness test 11........................................................................ 32
Table 3 Physical fitness evaluation chart for the Canadian home fitness test 11 .......................... 32
Table 4 Energy requirements in l.min-1 of the CHFT stages 115 ...................................................... 34
Table 5 CST oxygen cost estimates (VO2 in ml.kg-1.min-1) for varying step heights (m) and
stepping rates (steps per minute) 123 .......................................................................... 37
Table 6 Parameters of the step tests developed to predict fitness............................................... 42
Table 7 Strengths and weaknesses of step tests ........................................................................... 43
Table 8 Step test configurations .................................................................................................... 59
Table 9 Energy expenditure (EE) heart rate recovery (HRR), total heart beats and respiratory
exchange ratio (RER) for stepping rates 20, 24 and 28 steps per minute. Data
expressed as means and standard deviations. ........................................................... 61
Table 10 Energy expenditure (EE), heart rate recovery (HRR), total heart beats, respiratory
exchange ratio (RER) and rating of perceived exertion (RPE) for 24 steps per minute.
Data expressed as means and standard deviation...................................................... 62
Table 11 Range of participant height in relation to step height from the shortest female (♀) to the
tallest male (♂). ........................................................................................................... 69
Table 12 Descriptive characteristics of participants (Means ± standard deviations) ...................... 71
Table 13 Energy expenditure (EE), heart rate recovery (HRR), maximum heart rate (MHR),
maximum heart rate as a percentage of age predicted maximum heart rate, (% AP
MHR), total heart beats (THB) and rating of perceived exertion (RPE) for 3 stepping
rates: 16, 20 and 24 steps per minute. Data expressed as mean ± standard deviation,
F value and p value. ..................................................................................................... 72
Table 14 Limits of agreement for energy expenditure (EE), heart rate recovery (HRR), total heart
beats (THB), maximum heart rate (MHR), maximum heart rate as a percentage of
age predicted maximum heart rate (% AP MHR) and rating of perceived exertion
(RPE) for the three stepping rates 16, 20 and 24 steps per minute. .......................... 75
Table 15 Energy expenditure (EE), heart rate recovery (HRR), total heart beats (THB), maximum
heart rate (MHR), maximum heart rate as a percentage of age predicted maximum
heart rate (% AP MHR) and rating of perceived exertion (RPE) for testing order 1, 2
and 3 of the 3 step tests. ............................................................................................. 76
Table 16 Descriptive characteristics of participants (means and standard deviations) .................. 86
Table 17 Energy expenditure (EE), heart rate recovery (HRR), maximum heart rate (MHR),
maximum heart rate as a percentage of age predicted maximum heart rate, (% AP
MHR), total heart beats (THB), rating of perceived exertion (RPE) and peak
respiratory exchange ratio (RER). ............................................................................... 87
Table 18 Intraclass correlation coefficient and confidence intervals for energy expenditure (EE),
heart rate recovery (HRR), maximum heart rate (MHR), maximum heart rate as a
percentage of age predicted maximum heart rate, (% AP MHR), total heart beats
(THB), rating of perceived exertion (RPE) and peak respiratory exchange ratio (RER).
..................................................................................................................................... 88

xi
Table 19 Effect size and 95% confidence intervals for the effect size (in brackets) for energy
expenditure (EE), heart rate recovery (HRR), maximum heart rate (MHR), maximum
heart rate as a percentage of age predicted maximum heart rate, (% AP MHR), total
heart beats (THB), rating of perceived exertion (RPE) and peak respiratory exchange
ratio (RER). .................................................................................................................. 89
Table 20 Measurement error and confidence intervals for energy expenditure (EE), heart rate
recovery (HRR), maximum heart rate (MHR), maximum heart rate as a percentage of
age predicted maximum heart rate, (% AP MHR), total heart beats (THB), rating of
perceived exertion (RPE) and peak respiratory exchange ratio (RER). ....................... 90
Table 21 Typical error as a coefficient of variation (CVTEM) and confidence intervals for energy
expenditure (EE), heart rate recovery (HRR), maximum heart rate (MHR), maximum
heart rate as a percentage of age predicted maximum heart rate, (% AP MHR), total
heart beats (THB), rating of perceived exertion (RPE) and peak respiratory exchange
ratio (RER). .................................................................................................................. 91
Table 22 Typical error of measurement (TEM), typical error as a coefficient of variation (CVTEM)
and the smallest worthwhile difference (SWD) for energy expenditure (EE), heart
rate recovery (HRR), maximum heart rate (MHR), maximum heart rate as a
percentage of age predicted maximum heart rate, (% AP MHR), total heart beats
(THB), rating of perceived exertion (RPE) and peak respiratory exchange ratio (RER).
..................................................................................................................................... 92
Table 23 Descriptive characteristics of participants who chose 20 steps per minute versus 24
steps per minute ......................................................................................................... 93
Table 24 Measurement error for 20 steps per minute and 24 steps per minute for energy
expenditure (EE), heart rate recovery (HRR), maximum heart rate (MHR), maximum
heart rate as a percentage of age predicted maximum heart rate, (% AP MHR), total
heart beats (THB), rating of perceived exertion (RPE) and peak respiratory exchange
ratio (RER). .................................................................................................................. 94
Table 25 Participants in each cell defined by age and level of physical activity (n = 273) ............ 104
Table 26 Step test durations for a male 1.55 m tall (step height 29 cm) and 2.00 m tall (step height
38 cm) and varying body mass (50 kg to 100 kg) ...................................................... 105
Table 27 The Bruce treadmill protocol 117 ..................................................................................... 107
Table 28 Mean and standard deviation of physical characteristics (Males, n = 145)). The sample
size for each cell is shown in brackets (). The range is shown in []. .......................... 110
Table 29 Mean and standard deviation of physical characteristics (Females, n = 128). The sample
size for each cell is shown in brackets (). The range is shown in []. .......................... 111
Table 30 Mean and standard deviation of step test components (Males). The sample size for each
cell is shown in brackets (). The range is shown in []. ............................................... 112
Table 31 Mean and standard deviation of step test components (Females). The sample size for
each cell is shown in brackets (). The range is shown in []. ...................................... 112
Table 32 Mean and standard deviation of step test measures (Males). The sample size for each
cell is shown in brackets (). The range is shown in []. ............................................... 113
Table 33 Mean and standard deviation of step test measures (Females). The sample size for each
cell is shown in brackets (). The range is shown in []. ............................................... 114

xii
Table 34 Mean and standard deviation of VO2max measures (Males). The sample size for each cell
is shown in brackets (). The range is shown in []. ..................................................... 116
Table 35 Mean and standard deviation of VO2max measures (Females). The sample size for each
cell is shown in brackets (). The range is shown in []. ............................................... 117
Table 36 Linear regressions of the physical characteristics and VO2max ...................................... 120
Table 37 Linear regressions of the step test outcome measures and VO2max ............................. 122
Table 38 Regression summary: sex, age, stature and body mass (n = 273) .................................. 123
Table 39 Regression summary: Sex, age, stature, body mass, body fat percent and METS (n = 273)
................................................................................................................................... 123
Table 40 Regression summary: Body mass, body fat %, METS (n = 273). ..................................... 124
Table 41 Regression summary: Heart rate recovery, maximum heart rate, total heart beats,
average heart rate and rating of perceived exertion. (n = 273) ................................ 125
Table 42 Regression summary: Maximum heart rate, average heart rate and rating of perceived
exertion. (n = 273) ..................................................................................................... 125
Table 43 Regression summary: Sex, age, stature, body mass, body fat %, METS, HRR, MHR, Av HR,
heart beats, RPE (n = 273) ......................................................................................... 126
Table 44 Regressions summary: Age, body mass, body fat %, METS, HRR, MHR, Av HR (n = 273)
................................................................................................................................... 127
Table 45 Multiple linear regression summary for predicting VO2max from step test measures .. 127
Table 46 Participants in each cell defined by age and level of physical activity (n = 50) .............. 134
Table 47 Mean and standard deviation of anthropometric measures (Males). The sample size for
each cell is shown in brackets (). ............................................................................... 136
Table 48 Mean and standard deviation of anthropometric measures (Females). The sample size
for each cell is shown in brackets (). ......................................................................... 136
Table 49 Mean and standard deviation of step test components (Males). The sample size for each
cell is shown in brackets (). ....................................................................................... 138
Table 50 Mean and standard deviation of step test components (Females). The sample size for
each cell is shown in brackets (). ............................................................................... 138
Table 51 Mean and standard deviation of step test outcome measures (Males). The sample size
for each cell is shown in brackets (). ......................................................................... 140
Table 52 Mean and standard deviation of step test outcome measures (Females). The sample size
for each cell is shown in brackets (). ......................................................................... 140
Table 53 Mean and standard deviation of VO2max outcome measures (Males). The sample size
for each cell is shown in brackets (). ......................................................................... 141
Table 54 Mean and standard deviation of VO2max outcome measures (Females). The sample size
for each cell is shown in brackets (). ......................................................................... 141

xiii
List of Figures Figure 1 The graphic calculation of the number of steps that produce a pulse-ratio of 2.5 .......... 16
Figure 2 Energy expenditure for stepping rates 16, 20 and 24 steps per minute. ......................... 73
Figure 3 Heart rate recovery (A), maximum heart rate (B), total heart beats (C) and rating of
perceived exertion (D) for 16, 20 and 24 steps per minute. ....................................... 74
Figure 4 12 minute motion test distance versus (A) energy expenditure (EE), (B) heart rate
recovery (HRR), (C) maximum heart rate (MHR), (D) total heart beats (THB), (E) rating
of perceived exertion (RPE) and (F) respiratory exchange ratio (RER). ...................... 95
Figure 5 VO2max versus (A) age, (B) stature, (C) body mass, (D) body fat percent, (E) sum of seven
skinfolds and (F) METS of participants ( males and females)............................ 119
Figure 6 The relationship between VO2max and variables measured during the step test: heart
rate recovery, maximum heart rate, total heart beats, average heart rate and rating
of perceived exertion. ............................................................................................... 121
Figure 7 Validation and cross validation physical characteristics (Males). The data are
represented as mean and standard deviation (the units of the Y axis are general units
representing the different measurements). ............................................................. 137
Figure 8 Validation and cross validation physical characteristics (Females). The data are
represented as mean and standard deviation (the units of the Y axis are general units
representing the different measurements). ............................................................. 137
Figure 9 Validation and cross validation METS for males and females. The data are represented
as mean and standard deviation. .............................................................................. 138
Figure 10 Measured VO2max against predicted VO2max in ml.kg-1.min-1 ...................................... 142
Figure 11 Measured VO2max against predicted VO2max in ml.kg-1.min-1 ...................................... 143
Figure 12 Measured VO2max against predicted VO2max in ml.kg-1.min-1 ...................................... 144
Figure 13 Difference against mean for measured and predicted VO2max ..................................... 145

xiv
List of Appendices American College of Sports Medicine (ACSM) Pre-participation Screening Appendix 1
Questionnaire ............................................................................................................ 172
Global Physical Activity Questionnaire (GPAQ) (Abridged) ...................................... 173 Appendix 2
Global Physical Activity Questionnaire (GPAQ) Score sheet ..................................... 177 Appendix 3
Rating of Perceived Exertion (RPE) Scale ................................................................. 178 Appendix 4
Ethics Approval Studies A and B ................................................................................ 179 Appendix 5
Ethics Approval for Studies C and D .......................................................................... 180 Appendix 6
Recruitment Poster ................................................................................................... 181 Appendix 7
Informed Consent Form Study A and B ..................................................................... 182 Appendix 8
Participant information sheet Study A and B ............................................................ 186 Appendix 9
Informed Consent Form Study C and D ..................................................................... 189 Appendix 10
Participant information sheet study C and D ............................................................ 193 Appendix 11
VO2max score sheet .................................................................................................. 196 Appendix 12
Participant Report (Men) .......................................................................................... 197 Appendix 13
Participant Report (Women) ..................................................................................... 201 Appendix 14
Step test duration calculation ................................................................................... 205 Appendix 15
Workload determination ........................................................................................... 206 Appendix 16
Anthropometry.......................................................................................................... 207 Appendix 17
Cooper test ratings .................................................................................................... 208 Appendix 18

1
CHAPTER 1
LITERATURE REVIEW

2
1.1 Introduction
Cardiorespiratory fitness, which represents the effectiveness of the body’s respiratory and
circulatory system to supply adequate oxygen to working muscles, is generally regarded as a
marker for general fitness status. In addition to cardiorespiratory fitness the other components of
fitness are muscular endurance, flexibility, balance, speed, muscular strength, power, agility,
coordination, reaction time and body composition. The assessment of cardiorespiratory fitness
provides a measure of fitness status and changes in cardiorespiratory fitness provide a measure of
the effectiveness of a training programme. Also, an individualised exercise-training programme
can be prescribed based on cardiorespiratory fitness measured at the start of training.
As a consequence, cardiorespiratory fitness, also known as aerobic capacity, has often been
assessed in studies on physical activity and health. The first well documented test of aerobic
capacity was the Astrand and Ryhming test, developed in 1954 1. This was a submaximal test that
used a cycle ergometer to control the workload. The test gained popularity and in the 1960s many
other walking, running and stepping tests were developed to cater for different purposes and
needs. These tests required either a maximal effort, or were submaximal and predicted the aerobic
capacity from measurements during the test.
1.2 Measures of Cardiorespiratory Fitness
1.2.1 Maximal Tests
Maximum oxygen uptake (VO2max), the classical measurement of cardiorespiratory fitness is a
function of the maximum rate of oxygen consumption. The magnitude of VO2max is dependent
on the transport of oxygen by the cardiorespiratory system from the atmosphere to the exercising
muscles, followed by the utilisation of oxygen by the metabolically active tissue 2. To accurately
determine VO2max a participant performs a maximal test to exhaustion and oxygen consumption
is measured via indirect calorimetry. The test is usually performed either on a treadmill or cycle
ergometer in a laboratory; however tests can also be performed on other ergometers (e.g.
swimming flume, kayak ergometer). The VO2max test is regarded as the “gold standard”
measurement of aerobic capacity 3. A VO2max measurement is not an assessment of a

3
participant’s athletic performance per se, but rather it reflects the participant’s maximal ability to
consume oxygen during high intensity exercise. The accuracy of the measurement is dependent on
the measurement technique, which involves calibration of equipment for measuring oxygen,
carbon dioxide and volume of expired air. The participant also has to be fully motivated to exert
maximal effort. The VO2max also varies depending on the mode of exercise, with the highest
VO2max values recorded for exercise recruiting the most muscle mass 3. For example, VO2max
tests involving running on a treadmill elicit the highest VO2max values, while VO2max tests
conducted on a cycle ergometer, or kayak ergometer are lower because of the smaller muscle
mass used in the activity. Due to the specificity of metabolic responses to an exercise mode, it is
preferable to measure VO2max using a mode of exercise the participant is accustomed to. Intra-
individual day-to-day variation in VO2max is 4 to 6% in individuals with no cardiopulmonary
pathology or impairment 4.
The end of a VO2max test is defined by volitional exhaustion. If the participant does not exert
him/herself maximally the VO2max will be lower than the individual physiological capacity value 3.
Maximal tests also have practical limitations. For example, measurement of VO2max is
expensive, requires a high level of technical expertise and supervision, is time consuming and
impractical in non-laboratory and field-test situations. Furthermore a VO2max test is exhausting
for the participant and therefore not recommended for individuals with health problems, injuries
or low fitness levels 5. In such cases the test needs to be monitored by a physician. This has
resulted in a proliferation of submaximal tests to predict cardiorespiratory fitness 6, which have
overcome these limitations to some extent.
1.2.2 Submaximal Tests
Submaximal exercise refers to non-exhaustive exercise that disturbs homeostasis by increasing the
basal metabolic rate. An exercise intensity below 85 percent of age-predicted maximum heart rate
is considered to be submaximal 7. Submaximal tests in the laboratory usually involve one of three
modes of exercise: running, cycling or stepping and are conducted on a treadmill or cycle

4
ergometer or involve stepping up-and-down off a bench. The tests are either single stage or
multistage protocols. Worth mentioning is the nomogram for the prediction of aerobic capacity
from submaximal work which was developed by Astrand and Ryhming 1. The nomogram can be
used with a cycling, running or stepping protocol and considers the relationship between heart rate
during exercise and workload to predict VO2max. Balke 8 developed a 15 minute field
performance test involving running to assess the aerobic fitness of military personnel. The
average energy cost or oxygen consumption for the test was calculated using time and distance
measurements. Cooper also developed a shortened 12 minute running test in which participants
had to cover as much distance as possible 9. The distance covered was then used to predict
VO2max. A variety of other submaximal exercise tests have been developed since these early
aerobic capacity tests. The tests involving stepping will be discussed in detail later in this chapter.
The prediction formula of VO2max for submaximal exercise tests manipulates the linear
relationship between heart rate and oxygen consumption or the equivalent work rate. The
extrapolation of data from a measured submaximal performance to a predicted maximal value
makes the following assumptions: (1) linearity of the heart rate versus oxygen consumption
relationship, (2) a known maximum heart rate, and (3) if oxygen consumption is not measured
there is consistent mechanical efficiency of exercise 10. This principle has been applied in a
number of tests including the Astrand-Ryhming nomogram 1, the Canadian Home Fitness Test
based on a double bench stepping 11 and a simple step test for estimating VO2max 12. Some of the
tests are based on the assumption that the recovery of heart rate after exercise is related to
cardiorespiratory fitness. Cardiorespiratory fitness can therefore be predicted with reasonable
accuracy by applying these principles.
Exercise duration and the choice of protocol, steady state versus progressive/ incremental exercise
have an effect on physiological responses 13. When a submaximal test is used to predict VO2max
the test duration should be such that the participant assumes a steady state. Donald et al 14 suggest
that steady metabolic state can be attained within one minute of exercise. However Shephard 15
refutes the one minute proposal suggesting that it leads to serious errors and under-predicts

5
VO2max by 5 to 15% at higher workloads. Fitchett 13 found that heart rates from progressive
protocols were consistently lower than those from steady state protocols.
1.3 Heart Rate as a Physiological Determinant of Cardiorespiratory Fitness
Two of the most widely used variables to predict cardiorespiratory fitness are heart rate during
steady-state submaximal exercise and heart rate during recovery from steady state submaximal
exercise. Tests are based on the principle that the lower the heart rate during exercise or the faster
the heart rate recovers after exercise the fitter the individual. The relationship between heart rate
and other exercise-related parameters is influenced by physiological and environmental factors.
Although the heart initiates its own electrical impulse (intrinsic control) for contraction in the
sinoatrial node, the timing and effects can be altered through extrinsic systems, namely the
autonomic nervous system and the endocrine system (hormones) 16. The heart has a rich supply of
sympathetic and parasympathetic nerve fibres which regulate heart rate.
At rest the parasympathetic system activity predominates in a state referred to as vagal tone. The
parasympathetic innervation runs in the paired vagus (10th cranial) nerve. The vagus contains
preganglionic axons that synapse on postganglionic neurons in a ganglionic plexus that lies
among the cardiac muscle cells. Both the preganglionic and postganglionic neurons release the
transmitter acetylcholine. Postganglionic cells possess nicotinic receptors while cardiac cells
possess muscarinic receptors. Most of the parasympathetic postganglionic neurons synapse on
cells of the atria and conducting system, the sinoatrial and atrioventricular nodes and not on the
ventricular myocardium 17. The vagus nerve has a depressant effect on the heart. It slows the
impulse conduction and thus decreases heart rate. Maximal vagal stimulation can lower the heart
rate to between 20 and 30 beats per minute. The vagus nerve also decreases the force of cardiac
contraction 16.
The sympathetic nervous system has opposite effects. Sympathetic postganglionic cells connect to
the heart from the thoracic sympathetic chain ganglia. Sympathetic neurons make adrenergic
synapses both on the pace makers in the nodes and on the ventricular myocardium. Sympathetic

6
activation of the adrenal medulla delivers the hormone adrenaline to all parts of the heart by way
of the coronary circulation. As a result, the sympathetic nervous system can influence both the
heart rate and the strength of ventricular contraction in systole 17. Sympathetic stimulation
increases impulse conduction speed and thus heart rate. Maximal sympathetic stimulation allows
the heart rate to increase to about 200 beats per minute. Sympathetic input also increases the
contraction force. The sympathetic system predominates during times of physical or emotional
stress when the body’s demands are higher. After the stress subsides the parasympathetic system
again predominates 16.
The endocrine system exerts its effects through the hormones released by the adrenal medulla,
adrenaline and noradrenaline; these hormones (adrenaline and noradrenaline) are referred to
collectively as catecholamines. Similar to the effect of the sympathetic nervous system, these
hormones stimulate the heart, increasing its rate. In fact, release of these hormones is triggered by
sympathetic stimulation during times of stress, and their actions prolong the sympathetic response 16. Postganglionic sympathetic fibres that release noradrenaline are distributed in the entire
myocardium. A sympathetic activation of the adrenal medulla releases adrenaline and some
noradrenaline. The effect of transmitter substances are determined by the membrane receptors of
the target cells 18. There are two main groups of receptors, alpha (α) and beta (β) adrenergic
receptors with subgroups α1 and α2 and β1 and β2. Alpha-receptors are found mainly in the cell
membranes of vascular smooth muscle cells and α- adrenergic activity causes vasoconstriction. In
the heart α-receptors are sparse so adrenaline and noradrenaline activate mainly β receptors. This
increases the heart rate by increasing the firing pattern of the sinoatrial node and increases the
conduction velocity of the atria, the atrioventricular node and the Purkinje system. The effect is
the opposite of stimulation of the parasympathetic nerve and is called chronotropic action. β1
adrenergic activity increases the activity of myocardial contractility, that is, the strength of
contraction at any given end-diastolic volume. This increases stroke volume at the expense of a
reduced end-systolic volume. This effect exerted by catecholamines is called positive inotropic
action 18.

7
A chronotropic effect is an alteration of the heart rate. The bradycardia caused by the
parasympathetic input is a negative chronotropic effect, while the tachycardia caused by
sympathetic input is a positive chronotropic effect. Chronotropic effects are a result of changes in
the rate of diastolic depolarisation, the process by which the pacemakers of the sinoatrial SA node
automatically return to threshold after an action potential. An inotropic effect is an alteration of
the contractile properties of myocardial cells. Activation of the β1-adrenergic receptors of
myocardial cells by adrenaline or noradrenaline results in a positive inotropic effect, or increase in
the force of contraction during systole 17.
The venous filling of the heart determines the size of the stroke volume. An increased sympathetic
drive elevates the heart rate and the heart beat becomes more forceful. This increases the
myocardial oxygen uptake and coronary blood flow. The net effect is a dilation of the coronary
vessels. The inherent rate of the heart beat can be highly modified and can range from about 40
beats per minute at rest to about 200 beats per minute during heavy exercise in a young individual 18.
At rest in a supine position, cardiac output is 4 to 6 L.min-1 depending on body size. In a passive
feet down position cardiac output decreases due to venous pooling. The stroke volume is reduced
and the heart rate increases. The oxygen uptake is unchanged and hence the arteriovenous oxygen
difference (a-v) O2) is increased. Activation of the skeletal muscle pump propels the blood
towards the heart and heart rate may decrease as stroke volume increases. During exercise cardiac
output increases with increasing oxygen uptake. Blood flow is redistributed so that skeletal
muscles receive 80% to 85% of the cardiac output compared to about 15% at rest 18. Cardiac
output (Q) is the product of heart rate (HR) and stroke volume (SV). (Q = HR X SV) 16. Therefore
the relationship between heart rate, oxygen uptake and exercise intensity can be used to assess
cardiorespiratory fitness.
1.3.1 Resting Heart Rate
Resting heart rate decreases after endurance training 19,20,21. Wilmore at al 20 found small but
significant decreases in resting heart (2.7 to 4.6 beats.min-1 at 72 hours post training) after a 20

8
week endurance training programme. Smith et al 22 investigated the mechanism behind
bradycardia. They suggested that the decrease in resting heart rate after training was due to
changes in the intrinsic rhythmicity of the heart and an increase in the predominance of
parasympathetic control. The sympathetic contribution to heart rate decreases slightly 22.
1.3.2 Heart Rate during Exercise
The time between each heart beat varies at rest or during low intensity exercise; this is referred to
as heart rate variability. Heart rate variability decreases with increasing exercise intensity 23,24.
This is due to the different firing patterns of the autonomic nervous system as exercise intensity
increases 25. During rest and low intensity exercise the parasympathetic nervous system is
dominant and fires infrequently to cause variations in the time interval between heart beats 26. As
the exercise intensity increases the firing of the parasympathetic nervous system reduces 25 and
there is activation of the sympathetic nervous system 26,27,28, resulting in decreases in heart rate
variability.
1.3.3 Effect of Endurance Training on Submaximal and Maximal Heart Rate
Heart rate at the same submaximal exercise intensity under controlled conditions decreases after
endurance training. The decrease is due to a decrease in sympathetic activity 29,30,31,31, enhanced
intrinsic heart rate regulation, increased baroreceptor and metaboreceptor sensitivity and
improved autonomic balance after endurance training 32.
Maximal heart rate decreases with endurance training 33,34,35 and increases with detraining 36,37.
Maximum heart rate decreases by between 5 and 13 beats per minute with aerobic training and
increases by 4 to 10 beats with reduced training or detraining 38. Proposed mechanisms for the
decrease in maximal heart rate after endurance training include plasma volume expansion 34,
enhanced baroreflex function 39 and decreased β-adrenergic receptor number and density 40,41.
1.3.4 Factors Affecting Heart Rate during Exercise
Heart rate during exercise is affected by environmental conditions. When exercising in hot
conditions (i.e. temperatures above 30 ºC), heat loss mechanisms such as evaporation, conduction,

9
convection and radiation are less efficient. As a consequence heart rate is about 10 beats per
minute higher at submaximal exercise intensities in the heat than it would be during cool
conditions 42,43. Therefore under these conditions heart rate overestimates the intensity of exercise 44. These findings show that it is unreliable to use heart rate to monitor exercise intensity under
such conditions, although it remains a good general marker of physiological stress.
The time of day and altitude are other factors that affect heart rate during exercise and should be
controlled when heart rate is measured. Measurement of heart rate should be done at same time of
day to cater for circadian changes in heart rate and minimise circadian effect on heart rate 45.
When exercising at altitude the heart rate/VO2 relationship remains linear, however submaximal
heart rate is elevated at a given VO2. Another factor that can affect the heart rate/workload
relationship is the duration of exercise. After prolonged exercise, particularly exercise in the heat,
blood volume decreases. This results in an increase in submaximal heart rate at the same
submaximal workload 23,46.
In summary, submaximal heart rate can represent the exercise intensity and can also be monitored
at regular intervals and used as a marker of changes in training status. While a decrease in
submaximal heart rate at a controlled absolute workload indicates a positive adaptation to
training, an increase in submaximal heart rate indicates either overtraining 44,47, dehydration 46 or
a decreased training status.
1.3.5 Heart Rate after Exercise
Heart rate recovery is the rate at which heart rate decreases towards resting levels after moderate
to heavy exercise. Heart rate recovery is a measure of the regulation of the autonomic nervous
system 48. Following the cessation of exercise, heart rate decreases almost immediately, with the
initial decrease being almost linear. The rate of reduction of heart rate is dependent on the
withdrawal of input from the sympathetic nervous system and the reactivation of the input of the
parasympathetic nervous system 24,49,50,51. Many researchers describe a coordinated interaction
between parasympathetic reactivation and sympathetic withdrawal with sympathetic withdrawal
occurring faster and therefore playing an important role in the early decrease in heart rate

10
recovery 50,32,52,51. The parasympathetic drive is higher during recovery 50 than during the
preceding workload. Hence heart rate variability is also higher during recovery than during the
preceding exercise 24.
Heart rate recovery is an indicator of cardiorespiratory fitness; a general principle is that the faster
the rate of heart rate recovery, the higher the fitness level of participants 53,54. Indeed, the heart
rate of well-conditioned, trained, physically active participants recovers faster than untrained
participants 23,54,55,56,57,58. Cardiorespiratory fitness can be predicted with a reasonable accuracy by
applying the relationship between the rate of heart rate recovery and fitness 54,56,58. A heart rate
recovery of 12 beats or less in the first minute is a strong predictor of subsequent mortality 59,60.
The heart rate at the end of exercise influences the decrease in heart rate during recovery 27. Heart
rate recovery is slower after maximal exercise than after submaximal exercise. This is due to the
sympathetic nervous system, which is stimulated significantly more during maximal exercise 49
and continues to dominate into the recovery phase, contributing to sustained tachycardia despite
parasympathetic nervous system reactivation 27. After high intensity exercise sympathetic
withdrawal contributes to heart rate deceleration whereas after submaximal exercise heart rate
recovery is mainly controlled by parasympathetic reactivation. Exercise intensities ranging
between 86 and 93% of maximum heart rate have the most stable heart rate recovery, therefore
the highest sensitivity to detect meaningful changes on a day-to-day basis 61.
1.3.6 Application of the Heart Rate Data
Heart rate and VO2 increase linearly with increasing exercise intensity up to near maximal
exercise. An individual’s aerobic fitness is reflected in the slope of the heart rate-VO2 curve.
Heart rate during exercise can therefore be used to estimate VO2. Astrand and Ryhming 1 used the
heart rate-VO2 relationship in a nomogram designed to predict VO2max. The method is based on
the assumption that the relationship between heart rate and VO2 is linear over the entire range of
exercise intensities. In fact the relationship is curvilinear at very low exercise intensities and
towards maximal exercise. Therefore the accuracy of the prediction diminishes at these extreme

11
ends of the relationship. Also, the prediction of VO2max from submaximal heart rate has
limitations if the factors that affect heart rate during submaximal exercise are not controlled.
In summary, heart rate can be used as a marker of exercise intensity. Furthermore, both resting
and submaximal heart rates decrease with endurance training, whilst heart rate recovery after
exercise increases with endurance training. All these measurements are affected by external
factors that need to be controlled to improve sensitivity. Heart rate recovery after exercise can be
used to predict cardiorespiratory fitness using the relationship between heart rate recovery and
fitness. If the heart rate/VO2 relationship is known, VO2max can be predicted from heart rate.
This relationship has practical application and has been used with several different exercise
modalities 4,62,63,64,65,66,67,68,69,70,71,72,73,74,75,76. Step tests have been the most popular mode of
exercise to assess cardiorespiratory fitness and have received the most attention from a validation
perspective. The explanation for this is that most people are accustomed to stepping and therefore
do not have to be familiarised with the mode of exercise, and the step test does not require
expensive equipment. For these reasons step tests have the potential to have a useful practical
application for the assessment of cardiorespiratory fitness.
The next section will discuss the various step tests that have been developed to predict VO2max
using the principles of measuring heart rate either during or after exercise.
1.4 Step Tests
1.4.1 Introduction
Step tests are amongst the earliest submaximal tests designed to predict VO2max 1, possibly
because the protocols can be easily controlled. Step testing is an inexpensive form of a
submaximal test and is appealing because it does not involve laboratory equipment. The first step
tests were used in the early part of the 20th century. Many of the step tests that are used today are
derived from these early tests. As a result there are a multitude of tests that are currently in use,
some which have been validated and others which have not. Unfortunately it has become difficult
to differentiate the validated tests from those that have been developed without undergoing any

12
form of systematic analysis. The following section is a review of all known step tests. The aim of
the review is to describe each of the tests, in particular the information that describes the accuracy
and validity of each test. The review describes the required protocol when performing step tests
and also analyses the manner in which the step tests were validated. A brief description of each
step test is given in Table 1.

13
Table 1 Brief description of step tests
Year Test Brief description Publication 1920 Cardiovascular
efficiency test Cardiovascular rating based on changes in cardiovascular system following six different interventions, including 15 seconds step test
Schneider, E.C. 77
1931 Pulse-Ratio test The ratio of the resting heart rate to heart rate after exercise (obtained by dividing two minutes heart rate after a known amount of exercise by one minute resting heart rate).
Tuttle,W.W. 78
1942 Harvard step test Five minute step test, the score is obtained by dividing the duration of exercise by the total of the heart beats during the different phases of recovery
Johnson,R.E.Brouha, L. Darling,R.C.79
1954 Astrand-Ryhming nomogram
Submaximal step test, treadmill test or cycle test. Oxygen at 50% and 70% of VO2max is plotted against heart rate and nomogram worked out with scales of work levels (cycle test) and body weight (step test). Oxygen intake from the scales and heart rate were used to calculate VO2max.
Astrand, P.O., Ryhming, I. 1
1961 YMCA 3-Minute step test
Three minute step test, 30.5 cm step at 24 steps per minute. One minute sitting recovery heart rate determines fitness category
Kasch, F.W. 80
1965 Balke step test Adjustable platform from 2 to 50 cm, 24 or 30 steps per minute for 20 minutes or to exhaustion respectively. Total oxygen intake obtained using the equation: Total VO2 = standing VO2 + 1.33 × horizontal VO2 + 2.4 × vertical ascent
Nagle, F.J., Balke, B., Naughton, J.P. 81
1972 Queen’s college step test
Three minutes step test, 15 s recovery heart rate, regression line used to predict VO2max
McArdle, W. et al. 82
1975 Canadian home fitness test
Multistage step test, each stage three minutes long, double step used, 10 s recovery heart rate
Shephard, R.J. et al 11
1995 Chester step test Five stage step test each stage two minutes long, heart rate and RPE are continuously measured throughout the test
Sykes, K. Roberts, A. 83

14
2003 Cambridge step test
Eight minutes step test, gradual increase in stepping rate, resting, exercise and recovery heart rate used to predict VO2max
HSE 84,85
1.4.2 Cardiovascular Efficiency Test
The Cardiovascular efficiency test was developed during the First World War in response to the
need to measure physical efficiency, fatigue, physical fitness and health of aviators 77. A
cardiovascular rating based on six sets of observations of cardiovascular changes was developed
for the test: (1) reclining heart rate (2) standing heart rate, (3) heart rate increase from reclining to
standing, (4) heart rate increase due to exercise, (5) time taken for heart rate to return to resting
heart rate from a standing posture and (6) rise or fall in systolic blood pressure on standing.
The participant reclines for five minutes and heart beats are counted for 20 seconds, multiplied by
three to get heart rate in beats per minutes and recorded. Systolic blood pressure is recorded when
the participant is still reclining. From a standing position heart beats are counted for 20 seconds,
multiplied by three and heart rate recorded. The difference between the standing and reclining
heart rate is recorded. Standing systolic blood pressure is recorded and the difference between
standing and reclining systolic blood pressure is determined. The stepping exercise follows. This
involves stepping on a chair about 45.7 cm high five times in 15 seconds. This is equivalent to a
stepping rate of 20 steps per minute. Immediately after the 15 seconds of exercise the heart beat is
counted for fifteen seconds, multiplied by four and recorded. Counting continues in fifteen
seconds intervals for two minutes, with the counts being recorded at 60, 90 and 120 seconds. The
difference between exercise heart rate and standing heart rate is determined. The time taken for
the heart rate to return to standing heart rate is also recorded. The scores for each of the six items
range from +3 to -3. When all items are added together the perfect score is 18. A score of 9 or less
is considered a low score that requires further investigation by a medical examiner.
The results obtained from the cardiovascular efficiency test were compared with medical
examination results 77. Aviators underwent a thorough medical examination and 54 were found to

15
be physically unfit. The Cardiovascular efficiency test was administered on the 54 aviators and
89% had scores ranging from -1 to 9. Only 11% scored above 9. The results indicated that a score
of 9 or less is characteristic of unfit men.
To verify the results obtained from the cardiovascular efficiency test, 150 men were tested and 46
men scored 9 or less. Medical examination results of the 46 men indicated that 65% were “unfit”.
The Cardiovascular efficiency test scored men as either “fit” or “unfit” according to
cardiovascular responses. Whilst the test gives some indication of an individual’s fitness,
questions concerning the aerobic capacity of the participant remain unanswered. The test does not
provide precise individual measurements of fitness and has not undergone a systematic
evaluation.
1.4.3 Pulse-ratio Test
The next recorded step test was the pulse-ratio 78. This test was designed to measure physical
efficiency based on various tests that had been done at State University of Iowa. The objective
was to develop a test for coaches for rating physical efficiency with a high degree of accuracy.
The pulse-ratio represents the ratio of the resting heart rate to heart rate after exercise and is
obtained by dividing total number of heart beats for two minutes after a known amount of
exercise by the heart beats in one minute during rest. For example, if the total number of heart
beats for two minutes after exercise is 210 beats and the resting heart rate for one minute is 70
beats, then the pulse ratio is three.
This protocol requires a standard exercise that has the same relative demands on all participants,
for a comparison of heart rate response between individuals or the same individual under different
conditions. In earlier research Hambly and his workmates 86,87 investigated various types of
exercise such as walking, stair-climbing and running and recommended using a stepping or stool
climbing exercise as this could be standardised and the protocol is convenient, flexible, and does
not require skill. The amount of work performed can be varied to suit the experiment under
consideration by varying the rate of stepping or by increasing the duration at a uniform rate. A 33

16
cm stool is used with stepping rates ranging from 15 steps per minute to 60 steps per minute.
Uniformity in technique execution is emphasised. A calibrated metronome is used to control the
stepping rate. The participant steps for one minute at a determined stepping rate. Immediately
after the exercise, heart beats are counted for two minutes.
An empirical standard pulse-ratio of 2.5 was adopted to compare the efficient ratings of different
individuals or those of the same individual under different conditions. According to the procedure
the standard pulse ratio remains constant while the amount of standard exercise required to
produce it is the variable factor. The amount of work required to produce a pulse-ratio of 2.5 is
determined as number of steps per minute and is the basis of rating an individual’s efficiency.
This value is derived from a graphic calculation where two ratios are given, one below and the
other above the 2.5 ratio. A certain amount of work is selected, for example 18 steps per minute,
which gives a pulse-ratio below 2.5. Then a second one is employed, 30 or 40 steps per minute,
which gives a ratio above 2.5. Two data points are plotted and connected by a straight line on a
graph, with number of steps on the X axis plotted against pulse ratio on the Y axis. A line is
dropped from the point where the line crosses the 2.5 pulse-ratio to the base-line (X axis)
representing the number of steps per minute.
Figure 1 The graphic calculation of the number of steps that produce a pulse-ratio of 2.5
0 10 20 30 402.00
2.25
2.50
2.75
3.00
Number of steps
Pu
lse-r
ati
o

17
For comparison purposes the number of steps required to produce a 2.5 pulse-ratio is converted
into percent efficiency. The amount of exercise required to produce a pulse-ratio of 2.5 is assumed
to be 50 steps and the value 100% is assigned. The following formula is used to reduce the data to
an arbitrary percent.
Efficiency rating = 100 (Number of steps required for 2.5 pulse-ratio) 50 (Equation i)
The basis of the pulse-ratio test is to measure the cardiac response to exercise. It shows
physiological changes that are reflected by the compensatory mechanism of the heart. The test has
been used to investigate the effect of athletic performance 88,89, physical efficiency 90,91, fatigue 78
and smoking 78 on cardiac response to exercise.
Physical efficiency of athletes (n = 80) was compared with the physical efficiency of sedentary
people (n = 90) 78. Athletes had a mean efficiency rating 6% higher than non-athletes. However,
the study does not provide measurement error data making it impossible to determine whether the
6% was outside the margin of error. Data also indicated a 95% chance that athletes have a higher
efficiency than non-athletes. An investigation on the effects of fatigue data showed that fatigue
induced by 250 deep knee-bends decreased efficiency by 22%.
An investigation on the effect of smoking on high school boys (n = 15) showed that the mean
efficiency of smokers was 5% less than that for non-smokers 78. The authors acknowledge that the
sample is small but the results agree with the general accepted view regarding smoking. In
another study the physical efficiency of university women who were habitual smokers (n = 10)
was determined by the pulse-ratio test 78. Smokers were 13% less efficient than non-smokers.
The concept of standardising work for a test of physical fitness was considered by Tuttle in the
pulse ratio test 88. It occurred to him that a step test presented as a simple physical activity that
could be standardised for participants for comparison purposes. The pulse-ratio test rates physical
efficiency. However, assumptions were made when designing the test, making the results only

18
good for comparison purposes, and not as a measure of an individual’s fitness level. For example,
the use of 2.5 as a standard pulse ratio was done so that efficiency ratings of different individuals
could be compared. Another assumption made was that 50 steps was the number of steps that
result in 100% efficiency. Tuttle also observed that when the calculated number of steps required
for a 2.5 ratio was performed, the resulting pulse-ratio was not 2.5 78. Due to the development of
later tests that could either predict or measure physical fitness, the pulse-ratio test was relegated as
a fitness test and has not been adopted as a protocol in research.
1.4.4 Harvard Step Test
The Harvard step test, first described in 1942, was developed in the Harvard Fatigue Laboratories
during World War II and has since been used in research 79. During the test the participant steps
up and down, 30 times a minute for five minutes off a 50.8 cm platform. The test may end before
five minutes if the participant gets exhausted before that. With the original version of the test the
tester counted the pace up - 2 - 3 - 4, every two seconds, however more recently a metronome has
been used to control the pacing. At the end of the test the participant sits down. The tester records
the duration of exercise and the number of heart beats from 1 to1 ½, 2 to 2½ and 3 to 3½ minutes
after the end of the exercise. The score is obtained by dividing the duration of exercise in seconds
by the total of the heart beats during the different phases of recovery, according to the following
formula.
Index* = Duration of exercise (seconds) x 100 2 x total heart beats in recovery** (Equation ii)
*The index has no units, it is just a numerical value
**Sum of beats from 1 to1 ½, 2 to 2½ and 3 to 3½ minutes
The interpretation of the test was simplified by the compilation of a table for participants who
managed to complete five minutes of the test. The heart beats for the three recovery periods are
added and the scores compared to normative data. The score is interpreted as follows: below 55 =
poor; from 55 to 64 = low average; from 65 to 79 = high average; from 80 to 89 = good; above 90

19
= excellent 92. The fitness categories were derived from the results of many tests that were done in
the Harvard Laboratories. There are differences in the fitness categories that were used when the
test was first described for different forms of exercise such as running uphill on a treadmill,
pulling a stone boat with a load one-third of the participant’s body mass, rowing against a heavy
load, cycling on a bicycle ergometer against a load proportional to the body mass 79 and the
fitness categories when stepping was the mode of exercise 92. The average score for the Harvard
College population irrespective of training was 75 with a range from 15 to 120 92.
The original Harvard step test was designed for adult men. Reedy, Saiger and Hosler conducted a
study on army trainees to determine if height and weight influenced an individual’s performance
in the Harvard step test 93. They showed that a combination of height and weight factors had no
significant influence on the scoring of the Harvard step test. When height was analysed
independently it did not influence the Harvard test score significantly. However, when weight was
analysed independently, lighter men achieved significantly higher scores than heavier men
regardless of the fitness of the participants. Sloan 94 modified the Harvard step test to
accommodate women by lowering the height of the step to 43.2 cm. Bandyopadhyay 95 concurred
with Sloan 94 that the original Harvard step test was very strenuous and unsuitable for children,
short, untrained and aged people.
However, Ricci et al 96 showed that it was not necessary to lower the step height to cater for
shorter people. They investigated the energy cost and efficiency of the Harvard step test
performance with two male and two female graduate students in the same work categories using a
50.8 cm bench. Females were 159 cm and 163 cm stature whereas the males were 175 cm and 185
cm tall. Females also had shorter leg lengths and weighed less than the males. Participants
performed the Harvard step test on alternate class days during a six-week period. The test scores
of all participants improved with females achieving the “excellent” category of the Harvard step
test and the males achieved “good” and “high average” scores. Open-circuit indirect calorimetry
was used and exhaled gases were collected in Douglas bags. A similar pattern in oxygen uptake
during the Harvard step test and recovery was observed in males and females with female values
slightly lower than males. The energy cost for males was also slightly higher than females.

20
However female participants had higher net efficiency ratings than males. Participants reported
discomfort in the quadriceps and none reported discomfort in the knee joint due to fatigue.
Contrary to the findings of Sloan 94, Ricci et al 96 found no justification for lowering the step
height for women as they achieved high Harvard step test score, high net efficiency ratings and
low oxygen debt values. They suggested that the unsuccessful completion of the test, especially
by women, might be a reflection of motivation levels and discomfort tolerance levels rather than
cardiorespiratory response to exercise. However it should be pointed out that the sample size of
the study of Ricci et al 96 was too small to represent all women, and therefore their conclusions are
inconclusive.
Many single stage step tests have been developed from the original Harvard step test by
modifying work variables (step height, step frequency, stepping duration) and the scoring method.
For example of such tests are the Queen’s college step test 82 and the YMCA three minute test 80.
1.4.5 Astrand-Ryhming Nomogram
Astrand and Ryhming 1 developed a nomogram for calculating aerobic capacity based on a series
of studies on healthy men and women aged 20-30 years. Participants did submaximal work
adjusted so the workload demanded oxygen intake of approximately 50% of VO2max. This
elicited a mean heart rate of about 128 beats per minute in men and 138 beats per minute in
women after about six minutes. Participants then exercised at an oxygen intake 70% of VO2max.
The heart rates at this workload were about 154 and 164 beats per minute in men and women
respectively. The relationship between heart rate and oxygen intake expressed as a percentage of
VO2max was plotted on a graph using the two data points. A nomogram to calculate aerobic
capacity was determined based on these relationships.
Astrand 97 found that oxygen intake could be calculated from work level within a range of ± 6%
in two thirds of the participants. A similar range was obtained when oxygen intake was calculated
from work done on a step test 98. The step height was 40 cm for men and 33 cm for women and
the stepping rate was 22.5 steps per minute. The work done was calculated from body mass, step
height and a constant mechanical efficiency.

21
Based on the findings of the experiments by Astrand and Ryhming 97,98 scales for work levels
(cycle test) and body mass (step test) were added to the nomogram. A conception of energy output
can be obtained by reading horizontally from these scales to the ‘oxygen intake’ scale.
A study examined the validity of the predicted measurement of VO2max against measured
VO2max determined in maximal treadmill or cycle ergometer tests 97. Well trained participants
(27 males and 31 females) aged between 20 and 30 years performed a submaximal cycle test at
900 kg m.min-1 (women) and 1200 kg m.min-1(men). The difference between measured and
calculated VO2max was 0.55% in men and 0.34% in women 1. The coefficient of variation was
less than 7% for men and 9% for women. However, with a lower work rate, (600 kg m.min-1 for
women and 900 kg m.min-1for men), the coefficient of variation was higher, 14% and 10%
respectively.
In another study designed to validate the nomogram 18 well trained male participants aged 18-19
years did a VO2max test 99. It is not clear if the VO2max test was done on a treadmill or cycle
ergometer. Participants also did two submaximal tests; a step test with a step height of 40 cm at
22.5 steps per minute and a treadmill test with the treadmill set at 1º elevation and at 10 km.h-1.
Oxygen intake and heart rate data measured during these submaximal tests were used to predict
VO2max. The difference between predicted and measured VO2max was 0.15% in the step test and
0.49% in the treadmill test. The coefficient of variation was less than 7% 1.
VO2max for 31 female and 28 male participants aged 20-30 years was calculated from heart rate
and oxygen intake obtained from a cycle test of 600 kg m.min-1 (women), 900 kg m.min-1 (men)
and a step test and the results were compared. The difference between the means was 0.61% for
women and 0.10% for men. The standard deviation was 9.5% for men and 7.3% for women. Both
the cycle test and step test had similar VO2max predictions.
The Astrand-Ryhming nomogram does have limitations. For example, comparisons of predicted
and measured VO2max have consistently shown that the Astrand-Ryhming nomogram under
predicts VO2max 100,101,102,103,104. However, many of the studies attempting to validate the

22
nomogram have had methodical concerns, which have militated against the interpretation of the
results. Also some of the experiments compared VO2max predicted from a cycle ergometer
protocol with that measured from a treadmill protocol 100,105.
Another limitation of the Astrand-Ryhming nomogram is the assumption of the linearity between
VO2 and heart rate over the whole range of effort 105. It is understood that at near maximal levels
the relationship is non-linear, exponential and asymptotic 101,106,107.
The nomogram was developed on healthy participants aged 18 - 30 and subsequently adapted for
use over a wide range of age groups and physical fitness levels. Individual variations in fitness
affect the accuracy of construction and predictive ability of the nomogram and limit its
applicability to groups of different ages and fitness. The authors were aware of this limitation and
advised that caution should be taken when using the nomogram for different age groups. They
developed an age correction factor 108.
In summary, the Astrand-Ryhming nomogram was developed on a group of young men and
women and the prediction equation was adjusted for older people. The test is based on
submaximal work; up to 70% of an individual’s age predicted maximum heart rate that engages
large groups of muscles (i.e. bench stepping, cycling on a cycle ergometer and running on
treadmill). The test duration is five to six minutes, a duration that allows circulation and
ventilation adjustments to the level of exercise. VO2max is calculated from heart rate and oxygen
intake or work level reached during the test. Although the precision of the prediction equation has
been established, some of the validation studies had methodological limitations and therefore
these results should be interpreted with caution.
1.4.6 YMCA 3-Minute Step Test
The 3-minute step test was developed by Kasch and first documented in 1961 80. The step test
involves stepping on a 30.5 cm step at 24 steps per minute for three minutes. Within five seconds
of completing the test the participant sits on a bench and heart beats are counted for one minute.
In its original form the step test used one minute heart beat count as the score to determine a

23
participant’s fitness category 109. Now the test uses heart rate after one minute of recovery to
categorise participants according to age and sex. The categories are: very poor, poor, below
average, average, above average, good and excellent. A low heart rate at the end of the one minute
of recovery is rated highly. In 1970 the Young Men’s Christian Association (YMCA) adopted the
3-minute step test as a simple and fast method of assessing cardiorespiratory fitness and this
became known as the YMCA 3-minute step test 109.
The YMCA 3-minute step test categorised cardiorespiratory fitness but did not estimate VO2max.
Therefore it could not be used to design individualised training programmes based on VO2max
data.
Santo and Golding 109 investigated the effect of adjusting step height on the relationship between
heart beat count in the YMCA 3-minute step test and VO2max. They also investigated whether a
shorter recovery heart beat count of 15 seconds resulted in a better correlation between VO2max
and heart beat count than a longer period of one minute. Sixty participants (27 women and 33
men) aged 18 to 55 years performed the YMCA 3-minute step test followed by a VO2max test.
Step height was adjusted according to participant stature using the equation Hf = (0.187) (Ih) for
women and Hf = (0.190) (Ih) for men, where Hf represents bench height in cm, and Ih represents
the participant’s height in cm 53,110. Heart beat count was recorded by an electrocardiogram (ECG)
and the printout was used to determine heart beat count at 15 seconds and one minute after the
step test.
Forty-four participants (22 women and 22 men) satisfied the VO2max test criteria and had their
results analysed. There were significant correlations between both the 15 seconds recovery heart
beat count and one minute recovery heart beat count with VO2max, (r = 0.58) and (r = 0.61)
respectively. The standard error of estimate (SEE) for predicting VO2max from 15 seconds and
one minute heart beat count were 8.8 and 8.5 ml.kg-1.min-1 respectively. SEE values were higher
than desirable, 15 to 20% of the measured mean, probably due to the use of heart beat count and
not heart rate. Heart beat count gives the total number of heart beats in a minute whereas heart
rate gives the rate at which the heart beats which may vary from beat to beat. During recovery

24
from exercise, heart rate decreases markedly in the first minute. Heart beat count cannot be used
to represent heart rate recovery. Contrary to earlier studies 2,82 which suggested that the first 20
seconds recovery heart beat count yielded greater reliability than one minute recovery heart beat
count, Santo and Golding 109 found no statistical significance in the 15 seconds and one minute
heart beat count prediction of VO2max. Santo and Golding 109 used sitting recovery heart beat
count as opposed to standing recovery heart beat count used in previous studies 2,82. This could be
the source of the difference in findings.
One limitation of the study by Santo and Golding 109 was that they assumed a discrepancy in heart
beat count from the original 3-Minute Step test which did not adjust step height according to
participant height. Since the participants of this study did not perform the original YMCA 3-
Minute Step test, the validity of this assumption could not be ascertained. Also, the YMCA Step
test did not predict VO2max, so no comparison could be made between the original test and the
modified test.
The step test was popularised by its adoption by the YMCA. It is part of their fitness test battery
and is used as a fast and convenient way of testing cardiorespiratory fitness. Since the test does
not predict VO2max it could not be validated.
1.4.7 Balke Step Test
The Balke step test is a maximal effort graded step test that differs from other step tests in that it
has a gradual increase in step height and continues until the participant is exhausted 81. Nagle et al 81 investigated the feasibility of a progressive step test for the assessment of work capacity. They
evaluated two stepping procedures with an adjustable platform that could be elevated or lowered
from 2 to 50 cm as the participant stepped. They used the data from the test to derive equations
for the prediction of oxygen costs of stepping at various stepping rates and step heights.
Thirty-eight men aged 18 to 49 years and weighing 62 to 98 kg performed a step test at 30 steps
per minute 81. The platform was set at two centimetres and raised two centimetres every minute.
Heart rate, blood pressure, respiratory exchange ratio and ventilation were measured and

25
recorded. The test was stopped when the participant could not maintain the stepping rhythm or
when pulse pressure began declining at near maximum heart rates.
To cater for participants of low physical working capacity a slower stepping rate was used.
Twenty-two man aged 29 to 68 years and weighing 61 to 109 kg performed a similar test
procedure at 24 steps per minute 81. The initial platform height was 3.3 centimetres and was raised
1.7 centimetres every minute. The test was terminated after 20 minutes. Some participants did not
attain their aerobic capacity when the test was terminated.
The work done when stepping was a summation of the positive work of lifting the body onto a
raised platform and the negative work of lowering the body down. Experiments were done to
determine the metabolic costs of each phase of a stepping cycle, standing, stepping forward,
stepping down and normal stepping. To determine negative work a gradational stepping device
with a windlass mechanism was used which lifted the participant rapidly to a certain height from
which they stepped down. The energy cost of the negative work was obtained by subtracting the
costs of standing and stepping forward horizontally from the total energy expenditure of the
exercise procedure. This was done at 12 and 18 steps per minute due to mechanical limitations of
the windlass mechanism. Oxygen cost for positive work was calculated by subtracting the cost of
standing and negative work from the oxygen cost of the normal stepping procedure.
The oxygen intake at varying step heights at the rate of 30 steps per minute ranged from 12.0 ±
1.2 to 40.8 ± 3.5 ml.kg-1.min-1. At 24 steps per minute oxygen intake ranged from 10.7 ± 1.1 to
28.8 ± 1.3 ml.kg-1.min-1.
Negative work was about a third of positive work. Assuming that the same distribution of energy
costs occurs for any combination of stepping rate and step height, an equation was derived for
predicting the energy cost for stepping, where VO2 is in ml.kg-1.min-1, vertical ascent in metres
per minute and 1.8 is the approximate oxygen requirement in millilitres for 1 kg per metre of
work:

26
Total VO2 = standing VO2 + horizontal VO2 + vertical ascent × 1.8 + 0.33 (horizontal VO2 + (vertical ascent × 1.8)) (Equation iii)
or simplified:
Total VO2 = standing VO2 + (1.33 X horizontal VO2) + (2.394 × vertical ascent) (Equation iv)
The total energy cost for stepping is the sum of oxygen requirements for standing, stepping
forward, stepping upward and the negative work of stepping down. The applicability of the
formula was tested by comparing the predicted metabolic cost of stepping with the measured
values. When stepping at 30 steps per minute the predicted oxygen intake values were
approximately the same as the measured values. At 24 steps per minute the predicted values were
slightly higher than the measured values but within one standard deviation of the measured,
except for the last minute of work which had identical values. Therefore the energy costs of
stepping at reasonable rates and heights can be predicted closely 81.
With a resting metabolic rate of 3.5 ml.kg-1.min-1 the step tests may be used to evaluate
individuals with energy expenditure ranging from 2.5 to 12 times resting metabolic rate. The 30
steps per minute test ranged from 3 to 12 times and the 24 steps per minute test ranged from 2.5 to
8 times resting metabolic rate. The work intensity of the step test progresses gradually allowing
for monitoring, thus conforming to the general guidelines of maximal exercise testing. The tests
however could not accommodate highly trained participants who exceeded metabolic levels of 12
times resting metabolic rate at approximately 40 centimetre step height in the 20th minute of the
test.
1.4.8 Queen’s College Step Test
McArdle et al developed the Queen’s College Step Test (QCST) at Queens College of the City
University of New York in 1972 to assess VO2max in female students 82. The QCST protocol
requires that the participant steps on and off a 41.3 cm step for three minutes at the rate of 22
steps per minute. After the test the participant stands motionless. With the original version of the
test heart rate was measured by counting the pulse of the carotid artery for 15 seconds (5 - 20

27
seconds) and for another 15 seconds after one minute recovery (60 - 75 seconds). However, this is
now done more accurately using a heart rate monitor. A regression line is used to predict VO2max
from the first 15 seconds recovery heart rate using the equation;
Y = 65.81 – 0.1847X (Equation v)
where X is recovery heart rate in beats per minute 82.
McArdle et al 82 evaluated VO2max predicted from the QCST in 41 female students at Queens
College and related VO2max to physical work capacity (PWC). PWC was defined as the time in
seconds the participant ran before the heart rate reached 150 beats.min-1 (PWC150), 170 beats.min-
1 (PWC170), and the point at which the participant could no longer continue running (PWCmax).
Participants performed a Balke treadmill test on two separate occasions within 3-5 days to
determine VO2max test-retest reliability. After the treadmill test participants performed the QCST
twice in one week to determine the reliability of the recovery heart rate scores.
The VO2max test-retest reliability coefficient was r = 0.95, indicating that the treadmill test is
highly reliable for the assessment of aerobic capacity in women. The highest validity coefficient r
= -0.76 was obtained when VO2max was correlated with the first 15 seconds recovery heart rate
of the QCST. Therefore approximately 58% of the variability in aerobic capacity can be explained
by the recovery heart rate from the QCST. The coefficients r = 0.62, r = 0.68 and r = 0.75 were
obtained when VO2max was correlated with PWC150, PWC170 and PWCmax respectively.
Chatterjee et al 111 investigated the suitability of the QCST in predicting VO2max in 30 young,
sedentary male students. Participants performed the QCST for the prediction of VO2max and a
bicycle ergometer test for direct measurement of VO2max four days later. The 15 seconds heart
rate was converted into beats per minute. It should be pointed out that heart rate from heart beats
at the end of the 15 seconds recovery is different from heart rate measured by a heart rate monitor.
Maximum oxygen uptake was predicted from the following equation:
VO2max (ml.kg-1min-1) = 111.33 – (0.42 x heart rate in beats per minute) (Equation vi)

28
There were no significant differences between VO2max measured directly (39.8 ml.kg-1.min-1)
and VO2max predicted from QCT (39.3 ml.kg-1.min-1). The mean difference between measured
VO2max and QCT predicted VO2max was 0.46 ml.kg-1.min-1 with 95% confidence interval of -
0.09 to 1.01 ml.kg-1.min-1. There was a significant correlation (r = -0.96,) between QCST recovery
heart rate and VO2max. Chatterjee et al (2004) recommended the QCST as a valid test of aerobic
capacity in young Indian men.
Chatterjee, Chatterjee and Bandyopadhyay 112 assessed the applicability of the QCST in
predicting VO2max in 40 sedentary female university students. VO2max was measured after the
participants cycled to exhaustion on a cycle ergometer and indirectly by QCST at a four day
interval in a random cross-over design. The equation developed by McArdle et al 82 was used to
predict maximum oxygen capacity. There was a significant difference between predicted VO2max
(35.5 ± 4.4 ml.kg-1.min-1) and VO2max (32.8 ± 3.8 ml.kg-1.min-1) measured directly. The limits of
agreement between predicted VO2max and directly measured VO2max were rather large (0.4 to
6.0 ml.kg-1min-1) indicating that the protocol was inappropriate for this population. However
QCST recovery heart rate was negatively correlated (r = -0.83, p < 0.0001) with directly measured
VO2max.
A prediction equation (equation iii) was computed from the data for accurate assessment of
VO2max in young women.
Y = 54.12 - 0.13X (Equation vii)
where X was recovery heart rate in beats per minute
Results from the new equation showed a variation from VO2max measured directly of less than
5% in 24 participants, 5 to 9% in 10 participants, 10 to 14% in two participants, and 15 to 19% in
four participants. Chatterjee et al 112 recommended using the new equation for valid prediction of
VO2max from the QCST in sedentary Indian female students.

29
Sedentary Indian men experienced premature fatigue in the lower limbs when performing the
Harvard step test due the high step (50.8 cm, which was not adjusted for stature) and fast stepping
cadence (30 steps per minute) that compelled them to stop 113. This has limited the use of the
Harvard step test in this population. As a consequence Bandyopadhyay 113 assessed the suitability
of the QCST in determining physical fitness index in 155 sedentary male Indian students.
Participants were randomly divided into a study group (n = 100) and confirmatory group (n = 55).
The QCST and the Harvard step test were performed at an interval of four days by random cross-
over design in which half the study sample performed the QCST first and the other half performed
the Harvard step test first. All participants performed the QCST test properly but 20 and 15
participants from the study group and confirmatory group respectively failed to complete the
Harvard step test.
There was a significant correlation (r = -0.91) between QCST heart rate and physical fitness index
in the study group. The following regression equation was computed from the correlation for the
prediction of physical fitness index from QCST and was validated in the confirmatory group.
Physical fitness index*= 130.907 – 1.503 x QCST heart rate (Equation viii)
*The index has no units, just a numerical value.
There was no significant variation between the physical fitness index measured using the Harvard
step test (68.3 ±0.5) and the physical fitness index predicted from QCST (69.9 ± 0.6) in the
confirmatory group. The mean difference between physical fitness index scores obtained from
Harvard step test and QCST equation was 0.1. The limits of agreement (-2.6 and 2.9) were
sufficiently small for QCST to be used confidently for prediction of physical fitness index in
sedentary Indian men.
Bandyopadhyay 95 assessed the suitability of the QCST in determining physical fitness index in
155 young sedentary females in India. Participants were randomly divided into study group (n =
100) and confirmatory group (n = 55). The QCST and the Harvard step test were performed at an
interval of four days by random cross-over design in which the Harvard step test was followed by
30
the QCST in half the sample and the QCST was followed by the Harvard step test in the other
half. All participants completed the QCST but 20 participants from the study group and 15
participants from the confirmatory group could not complete the Harvard step test due to
premature fatigue in lower limbs.
There was a significant correlation (r = -0.90) in the study group between QCST heart rate and
physical fitness index that resulted in the following norm for prediction of physical fitness index
using the QCST.
Physical fitness index = 195.09 – 3.09 x QCST heart rate (Equation ix)
The norm was applied in the confirmatory group and there was no significant variation between
physical fitness index obtained from the Harvard step test (63.4 ± 5.7) and that obtained using the
QCST norm (63.5 ± 6.3). The mean difference between physical fitness index scores obtained in
the Harvard step test and QCST norm was 0.1. The QCST norm predicted physical fitness index
by between 1.3 and -1.1. The limits of agreement (-2.3 and 2.5) were sufficiently small for the
QCST to be used as an alternative to the Harvard step test for prediction of physical fitness index
in sedentary females in India. A different equation was derived for the female sample from that
for the males.
In summary, prediction of VO2max from the QCST depends largely on the prediction equation
used. McArdle et al 82 found a low prediction validity as depicted by the moderate validity
coefficient r = -0.76. Using a different prediction equation Chatterjee et al 111 found no significant
variation between VO2max measured directly and VO2max predicted from the QCST in young
Indian males. When Chatterjee, Chatterjee and Bandyopadhyay 112 used the McArdle 82 equation
on young Indian females, there was a significant difference between VO2max measured directly
and VO2max predicted from the QCST. When a prediction equation based on the correlation
between recovery pulse rate and directly measured VO2max was used, there was little variation
between predicted and measured VO2max. Bandyopadhyay 111,113 demonstrated the capability of

31
the QCST to predict the physical fitness index. The QCST is a valid test for the prediction of
physical fitness index and VO2max provided the appropriate prediction equation is used.
1.4.9 The Canadian Home Fitness Test
The Canadian home fitness test (CHFT) was developed to motivate Canadians to increase their
physical activity to improve their physical fitness 11. It was designed to be a self-administered test
that comprises seven stages for males and six stages for females. The test begins with the
participant stepping on a 20 cm double step at 65% to 70% of anticipated aerobic power (Table 2)
of a person in the next 10-year age group. This phase serves as a warm up. The participant then
counts his/her pulse from 5 to 15 seconds after exercise. If the participant has not reached a
predetermined heart rate (Table 3) he/she proceeds to the next level where stepping occurs for
three minutes at 65% to 70% of anticipated aerobic power of a sedentary person. Pulse count is
taken from 5 to 15 seconds.
The test is stopped after six minutes. However data and music allow a further three minutes at a
rate 65% to 70% of the average aerobic power for a person ten years younger than the participant.
Stepping is performed to a musical rhythm with a six pace cycle: one foot on the middle step, the
other foot on the top step, both feet on the top step, one foot on the middle step, the other foot on
the ground and both feet on the ground.
The stepping rate and cadence were based on the average fitness of a sedentary Canadian (0). The
data were obtained from a sample drawn from Toronto. The data were comparable with a sample
from another region in Canada, Saskatoon. Submaximal tests demand 75% to 85% of aerobic
power. Shephard et al 11 calculated stepping rates that yield 75% of aerobic capacity on the
double 22.5 cm laboratory step and 65% to 70 % of aerobic power using lowest two steps of the
20 cm domestic staircase. The cadence was determined by assuming a basal oxygen consumption
of 3 ml.kg-1.min-1, a climbing mechanical efficiency of 16% and an energy yield of approximately
21 joules per litre of oxygen.

32
Table 2 Basis of the Canadian home fitness test 11
Anticipated gross VO2 max (ml.kg-1.min-1)
Required rate of climbing (ascents.min-1)
Corresponding 6-beat cadence (beats.min-1)
Age (years) M F M F M F Spare music bands
156 132
15 - 19 156 120 20 - 29 47 38 24.2 19.1 144 114 30 - 39 43 39 21.9 19.7 132 114 40 - 49 38 35 19.1 17.4 114 102 50 - 59 33 30 16.3 14.6 96 84 60 - 69 27 24 12.9 11.2 78 66 Warm up for oldest age group 60 60 Where M = male, F = female
Bailey 114 tested 1544 people in Saskatoon. Fitness was divided into six categories ranging from
very poor to very good. These categories were combined into three categories for the Canadian
Home Fitness Test (Table 3), according to the fitness characteristics of undesirable, minimum or
recommended. The categories were defined by the number of test stages the subject completed
and the 10 second recovery heart rate. The test was stopped after three minutes if the participant
had undesirable fitness. After six minutes a participant is described as having achieved either
minimum fitness or recommended fitness according to the 10 seconds heart beats as shown in
Table 3.
Table 3 Physical fitness evaluation chart for the Canadian home fitness test 11
10 seconds heart beats
Age (years) Undesirable fitness after 3 min
Minimum fitness after 6 min
Recommended fitness after 6 min
15 - 19 ≥ 30stop exercise ≥ 27 ≤ 26
20 - 29 ≥ 29 stop exercise ≥ 26 ≤ 25
30 - 39 ≥ 28 stop exercise ≥ 25 ≤ 24
40 - 49 ≥ 26 stop exercise ≥ 24 ≤ 23
50 - 59 ≥ 25 stop exercise ≥ 23 ≤ 22
60 - 69 ≥ 24 stop exercise ≥ 23 ≤ 22

33
Shephard, Bailey and Mirwald 11 compared VO2max predicted from CHFT recovery heart rates
recorded with an ECG with VO2max predicted from a submaximal bicycle ergometer test 108. The
two sets of data were correlated (r = 0.72, n = 1152), but predictions of VO2max on the cycle
ergometer were lower than predictions of VO2max from recovery heart rates after the CHFT. This
difference can possibly be attributed to the quadriceps weakness that would have caused the
participants to underperform in the cycle test.
Two studies, Jette et al 115 and Shephard, Bailey and Mirwald 11 reported inaccuracies in palpated
heart beats. The relationship between heart rate measured with ECG and palpated heart rats were r
= 0.50 115 and 0.59 11. Shephard, Bailey and Mirwald 11 argued that the low correlation was due to
the participants’ lack of experience in pulse counting. In an earlier study of children speed skaters
Bailey and Mirwald demonstrated that with experience actual (135 beats/min) and palpated (127
beats/min) heart rates were slightly different. This translated in a correlation coefficient of r =
0.94 for experienced children as compared to r = 0.76 when pulse was counted by a friend and r =
0.37 when pulse rate was recorded by inexperienced children 11.
Jette at al 115 investigated whether VO2max could be predicted from Canadian Home Fitness Test
variables. In particular they investigated whether the limitations of using just heart rate as a
predictor of VO2max could be overcome by using many variables. Fifty-nine participants (15 – 74
years) completed the Canadian Home Fitness Test and 30 minutes later did a progressive exercise
treadmill test to fatigue to directly determine VO2max. The participant’s oxygen consumption in
the last stage, weight, post exercise heart rate, age, body surface area, standing heart rate, sitting
heart rate and age adjusted maximum heart rate were the predictor variables used. The multiple
regression equation was as follows:
VO2max = 42.5 + 16.6(VO2) – 0.12(W) – 0.12(HR) – 0.24(A) (Equation x)
where, VO2max is the aerobic power in ml.kg-1.min-1, VO2 is the energy cost or average oxygen
cost of the last completed exercise stage in l.min-1 (0), W is the body mass or weight in kg, HR is
the post exercise heart rate in beats per minute and A is the subject’s age in years.

34
The observed VO2max was plotted against the predicted VO2max in ml.kg-1.min-1 and the line of
best fit was determined (r = 0.91). The standard error of estimate was 4.1 ml.kg-1.min-1. There was
no significant difference between the mean predicted VO2max (35.9 ± 9.3 ml.kg-1.min-1) and the
mean observed VO2max (36.0 ± 10.4 ml.kg-1.min-1) (P < 0.01; paired t test).
Table 4 Energy requirements in l.min-1 of the CHFT stages 115
Cumming and Glenn 116 evaluated the Canadian Home Fitness Test in 230 men aged 45 to 69
years. Fifteen minutes after completing the CHFT participants performed the Bruce treadmill test 117 to fatigue and VO2max was estimated. Heart rates were obtained using ECG for the last 10
seconds of the CHFT and by pulse counting and ECG from 5 to 15 seconds after the CHFT.
Participants underestimated heart rate by as much as 13 beats per minute when counting
compared to when heart rate was measured with ECG. VO2max predicted from CHFT ECG heart
rates and from treadmill test were very close but lower than VO2max predicted from CHFT
subjects’ pulse counts by as much as 26%.
Fifty participants rated the intensity of the Canadian Home Fitness Test and the treadmill test
using Borg’s numerical scale. There was a correlation between RPE and heart rate in the second
stage of the CHFT (r = 0.76). Cumming and Glenn 116 observed that participants failed to
maintain the correct stepping cadence and made heart rate counting errors regardless of training.
This was a different observation from Jette at al 115 and Shephard, Bailey and Mirwald 11 who
indicated that counting improved with training. Cumming and Glenn 116 concluded that the
Canadian Home Fitness Test was unsuitable for home measurement of fitness because of the
Stage Males Females 1 1.1391 0.939 2 1.3466 1.0484 3 1.6250 1.3213 4 1.8255 1.4925 5 2.0066 1.6267 6 2.3453 1.7867 7 2.7653

35
pulse counting errors that impacted on VO2max predictions. They suggested the use of Borg’s
RPE with the CHFT to predict VO2max instead of heart rate.
Cumming and Glenn 116 argued that the 0.91 correlation obtained by Jette at al 115 used height, age
and weight to predict VO2max, not heart rate which the CHFT relies on. However, in response,
Shephard 118 explained that the CHFT is not designed to be highly precise, but rather is designed
to heighten awareness of fitness and motivate Canadians to be physically active.
Weller et al 119 assessed the validity of VO2max values predicted using the equation of Jette et al 115. They compared these predicted VO2max values with peak VO2 values measured during a
treadmill protocol using a large sample of males and females of broad age range and varied fitness
levels. Participants (n = 129) performed the CHFT on two laboratory visits. Forty five minutes
after one of the CHFT tests participants performed a maximal treadmill test. Heart rates were
recorded using ECG during the last 10 seconds of each stage of the CHFT and from 5 to 15
seconds after exercise. There were no significant differences in heart rates between the two
CHFTs, suggesting there was no heart rate habituation to the CHFT. A correlation coefficient of r
= 0.83 was obtained between treadmill measured peak VO2 and CHFT VO2max predicted using
the Jette at al equation 115. VO2max values from the treadmill test were significantly higher than
VO2max predicted from CHFT using the equation of Jette al 115. The similar regression
coefficients (r = 0.83 and r = 0.75; Jette at al 115 and Weller at al 119 respectively) indicate that the
Jette et al equation 115 is reliable across populations. The underestimation of VO2max should
probably be a result of the CHFT protocol, which has a limited number of stages that may not
allow some participants to reach their target heart rate, rather than the equation.
One weakness of the Jette et al equation 115 is that more than 77% of the variance is attributed to
the first two variables; the weight of the subject and the average oxygen cost of stepping. This
leaves a small component of the prediction to be determined by a cardiovascular measure, in this
case post exercise heart rate 120.

36
In its original form the CHFT could only categorise participants into three fitness categories. The
Jette et al equation 115 enabled the CHFT to predict VO2max. Studies 115,119 have shown that the
CHFT is a valid test for the prediction of aerobic capacity. One major limitation and criticism of
the CHFT was the error associated with the pulse count. This limitation cannot be minimised by
the using heart rate monitors as a pulse count is different from heart rate measured with a heart
rate monitor.
1.4.10 Chester Step Test
The Chester step test (CST) was developed in 1995 at University College Chester to assess
aerobic fitness under submaximal conditions 121. The test consists of five stages during which
heart rate and exertion levels (RPE) 122 are measured continuously. The stepping rate is controlled
by a metronome. The test begins with the participant stepping on a 15, 20, 25, or 30 centimetre
step at the rate of 15 steps per minute for two minutes. The CST testing package provides
standardised criteria for choosing step height according to the participant’s age and training status.
According to these criteria, the stepping rate increases by five steps per minute every two minutes
until the participant reaches 80% of age estimated maximum heart rate (220 minus age). The
maximum duration of the test is 10 minutes, which occurs with stage five. For each CST stage the
predicted oxygen cost of exercise is provided (Table 5). Sykes and Roberts 83 did not explain how
the oxygen cost for the CST was determined. Heart rates for the CST stages are plotted against the
oxygen cost for each stage. A line of best fit is drawn joining the data points and then extrapolated
to age-estimated maximum heart rate at which point the corresponding aerobic capacity is
determined.

37
Table 5 CST oxygen cost estimates (VO2 in ml.kg-1.min-1) for varying step heights (m) and stepping rates (steps per minute) 123
The predictive procedure of the CST assumes that there is a linear relationship between CST
stages and heart rates and VO2. It also assumes that maximum heart rate coincides with VO2max
and that maximum heart rate equals 220 minus age.
Buckley et al 123 assessed the validity and reliability of the following CST measures: predicted
VO2 at each CST stage, heart rate, RPE, age estimated maximum heart rate, predicted VO2max,
the correlation between RPE and % VO2max, the correlation between RPE and % HRmax and the
correlation between % VO2max and % HRmax. Thirteen students (seven males and six females)
performed the CST on two separate days. On the third day participants performed an incremental
treadmill protocol to determine actual maximum heart rate and VO2max. Heart rate and RPE were
recorded during the last 15 seconds of each stage.
Results showed a linear response for RPE, a curvilinear response for VO2 and a curvilinear
response for heart rate with each progressive CST stage. The curvilinear response could be
attributed to a significant underestimation of VO2 at stage one of the CST. If heart rate data from
stage one were excluding when drawing the line of best fit there would be a linear relationship
between work rate increments and heart rate and VO2. Estimated VO2 for CST stages differed
from measured VO2 with errors ranging between 11% and 19%. There were no significant
differences between trial one and trial two for RPE, submaximal heart rate or VO2 at each stage of
the CST. The 95% limits of agreement of the CST predicted VO2max between trial one and trial
two of 3.7 ml.kg-1.min-1 was not statistically significant, making the CST a reliable test. Measured
Stage
I II III IV V
Stepping rate Step height (m) 15 20 25 30 35 0.15m 11 14 18 21 25 0.20m 12 17 21 26 29 0.25m 14 19 24 28 33 0.30m 16 21 27 32 37

38
maximum heart rate was significantly lower (five beats per minute) than age predicted maximum
heart rate.
The 95% limits of agreement around the maximum heart rate bias was 12 beats per minute.
Therefore the difference between actual and estimated maximum heart rate could be as much as
17 beats per minute, a result in agreement with reported errors of age estimated maximum heart
rate 124,125,126. The CST predicted VO2max was an underestimation of actual VO2max by -2.8
ml.kg-1.min-1 in trial one. The 95% limits of agreement showed that the CST could underestimate
VO2max by 9 ml.kg-1.min-1 or overestimate VO2max by 5.5 ml.kg-1.min-1. Therefore, based on
these results the CTS can be assumed to be a reliable field test in detecting improvements in
aerobic fitness. However, its validity to predict VO2max is questionable 123.
Contrary to the results of Buckley et al, the CST developers found the test valid at predicting
VO2max. Sykes and Roberts 83 compared the CST predicted VO2max with VO2max measured
directly on a treadmill. There was a high correlation between treadmill measured VO2max and
VO2max predicted from the CST (r = 0.92; P < 0.001) with a standard error of estimate of 3.9
ml.kg-1 min-1 giving prediction accuracy of approximately 5 to 15% in participants with VO2max
ranging from 25 to 68 ml.kg-1.min-1. The prediction was slightly more accurate in females than
males. They also tested the reproducibility of the test with participants of varying ages and fitness
levels. Sixty-eight participants (18 to 52 years) performed a treadmill VO2max test and then the
CST twice, on separate occasions. A test-retest reliability for the CST obtained as the mean
difference between CST one and CST two was -0.7 ml.kg-1.min-1.
Elliott et al 127 examined the influence of an active arm action when performing the CST on
predicted VO2max. Twenty-five participants (10 males and 15 females) performed the CST, once
with an active arm action and once with a passive arm action in a random cross over design.
Active arm action resulted in an increase of about seven beats per minute at the three stages of the
CST that were completed, a difference that falls within the CST test-retest variation. The increase
in heart rate did not have a significant impact on VO2max.

39
The basis of the CST is the estimated VO2 for each stage of the test. The CST assumes that the
heart rate and VO2 responses to increasing work rate should be linear, that maximum heart rate is
equal to 220 minus age and that maximum heart rate coincides with VO2max. An error in one
assumption reduces the validity of the test. All assumptions were proved to be wrong. Buckley et
al 123 found a non-linear response which renders the predictions made from the extrapolated line
of best fit inaccurate. Age estimated maximum heart rate significantly overestimated actual
maximum heart rate 123. There were differences between measured and estimated VO2 for the
CST stages 123. The CST should therefore be used as a reliable fitness test where the focus is on
assessing improvement in fitness and not in predicting VO2max.
1.4.11 Cambridge Step Test
The test was developed by researchers at the MRC Epidemiology unit in Cambridge 84,85. The
participant steps on and off a 21.5 cm step at a slow pace, one leg movement per second, for one
minute. This converts to one step in four seconds and 15 steps per minute. Stepping pace
increases gradually to 33 steps per minute by the end of the eighth minute. Heart rate is recorded
at 30 second intervals during the test and at 15 seconds intervals after the test for two minutes.
Exercise heart rates are combined with resting heart rate to determine the relationship between
heart rate and VO2. The relationship is extrapolated to age-predicted maximal heart rate to
estimate VO2max 128.
The mechanical work rate for lifting the body was given by the product of body lift frequency,
step height and gravitational force as shown in the following equation 128:
Lift power (J.min-1.kg-1) = lift frequency (lifts/min) x step height (m) x 9.81 m.s-1
(Equation xi)

40
Another equation was derived to estimate the physiological activity intensity (PAI) or net energy
turnover required for the mechanical work for the step test 128:
PAI (J.min-1.kg-1) = (3.72* Lift power) + (64.1 x time) – (13.2 x time2) + 0.99 x time
(Equation xii)
Data for the first minute of stepping were excluded and a linear regression was computed between
estimated PAI and the heart rate above rest (HRaR) to yield slope (betastep) and intercept
(alphastep). The first 90 seconds of recovery heart rate were included into a quadratic regression
equation against recovery time from which one minute recovery heart rate HRaR (recovHRaRstep)
was calculated. Submaximal PAI during treadmill walking and running was derived using five
parameters: betastep, alphastep, one minute recovery heart rate, step test duration and resting heart
rate.
PAIwalk/run (J.min-1.kg-1) = 4.2 + 0.45*betastep - 0.014*recovHRaRstep)* HRaR + 0.37*alphastep + 14.8*step test duration - 0.63*recovHRaRstep -0.14*RHR – 149 128 (Equation xiii)
Maximal PAI (VO2max) can be derived by substituting exercise heart rate by an estimate of the
maximal heart rate predicted from age 129 and adding an estimate of resting metabolic rate (RMR) 130 to yield maximal total metabolic yield. Joules are divided by the energetic value of oxygen
0.23J.ml-1 to convert into millilitres of oxygen 131.
VO2max (ml.kg-1. min-1) = (max PAIwalk/run + RMR)/0.23 (Equation xiv)
The Cambridge step test has not been validated in a published paper. However, the method was
developed from that devised by researchers in the MRC Epidemiology Unit at Cambridge 132
using information from a variety of studies. This information included a step test field pilot on the
Health Survey for England (HSE) in 2005 recorded in an unpublished report on step test
feasibility, and again in 2007 using the protocol that was used in the main HSE 2008. Previous
research had demonstrated that the step test was suitable for use in a general population household
survey. The 2005 HSE feasibility study found that it was practical to administer the test once the

41
step was in the participant’s home and that the participants enjoyed the test. The test was used in
a Physical activity and fitness Household Survey that was done in England in 2008 as an objective
measure of physical fitness for adults aged 16 to 74 years. The survey was published in 2009 as
two volumes 84,85.
1.5 Summary
The purpose of an exercise test varies. In most cases an exercise test provides information about
the person’s physical condition. For example, a person may have a cardiac or pulmonary
condition, be a sedentary adult about to embark on an exercise training programme or an already
trained person. Just as the reasons for testing vary, as such do the testing procedures. Some people
can withstand maximum tests where they exercise to exhaustion. Others cannot because of the
risks associated with exercising to exhaustion. Expense and availability of equipment are also
limiting. Submaximal tests incorporate either walking, running, cycling or stepping as the mode
of exercise. Submaximal tests are only meaningful if they can predict maximal aerobic capacity
with accuracy. A submaximal test with stepping exercise has advantages over other submaximal
tests. They do not need expensive equipment and are easy to administer.
A review of the existing step tests was conducted to determine whether there is a reliable, easy to
use submaximal fitness test that caters for people of all ages and fitness levels. The review
showed that although some step tests have been validated, others have not. The protocols also
vary. A summary of the protocols of the step tests that have been developed to predict fitness is
shown in Table 6.

42
Table 6 Parameters of the step tests developed to predict fitness
Step test Step height (cm)
Steps per min
Duration Measurements Stages Fitness determination
Cardiovascular efficiency test
45.7 20 15 s 1HRR: 15 s intervals for 2 min
Single Fitness score from summation of 6 items
Pulse-Ratio test 33 15-60 1–3 min HRR: 2 min Single Graph of number of steps against pulse-ratio
Harvard step test
50.8 30 5 min HRR: 60-90, 120-150, 180-220 s
Single Fitness index: Test duration divided by HRR
YMCA 3-Minute step test
30.5 24 3 min HRR 60 s Single Fitness category
Balke step test 2 to 50
24/30 20/Exhaustion
2VO2 Single Total VO2
Queen’s College step test
41.3 22 3 min HRR: 5-20 s, 60-75 s
Single 3VO2max: Regression line
Canadian Home fitness test
20 x 2 11 –25 6 min HRR: 5-15 s 2 10 s 4HR. Regression equation
Chester step test 15-30 15-35 10 min HR for each stage
5 HR against 5O2. Line of best fit
Cambridge
21.5 15-33 8 min HR: 30 s intervals, HRR: 15 s intervals for 2 min.
Single Max 6PAI added to 7RMR to give VO2max
1Heart rate recovery 5Oxygen 2Volume of oxygen consumed 6Physiological activity intensity 3Maximal oxygen consumption 7Resting metabolic rate 4Heart rate

43
Each test has strengths and weaknesses associated with the protocol. These are summarised in
Table 7.
Table 7 Strengths and weaknesses of step tests
Step test Strengths Weaknesses Cardiovascular efficiency test
Cardiovascular efficiency results agreed with medical examination results
Test duration short; does not test cardiorespiratory fitness, only categorises as “fit” or “unfit”; uses heart beats count
Pulse-Ratio test Measures cardiac response to exercise; Standardised relative workload
Use of 2.5 as standard pulse ratio; when the calculated number of steps required for a 2.5 ratio was performed, the resulting pulse-ratio was not 2.5; Use of 50 as the steps that result in 100% efficiency; does not predict VO2max; extremely high stepping rates cause peripheral fatigue
Harvard step test Index categorises fitness
Step very high; test difficult, caters only for fit adult men; index has no units; uses heart beats; does not predict VO2max
YMCA 3-minute step test
Caters for the unfit, test has short duration, stepping rate manageable
Does not predict VO2max; test too short to allow meaningful cardiorespiratory response to exercise
Balke step test Accounted for negative work; used 2 stepping rates to cater for individuals of low working capacity
Maximal effort test therefore not suitable for everyone; adjustable step complicated to make and operate, detracts from the simplicity of a step test; extreme step heights, too low to pose physical strain, or very high causing local fatigue; cannot be used by participants of low stature; stipulated duration very unlike a maximal test, some participants do not attain their maximum; could not accommodate highly trained participants whose metabolic levels exceeded 12 times resting metabolic rate.
Queen’s College step test
Predicts VO2max with the appropriate equation in men and women
Original test used recovery pulse count; too short to allow meaningful physiological responses to exercise especially in fit individuals

44
Canadian home fitness test
Self-administered; Predicts VO2max with the Jette equation
Pulse counting errors; Original test only had three fitness categories
Chester step test Predicts VO2max The predictive procedure assumes there is a linear relationship between CST stages and heart rates and VO2; also assumes that maximum heart rate coincides with VO2max and that maximum heart rate equals 220 – age; Step height determined by age and training status instead of by stature
Cambridge step test
Predicts VO2max Has not been validated in a published paper
The common strength of the step tests is that they all give some measure or indication of an
individual’s fitness. A weakness of the early tests is the use of heart beat counts as the main
outcome measure. This measurement is marred with numerous counting errors. It is difficult to
overcome these sources of error, even with heart rate monitors, as the heart rate monitors measure
rate, not count.
Some early tests did not predict VO2max, which limited their use. For the tests that predicted
VO2max, the predictive capacity needs to be refined. Whilst some tests used more than one step
height, none of the reviewed tests adjusted step height according to the participant’s height, or
considered the participant’s body mass. Most step tests have a standardised task in terms of
duration 79,113,115 or in terms of distance the participant would theoretically cover 133. Therefore
each test provided an absolute workload and the relative work done by the participant was not
considered. While it may be argued that the Pulse-ratio test has a relative workload, it is based on
an assumed standard ratio, which may vary from person-to-person.
Therefore, there is a need to develop a step test that is submaximal with the ability to predict
VO2max with reasonable accuracy. There is also a need for a step test that considers the size
(stature and body mass) of the participant, and adjusts the protocol parameters accordingly to
make the demands of the test relative to each person’s characteristics. The submaximal step test

45
should cater for people of varied ages and physical fitness levels. In developing this test the
principles of clinimetrics need to be applied. These principles will be described in the next
section.
1.6 Clinimetrics
Clinimetrics is a methodological and statistical discipline that focuses on the development of
quality instruments and the assessment of the quality of their measurement 134. It is a discipline of
the methodology of measuring biologic phenomena. The key concepts of clinimetrics are
reliability, validity and responsiveness. Clinimetrics is fundamental in clinical medicine, sports
medicine, health science, or sports science. Diagnostic, evaluative or prognostic information from
any instrument can only be trusted and used with confidence if the instrument quality has been
positively evaluated. When developing an instrument the measurement quality is a major concern
and is reviewed through a series of steps including selection of proper outcome measures,
standardisation of material and assessment procedures and attention to interpretability of test
results. Even if the process of instrument development addresses all aspects to do with minimising
error, clinimetrics remains a crucial process. An instrument cannot be used with confidence until
it has fulfilled the criteria of a clinimetrics assessment. Potential sources of error should be
identified and adjustments and modifications made to improve measurement quality 134. This is
made from published data or from empirical research done to assess the properties. If a new
instrument is developed for use, the quality of the measurement has to be assessed before it is
used in a clinical setting or for research. The first step involves determining the reliability of the
measurement. The next step involves validation of the instrument. A measurement is valid if it
measures what it is intended to measure 134. The responsiveness and measurement error also have
to be determined.
The development of measuring instruments is needs driven and the process of development and
evaluation may take a long time. The discussion about the various step test protocols has
highlighted their deficiencies. It is clear that a step test needs to be developed that overcomes
these deficiencies. In particular, there is a need for a submaximal step test that quantifies the work
done by the participant and predicts cardiorespiratory fitness with accuracy. The step test also

46
needs to be suitable for a range of participants, varying in size and fitness. The next section
discusses the broad outline associated with developing the step test and describes the objectives of
this thesis.

47
CHAPTER 2
PURPOSE OF THE STUDY

48
2.1 Introduction
Fitness testing provides information in the quest to promote health and exercise habits among
individuals and populations. Fitness testing is used to evaluate health and the response to exercise
training and monitor training status. VO2max is used to measure cardiorespiratory fitness. The
VO2max test requires expensive equipment and a maximal effort from the participant. Due to
risks associated with cardiovascular disease some people cannot perform the VO2max test. Since
the test is not readily available for the majority of people due to expense, complexity, technical
expertise and health issues, submaximal tests are used to predict VO2max.
When testing an unscreened participant in field conditions the submaximal testing protocol should
be easy to administer, convenient and safe, the equipment inexpensive and the testing conditions
and time requirements reasonable. The exercise modality of stepping satisfies the characteristics
of an exercise test. Stepping is a simple and inexpensive exercise mode that can be performed by
individuals of all abilities with low risk of injury. The stepping protocol can be regulated to
increase metabolic rate in a predictable way. It is for these reasons that stepping has been selected
as the mode of exercise for the submaximal test that forms the basis of this thesis.
The main requirements of an exercise test are accuracy, feasibility and safety. Accuracy
presupposes validity (criterion-valid) and reliability of test parameters and data interpretation.
Feasibility refers to the practicality of the test; or the degree to which the test can be easily and
conveniently done. Feasibility also refers to the test’s usefulness for assessing the fitness of
relevant population samples. Step tests have been used to test fitness for about a century now.
However, the review of literature in Chapter 1 on step tests has exposed their weaknesses. One
common weakness is that participants perform the same protocol, which does not consider
differences in size. Stepping involves lifting the body mass, up a height, defined by the height of
the step. Therefore the load imposed by the test is influenced by the participant’s body mass. If
the duration and stepping rate of the test is constant, participants with a different body mass will
do different amounts of work.
It stands to reason that a step test with a standardised workload overcomes many of the limitations
that were exposed in the review of the literature in Chapter 1. The workload can be standardised

49
by accounting for body mass, duration and stepping rate (cadence) in the protocol. The
physiological responses to a standardised protocol are likely to be more interpretable than the
physiological responses resulting from a protocol in which physiological demands differ. This
thesis revolves around developing a standardised step test, which overcomes the limitations of the
various step tests that have been developed. The overall goal is to develop a step test that is
reliable and valid and suitable for testing participants with a range of fitness levels.
2.2 Aim of the Thesis
The aim of the thesis is to develop and evaluate a step test which fulfils the characteristics of
being valid, reliable, feasible, safe, simple and practicable, and that can be used to test the
cardiorespiratory fitness of participants who vary in sex, age and level of fitness.
2.3 Objectives of the Thesis
The following objectives will be achieved by the thesis:
To pilot the step test to assess feasibility and protocol configurations.
To test the reliability of the step test using three configurations of the protocol, each with
varying stepping rates (16, 20 and 24 steps per minute).
To test the repeatability of the step test using a stepping rate of the participant’s choice.
To validate the step test against the VO2max test measured directly on a treadmill using a
diverse sample of participants.
To cross-validate the step test using the same protocol on a different sample of the same
population characteristics.
2.4 Summary
The purpose of this thesis is to develop a submaximal test of cardiorespiratory fitness using a
novel step test that has been designed specifically to overcome the weaknesses of the previously
published step tests. Each phase of the test will be subjected to evaluation so that the final
protocol is supported by a series of studies supporting the piloting, development, validation and
cross-validation of the test.

50
CHAPTER 3
STEP TEST DEVELOPMENT

51
3.1 Introduction
The need for a submaximal step test that accurately predicts cardiorespiratory fitness in people
with varying fitness levels has formed the basis of this protocol for a step test. The variables of a
step test are stepping rate, step height, duration and workload. Step tests differ in the
configurations of these variables. In the subsequent sections the development of the step test goes
through several phases to determine each variable; each phase is explained and subjected to
evaluation.
Several steps were followed in the development of the test. First, configurations were trialled
theoretically to determine the magnitude of each variable for a certain workload. Then two pilot
studies were done to assess the test in practice. Attention was paid to the stepping frequency,
ensuring that participants could cope with the speed. Also workload and how it affects test
duration and the physiological responses such as heart rate were considered. The resultant step
test, standardised for workload, was then validated to satisfy the dictates of clinimetrics 134.
3.2 Why Step Test?
The reason a step test was selected as the modality of exercise was addressed in Chapters 1 and 2.
However, as a reminder, a step test was chosen over the other tests that used cycling and running
on a treadmill because step testing is flexible in terms of administration and is inexpensive. It only
requires a platform of the required stepping height. The platform can be placed indoors or
outdoors and does not occupy much space. The administration of the step testing protocol does
not require much expertise; anyone can administer it with appropriate instruction, including the
participant administering to self, as in the case of the Canadian step test 11 which was designed
specifically for self-administration. Also most people are familiar with the mode of stepping and
therefore do not need to be familiarised with the activity.
The next section will discuss the impact of workload, step height and stepping rate on the step test
protocol and how decisions were taken to refine the protocol.

52
3.3 Workload
The workload in a step test involves lifting the body mass as high as the step height. Research by
Reedy, Saiger and Hostler 93 on the Harvard step test showed that lighter men achieved
significantly higher scores than heavier men regardless of their fitness. In this case the test had the
same duration so the lighter men did less work than the heavy men, hence the high scores. The
workload for a step test is calculated using body mass of the participant since step testing involves
lifting a weight up. Body mass in stepping up onto a bench influences the accurate calculation of
cardiorespiratory fitness given that VO2 is proportional to workload during submaximal exercise.
Exercise standardised to an absolute external workload may produce large differences in internal
cardiovascular and metabolic stress between individuals, particularly if there is a wide range of
fitness levels. Therefore a common practice is to prescribe exercise according to relative intensity 135,136,137. This approach produces an approximately equal exercise stress among individuals and
provides a foundation for explaining differences in physiological and functional capacity between
participants. There are different ways to prescribe relative exercise intensity 138. The most
conventional way uses either the percentage of maximal oxygen consumption (VO2max) or
maximal heart rate (HRmax). These methods have been favoured in many studies 139,140,141,142,143,144,145. However the use of % VO2max and % HRmax for prescription of exercise
intensity has been criticised 146,147,148,149,150,151,152,153. Criticisms state that the use of % VO2max
does not account for individual differences in resting metabolic rate and that it is preferable to
prescribe exercise relative to an individual’s oxygen consumption reserve (VO2R); VO2max
minus resting oxygen consumption (VO2). Percentage of oxygen consumption reserve (% VO2R)
places individuals at equivalent relative intensity. Research shows that % VO2R and percent heart
rate reserve (% HRreserve); HRmax minus resting heart rate, are equivalent methods of exercise
intensity prescription whereas % VO2max and % HRreserve may differ noticeably at lower exercise
intensities 147,148,154. The 1998 ACSM Position Stand recommends prescribing exercise using the
% VO2R - % HRreserve relationship for heart rate based training monitoring 7. However, some
research has questioned the use of the % VO2R - % HRreserve relationship 155,156,157. The 2011
ACSM guidelines 137 recommend all four, % VO2max, % HRmax, % VO2R and % HRreserve for
prescription of exercise intensity.

53
Another criticism for % VO2max and % HRmax is that the methods fail to account for differences
in metabolic stress 149,150,151,152,153. The critics of % VO2max and % HRmax recommend the use
of metabolic thresholds, i.e. aerobic and anaerobic threshold for relative exercise prescription 158,159,160,161. However, the method of threshold calculation is difficult to implement outside the
laboratory and lacks consistency in the laboratory rendering the theoretical basis of thresholds
controversial 162,163,164.
Each method of prescribing relative exercise intensity has strengths and limitations when both
theoretical and practical aspects are considered 138. Therefore when making a decision about how
to prescribe relative exercise intensity, factors such as exercise intensity, number of participants,
participant characteristics and laboratory resources should be considered.
Exercise intensity, exercise duration and other variables specific to tests and exercise mode make
up workload. Just like exercise intensity, prescription of workload can either be absolute or
relative. The physiological responses to absolute workload are different from the responses to a
relative workload.
In this study we decided to control for relative external workload. This decision was made for two
reasons: (i) external workload is a key outcome of stepping exercise which can be controlled
relatively easily, (ii) it provides a quantifiable external load, therefore the physiological responses
to this load have a fundamental source of comparison. The decision to standardise relative
external workload was based on three assumptions: (i) the standardised external load would elicit
responses commensurate with the fitness of the participant, (ii) the magnitude of the differences in
duration of the test would not impact on the physiological responses to the test and (iii) the
magnitude of the differences in exercise intensity would not impact on the physiological
responses to the test.
The evidence that contributed to decisions about the step height follows.

54
3.4 Step Height
The impact of the step height in the step test protocol was considered as early as 1946 when
Seltzer 165 noted a correlation between the Harvard step test index and the length of the lower
limb. Ebel et al 166 found a significant correlation (P < 0.05) between the Harvard step test index
scores and limb length. Keen and Sloan 167 observed stature and limb length as factors which have
an influence on the Harvard step test scores. The Harvard step test step height was adjusted to
accommodate women 94. The original Harvard step test protocol caused local fatigue due to the
high step and fast cadence that compelled participants to stop the test prematurely.
Shahnawaz investigated the effect of step height adjusted to participant’s limb length on
physiological responses (oxygen consumption) at standard workload in a step test exercise 168.
Workload was standardised per participant at 10 m.min-1 multiplied by body mass at various
stepping rates for each step height. Oxygen consumption at step heights 40 to 55% of limb length
were significantly lower (p < 0.05) than at any other step height. There exists an optimal step
height expressed as a percentage of the participants’ limb length (for efficiency in oxygen
consumption). The validity of any form of step test is enhanced if step height is related to the
participant’s limb length.
According to Francis and Culpepper the lack of consideration of an individual’s stature may cause
tall or short individuals to work at different intensities during a test that is purported to be
equivalent. As a result cardiovascular responses may differ, and hence estimates of oxygen
consumption may deviate sharply among individuals of various heights within the target group
being tested 169. Francis and Culpepper acknowledge that the use of a uniform step height exposes
participants to different work episodes that may influence or bias cardiovascular responses.
However they did not adjust the duration of the test. As a result participants performed varying
amounts of work during the test according to their body mass.
Just as high steps are inappropriate as they cause peripheral fatigue, very low steps are inefficient.
Biomechanical efficiency, oxygen consumption and work rate are determined by step height. A
decrease in efficiency due to a high platform results in the consumption of more energy and

55
oxygen. A study designed to determine efficiency when stepping found minimum oxygen
consumption for a step height of 25.4 cm when compared to a lower step height of 12.7 cm or a
higher step height of 50.8 cm 133. The study confirms that step height affects the stepping exercise
and should be considered in the protocol. If the step height is such that knee flexion at the
initiation of stepping is greater for a shorter person, the centre of mass travels through a greater
range of motion to complete the step than for a taller person. Therefore consideration of
participant’s height when determining step height improves the standardisation of the test 54. High
step heights are not reliable for assessing cardiorespiratory fitness in short participants since they
cause local muscle fatigue before an accurate estimate of aerobic capacity can be established. Low
step heights do not provide much of a physiological challenge and produce low correlations
between recovery heart rate and VO2max 170. Shephard and Bouchard 120 reported differences in
external work performance depending on how participants placed both feet on the floor (whether
flat or not) and how participants stand on the step (erect or not). A step test with an adjustable step
height proportionate with participant height provides standardised efficiency of stepping that
accommodates variations in heights and is more applicable as a field test for testing various
groups of people.
Culpepper and Francis 54 developed an equation that used participant height to calculate step
height. Through a series of equations they established that step height can be calculated using the
equation:
Hf = (h) (1 – cos θ) (Equation xv)
where Hf is the height the foot rises when the hip is flexed at angle θ, and h is the length of the
femur in centimetres 54. Anderson and Green 171 established that femur length can be calculated as
0.2626 and 0.2672 times the statute height for mature females and males respectively. Therefore,
where Ih is statute height, step height can be calculated using the equations:
Hf = (02626 Ih) (1 – cos θ) females (Equation xvi)

56
Hf = (02672 Ih) (1 – cos θ) males (Equation xvii)
Greater correlations of recovery heart rate and aerobic capacity were obtained when step height
created a hip angle closer to 73.3º 54,170. Therefore, 73.3º was used to determine hip angle in the
model and was substituted for θ in the above equations to determine the foot height (i.e. the height
the foot is raised). The angle is formed between the thigh and the vertical.
Hf =0.187 Ih females (Equation xviii)
Hf =0.190 Ih males (Equation xix)
Tests were done to determine the relationship between the angle of flexion and foot height.
Participants placed their right foot onto a step platform and the resulting hip angles were
measured. Hip angles were varied by raising or lowering the step 0.5 cm. Step height and
corresponding hip angles were recorded. Correlation coefficients of r = 0.93 and r = 0.99 between
hip angles and foot heights were obtained in females and males respectively, leading to the
conclusion that hip angles determine step height 54.
Step heights were set according to the equations xviii and xix and hip angles of participants were
measured. Mean hip angles of 73.3º ± 2.2 and 73.3º ± 2.1 in females and males respectively were
obtained 54. Therefore the model can accurately predict step height with reasonable accuracy
given stature and hip angle, or hip angle given stature and foot height.
Francis and Culpepper 53 validated the anatomical model with step height adjusted based on
height of the foot when the hip was flexed at 73.3º using a three minute step test with female
students. A regression line was used to predict VO2max from 15 seconds (5 to 20 s) heart rate
recovery. Prediction accuracy was such that 68% of the points were within ± one standard error
unit around the best fit line. A significant (p < 0.05) correlation coefficient of prediction between
heart rate recovery and directly measured VO2max of r = 0.70 was obtained. The standard error of
estimate was ± 2.9 ml.kg-1.min-1 which is on average within 7% of actual values and compares
well with results from well-known submaximal tests such as the Astrand-Ryhming test 172. The
57
average step height from the height adjusted step heights was 32.5 cm, a height similar to the
more predictable fixed step heights of 32.5 to 40.0 cm, which have produced significant
correlations between recovery heart rates and VO2 max 53,82,170.
Francis and Brasher 110 validated the height-adjusted, rate specific, single stage step test in males.
Forty-three males performed three step tests randomly at 22, 26 and 30 steps per minute on a
participant height adjusted platform for three minutes. The first step test was followed by the
VO2max test on a treadmill. The remaining step tests were completed 24 to 48 hours later. Step
height was obtained by multiplying participant height with a constant 0.190. Recovery heart rate
was measured from 5 to 15 seconds post exercise. The height adjusted step height and stepping
rate of 26 steps per minute produced the highest correlation between recovery heart rate and
VO2max (r = 0.81), similar to the correlation in females (r = 0.80) with the same stepping rate.
Shapiro et al 170 found the same correlation with a fixed step height and stepping rate of 25 steps
per minute. At 22 steps per minute the relationship (r = 0.72) is comparable to that found by
McArdle et al 82 (r = 0.75) at the same stepping rate. The cross validation of the observed
VO2max and the calculated VO2max at 26 steps per minute was highly significant (p < 0.001)
with a correlation coefficient of r = 0.98. There was no significant difference between VO2max
obtained in the cross-validation group and the initial test group. The participant height-adjustable
step test is therefore a valid method for the prediction of VO2max from heart rate recovery. All
three stepping frequencies provide similar r values for the prediction of VO2max from heart rate
recovery.
3.5 Stepping Rate
Passmore and Thomson 133 tested the efficiency of stepping rates from 6 steps per minute to 60
steps per minute and found that stepping rates between 14 and 18 steps per minute had the least
oxygen consumption. In an earlier study Lupton 173 had found similar results of minimum oxygen
consumption at a stepping rate of 1.3 seconds a step when climbing a flight of stairs. This
translates to about 23 steps per minute even though the conversion is confounded because the
participants do not have both feet placement on the step and do not step down. Shahnawaz 168

58
found minimum oxygen consumption when stepping at 20 to 25 steps per minute, and therefore
concluded the most efficient rate for stepping was within this range.
In another study Francis and Culpepper 169 validated the anatomical model using the 3-minute
step test by McArdle et al 82 in a group of female students. Step height was substituted with a
height-adjusted step height and two more stepping frequencies of 26 and 30 steps per minute were
added to the established 22 steps per minute. Participants performed the three step tests in a
random order. The treadmill test followed the first step test. The other two step tests were done 24
to 48 hours later. Step height was defined as the foot height when the hip was flexed at 73.3º.
Recovery heart rate was recorded from 5 to 20 seconds post exercise for the three stepping rates
of 22, 26 and 30 steps per minute. Recovery heart rate increased with increasing stepping
frequency. For example, the heart rate recovery was 33, 37 and 39 beats for 22, 26 and 30 steps
per minute, respectively. The Pearson product moment correlation coefficients for the stepping
rates of 22, 26 and 30 steps per minute were r = 0.74, r = 0.80 and r = 0.77 respectively (all
significant). Approximately 68% of the points were within ± one standard error unit about the best
fit line. The standard errors of estimates were relatively small, 3.1, 2.9 and 2.6 ml.kg-1.min-1 for
the respective stepping frequencies of 22, 26 and 30 steps per minute. The smallest standard error
of estimate of 2.6 from the 30 steps per minute test is within 5.9% of actual values, and provides
a more accurate estimate than both the Astrand-Ryhming nomogram 172 and the McArdle et al
step test 82 which was modified in this study by adjusting height. The stepping rate of 22 steps per
minute produced a correlation coefficient (r = 0.74) between predicted and directly measured
VO2max, which is similar to the McArdle et al test 82 (r = 0.75) which used the same stepping
frequency. The highest correlation coefficient between predicted and measured VO2max (r = 0.8)
occurred with the stepping frequency of 26 steps per minute.
The prediction capacity of a submaximal test improves with increasing intensity. The faster the
stepping rate the higher the intensity and the better the predictability. Nagle at al 81 had better
predictability at 30 steps per minute than at 24 steps per minute. The study was done on healthy
men. Participants of low physical fitness levels may have greater predictability at lower stepping
rates.

59
Whilst maximum stepping efficiency exhibits a broad optimum it should be noted that stepping
rates at the extremes present challenges. A stepping rate of 36 steps per minute is fast and
therefore presents two problems. Firstly it makes the test a high intensity test with the potential of
being a maximal test to the relatively unfit participants. Secondly unfit participants generally
struggle with rhythm and maintaining the cadence. Stepping rates as slow as 10 steps per minute
have limitations. Firstly they increase the duration of the test to achieve required heart rates or
workload. Secondly energy is wasted in posture maintenance and balance. Based on these studies
the stepping rates used in the subsequent pilot studies ranged from 16 steps per minute to 30 steps
per minute.
3.6 Trialling and Pilot Studies
Based on the above discussion we decided to standardise the workload in the novel step test.
There were several stages to achieve this goal. These stages involved trialling different
configurations of step test variables, namely stepping rate, duration and the most appropriate
workload. Since there is much research on the relationship between participant height and step
height, (discussed in section 3.4), we decided to use these data and calculate step height from the
participant’s height.
Configurations in Table 8 were tested in theory with a hypothetical participant of height 160 cm, a
body mass of 65 kg and a workload of 30 kJ, excluding the work of stepping down. Step height
was rounded to the nearest cm.
Table 8 Step test configurations
Configuration Step height (cm)
Stepping rate (steps/min)
Duration (min)
1 30 36 4.36
2 30 30 5.23
3 30 28 5.60
4 30 24 6.53
5 30 20 7.84

60
The test duration to produce an external workload of 30 kJ was nearly 8 minutes for a test with a
stepping frequency of 20 steps per minute and for a participant of medium body build. This was a
reasonable time and was within workloads of other step tests. Therefore 30 kJ was used for the
subsequent piloting studies.
The next phase of step test development was piloting the test workload and stepping rate. Three
pilot studies were done before the more formal experiments.
3.6.1 Pilot Study 1
In the first pilot study the researcher self-administered the step test. The objective of the trial was
to establish workable stepping rates and workload. She worked with three stepping rates of 22, 25
and 30 steps per minute. The tests were administered in three consecutive days at the same time of
day. Heart rate and oxygen consumption were measured during the tests. Test duration ranged
from 5.23 minutes (5 minutes and 14 seconds) to 7.13 minutes (7 minutes and 8 seconds). The
participant’s body mass was 65 kg. Workload was set at 30 kJ according to the configurations in
table 8. A step height of 30 centimetres, calculated from participant height 54 was used.
The participant finished all tests without undue distress. The peak heart rate for all tests were
below age predicted maximum heart rate. The height adjusted step height did not cause local
fatigue. Therefore step height calculated from participant height 54 was used in the subsequent
pilot studies.
3.6.2 Pilot Study 2
The objective of the second pilot study was to establish the workload for the test and stepping
rates on participants of varied fitness levels. Eleven participants (five males and six females) aged
22 to 27 years performed three step tests at 20, 24 and 28 steps per minute. Participant height
ranged from 165.5 to 183.0 cm and body mass ranged from 50.6 to 87.2 kg. The workload for the
step tests was 30 kJ. Participant mass, step height, stepping rate and gravitational force were used
to determine step test duration. Step height was determined using the equations for step height
described earlier. Participants performed the three step tests on three consecutive days at the same

61
time of day, with the exception of four participants who skipped one day between two tests due to
commitments. Participants maintained a constant diet and constant level of physical activity
during the testing days. An Oxycon (VIASYS health care, Germany) was used to measure gas
exchange and respiratory exchange ratio (RER) and a Suunto heart rate monitor (Suunto Oy,
Vantaa, Finland) measured heart rate. At the end of the test participants stood still and heart rate
recovery was measured for two minutes. Energy expenditure (EE) was calculated using caloric
equivalent of oxygen in kilocalories per litre (kcal.l-1) of oxygen and respiratory exchange ratio
(indirect calorimetry) 174 and then converted to kilojoules.
Table 9 Energy expenditure (EE) heart rate recovery (HRR), total heart beats and respiratory exchange ratio (RER) for stepping rates 20, 24 and 28 steps per minute. Data expressed as means and standard deviations.
Stepping rate
Variable 20 24 28
EE kJ 215 ± 19 214 ± 16 204 ± 23
HRR (beats) 27 ± 7 35 ± 15 41 ± 13
Total heart beats 989 ± 258 907 ± 206 811 ± 204
RER 0.97 ± 0.07 0.99 ± 0.07 1.02 ± 0.07
There were no significant differences in energy expenditure for all the tests. Heart rate recovery
and respiratory exchange ratio showed differences between 20 and 28 steps per minute. Total
heart beats were different for all tests. Of major concern was the short duration of the test for
some participants. Test duration ranged from 3 minutes 46 seconds to 10 minutes 4 seconds.
3.6.3 Pilot Study 3
The third pilot study was a repeatability study which sought to find if the same test results could
be obtained when the test was done three times. Eight participants (three males and five females)
performed a step test on three different days at the same time of day in three consecutive days.
Participants were 23 to 31 years old, 50.6 to 87.8 kg in body mass and 1.60 to 1.75 metres tall.
The stepping rate was 24 steps per minute, controlled by a metronome. Step height varied

62
according to participant height and test duration depended on participant body mass and step
height. The mechanical work of the step test was 30 kJ, a product of step height, stepping
frequency and test duration. Oxygen consumption, carbon dioxide production and respiratory
exchange ratio were measured using an oxycon (VIASYS health care, Germany). Heart rate was
measured throughout the test and two minutes after using a Suunto heart rate monitor (Suunto Oy,
Vantaa, Finland). Table 10 shows the means and standard deviations of the measured variables.
Table 10 Energy expenditure (EE), heart rate recovery (HRR), total heart beats, respiratory exchange ratio (RER) and rating of perceived exertion (RPE) for 24 steps per minute. Data expressed as means and standard deviation.
Stepping rate 24 steps per minute
Variable Test 1 Test 2 Test 3
EE kJ 210 ± 14 206 ± 26 212 ± 17
HRR 28 ± 16 28 ± 12 28 ± 13
Total heart beats 874 ± 202 906 ± 179 888 ± 169
RER 1.04 ± 0.08 1.01 ± 0.05 1.01 ± 0.07
RPE 12 ± 1 11 ± 1 11 ± 1
The results show that the step test is repeatable. There were no significant differences for energy
expenditure, heart rate recovery, heart beats and rating of perceived exertion.
3.7 Workload Determination
After the pilot study workload was increased from 30 kilojoules to 45 kilojoules. The decision
was based on a number of reasons. Firstly, when stepping at 24 steps per minute participants rated
the test as light on the rating of perceived exertion scale. Secondly, the test duration for
participants of large body mass was very short. Even though the sample did not have participants
who were heavy with a body mass exceeding 100 kg (heaviest was 87.8 kg) or taller than two
metres (tallest was 1.75 m), the shortest duration of the test was 3 minutes and 46 seconds. The
duration would have been even shorter if heavier or taller participants were tested. Thirdly, the
external workload of 30 kilojoules in many cases did not achieve a steady state for oxygen

63
consumption and heart rate. The workload of other step tests was calculated using mean body
mass for study samples. One minute workload ranged from 4 to 11 kilojoules and averaged 6
kilojoules. The workload for the tests ranged from 13 to 57 kilojoules and averaged 26 kilojoules
with the YMCA-3 minute step test at the lower end and the Harvard Step test at the upper end.
The 45 kJ workload for the standardised step test fell within the range of workloads of previous
step tests, a measurement large enough to elicit desired physiological responses without straining
the participant.
3.8 Stepping Rate Determination
Previous literature provided the recommended range of stepping rates. Pilot studies confirmed
workable stepping rates. For the reliability and validity studies that followed stepping rates of 16,
20 and 24 steps per minute were used. The choice was made basing on methodological and
research reasons. All stepping rates had to accommodate participants weighing between 50 and
100 kg and the test had to be at least six minutes long. Testing rates of 20, 24 and 28 steps per
minute could still have been used but 28 steps per minute made the test duration too short for
participants who weighed about a 100 kg. We decided to use 16, 20 and 24 steps per minute for
the next phase of testing.
3.9 Test Duration
The workload standardised step test has no predetermined duration, although we decided from a
practical perspective it should not be longer than 15 minutes. All the other variables, workload,
step height, stepping rate, body mass, are combined to determine the test duration. Each
individual has different combinations of step test variables, but a standardised workload. The pilot
studies ensured that the test would neither be very short nor very long for people of very large and
very small body masses respectively.
3.10 Summary
A step test standardised for external workload was developed and named the “workload
standardised step test” (WSST). Some aspects of the protocol were determined using previous
research, others were pilot tested. The product was a step test protocol designed to provide a

64
workload of 45 kJ with individualised step height based on the participant’s stature. The duration
of the test varied to provide the 45 kJ. The principle of clinimetrics requires that a new instrument
should be thoroughly assessed before it is used and applied. The following chapters explain how
the step test was evaluated through reliability and validity studies.

65
CHAPTER 4
THE ASSOCIATION BETWEEN MEASURES OF ENERGY
EXPENDITURE AND HEART RATE IN THREE SUBMAXIMAL
STEPPING TESTS STANDARDISED FOR EXTERNAL WORKLOAD.

66
4.1 Introduction
As previously described the step test protocol was developed based on established step test
protocols in the literature and pilot studies designed to refine the measurements. The protocol
comprised a variable step height, constant stepping rate, and variable duration calculated to
produce a constant workload (45 kJ). Step height was adjusted according to the participant’s
stature. Stepping rate was constant during the test for each participant, but varied from trial to
trial. Test duration varied among participants and depended on step height and stepping rate. The
aim of this study was to test the reliability of three configurations of the step test using 16, 20 and
24 steps per minute.
4.2 Methods
4.2.1 Participants
Thirty one untrained to moderately trained participants, 13 males and 18 females (20 to 60 years),
participated in the study. Sampling criteria excluded people with orthopaedic problems that may
have interfered with the trial, and chronic conditions requiring medication that might have
interfered with cardiorespiratory and metabolic responses to exercise. Participants with a body
mass of less than 50 and above 100 kg were also excluded. The Human Research Ethics
Committee, University of Cape Town approved the study (HREC REF: 170/2012) (Appendix 5).
4.2.2 Sample Size
The sample size for this study was based on a similar study 23, which examined the repeatability
of submaximal heart rate in a shuttle test. That study had sufficient statistical power with 44
participants. The workload was better controlled in our step test study, hence the slightly smaller
sample size needed to yield the same accuracy.
4.2.3 Pre-participation
Before the start of the study participants completed a pre-participation fitness screening
questionnaire according to the American College of Sports Medicine guidelines Appendix 1, to
screen for cardiovascular and pulmonary disease and orthopaedic problems 175. The experimental

67
protocol was explained and participants who met the study inclusion criteria were asked to sign
informed consent forms before participation.
4.2.4 Anthropometric Measurements
Participants’ stature, body mass and body fat were measured. Body mass was measured on a
calibrated scale before testing on all the three testing days and recorded to the nearest 100 g. The
participant was weighed in the minimum clothes possible; men in shorts only and women in shirts
and shorts, without shoes.
Stature was measured in cm the first day of testing using the Seca Leicester portable height
measure, (Seca, Birmingham, UK). Prior to measurement the participant was instructed to look
ahead and take a deep breath. Stature was recorded as the height from the floor to the vertex of the
head. The vertex is the highest point on the skull when an imaginary line between the lower
margin of the eye socket and the upper margin of the zygomatic bone is parallel to the ground.
The participants stood barefoot with their arms hanging by their sides. The heels, buttocks, upper
back and head were in contact with the wall. The measurement was recorded to the nearest mm.
Body fat was measured on the first visit using callipers (Holtain Limited, Crymych, United
Kingdom). Body fat was represented as the sum of the seven skinfolds (biceps, triceps,
subscapular, suprailiac, thigh, calf, abdominal) and as body fat percent 176. The skinfold was
measured by grasping the compressed thickness of a double layer fold of skin and the underlying
subcutaneous tissue, which is assumed to be adipose tissue, between the thumb and forefinger,
one to two centimetres above the site that was to be measured. The fold was pulled away from the
underlying muscle and the jaws of the callipers were placed on either side of the site, at a depth of
approximately one centimetre. The skinfold was held firmly throughout the application of the
calliper and the reading was taken when the needle became steady after the full pressure of the
calliper jaws had been applied. The callipers were applied at right angles to the fold at all times.
All measurements were taken on the participant's right side except for the abdominal skinfold that
was taken on the participant’s left side and recorded in millimetres.

68
Triceps skinfolds were measured from the back on the posterior surface of the right arm midway
between the top of the shoulder (acromion process) and the elbow (olecranon process). The
participant stood with the upper limb hanging loosely by the side. Biceps skin folds were
measured from the front on the anterior surface of the right arm midway between the top of the
shoulder and the elbow. The participant stood in the same posture as for the triceps measurement.
The subscapular skinfold was measured just below the inferior angle of the right scapula with the
fold in an oblique plane descending laterally (outwards) and downwards at an angle of
approximately 45° to the horizontal.
The suprailiac skinfold was measured five centimetres above the right iliac crest with the fold
oblique, descending medially (inwards) and downwards at an angle of about 45° to the horizontal.
The participant should stand erect with the upper limbs by the side and the abdominal muscles
relaxed. The abdominal skinfold was measured in a vertical plane five centimetres to the left of
the participant’s umbilicus.
The thigh skinfold was measured at the mid-point on the anterior surface of the right thigh with
the fold parallel to the long axis of the thigh. The participant's weight was on the left leg so that
the knee joint of the measured leg formed an angle of about 120°. The calf skinfold was measured
on the medial surface of the right calf at the level of the greatest calf circumference. The
participant's weight was placed on the left leg during measurement.
4.2.5 Step Test
Mechanical work in a step test is a product of step height, stepping rate, test duration and the
participant’s mass. The amount of work done can be standardised by manipulating variables that
contribute to mechanical work. The formula used is,
W = m × g × h (Equation xx)
Where:
W is work in joules (J),

69
m is the participant’s weight in kilogrammes,
g is acceleration due to gravity (9.81 m.s-1), and
h is the step height in metres 177.
The work done per single climb is multiplied by the stepping rate to get the work done in one
minute and by the test duration (minutes) to get the work done for the test. The step test provided
a constant external workload (45 kJ) by manipulating step height and step test duration in
accordance with participant’s mass and stature.
Step height was adjusted according to participant’s stature to ensure biomechanical stepping
efficiency using equations xviii and xix 54. Step height was manipulated by adding one centimetre
boards to five centimetre and ten centimetre piling boards. The step platform was 110 centimetres
long and 40 centimetres wide. The adjustable boards were 110 centimetres long and 45
centimetres wide. The platform was rubberised so that the participant’s feet were comfortable
without any danger of sliding or slipping.
Table 11 shows the range of stature of the participants, from the shortest to the tallest, and their
corresponding step heights.
Table 11 Range of participant height in relation to step height from the shortest female (♀) to the tallest male (♂).
Stature (cm) Step height (cm)
Participant 1 (♂) 189 36
Participant 2 (♀) 156 29
The heights of the remaining participants were between the two values (156 and 189 centimetres).
Participants performed three step test protocols at step frequencies of 16, 20 and 24 steps per
minute controlled by a metronome set at 64, 80 and 96 beats per minute respectively. At the first
beat the first leg stepped on the step, second beat both legs on step, third beat one leg down and
fourth beat both legs down (i.e. four beats per step cycle). The three step test protocols were
completed in random order within five days (Monday to Friday). The time of day the test was

70
conducted was kept constant to within one hour. Participants were asked to keep their eating and
physical activity habits constant during the five days in an attempt to maintain a similar metabolic
and physiological state. Before testing each day the researcher asked the participant about their
general condition and feeling. There were no reported violations of the protocol.
The duration of each test was modified to elicit 45 kJ work per test. Participants’ body mass, step
height, stepping rate and gravitational force were used to determine step test duration. In this
study duration ranged from five minutes 46 seconds for the heaviest participant to 19 minutes 30
seconds for the lightest participant. Participants were asked to step with a flat foot and to stand
erect on the step to control for energy expenditure 120.
Participants were allowed ten seconds to adjust to the cadence of the metronome. Ambient
temperature was controlled (20 - 22C) and humidity varied between 50 and 60 mmHg. Heart rate
was recorded throughout the test and for two minutes after the test using a Suunto T6 chest heart
rate transmitter and wrist monitor (Suunto Oy, Vantaa, Finland). During the two minute recovery
period the participant stood upright and motionless while heart rate was recorded. After the step
protocol, heart rate data were transferred from the wrist monitor to a computer for analysis. Heart
rate recovery and total number of heart beats when performing a step test were calculated.
Maximum heart rate attained during the test was also recorded. Heart rate data were checked
using Suunto training manager and any spurious recordings were deleted. This resulted in missing
data for heart rate recovery and total heart beats. Oxygen consumption and respiratory exchange
ratio (RER) were measured at 15 seconds intervals using an Oxycon (VIASYS health care,
Germany). Energy expenditure during the test was calculated using respiratory exchange ratio and
caloric equivalent of oxygen in kilocalories per litre (kcal.l-1) of oxygen (indirect calorimetry)
according to the fuel used during the exercise 174 and then converted to kilojoules. The
participant’s perception of effort (RPE) was recorded at the end of each minute using the Borg 6-
20 point scale 122. The scale assesses participants’ feelings of exertion, effort, discomfort and
strain experienced when doing physical activity.

71
4.3 Data Analysis
Descriptive statistics, (means and standard deviations), were used for the physical characteristics
of participants; i.e. age, stature, body mass, body mass index and body fat percent. Descriptive
statistics were also used to determine the means and standard deviations for energy expenditure,
heart rate recovery, total heart beats, rating of perceived exertion and maximum heart rate. An
analysis of variance (ANOVA) with repeated measures was used to compare the means of the
three step tests for energy expenditure, heart rate recovery, total heart beats, rating of perceived
exertion and maximum heart rate. A Tukey’s post-hoc analysis was used to determine the specific
differences. Testing order was analysed to determine whether it had an effect on results. The
Bland and Altman limits of agreement between the variables from the tests of different stepping
frequencies was calculated 178.
4.4 Results
The general descriptive characteristics of all participants are shown in Table 12.
Table 12 Descriptive characteristics of participants (Means ± standard deviations)
Variable Males (n = 13) Females (n =18) Total (n = 31)
Age (Years) 24.4 ± 3.3 24.4 ± 3.3 24.3 ± 5.2
Stature (m) 1.75 ± 0.09 1.65 ± 0.07 1.69 ± 0.09
Body mass (kg) 73.6 ± 12.6 64.6 ± 9.1 68.4 ± 11.4
BMI (kg/m2) 23.9 ± 3.1 23.8 ± 3.4 23.9 ± 3.5
Body fat percent 18 ± 4 29 ± 5 24 ±7
The energy expenditure, heart rate recovery, maximum heart rate, maximum heart rate as a
percentage of age predicted maximum heart rate, total heart beats and rating of perceived exertion
for the three stepping rates (16, 20 and 24 steps per minute) are shown in Table 13. The
significance of the comparisons between the tests is also shown in this table. There were
significant differences among all three step tests for all the variables measured except heart rate
recovery between 16 and 20 steps per minute. Energy expenditure was highest at 16 steps per
minute and steadily decreased with increasing stepping frequency.

72
Table 13 Energy expenditure (EE), heart rate recovery (HRR), maximum heart rate (MHR), maximum heart rate as a percentage of age predicted maximum heart rate, (% AP MHR), total heart beats (THB) and rating of perceived exertion (RPE) for 3 stepping rates: 16, 20 and 24 steps per minute. Data expressed as mean ± standard deviation, F value and p value.
Stepping rate Comparison
Variable 16 20 24 F and P 16 vs. 20 20 vs. 24 16 vs. 24
EE (kJ) 355 ± 30 335 ± 35 321 ± 29 F2,60 = 23.213
(P = 0.00001)
P < 0.001 P < 0.05 P < 0.001
HRR (b) 28 ± 7 29 ± 7 34 ± 9 F2,50 = 17.058
(P = 0.00001)
P > 0.05 P < 0.001 P < 0.001
MHR (bpm) 136 ± 22 149 ± 24 160 ± 22 F2.32 = 53.552
(P = 0.00001)
P < 0.001 P < 0.001 P < 0.001
% AP MHR 70 ± 11 76 ± 12 81 ± 10 F2,32 = 53.675
(P = 0.00001)
P > 0.05 P > 0.05 P < 0.01
THB (b) 1723 ± 545 1600 ± 474 1375 ± 440 F2.26 = 69.993
(P = 0.00001)
P < 0.001 P < 0.001 P < 0.001
RPE 10 ± 2 11 ± 2 12 ± 3 F2,56 = 16.980
(P = 0.00001)
P < 0.01 P < 0.05 P < 0.001

73
Figure 2 is a graphic representation of the relationship between the three stepping frequencies 16,
20 and 24 steps per minute and energy expenditure. Energy expenditure decreased with increasing
stepping frequency.
Figure 2 Energy expenditure for stepping rates 16, 20 and 24 steps per minute.
Figure 3 shows heart rate recovery, maximum heart rate, total heart beats and the rating of
perceived exertion for the three stepping frequencies. Heart rate recovery, maximum heart rate
and rating of perceived exertion increased with increasing stepping frequency whereas total heart
beats decreased.
16 20 24
250
300
350
400
450 Energy Expenditure
#*
**
Stepping Frequency
kJ

74
Figure 3 Heart rate recovery (A), maximum heart rate (B), total heart beats (C) and rating of perceived exertion (D) for 16, 20 and 24 steps per minute.
16 20 24
5
10
15 RPE
#*
**
D
Stepping frequency
RP
E
100
120
140
160
180
200 Maximum heart rate
# *
**
bp
m
B
500
1500
2500Total heart beats
#
***
C
bea
ts
10
30
50 Heart rate recovery**
A
bea
ts

75
The limits of agreement were calculated between stepping frequencies of 16-20, 16-24 and 20-24
steps per minute for energy expenditure, heart rate recovery, total heart beats, maximum heart rate
and rating of perceived exertion (Table 14). The biggest differences for all the variables occurred
between the 16 and 24 steps per minute.
Table 14 Limits of agreement for energy expenditure (EE), heart rate recovery (HRR), total heart beats (THB), maximum heart rate (MHR), maximum heart rate as a percentage of age predicted maximum heart rate (% AP MHR) and rating of perceived exertion (RPE) for the three stepping rates 16, 20 and 24 steps per minute.
Variable 16 vs. 20 16 vs. 24 20 vs. 24
EE (kJ) -42 to 83 -26 to 94 -29 to 56
HRR (b) -11 to 9 -24 to 8 -23 to 11
MHR (bpm) -28 to 7 -40 to -5 -34 to 9
% AP MHR -14 to 3 -21 to -2 -17 to 4
THB (b) -43 to 522 116 to 721 -134 to 472
RPE -5 to 3 -6 to 2 -4 to 2
Data for the step tests at 16, 20 and 24 steps per minute were sorted according to the order of
testing for all variables to determine whether the order had an effect on the results. Table 15
shows the means and standard deviations of energy expenditure, heart rate recovery, maximum
heart rate, maximum heart rate as a percentage of age predicted maximum heart rate, total heart
beats, and rating of perceived exertion. The p values (P > 0.05) show that the testing order had no
effect on the variables measured.

76
Table 15 Energy expenditure (EE), heart rate recovery (HRR), total heart beats (THB), maximum heart rate (MHR), maximum heart rate as a percentage of age predicted maximum heart rate (% AP MHR) and rating of perceived exertion (RPE) for testing order 1, 2 and 3 of the 3 step tests.
Variables Test 1 Test 2 Test 3 F value P Values
EE (kJ) 340 ± 38 343 ± 30 328 ± 33 1.7 0.19
HRR (b) 29 ± 8 31 ± 8 32 ± 8 1.0 0.38
MHR (beats.min-1
) 148 ± 24 148 ± 26 153 ± 22 0.3 0.71
THB (b) 1623 ± 545 1562 ± 483 1478 ± 480 0.5 0.61
% AP MHR (b) 75 ± 12 76 ± 12 78 ± 11 0.4 0.69
RPE 11 ± 3 10 ± 2 11 ± 3 0.6 0.53
4.5 Discussion
The aim of this study was to determine whether three step test protocols, varying in step
frequency and duration but standardised for 45 kJ external workload elicit the same physiological
responses. The study showed there were significant differences in the physiological responses
between the three stepping rates and therefore the different configurations of the test are not
interchangeable.
The three stepping rates of 16, 20 and 24 steps per minute differed in exercise intensities, as
measured by maximum heart rate and perception of effort during the test (Table 13). Maximum
heart rate during the test increased as stepping frequency increased. Therefore by implication the
intensity increased as the stepping frequency increased. Indeed maximum heart rate as a
percentage of age predicted maximum heart rate during the step test increased from a mean of
70% (16 steps per minute) to 81% (24 steps per minute).
The change in energy expenditure, despite the external workload remaining constant, can be
attributed to the fact that the anaerobic component was not accounted for in the calculation of
energy expenditure as the stepping frequency and exercise intensity increased. This is because the

77
method used to calculate energy expenditure of each participant has limitations as it is based on
oxygen consumption and does not include energy derived from oxygen independent methods 179.
Measurement of oxygen to predict energy expenditure is valid providing the substrate is known
(glucose or fat) and the exercise intensity is steady at a low to moderate rate. During short
duration high intensity exercise ATP is resynthesised through anaerobic glycolysis. An anaerobic
measurement is therefore required to account for this type of energy transfer. Oxygen
consumption can only be used to measure energy expenditure for exercises that are entirely
aerobic, and has limitations when measuring brief, intense, non-steady rate exercise that has a
large glycolytic ATP turnover component 179. Therefore it may be concluded that in this study, as
the intensity increased with increased stepping rate more of the energy was derived from oxygen
independent pathways.
There were significant differences in heart rate recovery between 16 and 24 steps per minute and
between 20 and 24 steps per minute but no significant difference between 16 and 20 steps per
minute. The differences were largest between the 16 steps per minute compared to the 24 steps
per minute (Table 13). Studies on heart rate during and after exercise found that changes in heart
rate and heart rate recovery had the least day-to-day variation and highest level of sensitivity if a
submaximal protocol elicits heart rate between 86 and 93% of maximum heart rate 23,24. In our
study all stepping rates did not elicit 86% of age predicted maximum heart rate and this could
have had an effect on measurement of heart rate recovery (Table 13).
The heart rate at the starting point of recovery influences the rate of recovery 27. High intensity
exercise causes both sympathetic stimulation and parasympathetic withdrawal. Low intensity
exercise causes parasympathetic withdrawal only. During heart rate recovery there is
parasympathetic reactivation and sympathetic withdrawal. Therefore exercise intensity has an
effect on heart rate recovery. Participants recovered faster from the 24 steps per minute test than
from the 20 steps per minute. Heart rate recovery is also influenced by temporary physical status,
load level, activity level and pre and post movement 64.

78
The total heart beats during the test decreased as stepping frequency increased. Step test duration
was shorter at higher stepping rates and longer at lower stepping rates. Since the total heart beats
is a product of heart rate and duration, it may be concluded that the decreasing trend in total heart
beats shows that the increase in heart rate with increasing stepping frequency was offset by the
shorter test duration.
There were significant differences in rating of perceived exertion for the three stepping
frequencies with 16 steps per minute being perceived as the lowest. Rating of perceived exertion
reflects the combined feedback from the cardiorespiratory, metabolic and thermal stimuli 180.
Rating of perceived exertion correlates with average heart rate 181 and acute changes in heart rate 182.
4.6 Conclusions
A standardised external workload elicits different physiological responses to exercise. This can be
attributed to different exercise intensities and test duration. Three step tests, all 45 kJ but with
different parameters (stepping rate and duration) produced significant differences (p < 0.05) in
energy expenditure and heart rate recovery in participants. Energy expenditure was highest at 16
steps per minute and steadily decreased with increasing stepping frequency. This can be attributed
to the duration of the test that lasted longer at low stepping frequencies and the exclusion of the
anaerobic component in the calculation of energy expenditure at high stepping frequencies. Total
heart beats decreased as stepping frequency increased. Step test duration had a greater effect on
the total heart beats than exercise intensity. Heart rate recovery was also different (16, 20 and 24
steps per minute) possibly as a consequence of different exercise intensities in the preceding
exercise. Therefore we conclude that standardisation of external workload by manipulating step
height, duration of the test and stepping frequency elicits different physiological responses when
the stepping frequency varies.

79
CHAPTER 5
THE REPEATABILITY OF THE MEASUREMENTS OF ENERGY EXPENDITURE AND HEART RATE IN A STEPPING TEST
STANDARDISED FOR EXTERNAL WORKLOAD

80
5.1 Introduction
The principle of clinimetrics requires that a tool for measurement must be tested for reliability and
validated before it can be used to make informative and interpretative measurements. Reliability
represents the reproducibility of observed values of a test, assay or other measurement in repeated
trials on the same individuals 183. Reliability is concerned with the consistency of observed values
when the measurements are repeated in the same environment by the same tester on the same
participants and under the same conditions.
Quantifying the reliability of a measurement enables decisions to be made about whether the
differences after intervention are real or a result of testing error. Within-participant variation is the
most important type of repeatability measure. The smaller the within-participant variation (typical
error of measurement) the better the precision of single measurements and better observation of
changes 183. Typical error of measurement (TEM) and typical error as a coefficient of variation
(CVTEM) quantify the amount of noise associated with a testing instrument and procedure. The
units of TEM are the same as the measurement whereas CVTEM is expressed as a percentage.
Quantifying reliability associated with testing contributes to better interpretation of results by
determining the smallest worthwhile difference of a measurement. In addition it is important to
establish if the differences in measurements are of practical relevance. The threshold for
differences considered to be practically relevant is based on Cohen’s effect size concept 184 and is
called the smallest worthwhile difference (SWD) (See calculation in methods section page 99).
Measurements that have a mean typical error of measurement (TEM) and typical error as a
coefficient of variation (CVTEM) lower than the smallest worthwhile difference have “good”
sensitivity while measurements that have differences following repeated trials equal to, or greater
than, the smallest worthwhile difference have “satisfactory” or “poor” sensitivity respectively 185.
Relative reliability is the degree to which individuals maintain their position in a sample over
repeated measurements 186. Intraclass correlation coefficient measures relative reliability.
Correlation coefficients define the degree of association between two sets of data or the
consistency of position within the distribution 186. A high intraclass correlation coefficient

81
represents a high relative reliability and a low influence of measurement error. Correlation
coefficient does not detect systematic error so two sets of data may be highly correlated but not
repeatable. If a group is heterogeneous, the intraclass correlation coefficient is high as there is
little chance for swapping positions of a measurement. Therefore, while intraclass correlation
coefficient provides useful information there is need for further analysis to confirm the reliability
of the measurements.
Absolute reliability is the degree to which repeated measurements vary for individuals 186. The
less they vary the higher the reliability. Absolute reliability is expressed in the actual units of the
measurements or as a proportion of the measurements. The standard error of measurement (SEM),
coefficient of variation (CV) and Bland and Altman’s limits of agreement all measure absolute
reliability 186. Coefficient of variation is defined as the ratio of standard deviation (σ) to the mean
(μ), σ/μ. Quantifying typical error contributes to an interpretation of whether the difference
between two trials is real or due to testing error.
This study follows the study in Chapter 4 that investigated physiological responses to three
submaximal step test protocols at stepping frequencies of 16, 20 and 24 steps per minute with step
height adjusted for participants’ height and test duration adjusted to standardise the external
workload at 45 kJ. In that study (Chapter 4) the workload was standardised at 45 kJ so that all
participants performed the same amount of external work. The study showed that the different
configurations of the test are not interchangeable with differences mostly occurring between the
16 and 24 steps per minute.
We therefore decided to keep the stepping rate constant when the repeatability of the step test
adjusted for an external workload of 45 kJ was determined. We also wanted to determine the
preferred cadence if a participant was given a choice. The study was approved by the Human
Research Ethics Committee of the Faculty of Health Sciences of the University of Cape Town
(HREC REF: 170/2012) (Appendix 5).
Research question

82
What is the typical error of measurement and the smallest worthwhile difference of measurement
of a step test protocol with step height and duration manipulated to produce 45 kJ of external
work while stepping rate remains constant?
5.2 Methods
The study was a cross sectional comparative design with repeated measures.
5.2.1 Sample
The sample consisted of healthy, untrained to moderately trained men (n = 19) and women (n
=15) aged 20 to 60 years who weighed between 50 and 100 kg. Sampling criteria excluded people
with orthopaedic problems that may have interfered with the trial, and chronic conditions
requiring medication that might have interfered with cardiorespiratory and metabolic responses to
exercise. The recruitment of participants was marketed through emails, fliers and word of mouth.
5.2.2 Pre-participation
Before the start of the study participants completed a pre-participation fitness screening
questionnaire according to the American College of Sports Medicine guidelines (Appendix 1).
This questionnaire screened for cardiovascular and pulmonary disease and orthopaedic problems.
The experimental protocol was explained and participants who met the study inclusion criteria
were asked to sign informed consent forms before participation.
5.2.3 Anthropometric Measurements
Stature, body mass and body fat of the participants were measured as described in the previous
study (Chapter 4, section 4.2.4).
5.2.4 Testing
Participants reported for testing four times a week. They performed a step test on the first three
days and on the fourth day they performed a twelve minute walk/run test in which they were
required to cover as much distance as possible.

83
During the familiarisation period on the first day of testing, participants were allowed to
experience three step test protocols of stepping rates 16, 20 and 24 steps per minute. They
selected a stepping rate that they found most comfortable. Ten participants chose 20 steps per
minute and 24 participants chose 24 steps per minute. Nobody selected 16 steps per minutes. Step
height was adjusted to participant stature using equations xviii and xix 54. The duration of the
protocol was calculated considering the step height and body mass to produce an external
workload of 45 kJ. The same protocol was repeated on three days within a five day period
(Monday to Friday), at the same time of day (within one hour) and under the same laboratory
conditions.
Reliability is affected by testing protocol, equipment and calibration, participant characteristics
and the period between repeated trials and testing conditions (testing time, temperature and
humidity). Ambient temperature (20 - 22C) and relative humidity (50 - 60 mmHg) were
controlled in air-conditioned laboratories. The same investigator recorded all measurements to
minimise random error as much as possible. Participants were asked to maintain a constant diet
and not change their physical activity habits during the five days. Participants were asked to
refrain from drinking caffeinated beverages two hours before testing. Participants did not warm
up before the test but were allowed 10 seconds to adjust to the cadence of the metronome (Vic
Firth, Korea).
Respiratory gas exchange was measured using an Oxycon breath-by-breath analyser (Jaeger Pro®,
VIASYS health care, Hoechberg, Germany). The Oxycon was calibrated before each trial using a
three litre syringe (SensorMedics®, Milan, Italy) and a reference gas of known composition (16%
oxygen, 5% carbon dioxide, balance nitrogen). Respiratory data were averaged at 15 seconds
intervals. Energy expenditure was calculated using respiratory exchange ratio and caloric
equivalent of oxygen in kilocalories per litre (kcal.l-1) of oxygen (indirect calorimetry) according
to the fuel used during the exercise 174 and then converted to kilojoules.

84
Heart rate for the test duration and two minutes after the test was measured with a Suunto T6
heart rate monitor (Suunto Oy, Vantaa, Finland). Heart rate was recorded every two seconds.
After the test heart rate data were transferred from the wrist monitor to a computer for analysis.
Heart rate data were checked using the Suunto training manager (Suunto Oy, Vantaa, Finland).
Heart rate recovery was calculated as the difference between the end of exercise heart rate (taken
as the average of the last 16 seconds of the test) and the one minute recovery heart rate (taken as
the average of the last 16 seconds of the first minute of recovery as previously described 24. Total
heart beats during the test were calculated. Maximum heart rate during the test was also recorded.
The participant’s perception of effort (RPE) was recorded at the end of each minute using the
Borg 6-20 point scale 122.
5.2.5 Physical Performance
All participants did the 12 minute walk/run motion test adapted from the Cooper test 9 within the
same week as the step tests. After an adequate warm-up of jogging and stretching participants
were asked to cover as much distance as possible in 12 minutes by either walking, jogging or
running. Participants were verbally encouraged to maintain motion at the highest speed possible
so that they could cover the maximal distance during the 12 minutes. The test was done on a
synthetic track (inside line 133 metres, middle of lane one 135 metres, line between lane one and
lane two 140 metres, middle of lane two lane 144 metres) in the Fitness Centre of the Sports
Science Institute of South Africa (SSISA). Participants were asked to use the inside line during
the test.
5.2.6 Data Analysis
Descriptive statistics were calculated and used to analyse physical characteristics of participants
and as well as step test outcome measures. Reliability data were analysed for statistical
significance using repeated measures analysis of variance (ANOVA) and significant differences
were further investigated using a Tukey’s post-hoc test using Statistica version 12 (Statsoft Inc.,
Tulsa, OK, USA) and Prism 5 (GraphPad Software, Inc., CA, USA). ANOVA and paired t tests
detect systematic bias between the means of two sets of data. Statistical significance was defined
as p ≤ 0.05. Between-trial differences were also investigated by calculating Cohen’s effect sizes

85
from the effect size calculator spreadsheet 184. These were interpreted as < 0.2 = trivial, ≥ 0.2 to <
0.5 = small, ≥ 0.5 to < 0.8 = moderate and ≥ 0.8 = large 184. Confidence intervals for the effect
sizes were also calculated. The smallest worthwhile difference was defined as the difference
equating to an effect size of 0.2. This was calculated as 0.2 multiplied by pooled standard
deviation. The smallest worthwhile difference (SWD) was compared with the noise in the
measurement as suggested by Hopkins 187.
Measurement reliability in the form of intraclass correlation coefficient (ICC), typical error of
measurement (TEM) and typical error as a coefficient of variation (CVTEM) were determined
using the spreadsheet “Reliability from consecutive pairs of trials”, in: A new view of statistics
downloaded from www.sportsci.org: Internet Society for Sport Science,
sportsci.org/resource/stats/xrely.xls 185. The between trial reliability statistic of typical error was
calculated as the standard deviation of the difference score divided by square root of two and was
converted to a coefficient of variation (CVTEM). All measures of reliability are expressed with
90% confidence intervals (90% C.I.) 185.
An independent t-test was used to determine the significance of differences between the group
that selected 20 steps per minute and the group that selected 24 steps per minute.
5.3 Results
The results will be presented in two sections: (i) whole group and (ii) comparison between 20 and 24 steps per minute (step cadence).
5.3.1 A. Whole Group
Participants’ height ranged from 154.5 cm to 198.0 cm. The step height accommodating these
heights ranged from 29 cm to 37 cm. The shortest duration of the test for the heaviest participant
was 5 minutes and 47 seconds and the longest duration of the test for the lightest participant was
12 minutes and 15 seconds.

86
The mean age of the participants was just over 33 years (Table 16). There were no significant
differences between the ages of men and women (P = 0.56). Men were generally taller (P = 0.01)
but average body mass and body mass index (BMI) of males and females were similar; (P = 0.63)
and (P = 0.26) respectively. Women generally had more fat than men as shown by the body fat
percent (P = 0.0001) and sum of seven skinfolds (P = 0.003).
Table 16 Descriptive characteristics of participants (means and standard deviations)
Variable Males (n = 19) Females (n = 15) Total (n = 34)
Age (years) 32.4 ± 9.4 34.5 ± 11.7 33.4 ± 10.3
Stature (cm) 174.8 ± 9.2 166.3 ± 7.7 171.0 ± 9.5
Body mass (kg) 71.8 ± 13.9 69.4 ± 13.9 70.7 ± 13.7
BMI (kg/m2) 23.4 ± 3.7 25.2 ± 5.2 24.2 ± 4.5
Body fat % 17.8 ± 7.0 30.8 ± 6.5 24.1 ± 9.4
Sum of 7 skinfolds (mm) 86.7 ± 48.3 147.9 ±57.9 116.3 ± 60.8
Energy expenditure, heart rate recovery and peak respiratory exchange ratio (RER) were not
different between trials (Table 17). There were however differences between the first trial and
third trial for maximum heart rate, age predicted maximum heart rate, heart beats and rating of
perceived exertion (RPE). RPE was also different between the first and second trials. However,
for average RPE (not shown in the table) there were no significant differences between the first
and the second trial and between the second and third trial.

87
Table 17 Energy expenditure (EE), heart rate recovery (HRR), maximum heart rate (MHR), maximum heart rate as a percentage of age predicted maximum heart rate, (% AP MHR), total heart beats (THB), rating of perceived exertion (RPE) and peak respiratory exchange ratio (RER).
Stepping rate Comparison Variable 1 2 3 Mean F 1 vs. 2 2 vs. 3 1 vs. 3
EE (kJ) 293 ± 36 293 ± 40 297 ± 40 295 ± 39 F2,66 = 0.4 (P = 0.65)
P > 0.05 P > 0.05 P > 0.05
HRR (b) 30 ± 12 32 ± 11 30 ± 12 31 ± 11 F2,66 = 2.8 (P = 0.07)
P > 0.05 P > 0.05 P > 0.05
MHR (bpm)
147 ± 22 145 ± 20 144 ± 20 146 ± 21 F2,66=3.7 (P = 0.03)
P > 0.05 P > 0.05 P < 0.05
% AP MHR 79 ± 12 78 ± 11 77 ± 11 78 ± 11 F2,66 =3.8 (P = 0.03)
P > 0.05 P > 0.05 P < 0.05
THB (b) 1256 ± 375
1233 ± 337
1213 ± 332
1234 ± 348
F2,66= 4.2 (P = 0.02)
P > 0.05 P > 0.05 P < 0.05
RPE 13 ± 3 12 ± 3 12 ± 3 12 ± 3 F2.66= 12.5 (P = 0.00)
P < 0.01 P > 0.05 P < 0.001
RER 1.00 ± 0.06
0.99 ± 0.07
0.98 ± 0.07
0.99 ± 0.07
F2,66 = 2.4 (P = 0.09)
P > 0.05 P > 0.05 P > 0.05
Intraclass correlation coefficients (R) were calculated to test for relative reliability. The data for
all the measured variables are presented in Table 18. Generally there was high intraclass
correlation among all measured variables with maximum heart rate, maximum heart rate as a
percentage of age predicted maximum heart rate, total heart beats and rating of perceived exertion
all R ≥ 0.95.

88
Table 18 Intraclass correlation coefficient and confidence intervals for energy expenditure (EE), heart rate recovery (HRR), maximum heart rate (MHR), maximum heart rate as a percentage of age predicted maximum heart rate, (% AP MHR), total heart beats (THB), rating of perceived exertion (RPE) and peak respiratory exchange ratio (RER).
Variable Intraclass correlation coefficient Mean 1 vs. 2 2 vs. 3 1 vs. 3
EE (kJ)
0.69 (0.51– 0.81 )
0.79 (0.66 – 0.88)
0.62 (0.41 -0.77)
0.69 (0.57– 0.80)
HRR (beats)
0.89 (0.82– 0.94)
0.90 (0.83 – 0.94)
0.88 (0.80 – 0.93)
0.89 (0.84– 0.94)
MHR (bpm)
0.96 (0.93 – 0.98)
0.95 (0.91 – 0.97)
0.95 (0.91 – 0.97)
0.96 (0.93– 0.97)
% APMHR
0.96 (0.93 – 0.98)
0.95 (0.92– 0.97)
0.95 (0.92 – 0.97)
0.96 (0.93 – 0.97)
THB (b)
0.97 (0.95 – 0.99)
0.98 (0.96 – 0.99)
0.96 (0.93-0.98)
0.97 (0.96 – 0.98)
RPE
0.96 (0.92 – 0.98)
0.97 (0.94 – 0.98)
0.93 (0.89 – 0.96)
0.95 (0.93 – 0.97)
RER
0.68 (0.49 - 0.81)
0.62 (0.40 - 0.77)
0.46 (0.21 - 0.66)
0.59 (0.45 - 0.73)
The effect sizes for the differences were calculated (Table 19) and were either trivial or small.
Standardised differences were trivial for energy expenditure, heart rate recovery, maximum heart
rate, total heart beats and maximum heart rate as a percentage of age predicted maximum heart
rate. For rating of perceived exertion and peak respiratory exchange ratio the differences were
trivial when the first two trials were compared and small when the first trial and third trial were
compared.

89
Table 19 Effect size and 95% confidence intervals for the effect size (in brackets) for energy expenditure (EE), heart rate recovery (HRR), maximum heart rate (MHR), maximum heart rate as a percentage of age predicted maximum heart rate, (% AP MHR), total heart beats (THB), rating of perceived exertion (RPE) and peak respiratory exchange ratio (RER).
Effect size < 0.2 = trivial, ≥ 0.2 to < 0.5 = small, ≥ 0.5 to < 0.8 moderate, ≥ 0.8 = large
Measurement error and confidence intervals for all the measured variables are presented in (Table
20). Typical error as a coefficient of variation is shown in Table 21.
Variable Effect size 1 vs. 2 2 vs. 3 1 vs. 3
EE (kJ)
0.0 (-0.5 – 0.5)
-0.1 (-0.6 – 0.4)
-0.1 (-0.6 – 0.4)
HRR (Beats)
-0.1 (-0.6 – 0.3)
0.2 (-0.3 – 0.7)
0.1 (-0.4 -0.5)
MHR (bpm)
0.1 (-0.4 – 0.6)
0.0 (-0.4 – 0.5)
0.1 (-0.3 – 0.6)
% AP MHR
0.1 (-0.4 – 0.6)
0.0 (-0.4 – 0.5)
0.1 (-0.3 – 0.6)
THB (beats)
0.1 (-0.4 – 0.5)
0.1 (-0.4 – 0.5)
0.1 (-0.4 – 0.6)
RPE
0.2 (-0.3 – 0.7)
0.1 (-0.4 – 0.6)
0.3 (-0.2 – 0.7)
RER 0.1
(-0.4 – 0.6) 0.2
(-0.3 – 0.7) 0.3
(-0.2 – 0.8)

90
Table 20 Measurement error and confidence intervals for energy expenditure (EE), heart rate recovery (HRR), maximum heart rate (MHR), maximum heart rate as a percentage of age predicted maximum heart rate, (% AP MHR), total heart beats (THB), rating of perceived exertion (RPE) and peak respiratory exchange ratio (RER).
Variable Typical error Mean 1 vs. 2 2 vs. 3 1 vs. 3
EE (kJ)
22 (18 - 27)
19 (16 - 23)
24 (20 - 30)
22 (19 - 24)
HRR (beats)
4 (3 - 5)
4 (3 - 4)
4 (3 - 5)
4 (3 - 4)
MHR (bpm)
4 (4 - 5)
5 (4 - 6)
5 (4 - 6)
5 (4 - 5)
% APMHR
2 (2 - 3)
2 (2 - 3)
3 (2 - 3)
2 (2 - 3)
THB (b)
59 (49 - 74)
50 (42 - 63)
75 (62 - 94)
62 (56 - 70)
RPE
0.7 (0.6 – 0.8)
0.6 (0.5 – 0.7)
0.8 (0.7 – 1.0)
0.7 (0.6 – 0.8)
RER
0.04 (0.03 - 0.04)
0.04 (0.03 - 0.04)
0.03 (0.03 - 0.04)
0.04 (0.03 - 0.04)

91
Table 21 Typical error as a coefficient of variation (CVTEM) and confidence intervals for energy expenditure (EE), heart rate recovery (HRR), maximum heart rate (MHR), maximum heart rate as a percentage of age predicted maximum heart rate, (% AP MHR), total heart beats (THB), rating of perceived exertion (RPE) and peak respiratory exchange ratio (RER).
Variable Typical error as a coefficient of variation (%) Mean 1 vs. 2 2 vs. 3 1 vs. 3
EE (kJ) 8.3 (6.9 – 10.6)
7.9 (6.6 – 10.1)
9.4 (7.8 – 12.0)
8.6 (7.6 – 9.8)
HRR (beats) 13.3
(11.0 – 17.0) 16.3
(13.4 – 20.9) 15.6
(12.9 – 20.1) 15.1
(13.5 – 17.3)
MHR (bpm) 3.0 (2.5 – 3.8)
3.3 (2.7 – 4.1)
3.4 (2.8 – 4.3)
3.2 (2.9 – 3.7
% APMHR 3.0
(2.5 – 3.8) 3.3
(2.7 – 4.1) 3.4
(2.8 – 4.3 3.2
(2.9 – 3.7)
THB 4.6 (3.9 – 5.9)
5.4 (4.5 – 6.8)
6.6 (5.5 – 8.3)
5.6 (5.0 – 6.4)
RPE 5.7
(4.7 – 7.2) 5.1
(4.3 – 6.5) 6.8
(5.6 – 8.6) 5.9
(5.3 – 6.7)
RER 3.6 (3.0 – 4.5)
3.7 (3.0 – 4.6)
3.5 (2.9 – 4.4)
3.6 (3.2 – 4.1)
Table 22 is a summary and extension of Table 20 and Table 21 showing the mean typical error of
measurement (TEM), mean typical error of measurement as a coefficient of variation (CVTEM)
and the smallest worthwhile difference (SWD) for all the variables measured. The categories of
comparison of measurement error and the smallest worthwhile difference suggested by Buchheit
et al 188 were used. If the TEM was smaller than the SWD the measurement was rated as “good”,
if TEM was the same as SWD the measurement was rated “OK” and if TEM was greater than
SWD the measurement was rated “marginal”.

92
Table 22 Typical error of measurement (TEM), typical error as a coefficient of variation (CVTEM) and the smallest worthwhile difference (SWD) for energy expenditure (EE), heart rate recovery (HRR), maximum heart rate (MHR), maximum heart rate as a percentage of age predicted maximum heart rate, (% AP MHR), total heart beats (THB), rating of perceived exertion (RPE) and peak respiratory exchange ratio (RER).
Energy expenditure, heart rate recovery, maximum heart rate and peak respiratory exchange ratio
had typical error of measurement greater than the smallest worthwhile difference. Total heart
beats had typical error of measurement lower than the smallest worthwhile difference whilst
maximum heart rate as a percentage of age predicted maximum heart rate and rating of perceived
exertion had typical error of measurement the same as the smallest worthwhile difference.
5.3.2 B. Step Cadence
The anthropometric characteristics of the participants who chose the 20 steps per minute were
compared with those who chose 24 steps per minute. There were no significant differences in age,
stature, body mass, body mass index, body fat percent and sum of seven skinfolds between the
two groups (Table 23).
Variable TEM CVTEM SWD Sensitivity
EE (kJ) 22 8.6 8 Marginal
HRR (b) 4 15.1 2 Marginal
MHR (bpm) 5 3.2 4 Marginal
% APMHR 2 3.2 2 OK
THB (b) 62 5.6 71 Good
RPE 1 5.9 1 OK
RER 0.04 3.6 0.01 Marginal

93
Table 23 Descriptive characteristics of participants who chose 20 steps per minute versus 24 steps per minute
Variable Step cadence All P value
20 (n = 10) 24 (n = 24)
Age (years) 33.5 ± 11.2 33.3 ± 10.2 33.4 ± 10.3 0.96
Stature (cm) 173.3 ± 9.4 170.1 ± 9.6 171.0 ± 9.5 0.38
Body mass (kg) 74.0 ± 11.6 69.4 ± 14.5 70.7 ± 13.7 0.37
BMI (kg/m2) 24.9 ± 5.0 23.9 ± 4.3 24.2 ± 4.5 0.58
Body fat % 29.0 ± 10.3 22.4 ± 8.6 24.1 ± 9.4 0.09
Sum of 7 skinfolds (mm) 144.0 ± 69.5 106.7 ± 55.9 116.3 ± 60.8 0.14
The measurement error about the two stepping cadences was also analysed and presented in Table
24. The measurement error for the 20 steps per minute was similar to that for 24 steps per minute
except for energy expenditure where the typical error of measurement was higher in the 24 steps
per minute group.

94
Table 24 Measurement error for 20 steps per minute and 24 steps per minute for energy expenditure (EE), heart rate recovery (HRR), maximum heart rate (MHR), maximum heart rate as a percentage of age predicted maximum heart rate, (% AP MHR), total heart beats (THB), rating of perceived exertion (RPE) and peak respiratory exchange ratio (RER).
Variable 20 steps per minute TEM 24 steps per minute TEM 1 vs. 2 2 vs. 3 1 vs. 3 Mean 1 vs. 2 2 vs. 3 1 vs. 3 Mean
EE (kJ) 9 (7-15)
16 (12-26)
9 (8-12)
11 (9-13)
25 (21-34)
20 (16-26)
22 (18-28)
22 (20-26)
HRR (b) 5
(3-8) 4
(3-7) 2
(2-3) 3
(3-4) 3
(3-4) 3
(3-4) 3
(3-4) 3
(3-4)
MHR (bpm)
4 (3-7)
4 (3-6)
2 (2-2)
3 (2-3)
5 (4-6)
5 (4-7)
5 (4-6)
5 (4-5)
%APMHR 2
(2-4) 2
(2-4) 1
(1-1) 2
(1-2) 2
(2-3) 2
(2-3) 2
(2-3) 2
(2-3)
THB (b) 76 (55-125)
32 (23-53)
46 (38-58)
51 (44-61)
49 (40-65)
56 (45-74)
63 (52-79)
57 (51-66)
RPE 0.7
(0.5-1.1) 0.6
(0.4-1.0) 0.5
(0.4-0.6) 0.5
(0.5-0.7) 0.7
(0.5-0.9) 0.6
(0.5-0.8) 0.7
(0.6-0.9) 0.7
(0.6-0.7)
RER 0.03 0.02-0.05
0.04 0.03-0.06
0.02 0.02-0.03
0.03 0.02-0.03
0.04 0.03-0.05
0.04 0.03-0.05
0.03 0.02-0.03
0.03 0.03-0.04
5.3.3 Twelve Minute Motion Test
The average distance covered in the 12 minute motion test 9 was 2229 ± 420 metres (range: 1347
to 2993 metres). Figure 4 is a graphic representation of all the step test measured variables against
the 12 minute motion test. The strongest relationships were inverse and between maximum heart
rate and distance (r = 0.69) and respiratory exchange ratio and distance (r = 0.69). There were
weaker inverse relationships between the 12 minute motion test and total heart beats (r = 0.47)
and rating of perceived exertion (r = 0.59). The relationship between the 12 minute motion test
compared to energy expenditure and heart rate recovery were not significant. There was no
relationship between the 12 minute motion test and energy expenditure and heart rate recovery.

95
Figure 4 12 minute motion test distance versus (A) energy expenditure (EE), (B) heart rate recovery (HRR), (C) maximum heart rate (MHR), (D) total heart beats (THB), (E) rating of perceived exertion (RPE) and (F) respiratory exchange ratio (RER).
EE
200
250
300
350
400
A
r = 0.1SEE = 30P = 0.63
EE
(kJ
)
HRR
0
20
40
60
80
B
r = 0.02SEE = 12P = 0.93
HR
R (
bea
ts)
MHR
100
120
140
160
180
200
r = 0.69SEE = 16p = 0.0001
C
MH
R (
bp
m)
THB
0
500
1000
1500
2000
D
r = 0.47SEE = 306P = 0.02
TH
B (
bea
ts)
RPE
0
5
10
15
20
E
r = 0.59SEE = 2P = 0.002
RP
E
RER peak
0 1000 2000 3000 4000
0.8
0.9
1.0
1.1
1.2
F
r = 0.69SEE = 0.04P = 0.0001
Distance (m)
RE
R p
eak

96
5.4 Discussion
The relative reliability of the workload standardised step test was investigated using intraclass
correlation coefficient. The ranking of all measured variables were highly correlated between tests
implying that participants maintained their ranked positions in the three trials. Maximum heart
rate, maximum heart rate as a percentage of age predicted maximum heart rate, total heart beats
and rating of perceived exertion, all had intraclass correlation coefficients around 0.95 indicating
that 95% of the observed variance could be accounted for and only 5% of the variance was due to
error 189 (Table 18). The heart rate recovery intraclass correlation coefficient ranged from r = 0.88
to 0.90. The mean (0.89) (Table 18) was higher than that reported by Dupuy et al 190 for both their
submaximal (0.69) and maximal (0.77) tests. Intraclass correlation coefficient values above 0.75
indicate good reliability and those below 0.75 indicate poor to moderate reliability 191. We
therefore can interpret the relative reliability of heart rate recovery from the workload
standardised step test as reasonably high 192. However, intraclass correlation can be influenced by
whether the group is heterogeneous or not 192. A heterogeneous group has a higher intraclass
correlation coefficient than a homogenous group for the same measurement. The coefficient of
variation for performance in the 12 minute motion test (Figure 4) was 19%. This shows that the
group was heterogeneous for this variable. Results from the 12 minute motion test confirm that
participants were of varying degrees of fitness. Hence the chance of participants maintaining the
same position in physiological responses to the step test in consecutive trials was high. Further
analyses were done to confirm the reliability of the measurements.
Firstly, the analysis of variance was used to test the differences between the means. This provides
an indication of systematic error. One likely source of systematic error for some of the variables
measured was a learning effect. Most participants tended to perform better in the second and third
trials. The significant differences between the first and third trial for maximum heart rate and
rating of perceived exertion (Table 17) could be attributed to familiarisation and learning effect 183. Participants probably got used to the test and had less anxiety, hence the decrease in variables
such as heart rate and respiratory exchange ratio. This resulted in the first and third trial
measurements being the furthest apart compared to the first and second or second and third

97
measurements. The time between trials was too short and the number of trials too few to attribute
any differences to physiological adaptations to training.
The maintenance of the same testing conditions for each participant for the three trials, especially
the stepping rate reduced the source of random error in the calculation of energy expenditure.
Energy expenditure was calculated using oxygen consumption 174. Participants stepped at a
particular stepping rate for all three tests. They respired either aerobically or anaerobically
depending on the cadence chosen and the fitness status of the participants. The exercise intensity
for the three trials was the same. The same energy pathways 179 were used as such the discrepancy
of the method of calculating energy expenditure which could not account for the anaerobic
component had the same effected on the calculation of energy expenditure for the three trials.
Hence the absence of significant differences in energy expenditure between trials.
The characteristics of the participants who chose 20 steps per minute were not different from the
characteristics of those who chose 24 steps per minute (Table 23). Therefore it can be concluded
that these characteristics did not influence their preferred cadence. Also the mean typical error of
measurement for all the variables measured during the tests were similar for the two stepping
cadences, except for energy expenditure. The mean typical error of measurement for energy
expenditure was slightly higher for the 24 steps per minute compared to 20 steps per minute
(Table 24). The measurement error could be due to the anaerobic component at higher stepping
frequencies that was not accounted for in the method of calculating energy expenditure. This was
discussed in the previous study. The differences however were negligible so the 24 steps per
minute cadence was used in the next study, since it was chosen by the majority of the participants.
Typical error of measurement was calculated to predict random error. Random error is due to
chance and is unpredictable 186. Typical error of measurement as a coefficient of variation
(CVTEM) was greatest for energy expenditure and heart rate recovery (Table 21) and was larger
than the smallest worthwhile difference (Table 22) for these variables. The absolute typical error
for heart rate recovery of four beats in the first minute of recovery is similar to that reported by
Mann et al 193 and Lamberts et al 24 from the same laboratory. However it is smaller than typical

98
error reported in other studies of eight to ten beats 194,61,195,196. Heart rate recovery is therefore a
better measure than in the reported studies.
There is no specific scale for interpretation of standard error of measurement and coefficient of
variation. In one study Buchheit defined a coefficient of variation less than 5% as representing a
reliable measurement 188. However, there is no evidence to suggest that 5% marks the level of
reliability for all measurements. The mean CVTEM for energy expenditure and heart rate recovery
was 9% (Table 21). The heart rate recovery CVTEM that ranged from 13 to 16% with a mean of
15% (Table 21) was slightly higher than that reported by Dupuy et al 190 from their submaximal
test (13%) and their maximal test (11%). Measurement error clouded the measurement making the
absolute reliability of heart rate recovery moderate. Differences in the methods of calculating
heart rate recovery could account for some of the differences as Dupuy et al 190 averaged the last
five seconds whereas we averaged the last 16 seconds in this study. We chose this method
because this has been used in several studies previously 24,197,193. The rest of the variables:
maximum heart rate, maximum heart rate as a percentage of age predicted maximum heart rate,
total heart beats, rating of perceived exertion and respiratory exchange ratio, all had good
repeatability as shown by coefficient of variation around 5% (Table 21) and a measurement error
smaller than or equal to the smallest worthwhile difference (Table 22).
The sensitivity of the measurements for energy expenditure, heart rate recovery, maximum heart
rate, rating of perceived exertion and peak respiratory exchange ratio were “marginal” due to
measurement error (Table 22). Total heart beats had “good” sensitivity whilst maximum heart rate
as a percentage of age predicted maximum heart rate was rated “OK”.
Day-to-day variation in heart rate recovery decreases with increasing exercise intensity 24 and is
most stable when the exercise ranges between 86 to 93% 61 of maximum heart rate. The
standardised step test is a submaximal test with a mean age predicted maximum heart rate of 78%,
at which level heart rate recovery tends to vary. Heart rate recovery one minute after exercise has
less variation than after two minutes 24. Variations of seven or eight beats in heart rate recovery
one minute after exercise were reported 24,198. The mean heart rate recovery for trials one to three

99
were 30, 32 and 30 respectively, a variation of two beats and non-significant. Since the
differences were within the seven beats accounted for by day-to-day variation it could also be
attributed to such.
Oxycon data output was set every 15 seconds to agree with the method for calculating energy
expenditure. Errors were noted in data where in some cases the first recording was at 00:00 or
00:01 and yet in other cases the first recording was at 00:15. The error affected the point at which
the test ended which also varied. There was no explanation for this variation in reporting data.
The same applied to the end of exercise, which also varied. This could have contributed to overall
measurement error as different data points would then have been used.
People who are trained tend to have a lower heart rate than unfit or untrained people at the same
absolute workload. This was confirmed by the results from the 12 minute motion test. Participants
who completed the longest distances in the 12 minute motion test were considered the fittest;
these participants generally had lower maximum heart rates for the step test. The same applied to
total heart beats where fit participants also had lower values. In terms of rating of perceived
exertion, participants who rated the step test as an easy test completed longer distances in the 12
minute motions test. Fit participants had a lower respiratory exchange ratio, the majority of which
were below a value of one. This implies that they utilised a higher proportion of fat as a fuel
during the test 199. We expected energy expenditure and heart rate recovery to follow the same
trend, that is, fitter participants expected to recover faster and use less energy for the test. Whilst
that seems to be the case, some outliers distorted the image.
The adjustment of step height to participant height improves the reliability of the workload
standardised step test. A study that compared the reliability between a 30 cm step height and a 40
cm step height found highest reliability was when using a 30 cm step height 64. The average
height of the male participants was 173.4 cm. The adjusted step height for such a stature would be
32.43 cm, a step height closer to 30 cm than to 40 cm. However the researchers could not account
for such a finding and attributed the result to the moderate load of the test 64.

100
5.5 Conclusions
Ideally the typical error of measurement should be smaller than the smallest worthwhile
difference for a measurement to be reliable. The workload standardised step test variables of heart
rate recovery, maximum heart rate, step test maximum heart rate as a percentage of age predicted
maximum heart rate, total heart beats, rating of perceived exertion and respiratory exchange ratio
all were reliable as there was not much difference between the typical error of measurement and
the smallest worthwhile difference.
The study determined the typical error of measurement and the smallest worthwhile difference of
measurement of the external work standardised step test for heart rate measurements, energy
expenditure, rating of perceived exertion and respiratory exchange ratio. The study showed that
the workload standardised step test is repeatable for most variables measured and therefore is a
reliable test of fitness. However typical error “noise” for some of the measurements needs to be
considered when data are interpreted. Since the step test is designed to be used for screening
purposes in a diverse group, it may be concluded that the reliability of all variables is satisfactory
and that there is sufficient precision in the measurements to proceed to the validation phase of the
protocol.
Reliability of a measurement is not an all-or-none phenomenon and is open to interpretation.
Reliability is population specific and related to the variability of the group. It is best estimated by
more than one index. Having the best reliability does not necessarily mean the measurement is the
most useful as a number of physiological measures have high reliability but may not be sensitive
or valid tools.

101
CHAPTER 6
THE ASSOCIATION BETWEEN CARDIORESPIRATORY FITNESS AND
PERFORMANCE IN A SUBMAXIMAL STEPPING TEST STANDARDISED
FOR EXTERNAL WORKLOAD

102
6.1 Introduction
The aim of this study was to determine which variables, or combination of variables measured in
the submaximal step test, predicted VO2max measured directly in a maximal test on a treadmill.
This was the next step in the clinimetric process of validating the novel step test protocol designed
to predict VO2max in a heterogeneous population. To summarise the steps, the first part of this
process showed that energy expenditure increased with increasing duration of the test, even when
the total mechanical work was kept constant (Chapter 4). This was followed by a study that
showed that the measurements of energy expenditure and heart rate from a step test standardised
for external workload were repeatable (Chapter 5). These studies also showed that the stepping
frequencies of 20 and 24 steps per minute are associated with the most repeatable results. The
outcome measures from the standardised step test that had an acceptable ratio between the
technical error of measurement and smallest worthwhile difference were total heart beats,
maximum heart rate, rating of perceived exertion, heart rate recovery and respiratory exchange
ratio. All the measurements were therefore considered in the determination of an equation to
predict VO2max from the step test (i.e. heart rate during the test and heart rate recovery after the
test, maximum heart rate, total heart beats and rating of perceived exertion. Respiratory exchange
ratio was not included since it is not readily measured and involves laboratories and expensive
machines. Step test maximum heart rate as a percentage of VO2max maximum heart rate was
calculated to find the intensity of the exercise but could not be used in the prediction equation
since it used VO2max data. Age predicted maximum heart rate 129 could not be used either as the
inclusion of predicted data would weaken the precision of the equation.
6.1.1 Aim of the Study
The study was designed to answer the following questions:
A) Can the outcome measures of the workload standardised step test (i.e. heart rate recovery,
maximum heart rate achieved during the test, total heart beats for the test, average heart
rate and perception of effort) be used to predict VO2max either on their own or in
combination in a heterogeneous group of males and females?
B) What is the relationship between VO2max measured during a treadmill protocol and
VO2max predicted from the equation established during the first part of this study?

103
6.2 Methods
6.2.1 Study Design
Testing was done in the laboratory at the Sports Science Institute of South Africa (SSISA).
During the first visit to the laboratory participants completed the American College of Sports
Medicine (ACSM) (Appendix 1) screening questionnaire to screen for cardiovascular and
pulmonary disease and orthopaedic problems 200. The experimental protocol was explained
(Appendix 11). Participants that were eligible then signed the informed consent form (Appendix
10) and responded to the Global Physical Activity Questionnaire (GPAQ) (Appendix 2) that was
used to categorise participants into three groups of physical activity 201. Participants performed the
step test first and had a familiarisation session on the treadmill. On the second visit participants
did a VO2max test (Bruce protocol) on the treadmill. The two tests were conducted on the same
time of day. Temperature and humidity were kept constant in air-conditioned laboratories.
6.2.2 Participants
Participants were recruited (Appendix 7) through fliers, emails, visiting organisations, word of
mouth and staff and students in the SSISA building. The original plan was to recruit two hundred
and forty participants, 120 males and 120 females (20 - 60 years), of four age groups and varying
levels of physical activity. However when testing started it was easier to recruit participants in the
age group 20 to 30 years and more participants in this age group were tested than was expected.
This accounted for a bigger sample size (n = 290). Seventeen participants withdrew from the
study after the first visit for various reasons ranging from commitments at work, at home and
being sick. It could also be inferred that some participants who did not report for the second visit
decided against doing a maximum test though they were not explicit about it. Two hundred and
seventy three participants (145 males and 128 females) completed the study (Table 25). A sample
size of n = 10 in each cell, with maximum rates of statistical error of 5% (type 1 error) and 20%
(type 2 error) has the power to detect a correlation of r = 0.8. The magnitude of this relationship
was considered acceptable for the goals of the study. Although the sample size calculation was
based on each cell, it was anticipated that the data from each cell would also be merged and
analysed. This would increase the heterogeneity of the sample and increase the potential for

104
establishing relationships between variables. Therefore we were confident a sample size of n =
240 would provide sufficient power for the planned statistical analyses.
The Global Physical Activity Questionnaire (GPAQ) 201,202 (Appendix 2) was used to predict the
physical activity level of each participant. The assignment to groups was based on their scoring in
the GPAQ. Participants were assigned to one of three groups; either “below the recommended
level of physical activity”, “achieved the recommended level of physical activity”, or “above the
recommended level of physical activity”.
Table 25 Participants in each cell defined by age and level of physical activity (n = 273)
Males Females
Age (years) below achieved above Total below achieved above Total
20-30 27 13 10 50 14 11 10 35
31-40 10 11 10 31 11 9 12 32
41-50 13 10 10 33 10 10 9 29
51-60 11 10 10 31 10 12 10 32
Total 61 44 40 145 45 42 41 128
below: below the recommended level of physical activity achieved: achieved the recommended level of physical activity above: above the recommended level of physical activity Exclusion criteria
younger than 20 and older than 60 years
orthopaedic problems which may interfere with the trial
chronic conditions requiring medication that might interfere with cardiorespiratory and
metabolic responses to exercise
Participant mass less than 50 kg or more than 100 kg
6.2.3 Participant Physical Characteristics
The stature, body mass and skin fold thickness of participants were measured during their first
visit to the laboratory. Body fat was represented as the sum of the seven skinfolds (biceps, triceps,

105
subscapular, suprailiac, abdominal, thigh, calf) (Appendix 17) measured using callipers as
described by Ross and Marfell-Jones 203. The tester gently pinched the skin at the appropriate site
to separate a double layer of skin and the underlying adipose tissue from the muscle. The
procedure is painless and non-invasive. Body fat was also estimated as a percentage from the
equation of Durnin and Womersley 176 (Appendix 17). Detailed descriptions of measurements are
in the previous study (Chapter 4, section 4.2.4).
6.2.4 Step Test
After the assessment of body composition each participant performed a step test. As shown in
Chapter 5 there were no major differences in outcome measures for the cadences of 20 and 24
steps per minute. However, for methodological reasons we decided to standardise the test and use
24 steps per minute in this validation study and cross validation study that follows. The duration
of each test was modified to elicit 45 kJ external work during the test. Step height was determined
by equations xviii and xix by Francis and Culpepper 54.
Table 26 shows the duration of the step test protocol for the variations in size of participants that
could be expected in the study. For this hypothetical example a short man (1.55 metres) and a tall
man (2.00 metres) of varying body mass from 50 kg to 100 kg has been used.
Table 26 Step test durations for a male 1.55 m tall (step height 29 cm) and 2.00 m tall (step height 38 cm) and varying body mass (50 kg to 100 kg)
Duration in minutes
Stature (m) 50 kg 60 kg 70 kg 80 kg 90 kg 100 kg
1.55 m 13.18 10.98 9.42 8.24 7.32 6.59
2.00 m 10.06 8.38 7.19 6.29 5.59 5.03
Adjusting the step height to accommodate differences in stature ensured that stepping was
efficient from a biomechanical perspective 54. Participants did not warm up before the test but
were allowed 10 seconds to adjust to the cadence of the metronome. Ambient temperature was

106
controlled (20 - 22C) and humidity varied between 50 and 60 mmHg in the laboratory. Ambient
conditions were measured before testing to ensure the conditions were within the expected range.
Heart rate was measured continuously during the test and for two minutes after the test using a
Suunto T6 chest heart rate transmitter and wrist monitor (Suunto Oy, Vantaa, Finland). Heart rate
was recorded every two seconds. After the test the heart rate data were transferred from the wrist
monitor to a computer for analysis. Heart rate recovery was calculated as the difference between
the end of exercise heart rate (taken as the average of the last 16 seconds of the test) and the first
minute recovery heart rate (taken as the average of the last 16 seconds of the first minute of
recovery) as previously described 24. Total heart beats during the test were calculated. Maximum
heart rate during the test and average heart rate were also recorded.
The participant’s perceived exertion (RPE) (Appendix 4) was recorded every minute using the
Borg’s rating of perceived exertion 6-20 point scale 122. The scale is numbered from 6 (no
exertion) to 20 (maximal exertion). The participant gave a verbal or visual score from the scale
that corresponded with the perceived intensity of the workout. The scale is based on the
assumption that physiological strain grows linearly with exercise intensity and that perception of
effort follows the same linear pattern. RPE can therefore be compared with physiological
measures such as heart rate or oxygen consumption.
6.2.5 VO2max Test
The Bruce protocol 117 is a validated test for measuring VO2max from maximal performance. The
test also caters for a range of fitness levels. The protocol starts at a low work level allowing time
for warm up and cardiovascular adaptation. The Bruce treadmill protocol was considered the most
appropriate for untrained participants as it gradually increases speed and gradient 117. The
participant warmed up for six minutes by walking, jogging or running on the treadmill at their
own pace after which they stretched for about five minutes. The test began at a treadmill speed of
2.74 km.h-1 and 10% gradient (Motor driven treadmill, Quinton Instruments, Seattle, WA, USA).
Speed and incline were increased every three minutes until the participant could not continue with
the test. Volitional fatigue was used as the termination point for the VO2max test. Participants

107
were verbally encouraged throughout the test to produce a maximum effort performance.
Following the protocol precisely is important. Due to the nature of the sample, which comprised a
wide range of age groups and physical activity levels, participants were allowed to hold on the
rails if they felt insecure.
Table 27 shows how the test progresses. During the test oxygen consumption and respiratory
exchange ratio were measured using an Oxycon (Jaeger Pro®, VIASYS health care, Hoechberg,
Germany).
Table 27 The Bruce treadmill protocol 117
Level Time (min) Speed (km.h-1) Gradient (%)
1 0 2.74 10 2 3 4.02 12 3 6 5.47 14 4 9 6.76 16 5 12 8.05 18 6 15 8.85 20 7 18 9.65 22 8 21 10.46 24 9 24 11.26 26
10 27 12.07 28
Participants wore face masks and respiratory gas exchange was measured using an Oxycon
breath-by-breath analyser (Jaeger Pro®, VIASYS health care, Hoechberg, Germany). The Oxycon
was calibrated before each trial using a three litre syringe (SensorMedics®, Milan, Italy) and a
reference gas of known composition (16% oxygen, 5% carbon dioxide, balance nitrogen).
The test ended when the participant could not continue with the test and stepped off the treadmill
to the side platform. VO2max was defined as the highest oxygen consumption measured in the last
stage the participant reached. When the exercise intensity was high, there were occasions when
participants took in deep breaths. These were identified by a sudden decrease in respiratory
exchange ratio and in most cases were followed by a deep exhalation. Such cases were not

108
recorded as the VO2max if they happened to be the highest achieved. VO2max was expressed in
relative terms as ml.kg-1.min-1.
6.2.6 Ethical Considerations
The study was approved by the Research and Ethics Committee of the Faculty of Health Sciences,
University of Cape Town (HREC/REF: 161/2013) (Appendix 6). Participants who met the
selection criteria were invited to participate after giving their signed informed consent. The
researcher provided a full and adequate written and verbal explanation of the requirements of the
study and the participant had an opportunity to ask questions. Participants had a right to withdraw
from the study at any stage without having to provide a reason. Study personnel also had the right
to withdraw a research participant from the study at any time. Data generated from the trial were
stored in a computer database in a secure facility and in a manner that maintained the participant’s
confidentiality.
6.2.7 Benefits to the Participants
There was no financial remuneration for participation in this study. Participants were given a
report (Appendix 13 and Appendix 14) of their data (VO2max, heart rate and body composition).
The feedback was in most cases novel for the participants and was written in a way that was of
interest for them.
6.2.8 Statistical Analysis
Descriptive analyses were done on age, stature, body mass, body mass index, body fat percent,
sum of seven skinfolds and self-reported physical activity levels. Descriptive data of each cluster
and for the entire group were calculated and presented as means and standard deviations. The
relationship between the variables and VO2max were determined with Pearson’s correlation
coefficients (Prism 5, GraphPad Software, Inc., CA, USA). VO2max was plotted against physical
characteristics of participants and against outcome measures of the step test using Prism 5. Linear
regression analysis was done in Prism to get the correlation coefficient, standard error of estimate
and p value. Several multiple regressions were done using Statistica version 13 (Statsoft Inc.,
Tulsa, OK, USA) to determine the best model that predicts VO2max.

109
6.3 Results
6.3.1 Physical Characteristics of Participants
The means and standard deviations of the physical characteristics of participants (age, stature,
body mass, body mass index, body fat percent, sum of seven skinfolds, and self-reported physical
activity levels) were calculated according to sex, age group and physical activity level as shown in
Table 28 and Table 29.

110
Table 28 Mean and standard deviation of physical characteristics (Males, n = 145). The sample size for each cell is shown in brackets (). The range is shown in [].
Variable Physical activity
20-30 years 31-40 years 41-50 years 51-60 years All age groups
Age (years) All Above Achieved Below
25 ± 3 (50) 24 ± 3 (27) 27 ± 3 (13) 26 ± 3 (10)
35 ± 3 (31) 35 ± 3 (10) 36 ± 3 (11) 35 ± 3 (10)
45 ± 3 (33) 45 ± 3 (13) 45 ± 3 (10) 45 ± 3 (10)
56 ± 2 (31) 55 ± 3 (11) 56 ± 2 (10) 57 ± 2 (10)
38 ± 12 (145) [20 - 60]
Stature (cm)
All Above Achieved Below
177.9 ± 7.4 (50) 178.9 ± 6.7 (27) 177.4 ± 4.6 (13) 175.9 ± 11.6 (10)
179.9 ± 6.5 (31) 180.5 ± 7.4 (10) 178.5 ± 7.4 (11) 180.9 ± 4.5 (10)
178.6 ± 7.0 (33) 177.1 ± 5.8 (13) 182.3 ± 7.0 (10) 177.0 ± 7.6 (10)
174.5 ± 7.8 (31) 177.8 ± 7.5 (11) 174.2 ± 8.3 (10) 171.1 ± 6.6 (10)
177.8 ± 7.4 (145) [159 – 195.3]
Body mass (kg)
All Above Achieved Below
74.6 ± 10.2 (50) 72.3 ± 8.7 (27) 78.6 ± 10.2 (13) 75.7 ± 12.9 (10)
80.7 ± 10.9 (31) 80.0 ± 10.9 (10) 76.5 ± 8.6 (11) 85.9 ± 12.0 (10)
84.2 ± 11.9 (33) 80.0 ± 13.8 (13) 87.5 ± 8.3 (10) 86.4 ± 11.5 (10)
77.4 ± 12.1 (31) 77.8 ± 10.1 (11) 75.7 ± 12.5 (10) 78.6 ± 14.6 (10)
78.7 ± 11.7 (145) [48.3 – 105.95]
BMI (kg/m2) All
Above Achieved Below
23.7 ± 3.1 (49) 22.6 ± 2.4 (27) 24.8 ± 3.2 (13) 25.1 ± 4.1 (9)
25.0 ± 3.4 (31) 24.4 ± 3.4 (10) 24.1 ± 1.7 (11) 26.4 ± 4.6 (10)
26.1 ± 3.4 (33) 25.5 ± 4.2 (13) 26.3 ± 1.3 (10) 26.6 ± 3.9 (10)
25.5 ± 4.0 (31) 24.6 ± 2.6 (11) 24.9 ± 3.7 (10) 26.9 ± 5.4 (10)
24.9 ± 3.6 (144) [18 – 36.5]
Body fat % All Above Achieved Below
15.4 ± 4.8 (49) 13.2 ±4.0 (27) 17.3 ± 4.6 (13) 19.1 ± 4.0 (9)
19.3 ± 5.4 (31) 17.8 ± 4.8 (10) 19.5 ± 6.2 (11) 20.6 ± 5.3 (10)
22.8 ± 5.2 (33) 19.6 ± 5.7 (13) 24.3 ± 4.0 (10) 25.3 ± 3.5 (10)
22.1 ± 5.8 (31) 22.4 ± 4.8 (11) 21.4 ± 6.3 (10) 22.5 ± 6.9 (10)
19.4 ±6.1 (144) [6.5 – 34.4]
Sum of skinfolds (mm)
All Above Achieved Below
84 ± 39 (49) 67 ± 26 (27) 97 ± 44 (13) 115 ± 37 (9)
95 ± 49 (31) 82 ± 43 (10) 94 ± 45 (11) 110 ± 59 (10)
100 ± 34 (33) 80 ± 33 (13) 110 ± 28 (10) 117 ± 31 (10)
87 ± 32 (31) 88 ± 26 (11) 82 ± 32 (10) 90 ± 41 (10)
91 ± 39 (144) [27.6 – 214.5]
METS All Above Achieved Below
2572 ± 1603 (50) 3661 ± 1216 (27) 1863 ± 807 (13) 554 ± 208 (10)
1763 ± 1400 (31) 3254 ± 1265 (10) 1200 ± 455 (11) 890 ± 999 (10)
1842 ± 1285(33) 3134 ± 903 (13) 1422 ± 493 (10) 584 ± 420 (10)
1509 ± 1005(31) 2536 ± 789 (11) 1300 ± 489 (10) 588 ± 397 (10)
2006 ± 1430 (145) [0 – 6720]

111
Table 29 Mean and standard deviation of physical characteristics (Females, n = 128). The sample size for each cell is shown in brackets (). The range is shown in [].
Variable Physical activity
20-30 years 31-40 years 41-50 years 51-60 years All age groups
Age (Years) All Above Achieved Below
25 ± 3 (35) 24 ± 3 (14) 26 ± 3 (11) 25 ± 4 (10)
35 ± 3 (32) 35 ± 3 (11) 34 ± 3 (9) 35 ± 3 (12)
46 ± 3 (29) 47 ± 3 (10) 47 ± 3 (10) 46 ± 2 (9)
55 ± 3 (32) 55 ± 3 (10) 55 ± 3 (12) 55 ± 2 (10)
40 ± 12 (128) [21 – 60]
Stature (cm)
All Above Achieved Below
167.1 ± 6.4 (35) 167.9 ± 5.6 (14) 166.6 ± 5.8 (11) 166.3 ± 8.3 (10)
164.2 ± 6.5 (32) 166.7 ± 5.0 (11) 167.2 ± 5.3 (9) 159.5 ± 6.2 (12)
165.4 ±6.7 (29) 167.5 ±7.4 (10) 162.5 ±6.7 (10) 166.4 ±5.1 (9)
165.6 ±7.1 (32) 163.8 ±5.5 (10) 165.7 ±8.4 (12) 167.4 ±7.0 (10)
165.6 ±6.7 (128) [151.5 – 180.5]
Body mass (kg)
All Above Achieved Below
66.1 ± 10.3 (35) 65.9 ± 11.1 (14) 60.8 ± 6.5 (11) 72.3 ± 9.8 (10)
66.7 ± 9.5 (32) 65.7 ± 6.0 (11) 66.6 ± 13.2 (9) 67.7 ± 9.5 (12)
68.0 ± 10.7 (29) 66.6 ± 12.6 (10) 68.9 ± 9.9 (10) 68.4 ± 10.3 (9)
65.1 ± 9.2 (32) 62.0 ± 9.3 (10) 62.5 ± 6.7 (12) 71.3 ± 9.5 (10)
66.4 ± 9.9 (128) [48.2 – 97.7]
BMI (kg/m
2)
All Above Achieved Below
23.5 ± 3.6 (35) 23.2 ± 3.7 (14) 21.6 ± 2.4 (11) 26.2 ± 3.4 (10)
24.9 ± 3.4 (31) 24.0 ± 2.2 (10) 23.7 ± 3.6 (9) 26.6 ± 3.7 (12)
24.9 ± 4.5 (29) 23.7 ± 4.6 (10) 26.4 ± 5.3 (10) 24.6 ± 3.1 (9)
23.6 ± 3.1 (32) 23.1 ± 3.4 (10) 22.5 ± 2.4 (12) 25.4 ± 3.0 (10)
24.2 ± 3.7 (127) [17.4 – 37.7]
Body fat % All Above Achieved Below
28.5 ± 4.7 (35) 28.2 ± 4.7 (14) 26.6 ± 4.0 (11) 31.0 ± 4.8 (10)
30.2 ± 4.2 (31) 28.6 ± 2.2 (10) 29.0 ± 5.9 (9) 32.6 ± 3.1 (12)
32.4 ± 4.4 (29) 30.6 ± 5.1 (10) 33.9 ± 4.6 (10) 32.7 ± 2.6 (9)
32.0 ± 4.1 (32) 30.0 ± 4.7 (10) 31.3 ± 3.0 (12) 34.9 ± 3.1 (10)
30.7 ± 4.6 (127) [18.3 – 43.8]
Sum of skinfolds (mm)
All Above Achieved Below
134 ± 39 (35) 136 ± 43 (14) 114 ± 27 (11) 153 ± 35 (10)
137 ± 42 (31) 124 ± 28 (10) 123 ± 51 (9) 158 ± 37 (12)
134 ± 47 (29) 119 ± 46 (10) 147 ± 62 (10) 136 ± 25 (9)
113 ± 32 (32) 101 ± 38 (10) 107 ± 24 (12) 133 ± 26 (10)
129 ± 41 (127) [46.2 – 307]
METS All Above Achieved Below
1784 ± 1001 (35) 2533 ± 781 (14) 1885 ± 499 (11) 624 ± 499 (10)
1361 ± 992 (32) 2511 ± 529 (11) 1219 ± 391 (9) 413 ± 297 (12)
1652 ± 1338 (29) 3002±1078 (10) 1612±443 (10) 198±277 (9 )
1718 ± 1314 (32) 3166 ± 1166 (10) 1434 ± 695 (12) 610 ± 442 (10)
1632 ± 1162 (128) [0 – 5520]
Men were generally taller and heavier than women. They also tended to engage in more physical
activity than women. Women had more fat than men. As expected the mean age of men and
women was similar because the recruitment process was stratified according to age.

112
6.3.2 Step Test Components
The means and standard deviations of the two components of the step test that varied according to
the characteristics of the participant, i.e. step height and test duration, were calculated (Table 30
and Table 31).
Table 30 Mean and standard deviation of step test components (Males). The sample size for
each cell is shown in brackets (). The range is shown in [].
Variable Physical activity
20-30 years 31-40 years 41-50years 51-60years All age groups
Step height (cm)
All Above Achieved Below
34 ± 2 (50) 34 ± 1 (27) 34 ± 1 (13) 33 ± 2 (10)
34 ± 1 (31) 34 ± 1 (10) 34 ± 2 (11) 34 ± 1 (10)
34 ± 1 (33) 33 ± 1 (13) 35 ± 1 (10) 34 ± 1 (10)
33 ± 2 (31) 34 ± 1 (11) 33 ± 2 (10) 32 ± 1 (10)
34 ± 1 (145) [30 – 37]
Duration (Minutes)
All Above Achieved Below
7.78 ± 1.38 (50) 7.96 ± 1.40 (27) 7.33 ± 1.06 (13) 7.85 ± 1.66 (10)
7.06 ± 1.05 (31) 7.08 ± 1.07 (10) 7.49 ± 1.08 (11) 6.58 ± 0.84 (10)
6.88 ± 1.21 (33) 7.38 ± 1.45 (13) 6.41 ± 0.81 (10) 6.69 ± 1.03 (10)
7.70 ± 1.52 (31) 7.41 ± 1.10 (11) 7.91 ± 1.71 (10) 7.82 ± 1.80 (10)
7.40 ±1.36 (145) [5.13 – 13.19]
Table 31 Mean and standard deviation of step test components (Females). The sample size for each cell is shown in brackets (). The range is shown in [].
Variable Physical activity
20-30 years 31-40 years
41-50years 51-60years All age groups
Step height (cm)
All Above Achieved Below
31 ± 1 (35) 31 ± 1 (14) 31 ± 1 (11) 31 ± 2 (10)
31 ± 1 (32) 31 ± 1 (11) 31 ± 1 (9) 30 ± 1 (12)
31 ± 1 (29) 32 ± 1 (10) 31 ± 1 (10) 31 ± 1 (9)
31 ± 1 (32) 31 ± 1 (10) 31 ± 2 (12) 31 ± 1 (10)
31 ± 1 (128) [28 – 34]
Duration (Minutes)
All Above Achieved Below
10 ± 2 (35) 10 ± 2 (14) 10 ± 1 (11) 9 ± 1 (10)
10 ± 1 (32) 9 ± 1 (11) 9 ± 2 (9) 10 ± 2 (12)
9 ± 2 (29) 9 ± 2 (10) 9 ± 1 (10) 10 ± 2 (9)
10 ± 2 (32) 10 ± 2 (10) 10 ± 1 (12) 9 ± 1 (10)
10 ± 2 (128) [5.93 – 13.83]
Due to the stature of men the mean step height for men was higher than that for women. The
average step height was 34 cm for men and 31 cm for women. Women had longer tests than men.
The duration of the test ranged from 5 minutes and 8 seconds to 13 minutes and 11 seconds for
males and 5 and 56 seconds to 13 minutes and 49 seconds for females.

113
6.3.3 Step Test Outcome Measures
Heart rate recovery, maximum heart rate, step test maximum heart rate as a percentage of
VO2max test maximum heart rate, total heart beats, average heart rate, minimum heart rate and
the rating of perceived exertion from the step test, all had their means and standard deviations
calculated according to sex, age group and physical activity levels (Table 32 and Table 33).
Table 32 Mean and standard deviation of step test measures (Males). The sample size for each cell is shown in brackets (). The range is shown in [].
Variable Physical activity
20-30 years 31-40 years 41-50 years 51-60 years All age groups
Heart rate recovery (beats)
All Above Achieved Below
28 ± 7 (50) 27 ± 7 (27) 26 ± 6 (13) 32 ± 7 (10)
25 ± 10 (31) 29 ± 12 (10) 24 ± 8 (11) 20 ± 9 (10)
30 ± 8 (33) 29 ± 7 (13) 34 ± 4 (10) 26 ± 11 (10)
26 ± 9 (31) 30 ± 11 (11) 27 ± 9 (10) 22 ± 7 (10)
27 ± 8 (145) [9 - 47]
Maximum heart rate (beats. min
-1)
All Above Achieved Below
144 ± 18 (50) 141 ± 18 (27) 140 ± 19 (13) 155 ± 16 (10)
144 ± 22 (31) 135 ± 19 (10) 141 ± 20 (11) 156 ± 23 (10)
136 ± 18 (33) 127 ± 19 (13) 139 ± 16 (10) 146 ± 13 (10)
129 ± 18 (31) 125 ± 17 (11) 125 ± 16 (10) 138 ± 18 (10)
139 ± 20 (145) [88 - 187]
% of maximum heart rate
All Above Achieved Below
76 ± 9 (50) 74 ± 9 (27) 74 ± 10 (13) 83 ± 7 (10)
77 ± 10 (31) 74 ± 9 (10) 75 ± 10 (11) 83 ± 10 (10)
76 ± 9 (33) 72 ± 10 (13) 78 ± 8 (10) 80 ± 5 (10)
76 ± 10 (31) 73 ± 8 (11) 74 ± 9 (10) 81 ± 10 (10)
76 ± 9 (145) [55 - 98]
Minimum heart rate (beats. min
-1)
All Above Achieved Below
92 ± 15 (50) 89 ± 17 (27) 92 ± 11 (13) 97 ± 10 (10)
92 ± 15 (31) 85 ± 14 (10) 94 ± 14 (11) 96 ± 15 (10)
84 ± 15 (33) 82 ± 16 (13) 84 ± 15 (10) 87 ± 16 (10)
79 ± 16 (31) 76 ± 14 (11) 74 ± 20 (10) 88 ± 12 (10)
87 ± 16 (145) [40 – 141]
Average heart rate (beats.min
-1)
All Above Achieved Below
126 ± 17 (50) 123 ± 18 (27) 125 ± 16 (13) 136 ± 14 (10)
128 ± 19 (31) 120 ± 16 (10) 126 ± 18 (11) 137 ± 21 (10)
119 ± 17 (33) 112 ± 16 (13) 123 ± 16 (10) 124 ± 17 (10)
112 ± 19 (31) 109 ± 14 (11) 106 ± 24 (10) 121 ± 15 (10)
122 ± 19 (145) [53 – 173]
Heart beats All Above Achieved Below
1017 ± 246 (50) 1022 ± 273 (27) 948 ± 195 (13) 1091 ± 222 (10)
929 ± 189 (31) 883 ± 129 (10) 982 ± 247 (11) 918 ± 169 (10)
843 ± 146 (33) 855 ± 157 (13) 823 ± 134 (10) 846 ± 156 (10)
881 ± 196 (31) 834 ± 140 (11) 850 ± 203 (10) 963 ± 233 (10)
929 ± 214 (145) [606 – 1953]
Rating of perceived exertion
All Above Achieved Below
12 ± 2 (50) 12 ± 1 (27) 12 ± 2 (13) 15 ± 3 (10)
13 ± 3 (31) 12 ± 2 (10) 12 ± 2 (11) 15 ± 3 (10)
13 ± 2 (33) 12 ± 1 (13) 13 ± 2 (10) 15 ± 1 (10)
13 ± 3 (31) 12 ± 2 (11) 13 ± 2 (10) 14 ± 3 (10)
13 ± 2 (145) [7 – 20]

114
There was no particular trend that could be established between heart rate recovery and age for
men. Maximum heart rate, minimum heart rate, average heart rate and total heart beats all
decreased with increasing age. For women all heart rate variables decreased with increasing age.
Rating of perceived exertion produced no detectable trend with age.
Table 33 Mean and standard deviation of step test measures (Females). The sample size for each cell is shown in brackets (). The range is shown in [].
Variable Physical activity
20-30 years 31-40 years 41-50 years 51-60 years All age groups
Heart rate recovery (beats)
All Above Achieved Below
32 ± 7 (35) 34 ± 7 (14) 33 ± 9 (11) 30 ± 5 (10)
31 ± 10 (32) 34 ± 11 (11) 29 ± 9 (9) 31 ± 10 (12)
29 ± 12 (29) 31 ± 9 (10) 32 ± 16 (10) 22 ± 7 (9)
27 ± 10 (32) 30 ± 10 (10) 28 ± 10 (12) 24 ± 11 (10)
30 ± 10 (128) [12 – 68]
Maximum heart rate (beats.min
-1)
All Above Achieved Below
160 ± 20 (35) 154 ± 19 (14) 153 ± 19 (11) 175 ± 11 (10)
157 ± 21 (32) 144 ± 18 (11) 161 ± 21 (9) 165 ± 19 (12)
151 ± 18 (29) 140 ± 16 (10) 152 ± 16 (10) 162 ± 15 (9)
146 ± 21 (32) 127 ± 17 (10) 151 ± 16 (12) 160 ± 18 (10)
154 ± 21 (128) [107 – 196]
% of Maximum heart rate
All Above Achieved Below
87 ± 10 (35) 83 ± 9 (14) 83 ± 9 (11) 96 ± 6 (10)
84 ± 9 (32) 78 ± 9 (11) 86 ± 10 (9) 89 ± 7 (12)
85 ± 11 (29) 79 ± 10 (10) 86 ± 10 (10) 92 ± 10 (9)
87 ± 12 (32) 76 ± 9 (10) 88 ± 5 (12) 96 ± 12 (10)
86 ± 11 (128) [63 – 115]
Minimum heart rate (beats.min
-1)
All Above Achieved Below
99 ± 16 (35) 96 ± 13 (14) 93 ± 16 (11) 111 ± 17 (10)
91 ± 17 (32) 90 ± 17 (11) 84 ± 21 (9) 99 ± 11 (12)
89 ± 13 (29) 88 ± 13 (10) 87 ± 13 (10) 94 ± 12 (9)
82 ± 18 (32) 77 ± 15 (10) 82 ± 13 (12) 87 ± 26 (10)
91 ± 17 (128) [46 – 130]
Average heart rate (beats.min
-1)
All Above Achieved Below
142 ± 19 (35) 138 ± 17 (14) 136 ± 20 (11) 157 ± 12 (10)
138 ± 18 (32) 129 ± 17 (11) 137 ± 15 (9) 146 ± 19 (12)
132 ± 15 (29) 122 ± 13 (10) 133 ± 15 (10) 141 ± 11 (9)
127 ± 18 (32) 114 ± 16 (10) 131 ± 14 (12) 137 ± 18 (10)
135 ± 18 (128) [96 – 176]
Heart beats All Above Achieved Below
1389 ± 270 (35) 1343 ± 240 (14) 1431 ± 285 (11) 1408 ± 309 (10)
1378 ± 306 (32) 1246 ± 121 (11) 1315 ± 341 (9) 1547 ± 339 (12)
1255 ± 215 (29) 1198 ± 262 (10) 1257 ± 124 (10) 1317 ± 242 (9)
1248 ± 260 (32) 1198 ± 131 (10) 1349 ± 267 (12) 1177 ± 326 (10)
1321 ±271 (128) [620 – 2294]
Rating of perceived exertion
All Above Achieved Below
14 ± 3 (35) 13 ± 2 (14) 12 ± 2 (11) 17 ± 2 (10)
13 ± 3 (32) 12 ± 2 (11) 12 ± 2 (9) 16 ± 3 (12)
13 ± 3 (29) 11 ± 1 (10) 13 ± 3 (10) 14 ± 4 (9)
13 ± 3 (32) 12 ± 2 (10) 12 ± 2 (12) 16 ± 4 (10)
13 ± 3 (128) [7 – 20]
Heart rate recovery was highest either for the participants who achieved the recommended level
of physical activity or those above the recommended level of physical activity. For all age groups,

115
both males and females, the “below the recommended level of physical activity” group had the
highest maximum heart rate for the step test and the “above the recommended level of physical
activity” had the lowest. Average heart rate and minimum heart rate also increased with
decreasing physical activity level. There was no defined trend for total heart beats with physical
activity levels. Participants who had levels of physical activity below the recommended level
perceived the step test as more difficult than those who do recommended and above
recommended physical activity.
6.3.4 VO2max Outcome Measures
The means and standard deviations of the variables measured during the VO2max test are
displayed in Table 34 and Table 35

116
Table 34 Mean and standard deviation of VO2max measures (Males). The sample size for each cell is shown in brackets (). The range is shown in [].
Variable Physical activity
20-30 years 31-40 years 41-50 years 51-60 years All age groups
VO2max (ml.kg
-1. min
-1)
All Above Achieved Below
54.6 ± 9.2 (50) 59.2 ± 8.0 (27) 51.9 ± 7.9 (13) 45.9 ± 6.0 (10)
48.3 ± 11.4 (31) 53.4 ± 11.6 (10) 49.7 ± 11.8 (11) 41.8 ± 7.9 (10)
47.7 ± 9.8 (33) 55.4 ± 9.2 (13) 46.5 ± 6.3 (10) 39.2 ± 5.0 (10)
45.3 ± 9.4 (31) 46.8 ± 8.8 (11) 46.0 ± 11.3 (10) 42.8 ± 8.2 (10)
49.7 ± 10.5 (145) [26 - 75]
Respiratory exchange ratio
All Above Achieved Below
1.24 ± 0.08 (50) 1.22 ± 0.08 (27) 1.23 ± 0.07 (13) 1.29 ± 0.07 (10)
1.24 ± 0.11 (31) 1.17 ± 0.06 (10) 1.26 ± 0.08 (11) 1.29 ± 0.14 (10)
1.23 ± 0.09 (33) 1.16 ± 0.05 (13) 1.25 ± 0.08 (10) 1.29 ± 0.08 (10)
1.21 ± 0.08 (31) 1.19 ± 0.07 (11) 1.21 ± 0.08 (10) 1.24 ± 0.08 (10)
1.23 ± 0.09 (145) [1.03 - 1.5]
Duration (minutes)
All Above Achieved Below
13.59 ± 2.03 (50) 14.50 ± 1.81 (27) 13.35 ± 1.70 (13) 11.46 ± 1.24 (10)
12.79 ±2.09 (31) 13.82 ±1.85 (10) 13.20 ±1.85 (11) 11.31 ±1.87 (10)
12.66 ±2.36 (33) 13.90 ±2.96 (13) 12.52 ±1.36 (10) 11.20 ±1.27 (10)
12.13 ±2.18 (31) 13.33 ±2.26 (11) 11.87 ±1.48 (10) 11.06 ±2.20 (10)
12.90 ± 2.20 (145) [7.85 - 21.28]
Maximum heart rate (beats.min
-1)
All Above Achieved Below
189 ± 9 (50) 190 ± 11 (27) 188 ± 7 (13) 187 ± 8 (10)
186 ± 10 (31) 182 ± 6 (10) 188 ± 10 (11) 188 ± 12 (10)
179 ± 10 (33) 176 ± 10 (13) 178 ± 14 (10) 183 ± 6 (10)
171 ± 9 (31) 171 ± 7 (11) 170 ± 10 (10) 171 ± 11 (10)
182 ± 12 (145) [147 - 212]
Minimum heart rate (beats.min
-1)
All Above Achieved Below
95 ± 14 (50) 93 ± 16 (27) 93 ± 12 (13) 99 ± 10 (10)
94 ± 9 (31) 91 ± 11 (10) 95 ± 9 (11) 95 ± 8 (10)
90 ± 14 (33) 83 ± 11 (13) 94 ± 19 (10) 94 ± 10 (10)
85 ± 10 (31) 82 ± 8 (11) 86 ± 14 (10) 88 ± 8 (10)
95 ± 41 (145) [56 - 137]
Average heart rate (beats.min
-1)
All Above Achieved Below
139 ± 12 (50) 140 ± 15 (27) 138 ± 9 (13) 138 ± 8 (10)
137 ± 9 (31) 135 ± 6 (10) 139 ± 12 (11) 138 ± 9 (10)
132 ± 12 (33) 128 ± 11 (13) 135 ± 15 (10) 132 ± 9 (10)
125 ± 9 (31) 126 ± 9 (11) 124 ± 12 (10) 125 ± 8 (10)
134 ± 12 (145) [104 -168]
Rating of perceived exertion
All Above Achieved Below
18 ± 2 (50) 19 ± 2 (27) 18 ± 2 (13) 19 ± 1 (10)
18 ± 3 (31) 17 ± 3 (10) 19 ± 1 (11) 18 ± 3 (10)
19 ± 1 (33) 19 ± 1 (13) 18 ± 1 (10) 19 ± 1 (10)
18 ± 1 (31) 18 ± 1 (11) 18 ± 1 (10) 19 ± 2 (10)
18 ± 2 (145) [9 – 20]

117
Table 35 Mean and standard deviation of VO2max measures (Females). The sample size for each cell is shown in brackets (). The range is shown in [].
Variable Physical activity
20-30 years 31-40 years 41-50 years 51-60 years All age groups
VO2max (ml.kg
-1. min
-1)
All Above Achieved Below
41.9 ± 8.4 (35) 46.3 ± 6.5 (14) 43.9 ± 7.0 (11) 33.5 ± 5.9 (10)
40.5 ± 8.5 (32) 46.7 ± 8.6 (11) 41.5 ± 6.3 (9) 34.0 ± 4.6 (12)
36.4 ± 8.3 (29) 41.3 ± 8.5 (10) 35.2 ± 8.5 (10) 32.4 ± 5.6 (9)
37.7 ± 8.6 (32) 45.7 ± 8.9 (10) 36.0 ± 5.5 (12) 31.9 ± 5.3 (10)
39.3 ± 8.6 (128) [21 – 59]
Respiratory exchange ratio
All Above Achieved Below
1.21 ± 0.11 (35) 1.16 ± 0.08 (14) 1.25 ± 0.11 (11) 1.24 ± 0.13 (10)
1.23 ± 0.09 (32) 1.20 ± 0.08 (11) 1.20 ± 0.06 (9) 1.28 ± 0.11 (12)
1.23 ± 0.10 (29) 1.19 ± 0.08 (10) 1.22 ± 0.07 (10) 1.29 ± 0.14 (9)
1.22 ± 0.11 (32) 1.17 ± 0.08 (10) 1.23 ± 0.09 (12) 1.25 ± 0.14 (10)
1.22 ± 0.10 (128) [0.98 – 1.59]
Duration (minutes)
All Above Achieved Below
10.89 ± 1.55 (35) 11.66 ± 1.20 (14) 11.38 ± 1.18 (11) 9.28 ± 1.14 (10)
10.76 ± 2.03 (32) 11.62 ± 1.03 (11) 11.90 ± 2.47 (9) 9.11 ± 1.17 (12)
10.49 ± 1.73 (29) 11.52 ± 1.26 (10) 10.05 ± 1.55 (10) 9.83 ± 1.99 (9)
10.82 ± 2.78 (32) 12.83 ± 2.50 (10) 10.93 ± 2.66 (12) 8.67 ± 1.43 (10)
10.75 ± 2.05 (128) [6.25 – 18.70]
Maximum heart rate (beats.min
-1)
All Above Achieved Below
184 ± 9 (35) 185 ± 8 (14) 184 ± 9 (11) 182 ± 10 (10)
185 ± 10 (32) 183 ± 7 (11) 187 ± 9 (9) 186 ± 14 (12)
177 ± 9 (29) 177 ± 9 (10) 177 ± 9 (10) 176 ± 9 (9)
169 ± 12 (32) 168 ± 10 (10) 171 ± 15 (12) 167 ± 10 (10)
179 ± 12 (128) [145 – 205]
Minimum heart rate (beats.min
-1)
All Above Achieved Below
100 ± 14 (35) 101 ± 11 (14) 93 ± 11 (11) 107 ± 16 (10)
103 ± 15 (32) 101 ± 14 (11) 102 ± 12 (9) 106 ± 19 (12)
99 ± 12 (29) 96 ± 13 (10) 99 ± 9 (10) 103 ± 13 (9)
92 ± 15 (32) 84 ± 14 (10) 95 ± 16 (12) 96 ± 15 (10)
99 ± 14 (128) [57 – 134]
Av heart rate (beats.min
-1)
All Above Achieved Below
142 ± 11 (35) 143 ± 8 (14) 137 ± 10 (11) 144 ± 13 (10)
144 ± 14 (32) 140 ± 11 (11) 147 ± 8 (9) 147 ± 18 (12)
135 ± 10 (29) 134 ± 10 (10) 135 ± 9 (10) 137 ± 11 (9)
129 ± 11 (32) 127 ± 8 (10) 129 ± 13 (12) 131 ± 10 (10)
138 ± 13 (128) [104 – 175]
Rating of perceived exertion
All Above Achieved Below
17 ± 2 (35) 18 ± 2 (14) 17 ± 2 (11) 17 ± 3 (10)
18 ± 2 (32) 17 ± 2 (11) 18 ± 3 (9) 19 ± 2 (12)
17 ± 2 (29) 17 ± 2 (10) 17 ± 1 (10) 17 ± 2 (9)
17 ± 3 (32) 19 ± 2 (10) 17 ± 3 (12) 16 ± 3 (10)
17 ± 2 (128) [9 – 20]
VO2max, respiratory exchange ratio, test duration, maximum heart rate and average heart rate, all
decreased with increasing age for men. Maximum heart rate also decreased with increasing age in
women. Participants of high physical activity levels scored high in VO2max, had low respiratory
exchange ratio and longer test durations for all age groups. There was no defined trend for
maximum heart rate with physical activity level. Participants of high physical activity levels had
low minimum heart rates. The trend for perception of effort could not be established because the
test required maximum effort and participants were expected to reach “20” before they

118
disembarked from the treadmill. However there were situations where participants did not have
the opportunity to report the “20” rating. Rating of perceived exertion was recorded each minute.
Towards the end of the test at very high intensity perception of effort can change markedly within
a minute, say from 17 to 20 and disembarking. The participant may then end the test before the
next recording.
6.3.5 Relationship between VO2max, Physical Characteristics of Participants and Step Test Measures
Figure 5 shows the relationship between the VO2max and the physical characteristics of
participants. The data for males and females have been combined in each graph, but distinguished
by symbols ( males and females). The sample size for each graph can be obtained from Table
28 and Table 29.
There was an inverse relationship between age and VO2max (r = -0.3), with a standard error of the
estimate (SEE) of 10.51 ml.kg-1.min-1. Only 9% of the variance could be explained by this
relationship. Stature and METS had positive relationships with VO2max; 14 % and 36 %
respectively of the variance could be explained by the relationships. Body mass, body fat percent
and sum of seven skins folds were all inversely related to VO2max with variances of 1%, 58 %
and 45 % respectively.

119
Figure 5 VO2max versus (A) age, (B) stature, (C) body mass, (D) body fat percent, (E) sum of seven skinfolds and (F) METS of participants ( males and females)
Age
0
10
20
30
40
50
60
70
80
MalesFemales
r = -0.3see = 10.51p < 0.0001
A
Ag
e (
years
)
Stature
140
150
160
170
180
190
200
210
220
r = 0.38SEE = 10.18p < 0.0001
B
Sta
ture
(cm
)
Body mass
0
20
40
60
80
100
120
140
r = -0.12SEE = 10.93p = 0.052
C
Bo
dy m
ass (
kg
)
Body fat %
0
10
20
30
40
50
r = -0.76SEE = 7.100P < 0.0001
D
Bo
dy f
at
%
Sum of 7
0
100
200
300
400
r = -0.67SEE = 8.151p < 0.0001 E
Su
m o
f 7
Mets
0 10 20 30 40 50 60 70 80
0
2000
4000
6000
8000
r = 0.60SEE = 8.790p < 0.0001 F
VO2max
ME
TS

120
The linear regression equations of VO2max and physical characteristics of participants were
tabulated (Table 36). Age, body mass, body fat percent and sum of seven skinfolds had inverse
relationships. VO2max decreases with increasing age. Body mass and fat also have a negative
effect on VO2max. The daily physical activity (METS) was directly related to VO2max. Body fat
percent had the lowest standard error of estimate whilst body mass had the highest.
Table 36 Linear regressions of the physical characteristics and VO2max
Variable Equation SEE r
Age -3.079 (age) + 165.2 10.51 -0.3
Stature 3.111 (stature) -490.4 10.18 0.38
Body mass -7.491 (body mass) + 591.3 10.93 -0.12
Body fat % -1.835 (body fat %) + 90.10 7.10 -0.76
Sum of 7 -0.3690 (sum of 7) + 84.98 8.15 -0.67
METS 0.01381 (METS) + 19.59 8.79 0.60
Figure 6 is a graphic presentation of the linear regression results between VO2max and step test
variables. The relationship between VO2max and heart rate recovery was not significant (p =
0.17). The remaining variables were inversely related to VO2max. Twenty nine percent of the
variance could be explained in the relationship between VO2max and maximum heart rate, 7%
with total heart beats, 22% with average heart rate and 18% with rating of perceived exertion.

121
Figure 6 The relationship between VO2max and variables measured during the step test: heart rate recovery, maximum heart rate, total heart beats, average heart rate and rating of perceived exertion.
Heart rate recovery
0
10
20
30
40
50
60
70
80
Males
Females
A
HR
R (
beats
)Maximum heart rate
0
50
100
150
200
250
r = -0.54SEE = 9.242p < 0.0001
B
MH
R (
bp
m)
Total heart beats
0
500
1000
1500
2000
2500
r = -0.27SEE = 10.60p < 0.0001
C
TH
B (
beats
)
Average heart rate
0
50
100
150
200
r = -0.47SEE = 9.725p < 0.0001 D
Av H
R (
bp
m)
Rating of perceived exertion
0 10 20 30 40 50 60 70 80
0
5
10
15
20
25
r = -0.42 SEE = 9.986 P < 0.0001 E
VO2max
RP
E

122
Heart rate recovery had the highest standard error of estimate (Table 37). The other heart rate
measures (maximum heart rate, total heart beats and average heart rate) were inversely and
significantly related to VO2max. Perception of effort also had a significant relationship.
Table 37 Linear regressions of the step test outcome measures and VO2max
Variable Equation SEE r
HRR 14.19 (HRR) – 360.0 10.96 0.08
MHR -0.9484 (MHR) + 183.1 9.24 -0.54
THB -0.1326 (THB) +192.4 10.6 -0.27
Av HR -1.192 (Av HR) + 197.5 9.73 -0.47
RPE -9.795 (RPE) + 171.7 9.99 -0.42
SEE = Standard error of estimate
6.3.6 Multiple Regression Steps and Results
Having established the bivariate relationship between VO2max and the physical characteristics of
participants and VO2max and the step test variables, the next step was to determine which
combination of variables best predicted VO2max. Therefore multiple regression equations to
estimate VO2max were developed for the workload standardised step test. The development of
these equations was done in stages. The first step was to develop a multiple regression between
VO2max and the physical characteristics of participants. This regression equation represents a
minimalistic approach that does not require measurements from the step test. Sex, age, stature and
body mass were included in the model first (Table 38). All the variables were significant and the
overall model had a 49 % predictive power (Table 45).

123
Table 38 Regression summary: sex, age, stature and body mass (n = 273)
Variable B* Std Err B Std Err t value p value
Intercept 42.2098 13.36354 3.15858 0.001767
Sex -0.533521 0.058790 -11.7051 1.28982 -9.07499 0.000001
Age -0.199072 0.044387 -0.1813 0.04042 -4.48494 0.000011
Stature 0.302624 0.062237 0.3572 0.07346 4.86246 0.000002
Body mass -0.537921 0.053985 -0.4741 0.04758 -9.96419 0.000001
B = regression coefficient/ parameter estimate; B* = Standardised regression coefficient; Std Err = Standard error
Body fat percent and METS were added to the model. These measurements were not included in
the first analysis because measuring and calculating body fat percent (Appendix 17) needs a
trained person and the participants cannot do the measurement on their own. METS were
calculated from the Global physical activity questionnaire (GPAQ) (Appendix 2). The
interpretation of responses and calculations also needs a person trained in using the GPAQ. Body
mass index was left out of the regression because of its collinear relationship with body mass.
Sum of seven skinfolds was also left out of the model, as it is associated with body fat percent.
Physical characteristics of participants used in the development of the regression equation are
presented in Table 39. The contribution of body mass, body fat percent and METS to predicting
VO2max were significant. The overall predictive power was 71 % (Table 45).
Table 39 Regression summary: Sex, age, stature, body mass, body fat percent and METS (n = 273)
Variable b* Std Err B Std Err t value p value
Intercept 61.04644 10.44343 5.84544 0.000001
Sex -0.089503 0.077783 -1.96483 1.70754 -1.15068 0.250904
Age -0.042982 0.038052 -0.03917 0.03468 -1.12957 0.259681
Stature 0.047853 0.053016 0.05632 0.06239 0.90261 0.367557
Body mass -0.138278 0.060148 -0.12206 0.05309 -2.29896 0.022288
Body fat % -0.523028 0.080108 -0.73254 0.11220 -6.52901 0.000001
METS 0.357398 0.036978 0.00296 0.00031 9.66518 0.000001
B = regression coefficient/ parameter estimate; B* = Standardised regression coefficient; Std Err = Standard error

124
Next the significant variables, body mass, body fat and METS were analysed. Multiple regression
results show that they were still significant (Table 40) and had a predictive power of 70% (Table
45).
Table 40 Regression summary: Body mass, body fat %, METS (n = 273).
Variable b* Std Err B Std Err t value p value
Intercept 65.50026 2.762073 23.7142 0.000001
Body mass -0.068091 0.033594 -0.06011 0.029655 -2.0269 0.043669
Body fat % -0.629213 0.036103 -0.88126 0.050565 -17.4282 0.000001
METS 0.354818 0.036309 0.00294 0.000301 9.7723 0.000001
B = regression coefficient/ parameter estimate; B* = Standardised regression coefficient
This equation shows that VO2max can be predicted with 71% accuracy without testing the
participants.
The next phase of the multiple regression analysis was to include outcome variables from the step
test in an attempt to improve the predictive power. Heart rate recovery, maximum heart rate, total
heart beats, average heart rate and rating of perceived exertion were included in the model.
Maximum heart rate, average heart rate and rating of perceived exertion were significant, heart
rate recovery and total heart beats were not (Table 41). The predictive power was 35% (Table 45).

125
Table 41 Regression summary: Heart rate recovery, maximum heart rate, total heart beats, average heart rate and rating of perceived exertion. (n = 273)
Variable b* Std Err B Std Err t value p value
Intercept 88.09885 4.359982 20.20624 0.000001
HRR 0.057579 0.049556 0.06870 0.059126 1.16190 0.246315
MHR -0.710991 0.141127 -0.36545 0.072539 -5.03794 0.000001
THB 0.300424 0.146270 0.16734 0.081473 2.05391 0.040959
Av HR -0.026999 0.062199 -0.00095 0.002193 -0.43407 0.664585
RPE -0.232371 0.054119 -0.95405 0.222195 -4.29373 0.000025
B = regression coefficient/ parameter estimate; B* = Standardised regression coefficient
The step test measures that were significant were analysed and they all remained significant in the
multiple regression (Table 42). The predictive power remained at 35% (Table 45).
Table 42 Regression summary: Maximum heart rate, average heart rate and rating of perceived exertion. (n = 273)
Variable b* Std Err B Std Err t value p value
Intercept 90.33574 3.915255 23.07276 0.000001
MHR -0.703977 0.140624 -0.36184 0.072280 -5.00610 0.000001
Av HR 0.275868 0.138030 0.15366 0.076883 1.99861 0.046657
RPE -0.234447 0.053895 -0.96257 0.221278 -4.35005 0.000019
B = regression coefficient/ parameter estimate; B* = Standardised regression coefficient
Next the physical characteristics of participants were combined with step test variables in a
regression analysis. Age, body mass, body fat percent, METS, heart rate recovery, maximum
heart rate and average heart rate were significant (Table 43). The remaining variables (sex, total
heart beats and rating of perceived exertion) were not significant. The predictive power increased
to 76% (Table 45).

126
Table 43 Regression summary: Sex, age, stature, body mass, body fat %, METS, HRR, MHR, Av HR, heart beats, RPE (n = 273)
Variable b* Std Err B Std Err t value p value
Intercept 91.95516 13.54478 6.78897 0.000001
Sex -0.096220 0.071126 -2.11227 1.56139 -1.35281 0.177296
Age -0.141914 0.040824 -0.12934 0.03721 -3.47626 0.000596
Stature 0.011932 0.053373 0.01404 0.06281 0.22355 0.823283
Body mass -0.214156 0.082316 -0.18904 0.07266 -2.60163 0.009812
Body fat % -0.433628 0.076155 -0.60733 0.10666 -5.69399 0.000001
METS 0.244370 0.037858 0.00203 0.00031 6.45485 0.000001
HRR 0.102891 0.032560 0.12266 0.03882 3.16001 0.001765
MHR -0.393206 0.091612 -0.20209 0.04709 -4.29209 0.000025
Av HR 0.228110 0.109726 0.12695 0.06106 2.07890 0.038611
Heart beats -0.130771 0.102325 -0.00460 0.00360 -1.27800 0.202394
RPE -0.028899 0.036619 -0.11955 0.15149 -0.78919 0.430722
B = regression coefficient/ parameter estimate; B* = Standardised regression coefficient
The non-significant variables were removed (Table 44). The contribution of average heart rate to
the model became non-significant and the predictive power was 75% (Table 45). Removing
average heart rate did not change the predictive capacity of the equation (Table 45).

127
Table 44 Regressions summary: Age, body mass, body fat %, METS, HRR, MHR, Av HR (n = 273)
Variable b* Std Err B Std Err value p value
Intercept 83.34846 4.550127 18.3178 0.000001
Age -0.119722 0.038772 -0.10911 0.035336 -3.0879 0.002232
Body mass -0.069984 0.030887 -0.06178 0.027265 -2.2658 0.024276
Body fat % -0.538928 0.040440 -0.75481 0.056639 -13.3267 0.000001
METS 0.251126 0.036140 0.00208 0.000300 6.9486 0.000001
HRR 0.097606 0.032314 0.11636 0.038522 3.0206 0.002771
MHR -0.380395 0.089473 -0.19551 0.045986 -4.2515 0.000030
Av HR 0.142939 0.086919 0.07955 0.048372 1.6445 0.101267
B = regression coefficient/ parameter estimate; B* = Standardised regression coefficient
A summary of the different models for predicting VO2max is shown in Table 45.
Table 45 Multiple linear regression summary for predicting VO2max from step test measures
Variables R R2 ΔR2 p SEE
Sex, age, stature, mass, 0.70 0.49 0.49 0.00 7.87
Sex, age, stature, mass, body fat %, METS 0.84 0.71 0.70 0.00 6.03
Mass, body fat %,METS 0.84 0.70 0.70 0.00 6.03
HRR, MHR,THB, Av HR, RPE 0.60 0.35 0.34 0.00 8.89
MHR, Av HR, RPE 0.59 0.35 0.34 0.00 8.88
Sex, age, stature, mass, body fat %, METS, HRR,
MHR, THB, Av HR, RPE
0.87 0.76 0.75 0.00 5.50
Age, mass, body fat %, METS, HRR, MHR, Av HR 0.87 0.75 0.75 0.00 5.51
Age, mass, body fat %, METS, HRR, MHR 0.87 0.75 0.75 0.00 5.53
R = Multiple regression correlation coefficient; R2 = Coefficient of determination; ΔR2 = Adjusted coefficient of
determination; SEE = Standard error of Estimate.

128
Considering predictive power of the various equations and objective variables which are relatively
easy to measure during and after in the step test, we selected the following equation as the most
appropriate:
VO2max (ml.kg-1.min-1) = -0.10911 (age) - 0.06178 (body mass) - 0.75481 (body fat %) +0.00208 (METS) + 0.11636 (HRR) - 0.019551 (MHR) + 0.07955 (Av HR) + 83.34846 (Equation xxi)
Where METS is metabolic equivalents, HRR is heart rate recovery, MHR is maximum heart rate
and Av HR is average heart rate.
The equation comprised a combination of significant physical characteristics and outcomes of the
step test (Table 44) and had a predictive capacity of 75%. Furthermore, it was relatively easy to
measure all the variables making the test inexpensive and practical.
6.4 Discussion
This study determined the equation for the prediction of VO2max, using a combination of physical
characteristics of participants and outcome measures of the step test. The model has potential for
accurately predicting VO2max as shown by a high regression correlation coefficient (R = 0.87) a
high coefficient of determination (R2 = 0.75) and a low standard error of estimate (SEE = 5.51
ml.kg-1.min-1). The correlation coefficient of a multiple regression informs how much the
independent variables correlate with the outcome variable. R2, the coefficient of determination
shows how much variance in VO2max is accounted for by the interaction of the independent
variables. In this study the coefficient of determination was similar to that found from a peak
performance treadmill work prediction model (R2 = 0.75 for men and 0.72 for women) 73 in a
study that developed VO2max prediction models from peak performance treadmill work and
submaximal performance treadmill work and better than that found from submaximal models (R2
= 0.55 for men and 0.56 for women 73, R2 = 0.48 74 in a study that predicted aerobic capacity in
fire fighters using submaximal treadmill and stair mill protocols). The SEE was similar to that
reported in previous studies for both peak performance (SEE = 4.63 ml.kg-1.min-1 for men and

129
4.11 ml.kg-1.min-1 for women 73) and submaximal performance (SEE = 6.24 ml.kg-1.min-1for men
and 5.17 ml.kg-1.min-1for women 73, SEE = 4.85 ml.kg-1.min-1 74). SEE represents the variability
around the regression line, hence the smaller the SEE the better the predictive validity. Therefore
in this example, 75% of the variance in predicting VO2max is accounted for by age, body mass,
body fat percent, metabolic equivalent, heart rate recovery, maximum heart rate and average heart
rate. There was no difference between R2 and adjusted R2, which suggests that all the dependent
variables were contributing to the prediction of the independent variable (VO2max) and were not
related to each other. This also shows there was minimal shrinkage in the prediction, which is a
favourable outcome. Small shrinkage gives confidence in the generalisability of the equation.
The standardised beta weights indicate that of all the significant variables in the prediction
equation, body fat percent is the key determinant of VO2max and explained the most amount of
variance in VO2max values followed by maximum heart rate, then METS. Body mass had the
least influence.
Rating of perceived exertion was among the variables that were non-significant and was left out
of the prediction equation. Whilst physiological strain increases linearly with exercise intensity
and perception of effort follows the same linear pattern, participants may underrate or overrate
their perception of effort 204,205. Since the measure may be considered subjective, leaving it out of
the model makes the prediction of VO2max based entirely on objective measurements.
The equation of the step test was developed from a heterogeneous sample of participants. For
example, the participants in this study had a broad range of ages (20 to 60 years) and habitual
physical activity (physically inactive to exceeding the daily recommendation of physical activity).
This increases the generalisability and usefulness of the standardised step test in a variety of
settings.
As expected VO2max scores were highest in participants of high physical activity levels for all
age groups, confirming a relationship between physical activity level and physical fitness. This
relationship has been found in a previous study 70. VO2max was also higher in young participants

130
than in older participants. The level of fitness is dependent upon age, gender, anthropometry
(body mass and stature) and training or exercise intensity 64. The prediction equation shows that
age is an important variable in predicting cardiorespiratory fitness in a heterogeneous sample. The
result concurs with earlier studies 72,206. The type of test, body mass and stature have significant
influence on the validity of a test depending on the intensity of the workload 64,72,207. Body mass
and stature influence cardiorespiratory tests significantly as they are closely related to the load
intensity of the test. Jinzhou et al 64 assessed the influence of stature and body mass on the
reliability and sensitivity of three submaximal tests. They examined the relative heart rate
recovery index of the tests. Relative heart rate recovery index was normalised by stature and body
mass. Body mass influenced the test reliability significantly while stature was at a minimal level.
Normalisation by body mass increased the test sensitivity while the influence of stature was
negligible.
The inverse relationship between age and VO2max was due to the aging process that causes
muscle loss 208,209 and low oxygen consumption which reduces functional capacity 209,210,211. The
results confirm previous findings that age is an important variable in the prediction of
cardiorespiratory fitness 72,212. The age range of the participants in this study was 20 to 60 years.
The risk of performing a maximal test increases with age. Since the study involved a maximal test
participants older than 60 were left out of the study for safety reason. There had to be a cut-off
point between adults and children and for this study we settled for twenty. However the prediction
equation can be used for participants outside the age range of the participants as it has proved to
be quite generalisable.
Participant effort in the VO2max test was satisfactory. The mean respiratory exchange ratio (RER)
was 1.23 and 1.22 for men and women respectively. A respiratory exchange ratio of 1.10 has been
used to mark the end of other studies 213,76. RER is the ratio between the amount of CO2 exhaled
and O2 inhaled in one breath (VCO2/VO2). It is used for estimating respiratory quotient (RQ), an
indicator of which fuel, carbohydrate or fat is being metabolised to supply the body with energy.
RER of 0.70 indicates that fat is the predominant fuel source, 0.85 indicates a mixture of fat and
carbon dioxide, and 1.00 and above shows that carbohydrate is the predominant source of fuel.

131
Exercise intensities ranging between 86% and 93% of maximum heart rate have the most stable
heart rate recovery, therefore the highest sensitivity to detect meaningful changes on a day-to-day
basis 61. The workload standardised step test induced maximum heart rate ranging between 55%
and 98% and the means for the age groups ranged between 72% and 96%. Participants who did
the least activity had the highest maximum heart rate and women had higher maximum heart rates
than men. Since the workload standardised step test was designed to predict VO2max and not
detect changes on a day-to-day basis maximum heart rates varied according to physical activity, a
fact that did not affect the prediction capacity of the test.
6.5 Conclusions
The study validated the workload standardised step test against the VO2max test. A multivariate
regression equation comprising step test variables and physical characteristics of participants was
developed for the prediction of VO2max. The equation has the capacity to predict maximal
oxygen consumption as depicted by the coefficient of determination (R2 = 0.75). The next study
was a cross validation study which evaluated accuracy of the prediction equation using an
independent sample.

132
CHAPTER 7
CROSS VALIDATION STUDY

133
7.1 Introduction
The process of developing a test for cardiorespiratory fitness started with the determination of
step test variables, step height, stepping rate, test duration and the workload. Three step test
configurations that had the same external workload but differed in stepping rates of 16, 20 and 24
steps per minute, were tested. Physiological responses to the three configurations were
significantly different. The differences were attributed to different exercise intensities. In the next
study the repeatability of the standardised step test was tested. The step test was highly repeatable.
The validation study had participants perform the step test on one day and a VO2max test on
another day. Regression analysis was done first between the physical characteristics of
participants and VO2max results, and then between step test outcomes and the VO2max. Physical
characteristics of participants and step test outcomes were then combined in a regression analysis.
The significant variables were further analysed to develop the selected prediction equation. The
last stage of verifying the prediction equation is through a cross validation study. Cross validation
is the evaluation of the accuracy of the prediction equation on an independent sample with
characteristics similar to those of the development population. Ideally, a prediction model should
be tested on an independent sample to confirm or confute its validity. The cross validation study
determines the relationship between VO2max measured directly on a treadmill, and VO2max
predicted from the equations established in Chapter 6.
7.2 Methods
Fifty participants aged 20 to 60 years were recruited for the cross validation study. The
recruitment procedure was the same as that used in the validation study. Participants completed
the informed consent form and responded to the Global Physical Activity Questionnaire. Stature,
body mass and skinfold were measured.
On the first visit participants performed the workload standardised step test. Heart rate was
measured during the test and two minutes after the test using a heart rate monitor (Suunto Oy,
Vantaa, Finland). Perception of effort was recorded each minute. On the second visit participants
did a VO2max test running on a treadmill (Motor driven treadmill, Quinton Instruments, Seattle,
WA, USA). Gas exchange during the test was measured by an Oxycon (Jaeger Pro®, VIASYS

134
health care, Hoechberg, Germany). The Oxycon was calibrated before each testing session using a
three litre syringe (SensorMedics®, Milan, Italy) and a reference gas of known composition (16%
oxygen, 5% carbon dioxide, balance nitrogen). Heart rate was measured using a Suunto T6 chest
heart rate transmitter and wrist monitor (Suunto Oy, Vantaa, Finland). Heart rate data were
downloaded and recorded at two seconds intervals. Temperature and humidity were maintained
relatively constant for the two testing episodes in air-conditioned laboratories.
7.2.1 Participants
Participants were recruited according to sex, age and physical activity levels to match the
validation sample. Each sub-cell had two participants except the 20 to 30 age groups which had
three participants for both sexes (Table 46). The recruitment strategy was the same, fliers, emails,
word of mouth, visits, staff and students.
Table 46 Participants in each cell defined by age and level of physical activity (n = 50)
Males Females
Age (years) below achieved above Total below achieved above Total
20-30 2 2 3 7 2 2 3 7
31-40 2 2 2 6 2 2 2 6
41-50 2 2 2 6 2 2 2 6
51-60 2 2 2 6 2 2 2 6
Total 8 8 9 25 8 8 9 25
below: below the recommended level of physical activity achieved: achieved the recommended level of physical above: above the recommended level of physical activity
7.2.2 Statistical Analysis
The participants’ characteristics were summarised with descriptive statistics. The means and
standard deviations of step test outcome measures and VO2max outcome measures were used to
analyse participant performance and response to exercise. Predicted VO2max scores derived from
the equation developed in Chapter 6 were plotted against measured VO2max scores in Prism

135
(Prism 5, GraphPad Software, Inc., CA, USA). Regression analysis was done using Prism 5 to
determine the Pearson’s product moment correlation coefficient (r) between predicted and
measured VO2max. Standard error of estimate (SEE) values were used to determine the degree of
error associated with prediction equations developed from statistics. Paired student’s t test
compared measured and estimated VO2max. To test the validity, Pearson’s correlation coefficient
statistic was calculated to determine the direction and strength of the association between
measured VO2max and VO2max predicted by the step test. The Bland and Altman analysis 214 was
done to assess agreement between measured and predicted VO2max.
7.3 Results
The results were tabulated in four sections, physical characteristics of participants, step test
components, outcome measures of the step test and outcome measures of the VO2max test.
7.3.1 Physical Characteristics of Participants
The physical characteristics of participants are presented as means and standard deviations (Table
47 and Table 48). The recruitment process was structured to get a balance in age between males
and females. Whilst stature tended to increase in men with increasing age, there was no particular
trend in women. Body mass did not define any pattern with age for both men and women. The 51
to 60 age groups for both sexes had the largest percentages of body fat. The youngest age group in
women were the most active whilst the 31 to 40 men age group was the most active.

136
Table 47 Mean and standard deviation of anthropometric measures (Males). The sample size for each cell is shown in brackets ().
Variable 20-30 years 31-40 years 41-50 years 51-60 years All
Age (years) 26 ± 3 (7) 34 ± 3 (6) 44 ± 3 (6) 55 ± 3 (6) 39 ± 11 (25)
Stature (cm) 172.9 ± 5.2 (7) 177.6 ± 5.3 (6) 181.6 ± 8.8 (6) 181.5 ± (4.5) 6 178.2 ± 6.9 (25)
Mass (kg) 72.2 ± 16.8 (7) 89.2 ± 17.7 (6) 87.1 ± 15.4 (6) 83.0 ± 7.3 (6) 82.4 ± 15.6 (25)
BMI (kg/m2) 24.1 ± 5.4 (7) 28.2 ± 5.1 (6) 26.3 ± 3.1 (6) 25.3 ± 2.6 (6) 25.9 ± 4.3 (25)
Body fat % 14.3 ± 5.7 (7) 21.4 ± 4.8 (6) 19.6 ± 4.2 (6) 23.1 ± 3.8 (6) 19.4 ± 5.6 (25)
Sum of 7 76.3 ± 41.5 (7) 108.7 ± 40.8 (6) 82.3 ± 24.6 (6) 98.4 ± 21.4 (6) 90.8 ± 34.3 (25)
METS 2234 ± 2009 (7) 2360 ± 2648 (6) 1880 ± 1020 (6) 1547 ± 1195 (6) 2014 ±1757 (25)
Table 48 Mean and standard deviation of anthropometric measures (Females). The sample size for each cell is shown in brackets ().
Variable 20-30 years 31-40 years 41-50 years 51-60 years All
Age (years) 27 ± 2 (7) 36 ± 3 (6) 46 ± 2 (6) 57 ± 4 (6) 41 ± 12 (25)
Stature (cm) 163.7 ± 6.4 (7) 161.6 ± 3.7 (6) 166.1 ± 7.1 (6) 160.1 ± 5.2 (6) 162.9 ± 5.9 (25)
Mass (kg) 72.9 ± 16.3 (7) 61.8 ± 6.0 (6) 66.6 ± 13.3 (6) 68.1 ± 9.5 (6) 67.6 ± 12.1 (25)
BMI (kg/m2) 27.1 ± 5.9 (7) 23.8 ± 2.8 (6) 24.3 ± 5.8 (6) 26.0 ± 3.6 (6) 25.4 ± 4.7 (25)
Body fat % 29.4 ± 5.8 (7) 26.3 ± 4.4 (6) 30.2 ± 4.7 (6) 35.6 ± 2.4 (6) 30.3 ± 5.4 (25)
Sum of 7 142.6 ± 54.8 (7) 109.3 ± 34.0 (6) 113.5 ± 8.5(6) 141.4 ± 22.8 (6) 127.3 ±40.7 (25)
METS 2669 ± 2460 (7) 1319 ± 1041 (6) 1276 ±1159(6) 1140 ± 947 (6) 1643 ± 1623(25)
The physical characteristics of participants for the validation and cross validation samples were
graphed (Figure 7, Figure 8 and Figure 9). The two groups were similar in all characteristics.

137
1 2 1 2 1 2 1 2 1 2 1 2
020406080
100120140160180200
StatureBod MassBMIBody fat %Sum of 7
1 = Validation 2 = Cross validation
Scale
Figure 7 Validation and cross validation physical characteristics (Males). The data are represented as mean and standard deviation (the units of the Y axis are general units representing the different measurements).
1 2 1 2 1 2 1 2 1 2 1 2
0
20
40
60
80
100
120
140
160
180
200StatureBody MassBMIBody fat %Sum of 7
1 = Validation 2 = Cross validation
Scale
Figure 8 Validation and cross validation physical characteristics (Females). The data are represented as mean and standard deviation (the units of the Y axis are general units representing the different measurements).

138
1 2 1 2
0
500
1000
1500
2000
2500
3000
3500
4000Females
1 = Validation 2 = Cross validation
ME
TS
Figure 9 Validation and cross validation METS for males and females. The data are represented as mean and standard deviation.
7.3.2 Step Test Components
The mean step height for men was three centimetres higher than that for women (Table 49 and
Table 50). On average the women’s test was two minutes and twenty-eight seconds longer than
the men’s test.
Table 49 Mean and standard deviation of step test components (Males). The sample size for
each cell is shown in brackets ().
Variable 20-30 years 31-40 years 41-50 years 51-60 years All
Step height(cm) 32 ± 3 (7) 34 ± 1 (6) 35 ± 2 (6) 34 ± 1 (6) 33 ± 2 (25)
Duration (min) 8.47 ± 1.92 (7) 6.57 ± 1.25 (6) 6.50 ± 1.16 (6) 6.75 ± 0.55 (6) 7.13 ± 1.53 (25)
Table 50 Mean and standard deviation of step test components (Females). The sample size for each cell is shown in brackets ().
Variable 20-30 years 31-40 years 41-50 years 51-60 years All
Step height(cm) 31 ± 1 (7) 30 ± 1 (6) 31 ± 2 (6) 30 ± 1 (6) 30 ± 1 (25)
Duration (min) 8.99 ± 2.15 (7) 10.33 ± 0.95 (6) 9.52 ± 1.79 (6) 9.61 ± 1.64 (6) 9.59 ± 1.68 (25)

139
The validation sample step height for men and women (Table 30 and Table 31 respectively) were
one centimetre higher than the cross validation sample step height for men and women (Table 49
and Table 50 respectively). Step test duration for women was the same for both the validation
(Table 31) and cross validation sample (Table 50). The men’s test duration for the validation
sample (Table 30) was sixteen seconds more than that for the cross validation sample (Table 50).
7.3.3 Outcome Measures of the Step Test
Maximum heart rate decreased with increasing age for men. Women also followed the same trend
except the 51 to 60 years age group, which had the highest values. There was no defined trend for
both males and females for the rest of the outcome measures of the step test, heart rate recovery,
step test maximum heart rate as a percentage of VO2max maximum heart rate, average heart rate,
total heart beats and rating of perceived exertion (Table 51 and Table 52). Step test heart rate
measures and perception of effort for the validation sample (Table 32 and Table 33) were
comparable with those for the cross validation sample (Table 51 and Table 52).

140
Table 51 Mean and standard deviation of step test outcome measures (Males). The sample size for each cell is shown in brackets ().
Variable 20-30 years 31-40 years 41-50 years 51-60 years All
HRR (beats) 33 ± 8 (7) 34 ± 15 (6) 29 ± 11 (6) 36 ± 6 (6) 33 ± 10 (25)
MHR (bpm) 144 ± 20 (7) 143 ± 32 (6) 138 ± 13 (6) 137 ± 15 (6) 141 ± 20 (25)
% of MHR 79 ± 10 (7) 77 ± 15 (6) 77 ± 6 (6) 80 ± 10 (6) 78 ± 10 (25)
Av HR (bpm) 125 ± 23 (7) 126 ± 30 (6) 121 ± 10 (6) 119 ± 13 (6) 123 ± 20 (25)
Min HR (bpm) 87 ± 17 (7) 92 ± 26 (6) 90 ± 6 (6) 78 ± 14 (6) 86 ± 17 (25)
Heart beats 1114 ± 373 (7) 853 ± 213 (6) 812 ± 157 (6) 843 ± 83 (6) 914 ± 259 (25)
RPE 10 ± 3 (7) 13 ± 4 (6) 13 ± 1 (6) 13 ± 4 (6) 12 ± 3 (25)
Table 52 Mean and standard deviation of step test outcome measures (Females). The sample size for each cell is shown in brackets ().
Variable 20-30 years 31-40 years 41-50 years 51-60 years All
HRR (beats) 30 ± 11 (7) 30 ± 5 (6) 30 ± 7 (6) 32 ± 10 (6) 30 ± 8 (25)
MHR (bpm) 157 ± 24 (7) 152 ± 21 (6) 151 ± 12 (6) 160 ± 23 (6) 155 ± 20 (25)
% of MHR 87 ± 15 (7) 85 ± 8 (6) 87 ± 7 (6) 93 ± 12 (6) 88 ± 11 (25)
Av HR (bpm) 138 ± 18 (7) 137 ± 19 (6) 135 ± 11 (6) 135 ± 14 (6) 136 ± 15 (25)
Min HR (bpm) 88 ± 23 (7) 95 ± 10 (6) 95 ± 12 (6) 88 ± 23 (6) 91 ± 18 (25)
Heart beats 1254 ± 220 (7) 1442 ± 163 (6) 1326 ± 253 (6) 1334 ± 278 (6) 1335 ± 228 (25)
RPE 14 ± 4 (7) 14 ± 2 (6) 13 ± 3 (6) 14 ± 4 (6) 14 ± 3 (25)
7.3.4 Outcome Measures of the VO2max Test
VO2max decreased with increasing age for both men and women. Maximum heart also decreased
with age for women. For men, VO2max for the 31 to 40 age group was higher than the previous
age group, distorting the trend. The rest of the outcome measures of the VO2max test for both men
and women followed no particular direction.

141
Table 53 Mean and standard deviation of VO2max outcome measures (Males). The sample size for each cell is shown in brackets ().
Variable 20-30 years 31-40 years 41-50 years 51-60 years All
VO2max 52.9 ± 12.9 (7) 47.7 ± 10.1 (6) 47.6 ± 6.6 (6) 42.5 ±5.9 (6) 47.9 ± 9.7 (25)
RER 1.26 ± 0.08 (7) 1.22 ± 0.10 (6) 1.29 ± 0.06 (6) 1.26 ± 0.04 (6) 1.26 ±0.07 (25)
Duration (min) 12.39 ±2.81(7) 13.31 ±3.99(6) 12.18 ±1.56(6) 11.40 ±1.79(6) 12.32 ± 2.63(25)
MHR (bpm) 183 ± 17 (7) 184 ± 12 (6) 179 ±5 (6) 173 ± 11 (6) 180 ± 12 (25)
Av HR (bpm) 134 ± 13 (7) 138 ± 13 (6) 129 ± 4 (6) 129 ± 14 (6) 133 ± 12 (25)
Min HR (bpm) 94 ± 10 (7) 91 ± 17 (6) 90 ± 5 (6) 93 ± 16 (6) 92 ± 12 (25)
RPE 17 ± 3 (7) 19 ± 1 (6) 18 ± 2 (6) 18 ± 4 (6) 18 ± 3 (25)
Table 54 Mean and standard deviation of VO2max outcome measures (Females). The sample size for each cell is shown in brackets ().
Variable 20-30 years 31-40 years 41-50 years 51-60 years All
VO2max 42.2 ± 13.0 (7) 40.0 ± 8.8 (6) 37.7 ± 7.9 (6) 35.4 ± 8.9 (6) 38.9 ± 9.7 (25)
RER 1.18 ± 0.08 (7) 1.21 ± 0.15(6) 1.24 ± 0.02 (6) 1.22 ± 0.08 (6) 1.21 ± 0.09 (25)
Duration (min) 10.89 ±2.55(7) 11.26 ±1.16(6) 10.89 ±1.42(6) 11.43 ±3.09(6) 11.11 ± 2.09(25)
MHR (bpm) 180 ± 11 (7) 178 ± 16 (6) 174 ± 6 (6) 171 ± 8 (6) 176 ± 11 (25)
Av HR (bpm) 141 ± 9 (7) 141 ± 18 (6) 137 ± 10 (6) 135 ± 6 (6) 138 ± 11 (25)
Min HR (bpm) 97 ± 12 (7) 102 ± 17 (6) 92 ± 18 (6) 97 ± 9 (6) 97 ± 14 (25)
RPE 18 ± 2 (7) 19 ± 2 (6) 19 ± 2 (6) 17 ± 4 (6) 18 ± 2 (25)
7.3.5 Prediction of VO2max from the Equation
Equation xxi: VO2max (ml.kg-1.min-1) = -0.10911 (age) - 0.06178 (body mass) - 0.75481 (body fat
%) + 0.00208 (METS) + 0.11636 (HRR) – 0.019551 (MHR) + 0.07955 (Av HR) + 83.34846 from
the validation study was used to predict VO2max in the cross validation sample.
Pearson’s correlation coefficients showed a strong, positive relationship between directly
measured VO2max and VO2max predicted from the standardised step test, r = 0.87 (Figure 10).

142
0 10 20 30 40 50 60 70 80
0
10
20
30
40
50
60
70
80
MenWomen
r = 0.87SEE = 5.186P < 0.0001
Measured VO2max
Pre
dic
ted
VO
2m
ax
Figure 10 Measured VO2max against predicted VO2max in ml.kg-1.min-1
A paired t test analysis was done between the measured VO2max and predicted VO2max. There
were no significant differences between the means (P = 0.16). The pairing was significant (P <
0.0001).
Two more prediction equations had their prediction capacity tested. The first was the equation that
used all physical characteristics and all outcome measures of the workload standardised step test.
VO2max (ml.kg-1.min-1) = -2.11227 (sex) - 0.12934 (age) + 0.01404 (stature) - 0.18904 (body mass) - 0.60733 (body fat %) + 0.00203 (METS) + 0.12266 (HRR) - 0.20209 (MHR) + 0.12695 (Av HR) - 0.00460 (heart beats) - 0.11955 (RPE) + 91.95516 (Equation xxii) Where METS is metabolic equivalents, HRR is heart rate recovery, MHR is maximum heart rate,
Av HR is average heart rate and RPE is rating of perceived exertion.
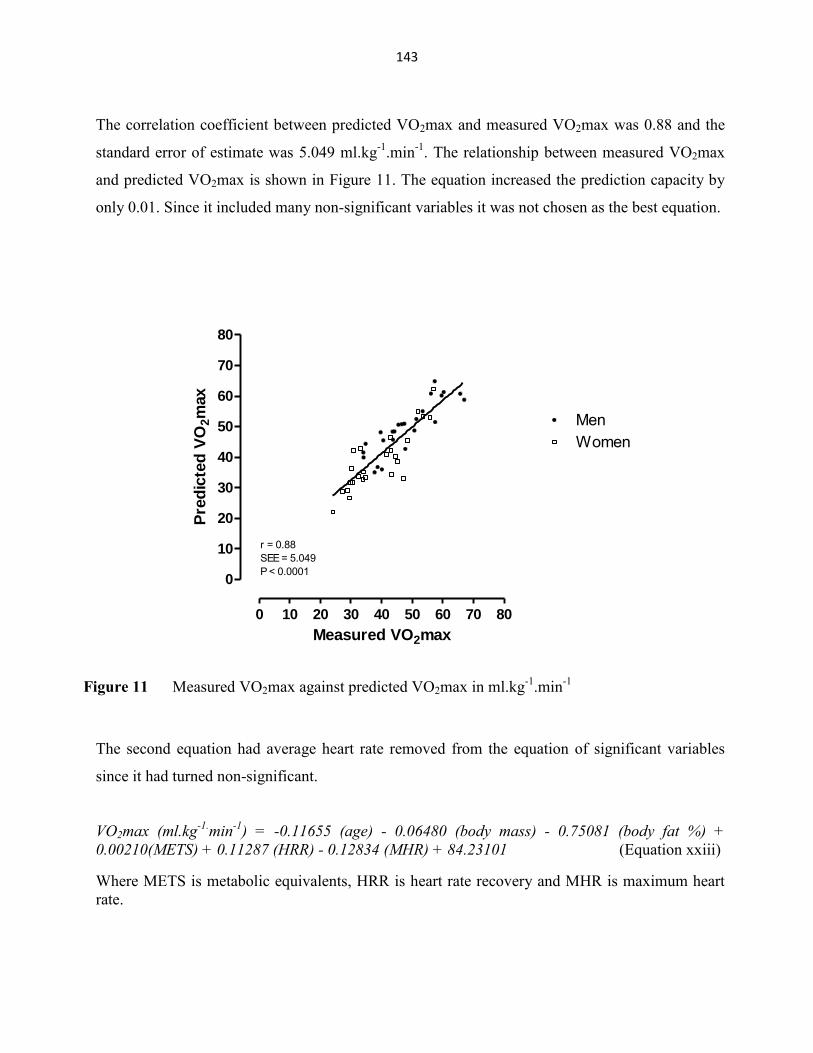
143
The correlation coefficient between predicted VO2max and measured VO2max was 0.88 and the
standard error of estimate was 5.049 ml.kg-1.min-1. The relationship between measured VO2max
and predicted VO2max is shown in Figure 11. The equation increased the prediction capacity by
only 0.01. Since it included many non-significant variables it was not chosen as the best equation.
0 10 20 30 40 50 60 70 80
0
10
20
30
40
50
60
70
80
MenWomen
r = 0.88SEE = 5.049P < 0.0001
Measured VO2max
Pre
dic
ted
VO
2m
ax
Figure 11 Measured VO2max against predicted VO2max in ml.kg-1.min-1
The second equation had average heart rate removed from the equation of significant variables
since it had turned non-significant.
VO2max (ml.kg-1.min-1) = -0.11655 (age) - 0.06480 (body mass) - 0.75081 (body fat %) + 0.00210(METS) + 0.11287 (HRR) - 0.12834 (MHR) + 84.23101 (Equation xxiii)
Where METS is metabolic equivalents, HRR is heart rate recovery and MHR is maximum heart rate.

144
Figure 12 is the graphic presentation of the relationship between measured and predicted
VO2max. The correlation coefficient remained 0.87 so the equation with average heart rate
remained the preferred equation.
0 10 20 30 40 50 60 70 80
0
10
20
30
40
50
60
70
80
MenWomen
r = 0.87SEE = 5.171P < 0.0001
Measured VO2max
Pre
dic
ted
VO
2m
ax
Figure 12 Measured VO2max against predicted VO2max in ml.kg-1.min-1
To assess the agreement between the measured VO2max and VO2max predicted using equation
xxii which was considered the best equation, the Bland and Altman analysis was done. Figure 13
is the plot showing the limits of agreement.

145
0 10 20 30 40 50 60 70 80-20
-15
-10
-5
0
5
10
15
20
Mean + 2 Std Dev
Mean
Mean - 2 Std Dev
Average (measured:predicted VO2max)
Measu
red
- p
red
icte
d V
O2m
ax
Figure 13 Difference against mean for measured and predicted VO2max
The limits of agreement are 9.65 ml.kg-1.min-1 above the mean and 11.84 ml.kg-1.min-1 below the
mean; 95% of the measurements lie within these limits.
7.4 Discussion
The predicted VO2max values correlated significantly with measured VO2max values (r = 0.87, P
< 0.0001), a result that compares favourably with previous findings of r = 0.85 70, r = 0.87 and r =
0.85 for men and women respectively 73. Cross validation of a VO2max prediction equation that
used age, sex, body mass, heart rate and time for the track walk resulted in r = 0.88 72. The
Pearson correlation coefficient r is used for validity and accuracy of prediction. It indicates how
well the estimated measure relates to the true criterion measure; r = 1 is a perfect correlation, r ≥
0.5 represents a strong correlation, r ≥ 0.3 moderate, r ≥ 0.1 small, and r = 0 is no correlation at
all. According to Cohen statistics a correlation coefficient of 0.88 is considered a strong
association 184. A predictive test is considered valid if it has a validity coefficient ≥ 0.80 215.

146
The use of standard error of estimate (SEE) is preferred over correlation coefficient when
comparing prediction equations generated from different samples. The SEE measures the
accuracy of the prediction by providing an estimate of the dispersion of the prediction errors. A
standard error of estimate of 5.2 ml.kg-1.min-1 is small, hence the model can predict VO2max
accurately. The SEE is similar in magnitude to that reported in an earlier cross validation analysis
of the one mile track of 4.4 ml.kg-1.min-1 72. The workload standardised step test predicts VO2max
more accurately than the widely used ACSM equation (r = 0.64, SEE = 6.18 216) Therefore the
submaximal standardised step test has a measurement error for maximal oxygen consumption that
is aligned to previously used procedures.
The coefficient of determination from the validation sample (R2 = 0.75) was compared with that
from the cross validation sample (R2 = 0.76). A shrinkage of 0.0018 revealed that the prediction
equation was successful in predicting VO2max 75.
The product moment correlation coefficient (r) measures the strength of the relationship between
two variables. The high product moment correlation coefficient between measured and predicted
means there is a strong linear relationship between the prediction and measurement of VO2max.
The Bland and Altman plot 214 was used to assess the limits of agreement between the measured
and predicted VO2max. This calculation showed that the limits of agreement are between -11.84
ml.kg-1.min-1 and 9.65 ml.kg-1.min-1. The limits of agreement are narrow enough that the
workload standardised step test can be confidently used confidently for the prediction of VO2max
in the studied population. In other words, 95% of the differences between measured and predicted
VO2max lie between these limits.
The VO2max prediction equation (Equation xxi) was developed on a large sample (n = 273) and
cross validated on fifty participants. The recruitment process for the cross validation group
considered sex, age and physical activity levels to ensure the validation and cross validation
samples were similar.

147
The validation sample is more than five times larger than the samples used for most submaximal
tests 99,109,81,82,111,112,83,123. Large sample sizes are essential for the development and cross
validation of prediction equations.
The workload standardised step test satisfied all the requirements of clinimetrics. Some previous
tests of cardiorespiratory fitness were not validated. Those that were validated had aspects that
limited their VO2max prediction accuracy. For example, both the Chester step test and the
Cambridge step test used age predicted maximum heart rate, a variable that has since been proven
to be an inaccurate predictor of maximum heart rate 129. The Cambridge step test also assumes
that age predicted maximum heart rate coincides with VO2max. The Chester step test is based
estimated VO2 for each stage of the test. All the variables used in the prediction equation of the
workload standardised step test were measured, reducing the error of prediction and improving
validity. The variables were in the marginal category of comparison of measurement error and the
smallest worthwhile difference.
In summary, the validation study generated several equations for the prediction of VO2max. Three
of the equations, with a similar accuracy of predicting VO2max, were used to predict VO2max on
the cross validation sample. One equation (Equation xxi), based on predictive ability and ease of
measuring the output variables was then chosen as the optimal equation to use with the workload
standardised step test. The use of more than one physiological variable improves accuracy of
prediction. Since the equation was derived and tested on participants of all physical activity levels
from the most active to the inactive, the prediction equation can be generalised for participants of
all categories. However, the prediction equation is specific to treadmill measured VO2max and
may not work for cycling VO2max.
We conclude that the workload standardised step test can predict VO2max with good precision
(SEE ≈ 5 ml.kg-1.min-1) in a heterogeneous healthy population with individuals of both sexes, and
varying ages and levels of physical activity.

148
CHAPTER 8
SUMMARY AND CONCLUSIONS

149
8.1 Summary
Cardiorespiratory fitness describes the capacity of the cardiovascular and respiratory systems to
provide muscles with oxygen during sustained or intense exercise. Cardiorespiratory fitness is a
component of health related fitness. The maximal rate at which oxygen can be processed by
muscle cells 70, maximum oxygen uptake (VO2max), involves the integration of functions of the
neuromuscular, cardiovascular, and pulmonary systems. VO2max is used to classify individuals
into categories of cardiorespiratory fitness and is frequently used as the basis for exercise
prescription. Other reasons for measuring VO2max are; determine a person’s current fitness
status, create an exercise programme and prescribe exercise, provide feedback on a participant’s
progress during training, identify limitations that can affect an exercise programme and evaluate
cardiovascular responses to exercise. Although VO2max can be measured from standardised
protocols using the treadmill, cycle ergometer, or arm ergometer, it is sometimes not possible.
These tests are expensive and require laboratories and trained personnel and some people cannot
do maximal tests for health reasons. Furthermore the laboratory protocols are time consuming and
cannot be used for testing large numbers. In response to these challenges, submaximal tests of
cardiorespiratory fitness have been developed to test fitness and to predict VO2max. These tests
involve different forms of exercise. Step testing is often considered the preferred choice as the
mode of exercise does not require skill to perform, the test does not require expensive equipment,
and it is easy to implement. Most of the step tests that are available have limitations and have not
been validated.
This study sought to develop a submaximal test of aerobic capacity in the form of stepping that
could accurately predict VO2max. The test had to cater for a heterogeneous group (with reference
to gender, age and levels of physical activity), be relatively easy to administer, and not depend on
expensive equipment. After reviewing the literature it became clear that the existing step tests did
not control the absolute workload, making the interpretation of results difficult. As a consequence
a method was developed which standardised the external workload of the step test, exposing the
participants to the same amount of work. The reasoning behind this approach was that the
differences in the outcome measures would more likely reflect changes in cardiorespiratory
fitness between participants than if the workload was not standardised.

150
The thesis was developed in accordance with the principles of clinimetrics to ensure that each
component of the test was understood. The first stage was general step test development
examining the components of the test that were subject to manipulation. Step height was
determined using previous studies that calculated step height using participant height. Stepping
rate and workload were determined after theoretical exercises and pilot studies. Step test duration
was calculated from the other components. This was followed by two reliability studies, the
development of a multivariate equation to predict VO2max, and then a cross validation study to
test the accuracy of the equation.
The first study tested the reliability of three configurations of the step test using 16, 20 and 24
steps per minute. There were significant differences among all three step tests for all the variables
measured except heart rate recovery between 16 and 20 steps per minute. Energy expenditure was
highest at 16 steps per minute and steadily decreased with increasing stepping frequency. This
study showed that a step test using different cadences but standardised for external workload can
elicit different physiological responses to exercise. This was attributed to varying cadences
resulting in different exercise intensities and test duration. Three step tests, all 45 kJ but different
parameters (stepping rate and duration) produced significant differences (p < 0.05) in energy
expenditure and heart rate recovery in participants. This study showed that relative exercise
intensity needs be considered, even if the external workload is standardised.
The next study tested the repeatability of the step test. We also determine the preferred cadence,
if a participant was given a choice. Energy expenditure, heart rate recovery and peak respiratory
exchange ratio (RER) were not different between trials. Generally there was high intraclass
correlation among all measured variables with maximum heart rate, maximum heart rate as a
percentage of age predicted maximum heart rate, total heart beats and rating of perceived exertion
all R ≥ 0.95.
The third study sought to establish if the outcome measures of the standardised step test (i.e. heart
rate recovery, maximum heart rate achieved during the test, total heart beats for the test, average

151
heart rate and perception of effort) could be used to predict VO2max either on their own or in
combination in a heterogeneous group of males and females. The variables measured during the
step test, such as heart rate recovery, maximum heart rate, step test maximum heart rate as a
percentage of age predicted maximum heart rate, total heart beats during the test, average heart
rate and rating of perceived exertion all contributed to the predictions equation as there was not
much difference between the typical error of measurement and the smallest worthwhile
difference. However, after considering the variables that contributed to the prediction of VO2max
and the practicality of the measurements, the following equation was selected as being the most
accurate and practical to predict VO2max was:
VO2max = -0.10911 (age) - 0.06178 (body mass) - 0.75481 (body fat %) +0.00208 (METS) +
0.11636 (HRR) - 0.019551 (MHR) + 0.07955 (Av HR) + 83.34846 (Equation xxi)
Where; METS is Metabolic equivalents, HRR is Heart rate recovery, MHR is Maximum heart
rate and Av HR is Average heart rate.
The last study was the cross validation of the equation developed in the previous study to predict
VO2max. In this study another sample (n = 50) of participants with similar characteristics to the
participants in the validation sample were tested. There was a strong, positive relationship
between directly measured VO2max and VO2max predicted from the standardised step test, r =
0.87. The SEE of the equation was 5.2 ml.kg-1.min-1.

152
8.2 Conclusions
The workload standardised step test and the prediction equation are practical alternatives to
maximal exercise testing. The test is submaximal, lasts between five and fifteen minutes and
caters for differences in body mass (50 to 100 kg) and height (150 to 200 cm). The prediction
equation below has potential to predict VO2max in a heterogeneous population with individuals of
both sexes, varying ages (20 to 60 years), physical activity levels and fitness levels.
VO2max (ml.kg-1.min-1) = - 0.10911 (age) - 0.06178 (body mass) - 0.75481 (body fat %) +
0.00208 (METS) + 0.11636 (HRR) - 0.019551 (MHR) + 0.07955 (Av HR) + 83.34846

153
REFERENCE LIST (most journals are abbreviated, some journals do not have abbreviations)
1. Astrand, P. O and Ryhming, I. (1954). A nomogram for calculation of aerobic capacity (physical fitness) from pulse rate during sub-maximal work. J. Appl. Physiol 7 (2): 218-221.
2. Watkins, J. (1984). Step tests of cardiorespiratory fitness suitable for mass testing. Br. J. Sports Med. 18 (2): 84-89.
3. Hammond, H. K. and Froelicher, V. F. (1984). Exercise testing for cardiorespiratory fitness. Sports Med 1 (3): 234-239.
4. Noonan, V. and Dean, E. (2000). Submaximal exercise testing: clinical application and interpretation. Phys. Ther. 80 (8): 782-807.
5. Astrand, P. O (1984). Principles in Ergometry and their Implications in Sports and Practice. Sports Med 1 (1): 1-5.
6. Maud, P. J. and Foster, C. (1995). Physiological Assessment of Human Fitness. Human Kinetics:Champain IL.
7. American College of Sports Medicine (1998). American College of Sports Medicine Position Stand. The recommended quantity and quality of exercise for developing and maintaining cardiorespiratory and muscular fitness, and flexibility in healthy adults. Med Sci. Sports Exerc. 30 (6): 975-991.
8. Balke, B. (1963). A simple field test for the assessment of physical fitness. REP 63-6. Rep. Civ. Aeromed. Res. Inst. US. 1-8.
9. Cooper, K. H. (1968). A means of assessing maximal oxygen intake. Correlation between field and treadmill testing. JAMA 203 (3): 201-204.
10. Shephard, R. J. (1984). Tests of maximum oxygen intake. A critical review. Sports Med 1 (2): 99-124.
11. Shephard, R. J., Bailey, D. A., and Mirwald, R. L. (1976). Development of the Canadian Home Fitness Test. Can. Med. Assoc. J. 114 (8): 675-679.
12. Siconolfi, S. F., Garber, C. E., Lasater, T. M., and Carleton, R. A. (1985). A simple, valid step test for estimating maximal oxygen uptake in epidemiologic studies. Am. J. Epidemiol. 121 (3): 382-390.
13. Fitchett, M. A. (1985). Predictability of VO2 max from submaximal cycle ergometer and bench stepping tests. Br. J. Sports Med. 19 (2): 85-88.

154
14. Donald, K. W., Bishop, J. M., Cumming, G., and Wade, O. L. (1955). The effect of exercise on the cardiac output and circulatory dynamics of normal subjects. Clin Sci. (Lond) 14 (1): 37-73.
15. Shephard, R. J. (1967). The prediction of 'maximal' oxygen consumption using a new progressive test. Ergonomics 10 (1): 1-15.
16. Wilmore, J. H. and Costill, D. L. (1999). Physiology of Sport and Exercise. (2nd Ed) (Human Kinetics:Champaign, IL.
17. Moffett, D. F., Moffett, S. B., and Schauf, C. L. (1993). Human Physiology: Foundations and Frontiers. Second (Mosby-Year Book Inc.:Missouri.
18. Astrand, P. O, Rodahl, K., Dahl, H. A., and Stromme, S. B. (2003). Textbook of Work Physiology: Physiological Bases of Exercise. 4th Edition (McGraw-Hill:New York.
19. Bonaduce, D., Petretta, M., Cavallaro, V., Apicella, C., Ianniciello, A., Romano, M., Breglio, R., and Marciano, F. (1998). Intensive training and cardiac autonomic control in high level athletes. Med Sci. Sports Exerc. 30 (5): 691-696.
20. Wilmore, J. H., Stanforth, P. R., Gagnon, J., Rice, T., Mandel, S., Leon, A. S., Rao, D. C., Skinner, J. S., and Bouchard, C. (2001). Heart rate and blood pressure changes with endurance training: the Heritage Family Study. Med Sci. Sports Exerc. 33 (1): 107-116.
21. Levy, W. C., Cerqueira, M. D., Harp, G. D., Johannessen, K. A., Abrass, I. B., Schwartz, R. S., and Stratton, J. R. (1998). Effect of endurance exercise training on heart rate variability at rest in healthy young and older men. Am. J Cardiol. 82 (10): 1236-1241.
22. Smith, M. L., Hudson, D. L., Graitzer, H. M., and Raven, P. B. (1989). Exercise training bradycardia: the role of autonomic balance. Med Sci. Sports Exerc. 21 (1): 40-44.
23. Lamberts, R. P., Lemmink, K. A., Durandt, J. J., and Lambert, M. I. (2004). Variation in heart rate during submaximal exercise: implications for monitoring training. J. Strength. Cond. Res. 18 (3): 641-645.
24. Lamberts, R. P. and Lambert, M. I. (2009). Day-to-day variation in heart rate at different levels of submaximal exertion: implications for monitoring training. J. Strength. Cond. Res. 23 (3): 1005-1010.
25. Carter, J. B., Banister, E. W., and Blaber, A. P. (2003). Effect of endurance exercise on autonomic control of heart rate. Sports Med 33 (1): 33-46.

155
26. Goldsmith, R. L., Bloomfield, D. M., and Rosenwinkel, E. T. (2000). Exercise and autonomic function. Coron. Artery Dis. 11 (2): 129-135.
27. Pierpont, G. L., Stolpman, D. R., and Gornick, C. C. (2000). Heart rate recovery post-exercise as an index of parasympathetic activity. J Auton. Nerv. Syst. 80 (3): 169-174.
28. Robinson, B. F., Epstein, S. E., Beiser, G. D., and Braunwald, E. (1966). Control of heart rate by the autonomic nervous system. Studies in man on the interrelation between baroreceptor mechanisms and exercise. Circ. Res. 19 (2): 400-411.
29. Pigozzi, F., Alabiso, A., Parisi, A., Di, Salvo, V, Di, Luigi L., Spataro, A., and Iellamo, F. (2001). Effects of aerobic exercise training on 24 hr profile of heart rate variability in female athletes. J Sports Med Phys. Fitness 41 (1): 101-107.
30. Skinner, J. S., Gaskill, S. E., Rankinen, T., Leon, A. S., Rao, D. C., Wilmore, J. H., and Bouchard, C. (2003). Heart rate versus %VO2max: age, sex, race, initial fitness, and training response--Heritage. Med Sci. Sports Exerc. 35 (11): 1908-1913.
31. Lake, M. J. and Cavanagh, P. R. (1996). Six weeks of training does not change running mechanics or improve running economy. Med Sci. Sports Exerc. 28 (7): 860-869.
32. Javorka, M., Zila, I., Balharek, T., and Javorka, K. (2002). Heart rate recovery after exercise: relations to heart rate variability and complexity. Braz. J Med Biol. Res. 35 (8): 991-1000.
33. Spina, R. J., Ogawa, T., Martin, W. H., III, Coggan, A. R., Holloszy, J. O., and Ehsani, A. A. (1992). Exercise training prevents decline in stroke volume during exercise in young healthy subjects. J Appl. Physiol (1985. ) 72 (6): 2458-2462.
34. Convertino, V. A. (1983). Heart rate and sweat rate responses associated with exercise-induced hypervolemia. Med Sci. Sports Exerc. 15 (1): 77-82.
35. Costill, D. L., Flynn, M. G., Kirwan, J. P., Houmard, J. A., Mitchell, J. B., Thomas, R., and Park, S. H. (1988). Effects of repeated days of intensified training on muscle glycogen and swimming performance. Med Sci. Sports Exerc. 20 (3): 249-254.
36. Houmard, J. A., Costill, D. L., Mitchell, J. B., Park, S. H., Hickner, R. C., and Roemmich, J. N. (1990). Reduced training maintains performance in distance runners. Int. J Sports Med 11 (1): 46-52.
37. Coyle, E. F., Martin, W. H., III, Sinacore, D. R., Joyner, M. J., Hagberg, J. M., and Holloszy, J. O. (1984). Time course of loss of adaptations after stopping prolonged intense endurance training. J Appl. Physiol Respir. Environ. Exerc. Physiol 57 (6): 1857-1864.

156
38. Zavorsky, G. S. (2000). Evidence and possible mechanisms of altered maximum heart rate with endurance training and tapering. Sports Med 29 (1): 13-26.
39. Kingwell, B. A., Dart, A. M., Jennings, G. L., and Korner, P. I. (1992). Exercise training reduces the sympathetic component of the blood pressure-heart rate baroreflex in man. Clin Sci. (Lond) 82 (4): 357-362.
40. Werle, E. O., Strobel, G., and Weicker, H. (1990). Decrease in rat cardiac beta 1- and beta 2-adrenoceptors by training and endurance exercise. Life Sci. 46 (1): 9-17.
41. Sylvestre-Gervais, L., Nadeau, A., Nguyen, M. H., Tancrede, G., and Rousseau-Migneron, S. (1982). Effects of physical training on beta-adrenergic receptors in rat myocardial tissue. Cardiovasc. Res. 16 (9): 530-534.
42. Gonzalez-Alonso, J., Teller, C., Andersen, S. L., Jensen, F. B., Hyldig, T., and Nielsen, B. (1999). Influence of body temperature on the development of fatigue during prolonged exercise in the heat. J Appl. Physiol (1985. ) 86 (3): 1032-1039.
43. Gonzalez-Alonso, J., Mora-Rodriguez, R., and Coyle, E. F. (2000). Stroke volume during exercise: interaction of environment and hydration. Am. J Physiol Heart Circ. Physiol 278 (2): H321-H330.
44. Achten, J. and Jeukendrup, A. E. (2003). Heart rate monitoring: applications and limitations. Sports Med. 33 (7): 517-538.
45. Ribeyre, J., Fellmann, N., Vernet, J., Delaitre, M., Chamoux, A., Coudert, J., and Vermorel, M. (2000). Components and variations in daily energy expenditure of athletic and non-athletic adolescents in free-living conditions. Br. J Nutr. 84 (4): 531-539.
46. Montain, S. J. and Coyle, E. F. (1992). Influence of graded dehydration on hyperthermia and cardiovascular drift during exercise. J Appl. Physiol (1985. ) 73 (4): 1340-1350.
47. Kuipers, H. (1998). Training and overtraining: an introduction. Med Sci. Sports Exerc. 30 (7): 1137-1139.
48. Borresen, J. and Lambert, M. I. (2007). Changes in heart rate recovery in response to acute changes in training load. Eur. J. Appl. Physiol 101 (4): 503-511.
49. Borresen, J. and Lambert, M. I. (2008). Autonomic control of heart rate during and after exercise : measurements and implications for monitoring training status. Sports Med. 38 (8): 633-646.
50. Kannankeril, P. J., Le, F. K., Kadish, A. H., and Goldberger, J. J. (2004). Parasympathetic effects on heart rate recovery after exercise. J Investig. Med 52 (6): 394-401.

157
51. Pierpont, G. L. and Voth, E. J. (2004). Assessing autonomic function by analysis of heart rate recovery from exercise in healthy subjects. Am. J Cardiol. 94 (1): 64-68.
52. Kannankeril, P. J. and Goldberger, J. J. (2002). Parasympathetic effects on cardiac electrophysiology during exercise and recovery. Am. J Physiol Heart Circ. Physiol 282 (6): H2091-H2098.
53. Francis, K. and Cuipepper, M. (1988). Validation of a three minute height-adjusted step test. J. Sports Med. Phys. Fitness 28 (3): 229-233.
54. Culpepper, M. I. and Francis, K. T. (1987). An anatomical model to determine step height in step testing for estimating aerobic capacity. J. Theor. Biol. 129 (1): 1-8.
55. Powers, S. K. and Howley, E. T. (2001). Exercise Physiology. 4th Ed. (McGraw-Hill:New York.
56. Liu, C. M. and Lin, K. F. (2007). Estimation of VO2max: A Comparative Analysis of Post-exercise Heart Rate and Physical Fitness Index from 3-minute Step Test. J. Exerc. Sci. Fit. 5 (2): 118-123.
57. Bunc, V., Heller, J., and Leso, J. (1988). Kinetics of heart rate responses to exercise. J Sports Sci. 6 (1): 39-48.
58. Danieli, A., Lusa, L., Potocnik, N., Meglic, B., Grad, A., and Bajrovic, F. F. (2014). Resting heart rate variability and heart rate recovery after submaximal exercise. Clin Auton. Res. 24 (2): 53-61.
59. Lipinski, M. J., Vetrovec, G. W., and Froelicher, V. F. (2004). Importance of the first two minutes of heart rate recovery after exercise treadmill testing in predicting mortality and the presence of coronary artery disease in men. Am. J Cardiol. 93 (4): 445-449.
60. Morshedi-Meibodi, A., Larson, M. G., Levy, D., O'Donnell, C. J., and Vasan, R. S. (2002). Heart rate recovery after treadmill exercise testing and risk of cardiovascular disease events (The Framingham Heart Study). Am. J Cardiol. 90 (8): 848-852.
61. Lamberts, R. P., Maskell, S., Borresen, J., and Lambert, M. I. (2011). Adapting workload improves the measurement of heart rate recovery. Int. J Sports Med 32 (9): 698-702.
62. Goosey-Tolfrey, V. L. and Tolfrey, K. (2004). The oxygen uptake-heart rate relationship in trained female wheelchair athletes. J. Rehabil. Res. Dev. 41 (3B): 415-420.

158
63. Chien, M. Y., Wu, Y. T., Hsu, A. T., Yang, R. S., and Lai, J. S. (2000). Efficacy of a 24-week aerobic exercise program for osteopenic postmenopausal women. Calcif. Tissue Int. 67 (6): 443-448.
64. Yuan, J., Fu, Y., Zhang, R., Li, X., and Shan, G. (2008). The reliability and sensitivity of indices related to cardiovascular fitness evaluation. Kinesiology 40 (2): 138-145.
65. Oliveira, N. A., Silveira, H. S., Carvalho, A., Hellmuth, C. G. S, Santon, T. M., Martins, J. V., Cavalcanti, J. L, Laks, J., and Deslandes, A. C. (2013). Assessment of cardiorespiratory fitness using submaximal protocol in older adults with mood disorder and Parkinson's disease. Rev Psiq Clin 40 (3): 88-92.
66. Akalan, C and Robergs, R. A. (2008). Prediction of VO2max from an individualised submaximal cycle ergometer. J of Exerc Physiol Online 11 (2): Online-
67. Grant, J. A., Joseph, A. N., and Campagna, P. D. (1999). The prediction of VO2max: A comparison of 7 indirect tests of aerobic power. J Strength. Cond. Res. 13 (4): 346-352.
68. Marcora, S. M., Casanova, F., Fortes, M. B., and Maddison, P. J. (2007). Validity and reliability of the Siconolfi Step Test for assessment of physical fitness in patients with systemic lupus erythematosus. Arthritis Rheum. 57 (6): 1007-1011.
69. Sporis, G. (2013). Validity of 2-Mile run test for determination of VO2max among soldiers. Journal of Sport and Human Performance 1 (1): 15-22.
70. Loudon, J. K., Cagle, P. E., Figoni, S. F., Nau, K. L., and Klein, R. M. (1998). A submaximal all-extremity exercise test to predict maximal oxygen consumption. Med Sci. Sports Exerc. 30 (8): 1299-1303.
71. Nordgren, B., Friden, C., Jansson, E., Osterlund, T., Grooten, W. J., Opava, C. H., and Rickenlund, A. (2014). Criterion validation of two submaximal aerobic fitness tests, the self-monitoring Fox-walk test and the Astrand cycle test in people with rheumatoid arthritis. BMC. Musculoskelet. Disord. 15 (305-315.
72. Kline, G. M., Porcari, J. P., Hintermeister, R., Freedson, P. S., Ward, A., McCarron, R. F., Ross, J., and Rippe, J. M. (1987). Estimation of VO2max from a one-mile track walk, gender, age, and body weight. Med Sci. Sports Exerc. 19 (3): 253-259.
73. Loe, H., Nes, B. M., and Wisloff, U. (2016). Predicting VO2peak from Submaximal- and Peak Exercise Models: The HUNT 3 Fitness Study, Norway. PLoS. One. 11 (1): e0144873-
74. Tierney, M. T., Lenar, D., Stanforth, P. R., Craig, J. N., and Farrar, R. P. (2010). Prediction of aerobic capacity in firefighters using submaximal treadmill and stairmill protocols. J Strength. Cond. Res. 24 (3): 757-764.

159
75. Billinger, S. A., Van, Swearingen E., McClain, M., Lentz, A. A., and Good, M. B. (2012). Recumbent stepper submaximal exercise test to predict peak oxygen uptake. Med Sci. Sports Exerc. 44 (8): 1539-1544.
76. Vehrs, P. R., George, J. D., Fellingham, G. W., Plowman, S. A., and Dustman-Allen, K (2007). Submaximal treadmill exercise test to predict VO2max in fit adults. Meas. Phys. Educ. Exerc. Sci. 11 (2): 61-72.
77. Schneider, E. C. (1920). A Cardiovascular Rating as a Measure of Physical Fatigue and Efficiency. J. Am. Med. Assoc. 74 (22): 1507-1510.
78. Tuttle, W. W. (1931). The Use of the Pulse-Ratio Test for Rating Physical Efficiency. Res. Q. 11 (2): 5-17.
79. Johnson, R. E., Brouha, L., and Darling, R. C. (1942). A Test of Physical Fitness for Strenuous Exertion. Rev Can Biol 1 (5): 491-503.
80. Kasch, F. W. (1961). A comparison of the exercise tolerance of post-rheumatic and normal boys. J. Assoc. Phys. Ment. Rehab. 15 (35-40.
81. Nagle, F. J., Balke, B., and Naughton, J. P. (1965). Gradational step tests for assessing work capacity. J. Appl. Physiol 20 (4): 745-748.
82. McArdle, W. D., Katch, F. I., Pechar, G. S., Jacobson, L., and Ruck, S. (1972). Reliability and interrelationships between maximal oxygen intake, physical work capacity and step-test scores in college women. Med. Sci. Sports 4 (4): 182-186.
83. Sykes, K. and Roberts, A. (2004). The Chester step test - a simple yet effective tool for the prediction of aerobic capacity. Physiotherapy 90 (183-188.
84. Health Survey for England (2009). Health Survey for England: 2008 Volume 1 Physical Activity and Fitness. 1-395. The Information Centre for Health and Social care:London,UK.
85. Health Survey for England (2009). Health Survey for England: 2008 Volume 2 Methods and Documentation. The Information Centre for Health and Social Care:London,UK.
86. Hunt, G. H. and Pembrey, M. S. (1921). Tests of Physical efficiency,Part 1. Guy's Hospital Reports 71 (415-428.
87. Hambly, W. D., Hunt, G. H., Parker, L. E. L., Pembrey, M. S., and Warner, E. C. (1922). Tests for Physical Efficiency,Part 2. Guy's Hosp. Rep. 72 (367-385.

160
88. Tuttle, W. W. and Wilkins, R. C. (1930). The application of the pulse-ratio test to efficiency in perfoming on gymnasium apparatus: The horizontal bar. Arbeitsphysiologie 30 (6): 449-455.
89. Schroeder, E. G. and Tuttle, W. W. (1931). The application of the pulse-ratio test to efficiency in performing on gymnasium apparatus: The parallel bars. Arbeitsphysiologie 4 (6): 443-452.
90. Tuttle, W. W. and Skien, J. S. (1930). The Efficiency Rating of High School Boys as Shown by the Pulse-ratio Test. Research Quarterly. American Physical Education Association 1 (3): 19-33.
91. Tuttle, W. W. and Frey, H. (1930). A Study of the Physical Efficiency of College Women as Shown by the Pulse-Ratio Test. Research Quarterly. American Physical Education Association 1 (4): 17-25.
92. Brouha, L, Graybiel, A., and Heath, C. W. (1943). A Simple Method of Measuring Physical Fitness for Hard Muscular Work in Adult Man. Rev Can Biol 2 (86-91.
93. Reedy, J. D., Saiger, G. L., and Hosler, R. H. (1958). Evaluation of the Harvard Step Test with respect to factors of height and weight. Int. Z. Angew. Physiol 17 (2): 115-119.
94. Sloan, A. W. (1959). A modified Harvard step test for women. J. Appl. Physiol 14 (985-986.
95. Bandyopadhyay, A. (2008). Queen's College Step Test as an Alternative of Harvard Step Test in Young Indian Women. International Journal of Sport and Health Science 6 (15-20.
96. Ricci, B., Baldwin, K., Hakes, R., Fein, J., Sadowsky, D., Tufts, S., and Wells, C. (1966). Energy cost and efficiency of Harvard step-test performance. Int. Z. Angew. Physiol 22 (2): 125-130.
97. Astrand, P. O. (1952). Experimental studies of physical working capacity in relatio to sex and age. E. Munksgaard, Impr.:Copenhagen.
98. Ryhming, I. (1953). A modified Harvard step test for the evaluation of physical fitness. Arbeitsphysiologie 15 (3): 235-250.
99. Astrand, P. O. (1953). A study of capacity for hard muscular work of 17 to 19-year-old male youths. Arbeitsphysiologie 15 (3): 251-254.
100. Cink, R. E. and Thomas, T. R. (1981). Validity of the Astrand-Ryhming nomogram for predicting maximal oxygen intake. Br. J Sports Med 15 (3): 182-185.

161
101. Davies, C. T. (1968). Limitations to the prediction of maximum oxygen intake from cardiac frequency measurements. J Appl. Physiol 24 (5): 700-706.
102. DeVries, H. A. and Klafs, C. E. (1965). Prediction of maximal oxygen intake from submaximal tests. J Sports Med Phys. Fitness 5 (4): 207-214.
103. Glassford, R. G., Baycroft, G. H., Sedgwick, A. W., and Macnab, R. B. (1965). Comparison of maximal oxygen uptake values determined by predicted and actual methods. J Appl. Physiol 20 (3): 509-513.
104. Jessup, G. T., Riggs, C. E., Lambert, J., and Miller, W. D. (1977). The effect of pedalling speed on the validity of the Astrand-Rhyming aerobic work capacity test. J Sports Med Phys. Fitness 17 (4): 367-371.
105. Legge, B. J. and Banister, E. W. (1986). The Astrand-Ryhming nomogram revisited. J Appl. Physiol (1985. ) 61 (3): 1203-1209.
106. Wyndham, C. H., Strydom, N. B., Maritz, J. S., Morrison, J. F., Peter, J., and Potgieter, Z. U. (1959). Maximum oxygen intake and maximum heart rate during strenuous work. J Appl. Physiol 14 (927-936.
107. Rowell, L. B., Taylor, H. L., and Wang, Y. (1964). Limitations to prediction of maximal oxygen intake. J Appl. Physiol 19 (919-927.
108. Astrand, I. (1960). Aerobic work capacity in men and women with special reference to age. Acta Physiol Scand. Suppl 49 (169): 1-92.
109. Santo, A. S. and Golding, L. A. (2003). Predicting maximum oxygen uptake from a modified 3-minute step test. Res. Q. Exerc. Sport 74 (1): 110-115.
110. Francis, K. and Brasher, J. (1992). A height-adjusted step test for predicting maximal oxygen consumption in males. J. Sports Med. Phys. Fitness 32 (3): 282-287.
111. Chatterjee, S., Chatterjee, P., Mukherjee, P. S., and Bandyopadhyay, A. (2004). Validity of Queen's College step test for use with young Indian men. Br. J. Sports Med. 38 (3): 289-291.
112. Chatterjee, S., Chatterjee, P., and Bandyopadhyay, A. (2005). Validity of Queen's College Step Test for estimation of maximum oxygen uptake in female students. Indian J. Med. Res. 121 (1): 32-35.
113. Bandyopadhyay, A. (2007). Queen's College Step Test - an Alternative of Harvard Step Test in Young Indian Men. International Journal of Applied Sports Sciences 19 (2): 1-6.

162
114. Bailey, D. A., Shephard, R. J., Mirwald, R. L., and McBride, G. A. (1974). A current view of Canadian cardiorespiratory fitness. Can. Med. Assoc. J. 111 (1): 25-30.
115. Jette, M., Campbell, J., Mongeon, J., and Routhier, R. (1976). The Canadian Home Fitness Test as a predictor for aerobic capacity. Can. Med. Assoc. J. 114 (8): 680-682.
116. Cumming, G. R. and Glenn, J. (1977). Evaluation of the Canadian Home Fitness Test in middle-aged men. Can. Med. Assoc. J. 117 (4): 346-349.
117. Bruce, R. A., Kusumi, F., and Hosmer, D. (1973). Maximal oxygen intake and nomographic assessment of functional aerobic impairment in cardiovascular disease. Am. Heart J 85 (4): 546-562.
118. Shephard, R. J. (1977). Canadian home fitness test. Can. Med. Assoc. J. 116 (5): 472-475.
119. Weller, I. M. R, Thomas, S. G, Cox, M. H., and Corey, P. N. (1992). A Study to Validate the Canadian Aerobic Fitness Test. Can. J. Public Health 83 (2): 120-124.
120. Shephard, R. J. and Bouchard, C. (1993). A new approach to the interpretation of Canadian Home Fitness Test scores. Can. J. Appl. Physiol 18 (3): 304-316.
121. Sykes, K. (1995). Capacity assessment in the workplace: a new step test. Occup. Health (Lond) 47 (1): 20-22.
122. Borg, G. A. V. (1998). Borg's Rating of Perceived Exertion and Pain Scales. Human Kinetics:Champaign, IL.
123. Buckley, J. P., Sim, J., Eston, R. G., Hession, R., and Fox, R. (2004). Reliability and validity of measures taken during the Chester step test to predict aerobic power and to prescribe aerobic exercise. Br. J. Sports Med. 38 (2): 197-205.
124. Robinson, S. (1938). Experimental studies of physical fitness in relation to age. Arbeitsphysiologie 10 (3): 251-323.
125. Astrand, I, Astrand, P. O, and Rodahl, K. (1959). Maximal heart rate during work in older men. J. Appl. Physiol 14 (4): 562-566.
126. Londeree, B. R. and Moeschberger, M. L. (1982). Effect of age and other factors on maximal heart rate. Res. Q. Exerc. Sport 53 (4): 297-304.
127. Elliott, D., Abt, G., and Barry, T. (2008). The effect of an active arm action on heart rate and predicted VO(2max) during the Chester step test. J Sci Med Sport 11 (2): 112-115.

163
128. Brage, S., Ekelund, U., Brage, N., Hennings, M. A., Froberg, K., Franks, P. W., and Wareham, N. J. (2007). Hierarchy of individual calibration levels for heart rate and accelerometry to measure physical activity. J. Appl. Physiol 103 (2): 682-692.
129. Tanaka, H., Monahan, K. D., and Seals, D. R. (2001). Age-predicted maximal heart rate revisited. J Am. Coll. Cardiol. 37 (1): 153-156.
130. Henry, C. J. (2005). Basal metabolic rate studies in humans: measurement and development of new equations. Public Health Nutr. 8 (7A): 1133-1152.
131. Consolazio, C. F., Johnson, R. E., and Pecora, L. J. (1963). Physiological measurements of metabolic functions in man. McGraw Hill:New York.
132. Brage, S., Brage, N., Franks, P. W., Ekelund, U., and Wareham, N. J. (2005). Reliability and validity of the combined heart rate and movement sensor Actiheart. Eur. J Clin Nutr. 59 (4): 561-570.
133. Passmore, R. and Thomson, J. G. (1950). Energy expenditure during stepping. Br. J Soc. Med 4 (4): 234-237.
134. de Vet, H. C., Terwee, C. B., and Bouter, L. M. (2003). Current challenges in clinimetrics. J Clin Epidemiol. 56 (12): 1137-1141.
135. Hills, A. P., Byrne, N. M., and Ramage, A. J. (1998). Submaximal markers of exercise intensity. J Sports Sci. 16 Suppl (S71-S76.
136. Carvalho, V. O. and Mezzani, A. (2011). Aerobic exercise training intensity in patients with chronic heart failure: principles of assessment and prescription. Eur. J Cardiovasc. Prev. Rehabil. 18 (1): 5-14.
137. Garber, C. E., Blissmer, B., Deschenes, M. R., Franklin, B. A., Lamonte, M. J., Lee, I. M., Nieman, D. C., and Swain, D. P. (2011). American College of Sports Medicine position stand. Quantity and quality of exercise for developing and maintaining cardiorespiratory, musculoskeletal, and neuromotor fitness in apparently healthy adults: guidance for prescribing exercise. Med Sci. Sports Exerc. 43 (7): 1334-1359.
138. Mann, T., Lamberts, R. P., and Lambert, M. I. (2013). Methods of prescribing relative exercise intensity: physiological and practical considerations. Sports Med 43 (7): 613-625.
139. Sedlock, D. A., Lee, M. G., Flynn, M. G., Park, K. S., and Kamimori, G. H. (2010). Excess postexercise oxygen consumption after aerobic exercise training. Int. J Sport Nutr. Exerc. Metab 20 (4): 336-349.

164
140. Killgore, G. L., Coste, S. C., O' Meara, S. E., and Konnecke, C. J. (2010). A comparison of the physiological exercise intensity differences between shod and barefoot submaximal deep-water running at the same cadence. J Strength. Cond. Res. 24 (12): 3302-3312.
141. Van, Proeyen K., Szlufcik, K., Nielens, H., Ramaekers, M., and Hespel, P. (2011). Beneficial metabolic adaptations due to endurance exercise training in the fasted state. J Appl. Physiol (1985. ) 110 (1): 236-245.
142. McPhee, J. S., Williams, A. G., Perez-Schindler, J., Degens, H., Baar, K., and Jones, D. A. (2011). Variability in the magnitude of response of metabolic enzymes reveals patterns of co-ordinated expression following endurance training in women. Exp. Physiol 96 (7): 699-707.
143. Nordsborg, N. B., Lundby, C., Leick, L., and Pilegaard, H. (2010). Relative workload determines exercise-induced increases in PGC-1alpha mRNA. Med Sci. Sports Exerc. 42 (8): 1477-1484.
144. Katayama, K., Goto, K., Ishida, K., and Ogita, F. (2010). Substrate utilization during exercise and recovery at moderate altitude. Metabolism 59 (7): 959-966.
145. Donges, C. E., Duffield, R., and Drinkwater, E. J. (2010). Effects of resistance or aerobic exercise training on interleukin-6, C-reactive protein, and body composition. Med Sci. Sports Exerc. 42 (2): 304-313.
146. Swain, D. P., Abernathy, K. S., Smith, C. S., Lee, S. J., and Bunn, S. A. (1994). Target heart rates for the development of cardiorespiratory fitness. Med Sci. Sports Exerc. 26 (1): 112-116.
147. Swain, D. P. and Leutholtz, B. C. (1997). Heart rate reserve is equivalent to %VO2 reserve, not to %VO2max. Med Sci. Sports Exerc. 29 (3): 410-414.
148. Swain, D. P., Leutholtz, B. C., King, M. E., Haas, L. A., and Branch, J. D. (1998). Relationship between % heart rate reserve and % VO2 reserve in treadmill exercise. Med Sci. Sports Exerc. 30 (2): 318-321.
149. Katch, V., Weltman, A., Sady, S., and Freedson, P. (1978). Validity of the relative percent concept for equating training intensity. Eur. J Appl. Physiol Occup. Physiol 39 (4): 219-227.
150. Dwyer, J. and Bybee, R. (1983). Heart rate indices of the anaerobic threshold. Med Sci. Sports Exerc. 15 (1): 72-76.
151. Meyer, T., Gabriel, H. H., and Kindermann, W. (1999). Is determination of exercise intensities as percentages of VO2max or HRmax adequate? Med Sci. Sports Exerc. 31 (9): 1342-1345.

165
152. Scharhag-Rosenberger, F., Meyer, T., Gassler, N., Faude, O., and Kindermann, W. (2010). Exercise at given percentages of VO2max: heterogeneous metabolic responses between individuals. J Sci. Med Sport 13 (1): 74-79.
153. Vollaard, N. B., Constantin-Teodosiu, D., Fredriksson, K., Rooyackers, O., Jansson, E., Greenhaff, P. L., Timmons, J. A., and Sundberg, C. J. (2009). Systematic analysis of adaptations in aerobic capacity and submaximal energy metabolism provides a unique insight into determinants of human aerobic performance. J Appl. Physiol (1985. ) 106 (5): 1479-1486.
154. Lounana, J., Campion, F., Noakes, T. D., and Medelli, J. (2007). Relationship between %HRmax, %HR reserve, %VO2max, and %VO2 reserve in elite cyclists. Med Sci. Sports Exerc. 39 (2): 350-357.
155. Cunha, F. A., Midgley, A. W., Monteiro, W. D., Campos, F. K., and Farinatti, P. T. (2011). The relationship between oxygen uptake reserve and heart rate reserve is affected by intensity and duration during aerobic exercise at constant work rate. Appl. Physiol Nutr. Metab 36 (6): 839-847.
156. da Cunha, F. A., Farinatti, Pde T., and Midgley, A. W. (2011). Methodological and practical application issues in exercise prescription using the heart rate reserve and oxygen uptake reserve methods. J Sci. Med Sport 14 (1): 46-57.
157. Cunha, F. A., Midgley, A. W., Monteiro, W. D., and Farinatti, P. T. (2010). Influence of cardiopulmonary exercise testing protocol and resting VO(2) assessment on %HR(max), %HRR, %VO(2max) and %VO(2)R relationships. Int. J Sports Med 31 (5): 319-326.
158. Aellen, R., Hollmann, W., and Boutellier, U. (1993). Effects of aerobic and anaerobic training on plasma lipoproteins. Int. J Sports Med 14 (7): 396-400.
159. Jenkins, D. G. and Quigley, B. M. (1992). Endurance training enhances critical power. Med Sci. Sports Exerc. 24 (11): 1283-1289.
160. Billat, V., Sirvent, P., Lepretre, P. M., and Koralsztein, J. P. (2004). Training effect on performance, substrate balance and blood lactate concentration at maximal lactate steady state in master endurance-runners. Pflugers Arch. 447 (6): 875-883.
161. Vanhatalo, A., Doust, J. H., and Burnley, M. (2008). A 3-min all-out cycling test is sensitive to a change in critical power. Med Sci. Sports Exerc. 40 (9): 1693-1699.
162. Myers, J. and Ashley, E. (1997). Dangerous curves. A perspective on exercise, lactate, and the anaerobic threshold. Chest 111 (3): 787-795.

166
163. Hopker, J. G., Jobson, S. A., and Pandit, J. J. (2011). Controversies in the physiological basis of the 'anaerobic threshold' and their implications for clinical cardiopulmonary exercise testing. Anaesthesia 66 (2): 111-123.
164. Whipp, B. J. and Ward, S. A. (2011). The physiological basis of the 'anaerobic threshold' and implications for clinical cardiopulmonary exercise testing. Anaesthesia 66 (11): 1048-1049.
165. Seltzer, C. C. (1946). Anthropometric characteristics and physical fitness. Res. Q. 17 (10-20.
166. Elbel, E. R., Reid, K. M., and Ormond, D. E. (1958). Comparison of certain tests of physical fitness and certain bodily measurements. J Appl. Physiol 12 (1): 37-41.
167. Keen, E. N. and Sloan, A. W. (1958). Observations on the Harvard step test. J. Appl. Physiol 13 (2): 241-243.
168. Shahnawaz, H. (1978). Influence of limb length on a stepping exercise. J Appl. Physiol Respir. Environ. Exerc. Physiol 44 (3): 346-349.
169. Francis, K. and Culpepper, M. (1989). Height-adjusted, rate-specific, single-stage step test for predicting maximal oxygen consumption. South. Med. J. 82 (5): 602-606.
170. Shapiro, A., Shapiro, Y., and Magazanik, A. (1976). A simple step test to predict aerobic capacity. J. Sports Med. Phys. Fitness 16 (3): 209-214.
171. Anderson, M. and Green, W. T. (1948). Lengths of the femur and the tibia; norms derived from orthoroentgenograms of children from 5 years of age until epiphysial closure. Am. J. Dis. Child 75 (3): 279-290.
172. Astrand, P. O. and Ryhming, I. (1954). A nomogram for calculation of aerobic capacity (physical fitness) from pulse rate during sub-maximal work. J. Appl. Physiol 7 (2): 218-221.
173. Lupton, H. (1923). An analysis of the effects of speed on the mechanical efficiency of human muscular movement. J Physiol 57 (6): 337-353.
174. Lusk, G. (1928). The elements of the science of nutrition. 4th (W.B.Saunders company:Philadelphia.
175. American College of Sports Medicine (1998). American College of Sports Medicine Position Stand and American Heart Association. Recommendations for cardiovascular screening, staffing, and emergency policies at health/fitness facilities. Med Sci. Sports Exerc. 30 (6): 1009-1018.
167
176. Durnin, J. V. and Womersley, J. (1974). Body fat assessed from total body density and its estimation from skinfold thickness: measurements on 481 men and women aged from 16 to 72 years. Br. J Nutr. 32 (1): 77-97.
177. Cataneo, D. C. and Cataneo, A. J. (2007). Accuracy of the stair climbing test using maximal oxygen uptake as the gold standard. J Bras. Pneumol. 33 (2): 128-133.
178. Bland, J. M. and Altman, D. G. (2012). Agreed statistics: measurement method comparison. Anesthesiology 116 (1): 182-185.
179. Scott, C. (2005). Misconceptions about Aerobic and Anaerobic Energy Expenditure. J Int. Soc. Sports Nutr. 2 (32-37.
180. Eston, R. (2012). Use of ratings of perceived exertion in sports. Int. J Sports Physiol Perform. 7 (2): 175-182.
181. Robinson, D. M., Robinson, S. M., Hume, P. A., and Hopkins, W. G. (1991). Training intensity of elite male distance runners. Med Sci. Sports Exerc. 23 (9): 1078-1082.
182. Green, J. M., McLester, J. R., Crews, T. R., Wickwire, P. J., Pritchett, R. C., and Lomax, R. G. (2006). RPE association with lactate and heart rate during high-intensity interval cycling. Med Sci. Sports Exerc. 38 (1): 167-172.
183. Hopkins, W. G. (2000). Measures of reliability in sports medicine and science. Sports Med 30 (1): 1-15.
184. Cohen, H. (1988). Statistical power analysis for the behavioural sciences. Second (1-567. Lawrence Erlbaum Associates:New Jersey.
185. Hopkins, W. G. (2015). A new view of statistics. Sportsci.org: Internet society for Sport Science.
186. Bruton, A., Conway, J. H., and Holgate, S. T. (2000). Reliability: What is it and how is it measured? Physiotherapy 86 (2): 94-99.
187. Hopkins, W. G. (2011). How to interpret changes in an athletic performance test. Sportscience 8 (1-7.
188. Buchheit, M., Lefebvre, B., Laursen, P. B., and Ahmaidi, S. (2011). Reliability, usefulness, and validity of the 30-15 Intermittent Ice Test in young elite ice hockey players. J Strength. Cond. Res. 25 (5): 1457-1464.
189. Weir, J. P. (2005). Quantifying test-retest reliability using the intraclass correlation coefficient and the SEM. J Strength. Cond. Res. 19 (1): 231-240.

168
190. Dupuy, O., Mekary, S., Berryman, N., Bherer, L., Audiffren, M., and Bosquet, L. (2012). Reliability of heart rate measures used to assess post-exercise parasympathetic reactivation. Clin Physiol Funct. Imaging 32 (4): 296-304.
191. Portney, L. G. and Watkins, M. P. (1993). Foundation of clinical research: Applications to practice. 1st Edition (Appleton and Lange:Norwalk (CT).
192. Atkinson, G. and Nevill, A. M. (1998). Statistical methods for assessing measurement error (reliability) in variables relevant to sports medicine. Sports Med 26 (4): 217-238.
193. Mann, T. N., Webster, C., Lamberts, R. P., and Lambert, M. I. (2014). Effect of exercise intensity on post-exercise oxygen consumption and heart rate recovery. Eur. J Appl. Physiol 114 (9): 1809-1820.
194. Al, Haddad H., Laursen, P. B., Chollet, D., Ahmaidi, S., and Buchheit, M. (2011). Reliability of resting and postexercise heart rate measures. Int. J Sports Med 32 (8): 598-605.
195. Buchheit, M., Millet, G. P., Parisy, A., Pourchez, S., Laursen, P. B., and Ahmaidi, S. (2008). Supramaximal training and postexercise parasympathetic reactivation in adolescents. Med Sci. Sports Exerc. 40 (2): 362-371.
196. Bosquet, L., Gamelin, F. X., and Berthoin, S. (2008). Reliability of postexercise heart rate recovery. Int. J Sports Med 29 (3): 238-243.
197. Lamberts, R. P., Swart, J., Noakes, T. D., and Lambert, M. I. (2009). Changes in heart rate recovery after high-intensity training in well-trained cyclists. Eur. J. Appl. Physiol 105 (5): 705-713.
198. Lucia, A., Hoyos, J., Perez, M., and Chicharro, J. L. (2000). Heart rate and performance parameters in elite cyclists: a longitudinal study. Med Sci. Sports Exerc. 32 (10): 1777-1782.
199. Ramos-Jimenez, A., Hernandez-Torres, R. P., Torres-Duran, P. V., Romero-Gonzalez, J., Mascher, D., Posadas-Romero, C., and Juarez-Oropeza, M. A. (2008). The Respiratory Exchange Ratio is Associated with Fitness Indicators Both in Trained and Untrained Men: A Possible Application for People with Reduced Exercise Tolerance. Clin Med Circ. Respirat. Pulm. Med 2 (1-9.
200. Thomas, S., Reading, J., and Shephard, R. J. (1992). Revision of the Physical Activity Readiness Questionnaire (PAR-Q). Can. J. Sport Sci. 17 (4): 338-345.
201. GPAQ (2002). Global Physical Activity Questionnaire (GPAQ). World Health Organisation (WHO):

169
202. Bull, F. C., Maslin, T. S., and Armstrong, T. (2009). Global physical activity questionnaire (GPAQ): nine country reliability and validity study. J Phys. Act. Health 6 (6): 790-804.
203. MacDougall, J. D., Wenger, H. A., and Green, H. S. (1991). Physiological Testing of the High Performance Athlete. 223-308. Human Kinetics:Champaign, IL.
204. Joo, K. C., Brubaker, P. H., MacDougall, A., Saikin, A. M., Ross, J. H., and Whaley, M. H. (2004). Exercise prescription using resting heart rate plus 20 or perceived exertion in cardiac rehabilitation. J Cardiopulm. Rehabil. 24 (3): 178-184.
205. Ritchie, C. (2012). Rating of perceived exertion (RPE). J Physiother. 58 (1): 62-
206. Ebbeling, C. B., Ward, A., Puleo, E. M., Widrick, J., and Rippe, J. M. (1991). Development of a single-stage submaximal treadmill walking test. Med Sci. Sports Exerc. 23 (8): 966-973.
207. Ashley, C. D., Smith, J. F., and Reneau, P. D. (1997). A modified step test based on a function of subjects' stature. Percept. Mot. Skills 85 (3 Pt 1): 987-993.
208. Ross, R. M., Murthy, J. N., Wollak, I. D., and Jackson, A. S. (2010). The six minute walk test accurately estimates mean peak oxygen uptake. BMC. Pulm. Med 10 (31-
209. Arcuri, J. F., Borghi-Silva, A., Labadessa, I. G., Sentanin, A. C., Candolo, C., and Pires Di Lorenzo, V. A. (2016). Validity and Reliability of the 6-Minute Step Test in Healthy Individuals: A Cross-sectional Study. Clin J Sport Med 26 (1): 69-75.
210. Carter, R., Holiday, D. B., Stocks, J., Grothues, C., and Tiep, B. (2003). Predicting oxygen uptake for men and women with moderate to severe chronic obstructive pulmonary disease. Arch. Phys. Med Rehabil. 84 (8): 1158-1164.
211. Wanderley, F. A., Silva, G., Marques, E., Oliveira, J., Mota, J., and Carvalho, J. (2011). Associations between objectively assessed physical activity levels and fitness and self-reported health-related quality of life in community-dwelling older adults. Qual. Life Res. 20 (9): 1371-1378.
212. Vehrs, P. R., Keller, D. M., George, J. D., Hager, R. L., and Fellingham, G. W. (2007). Monitoring VO2max during fourteen weeks of endurance training using the CardioCoach. J Strength. Cond. Res. 21 (1): 62-66.
213. Issekutz, B., Jr. and Rodahl, K. (1961). Respiratory quotient during exercise. J Appl. Physiol 16 (606-610.
214. Bland, J. M. and Altman, D. G. (1986). Statistical methods for assessing agreement between two methods of clinical measurement. Lancet 1 (8476): 307-310.

170
215. Safrit, M. J. (1990). Introduction to measurement in Physical Education and Exercise Science. 2nd Ed (Mosby College Publishing:Toronto.
216. Koutlianos, N., Dimitros, E., Metaxas, T., Cansiz, M., Deligiannis, A., and Kouidi, E. (2013). Indirect estimation of VO2max in athletes by ACSM's equation: valid or not? Hippokratia. 17 (2): 136-140.

171
APPENDICES

172
American College of Sports Medicine (ACSM) Pre-participation Screening Appendix 1Questionnaire
Asses your health needs by marking all true statements History
You have had: - a heart attack - heart surgery - cardiac catheterisation - coronary angioplasty (PTCA) - pacemaker/implantable cardiac defibrillator/rhythm disturbance - heart valve disease - heart failure - heart transplantation - congenital heart disease Symptoms
- You experience chest discomfort with exertion - You experience unreasonable breathlessness - You experience dizziness, fainting, or blackouts - You take heart medications. Other health issues
- You have diabetes. - You have asthma or other lung disease. - You have burning or cramping sensation in your lower legs when walking short distances. - You have musculoskeletal problems that limit your physical activity - You have concerns about the safety of exercise. - You take prescription medication(s). - You are pregnant. If you marked any of the statements in this section, consult your physician or other appropriate health care provider before engaging in exercise. You may need to use a facility with a medically qualified staff
Cardiovascular Risk Factors
- You are a man older than 45 years. - You are a woman older than 55 years, have had a hysterectomy, or are postmenopausal. - You smoke, or quit smoking within the previous 6 months. - Your blood pressure is > 140/90 mm Hg. - You do not know your blood pressure - You take blood pressure medication. - Your blood cholesterol level is > 5.2 mmol.l-1. - You do not know your cholesterol level - You have a close blood relative who had a heart attack or heart surgery before age 55 (father or brother) or age 65 (mother or sister). - You are physically inactive (i.e., you get < 30 minutes of physical activity on at least 3 days per week) - You are > 20 pounds (9 kg) overweight. If you marked two or more of the statements in this section, you should consult your physician or other appropriate healthcare provider before engaging in exercise. You might benefit by using a facility with a professionally qualified exercise staff to guide your exercise programme. - None of the above is true. You should be able to exercise safely without consulting your physician or other appropriate health care provider in a self-guided programme or almost any facility that meets your exercise programme needs. Participant name Signature Date

173
Global Physical Activity Questionnaire (GPAQ) (Abridged) Appendix 2

174
Physical Activity I am going to ask you about the time you spend doing different types of physical activity in a typical week. Please answer these questions even if you do not consider yourself to be a physically active person.
Think first about the time you spend doing work. Think of work as the things that you have to do such as paid or unpaid work, study/training, household chores, harvesting food/crops, fishing or hunting for food, seeking employment. [Insert other examples if needed]. In answering the following questions 'vigorous-intensity activities' are activities that require hard physical effort and cause large increases in breathing or heart rate, 'moderate-intensity activities' are activities that require moderate physical effort and cause small increases in breathing or heart rate. Questions Response Code Activity at work 1 Does your work involve vigorous-intensity activity that causes
large increases in breathing or heart rate like [carrying or Yes 1
lifting heavy loads, digging or construction work] for at least P1
10 minutes continuously? No 2 If No, go to P 4
[INSERT EXAMPLES] (USE SHOWCARD)
2 In a typical week, on how many days do you do vigorous- Number of days
P2
intensity activities as part of your work?
3 How much time do you spend doing vigorous-intensity Hours:minute P3
activities at work on a typical day?
(a-b)
4 Does your work involve moderate-intensity activity that causes small increases in breathing or heart rate such as Yes 1
brisk walking [or carrying light loads] for at least 10 minutes P4
continuously? No 2 If No, go to P 7
[INSERT EXAMPLES] (USE SHOWCARD)
5 In a typical week, on how many days do you do moderate- Number of days P5
intensity activities as part of your work?
6 How much time do you spend doing moderate-intensity Hours:minutes
activities at work on a typical day?
(a-b)
Travel to and from places The next questions exclude the physical activities at work that you have already mentioned. Now I would like to ask you about the usual way you travel to and from places. For example to work, for shopping, to market, to place of worship. [insert other examples if needed] 7 Do you walk or use a bicycle (pedal cycle) for at least 10 Yes 1
P7
minutes continuously to get to and from places?
No 2 If No, go to P 10
8 In a typical week, on how many days do you walk or bicycle Number of days P8
for at least 10 minutes continuously to get to and from places?
9 How much time do you spend walking or bicycling for travel Hours :Minutes P9
on a typical day?
(a-b)
Recreational activities
The next questions exclude the work and transport activities that you have already mentioned.
Now I would like to ask you about sports, fitness and recreational activities (leisure), [insert relevant terms].
10 Do you do any vigorous-intensity sports, fitness or recreational Yes 1
(leisure) activities that cause large increases in breathing or
heart rate like [running or football,] for at least 10 minutes P10
continuously?

175
No 2 If No, go to P 13
[INSERT EXAMPLES] (USE SHOWCARD)
11 In a typical week, on how many days do you do vigorous- Number of days P11
intensity sports, fitness or recreational (leisure) activities?
12 How much time do you spend doing vigorous-intensity sports, Hours :Minutes P12
fitness or recreational activities on a typical day?
(a-b)
Physical Activity (recreational activities) contd. Questions Response Code
13 Do you do any moderate-intensity sports, fitness or Yes 1
recreational (leisure) activities that causes a small
increase in breathing or heart rate such as brisk P13
walking,(cycling, swimming, volleyball)for at least 10
minutes continuously? No 2 If No, go to P16
[INSERT EXAMPLES] (USE SHOWCARD)
14 In a typical week, on how many days do you do Number of days
P14
moderate-intensity sports, fitness or recreational (leisure)
activities?
15 How much time do you spend doing moderate-intensity Hours : Minutes P15
sports, fitness or recreational (leisure) activities on a
typical day? (a-b)
Sedentary behaviour The following question is about sitting or reclining at work, at home, getting to and from places, or with friends including time spent [sitting at a desk, sitting with friends, travelling in car, bus, train, reading, playing cards or watching television], but do not include time spent sleeping. [INSERT EXAMPLES] (USE SHOWCARD) 16 How much time do you usually spend sitting or reclining Hours Minutes P16
on a typical day?
(a-b)
MET values
For the calculation of physical activity the following MET values are used:
Domain METS value
Work Moderate MET value = 4.0
Vigorous MET value = 8.0
Transport Cycling and walking MET value = 4.0
Recreation Moderate MET value = 4.0
Vigorous MET value = 8.0

176
Analysis, Guidelines and Calculations Total physical activity MET-minutes/ week (= the sum of the total MET minutes of activity computed for each setting) Equation: Total Physical Activity = [(P2*P3*8) + (P5*P6*4) + (P8*P9*4) + (P11*P12*8) +
(P14*P15*4)
Level of total physical activity Physical activity cutoff value
High IF:(P2 + P11) >= 3 days AND Total physical activity MET minutes per week >1500
OR
IF: (P2 + P5 + P8 + P11 + P14) >= 7 days AND total physical activity
MET minutes per week ≥ 3000
Moderate IF: (P2 + P11) >= 3 days AND ((P2 * P3) + (P11 * P12)) >= 60 minutes
OR
IF: (P5 + P8 + P14) >= 5 days AND ((P5 * P6) + (P8 * P9) + (P14 *
P15) ≥150 minutes OR
IF: (P2 + P5 + P8 + P11 + P14)>= 5 days AND Total physical activity
Minutes per week ≥ 600
Low F: the value does not reach the criteria for either high or moderate levels of physical activity

177
Global Physical Activity Questionnaire (GPAQ) Score sheet Appendix 3
Name: …………………………………………… Age: ……. Sex: ……………….
Question code Response Days Hours Minutes
P1
P2
P3
P4
P5
P6
P7
P8
P9
P10
P11
P12
P13
P14
P15
P16
Total

178
Rating of Perceived Exertion (RPE) Scale Appendix 4
Category Scale
6
7 Very, very light
8
9 Very light
10
11 Fairly light
12
13 Somewhat hard
14
15 Hard
16
17 Very hard
18
19 Very, very hard
20
Borg G. (1998) Borg’s Rating of Perceived Exertion (RPE) and Pain Scales. Champaign, IL: Human Kinetics.

179
Ethics Approval Studies A and B Appendix 5

180
Ethics Approval for Studies C and D Appendix 6

181
Recruitment Poster Appendix 7
If so, the University of Cape Town invites you to take part in exciting research on the
association between cardiorespiratory fitness and performance in a submaximal step test
standardised for energy expenditure
What’s in it for me?
Pertinent personalised feedback relating to valuable measures of your health and fitness: VO2max, BMI, body fat % and heart rate recovery.
Corrective programmes based on your movement competence. General feedback at the end of the study about the validity of the step test.
What would I have to do?
Commit to 2 visits to the Sports Science Institute of South Africa in Newlands
Agree to heart rate and oxygen consumption measurements (no needles, promise!)
What are the requirements for taking part?
Generally healthy, injury-free and between the ages of 20 and 60 years Body mass between 50 kg and 100 kg
How can I sign up or find out more?
Please contact Lynnette Huchu: [email protected]
You want to know your fitness level?
Visit 1 ACSM screening, informed
consent, body composition
step test, evaluation of
mobility and stability
Visits 2 VO2max test
Visit 4 12 minute motion test

182
Informed Consent Form Study A and B Appendix 8
The association between cardiorespiratory fitness and performance in a submaximal
stepping test standardised for energy expenditure: reliability of the measurements
Dear Participant
Thank you for your interest in participating in the study (The association between
cardiorespiratory fitness and performance in a submaximal stepping test standardised for energy
expenditure: reliability of the measurements) which is being conducted by the MRC/UCT
Research Unit for Exercise Science and Sports Medicine. This study is divided into 2 parts: (A)
The cardiorespiratory responses (measured by your heart rate and oxygen consumption) to a
standardised step test and (B) Repeatability of a standardised step test. Through these studies we
will establish the effect of manipulating external workload on physiological responses. This
information will allow us to validate the step test and accurately predict cardiorespiratory fitness.
The following description applies to both part A and part B of the study.
Brief description of the study
Before you can participate in the study you have to complete a pre-participation questionnaire that
is designed to identify any factors which indicate a risk of you participating in exercise. This
should take a few minutes and is designed to identify any factors that indicate a risk of you
participating in exercise. If you satisfy the requirements of this test and fulfil the inclusion criteria
for participation, you will be informed of the days you visit the laboratory for testing.
On the first day of testing we will measure your height, body mass and the thickness of 7
skinfolds. The skinfold measurement is not painful and will involve the researcher gently
pinching the skin and underlying fat. You will then put a mask over your mouth and nose for the
measurement of oxygen consumption. This does not restrict your breathing at all. A strap with a
small heart rate transmitter will be attached around your chest and a monitor, the size of a watch
will be attached to your wrist. The oxygen analyser will be switched on and the metronome set to
183
either 16, 20 or 24 steps per minute depending on the test being conducted on that particular day.
You will be informed of the duration of the test which depends on your weight and step height.
This will range between 5 and 17 minutes. The researcher demonstrates stepping and you have 10
seconds to practise stepping to the metronome rhythm. During the test your oxygen consumption
and heart rate will be measured continuously. The researcher will continually inform you about
how much time you have to complete the test. The researcher informs you when you are half way
in the test so you can change the leading leg when stepping. At the end of the test you have to
provide a rating of your perception of effort before standing motionless for 2 minutes while
oxygen consumption and heart rate are recorded. After the test a researcher will assist you in
removing the mask and heart rate monitor.
You will come back to the laboratory twice within 5 working days at the same time as the first
day for the remaining step test protocols. If you are participating in Study A the stepping cadence
will be altered (one of 16, 20 or 24 steps per minute allocated in a random order). If you are
participating in study B the stepping cadence will be kept the same.
Either before the start of the trial or within 1 week of the last step test you will do the 12 minute
motion test. After an adequate warm-up of walking and stretching you will be asked to cover as
much distance as possible in 12 minutes by either walking or jogging. This test will be done on a
track in the Fitness Centre of the Sports Science Institute.
Possible risks of participation
The step test used in this study poses very low risk to the participants, similar to the risks
associated with stepping when walking or jogging at a moderate intensity for 12 minutes.
Should there be any unexpected event such a tripping or straining a muscle while participating in
this trial, on-site medical care will be provided by one of the medical personnel in the building
who are always on call via an emergency system that is in place.

184
Benefits
There is no direct benefit to individuals, however, after the results have been analysed we will
inform you of the significance of our findings. We will also provide you with a comprehensive
assessment of your performance tests. You will also receive in invitation to our annual research
evening for research participants which will be held in November.
Ethics and insurance
The study will be performed in accordance with the principles of the Declaration of Helsinki, ICH
Good Clinical Practice and the laws of South Africa.
Please note that UCT does offer a no-fault insurance that will cover all participants in the event
that something may go wrong. This insurance will provide prompt payment of compensation for
any trial-related injury according to the Association of the British Pharmaceutical Industry (ABPI)
guidelines (1991). These guidelines recommend that UCT, without any legal commitment, should
compensate you without you having to prove that UCT is at fault. An injury is considered trial-
related if, and to the extent that, it is caused by study activities. You must notify the study
investigators immediately of any injuries during the trial, whether they are research-related or
other related complications. UCT reserves the right not to provide compensation if, and to the
extent that, your injury came about because you chose not to follow the instructions that you were
given while taking part in the study. Your right in law to claim compensation for injury where
you prove negligence is not affected.
Statement of understanding and consent:
I confirm that the exact procedure and techniques, and possible complications of the above tests
have been thoroughly explained to me. I am free to withdraw from the study at any time, should I
choose to do so. I understand that I may ask questions at any time during the testing procedure. I
know that the personal information required by the researchers and derived from the testing
procedure will remain strictly confidential and will only be revealed as a number in statistical
analysis.

185
I have carefully read this form and understand the nature, purpose and procedures of this study. I
agree to participate in this research project of the MRC / UCT Research Unit for Exercise Science
and Sports Medicine.
Name of volunteer: .……………………………………………………...
Signature: …………….…………………………………………..
Name of investigator: ……………………………………………..………….
Signature: ..………………………………….…………………...
Date: ….………………………………………………
=============================================================
Contact details Principal investigator: Ms Linet Huchu UCT/MRC Research Unit for Exercise Science and Sports Medicine, PO Box 155 Newlands 7725 E-mail: [email protected] Co-investigator: Professor Mike Lambert UCT/MRC Research Unit for Exercise Science and Sports Medicine, PO Box 155 Newlands 7725 Tel: 021-6504550 E-mail: [email protected] Co-investigator: Raeesa Solwa [email protected] Professor Marc Blockman Faculty of Heath Sciences Faculty of Health Sciences Human Research Ethics Committee Room 52-54 Groote Schuur Hospital Old Main Building Observatory 7925 Tel (021) 406 6492 facsimile (021) 406 6411 Email: [email protected]

186
Participant information sheet Study A and B Appendix 9
The association between cardiorespiratory fitness and performance in a submaximal
stepping test standardised for energy expenditure: reliability of the measurements
Dear Participant
Thank you for your interest in participating in the study (The association between
cardiorespiratory fitness and performance in a submaximal stepping test standardised for energy
expenditure: reliability of the measurements) which is being conducted by the MRC/UCT
Research Unit for Exercise Science and sports Medicine. This study is divided into 2 parts: (A)
The cardiorespiratory responses (measured by your heart rate and oxygen consumption) to a
standardised step test (B) Repeatability of a standardised step test protocol. These studies are
important because they will enable us to understand the effect of standardising step test work on
cardiorespiratory responses. The information will be fundamental for the accurate prediction of
cardiorespiratory fitness using a step test and for the subsequent validation of the step test
protocol.
Brief description of the study
For you to participate in the study you have to complete the pre-participation questionnaire that is
designed to identify any factors which indicate a risk of you participating in exercise. This takes a
few minutes. You may be asked to get cleared by your medical doctor if you have any risk
factors. If you satisfy the requirements of this test and fulfil the inclusion criteria for participation,
you will be recruited into the study. The study will be explained to you and you ask questions
after which you sign the informed consent form.
On the first day of testing we will measure the thickness of 7 skinfolds on your torso, arms and
legs. This is not painful and will involve the researcher gently pinching the skin and underlying
fat to record the measurement. We also measure and record you height and body mass. You are
required to maintain a constant diet and physical activity programme during the testing days.

187
Part A
On the first day of testing you do a step test at either 16, 20 or 24 steps per minute in random
order. The researcher demonstrates stepping and you are allowed time to practise after which
testing begins. Test duration is determined by your body mass, stepping rate and step height.
Heart rate, oxygen consumption and respiratory exchange ratio are measured during the test and 2
minutes after the test. You will come to the laboratory twice within 5 working days to do the
remaining tests at the same time of day and under similar testing conditions.
Part B
You will visit the laboratory 3 times in 5 working days to do the same step test. On the first day
the 3 step test protocols are explained and demonstrated. You are allowed time to try them after
which you choose the test you are most comfortable with. Test duration depends on the protocol
chosen, your body mass and step height. Heart rate, oxygen consumption and respiratory
exchange ratio are measured during the test and 2 minutes after the test.
Either before the start of the trial or within 1 week of the last step test you will do the 12 minute
motion test. After an adequate warm-up of walking and stretching you will be asked to cover as
much distance as possible in 12 minutes by either walking or jogging on a track in the Fitness
Centre of the Sports Science Institute.
Possible risks of participation
The step test used in this study poses very low risk to the participants, similar to the risks
associated with stepping when walking or jogging at a moderate intensity for 12 minutes.
Should there be any unexpected event such a tripping or straining a muscle while participating in
this trial, on-site medical care will be provided by one of the medical personnel in the building
who are always on call via an emergency system that is in place.

188
Benefits
At the end of the study we will provide you with a comprehensive assessment of your
performance tests. After the results have been analysed we will inform you of the significance of
our findings
Ethics and insurance
The study will be performed in accordance with the principles of the Declaration of Helsinki, ICH
Good Clinical Practice and the laws of South Africa.
Please note that UCT does offer a no-fault insurance that will cover all participants in the event
that something may go wrong. This insurance will provide prompt payment of compensation for
any trial-related injury according to the Association of the British Pharmaceutical Industry (ABPI)
guidelines (1991). These guidelines recommend that UCT, without any legal commitment, should
compensate you without you having to prove that UCT is at fault. An injury is considered trial-
related if, and to the extent that, it is caused by study activities. You must notify the study
investigators immediately of any injuries during the trial, whether they are research-related or
other related complications. UCT reserves the right not to provide compensation if, and to the
extent that, your injury came about because you chose not to follow the instructions that you were
given while taking part in the study. Your right in law to claim compensation for injury where
you prove negligence is not affected.

189
Informed Consent Form Study C and D Appendix 10
The association between cardiorespiratory fitness and performance in a submaximal
stepping test standardised for energy expenditure
Dear Participant
Thank you for your interest in participating in the study (The association between
cardiorespiratory fitness and performance in a submaximal stepping test standardised for energy
expenditure) which is being conducted by the MRC/UCT Research Unit for Exercise Science and
Sports Medicine. This is a validation study which uses measurements from the step test (i.e. heart
rate during the test and heart rate recovery after the test) to predict performance measured during
a treadmill protocol.
Brief description of the study
To participate in the study you have to complete a pre-participation questionnaire that is designed
to identify any factors which indicate a risk of you participating in exercise. This should take a
few minutes. If you satisfy the requirements of this test and fulfil the inclusion criteria for
participation, you will be recruited into the study. You will then answer questions from a
questionnaire designed to predict your physical activity level.
On the first day of testing we will measure your height, body mass and the thickness of 7
skinfolds. The skinfold measurement is not painful and will involve the researcher gently
pinching the skin and underlying fat. You will then perform a step test and a functional
participation screen in random order. For the step test a strap with a small heart rate transmitter
will be attached around your chest and a monitor, the size of a watch will be attached to your
wrist. The metronome will be set at 24 steps per minute. You will be informed of the duration of
the test which varies between 5 and 15 minutes depending on your weight and step height. The
researcher will demonstrate stepping and you have an opportunity to practise stepping to the
metronome rhythm. During the test heart rate will be measured continuously. The researcher will
continually inform you about how much time you have to complete the test. The researcher

190
informs you when you are half way in the test so you can change the leading leg when stepping.
At the end of the test you will stand motionless for 2 minutes while heart rate is recorded. You
then remove the heart rate monitor.
On the same day as the step test you will perform the functional participation screen. You warm
up by doing dynamic stretching followed by 5 minutes of submaximal cycling on a stationary
ergometer. You then do 7 screen tests designed to test movement pattern. The movements will be
explained and demonstrated by the researcher. The testing protocol takes about 12 minutes. All
tests are scored out of three, with the possibility of scoring from 0 – 3 depending on how accurate
your performance is and whether or not you feel pain.
You will come back to the laboratory after 2-3 days to do a maximal effort test on a treadmill. The
test protocol will be explained and you warm up for 6 minutes. The researcher will put a mask
over your mouth and nose for the measurement of oxygen consumption. This does not restrict
your breathing. The oxygen analyser will be switched on and the test begins at a treadmill speed
of 2.74 km/ h and 10% gradient. Speed and incline will be increased every 3 minutes until you
cannot continue with the test. You will be verbally encouraged throughout the test to produce a
maximum effort performance. After the test the researcher will assist you in removing the mask.
Possible risks of participation
The step test used in this study poses very low risks to participants similar to that of brisk
walking. The risks associated with the maximal working level test are similar to that of self-
limiting, vigorous intensity exercise. Only those persons meeting American College of Sports
Medicine criteria for low risk will be included in the study. All the functional participation screen
test movements are slow and controlled and only use body weight as the load. In terms of effort
they may be equated to the types of exercises done in a yoga class. The researchers will ensure
that the instructions are clear so that participants will do the tests strictly according to the protocol
to reduce any risk of injury.

191
Benefits There is no financial remuneration for participation in this study. However, after the results have
been analysed we will inform you of the significance of our findings. We will also provide you
with a comprehensive assessment of your performance tests. You will also receive an invitation to
our annual research evening for research participants which will be held in November.
Ethics and insurance
The study will be performed in accordance with the principles of the Declaration of Helsinki, ICH
Good Clinical Practice and the laws of South Africa. Please note that UCT has a no-fault
insurance policy that will cover participants in the event of some untoward event occurring during
the study.
Statement of understanding and consent:
I confirm that the exact procedure and techniques, and possible complications of the above tests
have been thoroughly explained to me. I am free to withdraw from the study at any time, should I
choose to do so. I understand that I may ask questions at any time during the testing procedure. I
know that the personal information required by the researchers and derived from the testing
procedure will remain strictly confidential and will only be revealed as a number in statistical
analysis.
I have carefully read this form and understand the nature, purpose and procedures of this study. I
agree to participate in this research project of the MRC / UCT Research Unit for Exercise Science
and Sports Medicine.
Name of volunteer: .……………………………………………..
Signature:…………….…………………………………………..
Name of investigator: ………………………………..………….
Signature: ..………………………………….…………………...
Date: ……………………………………………………………..
=============================================================

192
Contact details Principal investigator: Ms Linet Huchu UCT/MRC Research Unit for Exercise Science and Sports Medicine, PO Box 155 Newlands 7725 E-mail: [email protected] Co-investigator: Professor Mike Lambert UCT/MRC Research Unit for Exercise Science and Sports Medicine, PO Box 155 Newlands 7725 Tel: 021-6504550 E-mail: [email protected] Professor Marc Blockman Faculty of Heath Sciences Faculty of Health Sciences Human Research Ethics Committee Room 52-54 Groote Schuur Hospital Old Main Building Observatory 7925 Tel (021) 406 6492 facsimile (021) 406 6411 Email: [email protected]

193
Participant information sheet study C and D Appendix 11
The association between cardiorespiratory fitness and performance in a submaximal
stepping test standardised for energy expenditure
Dear participant
Thank you for your interest in participating in the study (The association between
cardiorespiratory fitness and performance in a submaximal stepping test standardised for energy
expenditure) which is being conducted by the MRC/UCT Research Unit for Exercise Science and
Sports Medicine. This is a validation of the step test using heart rate during the test and heart rate
recovery after the test to predict performance measured during a treadmill protocol
Brief description of the study
To participate in the study you have to complete the pre-participation questionnaire that is
designed to identify any factors which indicate a risk of you doing exercise. This takes a few
minutes. You may be asked to get cleared by your medical doctor if you have any risk factors. If
you satisfy the requirements of this test you will be recruited into the study. The study will be
explained to you and you ask questions after which you sign the informed consent form. You will
answer questions from a questionnaire designed to predict your physical activity level.
On the first day of testing we will measure the thickness of 7 skinfolds on your torso, arms and
legs. This is not painful and will involve the researcher gently pinching the skin and underlying
fat to record the measurement. We also measure and record you height and body mass. You are
asked to maintain a constant diet and physical activity programme during the testing days.
Step test
On the first day of testing you will be asked to perform a step test at 24 steps per minute that will
elicit 45 kJ. The researcher will demonstrate stepping and you will be allowed time to practise

194
after which testing will begin. Test duration will be determined by your body mass and step
height. Heart rate will be measured during the test and 2 minutes after the test.
The Functional Participation Screen
On the same day as the step test you will be asked to perform a series of functional participation
screening tests to determine general functional strength and flexibility. You first warm up by
stretching and cycling on a stationary ergometer for 5 minutes. Then you perform 7 screen tests
designed to test movement pattern. The movements will be explained and demonstrated. The
testing protocol takes about 12 minutes. All tests are scored out of three, with the possibility of
scoring from 0 – 3.
VO2max test
On your next visit, after 2-3 days, you will perform a test that causes maximal exhaustion on a
treadmill. You warm up for 6 minutes. The test begins at a treadmill speed of 2.74 km/ h and 10%
gradient. Speed and incline are increased every 3 minutes until you cannot continue with the test.
You will be verbally encouraged throughout the test to produce a maximum effort performance.
During the test oxygen consumption and respiratory exchange ratio are measured using an
Oxycon. Maximal working level will be defined as the highest oxygen consumption measured for
30 s during the test.
Possible risks of taking part
The step test used in this study poses very low risks to participants similar to that of brisk
walking. The risks associated with the maximal effort test are similar to that of self-limiting,
vigorous intensity exercise. Only those persons meeting American College of Sports Medicine
criteria for low risk will be included in the study. All the functional participation screen test
movements are slow and controlled and only use body weight as the load. In terms of effort they
may be equated to the types of exercises done in a yoga class. The researchers will ensure that the
instructions are clear so that participants will do the tests strictly according to the protocol to
reduce any risk of injury.

195
Benefits At the end of the study we will provide you with a report of your data (maximal working level,
heart rate and body composition). After the results have been analysed we will inform you of the
significance of our findings.
Ethics and insurance
The study will be performed in accordance with the principles of the Declaration of Helsinki, ICH
Good Clinical Practice and the laws of South Africa. Please note that UCT has a no-fault
insurance policy that will cover participants in the event of some untoward event occurring during
the study.
Contact details Principal investigator: Ms Linet Huchu UCT/MRC Research Unit for Exercise Science and Sports Medicine, PO Box 155 Newlands 7725 E-mail: [email protected] Co-investigator: Professor Mike Lambert UCT/MRC Research Unit for Exercise Science and Sports Medicine, PO Box 155 Newlands 7725 Tel: 021-6504550 E-mail: [email protected] Professor Marc Blockman Faculty of Heath Sciences Faculty of Health Sciences Human Research Ethics Committee Room 52-54 Groote Schuur Hospital Old Main Building Observatory 7925 Tel (021) 406 6492 facsimile (021) 406 6411 Email: [email protected]

196
VO2max score sheet Appendix 12
VO2max Score Sheet
Name: Male/Female: Age:
Height: Weight : Sport:
Hand Dominance: RHS/LHS Foot Dominance: RHS/LHS
Time Workload HR RPE VO2 (ml.kg-1.min-1)
0 2.74 km.h-1 @ 10%
1
2
3 4.02 km.h-1 @ 12%
4
5
6 5.47 km.h-1 @ 14%
7
8
9 6.76 km.h-1 @ 16%
10
11
12 8.05 km.h-1 @ 18%
13
14
15 8.85 km.h-1 @ 20%
16
17
18 9.65 km.h-1 @ 22%
19
20
21 10.46 km.h-1 @
24%
Time achieved: ……………………. . mins and sec
Maximum heart rate: ………………. .bpm
Maximum workload: ………………. km.h-1 ….. %

197
Participant Report (Men) Appendix 13
ANTHROPOMETRY
Height: metres
Mass: kilogrammes
BMI:
Skin folds
Biceps mm
Triceps mm
Subscapular mm
Suprailiac mm
Abdominal mm
Thigh mm
Med. Calf mm
Sum of skinfolds: mm
Predicted body fat percentage (±1%)
(Durnin & Womersley) %
Fat mass kg
Fat-free mass kg

198
Physiological Results
VO2max (ml/kg/min)
VO2max (l/min)
LT Heart Rate
(bpm) LT Heart Rate Range
(bpm)
Crossover Point Heart Rate (bpm)
Crossover point HR Range (bpm)
Peak RER Maximal heart rate (bpm)
Treadmill Speed
(km.h-1) Treadmill Incline
(%)
Heart Rate Recovery (Step Test) ↓ in beats in the first minute after exercise Time to Exhaustion
VO2max: Maximal measured rate of oxygen uptake. This figure is displayed as an absolute and relative value.
Respiratory Exchange Ratio (RER): The relationship between O2 and CO2 inhalation and Expiration, this indicates how hard you were able to push yourself. This result is influenced by training and fatigue
Lactate Threshold (LT): The point at which lactate starts to accumulate, the goal of training is to push this point closer to your maximum
BPM: The number of times the heart beats per minute
VO2MAX RESULTS
The requirement of O2 by the various tissue cells of the body is met by the combined cardiovascular and pulmonary systems, which function as a unit termed the O2 transport system of the body. There is a normative data table below for athletic populations. Higher scores indicate a greater propensity for increased oxygen delivery and uptake which may be associated with higher levels of endurance performance.

199
MALE VO2 NORMS
HEART RATE RECOVERY
Heart Rate Recovery looks at the decrease in heart rate within the first few minutes, after the cessation of exercise. The faster the rate of recovery the higher the fitness level of an individual. A heart rate recovery of less than 12 beats is associated with heart related risk of mortality. A value higher than 12 indicates reduced risk of developing heart related risk factors associated with coronary heart disease.
Heart Rate Recovery
BODY MASS INDEX The body max index (BMI) is used to assess weight relative to height and is calculated by dividing body weight in kilograms by height in meters squared (kg/m2). Obesity related health problems increase beyond a BMI of 25. This Measurement does not, however, take into consideration the composition (fat vs. fat free) of your body mass and therefore can give inaccurate classifications. Therefore body composition is calculated
Classification Risk BMI Underweight Moderate < 18.5
Normal Very Low 18.5-24.9 Moderately Overweight Low 25-29.9
Overweight Moderate >30
BODY FAT PERCENTAGE Body fat percentage is measured by way of skinfold callipers, 7 different skinfolds sites are measured and then used to calculate total percentage body fat. This figure also increases with age as can be seen with the increased fat percentages within the next increase in age group. There is also a trend to calculate the sum of the pinches of skin (mm) from the seven sites. The changes in this figure do not take into consideration age.
Age Low Score Below Average Average Above
Average High Score
20-29 <35 35-45 45-55 55-65 >65 30-39 <32.5 32.5-42.5 42.5-52.5 52.5-62.5 >62.5 40-49 <30 30-40 40-50 50-60 >60 50-59 <27.5 27.5-37.5 37.5-47.5 47.5-57.5 >57.5 +60 <25 25-35 35-45 45-55 >55

200
MALE BODY FAT NORMS
TRAINING ZONES
Zone: Heart Rate (bpm)
Target
Zone 1 < 167 Rest
Zone 2 167 - 187 (Fat burning / Recovery)
Zone 3 187 - 197 (Aerobic conditioning)
Zone 4 197 – 207 (LT)
Zone 5 > 207 (High intensity)
The training zones are based on your body’s physiological response to exercise intensity. These zones are individually dependant on your personal physiology and should all be trained to gain the optimal results from your training.
Thank you for being a participant, your assistance is greatly appreciated
Age Low Score Below Average Average Above
Average High Score
20-29 >22.4 17.4-22.4 9.4-17.4 7.1-9.4 <7.1 30-39 >24.2 20.5-24.2 13.9-20.5 11.3-13.9 <11.3 40-49 >26.1 22.5-26.1 16.3-22.5 13.6-16.3 <13.6 50-59 >27.5 24.1-27.5 24.1-17.9 15.3-17.9 <17.9 +60 >28.5 25.0-28.5 18.4-25.0 15.3-18.4 <15.3

201
Participant Report (Women) Appendix 14
ANTHROPOMETRY
Height: metres
Mass: kilogrammes
BMI:
Skin folds
Biceps mm
Triceps mm
Subscapular mm
Suprailiac mm
Abdominal mm
Thigh mm
Med. Calf mm
Sum of skinfolds: mm
Predicted body fat percentage (±1%)
(Durnin & Womersley) %
Fat mass kg
Fat-free mass kg

202
PHYSIOLOGICAL RESULTS
VO2max (ml/kg/min)
VO2max (l/min)
LT Heart Rate
(bpm) LT Heart Rate Range
(bpm)
Crossover Point Heart Rate (bpm)
Crossover point HR Range (bpm)
Peak RER Maximal heart rate (bpm)
Treadmill Speed
(km.h-1) Treadmill Incline
(%)
Heart Rate Recovery (Step Test) ↓ in beats in the first minute after exercise Time to Exhaustion
VO2max: Maximal measured rate of oxygen uptake. This figure is displayed as an absolute and relative value.
Respiratory Exchange Ratio (RER): The relationship between O2 and CO2 inhalation and Expiration, this indicates how hard you were able to push yourself. This result is influenced by training and fatigue
Lactate Threshold (LT): The point at which lactate starts to accumulate, the goal of training is to push this point closer to your maximum
BPM: The number of times the heart beats per minute
VO2MAX RESULTS
The requirement of O2 by the various tissue cells of the body is met by the combined cardiovascular and pulmonary systems, which function as a unit termed the O2 transport system of the body. There is a normative data table below for athletic populations. Higher scores indicate a greater propensity for increased oxygen delivery and uptake which may be associated with higher levels of endurance performance.

203
FEMALE VO2 NORMS
HEART
RATE RECOVERY Heart Rate Recovery looks at the decrease in heart rate within the first few minutes, after the cessation of exercise. The faster the rate of recovery the higher the fitness level of an individual. A heart rate recovery of less than 12 beats is associated with heart related risk of mortality. A value higher than 12 indicates reduced risk of developing heart related risk factors associated with coronary heart disease.
Heart Rate Recovery
BODY MASS INDEX The body max index (BMI) is used to assess weight relative to height and is calculated by dividing body weight in kilograms by height in meters squared (kg/m2). Obesity related health problems increase beyond a BMI of 25. This Measurement does not, however, take into consideration the composition (fat vs. fat free) of your body mass and therefore can give inaccurate classifications. Therefore body composition is calculated
Classification Risk BMI Underweight Moderate < 18.5
Normal Very Low 18.5-24.9 Moderately Overweight Low 25-29.9
Overweight Moderate >30
BODY FAT PERCENTAGE
Body fat percentage is measured by way of skinfold callipers, 7 different skinfolds sites are measured and then used to calculate total percentage body fat. This figure also increases with age as can be seen with the increased fat percentages within the next increase in age group. There is
Age Low Score Below Average Average Above
Average High Score
20-29 <25 25-35 35-45 45-55 >55 30-39 <22.5 22.5-32.5 32.5-42.5 42.5-52.5 >52.5 40-49 <20 20-30 30-40 40-50 >50 50-59 <17.5 17.5-27.5 27.5-37.5 37.5-47.5 >47.5 +60 <15 15-25 25-35 35-45 >45

204
also a trend to calculate the sum of the pinches of skin (mm) from the seven sites. The changes in this figure do not take into consideration age.
FEMALE BODY FAT NORMS
TRAINING ZONES
Zone: Heart Rate (bpm)
Target
Zone 1 < 104 Rest
Zone 2 104 - 124 (Fat burning / Recovery)
Zone 3 124 - 147 (Aerobic conditioning)
Zone 4 147 - 157 (LT)
Zone 5 > 157 (High intensity)
The training zones are based on your body’s physiological response to exercise intensity. These zones are individually dependant on your personal physiology and should all be trained to gain the optimal results from your training.
Thank you for being a participant, your assistance is greatly appreciated
Age Low Score Below Average
Average Above Average
High Score
20-29 >27.7 23.7-27.7 17.1-27.7 14.5-17.1 <14.5 30-39 >29.3 24.9-29.3 18.0-24.9 15.5-18.0 <15.5 40-49 >32.1 28.1-32.1 21.3-28.1 18.5-21.3 <18.5 50-59 >35.9 31.6-35.9 25.0-31.6 21.9-25.0 <25.0 +60 >36.6 32.5-36.6 25.1-32.5 21.1-25.1 <21.1

205
Step test duration calculation Appendix 15
Gravity 9.81 m/s
Work done 45000 Joules
Step height 0.3 metres
Stepping rate 24 Steps per minute
Participant Mass Duration
1 50 12.7421 2 55 11.58373 3 60 10.61842 4 65 9.801615 5 70 9.1015 6 72 8.84868 7 74 8.609527 8 76 8.38296 9 78 8.168013 10 80 7.963812

206
Workload determination Appendix 16
Gravity 9.81 m/s Step
height 0.3 metres Stepping
rate 20 24 28 Steps per minute Mass 50 kg
80 kg
100 kg
Duration Work
16 Work
20 Work
24 Work
16 Work 20 Work 24 Work
16 Work 20 Work 24 5 14715 17658 20601 23544 28252.8 32961.6 29430 35316 41202 6 17658 21189.6 24721.2 28252.8 33903.36 39553.92 35316 42379.2 49442.4 7 20601 24721.2 28841.4 32961.6 39553.92 46146.24 41202 49442.4 57682.8 8 23544 28252.8 32961.6 37670.4 45204.48 52738.56 47088 56505.6 65923.2 9 26487 31784.4 37081.8 42379.2 50855.04 59330.88 52974 63568.8 74163.6
10 29430 35316 41202 47088 56505.6 65923.2 58860 70632 82404 11 32373 38847.6 45322.2 51796.8 62156.16 72515.52 64746 77695.2 90644.4 12 35316 42379.2 49442.4 56505.6 67806.72 79107.84 70632 84758.4 98884.8 13 38259 45910.8 53562.6 61214.4 73457.28 85700.16 76518 91821.6 107125.2 14 41202 49442.4 57682.8 65923.2 79107.84 92292.48 82404 98884.8 115365.6 15 44145 52974 61803 70632 84758.4 98884.8 88290 105948 123606 16 47088 56505.6 65923.2 75340.8 90408.96 105477.1 94176 113011.2 131846.4 17 50031 60037.2 70043.4 80049.6 96059.52 112069.4 100062 120074.4 140086.8 18 52974 63568.8 74163.6 84758.4 101710.1 118661.8 105948 127137.6 148327.2 19 55917 67100.4 78283.8 89467.2 107360.6 125254.1 111834 134200.8 156567.6 20 58860 70632 82404 94176 113011.2 131846.4 117720 141264 164808

207
Anthropometry Appendix 17
Name:
Date:
Mass(kg): Gender: male = 1, female = 2
Age:
SKINFOLDS (mm)
RESULTS
triceps biceps
SOMATOTYPE subscapular
endomorphy -0.7
suprailiac
mesomorphy 4.5 calf
ectomorphy #DIV/0!
thigh abdominal
lean thigh volume (cc) 0
DIAMETER (cm) humerus
0.0
DURNIN/WOMERSLEY
femur
0.0
%fat =
#NUM!
fat mass (kg ) = #NUM!
GIRTH (cm)
LBM (kg) = #NUM! con arm
0.0
calf
0.0 sub-gluteal
0.0
mid-thigh
0.0
Sum of Skinfolds 0.000 above knee
0.0
forearm
0.0
HEIGHT (cm)
MUSCLE stature
% Muscle Mass #DIV/0!
sub-gluteal to knee
muscle (kg) = -2.4
BODY MASS INDEX = #DIV/0!

208
Cooper test ratings Appendix 18
Male Athletes
Age Excellent Above Average Average Below Average Poor
13-14 >2700m 2400-2700m 2200-2399m 2100-2199m <2100m
15-16 >2800m 2500-2800m 2300-2499m 2200-2299m <2200m
17-19 >3000m 2700-3000m 2500-2699m 2300-2499m <2300m
20-29 >2800m 2400-2800m 2200-2399m 1600-2199m <1600m
30-39 >2700m 2300-2700m 1900-2299m 1500-1999m <1500m
40-49 >2500m 2100-2500m 1700-2099m 1400-1699m <1400m
>50 >2400m 2000-2400m 1600-1999m 1300-1599m <1300m
Female Athletes
Age Excellent Above Average Average Below Average Poor
13-14 >2000m 1900-2000m 1600-1899m 1500-1599m <1500m
15-16 >2100m 2000-2100m 1700-1999m 1600-1699m <1600m
17-20 >2300m 2100-2300m 1800-2099m 1700-1799m <1700m
20-29 >2700m 2200-2700m 1800-2199m 1500-1799m <1500m
30-39 >2500m 2000-2500m 1700-1999m 1400-1699m <1400m
40-49 >2300m 1900-2300m 1500-1899m 1200-1499m <1200m
>50 >2200m 1700-2200m 1400-1699m 1100-1399m <1100m
Cooper, K.H. (1968) A means of assessing maximal oxygen intake. JAMA. 203, p. 135-138