Total Rewards that retain - University of Cape Town
127
The copyright of this thesis vests in the author. No quotation from it or information derived from it is to be published without full acknowledgement of the source. The thesis is to be used for private study or non- commercial research purposes only. Published by the University of Cape Town (UCT) in terms of the non-exclusive license granted to UCT by the author. University of Cape Town
-
Upload
khangminh22 -
Category
Documents
-
view
0 -
download
0
Transcript of Total Rewards that retain - University of Cape Town
The copyright of this thesis vests in the author. No quotation from it or information derived from it is to be published without full acknowledgement of the source. The thesis is to be used for private study or non-commercial research purposes only.
Published by the University of Cape Town (UCT) in terms of the non-exclusive license granted to UCT by the author.
Univers
ity of
Cap
e Tow
n
Univers
ity of
Cap
e Tow
n
Total Rewards that retain: A study of demographic preferences
Monica Pregnolato
(PRGMON001)
A dissertation submitted in partial fulfillment of the requirements for the award of the
degree of Master of Social Science in Organisational Psychology
Faculty of Humanities
University of Cape Town
2010
Supervisor: Associate Professor Anton Schlechter
COMPULSORY DECLARATION
This work has not been previously submitted in whole, or in part, for the award of any
degree. It is my own work. Each significant contribution to, and quotation in, this dissertation
from the work, or works, of other people has been attributed, and has been cited and
referenced.
Signature: Date:
Univers
ity of
Cap
e Tow
n
i
Acknowledgements
I would like to acknowledge the invaluable guidance and support of my supervisor,
Dr. Anton Schlechter who provided continuous motivation and encouragement
throughout the year for this study. I would also like to extend my gratitude to Dr Felix
Eggers of the University of Hamburg for his assistance in developing the on-line
questionnaire and providing expert assistance and guidance with respect to conjoint
analysis. I would also like to express my appreciation to the South African Reward
Association (SARA) for sponsoring my studies and providing me with access to their
corporate membership database. In addition I am grateful to the management and
employees of Chevron South Africa (Pty) Ltd who participated in this study.
I would also like to acknowledge my colleagues in Total Remuneration at Chevron,
Julie Abbott and Fran Kendrick for providing me with technical assistance, especially
in the field of benefits. And lastly, my family who have been exceptionally supportive
and understanding throughout the year – I am most grateful.
Univers
ity of
Cap
e Tow
n
ii
Table of Contents
Abstract ................................................................................................................................................... 1
CHAPTER 1 ............................................................................................................................................. 3
Introduction ........................................................................................................................................... 3
CHAPTER 2 ............................................................................................................................................. 6
Literature Review ................................................................................................................................... 6
Retention trends Globally and in South Africa ......................................................................................... 6
Total rewards and Retention .................................................................................................................... 8
Elements of Total Rewards ...................................................................................................................... 9
Remuneration ............................................................................................................................. 10
Benefits ....................................................................................................................................... 12
Work-Life .................................................................................................................................... 13
Performance Management ......................................................................................................... 14
Recognition................................................................................................................................. 15
Career Opportunities ................................................................................................................. 16
Career Development ................................................................................................................. 17
Conclusion of Total Rewards model overview ...................................................................................... 18 Rewards that Retain Knowledge Workers ............................................................................................ 19 Rewards that Retain Employment Equity candidates ........................................................................... 20 Rewards that Retain Female Employees .............................................................................................. 21 Rewards that Retain Employees of different age groups ..................................................................... 23
Conclusion ............................................................................................................................................. 26
CHAPTER 3 .......................................................................................................................................... 27
Method .................................................................................................................................................. 27
Research Design ................................................................................................................................... 27
Sample .................................................................................................................................................. 29 Questionnaire 1 .......................................................................................................................... 30 Questionnaire 2 and 3 ................................................................................................................. 30 Measuring Instruments .......................................................................................................................... 36 Remuneration Managers Questionnaire ..................................................................................... 39 WorldatWork Total Rewards Questionnaire ................................................................................ 40 Conjoint Task Questionnaire ........................................................................................................ 40 Data Collection procedure ..................................................................................................................... 46 Data Analysis ........................................................................................................................................ 47 CHAPTER 4 .......................................................................................................................................... 48
Results ................................................................................................................................................. 48
Remuneration Manager Questionnaire(Questionnaire 1) .................................................................... 48
Analysis of Remuneration Manager responses ........................................................................... 48 WorldatWork Total Rewards Questionnaire .......................................................................................... 51
Univers
ity of
Cap
e Tow
n
iii
Validity and Reliability ................................................................................................................... 51 Factor Analysis ............................................................................................................................. 52 Reliability Analysis ........................................................................................................................ 55 Descriptive Statistics ..................................................................................................................... 55 Differences between gender and race groups .............................................................................. 57 Analysis of Variance for different generations, education levels and job levels ........................... 60 Conjoint Task Questionnaire ................................................................................................................ 66 Reliability of the conjoint model ...................................................................................................... 67 Validity of the conjoint model ......................................................................................................... 67 Relative attribute importance overall and per demographic group ................................................ 68 The ideal mix of Total Rewards overall and per demographic group ............................................ 76 CHAPTER 5 .......................................................................................................................................... 80
Discussion ........................................................................................................................................... 80
The overall ideal Total Rewards mix ...................................................................................................... 81 Rewards that Retain Knowledge Workers ............................................................................................ 83 Rewards that Retain Employment Equity candidates ........................................................................... 89 Rewards that Retain Female employees .............................................................................................. 91 Rewards that Retain employees of different age groups ...................................................................... 93 Summary of findings ............................................................................................................................. 97 Limitations and Recommendations ..................................................................................................... 100 Theoretical contribution ....................................................................................................................... 101 Practical contribution ........................................................................................................................... 102 Conclusion ........................................................................................................................................... 102
References ......................................................................................................................................... 104
Appendix A- Remuneration Manager Questionnaire .................................................................... 111
Appendix B -WorldatWork Questionnaire and Conjoint Task Questionnaire ............................ 116
Univers
ity of
Cap
e Tow
n
iv
List of Tables CHAPTER 3 ........................................................................................................................................... 27
Method .................................................................................................................................................. 27
Table 1.1 Participant Companies by Economic Sector .......................................................................... 30
Table 1.2 Remuneration Managers company size –Based on Number of Employees ........................ 30
Table 1.3 Gender distribution ................................................................................................................. 31
Table 1.4 Racial distribution ................................................................................................................... 31
Table 1.5 Age group distribution ............................................................................................................ 32
Table 1.6 Education level distribution .................................................................................................... 32
Table 1.7 Job level distribution .............................................................................................................. 33
Table 1.8 Industry distribution ................................................................................................................ 34
Table 1.9 Re-categorisation of Race sample into Blacks and Whites ................................................... 35
Table 1.10 Re-categorisation of Age sample into Generation Groups .................................................. 35
Table 1.11 Re-categorisation of Education level sample into Matric, Undergraduates, Postgraduate . 35
Table1.12 Re-categorisation of Job level sample into Non-Managerial, Supervisor/Middle
Management and Senior Management/ Executive ............................................................................... 36
Table 1.13 Frequency count of Employment Equity Demographics-Race and Gender .….……………36
Table 1.14 Frequency Count across age groups, job and education levels .............. …………………..38
Table 1.15 Holdout Stimuli for Conjoint Task ....................................................................................... 45 CHAPTER 4 ........................................................................................................................................... 48
Results ................................................................................................................................................. 48
Table 2.1 Results of Remuneration Managers Questionnaire ............................................................... 49
Table 2.2 Attributes and levels for the conjoint task as derived from the Remuneration Managers
Questionnaire ......................................................................................................................................... 50
Table 2.3 Factor Analysis for Total Rewards Scale ............................................................................... 54
Table 2.4 Cronbach’s Alpha coefficients for the Total Rewards model ................................................ 55
Table 2.5 Means and Standard Deviations of total reward elements across all demographic groups .. 56
Table 2.6 T-test results for gender ......................................................................................................... 59
Table 2.7 T-test results for race ............................................................................................................. 59
Table 2.8 Results of ANOVA for total rewards that retain across Generations ..................................... 61
Table 2.9 Tukey’s Post-Hoc Comparison of total rewards that retain across Generations ................... 62
Table 2.10 Results of ANOVA for total rewards that retain across Education levels ............................ 63
Table 2.11 Tukey’s Post-Hoc Comparison of total rewards that retain across Education levels .......... 64
Table 2.12 Results of ANOVA for total rewards that retain across Job levels ....................................... 65
Table 2.13 Tukey’s Post-Hoc Comparison of total rewards that retain across Job levels ..................... 66
Table 2.14 Relative Importance of Attributes overall ............................................................................. 70
Table 2.15 Relative Importance of Attributes by Gender ....................................................................... 71
Table 2.16 Relative Importance of Attributes by Race ......................................................................... 72
Table 2.17 Relative Importance of Attributes by Generation ................................................................ 73

Univers
ity of
Cap
e Tow
n
v
Table 2.18 Relative importance of Attributes across Education levels .................................................. 74
Table 2.19 Relative importance of Attributes across different Job levels ............................................. 75 Table 2.20 Ideal Total Rewards mix- overall ........................................................................................ 77
Table 2.21 Ideal Total Rewards mix for male and female employees .................................................. 77
Table 2.22 Ideal mix of Total Rewards for black and white employees ................................................ 78
Table 2.23 Ideal mix of Total Rewards for Generation X and Y and Baby Boomers ........................... 78
Table 2.24 Ideal Mix of Total Rewards for Matriculants, Undergraduates and Postgraduates ............. 79
Table 2.25 Ideal Mix of Total Rewards for Non-Management, Middle Management and Senior
Management ........................................................................................................................................ 79
Univers
ity of
Cap
e Tow
n
vi
List of Figures CHAPTER 2 ............................................................................................................................................. 6
Introduction ............................................................................................................................................ 6
Figure 1. Total Rewards Model ............................................................................................................. 10
CHAPTER 3 ........................................................................................................................................... 27
Method .................................................................................................................................................. 27
Figure 2 Example of Conjoint based conjoint model ............................................................................ 29
CHAPTER 4 ........................................................................................................................................... 48
Results ................................................................................................................................................. 48
Figure 3 Comparison of the means of total rewards across demographic groups ............................... 57
CHAPTER 5 ........................................................................................................................................... 80
Discussion ........................................................................................................................................... 80
Figure 4 The overall ideal mix of total rewards ................................................................................... 83
Figure 5 The ideal mix of total rewards and reward elements identified as significant in the retention of
knowledge workers at various education levels ................................................................................... 88
Figure 6 The ideal mix of total rewards and reward elements identified as significant in the retention of
knowledge workers at various job levels .............................................................................................. 88
Figure 7 -The ideal mix of total rewards for black and white employees and reward elements identified
as significant in the retention of black employees ................................................................................. 91
Figure 8-The ideal mix of total rewards for male and female employees and reward elements
identified as significant in the retention of female employees ................................................................ 93
Figure 9 -The ideal mix of total rewards for Baby Boomers, Generation X and Generation Y and
reward elements identified as significant in the retention of Generation X and Y ................................. 97
Figure 10-Summary of Conjoint Task-Ranked attributes per Demographic Group ............................... 98
Figure 11-Summary of Conjoint Task-Selected levels of reward attributes per Demographic Group ... 99
Univers
ity of
Cap
e Tow
n
1
Abstract
Orientation-Changing workplace demographics and a scarcity of skills have forced employers to understand which total reward factors influence the retention of talented employees, as undifferentiated retention strategies are no longer appropriate. Research purpose-The objectives of this study were to develop an understanding of the total reward factors and the ideal combination and quantum of total rewards that retain employees from various demographic groups including: knowledge workers, employees of different races, genders and age groups. Motivation for the study-People are integral to an organisations‘ competitive advantage but talent retention is a challenge for companies globally. To survive the war for talent it is necessary to understand the total reward factors that retain employees. This is especially applicable in South Africa where the demographic profile of the workplace is changing and differentiated retention strategies are needed to retain employees from diverse groups. Research Design-A quantitative research approach adopting a descriptive design was used. Data was collected via convenience sampling by way of three questionnaires. Remuneration Managers (n=7) completed the first questionnaire to identify different total reward offerings that are believed to retain skilled employees. These results, together with total reward elements constructed from the WorldatWork Total Rewards model, were used to develop the second and third questionnaires which were distributed to corporate members of the South African Reward Association (SARA) as well as to a multinational Oil Company (n=361). Data from questionnaire 2 was analysed using descriptive statistics, t-tests and ANOVAs. Conjoint analysis was employed to identify an ideal total rewards mix based on responses from questionnaire 3. Main findings-The results of the conjoint task revealed that all respondents considered the highest value of financial rewards including: Benefits, Remuneration and Performance and Recognition as components in their total rewards package that lead to their retention. Results of the t-tests and ANOVA‘s revealed significant differences in respondents‘ preferences for Performance and Recognition, Learning and Career Advancement and Work-Life Balance. Performance and Recognition was valued in the retention of Generation X and Y and black employees while Non-Management, Middle-Management, females and Generation X and Generation Y employees considered Learning and Career Advancement as significant in their retention. Matriculants, Undergraduates, Generation Y and black employees considered Work-Life Balance Climate important in their retention, while Work-Life Balance Practices were valued by Non-Management and Middle Management in their retention.
Univers
ity of
Cap
e Tow
n
2
Practical/Managerial Implications-The unique application of conjoint analysis allowed for the identification of both the combination and quantum of total rewards that retain the various demographic groups. Organisations are able to incorporate these findings into differentiated retention strategies. Contribution/value add-A dearth of research exists in South Africa which highlights the total rewards that retain various demographic groups. No literature exists which identifies the desired reward mix and the amount of rewards that retain employees. The current study succeeded in identifying the total rewards and the ideal mix of total rewards that retain knowledge workers and employees of different gender, race and age groups.
Univers
ity of
Cap
e Tow
n
3
CHAPTER 1
INTRODUCTION
Employee retention is overwhelmingly cited by CEO‘s of some of the fastest growing
companies as the number one priority on the HR agenda (Frank, Finnegan & Taylor,
2004). Talent retention is deemed to be a key driver of future organisational
effectiveness and has been identified as playing a significant role in maintaining an
organisation‘s competitive advantage. Business strategies, products and services
can be copied, but it is not possible to replicate a company‘s talent whereby a
business distinguishes itself from its competitors (Jensen, McMullen & Stark, 2007).
Employee retention has been defined as the effort by an employer to keep desirable
workers in order to meet business objectives. Alternatively, turnover describes the
unplanned loss of workers who voluntarily leave and whom employers would prefer
to keep (Frank et al., 2004). Unplanned voluntary turnover is often associated with
both direct and indirect costs, including the recruitment costs of replacing
employees, plus the more tangible aspects of loss of productivity; quality shortfalls;
poor morale amongst the remaining employees; negative impact on customers; and
loss of organisational memory. These costs are estimated to be higher than the
annual salary of the departing employee (Corporate Leadership Council, 2004). For
these reasons, the retention of human capital has become a business imperative
where organisations must make every effort to retain talent in order to secure a
sustained competitive advantage in the current knowledge economy (Jensen,
McMullen & Stark, 2007).
The retention of human capital is, however, becoming an increasingly difficult task
for organisations to manage, with the attrition of talent being viewed as a major
cause of the so-called war for talent which is characterised by a global scarcity of
skills, where demand outweighs supply (Hay, 2002). A group of employees who
have been the particular focus of retention efforts and who are considered to be the
fastest-growing talent pool in most organisations are knowledge workers (Guthridge,
Komm & Lawson, 2008). This group of employees are considered to be both critical
to long-term organisational success and integral to organisations intellectual capital
Univers
ity of
Cap
e Tow
n
4
(Birt, Wallis & Winternitz, 2004). Yet the performance of knowledge-intensive
companies within the same industry varies significantly, suggesting that some of
these organisations struggle to extract value from this newly enlarged group of
employees. Furthermore, the technology supporting the work of knowledge workers
has created faster and improved ways to share information, and this further drives
the demand for such employees and their potential impact (Guthridge et al., 2008).
Given the importance and the value added by knowledge workers, they were
considered to be an essential group to include in the focus of the current study.
The successful retention of human capital in the global workplace has also been
affected by extensive changes in workforce demographics, as organisations are
required to manage diverse groups of talent. In particular, changes in the age profile
of the labour market have emerged, especially in the United States where the Baby
Boomer generation (born between 1943 and 1960) is retiring and too few workers
exist in the current labour supply pipeline to fill their jobs. This is likely to require
employers to consider ways to retain older workers (Brock, 2003). Significantly more
women are also entering the global workplace, motivated by shifting cultural norms
and economic necessities. In the United States, growing numbers of ethnic
minorities are also entering the labour market while - in the context of South Africa -
the Employment Equity Act No. 55 of 1998 has been instrumental in changing the
demographic profile of the local labour market, as organisations act as catalysts for
developing equity employees who were under -developed during the apartheid era
(Maisela, 2001; Tucker, Kao & Verma, 2005).
The introduction of equity legislation in South Africa has exacerbated the difficulties
organisations face in retaining black employees. In an effort to meet equity targets,
companies often seek quick fix solutions, such as poaching equity candidates,
resulting in these employees being highly marketable and mobile (Maisela, 2001).
―Equity candidates are categorised as having business imperative skills and hence
the (retention) focus is on them‖ (Bussin, 2002, p.29).
Employees from diverse demographic groups have different expectations and
demands from their work environments and as such, a one-size fits all retention
strategy will not work (Bussin, 2002). To succeed in the war for talent in South Africa,
Univers
ity of
Cap
e Tow
n
5
employers need to have an understanding of those reward factors that influence
whether their talented employees choose to ―stay‖ or ―leave‖ (Dibble as cited in
Kotze & Roodt, 2005, p.48). A paucity of empirical research exists which identifies
reward factors that retain employees of different demographic groups in South
Africa. Much of the existing literature focuses on the antecedents of turnover and
often the findings are only applicable to designated groups outside of the South
African workplace. Furthermore, no studies appear to outline the combination and
the quantum of rewards that serve to retain different demographic groups.
The current study therefore aims to identify the mix and the desired amount of total
rewards that retain employees from various demographic groups, which - in the
context of the current study - refers to knowledge workers and employees from
different race, gender and age groups. An additional objective of the current study is
to develop an understanding of the total rewards that these employees, in the
context of the South African workplace, deem important in their retention.
Univers
ity of
Cap
e Tow
n
6
CHAPTER 2
LITERATURE REVIEW
Retention trends globally and in South Africa
Despite the current global economic recession and high levels of unemployment,
many organisations are faced with the possibility of a future scarcity of talent. In May
2009, consulting firm Deloittes conducted a survey which indicated that 52% of 319
executives surveyed worldwide predicted an increase in voluntary turnover at their
companies, while 65% of these executives also reported a high level of concern for
the likelihood of losing key talent (Farren, 2009). In July 2009, the Chartered Institute
of Personnel Development (CIPD) in the United Kingdom noted that of 3000
employees surveyed, 33% wanted to change jobs and careers after the recession
(Farren, 2009). These studies provide an indication that once the economy recovers,
employers will experience difficulties in retaining the skilled talent they need to
remain competitive.
In the context of the current study, skilled talent refers to knowledge workers who,
according to Guthridge et al., (2008) create three times more profit than other
employees as their work requires minimal oversight. They are also the fastest
growing group of skilled employees in the United States. By one estimate, 48 million
of the 137 million workers in the United States are classified as knowledge workers
(Guthridge et al., 2008). This group of employees recognises that they represent
highly valued assets and that they have the skills to move from one organisation to
another. This has made it more difficult for organisations to retain highly qualified
employees, which has contributed to a critical skills shortage in a number of
professions and countries (Drucker, 2002).
The war for talent, characterised by a global scarcity of skilled talent, where demand
outweighs supply is not a phenomenon foreign to South Africa. Human Resources
consultancy P-E Corporate Services conducted a study in 2007 of more than 850
companies employing 1.5 million employees. Results of this study indicated that
skilled staff turnover averages 17% a year in South Africa (Milazi, 2007). Locally, the
demand for and retention of talent poses additional challenges such as a severe lack
Univers
ity of
Cap
e Tow
n
7
of specialist and managerial employees due to an oversupply of unskilled labour and
an undersupply of skilled labour. Productivity SA and the 2007 International Institute
for Management Development (IMD) World Competitiveness Yearbook noted that
South Africa has severe shortages in financial skills and senior management
competence, ranking 52nd and 51st out of 55 countries respectively (Smith, 2008).
The inability of the education system to produce significant numbers of young black
graduates in technical fields such as science, engineering and accountancy has also
served to exacerbate the problem (Temkin, 2008). Furthermore, the emigration of
skilled employees who are able to compete for jobs globally and who are highly
mobile has resulted in South African having the highest brain drain in the world
according to Productivity SA and the 2007 IMD World Competitiveness Yearbook
(Smith, 2008).
The drive to address employment equity and thereby redress past imbalances has
increased the need to retain employees from designated groups (Milazi, 2007). Black
employee retention falls within the scope of the current study especially since equity
candidates are categorized as having business imperative skills and therefore have
become the focus of retention efforts in South Africa (Bussin, 2002). This has
resulted in a 30% increase in poaching of skilled black employees, partly because
companies need to meet employment equity targets (Finweek, 2008). It is intended
that 65% of senior management positions will be occupied by previously
disadvantaged individuals between 2006 and 2010. In 2008, P-E Corporate Services
noted that a quarter of senior management positions were held by black executives.
While this compared favourably with less than 5% in 1994, it continues to fall short of
Department of Labour (DOL) targets (Milazi, 2007).
Another designated group that will be studied in the current research and who form
the focus of retention efforts in South Africa are female employees. According to
executive search firm, Jack Hammer Executive Headhunters, statistics indicate that
black female placements increased from 10% to 33% between 2006 and 2008 which
implies that the greatest area of transformation has taken place amongst black
women (Temkin, 2008). Due to a shortage of appropriate black skills, approximately
half of South African companies pay premiums to attract black senior management
Univers
ity of
Cap
e Tow
n
8
(both males and females). Most premiums were between 10% and 20% above
established company pay scales (Temkin, 2008).
Finally, employees across different age groups also fall within the scope of the
current study. The retention of young skilled professionals in South Africa is
becoming increasingly problematic, with many young black professionals leveraging
themselves in the market to increase salaries after short periods of tenure with a
company. This practice of job hopping comes at a considerable cost to businesses
and the South African economy (Finweek, 2008).
The P-E Corporate Services 2007 survey notes that the cost of replacing employees
including the costs of recruiting replacements and building skills and experience
could amount to between 35 and 40% of the annual remuneration package. This
represents a cost to the South African economy of R25 billion a year based on South
African Reserve Bank figures, which showed that employee remuneration costs
companies approximately R600 billion per annum (Finweek, 2008).
With the associated financial and non-financial costs of turnover, a need exists to
determine those factors that will retain skilled employees or knowledge workers as
well as employees from different demographic sectors who are classified as having
business imperative skills. Knowledge workers as well as employees of different
race, gender and age groups have different expectations and demands from their
work environments and as such, a one-size-fits-all retention strategy will not work
(Bussin, 2002). Furthermore, US studies indicate that while strategically designed
remuneration and benefits programmes may be valuable, most successful
companies have realized that a total rewards approach, emphasizing attraction,
motivation and retention, is required to retain talent across various employee groups
(WorldatWork, 2003).
Total Rewards and Retention
There are numerous definitions of total rewards but two definitions are widely
recognized:
Univers
ity of
Cap
e Tow
n
9
WorldatWork defines total rewards as ―…all of the employer‘s available tools that
may be used to attract, retain and motivate and satisfy employees‖ (WorldatWork,
2003, p.3).
Thomson (as cited in Armstrong & Murlis, 2004, p.11) states that ―…definitions of
total reward typically encompass not only traditional, quantifiable elements like
salary, variable pay and benefits but also intangible non–cash elements such as
scope to achieve and exercise responsibility, career opportunities, learning and
development, the intrinsic motivation provided by the work itself and the quality of
working life provided by the organisation.‖
It should be noted that it is not simply the type of reward that will be offered but also
the level of reward that is a determining factor of retention. This was indicated in a
study conducted almost 40 years ago by Porter and Steers (1973), where findings
revealed that employees place a high valence on their expectations of pay,
promotions, supervisory relations and peer group interactions, but individuals also
place varying degrees of importance on the host of rewards available from their job.
Whatever the composition of the employee‘s expectation set, it was important that
those factors be substantially met if the employee is to feel worthwhile and to remain
with the organisation (Porter & Steers, 1973).
Elements of Total Rewards
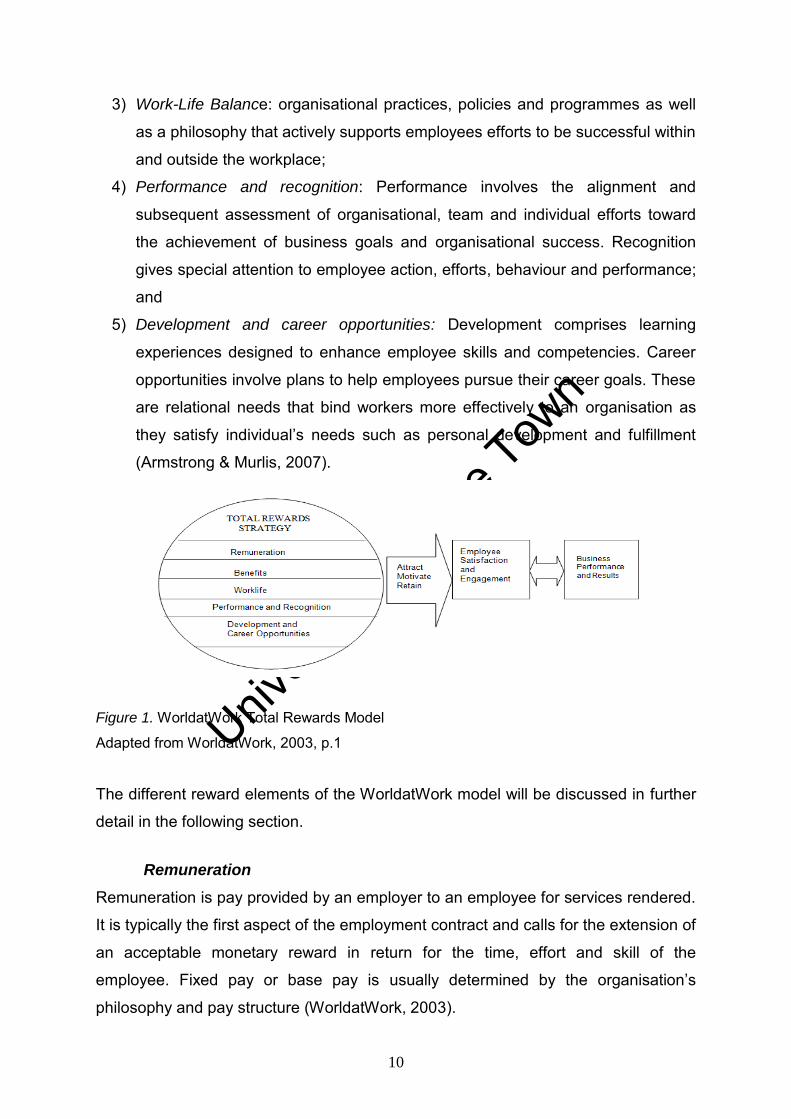
WorldatWork (2003) propose a total rewards model that involves the integration of
five key elements that attract, motivate and retain the talent required to achieve
desired business results and lead to employee job satisfaction and engagement.
This model is illustrated in Figure 1 and includes:
1) Remuneration: cash provided by an employer to an employee for services
rendered;
2) Benefits: programmes that an employer uses to supplement the cash
remuneration an employee receives. These satisfy protection needs and are
unlikely to be performance based;
Univers
ity of
Cap
e Tow
n
10
3) Work-Life Balance: organisational practices, policies and programmes as well
as a philosophy that actively supports employees efforts to be successful within
and outside the workplace;
4) Performance and recognition: Performance involves the alignment and
subsequent assessment of organisational, team and individual efforts toward
the achievement of business goals and organisational success. Recognition
gives special attention to employee action, efforts, behaviour and performance;
and
5) Development and career opportunities: Development comprises learning
experiences designed to enhance employee skills and competencies. Career
opportunities involve plans to help employees pursue their career goals. These
are relational needs that bind workers more effectively to an organisation as
they satisfy individual‘s needs such as personal development and fulfillment
(Armstrong & Murlis, 2007).
Figure 1. WorldatWork Total Rewards Model
Adapted from WorldatWork, 2003, p.1
The different reward elements of the WorldatWork model will be discussed in further
detail in the following section.
Remuneration
Remuneration is pay provided by an employer to an employee for services rendered.
It is typically the first aspect of the employment contract and calls for the extension of
an acceptable monetary reward in return for the time, effort and skill of the
employee. Fixed pay or base pay is usually determined by the organisation‘s
philosophy and pay structure (WorldatWork, 2003).
Univers
ity of
Cap
e Tow
n
11
Pay is the most commonly cited reward element used in retention strategies, while-
in reality- it is the fifth most common reason for leaving an organisation (Bussin,
2002). De Vos and Meganck (2007) found that 64% of HR managers ranked
financial rewards as the primary reason for leaving. As part of the same study,
employees were surveyed and the results indicated that a lack of career
development was the main reason for leaving organisations, while financial rewards
only ranked fourth in importance as a retention factor. Similarly, a Corporate
Leadership Council (2006) Employment Value Proposition Survey indicated that
remuneration is one of the strongest drivers for employee attraction, but more than
25 other Employee Value proposition attributes play a greater role in retention.
Higginbotham (1997) found that high levels of remuneration were not considered
essential in employee retention, although the perception of being paid fairly was
strongly correlated to employee commitment. Kochanski and Ledford (2001)
supported the notion that employees are more likely to be retained when
remuneration is deemed to be competitive and employees understand their pay
system as well as the goals that need to be met in order to receive a salary increase.
Remuneration can also be used to determine who leaves and when. For example
companies pay so-called ‗hot skills‘ premiums to employees whose expertise is
crucial and in short supply. The premiums cease once the skills are more readily
available in the market. The payment of sign-on bonuses also ensures new
employees remain with the organisation in the short term. Deferred sign-on bonuses
are the norm for executives (Cappelli, 2000a). In a 2005/2006 US Compensation
Planning Survey conducted by Mercer Human Resources, 55% of companies
reported using sign-on bonuses to retain key employees (HR Focus, 2005).
The most common form of remuneration used for retention purposes are ‗golden
handcuffs‘, which are defined as ―…remuneration packages that reward employees
for staying with the company‖ (Capelli, 2000b, p.106). They are often paid to
employees who are subject to severe market pressure and are also used as a
means to keep employees in departments that have experienced cut backs due to
redundancy, so as to ensure that the best employees are retained. Golden handcuffs
can be paid in the form of phased lump sum payments, guaranteed bonuses or tied
Univers
ity of
Cap
e Tow
n
12
to performance and delivery during times of reorganisation to retain people until the
business unit closes. They may also take the form of shares or stock options,
especially at executive level, as it is assumed that equity participation engenders
additional commitment (Capelli, 1999).
Unfortunately, pay is the easiest element in the total rewards model for competitors
to match. Recruiters routinely buy-out golden handcuffs with sign-on bonuses or
golden hello‘s i.e. payments made to entice sought-after individuals to join a
company (Armstrong & Murlis, 2002). Retention incentives ultimately become
another element of remuneration contributing to wage inflation as opposed to long
term retention (Cappelli, 2000a). Nevertheless in 2002, WorldatWork conducted a
Retention Bonus Survey which indicated that more companies (32%) offered
retention bonuses, compared to survey results in 2000, where only 24% offered
these bonuses. The primary reason for these retention bonus programmes was to
retain key employees during organisational restructuring. These programmes were
viewed as an effective retention tool by 84% of participants (WorldatWork, 2002).
Benefits
Benefits are a core element of the total rewards model and include health and
welfare plans (including death and disability benefits), retirement plans (both defined
benefit and defined contribution plans) and programmes providing pay for time not
worked (e.g. paid vacation). The WorldatWork Attraction and Retention survey
(2007) indicated that 90% of participants rated paid vacation as having the highest
impact on attraction and retention. The same percentage of participants rated
medical plans as either having a moderate or high impact on attraction and retention.
In addition to this, defined benefit plans were also seen to retain employees. By their
nature these plans induce retention since they are based on pay and service
(WorldatWork, 2007). Kochanski and Ledford (2001) similarly indicated that
employees in high technology environments valued the benefit of paid time off
(which would include annual, sick and family responsibility leave). This was
considered to be the most significant indirect benefit which was able to predict
retention. Furthermore employees were not concerned about how their benefits were
administered, but rather what the value of these benefits were.
Univers
ity of
Cap
e Tow
n
13
In South Africa, benefits are becoming increasingly valued due to the high costs
thereof. For example, healthcare has increased on average by 10.25% over the last
five years and comprises approximately 30% of employees‘ income (Du Preez,
2009). Healthcare accessibility continues to be a concern for the majority of South
Africans with government initiatives such as a National Healthcare system being
planned to address this issue. These factors provide some indication of the reason
for medical care being valued as a benefit.
Increasingly, companies in South Africa are also moving away from defined benefit
to defined contribution retirement plans. This has required employees to assume
more responsibility for the investment decisions of their retirement plans.
Accompanying these changes is a greater awareness of the adequacy of the
provision made for retirement, and an appreciation of the value of the company
contribution towards employees‘ long term financial security (Du Preez, 2009). Many
South Africans also have limited access to retirement funding resulting in a
dependency on a social welfare pension, which is largely inadequate (Department of
Social Development, 2008). Taking such factors into account, it is plausible that
employees in South Africa would place a high value on their retirement benefits
offered by the employer.
Work-Life
The introduction of the Basic Conditions of Employment Act No.75 of 1997 provided
a significant turning point in the improvement of working conditions in South Africa.
One such advancement was the provision of more flexible working arrangements as
was evidenced by the introduction of maternity and paternity leave, as well as
companies increasing recognition of the need for a variety of flexible work options
such as flextime, a compressed work week and telecommuting (WorldatWork, 2003).
Other intangible rewards which form part of the work-life component of total rewards
emanate as a result of employers‘ realization that the workplace is a social institution
and employees expect, to some degree, to have a workplace that forms a
community or network. Team lunches, away-days or fund-raising for charities
strengthen the social fabric of the workplace and also create a sense of belonging
that enhances engagement. The work-life factor is also seen to influence retention,
as leaving the company means leaving one‘s social network. Working in closely-knit

Univers
ity of
Cap
e Tow
n
14
teams with like-minded colleagues also increases the likelihood of retention as
employees who would not waiver to leave an organisation may find it difficult to leave
team-mates (Cappelli, 2000a).
Work-life programmes also include components that aim to support employees‘
health and wellness. This may encompass Employee Assistance Programmes
(EAP‘s) that provide counselling or referral services including psychological,
financial, legal, family and career counselling. Proactive wellness strategies also
assist in lowering stress levels and may include programmes such as fitness centre
affiliations and on-site health seminars (WorldatWork, 2003).
WorldatWork (2007) conducted a survey to identify the prevalence and perceptions
of programmes that attract and retain talent with a specific focus on work-life
programmes. Survey results indicated that 62% of survey participants offered
telecommuting programmes but only 46% indicated that the programme had a high
impact on employee retention. Other work-life programmes that had a high impact
included emergency back-up dependant care services, on-site childcare and
sabbaticals. Wellness programmes such as health screenings, smoking-cessation
assistance and stress management programmes reported only a minor impact on
employee retention.
Performance Management
Performance Management is a process for establishing a shared understanding of
what will be achieved and how it will be achieved in an organisation. It is a way of
managing people that increases the probability of both individual and organisational
success (Jensen et al., 2007). Performance management is a key component in
creating an engaging environment that is conducive to the retention of employees.
Employee commitment and retention are also enhanced by the use of a robust
performance management process which allows managers to clarify expectations,
increase employee motivation by setting challenging goals, develop employees via
coaching and provide rewards for the accomplishment of performance targets
(Jensen et al., 2007).
Univers
ity of
Cap
e Tow
n
15
Employee performance against defined goals may be rewarded via merit pay or
extra payments, such as cash bonuses. Organisations may provide employees with
an annual increase in the form of a merit adjustment tied to individual performance.
This is an example of pay for performance being linked to the base salary
component of a total package (Armstrong & Murlis, 2002). The importance of pay for
performance was emphasized in a Corporate Leadership Council study, when a
differentiation of remuneration of at least 10% between top and low performers was
considered to be the single biggest retention factor amongst high value employees
(Bussin, 2002).
Performance rewards may also be linked to variable pay or pay at risk. Variable pay
programmes may be based on individual objectives, team or unit goals or company
targets. Incentive programmes are deemed to be the most effective variable pay
programmes in terms of driving performance and motivation (Jensen et al., 2007).
Incentive plans may include gainsharing and profit-sharing programmes.
Gainsharing programmes are incentives designed to share the results of productivity
gains with employees as a group. Profit-sharing plans are provided to employees
based on the profits of the company. Predetermined goals and formulae are used to
determine the amount allocated to employees. Payouts are in the form of cash,
deferred cash, company stocks or cash stocks (WorldatWork, 2003). These are often
used to retain executives (Capelli, 1999).
The Hay Groups 2010 report, The Changing Face of Reward, indicates that variable
pay programmes are increasingly being emphasized in total rewards offerings and
contributes significantly to employee motivation and commitment when linked directly
to individual performance and organisational goals (McMullen, 2010).
Recognition
Employees cite a lack of recognition as one of the main reasons for leaving their
employer. Only a lack of career advancement rates higher for most employees
(Holmes, 2008). Recognition is viewed as an important part of the total work
experience and is instrumental in reducing turnover, increasing productivity and
creating a positive work environment. Recognition involves a total commitment by
the organisation and its leadership (WorldatWork, 2003).
Univers
ity of
Cap
e Tow
n
16
Recognition programmes acknowledge employees actions, efforts and performance
and can meet an intrinsic psychological need for appreciation (WorldatWork, 2003).
The Motivation-Hygiene Theory proposed by Frederick Hertzberg provides an
indication of the importance of recognition. According to Hertzberg (as cited in
Jensen et al., 2007) remuneration will at best prevent employees from being
dissatisfied with their work environment, but it is recognition which provides
employees with a level of satisfaction.
Recognition may be either formal or informal. Formal approaches to recognition may
be monetary or non-monetary and include bonuses which differ from incentives as
they are provided without prior objectives being achieved. These include annual
bonuses, which reward individuals and groups for contributions to the organisation
and smaller ‗spot‘ bonuses given for extra contributions by either teams or
individuals. Other formal non-cash approaches to recognition may include service
awards, flexible work schedules and reserved parking (WorldatWork, 2003). Informal
approaches to recognition include inter alia gift certificates, thank you cards, team
dinners or personal or group recognition e.g. when managers act upon the
suggestions of team members and acknowledge this contribution (Armstrong &
Murlis, 2004).
One example of the impact of a successful recognition programme on retention was
illustrated by Sanlam Personal Finance which reported a reduction in staff turnover
of more than 3% after the introduction of a recognition programme (Holmes, 2008).
Career Opportunities
Career opportunities involve plans for employees to pursue their own career goals
and may include advancement into a more responsible position in an organisation.
Opportunities may include: increased exposure outside the department; publishing
articles; learning a foreign language; internships and apprenticeships with experts;
overseas assignments; internal job posting; job advancement/promotions; career
ladders; and succession planning (WorldatWork, 2003). A 2003 Towers Perrin Talent
report indicated that career advancement opportunities were rated amongst the top
two reward elements that retained employees. These findings are supported by the
Corporate Leadership Council‘s 2006 Employment Value Proposition Survey.
Univers
ity of
Cap
e Tow
n
17
Results of this survey indicated that 45% of participants stated that development
opportunities, job interest alignment and organisational respect for employees
created the highest impact on organisational commitment. Similarly in a study of
8000 employees in 35 countries, Kaye and Jordan-Evans (2002) noted that exciting
work and challenge as well as career growth and opportunities were rated by
employees as the top two reward factors that retained them.
Employers need to support the provision of internal career opportunities in order to
ensure that the most talented employees are deployed in positions that enable them
to deliver the greatest value to the organisation (WorldatWork, 2003). Companies
also need to ensure that talented employees are in jobs that are challenging and
interesting with meaningful work assignments as this will make optimal use of their
skills and enhance delivery of company goals such as operational efficiency, quality
of product or service and productivity. Job design is a pivotal part of this process
(Armstrong & Murlis, 2004). Butler and Waldroop (1999) recommend the process of
job sculpting or creating a customised career path which matches people to jobs that
allow their deeply embedded life interests to be expressed. Capelli (2000a) also
suggests focusing on redesigning jobs where these include tasks that are likely to
influence turnover. This was demonstrated in a study of UPS drivers, where the task
of loading packages was often quoted as the reason for driver turnover. These jobs
were subsequently redesigned.
Career Development
Career development consists of learning experiences designed to enhance
employees‘ applied skills and competencies. Employers can offer the opportunity for
learning and development by providing employees with a sequence of experiences
and training that equips them for their respective levels of responsibility (Armstrong &
Murlis, 2004). The following are some examples of learning opportunities: corporate
universities; new technology training; attendance at outside seminars and
conferences; self development tools and techniques; on-the-job training; rotational
assignments at a progressively higher scale including leading a project or
participating in a major project; and sabbaticals (WorldatWork, 2003).
Univers
ity of
Cap
e Tow
n
18
Increasingly, coaching and mentoring arrangements are also used to fast-track
learning at senior levels where specific behavioural issues may need to be
addressed. Leadership and management training are often included as part of such
opportunities (WorldatWork, 2003). Training and skills development are deemed
important elements in an employee‘s overall reward package, especially in
organisations where upward promotions are restricted and lateral movements are
common practice (Armstrong & Murlis, 2004).
Training and development are noted as having a positive impact on retention,
motivation and engagement, as it serves as a clear indication of an organisation‘s
investment in employees (Bussin, 2002). Cataldo, van Assen and D‘Alessandro
(2000) also indicated that training creates an increased sense of self-worth amongst
employees. Agarwal and Ferratt (1999) noted that employees in organisations that
provided job rotation and mentoring opportunities perceived these companies to
value their human resources and wished to maintain a long-term relationship with
them. In a Hay study conducted across 300 companies with over half a million
employees surveyed, the most important reward that retained employees was the
opportunity to learn new skills (Prewitt, 1999).
Conclusion of Total Rewards model overview
It is apparent from the above overview of total rewards that previous research has
identified a variety of rewards as being successful in the retention of employees in
general. Employees have different expectations and needs from their organisations
total rewards offering, and it is imperative that these needs be understood, otherwise
retention is likely to remain an ongoing challenge (Bussin, 2002). For this reason, it
is important to highlight the findings of previous research into the rewards that retain
specific groups of employees that form the focus of this study.
Rewards that retain Knowledge Workers
Drucker (2002, p.71) defined knowledge workers as ―…individuals who gain access
to jobs through formal education and who carry knowledge as a powerful resource
which they, rather than the organisation, own.‖ Knowledge workers also gain access
to jobs via formal education. Studies of knowledge workers across various industries
Univers
ity of
Cap
e Tow
n
19
in South Africa e.g. finance, information technology and engineering have been
conducted and a common set of total rewards appears to exist across this research.
Kinnear and Sutherland (2000) noted that the most important rewards that retained
knowledge workers from the fields of science, technology, financial services and
information technology were financial rewards, recognition and developmental
opportunities. A high value was also placed on performance based incentives,
(which is in alignment with the highly competitive nature of knowledge workers) as
well as on learning from professional colleagues and development in their areas of
expertise. Studies by Horwitz, Heng and Quazi (2003), Horwitz, Heng, Quazi,
Nonkwelo, Roditi and Van Eck (2006) as well as by Sutherland and Jordaan (2004),
supported the findings of Kinnear and Sutherland (2000) and similarly noted that
financial rewards, performance based incentives and recognition retained knowledge
workers. In addition, Sutherland (2004) noted that the need for challenging work and
career development opportunities were highly sought after in the retention of
knowledge workers.
Findings from Horwitz et al.‘s (2003) study of knowledge workers in Singapore
indicated that challenging work, competitive pay, performance bonuses and
incentives were valued retention strategies amongst Singaporeans. In a further study
of knowledge workers in South Africa and Singapore, Horwitz et al. (2006), noted
that South African knowledge workers were retained most effectively when provided
with challenging assignments and fulfilling work as well as incentive and
performance bonuses.
Lee and Maurer‘s (1997) study of knowledge workers focused on various types of
engineers and their turnover decisions. The results of their research indicated that
under varying decision paths the following reward factors influenced retention:
intrinsic challenges and the availability of a technical career ladder increased
retention amongst project and professional engineers; while training and
development interventions increased retention amongst professional and
management engineers.
Univers
ity of
Cap
e Tow
n
20
Birt et al., (2004) studied knowledge workers at a financial services institution.
Amongst the top variables chosen by participants as being effective retention tools
were challenging and meaningful work, career advancement opportunities and new
opportunities and challenges. Gaylard, Sutherland and Viedge (2005) in their study
of 239 IT workers noted that the main retention factor was a sense of equity in the
employment relationship via fairness of salary, work-life balance and job security.
Based on the aforementioned studies, it is apparent that the typical reward factors
that retain knowledge workers include: competitive pay, career advancement,
development opportunities, challenging work assignments, and performance based
incentives. There is also a similarity in reward elements considered unimportant to
knowledge workers. Sutherland and Jordaan‘s study (2004) indicated that reward
elements relating to personal comfort including medical aid benefits, social relations
at work, pension and contractual obligations did not retain knowledge workers. Birt et
al. (2004) similarly noted the lack of value placed on traditional retention strategies
such as work-life balance practices e.g. extra vacation, childcare facilities or
teambuilding exercises. Horwitz et al.‘s 2006 study supported these findings as
workplace fun and flexible work practices were deemed ineffective for South African
and Singaporean knowledge workers respectively.
Rewards that retain Employment Equity candidates
Limited social science and business literature exists in South Africa to indicate the
mix of total rewards that retain previously disadvantaged individuals (PDI‘s) or
candidates from designated groups, as per the Employment Equity Act No.55 of
1998. The designated group includes Africans, Indians and Coloureds as well as
females of all races.
Maisela (2001) noted that black professionals considered work environments with
strong Employment Equity (EE) initiatives and diverse work groups as key retention
factors. While Kotze and Roodt‘s (2005) study of demographic differences in
retention factors affecting managerial and specialist bank staff indicated that PDI‘s
rated performance standards, diversity, competitive remuneration and employer of
choice perception as rewards that were less likely to retain them, than non-PDI‘s.
Booysen‘s (2007) study of barriers to the effective retention of black managerial
Univers
ity of
Cap
e Tow
n
21
employees in a South African bank, noted that poor talent management, lack of
coaching, mentoring and career succession were obstacles to retention. In a study of
black professionals by Khanyile and Mapongo (2007) no clear relationship between
income and employee commitment was established although it was noted that this
group was more likely to remain in their current job because they valued the work
they were engaged in rather than the company they worked for.
The overview of South African studies provided above therefore indicates that career
opportunities are important for retention amongst PDI‘s. There also appears to be
limited research outside of South Africa with respect to those rewards that retain PDI
employees. Studies out of the United States tend to focus on antecedents of
turnover amongst minority groups in general.
Griffeth, Hom and Gaertner (2000) noted the following factors as being responsible
for US minority turnover: supervisor bias; pay inequity; impoverished job duties;
performance pressures; blocked careers; unsupportive colleagues; and tokenism.
These factors are generally believed to influence turnover via decreased job
satisfaction and organisational commitment. Other studies such as that of Thomas
and Gabarro (1999, as cited in Hom, Ellis & Roberson, 2008) noted that minority
executives experienced slower career progress than their white counterparts during
their early career stages (i.e. entry level to middle management). This may send a
message to minority employees that limited career advancement exists and
consequently induces early exits.
The source of the turnover reasons amongst US minorities tends to stem from career
advancement opportunities or poor talent management. Although these findings may
be similar to the South African research, they may also be considered incomparable
given the differences in the history of racial inequality as well as current South
African labour legislation which may influence the work experiences of PDI‘s.
Rewards that retain Female Employees
Significantly larger numbers of women have entered the global workforce as a result
of changing cultural norms and economic necessities. The International Labour
Organisation has indicated that women represent 40% of the global workforce with

Univers
ity of
Cap
e Tow
n
22
70% of women in the developed world and 60% of women in the developing world
engaged in paid employment. By 2015 it is expected that women will make up 48%
of the US workforce with similar numbers predicted for the European Union (Tucker
et. al., 2005).
In South Africa women are classified as equity candidates under the Employment
Equity Act No.5 of 1998. Female retention is therefore deemed to be a business
imperative and with the global change in workplace demographics it is necessary to
understand what causes turnover amongst women and subsequently what elements
of the total reward offering are considered effective retention tools for this group of
employees. Limited literature exists in both South Africa and internationally to
indicate the rewards that retain female employees and therefore the following studies
highlight the antecedents of turnover amongst female employees.
Contending reasons exist in the literature as to why women leave their current
employment. Schwartz (1989) suggested that female managers leave employment
due to their family structures (e.g. dual-earner status and number of children).
Similarly, Sicherman (1996) noted that a higher proportion of women than men left
their jobs for reasons such as household responsibilities and illness in the family.
Other factors such as higher wages were also quoted in Sicherman‘s research while
findings from a study by Stroh, Brett and Reilly (1996) indicated that female
managers‘ turnover was more closely related to traditional work related predictors of
turnover such as lack of career opportunities or hitting the glass ceiling. Related to
these findings, Krishnan (2009) investigated the career paths of women, who left
their organisations, and discovered that in 51% of the cases women joined rival
organisations in more prestigious positions, again suggesting that they lacked career
opportunities at previous employers.
In contrast to these findings, Kotze and Roodt (2005) noted one statistically
significant difference in retention factors between male and female senior managers
at a financial institution, notably that of employee well-being. In the context of Kotze
and Roodt‘s (2005) study, well-being pertained to talent development, career
advancement opportunities, the prospect of better pay and better communication.
Results indicated that females noted a higher level of employee well-being than their
Univers
ity of
Cap
e Tow
n
23
male counterparts. It was suggested that Employment Equity legislation and
practices may have had a negative impact on the well-being of white males (Kotze &
Roodt, 2005).
Based on the studies outlined above, rewards that should form the focus of retention
practices for female employees include work-life balance and associated flexible
work schedules and where a lack of career opportunities exist, career ladders and
career-enhancement opportunities may be effective.
Rewards that retain employees of different age groups
Age demographics of the global workforce are changing significantly with employees
aged 20-30 years old representing 70% of the US labour market (Tucker et al.,
2005). Over the next two decades 78 million employees in the United States will turn
65 (traditional retirement age in the Unites States) which will potentially create a
severe talent shortage especially in the financial services, healthcare, engineering
and education sectors (Tiku, 2007). Similarly in South Africa, experienced non-PDI
employees, aged 50+, will be exiting the labour market over the next 10 years,
leaving a large skills gap which the current education system is failing to address
(Temkin, 2008). This has created a situation where employers need to ensure that
they can grow and retain their young talent even though this is becoming an
increasingly difficult task with skilled professionals of all races increasingly choosing
to job hop in an effort to satisfy their need for 'instant career growth‖ (Jekwa,
2007,p.24)
Employees at different stages of their lives place emphasis on different aspects of
their total rewards mix. According to a study conducted by Towers Perrin (2003)
employees aged between 18-29 value base salary, variable pay and shares the
most, while employees aged between 30-44 value medical aid, base salary and
deferred remuneration. Employees aged between 45-54 view base salary, deferred
remuneration and retirement funding as important while employees of 55 years or
older value retirement funding and base salary equally together with medical aid
(Bussin, 2002).
Univers
ity of
Cap
e Tow
n
24
US research into different rewards that retain employees of different age groups
focuses on different generations. Generation is a term used to refer to people born in
the same general time span and who share historical or social life experiences. Due
to these distinct life experiences, each generation develops a unique personality that
determines its feelings towards authority and organisation. This generational
personality will also influence what individuals expect from their employer and how
they intend to satisfy their needs (Gursoy, Maier & Chi, 2007). Generations that have
been identified include: Baby Boomers (born between 1943 and 1960); Generation X
(born between 1961 and1980); and Generation Y or Millennials (born between 1981
and 2000).
One of the most apparent differences that exist between generations are the beliefs
they hold about the psychological work contract between employees and employers
(D‘Amato & Herzfeldt, 2008). The psychological contract is a set of tacit agreements
between members of the organisation and their managers, specifically mutual
promises and obligations between employers and employees (Robinson &
Rousseau, 1994). Baby Boomers (i.e. born between 1943 and 1960) are more likely
to believe in a psychological contract such that loyalty towards the employer and
hard work is rewarded with job security (i.e. ‗a job for life‘) and gradual pay
increases. During the 1980‘s, the trends of downsizing, restructuring and outsourcing
resulted in many organisations valuing capabilities more than loyalty. These changes
produced a shift in the psychological contract with the result that younger
generations, namely Generation X (i.e. born between 1961 and 1980) and
Generation Y (i.e. born between 1981 and 2000) did not expect a lifetime of
employment when they entered the workforce (D‘Amato & Herzfeldt, 2008). Instead,
Generation X and Y employees are more independent and self-reliant than Baby
Boomers; they are likely to have multiple careers; are prepared to make rapid career
transitions and leave an organisation when their needs are not being met; and
emphasize work-life balance. Baby Boomers however expect a linear career path as
well as career growth in one organisation and are prone to being workaholics. They
also prefer to be managed and expect to retire by age 65 (Ahlrichs, 2000).
Baby Boomers make up a sizeable portion of the current workforce and have
extensive knowledge and business experience. As such, they are considered to be
Univers
ity of
Cap
e Tow
n
25
the company‘s intellectual capital. Literature indicates that this generation is retained
by benefits programmes such as medical aid and retirement benefits and initiatives
to assist in preparing for their retirement (Tiku, 2007). These findings are supported
by the Towers Perrin (2003) study outlined above as well as by Wallace (2006) in a
study of generational differences across the legal profession where pay was deemed
to be more important to Baby Boomers than to Generation X‘ers.
The most successful reward elements to retain Generation X employees include the
offer of career development opportunities including jobs that aid this generation in
advancing to the next job; career ladders; and providing challenging assignments
(Harvard Business Essentials, 2002). These rewards are in alignment with this
generation‘s need to be loyal to their own skills as opposed to a particular company.
D‘Amato and Herzfeldt (2008) studied generational differences across retail
managers in Europe and noted Generation X‘ers need for continuous learning and
expansion of skills which created a sense of organisational commitment. Gursoy et
al.‘s (2008) focus group study of Generation X‘ers also highlighted their need to
‗leave work at work‘ as well as trying to strike a balance in their lives. These findings
were supported by Gabriel‘s (1999) study where work-life programmes such as
sabbaticals and flexitime were popular amongst Generation X‘ers.
Studies indicate that Generation Y have similar needs to Generation X. The South
African Graduate Recruitment Association (SAGRA) conducted a Talent Retention
Study amongst graduates in South Africa in 2005. Results of this study indicated that
the top five items deemed important to retain Generation Y graduates were:
advancement opportunities; developing new knowledge; open and transparent
communication; challenging and meaningful work; and work-life balance. Similarly, in
a University of Cape Town Graduate School of Business study of Generation Y MBA
students, flexibility; work-life balance; mobility; and career development opportunities
were deemed important as workplace needs (Cape Argus Workplace, 2010).
These findings are supported by literature in the US where job rotations and shifting
job assignments are proposed as retention strategies for Generation Y (Ruch, 2000).
Work-life and flexibility options such as flexitime, encouraging the use of online
Univers
ity of
Cap
e Tow
n
26
social networks like Facebook and Twitter or flexi office are seen as ways to satisfy
the Millennials‘ need for loyalty to their lifestyle rather than their job (Roy, 2008).
Contrary to the findings outlined above, a study by Willmer (2008), revealed that only
26% of Generation Y‘ers surveyed considered opportunities for advancement as a
career concern whilst 33% indicated compensation and benefits as their top career
concern. These findings were attributed to Generation Y employees in the United
States being more conscious of growing up in an environment where the US
healthcare system delivered fewer services at higher costs and the future of Social
Security benefits was in doubt (Willmer, 2008).
Conclusion
It is apparent from the above studies that to succeed in the war for talent in South
Africa, employers need to have an understanding of those reward factors that
influence whether or not their talented employees choose to ―stay‖ or ―leave‖ (Dibble
as cited in Kotze & Roodt, 2005,p.48). Much of the literature focuses on the
antecedents of turnover and these findings are often applicable to designated groups
outside of the South African workplace. Furthermore, no studies appear to outline
the combination and the quantum of rewards that retain knowledge workers or
employees of different races, genders or age groups.
The current study therefore has two main research objectives which it aims to
address: to identify the mix and the desired amount of total rewards that retain
employees from various demographic groups, which - in the context of the current
study - refers to knowledge workers and employees from different race, gender and
age groups. The second objective is to develop an understanding of the total
rewards that these employees, in the context of the South African workplace, deem
important in their retention.
Univers
ity of
Cap
e Tow
n
27
CHAPTER 3
METHOD
This chapter will describe the methods used within the current study to address the
research questions. The research approach and motivation for using the research
design will be discussed. Descriptive statistics of the research samples will be
outlined as will the sampling processes followed. Details of the three measuring
instruments as well as the data collection procedures employed will also be
described. Finally the methods for statistical analysis will be reviewed with specific
details provided in respect of conjoint analysis.
Research Design
This study follows the quantitative research tradition while adopting a descriptive
research design to determine the answers to the research questions. A quantitative
research approach involves the collection of primary data from a large number of
individuals via a questionnaire which allows individuals‘ attitudes and opinions to be
evaluated in a measurable way (Martins, Loubser & Van Wyk, 1996; Babbie &
Mouton, 2001). Quantitative data provides objectivity to the research process by
applying statistical criteria to measures. Objectivity is considered an important
component of the science of research (Hair, Babin, Money & Samouel, 2003).
A descriptive study aims to accurately describe phenomena without providing causal
explanations thereof (Terre Blanche, Durrheim & Painter, 2006). Such designs are
usually structured to measure the characteristics described in the research question
(Hair et al., 2003). Descriptive research aims to gather data without manipulating the
research context. It is a non-intrusive research approach and deals with naturally
occurring phenomena, but it cannot be used to create a causal relationship i.e.
where one variable affects another (Babbie & Mouton, 2001). The current study
used a descriptive design to depict the total rewards and the ideal mix of total
rewards that retain different demographic groups. This study does not describe
antecedents that cause the ideal mix of total rewards to retain different groups of
employees, which would imply a causal relationship.

Univers
ity of
Cap
e Tow
n
28
The method that was used to determine the ideal mix of total rewards was conjoint
analysis. Conjoint analysis is one of the most widely-used quantitative methods in
Marketing Research (http://www.sawtoothsoftware.com). More particularly it is
employed to identify which attributes in a product, service or concept are most
desired by an individual (Martins et al., 1996).
Terminology of aspects relevant in conjoint studies are listed and defined below:
Attribute: Is a general feature of a concept/product/service. Each attribute is made
up of levels (Hair, Anderson, Tatham & Black, 1987).
Level: Is a specific value describing a factor (Hair et al., 1987).
Stimulus: Specific set of levels (one per factor) evaluated by respondents (Hair et
al., 1987).
Utility: An individual‘s subjective preference judgment representing the holistic
value or worth of a specific object. It is assumed to be formed from a combination of
part-worth estimates for any specified set of levels with the use of an additive model
(Hair et al., 1987).
Part-worth: the utility individuals attach to the levels of each attribute or a
representation of the importance of each aspect of a concept/product or service in
the individuals overall preference ratings (Hair et al., 1987).
Conjoint analysis is based on the assumption that individuals perceive products as
consisting of a number of attributes, each offering a measure of worth/value or utility.
Conjoint analysis identifies the relative worth of each of the attributes making up a
product/service or concept in order to find the offering which contains the most
desirable combination of attributes (Martins et al., 1996). Rather than asking survey
respondents directly what attributes they find most important, conjoint analysis
utilizes the more realistic context of respondents evaluating potential profiles (Orme,
2009). Each profile includes multiple conjoined product features (hence, conjoint
analysis), such as illustrated in Figure 2 below:
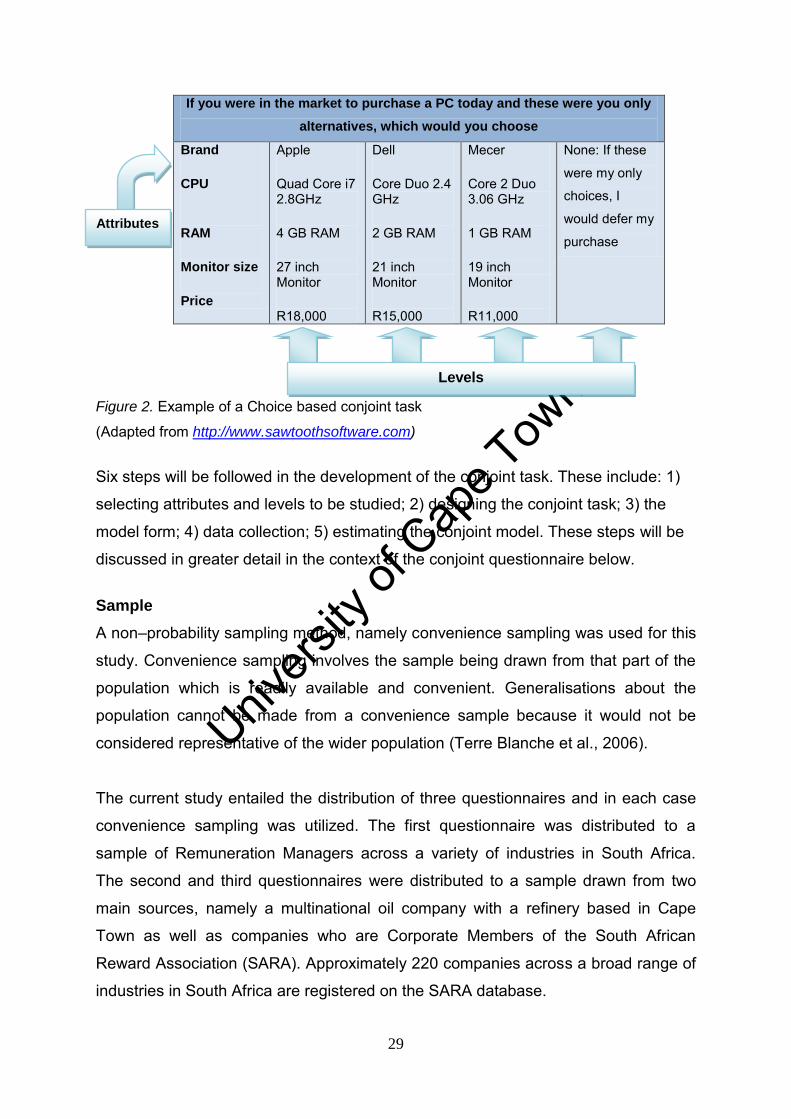
Univers
ity of
Cap
e Tow
n
29
If you were in the market to purchase a PC today and these were you only
alternatives, which would you choose
Brand
CPU
RAM
Monitor size
Price
Apple
Quad Core i7 2.8GHz
4 GB RAM
27 inch Monitor
R18,000
Dell
Core Duo 2.4 GHz
2 GB RAM
21 inch Monitor
R15,000
Mecer
Core 2 Duo 3.06 GHz
1 GB RAM
19 inch Monitor
R11,000
None: If these
were my only
choices, I
would defer my
purchase
Figure 2. Example of a Choice based conjoint task
(Adapted from http://www.sawtoothsoftware.com)
Six steps will be followed in the development of the conjoint task. These include: 1)
selecting attributes and levels to be studied; 2) designing the conjoint task; 3) the
model form; 4) data collection; 5) estimating the conjoint model. These steps will be
discussed in greater detail in the context of the conjoint questionnaire below.
Sample
A non–probability sampling method, namely convenience sampling was used for this
study. Convenience sampling involves the sample being drawn from that part of the
population which is readily available and convenient. Generalisations about the
population cannot be made from a convenience sample because it would not be
considered representative of the wider population (Terre Blanche et al., 2006).
The current study entailed the distribution of three questionnaires and in each case
convenience sampling was utilized. The first questionnaire was distributed to a
sample of Remuneration Managers across a variety of industries in South Africa.
The second and third questionnaires were distributed to a sample drawn from two
main sources, namely a multinational oil company with a refinery based in Cape
Town as well as companies who are Corporate Members of the South African
Reward Association (SARA). Approximately 220 companies across a broad range of
industries in South Africa are registered on the SARA database.
Attributes
Levels
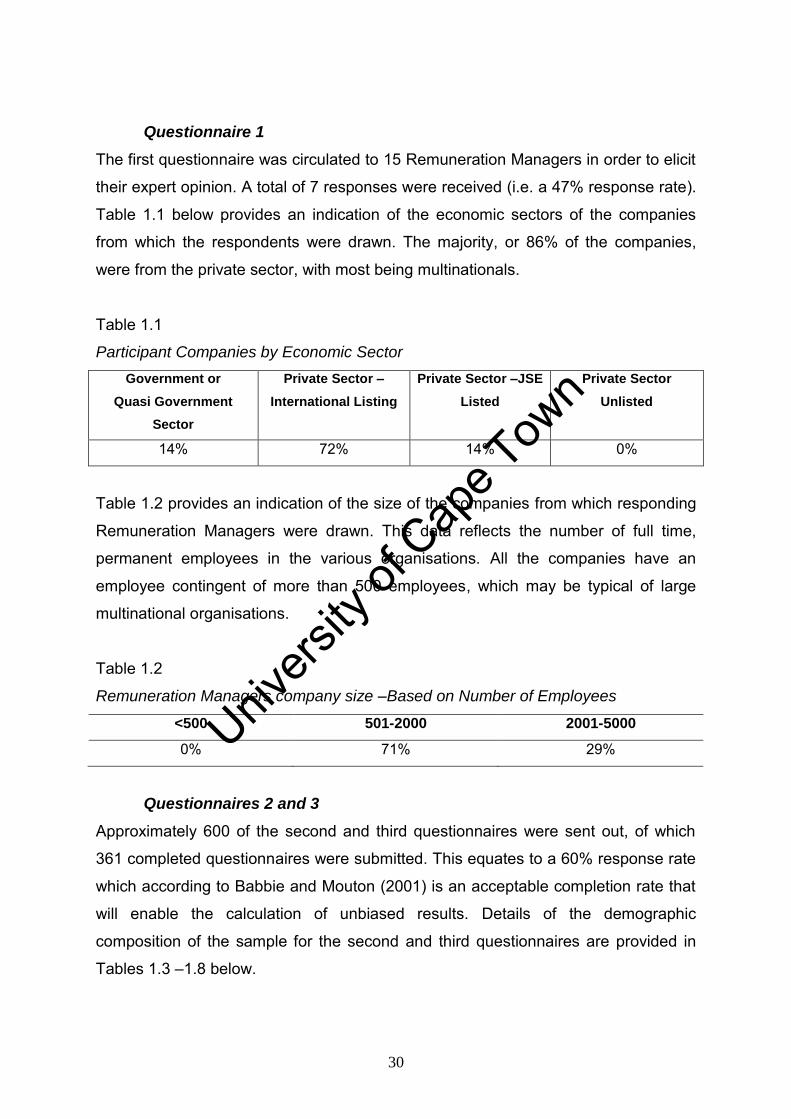
Univers
ity of
Cap
e Tow
n
30
Questionnaire 1
The first questionnaire was circulated to 15 Remuneration Managers in order to elicit
their expert opinion. A total of 7 responses were received (i.e. a 47% response rate).
Table 1.1 below provides an indication of the economic sectors of the companies
from which the respondents were drawn. The majority, or 86% of the companies,
were from the private sector, with most being multinationals.
Table 1.1
Participant Companies by Economic Sector
Government or
Quasi Government
Sector
Private Sector –
International Listing
Private Sector –JSE
Listed
Private Sector
Unlisted
14% 72% 14% 0%
Table 1.2 provides an indication of the size of the companies from which responding
Remuneration Managers were drawn. This data reflects the number of full time,
permanent employees in the various organisations. All the companies have an
employee contingent of more than 500 employees, which may be typical of large
multinational organisations.
Table 1.2
Remuneration Managers company size –Based on Number of Employees
<500 501-2000 2001-5000
0% 71% 29%
Questionnaires 2 and 3
Approximately 600 of the second and third questionnaires were sent out, of which
361 completed questionnaires were submitted. This equates to a 60% response rate
which according to Babbie and Mouton (2001) is an acceptable completion rate that
will enable the calculation of unbiased results. Details of the demographic
composition of the sample for the second and third questionnaires are provided in
Tables 1.3 –1.8 below.
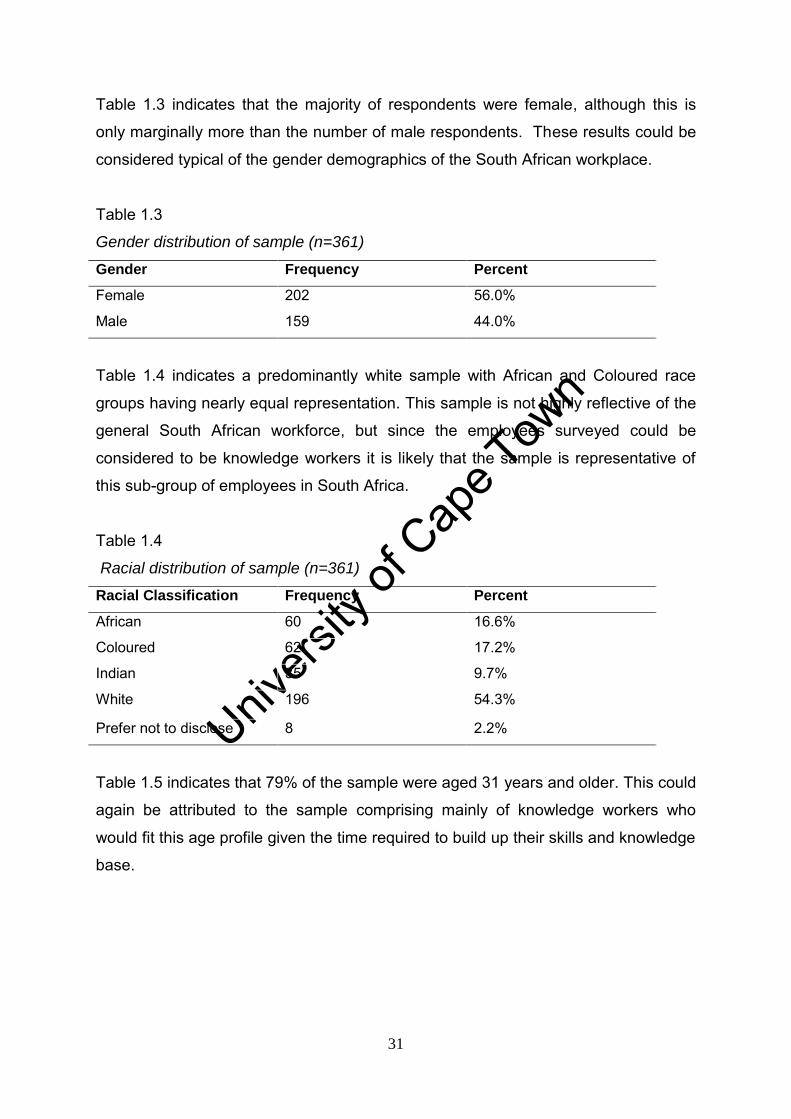
Univers
ity of
Cap
e Tow
n
31
Table 1.3 indicates that the majority of respondents were female, although this is
only marginally more than the number of male respondents. These results could be
considered typical of the gender demographics of the South African workplace.
Table 1.3
Gender distribution of sample (n=361)
Gender Frequency Percent
Female 202 56.0%
Male 159 44.0%
Table 1.4 indicates a predominantly white sample with African and Coloured race
groups having nearly equal representation. This sample is not highly reflective of the
general South African workforce, but since the employees surveyed could be
considered to be knowledge workers it is likely that the sample is representative of
this sub-group of employees in South Africa.
Table 1.4
Racial distribution of sample (n=361)
Racial Classification Frequency Percent
African 60 16.6%
Coloured 62 17.2%
Indian 35 9.7%
White 196 54.3%
Prefer not to disclose 8 2.2%
Table 1.5 indicates that 79% of the sample were aged 31 years and older. This could
again be attributed to the sample comprising mainly of knowledge workers who
would fit this age profile given the time required to build up their skills and knowledge
base.
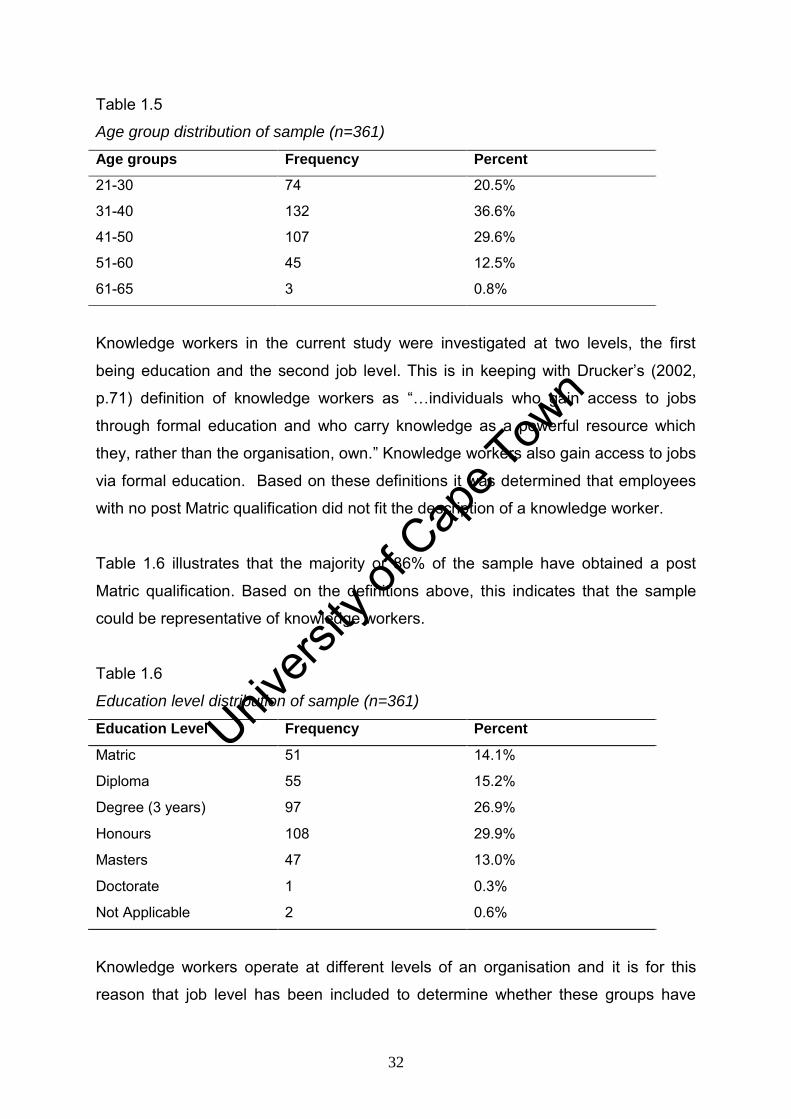
Univers
ity of
Cap
e Tow
n
32
Table 1.5
Age group distribution of sample (n=361)
Age groups Frequency Percent
21-30 74 20.5%
31-40 132 36.6%
41-50 107 29.6%
51-60 45 12.5%
61-65 3 0.8%
Knowledge workers in the current study were investigated at two levels, the first
being education and the second job level. This is in keeping with Drucker‘s (2002,
p.71) definition of knowledge workers as ―…individuals who gain access to jobs
through formal education and who carry knowledge as a powerful resource which
they, rather than the organisation, own.‖ Knowledge workers also gain access to jobs
via formal education. Based on these definitions it was determined that employees
with no post Matric qualification did not fit the description of a knowledge worker.
Table 1.6 illustrates that the majority or 86% of the sample have obtained a post
Matric qualification. Based on the definitions above, this indicates that the sample
could be representative of knowledge workers.
Table 1.6
Education level distribution of sample (n=361)
Education Level Frequency Percent
Matric 51 14.1%
Diploma 55 15.2%
Degree (3 years) 97 26.9%
Honours 108 29.9%
Masters 47 13.0%
Doctorate 1 0.3%
Not Applicable 2 0.6%
Knowledge workers operate at different levels of an organisation and it is for this
reason that job level has been included to determine whether these groups have
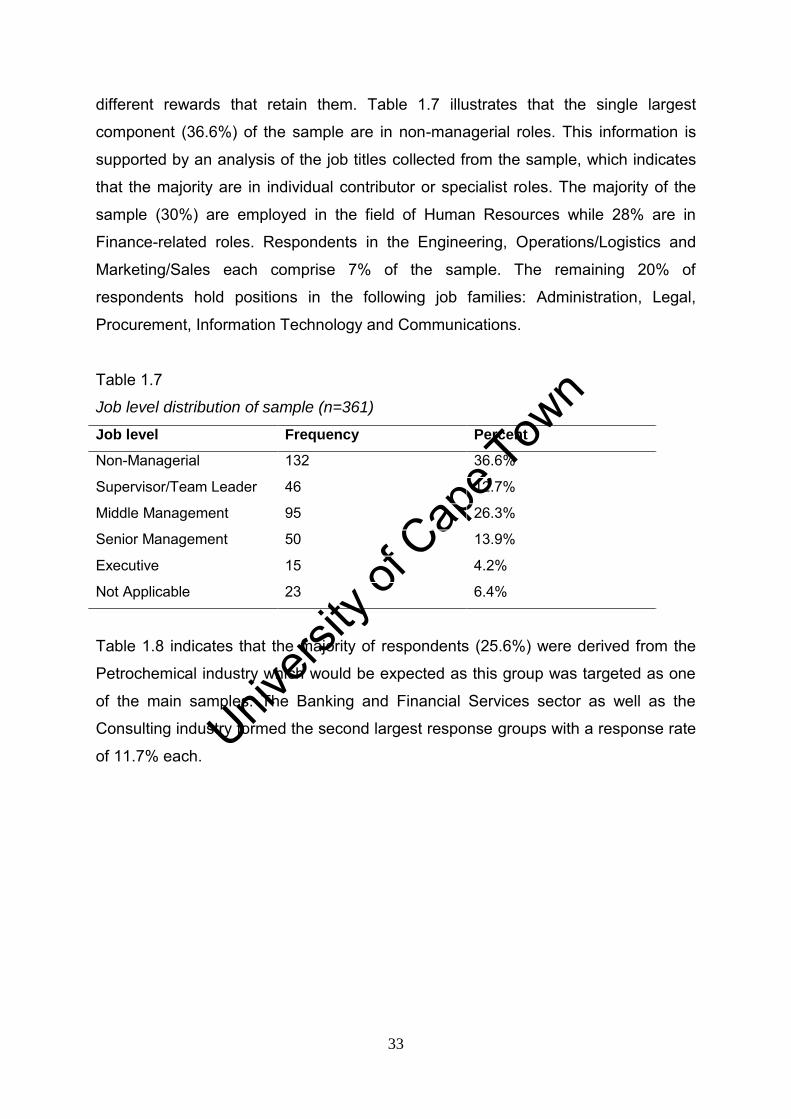
Univers
ity of
Cap
e Tow
n
33
different rewards that retain them. Table 1.7 illustrates that the single largest
component (36.6%) of the sample are in non-managerial roles. This information is
supported by an analysis of the job titles collected from the sample, which indicates
that the majority are in individual contributor or specialist roles. The majority of the
sample (30%) are employed in the field of Human Resources while 28% are in
Finance-related roles. Respondents in the Engineering, Operations/Logistics and
Marketing/Sales each comprise 7% of the sample. The remaining 20% of
respondents hold positions in the following job families: Administration, Legal,
Procurement, Information Technology and Communications.
Table 1.7
Job level distribution of sample (n=361)
Job level Frequency Percent
Non-Managerial 132 36.6%
Supervisor/Team Leader 46 12.7%
Middle Management 95 26.3%
Senior Management 50 13.9%
Executive 15 4.2%
Not Applicable 23 6.4%
Table 1.8 indicates that the majority of respondents (25.6%) were derived from the
Petrochemical industry which would be expected as this group was targeted as one
of the main samples. The Banking and Financial Services sector as well as the
Consulting industry formed the second largest response groups with a response rate
of 11.7% each.
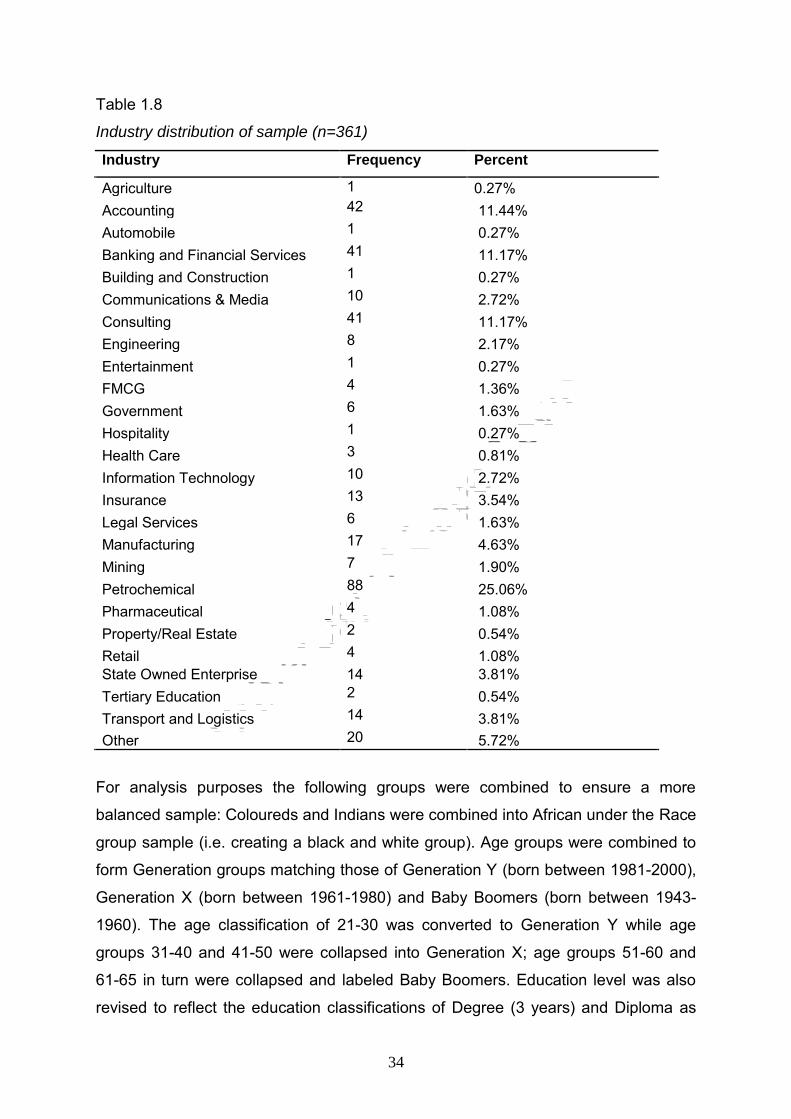
Univers
ity of
Cap
e Tow
n
34
Table 1.8
Industry distribution of sample (n=361)
Industry Frequency Percent
Agriculture 1 0.27% Accounting 42 11.44% Automobile 1 0.27% Banking and Financial Services 41 11.17% Building and Construction 1 0.27% Communications & Media 10 2.72% Consulting 41 11.17% Engineering 8 2.17% Entertainment 1 0.27% FMCG 4 1.36% Government 6 1.63% Hospitality 1 0.27% Health Care 3 0.81% Information Technology 10 2.72% Insurance 13 3.54% Legal Services 6 1.63% Manufacturing 17 4.63% Mining 7 1.90% Petrochemical 88 25.06% Pharmaceutical 4 1.08% Property/Real Estate 2 0.54% Retail 4 1.08% State Owned Enterprise 14 3.81% Tertiary Education 2 0.54% Transport and Logistics 14 3.81% Other 20 5.72%
For analysis purposes the following groups were combined to ensure a more
balanced sample: Coloureds and Indians were combined into African under the Race
group sample (i.e. creating a black and white group). Age groups were combined to
form Generation groups matching those of Generation Y (born between 1981-2000),
Generation X (born between 1961-1980) and Baby Boomers (born between 1943-
1960). The age classification of 21-30 was converted to Generation Y while age
groups 31-40 and 41-50 were collapsed into Generation X; age groups 51-60 and
61-65 in turn were collapsed and labeled Baby Boomers. Education level was also
revised to reflect the education classifications of Degree (3 years) and Diploma as
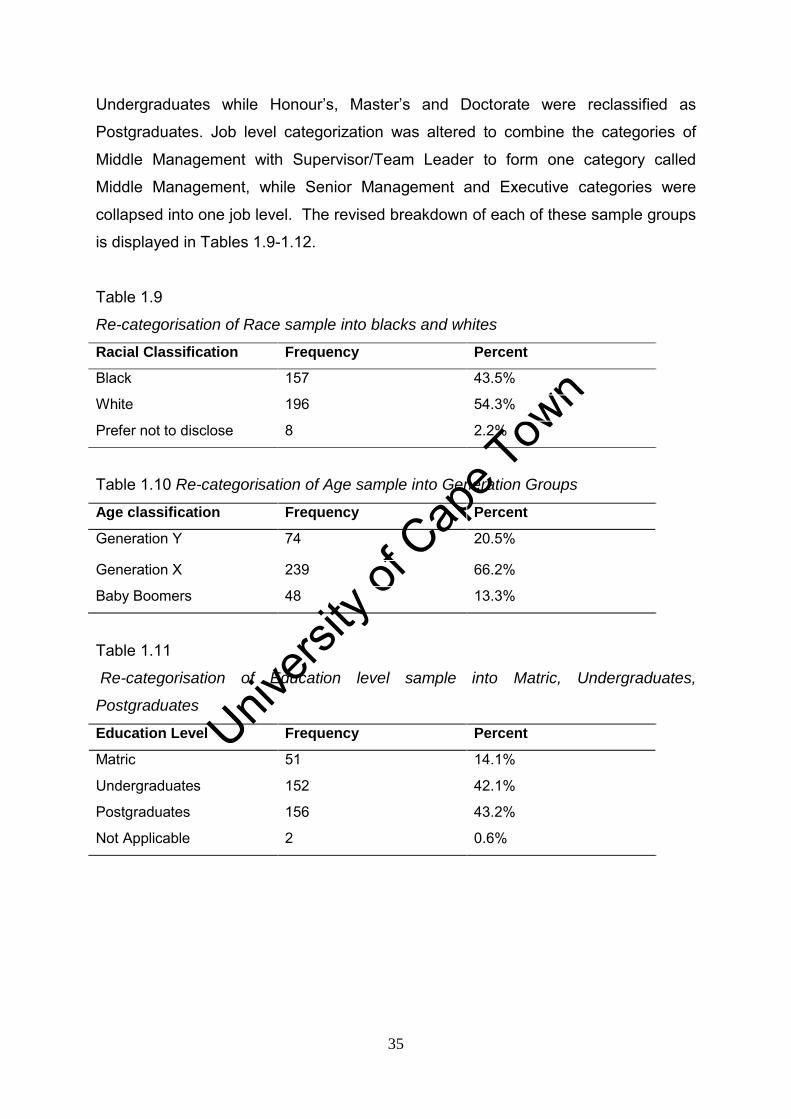
Univers
ity of
Cap
e Tow
n
35
Undergraduates while Honour‘s, Master‘s and Doctorate were reclassified as
Postgraduates. Job level categorization was altered to combine the categories of
Middle Management with Supervisor/Team Leader to form one category called
Middle Management, while Senior Management and Executive categories were
collapsed into one job level. The revised breakdown of each of these sample groups
is displayed in Tables 1.9-1.12.
Table 1.9
Re-categorisation of Race sample into blacks and whites
Racial Classification Frequency Percent
Black 157 43.5%
White 196 54.3%
Prefer not to disclose 8 2.2%
Table 1.10 Re-categorisation of Age sample into Generation Groups
Age classification Frequency Percent
Generation Y 74 20.5%
Generation X 239 66.2%
Baby Boomers 48 13.3%
Table 1.11
Re-categorisation of Education level sample into Matric, Undergraduates,
Postgraduates
Education Level Frequency Percent
Matric 51 14.1%
Undergraduates 152 42.1%
Postgraduates 156 43.2%
Not Applicable 2 0.6%
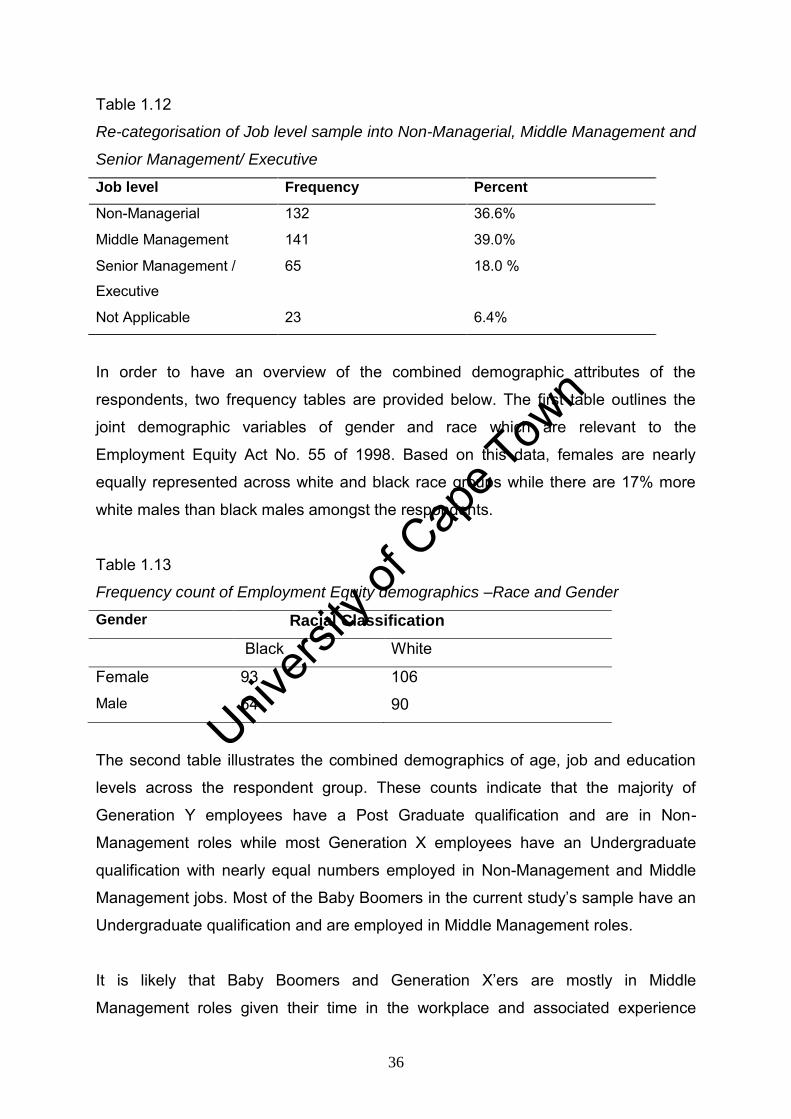
Univers
ity of
Cap
e Tow
n
36
Table 1.12
Re-categorisation of Job level sample into Non-Managerial, Middle Management and
Senior Management/ Executive
Job level Frequency Percent
Non-Managerial 132 36.6%
Middle Management 141 39.0%
Senior Management /
Executive
65 18.0 %
Not Applicable 23 6.4%
In order to have an overview of the combined demographic attributes of the
respondents, two frequency tables are provided below. The first table outlines the
joint demographic variables of gender and race which are relevant to the
Employment Equity Act No. 55 of 1998. Based on this data, females are nearly
equally represented across white and black race groups while there are 17% more
white males than black males amongst the respondents.
Table 1.13
Frequency count of Employment Equity demographics –Race and Gender
Gender Racial Classification
Black White
Female 93 106 Male 64 90
The second table illustrates the combined demographics of age, job and education
levels across the respondent group. These counts indicate that the majority of
Generation Y employees have a Post Graduate qualification and are in Non-
Management roles while most Generation X employees have an Undergraduate
qualification with nearly equal numbers employed in Non-Management and Middle
Management jobs. Most of the Baby Boomers in the current study‘s sample have an
Undergraduate qualification and are employed in Middle Management roles.
It is likely that Baby Boomers and Generation X‘ers are mostly in Middle
Management roles given their time in the workplace and associated experience

Univers
ity of
Cap
e Tow
n
37
which has facilitated them moving into more senior roles than their less experienced
counterparts in Generation Y. The frequency count for education level may also be
reflective of the current South African workplace as Baby Boomers and Generation
X‘ers may have only required an Undergraduate qualifications upon entering the job
market while Generation Y‘s may have noted an increasing need to have Post
Graduate qualifications to secure entry level employment in the current labour
market.

Univers
ity of
Cap
e Tow
n
38
Table 1.14
Frequency count across age groups, job and education levels
Age
Classification
Generation Y Generation X Baby Boomers
Job
Level Non-
Mngment Middle
Mngment
Senior Mngment/
Execs
Not
Applicable Non-
Mngment Middle
Mngment
Senior Mngment/
Execs
Not
Applicable Non-
Mngment Middle
Mngment
Senior Mngment/
Execs
Not
Applicable
Education
Level
Matric 6 0 0 1 14 12 2 3 3 8 1 1
Undergraduate 12 6 0 2 45 46 13 4 2 14 8 0
Post Graduate 22 13 3 9 26 38 32 2 1 3 6 1
Not Applicable 0 0 0 0 1 1 0 0 0 0 0 0
Univers
ity of
Cap
e Tow
n
39
Measuring Instruments
Remuneration Managers Questionnaire
Three questionnaires were developed for this study. The first questionnaire
(Appendix A) was designed to elicit expert opinion from Remuneration Managers
and aid in the development of the conjoint task required for questionnaire 3. The
conjoint task required the identification of different total rewards which were deemed
to retain employees. In addition three levels of these total rewards, ranging from
small, medium and large, had to be identified.
Taking the goal of creating a conjoint model with different attributes and levels into
account, questionnaire 1 first outlined a scenario of 3 employees, (Person A, B and
C), each with different skill sets or talents which employers may or may not choose
to retain in their organisations. Employee A, was classified as scarce talent and
posed a high retention risk to the company were they to resign. Employee B had
technical skills and posed a moderate retention risk. Employee C was not considered
key talent and was easily replaceable. Employee C was considered to be the
recipient of the lowest level of rewards and would equate to level 3 in the conjoint
task while Employee A, the recipient of the highest level of rewards, would equate to
level 1 and Employee B to the intermediate level or level 2.
In order to describe the various values of the total reward elements across the three
levels, five total reward elements were first identified using the WorldatWork Total
Rewards model, these included:1) Remuneration and Benefits; 2) Work-Life; 3)
Career Advancement; 4) Learning and Development; and 5) Recognition and
Performance. These total reward elements were identified as commonly applicable
in many large organisations according to a Remchannel South African Benefits
Guide survey (2007). The quantum of each total reward element was then described
in varying proportions ranging from small, medium and large.
Remuneration Managers were subsequently requested to identify the different size
or levels of total rewards which, in either their experience or in their opinion were
likely to retain employees A, B or C. Consequently the level of total reward that
received the highest percentage for employees A, B and C was converted into level,
1, 2 or 3 in the conjoint task.
Univers
ity of
Cap
e Tow
n
40
It should be noted that employee benefits cannot be provided on a differentiated
basis to retain employees as these form part of the conditions of employment for all
employees. Benefits were therefore not included in the Remuneration Manager
questionnaire. Practically, however, many companies provide employees with
benefits such as retirement funding and medical aid of which they are often
permitted to select flexible options of varying amounts depending on personal needs.
In order to replicate such flexible total rewards offerings, benefits of varying levels
were included in the conjoint task in questionnaire 3.
WorldatWork Total Rewards Questionnaire
The second questionnaire was developed using the WorldatWork Total Rewards
model and was designed to determine which total rewards respondents deemed
most important in deciding whether to stay or leave their current organisation. This
questionnaire was also developed with the aim of allowing employees to identify the
total reward elements that they considered significant in their retention but may
nevertheless have traded off against another reward element in the context of the
conjoint task which required a different cognitive approach to selecting rewards that
were valued in their retention.
Responses were recorded on a 5-point Likert-type scale where 1 represented ―Not
at all important‖ and 5 ―Very Important.‖ The scale comprised 20 questions covering
six total rewards namely: 1) Performance and Recognition; 2) Work-Life Balance; 3)
Learning; 4) Career Advancement; 5) Remuneration; and 6) Benefits. Typical reward
offerings, as identified in the results of questionnaire 1, were used to develop the
scale items. Performance and Recognition was covered by five items, Work-Life
Balance by eight items, Learning by two items, Career Advancement by two items,
Remuneration by two items and Benefits by one item. A copy of this questionnaire is
attached in Appendix B.
Conjoint Task Questionnaire
The third questionnaire contained a computer generated conjoint task which was
used to establish employee preferences for the ideal mix of total rewards. As
Univers
ity of
Cap
e Tow
n
41
mentioned above there are six steps which are followed in the design and execution
of the conjoint task included in the conjoint questionnaire:
Step 1: Select attributes and levels to be studied
The conjoint method assumes that individuals view offerings as consisting of bundles
of attributes. Respondents are required to trade off hypothetical products each
described by a different attribute mix. To define a product bundle, each predefined
attribute must be described by levels which are ranked from smallest to biggest.
Product bundles are then constructed by combining different levels from each of the
predefined attributes, as demonstrated in Figure 2 (Martins et al., 1996).
The first step in the current conjoint study was to select the attributes appropriate to
rewards that retain. Both attributes and levels of rewards were determined by the
literature review and validated via the first questionnaire sent to Remuneration
Managers. Based on the outcome of both of these exercises the conjoint task
included five attributes and three levels. A total of eight conjoint tasks were
presented in questionnaire 3. An example of one of the conjoint tasks generated is
presented in Appendix B.
Step 2: Designing the Conjoint task
There are various conjoint methods that can be adopted and include amongst other
options, the traditional and the choice based methods. The traditional method is best
suited when the number of attributes is less than ten. A respondent evaluates stimuli
constructed with selected levels from each attribute, known as full profiles (Hair et
al., 1987). Each attribute is equally represented and considered in a single profile.
For this reason traditional conjoint analysis has been associated with an information-
intensive approach to decision making (Hair et al., 1987).
In the choice based conjoint method, respondents choose amongst a smaller subset
of factors upon which comparisons and choice are ultimately made. For this reason
the choice based conjoint model is considered to be more complex and only six or
less attributes are generally utilised (Hair et al., 1987). One of the main advantages
of the choice based conjoint task is the realistic choice process portrayed by the
choice set. Elrod, Louviere and Davey (1992) also indicate the advantage of models
Univers
ity of
Cap
e Tow
n
42
estimated from choice data which allow for the direct prediction of choice shares,
avoiding the need for conjoint simulators which may use questionable assumptions
to translate predicted ratings into choices. These advantages were the basis for the
decision to use choice based conjoint analysis in the current study.
Step 3: Model Form
In order for conjoint analysis to explain the preference structure, it is necessary to
specify the composition rule to be used. The composition rule describes how
participants combine attributes to produce a judgment of relative value or utility for a
service or product. The choice of composition rule determines the type and number
of stimuli that the participants must evaluate. The most basic composition rule which
was used in this study was the additive model as opposed to the interaction model,
which assumes that the participants add up the values for each attribute (i.e. the
part-worths of the levels) to derive the total value for a combination of attributes (Hair
et al., 1987).
Step 4: Data Collection
Using choice-based conjoint analysis requires respondents to choose a full-profile
stimulus from a set of alternative stimuli known as a choice set. This method is
deemed more representative of the actual process of selecting items from a set of
competing items. Sawtooth Software (used in the development of the current study‘s
conjoint task) further aids this process by generating a series of unique combinations
of levels and attributes and presents these randomly to respondents. Choice-based
conjoint analysis also provides an option of not choosing any of the presented stimuli
by including a no choice option in the choice set (Hair et al., 1987).
The process of selecting a subset of all possible stimuli must be performed in a way
that maintains the orthogonality (i.e. no correlation among levels of attributes) and
balance of the design (i.e. each level in a factor appears the same number of times).
Choice sets should have minimal overlap since alternatives that have the same level
of an attribute provide no information on the preference for that attribute (Haaijer,
1999).
Univers
ity of
Cap
e Tow
n
43
Step 5: Estimating the Conjoint Model
Evaluations of each stimulus can be used to estimate part-worth‘s for each level and
ultimately define the importance of each attribute. Estimated part-worth‘s are used to
generate predicted preference values for each stimulus. (Hair et al.,1987). The
development of the MultiNomial Logit (MNL) estimation technique provided an
operational method for estimating choice based conjoint models. MNL relates the
utilities of the chosen option to the sum of the utilities across all alternatives in the
choice set. The multinomial logit model is therefore used to predict choice
probabilities or preference shares using the following equation (Eggers & Sattler,
2008):
[p (alt_1) = exp(util_alt_1 exp (util_alt_1)+ exp (util_alt_2)+…+exp (util _none)]
Choice-based conjoint models used to be estimated from data pooled across all
individuals, but a method called Hierarchical Bayesian modeling was introduced
which allows for individual part-worth estimates to be determined. This study aims to
investigate individual part-worths and for this reason Hierarchical Bayes modeling
was used here. Estimation at the individual level assumes that individual‘s
parameters are self-consistent and different from aggregated data and therefore
individuals‘ data receives more weighting in the estimation of part-worth‘s (Green,
Krieker & Wind, 2001).
Hierarchical Bayesian modeling operates on the assumption that individual part-
worth‘s are described by a multivariate normal distribution, characterized by a series
of means and covariance‘s. Initial estimates of part-worth‘s for each respondent are
estimated and then updated using an iterative process called Gibbs sampling (Orme,
2000). With each iteration, an estimate is made for each parameter based on the
current estimates of the others. After numerous iterations, the Hierarchical Bayes
method produces part-worth‘s that fit each individual‘s outcome reasonably well, but
borrows information from other respondents to stabilize the estimates (Orme, 2000,
p.3).
After a certain number of iterations (often 10 000 or more), convergence is assumed
and the estimates of respondent part-worth‘s are saved after every subsequent
Univers
ity of
Cap
e Tow
n
44
iteration. These saved results are called draws and reflect the uncertainty around
each respondent‘s part-worth‘s. Estimates of part-worth‘s are computed for each
respondent by averaging the respondent‘s draws (Orme, 2000).
Step 6: Assessing Reliability and Validity
To assess the quality of the estimation model, the goodness-of-fit must be
determined by comparing actual values with the values predicted by the estimation
model. The most common procedure is to include holdout stimuli or validation
stimuli, which are a set of stimuli that are not used in the estimation of part-worth‘s
(Hair et al., 1987). Estimated part-worths are used to predict preferences for the
validation stimuli to assess validity and reliability of the original estimates. By
correlating the predicted evaluations with those obtained from respondents, internal
validity can be determined (Malhotra, 2004).
Holdout stimuli must be designed to ensure that one choice does not dominate in the
sense that all respondents agree which is best and should also not present concepts
that are equally attractive, since equal shares of preference are likely to be
predicted. Effective holdout stimuli are designed with some prior knowledge of
respondent preferences (Johnson, 1997). Little information was available in the
literature to indicate the likely preference for total rewards that retain and as such the
holdout stimuli for this study was designed on a near random basis using an
approximation of 50/20/20/10 estimated preference share for the 4 choices (including
the no choice option). The holdout stimuli for this study are presented in Table 1.13
below.
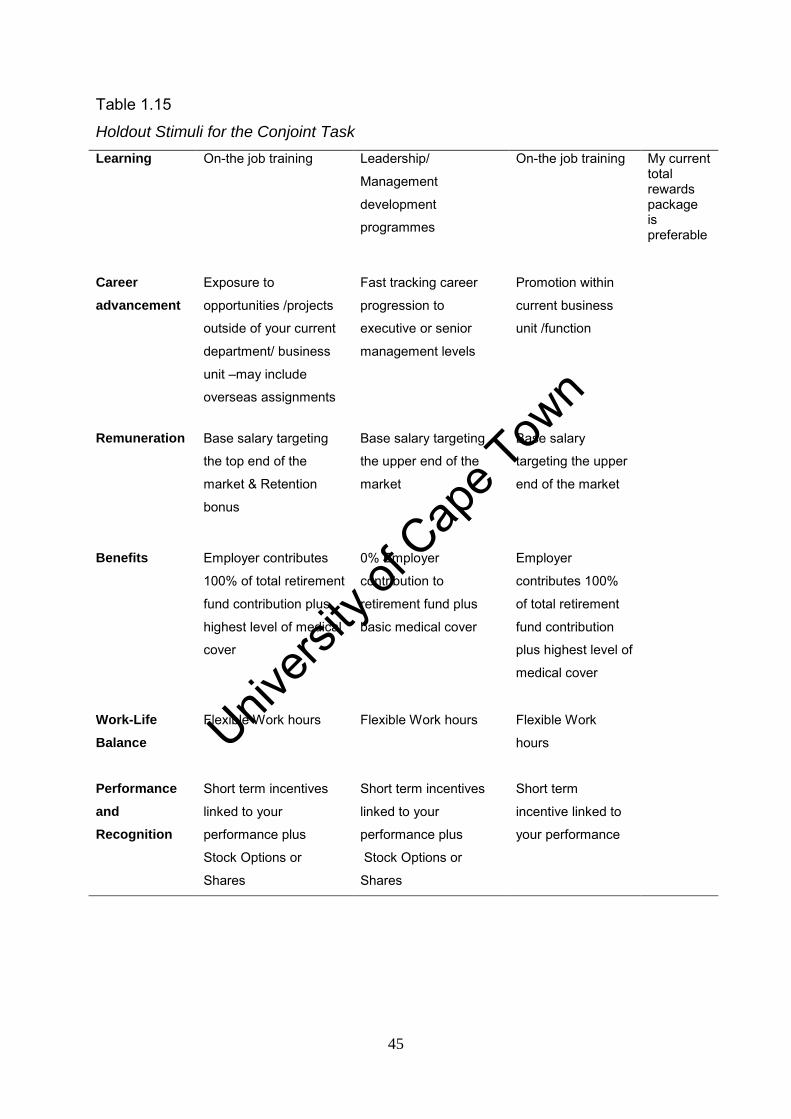
Univers
ity of
Cap
e Tow
n
45
Table 1.15
Holdout Stimuli for the Conjoint Task
Learning On-the job training Leadership/
Management
development
programmes
On-the job training My current total rewards package is preferable
Career
advancement
Exposure to
opportunities /projects
outside of your current
department/ business
unit –may include
overseas assignments
Fast tracking career
progression to
executive or senior
management levels
Promotion within
current business
unit /function
Remuneration Base salary targeting
the top end of the
market & Retention
bonus
Base salary targeting
the upper end of the
market
Base salary
targeting the upper
end of the market
Benefits Employer contributes
100% of total retirement
fund contribution plus
highest level of medical
cover
0% Employer
contribution to
retirement fund plus
basic medical cover
Employer
contributes 100%
of total retirement
fund contribution
plus highest level of
medical cover
Work-Life
Balance
Flexible Work hours Flexible Work hours Flexible Work
hours
Performance
and
Recognition
Short term incentives
linked to your
performance plus
Stock Options or
Shares
Short term incentives
linked to your
performance plus
Stock Options or
Shares
Short term
incentive linked to
your performance
Univers
ity of
Cap
e Tow
n
46
Data Collection Procedure
Questionnaire 1 was emailed to Remuneration Managers whose details were
obtained from SARA. The survey took approximately 10 minutes to complete and
Remuneration Managers were given two weeks to return the document via email.
Consent to distribute Questionnaire 1, 2 and 3 was obtained from SARA.
An electronic questionnaire was developed for questionnaires 2 and 3. Sawtooth
Software version 6 was used to develop the choice based conjoint task in
questionnaire 3. Questionnaire 2 and 3 were combined in order to avoid respondent
fatigue. Four conjoint tasks were initially presented followed by ten Likert-type scale
questions. The same format was then repeated with the remaining four conjoint
tasks followed by 10 Likert-type scale questions. This was done specifically to
reduce respondent fatigue, a factor which often affects conjoint tasks as they are
known to be cognitively taxing. Demographic information was captured in a separate
section at the end of the questionnaire and consisted of eight items covering gender,
race, age, education level, industry, job title, job and years of service.
Both questionnaires were piloted amongst 10 people resulting in some amendments
being made. They were submitted to the UCT Commerce Faculty Ethics Committee
and ethics approval was granted. The questionnaire was subsequently presented to
the Human Resources Manager of a multinational Oil company and consent was
granted to distribute both questionnaires at Head Office and at the Refinery.
The questionnaire was embedded via a hyperlink in an e-mail and distributed to
senior management at the Oil Company with a request for them to forward this to
their staff. Simultaneously the questionnaire was distributed via a SARA e-mail
bulletin to Human Resources Managers who are corporate members of SARA.
Details of the purpose of the study and a request to distribute the e-mail and
questionnaire link to their staff were included. Instructions for completion were
included in the body of the questionnaire and directed respondents to click on the
hyperlink (url) embedded in the email. By clicking on the hyperlink, the webpage
containing the e-questionnaire was opened. Once a response was entered it was
automatically saved, although respondents were able to navigate back to previous
questions and adjust their answers.
Univers
ity of
Cap
e Tow
n
47
A submit button was included at the end of the questionnaire and respondents were
required to click on this in order to register their responses. If this step was not
followed the survey was counted as incomplete and the data discarded. In order to
obtain an optimal response rate, a R1000 Woolworths shopping voucher was offered
via lucky draw to all respondents. To qualify, respondents were required to capture
their email address on the questionnaire. Confidentiality was maintained by ensuring
that the respondent‘s e-mail address was not linked to the response data. Details of
the date of the draw were noted on the questionnaire and the winner advised via
email.
The questionnaire was administered over a three week period and took
approximately 10 minutes to complete. After the closing date of the questionnaire,
the conjoint task data was calculated using Sawtooth Software and this output
together with the results of the Likert scale items were downloaded into MS Excel.
The data from questionnaire 2 was transferred for analysis into the Statistical
Package for the Social Sciences (SPSS) version 18.
Data Analysis
The results of questionnaire 1 were analysed using descriptive statistics such as
percentages while the results of questionnaire 2 were analysed using descriptive and
inferential statistics such as, t-tests and Analysis of Variance (ANOVA).
The outcomes of questionnaire 3 were analysed using conjoint analysis. The utilities
resulting from the estimation process formed the basis of the data to be analysed.
These were used to identify and calculate the relative importance of individual
attributes among all other attributes and to investigate the perceived attractiveness
of the various attribute level combinations to ultimately determine the ideal total
rewards mix (Martins et al., 1996).
Univers
ity of
Cap
e Tow
n
48
CHAPTER 4
RESULTS
Results obtained from the three questionnaires form the focus of this section. Counts
and percentages were used as the basis of analysis for questionnaire 1. Exploratory
Factor Analysis (EFA) was used to determine the underlying factor structure of the
items in questionnaire 2. Internal consistency (i.e. reliability) was assessed using
Cronbach‘s Alpha coefficients for both the original factor structure as well as for the
EFA derived factor structure or measurement model. Differences between the results
for males and females and between the results for blacks and whites were assessed
via t-tests. Analysis of Variance (ANOVA) was used to determine the differences
between respondents across different educational levels, job levels and age groups.
Finally, the results from questionnaire 3 were analysed using conjoint analysis. The
relative attribute importance as well as the ideal mix of total rewards across all
demographic groups will be illustrated.
Remuneration Manager Questionnaire (Questionnaire 1)
Analysis of Remuneration Managers responses
The responses provided by Remuneration Managers to questionnaire 1 were
analyzed. Percentages were used to display the results as this was deemed to be
the simplest, but most meaningful representation of the frequency of responses
(Tredoux & Durrheim, 2002). The data was analysed by first focusing on the
question with the highest percentage of responses under the category of Employee
C. This question was noted and subsequently eliminated from further analysis and
classified as level 3 in the conjoint task. This process was followed as it was
assumed that the rewards received by Employee A will always be inclusive of those
which Employee B and C receive, and likewise the rewards that Employee C
receives are always assumed to be relevant to Employee B.
The question with the highest percentage of responses for Employee B was then
used to establish level 2 of the conjoint task before being removed for further
analysis. The remaining question with the highest percentage for Employee A was
then translated into level 1 of the conjoint task. Where the results were equal across
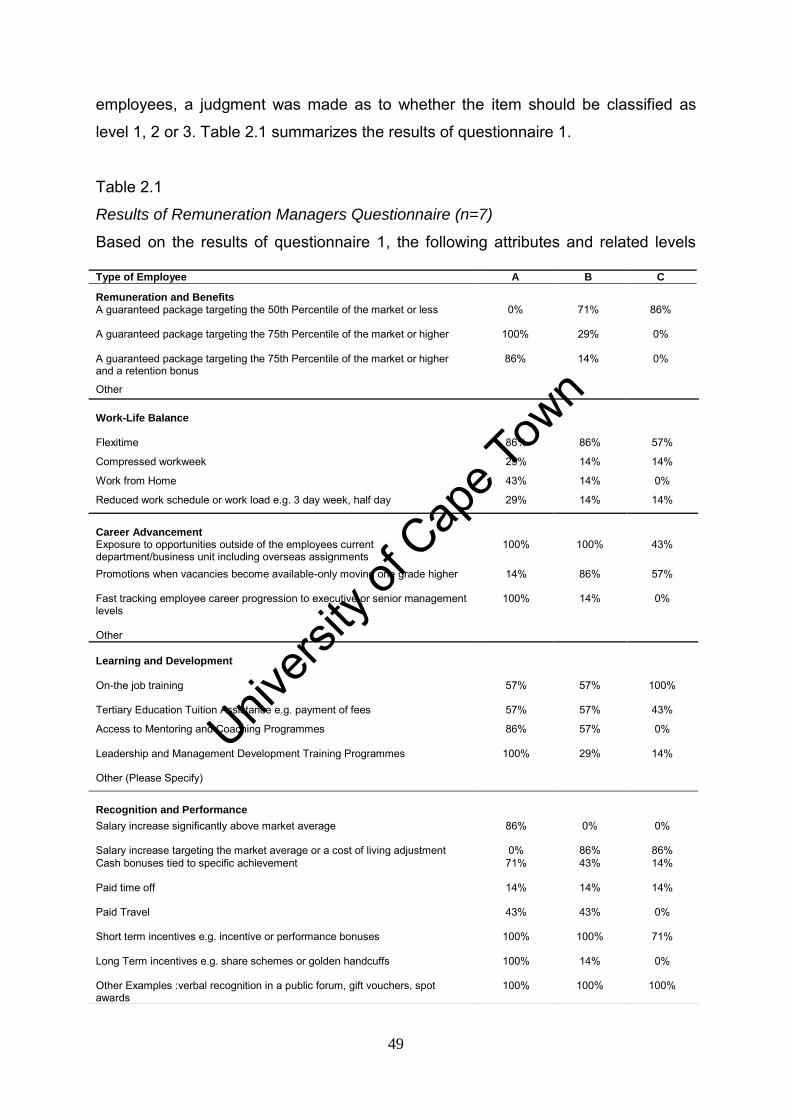
Univers
ity of
Cap
e Tow
n
49
employees, a judgment was made as to whether the item should be classified as
level 1, 2 or 3. Table 2.1 summarizes the results of questionnaire 1.
Table 2.1
Results of Remuneration Managers Questionnaire (n=7)
Based on the results of questionnaire 1, the following attributes and related levels
Type of Employee A B C
Remuneration and Benefits A guaranteed package targeting the 50th Percentile of the market or less
0% 71% 86%
A guaranteed package targeting the 75th Percentile of the market or higher
100% 29% 0%
A guaranteed package targeting the 75th Percentile of the market or higher and a retention bonus
86% 14% 0%
Other Work-Life Balance Flexitime 86% 86% 57%
Compressed workweek 29% 14% 14%
Work from Home 43% 14% 0%
Reduced work schedule or work load e.g. 3 day week, half day 29% 14% 14%
Career Advancement Exposure to opportunities outside of the employees current department/business unit including overseas assignments
100% 100% 43%
Promotions when vacancies become available-only moving one grade higher
14% 86% 57%
Fast tracking employee career progression to executive or senior management levels
100% 14% 0%
Other Learning and Development On-the job training
57% 57% 100%
Tertiary Education Tuition Assistance e.g. payment of fees 57% 57% 43%
Access to Mentoring and Coaching Programmes
86% 57% 0%
Leadership and Management Development Training Programmes
100% 29% 14%
Other (Please Specify)
Recognition and Performance Salary increase significantly above market average
86% 0% 0%
Salary increase targeting the market average or a cost of living adjustment 0% 86% 86% Cash bonuses tied to specific achievement
71% 43% 14%
Paid time off
14% 14% 14%
Paid Travel
43% 43% 0%
Short term incentives e.g. incentive or performance bonuses
100% 100% 71%
Long Term incentives e.g. share schemes or golden handcuffs
100% 14% 0%
Other Examples :verbal recognition in a public forum, gift vouchers, spot awards
100% 100% 100%
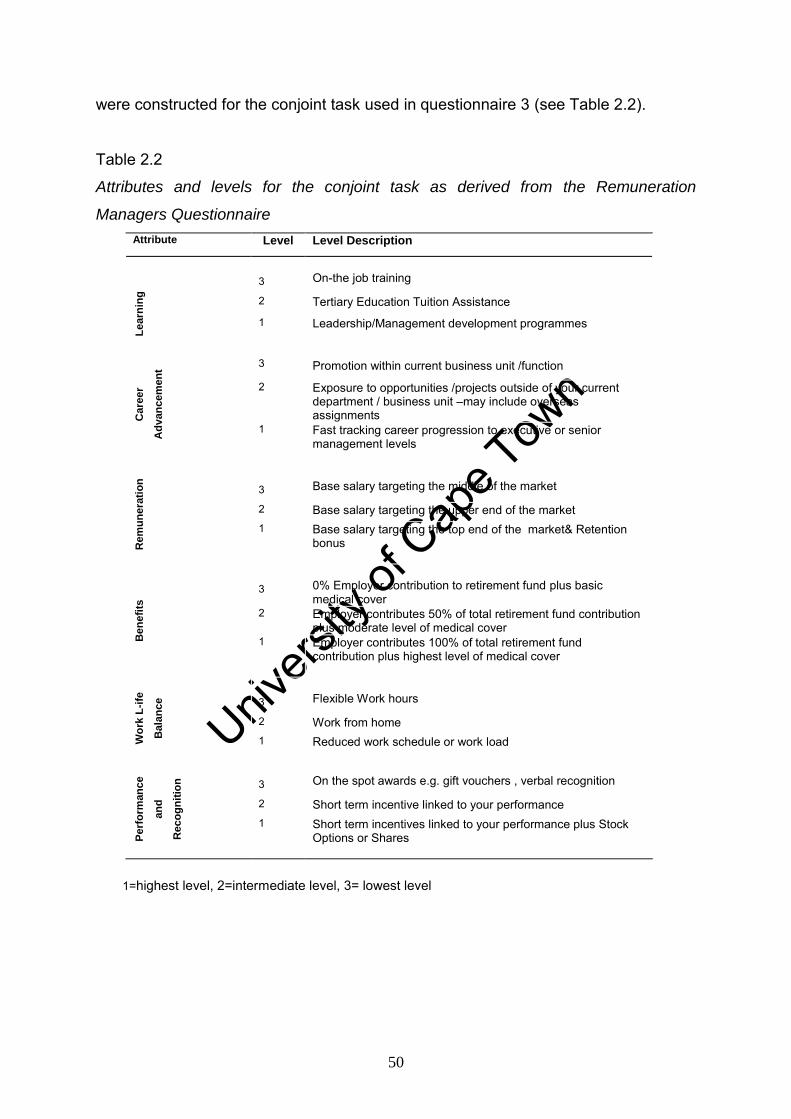
Univers
ity of
Cap
e Tow
n
50
were constructed for the conjoint task used in questionnaire 3 (see Table 2.2).
Table 2.2
Attributes and levels for the conjoint task as derived from the Remuneration
Managers Questionnaire
Attribute Level Level Description
Le
arn
ing
3 On-the job training
2 Tertiary Education Tuition Assistance
1 Leadership/Management development programmes
Care
er
Ad
van
cem
en
t
3
Promotion within current business unit /function
2 Exposure to opportunities /projects outside of your current department / business unit –may include overseas assignments
1 Fast tracking career progression to executive or senior management levels
Rem
un
era
tio
n
3 Base salary targeting the middle of the market
2 Base salary targeting the upper end of the market 1 Base salary targeting the top end of the market& Retention
bonus
Ben
efi
ts
3 0% Employer contribution to retirement fund plus basic medical cover
2 Employer contributes 50% of total retirement fund contribution plus moderate level of medical cover
1 Employer contributes 100% of total retirement fund contribution plus highest level of medical cover
Wo
rk L
-ife
Bala
nc
e
3 Flexible Work hours
2 Work from home 1 Reduced work schedule or work load
Perf
orm
an
ce
an
d
Reco
gn
itio
n
3 On the spot awards e.g. gift vouchers , verbal recognition
2 Short term incentive linked to your performance 1 Short term incentives linked to your performance plus Stock
Options or Shares
1=highest level, 2=intermediate level, 3= lowest level
Univers
ity of
Cap
e Tow
n
51
WorldatWork Total Rewards Questionnaire
Validity and reliability
Exploratory Factor Analysis (EFA) was used to establish the underlying factor
structure of the scale which was based on the WorldatWork Total Rewards model,
and which made up questionnaire 2. EFA is also used as an indicator of the
construct validity of the measure and assesses what the scale is, in fact, measuring
(Hair et al., 2007). Principle Component Analysis using Varimax, with Kaiser
Normalisation rotation was used. Varimax is one of the most popular orthogonal
rotation techniques. The goal of Varimax rotation is to disperse the maximum
amount of variance across the factors while simultaneously trying to obtain a simple
factor structure (Kerlinger & Lee, 2000). An orthogonal rotation strategy was selected
as this treats factors as being independent and maintains the uncorrelated nature of
the factors with one another. Orthogonal rotation also aids in the interpretation
process since uncorrelated factors are easier to interpret (Kieffer, 1998). It was
believed that the factors that made up questionnaire 2 were
independent/uncorrelated.
The inclusion criteria used for the Factor Analysis were that factor loadings need to
be > 0.45; and if the difference in factor loadings across factors was < 0.25 then the
item was considered to have crossloaded. If an item did not meet these criteria it
was excluded and thereafter a new round of Factor Analysis was conducted. This
process was repeated until all the items met these inclusion criteria and a final, or so
called ‗clean‘ factor structure, was obtained.
Internal consistency (i.e. reliability) was established by means of calculating
Cronbach Alpha coefficients. Internal consistency is estimated by determining the
degree to which each item in a scale correlates with each other item. Cronbach‘s
Alpha coefficient is the most general method of finding estimates of reliability through
internal consistency (Kerlinger & Lee, 2000). Nunnally (1970) suggests that
Cronbach Alpha coefficients above 0.70 are considered satisfactory while
coefficients of 0.6 to <0.7 are considered moderate determinants of reliability while a
coefficient of <0.6 is considered poor. It should be noted that the purpose of the
scale must be considered when assessing whether or not the Alpha coefficient is of
an acceptable level. The various coefficients were analysed to determine whether

Univers
ity of
Cap
e Tow
n
52
the EFA derived factor structure was reliable and whether it was ‗more reliable‘ than
the original factor structure. Where the EFA derived factor structure was more
reliable (i.e. when numerically comparing Cronbach Alpha coefficients), this factor
structure was adopted.
Factor Analysis
In order to conduct a Factor Analysis the Kaiser-Meyer-Olkin (KMO) Measure of
Sampling Adequacy should be > 0.6 and the Bartlett‘s Test of Sphericity should be
significant with p<0.05 (Pallant, 2004). The KMO Measure of Sampling Adequacy for
the Factor Analysis was 0.75 and the Bartlett‘s Test of Sphericity was significant
(p=0.00). These results therefore indicate that it was appropriate to conduct an
Exploratory Factor Analysis on the data. In order to determine how many factors will
be extracted only those factors with an Eigenvalue of more than 1 were selected (the
so-called Kaiser criterion).
Considering the inclusion criteria, after the first round, items Q5: ―The quality of
performance feedback and performance discussions you have with your supervisor‖;
Q9: ―Having a manageable workload and reasonable work pace‖; Q10: ―Having
supportive and like-minded colleagues‖; Q20: ―The provision of recognition via non-
financial means e.g. certificates of recognition.‖ were removed as they did not meet
the inclusion criteria (> .45 and <.25). After the second round the following two items
were deleted: Q1: ―Recognition provided to you by your employer e.g. Financial
recognition such as cash, paid travel‖; Q2: ―The extent to which your employer
respects differences in race, gender and age.‖
The third round of Exploratory Factor Analysis was accepted as the final factor
structure. An inspection of the scree plot, using Catell‘s scree test, confirmed the
presence of five factors (Pallant, 2004). Table 2.3 illustrates the items within the
scale that loaded on five factors and explained 67.70% of the total variance: factor 1
(Eigenvalue =3.90) explained 27.88% of the variance, factor 2 (Eigenvalue= 1.64)
explained 11.74% of the variance, factor 3 (Eigenvalue 1.47) explained 10.55% of
the variance, factor 4 (Eigenvalue=1.31) explained 9.39% of the variance and factor
5 (Eigenvalue=1.14) explained 8.14% of the variance. The factors that remained
were labeled: Learning and Career Advancement, Remuneration and Benefits,
Univers
ity of
Cap
e Tow
n
53
Performance and Recognition and Work-Life Balance (Organisational Climate) and
Work-Life Balance (Practices). It should be noted that items originally classified as
Learning merged with Career Advancement. Work-Life Balance items were clearly
divided into two separate sets of items which appeared to reflect the underlying
constructs of Work-Life Balance Practices (employers support for a balanced lifestyle
and flexible work arrangements) and Work-Life Balance factors which contribute to
creating Organisational Climate (social friendships at work, team building exercises
and health and wellness programmes).
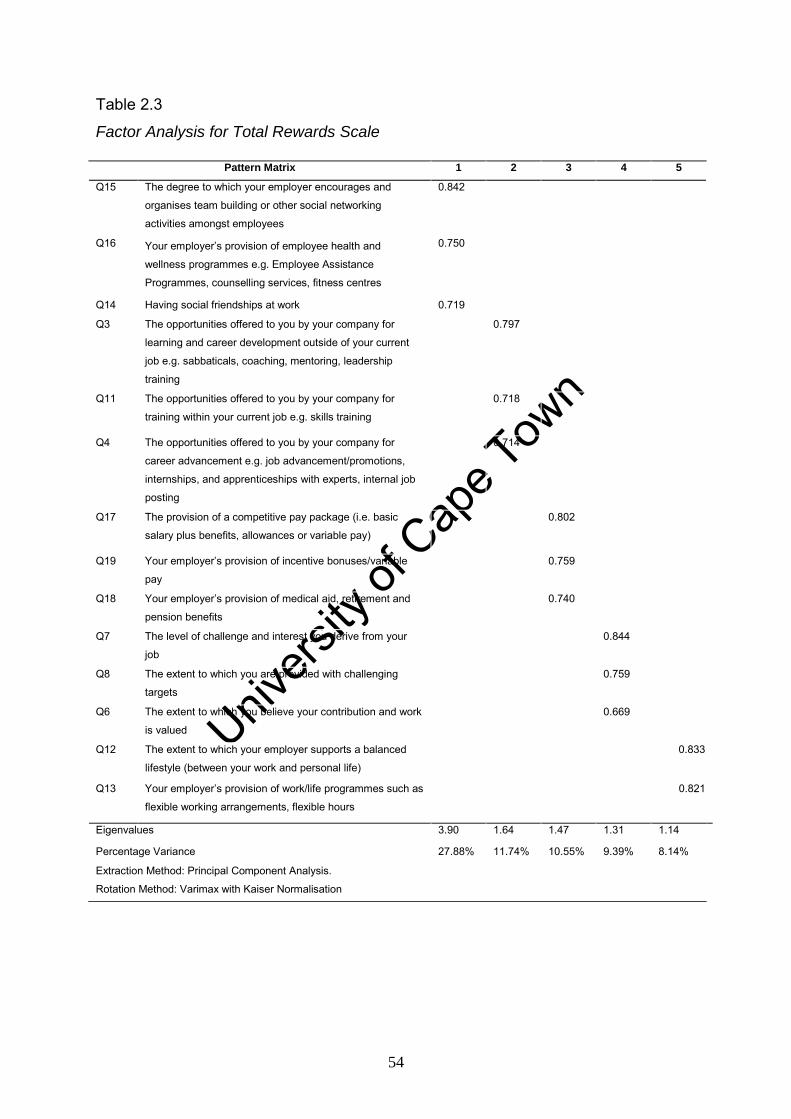
Univers
ity of
Cap
e Tow
n
54
Table 2.3
Factor Analysis for Total Rewards Scale
Pattern Matrix 1 2 3 4 5
Q15 The degree to which your employer encourages and
organises team building or other social networking
activities amongst employees
0.842
Q16 Your employer‘s provision of employee health and
wellness programmes e.g. Employee Assistance
Programmes, counselling services, fitness centres
0.750
Q14 Having social friendships at work 0.719
Q3 The opportunities offered to you by your company for
learning and career development outside of your current
job e.g. sabbaticals, coaching, mentoring, leadership
training
0.797
Q11 The opportunities offered to you by your company for
training within your current job e.g. skills training
0.718
Q4 The opportunities offered to you by your company for
career advancement e.g. job advancement/promotions,
internships, and apprenticeships with experts, internal job
posting
0.714
Q17 The provision of a competitive pay package (i.e. basic
salary plus benefits, allowances or variable pay)
0.802
Q19 Your employer‘s provision of incentive bonuses/variable
pay
0.759
Q18 Your employer‘s provision of medical aid, retirement and
pension benefits
0.740
Q7 The level of challenge and interest you derive from your
job
0.844
Q8 The extent to which you are provided with challenging
targets
0.759
Q6 The extent to which you believe your contribution and work
is valued
0.669
Q12 The extent to which your employer supports a balanced
lifestyle (between your work and personal life)
0.833
Q13 Your employer‘s provision of work/life programmes such as
flexible working arrangements, flexible hours
0.821
Eigenvalues 3.90 1.64 1.47 1.31 1.14
Percentage Variance 27.88% 11.74% 10.55% 9.39% 8.14%
Extraction Method: Principal Component Analysis.
Rotation Method: Varimax with Kaiser Normalisation
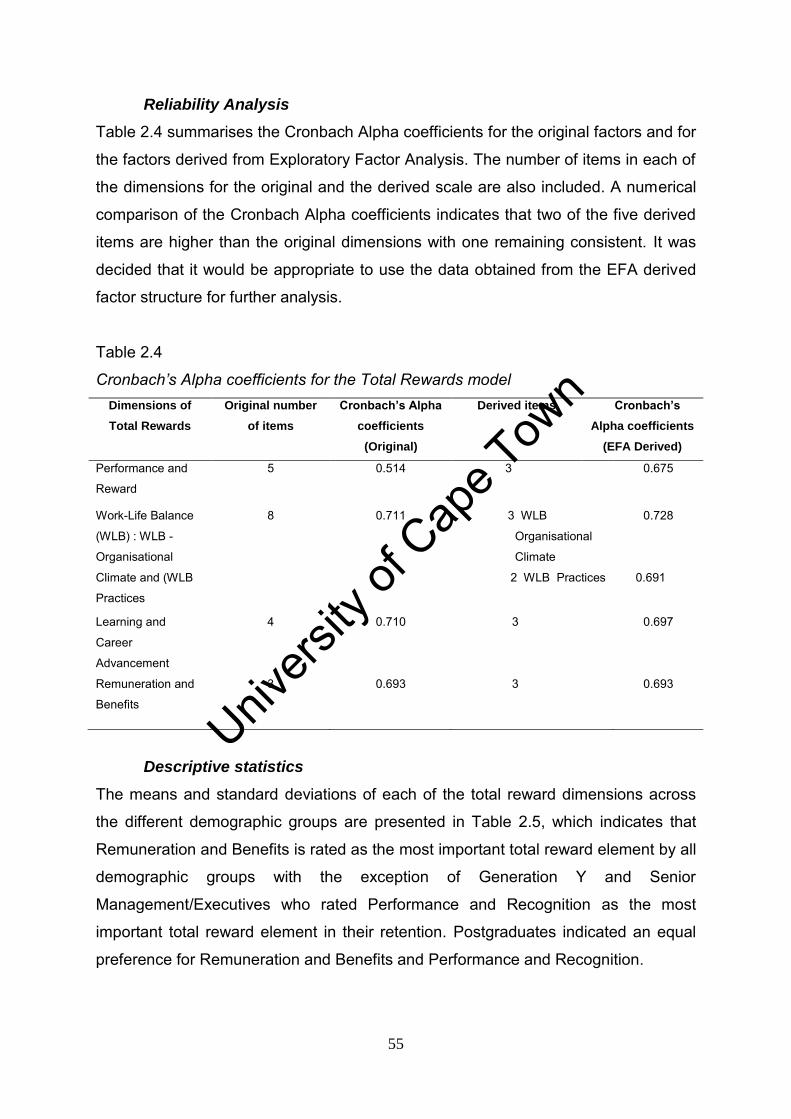
Univers
ity of
Cap
e Tow
n
55
Reliability Analysis
Table 2.4 summarises the Cronbach Alpha coefficients for the original factors and for
the factors derived from Exploratory Factor Analysis. The number of items in each of
the dimensions for the original and the derived scale are also included. A numerical
comparison of the Cronbach Alpha coefficients indicates that two of the five derived
items are higher than the original dimensions with one remaining consistent. It was
decided that it would be appropriate to use the data obtained from the EFA derived
factor structure for further analysis.
Table 2.4
Cronbach’s Alpha coefficients for the Total Rewards model
Dimensions of
Total Rewards
Original number
of items
Cronbach’s Alpha
coefficients
(Original)
Derived items Cronbach’s
Alpha coefficients
(EFA Derived)
Performance and
Reward
5 0.514 3 0.675
Work-Life Balance
(WLB) : WLB -
Organisational
Climate and (WLB
Practices
8 0.711 3 WLB
Organisational
Climate
0.728
2 WLB Practices 0.691
Learning and
Career
Advancement
4 0.710 3 0.697
Remuneration and
Benefits
3 0.693 3 0.693
Descriptive statistics
The means and standard deviations of each of the total reward dimensions across
the different demographic groups are presented in Table 2.5, which indicates that
Remuneration and Benefits is rated as the most important total reward element by all
demographic groups with the exception of Generation Y and Senior
Management/Executives who rated Performance and Recognition as the most
important total reward element in their retention. Postgraduates indicated an equal
preference for Remuneration and Benefits and Performance and Recognition.
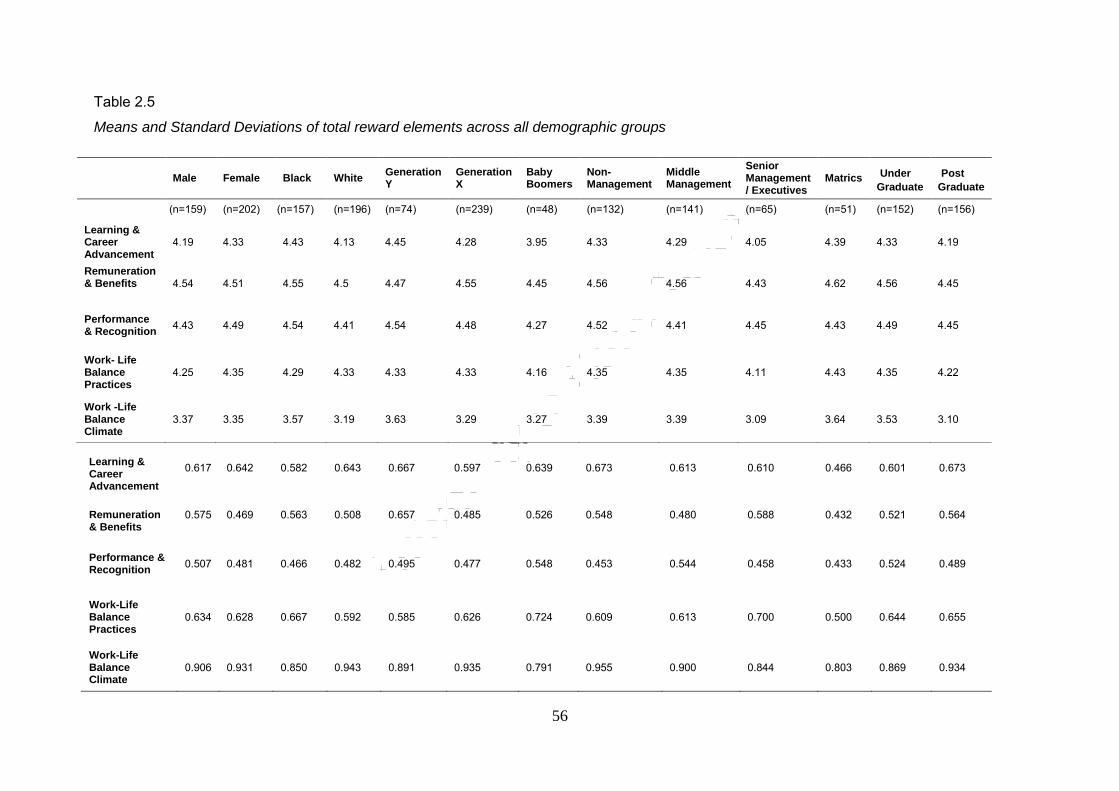
Univers
ity of
Cap
e Tow
n
56
Table 2.5
Means and Standard Deviations of total reward elements across all demographic groups
Learning & Career Advancement
0.617 0.642 0.582 0.643 0.667 0.597 0.639 0.673 0.613 0.610 0.466 0.601 0.673
Remuneration & Benefits
0.575 0.469 0.563 0.508 0.657 0.485 0.526 0.548 0.480 0.588 0.432 0.521 0.564
Performance & Recognition
0.507 0.481 0.466 0.482 0.495 0.477 0.548 0.453 0.544 0.458 0.433 0.524 0.489
Work-Life Balance Practices
0.634 0.628 0.667 0.592 0.585 0.626 0.724 0.609 0.613 0.700 0.500 0.644 0.655
Work-Life Balance Climate
0.906 0.931 0.850 0.943 0.891 0.935 0.791 0.955 0.900 0.844 0.803 0.869 0.934
Male Female Black White Generation Y
Generation X
Baby Boomers
Non-Management
Middle Management
Senior Management/ Executives
Matrics Under
Graduate Post
Graduate
(n=159) (n=202) (n=157) (n=196) (n=74) (n=239) (n=48) (n=132) (n=141) (n=65) (n=51) (n=152) (n=156)
Learning & Career Advancement
4.19 4.33 4.43 4.13 4.45 4.28 3.95 4.33 4.29 4.05 4.39 4.33 4.19
Remuneration & Benefits
4.54 4.51 4.55 4.5 4.47 4.55 4.45 4.56 4.56 4.43 4.62 4.56 4.45
Performance & Recognition
4.43 4.49 4.54 4.41 4.54 4.48 4.27 4.52 4.41 4.45 4.43 4.49 4.45
Work- Life Balance Practices
4.25 4.35 4.29 4.33 4.33 4.33 4.16 4.35 4.35 4.11 4.43 4.35 4.22
Work -Life Balance Climate
3.37 3.35 3.57 3.19 3.63 3.29 3.27 3.39 3.39 3.09 3.64 3.53 3.10
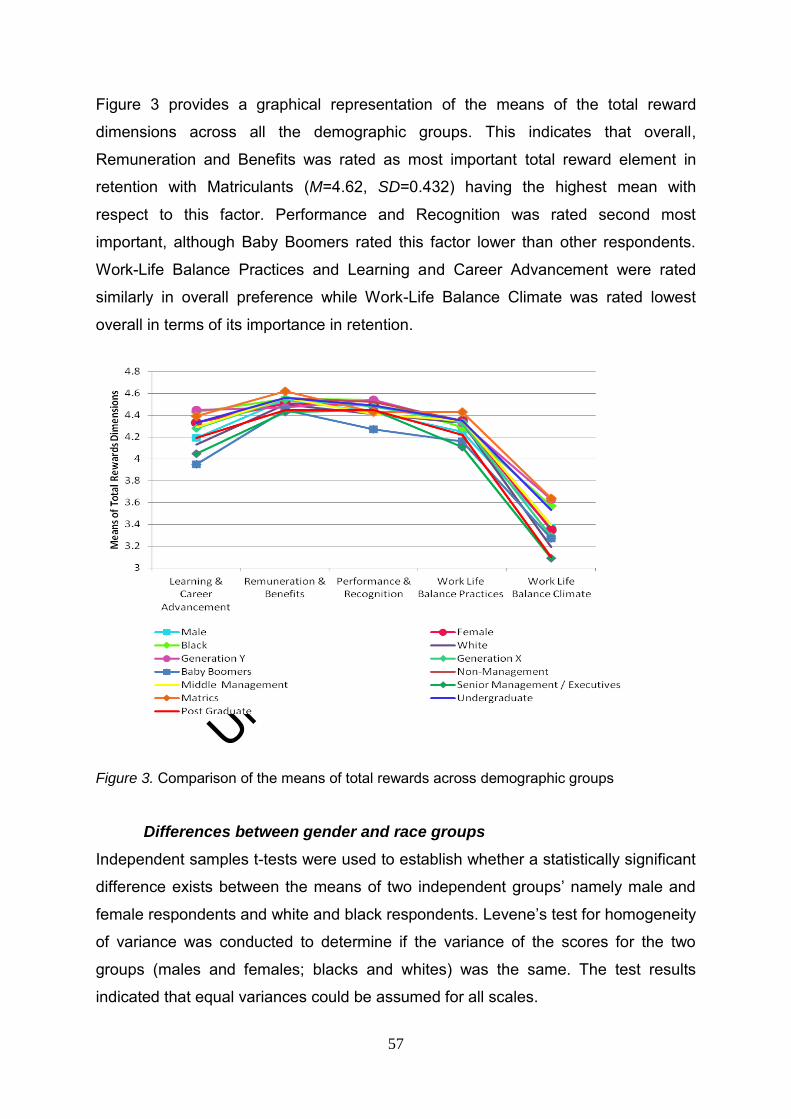
Univers
ity of
Cap
e Tow
n
57
Figure 3 provides a graphical representation of the means of the total reward
dimensions across all the demographic groups. This indicates that overall,
Remuneration and Benefits was rated as most important total reward element in
retention with Matriculants (M=4.62, SD=0.432) having the highest mean with
respect to this factor. Performance and Recognition was rated second most
important, although Baby Boomers rated this factor lower than other respondents.
Work-Life Balance Practices and Learning and Career Advancement were rated
similarly in overall preference while Work-Life Balance Climate was rated lowest
overall in terms of its importance in retention.
Figure 3. Comparison of the means of total rewards across demographic groups
Differences between gender and race groups
Independent samples t-tests were used to establish whether a statistically significant
difference exists between the means of two independent groups‘ namely male and
female respondents and white and black respondents. Levene‘s test for homogeneity
of variance was conducted to determine if the variance of the scores for the two
groups (males and females; blacks and whites) was the same. The test results
indicated that equal variances could be assumed for all scales.
Univers
ity of
Cap
e Tow
n
58
T-tests with a p value less than 0.05 indicate a significant difference between the
groups (Hair et al., 2007). An independent samples t-test revealed one significant
difference between the means for the five subscales of male and female
respondents. There was a statistically significant difference between males (M =
4.19, SD = 0.64) and females (M = 4.33, SD = 0.61; t (359) = 2.18, p = 0.02 (two
tailed) for the measure of Learning and Career Advancement (p< 0.05), with females
seemingly placing greater importance on this factor in their retention than males.
Three statistically significant differences were also noted between the means of
black and white respondents. There was a statistically significant difference between
whites (M = 4.13, SD = 0.64) and blacks (M = 4.43, SD = 0.58; t (351) = 4.55, p
=0.00 (two tailed) for the Learning and Career Advancement measure (p<0.05)
where blacks considered this factor to be more important in their retention than
whites. The second statistically significant difference that was noted between whites
(M= 4.41, SD=0.48) and blacks (M = 4.54, SD = 0.46; t (351) = 2.64, p =0.00)
pertained to the measure of Performance and Recognition (p<0.05), where black
employees considered this factor key in their retention. The third statistically
significant difference was noted between whites (M = 3.19, SD = 0.94) and blacks (M
= 3.57, SD = 0.85; t (351) = 3.94, p=0.00 (two tailed) for the measure of Work-Life
Balance Climate (p<0.05) where blacks considered this factor to be more relevant in
their retention than whites.
The results of the t-tests for gender and race groups are summarized in Tables 2.6
and 2.7.
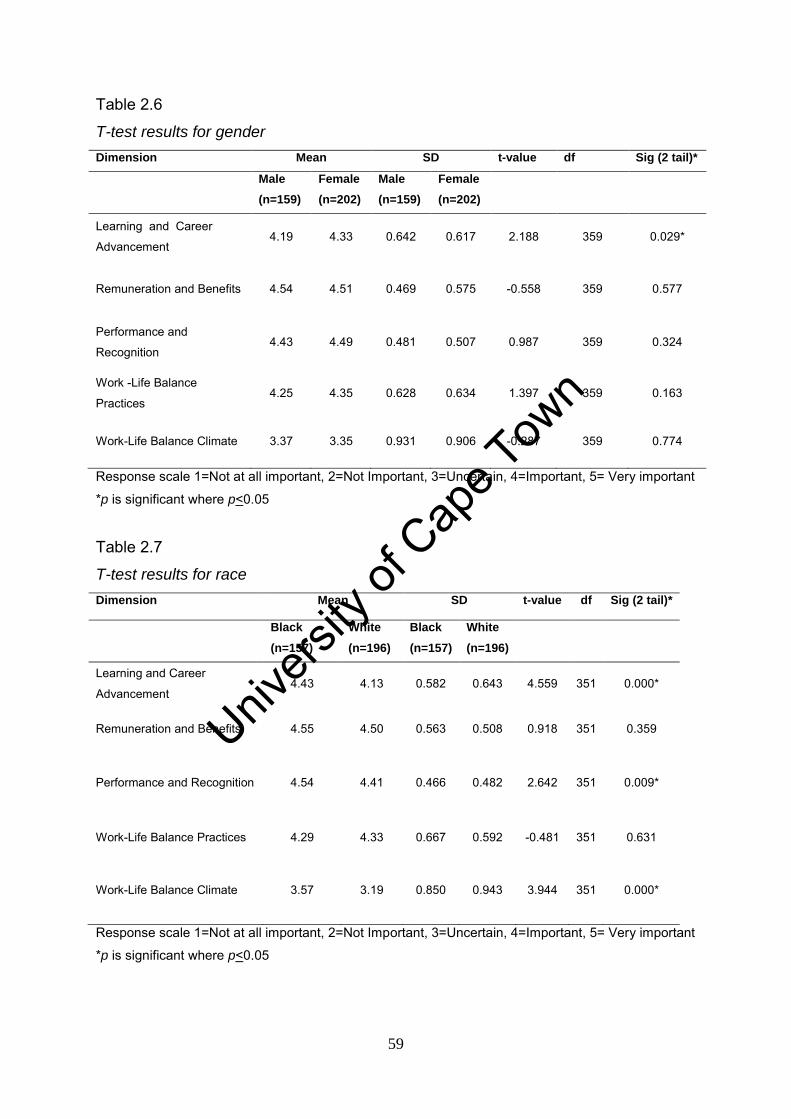
Univers
ity of
Cap
e Tow
n
59
Table 2.6
T-test results for gender
Dimension Mean SD t-value df Sig (2 tail)*
Male
(n=159)
Female
(n=202)
Male
(n=159)
Female
(n=202)
Learning and Career
Advancement 4.19 4.33 0.642 0.617 2.188 359 0.029*
Remuneration and Benefits 4.54 4.51 0.469 0.575 -0.558 359 0.577
Performance and
Recognition 4.43 4.49 0.481 0.507 0.987 359 0.324
Work -Life Balance
Practices 4.25 4.35 0.628 0.634 1.397 359 0.163
Work-Life Balance Climate 3.37 3.35 0.931 0.906 -0.287 359 0.774
Response scale 1=Not at all important, 2=Not Important, 3=Uncertain, 4=Important, 5= Very important
*p is significant where p<0.05
Table 2.7
T-test results for race
Dimension Mean SD t-value df Sig (2 tail)*
Black
(n=157)
White
(n=196)
Black
(n=157)
White
(n=196)
Learning and Career
Advancement 4.43 4.13 0.582 0.643 4.559 351 0.000*
Remuneration and Benefits 4.55 4.50 0.563 0.508 0.918 351 0.359
Performance and Recognition 4.54 4.41 0.466 0.482 2.642 351 0.009*
Work-Life Balance Practices 4.29 4.33 0.667 0.592 -0.481 351 0.631
Work-Life Balance Climate 3.57 3.19 0.850 0.943 3.944
351
0.000*
Response scale 1=Not at all important, 2=Not Important, 3=Uncertain, 4=Important, 5= Very important
*p is significant where p<0.05
Univers
ity of
Cap
e Tow
n
60
Analysis of variance for different generations, education levels and job
levels
ANOVA was used to assess the statistical differences between the means of three or
more groups. T-tests are only able to compare the difference between two means
(Hair et al., 2007). For this reason it is appropriate to use ANOVA to determine
differences between generations, education levels and job levels. A one-way
ANOVA was used whereby the impact of one independent variable, which has a
number of different levels, is evaluated in relation to a continuous dependent variable
(Pallant, 2004).
The ANOVA indicates whether significant group differences exist, but a post-hoc test
is needed to indicate where the differences lie. The Tukey HSD (Honestly Significant
Difference) post-hoc test was used. This entails first finding the differences between
the means of all the groups and then comparing the difference in scores to a critical
value to see if the difference is significant. The critical value is the HSD (honestly
significant difference) which is the point when a mean difference becomes honestly
significantly different (Tredoux & Durrheim, 2002).
The results of the ANOVA indicated that a statistically significant difference at the
p<0.05 level exists between the means for the different generations with respect to
Learning and Career Advancement: F (2, 358) =9.29, p=0.00, Performance and
Recognition: F (2,358) = 4.79, p= 0.00 and Work-Life Balance Climate F (2,358) =
4.15, p= 0.01. These results are reflected in Table 2.8.
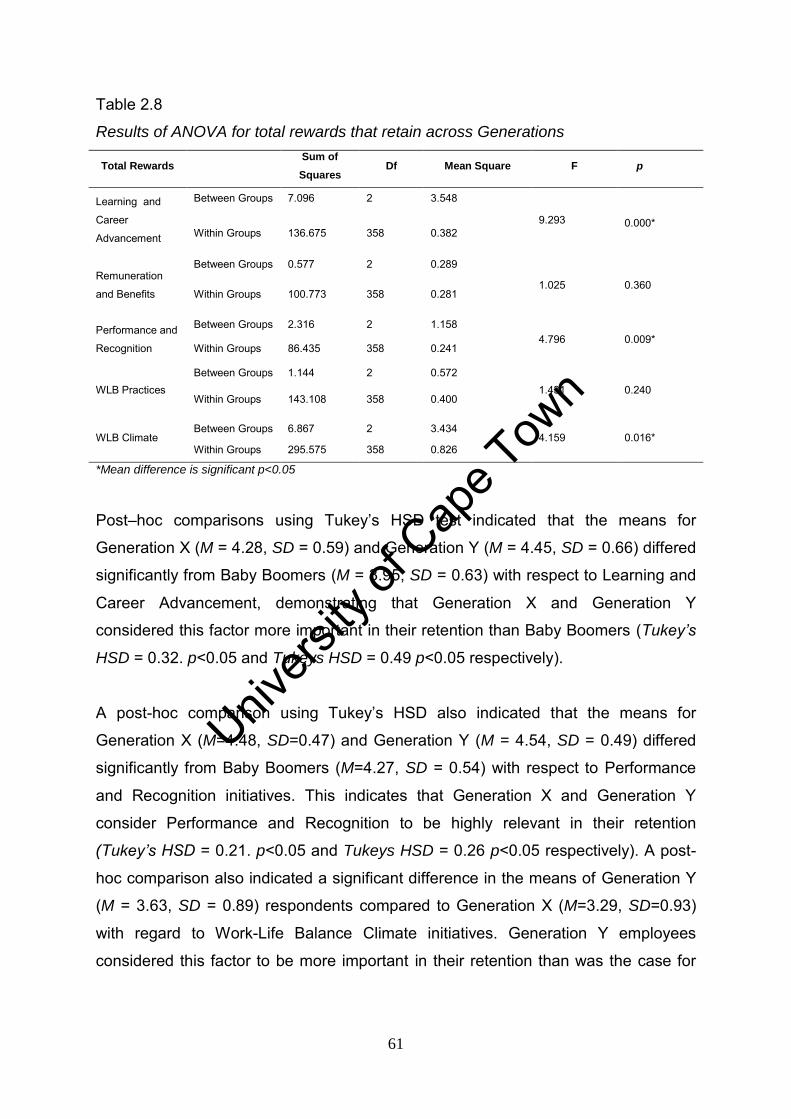
Univers
ity of
Cap
e Tow
n
61
Table 2.8
Results of ANOVA for total rewards that retain across Generations
Total Rewards Sum of
Squares Df Mean Square F p
Learning and
Career
Advancement
Between Groups 7.096 2 3.548
9.293 0.000* Within Groups 136.675 358 0.382
Remuneration
and Benefits
Between Groups 0.577 2 0.289
1.025 0.360 Within Groups 100.773 358 0.281
Performance and
Recognition
Between Groups 2.316 2 1.158 4.796 0.009*
Within Groups 86.435 358 0.241
WLB Practices Between Groups 1.144 2 0.572
1.431 0.240 Within Groups 143.108 358 0.400
WLB Climate Between Groups 6.867 2 3.434
4.159 0.016* Within Groups 295.575 358 0.826
*Mean difference is significant p<0.05
Post–hoc comparisons using Tukey‘s HSD test indicated that the means for
Generation X (M = 4.28, SD = 0.59) and Generation Y (M = 4.45, SD = 0.66) differed
significantly from Baby Boomers (M = 3.95, SD = 0.63) with respect to Learning and
Career Advancement, demonstrating that Generation X and Generation Y
considered this factor more important in their retention than Baby Boomers (Tukey’s
HSD = 0.32. p<0.05 and Tukeys HSD = 0.49 p<0.05 respectively).
A post-hoc comparison using Tukey‘s HSD also indicated that the means for
Generation X (M=4.48, SD=0.47) and Generation Y (M = 4.54, SD = 0.49) differed
significantly from Baby Boomers (M=4.27, SD = 0.54) with respect to Performance
and Recognition initiatives. This indicates that Generation X and Generation Y
consider Performance and Recognition to be highly relevant in their retention
(Tukey’s HSD = 0.21. p<0.05 and Tukeys HSD = 0.26 p<0.05 respectively). A post-
hoc comparison also indicated a significant difference in the means of Generation Y
(M = 3.63, SD = 0.89) respondents compared to Generation X (M=3.29, SD=0.93)
with regard to Work-Life Balance Climate initiatives. Generation Y employees
considered this factor to be more important in their retention than was the case for
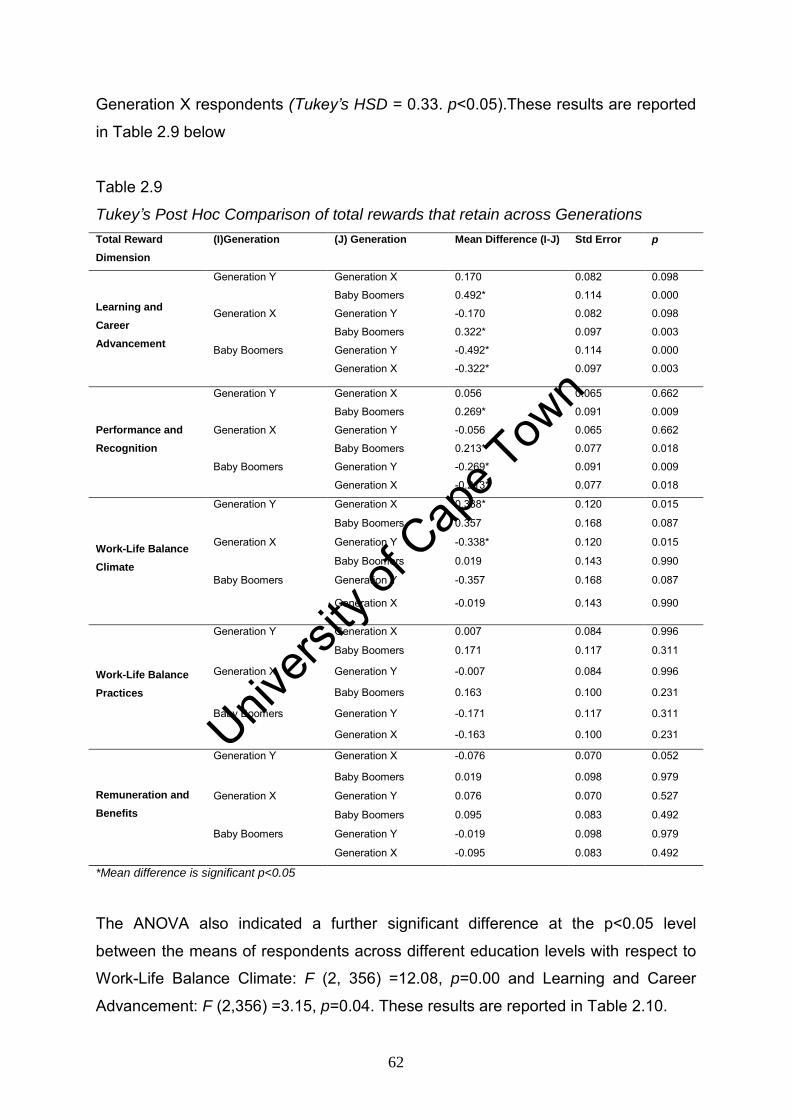
Univers
ity of
Cap
e Tow
n
62
Generation X respondents (Tukey’s HSD = 0.33. p<0.05).These results are reported
in Table 2.9 below
Table 2.9
Tukey’s Post Hoc Comparison of total rewards that retain across Generations
Total Reward
Dimension
(I)Generation (J) Generation Mean Difference (I-J) Std Error p
Learning and
Career
Advancement
Generation Y Generation X 0.170 0.082 0.098
Baby Boomers 0.492* 0.114 0.000
Generation X Generation Y -0.170 0.082 0.098
Baby Boomers 0.322* 0.097 0.003
Baby Boomers Generation Y -0.492* 0.114 0.000
Generation X -0.322* 0.097 0.003
Performance and
Recognition
Generation Y Generation X 0.056 0.065 0.662
Baby Boomers 0.269* 0.091 0.009
Generation X Generation Y -0.056 0.065 0.662
Baby Boomers 0.213* 0.077 0.018
Baby Boomers Generation Y -0.269* 0.091 0.009
Generation X -0.213* 0.077 0.018
Work-Life Balance
Climate
Generation Y Generation X 0.338* 0.120 0.015
Baby Boomers 0.357 0.168 0.087
Generation X Generation Y -0.338* 0.120 0.015
Baby Boomers 0.019 0.143 0.990
Baby Boomers Generation Y -0.357 0.168 0.087
Generation X -0.019 0.143 0.990
Work-Life Balance
Practices
Generation Y Generation X 0.007 0.084 0.996
Baby Boomers 0.171 0.117 0.311
Generation X Generation Y -0.007 0.084 0.996
Baby Boomers 0.163 0.100 0.231
Baby Boomers Generation Y -0.171 0.117 0.311
Generation X -0.163 0.100 0.231
Remuneration and
Benefits
Generation Y Generation X -0.076 0.070 0.052
Baby Boomers 0.019 0.098 0.979
Generation X Generation Y 0.076 0.070 0.527
Baby Boomers 0.095 0.083 0.492
Baby Boomers Generation Y -0.019 0.098 0.979
Generation X -0.095 0.083 0.492
*Mean difference is significant p<0.05
The ANOVA also indicated a further significant difference at the p<0.05 level
between the means of respondents across different education levels with respect to
Work-Life Balance Climate: F (2, 356) =12.08, p=0.00 and Learning and Career
Advancement: F (2,356) =3.15, p=0.04. These results are reported in Table 2.10.
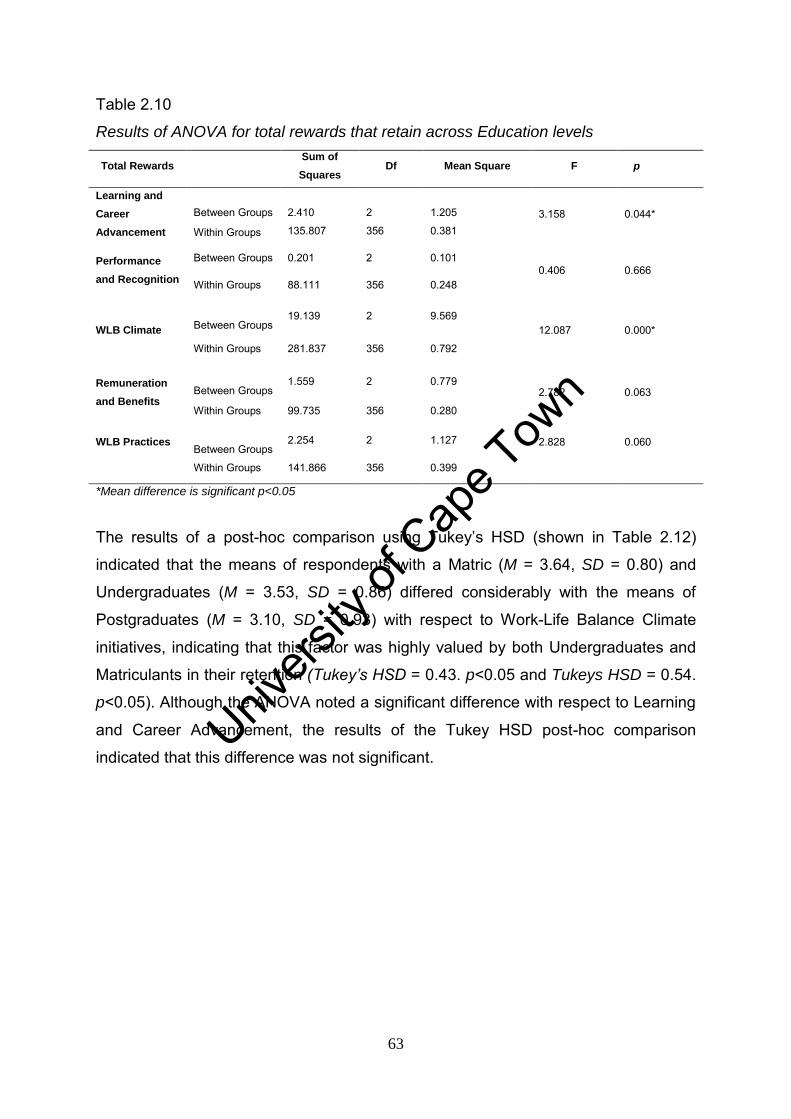
Univers
ity of
Cap
e Tow
n
63
Table 2.10
Results of ANOVA for total rewards that retain across Education levels
Total Rewards Sum of
Squares Df Mean Square F p
Learning and
Career
Advancement
Between Groups
2.410
2
1.205 3.158 0.044*
Within Groups 135.807 356 0.381
Performance
and Recognition
Between Groups 0.201 2 0.101 0.406 0.666
Within Groups 88.111 356 0.248
WLB Climate
Between Groups 19.139 2 9.569
12.087 0.000*
Within Groups 281.837 356 0.792
Remuneration
and Benefits
Between Groups 1.559 2 0.779
2.782 0.063
Within Groups 99.735 356 0.280
WLB Practices
Between Groups 2.254 2 1.127 2.828
0.060
Within Groups 141.866 356 0.399
*Mean difference is significant p<0.05
The results of a post-hoc comparison using Tukey‘s HSD (shown in Table 2.12)
indicated that the means of respondents with a Matric (M = 3.64, SD = 0.80) and
Undergraduates (M = 3.53, SD = 0.86) differed considerably with the means of
Postgraduates (M = 3.10, SD = 0.93) with respect to Work-Life Balance Climate
initiatives, indicating that this factor was highly valued by both Undergraduates and
Matriculants in their retention (Tukey’s HSD = 0.43. p<0.05 and Tukeys HSD = 0.54.
p<0.05). Although the ANOVA noted a significant difference with respect to Learning
and Career Advancement, the results of the Tukey HSD post-hoc comparison
indicated that this difference was not significant.
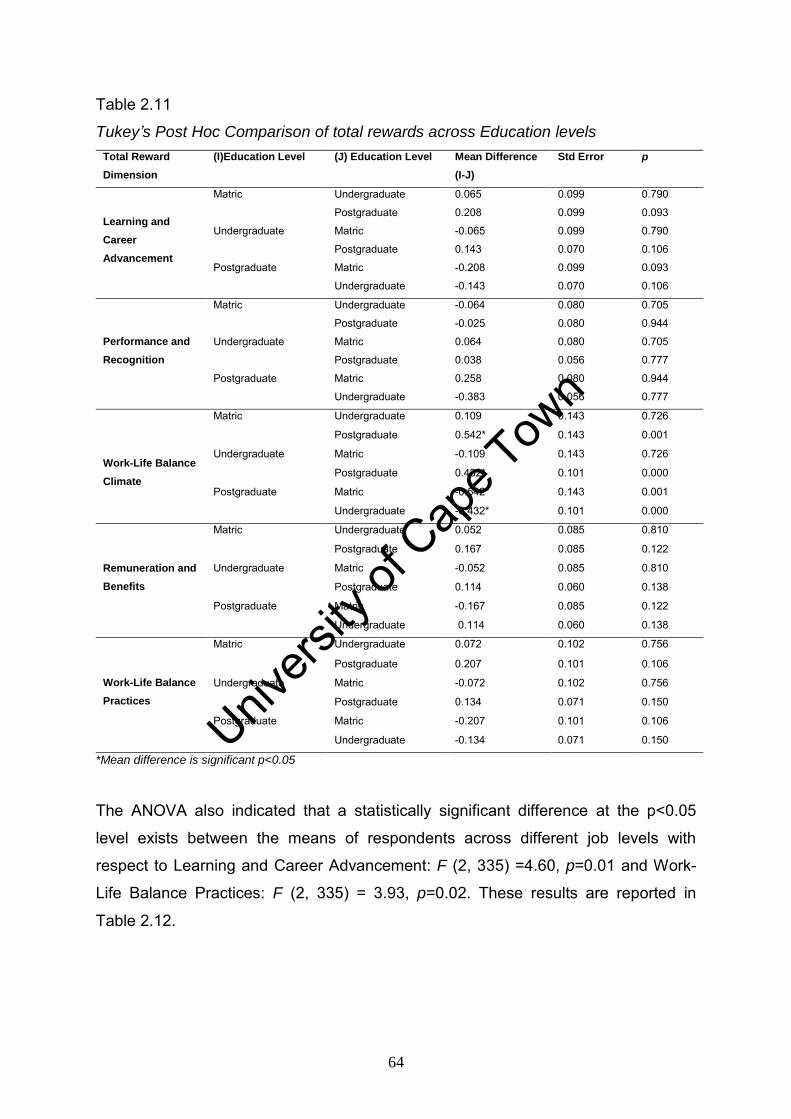
Univers
ity of
Cap
e Tow
n
64
Table 2.11
Tukey’s Post Hoc Comparison of total rewards across Education levels
Total Reward
Dimension
(I)Education Level (J) Education Level Mean Difference
(I-J)
Std Error p
Learning and
Career
Advancement
Matric Undergraduate 0.065 0.099 0.790
Postgraduate 0.208 0.099 0.093
Undergraduate Matric -0.065 0.099 0.790
Postgraduate 0.143 0.070 0.106
Postgraduate Matric -0.208 0.099 0.093
Undergraduate -0.143 0.070 0.106
Performance and
Recognition
Matric Undergraduate -0.064 0.080 0.705
Postgraduate -0.025 0.080 0.944
Undergraduate Matric 0.064 0.080 0.705
Postgraduate 0.038 0.056 0.777
Postgraduate Matric 0.258 0.080 0.944
Undergraduate -0.383 0.056 0.777
Work-Life Balance
Climate
Matric Undergraduate 0.109 0.143 0.726
Postgraduate 0.542* 0.143 0.001
Undergraduate Matric -0.109 0.143 0.726
Postgraduate 0.432* 0.101 0.000
Postgraduate Matric -0.542* 0.143 0.001
Undergraduate -0.432* 0.101 0.000
Remuneration and
Benefits
Matric Undergraduate 0.052 0.085 0.810
Postgraduate 0.167 0.085 0.122
Undergraduate Matric -0.052 0.085 0.810
Postgraduate 0.114 0.060 0.138
Postgraduate Matric -0.167 0.085 0.122
Undergraduate 0.114 0.060 0.138
Work-Life Balance
Practices
Matric Undergraduate 0.072 0.102 0.756
Postgraduate 0.207 0.101 0.106
Undergraduate Matric -0.072 0.102 0.756
Postgraduate 0.134 0.071 0.150
Postgraduate Matric -0.207 0.101 0.106
Undergraduate -0.134 0.071 0.150
*Mean difference is significant p<0.05
The ANOVA also indicated that a statistically significant difference at the p<0.05
level exists between the means of respondents across different job levels with
respect to Learning and Career Advancement: F (2, 335) =4.60, p=0.01 and Work-
Life Balance Practices: F (2, 335) = 3.93, p=0.02. These results are reported in
Table 2.12.
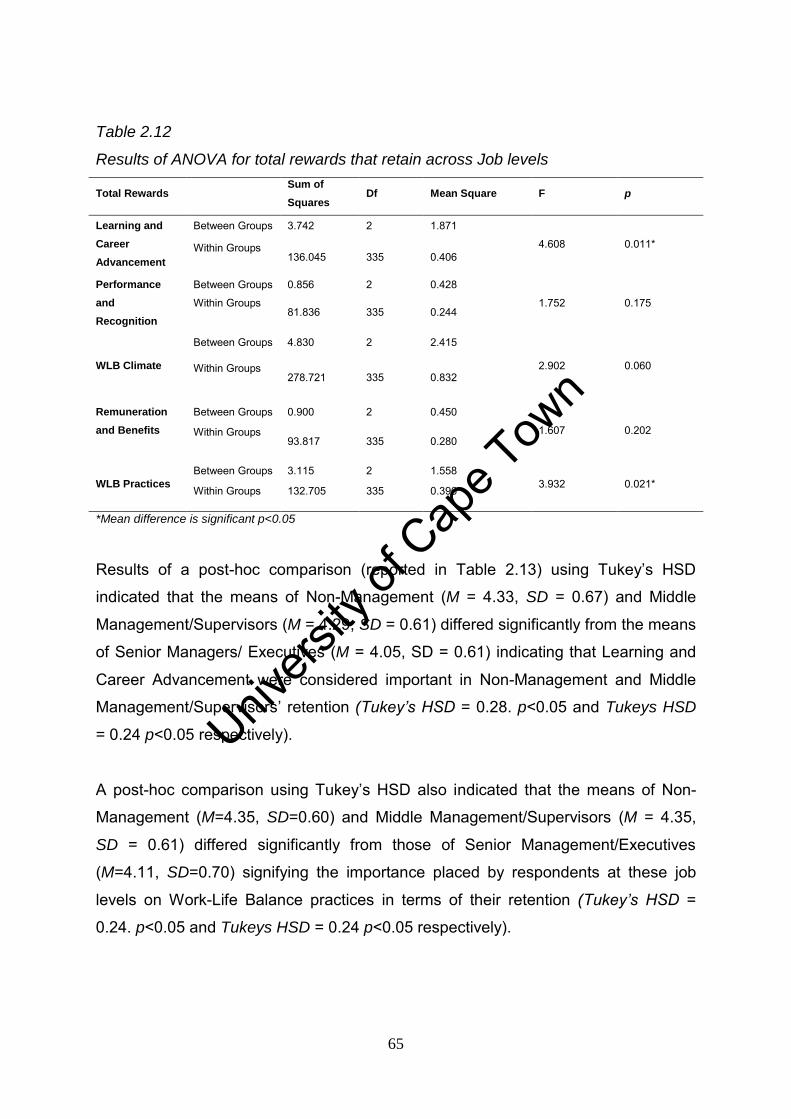
Univers
ity of
Cap
e Tow
n
65
Table 2.12
Results of ANOVA for total rewards that retain across Job levels
Total Rewards Sum of
Squares Df Mean Square F p
Learning and
Career
Advancement
Between Groups 3.742 2 1.871
4.608 0.011* Within Groups
136.045 335 0.406
Performance
and
Recognition
Between Groups 0.856 2 0.428
1.752 0.175 Within Groups
81.836 335 0.244
WLB Climate
Between Groups 4.830 2 2.415
2.902 0.060 Within Groups
278.721 335 0.832
Remuneration
and Benefits
Between Groups 0.900 2 0.450
1.607 0.202 Within Groups
93.817 335 0.280
WLB Practices
Between Groups 3.115 2 1.558 3.932 0.021* Within Groups 132.705 335 0.396
*Mean difference is significant p<0.05
Results of a post-hoc comparison (reported in Table 2.13) using Tukey‘s HSD
indicated that the means of Non-Management (M = 4.33, SD = 0.67) and Middle
Management/Supervisors (M = 4.29, SD = 0.61) differed significantly from the means
of Senior Managers/ Executives (M = 4.05, SD = 0.61) indicating that Learning and
Career Advancement were considered important in Non-Management and Middle
Management/Supervisors‘ retention (Tukey’s HSD = 0.28. p<0.05 and Tukeys HSD
= 0.24 p<0.05 respectively).
A post-hoc comparison using Tukey‘s HSD also indicated that the means of Non-
Management (M=4.35, SD=0.60) and Middle Management/Supervisors (M = 4.35,
SD = 0.61) differed significantly from those of Senior Management/Executives
(M=4.11, SD=0.70) signifying the importance placed by respondents at these job
levels on Work-Life Balance practices in terms of their retention (Tukey’s HSD =
0.24. p<0.05 and Tukeys HSD = 0.24 p<0.05 respectively).
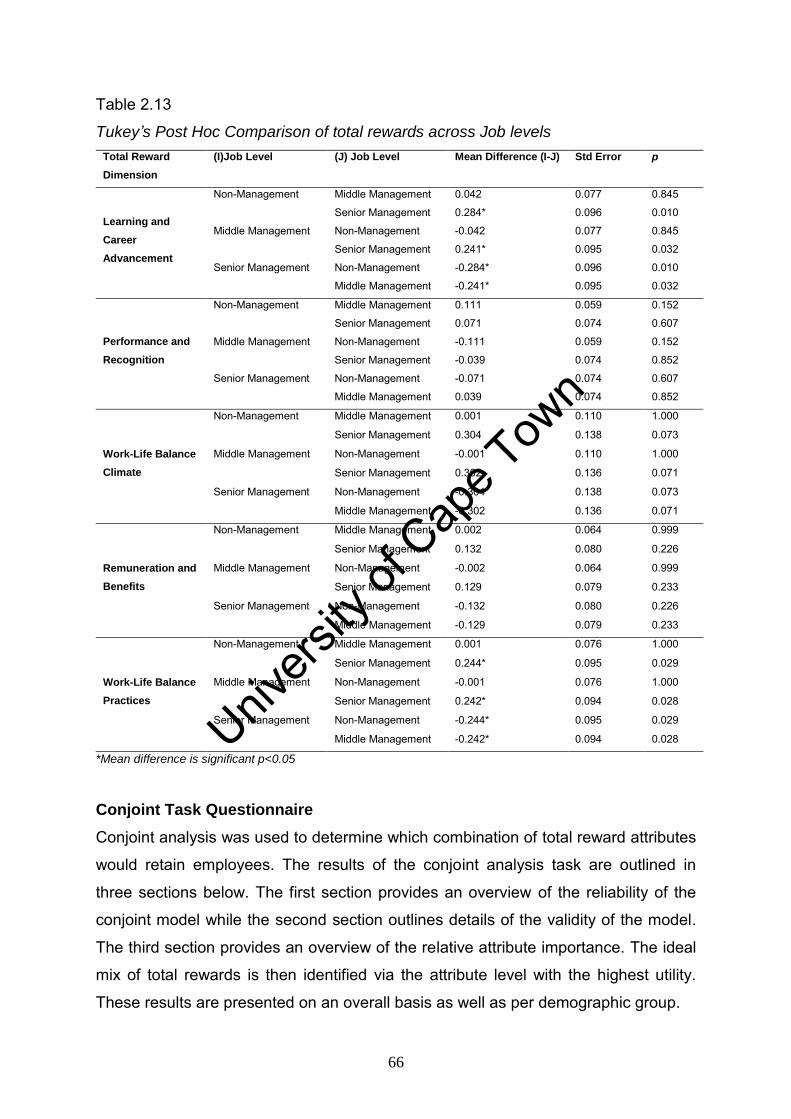
Univers
ity of
Cap
e Tow
n
66
Table 2.13
Tukey’s Post Hoc Comparison of total rewards across Job levels
Total Reward
Dimension
(I)Job Level (J) Job Level Mean Difference (I-J) Std Error p
Learning and
Career
Advancement
Non-Management Middle Management 0.042 0.077 0.845
Senior Management 0.284* 0.096 0.010
Middle Management Non-Management -0.042 0.077 0.845
Senior Management 0.241* 0.095 0.032
Senior Management Non-Management -0.284* 0.096 0.010
Middle Management -0.241* 0.095 0.032
Performance and
Recognition
Non-Management Middle Management 0.111 0.059 0.152
Senior Management 0.071 0.074 0.607
Middle Management Non-Management -0.111 0.059 0.152
Senior Management -0.039 0.074 0.852
Senior Management Non-Management -0.071 0.074 0.607
Middle Management 0.039 0.074 0.852
Work-Life Balance
Climate
Non-Management Middle Management 0.001 0.110 1.000
Senior Management 0.304 0.138 0.073
Middle Management Non-Management -0.001 0.110 1.000
Senior Management 0.302 0.136 0.071
Senior Management Non-Management -0.304 0.138 0.073
Middle Management -0.302 0.136 0.071
Remuneration and
Benefits
Non-Management Middle Management 0.002 0.064 0.999
Senior Management 0.132 0.080 0.226
Middle Management Non-Management -0.002 0.064 0.999
Senior Management 0.129 0.079 0.233
Senior Management Non-Management -0.132 0.080 0.226
Middle Management -0.129 0.079 0.233
Work-Life Balance
Practices
Non-Management Middle Management 0.001 0.076 1.000
Senior Management 0.244* 0.095 0.029
Middle Management Non-Management -0.001 0.076 1.000
Senior Management 0.242* 0.094 0.028
Senior Management Non-Management -0.244* 0.095 0.029
Middle Management -0.242* 0.094 0.028
*Mean difference is significant p<0.05
Conjoint Task Questionnaire
Conjoint analysis was used to determine which combination of total reward attributes
would retain employees. The results of the conjoint analysis task are outlined in
three sections below. The first section provides an overview of the reliability of the
conjoint model while the second section outlines details of the validity of the model.
The third section provides an overview of the relative attribute importance. The ideal
mix of total rewards is then identified via the attribute level with the highest utility.
These results are presented on an overall basis as well as per demographic group.
Univers
ity of
Cap
e Tow
n
67
Reliability of the conjoint model
A method of assessing reliability of the conjoint model is to determine the goodness-
of-fit of the estimation model which in this study is the MultiNomial Logit model
(MNL). Logit analysis is an iterative procedure to find the solution which is most likely
to fit the MultiNomial Logit model to the data. For each iteration, the log-likelihood is
reported together with a value of RLH or Root LikeliHood. This is a measure of how
well the model fits the choice data (Sawtooth Software, 2008). A respondent who
answered inconsistently would have a low RLH value. The best possible value is 1.0
which means that all choices can be explained by the preference estimates. The
worst value for this model would be 0.25 meaning that with four choice sets, a
random model would predict 25% of the choices correctly (Eggers, Farsky & Gerber,
2009).
An RLH below 0.25 was reported for one respondent. All other respondents were
above this value with 0.93 being the highest RLH value. This indicates that there was
a high level of reliability for this model.
Validity of the conjoint model
In conjoint validation studies, validity is established by comparing the actual choice
for each respondent in the holdout task with the predicted choice. The ratio of
correctly predicted choices is called the hit rate which is a common validity measure.
A second validity measure is the Mean Absolute Error rate which is an indication of
the absolute differences between the predicted and actual shares.
The hit rate was determined by using the estimation model to predict the actual
choices in the holdout stimuli, which were identical for each respondent and not used
for estimation. The first step in this process entailed calculating the utilities of the
three choices (four with the none-option) by summing up the utilities of each level
within the task. Example Alterative 1:
util (On-the job training) + util (Exposure to Opportunities)+ util (Base salary targeting
the top end of the market& Retention bonus )+ util (Employer contributes 100% of
total retirement fund contribution plus highest level of medical cover )+ util (Flexible
Univers
ity of
Cap
e Tow
n
68
Work hours )+util (Short term incentives linked to your performance plus Stock
Options or Shares).
The predicted choice is the alternative with the highest utility. The ratio of correctly
predicted choices is represented by the hit rate (Eggers et al., 2009). The hit rate for
the conjoint model in this study was 38.5% which means that the model was able to
produce 38.5% correct predictions from the holdout set. With four alternatives in the
holdout set, a chance model would have resulted in 25% of predictions being correct.
The hit rate for this study needs to be interpreted in the context of the holdout stimuli
being developed on the basis of chance given that no previous research existed to
guide the design of the stimuli. As such a 38.5% hit rate is considered reasonable.
As a second measure of validity, the absolute sum of differences between actual
choice shares and predicted choice shares on an aggregated level were calculated,
resulting in a Mean Absolute Error of prediction (MAE) of 3.2%. This indicates that
deviation in the share prediction per alternative is very low and is considered
satisfactory (Eggers et al., 2009).
Relative attribute importance overall and per demographic group
Derived utilities are used to calculate the relative importance of individual attributes
(Martins et al., 1996). The range of utilities within each attribute is calculated using
the difference between the highest and lowest utilities per attribute, divided by the
sum of the ranges across all attributes. Each attributes utility range is expressed as a
percentage of the sum of the utility ranges across all attributes. These percentages
provide an indication of the importance employees attach to the various total reward
attributes in their ability to retain. Attributes with a larger range have a greater impact
on the calculated utility values and are therefore deemed to be of greater importance
(Martins et al., 1996). Tables 2.14-2.19 provide the results of the relative attribute
importance overall and per demographic group
Results indicate that three total rewards attributes were consistently deemed to be
important in retention. These include: Benefits; Performance and Recognition; and
Remuneration. Benefits were also considered twice as important as Remuneration in
deriving utility scores and preferences within the overall sample as well as in all the
Univers
ity of
Cap
e Tow
n
69
demographic groups, as the relative importance of Benefits was on average 35%
while Remuneration was on average 17%.
Variations of the relative importance of attributes can be noted across demographic
groups. Results for gender indicate that Benefits were considered to be important in
retention for both men and women; however the relative importance was greater for
men (37.1%) than for women (33.7%), while Performance and Recognition was
deemed slightly more important for women (21%) than for men (18.6%).
The race groups indicated no significant differences in the relative importance
ascribed to attributes. Benefits were noted as highest (35%) for both blacks and
whites in terms of its relative importance in retention. Few differences were noted
across different generation groups with all three groups indicating a preference for
Benefits while Generation Y assigned a slightly lower level of importance to
Remuneration (15%) versus Generation X (17%) and Baby Boomers (18%).
Generation Y also specified Work-Life Balance as being slightly more important
(12%) in their retention compared to Generation X (8%) and Baby Boomers (7%).
Respondents across different education levels also indicated that Benefits were most
important although Matriculants were moderately higher in their preference of this
attribute (38%) compared to Undergraduates (35%) and Postgraduates (35%). A
notable difference in preference did exist with respect to the importance Matriculants
assigned to Work-Life Balance (12%) versus Undergraduates (8%) and
Postgraduates (8%). A further difference was also detected in the importance
Matriculants assigned to Learning as an attribute (4%) which was moderately lower
than that of Undergraduates (9%) and Postgraduates (10%).
Benefits were also classified as the most important attribute across job levels. Some
differences were apparent across other attributes however. Learning was considered
less important for Non-Management levels (6%) versus Middle Management (11%)
and Senior Management (12%), while Career Advancement was considered more
important at Non-Managerial levels (12%) than at Middle Management level (10%)
and Senior Management level (10%). Work-Life Balance was also deemed more
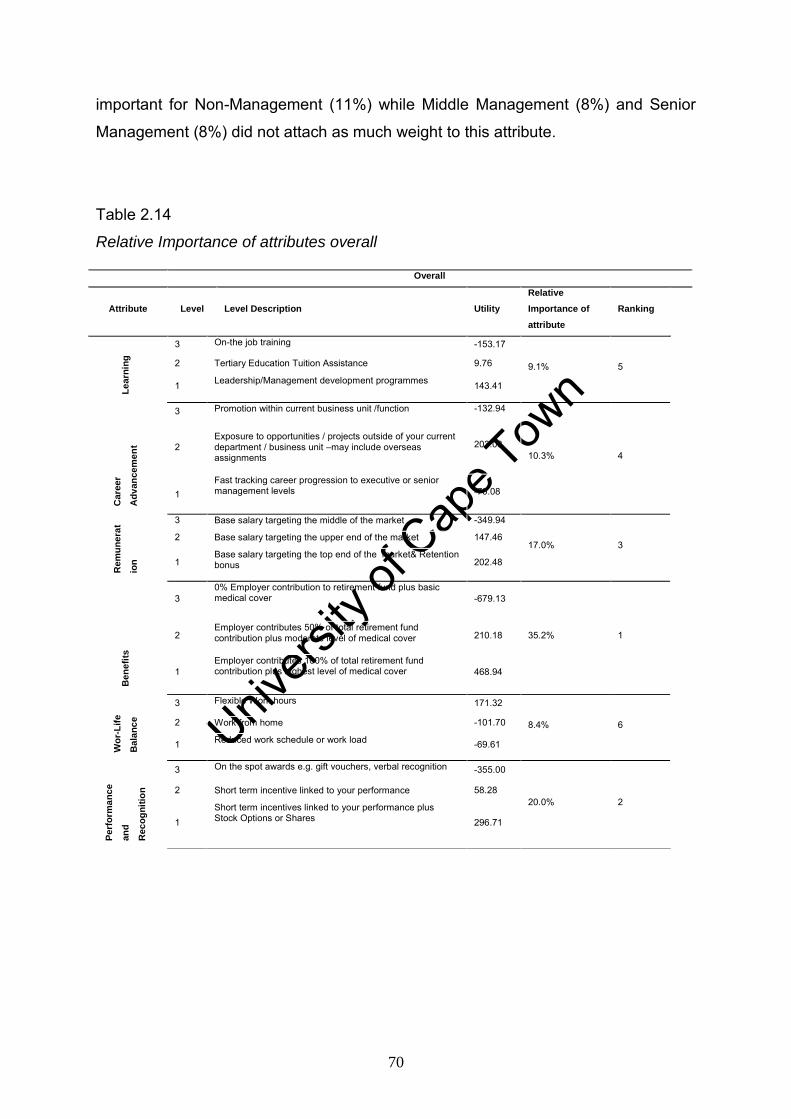
Univers
ity of
Cap
e Tow
n
70
important for Non-Management (11%) while Middle Management (8%) and Senior
Management (8%) did not attach as much weight to this attribute.
Table 2.14
Relative Importance of attributes overall
Overall
Attribute Level Level Description Utility
Relative
Importance of
attribute
Ranking
Le
arn
ing
3 On-the job training -153.17
9.1%
5
2 Tertiary Education Tuition Assistance 9.76
1 Leadership/Management development programmes 143.41
Care
er
Ad
van
cem
en
t
3 Promotion within current business unit /function -132.94
10.3% 4 2
Exposure to opportunities / projects outside of your current department / business unit –may include overseas assignments
203.03
1 Fast tracking career progression to executive or senior management levels -70.08
Rem
un
era
t
ion
3 Base salary targeting the middle of the market -349.94
17.0% 3 2 Base salary targeting the upper end of the market 147.46
1 Base salary targeting the top end of the market& Retention bonus 202.48
Ben
efi
ts
3 0% Employer contribution to retirement fund plus basic medical cover -679.13
35.2%
1
2 Employer contributes 50% of total retirement fund contribution plus moderate level of medical cover
210.18
1 Employer contributes 100% of total retirement fund contribution plus highest level of medical cover 468.94
Wo
r-L
ife
Bala
nc
e
3 Flexible Work hours 171.32
8.4% 6 2 Work from home -101.70
1 Reduced work schedule or work load -69.61
Perf
orm
an
ce
an
d
Rec
og
nit
ion
3 On the spot awards e.g. gift vouchers, verbal recognition -355.00
20.0% 2 2 Short term incentive linked to your performance 58.28
1 Short term incentives linked to your performance plus Stock Options or Shares 296.71
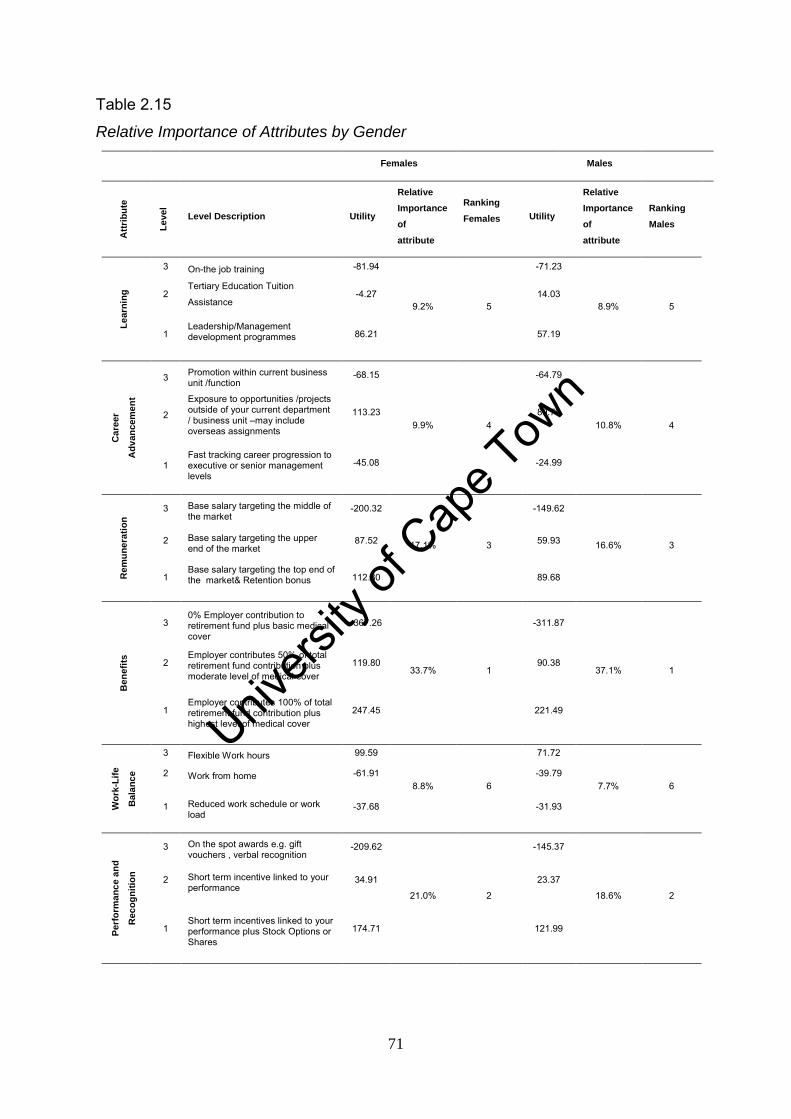
Univers
ity of
Cap
e Tow
n
71
Table 2.15
Relative Importance of Attributes by Gender
Females
Males
Att
rib
ute
Le
vel
Level Description Utility
Relative
Importance
of
attribute
Ranking
Females Utility
Relative
Importance
of
attribute
Ranking
Males
Le
arn
ing
3 On-the job training -81.94
9.2% 5
-71.23
8.9% 5 2
Tertiary Education Tuition
Assistance -4.27 14.03
1 Leadership/Management development programmes
86.21 57.19
Care
er
Ad
van
cem
en
t
3 Promotion within current business unit /function
-68.15
9.9% 4
-64.79
10.8% 4 2
Exposure to opportunities /projects outside of your current department / business unit –may include overseas assignments
113.23 89.79
1 Fast tracking career progression to executive or senior management levels
-45.08 -24.99
Rem
un
era
tio
n
3 Base salary targeting the middle of the market
-200.32
17.1% 3
-149.62
16.6% 3 2 Base salary targeting the upper end of the market
87.52 59.93
1 Base salary targeting the top end of the market& Retention bonus
112.80 89.68
Ben
efi
ts
3 0% Employer contribution to retirement fund plus basic medical cover
-367.26
33.7% 1
-311.87
37.1% 1 2
Employer contributes 50% of total retirement fund contribution plus moderate level of medical cover
119.80 90.38
1 Employer contributes 100% of total retirement fund contribution plus highest level of medical cover
247.45 221.49
Wo
rk-L
ife
Bala
nc
e
3 Flexible Work hours 99.59
8.8% 6
71.72
7.7% 6 2 Work from home -61.91 -39.79
1 Reduced work schedule or work load
-37.68 -31.93
Perf
orm
an
ce a
nd
Rec
og
nit
ion
3 On the spot awards e.g. gift vouchers , verbal recognition
-209.62
21.0%
2
-145.37
18.6% 2
2 Short term incentive linked to your performance
34.91 23.37
1 Short term incentives linked to your performance plus Stock Options or Shares
174.71 121.99
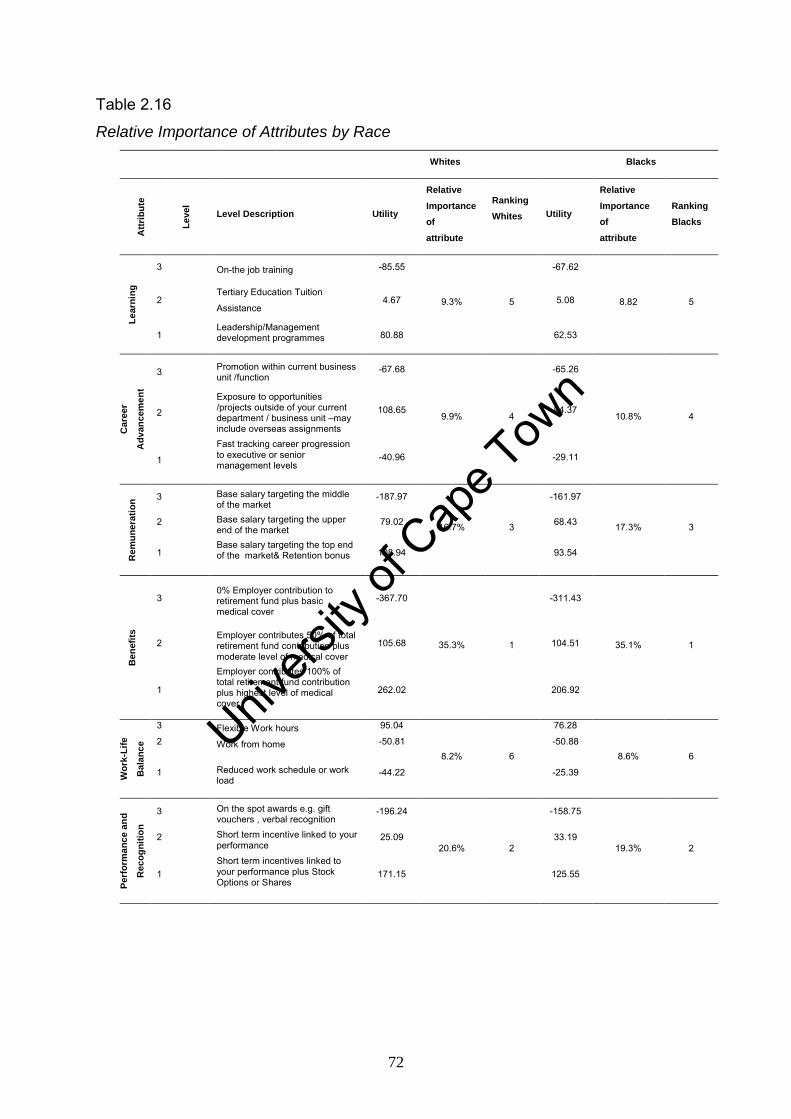
Univers
ity of
Cap
e Tow
n
72
Table 2.16
Relative Importance of Attributes by Race
Whites Blacks
Att
rib
ute
Le
vel
Level Description Utility
Relative
Importance
of
attribute
Ranking
Whites Utility
Relative
Importance
of
attribute
Ranking
Blacks
Le
arn
ing
3 On-the job training -85.55
9.3% 5
-67.62
8.82 5 2 Tertiary Education Tuition
Assistance 4.67 5.08
1 Leadership/Management development programmes
80.88 62.53
Care
er
Ad
van
cem
en
t
3 Promotion within current business unit /function
-67.68
9.9% 4
-65.26
10.8% 4 2
Exposure to opportunities /projects outside of your current department / business unit –may include overseas assignments
108.65 94.37
1
Fast tracking career progression to executive or senior management levels
-40.96 -29.11
Rem
un
era
tio
n 3 Base salary targeting the middle
of the market -187.97
16.7% 3
-161.97
17.3% 3 2 Base salary targeting the upper end of the market
79.02 68.43
1 Base salary targeting the top end of the market& Retention bonus
108.94 93.54
Ben
efi
ts
3 0% Employer contribution to retirement fund plus basic medical cover
-367.70
35.3% 1
-311.43
35.1% 1 2 Employer contributes 50% of total retirement fund contribution plus moderate level of medical cover
105.68 104.51
1
Employer contributes 100% of total retirement fund contribution plus highest level of medical cover
262.02 206.92
Wo
rk-L
ife
Bala
nc
e
3 Flexible Work hours 95.04
8.2% 6
76.28
8.6% 6 2 Work from home -50.81 -50.88
1 Reduced work schedule or work load
-44.22 -25.39
Perf
orm
an
ce a
nd
Rec
og
nit
ion
3 On the spot awards e.g. gift vouchers , verbal recognition
-196.24
20.6%
2
-158.75
19.3% 2 2 Short term incentive linked to your
performance 25.09 33.19
1 Short term incentives linked to your performance plus Stock Options or Shares
171.15 125.55
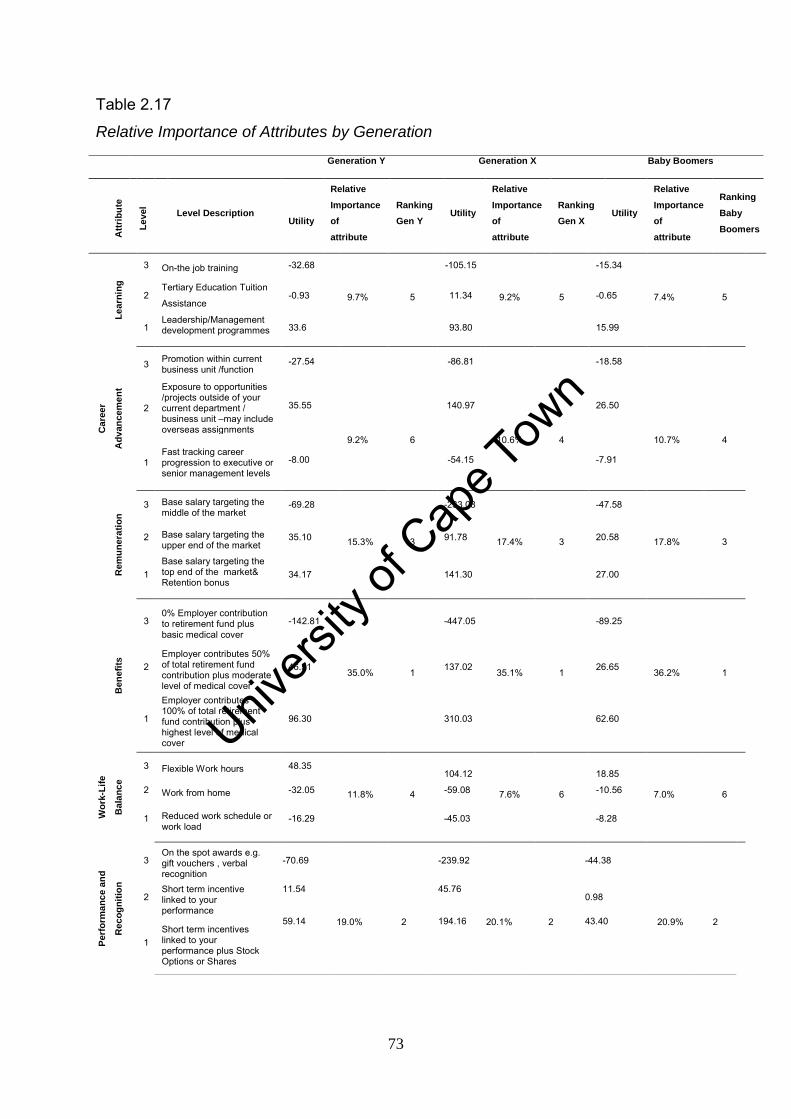
Univers
ity of
Cap
e Tow
n
73
Table 2.17
Relative Importance of Attributes by Generation
Generation Y Generation X Baby Boomers
Att
rib
ute
Le
vel
Level Description
Utility
Relative
Importance
of
attribute
Ranking
Gen Y Utility
Relative
Importance
of
attribute
Ranking
Gen X Utility
Relative
Importance
of
attribute
Ranking
Baby
Boomers
Le
arn
ing
3 On-the job training -32.68
9.7%
5
-105.15
9.2% 5
-15.34
7.4% 5 2 Tertiary Education Tuition
Assistance -0.93 11.34 -0.65
1 Leadership/Management development programmes
33.6 93.80 15.99
Care
er
Ad
van
cem
en
t
3 Promotion within current business unit /function
-27.54
9.2%
6
-86.81
10.6%
4
-18.58
10.7%
4
2
Exposure to opportunities /projects outside of your current department / business unit –may include overseas assignments
35.55 140.97 26.50
1 Fast tracking career progression to executive or senior management levels
-8.00 -54.15 -7.91
Rem
un
era
tio
n
3 Base salary targeting the middle of the market
-69.28
15.3%
3
-233.08
17.4% 3
-47.58
17.8% 3 2 Base salary targeting the upper end of the market
35.10 91.78 20.58
1 Base salary targeting the top end of the market& Retention bonus
34.17 141.30 27.00
Ben
efi
ts
3 0% Employer contribution to retirement fund plus basic medical cover
-142.81
35.0% 1
-447.05
35.1%
1
-89.25
36.2% 1 2 Employer contributes 50% of total retirement fund contribution plus moderate level of medical cover
46.51 137.02 26.65
1
Employer contributes 100% of total retirement fund contribution plus highest level of medical cover
96.30 310.03 62.60
Wo
rk-L
ife
Bala
nc
e
3 Flexible Work hours 48.35
11.8%
4
104.12
7.6% 6
18.85
7.0% 6 2 Work from home -32.05 -59.08 -10.56
1 Reduced work schedule or work load
-16.29 -45.03 -8.28
Perf
orm
an
ce a
nd
Rec
og
nit
ion
3 On the spot awards e.g. gift vouchers , verbal recognition
-70.69
19.0%
2
-239.92
20.1%
2
-44.38
20.9%
2
2 Short term incentive linked to your performance
11.54 45.76 0.98
1 Short term incentives linked to your performance plus Stock Options or Shares
59.14 194.16 43.40
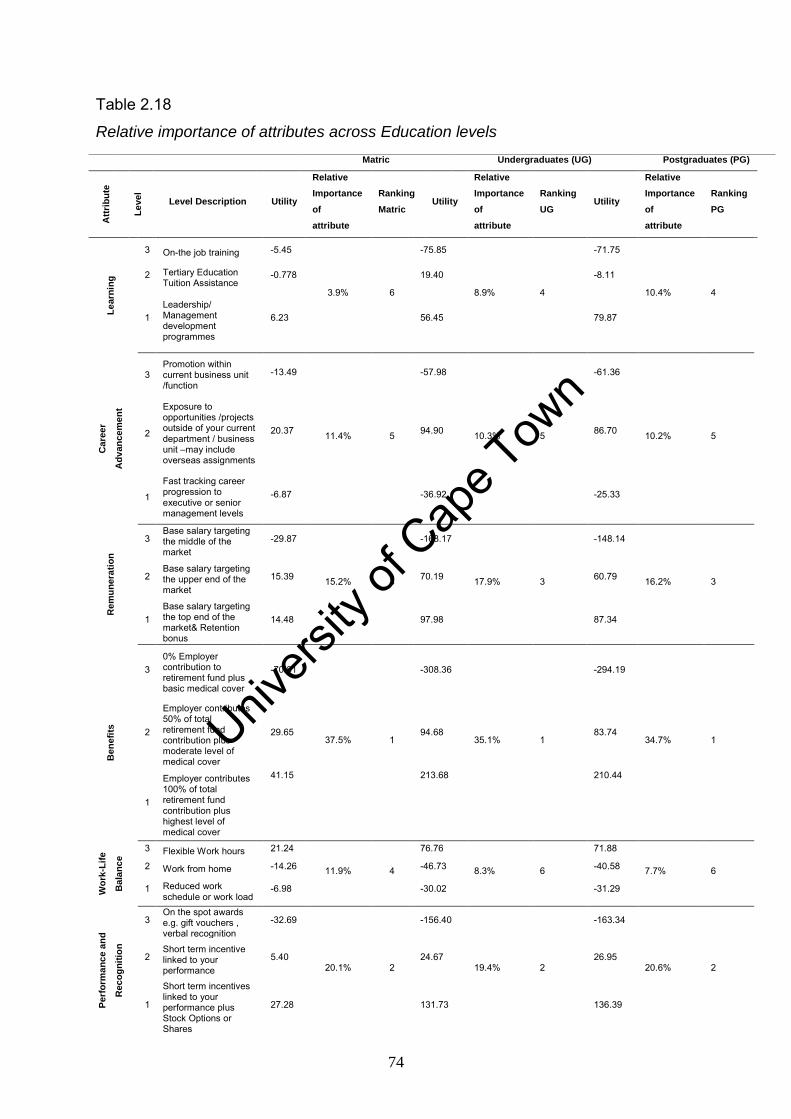
Univers
ity of
Cap
e Tow
n
74
Table 2.18
Relative importance of attributes across Education levels
Matric Undergraduates (UG) Postgraduates (PG)
Att
rib
ute
Le
vel
Level Description Utility
Relative
Importance
of
attribute
Ranking
Matric Utility
Relative
Importance
of
attribute
Ranking
UG Utility
Relative
Importance
of
attribute
Ranking
PG
Le
arn
ing
3 On-the job training -5.45
3.9% 6
-75.85
8.9% 4
-71.75
10.4% 4
2 Tertiary Education Tuition Assistance
-0.778 19.40 -8.11
1
Leadership/ Management development programmes
6.23 56.45 79.87
Care
er
Ad
van
cem
en
t
3 Promotion within current business unit /function
-13.49
11.4% 5
-57.98
10.3% 5
-61.36
10.2% 5 2
Exposure to opportunities /projects outside of your current department / business unit –may include overseas assignments
20.37 94.90 86.70
1
Fast tracking career progression to executive or senior management levels
-6.87 -36.92 -25.33
Rem
un
era
tio
n
3 Base salary targeting the middle of the market
-29.87
15.2% 3
-168.17
17.9% 3
-148.14
16.2% 3 2 Base salary targeting the upper end of the market
15.39 70.19 60.79
1 Base salary targeting the top end of the market& Retention bonus
14.48 97.98 87.34
Ben
efi
ts
3 0% Employer contribution to retirement fund plus basic medical cover
-70.81
37.5% 1
-308.36
35.1% 1
-294.19
34.7%
1 2
Employer contributes 50% of total retirement fund contribution plus moderate level of medical cover
29.65 94.68 83.74
1
Employer contributes 100% of total retirement fund contribution plus highest level of medical cover
41.15 213.68 210.44
Wo
rk-L
ife
Bala
nc
e
3 Flexible Work hours 21.24
11.9% 4
76.76
8.3% 6
71.88
7.7% 6 2 Work from home -14.26 -46.73 -40.58
1 Reduced work schedule or work load
-6.98 -30.02 -31.29
Perf
orm
an
ce a
nd
Rec
og
nit
ion
3 On the spot awards e.g. gift vouchers , verbal recognition
-32.69
20.1% 2
-156.40
19.4% 2
-163.34
20.6% 2 2
Short term incentive linked to your performance
5.40 24.67 26.95
1
Short term incentives linked to your performance plus Stock Options or Shares
27.28 131.73 136.39

Univers
ity of
Cap
e Tow
n
75
Table 2.19
Relative importance of Attributes across different Job levels
Non-Management
Middle Management/
Supervisor
Senior
Management/
Executive
Att
rib
ute
Le
vel
Level Description Utility
Relative
Importance
of
attribute
Ranking
Non-Mgt
Utility
Relative
Importance
of attribute
Utility
Ranking
Mid Mgt
Relative
Importance
of
attribute
Ranking
Snr Mgt
/Execs
Le
arn
ing
3 On-the job training -41.76
6.3% 6
-77.61
10.8%
-31.36
4 11.6% 4 2 Tertiary Education Tuition
Assistance 10.01 14.32 -8.30
1 Leadership/Management development programmes
31.75 63.28 39.67
Care
er
Ad
van
cem
en
t
3 Promotion within current business unit /function
-51.45
11.8% 4
-50.67
9.5%
-22.63
5 9.8% 5 2
Exposure to opportunities /projects outside of your current department / business unit –may include overseas assignments
84.86 72.39 36.71
1
Fast tracking career progression to executive or senior management levels
-33.41 -21.72 -14.08
Rem
un
era
tio
n 3 Base salary targeting the
middle of the market -126.08
17.1% 3
-131.59
15.4%
-67.41
3 18.7% 3 2 Base salary targeting the upper end of the market
54.42 61.80 20.77
1 Base salary targeting the top end of the market& Retention bonus
71.65 69.79 46.64
Ben
efi
ts
3 0% Employer contribution to retirement fund plus basic medical cover
-240.02
33.8% 1
-275.22
36.7%
-113.53
1 31.5% 1 2
Employer contributes 50% of total retirement fund contribution plus moderate level of medical cover
89.45 72.42 35.57
1
Employer contributes 100% of total retirement fund contribution plus highest level of medical cover
150.36 202.80 77.95
Wo
rk-L
ife
Bala
nc
e
3 Flexible Work hours 77.86
10.9% 5
56.92
7.69%
27.79
6 7.9% 6 2 Work from home -48.51 -43.18 -7.07
1 Reduced work schedule or work load
-29.35 -13.73 -20.7
Perf
orm
an
ce a
nd
Rec
og
nit
ion
3 On the spot awards e.g. gift vouchers , verbal recognition
-128.88
19.7% 2
-134.50
19.7%
-67.73
2 20.2% 2 2
Short term incentive linked to your performance
29.70 11.99 12.42
1 Short term incentives linked to your performance plus Stock Options or Shares
99.17 122.51 55.30
Univers
ity of
Cap
e Tow
n
76
The ideal mix of total rewards overall and per demographic group
To determine the total reward mix which is most preferred, the levels of attributes are
evaluated for desirability by respondents (Smith & Albaum, 2005). Utilities were
summed up across levels 1-3 for each attribute. The level with the highest utility per
attribute was regarded as the most preferred option in terms of its ability to retain.
Once the highest utility had been identified, the ideal mix emerged per grouping.
Tables 2.20- 2.25 provide details of the ideal total rewards mix overall and per
demographic group based on the utilities reflected in Tables 2.14-2.19 above.
The results indicate a relatively consistent preference across all groups with respect
to the ideal total rewards mix. Level 1 produced the highest utilities for the following
attributes across all groups except Generation Y and Matriculants: Learning
(Leadership/Management development programmes), Remuneration (Base salary
targeting the top end of the market and a Retention bonus), Benefits (Employer
contributes 100% of total retirement fund contribution plus highest level of medical
cover) and Performance and Reward (Short term incentives linked to your
performance plus Stock Options or Shares). Level 2 of the Remuneration attribute,
―Base salary targeting the upper end of the market,‖ was selected by Generation Y
and Matriculants as most preferential in terms of retention. All groups selected level
2 of the Career Advancement attribute, ―Exposure to opportunities /projects outside
of your current department / business unit –may include overseas assignments,‖ and
all groups selected Level 3 of the Work-Life Balance attribute, ―Flexible Work Hours‖.
Overall most groups appear to value the monetary components of the Total Rewards
model and consider these elements as important determinants in their retention.
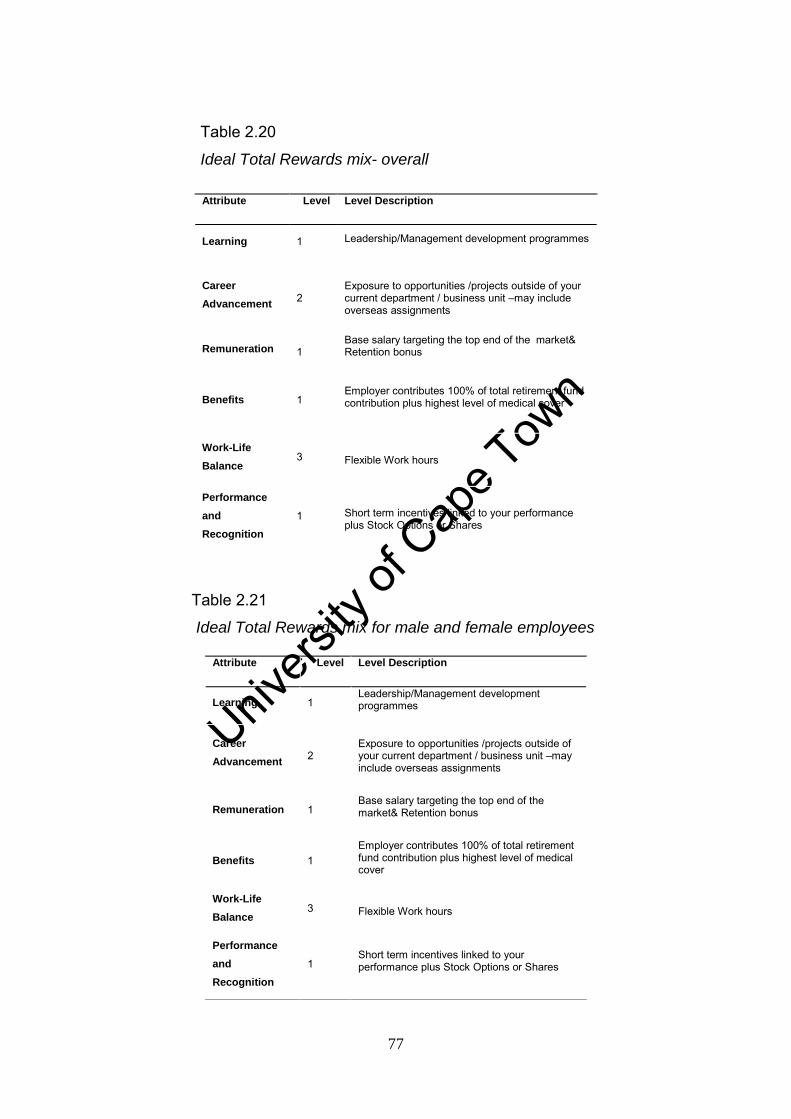
Univers
ity of
Cap
e Tow
n
77
Table 2.20
Ideal Total Rewards mix- overall
Table 2.21
Ideal Total Rewards mix for male and female employees
Attribute Level Level Description
Learning 1 Leadership/Management development programmes
Career
Advancement 2
Exposure to opportunities /projects outside of your current department / business unit –may include overseas assignments
Remuneration 1 Base salary targeting the top end of the market& Retention bonus
Benefits 1 Employer contributes 100% of total retirement fund contribution plus highest level of medical cover
Work-Life
Balance 3 Flexible Work hours
Performance
and
Recognition
1 Short term incentives linked to your performance plus Stock Options or Shares
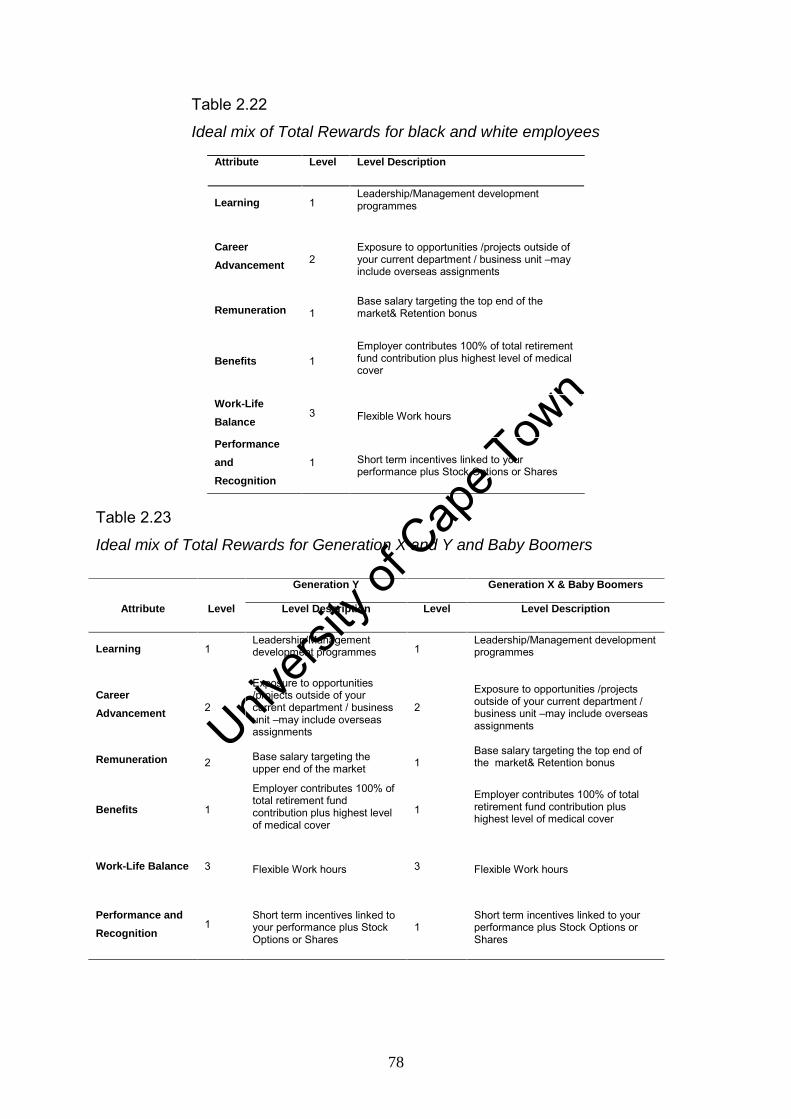
Univers
ity of
Cap
e Tow
n
78
Table 2.22
Ideal mix of Total Rewards for black and white employees
Table 2.23
Ideal mix of Total Rewards for Generation X and Y and Baby Boomers
Attribute Level Level Description
Learning 1 Leadership/Management development programmes
Career
Advancement 2
Exposure to opportunities /projects outside of your current department / business unit –may include overseas assignments
Remuneration 1 Base salary targeting the top end of the market& Retention bonus
Benefits 1 Employer contributes 100% of total retirement fund contribution plus highest level of medical cover
Work-Life
Balance 3 Flexible Work hours
Performance
and
Recognition
1 Short term incentives linked to your performance plus Stock Options or Shares
Generation Y Generation X & Baby Boomers
Attribute Level Level Description Level Level Description
Learning 1 Leadership/Management development programmes
1 Leadership/Management development programmes
Career
Advancement 2
Exposure to opportunities /projects outside of your current department / business unit –may include overseas assignments
2
Exposure to opportunities /projects outside of your current department / business unit –may include overseas assignments
Remuneration 2 Base salary targeting the upper end of the market 1
Base salary targeting the top end of the market& Retention bonus
Benefits 1
Employer contributes 100% of total retirement fund contribution plus highest level of medical cover
1 Employer contributes 100% of total retirement fund contribution plus highest level of medical cover
Work-Life Balance 3 Flexible Work hours 3 Flexible Work hours
Performance and
Recognition 1
Short term incentives linked to your performance plus Stock Options or Shares
1 Short term incentives linked to your performance plus Stock Options or Shares
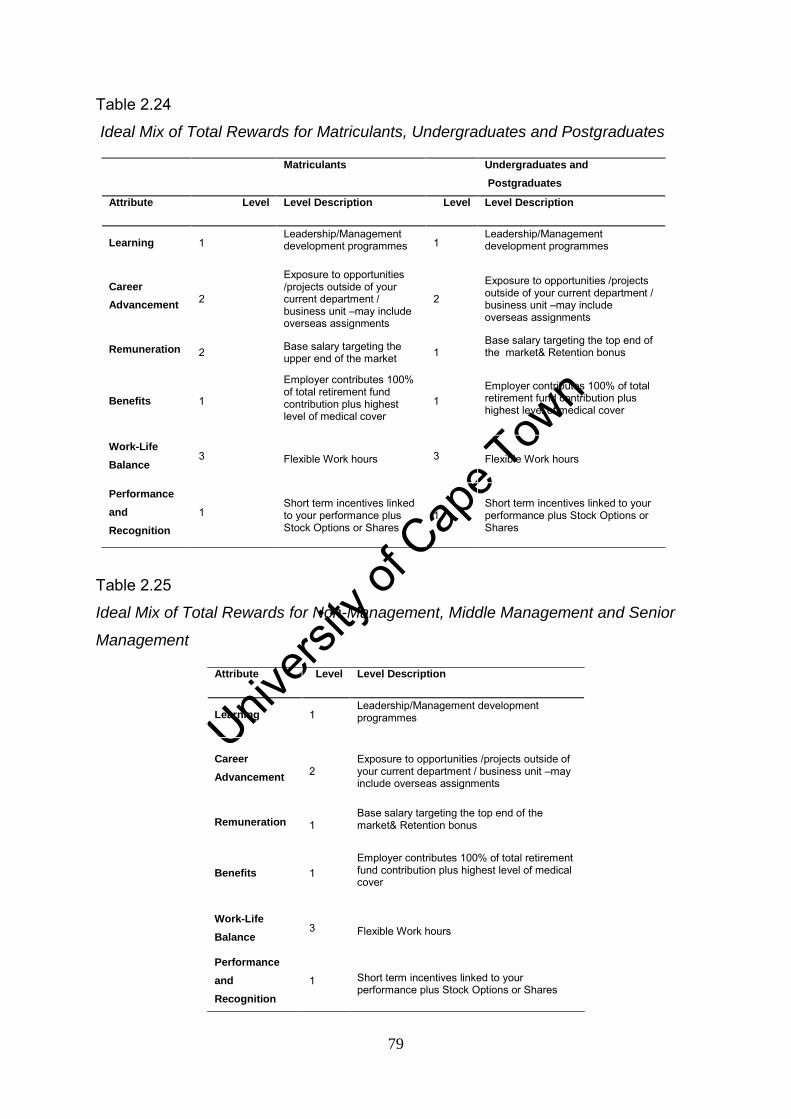
Univers
ity of
Cap
e Tow
n
79
Table 2.24
Ideal Mix of Total Rewards for Matriculants, Undergraduates and Postgraduates
Table 2.25
Ideal Mix of Total Rewards for Non-Management, Middle Management and Senior
Management
Matriculants Undergraduates and
Postgraduates
Attribute Level Level Description Level Level Description
Learning 1 Leadership/Management development programmes
1 Leadership/Management development programmes
Career
Advancement 2
Exposure to opportunities /projects outside of your current department / business unit –may include overseas assignments
2
Exposure to opportunities /projects outside of your current department / business unit –may include overseas assignments
Remuneration 2 Base salary targeting the upper end of the market 1
Base salary targeting the top end of the market& Retention bonus
Benefits 1
Employer contributes 100% of total retirement fund contribution plus highest level of medical cover
1 Employer contributes 100% of total retirement fund contribution plus highest level of medical cover
Work-Life
Balance 3 Flexible Work hours 3 Flexible Work hours
Performance
and
Recognition
1 Short term incentives linked to your performance plus Stock Options or Shares
1 Short term incentives linked to your performance plus Stock Options or Shares
Attribute Level Level Description
Learning 1 Leadership/Management development programmes
Career
Advancement 2
Exposure to opportunities /projects outside of your current department / business unit –may include overseas assignments
Remuneration 1 Base salary targeting the top end of the market& Retention bonus
Benefits 1 Employer contributes 100% of total retirement fund contribution plus highest level of medical cover
Work-Life
Balance 3 Flexible Work hours
Performance
and
Recognition
1 Short term incentives linked to your performance plus Stock Options or Shares
Univers
ity of
Cap
e Tow
n
80
CHAPTER 5
DISCUSSION
The retention of human capital is a key business imperative essential to securing a
competitive advantage for organisations (Jensen et al., 2007). This is especially true
in the current economic climate as companies are realizing the need to retain their
most talented employees to assist in maintaining the profitability of the organisation
(Hay, 2002). The significant financial and non-financial costs associated with the loss
of business imperative skills, especially those classified as Previously
Disadvantaged Individuals in the South African context, provides further impetus for
organisations to understand which total rewards are likely to retain these groups
(Finweek, 2008).
The current study aimed to develop an understanding of the total rewards that retain
employees across different demographic groups including race, gender and age
groups, as well as knowledge workers from different education and job levels. The
research objectives were investigated in two ways; the first utilised a conjoint task
which presented various reward elements to employees and allowed them to trade
these off against each other to produce the ideal total rewards mix they deemed
most attractive and most likely to retain them; the second used the WorldatWork
Total Rewards model to identify which total reward elements were valued by
employees and served to retain them. This questionnaire allowed employees to
identify the total reward elements that they considered significant in their retention
but may nevertheless trade off against another reward element in the context of the
conjoint task which required a different cognitive approach to selecting rewards that
were valued in their retention.
The current research is important for a number of reasons, most notably because
different groups of employees have varying needs and demands from their work
environments. It is imperative that organisations understand what these demands
entail and ensure that the appropriate mix of totals rewards is provided to
successfully retain these groups (Bussin, 2002).
Univers
ity of
Cap
e Tow
n
81
The discussion below will first outline the overall results of the ideal total rewards
mix; this will be followed by a discussion of the ideal total rewards mix per
demographic group, in conjunction with the findings from the study of reward
elements that employees value in their retention (i.e. based on the WorldatWork
rewards model).
The overall ideal Total Rewards mix
In the current study the conjoint task produced an ideal mix of total rewards
(graphically represented in Figure 4) of which three reward elements were
consistently classified as highly valued and important in the retention of employees.
The highest level of Benefits, namely a 100% employer contribution towards
retirement funding, and the highest level of medical cover, were deemed most
important in the retention of employees. These findings are consistent with the
results of the WorldatWork Attraction and Retention survey (2007), whereby 90% of
participants rated medical aid as having a moderate to high impact on retention. It is
plausible that South African employees, such as those in the current study, would
consider benefits important in retention, given the high costs associated with medical
care and the value placed on company contributions to retirement funding. These
sentiments were also noted in Kochanski and Ledford‘s (2001) study, where
employees indicated that the value of benefits impacted on their retention. Given that
a large portion of the South African population does not have access to benefits, and
public healthcare and social welfare pensions can be considered to be inadequate,
employees are likely to highly value the benefits offered by their organisations.
The largest level of Performance and Recognition as presented in the conjoint task,
(i.e. short term incentives linked to performance plus stock options or shares) was
considered to be the next most valued reward element in the total rewards mix.
These findings partially support the literature, especially the findings of the Hay
Groups 2010 report, The Changing Face of Reward, where variable pay
programmes contributed significantly to employee commitment. Holmes (2008) also
commented on the value of recognition in retaining employees, although career
advancement was noted as being more important in retaining employees in this
Univers
ity of
Cap
e Tow
n
82
study. The importance attached to Performance and Recognition in the current
research could be attributed to the continued prevalence of generous variable pay
programmes in South Africa, where these often equate to one month‘s additional
salary. At executive and senior management levels, incentive bonuses may often
exceed 80% of annual salary (Labour Research Service, 2010).
The highest level of Remuneration (i.e. base salary targeting the top end of the
market and a retention bonus) was rated as the third most important reward element
that retains employees. The findings of the current study are similar to those of De
Vos and Meganck (2007), where employees ranked financial rewards as fourth most
important in their retention, although career development was ranked as most
important in that study. Results from the Corporate Leadership Council‘s (2006)
Employee Value Proposition survey are also contrary to the findings of the current
study, whereby 25 other Employee Value proposition attributes were considered
more important in retention that remuneration. Employees in the current study may
value remuneration as they view their pay as competitive and possibly have a
reasonable understanding of how their pay systems work, and (especially) the
manner in which they are able to earn salary increases. These sentiments would be
in line with studies by Higginbotham (1987) and Kochanski and Ledford (2001).
Career Advancement, Learning and Work-Life Balance were all ranked similarly in
terms of overall importance in employee retention. The second level of Career
Advancement was considered most important in employee retention (i.e. Exposure
to opportunities/projects outside of your current department/business unit- may
include overseas assignments). This is contrary to much of the literature e.g. the
2003 Towers Perrin Report, which indicated that career advancement opportunities
were amongst the top two reward elements that retained employees. Similarly the
Corporate Leadership Council (2006) noted that 45% of participants in the
Employment Value Proposition Survey ranked career advancement as having the
highest impact on organisational commitment.
The highest rated level of Learning (i.e. leadership/management development
programmes) was regarded as important in employee retention in the current study.
Previous literature overwhelmingly indicated that learning retains employees, with a
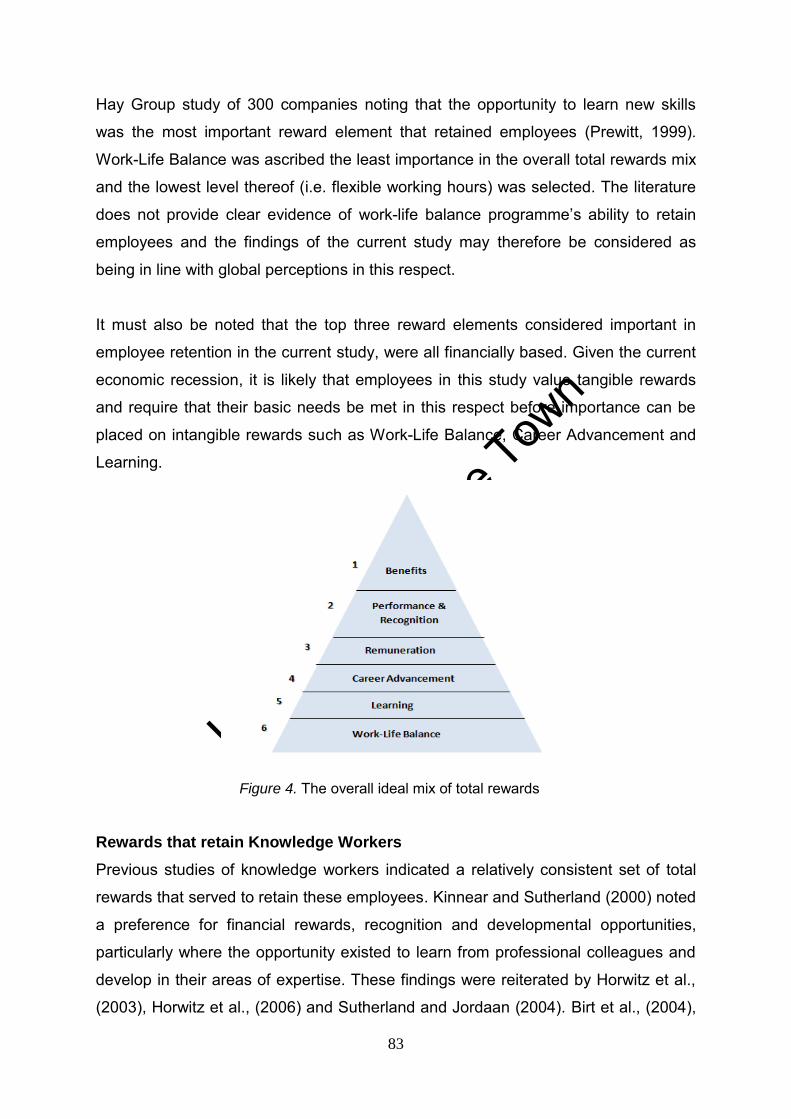
Univers
ity of
Cap
e Tow
n
83
Hay Group study of 300 companies noting that the opportunity to learn new skills
was the most important reward element that retained employees (Prewitt, 1999).
Work-Life Balance was ascribed the least importance in the overall total rewards mix
and the lowest level thereof (i.e. flexible working hours) was selected. The literature
does not provide clear evidence of work-life balance programme‘s ability to retain
employees and the findings of the current study may therefore be considered as
being in line with global perceptions in this respect.
It must also be noted that the top three reward elements considered important in
employee retention in the current study, were all financially based. Given the current
economic recession, it is likely that employees in this study value tangible rewards
and require that their basic needs be met in this respect before importance can be
placed on intangible rewards such as Work-Life Balance, Career Advancement and
Learning.
Figure 4. The overall ideal mix of total rewards
Rewards that retain Knowledge Workers
Previous studies of knowledge workers indicated a relatively consistent set of total
rewards that served to retain these employees. Kinnear and Sutherland (2000) noted
a preference for financial rewards, recognition and developmental opportunities,
particularly where the opportunity existed to learn from professional colleagues and
develop in their areas of expertise. These findings were reiterated by Horwitz et al.,
(2003), Horwitz et al., (2006) and Sutherland and Jordaan (2004). Birt et al., (2004),
Univers
ity of
Cap
e Tow
n
84
Horwitz et al., (2006) and Sutherland and Jordaan (2004) also indicated which
rewards were considered unimportant and ineffective in retaining knowledge
workers. These included: social relations at work; work-life balance practices e.g.
team building; and traditional benefits such as medical aid and pension funds.
In the context of the current study, knowledge workers were investigated at two
levels, namely education and job level. The results of the conjoint tasks for
knowledge workers across both education and job levels, differed from previous
research, as the results indicated that the highest level of Benefits (i.e. 100%
employer contribution to retirement fund plus highest level of medical cover) were
considered to be the most preferred reward with Matriculants indicating a moderately
higher level of preference. Since Matriculants were not considered to be knowledge
workers in the context of the current study, these findings partially support previous
research but- on balance -the results contradict studies by Birt et al., (2004), Horwitz
et al., (2006) and Sutherland and Jordaan (2004) where benefits were noted as
ineffective in retaining knowledge workers.
The results of the current study could be ascribed to a number of factors, the first
being the current economic recession in South Africa which has been characterised
by growing levels of unemployment and increasing numbers of retrenchments across
various industries, leaving a workforce whose job stability is threatened. In this
environment, it is likely that knowledge workers may value those rewards that are not
easily replaceable during periods of unemployment or self-employment and are also
becoming an increasingly expensive component of the total rewards package.
Knowledge workers may have a superior understanding of the value of a company‘s
contribution to their benefits. For instance, risk benefits are included in many
retirement funds and are significantly discounted as part of a collective arrangement.
Purchasing these risk benefits on an individual basis is significantly more expensive.
Knowledge workers may be more familiar and informed about such details and
therefore place a greater value on their benefits. It could also be expected that
knowledge workers are more aware of the growing need to be adequately prepared
for retirement, and often the provision that has been made is not sufficient.
Furthermore, they are likely to be conscious of the lack of alternative benefits such
Univers
ity of
Cap
e Tow
n
85
as state funded medical facilities or a National Social Security system which are
either non-existent or inadequate.
Performance and Recognition was considered to be the next most valued reward for
knowledge workers across education and job levels. The highest level of this reward
offering was selected and included short term incentives linked to performance and
stock options plus shares. It is likely that knowledge workers are largely eligible for
variable pay plans and long term incentives such as shares and stock options, and
consider this to be a significant and valued component of their package which
recognizes the skills and knowledge which they bring to their organisations. These
results corroborate the findings of Horwitz et al., (2003) and Kinnear and Sutherland
(2000) where recognition and performance bonuses and incentives were found to
retain knowledge workers.
Remuneration was also identified as a sought-after reward element across all
education and job levels, in the current study. The top level of this reward (i.e. Base
salary targeting the top end of the market and a Retention bonus) was also selected
across all education and job levels with the exception of Matriculants who viewed the
second highest level of Remuneration (i.e. Base salary targeting the upper end of the
market) as more preferable in their retention. This could largely be due to their
placing greater value on Work-Life Balance in their total rewards mix even though
the lowest level of Work-Life Balance (i.e. Flexible working hours) was selected as
optimal in their retention.
Learning and Career Advancement were ranked as fourth and fifth in terms of
relative importance across all education levels, with the exception of Matriculants
who rated Work-Life Balance as more important than either of these. Employees
classified as Non-Management also indicated a preference for Work-Life Balance
but, unlike Matriculants, valued Career Advancement more. Both Work-Life Balance
and Career Advancement were traded off against Learning which was considered to
be the element least likely to retain Non-Management and Matriculants in the context
of an overall rewards offering. Despite Work-Life Balance being identified as
important in the retention of Non-Management, the lowest level of this reward
element, namely flexible working hours , was selected across all job levels.
Univers
ity of
Cap
e Tow
n
86
The lack of importance placed on Learning amongst Matriculants provides support
for the likelihood that these employees are not knowledge workers who Kinnear and
Sutherland (2000) noted as being retained by learning opportunities, particularly
where the possibility existed for them to learn from professional colleagues. It is also
likely that Matriculants have not had access to further education, but have
nevertheless made reasonable progress within an organisation. Amongst Non-
Managerial employees, it is likely that learning is not recognized as a satisfactory
strategy for progression to Middle or Senior Management/Executive levels in the
organisation. Furthermore, this group consists of a large number of specialists and
individual contributors who may already have a wide knowledge base and were
therefore not attracted to the options of on-the-job- training or Tertiary education,
listed under levels of Learning, as they may already have acquired sufficient
amounts of both of these elements. The third level of Learning (i.e. leadership and
management development programmes) may also not appeal to an individual in a
specialist role and for this reason the overall attraction to Learning as a reward
element that retains, was low.
Despite Non-Management rating Learning as least likely to retain them in the context
of the conjoint task, the results of the study based on the WorldatWork Total
Rewards Model indicated that Non-Management and Middle Management registered
a significant preference for Learning and Career Advancement compared to Senior
Management /Executives. These findings corroborate those of Horwitz et al., (2003),
Horwitz et al., (2006), Kinnear and Sutherland (2000), Sutherland and Jordaan
(2004) and Sutherland (2004) who all noted that knowledge workers showed a
preference for career development opportunities as well as a desire to develop in
their areas of expertise. Lee and Maurer‘s (1997) study also provides support for
these findings as knowledge workers in this study indicated that training and learning
interventions were important in their retention.
A possible explanation for Senior Managers/Executives not placing a high level of
importance on Learning and Career Advancement may be attributed to their already
having progressed to the top of their organisations, and therefore Career
Advancement would not be considered a valued reward offering to use as a retention
Univers
ity of
Cap
e Tow
n
87
tool. Employees at Non-Management and Middle Management levels may
nevertheless view Career Advancement as an opportunity to strive for, making it
more attractive as a retention factor.
An outcome of the WorldatWork Total Rewards study which supports the findings of
the conjoint tasks, relates to the importance placed on Work-Life Balance Practices
by Non-Management and Middle Management as well as Matriculants and
Undergraduates preference for Work-Life Balance Climate initiatives which were not
rated as important in the retention of Postgraduates. Since Matriculants are not
classified as knowledge workers in the context of this study, these findings support
the research of Birt et al., (2004), Horwitz et al., (2006) and Sutherland and Jordaan
(2004) who noted that knowledge workers are not retained by work-life balance
initiatives.
Gaylard et al., (2005) noted that knowledge workers were retained by work-life
balance which provides some support for Undergraduates preference for work-life
balance as a retention factor. On balance however most literature indicates that
knowledge workers are not retained by work-life balance initiatives. A possible
explanation for Undergraduates as opposed to Postgraduates preference for Work-
Life Balance Climate may relate to their motivation to achieve. Employees with a
Postgraduate qualification may have a stronger drive to achieve both academically
and professionally compared with Undergraduates and therefore the nature of Work-
Life Balance Climate practices may not be aligned with, or facilitate, the attainment
of their professional goals and ambitions.
The lack of emphasis on Work-Life Balance amongst Postgraduates and Senior
Management/Executives may be indicative of these knowledge workers naturally
high levels of competitiveness (Sutherland & Jordaan, 2004). A further reason for
knowledge workers not wishing to adopt high levels of Work-Life Balance was noted
by Remuneration Managers in questionnaire 1, where employees in management
roles, who were considered to be a high retention risk, did not favour flextime,
quoting that they feared being ‗out of sight and out of mind‘ when an opportunity may
present itself which could advance their careers. The demands at this job level may
also not practically permit senior managers to adopt flexible hours
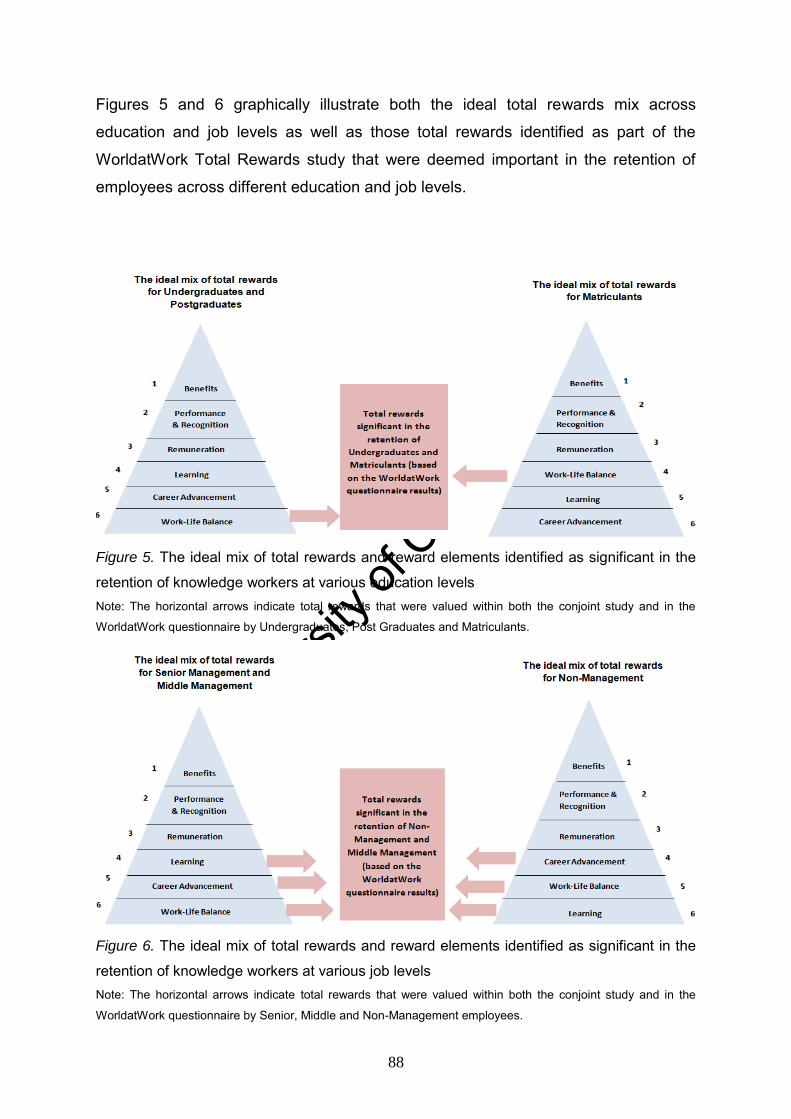
Univers
ity of
Cap
e Tow
n
88
Figures 5 and 6 graphically illustrate both the ideal total rewards mix across
education and job levels as well as those total rewards identified as part of the
WorldatWork Total Rewards study that were deemed important in the retention of
employees across different education and job levels.
Figure 5. The ideal mix of total rewards and reward elements identified as significant in the
retention of knowledge workers at various education levels Note: The horizontal arrows indicate total rewards that were valued within both the conjoint study and in the
WorldatWork questionnaire by Undergraduates, Post Graduates and Matriculants.
Figure 6. The ideal mix of total rewards and reward elements identified as significant in the
retention of knowledge workers at various job levels Note: The horizontal arrows indicate total rewards that were valued within both the conjoint study and in the
WorldatWork questionnaire by Senior, Middle and Non-Management employees.
Univers
ity of
Cap
e Tow
n
89
Rewards that retain Employment Equity candidates
Previous studies of total rewards that retain black employees in South Africa are
limited. Studies by Khanyile and Mapongo (2007) and Booysen‘s (2007) both
indicated that career advancement and opportunities formed a strong retention
factor. These findings were supported by studies conducted in the United States by
Griffeth et al., (2000) and Thomas and Gabarro (1999, as cited in Hom, Ellis &
Roberson) where minority executives reported slower career progress than their
white counterparts.
The current study partially supports these findings, although a unique outcome was
the value attributed to Benefits by black employees who, together with white
employees, identified this as the most attractive reward element in the mix of total
rewards. It should also be noted that the highest value of Benefits was selected by
both race groups. A possible explanation for these findings includes black
employees‘ previous lack of access to adequate retirement funding and medical
care. The current generation of black employees may be witness to the effects of a
lifetime of low income where provision could not be made for retirement, creating an
increased dependence on social welfare pensions. It is also possible that black
employees have an extended family, who are dependent on their benefits such as
medical aid, and for this reason benefits are valued, given the impact on the broader
family unit.
The highest levels of Remuneration and Performance and Recognition were also
valued equally by black and white employees in the total rewards mix. In contrast to
these results the study of reward elements drawn from the WorldatWork model
indicated that black employees deemed Performance and Recognition as well as
Learning and Career Advancement and Work-Life Balance Climate initiatives to be
more important in their retention than white employees.
These findings differ to those of Kotze and Roodt‘s (2005) study which purported that
competitive remuneration, performance standards as well as diversity initiatives,
were not effective in retaining Previously Disadvantaged Individuals. A possible
explanation for these differences may be associated with the quality of performance
management systems at the organisations included in the current study. Black
Univers
ity of
Cap
e Tow
n
90
employees may perceive the performance management system to be fair and
equitable and one which recognizes and rewards their contribution.
The value attached to Career Advancement and Learning by black employees in
their retention is in keeping with much of the literature where career advancement
was noted as a retention factor (Griffeth et al., 2000 and Khanyile and Mapongo,
2007 and Thomas and Gabarro 1999, as cited in Hom, Ellis & Roberson).
Preferences for rewards such as Career Advancement and Learning and
Performance and Recognition may indicate the desire of black employees not to be
appointed as tokens, but rather for organisations to value their contribution.
Organisations providing their equity candidates with these rewards are also likely to
be indicating a level of trust and respect.
No literature exists to explain the importance black employees place on Work-Life
Balance Climate initiatives. Since Work-Life Balance Climate pertains to team
building and social friendships at work, it is likely that black employees value the
sense of community created in their organisations.
Figure 7 graphically represents the ideal total rewards mix for black and white
employees as well as the total rewards identified in the WorldatWork Total Rewards
model which served to retain black employees.
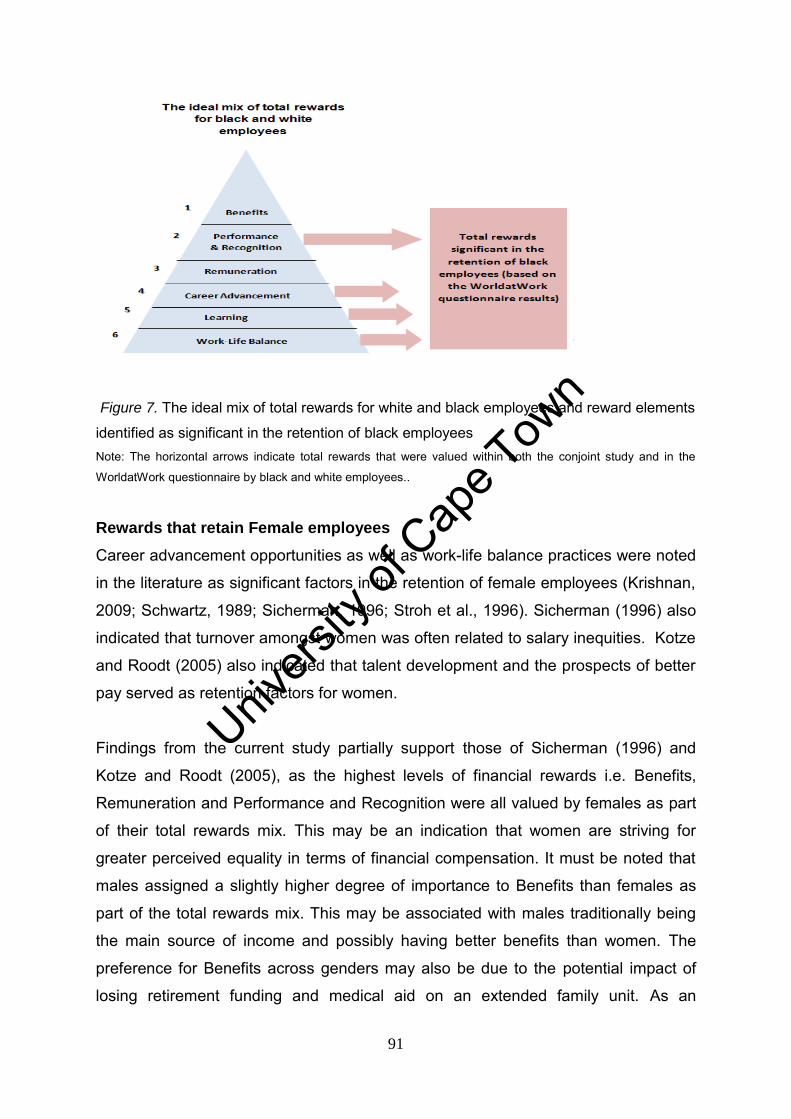
Univers
ity of
Cap
e Tow
n
91
Figure 7. The ideal mix of total rewards for white and black employees and reward elements
identified as significant in the retention of black employees Note: The horizontal arrows indicate total rewards that were valued within both the conjoint study and in the
WorldatWork questionnaire by black and white employees..
Rewards that retain Female employees
Career advancement opportunities as well as work-life balance practices were noted
in the literature as significant factors in the retention of female employees (Krishnan,
2009; Schwartz, 1989; Sicherman, 1996; Stroh et al., 1996). Sicherman (1996) also
indicated that turnover amongst women was often related to salary inequities. Kotze
and Roodt (2005) also indicated that talent development and the prospects of better
pay served as retention factors for women.
Findings from the current study partially support those of Sicherman (1996) and
Kotze and Roodt (2005), as the highest levels of financial rewards i.e. Benefits,
Remuneration and Performance and Recognition were all valued by females as part
of their total rewards mix. This may be an indication that women are striving for
greater perceived equality in terms of financial compensation. It must be noted that
males assigned a slightly higher degree of importance to Benefits than females as
part of the total rewards mix. This may be associated with males traditionally being
the main source of income and possibly having better benefits than women. The
preference for Benefits across genders may also be due to the potential impact of
losing retirement funding and medical aid on an extended family unit. As an
Univers
ity of
Cap
e Tow
n
92
example, death and disability cover are included in retirement benefits and the
provision thereof impacts on the financial security of a family.
Within the total rewards mix, women assigned slightly more importance (i.e. 21%) to
Performance and Recognition than men (i.e. 18.6%). Performance and Recognition
in the current study was associated with the provision of short term incentives linked
to performance plus stock options or shares. It is likely that women may value these
variable rewards as a means of compensating for potential perceived pay
inequalities in base pay remuneration.
It should also be noted that in comparison to previous literature emphasizing female
employees‘ preferences for work-life balance initiatives, findings from the current
study revealed that Work-Life Balance (i.e. flexible working hours ), was considered
the least attractive element in the total reward mix and therefore not deemed
important in the retention of female employees (Schwartz, 1989; Sicherman, 1996).
This result may be attributed to female employees‘ continued drive to ensure equity
with their male colleagues, and Work-Life Balance initiatives may also be considered
counter to the importance assigned to career advancement.
The study of reward elements from the WorldatWork Total Rewards model revealed
that a significant difference exists between males and females with respect to
Learning and Career Advancement. Women placed greater importance on this factor
than men in terms of its ability to retain. These findings are in keeping with Kotze and
Roodt (2005) and Krishnan (2009), whose studies indicated that women were
retained by career advancement opportunities to a greater extent than men. This
may be attributed to more career opportunities becoming available to women, as
opposed to men, given their status under the Employment Equity Act No.55 of 1998.
Figure 8 graphically represents the ideal total rewards mix for female and male
employees as well as the total rewards drawn from the WorldatWork model that are
deemed important in the retention of female employees.
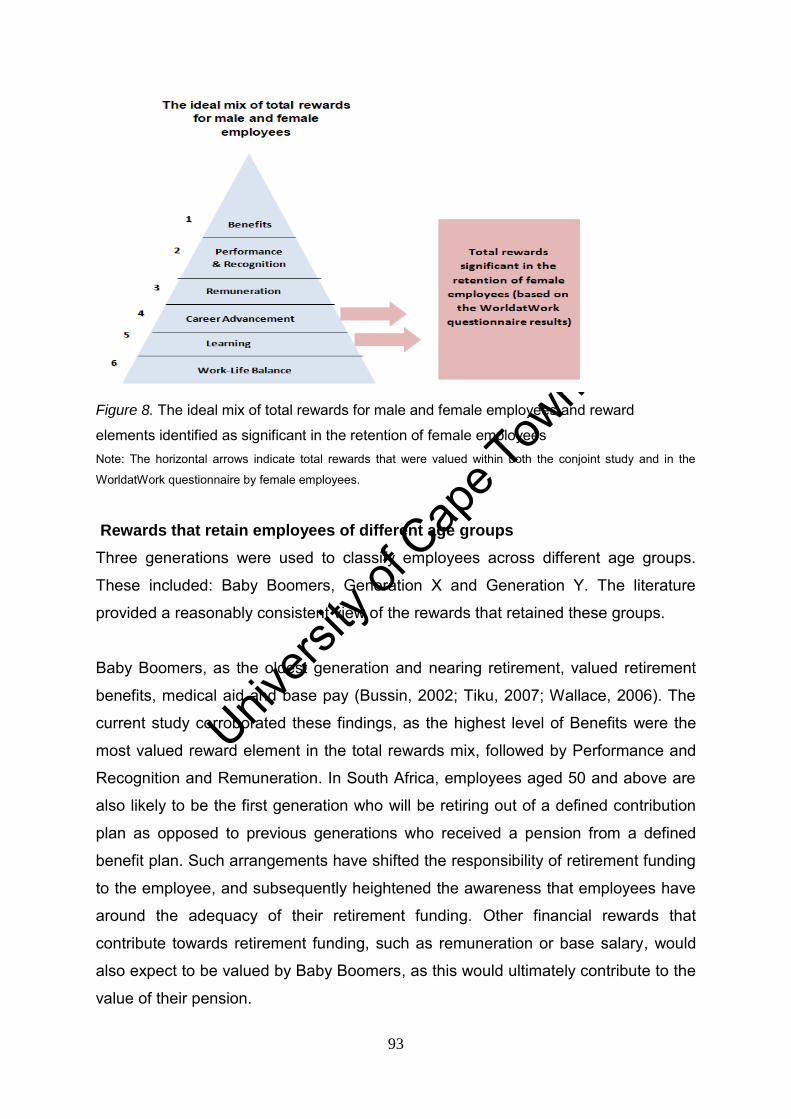
Univers
ity of
Cap
e Tow
n
93
Figure 8. The ideal mix of total rewards for male and female employees and reward
elements identified as significant in the retention of female employees
Note: The horizontal arrows indicate total rewards that were valued within both the conjoint study and in the
WorldatWork questionnaire by female employees.
Rewards that retain employees of different age groups
Three generations were used to classify employees across different age groups.
These included: Baby Boomers, Generation X and Generation Y. The literature
provided a reasonably consistent view of the rewards that retained these groups.
Baby Boomers, as the oldest generation and nearing retirement, valued retirement
benefits, medical aid and base pay (Bussin, 2002; Tiku, 2007; Wallace, 2006). The
current study corroborated these findings, as the highest level of Benefits were the
most valued reward element in the total rewards mix, followed by Performance and
Recognition and Remuneration. In South Africa, employees aged 50 and above are
also likely to be the first generation who will be retiring out of a defined contribution
plan as opposed to previous generations who received a pension from a defined
benefit plan. Such arrangements have shifted the responsibility of retirement funding
to the employee, and subsequently heightened the awareness that employees have
around the adequacy of their retirement funding. Other financial rewards that
contribute towards retirement funding, such as remuneration or base salary, would
also expect to be valued by Baby Boomers, as this would ultimately contribute to the
value of their pension.
Univers
ity of
Cap
e Tow
n
94
Bussin (2002) indicated that Generation X was retained by financial rewards such as
base salary, medical aid and deferred compensation. The current study supports
these findings, as the highest level of Benefits; Performance and Recognition; and
Remuneration were deemed to be the most attractive elements in the reward mix
and the most effective in the retention of Generation X employees. Possible reasons
for Generation X favouring Benefits and other financial rewards could be attributed to
this group‘s family focus, as they are likely to have young dependants for whom
provision must be made in respect of medical aid. Risk benefits are also likely to be
considered important in respect of the financial security they offer this group‘s
extended family. Other forms of financial rewards, especially performance and
recognition, are likely to be favoured by Generation X employees, as this equates to
increased earnings, further financial security for their families and greater spending
power while also recognising these employees‘ contributions.
The importance ascribed to Performance and Recognition was also noted in the
results generated from the current study based on the WorldatWork model. A
significant difference emerged between Generation X and Baby Boomers, with
Generation X employees indicating that Performance and Recognition as well as
Learning and Career Advancement were reward elements that retain them.
Generation X‘s preference for Learning and Career Advancement, as rewards that
retain, is in line with previous research by D‘Amato and Herzfeldt (2008). It was also
noted that Generation X are loyal to their own skills as opposed to expressing loyalty
to a particular company and for this reason they may favour Learning (Harvard
Business Essentials, 2002). Since Generation X employees are also likely to be in
the middle stages of their career and ambitious to progress further in an
organisation, a preference for Career Advancement is plausible.
The findings of the current study did not support previous research which indicated
that Generation X employees value Work-Life Balance as a retention tool (Gursoy et
al., 2008; Gabriel, 1999). The lowest level of Work-Life Balance was selected by
Generation X employees, while a greater level of importance was placed on Career
Advancement and Learning in determining the ideal total rewards mix. These results
Univers
ity of
Cap
e Tow
n
95
may be attributed to Generation X employees viewing Work-Life Balance initiatives
as interfering with Career Advancement ambitions.
In a study of factors that retain Generation Y employees, Willmer (2008) indicated a
preference for benefits amongst this group of employees in the United States. The
current study supports these findings as Generation Y employees indicated that the
highest level of Benefits in the total rewards mix retained them. The reason for this
preference may be similar to that of the Generation Y employees in the US who grew
up in an environment where the US healthcare system delivered fewer services at
higher costs (Willmer, 2008). In South Africa, Generation Y employees are also likely
to have been exposed to an inadequate public health care system as well as ever
increasing health costs. Furthermore, the parents of Generation Y employees may
have made inadequate provision for their retirement and not received a reasonable
pension or in some cases received no pension and were dependent on social
welfare. Such experiences may have heightened Generation Y employees‘
awareness of the need to make adequate provision for their retirement and for this
reason they may have an appreciation for the value of a company‘s contribution to
benefits such as retirement funding and medical care.
The current study also corroborates the findings of the 2003 Towers Perrin survey
where base salary and variable pay were identified as factors that retained
Generation Y employees (Bussin, 2002). Within the current study Performance and
Recognition (i.e. Short term incentives linked to your performance plus Stock
Options or Shares) and Remuneration (i.e. Base Salary targeting the upper end of
the market) were deemed important in Generation Y‘s retention. Unlike Baby
Boomers and Generation X however, Generation Y selected the second level of the
Remuneration reward element which was comparatively lower than the first level
selected by Baby Boomers and Generation X.
These results may be attributed to Generation Y employees assigning more
importance to non-financial factors such as Work-Life Balance in their total rewards
mix. Work-Life Balance was deemed more attractive than Career Advancement in
Generation Y‘s total rewards mix but in the study of reward elements based on the
WorldatWork model, a significant difference between Generation Y and Baby
Univers
ity of
Cap
e Tow
n
96
Boomers existed with respect to the importance they attached to Learning and
Career Advancement and Performance and Recognition. Generation Y also
displayed a significant difference in the value assigned to Work-Life Balance Climate
initiatives when compared to Generation X and Baby Boomers which corroborates
the results of the conjoint task. These findings are supported by those of the 2005
South African Graduate Recruitment Association (SAGRA) survey which indicated
that the youngest generation, namely Generation Y, was retained by career
advancement opportunities, challenging assignments and work-life balance.
Furthermore Ruch (2000) and Roy (2008) both indicated that Generation Y
employees were retained by organisations which allowed them to be loyal to their
lifestyle rather than their jobs.
Given that Generation Y employees are in the early stages of their career, providing
challenging opportunities via performance and recognition programmes may be
viewed as a retention tool, as they are able to stretch their abilities and use such
exposure to rapidly progress their careers. The emphasis on Work-Life Balance, as
opposed to career advancement, may be a result of the change in psychological
contract that occurred post the 1980‘s trends of recessions, downsizing and
reorganizations. The current contingent of Generation Y employees are likely to have
witnessed their parents being loyal to an organisation and placing their career first to
the detriment of other aspects of their life. Generation Y employees may therefore
wish to adopt a different work ethic to that of their parents.
Figure 9 provides an illustration of the ideal mix of total rewards as well as the
reward factors which Generation X and Y value in their retention.
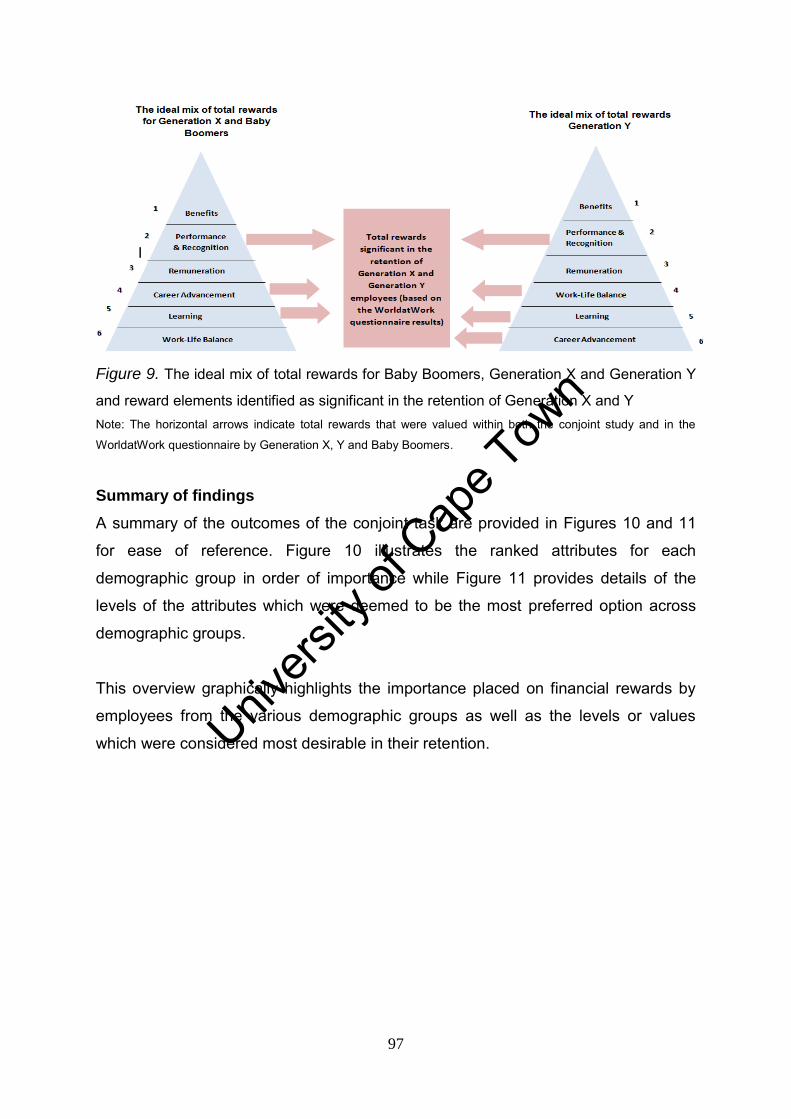
Univers
ity of
Cap
e Tow
n
97
Figure 9. The ideal mix of total rewards for Baby Boomers, Generation X and Generation Y
and reward elements identified as significant in the retention of Generation X and Y Note: The horizontal arrows indicate total rewards that were valued within both the conjoint study and in the
WorldatWork questionnaire by Generation X, Y and Baby Boomers.
Summary of findings
A summary of the outcomes of the conjoint task are provided in Figures 10 and 11
for ease of reference. Figure 10 illustrates the ranked attributes for each
demographic group in order of importance while Figure 11 provides details of the
levels of the attributes which were deemed to be the most preferred option across
demographic groups.
This overview graphically highlights the importance placed on financial rewards by
employees from the various demographic groups as well as the levels or values
which were considered most desirable in their retention.
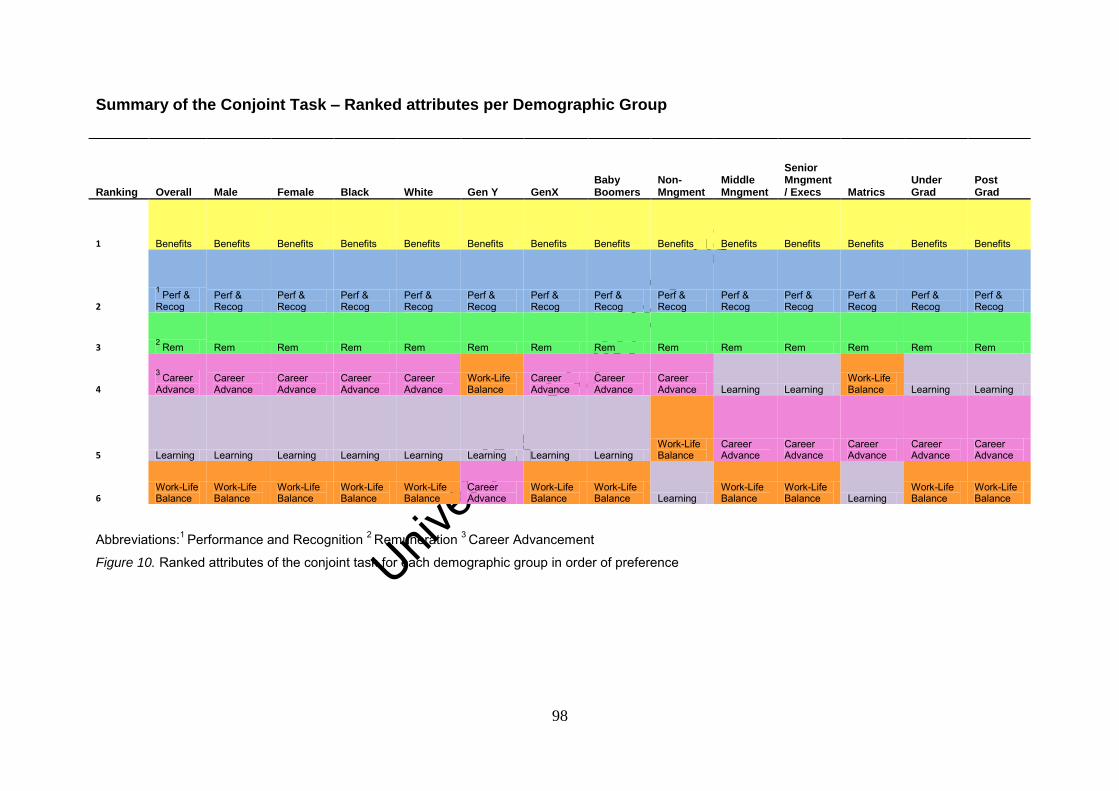
Univers
ity of
Cap
e Tow
n
98
Summary of the Conjoint Task – Ranked attributes per Demographic Group
Abbreviations:1 Performance and Recognition 2 Remuneration 3 Career Advancement Figure 10. Ranked attributes of the conjoint task for each demographic group in order of preference
Ranking Overall Male Female Black White Gen Y GenX Baby Boomers
Non-Mngment
Middle Mngment
Senior Mngment/ Execs Matrics
Under Grad
Post Grad
1 Benefits Benefits Benefits Benefits Benefits Benefits Benefits Benefits Benefits Benefits Benefits Benefits Benefits Benefits
2
1 Perf & Recog
Perf & Recog
Perf & Recog
Perf & Recog
Perf & Recog
Perf & Recog
Perf & Recog
Perf & Recog
Perf & Recog
Perf & Recog
Perf & Recog
Perf & Recog
Perf & Recog
Perf & Recog
3 2 Rem Rem Rem Rem Rem Rem Rem Rem Rem Rem Rem Rem Rem Rem
4
3 Career Advance
Career Advance
Career Advance
Career Advance
Career Advance
Work-Life Balance
Career Advance
Career Advance
Career Advance Learning Learning
Work-Life Balance Learning Learning
5 Learning Learning Learning Learning Learning Learning Learning Learning Work-Life Balance
Career Advance
Career Advance
Career Advance
Career Advance
Career Advance
6 Work-Life Balance
Work-Life Balance
Work-Life Balance
Work-Life Balance
Work-Life Balance
Career Advance
Work-Life Balance
Work-Life Balance Learning
Work-Life Balance
Work-Life Balance Learning
Work-Life Balance
Work-Life Balance
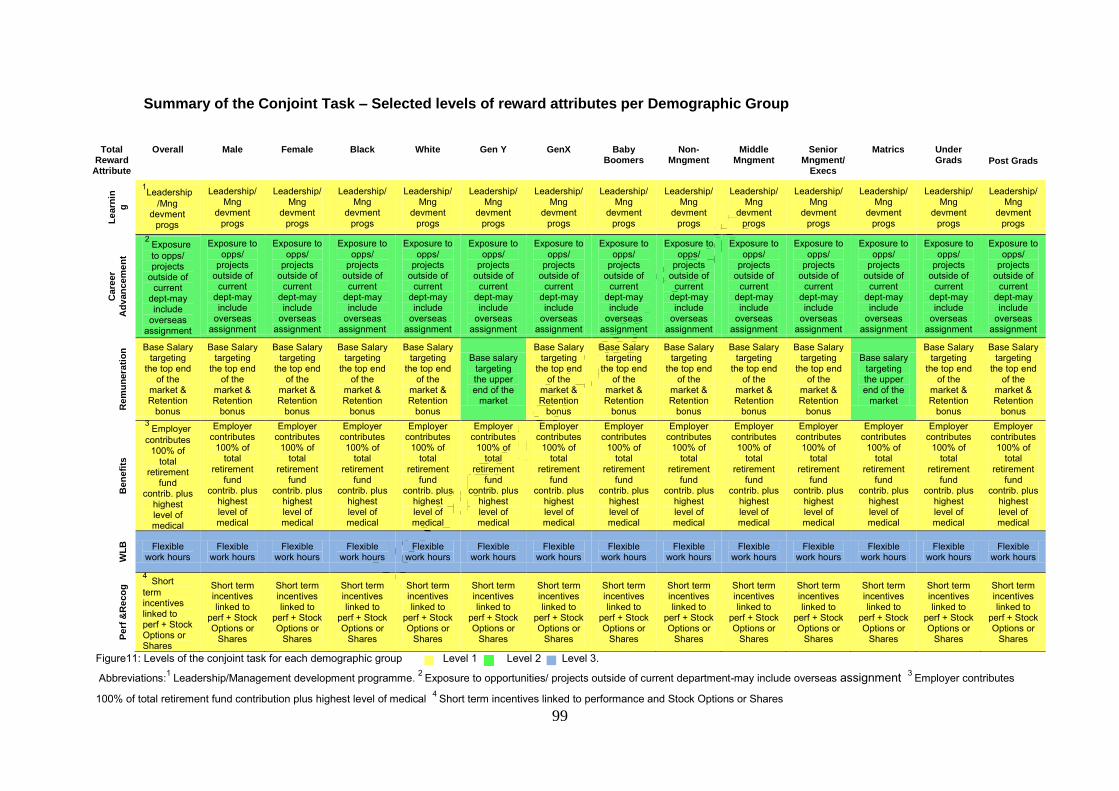
Univers
ity of
Cap
e Tow
n
99
Summary of the Conjoint Task – Selected levels of reward attributes per Demographic Group
Figure11: Levels of the conjoint task for each demographic group Level 1 Level 2 Level 3.
Abbreviations:1 Leadership/Management development programme. 2 Exposure to opportunities/ projects outside of current department-may include overseas assignment 3 Employer contributes
100% of total retirement fund contribution plus highest level of medical 4 Short term incentives linked to performance and Stock Options or Shares
Total Reward
Attribute
Overall Male Female Black White Gen Y GenX Baby Boomers
Non-Mngment
Middle Mngment
Senior Mngment/
Execs
Matrics Under Grads
Post Grads
Le
arn
in
g
1Leadership/Mng
devment progs
Leadership/Mng
devment progs
Leadership/Mng
devment progs
Leadership/Mng
devment progs
Leadership/Mng
devment progs
Leadership/Mng
devment progs
Leadership/Mng
devment progs
Leadership/Mng
devment progs
Leadership/Mng
devment progs
Leadership/Mng
devment progs
Leadership/Mng
devment progs
Leadership/Mng
devment progs
Leadership/Mng
devment progs
Leadership/Mng
devment progs
Care
er
Ad
van
cem
en
t
2 Exposure to opps/ projects
outside of current
dept-may include
overseas assignment
Exposure to opps/
projects outside of
current dept-may include
overseas assignment
Exposure to opps/
projects outside of
current dept-may include
overseas assignment
Exposure to opps/
projects outside of
current dept-may include
overseas assignment
Exposure to opps/
projects outside of
current dept-may include
overseas assignment
Exposure to opps/
projects outside of
current dept-may include
overseas assignment
Exposure to opps/
projects outside of
current dept-may include
overseas assignment
Exposure to opps/
projects outside of
current dept-may include
overseas assignment
Exposure to opps/
projects outside of
current dept-may include
overseas assignment
Exposure to opps/
projects outside of
current dept-may include
overseas assignment
Exposure to opps/
projects outside of
current dept-may include
overseas assignment
Exposure to opps/
projects outside of
current dept-may include
overseas assignment
Exposure to opps/
projects outside of
current dept-may include
overseas assignment
Exposure to opps/
projects outside of
current dept-may include
overseas assignment
Rem
un
era
tio
n Base Salary
targeting the top end
of the market & Retention
bonus
Base Salary targeting
the top end of the
market & Retention
bonus
Base Salary targeting
the top end of the
market & Retention
bonus
Base Salary targeting
the top end of the
market & Retention
bonus
Base Salary targeting
the top end of the
market & Retention
bonus
Base salary targeting the upper end of the
market
Base Salary targeting
the top end of the
market & Retention
bonus
Base Salary targeting
the top end of the
market & Retention
bonus
Base Salary targeting
the top end of the
market & Retention
bonus
Base Salary targeting
the top end of the
market & Retention
bonus
Base Salary targeting
the top end of the
market & Retention
bonus
Base salary targeting the upper end of the
market
Base Salary targeting
the top end of the
market & Retention
bonus
Base Salary targeting
the top end of the
market & Retention
bonus
Ben
efi
ts
3 Employer contributes
100% of total
retirement fund
contrib. plus highest level of medical cover
Employer contributes
100% of total
retirement fund
contrib. plus highest level of medical cover
Employer contributes
100% of total
retirement fund
contrib. plus highest level of medical cover
Employer contributes
100% of total
retirement fund
contrib. plus highest level of medical cover
Employer contributes
100% of total
retirement fund
contrib. plus highest level of medical cover
Employer contributes
100% of total
retirement fund
contrib. plus highest level of medical cover
Employer contributes
100% of total
retirement fund
contrib. plus highest level of medical cover
Employer contributes
100% of total
retirement fund
contrib. plus highest level of medical cover
Employer contributes
100% of total
retirement fund
contrib. plus highest level of medical cover
Employer contributes
100% of total
retirement fund
contrib. plus highest level of medical cover
Employer contributes
100% of total
retirement fund
contrib. plus highest level of medical cover
Employer contributes
100% of total
retirement fund
contrib. plus highest level of medical cover
Employer contributes
100% of total
retirement fund
contrib. plus highest level of medical cover
Employer contributes
100% of total
retirement fund
contrib. plus highest level of medical cover
WL
B
Flexible work hours
Flexible work hours
Flexible work hours
Flexible work hours
Flexible work hours
Flexible work hours
Flexible work hours
Flexible work hours
Flexible work hours
Flexible work hours
Flexible work hours
Flexible work hours
Flexible work hours
Flexible work hours
Perf
&R
eco
g
4 Short term incentives linked to perf + Stock Options or Shares
Short term incentives linked to
perf + Stock Options or
Shares
Short term incentives linked to
perf + Stock Options or
Shares
Short term incentives linked to
perf + Stock Options or
Shares
Short term incentives linked to
perf + Stock Options or
Shares
Short term incentives linked to
perf + Stock Options or
Shares
Short term incentives linked to
perf + Stock Options or
Shares
Short term incentives linked to
perf + Stock Options or
Shares
Short term incentives linked to
perf + Stock Options or
Shares
Short term incentives linked to
perf + Stock Options or
Shares
Short term incentives linked to
perf + Stock Options or
Shares
Short term incentives linked to
perf + Stock Options or
Shares
Short term incentives linked to
perf + Stock Options or
Shares
Short term incentives linked to
perf + Stock Options or
Shares
Univers
ity of
Cap
e Tow
n
100
Limitations and recommendations
The main limitation of this study is the issue of confounding variables. In particular,
this refers to the current economic environment and associated factors such as job
stability. These factors are likely to have had a moderating effect on the results, as
employees will elect rewards that meet basic physical and safety needs above
esteem needs or self-actualization needs (Robbins, Odendaal & Roodt, 2001). The
results may have been further influenced by the effects of the economic recession,
as one of the organisations from which the largest proportion of the sample was
drawn, was undergoing an extensive retrenchment exercise at the time. It is
recommended that further research be conducted during a period of greater
economic stability, as this is likely to produce different responses.
The current study is descriptive in nature and no causal relationships could be
determined. It was therefore not possible to explore the reasons for employees‘
selection or their preference for specific reward elements or the rationale for why
these rewards retained them. A study of the causal relationships between rewards
and retention amongst different demographic groups should be conducted.
A further limitation was the number of Remuneration Managers who responded to
the first questionnaire. There were limited responses and these were mostly from
large organisations with well structured and extensive total rewards offerings. If this
sample had been more varied and included smaller companies, the variables
included in the conjoint study may have been quite different and ultimately resulted
in a different ideal total rewards mix.
Another limitation relates to the use of a conjoint model, which focused on the main
effects as opposed to interaction effects of the variables used. Richer results may
have been achieved had the various demographic groups results been
amalgamated, although a much larger sample would have been required as would a
different conjoint method. This method may not have been as stable as the choice
based model used in this study. In addition it should be noted that many other total
rewards models, besides the WorldatWork model, exist. These models cover certain
rewards more extensively than the WorldatWork model and may be considered as
the basis for a conjoint model in future research. Were further studies to be
Univers
ity of
Cap
e Tow
n
101
conducted in this area, using conjoint analysis, these adjustments should be noted
and factored into the study.
A final limitation to note was that the sample was primarily drawn from the Petroleum
Industry where employees may fit a specific profile in terms of total rewards that they
value in their retention. In addition a non-random sampling method was used which
does not permit these findings to be extended to the wider South African workforce.
Theoretical contribution
Theoretically, the current study has a number of contributions to make. Firstly, a
dearth of empirical social science research exists in South Africa which highlights the
total rewards that retain knowledge workers as well as different gender, race and
age groups. The current study succeeded in identifying those total rewards, based
on the WorldatWork total rewards model that respondents from the different
demographic groups deemed valuable in their retention.
A further contribution made by the current research lies in the method used to
determine the ideal mix of total rewards, namely conjoint analysis. This approach
has not previously been used in the domain of Industrial/Organisational Psychology
(IOP) and its application facilitated the process of developing a total rewards
preference structure for each demographic group i.e. the ideal total rewards mix. The
preference structure provided an indication of the relative importance, as well as the
desired amount, of each total reward element. By utilizing the conjoint analysis
method, a further theoretical contribution to the body of social science research has
been made, as no prior studies have succeeded in identifying both a combination of
total rewards as well as the amount of each total reward element that retains various
demographic groups. Knowledge of the quantum of total rewards that retain
employees is a particularly important contribution to the body of employee retention
literature, because as Porter and Steers (1973) noted nearly 40 years ago, not only
is the composition of the employee‘s expectation set important, but the value of
these factors must be substantially met if the employee is to feel worthwhile and to
remain with the organisation.
Univers
ity of
Cap
e Tow
n
102
Practical contribution
The findings of the current research also make a practical contribution, especially for
organisations concerned with the retention of employees with business imperative
skills such as PDI‘s or scarce skills such as those held by knowledge workers. The
current study is able to provide such organisations with an indication of the
combination and quantum of total rewards which companies could consider offering
employees from the various demographic groups to ensure that they are retained.
The study also provides companies with an indication of the total reward elements
(based on the WorldatWork model) which employees from different demographic
groups consider important and desirable in their retention.
These findings also provide guidance to companies with respect to those factors that
should be incorporated into differentiated retention strategies catering for the needs
of the various demographic groups. Furthermore, organisations may have greater
insight into whether they are able to meet the needs of the various groups given
financial or practical constraints, especially given the current economic climate.
Conclusion
The aim of the current study was to identify the mix and the desired amount of total
rewards that retain employees from various demographic groups including
knowledge workers and employees from different race, gender and age groups. An
additional objective was to develop an understanding of the total rewards that these
employees, in the context of the South African workplace, deem important in their
retention.
The findings of this study revealed that employees from the various demographic
groups ascribed a high degree of importance to the financial reward elements in the
total rewards mix with Benefits, Performance and Recognition and Remuneration
being consistently valued in the retention of these groups. The highest quantum of
each of these rewards was also rated as significant in the retention of different
demographic groups. With the exception of Generation Y employees and
Matriculants, all other demographic groups rated Work-Life Balance, as an element
in the total rewards mix, as least important in their retention.
Univers
ity of
Cap
e Tow
n
103
The second objective of the study was to identify the reward elements, based on the
WorldatWork model, which different demographic groups considered important in
their retention. The results indicated that Performance and Recognition was valued
in the retention of black employees as well as Generation X and Y employees.
Employees classified as Non-Management and Middle-Management, females and
Generation X and Generation Y employees all considered Learning and Career
Advancement as significant in their retention. Work-Life Balance Climate was
considered important in the retention of black employees, Matriculants,
Undergraduates and Generation Y employees, while Work-Life Balance Practices
were valued by Non-Management and Middle Management in their retention.
These findings support Bussin‘s (2002) opinion that: employees from diverse
demographic groups have different expectations and demands from their work
environments and, as such, a one-size fits all retention strategy will not work. The
importance and value of the current study is highlighted in this statement as it is
clear from the findings that employees from the various demographic groups value
different total rewards in their retention. The ability for organisations to establish
highly refined and differentiated retention strategies will be facilitated further by the
findings of this study, which provide an indication of the amount and the type of
reward elements which are most valued within a total rewards mix.
Business leaders will need to remain constantly abreast of the unique demands of
diverse demographic groups in the workplace in order to be successful in the war for
talent. It is no longer sufficient to approach the retention of critical talent segments
using one standardized talent retention strategy. As noted by Frank et al., 2004,
p.23: ―The ‗tried and true‘ programmes for dealing with turnover and lack of
engagement have been tested over time and have largely failed to deliver the results
that will be needed in the future.‖ New ideas are constantly required to determine
creative solutions to overcome the problem of retention. The unique approach used
in the current study of identifying the combination and amount of total rewards that
retain various demographic groups, is intended to provide one such creative
response.
Univers
ity of
Cap
e Tow
n
104
REFERENCES
Agarwal, R., & Ferratt, T.W. (1999). Coping with labour scarcity in IT: Strategies and
practices for effective recruitment and retention. Cincinatti:Pinnaflex.
Ahlrichs, N. (2000). Competing for talent: Key recruitment and retention strategies for
becoming an employer of choice. Palo Alto, California: Davies-Black Publishing.
Armstrong, M., & Murlis, H. (2004). Reward management: A handbook of remuneration strategy and practice (5th ed.). London: Kogan Page Limited.
Babbie, E., & Mouton, J. (2001). The practice of Social Research. South Africa: Oxford University Press.
Birt, M., Wallis, T., & Winternitz, G. (2004). Talent retention in a changing workplace: An investigation of variables considered important to South African talent. South African Journal of Business Management, 35(2), 25-31.
Booysen, L. (2007). Barriers to employment equity implementation and retention of blacks in management in South Africa. South African Journal of Labour Relations, 31(1),47-71.
Brock,F. (2003). Seniority, who‘ll sit at the Boomers desks? New York Times, October 12. Retrieved from: http://query.nytimes.com/gst/fullpage.html?res=9802E5DD123FF931A25753C1A9659C8B63
Bussin, M. (2002). Retention strategies: Remuneration answers. Johannesburg: Knowledge Resources.
Butler, T., & Waldroop, J. (1999). Job sculpting. Harvard Business Review, 77(5), 144-152.
Cappelli, P. (1999). The new deal at work: Managing the market driven workforce. Boston, Massachusetts: Harvard Business School Press.
Cappelli, P. (2000a). Managing without commitment. Organizational Dynamics, 28(4), 11-24.
Cappelli, P. (2000b). A market-driven approach to retaining talent. Harvard Business Review, (January-February), 103-111.
Cataldo, P., Van Assen,J., & D‘Alessandro, A.(2000). How to win the telecom talent war: Companies can maintain a best-in-class workforce in a highly competitive
Univers
ity of
Cap
e Tow
n
105
labour market using a knowledge based approach that emphasises continuous learning. America’s Network 104(11)55
Corporate Leadership Council. (2004). Retention Drivers and Strategies at Employers of Choice. Retrieved August 24th, 2010, from www.clc.executiveboard.com
Corporate Leadership Council. (2006). Attraction and Retaining Critical Talent Segments. Identifying Drivers of attraction and Commitment in the Global Labor Market Washington: CLC Competitive Employment Value Proposition Initiative, Volumne 1.
D'Amato, A., & Herzfeldt, R. (2008). Learning orientation, organizational commitment and talent retention across generations: A study of European managers. Journal of Managerial Psychology, 23(8), 929-953.
Department of Social Development.(June 2008).Discussion Document :Creating our Future. Strategic considerations for a comprehensive system of Social Security. Retrieved from http://www.blacksash.org.za/docs/dsd.pdf
De Vos, A., & Meganck, A. (2009). What HR managers do versus what employees‘ value. exploring both parties' views on retention management from a psychological contract perspective. Personnel Review, 38(1), 45-60.
Drucker,P.F. (2002).They‘re not employees, they‘re people. Harvard Business Review, February, 70-77
Du Preez, L. (2009, September 15). Medical schemes seek to play a role in new national health system. Personal Finance.
Eggers, F., & Sattler, H. (2008) Hybrid individualized two-level choice-based conjoint (HIT-CBC): A new method for measuring preference structures with many attribute levels. International Journal of Research in Marketing, 26 () 108–118
Eggers, F., Farsky, M., & Gerber, C., (2009). Monetary assessment of brand positioning. Unpublished manuscript, University of Stellenbosch, South Africa.
Elrod,T., Louviere, J.J., Davey, K.S.(1992) An Empirical Comparison of Ratings- Based and Choice-Based Conjoint Models, Journal of Marketing Research 29 (8),368-377
Farren , C. (2009). How to keep your top talent during an economic recovery. Workspan, December, 21-24
Frank, F.D., Finnegan, R.P., & Taylor, C.R. (2004). The race for talent: Retaining and engaging workers in the 21st century. Human Resource Planning, 27(3), 12-25.
Univers
ity of
Cap
e Tow
n
106
Gabriel, A. R. (1999). Retaining Gen Xers: Not such a mystery anymore. Commercial Law Bulletin, 14(4), 32.
Gaylard, M., Sutherland, M., & Viedge, C. (2005). The factors perceived to influence the retention of information technology workers. South African Journal of Business Management, 36(3), 87-97.
Generation Y will make history (2010, May 26) Cape Argus Workplace , pp.1
Green,P. K, Krieger, A.M., & Wind, Y.(2001). Thirty Years of conjoint analysis : Reflections and Prospects. Marketing Engineering 31(3),56-73
Griffeth, R. W., Hom, P. W., & Gaertner, S. (2000). A meta-analysis of antecedents and correlates of employee turnover: Update, moderator tests, and research implications for the next millennium. Journal of Management, 26(3), 463-488.
Gursoy, D., Maier, T. A., & Chi, C. G. (2008). Generational differences: An examination of work values and generational gaps in the hospitality workforce. International Journal of Hospitality Management, 27(3), 448-458.
Guthridge, M., Komm, A.B., & Lawson, E. (2008.). Making talent a strategic priority. The McKinsey Quarterly.
Haaijer,M.E.(1999). Modeling conjoint choice experiments with the probit model (Doctorial Dissertation, Rijksuniversiteit Groningen). Retrieved from http://dissertations.ub.rug.nl/faculties/eco/1999/m.e.haaijer/
Hair, J. F., Anderson, R. E., Tatham, R. L., & Black, W. C. (1987). Multivariate data analysis (Third Edition ed.). New York: Maxwell Macmillan.
Hair, J. F., Babin, B., Money, A.H., & Samouel, P. (2003). Essentials of business research methods. Hoboken , NJ :Wiley.
Harvard Business Essentials. (2002). Hiring and keeping the best people. Boston, Massachusetts: Harvard Business School Publishing.
Hay, M. (2002). Strategies for survival in the war of talent. Career Development International, 7(1), 52-55.
Higginbotham, J.S. (1997) The satisfaction equation. Research and Development, 39(10) 1-9.
Holmes, M. (2008) Recognition and rewards galvanise company's staff. Business Day,(February), 15.
Hom, P., Ellis, A., & Roberson, L. (2008). Challenging conventional wisdom about who quits: Revelations from corporate America. Journal of Applied Psychology, 93(1), 1-34.
Univers
ity of
Cap
e Tow
n
107
Horwitz, F. M., Heng,C.T., & Quazi, H. A. (2003). Finder‘s keepers: What works best? Attracting, motivating and retaining knowledge workers. Human Resources Management Journal, 13(4), 23-45.
Horwitz, F. M., Heng, C. T., Quazi, H. A., Nonkwelo, C., Roditi, D., & van Eck, P. (2006). Human resource strategies for managing knowledge workers: An Afro-Asian comparative analysis. International Journal of Human Resource Management, 17(5), 775-811.
Jekwa, S. (2007, 11 October). Rolling stones gather no colour. Is job-hopping a black phenomenon? Finweek .
Jensen, D., McMullen, T., & Stark, M. (2007). The Manager’s guide to Rewards: what you need to know to get the best for –and from-your. New York, United States of America: Amacom
Johnson,R.M. (1997) Including Holdout Choice Tasks in Conjoint Studies .Washington: Sawtooth Software. Retrieved from http://www.sawtoothsoftware.com/download/techpap/inclhold.pdf
Kaye , B. & Jordan –Evans, S. (2002), Retention in tough times, Training and Development, 54(4), 32-37
Kerlinger,F.N., & Lee, H.B. (2000) Foundations of Behavioral Research.(4th ed.)Fort Worth: Wadsworth Thompson Learning.
Khanyile, N., & Mapongo,R. (2007, June). The Rolling Stones-exploring the job-hopping phenomenon among black professionals. Paper presented at the 28th SA Marketing Research Association Conference, Stellenbosch.
Kiefer, K.M. (1998, November).Orthogonal versus Oblique Factor Rotation: A Review of the Literature regarding the Pro’s and Con’s. Paper presented at the 27th Meeting of the Mid-South Educational Research Association, New Orleans.
Kinnear, L., & Sutherland, M. (2000). Determinants of organisational commitment amongst knowledge workers. South African Journal of Business Management, 31(3), 106.
Kochanski,J. & Ledford, G. (2001). ―How to keep me‖-retaining technical professionals. Research Technology Management, 44(3), 31-38
Kotze, K., & Roodt, G. (2005).Factors that affect the retention of Managerial and Specialist staff: An Exploratory Study of an Employee Commitment Model. South African Journal of Human Resources Management, 3(2),48-55.
Krishnan, H. A. (2009). What causes turnover among women on top management teams? Journal of Business Research, 62, 1181-1186.
Labour Research Service, Directors Fees and Company Performance Highlights. (2010). Retrieved from http://www.lrs.org.za/
Univers
ity of
Cap
e Tow
n
108
Lee, T. W., & Maurer, S. D. (1997). The retention of knowledge workers with the unfolding model of voluntary turnover. Human Resource Management Review, 7(3), 247.
Maisela, J. M. (2001). Success factors for attracting and retaining highly skilled black professionals. (Unpublished MM). University of Witwatersrand, Johannesburg.
Malhotra, N. K. (2004). Marketing research (4th ed.). Upper Saddle River, N.J.: Pearson Prentice Hall.
Martins, J. H., Loubser, M., & Van Wyk, H. de J. (1996). Marketing research: A South African approach (1st ed.). Pretoria: University of South Africa Press.
McMullen, T. (2010). Reward next practices. Philadelphia: Hay Group. Retrieved
from http://www.haygroup.com
Milazi, A. (2007, June 6). Corporate scramble to attract top staff — study. Business
Day. Retrieved from
http://www.businessday.co.za/Articles/Content.aspx?id=31758
Nunnally, J.C. (1970). Introduction to psychological measurement. New York: McGraw Hill
Orme, B. (2000). Hierarchical bayes: Why all the attention. Washington: Sawtooth Software. Retrieved from http://www.sawtoothsoftware.com/download/techpap/hbwhy.pdf
Orme, B. (2009). Which Conjoint Method Should I use? Washington: Sawtooth Software. Retrieved from http://www.sawtoothsoftware.com/download/techpap/whichmth.pdf
Pallant, J. (2004). SPSS Survival Manual. (2nd ed.) New York: Open University Press, McGraw Hill Education.
Porter, L. W., & Streers, R. M. (1973). Organizational, work and personal factors in employee turnover and absenteeism. Psychological Bulletin, 80(2), 151-176.
Prewitt, E. (1999). How to keep your company‘s star employees. Harvard Management Update,4(8),4-5.
Remchannel. (November 2007). South African Employee Benefits Guide [Survey] Johannesburg: Remchannel.
Robbins, S.P.,Odendaal, A., & Roodt, G.(2001). Organisational Behaviour .Global and Southern African Perspectives. (9th ed.) Cape Town: Pearson Education
Univers
ity of
Cap
e Tow
n
109
Robinson, S.L. & Rousseau, D.M. (1994). Violating the psychological contract: not the exception but the norm. Journal of Organizational Behavior, 15(3), 245-259.
Roy, J. G. (2008). Ten tips for retaining the next generation. Utility Automation & Engineering T&D, 13(12), 8-11.
Ruch, W. (2000). How to keep gen X employees from becoming X-employees. (cover story). Training & Development, 54(4), 40.
Sawtooth Software, Technical Paper Series. (2008) CBC v6.0. Retrieved from: http://www.sawtoothsoftware.com/download/techpap/cbctech.pdf
Schwartz, F. N. (1989). Management women and the new facts of life. Harvard Business Review, January-February
Serial job-hoppers.(2008, 7 February). Finweek, 16-16.
Sicherman, N. (1996). Gender differences in departures from a large firm. Industrial and Labor Relations Review, 49(3), 484-505.
Smith, C. (2008, May 7). Get SA out of BEE trouble. Retrieved from http://www.fin24.com/Business/Get-SA-out-of-BEE-trouble-20080507
Smith, S., & Albaum, A.S.(2005), Fundamentals of Marketing Research. Thousand Oaks ,California :Sage Publications Inc.
South African Graduate Recruitment Association. (2005). Talent retention survey [Survey]. Cape Town
Stroh, L. K., Brett, J. M., & Reilley, A. H. (1996). Family structure,glass ceiling, and traditional explanations for differential rate of turnover of female and male managers. Journal of Vocational Behavior, 49, 99-118.
Sutherland, M., Jordaan, W. (2004). Factors affecting the retention of knowledge workers. SA Journal of Human Resource Management, 2(2), 55-64.
Sutherland, M. M. (2004). Factors affecting the retention of knowledge workers. Unpublished Doctor in Commerce, Rand Afrikaans University, Johannesburg.
Temkin, S. (2008, December 2). Quarter of Senior Manager jobs held by Blacks. Business Day. Retrieved from http://www.businessday.co.za/Articles/Content.ascpx?id=57342
Temkin, S. (2008, December 12). Black women getting top management jobs. Business Day. Retrieved from http://www.businessday.co.za/Articles/Content.aspx?id=57820
Terre Blanche, M., Durrheim, K., & Painter, D. (2006). Research in practice: Applied methods for the social sciences (2nd ed.). Cape Town: University of Cape Town Press

Univers
ity of
Cap
e Tow
n
110
Tiku, N. (2007). Boomer benefits :As workers retire, small companies face a talent crunch. Inc Magazine, (August), 44-46.
Total Rewards and Incentives, Not Big Raises, Will star in 2006. HR Focus 82 (12), December 2005.
Towers Perrin. (2003). Working today: Understanding what drives employee engagement . Retrieved from http://www.towersperrin.com
Tredoux,C. & Durrheim,K.(2002) Numbers, Hypotheses and Conclusions: A course in Statistics for the Social Sciences. Cape Town: University of Cape Town Press
Tucker, E., Kao, T., & Verma, N. (2005). Next generation talent management: Insights on how workforce trends are changing the face of talent management. Retrieved from http://www.hewitt.com
Wallace, J. E. (2006). Work commitment in the legal profession: A study of Baby Boomers and Generation Xers. International Journal of the Legal Profession, 13(2), 137-151.
Willmer, D. (2008). Gen 101: What you need to know about recruiting and retaining
the workforce of tomorrow. OfficePro, Executive Edition, 8-11.
WorldatWork. (2002). Retention bonus survey .Retrieved from http://www.worldatwork.org/waw/research/html/retention-survey-2002.html
WorldatWork. (2007). Attraction and retention: The impact and prevalence of work-life and benefit programs. Scottsdale, Arizone: WorldatWork Press.
WorldatWork. (2003). GR1 Total rewards management, Scottsdale, Arizona: WorldatWork Press.
Univers
ity of
Cap
e Tow
n
111
Appendix A
University of Cape Town Private Bag
Rondebosch 7701
Dear Colleague
I am currently engaged in Masters Research for the University of Cape Town under the
supervision of A/Prof. Anton Schlechter and sponsored by SARA. The focus of this study is
to determine the mix of total reward factors that retain employees of different demographic
groups in South Africa.
Total rewards for the purposes of this study includes not only traditional, quantifiable
elements like salary, variable pay and benefits but also intangible non-cash elements such
as career opportunities, learning and development and the quality of working life provided by
an organisation.
The attached questionnaire presents a scenario which aims to identify the different degrees
or levels of total reward offerings which, in your professional opinion and experience, are
likely to be successful in retaining different employees in your organisations. The results of
this questionnaire will be used as the basis for a follow up questionnaire directed at
employees to determine their preference for the total rewards mix identified. I would be
grateful if you could assist with this study by answering the attached questionnaire which
should take approximately 10 minutes to complete. Please note that all responses remain
confidential and will not be used for purposes beyond the scope of this study.
I would appreciate your response by Friday 9th July 2010. If you are interested in a
summarised copy of the research findings, please indicate this via email to me and I will
provide this report for you at the end of the study.
Thank you very much for your participation.
Monica Pregnolato email address : [email protected]
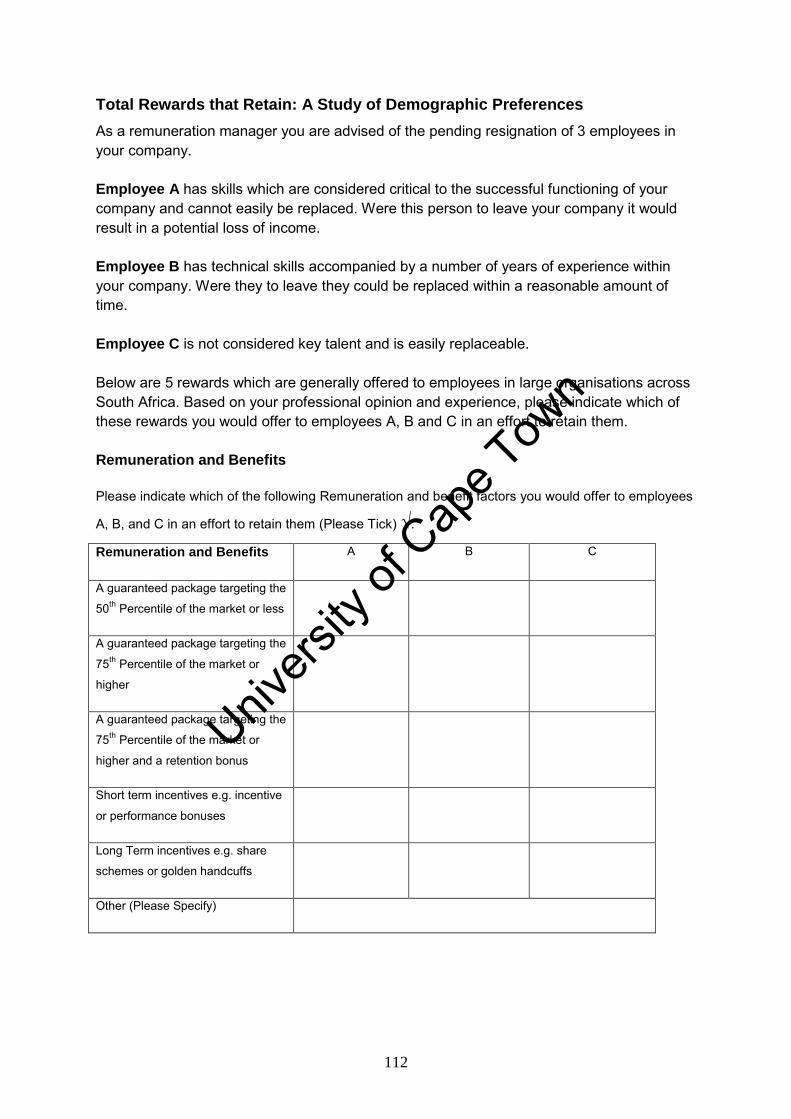
Univers
ity of
Cap
e Tow
n
112
Total Rewards that Retain: A Study of Demographic Preferences
As a remuneration manager you are advised of the pending resignation of 3 employees in your company.
Employee A has skills which are considered critical to the successful functioning of your company and cannot easily be replaced. Were this person to leave your company it would result in a potential loss of income. Employee B has technical skills accompanied by a number of years of experience within your company. Were they to leave they could be replaced within a reasonable amount of time. Employee C is not considered key talent and is easily replaceable. Below are 5 rewards which are generally offered to employees in large organisations across South Africa. Based on your professional opinion and experience, please indicate which of these rewards you would offer to employees A, B and C in an effort to retain them. Remuneration and Benefits
Please indicate which of the following Remuneration and benefit factors you would offer to employees
A, B, and C in an effort to retain them (Please Tick) √:
Remuneration and Benefits A B C
A guaranteed package targeting the
50th Percentile of the market or less
A guaranteed package targeting the
75th Percentile of the market or
higher
A guaranteed package targeting the
75th Percentile of the market or
higher and a retention bonus
Short term incentives e.g. incentive
or performance bonuses
Long Term incentives e.g. share
schemes or golden handcuffs
Other (Please Specify)
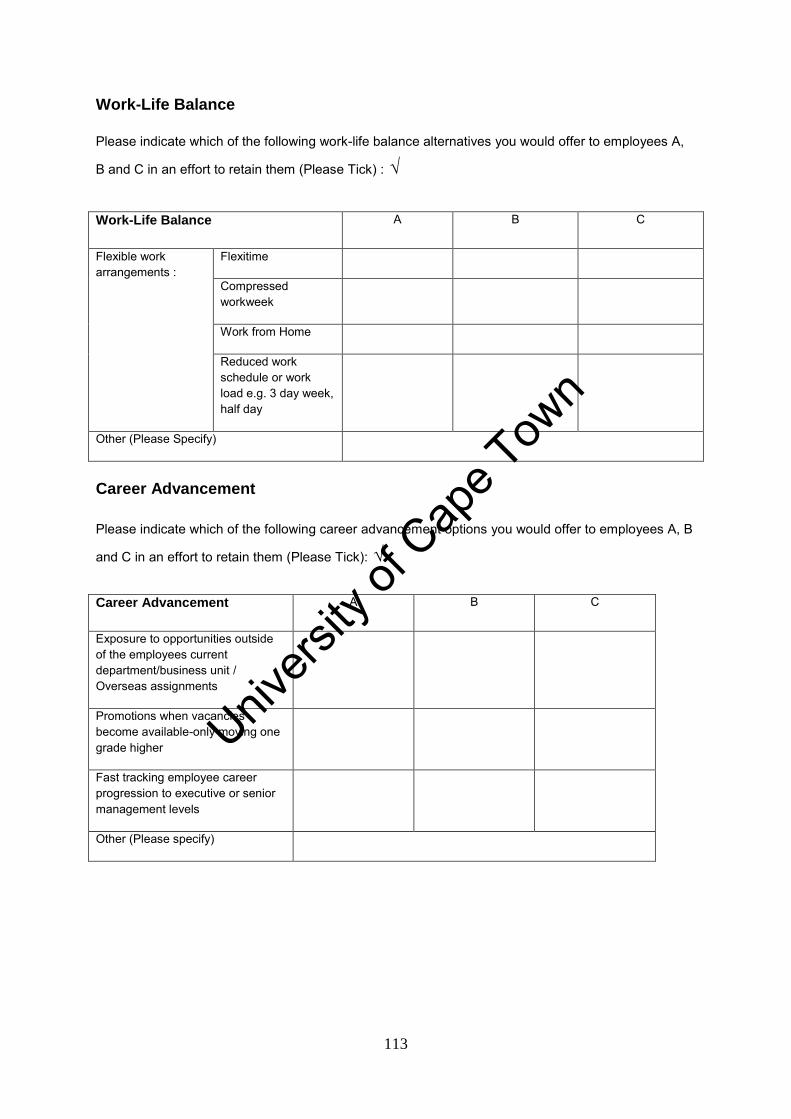
Univers
ity of
Cap
e Tow
n
113
Work-Life Balance
Please indicate which of the following work-life balance alternatives you would offer to employees A,
B and C in an effort to retain them (Please Tick) : √
Work-Life Balance A B C
Flexible work arrangements :
Flexitime
Compressed workweek
Work from Home
Reduced work schedule or work load e.g. 3 day week, half day
Other (Please Specify)
Career Advancement
Please indicate which of the following career advancement options you would offer to employees A, B
and C in an effort to retain them (Please Tick): √
Career Advancement A B C
Exposure to opportunities outside of the employees current department/business unit / Overseas assignments
Promotions when vacancies become available-only moving one grade higher
Fast tracking employee career progression to executive or senior management levels
Other (Please specify)
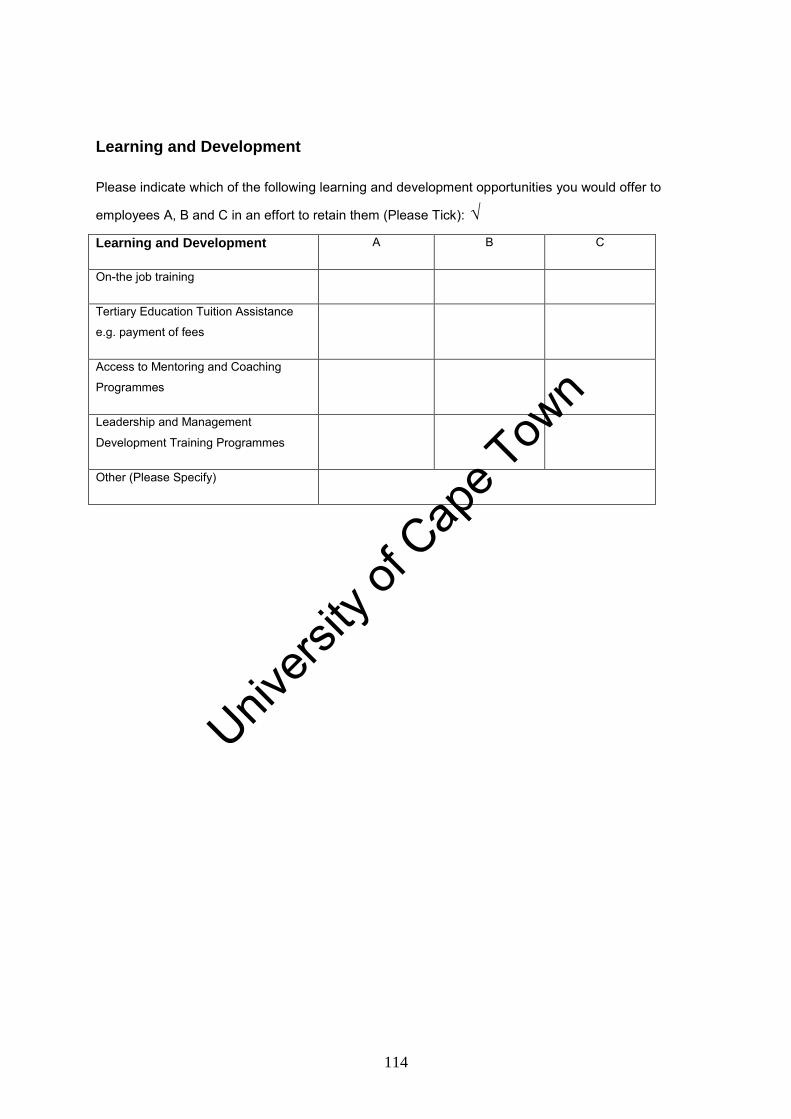
Univers
ity of
Cap
e Tow
n
114
Learning and Development
Please indicate which of the following learning and development opportunities you would offer to
employees A, B and C in an effort to retain them (Please Tick): √
Learning and Development A B C
On-the job training
Tertiary Education Tuition Assistance
e.g. payment of fees
Access to Mentoring and Coaching
Programmes
Leadership and Management
Development Training Programmes
Other (Please Specify)
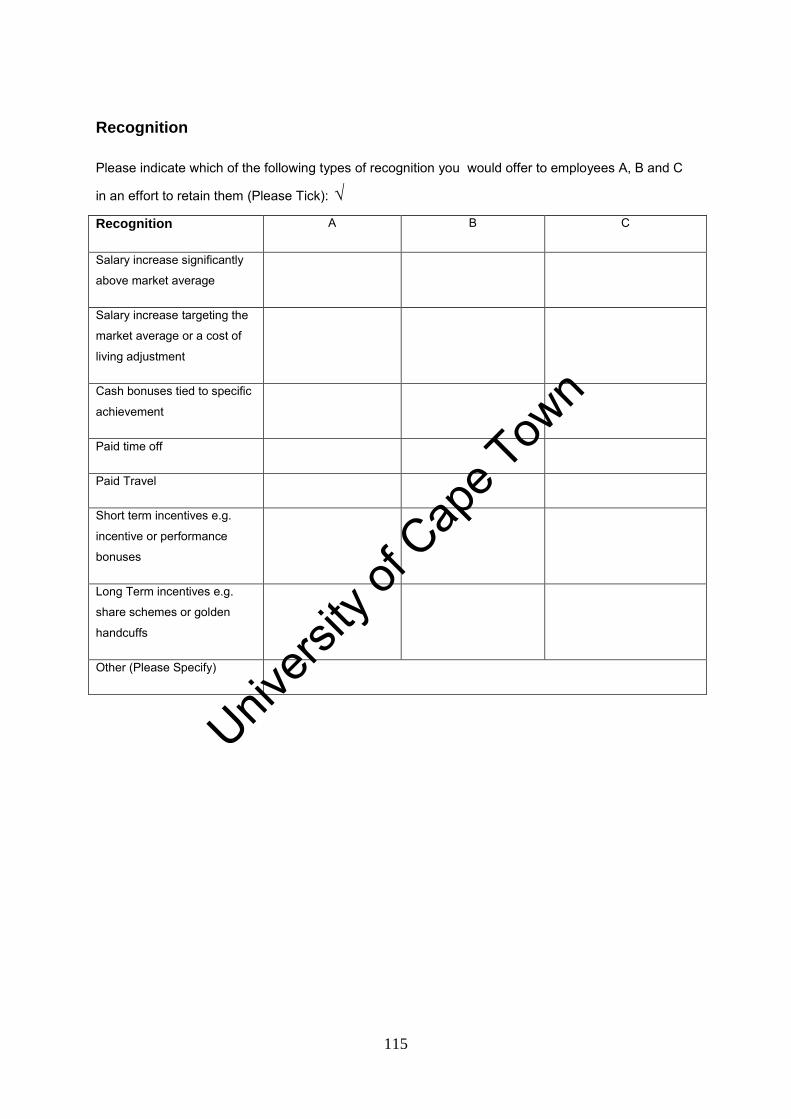
Univers
ity of
Cap
e Tow
n
115
Recognition
Please indicate which of the following types of recognition you would offer to employees A, B and C
in an effort to retain them (Please Tick): √
Recognition A B C
Salary increase significantly
above market average
Salary increase targeting the
market average or a cost of
living adjustment
Cash bonuses tied to specific
achievement
Paid time off
Paid Travel
Short term incentives e.g.
incentive or performance
bonuses
Long Term incentives e.g.
share schemes or golden
handcuffs
Other (Please Specify)
Univers
ity of
Cap
e Tow
n
116
Appendix B
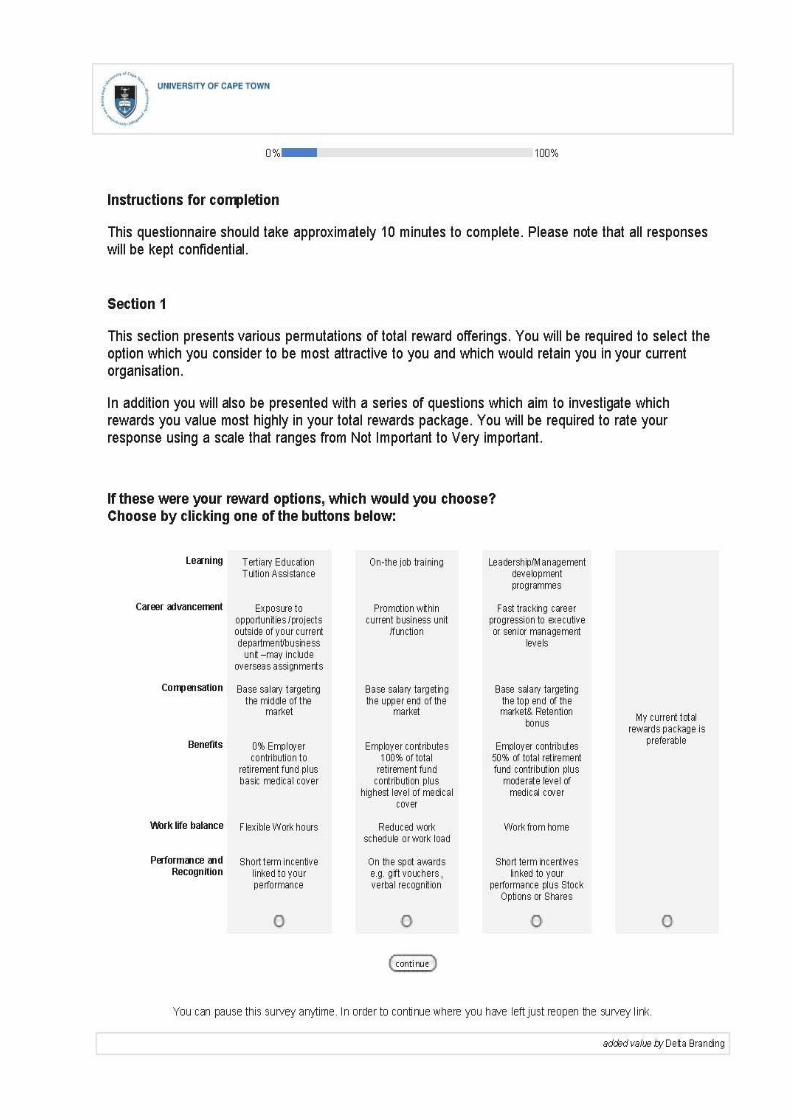
Univers
ity of
Cap
e Tow
n
117
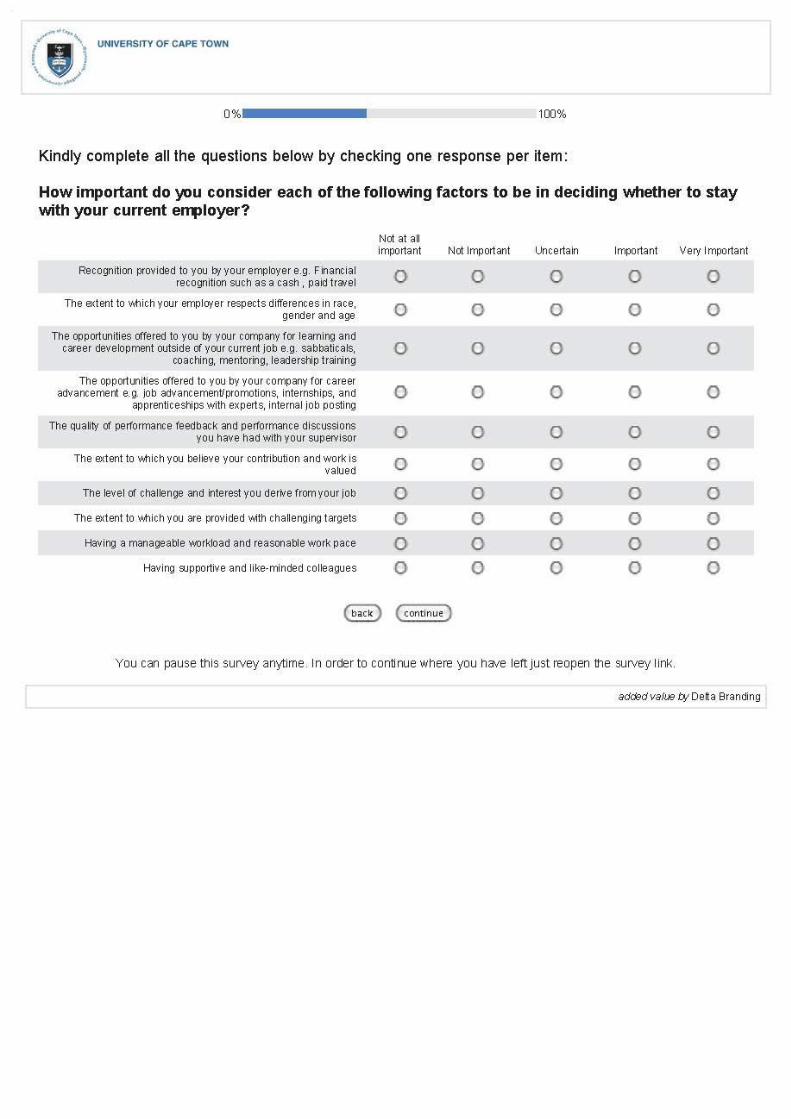
Univers
ity of
Cap
e Tow
n
118
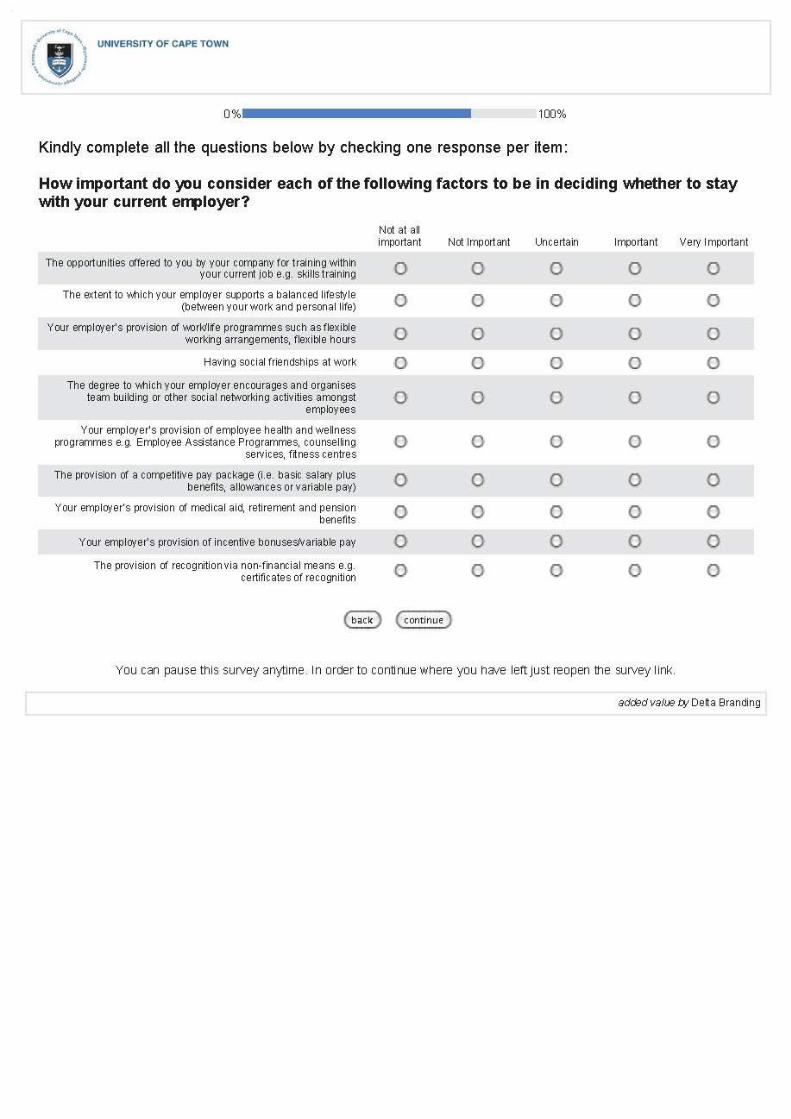
Univers
ity of
Cap
e Tow
n
119