Monetary Rewards for Elementary School Teachers - CORE
154
University of North Dakota UND Scholarly Commons eses and Dissertations eses, Dissertations, and Senior Projects 5-1-1984 e Relationships Among Performance Ratings, Job Satisfaction Perceptions, and Preferred Non- Monetary Rewards for Elementary School Teachers Beth Stangeland Randklev Follow this and additional works at: hps://commons.und.edu/theses is Dissertation is brought to you for free and open access by the eses, Dissertations, and Senior Projects at UND Scholarly Commons. It has been accepted for inclusion in eses and Dissertations by an authorized administrator of UND Scholarly Commons. For more information, please contact [email protected]. Recommended Citation Randklev, Beth Stangeland, "e Relationships Among Performance Ratings, Job Satisfaction Perceptions, and Preferred Non- Monetary Rewards for Elementary School Teachers" (1984). eses and Dissertations. 1129. hps://commons.und.edu/theses/1129
-
Upload
khangminh22 -
Category
Documents
-
view
2 -
download
0
Transcript of Monetary Rewards for Elementary School Teachers - CORE
University of North DakotaUND Scholarly Commons
Theses and Dissertations Theses, Dissertations, and Senior Projects
5-1-1984
The Relationships Among Performance Ratings,Job Satisfaction Perceptions, and Preferred Non-Monetary Rewards for Elementary SchoolTeachersBeth Stangeland Randklev
Follow this and additional works at: https://commons.und.edu/theses
This Dissertation is brought to you for free and open access by the Theses, Dissertations, and Senior Projects at UND Scholarly Commons. It has beenaccepted for inclusion in Theses and Dissertations by an authorized administrator of UND Scholarly Commons. For more information, please [email protected].
Recommended CitationRandklev, Beth Stangeland, "The Relationships Among Performance Ratings, Job Satisfaction Perceptions, and Preferred Non-Monetary Rewards for Elementary School Teachers" (1984). Theses and Dissertations. 1129.https://commons.und.edu/theses/1129
THE RELATIONSHIPS AMONG PERFORMANCE RATINGS, JOB SATISFACTION
PERCEPTIONS, AND PREFERRED NON-MONETARY REWARDS
FOR ELEMENTARY SCHOOL TEACHERS
byBeth Stangeland Randklev
Bachelor of Science, Moorhead State University, 1975 Master of Education, University of North Dakota, 1981
A Dissertation
Submitted to the Graduate Faculty
of the
University of North Dakota
in partial fulfillment of the requirements
for the degree of
Doctor of Philosophy
Grand Forks, North Dakota
May1984
This dissertation submitted by Beth Stangeland Randklev in partial fulfillment of the requirements for the Degree of Doctor of Philosophy from the University of North Dakota is hereby approved by the Faculty Advisory Committee under whom the work has been done.
(Chairperson)
This dissertation meets the standards for conforms to the style and format requirements of of the University of North Dakota, and is hereby
appearance and the graduate school approved.
duate School
11
Permission
THE RELATIONSHIPS AMONG PERFORMANCE RATINGS, JOB SATISFACTION PERCEPTIONS, AND PREFERRED NONMONETARY REWARDS, FOR ELEMENTARY TEACHERS
Title
Department____Educational Administration
Degree Doctor of Philosophy
In presenting this dissertation in partial fulfillment of the requirements for a graduate degree from the University of North Dakota, I agree that the Library of this University shall make it freely available for inspection. I further agree that permission for extensive copying for scholarly purposes may be granted by the professor who supervised my dissertation work or, in his absence, by the Chairman of the Department or the Dean of the Graduate School. It is understood that any copying or publication or other use of this dissertation or part thereof for financial gain shall not be allowed without my written permission. It is also understood that due recognition shall be given to me and to the University of North Dakota in any scholarly use which may be made of any material in my dissertation .
Signature
Date
i n
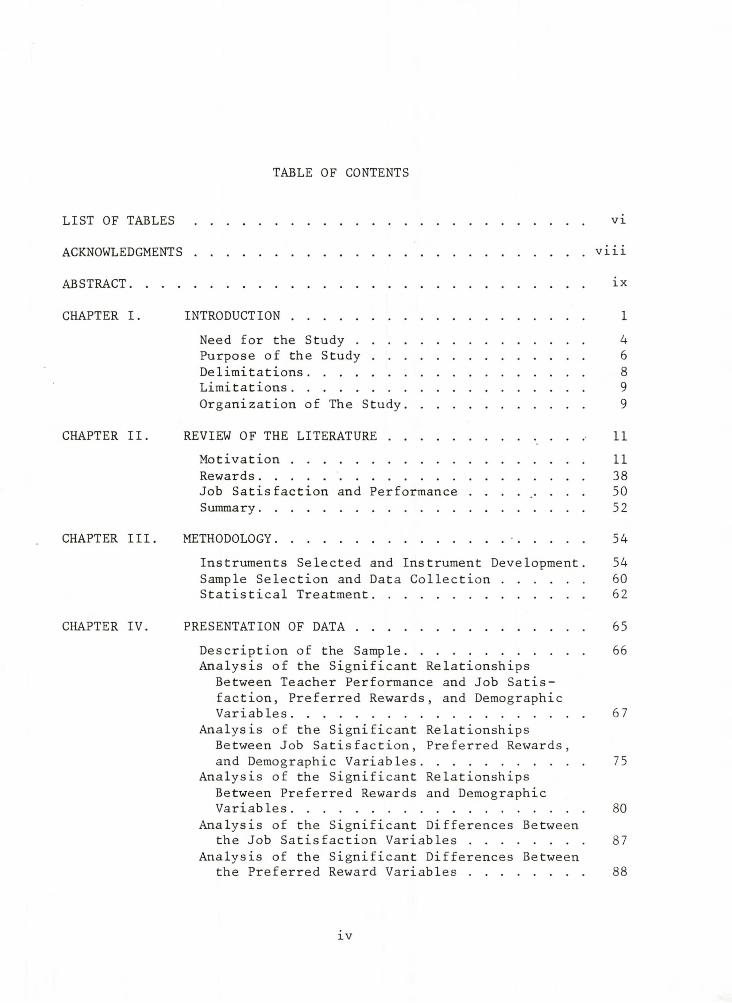
TABLE OF CONTENTS
LIST OF T A B L E S ................................................ vi
ACKNOWLEDGMENTS ................................................ viii
ABSTRACT......................................................... ix
CHAPTER I. INTRODUCTION ..................................... 1Need for the Study............................ 4Purpose of the Study.......................... 6Delimitations............ 8Limitations.................................... 9Organization of The Study...................... 9
CHAPTER II. REVIEW OF THE LITERATURE................ .. . . . 11Motivation.................................... 11Rewards........................................ 38Job Satisfaction and Performance . . . . . . . . . 50Summary........................................ 52
CHAPTER III. METHODOLOGY............................ •......... 54Instruments Selected and Instrument Development. 54Sample Selection and Data Collection .......... 60Statistical Treatment.......................... 62
CHAPTER IV. PRESENTATION OF D A T A ............................. 65Description of the Sample...................... 66Analysis of the Significant Relationships
Between Teacher Performance and Job Satisfaction, Preferred Rewards, and DemographicVariables.................................... 67
Analysis of the Significant RelationshipsBetween Job Satisfaction, Preferred Rewards,and Demographic Variables.................... 75
Analysis of the Significant Relationships Between Preferred Rewards and DemographicVariables.................................... 80
Analysis of the Significant Differences Betweenthe Job Satisfaction Variables .............. 87
Analysis of the Significant Differences Betweenthe Preferred Reward Variables .............. 88
IV
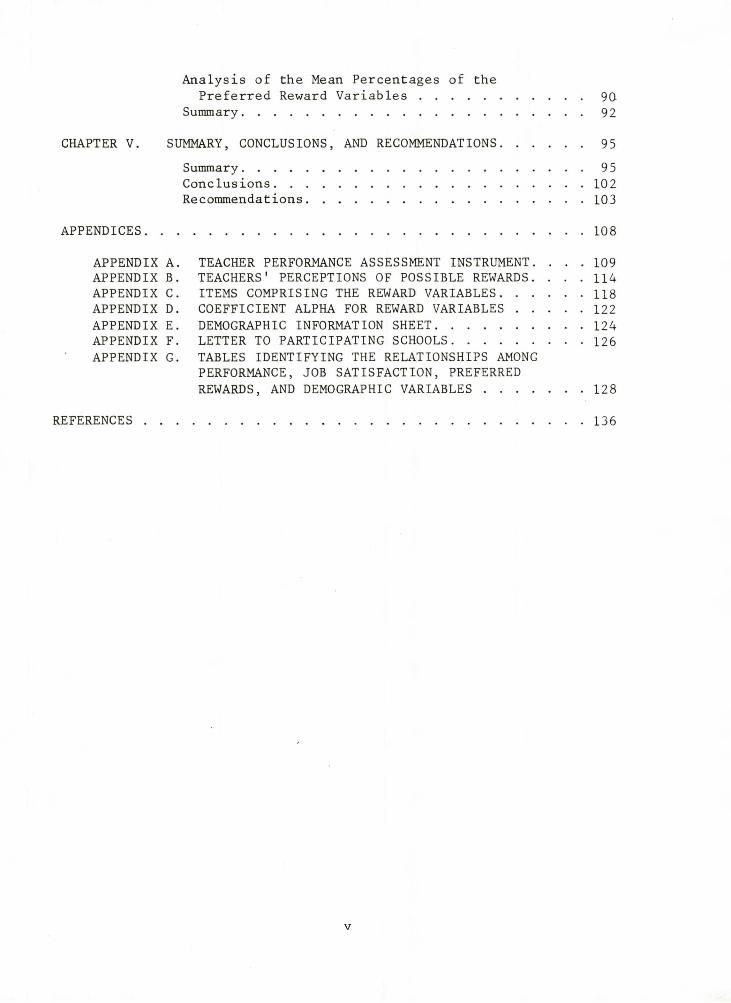
Analysis of the Mean Percentages of thePreferred Reward Variables .................... 90
Summary.............................................92
CHAPTER V. SUMMARY, CONCLUSIONS, AND RECOMMENDATIONS............ 95Summary.............................................95Conclusions........................................102Recommendations....................................103
APPENDICES........................................................ 108
APPENDIX A. TEACHER PERFORMANCE ASSESSMENT INSTRUMENT. . . . 109 APPENDIX B. TEACHERS' PERCEPTIONS OF POSSIBLE REWARDS. . . . 114APPENDIX C. ITEMS COMPRISING THE REWARD VARIABLES........... 118APPENDIX D. COEFFICIENT ALPHA FOR REWARD VARIABLES ......... 122APPENDIX E. DEMOGRAPHIC INFORMATION SHEET................... 124APPENDIX F. LETTER TO PARTICIPATING SCHOOLS................. 126APPENDIX G. TABLES IDENTIFYING THE RELATIONSHIPS AMONG
PERFORMANCE, JOB SATISFACTION, PREFERRED REWARDS, AND DEMOGRAPHIC VARIABLES ............. 128
REFERENCES........................................................ 136
v
69
70
71
72
72
73
74
75
76
77
78
78
79
81
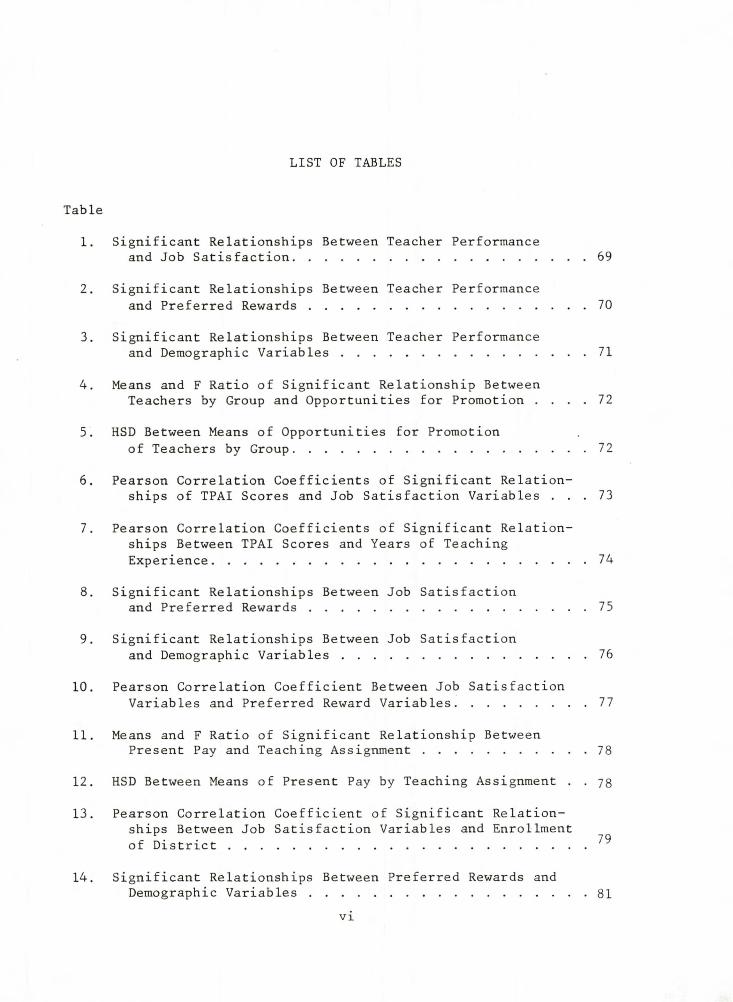
LIST OF TABLES
Significant Relationships Between Teacher Performanceand Job Satisfaction....................................
Significant Relationships Between Teacher Performanceand Preferred Rewards ..................................
Significant Relationships Between Teacher Performanceand Demographic Variables ..............................
Means and F Ratio of Significant Relationship BetweenTeachers by Group and Opportunities for Promotion . . . .
HSD Between Means of Opportunities for Promotionof Teachers by Group....................................
Pearson Correlation Coefficients of Significant Relationships of TPAI Scores and Job Satisfaction Variables . . .
Pearson Correlation Coefficients of Significant Relationships Between TPAI Scores and Years of Teaching Experience..............................................
Significant Relationships Between Job Satisfactionand Preferred Rewards ..................................
Significant Relationships Between Job Satisfactionand Demographic Variables ..............................
Pearson Correlation Coefficient Between Job Satisfaction Variables and Preferred Reward Variables................
Means and F Ratio of Significant Relationship BetweenPresent Pay and Teaching Assignment ....................
HSD Between Means of Present Pay by Teaching Assignment . .
Pearson Correlation Coefficient of Significant Relationships Between Job Satisfaction Variables and Enrollment of District ............................................
Significant Relationships Between Preferred Rewards and Demographic Variables ..................................
vi
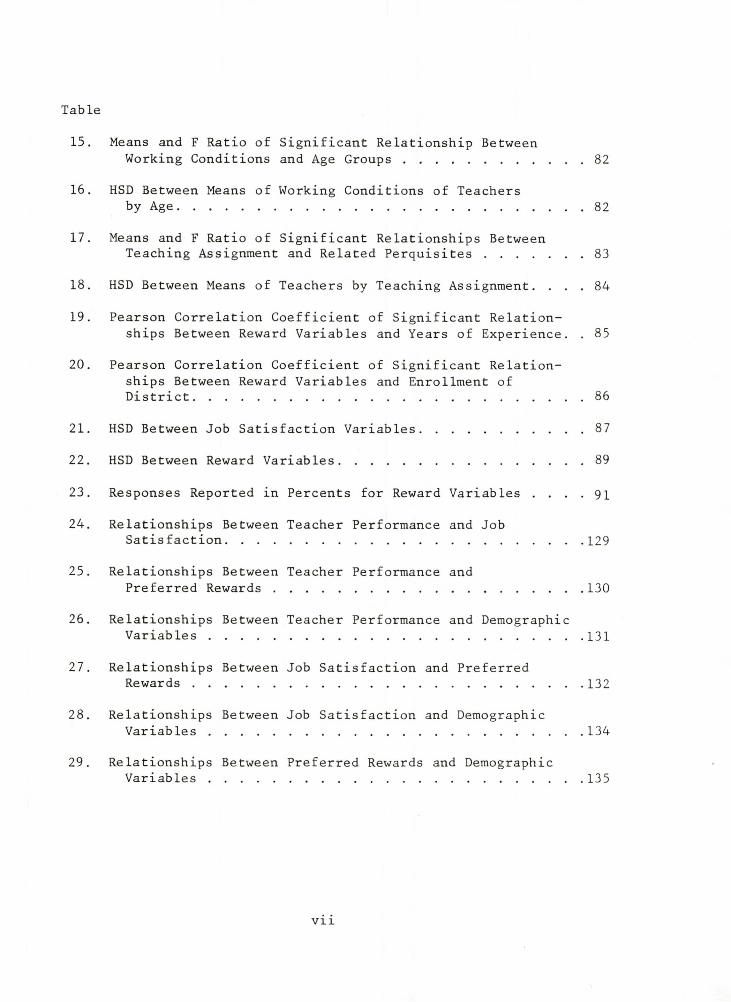
Table
15. Means and F Ratio of Significant Relationship BetweenWorking Conditions and Age Groups ...................... 82
16. HSD Between Means of Working Conditions of Teachersby Age.................................................... 82
17. Means and F Ratio of Significant Relationships BetweenTeaching Assignment and Related Perquisites ............ 83
18. HSD Between Means of Teachers by Teaching Assignment. . . . 84
19. Pearson Correlation Coefficient of Significant Relationships Between Reward Variables and Years of Experience. . 85
20. Pearson Correlation Coefficient of Significant Relationships Between Reward Variables and Enrollment ofDistrict.................................................. 86
21. HSD Between Job Satisfaction Variables......................87
22. HSD Between Reward Variables................................89
23. Responses Reported in Percents for Reward Variables . . . . 9X
24. Relationships Between Teacher Performance and JobSatisfaction............................................. 129
25. Relationships Between Teacher Performance andPreferred Rewards....................................... 130
26. Relationships Between Teacher Performance and DemographicVariables............................................... 131
27. Relationships Between Job Satisfaction and PreferredRewards................................................. 132
28. Relationships Between Job Satisfaction and DemographicVariables............................................... 134
29. Relationships Between Preferred Rewards and DemographicVariables............................................... 135
vii
ACKNOWLEDGMENTS
Many exceptional people have enriched my academic life and have
contributed to the completion of this dissertation. I am fortunate to
have had Dr. Richard Hill as an advisor through three years of doctoral
study. His enthusiasm for ideas has provoked many "yeasty" conversa
tions that I will surely miss. Dr. Larry Smiley, as both a committee
member and a boss, has provided me with many opportunities to grow
professionally. He has been a patient teacher, a trusted colleague,
and a valued friend. Appreciation should also be extended to other
members of my advisory committee— Dr. Richard Landry, Dr. Bruce
Eberhardt, and Dr. James Antes— who have each shared their expertise
throughout the dissertation process.
Friendships, old and new, have had a profound effect on my aca
demic life. Cindy Peterson and Ann Porter have inspired me with their
own intensity and have provided continuous encouragement in my pursuit
of this degree. Cindy Hankey has shared both office space and laughter.
Betty Myers and Bette Haskins, my compatriots in commiseration, have
provided me with support through comps and colic. Bette's countless
hours of marvelous childcare and Betty's skillful editing and sound
advice are major reasons that this dissertation has been completed.
My exceptional husband, Darrel, has shared my goals as well as
my life. His confidence in my abilities has never wavered. Our daugh
ter, Maggie, has given my life a new perspective and is a constant
reminder of my commitment to education and my hope for the future.v m

ABSTRACT
The purpose of this study was to determine whether or not there
was a relationship among job satisfaction, preferred rewards, percep
tions of teachers' performance, and selected demographic variables for
elementary classroom teachers in North Dakota and Minnesota. Eighty-
five teachers from seven selected elementary schools comprised the
sample.
Data were gathered by employing the following instruments: the
Teacher Performance Assessment Instrument (TPAI), the Job Descriptive
Index (JDI), and a preferred rewards instrument designed by the researcher
to measure the desirability and availability of various rewards. Teach
ers also completed a demographic information sheet which was used in
the data analysis.
The analysis of the data permitted the researcher to arrive at
the following conclusions:
1. Elementary teachers in school districts across North Dakota
and Minnesota were highly satisfied with their jobs in general and
with their colleagues. They were also satisfied with the supervision
they received. At the same time, these teachers were dissatisfied with
their present pay and with their opportunities for promotion.
2. Elementary teachers were very homogeneous concerning their
perceptions about rewards based on their levels of performance. Per
formance was not an indicator of which rewards elementary teachers per
ceive to be most desirable and available.L X

3. Although elementary teachers were generally dissatisfied
with present pay and with opportunities for promotion, those teachers
who were considered high performers were significantly more dissatis
fied with these two variables than other teachers.
4. The role of the salary in the elementary teachers' house
hold had no bearing on their satisfaction with pay or their perceptions
of the desirability and the availability of various rewards.
5. The rewards most preferred that are unmet for over half of
the elementary teachers included rewards related to "facilities, equip
ment and supplies"; "pay"; "working conditions"; and "decision making."
6. The enrollment of the school district may influence teachers'
attitudes about rewards. Teachers in larger districts reported that
rewards related to "administration," "decision making," "growth," and
"related perquisites" were more desirable and available than was true
for teachers in smaller districts.
x

CHAPTER I
INTRODUCTION
There are many challenges which face today's educational leaders:
exploding knowledge, expanding technology, declining resources, reduced
public support. School leaders are being challenged to do more with
less— to manage more frugally and to lead more creatively. In this
complicated context the building principal is viewed as the key indi
vidual in providing a fertile educational environment (Erlandson and
Pastor 1981, Stephens 1974). The principal is directly responsible
for the quality of education that is provided in the classrooms of
his/her school.
In recent years there has been a plethora of study on the quality
of the education being provided in the nation's schools. The findings
of these studies have all indicated that education needs to be improved
(Adler 1982, Boyer 1983, Cawelti 1984, Sizer 1984, Hunt, duPont, and
Cary 1983). Several of the studies have resulted in reports which have
contained recommendations on how school improvement might occur.
One area targeted for improvement in the national reports has
been the performance of teachers. Certainly student performance is the
ultimate concern of education, but, as the reports about the nation's
schools have suggested, teacher performance must improve before improve
ment in student performance can be expected (Adler 1982). The authors
of the various reports have suggested that teachers need to become
1
2
better prepared, to be more actively supervised, to be more appro
priately rewarded, and to become more highly motivated (Hunt et al.
1983). If working with teachers to improve performance of students
is accepted as a major responsibility of the building principal, he/she
is especially obligated to concentrate on the motivation of teachers.
Bruce (1978) claimed that a motivated teaching staff is the key ingre
dient in an effective school, and the principal is the key person in
promoting a motivated staff.
The subject of American education has captured the attention
of the nation. The media, public officials, and ordinary citizens, in
addition to professional educators have offered suggestions and opinions
on how the performance of teachers might be improved. In an attempt
to find solutions, much attention has been focused on the methods
employed in the private sector.
Business and industry have long studied ways to increase produc
tivity and profit through the incentive systems provided to workers
from the assembly line to the top executive (Fein 1976, Katz and Kahn
1978, Latham and Yukl 1975, Campbell and Pritchard 1976) while educa
tional research has lagged behind (Miskel 1982). The theories of Weber
(1947), Maslow (1970), McGregor (1966), Alderfer (1977), Vroom (1964),
Argyris (1964), and Porter and Lawler (1968) have all been the focus
of research in worker motivation, and its application in business and
industry. The writings of these theorists and the research that has
centered around their theories provide an immense volume of literature
for educators to consider when seeking ways to improve teaching perform
ance through motivation.
3
The use of rewards to increase employee motivation comprises
much of the literature on motivation and has been the focus of many
research efforts. The importance of pay and other extrinsic rewards
have been compared with the intrinsic rewards provided by the work
itself.
The effect of pay and its ability to motivate have long been
researched and argued (Spuck 1974, Fuller and Miskel 1972, Fein 1976,
Frase, Hetzel, and Grant 1982). Fein (1976), a supporter of using pay
as a motivator, asserted that pay tied to productivity is the most
powerful motivator of performance. He claimed that performance at
every level will rise when it is directly connected to one's pay. Fein
admitted, however, that the nature of compensation in the public sec
tor, including public schools, makes using pay as a motivator very dif
ficult. Not only is the compensation system not designed to pay
employees based on their performance, but the performance levels of
many public employees, including teachers, are difficult to measure.
Fein has faced stiff opposition to his position on using pay
as a motivator. Deci (1975) asserted that not only is pay not a moti
vator, it can become detrimental to motivation. Hamner (1982) claimed
that most merit pay plans in business and industry are mismanaged or
misunderstood and are largely unsuccessful.
The literature from business and industry, then, provides edu
cators with a place to start, ideas to try, and methodologies to
replicate. However, it does not provide any clear-cut, definitive
answers or remedies. Education is a service profession, not a profit-
based operation. The "products" of education are different from those
in industry, the nature of work in education is less specific and
4
routinized, and the criteria for performance are less clearly defined
and less easily measured. Education, as a profession, is labor inten
sive, and opportunities for improvement exist mainly in the improvement
of the school's human resources. Little research has been conducted
that attempts to discover how to measure and increase the performance
of teachers, and the research that has been conducted in education has
typically used a very narrow and largely untested theory base (Miskel
1982). These factors create the need for educational research in the
area of motivation.
Need for the Study
Steers (1977) indicated that it is the responsibility of manage
ment to set up suitable reward systems so that employees can satisfy
personal needs and goals while simultaneously pursuing organizational
objectives. Cusick (1981) observed that this responsibility is a par
ticularly difficult one for school principals. He noted that a limited
array of rewards is available for dispensation by principals. Cusick's
study also revealed that principals could not hire, fire, promote,
demote, or provide differential pay. These findings indicate that
many of the options available to managers in business and industry are
simply not available to the building principal.
The present study attempted to measure the attractiveness of a
variety of possible rewards that might be available for the principal
to use in rewarding teachers. However, it was not designed to deter
mine the "merits" of merit pay. Neither was the study designed to
ascertain the effect of salary on teacher motivation and performance
since the ability to control that particular reward is beyond the scope
5
of the building principal. Rather, this study sought to explore the
relative desirability of non-monetary rewards that might be employed
at the principal's discretion.
Much of the educational research that has been conducted has
attempted to measure either job satisfaction or motivation and the
rewards that help produce these elements (Fuller and Miskel 1972,
Miskel, Glasnapp, and Hatley 1972, Erlandson and Pastor 1981, Bruce
1978, Scott, Hickcox, and Ryan 1977, Gudridge 1980, Heath 1981, Taylor,
Rosenbach, and Gregory 1982). The research concerning job satisfaction,
motivation, and rewards generally does not include measurements of
teacher performance, however, and therefore the research might be con
sidered incomplete. Since the quality of education is directly depen
dent upon teacher performance, it seems crucial to consider rewards
which are related to performance as well as to job satisfaction. This
is not to say that satisfaction as a research variable is unworthy of
attention. Porter and Lawler (1968) contend, for example, that if a
relationship does exist between performance and satisfaction, that
satisfaction is the result of high performance. Fuller and Miskel
(Miskel 1972) indicated that employees— whether teachers or industrial
workers— preferred different types of rewards based on their levels of
satisfaction. These findings suggest that principals may be able to
use measures of job satisfaction as guides in providing appropriate
rewards. However, a satisfied group of teachers does not insure a
highly motivated or highly effective group of teachers. Research has
demonstrated that there is no causal relationship between job satisfac
tion and performance (Vroom 1964, Salancik and Pfeffer 1977, Mitchell
1979, Cherrington, Reitz, and Scott 1980). Furthermore, it cannot be
6
assumed that rewards related to job satisfaction will also be related
to performance.
Fruth, Bredeson, and Fasten (1982) conducted a study to deter
mine what type of rewards would retain the outstanding teachers whose
primary satisfactions were related to students and curriculum. More
such studies are needed. Erlandson and Pastor (1981) reported that
the teachers viewed as most outstanding— the highest performers— are
most dissatisfied. These studies indicate that principals need infor
mation on the relationships between the job satisfaction, performance,
and reward preferences of teachers. If it is true that the highest
performing teachers are the most dissatisfied, then studies must be
undertaken to discover how the reward systems in schools can be improved.
It is no longer enough to study just what type of rewards will produce
a satisfied teaching staff. Principals need to provide non-monetary
rewards within their discretion that will motivate teacher performance.
Purpose of the Study
The purpose of this exploratory study was eightfold:
1. To determine whether or not there was a relationship
between performance ratings of elementary teachers from selected
schools in North Dakota and Minnesota and the perceived level of job
satisfaction.
2. To determine whether or not there was a relationship between
performance ratings of elementary teachers from selected schools in
North Dakota and Minnesota and their preferences for certain types of
rewards.

7
3. To determine whether or not there was a relationship between
the perceived level of job satisfaction of elementary teachers from
selected schools in North Dakota and Minnesota and their preferences
for certain rewards.
4. To determine whether or not there was a relationship between
reward preferences of elementary teachers from selected schools in
North Dakota and Minnesota and the following demographic information:
sex, age, teaching assignment, years of teaching experience, years of
teaching in a particular building, enrollment of the school district,
and role of teaching salary in household income.
5. To determine whether or not there was a relationship between
perceived level of job satisfaction of elementary teachers from selected
schools in North Dakota and Minnesota and the following demographic
information: sex, age, teaching assignment, years of teaching experi
ence, years of teaching in a particular building, enrollment of a school
district, and role of teaching salary in household income.
6. To determine whether or not there was a relationship between
performance ratings of teachers (by supervisor and peers) of elementary
teachers from selected schools in North Dakota and Minnesota and the
following demographic information: sex, age, teaching assignment,
years of teaching experience, years of teaching in a particular build
ing, enrollment of a school district, and role of teaching salary in
household income.
7. To determine which rewards elementary teachers from selected
schools in North Dakota and Minnesota perceived were available to them.
8. To determine which rewards elementary teachers from selected
schools in North Dakota and Minnesota perceived were desirable and which

8
might, therefore, serve as motivators if those rewards would be awarded
based on teacher performance.
Specific answers to the following research questions were
sought:
1. Is there a relationship between the performance ratings of
teachers (by supervisor and peers) and perceived level of job satisfac
tion?
2. Is there a relationship between the performance ratings of
teachers (by supervisor and peers) and preferred rewards?
3. Is there a relationship between the perceived level of job
satisfaction of teachers and preferred rewards?
4. Is there a relationship between certain teacher demographic
information and preferred rewards?
5. Is there a relationship between certain teacher demographic
information and perceived level of job satisfaction?
6. Is there a relationship between performance ratings of
teachers (by supervisors and peers) and certain demographic infor
mation?
7. Which rewards do elementary teachers from selected schools
in North Dakota and Minnesota perceive are available to them?
8. Which rewards do elementary teachers from selected schools
in North Dakota and Minnesota consider most desirable?
Delimitations
This study was delimited to:
1. Elementary teachers who met one of the following criteria:
a. they were assigned to a regular elementary classroom
9
(kindergarten through grade six), or
b. they were assigned to a full-time elementary music
position, or
c. they were assigned to a full-time position comprised of
half-time elementary music and half-time regular elemen
tary classroom.
2. Public schools with ten or more elementary teachers selected
by the researcher to represent varying district enrollments and geo
graphic locations.
Limi tations
This study was limited by the inability of the researcher to
control:
1. The ability of teachers to accurately discern their percep
tions of the desirability and availability of preferred rewards.
2. The ability of the principals to accurately assess each
teacher's performance.
3. The ability of the teachers and principals to accurately
select the one-third of the teachers from the sample group who were
most productive and effective.
Organization of the Study
This study is organized in the following manner:
Chapter I includes the following areas: (1) introduction,
(2) need for the study, (3) purpose of the study, (4) delimitations
of the study, (5) limitations of the study, and (6) organization of the
study.
10
Chapter II contains a review of related literature.
Chapter III describes the acquisition of and the development of
the instruments employed to secure the data, the procedures used to col
lect the data, and the tests employed to analyze the data.
Chapter IV is a report of the results.
Chapter V contains the summary, conclusions, and recommenda
tions based upon the findings reported in Chapter IV.
CHAPTER II
REVIEW OF THE LITERATURE
Motivation
The advent of the twentieth century witnessed the scientific
management movement introduced by Frederick W. Taylor. Taylor, who
is often referred to as the father of scientific management, spent
his life seeking ways to improve efficiency in the work place. Based
on systematic data collection and analysis, Taylor simplified opera
tions and made tasks more repetitive. Taylor and contemporaries Frank
and Lillian Gilbreth and Henry Gantt relied on time studies as a basis
for establishing methods and standards for performing a job (Certo
1980).
Since the early days of the scientific management movement there
has been continuing study of organizations by an array of researchers
and practitioners. One area of research concerning organizations focused
on employees and their motivation to perform their jobs. Management
thought concerning employee motivation has evolved in three rather
distinct stages: (1) traditional, (2) human relations, and (3) human
resources (Steers 1981).
The traditional approach coincided with the period when
Frederick Taylor was exerting his influence— approximately 1900-1930.
Before that time employees were motivated largely through threat of
punishment including the loss of their jobs. Taylor believed that
11
12
financial incentives, which permitted workers to earn more by working
harder and more efficiently, was a better way to motivate them
(Chruden and Sherman 1980).
In 1927, Mayo, Roethlisberger, and Dickson began a series of
studies that are commonly referred to as the Hawthorne Studies. These
studies ushered in a new approach to employee motivation— the human
relations approach. The idea behind this approach was to secure
employee compliance by using interpersonal strategies to increase
employee satisfaction. This approach was most popular between 1930
and 1960 (Steers 1981).
Since 1960 the literature regarding motivation has viewed employ
ees as human resources. This approach recognizes the complexity of
motivation and assumes that many factors such as the nature of the
incentive system, social influences, the nature of the job, supervision
worker perceptions, and individual needs and values are all capable
of influencing behavior (Steers 1981).
Motivation is defined in a variety of ways throughout the litera
ture. An accepted definition of motivation was provided by Steers
(1981) as, ". . . that which energizes, directs, and sustains human
behavior" (p. 53). Steers identified three aspects of motivation inher
ent in this definition.
First, motivation represents an energetic force which drives people to behave in particular ways. Second, this drive is directed toward something. . . . Third, the idea of motivation is best understood within a systems perspective . . .it is necessary to examine the forces within individuals and their environments that provide them with feedback and reinforce their intensity and direction (p. 53).
13
Contained within the present day human resources approach are
a number of perspectives on how the concept of motivation can be
described. The various motivation theories are grouped into a variety
of categories throughout the motivation literature. One commonly
used method for discussing the various theories is to divide them into
two groups— content and process theories. This way of discussing moti
vation is consistent with Steers' three-part definition of motivation,
and therefore, will be employed by the researcher in the following sec
tion .
Content Models
Content models of motivation deal primarily with the first part
of the definition of motivation— that which energizes human behavior.
Content models of motivation include the need theories which concentrate
on which needs provide the impetus to act. Three content theories will
be described.
Over forty years old, Abraham Mas low's Hierarchy of Needs Theory
is one of the more popular theories of motivation in the management
and organizational behavior literature (Wahba and Bridwell 1976) . This
theory has formed the foundation of more recent theories and has pro
vided the basis for a large body of literature targeted at practitioners.
According to Maslow (1970) people are motivated by five general needs
which are arranged in hierarchical order— physiological, safety, belong
ingness, esteem, and self-actualization needs. The premise of Maslow's
model is based on the notion of prepotency which is composed of the
deprivation/domination and the gratification/activation components.
This means that the deprived need is dominant, but once it becomes
14
gratified, a need at the next level of the hierarchy is activated. For
example, if a person is very hungry the physiological needs will be
activated and dominate all the other needs which the person might
have. Once hunger is satisfied, that need diminishes, and the safety
needs become dominant. This process continues throughout the hierarchy
concluding with the need for self-actualization (Farrar 1981). Maslow
(1970) explained the theory:
. . . these physiological needs are the most prepotent of all needs. What this means specifically is that in the human being who is missing everything in life in an extreme fashion, it is most likely that the major motivation would be physiological needs rather than any others. A person who is lacking food, safety, love, and esteem would most probably hunger for food more strongly than for anything else (p. 37).
In a review of the research on Maslow's Need Hierarchy Theory,
Wahba and Bridwell (1976) found little empirical evidence to support
the theory. They reported no evidence that human needs are classified
into five distinct categories, although some studies did show lower
order needs (deficiency) and higher order needs (growth) clustering
together. There was also no support for the notion of a prepotent
hierarchy and little support for the domination/deprivation or the
gratification/activation components of the theory. Wahba and Bridwell
concluded that the need hierarchy theory is almost untestable. They
also identified the most problematic aspect which makes the theory
untestable as the basic concept of need. It is not clear what is meant
by need primarily because Maslow made no attempt to "provide rigor in
his writing or standard definitions of constructs" (p. 234). According
to Wahba and Bridwell, Maslow preferred to use logical and clinical
insight in formulating his theory rather than well-developed research.
15
Still, Maslow's Hierarchy of Needs model has proven useful in generat
ing ideas about the basic nature of human motives and how they affect
the behavior of people at work (Steers 1981).
Another content model of motivation concerned with energizing
behavior has been developed by Alderfer (1972). He identified three
basic need categories— existence, relatedness, and growth — commonly
called ERG. Existence needs include material and physiological
desires. Relatedness needs include relationships with significant
others while growth needs provide satisfaction for engaging problems
that require a person to utilize his capacities fully and may require
him to develop additional capacities.
Alderfer views ERG Theory as a modified and theoretically
improved version of Maslow's Needs Hierarchy. When Salancik and
Pfeffer (1977) wrote a strong critique of need theories, Alderfer
(1977) supplied a vigorous retort. He accused Salancik and Pfeffer
of holding a highly simplified and inaccurate view of need theory.
Wahba and Bridwell (1976) lent some support to Alderfer's defense in
their review of research on Maslow's Need Hierarchy. They stated,
"Alderfer provides impressive evidence in support of his theory, espe
cially in contrast with that of Maslow" (p. 235).
Through an extensive study of engineers and accountants from
industries in the Pittsburgh area, Herzberg, Mausner, and Synderman
(1959) developed yet another content theory— the motivation-hygiene,
or two-factor theory. The study was conducted using a critical-
incidents interview procedure in which each subject was asked to des
cribe critical events experienced at work that had resulted, first,
16
in improved job satisfaction and, second, in reduced job satisfaction
(Herzberg et al. 1959). In analyzing the data, Herzberg and his col
leagues (1959) discovered that while some factors truly motivated
behavior (the motivators), the other factors merely lessened the level
of dissatisfaction (hygiene factors). The positively satisfying fac
tors, or motivators, included achievement, recognition, the work itself,
responsibility, and advancement. The incidents that reduced job satis
faction most frequently involved the feelings of unfairness. These
feelings frequently involved personal relations with superiors and
peers, technical supervision, company policy, administration, and work
ing conditions. The researchers concluded that job satisfaction and
dissatisfaction were not opposite poles of a continuum. They stressed
that one set of factors, the motivators, will produce satisfaction
when present while another set, the hygienes, will produce dissatisfac
tion. If all of the causes of dissatisfaction could be totally elimi
nated, satisfaction would not result without the presence of the moti
vators .
The two-factor theory has been studied extensively in both
industry and education. With some variations, industrial employees,
secondary teachers, and secondary administrators have tended to relate
one set of factors with job satisfaction and a different set with job
dissatisfaction (Miskel 1982; Silver 1982).
Studies which replicate Herzberg's methodology by employing
the critical-incidents technique tend to confirm the two-factor
theory. In education two such studies are representative— Sergiovanni
(1967) with teachers, and Schmidt (1976) with administrators. Another
17
educational researcher, Blumberg (1980) applied Herzberg's methodology
to measure teachers' attitudes about supervision. His findings parallel
Herzberg's in that the most commonly listed motivators were first, the
need to have teaching achievements recognized; second, the need to have
professional and personal potential recognized; and third, the need
for status and public recognition.
Three studies using rating scales (Weissenberg and Gruenfeld
1968, Halpern 1966, and Armstrong 1971) all reported that motivation
factors are better predictors of job attitudes than hygiene factors.
Weissenberg and Gruenfeld (1968) conducted their study with 96 civil
service supervisors. Although their findings generally supported
Herzberg, advancement was not viewed as a motivator by their subjects.
They speculated that this finding might have been a function of the
way advancement occurs. In the civil service, advancement is based
largely on seniority rather than on performance.
Wernimont, Toren, and Kapell (1970) conducted a study with 755
scientists and technicians to determine which job factors affected
effort and satisfaction. This study and several other studies employ
ing a variety of methodologies failed to substantiate Herzberg's two-
factor notion.
In recent years the two-factor theory has been criticized fre
quently. One of the most common criticisms reported by Medved (1982)
is that it is "method-bound," referring to the use of the critical-
incident technique. Salancik and Pfeffer (1977) claimed that the theory
is weak, while Campbell, Dunnette, Lawler, and Weick (1970) asserted
that the theory should either be altered or abandoned. While Hackman
and Oldham (1976) credited Herzberg's theory as inspiring practitioners
18
in the redesign of work, they criticized it in three areas. First,
they asserted that separating factors into categories of "motivators"
and "hygienes" may have been "largely a methodological artifact"
(p. 251). Second, they noted that the concept of individual differ
ences in motivation were not dealt with, but rather the theory assumed
that the motivating factors could increase the work motivation of all
employees. Finally, Hackman and Oldham said that the theory didn't
specify how the presence or absence of motivating factors could be
measured for existing jobs.
Schmidt (1976) summarized the criticisms articulated in research
studies that have failed to confirm the two-factor theory. They included
the following:
1. The theory is too simple.2. The theory is too rigid.3. The theory is stated too often in contradictory
terms.4. The results are method-bound and are supportive
of the theory only when the full Herzberg interview technique and analysis are used.
5. The interview technique does not lend itself to considering the defensive mechanisms that come into play in the respondents' answers (p. 70).
In spite of the criticisms of Herzberg's theory, it continues to
be popular with practitioners, especially those in education, because
it is easily adapted to supervisory action at all levels (Hersey and
Blanchard 1977). Suggestions on how to implement applications of the
theory in educational settings continue to appear in the literature
(Medved 1982, Frase et al. 1982, Scott et al. 1977). This theory
also continues to dominate some textbooks in educational administra
tion (e.g. Sergiovanni 1979).
19
Miskel (1982), however, has urged educators to begin to use
other theories as the bases for their research and practice. With the
lack of empirical support for the theory and the mounting criticism
from writers including Salancik and Pfeffer (1977) and Campbell et al.
(1970), Miskel has argued that educators place too much faith in this
single theory, and consequently they ignore or neglect other theories.
Mitchell (1979) pointed out that, "theoretical richness is substantially
improved from 10 years ago" (p. 244). He also indicated that all three
content theories discussed to this point— Maslow, Alderfer, and Herzberg
— "have simply been absent from the current research" (p. 252). While
other areas (management, business, industry) have moved on to more
sophisticated theories, education has not. Miskel (1982) urged a change
in direction when he wrote,
. . . it is time for scholars in educational administration to reduce their reliance on the model. Mindless replications will not improve the knowledge base. Instead, the state of knowledge indicates that the field should rely more on process models such as expectancy theory (p. 73).
Process Models
While content models deal with only the first part of the defi
nition of motivation, process models embrace all of the components of
the definition. These process models seek to explain how behavior is
started, directed, sustained, and stopped. Process models attempt
to identify the major factors that determine the choice of the task
effort. In some cases the process models rely on need theory and in
this way content models and process models can be seen as complementary
(Alderfer 1977). Process models proceed a step beyond content models
20
by attempting to specify how different variables interact to influence
an individual's behavior. Theories described in this section include
equity theory, goal theory, the developing theory referred to as the
job characteristics model, and expectancy theory.
Equity Theory
Social comparison theories all focus on the individual's per
ceptions of how fairly they are being treated as compared to some
self-selected referent. Equity theory, as first described by Adams
(1965) and Weick (1966), is the most popular social comparison theory,
and is based on two assumptions about human behavior. First, individ
uals evaluate their work situation in terms of an exchange process.
That is, they measure the contributions that they make with the out
comes they receive in return. Second, individuals compare their situ
ation of inputs and outcomes with others in order to determine the
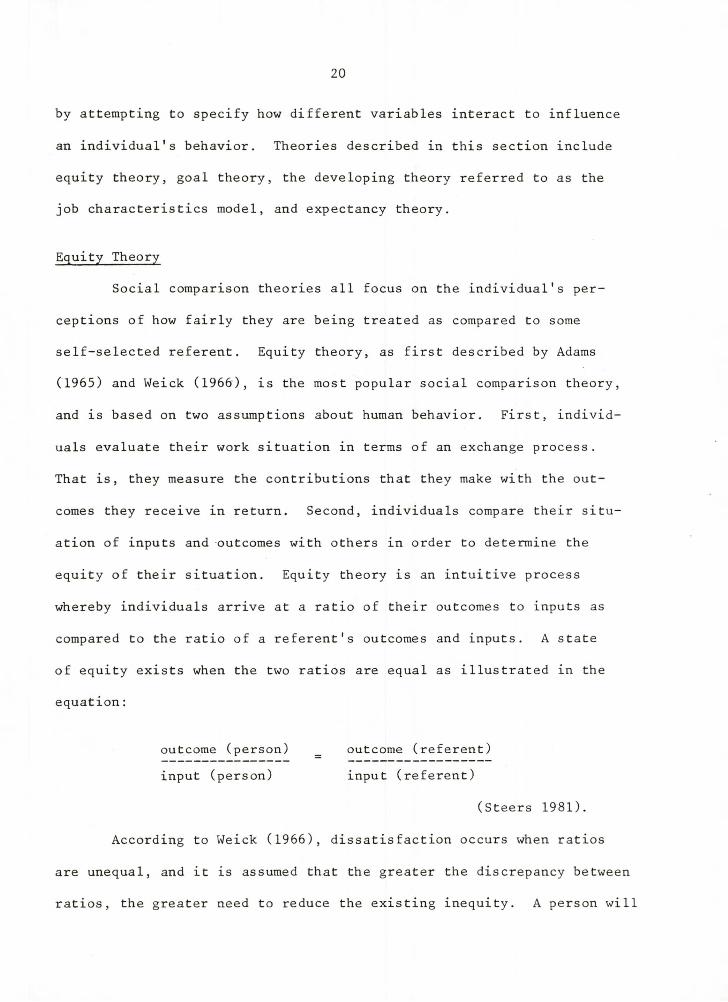
equity of their situation. Equity theory is an intuitive process
whereby individuals arrive at a ratio of their outcomes to inputs as
compared to the ratio of a referent's outcomes and inputs. A state
of equity exists when the two ratios are equal as illustrated in the
equation:
outcome (person) _ outcome (referent) input (person) input (referent)
(Steers 1981).
According to Weick (1966), dissatisfaction occurs when ratios
are unequal, and it is assumed that the greater the discrepancy between
ratios, the greater need to reduce the existing inequity. A person will
21
feel inequity if, while expending great effort, he/she experiences low
outcomes (high/low), and concomitantly observes a co-worker (his/her
chosen referent) receiving high rewards for the same amount of effort.
Even more dissatisfying, however, is the situation in which the person
perceives the co-worker receiving high outcomes for low effort (low/
high). Inequity is less unattractive when the person is being overre
warded. If not too great, overrewards can be perceived as "good for
tune" or as secretly deserved.
Equity theory postulates that when inequity exists, especially
when the person feels underrewarded, dissatisfaction occurs. A change
in behavior often results to reduce the perceived inequity and thereby
balance the equation. Weick (1966) identified several ways in which
inequity can be reduced:
1) By actually altering either inputs or outcomes,2) by perceptually distorting inputs or outcomes,3) by leaving the field,4) by getting the comparison person (referrent) to
change, or5) by changing to another comparison person
(referrent) (p. 418).
These techniques provide ways for people to cope with situations
they perceive as unfair. Motivation, here, is largely aimed at reduc
ing inequity and the tension it creates. Equity theory views indivi
duals in a constant state of flux striving to understand and control
their environment (Steers 1981).
Goal Theory
Goal theory, first introduced by Locke and his associates in
1968, is still evolving and is continuing to show promise as another
cognitive process approach to understanding work motivation (Mento,
22
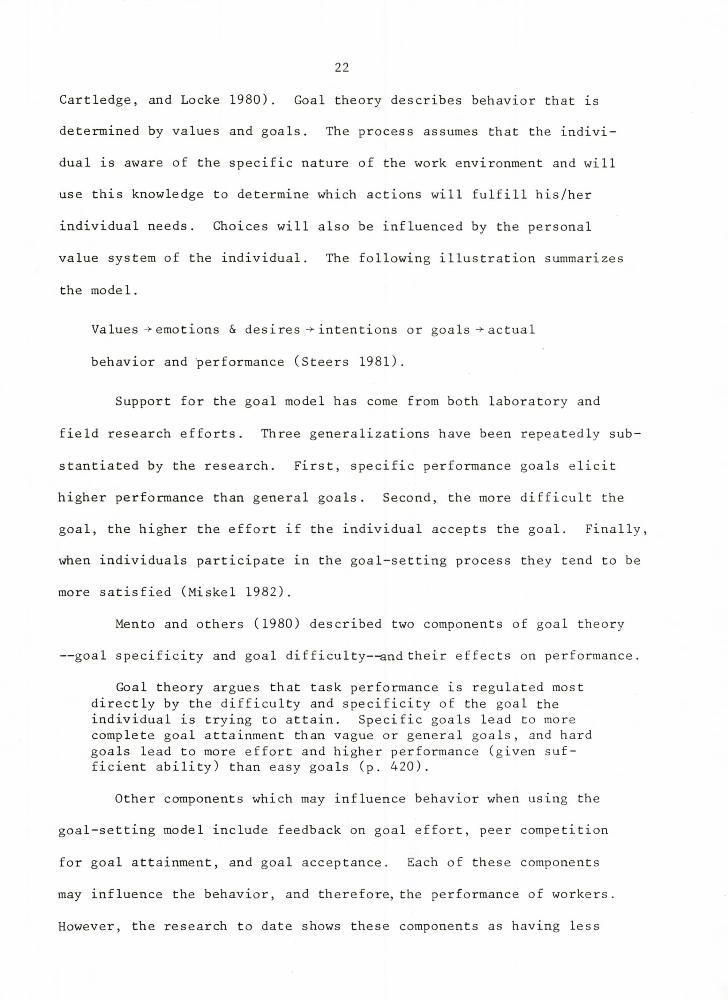
Cartledge, and Locke 1980). Goal theory describes behavior that is
determined by values and goals. The process assumes that the indivi
dual is aware of the specific nature of the work environment and will
use this knowledge to determine which actions will fulfill his/her
individual needs. Choices will also be influenced by the personal
value system of the individual. The following illustration summarizes
the model.
Values-> emotions & desires-* intentions or goals -> actual
behavior and performance (Steers 1981).
Support for the goal model has come from both laboratory and
field research efforts. Three generalizations have been repeatedly sub
stantiated by the research. First, specific performance goals elicit
higher performance than general goals. Second, the more difficult the
goal, the higher the effort if the individual accepts the goal. Finally,
when individuals participate in the goal-setting process they tend to be
more satisfied (Miskel 1982).
Mento and others (1980) described two components of goal theory
— goal specificity and goal difficulty— and their effects on performance.
Goal theory argues that task performance is regulated most directly by the difficulty and specificity of the goal the individual is trying to attain. Specific goals lead to more complete goal attainment than vague or general goals, and hard goals lead to more effort and higher performance (given sufficient ability) than easy goals (p. 420).
Other components which may influence behavior when using the
goal-setting model include feedback on goal effort, peer competition
for goal attainment, and goal acceptance. Each of these components
may influence the behavior, and therefore, the performance of workers.
However, the research to date shows these components as having less
23
influence than either goal specificity or goal difficulty (Steers
1981). Goal theory is particularly popular because the goal-setting
techniques complement and enhance other theories of work motivation,
such as expectancy theory and behavior modification.
Job Characteristics Theory
Another developing theory of work motivation is the job char
acteristic model initially introduced by Hackman and Oldham (1976).
At the most elementary level, this theory includes five core job
dimensions which are seen as prompting three critical psychological
states, which in turn lead to a number of beneficial personal and work
outcomes. Each of the core job dimensions corresponds to a particular
psychological need state. The first psychological state is the experi
enced meaningfulness of work which refers to the degree to which the
individual experiences the job as being worthwhile. In order to make
a job worthwhile three core dimensions— skill variety, task identity,
and task significance— should be present. A second psychological
state is the experienced responsibility for work outcomes and is
reflected in the amount of autonomy that exists on the job. A third
psychological state is knowledge of results, and the corresponding job
dimension is feedback (Hackman and Oldham 1976). Hackman and Oldham
have designed an equation implementing the five core job dimensions
to yield what they have termed a Motivating Potential Score (MPS). A
simplified version is presented by Steers (1981).
MPS = (skill variety + task identity + task significance) x
autonomy x feedback (p. 380).3
24
This formula shows that a near-zero score on any of the three factors
will reduce the MPS score to near-zero indicating a low level of moti
vation for the task.
In a recent revision of their work, Hackman and Oldham (1976)
presented an alternative framework for understanding the relationship
between organizational structure and employee reactions which they
called the job-modification framework. This framework suggests that
the structural properties of organizations influence employee reac
tions by shaping the characteristics of their jobs. This two-step
process was explained by Oldham and Hackman (1981) as follows:
An alternative framework for understanding the relationship between organizational structure and employee reactions can be called the job-modification framework. Here it is argued that the structural properties of organizations influence employee reactions by shaping the characteristics of their jobs. The explanation again has two steps. First, organizational structure is viewed as significantly affecting the overall amount of challenge and complexity (autonomy, skill variety, task identity, task significance, feedback) in the employees' jobs; second, job challenge and complexity are seen as directly influencing employees' reactions to the work and the organization (p. 68).
Taylor, Rosenbach, and Gregory (1982) applied the MPS in an
educational setting. The study was designed to measure the relation
ship between motivation and organizational climate. The organizational
climate survey developed by Rosenbach and Umsot (Taylor et al. 1982)
was adapted for use in a school setting. A motivating potential score,
or MPS, was calculated for all school employees including administra
tors, teachers, secretaries, custodians, librarians, cooks, and bus
drivers. The most significant findings were that K-6 teachers had
higher MPS scores than secondary teachers. The authors speculated
that the lower scores for secondary teachers were due to less skill
variety and feedback on their jobs. Another finding showed that
25
teachers in elementary schools which were smaller and more cohesive
scored significantly higher in psychological climate and satisfaction
with supervisors than teachers in secondary schools.
In reviewing research on Hackman and Oldham's original job
characteristics model (Hackman and Oldham 1976), Miskel (1982) found
support for this model in several studies. One study, by Erlandson
and Pastor (1981), did attempt to apply Hackman and Oldham's method
in an educational setting. The researchers used an instrument entitled
The Higher Order Need Strength Measure B with 150 secondary teachers.
This measure had been normed on industrial workers but had never been
used in an educational setting. The study measured higher and lower
order needs of the secondary teachers. Two-thirds of the teachers
surveyed possessed a predominance of higher order need strengths which
included participation in decision making, freedom and independence,
and challenge over the lower order need strengths which included fac
tors such as high pay, fringe benefits, and job security.
In spite of the support that has been demonstrated in some
studies for Hackman and Oldham's model, Miskel (1982) reported that
Hackman and Oldham themselves have acknowledged several shortcomings
in their theory. One weakness is that the links between the job char
acteristics and psychological states may not be as strong as the theory
purports. Also, the model treats the job characteristics as if they
were completely independent and discrete factors when actually jobs that
are high on one characteristic tend to be high on the others as well.
Because of these weaknesses, Miskel (1982) warned that this model should
be viewed as incomplete and still evolving. He suggested that it be
26
used as a guide to further research and theory development.
Expectancy Theory
Another process model which was originally introduced by Vroom
(1964) is most commonly referred to as expectancy theory. This
approach is also called valence-instrumentality-expectancy (VIE)
theory and value theory. When compared to other theories of motiva
tion, expectancy theory presents a highly complex view of the indi
vidual in the organization. This theory addresses the issue of indi
vidual differences in the areas of needs and goals. It also recog
nizes that individuals may perceive different connections between
their actions and the achievement of their goals. By permitting indi
vidual differences in both need and perceptions, the expectancy-theory
formulation is both more flexible and more complex than many of the
other process theories (Salancik and Pfeffer 1977). An additional
confusing element of expectancy theory exists because one of the sub
components of the theory carries the same name as the theory-expectancy
(Hoy and Miskel 1982).
Expectancy theory is based on two assumptions. First, indi
viduals use their abilities to think, reason, and anticipate future
events in order to make decisions about their own behavior. Motiva
tion is viewed as a conscious process in which individuals engage;
they subjectively evaluate the expected outcomes which should result
from their actions and after doing so, choose how they will behave.
The second assumption is not unique to expectancy theory but
is shared by other process models. This assumption postulates that
forces in the individual and the environment combine to determine
27
behavior. Forces within the individual such as values and attitudes,
for example, interact with role expectations and organizational cli
mate from the environment to influence behavior (Hoy and Miskel 1982).
Vroom (1964) originally presented two models of expectancy
theory, the first for the prediction of valences of outcomes, and
the second for the prediction of the force of effort toward behavior.
The term valence refers to the anticipated satisfaction that is asso
ciated with an outcome and should be distinguished from the value— or
actual satisfaction— of the outcome. In predicting effort, Vroom
focused on the force of effort an individual would expend, and not
that individual's level of performance because effort is considered a
behavior, while performance is an outcome.
Vroom's original effort and valence models have been combined,
and Vroom and others have made a number of modifications of expectancy
theory (Mitchell 1974). One highly popular, modified version of Vroom's
theory was developed by Porter and Lawler (1968).
In Porter and Lawler's model, expectancy theory contains two
basic components— the effort-reward probability component and the
valence component (Porter and Lawler 1968). Valence refers to how
"attractive or desirable is a potential outcome of an individual's
behavior in the work situation" (p. 18). The measurable variable which
comprises the valence component is more commonly referred to as rewards.
Rewards are defined in the Porter and Lawler model as the "desirable
outcomes or returns to a person that are provided by himself or by
others" (1968, p. 28). There are two important features of this defi
nition. First, the outcomes or rewards must be positively valued by
the individual. Second, these rewards can be either intrinsic or
28
extrinsic in nature. Intrinsic rewards are those rewards that the
individual can award him/herself, such as a feeling of accomplishment.
Extrinsic rewards are those rewards which are provided by others, such
as praise from a supervisor or a pay increase.
In addition to being valued, rewards must also be perceived as
equitable by the individual (Porter and Lawler 1968). Perceived equit
able rewards are defined as "the amount of rewards that a person feels
is fair given his performance on the tasks he has been asked to under
take by the organization" (p. 30). The degree to which the rewards
an individual receives are perceived to be equitable will influence,
in part, that individual's level of satisfaction. Satisfaction, accord
ing to Porter and Lawler (1968) is a "derivative variable" and will be
discussed later in this chapter.
The valence component of expectancy theory, then, is concerned
with the value, or attractiveness an individual assigns to potential
rewards. For the valence to be "high" the reward must be viewed as
desirable and distributed in an amount the individual perceives as
equitable.
Valence = Value Placed on Potential Rewards
The other component of expectancy theory, the effort-reward
probability, has two subcomponents: (1) the probability that perform
ance depends upon effort (expectancy), and (2) the probability that
reward depends upon performance (instrumentality). Effort is a key
variable in this equation, and must be clearly distinguished from per
formance. If a student is preparing for a test, effort would be the
actual energy expended on studying for that test, while performance
29
would refer to the score, or grade, which resulted.
Performance— or productivity as this variable is called by
some researchers— is the end result of the application of effort.
It is what organizations seek from their employees. Performance mea
sures can be purely objective as in units produced or number of sales;
however, more often than not, measures are subjective as in super
visory or self ratings.
The effort-performance, or expectancy subcomponent, describes
the probability that one's effort will, in fact, result in high per
formance. This component is mediated by an individual's unique traits
and abilities. A person who has no musical abilities will never be a
great pianist, no matter how much effort he/she puts into practicing
the piano. There are ways in which individuals in work situations can
compensate for their lack of some abilities; however, the expectancy
subcomponent of the model does imply that, "given two individuals who
put forth equivalent effort in a given area of endeavor, the one pos
sessing a greater amount of the relevant trait or ability will accom
plish more— he will achieve a higher level of performance" (Porter
and Lawler 1968, p. 23).
In the literature, the expectancy component is often referred
to as an effort-outcome relationship. In using this term, writers are
describing the relationship of behavior to performance (Hoy and Miskel
1982). The relationship is illustrated below.
Expectancy = ef fort-> performance
The second subcomponent of the effort-reward probability is
the performance-reward subcomponent, or instrumentality. This
30
subcomponent deals with the probability that an individual's perfor
mance will be rewarded appropriately. The degree of connection that
an individual sees between his/her performance and the resultant rewards
plays a key role in motivating the individual. Porter and Lawler
(1968) hypothesized that the greater the connection an individual makes
between performance and rewards, the more likely a person is to exert
effort to obtain a high level of performance. In actual work situa
tions, these connections are often quite nebulous or indirect. Some
organizations clearly reward their workers for effort, not performance.
In many organizations, employees may not see the connection between
how they perform and how they are rewarded, or the rewards the organi
zation thinks that the employees want are not attractive to the employ
ees at all (Porter and Lawler 1968). The result of these circumstances
is often to substantially reduce the potentially positive effect of
the performance-reward, or instrumentality, subcomponent.
The outcomes or rewards have two levels. They are referred to
as first- and second-level outcomes (Mitchell 1974) or direct and
indirect outcomes (Silver 1982). The direct outcomes are the immediate
results of an action, and the indirect outcomes are the consequences
of the direct outcomes. Silver (1982) put these concepts into an edu
cational setting when she wrote:
For example, when a teacher prepares a lesson for class, the result could be a good lesson, a mediocre lesson, or a poor lesson; those are the possible direct outcomes of the act of planning a lesson. If it is a good lesson, the students might be attentive and orderly, they might learn some content, the teacher might feel good, and the principal might recognize the teacher's accomplishment. If the lesson is poor, the students might be inattentive and unruly, they might create an embarrassing disruption, the principal might disapprove, and so forth. These are indirect outcomes of preparing a lesson (p. 552).
31
Writers refer to the instrumentality relationship as an outcome-
outcome one since it relates the outcomes of performance and rewards.
The instrumentality portion of the effort-reward component of expectancy
is illustrated below.
Instrumentality = performance -* reward
The relationships of the component parts of expectancy theory
can be expressed in a mathematical equation,
Force of Motivation = Expectancy E (Instrumentality multiplied
by Valence):
FM = E Z (IV).
This equation expresses the way in which the component parts are
thought to affect an individual's motivation. The effort an individual
expends combines with a number of personal and environmental factors
to yield a certain level of performance. The probability that a given
effort will yield an expected level of performance (expectancy, or E)
serves as feedback to modify the force of motivation. The individual
also assesses the probability that a certain level of performance will
result in perceived outcomes (instrumentality or I). In addition, the
individual assesses the desirability of those perceived outcomes
(valence or V). Since this is a multiplicative relationship, if either
expectancy, instrumentality, or valence falls to zero, then the force
of motivation also becomes zero (Hoy and Miskel, 1982).
Hoy and Miskel (1982) provided a summarization of expectancy
theory when they wrote:
32
. . . motivation to behave in a certain way is greatest when the individual believes that: (1) the behavior will lead to rewards (high instrumentality), (2) these outcomes have positive personal values (high valence), and (3) the ability exists to perform at the desired level (high expectancy). When faced with choices about behavior, the individual goes through a process of considering questions such as: Can I perform at that level if I work hard? If I perform at that level, what will I receive? How do I feel about these outcomes? The individual then decides to behave the way that appears to have the best chance of producing positive desired rewards (p. 156).
Although not presented in the equation, Porter and Lawler
(1968) recognize the effect of job satisfaction on an individual's
force of motivation. They have referred to job satisfaction as, "a
derivative variable" (p. 30). Satisfaction is defined as, "the extent
to which the rewards actually received, meet, or exceed the perceived
equitable level of rewards" (p. 30). It is important to note that satis
faction is affected by the level of rewards actually received and the
judgment the individual makes about how equitable that reward level is.
Porter and Lawler (1968) also discussed the relationship between
performance and satisfaction. They described four hypothetical per
formance-satisfaction situations:
Situation #1: Rewards are associated positively with performance differences— i.e., higher performers get higher rewards — but the perceived levels of rewards are approximately the same for high and low performers. In this case, the higher performers would be more satisfied since their perceived rewards were close to their equitable rewards.Situation #2: Rewards are associated positively with performance differences— i.e., higher performers get higher rewards — and the expected equitable levels of rewards are also in proportion to performance differences— i.e., higher performers expect more. In this situation, low performers would be as satisfied as high performers because the rewards they received were just as close to their expectations as was the case for the high performers.Situation #3: Rewards are not related to performance differences — i.e., everybody gets about the same level of rewards— and the perceived equitable levels of rewards are approximately the same for high and low performers. Again, high and low
33
performers would be about equally satisfied, since the differences between perceived equity and reality were about the same for the two groups.Situation #4: Rewards are not related to performance differences — i.e., everybody gets about the same level of rewards— but the higher performers expect more. Here, high performers would be more dissatisfied than low performers because their equity- reality difference was larger than that of the low performers (p. 37).
In Situation #1, satisfaction would be positive. Situations #2 and #3
would produce almost no satisfaction, or zero, and Situation #4
could expect to produce negative satisfaction or dissatisfaction.
Porter and Lawler (1968) hypothesized that when performance is
rewarded appropriately, it will have a more direct and positive effect
on satisfaction than satisfaction will have on performance. They empha
sized that even though feelings of satisfaction can influence future
performance, a strong causal relationship does not exist, and in fact,
there may be a far stronger causal relationship where performance appro
priately rewarded affects satisfaction. The relationship between these
two variables is further discussed in a later section of this chapter.
Considerable research on expectancy theory has been generated
in the last fifteen years. Since the 1950s and 1960s when the content
theories developed by Maslow, Alderfer, and Herzberg dominated the
field of motivational research, more than 75 percent of the motiva
tional research has been related to, or based upon, either expectancy
theory or the goal-setting approach (Mitchell 1979). The findings of
the research have been mixed. One problem has been the failure to con
sistently define and measure the theory's component parts (Heneman and
Schwab, 1972). This has been especially true for the expectancy (effort-
performance) factor of the equation. Where attempts have been made to
measure the expectancy factor, confusion has resulted because of the
34
difficulty of measuring the elements of expectancy component. These
inadequacies in the studies have, according to Heneman and Schwab
(1972), reduced the actual predictive power of the total theory.
Campbell and Pritchard (1976) reported that most of the research on
expectancy theory is of the correlational field studies variety. This
research is designed to investigate employees in their natural work
environment and, in doing so, provides a high degree of external valid
ity (Heneman and Schwab 1972).
Lawler and Suttle (1973) in a correlational field study found
support for expectancy theory. In examining thirty-four studies,
Mitchell (1974) also found general support for expectancy theory.
Mitchell's criticisms echoed those of Heneman and Schwab (1972) and
dealt with the design of the studies and not weaknesses in the theory.
He also found many instances of inappropriate measurement of the compon
ents of the theory.
Campbell and Pritchard (1976) criticized the expectancy theory
model for appearing too simple while attempting to explain a group
of highly complex variables. Still, they stated that "when all is said
and done, we think the heuristic value of the expectancy framework
will remain as a powerful force in organizational psychology even
though its empirical house in not in order" (p. 92).
In spite of the difficulties surrounding the use of expectancy
theory, there is a great deal of support for its continued use in field-
based research. Hackman and Porter (1968) concluded from their correla
tional field study that "expectancy theory can be a broadly useful
tool in understanding behavior in real world settings" (p. 426). Miskel
(1982) also reported the utility of research with an expectancy theory
35
base, and urged educational researchers to begin to, "rely more on
process models especially expectancy theory" (p. 73).
A few studies with an expectancy theory base appeared in the
educational literature. Holstrom and Beach (1973) conducted a study
of occupational choices made by graduate students in psychology and
found that the subjects' evaluations of potential rewards differed
significantly according to three occupational preferences— clinical,
teaching, research. In general, those subjects who chose clinical
practice and teaching as their occupational choices were more concerned
with interpersonally-oriented occupational rewards such as helping
people.
A study of innovative teaching practices by Stephens (1974)
supported expectancy theory and the findings suggested, ". . . the
reward system becomes the crucial factor in a school shaping teacher
behavior" (p. 42). This study involved teachers in both innovative
and traditional schools. The findings showed that teachers in inno
vative schools perceived rewards for quality of work, inventiveness,
and creativity, while teachers in traditional schools perceived rewards
for good relations with superiors and seniority. Teachers in both
schools indicated that they personally favored a "supportive" reward
system in which teachers were encouraged to be inventive, question
well-established ways of doing things, and pursue new and unusual ideas.
Only teachers in innovative schools felt that they were rewarded for
those behaviors. Also, teachers in both schools perceived that other
teachers actually preferred and endorsed restrictive rewards which
were designed to maintain the status-quo. Stephens called this para
dox between the rewards the teachers personally preferred and those
36
they perceived other teachers endorsed as, "pluralistic ignorance"
(p. 41) .
A study by Herrick (1981) was designed to test the relationship
between organizational structure and teacher motivation. Teacher moti
vation was defined in terms of the organization's reward system as mea
sured by expectancy theory. Herrick studied two types of organizational
structures— the multiunit and non-multiunit elementary schools. His
findings showed that decentralized multiunit schools had a signifi
cantly greater level of teacher motivation than non-multiunit schools.
Miskel, DeFrain, and Wilcox (1980) conducted a study which inves
tigated motivation, central life interests, voluntarism, and selected
personal and environmental characteristics as predictors of job satis
faction and job performance for teachers in secondary schools and
universities. The variables motivation, central life interests, and
voluntarism accounted for 47 percent of the variance in job satisfac
tion for secondary teachers, and 41 percent of the variance in job
satisfaction for university teachers. These same variables accounted
for 9 percent of the variance in job performance for secondary teachers
and 11 percent of the variance in job performance for university
teachers.
Expectancy theory is both flexible and complex. Several writers
view the theory as complementing other theories, models, and approaches.
Alderfer (1977) argued that expectancy theory and need theory are use
ful separately or together depending on what is to be predicted or
explained. He reasoned that, "viewing expectancy theory and need theory
as complementary means that one does not have to choose one theory over
another" (p. 658). Lawler (1969) argues that although most expectancy
37
theories do not specify why certain outcomes have reward value, "the
reward value of outcomes stems from their perceived ability to satisfy
one or more needs" (p. 427). Lawler, thus, recognized the connection
between expectancy theory and the security, social, esteem, and self-
actualization needs' of Maslow's hierarchy.
Connections have also been made between expectancy theory and
goal theory. Mento and associates (1980) recognized the effort-
performance probability, or expectancy factor of the equation, on the
success of goal theory. In goal theory, "specific goals lead to more
complete goal attainment than vague or general goals, and hard goals
lead to more effort and higher performance (given sufficient ability)
than easy goals" (p. 420). Georgopoulos Mahoney, and Jones (1957)
and House (1971) discussed the relationship between leaders' behavior
patterns and employees' motivation. This relationship, referred to as
the path-goal theory of leadership effectiveness, combines elements
from the job factors approach, expectancy theory, and an analysis of
leadership styles in an attempt to select the best path to available
goals.
Silver (1982) suggested that the sixteen job factors identified
by Herzberg could be interpreted using the expectancy theory framework
as indirect outcomes of people's actions on the job.
The expectancy model suggests that motivation factors are likely to be more highly attractive (or unattractive) than hygiene factors and thus will have more impact on individuals' motivation.In addition, motivation factors are the outcomes more closely associated with one's own effort; therefore, they are more likely to be closely linked with expectancies on a day-to-day basis.For example, a teacher can more readily expect praise (favorable recognition), a sense of accomplishment (achievement), and the satisfaction of having learned something (growth possibility) as outcomes of investing effort in teaching than he or she can
38
expect a salary increase, more pleasant surroundings, and better supervision as outcomes of that effort (p. 553).
Not all of the research on employee motivation fits neatly
under the rubric of a particular theory, and few contain a comparable
set of variable measures. Concomitant with the study of worker moti
vation has been the study of rewards and reward systems, as well as
such topics as job satisfaction, employee morale, and employee per
formance. Studies involving these issues in organizations will be
discussed in the following section.
Rewards
Researchers have labored to discern how various rewards affect
worker motivation. Practitioners seek to discover how to use rewards
to enhance motivation in order to achieve organizational goals more
effectively. A major controversy in the reward research deals with
the distinction between intrinsic and extrinsic rewards and the rela
tive importance of each.
Intrinsic and extrinsic are two terms which have been used
extensively to describe and classify outcomes, rewards, motives, and
needs that are related to internally and externally initiated behavior.
Although sometimes the actual distinction between the two terms is
difficult to clarify, extrinsic rewards are commonly thought of as any
rewards that are provided by the organization or other people. They
are external to the individual and include such things as pay, fringe
benefits, job title, and office space. Intrinsic rewards are those
mediated within the individual and that the individual grants to him
self or herself. Examples of intrinsic rewards include pride in
accomplishments, achievement, enjoyment of the work itself, feelings
39
of competence, and self-determination (Lawler 1969).
Traditionally the belief has been held that intrinsic and extrin
sic rewards would combine in an additive fashion to increase the motiva
tion strength. Deci (1975), a cognitive theorist, has disagreed with
this long-held generalization. He has theorized that where intrinsic
motivation exists people motivate themselves out of a desire to perform
competently. Conversely, when extrinsic rewards are dominant, people
are motivated out of the desire to achieve the reward. Deci maintained
that intrinsic motivation is the strongest type of motivation, and
that when extrinsic rewards are added the effect is not a positive one.
Deci (1975) postulated that extrinsic rewards can reduce the
power of intrinsic rewards in two ways. First, when external rewards
are introduced, they may provide conflicting evidence about the person's
competence. The individual no longer performs to his/her level of sat
isfaction, but to someone else's standards. Second, with the introduc
tion of extrinsic rewards the individual may begin to perform the
activity for the reward itself. In either case, the "locus of causal
ity," as Deci called it, shifts from within the individual to the
external reward. When this happens the extrinsic outcomes can reduce
both the feelings of competence and self-determination that provide
intrinsic motivation. Continuation of research in this area is needed
and will have significance for both the areas of theory and practice.
If future evidence shows that intrinsic and extrinsic motivators are
not additive, a change in the accepted knowledge about human behavior
will result. In practice, the way in which rewards are distributed
will certainly be affected, particularly if future research shows that
the addition of extrinsic rewards is counterproductive because intrinsic
40
motivation suffers.
Much of the literature on rewarding teachers encourages the use
of intrinsic rewards. An article by Gudridge (1980) is representative
of articles which have claimed that teachers do not teach for money
but for self-satisfaction, praise, and recognition. Williams (1978)
observed that union contracts seek to gain additional resources which
meet teachers' physiological and security needs. He claimed that most
schools are deficient in meeting the higher order esteem and self-
actualization needs which generally are met with intrinsic rewards.
Are intrinsic rewards more effective in motivating members of
the educational community or are these motivators viewed as most effec
tive because of the way in which teachers are compensated? In a
research action brief published by the U.S. Department of Health, Edu
cation, and Welfare (1980), the author pointed out that teachers have
very few extrinsic rewards available to them since they are paid on
the basis of education and seniority. The author wondered if teachers
have been "forced" to turn to intrinsic rewards because they are the
only true rewards available for excellent performance. Spuck (1974)
supported this line of reasoning. He stated that since public schools
distribute extrinsic rewards to all employees in a similar fashion,
they have little effect on influencing behaviors. Therefore, the
rewards in educational institutions which are most closely related to
individual performance are intrinsic in nature and have the greatest
influence on teachers' behaviors.
In a study of elementary teachers, Lortie (1975) concluded that
intrinsic rewards may be more meaningful as motivators than extrinsic

41
rewards because of the nature of rewards or reward distribution. Intrin
sic rewards may be more closely related to the effort teachers put
forth. Extrinsic rewards are generally not associated with individual
performance in educational settings. Lortie, in discussing the rela
tionship between rewards and organizational behaviors, posited the
universal manner in which extrinsic rewards are distributed to teachers
as the reason for their low degree of effectiveness. He concluded
that intrinsic rewards, especially those derived from effective commun
ication with students, are the rewards which teachers value most.
It is usually assumed that the private sector has and utilizes
more types of rewards— particularly extrinsic rewards— with workers
while the public sector experiences considerably less latitude. How
ever, this might not be as true in practice as it would appear. A con
siderable body of literature has indicated that most merit pay programs
neither adequately reward meritorious performance nor motivate people
to perform very well. Goldberg (1977) blamed the failure of merit pay
programs on three things: first, the salary structure itself; second,
the closed nature of merit pay programs; and third, the multiple objec
tives that most merit pay programs try to serve. Most experts agree
that much of the "merit" in the programs in the private sector is based
on seniority and inflation rather than on merit.
An outspoken supporter of paying for performance, or the use of
extrinsic rewards, is Fein. Fein (1976) claimed that although many
of the arguments for intrinsic motivators sound good, they appeal to
only 8 to 12 percent of the work force. According to Fein, the rest
of the workers are motivated by good pay, working conditions, and job
security. He indicated that when workers' pay was linked to performance,
42
productivity levels were higher and workers were generally more satis
fied. Fein concluded that efforts to motivate workers through
extrinsic rewards have failed because in the real world, most workers
are penalized, not rewarded, for improving their performance.
A study by Quinn and Cobb (1980) supported Fein's notion of the
importance of extrinsic and monetary rewards. The study found that
twenty-five facets of jobs rated by workers in terms of importance
could be represented by five dimensions— three of which refer to
extrinsic or monetary rewards. The five dimensions were: (1) comfort,
(2) challenge, (3) financial rewards, (4) relations with co-workers,
and (5) resources.
Fein (1976) allowed that rewarding public sector workers, such
as teachers, based on their performance is more difficult than it is
in the private sector. He listed the biggest problem as measurement
of output, or performance, citing the fact that conventional work
measures cannot be used. While rewarding public workers based on
performance is practically non-existent, it is still seen as desirable
by many writers and researchers in the field.
Using merit pay as an extrinsic reward designed to increase
motivation can fail to produce the desired results. This can be
explained in the context of equity theory. The employee can perceive
inequity in a number of different ways. He/She may perceive that the
merit increase is inappropriate— generally too low— when compared with
last year's performance. The employee may be very satisfied with the
actual dollar amount of the reward, but still fail to be motivated
because of the rewards of peers which he/she may perceive were higher
43
than deserved (Wheeler, Wallace, and Crandall 1982).
Nickerson (1984) described this situation in educational
settings.
The teachers or other employees become aware of who receives the merit pay, they compare themselves with those individuals and say, "Wait a minute, I did just as much as that person, but I am not being rewarded. Why should I do more if they are not going to reward me for doing what I am doing very well . . . " (p. 66).
This reaction was supported by Hamner (1982) who pointed out that
most employees whom he studied viewed their performance as above aver
age, and therefore, expected to be the recipients of merit pay. In
addition, Hamner maintained that although the principle behind merit
pay is a sound one, merit pay systems fail to increase motivation
because managers either mismanage merit pay programs or do not under
stand them.
Nickerson (1984) agreed with Hamner that it is difficult to
argue with the principle of merit pay but, also like Hamner, pointed
out that in the educational situations where it has been employed,
merit pay has not succeeded in serving as a motivator. Goldberg (1977)
is another researcher who emphasized that merit pay plans do not
actually reward outstanding performance, and therefore, they fail to
motivate workers. Nickerson further maintained that not only did merit
pay prove to be an ineffective motivator, it negatively affected one
of the factors necessary for school excellence— faculty esprit. He
concluded that as much as one might want merit pay to work, it simply
doesn't— at least in education.
It is time for the American public, specifically the American school people, to look at the problems inherent in merit pay for teachers. The bandwagon seems to be advocating merit pay. We

44
need to remember that there are detriments to merit pay as well.There are ways to cure the problems of abuse of tenure. There are ways to reward those who work hard and succeed. Merit pay is not the answer (p. 66).
Spuck (1974) studied the reward structures in public high schools.
His study included 497 teachers from twenty-eight high schools in
southern California. The sample included teachers from schools that
varied in size and ethnic population. The study examined the relation
ship between eight reward categories and the teacher behaviors of
absenteeism, recruitment, and retention. In conducting the study,
Spuck developed the Teacher Reward and Satisfaction Scales(TRASS) to
quantitatively assess teacher perceptions of reward levels available
in public high schools. The study found that intrinsic rewards were
highly related to the employee behaviors of recruitment, absenteeism,
retention, and turnover.
An Arizona school district reported success with a program of
rewarding teachers. The program for excellence in the Catalina Foot
hills district focuses on rewarding excellent teachers using motiva
tors identified by Herzberg (Frase et al. 1982). The motivation
factors that were identified— opportunities for professional recog
nition for a job well done— have been desirable rewards according to
the response of the district's teachers. However, officials of the
Catalina Foothills district caution that these motivators will not be
effective if hygiene needs are not met first.
Research studies and scholars in both industrial psychology
and education have attempted to determine how to most effectively
reward employees, which rewards employees prefer, and what effect
various rewards have on a variety of other variables such as employee
45
satisfaction, performance, morale, and turnover. Many of the studies
reinforce some form of intrinsic reward system, but the findings vary.
The findings of several studies, and the opinions of leading scholars
and practitioners are reported in the following section.
Lortie (1975) found that intrinsic rewards were related to
job performance, reduced absenteeism, improved peer and superordinate
relations, and enhanced the effectiveness of the teacher's classroom
behavior.
Porter and Lawler (1968) conducted research in which they modi
fied Maslow's hierarchy to include a sixth step— autonomy needs—
which they placed between esteem and self-actualization. Using this
additional need, and assuming that physiological needs were adequately
met for managerial and professional employees, Porter and Lawler
developed the Need Satisfaction Questionnaire (NSQ). In their studies
of managers at various levels, Porter and Lawler found that self-
actualization was most critical. They also found that esteem, security,
and autonomy needs were satisfied more often in middle-management posi
tions than they were for lower-level managers.
Trusty and Sergiovanni (1966) adapted the NSQ to the field of
education. They found that the largest deficiencies for professional
educators were esteem, autonomy, and self-actualization needs. Admin
istrators had fewer esteem needs than teachers and showed a higher need
deficiency in the self-actualization step. Trusty and Sergiovanni con
cluded that self-esteem presented the highest need deficiency for
teachers.
A more recent study employed the NSQ in an educational setting
and found that administrators exhibited fewer need deficiencies than
46
teachers on all five subscales. The researchers also found that the
greatest area of deficiency for both administrators and teachers was
autonomy needs (Miskel 1982).
Other authorities in the field of education have agreed with
the findings of Trusty and Sergiovanni. In the Practitioner, a publi
cation for secondary school principals, Bruce (1978) claimed, "the
greatest need deficiency levels for teachers, and probably for most
American adults, lie in the areas of love and belongingness and self
esteem" (p. 4). Bruce advised building principals to concentrate on
providing rewards that will meet the belongingness and self-esteem
needs of teachers.
In a study of a unionized manufacturing organization, Rand (1977)
asked three groups of workers— upper level managers, foremen, and hourly
employees— to rank their preferences of ten rewards. Three of the
rewards were considered intrinsic, and seven were extrinsic. All
three groups chose "opportunity for growth" and "achievement of sense
of accomplishment" as their first and second choices, respectively.
These were both considered intrinsic rewards. Pay was chosen fifth
by upper management and sixth by both foremen and hourly workers.
In addition to measuring reward preferences, Rand also measured
the prediction of the hourly workers reward preferences by upper manage
ment and foremen. Their predictions placed pay and job security as the
top two choices they expected hourly employees to make. The actual
first choice of the hourly workers— opportunity for growth— was pre
dicted to be fifth by upper management and ninth by foremen. This study
illustrated the importance of understanding what employees consider
important. Such understanding requires continuing and accurate
47
diagnosis of the reward preferences of employees.
In 1970 Dubin conducted a study of 3,088 industrial workers
and developed a three-tiered incentive system which differentiated
types of incentives offered according to the satisfaction level of
the worker, In general, Dubin found that: first, dissatisfied workers
valued extrinsic job factors, autonomy in work, and payoffs from work
ing; second, satisfied workers valued extrinsic job factors (but not
necessarily the same ones as dissatisfied workers), and cooperation at
work; and third, indifferent workers valued extrinsic job factors,
autonomy in work, payoffs for working, and cooperation at work (Fuller
and Miskel 1972) .
Fuller and Miskel (1972) performed a parallel study with 508
Kansas teachers and administrators. They found that satisfied teachers
considered features related to the job and to the school important, that
indifferent teachers selected money matters as being more important,
and that dissatisfied teachers were most likely to select features
related to initiatives of the teachers' association or union.
Fuller and Miskel (1972) modified Dubin's three-tiered incentive
system to form a two-tiered incentive system. The lowest tier included
features considered important by all groups of teachers and was related
to interpersonal relationships, extrinsic work factors, security, and
ancillary organizations. The second tier included features important
to each specific group of teachers— satisfied, dissatisfied, or indif
ferent. In this incentive system satisfied teachers would receive
intrinsic rewards related to achievement and recognition, indifferent
teachers would receive incentives related to autonomy in work and work
ing conditions, and dissatisfied teachers would be provided incentives
48
emphasizing ancillary organizations.
Heath (1981) conducted a study of 250 private school teachers.
Vocational satisfaction was measured using a twenty-eight item instru
ment and a Likert scale. According to the responses, Heath found that
salary ranked twenty-eighth out of twenty-eight items used to predict
satisfaction.
The primary purpose of the study was to examine the relation
ships between faculty burnout and low morale and vocational adaptation.
Heath concluded that teachers with the highest adaptation scores —
those who regarded teaching as a "calling" rather than a job— required
intrinsic rewards in order to achieve satisfaction. Heath also noted
that as fewer and fewer intrinsic rewards are present in teaching,
teachers seek satisfaction in extrinsic rewards such as increased
salary and benefits. Heath warned that increasing extrinsic rewards
alone will not reduce the problems of burnout and low morale.
Two other researchers, Chapman and Otteman (1979) studied employee
preferences regarding available rewards. Their study examined employee
preferences for various compensation and fringe benefit options. The
study was based on the expectancy theories of Vroom, and Porter and
Lawler. The findings of the study indicated that age and marital
status played a significant role in the desirability of some benefits
and that sex did not play a significant role. In terms of expectancy
theory, the authors stated that traditional wage and benefit programs
fail to increase employee motivation because of the lack of emphasis
on individual differences in motivation and the individual preferences
associated with various organizational rewards. Based on the study find
ings, the authors recommended that organizations individualize their
49
compensation systems as much as possible in order to attract and retain
effective employees.
A recent theme in the literature on rewards is the notion that
rewards should be tailored to each individual as much as possible.
Three studies by Miskel, (Miskel et al. 1972, Miskel 1974, Miskel 1977)
all found that different employees prefer different rewards. As a
result of his research, Spuck (1974) also recommended that reward pre
ferences need to be studied on an individual level— in addition to an
organizational level— so that appropriate rewards can be provided.
Chapman and Otteman (1979) concurred and stressed that organizations
which emphasize individualizing rewards as much as possible will be in
a better position to attract and hold an effective work force.
Williams (1978) noted that in developing a strategy for motivat
ing teachers, administrators need to be aware of individual differ
ences. In planning a reward system one particular plan will not moti
vate all the members of the group. Administrators, Williams advised,
must be able to diagnose teachers' needs and match opportunities and
rewards to satisfy those needs.
Although the literature makes a strong case for individualizing
rewards, there are few suggestions for how to diagnose needs, or how
to implement a differentiated reward system. Articles on merit pay
provide one suggestion for rewarding individuals differently; however,
that differentiation is based on some level of performance, not on
needs or reward preferences. Also, merit pay plans suggest one way of
rewarding people individually— through their pay. No mention is given
to providing other individual rewards that might be attractive to, and
motivate, individual employees. While it is difficult to argue with
50
the contention in the literature that individualizing rewards is
desirable, suggestions for implementing programs aimed at individualiz
ing rewards are scarce.
Many of the studies described in the preceding section concerned
with measuring preferred rewards included job satisfaction in the list
of variables. Preferred rewards and job satisfaction are related
because when individuals feel appropriately rewarded some degree of
satisfaction results.
Job Satisfaction and Performance
Job satisfaction has received a great deal of attention by
researchers apart from its direct tie to rewards, however. Steers
(1977) described job satisfaction as one of the most popular indicators
used by analysts and investigators to assess organizational effective
ness.
Contrary to the notion that teachers are among the most dissatis
fied of the professional groups, studies on faculty burnout, morale,
and vocational adaptation by Heath (1981) and Fruth, Bredeson, and
Fasten (1982) found that teachers do not differ from other profession
als in either the quality or content of vocational satisfaction.
In another study, Miskel and associates (1972) reviewed litera
ture from industry and education and attempted to adapt the informa
tion and instruments found in industry to the field of education. This
study included a sample of 3400 public school teachers in Kansas and
the findings indicated that female elementary and secondary teachers
who scored higher on satisfaction were also more job oriented, had a
job in which a higher potential for personal challenge and development
51
existed, where there was less work pressure, and where there were
more incentives relating to physical surroundings. Male elementary
teachers who scored higher on satisfaction were more job oriented.
A study by Knoop (1980) examined the interrelationships of job
satisfaction, job involvement, and job motivation. The study involved
1800 elementary and secondary teachers employed in thirty-two school
districts throughout Ontario, Canada. The results of the study showed
that educators who were highly involved in their jobs were also highly
satisfied with both their jobs and their supervisors. Those who felt
they participated in making decisions reported a high degree of job
involvement as did those who were highly motivated. Knoop summarized
his findings by stating,
Involvement may be high because a person is satisfied with or motivated by, his or her job; or a person may experience high job satisfaction, or job motivation, because of high job involvement . . . if one of these variables is high it may be likely that the other two are also high. Can one not expect people who are involved in their job to be also motivated and satisfied (p. 16).
A strong causal link was once thought to exist between job satis
faction and performance. However, in their systematic review of
research, Salancik and Pfeffer (1977) reported that they found no rela
tionship between satisfaction and performance. Mitchell (1979), in
another review of research, drew the same conclusion. He stated, "No
empirically strong or theoretically compelling relationship between
satisfaction and performance is apparent" (p. 248).
A study by Cherrington, Reitz, and Scott (1980) illustrated the
absence of an inherent relationship between satisfaction and performance.
In the study, two groups of subjects performed the same task. One group
52
was rewarded and one group was not. Cherrington reported that the per
formance scores between the two groups did not differ. The subjects
performed at equal levels even though one group was rewarded and one
group was not. The levels of satisfaction, however, differed signifi
cantly. The group that was rewarded was significantly more satisfied
than the group that was not rewarded. The study suggested that although
satisfaction does not cause high performance, satisfaction is still a
variable which merits consideration.
Performance is usually a very subjective measure in education.
There is no definitive way in which to judge performance: Should
student achievement scores be used? Teacher competency tests? Class
room observations? Is it some combination? In a comprehensive study
of teacher evaluation models Darling-Hammond, Wise, and Pease (1983)
illustrated that different attitudes about the nature of teaching
cause different performance measures to be employed. They asserted
that there are four ways of viewing teaching: labor, craft, profes
sion, or art. The different views bring with them different expecta
tions for performance. These different expectations can greatly influ
ence how performance is measured as a research variable, and makes it
a difficult variable to include in research studies. It is, however,
an important factor in the study of motivation and rewards.
Summary
In reviewing the literature on motivation, this researcher was
influenced by the recommendations of Miskel (1982) that educational
researchers begin to employ process theories, such as expectancy theory,
in the study of teacher motivation. Using expectancy theory as a guide,
53
the variables of performance, rewards, and satisfaction emerged as
important variables for further study. The present study focuses upon
these variables; the methodology employed is explained in the follow
ing chapter.
CHAPTER III
METHODOLOGY
The problem of this study was to determine which non-monetary
rewards were desired by teachers and whether or not the rewards
desired varied with either the perceived performance or the job satis
faction of classroom teachers from seven selected elementary schools.
The data collected permitted analysis between the variables of job
satisfaction, teachers' perceptions of available and desirable rewards,
teacher performance ratings and scores, and the demographic variables
of sex, age, teaching assignment, teaching experience, years of teach
ing in a particular building, district enrollment, and the role of the
teacher's salary in the household income.
The procedures followed in conducting this study are discussed
in three sections: (1) instruments selected and instrument develop
ment, (2) sample selection and data collection, and (3) statistical
treatment.
Instruments Selected and Instrument Development
Three instruments were employed in the study. The instrument
selected to measure job satisfaction had two components. The Job
Descriptive Index (JDI) and the Job In General (JIG) are designed for
use together. The Eighth Mental Measurements Yearbook was consulted
54
55
in selecting this instrument. Bowling Green University holds the copy
right on this instrument and copies were purchased for use in the
study.
The Job Descriptive Index has five scales: (1) work on present
job, (2) present pay, (3) opportunities for promotion, (4) supervision
on present job, and (5) people on your present job. In addition to the
Job Descriptive Index, the Job In General was administered. The Job In
General is an instrument which was designed to supplement the Job Des
criptive Index. The Job In General provided a summary for the five
scales of the Job Descriptive Index. All five scales of the Job Des
cription Index and the Job In General are scaled to yield scores rang
ing from zero to fifty-four with zero indicating no satisfaction and
fifty-four indicating extremely high satisfaction. For the purposes
of this study, the Job In General was employed as a sixth job satisfac
tion variable. Each teacher in the study completed this instrument.
The study also attempted to measure teacher performance. Per
formance is a very subjective element to measure, and yet it is an
extremely important variable in maintaining effective schools. Teachers
who are high performers are desirable employees. Principals are eager
to gain insights related to rewarding and motivating high performing
teachers so that these teachers will continue to work with energy
and commitment.
In this study, high performing teachers were identified in
two ways. The teachers in the study were rated by their principals
using the Teacher Performance Assessment Instrument (TPAI). Two of
the five subsections of the TPAI were used. The subsections used were
56
designed to measure teachers' performance on classroom procedures and
interpersonal skills. These two subsections are organized into two
different clusters. Cluster I contains ten items that measure a
teacher's performance related to classroom procedures, and six items
that measure a teacher's performance related to interpersonal skills.
The instruments yielded three scores per teacher— a score on classroom
procedures, a score on interpersonal skills, and a total score. Each
item on the instrument is behaviorally described with five specific
descriptors in order to cause the principal to score the teachers with
as much precision as possible. The TPAI was obtained from the College
of Education at the University of Georgia. (The subsections of the
TPAI used in this study are contained in Appendix A.)
In addition to using the TPAI to identify high performing
teachers, principals and teachers in each building were also asked to
select the teachers whom they considered to be the most productive and
effective from among the sample group in their particular building.
Principals and teachers were asked to identify the top one-third of
the sample group without ranking them in any order. No specific
behavioral criteria were suggested. The instructions stated only that
the principals and teachers identify, "the most productive and effec
tive teachers." Teachers were allowed to consider themselves in their
selection. A process was employed to ensure that the ratings were
anonymous. The researcher prepared a faculty roster and assigned
each teacher in the sample group to a corresponding numeral. Teachers
and principals selected the top one-third of the group on a prepared
page that contained only the numerals. The principals and teachers
57
then destroyed the lists that contained the names of the participating
teachers.
Four groups of teachers emerged based on the selections made
by teachers and principals: (1) the group of teachers not selected
as the most productive and effective, (2) the group of teachers selected
by teachers but not by principals as the most productive and effective,
(3) the group of teachers selected by principals but not by teachers
as the most productive and effective, and (4) the group selected by
both teachers and principals as the most productive and effective.
The third instrument used in the study was developed by the
researcher. It was designed to measure the availability and desirabil
ity of a variety of different rewards. Herrick (1981) identified
sixty-one possible rewards which formed the basis of the reward instru
ment used in this study (pp. 65-66). (The instrument is contained in
Appendix B.) Each of the sixty-one rewards was listed on a separate
card. After preliminary examination, the researcher combined reward
items and deleted others that were judged to be inappropriate or
redundant until fifty-eight items remained. The researcher then
grouped items together that appeared to be related in one way or
another and labels were created for each group of rewards. Four edu
cational administration faculty members examined these groups of
rewards and their respective labels and made suggestions for changes
for two of the labels. These categories were then renamed. Nine reward
groups existed under the following labels: "progressive administration,"
"benefits," "participation in decison making," "facilities," "opportuni
ties for growth " "pay," "recognition," "socializing opportunities," and
"working conditions." These nine categories and an additional one
58
titled, "none of the above," were listed. A modified list of fifty-
eight possible rewards was also reproduced. These fifty-eight rewards
and the ten labels were distributed to a panel of thirteen educational
administration graduate students and faculty members. These individuals
were instructed to place each reward under the label that seemed most
appropriate. If they felt unable to place a reward item under one
single label, they were to place it under the label, "none of the
above." No attempt was made to describe, explain, or define the mean
ing of the labels.
The responses were then tallied. Twenty-seven of the rewards
were placed under one or the other of the labels by seventy-five percent
or more of the panel. These items were then recorded in that specific
category. Four of these items appeared redundant and were combined
so that twenty-three items remained classified under the nine labels.
Examination of the responses, and questions about the meaning
of some of the labels caused the researcher to edit the labels with
the aid of the researcher's advisor. The labels were shortened to one
word where possible and then a brief descriptor was included with each
label. For example, "progressive administration" was altered to read,
"administration— nature of and relationship to." These edited labels
were then listed. The rewards that had not been placed under one label
or another by seventy-five percent of the respondents were then re
examined. After editing, ten new items were created. Thirty-six items
were then presented for a second test to another panel of thirteen edu
cational administration graduate students and faculty members. This
time each item had to be placed under one of the labels with an attached
descriptor. There was no label entitled, "none of the above."
59
Of the thirty-six items categorized in the second setting,
twenty-two were identified by seventy-five percent or more of the res
pondents as fitting under one specific label. Four additional items
were viewed by the researcher as important enough to include in the
instrument, even though these items had not been placed under a specific
label by seventy-five percent or more of the respondents. The label,
"related perquisites" was created to describe these four reward items.
Forty-nine items appeared in the final instrument. A table of random
numbers was used to determine the order in which the items would appear
on the instrument. These forty-nine items formed the ten variables
and were analyzed in the preferred rewards instrument. The reward
variables were labeled: (1) "administration," (2) "belongingness,"
(3) "benefits," (4) "decision making," (5) "facilities, equipment, and
supplies," (6) "growth," (7) "pay," (8) "recognition," (9) "working
conditions," (10) "related perquisites." Each reward variable was
comprised of a number of specific items. The variable "administration"
contained four items; belongingness contained four items; benefits con
tained four items; facilities, equipment and supplies contained four
items; growth contained six items; pay contained five items, recogni
tion contained eight items; working conditions contained six items; and
related perquisities contained four items. (The labels with their
descriptors and the specific reward items that comprised these variables
are found in Appendix C.)
The Statistical Package for the Social Sciences (SPSS) subpro
gram Reliability Analysis for Scale was used for each group of rewards
which comprised each reward variable. The coefficient alpha was
analyzed to determine whether or not the reliability of adding the
60
reward items under the specific labels was greater than examining the
reward items singly. The alpha values ranged from .34 to .72. These
results indicated that the rewards could be analyzed by groups rather
than as single items. (All of the alpha values are found in Appendix
D.)
A demographic information sheet was also designed by the
researcher to collect specific demographic information from each
teacher in the sample. (The demographic information sheet is con
tained in Appendix E.) Information gathered was related to the teacher's
sex, age, teaching assignment, role of salary in the household income,
years of teaching experience, years in present building, and enrollment
of the district.
Every teacher was assigned a numeral and all three instruments
and the demographic information sheets were marked with each teacher's
assigned numeral, thus assuring anonymity for respondents.
Sample Selection and Data Collection
Seven elementary schools were selected for the study. The
selection was not random. Nevertheless, an attempt was made to obtain
data from schools of varying sizes and geographic locations across
North Dakota and in western Minnesota.
The superintendent in each of the sample schools was contacted
by telephone in early October, 1983, by the researcher's major advisor.
Each superintendent was asked for permission to allow the researcher
to contact an elementary principal in the district in order to enlist
that principal's participation in the study. Each superintendent who
was contacted gave permission, and where multiple elementary schools

61
existed in the district, the superintendent recommended which elemen
tary school should be contacted by the researcher.
The researcher contacted every elementary principal by telephone
and explained the purpose of the study, the instruments that would be
employed, and the faculty sample that would be needed. Each of the
principals contacted expressed a willingness to participate and
guaranteed a minimum of ten classroom teachers for the sample. The
researcher requested no less than ten and no more than fifteen
teachers from each school. Special service teachers were not included
in the sample. Classroom teachers, classroom teachers with part-time
music assignments, and music teachers were used in the sample. A
date and time for the researcher to visit each school to administer the
instruments was also agreed upon during the telephone conversation with
each principal.
The researcher visited every school and collected data in
October and November of 1983. The researcher explained the purpose
of the study to the participating teachers, assigned each teacher an
identification numeral, distributed the instruments, explained how to
complete each instrument, and collected the instruments. During the
same visit the researcher left a set of the Teacher Performance Assess
ment Instruments (TPAIs) with the principal and explained how he/she
was to fill out one instrument for each teacher in the sample. The
task of completing these instruments required an extensive block of
time; therefore, the instruments were left with each principal along
with a self-addressed, stamped envelope. All principals subsequently
completed the instruments and returned them to the researcher within
one week.
62
All instruments were hand scored by the researcher by Decem
ber 15, 1983. A total of eighty-five elementary classroom teachers
completed the instruments. A summary of the study results and a
letter thanking the teachers and principals for their participation
in the study were mailed on May 10, 1984. (The letter is contained in
Appendix F.)
Statistical Treatment
The SPSS subprogram Frequencies was used to compute the fre
quency of responses from eighty-five teachers. This program was used
to provide a description of the demographic characteristics of the
sample. The subprogram, Frequencies, was also used in the analysis of
the teachers' responses on the preferred reward variables. The respon
ses to each preferred reward item were analyzed. The percentages of
the teachers responding to each choice for each item were summed and
mean percentages were calculated for each reward variable. For instance,
in regard to the variable "benefits," 41 percent of the teachers
reported that those reward items were desirable, 14 percent of the
teachers reported that those reward items were available, 39 percent
of the teachers reported that those reward items were both available
and desirable, and 7 percent of the teachers reported that the reward
items related to the benefits were neither desirable nor available.
The SPSS subprogram One Way was used to test for the significance
of mean differences between teachers by group (1. teachers unchosen by
principals or teachers, 2. teachers chosen by teachers but not by
principals, 3. teachers chosen by principals but not by teachers,
4. teachers chosen by both principals and teachers as most productive
63
and effective) and the six job satisfaction variables: between teachers
by group and the preferred reward variables; between teachers by group
and the demographic variables of age, sex, teaching assignment, and
role of salary. The SPSS subprogram One Way also tested for the
significance of mean difference between the job satisfaction variables
and the preferred reward variables, and between the job satisfaction
variables and the demographic variables of age, sex, teaching assign
ment, and role of salary. Finally, the subprogram One Way was used to
test for the significance between the preferred reward variables and
the demographic variables of age, sex, teaching assignment, and role
of salary. Differences in the means were considered significant at 0.05
leve1.
Tukey's Honestly Significant Difference (HSD) Test was used to
determine which groups had significantly different means at the 0.05
level. If the analysis of the subprogram One Way indicates that a sig
nificant difference between means exists, the HSD test will identify
the specific means that are significantly different. There may be sig
nificant differences between all the means; however, Tukey's HSD will
yield at least one significant difference when the overall F-Test is
significant (Roscoe 1975). Where the groups were unequal in size
Tukey's Modified HSD for Unequal Cells was employed.
The SPSS subprogram Pearson Corr was used to determine signifi
cant relationships between TPAI scores and job satisfaction variables;
between TPAI scores and preferred reward variables; and between TPAI
scores and the demographic variables of years of experience, years in
present building, and enrollment of the district. Relationships between
the variables were considered significant at the 0.05 level.
64
The SPSS subprogram Reliability Analysis for Scale was used
to determine significant differences between the six job satisfaction
variables and between the ten preferred reward variables. Tukey's
HSD test was also administered to determine which variables were sig
nificantly different at the 0.05 level.
The data collected for this study and the analysis described
above are presented in Chapter IV.
CHAPTER IV
PRESENTATION OF DATA
The purpose of this chapter is to present statistics which indi
cate the relationships found among the three primary variables of per
formance, job satisfaction, and preferred rewards. This chapter also
contains statistics which indicate the nature of the relationships
found between these three primary variables and selected demographic
variables for the sample group. The relationships among all of the
variables were analyzed.
Only statistically significant relationships are analyzed and
discussed in this chapter; non-significant relationships are included
in observations and conclusions contained in Chapter V. (Appendix G
contains the data which demonstrate which relationships were and were
not significant.)
The results are presented in eight parts: (1) a description of
the sample, (2) analysis of the significant relationships between
teacher performance, job satisfaction, preferred rewards, and demographic
variables, (3) analysis of the significant relationships between job
satisfaction, preferred rewards, and demographic variables, (4) analy
sis of the significant relationships between preferred rewards and
demographic variables, (5) analysis of the significant differences
between the job satisfaction variables, (6) analysis of the signifi
cant differences between the preferred reward variables, (7) analysis
65

66
of the mean percentages of the reward variables, and (8) summary.
Description of the Sample
The sample included eighty-five teachers from seven selected
elementary schools in North Dakota and Minnesota. The schools selected
represented a range of enrollments and geographic locations. Five
schools were located in North Dakota and two schools were located in
Minnesota. The enrollments of the school districts from which the
seven schools were selected ranged from 374 to 8400 students. The
researcher contacted each principal and requested participation from
not less than ten, and not more than fifteen of the elementary class
room teachers in each building. Full-time teachers with a combination
assignment of a classroom and elementary music were accepted in the
sample, as were full-time elementary music teachers. In the schools
with lower enrollments, all of the elementary classroom teachers par
ticipated in the study in order to obtain data from the minimum of ten
teachers per school. In the schools with larger enrollments, each
principal used his/her own system of selection ranging from volunteer-
ism to random sampling.
Of the 85 teachers comprising the sample 7 were male, 76 were
female, and 2 teachers did not respond to the item. Twenty-six teachers
were 30 years of age or younger; 27 teachers were between the ages of 31
and 40; 21 teachers were between the ages of 41 and 50; and 11 teachers
were age 51 or older.
Teachers were asked to indicate their present teaching assign
ment. Their responses were as follows: kindergarten, 7; grade one, 14;
grade two, 14; grade three, 11; grade four, 11; grade five, 8; and

67
grade six, 4 respondents. Nine teachers were assigned to some type of
combination arrangement whereby they taught two grade levels, or a half
time classroom and half-time elementary music, or full-time elementary
music. Seven teachers did not indicate their teaching assignment.
Eighteen of the teachers in the study had 5 years of teaching
experience or less; 23 teachers had between 6 and 10 years of experience,
while 30 teachers had between 10 and 20 years of teaching experience.
There were 14 teachers who ranged in experience from 20 to 36 years.
Thirty-five of the teachers in the study had served in their
present elementary building for five years or less. Eighteen teachers
had taught in their present building between 6 and 10 years. Twenty-
four teachers had taught in their present building between 11 and 20
years, and 6 teachers had been in their present building for over 20
years. Two teachers did not respond to this item.
Teachers were asked to indicate the role their teaching salary
played in their family income. Sixteen teachers indicated that their
teaching salary comprised their total household income. Twenty-seven
teachers indicated that their teaching salary was the primary income
of a multiple-income household, and forty-two teachers reported that
their teaching salary supplemented another larger income in their house
hold.
Analysis of the Significant Relationships Between Teacher Performance and Job Satisfaction, Preferred
Rewards, and Demographic Variables
This study examined the relationships between the scores of three
different instruments and the information from a demographic information
sheet completed by each teacher. The three instruments measured teacher
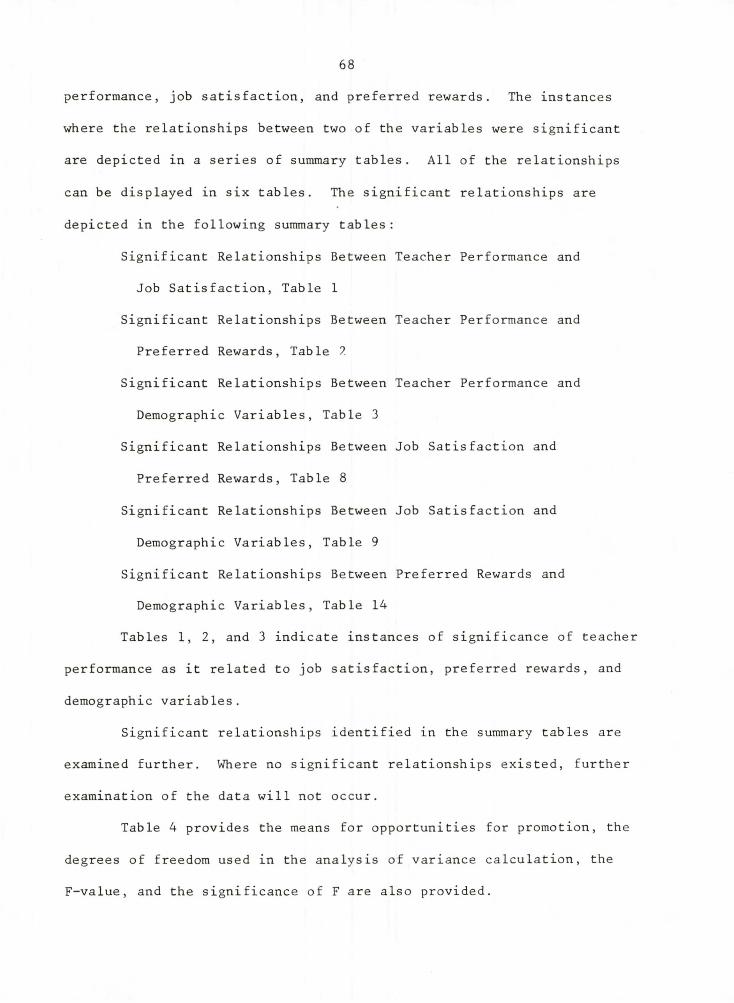
68
performance, job satisfaction, and preferred rewards. The instances
where the relationships between two of the variables were significant
are depicted in a series of summary tables. All of the relationships
can be displayed in six tables. The significant relationships are
depicted in the following summary tables:
Significant Relationships Between Teacher Performance and
Job Satisfaction, Table 1
Significant Relationships Between Teacher Performance and
Preferred Rewards, Table 2
Significant Relationships Between Teacher Performance and
Demographic Variables, Table 3
Significant Relationships Between Job Satisfaction and
Preferred Rewards, Table 8
Significant Relationships Between Job Satisfaction and
Demographic Variables, Table 9
Significant Relationships Between Preferred Rewards and
Demographic Variables, Table 14
Tables 1, 2, and 3 indicate instances of significance of teacher
performance as it related to job satisfaction, preferred rewards, and
demographic variables.
Significant relationships identified in the summary tables are
examined further. Where no significant relationships existed, further
examination of the data will not occur.
Table 4 provides the means for opportunities for promotion, the
degrees of freedom used in the analysis of variance calculation, the
F-value, and the significance of F are also provided.
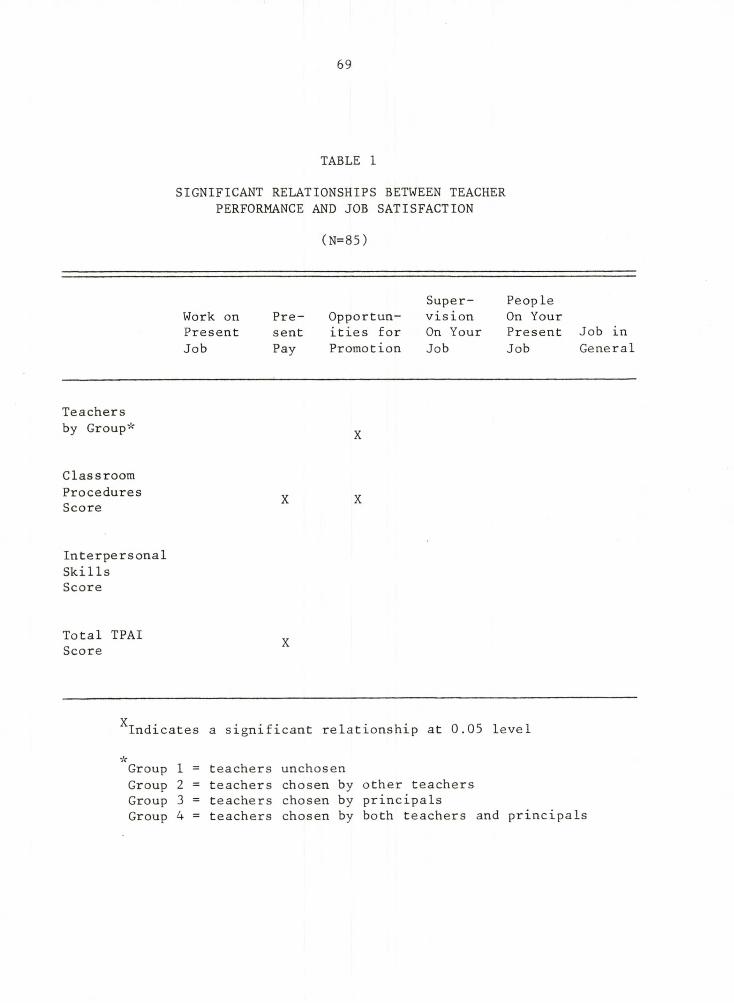
69
SIGNIFICANT RELATIONSHIPS BETWEEN TEACHER PERFORMANCE AND JOB SATISFACTION
(N=85)
TABLE 1
Super- PeopleWork on Pre- Opportun- vision On YourPresent sent ities for On Your Present Job inJob Pay Promotion Job Job General
Teachers by Group* X
ClassroomProceduresScore
InterpersonalSkillsScore
X X
Total TPAI Score X
X .Indicates a significant relationship at 0.05 level
*GroupGroupGroupGroup
1 = teachers unchosen2 = teachers chosen by other teachers3 = teachers chosen by principals4 = teachers chosen by both teachers and principals
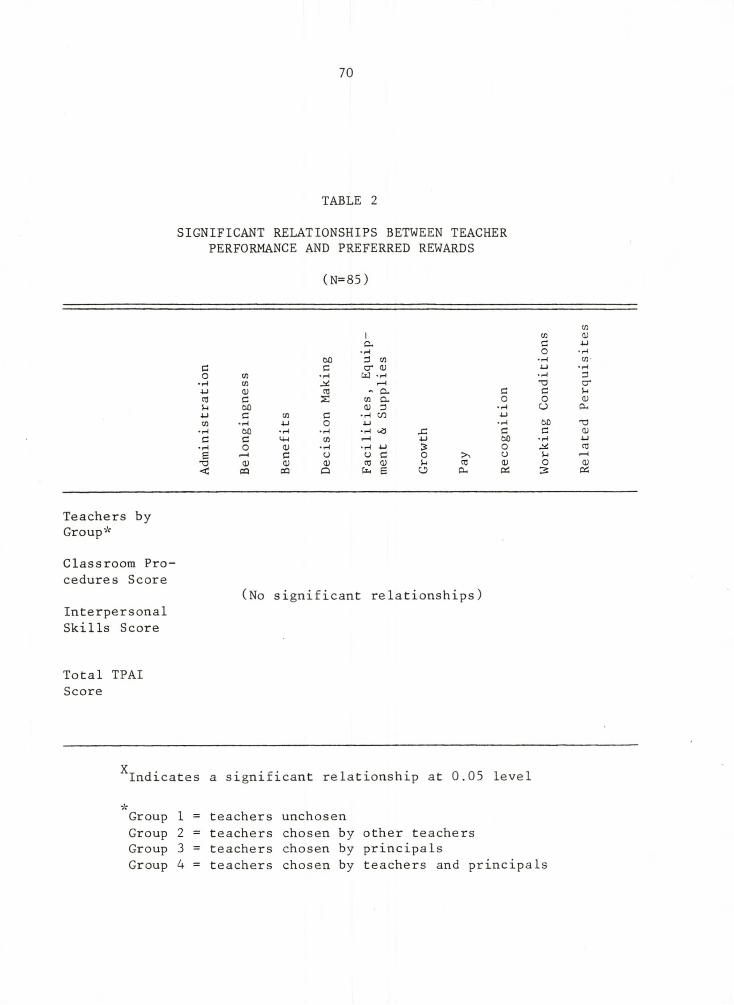
70
SIGNIFICANT RELATIONSHIPS BETWEEN TEACHER PERFORMANCE AND PREFERRED REWARDS
(N=85)
TABLE 2
CO1 co d)CL C 4-1
• H o • H00 3 co • r-4 CO
c a O " <0 4-J • Ho CO • H W -H • H 3• H CO r 4 T 3 c rU d ) CT3 - CL C CCTJ C S co O- O O d )U 00 <u 3 • r-4 CJ■U c CO C • H C O 4-1CO • p4 4-1 o ■u • r-4 00 T 3
•H 00 • H • r - 1 •h -C c c dJc c <4-4 CO t— 4 4-J 00 • H 4-1
• H o d ) • H • H - U o CTJ
B r—i C U C J C O CJ r—4
T 3 (V <1) d ) CT3 CD CT3 d J O d )
< CQ CQ Q 6 o PU 02 3 02
Teachers by Group*
Classroom Procedures Score
(No significant relationships)Interpersonal Skills Score
Total TPAI Score
XIndicates a significant relationship at 0.05 level
Group 1 Group 2 Group 3 Group 4
teachers unchosenteachers chosen by other teachersteachers chosen by principalsteachers chosen by teachers and principals
71
SIGNIFICANT RELATIONSHIPS BETWEEN TEACHER PERFORMANCE AND DEMOGRAPHIC VARIABLES
(N=85)
TABLE 3
60 O"0 *H■U CD i—1 L
C CJ CQ 4-1
CD C COB (D 4-1 • r 4
c • r 4 a Q60 u CD
• r 4 <D CO <4-1
co C0 C L CD oCO f —1 X L i
< c0 w Cl 4-1
CO c60 L -4 C CDc <4-4 o • H E
• r 4 o r— 1
SI CO CO r—4
u CD u L i 0CD X CO r - 4 CO c0 L i
60 CD CD o CD CD a< CO H > - >-» w
Teachers by Group*
Classroom Procedure Score
Interpersonal Skills Score
(No significant relationships)
Total TPAI Score
XIndicates a significant relationship at 0.05 level
Group 1 Group 2 Group 3 Group 4
teachers unchosenteachers chosen by other teachersteachers chosen by principalsteachers chosen by both teachers and principals
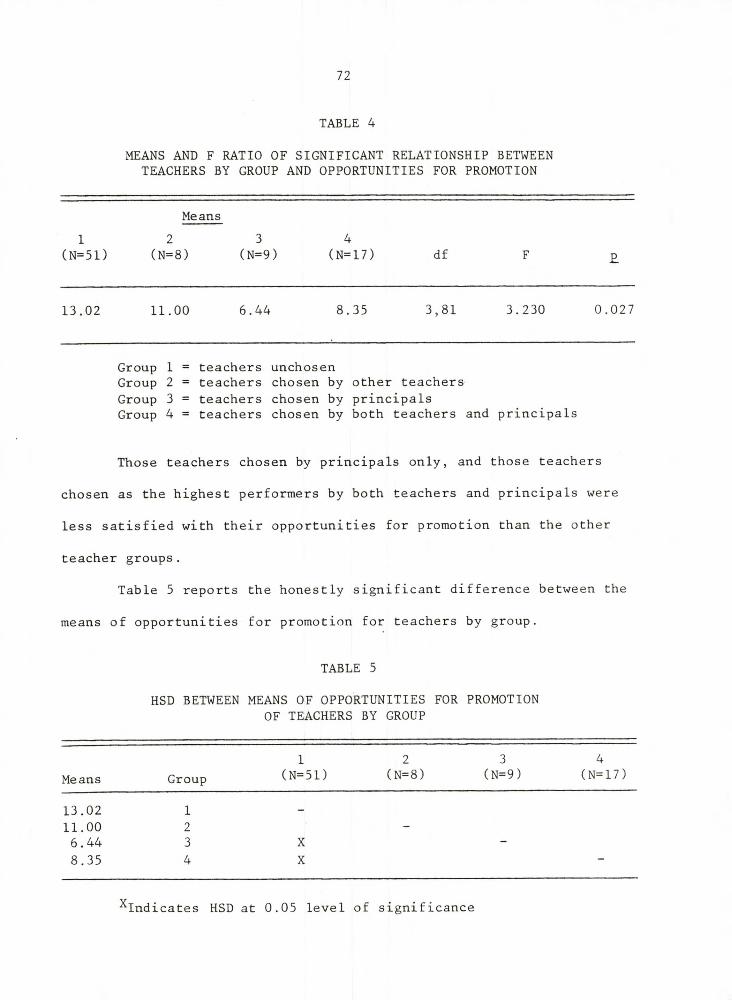
72
MEANS AND F RATIO OF SIGNIFICANT RELATIONSHIP BETWEEN TEACHERS BY GROUP AND OPPORTUNITIES FOR PROMOTION
TABLE 4
Means1 2 3 4( N= 51 ) (N=8) ( N=9) ( N=17) df
13.02 11.00 6.44 8.33 3,81 3.230 0.027
Group 1 = teachers unchosenGroup 2 = teachers chosen by other teachers Group 3 = teachers chosen by principalsGroup 4 = teachers chosen by both teachers and principals
Those teachers chosen by principals only, and those teachers
chosen as the highest performers by both teachers and principals were
less satisfied with their opportunities for promotion than the other
teacher groups.
Table 5 reports the honestly significant difference between the
means of opportunities for promotion for teachers by group.
TABLE 5
HSD BETWEEN MEANS OF OPPORTUNITIES FOR PROMOTION OF TEACHERS BY GROUP
1 2 3 4Means Group (N= 51) (N=8) (N=9) (N=17 )
13.02 1 -
11.00 2 -6.44 3 X -8.35 4 X —
^Indicates HSD at 0.05 level of significance
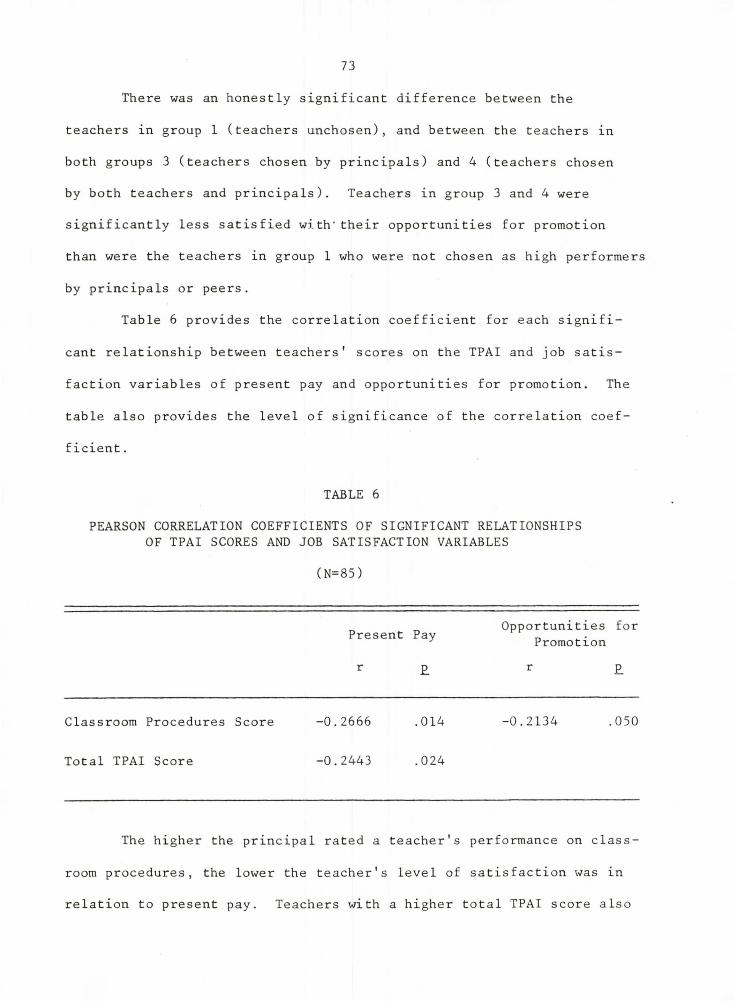
73
There was an honestly significant difference between the
teachers in group 1 (teachers unchosen), and between the teachers in
both groups 3 (teachers chosen by principals) and 4 (teachers chosen
by both teachers and principals). Teachers in group 3 and 4 were
significantly less satisfied with- their opportunities for promotion
than were the teachers in group 1 who were not chosen as high performers
by principals or peers.
Table 6 provides the correlation coefficient for each signifi
cant relationship between teachers' scores on the TPAI and job satis
faction variables of present pay and opportunities for promotion. The
table also provides the level of significance of the correlation coef
ficient .
TABLE 6
PEARSON CORRELATION COEFFICIENTS OF SIGNIFICANT RELATIONSHIPS OF TPAI SCORES AND JOB SATISFACTION VARIABLES
(N=85)
Present Pay OpportunitiesPromotion
for
r £ r P
Classroom Procedures Score -0.2666 .014 -0.2134 .050
Total TPAI Score -0.2443 .024
The higher the principal rated a teacher's performance on class
room procedures, the lower the teacher's level of satisfaction was in
relation to present pay. Teachers with a higher total TPAI score also
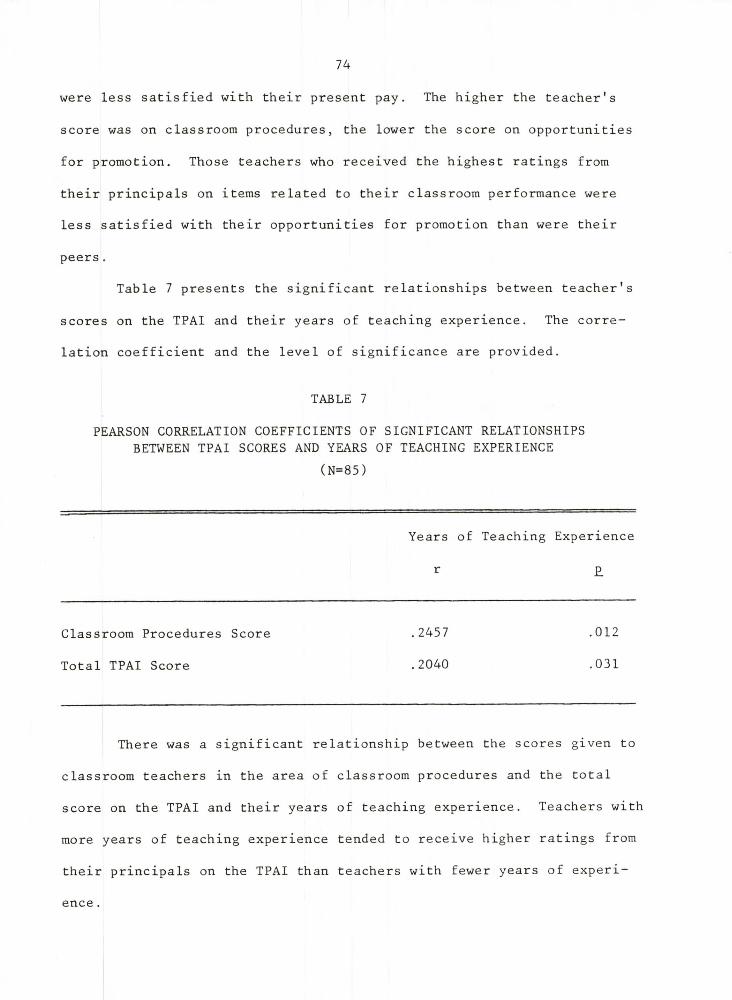
74
were less satisfied with their present pay. The higher the teacher's
score was on classroom procedures, the lower the score on opportunities
for promotion. Those teachers who received the highest ratings from
their principals on items related to their classroom performance were
less satisfied with their opportunities for promotion than were their
peers .
Table 7 presents the significant relationships between teacher's
scores on the TPAI and their years of teaching experience. The corre
lation coefficient and the level of significance are provided.
TABLE 7
PEARSON CORRELATION COEFFICIENTS OF SIGNIFICANT RELATIONSHIPS BETWEEN TPAI SCORES AND YEARS OF TEACHING EXPERIENCE
(N=85)
Years of Teaching Experience
r £
Classroom Procedures Score
Total TPAI Score
.2457 .012
.2040 .031
There was a significant relationship between the scores given to
classroom teachers in the area of classroom procedures and the total
score on the TPAI and their years of teaching experience. Teachers with
more years of teaching experience tended to receive higher ratings from
their principals on the TPAI than teachers with fewer years of experi
ence .
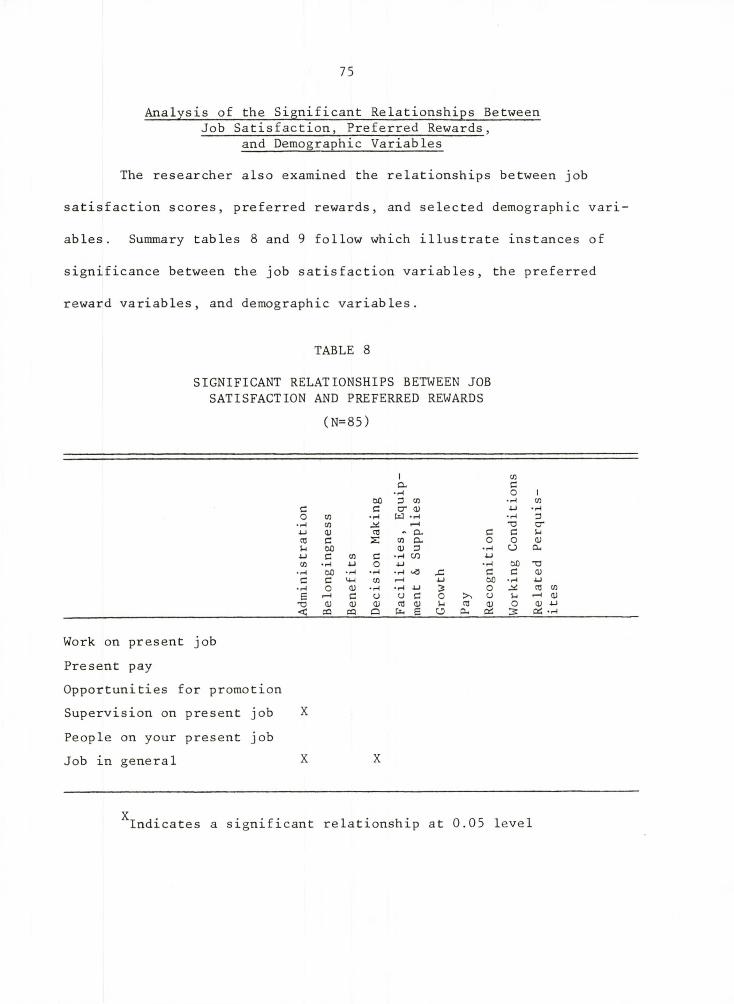
75
Analysis of the Significant Relationships Between Job Satisfaction, Preferred Rewards,
and Demographic Variables
The researcher also examined the relationships between job
satisfaction scores, preferred rewards, and selected demographic vari
ables. Summary tables 8 and 9 follow which illustrate instances of
significance between the job satisfaction variables, the preferred
reward variables, and demographic variables.
TABLE 8
SIGNIFICANT RELATIONSHIPS BETWEEN JOB SATISFACTION AND PREFERRED REWARDS
(N=85)
I 03a. e■ H O I
GO 3 CD • 1—1 CDc c CT CD 4-» • Ho CD • H W • r4 • tL 3
• T—1 CD t—1 X c r4-J <D 03 « a - c c u03 c s CD a o o CDL GO <D a • H CJ CL■U c CD c • r4 CO 4->CD • r-l ■U o 4-J • T—1 GO X
• r-l GO • r-l •r-l • i—1 JZ c c CDc c L—1 CD r—1 4-1 GO • r-l 4-J• H o CD • r-l • r-l 4-J 3 o 03 CDE r-H c u a c o u Li i—1 (D
X) <d CD CD 01 CD u 03 CD O <D 4-1< co CQ a pL e U PL. oc s PC • H
Work on present job Present payOpportunities for promotion Supervision on present job XPeople on your present jobJob in general X
Indicates a significant relationship at 0.05 level
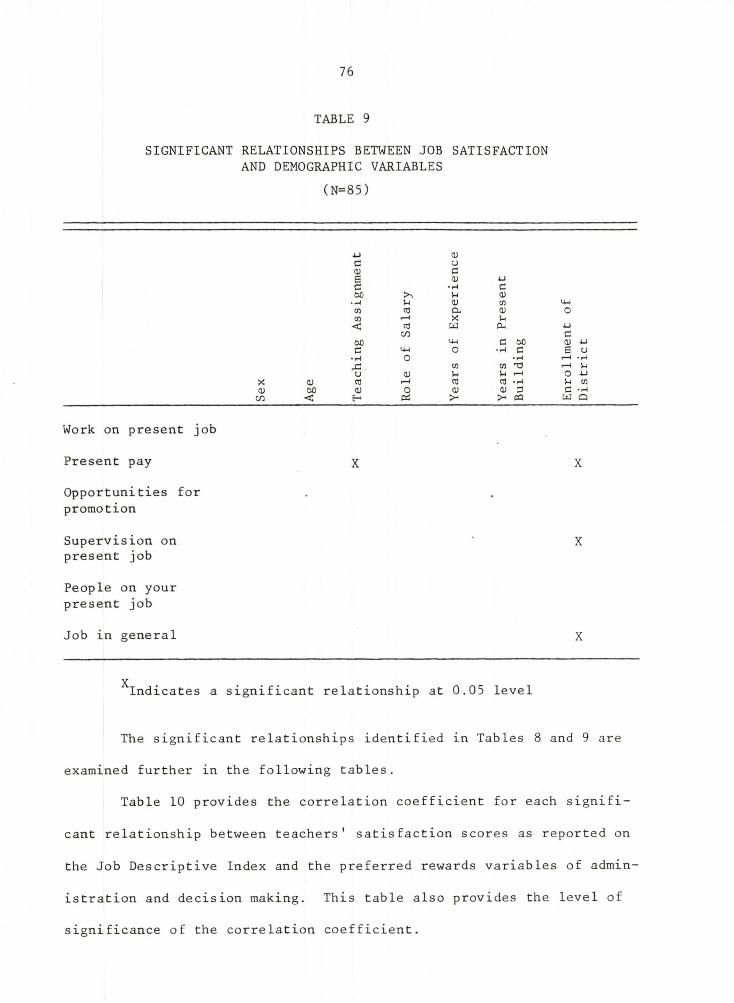
76
SIGNIFICANT RELATIONSHIPS BETWEEN JOB SATISFACTION AND DEMOGRAPHIC VARIABLES
(N=85)
TABLE 9
■U dJC U<u cB dJ ua • H c00 >> J-t <u
• H u d) 03 CM03 03 Cu dJ O03 t—i X U
< 03 CjJ a - •UCO c
cm c 00 0) -Uc CM O • H C 6 o
• H o • H r—1 • MJ 2 03 03 T JO a> U r-H O 4-J
X <D 03 r—1 03 03 *H U cn<D 00 (D o <u d) a C «H
CO < H > - >* 03 W Q
Work on present job
Present pay X X
Opportunities for promotion
Supervision on ' Xpresent job
People on your present job
Job in general X
XIndicates a significant relationship at 0.05 level
The significant relationships identified in Tables 8 and 9 are
examined further in the following tables.
Table 10 provides the correlation coefficient for each signifi
cant relationship between teachers' satisfaction scores as reported on
the Job Descriptive Index and the preferred rewards variables of admin
istration and decision making. This table also provides the level of
significance of the correlation coefficient.
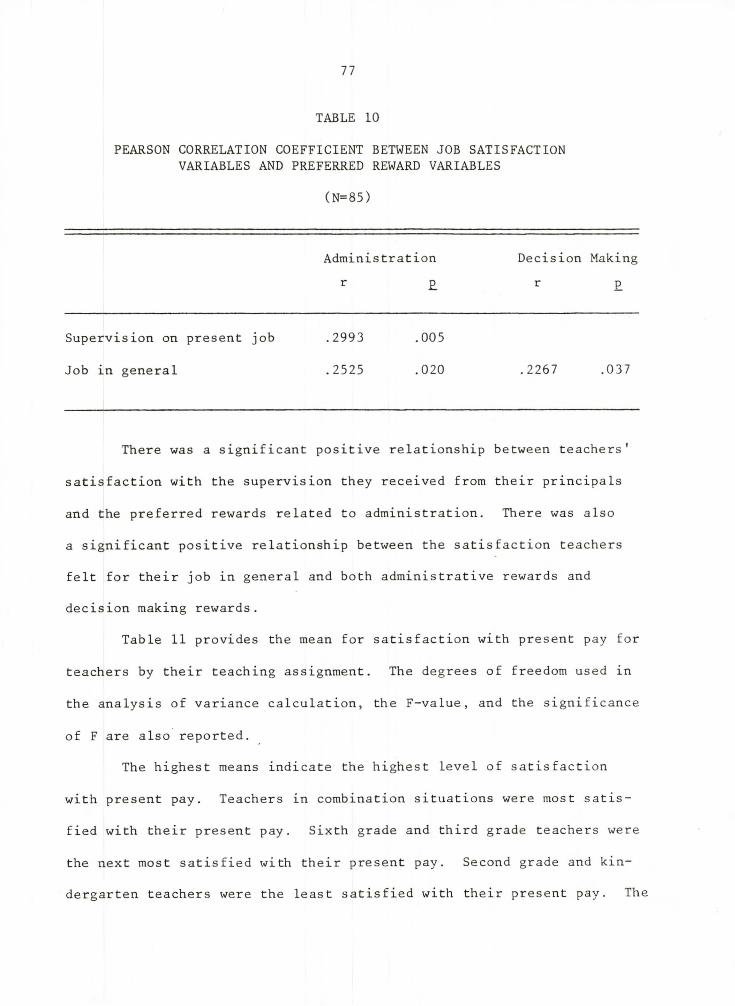
77
PEARSON CORRELATION COEFFICIENT BETWEEN JOB SATISFACTION VARIABLES AND PREFERRED REWARD VARIABLES
(N=85)
TABLE 10
Administration Decision Makingr £ r £
Supervision on present job .2993 .005
Job in general . 2525 .020 .2267 .037
There was a significant positive relationship between teachers'
satisfaction with the supervision they received from their principals
and the preferred rewards related to administration. There was also
a significant positive relationship between the satisfaction teachers
felt for their job in general and both administrative rewards and
decision making rewards.
Table 11 provides the mean for satisfaction with present pay for
teachers by their teaching assignment. The degrees of freedom used in
the analysis of variance calculation, the F-value, and the significance
of F are also reported.
The highest means indicate the highest level of satisfaction
with present pay. Teachers in combination situations were most satis
fied with their present pay. Sixth grade and third grade teachers were
the next most satisfied with their present pay. Second grade and kin
dergarten teachers were the least satisfied with their present pay. The
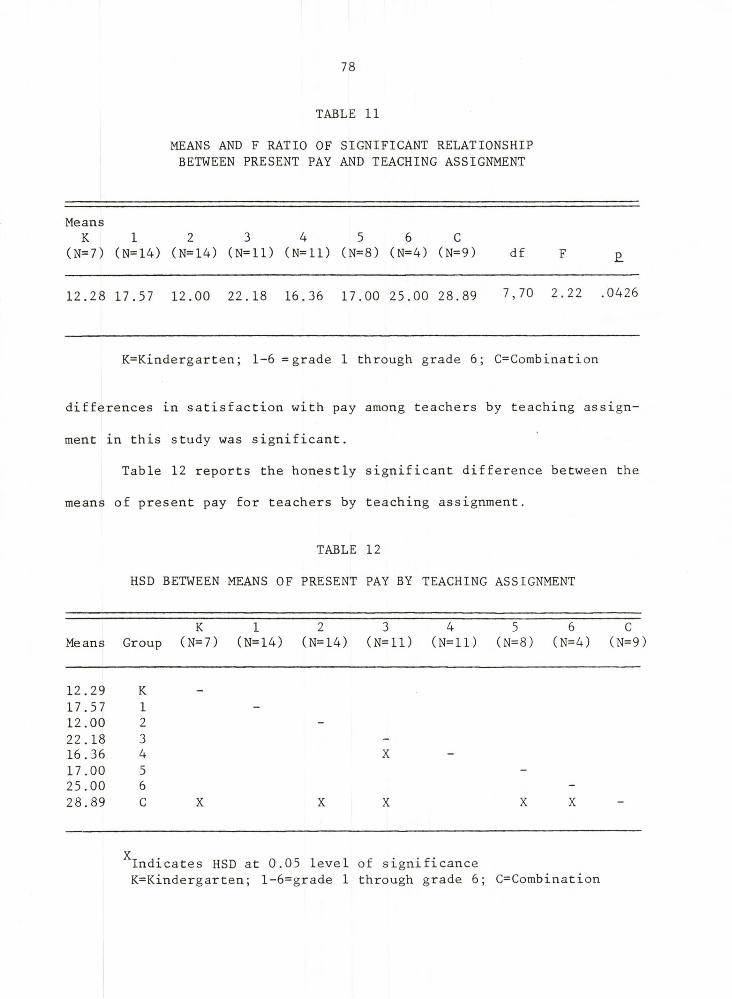
78
MEANS AND F RATIO OF SIGNIFICANT RELATIONSHIP BETWEEN PRESENT PAY AND TEACHING ASSIGNMENT
TABLE 11
MeansK
(N=7)1
(N=14)2
(N=14)3
(N= 11)4
( N= 11)5
(N=8)6
(N=4)C
(N=9) df F E
12.28 17.57 12.00 22.18 16.36 17.00 25.00 28.89 7,70 2.22 .0426
K=Kindergarten; 1-6 = grade 1 through grade 6; C=Combination
differences in satisfaction with pay
ment in this study was significant.
Table 12 reports the honestly
means of present pay for teachers by
among teachers by teaching assign-
significant difference between the
teaching assignment.
TABLE 12
HSD BETWEEN MEANS OF PRESENT PAY BY TEACHING ASSIGNMENT
Means GroupK
(N=7)1 2 3 4 5 6 C
(N=14) (N=14) (N=ll) (N=ll) (N=8) (N=4) (N=9:
12.29 K __17.57 1 -12.00 2 -22.18 3 -16.36 4 X17.00 5 -25.00 6 -28.89 C X X X X X -
Indicates HSD at 0.05 level of significance K=Kindergarten; l-6=grade 1 through grade 6; C=Combination
V
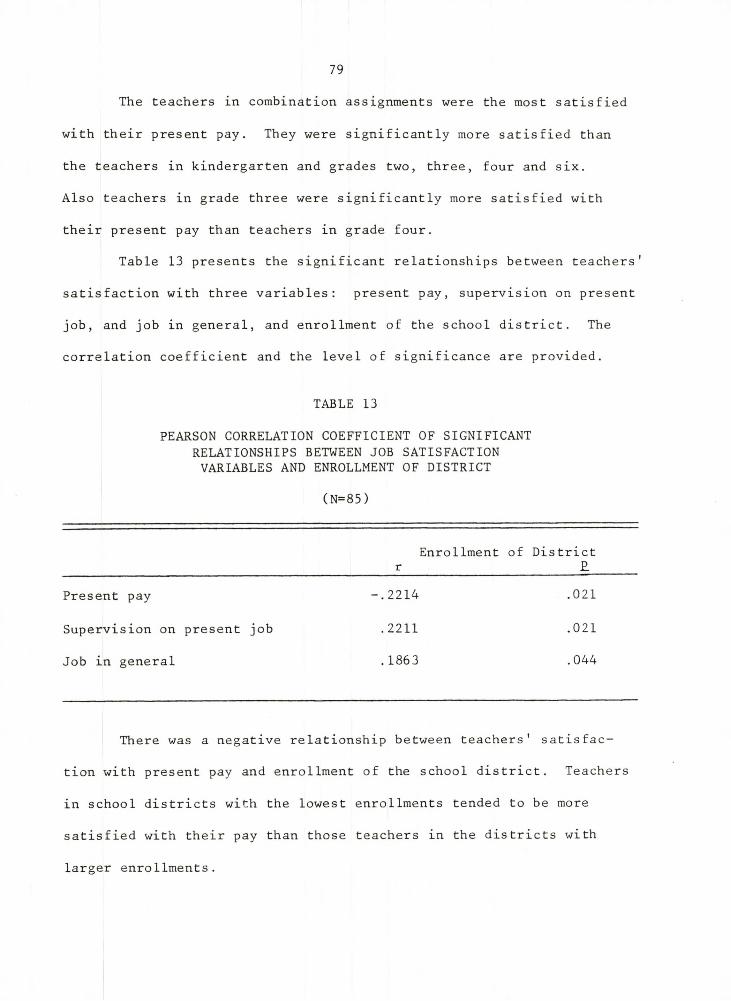
79
The teachers in combination assignments were the most satisfied
with their present pay. They were significantly more satisfied than
the teachers in kindergarten and grades two, three, four and six.
Also teachers in grade three were significantly more satisfied with
their present pay than teachers in grade four.
Table 13 presents the significant relationships between teachers'
satisfaction with three variables: present pay, supervision on present
job, and job in general, and enrollment of the school district. The
correlation coefficient and the level of significance are provided.
TABLE 13
PEARSON CORRELATION COEFFICIENT OF SIGNIFICANT RELATIONSHIPS BETWEEN JOB SATISFACTION VARIABLES AND ENROLLMENT OF DISTRICT
(N=85)
Enrollment of Districtr £
Present pay -.2214 .021
Supervision on present job .2211 .021
Job in general . 1863 .044
There was a negative relationship between teachers' satisfac
tion with present pay and enrollment of the school district. Teachers
in school districts with the lowest enrollments tended to be more
satisfied with their pay than those teachers in the districts with
larger enrollments.
80
There was a positive relationship between teachers' satisfaction
with the supervision they received and the enrollment of the district.
Teachers in the districts with the larger enrollments tended to be more
satisfied with the supervision they received from their principals.
A positive relationship existed between the overall level of
satisfaction teachers had and the enrollment of the district. Teachers
in the districts with the larger enrollments were slightly more satis
fied than teachers in districts with smaller enrollments.
Analysis of the Significant Relationships Between Preferred Rewards and Demographic Variables
The relationships between preferred reward variables and selected
demographic variables were also examined. The study was designed to
detect those demographic variables that affect the preference of
teachers for various rewards. Summary Table 14 illustrates the sig
nificant relationships between these variables.
The significant relationships between preferred rewards and
demographic variables found in Summary Table 14 are examined further
in the succeeding tables.
Table 15 provides the means of the responses to the reward
variable working conditions made by the teachers by age group. The
degrees of freedom used in the analysis of variance calculation, the
F-value, and the significance of F are also reported.
There was a significant difference among the various age groups
of teachers on their preference for rewards related to working condi
tions. Since the level of significance was less than 0.05 the
researcher concluded that a significant difference existed between two
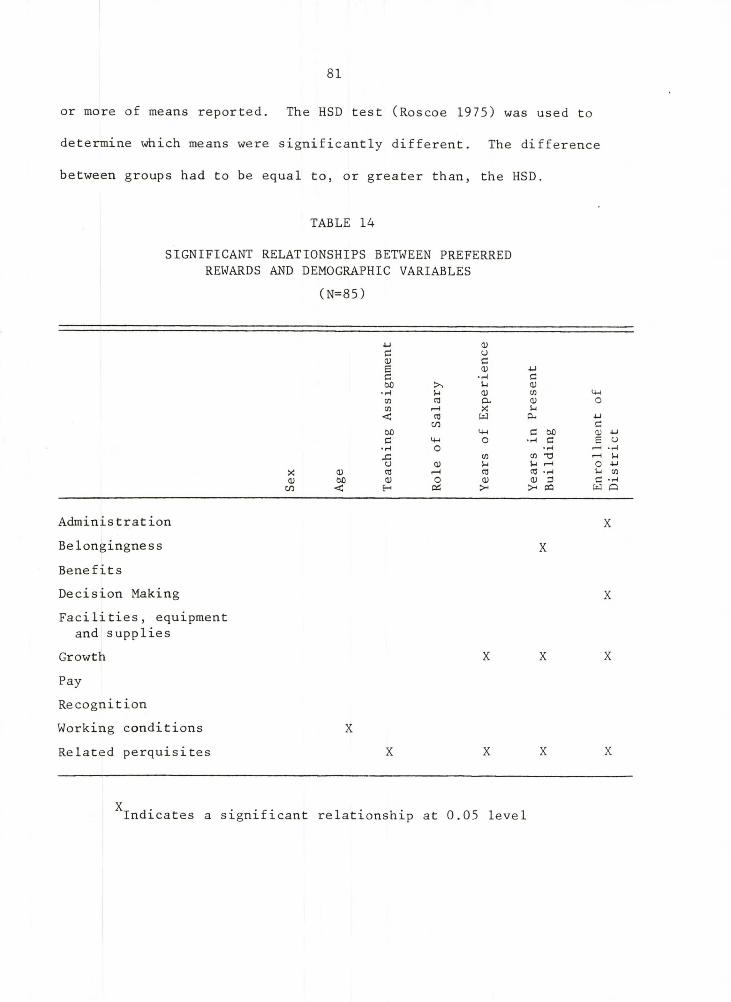
81
or more of means reported. The HSD test (Roscoe 1975) was used to
determine which means were significantly different. The difference
between groups had to be equal to, or greater than, the HSD.
TABLE 14
SIGNIFICANT RELATIONSHIPS BETWEEN PREFERRED REWARDS AND DEMOGRAPHIC VARIABLES
(N=85)
Adminis trationBelongingnessBenefitsDecision MakingFacilities, equipment and supplies
GrowthPayRecognition Working conditions Related perquisites
4-1 (VC a0) Ce a ) ■ u
a • H CG O 5 ^ U a )
• r4 u <u 03 U - l
03 cd a - CD o03 r—4 X 5-4
< cd w a - 4-1
c n cG O L M C G O 0) 4-1
c M -l o • H C e O• H o • H r — 4 • r - 1
S I 03 03 T 3 t—H 5-ia a> J-l 5-4 o 4-1
X 0) cd p— < cd Cd - H 5-i 03
<u G O <D o CD <U 3 a • r-4c n < H o s C Q w Q
XX
X
X X X
XX X X X
Indicates a significant relationship at 0.05 level
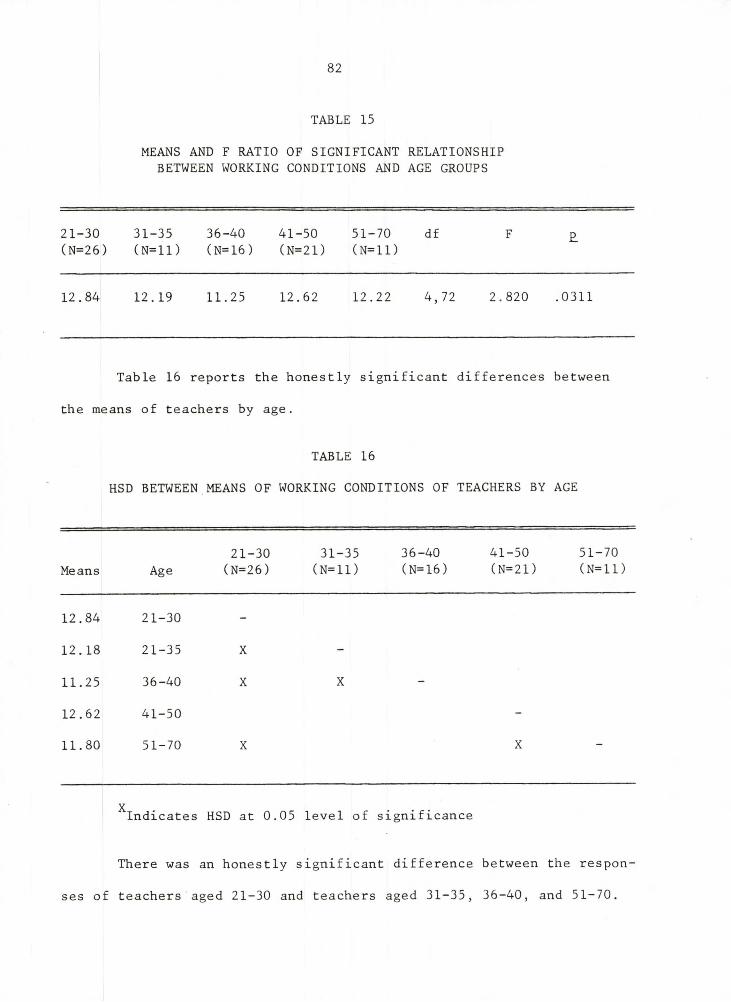
82
MEANS AND F RATIO OF SIGNIFICANT RELATIONSHIP BETWEEN WORKING CONDITIONS AND AGE GROUPS
TABLE 15
21-30(N=26)
31-35 (N=11)
36-40(N=16)
41-50(N=21)
51-70 ( N= 11)
df F £
12.84 12.19 11.25 12.62 12.22 4,72 2.820 .0311
Table 16 reports the honestly significant
the means of teachers by age.
TABLE 16
HSD BETWEEN MEANS OF WORKING CONDITIONS OF
differences
TEACHERS BY
between
AGE
21-30 31-35 36-40 41-50 51-70Means Age (N=26) (N=11) (N=16) (N=21) (N=11)
12.84 21-30 -
12.18 21-35 X -
11.25 36-40 X X
12.62 41-50 -
11.80 51-70 X X -
Indicates HSD at 0.05 level of significance
There was an honestly significant difference between the respon
ses of teachers aged 21-30 and teachers aged 31-35, 36-40, and 51-70.
X
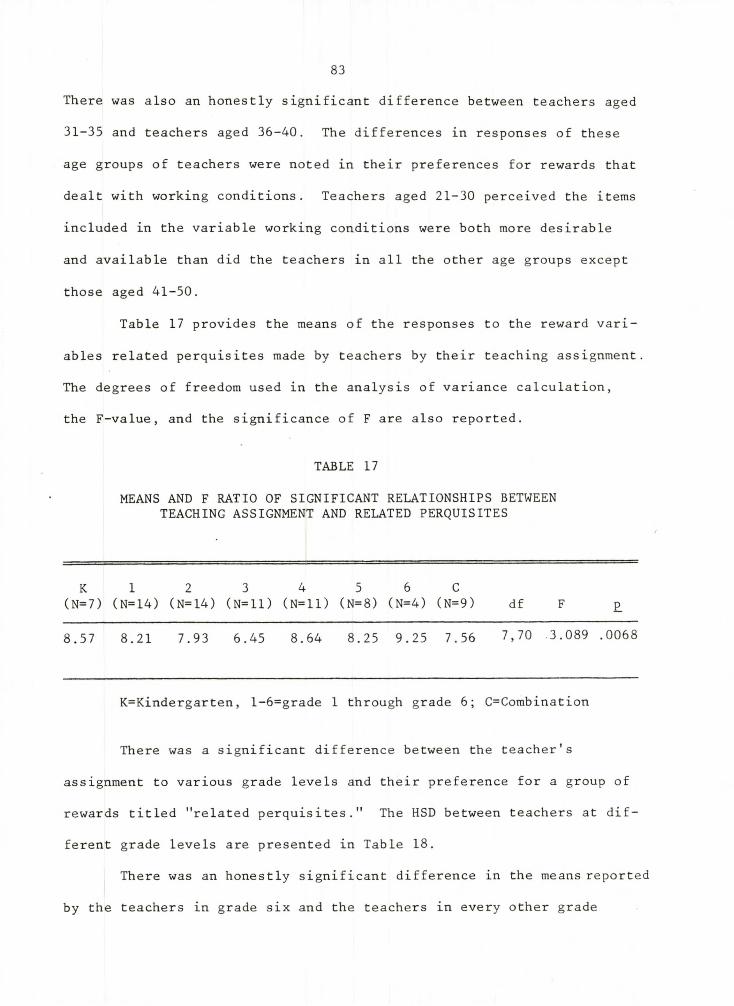
83
There was also an honestly significant difference between teachers aged
31-35 and teachers aged 36-40. The differences in responses of these
age groups of teachers were noted in their preferences for rewards that
dealt with working conditions. Teachers aged 21-30 perceived the items
included in the variable working conditions were both more desirable
and available than did the teachers in all the other age groups except
those aged 41-50.
Table 17 provides the means of the responses to the reward vari
ables related perquisites made by teachers by their teaching assignment.
The degrees of freedom used in the analysis of variance calculation,
the F-value, and the significance of F are also reported.
TABLE 17
MEANS AND F RATIO OF SIGNIFICANT RELATIONSHIPS BETWEEN TEACHING ASSIGNMENT AND RELATED PERQUISITES
K 1 2 3 4 5 6 C(N=7) (N=14) (N= 14) (N=11) ( N= 11) (N=8) (N=4) (N=9) df F £
8.57 8.21 7.93 6.45 8.64 8.25 9.25 7.56 7,70 3.089 .0068
K=Kindergarten, l-6=grade 1 through grade 6; C=Combination
There was a significant difference between the teacher's
assignment to various grade levels and their preference for a group of
rewards titled "related perquisites." The HSD between teachers at dif
ferent grade levels are presented in Table 18.
There was an honestly significant difference in the means reported
by the teachers in grade six and the teachers in every other grade
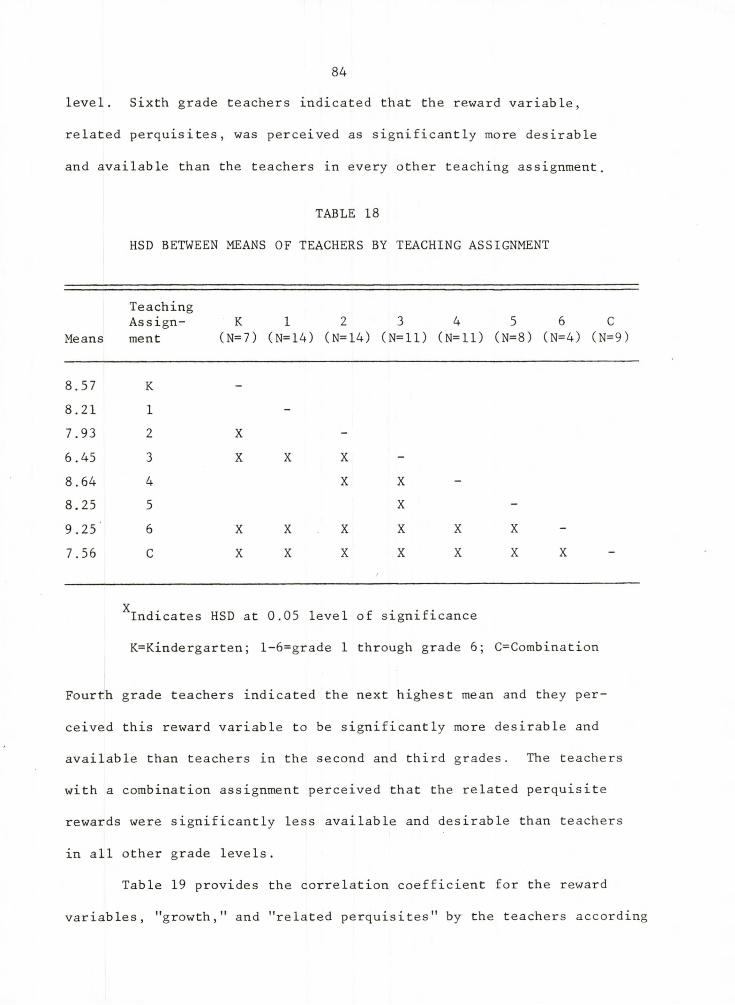
84
level. Sixth grade teachers indicated that the reward variable,
related perquisites, was perceived as significantly more desirable
and available than the teachers in every other teaching assignment.
TABLE 18
HSD BETWEEN MEANS OF TEACHERS BY TEACHING ASSIGNMENT
Means
TeachingAssignment
K(N=7)
1(N=14)
2(N=14)
3( N= 11)
4(N= 11)
5 6 C (N=8) (N=4) (N=9)
8.57 K -
8.21 1 -7.93 2 X -6.45 3 X X X -8.64 4 X X -8.25 5 X -9.25 6 X X X X X X7.56 C X X X X X X X -
YIndicates HSD at 0.05 level of significance
K=Kindergarten; l-6=grade 1 through grade 6; C=Combination
Fourth grade teachers indicated the next highest mean and they per
ceived this reward variable to be significantly more desirable and
available than teachers in the second and third grades. The teachers
with a combination assignment perceived that the related perquisite
rewards were significantly less available and desirable than teachers
in all other grade levels.
Table 19 provides the correlation coefficient for the reward
variables, "growth," and "related perquisites" by the teachers according
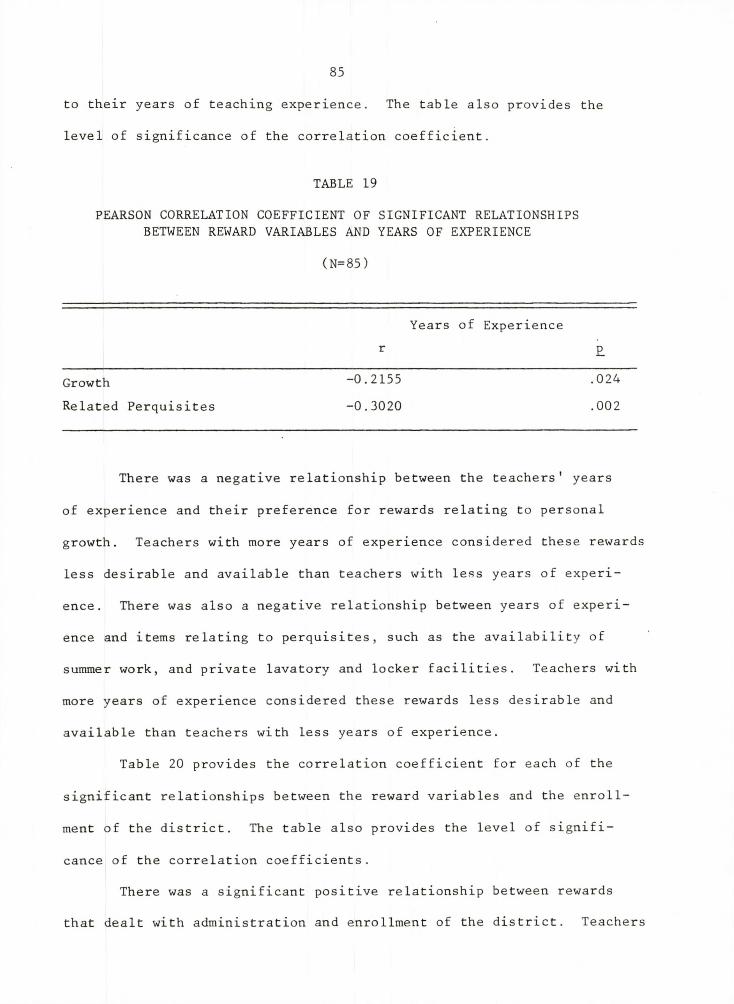
85
to their years of teaching experience. The table also provides the
level of significance of the correlation coefficient.
TABLE 19
PEARSON CORRELATION COEFFICIENT OF SIGNIFICANT RELATIONSHIPS BETWEEN REWARD VARIABLES AND YEARS OF EXPERIENCE
(N=85)
Years of Experiencer P
Growth -0.2155 .024Related Perquisites -0.3020 .002
There was a negative relationship between the teachers' years
of experience and their preference for rewards relating to personal
growth. Teachers with more years of experience considered these rewards
less desirable and available than teachers with less years of experi
ence. There was also a negative relationship between years of experi
ence and items relating to perquisites, such as the availability of
summer work, and private lavatory and locker facilities. Teachers with
more years of experience considered these rewards less desirable and
available than teachers with less years of experience.
Table 20 provides the correlation coefficient for each of the
significant relationships between the reward variables and the enroll
ment of the district. The table also provides the level of signifi
cance of the correlation coefficients.
There was a significant positive relationship between rewards
that dealt with administration and enrollment of the district. Teachers
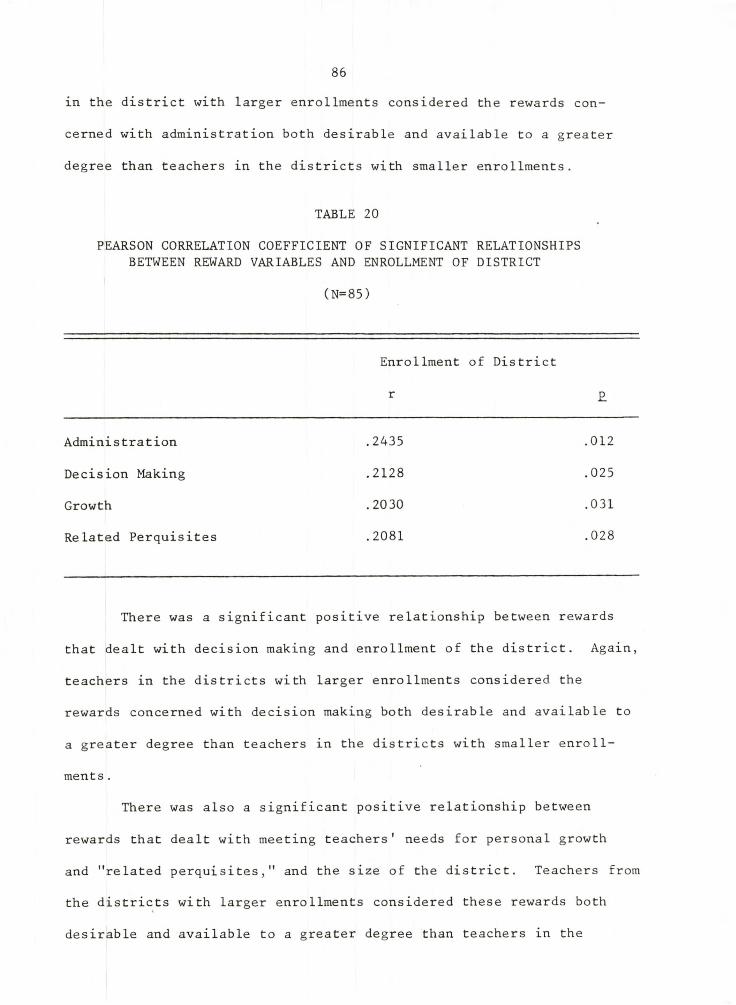
86
in the district with larger enrollments considered the rewards con
cerned with administration both desirable and available to a greater
degree than teachers in the districts with smaller enrollments.
TABLE 20
PEARSON CORRELATION COEFFICIENT OF SIGNIFICANT RELATIONSHIPS BETWEEN REWARD VARIABLES AND ENROLLMENT OF DISTRICT
(N=85)
Enrollment of District
r £
Administration .2435 .012
Decision Making .2128 .025
Growth .2030 .031
Related Perquisites .2081 .028
There was a significant positive relationship between rewards
that dealt with decision making and enrollment of the district. Again,
teachers in the districts with larger enrollments considered the
rewards concerned with decision making both desirable and available to
a greater degree than teachers in the districts with smaller enroll
ments .
There was also a significant positive relationship between
rewards that dealt with meeting teachers' needs for personal growth
and "related perquisites," and the size of the district. Teachers from
the districts with larger enrollments considered these rewards both
desirable and available to a greater degree than teachers in the
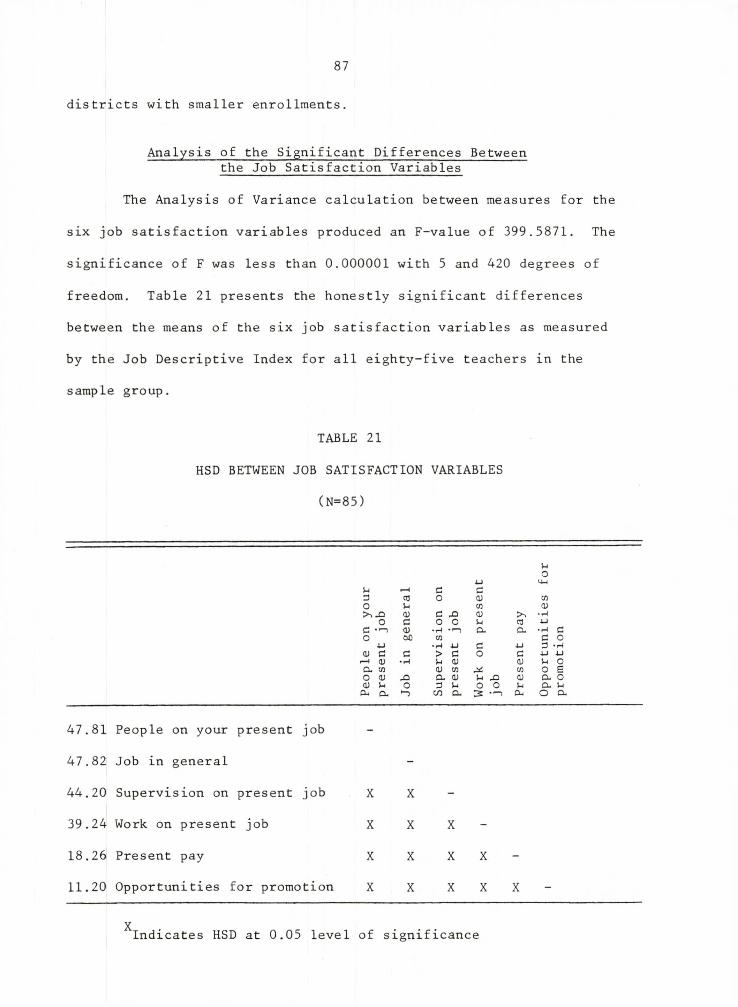
87
districts with smaller enrollments.
Analysis of the Significant Differences Between the Job Satisfaction Variables
The Analysis of Variance calculation between measures for the
six job satisfaction variables produced an F-value of 399.5871. The
significance of F was less than 0.000001 with 5 and 420 degrees of
freedom. Table 21 presents the honestly significant differences
between the means of the six job satisfaction variables as measured
by the Job Descriptive Index for all eighty-five teachers in the
sample group.
TABLE 21
HSD BETWEEN JOB SATISFACTION VARIABLES
(N=85)
}-iO4-1 CMu r-—( G c3 o <u C DO c/) <V> , X CD c X (U • r4o C o o 5 - i 4-1G V • r4 •*-1 c l CL • H cO a fl cn c o
u * H -u c 4—1 3 • H<u c c > c o c 4-1 4-1I— 1 0 ) • i—4 U <D u OCL C/D CD C D C/D o tdO X CL 0) u X a ; CL o0 J u o 3 U o o 5 - i CL 5-4P-i Q , *“ > CO CL 3 •■— l Cl o CL
47.81 People on your present job
47.82 Job in general ~
44.20 Supervision on present job X X -
39.24 Work on present job X X X
18.26 Present pay X X X X -
11.20 Opportunities for promotion X X X X X
Indicates HSD at 0.05 level of significance
88
There was a significant difference between all job satis
faction variables except between "people on your present job" and
the "job in general." Teachers were most satisfied with the "people
on your present job." There was no significant difference between
teachers' satisfaction with the "people on your present job" and the
summary variable, "job in general." A perfect score on the job satis
faction variables was a 54; therefore, the mean scores of 47.81 and
47.62 indicate a very high level of satisfaction with these two job
satisfaction variables. Although there was a significant difference
between the "job in general" variable and "supervision on present
job," that variable also could be considered highly satisfying with
a mean score of 44.2. There was a significant difference between
satisfaction with "supervision on present job" and "work on present
job." The mean score for the variable, "work on present job" was
39.24. There was also a significant difference between "work on pre
sent job" and "present pay." A mean of 18.26 out of a possible 54
indicates a low level of satisfaction with present pay. An even lower
level of satisfaction existed with "opportunity for promotion" which
received a mean score of 11.20.
Analysis of the Significant Differences Between The Preferred Reward Variables
The Analysis of Variance calculation between measures for the
ten reward variables produced an F-value of 21.2536. The significance
of F was less than 0.000001 with 9 and 756 degrees of freedom. Table 22
presents the honestly significant differences in the mean scores of
all of the teachers on the ten reward variables.
The reward variable that teachers considered the most desirable
and available was "recognition." There was a significant difference
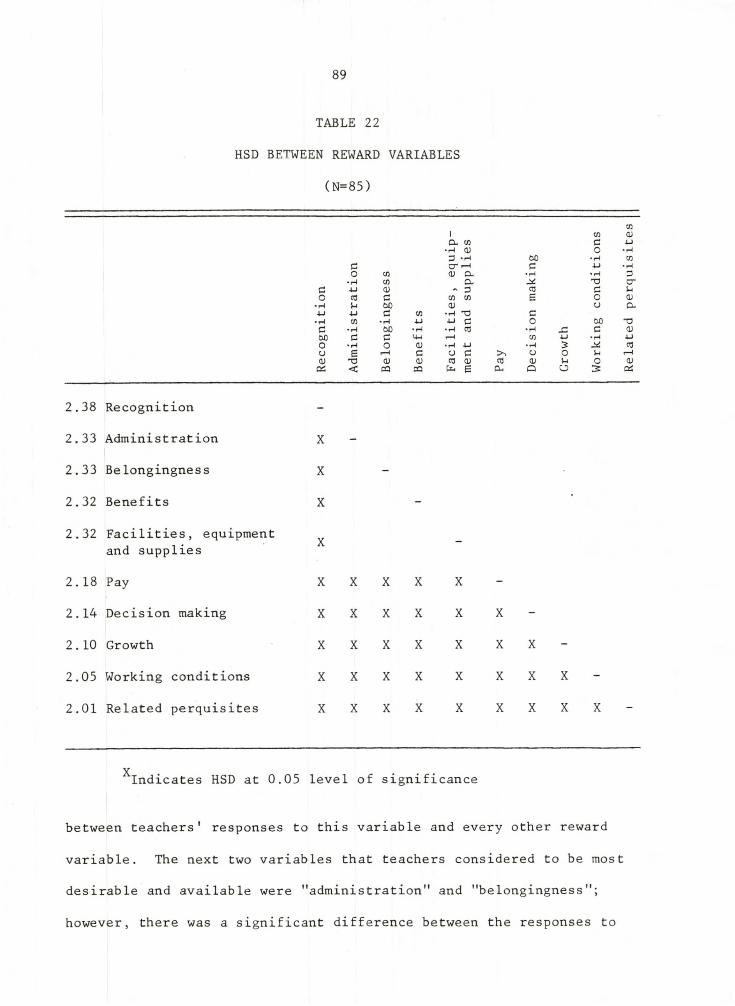
89
TABLE 22
HSD BETWEEN REWARD VARIABLES
(N=85)
I tn 01CL 03 c -U(0 o • r-l60 • r4 03c CT C 4-3 * Ho 03 <0 CL •H • iH D
• r4 03 CL T3 cre ■u V - D CT3 C uo CT3 C 03 03 e o <d•H u 60 a> o CL4-» u c 03 •H TD c•H 03 • rH 4-1 ■u C o 60 T3c • r4 60 • r-4 •fl CTJ •H -C C CD60 e C 4-1 r—1 03 4-J • H 4-1O • rH O • r-l 4-1 • r4 2 CT3o a r—1 c a C u o U0) a; V CT3 CD CT3 a) u o <DC6 < 03 03 a a- Q o 3 02
2.38 Recognition -
2.33 Administration X -
2.33 Belongingness X -
2.32 Benefits X - •
2.32 Facilities, equipment and supplies X -
2.18 Pay X X X X X -
2.14 Decision making X X X X X X -
2.10 Growth X X X X X X X
2.05 Working conditions X X X X X X X X -
2.01 Related perquisites X X X X X X X X X
X .Indicates HSD at 0.05 level of significance
between teachers' responses to this variable and every other reward
variable. The next two variables that teachers considered to be most
desirable and available were "administration" and "belongingness";
however, there was a significant difference between the responses to
90
these variables and "recognition." There was no significant dif
ference between the reward variables "administration"; "belong
ingness"; "benefits"; and "facilities, equipment, and supplies."
There was a significant difference between all of the above variables
and "present pay." Pay as a reward was not as simultaneously avail
able and desirable as the previously listed variables. There was a
significant difference between "pay" and "decision making." There
was also a significant difference between the reward variables
"decision making" and "growth," and between "growth" and "working con
ditions." There was also a significant difference between "working
conditions" and the reward variable category, "related perquisites."
Those rewards rated lowest were those in the categories "related perquis
ites," "working conditions," "growth," "decision making," and "pay."
Analysis of the Mean Percentages of the Preferred Reward Variables
Table 23 presents the responses reported for each of the pre
ferred reward variables in mean percentages. The eighty-five teachers
in the sample group indicated that each reward item was either avail
able or desirable, both available and desirable, or neither available
nor desirable.
Table 23 provides the mean percentages for the four responses
on the preferred rewards instrument. The column headed "desirable"
provides thepercentage of teachers that viewed the items comprising
that reward variable as desirable, but not available. The variables
considered desirable, but not available by over 50 percent of the
teachers were: "facilities, equipment and supplies"; "pay"; "decision
making"; and "working conditions." These variables were viewed by
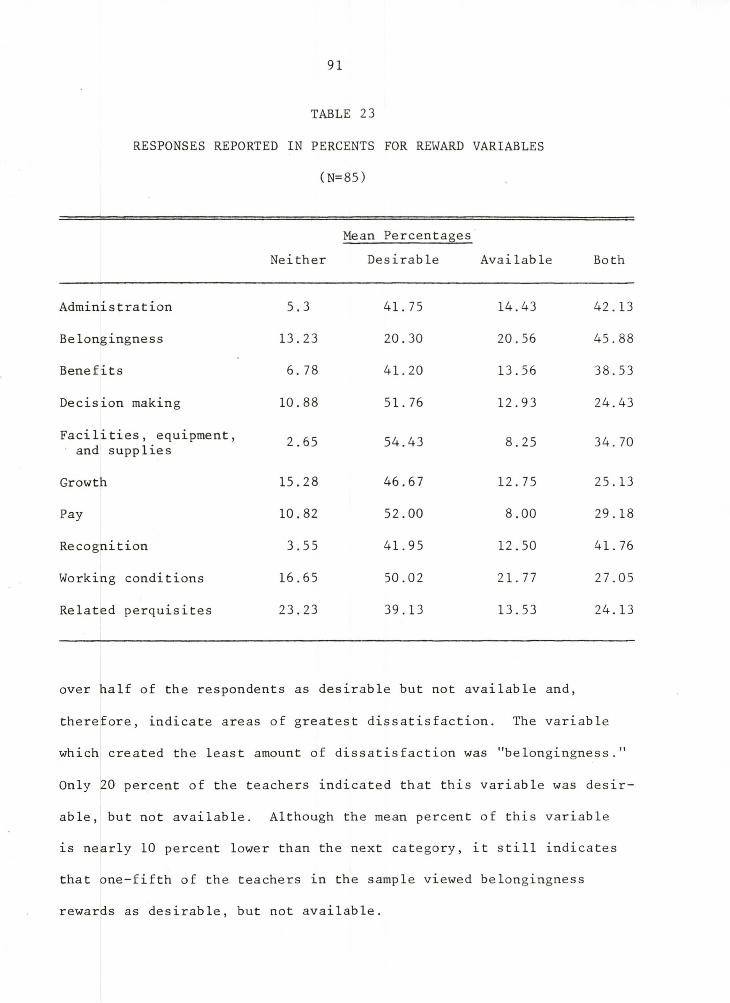
91
TABLE 23
RESPONSES REPORTED IN PERCENTS FOR REWARD VARIABLES
(N=85)
NeitherMean Percentages
Desirable Available Both
Administration 5.3 41.75 14.43 42.13
Belongingness 13.23 20.30 20.56 45.88
Benefits 6. 78 41.20 13.56 38.53
Decision making 10.88 51.76 12.93 24.43
Facilities, equipment, and supplies 2.65 54.43 8.25 34.70
Growth 15.28 46.67 12.75 25.13
Pay 10.82 52.00 8.00 29.18
Recognition 3.55 41.95 12.50 41.76
Working conditions 16.65 50.02 21.77 27.05
Related perquisites 23.23 39.13 13.53 24.13
over half of the respondents as desirable but not available and,
therefore, indicate areas of greatest dissatisfaction. The variable
which created the least amount of dissatisfaction was "belongingness."
Only 20 percent of the teachers indicated that this variable was desir
able, but not available. Although the mean percent of this variable
is nearly 10 percent lower than the next category, it still indicates
that one-fifth of the teachers in the sample viewed belongingness
rewards as desirable, but not available.
92
Summary
Data from eighty-five elementary teachers in seven North Dakota
and Minnesota schools were analyzed to determine the relationships
among three primary variables— teacher performance, job satisfaction,
and preferred rewards— and a selected group of demographic vari
ables .
No significant relationships existed between four groups of
teachers based on perceptions of their performance and preferred
rewards. Teachers who were perceived as among the most productive
and effective by their principal or peers were significantly less
satisfied with opportunities for promotion and present pay. The
teachers with more years of teaching experience tended to receive
higher ratings from their principals on the TPAI.
Teachers who indicated a high level of satisfaction with the
supervision they received and their job in general also perceived
that rewards related to the administration were more desirable and
available than other teachers. Teachers who were most satisfied
with their job in general perceived that opportunities to participate
in decision making activities were both desirable and available to a
greater degree than did other teachers.
Although teachers indicated a low level of satisfaction for
their present pay, kindergarten and second grade teachers were the
most dissatisfied. Teachers in school districts with lower enroll
ments were slightly more satisfied with their present pay, while
teachers in districts with larger enrollments were slightly more satis
fied with the supervision they received and their job in general.
93
There was no significant difference in the types of rewards
which teachers preferred based on sex or role of the salary in the
household. Younger teachers perceived rewards related to working
conditions as both more desirable and available than almost every
other age group. Teachers with more years of experience perceived
rewards related to growth and specific perquisites significantly
less than teachers with fewer years of experience.
Teachers perceived the desirability and availability of related
perquisites differently based on their teaching assignment. Sixth-
grade teachers perceived that these rewards were significantly more
desirable and available than every other group. Concomitantly, teachers
in combination assignments perceived these rewards as significantly
less desirable and available than every other group.
The size of the enrollment of the school district in which the
teachers worked affected their perception of the desirability and
availability of four reward variables. Teachers in larger districts
perceived rewards related to administration, decision making, growth,
and related perquisites as significantly more desirable and available
than did teachers in smaller districts.
The teachers in this study were highly satisfied with the other
people on their jobs and their jobs in general. They also indicated
satisfaction, to a lesser degree, with the supervision they received
from their principals. The teachers in the sample were significantly
less satisfied with the opportunities for promotion available to them.
They were significantly more satisfied with their present pay; however,
this variable also received a low rating.
94
Over half of the teachers in the sample indicated that rewards
related to facilities, equipment, and supplies; pay; decision making;
and working conditions were not being met. These teachers indicated
that these rewards were desirable but they did not perceive them as
available.

CHAPTER V
SUMMARY, CONCLUSIONS, AND RECOMMENDATIONS
Summary
The purpose of this exploratory study was eightfold:
1. To determine whether or not there was a relationship
between performance ratings of elementary teachers from selected schools
in North Dakota and Minnesota and perceived level of job satisfaction.
2. To determine whether or not there was a relationship between
performance ratings of elementary teachers from selected schools in
North Dakota and Minnesota and their preferences for certain types of
rewards.
3. To determine whether or not there was a relationship between
the perceived level of job satisfaction of elementary teachers from
selected schools in North Dakota and Minnesota and their preference for
certain rewards.
4. To determine whether or not there was a relationship between
reward preferences of elementary teachers from selected schools in
North Dakota and Minnesota and the following demographic information:
sex, age, teaching assignment, years of teaching experience, years of
teaching in a particular building, enrollment of the school district,
and role of teaching salary in household income.
5. To determine whether or not there was a relationship between
perceived level of job satisfaction of elementary teachers from selected95

96
schools in North Dakota and Minnesota and the following demographic
information: sex, age, teaching assignment, years of teaching experi
ence, years of teaching in a particular building, enrollment of a
school district, and role of teaching salary in household income.
6. To determine whether or not there was a relationship
between performance ratings of teachers (by supervisor and peers)
of elementary teachers from selected schools in North Dakota and
Minnesota and the following demographic information: sex, age, teach
ing assignment, years of teaching experience, years of teaching in a
particular building, enrollment of a school district, and role of teach
ing salary in household income.
7. To determine which rewards elementary teachers from selected
schools in North Dakota and Minnesota perceived were available to them.
8. To determine which rewards elementary teachers from selected
schools in North Dakota and Minnesota perceived were desirable and
which might, therefore, serve as motivators if those rewards would be
awarded based on teacher performance.
The relationships between the primary variables of teacher per
formance, job satisfaction, and preferred rewards were analyzed. Also
examined were the relationships between each of these primary variables
and selected demographic variables.
Teacher performance was measured in two ways. Each teacher in
the sample was rated by the principal using the Teacher Performance
Assessment Instrument (TPAI) Cluster I. This instrument yielded three
scores for each teacher: classroom procedures, interpersonal skills,
and a total score. Teachers were also grouped into categories based
on the perceptions of their productivity and effectiveness by principals
97
and peers. Four groups emerged: (1) teachers not chosen as the top
one-third of the sample who were most productive and effective,
(2) teachers chosen by other teachers but not by principals as most
productive and effective, (3) teachers chosen by principals but not
by other teachers as most productive and effective, (4) teachers chosen
by both their principal and other teachers as being most productive
and effective.
The Job Descriptive Index (JDI) was used to measure teachers'
job satisfaction with six variables: (1) work on present job, (2) pre
sent pay, (3) opportunities for promotion, (4) supervision on present
job, (5) people on your present job, and (6) job in general.
An instrument designed by the researcher measured the teacher's
perceptions of the availability and desirability of forty-nine reward
items. These items were categorized into ten variables and analyzed.
The ten variables were related to: (1) administration, (2) belonging
ness, (3) benefits, (4) decision making, (5) facilities, equipment,
and supplies, (6) growth, (7) pay, (8) recognition, (9) working condi
tions, and (10) related perquisites.
The sample consisted of eighty-five elementary teachers from
seven selected schools in North Dakota and Minnesota. Each teacher
completed the Job Description Index, the preferred rewards instrument,
and a one-page demographic information sheet. Each principal completed
the Teacher Performance Assessment Instrument (TPAI) for each of the
teachers participating in the study. Each principal and each teacher
also identified one-third of the teachers participating in the study
from their school whom they considered the most productive and effec
tive .
98
A frequencies distribution, one-way analyses of variance, and
product-moment correlations were used to analyze the data. Results of
the analyses follow.
No significant relationships were found between teachers' per
formance and preferred rewards. This study was particularly concerned
with discerning whether teachers considered to be high performers —
whether measured by their principals on a formal rating instrument,
or perceived as the highest performers by their peers— preferred dif
ferent rewards than other teachers. This study found no significant
relationships between these two primary variables for this sample of
teachers.
Significant relationships were found between teachers' perform
ance and their satisfaction with both present pay and opportunities
for promotion. Teachers receiving the highest ratings by principals
were least satisfied with these two variables.
No significant relationships were found between teachers' per
formance and the demographic variables of age, sex, teaching assignment,
role of the salary in their household income, years in the present
building or enrollment of the district. A significant relationship did
exist between the years of teaching experience and the scores teachers
received on the TPAI. Teachers with more years of experience received
higher performance ratings from their principals on that instrument.
Teachers who were most satisfied with the supervision they
received also perceived that rewards related to administration were
more desirable and available than did the other teachers. These teachers
also perceived that rewards related to decision making were more desir
able and available than did the other teachers.
99Teachers in various grade levels expressed significant differ
ences in their degree of satisfaction with their pay. Although all
teachers indicated a low level of satisfaction with pay, kindergarten
and second grade teachers were the most dissatisfied.
The level of the teachers' satisfaction varied with the enroll
ment of the district. Teachers from larger districts were more satis
fied with supervision and their jobs in general while teachers from
smaller districts were more satisfied with their present pay.
No significant relationships were found between teachers' satis
faction and age, sex, years of teaching experience, years in the pre
sent building, or role of the salary in the household income. Almost
half of the teachers indicated that their salary was the sole or
primary income in the household while the other half indicated that
their salary was a supplementary income. There was no relationship
between the role of the teacher's salary in the household income and
job satisfaction with pay, or any of the other satisfaction variables.
The demographic variables of sex and role of the salary in the
household income were not significant predictors of reward preferences.
However, teachers of various age groups differed significantly on the
desirability and availability of rewards related to working conditions.
Teachers under thirty years of age perceived that rewards concerning
working conditions were more desirable and available than teachers
in the other age categories.
There were significant differences between the enrollment of
the district and the teachers' perceptions of the desirability and
availability of the reward variables "administration," "decision
making," "growth," and "related perquisites." Teachers from larger
100
districts perceived that these rewards were more desirable and avail
able than teachers from smaller districts.
Teachers with more years of experience were less interested
in rewards related to growth and related perquisites than were teachers
with less experience.
The data indicated that teachers in this sample were highly
satisfied with the people on their present jobs, their jobs in general,
and the supervision on their jobs. They were dissatisfied with their
present pay and even more dissatisfied with opportunities for promotion.
Teachers perceived that rewards related to recognition were
most available and desirable. "Administratiori1.; "belongingness";
"benefits"; and "facilities, equipment, and supplies" were all con
sidered the next most available and desirable of the ten reward vari
ables, while pay was sixth in terms of its availability and desirabil
ity.
Further analysis of the data indicated that over half of the
teachers considered the following rewards desirable, but not avail
able: "facilities, equipment, and supplies"; "pay"; "decision making";
and "working conditions."
Some of the findings of the study had been anticipated by the
researcher. It was not surprising to discover that the perceived
performance of the teachers in this sample was not affected by the
demographic variables of age, sex, teaching assignment, role of salary
in the household income, years of teaching in present building, or
enrollment of the district. It was also not surprising that principals
tended to give higher scores to teachers with more experience who perhaps
101
have had more time to establish a professional reputation. Further
more, it was expected that teachers who wanted to be, and were involved
in decision making opportunities, and had opportunities to interact
with the administration, .would be more satisfied with the supervision
they received. Another expected finding revealed that larger districts,
by the nature of their size, were generally thought to provide more
opportunities for growth and generally had more of the related per
quisites at their disposal. Finally, it was not surprising that older
teachers were less interested in rewards relating to their growth
because these teachers may have had many of their growth needs met
over the years by attending workshops, conferences, and graduate
classes.
The study also produced some findings which were not antici
pated. Although the researcher suspected that high performing teachers
were less satisfied with pay and opportunties for promotion, the
researcher was surprised that these teachers did not differ in their
preferences for various rewards. Another unexpected finding was that
the role of the salary in the household income had no effect on the
satisfaction level of teachers with their pay, or with the other sat
isfaction variables. Also the role of the salary provided no dif
ferences among reward preferences. It was surprising that with half
of the teachers reporting that their incomes were either the sole or
primary income in the household, and with the other half of the
teachers reporting that their incomes were supplementary to the house
hold income, that there was no difference in either the satisfaction
level or the preferred rewards.
102
Another finding relating to pay indicated that teachers in the
smaller districts were more satisfied with their pay than teachers
in the larger districts. Smaller districts usually provide a smaller
range in their salary schedules; thus teachers in the smaller districts
frequently receive less pay than their counterparts in the larger
districts. It was beyond the scope of this study to determine what
mediating variables caused teachers in smaller districts to be more
satisfied with pay.
Another unexpected finding concerned teachers' satisfaction
with pay and their overall job satisfaction. It was not surprising
to find that the teachers in the sample were largely dissatisfied
with their pay. What was surprising was that in spite of their feel
ings about their pay, the teachers were highly satisfied with their
jobs. The entire group of teachers indicated an overwhelming degree
of satisfaction both with their jobs in general and with their peers.
This data provided a positive view of the teaching profession and tends
to refute much of the current negative attention that teaching as a
profession has received.
Conclusions
Findings from the study permit the following conclusions:
1. Elementary teachers in selected school districts in North
Dakota and Minnesota were highly satisfied with their jobs in general
and with their colleagues. They were also satisfied with the super
vision they received. At the same time, these teachers were dissatis
fied with their present pay and with their opportunities for promotion.

103
2. Elementary teachers were very homogeneous concerning their
perceptions about rewards based on their levels of performance. Per
formance was not an indicator of which rewards elementary teachers
perceived tobe most desirable and available.
3. Although elementary teachers were generally dissatisfied
with present pay and with opportunities for promotion, those teachers
who were considered high performers were significantly more dissatis
fied with these two variables than other teachers.
4. The role of the salary in the elementary teachers' house
hold had no bearing on their satisfaction with pay or their perceptions
of the desirability and the availability of various rewards.
5. The rewards most preferred that are unmet for over half
of the elementary teachers included rewards related to "facilities,
equipment and supplies"; "pay"; "working conditions"; and "decision
making."
6. The enrollment of the school district may influence teachers'
attitudes about rewards. Teachers in larger districts reported that
rewards related to "administration," "decision making," "growth," and
"related perquisites" were more desirable and available than was true
for teachers in smaller districts.
Recommendations
Conclusions for the present study together with insights from
the literature permitted the researcher to make the following recom
mendations . Five policy recommendations are made as a result of this
s tudy.

104
1. National and state legislatures, funding agencies, and
institutions of higher education should support efforts to continue
research in the area of teacher motivation and other areas of educa
tional research which are designed to improve the quality of education.
2. State legislatures should keep policies broad with the aim
of permitting school districts the capacity to reward teachers for
performance in ways that are best-suited to each school district. State
legislatures must avoid the temptation to provide regulations which
require all districts to comply with one "best” method of motivating
teachers.
3. School boards, central office administrators, building prin
cipals, and teachers need to work together to design policies and
negotiated agreements which permit the rewarding of high quality
teacher performance.
4. Professional associations need to recognize their respon
sibility for, and take the lead in, encouraging state agencies to be
certain that principals are capably trained and properly licensed to
perform as principals before they are allowed to fill those positions.
5. Teacher associations should promote contract language which
includes utilizing the principal's discretion in rewarding teachers.
Six recommendations for practice are made as a result of this
study.
1. Principals should begin to seek ways to make some rewards
contingent upon performance. For this to be successful they need to
enlarge the number of rewards presently available and insure that
those rewards are valued by teachers.

105
2. Principals need to continue to develop skills in the super
vision and evaluation of teachers in order to assist teachers in improv
ing their performance.
3. School boards and central office administrators need to
assist principals in rewarding teachers by providing discretionary
funds that may be used to provide teachers with rewards which they
value. Principals also need to use their creativity to generate addi
tional resources which can be employed to reward teachers. These
resources could be used at the principal's discretion for such items
as: travel and registration fees for teachers to attend conferences
and workshops; special instructional materials and equipment; pay for
substitutes in order to release a teacher to visit another school or
classroom, make a presentation at another school or at a conference,
attend professional meetings, write curriculum, or work on special
projects that will benefit the district. (Although these items pre
sent some cost to the district, they are not salaried items, and the
total cost to the district may actually represent a small fraction of
the budget while providing substantial benefits.)
4. School administrators at both the district and building level
need to find opportunities to promote teachers. Teachers could be
selected annually for work on curriculum projects, inservice programs,
or other areas as ways to recognize their past accomplishments and their
expertise. This also allows the district to make use of valuable
resources that are available for little or no expense. An excellent
teacher might be selected to attend a special conference and then would
be responsible for bringing back ideas and providing training for other
teachers in formal and informal settings.
106
5. Teachers need to be included in making decisions that
affect the students and curriculum with which they work directly or
when the decisions require their support and cooperation. This is one
way to recognize the performance and the expertise of the teachers;
it may also improve the commitment to many of the decisions that are
made.
6. Universities and colleges must select quality students for
programs in administration. These institutions must provide programs
in administration that include an understanding of organizational
behavior. These programs also need to include opportunities for stu
dents in administration to develop well-honed skills in supervision and
in human relations.
The following recommendations for further study are made as a
result of the findings from this study.
1. The same research questions used in this study should be
employed with both secondary teachers and special service teachers in
order to provide information concerning those groups. Researchers
need to discern how similarly or differently the groups of teachers
respond in order to provide information which will assist practitioners
in developing district-wide policies.
2. The same research questions used in this study should be
employed in more diverse settings in other geographic regions in both
urban and suburban school districts.
3. Further studies of teacher motivation based on expectancy
theory should be conducted. Study efforts need to explore better
methods of measuring all of the factors of the expectancy formula.
Researchers particularly need to seek better answers to the
107
instrumentality (performance -* rewards) and valence components.
4. Educational researchers need to continue to adapt and develop
instruments that will measure the factors of expectancy theory in edu
cation.
5. The expectancy factor (effort -*■ performance) has been largely
ignored in research on expectancy theory in all sectors, including
education. Research efforts need to discern the effect this factor
has on teachers' motivation.
6. Researchers need to employ other process theories in
research designs. The job characteristics model is an emerging
theory which shows promise. The job dimensions of this model— task
identity, task significance, skill variety, autonomy and feedback—
may provide additional insights into the complexity of the nature of
teaching and its effects on the motivation of teachers.
This study, conducted in a limited geographic region with few
subjects and developing instruments, has provided some insights into
the study of teacher motivation. The researcher is persuaded that
further research should provide more definitive policy and practice
recommendations.
APPENDIX A
Teacher Performance Assessment Instrument
Cluster I
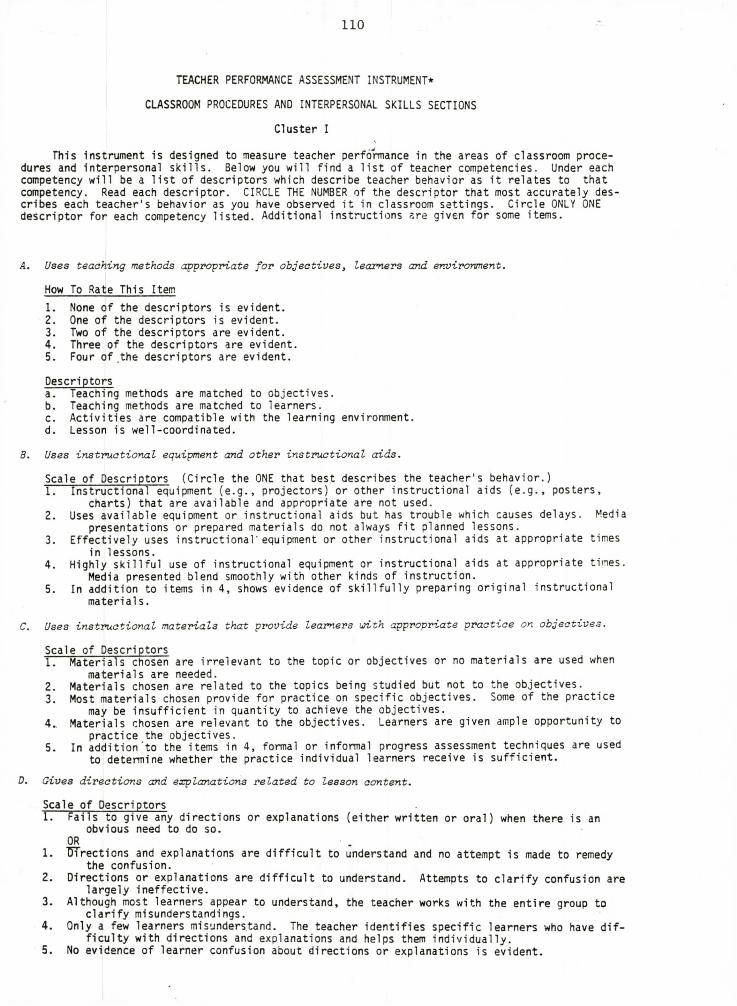
110
TEACHER PERFORMANCE ASSESSMENT INSTRUMENT*CLASSROOM PROCEDURES AND INTERPERSONAL SKILLS SECTIONS Cluster IThis instrument is designed to measure teacher performance in the areas of classroom procedures and interpersonal s k i l ls . Below you will find a l is t of teacher competencies. Under each competency will be a l is t of descriptors which describe teacher behavior as i t relates to that competency. Read each descriptor. CIRCLE THE NUMBER of the descriptor that most accurately describes each teacher's behavior as you have observed i t in classroom settings. C ircle ONLY ONE descriptor for each competency lis te d . Additional instructions are given for some items.A. Uses teaching methods appropriate for objectives, learners and environment.How To Rate This Item1. None of the descriptors is evident.2. One of the descriptors is evident.3. Two of the descriptors are evident.4. Three of the descriptors are evident.5. Four of the descriptors are evident.Descriptorsa. Teaching methods are matched to objectives.b. Teaching methods are matched to learners.c . A ctiv ities are compatible with the learning environment.d. Lesson is well-coordinated.B. Uses instructional equipment and other instructional aids.Scale of Descriptors (Circle the ONE that best describes the teacher's behavior.)1. Instructional equipment ( e .g . , projectors) or other instructional aids ( e .g . , posters,charts) that are available and appropriate are not used.2. Uses available equipment or instructional aids but has trouble which causes delays. Mediapresentations or prepared materials do not always f i t planned lessons.3. Effectively uses instructional'equipment or other instructional aids at appropriate timesin lessons.4. Highly s k illfu l use of instructional equipment or instructional aids at appropriate times.Media presented blend smoothly with other kinds of instruction.5. In addition to items in 4, shows evidence of s k illfu lly preparing original instructionalmaterials.C. Uses instructional materials that provide learners with appropriate practice on objectives.Scale of Descriptors1. Materials chosen are irrelevant to the topic or objectives or no materials are used whenmaterials are needed.2. Materials chosen are related to the topics being studied but not to the objectives.3. Most materials chosen provide for practice on specific objectives. Some of the practicemay be insufficien t in quantity to achieve the objectives.4.. Materials chosen are relevant to the objectives. Learners are given ample opportunity to practice the objectives.5. In addition to the items in 4, formal or informal progress assessment techniques are used to determine whether the practice individual learners receive is su ffic ie n t.D. Gives directions and explanations related to lesson content.Scale of Descriptors1. Fails to give any directions or explanations (either written or oral) when there is an obvious need to do so.OR1. TJTrections and explanations are d if f ic u lt to understand and no attempt is made to remedythe confusion.2. Directions or explanations are d if f ic u lt to understand. Attempts to c la r ify confusion arelargely ineffective.3. Although most learners appear to understand, the teacher works with the entire group toc la r ify misunderstandings.4. Only a few learners misunderstand. The teacher identifies specific learners who have d iffic u lty with directions and explanations and helps them individually.5. No evidence of learner confusion about directions or explanations is evident.
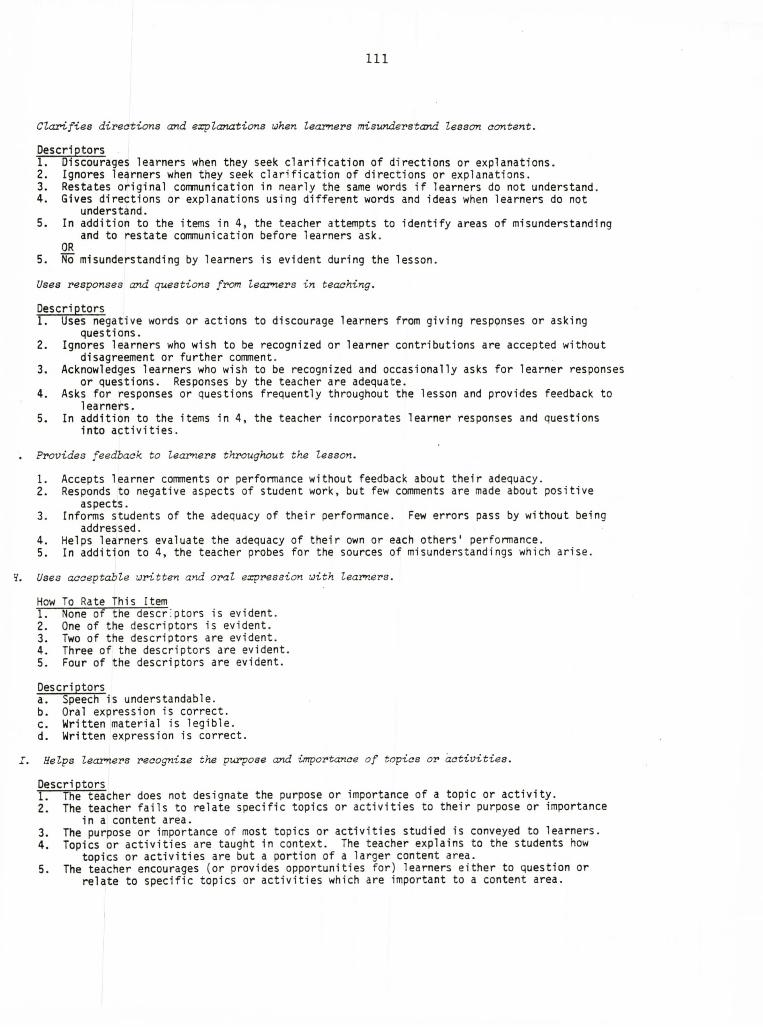
Ill
Clarifies directions and explanations when learners misunderstand lesson content.Descriptors1. Discourages learners when they seek cla rificatio n of directions or explanations.2. Ignores learners when they seek cla rificatio n of directions or explanations.3. Restates original communication in nearly the same words i f learners do not understand.4. Gives directions or explanations using different words and ideas when learners do notunderstand.5. In addition to the items in 4, the teacher attempts to identify areas of misunderstandingand to restate communication before learners ask.OR5. No misunderstanding by learners is evident during the lesson.Uses responses and questions from learners in teaching.DescriptorsT. Uses negative words or actions to discourage learners from giving responses or asking questions.2. Ignores learners who wish to be recognized or learner contributions are accepted withoutdisagreement or further comment.3. Acknowledges learners who wish to be recognized and occasionally asks for learner responsesor questions. Responses by the teacher are adequate.4. Asks for responses or questions frequently throughout the lesson and provides feedback tolearners.5. In addition to the items in 4, the teacher incorporates learner responses and questionsinto a c tiv itie s .Provides feedback to learners throughout the lesson.1. Accepts learner comments or performance without feedback about their adequacy.2. Responds to negative aspects of student work, but few comments are made about positiveaspects.3. Informs students of the adequacy of their performance. Few errors pass by without beingaddressed.4. Helps learners evaluate the adequacy of their own or each others' performance.5. In addition to 4, the teacher probes for the sources of misunderstandings which arise.Uses acceptable written and oral expression with learners.How To Rate This Item1. None of the descriptors is evident.2. One of the descriptors is evident.3. Two of the descriptors are evident.4. Three of the descriptors are evident.5. Four of the descriptors are evident.Descriptorsa. Speech is understandable.b. Oral expression is correct.c . Written material is legib le .d. Written expression is correct.Helps learners recognize the purpose and importance of topics or activities.Descriptors1. The teacher does not designate the purpose or importance of a topic or a c tiv ity .2. The teacher fa ils to relate specific topics or a c tiv itie s to their purpose or importancein a content area.3. The purpose or importance of most topics or a c tiv itie s studied is conveyed to learners.4. Topics or a c tiv itie s are taught in context. The teacher explains to the students howtopics or a ctiv itie s are but a portion of a larger content area.5. The teacher encourages (or provides opportunities for) learners either to question orrelate to specific topics or a c tiv itie s which are important to a content area.
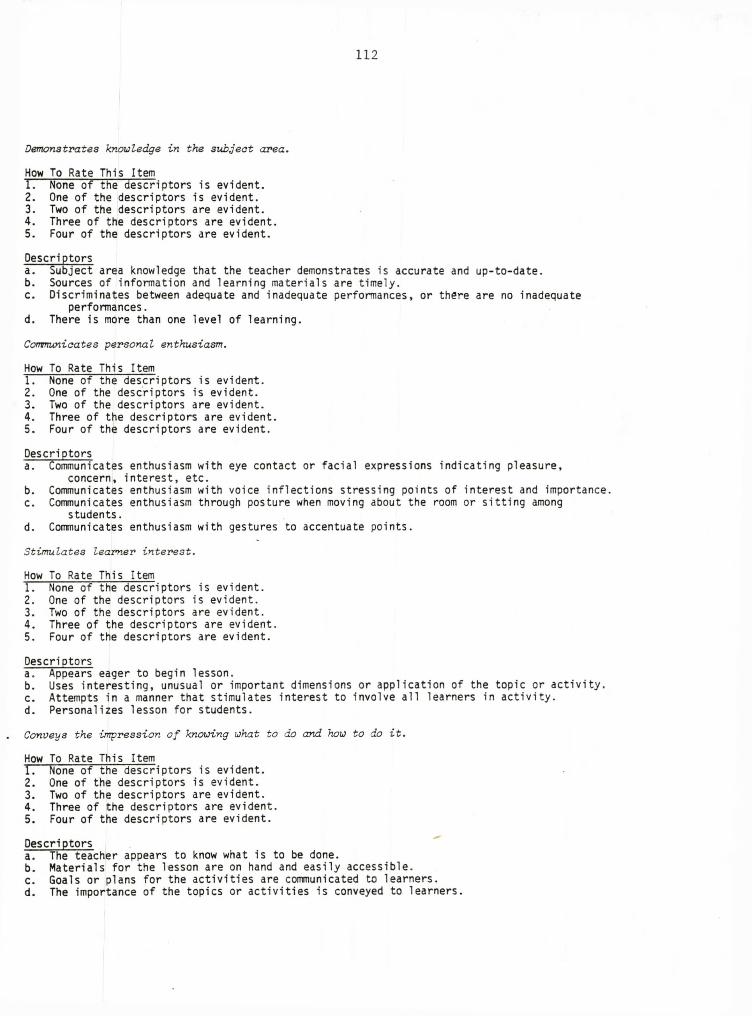
112
Demonstrates knowledge in the subject area.How To Rate This Item1. None of the descriptors is evident.2. One of the descriptors is evident.3. Two of the descriptors are evident.4. Three of the descriptors are evident.5. Four of the descriptors are evident.Descriptorsa. Subject area knowledge that the teacher demonstrates is accurate and up-to-date.b. Sources of information and learning materials are timely.c . Discriminates between adequate and inadequate performances, or there are no inadequateperformances.d. There is more than one level of learning.Communicates personal enthusiasm.How To Rate This ItemT. None of the descriptors is evident.2. One of the descriptors is evident.3. Two of the descriptors are evident.4. Three of the descriptors are evident.5. Four of the descriptors are evident.Descriptorsa. Communicates enthusiasm with eye contact or facial expressions indicating pleasure,concern, interest, etc.b. Communicates enthusiasm with voice inflections stressing points of interest and importance.c . Communicates enthusiasm through posture when moving about the room or s ittin g amongstudents.d. Communicates enthusiasm with gestures to accentuate points.Stimulates learner interest.How To Rate This Item1. None of the descriptors is evident.2. One of the descriptors is evident.3. Two of the descriptors are evident.4. Three of the descriptors are evident.5. Four of the descriptors are evident.Descriptorsa. Appears eager to begin lesson.b. Uses interesting, unusual or important dimensions or application of the topic or a c tiv ity .c . Attempts in a manner that stimulates interest to involve a ll learners in a c tiv ity .d. Personalizes lesson for students.Conveys the impression of knowing what to do and how to do it.How To Rate This Item T None of the descriptors is evident.2. One of the descriptors is evident.3. Two of the descriptors are evident.4. Three of the descriptors are evident.5. Four of the descriptors are evident.Descriptorsa. The teacher appears to know what is to be done.b. Materials for the lesson are on hand and easily accessible.c . Goals or plans for the a c tiv itie s are communicated to learners.d. The importance of the topics or a c tiv itie s is conveyed to learners.
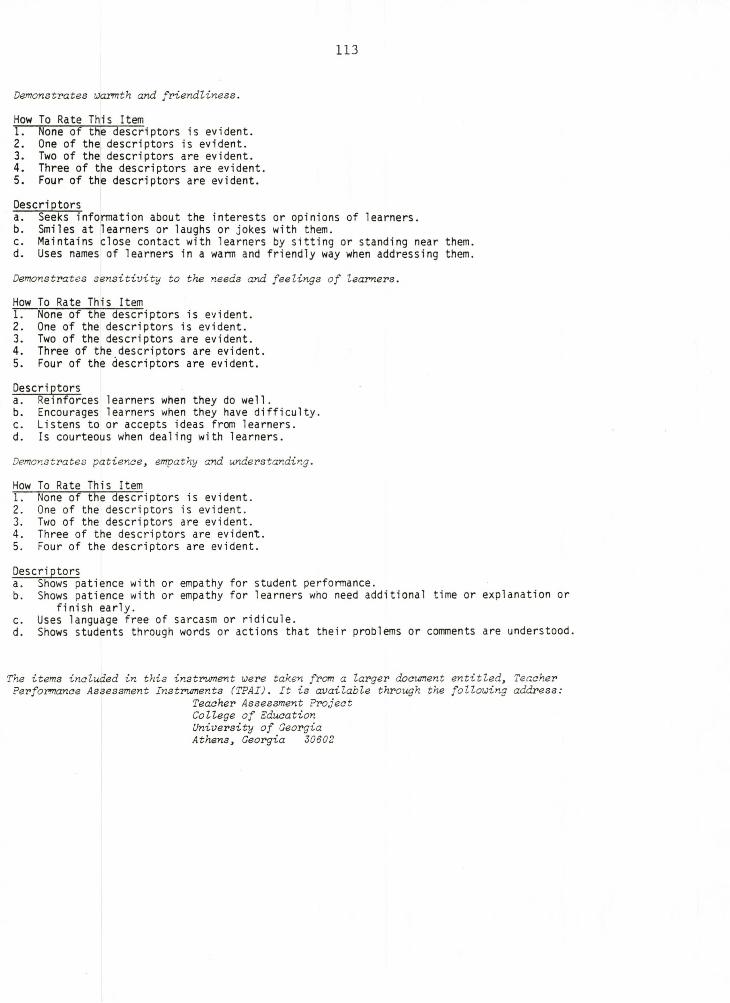
113
Demonstrates warmth and friendliness.How To Rate This Item1. None of the descriptors is evident.2. One of the descriptors is evident.3. Two of the descriptors are evident.4. Three of the descriptors are evident.5. Four of the descriptors are evident.Descriptorsa. Seeks information about the interests or opinions of learners.b. Smiles at learners or laughs or jokes with them.c . Maintains close contact with learners by s ittin g or standing near them.d. Uses names of learners in a warm and friendly way when addressing them.Demonstrates sensitivity to the needs and feelings of learners.How To Rate This Item1. None of the descriptors is evident.2. One of the descriptors is evident.3. Two of the descriptors are evident.4. Three of the descriptors are evident.5. Four of the descriptors are evident.Descriptorsa. Reinforces learners when they do well.b. Encourages learners when they have d iffic u lty .c. Listens to or accepts ideas from learners.d. Is courteous when dealing with learners.Demonstrates patience, empathy and understanding.How To Rate This Item1. None of the descriptors is evident.2. One of the descriptors is evident.3. Two of the descriptors are evident.4. Three of the descriptors are evident.5. Four of the descriptors are evident.Descri ptorsa. Shows patience with or empathy for student performance.b. Shows patience with or empathy for learners who need additional time or explanation orfinish early.c . Uses language free of sarcasm or rid icule .d. Shows students through words or actions that their problems or comments are understood.
The items included in this instrument were taken from a larger document entitled, Teacher Performance Assessment Instruments (TPAI). It is available through the following address:
Teacher Assessment Project College of Education University of Georgia Athens, Georgia Z0S02
APPENDIX B
Teachers' Perceptions of Possible Rewards
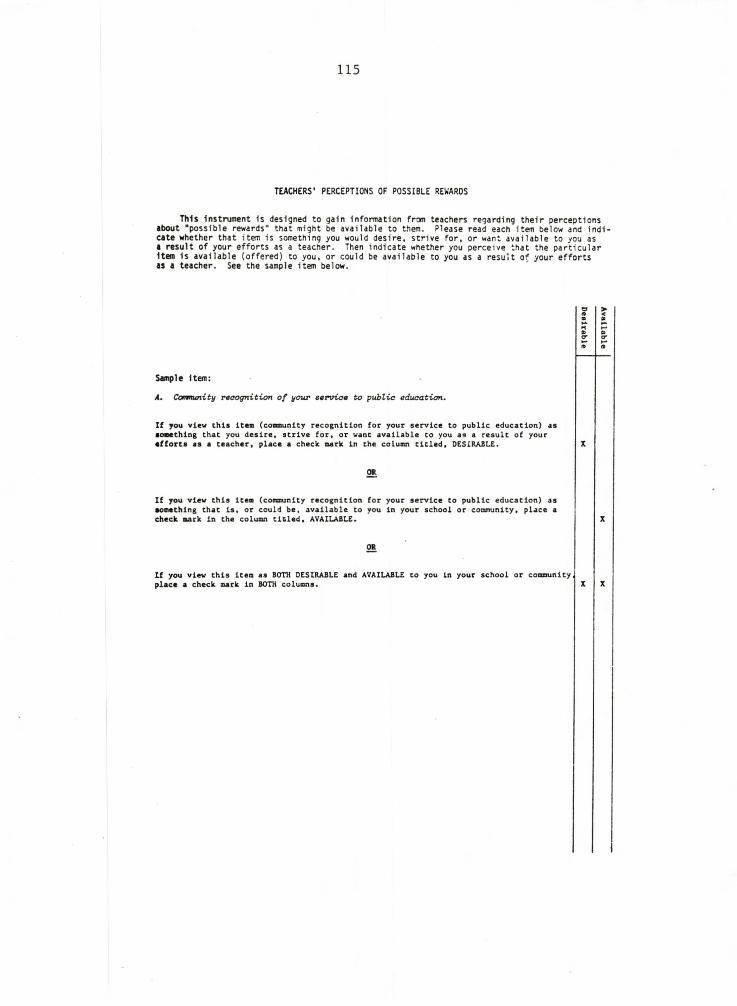
115
TEACHERS' PERCEPTIONS OF POSSIBLE REWAROS
This Instrument 1s designed to gain Information from teachers regarding their perceptions about "possible rewards" that might be available to them. Please read each item below and indicate whether that item is something you would desire, strive for, or want available to you as a result of your efforts as a teacher. Then indicate whether you perceive that the particular Item 1s available (offered) to you, or could be available to you as a result of your efforts as a teacher. See the sample item below.
©
Sample item:
A. Ccnrrunity recognition of your service to public education.
If you view this item (community recognition for your service to public education) as something that you desire, strive for, or want available to you as a result of your efforts as a teacher, place a check mark in the column titled, DESIRABLE. X
If you view this item (community recognition for your service to public education) as something that is, or could be, available to you in your school or community, place a check mark in the column tided, AVAILABLE. X
O R
If you view this item as BOTH DESIRABLE and AVAILABLE to you in your school or community, place a check mark in BOTH columns. X X
Available
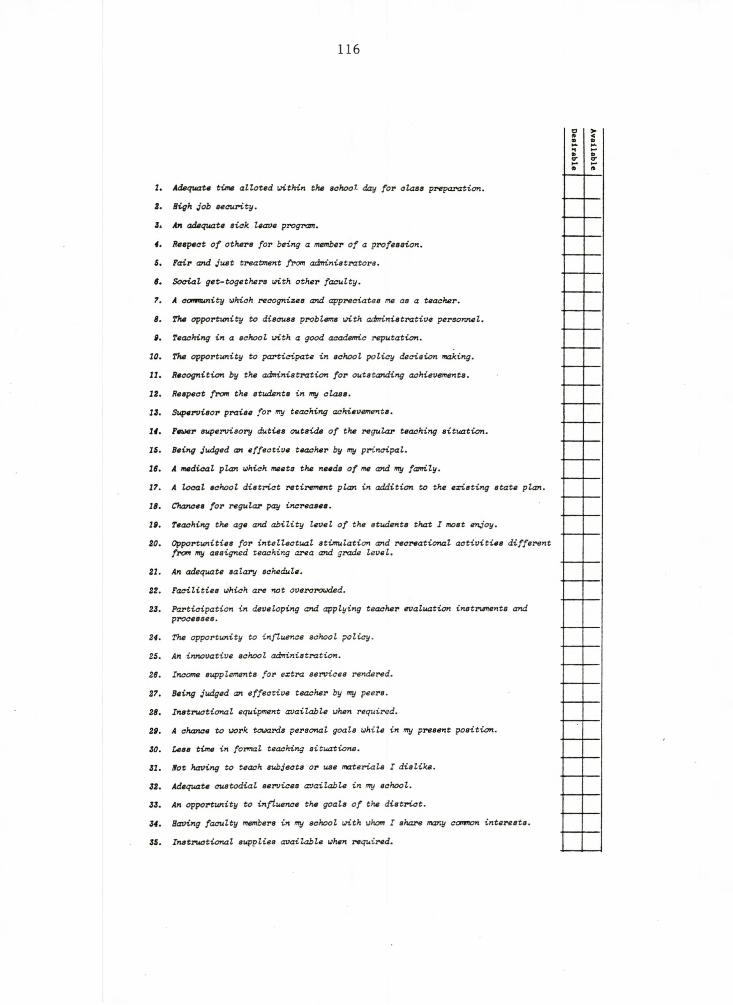
116
1.
2.
3*4.
5.6.7.
8.
9.
10.
11.
12.13.
14.
15.16.
17.
18.
19.
20.
21.
22.
23.
24.
25.
26.
27.
28.
29.
30.
31.
32.
33.
34.
35.
Adequate time alloted within the school- day for class preparation.
High job security.
An adequate sick leave program.
Respect of others for being a member of a profession.
Pair and just treatment from administrators.
Social get-togethers with other faculty.
A community which recognizes and appreciates me as a teacher.
The opportunity to discuss problems with administrative personnel.
Teaching in a school with a good academic reputation.
The opportunity to participate in school policy decision making.
Recognition by the administration for outstanding achievements.
Respect from the students in my class.
Supervisor praise for my teaching achievements.
Fewer supervisory duties outside of the regular teaching situation.
Being judged an effective teacher by my principal.
A medical plan which meets the needs of me and my family.
A local school district retirement plan in addition to the existing state plan.
Chances for regular pay increases.
Teaching the age and ability level of the students that I most enjoy.
Opportunities for intellectual stimulation and recreational activities different from my assigned teaching area and grade level.
An adequate salary schedule.
Facilities which are not overcrowded.
Participation in developing and applying teacher evaluation instruments and processes.
The opportunity to influence school policy.
An innovative school administration.
Income supplements for extra services rendered.
Being judged an effective teacher by my peers.
Instructional equipment available when required.
A chance to work towards personal goals while in my present position.
Less time in formal teaching situations.
Hot having to teach subjects or use materials I dislike.
Adequate custodial services available in my school.
An opportunity to influence the goals of the district.
Having faculty members in my school with whom I share many common interests.
Instructional supplies available when required.
Desirable
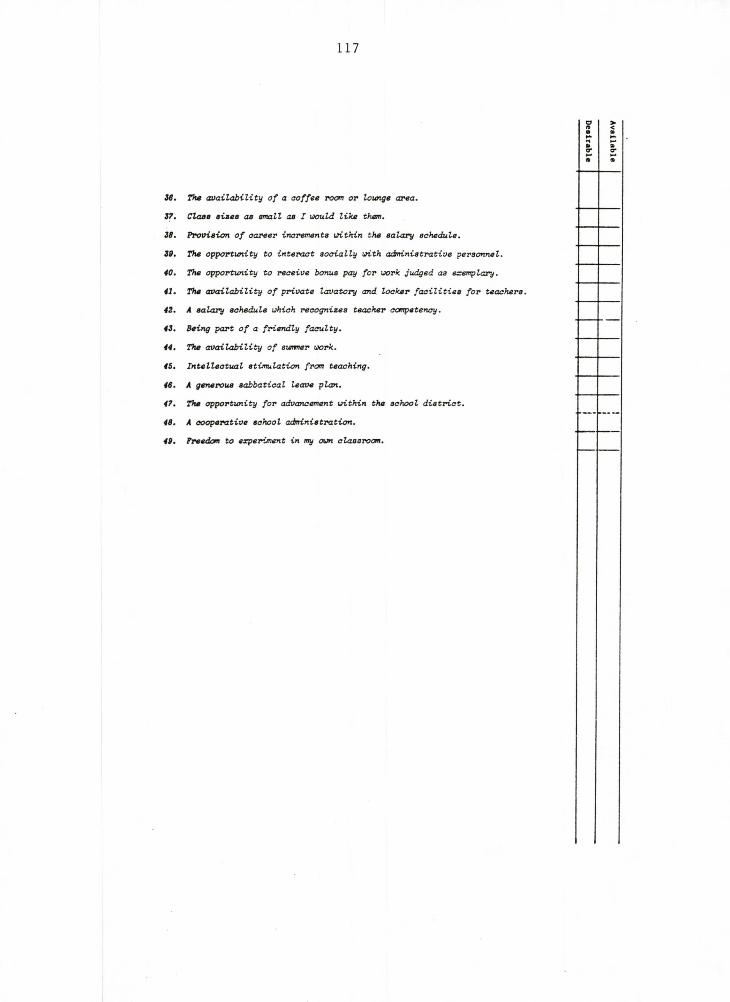
117
36.
37.
38.
39.
40.
41.
42.
43.
44.
45.
46.
47.
48.
49.
The availability of a coffee room or lounge area.
Claes sizes as small as I would like them.
Provision of career increments within the salary schedule.
The opportunity to interact socially with administrative personnel.
The opportunity to receive bonus pay for work judged as exemplary.
The availability of private lavatory and locker facilities for teachers.
A salary schedule which recognizes teacher competency.
Being part of a friendly faculty.
The availability of stumer work.
Intellectual stimulation frcm teaching.
A generous sabbatical leave plan.
The opportunity for advancement within the school district.
A cooperative school administration.
Freedom to experiment in my own classroom.
Desirable
APPENDIX C
Items Comprising the Reward Variables

119
ITEMS COMPRISING THE REWARD VARIABLES
ADMINISTATION (Nature of and relationship to)
5 Fair and just treatment from administrators.
8 Opportunity to discuss .problems with administrative personnel.
25 An innovative school administration.
48 A cooperative school administration
BELONGINGNESS (Opportunities for companionship, socializing opportunities, support and enjoyment with valued colleagues)
6 Social get-togethers with other faculty members.
34 Having faculty members in your school with whom you share manycommon interests.
39 Opportunity to interact socially with administrative personnel.
43 Being part of a friendly faculty.
BENEFITS (Financial rewards other than direct remuneration)
2 High job security.
3 An adequate sick leave program.
16 A medical plan which meets the needs of you and your family.
17 A local school district retirement plan in addition to theexisting state retirement.
DECISION MAKING (Appropriate level of discretion, opportunity to participate in and influence decisions)
10 Opportunity to participate in school policy decision making.
23 Participation in developing and applying teacher evaluation instruments.
24 Opportunity to influence school policy.
33 An opportunity to influence the goals of the district.
FACILITIES, EQUIPMENT AND SUPPLIES (Quality and care of facilities;adequacy and appropriateness of equipment and supplies)
22 Facilities which are not overcrowded.
28 Instructional equipment available when required.
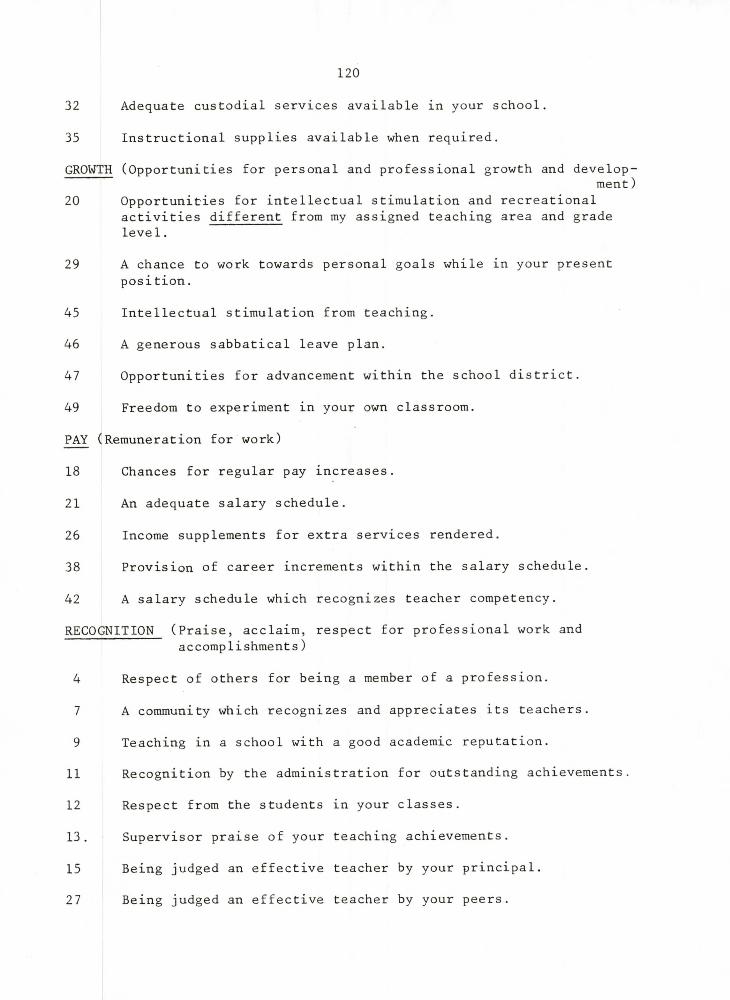
120
32 Adequate custodial services available in your school.
35 Instructional supplies available when required.
GROWTH (Opportunities for personal and professional growth and development
20 Opportunities for intellectual stimulation and recreational activities different from my assigned teaching area and grade leve1.
29 A chance to work towards personal goals while in your presentposition.
45 Intellectual stimulation from teaching.
46 A generous sabbatical leave plan.
47 Opportunities for advancement within the school district.
49 Freedom to experiment in your own classroom.
PAY (Remuneration for work)
18 Chances for regular pay increases.
21 An adequate salary schedule.
26 Income supplements for extra services rendered.
38 Provision of career increments within the salary schedule.
42 A salary schedule which recognizes teacher competency.
RECOGNITION (Praise, acclaim, respect for professional work and accomplishments)
4 Respect of others for being a member of a profession.
7 A community which recognizes and appreciates its teachers.
9 Teaching in a school with a good academic reputation.
11 Recognition by the administration for outstanding achievements.
12 Respect from the students in your classes.
13. Supervisor praise of your teaching achievements.
15 Being judged an effective teacher by your principal.
Being judged an effective teacher by your peers.27

121
WORKING CONDITIONS (Factors relating to the nature of the teachingassignment that affect the way in which the teacher will carry out his/her job)
1 Adequate time allotted within the school day for class preparation
14 Fewer supervisory duties outside of the regular teaching situation
19 Teaching the age and ability level of students that you most enjoy.
30 Less time in formal teaching situations.
31 Not having to teach subjects or use material I dislike.
37 Class sizes as small as you would like them.
RELATED PERQUISITES (Opportunities for additional salary and privilegesas a result of the teaching position)
36 The availability of a coffee room or lounge area.
40 Opportunities to receive bonus pay for work judged as exemplary.
44. Availability of summer work.
The availability of private labatory and locker facilities for teachers.
80
APPENDIX D
Coefficient Alpha for Reward Variables
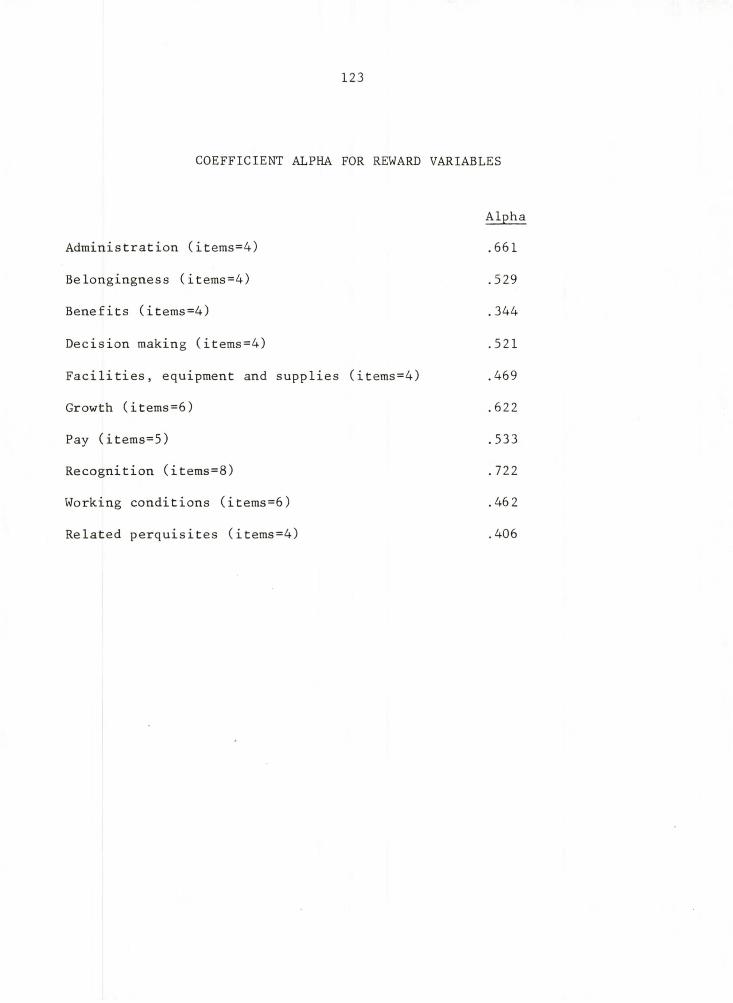
123
COEFFICIENT ALPHA FOR REWARD VARIABLES
Alpha
Administration (items=4) .661
Belongingness (items=4) .529
Benefits (items=4) .344
Decision making (items=4) .521
Facilities, equipment and supplies (items=4) .469
Growth (items=6) .622
Pay (items=5) .533
Recognition (items=8) .722
Working conditions (items=6) .462
Related perquisites (items=4) .406
APPENDIX E
Demographic Information Sheet
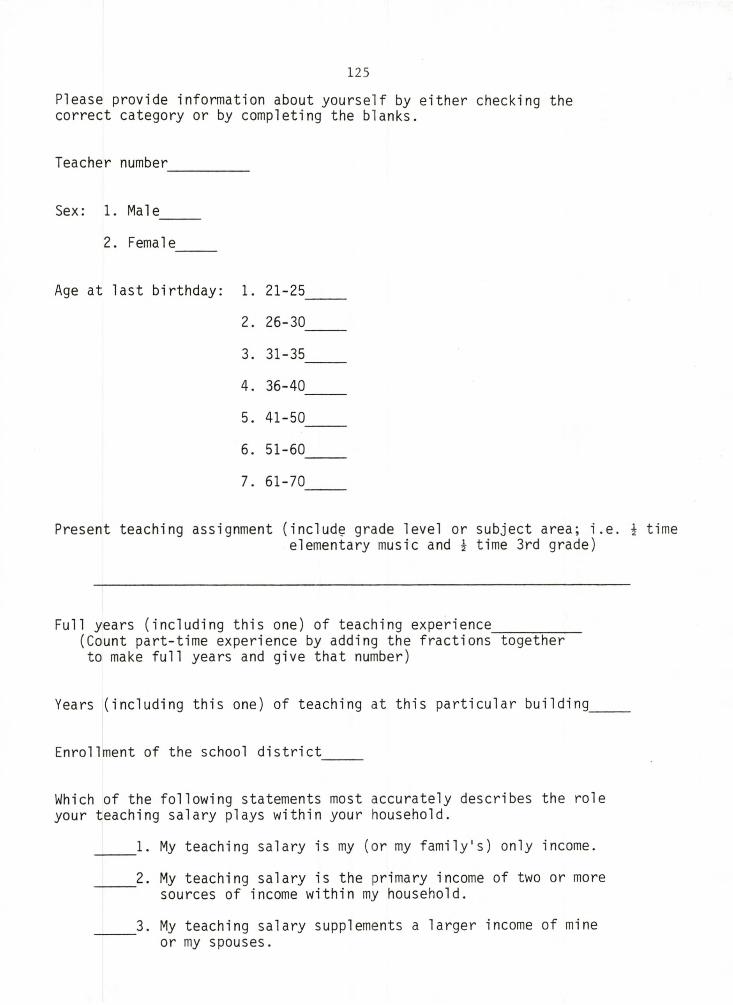
125
P l e a s e p r o v i d e i n f o r m a t i o n a b o u t y o u r s e l f by e i t h e r c h e c k i n g the c o r r e c t c a t e g o r y or by c o m p l e t i n g the blanks.
T e a c h e r n u m b e r ______________
Sex: 1. M a l e _______
2. F e m a l e ______
A g e at l a s t b i r t h d a y : 1. 2 1 - 2 5 _______
2. 2 6 - 3 0 _______
3. 3 1-35_______
4. 3 6 - 4 0_______
5. 4 1 - 5 0 _______
6. 5 1 - 6 0 _______
7. 6 1 - 7 0 _______
P r e s e n t t e a c h i n g a s s i g n m e n t ( i n c l u d e g r a d e level o r s u b j e c t area; i.e. i timee l e m e n t a r y m u s i c and 1 time 3rd grade)
Full y e a r s ( i n c l u d i n g this one) of t e a c h i n g e x p e r i e n c e _______________(Cou n t p a r t - t i m e e x p e r i e n c e by a d d i n g t h e f r a c t i o n s t o g e t h e r to m a k e full y e a r s a n d g i v e t h a t number)
Y ears ( i n c l u d i n g this one) of t e a c h i n g at this p a r t i c u l a r b u i l d i n g
E n r o l l m e n t of t h e school d i s t r i c t
W h i c h of the f o l l o w i n g s t a t e m e n t s m o s t a c c u r a t e l y d e s c r i b e s the role y o u r t e a c h i n g s a l a r y p l ays w i t h i n y o u r h o u s e h o l d .
_______1. M y t e a c h i n g s a l a r y is m y (or m y f a m i l y ' s ) o n l y income.
_______2. M y t e a c h i n g s a l a r y is the p r i m a r y i n c o m e of two or m o r es o u r c e s of i n c o m e w i t h i n m y h o u s e h o l d .
_______3. M y t e a c h i n g s a l a r y s u p p l e m e n t s a l a r g e r i n c o m e o f m i n eo r m y spous e s .
APPENDIX F
Letter to Participating schools
1273810 Berkeley Drive Apartment 6Grand Forks, North Dakota 58201
May 10, 1984
Dear
In the months since I visited your school I have analyzed the data which you so willinging provided, and I have completed my dissertation. Your perceptions and attitudes were extremely valuable to me in conducting my research study on teachers' performance, job satisfaction, and preferred rewards.
During my visit to your school I promised that I would send you a summary of my findings when my analysis was completed. Enclosed you will find such a summary. I hope you will find it interesting and informative.
I want to sincerely thank each of you for your participation in my study and your interest in research that is designed to help principals support teachers. I wish continued professional success to each of you.
Again, my thanks.
Sincerely,
Beth S. Randklev Graduate Student University of North Dakota
APPENDIX G
Tables Identifying the Relationships Among Performance,Job Satisfaction, Preferred Rewards, and Demographic Variables
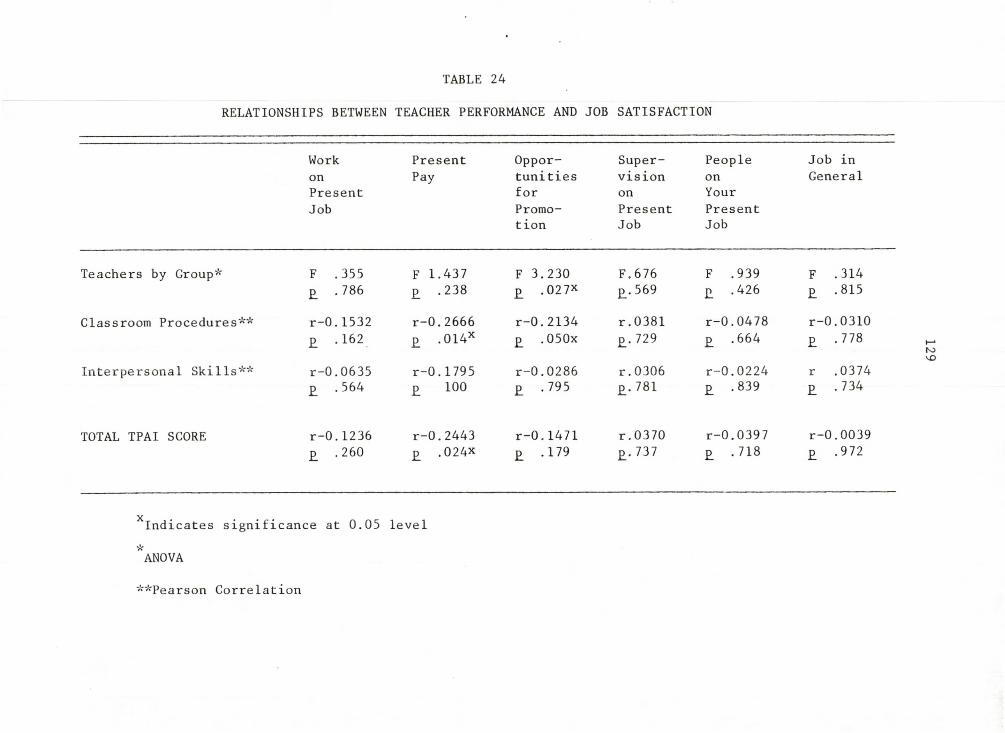
TABLE 24
RELATIONSHIPS BETWEEN TEACHER PERFORMANCE AND JOB SATISFACTION
WorkonPresentJob
PresentPay
OpportunitiesforPromotion
SupervisiononPresentJob
PeopleonYourPresentJob
Job in General
Teachers by Group* F .355 F 1.437 F 3.230 F. 676 F .939 F .314£ . 786 £ .238 £ .027x £.569 £ . 426 £ .815
Classroom Procedures** r-0.1532 r-0.2666 r-0.2134 r.0381 r-0.0478 r-0.0310£ -162. £ .014x £ .050x £. 729 £ . 664 £ .778
Interpersonal Skills** r-0.0635 r-0.1795 r-0.0286 r.0306 r-0.0224 r .0374£ . 564 £ 100 £ . 795 £. 781 £ .839 £ . 734
TOTAL TPAI SCORE r-0.1236 r-0.2443 r-0.1471 r. 0370 r-0.0397 r-0.0039£ .260 £ . 024x £ .179 £. 737 £ . 718 £ .972
indicates significance at 0.05 level
"anova
**Pearson Correlation
129
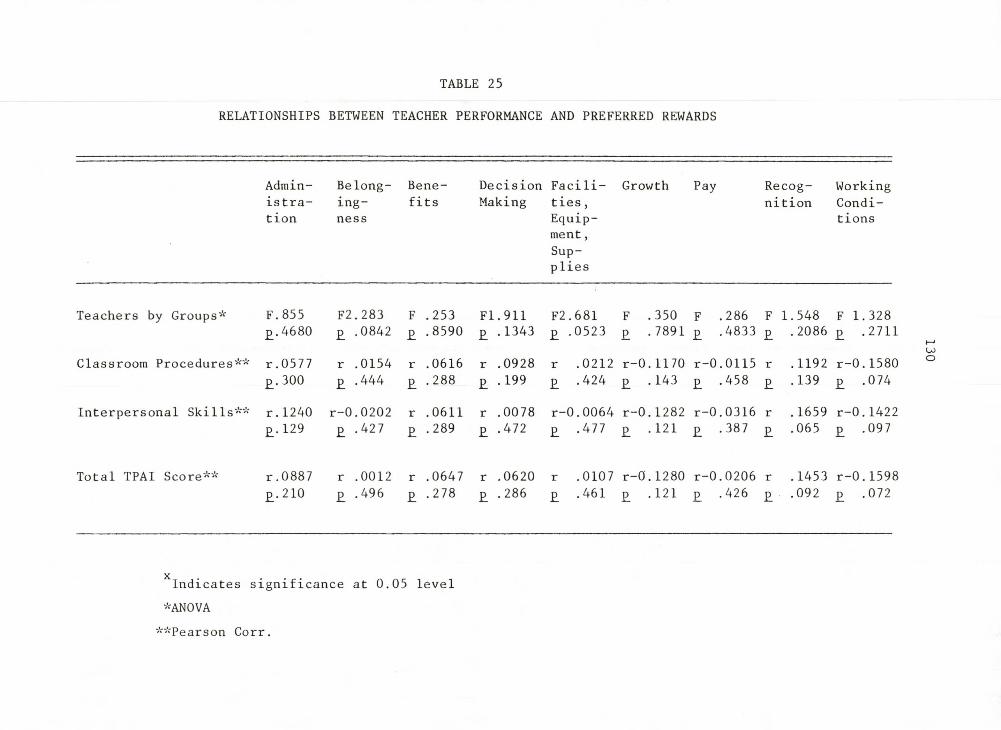
TABLE 25
RELATIONSHIPS BETWEEN TEACHER PERFORMANCE AND PREFERRED REWARDS
Admin- Be long- Bene- Decision Facili- Growth Pay Recog- Workingistra-tion
ing-ness
fits Making ties, Equipment , Supplies
nition Conditions
Teachers by Groups* * F. 855 F2.283 F .253 FI .911 F2 .681 F .350 F . 286 F ]..548 F 1.328£. 4680 £ .0842 £ .8590 £ . 1343 £ .0523 £ .7891 £ .4833 £ . 2086 £ .2711
Classroom Procedures** r. 0577 r .0154 r .0616 r .0928 r .0212 r-0.1170 r-0.0115 r .1192 r-0.1580£.300 £ . 444 £ .288 £ . 199 £ .424 £ . 143 £ .458 £ .139 £ .074
Interpersonal Skills** r.1240 r-0.0202 r .0611 r .0078 r-0.0064 r-0.1282 r-0.0316 r . 1659 r-0.1422£. 129 £ .427 £ .289 £ .472 £ .477 £ . 121 £ .387 £ .065 £ .097
Total TPAI Score** r.0887 r .0012 r .0647 r .0620 r .0107 r-0.1280 r-0.0206 r .1453 r-0.1598£.210 £ .496 £ .278 £ .286 £ .461 £ . 121 £ . 426 £ .092 £ .072
Indicates significance at 0.05 level*ANOVA
**Pearson Corr.
130
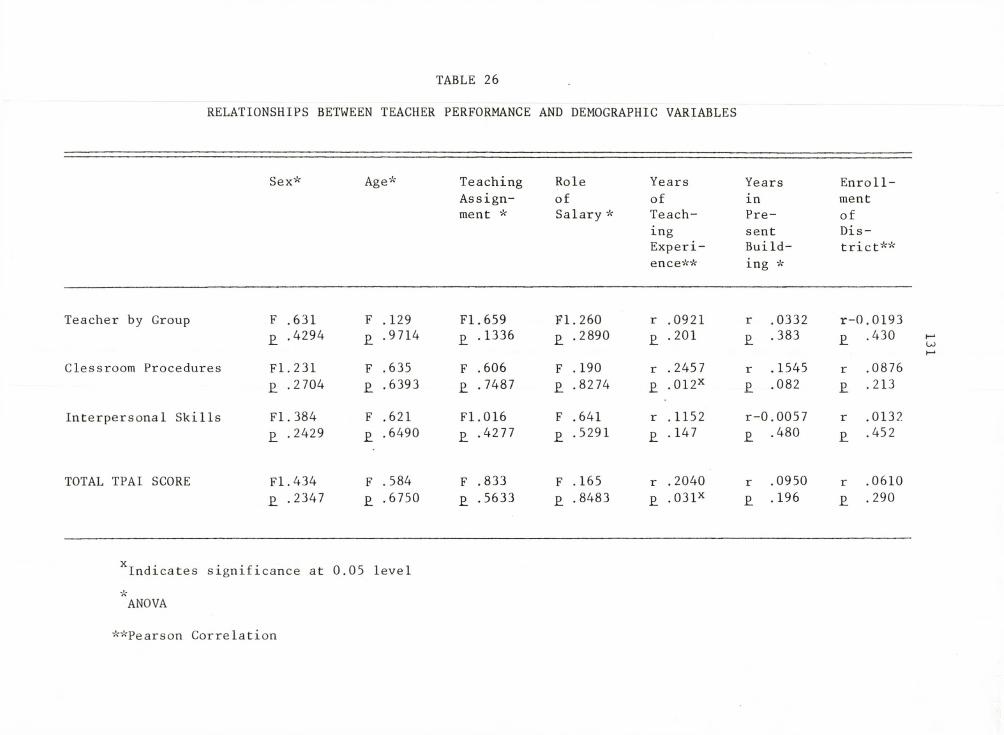
TABLE 26
RELATIONSHIPS BETWEEN TEACHER PERFORMANCE AND DEMOGRAPHIC VARIABLES
Sex* Age> A Teaching Assignment *
RoleofSalary *
YearsofTeachingExperience**
YearsinPresent Building *
EnrollmentofDistrict**
Teacher by Group F .631 F .129 FI.659 FI. 260 r .0921 r .0332 r-0.0193R .4294 £ •9714 £ .1336 £ •2890 £ •201 £ .383 £ •430
Clessroom Procedures FI.231 F .635 F .606 F .190 r .2457 r .1545 r 0876£ .2704 £ •6393 £ .7487 £ •8274 £ •012x £ .082 £ •213
Interpersonal Skills FI.384 F .621 FI.016 F .641 r . 1152 r-0.0057 r 0132£ .2429 £ •6490 £ .4277 £ •5291 £ •147 £ . 480 £ •452
TOTAL TPAI SCORE FI.434 F .584 F .833 F .165 r .2040 r .0950 r 0610£ .2347 £ •6750 £ .5633 £ •8483 £ •031x £ . 196 £ •290
x . . .Indicates significance at 0.05 level
"anova
**Pearson Correlation
131
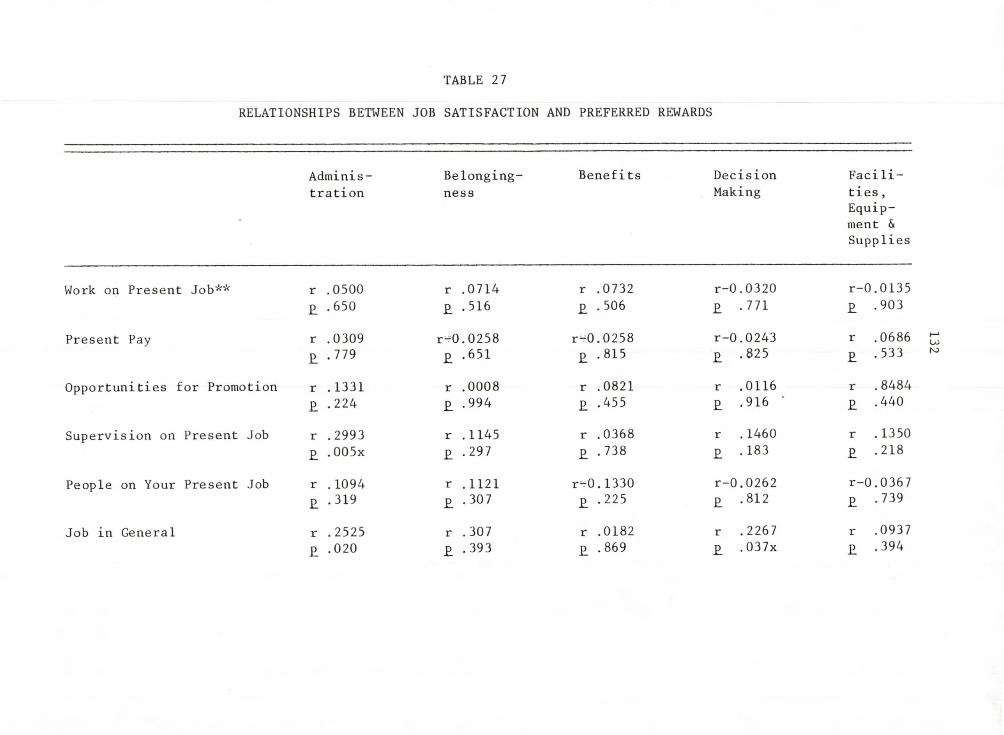
TABLE 27
RELATIONSHIPS BETWEEN JOB SATISFACTION AND PREFERRED REWARDS
Adminis Belonging Benefits Decision Facilitration ness Making ties ,
Equipment & Supplies
Work on Present Job**
Present Pay
Opportunities for Promotion
Supervision on Present Job
People on Your Present Job
r .0500 £ .650
r .0309 £ .779
r .1331 £ .224
r .2993 £ ,005x
r .1094 £ .319
r .2525£ .020
r .0714 £ .516
r-0.0258 £ .651
r .0008 £ .994
r .1145 £ .297
r .1121 £ .307
r .307 £ .393
r .0732 £ . 506
r-0.0258 £ .815
r .0821 £ .455
r .0368 £ .738
r-0.1330 £ .225
r .0182 £ .869
r-0.0320 £ . 771
r-0.0243 £ .825
r .0116 £ .916
r .1460 £ . 183
r-0.0262 £ .812
r .2267 £ .037x
r-0 .0135£ .903
r .0686£ .533
r .8484£ .440
r . 1350£ .218
r-0 .0367£ .739
r .0937£ .394
Job in General
132
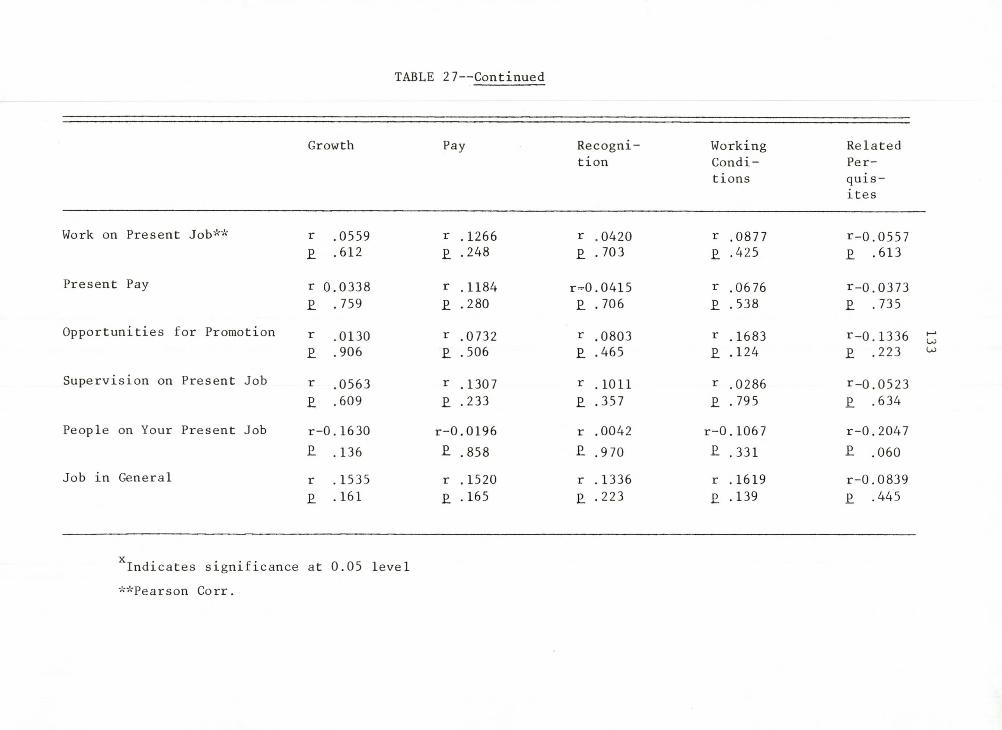
TABLE 27— Continued
Growth Pay Recognition
WorkingConditions
RelatedPerquisites
Work on Present Job** r .0559 r ,. 1266 r .0420 r .0877 r-0.0557£ .612 £ .248 £ . 703 £ .425 £ .613
Present Pay r 0..0338 r . 1184 r-0 .0415 r .0676 r-0.0373£ .759 £ ..280 £ . 706 £ .538 £ . 735
Opportunities for Promotion r .0130 r .0732 r .0803 r . 1683 r-0.1336£ ..906 £ •.506 £ ..465 £ .124 £ .223
Supervision on Present Job r .0563 r . 1307 r . 1011 r .0286 r-0.0523£ ..609 £ ..233 £ .357 £ . 795 £ .634
People on Your Present Job r-0.. 1630 r-0,.0196 r ,.0042 r-0 . 1067 r-0.2047£ .. 136 £ ,.858 £ ,.970 £ .331 £ .060
Job in General r . 1535 r ,. 1520 r .. 1336 r ,. 1619 r-0.0839£ ■. 161 £ •. 165 £ . 223 £ . 139 £ .445
xIndicates significance at 0.05 leve 1**Pearson Corr.
133
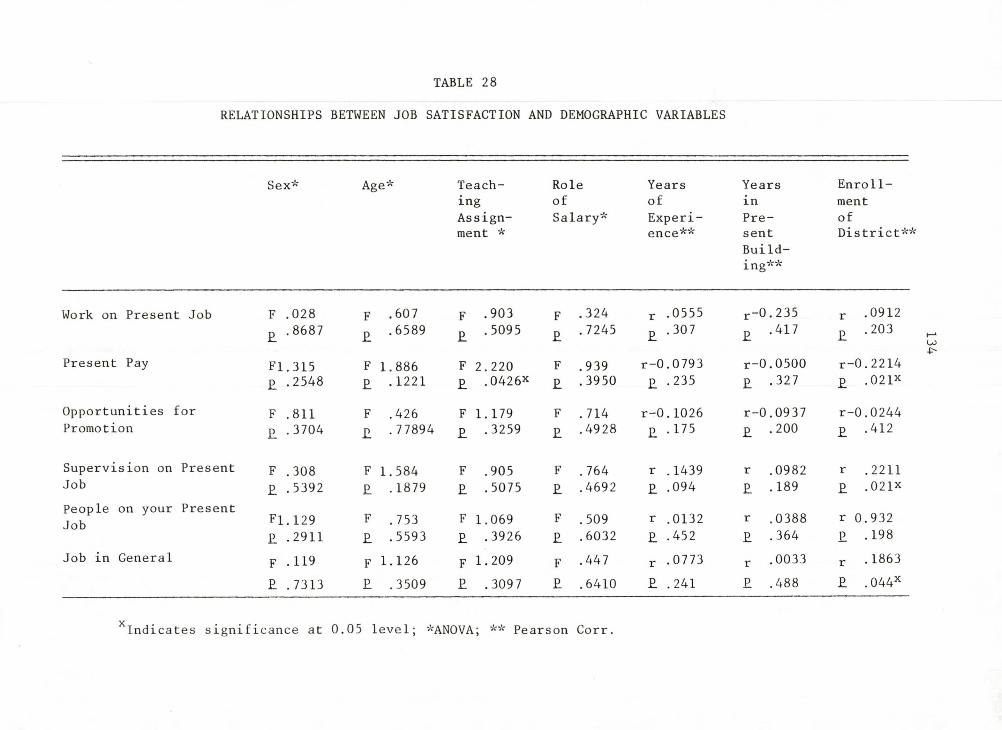
TABLE 28
RELATIONSHIPS BETWEEN JOB SATISFACTION AND DEMOGRAPHIC VARIABLES
Sex* Age* Teach Role Years Years Enrolling of of in mentAssign Salary* Experi Pre ofment * ence** sent
Building**
District
Work on Present Job F .028 F .607 F .903 F .324 r •.0555 r-0.235 r .0912£ .8687 £ .6589 £ .5095 £ .7245 £ '.307 £ .417 £ .203
Present Pay FI.315 F 1.886 F 2.220 F .939 r-0,.0793 r-0.0500 r-0.2214£ .2548 £ . 1221 £ .0426x £ .3950 £ .235 £ .327 £ .021*
Opportunities for F .811 F .426 F 1.179 F . 714 r-0,. 1026 r-0.0937 r-0.0244Promotion £ .3704 £ .77894 £ .3259 £ .4928 £ ■. 175 £ .200 £ .412
Supervision on Present F .308 F 1.584 F .905 F .764 r . 1439 r .0982 r .2211Job £ .5392 £ . 1879 £ .5075 £ .4692 £ .094 £ .189 £ . 021xPeople on your Present Job Fl.129 F .753 F 1.069 F .509 r .0132 r .0388 r 0.932
£ .2911 £ .5593 £ .3926 £ .6032 £ .452 £ .364 £ . 198Job in General F .119 F 1.126 F 1.209 F .447 r .0773 r .0033 r .1863
£ .7313 £ .3509 £ .309 7 £ .6410 £ .241 £ .488 £ .044x
XIndicates significance at 0.05 level; *ANOVA; ** Pearson Corr.
134
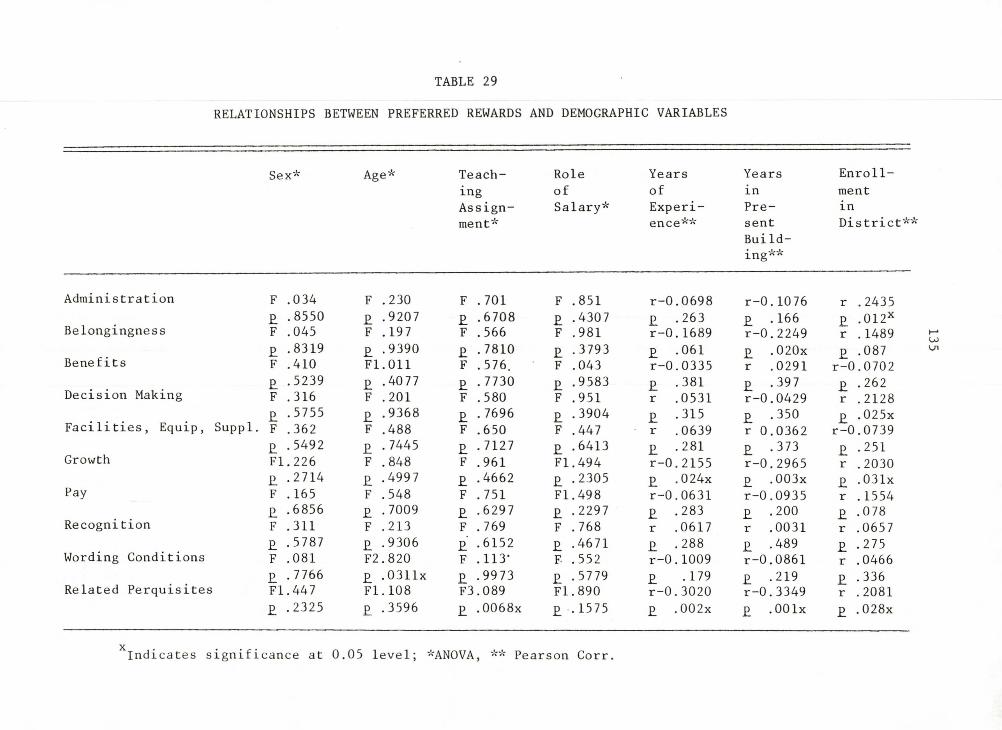
TABLE 29
RELATIONSHIPS BETWEEN PREFERRED REWARDS AND DEMOGRAPHIC VARIABLES
Sex* Age* TeachingAssignment*
RoleofSalary*
YearsofExperience**
YearsinPresent Build-ing**
EnrollmentinDistrict*"
Administration F .034 F .230 F ., 701 F .851 r-0.0698 r-0.1076 r .2435£ .8550 £ .9207 £ ■.6708 £ .4307 £ .263 £ . 166 £ . 012x
Belongingness F .045 F . 197 F ,.566 F .981 r-0.1689 r-0.2249 r .1489£ .8319 £ .9390 £ ■. 7810 £ .3793 £ .061 £ .020x p .087
Benefits F .410 FI .011 F ..576. F .043 r-0.0335 r .0291 r-0.0702£ .5239 £ .4077 £ •. 7730 £ .9583 £ .381 £ .397 £ .262
Decision Making F .316 F .201 F ..580 F .951 r .0531 r-0.0429 r .2128£ .5755 £ .9368 £ •. 7696 £ .3904 £ .315 £ .350 £ .025x
Facilities, Equip, Suppl. F .362 F .488 F ..650 F .447 r .0639 r 0.0362 r-0.0739£ .5492 £ . 7445 £ ■, 7127 £ .6413 £ . 281 £ .373 £ .251
Growth FI.226 F .848 F .,961 FI.494 r-0.2155 r-0.2965 r .2030£ .2714 £ .499 7 £ ■.4662 £ .2305 £ .024x £ ,003x £ .031x
Pay F .165 F ,.548 F .,751 FI.498 r-0.0631 r-0.0935 r .1554£ .6856 £ .7009 £ ■,6297 £ .2297 £ .283 £ .200 £ .078
Recognition F .311 F .213 F .,769 F .768 r .0617 r .0031 r .0657£ .5787 £ .9306 £ ■,6152 £ .4671 £ . 288 £ .489 £ .275
Wording Conditions F .081 F2,.820 F .113- F .552 r-0.1009 r-0.0861 r .0466p .7766 £ . 0311x £ ■9973 £ .5779 £ . 179 £ .219 £ .336
Related Perquisites FI.447 FI.. 108 F3. 089 FI.890 r-0.3020 r-0.3349 r .2081£ .2325 £ ■.3596 £ ■0068x £ .1575 £ ,002x £ .00 lx £ ,028x
Indicates significance at 0.05 level; *ANOVA, Pearson Corr.
135
REFERENCES
Adams, J. S. "Injustice in Social Exchange." In Advances in Experimental Social Psychology, pp. 267-299. Edited by L. Berkowitz. New York: Academic Press, 1965.
Adler, Mortimer J. The Paideia Proposal: An Educational Manifesto.New York: MacMillan Publishing Co., Inc., 1982.
Alderfer, C. P. Existence, Relatedness and Growth: Human Needs in Organizational Settings. New York: Collier-MacMillan,1972.
Alderfer, C. P. "A Critique of Salancik and Pfeffer's Examination of Need Satisfaction Theories." Administrative Science Quarterly 22 (December 1977): 658-669.
Argyris, Chris. Integrating the Individual and the Organization.New York: John Wiley & Sons, 1964.
Armstrong, Thomas B. "Job Content and Content Factors Related toSatisfaction for Different Occupational Levels." Journal of Applied Psychology 55 (February 1971): 57-65.
Arnold, H. J. "A Test of the Validity of the Multiplicative Hypothesis of Expectancy-Valence Theories of Work Motivation." Academy of Management Journal 24 (March 1981): 128-141.
Bliss, Traci. "Endowed Chairs in Public Schools." Phi Delta Kappan 64 (December 1982): 272-273.
Blumberg, Arthur. Supervisor and Teachers: A Private Cold War. Berkeley: McCutchan Publishing Corporation, 1980.
Boyer, Ernest L. High School: A Report on Secondary Education in America. New York: Harper & Row Publishers, 1983.
Bruce, Carol, ed. "Providing Leadership For . . . Teacher Motivation," The Practitioner NASSP Newsletter 10 (November 1978).
Bruno, James E. "Response to Sergiovanni," Educational Administration Quarterly 11 (Spring 1975): 118-120.
Cameron, Kim S., and Whetten, David A., eds. Organizational Effectiveness: A Comparison of Multiple Models. New York: AcademicPress, 1983.
137
138
Campbell, J. P.; Dunnette, M. D.; Lawler, E. E.; and Weick, K. E. Managerial Behavior, Performance, and Effectiveness. New York: McGraw-Hill, 1970.
Campbell, J. P., and Pritchard, Robert D. "Motivation Theory Industrial and Organizational Psychology." In Handbook of Industrial and Organizational Psychology, pp. 63-128. Edited by M. D. Dunnette. Chicago: Rand McNally, 1976.
Casey, William F. III. "Would Bear Bryant Teach In The Public Schools? The Need For Teacher Incentives." Phi Delta Kappan 60 (March 1979): 500-501.
Cawelti, Gordon. "Behavior Patterns of Effective Principals." Educational Leadership 41 (February 1984): 3.
Certo, Samuel C. Principles of Modern Management: Functions and Systems. Dubuque, Iowa: Wm. C. Brown Company, 1980.
Chapman, J. Brad, and Otteman, Robert. "Employee Preference ForVarious Compensation and Fringe Benefit Options." In Personnel: A Book of Readings. pp. 288-308. Edited by William F. Glueck. Dallas: Business Publicatins, Inc., 1979.
Cherrington, David J.; Reitz, H. Joseph; and Scott, William E. Jr."Efforts of Contingent and Noncontingent Reward on the Relationship Between Satisfaction and Task Performance." In The Study of Organizations, pp. 257-264. Edited by Daniel Katz, Robert L. Kahn, and J. Stacy Adams. San Francisco: Jossey- Bass Publishers, 1980.
Chruden, H. J., and Sherman, A. W. Jr. Personnel Management: The Utilization of Human Resources. 6th ed. Cincinnati, Ohio: South-Western Publishing Co., 1980.
Cusick, P. A. "A Study of Networks Among Professional Staffs in Secondary Schools." Educational Administration Quarterly.17 (Summer 1981): 114-138.
Darling-Hammond, Linda; Wise, Arthur E.; Pease, Sara R. "Teacher Evaluation in the Organizational Context: A Review of the Literature." Review of Educational Research. 53 (Fall 1983): 285-328.
Deci, E. L. Intrinsic Motivation. New York: Plenum, 1975.
Deegan, Arthur X. II. Coaching: A Management Skill for Improving Individual Performance. Reading, Massachusetts: Addison- Wesley Publishing Company, 1979.
139
Erlandson, David A., and Pastor, Margaret C. "Teacher Motivation,Job Satisfaction, and Alternatives— Directions for Principals." NASSP Bulletin 65 (February 1981): 5-9.
Farrar, Steve M. "Teachers' and Administrators' Perceptions of Potential Performance Motivators." Ph.D. dissertation, Cornell University, 1981.
Fein, Mitchell. "Improving Productivity by Improved Profit Sharing." The Conference Board Record 13 (July 1976): 44-49.
Frase, Larry E.; Hetzel, Robert W.; and Grant, Robert T. "Merit Pay:A Research-Based Alternative in Tucson," Phi Delta Kappan 64 (December 1982): 266-269.
Fruth, Marvin J.; Bredeson, Paul V.; and Kasten, Katherine L. "Commitment to Teaching: Teachers' Responses to Organizational Incentives Working Paper No. 323." University of Wisconsin-Madison, 1982.
Fuller, M. Rex, and Miskel, Cecil G. Sources of Work Attachment Among Public School Teachers. Paper presented at the Annual Meeting of the American Educational Research Association at Chicago.ERIC Document Reproduction Service, ED 061 171, April, 1972.
Georgopoulos, Basil S.; Mahoney, Gerald M.; and Jones, Niles W.Jr. "A Path-Goal Approach to Productivity." Journal of Applied Psycho logy 41 (December 1957): 345-353.
Goldberg, Myles H. "Another Look at Merit Pay Programs." Compensation Review 9 (Third Quarter 1977) pp. 20-28.
Gudridge, Beatrice M. "Great Teachers Deserve Great Rewards." The American School Board Journal. 167 (July 1980): 30-31.
Haber, Ralph Norman, ed. Current Research in Motivation. New York: Holt, Rinehart, and Winston, Inc., 1966.
Hackman, J. Richard, and Oldham, Greg R. "Motivation Through theDesign of Work: Test of a Theory." Organizational Behavior and Human Performance 16 (August 1976): 250-279.
Hackman, J. Richard, and Porter, Lyman W. "Expectancy Theory Predictions of Work Effectiveness." Organizational Behavior and Human Performance 3 (November 1968): 417-426.
Halpern, Gerald. "Relative Contributions of Motivator and Hygiene Factors to Overall Job Satisfaction." Journal of Applied Psychology 50 (June 1966): 198-200.
140
Hamner, W. Clay. "How to Ruin Motivation With Pay." In PracticingHuman Resource Administration: Cases, Issues, and Experiences in Personnel, pp. 209-215. Edited by Kenneth Wheeler; Marc J. Wallace Jr.; and Fredric N. Crandall. New York: Random House Business Division, 1982.
Heath, Douglas. Faculty Burnout, Morale, and Vocational Adaptation.Boston: The National Association of Independent Schools, 1981.
Heaton, Herbert. Productivity in Service Organizations: Organizing for People. New York: McGraw-Hill, Inc., 1977.
Heneman, H. G. Ill, and Schwab, D. P. "An Evaluation of Research on Expectancy Theory Predictions of Employee Performance." Psychological Bulletin 78 (July 1972): 1-9.
Herrick, H. Scott. The Relationship of Organizational Structure to Teacher Motivation in Multiunit and Non-Multiunit Elementary Schools. Bethesda, MD: ERIC Document Reproduction Service,ED 101 442, 1981.
Hersey, Paul, and Blanchard, Kenneth H. Management of Organizational Behavior : Utilizing Human Resources. 3rd ed. Englewood Cliffs, NJ: Prentice-Hall, Inc., 1977.
Hersh, Richard H.; Carnine, Douglas; Gall, Meredith; Stockard, Jean;Carmack, Mary Ann; and Gannon, Paul. The Management of Education Professionals in Instructionally Effective Schools: Toward a Research Agenda. Eugene, OR: ERIC Document Reproduction Service, ED 208 521, 1981.
Herzberg, F. ; Mausner, B.; and Snyderman, B. B. The Motivation to Work. New York: Wiley, 1959.
Holstrom, Valerie L., and Beach, Lee Roy. "Subjective Expected Utility and Career Preferences." Organizational Behavior and Human Performance 10 (October 1973): 201-207.
House, R. J. "A Path-Goal Theory of Teacher Effectiveness." Administrative Science Quarterly 16 (September 1971): 321-338.
Hoy, Wayne K., and Miskel, Cecil G. Educational Administration: Theory, Research, and Practice. 2nd ed. New York: Random House, 1982.
Hunt, James B. Jr.; duPont, Pierre S.; and Cary, Frank. Action for Excellence. Denver: A. B. Hirschfeld Press, 1983.
Irvine, Jacqueline Jordan. "The Effects of the Integrated Model forthe Training and Supervision of Teachers on the Self-Assessment Skills of Pre-service Teachers." Paper presented at the Annual Meeting of the American Educational Research Association, New York, NY, March 1980.
141
Katz, Daniel, and Kahn, Robert L. The Social Psychology of Organizations . 2nd ed. New York: Wiley, 1978.
Knezevich, Stephen J. Administration of Public Education: A Source- book for the Leadership and Management of Educational Institutions . 4th ed. New York: Harper and Row, 1984.
Knoop, Robert. Job Involvement of Teachers. Paper presented to the Mid-Western Educational Research Association, Toledo, Ohio.ERIC Document Reproduction Service, ED 208 508, October 1980.
Latham, G. P., and Yukl, G. "A Review of Research of the Application of Goal-Setting in Organizations." Academy of Management Jour- nal 18 (December 1975): 824-845.
Lawler, E. E. III. "Job Design and Employee Motivation." Personnel Psychology 22 (Winter 1969): 426-435.
Lawler, E. E. Ill, and Suttle, Lloyd J. "Expectancy Theory and Job Behavior." Organizational Behavior and Human Performance 9 (July 1973) : 482-503.
Lee, James A. The Gold and the Garbage in Management Theories and Prescriptions. Athens, Ohio: Ohio University Press, 1980.
Lortie, Dan C. Schoolteacher. Chicago: The University of Chicago Press, 1975.
Mas low, Abraham H. Motivation and Personality. 2nd ed. New York: Harper & Row, 1970.
McGregor, Douglas. Leadership and Motivation. Cambridge, Mass.: M.I.T. Press, 1966.
Medved, James A. "The Applicability of Herzberg's Motivation-Hygiene Theory." Educational Leadership 39 (April 1982): 555.
Mento, Anthony J.; Cartledge, Norman D.; and Locke, Edwin A. "Maryland vs Michigan vs Minnesota: Another Look at the Relationship of Expectancy and Goal Difficulty to Task Performance." Organizational Behavior and Human Performance 25 (June 1980): 419-440.
Miller, Harry G., and Sevick, Kevin J. "Community Incentives for Teacher Excellence." Education 96 (Spring 1976): 235-237.
Millman, Jason, ed. Handbook of Teacher Evaluation. Beverly Hills: Sage Publications, 1983.
Miskel, C. "The Motivation of Educators to Work." Educational Administration Quarterly 9 (Winter 1972): 42-53.
142
Miskel, C. "Intrinsic, Extrinsic, and Risk Propensity Factors in the Work Attitudes of Teachers, Educational Administrators, and Business Managers." Journal of Applied Psychology 59 (June 1974): 339-343.
Miskel, Cecil G. "Principals' Attitudes Toward Work and Co-Workers, Situational Factors, Perceived Effectiveness, and Innovation Effort." Educational Administration Quarterly 13 (Spring 1977): 51-70.
Miskel, Cecil G. "Motivation in Educational Organizations." Educational Administration Quarterly 18 (Summer 1982): 65-68.
Miskel, Cecil; DeFrain, Jo Ann; and Wilcox, Kay. "A Test of Expectancy Work Motivation Theory in Educational Organizations." Educational Administration Quarterly 16 (Winter 1980): 70-92.
Miskel, Cecil G. ; Glasnapp, Douglas R.; and Hatley, Richard V. "Public School Teachers' Work Motivation, Organizational Incentives, Job Satisfaction, and Primary Life Interests." Washington, D.C.: U.S. Department of Health, Education, and Welfare. (1972).
Mitchell, T. R. "Expectancy Models of Job Satisfaction, Occupational Preference, and Effort: A Theoretical, Methodological, and Empirical Appraisal." Psychological Bulletin 81 (December 1974): 1053-1077.
Mitchell, T. R. "Organizational Behavior." Annual Review of Psychology 30 (1979): 243-281.
Nickerson, Neal C. "Merit Pay— Does it Work in Education?" NASSP Bulletin 68 (March 1984): 65-66.
Oldham, Greg R., and Hackman, J. Richard. "Relationships Between Organizational Structure and Employee Reactions: Comparing Alternative Frameworks." Administrative Science Quarterly 26 (March 1981): 66-83.
Owens, Robert G. Organizational Behavior in Education. Englewood Cliffs, New Jersey: Prentice-Hall, Inc., 1981.
Porter, L. W., and Lawler, E. E. Managerial Attitudes and Performance. Homewood, IL: Irwin-Dorsey, 1968.
Quick, Thomas L. Understanding People at Work: A Manager's Guide tothe Behavioral Sciences. New York: Executive Enterprises Publications Co., Inc., 1976.
Quinn, Robert P., and Cobb, William Jr. "What Workers Want: Factor Analyses of Important Ratings of Job Facets." In The Study of Organizations, pp. 275-283. Edited by Daniel Katz, Robert L.Kahn, and J. Stacey Adams. San Francisco: Jossey-Bass Publishers, 1980.
143
Rand, Thomas M. "Diagnosing the Valued Reward Orientations ofEmployees." Personnel Journal 56 (September 1977): 451-453,464.
Reif, William E. "Intrinsic Versus Extrinsic Rewards: Resolving the Controversy." Human Resource Management 14 (Summer 1975):2-9.
Roscoe, John T. Fundamental Research Statistics for the BehavioralSciences. 2nd ed. New York: Holt, Rinehart and Winston, Inc. 1975.
Salancik, G. R., and Pfeffer, J. "An Examination of Need-Satisfaction Models of Job Attitudes." Administrative Science Quarterly 22 (Spring 1977): 427-456.
Schmidt, G. L. "Job Satisfaction Among Secondary School Administrators Educational Administration Quarterly 17 (Spring 1976): 68-86.
Schwab, D. P.; Olian-Gottlieb, J. D.; and Heneman, H. G. III. "Between Subjects Expectancy Theory Research: A Statistical Review of Studies Predicting Effort and Performance." Psychological Bulletin 86 (January 1979): 139-147.
Scott, J. Glenn; Hickcox, Edward S.; and Ryan, Doris W. "The Shape of Educational Management: The Declining Years of the 70's."Paper presented at the Regional Series of Conferences sponsored by the Ontario School Trustees' Council at Toronto, Ottawa, and Niagara Falls. ERIC Document Reproduction Service. ED 010 180, November and December 1977.
Sergiovanni, T. "Factors Which Affect Satisfaction and Dissatisfaction of Teachers." Journal of Educational Administration 5 (May 1967): 66-82.
Sergiovanni, T. The New School Executive. 2nd ed. Englewood Cliffs, NJ: Prentice-Hall, 1979.
Sergiovanni, Thomas, and Carver, Fred D. The New School Executive: A Theory of Administration. New York: Dodd, Mead and Company, 1973.
Silver, Paula F. "Synthesis of Research on Teacher Motivation." Educational Leadership 39 (April 1982): 551-554.
Silver, Paula F. Educational Administration: Theoretical Perspectives on Practice and Research. New York: Harper and Row, 1983.
Sizer, Theodore R. Horace's Compromise: The Dilemma of the American High School. Boston: Houghton Mifflin Company, 1984.
Spuck, Dennis W. "Reward Structures in the Public High School." Educational Administration Quarterly 10 (Winter 1974): 18-34.
144
Stephens, Thomas. "Innovative Teaching Practices: Their Relation to System Norms and Rewards." Educational Administration Quarterly 10 (Winter 1974): 35-43.
Steers, Richard M. Organizational Effectiveness: A Behavioral View. Santa Monica, California: Goodyear Publishing Company, Inc., 1977.
Steers, Richard M. Introduction to Organizational Behavior. Glenview IL: Scott, Foresman and Company, 1981.
Stinnett, T. M. Professional Problems of Teachers. 3rd ed. New York The Macmillan Company, 1968.
Taylor, Robert L.; Rosenbach, William E.; and Gregory, Robert A."Improving School Climate and Morale." The School Administrator 39 (September 1982): 18-20.
Thompson, James D., ed. Approaches to Organizational Design. Pittsburgh: University of Pittsburgh Press, 1963.
Trusty, F. M., and Sergiovanni, T. J. "Perceived Need Deficiencies of Teachers and Administrators: A Proposal for Restructuring Teacher Roles." Educational Administration Quarterly 2 (Autumn 1966): 168-180.
U.S. Department of Health, Education, and Welfare. ERIC Clearinghouse on Educational Management Research Action Brief No. 13, Eugene, OR: ERIC Document Reproduction Service, ED 196 116, 1980.
Vroom, Victor H. Work and Motivation. New York: John Wiley & Sons, Inc., 1964.
Wahba, M. A., and Bridwell, L. G. "Maslow Reconsidered: A Review of Research on the Need Hierarchy Theory." Organizational Behavior and Human Performance 15 (April 1976): 212-240.
Weber, Max. Theory of Social and Economic Organization. Translated and edited by A. M. Henderson and Talcott Parsons. London: Oxford University Press, 1947.
Weick, K. E. "The Concept of Equity in the Perceptions of Pay."Administrative Science Quarterly 11 (December 1966): 414-439.
Weissenberg, Peter and Gruenfeld, Leopold W. "Relationship Between Job Satisfaction and Job Involvement." Journal of Applied Psychology 52 (December 1968): 469-473.
Wernimont, Paul F.; Toren, Paul; and Kapell, Henry. "Comparison of Sources of Personal Satisfaction and of Work Motivation." Journal of Applied Psychology 54 (February 1970): 95-102.
Wheeler, Kenneth; Wallace, Marc J., Jr.; and Crandall, N. Fredric.Practicing Human Resource Administration: Cases, Issues, and Experiences in Personnel. New York: Random House, 1982.
Williams, Robert T. "Application of Research: Teacher Motivationand Satisfaction." NASSP Bulletin 62 (December 1978): 89-94.
145