
at the Crossroads - IMF eLibrary - International Monetary Fund
Upload
khangminh22Category
view
0download
0
1
May 2014Volume 1, Number 1
International Monetary Review
July 2019, Vol. 6, No. 3
Nout WellinkMy Take of China’s Economic Policy
Dong Jinyue and Xia LePutting the Final Piece into the New Monetary Policy Framework Timing is the Key
John Greenwood and Steve H. HankeMagical Monetary Theory
Fernando RestoyProportionality in Financial Regulation: Where Do We Go From Here?
Herbert PoenischBoosting Internationalisation of RMB in Times of Trade Tensions
Andrew Sheng and Xiao GengHow Will the US-China Trade War End
Christine LagardeBelt and Road Initiative: Two Key Channels to Achieving Financial Connectivity
Agustín CarstensInnovation Transforms Central Banking
2
IMI International Monetary Review
Advisory Board: (in alphabetical order of surname)Edmond Alphandery Yaseen Anwar Chen Yulu Chen YunxianLord Neil Davidson Han Seong-sooSteve H. Hanke Li Ruogu Li Yang Ma DelunRobert A. Mundell Joseph C.K. Yam Pan Gongsheng Su Ning Wang Zhaoxing Nout Wellink Wu Qing Xia Bin Xuan Changneng
Editorial Board: (in alphabetical order of surname)Ben Shenglin Cao TongMichael Chang Chen WeidongDing Jianping Ding ZhijieRobert Elsen E ZhihuanTomoyuki Fukumoto Fariborz GhadarThorsten Giehler Yuksel GormezGuo Qingwang Ji ZhihongJaya Josie Rainer KlumpKees Koedijk Wolfgang KoenigIikka Korhonen Il Houng LeeLiu Jun Lu LeiDavid Marsh Juan Carlos Martinez OlivaJukka Pihlman Herbert PoenischAlain Raes Alfred SchipkeAnoop Singh Sun LujunWanda Sung-Hwa Tseng Tu YonghongWei Benhua Xiang SongzuoMichael Zhang Zhang JieZhang Xiaopu Zhang ZhixiangZhao Xijun
Name of Journal: International Monetary ReviewFrequency of Publication: QuarterlySponsor: International Monetary Institute of Renmin University of ChinaPublisher: Editorial Office of International Monetary ReviewEditor-in-Chief: Ben ShenglinAssociate Editors: Song Ke, Qu Qiang, Xia LeManaging Editor: Herbert PoenischAssociate Managing Editor: Dong XijunAssistant Editors: Zhang Yuezhou, Chen Jingmei, Chen Shuai, Guo Yu, Han Ziyan, Hu Ruiying, Li Chunying, Ma Boyuan, Wen Xiaoliang, Wen Xiaoyue, Xu Hongyu, Zhang Suyan, Zheng Yifan, Zhu DanyangEditorial Office:International Monetary Institute, Renmin University of ChinaRoom 605, No. 59 Zhongguancun Avenue, Beijing 100872, ChinaTel: 86-10-62516755Email: [email protected]
Introduction to the International Monetary Institute ( IMI )
Established on December 20, 2009, IMI is a non-profit academic institution affiliated to China Financial Policy Research Center and the School of Finance of Renmin University.
Following the "general theory of macro-finance", IMI aims to become a world-class think tank, focusing on the studies of international finance, in particular the international monetary system and RMB internationalization. Despite its relatively short history so far, IMI has established itself as a leading research institution and important forum, where industry leaders, policy makers and academic experts from home and abroad share their insights and expertise.
We only share the most valuable financial insights WeChat
3
May 2014Volume 1, Number 1
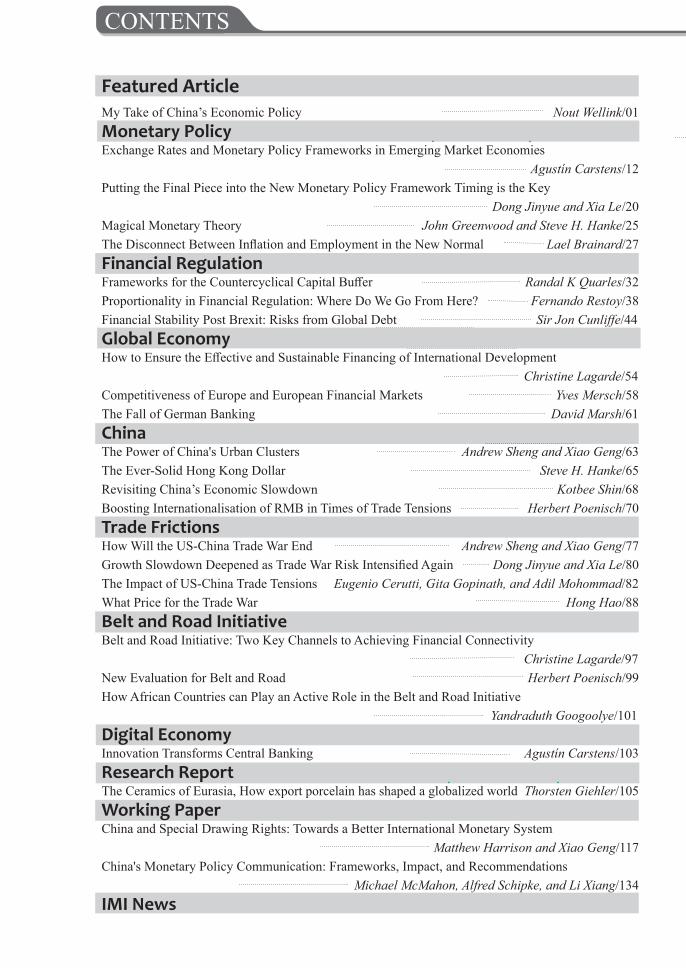
CONTENTS
Featured ArticleMy Take of China’s Economic Policy Nout Wellink/01Monetary PolicyExchange Rates and Monetary Policy Frameworks in Emerging Market Economies
Agustín Carstens/12Putting the Final Piece into the New Monetary Policy Framework Timing is the Key Dong Jinyue and Xia Le/20Magical Monetary Theory John Greenwood and Steve H. Hanke/25The Disconnect Between Inflation and Employment in the New Normal Lael Brainard/27Financial RegulationFrameworks for the Countercyclical Capital Buffer Randal K Quarles/32Proportionality in Financial Regulation: Where Do We Go From Here? Fernando Restoy/38Financial Stability Post Brexit: Risks from Global Debt Sir Jon Cunliffe/44Global EconomyHow to Ensure the Effective and Sustainable Financing of International Development Christine Lagarde/54Competitiveness of Europe and European Financial Markets Yves Mersch/58The Fall of German Banking David Marsh/61ChinaThe Power of China's Urban Clusters Andrew Sheng and Xiao Geng/63 The Ever-Solid Hong Kong Dollar Steve H. Hanke/65Revisiting China’s Economic Slowdown Kotbee Shin/68Boosting Internationalisation of RMB in Times of Trade Tensions Herbert Poenisch/70Trade FrictionsHow Will the US-China Trade War End Andrew Sheng and Xiao Geng/77Growth Slowdown Deepened as Trade War Risk Intensified Again Dong Jinyue and Xia Le/80The Impact of US-China Trade Tensions Eugenio Cerutti, Gita Gopinath, and Adil Mohommad/82What Price for the Trade War Hong Hao/88Belt and Road InitiativeBelt and Road Initiative: Two Key Channels to Achieving Financial Connectivity Christine Lagarde/97New Evaluation for Belt and Road Herbert Poenisch/99How African Countries can Play an Active Role in the Belt and Road Initiative Yandraduth Googoolye/101Digital EconomyInnovation Transforms Central Banking Agustín Carstens/103Research ReportThe Ceramics of Eurasia, How export porcelain has shaped a globalized world Thorsten Giehler/105Working PaperChina and Special Drawing Rights: Towards a Better International Monetary System Matthew Harrison and Xiao Geng/117China's Monetary Policy Communication: Frameworks, Impact, and Recommendations Michael McMahon, Alfred Schipke, and Li Xiang/134IMI News
4
IMI International Monetary Review
顾问委员会:(以姓氏拼音为序)
Edmond Alphandery、Yaseen Anwar、陈雨露、陈云贤、Lord Neil Davidson、韩升洙、
Steve H. Hanke、李若谷、李扬、马德伦、Robert A. Mundell、任志刚、潘功胜、苏宁、
王兆星、Nout Wellink、吴清、夏斌、宣昌能
编委会:(以姓氏拼音为序)
贲圣林、曹彤、陈卫东、丁剑平、丁志杰、Robert Elsen、鄂志寰、福本智之、
Fariborz Ghadar、Thorsten Giehler、Yuksel Gormez、郭庆旺、纪志宏、Jaya Josie、Rainer Klump、Kees Koedijk、Wolfgang Koenig、Iikka Korhonen、李一
衡、刘珺、陆磊、David Marsh、Juan Carlos Martinez Oliva、Jukka Pihlman、Alain Raes、Alfred Schipke、Anoop Singh、孙鲁军、曾颂华、涂永红、魏本华、向松祚、
张杰、张晋源、张晓朴、张岳鹏、张之骧、赵锡军
刊 名:International Monetary Review
刊 期:季刊
主办单位:中国人民大学国际货币研究所
出版单位:《International Monetary Review》编辑部
主 编:贲圣林
联席主编:Herbert Poenisch
副 主 编:宋科、曲强、夏乐
执行副主编:董熙君
编辑部成员:张悦洲、陈静美、陈帅、郭语、韩子砚、胡睿颖、李春颖、马博远、
欧阳泉、彭彦榕、温晓靓、温晓玥、徐红玉、张苏琰、郑一繁、朱丹阳
编辑部地址:北京市海淀区中关村大街 59 号文化大厦 605 室
邮 编:100872
电 话:86-10-62516755
网 址:www.imi.org.cn
更多精彩内容请登录国际货币网(英文版)http://www.imi.org.cn/en/
只分享最有价值的财经视点We only share the most valuable financial insights 【IMI 财经观察】

International Monetary Review July 2019, Vol. 6, No. 3
1
Featured Article
My Take of China’s Economic Policy
By NOUT WELLINK*
Introduction
The Chinese economy is the second largest in the world. At the same time it ranks 73rd on a
GDP per capita basis (IMF, 2018). This results in kind of a quandry: some observers focus on
the size, others on the living standard of ordinary people. The legitimate ambition of the Chinese
Authorities is to substantially raise these living standards in the next decades. The result will,
absent shocks, be an economy that is in absolute terms larger (in the long run much larger) than
today’s number 1, the US-economy. As to the long run, if the per capita GDP would be at the
level of, e.g., my country (the Netherlands), the Chinese economy would have outgrown the US
with a multiple of more than 3. This perspective explains to some extent the fast growing
tensions between the US and China, the two most powerful countries in the world.
The daunting task in front of us is how to smoothly integrate an economy of the size of China
into the global economy. Not only the present and future size of the Chinese economy makes
this integration process without precedent in economic history, but also the economic, cultural
and political differences that still exist. China is creating a market economy that fully
participates in the global economy, but with Chinese characteristics and under the strong
leadership of the Party. This sounds anathema to Western observers, but I think that it is
important to try and understand this model that is indeed different from the model existing in the
Western part of the world. “It makes”, as Andrew Sheng and Xiao Geng wrote, “little sense to view Chinese political developments through a Western lens, especially at a time when the world is shifting from a unipolar to a multipolar system”1. I agree with this, but that is not to say that
there should not be mutual respect for each other’s values and approaches when the two worlds
meet in the international arena. Living up by all countries to the internationally agreed-upon
trade rules is of paramount importance.
The necessity of a smooth, gradual transition and integration process
A smooth transition and integration process is in everybody’s interest. An economic
disruption would not only hit China hard, but also heavily affect the global economy. Let’s not
forget that China nowadays accounts for one-third of global growth. Especially since the
beginning of the financial crisis this country has become the locomotive not only for Asia but
also for the rest of the world. An important figure in this context: China succeeded in reducing
*Nout Wellink, member of IMI International Advisory Board, Former Governor of the Dutch Central Bank 1 Andrew Sheng and Xiao Geng, “America’s Self-Defeating China Policy”. International Monetary Institute
(IMI), 6-11-2018.
2
its current account surplus, after an all time high of 11.1% of GDP in December 2006, to less
than 2% in 2011, thereby substantially contributing to the growth in other countries. In the
subsequent years the surplus hovered around that figure. Without China the financial crisis in the
rest of the world would have been much deeper. But it came at a price. China is still suffering
from some legacy problems due to its mind-boggling crisis program.
For 2019 and 2020 a basically balanced current account is expected. Larry Summers, former
US Treasury Secretary, rightly stressed last April in The Financial Times that “today China’s global surpluses are far below past negotiations targets of a few years ago”2. However, in the
coming years current account deficits cannot be excluded. China is aging, young people save
less and old people will draw from their savings. The savings ratio already declined from the
peak of 52% of GDP in 2008 to 46% in 2017 but is still one of the world’s highest, thereby
distorting (or mirroring a distortion of) the economic structure. It seems reasonable to assume
that in the years ahead the savings rate will further decline. After all, in a richer country the
spending appetite of consumers also increases. This could lead to a current account deficit. On
the other hand, the foreseen lower growth rate requires less investment. In addition, if the
Chinese government would be successful in reducing what is called by the IMF the “augmented”
deficit, the current account might nethertheless end up in positive territory.
On balance – barring unforeseen developments – I am rather relaxed about China’s current
account perspectives. The same holds for the onshore exchange rate, which has been allowed
(since 2015) to move in either direction of a daily trading band midpoint set by the central bank.
In real terms, on a weighted basis,the RMB (real broad effective exchange rate; REER) has
appreciated substantially since 2007 (index 2010=100; February 2007: 89.65, February 2019:
124.513). In its 2018 Art.4 Consultation the IMF4 came to the following conclusion: “While the external position was moderately stronger (with the level consistent with medium-term fundamentals and desirable policies) theRMB in 2017 was broadly in line with fundamentals and desirable policies”. Since then the figures have changed a bit (also due to the US pressure
on China). From a level of 130 in 2015 the REER depreciated to around 125 in 2019. but I think
it is fair to draw the conclusion that China succeeded in realizing reasonably balanced overall
results for its exchange rate and current account. The outlook for the capital account seems to me
less certain. There is always the risk of sudden outflows, in spite of capital controls. On the other
hand, the gradual further opening of its financial markets (recently China extended for example
its Renminbi Qualified Foreign Institutional Investers - RQII - program to the Netherlands) will
most certainly attract additional capital from foreign sources. This measure was very much
welcomed by investors in my country. Therefore, externally China is contributing to a smooth
integration process. However, internally the re-balancing process has not been completed yet.
President Trump has a different view with respect to the exchange rate. As to theRMB Trump
repeated in June 2019 his now well known song: the Chinese “devalue their currency, they have for years; it’s put them at a tremendous competitive advantage”. His own Ministry of Finance
came in the autumn of 2018 to the conclusion that there was no exchange rate manipulation on
theChinese side. The reasons: the current account surplus of China amounted to less than 3% of
GDP and the scale of interventions in the exchange markets, co-determining whether a country
is manipulating its currency, were clearly not fulfilled. Compared to the peak in 2015 the real
effective exchange rate has indeed declined by 4%, but was still substantially higher than on the
2 Lawrence Summers, “Donald Trump trade threats lack credibility”. Financial Times, 9 April 2018. 3 Bank for International Settlements, Real Broad Effective Exchange Rate (RBCNBIS), retrieved from Federal
Reserve Bank of St.Louis; https://fred.stlouisfed.org/series/RBCNBIS, June 15, 2019. 4 International Monetary Fund, “People’s Republic of China. Staff Report for the Article IV Consultation”. June
28, 2018
July 2019
Vol.6, No.3
3
eve of the financial crisis and broadly in line with the external position. Therefore it would be
more logic for the US to focus on the domestic causes of its persistently high current account
deficit than blaming other countries. The reserve currency character of the dollar has made it
possible for the Americans to live beyond their means for many years in a row.
The Chinese economy: a mammoth tanker See the Chinese economy for a moment as a mammoth tanker, trying to harbour in the world
economy, Changing the course of such a tanker into the right direction takes time, but making
mistakes during this potentially accident prone change of course could turn out to be very costly.
I belong tothose who are strongly in favour of a step-by-step approach, thus minimizing the risks
involved in this harbouring process. After the fall of the wall in 1989 Russia was ill-advised by
those (amongst them prominent US economists) who suggested to liberalize the Russian
economy more or less overnight. This is a dangerous approach when the country is large and an
adequate institutional, supervisory and legal framework is lacking. As we all know, in Russia it
initially ended up in economic and political chaos. In the Russian case, two lines of thinking
were behind the suggested approach. A dogmatic one, based on the idea that in a liberalized
economy all problems would be solved more or less automattically. The other line of thinking
was that only quick and drastic measures would create an irreversible situation. The best
approach in the Chinese circumstances is to my mind a step-by-step approach, a controlled,
gradual integration in the world economy.
The real issue is: what does a step-by-step approach mean. How big should these steps in
practice be. And how credible is such an approach. Isn’t a step-by-step policy kind of a trick to
hide that you do not really want to change. This credibility issue is at the heart of many
discussions between Western countries and China. A lot of people in the Western world
unfortunately simply don’t believe the Chinese Authorities when they say, as they do, that
structural reforms are high on their priority list. Following closely the economic developments in
China, I am convinced that the government wants to live up to its promises, realizing that it is in
the country’s best interest to deliver. After all, its own credibility is at stake. Admittedly, the
process is sometimes a bit slower than outsiders expect, but this reminds me of a famous fairy
tale from my childhood. It is about a running competition between a hare and a turtle. Everybody
expects the hare to win the race, but it is the turtle. The hare is always distracted during the race,
the turtle is very focussed and, although a much slower runner, the first at the finish.
Re-balancing measures
The step-by-step approach obscures that in recent years in China important economic
measures have been taken. Perhaps these measures haven’t been “sold” sufficiently enough. Far
reaching measures were, for example, taken in the following area’s: the liberalization of interest
rates,, the granting of foreign majority interests in financial institutions, the exchange rate policy,
the approach to overcapacity and the protection of intellectual property rights. Let me dwell a bit
further on three set of these areas, so as to clarify my case for a step-by-step approach. It is of
course outside the scope of this contribution to deal with all the structural reforms.
Interest rates
During my term as a Board member of BoC, China has liberalized to a very high extent
interest rates for deposits and loans, but - admittedly - under certain circumstances the
authorities still provide so-called “window guidance”. That happened for example when the Chinese SMEs got into financing problems. I see this kind of guidance as a positive element of
the Chinese system, but too much pressure on the banks, resulting in loss-making loans, is of

4
course not a good idea. What is needed, is a balance between the social and financial
responsibilities of banks.
The liberalization of interest rates took several years. Rightly so, because such an approach
almost by definition implies a shrinking of the interest margin and a huge pressure on the
profitability of banks. Banks will, therefore, engage in new activities, such as the introduction of
(complex) wealth management products. But this introduction requires sufficient knowledge of
these new products, clear accounting rules, adequate risk management, strong supervision, etc.
Continuing with financial repression wasn’t an option either, because then clients of the bank
would move to risky products in the shadow banking sector (as they did). The point I want to
make is that decisions on certain steps or on refraining from these steps only can be taken if you
have thought through all the implications and have sufficiently prepared yourselve to cope with
these implications. Sequencing, patience and endurance are crucial in the context of structural
reforms. That takes time, but disregarding these aspects is a recipe for disaster.
Intellectual property rights
As to intellectual property rights, this issue is now hotly debated, especially between China
and the USA. My perception is that China started late, too late, with addressing this issue, but it
nowadays has a vested interest in protecting intellectual property rights. The country is in the
midst of an innovation boom. It is not surprising that Prime Minister Li Keqiang in 2018 stressed
that “enhancing the protection of intellectual property rights is a matter of overall strategic significance, and it is vital for the development of the socialist market economy”.
The authorities have indeed taken action. It required new legislation, specialized courts,
trained judges, etc. A recent article of William Weidman5 illustrates convincingly that China is
seriously addressing local judicial protection, small damage awards, the process of discovery,
and the bias against foreign companies. He quotes an earlier study that found that between 2006
and 2011 foreign companies brought over 10% of infringement cases in China and won over
70% of these cases. According to Weightman, today’s win rates average around 80%. A few
months ago I myself spoke to a Dutch entrepeneur who has been working in China for several
decades. He had won 3 of the 4 intellectual property infringement cases. The fourth went wrong,
but in his view rightly so, because he said he had provided insufficient evidence.
That said, there is still room for further improvement. The Chinese Authorities themselves
have launched a nationwide campaign in April 2019 to tackle the infringement of intellectual
property rights. I am not enough an expert to conclude that the situation is perfect, but itseems to
me that much more has been done than is often understood by observers in the West.
Protection of foreign investors
The same holds for the protection of foreign investors. In addition to measures already taken,
a new “Foreign Investment Law” will enter into force on 1 January 2020. This is an important
law that offers protection to foreign investors in a number of areas: expropriation rules, transfer
of profits to foreign countries, equal treatment of domestic and foreign companies, etc. It is a
mystery to me why the progress with respect to these topics is not acknowledged, especially
because meanwhile several foreign financial institutions, including from Germany,Taiwan and
Korea, have been allowed to set up local subsidiairies in China. A few onther examples. A bank
of my own country, ING, was allowed to take a majority stake in a joint venture with the Bank
of Beijing, and J.P. Morgan has since taken a majority stake in a Chinese asset manager.
5 William Weidman, “China’s Progress on Intellectual Property Rights”. The Diplomat, 20 January 2018.
July 2019
Vol.6, No.3
5
All of this, of course, does not mean that suddenly it has become very easy for foreign
financial institutions to penetrate deep into the Chinese economy. There are all kinds of
obstacles, such as the lack of a branch network, the actual monopoly position of the existing
banks, costs, etc. As a result, it remains difficult for foreign parties to compete with domestic
counterparts. My feeling is that the Chinese government would like to see this happen. Indeed,
these measures not only serve the interests of Western investors, but are also in China’s interest.
They are needed to channel savings towards more efficient uses and to slow down the growth of
the shadow banking sector. As said before, in the context of this article I cannot deal with all the
structural reforms that already have been taken or are in the pipeline, but my conclusion is that
quite a lot has happened already and is still happening.
Results at the macro level
A more balanced growth
Where have all these developments led to? Is China successful in transforming its economy.
China is no longer an economy with double digit growth figures. The focus nowadays is on the
quality of growth. Healthcare, poverty alleviation, social security, pensions, the fight against
polution and corruption are getting more attention. This policy change was necessary for social
reasons but also because growth rates of 10% or more could only be achieved through a
combination of exuberant export growth and financial government incentives that for budgetary
reasons could not be sustained. Although the official budget deficit was around 3%, the so-called
“augmented” deficit (a broader notion used by the IMF) is in the order of 10%. My feeling is
that the IMF is overdoing the “augmentation” a bit, because the government is not responsible
for the whole gap between the two figures. On the contrary, it has taken action to escape from
that responsibility. To the extent the gap (the deficit of other sectors than the central
government) would disappear, this would have the same impact on the economy as a reduction
of the official budget deficit. Also for environmental reasons a double-digit growth rate could
not be kept up.
The present growth figure of around 6.5% is more sustainable and healthy than the previous
double digit growth rates. I interpret this figure as something between a target and a best guess.
It is more than just a forecast, because the actual growth figures should fit into the ambition of a
doubling of GDP in the period till 2020. The consequences of the slowdown in the growth rate
are in absolute terms less dramatic than a lot of people think. Since 2007 a doubling of China’s
real GDP has taken place. A growth rate of 6,5% now is in absolute terms comparable with, say,
13% in 2007.
The growth rate is not only lower, but in terms of composition also more balanced than in the
past: a smaller share of exports, more consumption, less public investment. In 2017 the
agricultural sector contributed 7,2% to GDP, the industry 40,7% and services 52,2%, to be
compared with 10,73%, 47,5% and 41,82% respectively in 2008. All in all remarkable shifts.
The figure for the service sector might even be too low, according to an OECD study, the reason
being that in the Chinese statistics companies are assigned to their main activity. If a second
activity of a company is in the service sector, it is not reflected in the statistics. The objective of
the Chinese government is a service sector of 60% of GDP in 2025. This seems to me a realistic
goal and implies a further re-balancing of the Chinese economy.

6
State owned versus private sector companies
Prime Minister Liu recently summarized6 in another way how much the structure of the
Chinese economy has changed in recent years and has also come to rely on the private sector:
50% of the tax revenues now stems from the private sector, 60% of GDP, 70% from
technological innovation, 80% from urban employment, and 90% from new jobs and new
businesses.
At first glance Prime Minister Liu’s remarks seem at odds with those of President Xi who has
repeatedly emphasized the importance of state-owned companies, but Liu’s remarks are not
necessarily contradictory to Xi’s. State-owned companies are in President Xi’s view
instrumental in the economic development in China. They are important for vital sectors in the
economy. Critics in the Western world of this approach often forget that in the past their
countries have followed the same kind of policies. I myself have been – on behalf of the
government – in the 70s of the last century a member of the supervisory Board of several
state-owned companies. I also remember vividly the discussions we had, for example, during
those days about the abolishment of subsidies for shipbuilding yards. A government being
involved in vital industries seems to me a characteristic of a certain phase in the economic
development of a country.
That does not mean that state-ownership should be forever or that there are no risks involved.
One of them is poor efficiency, showing up for example in low productivity, overcapacity, etc.
These companies should also not be used for unfair competition international markets.
Furthermore it is often costly and, therefore, subsidizing them is not always the best use of tax
revenues. Overcapacity is a burden for the rest of the world in case of dumping on the
international markets. But it is a heavy burden for the country itself with overcapacity industries
too. China tries to get rid of overcapacity industries but at a gradual pace. My experience with
the Chinese banking system is that these issues are being addressed, but that there is still a long
way to go.
If possible this process should be accelerated but political and social constraints are
phenomena the Western world is familiar with too. Since 2013 several million people have lost
their job in the overcapacity industries in China. The privatization in China is gaining track and
positively influencing the economy. Nicolas Lardy7who has analyzed the period since the late
1970’s, concludes that private companies have contributed significantly more to the rapid
growth of the Chinese economy than State-Owned Companies/State Controlled (SOE’s)
Companies. The root-cause of this is the much higher productivity- and profit increase in the
private sector. An important role in recent decades was the government gradually removing all
kind of obstacles to private entrepeneurship and that the large banks, which in the past mainly
focussed on financing SOE’s, have become open to finance private companies. The challenge
now is to also improve further the productivity of the SOE’s.
Interesting is that, according to Lardy, the share of private companies in the export of China
has increased substantially from zero in the nineties of the last century to 44% in 2015. It is in
his view not unlikely that this percentage has increased further in subsequent years. This means
that the participation of China in international trade is considerably less government driven than
in the past, which fits in the re-balancing process.
6 See Andrew Sheng and Xiao Geng, “The Right Way to Judge Chinese Governance”. International Monetary
Institute (IMI), 3-4-2018. 7 Nicholas Lardy, “The Changing Role of the Private Sector in China”. Reserve Bank of Australiam Conference
Volume 2016, p.37-50.
July 2019
Vol.6, No.3
7
Increase in wage share
The rebalancing of the Chinese economy is also reflected in the distribution of national
income. In contrast with developments in the OECD area as a whole, the wage share of GDP has
risen sharply in China since 2011. After years of decline (in the period of very unbalanced
growth) this share is again at the average level of the OECD countries, but – admittedly - still
much lower than in the US or Europe. One of the causes behind the increase in the share of
wages is the already mentioned structural shift from industry to the more labour-intensive
service sector. An increase in labour shares affect macro-economic aggregates such as cost to
enterprises and household consumption, and contributes to the further restructuring of the
economy. It goes without saying that the rise in wage share in China has gone hand in hand with
an increase in personal consumption.
Taken together, developoments at the macro-level are clearly moving into the right direction.
The necessary re-balancing of the Chinese economy is underway, but not yet completed. The
world (and also China) will have to get used to the fact that the Chinese economy will become
gradually more volatile. After all, a market economy is characterized by fewer government
interventions.
Spearheads of Chinese economic policy
Two spearheads of the economic policies of China during the present transition process I find
extremely important. These spearheads will underpin a favourable growth climate in the years to
come. First of all the so-called “Belt and Road Initiative” (BRI; Silk Road Project) and,
secondly, “Made in China 2025” (MIC 2025). Both projects fit into an approach aimed at
preventing China to end up in the so-called “middle income trap”. In such a trap a country is too
expensive for mass production due to increased wages, but not advanced enough to compete
with the most developed countries. To prevent such a situation (with stagnation and social
unrest) a country has to re-invent itself. That is what China is doing with these two projects. Of
course, there are more important projects but I can only deal with two of them.
The Belt and Road project The significance of the Belt and Road Project for China but also for the countries through
which this route is being constructed is, in my opinion, still underestimated. The project covers
an area with 4.6 bln people (60% of the world population). Pakistan’s former central bank
governor, Yaseen Anwar, compared the importance of this project with the importance of the
New Deal for the US in the 1930’s. And rightly so. It is indeed a gigantic project that will
become a growth engine for a number of countries that untill now, for a variety of reasons, were
unable to raise sufficient foreign capital.
For example, the port of Piraeus in Greece has developed explosively since the Chinese
involvement, numerous new companies have been set up in Africa that can use the Silk Road
infrastructure, roads have been built in Pakistan and Kazakhstan, etc. But also China itself will
be further opened through this project. Until now most Belt-related loans are for projects in
China. These loans focus on electricity, gas, heating, water. I’ve visited bank branches along the
Silk Road and was pleasantly surprised by the enthousiastic approach of the bank managers.
The US authorities took a shortsighted viewpoint and opposed the establishment of the Asian
Infrastructure Investment Bank (AIIB) which is instrumental in the financing of the BRI. China
is said to have started this project not only for economic reasons, but also on power political
grounds. In this respect today’s world does not differ much from yesterday’s. But let’s not forget that huge investments in public infrastructure are a prerequisite for the development of many of
the Silk Road countries, amongst them the countries on the African continent with a rapidly
growing population. A positive development of this continent is of paramount importance for

8
many reasons, including the containment of potential future migration flows. I welcome the
participation of the Netherlands in the AIIB and I deeply regret that the US stubbornly refused to
participate.
All this does not mean that theBelt and Road Project is without problems. We have seen this,
for example, in Malaysia, Pakistan and Sri Lanka. Some of the projects are too large for a
country and the same holds for some of the loans. Many, amongst them the World Bank, have
expressed concerns about a possible future African debt crisis. Unfortunately, there is sometimes
a lot of uncertainty about the size and the conditions under which Chinese loans have been
granted. More transparancy is indeed required. If receiving countries run into problems and
recourse to the IMF is inevitable, the Fund must first determine the so-called “debt sustainability
position” before it can come to the rescue of the country. That is difficult if there is a lack of
transparancy about the debt position. China is not a member of the Paris restructuring club,
although it has participated on an ad hoc basis. It would be helpful if China would become a full
member of this club, taking into account that China is financially involved in an increasing
number of countries.
Positive developments
During a symposium in Beijing at the end of April 2019 Christine Lagarde, Managing
Director of the IMF, quoted an old proverb regarding the Silk Road Project: “It’s easy to start a venture, the more difficult challenge is what comes next”. Madame Lagarde is positive about the
second Phase of the project, the reason being that the Chinese authorities have committed
themselves to more transparancy and enhanced cooperation with the international community –
the official as well as the private sector. Furthermore the Chinese Authorities have put high on
their agenda water management, the circular economy, the fight against corruption, debt
sustainability and green sustainability (the importance of the environment). The communique
issued after the Second Silk Road Conference at the end of April 2019 contains many
encouraging sentences. There is no reason to doubt the intentions expressed. In the words of
President Xi: “Chinese people value a promise as much as gold”. If the intentions and
expectations of the Silk RouteProject come true, this project will be seen in the future as one of
the most importante conomic endeavours of our time.
Made in China 2025
Technology is also a priority on the Chinese policy agenda. Since the future is highly
technology dependent, the logic of this choice is compelling. China is aiming at a leadership role
in, amongst others, robotica, transport, information technology, etc. The country is of course
fully entitled to have this ambition. Unlike many other countries China has a clearly defined
long-term strategy, and wants to become less dependent on other countries. Whatever the
outcome of the Huawei discussions with the USA, the mere fact that overnight one of its most
important industries can be put on a black list, will only strengthen the self-reliance tendencies.
Therefore, even if the Presidents Trump and Xi succeed in finding a compromise, irreversable
damage has already been done.
Ambitious goals ”Made in China 2025” is inspired by Germany’s “Industry-4-Plan”, but it is more
encompassing. The Germans have “the internet of things” in mind, the Chinese government is targeting a total upgrade of the quality of the production capacity, with an emphasis on
technological innovation. At the same time - and that seems in the eyes of Western countries a
bit contradictory - MIC 2025 calls for the use of market institutions, the strengthening of

July 2019
Vol.6, No.3
9
intellectual property rights, the introduction of international standards, etc. It seems a dual-track
policy with build-in fields of tensions due to a lack of understanding of the progress made by
China in these areas.
Scale and central management have proven to be successful keywords in the past and again
form the core of the policy approach. The targets pursued, in particular with respect to the
percentage of Chinese companies and production components in high-tech industries, are aimed
at a high self-sufficiency rate. The Chinese plans have led to much nervousness, especially in the
USA, partly because they would be accompanied by a forced transfer of technology by
companies operating in China or wishing to operate in this country. From the Chinese side this is
always denied resp. trivialized. Yet the Americans have suddenly been shot in a kind of cramp.
That cramp is now spreading across the Western world. Increasingly, current developments are
seen as a serious threat to the economic and political power of the West. It is true, the ambitions
are high and the Chinese commitment is unprecedented.
The US Administration is trying to slow down technological developments (including
artificial intelligence) in China, using “national security” as an argument. To what extent it will
be successful I don’t know, but it seems clear to me that China will and can not change its
ambitions and will eventually overcome the hurdles.
A game changer Kai-Fu Lee8 makes convincingly clear that China’s leading role in artificial intelligence is
linked to deeply rooted characteristics of the Chinese economy: Chinese entrepreneurship that is
the fruit of tremendous hard work, killing domestic competition, the unimaginable amount of
data and the high priority given by the government to AI. Lee quotes an estimate of PwC with
regard to the contribution of AI to the world wide GDP. This estimate amounts to 15.7 trillion
dollar, of which 7 trillion comes from China and 3.7 from the US. Whatever the accuracy of the
figures, it is clear that in PwC’s opinion China is going to take the lead. Let me quote again Lee:
“The dawn of AI in China will be like the harnessing of electricity: a gamechanger that supercharges industries across the board”, and: “If AI is the new electricity, big data is the oil that powers the generators”. I think Lee is right.
Risks
The present and future is self evidently not risk free. I see actual risks in the real estate sector,
the industry, the wholesale- and retail )sector. Eventually, I think, China can cope with these
problems. The problems in the industry are by no means negigible, especially in the overcapacity
industry. The writing off of non-performing loans and the restructuring and sometimes closing of
the companies involved will continue in the years to come, but seem manageable to me. The
major banks can gradually absorb their losses, also according to the IMF. My observation is that
the banks address the bad assets problems in a very structured way, using different instruments.
To my mind the greatest risks are in the inevitable liberalization process, the many
interdependencies in the Chinese economy (a.o. formal and informal guarantee chains) and the
high and difficult to control debt level of the corporate sector and the local governments.
Looking at the banking sector I think that the many small and medium-sized banks are the
most risky. These banks are local and/or regional players and extremely important for the
economic development in their direct environment. For an outsider it is difficult to come to grips
with the quality of the assets on the balance sheets of these banks, their capital buffers, their risk
management, governance, etc. In May 2019 one of these smaller banks, Baoshang Bank, ran into serious problems and the Authorities immediately took action, involving China Construction
8 Kai-Fu Lee, “AI Superpowers. China, Silicon Valley and the New World Order”. 2018.

10
Bank, an approach we also in the Netherlands followed when in the past a small bank had to be
rescued. There was always a big brother that solved the problem. That was the past, but is not
anymore the case.
As to the 4 big banks in China, they are well capitalized, although the capital and other
requirements of the regulators and supervisors sometimes look like moving targets, becoming
more and more demanding. As to the Basel III Accord, the systemically relevant Chinese banks
have implemented the new rules of the game conscientiously (sometimes under the pressure of
the supervisor) and at the agreed upon speed. I think this is very important because the Chinese
big four are really big. In this regard the international landscape has changed fundamentally.
Before the outburst of the financial crisis, in 2007, the three biggest banks in the world - using
Tier-1 capital as a benchmark - were American banks, followed by three European banks.
Nowadays 4 Chinese banks are at the top of the list, followed by two American banks. The
increased importance of the Chinese banks entails increased responsibilities, at home and
abroad.
The most serious short term risk
The most serious risk for the Chinese economy in the short run relates to the trade war with
the Americans. This trade war holds the key to the outlook for the world economy in the coming
years and will, if tensions persist, raise doubts on the projected recovery path. A trade war is
fighting fire with fire. If the Americans keep down that path, everyone will burn including the
Americans themselves.
The US is using tariffs partly as a weapon for the realization of trade-unrelated goals. It is
seeking far-reaching changes in China, including an end to forced technology transfers and the
theft of intellectual property secrets, seemingly disregarding the measures already taken and/or
already announced. The tariff war between China and the US (and also between the US and
other countries) is spreading to other areas. A few examples. Top universities in the US are,
regrettably, reconsidering their partnerships with Chinese counterparts, and in June 2018 Senator
Rubio started to question the global index provider MSCI Inc. about why the company had
included certain Chinese stocks in its emerging market index (“What MSCI is doing is allowing
the Chinese Communist Party controlled market … to access a critical source of capital and
clothe itself in a facade of legitimacy”).
The trade war is not only hurting the Americans and the Chinese. The US Administration is
misleading the US citizens by saying that it is only the Chinese who bear the burden of the
tariffs. A tariff is a tax and its consequences are borne by providers and buyers of a product. The
providers of Chinese products include foreign companies in China and all those in other
countries that are part of the supply chain. I’ve seen calculations that estimate the share of
foreign content in China’s export at 40 to 50%. Relatively sophisticated sectors such as
computer- and electronic products have a much higher foreign content. The implication is that in
today’s world the direct impact of tariffs is spread over a number of (often neighbouring)
countries.
Probably the main impact of a trade war is through the damage to the confidence. Financial
markets react heavily to news about a trade war. Losses in these markets are often a multiple of
the direct effects of (announced) tariffs. But (the danger of) a trade war also influences the
behaviour of investors and consumers. The tensions between the US and China have already put
pressure on the growth of consumption in China, a pressure the government tries to counteract, among other things, through tax cuts.
July 2019
Vol.6, No.3
11
The victims of a trade warThe question “Who will suffer most: the US or China?”, is
discussed frequently. To my mind this is not very productive. That said, the potential for tariff
measures is bigger on the American side since the Chinese exports to the US are much larger
than those of America to China. Moreover, the American economy is very strong and growing
fast. Mid-2019 the US-economy will have experienced the longest expansion in recorded history
and unemployment is at levels not seen in half a century. So, this economy can take a beating, at
least for the time being. On the other hand, Trump’s position is potentially fragile. Support for
his policy can fade away quickly if the business cycle would change (the clouds in the sky seem
to become darker). More importantly, the Chinese government still has effective instruments at
its disposal. During the financial crisis the government has shown that it can mobilize these
instruments massively and at very short notice: monetary policy instruments (interest rates,
reserve requirements), further tax reductions, public infrastructure, etc. Unfortunately, there is no
such thing as a free lunch. Such a policy comes at a price: a delay in structural reforms, an end to
the deleveraging process. This is in nobody’s interest. It adds to the conclusion that a trade war
only has losers.
In summary
According to the “2018 Report to Congress on China’s WTO Compliance” China’s record of
compliance with WTO is poor. The country is said to have failed to comply with the
expectations and “has moved further away from open market oriented policies ……has used the benefits of WTO membership to become WTO’s largest trader, while resisting calls for further liberalization of its trade regime by claiming to be a “developing” country”. In the beginning of
this article I pointed to a quandry: being a large country and at the same time not high enough on
the per capita income list. China is in several aspects indeed still a developing country, whatever
the precise definition, and in spite of the “upper middle income” ranking by the World Bank.
According the the World Bank the country has lifted around 850 million people out of poverty.
That is more than impressive and should be taken into account in the assessment of the policies
pursued by the government. But at this very moment there are still more people in China below
the “upper middle income line” than citizens in the US. It is the ambition of the government to
eliminate absolute poverty and create “a moderately prosperous society” by 2020/2022.
Step-by-step China is realizing its goals, trying to balance internal needs and external
requirements. It is in its own way moving to a market-based economy and has made much more
progress in many areas than is being realized. Nevertheless, a further re-balancing remains
necessary to ensure sustainable growth. Differences of opinion about the methods used and the
balance between internal needs and external requirements should be discussed and not fought
through a trade war.
12
Monetary Policy
Exchange Rates and Monetary Policy Frameworks in
Emerging Market Economies
By AGUSTÍN CARSTENS*
Introduction
I am particularly happy to share the floor with Andrés Velasco, for whom I have great
admiration as an academic and as a policymaker. My interaction with Andrés was remarkably
fruitful back in 2008 and 2009, when we were finance ministers of our respective countries -
both well run, open economies in Latin America. At the time, we commiserated with each other
about massive spillovers from crisis-stricken advanced economies (AEs) during the Great
Financial Crisis (GFC). Regretfully, emerging market economies (EMEs) still face this type of
problem, as I hope to illustrate during this lecture.
Monetary policy frameworks are being actively discussed again as central banks around the
world attempt to chart their course in the unfamiliar post-crisis economic waters. The Federal
Reserve has embarked on a review of its monetary policy framework, and other AE central
banks are acutely aware of the need to adapt their own frameworks so that they are fit to meet
new challenges.
EME central banks find themselves in similar circumstances. Even though EMEs were not at
the epicentre of the GFC, they suffered its shockwaves; and since then, they have been dealing
with the spillovers of the needed remedial policies that AEs have been implementing. The
unconventional monetary policies that AE central banks have embarked on in the past 10 years
have created unprecedented amounts of liquidity in the international financial system, part of
which has been channelled to practically all EMEs - induced by the mantra of "search for yield".
Such flows have taken the form of portfolio investments, including corporate and sovereign debt
foreign direct investment, and bank lending, but also trade financing.
These flows act through different channels and therefore have different consequences. But the
common thread is that they affect the exchange rate, making it more volatile and subject to large
swings as the capacity of EMEs to handle massive capital flows and huge stocks of foreign
resources is tested. This has been a phenomenon during the past several years of inordinately
accommodative monetary policies in AEs, and will continue into the future as accommodation
persists but also when it is reversed. This situation has challenged, and will continue to challenge,
the monetary policy frameworks adopted by EMEs during the last two decades. The main reason
This lecture is delivered at the London School of Economics, London on May 2, 2019. *Agustín Carstens, General Manager of the BIS
July 2019
Vol.6, No.3
13
is that the behaviour of the exchange rate can fundamentally affect the dynamics of inflation and
the capacity of monetary policy to produce the expected results.
Thus, in the course of my lecture today, I will concentrate on how EME central banks have
fared in the post-crisis era, and what challenges they face in shaping the contours of a monetary
policy framework that can serve them well in the coming years.
In some respects, EMEs have had a head start in charting their monetary policy strategies as
they revamped their policy frameworks in the wake of the severe financial crises that hit them in
the 1990s. The most notable change was the exchange rate regime. There was a general move
away from fixed or heavily managed exchange rate arrangements towards flexible exchange
rates. The vast majority of EME central banks today operate under an explicit inflation targeting
regime with flexible exchange rates, while only a few use an explicit exchange rate anchor. This
framework has taken deep root and has served central banks well. Last summer, EMEs suffered
from financial turbulence. By and large, however, most EMEs came out of this turbulence
unscathed. I believe their resilience owes much to the flexibility built into their monetary policy
frameworks, together with stronger fundamentals, including more prudent fiscal policies and
enhanced financial regulation and supervision.
But reality reflects the importance of the exchange rate. Irrespective of the official labelling,
EME central banks have, in practice, attached a significant weight to the exchange rate in the
conduct of their monetary policy, as reflected for instance in the evolution of FX reserves in
EMEs over the past two decades. "Benign neglect of the exchange rate" has been a dictum
honoured more in its breach than in its observance as a guide for monetary policy. As a
consequence, many EMEs have a quasi-managed floating exchange rate regime where central
banks lean against swings in the exchange rate, both on the way up and on the way down. I shall
argue that this approach is one where the practice outruns the theory, and it is arguably the
theory that needs to catch up. That said, the enduring challenge for EME central banks is to
design their monetary policy frameworks in a way that incorporates in a rigorous way the precise
role of the exchange rate for their domestic economic outcomes. The BIS is expending a great
deal of analytical effort in this direction, and I would like to share a few of the key findings
today.
Challenges posed by swings in exchange rates
Why do EME central banks care so much about the exchange rate? At a basic level, it's
because the exchange rate is a core determinant of the nominal anchor in a small open economy.
It goes to the heart of what central banks are meant to do: preserve the value of money. Large
swings in the exchange rate, and especially large depreciations, can destabilise prices, and can
do so in non-linear and even discontinuous ways. Monetary stability, usually accompanied by at
least moderate exchange rate stability in the medium term, is the cornerstone of orderly
economic activity. And for monetary stability to prevail, it is vital to maintain the hard-won
credibility of the monetary framework.
Exchange rates and the nominal anchor
Exchange rates impact domestic inflation through their effect on the price of tradables.
However, the ultimate effect of exchange rate changes on the broader price level depends
crucially on the characteristics of the domestic inflation process, and specifically on the
propagation of the initial impact through "second-round" effects. In particular, the initial impact
on the price of tradables can feed into the non-tradables sector and to the general price level. The
bigger the initial shock, the greater the chance of inflation expectations being set adrift from the
central bank's target. The unmooring of inflation has occurred throughout history. It is non-linear

14
and sometimes discontinuous. It's worth remembering that a large depreciation and economic
downturn are often followed by a sharp rise in inflation, despite the slowdown in economic
activity. The extent of such second-round effects depends, in turn, on how well inflation
expectations are anchored to the central bank's target. The less well anchored inflation
expectations are, the more pronounced second-round effects will be.
To anchor inflation expectations in the face of destabilising domestic currency depreciations,
central banks tend to tighten their monetary policy stance, usually by adjusting a short-term
reference interest rate. In technical terms, this type of reaction function would be equivalent to
having a Taylor rule that would include exchange rate considerations, reflecting precisely the
influence of the exchange rate on inflation dynamics.
In circumstances of extreme market volatility though, traditional monetary policy adjustment
through short-term interest rates might not be enough to preserve the anchoring of inflation
expectations. In such cases, it would be appropriate to use other instruments, such as foreign
exchange interventions and/or macroprudential policies. Given the possibility of massive stock
adjustments in capital markets as part of the settling process for the unprecedented liquidity in
the international financial system, the need to stabilise using multiple instruments might very
well prove to be the norm rather than the exception. As a matter of fact, various episodes in
multiple countries have been providing evidence in this direction. Here is where the theory needs
to catch up with the reality. Having said all this, it is true that exchange rate pass-through to
inflation in many EMEs has decreased considerably over the past two decades, although it often
remains larger than in AEs. The decline in exchange rate pass-through to prices is one of the
notable achievements of the inflation targeting regimes put in place since the 1990s. There are,
however, major regional differences, with pass-through in Latin America being considerably
higher than in emerging Asia, reflecting differences in the significance of second-round
effects. To some extent, the hard-won gains in reducing pass-through may well reflect the
monetary policy practice of limiting swings in exchange rates. In this respect, I believe that the
departures of monetary policy practice from the textbook prescriptions have been important in
consolidating the gains.
So, while exchange rate pass-through has declined, it would be too complacent of us to
assume that inflation has been vanquished. In fact, many of the vulnerabilities that lie just below
the surface can be exposed at times of economic and financial stress.
Before we delve deeper into the discussion about the appropriate role of the exchange rate in
EME monetary frameworks, it is important to understand in greater detail the main avenues
through which exchange rate fluctuations work across different layers of the economy.
Exchange rates and export volumes
Let me start with exports. Generally, a depreciation of the currency improves international
competitiveness and boosts economic activity. However, this benign picture might be missing
some key elements. In particular, as a consequence of widespread dollar invoicing, there is a
financial channel of exchange rates through global trade financing that weakens the traditional
trade channel.
The role of trade finance has increased as global value chains (GVCs) have lengthened,
requiring greater financial resources to underpin their expansion. One summary measure of the
prevalence of GVC activity is the ratio of global trade to global GDP. Since trade measures gross
output while GDP is about value added, the ratio of trade to GDP is a useful proxy for GVC activity. As a stronger US dollar is usually associated with tighter credit conditions for EMEs,
this financial dimension weakens the expansionary effect of currency depreciation on a country's
exports. In the extreme, currency depreciation could even have a contractionary effect on exports

July 2019
Vol.6, No.3
15
if GVCs are curtailed due to tighter credit conditions. One indication of the relevance of such
mechanisms is that the ratio of global trade to global GDP is negatively linked to the strength of
the US dollar. At the BIS, we are currently looking into how much the recent downturn in
manufacturing and trade can be attributed to this channel.
Exchange rates and domestic economic activity and financial conditions
In EMEs, the exchange rate also affects domestic economic activity through financial
conditions, further complicating the central bank's task. EMEs' exposure to financial channels of
the exchange rate arises from two key features of their financial structure: (i) EME borrowers,
especially corporates, rely heavily on foreign currency borrowing; and (ii) foreign investors'
large holdings of EME local currency sovereign debt. Through both channels, exchange rate
appreciation tends to loosen domestic financial conditions, exerting an expansionary effect on
domestic economic activity. Since monetary policy works through financial markets, central
banks understandably care about exchange rates in the context of their domestic demand
conditions. More broadly, looser financial conditions lead to the build-up of financial
vulnerabilities that may pose risks to price stability over longer horizons.
Over the past two decades, the stock of foreign currency debt of EMEs has surged, driven in
particular by the non-financial corporate sector, and in many cases it has not been matched with
FX assets and revenues, giving rise to currency mismatches. Corporates have incurred long-term
debt in foreign currencies, often to finance long-term real investment, or simply to accumulate
financial assets, such as loans to other, less creditworthy companies, often in domestic currency.
Such currency mismatches on borrower balance sheets make financial conditions a function of
the exchange rate. For instance, an appreciation of the domestic exchange rate against the
funding currency reduces debt servicing costs and debt burdens, lowering EME borrowers' credit
risk, attracting more capital inflows and loosening financial conditions. These mechanisms work
in reverse when the currency depreciates, but are then potentially amplified through higher
foreign currency debt burdens accumulated in the appreciation phase.
Even in the absence of currency mismatches on borrower balance sheets, exchange rate
swings influence EME domestic financial conditions. EME sovereigns have increasingly relied
on local currency debt issuance, facilitated by the rapid development of local currency bond
markets. However, the ability to borrow in domestic currency has not alleviated the exposure to
exchange rate swings. It has rather shifted it to a different form, as a large share of EME local
currency sovereign bonds is held by foreign investors, reflecting the search for yield by asset
managers.
Since foreign investors are subject to risk constraints in global currencies, the currency risk
merely migrates from borrowers' to lenders' balance sheets. Currency and rollover risks on the
borrower side have been replaced by duration and currency risk on the lender side. Exchange
rate moves then tend to amplify investors' gains and losses, so that exchange rate fluctuations
amplify portfolio flows. Exchange rate appreciation increases credit supply from foreign
investors, pushing down bond yields. The same mechanism plays out in reverse when the
exchange rate depreciates.
Since central banks care about domestic activity, exchange rates matter because they influence
long-term interest rates above and beyond the textbook transmission channels of monetary policy.
A strongly appreciating domestic currency is associated with compressed term premia, while a
sharply depreciating domestic currency is associated with widening term premia. Even for a
central bank that doesn't worry about financial stability, these swings in long-term rates matter
for demand conditions. When financial stability considerations are factored in, the impact of
exchange rates is greater still. External borrowing - from both banks and capital markets - and
16
domestic borrowing interact. There is ample evidence that external borrowing increases relative
to domestic borrowing during credit booms. And that strong credit expansion coupled with
strong exchange rate appreciations has preceded financial crisis. In this way, global financial
conditions and domestic financial cycles reinforce each other.
The strong presence of global investors in EME markets further implies that financial shocks,
such as a change in AEs' monetary policy or a change in investor sentiment, can trigger portfolio
flows that are so large that they can become a driver of the exchange rate. The exchange rate
may hence increasingly act as a transmitter and amplifier of financial shocks, rather than as an
absorber of real shocks.
Taking account of exchange rates in monetary policy conduct
The link between exchange rates and domestic financial conditions and the weakening of the
traditional trade channel have important implications for monetary policy. A depreciation of the
domestic currency would push up inflation through exchange rate pass-through, but would have
little effect on domestic output through traditional trade channels, at least in the near term.
Through financial channels, exchange rate depreciation would further lead to a tightening of
financial conditions across the board, exerting a contractionary effect on the domestic economy.
As a consequence, the central bank may face the dilemma of rising inflation and a weak real
economy when the exchange rate depreciates. A short-term trade-off between inflation and
output stabilisation may arise which would complicate the conduct and the communication of
monetary policy.
Moreover, thanks to the presence of powerful financial channels, exchange rate fluctuations
push inflation and debt in opposite directions, potentially raising an intertemporal trade-off for
the central bank in the pursuit of price stability. This trade-off is best described in the context of
an appreciating currency. Exchange rate appreciation tends to push down inflation, but fuels the
accumulation of debt by loosening financial conditions, raising vulnerabilities over the medium
run. Since financial stability risks also imply risks to longer-run price stability, this raises, for
central banks, an intertemporal trade-off between short-term and medium-term for both output
and price stability.
In the face of these difficult trade-offs, traditional monetary policy response through
short-term interest rates runs the risk of falling short of what is needed. Thus, EME central banks
have responded to these trade-offs and challenges through the activation of additional supporting
policy instruments aimed at mitigating exchange rate swings and their macro-financial
repercussions.
FX intervention
Intervention in foreign exchange markets is a tool that can help shape more favourable
trade-offs from exchange rate swings. EME central banks have extensively relied on this
instrument over the past two decades, as reflected in a significant increase in their FX reserves.
And, validating this practice, there is empirical evidence indicating that sterilised FX purchases
in EMEs exert a statistically and economically significant depreciating effect on exchange rates,
at least temporarily.
FX intervention helps address the challenges from exchange rate swings in two main ways.
First, through its effect on the exchange rate, it can directly counteract exchange rate swings that
would have undesired effects on the inflation rate and on the real economy. In doing so, it takes some of the burden off conventional monetary policy conducted through interest rates and adds a
degree of freedom for monetary policy.
Second, the accumulation of reserves has macroprudential-like features. For one, it provides
July 2019
Vol.6, No.3
17
self-insurance against large devaluations in the future and, in doing so, it represents an integral
element of the global financial safety net. Indeed, there are indications that FX reserve buffers
helped mitigate the impact of recent episodes of global financial stress on EME exchange rates,
including during the GFC. For this purpose, the reserve accumulation itself does not even need
to have an influence on the exchange rate. In fact, when building up reserves with this objective
in mind, some central banks seek to have as little impact as possible on the external value of the
currency. This objective was quite common after the experience of the currency crises of the
1990s.
At the same time, sterilised FX intervention counteracts the mutually reinforcing feedback
loop between exchange rate appreciation and capital inflows that fuels domestic credit creation.
In other words, FX reserve buffers do not just clean, once capital flows reverse and stress arises,
but their accumulation also "leans" against the build-up of financial imbalances in the first place,
reducing the risk, or at least the amplitude, of a possible reversal.
The analogy with macroprudential instruments such as minimum loan-to-value ratios or the
countercyclical capital buffer is obvious. Indeed, there are good arguments for including both
macroprudential measures and FX intervention as part of an integrated macro-financial stability
framework.
However, holding FX reserves is costly, in particular in periods of very low interest rates in
reserve currencies, as is the case currently, and especially in countries with high domestic
interest rates. The extent of precautionary reserve accumulation and of the use of intervention as
a stabilisation tool will depend on the assessment of the net benefits, taking into account all
perceived benefits and costs, which will vary across countries and over time.
Thus, while national foreign reserves are an important element of the global financial safety
net, they are quite costly and, also for that reason, will always be limited. In times of large stock
adjustment by global investors, outsize capital outflows can overstretch the central bank's FX
reserve buffer. The mere possibility of such a scenario already makes speculative runs more
likely. In order to mitigate this risk, sound policy frameworks and FX reserve buffers at the
country level must be complemented by adequately equipped global lender of last resort
facilities at the IMF.
Targeted policy measures
Besides FX intervention, EME central banks have also resorted to traditional macroprudential
tools and (although less frequently) to non-orthodox balance sheet policies to deal with the
challenges from exchange rate swings.
The targeted nature of macroprudential tools has the advantage of reduced collateral damage
if imbalances and vulnerabilities are concentrated in a specific segment of the financial sector. At
the same time, this makes them susceptible to circumvention, which might reduce their
effectiveness. Overall, the experiences of the past two decades suggests that such targeted
measures can be effective and can help alleviate the trade-offs faced by monetary policy in the
face of exchange rate swings. They can enhance the resilience of the economy and mitigate the
build-up of vulnerabilities. That said, our knowledge about the effectiveness of macroprudential
tools is still somewhat limited, and more research is needed to enhance our understanding in this
respect. Moreover, most macroprudential instruments are bank-oriented and hence unsuitable to
deal with imbalances and vulnerabilities that may arise in capital markets.
In such situations, EME central banks may instead resort to non-orthodox balance sheet
policies. One such policy that has been implemented by several EME central banks is to offer
foreign exchange protection to investors without affecting the level of international reserves.
This is achieved by auctioning non-deliverable forwards (NDFs), thereby compensating the

18
holders for domestic currency depreciation. The central bank has a natural hedge for this
derivative exposure, precisely through its international reserves. Thus, the offering of exchange
note protection through NDFs is equivalent to adjusting the currency denomination of the central
bank's balance sheet.
Central banks could also prevent capital flows, and thus exchange rate pressures, by
facilitating the duration adjustment of portfolios in times of stress. Specifically, when a large
amount of foreign capital has been channelled to long-duration public debt and threatens to flow
out quickly, the central bank can use its balance sheet to stabilise markets by offering
shorter-duration instruments. For example, in 2013 the Bank of Mexico swapped long-term
securities for short-term securities via auctions. The reason was that long-term instruments were
not in the hands of strong investors and there was market demand for short-term securities in
order to address stock adjustment by global investors. This policy stabilised conditions in
peso-denominated bond markets.
EME monetary policy frameworks: which way forward?
What do all these considerations mean for monetary policy frameworks in EMEs? The
textbook version of the inflation targeting framework, which prescribes pursuing inflation
stability with floating exchange rates through adjustments of a short-term interest rate, is
obviously too narrow for EME central banks. In particular, the financial channel of the exchange
rate gives rise to difficult trade-offs for monetary policy, while at the same time complicating the
conduct of monetary policy by weakening its transmission.
EME central banks have risen to this challenge through their innovative use of additional
policy instruments. They have turned to FX intervention to deal directly with the financial
channel or insure against undesired exchange rate swings, and to other non-orthodox balance
sheet policies as well as macroprudential tools to deal with specific imbalances or vulnerabilities
in a targeted way. EME central banks' policy reaction function in the pursuit of price stability
can therefore be described as a multi-instrument reaction function responding to
multiple-indicator variables, including the exchange rate. Interest rates, FX intervention and
targeted measures can be seen as forming the corners of a policy triangle, which authorities rely
on in the pursuit of price stability. The calibration of the multi-dimensional instrument strategy
will depend on country-specific characteristics and the underlying factors driving exchange rate
and macro-financial dynamics.
Going forward, EME central banks will need to further develop their toolbox for dealing with
the challenges of exchange rate and capital flow gyrations. In particular, in a time of large and
internationally mobile stocks of financial capital and low interest rates, search for yield and
risk-taking acquire greater prominence in global capital flows and can expose EMEs to
disruptive stock adjustments by global investors. In order to deal with this challenge, EME
central banks may need to consider whether to further develop non-orthodox balance sheet
policies to deal with stock adjustments, such as asset purchases or asset swaps similar in nature
to the measures launched by major AE central banks to bring down long-term interest rates once
short rates hit the lower bound.
EME central banks also need to contend with how to address the intertemporal trade-offs that
exchange rate fluctuations have given rise to. As discussed before, through the presence of
powerful financial channels, the implications of exchange rate gyrations for inflation in the short
and medium run can be very different. For instance, exchange rate appreciation can be disinflationary in the short term, but may foster the build-up of financial imbalances, raising the
risk of large capital outflows and exchange rate depreciation in the future, thus creating risks for
medium-term price stability. In order to address this challenge, besides drawing on an extended

July 2019
Vol.6, No.3
19
set of policy instruments, EME central banks need to incorporate sufficient flexibility and
sufficiently long horizons in the interpretation of their price stability mandates. That way, the
longer-run risks to price stability posed by exchange rate-driven financial imbalances could be
incorporated into the decision-making process, and short-term policy activism be avoided.
Finally, EME policymakers need to consider measures to reduce the vulnerability of their
countries to exchange rate gyrations. This could be achieved in particular through structural
reforms boosting growth potential and thus enhancing debt sustainability. And, as always, there
is just no substitute for strong economic fundamentals.
20
Putting the Final Piece into the New Monetary Policy
Framework Timing is the Key
By DONG JINYUE AND XIA LE*
China’s authorities have recently raised their rhetoric of completing the new monetary policy
framework. In particular, many analysts view it as a signal of lifting the benchmark policy rates. We, however, do not envisage that the removal of benchmark policy rates will happen this year
given still-large growth headwinds and the lack of alternatives. Instead, we expect two cuts in
benchmark policy rates through the rest of the year as the authorities seek to increase their support for growth.
The PBoC is accelerating the pace of establishing a new policy framework
Over the past three decades, China’s authorities have been endeavouring to upgrade its
monetary policy framework to suit the needs of its increasingly complex market economy. The
reforms in this respect proceeded steadily in parallel with other important elements of China’s
financial reform, including commercialization of Chinese banks, exchange rate liberalization,
capital account opening etc. Despite several times of interruption and delay caused by strong
external shocks or entrenched China’s gradualism, the reform of China’s monetary policy
framework seemingly comes to its final stage now.
As discussed in our previous report (Monetary Policy: New Framework, New Stance), the
existing framework of China’s monetary policy features a dual-track policy rate system. On the
one hand, the authorities have already established a “corridor” interest rate system. The pledged
7-day interbank market rate (DR007) is the central bank’s policy rate under the “corridor”
system, whose movement is confined to a narrow corridor by design. The upper bound of the
“corridor”is constituted by a series of interest rates of the PBoC’s lending facilities at various
tenors, through which the PBoC discretionarily inject liquidity to the banking sector. At the
lower bound of the “ corridor” is the interest rate which the central bank pays on banks’
excessive deposit reserves (currently at 0.72%).
Meanwhile, the PBoC continues to announce its benchmark lending and deposit rates, which
used to be policy rates of the PBoC. The benchmark policy rates are not market-based. In history,
they directly dictated the interest rates of commercial banks offered to their customers, either
borrowers or depositors. After years of interest rate liberalization, Chinese commercial banks
today are allowed to freely offer interest rates to their customers. However, the interest rate in a
loan contract is still stipulated as benchmark policy rate plus or minus certain basis points. As
such, a chunk of banks’ loans and deposit products are still linked to the benchmark policy rates.
The PBoC has recently raised their rhetoric of completing the new monetary policy
framework. In particular, the PBoC reportedly started to enquire the commercial banks for their
opinions about the potential impact of removing benchmark lending rate. In addition, some
This article appeared in China Economic Watch in April, 2019. *Dong Jinyue, China Economist, BBVA; Xia Le, Senior Research Fellow of IMI, Chief Economist for Asia,
BBVA

July 2019
Vol.6, No.3
21
PBoC senior officials intentionally mentioned the possibility of unifying the dual-track policy
rate system on various occasions. For instance, Mr. Sun Guofeng, Head of Monetary Policy
Department of the PBoC, said in February that the key part of unifying dual-track policy rate
system is to enable the central bank’s policy rate, which he referred to DR007, to play a
dominant role in the commercial decisions of setting their lending and deposit rates offered to
borrowers and depositors.
What prompted the PBoC to accelerate the change?
To complete the reform of monetary policy framework is always on the top of the authorities’
reform agenda. However, we suspect that a couple of factors with respect to the recent
development in domestic economy and external environment could have prompted the
authorities to accelerate the change.
First, some deep seated changes in China’s Balance of Payment (BOP) are calling for a
price-tool-centred monetary policy framework. During most of the time between 1994 and 2013,
China’s BOP had “twin surplus” under both the current and capital accounts. In the face of large
net inflows, the central bank frequently used some quantitative policy tools, including the rise in
required reserve ratio (RRR) and the issuance of central bank bills, to conduct monetary policy.
Indeed, these quantitative tools are suitable for the then environment of abundant liquidity
brought by large-scale inflows since they can function as the sterilization tools as well.
Since 2015, the situation of China’s BOP has undergone important changes. The market crash
in Chinese stock markets and the following RMB devaluation in mid-2015 reinforced the
momentum of capital outflows from the country. Even the authorities tightened the grip of the
capital account in the aftermath of financial turmoil; the frequently appeared deficit under the
capital account has become part of Chinese economy’s “new norm”. (Figure 1)
At the same time, the surplus of China’s current account is shrinking at a fast pace. In 2007,
China’s current account surplus reached its record high of 9.9% of GDP, which has been in a
continuous decline till today in tandem with the economic rebalancing towards domestic
consumption. In 2018, the current account surplus only accounted for 0.39%. Now it is widely
anticipated that the ongoing trade tension between China and the US will tip the former’s current
account into a deficit soon. (Figure 2)
The profound changes in China’s BOP have prompted the authorities to accelerate the
upgrading of the monetary policy framework to make it suitable for the new environment. In
particular, when external inflows cannot provide adequate liquidity, the central bank needs to
adjust the size of their own balance sheet to manage the liquidity in the banking sector. Under
such a circumstance, the use of traditional quantitative policy tools could have strong knock-on
effects on financial markets and even lead to financial instability. Therefore, the authorities are
in need of an efficient price tool of monetary policy more than ever.
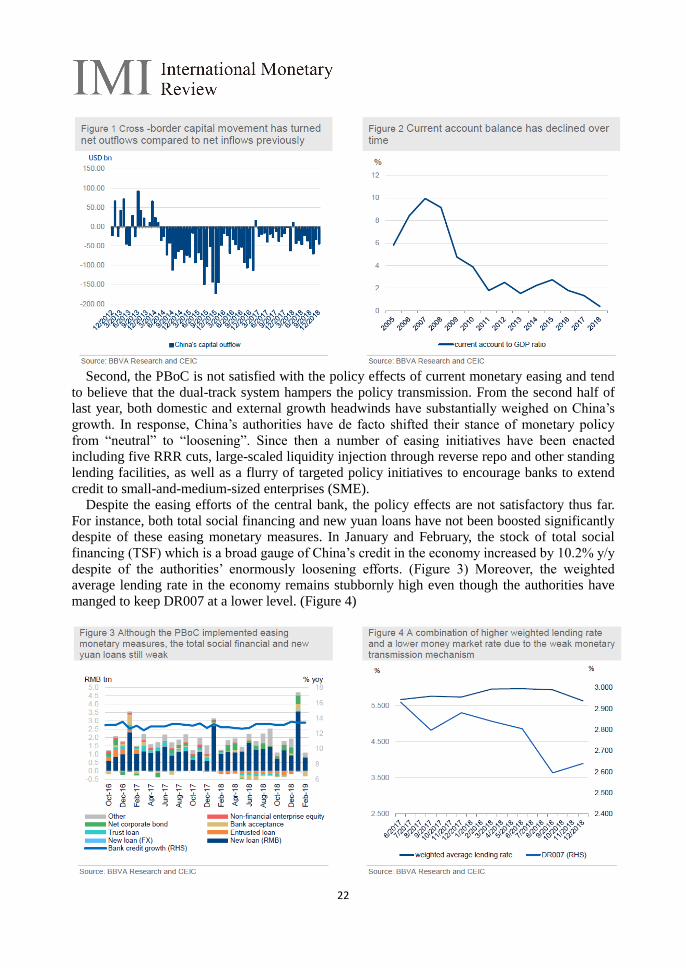
22
Second, the PBoC is not satisfied with the policy effects of current monetary easing and tend
to believe that the dual-track system hampers the policy transmission. From the second half of
last year, both domestic and external growth headwinds have substantially weighed on China’s
growth. In response, China’s authorities have de facto shifted their stance of monetary policy
from “neutral” to “loosening”. Since then a number of easing initiatives have been enacted
including five RRR cuts, large-scaled liquidity injection through reverse repo and other standing
lending facilities, as well as a flurry of targeted policy initiatives to encourage banks to extend
credit to small-and-medium-sized enterprises (SME).
Despite the easing efforts of the central bank, the policy effects are not satisfactory thus far.
For instance, both total social financing and new yuan loans have not been boosted significantly
despite of these easing monetary measures. In January and February, the stock of total social
financing (TSF) which is a broad gauge of China’s credit in the economy increased by 10.2% y/y
despite of the authorities’ enormously loosening efforts. (Figure 3) Moreover, the weighted
average lending rate in the economy remains stubbornly high even though the authorities have
manged to keep DR007 at a lower level. (Figure 4)

July 2019
Vol.6, No.3
23
The PBoC seems to blame the dual-track policy rate system as one prime culprit of
unsatisfactory policy effects. They believe that commercial banks are insensitive to the change
of DR007 because a chunk of their loans and deposit products tied to the benchmark interest
rates. That being said, the elimination of the benchmark interest rates might help the central bank
to improve the policy transmission. Timing is the key to the success of the monetary policy
framework reform.
Although we agree to the point that unifying the dual-track policy rate system is the long-term
goal for China’s financial reform, we don’t envisage that the removal of the benchmark policy
rate will happen this year. On the contrary, we anticipate that the authorities will cut the
benchmark policy rate this year in coordination with other easing initiatives in support of a
fast-slowing economy.
It is notoriously difficult for a central bank to stimulate the economy by easing monetary
policy, which was described by some people as a process of “pushing on a string”. During
previous economic downturns, both the US and Euro zone were unable to use traditional
monetary policy tools to put the growth back on track and therefore chose to implement some
unconventional monetary policy tools including quantitative easing, forward guidance, negative
interest rate, TLTRO etc. That being said, the existence of dual-track policy rate could be one of
many reasons why China’s monetary policy transmission mechanism doesn’t function well. But
the lift of benchmark policy rate is unlikely to fix the problem of policy transmission.
Indeed, a more relevant problem to the policy transmission is banks’ aggravated risk appetite
in the face of increasing growth headwinds. The clampdown of shadow banking activities has
forcefully driven a lot of borrowers out of the credit market and led to growth slowdown. The
still unsolved trade war with the US not only stalls the export sector but also hits consumers and
producers’ confidence. At such a juncture, banks’ concerns over asset quality may override the
authorities’ efforts of policy easing so that these risk-averse banks are reluctant to transmit the
lower financing costs (from the interbank market) to their clients. (Figure 5)
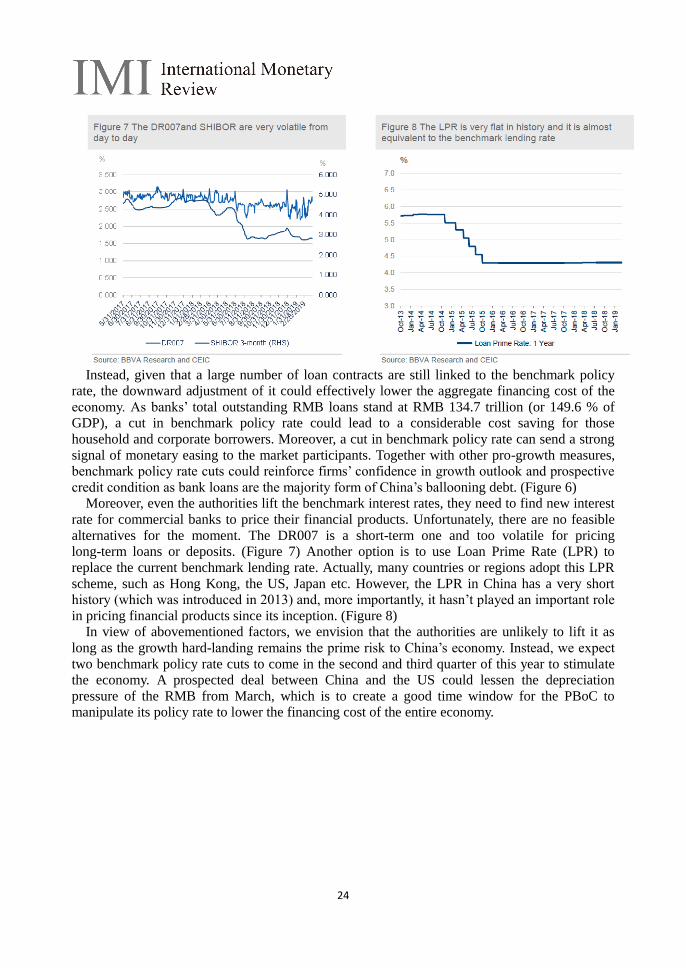
24
Instead, given that a large number of loan contracts are still linked to the benchmark policy
rate, the downward adjustment of it could effectively lower the aggregate financing cost of the
economy. As banks’ total outstanding RMB loans stand at RMB 134.7 trillion (or 149.6 % of
GDP), a cut in benchmark policy rate could lead to a considerable cost saving for those
household and corporate borrowers. Moreover, a cut in benchmark policy rate can send a strong
signal of monetary easing to the market participants. Together with other pro-growth measures,
benchmark policy rate cuts could reinforce firms’ confidence in growth outlook and prospective
credit condition as bank loans are the majority form of China’s ballooning debt. (Figure 6)
Moreover, even the authorities lift the benchmark interest rates, they need to find new interest
rate for commercial banks to price their financial products. Unfortunately, there are no feasible
alternatives for the moment. The DR007 is a short-term one and too volatile for pricing
long-term loans or deposits. (Figure 7) Another option is to use Loan Prime Rate (LPR) to
replace the current benchmark lending rate. Actually, many countries or regions adopt this LPR
scheme, such as Hong Kong, the US, Japan etc. However, the LPR in China has a very short
history (which was introduced in 2013) and, more importantly, it hasn’t played an important role
in pricing financial products since its inception. (Figure 8)
In view of abovementioned factors, we envision that the authorities are unlikely to lift it as
long as the growth hard-landing remains the prime risk to China’s economy. Instead, we expect
two benchmark policy rate cuts to come in the second and third quarter of this year to stimulate
the economy. A prospected deal between China and the US could lessen the depreciation
pressure of the RMB from March, which is to create a good time window for the PBoC to
manipulate its policy rate to lower the financing cost of the entire economy.
July 2019
Vol.6, No.3
25
Magical Monetary Theory
By JOHN GREENWOOD AND STEVE H. HANKE*
“Modern monetary theory” is the latest craze to circulate among the chattering classes. It is a
fuzzy, post-Keynesian theory that has caught on in antiausterity circles. The MMT doctrine
states that fiscal deficits don’t matter as long as countries borrow in their own currencies and
inflation stays in check. This is like manna from heaven for proponents of more government
spending and larger fiscal deficits.
Not surprisingly, MMT has reared its head in Japan, where debt is denominated in yen,
inflation is nowhere to be found, and the ratio of government debt to gross domestic product has
gone to the moon. MMT advocates claim Japan provides proof for their theory, but nothing
could be further from the truth.
Separate, potent forces have given rise to two seemingly strange trends in the Japanese
economy: dramatic changes in the savings-investment balances in the public and private sectors,
and the failure of monetary policy. MMT doesn’t explain either one.
At the outbreak of the global financial crisis in 2008, Japan’s government deficit was only 2%
of GDP, while the combined corporate and household surplus amounted to 5.1%. Within a year,
a massive contraction of private investment and consumption occurred in Japan. By the fourth
quarter of 2009, the private-sector surplus had surged to 12% of GDP. At the same time, the
government deficit exploded to 9.9% of GDP. The resulting net savings surplus has fueled
capital outflows. Today, these outflows amount to 2.1% of GDP and finance a stream of Japanese
foreign investment.
This pattern of large private savings surpluses offset in part by large public deficits continues.
The result has been a massive increase in the size and role of the Japanese public sector.
Government debt has risen from 60% of GDP in 1990 to an astounding 235% today. But
contrary to MMT, this fiscal extravagance has done nothing to boost the economy.
Separate from Japan’s overall savings surpluses, its broad-money metrics have grown at a
snail’s pace. Since Japan’s bubble burst in 1990-91, broad money has grown at a paltry 2.6% a
year, as measured by M2. In addition, since the 1950s money velocity has been negative,
decreasing at an average rate of close to 2% a year. This is one of the most striking and
consistent macroeconomic relationships on record. Japan’s slow broad-money growth mixed
with a contracting money velocity has held down nominal GDP growth.
Faced with a contracting money velocity, Japan would have to increase its M2 money supply
at a minimum of 5% a year, which is double its trend rate, to hit its inflation target of 2% a year
and reach its potential annual growth rate of 1%. In practice, inadequate M2 growth over nearly
three decades, combined with a declining money velocity, has translated into average real
growth of just 0.9% a year. This has put Japan into a deflationary straitjacket, with prices
decreasing by an average of 0.6% a year, as measured by the GDP deflator.
As long as M2 growth in Japan remains minimal, low inflation—or outright deflation—will
prevail regardless of whether the public and private sectors are running savings surpluses or
deficits. As Milton Friedman counseled, “Inflation is always and everywhere a monetary
phenomenon.” The same is true of deflation. Money dominates.
This article appeared on The Wall Street Journal on June 5, 2019. *John Greenwood, Chief Economist at Invesco in London; Steve H. Hanke, Member of IMI International
Committee, Professor of Applied Economics at the Johns Hopkins University
26
Understanding Japan and other economies requires classical monetary theory, not MMT
nostrums. From 1974-84, Japan enjoyed a golden period with generally stable broad-money
growth, steady real GDP growth, and low inflation. Then monetary policy was derailed by the
1985 Plaza Accord and the 1987 Louvre Accord. The Bank of Japan dropped monetary targets
and began to focus on interest-rate targets. The result was Japan’s disastrous bubble from
1987-90, followed by a so-called lost decade, which has turned into a lost generation.
According to the Bank of Japan, the basic idea of interest-rate targeting is that if interest rates
can be pushed low enough, sooner or later companies or households will start spending. But as
Irving Fisher showed a century ago, interest rates follow inflation; they don’t precede it. That is
why economies experiencing high rates of inflation, like Argentina and Turkey, have high
interest rates, while Japan and the eurozone have very low or even negative rates.
For Japan (and the eurozone), this circle can be broken only by increasing broad-money
growth. The best way to do that would be for the central bank to purchase securities from
nonbank institutions such as insurance companies and pension funds, creating new deposits. But
the vast bulk of the Bank of Japan’s securities purchases currently come from banks. That’s why
broad-money growth in Japan remains anemic.
Recent U.S. history also demonstrates the superior explanatory power of classical monetary
theory. From 1971-82, M3 money-supply growth averaged 11.6% a year, while the average level
of government debt was only 40.1% of GDP. This combination of rapid monetary growth and
low government debt resulted in relatively high inflation. Money dominated.
Today the U.S. faces the opposite: low broad-money growth with high government debt. Since
2009, M3 growth has averaged 4.5% a year, while federal, state and local government debt today
is more than 100% of GDP. This combination has resulted in relatively low inflation. This is no
mystery. As always, money dominates.
MMT advocates would have us believe that governments can run deficits without limit as long
as they are financed by securities denominated in their own currencies—at least until inflation
takes off. What they fail to understand is that budget deficits have nothing to do with inflation,
unless they are financed by rapid broad-money growth. Money dominates economic trends, and
classical monetary theory tells us why. Beware of those peddling MMT snake oil.

July 2019
Vol.6, No.3
27
The Disconnect Between Inflation and Employment in the
New Normal
By LAEL BRAINARD*
It is a pleasure to be here at the National Tax Association Annual Spring Symposium. Just as it
may take the tax experts and practitioners here today some time to disentangle the longer-term
implications of recent major changes to tax policy, so, too, we are in the process of analyzing the
lessons for monetary policy of apparent post-crisis changes in the relationships among
employment, inflation, and interest rates.
The Congress has assigned the Federal Reserve the job of using monetary policy to achieve
maximum employment and price stability. Price stability means moderate and stable inflation,
which the Federal Reserve has defined to be 2 percent inflation. Maximum employment is
understood as the highest level of employment consistent with price stability. In the aftermath of
the Great Recession, which had deep and persistent effects, it is important to understand whether
there have been long-lasting changes in the relationships among employment, inflation, and
interest rates in order to ensure our policy framework remains effective.
Employment and Inflation
This expansion will soon become the longest on record in the United States. Growth has
persisted throughout the past decade, overcoming downdrafts from abroad and pullbacks in
fiscal support earlier in the expansion and benefiting last year from a large fiscal boost. Recent
data confirm that consumers remain confident, workers are productive, and businesses are hiring,
although trade conflict is creating uncertainty.
The job market is strong. At 3.6 percent, the unemployment rate is now lower than it was
before the crisis. At 80 percent, the employment rate for workers in their prime working-age
years—a more comprehensive measure of slack that includes shifts in labor force participation
as well as unemployment—has recently risen close to its pre-crisis level.
In contrast, the picture on inflation is puzzling this far into an expansion. Despite the
strengthening of the labor market, the measure of core inflation excluding volatile food and
energy prices did not move up to 2 percent on a sustained basis until last year, and in the most
recent reading, the 12-month change has moved down to 1.6 percent. Other inflation measures
paint a somewhat more reassuring picture. The Dallas Fed’s trimmed mean measure of inflation,
which provides a different way to filter out idiosyncratic movements in various components of
inflation, has increased 2 percent in the past 12 months, slightly higher than its level of 1.9
percent for the two previous years.
The New Normal
Since the Great Recession, there have been several changes in macroeconomic relationships,
which I refer to as the new normal. Now is a good time to assess the characteristics of the new
normal and what they mean for monetary policy. The emerging contours of today’s new normal
This speech is delivered at the National Tax Association 49th Annual Spring Symposium "Certain Uncertainty:
Tax Policy in Unsettled Times" on May 16, 2019. *Lael Brainard, Member of the Board of Governors of the Federal Reserve System

28
are defined by low sensitivity of inflation to changes in labor market slack, a low long-term
neutral rate of interest, and low underlying trend inflation.Let me take each in turn.
In today’s new normal, price inflation has not moved up consistently as the labor market has
strengthened considerably over the course of the long expansion. This is what economists mean
when they say the Phillips curve is very flat: The historical relationship between resource slack
and price inflation appears to have broken down. Although wage growth has been moving
progressively higher as labor market slack has diminished, broader price inflation has remained
muted.
Another important feature of today’s new normal is that the long-run neutral interest rate
seems to be lower than it was historically. The neutral rate of interest refers to the level of the
federal funds rate that would maintain the economy at full employment and 2 percent inflation if
no tailwinds or headwinds were buffeting the economy.The decline in the neutral rate likely
reflects a variety of forces globally, such as the aging of the population in many large economies,
some slowing in the rate of productivity growth, and increases in the demand for safe assets.
When one looks at the Federal Reserve’s Summary of Economic Projections (SEP), it is striking
that over the past five years, since the SEP interest rate projections first became available, the
median estimate of the long-run federal funds rate has declined 1-1/2 percentage points, from
4-1/4 percent to 2-3/4 percent. Going back further to the two decades before the crisis shows a
similar decline in today’s long-run neutral rate relative to earlier Blue Chip consensus forecasts
of the long-run federal funds rate.
Third, underlying trend inflation—the trend in inflation after filtering out idiosyncratic and
transitory factors—appears to be somewhat below the Federal Reserve’s goal of 2 percent. This
raises the risk that households and businesses could come to expect inflation to run persistently
below the Federal Reserve’s target and could change their behavior in a way that reinforces that
expectation. Expectations are an important determinant of actual inflation because wage and
price behavior by businesses and households is partly based on expectations of future inflation.
While low inflation and low interest rates have many benefits, the new normal presents a
challenge for the conventional approach to monetary policy, in which the Federal Reserve could
rely on changes in the level of the federal funds rate to achieve its inflation and employment
goals. In past recessions, the Federal Reserve has typically cut interest rates by 4 to 5 percentage
points in order to support household and business spending and hiring. With the long-run neutral
rate low and with underlying trend inflation somewhat below target, nominal interest rates are
likely to remain below those levels, which therefore leaves less room to cut rates as much as
needed. With less room to ease financial conditions and support economic activity using our
conventional policy tool, the economy may endure prolonged periods during and after recessions
with short-term interest rates pinned at their effective lower bound. That, of course, was what
happened following the financial crisis, when the Federal Reserve kept interest rates close to
zero from December 2008 through November 2015.
That constraint limits the Federal Reserve’s ability to provide stimulus through its
conventional tool and thus could tend to leave inflation lower than it would otherwise be, and
unemployment higher. The experience of several years with the federal funds rate pinned at its
effective lower bound and actual inflation below our target could weigh on expectations for
future inflation and thereby influence the behavior of households and businesses that helps
determine wages and prices. The experience of a sustained period of low inflation could depress
underlying trend inflation by feeding into lower inflation expectations, further reducing nominal interest rates and the space to cut interest rates in what could become a downward spiral. So we
need to be especially careful to preserve as much of our conventional policy space as we can,
while exploring mechanisms to augment the effectiveness of our framework.

July 2019
Vol.6, No.3
29
Maximum Employment in the New Normal
The new normal has some important benefits.With subdued inflation, the sustained expansion
has drawn workers back into the labor market after a damaging recession.The unemployment
rate is approaching a 50-year low, and the overall labor force participation rate has remained
constant despite the long-term aging of the population that would otherwise be pushing
participation lower.
Like the overall unemployment rate, broader measures of labor market slack are also lower
than their pre-crisis levels.The Bureau of Labor Statistics’ U-6 measure shows that two groups
have recently shrunk to pre-crisis levels after rising considerably during the recession: those
working part time who would prefer full-time employment and people marginally attached to the
labor force who have looked for work in the previous year but stopped looking more recently.
The strong labor market is leading to employment gains among workers with disabilities.
Research suggests it may be helping to narrow some of the long-standing disparities for some
racial minorities, although this development is tentative and modest.
We hear from business contacts that they are now hiring workers they may not previously
have considered. During the recession, the evidence suggests that many employers raised their
requirements for many job categories. As labor markets have tightened, employers in certain
sectors, occupations, and areas of the country report they are loosening requirements and
investing more in training.That means today’s economy is providing opportunities for workers
who might previously have been left on the sidelines—including those with records of past
incarceration or who lack a particular certification or degree.
Given that the large majority of working-age households, those at the middle and lower ends
of the income distribution, rely primarily on wage income, advancing our employment mandate
has served the country well. In today’s new normal, with the low responsiveness of inflation to
labor market tightness, there appears to be little evidence so far of a tradeoff with our
price-stability objective.The sustained strengthening of the labor market also adds to the
productive capacity of the economy by attracting people on the sidelines to join or rejoin the
labor force and move into employment.
What about the Risks?
Of course, there are also risks.The past three downturns were precipitated not by rising
inflation pressure, but rather by the buildup of financial imbalances.Extended periods of above
potential growth and low interest rates tend to be accompanied by rapid credit growth and
elevated asset valuations, which tend to boost downside risks to the economy. It is not hard to
see why a high-pressure economy might be associated with elevated financial imbalances,
especially late in the cycle. As an expansion continues, the memory of the previous recession
fades. Profits tend to rise, experienced loss rates on loans are low, and people tend to project
recent trends into the future, which leads financial market participants and borrowers to become
overly optimistic. Risk appetite rises, asset valuations become stretched, and credit is available
on easier terms and to riskier borrowers than earlier in the cycle when memories of losses were
still fresh.
Historically, when the Phillips curve was steeper, inflation tended to rise as the economy
heated up, which naturally prompted the Federal Reserve to raise interest rates.In turn, the
interest rate increases would have the collateral effect of damping increases in asset prices and
risk appetites. With a flat Phillips curve, inflation does not rise as much as resource utilization
tightens, and, accordingly, provides less necessity for the Federal Reserve to raise rates to
restrictive levels. At the same time, low interest rates along with sustained strong economic
conditions are conducive to increasing risk appetites prompting reach-for-yield behavior and
30
boosting financial excesses late in an expansion.
With the forces holding down interest rates likely to persist, valuation pressures and risky
corporate debt, such as leveraged lending, could well remain at elevated levels.Elevated
valuations and corporate debt could leave the economy more vulnerable to negative shocks.The
market volatility in December is a reminder of how sensitive markets can be to downside
surprises.
A key implication of the weakening in the relationship between inflation and employment,
then, is that we should not assume monetary policy will act to restrain the financial cycle as
much as previously. As a consequence, policymakers may need to think differently about the
interplay of the financial and business cycles due to the combination of a low neutral rate, a flat
Phillips curve, and low underlying inflation.With financial stability risks likely to be more
tightly linked to the business cycle than in the past, it may make sense to take actions other than
tightening monetary policy to temper the financial cycle. In order to enable monetary policy to
focus on supporting the return of inflation to our symmetric 2 percent target on a sustained basis
along with maximum employment, we should be looking to countercyclical tools to temper the
financial cycle.
One tool other central banks have been using to help temper the financial cycle is the
countercyclical capital buffer (CCyB).The CCyB provides regulators with the authority to
require large banks to build up an extra capital buffer as financial risks mount. Although the
CCyB was authorized as part of the post-crisis package of reforms, so far, the Federal Reserve
has chosen not to use it. Turning on the CCyB would build an extra layer of resilience and signal
restraint, helping to damp the rising vulnerability of the overall system.Moreover, because the
CCyB is explicitly countercyclical, it is intended to be cut if the outlook deteriorates, boosting
the ability of banks to make loans when extending credit is most needed and providing a
valuable signal about policymakers’ intentions.This feature proved to be valuable in the United
Kingdom in the wake of the Brexit referendum.
If countercyclical tools and other regulatory safeguards are not adequate over the cycle,
monetary policy will need to carry a greater burden in leaning against financial excesses. That
would be unfortunate, because adding financial stability concerns to the burden of conventional
monetary policy might undermine sustained achievement of our employment and inflation goals.
Because the financial cycle is today likely to be tempered less than in the past by material
increases in interest rates as the economy expands, the appropriate level of bank capital for
today’s conditions is unlikely to be the same as in past business cycles: Because interest rates
likely will do less than in past cycles, regulatory buffers will need to do more. As a consequence,
now is a bad time to be weakening the core resilience of our largest banking institutions or to be
weakening oversight over the nonbank financial system.Instead, we should be safeguarding the
capital and liquidity buffers of banks at the center of the system, carefully monitoring risks in the
nonbank sector, and making good use of the countercyclical tool that we have.
Achieving our Inflation Objective on a Sustained Basis
Finally, let us turn to the apparent softness in underlying trend inflation.One hypothesis for the
flat Phillips curve is that central banks have been so effective in anchoring inflation expectations
that tightening resource utilization is no longer transmitted to price inflation. Another possibility
is that structural factors such as administrative changes to health care costs, globalization, or
technological-enabled disruption have been dominant in recent years, masking the operation of cyclical forces. Regardless, because inflation is ultimately a monetary phenomenon, the Federal
Reserve has the capacity and the responsibility to ensure inflation expectations are firmly
anchored at—and not below—our target.

July 2019
Vol.6, No.3
31
As I have argued in the past, the fact that inflation has been running somewhat below our
longer-run goal of 2 percent may not be entirely due to labor market slack or to transitory shocks;
it also likely reflects some softening in inflation’s underlying trend. First, estimates of
underlying inflation based on statistical filters are lower than they were before the financial crisis
and are currently below 2 percent. Second, estimates of longer-run inflation expectations based
on the University of Michigan Surveys of Consumers and on inflation compensation from
financial market pricing are also running lower than before the financial crisis.
Our goal now is to get underlying trend inflation around our target on a sustained basis.
What would this take? We can get some sense from statistical models. Although there is no
one widely agreed-upon method of measuring underlying inflation, one statistical approach that
has received attention in recent years captures the idea that underlying inflation responds to the
experience with actual inflation, and that this responsiveness varies over time. We can use such
an approach to get an idea of how much, and how quickly, underlying inflation might respond to
any particular path for actual inflation. It provides some reassurance that our goal may be
achievable if inflation moves only slightly above 2 percent for a couple of years.The SEP
inflation projections of Committee members suggest that many have, over the past year or so,
envisaged a few years of a mild overshoot.
Of course, it is not entirely clear how to move underlying trend inflation smoothly to our
target on a sustained basis in the presence of a very flat Phillips curve. One possibility we might
refer to as “opportunistic reflation” would be to take advantage of a modest increase in actual
inflation to demonstrate to the public our commitment to our inflation goal on a symmetric basis.
For example, suppose that an unexpected increase in core import price inflation drove overall
inflation modestly above 2 percent for a couple of years. The Federal Reserve could use that
opportunity to communicate that a mild overshooting of inflation is consistent with our goals
and to align policy with that statement. Such an approach could help demonstrate to the public
that the Committee is serious about achieving its 2 percent inflation objective on a sustained
basis.
Conclusion
In today’s new normal, it is important to achieve inflation and inflation expectations around
our 2 percent target on a sustained basis while guarding against financial imbalances through
active use of countercyclical tools.We want to be mindful of the risk of financial imbalances that
could amplify any shock and help tip the economy into recession, which the Federal Reserve has
less conventional space to address in today’s low interest rate environment.
In my view, it is therefore wise to proceed cautiously, helping to sustain the expansion and
further gains in employment and with appropriate regulatory safeguards that reduce the risk of
dangerous financial imbalances.
32
Financial Regulation
Frameworks for the Countercyclical Capital Buffer
By RANDAL K QUARLES*
It is a pleasure to address the Manhattan Institute's Shadow Open Market Committee (SOMC)
today. The SOMC has long served as an important forum for debate regarding the appropriate
stance of monetary policy--debates that have often brought alternative perspectives to the
challenges facing the Federal Open Market Committee (FOMC) in the pursuit of its dual
mandate of maximum employment and stable prices. As Allan Meltzer wrote about his and Karl
Brunner's founding of the SOMC, "Our objective at the time and after was not just to complain
about the results of policy actions. ... We hoped also to improve policy discussion."
This afternoon, I will briefly remark on the economic outlook and the current stance of
monetary policy, and I would then like to devote some time to a discussion of the approach the
Federal Reserve has taken on the setting of the countercyclical capital buffer (CCyB) and why I
see a setting of 0 percent, as recently affirmed by the Board, as the current appropriate setting for
the CCyB. Also, I will review some of the international experience with the CCyB. Given that
the CCyB is a relatively new element of our regulatory toolkit, the international experience has
the potential to provide useful information on how the CCyB can be made most effective.
The Economic Outlook
But first, let me turn to the economic outlook. At last week's meeting, the FOMC left the
policy rate unchanged and reiterated its patient approach toward future policy adjustments. I
supported this decision. It is prudent at this point to watch the evolution of the incoming data in
determining the appropriate stance of policy, particularly given some indication that growth has
slowed, at least temporarily, in the most recent data. That said, I remain optimistic about the
outlook for the U.S. economy, and I think that we have the potential to maintain growth at a
healthy pace in the years ahead.
With regard to the recent data, a sharp falloff in some retail sales measures in December
suggested a slowing of consumption, the mainstay component of aggregate demand. While I
would not suggest ignoring this decline, it does seem rather inconsistent with a number of other
indicators, including the continued strength of the labor market and wage gains in recent months.
And the labor market does remain strong. Even with a weak reading in February, the
three-month average gain in payrolls, at 186,000, remains above most estimates of the pace of
job gains needed to maintain downward pressure on an already historically low unemployment
rate. As with retail sales, the February payroll number seems a bit odd, especially when
This speech is delivered at the "Strategic Approaches to the Fed's Balance Sheet and Communications" Spring
2019 Meeting of the Manhattan Institute's Shadow Open Market Committee on March 29, 2019. *Randal K. Quarles, Vice Chairman for Supervision of the Board of Governors of the Federal Reserve System
July 2019
Vol.6, No.3
33
measured against the continued strength of the household survey for the same month. That said,
weak February payrolls are another reason to continue patiently watching the data to see how
economic conditions evolve.
Looking past the near-term data, I see many reasons to expect relatively strong growth in the
coming years, supported by gains in the productive capacity of the economy. Regarding the
inputs of production, I have been encouraged by the increase in labor force participation over the
past year. After a period of subdued growth, investment was also strong last year, with spending
on equipment and intangibles rising 7-1/2 percent, increasing the capital stock and adding to the
productive potential of the economy. Though some recent investment indicators have been less
robust, these data are volatile, and I expect continued gains supported by profit growth,
continuing impetus from incentives in the tax bill, and a generally favorable business
environment.
Most important, I have been encouraged by the recent step-up in labor productivity growth.
Last year's increase of almost 2 percent marked the strongest growth since the immediate
aftermath of the financial crisis and was well above the 1 percent pace that prevailed in the
preceding five years. I think there are many reasons to believe that this faster productivity
growth could be persistent. My expectation for further increases in capital spending is one. For
another, it could be that tight labor markets have played a role in boosting labor productivity
growth as employers work to increase efficiency as new workers become harder to find.
Turning to inflation, given the volatility and idiosyncrasies of the data, I view the current
reading on core PCE (personal consumption expenditures) inflation, at 1.8 percent, as being
roughly consistent with our 2 percent objective. Overall, inflation pressures are muted. But I do
not believe that the seeming unresponsiveness of inflation to the apparent tightness of the labor
market and other aspects of the economy tells the whole story in evaluating slack versus
constraint in the economy. Of the many explanations for this phenomenon that have been offered,
one possibility that we have to keep in mind is that inflation has remained stable precisely
because of the public's confidence that the Fed will maintain a framework that keeps the
economy from overheating and inflation from rising significantly above the 2 percent benchmark.
Inflation could then for some time remain quite stable in the face of an economy running hot.
But if public confidence began to erode because of Fed inaction, a possible consequence could
be the de-anchoring of inflation expectations, rather than a gradual and controlled move to an
inflation rate sustainably around our 2 percent goal. Of course, there are a variety of alternative
explanations for the current surprising relationship between inflation and unemployment, and
perhaps all of them are part of a full account. We should also be wary of a material and durable
downward drift in inflation expectations below our objective, were we to see that develop,
perhaps due to secular changes in the formation of prices or perceived constraints on the ability
of monetary policy to react to future downturns. Either way, as a matter of prudent risk
management, we must conduct policy in a manner consistent with keeping inflation near target,
validating the public's trust in our commitment to our inflation objective and keeping inflation
expectations anchored.
In regard to policy, I am very comfortable remaining patient at this point and monitoring the
incoming data. That said, my sense is that further increases in the policy rate may be necessary
at some point, a stance I believe is consistent with my optimistic view of the economy's growth
potential and momentum. In the language of central banking, my estimate of the neutral policy
rate remains somewhat north of where we are now.
Communicating a data-dependent policy framework can be challenging, especially if we do
not want to appear to be overly discretionary. It would probably be clearest if we defined what
data we are dependent on and how we depended on those data--that is to say, if we adopted a
34
monetary policy rule. Strict rules, however--to achieve their valuable heuristic benefit--are as
much about ignoring some data as they are about paying attention to other specific data. Indeed,
while rules provide useful and important benchmarks, the complexity and evolving nature of the
economy at the current juncture argue for the consideration of a wide range of indicators in
assessing the state of that economy. This, in turn, can complicate the communication of data
dependence: How can we adopt and convey a clear strategic stance on policy while maintaining
our credibility if evolution of the data requires an evolution of that strategy?
I prefer a framework where we make it clear that we are focused on broad trends--elsewhere I
have used the aviation analogy that we should not "chase the needles" on the instrument panel.
We should be clear that, while we will respond to clear and durable evolution in these broad
trends, we are not reacting to every piece of volatile data.
The Countercyclical Capital Buffer and Financial Stability
Let me now shift gears and return to the CCyB, beginning with how it fits within our broad set
of efforts to promote financial stability. The core of that approach has been to establish a set of
structural, through-the-cycle regulatory and supervisory standards to ensure resilience against a
broad range of shocks. In contrast to the pre-crisis framework, banks, especially the largest and
most systemic banks, are now required to maintain substantially higher and higher-quality loss
absorbing capital and other cushions; stress testing examines the resilience of large banks to
severely adverse economic conditions; liquidity requirements and regulatory incentives to limit
reliance on short-term wholesale funding have reduced funding risk among large banks and their
affiliated broker-dealers; and resolution planning requirements reduce the risks that the failure of
a large firm would spill into the broader economy. Outside of the banking system, money market
mutual fund reform has reduced this sector's susceptibility to destabilizing runs by investors, and
requirements that many derivatives be centrally cleared have decreased the opacity and
interconnectedness that contributed to the chaos of 2008.
In addition to these through-the-cycle measures, the Federal Reserve actively monitors for the
buildup of financial stability vulnerabilities and can require large banks to increase their loss
absorbing capacity through increases in the CCyB when systemic vulnerabilities are sufficiently
large. While such countercyclical tools are new, their goal is to mitigate the buildup of
vulnerabilities during buoyant periods, since experience has proven time and again that
vulnerabilities can build during good times as risk appetite grows and memories of earlier
instability fade.
Effectively mitigating the buildup of risk through the CCyB requires a systematic framework
for analyzing vulnerabilities and a mapping of such changes in financial-sector risks into the
appropriate level for the CCyB. The Board developed its framework outlining the objectives of
the tool and the factors that would influence the determination of its appropriate level through a
process of public consultation.
Under our policy, the primary objective for activating the CCyB is to build financial-sector
resilience during periods when the risks to financial stability have risen to meaningfully above
normal levels and there is an elevated possibility of potential losses within the banking sector
that could place strains on the supply of credit or otherwise substantially impede economic and
financial activity. A secondary objective for using the CCyB is its potential to limit the buildup
of financial vulnerabilities by slowing the rate of credit expansion--that is, the possibility that the
CCyB may "lean against the wind" of credit fluctuations. This secondary objective, both in the original Basel discussions and in the Federal Reserve's framework, is less central.
A notable feature of the Board's current framework is the decision to maintain a 0 percent
CCyB when vulnerabilities are within their normal range. Because we set high,
July 2019
Vol.6, No.3
35
through-the-cycle capital requirements in the United States that provide substantial resilience to
normal fluctuations in economic and financial conditions, it is appropriate to set the CCyB at
zero in a normal risk environment. Thus, our presumption has been that the CCyB would be zero
most of the time.
Current Assessment of Financial Vulnerabilities
When, then, would it be appropriate--given this framework--to activate the CCyB? That is,
how do we know when financial vulnerabilities are elevated? The Federal Reserve continuously
monitors vulnerabilities, as highlighted in our recent Financial Stability Report. Our approach is
organized around tracking four broad vulnerabilities that academic research and practical
experience have shown can amplify negative shocks and result in outsized losses in the real
economy. These are asset valuation pressures, household and business debt, funding risk, and
financial-sector leverage. As part of this process, the Board considers a number of quantitative
indicators--one of which is the credit-to-GDP (gross domestic product) gap proposed in the
Basel Committee guidance--that are indicative of potential vulnerabilities. Nonetheless,
judgment must play an important role in this process, especially in assessing how interactions
between vulnerabilities may serve to mute or amplify the transmission of different kinds of
shocks. The framework requires further judgment as to whether the CCyB is the most
appropriate tool to address the particular areas of concern, which will depend on, among other
things, the extent to which banks subject to the CCyB are exposed to vulnerabilities or
contributing to them.
Assessing the current state of financial vulnerabilities is thus a critical part of the decision on
whether to activate the CCyB. Let me briefly give you my view of each of the four categories in
turn. Asset valuations increased to the high end of their historical ranges in many markets over
2017 and the first half of 2018, supported by the solid economic expansion and an apparent
increase in investors' appetite for risk. The market volatility and subsequent rebound have
muddied the picture somewhat; however, it does seem that valuation pressures have eased to
some extent in a particular locus of concern, the market for leveraged loans--that is, syndicated
loans to lower rated or unrated borrowers with already significant debt loads.
Now, regarding debt outstanding, borrowing by businesses has reached a historically high
level relative to the size of the economy or business assets and there are also signs of
deteriorating underwriting standards. Of course, this has happened at a time when corporate
profits relative to the size of the economy are also quite high, mitigating some of the concern this
might suggest-but the riskiest forms of business debt have increased the most amid such signs.
These developments could potentially leave the corporate sector vulnerable to a sharp slowing in
economic growth, although we think the banking sector has only limited direct exposures to such
borrowers and, to the extent they can be measured, indirect exposures are also limited.
The notable levels of vulnerability in asset valuation pressures and business borrowing must
be considered alongside modest vulnerabilities associated with household borrowing and the
historically low levels of financial-sector leverage and funding risk. Household debt relative to
GDP has fallen substantially from the level of a decade ago, and the credit quality of household
borrowing remains relatively solid, despite pockets of weakness evident in some areas of auto
lending. Even more important, banks now have substantially higher-quality capital and more of
it than in the 2000s, owing importantly to the structural reform of capital requirements and stress
testing. In fact, under last year's stress tests, capital levels at the largest U.S. banks after a
hypothetical severe global recession would have been higher than the actual capital levels of
large banks in the years before the crisis. Moreover, around 20 percent of the assets of the most
systemically important financial institutions are highly liquid assets that can be sold quickly in
36
the event of stress. And, following reforms to money market mutual funds and other steps, the
volume of short-term uninsured funding, most prone to runs, is well below pre-crisis levels.
Taken as a whole, financial system vulnerabilities strike me as being not outside their normal
range, which is consistent with a zero CCyB under the Board's framework and is why I
supported the Board's decision to keep the CCyB at zero earlier this month.
International Experience with the Countercyclical Capital Buffer
While policymakers in the United States have maintained the CCyB at zero since 2016, other
countries have adjusted their countercyclical buffers in response to vulnerabilities within their
financial sectors. Currently, 13 countries have announced a CCyB above zero, ranging from 0.25
percent in Luxembourg to 2.5 percent in Hong Kong, Norway, and Sweden. The CCyB is a
novel approach to financial regulation, and I think it is important that we, as regulators, learn
from other countries' experiences with the CCyB. I see three important explanations for
differences in the CCyB across countries.
Perhaps the most important and direct reason for different CCyB levels among different
countries is that they face different vulnerabilities. According to national authorities'
announcements, the decisions to activate the buffers were generally motivated by credit growth,
household debt, and housing prices; in this regard, it is notable that mortgage credit or house
prices have expanded rapidly in several countries deploying the CCyB, including Hong Kong
and the Nordic countries that have set their CCyB at 2.5 percent. For example, the Hong Kong
Monetary Authority's decision to increase the CCyB level to 2.5 percent in January 2018 was
importantly linked to housing developments.
Another explanation for the differences in observed CCyB levels across countries is the range
of available macroprudential tools to stem the buildup in financial vulnerabilities in different
countries and the degree to which such tools have been the preferred means for addressing
identified vulnerabilities. For example, housing market booms, as noted above for Hong Kong,
have been a concern in several countries in recent years. Accordingly, some national authorities
have used macroprudential tools focused on housing, such as caps on loan-to-value ratios, to try
to increase the resilience of borrowers and to indirectly strengthen the resilience of the banks and
the financial system should their housing booms turn to busts. For example, policymakers in
Canada have not activated the CCyB in response to concerns about housing market risks, but
they have lowered the maximum loan-to-value ratio for various mortgage products and capped
debt-service-to-income ratios. The availability of such alternative tools for limiting systemic risk
may be among the factors influencing the decision to adjust, or not adjust, the CCyB in a number
of countries. In this regard, it is notable that the set of macroprudential tools in the United States
is limited relative to that in many other countries.
Finally, another difference, one that is particular to the United Kingdom, is the framework
adopted by the U.K. Financial Policy Committee (FPC) to integrate the CCyB with its structural
capital requirements. Specifically, under the FPC's framework, the CCyB would equal 1 percent
in standard risk conditions--but to avoid having this be a significant increase to already very high
levels of capital, the FPC undertook a one-time adjustment to its other capital buffers in order to
offset part of this increase. The effect of the policy is that the buffer can be varied--both up and
down--in line with the changing risks that the banking system faces over time. This approach is
an interesting deviation from the idea in the original Basel discussions and the framework
adopted in many other jurisdictions, in which structural capital requirements are set at levels aimed to deliver the desired level of resilience, with the CCyB raised to positive values only at
times when vulnerabilities are above normal.
July 2019
Vol.6, No.3
37
In practice, the U.K. framework appears to have provided the FPC with additional flexibility,
as it has adjusted the CCyB with evolving financial risks associated with, for example, Brexit.
As I examine this experience, systems similar to the United Kingdom's, where the CCyB is
positive during normal times, may allow policymakers to react more quickly to economic,
financial, or even geopolitical shocks that occur amid otherwise normal conditions, without
relying on the slow-moving credit aggregates contemplated in the original Basel proposal.
Moreover, this setting of the CCyB permits more gradual adjustments in the CCyB, especially in
periods with a high degree of uncertainty about the level of financial vulnerabilities. Another
possible benefit of a system that has additional flexibility is the ability to coordinate the setting
of the CCyB with the setting of monetary policy in situations where such coordination is
valuable. At the same time, I would not expect such situations to be the norm, as the objectives
and governance of monetary policy and macroprudential policies are separate for good reasons.
Conclusion
In the United States, we have built a substantially safer financial system by focusing on using
structural tools that confer through-the-cycle resilience. With that construction work largely
behind us, attention naturally turns to the set of time-varying financial regulations--particularly
the CCyB.
The overall capital framework in the United States has been designed to ensure high capital
levels without having to activate the CCyB, with the implication being that the bar for activation
would be a high one; but, as a result, much of the time there would not be any buffer to reduce if
conditions were to precipitously deteriorate. The United Kingdom's approach to setting the
CCyB also relies on having a high overall level of capital during normal times, but, by
"swapping" some portion of static capital for CCyB in reaching that high capital level during
normal times, and thus making some of that capital part of a releasable buffer, U.K.
policymakers have built in more flexibility to move buffers down in times of stress. Other
countries provide additional "data points" in terms of possible ways of approaching the CCyB.
With the CCyB in active use around the world, I am confident that the academic and policy
communities will learn a great deal about how best to use this new tool to build a more resilient
financial system.
38
Proportionality in Financial Regulation: Where Do We Go
from Here
By FERNANDO RESTOY*
Introduction
Now that the post-crisis reforms are almost completed, prudential authorities are focused on
implementing the agreed global standards. As part of this broader shift towards policy
implementation, the question of proportionality has taken centre stage. And, given the increased
complexity of Basel III and other regulatory standards, it is only natural to discuss how these
standards can be most appropriately applied, particularly in light of the diversity of firms and
financial systems operating around the world.
An equally important debate - and one that often gets drowned out in the discussions around
proportionality and regulation - is how day-to-day supervision should be tailored to reflect the
systemic importance, complexity and risk profile of regulated entities.
This meeting provides a timely opportunity to take stock of, and exchange views on the
proportionality practices in various jurisdictions, and complement country-specific experiences
with the broader analytical work done by various international organisations and academics. At
the FSI, we've published several papers on proportionality during the past two years and I'll refer
to some of our key findings during these remarks.
This morning, I want to touch upon three key issues. First, I will outline the concept,
objectives and considerations involved with adopting the proportionality principle. Second, I
will take stock of how proportionality has been applied at the global level, drawing from our
analytical work at the FSI and at other international bodies. Third, I will raise a few implications
for policy in the context of proportionality and conclude with brief remarks.
The concept
The concept of proportionality stems from the need to limit public intervention - in the form
of rules, sanctions and oversight - to what is actually needed to achieve the desired policy
objectives.
Financial sector policy objectives typically include financial stability, market integrity and
consumer protection. Within this domain, proportionality aims at avoiding policies that could
distort the financial services market, for example, by unduly constraining its development;
curbing competition or limiting the diversity of market participants.
Focusing on the financial stability mandate, prudential authorities generally impose, on a
proportionate basis, a range of regulatory, supervisory and resolution policies to applicable
entities. The proportionality objectives of these three policies, however, are not necessarily the
same.
In regulation, a proportionate approach means tailoring regulatory requirements to a firm's
size, systemic importance, complexity and risk profile. Here, the aim is to avoid excessive
This speech is delivered at the BIS/IMF policy implementation meeting on proportionality in financial
regulation and supervision on May 8, 2019. *Fernando Restoy, Chairman, Financial Stability Institute, Bank for International Settlements
July 2019
Vol.6, No.3
39
compliance costs or regulatory burden for smaller and non-complex banks that could unduly
dampen their competitive positions without a clear prudential justification (Lautenschläger
(2017)).
In supervision, proportionality has a somewhat different focus: the main aim is to facilitate the
efficient allocation of scarce supervisory resources and supervisory activities on firms that are
either systemically important or are considered high risk. It is, therefore, closely associated with
the concept of risk-based supervision. Naturally, a by-product of this approach is to lighten the
supervisory burden on smaller, less complex and healthy banks. This dovetails nicely with the
proportionality objectives of regulation.
In regard to resolution policies, the aim of proportionality is to adjust the requirements for
recovery and resolution planning and resolvability to the likelihood that regulated firms will
cause systemic stress if they fail; and the expectation that firms can be subject to applicable
insolvency procedures without systemic impact.
Against this backdrop, to apply proportionality necessarily means that different institutions
are subject to a differentiated set of requirements. The risk therefore exists that proportionality
could be misused to offer a sort of regulatory subsidy to specific institutions, thus creating rather
than removing competitive distortions, and preventing (or delaying) an otherwise orderly
restructuring of the industry.
In addition, proportionality - at least in the context of regulation - generally involves the
imposition of simpler, less-risk sensitive requirements to applicable entities. One unintended
consequence is that it can encourage risky behaviour by firms that benefit from the simplified
rules.
Collectively, these risks suggest that sound proportionality regimes should, ideally, meet at
least three conditions: first, the adoption of simplified requirements should not undermine key
prudential safeguards, particularly the requisite capital and liquidity backstops needed to
promote confidence in regulated institutions and the financial system; second, supervisors should
maintain sufficient awareness and control of the overall risk profile of entities that benefit from
simplified regulatory rules; and third, the proportionality regime should not seek to overprotect
small or medium-sized firms from competition, particularly if there is overcapacity and where
consolidation can help to promote a more efficient and viable banking industry.
The evidence
Let me now turn to how the proportionality principle has been implemented in practice.
Proportionality is widely applied in tailoring regulatory, supervisory and resolution policies for
banks and other financial institutions.
Prudential regulation The proportionality strategies used to tailor regulatory requirements vary markedly across
jurisdictions, including the criteria used to differentiate institutions; the scope of application (eg
which requirements are affected); and the methods used to apply proportionality (eg exemptions
from rules, modifications to applicable Basel rules, or replacement of Basel rules by domestic
standards).
These differences may reflect the lack of international guidance on how to apply
proportionality. In banking, beyond the expectation that all Basel standards are applicable for
internationally active banks, there is no commitment for prudential authorities to extend their
application to other banks operating in their respective jurisdictions. In addition, as an
'internationally active bank' has purposely never been defined by the BCBS, national authorities
are free to interpret this term in their own way.
40
As for insurance, differences in proportionate solvency regulation across jurisdictions are even
more pronounced than in the banking sector, as there is currently no global capital standard for
internationally active insurance groups. Moreover, the Insurance Core Principles are not
prescriptive in the application of proportionality to solvency regulation, leaving much flexibility
to individual jurisdictions to implement their own approaches (Yong and Löfvendahl (2018)).
The evidence on proportionality in banking regulation suggests that this concept is most often
applied to the market risk framework, the quantitative liquidity standards and the large exposures
regime as well as to disclosure and reporting obligations (Castro Carvalho et al (2017), BCBS
(2019)). In general, most adjustments in regulation aim at reducing complexity without
necessarily diminishing stringency (Restoy (2018)).
In non-BCBS member jurisdictions - which are under no commitment to adopt Basel
standards - and where the vast majority of locally incorporated banks are unlikely to be
internationally active, the differences in how proportionality is applied are more widespread.
In a recent FSI paper (Hohl et al (2018)), we review the proportionality practices of 100
non-BCBS jurisdictions regarding their application of Pillar 1 requirements of the Basel
framework. One of the most interesting findings is that a wide variety of prudential regimes are
implemented in non-BCBS jurisdictions. These include at least three Basel versions of the
risk-based capital (RBC) regime (Basel I, II, III); two Basel versions of the large exposure rules
(1991 and 2014); and the extensive use of domestic liquidity and large exposure rules in lieu of
applicable Basel standards.
Another insight is that jurisdictions apply different tailoring methods for different iterations of
the Basel standards that they have chosen to adopt. For example, despite the simplicity of Basel I,
jurisdictions under that standard still tend to make modifications to reflect country specificities,
but these adjustments are generally applied to all banks in the system - with only limited
differentiation in rules between smaller versus more systemically important firms.
In contrast, as countries shift to the Basel III RBC regime, greater differentiation and more
multifaceted proportionality strategies are applied. This reflects Basel III's additional features
and complexity.
Notwithstanding the range of proportionality methods applied in non-BCBS jurisdictions,
some have argued against an excessive reliance on proportionality. In a recent paper by the
Center for Global Development, the authors note that an undue reliance on proportionality can
undermine the perceived benefits of a common global set of regulatory standards, raising
level-playing-field concerns and complicating the task of making cross-country comparisons.
Supervision
With respect to proportionality and supervision, a forthcoming FSI paper (Duckwitz et al
(2019)) - based on a survey of 16 BCBS and non-BCBS jurisdictions - indicates that all
surveyed authorities apply proportionality, which demands various degrees of supervisory
judgment.
To facilitate a proportionate approach in supervision, some authorities rely more on
principles-based approaches that emphasise a holistic assessment of a firm. By contrast, others
have developed more structured methodologies, which we refer to as "guided discretion". We
find that authorities rely more on guided discretion approaches when setting the supervisory
intensity of a firm and in determining the amount of capital add-ons under Pillar 2; meanwhile,
principles-based approaches, which require a more intricate degree of judgment from supervisors,
are used in assessing the quality of a firm's corporate governance. The key takeaway is that the use of proportionality in supervision is not a choice; it is an
intrinsic part of supervision that allows supervisory resources to be better allocated to firms that
pose the greatest risks. Further, it also helps supervisors to better align a bank's risk profile with
July 2019
Vol.6, No.3
41
its financial buffers and the quality of its risk management/governance arrangements. These
issues simply should not, and cannot, be dealt with by regulation alone.
Resolution
Proportionality is also used in tailoring resolution planning requirements - in terms of both
scope and intensity - to achieve policy objectives. A recent peer review report by the Financial
Stability Board (FSB (2019)) highlights the variety of proportionality methods FSB jurisdictions
have applied in introducing resolution planning requirements.
In terms of scope of application, the approaches vary from jurisdictions that require resolution
plans for all banks to others that impose requirements only on their G-SIBs and/or D-SIBs, and a
few jurisdictions that follow other approaches, for example, by imposing requirements on banks
that meet an asset size threshold or tailoring rules on banks on a discretionary basis.
However, where jurisdictions, such as the European Union (EU), impose resolution plans for
all banks, proportionality is introduced by providing for a tailored application of some aspects of
resolution planning requirements (eg the frequency of resolution plan review, data reporting and
plan content). Indeed, in the Banking Union and the EU member States, resolution planning for
small less-systemic banks that can be liquidated through normal insolvency proceedings focuses
mainly on arrangements to assist the liquidation, such as a single customer view to enable swift
depositor payouts.
Policy implications
Let me now turn to some of the policy challenges.
On the one hand, the variety of proportionality approaches taken may well reflect different
characteristics in national banking markets. On the other, it is unlikely that all proportionality
approaches taken in various jurisdictions could deliver the same outcomes with respect to the
objective of ensuring a level playing field while protecting financial stability.
By way of example, if we compare how aspects of Basel III have been applied in the United
States and the European Union, we find vastly different approaches taken with respect to
proportionality.
In the United States, only a few banks with total assets of $250 billion or more or $10 billion
or more in total on-balance sheet foreign exposure are subject to Basel III's risk-based capital
and leverage requirements, with additional capital requirements applicable to US G-SIBs.
In regard to the LCR, the full LCR requirement generally applies to US banking organisations
that are under the advanced approaches to regulatory capital measurement and their subsidiary
organisations that have consolidated assets of $10 billion or more.
In contrast, in the European Union, nearly all banks are subject to Basel III, with a few
exceptions for smaller banks.
These vastly different approaches, while well within each jurisdiction's purview, illustrates the
need to achieve a common understanding of the pros and cons of the varied proportionality
approaches that have been taken or are being considered.
Against this background, consideration could be given to adopting a categorisation (or tiering)
approach, where banks are grouped into several classes (defined by various criteria); and these
categories are used as the basis for differentiating requirements. Indeed, this is the approach
followed in countries such as Brazil and Switzerland (Castro Carvalho et al (2017), and it is the
one that the United States is planning to adopt soon (US Federal Reserve (2018)). Ideally, the
defined categories could be used not only to establish specific prudential rules but also
supervisory criteria and resolution planning requirements.
In this context, banks which are considered systemically important to the domestic economy -
regardless of the complexity of their business models - should be subject to the most stringent
42
regulatory, supervisory and resolution policies, in relation to other entities operating in those
jurisdictions. I mention what appears to be an obvious takeaway, because our recent FSI study
suggests that jurisdictions that remain under earlier iterations of the Basel RBC regime tend not
to make such distinctions.
More generally, to the extent that less complex rules imply less risk sensitivity, authorities
may consider introducing certain regulatory requirements and supervisory policies to mitigate
the potential incentives for firms to take on excessive risks. In particular, there could be merit in
imposing more stringent regulatory requirements for banks that are subject to simpler obligations,
as an explicit trade-off for adopting less risk-sensitive methodologies.
One such approach, as currently proposed in the United States, will allow banks with
consolidated assets of less than $10 billion to opt into to a community bank leverage ratio
framework, provided that they meet other qualifying criteria and maintain a minimum leverage
ratio requirement of greater than 9%. Banking organisations that elect to maintain the leverage
ratio requirement of greater than 9% would no longer be subject to other risk-based capital or
leverage requirements. It is important to note that the imposition of a 9% leverage requirement
would - more likely than not - require banks, on average, to hold more capital than the minimum
RBC requirements under Basel III.
Having said this, we should also acknowledge some market realities. The ability to apply
proportionality in financial regulation and supervision - without pushback from rating agencies,
institutional investors and other market participants - seems to favour those economies that have
"exorbitant privilege" in the structure of the global financial system.
For economies that do not benefit from this privilege, additional work at the international
level to identify good proportionality practices could serve as a reference for the supervisory
community. These references may be particularly valuable for emerging market economies as
they will need to ensure that their regulatory framework - particularly if it deviates in some
respects from Basel standards for small and non-complex institutions - is still perceived
internationally as being sufficiently rigorous.
Final remarks
In closing, let me quote the great Irish playwright George Bernard Shaw, who said: "The
reasonable man adapts himself to the world: the unreasonable one persists in trying to adapt the
world to himself. Therefore all progress depends on the unreasonable man." For policymakers
(notwithstanding the political challenges), it may well be easier to simply take the global Basel
standards and apply them to all banks in their jurisdiction, regardless of the fit.
It is much more difficult to analyse the design of Basel standards, deconstruct them and decide
which aspects make sense for which group(s) of regulated entities. And all this has to be done in
a way that reinforces key prudential objectives, and that upholds a competitive, level playing
field in both domestic and international markets.
In the wake of the post-crisis reforms, applying proportionality begins with a more humble
endeavour: knowing your regulated firms in a manner that allows for a sensible tiering of
regulation, supervision and resolution.
References
Angeloni, I (2018): "Another look at proportionality in banking supervision", speech at the
13th Asia-Pacific High-level meeting on Banking Supervision, Singapore, 28 February. Basel Committee on Banking Supervision (2019): "Proportionality in banking regulation and
supervision - a survey of current practices", March.

July 2019
Vol.6, No.3
43
Castro Carvalho, A, S Hohl, R Raskopf and S Ruhnau (2017): "Proportionality in banking
regulation: a cross-country comparison", FSI Insights, no 1, August.
Center for Global Development (2019): "Making Basel III work for Emerging Market and
Development Economies", A CGD Task Force Report, co-chaired by Thorsten Beck and Liliana
Rojas-Suarez, 23 April.
Coelho, R, J Mazzillo, J Svoronos and T Yu (2019): "Regulation and supervision of financial
cooperatives", FSI Insights, no 15, January.
Duckwitz V, S Hohl, K Weissenberg and R Zamil (2019): "Pillar 2, risk-based supervision
and proportionality", FSI Insights, no 16, forthcoming.
Financial Stability Board (2019): "Thematic review on bank resolution planning", 29 April.
Hohl, S, M Sison, T Stastny and R Zamil (2018): "The Basel framework in 100 jurisdictions:
implementation status and proportionality practices", FSI Insights, no 11, November.
Lautenschläger, S (2017): "Is small beautiful? Supervision, regulation and the size of banks",
speech at an IMF seminar, Washington DC, 14 October.
Restoy, F, (2018): "Proportionality in banking regulation", speech at Westminster Business
Forum Keynote Seminar, London, 4 July.
US Federal Register (2018): "Proposed changes to applicability thresholds for regulatory
capital and liquidity requirements", vol 83, no 245, 21 December.
--- (2019): "Regulatory Capital Rule: Capital simplification for qualifying community banking
organisations", vol 84, no 27, 8 February.
Yong, J and G Löfvendahl (2018): "Proportionality in the application of insurance solvency
requirements", FSI Insights, no 14, December.
44
Financial Stability Post Brexit: Risks from Global Debt
By SIR JON CUNLIFFE*
Speaking today at your conference on “Financial Stability Post Brexit” I suspect that when this
subject was chosen and the invitation sent, it was assumed that Brexit itself would have
happened by the time of the conference. As it is, not only has Brexit not occurred, but the path to
it and its eventual outcome are perhaps less clear now than a few months ago.
So it is perhaps worth spending a little time today on the financial stability risks that might
arise from Brexit. I will then go on to examine the financial stability risk environment more
generally.
Before going further, a health warning is necessary. It cannot be repeated too often that the
Bank’s approach to its financial stability objective is, in one key respect, very different to its
approach to its monetary stability objective. For the latter, the Monetary Policy Committee
makes the best forecast we can of the path of the economy and the path of inflation – the central
case. We set out clearly and graphically the risks around those forecast, but it is the central case
– what we think most likely to happen – that informs our policy decisions.
For financial stability, the focus of the Financial Policy Committee (FPC) is not on the central
case – on what is most likely to happen; rather it is on the risks – on what could happen even if it
is not the most likely scenario. It is the risks, what could happen, that inform our policy
decisions.
Brexit
That is why our financial stability focus has been on the risks from a disorderly Brexit.
The Bank has been working since the referendum to reduce the risks to financial stability and
the risk of disruption to financial services, in the event, that the UK leaves the EU without a deal
and without any transition period.
This has been a pretty large task.
Alongside the Treasury and the FCA we have made sure that we will have a working legal
and regulatory framework for the financial sector at the point that EU law no longer applies in
the UK.
Over 10,000 pages of financial sector related EU legislation has been assessed to see what
changes would be required to make the legislation operable in the UK statute book.
Over 1,000 pages of amendments have been made by the Treasury in 50 statutory instruments.
The Bank has reviewed 6,000 pages of Binding Technical Standards and over 6,500 rules, and
published 473 pages of amendments in 15 EU Exit Instruments.
We have also put in place temporary permission and recognition regimes so that EU firms
providing financial services into the UK will be able to do so without disruption even in the
event of a ‘no deal, no transition’ Brexit.
Some risks have required action on both sides of the Channel. We have worked with the ECB
and other EU authorities to identify and mitigate these. We have not, to be frank, agreed on
everything and there remain areas of potential disruption that, as of the last FPC assessment,
*Jon Cunliffe, Deputy Governor for Financial Stability, Member of the Monetary PolicyCommittee, Member of
the Financial Policy Committee and Member of the Prudential Regulation Committee
July 2019
Vol.6, No.3
45
need to be addressed.1 But, action, at EU and member state level, has been taken on most of the
main financial stability risks.
The other financial stability risk is the general economic impact of a disorderly Brexit upon
the financial system.
The Bank of England tests the core UK banking system annually against a stress scenario to
ensure it has the resilience to absorb the losses that would arise from a very severe but plausible
set of domestic, global and market shocks.2
To address resilience to Brexit risks, we developed a worst case Brexit scenario, and
compared its impact to the impact of the Bank’s 2018 annual stress test that the core banks had
passed.
The conclusion was that our annual stress tests comprised stresses of a scale and nature that
encompassed even the worst case disorderly Brexit scenario and that the core banking system
would be resilient to such an outcome, were it to occur. We have also assessed other parts of the
financial system in the same vein. And of course over recent months, as we approached ‘crunch’
Brexit dates and events, we have developed and have been ready to implement contingency
plans to respond to financial sector stress.
I would make three observations about this work that has occupied an increasing amount of
the Bank’s resources over the last year and a half.
First, we have sought to address risks to financial stability. Financial stability is a high hurdle.
It does not mean market or economic stability or absence of any disruption or absence of losses.
In the event of a no deal, no transition Brexit, markets would be likely to be very volatile – as
they were after the referendum - as prices adjust to that outcome. The banking system has the
ability to withstand the losses that would accompany a serious downturn – but one would still
expect there to be losses. And, of course, while we have addressed all of the risks we can foresee,
stress events can evolve and combine with other events in unpredictable ways.
Second, to return to my opening point, the reason we have focused on the risks from a
disorderly no deal, no transition Brexit is not because that is what we expect to happen but
because the financial system needs to be able to withstand what could happen. The crisis taught
us the costs to the economy and to society of a breakdown in the financial system.
Third, we have been fully transparent in our assessment of the risks and the actions necessary
to address them.
The FPC has published its assessment of Brexit risks and it’s ‘Checklist’ of actions necessary
on both sides of the Channel regularly since 2017. The FPC also published, in response to a
request from Parliament, its severely adverse Brexit stress scenarios.
This approach has not been without some criticism – in the UK and in the EU. I would argue
however that not only is it our statutory duty to report on risks to financial stability but that by
making our assessments public we have encouraged others to prepare for the risks.3
1 The March FPC statement noted that, while most risks to UK financial stability that could arise from a
disruptive Brexit have been mitigated, in the absence of further actions some potential risks to financial stability
remain. These risks were: the ability of UK and global banks to provide wholesale banking to EU clients; the
operational risks involved with migrating businesses, assets, and contracts in a short period of time; and the
ability of UK-EU counterparts to use uncleared derivatives to manage risks. 2 The scenario for the 2019 test includes a deep recession in the UK with GDP falling by 4.7 % from peak to
trough, house price falls of 33%, falls in commercial real estate prices of 41%, recessions in the Euro Area, the
US, and China and market stresses including a 41% fall in equity prices and a nearly 400bps widening of
investment grade spreads 3 This is set out in section 9W(4) of the Bank of England Act 1998: (1)The Financial Policy Committee must
prepare and publish reports relating to financial stability (“financial stability reports”). (2)Two financial stability
reports must be published in each calendar year. (3)A financial stability report must include— (a) the
46
And by making transparent not just our assessment of the resilience of the financial system
but the assumptions and judgments that underpin them, we reduce risk by ensuring people can
have confidence in the system even if it comes under severe stress.
Looking further forward, there are two Brexit related financial stability risks that may surface
after we have left the EU.
The first are the risks that may arise from our future relationship with the EU. The choice of
that relationship is for government and parliament and not for central bankers. It will need to
balance very different economic and social objectives on which views are, as we have seen in
recent months, very divided.
Financial stability, which is my responsibility in the Bank, is I think an important
consideration in that equation, but it is only one consideration.
However, a situation in which the UK is home to the largest and most complex financial
centre in the world, along with a large domestic financial sector, but effectively has no say in the
regulation of that financial sector would, as I have said before, become very uncomfortable with
regard to the Bank’s financial stability objective and our ability to manage financial stability
risks.
By the same token, pressure to weaken regulation post Brexit would create financial stability
risks: the FPC has made clear that given the size and complexity of its financial sector post
Brexit the UK will need a level of resilience as least as great as that currently planned, which
itself exceeds that required by international baseline standards.
The second risk that may arise after we have left the EU, is the related but perhaps more
prosaic issue of the flexibility of the UK’s regulatory framework and allocation of
responsibilities within it – the division of tasks between Parliament, Government and the
regulatory authorities.
Much of our financial sector legislation and regulation has been made at the EU level. This
has increasingly taken the form of extremely detailed EU primary and secondary legislation
directly applicable in Member States.4
This approach has been justified as necessary in the EU by the need to prevent divergences
between member states. The cost, however, as some have observed, is an over complex and rigid
regulatory framework.5
As a preparatory step for Brexit, Parliament has ‘onshored’ EU legislation and regulation and
also the allocation of responsibilities that lie behind it.
At some point, post Brexit, we will, I think, need to address this rigidity and hard wiring of
detail to ensure we have a coherent, effective and flexible regulatory system with appropriate
accountability. How we do that will have an impact on how we address risks, at firm and at
system level, in a fast changing financial system.
Committee's view of the stability of the UK financial system at the time when the report is prepared, (b) an
assessment of the developments that have influenced the current position, (c) an assessment of the strengths and
weaknesses of the UK financial system, (d) an assessment of risks to the stability of the UK financial system,
and (e) the Committee's view of the outlook for the stability of the UK financial system. 4 For example, the Capital Requirements Regulation for banks, and the Solvency 2 Delegated Act for insurers
and the European Market Infrastructure Regulation for CCPs. 5 See for example, “The evolution of the financial services regulation in a post-Brexit Europe" - Speech by
Robert Ophele, Chairman of the Autorite des marches financiers – 13 November 2017 “This has led to a
hypertrophy or swelling of regulations that - probably to avoid national drifts - has entered a stage of extreme
luxury of details... and has led to a rigidifying of regulation of a very damaging sort.”
July 2019
Vol.6, No.3
47
Financial stability post-Brexit
With that nod to the future, I will leave Brexit - for today at any rate – and turn to the
examination question you have set for today – financial stability post Brexit. I would like to
focus on the question of debt.
Debt, its level, its growth, its composition and its sustainability lies at the centre of the
financial stability mandate.
Modern societies and economies are built around the claims we hold on each other. A very
large proportion of those claims are expressed as financial claims to be honoured in the future.
The future, of course, does not always turn out to be what we expect and the value of our claims
has sometimes to be adjusted downwards.
Some financial claims, like equity, adjust the value of the return relatively smoothly. Debt
liabilities, however, are fixed and amplify the impact of any negative shock to the income or
assets of the debtor. And if the impact cannot be accommodated, the result can be a painful
write-down or deleveraging of the economy. Financial crises are much more likely to be
associated with corrections of asset values where asset purchases have been financed with debt
rather than equity.
Aggregate global debt – public, private and financial – is now around 320% of global GDP,
close to its record highs. Excluding financial sector debt, the debt of the real economy is around
240% of global GDP.6
But aggregates can only tell you so much. And they can hide a multitude of sins. We need to
need to look not just at the level of the total, but the growth rate and sustainability. And we need
to drill down into the composition to see where the risks are most prominent.
Growth, level and sustainability
Research suggests that it is the growth rate of debt rather than its actual level that is the
leading indicator of financial crises. Bank of England work based on 130 downturns in 26
advanced economies since the 1970s suggests that a rapid build up of debt is the best early
warning indicator of a recession.7 Other academic work supports this conclusion.8
The actual level of debt matters rather in determining the depth, as opposed to the probability,
of the crisis. So we need to look at the growth rate as well as the level.
Between 2000 and the crisis in 2008, total global debt as a proportion of global GDP grew by
over 60 percentage points, a growth rate of nearly 30%. Between 2008 and 2018 it has grown by
around 25 percentage points, a growth rate over the last 10 years of just under 10%.
However, the bulk of the post crisis growth occurred in the first 5 years after the crisis as
governments stepped in to offset private sector deleveraging and support the economy. Since
6 See IIF Global Debt Monitor. Of the 317% of global debt to GDP, 60pp is household debt, 90pp is to
non-financial corporates, 86 is government, and 80pp is financial corporates. Including financial sector debt in
the total leads to some double counting. But in my view, including financial sector debt is informative as it
reveals information about the financial system that is intermediating credit - and as such, about financial
stability. 7 ‘Down in the slumps: the role of credit in five decades of recessions’ by Jonathan Bridges, Chris Jackson and
Daisy McGregor (Bank of England Staff Working Paper No. 659). As reported in Carney (2019), ‘The global
outlook’, over half of recessions are preceded by private sector credit booms and within advanced economies,
two-thirds of private credit booms have also ended in recessions. 8 See, for example, Schularick and Taylor (2012), ‘Credit booms gone bust: Monetary policy, leverage cycles
and financial crises, 1870-2008’, American Economic Review, 102(2): 1029-61, and Kaminsky and Reinhart
(1999), ‘The twin crises: the causes of banking and balance of payments problems’, American Economic Review,
89: 473-500.
48
then, global debt has stabilized, growing by only 1% in total, relative to global GDP, over the
past 5 years.
The aggregate growth rate is not therefore signaling an impending correction. The level,
however, may well represent a significant vulnerability given that high levels of debt are
associated with deeper and more persistent recessions.
Assessing the sustainability of this debt is more difficult. Whether debt is sustainable depends
on the difference between the interest rate and the growth rate of the income stream that will be
used to repay the debt. The future is not known – in assessing today whether a given level of
debt is sustainable, we must rely on our best forecast of future interest rates and growth.
The level of debt that is sustainable in an economy is not a constant. It can change over time
and indeed has changed enormously over the last 150 years. The ratio of credit to GDP in the
late Victorian British economy was under 20% (not including the financial sector). In the
mid-twentieth century it was around 60% and by the early 1990s over 100%.
It is influenced by many factors including, very importantly, the long run real rate of interest.
There is strong evidence that the long run, or trend real rate has come down materially over the
past 40 years as a result of slow moving, secular changes in the supply of savings and the
demand for investment.
The MPC published analysis last August suggesting that the trend real rate in the UK has
fallen by more than 2pp since 1990. Slower population growth, increased life expectancy and
slower productivity growth have all contributed to this fall.9
Looking forward, many of the structural factors currently weighing on the trend real rate – in
particular, changes in demographics – are likely to persist for many years to come, though other
factors could push in the opposite direction.10
The trend real rate of interest, however, cannot be observed directly. It can only be estimated
and while most estimates suggest it has reduced materially, estimates do vary widely.
As to income growth, to the extent that expected low real rates reflect expected lower
productivity and hence expected lower income growth, they would not make debt more
sustainable.
Over the economic cycle, of course, the short-term real rate of interest will be moved around
its longer-term trend by more temporary factors. But the persistence of the fall in the trend real
rate means interest rates are likely to need to remain low by historical standards for some time to
come. One might therefore expect this generally to support the sustainability of global debt
overall, though given the uncertainties of estimates and forecasts of trend real rates, there are
clearly risks to this assessment.
Composition
From a financial stability viewpoint, the composition of the debt stock matters. Even if the
aggregate level of debt is not growing and there are reasons to believe its sustainability may
generally be supported by relatively low rates going forward, components of the debt stock can
vary greatly in riskiness and vulnerability to correction.
The composition of the global debt stock has changed since the crisis.
Overall, advanced economy private sector debt has reduced a little since the crisis. The
increase in advanced economy debt has been in the public sector.
9 See August 2018 Inflation Report. See also ‘Secular drivers of the global real interest rate’ by Lukasz Rachel
and Thomas D Smith (Bank of England Staff Working Paper No. 571). 10 For example, increasing financial integration of lower-income countries, a pickup in overall global
productivity growth and increasing automation.
July 2019
Vol.6, No.3
49
I do not want here to enter into a discussion of fiscal sustainability and limits to government
borrowing. But I would observe, from a narrow financial stability perspective, that growth of
own currency sovereign debt, especially when financed internally, is not a good predictor of
financial crises. Elevated own currency sovereign debt can certainly weigh very heavily on
economies but its adverse effects are usually chronic rather acute.
The rotation of debt in advanced economies from the private sector to the government, post
crisis, makes it more likely that any correction will lead to chronic rather than acute problems.11
By contrast, the decline in the aggregate level of advanced economy private debt may not be
as comforting as it is appears. Aggregates, as I have said, can hide a multitude of sins.
Household debt came down post crisis in most advanced economies – falling from 83% of
GDP in 2009 to around 73% today – and has grown very slowly, if at all, since, moving within a
percentage point for the last five years.12
Financial sector debt in advanced economies has also grown very slowly after the very painful
deleveraging of the financial sector during and after the crisis. This reflects greater risk aversion
in the banking sector reinforced by the much higher level of capital banks are now required to
hold against losses, a very positive development for financial stability.
Corporate debt in advanced economies, however, is a more mixed story. It has not grown
much overall over the past 5 years. But within that, over the past 3 years its growth rate has
accelerated in some countries – particularly the US and France. And perhaps more importantly,
while the totals may not be changing much, the riskiness has been increasing.
Within corporate debt, the proportion of leveraged lending and lower grade corporate bonds
has risen rapidly in recent years, and in the UK and US there is a larger tail of highly indebted
companies than there was before the crisis.13
Alongside this, protections for investors have been weakened materially. There has been an
increase in borrower leverage, greater use of earnings add-backs and a relaxation of other
investor protections like restrictions on collateral transfers. The share of ‘covenant-lite’ loans has
reached record highs.14
Leveraged loans originate in the banking system. Much of the exposure, however, appears to
have been passed on to market based investors, such as investment funds, insurance companies
and pension funds either directly or in the form of collateralized loan obligations (CLOs).
The growth of market-based finance has been one of the major changes of the post crisis
financial landscape. Assets under management (AuM) globally now total $184 trillion as
opposed to $100 trillion ten years ago. The growth in corporate borrowing over the same period
has largely come through the market-based channel, rather than banks, as has the increase in net
external borrowing by emerging markets.
The development of market based finance in and of itself probably increases the resilience of
the financial system by providing an alternative channel of credit.15
11 The Euro area is perhaps something of an exception, given that Euro members issue debt in a common
currency rather than a national currency. This removes the exchange rate and inflation mechanisms for correcting
debt values that can operate when sovereigns issue in their own currency and makes the adjustment mechanism
of default more likely, as was seen in the Euro crisis. 12 There are exceptions such as Canada, France and the Nordic economies. 13 This refers to firms with net debt to EBITDA ratios greater than 4x. 14 At around 60% of the flow of leveraged loan issuance in 2018 (vs. a pre-crisis peak of 20%). 15 For example, in the US the stock of market-based lending in the two years from Q3 2008 to Q3 2010 was
broadly stable (going from $5.1tn to $5.2tn) helping to moderate the impact of the 11% fall in bank loans over
the same period (from $5.5n to $4.9tn).
50
Its use of leverage is much less than the banking channel. Investors using the market-based
channel have a claim on the value of their investments not the nominal amount they invested and
their claims should therefore be able to adjust to losses more smoothly.
Nonetheless, market-based finance often involves liquidity and maturity transformation and
can be subject to run risk.16 And one of the developments over the last ten years has been the
expansion of the investment fund component of market finance into riskier and less liquid areas.
We know much less about how this channel of finance will behave under stress say, following
the loss of confidence in an asset class such as high yield corporate debt and leveraged loans.
High yield corporate bonds and leveraged loans are only 15% of advanced economy corporate
debt. But while it is important to look at aggregates, it is also worth recalling that a very sharp
correction in a relatively small asset class can have major repercussions: the stock of US
subprime mortgage was only $1.1 trillion in 2006, or 13% of the total stock of US mortgages.
There are of course many differences between leveraged loans and associated CDOs and
subprime.17 But, as the Financial Stability Board announced last week, it is now a priority for
the international regulatory community to understand better how this market might behave under
stress and who is holding the risk.18
The other striking development that I would note in the evolution of debt over the past 10
years has been in emerging markets, primarily China, rather than advanced economy debt.
Emerging market debt now accounts for over a quarter of the global total compared to an eighth
before the crisis.
Within this, there has been a persistent buildup of private debt to record levels in China:
excluding the financial sector, private debt has risen from 115% in 2008 to 203% of GDP.
The majority of this increase occurred in the years after the financial crisis but Chinese private
debt has continued to grow, by 30 percentage points of GDP, over the past 5 years, much of it
intermediated through the less regulated shadow banking sector.19
The largest increases have been in the corporate sector, mainly in state owned enterprises, but
more recently household debt has begun to grow quickly.
As published by the Bank in the past, the rate of growth and level have passed the points
where other economies, advanced and emerging, have experienced sharp corrections in the past
(Chart 1).
16 The Financial Stability Board’s Global Monitoring Report on Non-Bank Financial Intermediation 2018 shows
that collective investment vehicles with features that make them susceptible to runs represent 71% ($37 trn) of
the FSB’s risk-based narrow measure of non-bank financial intermediation. 17 See the November Financial Stability Report for a discussion of the similarities and differences between the
current leveraged lending market and sub-prime lending in the run up to the crisis. Chart F.8 also illustrates
which market actors are holding the collateralised loan obligations. 18 See FSB Plenary Press Release 19 IIF Global Debt Monitor.

July 2019
Vol.6, No.3
51
Chart 1: China’s credit boom in a historical context
The Chinese authorities have, since the start of 2017, taken material policy measures to de risk
the financial sector and bring the growth rate of debt into line with the growth rate of nominal
GDP.
More recently, however, in the face of slowing economic growth, they have adopted a range
of measures to support domestic credit. A sharp slowdown in economic growth would make
China’s elevated debt levels significantly less sustainable.
China’s external debt is small and denominated in its currency. Although a number of
international banks are active in its jurisdiction, its financial system is not highly integrated into
the global system. A debt correction in China would first and most directly affect the Chinese
economy.
The impacts could be expected to spillover, however, to wider financial stability through a
number of channels.
The Chinese economy is now pivotal to regional growth and one of the main pillars of world
growth and trade. As well as the economic effects and effects directly through banking
exposures, it is likely that there would be a severe impact on financial market sentiment, this
effect was seen in 2015 when a period of sharp correction in domestic Chinese financial markets
sparked a correction in US financial assets.
Pricing of risk
Finally, I have tried today to trace a line from financial stability risks in the overall level and
growth rate of global debt to those that may lie beneath the surface of the aggregate numbers.
Another perspective on the risks around debt is pricing – whether investors have taken all risks into account, and priced them prudently or whether there’s a degree of optimism that is
reflected in the pricing (just as optimism can be a factor in rising debt levels).
Pricing for much of the stock of global debt is not easily visible, but for debt traded in markets
– typically corporate bonds – we can observe the following.
52
Spreads – the amount charged for risk, be that credit risk or liquidity risk – are low by
historical standards at the moment. The relatively low compensation demanded for risk can also
be seen in the small difference between the price of investment grade and high yield bonds.
We can observe some of these trends in non-traded debt. Spreads on leveraged loans are
roughly 100bps lower than they were in 2015 for the US, which comprises most of the global
market, and 70 bps lower in the UK.
Alongside this low pricing for risk, volatility is low. The VIX ended April at about 13 – well
below its 21st century average of about 20. And US equities are similarly priced – implying
investors are demanding a low equity risk premium.
Moreover, risk-free rates are low in many jurisdictions, and yield curves are broadly flat in all
major jurisdictions. This suggests there is little market expectation of any pickup in growth or,
perhaps more notably, inflation. Similar conditions have persisted for much of the last few years.
An environment of low pricing for risk and low volatility might appear to suggest that global
markets are not expecting large changes in asset prices.
And yet, in a short period over the end of last year and start of this one we saw very sharp
moves across asset markets in response to what seemed relatively modest amounts of news.
Between mid-October and the end of the year spreads on investment grade bonds, for example,
went up by around 50bps.
Since then, these moves have completely retraced – spreads at the start of May were the same
as they were in mid-October last year. Bonds in other currencies and high yield bonds went on a
similar roundtrip. At one point towards the end of 2018, the S&P was 15% lower than it had
been just 3 weeks earlier – it is now at record highs.20
The fall in financial asset prices seems to have been due in no small part first to market
concerns about future economic growth and the recovery to better news about the world
economy and to the signal of greater support to economic growth from central banks than had
hitherto been perceived.
But the episode may also suggest that when it comes to expectations about the value of debt,
the market itself is very sensitive to changes in sentiment and a correction might come very
quickly, either because of weakening expectations of economic performance or signs of inflation.
Given the apparent current compression of risk pricing, such a correction could be a sharp one.
Conclusion
The level of the global debt stock relative to GDP remains near its record high, though it has
stabilized over the past five years. The sustainable level of debt to GDP is not, however, a
constant and there are reasons to believe that the lower trend real rate will likely support
sustainability. While less expected, however, a relatively small increase in the trend rate could
lead to a reassessment of debt sustainability.
While there is evidence that the level of debt, as opposed to the growth rate, does not appear
to be a good predictor of recessions and financial crises, the level does seem to be associated
with depth of losses when crises occur. The historically high level of debt may generally suggest
a higher vulnerability in periods of stress.
The composition of debt, within the aggregate numbers, has changed since the crisis.
Emerging market debt has grown as a proportion of the global debt stock, over the past 10 years,
with much of the increase driven by China.
20 For UK assets, there has been the additional impact of fluctuations in Brexit news and sentiment. The
evaluation of Brexit outcomes seems to have dominated responsiveness to near-term domestic news.

July 2019
Vol.6, No.3
53
Advanced economy public debt has risen but household and financial sector debt is lower now
and the lower post crisis levels have been stable for a number of years. Advanced economy
corporate debt, however, has grown rapidly in recent years in some major jurisdictions,
particularly the US, and its riskiness has increased. The pricing of risk in financial markets is
relatively compressed by historic standards, as is market volatility. But recent events suggest the
market may be very sensitive to changes in expectations of growth or inflation.
As always, the risk picture is mixed. From a financial stability perspective, the right response
to this picture is to ensure that the financial system is sufficiently resilient to a very severe but
plausible correction in values should it occur.
A colleague of mine recently asked me why the financial stability side of the Bank was so
gloomy, always pointing to risks on the horizon and seeing the glass as half empty at best? My
answer was that it was our job to worry about what could plausibly happen - and to ensure that if
it did happen, the glass did not suddenly empty entirely.
54
Global Economy
How to Ensure the Effective and Sustainable Financing of
International Development
By CHRISTINE LAGARDE*
Our focus today is on sustainability. Sustainable debt for sustainable growth—and, may I add,
on a sustainable planet and for a sustainable future.
The challenge of attaining the SDGs
We are all committed to see low-income countries make decisive and lasting advances in
development.
This commitment is embodied in the Sustainable Development Goals, or SDGs—the noble
trifecta of economic prosperity, social inclusion, and environmental sustainability.
Attaining the SDGs is both an economic and ethical imperative.
Yet we face a steep uphill climb. Our work at the IMF has shown that many countries need to
significantly scale up spending to meet the SDGs by 2030.
The additional spending needs in vital areas such as health, education, and priority
infrastructure represent as much as 15 percentage points of GDP on average in low-income
developing countries—which is equivalent to about half a trillion US dollars in 2030. This is
clearly a considerable challenge.
How can this be financed in a way that is sustainable? This is the key question. The first step
begins at home—raising more domestic revenue, making spending more efficient, reducing
corruption, and improving the business environment.
We believe that countries can raise as much as 5 percentage points of GDP in additional tax
revenue—ambitious, but doable.
But this alone will not be enough. Developing countries will also need support from the
international community—from bilateral donors, international institutions, and the private sector.
On the latter: It is high time for the private sector to embrace a greater sense of social
responsibility, focusing more on long-term development and less on short-term profit.
Fortunately, we are seeing far greater interest in “impact investing” and financial instruments
that embrace environmental, social, and governance issues. This certainly bodes well for the
SDGs.
*Christine Lagarde, IMF Managing Director

July 2019
Vol.6, No.3
55
The financing conundrum
We also need to talk about debt financing, which has become again an issue of concern. Let
me drill down a little on this topic.
On one level, of course, there is nothing wrong with borrowing for development—if it is done
sustainably. Here, let me share some good news and some not-so-good news.
First, the good news. In recent years, low-income countries have been able to access more
financing. This partly reflects relatively easy global financing conditions.
More importantly, we have also seen a diverse group of official creditors step up to make
funding available, and sometimes on a very significant scale in support of potentially
transformative infrastructure investment.
China’s Belt and Road Initiative has attracted considerable attention in this regard. The Asian
Infrastructure Investment Bank (AIIB) has also emerged as an important source of financing,
and the Islamic Development Bank’s capital was more than tripled recently.
Now for the not-so-good news. Unfortunately, not all borrowers have managed this increased
financing well, and others have been hit by significant economic shocks.
The result has been a rapid rise in the median debt burden to 47 percent of GDP in 2018 for
low-income developing countries. The rise has been particularly concentrated in commodity
producers.
Forty-three percent of low-income developing countries are currently assessed at either high
risk of debt distress or are already in debt distress, compared with 21 percent in 2013.
So how can we get past the conundrum that countries need to spend more while their
macroeconomic stability is in jeopardy?
International initiatives
As I survey the landscape, I do see a lot of efforts in the global community to find solutions
that contain debt vulnerabilities. Just to give some examples:
• The German Presidency of the G-20 initiated the Compact with Africa. It stressed the
need for better public financial and macroeconomic management, as well as legal and
regulatory frameworks to encourage private investment and strengthen borrowing countries’
ability to better manage debt.
• China just announced a new framework for evaluating debt sustainability in Belt and
Road recipients—closely aligned with the framework employed by the World Bank and the
IMF. We welcome this initiative by an important official creditor.
• And Caribbean countries have been exploring ways to adapt their debt instruments to
build resilience against shocks—with the support of the Paris Club, the World Bank, and the
IMF.
These are all excellent examples of multilateralism at work, of global solidarity. We need to
continue to push these initiatives forward together.
The role of borrowing countries
Of course, borrowing countries themselves have a role to play, first and foremost by raising
the payoff from public investment.
Moving from the lowest to the highest public investment efficiency quartile could double the
impact of investment on output, and thereby better underpin debt sustainability.
Strengthening debt management will also be crucial. This can be quite tricky. As debt
instruments get more complicated, debt management capacity needs to become more
sophisticated.
56
Yet today, only 40 percent of countries meet basic standards for debt recording, while just a
third meet standards for reporting and monitoring of guarantees.
Technical assistance will be critical here. Many of you have made contributions to the World
Bank-IMF Debt Management Trust Fund, to support this kind of capacity building, and I am
extremely grateful for your support.
Backed by this Trust Fund, we will scale up our assistance over the next five years, with the
aim to double it. Better debt management also leads to greater transparency. This is fundamental
to sustainable financing.
The role of creditors
Let me now talk about the role of creditors, who have a vital role to play in encouraging
greater transparency.
As we have seen in Mozambique, private lenders can effectively facilitate hidden debt. Even
for official creditors, non-disclosure agreements or complicated financing modalities can work
against transparency.
I therefore welcome the work being done by the Institute of International Finance (IIF)
on Principles for Debt Transparency of private creditors.
I also welcome the G-20’s self-assessment relative to its operational guidelines for sustainable
financing. I encourage all G-20 members to participate.
It is vitally important to push ahead with further reforms. The new creditor and instrument
landscape is making it much harder to help countries restructure their debt.
Recent cases, such as the Republic of Congo and The Gambia, showed that restructurings can
be drawn out, in part because we cannot rely on established creditor coordination mechanisms.
And there is no one-size-fits-all solution here. In each of these cases, there was a different set
of creditors. There is no one creditor to single out; it is a deeper and broader problem.
Yet there are potential solutions on the table.
The role of the Paris Club
Most importantly, the Paris Club can play an important role in coordinating debt resolution
because it incorporates best practices and has a wide membership—recently expanded to include
Korea and Brazil.
Wider membership of the Paris Club, including new official and plurilateral creditors, could
help secure more rapid and coordinated debt resolutions.
Short of that, any debt restructuring efforts involving non-members would do well to closely
follow the tested rules that Paris Club members have used for many years.
Conclusion
Let me conclude this morning by mentioning the role of the IMF and the World Bank in all of
this.
Our two institutions have been collaborating closely on a detailed multi-pronged work
program to address debt vulnerabilities.
This includes strengthening debt analytics to help lenders and borrowers better understand
risks. It also includes improving the quality, comprehensiveness, and transparency of debt data;
and strengthening countries’ capacity to manage debt.
Over the coming decade, mobilizing financing to support the SDGs will be one of the most important challenges faced by the global community, but financing needs to be more sustainable
than before.

July 2019
Vol.6, No.3
57
We look forward to working with the international community to develop and implement the
ideas to resolve these issues, and welcome today’s forum to help advance our efforts.
After all, it is about the flourishing of all people in a way that respects the limits of nature.
What can be more important?
We have identified and acknowledged the challenge, now we must act together to deliver.
58
Competitiveness of Europe and European Financial Markets
By YVES MERSCH*
Competitiveness in Europe
To increase competitiveness is the main driver for higher potential growth. Member states
have to pursue politics and establish institutions that stimulate the dynamics of a competitive
private sector.
In most euro area countries potential growth has remained too low, however. Labour market
rigidities and inefficient business environment conditions seem to be major impediments. In
particular, labour supply is held back by policies which do not sufficiently motivate to take up
jobs and do not tackle skill mismatch or labour shortages. Moreover, investment could be
strengthened through fostering competition, improve the business environment and reduce
uncertainty e.g. through improving the quality and efficiency of public institutions more
generally.
Despite favourable economic and financing conditions, structural reform progress has been
rather limited, including in several of the weakest countries.
The trend of insufficient structural reform implementation observed in particular since 2014
has continued during the last year. Only a few countries have engaged in more far-reaching
structural reforms, most notably Greece and France. Some countries even reversed recent
reforms that had been designed to improve the smooth functioning of the economy, most notably
in the areas of labour markets and pension systems. Overall, reform efforts were not in line with
reform needs.
These policy areas concern national competencies, but in a single markets cross-border
spill-over effects are generated. Governments therefore need to act at national levels, enhanced
through procedures, rules and harmonization at EU level.
Against the background of limited reform effort and in spite of the robust cyclical upswing,
overall risks and vulnerabilities in many cases have only moderately declined since last year.
The Commission’s annual assessment of country specific recommended reforms finds only
limited progress. Out of 73 country specific recommendations (CSRs), none saw full
implementation, and substantial progress was made in only two cases. For the overwhelming
majority of CSRs (more than 90%), the Commission found that Member States made at best
some or limited progress. On two CSRs, no progress was made. Most concerning, despite being
very vulnerable, the countries experiencing excessive imbalances did not make significantly
more reform progress during the last year than the EU average. The same is true for the countries
experiencing imbalances. Overall, progress on reforms this year was as weak as last year.
The international role of the euro
But also on the European level there is not only a role to harmonize national action in order to
reap the benefits of the Single Market. Where competence has been transferred to the EU level,
the need to spur competitiveness is at the EU level.
The European Commission presented a set of action points to strengthen the euro’s global role.
This speech is delivered at The Outlook for the Economy and Finance conference on April 6, 2019. * Yves Mersch, Member of the Executive Board of the ECB
July 2019
Vol.6, No.3
59
More recently, the COM has underscored the increasing relevance of capital markets union in
supporting the international role of the euro amid geopolitical changes (e.g. Brexit and US
foreign and trade policy).
To this end, the euro should become even more compelling as a means of payment and a
trustworthy investment currency. Without prejudice to the ECB’s independence, we took note of
the Commission’s support for our initiatives on market infrastructure and payments, which help
to increase efficiency and financial market integration in the euro area.
International trade
It was important to resist, the temptation to gain competitive advantage or create national
champions by tilting the system in one’s favour (e.g. in the area of tax, privacy, cyber security
and fintech policies).
The costs of fragmentation of global trade would be high. IMF staff simulations of a global
trading system that had been fragmented into three trading blocs show that in such a scenario,
each of the blocs was overall worse off, although individual countries within the bloc may
actually gain. These issues would also apply to other areas like the international flow of data and
access to the global payments system.
There are five dimensions where progress is needed:
· Consensus on how to address social and economic grievances;
· A rethinking of the appropriate mix of domestic policies;
· Strengthening and updating of the international rules of the game;
· Adequate management of global public goods;
· Securing the global financial safety net.
Payments systems
The ECB’s responsibility for promoting the smooth operation of payment systems indirectly
supports the international standing of the euro. The Eurosystem has contributed to reshaping and
consolidating the infrastructure for large-value payments, for post-trading services for financial
instruments and, most recently, for instant retail payments.
Over the next two or three years we aim attacking measures to consolidate TARGET2 and
TARGET2-Securities (T2S), in particular by delivering a centralised liquidity management
function; developing a single collateral management system that will be capable of managing the
assets used as collateral in Eurosystem credit operations for all euro area countries.
Harmonization agenda
More harmonization is necessary to achieve a safe and efficient European post trade landscape.
The European Post Trade Forum (EPTF) Report identifies barriers which have not yet been
dismantled (formerly known as “Giovannini Barriers”), as well as new bottlenecks which need
to be addressed to promote more efficient and resilient market infrastructures in the EU. These
include:
Inefficient withholding tax collection procedures
Legal inconsistencies and uncertainties
Fragmented corporate actions and general meeting processes
More harmonisation of national insolvency rules is needed to make European resolution more
effective. The recently agreed proposal (December 2018) is a minimum harmonization directive
allowing member states to go further when transposing the rules into national law.
European issuance
An important element in a well-functioning capital market is the smooth interplay between

60
issuance on the primary market, investors and secondary markets. In Europe, the issuance and
distribution of securities is still complex and operational cost are elevated. Securities are still
issued along different national rules, standards and habits.
Central Securities Depositories (CSD) play a pivotal role in this process. Today, issuers
usually issue in one CSD. All other CSDs, and their national customer base, need to access these
securities by connecting to this initial one. This chopped-up process is complex and relatively
expensive. Investors and issuers alike see scope for improvements.
July 2019
Vol.6, No.3
61
The Fall of German Banking
By DAVID MARSH*
Former German Chancellor Helmut Schmidt used to lament how Germany's giant banking
groups would stoke up dangerous enmity among neighbouring countries by inevitably
dominating European finance. A senior French banker once told me that French and German
banks would never merge because the Germans would always have the upper hand – partly
because German bankers were bigger and taller than their Gallic counterparts.
Those fears from past decades now look near-comical. The collapse of merger talks between
Deutsche Bank and Commerzbank, the No.1 and No2. German lenders, marks the latest episode
in a 30-year downward spiral of German banks that were once by far Europe's best capitalised
financial institutions. In 1990 Deutsche was worth the combined totals of most of its European
rivals. HSBC, now Europe's highest capitalised bank, is worth around 10 times that of the bank
that bears the name of Europe's largest economy.
This is the third time since the beginning of the century that attempts to consolidate
Germany's heavyweight but below-par private banks have run into failure.
In 2000, a much-heralded merger between Deutsche and Dresdner Bank, its long-standing
domestic rival, was abandoned above all because of opposition from Deutsche's London-based
investment bankers. In 2008, a second-best merger between Dresdner (which had been taken
over in 2001 by the Allianz insurance group) and Commerzbank was consummated – but, laid
low by the financial crisis, the link never produced the desired outcomes.
At each setback, German commentators bemoan the lack of competitiveness of the country's
stock market-quoted banks. The reasons for the shortcomings have been extensively diagnosed.
They are fighting against the triple challenge of Germany's established co-operative and
state-backed savings banking networks, European competitors that have far more successfully
consolidated their national banking markets in the past 20 years , and US institutions extensively
recovered from the 2008 financial crisis.
One notable casualty will be Paul Achleitner, Deutsche's luckless supervisory board chief,
who has been (along with Olaf Scholz, the German finance minister) one of the few strong
backers of the deal. Achleitner will again have to readjust a strategy that has been singularly
lacking in conviction and results.
The biggest fall-out may emerge in the political sphere. In contrast to Scholz, Chancellor
Angela Merkel, who will bow out as Germany's leader in the next year or so after 14 years at the
helm, never gave overt support to the deal, fearing trade union opprobrium over job losses.
Owning 15.6% of Commerzbank following a post-crisis capital injection that has
spectacularly failed to pay out for German taxpayers, the Berlin government will have a big say
in the aftermath. This is likely to demonstrate Germany's vulnerability to economic setbacks –
and this will have difficult political consequences, too.
Both Deutsche and Commerzbank are in positions of extreme weakness, with share prices
down more than 90% from their pre-crisis highs. Their combined market capitalisation of €29bn
is dwarfed by €83bn for Spain's Santander, €69bn for France's BNP Paribas, €52bn for the
Netherlands' ING Group, and €32bn for Italy's Unicredit. At least two of these institutions are contenders to buy Commerzbank. And a foreign bid for Deutsche Bank – once unthinkable –
This article firstly appeared in OMFIF Commentary on April 29, 2019. * David Marsh, member of IMI International Committee, Chairman of OMFIF
62
may not be far off.
Germany will be under pressure over its European policies, too. Berlin's previous backing for
the merger and formation of a 'national champion' appeared to counter some key precepts of
European banking union that Germany otherwise says it supports. Merkel and Scholz will now
face pressure from France and other European partners for Berlin to invite European bids for
either of its top banks. This could invite strong questioning, especially from France, of
Germany's ultimate European goals.
If a foreign bid went through, many German politicians believe the country could be exposed
in the next financial crisis to a lack of nationally strong banks helping to shore up domestic
industry. As the Frankfurter Allgemeine Zeitung daily wrote on Friday, 'The Germans don't like
their banks. They may see their benefits only when there are none left.'
If, on the other hand, the Germans block foreign bids on indirectly protectionist grounds, this
would cause a major backlash around Europe. Banking could be the ultimate battleground where
Germany must decide between national and European priorities. Whatever happens, for
Germany this will be painful.

July 2019
Vol.6, No.3
63
China
The Power of China's Urban Clusters
By ANDREW SHENG AND XIAO GENG*
The “Chinese Dream” of national rejuvenation touted by President Xi Jinping is not, as some in the West seem to think, about world domination. Instead, China has advanced a vision of
inclusive, sustainable economic growth – and its leaders are doing what it takes to translate that vision into reality.
In February, China’s State Council unveiled guidelines for developing the “Greater Bay Area”
(GBA), covering nine cities around the Pearl River Delta in Guangdong province, plus Hong
Kong and Macau. While the rest of the world remains mired in a seemingly interminable debate
over how to achieve inclusive and sustainable growth, China is working to deliver it.
According to China’s long-term development strategy, the central government remains
responsible for overall stability and national security. Against this background, lower-level
governments, state-owned enterprises, and the private sector (including foreign companies)
should compete to generate new ideas and establish best practices that can be applied more
broadly.
In 2010, China identified three major urban clusters that would lead this process: the Pearl
River Delta (which later expanded to the GBA); the Yangtze River Delta (YRD), centered on
Shanghai; and the Beijing-Tianjin-Hebei cluster (BTH). Together, these regions are home to 300
million people, cover 400,000 square kilometers (154,000 square miles), and contribute $4.8
trillion, or more than 35%, to China’s total GDP.
Though it is the smallest of the three, with 70 million inhabitants, the GBA accounts for $1.5
trillion of China’s GDP. Thanks to dynamic private companies, some with foreign investors, and
deep engagement in global trade, the GBA (excluding Hong Kong and Macau) grew by 14%
annually between 1980 and 2017. The GBA is a poster child for the benefits of China’s
market-oriented reform and opening up, and the constant experimentation and adaptation that
have shaped it.
At a time when climate change, geopolitical tensions, and disruptive technologies are
transforming global value chains and ways of life, such experimentation and adaptation – for
which cities and urban clusters have been critical platforms – will remain vital to China’s future.
Indeed, it is the key to developing and implementing more sustainable and inclusive economic
models.
This article appeared in Project Syndicate on April 25, 2019. * Andrew Sheng, Distinguished Fellow of the Asia Global Institute at the University of Hong Kong;
Xiao Geng, Member of IMI Academic Committee; Professor, Peking University HSBC Business School;
President, Hong Kong Institution for International Finance
64
The effort to achieve a green, inclusive, and innovative future will play out on three main
fronts. First, dynamic companies – including established giants like Huawei and Tencent, as well
as a host of emerging firms – will compete to deliver more resource-efficient, consumer-oriented
products and services. World-class universities and research teams will also contribute to this
process.
Second, China will continue to make progress on social inclusion and stability, through
measures such as tax cuts and reduction of bureaucratic red tape for small firms, minimum-wage
increases, and improvements to social security, health care, and education. To this end, the
central government has been working closely with local authorities to transform them from rigid
bureaucratic units into competing providers of infrastructure and public services.
At the same time, some cities – such as those in the GBA – have adopted stringent regulations
on real-estate speculation to curb rising property prices, while expanding the availability of
subsidized housing to low-income households and young graduates. Such inclusive housing
policies, together with rising real incomes for most urban residents, not only bolster social
stability, but also help to counter rising income and wealth inequality.
Finally, China will continue to ramp up its efforts to create green cities. This means reducing
air and water pollution, including through the construction of innovative vertical forests, while
implementing and expanding urban decarbonization schemes.
According to Nature Sustainability magazine, China accounted for 25% of the net global
increase in green leaf areas in 2000-2017, thanks to re-forestation programs and improved
land-use management. China is also a world leader in the development of autonomous electric
vehicles, an innovation that will be facilitated by next-generation 5G wireless infrastructure.
Of course, the imperatives are not the same for all cities and urban clusters. For the GBA,
developments in Hong Kong will be particularly important. The city already has strong
advantages in the global knowledge economy. But that economy is changing fast, including
through digitalization. As a result, a bold and forward-thinking reevaluation of Hong Kong’s
role will be required, with a view to supporting more effectively both Hong Kong’s and
mainland China’s long-term development goals.
Specifically, Hong Kong faces short-term bottlenecks, both in terms of physical space and the
market, which need to be overcome by, for example, linking the city’s infrastructure (hard and
soft) to that of mainland China. Fortunately, the GBA region has already proved adept at
removing “last-mile” delivery bottlenecks in public services, from transportation to health care
to education.
The “Chinese Dream” of national rejuvenation touted by President Xi Jinping is not, as some
in the West seem to think, about world domination. After all, market competition, innovation,
and entrepreneurship do not have to be zero-sum games. Instead, China has advanced a vision of
inclusive, sustainable economic growth that supports global peace and prosperity. And its
leaders are doing what it takes to translate that vision into reality.

July 2019
Vol.6, No.3
65
The Ever-Solid Hong Kong Dollar
By STEVE H. HANKE*
This week, turmoil gripped a usually dynamic, but well-ordered and calm, Hong Kong. Police
stood by as young protestors stormed and sacked Hong Kong’s parliament building. Contrary to
dire predictions by currency speculators, one thing that remained rock solid was the Hong Kong
dollar (HKD).
The HKD’s exchange rate is the responsibility of the Hong Kong Monetary Authority
(HKMA). The HKMA has many responsibilities. One of the most important ones is the
management of Hong Kong’s currency board. A currency board issues notes and coins
convertible on demand into a foreign anchor currency at a fixed rate of exchange. As reserves, it
holds low-risk, interest-bearing bonds denominated in the anchor currency. The reserve levels
(both floors and ceilings) are set by law and are equal to 100%, or slightly more, of its monetary
liabilities (notes, coins, and deposits). A currency board generates profits (seigniorage) from the
difference between the interest it earns on its reserve assets and the expense of maintaining its
liabilities.
By design, and unlike central banks, a currency board has no discretionary monetary powers
and cannot engage in the fiduciary issue of money. It has an exchange rate policy (the exchange
rate is fixed) but no monetary policy. A currency board’s operations are passive and automatic.
The sole function of a currency board is to exchange the domestic currency it issues for an
anchor currency at a fixed rate. Consequently, the quantity of domestic currency in circulation is
determined solely by market forces, namely the demand for domestic currency.
Since the Hong Kong dollar’s anchor currency is the U.S. dollar (USD), the HKD is a clone of
the USD, and Hong Kong is a part of a unified currency area with the United States. There is no
better way to tell a financial story than with a balance sheet. For the HKMA’s currency board
story, one needs to focus on the HKMA’s segregated currency board account. Unfortunately,
many are confused by the HKMA’s consolidated accounts, which include many non-currency
board accounts, such as the fiscal reserves the HKMA holds for the government. These are
significant, and they are managed by the HKMA. Recall that, during the Asian financial crisis in
1998, the HKMA used those reserves to intervene in Hong Kong’s stock market on a massive
scale.
So, with the HKMA, unlike a central bank, lacking any discretionary monetary powers, how is
the money supply determined in Hong Kong? Well, it’s determined by the free market for Hong
Kong dollars. The Hong Kong dollar chart below shows how the quantity of Hong Kong dollars
(the monetary base, M0) is determined in a free market for Hong Kong dollars. The HKMA’s
currency board sets the HKD/USD exchange rate at 7.8. That rate always remains fixed. So, the
supply of HKDs is infinitely elastic (represented by the horizontal line). The demand for HKDs
determines the magnitude of the monetary base (M0), which is the quantity associated with the
point at which the supply and demand for HKDs are equated. At present, that quantity is HKD
1,627,905 million. If the demand for HKDs increases, the demand curve would shift to the right
and move along the supply curve, resulting in an increase in the monetary base. The market, not
the HKMA, determines the magnitude of Hong Kong’s monetary base.
This article appeared on Forbes.com on July 5, 2019. * Steve H. Hanke, Member of IMI International Advisory Board, Professor of Applied Economics at the Johns
Hopkins University.

66
So, how has the market-determined money supply worked out in Hong Kong? Let’s take
Hong Kong’s monetary temperature. To do that, we first determine the “golden growth” rate for
the money supply, and then compare the actual growth rate in Hong Kong to the golden growth
rate. To calculate the golden growth rate, I use the quantity theory of money (QTM). The income
form of QTM states: MV=Py, where M is the money supply, V is the velocity of money, P is the
price level, and y is real GDP.
Let’s use the QTM to make some bench calculations to determine what the golden growth rate
is for the money supply. This is the rate of broad money growth that would allow the HKMA to
hit an inflation target. But, the HKMA operates a currency board and has no monetary policy. So,
the U.S. inflation target of 2%/yr is used.
According to my calculations, the average percent real GDP growth since 2006 was 3.06%,
and the average change in the velocity of money was -3.25%. Using these values and the U.S.
Federal Reserve’s inflation target of 2%, I calculated Hong Kong’s golden growth rate for Total
Money to be 8.30% (see the chart below).
Calculations:
Golden Growth rate = Inflation target + Average real GDP growth – Average percent change
in velocity
Golden Growth rate = 2.000% + 3.058% - (-3.246%) = 8.30%
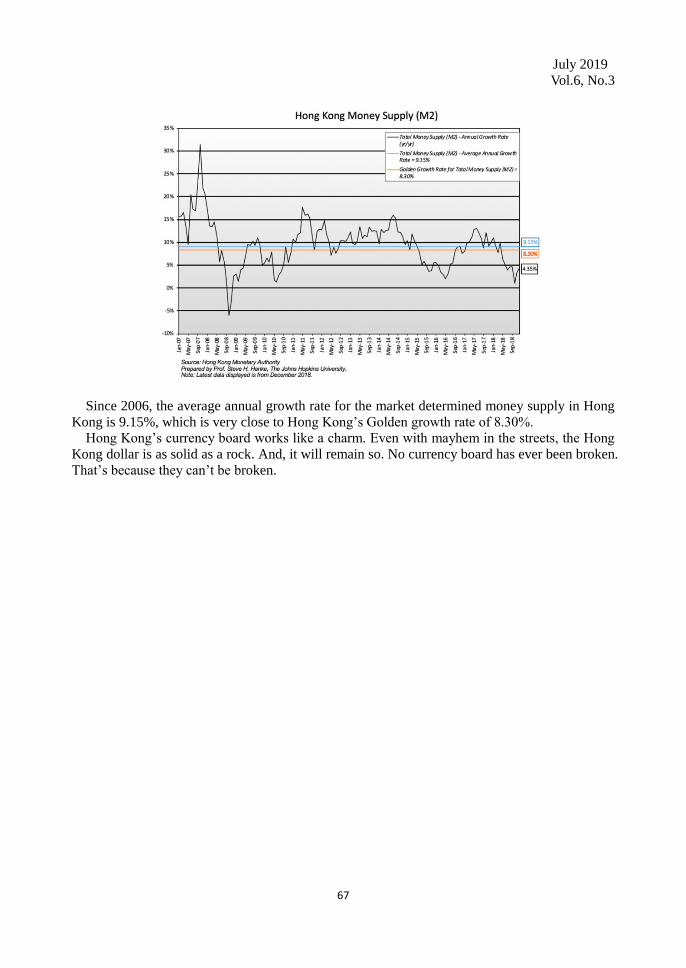
July 2019
Vol.6, No.3
67
Since 2006, the average annual growth rate for the market determined money supply in Hong
Kong is 9.15%, which is very close to Hong Kong’s Golden growth rate of 8.30%.
Hong Kong’s currency board works like a charm. Even with mayhem in the streets, the Hong
Kong dollar is as solid as a rock. And, it will remain so. No currency board has ever been broken.
That’s because they can’t be broken.

68
Revisiting China’s Economic Slowdown
By KOTBEE SHIN *
Amid escalating U.S.-China trade disputes, the Chinese economy grew at 6.6% in 2018. The
figure was slightly above the target growth rate of 6.5%, but still the lowest level since 1991. At
the National People’s Congress, China announced its economic growth rate target for 2019 as
6.0‒6.5%. Setting a target range of growth, rather than a specific number, can be attributed to
China’s acknowledgement of increasing uncertainties and complicated circumstances. There are
many reasons for concern about the Chinese economic slowdown as Christine Lagarde,
Managing Director of the International Monetary Fund, has warned the Chinese slowdown will
act as one of the “four clouds” undermining progress in the global economy.
Looking at the breakdown of GDP expenditure, China’s final consumption expenditure grew
by 5.03 percent in 2018. The final consumption expenditure growth is a main driving force of
growth, contributing 76.2 percent to GDP growth. In particular, retail sales growth was 9 percent
despite subdued sales of automobiles and mobile phones. Retail sales in rural areas outpaced
retail sales in urban areas thanks to e-commerce market growth. Online sales reached 1.37
trillion yuan1 in rural areas, increasing by 30.4 percent. Consumption growth seems also well
backed by disposable income growth, which went up by 6.5 percent in real term.
Gross capital formation was in an overall slump last year compared to final consumption
expenditure, growing by only 2.14 percent and contributing 32.4 percent of GDP growth. Fixed
asset investment increased by 5.9 percent last year. The main downside factor is that
infra-structure investment grew only 3.8 percent, slowing down sharply from 19 percent last
year. However, growth in manufacturing investment has been picking up, rising to 9.5 percent
by the end of 2018, and real estate investment expanded by 8.3 percent.
Net exports dragged down China’s growth by 8.6 percent last year. Exports rose 9.9 per-cent
from 2017 while imports grew faster, by 15.8 percent. One noticeable fact is that despite the U.S.
imposing additional tariffs on Chinese goods, Chinese exports to the U.S. surged by 11.3
percent.2 This increase may reflect front-loading by exporters. Due to diversification in the
Chinese export market, exports to Brazil, Australia, ASEAN, New Zealand and Russia also rose
more than 10 percent year-on-year. However, considering that the effects of tariffs will mainly
be realized in 2019, the export growth rate is likely to slow down considerably this year.
Although macroeconomic conditions point to a modest slowdown in real economic activity in
2018, the Chinese economy seems to be facing increasingly tough headwind. The impacts of
protectionism triggered by U.S.-China disputes will be realized this year, feeding downward
pressure on the Chinese economy. It will also be necessary for the government to pursue a
deleveraging campaign to promote the economy’s long-term sustainable growth.
*Kotbee Shin, Ph.D., Associate Research Fellow, China Team/International Macroeconomics Team, Korea
Institute for International Economic Policy 1 China Global Television Network. 2019. China's Online Retail Sales Exceeded 9 Trillion Yuan in 2018.
Available at https://news.cgtn.com/news/3d3d674d3551444f32457a6333566d54/index.html (accessed April 25,
2019). 2 Tan, Huileng. 2019. US Trade Deficit with China Grows to a Record and It’s Likely Even Worse Than the Data
Show. Available at
https://www.cnbc.com/2019/01/14/china-2018-full-year-december-trade-exports-imports-trade-balance.html
(accessed April 25, 2019).
July 2019
Vol.6, No.3
69
In order to mitigate the effect of internal and external challenges, the government pledged a
proactive fiscal stimulus plan to boost the economy at the National People’s Congress. The
Chinese government has announced an additional cut in the value-added tax (VAT) on top of
last year’s reduction, which will make most goods and services cheaper for households and
should spur consumption. The government is also planning to cut corporate taxes and various
fees, including the social security fee companies have to shoulder, by nearly 2 trillion yuan. In
addition to this, local governments will be allowed to issue 2.15 trillion yuan of special purpose
bonds for infrastructure investment, up 0.8 trillion yuan from last year.
To be sure, the Chinese economy will slow down in the long-term as it continues to mature. It
is also likely to show further slowing this year, considering the exacerbated external conditions.
However, the Chinese government is taking the challenges seriously and will increase its grip on
the economy. As we refer to the statistics, Chinese growth no longer depends heavily on external
conditions. Given the Chinese domestic market expansion and fiscal policies, the concerns about
the Chinese slowing down seem to be overstated.
70
Boosting Internationalisation of RMB in Times of Trade
Tensions
By HERBERT POENISCH*
The current tug of trade war between the US and China has emboldened the sceptics of
economic theories. No longer can free prices and exchange rates be trusted to balance the global
economy. Over the past 20 years China has started to trust the functioning of economic levers
and gradually allowed them to function. The expected results started to appear, such as a reduced
current account surplus.
Now this trust in the functioning of economic levers has been damaged, arguably beyond
repair. It has been damaged by the champion of free markets itself, the United States. Before that
they led the global proliferation of free market theories, notably after the collapse of the Soviet
Union and other Socialist countries. These countries were reluctant to allow these free market
mechanisms to function, fearing of being put at a disadvantage compared with established
players. The US and the organisations dominated by them, such as the IMF and the IBRD went
out to spread the gospel and to force countries to allow the invisible hand to work. The results
were mixed.
China was far more reluctant to embrace the functioning of economic levers. They rightfully
chose a more prudent path to globalisation than those following the US advice. The benefit
reaped by China was a gradual transition to a market-based economy, avoiding the hardships
experienced by former Socialist countries. Weaker economies are well advised to some
protective measures before opening up.
The US has now declared itself the victim of the mechanism of globalisation and fully
embraced protectionism. The main target is China and any weapons are used, ranging from
weakening the exchange rate to capital account measures such as keeping out certain FDI to
micro-management such as barring Huawei from the US market.
China has been caught in the middle of opening up and following international rules. The first
and foremost among them are a freely floating exchange rate and opening up the financial
account. China joined the SDR in 2016, promising to allow RMB to float more freely and
liberalise the financial account. All this is put on a back burner, putting both, exchange rate
regime and liberalisation of capital flows on the table as bargaining chips in the great tussle with
the US.
How can this game continue without damaging China’s trading and investment partners,
prominently those in the Belt and Road Initiative? The solution should be a carefully conducted
expansion of the RMB zone. This will be the result ofa two-pronged approach, the visible hand
leading, meaning measures taken by Chinese authorities as well as the invisible hand following,
by partner currencies moving more closely with the RMB rather than USD.
This article will cover China’s global commitments in trade and finance and the impact on
major trading partners and Belt and Road countries. Can these countries be sheltered from these
uncertainties by proving a sphere of stability in the form of a regional RMB zone? The best indicator of an emerging RMB zone is the stronger co-movement of trading partner currencies
*Herbert Poenisch, member of IMI International Committee, Former Senior Economist of BIS

July 2019
Vol.6, No.3
71
with the onshore RMB. If global stability is fought over, the countries in China’s orbit can
import stability from RMB denominated trade and investment and a more predictable monetary
and exchange rate policy in China.
This article will conclude which measures should be taken to bring trading and investment
partners into the orbit of China’s monetary and financial system.
1. Needs of China’s trade and investment partners
In an interconnected world with value added chains stretching across a number of countries
the US tariff measures will not only affect China but also countries in the supply chain,
including the US itself. Can the impact of these tariffs on Chinese exports and imports from
emerging markets be cushioned by boosting the RMB zone? Will invoicing and payment in
RMB prevent a pass through of the trade shock?
Reducing the dependence on the USD has not only been a political aim but also an economic
necessity. Although global liquidity is still ample, USD liquidity might be unequally distributed.
There is not only a shortage in most EME economies but increasingly also in China. The USD
borrowing by Chinese entities, financing of essential imports as well as ambitious Belt and Road
projects in USD might lead to a USD shortage in China if the trade tensions continue.
China has become the main trading partner of more than 50 countries all over the world, but
mainly in Asia. It is supplying not only consumer goods but also high-quality investment goods
which form part of the Belt and Road strategy. In return China buys primary products and
intermediary goods for its export production as well as domestic investment and consumption.
In the past few years China has shifted away from export led production to domestic
investment and consumption. While this rebalancing is under way, exports continue to play an
important role, however, with a shrinking contribution to the GDP. Rebalancing is not only a
shift from export and investment led growth to consumption led growth while reducing the credit
element in financing growth.
Assuming that domestic investment and consumption will absorb most of the imports, a
strengthening of the RMB element will stabilise import prices for China as well as export prices
for EME suppliers. The benefit of a RMB zone will be a greater predictability of prices within
the zone and less disturbance from the USD volatility.
In addition, China can help its 65 Belt and Road partners by providing finance denominated in
RMB which will create a predictable debt in future. These countries can raise debt also by
issuing Panda Bonds in the vast Chinese onshore RMB market. As a result these countries could
wean themselves off the dependence on the USD for trade and investment.
However, the beginnings since 2009 were very modest and far off the critical mass of tying
countries to the RMB. For nearly all indicators the end of 2015 or early 2016 saw the peak. The
BIS forex survey of spring 2016 showed a RMB share of 2% (4% for currency pairs). Since then
most of them stalled, some of them even declined.
The share of China’s trade denominated and settled in RMB declined from 26% in 2015 to 15%
in 2018. Payments in RMB reported by SWIFT, CIEC and RMB Globalisation indices such as
by Standard Chartered Bank and IMI were flat since end 2015, even declining during some
periods. The first quarter of 2019 saw such a decline.
On the financial account, FDI settled in RMB, both inward and outward mostly declined since
end 2015. Only the RMB share of ODI increased in 2018, due to a decline in ODI in advanced
economies. The share of cross-border bank lending in RMB by banks in China remained at 10%
while the share of forex lending by Chinese banks globally accounted for the major part of the
business. Cross border deposits remained unchanged at 30% mainly due to Hong Kong RMB
deposits. The only component which showed an upward trend was the purchase of RMB
denominated securities, equities as well as bonds by foreigners, private as well as official. While

72
the share of official forex reserves increased steadily, the private RMB ones were volatile. The
share of official reserves was close to 2% at the end of 2018.
While the purchase and holding of RMB denominated securities increased, their share in total
stock market capitalisation and of total domestic bonds issued remained below 2%. The only
exception is Chinese central government bonds, where the share of foreign holdings is 8%. The
main reason is the lack of trust in financial information issued by financials, corporates and
sub-national governments.
The share of lending in RMB to Belt andRoad countries for Chinese projects has been
incredibly low and the issue of Panda bonds by Belt and Road countries has been negligible. The
increase in RMB deposits with Chinese banks, the decline in RMB denominated lending at the
end of 2018 presents a repatriation of RMB, a capital inflow. This was reinforced by the
overseas issue of RMB securities by the PBoC to mop up CNH liquidity.
Despite widespread declarations to boost the internationalisation of the RMB by the visible
hand, the Chinese authorities, the results have been rather modest. Since the financial instability
of 2015, already before the trade tensions broke out, most indicators have been underperforming.
All these indicators are the nexus where the visible hand hold hands with the invisible hand.
Have the administrative measures and monetary and exchange rate policies failed to generate
greater confidence among market participants to invest and trade in RMB, thus not consolidating
the foundations of an RMB zone?
2. China’s recent monetary and exchange rate policy
China has made great strides since moving away from a fixed RMB/USD exchange rate in
2005 to an independent monetary policy and more flexible exchange rate policy.The RMB
exchange rate versus the USD and other major currencies moved in both directions in recent
years. EME currencies shadowing the RMB would provide stability and form the essential core
of a RMB zone.
The main phases were from 2005 to 2015, from 2015 until 2017, and since then.
The first phase was characterised by a shift from a RMB/USD peg to a floating rate regime
based on supply and demand with reference to an undisclosed basket. There were few currencies
in the basket at the beginning, widened to 13 currencies in 2015 and 24 currencies in 2017. The
central parity would be announced at the beginning of the trading day and the limits for
deviations for the RMB/USD rate as well as for the other core currencies, ie the EUR, the JPY
and the HKD were specified and widened during this period. The USD rate still played a key
role with a narrower trading band. During the global financial crisis from 2008 to 2010 the
RMB/USD rate was stabilised, a return to the previous regime.
This regime survived a massive appreciation linked with capital inflows until mid-2014 as
well as outflows followed by a depreciation of the RMB until mid-2015. Then the PBoC
announced a new central parity setting mechanism. The closing rate of one day would be the
opening rate for the next day, thus strengthening the market determination of the central rate.
This unexpected change was followed by further capital outflows in the second half of 2015 and
2016 as a result of unwinding of carry trade and capital flight, with the RMB depreciating to the
CFETS basket by 10% between mid-2015 and end 2016.
Once the CFETS basket was published and the new central parity system allowed to work the
RMB stabilised in relation to the basket. The forex market understood the exchange rate policy
and acted accordingly and EME currencies moved more closely with the RMB. In May 2017 the
parity setting mechanism was disturbed by a counter-cyclical adjustment factor (CCAF), driving a wedge between the closing rate and the new opening rate. The purpose was to lean against
depreciation expectations and herding behaviour and to stabilise the RMB/USD rate. The market
interpreted this adjustment as reverting back to a RMB/USD target.
July 2019
Vol.6, No.3
73
In relation to partner EME currencies, the period of pegging to a basket could be called the
golden period as co-movements between the RMB and EME currencies became closer and more
significant. This was the beginning of a RMB zone accepted by market participants, the invisible
hand. McCauley and Chang have shown that the link between RMB and EME currencies
strengthens as a result of multilateral and predictable policies. Once the CCAF was introduced
this link weakened.
The CCAF was re-enacted in 2018 when the depreciation pressure on the RMB intensified as
a result of the escalating trade war with the US. The RMB declined, both in terms of USD as
well as the CFETS basket until this very day. Now that the RMB/USD rate has been thrown into
the negotiating basket the exchange regime is ever so uncertain for EME currencies.
The RMB/USD exchange rate has become the focus of the US attention, as they feel that
China might weaken the RMB to counter the effect of tariffs. So far China has not been accused
as currency manipulator but China cannot take major steps towards wider floating under present
circumstances. These might be interpreted as trade related measures provoking a tough response
from the US. Thus an independent monetary and exchange rate policy is off for the time being.
3. Declared monetary and exchange rate regime
The IMF classifies monetary and exchange rate regimes of countries according to the actual
practices and published these categories in the annual report on exchange arrangements and
exchange restrictions. All SDR countries are in the category of inflation targeting and floating
exchange rates, where only Japan attaches greater importance to the bilateral JPY/USD
exchange rate. China was moving towards this when the trade war broke out.
China pursues a variety of targets in its monetary policy, monetary aggregates as well as an
inflation target between 2-3%. According to market understanding these are subordinate to an
exchange rate target of shadowing the USD. This becomes even more prominent during times of
trade tensions.
Regarding exchange rates, China was in the category of USD pegging countries until 2005
when it was moved into the category of stabilised arrangements similar to Singapore with a peg
to an undisclosed basket, both in composition and weights. In 2017 it was moved again into a
category of crawl-like arrangement with an anchor to a composite (basket). Since then, greater
deviation from a stable RMB/USD has been prevented by the adjustment factor CCAF giving
the market a clear signal of a closer link with USD. This also served to calm US concerns of a
deprecation of the RMB which might have caused a US accusation of currency manipulator.
However, this deviates from offering an alternate exchange rate regime for trade and
investment partners. During the basket pegging period, EME currencies followed RMB more
closely and diverged from the USD, creating a RMB zone. During the present negotiated
exchange rate regime, both RMB and EME currencies revert to closely following the USD, a
setback for establishing a RMB zone.
While the external pressure to tie the RMB to the USD has been the main explanatory variable
there is also a fair amount of fear of floating in China. This fear is different from other EME
currencies because of the following factors.
The exchange rate expectations are the same as other EME. They lead economic agents to
pro-cyclical behaviour. In periods of expected appreciation, export funds are repatriated and
capital inflows due to unwinding or carry trade but also speculative inflows reinforce this trend.
Once the tide turns, the opposite effect happens, accelerating the depreciation. Big Chinese
banks and corporations ride the tide rather than take opposing positions. Their goal is to make
profit, particularly out of exchange rate movements.
The element different from other EME is the fear of debt servicing in foreign currencies
which might deplete forex reserves. First of all, China’s forex reserves are plentiful by any
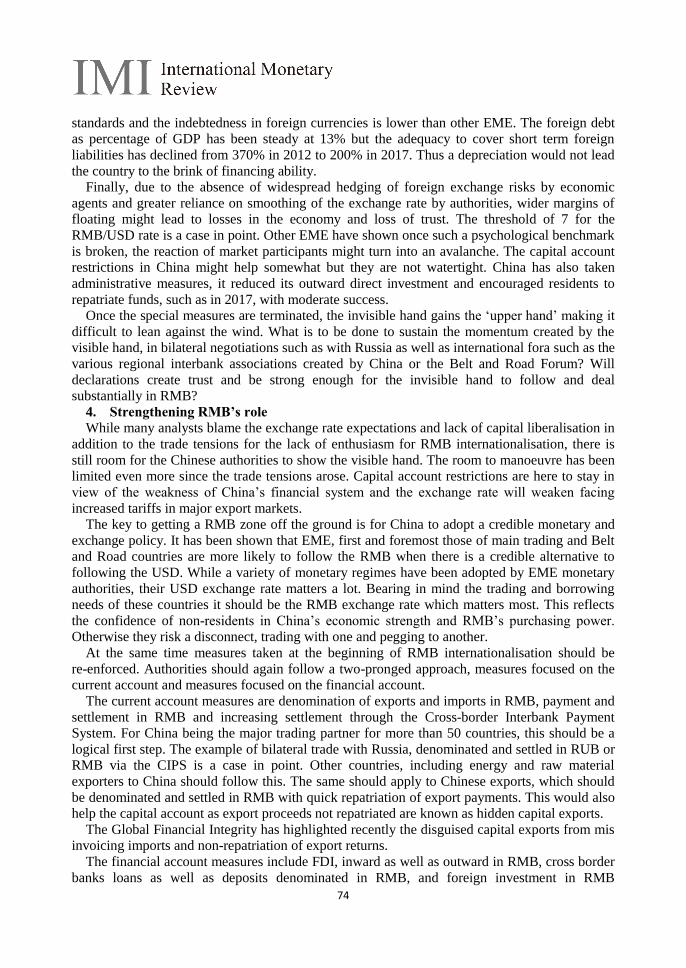
74
standards and the indebtedness in foreign currencies is lower than other EME. The foreign debt
as percentage of GDP has been steady at 13% but the adequacy to cover short term foreign
liabilities has declined from 370% in 2012 to 200% in 2017. Thus a depreciation would not lead
the country to the brink of financing ability.
Finally, due to the absence of widespread hedging of foreign exchange risks by economic
agents and greater reliance on smoothing of the exchange rate by authorities, wider margins of
floating might lead to losses in the economy and loss of trust. The threshold of 7 for the
RMB/USD rate is a case in point. Other EME have shown once such a psychological benchmark
is broken, the reaction of market participants might turn into an avalanche. The capital account
restrictions in China might help somewhat but they are not watertight. China has also taken
administrative measures, it reduced its outward direct investment and encouraged residents to
repatriate funds, such as in 2017, with moderate success.
Once the special measures are terminated, the invisible hand gains the ‘upper hand’ making it
difficult to lean against the wind. What is to be done to sustain the momentum created by the
visible hand, in bilateral negotiations such as with Russia as well as international fora such as the
various regional interbank associations created by China or the Belt and Road Forum? Will
declarations create trust and be strong enough for the invisible hand to follow and deal
substantially in RMB?
4. Strengthening RMB’s role
While many analysts blame the exchange rate expectations and lack of capital liberalisation in
addition to the trade tensions for the lack of enthusiasm for RMB internationalisation, there is
still room for the Chinese authorities to show the visible hand. The room to manoeuvre has been
limited even more since the trade tensions arose. Capital account restrictions are here to stay in
view of the weakness of China’s financial system and the exchange rate will weaken facing
increased tariffs in major export markets.
The key to getting a RMB zone off the ground is for China to adopt a credible monetary and
exchange policy. It has been shown that EME, first and foremost those of main trading and Belt
and Road countries are more likely to follow the RMB when there is a credible alternative to
following the USD. While a variety of monetary regimes have been adopted by EME monetary
authorities, their USD exchange rate matters a lot. Bearing in mind the trading and borrowing
needs of these countries it should be the RMB exchange rate which matters most. This reflects
the confidence of non-residents in China’s economic strength and RMB’s purchasing power.
Otherwise they risk a disconnect, trading with one and pegging to another.
At the same time measures taken at the beginning of RMB internationalisation should be
re-enforced. Authorities should again follow a two-pronged approach, measures focused on the
current account and measures focused on the financial account.
The current account measures are denomination of exports and imports in RMB, payment and
settlement in RMB and increasing settlement through the Cross-border Interbank Payment
System. For China being the major trading partner for more than 50 countries, this should be a
logical first step. The example of bilateral trade with Russia, denominated and settled in RUB or
RMB via the CIPS is a case in point. Other countries, including energy and raw material
exporters to China should follow this. The same should apply to Chinese exports, which should
be denominated and settled in RMB with quick repatriation of export payments. This would also
help the capital account as export proceeds not repatriated are known as hidden capital exports.
The Global Financial Integrity has highlighted recently the disguised capital exports from mis invoicing imports and non-repatriation of export returns.
The financial account measures include FDI, inward as well as outward in RMB, cross border
banks loans as well as deposits denominated in RMB, and foreign investment in RMB

July 2019
Vol.6, No.3
75
denominated securities, equities as well as bonds. Foreign borrowers should be encouraged to
borrow in RMB, through both onshore Panda Bonds and offshore Dim Sum Bonds.
The Belt and Road Initiative (BRI) offers a golden opportunity to boost RMB
internationalisation. Projects should be calculated and invoiced in RMB. As most suppliers are
Chinese companies this should be welcome. The loans extended by Chinese banks, first and
foremost the China Development Bank, the China Import Export Bank but also the major
commercial banks should be denominated in RMB. These banks should match their currencies
rather than hedging on exchange rate expectations. The recipient countries will incur a RMB
liability, repayments as well as debt service. Hedging instruments in RMB should be available,
free of any penalty such as reserve requirements on RMB forwards. BRI countries should also be
given the possibility to tap into the Panda Bonds market, covering their RMB financing needs.
The recent authorisation for Malaysia to issue Panda Bonds in addition to actual borrowing by
the Philippines are cases in point. Ultimately they might use existing swap arrangements with
the PBoC to obtain RMB.
The Bank of Korea has been very creative using the RMB/KRW swap facility, using these for
individual transactions rather than as a liquidity instrument. Korean importers of Chinese goods
trigger the swap arrangements, providing Chinese banks with KRW. Alternatively, collateral and
guarantees in KRW are issued to Chinese banks. Such arrangements should be extended to
weaker currencies, such as the PKR.
Bank lending from mainland China but also from overseas branches and subsidiaries of
Chinese owned banks should be through RMB. The concluded interbank associations with
BRICS countries, SCO countries, the ASEAN association, the CEEC, Africa and Arab interbank
associations already stipulated the goal of boosting RMB lending.
Investment in the buoyant RMB onshore securities market, in equities as well as bonds has
performed reasonably well in the recent downturn of RMB internationalisation. PBoC Governor
Yi Gang outlined the further path of RMB globalisation in the recent Lujiazui Forum. He
focused on RMB denominated assets and the role to be played by Shanghai as a centre for RMB
investments. He reminded of the Hong Kong Shanghai Stock and Bond Connect, of the
Shanghai Gold Exchange and Crude Oil Futures, all easing the access to RMB denominated
assets.
While the further opening of China’s capital account is subject to the US-China trade
negotiations, the potential under existing regulations has not been fully utilised. Many foreign
fund managers view their existing RMB portfolio as sufficient and make deeper involvement in
RMB onshore markets dependent on further reform not only of the trading system, but also on
the transparency of financial information and the adoption of international accounting and
reporting standards.
In the onshore bond market, the most attractive securities are China Government Bonds.
Bonds issued by subnational governments, financial and corporate bonds carry a lot of
uncertainty regarding regulation, supervision and credit risk. Their performance does not follow
textbook rules due to idiosyncrasies of the Chinese bond market which makes it difficult for long
term foreign investors to predict performance.
The stock market is considered as too volatile, given the large share or individual investors.
Major participation of institutional investors would lend stability to the market. Other concerns
are insider trading and distorted company news. These have been addressed by the supervisory
authorities. However, the inclusion of Chinese equity in the MSCI and recently in the
FTSE/Russell will boost confidence of international investors in addition to pouring passive
funds tracking the indices into the Chinese stock market.

76
Conclusion
The present trade tensions, which are set to continue have narrowed the scope for monetary
and exchange rate policy. However, Chinese authorities have levers at their disposal to boost the
internationalisation of RMB. They include clear leadership in monetary and exchange rate policy
for other EME currencies to follow. The main candidates are China’s major trading partners, but
also the BRI countries, which would benefit from eliminating the USD conduit. This would get
rid of the exchange rate distortions when trade and investment is denominated in USD. As China
integrates into the world economy with a more open attitude, the soundness of the Chinese
economy and finance will be transferred to partner countries through this mechanism.
Literature
BIS (2019): chapter II Monetary policy frameworks in EME: inflation targeting, the exchange
rate and financial stability, June www.bis.org/publications
CEIC (2019): China cross-border RMB settlementwww.ceicdata.com
Chan, Susan (2017): the Belt and Road Initiative: implications for China and East Asian
economies. In: The Copenhagen Journal of Asian studies 35 (2).www.cbs.dk
Das, Sonali (2019): China’s evolving exchange rate regime. In: IMF Working Papers,
WP19/50, Marchwww.imf.org/publications
Global Financial Integrity (2019): Newsletter June www.gfintegrity.org
IMF (2017): China Article IV Consultation. In IMF Country Reports 17/247,
Augustwww.imf.org/publications
IMI (2019): RMB internationalisation report. High quality development and high standard
financial opening up. www.imi.org.cn
McCauley, Robert N and Chang, Shu (2018):Recent RMB policy and currency co-movements.
In: BIS Working Papers No 727, Junewww.bis.org/publications
Peoples Bank of China (2019): RMB financial assets held by overseas entities
www.pbc.gov.cn
Peoples Bank of China (2018): RMB Internationalisation Report 2018, September
www.pbc.gov.cn
Poenisch, Herbert (2019): China writing new interbank rules. In: OMFIF, June
www.omfif.org
SWIFT (2019): RMB tracker, June www.swift.org
Yi Gang(2019): welcome address at 11thLujiazui Forum, Shanghai, June
www.bis.org/speeches

July 2019
Vol.6, No.3
77
Trade Frictions
How Will the US-China Trade War End
By ANDREW SHENG AND XIAO GENG*
The US-China trade war seems not to have caused much pain yet. But after 117 consecutive
months of economic expansion – compared to an historical average of 48 months – the US could soon find itself thrown back into a painful recession, owing to disruptions caused by its own
trade policy.
Dashing hopes of a quick agreement on trade relations with China, US President Donald
Trump’s administration has imposed punitive tariffs on another $200 billion of Chinese goods.
Now that the Chinese government has responded with new tariffs on $60 billion of US products,
the United States is threatening tariffs targeting yet another $300 billion of Chinese imports.
Both sides are now digging in for a long fight – largely because Americans have yet to feel the
pain of Trump’s policies.
China has understood Trump’s transactional style for some time. But it only recently began to
appreciate fully the significance of Trump’s “America First” doctrine, which according to US
State Department Policy Director Kiron Skinner, rests on four pillars: national sovereignty,
reciprocity, burden-sharing, and regional partnerships.
National sovereignty and reciprocity are standard features of any country’s foreign policy.
They form the foundations of the 1648 Peace of Westphalia, which recognized after the Thirty
Years War that sovereign states have their own interests to defend, and must engage with other
states on a reciprocal basis.
But the Trump administration often takes reciprocity too far, weakening America’s capacity to
build and maintain partnerships, regional or otherwise. Indeed, under Trump, the US has
undercut the interests of its closest allies for its own narrow benefit, even threatening to impose
broad tariffs on automobile and auto-part imports from the European Union, Japan, and South
Korea, claiming that they pose a national security threat.
In any case, the active ingredient of the Trump doctrine is burden-sharing. Skinner interprets
this narrowly, focusing on the need for America’s NATO allies to increase their defense
spending. What she does not acknowledge is that the US is also forcing the rest of the world to
share the burden of its unsustainable structural savings deficit.
The US consistently runs both a fiscal deficit – with total expenditure (of which defense
comprised 14.8% in 2017) significantly exceeding its income – and a current-account deficit. If
This article appeared in Project Syndicate on May 27, 2019. *Andrew Sheng, Distinguished Fellow of the Asia Global Institute at the University of Hong Kong;
Xiao Geng, Member of IMI Academic Committee; Professor, Peking University HSBC Business School;
President, Hong Kong Institution for International Finance

78
those twin deficits run at a trend rate of over 3% of GDP per annum, net US debt to the rest of
the world – currently at 40% of GDP – will double in less than 24 years.
The Trump administration insists that the only deficit to worry about is the bilateral trade
deficit with China. But even if China bowed to US demands and eliminated the bilateral deficit,
America’s imbalance of saving and investment would merely shift its external deficit – like
water in a squeezed balloon – toward other surplus economies, like the EU, Japan, and South
Korea (the targets of the threatened automotive tariffs).
For decades, the US saving shortfall seemed like a problem to be managed, not solved. Since
the US started running structural deficits in the 1970s, there has been a kind of global “grand
bargain” on the topic. The world willingly finances America’s current-account deficit in US
dollars; in exchange, the US acts as a guarantor of free trade and global security.
The Trump doctrine upends that bargain. By weaponizing America’s economic leverage
(including the US dollar), it aims to force the world to uphold its end, with no guarantee that the
US will respond in kind.
This approach will end up costing virtually everyone – beginning with American consumers.
With its trade war, the Trump administration is engaging in tax subterfuge. Historically,
governments have addressed their excessive debts with tax increases, spending cuts, higher
inflation (with negative real interest rates), or, in the case of the Roman Empire, conquest of
creditors.
It seems to be politically impossible for the US government to raise taxes domestically. So the
Trump administration has found a workaround: tariff increases end up serving effectively as
consumption taxes, but because they can be blamed on foreigners, they are more palatable to the
American public.
From Trump’s perspective, the costs of this approach appear low. With the US economy still
growing, stock markets at record highs, and unemployment at record lows, JPMorgan
has estimated that the trade war’s direct costs will amount to just -0.2% of GDP for the US, -0.4%
of GDP for China, and -0.22% of GDP for the rest of the world through 2020.
But today’s prosperity hinges mainly on the temporary effects of budget-busting tax cuts and
quantitative easing by the US Federal Reserve, which expanded its balance sheet by $3.6 trillion
from 2007 to 2017 (it has since reduced that total by $391 billion). Historically low interest rates
and liquidity-inflated asset bubbles financed the fiscal deficit and enabled the household sector
to deleverage. It was thanks largely to QE that US net wealth increased by $33.6 trillion from
2010 to 2018.
That wealth was not, however, shared equally; on the contrary, the QE-centered approach has
deepened domestic inequality. For example, every time the S&P 500 has dipped over the last
decade, corporate share buybacks (amounting to $5 trillion from 2008 to 2018) provided a
cushion. This was technically good for growth: the S&P 500 index rose by a total of 319% from
its 2009 trough to its March 2019 peak. But Trump’s trade war is threatening even those
narrowly shared (and, for the Fed, costly) gains.
For the top 25 S&P companies – with a combined market capitalization exceeding $20 trillion
– just under one-third of revenues come from China and Taiwan (weighted average), meaning
that tariffs on Chinese imports will hit profits. Tech giants that depend on chips, components,
and software sales to China – amounting to 20-65% of total revenue – will face particularly high
costs, as will US shoe importers.
The trade war seems not to have caused much pain yet, because financial markets assume (perhaps wrongly) that central banks will bail them out with more QE. But after 117 consecutive
months of economic expansion – compared to an historical average of 48 months – the US could

July 2019
Vol.6, No.3
79
soon find itself in a painful recession, owing to disruptions caused by Trump’s trade war.
Perhaps then it will be ready for a truce.

80
Growth Slowdown Deepened as Trade War Risk Intensified
Again
By DONG JINYUE AND XIA LE*
A batch of May economic indicators are announced today, together with previously released
trade and credit data, suggesting that the risk of growth deceleration looms large as US-China
trade war remain unsettled. We anticipate more monetary and fiscal easing measures to be
deployed in the rest of the year in a bid to sustain growth momentum and offset intensifying
headwinds from deteriorating trade tensions. In our base scenario, there is still a two-thirds
possibility that China and the US could reach a deal to end the confrontations. We therefore
maintain our full-year growth projection at 6% for 2019, in line with the authorities’ range target
of 6-6.5%.
May economic indicators suggest that growth slowdown is broad-based: industrial production
decelerated from 5.4% y/y of April to 5% y/y; fixed asset investment also decreased to 5.6% ytd
y/y from 6.1% ytd y/y in April, indicating the investors’ sentiments still weak. The only silver
lining is retail sales which improved to 8.6% y/y from 7.2%. (Table 1; Figure 3-8)
May credit data is broadly stable with the previous month readings. M2 growth maintains at
8.5% y/y as of the previous month. Both total social financing and new yuan loans marginally
increased from the last month readings. Altogether, our BBVA MICA model yields a GDP
prediction based on monthly data at 6.3% for Q2 2019, in line with the growth slowdown.
(Figure 2)
This article appeared in BBVA Research on June 14, 2019. *Dong Jinyue, China Economist, BBVA; Xia Le, Senior Research Fellow of IMI, Chief Economist for Asia,
BBVA

July 2019
Vol.6, No.3
81

82
The Impact of US-China Trade Tensions
By EUGENIO CERUTTI, GITA GOPINATH, AND ADIL MOHOMMAD*
US-China trade tensions have negatively affected consumers as well as many producers in
both countries. The tariffs have reduced trade between the US and China, but the bilateral trade
deficit remains broadly unchanged. While the impact on global growth is relatively modest at
this time, the latest escalation could significantly dent business and financial market sentiment,
disrupt global supply chains, and jeopardize the projected recovery in global growth in 2019.
Evolution of trade in the US and China
The raising of US tariffs to 25 percent on $200 billion of annual Chinese imports on May 10,
together with the announced Chinese retaliation, marks the latest escalation in the US–China
trade tensions.
The impact of previously imposed tariffs by the US and subsequent retaliation by China is
already evident in trade data. Both the countries directly involved and their trading partners have
been affected by rising tariffs.
This article first appeared in IMFBlog in May 23, 2019. *Eugenio Cerutti, the Assistant to the Director at the Research Department of the IMF; Gita Gopinath, the
Economic Counsellor and Director of the Research Department at the IMF; Adil Mohommad, currently an
Economist in the Research Department of the IMF
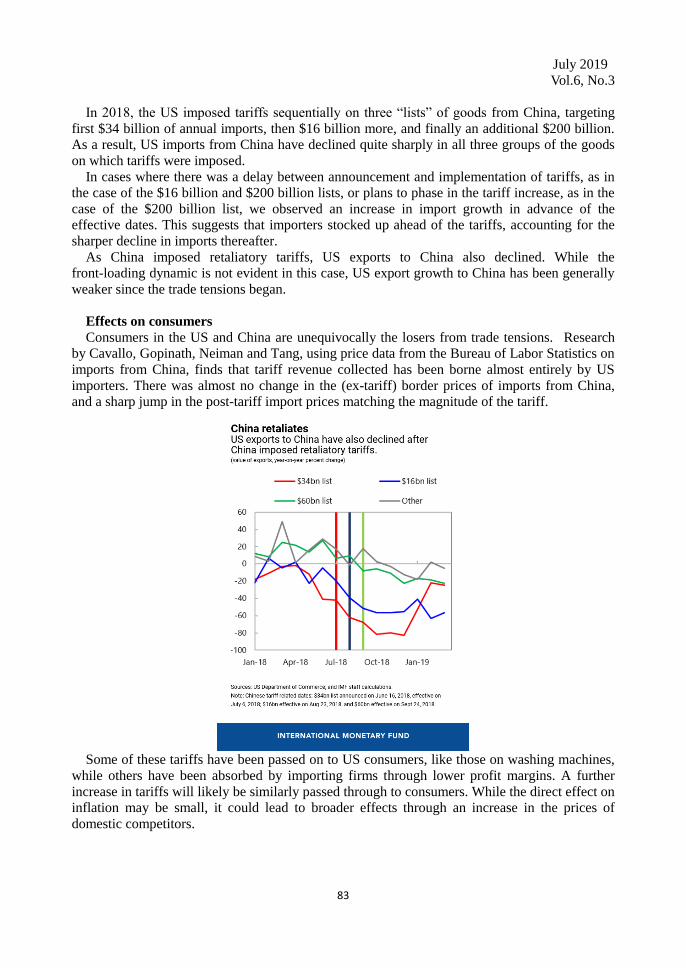
July 2019
Vol.6, No.3
83
In 2018, the US imposed tariffs sequentially on three “lists” of goods from China, targeting
first $34 billion of annual imports, then $16 billion more, and finally an additional $200 billion.
As a result, US imports from China have declined quite sharply in all three groups of the goods
on which tariffs were imposed.
In cases where there was a delay between announcement and implementation of tariffs, as in
the case of the $16 billion and $200 billion lists, or plans to phase in the tariff increase, as in the
case of the $200 billion list, we observed an increase in import growth in advance of the
effective dates. This suggests that importers stocked up ahead of the tariffs, accounting for the
sharper decline in imports thereafter.
As China imposed retaliatory tariffs, US exports to China also declined. While the
front-loading dynamic is not evident in this case, US export growth to China has been generally
weaker since the trade tensions began.
Effects on consumers
Consumers in the US and China are unequivocally the losers from trade tensions. Research
by Cavallo, Gopinath, Neiman and Tang, using price data from the Bureau of Labor Statistics on
imports from China, finds that tariff revenue collected has been borne almost entirely by US
importers. There was almost no change in the (ex-tariff) border prices of imports from China,
and a sharp jump in the post-tariff import prices matching the magnitude of the tariff.
Some of these tariffs have been passed on to US consumers, like those on washing machines,
while others have been absorbed by importing firms through lower profit margins. A further
increase in tariffs will likely be similarly passed through to consumers. While the direct effect on
inflation may be small, it could lead to broader effects through an increase in the prices of
domestic competitors.

84
Effects on producers
The effect on producers is more mixed, with some winners and many losers. Some US and
Chinese producers of goods competing in domestic markets with imports affected by tariffs, as
well as competing third country exporters, are potential winners. However, US and Chinese
producers of the goods affected by the tariffs as well as producers that use those goods as
intermediate inputs, are potential losers.
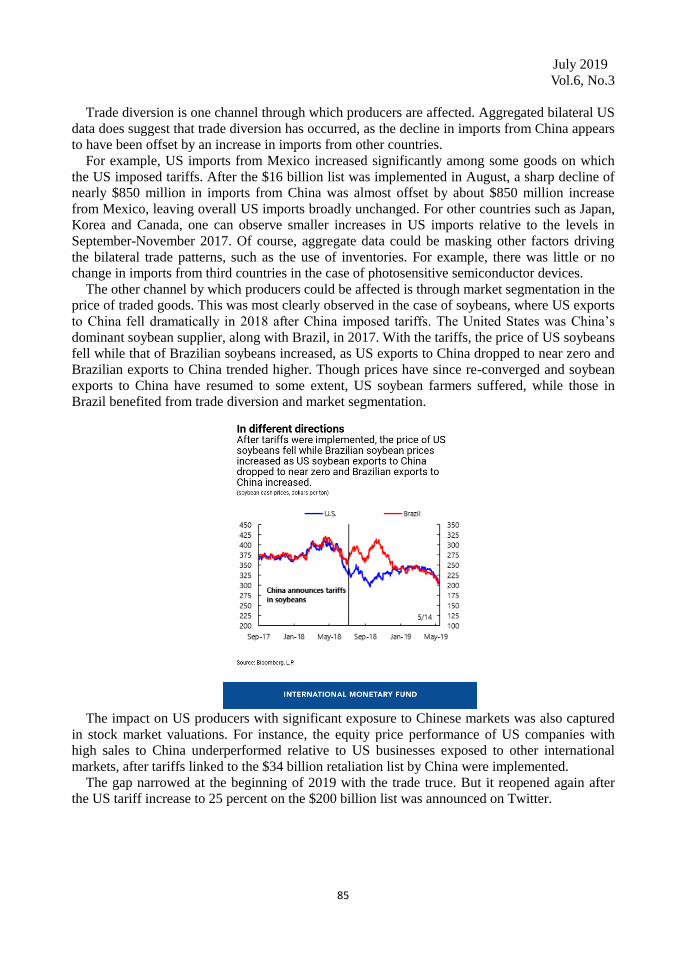
July 2019
Vol.6, No.3
85
Trade diversion is one channel through which producers are affected. Aggregated bilateral US
data does suggest that trade diversion has occurred, as the decline in imports from China appears
to have been offset by an increase in imports from other countries.
For example, US imports from Mexico increased significantly among some goods on which
the US imposed tariffs. After the $16 billion list was implemented in August, a sharp decline of
nearly $850 million in imports from China was almost offset by about $850 million increase
from Mexico, leaving overall US imports broadly unchanged. For other countries such as Japan,
Korea and Canada, one can observe smaller increases in US imports relative to the levels in
September-November 2017. Of course, aggregate data could be masking other factors driving
the bilateral trade patterns, such as the use of inventories. For example, there was little or no
change in imports from third countries in the case of photosensitive semiconductor devices.
The other channel by which producers could be affected is through market segmentation in the
price of traded goods. This was most clearly observed in the case of soybeans, where US exports
to China fell dramatically in 2018 after China imposed tariffs. The United States was China’s
dominant soybean supplier, along with Brazil, in 2017. With the tariffs, the price of US soybeans
fell while that of Brazilian soybeans increased, as US exports to China dropped to near zero and
Brazilian exports to China trended higher. Though prices have since re-converged and soybean
exports to China have resumed to some extent, US soybean farmers suffered, while those in
Brazil benefited from trade diversion and market segmentation.
The impact on US producers with significant exposure to Chinese markets was also captured
in stock market valuations. For instance, the equity price performance of US companies with
high sales to China underperformed relative to US businesses exposed to other international
markets, after tariffs linked to the $34 billion retaliation list by China were implemented.
The gap narrowed at the beginning of 2019 with the trade truce. But it reopened again after
the US tariff increase to 25 percent on the $200 billion list was announced on Twitter.

86
Macroeconomic effects
The ratcheting up of bilateral tariffs between the US and China has had limited effect on their
bilateral trade balance. In fact, in 2018, the trade deficit increased for the US as imports from
China rose, which partly reflects the front-loading. As of March 2019, a small decline can be
observed, but US exports to China are also falling.
Indeed, macroeconomic factors—including relative aggregate demand and supply in partner
countries and their underlying drivers—play a much bigger role than tariffs in determining
bilateral trade balances.

July 2019
Vol.6, No.3
87
At the global level, the additional impact of the recently announced and envisaged new
US-China tariffs, expected to extend to all trade between those countries, will subtract about 0.3
percent of global GDP in the short term, with half stemming from business and market
confidence effects. The IMF’s forthcoming G-20 Surveillance Note in early June will provide
further details. These effects, while relatively modest at this time, come on top of tariffs already
implemented in 2018.
Moreover, failure to resolve trade differences and further escalation in other areas, such as the
auto industry, which would cover several countries, could further dent business and financial
market sentiment, negatively impact emerging market bond spreads and currencies, and slow
investment and trade.
In addition, higher trade barriers would disrupt global supply chains and slow the spread of
new technologies, ultimately lowering global productivity and welfare. More import restrictions
would also make tradable consumer goods less affordable, harming low-income households
disproportionately. This type of scenario is among the reasons why we referred to 2019 as a
delicate year for the global economy.
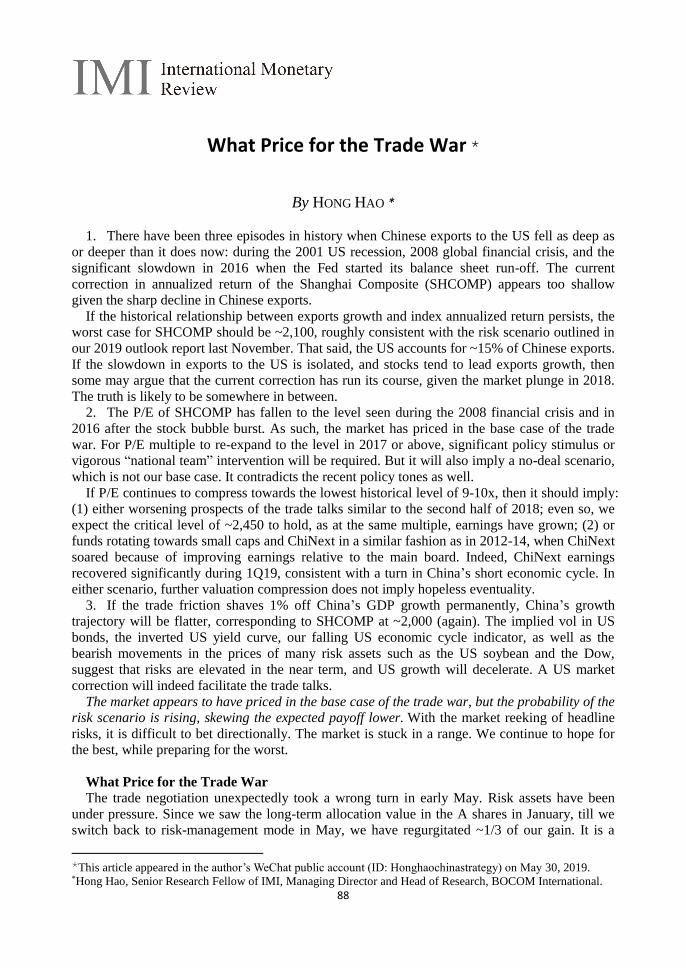
88
What Price for the Trade War
By HONG HAO *
1. There have been three episodes in history when Chinese exports to the US fell as deep as
or deeper than it does now: during the 2001 US recession, 2008 global financial crisis, and the
significant slowdown in 2016 when the Fed started its balance sheet run-off. The current
correction in annualized return of the Shanghai Composite (SHCOMP) appears too shallow
given the sharp decline in Chinese exports.
If the historical relationship between exports growth and index annualized return persists, the
worst case for SHCOMP should be ~2,100, roughly consistent with the risk scenario outlined in
our 2019 outlook report last November. That said, the US accounts for ~15% of Chinese exports.
If the slowdown in exports to the US is isolated, and stocks tend to lead exports growth, then
some may argue that the current correction has run its course, given the market plunge in 2018.
The truth is likely to be somewhere in between.
2. The P/E of SHCOMP has fallen to the level seen during the 2008 financial crisis and in
2016 after the stock bubble burst. As such, the market has priced in the base case of the trade
war. For P/E multiple to re-expand to the level in 2017 or above, significant policy stimulus or
vigorous “national team” intervention will be required. But it will also imply a no-deal scenario,
which is not our base case. It contradicts the recent policy tones as well.
If P/E continues to compress towards the lowest historical level of 9-10x, then it should imply:
(1) either worsening prospects of the trade talks similar to the second half of 2018; even so, we
expect the critical level of ~2,450 to hold, as at the same multiple, earnings have grown; (2) or
funds rotating towards small caps and ChiNext in a similar fashion as in 2012-14, when ChiNext
soared because of improving earnings relative to the main board. Indeed, ChiNext earnings
recovered significantly during 1Q19, consistent with a turn in China’s short economic cycle. In
either scenario, further valuation compression does not imply hopeless eventuality.
3. If the trade friction shaves 1% off China’s GDP growth permanently, China’s growth
trajectory will be flatter, corresponding to SHCOMP at ~2,000 (again). The implied vol in US
bonds, the inverted US yield curve, our falling US economic cycle indicator, as well as the
bearish movements in the prices of many risk assets such as the US soybean and the Dow,
suggest that risks are elevated in the near term, and US growth will decelerate. A US market
correction will indeed facilitate the trade talks.
The market appears to have priced in the base case of the trade war, but the probability of the risk scenario is rising, skewing the expected payoff lower. With the market reeking of headline
risks, it is difficult to bet directionally. The market is stuck in a range. We continue to hope for
the best, while preparing for the worst.
What Price for the Trade War
The trade negotiation unexpectedly took a wrong turn in early May. Risk assets have been
under pressure. Since we saw the long-term allocation value in the A shares in January, till we
switch back to risk-management mode in May, we have regurgitated ~1/3 of our gain. It is a
This article appeared in the author’s WeChat public account (ID: Honghaochinastrategy) on May 30, 2019. *Hong Hao, Senior Research Fellow of IMI, Managing Director and Head of Research, BOCOM International.

July 2019
Vol.6, No.3
89
humbling experience, and will certainly not be our last. While we continue to believe that the
long-term trend trumps short-term fluctuations, short-term noises can still overwhelm even the
staunchest long-term investors—especially in a market where fund managers are measured and
ranked daily.
As we were discussing the market with our clients and friends during a mahjong game, the
stress was palpable. But the fund managers were a rambunctious bunch, with a good sense of
humor. “Don't worry,” one of them said as he was dealt a hand that was hard to “mahjong”.
“You play mahjong for the money, or for the fun? Stocks are the same.” All of us were greatly
amused by his comment, and “gan-bei” the Moutai in our cups.
In this note, we try our best to provide some perspectives on how the market is pricing in the
impact of the tense trade talks. We cannot claim that we have arrived at definitive answers. But
directional judgments based on our analysis are possible.
Risks Still Elevated
The Shanghai Composite has declined around 10%, and entered the correction territory. Now
the question is whether this is simply a pause, or the market has peaked.
To answer this question, we compare the price change in US bond swaption with the
annualized return of the Chinese stocks represented by the CSI300 index. We can see that, since
the 2008 financial crisis, the swaption price change has been inversely correlated with the return
of CSI300—except during the Chinese market bubble in 2015 when fundamentals had clearly
deteriorated, but stock prices continued to soar unfettered (Figure 1).
Figure 1: Bond vol implies persistent pressure on Chinese stocks
Source: Bloomberg, BOCOM Int'l
Currently, the swaption price change has started to climb, and will likely rise further.
Meanwhile, the annualized return of the CSI300 index peaked in early May, after making an
important low in the first week of January 2019. Such a pattern suggests that the pressure on the
Chinese market is likely to persist in the near term. This phenomenon is a reflection of the
uncertainties surrounding the trade talks. The movements in other risk asset prices also seem bearish. In Figure 2, we show that the
Dow is running into significant triple tops. That said, the US market developed the same
technical pattern between 2015 and 2016 when the Chinese stock bubble burst upset the entire
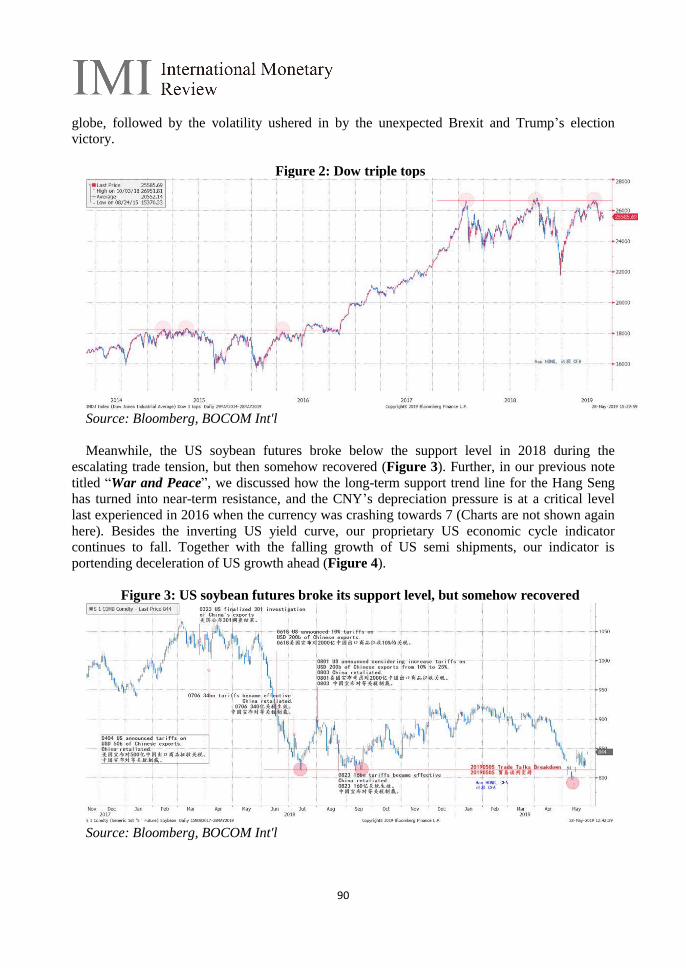
90
globe, followed by the volatility ushered in by the unexpected Brexit and Trump’s election
victory.
Figure 2: Dow triple tops
Source: Bloomberg, BOCOM Int'l
Meanwhile, the US soybean futures broke below the support level in 2018 during the
escalating trade tension, but then somehow recovered (Figure 3). Further, in our previous note
titled “War and Peace”, we discussed how the long-term support trend line for the Hang Seng
has turned into near-term resistance, and the CNY’s depreciation pressure is at a critical level
last experienced in 2016 when the currency was crashing towards 7 (Charts are not shown again
here). Besides the inverting US yield curve, our proprietary US economic cycle indicator
continues to fall. Together with the falling growth of US semi shipments, our indicator is
portending deceleration of US growth ahead (Figure 4).
Figure 3: US soybean futures broke its support level, but somehow recovered
Source: Bloomberg, BOCOM Int'l
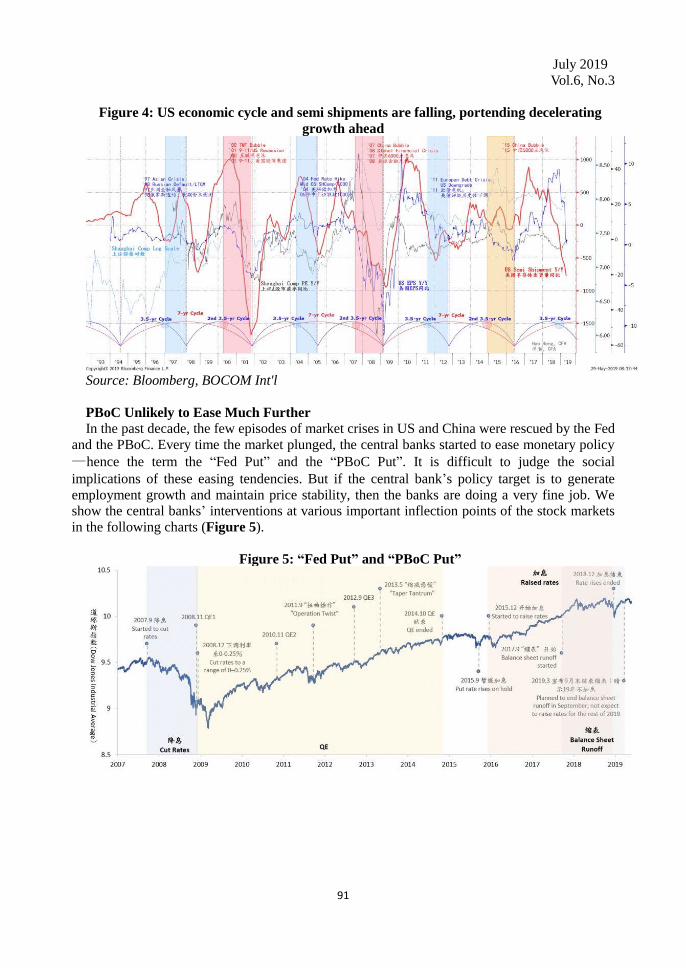
July 2019
Vol.6, No.3
91
Figure 4: US economic cycle and semi shipments are falling, portending decelerating
growth ahead
Source: Bloomberg, BOCOM Int'l
PBoC Unlikely to Ease Much Further
In the past decade, the few episodes of market crises in US and China were rescued by the Fed
and the PBoC. Every time the market plunged, the central banks started to ease monetary policy
—hence the term the “Fed Put” and the “PBoC Put”. It is difficult to judge the social
implications of these easing tendencies. But if the central bank’s policy target is to generate
employment growth and maintain price stability, then the banks are doing a very fine job. We
show the central banks’ interventions at various important inflection points of the stock markets
in the following charts (Figure 5).
Figure 5: “Fed Put” and “PBoC Put”

92
Source: Bloomberg, BOCOM Int'l
But after years of monetary easing to prolong the economic cycle, it is unclear whether the
central banks could ease much further. In the above chart, we can see that the Fed’s balance
sheet continues to run off. For the PBoC, we use the change in RRR as a proxy to gauge the
central bank’s easing tendency. Historically, the change in RRR and the change in Chinese
inflationary pressure measured by CPI are mostly in tandem—except for two episodes: (1)
during and after the 2015 stock market bubble; and (2) from 2018 till now.
Arguably, the central bank’s easing stance even as inflationary pressure persisted in 2015
while the economic fundamentals were deteriorating was the cause of the stock market bubble
then—in hindsight. But it was not enough to arrest the market plunge until the market valuation
had regressed to normal levels.
Since 2018, the PBoC again has been cutting RRR consistently despite lingering inflationary
pressure yet decelerating economic growth. But the change in RRR appears to have arrived at a
near-term turning point, as China’s short economic cycle starts to stabilize in the first quarter of
2019—unless the trade disputes deteriorate much further from here and drag the economy down
with it (Figure 6).
Figure 6: PBoC’s easing stance has changed, but will likely stay accommodative
Source: Bloomberg, BOCOM Int'l
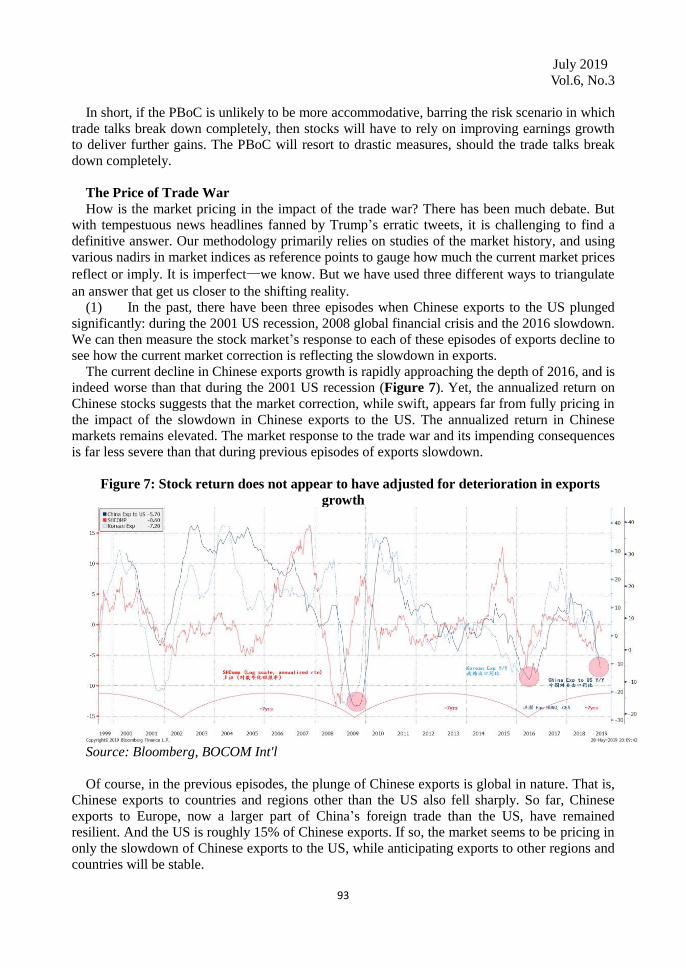
July 2019
Vol.6, No.3
93
In short, if the PBoC is unlikely to be more accommodative, barring the risk scenario in which
trade talks break down completely, then stocks will have to rely on improving earnings growth
to deliver further gains. The PBoC will resort to drastic measures, should the trade talks break
down completely.
The Price of Trade War
How is the market pricing in the impact of the trade war? There has been much debate. But
with tempestuous news headlines fanned by Trump’s erratic tweets, it is challenging to find a
definitive answer. Our methodology primarily relies on studies of the market history, and using
various nadirs in market indices as reference points to gauge how much the current market prices
reflect or imply. It is imperfect—we know. But we have used three different ways to triangulate
an answer that get us closer to the shifting reality.
(1) In the past, there have been three episodes when Chinese exports to the US plunged
significantly: during the 2001 US recession, 2008 global financial crisis and the 2016 slowdown.
We can then measure the stock market’s response to each of these episodes of exports decline to
see how the current market correction is reflecting the slowdown in exports.
The current decline in Chinese exports growth is rapidly approaching the depth of 2016, and is
indeed worse than that during the 2001 US recession (Figure 7). Yet, the annualized return on
Chinese stocks suggests that the market correction, while swift, appears far from fully pricing in
the impact of the slowdown in Chinese exports to the US. The annualized return in Chinese
markets remains elevated. The market response to the trade war and its impending consequences
is far less severe than that during previous episodes of exports slowdown.
Figure 7: Stock return does not appear to have adjusted for deterioration in exports
growth
Source: Bloomberg, BOCOM Int'l
Of course, in the previous episodes, the plunge of Chinese exports is global in nature. That is,
Chinese exports to countries and regions other than the US also fell sharply. So far, Chinese
exports to Europe, now a larger part of China’s foreign trade than the US, have remained resilient. And the US is roughly 15% of Chinese exports. If so, the market seems to be pricing in
only the slowdown of Chinese exports to the US, while anticipating exports to other regions and
countries will be stable.

94
Of course, given that stocks tend to lead exports slowdown by six months, one could argue
that the plunge in 2018 was indeed the reflection of the current exports slowdown. But we would
rather be more conservative. If we apply the historical relationship between export growth and
stock market return, assuming exports to all countries and regions are highly correlated during
difficult times, then the Shanghai Composite would be trading at ~2,100—largely consistent
with our risk scenario for the Shanghai Composite of ~2,000 laid out in our 2019 outlook report
titled “Outlook 2019: Turning a Corner” published on 19 November 2018.
(2) We can also use the change in valuation to see how the market is reflecting the
uncertainties surrounding the trade war. We find that the P/E of the Shanghai Composite has
fallen to around 13-14x, the level last seen at the depth of the 2008 financial crisis, as well as
during the 2016 slowdown. But it is still significantly higher than the level seen between 2012
and 2014, as well as in the second half of 2018. During these periods, the composite’s P/E fell to
around 9-10x (Figure 8).
Figure 8: Shanghai’s P/E is at the level seen during the 2008 and 2015 crises
Source: Bloomberg, BOCOM Int'l
Note that valuation has fallen more than the index price. This is because earnings growth
indeed recovered significantly during the first quarter of 2019. It is confirming evidence that
China’s short economic cycle has started to turn around. As earnings recover, yet index price is
still affected by the trade war, valuation thus is falling to the level seen during the previous crises
(Figure 9).
Figure 9: Earnings growth recovered substantially during the first quarter
Source: Bloomberg, BOCOM Int'l

July 2019
Vol.6, No.3
95
Has valuation fallen far enough to reflect the impact from the trade war? We note that the
reason why P/E fell below its current level between 2012 and 2014 was due to market rotation
towards ChiNext/small caps. And, in 2018, it was because of the worsening prospects of the
trade war.
These two periods of exception provide valuable clues for discerning market outlook.
Essentially, for P/E to re-expand above the 2008 and 2016 levels, extraordinary policy stimulus
similar to the four-trillion yuan package in late 2008, or vigorous “national team” intervention
similar to after the market bubble burst in 2016, will be required.
If our base case is for a trade agreement in the near term, then the scenario of extraordinary
policy stimulus is unlikely. The current tempered policy mantra also makes such strong stimulus
a doubtful option. Meanwhile, a scenario similar to the second half of 2018 also seems unlikely,
when P/E multiple compressed significantly due to the worsening prospect of the trade war (i.e.
no agreement).
If a trade agreement is reached in the near term, earnings growth should continue to recover,
with that of smaller caps and the ChiNext likely recovering faster. If so, we should see a similar
situation to the one between 2012 and 2014, when funds rotated towards smaller caps and
ChiNext. This inference is contrary to current consensus advocating large cap blue chips, but
makes logical sense. If no agreement is reached, then P/E will likely compress towards 10x, as it
did in the second half of 2018. Even so, the index will likely stay above the critical level of
2,450, as earnings must have grown by now.
(3) We can also estimate how the worsening prospects of the trade disputes will impact
the growth trajectory of the Chinese economy. Back in June 2016, we postulated in our report
titled “The Market Bottom: When and Where” that the internal rate of return of ~7% generated
by the Shanghai Composite since inception coincided with the implicit economic growth target
embedded in China’s Five-Year-Plan (Figure 10).
Figure 10: Shanghai is finding support at its long-term rising trend line
Source: Bloomberg, BOCOM Int'l
If we connect the lowest points in the Shanghai Composite over the years, we can see that it is
an ascending linear support line, with the lowest level doubling roughly every ten years,
implying a compounded annual return of 7%.
The exports slowdown in 2016 reduced exports contribution to GDP growth by roughly 1% at
its worst. If we assume that such 1% annual growth reduction is permanent, then the ascending

96
trend line of the Shanghai Composite will be less steep. Its trajectory will be flatter, implying
longer time required to double the lowest index levels. If so, in the worst case, the Shanghai
Composite should trade around 2,000—roughly consistent with our risk scenario outlined in our
2019 outlook report.
July 2019
Vol.6, No.3
97
Belt and Road Initiative
Belt and Road Initiative: Two Key Channels to Achieving
Financial Connectivity
By CHRISTINE LAGARDE*
As we meet during this beautiful springtime weather it brings to mind the words of the
Chinese proverb, “ The whole year must be planned for in the spring.”
Over the next three days we will consider the ways the Belt and Road Initiative — the
BRI—can help better connect the world physically and financially for years to come. It is fitting
that we begin these conversations with financial connectivity. Why? Because history teaches us
that physical and financial connectivity go hand-in-hand.
Think of the original Silk Road. The desire for trade drove merchants to travel thousands of
kilometers. Over time, infrastructure in the form of bridges, buildings, and even entire new cities
were built to accommodate what began as small trading posts and financial exchanges.
So where there is financial connection, we see that rapid improvements in quality of life can
quickly follow.
In our modern context, there are several important channels to achieving this greater financial
connectivity. I want to highlight two today: increased capital mobility and increased financial
inclusion.
1. Increased Capital Mobility
First, enabling capital to flow more freely.
Allowing capital to flow across borders can help support inclusive growth. How? By
enhancing investments in infrastructure, manufacturing, and even health care.
Right now, foreign direct investment —FDI — is only 1.9 percent of GDP in developing
countries. Before the global financial crisis, it was at 2.5 percent. Making progress on major
infrastructure needs will require capital flows to rise again and to be managed safely.
Greater openness to capital flows can also bring down the cost of finance, improve the
efficiency of the financial sector, and allow capital to support productive investments and new
jobs.
That is certainly the case here in China, where a further opening of the bond market to foreign
investors will enable diversification and foster the internationalization of the Renminbi (RMB).
This speech was given at Belt and Road Forum Session on Financial Connectivity on April 24, 2019. *Christine Lagarde, IMF Managing Director
98
In fact, the IMF recently published a book on this topic, called “The Future of China’s Bond
Market”. It outlines how the inclusion of China’s bonds in global indexes can be a gamechanger
not only for China’s own financial markets but also for global investors.
The book also underscores the challenges that come with opening up capital markets.
Thankfully, we know from experience the elements that are required for success. These include
sound financial regulation, transparent rules for investment, and attention to fiscal sustainability.
On this last point, China’s increased focus on the long-term success of BRI projects, and the
announcement today by Finance Minister Liu of a BRI debt sustainability framework, are very
welcome steps in the right direction.
So too is the work that is now beginning to ensure that investment in BRI projects is green,
low-carbon and climate resilient. This will lead to increased environmental sustainability.
2. Increased Financial Inclusion
We also need increased financial inclusion — my second channel for a more effective BRI.
A few numbers: close to half of the adult population in low and middle-income Asia-Pacific
economies do not have a bank account. Less than 10 percent have ever borrowed from a
financial institution.
And yet, we know that closing the finance gap is an “economic must-have” for nations to
thrive in the 21st century. IMF analysis shows that if the least financially inclusive countries in
Asia narrowed the finance gap to the level of Thailand — an emerging market economy — the
poverty rate in those countries could be reduced by nearly 4 percent.
How can we get there? In part, through policies that enable more women and rural citizens to
access financial services. The financial gender gap for women in developing countries is about 9
percent and has remained largely unchanged since 2011.
There is no silver bullet, but we know that fintech can play a catalyzing role.
In Cambodia, for example, strong public-private partnerships in supporting mobile finance has
led to a tripling in the number of micro-financial institutions since 2011. These institutions have
now provided loans to over 2 million new borrowers, representing nearly 20 percent of the adult
population. Many of these citizens had never had a bank account. Now they can save for the
future and perhaps even start a business of their own.
These are ideas that can work everywhere. But countries have to be willing to partner and
learn from each other.
That is one of the major reasons why last October, the IMF and World Bank launched the Bali
Fintech Agenda. The agenda lays out key principles — from developing financial markets to
safeguarding financial integrity — that can help each nation as it strives for greater financial
inclusion.
It is a model for international collaboration, much like this forum.
Let me conclude.
I began with a Chinese proverb. In the spirit of global connections, I will close with a western
poet. The English poet John Donne, who wrote about the Silk Road, was right when he said, “No
man (or woman!) is an island, entire of itself; every man is a piece of the continent, a part of the
main.”
Just like our history, our modern financial landscape reveals the enormous potential of better
connections between nations and between financial institutions across borders. These financial
connections can lead to new construction, new jobs, new opportunities, and, ultimately, the ability to achieve economic security.
If we find ways to harness the potential, we can build more prosperous, inclusive economies
that benefit all.

July 2019
Vol.6, No.3
99
New Evaluation for Belt and Road
By HERBERT POENISCH*
As the second Belt and Road forum for international co-operation drew to a close last month,
concerns about China's strategy were apparent in the joint statement issued by the leaders'
roundtable. Chaired by Chinese President Xi Jinping, the roundtable included the leaders of BRI
recipient countries, as well as International Monetary Fund Managing Director Christine
Lagarde, and António Guterres, secretary-general of the United Nations.
The arguments for and against the Belt and Road initiative are well-known. China claims
its infrastructure projects will boost growth and connectivity in recipient countries. Opponents
say it will increase these countries' debt burdens without major benefits for the local population
or economy.
In contrast to previous iterations, this statement stresses the importance of ensuring
sustainability in various aspects of the strategy. These range from economic, social, fiscal,
financial, environmental and energy sustainability to food security and water saving. They also
include sustainable agriculture, forestry and protection of the biodiversity. The IMF even
suggested a new, fully sustainable BRI.
The leaders' statement refers explicitly to a 'commitment to the United Nations 2030 agenda
for sustainable development' and to 'following the principles of the UN Global Impact'. As a
result, China has pledged to observe UN sustainability standards in all its BRI projects.
While this is a non-binding commitment, it does present a new approach to measuring the
benefits of BRI for recipient countries. This evaluation should take a broad view by looking at
projects' impact on all 17 SDGs.
It is beyond doubt that BRI projects will increase recipient countries' debt burden.
Considering the sums being spent and requiring future repayment, there should be an objective
measure of the long-term benefits for BRI countries.
The joint statement calls for 'results-based co-operation'. It says each initiative should be
assessed on its potential contribution to the SDGs. A holistic approach is needed to scrutinise
projects. Currently they are being looked at from a narrow perspective, one that assumes both
China and recipient countries will benefit from BRI.
A holistic approach would measure the impact of BRI projects on reducing poverty (SDG 1),
decent work and economic growth (SDG 8), industry, innovation and infrastructure (SDG 9),
reducing inequalities (SDG 10), and climate (SDG 13). The statement refers explicitly to food
security (SDG 2), clean water and sanitation (SDG 6), and life on land (SDG 15). SDG 17, to
'revitalise the global partnership for sustainable development' should also feature in this new
approach.
The practical calculation is simple. Before a project is signed, its impact on all SDGs are
assessed, whether positive, negative or non-existent. At this early stage, it will be difficult to
quantify initiatives, and only those with a broad positive impact should be approved.
In order to fulfil SDG 17, all stakeholders should take part in the assessment process. This
includes China, the recipient country's government and civil society, and an outside expert,
possibly with links to the UN. The whole endeavour should be the responsibility of the UN
This article first appeared in OMFIF Commentary on May 28, 2019. *Herbert Poenisch, member of IMI International Committee, Former Senior Economist of BIS

100
regional economic commissions, whose mandate is 'to promote the regional implementation of
internationally agreed development goals'.
It is in the interest of the recipient countries to justify the additional debt burden by bringing
the country closer to achieving the SDG goals. It should also be in the interest of China for BRI
projects to be assessed positively by recipient countries, to enhance transparency and build
confidence.
July 2019
Vol.6, No.3
101
How African Countries can Play an Active Role in the Belt and
Road Initiative
By YANDRADUTH GOOGOOLYE*
Last October, at the official opening of the Belt and Road International Financial Exchange
and Cooperation Seminar organised by the Bank of China, I had stressed on Africa’s eagerness
to be part of China’s vision to enhance cooperation and connectivity among countries that will
be part of the Belt and Road Initiative.
Africa is endowed with considerable human capital, millions of acres of arable land and a
myriad of natural resources. Therefore, ladies and gentlemen, the combination of China’s capital,
technology, market, enterprises, talents and experiences and Africa’s abundant resources, huge
demographic dividend and great market potential should create economic wonders.
Testimony to Africa’s willingness to support the Belt and Road initiative is member states of
the African Union endorsement of “Agenda 2063: The Africa We Want”, a roadmap for
structural economic transformation over a fifty-year time scale.
Whilst the Initiative will undoubtedly enable a smooth flow of goods and services against
efficient mechanisms of payment flows, Africa must also see to it that adequate and timely
resources are geared towards the modernization of financial market infrastructures as well as to
the opening and promotion of free trade areas. These will be instrumental in supporting the
expansion of the trade corridor between China and Africa and in upholding cross-border
e-commerce.
Ladies and gentlemen, a key target of the Initiative rests on financial integration and
cooperation. Besides enhancing financial regulation cooperation, it will increase the scope and
scale of bilateral currency swaps and settlements as well as the issuance of bonds in Chinese
Yuan. It is, therefore, to the advantage of countries across Africa to encourage commercial
equity investment funds and private funds to participate fully in the construction of key projects
stemming from the Belt and Road Initiative.
The Initiative will also push forth an additional currency of choice and set the RMB among
the reserve currencies for African countries. A currency that can be used, not only for trade
between Africa and China, but also for intra-African commercial flows.
African central banks and other regulatory entities must fully embrace the crucial role they
will be called upon to play. African monetary policymakers will in effect be required to come up
with strong frameworks that will build sufficient macroeconomic and institutional capacity to
absorb investment flows, tap benefits and manage associated risks.
Another key area of focus for African countries is the payment infrastructure. Indeed, while
most countries are upgrading their payment infrastructures, the African payment landscape
remains fragmented into regional blocks such as the COMESA, SADC and Western and Central
African States’ monetary unions. Though some initiatives are underway at the level of the
Association of African Central Banks for the setup of a fully integrated African payment system,
This speech was delivered at the Financial Connectivity Thematic Forum on "How African countries can play
an active role in the Belt and Road Initiative" on April 25, 2019. *Yandraduth Googoolye, Governor of the Bank of Mauritius

102
I believe that this initiative needs to be encouraged. African countries equally need to consider
whether the adoption of a federal approach to an integrated payment system can be a boost.
Financial Technology is another key area if Africa ambitions for an innovative financial
industry as well as an inclusive development. Infrastructure expansion is a priority for
effectively linking countries across the continent so that they are poised to tap the opportunities
offered by the Belt and Road Initiative. In that regard, our sister countries must urgently focus on
the development of appropriate land, sea and air transport logistics and framework. This will
contribute to bringing down the obstacles that stand on the path of the economic evolution of the
continent.
Before concluding, let me quote a Chinese proverb that I deem fitting. I quote: “One bee
cannot produce honey; one grain of rice cannot produce a meal”. Unquote.
Ladies and gentlemen, if the common goal is the overall development of our respective
nations, then the only way forward is for us all to join hands in furtherance of friendship, unity
and progress for our people.
July 2019
Vol.6, No.3
103
Digital Economy
Innovation Transforms Central Banking
By AGUSTÍN CARSTENS*
The future of central banking is inextricably bound to innovation. The technological sea
change that is transforming the financial sector and the wider economy is affecting all aspects of
our work, from payments to monetary policy to financial regulation. Our mandate to preserve
monetary and financial stability, now and in the future, comes with a responsibility to lead an
intensifying debate about the nature of money in a digital world and how new players will
reshape the provision of financial services, and to show the way by upgrading our own tools and
instruments.
As guardians of monetary stability, central banks have more at stake than most in the future of
money, be it in its traditional or digital form. Today's cryptocurrencies, for example, do not fulfil
money's basic premise: to serve as a unit of account, a means of payment and a store of value.
Central banks have called out the false promises made by the creators of cryptocurrencies and
will remain alert to potential threats to monetary stability. At the same time, they are actively
exploring the possibilities that the underlying distributed ledger technology opens up for
payments, clearing and settlement systems as well as digital currencies.
And as guardians of financial stability, central banks are directly affected by innovation in the
financial sector and in the infrastructure underpinning financial markets. Financial stability
matters because it reassures consumers that their savings will not evaporate overnight. At the
same time, it ensures that credit provision will continue to support economic activity. Hence the
importance of getting the balance right between innovation and stability.
The new waters that central banks are navigating are perhaps most evident in banking, where
incumbents are under pressure from both below, from fintech start-ups, and above, from
technology giants. As supervisors and regulators of a rapidly changing sector, central banks and
other financial authorities need to be as creative, nimble and tech-savvy as any new kid on the
banking block. Our daily vocabulary now includes suptech and regtech - as the intersection
between technology and supervision or regulation respectively is known. Authorities are
harnessing advances in artificial intelligence and its practical applications to help shape new
supervisory tools. And they are creating innovation hubs to bring entrepreneurs and incumbents
together, as well as "regulatory sandboxes" that allow innovators to test new technologies and
products in a safe environment.
Central banks are carefully charting the activities of fintech businesses in their jurisdictions. I
am a strong believer in the principle of "same risk, same regulation": generally, if an institution
acts like a bank, it should be regulated like a bank. This activity-based regulation can
complement the traditional approach. But Big Tech firms pose particular challenges for
This article appeared in Reuters Breakingviews on June 3, 2019. *Agustín Carstens, General Manager of the BIS
104
regulators - for example, in safeguarding data usage and privacy and in the need for international
coordination.
Central banks are also upgrading their payment systems, which are crucial to the functioning
of the global economy, to be ready for the future. They are opening their doors to new players,
such as fintechs and mobile payment schemes, with a view to increasing competition and
ensuring a level playing field. For retail payment systems, used for processing everyday
consumer transactions, new "fast payment" systems allow transfers within seconds, anytime and
anywhere. Some companies are testing cashless systems - no cashiers, no lines, no cash, no
physical payment devices.
Central banks are also working hard to make existing financial infrastructures more resilient
and secure. Complying with existing rules does not guarantee security against cyberattacks.
Criminals are mastering the art of international cooperation, with "hacktivists", cyber criminals
and others who may be coordinating targeted attacks. The best defence lies in cooperation and
coordination. Cybersecurity is a priority for the Basel-based standard-setting bodies, who are
working with the industry to improve their defences as well as our own. The Bank for
International Settlements recently hosted a seminar for central banks on cybersecurity, including
a simulated attack on a payment system, and more work will be done in this area.
Some argue that a central bank digital currency would be the ultimate new central bank tool in
this digital age, replacing cash altogether. Many monetary policymakers are indeed studying this
possibility. But very few see a chance of turning theory into practice any time soon. Central bank
digital currencies could bring profound changes to the financial system, potentially crowding out
commercial banks. They could also change the way monetary policy operates. The implications
for monetary and financial stability need careful consideration.
So far, there is little need or demand for such digital currencies: despite increased use of
electronic payments, appetite for cash remains strong. Central banks will be ready if this
situation changes, and always with the goal of preserving monetary and financial stability.
Navigating new waters may require recalibrating the compass, but central banks will always
have their pole star.
July 2019
Vol.6, No.3
105
Research Report
The Ceramics of Eurasia,How Export Porcelain Has Shaped a
Globalized World
By THORSTEN GIEHLER*
Introduction
The history of Asian ceramics is a history of cultural interaction and trade. The famous Silk
Road already linking the East and West together 2,000 years ago may not have been an
important route for trading ceramics when it was first established between the Roman Empire
and China. However, Chinese Tang dynasty (618-906) ceramics have been found along the Silk
Road in Persia, Iraq and Egypt, and one of the first known foreign recipients of exquisite
chinaware was the Abbasid Caliph Harun al Rashid around 800. During the Tang dynasty a
vibrant trade between China and the Islamic world started. The Abbasid caliphate (750-1258)
had already imported millions of Chinese ceramics – beautiful white monochromes from
northern China and green glazed stoneware from the southern province of Zhejiang. Most of
these ceramics do not exist anymore, but in some fortunate cases shipwrecks found along the
former maritime trading routes give us evidence of these early forms of global trade. One of the
most famous discoveries was the Belitung shipwreck, an Arab dhow, which sailed with a cargo
of 60,000 ceramics from China towards an unknown Abbasid port, and which sunk near the
Indonesian island of Belitung. One bowl found intact on the seabed was inscribed with a date:
“16th day of the 7th month of the reign of Baoli” or 826. The treasure is now displayed in the
Maritime Experimental Museum of Singapore – where also the most relevant harbor city of the
modern globalized world is located. Another shipwreck of the 10th century found off the coast of
Java near the port of Cirebon had a cargo of 250,000 Chinese ceramics (see map 1).
This intensive trade relationship was replicated a couple of centuries later between China and
the Western world. A driving force of the Portuguese, Spanish, Dutch and English expeditions
and discoveries taking place from 1450 onwards was the quest for Asian commodities: spices,
silk, cotton, porcelain and tea. Porcelain – even not the most important trade ware – played its
role in shaping a global economy and in exploring new roads and maritime routes. An estimated
185 million pieces of porcelain were exported from East Asia to Europe between 1550 and 1800.
The age of discovery is also the age of porcelain.
But more important than the mere trade relationships, are the cultural interactions taking place
by trading ceramics. Ceramics are manmade – shapes and decoration vary and they can reflect
the cultural traditions of the producer and/or the traditions of the client. Asian export ceramics
IMI Research Report No. 1902 [EN]. This research report will be published by installments on International
Monetary Review. This is the first piece.
* Thorsten Giehler,Member of IMI International Committee, Country Director of GIZ Office China.

106
reflect both. A joint Sino-Islamic, Sino-Western and Islamic-Western culture has been created
over centuries and can still be sensed today. Therefore, it would be reasonable to call them
Eurasian ceramics in order to express the unifying effects they have on the double continent
stretching from Lisbon to Tokyo. And even more, to perceive them as common Eurasian history
and heritage.
The trade relationships and the interactions, in jointly developing cross-cultural decor and
shapes was only the starting point. The strong demand for porcelain prompted, in many regions,
local initiatives to produce similar items. Most of the main Asian ceramic production centers
which were established after 900 along the Silk Road or the maritime routes were to some extent
influenced by Chinese design or techniques: Egypt, Syria, Iraq, Persia in the Middle East;
Vietnam, Thailand, Cambodia and Burma in South East Asia; and Korea and Japan in East Asia.
The three color ceramic (san cai) of the Tang dynasty has also been produced in the Islamic
world, celadon stoneware mainly in Vietnam, Thailand and Korea, underglaze blue porcelain in
Vietnam, Korea and Japan and a similar underglaze green decoration in Burma. Moreover, the
“blue and white” is the most widespread decoration style in Asia and Europe, and we can find it
not only in its place of origin, in the province of Jiangxi in South East China, but it was copied
in Mameluk Egypt and Syria, and Timurid Persia in the 15th century, in the Ottoman Iznik
during the 16th century, and in Safavid Persia until the 19th century. Chinese influence can also
be recognized in Europe, where the production of Faience in Italy, Portugal, France, the
Netherlands and Germany was an attempt to imitate the Chinese blue and white porcelain. And it
applies also to the design of the first true
European porcelain produced in Meißen in Germany. However, all these ceramic centers have
developed their own style. The turquoise celadon ware along the Silk Road in Syria (Raqqa) and
Persia (Kashan) and the green inlaid celadons of Korea during the Koryo dynasty (918-1392),
such as the Vietnamese blue and white porcelains reached a beauty and finesse able to compete
with the best products of China during the Song dynasty, when the celadon production had
reached its peak, or of Ming China when blue and white porcelain became popular. Thus, it
would be unfair to call these products simple copies of Chinese originals. They are products of
cultural exchange, creating universal globalized pieces of applied art. The blue and white
ceramics are particularly an expression of the Eurasian culture.
The Silk Road, of course, was not only a commercial tie between the East and the West. It also
facilitated the expansion of thought and religions, and with them also new designs, forms and
patterns. Buddhism came to Central Asia, Tibet, Mongolia, China, Korea and Japan, from Nepal
and India via the Silk Road. The impressive clay figurines in the Mogao Caves of Dunhuang in
the Western Chinese province of Gansu, and the Terracotta Buddha and Bodhisattvas and votive
tablets made of molded clay in Tibet and Mongolia, are evidence of the exchange of religious
belief that originated in India and mixed with the artistic taste of the Tang dynasty and local
design. The lotus flower became the most widely used Buddhist decoration element on Asian
ceramics. Lotus flowers and petals are painted, carved, incised, and imprinted on ceramics, the
form of rims and covers of jars and bowls often make reference to the lotus leaf, and lotus fruits
and seeds can be identified on plates, tureens and inside bowls. The royal celadon ceramics of
Korea during the Buddhist Koryo dynasty (918-1392) are not only masterpieces of art, but
express by form and decoration Buddhist belief. Korean celadons cannot deny the Chinese
influence. However, it might be reasonable to say that the celadon art in terms of innovations
reached its peak in Korea, rather than in China. Several new decoration techniques were developed or further refined such as the inlaid work (sanggam), engobe painting and openwork
style.
Islam made its way from Damascus and Baghdad, via Persia, towards northern India, and
July 2019
Vol.6, No.3
107
along the northern or southern route of the Taklimakan desert to West China, and by sea to the
Malay Peninsula and Indonesia, to North Africa, the Iberian Peninsula and the Balkans. With
Muslims travelling along the old Silk Road, Islamic ceramics can be found in West China, but
also in Portugal and Spain. Hinduism and its designs brought by Indian traders and business man
influenced the Khmer Empire of Angkor, Champa in southern Vietnam, the island of Bali, and
via the Khmer, also the Thai Kingdoms of Sukhothai and Ayutthaya. Buddhism reached South
East Asia later, through missionaries from Sri Lanka and India. The Mon people in present-day
Thailand and Burma were the first in South East Asia to adopt Theravada Buddhism – the
dominant religion in this region to this day. The Eurasian double continent is not only a
geographic dimension; it is above all a cultural reality. Ceramics have always played an
important role in developing, and contributing to, a unified Eurasian culture. This is the story
blue and white porcelain still has to tell us – a story which starts in East China under the
Mongolian Yuan dynasty.
The book tries to trace back the origins of a joint East and West cultural identity. It describes
the development of a Eurasian décor by analyzing the cultural interactions, the trading routes,
the merchants, customers and the economics of the trade. Porcelain is the carrier of culture; the
trading routes and ships were the means; and the trade itself was the mechanism for the
intercultural contacts.
The first chapter is dedicated to the products of China, the second focuses on the agents and
their routes – from Portugal, the Netherlands, the UK, Sweden and other countries. The third
chapter analyses the mechanism of exchange. China is in the center of these three chapters since
more than 95% of all export ceramics from 850 until 1850 are of Chinese origin. However, it is
shown, that China even having produced them has incorporated designs from all over the world
and has vice versa influenced all regions. The fourth chapter gives a brief overview of the other
important Asian ceramic exporters – especially Japan, but also Vietnam and Thailand. Chapter
five looks into the effects the export had on the countries of destination. Here we will understand
the unifying effects of porcelain on the art and culture of Eurasia. This book is an
interdisciplinary work. It combines history, economics, applied art and intercultural relations –
which is, in my view, the only way to address complex issues.
Being far from a specialist on ceramics, I would like to express my appreciation to the work
and the excellent publications on shipwreck porcelain of Roxanna Brown who has opened my
eyes to the beauty of South Asian ceramics. I also owe much to the work of Christiaan Jörg, who
gave detailed insights into the Dutch-Asian porcelain trade, to Geoffrey Godden who first
bridged the gap between European ceramics and Asian ceramics and to Andrew Madsen and
Carolyn White, who did an excellent job on dating Chinese export ceramics. This has helped me
very much in identifying the items of my own collection. Many researchers have worked on this
topic before and many more will come afterwards. We draw on their experience and we hope
that future researchers will find our work as helpful as we have found the efforts of others. The
same applies to the collection – the second part of the book. Many have owned the items before
– in most cases we do not know their names, who they were, where they have lived, what they
have done. Many will follow as well; nobody really owns them. They own us and they remind us
that we belong to the same Eurasian family.
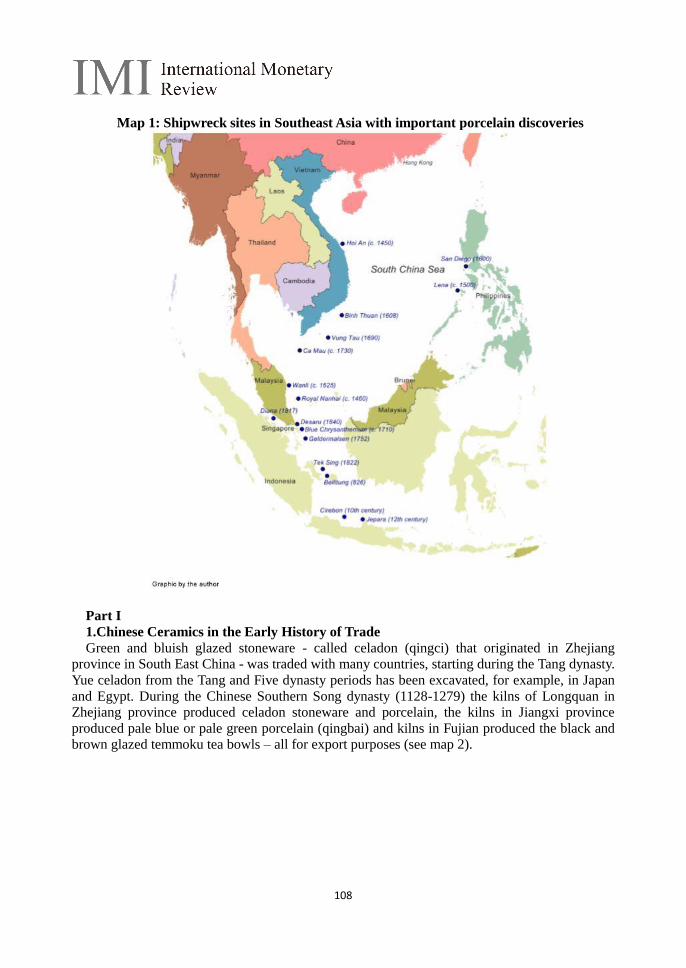
108
Map 1: Shipwreck sites in Southeast Asia with important porcelain discoveries
Part I
1.Chinese Ceramics in the Early History of Trade
Green and bluish glazed stoneware - called celadon (qingci) that originated in Zhejiang
province in South East China - was traded with many countries, starting during the Tang dynasty.
Yue celadon from the Tang and Five dynasty periods has been excavated, for example, in Japan
and Egypt. During the Chinese Southern Song dynasty (1128-1279) the kilns of Longquan in
Zhejiang province produced celadon stoneware and porcelain, the kilns in Jiangxi province
produced pale blue or pale green porcelain (qingbai) and kilns in Fujian produced the black and
brown glazed temmoku tea bowls – all for export purposes (see map 2).
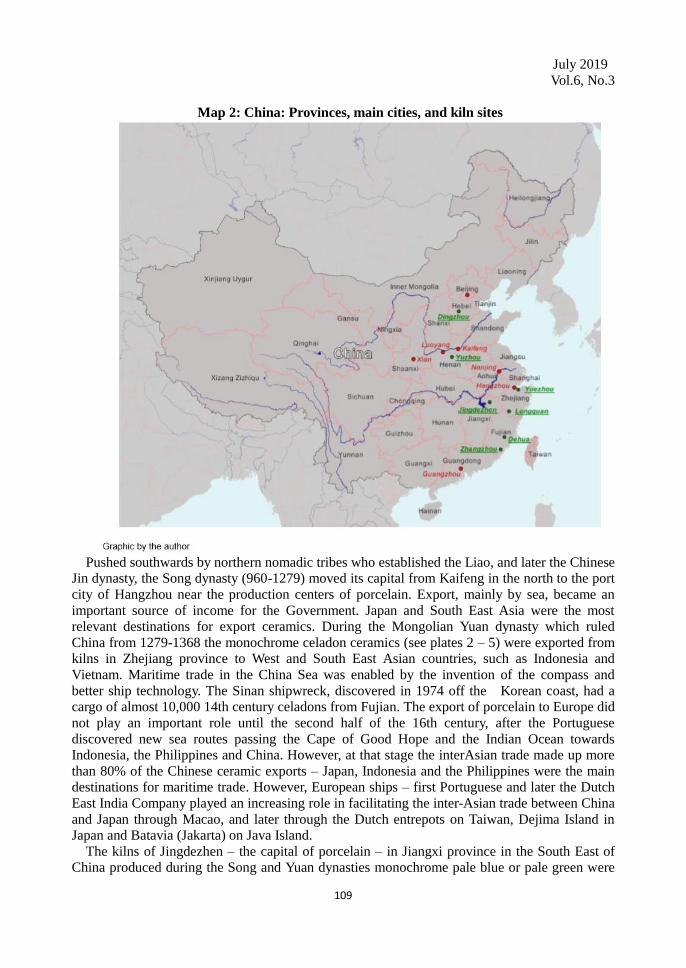
July 2019
Vol.6, No.3
109
Map 2: China: Provinces, main cities, and kiln sites
Pushed southwards by northern nomadic tribes who established the Liao, and later the Chinese
Jin dynasty, the Song dynasty (960-1279) moved its capital from Kaifeng in the north to the port
city of Hangzhou near the production centers of porcelain. Export, mainly by sea, became an
important source of income for the Government. Japan and South East Asia were the most
relevant destinations for export ceramics. During the Mongolian Yuan dynasty which ruled
China from 1279-1368 the monochrome celadon ceramics (see plates 2 – 5) were exported from
kilns in Zhejiang province to West and South East Asian countries, such as Indonesia and
Vietnam. Maritime trade in the China Sea was enabled by the invention of the compass and
better ship technology. The Sinan shipwreck, discovered in 1974 off the Korean coast, had a
cargo of almost 10,000 14th century celadons from Fujian. The export of porcelain to Europe did
not play an important role until the second half of the 16th century, after the Portuguese
discovered new sea routes passing the Cape of Good Hope and the Indian Ocean towards
Indonesia, the Philippines and China. However, at that stage the interAsian trade made up more
than 80% of the Chinese ceramic exports – Japan, Indonesia and the Philippines were the main
destinations for maritime trade. However, European ships – first Portuguese and later the Dutch
East India Company played an increasing role in facilitating the inter-Asian trade between China
and Japan through Macao, and later through the Dutch entrepots on Taiwan, Dejima Island in Japan and Batavia (Jakarta) on Java Island.
The kilns of Jingdezhen – the capital of porcelain – in Jiangxi province in the South East of
China produced during the Song and Yuan dynasties monochrome pale blue or pale green were
110
(qingbai) (see plate 7) and the production of the so-called blue and white porcelain (qinghua) did
not start until around 1320. The term “blue and white porcelain” stands for white porcelain with
a cobalt blue decoration on the white shard under a transparent glaze. A decade later the export
of the first Chinese blue and white porcelain started from Jingdezhen (see plate 14). The
Mongolian who have created under their reign a huge Asian-European and inter-Asian free-trade
area enabled the emergence of blue and white porcelain by the import of cobalt from Persia and
the demand for that kind of porcelain, made for the taste of the Islamic world, in West Asia and
the Middle East. Persia and China at that time were both part of the Mongolian empire. Outside
the empire, thousands of blue and white shards from the Yuan dynasty have been excavated: for
example, in Damascus and about half a million broken pieces have been found in Fustat (today
Cairo)3. Blue and white porcelain – which today is by and large a synonym of classical Chinese
porcelain – is in the end, a result of trade relations and the exchange of tastes during the Yuan
dynasty, which itself is a result of mixing Mongolian, Chinese, Persian, Islamic and also Turkish
or Uyghur cultural influences. Moreover, blue and white porcelain also became the most popular
ceramic in Europe – imported from China or produced domestically for example in Delft,
Meißen or Staffordshire. In the beginning of the 15th century, blue and white porcelain gained
appreciation by the imperial court (first in the Yongle period from 1403-24) and it is said that the
blue and white ware in the Xuande period (1426-1435) reached its peak in terms of fineness and
art but also reflected the exchange with the Islamic world. The porcelain vessel shapes of the
early Chinese Ming dynasty show strong Central Asian, Persian and Arabic influences.
Initiatives in other regions to produce porcelain have partly been fostered by the distortion of
the inter-Asian and Asian-European trade due to domestic Chinese circumstances. The export of
Chinese ceramics was hampered from 1350-1360 when the soldiers of the later Ming dynasty
were fighting against Mongolian rule. With the establishment of the Ming dynasty, the open and
cosmopolitan attitude of the Mongolian dynasty towards trade was replaced by close-door
politics: officially the Ming banned private export from 1368 until 1567. And even when this ban
could not be fully enforced, there is clear evidence of a sharp reduction of production and
trading of Chinese ceramics. The so-called “Ming gap” describes the fact that Chinese
commodities were missing in the export markets for a substantial period of time. Close-door
periods have been repeated many times during Chinese history; hopefully the last ended in 1978
when China started its reform process after years of Maoist isolation. During the Ming gap, the
Thai kilns in Sukhothai and Si Satchanalai originated and were able to partly substitute Chinese
exports. In the 15th century, Vietnamese ware partly substituted the missing blue and white
products from China. “The mere presence of Southeast Asian ceramics at every maritime
shipwreck site from the late 14th century to the beginning of the 16th century in proportions of
sixty to ninety-nine per cent, as opposed to 100 per cent Chinese trade ware at earlier sites, is
itself evidence of a Chinese shortage”4. During that period Thai and Vietnamese ceramics have
partly compensated the shrinking export volumes of Chinese ceramics in the South East Asian
markets. A similar distortion of trade took place during the violent transitional period between
the Ming and Qing dynasty from 1644 to 1684. The kilns of Jiangxi province were affected by
war and production stopped for more than two decades. During this time Chinese porcelain
exports to Europe were replaced by Japanese products and by the emergence of the Dutch
Faience industry in Delft.
However, even during the Ming gap the export to South East Asia never came to a complete
standstill. The best customer of Yuan and Ming blue and white ceramics was the Ottoman court in Istanbul. The Topkapi Palace holds the biggest collection of Chinese ceramics in the world.
The Lena junk with blue and white porcelain from the Ming Emperor Hongzhi sunk around
1500 off the Philippine Island of Busuanga5. The cargo from Jingdezhen was probably on its
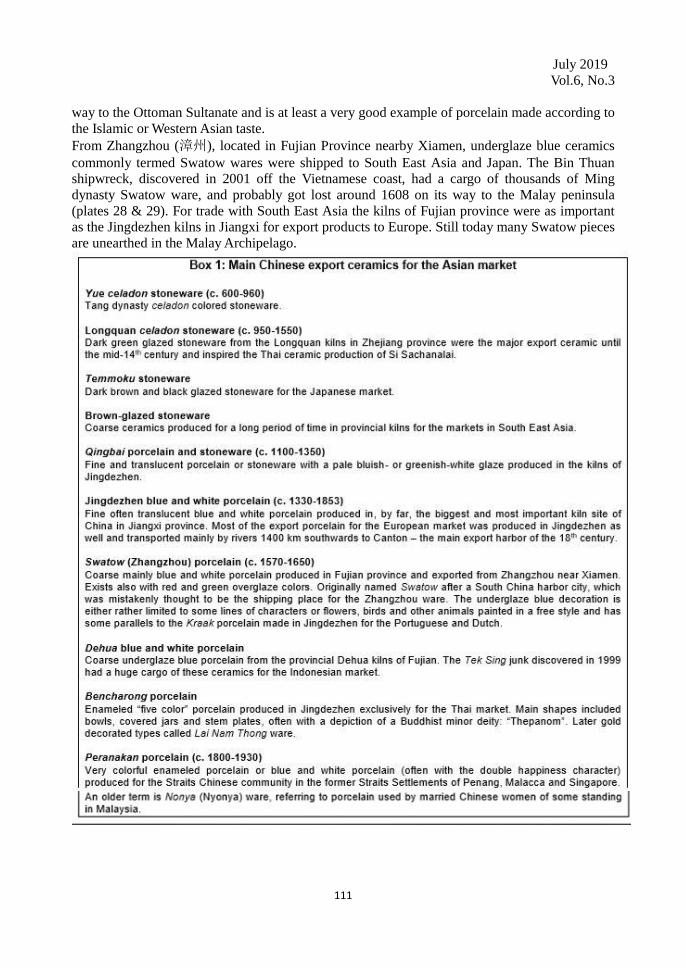
July 2019
Vol.6, No.3
111
way to the Ottoman Sultanate and is at least a very good example of porcelain made according to
the Islamic or Western Asian taste.
From Zhangzhou (漳州), located in Fujian Province nearby Xiamen, underglaze blue ceramics
commonly termed Swatow wares were shipped to South East Asia and Japan. The Bin Thuan
shipwreck, discovered in 2001 off the Vietnamese coast, had a cargo of thousands of Ming
dynasty Swatow ware, and probably got lost around 1608 on its way to the Malay peninsula
(plates 28 & 29). For trade with South East Asia the kilns of Fujian province were as important
as the Jingdezhen kilns in Jiangxi for export products to Europe. Still today many Swatow pieces
are unearthed in the Malay Archipelago.

112
References
Albert Amor Ltd.: Dr. John Wall, 1708 – 1776. A Commemorative Loan Exhibition of Dr. Wall
Period Worcester Porcelain, London 1976
Andrade, Tonio: Lost Colony: The untold story of China’s first great victory over the West,
Princeton and Oxford, 2011
Arensberg, Ingrid: Ostindiefararen Götheborg SeglarIgen: The Swedish Ship Götheborg sails
again, Mölndal, 2009
Aronson, Robert D.: In the Eye of the Beholder: Perspectives on Dutch Delftware, Amsterdam
2011
Avitabile, Gunhild and Graf von der Schulenburg, Stephan: ChinesischesPorzellan, Frankfurt,
1992
Bai Shouyi: Chinas Geschichte m Überblick, Beijing, 2009
Barnes, Ian and Hudson, Robert: Historical Atlas of Asia, New York, 1998
Beijing Capital Museum: Porcelains of the Yuan dynasty, Beijing, 2004
Beurdeley, Michel: Porzellanaus China: Compagnie des Indes, München, 1962
Bi Keguan: Chinese Folk Painting on Porcelain, Beijing, 1991
Bramsen, Christopher Bo: Peace and Friendship. Denmark’s Official Relations with China 1674
– 2008, Hong Kong, 2008
Brown, Roxanna M.: The Ceramics of South-East Asia: Their dating and identification, Chicago,
2000
Brown, Roxanna M.: The Ming Gap and Shipwreck Ceramics in Southeast Asia, Bangkok, 2009
Burnet, Ian: East Indies: The 200 year struggle between the Portuguese Crown, the Dutch East
India Company and the English East India Company for supremacy in the Eastern Seas,
Sydney, 2013
Butterfields: Treasures from the Hoi An Hoard. Important Vietnamese Ceramics from a late
15th/ early 16th Century Cargo, Auction catalogue, San Francisco and Los Angeles, October
11 – 13, 2000, two volumes
Carswell, John: Iznik Pottery, London, 1998
Carswell, John: Blue & White: Chinese porcelain around the world, London, 2000
The Chalre collection: Ceramic treasures of Southeast Asia,
http://ceramics.chalre.com/index.html
Chandhavij, Bhujjong: Blue-and-White Chinaware and Siamese Ceramics, Bangkok, 2015
Chen IengHin, Roy, Sit Kai Sin: A Rota Marítima da Porcelana. Relíquias dos Museus de
Guangdong, Hong Kong e Macau, 2012
Chaudhuri, Kirti Narayan: The Trading World of Asia and the English East India Company 1660
– 1760, Cambridge, 1978
Chen, Xiejun and Chen, Kelun: Traces of the Trade: Chinese export porcelain donated by Henk
B. Nieuwenhuys, Shanghai, 2009
Chicarelli, Charles F.: Buddhist Art: An illustrated introduction, Chiang Mai 2004
China Guardian Seasons Auctions: Shipwreck Treasures of South China Sea, Auction catalogue,
December 16, 2006 Beijing
Christie’s: The Vung Tau Cargo, Auction catalogue, 7 – 4 April, 1992, Amsterdam
Christie’s: The BinhThuan Shipwreck, Auction catalogue, 1 – 2 March, 2004, Melbourne
Christie’s South Kensington: The property of the late Valerie Howard removed from 4 Camden
Street Collani, Claudia von: Von Jesuiten, Kaisern und Kanonen: Europa und China – eine
wechselvolle eschichte, Darmstadt, 2012
Copeland, Robert: Blue and White Transfer-Printed Pottery, Oxford, 2010
July 2019
Vol.6, No.3
113
Copeland, Robert: Spode’s Willow Pattern and Other Designs After the Chinese, London, 1980
Corrigan, Karina, Campen, Jan van, Diercks, Femke, Blyberg, Janet C. (Ed.): Asia in Amsterdam:
The culture of luxury in the Golden Age. Salem, Amsterdam, 2015
Cox, Ian: Royal Crown Derby Imari Wares, London, 1998
Crick, Monique: Chinese Trade Ceramics for South-East Asia: Collection of Ambassador and
Mrs Charles Müller, Milan, 2010
Curatola, Giovanni (Ed.): Persian Ceramics from the 9th to the 14th century, Milan, 2006
van Dam, Jan Daniel: Delffse Porceleyne: Dutch delftware 1620 – 1850, Amsterdam, 2004
Darwin, John: After Tamerlane: The Rise and Fall of Global Empires, London, 2007
Davis, Howard: Chinoiserie: Polychrome Decoration on Staffordshire Porcelain 1790 – 1850,
London, 1991
De Jonge, C.H.: Delfter Keramik, Tübingen. 1969
The Desaru ship: http://www.mingwrecks.com/desaru.html, accessed on 17.12.2017
Diamond, Jared: Arm und Reich: Die Schicksale menschlicher Gesellschaften, Frankfurt 2006
Van Dyke, Paul A.: The Canton Trade: Life and Enterprise on the China Coast, 1700 – 1845,
Hong Kong, 2007
Van Dyke, Paul A. and Mok, Maria Kar-Wing: Images of the Canton Factories 1760 – 1822,
Hong Kong, 2015
Edwards, Hugh: Weisses Gold ausblauerTiefe, München, 2001
Farris, Jonathan Andrew: Enclave to Urbanity: Canton, Foreigners, and Architecture from the
Late Eighteenth to the Early Twentieth Centuries, Hong Kong, 2016
Fehérvári, Géza: Pottery of the Islamic World in the Tareq Rajab Museum, Hawally, 1998
Feldbauer, Peter: Die Portugiesen in Asien 1498 – 1620, Essen, 2005
Frank, Andre Gunder: ReOrient: Global Economy in the Asian Age, Berkeley and Los Angeles,
1998
Freunde des Historischen Museums Bayreuth e.V.: Bayreuther Fayencen: Sammlung Burkhardt,
Bayreuth, 2006
Freundeskreis Kunstgewerbemuseume.V. Schloss Pillnitz: Teichert-Werke Meißen. Keramik und
Porzellan 1863 – 1945, Dresden, 2003
Fung Ping Shan Museum: Green wares from Zhejiang, Hong Kong, 1993
Ganse, Shirley: Chinese Porcelain: An export to the world, Hong Kong, 2008
Garnier, Derick: Ayutthaya: Venice of the East, Bangkok, 2004
Gawronski, Jerzy (Ed.): Amsterdam Ceramics. A city’s history and an archaeological ceramics
catalogue 1175 – 2011, Amsterdam, 2012
Godden, Geoffrey A.: Oriental Export Market Porcelain and its Influence on European Wares,
London, 1979
Godden, Geoffrey A.: Encyclopedia of British Pottery and Porcelain Marks, London, 1986
Godden, Geoffrey A.: Godden’s Guide to English blue and white porcelain, Woodbridge, 2004
Goddio, Franck: Das Geheimnis der San Diego, Zürich, 1996
Goddio, Franck: Weißes Gold, Göttingen, 1997
Gøbel, Erik: AsiatiskKompagnisKinafart 1732 – 1833, Denmark, 1978
Goepper, Roger (Ed.): Legende und Wirklichkeit. Frühe Keramikenaus -stasien, Köln, 1977
Guerin, Nicol and van Oenen, Dick: Thai ceramic art, Singapore, 2005
Gunn, Geoffrey C.: History Without Borders: The making of an Asian Wold Region, 1000 –
1800, Hong Kong, 2011
Guratzsch, Herwig (Ed.): Fayencenaus dem Ostseeraum: KeramischeKostbarkeiten des Rokoko,
München, 2003
Haggar, Reginald and Adams, Elizabeth: Mason Porcelain & Ironstone: 1796 – 1853, London,
114
1977
Harding, Richard, Jarvis, Adrian and Kennerley, Alston: British Ships in China Seas: 1700 to the
present day, Liverpool, 2004
Harrisson, Barbara: Swatow, Leeuwarden, 1979
He Li: Chinese Ceramics: The new standard guide, London 1996
Heilbronner Kunst- und Auktionshaus Jürgen Fischer: 66. Fischer Auktion, Fayence- und
Steinzeugsammlung Heinz Weck, 28. März, 1992
Hess, Catherine (Ed.): The Arts of Fire: Islamic influences on glass and ceramics of the Italian
Renaissance, Los Angeles, 2004
Hetjens-Museum, DeutschesKeramikmuseum (Ed.), Pantzer, Peter: Imari-Porzellan am Hofe der
Kaiserin Maria Theresia, Düsseldorf, 2000
Ho, Wing Meng: Straits Chinese Porcelain: A collector’s guide, Singapore, 2008
Impey, Oliver: Chinoiserie: The impact of oriental styles on western art and decoration, London,
1977
Irvine, Gregory (Ed.): Der Japonismus und die Geburt der Moderne: Die Khalili-Sammlung,
Leipzig, 2014
Jahn, Gisela: Meiji Ceramics: The art of Japanese export porcelain and Satsuma ware 1868 –
1912, Stuttgart, 2004
Jenkins-Madina, Marilyn: Raqqa Revisited: Ceramics of Ayyubid Syria, New York, 2006
Koh Antique: Jepara shipwreck: http://www.koh-antique.com/jepara/jepara%20wreck.htm,
accessed 31 December, 2017
Jörg, Christiaan J.A.: Porcelain and the Dutch China Trade, The Hague, 1982
Jörg, Christiaan J.A.: The Geldermalsen: History and porcelain, Groningen, 1986
Jörg, Christiaan J.A.: Fine & Curious: Japanese Export Porcelain in Dutch Collections,
Amsterdam, 2003
Jörg, Christiaan J. A.: FamilleVerte: Chinese porcelain in green enamels, Schoten, 2011
Kerr, Rose (Ed.): The World in Colors, The Oriental Ceramic Society, 2006
Kerr, Rose and Mengoni, Luisa E.: Chinese Export Ceramics, London, 2011
Ketel, Christine: https://independent.academia.edu/ChristineKetel, Identification of export
porcelains from early 17th century VOC shipwrecks and the linkage to their cultural
identification, accessed on 29.04.2017
Kjellberg, Sven T.: Svenska OstindiskaCompagnierna, 1731 – 1813: Kryddor, Te, Porslin, Siden,
Malmö, 1974
Klein, Adalbert: IslamischeKeramik, Baden Baden, 1976
Koninckx, Christian: The First and Second Charters of the Swedish East India Company (1731 –
1766), Kortrijk, 1980
Krist, Gabriela and Iby, Elfriede (Eds): Investigation and Conservation of East Asian Cabinets in
Imperial Residences (1700 – 1900), Vienna, 2015
Lawrence, Louis: Satsuma. The Romance of Japan, Tarzana, 2011
Langer, Axel: BlauerLotos – weisserDrache: Blau-weisseKeramikausAsien und Europa, Zürich,
2006
Madsen, Andrew D. and White, Carolyn L.: Chinese Export Porcelains, Walnut Creek, 2011
Miedtank, Lutz: Zwiebelmuster: Zur 300jährigen Geschichte des Dekors auf Porzellan, Fayence
und Steingut, Leipzig 2001
Miksic, John, N.: Southeast Asian Ceramics: New light on old pottery, Singapore, 2009 Morris, Ian: Werregiert die Welt? WarumZivilisationenherrschenoderbeherrschtwerden,
Frankfurt, 2011
Mostert, Tristan and van Campen, Jan: Silk Thread: China and the Netherlands from 1600,
July 2019
Vol.6, No.3
115
Amsterdam, 2015
Museum fürKunsthandwerk Frankfurt am Main: Deutsches Porzellan des 18. Jahrhunderts.
Geschirr und Ziergerät, Frankfurt, 1983
Nagel Auktionen: Der Schatz der Tek Sing, 1999
Narantuya, Ts. and Shur, B.: Masterpieces of Nomadic Mongolia, Ulaanbaatar, 2010
Nezu Museum: Ko-Imari: A Catalogue of Hizen Porcelain from the Nezu Museum’s Yamamoto
Collection, Tokyo, 2017
Nielson, Jan Eric: Gotheborg.com: http://gotheborg.com/dest/company.shtml, accessed on
29.04.2017
Nielson, Jan Eric (2): Japanese porcelain marks:
http://www.gotheborg.com/marks/fukagawa.shtml, accessed on 23 December 2017
Nierstrasz, Chris: Rivalry for Trade in Tea and Textiles: the English and Dutch East India
Companies (17001800), Houndsmills, 2015
Nyström, Johan Fredrik: De svenska ostindiskakompanierna: historisk-statistisk framställning,
Göteborg 1883
Olson, Steve: Herkunft und Geschichte des Menschen.: Was die Gene
überunsereVergangenheitverraten, Berlin, 2002
Osterhammel, Jürgen: Die EntzauberungAsiens: Europa und die asiatischenReicheim 18.
Jahrhundert, München, 2010
Palmer, Arlene M.: A Winterthur Guide to Chinese Export Porcelain, New York, 1976
Picard, R., Kerneis, J.-P., Bruneau, Y.: Les Compagnies des Indes Route de la Porcelaine, France,
1966
Pichelkastner, Eleonore: Bruckmann’sFayence-Lexikon, Majolica, Fayence, Steingut, München,
1981
Pietsch, Ulrich: Meissener orzellan und seine ostasiatischenVorbilder, Leipzig, 1996
Pietsch, Ulrich, Loesch, Anette and Ströber, Eva: China, Japan, Meissen: Die
Porzellansammlungzu Dresden, Berlin, 2006
Pietsch, Ulrich and Bischoff, Cordula: Japanisches Palais zu Dresden: Die
königlichePorzellansammlung Augusts des Starken, Dresden, 2014
Pitcher, Philip Wilson: Fifty Years in Amoy: Or a history of the Amoy mission, China, Founded
February 24, 1842, New York, 1893
Pluis, Jan: De NederlandseTegel: Decors enbenamingen 1570-1930, Leiden, 2013
Ptak, Roderich: Die maritime Seidenstraße, München, 2007
Puga, Rogério Miguel: The British Presence in Macau 1635 – 1793, Hong Kong, 2013
Qu, Yongjian: Dating and Connoisseur of Ceramic Sherds Unearthed from the Beijing city,
Beijing, 2011
Reinhard, Wolfgang: Die Unterwerfung der Welt. Globalgeschichte der europäischen Expansion
1415 – 2015, Bonn, 2017
Robinson, Natalie V.: Sino-Thai Ceramics, Bangkok, 1982
Röntgen, Robert E.: Deutsche Porzellanmarken von 1710 bis heute, Regenstauf, 2007
Rooney, Dawn F.: Khmer ceramics: Beauty and meaning, Bangkok, 2010
Rooney, Dawn F.: Bencharong. Chinese Porcelain for Siam, Bangkok, 2017
The Royal Nanhai shipwreck site: http://www.sawankhalok.com/royalnanhai.html, accessed on
01.10.2017
Savage, George: Seventeenth and Eighteenth Century French Porcelain, Feltham, 1969
Schaap, Ella B.: Delft Ceramics at the Philadelphia Museum of Art, Philadelphia, 2003
Schiffer, Herbert, Schiffer, Peter and Schiffer, Nancy: Chinese Export Porcelain. Standard
patterns and forms, 1780 to 1880, Exton, 1975

116
Schiffer, Nancy: Japanese Porcelain 1800-1950, West Chester, Pennsylvania, 1986
Schmitt, Eberhard, Schleich, Thomas and Beck, Thomas (Ed.): KaufleutealsKolonialherren: Die
Handelswelt der Niederländer vom Kap der Guten Hoffnung bis Nagasaki 1600 – 1800,
Bamberg, 1988
Shaw, J.C.: Introducing Thai ceramics, also Burmese and Khmer, Bangkok, 1987
Shono, Masako: Japanisches Aritaporzellan im sogenannten Kakiemonstilals Vorbild für die
Meißener Porzellanmanufaktur, München, 1973
Sjostrand, Sten, Taha, Adi Haji and Sahar, Samsol: Mysteries of Malaysian Shipwrecks,
Department of Museums Malaysia, 2006
Sjostrand, Sten and Sharipah Lok Lokbt. Syed Idrus: The Wanli Shipwreck and its Ceramic
Cargo, Malaysia, 2007
Staatliche Kunstsammlungen Dresden and VEB Staatliche PorzellanManufaktur Meissen:
MeissenerBlaumalereiausdreiJahrhunderten, Leipzig, 1989
Staatliche Kunstsammlungen Dresden: Die schönsten Porzellane im Zwinger. Katalog der
Sammlung in Dresden, Gütersloh, 1982
Sterba, Günther: Meissner Tafelgeschirr, Stuttgart, 1989
Stevenson, John and Guy, John: Vietnamese Ceramics: A separate tradition, Chicago,
Tan, Rita C.: Zhangzhou Ware Found in the Philippines: “Swatow” export ceramics from Fujian
16th – 17th century, Malaysia, 2007
Tan, Heidi (Ed.): Marine Archaeology in Southeast Asia: Innovation and Adaptation, Singapore,
2012
Übersee Museum: Keramikaus Thailand. Sukhothai &Sawankhalok, Exhibition catalogue, 1977
Ulrichs, Friederike: Johan NieuhofsBlick auf China (1655-1657): Die Kupferstiche in
seinemChinabuch und ihreWirkung auf den Verleger Jacob van Meurs, Wiesbaden, 2003
Volker, T.: Porcelain and the Dutch East India Company: As recorded in the dagh-registers of
Batavia castle, those of Hirado and Deshima and other contemporary papers 1602 – 1682,
Leiden, 1954
Watney, Bernard: English Blue & White Porcelain: of the 18th Century, London, Boston, 1979
Watson, Oliver: Ceramics from Islamic lands, Kuwait national museum, Singapore, 2004
Wellington, Donald C.: French East India Companies: A historical account and record of trade,
Lanham, 2006
Wiesner, Ulrich: ChinesischeKeramik auf Hormoz, Museum fürOstasiatische Kunst, Köln, 1979
Wolf, Norbert: Jugendstil, München, 2015
Wu Ruoming: The origins of Kraak Porcelain: in the late Ming Dynasty, Weinstadt, 2014
Yang-Chien Tsai, Simon: Trading for Tea: A Study of the English East India Company’s Tea
trade with China and the related financial issues, 1760 – 1833, Thesis at University of
Leicester, 2003
Zeh, Ernst: Hanauer Fayence, Hanau, 1978
Zhejiang province relict office: Longquan celadon of China, Zhejiang, 1998
Zweig, Stefan: Magellan: Der Mann und seine Tat, Frankfurt, 2011

July 2019
Vol.6, No.3
117
Working Paper
China and Special Drawing Rights: Towards a Better
International Monetary System*
By MATTHEW HARRISON AND XIAOGENG*
China and the international monetary system need each other. The international monetary
system is strained, with crisis just around the corner, yet reform is not on anyone’s agenda. Meanwhile China, deeply invested in the current system, faces narrowing options as trading
partners question its moves abroad, debt levels rise at home, and its current account moves from
surplus to deficit. RMB internationalization might appear to provide a way out, but the policy has its limits and tends to exacerbate rather than relieve tensions. We argue that a
tension-reducing solution is at hand to the problems of both the international monetary system and China—IMF-style Special Drawing Rights (SDRs). If in a unilateral initiative China were to
make the SDR central to its next phase of capital account opening, China’s institutions,
corporates and individuals—presently restricted in their access to international currency—would likely embrace it. Begun by China, with support from the international
community and Hong Kong, promulgation of the SDR would usher in an era of lower tensions,
providing space for development and avoidance of conflict within a reordered monetary system in which China would have a more prominent role.
Keywords: China, Special Drawing Rights (SDRs), International monetary system, RMB
internationalization, Belt and Road Initiative, Risk management
JEL Classification: F3; G1; P2
1. Introduction
In this commentary, drawing on ideas we first set out in Harrison and Xiao (2018), we argue
that two major monetary problems, seemingly loosely connected, have a common solution. The
two problems are, firstly, that of the international monetary system as a whole and, secondly, that
of China’s monetary relations with the rest of the world. We suggest a solution to these two
problems in expanded use of the International Monetary Fund (IMF)’s Special Drawing Rights
(SDRs). China would be in a position to unilaterally kick-start an SDR market, following which,
broad international participation would likely snowball.
In the present paper, we firstly establish the nature of the two problems. Regarding the
international monetary system, the signs of strain if not of imminent crisis are clear. Emerging
* IMI Working Paper No. 1904[EN] This paper is published in Journal of Risk and Financial Management.2019,12(2),60
* Matthew Harrison, Hong Kong Institution for International Finance, K K Leung Building, University of Hong Kong, Hong Kong. Xiao Geng, Member of IMI Academic Committee; Peking University HSBC Business School, PHBS 734, Peking University,
University Town, Nanshan District, Shenzhen 518055, China. Correspondence: [email protected]

118
markets were put under pressure by US interest rate rises, and Argentina and Pakistan have had
to approach the International Monetary Fund (IMF).Global indebtedness has reached 225% of
GDP—higher than in the aftermath of the Global Financial Crisis(GFC) (IMF 2019a).Central
banks, which provided USD 10 trillion to the financial markets via monetary easing, have begun
withdrawing their support (Fitch 2017).We argue that the current tensions in the international
monetary system result from a systemic cause, namely reliance on a single national currency, the
dollar, as the de facto global currency. Such a system is inherently prone to instability, yet
unfortunately there is no prospect of systemic reform.
Regarding China’s monetary relations with the world, there are again clear signs of building
crisis, most obviously the US–China trade war and China’s rising domestic indebtedness. There
are also grounds for a more positive outlook, namely political will on both sides to resolve the
trade war, China’s huge accumulated foreign exchange reserves, and the policy of RMB
internationalization, which creates new space outside the dollar arena. However, we argue that
these factors at best defer the crisis. China will need to further open its capital account and,
hence, step up its monetary relations with the world.
These two problems have a potential, common solution. Global imbalances would be reduced
if the world were to make wider use of SDRs as a fully-fledged currency. This is not a realistic
prospect given that the willingness of states to cooperate on multilateral initiatives is diminishing,
while the international monetary system is low among politicians’ priorities. However, a
currency version of SDRs would be useful to China as well in its capital account opening
process. As a separate currency it would be easy to track and control, while its fungibility with
the dollar and its inclusion of the RMB add further appeal. We argue for a unilateral initiative by
China to promote use of the SDR by its own institutions, corporates, and individuals. With Hong
Kong’s help, this could kickstart a global SDR ecosystem to the benefit of all.
The remainder of our paper discusses the risks of the proposed SDR initiative to China and
how these risks may be mitigated. The Chinese authorities have more experience than most in
the management of financial crises. Monetary quotas and geographical limits are among the
tools available. Given China’s prowess in FinTech there may even be a role for a cryptocurrency
version of SDRs, which would in turn provide risk-mitigating control and transparency.
Neither the international community nor China have unlimited time to confront their
respective monetary problems. The SDR is a solution whose time has come.
2. International Monetary System
2.1 Problems
The strains in the international monetary system are clear.
As we detail in Harrison and Xiao (2018), following the collapse in the early 1970s of the
Bretton Woods arrangements under which global currencies were pegged to the US dollar, which
in turn was pegged to the price of gold, the world gravitated to a de facto system centered on the
US dollar. This de facto system is characterized by free-floating exchange rates, massive private
capital flows, current account convertibility for most countries, and varying degrees of capital
account convertibility for many, with the IMF available to lend balance of payments support to
countries in difficulties. However, the post-Bretton Woods era has seen crisis after crisis, with
defaults ranging through Latin America (1980s), East Asia (1997/98), Russia (1998) the
developed West (2007/09), and emerging markets (2018–).
The present monetary setup has been described as ‘a deficient non-system’ (White 2015; see also Ocampo 2017). It is inherently crisis-prone because of the following drawbacks:
• Reliance on a national currency (the US dollar) as the de facto international currency. US
dollar interest rates are determined with reference to US domestic conditions and may be too

July 2019
Vol.6, No.3
119
high for some other countries (currently) or too low (during the immediate post-GFC years).
Moreover, the US authorities have ‘weaponized’ their currency by denying banking access
to actors considered hostile to US national interests.
• Inequity. Poorer developing countries are obliged to accumulate precautionary dollar
surpluses to insure against potential future balance of payments difficulties, so transferring
resources to the world’s richest country, the USA.
• Recessionary bias. Balance of payments debtors are forced to adjust when it is most painful
for them to do so, while creditors face no such adjustment pressure.
• Lack of oversight. The IMF monitors developments and issues warnings but has little
power to influence events until approached by a debtor nation.
• Limited policy coordination. The G20 is perhaps the closest to an economic policy
coordinating mechanism, but it has not been very effective in this role.
The US benefits from the system and so has resisted change. However, while as issuer of the
world’s currency the US gains seigniorage, prestige, and even an instrument of foreign policy,
these benefits come with costs. In order to provide the world with dollars, the US has to run
extended current account deficits, while the (forced) willingness of other nations to buy its debt
arguably encourages the US in fiscal irresponsibility, as exemplified in the Trump tax cuts of
December 2017. In the long run, the present system may not be good for the US either.
We argue that the dollar-centric monetary system is in urgent need of reform. As Rickards
(2015) puts it, ‘If the dollar fails, the entire international monetary system will fail with it’.
2.2 Existing Reform Proposals
If the present global monetary system is deficient, why has it persisted for so long?
There has been no shortage of reform proposals. In 2009, then-governor of the People’s Bank
of China Zhou Xiaochuan (Zhou 2009) expressed dissatisfaction with the dollar-centric system
and argued for more use of the SDR. The IMF (2011) took up the call and produced a paper on
the potential of the SDR. Palais-Royal (2011) urged, ‘…the reconstruction of a fully-fledged
international monetary order’ with a central role for the SDR. Other commentators have called
for a revival of Keynes’ clearing union, a larger role for the IMF, development of the SDR as a
true global currency, restrictions on private capital flows, and improved macro-economic
coordination among others. Meanwhile, the IMF (2018a) continues to advocate a larger role for
SDRs to moderate imbalances and counter weaknesses in the present system. However, none of
these proposals has gained traction.
In line with Ocampo (2017) and Li (2016), we hope for an evolution of the international
monetary system to a multicurrency one with a larger role for the SDR. However, even this
evolutionary scenario is unlikely to materialize.
Firstly, geopolitical alignment is lacking. The US, although wielding veto power within the
IMF, has lost moral authority because of the GFC, and in any case the world is now multipolar.
With the GFC receding into memory, and with nationalism and populism on the rise, states have
become less willing to cooperate in building a new monetary order.
Secondly, massive capital flows—often seen as the villain—can hardly be dismissed. Trading
and investing freely across the world’s markets and currencies has come to be seen as a right.
The world’s openness to private capital flows has, alongside its drawbacks, enabled multitudes
of investors and institutions to diversify and improve returns in ways that in the Bretton Woods
era would not have been possible. This is in many ways a good thing, and it is all but irreversible.
The genie is out of the bottle.
Top-down reform of the international monetary system appears unfeasible. Rather, we argue
that any reform will have to be de facto and bottom-up, the initiative of a single state or group of
states, and promulgated by the market process.
120
3. China’s International Monetary Options
We now consider China’s international monetary problem. Having established that there is a
problem, we consider two possible solutions, namely RMB internationalization and the
monetary implications of the Belt and Road Initiative (BRI), and argue that they cannot meet
China’s needs. In our view, a third solution is more promising for China—limited capital account
opening via SDRs.
3.1 Need for Capital Account Opening
At first glance, it might appear that China does not have an international monetary problem, or
at least not an unmanageable one. True, there is a building trade war with the US, but a
settlement of some kind will surely be reached. Even if the trade war should go badly, China has
cards to play. Internal consumption has room to take up the slack from exports; there are new
trading partners cultivated by the BRI; the foreign exchange reserves provide a huge cushion;
and while indebtedness is high at 266% of GDP, most of this debt is internal rather than external
(Bloomberg 2018a). China’s increasing technological prowess in areas ranging from FinTech to
space exploration, supercomputing, and telecommunications opens up new areas of opportunity.
Our view, however, is that China is near the limits of its existing development model.
Externally, that model is one of exploiting the openness of trading partners while keeping the
domestic market relatively closed. Internally, notwithstanding the market reforms of the past
forty years, China remains a state-permeated economy (Otero-Iglesias and Vermeiren 2015),
even more so in recent years as the position of state-owned enterprises is boosted and control
over opinion and information flow tightened.
Now, both dimensions of the development model are under threat. Externally, trading partners
are pushing back against China’s exports and overseas investments while demanding better
access to China’s domestic market. Even before these demands are addressed, rising
consumption (including the overseas spending of Chinese tourists) has tilted China’s current
account balance towards deficit (The Economist 2019). Nor can the Chinese authorities easily
resist these trends without jeopardizing the high rate of economic growth on which their claim to
legitimacy depends.
In order to finance its looming current account deficit, China must import capital. This would
not be difficult, since China has a vast and diverse economy to which foreign investors are keen
to gain exposure. However, given the restrictions and controls on capital movement, foreign
investors tend to limit the amounts they invest, currently owning only 2% of China’s bond
market (CNBC 2018). In order to attract further capital on a large scale, China would need to
substantially loosen capital account restraints. Yet this would allow China’s own citizens to ‘vote
with their feet’ financially, the resultant capital flight undermining the state-permeated
system.Even the vast foreign exchange reserves might not be enough to stem the flood.
We argue that China has a pressing need to open its capital account but cannot readily do so
without compromising the state-permeated system. Before turning to our preferred solution, we
first explore two policies which appear to offer a way out—RMB internationalization and the
monetary implications of the BRI.
3.2 RMB Internationalization
In the aftermath of the GFC, China embarked on a program of internationalizing its own
currency, encouraging use of the RMB for trade, for reserve-holding, and for investment
purposes, in order to reduce reliance on the dollar and in the longer run even supplant the dollar
as a global currency. How has this initiative fared, and what are its prospects? One school of thought, with Eichengreen (2014), expects the RMB to become an international
currency alongside the US dollar relatively soon. Another school, with Frankel (2012),
emphasizes the role of financial depth in determining a currency’s international acceptability and

July 2019
Vol.6, No.3
121
sees RMB internationalization as a more distant prospect. Prasad (2018) considers that the
RMB’s potential will remain unrealized unless China embarks on a broad range of financial
system and economic reforms.
China authorities have taken steps to support internationalization of their currency. To help
ensure RMB supply, the People’s Bank of China (PBoC) has concluded swap agreements with
the central banks of some 36 countries (EIU 2018). These agreements appear to have supported
bilateral trade between China and the countries concerned (Zhang et al. 2017). The IMF’s
inclusion of the RMB in its SDR basket provides justification for central banks to include the
currency in their reserves. On 8 October 2015, China launched the Cross-border Inter-bank
Payments System (CIPS) to rival the Society for Worldwide Interbank Financial
Telecommunication, SWIFT (CCTV 2017).RMB has been allowed to accumulate offshore in
Hong Kong and, to a lesser extent, other centers; in 2013, a link was set up between the Hong
Kong Monetary Authority (HKMA)’s RMB Real-Time Gross Settlement System and the
Shenzhen Financial Settlement System (HKMA 2016). Domestic financial markets have been
opened somewhat with the launch of Stock Connect and Bond Connect, with quotas on these
channels being relaxed over time. Meanwhile, the RMB was allowed to trade in a wider daily
band, linked to an undisclosed basket of currencies rather than simply pegged to the US dollar
(New York Times 2015). China also initiated the establishment of a new multilateral financial
institution, the Asian Infrastructure Investment Bank (AIIB) launched in January 2016, in which
it retained a 30% share (SCMP 2015).
From an almost negligible international profile the RMB contributed 1.7% of foreign
exchange reserves in Q3 2018, ranking sixth globally (IMF 2019b), while in January 2019 it
contributed 1.24% of SWIFT’s international transactions, ranking eighth (SWIFT 2019). Russia
has reduced the dollar share of its reserves and allocated 15% to RMB (Bloomberg 2019).
However, there is still a long way to go to rival the dollar.
The above supporting initiatives have had limited impact so far. BRI lending has largely been
in dollars (FT 2018), AIIB lending exclusively so (Global Times 2016). CIPS volumes are not
disclosed1, suggesting that they may not be too large. The RMB’s international footprint is
narrow, with 80% of RMB transactions passing through Hong Kong (SWIFT 2019). The
Connect schemes (again through Hong Kong) are designed to prevent RMB straying outside the
intended purposes. Offshore RMB (CNH) is not fungible with onshore RMB (CNY)—the two
have a different price and a different interest rate, and approval is needed for conversion of one
to the other (Currenxie 2016). Overall, as an international holder there are not too many things
that one can do with one’s RMB.
For RMB to become attractive enough for foreigners to want to hold it on a large scale, there
would have to be much greater freedom to exchange it for other currencies and to spend or earn
it within China or abroad. For there to be enough RMB in the international system, China would
have to run large and extended trade deficits, as the US has done. For large-scale RMB
investment and reserve holding by foreigners, China would need much deeper and more open
financial markets. Long before these conditions were met, China would face capital flight,
pressure on the exchange rate, and financial market turbulence—existential threats to the internal
order.
Katada (2018) draws lessons from Japan’s attempt to internationalize the Yen after the
1997/98 Asian Financial Crisis. Despite Japan’s advantages in economic size and open,
developed financial markets, the effort foundered on acceptance by the international community
1Statistics not apparently available on CIPS website, http://www.cips.com.cn/cipsen/, viewed on 25 February
2019; for example, the press release, ‘CIPS runs smoothly and hits new record’, 14 April 2017, has no statistics.
122
and domestic policy priorities. Although China today is bigger economically than Japan was then,
in other respects it is less well-placed.
Moreover, the benefits of RMB internationalization for China are hard to find (Huang and
Lynch 2013). The prestige or soft power accruing to the issuer of a global currency is a
long-term and remote benefit; nor does China have fiscal deficits needing to be financed with
international money. RMB internationalization would likely increase exchange rate volatility
rather than reduce it; denominating trade in RMB rather than US dollars would create financial
efficiencies but would not relieve China and its trading partners of the need to maintain
international competitiveness by means such as wage cuts or unemployment.
In China’s case, currency internationalization carries the further benefit of added impetus to
domestic reforms (RBA 2018). Nonetheless, domestic imperatives carry greater weight. Facing
internal financial instability, RMB depreciation and capital flight, the PBoC intervened in Hong
Kong’s offshore RMB market to buy up RMB and make offshore holding more difficult. This
signaled readiness to ‘sacrifice’ the offshore market in order to manage expectations of the value
of the RMB (Long and Kroeber 2016).
Overall, we do not see RMB internationalization as coherent with China’s state-permeated
system. RMB internationalization is perhaps more a response to crises such as the Asian
financial crisis and the global financial crisis, a short-term problem-solver rather than coherent
long-term strategy. At best, RMB internationalization could be described as a matter of ‘currency
normalization’ rather than ‘currency dominance’ (Bowles and Wang 2013).
3.3 Belt and Road Initiative
If RMB internationalization is problematic, there is the alternative, lesser goal of RMB
regionalization.
As China began its efforts to promote wider use of the RMB, there was scholarly discussion
about the possible formation of an RMB region in East Asia as a staging post on the RMB’s
journey to international acceptance (e.g., Chow 2013). China has substantial trade ties with the
region, from which it is a net importer; the countries concerned could naturally accumulate RMB
deposits. In this narrative, the RMB would become a major or even the dominant currency for
China’s relations with its nearby trading partners, leading to the formation of an East Asian
RMB bloc. RBA (2018) finds evidence that the Asian monetary system is becoming bipolar,
influenced by both the US dollar and the RMB. Nevertheless, it concludes that, ‘the US dollar is
still by far the most important anchor currency for most economies in the region.’
Could the BRI foster an RMB region? Among its aims, the BRI was intended to further RMB
internationalization, and it is expected to expand RMB usage for trade and investment (See Chan
2017; also City of London Corporation 2018). It could be argued that BRI countries would be to
a certain extent under China’s sway and, thus, less destabilizing to the state-permeated system
than the rambunctious foreigners of the developed West.
However, we question how much the BRI can help the cause of RMB internationalization.
Firstly, most BRI lending to date has been in dollars, not RMB. There are initiatives by BRI
countries to explore RMB facilities such as the March 2018 issue of Panda bonds by the
Philippines (PDI 2018), but the disincentives to RMB usage discussed in Section 3.2 still apply.
Secondly, the BRI strategy itself is controversial. As rising great power, China was in the
process of reaching out in manifold ways internationally; the BRI announced in 2013 was in part
a relabeling of these efforts in response to the US-led TPP (Brookings 2017)—the latter being
intended to exclude China but, in the event, not ratified by the US). The drivers of the BRI—whether commercial or in the nature of ‘Marshall Aid’-type grants, whether win-win for
the participant countries or ‘debt-trap diplomacy’—have not been thought through. The BRI has
evoked mixed responses abroad, in that while investment and infrastructure are generally

July 2019
Vol.6, No.3
123
welcomed, host countries have shown concern about debt sustainability (Pakistan, Myanmar,
and Sri Lanka), corruption (Malaysia), and the influx of Chinese workers (SCMP 2019). Within
China responses have also been mixed, with critics wondering whether the resources might be
better spent at home (Economic Times 2018).
According to Zhang (2018), while the West tends to see the BRI as China’s strategy to
ultimately rule the world, Chinese and most developing nations see it as China’s international
cooperation strategy to foster a more balanced and equitable world system. Liu et al. (2018) also
see the BRI as promoting more inclusive globalization. Nonetheless, to support this narrative
China needs to better explain its initiative as well as match its words with its deeds, so as to win
more trust and support from the international community.
Thirdly, the more than one hundred countries participating in the BRI (HKTDC 2019) are a
broad church, many of them in regions geographically remote from China (South America,
Africa, and Oceania).The motivations of these countries are also diverse, with most subscribing
to the goal of infrastructure and connectivity, but not necessarily fealty to China. It remains to be
seen whether China can steer so diverse and extended a group.
3.4 Special Drawing Rights (SDRs)—The Best Available Monetary Option
In our view, China has reached a stage in its development at which there is no obvious or easy
way forward. The existing model of keeping the domestic market relatively closed and relying
on the openness of trading partners is nearing its limits, while the newly assertive posture abroad
is arousing concern. Domestically, the renewed focus on state-owned enterprises, triggered
partly by national security concerns, will likely slow economic growth, while Made in China
2025 is not a sustainable solution, given pressures from trading partners, and has been
downplayed by the leadership (Bloomberg 2018b). The BRI provides an opportunity for new
sources of global growth that could also increase China’s global influence, but it brings
substantial geopolitical and cultural challenges, which have yet to be mastered. RMB
internationalization provides only marginal help and raises new challenges as well.
In terms of China’s broader economic development, we have detailed elsewhere our proposal
for controlled opening via Hainan free port and other special zones and areas (Harrison et al.
2019)—going far beyond the limited vision released by the authorities for the Hainan and for
Greater Bay Area (Shira and Associates 2019). In the monetary dimension, the concern of the
present paper, we propose a similarly calibrated initiative, this time of controlled capital account
opening via SDRs.
4. A Unilateral SDR Initiative by China
As per the IMF (2018), the SDR is an accounting unit used to express members’ reserve
balances. It is a basket of five currencies, currently US dollar (41.73%), euro (30.93%), Chinese
RMB (10.92%, added in October 2016), Japanese yen (8.33%), and British pound sterling
(8.09%). SDR204.2 billion (USD 291 billion) is extant—equivalent to less than 3% of global
foreign exchange reserves.
As we propose in Harrison and Xiao(2018), wider use of the SDR, not only as, “the principal
reserve asset in the international financial system”, as the IMF intended per its Articles of
Agreement (IMF 2016), but as a fully-fledged currency for use by governments, institutions,
firms and individuals, would be beneficial in reducing dollar-related imbalances. This in turn
should create space and a more favorable environment for structural reforms such as an SDR
clearing account at the IMF, more effective monitoring, and better policy coordination. However,
efforts to promote the SDR have foundered on the ‘liquidity premium’ (IMF 2011, p. 15)—the
higher interest rate that issuers of an SDR asset would have to pay to compensate buyers for its
lower liquidity.

124
How can the liquidity premium be overcome? The IMF has proposed ‘official institutions’
committing to act as market makers (2011, p. 26), but it is doubtful that these institutions’
members would be prepared to bear the costs. Even with deep-pocketed market makers, SDRs
will remain unattractive to users with ready access to the dollar.
4.1 China’s Pivotal Role
China’s support for the SDR was voiced strongly by then-PBoC Governor Zhao Xiaochuan in
2009. ed by Wang (2017), this advocacy of the SDR was in line with China’s longstanding
position that the international monetary system needs rebalancing away from the dollar. China’s
support for the SDR continued up to the RMB’s inclusion in 2016 and was followed by limited
SDR bond issuance in Shanghai—albeit that these issues were settled in RMB (Reuters 2016),
rather defeating the purpose.
We suggest that it is now time for a fully-fledged SDR initiative from China. Crucially, China
users would face a lower, or even negative, SDR liquidity premium because they do not enjoy
unrestricted access to international currency. If an SDR component were included in the next
round of capital account liberalization, China institutions, firms, and individuals would likely
take up SDR issuance and investment activity. Ideally, there would be some facilitative support
from the IMF (including reform of its own SDR quota system—Bird and Rowlands 2005) and
acceptance by SDR-constituent currency polities. Once China’s SDR activity took off, it would
prompt participation from international players and the development of an ecosystem. Hong
Kong would have a key role to play in channeling the related financial flows and providing
supporting services.
With increasing use of SDRs by the international community, the liquidity premium would
reduce. Given their relative stability, SDRs would become attractive for the pricing of long-term
contracts and commodities, and for reserve-holding and investment purposes generally. Greater
use of SDRs would help moderate the imbalances and inequities in the current international
monetary system. Because the change would be market-led and gradual, all parties would have
time to adjust. Reduced monetary tensions would lead naturally to peace in a broader sense, with
less reason for trade wars or currency wars.
A meaningful SDR market would be good for the world. It would also be good for China.
In our view, promotion of the SDR would have several advantages from China’s point of view.
Firstly, promulgation of the SDR achieves RMB internationalization at a stroke. The RMB’s
10.92% share of the SDR compares rather favorably with its present 1.7% share of global
reserves. Secondly, the SDR also incorporates the currencies of four other top trading
powers—the US, the EU, Japan, and the UK. Expanded use of the SDR would cast China as a
friend of these powers and as a multilateralist. Thirdly, initiation of an active SDR market would
create a global public good, which would again enhance China’s reputation as well as making for
a more favorable external environment. Fourth, as initiator, China would be a maker rather than
taker of rules in the emerging new global monetary order.
4.2 Implementation
If SDRs are a good idea for China, as well as for the world, how could they be implemented?
In Harrison and Xiao (2018), we detail unilateral steps that China could take to initiate a
market in SDRs. These steps can be summarized as follows:
• Policy opening. Incorporation of SDRs into the next round of capital account opening
measures for state and local government entities, firms, institutions, and individuals.
Essentially, all qualifying parties would be allowed to hold, issue, and otherwise transact in
SDRs as appropriate, and ancillary to that in the SDR component currencies, subject to
overall limits.
• Facilitative measures. Establishment of infrastructure such as clearing facilities for SDRs
July 2019
Vol.6, No.3
125
and the component currencies; introduction of risk management tools such as derivatives.
• ‘Ice-breaking’ issues of SDRs by state entities, both domestically and internationally.
• Communication of the initiative both domestically and internationally.
• Enlisting the support of Hong Kong to extend the domestic SDR market internationally.
We expect that strong policy endorsement and communication coupled with ‘ice-breaking’
issuance by state entities would be enough to kick-start the initiative. Development would
thereafter be market-led, subject to government-imposed limits, monitoring, and controls. The
key deterrent to SDR usage—the SDR liquidity premium—would be lower or even negative for
China-based users who do not presently enjoy unrestricted access to international currency. The
market should take off once users understand the aims and conditions. International players,
when permitted under the policy framework, would welcome the chance to participate.
Endorsement and facilitation by the IMF and other multilateral organizations, the
SDR-component currency-issuing entities, and ultimately the G20 would of course greatly assist
the SDR initiative and, at some point, would be essential to its further progress. However, we
believe that a good start can be made on a bottom-up market-led basis, provided the China
authorities supply the initial policy impetus.
Given the very limited use of the SDR at present, the supporting infrastructure provided by the
IMF—an interest rate determined weekly, settlement (between member states through IMF
auspices) taking several days, and rebalancing every five years (IMF 2018b)—is rather basic. To
support the proposed SDR initiative, it would be necessary to consider enhancements to the
IMF’s infrastructure and to set up additional infrastructure in China.
Hong Kong could provide support on the infrastructure side as well as more broadly helping
to link China’s SDR market with the global market. The HKMA already has real-time gross
settlement systems (RTGS) for three of the five SDR underlying currencies—US dollar, euro,
and RMB.
5. Risk Management
We have described above the opportunity for China to take the global lead on SDRs, the
benefits to China as well as the rest of the world, and the implementation steps. The remaining
considerations are around risk. What measures can the China authorities take to mitigate the
risks of the proposed SDR initiative?
5.1 China’s Overall Resilience
Following the Risk Governance Framework of the International Risk Governance Council
(IRGC, 2017), there are five stages in the approach to risk:
1. Pre-assessment—Identification and framing.
2. Appraisal—Assessing the perceived causes and consequences of the risk.
3. Characterization and evaluation—Making a judgment about the risk and the need to manage
it.
4. Management—Deciding on and implementing risk management options.
5. Cross-cutting aspects—Communicating and engaging with stakeholders, considering the
context.
Regarding items 1–3, advance consideration of risk, we acknowledge that any market-based
initiative in China’s state-permeated economy raises the dual risk of excess—since users may
embrace the new freedom too eagerly—and undermining of state authority. This is even more
true of financial liberalization initiatives because of finance’s immediacy, intangibility, and
far-reaching effects. In China, where a large financial system operates to its own dynamic behind
a capital account wall, ill-considered financial liberalization could be catastrophic.
The IRGC (2013) identifies slow-developing catastrophic risk (SLDR)—such as the build-up
126
of credit that gave rise to the GFC, or today’s crisis of global warming—as a crucial risk
category. SLDR, as the name indicates, builds slowly, but reaches a tipping point at which crisis
suddenly breaks. Systems—whether financial, economic, or climatic—comprise multiple
interlinked feedback loops that, on reaching a critical point, flip from positive to negative effects,
avalanching out of control. SLDRs, the IRGC argues, are consequently very difficult to prevent,
indeed from time to time will happen regardless of risk management. It is therefore necessary to
build resilience, so that in crisis the system quickly finds a new equilibrium, if necessary, with
changed institutions and policies.
The risks posed by our SDR initiative are of this catastrophic nature. However, any financial
opening initiative for China carries risks like this. As Xu (2018) puts it, ‘…further financial
openness will expose China’s flawed financial system to international capital flows and endanger
the nation’s financial and economic stability. Financial openness needs a solid foundation, such
as an efficient and robust banking sector, which China lacks.’ Moreover, the status quo carries
heavy costs in terms of inefficiency, and it is not sustainable either. Our proposed SDR initiative
is in some senses less risky than the status quo in that the targeted outcome is increased stability
while the risks are very much in view.
Moreover, the China system has resilience. China authorities have shown themselves able to
manage through multiple financial crises. Crisis-fighting initiatives of recent years have included
the spending surge following the GFC (which helped forestall a global recession as well as one
in China), the clampdown on shadow banking, the scaling back of excess credit, the
re-imposition of capital controls in 2016/17, and the clampdown on stock market abuse in the
same period. These initiatives involved policy reversals, changes in regulatory personnel, and
even changes in institutions–such as establishment of a Financial Stability and Development
Committee to lead the PBoC and a merger of the banking and insurance regulators into the
China Banking Insurance Regulatory Commission (EAF 2018). This is not to say that another
crisis would be welcome, but the system has demonstrated the capability to handle a crisis.
Turning now to IRGC item four, Management of risk, we propose a layered approach
incorporating monetary limits (quotas), geographical limits, the use (in part) of a cryptocurrency
version of the SDR, monitoring, responsiveness if a threat does occur, and building resilience
generally. Monetary limits, geographical limits, and a cryptocurrency SDR are discussed in turn
below.
5.2 Monetary Limits
An obvious way to limit the risk of new financial facilities is to set monetary limits on their
use. China has extensive experience of setting financial quotas for the interaction of its citizens
and institutions with the wider world—and indeed for foreign participation in China’s markets. A
quota regime for SDR usage could include an overall cap on the amount of SDR in circulation in
China (to which other quotas would be subject), limits on each institution’s SDR holdings, and
limits on individual holdings. An initial overall quota of SDR200 billion (USD 280 billion),
equivalent to 1.1% of the monetary base M2 of USD 25,600 billion-equivalent (CEIC2018),
would not seem too large. Ideally, SDR usage within the quota limits should require no further
permissions, merely compliance with existing regulations on banking, securities offering, and so
on.
The authorities could raise the quotas subsequently as experience was gained. In this regard, it
is worth noting the recent experience of Stock Connect, the bilateral linkage mechanism for
mutual access across the Mainland and Hong Kong stock markets. On 1 May 2018, the daily quotas for Northbound trading (by foreigners in the Mainland market) and for Southbound
trading (by Mainland investors in the Hong Kong market) were raised to RMB 52 billion and
RMB 42 billion from RMB 13 billion and RMB 10.5 billion, respectively, for each of the
July 2019
Vol.6, No.3
127
Shenzhen and Shanghai markets (HKEX 2018)—a fourfold rise.
5.3 Geographical Limits
Given China’s vast geographical extent, the enclave model—whereby new ideas and
institutions are trialed in a limited area before any application to the nation as a whole—has
obvious appeal and has been extensively used in both historical and recent times. In Harrison et
al.(2019), we advocate deepening the experimentation in Hainan and other free trade zones
(FTZs) and the Mainland municipalities of the Greater Bay Area, with the support of Hong Kong
and Macau. This ‘Hainan-plus’ platform, comprising some 8% of China’s GDP and 5% of its
population, could be used as the launchpad for the proposed SDR initiative. Including the 11
Mainland-based FTZs in the platform, this has the further advantage of providing the rest of the
country with filtered access to the new facilities.
Setting geographical limits to the use of SDRs makes the initiative easier to control. Earlier
attempts to use FTZs to spearhead financial reforms failed either because the scope of the
initiative was too small (Shanghai Waigaoqiao), or too large (when FTZ accounts could be
opened across the nation) such that the capital account wall was threatened. We suggest that the
Hainan-plus platform would be ‘just right’. Hainan-plus would be large enough for meaningful
financial activity while still being controllable.
5.4 Cryptocurrency SDR
In common with some other central banks, the PBoC has been examining the potential to
issue a crypto version of its currency for domestic use. There have been conflicting messages,
the central bank on the one hand clamping down on cryptocurrency operations nationwide, while
on the other, the central bank itself filing numerous patents for blockchain-related applications
(Bitcoin.com 2018).
We suggest that the experiment be tried first in respect of SDRs, thus limiting the risks to the
mainstream financial system. Cryptocurrency SDRs—say, ‘E-SDRs’—would be backed by, with
their value tied to, a basket of the SDR underlying currencies in the SDR composite ratio. The
E-SDR would be a ‘stable coin’. E-SDRs would be based on blockchain technology, thus
providing new functions to support the digital economy. E-SDRs would be created by
PBoC-authorized banks against deposit of the underlying currencies, and they would be
available to retail and business users as well as banks.
Barrdear and Kumhof (2016) see substantial benefits potentially flowing from a central
bank-issued digital currency (CBDC) version of the national fiat currency. Such issuance could
allow everyone, rather than just banks, to use central bank money for payments, remittances, and
holding, thus reducing financial frictions. CBDC would also provide transparency over monetary
transactions, yielding real-time data for policy-making and risk management.
Kumhof and Noone (2018, p. 5) set four core principles to minimize the risk of bank runs:
1. CBDC pays an adjustable interest rate.
2. CBDC and bank reserves are distinct, and not convertible into each other.
3. No guaranteed, on-demand convertibility of bank deposits into CBDC.
4. The central bank issues CBDC only against eligible (principally government) securities.
We suggest that the last of these, issuance against eligible securities, may not be necessary in
respect of SDRs, since SDR and RMB deposits would not be fungible with one another.
E-SDRs would be created/redeemed against baskets of the underlying fiat currencies by the
banks on behalf of themselves or their customers, thus rendering the creation/redemption process
accessible to anyone with a bank account and the requisite currency. As with exchange-traded
funds (ETFs), the redemption/creation process for E-SDRs would allow arbitrage by nominated
banks (and their customers) if the E-SDR price should drift out of line with the prices of the
underlying currencies. The currency baskets would be held by the creating banks, but visible to
128
the PBoC as supervising authority—and, via the blockchain mechanism, to the nominated banks
(and via them, to their customers and information vendors). E-SDRs would be traded on the
existing interbank currency market China Foreign Exchange Trade System and National
Interbank Funding Center (CFETS). Transactions in E-SDRs would be validated by the
nominated banks (under a ‘proof of stake’, i.e., authority, model), rather than by competing
‘miners’ under Bitcoin’s ‘proof of work’ mechanism, thereby avoiding excessive consumption of
electricity.
E-SDRs would possess the following other advantages—albeit that the scale of the benefits
would be proportionate to the scale of E-SDR issuance, which would be minor initially:
• E-SDRs would enable everyone, not just banks, to transact securely and immediately in
central bank money. This could relieve users of dependence on layers of financial
intermediaries, with significant reductions in costs and risks.
• Transactions in E-SDRs would be transparent as to amount and timing via the blockchain
mechanism, providing a granular view of transactions in the economy as they take
place—allowing real-time risk management and financial policy analysis.
• Transactions would be relatively secure and unhackable.
• Transactions would be anonymous to external viewers of the blockchain, although known
to the nominated bank concerned.
• Particular E-SDRs could be ‘colored’ (distinguished as a separate class or category) and
used as vehicles for securities issuance (initial coin offerings, ICOs). ored E-SDRs would
not be fungible with non-colored E-SDRs, and their value would diverge as well since they
would have securities-like attributes (part-ownership of a company).
Overall, the SDR proposal, if adopted by China, would provide useful space for
experimentation with CBDC. If the experiment should go well in respect of E-SDRs, the PBoC
could consider proceeding with an equivalent initiative for the RMB itself.
6.Conclusions
The present dollar-based international monetary system is perennially unstable, with emerging
market crisis never far away and developed markets also at risk. Reform of this problematic
system is needed, but in the current climate international consensus appears almost unreachable.
Meanwhile, geopolitical tensions such as the US–China trade war increase the risk of crisis.
One element of a solution would be wider use of the SDR as an international currency to
supplement the US dollar. Efforts in this direction have foundered on the SDR liquidity premium.
However, for China users the liquidity premium would be less off-putting, and China is large
enough for a unilateral initiative to make a difference. China is therefore able to launch an SDR
initiative that, with multilateral support, could help stabilize the global monetary system. China
itself, hard-pressed to reconcile its need for greater openness with domestic political imperatives,
would benefit from the delimited and controllable market opening that this proposal represents.
Overall, an SDR initiative would have win-win outcomes for both China and the international
community.
References
(Barrdear and Kumhof 2016) Barrdear, John, and Michael Kumhof. 2016. The Macroeconomics
of Central Bank Issued Digital Currencies. Staff Working Paper No. 605. London: Bank of
England, July 18.
(Bird and Rowlands 2005) Bird, Graham, and Dane Rowlands. 2005. IMF Quotas: Constructing
An International Organization Using Inferior Building Blocks. The Review of International
July 2019
Vol.6, No.3
129
Organizations, June 2006, Volume 1, Issue 2, pp 153–171.
(Bitcoin.com 2018) Bitcoin.com. 2018. A Chinese Government-Controlled Bitcoin Alternative Is
Reportedly in the Works, 18 December 2018. Available online:
https://news.bitcoin.com/a-chinese-government-controlled-bitcoin-alternative-is-reportedly-in
-the-works/ (accessed on 25 March 2019).
(Bloomberg 2018a) Bloomberg.2018a. China’s Debt Bomb, 17 September 2018. Available
online: https://www.bloomberg.com/quicktake/chinas-debt-bomb (accessed on 27 March
2019).
(Bloomberg 2018b) Bloomberg. 2018b. China’s Made in 2025 Plan Is a Paper Tiger, 18
December 2018. Available online:
https://www.bloomberg.com/opinion/articles/2018-12-16/china-s-made-in-2025-industrial-am
bitions-are-a-paper-tiger (accessed on 25 March 2019).
(Bloomberg 2019) Bloomberg. 2019. Russia Buys Quarter of World Yuan Reserves in Shift
From Dollar, 10 January 2019. Available online:
https://www.bloomberg.com/news/articles/2019-01-09/russia-boosted-yuan-euro-holdings-as-
it-dumped-dollars-in-2018 (accessed on 25 March 2019).
(Bowles and Wang 2013) Bowles, Paul, and Baotai Wang. 2013. Renminbi Internationalization:
A Journey to Where? Development and Change 44: 1363–85.
(Brookings 2017) Brookings Institution. 2017. China’s One Belt One Road initiative: A view
from the United States, 19 June 2017. Available online:
https://www.brookings.edu/research/chinas-one-belt-one-road-initiative-a-view-from-the-unit
ed-states/ (accessed on 25 March 2019).
(CCTV 2017) CCTV. 2017. China Breakthroughs: New International Payments System Goes
into Action, 19 October 2017. Available online:
http://english.cctv.com/2017/10/19/ARTIXz5AbEqSewRu8jDIFRKO171019.shtml (accessed
on 25 March 2019).
(CEIC 2018) CEIC. 2018. China Money Supply M2, December 2017. Available online:
https://www.ceicdata.com/en/indicator/china/money-supply-m2 (accessed on 25 March
2019).
(Chan 2017) Chan, Sarah. 2017. The Belt and Road Initiative: Implications for China and East
Asian Economies. The Copenhagen Journal of Asian Studies 35: 52–78.
(Chow 2013) Chow, Hwee Kwan. 2013. Is the Renminbi East Asia’s Dominant Reference
Currency? A Reconsideration. Paper presented at 9th APEA Asia Pacific Economic
Association Conference, Osaka, Japan, July 27–28, pp. 1–22.
(City of London Corporation 2018) City of London Corporation. 2018. Building an Investment
and Financing System for the Belt and Road Initiative. Available online:
https://www.cityoflondon.gov.uk/business/asia-programme/greater-china/Documents/building
-an-investment-and-financing-system-for-the-bri.pdf (accessed on 26 March 2019).
(CNBC 2018) CNBC.2018. Amid Trade Tensions and Stock Turmoil, China Cracks Open Its
Bond Market Further to Foreigners, 12 October 2018. Available online:
https://www.cnbc.com/2018/10/12/china-cracks-open-its-bond-market-further-to-foreigners.h
tml (accessed on 27 March 2019).
(Currenxie 2016) Currenxie. 2016. How to Take Advantage of the CNY-CNH Spread? 10 April
2016. Available
online:https://currenxie.com/blog/how-to-take-advantage-of-the-cny-cnh-spread-20160810.ht
ml (accessed on 25 March 2019).
(EAF 2018) East Asia Forum. 2018. Regulatory Reshuffle in China’s Financial Governance, 4
July 2018. Available online:
130
https://www.eastasiaforum.org/2018/07/04/regulatory-reshuffle-in-chinas-financial-governanc
e/ (accessed on 25 March 2019).
(Economic Times 2018) Economic Times. 2018. China’s BRI Comes under Severe Criticism on
Its Fifth Anniversary, 4 January 2018. Available online:
https://economictimes.indiatimes.com/news/international/world-news/chinas-bri-comes-under
-severe-criticism-on-its-fifth-anniversary/articleshow/67384058.cms (accessed on 25 March
2019).
(Eichengreen 2014) Eichengreen, Barry. 2014. International Currencies Past, Present and Future:
Two Views from Economic History.Bank of Korea Working Paper No.2014-31.
October.Seoul: BOK Economic Research Institute.
(EIU 2018) Economist Intelligence Unit. 2018. Renminbi Internationalisation and the BRI:
Rebuilding Momentum? 10 April 2018. Available online:
https://www.business.hsbc.com/china-growth/renminbi-internationalisation-and-the-bri-rebuil
ding-momentum (accessed on 25 March 2019).
(Fitch 2017) Fitch Solutions. 2017. Unwinding QE: What Will It Look Like and What Impact
Will It Have? Executive Brief. Available online:
http://your.fitch.group/rs/732-CKH-767/images/fs-executive-brief-unwinding-qe.PDF?mkt_to
k=eyJpIjoiWm1NM04yVTRaREF4TmpFMiIsInQiOiI0dzdsMFpSVHM2d0dYUG9CeXcxV
DdCSWJwVWo5WEVMMnhURStRU3JITCtNcm1FQWl5enphRnkwcmV6YmdiaWtraG5W
SW5Ib3lqa0xoc3Vqc3lTdW9SY3VFVEpPXC8yOUFFazlEa0ZrcExsWWphaVhXZ211bHM
rVmZnWGYwRkNQemwifQ%3D%3D,.%5bCrossRef (accessed on 25 March 2019).
(Frankel 2012) Frankel, Jeffrey. 2012. Internationalization of the RMB and Historical Precedents.
Journal of Economic Integration 27: 329–65.
(FT 2018) FT. 2018. The Belt and Road’s dollar problem, FT Alphaville, December 18.
Available
online:https://ftalphaville.ft.com/2018/12/18/1545130791000/The-Belt-and-Road-s-dollar-pro
blem/ (accessed on 25 March 2019).
(Global Times 2016) Global Times. 2016. AIIB Decision to Use US Dollars for Loans Not a
Response to Recent Slide in Yuan, 17 January 2016. Available online:
http://www.globaltimes.cn/content/964106.shtml (accessed on 25 March 2019).
(Harrison and Xiao 2018) Harrison, Matthew, and Geng Xiao. 2018. Enhanced Special Drawing
Rights—How China Could Contribute to a Reformed International Monetary Architecture.
China & World Economy26: 41–61.
(Harrison et al. 2019) Harrison, Matthew, Geng Xiao, Wendy Hong, and Shirley Lam. 2019.
Hainan Free Trade Zone—Realising the Potential. Working Paper under Review for
Publication.
(HKEX 2018) HKEX. 2018. HKEX Comments on Stock Connect Daily Quotas Expansion, 11
April 2018. Available online:
https://www.hkex.com.hk/News/News-Release/2018/180411news?sc_lang=en (accessed on
25 March 2019).
(HKMA 2016) Hong Kong Monetary Authority. 2016. Hong Kong—The Global Offshore RMB
Business Hub, Hong Kong Monetary Authority, p. 17. Available online:
https://www.hkma.gov.hk/media/eng/doc/key-functions/monetary-stability/rmb-business-in-h
ong-kong/hkma-rmb-booklet.pdf(accessed on 26 March 2019).
(HKTDC 2019) Hong Kong Trade Development Council. 2019. The Belt and Road Initiative: Country Profiles. Available online:
http://china-trade-research.hktdc.com/business-news/article/The-Belt-and-Road-Initiative/The
-Belt-and-Road-Initiative-Country-Profiles/obor/en/1/1X000000/1X0A36I0.htm (accessed on
July 2019
Vol.6, No.3
131
25 March 2019).
(Huang and Lynch 2013) Huang, Yukon, and Clare Lynch. 2013. Does Internationalizing the
RMB make sense for China? Cato Journal 33: 571.
(IMF 2011) International Monetary Fund. 2011. Enhancing International Monetary Stability—A
Role for the SDR? Discussion Paper, January 7. Available online:
https://www.imf.org/external/np/pp/eng/2011/010711.pdf (accessed on 26 March 2019).
(IMF 2016) International Monetary Fund. 2016. Articles of Agreement of the International
Monetary Fund, April, Second Amendment (AoA XXII). Available online:
https://www.imf.org/external/pubs/ft/aa/index.htm (accessed on 25 March 2019).
(IMF 2018a) International Monetary Fund. 2018a. Special Drawing Right (SDR). IMF Fact
Sheet, April 19. Available online:
https://www.imf.org/en/About/Factsheets/Sheets/2016/08/01/14/51/Special-Drawing-Right-S
DR (accessed on 25 March 2019).
(IMF 2018b) International Monetary Fund. 2018b. Considerations on the Role of the SDR.
Policy Paper, April 11. Avaiable online:
https://www.imf.org/en/Publications/Policy-Papers/Issues/2018/04/11/pp030618consideration
-of-the-role-the-sdr (accessed on 26 March 2019).
(IMF 2019a) International Monetary Fund. 2019a. New Data on Global Debt, Blog, January 2.
Available online: https://blogs.imf.org/2019/01/02/new-data-on-global-debt/ (accessed on 25
March 2019).
(IMF 2019b) International Monetary Fund. 2019b. Currency Composition of Official Foreign
Exchange Reserves, 8 January 2019. Available online:
http://data.imf.org/?sk=E6A5F467-C14B-4AA8-9F6D-5A09EC4E62A4 (accessed on 25
March 2019).
(International Risk Governance Council 2013) International Risk Governance Council. 2013.
Preparing for Future Catastrophes—Governance Principles for Slow-Developing Risks that
May Have Catastrophic Consequences, Concept Note, 11 March 2013. Available online:
https://www.irgc.org/wp-content/uploads/2013/03/CN_Prep.-for-Future-Catastrophes_final_1
1March13.pdf (accessed on 26 March 2019).
(International Risk Governance Council 2017) International Risk Governance Council. 2017.
IRGC Risk Governance Framework. Available online:
https://irgc.org/risk-governance/irgc-risk-governance-framework/ (accessed on 25 March
2019).
(Katada 2018) Katada, Saori. 2018. Can China Internationalize the RMB? Lessons From Japan,
Foreign Affairs, SNAPSHOT, January 1. Available online:
https://www.foreignaffairs.com/articles/china/2018-01-01/can-china-internationalize-rmb
(accessed on 26 March 2019).
(Kumhof and Noone 2018) Kumhof, Michael, and Clare Noone. 2018. Central Bank Digital
Currencies—Design Principles and Balance Sheet Implications. Staff Working Paper No. 725.
London: Bank of England, May.
(Li 2016) Li, Ruogu. 2016. Reform of The International Monetary System and
Internationalization of The Renminbi. Singapore: World Scientific.
(Liu et al. 2018) Liu, Weidong, Michael Dunford, and Boyang Gao. 2018. A discursive
construction of the Belt and Road Initiative: From neo-liberal to inclusive globalization.
Journal of Geographical Sciences 28: 1199–214.
(Long and Kroeber 2016) Long, Chen, and Arthur Kroeber. 2016. Retreating from an
International Renminbi. Gavekal onomics, January 14.
(New York Times 2015) New York Times. 2015. China to Track Renminbi Based on Basket of

132
Currencies. New York Times, December 11. Available online:
https://www.nytimes.com/2015/12/12/business/international/china-to-track-renminbi-based-o
n-basket-of-currencies.html (accessed on 25 March 2019).
(Ocampo 2017) Ocampo, Jose. 2017. Resetting the International Monetary (Non)System. A
Study Prepared by the United Nations University World Institute for Development Economics
Research. Oxford: Oxford University Press.
(Otero-Iglesias and Vermeiren 2015) Otero-Iglesias, Miguel, and Mattias Vermeiren. 2015.
China’s state-Permeated market economy and its constraints to the internationalization of the
renminbi. International Politics 52: 684–703.
(Palais-Royal 2011) Palais-Royal. 2011. Reform of the International Monetary System—A
Cooperative Approach for the Twenty-First Century, 8 February 2011. Available online:
http://global-currencies.org/smi/gb/telechar/news/Rapport_Camdessus-integral.pdf (accessed
on 26 March 2019).
(PDI 2018) Philippine Daily Inquirer. 2018. PH Sells P12B Panda Bonds Amid Strong Demand,
21 March 2018. Available
online:https://business.inquirer.net/248021/ph-sells-p12b-panda-bonds-amid-strong-demand
(accessed on 25 March 2019).
(Prasad 2018) Prasad, Eswar S. 2018. The slow, uneven rise of the Renminbi. Cato Journal 38:
521–29.
(RBA 2018) Reserve Bank of Australia. 2018. RMB Internationalisation: Where to Next?
Reserve Bank of Australia Bulletin, September 20.
(Reuters 2016) Reuters.2016. Standard Chartered Successfully Issues SDR Bonds in China, 26
October 2016. Available
online:https://www.reuters.com/article/uk-china-bonds-sdr/standard-chartered-successfully-is
sues-sdr-bonds-in-china-idUKKCN12Q0WJ (accessed on 27 March 2019).
(Rickards 2015) Rickards, James. 2015 The death of money: the coming collapse of the
international monetary system. Portfolio/Penguin, March 15.
(SCMP 2015) South China Morning Post. 2015. China to Hold 30 per Cent Stake in AIIB and 26
per Cent Voting Rights, 30 June 2015. Available online:
https://www.scmp.com/news/china/policies-politics/article/1829095/founding-nations-attend-
signing-ceremony-china-led (accessed on 25 March 2019.
(SCMP 2019) South China Morning Post. 2019. 2018 was meant to be Xi Jinping’s year. Then
China’s Belt and Road Unravelled, 11 January 2019. Available online:
https://www.scmp.com/week-asia/opinion/article/2178778/2018-was-meant-be-xi-jinpings-ye
ar-then-chinas-belt-and-road (accessed on 25 March 2019).
(Shira and Associates 2019) Shira, Dezan, and Associates. 2019. What Is the Greater Bay Area
Plan? China Briefing, February 21. Available online:
https://www.china-briefing.com/news/the-greater-bay-area-plan-china/ (accessed on 25
March 2019).
(SWIFT 2019) SWIFT. 2019. RMB Tracker, January 2019. Available online:
https://www.swift.com/our-solutions/compliance-and-shared-services/business-intelligence/re
nminbi/rmb-tracker/document-centre(accessed on 25 March 2019).
(The Economist 2019) The Economist.2019. China’s Current-Account Surplus Has Vanished, 14
March 2019. Available online:
https://www.economist.com/finance-and-economics/2019/03/16/chinas-current-account-surplus-has-vanished (accessed on 27 March 2019).
(Wang 2017) Wang, Hongying. 2017. China and the International Monetary System: Does
Beijing Really Want to Challenge the Dollar? Foreign Affairs, SNAPSHOT, December 19.
July 2019
Vol.6, No.3
133
(White 2015) White, William. 2015. Point of View: System Malfunction. Finance &
Development, IMF, March 2015, Volume 52, No. 1, page 44-47.
(Xu 2018) Xu, Guangdong. 2018. China’s Financial Repression: Symptoms, Consequences and
Causes. The Copenhagen Journal of Asian Studies 36:28–49.
(Zhang 2018) Zhang, Zhexin. 2018. The Belt and Road Initiative: China’s New Geopolitical
Strategy? China Quarterly of International Strategic Studies 4: 327–43.
(Zhang et al. 2017) Zhang, Fan, Miaojie Yu, Jiantuo Yu, and Jin Yang. 2017. The Effect of RMB
Internationalization on Belt and Road Initiative: Evidence from Bilateral Swap Agreements.
Emerging Markets Finance and Trade 53: 2845–57.
(Zhou 2009) Zhou, Xiaochuan. 2009. Reform the International Monetary System. Bank for
International Settlements March 23. Available at: https://www.bis.org/review/r090402c.pdf
(accessed on 26 March 2019).
134
China’s Monetary Policy Communication: Frameworks, Impact,
and Recommendations*
By MICHAL MCMAHON, ALFRED SCHIPKE, AND LI XIANG*
Financial markets are eager for any signal of monetary policy from the People’s Bank of China (PBC). The importance of effective monetary policy communication will only increase as China
continues to liberalize its financial system and open its economy. This paper discusses the country’s unique instituitional setup and empirically analyzes the impact on financial markets of
the PBC’s main communication channels, including a novel communication channel. The results
suggest that there has been signifcant progress but that PBC communication is still evolving toward the level of other major economies. The paper recommends medium-term policy reforms
and reforms that can be adopted quickly.
Keywords: Monetary Policy, People’s Bank of China, Communication, Central Bank, Financial
Markets, Monetary Policy Transmission
JEL Classification: E58; E52; E48
1. Introduction
The year 2018, marks 40 years since China initiated “reform and opening up”, during which
time the country became a growth miracle and the world’s second largest economy. As reforms
continue, including financial and external sector liberalization, monetary policy will draw
increasing attention. Changes to monetary policy, by affecting economic choices, help the
domestic economy grow and stabilize and, increasingly, have global implications. Market
participants, including international investors, are eager for any signals of monetary policy
from People’s Bank of China (PBC) communication.
Central banks increasingly use communication as a key lever of monetary policy. Gone are
the days of “never explain, never excuse”, as put by the Governor of the Bank of England,
Montagu Norman (1920–44).1 Today, central banks, especially in countries with developed
financial systems, regularly communicate. This includes low-frequency communication about
their policy frameworks and objectives, as well as higher-frequency communication of views on
current macroeconomic conditions, forecasts related to output and inflation, as well as the
rationale for policy decisions. 2 Since the global financial crisis, the implementation of
unconventional monetary policies and greater focus on financial sector stability has made
communication even more important, especially as it relates to forward guidance.
* IMI Working Paper No. 1905[EN] This paper is published in 2018 by International Monetary Fund,
WP/18/244
* Michael McMahon, Professor of Economics, Oxford University. Alfred Schipke, Senior Resident
Representative, IMF; Member of IMI International Committee. Li Xiang, Economist, Peking University and IMF.
Corresponding author [email protected]; [email protected] 1 See Bernanke (2007). 2 On principles and practices of inflation-forecast targeting in advanced economies see Adrian, Tobias;
Douglas Laxton, and Maurice Obstfeld (2018).
July 2019
Vol.6, No.3
135
Compared to other public institutions, central banks are often at the forefront of
communication. The PBC is no different and over the past years has strengthened its
communication and is keenly aware of the heightened global interest in information about the
country’s monetary policy. The increase in the number of press conferences and speeches has
coincided with sharp stock market adjustments, changes to the exchange rate framework, interest
rate liberalization,3 and greater financial market volatility in 2015/16. However, communication
has not yet become as potent a policy tool as in many advanced economies (such as the U.S.
Federal Reserve or the Bank of England) and some important emerging markets.
In many respects, China is at a communication’s crossroads, driven both by domestic and,
increasingly, external factors. Financial and external sector liberalization and greater reliance on
price and interest-rate-based allocation of resources, likewise, make communication all the more
important. Given the country’s global footprint and increasing financial sector linkages,
including through different bond and equity connect schemes, this is also true for the
international community. As the country moves toward a more flexible exchange rate in
conjunction with a monetary policy framework that relies more on short-term interest rates,
better communication will become paramount to improving the effectiveness of monetary policy,
reducing excessive volatility, and fostering financial sector stability.
The paper is structured as follows. Section II discusses China’s unique institutional setup and
Section III provides background about the PBC’s main communication channels. Section IV
reviews the relevant literature and Section V empirically analyzes the impact of the PBC’s
communication on financial markets. Section VI recommends policy actions to increase
monetary policy effectiveness and to reduce volatility, and Section VII concludes.
2. China’s Unique Institutional Setup
Compared to other central banks in advanced economies or emerging markets with modern
policy frameworks, China’s central bank communication is more constrained.
This is due to its unique institutional arrangements. In particular, China has multiple and
overlapping objectives across institutions. The key constraints are:
• First, the PBC does not have full decision-making power over money supply targets and
interest rate policy, and has only limited operational independence at the monetary policy
instrument level. Thus, the central bank is constrained in the information and forward guidance
that it can convey. At the same time, the PBC drafts and executes monetary policy and has some
operational independence, such as in setting short-term interest rates through open market
operations, short-term liquidity operations, or rates on standing- and medium-term lending
facilities. However, key decisions need to be approved by the State Council (China’s equivalent
to a government cabinet).4 Approval is needed, for example, for changes in the benchmark
interest rate, reserve requirements, and the setting of annual monetary aggregates.5 For these
key policy instruments, the PBC usually proposes policy plans when key economic indicators
such as GDP growth and inflation deviate from the targets set at the beginning of each year by
3 On May 11, 2015, the PBC expanded the upper limit of the deposit rate floating range from 1.3 times to
1.5 times the benchmark rate; on August 26, the central bank completely liberalized the upper limit of deposit
rates with fixed terms longer than one year; and, on October 24, it cancelled the deposit interest rate upper limit
of commercial banks and rural cooperative financial institutions. On August 11, 2015, the PBC announced that
the CNY/USD rate should refer to the closing rate of the previous day. On December 11 that year, the CFETS
CNY index was first released to reinforce the reference to the basket of currencies. Since February 2016, the
CNY/USD fixing rate mechanism consisting of the closing rate and the currency basket was gradually formed
and mechanism transparency was increased. 4 See Article 2 of the General Rules in the People’s Bank of China Law. 5 See Article 5 of the General Rules in the People’s Bank of China Law.
136
the State Council; the State Council then reviews the plans and makes the final decision (Huang,
Ge, and Wang 2018). The State Council also regularly approves the wording of the monetary
policy stance (Box 1 explains terminology).
• Second, monetary policy decisions are the result of consensus-building among various
stakeholders. State Council members have a broad range of economic and financial sector
objectives, and requests for monetary policy changes can be submitted to the State Council not
only by the PBC but also by other ministries or agencies. From the central bank’s perspective,
therefore, both the outcome and the timing of important monetary policy decisions are uncertain,
limiting the PBC from providing forward guidance. As the implementing agency, the PBC
publishes all monetary policy decisions. Also, important PBC personnel and budget decisions go
beyond PBC’s remit. The PBC governor is nominated by the premier of the State Council,
approved by the National People’s Congress (or its standing committee when the congress is not
in session), and finally appointed and dismissed by the country’s President.6 The PBC budget,
in turn, is part of the central government’s budget and supervised by the financial department of
the State Council.
• Third, China’s monetary policy has numerous objectives. According to Law of the People's
Republic of China on the People's Bank of China, “the objective of the monetary policy shall be
to maintain stability of the value of the currency and thereby promote economic growth”. The
PBC is not an inflation-targeting central bank and its objectives in fact go beyond price stability.
As the previous PBC governor stated, “the annual objectives of the PBC mandated by the
Chinese government have been maintaining price stability, boosting economic growth,
promoting employment, and broadly maintaining balance of payments” (Zhou 2016). In addition,
the 2017 PBC Work Conference called for monetary policy to balance among economic growth,
economic reform, economic structure, household welfare, and financial stability. These multiple
objectives often involve trade-offs and reduce transparency.7
As China’s monetary policy framework is increasingly moving from using quantitative targets
to a more price-based framework, effective central bank communication is becoming even more
important. As summarized in Huang, Ge, and Wang (2018), the PBC’s intermediate targets are
threefold: quantity-based money supply and bank credit, as well as priced -based market interest
rates. Successive waves of interest rate liberalization, which started with money market rates and
culminated with the formal elimination of the ceiling on bank deposit rates in 2015, have
facilitated the transition toward a modern price-based monetary policy framework. While the
process is not complete, the government in 2018 reiterated its commitment to deepen reforms to
make both interest rates and the exchange rate more market based (Li 2018).
The emphasis on quantitative targets has declined. Since 1994, China has had quantitative
monetary targets. However, reflecting financial innovation and a rapidly changing financial
system structure, its intermediate quantitative monetary target, M2, is correlated less and less
with inflation and growth (Ma 2017). In addition, the M2 outturn has deviated from the target
over the past couple of years (Figure 1). As a further indication that emphasis on quantitative
targets has declined, the 2018 government Annual Work Report did not specify a specific
target/projection for the monetary aggregate (M2), or credit aggregates (such as total social
financing). Compared to previous Annual Work Reports, this was an important step forward.
Instead, the language was more vague: “Our prudent monetary policy will remain neutral, with
easing or tightening as appropriate. We need to make sure that the value of M2 money supply,
credit, and aggregate financing ensue a reasonable, stable level of liquidity” (Li 2018).
6 Deputy governors are appointed and dismissed by China’s premier. 7 On transparency, see Dincer and Eichengreen (2014).
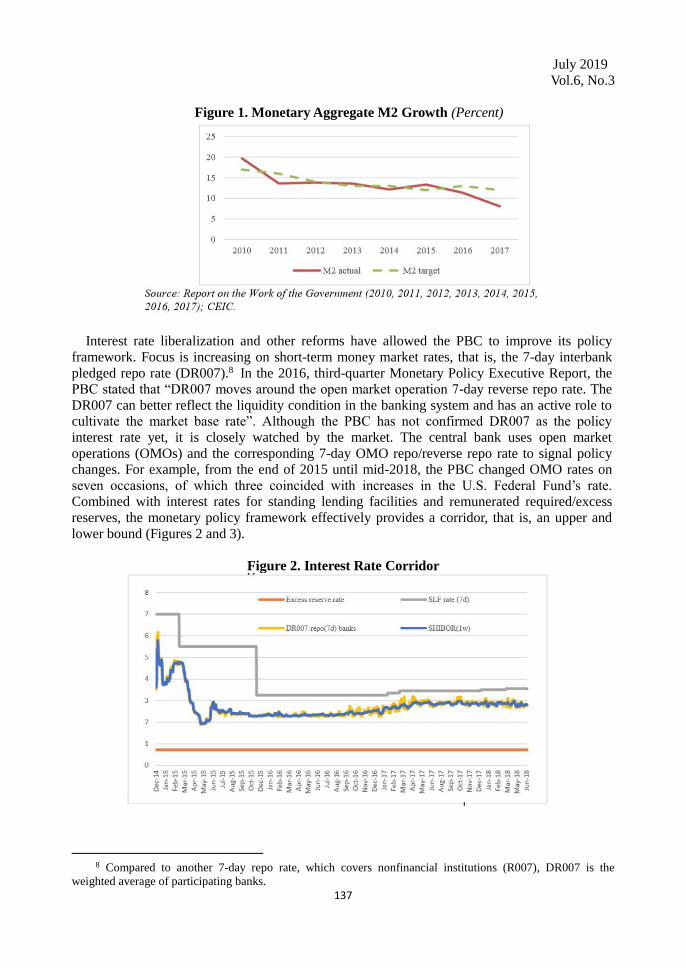
July 2019
Vol.6, No.3
137
Figure 1. Monetary Aggregate M2 Growth (Percent)
Interest rate liberalization and other reforms have allowed the PBC to improve its policy
framework. Focus is increasing on short-term money market rates, that is, the 7-day interbank
pledged repo rate (DR007).8 In the 2016, third-quarter Monetary Policy Executive Report, the
PBC stated that “DR007 moves around the open market operation 7-day reverse repo rate. The
DR007 can better reflect the liquidity condition in the banking system and has an active role to
cultivate the market base rate”. Although the PBC has not confirmed DR007 as the policy
interest rate yet, it is closely watched by the market. The central bank uses open market
operations (OMOs) and the corresponding 7-day OMO repo/reverse repo rate to signal policy
changes. For example, from the end of 2015 until mid-2018, the PBC changed OMO rates on
seven occasions, of which three coincided with increases in the U.S. Federal Fund’s rate.
Combined with interest rates for standing lending facilities and remunerated required/excess
reserves, the monetary policy framework effectively provides a corridor, that is, an upper and
lower bound (Figures 2 and 3).
Figure 2. Interest Rate Corridor
8 Compared to another 7-day repo rate, which covers nonfinancial institutions (R007), DR007 is the
weighted average of participating banks.
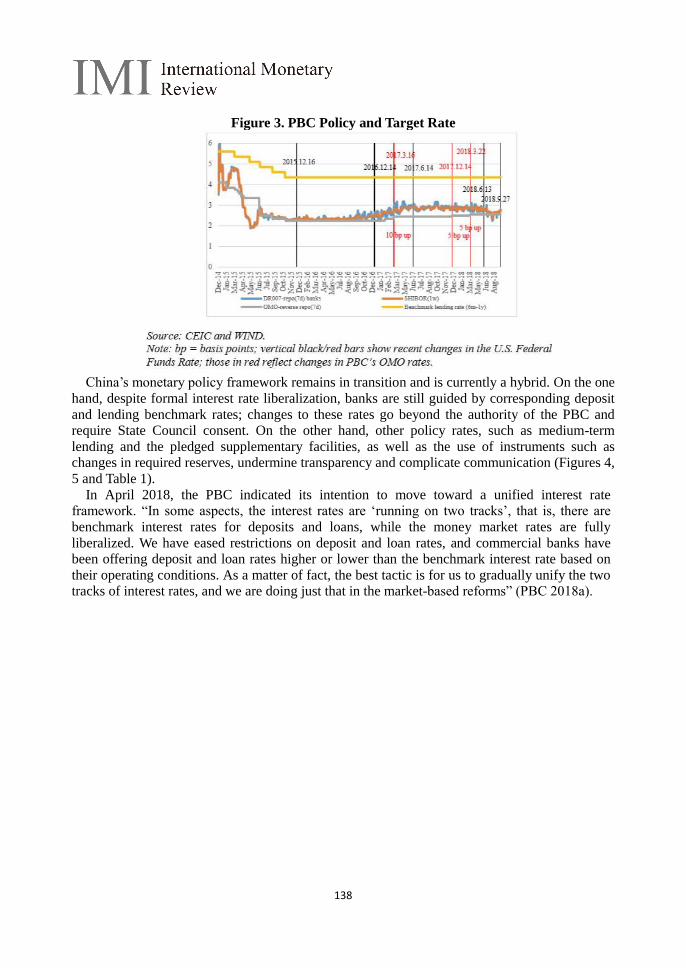
138
Figure 3. PBC Policy and Target Rate
China’s monetary policy framework remains in transition and is currently a hybrid. On the one
hand, despite formal interest rate liberalization, banks are still guided by corresponding deposit
and lending benchmark rates; changes to these rates go beyond the authority of the PBC and
require State Council consent. On the other hand, other policy rates, such as medium-term
lending and the pledged supplementary facilities, as well as the use of instruments such as
changes in required reserves, undermine transparency and complicate communication (Figures 4,
5 and Table 1).
In April 2018, the PBC indicated its intention to move toward a unified interest rate
framework. “In some aspects, the interest rates are ‘running on two tracks’, that is, there are
benchmark interest rates for deposits and loans, while the money market rates are fully
liberalized. We have eased restrictions on deposit and loan rates, and commercial banks have
been offering deposit and loan rates higher or lower than the benchmark interest rate based on
their operating conditions. As a matter of fact, the best tactic is for us to gradually unify the two
tracks of interest rates, and we are doing just that in the market-based reforms” (PBC 2018a).
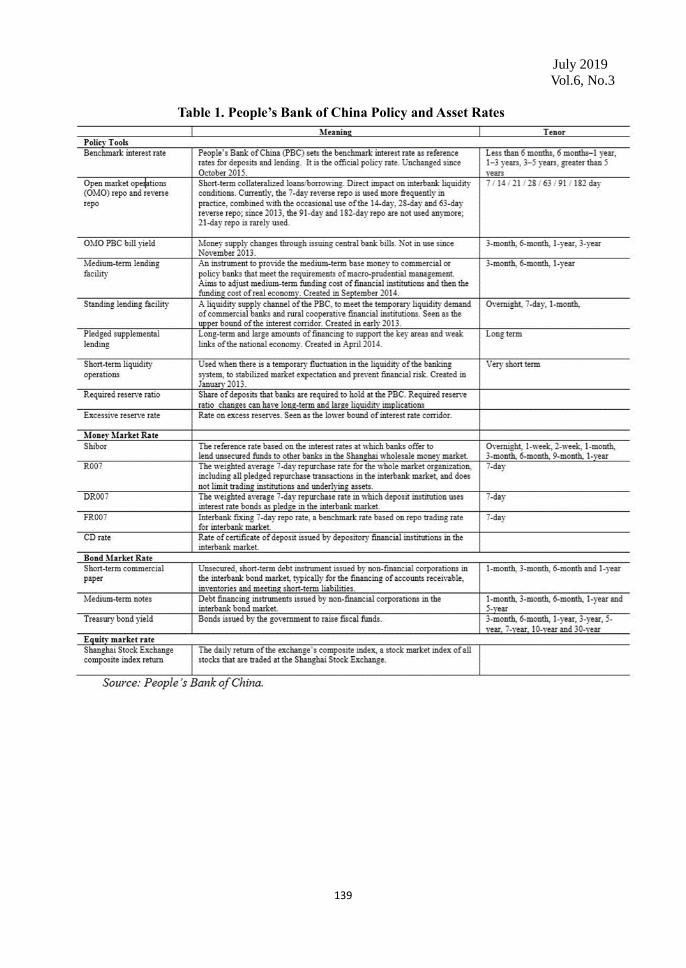
July 2019
Vol.6, No.3
139
Table 1. People’s Bank of China Policy and Asset Rates

140
Figure 4. PBC’s Hybrid Monetary Policy Framework (Percent, right scale RMB billion)
Figure 5. Widening of Interbank-Conventional Deposit Rate
3. Evolving Communications Channels
PBC communication, though still evolving, takes place primarily through four main channels
(Box 1 reviews key terms to describe China’s monetary policy and use of window guidance):
• Monetary Policy Executive Report (MPER). First issued in 2001, the PBC now releases its MPER quarterly. It covers most recent monetary policy decisions; an analysis of output, prices,
and money supply developments; information about important sectors; and assessment of
prospects for China’s macroeconomic development. Generally, report coverage is more
July 2019
Vol.6, No.3
141
backward looking, but increasingly it provides useful technical and operational
information—often within boxes—and, even more recently, some forward looking information.
• Press release on monetary policy committee meetings. The first monetary policy committee
meeting was in 1997 and the meeting now takes place at the end of each quarter. Since 2009, the
PBC has published press releases one or two days following the meeting. The actual meeting
dates, however, are not announced ahead of time and are only posted on the PBC’s website
following the meeting.
• Speeches and press conferences. Oral communication comprises public speeches by the
governor and deputy governors, as well as press conferences.9 Public officials regularly give
speeches at public conferences or international central bank governor summits. While the
contents center around the topics of the conference and cover the PBC’s policy stance,
sometimes speakers talk about future developments in a specific area. Press conferences are
usually scheduled after policy announcements to further explain the rationale for decisions.
• Open market operation notices. To better explain the rationale of OMOs, daily notices have
been standard since January 2016.10 Increasingly, these notices provide contextual information
by adding phrases such as “given ample liquidity, the PBC has intervened to keep liquidity
stable.”11
The PBC is committed to providing more timely information. In 2018, the PBC reiterated
that it is committed to “continuously improve the central bank’s credibility and transparency”
and would “strengthen its policy interpretation and information disclosure, deliver its policy
intensions in a timely way and reasonably guide market expectations” (PBC 2018a). As part of
the response to the increasing demand for timely information, the PBC now also communicates
regularly through social media, such as Weibo (China’s Twitter equivalent). As Figure 6 shows,
within only a few years the PBC has already reached a very large following in both absolute and
per capita numbers, compared with major central banks.
9 Both governors and/or relevant PBC staff are available to speak to journalists. The PBC’s governor gave 63
percent of 86 speeches delivered by the governor/deputy governors between 2007 and end of 2017. Out of 140
press conferences during the same period, the governor took questions or gave interviews in about 20 percent of
them. Oral communication surged in 2015–16, when important policy changes took place, such as interest rate
liberalization, changes in the exchange rate regime, and a sharp adjustment in equity prices. Communication
tends to be more ex post and with a focus on explanations rather than guiding expectations, reflecting—among
other things—China’s unique institutional setup and the PBC’s lack of operational independence. 10 The PBC started conducting weekly open market operations in 2003 and bi-weekly since 2004.
11 From 2017 until June 30, 2018, the PBC published 179 such notes, 122 of them on days with open market
operations.

142
Figure 6. Central Bank Social Media Presence (Thousands, right scale Percent)
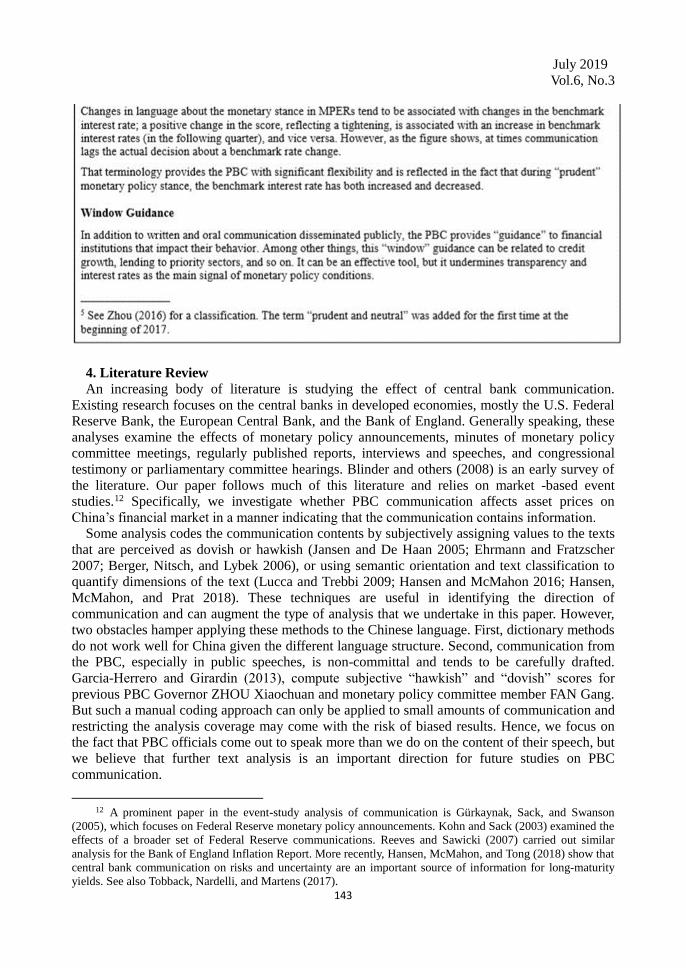
July 2019
Vol.6, No.3
143
4. Literature Review
An increasing body of literature is studying the effect of central bank communication.
Existing research focuses on the central banks in developed economies, mostly the U.S. Federal
Reserve Bank, the European Central Bank, and the Bank of England. Generally speaking, these
analyses examine the effects of monetary policy announcements, minutes of monetary policy
committee meetings, regularly published reports, interviews and speeches, and congressional
testimony or parliamentary committee hearings. Blinder and others (2008) is an early survey of
the literature. Our paper follows much of this literature and relies on market -based event
studies.12 Specifically, we investigate whether PBC communication affects asset prices on
China’s financial market in a manner indicating that the communication contains information.
Some analysis codes the communication contents by subjectively assigning values to the texts
that are perceived as dovish or hawkish (Jansen and De Haan 2005; Ehrmann and Fratzscher
2007; Berger, Nitsch, and Lybek 2006), or using semantic orientation and text classification to
quantify dimensions of the text (Lucca and Trebbi 2009; Hansen and McMahon 2016; Hansen,
McMahon, and Prat 2018). These techniques are useful in identifying the direction of
communication and can augment the type of analysis that we undertake in this paper. However,
two obstacles hamper applying these methods to the Chinese language. First, dictionary methods
do not work well for China given the different language structure. Second, communication from
the PBC, especially in public speeches, is non-committal and tends to be carefully drafted.
Garcia-Herrero and Girardin (2013), compute subjective “hawkish” and “dovish” scores for
previous PBC Governor ZHOU Xiaochuan and monetary policy committee member FAN Gang.
But such a manual coding approach can only be applied to small amounts of communication and
restricting the analysis coverage may come with the risk of biased results. Hence, we focus on
the fact that PBC officials come out to speak more than we do on the content of their speech, but
we believe that further text analysis is an important direction for future studies on PBC
communication.
12 A prominent paper in the event-study analysis of communication is Gürkaynak, Sack, and Swanson
(2005), which focuses on Federal Reserve monetary policy announcements. Kohn and Sack (2003) examined the
effects of a broader set of Federal Reserve communications. Reeves and Sawicki (2007) carried out similar
analysis for the Bank of England Inflation Report. More recently, Hansen, McMahon, and Tong (2018) show that
central bank communication on risks and uncertainty are an important source of information for long-maturity
yields. See also Tobback, Nardelli, and Martens (2017).
144
Central bank communication in emerging economies has only more recently attracted greater
attention. For example, Luangaram and Wongwachara (2017) implement text analysis
techniques previously applied for advanced economies to analyze communication by the Bank of
Thailand. For China, Garcia-Herrero and Girardin (2013) use the hawkish/dovish
communication classification described above to test the impact of PBC communication on
repo-market volatility and trading volume. Shu and Ng (2010) compile indices reflecting the
direction and intensity of the PBC’s monetary stance based on the quarterly monetary policy
executive reports and monetary policy committee meeting minutes. Sun (2013) studies the
impact of PBC communication on the macroeconomy, including GDP, inflation, and industrial
output.
This paper contributes to the existing literature in the following ways: First, it
comprehensively reviews China’s unique institutional setting, which is paramount to
understanding its evolving communication channels. Second, in addition to communication tools
analyzed elsewhere (that is, quarterly monetary policy executive reports, quarterly monetary
policy committee meeting minutes, as well as speeches and interviews), the study is novel in that
it includes OMO notices. As discussed in Section III, the PBC considers these informative
notices an important communication tool and started including them in 2016 (so-called “small
notes”). Third, we analyze the transmission of communication to different markets.
5. Empirical Analysis
The empirical event study focuses on whether PBC communications contain news for
financial market variables. Consistent with the central bank communication literature, we are
interested in the effect of communication on the intermediate target of monetary policy, that is,
short-term interest rates. The first step is to construct variables that capture PBC communication
events. As summarized in the previous section, the PBC communicates with the market in four
main ways: (1) quarterly MPERs; (2) monetary policy committee meeting minutes (Minutes); (3)
press conferences and speeches by the governor, deputy governors, and the then-chief economist
of the PBC Research Bureau (Oral); and (4) informative OMO notices. We search the PBC’s
website and collect the date and time at which the MPER, minutes, press conference transcripts,
texts of speeches, or OMO notices are posted. This information allows us, for every trading day, 13to create a dummy variable for each communication format: D(MPER), D(Minutes), D(Oral),
and D(OMO Notice), with 1 indicating PBC communicates with the market in a certain format
and 0 otherwise. We also construct an aggregate dummy D(PBC Communication) which is 1 if
the PBC has conducted at least one of the four communication formats, and 0 otherwise. For the
oral communication, we are interested in whether the effect of communication from the governor
differs from that of others, and so we also document the person who attended the press
conference or who delivered the speech. Hence, we disaggregate D(Oral) into D(Oral -
PBCGOV) and D(Oral -Others). Short-term money market rates are an important focus for the PBC. We therefore analyze the
effects of communication on the Shanghai Interbank Offered Rate (SHIBOR), the collateralized
interbank repo rate between depository financial institutions (DR007), and the collateralized
interbank repo rate between all financial institutions (R007). Moreover, we are interested in the
impact of the PBC’s communication on short-term and medium-term commercial paper (STN
and MTN), treasury bonds, and equity markets. The table 1 in Section II lists the details of these
market rates.
13 When the post time is between 3:00 pm and 9:00 am the following morning, we adjust the date to the
next trading day.
July 2019
Vol.6, No.3
145
To control for other factors that may affect market interest rate movements, we include (1) a
dummy variable D(Macro Release) to indicate the release of the main macroeconomic indicators,
including the consumer price index (CPI), GDP, Official Purchasing Manufacturing Index and
Caixin Purchasing Manufacturing Index (PMI), foreign trade and foreign exchange reserves; (2)
a dummy variable D(CEWC) to indicate the date of the government’s annual Central Economic
Work Conference, which determines the direction of economic policy for the following year14;
and (3) a dummy variable D(Rate Change) to indicate changes in PBC monetary policy
instruments. In case of the latter, we include changes in the benchmark interest rate, required
reserve ratio, OMO, and other instrument rates, that is, the standing lending liquidity facility
(SLF), short-term liquidity operations (SLO), medium-term lending facility (MLF), and the
pledged supplementary lending (PSL).
Our event-study analysis covers trading days during 2013–17. We report summary statistics
for the explanatory variables in Table 1.1, including communication and control variables, and
various market rates in Table 1.2. On average, the PBC communicated with the market on about
25 percent of all trading days. Speeches or press conferences are the most common format of
communication, taking place nearly every six trading days (16.1 percent of days in the sample).
OMO information notices are next most frequent, occurring on 7.8 percent of the days, but they
have become much more frequent since February 2017. Monetary Policy Executive Reports
represent 1.6 percent, and monetary policy committee meeting minutes 1.5 percent.15 On days
with communication, the average interest rates of the key assets are higher, reflecting more
communication towards the end of our sample, when interest rates had risen. The standard
deviations of these rates seem to be larger for longer- and smaller for shorter-term assets than on
days without communication.
We first plot the kernel density of the daily absolute change of the DR007 (Figure 7) and
3-month short-term notes (Figure 8) for various categories of communication. These plots show
that both communication and control variables indeed have some impact on market prices.
Surprisingly, minutes releases are associated with news for repo rates (DR007), but this effect is
not reflected in short-term notes. Oral communication, PBC interest rate changes, and OMO
notices are associated with relatively higher market reaction for both assets.
14 There are other regularly-held meetings at the central level such as the Politburo meetings, which may
also have implications for monetary policy. By adding a dummy variable to indicate the date of the politburo
meetings with economic issues discussed, we find that the politburo meetings do not significantly affect the
financial market rates and this additional variable does not affect the results of PBC communication(results are
available upon request). So we do not control the politburo meetings in the following analysis to keep a concise
specification. 15 Since 2018, the PBC has already taken additional measures to further strengtheny transparency and
communication by timely responding to public concerns and guiding market expectation. For instance, to better
explain the rational of OMOs, the PBC has released 85 pieces of notices during the 123 trading days in the first
half of 2018. In addition, the PBC has strengthened traditional channels, such as more press conferences (17
press conferences or interviews during the first six months of 2018), deeper analysis and more informative
Monetary Policy Executive Reports.

146
Figure 7. Kernel Density of Daily Absolute Changes of DR007
Figure 8. Kernel Density of Daily Absolute Changes of 3-Month Short-term Notes
5.1 Baseline Results: OLS Analysis of Communication News
First, we conduct an ordinary least squares (OLS) analysis by estimating the following
equations:
(1)
(2)
These regressions, as in other event studies, identify the average reaction of market prices to
the different types of communication events; the identifying assumption is that any systematic
reaction on communication days is driven by the communication event. The dependent variable
is, as for the Kernel densities, the daily absolute change in market rates. The advantage of using
the absolute value is that we measure the market reaction to the communication irrespective of
the direction of that reaction. The key test concerns the sign of the communication event dummy
variable. When communication is associated with news, it would cause a market adjustment and thus positive β coefficient. If, however, a communication event systematically reduced the noise
in the market, it would be associated with less market adjustment than on other trading days and
our estimated β coefficient would be negative.

July 2019
Vol.6, No.3
147
The key estimation results, correcting the standard errors using the Huber-White sandwich
estimators, are presented visually in Figures 9 and 10; the full regression results are presented in
appendix Tables 1.3 and 1.4.
Figure 10 suggests that PBC communication mainly affects short-term assets, while neither
monetary policy instruments nor communication systematically move longer-term markets much,
at least in a single days’ time frame. More specifically, the main results are the following:
• First, as expected, policy instrument changes are associated with market news. However,
PBC communication, in general, does not move the market too much, suggesting that the
effectiveness of PBC communication is somewhat limited. As reflected in Table 1.3, the
coefficients of D(Rate Change) are significantly positive for all assets with maturities less than 3
months, while the coefficients of D(PBC Communication) are only significant for the volatility
of 1-week Shibor and 1-month short-term notes. Communication slightly calms markets, but
does not move the market much.
• Second, the release of quarterly monetary policy executive reports tends to reduce the
volatility of short-term notes. It acts as an important channel for the PBC to communicate with
the market, as it contains a lot of operational details and sometimes forward-looking guidance,
though not very often. From Table 1.3 and 1.4, MPERs are associated with a decline of 0.03
percentage points in the absolute change of 1-month short-term notes and 0.01 percentage points
in that of 3-month short-term notes.
Figure 9. Estimated Coefficients of Figure 10. Estimated Coefficients of
Aggregated Communication Events Disaggregated Communication Events
• Third, oral communication of public speeches, as well as press conferences, appear to calm
the market. As Table 1.3 shows, oral communication is associated with a decrease in the market
news of Shibor 1week, and 1-month short-term notes. Table 1.4 shows that for the PBC’s DR007
target rate, communication events by the governor, either speeches or press conferences, is
associated with 0.023 percentage points less market movement. However, oral communication is
irregular, and the timing of oral communication is usually determined by market conditions.
5.2 Effect on Volatility and the Timing of Communication
Even if there is no systematic effect on the average price in the market, another possibility is
that communication events are associated with greater market volatility. OLS regressions do not
separately model the volatility of the residuals; the regressions analysis above did correct the

148
standard errors on coefficients for heteroskedasticity and auto-correlation. General
Autoregressive Conditional Heteroscedastic (GARCH) models will allow us to address the
possibility that time-series models may violate homoscedasticity (constant variance of errors).
These models are used extensively in financial econometrics as higher frequency data tend to
have periods of higher and lower volatility.
Specifically, we follow Nelson (1991), and explore the volatility effects of communication
using an EGARCH methodology (a particular class of GARCH model).
The advantage of an EGARCH model over a GARCH model is that it ensures that the
conditional variance is positive and allows for the asymmetric response of the volatility to good
and bad news. Our EGARCH(1,1) specification features a conditional mean equation in which it
is necessary to control for all the relevant variables that drive the mean to minimize the size and
variance of residuals:
(3)
(4)
To study the volatility effects while also ensuring that the dependent variables are stationary,
we use the daily change of interest rates as the main dependent variable (∆𝒓𝒕). (Earlier, we
focused on the market news given by the absolute value of the change in the interest rate). Given
that the communication variables are dummy variables which could have a positive or negative
effect on the level of the interest rate (depending on the message in the communication), in the
mean equation we control for the lag of the dependent variable (∆𝒓𝑡−1) and the change in the
7-day repo rate, but not for the communication event dummies.
Instead, we allow the communication events to affect volatility. However, as the EGARCH
model is a nonlinear model, it does not always have a smooth likelihood function that is easily
maximized. To ensure convergence of our estimates, we explore more parsimonious models in
this section than we did earlier. In particular, we first explore the volatility effects of each of the
four main communication events as used in (1) above. We then explore a more disaggregated
approach but focus on the marginal effects (over the average communication event) of D(MPER)
and D(Oral – PBCGOV).
An average PBC communication is associated with higher volatility of short-term market rates
(R007). When we disaggregate the effect a bit further, we find that this association is particularly
strong for speeches by the PBC governor. However, one needs to be cautious with the
interpretation of these findings. Especially for ad hoc events (such as an irregular press
conference or speech), it could be that the volatility in the market leads the PBC to feel the need
to comment. Even if the comment is calming, volatility could remain higher than usual and so
the event is associated with high volatility. The EGARCH attempts to control for this by
modelling volatility as dependent on the volatility from the previous trading day as well as other
covariates.

July 2019
Vol.6, No.3
149
The alternative interpretation of these results is that the event causes this higher volatility.
When the PBC initiates ad hoc communication, the markets get the message of the
communication and that the situation was severe or worrying enough to warrant communication.
Regular communication allows markets to focus on the message being delivered since the date
for the message is set in advance as is the case with the Bank of England inflation report or U.S.
Federal Open Market Committee meetings.
An advantage of the EGARCH is that it provides an estimate of the conditional variance (σt2 )
from each asset market. Figures 11 and 12 show this estimated conditional variance for the 7
-day repo market and the Treasury (3 year) market. These figures, augmented with indicators of
speeches by the PBC governor, highlight that it is likely that both explanations are present in the
data. In particular, speeches tend to be made irregularly and around higher volatility (as well as
after the liberalization of interest rate markets in 2016). In some cases, the speeches are followed
by increased volatility, and in others volatility falls from elevated levels.
Figure 11. 7-Day Repo Volatility Figure 12. Treasury 3-Year Volatility
5.3 Use and Impact of OMO Notices
OMOs are the important way in which the PBC intervenes in the market. The transmission
efficiency from OMO interest rates to the targeted market rates largely determines how monetary
policy works. Like other central banks, the PBC conducts OMO frequently and publishes OMO
notifications on its website. Usually OMO notices plainly state that the PBC has conducted
OMOs at a specific interest rate and amount. The frequency of OMO actions is shown in Figure
13 as the teal triangles. In our sample of 1,249 trading days, the PBC conducted OMO
interventions on 639 of them.
Since March 2016, however, the PBC at times has added short sentences about market
performance (that is, about liquidity and volatility) to explain the reason behind the OMOs,
including information about the injection or withdrawal of liquidity, or even the reason for not
intervening in the market.16 These informative OMO notices, compared to the standard ones, are
seen as “small notes” passed from the PBC to the market, and we identify it as a format of the
PBC’s communication. The dummy D (OMO Notice) takes the value of 1 when PBC publishes
16 The oldest notification dates back to January 2004. The PBC conducted OMOs weekly before May 2004,
then adjusted the frequency to bi-weekly until January 2016. From 2016 to 2017, the PBC published OMO
notifications daily, even for days without OMOs. Informative OMO notices started in March 2016.
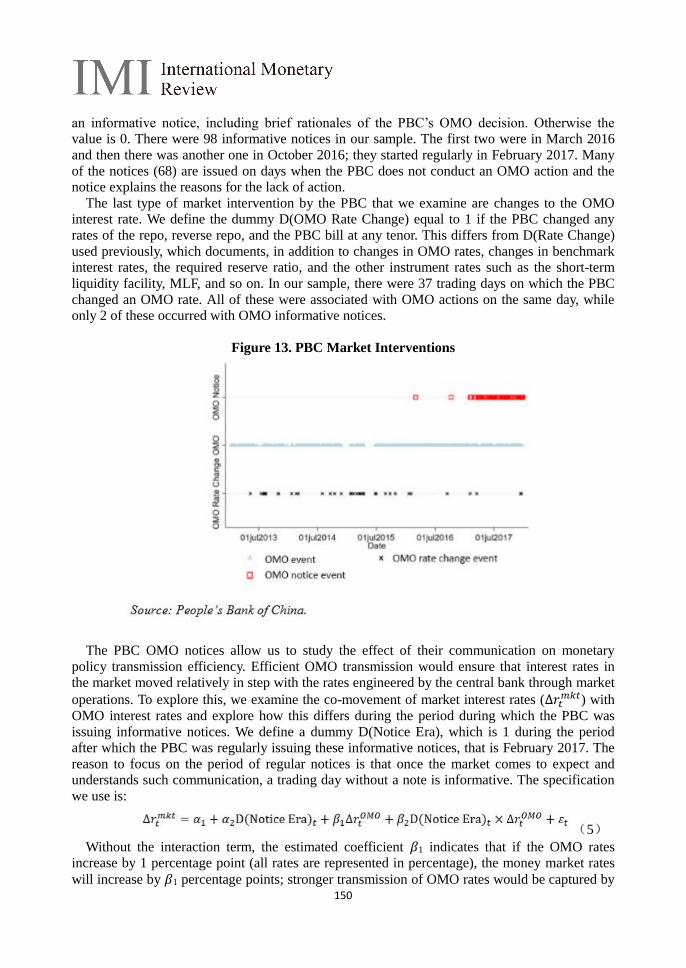
150
an informative notice, including brief rationales of the PBC’s OMO decision. Otherwise the
value is 0. There were 98 informative notices in our sample. The first two were in March 2016
and then there was another one in October 2016; they started regularly in February 2017. Many
of the notices (68) are issued on days when the PBC does not conduct an OMO action and the
notice explains the reasons for the lack of action.
The last type of market intervention by the PBC that we examine are changes to the OMO
interest rate. We define the dummy D(OMO Rate Change) equal to 1 if the PBC changed any
rates of the repo, reverse repo, and the PBC bill at any tenor. This differs from D(Rate Change)
used previously, which documents, in addition to changes in OMO rates, changes in benchmark
interest rates, the required reserve ratio, and the other instrument rates such as the short-term
liquidity facility, MLF, and so on. In our sample, there were 37 trading days on which the PBC
changed an OMO rate. All of these were associated with OMO actions on the same day, while
only 2 of these occurred with OMO informative notices.
Figure 13. PBC Market Interventions
The PBC OMO notices allow us to study the effect of their communication on monetary
policy transmission efficiency. Efficient OMO transmission would ensure that interest rates in
the market moved relatively in step with the rates engineered by the central bank through market
operations. To explore this, we examine the co-movement of market interest rates (∆𝑟𝑡𝑚𝑘𝑡) with
OMO interest rates and explore how this differs during the period during which the PBC was
issuing informative notices. We define a dummy D(Notice Era), which is 1 during the period
after which the PBC was regularly issuing these informative notices, that is February 2017. The
reason to focus on the period of regular notices is that once the market comes to expect and
understands such communication, a trading day without a note is informative. The specification
we use is:
(5)
Without the interaction term, the estimated coefficient 𝛽1 indicates that if the OMO rates
increase by 1 percentage point (all rates are represented in percentage), the money market rates
will increase by 𝛽1 percentage points; stronger transmission of OMO rates would be captured by
July 2019
Vol.6, No.3
151
larger reaction of market rates, although values over 1 would indicate an overreaction. The
estimated coefficient 𝛽2, on the interaction term, captures the marginal change in this
relationship in the era of the PBC issuing informative notices. A positive and
statistically-significant 𝛽2 coefficient indicates that the PBC’s communication from the
informative OMO notice has strengthened the transmission efficiency from the OMO rate to the
market rate.
The results are presented in Table 1.7. The era of issuing informative notices has been
associated with a stronger transmission of OMO rates to other market rates. Not unexpectedly,
given we are looking at a 7-day reverse repo interest rate as the OMO rate, the results are
strongest at the short end of the yield curve. Nonetheless, there has been a stronger co-movement,
even with 1-year Shibor rates since the OMO notices have been issued.
A first concern is that the informative notice era coincides with the period following the
liberalization. The overlap is not perfect; the PBC officially liberalized interest rates in October
2015, whereas the informative notices only became regular in February 2017. We consider two
alternative approaches. First, we examine the correlation on the days on which an informative
notice is issued; we replace D(Notice Era) with D(OMO Notice) in equation (5).17 esults, not
reported here for the sake of brevity, are similar. A second approach is to estimate the regression
in equation (5) but limiting the sample to the period after October 2015.
Another concern might be that rather than strengthen the transmission, the notices have simply
sped up the pass through from OMO interest rates to other market interest rates. The regression
analysis above only considers the contemporaneous correlation between market and OMO
interest rates. To explore the dynamic effects, we can allow for lags of OMO interest rates to
drive the market interest rates. To limit the number of interactions, we need to estimate the
following specification, estimated separately for the era before and after informative notices
were regularly issued:
(6)
Table 1.8 presents the relevant estimation results. We find that the transmission in the change
of the rate is not simply about faster transmission. Instead, we conclude that the transparency
from using informative OMO notices has strengthened the transmission channel from PBC
intervention to the market. We believe that understanding the rationale behind the PBC’s change
in the OMO rate, or reason for not intervening in markets, tends to help the market understand
the policy better and reduce the noise.
6. Policy Recommendations
Our empirical analysis suggests that while the PBC has made a number of important
improvements to its communication, the timing for strengthening communication still further,
and associated institutional changes, is propitious.
Institutional changes take time and require resources and political capital. But as China
develops its financial system, particularly market-based financing, the need for transparent, clear,
timely, and comprehensive communication will continue to increase. Failure to address existing
institutional shortcomings may limit the benefits of liberalization and slow economic
development.
While larger institutional changes will take time, practical actions could improve
17 The alternative equation is:
152
communication in advance. In fact, these suggestions are better if implemented in advance of or
at least in tandem with greater operational independence. For example, the Bank of England first
published its Inflation Report in February 1993 when it did not have control over U.K. monetary
policy. When it became operationally independent in June 1997, the central bank’s thinking and
analytical tools were already well understood by the market. Lack of independence should hence
not be viewed as a reason not to press ahead. As a matter of fact, certain “low-hanging fruit”
could be implemented quickly:
• Making information available in a timely fashion, in one place, and in English would go a
long way. This would also be consistent with the intention to make capital markets more
attractive, as well as China’s renminbi internationalization strategy, and its participation in global
forums.
• Expanding PBC economic forecasting capacity and publishing forecasts regularly, as well as
making information available about the associated framework and models. This would reduce
surprises, making monetary policy more predictable. While the PBC’s Research Bureau released
economic forecasts in 2015 and 2016, each with a mid-year update, these were discontinued in
2017. Of course, strengthening forecasting would require appropriate resources and expertise;
here the PBC could tap into the experience of modern central banks, as well as technical
collaboration with the IMF.
• Holding regular press conferences. A regular communication mechanism could reduce
information asymmetry between the central bank and the market and allow markets to better
interpret decisions and hence reduce uncertainty. As with forecasting, it is useful to begin these
efforts even in advance of greater operational independence. Such a process will help the PBC
learn how to communicate with the market directly and to build credibility that will serve it well,
if it is—as is warranted—to become operationally more independent.18
7. Conclusions
Central banks are increasingly using communication as a lever of monetary policy and are
often at the forefront of communication. The same is true for the PBC, which has taken
important steps to improve communication. Given China’s global footprint and stated policies
to further liberalize its financial system and continue moving toward price-based monetary
policy, further improvements in communication will be critical.
We assess the impact of PBC’s communication on financial markets using four types of
communication: (1) the quarterly published Monetary Policy Executive Report, (2) the quarterly
released Monetary Policy Committee Meeting Minutes, and (3) press conferences and speeches
by governors and deputy governors; the fourth channel is novel and includes informative OMO
notices. The daily absolute change of several market interest rates in the money and bond
markets, as well as equity market prices, are calculated to represent market reaction. They are
regressed on PBC communication and control variables to estimate whether PBC
communication affects market reaction and volatility.
The empirical analysis highlights that communication can have important benefits and that
greater central bank transparency and independence would help further improve PBC’s
effectiveness, including through forward guidance. The introduction of OMO information
notices, for example, reduced volatility and improved monetary policy effectiveness. While
some institutional changes are likely to take time, there are low-hanging fruits that could be
adopted in the short term. For example, providing timely information in one place (in Chinese and English), expanding PBC forecasting resources and capacity, and holding regular press
18 See IMF (2018a).

July 2019
Vol.6, No.3
153
conferences would not only be helpful for monetary policy, but also increase the attractiveness
of China’s capital markets and advance renminbi internationalization.
In 2018, the PBC reiterated its commitment to further strengthen communication and
transparency and has already taken additional steps, including through more press conferences
and interviews, deeper analysis and more informative Monetary Policy Executive Reports, to
guide market expectations.
References
Adrian, Tobias, Douglas Laxton, and Maurice Obstfeld. 2018. “An Overview of Inflation
Forecast Targeting.” In Advancing the Frontiers of Monetary Policy, edited by Adrian, Tobias;
Douglas Laxton, and Maurice Obstfeld, Washington, DC: IMF.
Berger, H., V. Nitsch, and T. Lybek. 2006. “Central Bank Boards Around the World: Why Does
Membership Size Differ?” IMF Working Paper No. 2006-2281. International Monetary Fund,
Washington.
Bernanke, B. S. 2007. “Federal Reserve Communications.” Speech at the Cato Institute 25th
Annual Monetary Conference, Washington, D.C., November 14.
https://www.federalreserve.gov/newsevents/speech/bernanke20071114a.htm.
Blinder, A. S., M. Ehrmann, M. Fratzscher, J. D. Haan, and D.-J. Jansen. 2008. “Central Bank
Communication and Monetary Policy: A Survey of Theory and Evidence.” Journal of
Economic Literature, American Economic Association 46 (4): 910–45.
Dincer, N. N. and B. Eichengreen. 2014. “Central Bank Transparency and Independence:
Updates and New Measures.” International Journal of Central Banking 10 (1): 189–259.
Ehrmann, M., and M. Fratzscher. 2007. “The Timing of Central Bank Communication.”
European Journal of Political Economy 23 (1). 124–145.
Garcia-Herrero, A., and E. Girardin. 2013. “China's Monetary Policy Communication: Money
Markets Not Only Listen, They Also Understand.” KKIMR Working paper No. 02/2013.
http://www.pbc.gov.cn/zhengwugongkai/127924/128038/128109/3544192/index.html.
Gürkaynak, R. S., B. Sack, and E. Swanson. 2005. “Do Actions Speak Louder Than Words? The
Response of Asset Prices to Monetary Policy Actions and Statements.” International Journal
of Central Banking 1 (1).
Hansen, S. and M. McMahon. 2016. “Shocking Language: Understanding the Macroeconomic
Effects of Central Bank Communication.” Journal of International Economics 99 (S1):
S114–S133.
Hansen, S., M. McMahon, and A. Prat. 2018. “Transparency and Deliberation within the FOMC:
A Computational Linguistics Approach.” The Quarterly Journal of Economics 133 (2):
801–870.
Hansen, S., M. McMahon, and M. Tong. 2018. “The Long-Run Information Effect of Central
Bank Communication.” CEPR Discussion Paper. Centre for Economic Policy Research,
London
Huang, Y., T. Ge, and C. Wang. 2018 “Monetary Policy Framework and Transmission
Mechanism.” Chapter in the Handbook of China’s Financial System, Edited by Marlene
Amstad, Guofeng Sun, Wei Xiong.
IMF 2018. “People’s Republic of China Staff Report for the 2018 Article IV Consultation.” IMF,
Washington, D.C.
https://www.imf.org/en/Publications/CR/Issues/2018/07/25/PeoplesRepublic-of-China-2018-Article-IV-Consultation-Press-Release-Staff-Report-Staff-46121.
Jansen, D. J., and J. De Haan. 2005. “Talking heads: The Effects of ECB Statements on the
Euro–Dollar Exchange Rate.” Journal of International Money and Finance 24 (2): 343–361.

154
Kohn, D. L., and B. P. Sack. 2003. “Central Bank Talk: Does It Matter and Why?” Divisions of
Research and Statistics and Monetary Affairs, Federal Reserve Board, Washington.
Li Keqiang. 2018. “Report on the Work of the Government.” National People’s Congress,
Beijing.
Luangaram, P. and W. Wongwachara. 2017. “More than Words: A Textual Analysis of Monetary
Policy Communication.” PIER Discussion Papers 54. PueyUngphakorn Institute for
Economic Research, Bangkok.
Lucca, D. O., and F. Trebbi. 2009. “Measuring Central Bank Communication: An Automated
Approach with Application to FOMC Statements.” NBER Working Paper No. w15367.
National Bureau of Economic Research, Cambridge, MA.
Ma J. and T. Guan. 2018. “Interest Rate Liberalization and Reform of China’s Monetary Policy
Framework.” China Financial Press (in Chinese).
MA Jun. 2017. “Interest Rate Transmission in a New Monetary Policy Framework.” In
Modernizing China’s Monetary Policy Framework, edited by Lahm, W.R., M. Rodlauer, and
Alfred Schipke. Washington, DC: IMF.
Nelson, D. B. 1991. “Conditional Heteroskedasticity in Asset Returns: A New Approach.
Econometrica: Journal of the Econometric Society 59 (2): 347–370.
People’s Bank of China (PBC). 2018a. “Information Disclosure and Transparency (in Chinese).”
PBC, Beijing. May 23.
http://www.pbc.gov.cn/zhengwugongkai/127924/128038/128109/3544192/index.html. ———.
2018b. “Q&A of Governor Yi Gang at Sub-forum ‘Monetary Policy Normalization’ of
BOAO Forum for Asia Annual Conference.” Question and answer of the PBC governor.
2018.
http://www.pbc.gov.cn/english/130724/3523967/index.html.
Reeves, R., and M. Sawicki. 2007. “Do Financial Markets React to Bank of England
Communication?” European Journal of Political Economy 23 (1): 207–227.
Shu, C., and B. Ng. 2010. “Monetary Stance and Policy Objectives in China: A Narrative
Approach.” HKMA China Economic Issues 1 (10), 1–40.
Sun, R. 2013. “Does Monetary Policy Matter in China? A Narrative Approach.” China Economic
Review 26 (C): 56–74.
Tobback, E., S. Nardelli, and D. Martens. 2017. “Between Hawks and Doves: Measuring Central
Bank Communication.”
Zhou, Xiaochuan. 2016. Press Conference on Financial Reform and Development during the
2016 National People's Congress March 12, 2016.
http://www.pbc.gov.cn/goutongjiaoliu/113456/113469/3030450/index.html.
Zhou, Xiaochuan. 2016. “Managing Multi-Objective Monetary Policy: From the Perspective of
Transitioning Chinese Economy.” The 2016 Michel Camdessus Central Banking Lecture,
June 24, 2016, International Monetary Fund, Washington, DC.

July 2019
Vol.6, No.3
155
Appendix
Table 1.1. Statistics Summary for Communication and Control Variables
Table 1.2. Statistics Summary for Market Rates
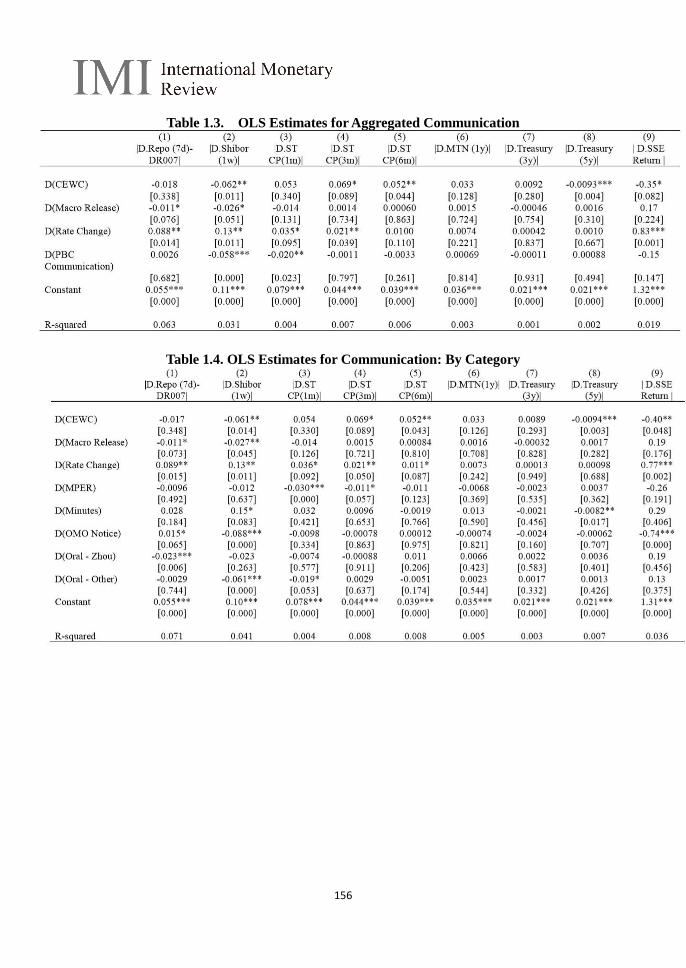
156
Table 1.3. OLS Estimates for Aggregated Communication
Table 1.4. OLS Estimates for Communication: By Category
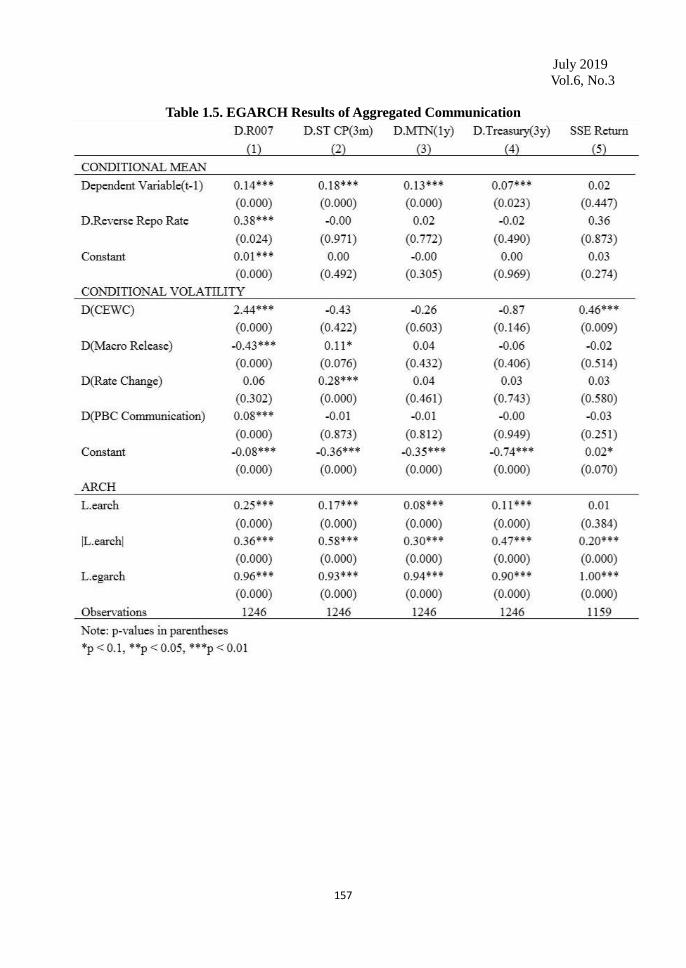
July 2019
Vol.6, No.3
157
Table 1.5. EGARCH Results of Aggregated Communication
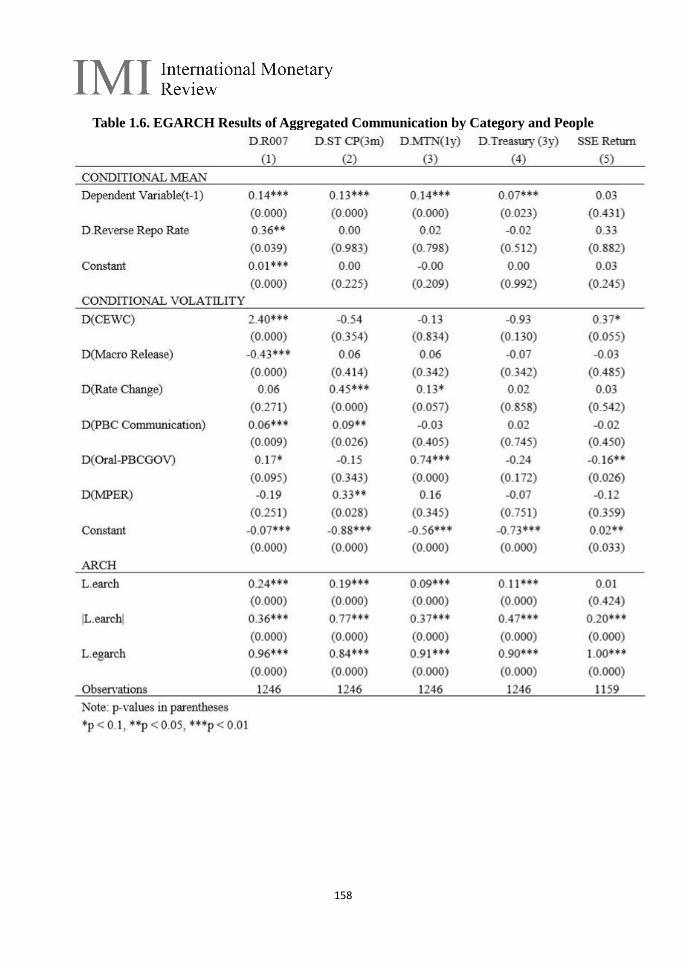
158
Table 1.6. EGARCH Results of Aggregated Communication by Category and People
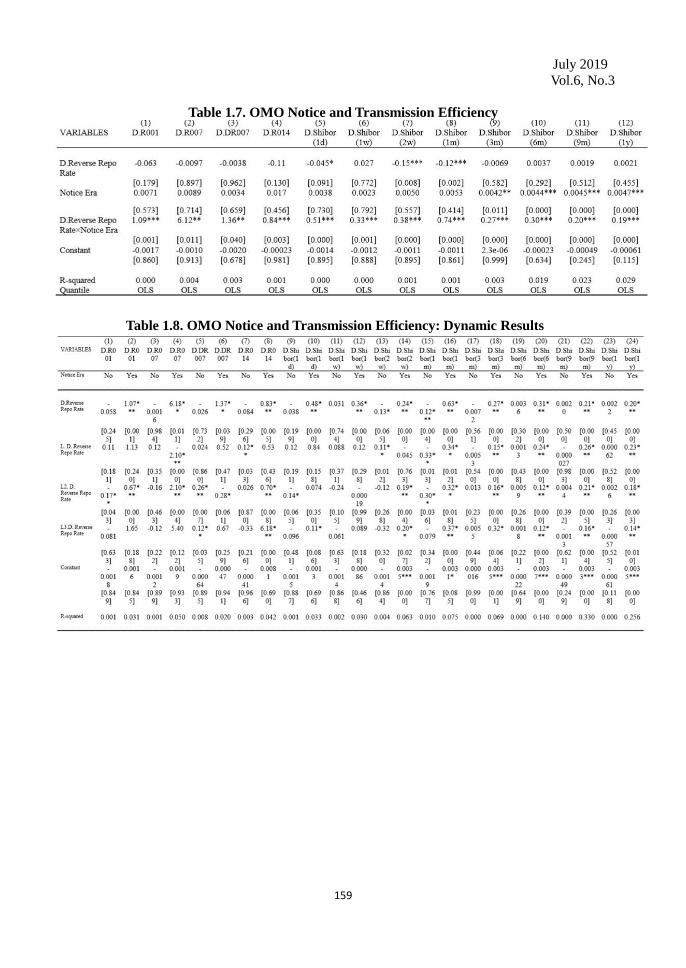
July 2019
Vol.6, No.3
159
Table 1.7. OMO Notice and Transmission Efficiency
Table 1.8. OMO Notice and Transmission Efficiency: Dynamic Results

160
IMI News
· On April 2, Macro-Finance Salon (No. 117) was held at Renmin University of China.
Georges Depeyrot, Professor of Paris Normal University, Board Member, Director of
Research, and Senior Researcher of French National Centre for Scientific Research, gave a
lecture on the topic “Europe, Asia, USA: Gold and Silver”, elucidating the transition from
bimetallism (gold and silver) to gold standard around the globe. Professor He Ping from
School of Finance of Renmin University of China, presided over the lecture.
· On April 13, the Young Economists Roundtable on Money and Finance (No. 3) themed on
"fiscal policy and local government debt" was held in Shanghai. Tang Yue, executive general
manager of Pingan Securities Fixed Income Research Team, Zhou Yue, chief fixed income
analyst of Sinolink Securities Research Institute, and Zhang Wenchun, IMI researcher and
associate professor of School of Finance, RUC, delivered keynote speeches successively.
The roundtable was presided over by Sun Chao, IMI researcher and executive secretary of
the FICCRUC.
· On April 14, Macro-finance Salon (No.118) was held in Renmin University of China. Wang
Yongsheng, Deputy Secretary-General of China Numismatic Society and Director of
Research and Information Department of China Numismatic Museum, delivered a speech
entitled “Round Coins with Square Holes on the Silk Road——The Nature of Wuzhu and
Kaiyuan Tongbao as International Currency”. Zhang Jie, Director of IMI and Professor of
School of Finance, RUC, attended the meeting. The meeting was hosted by Tu Yonghong,
Deputy Director of IMI and Professor of School of Finance, RUC.
· On April 20, the Yong Economists Roundtable on Money and Finance (NO.4) themed on
“Special Situation Investment and Non-Performing Assets Management” was held in
Renmin University of China. Luo Ning, Research Fellow and Senior Economist of Pangoal
Institution, Shi Xinjie, General Manager of Rocken international Investment management
C.,Ltd., Xiong Yuan, IMI Research Fellow and Chief Macro-Economy Analyst with
Guosheng Securities, Zhang Yu, IMI Research Fellow and Chief Macro-Economy Analyst
with Hua Chuang Securities, delivered keynote speeches. The seminar was chaired by Jiang
Bo, IMI Research Fellow and General Manager of Finance Department of the Tahoe Group.
· On April 23, the 2019 IMF Regional Economic Outlook for Asia and the Pacific was
launched by IMF Resident Representative Office in China, IMI and Research Institute of
Guotai Junan Securities at the Century Hall North of Renmin University of China.The
launch meeting was chaired by Wei Benhua, Former Deputy Administrator, State
Administration of Foreign Exchange, and Former IMF Executive Director for China.
· On April 26, Macro-Finance Salon (No. 119) was held in Renmin University of China. Dr.
D.J. Pandian, Vice President of AIIB, made a speech titled “Regional cooperation and
development challenges in Asia”. Prior to the salon, Wu Xiaoqiu, Vice President of Renmin
University of China, met with Dr. Pandian and his fellow colleagues. Prof. Zhang Chengsi,
Associate Dean of School of Finance, Prof. Di Dongsheng, Associate Dean of School of
International Studies, and Fang Ke, Manager of Implementation Monitoring Unit of AIIB
participated in the meeting.
· On May 7, Macro-finance Salon (No. 120) was held in Renmin University of China. Wan
Ming, associate researcher of ancient history at CASS delivered a speech under the theme of
Silver Dollar’s Monetization and Global Integration. Zhou Jianbo, director of the Institute of
Economic Thought History at the School of Economics at Peking University and Professor
July 2019
Vol.6, No.3
161
Wang Jue, academic leader in economic history at the School of Economics at Renmin
University attended the meeting and participated in the round-table discussion. The meeting
was moderated by Professor He Ping from the School of Finance at Renmin University.
· On May 7, the Macro-Finance Salon (No. 121) was held in Renmin University. Zhang
Chengsi, Associate Dean of the School of Finance in RUC, delivered a speech entitled “The
Historical Evolution of Modern Finance Discipline and the Logic Behind”. There were
many experts present at the conference. During discussion, guests talked about issues on
interest rate marketization, price indicator, the connection of macro-finance and
micro-finance, syllabus of finance and so on.
· On May 7, Professor Ben Shenglin, Co-Director of IMI and Dean of International Business
School, Zhejiang University (ZIBS), visited the Central Banking Publications, a famous
British financial publishing company, and signed a memorandum of understanding with it,
which opened an important chapter of the overseas strategic cooperation of IMI. David
Pagliaro, head of Insight Group of Infopro Digital, the parent company of the Central
Banking Publications, warmly welcomed Professor Ben Shenglin on behalf of the group.
· On May 11, Roundtable on Money and Finance·Spring 2019, jointly sponsored by the
School of Finance of RUC and IMI, was held in Renmin University of China. The theme of
the conference was “Financial Supply-side Structural Reform”.
· On May 18, the Macro-finance Salon (No. 122) was held at Renmin University of China.
Xiao Yuanqi, Chief Risk Officer and office manager of China Banking and Insurance
Regulatory Commission, attended the seminar and delivered a speech titled “Evolution,
Landscape and Lessons of the International Financial System”. This salon was chaired by
Song Ke, the deputy director of IMI. Experts and scholars from the government and
academic circles, representatives of advanced enterprises attended the meeting.
· On May 21, the “China-Kazakhstan Conference of Promoting Bilateral Cross-Border
Currency Use”, co-sponsored by the Xinjiang Branch of the Bank of China (BOC) and the
Bank of China Kazakhstan, was held at the China-Kazakhstan Khorgos International
Cooperation Center in Ili, Xinjiang. Zhao Xijun, member of IMI Academic Committee and
Associate Dean of the School of Finance of Renmin University of China and Jaynes Hards,
Mayor of Khorgos unveiled the IMI-Khorgos Cross-border Finance Laboratory.
· On May 23, the Roundtable on Long-term policy for China-Europe relations: Cooperation in
Trade, Investment and Finance was held in Renmin University of China. The meeting was
jointly organized by IMI and the Official Monetary and Financial Institutions Forum
(OMFIF) and the DZ Bank, and co-organized by the Cross Border Financial 50 Forum
(CBF50). The meeting was chaired by Wei Benhua, Former Deputy Administrator, SAFE
and Former IMF Executive Director for China. The participants had a discussion on
“Chinese and European Priorities in Finance, Investment and Trade” and “Multi-Currency
International Monetary System”. In the afternoon, the “Roundtable on Money and
Finance · 2019 Xinjiang Forum” and the “BRI and RMB internationalization Seminar”,
hosted by IMI, Xinjiang Finance Academy and the management committee of Khorgos
Economic Development Zone and organized by Khorgos Jianxin International, were
successfully held.
· On June 14, the Mckinnon Lectures (No.14) was held in Renmin University of China. Mr.
Mark Sobel, US Chairman of the Official Monetary and Financial Institutions Forum
(OMFIF), Former IMF Executive Director for the US Department of the Treasury, delivered a keynote speech entitled “The Future of Global Economy and Currency
Internationalization”. The meeting was chaired by Wei Benhua, Former Deputy
Administrator, SAFE; Former IMF Executive Director for China. Discussants include Liu
162
Hongwei from the Office of Financial Service of Beijing Chaoyang District , Zhen Xinwei,
Senior Manager of Finance Department at Bank of China, Li Jing, Professor at Capital
University of Economics and Business and other researchers.
· Macro-Finance Salon (No.123) was held on the afternoon of June 18 at Renmin University
of China. Mr. Song Yongming, deputy general manager of Minsheng Royal Fund
Management co., LTD was invited to be the keynote speaker, and gave a speech titled
“Analysis and Outlook on the Development of Asset Management Industry”. Participants
include IMI research fellows Jiang Bo and Yang Feng, etc. The Salon was chaired by Mr. Xu
Yisheng, IMI senior research fellow and chairman of board, China Soft Capital.
· On June 24, the Roundtable on Money and Finance·Summer 2019 and Seminar on Fintech
Development and Regulation was held in Renmin university. Wu Xiaoqiu, vice president of
Renmin University, Mu Changchun, deputy director of the Department of Payment and
Settlement of PBoC, Ye Mao, professor of the Department of Finance at the University of
Illinois at Urbana-Champaign, and Yang Tao, assistant director of the Institute of Finance of
the Chinese Academy of Social Sciences, delivered keynote speeches successively. Zhuang
Yumin, Dean of School of Finance and of Renmin University, made an opening remark. The
meeting was presided over by Zhao Xijun, associate dean of the School of Finance of
Renmin University.
· On June 28, Macro-Finance Salon (No. 124) was held at Renmin University of China. Mr.
Sanjaya Panth, Deputy Director at the IMF’s Strategy, Poliby and Review Department, made
a keynote speech on Comprehensive Surveillance Review. Mr. Wei Benhua, Former
Administrator at the State Administration of Foreign Exchange and Former IMF Executive
Director for China, and Prof. Zhao Xijun, Associate Dean of School of Finance at Renmin
University, attended the salon and made their comments. The salon was chaired by Mr.
Zhang Zhixiang, Former Director General of International Department of PBoC and Former
IMF Executive Director for China.
· On June 30, Macro-Finance Salon (No. 125) was held at Renmin University of China. Mr.
Yao Zhizhong, deputy director of the Institute of World Economy and Politics at the CASS,
made a keynote speech on the Evolution of China-US Trade War. Mr. Wei Benhua, Former
Deputy Administrator of the State Administration of Foreign Exchange, Prof. Di Dongsheng,
Associate Dean of the School of International Studies at Renmin University and IMI
Research Fellows Qian Zongxin, Zhang Jinfan and Jing Linde, participated in the salon. The
salon was chaired by Prof. Wang Fang, Assistant Dean of the School of Finance at Renmin
University.
· On July 6 to 7, the 2019 International Monetary Forum was held at Yifu Hall of Renmin
University of China, organized by School of Finance and China Financial Policy Research
Center of Renmin University, and co-organized by IMI, with the theme “High-quality
Development and High-standard Financial Opening-up”. The topics centered on Financial
Supply-side Reform and Financial Risk Prevention, Fiscal Reform and the Two-pillar
Macro-control System, Asset Management and Wealth Management Subsidiaries of Banks,
Renminbi Internationalization and High-standard Financial Opening-up, and Fintech.
Hundreds of experts and scholars from government sectors, academia and financial industry
attended the forum.
5
May 2014Volume 1, Number 1
International Monetary Review is an internal academic magazine sponsored by International Monetary Institute. Following the principle of including both Chinese and western merits with precise and practical academic spirit, International Monetary Review focuses on the cutting-edge theoretical researches in internationalization of RMB, reform of international monetary system, regional monetary and financial cooperation, China’s international financial strategies, and other macro-financial theories and policies. We welcome submissions by scholars, experts and practitioners in financial industry. Papers and articles should center on key financial issues and follow academic standard and scientific methodology. We welcome quality articles based on data analysis and theoretical model and other insightful articles with standard writing.
Prepare your articleGeneral rule: Submitted manuscripts should be double-spaced texts in 10.5 point font, and formatted for paper of standard size with margins of at least 20mm on all sides. Pages should be numbered, and an abstract (of no more than 200 words), as well as keywords and complete author affiliations, should be included in the paper in the title page. A regular article should not exceed 50 pages. Mathematics: Equations must be identified by consecutive Arabic numbers in parentheses on the right. Expressions should be aligned and compound subscripts and superscripts clearly marked if there is any potential for confusion.Figures: Figures must be of professional quality and ready for reproduction. They should be numbered consecutively. Black-and-white versions of figures are required for printing purposes, but color figures can also be supplied for online dissemination.Tables: Tables should be numbered consecutively throughout the article. Each table must include a descriptive title and headings to columns. Gather general footnotes to tables as “Note:” or “Notes:”, and use a, b, c, etc., for specific footnotes. Asterisks * and/or ** indicate significance at the 5 percent and 1 percent levels, respectively, if used.
Reference stylePlease follow the EPS Style Guide when preparing your article. http://eps.ruc.edu.cn/UserFiles/File/EPS%20Style%20Guide.pdf
Further considerations • Manuscript has been spell-checked and grammar-checked • References are in the correct format for this journal • All references mentioned in the reference list are cited in the text, and vice versa • Permission has been obtained for use of copyrighted material from other sources
Submit your articleManuscripts can be submitted via e-mail to [email protected]
Call for PapersInternational Monetary Review

6
IMI International Monetary Review
Copyright © 2022 FDOKUMEN