
A TOTAL REWARDS FRAMEWORK FOR THE ATTRACTION ...
351
A TOTAL REWARDS FRAMEWORK FOR THE ATTRACTION AND RETENTION OF THE YOUTH By KESHIA MOHAMED-PADAYACHEE submitted in accordance with the requirements for the degree of DOCTOR OF BUSINESS LEADERSHIP at the UNIVERSITY OF SOUTH AFRICA SUPERVISOR: DR M H R BUSSIN NOVEMBER 2017
-
Upload
khangminh22 -
Category
Documents
-
view
0 -
download
0
Transcript of A TOTAL REWARDS FRAMEWORK FOR THE ATTRACTION ...
A TOTAL REWARDS FRAMEWORK FOR THE ATTRACTION AND
RETENTION OF THE YOUTH
By
KESHIA MOHAMED-PADAYACHEE
submitted in accordance with the requirements
for the degree of
DOCTOR OF BUSINESS LEADERSHIP
at the
UNIVERSITY OF SOUTH AFRICA
SUPERVISOR: DR M H R BUSSIN
NOVEMBER 2017
DECLARATION
DBL Thesis_Keshia Mohamed-Padayachee Student Number 71364684 Page 2 of 351
I. DECLARATION
I, Keshia Mohamed-Padayachee, student number 736-468-4, hereby declare that A
Total Rewards Framework for the Attraction and Retention of the Youth is my own
work. It is submitted in fulfilment of the requirements for the degree of Doctorate in
Business Leadership, University of South Africa School of Business Leadership. It
has not been submitted before for any degree or examination at any other university.
I further declare that I have obtained the necessary authorisation to carry out this
research, and that the sources that I have used or quoted have been indicated and
acknowledged by means of complete references.
__________________________ ________________________
SIGNATURE DATE
Keshia Mohamed-Padayachee
ABSTRACT
DBL Thesis_Keshia Mohamed-Padayachee Student Number 71364684 Page 3 of 351
II. ABSTRACT
Orientation: The face of the workforce as we know it, is changing dramatically through
globalisation and the retirement of the older generation, and organisations are
confronted with the need to change. Company strategies for attraction and retention
require adaption, as the ‘one-size-fits-all’ model no longer appears to be appropriate
for today’s multigenerational workforce. As employers aim to attract and retain high-
value youth employees, it is more important than ever to understand the total rewards
expectations that will attract and retain them.
Research purpose: To determine what changes and priorities organisations need to
consider for their total rewards models to attract and retain qualified youths entering
the workforce.
Motivation for the study: The need to understand what intrinsic and extrinsic rewards
are aligned with the aspirations and values of skilled youths, in an ongoing attempt to
attract and retain them.
Research methodology: The researcher utilised a sequential mixed-method
research approach to evaluate the effectiveness of the reward categories of the
WorldatWork (2015) Total Rewards Model and other reward elements identified during
the literature review. Data were collected in two phases, using quantitative and
qualitative methods.
Phase I: The quantitative method entailed a research questionnaire, distributed to
defined professional databases, tertiary institutions, private and public listed
companies, as well as parastatals. The researcher distributed 450 questionnaires, of
which 276 usable questionnaire responses were received — a response rate of 61.3%.
Phase II: The qualitative method utilised interviews exploring the results obtained from
Phase I; 11 interviews were conducted with qualified youths and human resource (HR)
practitioners (HR generalists and recruitment-, remuneration-, and organisation
development specialists). Their responses were captured and analysed.
ABSTRACT
DBL Thesis_Keshia Mohamed-Padayachee Student Number 71364684 Page 4 of 351
In both Phase I and Phase II, data were gathered while ensuring a high ethical
standard and adhering to the defined research approaches. The data were analysed
using appropriate statistical techniques to determine the relationship between the
variables, ensuring reliability, consistency, and generalisability in Phase I, and
transferability, credibility, dependability, and confirmability in Phase II, where a
combination of deductive (for quantitative research) and inductive (for qualitative
research) methods was applied.
Main findings/results: It was evident from the results that a different approach was
required for attraction and retention of the youth, and that the ‘one-size-fits-all’
approach of the past will not be effective in the future. Through the research
processes, the researcher found that the reward categories of the WorldatWork (2015)
model are currently effective in attracting and retaining young talent, but that more will
be required in the future. A new total rewards framework was constructed, reflecting
the youth’s priorities, to aid attraction and retention of this generation.
Main outcomes:
Attraction: Seven reward categories were found to affect the youth’s attraction to
organisations. These, in order of importance, are: (1) leadership and environment
— supportive management and work environment, (2) benefits — retirement fund,
medical aid, and leave, (3) performance incentives — long- and short-term
incentives and share options; (4) individual development, (5) a safe/secure
working environment — coaching/mentoring, working in different organisations to
maximise career growth, CSR, and long-term job security; (6) work‒life and
resources — extended employee benefits and tools to execute one’s work; (7)
performance recognition — informal recognition and non-financial rewards; and
formal recognition — formal recognition and lump-sum and annual bonus payments.
Retention: Seven reward categories were found to affect youths’ retention in
organisations. These, in order of importance, are: (1) leadership and environment
— supportive management and environment; (2) flexible and variable payment
options — flexible payment options and Salary/Pay; (3) benefits — retirement fund,
medical aid, and leave; (4) value-added benefits and services and individual
development — employee wellness, CSR, employee discounts, formal coaching or
mentoring, and extended time off; (5) recognition — informal and formal recognition
ABSTRACT
DBL Thesis_Keshia Mohamed-Padayachee Student Number 71364684 Page 5 of 351
and non-financial rewards; (6) career development — Career/Growth opportunities
and learning and development; and (7) incentives — long- and short-term incentives
and share options.
Research limitations: This research was limited to skilled youths.
Research implications, originality, and value: No empirical study exists that
authenticates the WorldatWork (2015) Total Rewards Model and Generation Y theory.
As employers strive to attract and retain high-value young employees, it is more
important than ever to understand the expectations of these employees. This study
contributes to the body of knowledge by identifying the reward preferences of the youth
by offering a relevant rewards framework for attraction and retention of the youth.
Article type: Research paper
KEYWORDS
DBL Thesis_Keshia Mohamed-Padayachee Student Number 71364684 Page 6 of 351
III. KEYWORDS
Total rewards, WorldatWork total rewards model, remuneration, compensation,
attraction, retention, youth, employee life stages, generational theories, Generation Y,
Generation X, Baby Boomers
ACKNOWLEDGEMENTS
DBL Thesis_Keshia Mohamed-Padayachee Student Number 71364684 Page 7 of 351
IV. ACKNOWLEDGEMENTS
I would like to express my appreciation to the following persons whose assistance
made this phenomenal achievement possible.
To the highest and the greatest, I say ALHUMDULILAH!
To my wonderful and supportive husband, Clint Padayachee, my children, Ameerah
and Joaquin-Amir, I give the utmost acknowledgement for always being there,
believing in me, and your unwavering support and understanding. Thank you for
giving me the time and space to achieve my dream. Clint, thank you for carrying my
load, you share my dream with me.
To my mom, Rashida Mohamed, thank you for always being there and believing in
me, no matter the obstacles. Without your words of encouragement to follow my heart,
this would not have been possible. You showed me the power of belief and
encouragement. You live this quote: “Behind every young child who believes is a
parent who believed first” ‒ Mathew L. Jacobson.
To my Aunt, Nisha Jones, how do I begin to thank you? No words can express my
gratitude for your presence, support, encouragement, and unwavering understanding.
To my sister, Zenith Mohamed and brother, Ra’ees Mohamed, thank you for your
support and always being there. No task was ever too big or small.
To my cousin, Dr. Rene Smith, thank you for creating opportunities for me and being
my source of guidance and directing me on this wondrous path.
Professor Mark Bussin, thank you for your positive and encouraging words when
giving feedback. Your guidance, breadth and depth of knowledge have made this
possible. I have learned so much from you! The impact of your availability and being
in tune with change, your humility, and lateral thinking made this journey a positive
and possible one. To you I say a heartfelt thank you!
ACKNOWLEDGEMENTS
DBL Thesis_Keshia Mohamed-Padayachee Student Number 71364684 Page 8 of 351
Professor Rica Viljoen, thank you for the incredible creation of opportunities to conduct
my research and explore my theories. Your inputs, support and insights into
qualitative research proved invaluable.
Dr. Joyce Toendepi, thank you for your availability and sharing what you know about
qualitative research and analysis with me. Your review and constant support proved
invaluable to me.
To my mentor and friend, Dumisani Ncala, thank you for your wisdom and guidance,
and for always being there. To Nandi Manentsa, thank you for your words of
encouragement and always seeing the best in me. Mohini Moodley, thank you for
your time and insights, they were perfect!
To the organisations and universities who supported me and opened their doors for
me to come and do my research at your institutions, thank you for supporting my
research. Your inputs into the questionnaire and distribution to your vast database
contributed to the richness of the data.
Everyone who completed my questionnaires, sent me correspondence manually, and
made time for me to interview you, I too thank wholeheartedly. Thank you for sharing
your valuable insights and views with me and making yourself available to meet with
me.
Finally, thank you to everyone who believed in me and supported me for your prayers
and well wishes.
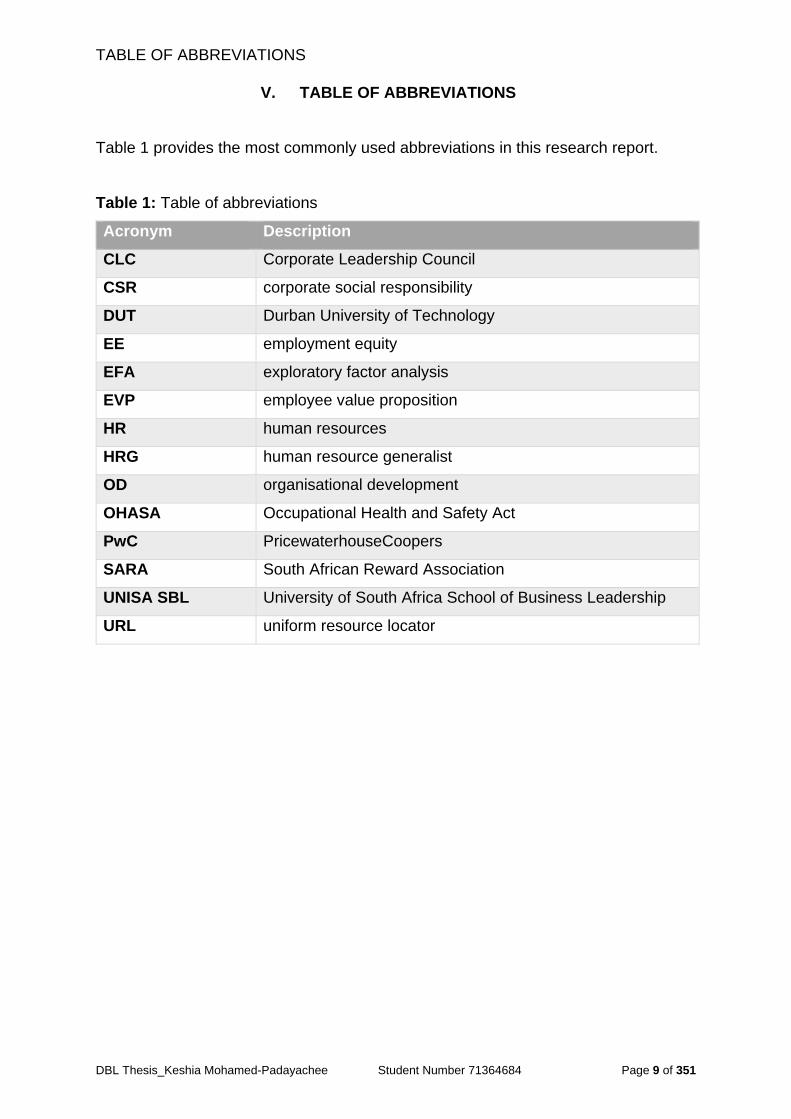
TABLE OF ABBREVIATIONS
DBL Thesis_Keshia Mohamed-Padayachee Student Number 71364684 Page 9 of 351
V. TABLE OF ABBREVIATIONS
Table 1 provides the most commonly used abbreviations in this research report.
Table 1: Table of abbreviations
Acronym Description
CLC Corporate Leadership Council
CSR corporate social responsibility
DUT Durban University of Technology
EE employment equity
EFA exploratory factor analysis
EVP employee value proposition
HR human resources
HRG human resource generalist
OD organisational development
OHASA Occupational Health and Safety Act
PwC PricewaterhouseCoopers
SARA South African Reward Association
UNISA SBL University of South Africa School of Business Leadership
URL uniform resource locator
DESCRIPTION OF TERMS
DBL Thesis_Keshia Mohamed-Padayachee Student Number 71364684 Page 10 of 351
VI. DESCRIPTION OF TERMS
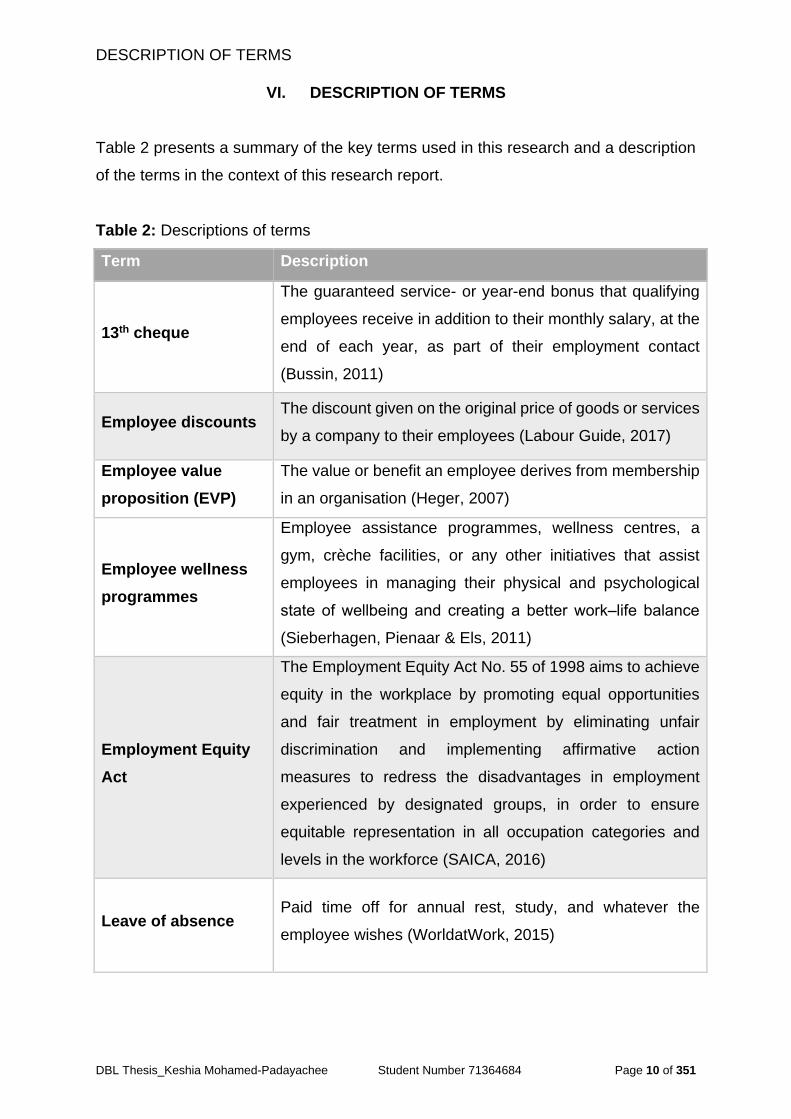
Table 2 presents a summary of the key terms used in this research and a description
of the terms in the context of this research report.
Table 2: Descriptions of terms
Term Description
13th cheque
The guaranteed service- or year-end bonus that qualifying
employees receive in addition to their monthly salary, at the
end of each year, as part of their employment contact
(Bussin, 2011)
Employee discounts The discount given on the original price of goods or services
by a company to their employees (Labour Guide, 2017)
Employee value
proposition (EVP)
The value or benefit an employee derives from membership
in an organisation (Heger, 2007)
Employee wellness
programmes
Employee assistance programmes, wellness centres, a
gym, crèche facilities, or any other initiatives that assist
employees in managing their physical and psychological
state of wellbeing and creating a better work‒life balance
(Sieberhagen, Pienaar & Els, 2011)
Employment Equity
Act
The Employment Equity Act No. 55 of 1998 aims to achieve
equity in the workplace by promoting equal opportunities
and fair treatment in employment by eliminating unfair
discrimination and implementing affirmative action
measures to redress the disadvantages in employment
experienced by designated groups, in order to ensure
equitable representation in all occupation categories and
levels in the workforce (SAICA, 2016)
Leave of absence Paid time off for annual rest, study, and whatever the
employee wishes (WorldatWork, 2015)

DESCRIPTION OF TERMS
DBL Thesis_Keshia Mohamed-Padayachee Student Number 71364684 Page 11 of 351
Term Description
Long-term incentive
A form of variable pay, a long-term incentive plan is defined
as a reward system designed to improve employees’ long-
term performance by providing rewards that may not be tied
to the company’s share price (Arsalidou, 2015)
Lump sum annual
bonus payment
Similar to a short-term incentive bonus payment, it is linked
to individual performance — cash is paid out as a yearly
bonus for merit (Heneman, 2002)
Medical aid
Primary health care made accessible at a cost a company
an employee can afford, with methods that are practical,
scientifically sound and socially acceptable (Nutbeam,
1998)
Participants/
Interviewees
Individuals who partook in the interviews during Phase II of
the research
Resources Assets employees require to successfully execute their work
(PwC, 2013)
Respondents Individuals who completed the questionnaire during Phase I
of the research
Retirement fund
A fund established by an employer to facilitate and organise
the investment of employees' retirement savings, to which
both the employer and employees contribute, meant to
generate stable growth over the long term and provide
retirement pensions for employees (Mtayi, 1997)
Sabbaticals and
other scheduled time
reductions
A paid period of leave subject to certain conditions for the
purpose of undertaking research or other appropriate study
related to an academic or professional field (Creswell, 2012)
Salary/Pay
Any payment in money or even kind or both in money and
kind, made or owing any person in return for that person
working for any other person (South Africa Department of
Labour, 2005)
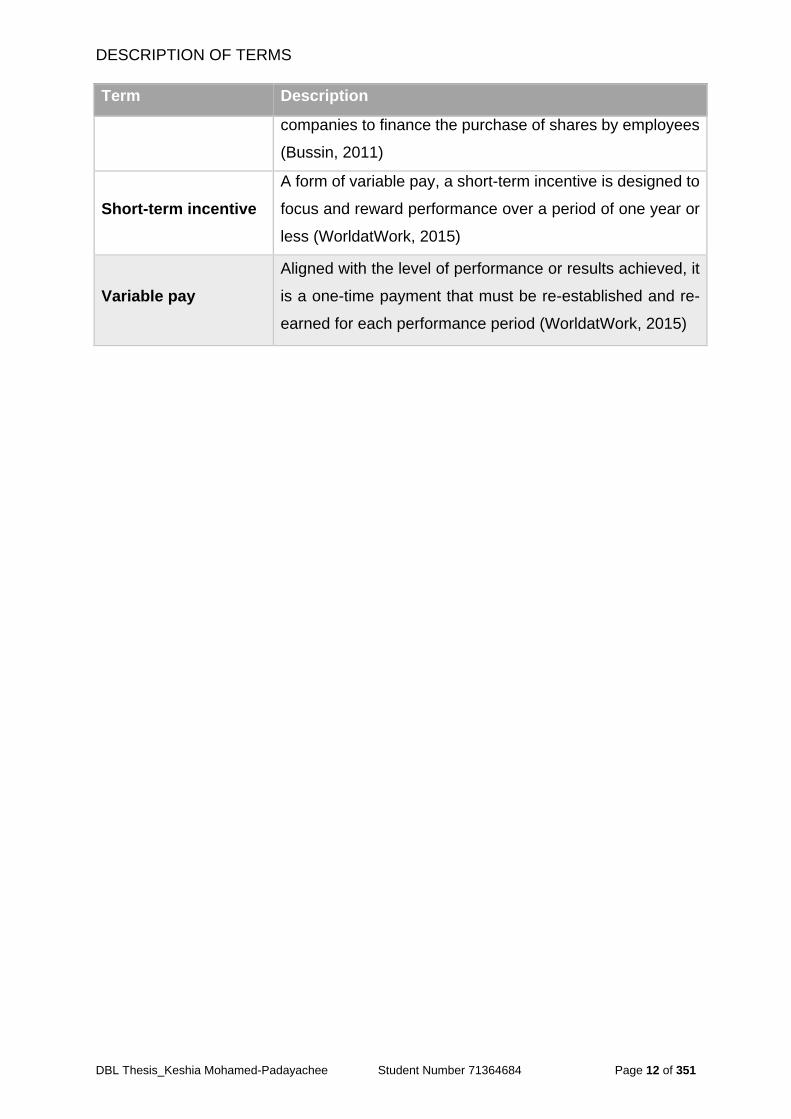
Share options A unit of ownership in a company; shares must be paid for
in cash, except in the case of share schemes, which allow
DESCRIPTION OF TERMS
DBL Thesis_Keshia Mohamed-Padayachee Student Number 71364684 Page 12 of 351
Term Description
companies to finance the purchase of shares by employees
(Bussin, 2011)
Short-term incentive
A form of variable pay, a short-term incentive is designed to
focus and reward performance over a period of one year or
less (WorldatWork, 2015)
Variable pay
Aligned with the level of performance or results achieved, it
is a one-time payment that must be re-established and re-
earned for each performance period (WorldatWork, 2015)
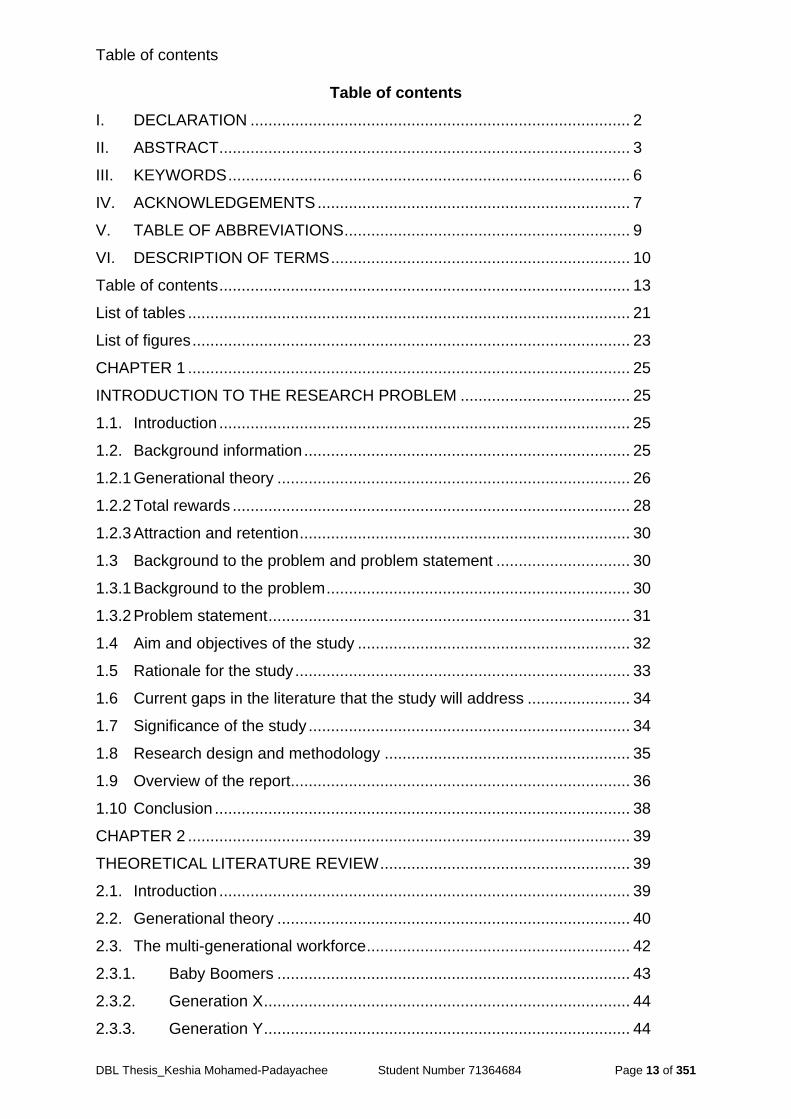
Table of contents
DBL Thesis_Keshia Mohamed-Padayachee Student Number 71364684 Page 13 of 351
Table of contents
I. DECLARATION ..................................................................................... 2
II. ABSTRACT ............................................................................................ 3
III. KEYWORDS .......................................................................................... 6
IV. ACKNOWLEDGEMENTS ...................................................................... 7
V. TABLE OF ABBREVIATIONS ................................................................ 9
VI. DESCRIPTION OF TERMS ................................................................... 10
Table of contents ............................................................................................ 13
List of tables ................................................................................................... 21
List of figures .................................................................................................. 23
CHAPTER 1 ................................................................................................... 25
INTRODUCTION TO THE RESEARCH PROBLEM ...................................... 25
1.1. Introduction ............................................................................................ 25
1.2. Background information ......................................................................... 25
1.2.1 Generational theory ............................................................................... 26
1.2.2 Total rewards ......................................................................................... 28
1.2.3 Attraction and retention .......................................................................... 30
1.3 Background to the problem and problem statement .............................. 30
1.3.1 Background to the problem .................................................................... 30
1.3.2 Problem statement ................................................................................. 31
1.4 Aim and objectives of the study ............................................................. 32
1.5 Rationale for the study ........................................................................... 33
1.6 Current gaps in the literature that the study will address ....................... 34
1.7 Significance of the study ........................................................................ 34
1.8 Research design and methodology ....................................................... 35
1.9 Overview of the report............................................................................ 36
1.10 Conclusion ............................................................................................. 38
CHAPTER 2 ................................................................................................... 39
THEORETICAL LITERATURE REVIEW ........................................................ 39
2.1. Introduction ............................................................................................ 39
2.2. Generational theory ............................................................................... 40
2.3. The multi-generational workforce ........................................................... 42
2.3.1. Baby Boomers ............................................................................... 43
2.3.2. Generation X .................................................................................. 44
2.3.3. Generation Y .................................................................................. 44
Table of contents
DBL Thesis_Keshia Mohamed-Padayachee Student Number 71364684 Page 14 of 351
2.4. Total reward systems ............................................................................. 52
2.4.1 Total reward models .............................................................................. 53
2.4.1.1 WorldatWork total rewards model .................................................. 53
2.4.1.2 The Hay Group total rewards model .............................................. 55
2.4.1.3 Zingheim and Schuster total rewards model .................................. 57
2.4.1.4 Towers Watson total rewards ........................................................ 59
2.4.1.5 The Towers Perrin total rewards model ......................................... 60
2.4.1.6 Why the WorldatWork total rewards model was tested? ................ 63
2.5. Life- and career-stage Models ............................................................... 65
2.5.1. Career-stage Model ....................................................................... 65
2.5.1.1. The Entry stage ............................................................................. 66
2.5.1.2. The Colleague stage ...................................................................... 66
2.5.1.3. The Counsellor stage ..................................................................... 67
2.5.1.4. The Advisor stage .......................................................................... 67
2.5.2. Life-stage Model ............................................................................ 69
2.6. Theories of motivation............................................................................ 71
2.6.1. Incentive theory of motivation ........................................................ 72
2.6.2. Maslow’s hierarchy of needs .......................................................... 72
2.6.3. Herzberg's two-factor theory .......................................................... 74
2.6.4. Expectancy theory ......................................................................... 76
2.6.5. Equity theory .................................................................................. 76
2.7. Attraction and retention strategies ......................................................... 77
2.8. Categories and elements of rewards ..................................................... 78
2.8.1. Categories and elements derived from generation theory ............. 78
2.8.2. Categories and elements derived from life and career stage models
....................................................................................................... 79
2.8.3. Categories and elements derived from total rewards systems ....... 79
2.8.3.1. WorldatWork total rewards model .................................................. 80
2.8.3.2. Hay Group Total rewards model .................................................... 80
2.8.3.3. Zingheim and Schuster total rewards model .................................. 80
2.8.3.4. Towers Watson total rewards model .............................................. 81
2.8.3.5. The Towers Perrin total rewards model ......................................... 81
2.8.4. Categories and elements derived from motivational theories ........ 82
2.8.5. Categories and elements derived from attraction and retention strategies
....................................................................................................... 83
Table of contents
DBL Thesis_Keshia Mohamed-Padayachee Student Number 71364684 Page 15 of 351
2.8.6. Summary of categories and elements derived from the theoretical
literature review .............................................................................................. 83
2.9. Conclusion ............................................................................................. 84
CHAPTER 3 ................................................................................................... 87
RESEARCH METHODOLOGY ...................................................................... 87
3.1. Introduction and overview ...................................................................... 87
3.2. Research philosophy ............................................................................. 87
3.2.1. Ontology ........................................................................................ 87
3.2.2. Epistemology ................................................................................. 90
3.3. Research approach ............................................................................... 92
3.3.1. Phase I: Quantitative research approach ....................................... 93
3.3.2. Phase II: Qualitative approach ....................................................... 93
3.4. Research methodology .......................................................................... 95
3.4.1. Phase I: Quantitative methods ....................................................... 97
3.4.2. Pilot study ...................................................................................... 98
3.4.3. The measuring instrument ............................................................. 99
3.4.3.1. Section A: Demographic data ........................................................ 99
3.4.3.2. Section B: Total Reward Elements ................................................ 101
3.4.3.3. Section B: Total reward options’ rank order ................................... 104
3.4.3.4. Section C: Feedback ...................................................................... 104
3.4.4. Sampling methods ......................................................................... 105
3.4.5. Data collection ............................................................................... 107
3.4.6. Method of statistical analysis ......................................................... 108
3.4.6.1. Variable analysis ............................................................................ 109
3.4.6.2. Frequency distribution .................................................................... 110
3.4.6.3. Chi-square test .............................................................................. 110
3.4.6.4. Factor analysis ............................................................................... 112
3.4.7. Generalisability .............................................................................. 115
3.4.8. Validity and reliability ..................................................................... 115
3.5. Phase II: Qualitative research ................................................................ 115
3.5.1. Sampling methods ......................................................................... 116
3.5.2. Measuring instrument and pilot study ............................................ 117
3.5.3. Scheduling the interviews .............................................................. 118
3.5.4. Data collection ............................................................................... 119
3.5.5. Data analysis ................................................................................. 119
Table of contents
DBL Thesis_Keshia Mohamed-Padayachee Student Number 71364684 Page 16 of 351
3.5.5.1. Stage 1: Interview guide developed ............................................... 120
3.5.5.2. Stage 2: Interviews conducted, transcribed and grouped .............. 121
3.5.5.3. Stage 3: Coding ............................................................................. 121
3.5.5.3.1. Pre-set codes ................................................................................. 121
3.5.5.3.2. Emergent codes ............................................................................. 121
3.5.5.3.3. Codes refined ................................................................................ 122
3.5.5.4. Stage 4: Themes............................................................................ 122
3.5.5.5. Stage 5: Narrative .......................................................................... 122
3.5.5.5.1. Meaning condensation ................................................................... 124
3.5.5.5.2. Meaning categorisation .................................................................. 124
3.5.6. Transferability of the data .............................................................. 125
3.5.7. Credibility of the data ..................................................................... 126
3.6. Ethical considerations ............................................................................ 127
3.7. Conclusion ............................................................................................. 128
CHAPTER 4 ................................................................................................... 129
RESULTS: QUANTITATIVE RESEARCH ...................................................... 129
4.1. Introduction ............................................................................................ 129
PART I DESCRIPTIVE ANALYSIS ................................................................ 130
4.2. Demographic profile ............................................................................... 130
4.2.1. Demographic profile of respondents .............................................. 131
4.2.1.1. Year of birth by group .................................................................... 131
4.2.1.2. Gender ........................................................................................... 132
4.2.1.3. Race .............................................................................................. 133
4.2.1.4. Work experience ............................................................................ 134
4.2.1.5. Relationship status ......................................................................... 135
4.2.1.6. Education ....................................................................................... 136
4.2.1.7. Field of study ................................................................................. 137
4.2.1.8. Province ......................................................................................... 137
4.2.1.9. Employment status ........................................................................ 138
4.2.1.10. Employment sector ........................................................................ 139
4.2.1.11. Living arrangements ...................................................................... 139
4.3. Total rewards options ............................................................................ 140
4.3.1. Total reward findings for Attraction ................................................ 140
4.3.1.1. Remuneration ................................................................................ 145
4.3.1.2. Benefits .......................................................................................... 146
Table of contents
DBL Thesis_Keshia Mohamed-Padayachee Student Number 71364684 Page 17 of 351
4.3.1.3. Performance recognition ................................................................ 148
4.3.1.4. Career development ...................................................................... 148
4.3.1.5. Work‒life ........................................................................................ 150
4.3.1.6. Safety/Security ............................................................................... 150
4.3.1.7. Social support ................................................................................ 151
4.3.1.8. Frequency distribution for Attraction .............................................. 152
4.3.2. Total reward findings for Retention ................................................ 154
4.3.2.1. Remuneration ................................................................................ 158
4.3.2.2. Benefits .......................................................................................... 159
4.3.2.3. Performance recognition ................................................................ 160
4.3.2.4. Career development ...................................................................... 161
4.3.2.5. Work‒life ........................................................................................ 163
4.3.2.6. Safety/Security ............................................................................... 163
4.3.2.7. Social support ................................................................................ 164
4.3.2.8. Frequency distribution for Retention .............................................. 165
4.3.3. Total reward categories’ ranking .................................................... 167
PART II INFERENTIAL ANALYSIS ................................................................ 169
4.4. Associations between demographic characteristics and reward preferences
....................................................................................................... 169
4.5. Study hypotheses .................................................................................. 176
4.5.1. Hypothesis testing results for Attraction ......................................... 177
4.5.2. Hypothesis testing results for Retention ......................................... 181
4.6. Factor analysis ....................................................................................... 184
4.6.1. Factor analysis for Attraction ......................................................... 184
4.6.2. Factor analysis for Retention ......................................................... 189
4.7. Reliability ............................................................................................... 193
4.8. Total rewards framework for the youth................................................... 196
4.8.1. Evaluation of the WorldatWork total rewards ................................. 198
4.8.2. Ranking the reward factors ............................................................ 199
4.8.2.1. Attraction ........................................................................................ 199
4.8.2.2. Retention ....................................................................................... 199
4.9. Conclusion ............................................................................................. 200
CHAPTER 5 ................................................................................................... 202
RESULTS: QUALITATIVE RESEARCH ......................................................... 202
5.1. Introduction ............................................................................................ 202
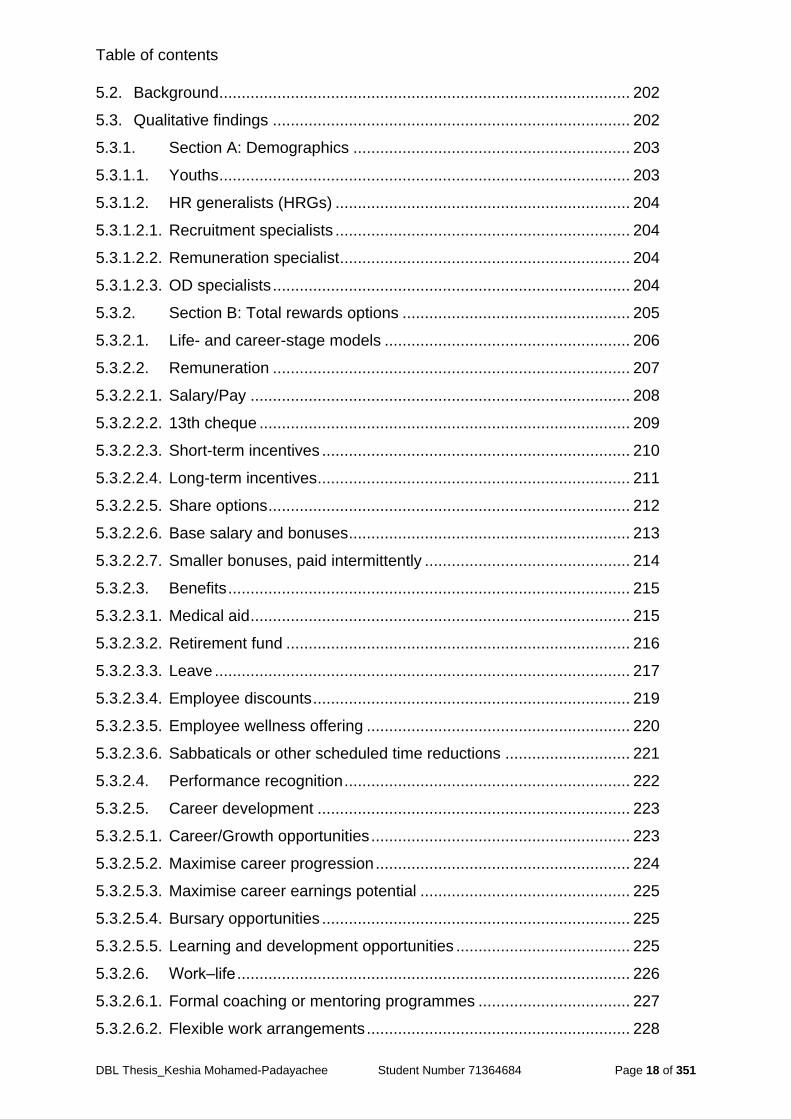
Table of contents
DBL Thesis_Keshia Mohamed-Padayachee Student Number 71364684 Page 18 of 351
5.2. Background ............................................................................................ 202
5.3. Qualitative findings ................................................................................ 202
5.3.1. Section A: Demographics .............................................................. 203
5.3.1.1. Youths ............................................................................................ 203
5.3.1.2. HR generalists (HRGs) .................................................................. 204
5.3.1.2.1. Recruitment specialists .................................................................. 204
5.3.1.2.2. Remuneration specialist ................................................................. 204
5.3.1.2.3. OD specialists ................................................................................ 204
5.3.2. Section B: Total rewards options ................................................... 205
5.3.2.1. Life- and career-stage models ....................................................... 206
5.3.2.2. Remuneration ................................................................................ 207
5.3.2.2.1. Salary/Pay ..................................................................................... 208
5.3.2.2.2. 13th cheque ................................................................................... 209
5.3.2.2.3. Short-term incentives ..................................................................... 210
5.3.2.2.4. Long-term incentives ...................................................................... 211
5.3.2.2.5. Share options ................................................................................. 212
5.3.2.2.6. Base salary and bonuses ............................................................... 213
5.3.2.2.7. Smaller bonuses, paid intermittently .............................................. 214
5.3.2.3. Benefits .......................................................................................... 215
5.3.2.3.1. Medical aid ..................................................................................... 215
5.3.2.3.2. Retirement fund ............................................................................. 216
5.3.2.3.3. Leave ............................................................................................. 217
5.3.2.3.4. Employee discounts ....................................................................... 219
5.3.2.3.5. Employee wellness offering ........................................................... 220
5.3.2.3.6. Sabbaticals or other scheduled time reductions ............................ 221
5.3.2.4. Performance recognition ................................................................ 222
5.3.2.5. Career development ...................................................................... 223
5.3.2.5.1. Career/Growth opportunities .......................................................... 223
5.3.2.5.2. Maximise career progression ......................................................... 224
5.3.2.5.3. Maximise career earnings potential ............................................... 225
5.3.2.5.4. Bursary opportunities ..................................................................... 225
5.3.2.5.5. Learning and development opportunities ....................................... 225
5.3.2.6. Work‒life ........................................................................................ 226
5.3.2.6.1. Formal coaching or mentoring programmes .................................. 227
5.3.2.6.2. Flexible work arrangements ........................................................... 228
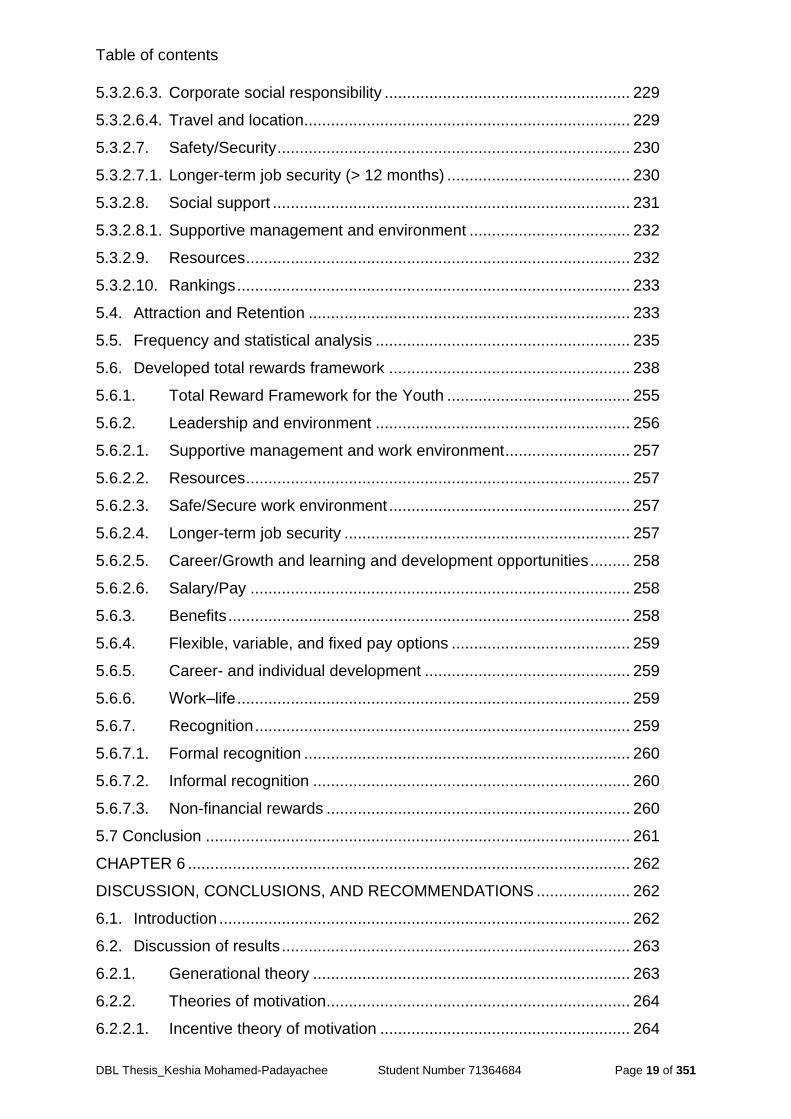
Table of contents
DBL Thesis_Keshia Mohamed-Padayachee Student Number 71364684 Page 19 of 351
5.3.2.6.3. Corporate social responsibility ....................................................... 229
5.3.2.6.4. Travel and location ......................................................................... 229
5.3.2.7. Safety/Security ............................................................................... 230
5.3.2.7.1. Longer-term job security (> 12 months) ......................................... 230
5.3.2.8. Social support ................................................................................ 231
5.3.2.8.1. Supportive management and environment .................................... 232
5.3.2.9. Resources ...................................................................................... 232
5.3.2.10. Rankings ........................................................................................ 233
5.4. Attraction and Retention ........................................................................ 233
5.5. Frequency and statistical analysis ......................................................... 235
5.6. Developed total rewards framework ...................................................... 238
5.6.1. Total Reward Framework for the Youth ......................................... 255
5.6.2. Leadership and environment ......................................................... 256
5.6.2.1. Supportive management and work environment ............................ 257
5.6.2.2. Resources ...................................................................................... 257
5.6.2.3. Safe/Secure work environment ...................................................... 257
5.6.2.4. Longer-term job security ................................................................ 257
5.6.2.5. Career/Growth and learning and development opportunities ......... 258
5.6.2.6. Salary/Pay ..................................................................................... 258
5.6.3. Benefits .......................................................................................... 258
5.6.4. Flexible, variable, and fixed pay options ........................................ 259
5.6.5. Career- and individual development .............................................. 259
5.6.6. Work‒life ........................................................................................ 259
5.6.7. Recognition .................................................................................... 259
5.6.7.1. Formal recognition ......................................................................... 260
5.6.7.2. Informal recognition ....................................................................... 260
5.6.7.3. Non-financial rewards .................................................................... 260
5.7 Conclusion ............................................................................................... 261
CHAPTER 6 ................................................................................................... 262
DISCUSSION, CONCLUSIONS, AND RECOMMENDATIONS ..................... 262
6.1. Introduction ............................................................................................ 262
6.2. Discussion of results .............................................................................. 263
6.2.1. Generational theory ....................................................................... 263
6.2.2. Theories of motivation .................................................................... 264
6.2.2.1. Incentive theory of motivation ........................................................ 264
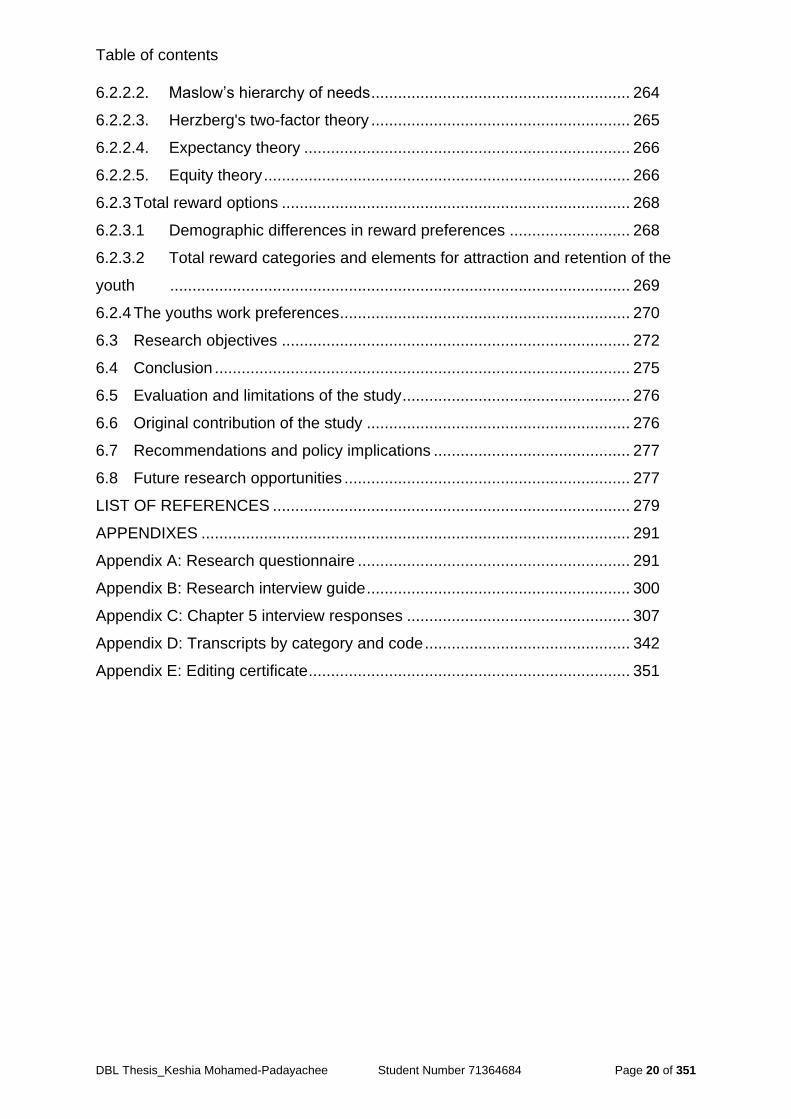
Table of contents
DBL Thesis_Keshia Mohamed-Padayachee Student Number 71364684 Page 20 of 351
6.2.2.2. Maslow’s hierarchy of needs .......................................................... 264
6.2.2.3. Herzberg's two-factor theory .......................................................... 265
6.2.2.4. Expectancy theory ......................................................................... 266
6.2.2.5. Equity theory .................................................................................. 266
6.2.3 Total reward options .............................................................................. 268
6.2.3.1 Demographic differences in reward preferences ........................... 268
6.2.3.2 Total reward categories and elements for attraction and retention of the
youth ....................................................................................................... 269
6.2.4 The youths work preferences ................................................................. 270
6.3 Research objectives .............................................................................. 272
6.4 Conclusion ............................................................................................. 275
6.5 Evaluation and limitations of the study ................................................... 276
6.6 Original contribution of the study ........................................................... 276
6.7 Recommendations and policy implications ............................................ 277
6.8 Future research opportunities ................................................................ 277
LIST OF REFERENCES ................................................................................ 279
APPENDIXES ................................................................................................ 291
Appendix A: Research questionnaire ............................................................. 291
Appendix B: Research interview guide ........................................................... 300
Appendix C: Chapter 5 interview responses .................................................. 307
Appendix D: Transcripts by category and code .............................................. 342
Appendix E: Editing certificate ........................................................................ 351
List of tables
DBL Thesis_Keshia Mohamed-Padayachee Student Number 71364684 Page 21 of 351
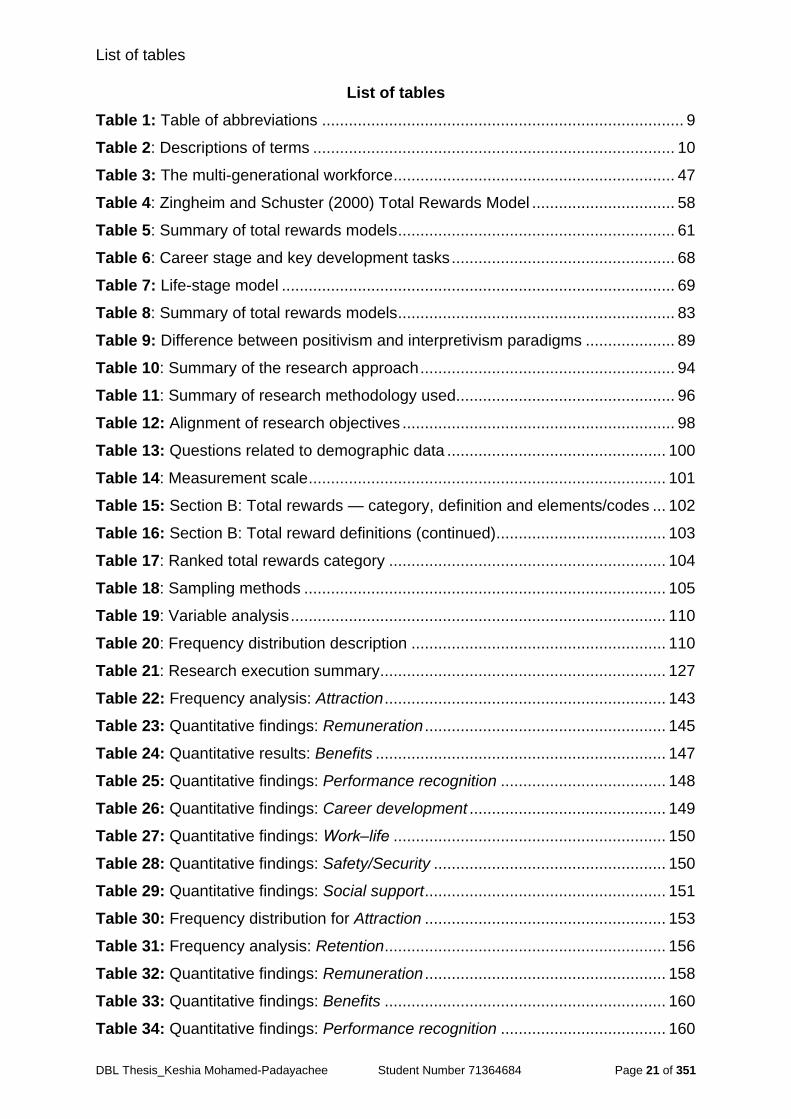
List of tables
Table 1: Table of abbreviations ................................................................................. 9
Table 2: Descriptions of terms ................................................................................. 10
Table 3: The multi-generational workforce ............................................................... 47
Table 4: Zingheim and Schuster (2000) Total Rewards Model ................................ 58
Table 5: Summary of total rewards models .............................................................. 61
Table 6: Career stage and key development tasks .................................................. 68
Table 7: Life-stage model ........................................................................................ 69
Table 8: Summary of total rewards models .............................................................. 83
Table 9: Difference between positivism and interpretivism paradigms .................... 89
Table 10: Summary of the research approach ......................................................... 94
Table 11: Summary of research methodology used................................................. 96
Table 12: Alignment of research objectives ............................................................. 98
Table 13: Questions related to demographic data ................................................. 100
Table 14: Measurement scale ................................................................................ 101
Table 15: Section B: Total rewards — category, definition and elements/codes ... 102
Table 16: Section B: Total reward definitions (continued) ...................................... 103
Table 17: Ranked total rewards category .............................................................. 104
Table 18: Sampling methods ................................................................................. 105
Table 19: Variable analysis .................................................................................... 110
Table 20: Frequency distribution description ......................................................... 110
Table 21: Research execution summary ................................................................ 127
Table 22: Frequency analysis: Attraction ............................................................... 143
Table 23: Quantitative findings: Remuneration ...................................................... 145
Table 24: Quantitative results: Benefits ................................................................. 147
Table 25: Quantitative findings: Performance recognition ..................................... 148
Table 26: Quantitative findings: Career development ............................................ 149
Table 27: Quantitative findings: Work‒life ............................................................. 150
Table 28: Quantitative findings: Safety/Security .................................................... 150
Table 29: Quantitative findings: Social support ...................................................... 151
Table 30: Frequency distribution for Attraction ...................................................... 153
Table 31: Frequency analysis: Retention ............................................................... 156
Table 32: Quantitative findings: Remuneration ...................................................... 158
Table 33: Quantitative findings: Benefits ............................................................... 160
Table 34: Quantitative findings: Performance recognition ..................................... 160
List of tables
DBL Thesis_Keshia Mohamed-Padayachee Student Number 71364684 Page 22 of 351
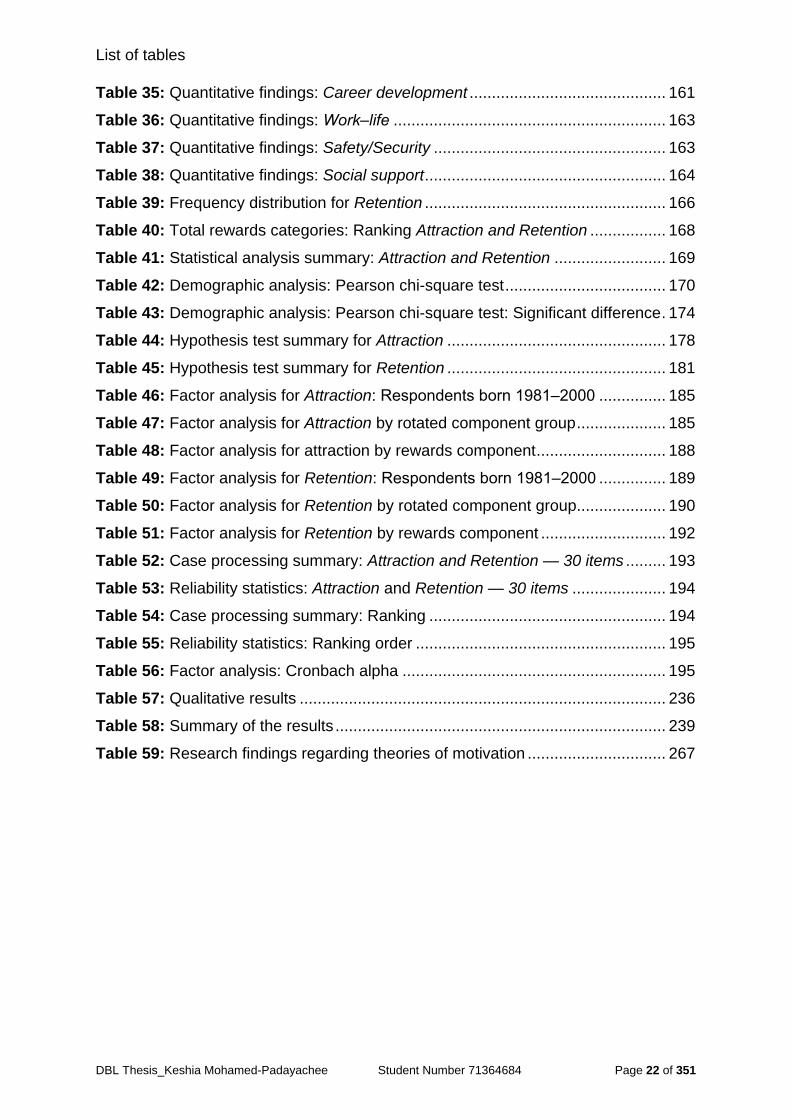
Table 35: Quantitative findings: Career development ............................................ 161
Table 36: Quantitative findings: Work‒life ............................................................. 163
Table 37: Quantitative findings: Safety/Security .................................................... 163
Table 38: Quantitative findings: Social support ...................................................... 164
Table 39: Frequency distribution for Retention ...................................................... 166
Table 40: Total rewards categories: Ranking Attraction and Retention ................. 168
Table 41: Statistical analysis summary: Attraction and Retention ......................... 169
Table 42: Demographic analysis: Pearson chi-square test .................................... 170
Table 43: Demographic analysis: Pearson chi-square test: Significant difference . 174
Table 44: Hypothesis test summary for Attraction ................................................. 178
Table 45: Hypothesis test summary for Retention ................................................. 181
Table 46: Factor analysis for Attraction: Respondents born 1981‒2000 ............... 185
Table 47: Factor analysis for Attraction by rotated component group .................... 185
Table 48: Factor analysis for attraction by rewards component ............................. 188
Table 49: Factor analysis for Retention: Respondents born 1981‒2000 ............... 189
Table 50: Factor analysis for Retention by rotated component group.................... 190
Table 51: Factor analysis for Retention by rewards component ............................ 192
Table 52: Case processing summary: Attraction and Retention — 30 items ......... 193
Table 53: Reliability statistics: Attraction and Retention — 30 items ..................... 194
Table 54: Case processing summary: Ranking ..................................................... 194
Table 55: Reliability statistics: Ranking order ........................................................ 195
Table 56: Factor analysis: Cronbach alpha ........................................................... 195
Table 57: Qualitative results .................................................................................. 236
Table 58: Summary of the results .......................................................................... 239
Table 59: Research findings regarding theories of motivation ............................... 267
List of figures
DBL Thesis_Keshia Mohamed-Padayachee Student Number 71364684 Page 23 of 351
List of figures
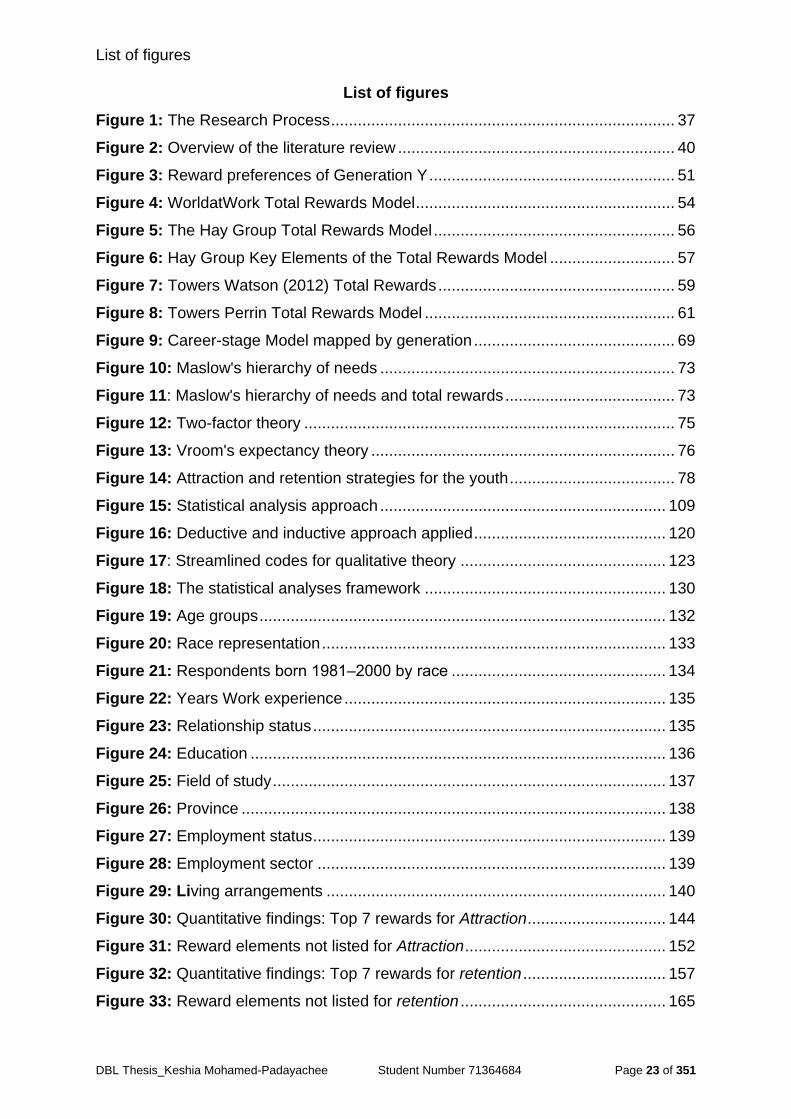
Figure 1: The Research Process ............................................................................. 37
Figure 2: Overview of the literature review .............................................................. 40
Figure 3: Reward preferences of Generation Y ....................................................... 51
Figure 4: WorldatWork Total Rewards Model .......................................................... 54
Figure 5: The Hay Group Total Rewards Model ...................................................... 56
Figure 6: Hay Group Key Elements of the Total Rewards Model ............................ 57
Figure 7: Towers Watson (2012) Total Rewards ..................................................... 59
Figure 8: Towers Perrin Total Rewards Model ........................................................ 61
Figure 9: Career-stage Model mapped by generation ............................................. 69
Figure 10: Maslow's hierarchy of needs .................................................................. 73
Figure 11: Maslow's hierarchy of needs and total rewards ...................................... 73
Figure 12: Two-factor theory ................................................................................... 75
Figure 13: Vroom's expectancy theory .................................................................... 76
Figure 14: Attraction and retention strategies for the youth ..................................... 78
Figure 15: Statistical analysis approach ................................................................ 109
Figure 16: Deductive and inductive approach applied ........................................... 120
Figure 17: Streamlined codes for qualitative theory .............................................. 123
Figure 18: The statistical analyses framework ...................................................... 130
Figure 19: Age groups ........................................................................................... 132
Figure 20: Race representation ............................................................................. 133
Figure 21: Respondents born 1981‒2000 by race ................................................ 134
Figure 22: Years Work experience ........................................................................ 135
Figure 23: Relationship status ............................................................................... 135
Figure 24: Education ............................................................................................. 136
Figure 25: Field of study ........................................................................................ 137
Figure 26: Province ............................................................................................... 138
Figure 27: Employment status ............................................................................... 139
Figure 28: Employment sector .............................................................................. 139
Figure 29: Living arrangements ............................................................................ 140
Figure 30: Quantitative findings: Top 7 rewards for Attraction ............................... 144
Figure 31: Reward elements not listed for Attraction ............................................. 152
Figure 32: Quantitative findings: Top 7 rewards for retention ................................ 157
Figure 33: Reward elements not listed for retention .............................................. 165
List of figures
DBL Thesis_Keshia Mohamed-Padayachee Student Number 71364684 Page 24 of 351
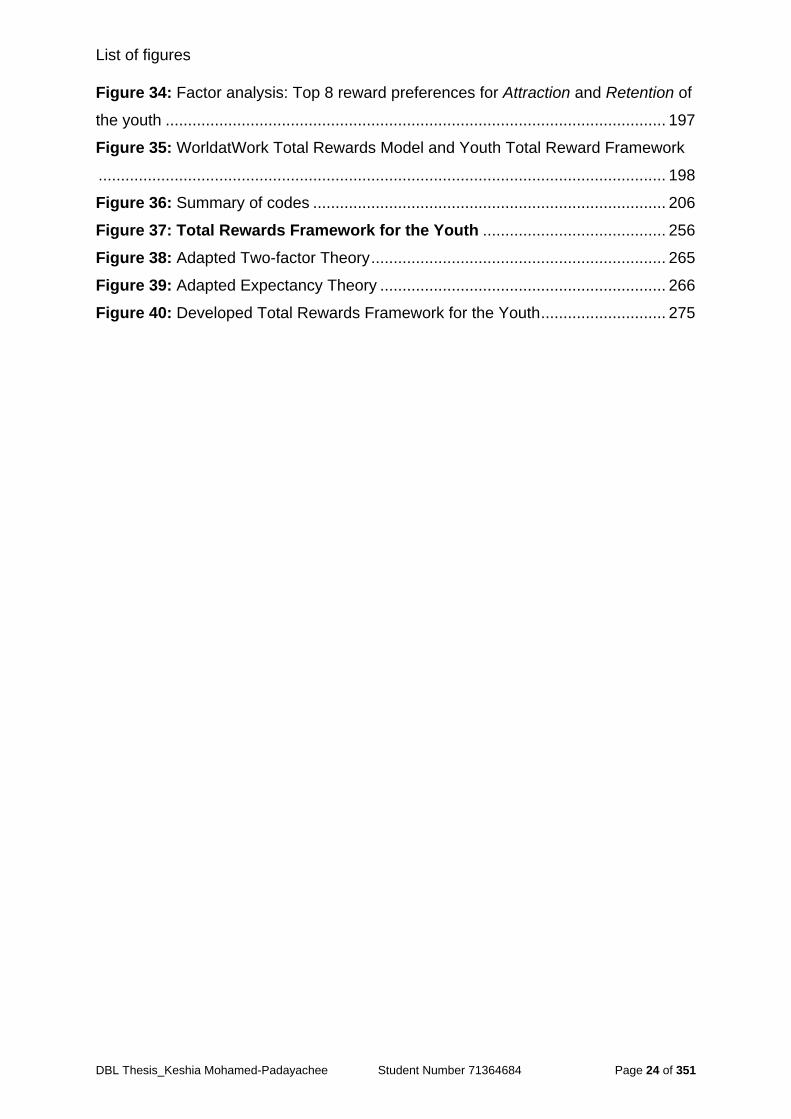
Figure 34: Factor analysis: Top 8 reward preferences for Attraction and Retention of
the youth ................................................................................................................ 197
Figure 35: WorldatWork Total Rewards Model and Youth Total Reward Framework
............................................................................................................................... 198
Figure 36: Summary of codes ............................................................................... 206
Figure 37: Total Rewards Framework for the Youth ......................................... 256
Figure 38: Adapted Two-factor Theory .................................................................. 265
Figure 39: Adapted Expectancy Theory ................................................................ 266
Figure 40: Developed Total Rewards Framework for the Youth ............................ 275
CHAPTER 1
DBL Thesis_Keshia Mohamed-Padayachee Student Number 71364684 Page 25 of 351
CHAPTER 1
INTRODUCTION TO THE RESEARCH PROBLEM
1.1. Introduction
Organisational environments are characterised by increasing shortages of skilled
labour, and designing employment systems that prioritise human resource
development to create a competitive advantage has become imperative (Holland,
Sheehan, De Cieri, 2007).
Rewards drive employee morale; therefore, employee rewards distribution has always
loomed large in organisations (Appelbaum, Serena & Shapiro, 2005). With labour
costs accounting for more than 50% of the total costs of doing business, strategic
management of human capital assets is of primary importance. For employees, an
equitable rewards distribution system signals management's emphasis on valuing
employees (Datta, 2012).
Incentives play an important role in attracting, motivating, rewarding, energising, and
retaining employees, and a ‘one-size-fits-all’ plan is not appropriate for today’s
multigenerational workplace (Hewitt Aon (Aon), 2016). Flexible work arrangements
and other initiatives aimed at enhancing quality of life have universal appeal (Nelson,
1999). The focus and purpose of the present research is to identify what intrinsic and
extrinsic rewards are important to skilled and qualified youth employees born in the
years 1980 to 2000, with reference to the reward categories of total rewards models,
generational and motivational theories and attraction and retention strategies. This
research will inform organisations regarding the remuneration and benefits they can
incorporate into their total reward strategies to attract and retain skilled and qualified
youths.
1.2. Background information
The South African National Youth Policy (2009) defines youths as persons between
the ages of 14 and 35 years. This wide scope of youths includes those who have been
exposed to different socio-political and historical experiences.
INTRODUCTION TO THE RESEARCH PROBLEM
DBL Thesis_Keshia Mohamed-Padayachee Student Number 71364684 Page 26 of 351
Today, a 35-year-old youth lived during a period of heightened political conflicts, when
he or she was a learner in school, while a 14-year-old youth is growing up in an
environment where many of the new reforms and aims of political struggles are being
realised. It is for these reasons that the researcher considered generational theories,
which reviews generations over the same time span.
Strauss and Howe (1991) define a generation as a unique cohort born within a period
of about 20 years, whose boundaries are fixed by peer personality. The group
encounters key historical events and social trends while occupying the same phase of
life. Bell and Narz (2007) describe generations as defined by demographics and key
life events that shape, at least to some degree, distinctive generational characteristics.
Based on the above definitions, the researcher identified the parallel between the
South African National Youth Policy (2009) and Strauss and Howe’s (1991)
generational theories to describe the modern-day youth employee.
1.2.1 Generational theory
Today’s workplace consists of three generations: Baby Boomers, Generation X, and
Generation Y, who have been influenced by the events of their time, creating new
challenges for employers (Kapoor & Solomon, 2011). The research will review all
three these generations, with a specific emphasis on Generation Y as representing
youth employees. While the outgoing generation of Baby Boomers and the existing
workforce of Generation X have shaped the working environment of today, the
emerging Generation Y will contribute to shaping the workforce over the years to
come.
For the purposes of this study, Generation Z, has not been included due to the ages
of this generation who have largely not entered the workforce. This generation has
been defined as teenagers by Howe and Strauss (2005) and excluded from the South
African National Youth Policy (2009).
A 14th century Bedouin, Ibn Khaldun (1332‒1406), was the first philosopher to
describe a four-generation cycle in detail. The works of Greek historian Cicero (106
BC–43 BC), Greek writers Heraclitus (1912) and Homer (700‒800 BC), Chinese
INTRODUCTION TO THE RESEARCH PROBLEM
DBL Thesis_Keshia Mohamed-Padayachee Student Number 71364684 Page 27 of 351
philosopher Lin Yuang (1895–1976), and the Old Testament (especially the book of
Judges), show that this cyclical nature of history and generational development have
not just been recently noticed. Historically, philosophers who have attempted to
describe generational theory include Auguste Comte (1865), Maximilien Littre (1859),
John Stuart Mill (1974), Ottokar Lorenz (1861), Wilhelm Dilthey (1883), and Emile
Durkheim (1887). The primary European contributors to the generational theory in the
20th century have been Jose Ortega y Gasset (1923), Julius Peterson (1930), Wilhelm
Pinder (1926), Julian Marias (1961), and Pierre Bourdieu (1972). Their works were
popularised by the writings of Howe and Strauss (1990), and Codrington and Grant-
Marshall (2008).
Strauss and Howe (1991) based their definition of a generation on the work of various
writers and social philosophers, from ancient writers to modern social theorists such
as José Ortega y Gasset and Karl Mannheim (1923), John Stuart Mill (1947),
Maximilien Littre (1859), Auguste Comte (1798) and François Mentré (1920).
Generational theory is sometimes considered contentious, especially because
psychologists have over-used the generational labels; and sociologists have not
sufficiently established commonly accepted definitions. However, there is
comprehensive evidence and on-going research to show that a generational approach
to understanding society and groups of people is scientifically acceptable and well-
grounded in respectable social science. Generational differences reflect changes in
the culture as a whole, and are a useful proxy for the socio-cultural environment of
different time periods (Twenge, 2010).
The present study is focused on youths born from 1981 to 2000, aligned with the
definition of the South African National Youth Policy (2009) and the description of
Generation Y of Strauss and Howe (1991). Members belonging to the other age
groups with the exception of Generation Z were also included for comparison
purposes, aligned with the descriptions of Generation X and Baby Boomers of Strauss
and Howe (1991).
The proposed research will review the empirical evidence on generational theory in
terms of work values, in order to give managers, human resource (HR) practitioners,
and other interested parties responsible for attracting and retaining high-value
INTRODUCTION TO THE RESEARCH PROBLEM
DBL Thesis_Keshia Mohamed-Padayachee Student Number 71364684 Page 28 of 351
multigenerational employees, a clearer picture of what attracts and retains the youth
entering today’s multigenerational workplace. This will provide leadership with an
enhanced understanding of these new employees, their reward expectations, and their
priorities, which will assist employers in creating job offerings and work environments
that are more likely to attract and retain them (Ng, Schweitzer & Lyons, 2010).
As employers strive to attract and retain high-value young employees, it is more
important than ever for employers to understand the expectations that the youth bring
to the labour market (Ng, et al, 2010). Rewards must make joining or staying with an
organisation more attractive to the youth entering the workforce, given that rewards
are a core organisational reality that drives employee morale. This research will
evaluate total reward models and Generation Y theories, as well as the opportunities
that exist in designing total rewards structures for young, educated employees, in an
area in which little empirical research has been done.
The literature highlights that each generation has distinct characteristics, which affect
how the war for talent is waged (Twenge, 2010). The three generations currently in
the workplace will therefore be evaluated to determine and differentiate the
preferences of Generation Y. Companies must make workplace adjustments in order
to create a productive environment for all employees, regardless of their generation
(Kapoor & Solomon, 2011). Due to its size, compared to the smaller Generation X
and the gradual retirement of Baby Boomers, Generation Y has the potential of having
a large influence on the work environment (Borngräber-Berthelsen, 2008), which
cannot be ignored.
1.2.2 Total rewards
As described by Wang (2012), in the early 20th century, changes to business
landscape gave birth to a new discipline, which is, industrial and labour relations.
Labour unions rose, workers’ benefits increased, and the first eight-hour workdays
were introduced in India and later adopted by Ford in the United States of America.
Personnel management emerged as a discipline, and the mid-1930s saw the
development of labour protection and, with it, collective bargaining. In the 1940s,
fringe benefits emerged, and compensation and benefits as well as administration
positions were created in organisations when annual increases were introduced. The
1950s saw the implementation of executive compensation surveys and the use of
INTRODUCTION TO THE RESEARCH PROBLEM
DBL Thesis_Keshia Mohamed-Padayachee Student Number 71364684 Page 29 of 351
stock options to remunerate executives. In 1955, the WorldatWork was founded. In
the 1960s, the field of HR management was born. In the 1970s, new terms emerged;
the term work‒life balance was coined in the United Kingdom, and organisations
began measuring performance and competence, and instituting telecommuting and
flexible benefits. Germany originated flexi-time, and childcare became a workplace
issue. In the 1980s, HR systems were developed, and technology began to make HR
management more efficient and effective. The 1990s saw the emergence of strategic
pay concepts, offshoring, skyrocketing CEO pay, and labour legislation being enacted.
Total rewards were first used in the 1990s, and the stock-market crash helped to bring
to an end defined benefit plans. The Pension Protection Act (2006), of America was
promulgated, and investors started having a say in employees’ pay (Wang, 2012).
The idea of total rewards emerged in the 1990s, and, in 2000, WorldatWork introduced
its first total rewards model after discussions with leading thinkers in the field. The
WorldatWork Total Rewards Model was intended to advance the concept of rewards,
and help practitioners think about and execute remuneration in new ways. From 2000
to 2005, the body of knowledge associated with total rewards became more robust as
practitioners experienced the power of integrated strategies. During the past two
decades, various total rewards models were published. Each approach presents a
unique point of view, but all of the models recognise the importance of leveraging
multiple programmes, practices, and cultural dynamics to satisfy and engage the best
employees, contributing to improved business performance and results (Wang, 2012).
It has become clear that the battle for talent involves much more than highly effective,
strategically designed compensation and benefits programmes. While these
programmes remain critical, the most successful companies have realised that they
must take a much broader look at the factors involved in attraction, motivation, and
retention. They must employ all the factors — including compensation, benefits, work‒
life, performance recognition, development, and career opportunities — to their
strategic advantage (Wang, 2012).
To understand the rewards required to attract and retain talent, the researcher will
review the total rewards models, discussed in chapter 2, which include and will
hereafter be referred to as WorldatWork (2015), Hay Group (2008), Zingheim and
Schuster (2000), Towers Watson (2012), and Watson Perrin Total Rewards Models
INTRODUCTION TO THE RESEARCH PROBLEM
DBL Thesis_Keshia Mohamed-Padayachee Student Number 71364684 Page 30 of 351
(Armstrong, 2010). Emphasis will be put on the reward categories of the WorldatWork
(2015) Total Rewards Model.
1.2.3 Attraction and retention
Scholars have long noted that the ability to attract and retain high-quality workers is
critical to organisational competitiveness (Holland, Sheehan, De Cieri, 2007).
Research conducted by Aon (2012) across many disciplines indicates that a
combination of rewards offered by an employer represents a system of inducements,
where different reward elements drive different behaviours and outcomes. Some
rewards are strong attractors, while others play a more important role in motivating or
engaging employees. This insight is collaborated by the researcher’s personal
experience. Failure to identify and properly manage rewards can ultimately lead to a
reduced ability to attract and retain employees. Furthermore, understanding what
attracts employees is just as important as understanding what retains them.
1.3 Background to the problem and problem statement
1.3.1 Background to the problem
For years, employers have been aware of employee attraction and retention issues in
their workplaces (Gilbert, 2011). Organisations have one engagement policy (without
any differentiation for the generations of employees), yet these generations have
different needs, desires, and attitudes, and none of the existing total rewards
frameworks can address this issue effectively, especially as far as the youth is
concerned, who represent the vastest generation (Myers & Dreachslin, 2007; Rollsjö,
2009; Crampton & Hodge, 2006). As Generation Y grows into the workforce and Baby
Boomers retire, managers and HR practitioners will need to develop new models for
attraction and retention, taking into account the generational differences between
Baby Boomers, Generation X, and Generation Y (Gilbert, 2011).
The profile of employees is changing, with members of Generation Y graduating and
entering the workforce. They are the fastest-growing segment of today’s workforce.
As organisations compete for available talent, employers cannot ignore the needs,
desires, and attitudes of this vast generation (Kane, 2012).
INTRODUCTION TO THE RESEARCH PROBLEM
DBL Thesis_Keshia Mohamed-Padayachee Student Number 71364684 Page 31 of 351
According to Bussin (2014), organisations are challenged by increasing difficulty in
attracting and retaining the youth. While organisations are easily able to attract
unemployed youths, once these employees have gained the necessary experience
and become marketable, organisations are finding it difficult to retain them.
Organisations are faced with the challenge of understanding why these employees
are leaving and how they need to change their reward strategies to attract and retain
high-calibre employees (Gilbert, 2011).
One-size-fits-all plans are not appropriate for today’s multigenerational workplace
(Aon, 2016). In addition, existing rewards models were developed by previous
generations for previous generations.
The purpose of the present study therefore, is to determine if Generation Y is different
from the previous generations, and, if so, to develop a more effective total rewards
framework, consisting of the rewards that will attract and retain the youth in
organisations. The research will consider previous generations’ reward preferences,
which will assist in answering the research question whether a different rewards model
is required to attract and retain youth employees in organisations.
Understanding the external and internal rewards that incentivise skilled and qualified
youths to determine what changes and priorities organisations need to consider for
their total rewards models to attract and retain these youths entering the workforce is
critical. This research will inform organisations regarding the remuneration and
benefits they can incorporate into their total reward strategies to attract and retain
skilled and qualified youths. This was the matter, which the researcher focused on
together with the degree of the importance of each of these to the youth in this
research.
1.3.2 Problem statement
Based on the abovementioned, the research problem is framed in terms of the
following research question:
How can a total rewards framework for the youth be conceptualised best?
The sub-research questions are:
INTRODUCTION TO THE RESEARCH PROBLEM
DBL Thesis_Keshia Mohamed-Padayachee Student Number 71364684 Page 32 of 351
1. Is the reward categories of the WorldatWork (2015) Total Rewards Model
effective in attracting the youth?
2. Is the reward categories of the WorldatWork (2015) Total Rewards Model
effective in retaining the youth?
With reference to generational theory, motivational theories, total reward models, and
attraction and retention strategies (described in Chapter 2) the sub-research questions
are as follows:
3. Which rewards factors attract the youth to organisations?
4. Which reward factors retain the youth in organisations?
5. What changes are to be made to the WorldatWork (2015) Total Rewards Model
for it to be more effective in attracting and retaining the youth?
1.4 Aim and objectives of the study
To evaluate the effectiveness of the reward categories of the WorldatWork (2015) total
rewards model and other total reward models in order to determine what changes
need to be made to it; and identify the factors (of attraction and retention of the youth
in organisations) from other total reward models and literature; and subsequently
develop a more relevant total rewards framework for the youth.
The specific objectives of the study are to:
evaluate the effectiveness of the reward categories of the WorldatWork (2015)
Total Rewards Model;
identify the factors that attract the youth to organisations;
identify the factors that retain the youth in organisations;
determine what changes need to be made to the reward categories of the
WorldatWork (2015) Total Rewards Model to make it more effective; and
develop an effective total rewards framework for attracting and retaining the
youth.
INTRODUCTION TO THE RESEARCH PROBLEM
DBL Thesis_Keshia Mohamed-Padayachee Student Number 71364684 Page 33 of 351
Hypotheses
The following hypotheses will be tested:
1. Ho1: There is no association between the reward categories (e.g.,
remuneration, benefits, performance recognition, etc.) that attract people to
organisations and the generation to which they belong.
Ha1: There is an association between the reward categories that attract people
to organisations and the generation to which they belong.
2. Ho2: There is no association between the reward categories that retain people
in organisations and the generation to which they belong.
Ha2: There is an association between the reward categories that retain people
in organisations and the generation to which they belong.
1.5 Rationale for the study
Too often, companies offer their employees benefits that they do not want or value as
highly as others do. Employers need to establish what their employees want, and
tailor their total rewards offering accordingly (Aon, 2012). Employees cannot be
treated as one homogeneous group, and good employers will increasingly want to
ensure a fit between benefits and the preferences and requirements of individual
employees (Silverman & Riley, 2003).
The reward needs of employees are an important consideration in designing a total
rewards strategy. Understanding employees’ reward preferences will therefore
influence the reward strategy, which will, in turn, shape the total rewards framework
(Giancola, 2008). In this regard, Menefee and Murphy (2004) stated, “The employee
value rankings of the monetary and non-monetary rewards provide a blueprint for total
reward packages offered to employees” (Nienaber, 2008: 34).
A total rewards strategy with a detailed framework is integral to an organisation’s
success. In designing the framework, the components offered by competitor
organisations should be considered, as well as the value that employees attach to the
respective components (Corporate Leadership Council (CLC), 2005).
Young employees are critical to the future success of all organisations, due to the fact
that Baby Boomers, currently the largest generation of active workers, are retiring from
INTRODUCTION TO THE RESEARCH PROBLEM
DBL Thesis_Keshia Mohamed-Padayachee Student Number 71364684 Page 34 of 351
the workforce (Engelman, 2009; Gilbert, 2011). By understanding what youths are
seeking when joining, or why they are leaving, organisations will be better equipped
to appropriately adapt their total rewards model to increase employee motivation and
engagement. Sufficient literature exists in this area, which the researcher will explore
in Chapter 2, in addition demonstrating what the contribution of the present research
is to the body of knowledge.
This study is intended to answer the question of what changes are required to be made
to the reward categories of the WorldatWork (2015) Total Rewards Model, which
organisations need to incorporate, to attract and retain this talented group of
individuals. This study aims to develop a total rewards framework for the youth that
meets the specific preferences of this generation.
1.6 Current gaps in the literature that the study will address
There is a need to evaluate what attracts the youth to organisations and then retains
them. Existing total rewards models, including the WorldatWork (2015) Total Rewards
Model, do not adequately cater for individual generations’ needs and preferences, due
to a lack of information. This is particularly important when one considers the attraction
and retention of the youth in organisations, as the youth is increasingly becoming a
formidable factor in organisations’ success and sustainability. This study determined
the needs and preferences of the different generations, for differentiation in reward
offerings, with the aim of providing an effective total rewards framework for the youth.
1.7 Significance of the study
The research results will aid understanding of the youth reward preferences through
an appreciation of how to manage them through appropriate rewards, in order to
amplify the contribution, they make to organisations. The study proposes a total
rewards framework informed by the reward priorities of the youth.
Empirical evidence supports and highlights the reward preferences of the youth,
making a positive contribution to managing rewards in a challenging work
environment. In Chapter 6, the researcher highlights some of the characteristics that
differentiate the youth from other generations, thereby substantiating the need for a
INTRODUCTION TO THE RESEARCH PROBLEM
DBL Thesis_Keshia Mohamed-Padayachee Student Number 71364684 Page 35 of 351
differentiated rewards model. Furthermore, the study highlights the lack of research
focused on the youth, thereby contributing to the existing literature. The study aims to
demonstrate that “the right total reward strategy can deliver the right amount to the
right people at the right time, for the right reasons” (Nienaber, 2008: 37).
The study also contributes to the body of knowledge in this arena, and, as a result, is
beneficial to academics, practitioners and students in the field of HR management.
1.8 Research design and methodology
A sequential mixed-methodology approach was adopted, in which a survey and
interviews was conducted to collect the necessary data, to be objectively analysed, in
order to answer the research question and sub-questions. Creswell and Clark (2007)
defines mixed-methods research as a methodology for collecting, analysing, and
integrating and writing the results of a study, while qualitative research is the approach
to data collection, analysis, and report writing differing from the traditional, quantitative
approaches.
The sequential mixed-methods approach was employed in this research. The study
consisted of two phases, namely, quantitative and qualitative phases. In Phase I
(quantitative), a survey questionnaire was used to collect quantitative data from
professional databases and respondents (including students and employed youths)
situated in tertiary institutions, private and public companies, as well as parastatals.
Phase II entailed a qualitative study in which interviews were conducted to collect
detailed qualitative data to explain and interpret the results of Phase I in detail. A
semi-structured interview guide was used. Rich and in-depth information aided
validation of the preliminary conclusions drawn from the quantitative data collected in
Phase I, by adding explanations and interpretations of the identified significant
relationships between the key variables and the factors that are considered to affect
the attraction and retention of the youth in organisations. In other words, the qualitative
results filled the gaps in the explanations and interpretations of the results of the
quantitative research. Details of the research design and methodology are provided
in Chapter 3.
INTRODUCTION TO THE RESEARCH PROBLEM
DBL Thesis_Keshia Mohamed-Padayachee Student Number 71364684 Page 36 of 351
The methodology assisted the collection of the necessary data for analysis to
subsequently develop a new total rewards framework built on the WorldatWork (2015)
Total Rewards Model. The design of the data collection tool, apart from focusing on
the WorldatWork (2015) Total Rewards Model, was also based on other popular
rewards models including the Hay Group (2008), Zingheim and Schuster (2000),
Towers Watson (2012), and Towers Perrin (Armstrong, 2010)—generation and
motivation theories.
The reason for this was to review all the existing relevant and current theoretical
literature (which included these rewards models), and identify all the potential rewards
factors for the attraction and retention of the youth in the workplace. By investigating
all the potential factors that play a role in the desired remuneration of the youth, the
researcher could modify the WorldatWork (2015) Total Rewards Model by adding and
subtracting from it, in order to develop a more comprehensive and effective total
rewards framework for the youth.
1.9 Overview of the report
The next chapter provides an overview of the existing literature on the theoretical
frameworks of generational theory and theories of motivation, setting the context and
highlighting the dynamics of the problem. The theoretical literature review, in addition,
presents an overview of the subject of attraction and retention of the youth,
demonstrating the importance of the research question and sub-questions previously
stated.
The theoretical literature review will also discuss career- and life-stage models, and
will highlight conflicting research results. The review will, further, discuss the
relationship between generation theory and reward preferences. A review of total
reward frameworks and the total rewards models that informed the research design
and methodology is provided in Chapter 3. Total rewards will be presented as a
combination of financial and non-financial rewards given to employees in exchange
for their efforts (Christopherson & King, 2006).
Chapter 3 will describe how the researcher went about addressing the research
questions by selecting the appropriate research approach, design, and methodology,
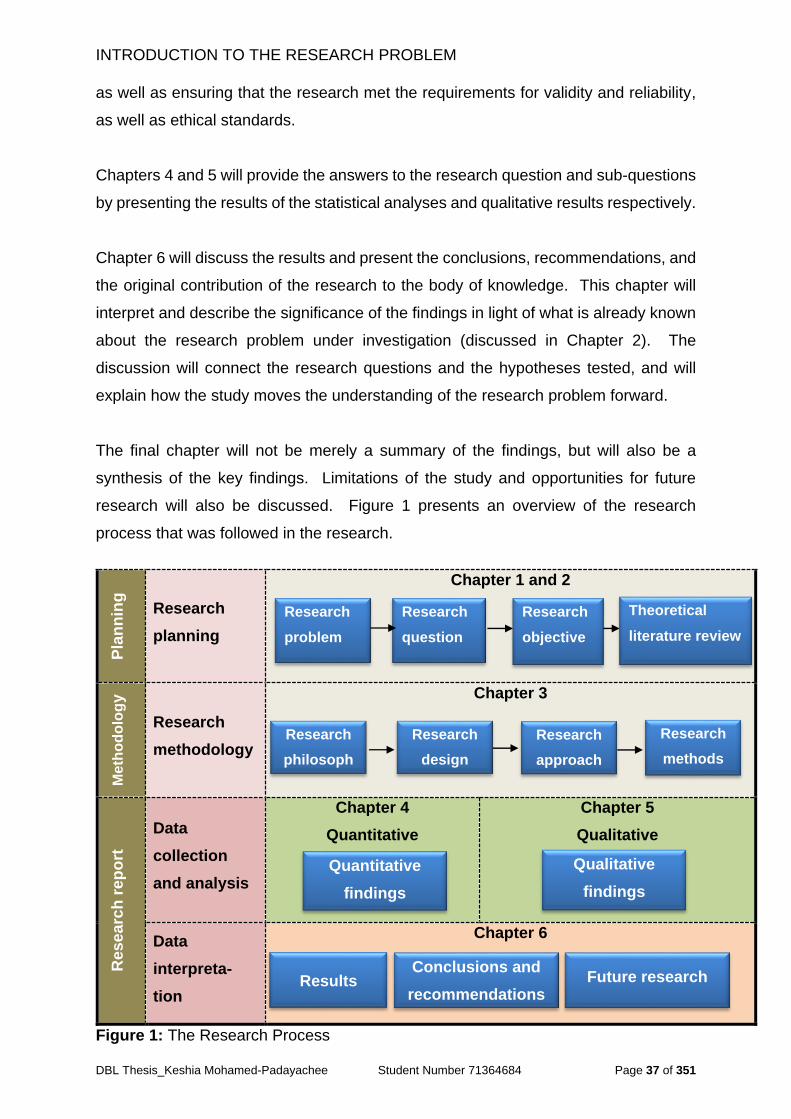
INTRODUCTION TO THE RESEARCH PROBLEM
DBL Thesis_Keshia Mohamed-Padayachee Student Number 71364684 Page 37 of 351
as well as ensuring that the research met the requirements for validity and reliability,
as well as ethical standards.
Chapters 4 and 5 will provide the answers to the research question and sub-questions
by presenting the results of the statistical analyses and qualitative results respectively.
Chapter 6 will discuss the results and present the conclusions, recommendations, and
the original contribution of the research to the body of knowledge. This chapter will
interpret and describe the significance of the findings in light of what is already known
about the research problem under investigation (discussed in Chapter 2). The
discussion will connect the research questions and the hypotheses tested, and will
explain how the study moves the understanding of the research problem forward.
The final chapter will not be merely a summary of the findings, but will also be a
synthesis of the key findings. Limitations of the study and opportunities for future
research will also be discussed. Figure 1 presents an overview of the research
process that was followed in the research.
Figure 1: The Research Process
Pla
nn
ing
Research
planning
Chapter 1 and 2
Meth
od
olo
gy
Research
methodology
Chapter 3
Researc
h r
ep
ort
Data
collection
and analysis
Chapter 4
Quantitative
Phase I
Chapter 5
Qualitative
Phase II
Data
interpreta-
tion
Chapter 6
Research
problem
Research
objective
Theoretical
literature review
Research
question
Research
philosoph
Research
design
Research
approach
Research
methods
Quantitative
findings
Qualitative
findings
Results Conclusions and
recommendations Future research
INTRODUCTION TO THE RESEARCH PROBLEM
DBL Thesis_Keshia Mohamed-Padayachee Student Number 71364684 Page 38 of 351
Source: Adapted from Reynolds & Holwell (2010)
1.10 Conclusion
This chapter presented the research problem, the background to the research, the
objectives, and the applicable theories. The current gap in the literature in this field
was also indicated. The next chapter provides a review of the current and relevant
theoretical literature.
CHAPTER 2
DBL Thesis_Keshia Mohamed-Padayachee Student Number 71364684 Page 39 of 351
CHAPTER 2
THEORETICAL LITERATURE REVIEW
2.1. Introduction
The previous chapter introduced the study and presented the research problem and
the objectives of this study. This chapter presents a critical review of current and
relevant theoretical literature, highlighting existing theories and conceptual models in
the area of employee rewards and recognition. The review helped the researcher to
know what has been done on the topic and to conceptualise the study.
The theoretical literature review begins with a definition of the three generations
currently in the workforce, together with the theories that underpin this field of
research. Some modern-day researchers are concerned whether generational theory
is a scientific area and about the relevance of career- and life-stage models. The
researcher therefore reviewed generational theories and career- and life-stage models
to ensure that all relevant areas of research were considered in the design of the
solution according to the findings of the research.
Total rewards encompass the reward framework for an organisation and the strategy
to attract and retain talent and total reward frameworks are discussed with an
emphasis on the WorldatWork (2015) Total Rewards Model. The researcher then
explored the theories of motivation based on their relevance to rewards and concludes
with a review of the attraction and retention strategies for the youth.
Figure 2 summarises the approach the researcher followed in reviewing the existing
literature.
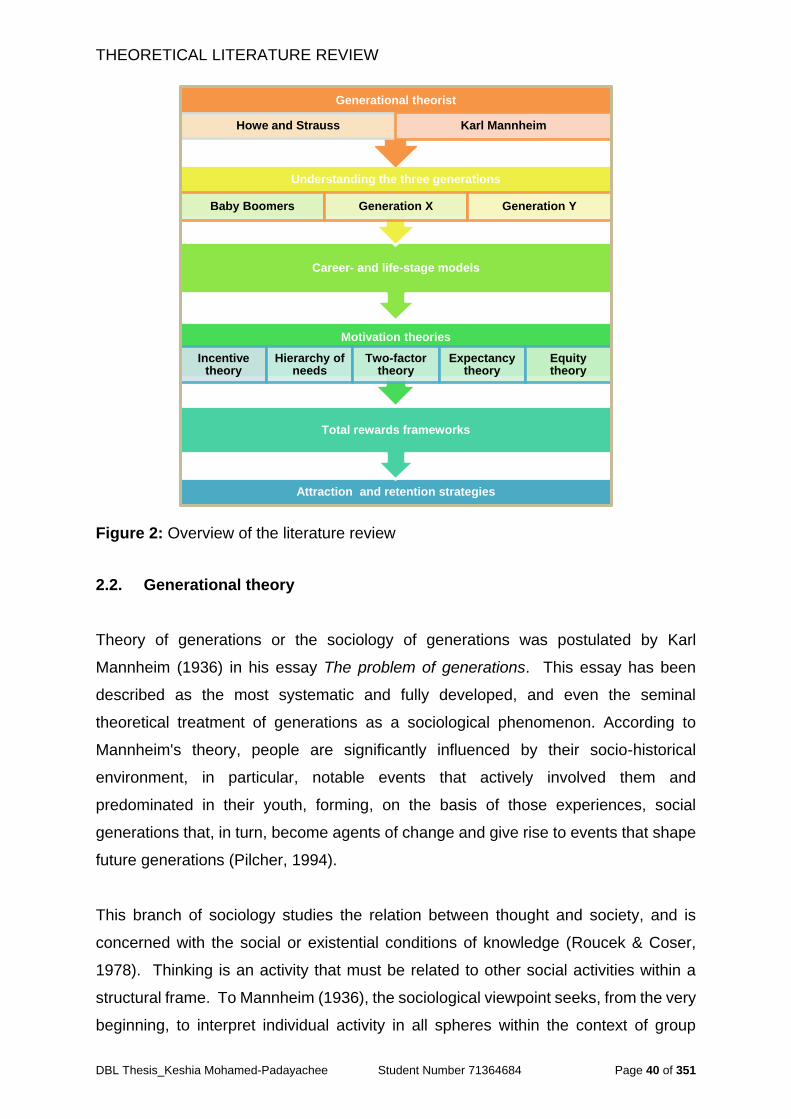
THEORETICAL LITERATURE REVIEW
DBL Thesis_Keshia Mohamed-Padayachee Student Number 71364684 Page 40 of 351
Figure 2: Overview of the literature review
2.2. Generational theory
Theory of generations or the sociology of generations was postulated by Karl
Mannheim (1936) in his essay The problem of generations. This essay has been
described as the most systematic and fully developed, and even the seminal
theoretical treatment of generations as a sociological phenomenon. According to
Mannheim's theory, people are significantly influenced by their socio-historical
environment, in particular, notable events that actively involved them and
predominated in their youth, forming, on the basis of those experiences, social
generations that, in turn, become agents of change and give rise to events that shape
future generations (Pilcher, 1994).
This branch of sociology studies the relation between thought and society, and is
concerned with the social or existential conditions of knowledge (Roucek & Coser,
1978). Thinking is an activity that must be related to other social activities within a
structural frame. To Mannheim (1936), the sociological viewpoint seeks, from the very
beginning, to interpret individual activity in all spheres within the context of group
Attraction and retention strategies
Total rewards frameworks
Motivation theories
Incentive theory
Hierarchy of needs
Two-factor theory
Expectancy theory
Equity theory
Career- and life-stage models
Understanding the three generations
Baby Boomers Generation X Generation Y
Generational theorist
Howe and Strauss Karl Mannheim
THEORETICAL LITERATURE REVIEW
DBL Thesis_Keshia Mohamed-Padayachee Student Number 71364684 Page 41 of 351
experiences (Mannheim, 1936). Thinking is never a privileged activity, free from the
effects of group life; therefore, it must be understood and interpreted within its context.
No individual, in striving to learn the truth, constructs a worldview out of the data of his
or her own experience. Knowledge is, from the very beginning, a co-operative process
of group life, in which everyone unfolds his or her knowledge within a framework of a
common fate, a common activity, and the overcoming of common difficulties
(Mannheim, 1936).
The generational theory developed by Strauss and Howe (1991) describes the history
of the United States of America, including that of the 13 colonies and their Anglo
antecedents, and this is where the most detailed research has been accomplished.
The authors also examined generational trends elsewhere in the world, and identified
similar cycles in several developed countries. Neil Howe and William Strauss wrote a
number of scholarly and popular books about American history and generations, and
a number of books on Generation Y’s impact on various sectors.
Generations are among the most powerful forces in history. Tracking their march
through time lends order and even a measure of predictability to long-term trends
(Howe & Strauss, 2007). As each generation ages into the next phase, that is, from
youth to young adulthood to midlife to elderhood, its attitudes and behaviours mature,
producing new currents in the public mood. In other words, people do not belong to
their age brackets. A woman of 40 today has less in common with 40-year-old women
across the ages than with others of her generation; they are united by memories,
language, habits, beliefs, and life lessons.
Generations follow observable historical patterns, a phenomenon that offers a very
powerful tool for predicting future trends. To anticipate what 40-year-olds will be like
20 years from now, one should not look at today’s 40-year-olds, but rather today’s 20-
year-olds. Howe and Strauss (2007) found that generations shaped by similar early-
life experiences often develop similar collective personae and follow similar life
trajectories. The patterns are strong enough to support a measure of predictability.
Historical precedents make it possible to foresee how the generations alive today will
think and act in decades to come (Howe & Strauss, 2007).
THEORETICAL LITERATURE REVIEW
DBL Thesis_Keshia Mohamed-Padayachee Student Number 71364684 Page 42 of 351
French lexicographer Emile Littré (1801–1881), a historian of medicine, philosopher,
linguist, philologist, and translator, best known for his Dictionnaire de la langue
française (1863‒72, supplement 1877), defined a generation as all men living more or
less at the same time (Howe & Strauss, 2007).
Eyerman and Turner (1998) define a generation as a cohort of persons passing
through time, who share a common habitus, hexes, and culture, a function of which is
to provide them with a collective memory that serves to integrate the cohort over a
finite period of time.
Howe and Strauss (2007) argued that the basic length of a generation — about twenty
years — is due to longstanding socially and biologically determined phases of life,
which is why the length has remained constant over centuries. However, some argue
that rapid increases in technology in recent decades are shortening the length of a
generation. Howe and Strauss (2007) state that, that is not the case, but admit that
the precise boundaries of generations and turnings are erratic. This implies that the
interpretation of the data in the present study had to be done with care in applying
generation theory to identify the potential components of rewards for the youth.
2.3. The multi-generational workforce
Today, three generations are working side by side, each with distinct differences, who
are categorised into three distinct groups (Kane, 2013). The challenge for
organisational leaders is to understand the profiles of these employees, in order to
know what rewards attract and retain these generations, in particular, the newest
generation entering the workforce — Generation Y.
The researcher will provide a brief review of these three generations, to advance a
common understanding of the generations and what the existing total reward models
have been based on, by providing an overview of the relevant research conducted in
this field.
Many researchers and authors disagree on exactly when each generation starts and
ends. For the purpose of the present study, the timeframe for each generation was
aligned with the generational theory of Strauss and Howe (1991).
THEORETICAL LITERATURE REVIEW
DBL Thesis_Keshia Mohamed-Padayachee Student Number 71364684 Page 43 of 351
Generation Y is represented by employees born between 1981 and 2000; there are
various names for this generation, that is, Millennials, Echo Boomers, Generation
Next, GenY, nGen, or GenMe. Generation X was born between 1965 and 1980, and
Baby Boomers were born between 1946 and 1964. The three generations, for the
purpose of this research, will be termed Baby Boomers (born 1946‒1964), Generation
X (born 1965‒1980), and Generation Y (born 1981‒2000).
2.3.1. Baby Boomers
The impending retirement of Baby Boomers has created a crisis in organisations as
they strive to recruit and retain the youth, who purportedly hold significantly different
values, attitudes, and expectations, compared to the generations of workers who
preceded them (Ng, et al., 2010).
Baby Boomers (born between 1946 and 1964) are predominantly in their late 50s and
60s, and are nearing retirement; they will exit the workplace within the next decade.
They are well established in their careers, and hold positions of power and authority.
This generational segment constitutes the majority of today's leaders, corporate
executives, senior professionals, and managers. This unprecedented loss of skilled
labour, consisting largely of partners, executives, senior support staff, managers, and
other thought leaders, poses a risk for organisations (Kane, 2013).
Baby Boomers are the largest generation in history. They are competitive by nature,
and they believe in growth, change, and expansion. They want it all, and work long
hours to attain what they want. They show loyalty, and will be ruthless if necessary to
obtain success and material possessions. Many do not plan to retire. This generation
also redefined family through increased divorce rates. They respect authority, but
want to be viewed and treated as equals (Eisner, 2005; Gilbert, 2011).
Baby Boomers tend to seek consensus in the workplace. They dislike laziness and
authoritarianism, but tend to micro-manage others. They have paid their dues and
proactively climbed the corporate ladder, making new rules along the way (Lowe,
Levitt & Wilson, 2008). Described as hardworking, they have a sense of entitlement.
They are optimistic, but are cynical towards institutions, and they believe in endless
youth (Globoforce, 2013).
THEORETICAL LITERATURE REVIEW
DBL Thesis_Keshia Mohamed-Padayachee Student Number 71364684 Page 44 of 351
2.3.2. Generation X
Born between 1965 and 1980, members of Generation X are mainly in their late 30s
and 40s. On the whole, they are more ethnically diverse and better educated than the
Baby Boomers. They are unlikely to work for a single company or value long working
hours. They value developing skills and keeping up to date, and respond well to a
coaching management style that provides prompt feedback and credit for positive
results. This generation finds ways to get things done smartly and quickly, and even
to bend the rules (Eisner, 2005).
They strive for work‒life balance, and they are able to embrace change. What they
lack in social skills, they make up for in their technical ability (Lowe, et al., 2008). At
work, members of Generation X work hard, prefer hands-off supervision, seek
immediate gratification, and want their need for a work‒life balance respected
(Globoforce, 2013). They lack loyalty to an organisation, and want to possess a variety
of skills to make them marketable. They value education, independence, and
parenting above work. This attitude is also prevalent in the children of members of
Generation X (Crampton & Hodge, 2006).
2.3.3. Generation Y
Members of Generation Y, born between 1981 and 2000, are increasingly joining the
workforce, and, unlike Generation X and Baby Boomers, have developed work
characteristics and tendencies as a result of doting parents, structured lives, and
contact with diverse people (Kane, 2013).
They are well-educated, technologically advanced, very self-confident, able to multi-
task, and have abundant energy. They have high expectations of themselves, and
prefer to work in teams, rather than as individuals. They seek challenges and
opportunities, yet, a work‒life balance is of utmost importance to them. They do,
however, realise that their need for social interaction, immediate results in their work,
and the desire for speedy advancement may be seen as weaknesses by older
colleagues (Gilbert, 2011; Macky, Gardner & Forsyth, 2008; Clement, 2008;
Globoforce, 2013; Martin & Tulgan, 2006; Crampton & Hodge, 2006). They seek work
that is meaningful and fulfilling (Lancaster & Stillman, 2002; Yang & Guy, 2006).
THEORETICAL LITERATURE REVIEW
DBL Thesis_Keshia Mohamed-Padayachee Student Number 71364684 Page 45 of 351
Members of this generation are used to working in teams — they actually prefer
teamwork — and they value structure, interactivity, and image-rich environments.
They want to make friends with people at work, and work well with diverse co-workers
(Kane, 2013; Wessels & Steenkamp, 2009). Promotion is very important to members
of Generation Y, but they want this with minimal effort, perhaps reflecting a sense of
entitlement that is the product of a pampered upbringing (Ng, et al., 2010; CLC, 2005;
Nelson & Twenge, 2005).
The members of this rising generation tend to be upbeat, team-oriented, close to their
parents, and confident about their future. Unlike Baby Boomers, they do not want to
‘teach the world to sing.’ Furthermore, unlike members of Generation X, they do not
act impulsively; they plan ahead (Howe & Strauss, 2007). Members of Generation Y
‘want it all’ and ‘want it now’ in terms of better pay and benefits, rapid advancement,
work‒life balance, interesting and challenging work, and making a contribution to
society (Ng, et al., 2010: 282).
Many have developed a work-to-live rather than live-to-work mind-set that spills over
into valuing the quality of the work environment and a work‒life balance (Eisner, 2005).
They can be fickle and demanding, and have a sense of entitlement. They are
technologically sophisticated, and breathe new life into staid companies. They are
team players, and thrive in collaborative work environments. They have been praised
all their lives, and cannot deal with failure. They expect acknowledgement, even when
they do not deserve it. They want to be put on the fast track, whether they deserve it
or not, but they dislike working long hours (Macky, Gardner & Forsyth, 2008; Clement,
2008).
PricewaterhouseCoopers (PwC) (2013) conducted a comprehensive two-year global
generational study in collaboration with the University of Southern California and the
London Business School. This was one of the largest, most comprehensive studies
on the attitudes and behaviours of Generation Y employees, and focused on their
aspirations, work styles, and values.
A wide range of data was gathered from PwC employees and partners around the
globe, involving people from different generations, career stages, and cultural
backgrounds. The study, which gathered more than 40 000 responses from
THEORETICAL LITERATURE REVIEW
DBL Thesis_Keshia Mohamed-Padayachee Student Number 71364684 Page 46 of 351
Generation Y and non-Generation Y members, captured the various forces influencing
the experiences of Generation Y. These include workplace culture, communication,
work styles, compensation, career structure, career development and opportunities,
and work‒life balance. The study revealed that enhancing workplace flexibility and
equity between work- and home life are some of the keys to improving job satisfaction
among Generation Y (PwC, 2013).
According to a study by Kane (2012) Generation Y grew up with technology, and rely
on it to perform their jobs better. Using technology 24 hours per day, seven days a
week, they prefer communication through e-mail and text messages, rather than face-
to-face contact and traditional lecture-style presentations. The fast track has lost much
of its appeal to members of Generation Y, who are willing to trade high pay for fewer
billable hours, flexible schedules, and a better work‒life balance. While older
generations may view this attitude as narcissistic or lacking commitment, discipline,
and drive, Generation Y professionals have a different vision of workplace
expectations, and they prioritise family over work. They were nurtured and pampered
by their parents, who did not want to repeat the parenting mistakes of the previous
generation. They are confident, ambitious, and achievement-oriented (Kane, 2013).
Generation Y has a ‘no-person-left-behind’ mind-set. They are loyal and committed,
and want to be included and involved. Members of this generation crave attention in
the form of feedback and guidance, and appreciate being kept informed. They seek
frequent praise and reassurance. Generation Y may benefit greatly from mentors who
can help guide and develop their young careers (Kane, 2013).
Lowe et al. (2008) found that members of Generation Y have some values held by
Traditionalists, who were born between 1925 and 1945. According to their study, both
tend to have a strong sense of morality, are patriotic, are willing to fight for freedom,
are sociable, and value their home and family.
Table 3 provides a brief summary of the core values that describe these generations,
together with the key world- and South African events that shaped these generations
and impacted their outlook on the world.
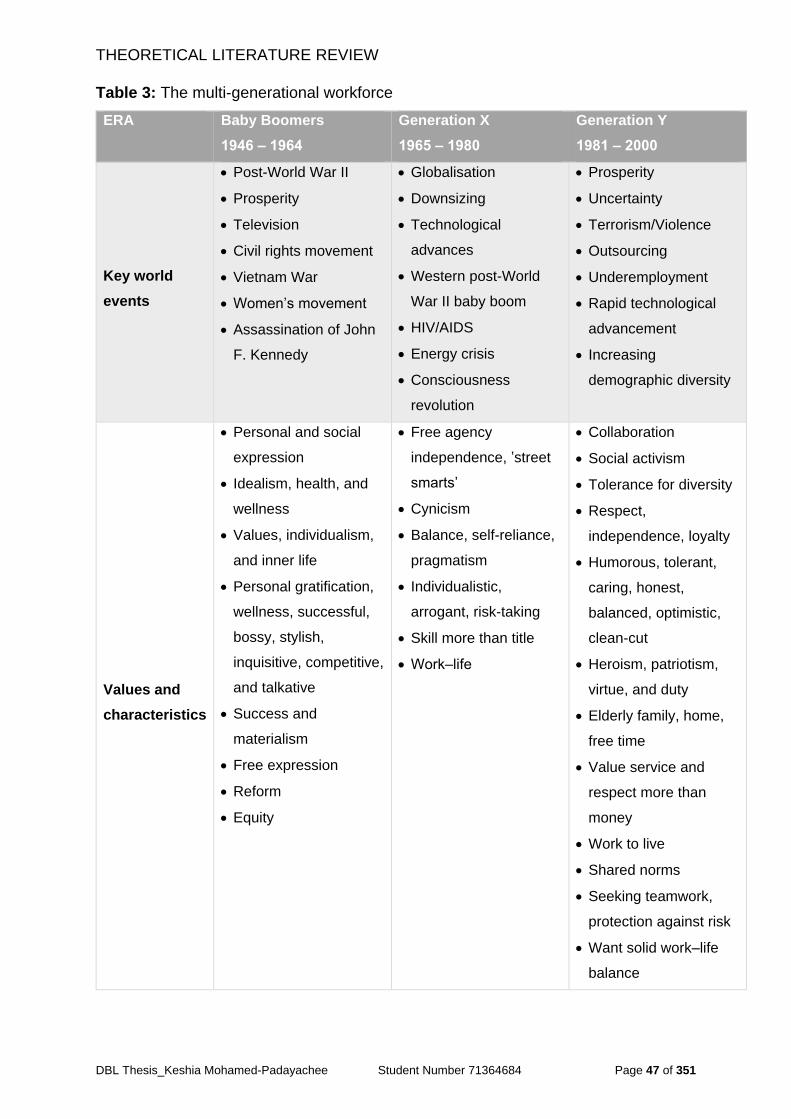
THEORETICAL LITERATURE REVIEW
DBL Thesis_Keshia Mohamed-Padayachee Student Number 71364684 Page 47 of 351
Table 3: The multi-generational workforce
ERA Baby Boomers
1946 ‒ 1964
Generation X
1965 ‒ 1980
Generation Y
1981 ‒ 2000
Key world
events
Post-World War II
Prosperity
Television
Civil rights movement
Vietnam War
Women’s movement
Assassination of John
F. Kennedy
Globalisation
Downsizing
Technological
advances
Western post-World
War II baby boom
HIV/AIDS
Energy crisis
Consciousness
revolution
Prosperity
Uncertainty
Terrorism/Violence
Outsourcing
Underemployment
Rapid technological
advancement
Increasing
demographic diversity
Values and
characteristics
Personal and social
expression
Idealism, health, and
wellness
Values, individualism,
and inner life
Personal gratification,
wellness, successful,
bossy, stylish,
inquisitive, competitive,
and talkative
Success and
materialism
Free expression
Reform
Equity
Free agency
independence, ‛street
smarts’
Cynicism
Balance, self-reliance,
pragmatism
Individualistic,
arrogant, risk-taking
Skill more than title
Work‒life
Collaboration
Social activism
Tolerance for diversity
Respect,
independence, loyalty
Humorous, tolerant,
caring, honest,
balanced, optimistic,
clean-cut
Heroism, patriotism,
virtue, and duty
Elderly family, home,
free time
Value service and
respect more than
money
Work to live
Shared norms
Seeking teamwork,
protection against risk
Want solid work–life
balance
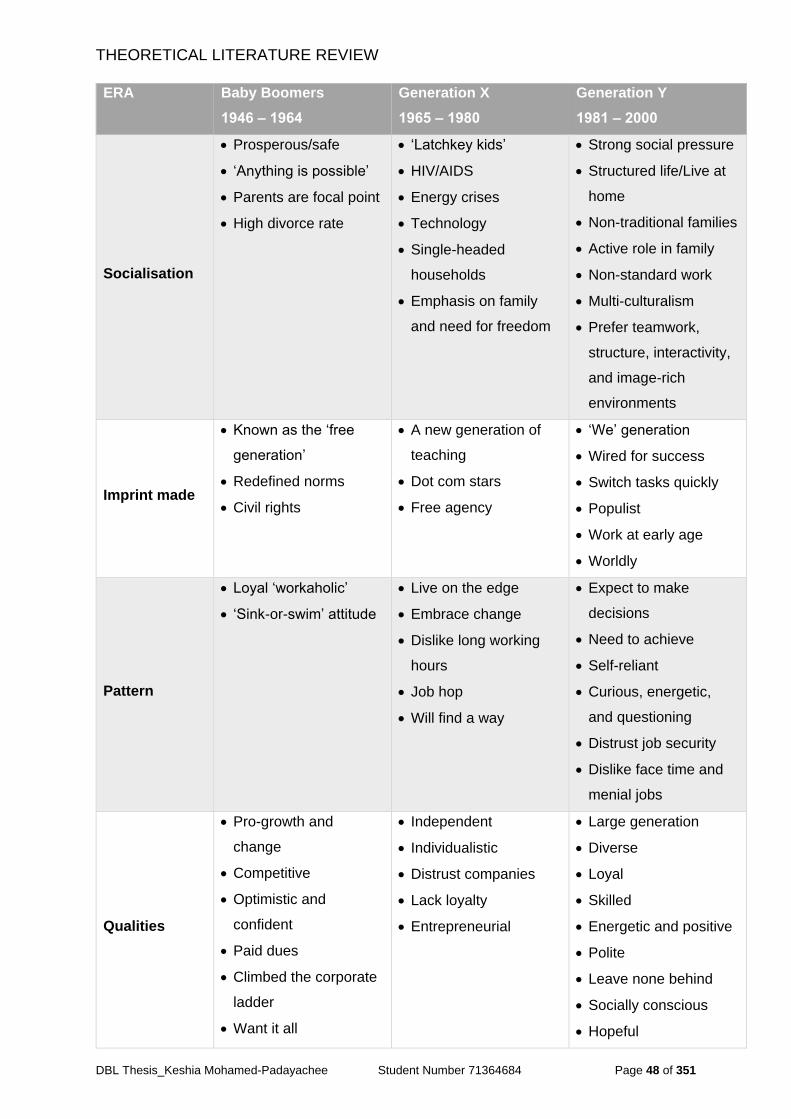
THEORETICAL LITERATURE REVIEW
DBL Thesis_Keshia Mohamed-Padayachee Student Number 71364684 Page 48 of 351
ERA Baby Boomers
1946 ‒ 1964
Generation X
1965 ‒ 1980
Generation Y
1981 ‒ 2000
Socialisation
Prosperous/safe
‘Anything is possible’
Parents are focal point
High divorce rate
‘Latchkey kids’
HIV/AIDS
Energy crises
Technology
Single-headed
households
Emphasis on family
and need for freedom
Strong social pressure
Structured life/Live at
home
Non-traditional families
Active role in family
Non-standard work
Multi-culturalism
Prefer teamwork,
structure, interactivity,
and image-rich
environments
Imprint made
Known as the ‘free
generation’
Redefined norms
Civil rights
A new generation of
teaching
Dot com stars
Free agency
‘We’ generation
Wired for success
Switch tasks quickly
Populist
Work at early age
Worldly
Pattern
Loyal ‘workaholic’
‘Sink-or-swim’ attitude
Live on the edge
Embrace change
Dislike long working
hours
Job hop
Will find a way
Expect to make
decisions
Need to achieve
Self-reliant
Curious, energetic,
and questioning
Distrust job security
Dislike face time and
menial jobs
Qualities
Pro-growth and
change
Competitive
Optimistic and
confident
Paid dues
Climbed the corporate
ladder
Want it all
Independent
Individualistic
Distrust companies
Lack loyalty
Entrepreneurial
Large generation
Diverse
Loyal
Skilled
Energetic and positive
Polite
Leave none behind
Socially conscious
Hopeful
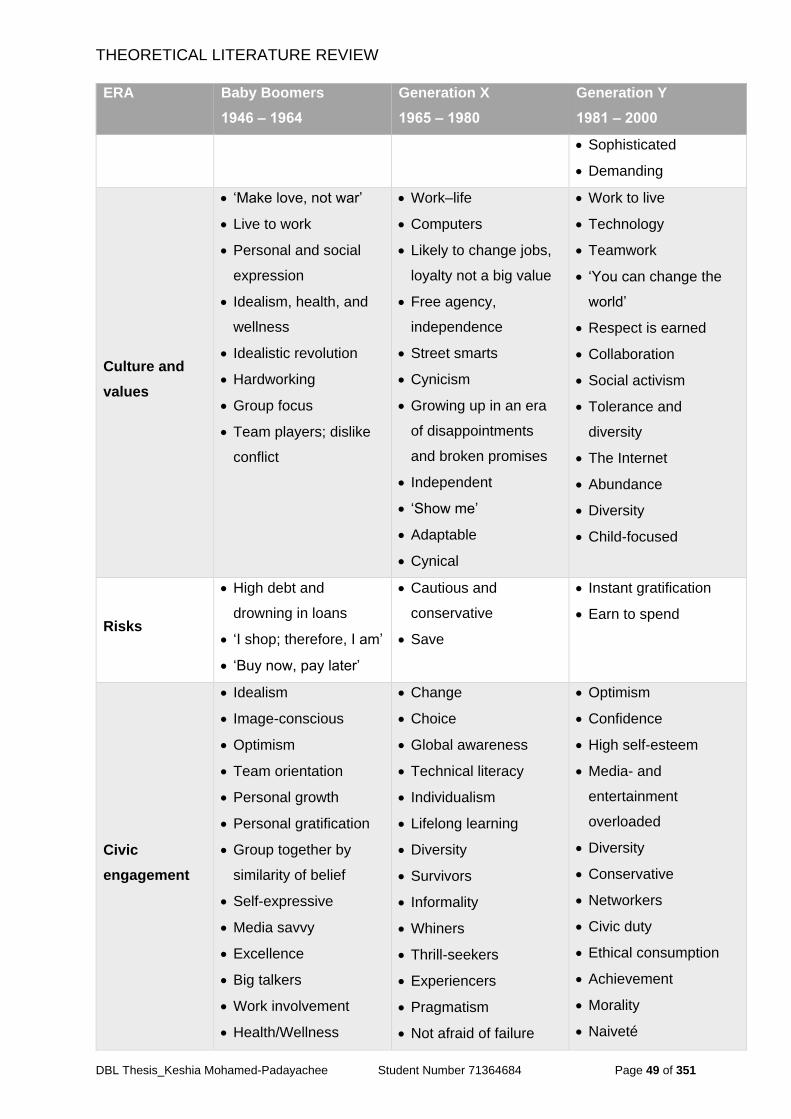
THEORETICAL LITERATURE REVIEW
DBL Thesis_Keshia Mohamed-Padayachee Student Number 71364684 Page 49 of 351
ERA Baby Boomers
1946 ‒ 1964
Generation X
1965 ‒ 1980
Generation Y
1981 ‒ 2000
Sophisticated
Demanding
Culture and
values
‘Make love, not war’
Live to work
Personal and social
expression
Idealism, health, and
wellness
Idealistic revolution
Hardworking
Group focus
Team players; dislike
conflict
Work‒life
Computers
Likely to change jobs,
loyalty not a big value
Free agency,
independence
Street smarts
Cynicism
Growing up in an era
of disappointments
and broken promises
Independent
‘Show me’
Adaptable
Cynical
Work to live
Technology
Teamwork
‘You can change the
world’
Respect is earned
Collaboration
Social activism
Tolerance and
diversity
The Internet
Abundance
Diversity
Child-focused
Risks
High debt and
drowning in loans
‘I shop; therefore, I am’
‘Buy now, pay later’
Cautious and
conservative
Save
Instant gratification
Earn to spend
Civic
engagement
Idealism
Image-conscious
Optimism
Team orientation
Personal growth
Personal gratification
Group together by
similarity of belief
Self-expressive
Media savvy
Excellence
Big talkers
Work involvement
Health/Wellness
Change
Choice
Global awareness
Technical literacy
Individualism
Lifelong learning
Diversity
Survivors
Informality
Whiners
Thrill-seekers
Experiencers
Pragmatism
Not afraid of failure
Optimism
Confidence
High self-esteem
Media- and
entertainment
overloaded
Diversity
Conservative
Networkers
Civic duty
Ethical consumption
Achievement
Morality
Naiveté
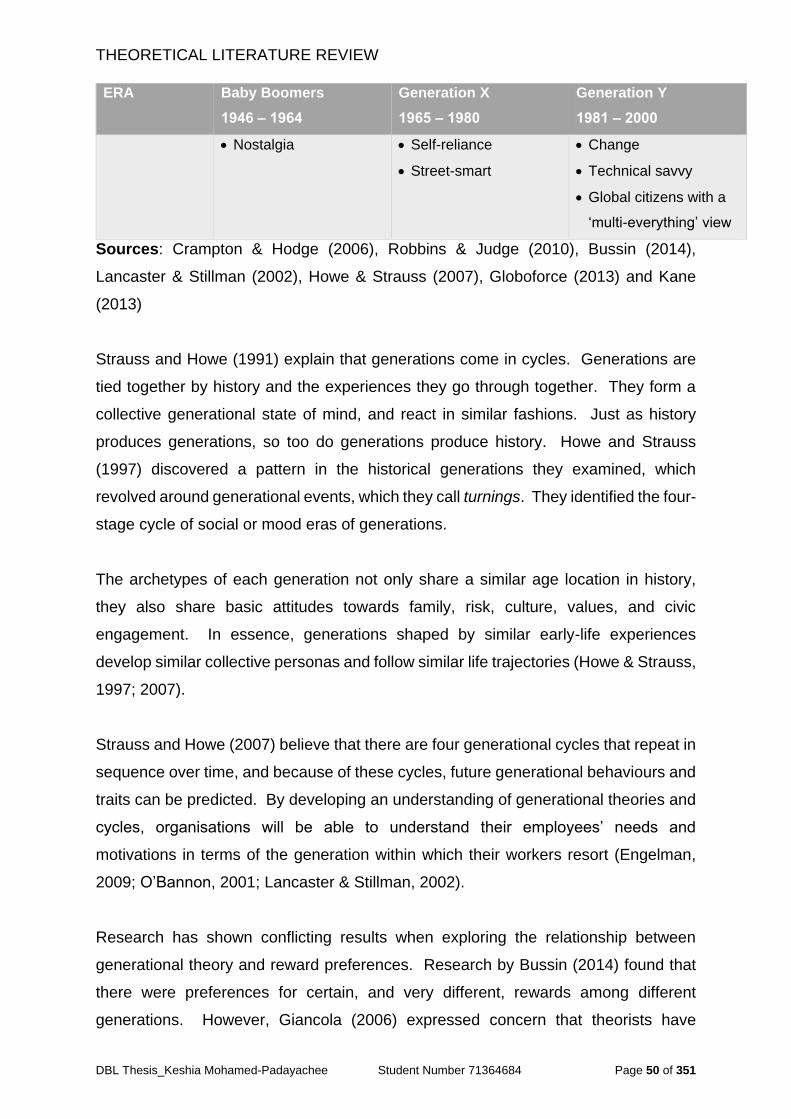
THEORETICAL LITERATURE REVIEW
DBL Thesis_Keshia Mohamed-Padayachee Student Number 71364684 Page 50 of 351
ERA Baby Boomers
1946 ‒ 1964
Generation X
1965 ‒ 1980
Generation Y
1981 ‒ 2000
Nostalgia Self-reliance
Street-smart
Change
Technical savvy
Global citizens with a
‘multi-everything’ view
Sources: Crampton & Hodge (2006), Robbins & Judge (2010), Bussin (2014),
Lancaster & Stillman (2002), Howe & Strauss (2007), Globoforce (2013) and Kane
(2013)
Strauss and Howe (1991) explain that generations come in cycles. Generations are
tied together by history and the experiences they go through together. They form a
collective generational state of mind, and react in similar fashions. Just as history
produces generations, so too do generations produce history. Howe and Strauss
(1997) discovered a pattern in the historical generations they examined, which
revolved around generational events, which they call turnings. They identified the four-
stage cycle of social or mood eras of generations.
The archetypes of each generation not only share a similar age location in history,
they also share basic attitudes towards family, risk, culture, values, and civic
engagement. In essence, generations shaped by similar early-life experiences
develop similar collective personas and follow similar life trajectories (Howe & Strauss,
1997; 2007).
Strauss and Howe (2007) believe that there are four generational cycles that repeat in
sequence over time, and because of these cycles, future generational behaviours and
traits can be predicted. By developing an understanding of generational theories and
cycles, organisations will be able to understand their employees’ needs and
motivations in terms of the generation within which their workers resort (Engelman,
2009; O’Bannon, 2001; Lancaster & Stillman, 2002).
Research has shown conflicting results when exploring the relationship between
generational theory and reward preferences. Research by Bussin (2014) found that
there were preferences for certain, and very different, rewards among different
generations. However, Giancola (2006) expressed concern that theorists have
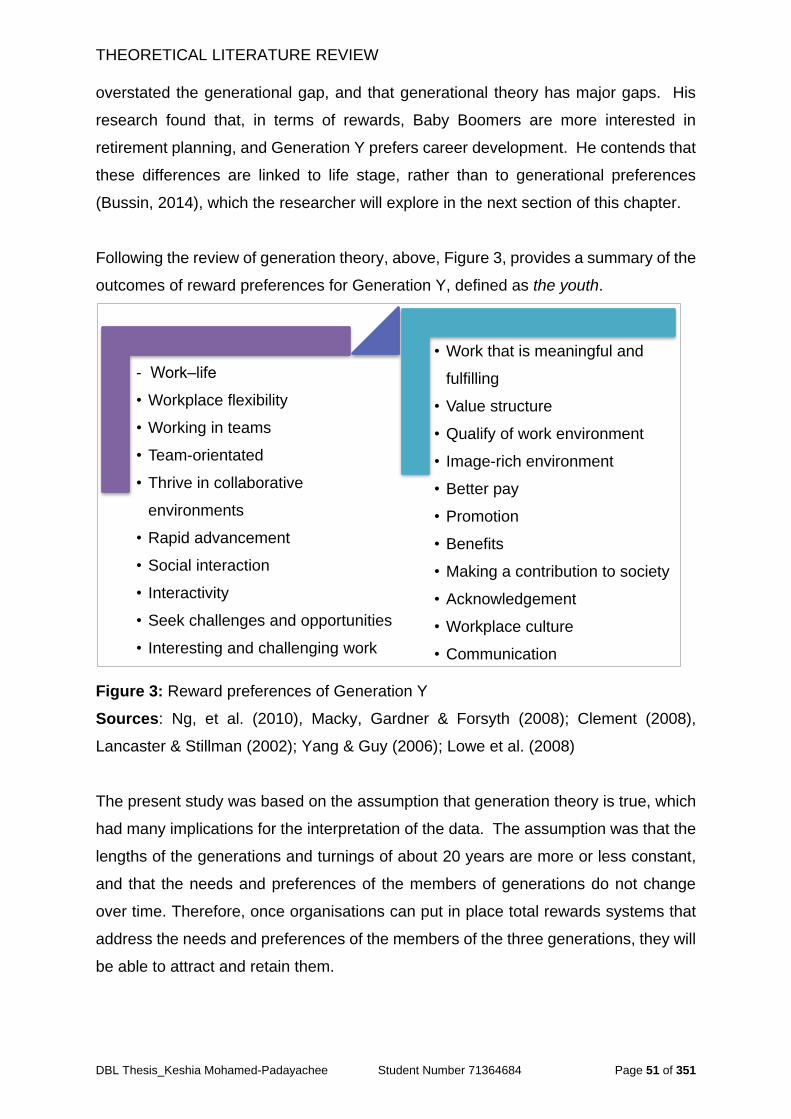
THEORETICAL LITERATURE REVIEW
DBL Thesis_Keshia Mohamed-Padayachee Student Number 71364684 Page 51 of 351
overstated the generational gap, and that generational theory has major gaps. His
research found that, in terms of rewards, Baby Boomers are more interested in
retirement planning, and Generation Y prefers career development. He contends that
these differences are linked to life stage, rather than to generational preferences
(Bussin, 2014), which the researcher will explore in the next section of this chapter.
Following the review of generation theory, above, Figure 3, provides a summary of the
outcomes of reward preferences for Generation Y, defined as the youth.
Figure 3: Reward preferences of Generation Y
Sources: Ng, et al. (2010), Macky, Gardner & Forsyth (2008); Clement (2008),
Lancaster & Stillman (2002); Yang & Guy (2006); Lowe et al. (2008)
The present study was based on the assumption that generation theory is true, which
had many implications for the interpretation of the data. The assumption was that the
lengths of the generations and turnings of about 20 years are more or less constant,
and that the needs and preferences of the members of generations do not change
over time. Therefore, once organisations can put in place total rewards systems that
address the needs and preferences of the members of the three generations, they will
be able to attract and retain them.
- Work‒life
• Workplace flexibility
• Working in teams
• Team-orientated
• Thrive in collaborative
environments
• Rapid advancement
• Social interaction
• Interactivity
• Seek challenges and opportunities
• Interesting and challenging work
• Work that is meaningful and
fulfilling
• Value structure
• Qualify of work environment
• Image-rich environment
• Better pay
• Promotion
• Benefits
• Making a contribution to society
• Acknowledgement
• Workplace culture
• Communication
THEORETICAL LITERATURE REVIEW
DBL Thesis_Keshia Mohamed-Padayachee Student Number 71364684 Page 52 of 351
However, the researcher had to be cautious in interpreting the data regarding effects
like technology, knowledge proliferation, and economic conditions, as these are
changing rapidly, through globalisation, which might affect, not only the length of a
generation and turnings, but also the changing preferences of the members of a
generation.
2.4. Total reward systems
A total rewards system encompasses the reward framework for an organisation and
the strategy to attract and retain talent. As the war for talent intensifies and competition
between organisations increases, it is vital that companies create a competitive
advantage in attracting and retaining talent.
According to Tsede and Kutin (2013), total reward is an integral element of reward
management, and is the combination of financial and non-financial rewards given to
employees in exchange for their efforts.
Thompson (2002) and Armstrong (2010) define total rewards as typically
encompassing, not only traditional, quantifiable elements like pay and benefits, but
also intangible elements such as scope to achieve and exercise responsibility, career
opportunities, learning and development, the intrinsic motivation provided by the work
itself, and the quality of the work-life provided by the organisation. This requires
consideration of all aspects of the work experience that employees value.
As expressed by Lawler (2003), employees’ motivation is greatest when they perform
tasks that are both intrinsically and extrinsically rewarding (Tsede & Kutin, 2013).
Armstrong (2010) considers reward management as the strategies, policies, and
processes required to ensure that the value of people and the contributions they make
to achieving organisational, departmental, and team goals are recognised and
rewarded. The total rewards approach is a hybrid strategy in rewards management,
and seeks to match the needs of the organisation with those of its employees (Murlis
& Schubert, 2002).
THEORETICAL LITERATURE REVIEW
DBL Thesis_Keshia Mohamed-Padayachee Student Number 71364684 Page 53 of 351
2.4.1 Total reward models
Over the last decade, as the external environment has become more turbulent,
organisations have sought initiatives to ensure the recruitment and retention of a high-
quality workforce. Many organisations have attempted to remedy this problem by
simply offering increased pay. While this may provide some respite in the form of a
short-term solution, this approach may not deliver the best results. Realising the
shortcomings of this approach, some organisations have turned to wider reward
mechanisms.
Total reward encompasses a whole range of mechanisms that aim to attract, retain,
and motivate staff (Silverman & Reily, 2003). The aim of this study was to develop a
total rewards framework for the attraction and retention of the youth. In order to
develop a more comprehensive and effective framework for the youth, total rewards
systems were considered to affect attraction and retention of the youth in
organisations. Some of the most popular frameworks are discussed below, namely,
the WorldatWork (2015), Hay Group (2008), Zingheim and Schuster (2000), Towers
Watson (2012), and Watson Perrin Total Rewards Models (Armstrong, 2010).
Emphasis will be placed on identified reward categories of WorldatWork (2015) Total
Rewards Model.
2.4.1.1 WorldatWork total rewards model
WorldatWork is a non-profit HR association, founded in 1955, for professionals and
organisations focused on compensation, benefits, and work‒life balance. The
association provides certification training to HR and reward specialists. The
WorldatWork (2015) Total Rewards Model (Figure 4) provides a framework strategy
for organisations for attracting employees, together with key considerations in the
quest to retain employees (WorldatWork, 2015). The WorldatWork (2015) Total
Rewards Model demonstrates the dynamic relationship between employers and
employees. Originally introduced in 2000, it has evolved to depict the strategic
elements of the employer-employee exchange as well as to reflect how external
influences and an increasingly global business environment affect attraction,
motivation, retention and engagement (WorldatWork, 2015).
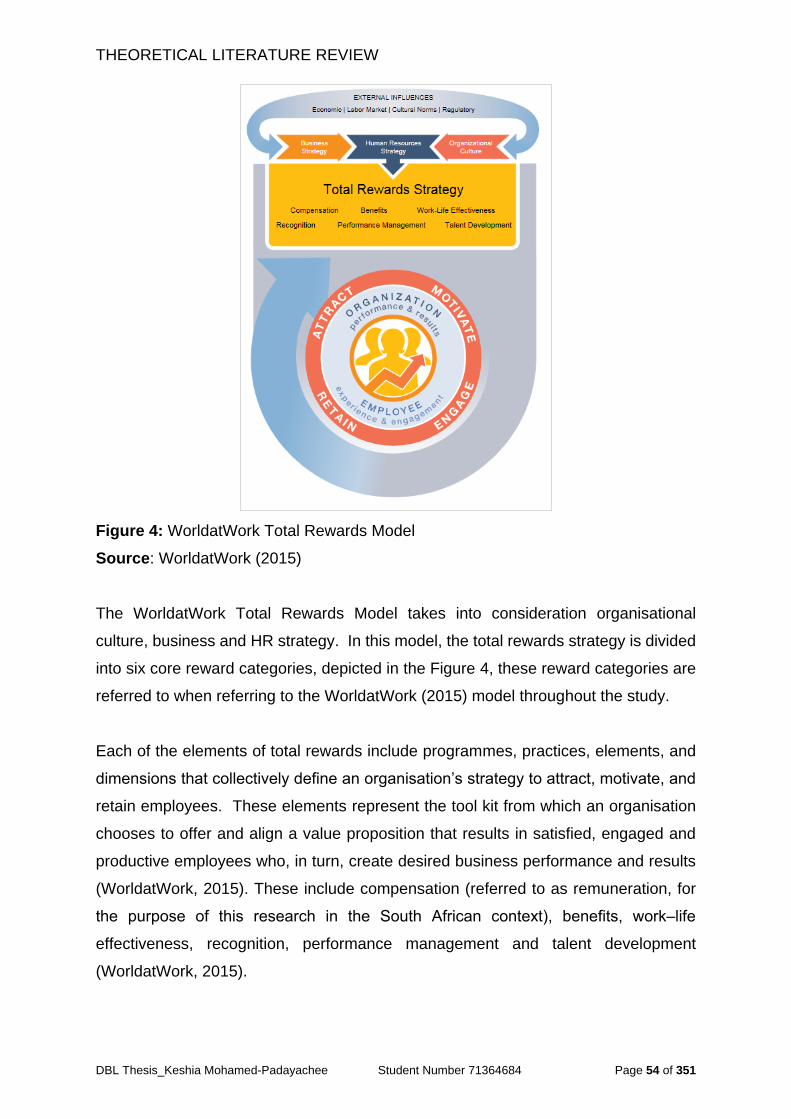
THEORETICAL LITERATURE REVIEW
DBL Thesis_Keshia Mohamed-Padayachee Student Number 71364684 Page 54 of 351
Figure 4: WorldatWork Total Rewards Model
Source: WorldatWork (2015)
The WorldatWork Total Rewards Model takes into consideration organisational
culture, business and HR strategy. In this model, the total rewards strategy is divided
into six core reward categories, depicted in the Figure 4, these reward categories are
referred to when referring to the WorldatWork (2015) model throughout the study.
Each of the elements of total rewards include programmes, practices, elements, and
dimensions that collectively define an organisation’s strategy to attract, motivate, and
retain employees. These elements represent the tool kit from which an organisation
chooses to offer and align a value proposition that results in satisfied, engaged and
productive employees who, in turn, create desired business performance and results
(WorldatWork, 2015). These include compensation (referred to as remuneration, for
the purpose of this research in the South African context), benefits, work‒life
effectiveness, recognition, performance management and talent development
(WorldatWork, 2015).
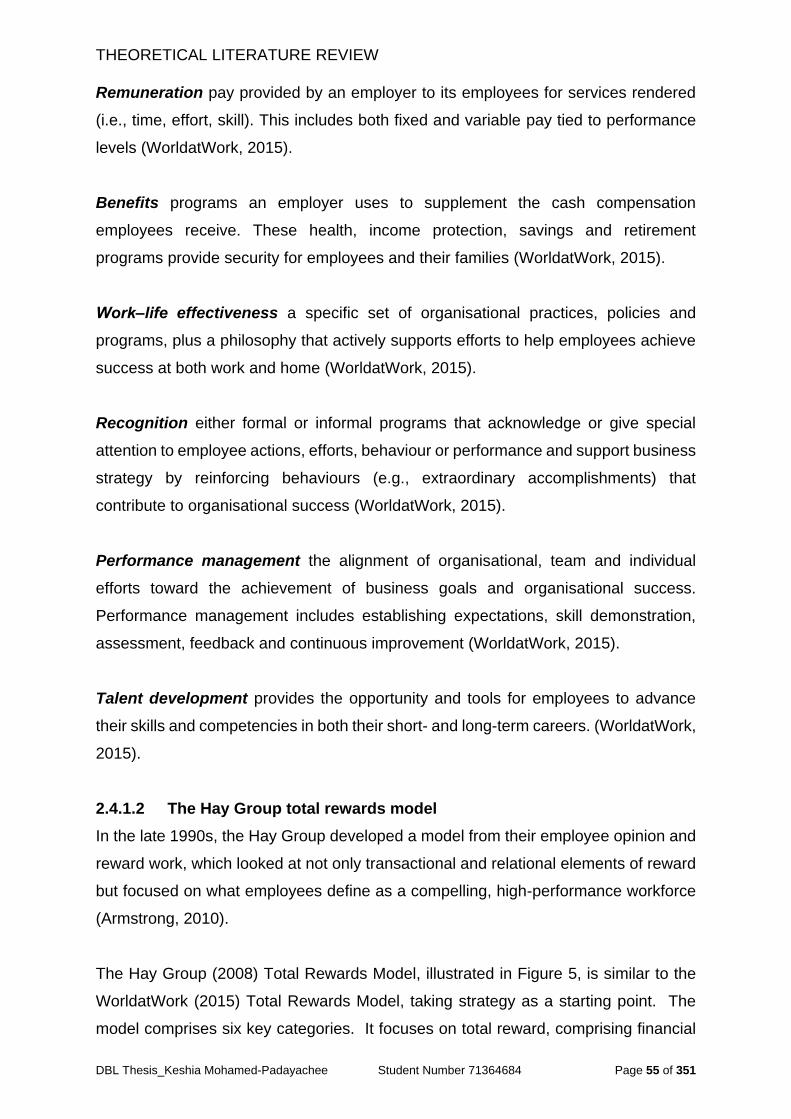
THEORETICAL LITERATURE REVIEW
DBL Thesis_Keshia Mohamed-Padayachee Student Number 71364684 Page 55 of 351
Remuneration pay provided by an employer to its employees for services rendered
(i.e., time, effort, skill). This includes both fixed and variable pay tied to performance
levels (WorldatWork, 2015).
Benefits programs an employer uses to supplement the cash compensation
employees receive. These health, income protection, savings and retirement
programs provide security for employees and their families (WorldatWork, 2015).
Work‒life effectiveness a specific set of organisational practices, policies and
programs, plus a philosophy that actively supports efforts to help employees achieve
success at both work and home (WorldatWork, 2015).
Recognition either formal or informal programs that acknowledge or give special
attention to employee actions, efforts, behaviour or performance and support business
strategy by reinforcing behaviours (e.g., extraordinary accomplishments) that
contribute to organisational success (WorldatWork, 2015).
Performance management the alignment of organisational, team and individual
efforts toward the achievement of business goals and organisational success.
Performance management includes establishing expectations, skill demonstration,
assessment, feedback and continuous improvement (WorldatWork, 2015).
Talent development provides the opportunity and tools for employees to advance
their skills and competencies in both their short- and long-term careers. (WorldatWork,
2015).
2.4.1.2 The Hay Group total rewards model
In the late 1990s, the Hay Group developed a model from their employee opinion and
reward work, which looked at not only transactional and relational elements of reward
but focused on what employees define as a compelling, high-performance workforce
(Armstrong, 2010).
The Hay Group (2008) Total Rewards Model, illustrated in Figure 5, is similar to the
WorldatWork (2015) Total Rewards Model, taking strategy as a starting point. The
model comprises six key categories. It focuses on total reward, comprising financial
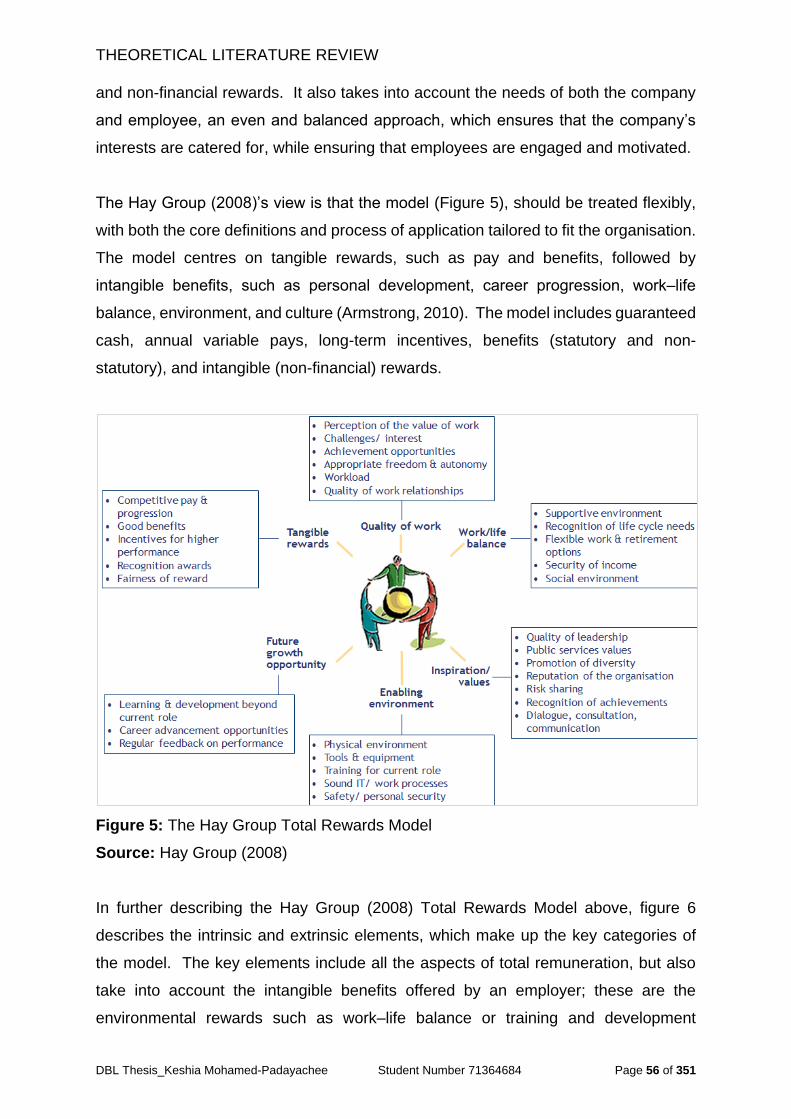
THEORETICAL LITERATURE REVIEW
DBL Thesis_Keshia Mohamed-Padayachee Student Number 71364684 Page 56 of 351
and non-financial rewards. It also takes into account the needs of both the company
and employee, an even and balanced approach, which ensures that the company’s
interests are catered for, while ensuring that employees are engaged and motivated.
The Hay Group (2008)’s view is that the model (Figure 5), should be treated flexibly,
with both the core definitions and process of application tailored to fit the organisation.
The model centres on tangible rewards, such as pay and benefits, followed by
intangible benefits, such as personal development, career progression, work‒life
balance, environment, and culture (Armstrong, 2010). The model includes guaranteed
cash, annual variable pays, long-term incentives, benefits (statutory and non-
statutory), and intangible (non-financial) rewards.
Figure 5: The Hay Group Total Rewards Model
Source: Hay Group (2008)
In further describing the Hay Group (2008) Total Rewards Model above, figure 6
describes the intrinsic and extrinsic elements, which make up the key categories of
the model. The key elements include all the aspects of total remuneration, but also
take into account the intangible benefits offered by an employer; these are the
environmental rewards such as work‒life balance or training and development
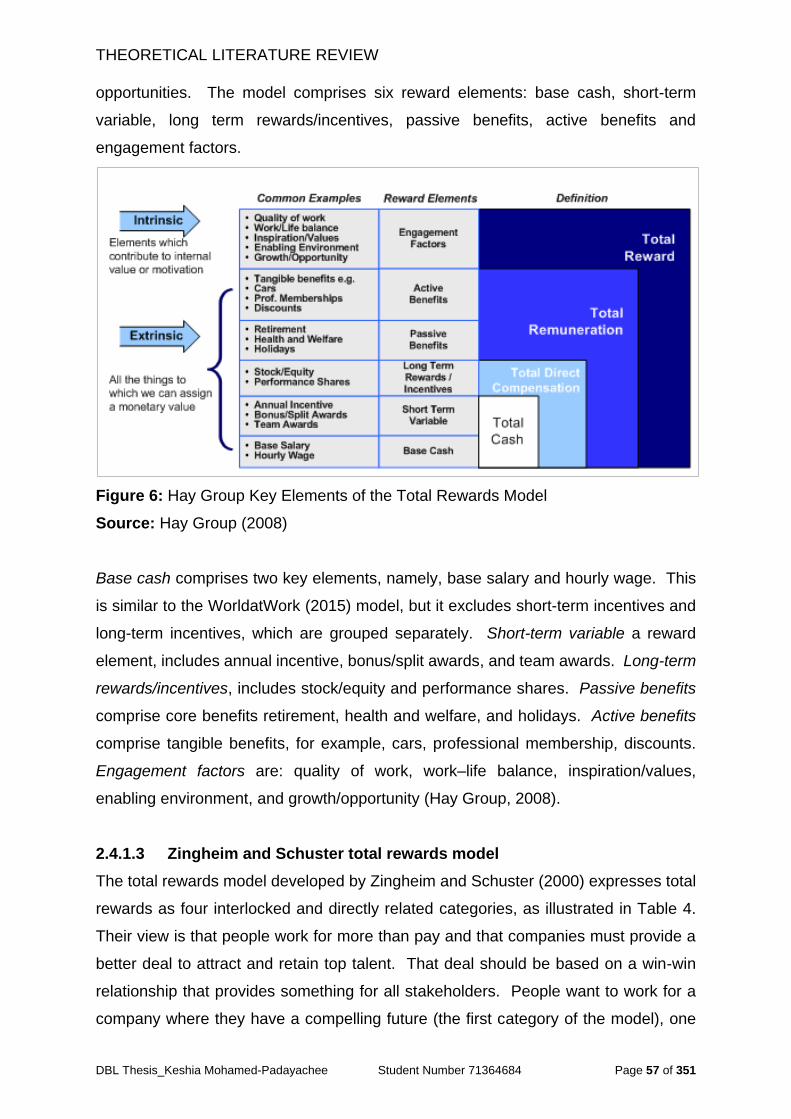
THEORETICAL LITERATURE REVIEW
DBL Thesis_Keshia Mohamed-Padayachee Student Number 71364684 Page 57 of 351
opportunities. The model comprises six reward elements: base cash, short-term
variable, long term rewards/incentives, passive benefits, active benefits and
engagement factors.
Figure 6: Hay Group Key Elements of the Total Rewards Model
Source: Hay Group (2008)
Base cash comprises two key elements, namely, base salary and hourly wage. This
is similar to the WorldatWork (2015) model, but it excludes short-term incentives and
long-term incentives, which are grouped separately. Short-term variable a reward
element, includes annual incentive, bonus/split awards, and team awards. Long-term
rewards/incentives, includes stock/equity and performance shares. Passive benefits
comprise core benefits retirement, health and welfare, and holidays. Active benefits
comprise tangible benefits, for example, cars, professional membership, discounts.
Engagement factors are: quality of work, work‒life balance, inspiration/values,
enabling environment, and growth/opportunity (Hay Group, 2008).
2.4.1.3 Zingheim and Schuster total rewards model
The total rewards model developed by Zingheim and Schuster (2000) expresses total
rewards as four interlocked and directly related categories, as illustrated in Table 4.
Their view is that people work for more than pay and that companies must provide a
better deal to attract and retain top talent. That deal should be based on a win-win
relationship that provides something for all stakeholders. People want to work for a
company where they have a compelling future (the first category of the model), one
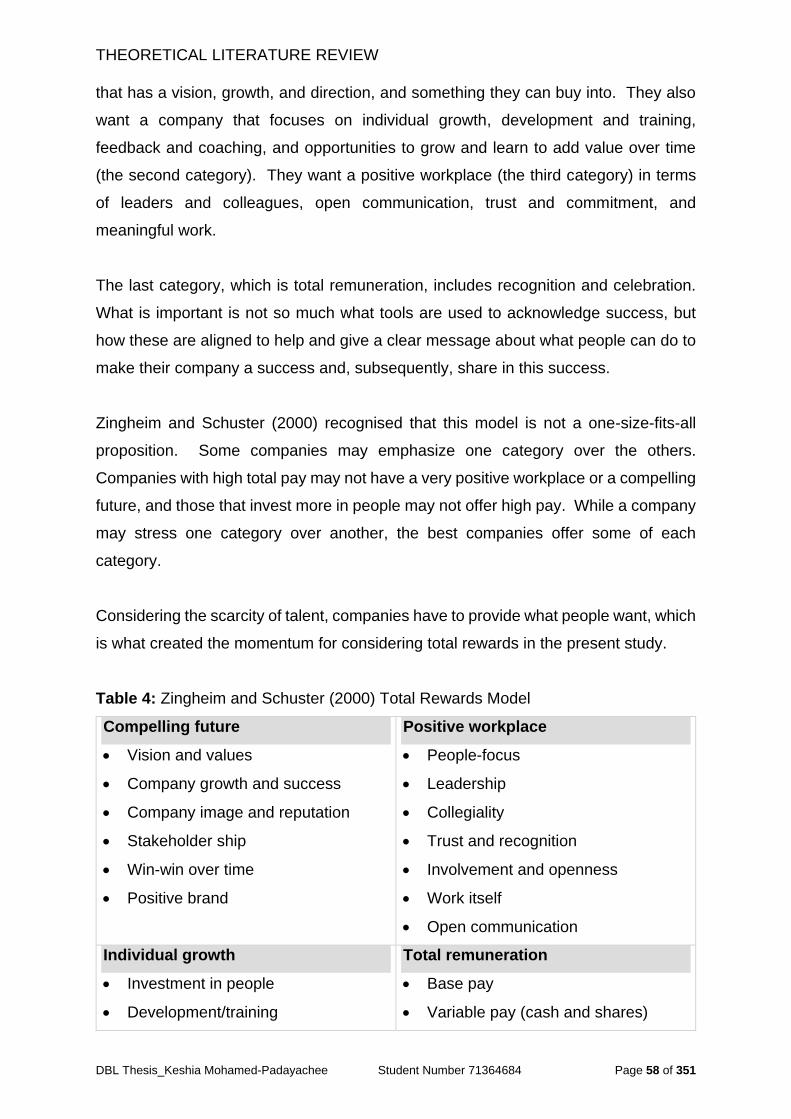
THEORETICAL LITERATURE REVIEW
DBL Thesis_Keshia Mohamed-Padayachee Student Number 71364684 Page 58 of 351
that has a vision, growth, and direction, and something they can buy into. They also
want a company that focuses on individual growth, development and training,
feedback and coaching, and opportunities to grow and learn to add value over time
(the second category). They want a positive workplace (the third category) in terms
of leaders and colleagues, open communication, trust and commitment, and
meaningful work.
The last category, which is total remuneration, includes recognition and celebration.
What is important is not so much what tools are used to acknowledge success, but
how these are aligned to help and give a clear message about what people can do to
make their company a success and, subsequently, share in this success.
Zingheim and Schuster (2000) recognised that this model is not a one-size-fits-all
proposition. Some companies may emphasize one category over the others.
Companies with high total pay may not have a very positive workplace or a compelling
future, and those that invest more in people may not offer high pay. While a company
may stress one category over another, the best companies offer some of each
category.
Considering the scarcity of talent, companies have to provide what people want, which
is what created the momentum for considering total rewards in the present study.
Table 4: Zingheim and Schuster (2000) Total Rewards Model
Compelling future
Vision and values
Company growth and success
Company image and reputation
Stakeholder ship
Win-win over time
Positive brand
Positive workplace
People-focus
Leadership
Collegiality
Trust and recognition
Involvement and openness
Work itself
Open communication
Individual growth
Investment in people
Development/training
Total remuneration
Base pay
Variable pay (cash and shares)
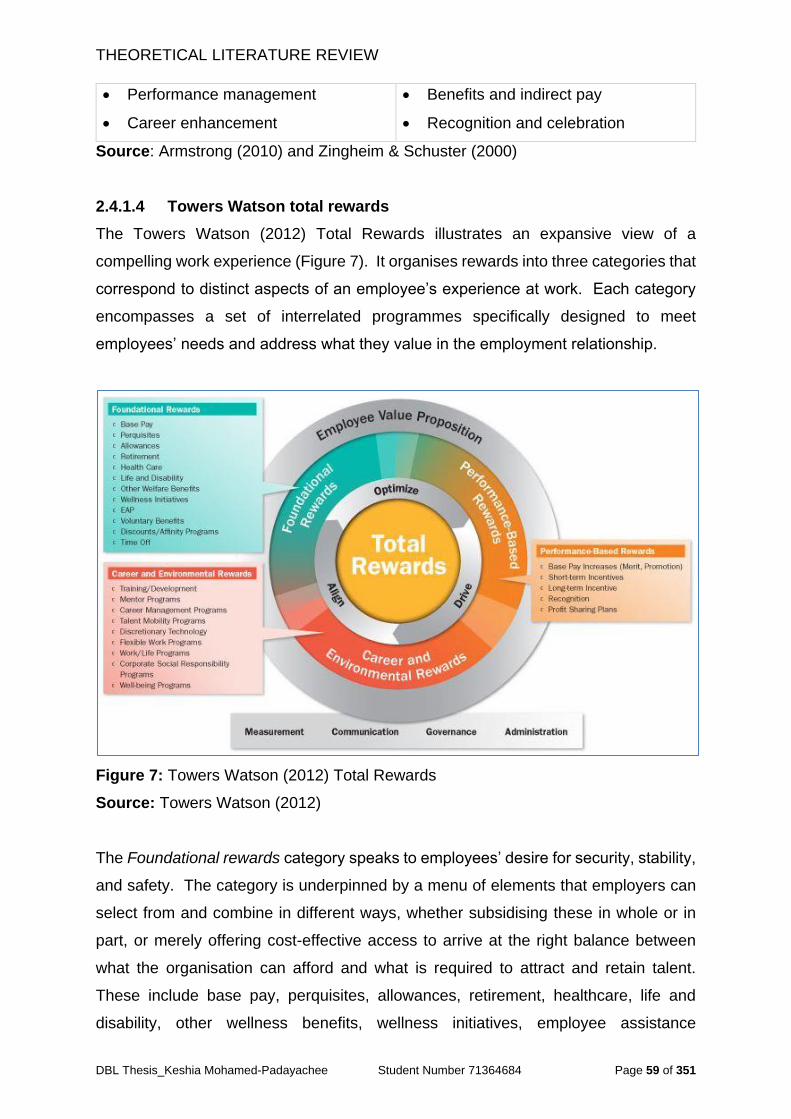
THEORETICAL LITERATURE REVIEW
DBL Thesis_Keshia Mohamed-Padayachee Student Number 71364684 Page 59 of 351
Performance management
Career enhancement
Benefits and indirect pay
Recognition and celebration
Source: Armstrong (2010) and Zingheim & Schuster (2000)
2.4.1.4 Towers Watson total rewards
The Towers Watson (2012) Total Rewards illustrates an expansive view of a
compelling work experience (Figure 7). It organises rewards into three categories that
correspond to distinct aspects of an employee’s experience at work. Each category
encompasses a set of interrelated programmes specifically designed to meet
employees’ needs and address what they value in the employment relationship.
Figure 7: Towers Watson (2012) Total Rewards
Source: Towers Watson (2012)
The Foundational rewards category speaks to employees’ desire for security, stability,
and safety. The category is underpinned by a menu of elements that employers can
select from and combine in different ways, whether subsidising these in whole or in
part, or merely offering cost-effective access to arrive at the right balance between
what the organisation can afford and what is required to attract and retain talent.
These include base pay, perquisites, allowances, retirement, healthcare, life and
disability, other wellness benefits, wellness initiatives, employee assistance
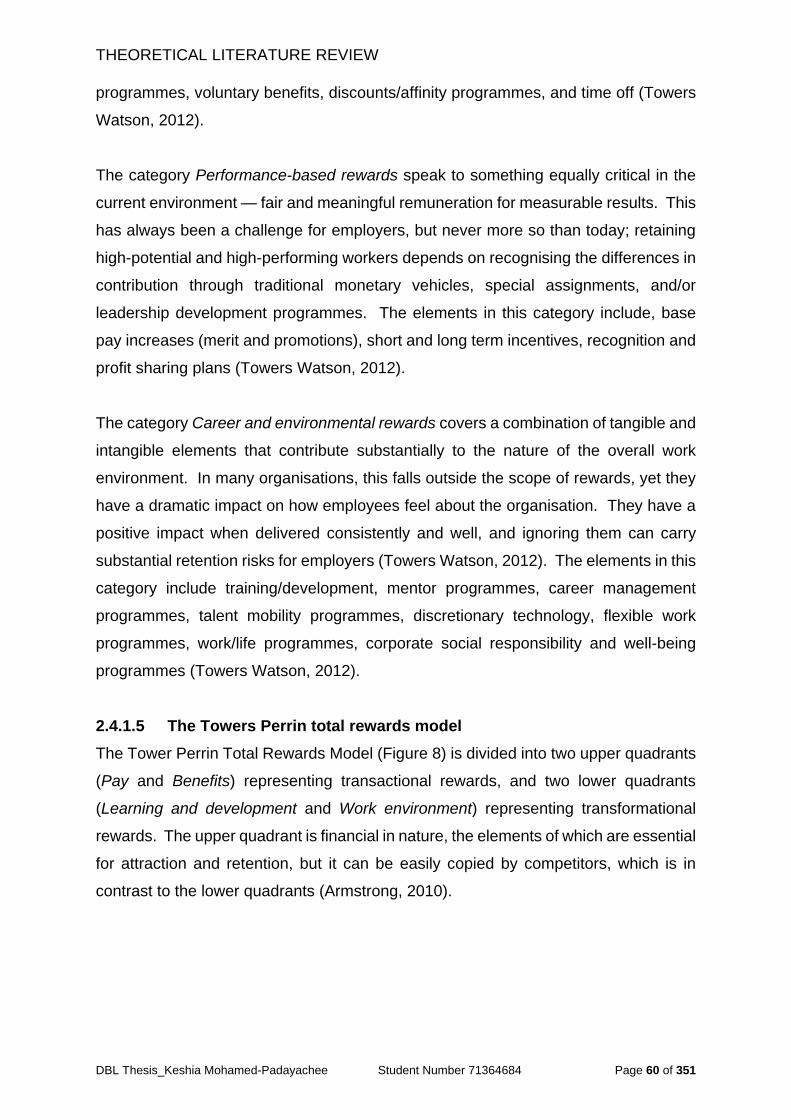
THEORETICAL LITERATURE REVIEW
DBL Thesis_Keshia Mohamed-Padayachee Student Number 71364684 Page 60 of 351
programmes, voluntary benefits, discounts/affinity programmes, and time off (Towers
Watson, 2012).
The category Performance-based rewards speak to something equally critical in the
current environment — fair and meaningful remuneration for measurable results. This
has always been a challenge for employers, but never more so than today; retaining
high-potential and high-performing workers depends on recognising the differences in
contribution through traditional monetary vehicles, special assignments, and/or
leadership development programmes. The elements in this category include, base
pay increases (merit and promotions), short and long term incentives, recognition and
profit sharing plans (Towers Watson, 2012).
The category Career and environmental rewards covers a combination of tangible and
intangible elements that contribute substantially to the nature of the overall work
environment. In many organisations, this falls outside the scope of rewards, yet they
have a dramatic impact on how employees feel about the organisation. They have a
positive impact when delivered consistently and well, and ignoring them can carry
substantial retention risks for employers (Towers Watson, 2012). The elements in this
category include training/development, mentor programmes, career management
programmes, talent mobility programmes, discretionary technology, flexible work
programmes, work/life programmes, corporate social responsibility and well-being
programmes (Towers Watson, 2012).
2.4.1.5 The Towers Perrin total rewards model
The Tower Perrin Total Rewards Model (Figure 8) is divided into two upper quadrants
(Pay and Benefits) representing transactional rewards, and two lower quadrants
(Learning and development and Work environment) representing transformational
rewards. The upper quadrant is financial in nature, the elements of which are essential
for attraction and retention, but it can be easily copied by competitors, which is in
contrast to the lower quadrants (Armstrong, 2010).
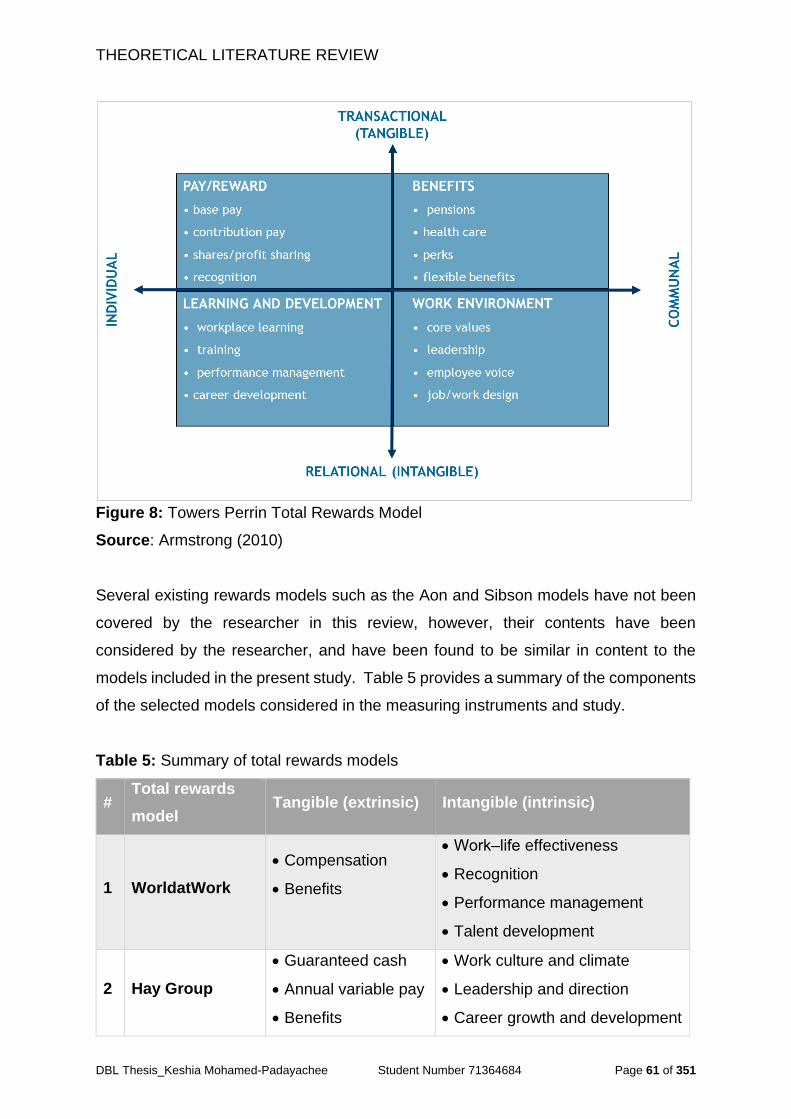
THEORETICAL LITERATURE REVIEW
DBL Thesis_Keshia Mohamed-Padayachee Student Number 71364684 Page 61 of 351
Figure 8: Towers Perrin Total Rewards Model
Source: Armstrong (2010)
Several existing rewards models such as the Aon and Sibson models have not been
covered by the researcher in this review, however, their contents have been
considered by the researcher, and have been found to be similar in content to the
models included in the present study. Table 5 provides a summary of the components
of the selected models considered in the measuring instruments and study.
Table 5: Summary of total rewards models
# Total rewards
model Tangible (extrinsic) Intangible (intrinsic)
1 WorldatWork
Compensation
Benefits
Work‒life effectiveness
Recognition
Performance management
Talent development
2 Hay Group
Guaranteed cash
Annual variable pay
Benefits
Work culture and climate
Leadership and direction
Career growth and development
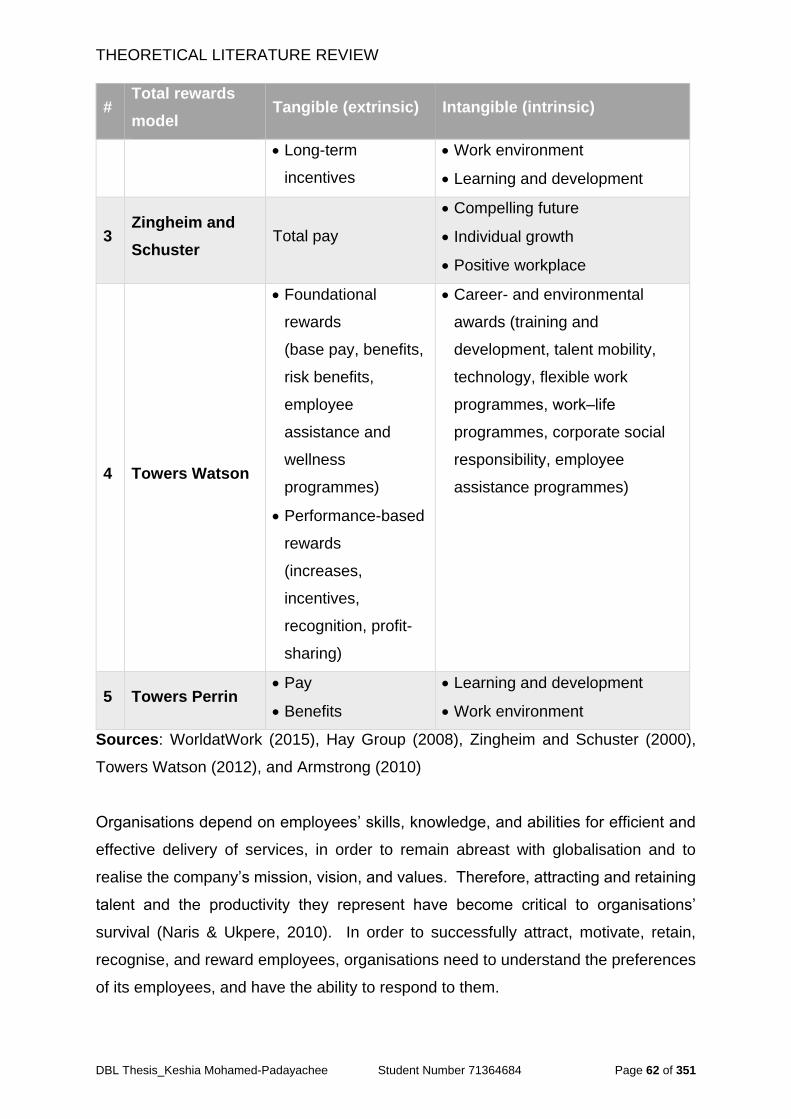
THEORETICAL LITERATURE REVIEW
DBL Thesis_Keshia Mohamed-Padayachee Student Number 71364684 Page 62 of 351
# Total rewards
model Tangible (extrinsic) Intangible (intrinsic)
Long-term
incentives
Work environment
Learning and development
3 Zingheim and
Schuster Total pay
Compelling future
Individual growth
Positive workplace
4 Towers Watson
Foundational
rewards
(base pay, benefits,
risk benefits,
employee
assistance and
wellness
programmes)
Performance-based
rewards
(increases,
incentives,
recognition, profit-
sharing)
Career- and environmental
awards (training and
development, talent mobility,
technology, flexible work
programmes, work‒life
programmes, corporate social
responsibility, employee
assistance programmes)
5 Towers Perrin Pay
Benefits
Learning and development
Work environment
Sources: WorldatWork (2015), Hay Group (2008), Zingheim and Schuster (2000),
Towers Watson (2012), and Armstrong (2010)
Organisations depend on employees’ skills, knowledge, and abilities for efficient and
effective delivery of services, in order to remain abreast with globalisation and to
realise the company’s mission, vision, and values. Therefore, attracting and retaining
talent and the productivity they represent have become critical to organisations’
survival (Naris & Ukpere, 2010). In order to successfully attract, motivate, retain,
recognise, and reward employees, organisations need to understand the preferences
of its employees, and have the ability to respond to them.
THEORETICAL LITERATURE REVIEW
DBL Thesis_Keshia Mohamed-Padayachee Student Number 71364684 Page 63 of 351
Literature indicates that customised reward frameworks positively affect engagement
levels, leading to greater levels of productivity and improved organisational
performance (CLC, 2004). In today’s competitive economic environment, the
challenge for employers is to design reward practices that support business goals
being achieved and to motivate employees to perform at uninterruptedly high levels.
The reward needs of employees are an important consideration in designing an
operational total rewards strategy, which should positively affect employee behaviours
through the incorporation of extrinsic and intrinsic rewards as motivators (CLC, 2004).
Creating a combination of transactional and relational rewards is required to attract,
motivate, and retain high-performance employees. Further, while attraction has been
related closely to transactional rewards, motivation and retention have been shown to
be closely related to relational rewards (Bussin & Toerin, 2015).
For the purposes of the present research, and based on the similarity of the total
rewards models discussed above and reasons presented below, the researcher tested
the reward categories of the WorldatWork (2015) Total Rewards Model considering
the other total rewards models discussed above and summarised in Table 5.
2.4.1.6 Why the WorldatWork total rewards model was tested?
WorldatWork is a non-profit human resources association and compensation authority
for professionals and organisations focused on compensation, benefits and total
rewards. The organisation empowers professionals by providing thought leadership
in total rewards disciplines from the world's most respected experts; ensuring access
to timely, relevant content; and fostering an active community of total rewards
practitioners and leaders.
WorldatWork and its affiliates provide comprehensive education, certification,
research, advocacy and community to members and the total rewards community.
WorldatWork has more than 70,000 members and subscribers worldwide; more than
80% of Fortune 500 companies employ a WorldatWork member. Founded in 1955,
WorldatWork has offices in Scottsdale, Ariz., and Washington, D.C., and is affiliated
with more than 70 human resources associations around the world.
THEORETICAL LITERATURE REVIEW
DBL Thesis_Keshia Mohamed-Padayachee Student Number 71364684 Page 64 of 351
WorldatWork Society of Certified Professionals® is the certifying body for eight
prestigious designations: the Certified Compensation Professional® (CCP®), Certified
Benefits Professional® (CBP®), Global Remuneration Professional (GRP®), Work-
Life Certified Professional® (WLCP®), Certified Sales Compensation Professional
(CSCP)®, Certified Executive Compensation Professional (CECP)®, Advanced
Certified Compensation Professional (ACCP)™ and Master Certified Compensation
Professional (MCCP)™ (WorldatWork, 2015).
The WorldatWork 2015 model recognises that total rewards operate in the context of
overall business strategy, organisational culture, and HR strategy. The model
integrates six key categories, which are the same as those in other total reward
models; each of which includes programmes and practices that collectively define an
organisational strategy to motivate and retain the talent required to achieve business
results (Tsede & Kutin, 2013).
The WorldatWork 2015 model provides a comprehensive framework of monetary and
non-monetary returns employers provide in exchange for employees’ time, talents,
effort, and results (WorldatWork, 2015). The model includes all the elements of
remuneration, benefits, work‒life balance, performance and recognition, and
development- and career opportunities (WorldatWork, 2015). All of these were aligned
with the aim of the present research — to create an increased understanding of the
attraction and retention of youth employees based on their reward preferences.
A company's exceptional culture and external brand value may be considered as
critical components of the total employment value proposition (EVP). The backdrop
of the WorldatWork model, representing the external influences on a business, such
as economic, labour market, cultural norms and regulatory for which there is little or
no control must be considered if organisations are to be successful in understanding
total rewards (WorldatWork, 2015). An important dimension of the model is the
‘exchange relationship’ between the employer and employee. Successful companies
realise that productive employees create value for their organisations in return for
tangible and intangible rewards that enrich their lives (Wang, 2012).
THEORETICAL LITERATURE REVIEW
DBL Thesis_Keshia Mohamed-Padayachee Student Number 71364684 Page 65 of 351
2.5. Life- and career-stage Models
In this section of the theoretical literature review, the researcher evaluates if career-
and life-stage models can be applied as predictors of what is important to the youth
and will attract and retain them.
Theorists have attempted to conceptualise careers from a developmental point of
view. They see the individual's experiences, roles, and relationships in work-related
organisations as developing, or having the possibility of developing, along some
course (Lawrence, Arthur & Hall, 1995).
Life-cycle and career-stage Models of adult development are underpinned by the
theory that, over the human lifespan, an adult pass through a sequence of stages.
Each stage is characterised by specific developmental activities, life- and career tasks,
and challenges (Hardigree, 2008). This section begins with a review of the Career-
stage Model, followed by the Life-stage Model.
2.5.1. Career-stage Model
Recognising the unique characteristics of professional careers, Dalton, Thompson,
and Price (1977) introduced a career-stage Model for professional growth that
identifies and describes the distinct stages of professional careers. Associated with
each career stage are identifiable characteristics and needs that guide thought,
behaviours, and actions in that particular stage, describing four distinct stages of
professional careers. These ultimately have an effect on the nature of developmental
opportunities appropriate at a particular stage (Rennekamp & Nall, 1993).
Building upon the work of Dalton, Thompson, and Price (1977), Rennekamp and Nall
(1993) modified and adapted the original model for use in the Cooperative State
Research, Education, and Extension Service. The model holds that there are four
distinct stages in a career: entry, colleague, counsellor, and advisor. Each stage
includes a distinct set of motivators that drive professional development at that point.
These motivators provide both the impetus for participating in and the criteria for
selecting from among various professional development opportunities (Rennekamp &
Nall, 1993).
THEORETICAL LITERATURE REVIEW
DBL Thesis_Keshia Mohamed-Padayachee Student Number 71364684 Page 66 of 351
The Career-stage Model demonstrates the career stages that individuals move
through in their careers, typically: establishment, advancement, maintenance, and
retirement. The approximate age of the individual in this stage varies from 21 to 26
years. During this stage, persons learn the basic elements of the job and where they
fit within an organisation. Individuals who change the career later in life would go
through this stage at a more advanced age (Rennekamp & Nall, 1993).
2.5.1.1. The Entry stage
The entry stage is when the individual first enters a profession or a new job within a
profession. It is essential that all professionals move out of this stage to attain career
satisfaction. The entry stage is characterised by psychological dependency. Central
motivators for professional development include attaining the foundational skills
required to do the job and understanding the organisation's structure, function, and
culture at that point in the organisation's history (Rennekamp & Nall, 1993).
Motivators for professional development at the entry stage, as described by
Rennekamp and Nall (1993), include understanding the organisation’s structure,
function, and culture, attaining base-level technical skills, and giving relevance to
previous training. These individuals exercise directed creativity and initiative, and
move from dependency to independence. With this comes the opportunity to have a
mentor relationship with a senior professional, exploring personal and professional
dynamics, and building relationships with professional peers.
2.5.1.2. The Colleague stage
Many individuals look forward to having their own projects or areas of responsibility.
This marks the colleague stage. The colleague stage can be a satisfactory level for
many professionals for a number of years, as long as growth in expertise or
responsibility continues. Some people never need to move beyond this level, thriving
on independent work (Simonsen, 1986). Individuals in the colleague stage have been
accepted as members of the professional community, and independently, they
contribute their expertise to solving problems and carrying out programmes. The
colleague seeks to build at least one area of expertise for which he or she is noted,
and often shares that expertise on developmental committees and through special
assignments.
THEORETICAL LITERATURE REVIEW
DBL Thesis_Keshia Mohamed-Padayachee Student Number 71364684 Page 67 of 351
Motivators for professional development at the colleague stage have been described
as the individual developing an area of expertise and becoming an independent
contributor in problem solving, developing a professional identity, and gaining
membership of the professional community. Individuals in this stage are also
motivated by expanding creativity and innovation, moving from independence to
interdependence, and expanding their knowledge on relevant issues (Rennekamp &
Nall, 1993).
2.5.1.3. The Counsellor stage
The counsellor stage is marked by an individual’s decision and ability to contribute to
the development of professionals who have reached the counsellor stage and are
ready to take on responsibility, either formal or informal, for developing others in the
organisation as a coach, mentor, or team- or project leader, while not neglecting their
own personal growth and development. They often seek to develop additional areas
of expertise beyond those they currently possess. Such efforts result in a broad‐based
expertise that can be utilised in organisational problem‐solving (Rennekamp & Nall,
1993).
Counsellors often chair committees or take on leadership roles in professional
associations. Rather than being independent contributors, they understand the need
for an interdependent role, and accomplish much of their work through others. They
are extensive boundary‐spanners, and often have extensive networks, both within and
outside of the organisation. A move to the counsellor stage does not necessarily imply
a change of job to a supervisory or managerial position, but those in the counsellor
stage must, at some point, be able to contribute to the growth of others in the system
(Rennekamp & Nall, 1993).
2.5.1.4. The Advisor stage
Individuals in the advisor stage play a key role in shaping the future of the organisation
by sponsoring promising people, programmes, and ideas. Often, the advisor has
developed distinct competencies in several areas of expertise, and has a regional or
national reputation. Advisors have a thorough understanding of the organisation, and
can be a catalyst for positive change. They are capable of exercising formal and
informal influence in the decision-making process (Rennekamp & Nall, 1993). Table
6 provides a summary of the Career-stage Model of Super (1957).
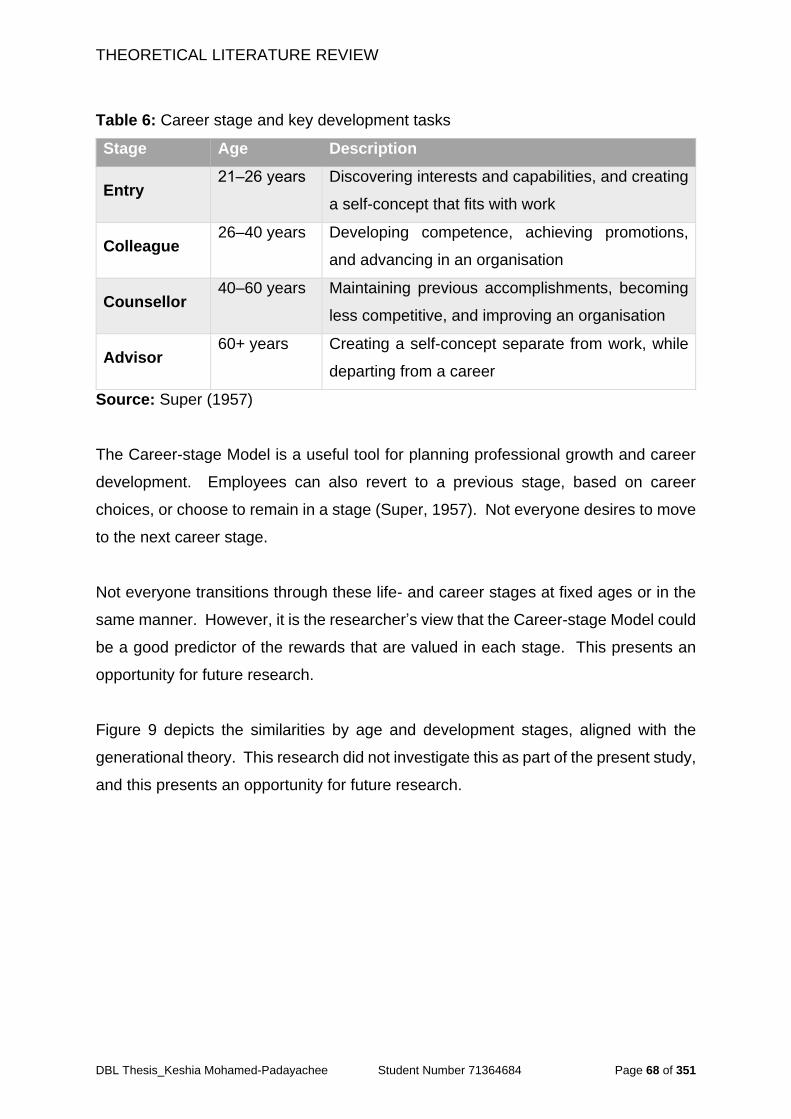
THEORETICAL LITERATURE REVIEW
DBL Thesis_Keshia Mohamed-Padayachee Student Number 71364684 Page 68 of 351
Table 6: Career stage and key development tasks
Stage Age Description
Entry 21‒26 years Discovering interests and capabilities, and creating
a self-concept that fits with work
Colleague 26–40 years Developing competence, achieving promotions,
and advancing in an organisation
Counsellor 40–60 years Maintaining previous accomplishments, becoming
less competitive, and improving an organisation
Advisor 60+ years Creating a self-concept separate from work, while
departing from a career
Source: Super (1957)
The Career-stage Model is a useful tool for planning professional growth and career
development. Employees can also revert to a previous stage, based on career
choices, or choose to remain in a stage (Super, 1957). Not everyone desires to move
to the next career stage.
Not everyone transitions through these life- and career stages at fixed ages or in the
same manner. However, it is the researcher’s view that the Career-stage Model could
be a good predictor of the rewards that are valued in each stage. This presents an
opportunity for future research.
Figure 9 depicts the similarities by age and development stages, aligned with the
generational theory. This research did not investigate this as part of the present study,
and this presents an opportunity for future research.
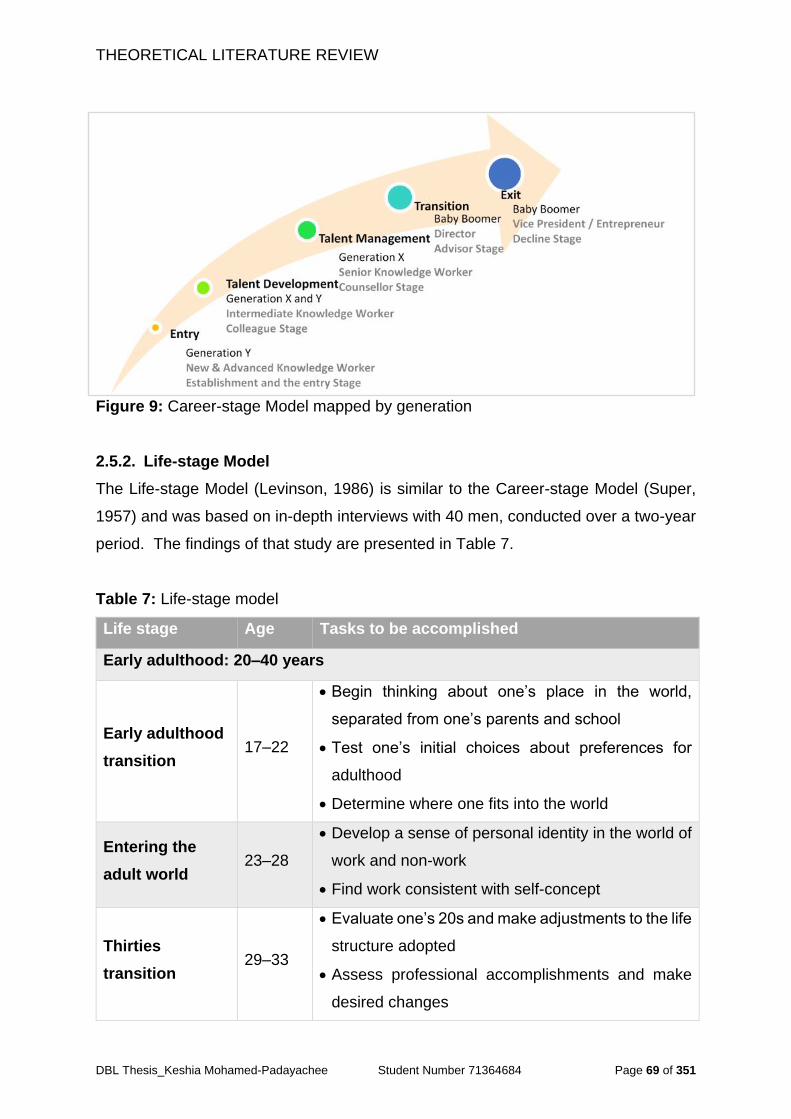
THEORETICAL LITERATURE REVIEW
DBL Thesis_Keshia Mohamed-Padayachee Student Number 71364684 Page 69 of 351
Figure 9: Career-stage Model mapped by generation
2.5.2. Life-stage Model
The Life-stage Model (Levinson, 1986) is similar to the Career-stage Model (Super,
1957) and was based on in-depth interviews with 40 men, conducted over a two-year
period. The findings of that study are presented in Table 7.
Table 7: Life-stage model
Life stage Age Tasks to be accomplished
Early adulthood: 20–40 years
Early adulthood
transition 17–22
Begin thinking about one’s place in the world,
separated from one’s parents and school
Test one’s initial choices about preferences for
adulthood
Determine where one fits into the world
Entering the
adult world 23–28
Develop a sense of personal identity in the world of
work and non-work
Find work consistent with self-concept
Thirties
transition 29–33
Evaluate one’s 20s and make adjustments to the life
structure adopted
Assess professional accomplishments and make
desired changes
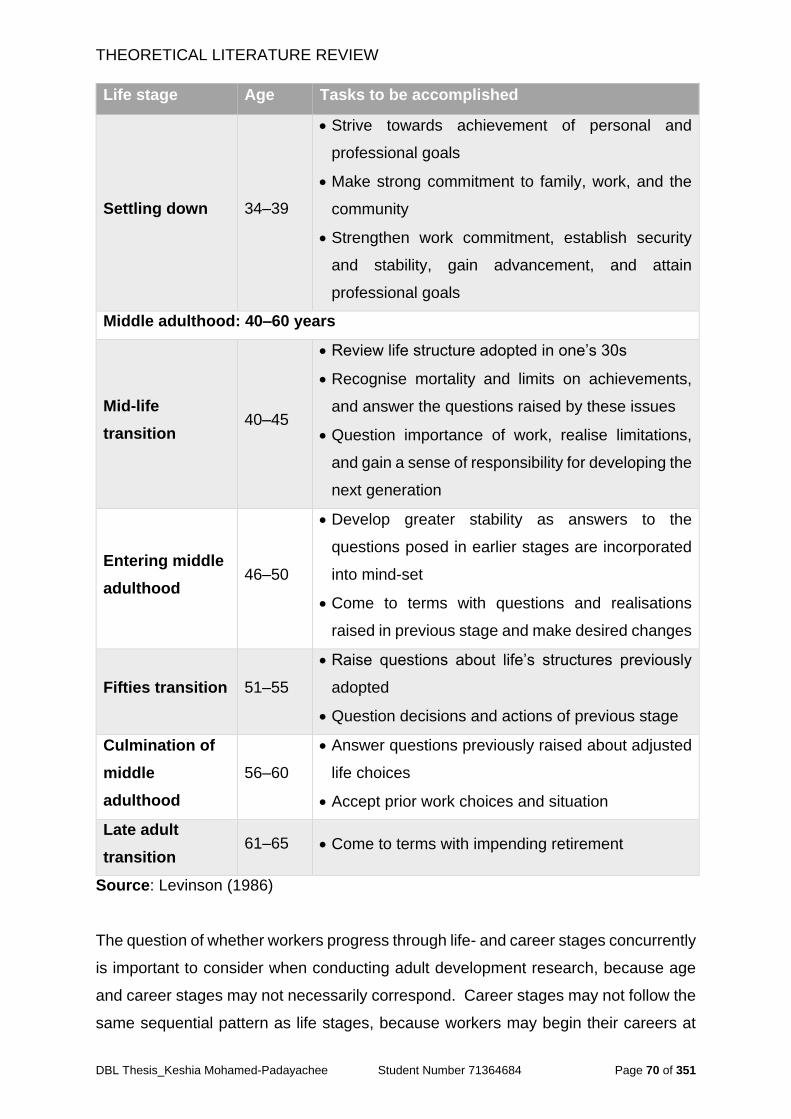
THEORETICAL LITERATURE REVIEW
DBL Thesis_Keshia Mohamed-Padayachee Student Number 71364684 Page 70 of 351
Life stage Age Tasks to be accomplished
Settling down 34–39
Strive towards achievement of personal and
professional goals
Make strong commitment to family, work, and the
community
Strengthen work commitment, establish security
and stability, gain advancement, and attain
professional goals
Middle adulthood: 40–60 years
Mid-life
transition 40–45
Review life structure adopted in one’s 30s
Recognise mortality and limits on achievements,
and answer the questions raised by these issues
Question importance of work, realise limitations,
and gain a sense of responsibility for developing the
next generation
Entering middle
adulthood 46–50
Develop greater stability as answers to the
questions posed in earlier stages are incorporated
into mind-set
Come to terms with questions and realisations
raised in previous stage and make desired changes
Fifties transition 51–55
Raise questions about life’s structures previously
adopted
Question decisions and actions of previous stage
Culmination of
middle
adulthood
56–60
Answer questions previously raised about adjusted
life choices
Accept prior work choices and situation
Late adult
transition 61–65 Come to terms with impending retirement
Source: Levinson (1986)
The question of whether workers progress through life- and career stages concurrently
is important to consider when conducting adult development research, because age
and career stages may not necessarily correspond. Career stages may not follow the
same sequential pattern as life stages, because workers may begin their careers at
THEORETICAL LITERATURE REVIEW
DBL Thesis_Keshia Mohamed-Padayachee Student Number 71364684 Page 71 of 351
different ages, or may experience interruptions along the way (Sullivan, 1999).
Researchers have noted that future research needs to “operationalise career stage
and disentangle possible effects of chronological age and career stage" (Hardigree,
2008: 2).
Career- and life-stage models do not consider what tangible and intangible rewards
employees are seeking when joining organisations, or what causes them to leave an
employer, which presents an opportunity for future research. These models do not
take into consideration external experiences, and the stages are categorised and
defined in the same manner — based on age.
2.6. Theories of motivation
Motivation is defined as an internally generated drive to achieve a goal or follow a
particular course of action. Highly motivated employees focus their efforts on
achieving specific goals; those who are unmotivated do not. Paying employees well
helps, but there are many other factors that influence a person’s desire, or lack thereof,
to excel in the workplace (Collins, 2009).
In this section, the researcher explores the theories of motivation, defining motivation
in terms of the impact it has on decision-making of employees in the work environment.
It is important to understand the intrinsic and extrinsic motivators that drive employees’
behaviour in order to achieve their goals. This will create a deeper appreciation of the
driving forces behind the attraction and retention of employees.
Based on the works of Armstrong (2010) and Wiley (1997), the researcher examined
five selected theories of motivation. The factors affecting human behaviour, motivation
and reward management strategy and systems, the following theories of motivation
were selected: the incentive theory of motivation, the hierarchy of needs, two-factor
theory, expectancy theory, and equity theory.
The researcher explores the selected theories of motivation not only to endeavour to
explain what motivates employees, but also to assist in designing the final Total
Reward Framework for the Youth.
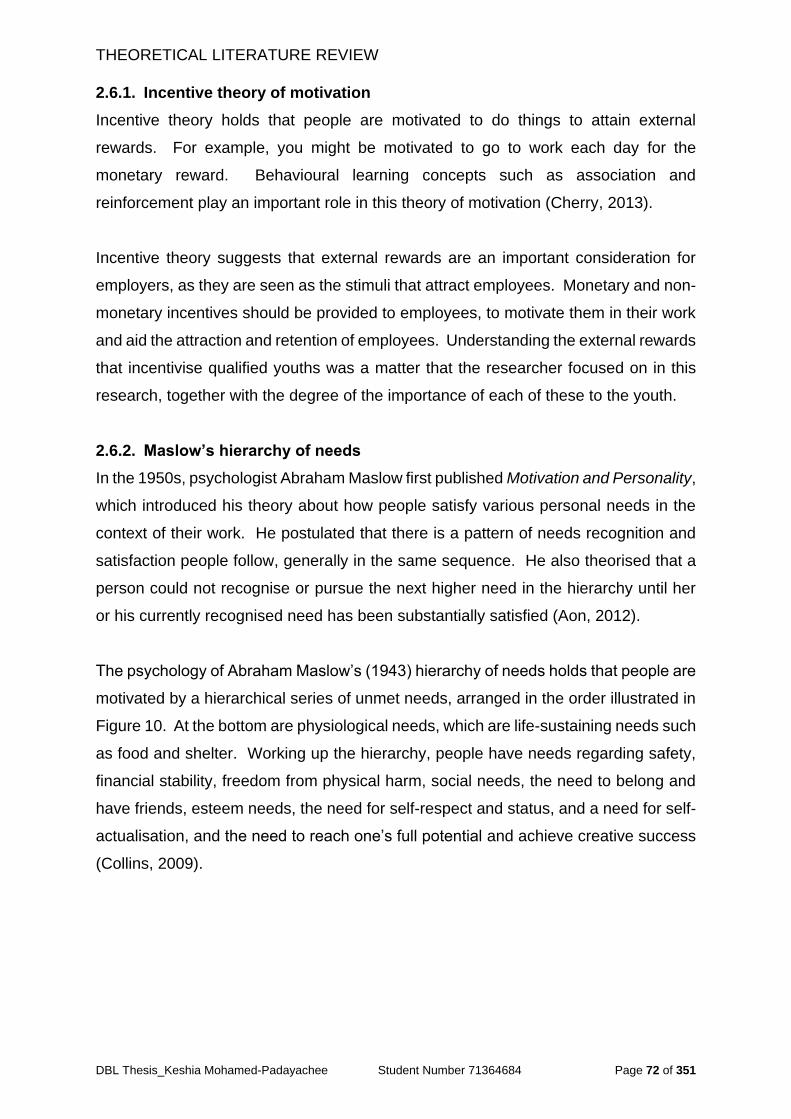
THEORETICAL LITERATURE REVIEW
DBL Thesis_Keshia Mohamed-Padayachee Student Number 71364684 Page 72 of 351
2.6.1. Incentive theory of motivation
Incentive theory holds that people are motivated to do things to attain external
rewards. For example, you might be motivated to go to work each day for the
monetary reward. Behavioural learning concepts such as association and
reinforcement play an important role in this theory of motivation (Cherry, 2013).
Incentive theory suggests that external rewards are an important consideration for
employers, as they are seen as the stimuli that attract employees. Monetary and non-
monetary incentives should be provided to employees, to motivate them in their work
and aid the attraction and retention of employees. Understanding the external rewards
that incentivise qualified youths was a matter that the researcher focused on in this
research, together with the degree of the importance of each of these to the youth.
2.6.2. Maslow’s hierarchy of needs
In the 1950s, psychologist Abraham Maslow first published Motivation and Personality,
which introduced his theory about how people satisfy various personal needs in the
context of their work. He postulated that there is a pattern of needs recognition and
satisfaction people follow, generally in the same sequence. He also theorised that a
person could not recognise or pursue the next higher need in the hierarchy until her
or his currently recognised need has been substantially satisfied (Aon, 2012).
The psychology of Abraham Maslow’s (1943) hierarchy of needs holds that people are
motivated by a hierarchical series of unmet needs, arranged in the order illustrated in
Figure 10. At the bottom are physiological needs, which are life-sustaining needs such
as food and shelter. Working up the hierarchy, people have needs regarding safety,
financial stability, freedom from physical harm, social needs, the need to belong and
have friends, esteem needs, the need for self-respect and status, and a need for self-
actualisation, and the need to reach one’s full potential and achieve creative success
(Collins, 2009).
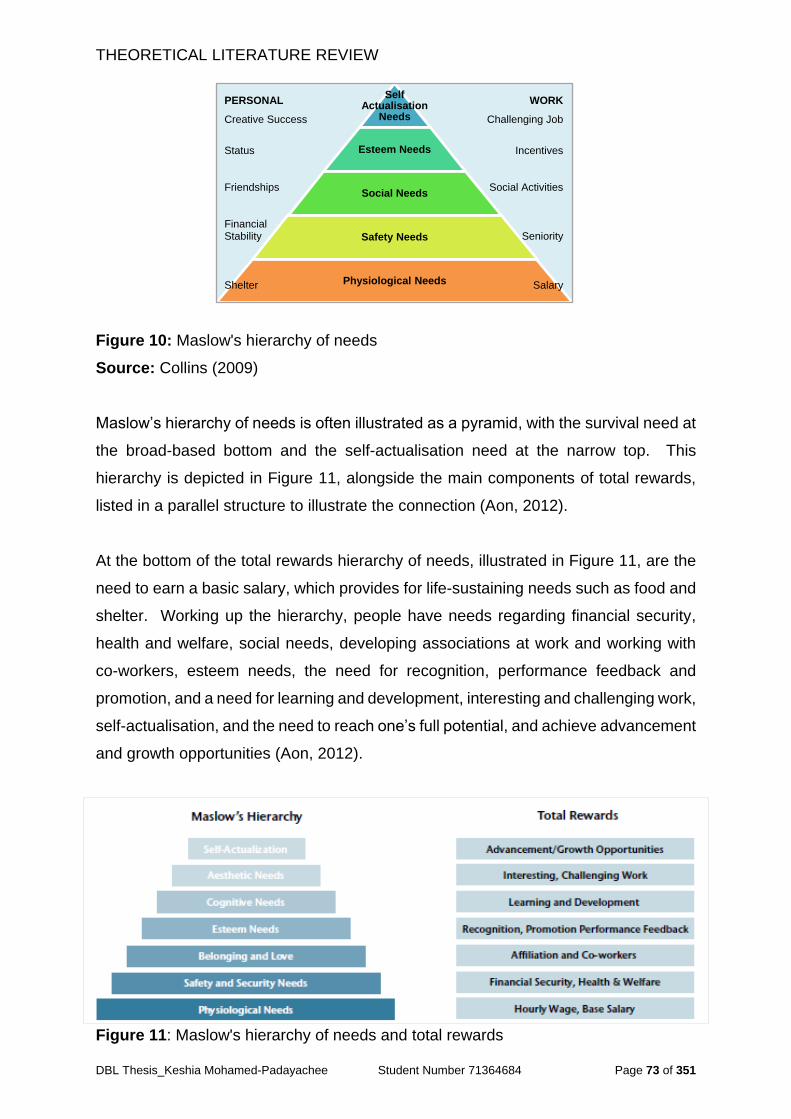
THEORETICAL LITERATURE REVIEW
DBL Thesis_Keshia Mohamed-Padayachee Student Number 71364684 Page 73 of 351
Figure 10: Maslow's hierarchy of needs
Source: Collins (2009)
Maslow’s hierarchy of needs is often illustrated as a pyramid, with the survival need at
the broad-based bottom and the self-actualisation need at the narrow top. This
hierarchy is depicted in Figure 11, alongside the main components of total rewards,
listed in a parallel structure to illustrate the connection (Aon, 2012).
At the bottom of the total rewards hierarchy of needs, illustrated in Figure 11, are the
need to earn a basic salary, which provides for life-sustaining needs such as food and
shelter. Working up the hierarchy, people have needs regarding financial security,
health and welfare, social needs, developing associations at work and working with
co-workers, esteem needs, the need for recognition, performance feedback and
promotion, and a need for learning and development, interesting and challenging work,
self-actualisation, and the need to reach one’s full potential, and achieve advancement
and growth opportunities (Aon, 2012).
Figure 11: Maslow's hierarchy of needs and total rewards
Self Actualisation
Needs
Esteem Needs
Social Needs
Safety Needs
Physiological Needs
WORK
Challenging Job
Incentives
Social Activities
Seniority
Salary
PERSONAL
Creative Success
Status Friendships Financial Stability Shelter
THEORETICAL LITERATURE REVIEW
DBL Thesis_Keshia Mohamed-Padayachee Student Number 71364684 Page 74 of 351
Source: Collins (2009) and Aon (2012)
Employees are motivated by different factors, and the needs that motivate individuals
can change over time. It is therefore important that organisations consider which
needs different employees are trying to satisfy, and to structure rewards and other
forms of recognition accordingly (Collins, 2009). Alderfer’s (1969) theory of existence,
relatedness and growth (ERG) is partly based on Maslow’s hierarchy. This theory,
unlike Maslow’s theory, argues that a higher-level need can be a motivator, even if a
lower-level need is not fully satisfied, and that, needs at more than one level can be
motivators at any time (George, Jones & Sharbrough, 1996).
2.6.3. Herzberg's two-factor theory
In the 1960s, sociologist Frederick Herzberg constructed a two-dimensional paradigm
of factors affecting people’s attitudes towards work. Herzberg set out to determine
which external work factors, such as remuneration, job security, or advancement,
made people feel positive about their jobs, and which factors made them feel negative.
He surveyed workers, and concluded that, to understand employee satisfaction or
dissatisfaction, he had to divide work factors into two categories, namely motivation
and hygiene (Herzberg, 2005).
Motivation factors are those factors that are strong contributors to job satisfaction, and
hygiene factors are those that are not strong contributors to satisfaction, but must be
present to meet a worker’s expectations and prevent job dissatisfaction (Herzberg,
2005).
He concluded that factors such as company policy, supervision, interpersonal
relations, working conditions, and salary are hygiene factors, rather than motivators.
According to his theory, the absence of hygiene factors can create job dissatisfaction,
but their presence does not motivate or create satisfaction. In contrast, he determined
from the data that motivators are the elements that enrich a person’s job; he found five
factors in particular that were strong determinants of job satisfaction: achievement,
recognition, the work itself, responsibility, and advancement. These motivators
(satisfiers) are associated with long-term positive effects in job performance, while the
hygiene factors (dissatisfiers) consistently produced only short-term changes in job
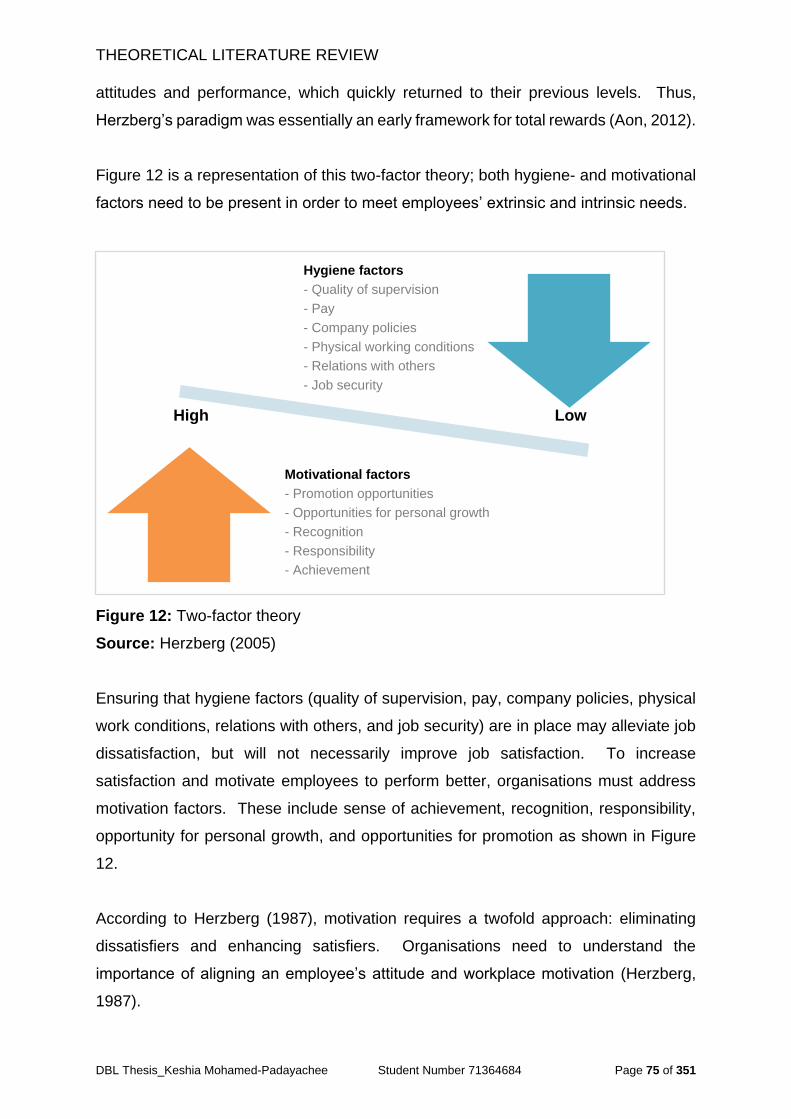
THEORETICAL LITERATURE REVIEW
DBL Thesis_Keshia Mohamed-Padayachee Student Number 71364684 Page 75 of 351
High Low
attitudes and performance, which quickly returned to their previous levels. Thus,
Herzberg’s paradigm was essentially an early framework for total rewards (Aon, 2012).
Figure 12 is a representation of this two-factor theory; both hygiene- and motivational
factors need to be present in order to meet employees’ extrinsic and intrinsic needs.
Figure 12: Two-factor theory
Source: Herzberg (2005)
Ensuring that hygiene factors (quality of supervision, pay, company policies, physical
work conditions, relations with others, and job security) are in place may alleviate job
dissatisfaction, but will not necessarily improve job satisfaction. To increase
satisfaction and motivate employees to perform better, organisations must address
motivation factors. These include sense of achievement, recognition, responsibility,
opportunity for personal growth, and opportunities for promotion as shown in Figure
12.
According to Herzberg (1987), motivation requires a twofold approach: eliminating
dissatisfiers and enhancing satisfiers. Organisations need to understand the
importance of aligning an employee’s attitude and workplace motivation (Herzberg,
1987).
Hygiene factors
- Quality of supervision
- Pay
- Company policies
- Physical working conditions
- Relations with others
- Job security
Motivational factors
- Promotion opportunities
- Opportunities for personal growth
- Recognition
- Responsibility
- Achievement
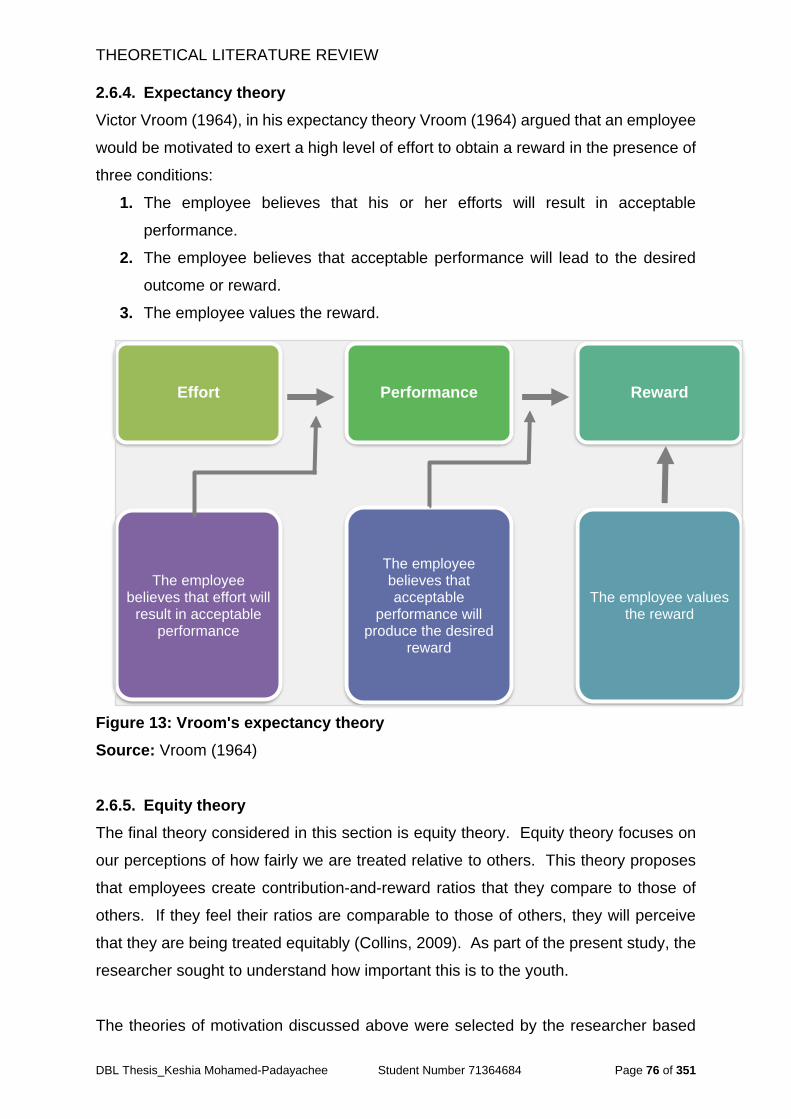
THEORETICAL LITERATURE REVIEW
DBL Thesis_Keshia Mohamed-Padayachee Student Number 71364684 Page 76 of 351
2.6.4. Expectancy theory
Victor Vroom (1964), in his expectancy theory Vroom (1964) argued that an employee
would be motivated to exert a high level of effort to obtain a reward in the presence of
three conditions:
1. The employee believes that his or her efforts will result in acceptable
performance.
2. The employee believes that acceptable performance will lead to the desired
outcome or reward.
3. The employee values the reward.
Figure 13: Vroom's expectancy theory
Source: Vroom (1964)
2.6.5. Equity theory
The final theory considered in this section is equity theory. Equity theory focuses on
our perceptions of how fairly we are treated relative to others. This theory proposes
that employees create contribution-and-reward ratios that they compare to those of
others. If they feel their ratios are comparable to those of others, they will perceive
that they are being treated equitably (Collins, 2009). As part of the present study, the
researcher sought to understand how important this is to the youth.
The theories of motivation discussed above were selected by the researcher based
Effort Performance Reward
The employee values the reward
The employee believes that acceptable
performance will produce the desired
reward
The employee believes that effort will
result in acceptable performance
THEORETICAL LITERATURE REVIEW
DBL Thesis_Keshia Mohamed-Padayachee Student Number 71364684 Page 77 of 351
on the review of the generation theory presented in this study to provide an overview
of what motivators influence and drive the youth’s decision-making.
2.7. Attraction and retention strategies
Each generation’s priorities vary, as well as their views regarding work. It would seem
that the more recent generations want to see what an organisation can do for them. It
is becoming increasingly important that organisations offer more of what future
generations of employees want (Crampton & Hodge, 2006), rather than what
organisations perceive they need.
Myers and Dreachslin (2007) suggests that the secret to successfully managing
Generation Y may lie in using the same strategies their parents used to raise them.
This may mean providing them with a lot of support and coddling, and giving them a
sense of belonging, but without turning the workplace into a day-care centre. Another
suggestion is to give Generation Y responsibilities fairly quickly, and allowing them the
flexibility to do the job their way, but to expect results and show them how their
contributions fit into the organisation’s goals and objectives (Myers & Dreachslin,
2007).
The tenth anniversary edition of MetLife’s (2013) Annual Study of Employee Benefits
Trends confirmed that, despite uncertain and shifting tides, the potential of benefits to
attract and retain key talent and improve employee productivity is stronger than ever.
One of the study’s most significant findings is the strong relationship between
satisfaction with benefits and job satisfaction. The power of benefits drives a universal
set of business objectives — employee attraction, retention, and productivity. This is
a central tenet for benefits professionals, and justifies to senior management the
investment in benefits (MetLife, 2013).
The way organisations attract, develop, and retain human resources will have to
change. Research indicates that organisations that are prepared to focus on
developing talent will be in a stronger position to retain key employees as the war for
talent intensifies (Boxall & Purcell, 2011).
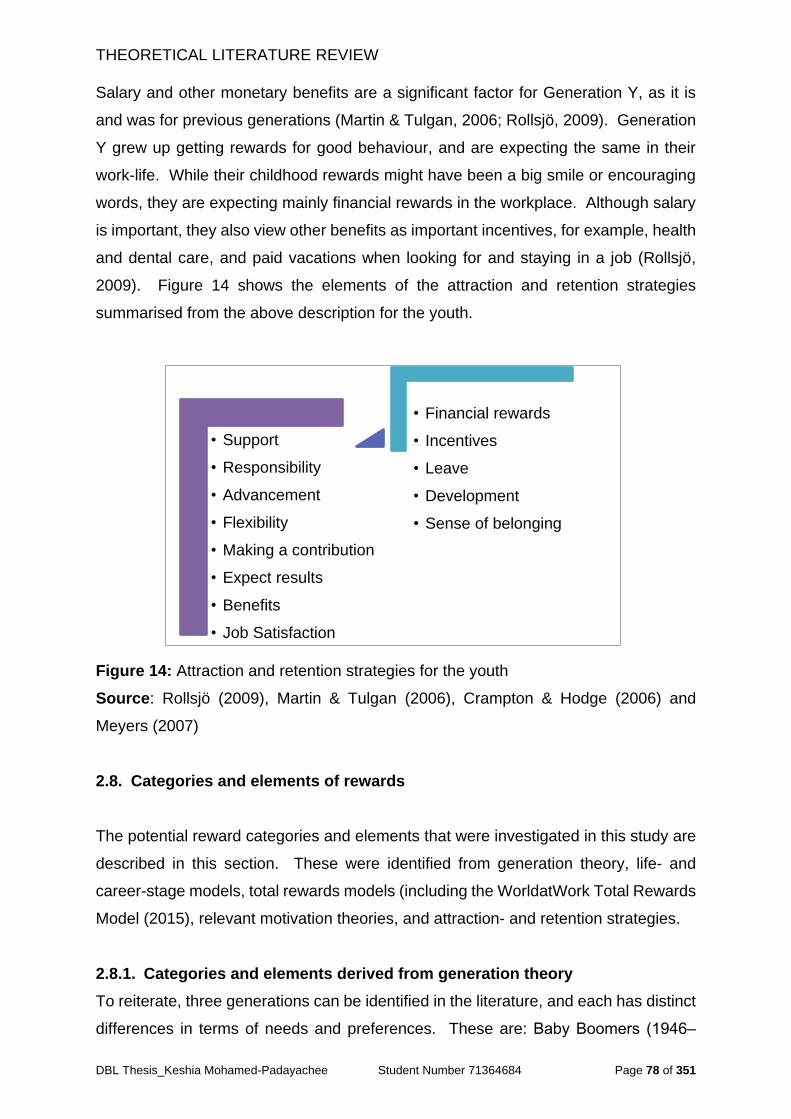
THEORETICAL LITERATURE REVIEW
DBL Thesis_Keshia Mohamed-Padayachee Student Number 71364684 Page 78 of 351
Salary and other monetary benefits are a significant factor for Generation Y, as it is
and was for previous generations (Martin & Tulgan, 2006; Rollsjö, 2009). Generation
Y grew up getting rewards for good behaviour, and are expecting the same in their
work-life. While their childhood rewards might have been a big smile or encouraging
words, they are expecting mainly financial rewards in the workplace. Although salary
is important, they also view other benefits as important incentives, for example, health
and dental care, and paid vacations when looking for and staying in a job (Rollsjö,
2009). Figure 14 shows the elements of the attraction and retention strategies
summarised from the above description for the youth.
Figure 14: Attraction and retention strategies for the youth
Source: Rollsjö (2009), Martin & Tulgan (2006), Crampton & Hodge (2006) and
Meyers (2007)
2.8. Categories and elements of rewards
The potential reward categories and elements that were investigated in this study are
described in this section. These were identified from generation theory, life- and
career-stage models, total rewards models (including the WorldatWork Total Rewards
Model (2015), relevant motivation theories, and attraction- and retention strategies.
2.8.1. Categories and elements derived from generation theory
To reiterate, three generations can be identified in the literature, and each has distinct
differences in terms of needs and preferences. These are: Baby Boomers (1946‒
• Support
• Responsibility
• Advancement
• Flexibility
• Making a contribution
• Expect results
• Benefits
• Job Satisfaction
• Financial rewards
• Incentives
• Leave
• Development
• Sense of belonging

THEORETICAL LITERATURE REVIEW
DBL Thesis_Keshia Mohamed-Padayachee Student Number 71364684 Page 79 of 351
1964), Generation X (1965‒1980), and Generation Y (1981‒2000). Leaders of
organisations must therefore understand the profiles of the members of these
generations, and what their needs and preferences are, in order to put the necessary
rewards in place to attract and retain them. Figure 3 and Table 3, showed the reward
preferences of Generation Y, including work‒life, workplace flexibility, working in
teams, team orientation, collaborative environments, rapid advancement, social
interaction, interactivity, etc.
2.8.2. Categories and elements derived from life and career stage models
According to the career-stage model, individual's experiences, roles, and relationships
in work-related organisations develop along some course (Lawrence, Arthur & Hall,
1995). The theory behind life-cycle and career-stage models of adult development
states that, over the human lifespan, an adult pass through a sequence of stages, and
each stage is characterised by specific developmental activities, life- and career tasks,
and challenges (Hardigree, 2008). Associated with each career stage are identifiable
characteristics and needs that guide thought, behaviours, and actions at that particular
stage, describing four distinct stages of professional careers (i.e. entry, colleague,
counsellor, and advisor) (Rennekamp & Nall, 1993). These ultimately have an effect
on the nature of developmental opportunities appropriate at a particular stage. Hence,
each stage includes a distinct set of motivators that drive professional development at
that point.
2.8.3. Categories and elements derived from total rewards systems
Every total rewards system identifies integral elements of a reward system. The
categories and elements derived from the total reward systems are a combination of
financial and non-financial (tangible or intangible) rewards, and are discussed below.
Different total rewards systems identify potential factors of rewards as an integral
element of reward management. The systems combine financial (such as pay and
benefits) and non-financial rewards (tangible or intangible) elements which include
scope to achieve and exercise responsibility, career opportunities, learning and
development, the intrinsic motivation provided by the work itself, and quality of the
work-life.
THEORETICAL LITERATURE REVIEW
DBL Thesis_Keshia Mohamed-Padayachee Student Number 71364684 Page 80 of 351
2.8.3.1. WorldatWork total rewards model
This model takes into consideration organisational culture and business- and HR
strategy. The total rewards strategy is divided into the six core reward categories.
Each of the six categories of total rewards include elements that collectively define an
organisation’s strategy to attract, motivate, and retain employees (WorldatWork,
2015). This approach meets an intrinsic psychological need for appreciation, and can
support a business strategy by reinforcing certain behaviours that contribute to
organisational success.
In conclusion, this total rewards model suggests tangible rewards as compensation
and benefits, as well as intangible rewards: work‒life effectiveness, recognition,
performance management and talent development.
2.8.3.2. Hay Group Total rewards model
This model focuses on total reward and comprises both financial and non-financial
rewards, centred on pay and benefits, followed by intangible benefits such as personal
development, career progression, work‒life balance, environment, and culture
(Armstrong, 2010). It also includes guaranteed cash, annual variable pays, long-term
incentives, and benefits (statutory and non-statutory).
In conclusion, this model suggests tangible rewards including guaranteed cash,
annual variable pay, benefits and long-term incentives, and intangible rewards, which
include work culture and climate, leadership and direction, career growth and
development, work environment, and learning and development.
2.8.3.3. Zingheim and Schuster total rewards model
This model expresses total rewards as four interlocked but directly related categories.
It argues that people want to work for a company that has a vision, growth, and
direction, and something they can buy into (i.e. first category). They also want a
company that focuses on individual growth, development and training, feedback and
coaching, and opportunities to grow and learn to add value over time (i.e. second
category), and a positive workplace (i.e. third category) in terms of leaders and
colleagues, open communication, trust and commitment, and meaningful work. The
fourth category involves total remuneration, which includes recognition and
celebration (Armstrong, 2010; Zingheim and Schuster, 2000).
THEORETICAL LITERATURE REVIEW
DBL Thesis_Keshia Mohamed-Padayachee Student Number 71364684 Page 81 of 351
In conclusion, the model suggests tangible rewards, i.e. total pay, and intangible
rewards, including a compelling future, individual growth, and a positive workplace.
2.8.3.4. Towers Watson total rewards model
This model organises rewards into three categories that correspond to distinct aspects
of an employee’s experience at work, namely, (1) the foundational rewards category
for employees’ desire for security, stability, and safety, (2) the performance-based
rewards category, which recommends fair and meaningful remuneration for
measurable results, in order to retain high-potential and high-performing workers by
recognising the differences in contribution through traditional monetary vehicles and
promotions, special assignments, and/or leadership development programmes and (3)
the category of career and environmental rewards, which covers a combination of
tangible and intangible elements that contribute substantially to the nature of the
overall work environment (Towers Watson, 2012).
In conclusion, this model suggests tangible rewards — foundational rewards (base
pay, benefits, risk benefits, employee assistance, and wellness programmes) and
performance-based rewards (increases, incentives, recognition, profit-sharing), and
intangible rewards — career- and environmental rewards (training and development,
talent mobility, technology, flexible work programmes, work‒life programmes,
corporate social responsibility, and employee assistance programmes).
2.8.3.5. The Towers Perrin total rewards model
This model has four categories: (1) pay — base pay, contribution pay, shares/profit
sharing, and recognition; (2) benefits — pension, health care, perks, employee
discounts and flexible benefits; (3) learning and development — workplace learning,
training, performance management, career development; and (4) work environment
— core values, leadership, employee voice, and job/work design (Armstrong, 2010).
In conclusion, the model suggests tangible rewards (pay, contribution pay and
shares/profit sharing) and intangible rewards (recognition, benefits, pension, health
care, training and development, performance management, career development and,
in the work environment, core values, leadership, employee voice, and job/work
design.
THEORETICAL LITERATURE REVIEW
DBL Thesis_Keshia Mohamed-Padayachee Student Number 71364684 Page 82 of 351
Salary and other monetary benefits are a significant factor for generation Y but other
benefits such health- and dental care and paid vacations, etc. are also important when
looking for, and staying in a job (Rollsjö, 2009).
In addition to the reward categories from the WorldatWork (2015) total rewards model,
other reward categories and elements were identified from the other reward models
discussed in this chapter above and included in the final research questionnaire.
2.8.4. Categories and elements derived from motivational theories
It is important to understand the intrinsic and extrinsic motivators that drive employees’
behaviour. These are the driving forces behind what attracts and retains employees.
Incentive theory of motivation suggests that external rewards (i.e. monitory and
non-monitory incentives) are important considerations for employers, and are seen as
the stimuli that attract employees (Silverman, 2004).
According to Maslow’s hierarchy of needs theory, employees are motivated by
different factors, and the needs that motivate individuals can change over time
(Collins, 2009). It is therefore important that organisations consider which needs
different employees are trying to satisfy, and to structure rewards and other forms of
recognition accordingly (Collins & Hussey, 2009).
According to the Herzberg's two-factor theory, external work factors such as
remuneration, job security, and advancement make people feel positive about their
jobs. This theory considers two categories of factors, namely motivation and hygiene.
Motivation factors are strong contributors to job satisfaction, and hygiene factors, while
not strong contributors to satisfaction, but must be present to meet a worker’s
expectations and prevent job dissatisfaction. Hygiene factors (i.e. quality of
supervision, pay, company policies, physical work conditions, relations with others,
and job security) which are in place may alleviate job dissatisfaction, but will not
necessarily improve job satisfaction. Employees also require a sense of achievement,
recognition, responsibility, opportunity for personal growth, and opportunities for
promotion. Hence, motivation requires a twofold approach: eliminating dissatisfiers
and enhancing satisfiers (Herzberg, 1987). What follows from this theory is the need
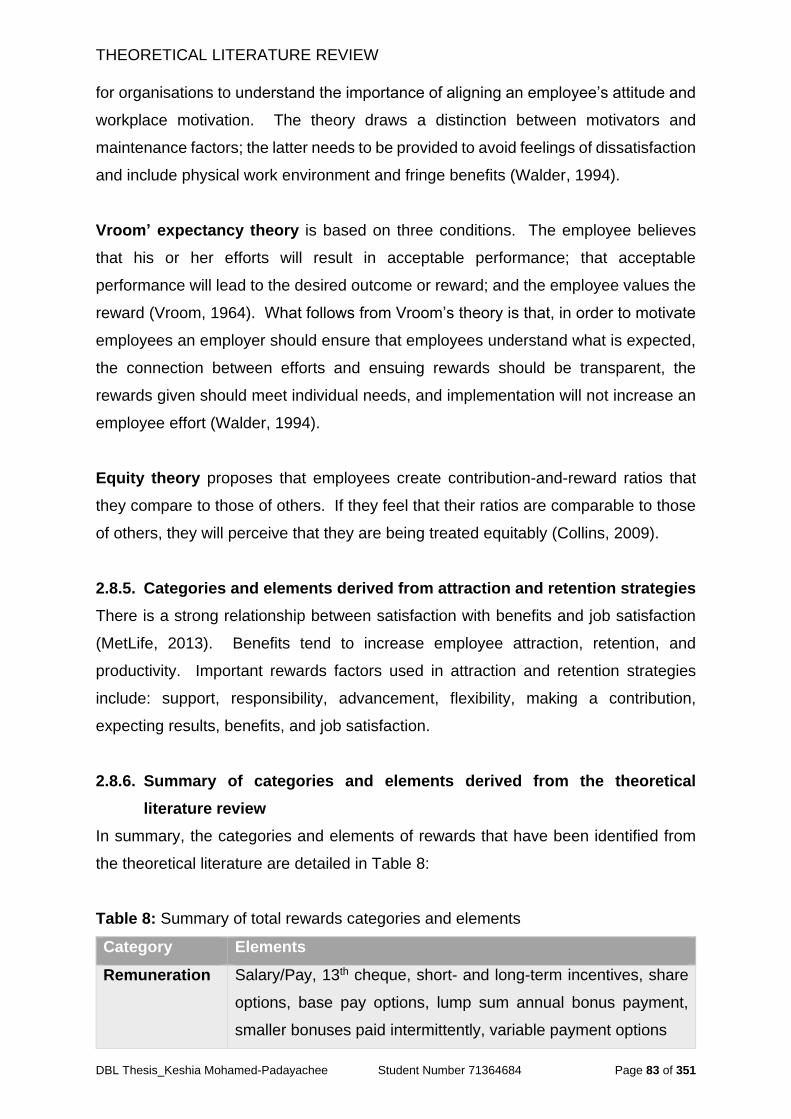
THEORETICAL LITERATURE REVIEW
DBL Thesis_Keshia Mohamed-Padayachee Student Number 71364684 Page 83 of 351
for organisations to understand the importance of aligning an employee’s attitude and
workplace motivation. The theory draws a distinction between motivators and
maintenance factors; the latter needs to be provided to avoid feelings of dissatisfaction
and include physical work environment and fringe benefits (Walder, 1994).
Vroom’ expectancy theory is based on three conditions. The employee believes
that his or her efforts will result in acceptable performance; that acceptable
performance will lead to the desired outcome or reward; and the employee values the
reward (Vroom, 1964). What follows from Vroom’s theory is that, in order to motivate
employees an employer should ensure that employees understand what is expected,
the connection between efforts and ensuing rewards should be transparent, the
rewards given should meet individual needs, and implementation will not increase an
employee effort (Walder, 1994).
Equity theory proposes that employees create contribution-and-reward ratios that
they compare to those of others. If they feel that their ratios are comparable to those
of others, they will perceive that they are being treated equitably (Collins, 2009).
2.8.5. Categories and elements derived from attraction and retention strategies
There is a strong relationship between satisfaction with benefits and job satisfaction
(MetLife, 2013). Benefits tend to increase employee attraction, retention, and
productivity. Important rewards factors used in attraction and retention strategies
include: support, responsibility, advancement, flexibility, making a contribution,
expecting results, benefits, and job satisfaction.
2.8.6. Summary of categories and elements derived from the theoretical
literature review
In summary, the categories and elements of rewards that have been identified from
the theoretical literature are detailed in Table 8:
Table 8: Summary of total rewards categories and elements
Category Elements
Remuneration Salary/Pay, 13th cheque, short- and long-term incentives, share
options, base pay options, lump sum annual bonus payment,
smaller bonuses paid intermittently, variable payment options
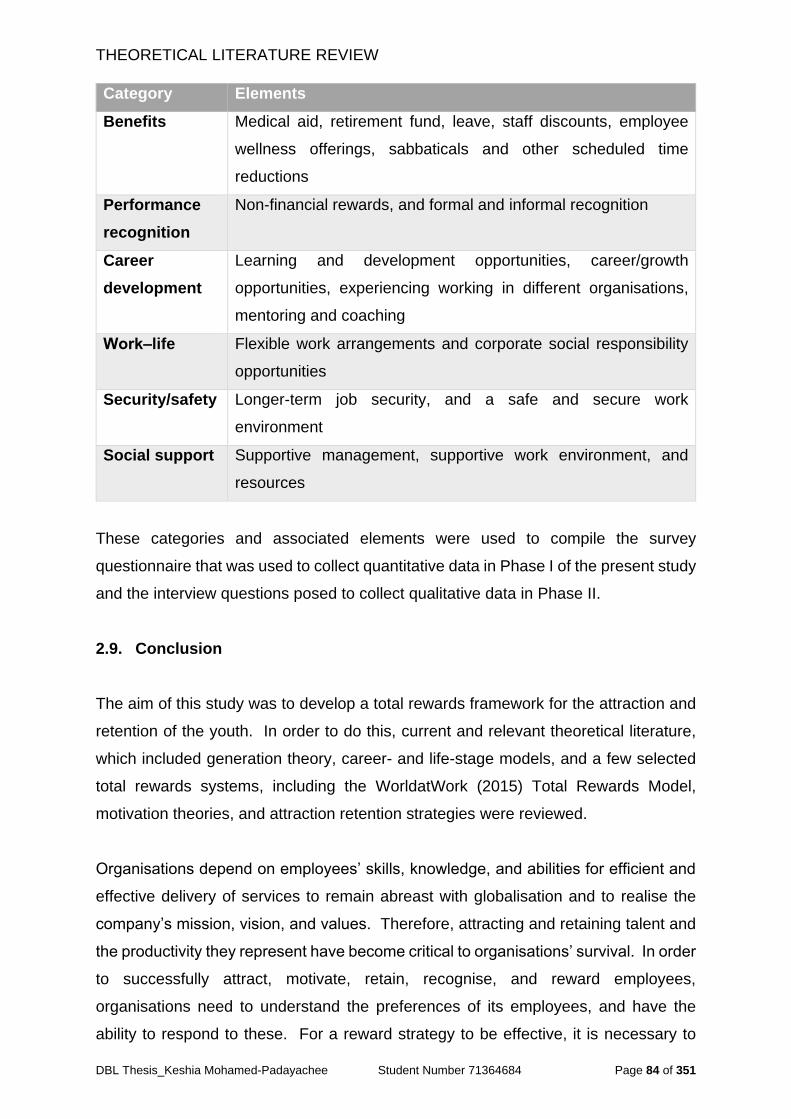
THEORETICAL LITERATURE REVIEW
DBL Thesis_Keshia Mohamed-Padayachee Student Number 71364684 Page 84 of 351
Category Elements
Benefits Medical aid, retirement fund, leave, staff discounts, employee
wellness offerings, sabbaticals and other scheduled time
reductions
Performance
recognition
Non-financial rewards, and formal and informal recognition
Career
development
Learning and development opportunities, career/growth
opportunities, experiencing working in different organisations,
mentoring and coaching
Work‒life Flexible work arrangements and corporate social responsibility
opportunities
Security/safety Longer-term job security, and a safe and secure work
environment
Social support Supportive management, supportive work environment, and
resources
These categories and associated elements were used to compile the survey
questionnaire that was used to collect quantitative data in Phase I of the present study
and the interview questions posed to collect qualitative data in Phase II.
2.9. Conclusion
The aim of this study was to develop a total rewards framework for the attraction and
retention of the youth. In order to do this, current and relevant theoretical literature,
which included generation theory, career- and life-stage models, and a few selected
total rewards systems, including the WorldatWork (2015) Total Rewards Model,
motivation theories, and attraction retention strategies were reviewed.
Organisations depend on employees’ skills, knowledge, and abilities for efficient and
effective delivery of services to remain abreast with globalisation and to realise the
company’s mission, vision, and values. Therefore, attracting and retaining talent and
the productivity they represent have become critical to organisations’ survival. In order
to successfully attract, motivate, retain, recognise, and reward employees,
organisations need to understand the preferences of its employees, and have the
ability to respond to these. For a reward strategy to be effective, it is necessary to

THEORETICAL LITERATURE REVIEW
DBL Thesis_Keshia Mohamed-Padayachee Student Number 71364684 Page 85 of 351
collect data on the preferences of employees, so that an organisation can devise
appropriate rewards strategies and assess the influence thereof on employees’
attraction, motivation, and retention.
Today, the challenge for employers is to design reward practices that will support
business goals being achieved and motivate employees to perform at uninterruptedly
high levels. Reward needs and preferences of employees are an important
consideration in designing an operational total rewards strategy that will positively
affect employee behaviours, and the strategy has to incorporate both extrinsic and
intrinsic rewards as motivators. Creating a combination of transactional and relational
rewards is required to attract, motivate, and retain high-performance employees.
Further, while attraction has been closely related to transactional rewards, motivation
and retention have been shown to be closely related to relational rewards (Bussin &
Toerien, 2015).
This study used generation theory and selected total rewards models, including the
WorldatWork (2016) Total Rewards Model, to identify the potential rewards factors that
attract and retain the youth. The questions in the questionnaire were based on these
categories and elements. Though the study was based on the reward categories of
the WorldatWork (2015) model and was intended to evaluate it, it was deemed
necessary to widen the potential elements and categories outside of this model, as the
overall objective of the study was to identify the changes that needed to be made to
the model, in order to design an effective total rewards framework for the youth.
The researcher identified numerous potential categories and elements that may be
used to attract and retain employees, specifically the youth, from the literature. The
WorldatWork Total Rewards Model, 2015 provides a comprehensive list of monetary
and non-monetary rewards to employees in exchange for their time, talents, efforts
and results. These include the categories of remuneration, benefits, work‒life
effectiveness, recognition, performance management and talent development, which
are considered by organisations to be the preferences desired by older generations,
but not necessarily those of the youth. In addition, the model, unlike some of the other
models reviewed, such as the Hay Group (2008) model does not consider work culture
and climate, leadership and direction, work environment, a compelling future, and
career- and environmental awards.
THEORETICAL LITERATURE REVIEW
DBL Thesis_Keshia Mohamed-Padayachee Student Number 71364684 Page 86 of 351
Each generation’s priorities or preferences vary, as well as their views regarding work.
It is increasingly important that organisations offer more of what future generations of
employees prefer, rather than what organisations perceive they need. The ideal,
therefore, is to ask the youth what their preferences are. This study was therefore
aimed at filling this gap by attempting to answer the following research question:
How can a total rewards framework for the youth be conceptualised best?
The hypotheses derived from this research question were:
1. There is an association between the reward categories (e.g., remuneration,
benefits, performance recognition, etc.) that attract people to organisations and
the generation to which they belong.
2. There is an association between the reward categories that retain people in
organisations and the generation to which they belong.
The key to retaining the youth in the workplace is understanding what they prefer and
providing it in a way that they find meaningful. This could include assigning
challenging, meaningful work with clear objectives and expectations, consistently
providing constructive feedback, immediate praise and reward for outstanding
performance, and creating a flexible and fun work environment and a workspace that
is technologically advanced and conducive to teamwork, the sharing of ideas, and
innovation. In conclusion, it was hypothesised that the youth are different from
previous generations, and understanding what they prefer is critical to an
organisation’s success; it is equal to understanding customers’ needs and wants.
In the next chapter, the researcher discusses, in detail, the research philosophy,
design, and approach adopted in this study in order to answer the research question.
In addition, the chapter details the ethical consideration, limitations, and procedure of
the research study.
CHAPTER 3
DBL Thesis_Keshia Mohamed-Padayachee Student Number 71364684 Page 87 of 351
CHAPTER 3
RESEARCH METHODOLOGY
3.1. Introduction and overview
With the problem defined and the goals of the study specified in the previous chapters,
the purpose of this chapter is to describe how the researcher proceeded in addressing
the research question and research objectives by selecting the appropriate research
design and methodology, with the aim to ensure that the research met validity and
reliability requirements.
3.2. Research philosophy
Before delving into the research design and approach, it is important to examine the
research philosophy of this study, which relates to the development of knowledge and
the nature of knowledge (Saunders, Lewis & Thornhill, 2009). The way in which social
research is carried out depends on how the researcher views the world (Seale, 1999).
Research philosophy is a belief about the way in which data should be gathered,
analysed, and used. The research philosophy comprises the research strategy
employed and research instruments used (Nissen, Klein & Hirschheim, 1991). The
philosophies regarding research approaches, which the researcher applied in this
research study, were ontology and epistemology. The term epistemology refers to
what is known to be true, and ontology refers to what is believed to be true (Nissen et
al., 1991).
3.2.1. Ontology
Ontology is the viewpoint and social reality of the researcher; and epistemology is how
the researcher knows and interprets the world (Schurink, 2009). Ontology is
concerned with the nature of reality and assumptions about how the world is
constituted, as well as the nature of things. Both aspects of ontology, namely,
subjectivism and objectivism were applied in this study. Subjectivism holds that social
phenomena are created from the perceptions and consequent actions of those social
actors concerned with their existence (Saunders, et al., 2009).
RESEARCH METHODOLOGY
DBL Thesis_Keshia Mohamed-Padayachee Student Number 71364684 Page 88 of 351
Social phenomena are a continual process, in that, through the process of social
interaction, these social phenomena are in a constant state of revision. Remenyi and
Williams (1998:35) stress the necessity to study “the details of the situation to
understand the reality or perhaps a reality working behind them.” This is often
associated with the term constructionism, or social constructionism (Saunders, et al.,
2009).
The subjectivist view is something that is created and re-created through a complex
array of phenomena, which include social interactions and physical factors to which
individuals attach certain meanings, rituals and myths. It is the meanings that are
attached to these phenomena by social actors within the organisation that need to be
understood in order for the culture to be understood (Saunders, et al., 2009). Bryman
and Bell (2015) considers social constructionism as social phenomena and their
meanings that are continually being changed and revised through social interaction.
Human beings construct the organisation and the culture, instead of the organisation
and culture being predetermined aspects that affect behaviours. Both these
philosophical positions were used in this study.
The objectivism position (or positivism) holds that social entities exist in objective
reality, independent of social actors. It deals with verifiable observations and
measurable relations between those observations, which do not depend on subjective
opinions. It uses the deductive approach and hypothesis testing to study phenomena
and interpret data or results.
According to Bryman and Bell (2015), the positivist position of an organisation is that
an organisation is a tangible object with rules, regulations, and procedures, with
people appointed to different jobs under a division of labour, within a hierarchy. It has
a mission and vision, and the organisation has an objective reality that is independent
of social actors within it, representing a social order that requires individuals to conform
to the rules and regulations. A summary of differences between the positivist and
interpretivist paradigms (Easterby-Smith, Thorpe & Lowe, 1991) are shown in Table
9.
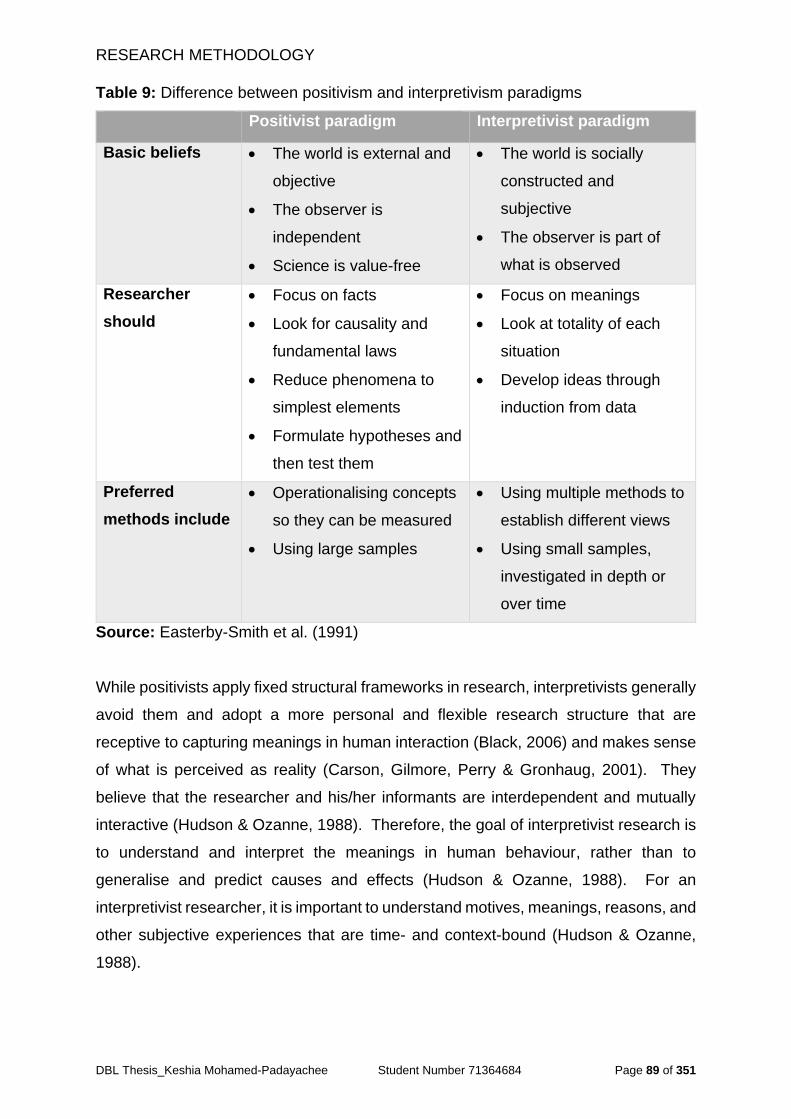
RESEARCH METHODOLOGY
DBL Thesis_Keshia Mohamed-Padayachee Student Number 71364684 Page 89 of 351
Table 9: Difference between positivism and interpretivism paradigms
Positivist paradigm Interpretivist paradigm
Basic beliefs The world is external and
objective
The observer is
independent
Science is value-free
The world is socially
constructed and
subjective
The observer is part of
what is observed
Researcher
should
Focus on facts
Look for causality and
fundamental laws
Reduce phenomena to
simplest elements
Formulate hypotheses and
then test them
Focus on meanings
Look at totality of each
situation
Develop ideas through
induction from data
Preferred
methods include
Operationalising concepts
so they can be measured
Using large samples
Using multiple methods to
establish different views
Using small samples,
investigated in depth or
over time
Source: Easterby-Smith et al. (1991)
While positivists apply fixed structural frameworks in research, interpretivists generally
avoid them and adopt a more personal and flexible research structure that are
receptive to capturing meanings in human interaction (Black, 2006) and makes sense
of what is perceived as reality (Carson, Gilmore, Perry & Gronhaug, 2001). They
believe that the researcher and his/her informants are interdependent and mutually
interactive (Hudson & Ozanne, 1988). Therefore, the goal of interpretivist research is
to understand and interpret the meanings in human behaviour, rather than to
generalise and predict causes and effects (Hudson & Ozanne, 1988). For an
interpretivist researcher, it is important to understand motives, meanings, reasons, and
other subjective experiences that are time- and context-bound (Hudson & Ozanne,
1988).
RESEARCH METHODOLOGY
DBL Thesis_Keshia Mohamed-Padayachee Student Number 71364684 Page 90 of 351
3.2.2. Epistemology
Epistemology is the philosophy of knowledge. Its focus is the origin and nature of
knowledge. Hence, it addresses the relationship between the researcher and
knowledge (Hirschheim, Klein & Lyytinen, 1995).
Epistemology relates to beliefs about how one might discover knowledge about the
world (Creswell, 2012), and refers to the science of knowing (Babbie, 2015). The
epistemological position the present study took was to investigate what intrinsic and
extrinsic rewards the youth value — what attracts and retains them.
The empirical part of the research is presented from the functional paradigm, which
means that, using instruments, the researcher will try to understand the behaviour of
this population. The ontology and epistemology of the researcher are that the
worldview is explainable, and that reality only exists as meaningful lives are played out
(Babbie, 2015).
In summary, ontology deals with how people view the world, how it is made up, and
the nature (being) of things. Lee (1999) defines ontology as a concept concerned with
the existence of, and relationship between, different aspects of society, such as social
actors, cultural norms, and social structure, while epistemology is about how to get
valid knowledge and who will supply it.
Integrating both concepts, the present study’s focus was the rewards systems used in
business organisations. An organisation consists of a group of people who collaborate
to achieve a commercial goal, and the organisational structure defines how activities
such as task allocation, co-ordination, and supervision are directed towards the
achievement of this goal. The organisational structure determines how roles, power,
and responsibilities are assigned, controlled, and co-ordinated, and how information
flows between the different levels. The structure depends on the organisation's
objectives and strategy. In a centralised structure, top management owns most of the
decision-making power, and has tight control over departments and divisions. The
decision-making power is distributed, and the departments and divisions may have
different degrees of independence.
RESEARCH METHODOLOGY
DBL Thesis_Keshia Mohamed-Padayachee Student Number 71364684 Page 91 of 351
The main research question was: How can a total rewards framework for youth be
conceptualised best?
The research objectives were to:
evaluate the effectiveness of the reward categories of the WorldatWork (2015)
Total Rewards Model;
identify the factors that attract the youth to organisations;
identify the factors that retain the youth in organisations;
determine what changes need to be made to the reward categories of the
WorldatWork (2015) Total Rewards Model make it more effective; and
develop an effective total rewards framework for attracting and retaining the
youth.
Some of the motivators of employees and the reward factors are quantitative and
others are qualitative in nature. Therefore, both the interpretivist and positivist
paradigms were applied in this study. In order for the researcher to collect valid and
reliable data, the researcher targeted both qualified youths and qualified non-youths,
particularly those in tertiary institutions, HR generalists (HRGs), and recruitment,
remuneration, and organisation development (OD) specialists, as these are the people
who were assumed to possess relevant knowledge regarding the issues being
investigated in this study.
In order to answer this research question, this study consisted of two phases. Because
some of the reward categories were quantitative in nature (such as remuneration,
benefits, work‒life, performance recognition, and career development), there were
hypotheses to be tested. All the key variables (including the qualitative concepts)
could be measured quantitatively, using a Likert scale (which also increased
objectivity); therefore, the positivism paradigm was applied in Phase I. In Phase II, as
some aspects of rewards were naturally subjective and context-bound, had evolved
from experience, and could change over time (from generation to generation),
interpretivist assumptions were applied. The qualitative methodology enabled the
researcher to make the study more comprehensive by gaining in-depth explanations
and interpretations of the significant relationships found in Phase I, by asking why and
how the relationships occurred. This aided validation of the results obtained in Phase
I.
RESEARCH METHODOLOGY
DBL Thesis_Keshia Mohamed-Padayachee Student Number 71364684 Page 92 of 351
3.3. Research approach
This study was set to fill the gaps that were identified in the body of knowledge by
critically reviewing the literature, which also guided the researcher in the following
direction.
The researcher utilised a sequential mixed-method approach to explore and guide the
evaluation of the reward categories of the WorldatWork (2015) Total Rewards Model
in attracting and retaining, to determine changes needed to be made to this model in
order to develop an effective total rewards framework for attraction and retention of
the youth.
To address the diversity, validity, and reliability of responses from participants, a mixed
methodology was necessary (Jupp, 2006). According to Halcomb and Andrew (2005),
the use of multiple data sources and methods to cross-check and validate findings
increases the depth and quality of the results to improve the consistency and accuracy
of data by providing a more complete picture of the results received in the quantitative
phase of the study.
The research approach that the researcher followed is described below. The
approach ensured maximum control over the validity, reliability (Phase I), credibility,
replicability, and transferability (Phase II) of the findings, describing how, why, when,
and where data were collected to answer the research question and test the
hypotheses.
In this descriptive and explanatory study, quantitative and qualitative data-collection
techniques were used, that is, questionnaires and semi-structured interviews, which
were required to explore and understand the outcomes. A sequential, exploratory,
mixed-method design strategy was employed in the collection and analysis of the data.
The qualitative results were used to explain and interpret the findings of the
quantitative phase of the study (Creswell, 2013). Each of these activities occurred at
different times. The tools and methodology employed are described below.
RESEARCH METHODOLOGY
DBL Thesis_Keshia Mohamed-Padayachee Student Number 71364684 Page 93 of 351
3.3.1. Phase I: Quantitative research approach
Phase I entailed a quantitative study by means of a questionnaire distributed to pre-
defined professional databases, tertiary institutions, private and public companies, as
well as parastatals. The questionnaire methodology was selected in order to collect
multiple responses from as many respondents as possible, including employed youths
and students, in order to understand what attracts them to and retains them in
organisations.
During Phase I of the research, the researcher took the view that outcomes could be
measured and expressed in numbers (Creswell, 2013); therefore, an objective stand
was taken with the quantitative review of the data. The researcher was objective, and
followed a holistic approach.
Quantitative research can be defined as research with the main purpose of quantifying
data collected during the analysis thereof (Bryman & Bell, 2015). By conducting a
survey, a large number of questionnaires were distributed electronically and in hard
copy, providing the researcher the opportunity to gain an accurate picture of the
preferences of the population (Brewerton & Millward, 2001).
The quantitative methodology shares its philosophical foundation with the positivist
paradigm, and is based on rigid rules of logic and measurement, truth, absolute
principles, and prediction (Halcomb & Andrew, 2005). This was supported by the
qualitative methodology with the interpretive paradigm — the view that there are many
truths and multiple realities (Bryman & Bell, 2015).
3.3.2. Phase II: Qualitative approach
Phase II entailed a qualitative study using interviews to explain and interpret the results
of Phase I more comprehensively by means of semi-structured interviews. Interviews
were scheduled with employed youths, HRGs, and HR specialists in recruitment,
remuneration, and OD to validate the findings (preliminary conclusions) and explain
the relationships found through the analysis of the responses to the questionnaires.
Qualitative research helped to fill the gaps left in the explanations and interpretations
of the results of the quantitative research by providing in-depth and rich information on
the issues that were investigated.
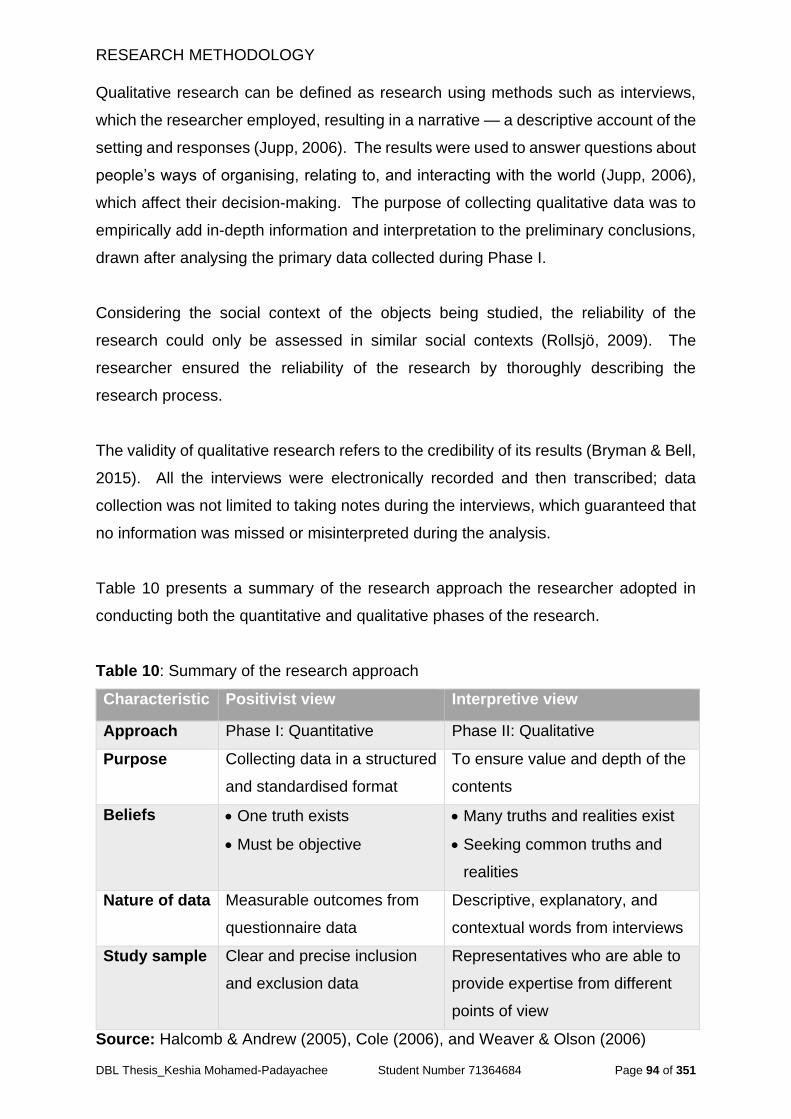
RESEARCH METHODOLOGY
DBL Thesis_Keshia Mohamed-Padayachee Student Number 71364684 Page 94 of 351
Qualitative research can be defined as research using methods such as interviews,
which the researcher employed, resulting in a narrative — a descriptive account of the
setting and responses (Jupp, 2006). The results were used to answer questions about
people’s ways of organising, relating to, and interacting with the world (Jupp, 2006),
which affect their decision-making. The purpose of collecting qualitative data was to
empirically add in-depth information and interpretation to the preliminary conclusions,
drawn after analysing the primary data collected during Phase I.
Considering the social context of the objects being studied, the reliability of the
research could only be assessed in similar social contexts (Rollsjö, 2009). The
researcher ensured the reliability of the research by thoroughly describing the
research process.
The validity of qualitative research refers to the credibility of its results (Bryman & Bell,
2015). All the interviews were electronically recorded and then transcribed; data
collection was not limited to taking notes during the interviews, which guaranteed that
no information was missed or misinterpreted during the analysis.
Table 10 presents a summary of the research approach the researcher adopted in
conducting both the quantitative and qualitative phases of the research.
Table 10: Summary of the research approach
Characteristic Positivist view Interpretive view
Approach Phase I: Quantitative Phase II: Qualitative
Purpose Collecting data in a structured
and standardised format
To ensure value and depth of the
contents
Beliefs One truth exists
Must be objective
Many truths and realities exist
Seeking common truths and
realities
Nature of data Measurable outcomes from
questionnaire data
Descriptive, explanatory, and
contextual words from interviews
Study sample Clear and precise inclusion
and exclusion data
Representatives who are able to
provide expertise from different
points of view
Source: Halcomb & Andrew (2005), Cole (2006), and Weaver & Olson (2006)
RESEARCH METHODOLOGY
DBL Thesis_Keshia Mohamed-Padayachee Student Number 71364684 Page 95 of 351
Due to the nature of the research, there was no single paradigm that could
satisfactorily deal with all the related methodological aspects. Therefore, the
researcher found it necessary to combine the quantitative, positivist paradigm with the
qualitative, interpretive paradigm. The blending of the paradigms provided the
researcher with the ability to statistically analyse the scientific data, whilst recognising
the environmental factors that influence the youth’s decision-making.
3.4. Research methodology
Research methodology is a collective term for the structured process of conducting
research. There are many different methodologies for the various types of research,
and the term is usually considered to include research design, data gathering, and
data analysis (Polit & Beck, 2001)
In the present study, data were firstly collected through questionnaires. Thereafter,
abstract and descriptive research, in the form of semi-structured interviews, was
conducted. According to Richards and Morse (2012), qualitative, descriptive
approaches are extremely helpful, because evidence of experience and knowledge
can easily be missed when quantitative methods are used, leaving gaps in the
explanations and interpretation of the results, especially when answering questions
related to why and how phenomena occur.
In order for the researcher to gain different perspectives and draw attention to factors
regarding the attraction and retention of the youth, descriptive research methods were
employed. According to Polit and Beck (2001), descriptive methods are used when
the researcher seeks to describe, observe, and document a naturally occurring
phenomenon that cannot readily be ascribed an objective value.
The research methodology is the method chosen by the researcher to execute the
research design in each of the phases. The research methodology encompasses
such concepts as the paradigm and quantitative and qualitative techniques. A
paradigm is a basic set of beliefs that guide action (Guba, 1990). These beliefs are
also called philosophical assumptions, epistemologies, or ontologies (Crotty, 1998).
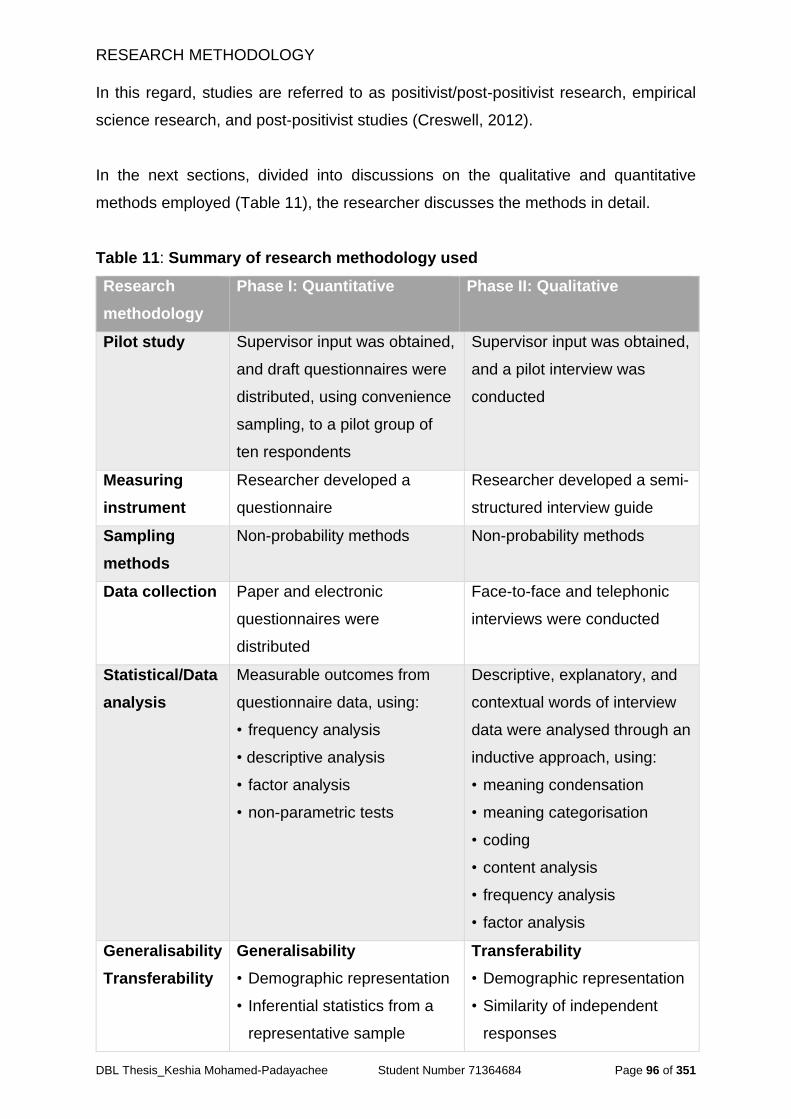
RESEARCH METHODOLOGY
DBL Thesis_Keshia Mohamed-Padayachee Student Number 71364684 Page 96 of 351
In this regard, studies are referred to as positivist/post-positivist research, empirical
science research, and post-positivist studies (Creswell, 2012).
In the next sections, divided into discussions on the qualitative and quantitative
methods employed (Table 11), the researcher discusses the methods in detail.
Table 11: Summary of research methodology used
Research
methodology
Phase I: Quantitative Phase II: Qualitative
Pilot study Supervisor input was obtained,
and draft questionnaires were
distributed, using convenience
sampling, to a pilot group of
ten respondents
Supervisor input was obtained,
and a pilot interview was
conducted
Measuring
instrument
Researcher developed a
questionnaire
Researcher developed a semi-
structured interview guide
Sampling
methods
Non-probability methods Non-probability methods
Data collection Paper and electronic
questionnaires were
distributed
Face-to-face and telephonic
interviews were conducted
Statistical/Data
analysis
Measurable outcomes from
questionnaire data, using:
• frequency analysis
• descriptive analysis
• factor analysis
• non-parametric tests
Descriptive, explanatory, and
contextual words of interview
data were analysed through an
inductive approach, using:
• meaning condensation
• meaning categorisation
• coding
• content analysis
• frequency analysis
• factor analysis
Generalisability
Transferability
Generalisability
• Demographic representation
• Inferential statistics from a
representative sample
Transferability
• Demographic representation
• Similarity of independent
responses
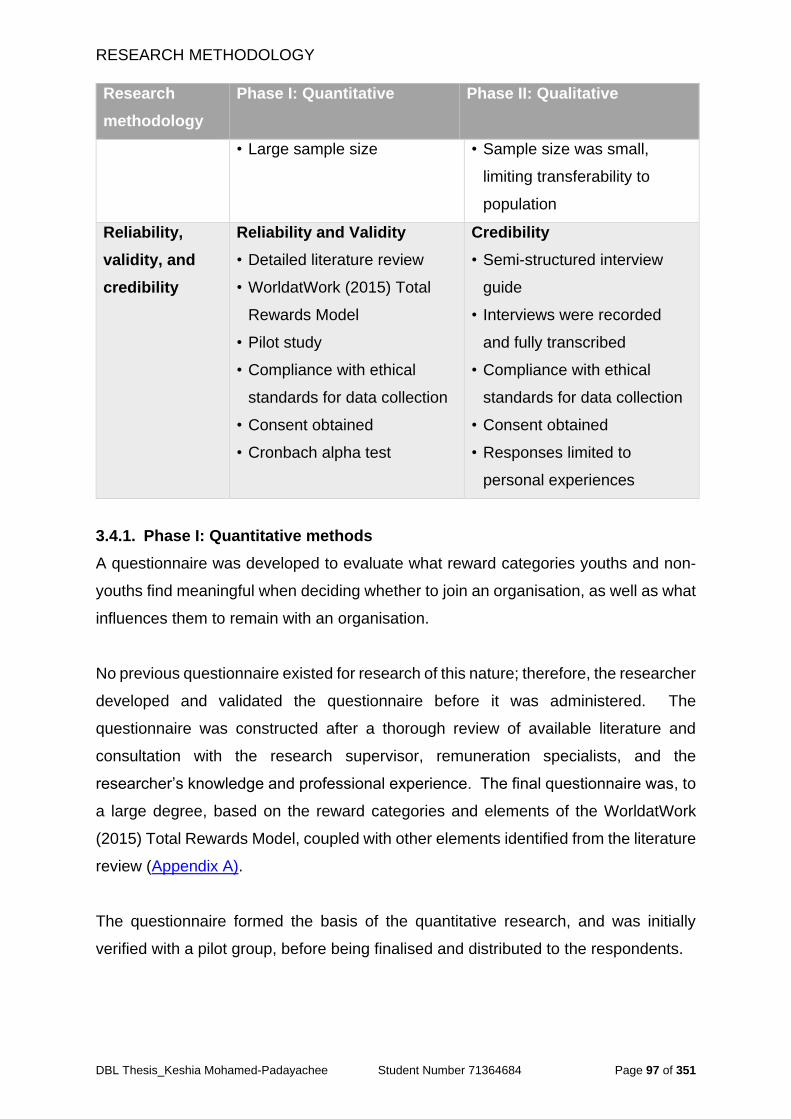
RESEARCH METHODOLOGY
DBL Thesis_Keshia Mohamed-Padayachee Student Number 71364684 Page 97 of 351
Research
methodology
Phase I: Quantitative Phase II: Qualitative
• Large sample size • Sample size was small,
limiting transferability to
population
Reliability,
validity, and
credibility
Reliability and Validity
• Detailed literature review
• WorldatWork (2015) Total
Rewards Model
• Pilot study
• Compliance with ethical
standards for data collection
• Consent obtained
• Cronbach alpha test
Credibility
• Semi-structured interview
guide
• Interviews were recorded
and fully transcribed
• Compliance with ethical
standards for data collection
• Consent obtained
• Responses limited to
personal experiences
3.4.1. Phase I: Quantitative methods
A questionnaire was developed to evaluate what reward categories youths and non-
youths find meaningful when deciding whether to join an organisation, as well as what
influences them to remain with an organisation.
No previous questionnaire existed for research of this nature; therefore, the researcher
developed and validated the questionnaire before it was administered. The
questionnaire was constructed after a thorough review of available literature and
consultation with the research supervisor, remuneration specialists, and the
researcher’s knowledge and professional experience. The final questionnaire was, to
a large degree, based on the reward categories and elements of the WorldatWork
(2015) Total Rewards Model, coupled with other elements identified from the literature
review (Appendix A).
The questionnaire formed the basis of the quantitative research, and was initially
verified with a pilot group, before being finalised and distributed to the respondents.
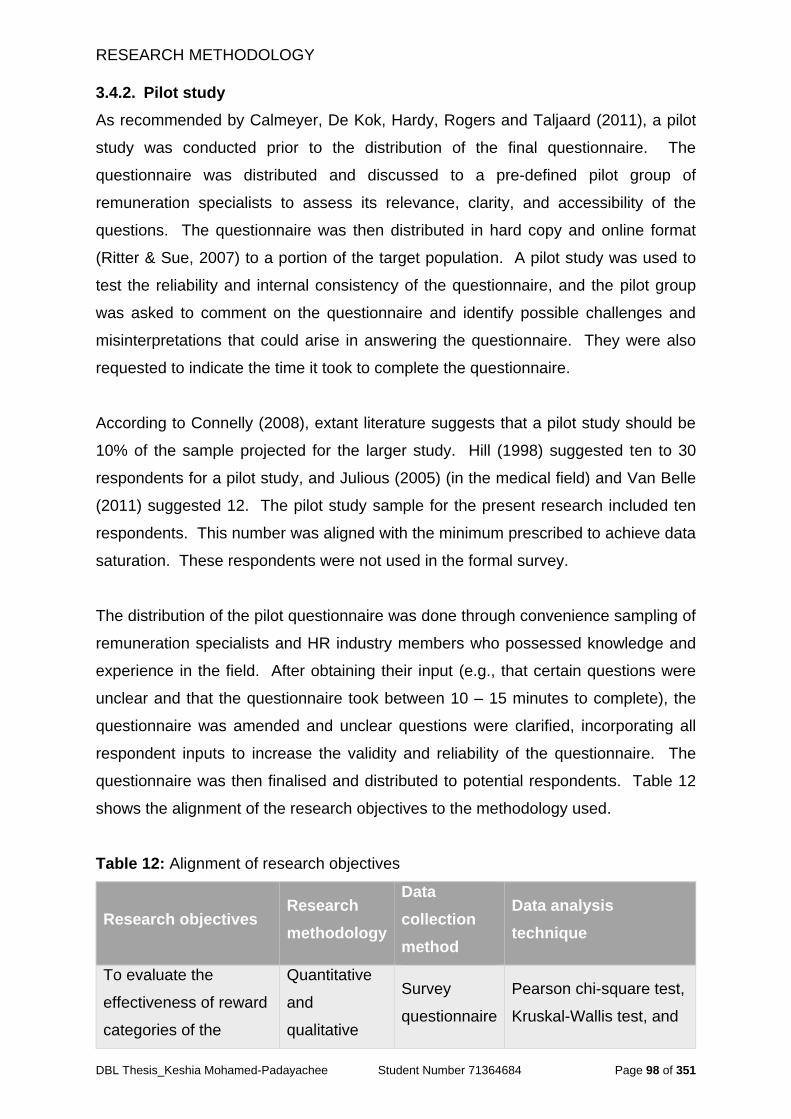
RESEARCH METHODOLOGY
DBL Thesis_Keshia Mohamed-Padayachee Student Number 71364684 Page 98 of 351
3.4.2. Pilot study
As recommended by Calmeyer, De Kok, Hardy, Rogers and Taljaard (2011), a pilot
study was conducted prior to the distribution of the final questionnaire. The
questionnaire was distributed and discussed to a pre-defined pilot group of
remuneration specialists to assess its relevance, clarity, and accessibility of the
questions. The questionnaire was then distributed in hard copy and online format
(Ritter & Sue, 2007) to a portion of the target population. A pilot study was used to
test the reliability and internal consistency of the questionnaire, and the pilot group
was asked to comment on the questionnaire and identify possible challenges and
misinterpretations that could arise in answering the questionnaire. They were also
requested to indicate the time it took to complete the questionnaire.
According to Connelly (2008), extant literature suggests that a pilot study should be
10% of the sample projected for the larger study. Hill (1998) suggested ten to 30
respondents for a pilot study, and Julious (2005) (in the medical field) and Van Belle
(2011) suggested 12. The pilot study sample for the present research included ten
respondents. This number was aligned with the minimum prescribed to achieve data
saturation. These respondents were not used in the formal survey.
The distribution of the pilot questionnaire was done through convenience sampling of
remuneration specialists and HR industry members who possessed knowledge and
experience in the field. After obtaining their input (e.g., that certain questions were
unclear and that the questionnaire took between 10 – 15 minutes to complete), the
questionnaire was amended and unclear questions were clarified, incorporating all
respondent inputs to increase the validity and reliability of the questionnaire. The
questionnaire was then finalised and distributed to potential respondents. Table 12
shows the alignment of the research objectives to the methodology used.
Table 12: Alignment of research objectives
Research objectives Research
methodology
Data
collection
method
Data analysis
technique
To evaluate the
effectiveness of reward
categories of the
Quantitative
and
qualitative
Survey
questionnaire
Pearson chi-square test,
Kruskal-Wallis test, and
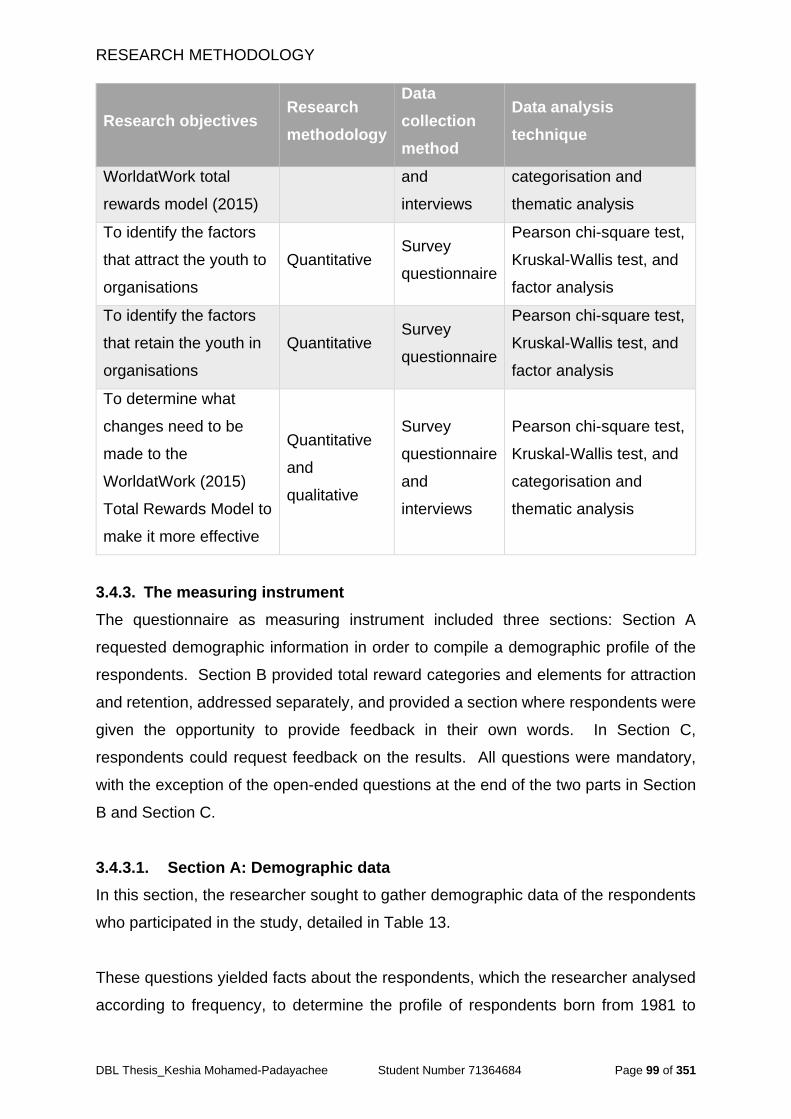
RESEARCH METHODOLOGY
DBL Thesis_Keshia Mohamed-Padayachee Student Number 71364684 Page 99 of 351
Research objectives Research
methodology
Data
collection
method
Data analysis
technique
WorldatWork total
rewards model (2015)
and
interviews
categorisation and
thematic analysis
To identify the factors
that attract the youth to
organisations
Quantitative Survey
questionnaire
Pearson chi-square test,
Kruskal-Wallis test, and
factor analysis
To identify the factors
that retain the youth in
organisations
Quantitative Survey
questionnaire
Pearson chi-square test,
Kruskal-Wallis test, and
factor analysis
To determine what
changes need to be
made to the
WorldatWork (2015)
Total Rewards Model to
make it more effective
Quantitative
and
qualitative
Survey
questionnaire
and
interviews
Pearson chi-square test,
Kruskal-Wallis test, and
categorisation and
thematic analysis
3.4.3. The measuring instrument
The questionnaire as measuring instrument included three sections: Section A
requested demographic information in order to compile a demographic profile of the
respondents. Section B provided total reward categories and elements for attraction
and retention, addressed separately, and provided a section where respondents were
given the opportunity to provide feedback in their own words. In Section C,
respondents could request feedback on the results. All questions were mandatory,
with the exception of the open-ended questions at the end of the two parts in Section
B and Section C.
3.4.3.1. Section A: Demographic data
In this section, the researcher sought to gather demographic data of the respondents
who participated in the study, detailed in Table 13.
These questions yielded facts about the respondents, which the researcher analysed
according to frequency, to determine the profile of respondents born from 1981 to
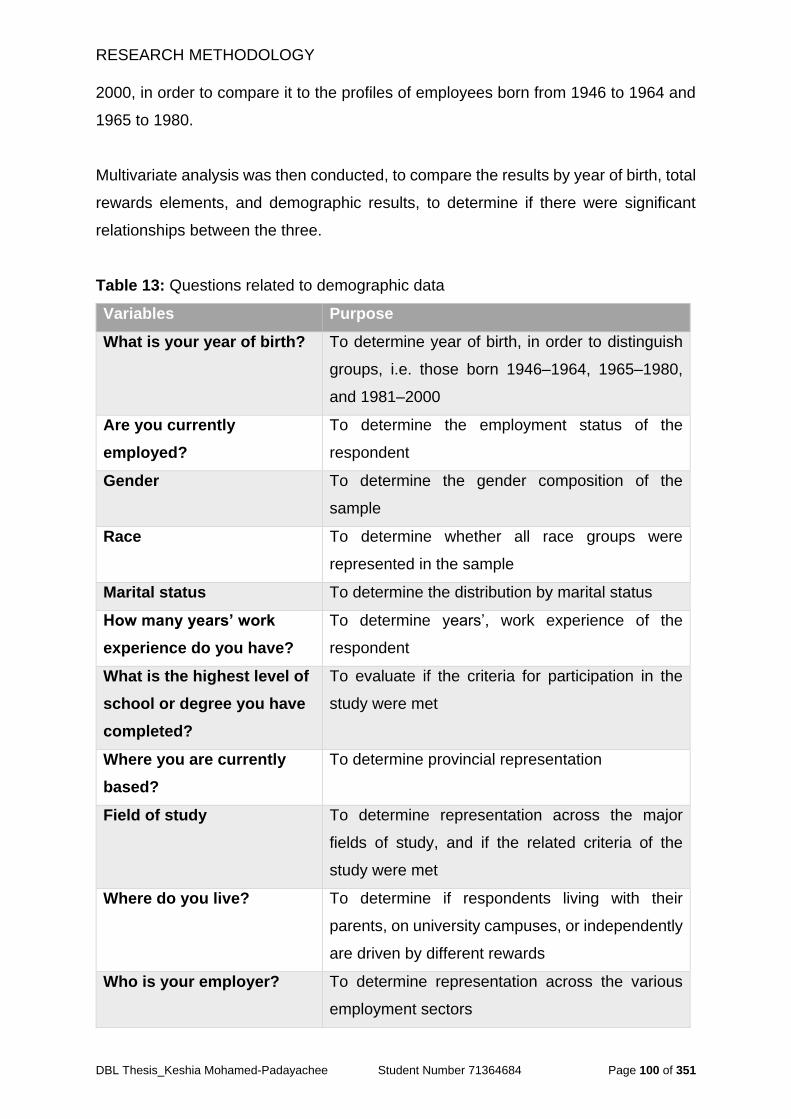
RESEARCH METHODOLOGY
DBL Thesis_Keshia Mohamed-Padayachee Student Number 71364684 Page 100 of 351
2000, in order to compare it to the profiles of employees born from 1946 to 1964 and
1965 to 1980.
Multivariate analysis was then conducted, to compare the results by year of birth, total
rewards elements, and demographic results, to determine if there were significant
relationships between the three.
Table 13: Questions related to demographic data
Variables Purpose
What is your year of birth? To determine year of birth, in order to distinguish
groups, i.e. those born 1946–1964, 1965–1980,
and 1981–2000
Are you currently
employed?
To determine the employment status of the
respondent
Gender To determine the gender composition of the
sample
Race To determine whether all race groups were
represented in the sample
Marital status To determine the distribution by marital status
How many years’ work
experience do you have?
To determine years’, work experience of the
respondent
What is the highest level of
school or degree you have
completed?
To evaluate if the criteria for participation in the
study were met
Where you are currently
based?
To determine provincial representation
Field of study To determine representation across the major
fields of study, and if the related criteria of the
study were met
Where do you live? To determine if respondents living with their
parents, on university campuses, or independently
are driven by different rewards
Who is your employer? To determine representation across the various
employment sectors
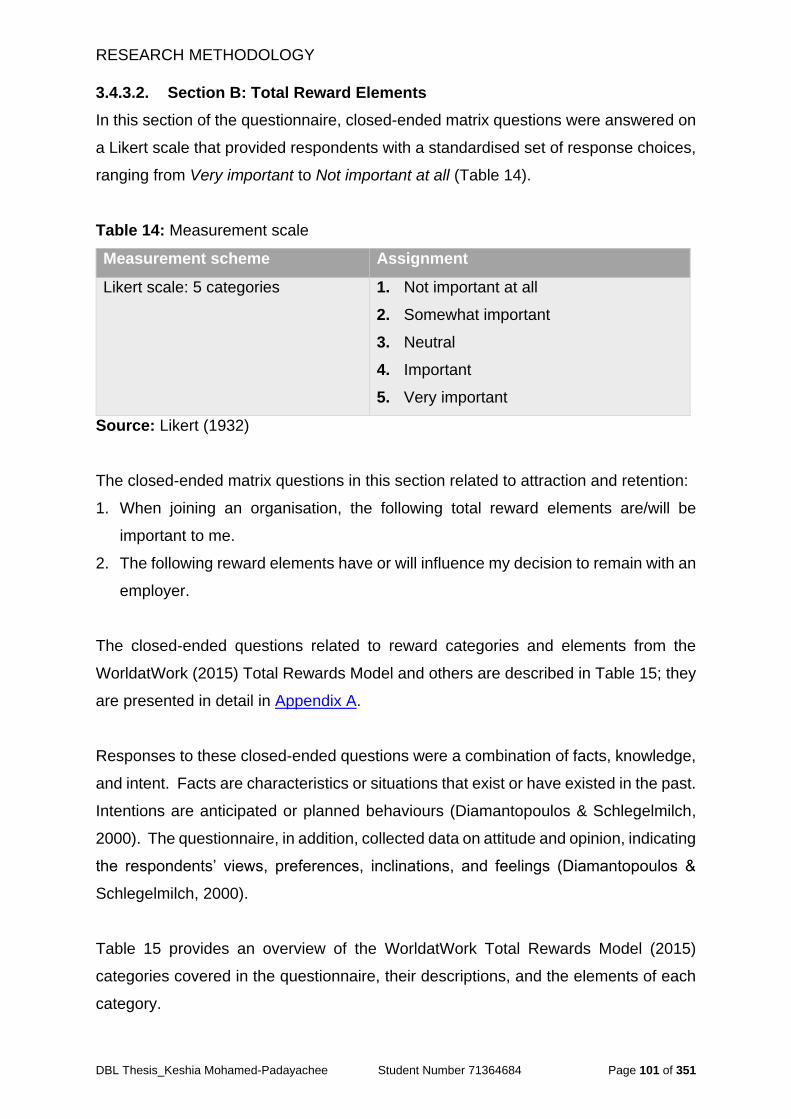
RESEARCH METHODOLOGY
DBL Thesis_Keshia Mohamed-Padayachee Student Number 71364684 Page 101 of 351
3.4.3.2. Section B: Total Reward Elements
In this section of the questionnaire, closed-ended matrix questions were answered on
a Likert scale that provided respondents with a standardised set of response choices,
ranging from Very important to Not important at all (Table 14).
Table 14: Measurement scale
Measurement scheme Assignment
Likert scale: 5 categories 1. Not important at all
2. Somewhat important
3. Neutral
4. Important
5. Very important
Source: Likert (1932)
The closed-ended matrix questions in this section related to attraction and retention:
1. When joining an organisation, the following total reward elements are/will be
important to me.
2. The following reward elements have or will influence my decision to remain with an
employer.
The closed-ended questions related to reward categories and elements from the
WorldatWork (2015) Total Rewards Model and others are described in Table 15; they
are presented in detail in Appendix A.
Responses to these closed-ended questions were a combination of facts, knowledge,
and intent. Facts are characteristics or situations that exist or have existed in the past.
Intentions are anticipated or planned behaviours (Diamantopoulos & Schlegelmilch,
2000). The questionnaire, in addition, collected data on attitude and opinion, indicating
the respondents’ views, preferences, inclinations, and feelings (Diamantopoulos &
Schlegelmilch, 2000).
Table 15 provides an overview of the WorldatWork Total Rewards Model (2015)
categories covered in the questionnaire, their descriptions, and the elements of each
category.
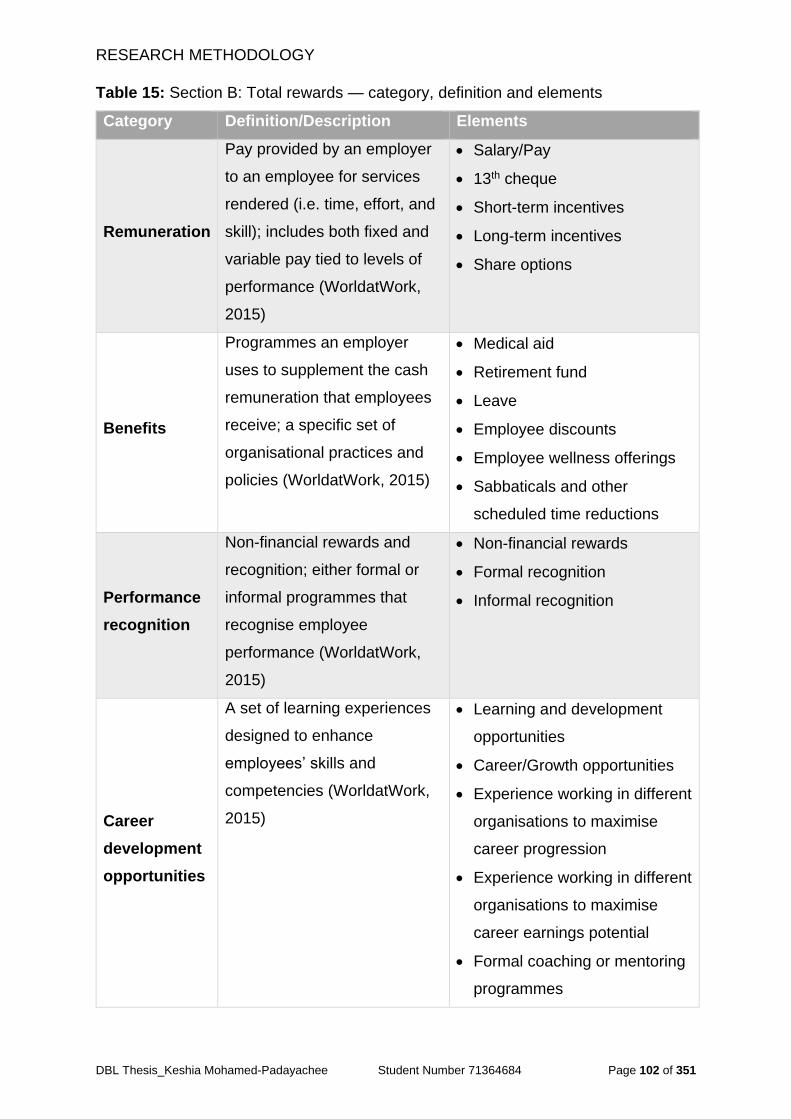
RESEARCH METHODOLOGY
DBL Thesis_Keshia Mohamed-Padayachee Student Number 71364684 Page 102 of 351
Table 15: Section B: Total rewards — category, definition and elements
Category Definition/Description Elements
Remuneration
Pay provided by an employer
to an employee for services
rendered (i.e. time, effort, and
skill); includes both fixed and
variable pay tied to levels of
performance (WorldatWork,
2015)
Salary/Pay
13th cheque
Short-term incentives
Long-term incentives
Share options
Benefits
Programmes an employer
uses to supplement the cash
remuneration that employees
receive; a specific set of
organisational practices and
policies (WorldatWork, 2015)
Medical aid
Retirement fund
Leave
Employee discounts
Employee wellness offerings
Sabbaticals and other
scheduled time reductions
Performance
recognition
Non-financial rewards and
recognition; either formal or
informal programmes that
recognise employee
performance (WorldatWork,
2015)
Non-financial rewards
Formal recognition
Informal recognition
Career
development
opportunities
A set of learning experiences
designed to enhance
employees’ skills and
competencies (WorldatWork,
2015)
Learning and development
opportunities
Career/Growth opportunities
Experience working in different
organisations to maximise
career progression
Experience working in different
organisations to maximise
career earnings potential
Formal coaching or mentoring
programmes
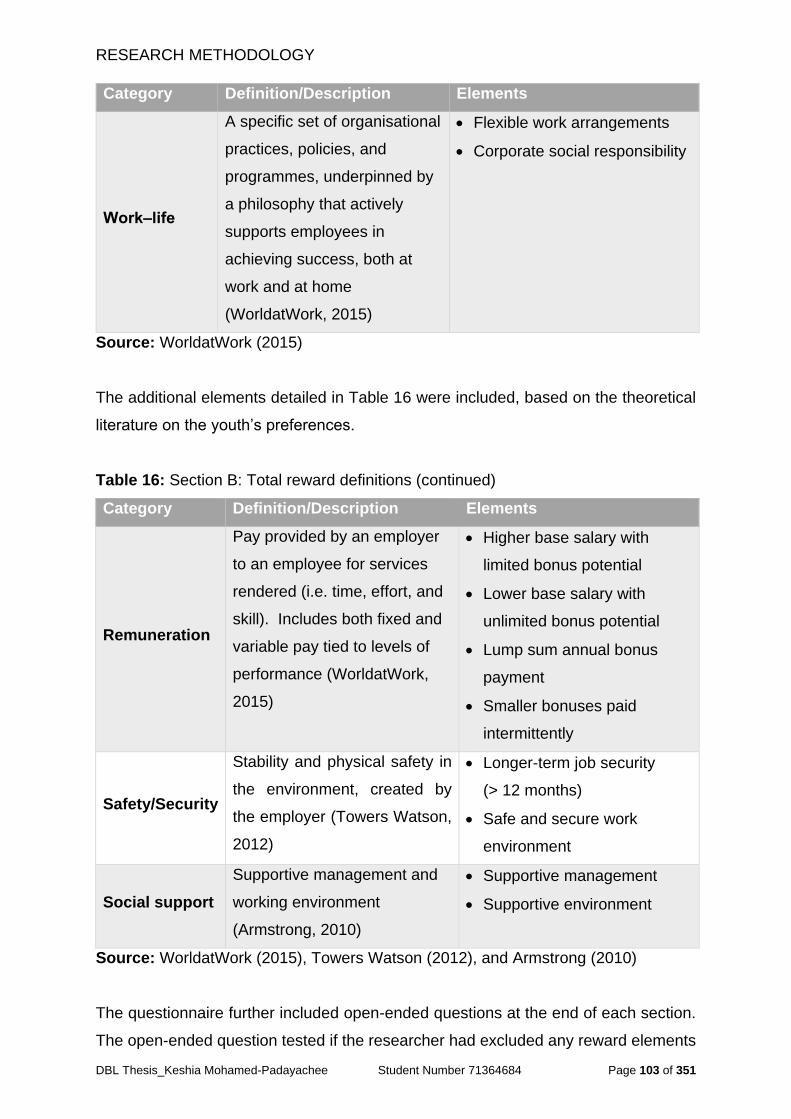
RESEARCH METHODOLOGY
DBL Thesis_Keshia Mohamed-Padayachee Student Number 71364684 Page 103 of 351
Category Definition/Description Elements
Work‒life
A specific set of organisational
practices, policies, and
programmes, underpinned by
a philosophy that actively
supports employees in
achieving success, both at
work and at home
(WorldatWork, 2015)
Flexible work arrangements
Corporate social responsibility
Source: WorldatWork (2015)
The additional elements detailed in Table 16 were included, based on the theoretical
literature on the youth’s preferences.
Table 16: Section B: Total reward definitions (continued)
Category Definition/Description Elements
Remuneration
Pay provided by an employer
to an employee for services
rendered (i.e. time, effort, and
skill). Includes both fixed and
variable pay tied to levels of
performance (WorldatWork,
2015)
Higher base salary with
limited bonus potential
Lower base salary with
unlimited bonus potential
Lump sum annual bonus
payment
Smaller bonuses paid
intermittently
Safety/Security
Stability and physical safety in
the environment, created by
the employer (Towers Watson,
2012)
Longer-term job security
(> 12 months)
Safe and secure work
environment
Social support
Supportive management and
working environment
(Armstrong, 2010)
Supportive management
Supportive environment
Source: WorldatWork (2015), Towers Watson (2012), and Armstrong (2010)
The questionnaire further included open-ended questions at the end of each section.
The open-ended question tested if the researcher had excluded any reward elements
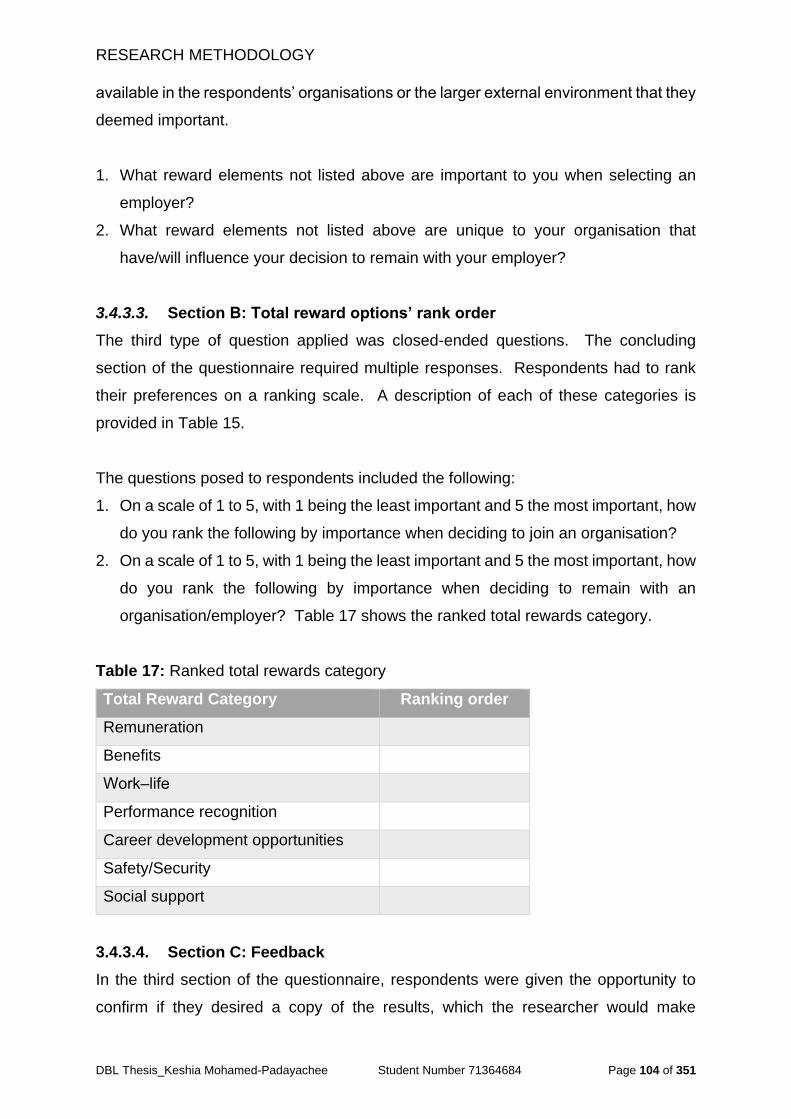
RESEARCH METHODOLOGY
DBL Thesis_Keshia Mohamed-Padayachee Student Number 71364684 Page 104 of 351
available in the respondents’ organisations or the larger external environment that they
deemed important.
1. What reward elements not listed above are important to you when selecting an
employer?
2. What reward elements not listed above are unique to your organisation that
have/will influence your decision to remain with your employer?
3.4.3.3. Section B: Total reward options’ rank order
The third type of question applied was closed-ended questions. The concluding
section of the questionnaire required multiple responses. Respondents had to rank
their preferences on a ranking scale. A description of each of these categories is
provided in Table 15.
The questions posed to respondents included the following:
1. On a scale of 1 to 5, with 1 being the least important and 5 the most important, how
do you rank the following by importance when deciding to join an organisation?
2. On a scale of 1 to 5, with 1 being the least important and 5 the most important, how
do you rank the following by importance when deciding to remain with an
organisation/employer? Table 17 shows the ranked total rewards category.
Table 17: Ranked total rewards category
Total Reward Category Ranking order
Remuneration
Benefits
Work‒life
Performance recognition
Career development opportunities
Safety/Security
Social support
3.4.3.4. Section C: Feedback
In the third section of the questionnaire, respondents were given the opportunity to
confirm if they desired a copy of the results, which the researcher would make
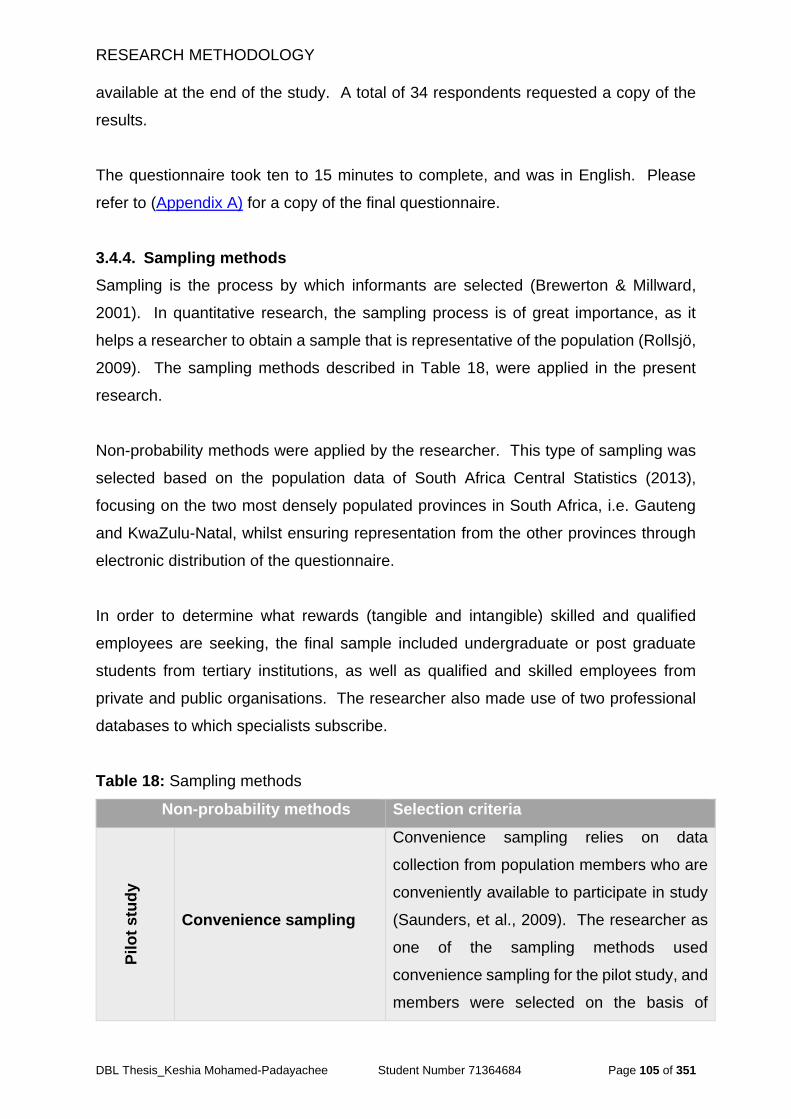
RESEARCH METHODOLOGY
DBL Thesis_Keshia Mohamed-Padayachee Student Number 71364684 Page 105 of 351
available at the end of the study. A total of 34 respondents requested a copy of the
results.
The questionnaire took ten to 15 minutes to complete, and was in English. Please
refer to (Appendix A) for a copy of the final questionnaire.
3.4.4. Sampling methods
Sampling is the process by which informants are selected (Brewerton & Millward,
2001). In quantitative research, the sampling process is of great importance, as it
helps a researcher to obtain a sample that is representative of the population (Rollsjö,
2009). The sampling methods described in Table 18, were applied in the present
research.
Non-probability methods were applied by the researcher. This type of sampling was
selected based on the population data of South Africa Central Statistics (2013),
focusing on the two most densely populated provinces in South Africa, i.e. Gauteng
and KwaZulu-Natal, whilst ensuring representation from the other provinces through
electronic distribution of the questionnaire.
In order to determine what rewards (tangible and intangible) skilled and qualified
employees are seeking, the final sample included undergraduate or post graduate
students from tertiary institutions, as well as qualified and skilled employees from
private and public organisations. The researcher also made use of two professional
databases to which specialists subscribe.
Table 18: Sampling methods
Non-probability methods Selection criteria
Pilo
t stu
dy
Convenience sampling
Convenience sampling relies on data
collection from population members who are
conveniently available to participate in study
(Saunders, et al., 2009). The researcher as
one of the sampling methods used
convenience sampling for the pilot study, and
members were selected on the basis of
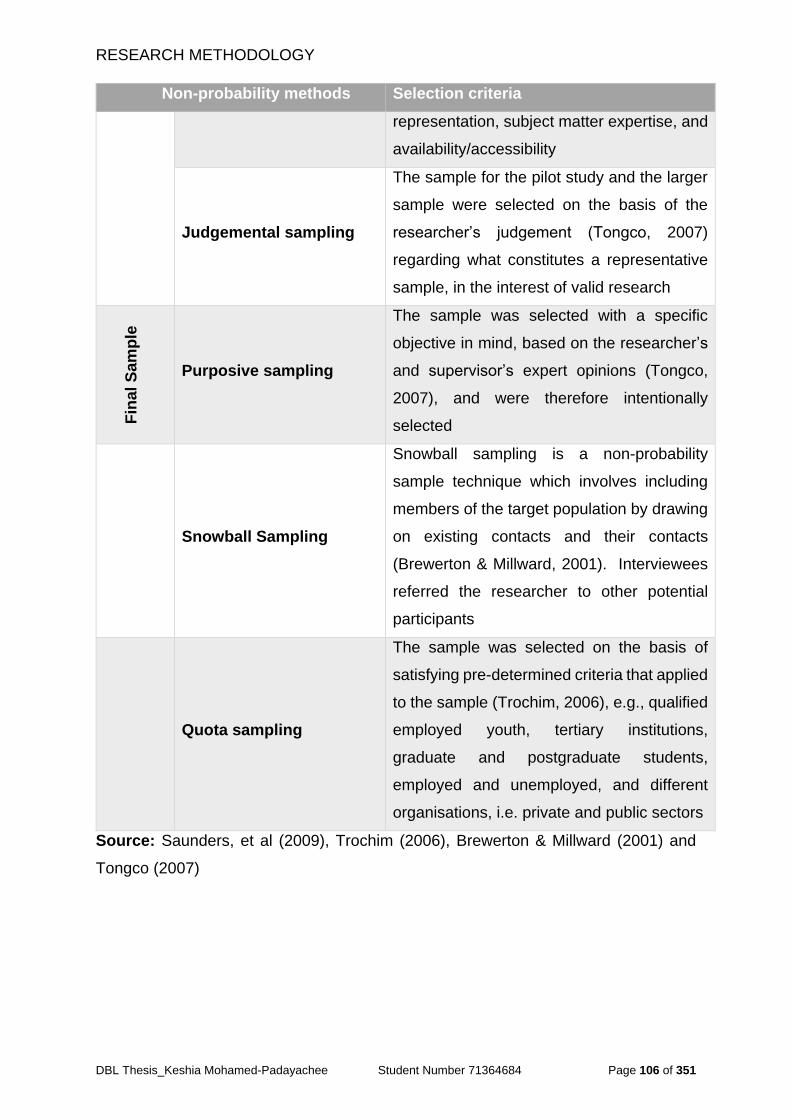
RESEARCH METHODOLOGY
DBL Thesis_Keshia Mohamed-Padayachee Student Number 71364684 Page 106 of 351
Non-probability methods Selection criteria
representation, subject matter expertise, and
availability/accessibility
Judgemental sampling
The sample for the pilot study and the larger
sample were selected on the basis of the
researcher’s judgement (Tongco, 2007)
regarding what constitutes a representative
sample, in the interest of valid research
Fin
al
Sam
ple
Purposive sampling
The sample was selected with a specific
objective in mind, based on the researcher’s
and supervisor’s expert opinions (Tongco,
2007), and were therefore intentionally
selected
Snowball Sampling
Snowball sampling is a non-probability
sample technique which involves including
members of the target population by drawing
on existing contacts and their contacts
(Brewerton & Millward, 2001). Interviewees
referred the researcher to other potential
participants
Quota sampling
The sample was selected on the basis of
satisfying pre-determined criteria that applied
to the sample (Trochim, 2006), e.g., qualified
employed youth, tertiary institutions,
graduate and postgraduate students,
employed and unemployed, and different
organisations, i.e. private and public sectors
Source: Saunders, et al (2009), Trochim (2006), Brewerton & Millward (2001) and
Tongco (2007)
RESEARCH METHODOLOGY
DBL Thesis_Keshia Mohamed-Padayachee Student Number 71364684 Page 107 of 351
3.4.5. Data collection
When trying to determine the preferences of a large group of individuals, the
quantitative research method is the most suitable (Brewerton & Millward, 2001). Once
the questionnaire for the present study had been finalised, and following the pilot
study, paper-based and electronic questionnaires were distributed as widely as
possible to the defined population.
The approach to obtaining the data varied, but was aligned to the objective of securing
responses from the defined population. The researcher sent a web-based
questionnaire using Inqwise (www.inqwise.co.za) an online survey tool, to the
identified companies and professional associations. Respondents were invited by e-
mail to the host survey site containing a URL/web address through which respondents
could access the questionnaire.
The email contained a standardised invitation, confirming the purpose of the research
and that participation was voluntary, together with a web link directing respondents to
the questionnaire, where they electronically confirmed their consent to participate in
the study before commencing with completion of the questionnaire. With the web-
based questionnaire, respondents had the opportunity to complete the survey in their
own time and space before the deadline.
Hard-copy questionnaires were distributed at a number of lectures, conferences, and
training sessions to attendees, with the approval of the organisation, tertiary institution
and/or professor. The questionnaire included an introductory letter, which provided
an overview and the purpose of the research, and a space on the form where
respondents had to indicate their consent to participate in the study.
The researcher distributed 450 questionnaires, of which 276 usable questionnaires
were received — a response rate of 61.3%.
The web-based tool, in addition to aiding the distribution and online completion of the
electronic questionnaire, allowed for the manual capturing of hard-copy questionnaire
responses. On completion of the capturing, the system assisted with the compilation
of graphs, which the researcher used in the analysis and presentation of the findings.
RESEARCH METHODOLOGY
DBL Thesis_Keshia Mohamed-Padayachee Student Number 71364684 Page 108 of 351
Following the capturing of the paper-based responses in the online survey database,
the researcher transferred the data into MS Excel, where it was coded and prepared
for upload to IBM SPSS Statistics Version 22 Data Editor (SPSS). The statistical
analysis was then completed in SPSS, using descriptive and inferential statistics, with
the assistance of a statistician.
3.4.6. Method of statistical analysis
The method of statistical analysis, using SPSS, involved a number of steps, described
below, to establish the reliability of the data and enable reporting.
The researcher began a frequency analysis evaluating the frequency of responses
(described in Chapter 4). Thereafter the researcher conducted a Cronbach alpha test,
to test the credibility and reliability of the instrument. The starting point in the
descriptive analysis was the construction of a frequency distribution for each variable
of interest, shown in absolute or relative percentages summarising different levels of
measurement (Diamantopoulos & Schlegelmilch, 2000).
Descriptive analysis was used to describe the data’s relevance and appropriateness.
A factor analysis was then conducted to establish the principle components of the key
variables measured. This was done by categorising the factors that were thought to
attract and retain the youth. Statistical inferential questions were used to collect data
that were analysed to relate variables and compare groups of variables, so that
inferences could be drawn regarding the sample and the population (Creswell, 2012).
The relationships between the variables were determined by using the chi-square test
and the Kruskal-Wallis test, a nonparametric test. As part of the analysis of frequency
distribution, the researcher used the mean and median to determine the central
tendencies of the variables. The mean represents the average equalling sum of the
values/total number of cases. The median represents the middle attribute in the
ranked distribution of observed cases (Diamantopoulos & Schlegelmilch, 2000).
The dispersion of the data was also considered, using the standard deviation and
variance, which is defined as the spread of the values around the central tendency.
The standard deviation measures how concentrated the data are around the mean —
the more concentrated the data are, the smaller the standard deviation is. This
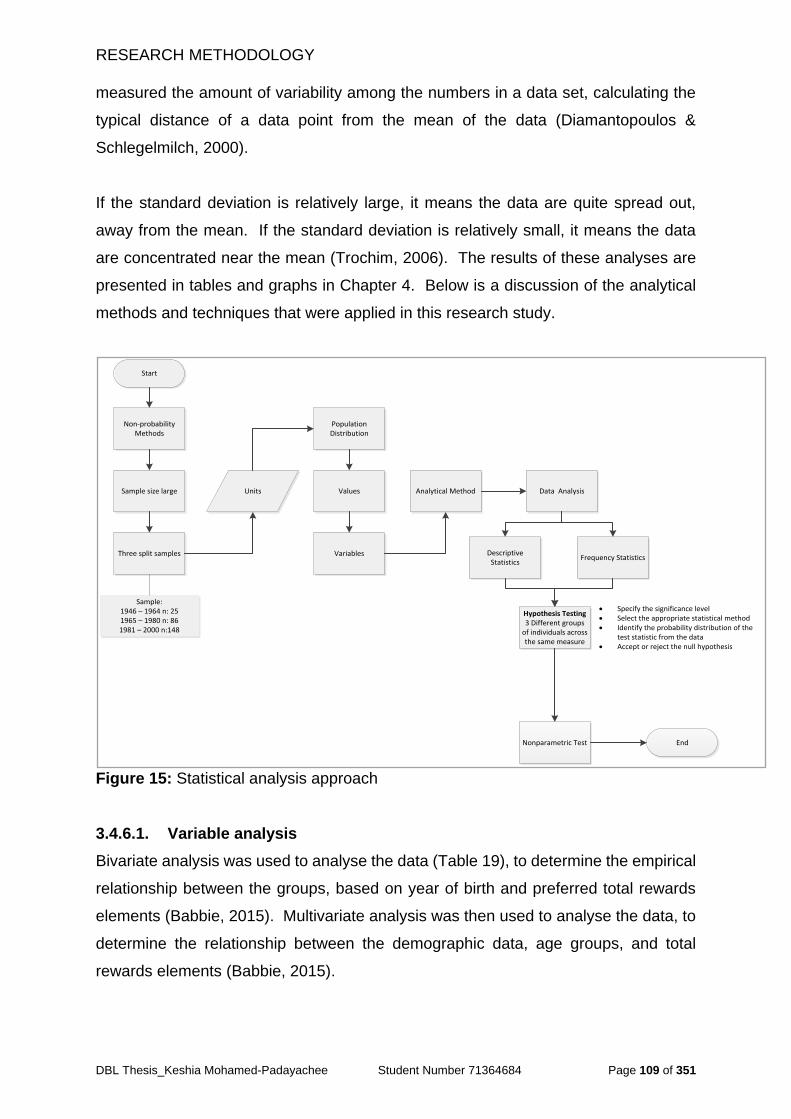
RESEARCH METHODOLOGY
DBL Thesis_Keshia Mohamed-Padayachee Student Number 71364684 Page 109 of 351
measured the amount of variability among the numbers in a data set, calculating the
typical distance of a data point from the mean of the data (Diamantopoulos &
Schlegelmilch, 2000).
If the standard deviation is relatively large, it means the data are quite spread out,
away from the mean. If the standard deviation is relatively small, it means the data
are concentrated near the mean (Trochim, 2006). The results of these analyses are
presented in tables and graphs in Chapter 4. Below is a discussion of the analytical
methods and techniques that were applied in this research study.
Figure 15: Statistical analysis approach
3.4.6.1. Variable analysis
Bivariate analysis was used to analyse the data (Table 19), to determine the empirical
relationship between the groups, based on year of birth and preferred total rewards
elements (Babbie, 2015). Multivariate analysis was then used to analyse the data, to
determine the relationship between the demographic data, age groups, and total
rewards elements (Babbie, 2015).
Non-probability Methods
Sample size large
Three split samples
Units Analytical Method
Population Distribution
Variables
Values
Descriptive Statistics
Data Analysis
Specify the significance level Select the appropriate statistical method Identify the probability distribution of the
test statistic from the data Accept or reject the null hypothesis
Hypothesis Testing 3 Different groups
of individuals across the same measure
Frequency Statistics
Sample: 1946 – 1964 n: 251965 – 1980 n: 861981 – 2000 n:148
Nonparametric Test End
Start
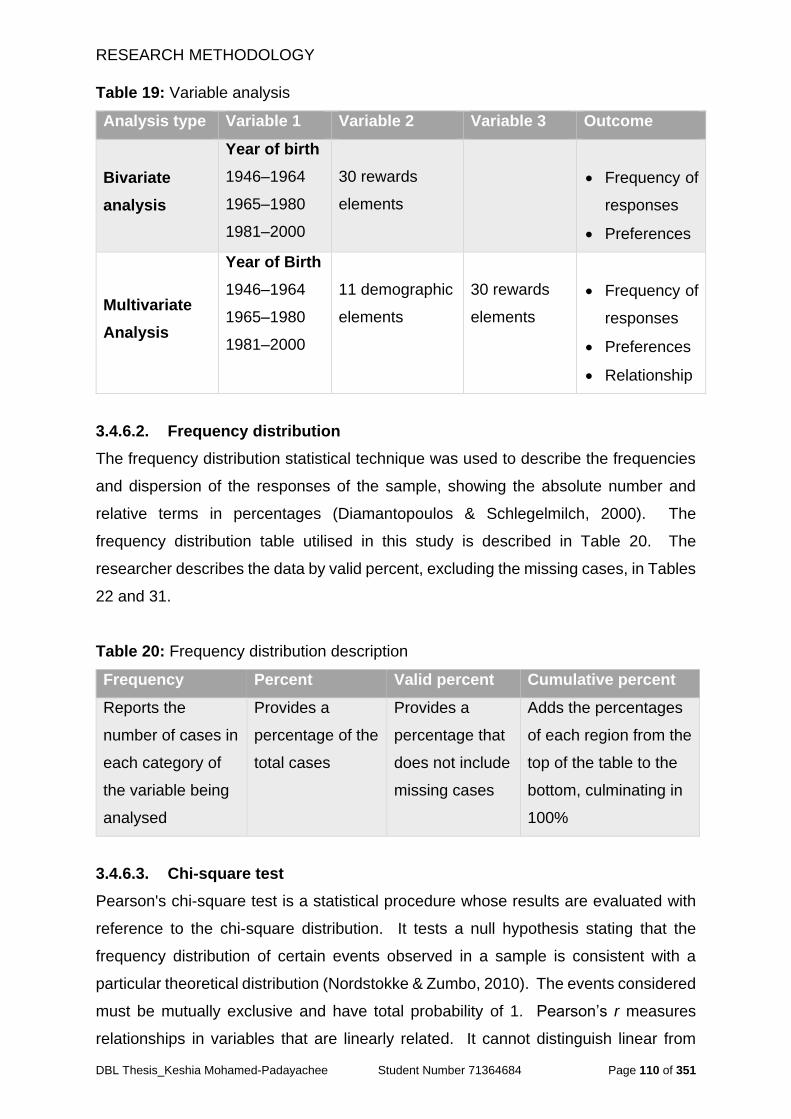
RESEARCH METHODOLOGY
DBL Thesis_Keshia Mohamed-Padayachee Student Number 71364684 Page 110 of 351
Table 19: Variable analysis
Analysis type Variable 1 Variable 2 Variable 3 Outcome
Bivariate
analysis
Year of birth
1946–1964
1965–1980
1981–2000
30 rewards
elements
Frequency of
responses
Preferences
Multivariate
Analysis
Year of Birth
1946–1964
1965–1980
1981–2000
11 demographic
elements
30 rewards
elements
Frequency of
responses
Preferences
Relationship
3.4.6.2. Frequency distribution
The frequency distribution statistical technique was used to describe the frequencies
and dispersion of the responses of the sample, showing the absolute number and
relative terms in percentages (Diamantopoulos & Schlegelmilch, 2000). The
frequency distribution table utilised in this study is described in Table 20. The
researcher describes the data by valid percent, excluding the missing cases, in Tables
22 and 31.
Table 20: Frequency distribution description
Frequency Percent Valid percent Cumulative percent
Reports the
number of cases in
each category of
the variable being
analysed
Provides a
percentage of the
total cases
Provides a
percentage that
does not include
missing cases
Adds the percentages
of each region from the
top of the table to the
bottom, culminating in
100%
3.4.6.3. Chi-square test
Pearson's chi-square test is a statistical procedure whose results are evaluated with
reference to the chi-square distribution. It tests a null hypothesis stating that the
frequency distribution of certain events observed in a sample is consistent with a
particular theoretical distribution (Nordstokke & Zumbo, 2010). The events considered
must be mutually exclusive and have total probability of 1. Pearson’s r measures
relationships in variables that are linearly related. It cannot distinguish linear from
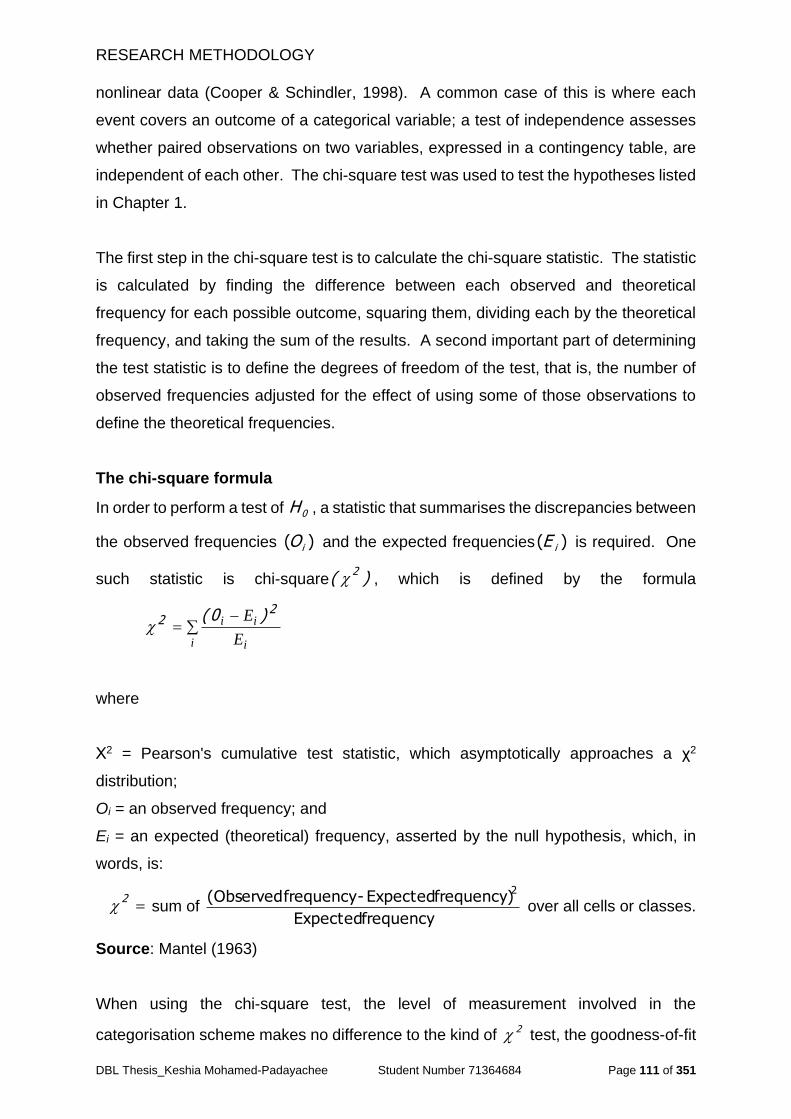
RESEARCH METHODOLOGY
DBL Thesis_Keshia Mohamed-Padayachee Student Number 71364684 Page 111 of 351
nonlinear data (Cooper & Schindler, 1998). A common case of this is where each
event covers an outcome of a categorical variable; a test of independence assesses
whether paired observations on two variables, expressed in a contingency table, are
independent of each other. The chi-square test was used to test the hypotheses listed
in Chapter 1.
The first step in the chi-square test is to calculate the chi-square statistic. The statistic
is calculated by finding the difference between each observed and theoretical
frequency for each possible outcome, squaring them, dividing each by the theoretical
frequency, and taking the sum of the results. A second important part of determining
the test statistic is to define the degrees of freedom of the test, that is, the number of
observed frequencies adjusted for the effect of using some of those observations to
define the theoretical frequencies.
The chi-square formula
In order to perform a test of 0H , a statistic that summarises the discrepancies between
the observed frequencies )( iO and the expected frequencies )( iE is required. One
such statistic is chi-square , which is defined by the formula
i i
ii
E
E 22 )0(
where
Χ2 = Pearson's cumulative test statistic, which asymptotically approaches a χ2
distribution;
Oi = an observed frequency; and
Ei = an expected (theoretical) frequency, asserted by the null hypothesis, which, in
words, is:
sum of over all cells or classes.
Source: Mantel (1963)
When using the chi-square test, the level of measurement involved in the
categorisation scheme makes no difference to the kind of 2 test, the goodness-of-fit
)(2
2
frequency Expected
frequency) Expected -frequency (Observed2
RESEARCH METHODOLOGY
DBL Thesis_Keshia Mohamed-Padayachee Student Number 71364684 Page 112 of 351
test, to be used. They all operate on frequency counts derived from any kind of data.
However, there are some rules for chi-square tests:
i. The number of items appearing in the 'expected' category, obtained during the
stages of computation, must be at least five.
ii. The tests must be carried out on the actual numbers of items that appear in the
cells, not on derived proportions or percentages. Even though the proportions of
numbers are unaltered, the test is invalidated if the original numbers are not used.
3.4.6.4. Factor analysis
Exploratory Factor Analysis (EFA) was used to identify the structure of the
relationships among the items in the total rewards framework, to assess the
dimensionality of the items. It was used to categorise the potential rewards factors to
attract and retain the youth (Demo, Neiva, Nunes & Rozzett, 2012). EFA was
particularly useful in this study, as it demonstrated the dimensionality of the rewards
factors measurement scale by identifying the number of latent constructs and the
underlying factor structure of a set of reward factors (Marsh, Muthén, Asparouhov,
Lüdtke, Robitzsch, Morin & Trautwein, 2009).
EFA requires that the minimum number of cases for reliable results to be at least five
times the number of questions or variables (Mundfrom, Shaw & Ke, 2005). The
technique of extracting factors attempts to take out as much common variance as
possible in the first factor. Subsequent factors are, in turn, intended to account for the
maximum amount of the remaining common variance, until, ideally, no common
variance remains. Direct extraction methods obtain the factor matrix directly from the
correlation matrix by application of specified mathematical models. Most factor
analysts agree that direct solutions are not sufficient (Mulaik, 1990). Adjustment to
the frames of reference by rotation methods improves the interpretation of factor
loadings by reducing some of the ambiguities that accompany the preliminary analysis
(Child, 1990). In the present study, the factors were obliquely rotated using the
varimax method of rotation with Kaiser normalisation (Norušis, 1998). According to
Norušis (1998), an oblique factor solution is appropriate if the objective of the research
is to obtain several theoretically meaningful factors. Latent root criterion was used to
decide which factors to eliminate Norušis (1998). A correlation matrix was generated
for the purpose of calculating the input variables and to assess the factorability of the
identified indicators.

RESEARCH METHODOLOGY
DBL Thesis_Keshia Mohamed-Padayachee Student Number 71364684 Page 113 of 351
Determining the number of factors to be extracted (by a factor analytic procedure)
means retaining the factors that account for the most variance in the data (Mulaik,
1990). The criteria for determining the number of factors are: Kaiser’s criterion,
suggested by Guttman (1982), considering factors with an eigenvalue greater than 1
as common factors (Nunnally, 1978), and Cattell’s (1966) scree test. The Kaiser
criterion helps one to use a number of factors equal to the number of the eigenvalues
of the correlation matrix that are equal to or greater than 1. The scree test is based
on an analogy between the debris called scree that collects at the bottom of a hill after
a landslide, and the relatively meaningless factors that result from over-extraction. On
a scree plot, because each factor explains less variance than the preceding factors,
an imaginary line connecting the markers for successive factors generally runs from
top left of the graph to the bottom right. If there is a point below which factors explain
relatively little variance and above which they explain substantially more, this usually
appears as an ‘elbow’ in the plot. This plot resembles the profile of a hillside
(Serumaga-Zake, 2014).
The portion beyond the elbow corresponds to the rubble, or scree, that gathers.
Cattell’s (1966) guidelines call for retaining factors above the elbow and rejecting those
below it. Proportion of variance accounted for keeps a factor, if it accounts for a
predetermined amount of the variance (e.g., 5%, 10%). A factor is defined by
considering the possible theoretical constructs that could be responsible for the
observed pattern of positive and negative loadings.
The factor analysis technique is used with interval data (Johnson, 1998). Field (2009)
states that factor analysis can be used to reduce a data set to a more manageable
size while retaining as much of the original information as possible. The factor analytic
procedure displays the correlation between each pair of the variables (items) in what
is known as an R-matrix, which is merely a table of correlation coefficients between
these variables. In this matrix, the diagonal elements are all ones (1), because each
variable will correlate perfectly with itself (Field, 2009).
The off-diagonal elements are the correlation coefficients between pairs of variables
or items. The presence of clusters or bunches of large correlation coefficients between
subsets of variables suggests that those variables could be measuring aspects of the
RESEARCH METHODOLOGY
DBL Thesis_Keshia Mohamed-Padayachee Student Number 71364684 Page 114 of 351
same thing or underlying dimension. These underlying dimensions are known as
factors. Thus, one is able to reduce the measured variables to a smaller set of factors
that explains the maximum amount of common variance in a correlation matrix using
the smallest number of explanatory constructs (Green, Lissitz & Mulaik, 1977).
There are numerous techniques and terms associated with factor analysis, such as
principal component analysis (PCA), principal factor analysis (PFA), and rotation of
data techniques, such as varimax rotation. The Kaiser-Meyer-Olkin (KMO) value,
which is an index that compares the sizes of the observed correlation coefficients to
the sizes of the partial correlation coefficients (Norusis, 2009), was used in the present
study. In short, if the KMO ratio is close to 1, it means that all the partial correlation
coefficients are small, compared to the ordinary correlation coefficients. This is what
one hopes to obtain, because it indicates that these variables are linearly related
(Norusis, 2010). Large KMO values (normally 0.6 or larger) are what one is looking
for, accompanied by a Bartlett’s sphericity value that is significant (p < 0.05). Bartlett’s
(1950) test measures whether the variance-covariance matrix is proportional to an
identity matrix. Thus, it effectively tests whether the diagonal elements of the variance-
covariance matrix are equal (group variances are the same), and that the off-diagonal
elements are approximately zero (independent variables are not correlated) (Field,
2009). If the result of Bartlett’s test (1950) is significant, it means that the correlation
between variables is (overall) significantly different from zero. Hence, a p-value < 0.05
is desirable for the plausibility of a factor analytic procedure (Field, 2009).
The factors that form the first iteration of the software are called unrotated factor
loadings (Kline, 2014). Unrotated factor loadings are not as enlightening, as, most of
the time, they will have cross-loadings of variables. Hence, to find some pattern in
which one factor heavily loads (has a high correlation coefficient) on some variables
and the other factor on others, the variables must be rotated (Kline, 2014). Rotation
can be carried out by either orthogonal or oblique methods (Comrey, 1978). Finally,
the interpretation of factor loadings is largely subjective. There is no way to calculate
the meanings of factors; they are what one sees in them (Cooper & Schindler, 1998).
RESEARCH METHODOLOGY
DBL Thesis_Keshia Mohamed-Padayachee Student Number 71364684 Page 115 of 351
3.4.7. Generalisability
To determine the degree to which the results of a study can be extrapolated to other
circumstances, so that it can be applied beyond the sample to the larger population, a
researcher has to test the generalisability of the results (Lee, 1999).
To test the generalisability of the results of the research to a wider population, the
researcher used inferential statistics. Instead of using the entire population to gather
the data, the researcher used a representative sample to make inferences about the
defined population (Lee, 1999).
3.4.8. Validity and reliability
The questionnaire was developed through a detailed literature review. The researcher
used the reward categories of the WorldatWork (2015) Total Rewards Model, as it
provided most of the descriptions of the concepts that were relevant to this study.
Cronbach's alpha tests for reliability and consistency were used to test the reliability
of the questionnaire (discussed in Chapter 4). Valid and reliable findings and
interpretation thereof were supported by statistical analysis, discussed in detail in the
next chapters.
Further to the above supporting the validity and reliability, the data from the
representative sample were obtained in an ethical manner, in compliance with the
institution and organisational standards, and were adequate to support practical
significance of the study.
3.5. Phase II: Qualitative research
The next section describes the research methodology for Phase II of the research.
This includes describing the measuring instrument and pilot study conducted, the
sampling methods, methods of data collection, statistical analyses, credibility,
replicability, transferability, dependability, and validity.
Qualitative research has its own set of requirements for quality, including credibility,
replicability, transferability, dependability, and validity. Credibility is the alternative to
validity. In this regard, the Cronbach alphas are presented in Chapter 4. This chapter
also describes the interview process, demonstrating the robustness of the process by
RESEARCH METHODOLOGY
DBL Thesis_Keshia Mohamed-Padayachee Student Number 71364684 Page 116 of 351
describing the research setting, population, and sample, aiding the replicability of the
study and showing the integrity of the process, approach, and methodology.
The study is described in detail, to ensure its replicability, enabling other researchers
to duplicate the study (Welman, Kruger & Mitchell, 2005). The sample selection
described in Chapter 3 could be replicated in similar settings or countries.
The study further meets the criteria of transferability, referring to whether the
research can be transferred from one situation to another (De Vos, Strydom, Fouche
& Delport, 2005). The transferability of the study is sound, and the research can be
replicated using other classes of employees, in and outside of the country. The
questionnaire’s reliability and consistency results were high, which formed the basis
for the guide for the semi-structured interviews.
Dependability was a concern, because of the ontological assumption underpinning
the present study’s methodology — that reality or the world is socially constructed,
and perceptions can vary greatly. However, the research process was
comprehensively documented, and is logical and auditable. The changes in the
research designed were also documented as it was refined over time (Bussin, 2014).
Internal validity was confirmed by comparing participants’ experiences and
perceptions. Probing and follow-up questions were asked when findings were
discussed with the participants, to confirm that the researcher’s understanding of the
participants’ experiences was a true reflection of their perspective. This mixed-method
approach was a key factor in ensuring the quality and soundness of the study. A
mixed-method approach is a strategy whereby more than one research method is
used to investigate the same topic (Collis & Hussey, 2009).
3.5.1. Sampling methods
In qualitative research, the question of representation is inferior to obtaining detailed
information about facts and feeling from the persons participating in the study (Bryman
& Bell, 2015). The sampling process is important in qualitative research, as the
informants should be best suited to providing information that will answer the research
questions (O’Leary, 2004). Since such assets are often managed by a manager and
rewarded by the HR department, the researcher interviewed HRGs and specialists in
RESEARCH METHODOLOGY
DBL Thesis_Keshia Mohamed-Padayachee Student Number 71364684 Page 117 of 351
recruitment, remuneration, and OD. To gain diverse perspectives on the
organisations’ benefits, the researcher also interviewed employees of the
organisations. The researcher, in addition, interviewed other employed youths.
To find suitable interviewees, the researcher selected interviewees from the
organisations from both the public and private sectors, as well as tertiary institutions.
The researcher used purposive sampling to ensure that the right decisions were made
about which interviewees were best suited to the study and could provide the desired
information (De Vaus & de Vaus, 2001; Burns & Grove, 1993).
3.5.2. Measuring instrument and pilot study
The researcher conducted semi-structured interviews — a combination of structured
and unstructured interviews (O’Leary, 2004). Considering the purpose of the
research, unstructured interviews would not have been of great use, and semi-
structured interviews were best suited to the purpose of the present study. Semi-
structured interviews allowed the researcher to set a framework for the interviews,
while still allowing the interviewees’ opinions to guide the conversation.
According to Taylor and Francis (2013), qualitative interviews attempt to make
meanings from individual accounts and experiences. The intent of the interviews was
to make meaning of the findings established in Phase I of the present research.
According to McNamara (2009: 8), the strength of a general interview guide approach
is giving the researcher the ability “to ensure that the same general areas of
information are collected from each interviewee; this provides more focus than the
conversational approach, but still allows a degree of freedom and adaptability in
getting information from the interviewee.” The development of the interview guide in
the present study was informed by the categories and elements determined through
Phase I.
Standardised, open-ended, semi-structured interview questions were formulated, as
no relevant interview guide existed. The researcher developed the interview guide by
referring to literature on how to develop a suitable semi-structured interview
questionnaire (McNamara, 2009). The researcher created the initial draft of the
interview guide, and sent this to her supervisor for review and input. Upon completion
RESEARCH METHODOLOGY
DBL Thesis_Keshia Mohamed-Padayachee Student Number 71364684 Page 118 of 351
of the supervisor’s review, the concern raised was that the interviews needed to be
limited to 30 minutes, implying a limit to the number of questions that could be asked.
It was then decided to group questions where possible, without compromising the goal
of the interviews.
Following this supervisory input, the researcher made the required updates to the
guide and proceeded to conduct a pilot interview. Upon completion of the pilot
interview, the approximate time it took to complete the interview was confirmed, as
well as changes required to the structure of some of the questions, which the
researcher corrected.
Following the pilot interview, the researcher refined and finalised the interview guide,
and began scheduling the interviews. The final version of the semi-structured
interview guide was prepared in English (Appendix B).
3.5.3. Scheduling the interviews
The researcher sent an initial e-mail to participants, who were selected through a
process of purposive, convenience, quota and snowball sampling. In the e-mail
correspondence, the researcher provided an overview of the research, the objectives
of the interview, and indicated the time required and the cut-off date for responses.
Four participants responded, and the researcher contacted them to schedule suitable
times and venues for the interviews.
The researcher followed up with those who had not responded, and extended a
second invitation; a further two participants confirmed their availability.
During the initial interviews, two interviewees referred colleagues who they felt would
be able to contribute to the research. The researcher contacted the referees and
scheduled interviews.
The researcher also employed other methods to solicit interviewees. These were cold
calling and inviting professionals to participate. This resulted in a further five
interviewees taking part in the study. The researcher was hoping for a sample of ten
RESEARCH METHODOLOGY
DBL Thesis_Keshia Mohamed-Padayachee Student Number 71364684 Page 119 of 351
participants, and managed to draw a sample of 11, two of whom had to be interviewed
telephonically.
3.5.4. Data collection
Data were gathered by means of nine face-to-face interviews and two telephonic
interviews, which each took between 20 to 60 minutes to conclude, depending on the
depth of the responses provided by the interviewees and opportunities the
conversation presented for further probing questions.
The HRGs and specialists were selected for the interviews, as they possessed an
enhanced understanding of the current issues and experiences in recruiting
employees, and had an understanding of total rewards models.
This method of data collection provided the interviewees with an opportunity to
contribute their real views in as much detail as they desired, which provided the
researcher with valuable information about the participants’ attitudes and opinions,
particularly how they explain and contextualise issues. This approach also allowed
the interviewer to adjust questions and change direction as the interview took place
(Langley, 1999).
The disadvantage of conducting research interviews is that they are time-consuming,
particularly when the interviews are recorded and fully transcribed. Therefore, in the
present study, the sample size was small and unlikely to be representative of the
population (Langley, 1999). The researcher, however, endeavoured to include as
many ethnic and gender groups as possible, in order to collect diverse views.
3.5.5. Data analysis
An inductive approach was applied to the semi-structured interviews, based on the
existing literature and rewards frameworks, which provided the foundation for
collecting and analysing the data. During the interviews, the researcher utilised the
interview guide as a framework to guide the discussions, whilst simultaneously probing
for additional meaning. Once the interviews had been completed and transcribed, the
researcher again utilised this structure to categorise and code the data (Burnard,
Stewart, Treasure & Chadwick, 2008).
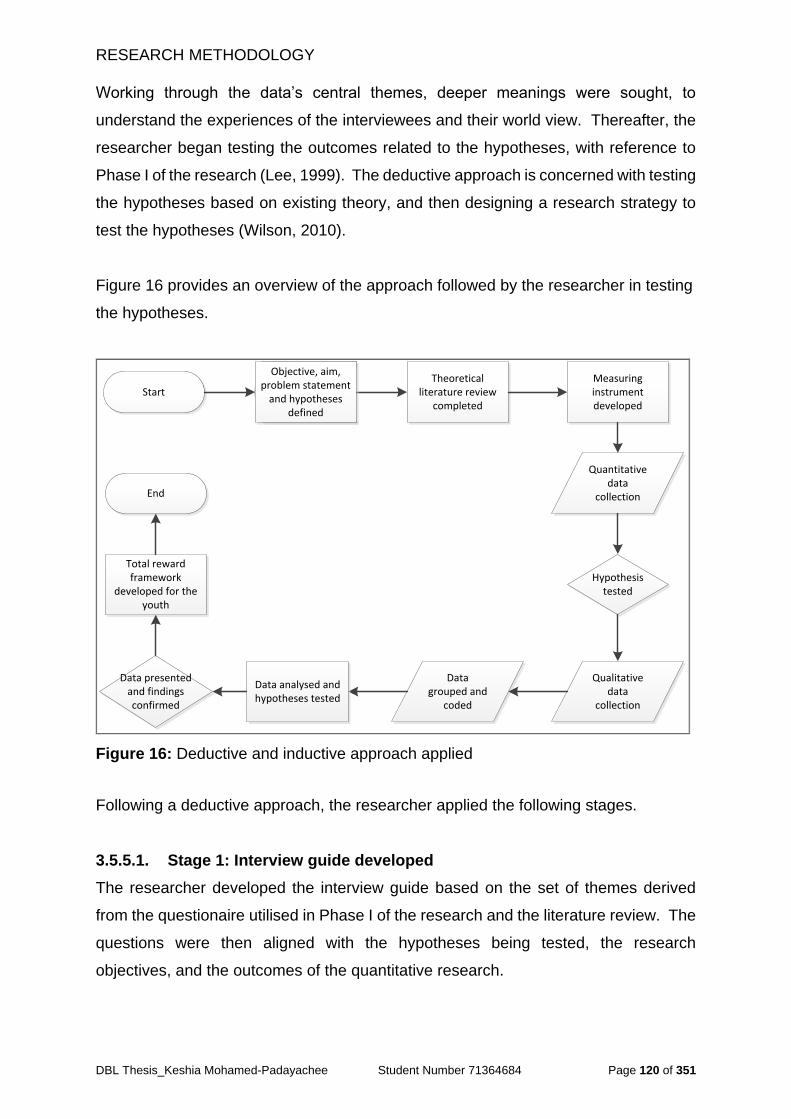
RESEARCH METHODOLOGY
DBL Thesis_Keshia Mohamed-Padayachee Student Number 71364684 Page 120 of 351
Working through the data’s central themes, deeper meanings were sought, to
understand the experiences of the interviewees and their world view. Thereafter, the
researcher began testing the outcomes related to the hypotheses, with reference to
Phase I of the research (Lee, 1999). The deductive approach is concerned with testing
the hypotheses based on existing theory, and then designing a research strategy to
test the hypotheses (Wilson, 2010).
Figure 16 provides an overview of the approach followed by the researcher in testing
the hypotheses.
StartTheoretical
literature review completed
Measuring instrument developed
Literature Review
Quantitative data
collection
Hypothesis tested
Qualitative data
collection
Data presented and findings confirmed
Data grouped and
coded
Total reward framework
developed for the youth
End
Objective, aim, problem statement
and hypotheses defined
Data analysed and hypotheses tested
Figure 16: Deductive and inductive approach applied
Following a deductive approach, the researcher applied the following stages.
3.5.5.1. Stage 1: Interview guide developed
The researcher developed the interview guide based on the set of themes derived
from the questionaire utilised in Phase I of the research and the literature review. The
questions were then aligned with the hypotheses being tested, the research
objectives, and the outcomes of the quantitative research.
RESEARCH METHODOLOGY
DBL Thesis_Keshia Mohamed-Padayachee Student Number 71364684 Page 121 of 351
3.5.5.2. Stage 2: Interviews conducted, transcribed and grouped
Once the interviews were conducted, they were transcribed verbatim. During Stage 2
of the process, the interviewees were grouped into two groups: (1) youths and (2)
HRGs, and recruitment, remuneration, and OD specialists (collectively referred to as
HR practitioners in the discussion of the findings).
3.5.5.3. Stage 3: Coding
The data were then coded, and sentences and paragraphs grouped together by group.
The sentences and paragraphs were labelled by allocating and labeling the data.
Codes were then grouped together, to create categories. The categories were then
connected to the main results of the questionnaire for each of the areas explored.
During Stage 3, coding was completed, which is the process of organising and sorting
the data from the interview process (Gibbs, 2008). Codes serve as a way to label,
compile, and organise data, allowing the researcher to summarise and synthesize the
data. It is generally understood that coding is analysis. Coding is the grouping of
knowledge about the world of the participants in the study (Gibbs, 2008).
3.5.5.3.1. Pre-set codes
Initially, codes were created based on the categories identified from the questionnaire:
Remuneration, Benefits, Reward recognition, Career development, Work‒life,
Safety/Security, and Social support. On reviewing the responses, new codes
emerged.
3.5.5.3.2. Emergent codes
Pre-set codes were created in alignment with the interview guide, which were linked
to the questionnaire used in the qualitative phase of the research. Further codes
emerged as the researcher started reviewing and coding the data from the transcripts,
which were different from the pre-set codes, but were relevant to the subject. QDA
miner, a qualitative analysis software program, was then used to assist with the coding
process, which further assisted with retrieval of sections of data and determining
frequencies of codes.
RESEARCH METHODOLOGY
DBL Thesis_Keshia Mohamed-Padayachee Student Number 71364684 Page 122 of 351
3.5.5.3.3. Codes refined
During this process, codes were refined, added, expanded, combined, and removed,
while the researcher sought connections between codes (Gibbs, 2008; Saldana,
2009).
3.5.5.4. Stage 4: Themes
Once the coding had been completed, the individual quotations that were initially
brought together by the grouping of the interviews according to the themes and
interview categories were checked and reconfirmed. Themes were then examined,
and ideas within the themes were sought.
3.5.5.5. Stage 5: Narrative
The researcher then began the process of constructing summaries of the responses
and constructing the narrative (detailed in Chapter 5). Quotes from the interviews
were then gathered, to support the statements made by the researcher in describing
the findings (detailed in Appendix C).
According to Merriam (1998), the analysis and interpretation of the study’s findings
reflect the constructs, concepts, language, models, and theories that formed the
structure of the study in the first place; therefore, the analysis procedure of the present
study was a thematic analysis. Figure 17 shows the streamlined codes for qualitative
theory (Saldana, 2009).
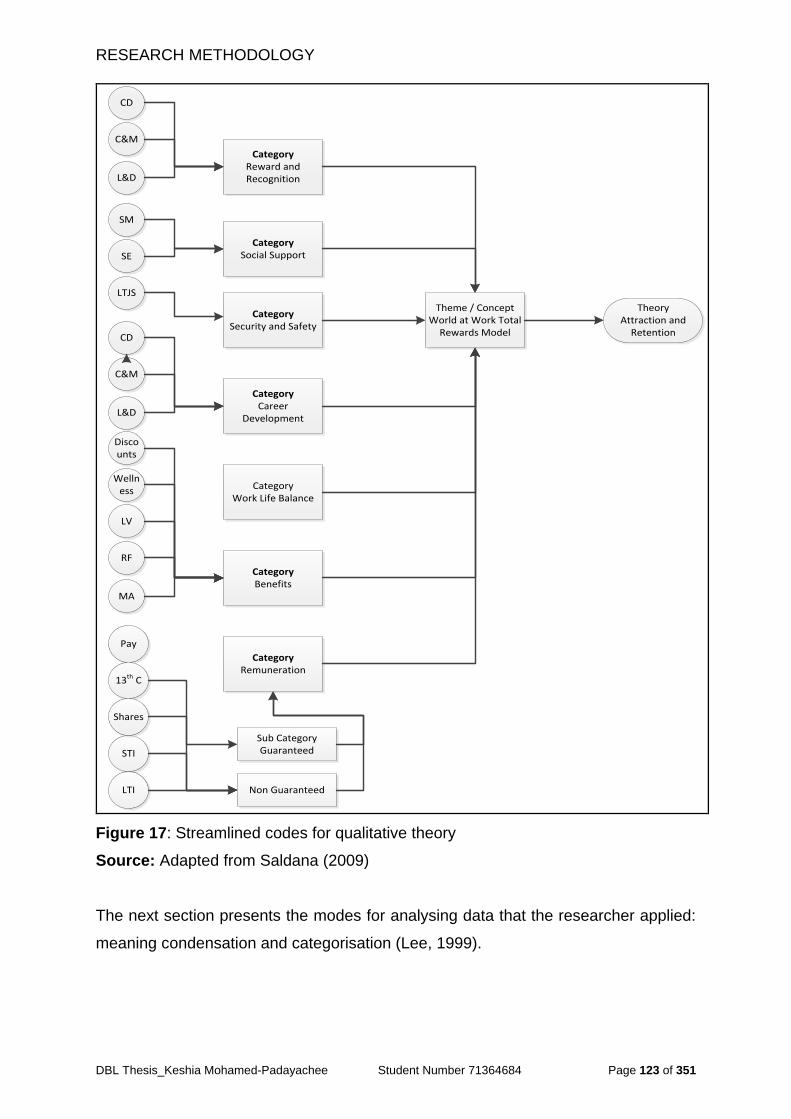
RESEARCH METHODOLOGY
DBL Thesis_Keshia Mohamed-Padayachee Student Number 71364684 Page 123 of 351
LV
RF
MA
Category Benefits
Pay
13th C
STI
Category Remuneration
Sub CategoryGuaranteed
Non Guaranteed
Theme / ConceptWorld at Work Total
Rewards Model
TheoryAttraction and
Retention
Category Work Life Balance
Category Career
Development
LTI
Shares
Wellness
Discounts
Category Security and Safety
Category Social Support
CD
C&M
L&D
Category Reward and Recognition
CD
C&M
L&D
SM
SE
LTJS
Figure 17: Streamlined codes for qualitative theory
Source: Adapted from Saldana (2009)
The next section presents the modes for analysing data that the researcher applied:
meaning condensation and categorisation (Lee, 1999).
RESEARCH METHODOLOGY
DBL Thesis_Keshia Mohamed-Padayachee Student Number 71364684 Page 124 of 351
3.5.5.5.1. Meaning condensation
Meaning condensation involved the reduction of data whilst simultaneously articulating
the data’s most important themes (Lee, 1999). The researcher began the process by
reading the interview transcripts to get a sense of the entire data set, and then
analysed each interview individually, and thereafter grouped the data.
The categories were then defined based on the categorisation approach, and the
researcher arranged and read the responses in each of the categories, to understand
the themes and responses in each. The researcher then made a decision on these
‟units’ naturalness, holism and relevance” to the identified category (Lee, 1999: 90).
3.5.5.5.2. Meaning categorisation
Meaning categorisation involved the researcher reducing the data to the most
important themes/categories, and then codes. The categories were binary (they either
occurred or did not occur), as well as ordinal, where the researcher noted it as very
important or not important to the participants, and assigned a percentage value to the
responses. The outcome of the categorisation was analysed qualitatively (Lee, 1999).
The researcher began this process of meaning categorisation by determining the
organising structure, which determined the basis for categorisation judgements and
defining the phenomena and variables of interest, based on existing theory.
The researcher then defined what was to be explored within each of the categories by
code. The researcher then attempted, where possible, to rate each of the codes by
interviewee, based on their responses, and then analysed these scores qualitatively,
using statistical analyses.
The collected data were processed by means of statistical and text analysis, and
interpreted across two databases (Creswell, 2012), namely QDA Miner4 and Microsoft
Office. QDA Miner is a qualitative data analysis software package for coding,
annotating, retrieving, and analysing collections of documents, which, in this case,
were the transcripts, divided by groups of interviewees. This data analysis tool was
further used to analyse the interview transcripts, and provided flexibility in analysing
and mining text (Provalis Research, 2014).
RESEARCH METHODOLOGY
DBL Thesis_Keshia Mohamed-Padayachee Student Number 71364684 Page 125 of 351
The coded data and identified themes, together with interview transcripts, were
analysed using this statistical program. Codes were used in the process of
categorising the qualitative data and describing the details and implications of these
categories. Quotes were considered, where apt, to demonstrate, inform, and support
findings. This approach enabled the researcher to interpret the meanings of the
explored phenomena (Theron, 2014). The findings are presented, in Chapter 5 and
substantiated by quotes verbatim from the interviews, in Appendix C.
3.5.6. Transferability of the data
The next paragraphs describe the interview approach the researcher applied for all
the face-to-face and telephonic interviews conducted. Before commencement of each
interview, the researcher ensured that the recorder was working and fully charged, to
ensure that the interviews were recorded in full. The interviewer initiated the
discussions by welcoming the interviewees and thanking them for their time. The
interviewer then proceeded to provide an overview of the research and what the
researcher was hoping to achieve through the interview. The researcher provided an
overview of the topic and questions, as well as the nature of expected responses, so
that interviewees would limit their responses to their personal experiences, and not
include literature or third-party accounts they may have read or heard. The researcher
then obtained the interviewees’ consent to continue and permission to audio-record
the interviews.
The interview questions began with introductory questions, to elicit personal
responses from the interviewees, setting the scene and tone for the conversation,
whilst simultaneously providing the researcher with an overview of the interviewees,
their area of responsibility, and the contribution they would make to the research. The
researcher thereafter asked the main questions.
The researcher was very engaging, without providing any input into the responses,
and nodded and probed with follow-up and probing questions where themes emerged.
The researcher encouraged discussion when the researcher felt the conversation was
fruitful.
RESEARCH METHODOLOGY
DBL Thesis_Keshia Mohamed-Padayachee Student Number 71364684 Page 126 of 351
The questions in the interview guide were predetermined, in order to guide the
discussion and to ensure consistency in the areas being evaluated, but included open-
ended questions that gave the participants the freedom to respond with new themes.
The interview structure and conditions were relaxed, and the conversations flowed
from category to category while the structured questions were used. The researcher,
at times, referred to the interview guide, maintaining a conversational tone and guiding
the conversation, whilst allowing the interviewees to steer their responses, based on
their experience.
The researcher did not interrupt interviewees, and allowed them the opportunity to
express their views. There were no right or wrong answers, since the researcher was
interested in their views, perceptions, and understanding of the youths’ acceptance of
the rewards they were being offered at their current and previous employers (where
applicable). Where asked to clarify and confirm questions, the researcher complied.
The conversations were rich, spontaneous, and specific. The responses were relevant
to the questions asked. The interviewer’s questions were short, and the interviewees’
responses were long. The interviewer, where required, asked follow-up questions and
the interviewees corroborated their opinions during the course of the interviews (Lee,
1999).
3.5.7. Credibility of the data
The interviews were audio-recorded, and the telephonic interviews were recorded in
notes. The narrative data were manually recorded by the interviewer and transcribed
immediately following each interview, ensuring that the responses were correctly
captured, providing an accurate portrayal of the responses.
During the face-to-face interviews, field notes were taken. The audio recording was
transcribed using the transcription software (https://transcribe.wreally.com).
Transcribe is an online transcription program that offers an audio player that is
integrated with a text editor on the same screen. It allows typing from tapes without
changing between software in the transcription from audio to tape, capturing an exact
record of the spoken conversation.
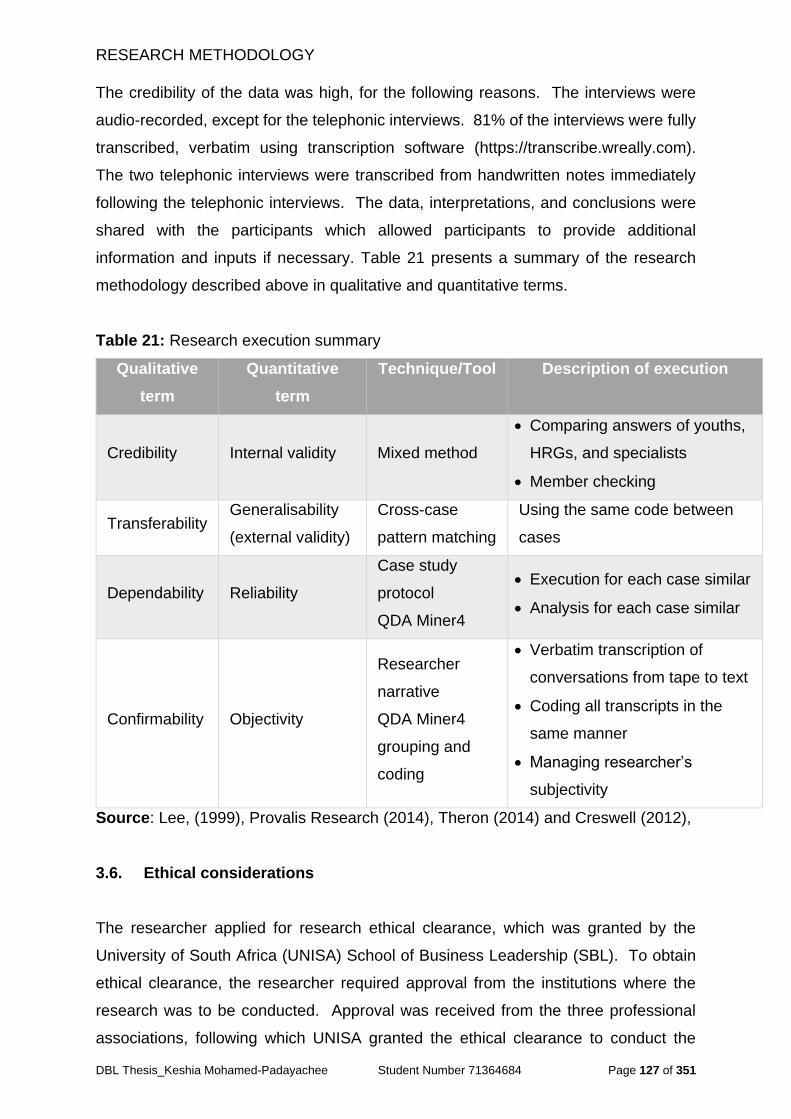
RESEARCH METHODOLOGY
DBL Thesis_Keshia Mohamed-Padayachee Student Number 71364684 Page 127 of 351
The credibility of the data was high, for the following reasons. The interviews were
audio-recorded, except for the telephonic interviews. 81% of the interviews were fully
transcribed, verbatim using transcription software (https://transcribe.wreally.com).
The two telephonic interviews were transcribed from handwritten notes immediately
following the telephonic interviews. The data, interpretations, and conclusions were
shared with the participants which allowed participants to provide additional
information and inputs if necessary. Table 21 presents a summary of the research
methodology described above in qualitative and quantitative terms.
Table 21: Research execution summary
Qualitative
term
Quantitative
term
Technique/Tool Description of execution
Credibility Internal validity Mixed method
Comparing answers of youths,
HRGs, and specialists
Member checking
Transferability Generalisability
(external validity)
Cross-case
pattern matching
Using the same code between
cases
Dependability Reliability
Case study
protocol
QDA Miner4
Execution for each case similar
Analysis for each case similar
Confirmability Objectivity
Researcher
narrative
QDA Miner4
grouping and
coding
Verbatim transcription of
conversations from tape to text
Coding all transcripts in the
same manner
Managing researcher’s
subjectivity
Source: Lee, (1999), Provalis Research (2014), Theron (2014) and Creswell (2012),
3.6. Ethical considerations
The researcher applied for research ethical clearance, which was granted by the
University of South Africa (UNISA) School of Business Leadership (SBL). To obtain
ethical clearance, the researcher required approval from the institutions where the
research was to be conducted. Approval was received from the three professional
associations, following which UNISA granted the ethical clearance to conduct the
RESEARCH METHODOLOGY
DBL Thesis_Keshia Mohamed-Padayachee Student Number 71364684 Page 128 of 351
research. Upon confirmation of the ethical clearance, a publicly funded institution gave
the researcher permission to conduct the research, followed, some months later, by a
parastatal.
During the course of the research, the researcher gained permission from senior
lecturers and professors to distribute the survey questionnaires to graduate and post-
graduate students. This sample of students might have negatively influenced the
findings of this study and, subsequently, its credibility, due to it being a homogeneous
sample that lacked a wide range of perspectives. Homogeneous samples tend to
impact negatively on the external validity of a study, as the researcher may not be able
to generalise the study findings (Nordstokke & Zumbo, 2010).
Participation in the study was voluntary, and consent to participate was obtained from
each participant. Participants were made aware of the purpose of the study, and were
assured that the information they shared would be kept confidential and that their
anonymity was guaranteed. The researcher undertook to keep all data collected for
purposes of the study confidential, and to make the results available to all participants
who so chose. The participants remained anonymous in statistical analysis and in
reporting on the interviews. The researcher upheld the ethical considerations related
to gaining access to data through interviews.
Institution and organisational ethical considerations were complied with, to ensure that
the required standards were maintained to ensure the reliability, validity, transferability,
and credibility of the research.
Copyright of this thesis, as well as ownership of the intellectual property arising from
the research, vests in the UNISA SBL, regardless of whether or not the thesis is
accepted or the research is completed, and the researcher/student gives her
irrevocable consent to the formal cession of any applicable rights to UNISA.
3.7. Conclusion
This chapter summarised the research methodology, describing the quantitative and
qualitative approach the researcher followed in answering the research question.
Hereafter, Chapters 4 and 5 present the analysis and findings from the quantitative
and qualitative phases of the study.
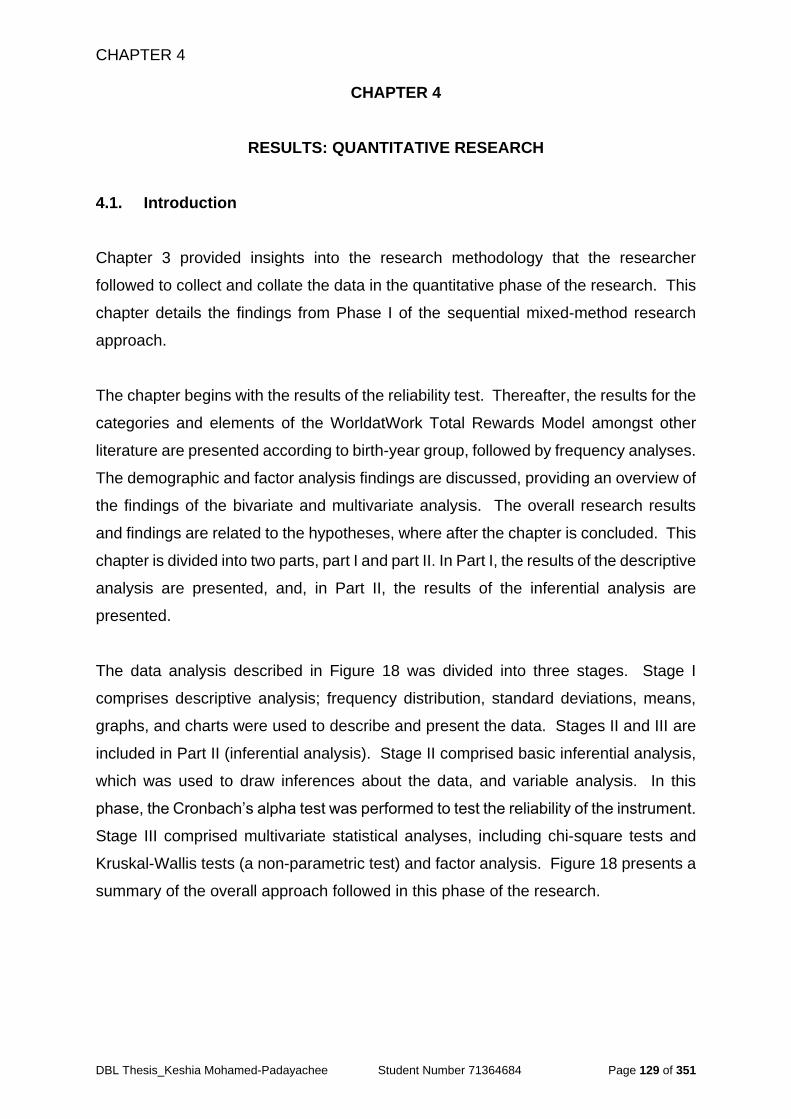
CHAPTER 4
DBL Thesis_Keshia Mohamed-Padayachee Student Number 71364684 Page 129 of 351
CHAPTER 4
RESULTS: QUANTITATIVE RESEARCH
4.1. Introduction
Chapter 3 provided insights into the research methodology that the researcher
followed to collect and collate the data in the quantitative phase of the research. This
chapter details the findings from Phase I of the sequential mixed-method research
approach.
The chapter begins with the results of the reliability test. Thereafter, the results for the
categories and elements of the WorldatWork Total Rewards Model amongst other
literature are presented according to birth-year group, followed by frequency analyses.
The demographic and factor analysis findings are discussed, providing an overview of
the findings of the bivariate and multivariate analysis. The overall research results
and findings are related to the hypotheses, where after the chapter is concluded. This
chapter is divided into two parts, part I and part II. In Part I, the results of the descriptive
analysis are presented, and, in Part II, the results of the inferential analysis are
presented.
The data analysis described in Figure 18 was divided into three stages. Stage I
comprises descriptive analysis; frequency distribution, standard deviations, means,
graphs, and charts were used to describe and present the data. Stages II and III are
included in Part II (inferential analysis). Stage II comprised basic inferential analysis,
which was used to draw inferences about the data, and variable analysis. In this
phase, the Cronbach’s alpha test was performed to test the reliability of the instrument.
Stage III comprised multivariate statistical analyses, including chi-square tests and
Kruskal-Wallis tests (a non-parametric test) and factor analysis. Figure 18 presents a
summary of the overall approach followed in this phase of the research.
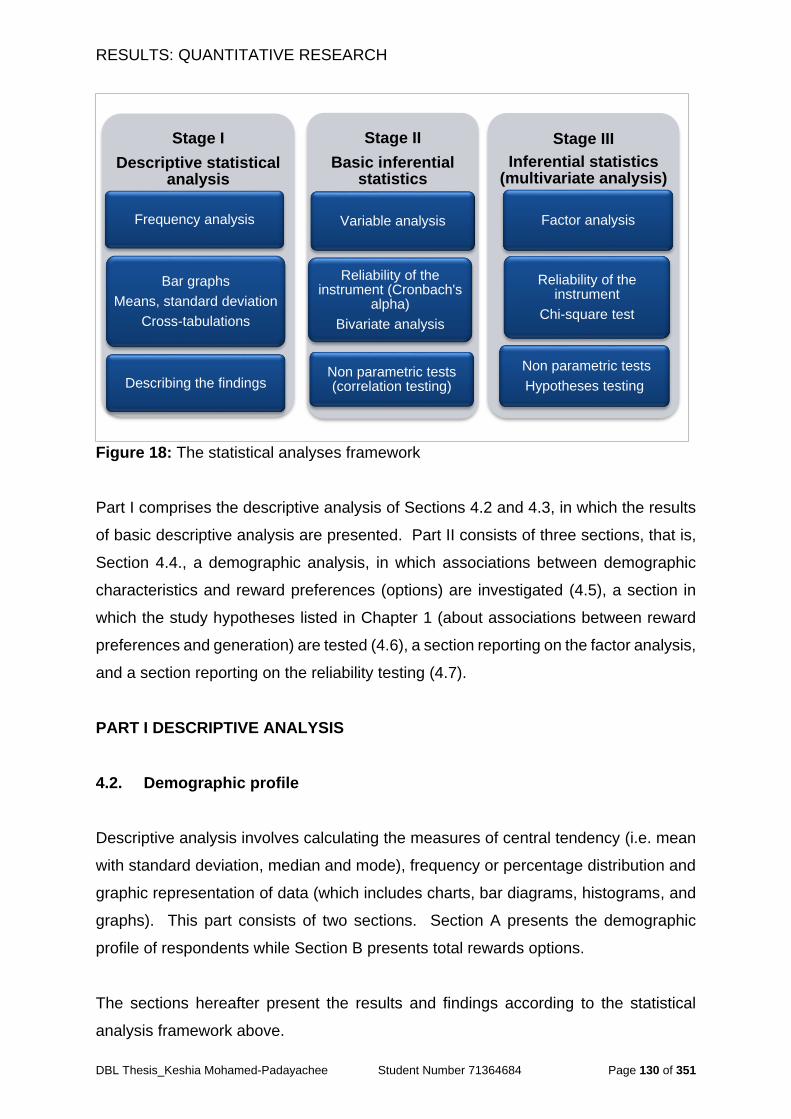
RESULTS: QUANTITATIVE RESEARCH
DBL Thesis_Keshia Mohamed-Padayachee Student Number 71364684 Page 130 of 351
Figure 18: The statistical analyses framework
Part I comprises the descriptive analysis of Sections 4.2 and 4.3, in which the results
of basic descriptive analysis are presented. Part II consists of three sections, that is,
Section 4.4., a demographic analysis, in which associations between demographic
characteristics and reward preferences (options) are investigated (4.5), a section in
which the study hypotheses listed in Chapter 1 (about associations between reward
preferences and generation) are tested (4.6), a section reporting on the factor analysis,
and a section reporting on the reliability testing (4.7).
PART I DESCRIPTIVE ANALYSIS
4.2. Demographic profile
Descriptive analysis involves calculating the measures of central tendency (i.e. mean
with standard deviation, median and mode), frequency or percentage distribution and
graphic representation of data (which includes charts, bar diagrams, histograms, and
graphs). This part consists of two sections. Section A presents the demographic
profile of respondents while Section B presents total rewards options.
The sections hereafter present the results and findings according to the statistical
analysis framework above.
Stage I
Descriptive statistical analysis
Frequency analysis
Bar graphs
Means, standard deviation
Cross-tabulations
Describing the findings
Stage II
Basic inferential statistics
Variable analysis
Reliability of the instrument (Cronbach's
alpha)
Bivariate analysis
Non parametric tests (correlation testing)
Stage III
Inferential statistics (multivariate analysis)
Factor analysis
Reliability of the instrument
Chi-square test
Non parametric tests
Hypotheses testing
RESULTS: QUANTITATIVE RESEARCH
DBL Thesis_Keshia Mohamed-Padayachee Student Number 71364684 Page 131 of 351
4.2.1. Demographic profile of respondents
The questionnaire was divided into two primary sections, namely Section A:
Demographic information and Section B: Total rewards options. The results are
discussed in the same format below.
Section A of the questionnaire collected data on respondents’ demographic profile,
including birth year, gender, race, years’ work experience, relationship status,
educational qualifications, field of study, employment status, employment sector, and
living arrangements. The demographic data provided the researcher with a profile of
the respondents, and enabled the comparison of data on youths to those of the other
groups.
A total of 276 responses were received and included in the analyses. This number of
responses provided the researcher with the breadth of data associated with a large,
statistically representative sample. The valid responses rate per age group ranged
from 25 (9.65%) responses from respondents born 1946‒1964, 86 (33.2%) responses
from respondents born 1965‒1980, and the remaining 148 (57.14%) responses from
respondents born 1981‒2000.
Section A further provided the researcher with an opportunity to analyse the data to
determine if life stage had an impact on their preferences, which may necessitate
organisations to consider reward elements differently, presenting an opportunity for
future research.
4.2.1.1. Year of birth by group
Of the 276 respondents who participated in the study, 259 responded to this question,
representing 93.8% of the total sample. The highest frequency of responses was from
respondents born 1981–2000 (57.14%); the second-highest response rate was from
respondents born 1965–1980 (33.2%), and the lowest was from respondents born
1946–1964 (9.65%). Figure 19 shows the frequency of the age groups within which
the respondents fell.
RESULTS: QUANTITATIVE RESEARCH
DBL Thesis_Keshia Mohamed-Padayachee Student Number 71364684 Page 132 of 351
Figure 19: Age groups
The researcher was satisfied that there was a high concentration of youth respondents
(born 1981–2000), compared to those born 1980–1965 and 1946–1964. The two
latter groups combined accounted for 42.85% of the total sample. This represented
the profile of the current age demographics in the work environment, with the youth
being the next-largest generation in the workforce, followed by those who will soon
retire (Borngräber-Berthelsen, 2008).
4.2.1.2. Gender
In this study, 44% of the respondents were men, and 56% were women. When
compared to data from South Africa Central Statistics (2013) (48.2% men and 51.7%
women), this was a fair representation of the population of South Africa. Of the
respondents, 56% were born 1981–2000; of these, 50.7% were women and 49.3%
were men.
1946 - 1964 1965 - 1980 1981 - 2000
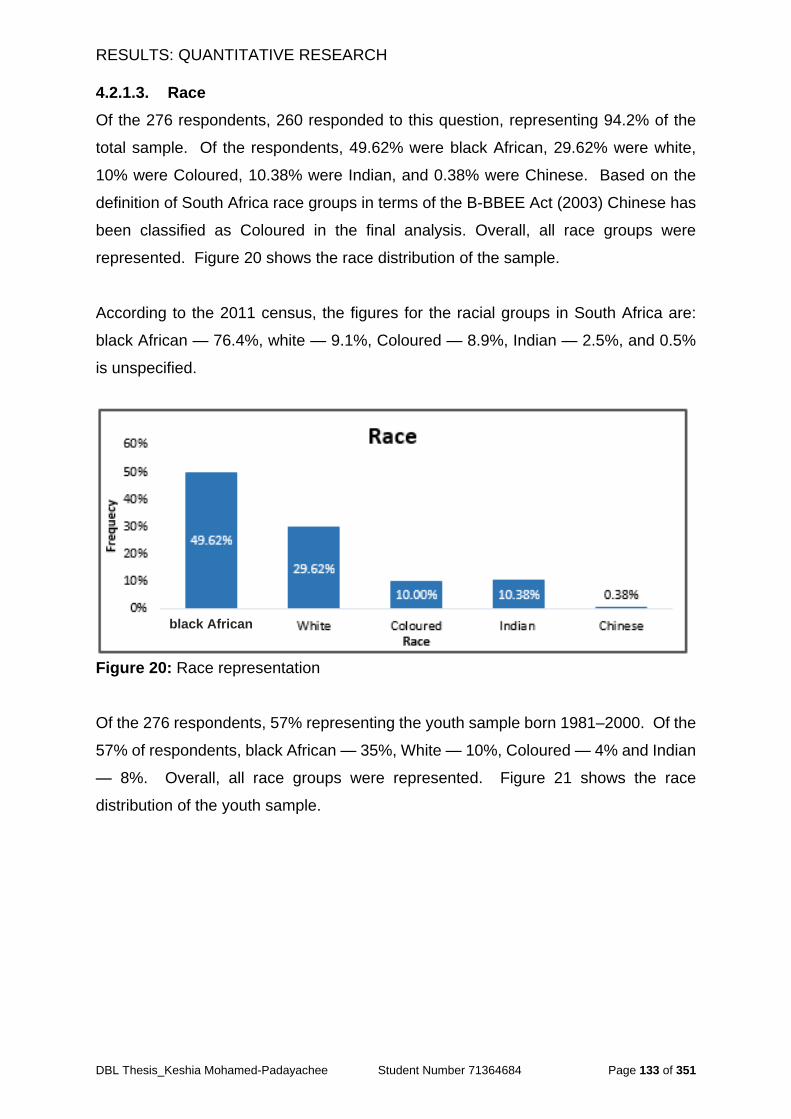
RESULTS: QUANTITATIVE RESEARCH
DBL Thesis_Keshia Mohamed-Padayachee Student Number 71364684 Page 133 of 351
4.2.1.3. Race
Of the 276 respondents, 260 responded to this question, representing 94.2% of the
total sample. Of the respondents, 49.62% were black African, 29.62% were white,
10% were Coloured, 10.38% were Indian, and 0.38% were Chinese. Based on the
definition of South Africa race groups in terms of the B-BBEE Act (2003) Chinese has
been classified as Coloured in the final analysis. Overall, all race groups were
represented. Figure 20 shows the race distribution of the sample.
According to the 2011 census, the figures for the racial groups in South Africa are:
black African — 76.4%, white — 9.1%, Coloured — 8.9%, Indian — 2.5%, and 0.5%
is unspecified.
Figure 20: Race representation
Of the 276 respondents, 57% representing the youth sample born 1981–2000. Of the
57% of respondents, black African — 35%, White — 10%, Coloured — 4% and Indian
— 8%. Overall, all race groups were represented. Figure 21 shows the race
distribution of the youth sample.
black African
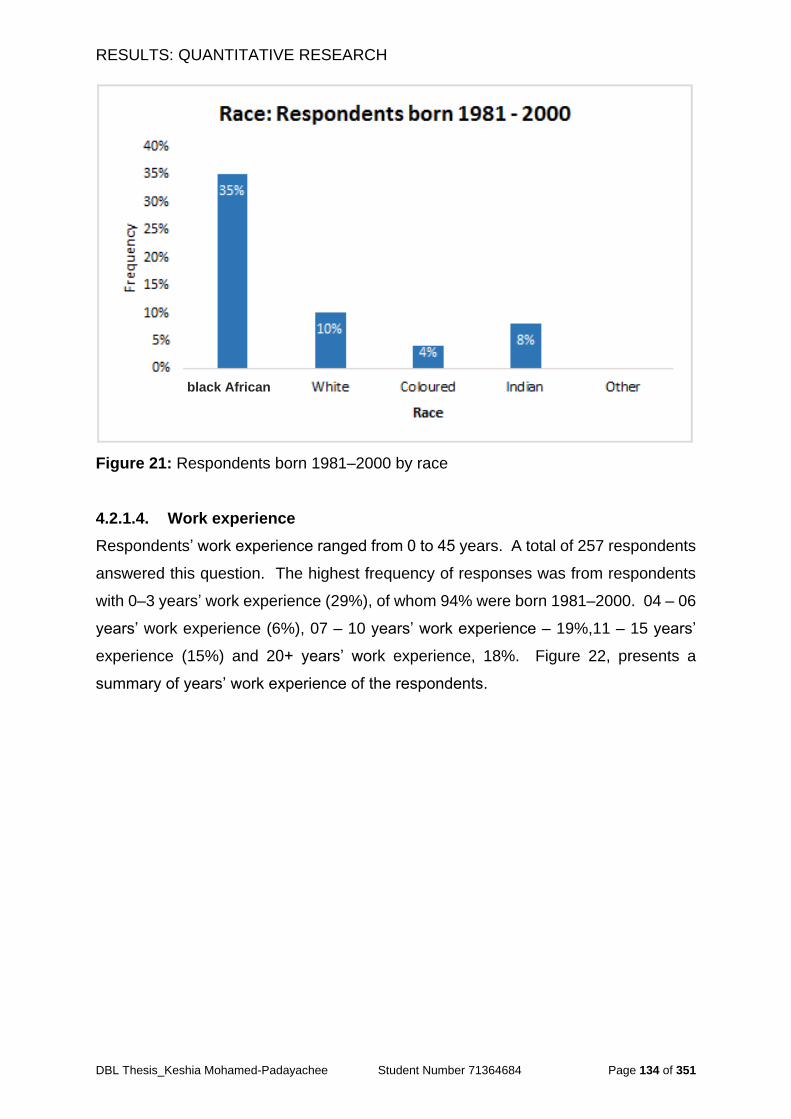
RESULTS: QUANTITATIVE RESEARCH
DBL Thesis_Keshia Mohamed-Padayachee Student Number 71364684 Page 134 of 351
Figure 21: Respondents born 1981‒2000 by race
4.2.1.4. Work experience
Respondents’ work experience ranged from 0 to 45 years. A total of 257 respondents
answered this question. The highest frequency of responses was from respondents
with 0–3 years’ work experience (29%), of whom 94% were born 1981‒2000. 04 – 06
years’ work experience (6%), 07 – 10 years’ work experience – 19%,11 – 15 years’
experience (15%) and 20+ years’ work experience, 18%. Figure 22, presents a
summary of years’ work experience of the respondents.
black African
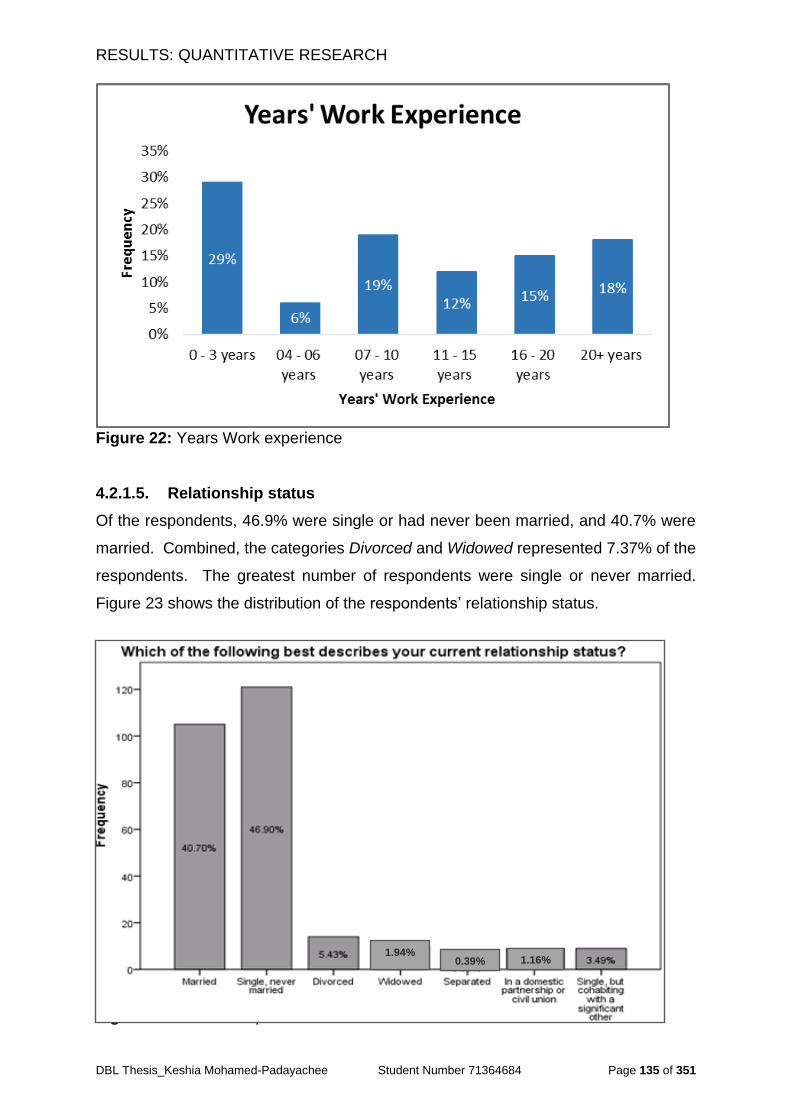
RESULTS: QUANTITATIVE RESEARCH
DBL Thesis_Keshia Mohamed-Padayachee Student Number 71364684 Page 135 of 351
Figure 22: Years Work experience
4.2.1.5. Relationship status
Of the respondents, 46.9% were single or had never been married, and 40.7% were
married. Combined, the categories Divorced and Widowed represented 7.37% of the
respondents. The greatest number of respondents were single or never married.
Figure 23 shows the distribution of the respondents’ relationship status.
Figure 23: Relationship status
0.39% 1.94% 1.16% 0.39% 1.94%
1.16%
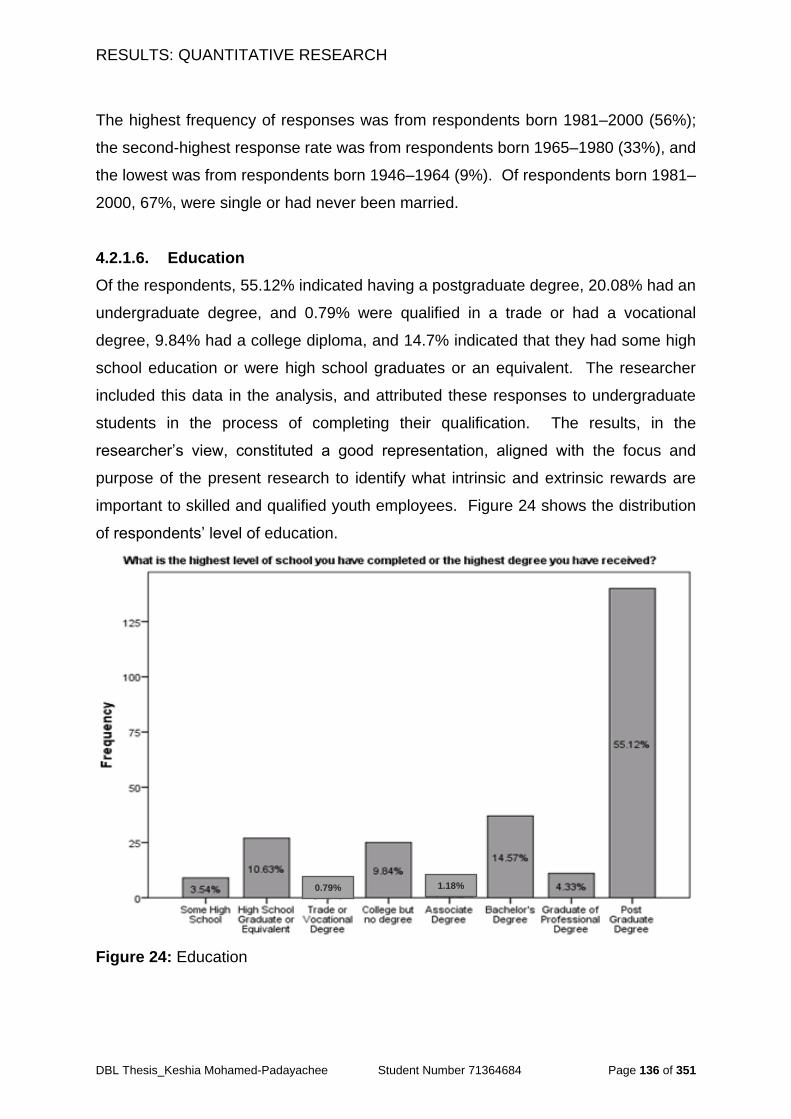
RESULTS: QUANTITATIVE RESEARCH
DBL Thesis_Keshia Mohamed-Padayachee Student Number 71364684 Page 136 of 351
The highest frequency of responses was from respondents born 1981–2000 (56%);
the second-highest response rate was from respondents born 1965–1980 (33%), and
the lowest was from respondents born 1946–1964 (9%). Of respondents born 1981–
2000, 67%, were single or had never been married.
4.2.1.6. Education
Of the respondents, 55.12% indicated having a postgraduate degree, 20.08% had an
undergraduate degree, and 0.79% were qualified in a trade or had a vocational
degree, 9.84% had a college diploma, and 14.7% indicated that they had some high
school education or were high school graduates or an equivalent. The researcher
included this data in the analysis, and attributed these responses to undergraduate
students in the process of completing their qualification. The results, in the
researcher’s view, constituted a good representation, aligned with the focus and
purpose of the present research to identify what intrinsic and extrinsic rewards are
important to skilled and qualified youth employees. Figure 24 shows the distribution
of respondents’ level of education.
Figure 24: Education
0.79% 1.18%
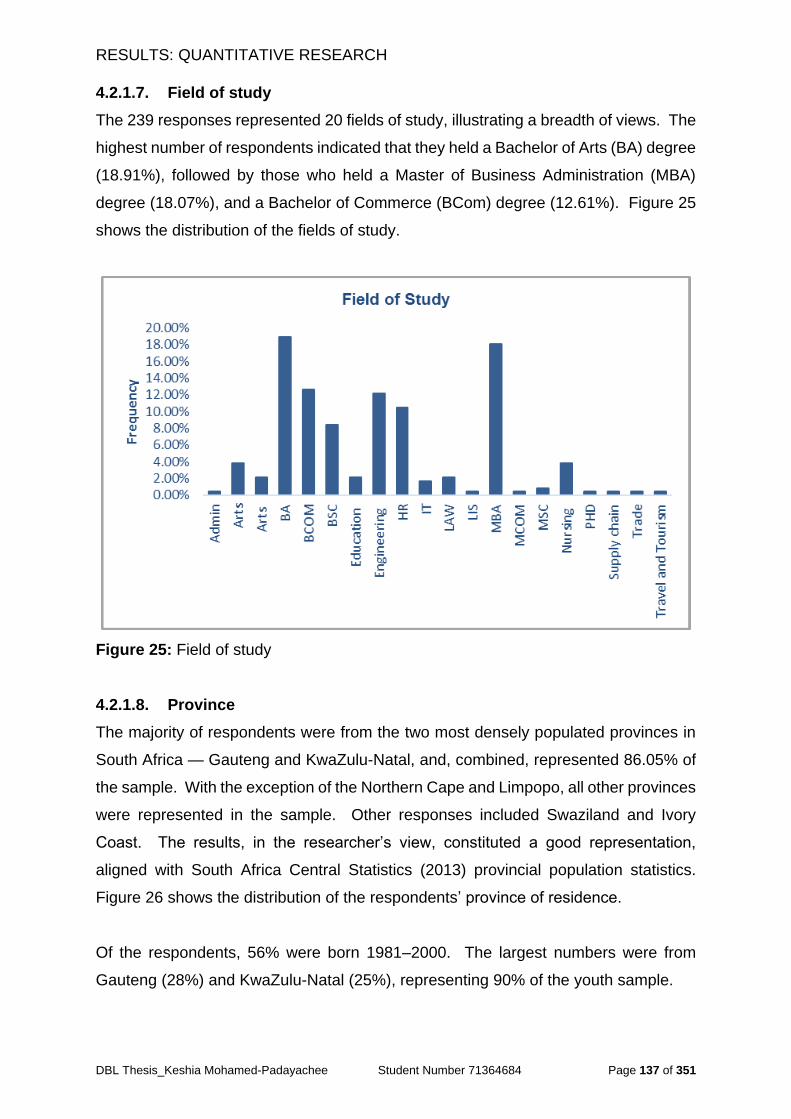
RESULTS: QUANTITATIVE RESEARCH
DBL Thesis_Keshia Mohamed-Padayachee Student Number 71364684 Page 137 of 351
4.2.1.7. Field of study
The 239 responses represented 20 fields of study, illustrating a breadth of views. The
highest number of respondents indicated that they held a Bachelor of Arts (BA) degree
(18.91%), followed by those who held a Master of Business Administration (MBA)
degree (18.07%), and a Bachelor of Commerce (BCom) degree (12.61%). Figure 25
shows the distribution of the fields of study.
Figure 25: Field of study
4.2.1.8. Province
The majority of respondents were from the two most densely populated provinces in
South Africa — Gauteng and KwaZulu-Natal, and, combined, represented 86.05% of
the sample. With the exception of the Northern Cape and Limpopo, all other provinces
were represented in the sample. Other responses included Swaziland and Ivory
Coast. The results, in the researcher’s view, constituted a good representation,
aligned with South Africa Central Statistics (2013) provincial population statistics.
Figure 26 shows the distribution of the respondents’ province of residence.
Of the respondents, 56% were born 1981–2000. The largest numbers were from
Gauteng (28%) and KwaZulu-Natal (25%), representing 90% of the youth sample.
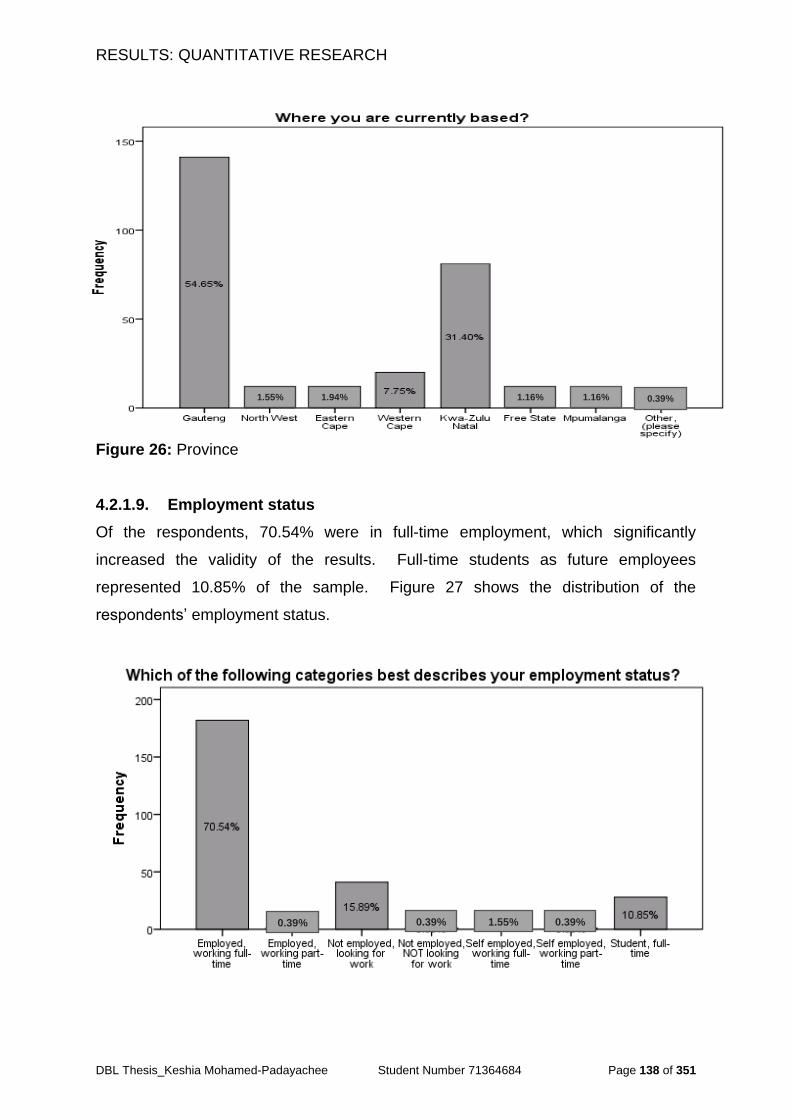
RESULTS: QUANTITATIVE RESEARCH
DBL Thesis_Keshia Mohamed-Padayachee Student Number 71364684 Page 138 of 351
Figure 26: Province
4.2.1.9. Employment status
Of the respondents, 70.54% were in full-time employment, which significantly
increased the validity of the results. Full-time students as future employees
represented 10.85% of the sample. Figure 27 shows the distribution of the
respondents’ employment status.
1.55% 1.94% 1.16% 1.16% 0.39%
0.39% 0.39% 1.55% 0.39%
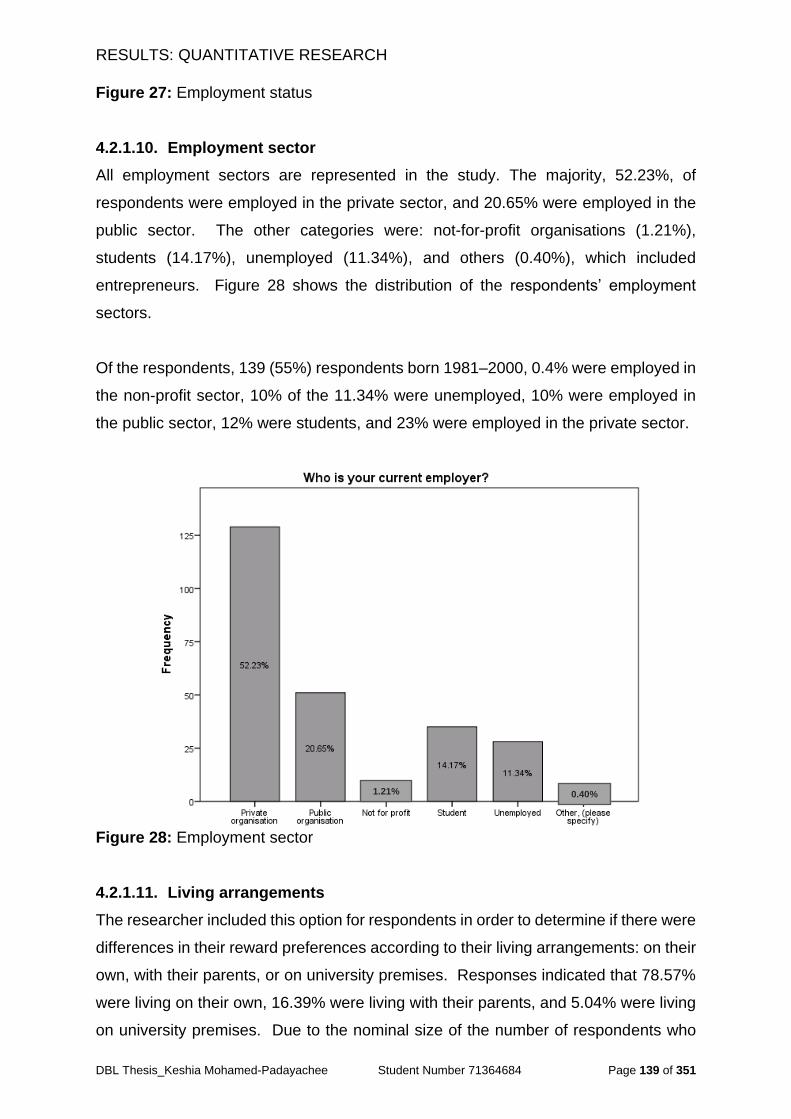
RESULTS: QUANTITATIVE RESEARCH
DBL Thesis_Keshia Mohamed-Padayachee Student Number 71364684 Page 139 of 351
Figure 27: Employment status
4.2.1.10. Employment sector
All employment sectors are represented in the study. The majority, 52.23%, of
respondents were employed in the private sector, and 20.65% were employed in the
public sector. The other categories were: not-for-profit organisations (1.21%),
students (14.17%), unemployed (11.34%), and others (0.40%), which included
entrepreneurs. Figure 28 shows the distribution of the respondents’ employment
sectors.
Of the respondents, 139 (55%) respondents born 1981–2000, 0.4% were employed in
the non-profit sector, 10% of the 11.34% were unemployed, 10% were employed in
the public sector, 12% were students, and 23% were employed in the private sector.
Figure 28: Employment sector
4.2.1.11. Living arrangements
The researcher included this option for respondents in order to determine if there were
differences in their reward preferences according to their living arrangements: on their
own, with their parents, or on university premises. Responses indicated that 78.57%
were living on their own, 16.39% were living with their parents, and 5.04% were living
on university premises. Due to the nominal size of the number of respondents who
1.21% 0.40%
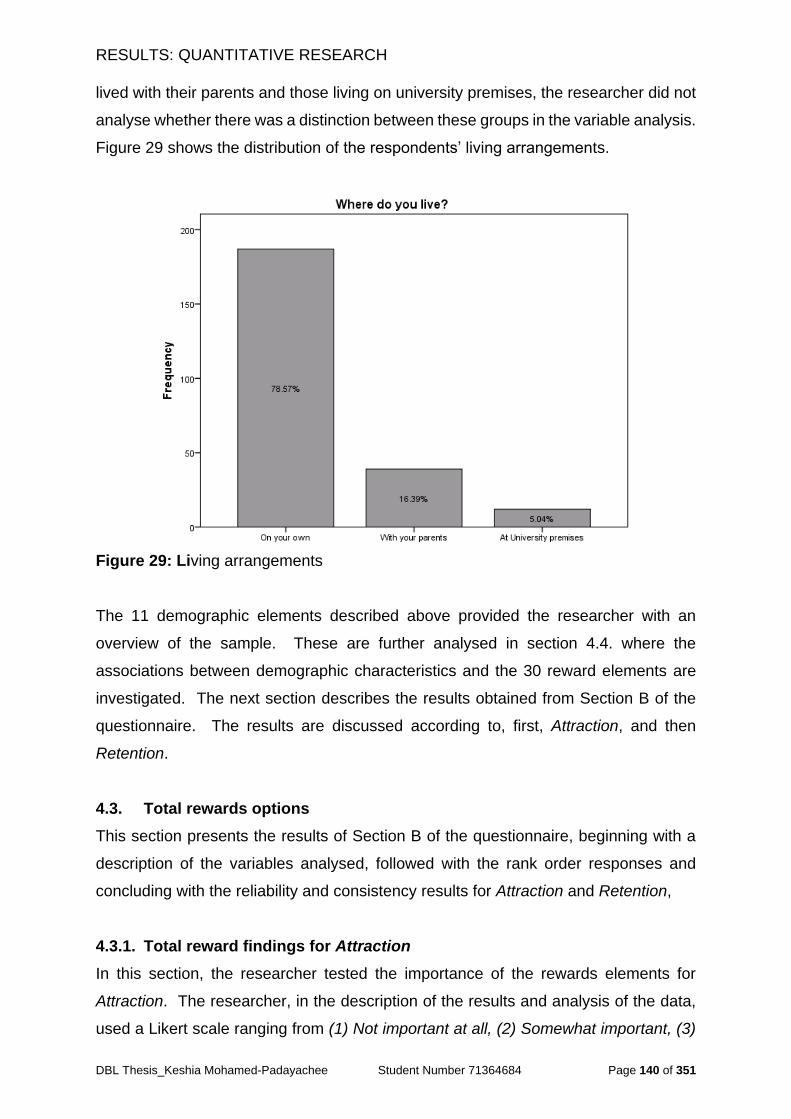
RESULTS: QUANTITATIVE RESEARCH
DBL Thesis_Keshia Mohamed-Padayachee Student Number 71364684 Page 140 of 351
lived with their parents and those living on university premises, the researcher did not
analyse whether there was a distinction between these groups in the variable analysis.
Figure 29 shows the distribution of the respondents’ living arrangements.
Figure 29: Living arrangements
The 11 demographic elements described above provided the researcher with an
overview of the sample. These are further analysed in section 4.4. where the
associations between demographic characteristics and the 30 reward elements are
investigated. The next section describes the results obtained from Section B of the
questionnaire. The results are discussed according to, first, Attraction, and then
Retention.
4.3. Total rewards options
This section presents the results of Section B of the questionnaire, beginning with a
description of the variables analysed, followed with the rank order responses and
concluding with the reliability and consistency results for Attraction and Retention,
4.3.1. Total reward findings for Attraction
In this section, the researcher tested the importance of the rewards elements for
Attraction. The researcher, in the description of the results and analysis of the data,
used a Likert scale ranging from (1) Not important at all, (2) Somewhat important, (3)
On university premises
RESULTS: QUANTITATIVE RESEARCH
DBL Thesis_Keshia Mohamed-Padayachee Student Number 71364684 Page 141 of 351
Neutral, (4) Important to (5) Very important. Referring to Table 14 in Chapter 3, the
research results of the frequency analysis for attraction are presented in Table 22, and
analysed from Tables 23 to 29.
The results from Table 23 to Table 29 are described according to three condensed
categories, namely:
1. Positive response, combining the responses Very important and Important;
2. Negative response, combining the responses Somewhat important and Not
important at all; and
3. Neutral response.
The terms used in the discussion of the results from Table 23 to Table 29 are:
Average — the sum of the values per group, divided by 3 (the three groups),
presented as a percentage; and
Trend — the overall pattern or tendency of responses across groups.
The question posed to respondents was: “Please indicate the extent to which you
agree or disagree with each of the following statements: When joining an organisation,
the following total rewards options are/will be important to me”
Respondents answered the questions on the defined Likert scale (Table 14, Chapter
3). The results from these responses are presented in Table 22 by total reward
element (in the left column), with corresponding year of birth across, and frequency of
response downwards and across by importance which ranged from (1) Not important
at all, (2) Somewhat important, (3) Neutral, (4) Important to (5) Very important. The
table only contains the valid percent. The highlighted numbers indicate the highest
percentages by group.
Considering the results in Table 22, the highest degree of similarity was found between
the groups, 1946 – 1964, 1965 – 1980 and 1981 – 2000, for Career/Growth
opportunities, Learning and development opportunities, Resources, Retirement fund,
Supportive management, and Salary/Pay. Figure 30 shows the top seven preferences
of the groups for Attraction based on the frequency analysis in Table 22.
RESULTS: QUANTITATIVE RESEARCH
DBL Thesis_Keshia Mohamed-Padayachee Student Number 71364684 Page 142 of 351
Considering the results in Table 22, the “1981 – 2000” group scored highest for
Career/Growth opportunities, learning and development opportunities, Retirement
fund, Medical aid, Salary/Pay.
Of the respondents born 1946–1964, the lowest-scored reward elements included
Smaller bonuses intermittently and Higher base salary with unlimited bonus potential.
For respondents born 1965–1980 and 1981‒2000, the lowest-scored reward elements
included Smaller bonuses intermittently and Lower base salary with unlimited bonus
potential.
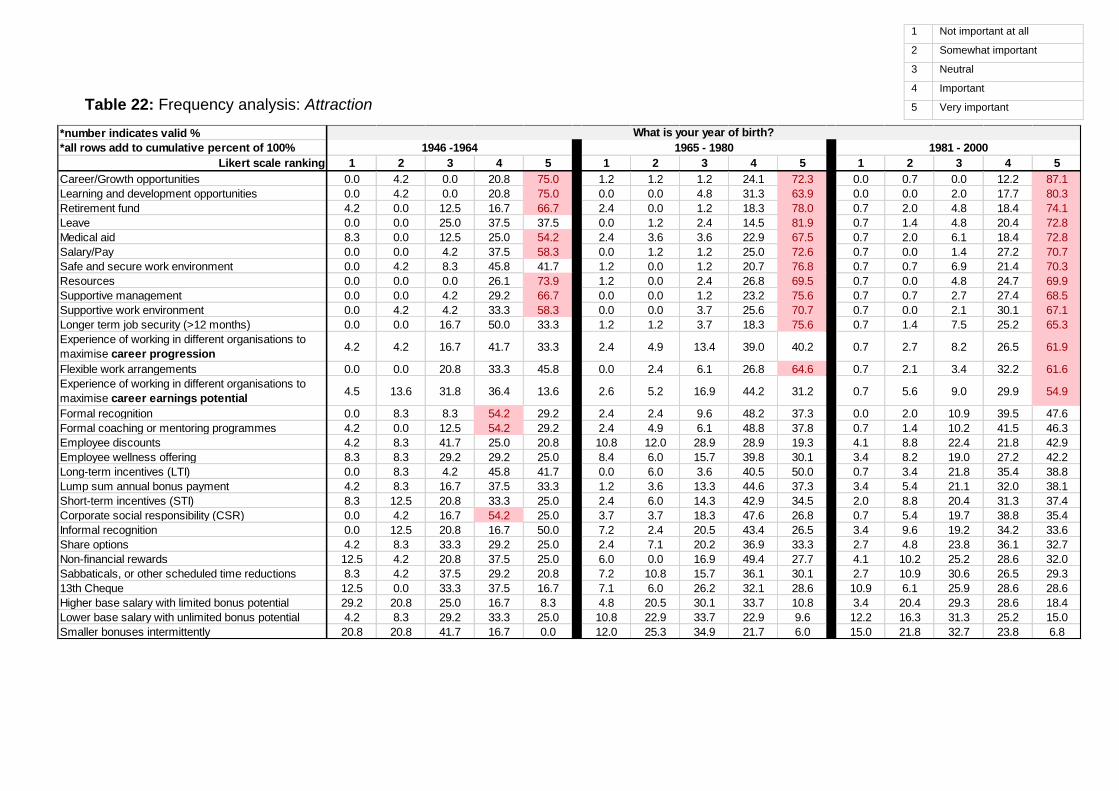
Table 22: Frequency analysis: Attraction
1 Not important at all
2 Somewhat important
3 Neutral
4 Important
5 Very important
*number indicates valid %
*all rows add to cumulative percent of 100%
Likert scale ranking 1 2 3 4 5 1 2 3 4 5 1 2 3 4 5
Career/Growth opportunities 0.0 4.2 0.0 20.8 75.0 1.2 1.2 1.2 24.1 72.3 0.0 0.7 0.0 12.2 87.1
Learning and development opportunities 0.0 4.2 0.0 20.8 75.0 0.0 0.0 4.8 31.3 63.9 0.0 0.0 2.0 17.7 80.3
Retirement fund 4.2 0.0 12.5 16.7 66.7 2.4 0.0 1.2 18.3 78.0 0.7 2.0 4.8 18.4 74.1
Leave 0.0 0.0 25.0 37.5 37.5 0.0 1.2 2.4 14.5 81.9 0.7 1.4 4.8 20.4 72.8
Medical aid 8.3 0.0 12.5 25.0 54.2 2.4 3.6 3.6 22.9 67.5 0.7 2.0 6.1 18.4 72.8
Salary/Pay 0.0 0.0 4.2 37.5 58.3 0.0 1.2 1.2 25.0 72.6 0.7 0.0 1.4 27.2 70.7
Safe and secure work environment 0.0 4.2 8.3 45.8 41.7 1.2 0.0 1.2 20.7 76.8 0.7 0.7 6.9 21.4 70.3
Resources 0.0 0.0 0.0 26.1 73.9 1.2 0.0 2.4 26.8 69.5 0.7 0.0 4.8 24.7 69.9
Supportive management 0.0 0.0 4.2 29.2 66.7 0.0 0.0 1.2 23.2 75.6 0.7 0.7 2.7 27.4 68.5
Supportive work environment 0.0 4.2 4.2 33.3 58.3 0.0 0.0 3.7 25.6 70.7 0.7 0.0 2.1 30.1 67.1
Longer term job security (>12 months) 0.0 0.0 16.7 50.0 33.3 1.2 1.2 3.7 18.3 75.6 0.7 1.4 7.5 25.2 65.3
Experience of working in different organisations to
maximise career progression4.2 4.2 16.7 41.7 33.3 2.4 4.9 13.4 39.0 40.2 0.7 2.7 8.2 26.5 61.9
Flexible work arrangements 0.0 0.0 20.8 33.3 45.8 0.0 2.4 6.1 26.8 64.6 0.7 2.1 3.4 32.2 61.6
Experience of working in different organisations to
maximise career earnings potential4.5 13.6 31.8 36.4 13.6 2.6 5.2 16.9 44.2 31.2 0.7 5.6 9.0 29.9 54.9
Formal recognition 0.0 8.3 8.3 54.2 29.2 2.4 2.4 9.6 48.2 37.3 0.0 2.0 10.9 39.5 47.6
Formal coaching or mentoring programmes 4.2 0.0 12.5 54.2 29.2 2.4 4.9 6.1 48.8 37.8 0.7 1.4 10.2 41.5 46.3
Employee discounts 4.2 8.3 41.7 25.0 20.8 10.8 12.0 28.9 28.9 19.3 4.1 8.8 22.4 21.8 42.9
Employee wellness offering 8.3 8.3 29.2 29.2 25.0 8.4 6.0 15.7 39.8 30.1 3.4 8.2 19.0 27.2 42.2
Long-term incentives (LTI) 0.0 8.3 4.2 45.8 41.7 0.0 6.0 3.6 40.5 50.0 0.7 3.4 21.8 35.4 38.8
Lump sum annual bonus payment 4.2 8.3 16.7 37.5 33.3 1.2 3.6 13.3 44.6 37.3 3.4 5.4 21.1 32.0 38.1
Short-term incentives (STI) 8.3 12.5 20.8 33.3 25.0 2.4 6.0 14.3 42.9 34.5 2.0 8.8 20.4 31.3 37.4
Corporate social responsibility (CSR) 0.0 4.2 16.7 54.2 25.0 3.7 3.7 18.3 47.6 26.8 0.7 5.4 19.7 38.8 35.4
Informal recognition 0.0 12.5 20.8 16.7 50.0 7.2 2.4 20.5 43.4 26.5 3.4 9.6 19.2 34.2 33.6
Share options 4.2 8.3 33.3 29.2 25.0 2.4 7.1 20.2 36.9 33.3 2.7 4.8 23.8 36.1 32.7
Non-financial rewards 12.5 4.2 20.8 37.5 25.0 6.0 0.0 16.9 49.4 27.7 4.1 10.2 25.2 28.6 32.0
Sabbaticals, or other scheduled time reductions 8.3 4.2 37.5 29.2 20.8 7.2 10.8 15.7 36.1 30.1 2.7 10.9 30.6 26.5 29.3
13th Cheque 12.5 0.0 33.3 37.5 16.7 7.1 6.0 26.2 32.1 28.6 10.9 6.1 25.9 28.6 28.6
Higher base salary with limited bonus potential 29.2 20.8 25.0 16.7 8.3 4.8 20.5 30.1 33.7 10.8 3.4 20.4 29.3 28.6 18.4
Lower base salary with unlimited bonus potential 4.2 8.3 29.2 33.3 25.0 10.8 22.9 33.7 22.9 9.6 12.2 16.3 31.3 25.2 15.0
Smaller bonuses intermittently 20.8 20.8 41.7 16.7 0.0 12.0 25.3 34.9 21.7 6.0 15.0 21.8 32.7 23.8 6.8
What is your year of birth?
1946 -1964 1965 - 1980 1981 - 2000
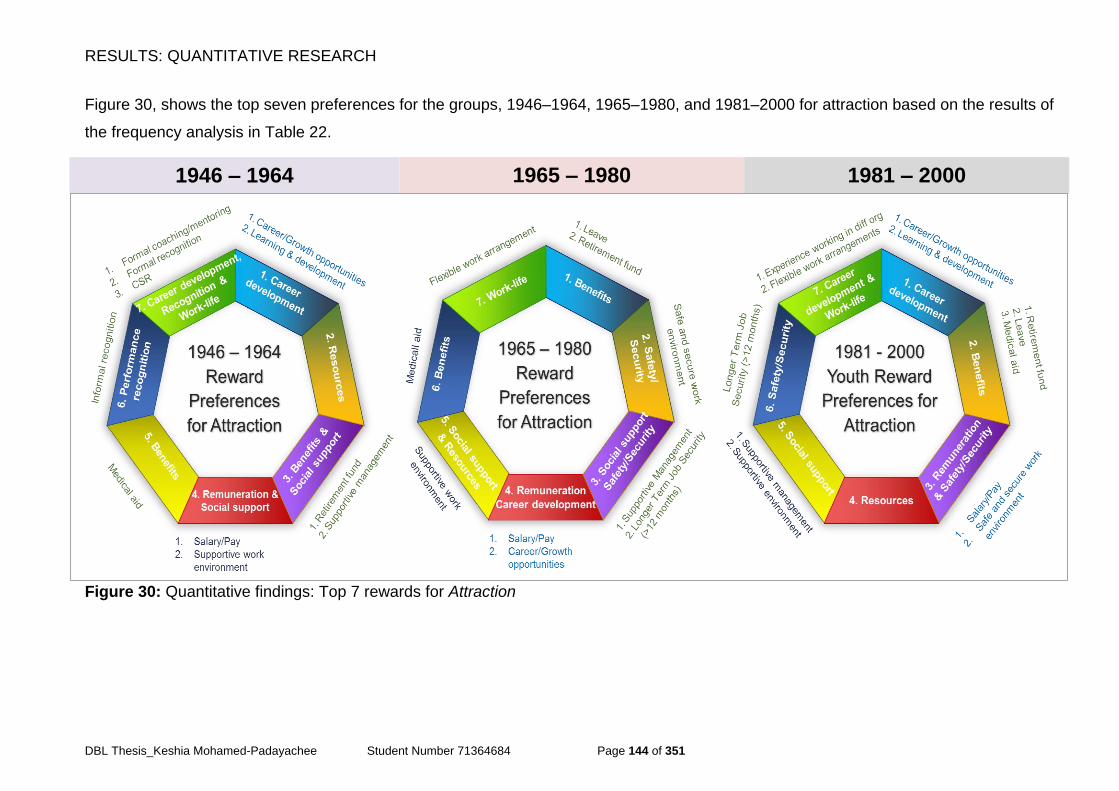
RESULTS: QUANTITATIVE RESEARCH
DBL Thesis_Keshia Mohamed-Padayachee Student Number 71364684 Page 144 of 351
Figure 30, shows the top seven preferences for the groups, 1946–1964, 1965–1980, and 1981‒2000 for attraction based on the results of
the frequency analysis in Table 22.
Figure 30: Quantitative findings: Top 7 rewards for Attraction
1981 – 2000 1965 – 1980 1946 – 1964
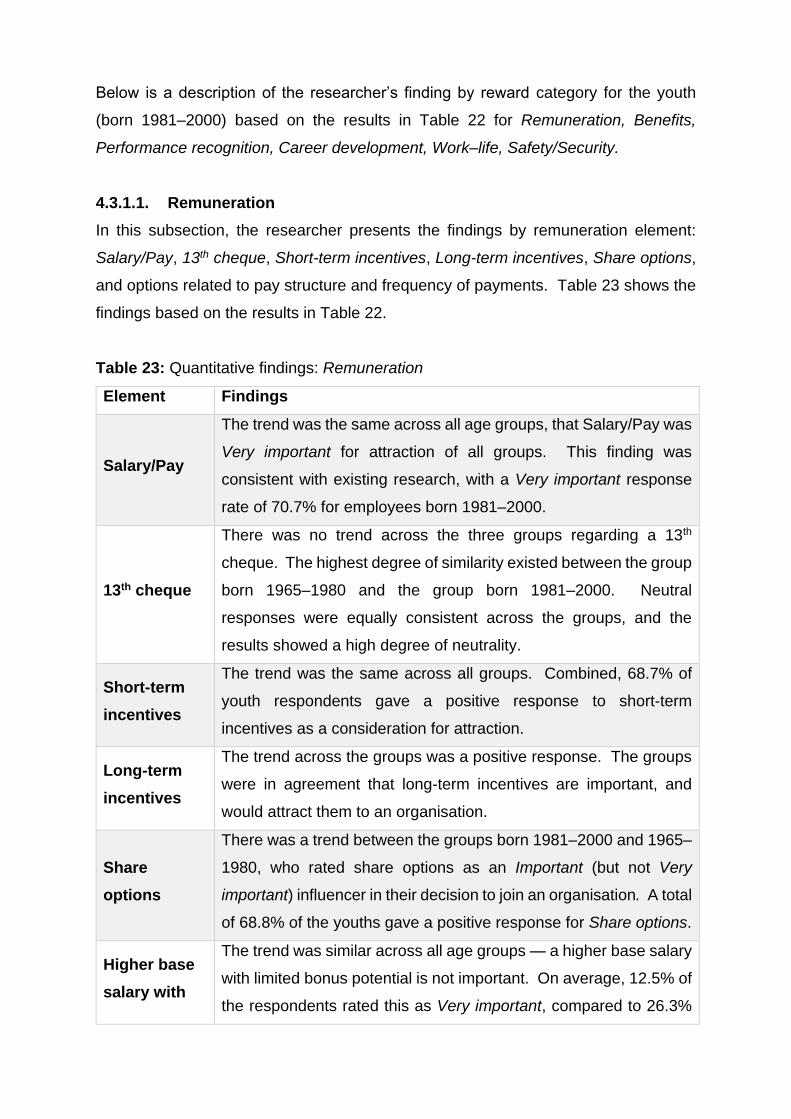
Below is a description of the researcher’s finding by reward category for the youth
(born 1981‒2000) based on the results in Table 22 for Remuneration, Benefits,
Performance recognition, Career development, Work‒life, Safety/Security.
4.3.1.1. Remuneration
In this subsection, the researcher presents the findings by remuneration element:
Salary/Pay, 13th cheque, Short-term incentives, Long-term incentives, Share options,
and options related to pay structure and frequency of payments. Table 23 shows the
findings based on the results in Table 22.
Table 23: Quantitative findings: Remuneration
Element Findings
Salary/Pay
The trend was the same across all age groups, that Salary/Pay was
Very important for attraction of all groups. This finding was
consistent with existing research, with a Very important response
rate of 70.7% for employees born 1981–2000.
13th cheque
There was no trend across the three groups regarding a 13th
cheque. The highest degree of similarity existed between the group
born 1965–1980 and the group born 1981–2000. Neutral
responses were equally consistent across the groups, and the
results showed a high degree of neutrality.
Short-term
incentives
The trend was the same across all groups. Combined, 68.7% of
youth respondents gave a positive response to short-term
incentives as a consideration for attraction.
Long-term
incentives
The trend across the groups was a positive response. The groups
were in agreement that long-term incentives are important, and
would attract them to an organisation.
Share
options
There was a trend between the groups born 1981–2000 and 1965–
1980, who rated share options as an Important (but not Very
important) influencer in their decision to join an organisation. A total
of 68.8% of the youths gave a positive response for Share options.
Higher base
salary with
The trend was similar across all age groups — a higher base salary
with limited bonus potential is not important. On average, 12.5% of
the respondents rated this as Very important, compared to 26.3%
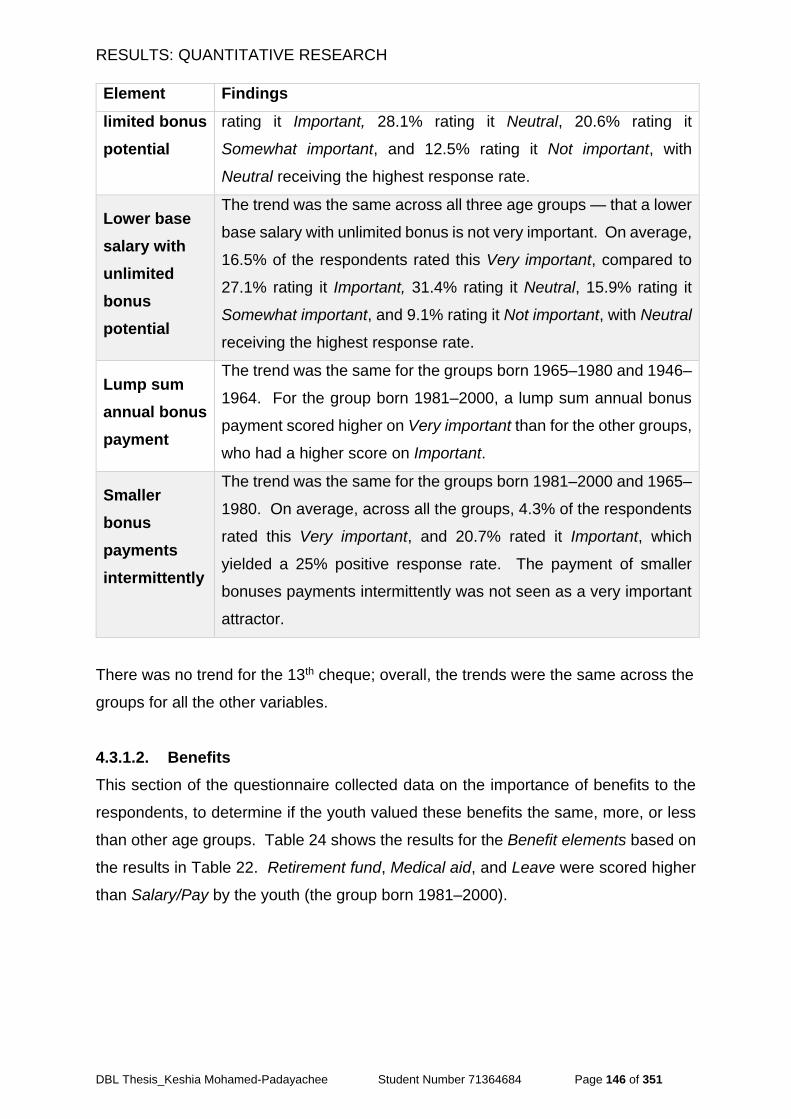
RESULTS: QUANTITATIVE RESEARCH
DBL Thesis_Keshia Mohamed-Padayachee Student Number 71364684 Page 146 of 351
Element Findings
limited bonus
potential
rating it Important, 28.1% rating it Neutral, 20.6% rating it
Somewhat important, and 12.5% rating it Not important, with
Neutral receiving the highest response rate.
Lower base
salary with
unlimited
bonus
potential
The trend was the same across all three age groups — that a lower
base salary with unlimited bonus is not very important. On average,
16.5% of the respondents rated this Very important, compared to
27.1% rating it Important, 31.4% rating it Neutral, 15.9% rating it
Somewhat important, and 9.1% rating it Not important, with Neutral
receiving the highest response rate.
Lump sum
annual bonus
payment
The trend was the same for the groups born 1965–1980 and 1946‒
1964. For the group born 1981–2000, a lump sum annual bonus
payment scored higher on Very important than for the other groups,
who had a higher score on Important.
Smaller
bonus
payments
intermittently
The trend was the same for the groups born 1981–2000 and 1965‒
1980. On average, across all the groups, 4.3% of the respondents
rated this Very important, and 20.7% rated it Important, which
yielded a 25% positive response rate. The payment of smaller
bonuses payments intermittently was not seen as a very important
attractor.
There was no trend for the 13th cheque; overall, the trends were the same across the
groups for all the other variables.
4.3.1.2. Benefits
This section of the questionnaire collected data on the importance of benefits to the
respondents, to determine if the youth valued these benefits the same, more, or less
than other age groups. Table 24 shows the results for the Benefit elements based on
the results in Table 22. Retirement fund, Medical aid, and Leave were scored higher
than Salary/Pay by the youth (the group born 1981–2000).
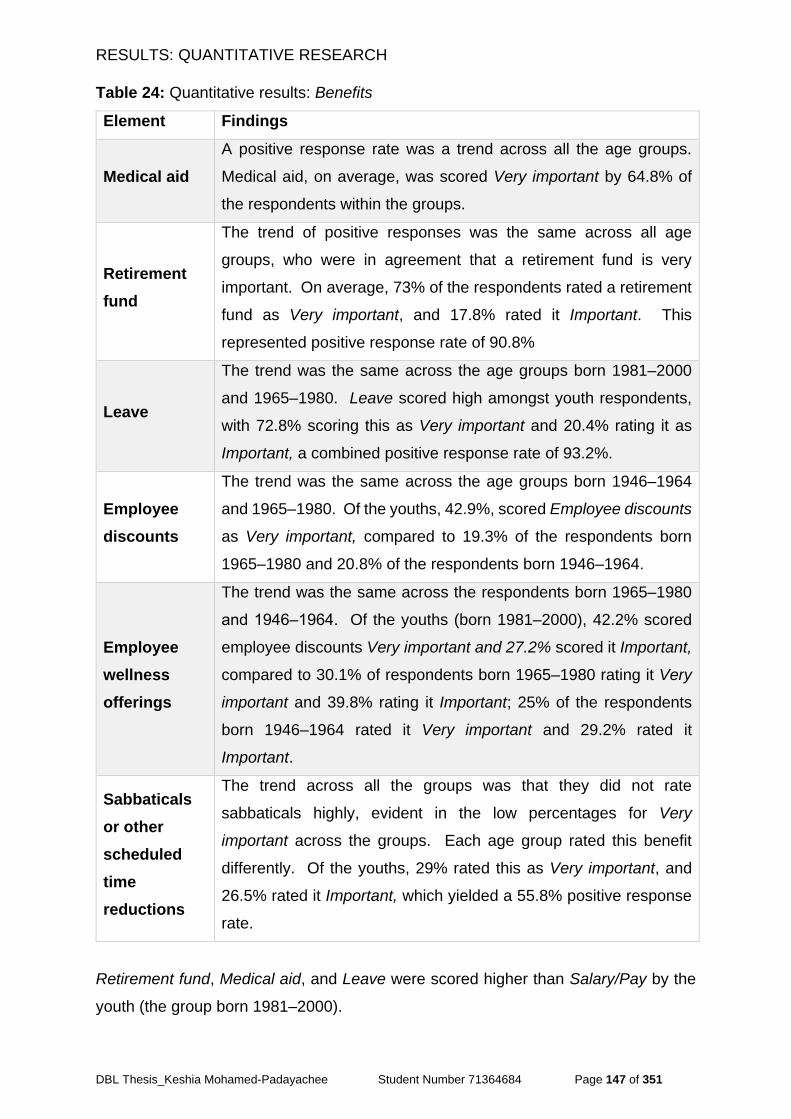
RESULTS: QUANTITATIVE RESEARCH
DBL Thesis_Keshia Mohamed-Padayachee Student Number 71364684 Page 147 of 351
Table 24: Quantitative results: Benefits
Element Findings
Medical aid
A positive response rate was a trend across all the age groups.
Medical aid, on average, was scored Very important by 64.8% of
the respondents within the groups.
Retirement
fund
The trend of positive responses was the same across all age
groups, who were in agreement that a retirement fund is very
important. On average, 73% of the respondents rated a retirement
fund as Very important, and 17.8% rated it Important. This
represented positive response rate of 90.8%
Leave
The trend was the same across the age groups born 1981–2000
and 1965–1980. Leave scored high amongst youth respondents,
with 72.8% scoring this as Very important and 20.4% rating it as
Important, a combined positive response rate of 93.2%.
Employee
discounts
The trend was the same across the age groups born 1946–1964
and 1965–1980. Of the youths, 42.9%, scored Employee discounts
as Very important, compared to 19.3% of the respondents born
1965–1980 and 20.8% of the respondents born 1946–1964.
Employee
wellness
offerings
The trend was the same across the respondents born 1965–1980
and 1946‒1964. Of the youths (born 1981‒2000), 42.2% scored
employee discounts Very important and 27.2% scored it Important,
compared to 30.1% of respondents born 1965–1980 rating it Very
important and 39.8% rating it Important; 25% of the respondents
born 1946–1964 rated it Very important and 29.2% rated it
Important.
Sabbaticals
or other
scheduled
time
reductions
The trend across all the groups was that they did not rate
sabbaticals highly, evident in the low percentages for Very
important across the groups. Each age group rated this benefit
differently. Of the youths, 29% rated this as Very important, and
26.5% rated it Important, which yielded a 55.8% positive response
rate.
Retirement fund, Medical aid, and Leave were scored higher than Salary/Pay by the
youth (the group born 1981–2000).
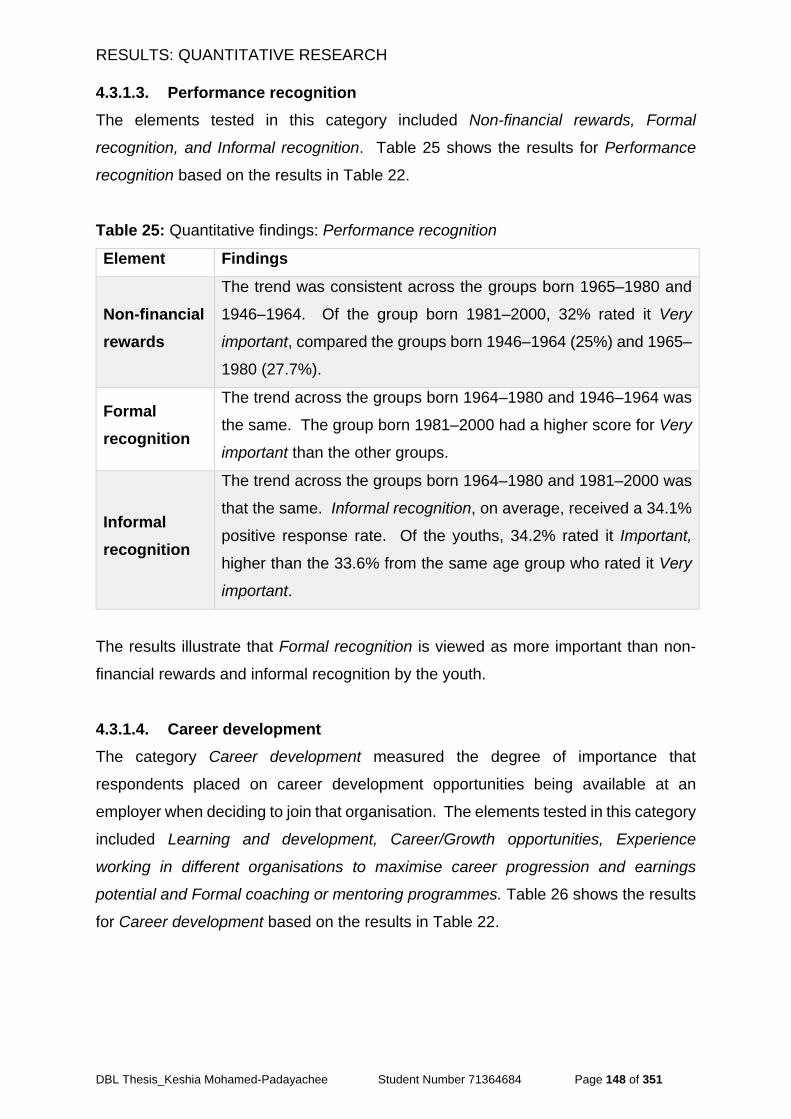
RESULTS: QUANTITATIVE RESEARCH
DBL Thesis_Keshia Mohamed-Padayachee Student Number 71364684 Page 148 of 351
4.3.1.3. Performance recognition
The elements tested in this category included Non-financial rewards, Formal
recognition, and Informal recognition. Table 25 shows the results for Performance
recognition based on the results in Table 22.
Table 25: Quantitative findings: Performance recognition
Element Findings
Non-financial
rewards
The trend was consistent across the groups born 1965–1980 and
1946–1964. Of the group born 1981–2000, 32% rated it Very
important, compared the groups born 1946–1964 (25%) and 1965–
1980 (27.7%).
Formal
recognition
The trend across the groups born 1964–1980 and 1946–1964 was
the same. The group born 1981‒2000 had a higher score for Very
important than the other groups.
Informal
recognition
The trend across the groups born 1964–1980 and 1981–2000 was
that the same. Informal recognition, on average, received a 34.1%
positive response rate. Of the youths, 34.2% rated it Important,
higher than the 33.6% from the same age group who rated it Very
important.
The results illustrate that Formal recognition is viewed as more important than non-
financial rewards and informal recognition by the youth.
4.3.1.4. Career development
The category Career development measured the degree of importance that
respondents placed on career development opportunities being available at an
employer when deciding to join that organisation. The elements tested in this category
included Learning and development, Career/Growth opportunities, Experience
working in different organisations to maximise career progression and earnings
potential and Formal coaching or mentoring programmes. Table 26 shows the results
for Career development based on the results in Table 22.
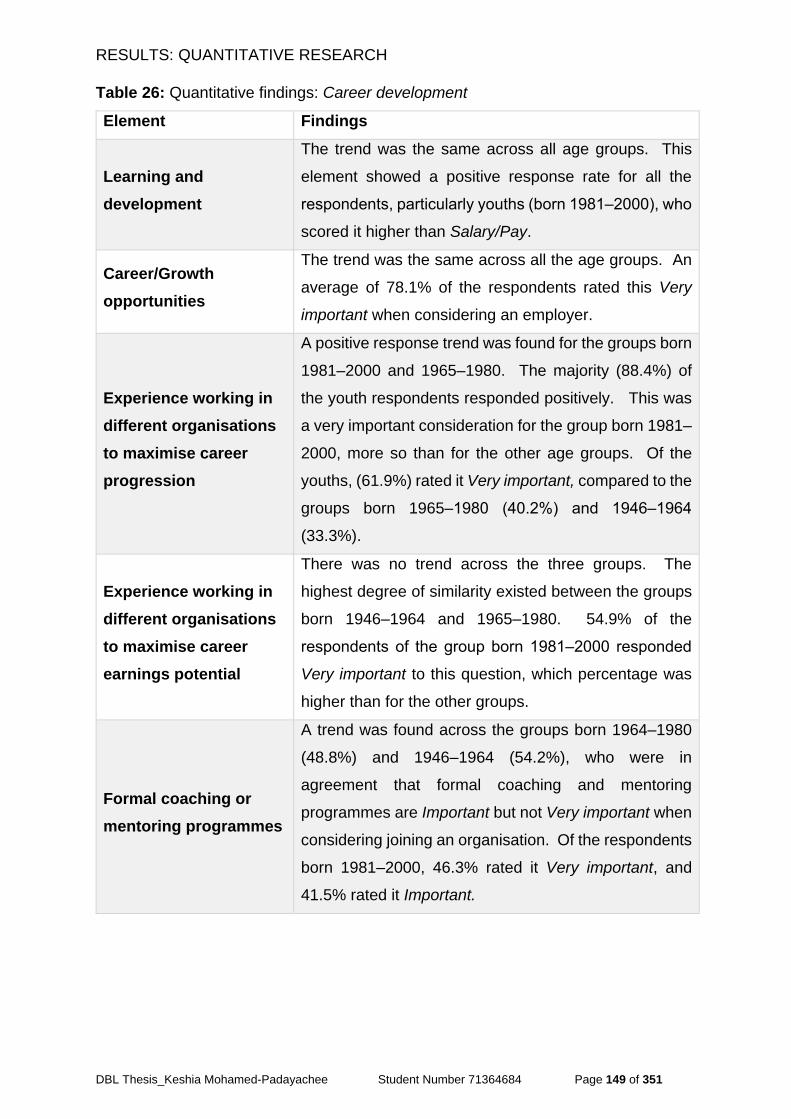
RESULTS: QUANTITATIVE RESEARCH
DBL Thesis_Keshia Mohamed-Padayachee Student Number 71364684 Page 149 of 351
Table 26: Quantitative findings: Career development
Element Findings
Learning and
development
The trend was the same across all age groups. This
element showed a positive response rate for all the
respondents, particularly youths (born 1981‒2000), who
scored it higher than Salary/Pay.
Career/Growth
opportunities
The trend was the same across all the age groups. An
average of 78.1% of the respondents rated this Very
important when considering an employer.
Experience working in
different organisations
to maximise career
progression
A positive response trend was found for the groups born
1981–2000 and 1965–1980. The majority (88.4%) of
the youth respondents responded positively. This was
a very important consideration for the group born 1981–
2000, more so than for the other age groups. Of the
youths, (61.9%) rated it Very important, compared to the
groups born 1965–1980 (40.2%) and 1946‒1964
(33.3%).
Experience working in
different organisations
to maximise career
earnings potential
There was no trend across the three groups. The
highest degree of similarity existed between the groups
born 1946–1964 and 1965–1980. 54.9% of the
respondents of the group born 1981‒2000 responded
Very important to this question, which percentage was
higher than for the other groups.
Formal coaching or
mentoring programmes
A trend was found across the groups born 1964–1980
(48.8%) and 1946–1964 (54.2%), who were in
agreement that formal coaching and mentoring
programmes are Important but not Very important when
considering joining an organisation. Of the respondents
born 1981–2000, 46.3% rated it Very important, and
41.5% rated it Important.
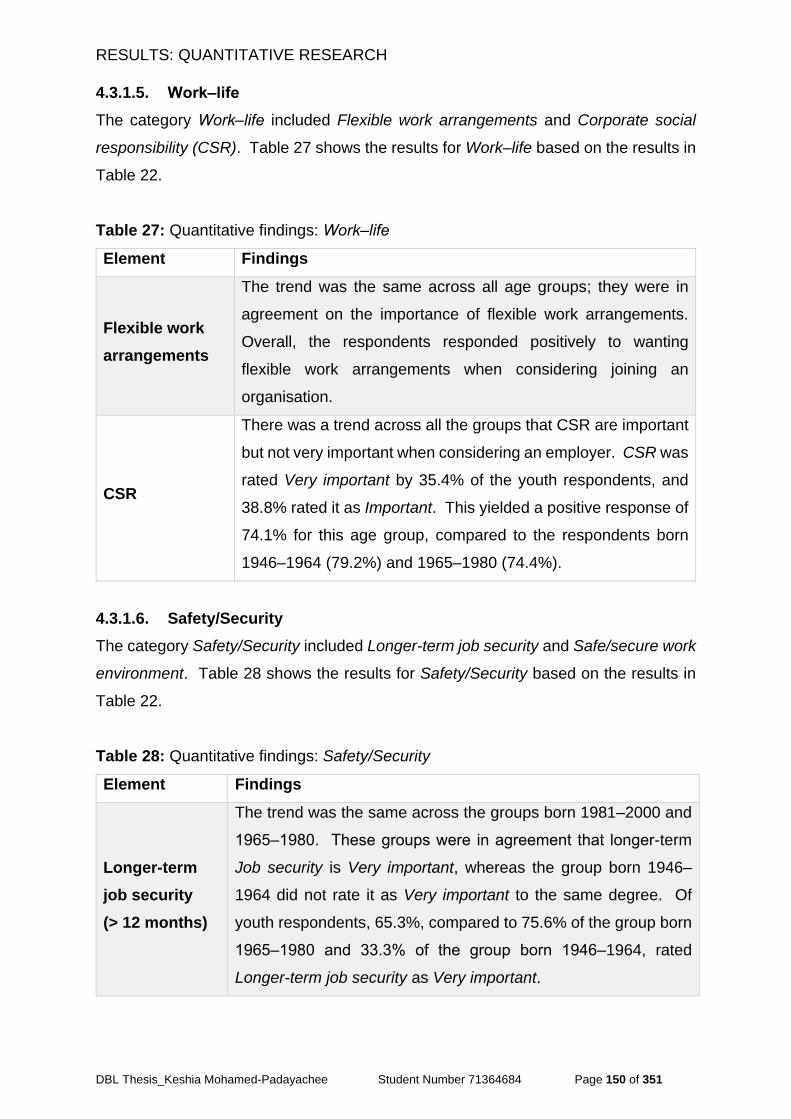
RESULTS: QUANTITATIVE RESEARCH
DBL Thesis_Keshia Mohamed-Padayachee Student Number 71364684 Page 150 of 351
4.3.1.5. Work‒life
The category Work‒life included Flexible work arrangements and Corporate social
responsibility (CSR). Table 27 shows the results for Work‒life based on the results in
Table 22.
Table 27: Quantitative findings: Work‒life
Element Findings
Flexible work
arrangements
The trend was the same across all age groups; they were in
agreement on the importance of flexible work arrangements.
Overall, the respondents responded positively to wanting
flexible work arrangements when considering joining an
organisation.
CSR
There was a trend across all the groups that CSR are important
but not very important when considering an employer. CSR was
rated Very important by 35.4% of the youth respondents, and
38.8% rated it as Important. This yielded a positive response of
74.1% for this age group, compared to the respondents born
1946‒1964 (79.2%) and 1965‒1980 (74.4%).
4.3.1.6. Safety/Security
The category Safety/Security included Longer-term job security and Safe/secure work
environment. Table 28 shows the results for Safety/Security based on the results in
Table 22.
Table 28: Quantitative findings: Safety/Security
Element Findings
Longer-term
job security
(> 12 months)
The trend was the same across the groups born 1981–2000 and
1965‒1980. These groups were in agreement that longer-term
Job security is Very important, whereas the group born 1946–
1964 did not rate it as Very important to the same degree. Of
youth respondents, 65.3%, compared to 75.6% of the group born
1965‒1980 and 33.3% of the group born 1946–1964, rated
Longer-term job security as Very important.
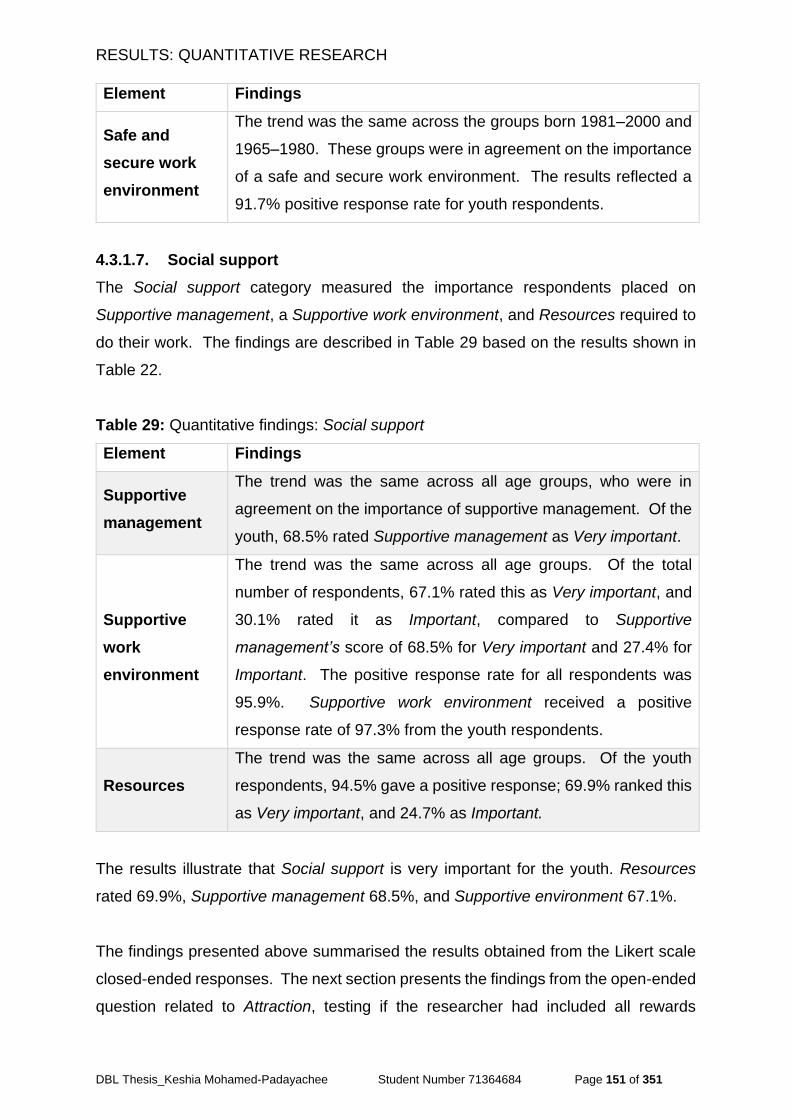
RESULTS: QUANTITATIVE RESEARCH
DBL Thesis_Keshia Mohamed-Padayachee Student Number 71364684 Page 151 of 351
Element Findings
Safe and
secure work
environment
The trend was the same across the groups born 1981–2000 and
1965–1980. These groups were in agreement on the importance
of a safe and secure work environment. The results reflected a
91.7% positive response rate for youth respondents.
4.3.1.7. Social support
The Social support category measured the importance respondents placed on
Supportive management, a Supportive work environment, and Resources required to
do their work. The findings are described in Table 29 based on the results shown in
Table 22.
Table 29: Quantitative findings: Social support
Element Findings
Supportive
management
The trend was the same across all age groups, who were in
agreement on the importance of supportive management. Of the
youth, 68.5% rated Supportive management as Very important.
Supportive
work
environment
The trend was the same across all age groups. Of the total
number of respondents, 67.1% rated this as Very important, and
30.1% rated it as Important, compared to Supportive
management’s score of 68.5% for Very important and 27.4% for
Important. The positive response rate for all respondents was
95.9%. Supportive work environment received a positive
response rate of 97.3% from the youth respondents.
Resources
The trend was the same across all age groups. Of the youth
respondents, 94.5% gave a positive response; 69.9% ranked this
as Very important, and 24.7% as Important.
The results illustrate that Social support is very important for the youth. Resources
rated 69.9%, Supportive management 68.5%, and Supportive environment 67.1%.
The findings presented above summarised the results obtained from the Likert scale
closed-ended responses. The next section presents the findings from the open-ended
question related to Attraction, testing if the researcher had included all rewards
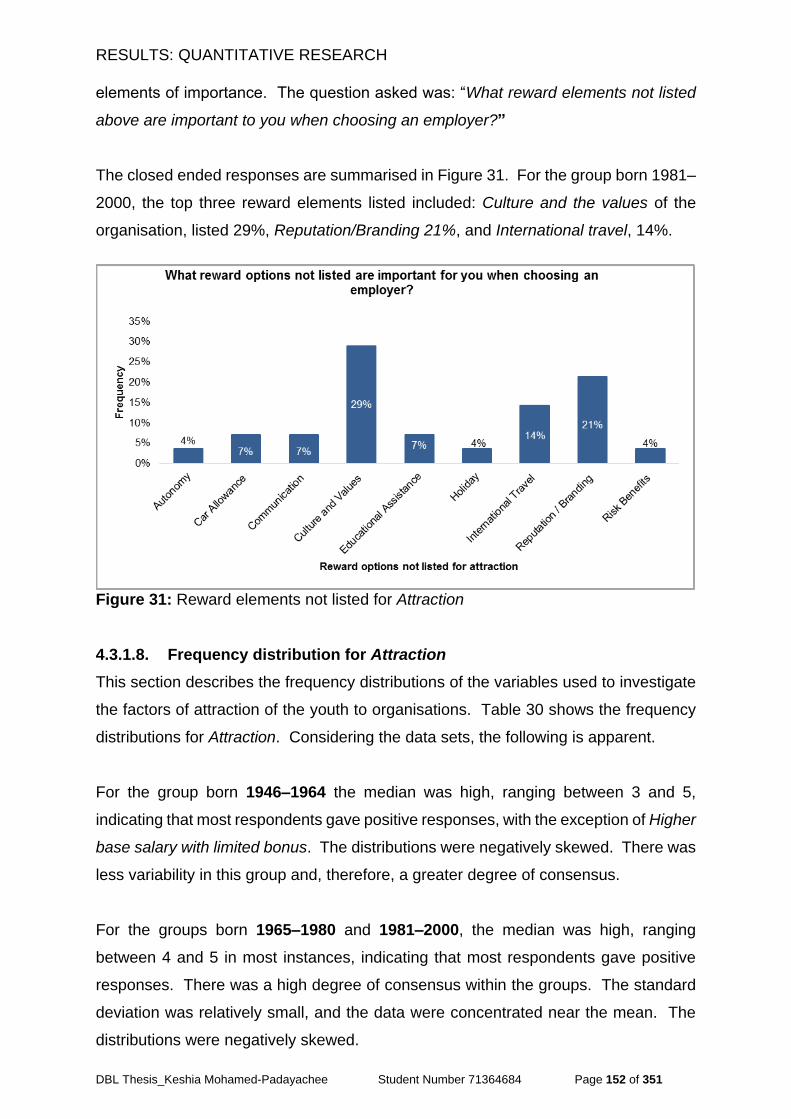
RESULTS: QUANTITATIVE RESEARCH
DBL Thesis_Keshia Mohamed-Padayachee Student Number 71364684 Page 152 of 351
elements of importance. The question asked was: “What reward elements not listed
above are important to you when choosing an employer?”
The closed ended responses are summarised in Figure 31. For the group born 1981–
2000, the top three reward elements listed included: Culture and the values of the
organisation, listed 29%, Reputation/Branding 21%, and International travel, 14%.
Figure 31: Reward elements not listed for Attraction
4.3.1.8. Frequency distribution for Attraction
This section describes the frequency distributions of the variables used to investigate
the factors of attraction of the youth to organisations. Table 30 shows the frequency
distributions for Attraction. Considering the data sets, the following is apparent.
For the group born 1946–1964 the median was high, ranging between 3 and 5,
indicating that most respondents gave positive responses, with the exception of Higher
base salary with limited bonus. The distributions were negatively skewed. There was
less variability in this group and, therefore, a greater degree of consensus.
For the groups born 1965–1980 and 1981–2000, the median was high, ranging
between 4 and 5 in most instances, indicating that most respondents gave positive
responses. There was a high degree of consensus within the groups. The standard
deviation was relatively small, and the data were concentrated near the mean. The
distributions were negatively skewed.
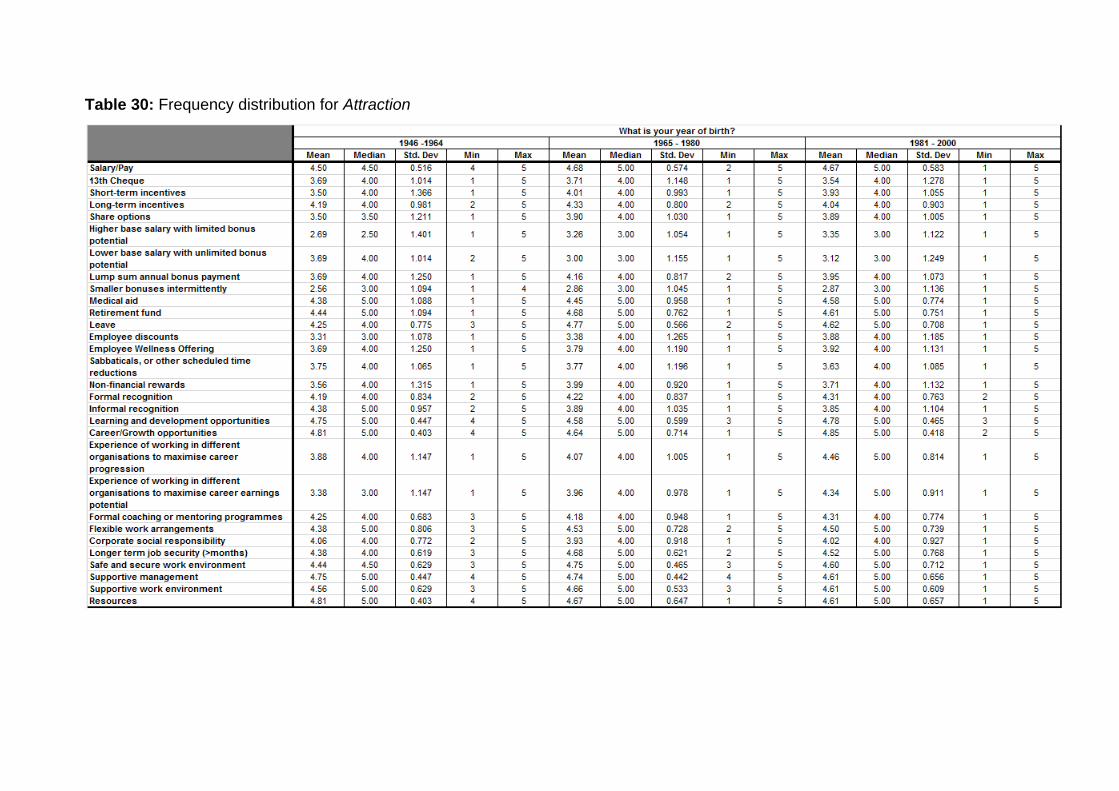
Table 30: Frequency distribution for Attraction
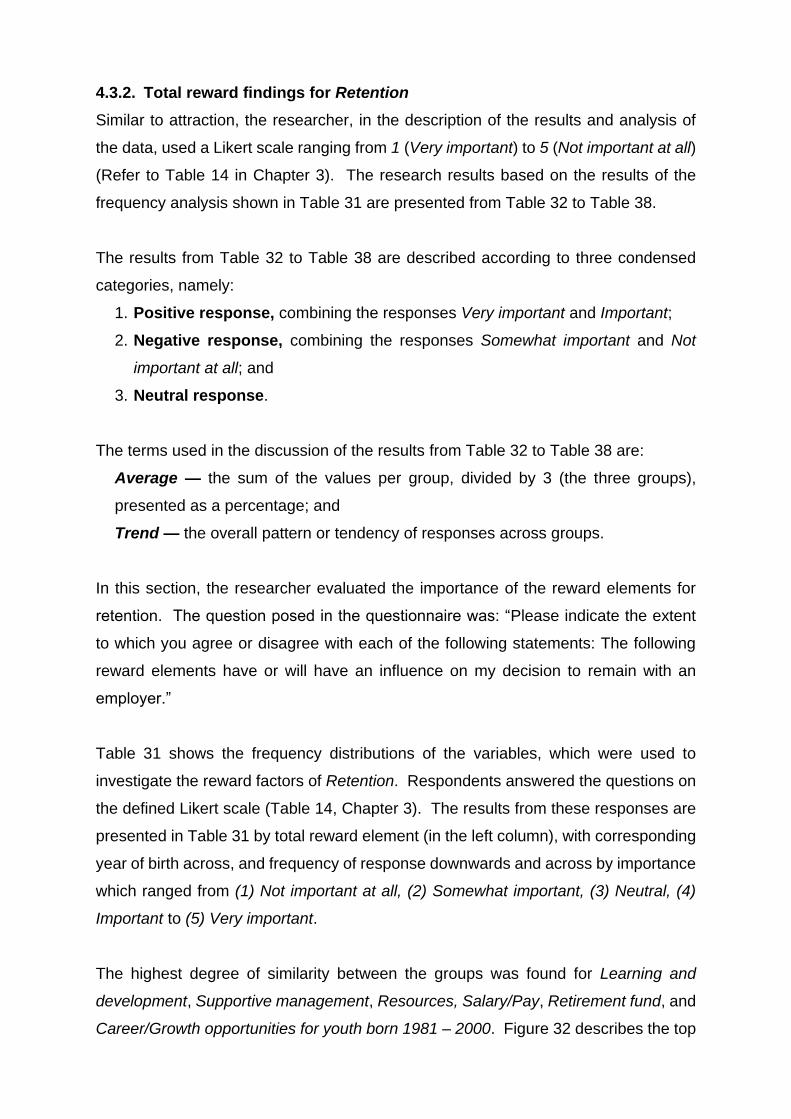
4.3.2. Total reward findings for Retention
Similar to attraction, the researcher, in the description of the results and analysis of
the data, used a Likert scale ranging from 1 (Very important) to 5 (Not important at all)
(Refer to Table 14 in Chapter 3). The research results based on the results of the
frequency analysis shown in Table 31 are presented from Table 32 to Table 38.
The results from Table 32 to Table 38 are described according to three condensed
categories, namely:
1. Positive response, combining the responses Very important and Important;
2. Negative response, combining the responses Somewhat important and Not
important at all; and
3. Neutral response.
The terms used in the discussion of the results from Table 32 to Table 38 are:
Average — the sum of the values per group, divided by 3 (the three groups),
presented as a percentage; and
Trend — the overall pattern or tendency of responses across groups.
In this section, the researcher evaluated the importance of the reward elements for
retention. The question posed in the questionnaire was: “Please indicate the extent
to which you agree or disagree with each of the following statements: The following
reward elements have or will have an influence on my decision to remain with an
employer.”
Table 31 shows the frequency distributions of the variables, which were used to
investigate the reward factors of Retention. Respondents answered the questions on
the defined Likert scale (Table 14, Chapter 3). The results from these responses are
presented in Table 31 by total reward element (in the left column), with corresponding
year of birth across, and frequency of response downwards and across by importance
which ranged from (1) Not important at all, (2) Somewhat important, (3) Neutral, (4)
Important to (5) Very important.
The highest degree of similarity between the groups was found for Learning and
development, Supportive management, Resources, Salary/Pay, Retirement fund, and
Career/Growth opportunities for youth born 1981 – 2000. Figure 32 describes the top
RESULTS: QUANTITATIVE RESEARCH
DBL Thesis_Keshia Mohamed-Padayachee Student Number 71364684 Page 155 of 351
seven preferences of the groups for Retention based on the results of the frequency
analysis in Table 31.
The lowest-scored reward elements were the same as for attraction. They were:
Smaller bonuses intermittently and Higher lower base pay with unlimited bonus
potential for the groups.
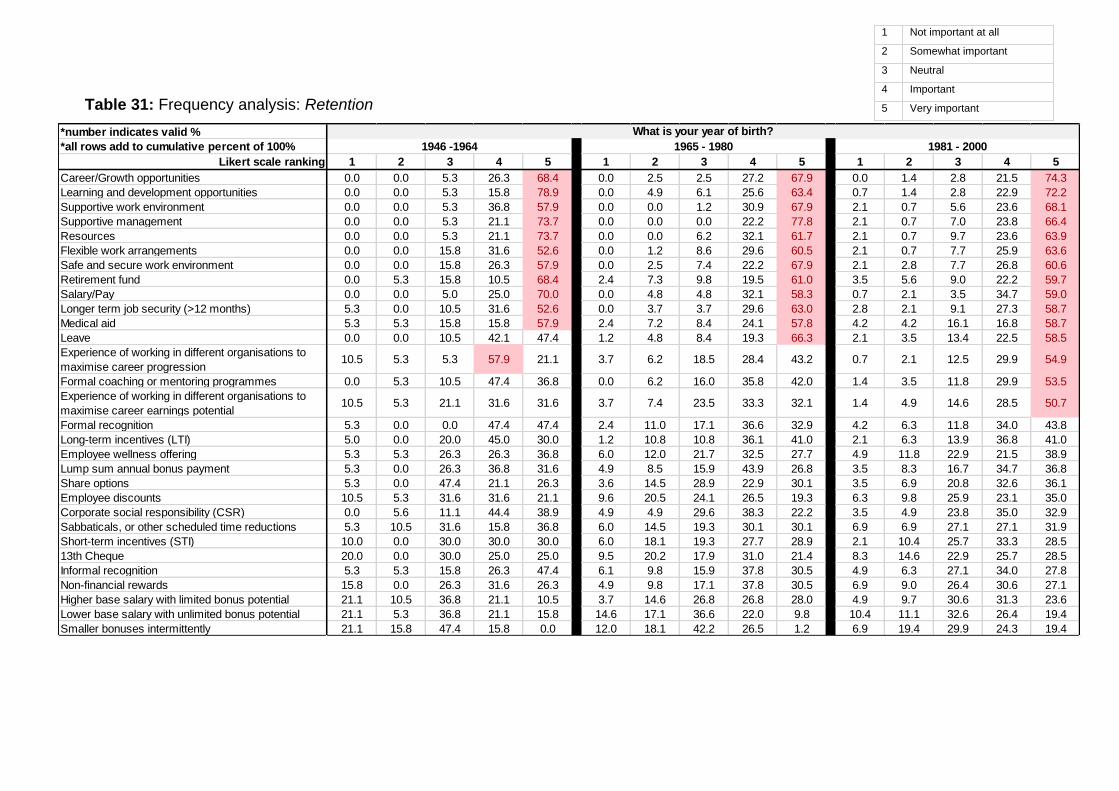
Table 31: Frequency analysis: Retention
1 Not important at all
2 Somewhat important
3 Neutral
4 Important
5 Very important
*number indicates valid %
*all rows add to cumulative percent of 100%
Likert scale ranking 1 2 3 4 5 1 2 3 4 5 1 2 3 4 5
Career/Growth opportunities 0.0 0.0 5.3 26.3 68.4 0.0 2.5 2.5 27.2 67.9 0.0 1.4 2.8 21.5 74.3
Learning and development opportunities 0.0 0.0 5.3 15.8 78.9 0.0 4.9 6.1 25.6 63.4 0.7 1.4 2.8 22.9 72.2
Supportive work environment 0.0 0.0 5.3 36.8 57.9 0.0 0.0 1.2 30.9 67.9 2.1 0.7 5.6 23.6 68.1
Supportive management 0.0 0.0 5.3 21.1 73.7 0.0 0.0 0.0 22.2 77.8 2.1 0.7 7.0 23.8 66.4
Resources 0.0 0.0 5.3 21.1 73.7 0.0 0.0 6.2 32.1 61.7 2.1 0.7 9.7 23.6 63.9
Flexible work arrangements 0.0 0.0 15.8 31.6 52.6 0.0 1.2 8.6 29.6 60.5 2.1 0.7 7.7 25.9 63.6
Safe and secure work environment 0.0 0.0 15.8 26.3 57.9 0.0 2.5 7.4 22.2 67.9 2.1 2.8 7.7 26.8 60.6
Retirement fund 0.0 5.3 15.8 10.5 68.4 2.4 7.3 9.8 19.5 61.0 3.5 5.6 9.0 22.2 59.7
Salary/Pay 0.0 0.0 5.0 25.0 70.0 0.0 4.8 4.8 32.1 58.3 0.7 2.1 3.5 34.7 59.0
Longer term job security (>12 months) 5.3 0.0 10.5 31.6 52.6 0.0 3.7 3.7 29.6 63.0 2.8 2.1 9.1 27.3 58.7
Medical aid 5.3 5.3 15.8 15.8 57.9 2.4 7.2 8.4 24.1 57.8 4.2 4.2 16.1 16.8 58.7
Leave 0.0 0.0 10.5 42.1 47.4 1.2 4.8 8.4 19.3 66.3 2.1 3.5 13.4 22.5 58.5
Experience of working in different organisations to
maximise career progression10.5 5.3 5.3 57.9 21.1 3.7 6.2 18.5 28.4 43.2 0.7 2.1 12.5 29.9 54.9
Formal coaching or mentoring programmes 0.0 5.3 10.5 47.4 36.8 0.0 6.2 16.0 35.8 42.0 1.4 3.5 11.8 29.9 53.5
Experience of working in different organisations to
maximise career earnings potential10.5 5.3 21.1 31.6 31.6 3.7 7.4 23.5 33.3 32.1 1.4 4.9 14.6 28.5 50.7
Formal recognition 5.3 0.0 0.0 47.4 47.4 2.4 11.0 17.1 36.6 32.9 4.2 6.3 11.8 34.0 43.8
Long-term incentives (LTI) 5.0 0.0 20.0 45.0 30.0 1.2 10.8 10.8 36.1 41.0 2.1 6.3 13.9 36.8 41.0
Employee wellness offering 5.3 5.3 26.3 26.3 36.8 6.0 12.0 21.7 32.5 27.7 4.9 11.8 22.9 21.5 38.9
Lump sum annual bonus payment 5.3 0.0 26.3 36.8 31.6 4.9 8.5 15.9 43.9 26.8 3.5 8.3 16.7 34.7 36.8
Share options 5.3 0.0 47.4 21.1 26.3 3.6 14.5 28.9 22.9 30.1 3.5 6.9 20.8 32.6 36.1
Employee discounts 10.5 5.3 31.6 31.6 21.1 9.6 20.5 24.1 26.5 19.3 6.3 9.8 25.9 23.1 35.0
Corporate social responsibility (CSR) 0.0 5.6 11.1 44.4 38.9 4.9 4.9 29.6 38.3 22.2 3.5 4.9 23.8 35.0 32.9
Sabbaticals, or other scheduled time reductions 5.3 10.5 31.6 15.8 36.8 6.0 14.5 19.3 30.1 30.1 6.9 6.9 27.1 27.1 31.9
Short-term incentives (STI) 10.0 0.0 30.0 30.0 30.0 6.0 18.1 19.3 27.7 28.9 2.1 10.4 25.7 33.3 28.5
13th Cheque 20.0 0.0 30.0 25.0 25.0 9.5 20.2 17.9 31.0 21.4 8.3 14.6 22.9 25.7 28.5
Informal recognition 5.3 5.3 15.8 26.3 47.4 6.1 9.8 15.9 37.8 30.5 4.9 6.3 27.1 34.0 27.8
Non-financial rewards 15.8 0.0 26.3 31.6 26.3 4.9 9.8 17.1 37.8 30.5 6.9 9.0 26.4 30.6 27.1
Higher base salary with limited bonus potential 21.1 10.5 36.8 21.1 10.5 3.7 14.6 26.8 26.8 28.0 4.9 9.7 30.6 31.3 23.6
Lower base salary with unlimited bonus potential 21.1 5.3 36.8 21.1 15.8 14.6 17.1 36.6 22.0 9.8 10.4 11.1 32.6 26.4 19.4
Smaller bonuses intermittently 21.1 15.8 47.4 15.8 0.0 12.0 18.1 42.2 26.5 1.2 6.9 19.4 29.9 24.3 19.4
What is your year of birth?
1946 -1964 1965 - 1980 1981 - 2000
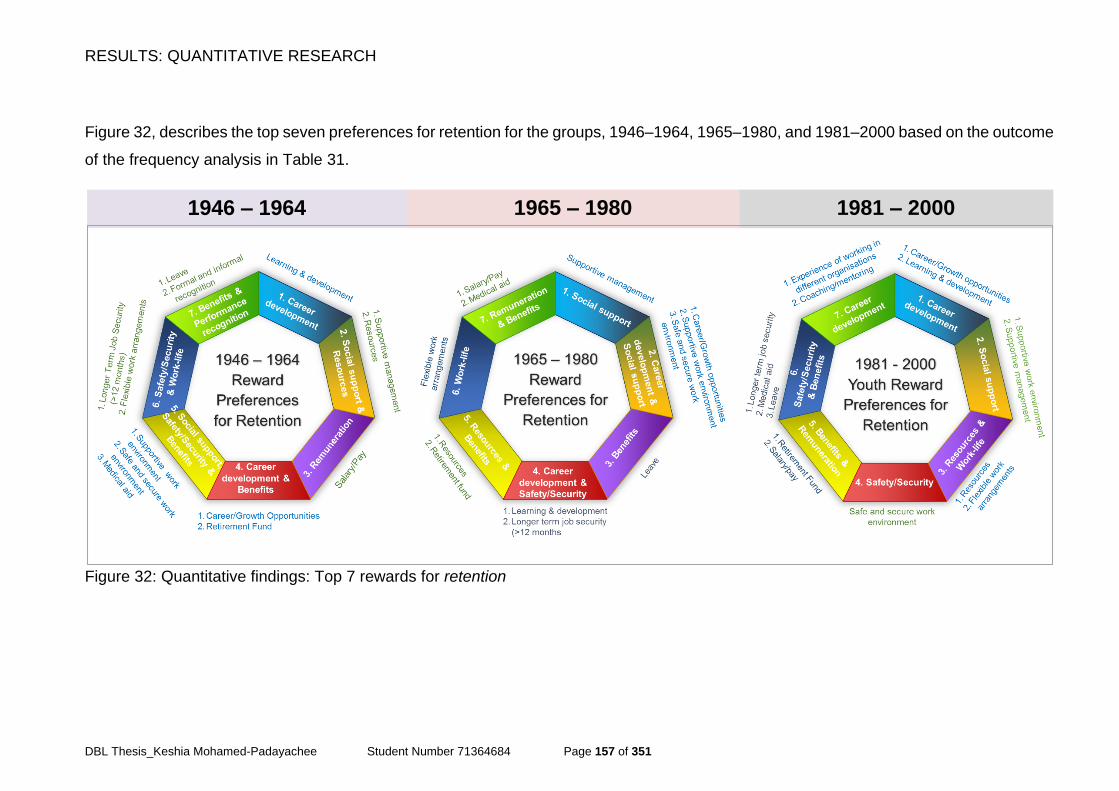
RESULTS: QUANTITATIVE RESEARCH
DBL Thesis_Keshia Mohamed-Padayachee Student Number 71364684 Page 157 of 351
Figure 32, describes the top seven preferences for retention for the groups, 1946–1964, 1965–1980, and 1981‒2000 based on the outcome
of the frequency analysis in Table 31.
Figure 32: Quantitative findings: Top 7 rewards for retention
1981 – 2000 1965 – 1980 1946 – 1964
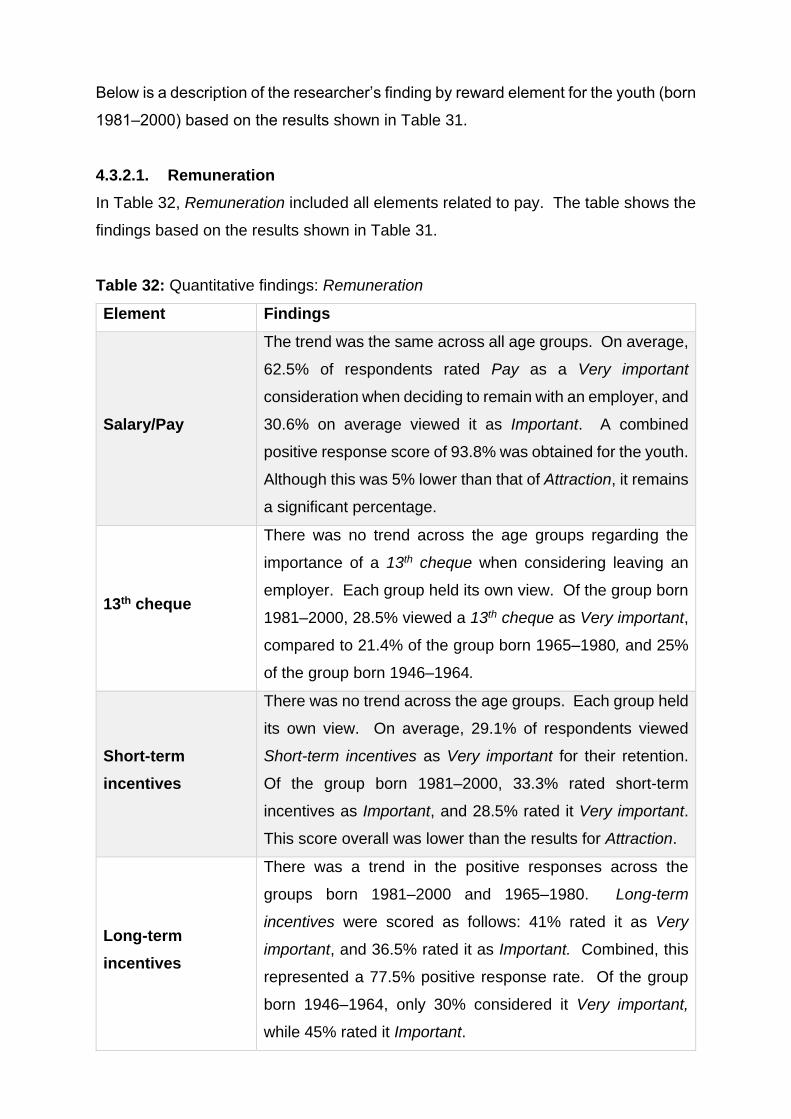
Below is a description of the researcher’s finding by reward element for the youth (born
1981‒2000) based on the results shown in Table 31.
4.3.2.1. Remuneration
In Table 32, Remuneration included all elements related to pay. The table shows the
findings based on the results shown in Table 31.
Table 32: Quantitative findings: Remuneration
Element Findings
Salary/Pay
The trend was the same across all age groups. On average,
62.5% of respondents rated Pay as a Very important
consideration when deciding to remain with an employer, and
30.6% on average viewed it as Important. A combined
positive response score of 93.8% was obtained for the youth.
Although this was 5% lower than that of Attraction, it remains
a significant percentage.
13th cheque
There was no trend across the age groups regarding the
importance of a 13th cheque when considering leaving an
employer. Each group held its own view. Of the group born
1981–2000, 28.5% viewed a 13th cheque as Very important,
compared to 21.4% of the group born 1965–1980, and 25%
of the group born 1946–1964.
Short-term
incentives
There was no trend across the age groups. Each group held
its own view. On average, 29.1% of respondents viewed
Short-term incentives as Very important for their retention.
Of the group born 1981–2000, 33.3% rated short-term
incentives as Important, and 28.5% rated it Very important.
This score overall was lower than the results for Attraction.
Long-term
incentives
There was a trend in the positive responses across the
groups born 1981–2000 and 1965–1980. Long-term
incentives were scored as follows: 41% rated it as Very
important, and 36.5% rated it as Important. Combined, this
represented a 77.5% positive response rate. Of the group
born 1946–1964, only 30% considered it Very important,
while 45% rated it Important.
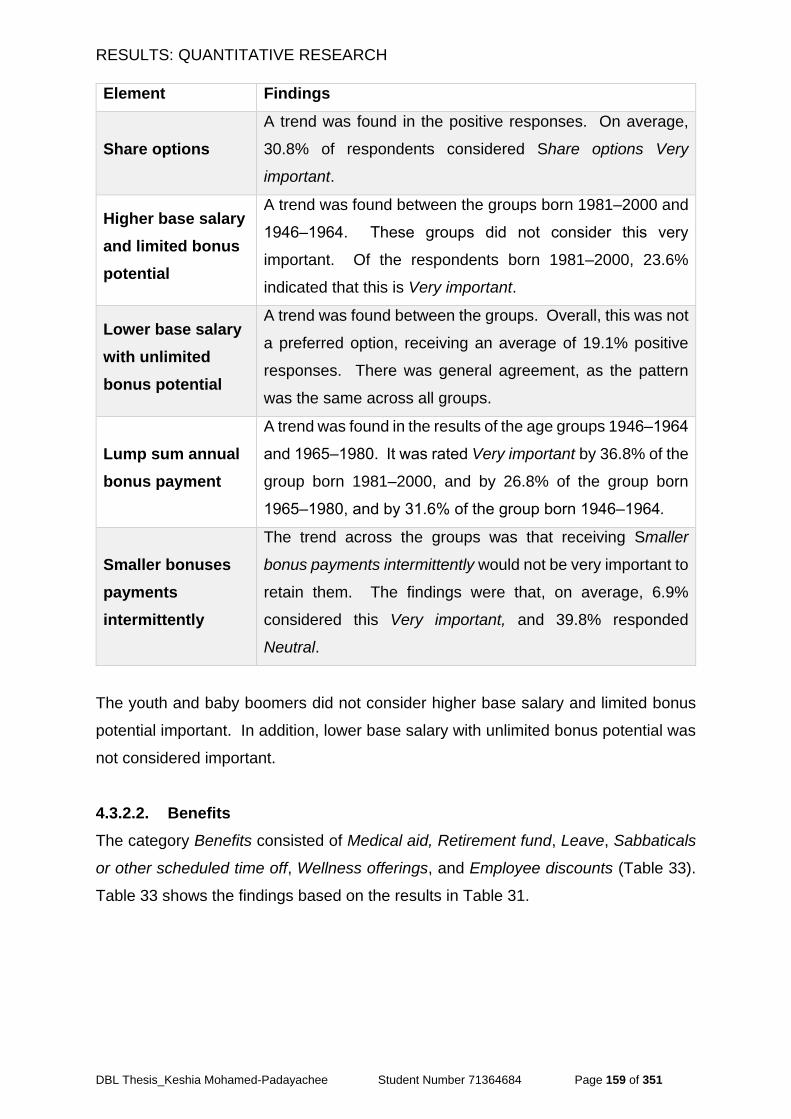
RESULTS: QUANTITATIVE RESEARCH
DBL Thesis_Keshia Mohamed-Padayachee Student Number 71364684 Page 159 of 351
Element Findings
Share options
A trend was found in the positive responses. On average,
30.8% of respondents considered Share options Very
important.
Higher base salary
and limited bonus
potential
A trend was found between the groups born 1981–2000 and
1946‒1964. These groups did not consider this very
important. Of the respondents born 1981–2000, 23.6%
indicated that this is Very important.
Lower base salary
with unlimited
bonus potential
A trend was found between the groups. Overall, this was not
a preferred option, receiving an average of 19.1% positive
responses. There was general agreement, as the pattern
was the same across all groups.
Lump sum annual
bonus payment
A trend was found in the results of the age groups 1946‒1964
and 1965‒1980. It was rated Very important by 36.8% of the
group born 1981–2000, and by 26.8% of the group born
1965‒1980, and by 31.6% of the group born 1946‒1964.
Smaller bonuses
payments
intermittently
The trend across the groups was that receiving Smaller
bonus payments intermittently would not be very important to
retain them. The findings were that, on average, 6.9%
considered this Very important, and 39.8% responded
Neutral.
The youth and baby boomers did not consider higher base salary and limited bonus
potential important. In addition, lower base salary with unlimited bonus potential was
not considered important.
4.3.2.2. Benefits
The category Benefits consisted of Medical aid, Retirement fund, Leave, Sabbaticals
or other scheduled time off, Wellness offerings, and Employee discounts (Table 33).
Table 33 shows the findings based on the results in Table 31.
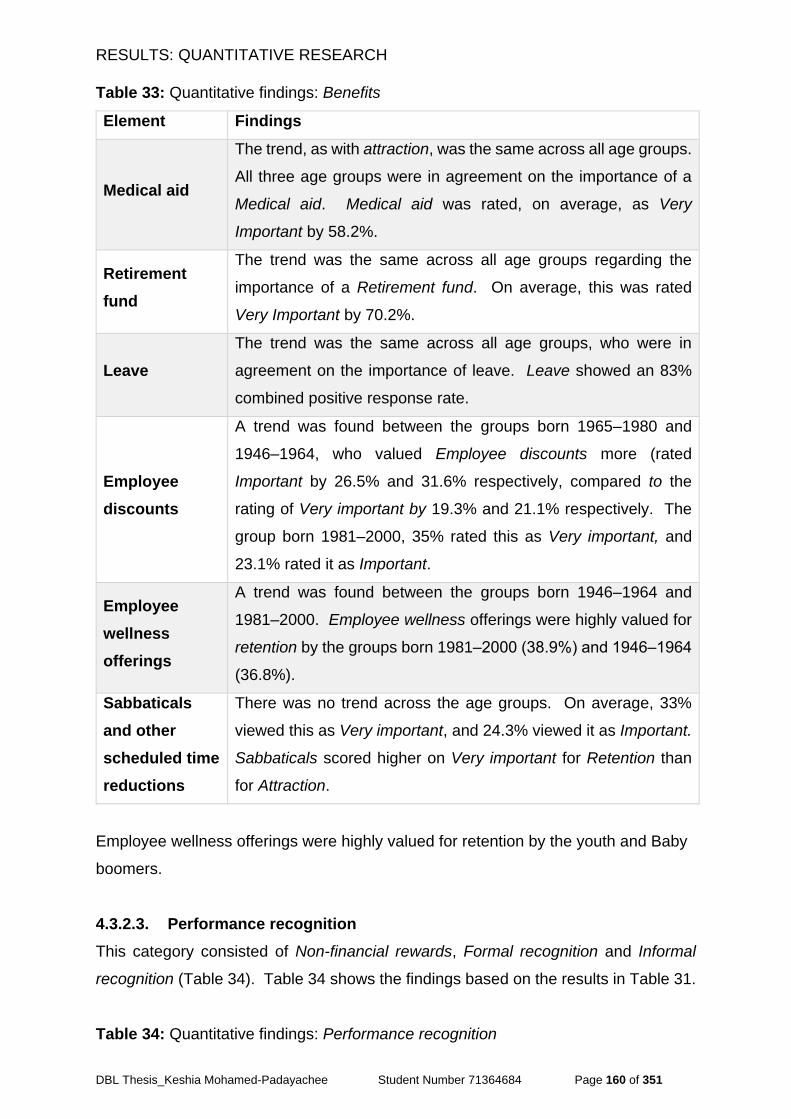
RESULTS: QUANTITATIVE RESEARCH
DBL Thesis_Keshia Mohamed-Padayachee Student Number 71364684 Page 160 of 351
Table 33: Quantitative findings: Benefits
Element Findings
Medical aid
The trend, as with attraction, was the same across all age groups.
All three age groups were in agreement on the importance of a
Medical aid. Medical aid was rated, on average, as Very
Important by 58.2%.
Retirement
fund
The trend was the same across all age groups regarding the
importance of a Retirement fund. On average, this was rated
Very Important by 70.2%.
Leave
The trend was the same across all age groups, who were in
agreement on the importance of leave. Leave showed an 83%
combined positive response rate.
Employee
discounts
A trend was found between the groups born 1965–1980 and
1946–1964, who valued Employee discounts more (rated
Important by 26.5% and 31.6% respectively, compared to the
rating of Very important by 19.3% and 21.1% respectively. The
group born 1981–2000, 35% rated this as Very important, and
23.1% rated it as Important.
Employee
wellness
offerings
A trend was found between the groups born 1946–1964 and
1981–2000. Employee wellness offerings were highly valued for
retention by the groups born 1981–2000 (38.9%) and 1946‒1964
(36.8%).
Sabbaticals
and other
scheduled time
reductions
There was no trend across the age groups. On average, 33%
viewed this as Very important, and 24.3% viewed it as Important.
Sabbaticals scored higher on Very important for Retention than
for Attraction.
Employee wellness offerings were highly valued for retention by the youth and Baby
boomers.
4.3.2.3. Performance recognition
This category consisted of Non-financial rewards, Formal recognition and Informal
recognition (Table 34). Table 34 shows the findings based on the results in Table 31.
Table 34: Quantitative findings: Performance recognition
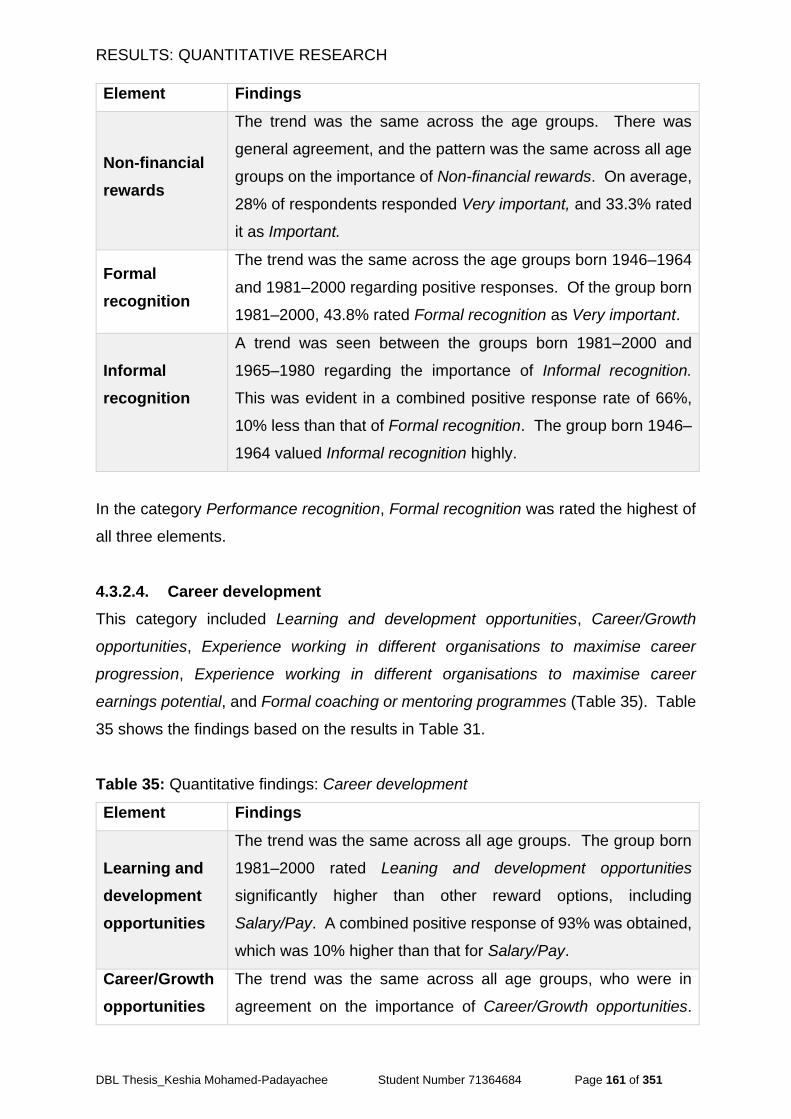
RESULTS: QUANTITATIVE RESEARCH
DBL Thesis_Keshia Mohamed-Padayachee Student Number 71364684 Page 161 of 351
Element Findings
Non-financial
rewards
The trend was the same across the age groups. There was
general agreement, and the pattern was the same across all age
groups on the importance of Non-financial rewards. On average,
28% of respondents responded Very important, and 33.3% rated
it as Important.
Formal
recognition
The trend was the same across the age groups born 1946–1964
and 1981–2000 regarding positive responses. Of the group born
1981–2000, 43.8% rated Formal recognition as Very important.
Informal
recognition
A trend was seen between the groups born 1981–2000 and
1965–1980 regarding the importance of Informal recognition.
This was evident in a combined positive response rate of 66%,
10% less than that of Formal recognition. The group born 1946–
1964 valued Informal recognition highly.
In the category Performance recognition, Formal recognition was rated the highest of
all three elements.
4.3.2.4. Career development
This category included Learning and development opportunities, Career/Growth
opportunities, Experience working in different organisations to maximise career
progression, Experience working in different organisations to maximise career
earnings potential, and Formal coaching or mentoring programmes (Table 35). Table
35 shows the findings based on the results in Table 31.
Table 35: Quantitative findings: Career development
Element Findings
Learning and
development
opportunities
The trend was the same across all age groups. The group born
1981–2000 rated Leaning and development opportunities
significantly higher than other reward options, including
Salary/Pay. A combined positive response of 93% was obtained,
which was 10% higher than that for Salary/Pay.
Career/Growth
opportunities
The trend was the same across all age groups, who were in
agreement on the importance of Career/Growth opportunities.
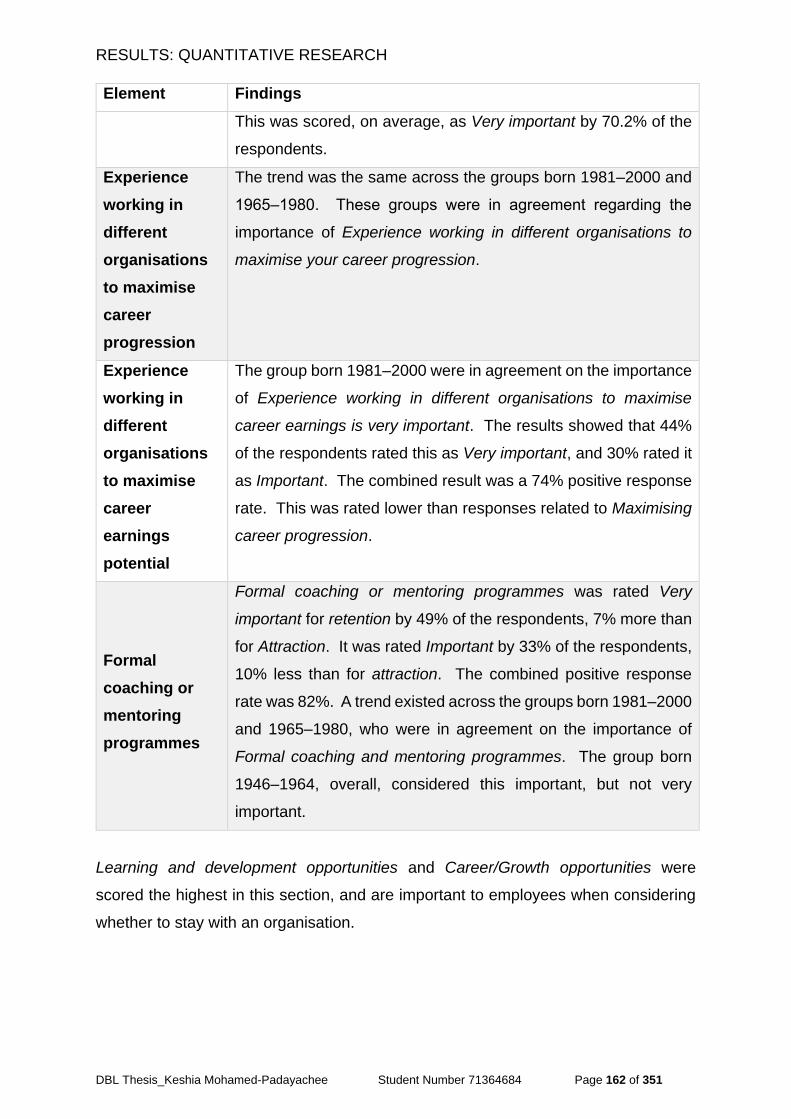
RESULTS: QUANTITATIVE RESEARCH
DBL Thesis_Keshia Mohamed-Padayachee Student Number 71364684 Page 162 of 351
Element Findings
This was scored, on average, as Very important by 70.2% of the
respondents.
Experience
working in
different
organisations
to maximise
career
progression
The trend was the same across the groups born 1981–2000 and
1965‒1980. These groups were in agreement regarding the
importance of Experience working in different organisations to
maximise your career progression.
Experience
working in
different
organisations
to maximise
career
earnings
potential
The group born 1981–2000 were in agreement on the importance
of Experience working in different organisations to maximise
career earnings is very important. The results showed that 44%
of the respondents rated this as Very important, and 30% rated it
as Important. The combined result was a 74% positive response
rate. This was rated lower than responses related to Maximising
career progression.
Formal
coaching or
mentoring
programmes
Formal coaching or mentoring programmes was rated Very
important for retention by 49% of the respondents, 7% more than
for Attraction. It was rated Important by 33% of the respondents,
10% less than for attraction. The combined positive response
rate was 82%. A trend existed across the groups born 1981–2000
and 1965–1980, who were in agreement on the importance of
Formal coaching and mentoring programmes. The group born
1946–1964, overall, considered this important, but not very
important.
Learning and development opportunities and Career/Growth opportunities were
scored the highest in this section, and are important to employees when considering
whether to stay with an organisation.
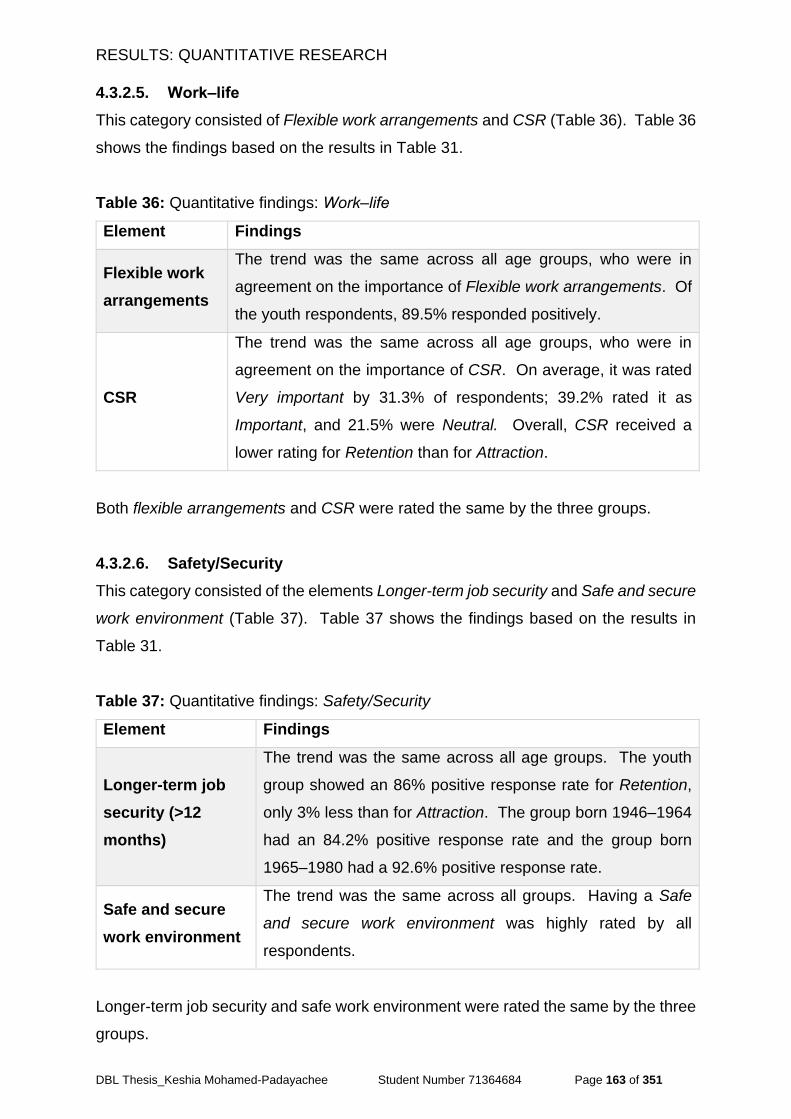
RESULTS: QUANTITATIVE RESEARCH
DBL Thesis_Keshia Mohamed-Padayachee Student Number 71364684 Page 163 of 351
4.3.2.5. Work‒life
This category consisted of Flexible work arrangements and CSR (Table 36). Table 36
shows the findings based on the results in Table 31.
Table 36: Quantitative findings: Work‒life
Element Findings
Flexible work
arrangements
The trend was the same across all age groups, who were in
agreement on the importance of Flexible work arrangements. Of
the youth respondents, 89.5% responded positively.
CSR
The trend was the same across all age groups, who were in
agreement on the importance of CSR. On average, it was rated
Very important by 31.3% of respondents; 39.2% rated it as
Important, and 21.5% were Neutral. Overall, CSR received a
lower rating for Retention than for Attraction.
Both flexible arrangements and CSR were rated the same by the three groups.
4.3.2.6. Safety/Security
This category consisted of the elements Longer-term job security and Safe and secure
work environment (Table 37). Table 37 shows the findings based on the results in
Table 31.
Table 37: Quantitative findings: Safety/Security
Element Findings
Longer-term job
security (>12
months)
The trend was the same across all age groups. The youth
group showed an 86% positive response rate for Retention,
only 3% less than for Attraction. The group born 1946‒1964
had an 84.2% positive response rate and the group born
1965‒1980 had a 92.6% positive response rate.
Safe and secure
work environment
The trend was the same across all groups. Having a Safe
and secure work environment was highly rated by all
respondents.
Longer-term job security and safe work environment were rated the same by the three
groups.
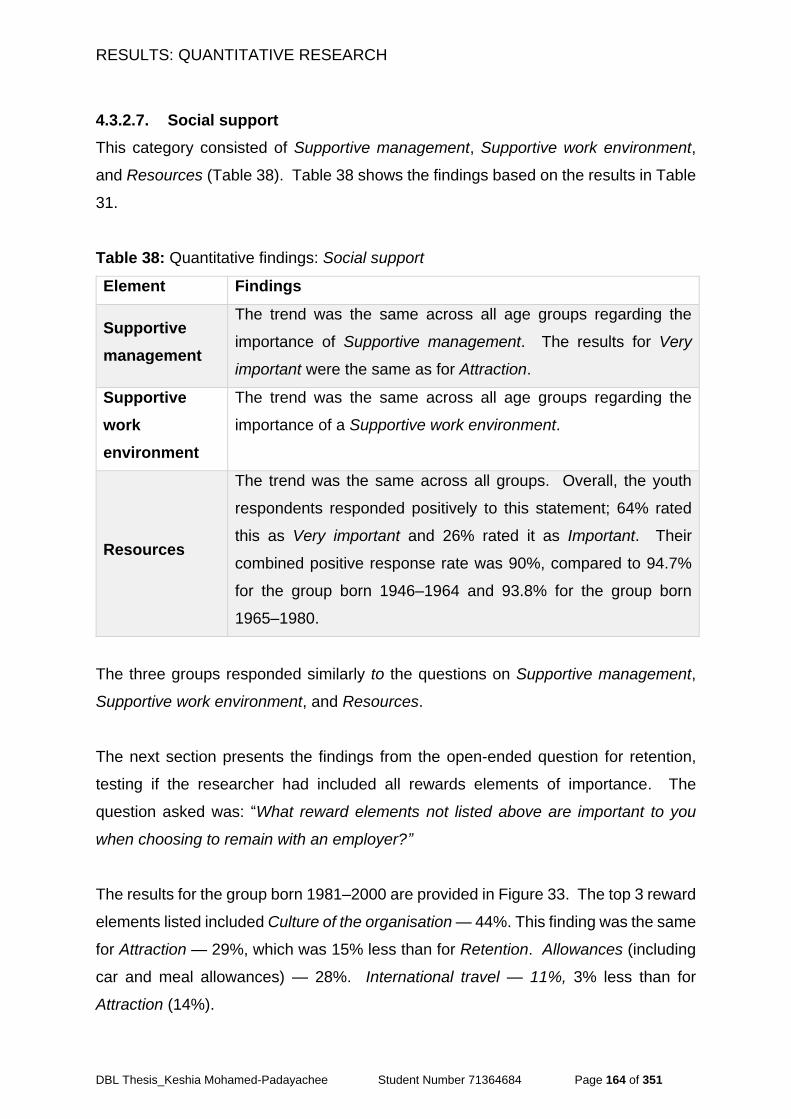
RESULTS: QUANTITATIVE RESEARCH
DBL Thesis_Keshia Mohamed-Padayachee Student Number 71364684 Page 164 of 351
4.3.2.7. Social support
This category consisted of Supportive management, Supportive work environment,
and Resources (Table 38). Table 38 shows the findings based on the results in Table
31.
Table 38: Quantitative findings: Social support
Element Findings
Supportive
management
The trend was the same across all age groups regarding the
importance of Supportive management. The results for Very
important were the same as for Attraction.
Supportive
work
environment
The trend was the same across all age groups regarding the
importance of a Supportive work environment.
Resources
The trend was the same across all groups. Overall, the youth
respondents responded positively to this statement; 64% rated
this as Very important and 26% rated it as Important. Their
combined positive response rate was 90%, compared to 94.7%
for the group born 1946‒1964 and 93.8% for the group born
1965‒1980.
The three groups responded similarly to the questions on Supportive management,
Supportive work environment, and Resources.
The next section presents the findings from the open-ended question for retention,
testing if the researcher had included all rewards elements of importance. The
question asked was: “What reward elements not listed above are important to you
when choosing to remain with an employer?”
The results for the group born 1981–2000 are provided in Figure 33. The top 3 reward
elements listed included Culture of the organisation — 44%. This finding was the same
for Attraction — 29%, which was 15% less than for Retention. Allowances (including
car and meal allowances) — 28%. International travel — 11%, 3% less than for
Attraction (14%).
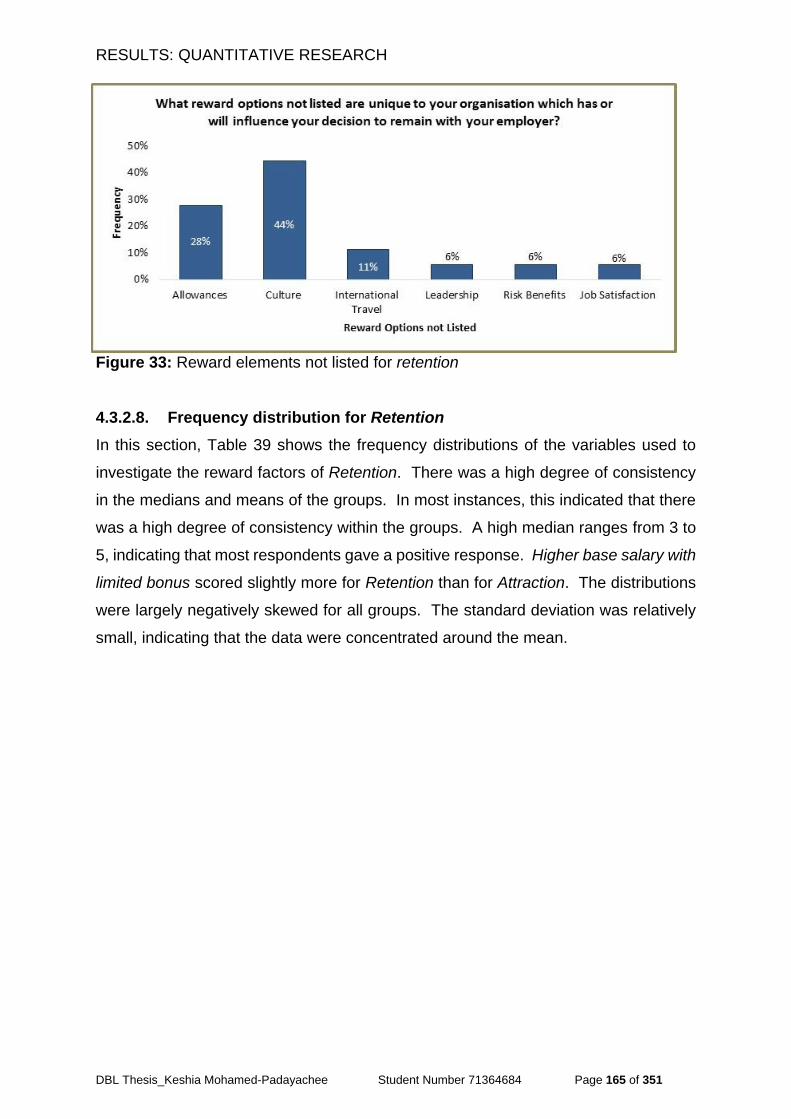
RESULTS: QUANTITATIVE RESEARCH
DBL Thesis_Keshia Mohamed-Padayachee Student Number 71364684 Page 165 of 351
Figure 33: Reward elements not listed for retention
4.3.2.8. Frequency distribution for Retention
In this section, Table 39 shows the frequency distributions of the variables used to
investigate the reward factors of Retention. There was a high degree of consistency
in the medians and means of the groups. In most instances, this indicated that there
was a high degree of consistency within the groups. A high median ranges from 3 to
5, indicating that most respondents gave a positive response. Higher base salary with
limited bonus scored slightly more for Retention than for Attraction. The distributions
were largely negatively skewed for all groups. The standard deviation was relatively
small, indicating that the data were concentrated around the mean.
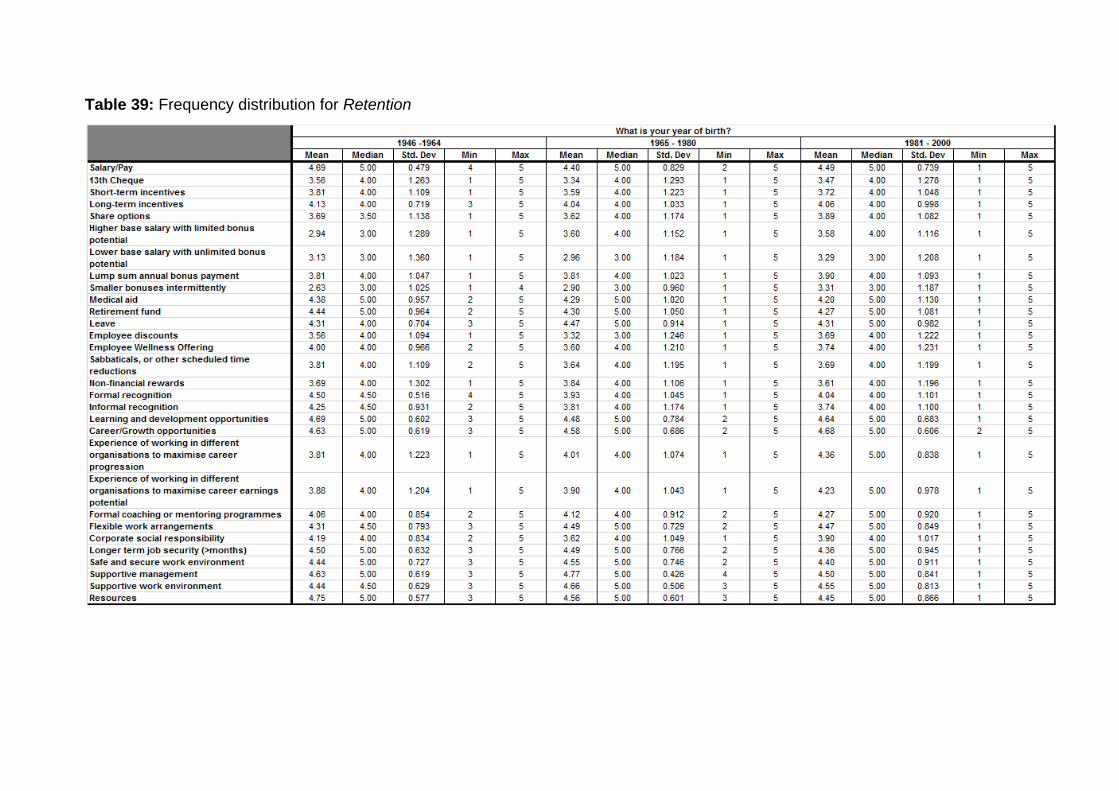
Table 39: Frequency distribution for Retention
4.3.3. Total reward categories’ ranking
In this section of the questionnaire, the researcher tested how respondents would
summarise their preferences. The question was further included to test the
consistency in responses against that of the previous section. The question posed in
the questionnaire was: “On a scale of 1 to 5, with 1 being the least important and 5 the
most important, how do you rank the following by importance when deciding to join an
organisation?”
Table 40 provides a summary of the groups’ responses; the highlighted areas are the
top-ranked categories for Attraction and Retention. The results indicated that the
group born 1946–1965 had strong preferences, with Performance recognition ranked
highest for this group for both Attraction and Retention, followed by Career
development. For the group born 1965–1980, the highest ranked for Attraction as
Remuneration and, for Retention, Career development. The top-ranked for the group
born 1981–2000 was Career development for both Attraction and Retention.
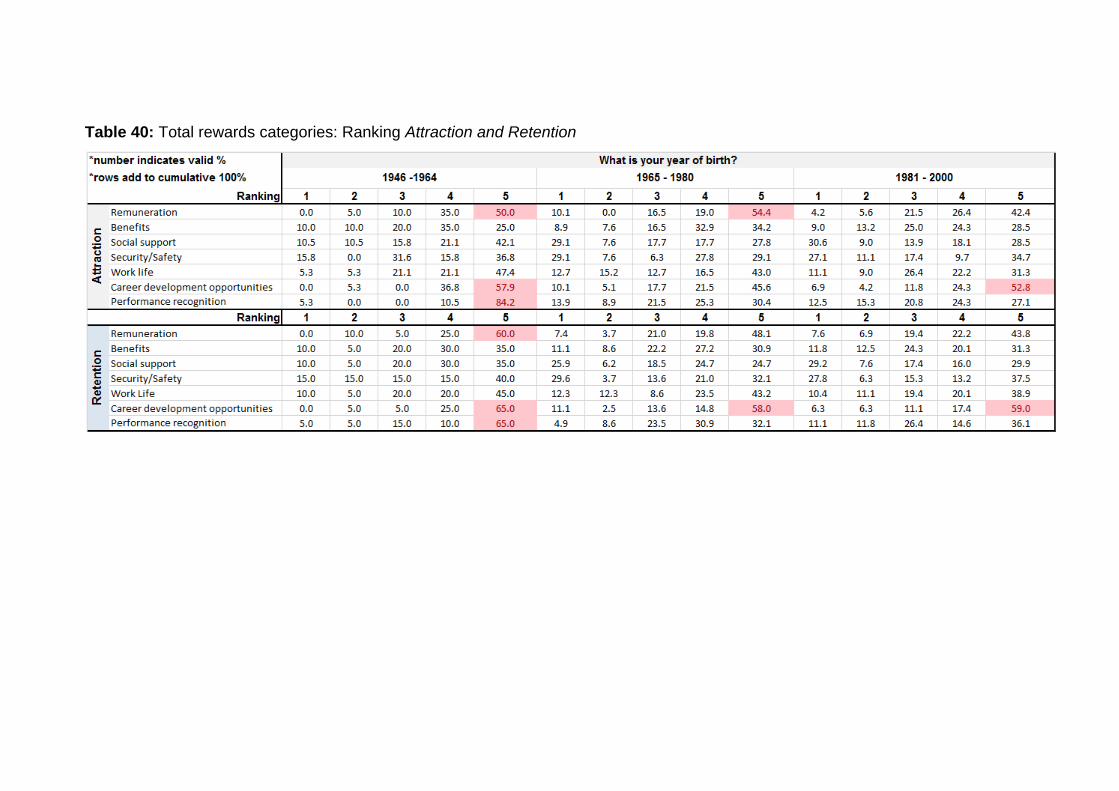
Table 40: Total rewards categories: Ranking Attraction and Retention
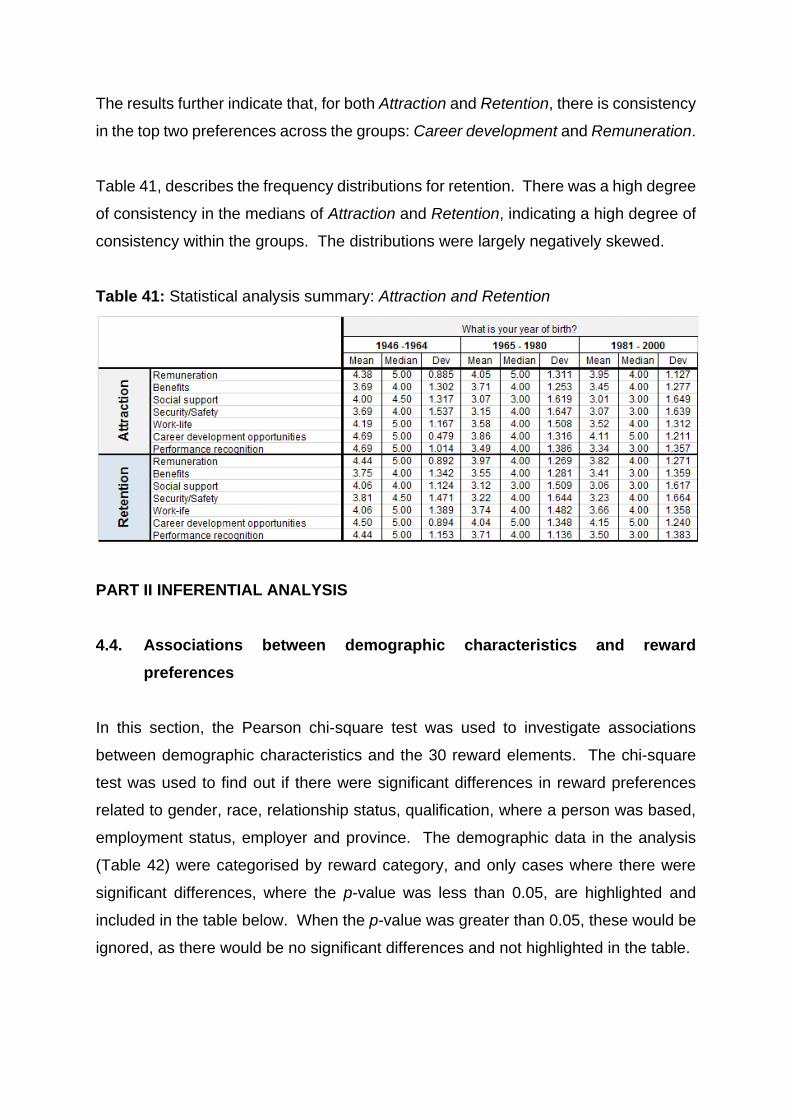
The results further indicate that, for both Attraction and Retention, there is consistency
in the top two preferences across the groups: Career development and Remuneration.
Table 41, describes the frequency distributions for retention. There was a high degree
of consistency in the medians of Attraction and Retention, indicating a high degree of
consistency within the groups. The distributions were largely negatively skewed.
Table 41: Statistical analysis summary: Attraction and Retention
PART II INFERENTIAL ANALYSIS
4.4. Associations between demographic characteristics and reward
preferences
In this section, the Pearson chi-square test was used to investigate associations
between demographic characteristics and the 30 reward elements. The chi-square
test was used to find out if there were significant differences in reward preferences
related to gender, race, relationship status, qualification, where a person was based,
employment status, employer and province. The demographic data in the analysis
(Table 42) were categorised by reward category, and only cases where there were
significant differences, where the p-value was less than 0.05, are highlighted and
included in the table below. When the p-value was greater than 0.05, these would be
ignored, as there would be no significant differences and not highlighted in the table.
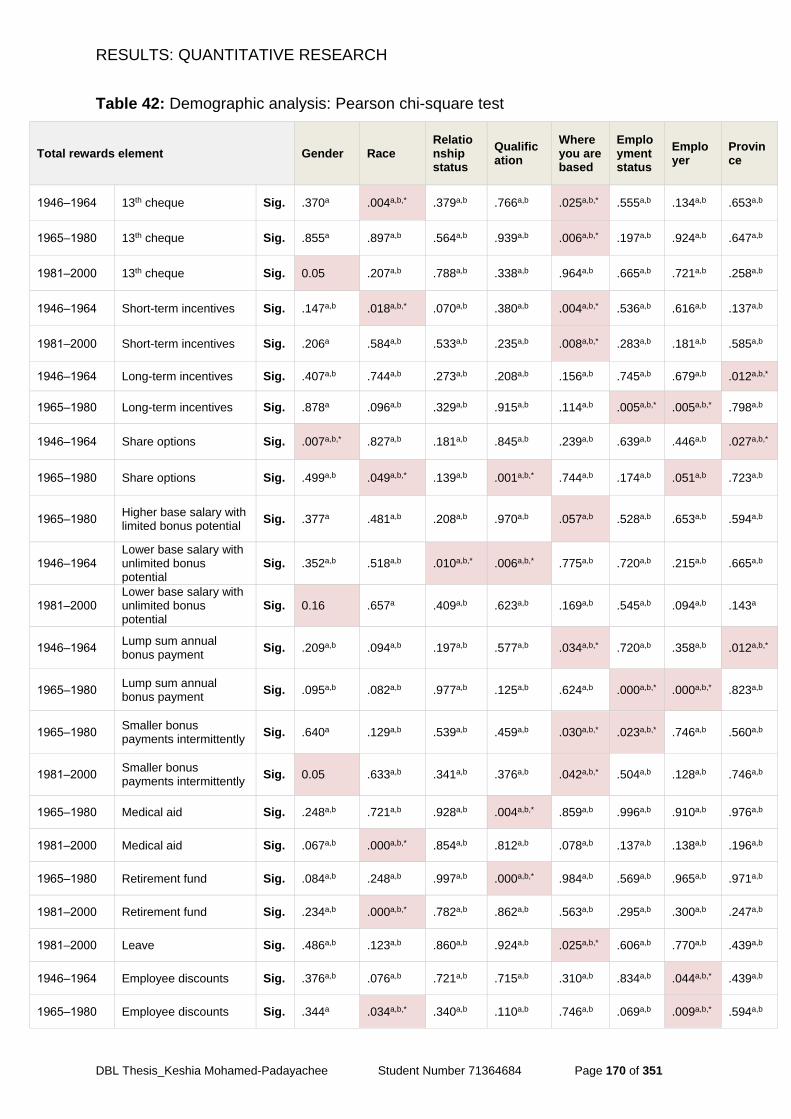
RESULTS: QUANTITATIVE RESEARCH
DBL Thesis_Keshia Mohamed-Padayachee Student Number 71364684 Page 170 of 351
Table 42: Demographic analysis: Pearson chi-square test
Total rewards element
Gender Race Relationship status
Qualification
Where you are based
Employment status
Employer
Province
1946‒1964 13th cheque Sig. .370a .004a,b,* .379a,b .766a,b .025a,b,* .555a,b .134a,b .653a,b
1965‒1980 13th cheque Sig. .855a .897a,b .564a,b .939a,b .006a,b,* .197a,b .924a,b .647a,b
1981‒2000 13th cheque Sig. 0.05 .207a,b .788a,b .338a,b .964a,b .665a,b .721a,b .258a,b
1946‒1964 Short-term incentives Sig. .147a,b .018a,b,* .070a,b .380a,b .004a,b,* .536a,b .616a,b .137a,b
1981‒2000 Short-term incentives Sig. .206a .584a,b .533a,b .235a,b .008a,b,* .283a,b .181a,b .585a,b
1946‒1964 Long-term incentives Sig. .407a,b .744a,b .273a,b .208a,b .156a,b .745a,b .679a,b .012a,b,*
1965‒1980 Long-term incentives Sig. .878a .096a,b .329a,b .915a,b .114a,b .005a,b,* .005a,b,* .798a,b
1946‒1964 Share options Sig. .007a,b,* .827a,b .181a,b .845a,b .239a,b .639a,b .446a,b .027a,b,*
1965‒1980 Share options Sig. .499a,b .049a,b,* .139a,b .001a,b,* .744a,b .174a,b .051a,b .723a,b
1965‒1980 Higher base salary with limited bonus potential
Sig. .377a .481a,b .208a,b .970a,b .057a,b .528a,b .653a,b .594a,b
1946‒1964 Lower base salary with unlimited bonus potential
Sig. .352a,b .518a,b .010a,b,* .006a,b,* .775a,b .720a,b .215a,b .665a,b
1981‒2000 Lower base salary with unlimited bonus potential
Sig. 0.16 .657a .409a,b .623a,b .169a,b .545a,b .094a,b .143a
1946‒1964 Lump sum annual bonus payment
Sig. .209a,b .094a,b .197a,b .577a,b .034a,b,* .720a,b .358a,b .012a,b,*
1965‒1980 Lump sum annual bonus payment
Sig. .095a,b .082a,b .977a,b .125a,b .624a,b .000a,b,* .000a,b,* .823a,b
1965‒1980 Smaller bonus payments intermittently
Sig. .640a .129a,b .539a,b .459a,b .030a,b,* .023a,b,* .746a,b .560a,b
1981‒2000 Smaller bonus payments intermittently
Sig. 0.05 .633a,b .341a,b .376a,b .042a,b,* .504a,b .128a,b .746a,b
1965‒1980 Medical aid Sig. .248a,b .721a,b .928a,b .004a,b,* .859a,b .996a,b .910a,b .976a,b
1981‒2000 Medical aid Sig. .067a,b .000a,b,* .854a,b .812a,b .078a,b .137a,b .138a,b .196a,b
1965‒1980 Retirement fund Sig. .084a,b .248a,b .997a,b .000a,b,* .984a,b .569a,b .965a,b .971a,b
1981‒2000 Retirement fund Sig. .234a,b .000a,b,* .782a,b .862a,b .563a,b .295a,b .300a,b .247a,b
1981‒2000 Leave Sig. .486a,b .123a,b .860a,b .924a,b .025a,b,* .606a,b .770a,b .439a,b
1946‒1964 Employee discounts Sig. .376a,b .076a,b .721a,b .715a,b .310a,b .834a,b .044a,b,* .439a,b
1965‒1980 Employee discounts Sig. .344a .034a,b,* .340a,b .110a,b .746a,b .069a,b .009a,b,* .594a,b

RESULTS: QUANTITATIVE RESEARCH
DBL Thesis_Keshia Mohamed-Padayachee Student Number 71364684 Page 171 of 351
Total rewards element
Gender Race Relationship status
Qualification
Where you are based
Employment status
Employer
Province
1946‒1964 Employee wellness offering
Sig. .190a,b .021a,b,* .076a,b .309a,b .605a,b .639a,b .189a,b .564a,b
1965‒1980 Employee wellness offering
Sig. .323a .749a,b .552a,b .510a,b .943a,b .063a,b .043a,b,* .626a,b
1965‒1980 Sabbaticals or other scheduled time reductions
Sig. .185a .559a,b .580a,b .144a,b .802a,b .013a,b,* .064a,b .807a,b
1981‒2000 Sabbaticals or other scheduled time reductions
Sig. .488a .370a,b .653a,b .636a,b .228a,b .101a,b .056a,b .035a,b,*
1965‒1980 Non-financial rewards Sig. .663a .454a,b .783a,b .646a,b .292a,b .000a,b,* .041a,b,* .426a,b
1981‒2000 Non-financial rewards Sig. .213a .070a,b .008a,b,* .059a,b .237a,b .006a,b,* .051a,b .266a,b
1965‒1980 Formal recognition Sig. .779a,b .054a,b .052a,b .222a,b .931a,b .000a,b,* .934a,b .885a,b
1981‒2000 Formal recognition Sig. .329a .062a,b .006a,b,* .853a,b .978a,b .764a,b .701a,b .295a,b
1946‒1964 Informal recognition Sig. .692a .034a,b,* .120a,b .169a,b .320a,b .157a,b .647a,b .073a,b
1965‒1980 Informal recognition Sig. .376a,b .358a,b .632a,b .069a,b .971a,b .008a,b,* .296a,b .399a,b
1965‒1980 Learning and development opportunities
Sig. .699a .002a,b,* .639a,b .604a,b .423a,b .756a,b .268a,b .739a,b
1946‒1964
Experience working in different organisations to maximise career progression
Sig. .050a,b,* .738a,b .574a,b .206a,b .604a,b .266a,b .139a,b .174a,b
1965‒1980
Experience working in different organisations to maximise career progression
Sig. .214a,b .026a,b,* .680a,b .009a,b,* .804a,b .907a,b .959a,b .797a,b
1981‒2000
Experience working in different organisations to maximise career earnings potential
Sig. .754a,b .395a,b .584a,b .463a,b .018a,b,* .484a,b .337a,b .661a,b
1946‒1964 Formal coaching or mentoring programmes
Sig. .087a,b .865a,b .641a,b .079a,b .400a,b .063a,b .057a,b .811a,b
1965‒1980 Formal coaching or mentoring programmes
Sig. .903a,b .044a,b,* .467a,b .020a,b,* .043a,b,* .709a,b .856a,b .829a,b
1946‒1964 Corporate social responsibility
Sig. .053a,b .874a,b .538a,b .254a,b .422a,b .372a,b .916a,b .811a,b
1965‒1980 Corporate social responsibility
Sig. .334a .485a,b .754a,b .715a,b .589a,b .000a,b,* .497a,b .879a,b
1965‒1980 Longer-term job security (> 12 months)
Sig. .661a,b .260a,b .757a,b .977a,b .993a,b .000a,b,* .880a,b .988a,b
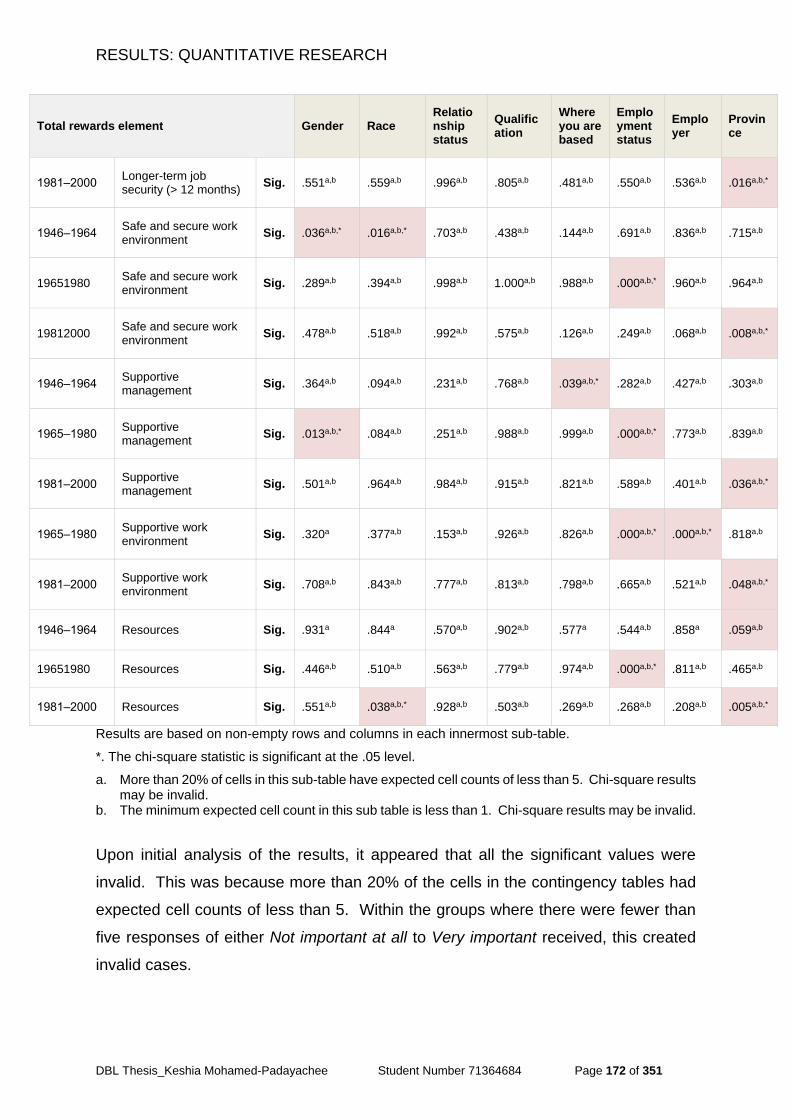
RESULTS: QUANTITATIVE RESEARCH
DBL Thesis_Keshia Mohamed-Padayachee Student Number 71364684 Page 172 of 351
Total rewards element
Gender Race Relationship status
Qualification
Where you are based
Employment status
Employer
Province
1981‒2000 Longer-term job security (> 12 months)
Sig. .551a,b .559a,b .996a,b .805a,b .481a,b .550a,b .536a,b .016a,b,*
1946‒1964 Safe and secure work environment
Sig. .036a,b,* .016a,b,* .703a,b .438a,b .144a,b .691a,b .836a,b .715a,b
19651980 Safe and secure work environment
Sig. .289a,b .394a,b .998a,b 1.000a,b .988a,b .000a,b,* .960a,b .964a,b
19812000 Safe and secure work environment
Sig. .478a,b .518a,b .992a,b .575a,b .126a,b .249a,b .068a,b .008a,b,*
1946‒1964 Supportive management
Sig. .364a,b .094a,b .231a,b .768a,b .039a,b,* .282a,b .427a,b .303a,b
1965‒1980 Supportive management
Sig. .013a,b,* .084a,b .251a,b .988a,b .999a,b .000a,b,* .773a,b .839a,b
1981‒2000 Supportive management
Sig. .501a,b .964a,b .984a,b .915a,b .821a,b .589a,b .401a,b .036a,b,*
1965‒1980 Supportive work environment
Sig. .320a .377a,b .153a,b .926a,b .826a,b .000a,b,* .000a,b,* .818a,b
1981‒2000 Supportive work environment
Sig. .708a,b .843a,b .777a,b .813a,b .798a,b .665a,b .521a,b .048a,b,*
1946‒1964 Resources Sig. .931a .844a .570a,b .902a,b .577a .544a,b .858a .059a,b
19651980 Resources Sig. .446a,b .510a,b .563a,b .779a,b .974a,b .000a,b,* .811a,b .465a,b
1981‒2000 Resources Sig. .551a,b .038a,b,* .928a,b .503a,b .269a,b .268a,b .208a,b .005a,b,*
Results are based on non-empty rows and columns in each innermost sub-table.
*. The chi-square statistic is significant at the .05 level.
a. More than 20% of cells in this sub-table have expected cell counts of less than 5. Chi-square results may be invalid.
b. The minimum expected cell count in this sub table is less than 1. Chi-square results may be invalid.
Upon initial analysis of the results, it appeared that all the significant values were
invalid. This was because more than 20% of the cells in the contingency tables had
expected cell counts of less than 5. Within the groups where there were fewer than
five responses of either Not important at all to Very important received, this created
invalid cases.
RESULTS: QUANTITATIVE RESEARCH
DBL Thesis_Keshia Mohamed-Padayachee Student Number 71364684 Page 173 of 351
On advice of the statistician, where possible, the demographic groups were grouped
together to increase the values. The demographic data were included in the analysis
below, due to the significance thereof to the study, and included Gender, Race, and
Relationship status. Only cases where there were significant differences were
included.
To increase the values for Race, two groups were created, aligned to the South African
employment equity (EE) categories, i.e. Previously disadvantaged (black African,
Indian, Coloured, and Chinese respondents) and Previously advantaged (white
respondents). For relationship status, only the results for Single, never married and
Married (as described at the beginning of this chapter) were included. For Gender,
the groups were not consolidated, and remained Male and Female. Where significant
differences were identified, these are discussed.
Table 43, provides a summary of the results for the three demographic characteristics,
described above, for which significant differences between the age groups were
identified. The larger the chi-square value was, the greater the probability of a
significant difference was.
Significant differences related to Gender were found for the following rewards
elements: Share options, Smaller bonus payments intermittently, Experience working
in different organisations to maximise career progression, CSR, Safe and secure work
environment, and Supportive management.
Significant differences related to Race were identified for the rewards elements 13th
cheque, Short-term incentives, Share options, Medical aid, Retirement fund,
Employee discounts, Employee wellness offering, Formal recognition, Informal
recognition, Learning and development opportunities, Experience working in different
organisations to maximise career progression, Formal coaching or mentoring
programmes, Safe and secure work environment, and Resources.
There were no significant differences according to race regarding Short-term
incentives for the groups born 1981–2000 and 1965‒1980. The significant difference
for the group born 1946–1964 was due to the difference in the results for Not important,
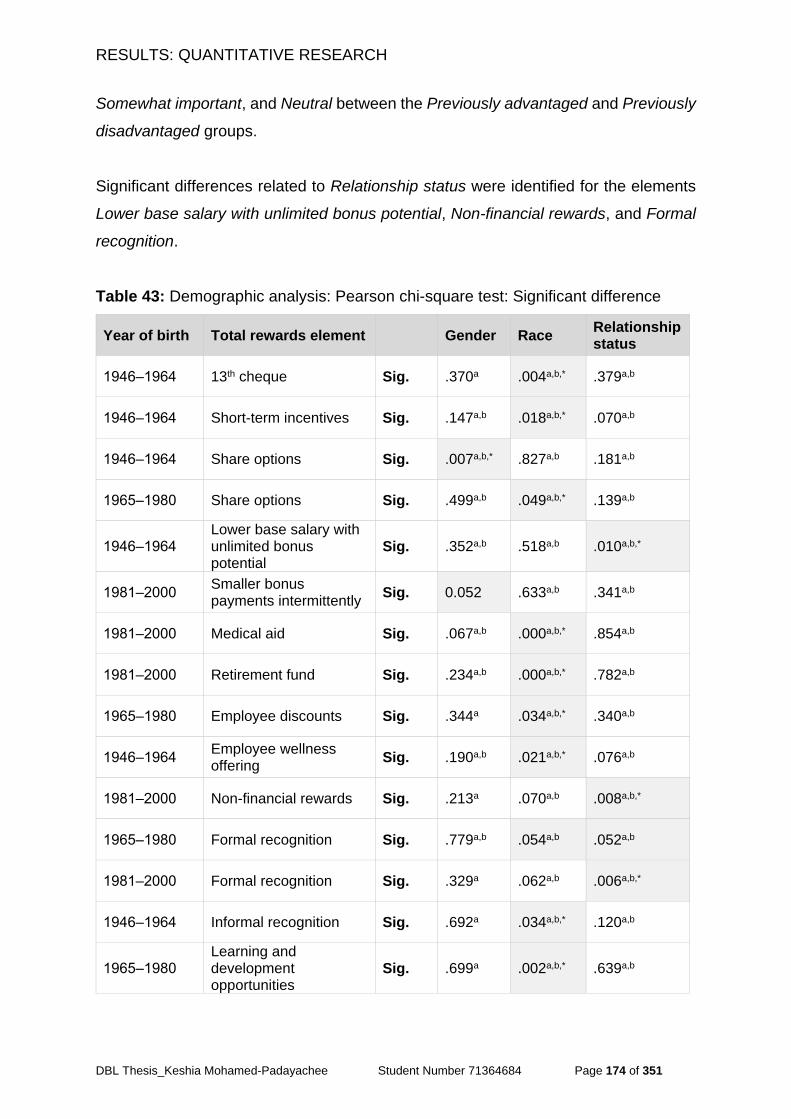
RESULTS: QUANTITATIVE RESEARCH
DBL Thesis_Keshia Mohamed-Padayachee Student Number 71364684 Page 174 of 351
Somewhat important, and Neutral between the Previously advantaged and Previously
disadvantaged groups.
Significant differences related to Relationship status were identified for the elements
Lower base salary with unlimited bonus potential, Non-financial rewards, and Formal
recognition.
Table 43: Demographic analysis: Pearson chi-square test: Significant difference
Year of birth Total rewards element Gender Race Relationship status
1946‒1964 13th cheque Sig. .370a .004a,b,* .379a,b
1946‒1964 Short-term incentives Sig. .147a,b .018a,b,* .070a,b
1946‒1964 Share options Sig. .007a,b,* .827a,b .181a,b
1965‒1980 Share options Sig. .499a,b .049a,b,* .139a,b
1946‒1964 Lower base salary with unlimited bonus potential
Sig. .352a,b .518a,b .010a,b,*
1981‒2000 Smaller bonus payments intermittently
Sig. 0.052 .633a,b .341a,b
1981‒2000 Medical aid Sig. .067a,b .000a,b,* .854a,b
1981‒2000 Retirement fund Sig. .234a,b .000a,b,* .782a,b
1965‒1980 Employee discounts Sig. .344a .034a,b,* .340a,b
1946‒1964 Employee wellness offering
Sig. .190a,b .021a,b,* .076a,b
1981‒2000 Non-financial rewards Sig. .213a .070a,b .008a,b,*
1965‒1980 Formal recognition Sig. .779a,b .054a,b .052a,b
1981‒2000 Formal recognition Sig. .329a .062a,b .006a,b,*
1946‒1964 Informal recognition Sig. .692a .034a,b,* .120a,b
1965‒1980 Learning and development opportunities
Sig. .699a .002a,b,* .639a,b
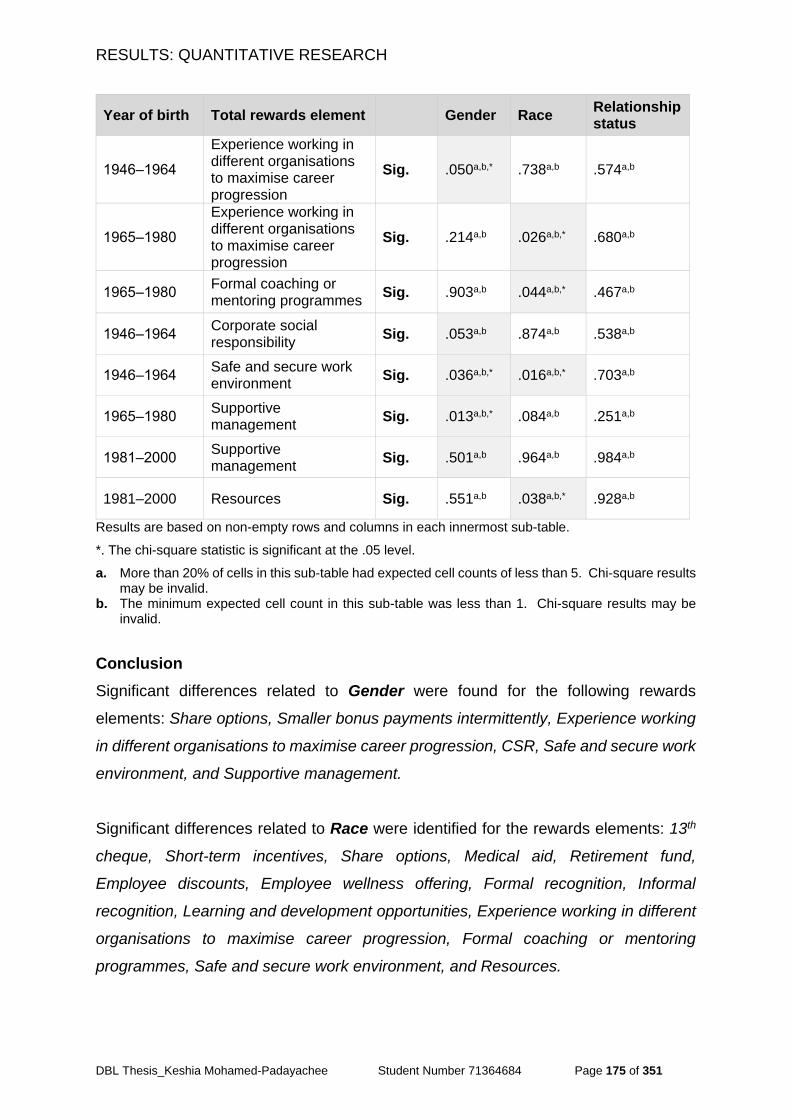
RESULTS: QUANTITATIVE RESEARCH
DBL Thesis_Keshia Mohamed-Padayachee Student Number 71364684 Page 175 of 351
Year of birth Total rewards element Gender Race Relationship status
1946‒1964
Experience working in different organisations to maximise career progression
Sig. .050a,b,* .738a,b .574a,b
1965‒1980
Experience working in different organisations to maximise career progression
Sig. .214a,b .026a,b,* .680a,b
1965‒1980 Formal coaching or mentoring programmes
Sig. .903a,b .044a,b,* .467a,b
1946‒1964 Corporate social responsibility
Sig. .053a,b .874a,b .538a,b
1946‒1964 Safe and secure work environment
Sig. .036a,b,* .016a,b,* .703a,b
1965‒1980 Supportive management
Sig. .013a,b,* .084a,b .251a,b
1981‒2000 Supportive management
Sig. .501a,b .964a,b .984a,b
1981‒2000 Resources Sig. .551a,b .038a,b,* .928a,b
Results are based on non-empty rows and columns in each innermost sub-table.
*. The chi-square statistic is significant at the .05 level.
a. More than 20% of cells in this sub-table had expected cell counts of less than 5. Chi-square results may be invalid.
b. The minimum expected cell count in this sub-table was less than 1. Chi-square results may be invalid.
Conclusion
Significant differences related to Gender were found for the following rewards
elements: Share options, Smaller bonus payments intermittently, Experience working
in different organisations to maximise career progression, CSR, Safe and secure work
environment, and Supportive management.
Significant differences related to Race were identified for the rewards elements: 13th
cheque, Short-term incentives, Share options, Medical aid, Retirement fund,
Employee discounts, Employee wellness offering, Formal recognition, Informal
recognition, Learning and development opportunities, Experience working in different
organisations to maximise career progression, Formal coaching or mentoring
programmes, Safe and secure work environment, and Resources.
RESULTS: QUANTITATIVE RESEARCH
DBL Thesis_Keshia Mohamed-Padayachee Student Number 71364684 Page 176 of 351
Significant differences related to Relationship status were identified for the elements:
Lower base salary with unlimited bonus potential, Non-financial rewards, and Formal
recognition.
The next section will present the findings related to the hypotheses.
4.5. Study hypotheses
The hypotheses of the present study were:
1. Ho1: There is no association between the reward categories (e.g.,
remuneration, benefits, performance recognition, etc.) that attract people to
organisations and the generation to which they belong.
2. Ha1: There is an association between the reward categories that attract people
to organisations and the generation to which they belong.
3. Ho2: There is no association between the reward categories that retain people
in organisations and the generation to which they belong.
4. Ha2: There is an association between the reward categories that retain people
in organisations and the generation to which they belong.
The researcher tested evidence from the sample that either supported the hypothesis
(H0) or rejected it and supported the alternative hypothesis, (Ha).
A non-parametric test was used to verify the equality of variances in the sample
(homogeneity of variance) — p > 0.05 (Nordstokke & Zumbo, 2010). The Kruskal-
Wallis test, a nonparametric test, was performed to test the null hypotheses because
the assumption of the chi-square test that none of the cells of the contingency table
should have an expected frequency of less than 5 was violated. Variables were
grouped by year of birth.
The significance level of the chi-square value (i.e. probability) being >0.05 indicated
that there was no statistically significant association between the variables, and that
the null hypothesis was not rejected. This indicated that there was no significant
difference in a reward element between the youth and previous generations.
H0 > 0.05 = H0
RESULTS: QUANTITATIVE RESEARCH
DBL Thesis_Keshia Mohamed-Padayachee Student Number 71364684 Page 177 of 351
The significance level being <0.05 indicated that there was a statistically significant
difference in a reward element between the youth and the previous generations. This
indicated that there was a significant difference in the rewards preferences between
the youth and previous generations.
H0 < 0.05 = Ha
4.5.1. Hypothesis testing results for Attraction
Of the 30 elements, ten showed a significant difference between the youth generation
and the previous generations. The alternative hypotheses for these elements were
correct (Table 44); however, because for more than 50% of elements the null
hypotheses were not rejected, the overall finding was that, for Attraction, the youth
have rewards preferences more or less similar to those of previous generations.
Leave proved to be more important to youths than to previous generations.
Furthermore, the youth value Employee discounts more than what previous
generations do. The results for Higher base salary with limited bonus potential and
Lower base salary with unlimited bonus potential indicated that the youth do not value
these two components.
From the findings, although it appears that Career development is important to all age
groups, it is more important to youths than to older generations. The results for
Career/Growth opportunities, Learning and development, Experience working in
different organisations to maximise career growth and Experience working in different
organisations to maximise career earnings potential. The preference of youths
regarding Long-term job security and a Safe work environment is different to that of
older generations. Table 44 shows the results of hypotheses testing using the Kruskal-
Wallis test.
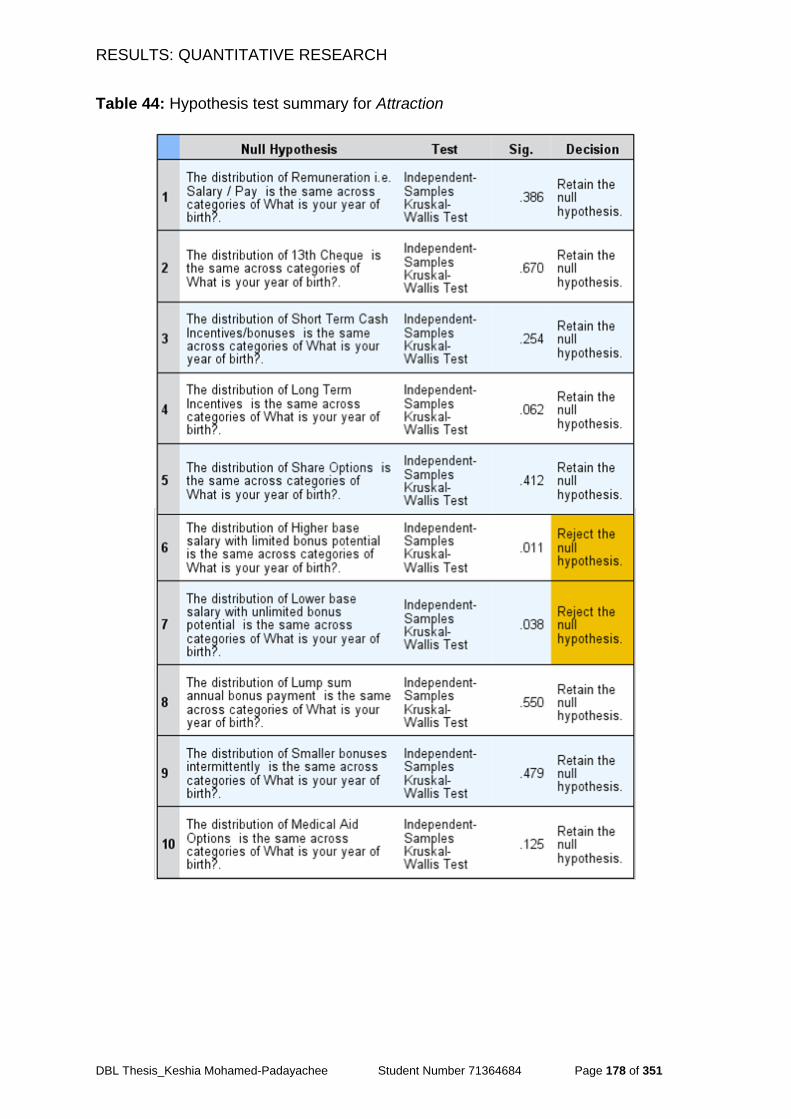
RESULTS: QUANTITATIVE RESEARCH
DBL Thesis_Keshia Mohamed-Padayachee Student Number 71364684 Page 178 of 351
Table 44: Hypothesis test summary for Attraction
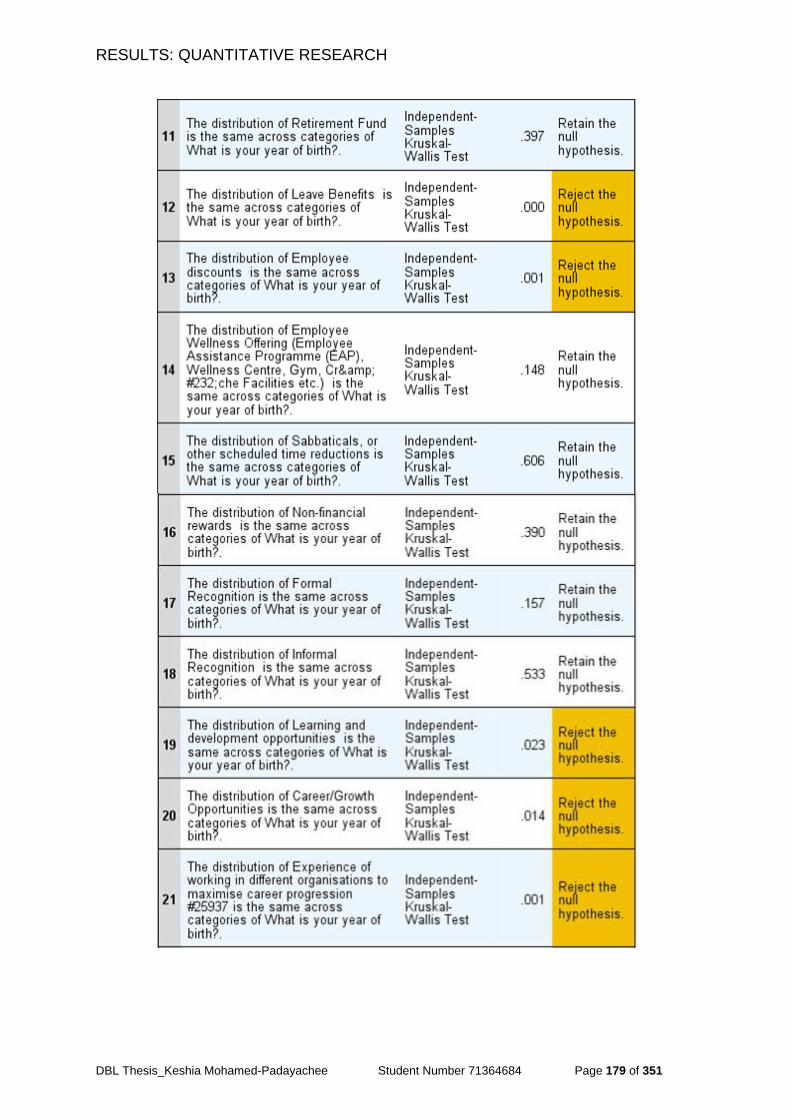
RESULTS: QUANTITATIVE RESEARCH
DBL Thesis_Keshia Mohamed-Padayachee Student Number 71364684 Page 179 of 351
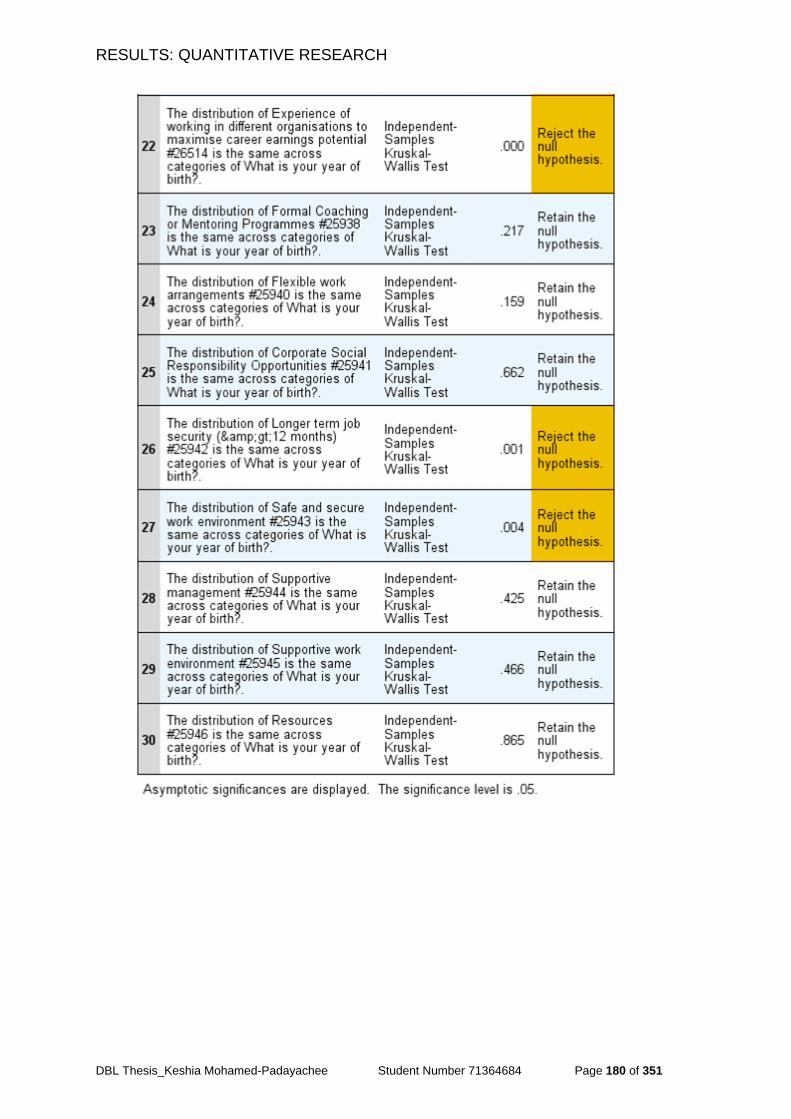
RESULTS: QUANTITATIVE RESEARCH
DBL Thesis_Keshia Mohamed-Padayachee Student Number 71364684 Page 180 of 351

RESULTS: QUANTITATIVE RESEARCH
DBL Thesis_Keshia Mohamed-Padayachee Student Number 71364684 Page 181 of 351
4.5.2. Hypothesis testing results for Retention
The result of the 30 elements tested was that four showed a significant difference, and
their null hypotheses were rejected (Table 45). The overall finding is that, for
Retention, youths have rewards preferences more or less similar to those of
previous generations.
Where the null hypotheses were rejected, the results differed in terms of the youths’
views on Smaller bonuses intermittently. They value Employee discounts more than
previous generations do. The results for Experience working in different organisations
to maximise career growth and Experience working in different organisations to
maximise career earnings potential.
Table 45: Hypothesis test summary for Retention
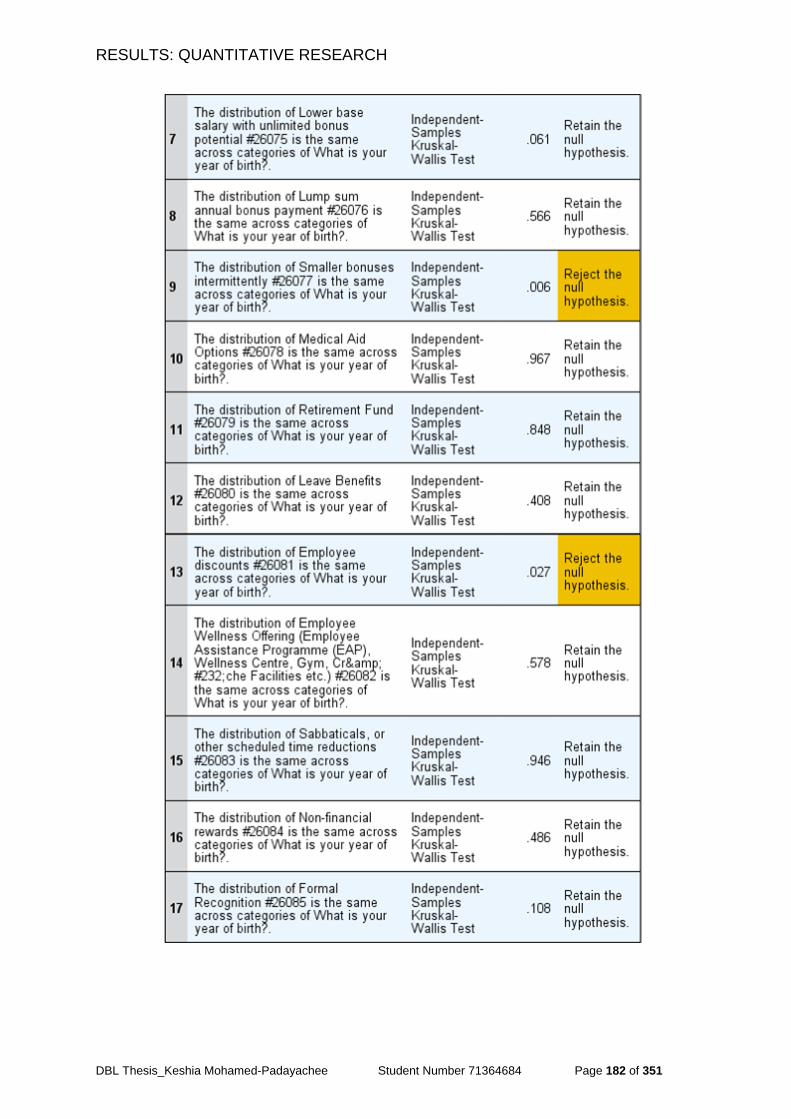
RESULTS: QUANTITATIVE RESEARCH
DBL Thesis_Keshia Mohamed-Padayachee Student Number 71364684 Page 182 of 351
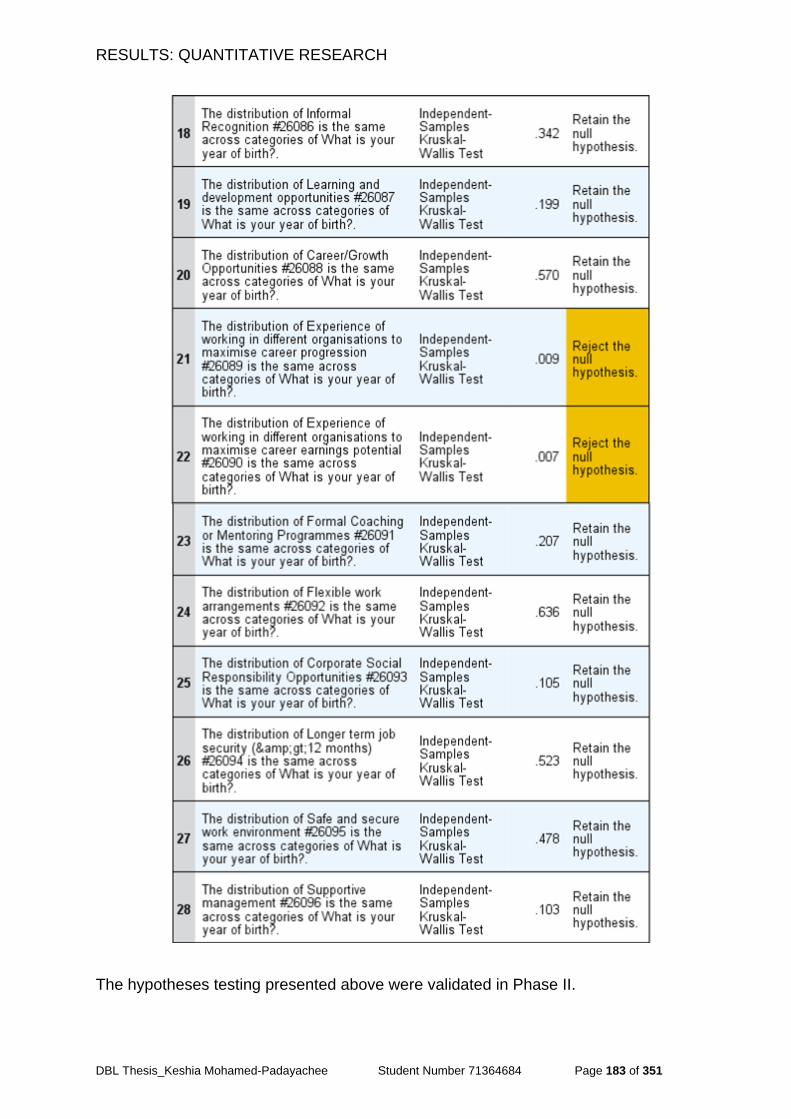
RESULTS: QUANTITATIVE RESEARCH
DBL Thesis_Keshia Mohamed-Padayachee Student Number 71364684 Page 183 of 351
The hypotheses testing presented above were validated in Phase II.
RESULTS: QUANTITATIVE RESEARCH
DBL Thesis_Keshia Mohamed-Padayachee Student Number 71364684 Page 184 of 351
Conclusion
For Attraction, the youth value Leave, Employee discounts, Long-term job security,
and a Safe work environment, reward elements more than the previous generations.
For Retention, the youth have rewards preferences more or less similar to those of
previous generations but they value Employee discounts more than previous
generations do.
Factor analysis was then done, using SPSS, to determine the common factors among
the observed correlated variables.
4.6. Factor analysis
Factor analysis is a method of data reduction that seeks underlying, unobservable
(latent) variables reflected in the observed variables (manifest variables). Factor
analysis is used to summarise data so that relationships and patterns can easily be
interpreted and understood (Yong & Pearce, 2013). Based on the scores, factor
analysis looks at the similarities and differences between the scores observed, the
variable of interest of the objects are then grouped into clusters with others with similar
scores (Diamantopoulos & Schlegelmilch, 2000).
In the present study, EFA was used to uncover complex patterns by exploring the
dataset and testing predictions (Child, 2006). To discover the number of factors
influencing variables and to analyse which variables ‘go together’ (DeCoster, 1998).
Only the group born 1981‒2000 was analysed for similarities between the scores
observed for attraction and retention. A report was generated, seeking groupings of
the variables (elements) that highly correlated with each other.
The next section presents the factor analysis results for attraction and then retention
for the group born 1981‒2000.
4.6.1. Factor analysis for Attraction
Of all 30 variables, nine components were extracted from the data, which explained
67.493% of the variability in the data (Table 46).
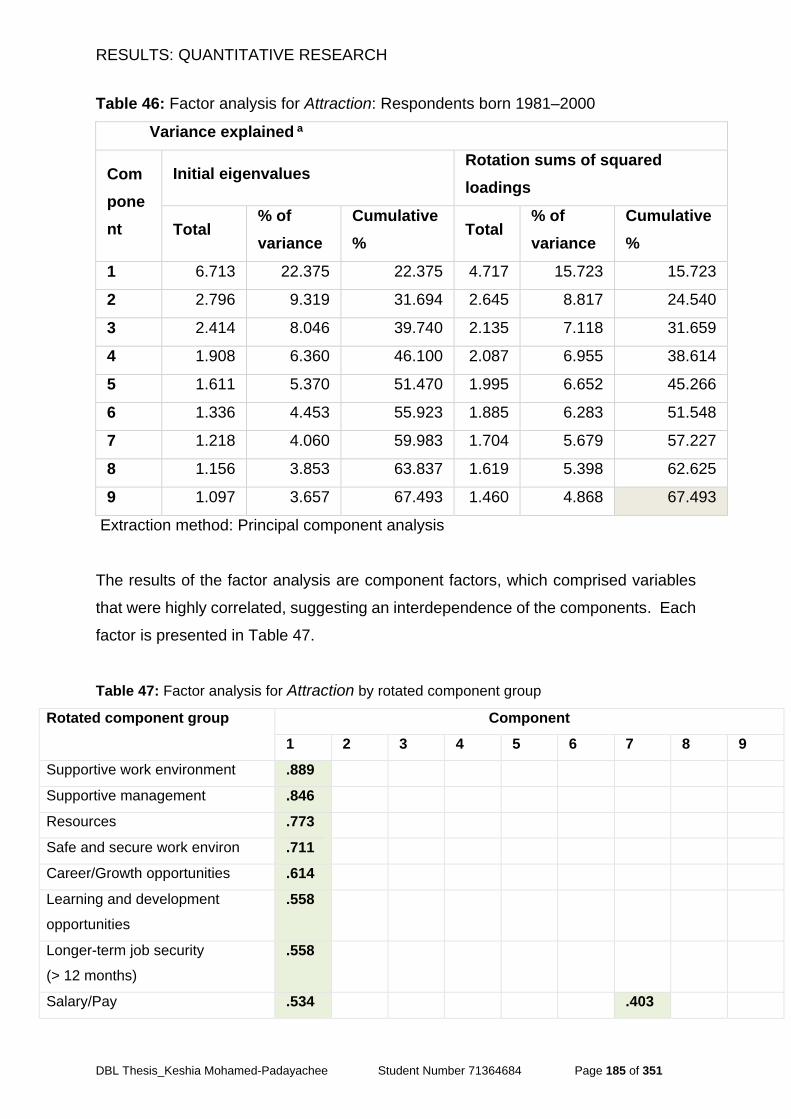
RESULTS: QUANTITATIVE RESEARCH
DBL Thesis_Keshia Mohamed-Padayachee Student Number 71364684 Page 185 of 351
Table 46: Factor analysis for Attraction: Respondents born 1981‒2000
Total Variance explained a
Com
pone
nt
Initial eigenvalues Rotation sums of squared
loadings
Total % of
variance
Cumulative
% Total
% of
variance
Cumulative
%
1 6.713 22.375 22.375 4.717 15.723 15.723
2 2.796 9.319 31.694 2.645 8.817 24.540
3 2.414 8.046 39.740 2.135 7.118 31.659
4 1.908 6.360 46.100 2.087 6.955 38.614
5 1.611 5.370 51.470 1.995 6.652 45.266
6 1.336 4.453 55.923 1.885 6.283 51.548
7 1.218 4.060 59.983 1.704 5.679 57.227
8 1.156 3.853 63.837 1.619 5.398 62.625
9 1.097 3.657 67.493 1.460 4.868 67.493
Extraction method: Principal component analysis
The results of the factor analysis are component factors, which comprised variables
that were highly correlated, suggesting an interdependence of the components. Each
factor is presented in Table 47.
Table 47: Factor analysis for Attraction by rotated component group
Rotated component group Component
1 2 3 4 5 6 7 8 9
Supportive work environment .889
Supportive management .846
Resources .773
Safe and secure work environ .711
Career/Growth opportunities .614
Learning and development
opportunities
.558
Longer-term job security
(> 12 months)
.558
Salary/Pay .534 .403

RESULTS: QUANTITATIVE RESEARCH
DBL Thesis_Keshia Mohamed-Padayachee Student Number 71364684 Page 186 of 351
Rotated component group Component
1 2 3 4 5 6 7 8 9
Flexible work arrangements .489
Retirement fund .856
Medical aid .836
Leave .686
Long-term incentives .794
Share options .770
Short-term incentives .570
Formal coaching or mentoring
programmes
.727
Experience working in different
organisations to maximise career
progression
.652
Experience working in different
organisations to maximise career
earnings potential
.586
CSR .477
Employee discounts .750
Sabbaticals or other scheduled
time reductions
.743
Employee wellness offering .425 .591
Non-financial rewards .791
Informal recognition .784
Lump sum annual bonus
payment
.815
Formal recognition .581
Higher base salary with limited
bonus potential
.704
13th cheque .413 .554
Smaller bonuses payments
intermittently
.789
Lower base salary with unlimited
bonus potential
.725
Extraction method: Principal component analysis
Rotation method: Varimax with Kaiser normalization
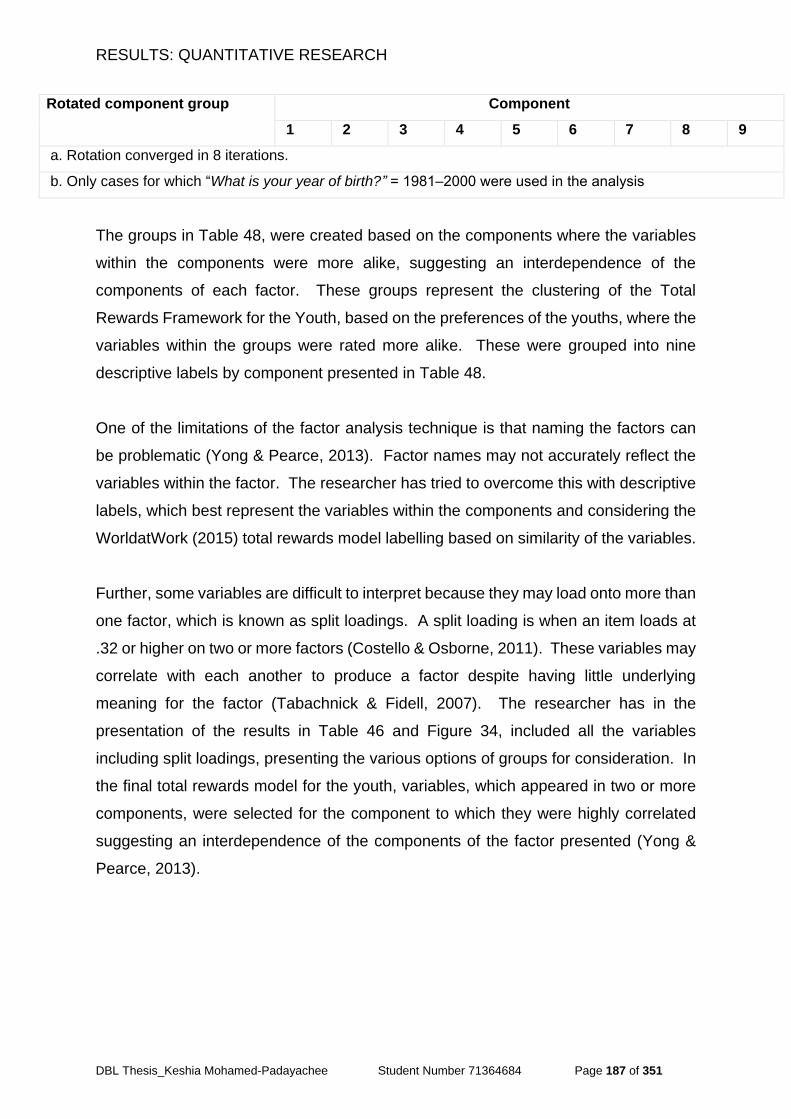
RESULTS: QUANTITATIVE RESEARCH
DBL Thesis_Keshia Mohamed-Padayachee Student Number 71364684 Page 187 of 351
Rotated component group Component
1 2 3 4 5 6 7 8 9
a. Rotation converged in 8 iterations.
b. Only cases for which “What is your year of birth?” = 1981‒2000 were used in the analysis
The groups in Table 48, were created based on the components where the variables
within the components were more alike, suggesting an interdependence of the
components of each factor. These groups represent the clustering of the Total
Rewards Framework for the Youth, based on the preferences of the youths, where the
variables within the groups were rated more alike. These were grouped into nine
descriptive labels by component presented in Table 48.
One of the limitations of the factor analysis technique is that naming the factors can
be problematic (Yong & Pearce, 2013). Factor names may not accurately reflect the
variables within the factor. The researcher has tried to overcome this with descriptive
labels, which best represent the variables within the components and considering the
WorldatWork (2015) total rewards model labelling based on similarity of the variables.
Further, some variables are difficult to interpret because they may load onto more than
one factor, which is known as split loadings. A split loading is when an item loads at
.32 or higher on two or more factors (Costello & Osborne, 2011). These variables may
correlate with each another to produce a factor despite having little underlying
meaning for the factor (Tabachnick & Fidell, 2007). The researcher has in the
presentation of the results in Table 46 and Figure 34, included all the variables
including split loadings, presenting the various options of groups for consideration. In
the final total rewards model for the youth, variables, which appeared in two or more
components, were selected for the component to which they were highly correlated
suggesting an interdependence of the components of the factor presented (Yong &
Pearce, 2013).
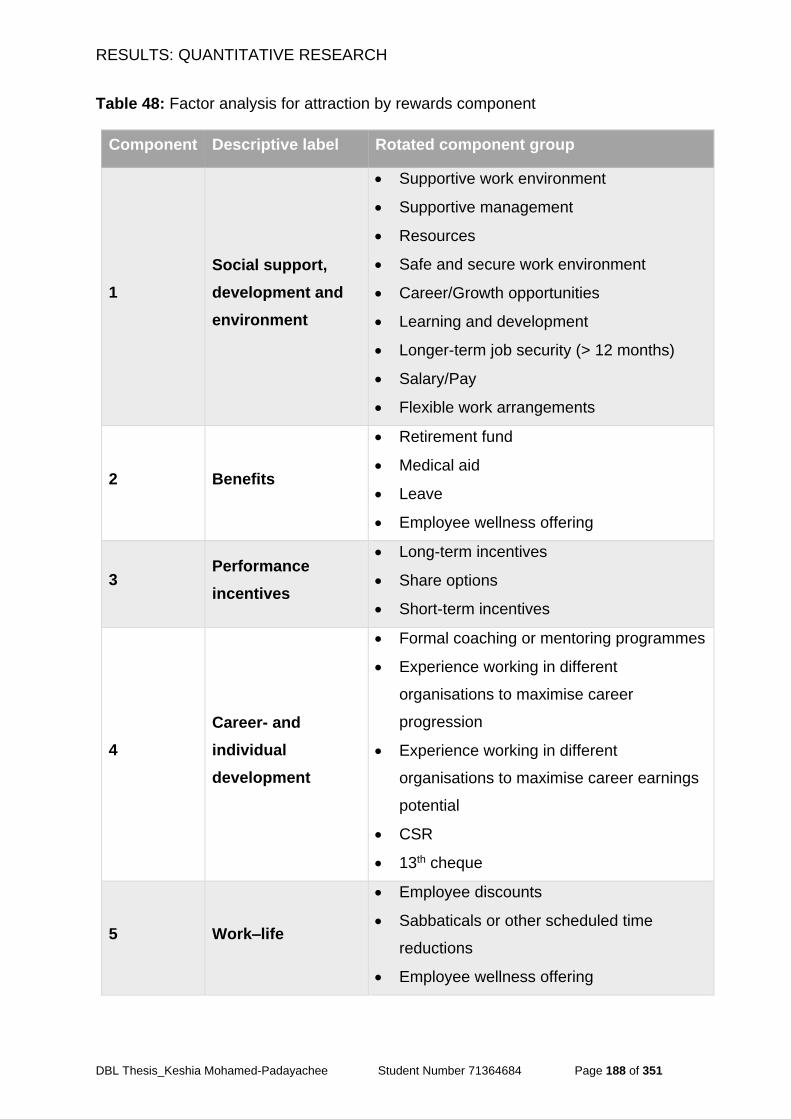
RESULTS: QUANTITATIVE RESEARCH
DBL Thesis_Keshia Mohamed-Padayachee Student Number 71364684 Page 188 of 351
Table 48: Factor analysis for attraction by rewards component
Component Descriptive label Rotated component group
1
Social support,
development and
environment
Supportive work environment
Supportive management
Resources
Safe and secure work environment
Career/Growth opportunities
Learning and development
Longer-term job security (> 12 months)
Salary/Pay
Flexible work arrangements
2 Benefits
Retirement fund
Medical aid
Leave
Employee wellness offering
3 Performance
incentives
Long-term incentives
Share options
Short-term incentives
4
Career- and
individual
development
Formal coaching or mentoring programmes
Experience working in different
organisations to maximise career
progression
Experience working in different
organisations to maximise career earnings
potential
CSR
13th cheque
5 Work‒life
Employee discounts
Sabbaticals or other scheduled time
reductions
Employee wellness offering
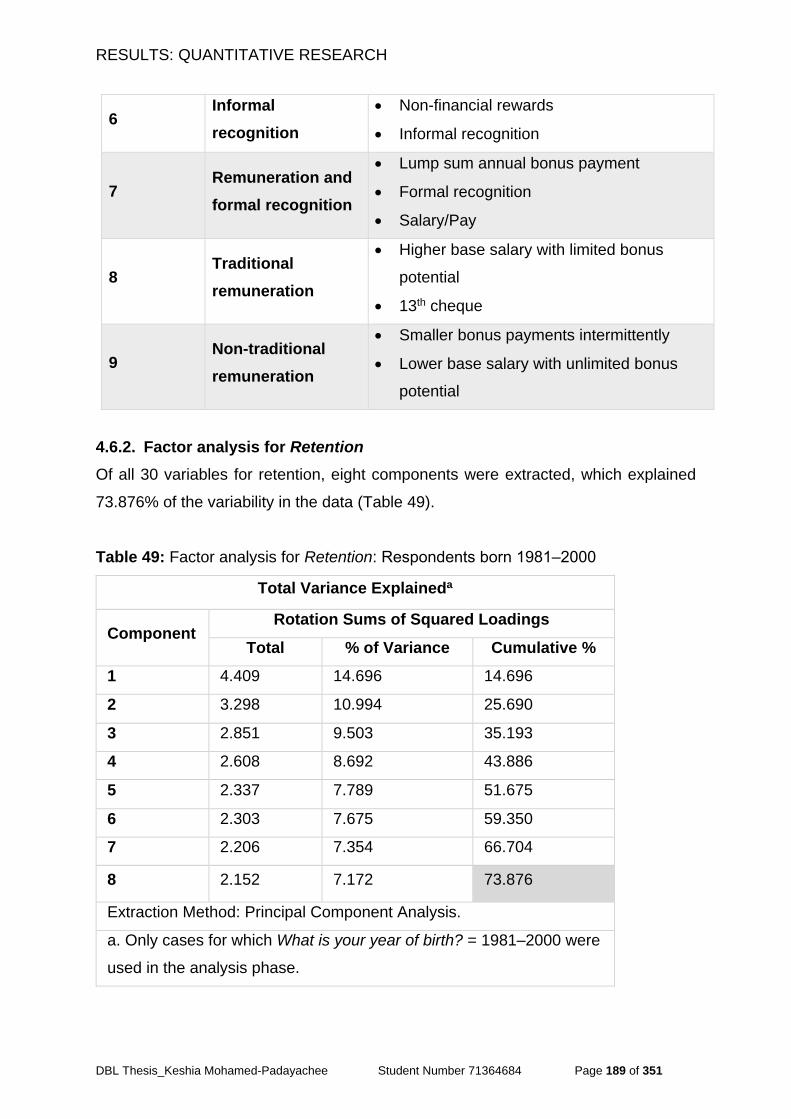
RESULTS: QUANTITATIVE RESEARCH
DBL Thesis_Keshia Mohamed-Padayachee Student Number 71364684 Page 189 of 351
4.6.2. Factor analysis for Retention
Of all 30 variables for retention, eight components were extracted, which explained
73.876% of the variability in the data (Table 49).
Table 49: Factor analysis for Retention: Respondents born 1981‒2000
Total Variance Explaineda
Component Rotation Sums of Squared Loadings
Total % of Variance Cumulative %
1 4.409 14.696 14.696
2 3.298 10.994 25.690
3 2.851 9.503 35.193
4 2.608 8.692 43.886
5 2.337 7.789 51.675
6 2.303 7.675 59.350
7 2.206 7.354 66.704
8 2.152 7.172 73.876
Extraction Method: Principal Component Analysis.
a. Only cases for which What is your year of birth? = 1981‒2000 were
used in the analysis phase.
6 Informal
recognition
Non-financial rewards
Informal recognition
7 Remuneration and
formal recognition
Lump sum annual bonus payment
Formal recognition
Salary/Pay
8 Traditional
remuneration
Higher base salary with limited bonus
potential
13th cheque
9 Non-traditional
remuneration
Smaller bonus payments intermittently
Lower base salary with unlimited bonus
potential
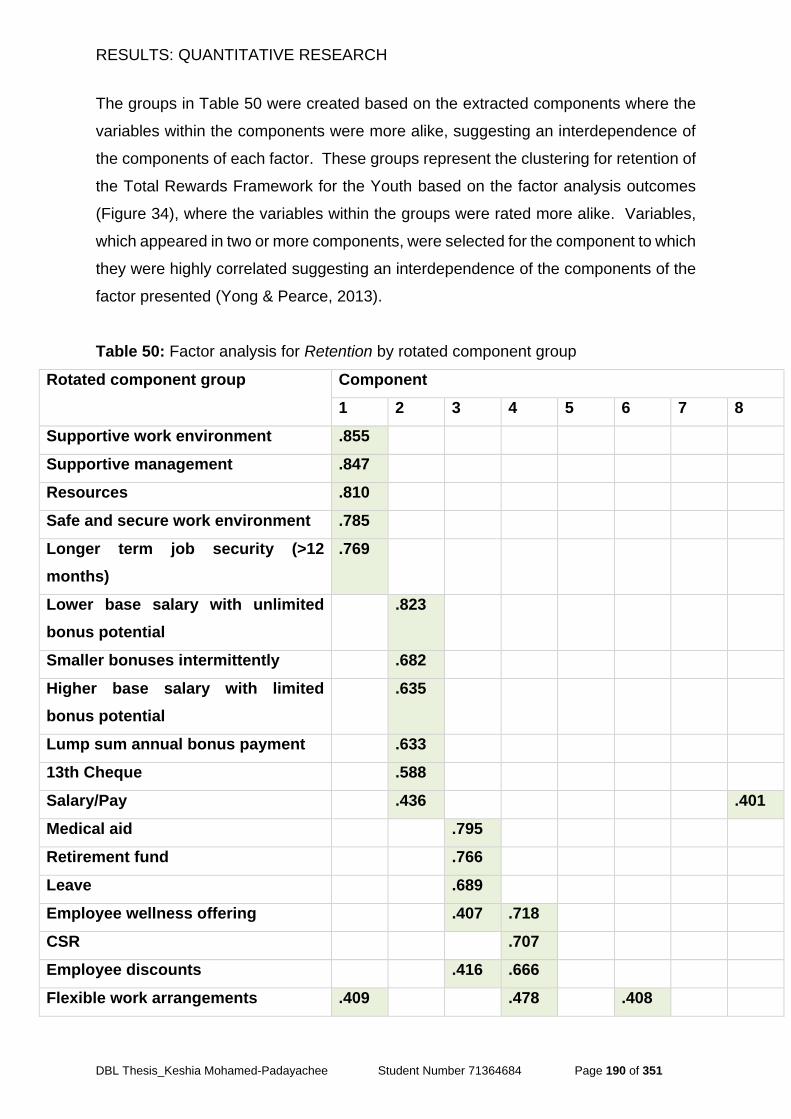
RESULTS: QUANTITATIVE RESEARCH
DBL Thesis_Keshia Mohamed-Padayachee Student Number 71364684 Page 190 of 351
The groups in Table 50 were created based on the extracted components where the
variables within the components were more alike, suggesting an interdependence of
the components of each factor. These groups represent the clustering for retention of
the Total Rewards Framework for the Youth based on the factor analysis outcomes
(Figure 34), where the variables within the groups were rated more alike. Variables,
which appeared in two or more components, were selected for the component to which
they were highly correlated suggesting an interdependence of the components of the
factor presented (Yong & Pearce, 2013).
Table 50: Factor analysis for Retention by rotated component group
Rotated component group Component
1 2 3 4 5 6 7 8
Supportive work environment .855
Supportive management .847
Resources .810
Safe and secure work environment .785
Longer term job security (>12
months)
.769
Lower base salary with unlimited
bonus potential
.823
Smaller bonuses intermittently .682
Higher base salary with limited
bonus potential
.635
Lump sum annual bonus payment .633
13th Cheque .588
Salary/Pay .436 .401
Medical aid .795
Retirement fund .766
Leave .689
Employee wellness offering .407 .718
CSR .707
Employee discounts .416 .666
Flexible work arrangements .409 .478 .408
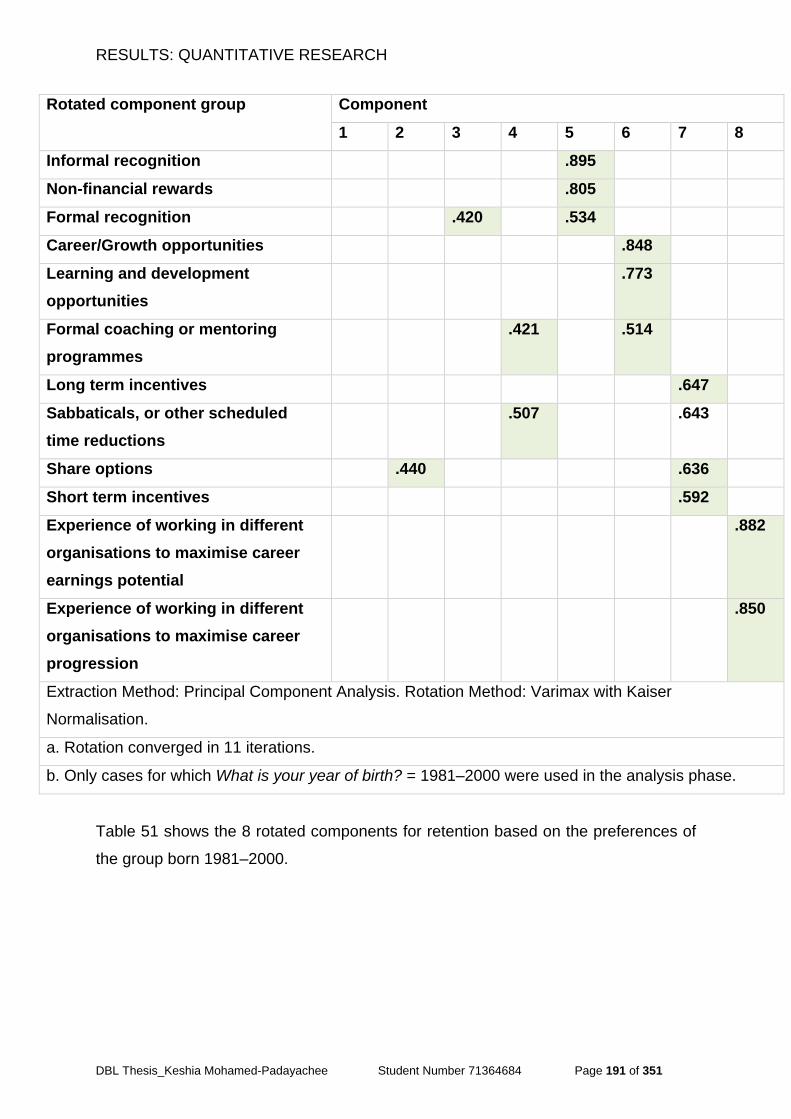
RESULTS: QUANTITATIVE RESEARCH
DBL Thesis_Keshia Mohamed-Padayachee Student Number 71364684 Page 191 of 351
Rotated component group Component
1 2 3 4 5 6 7 8
Informal recognition .895
Non-financial rewards .805
Formal recognition .420 .534
Career/Growth opportunities .848
Learning and development
opportunities
.773
Formal coaching or mentoring
programmes
.421 .514
Long term incentives .647
Sabbaticals, or other scheduled
time reductions
.507 .643
Share options .440 .636
Short term incentives .592
Experience of working in different
organisations to maximise career
earnings potential
.882
Experience of working in different
organisations to maximise career
progression
.850
Extraction Method: Principal Component Analysis. Rotation Method: Varimax with Kaiser
Normalisation.
a. Rotation converged in 11 iterations.
b. Only cases for which What is your year of birth? = 1981‒2000 were used in the analysis phase.
Table 51 shows the 8 rotated components for retention based on the preferences of
the group born 1981‒2000.
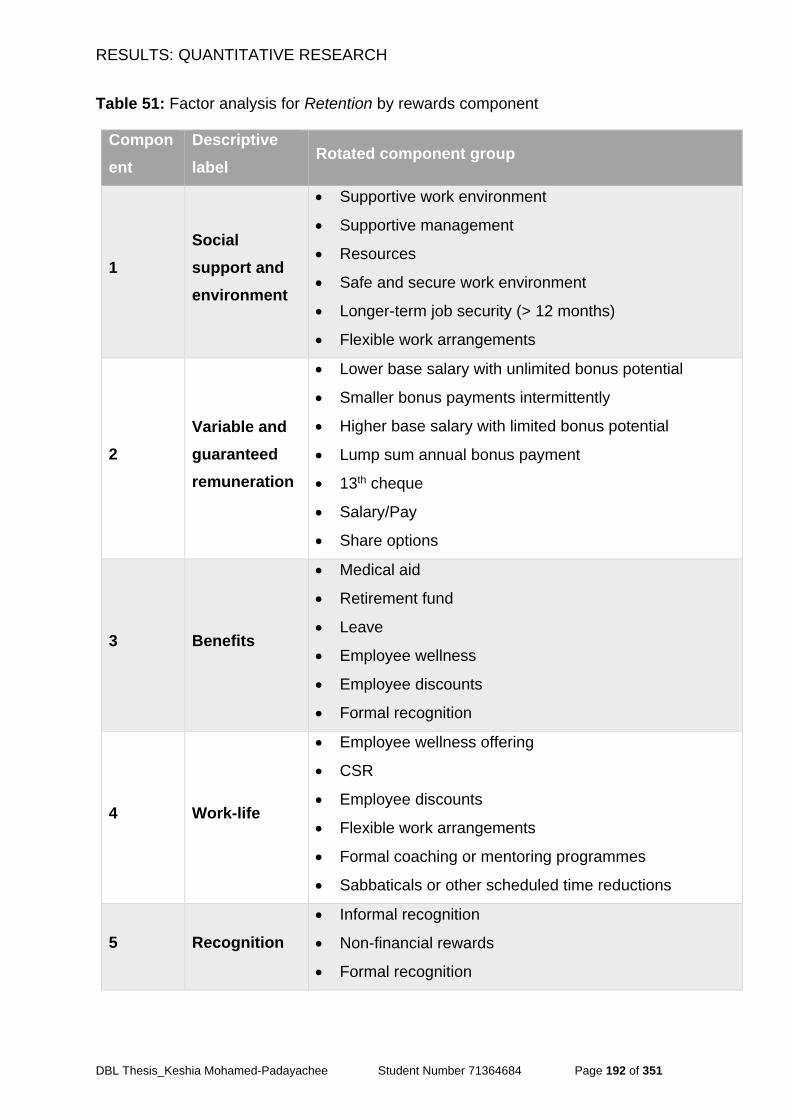
RESULTS: QUANTITATIVE RESEARCH
DBL Thesis_Keshia Mohamed-Padayachee Student Number 71364684 Page 192 of 351
Table 51: Factor analysis for Retention by rewards component
Compon
ent
Descriptive
label Rotated component group
1
Social
support and
environment
Supportive work environment
Supportive management
Resources
Safe and secure work environment
Longer-term job security (> 12 months)
Flexible work arrangements
2
Variable and
guaranteed
remuneration
Lower base salary with unlimited bonus potential
Smaller bonus payments intermittently
Higher base salary with limited bonus potential
Lump sum annual bonus payment
13th cheque
Salary/Pay
Share options
3 Benefits
Medical aid
Retirement fund
Leave
Employee wellness
Employee discounts
Formal recognition
4 Work-life
Employee wellness offering
CSR
Employee discounts
Flexible work arrangements
Formal coaching or mentoring programmes
Sabbaticals or other scheduled time reductions
5 Recognition
Informal recognition
Non-financial rewards
Formal recognition
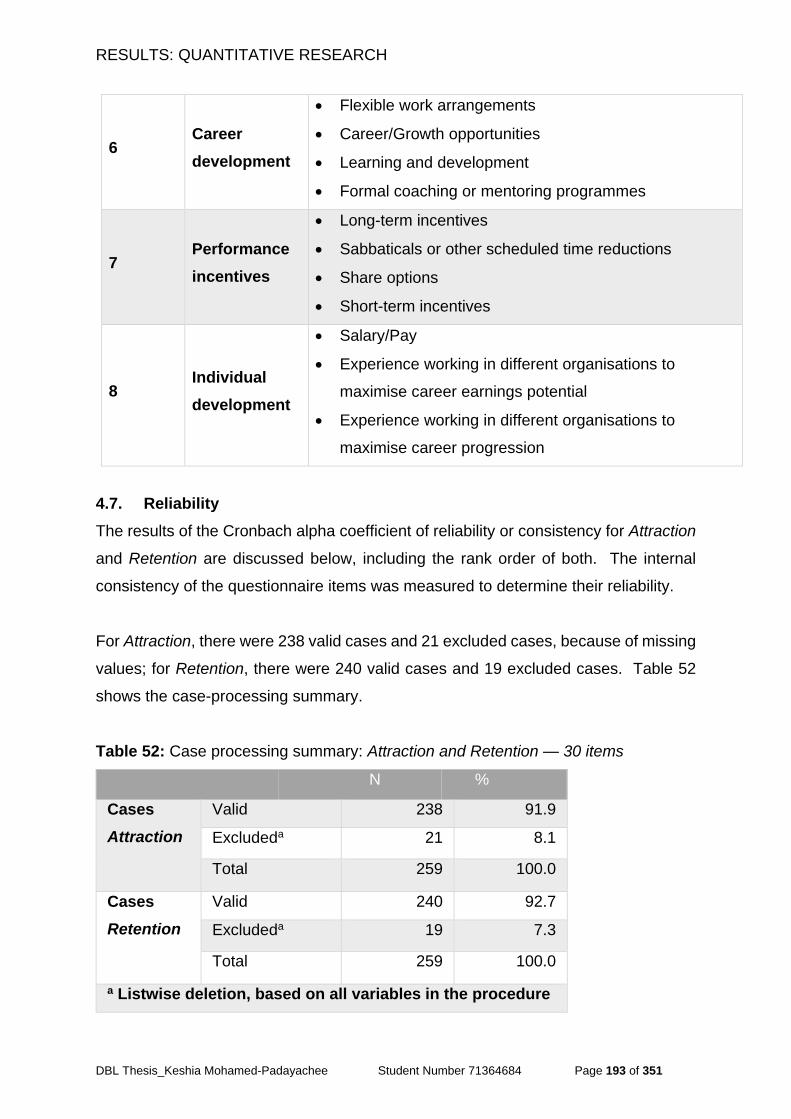
RESULTS: QUANTITATIVE RESEARCH
DBL Thesis_Keshia Mohamed-Padayachee Student Number 71364684 Page 193 of 351
4.7. Reliability
The results of the Cronbach alpha coefficient of reliability or consistency for Attraction
and Retention are discussed below, including the rank order of both. The internal
consistency of the questionnaire items was measured to determine their reliability.
For Attraction, there were 238 valid cases and 21 excluded cases, because of missing
values; for Retention, there were 240 valid cases and 19 excluded cases. Table 52
shows the case-processing summary.
Table 52: Case processing summary: Attraction and Retention — 30 items
N %
Cases
Attraction
Valid 238 91.9
Excludeda 21 8.1
Total 259 100.0
Cases
Retention
Valid 240 92.7
Excludeda 19 7.3
Total 259 100.0
a Listwise deletion, based on all variables in the procedure
6 Career
development
Flexible work arrangements
Career/Growth opportunities
Learning and development
Formal coaching or mentoring programmes
7 Performance
incentives
Long-term incentives
Sabbaticals or other scheduled time reductions
Share options
Short-term incentives
8 Individual
development
Salary/Pay
Experience working in different organisations to
maximise career earnings potential
Experience working in different organisations to
maximise career progression
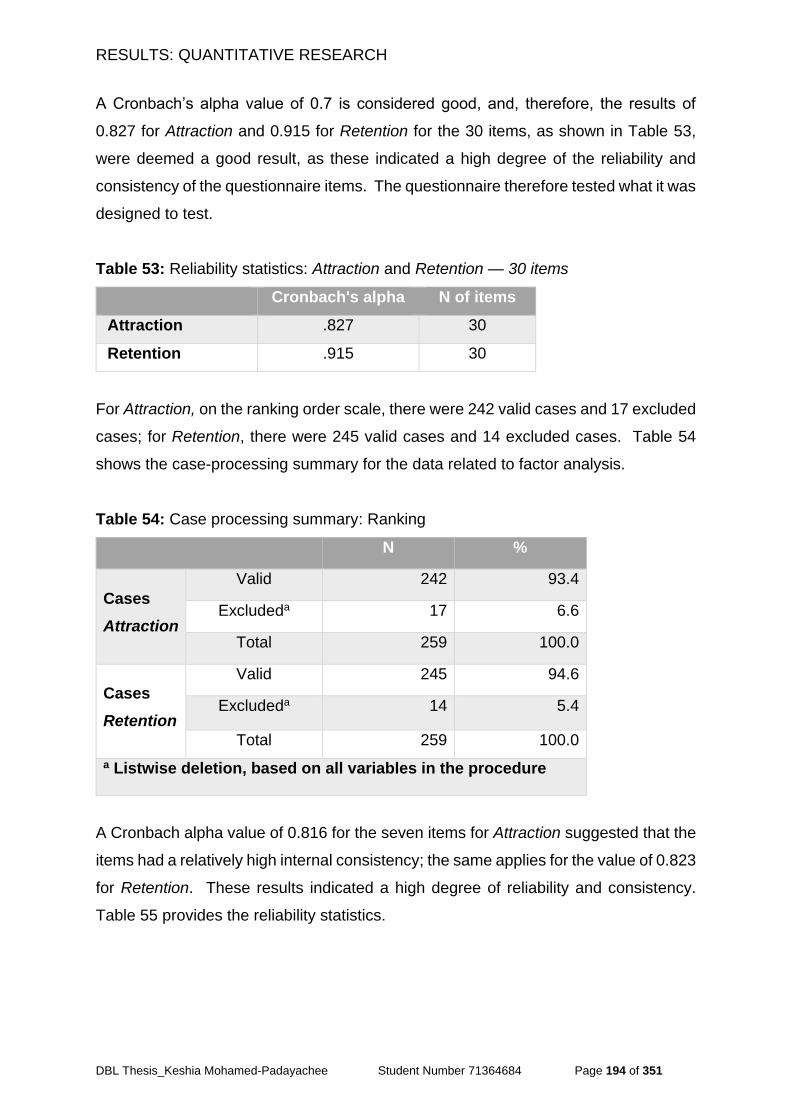
RESULTS: QUANTITATIVE RESEARCH
DBL Thesis_Keshia Mohamed-Padayachee Student Number 71364684 Page 194 of 351
A Cronbach’s alpha value of 0.7 is considered good, and, therefore, the results of
0.827 for Attraction and 0.915 for Retention for the 30 items, as shown in Table 53,
were deemed a good result, as these indicated a high degree of the reliability and
consistency of the questionnaire items. The questionnaire therefore tested what it was
designed to test.
Table 53: Reliability statistics: Attraction and Retention — 30 items
Cronbach's alpha N of items
Attraction .827 30
Retention .915 30
For Attraction, on the ranking order scale, there were 242 valid cases and 17 excluded
cases; for Retention, there were 245 valid cases and 14 excluded cases. Table 54
shows the case-processing summary for the data related to factor analysis.
Table 54: Case processing summary: Ranking
N %
Cases
Attraction
Valid 242 93.4
Excludeda 17 6.6
Total 259 100.0
Cases
Retention
Valid 245 94.6
Excludeda 14 5.4
Total 259 100.0
a Listwise deletion, based on all variables in the procedure
A Cronbach alpha value of 0.816 for the seven items for Attraction suggested that the
items had a relatively high internal consistency; the same applies for the value of 0.823
for Retention. These results indicated a high degree of reliability and consistency.
Table 55 provides the reliability statistics.
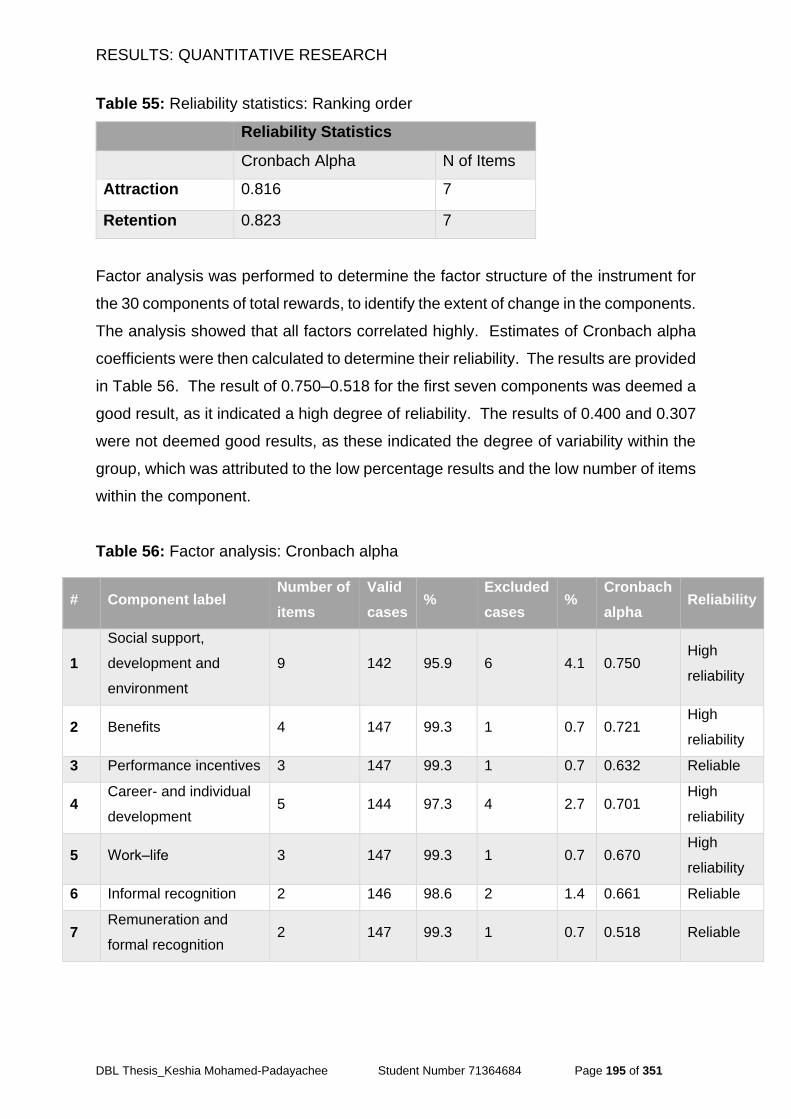
RESULTS: QUANTITATIVE RESEARCH
DBL Thesis_Keshia Mohamed-Padayachee Student Number 71364684 Page 195 of 351
Table 55: Reliability statistics: Ranking order
Reliability Statistics
Cronbach Alpha N of Items
Attraction 0.816 7
Retention 0.823 7
Factor analysis was performed to determine the factor structure of the instrument for
the 30 components of total rewards, to identify the extent of change in the components.
The analysis showed that all factors correlated highly. Estimates of Cronbach alpha
coefficients were then calculated to determine their reliability. The results are provided
in Table 56. The result of 0.750–0.518 for the first seven components was deemed a
good result, as it indicated a high degree of reliability. The results of 0.400 and 0.307
were not deemed good results, as these indicated the degree of variability within the
group, which was attributed to the low percentage results and the low number of items
within the component.
Table 56: Factor analysis: Cronbach alpha
# Component label Number of
items
Valid
cases %
Excluded
cases %
Cronbach
alpha Reliability
1
Social support,
development and
environment
9 142 95.9 6 4.1 0.750 High
reliability
2 Benefits 4 147 99.3 1 0.7 0.721 High
reliability
3 Performance incentives 3 147 99.3 1 0.7 0.632 Reliable
4 Career- and individual
development 5 144 97.3 4 2.7 0.701
High
reliability
5 Work‒life 3 147 99.3 1 0.7 0.670 High
reliability
6 Informal recognition 2 146 98.6 2 1.4 0.661 Reliable
7 Remuneration and
formal recognition 2 147 99.3 1 0.7 0.518 Reliable
RESULTS: QUANTITATIVE RESEARCH
DBL Thesis_Keshia Mohamed-Padayachee Student Number 71364684 Page 196 of 351
4.8. Total rewards framework for the youth
In this section, the results of the frequency analysis and those of factor analysis are
integrated. The eight common components and associated variables are used to
predict what reward factors attract and retain the youth more effectively. Figure 34,
describes the top eight preferences for attraction and retention for the group, 1981‒
2000 based on the results of the factor analysis.
Figure 34, presents the factor analysis results by rated component group for Attraction
and Retention. For Attraction, the first component, was similar for Retention. From
the second to the eighth components, the priorities and preferences differed for
Attraction and Retention.
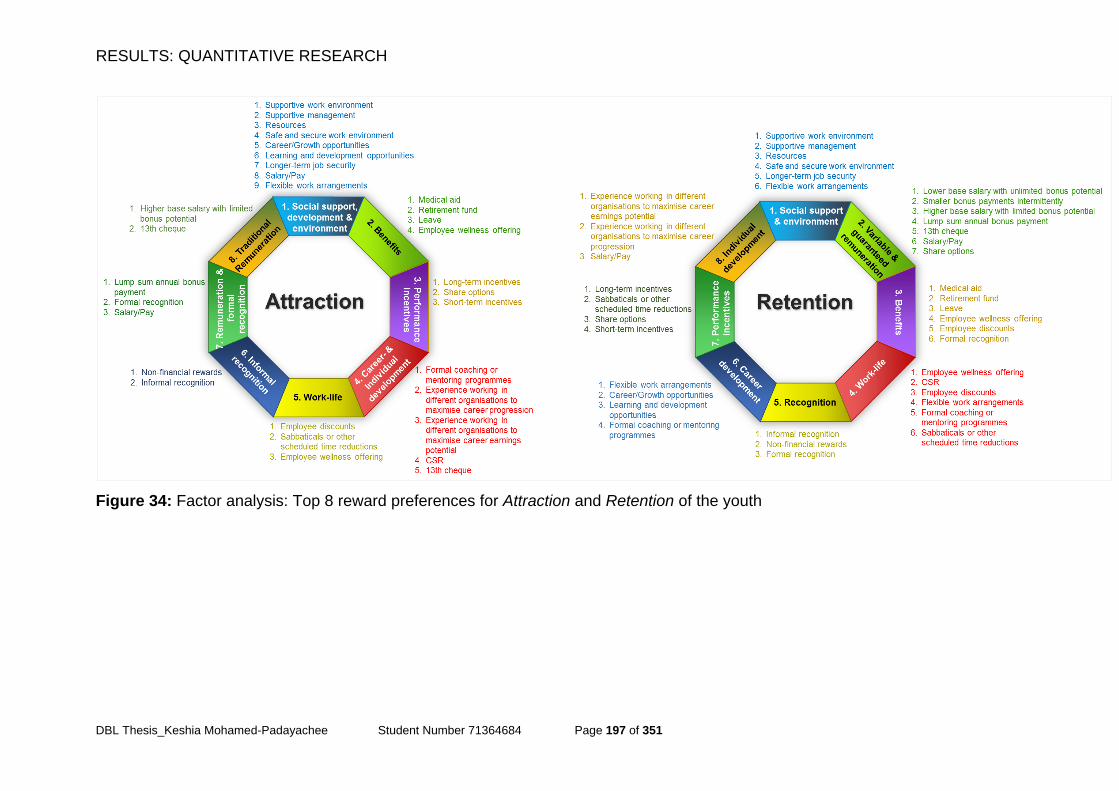
RESULTS: QUANTITATIVE RESEARCH
DBL Thesis_Keshia Mohamed-Padayachee Student Number 71364684 Page 197 of 351
Figure 34: Factor analysis: Top 8 reward preferences for Attraction and Retention of the youth
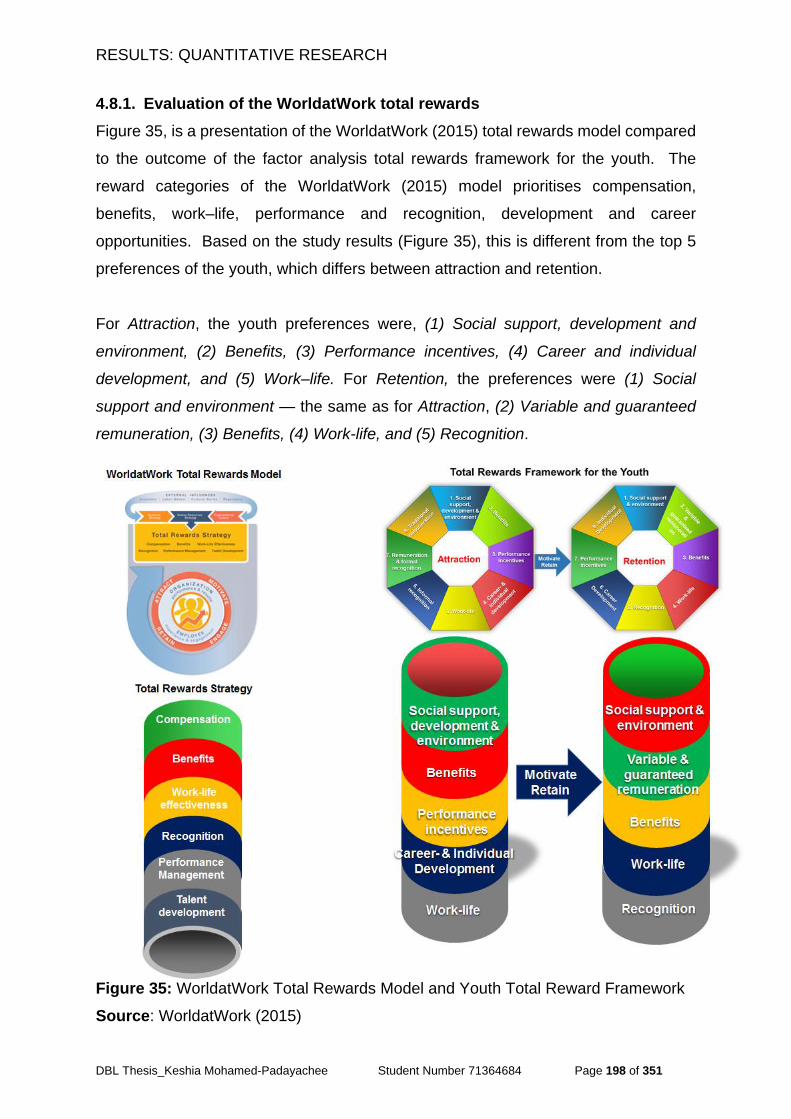
RESULTS: QUANTITATIVE RESEARCH
DBL Thesis_Keshia Mohamed-Padayachee Student Number 71364684 Page 198 of 351
4.8.1. Evaluation of the WorldatWork total rewards
Figure 35, is a presentation of the WorldatWork (2015) total rewards model compared
to the outcome of the factor analysis total rewards framework for the youth. The
reward categories of the WorldatWork (2015) model prioritises compensation,
benefits, work‒life, performance and recognition, development and career
opportunities. Based on the study results (Figure 35), this is different from the top 5
preferences of the youth, which differs between attraction and retention.
For Attraction, the youth preferences were, (1) Social support, development and
environment, (2) Benefits, (3) Performance incentives, (4) Career and individual
development, and (5) Work‒life. For Retention, the preferences were (1) Social
support and environment — the same as for Attraction, (2) Variable and guaranteed
remuneration, (3) Benefits, (4) Work-life, and (5) Recognition.
Figure 35: WorldatWork Total Rewards Model and Youth Total Reward Framework
Source: WorldatWork (2015)
RESULTS: QUANTITATIVE RESEARCH
DBL Thesis_Keshia Mohamed-Padayachee Student Number 71364684 Page 199 of 351
The limitation identified is that the WorldatWork (2015) Total Rewards Model does not
prioritise the preferences for the youth group; the reward categories is considered
applicable to all three generations currently in the workforce. Today’s workplace
consists of three generations: Baby Boomers, Generation X, and Generation Y.
Furthermore, the WorldatWork (2015) Total Rewards Model does not distinguish
between reward preferences for attraction and retention.
4.8.2. Ranking the reward factors
4.8.2.1. Attraction
Factor analysis extracted 9 reward preferences for Attraction. The Ranking of the
reward factors determined in this study through factor analysis is, (1) Social support
and environment, (2) Benefits, (3) Performance incentives, (4) Career- and individual
development, (5) Work‒life, (6) Informal recognition, (7) Remuneration and formal
recognition, (8) Traditional remuneration, and (9) Non-traditional remuneration.
The youth reward preferences identified from the results of Frequency analysis for
Attraction of the youth to organisations (in section 4.3.1.) in order of importance were:
(1) Career development, (2) Benefits, (3) Remuneration and Safety/Security, (4)
Resources, (5) Social support, (6) Safety/Security, and (7) Career development and
Work-life
This implies that the most important reward preferences for the youth, in order of
importance are: (1) Social support, development and environment (2) Benefits, and
(3) Performance incentives.
4.8.2.2. Retention
Factor analysis extracted 8 reward preferences for retention. The Ranking of the
reward factors determined in this study through factor analysis is, (1) Social support &
environment, (2) Variable and guaranteed remuneration, (3) Benefits, (4) Work-life, (5)
Recognition, (6) Career development, (7) Performance incentives, and (8) Individual
development.
RESULTS: QUANTITATIVE RESEARCH
DBL Thesis_Keshia Mohamed-Padayachee Student Number 71364684 Page 200 of 351
The youth reward preferences identified from the results of Frequency analysis for
retention of the youth in organisations (in section 4.3.2, figure 30) in order of
importance were, (1) Career development, (2) Social support, (3) Resources and
Work-life, (4) Safety/Security, (6) Benefits and Remuneration, and (7) Safety/Security
and Benefits.
This implies that the most important reward preferences for retention of the youth, in
order of importance, are: (1) Social support and environment, (2) Variable and
guaranteed remuneration, and (3) Benefits.
4.9. Conclusion
Attracting and retaining high-performing employees are imperative for organisational
success. This chapter summarised the research findings of Phase I, providing insights
into the preferences of respondents, particularly employees born 1981–2000.
Some associations between reward preferences and demographic characteristics
were found for gender, race and relationship status.
For Gender, the reward preferences were Share options, Smaller bonus payments
intermittently, Experience working in different organisations to maximise career
progression, CSR, Safe/secure work environment, and Supportive management.
For Race, they were: 13th cheque, Short-term incentives, Share options, Medical aid,
Retirement fund, Employee discounts, Employee wellness offering, Formal
recognition, Informal recognition, Learning and development opportunities,
Experience working in different organisations to maximise career progression, Formal
coaching or mentoring programmes, Safe/secure work environment, and Resources.
For Relationship status, they were: Lower base salary with unlimited bonus potential,
Non-financial rewards, and Formal recognition.
For Attraction, the youth value Leave, Employee discounts, Long-term job security,
and a Safe/secure work environment more than the previous generations. The most
RESULTS: QUANTITATIVE RESEARCH
DBL Thesis_Keshia Mohamed-Padayachee Student Number 71364684 Page 201 of 351
important reward preferences for the youth, in order of importance, are: (1) Social
support, development and environment (2) Benefits, and (3) Performance incentives.
For Retention, youth have rewards preferences more or less similar to those of
previous generations, but they value Employee discounts more than previous
generations do. The most important reward preferences for retention of the youth, in
order of importance are: ((1) Social support and environment, (2) Variable and
guaranteed remuneration, and (3) Benefits.
It was found that the youth’s preferences can be grouped into nine descriptive labels
for Attraction, namely Social support, development and environment, Benefits,
Performance incentives, Career and individual development, Work‒life, Informal
recognition, Remuneration and formal recognition, and Traditional and Non-traditional
remuneration. For Retention grouped into eight descriptive labels, namely: Social
support and environment, Variable and guaranteed remuneration, Benefits, Work-life,
Recognition, Career development, Performance incentives, and then Individual
development.
.
The next chapter presents the findings from the qualitative phase of the research.
CHAPTER 5
DBL Thesis_Keshia Mohamed-Padayachee Student Number 71364684 Page 202 of 351
CHAPTER 5
RESULTS: QUALITATIVE RESEARCH
5.1. Introduction
Qualitative data work well alongside quantitative data. Qualitative results provide in-
depth views, meaning, and experiences. This chapter presents the findings from
Phase II of the research, which helped to validate the findings from Phase I, providing
in-depth understanding of the topic at hand (Lee, 1999).
This chapter is structured similarly to Chapter 4, beginning with a summary of the
methodology described in Chapter 3, followed by the qualitative findings by total
rewards category and then the elements for attraction and retention. The chapter
concludes with a summary of the findings regarding attraction and retention and a
newly developed total rewards framework, provided in Section 5.6, and a conclusion
in Section 5.7.
5.2. Background
The methodology described in Chapter 3 was applied in the 11 interviews, which were
conducted over a period of four weeks. The researcher solicited participants from the
institutions where the quantitative research had been conducted. The researcher
interviewed representatives of two groups, namely (1) five youths and (2) eight HR
practitioners. The latter group consisted of three HRGs and five HR specialists
(comprising two recruitment specialists, one remuneration specialist, and two OD
specialists). Of the 11 interviewees, eight were from the sample who had completed
the questionnaire in Phase I.
5.3. Qualitative findings
The report on the qualitative findings begins with a review of the demographic profile
of the interviewees by group. The researcher thereafter presents the findings for the
various interviewee groups by total rewards category and element, and describes the
RESULTS: QUALITATIVE RESEARCH
DBL Thesis_Keshia Mohamed-Padayachee Student Number 71364684 Page 203 of 351
views on each of these. The narrative presenting the findings begins with the
researcher specifying the category and codes classified under each category, wherein
emerging codes were also noted. The researcher then presents the frequency of the
codes, and describes what was found within each code by interviewees group,
summarising the participants’ responses for each code, to corroborate the findings.
More detailed interview responses, including relevant extracts by group for each code,
are provided in Appendix C.
5.3.1. Section A: Demographics
The findings related to the demographics from Phase I of the quantitative findings were
presented as part of the interview process, to provide the interviewees with an
overview of the respondents’ and groups’ views, to solicit their views in this regard.
The participants during this process shared their demographic information with the
researcher, which is described next.
5.3.1.1. Youths
Five youth participants (born between 1981 and 2000) were interviewed, with the
eldest interviewee born in 1981 and the youngest born in 1990. The race- and gender
profiles of the interviewees were diverse: four women and one man represented the
black African (2), Coloured (2), and white race (1) groups. The Indian race group was
not represented, this could imply a possible limitation of the present study in terms of
racial representation. When compared to data from Statistics South Africa (2013), of
the population of South Africa 48.2% were men and 51.7% women. This implies a
possible limitation of the present study in terms of gender representation.
The interviewees’ fields of study were diverse; these included social sciences,
commerce, organisational psychology, humanities, business management, and law.
The interviewees were all from the Gauteng province, representing both the public and
private sectors. Of those interviewed, four were living on their own and one was living
with parents. Three were married and two were single or had never been married.
Their years’ experience ranged from two weeks to 14 years.
RESULTS: QUALITATIVE RESEARCH
DBL Thesis_Keshia Mohamed-Padayachee Student Number 71364684 Page 204 of 351
5.3.1.2. HR generalists (HRGs)
Interviews were conducted with three HRGs. Of these, two were executive managers
who had been in various roles in HR for the past 20 to 25 years. They were interviewed
in person. The third interview was telephonic, and was conducted with a senior HR
manager who had been in HR for the past 15 years. The third interviewee was
concerned about confidentiality, having shared confidential information on her
organisation during the interview. The researcher confirmed that confidentiality would
be upheld, and that the results would be sanitised.
A group of HR specialists were also interviewed. Their fields of specialisation were as
follows:
5.3.1.2.1. Recruitment specialists
One recruitment specialist was a talent acquisition (TA) specialist, and the other was
a director of a recruitment agency that recruited for clients across different industries.
The second interviewee was able to share information about youths in various
industries.
5.3.1.2.2. Remuneration specialist
The remuneration specialist interviewed had over 35 years’ remuneration experience
and a deep understanding of the field, which he shared of during the interview.
5.3.1.2.3. OD specialists
Of the OD specialists, one was an executive manager, and the other was a senior
manager. They both had more than 14 years’ experience in the field.
All the interviewees were relaxed during the interviews, and openly responded to the
questions posed. They shared many thoughts and experiences with the researcher,
and allowed the researcher the opportunity to probe and clarify their statements. Most
of the interviews took place at their place of employment, and the rest took place at a
convenient venue requested by the interviewee. The duration of the interviews ranged
from 20 to 60 minutes, and the interviewer was satisfied with the outcome.
RESULTS: QUALITATIVE RESEARCH
DBL Thesis_Keshia Mohamed-Padayachee Student Number 71364684 Page 205 of 351
5.3.2. Section B: Total rewards options
This section presents a summary of the participants’ responses based on trends (the
overall pattern or tendency of responses across groups), similarities, and differences
in each of the categories and elements by group (youths and then HR practitioners),
providing unbiased, in-depth, valid, reliable, credible, and rigorous findings by category
(Anderson, 2010).
Throughout this section, the findings are presented by categories and elements
grouped in this order, under headings with the name of the reward category.
Contradictory evidence, also known as deviant cases, were identified, examined, and
accounted for in the analysis, ensuring that researcher bias did not influence the
findings (Anderson, 2010). Constant comparison was conducted, which enabled the
researcher to identify emerging/unanticipated themes.
Presenting the qualitative results required that the researcher validate the findings with
verbatim responses (see Appendix C). Including large portions of an interview in the
research paper was not deemed necessary, and would have resulted in this chapter
being tedious for the reader. The researcher selected quotes by reward category that
are poignant and/or most representative of the research findings (Anderson, 2010).
These direct quotations from the interviews have been included in Appendix C by
category and element.
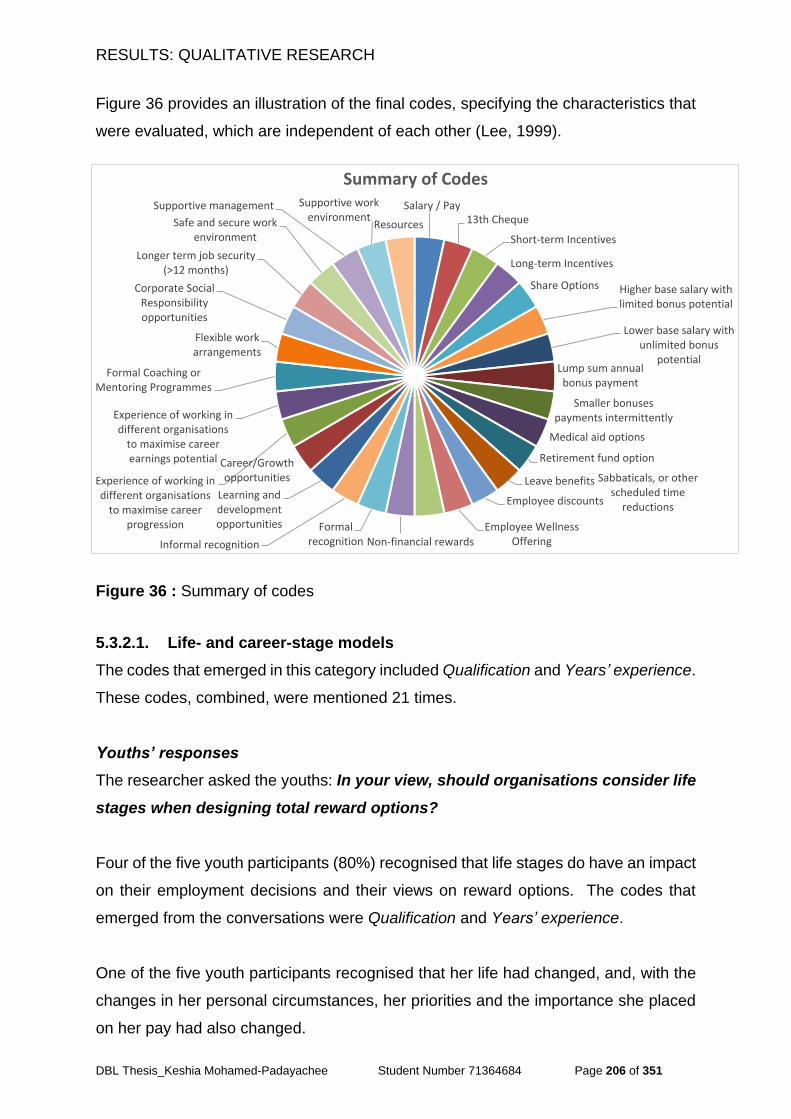
RESULTS: QUALITATIVE RESEARCH
DBL Thesis_Keshia Mohamed-Padayachee Student Number 71364684 Page 206 of 351
Figure 36 provides an illustration of the final codes, specifying the characteristics that
were evaluated, which are independent of each other (Lee, 1999).
Figure 36 : Summary of codes
5.3.2.1. Life- and career-stage models
The codes that emerged in this category included Qualification and Years’ experience.
These codes, combined, were mentioned 21 times.
Youths’ responses
The researcher asked the youths: In your view, should organisations consider life
stages when designing total reward options?
Four of the five youth participants (80%) recognised that life stages do have an impact
on their employment decisions and their views on reward options. The codes that
emerged from the conversations were Qualification and Years’ experience.
One of the five youth participants recognised that her life had changed, and, with the
changes in her personal circumstances, her priorities and the importance she placed
on her pay had also changed.
Salary / Pay 13th Cheque
Short-term Incentives
Long-term Incentives
Share Options Higher base salary with limited bonus potential
Lower base salary with unlimited bonus
potential Lump sum annual bonus payment
Smaller bonuses payments intermittently
Medical aid options
Retirement fund option
Leave benefits
Employee discounts
Employee Wellness Offering
Sabbaticals, or other scheduled time
reductions
Non-financial rewards
Formal recognition Informal recognition
Learning and development opportunities
Career/Growth opportunitiesExperience of working in
different organisations to maximise career
progression
Experience of working in different organisations
to maximise career earnings potential
Formal Coaching or Mentoring Programmes
Flexible work arrangements
Corporate Social Responsibility opportunities
Longer term job security (>12 months)
Safe and secure work environment
Supportive management Supportive work environment
Resources
Summary of Codes
RESULTS: QUALITATIVE RESEARCH
DBL Thesis_Keshia Mohamed-Padayachee Student Number 71364684 Page 207 of 351
Availability to travel was linked to life stages. Based on the responses, the participants
who had families were not as eager to travel as before.
Medical aid was also linked to life stage. One participant stated, “It is very important,
especially now that I have a family...”
HR practitioners’ responses
The question the researcher posed to the HR practitioners was: Does your
organisation consider life-stage modelling in its total rewards offering?
The response from two of the three HRG participants was that they did not consider
life-stage modelling, and one of the interviewees felt this was a very progressive way
of viewing rewards. The third interviewee was from the sales industry, and her
company did consider life stages. The importance of flexible work arrangements was
also linked to life stages, with HRGs stating that this becomes important for the youth
when “Moms with kids are looking for more flexibility.”
The two recruitment specialist participants did not mention life stages.
The response from the remuneration specialist was that life stages are applicable to
all employees, which they do take into consideration as an organisation when creating
their total rewards.
5.3.2.2. Remuneration
Included in this category were the codes Salary/Pay, 13th cheque, Short-term
incentives, Long-term incentives, Share options, and codes related to frequency of
payments and structure of pay. The emerging codes were Qualifications and Work
experience. Combined, these codes were mentioned 158 times.
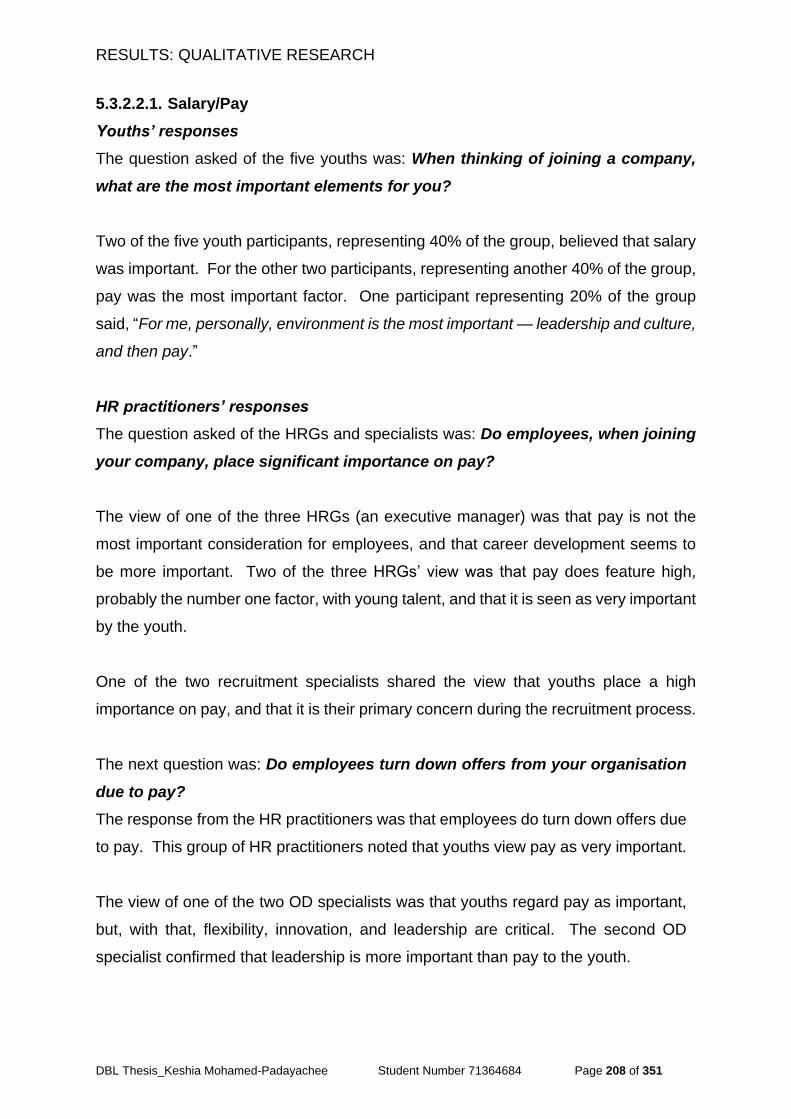
RESULTS: QUALITATIVE RESEARCH
DBL Thesis_Keshia Mohamed-Padayachee Student Number 71364684 Page 208 of 351
5.3.2.2.1. Salary/Pay
Youths’ responses
The question asked of the five youths was: When thinking of joining a company,
what are the most important elements for you?
Two of the five youth participants, representing 40% of the group, believed that salary
was important. For the other two participants, representing another 40% of the group,
pay was the most important factor. One participant representing 20% of the group
said, “For me, personally, environment is the most important — leadership and culture,
and then pay.”
HR practitioners’ responses
The question asked of the HRGs and specialists was: Do employees, when joining
your company, place significant importance on pay?
The view of one of the three HRGs (an executive manager) was that pay is not the
most important consideration for employees, and that career development seems to
be more important. Two of the three HRGs’ view was that pay does feature high,
probably the number one factor, with young talent, and that it is seen as very important
by the youth.
One of the two recruitment specialists shared the view that youths place a high
importance on pay, and that it is their primary concern during the recruitment process.
The next question was: Do employees turn down offers from your organisation
due to pay?
The response from the HR practitioners was that employees do turn down offers due
to pay. This group of HR practitioners noted that youths view pay as very important.
The view of one of the two OD specialists was that youths regard pay as important,
but, with that, flexibility, innovation, and leadership are critical. The second OD
specialist confirmed that leadership is more important than pay to the youth.
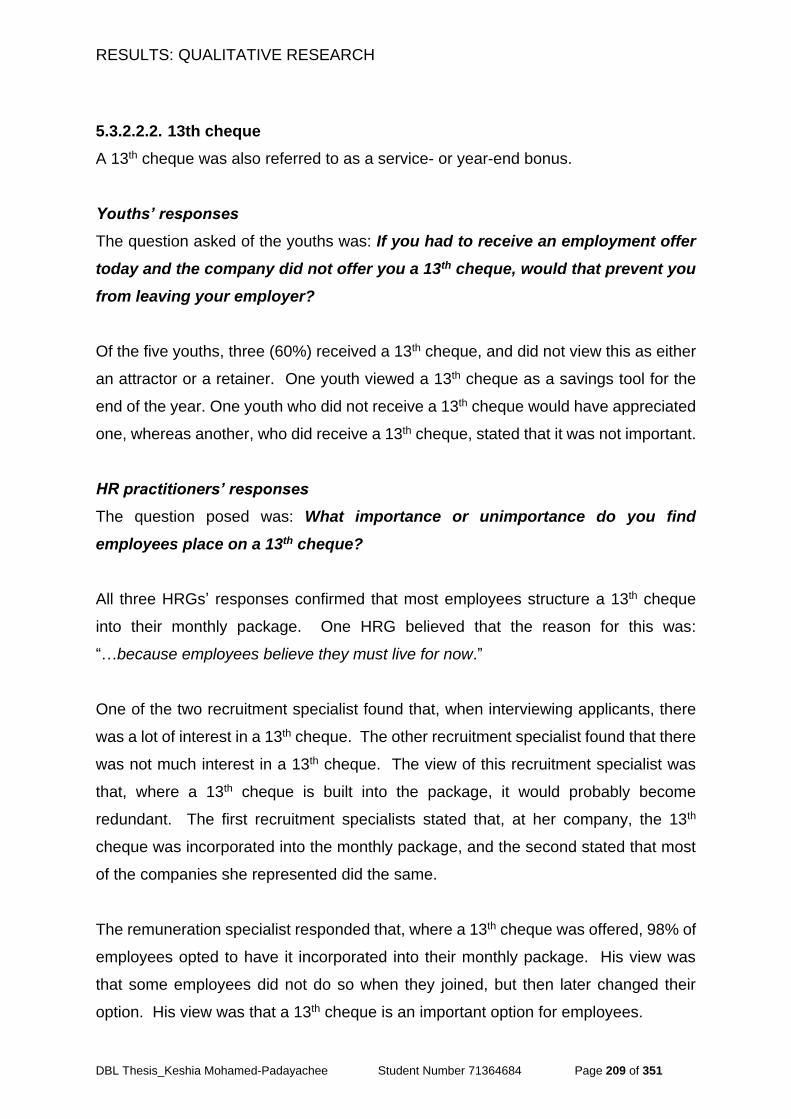
RESULTS: QUALITATIVE RESEARCH
DBL Thesis_Keshia Mohamed-Padayachee Student Number 71364684 Page 209 of 351
5.3.2.2.2. 13th cheque
A 13th cheque was also referred to as a service- or year-end bonus.
Youths’ responses
The question asked of the youths was: If you had to receive an employment offer
today and the company did not offer you a 13th cheque, would that prevent you
from leaving your employer?
Of the five youths, three (60%) received a 13th cheque, and did not view this as either
an attractor or a retainer. One youth viewed a 13th cheque as a savings tool for the
end of the year. One youth who did not receive a 13th cheque would have appreciated
one, whereas another, who did receive a 13th cheque, stated that it was not important.
HR practitioners’ responses
The question posed was: What importance or unimportance do you find
employees place on a 13th cheque?
All three HRGs’ responses confirmed that most employees structure a 13th cheque
into their monthly package. One HRG believed that the reason for this was:
“…because employees believe they must live for now.”
One of the two recruitment specialist found that, when interviewing applicants, there
was a lot of interest in a 13th cheque. The other recruitment specialist found that there
was not much interest in a 13th cheque. The view of this recruitment specialist was
that, where a 13th cheque is built into the package, it would probably become
redundant. The first recruitment specialists stated that, at her company, the 13th
cheque was incorporated into the monthly package, and the second stated that most
of the companies she represented did the same.
The remuneration specialist responded that, where a 13th cheque was offered, 98% of
employees opted to have it incorporated into their monthly package. His view was
that some employees did not do so when they joined, but then later changed their
option. His view was that a 13th cheque is an important option for employees.
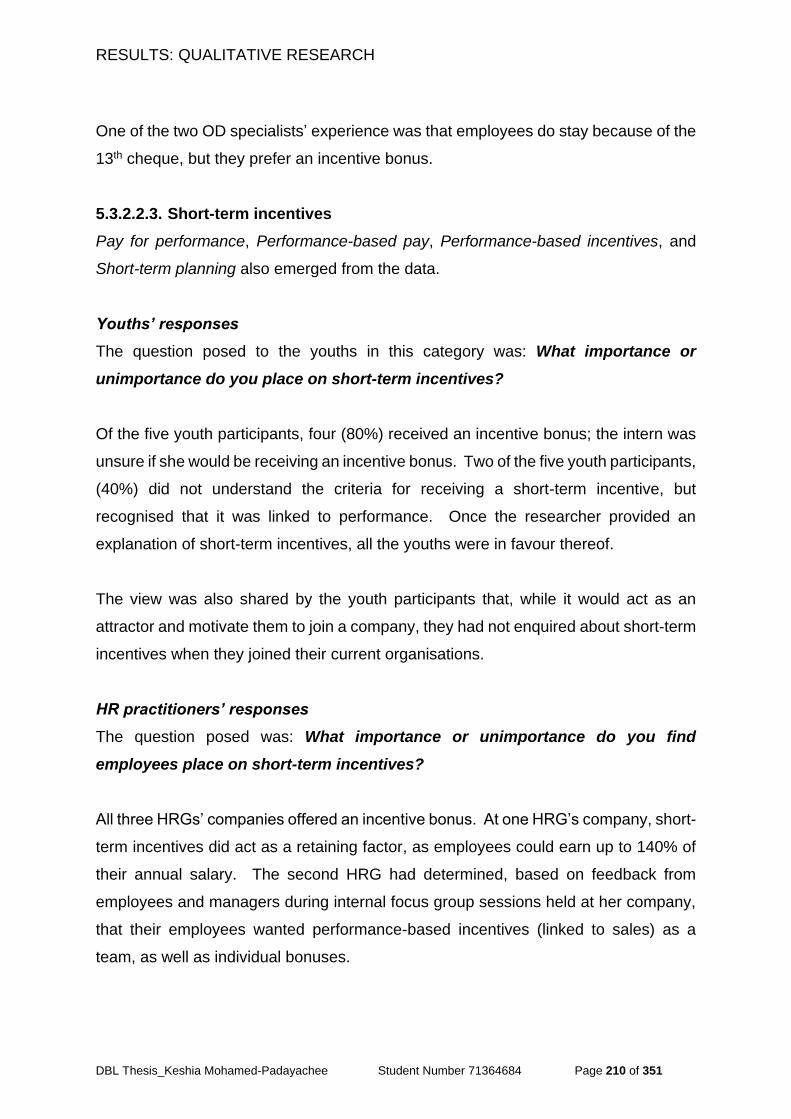
RESULTS: QUALITATIVE RESEARCH
DBL Thesis_Keshia Mohamed-Padayachee Student Number 71364684 Page 210 of 351
One of the two OD specialists’ experience was that employees do stay because of the
13th cheque, but they prefer an incentive bonus.
5.3.2.2.3. Short-term incentives
Pay for performance, Performance-based pay, Performance-based incentives, and
Short-term planning also emerged from the data.
Youths’ responses
The question posed to the youths in this category was: What importance or
unimportance do you place on short-term incentives?
Of the five youth participants, four (80%) received an incentive bonus; the intern was
unsure if she would be receiving an incentive bonus. Two of the five youth participants,
(40%) did not understand the criteria for receiving a short-term incentive, but
recognised that it was linked to performance. Once the researcher provided an
explanation of short-term incentives, all the youths were in favour thereof.
The view was also shared by the youth participants that, while it would act as an
attractor and motivate them to join a company, they had not enquired about short-term
incentives when they joined their current organisations.
HR practitioners’ responses
The question posed was: What importance or unimportance do you find
employees place on short-term incentives?
All three HRGs’ companies offered an incentive bonus. At one HRG’s company, short-
term incentives did act as a retaining factor, as employees could earn up to 140% of
their annual salary. The second HRG had determined, based on feedback from
employees and managers during internal focus group sessions held at her company,
that their employees wanted performance-based incentives (linked to sales) as a
team, as well as individual bonuses.
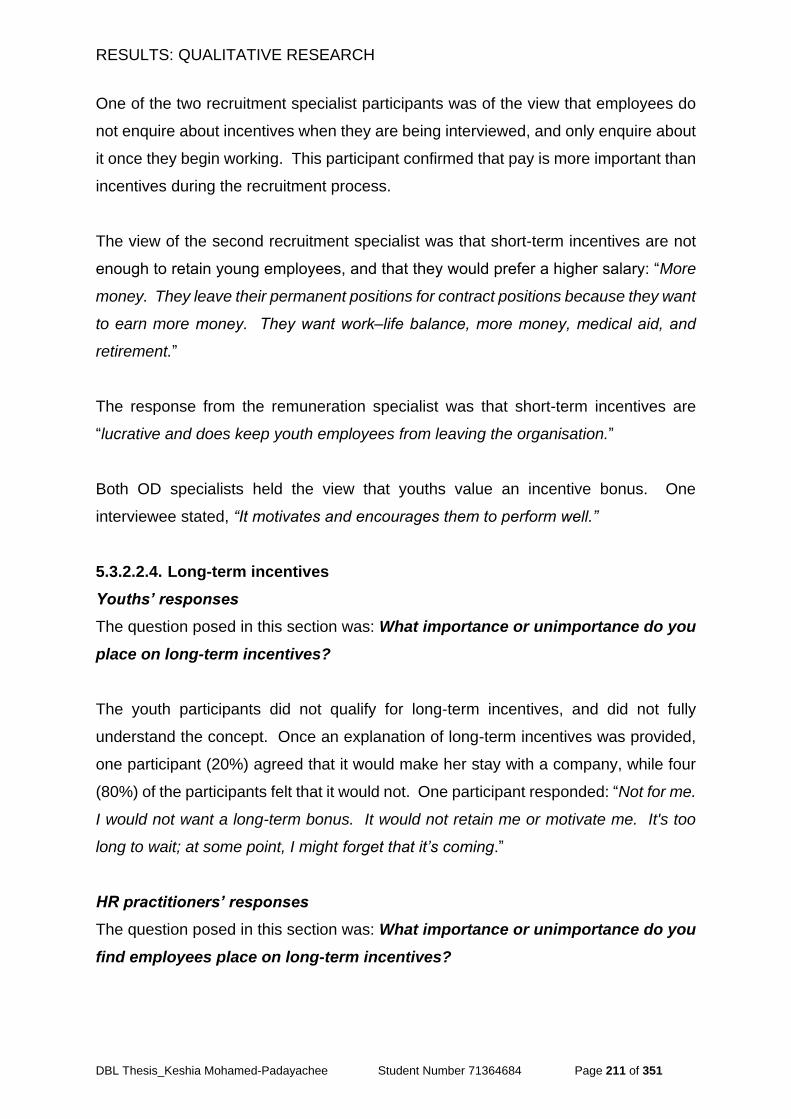
RESULTS: QUALITATIVE RESEARCH
DBL Thesis_Keshia Mohamed-Padayachee Student Number 71364684 Page 211 of 351
One of the two recruitment specialist participants was of the view that employees do
not enquire about incentives when they are being interviewed, and only enquire about
it once they begin working. This participant confirmed that pay is more important than
incentives during the recruitment process.
The view of the second recruitment specialist was that short-term incentives are not
enough to retain young employees, and that they would prefer a higher salary: “More
money. They leave their permanent positions for contract positions because they want
to earn more money. They want work‒life balance, more money, medical aid, and
retirement.”
The response from the remuneration specialist was that short-term incentives are
“lucrative and does keep youth employees from leaving the organisation.”
Both OD specialists held the view that youths value an incentive bonus. One
interviewee stated, “It motivates and encourages them to perform well.”
5.3.2.2.4. Long-term incentives
Youths’ responses
The question posed in this section was: What importance or unimportance do you
place on long-term incentives?
The youth participants did not qualify for long-term incentives, and did not fully
understand the concept. Once an explanation of long-term incentives was provided,
one participant (20%) agreed that it would make her stay with a company, while four
(80%) of the participants felt that it would not. One participant responded: “Not for me.
I would not want a long-term bonus. It would not retain me or motivate me. It's too
long to wait; at some point, I might forget that it’s coming.”
HR practitioners’ responses
The question posed in this section was: What importance or unimportance do you
find employees place on long-term incentives?
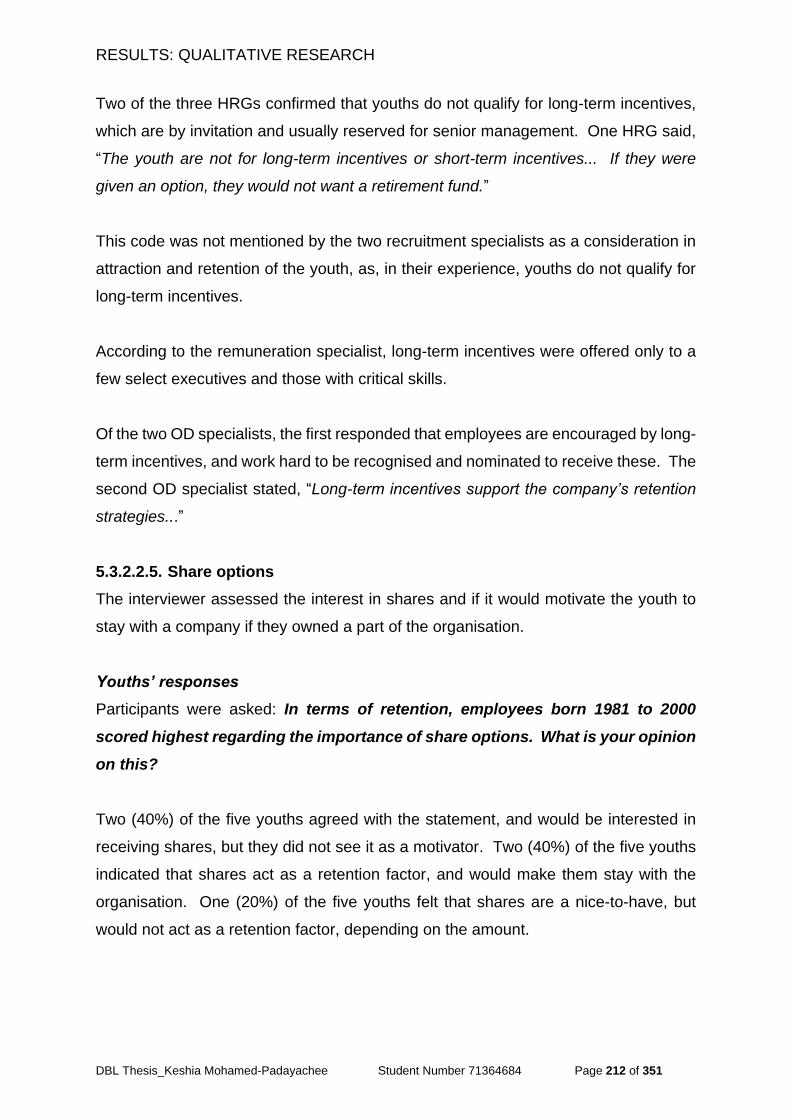
RESULTS: QUALITATIVE RESEARCH
DBL Thesis_Keshia Mohamed-Padayachee Student Number 71364684 Page 212 of 351
Two of the three HRGs confirmed that youths do not qualify for long-term incentives,
which are by invitation and usually reserved for senior management. One HRG said,
“The youth are not for long-term incentives or short-term incentives... If they were
given an option, they would not want a retirement fund.”
This code was not mentioned by the two recruitment specialists as a consideration in
attraction and retention of the youth, as, in their experience, youths do not qualify for
long-term incentives.
According to the remuneration specialist, long-term incentives were offered only to a
few select executives and those with critical skills.
Of the two OD specialists, the first responded that employees are encouraged by long-
term incentives, and work hard to be recognised and nominated to receive these. The
second OD specialist stated, “Long-term incentives support the company’s retention
strategies...”
5.3.2.2.5. Share options
The interviewer assessed the interest in shares and if it would motivate the youth to
stay with a company if they owned a part of the organisation.
Youths’ responses
Participants were asked: In terms of retention, employees born 1981 to 2000
scored highest regarding the importance of share options. What is your opinion
on this?
Two (40%) of the five youths agreed with the statement, and would be interested in
receiving shares, but they did not see it as a motivator. Two (40%) of the five youths
indicated that shares act as a retention factor, and would make them stay with the
organisation. One (20%) of the five youths felt that shares are a nice-to-have, but
would not act as a retention factor, depending on the amount.
RESULTS: QUALITATIVE RESEARCH
DBL Thesis_Keshia Mohamed-Padayachee Student Number 71364684 Page 213 of 351
HR practitioners’ responses
The question posed to the HR practitioners was: What importance or unimportance
do you find employees place on shares? The second question asked was: Do you
offer your employees share options? The final question was: Are employees
asking for share options?
The three HRGs stated that their companies did not offer shares, because they were
not listed entities. They could therefore not comment on shares attracting or retaining
youths, or on the views of youths in this regard.
The recruitment specialist stated that prospective employees do not ask about share
options. The remuneration specialist’s company was not listed, and therefore did not
offer shares, but offered gain share for operations, paid quarterly. It was the
participants’ experience that the gain shares offered to employees retained them.
The OD executive confirmed that the company did not offer employees share options,
because it was not a listed company.
5.3.2.2.6. Base salary and bonuses
The interviewer assessed the interest in a higher base salary with a limited bonus or
a lower base salary with an unlimited bonus.
Youths’ responses
The question posed to the youths was: If you could choose between a higher base
salary with limited bonus potential and a lower base salary with unlimited bonus
potential, what would you choose, or would you prefer to keep receiving a fixed
salary?
One of the five youths was not in favour of either of the options, and preferred a set
salary, because she had built her lifestyle around her pay, and was able to budget and
plan accordingly. A higher base salary was selected by two (40%) of the five youths,
and the view of one was that this would enable him to do more, because he could then
save money.
RESULTS: QUALITATIVE RESEARCH
DBL Thesis_Keshia Mohamed-Padayachee Student Number 71364684 Page 214 of 351
HR practitioners’ responses
The question posed to the participants was: If youth employees had the choice,
what do you think they would opt for: a higher base salary with limited bonus
potential or a lower base salary with unlimited bonus potential, or do you think
they would prefer to keep receiving a set salary?
Two of the three HRGs responded that youths prefer a higher base salary and a
smaller guaranteed bonus. One of the HRGs commented that she had observed this
preference even in senior employees. The third interviewee responded that a lower
basic salary is primarily suited to commission earners. This HRG also commented
that, to retain the youth, they needed to increase the basic salary offered by the
company, even for commission earners.
According to the recruitment specialists, youth employees prefer higher basic salaries,
because they are only interested in the guaranteed pay. Their response was that
some youth employees may prefer a lower base salary with unlimited bonus potential,
but the risk was that they would then spend their bonus recklessly, leading to financial
constraints the following month. The view was that youth employees sometimes lack
the maturity to spend a large bonus wisely.
The view of one of the two OD specialists was that youths, if they had the choice,
would opt for a higher base salary, as they consider guaranteed monthly pay very
important.
5.3.2.2.7. Smaller bonuses, paid intermittently
Youths’ responses
The participants were asked to indicate whether they agreed with the statement:
People seek immediate rewards. They don't want rewards once a year, but
prefer to have these divided into payments made quarterly.
Of the youths, three (60%) agreed with the statement. Two (40%)would have
preferred to have the incentive bonus paid annually.
RESULTS: QUALITATIVE RESEARCH
DBL Thesis_Keshia Mohamed-Padayachee Student Number 71364684 Page 215 of 351
HR practitioners’ responses
The participants were asked to indicate whether they agreed with the statement:
People seek immediate rewards. They don't want rewards once a year, but
prefer to have these divided into payments made quarterly.
Two of the three HRGs’ view was that employees must be very responsible to be able
to manage intermittent payments. One HRGs’ stated that the organisation would not
make such payments more than twice a year, due to the administrative workload it
would entail, which, in her words, “requires a very high-performance culture.”
The recruitment director, who recruited employees for an IT company, confirmed that
the company offered quarterly incentives as an increase, not as a bonus payment.
5.3.2.3. Benefits
The codes classified under this category included Medical aid, Retirement fund,
Leave, Employee discounts, Employee wellness offering, and Sabbaticals or other
scheduled time reductions. The code that emerged under this category was Study
leave, which was mentioned once, and was grouped under Sabbaticals or other
scheduled time reductions. Combined, these codes were mentioned 113 times.
5.3.2.3.1. Medical aid
Youths’ responses
The question posed to the youths was: Would you consider an employer who does
not offer medical aid, or is this not a factor?
Four (80%) of the five youths said they would not consider an employer who did not
offer medical aid. The view shared by the participants was that medical aid is a very
important consideration.
HR practitioners’ responses
The question posed to the HR practitioners was: The respondents considered this
an important consideration when deciding to join an organisation. Have you
had a similar experience?
RESULTS: QUALITATIVE RESEARCH
DBL Thesis_Keshia Mohamed-Padayachee Student Number 71364684 Page 216 of 351
All three HRGs agreed with the finding that medical aid is an important consideration
for employees when joining.
For the two recruitment specialists, medical aid was one of the important elements for
IT professionals, stating that a retirement fund was the most important, followed by
medical aid. One recruitment specialists agreed that, when employees consider an
employment offer, medical aid is important, and where companies do not offer medical
aid, employees enquire about medical aid.
The view of the remuneration specialist was that youths joining an organisation are
interested in the medical aid scheme. At his organisation and in his experience, most
youths are on a medical aid.
The OD senior manager responded that she knew of individuals who received the
monthly medical aid subsidy but did not pay it towards membership of a medical aid.
“They are satisfying their immediate need and not being responsible.”
5.3.2.3.2. Retirement fund
Youths’ responses
The questioned posed to the youths was: If an employer did not offer a retirement
fund, would you consider that offer of employment?
Two (40%) of the five youth participants responded that they would consider the offer
of employment. A third youth’s opinion was that a retirement fund is important, but
that he would prefer contributing towards it in later years. A fourth youth said she
would prefer the company handling the administration, because she found it
challenging to save and did not want to be burdened with the administration. For the
fifth youth, a retirement fund was more important than pay, because he considered it
wise to save for the future.
HR practitioners’ responses
The question posed was: The respondents considered this an important
consideration when deciding to join an organisation. Have you had a similar
experience?
RESULTS: QUALITATIVE RESEARCH
DBL Thesis_Keshia Mohamed-Padayachee Student Number 71364684 Page 217 of 351
The HRG was of the view that a retirement fund is important to the youth, and said
that, at her company, membership was compulsory. Another HRG agreed that a
retirement fund is important to employees, but voiced the concern that, if employees
had the option, they would encash it. The third HRG shared the view that, when
employees resign, instead of re-investing their retirement fund, the youth encash it
and pay off their house or pay off their debts, using a long-term investment to pay off
short-term debt.
One of the two recruitment specialist stated that, in her experience, employees do not
want to save towards a retirement fund.
The remuneration specialist said, based on his experience, retirement fund
contributions are viewed as very important by youth employees.
The two OD specialists reported that youth employees want to receive as much cash
as possible, and that they want the option to begin saving towards retirement at a later
stage in their lives.
5.3.2.3.3. Leave
The emerging codes in this category included Study leave, which was clustered under
Sabbaticals and other scheduled time reductions. The youths considered study leave
part of Sabbaticals and other scheduled time reductions, while the HR specialists
considered it part of Leave.
Youths’ responses
The question posed to the youths was: This is a generation who ‘works to live,’
which is different from previous generations, who ‘lived to work.’ Do you agree
with that statement? How important is leave to you?
Three (60%) of the five youths considered leave to be very important. For a second
youth (20%), leave was not very important. For a third (20%) participant, leave was
not more important than pay.
RESULTS: QUALITATIVE RESEARCH
DBL Thesis_Keshia Mohamed-Padayachee Student Number 71364684 Page 218 of 351
HRGs’ and specialists’ responses
The question posed to the HRG and specialist participants was: Leave was rated
high by all the groups of respondents. In your experience, is this an important
consideration for employees?
The three HRG agreed that leave is very important to youths, and that they value and
ask about leave. In one executive’s experience, youths are even beginning to
negotiate for more leave days.
The follow-up question posed was: Do employees request compensation for
differences in leave days when they join, if they received more leave days at
their previous employer?
One HRG executive related an experience in this regard: “I recently had someone that
was negotiating because they were joining one of the companies who had 15 days’
leave, and they were negotiating for two or three more leave days.” The second HRG’s
response was that, in her experience, employees value their leave and do not want to
work long hours. The third HRG stated that, in her experience, leave is important to
qualified employees, and that those who are older are asking for more leave days.
Her view was also that leave is attractive to youth employees, but that they are also
satisfied with having it paid out.
The two recruitment specialists agreed that leave is very important to youth
employees, and stated that they ask about their leave on the first day of employment.
One recruitment specialist stated that, in her experience, employees do not turn down
offers due to insufficient leave, but they do want the assurance that they will receive
leave.
The remuneration specialist’s view was that employees place a high degree of
importance on leave.
The OD executive said that, in her experience, leave is very important to the youth,
but noted that they do not want to go on leave, because the company has an
encashment policy, which they prefer.
RESULTS: QUALITATIVE RESEARCH
DBL Thesis_Keshia Mohamed-Padayachee Student Number 71364684 Page 219 of 351
5.3.2.3.4. Employee discounts
Youth’s responses
The question posed to the youths was: How important are employee benefits to
you as an attractor or retainer when deciding to join or leave a company?
The responses of the youth participants were that employee discounts are not very
important to the youth, and do not influence their decision to join or leave an
organisation.
HR practitioners’ responses
The question posed to the HRGs and specialists was: Do you find that employees
consider employee benefits a retainer when deciding if they will leave or stay
with a company?
The three HRGs’ view was that employee discounts are not important to the youth,
and are considered a nice-to-have. Their view was that employee discounts do not
act as a retainer, and is also not an important factor for employees when they join an
organisation.
There was agreement among the two recruitment specialists that employees do not
enquire about employee discounts when offers of employment are extended.
The remuneration specialist stated that, in previous years, his company had offered
discounts, which employees enjoyed, but the company no longer offered those. His
view was that companies should partner with other companies to create exciting,
relevant employee discounts.
According to the OD executive, youths do not really value employee discounts, and,
in her experience, employees only enquire if they can use the discounts once they
retire.
RESULTS: QUALITATIVE RESEARCH
DBL Thesis_Keshia Mohamed-Padayachee Student Number 71364684 Page 220 of 351
5.3.2.3.5. Employee wellness offering
Youths’ responses
The statement posed to the youths was: Respondents born 1981 to 2000 viewed
this benefit as more important than the other two categories of respondents in
the quantitative phase of the study. Do you agree or disagree with this result?
Four (80%) of the five participants felt that a wellness offering was important. One
(20%) participant disagreed, and felt that wellness offerings at work were not of
interest to the youth, because they manage their own health and wellness.
HR practitioners’ responses
The question posed was: Respondents born 1981 to 2000 viewed this benefit as
more important than the other two categories of respondents in the quantitative
phase of the study. Has your experience been similar?
The HRGs disagreed about the importance of an organisation offering a wellness
programme; two of the three HRGs viewed it as important, but one did not. The
company of the second participant saw wellness offerings as important, and the
participant stated that employees value these. The third participant’s company
supported factory workers’ welfare through primary healthcare, as they did not have
medical aid, and, for them, this was an important benefit.
One recruitment specialist, in her experience, found that employees are not concerned
about wellness programmes, and do not enquire about such offerings during the
recruitment process. The second recruitment specialist found that preferences in this
regard differ from industry to industry; for example, employees in the financial services
sector are very interested in wellness offerings. In her experience, it also depended
on leadership. Where there was a service provider managing wellness, employees
were very enthusiastic about it. Her view was that the youth wants gymnasiums and
counselling.
At the remuneration specialist’s company, the wellness programme had been
communicated extensively, and was used by employees.
RESULTS: QUALITATIVE RESEARCH
DBL Thesis_Keshia Mohamed-Padayachee Student Number 71364684 Page 221 of 351
5.3.2.3.6. Sabbaticals or other scheduled time reductions
Youths’ responses
The question asked in this category was: Are you interested in sabbaticals or
extended time off?
Study leave had emerged as a code in the quantitative phase of the study. The five
youth participants were not interested in sabbaticals, and were more interested in
extended time off for study leave.
HR practitioners’ responses
The question asked in this category was: Are you finding that employees are
requesting more time off than previously for sabbaticals or extended time off?
Based on the responses from the three HRG participants, few employees ask for
sabbaticals, and none of the participants’ companies had a policy on sabbaticals. One
HRG executive noted that, although the company did not have a policy on sabbaticals,
employees did enquire about it. The second HRG also stated that few employees
request sabbaticals. There had been more requests at her previous employer, where
it was requested for religious reasons, such as pilgrimages.
The recruitment specialists noted that employees do not enquire about sabbaticals
during the recruitment process. One recruitment specialist also noted that it is
predominantly requested by professionals in the healthcare fraternity, as well as when
the position is a highly specialised job requiring scarce skills.
In the remuneration specialist’s experience, employees did not enquire about
sabbaticals.
According to the OD executive, “Not a lot of people have used this. When we initially
introduced the policy, many employees were interested, until they were advised that it
would be unpaid time off. This does not act as a retainer for employees.”
RESULTS: QUALITATIVE RESEARCH
DBL Thesis_Keshia Mohamed-Padayachee Student Number 71364684 Page 222 of 351
Companies generally do not have policies regarding sabbaticals or extended leave.
Youths are not interested in sabbaticals, and would prefer extended study leave.
5.3.2.4. Performance recognition
This category included the codes Non-financial rewards, Formal recognition, and
Informal recognition. The emerging code was Years of service. Combined with those
of Performance recognition, these codes were mentioned 42 times.
Youths’ responses
The youths were asked: How do you feel about a recognition programme?
Four (80%) of the five youths were of the opinion that recognition motivates them to
perform better. The youth felt that reward and recognition are very important, and drive
and encourage them to do more. The youths were of the opinion that recognition
positively impacted their morale, and noted the importance of both formal and informal
recognition. One (20%) interviewee felt that recognition would not incentivise her to
do more.
Formal recognition was mentioned once (20%) by a youth, who preferred formal to
informal recognition, and viewed it as important to recognise superior performance
and contributions at a formal level. Informal recognition was mentioned as a
motivating factor by three (60%) of the youths. One participant’s view (20%) was: “I'd
be happy, definitely. I'd be over the moon, but I don't think it would have that much of
an effect on me. I'd be like, ‘Thank you,’ and that's it.” Another youth saw recognition
as creating a culture of recognition in the organisation.
HR practitioners’ responses
The question posed to the HRGs and specialists was: How do youths respond to
formal recognition programmes?
One of the three HRGs noted that, at her company, informal recognition included
awards for years’ service, which, according to her, the youth are very pleased to
receive. The second HRG noted that pressure from employees at her company had
RESULTS: QUALITATIVE RESEARCH
DBL Thesis_Keshia Mohamed-Padayachee Student Number 71364684 Page 223 of 351
forced them to change how they view employee rewards, and to devise rewards that
employees valued.
The view of one of the two recruitment specialists was that “Employees prefer both
formal and informal recognition, but it is important that it must not be an event...”
The remuneration specialist’s response was that employees are very motivated by
non-financial rewards, and that his organisation offered both formal and informal
recognition programmes.
The OD executive held the view that “Recognition incentivises employees, particularly
the youth, and they love it ...” The second OD specialist stated, “I think the informal
one; the response is better…”
5.3.2.5. Career development
The codes that formed part of this category were Career/Growth opportunities,
Learning and development opportunities, Experience working in different
organisations to maximise career progression, Experience working in different
organisations to maximise career earnings potential, and Formal coaching or
mentoring programmes. Furthermore, Bursary opportunities had emerged as a code
from Phase I of the study. Combined, these codes were mentioned 55 times.
5.3.2.5.1. Career/Growth opportunities
Youths’ responses
The question posed was: The results of the quantitative phase of my study
indicate that career growth opportunities are seen as more important than pay.
Do you agree or disagree with this statement?
Of the five youth participants, two (40%) rated career growth and pay as equally
important, and three (60%) rated career growth as more important than pay.
RESULTS: QUALITATIVE RESEARCH
DBL Thesis_Keshia Mohamed-Padayachee Student Number 71364684 Page 224 of 351
HR practitioners’ responses
The question posed was: The results of the quantitative phase of this study
showed that career growth is seen as more important than pay. What has your
experience been with respect to career- or growth opportunities for young
employees?
A HRG’s response was career development was cited as the number one reason for
people leaving.
A recruitment specialist said, “The youth in general are very interested in their career
growth.”
The OD executive said that employees consider bursaries very important. In her
experience, youths are also saying “‘…when you attract us, please do communicate
the career and learning paths available…”
5.3.2.5.2. Maximise career progression
Youths’ responses
The question posed to the youth was: Has the need for the experience working in
different organisations to maximise your career progression been a reason why
you have left a previous employer? Is it important for you to work in different
organisations?
One of the five youths said that this was one of the reasons why he had left previous
organisations. Another interviewee’s view was that she would not stay with a company
for many years, because she would like to be exposed to other environments. Another
response from an interviewee was, “The more experience I can gain, the quicker I can
climb the ladder, and that will also change in time, because not all people can move.”
HR practitioners’ responses
The question posed was: Research indicates that young employees have a
higher tendency than previous generations to remain with the same employer.
Are you experiencing the same, or are you finding that young employees are
leaving your organisations to maximise their career progression?
RESULTS: QUALITATIVE RESEARCH
DBL Thesis_Keshia Mohamed-Padayachee Student Number 71364684 Page 225 of 351
The response from the recruitment specialist was that, “The youth do move around a
lot, and this generation of youth employee has many entrepreneurs, and some refuse
to work for a boss. They prefer contracts over permanent positions in certain
industries, and believe in taking their careers into their own hands.”
5.3.2.5.3. Maximise career earnings potential
The question posed was: Has the need for experience working in different
organisations to maximise your earning potential been a reason you have left a
previous employer?
Youths’ responses
The youth participants agreed that, to maximise both career progression and earning
potential, experience gained through working in different organisations is required.
5.3.2.5.4. Bursary opportunities
Bursary opportunities emerged as a code in Phase I of the study.
The question posed was: If your company offered you a bursary, would that act
as an attractor or retainer for you?
Youths’ responses
The youths felt that they would be attracted to an employer who was prepared to
support them in their studies and invest in them. They also saw this as a retainer,
because they would be prepared to work back the time.
5.3.2.5.5. Learning and development opportunities
Youths’ responses
The question posed to the youths was: How important are learning and
development opportunities to you?
The youths’ views were that pay is important, but that development is more important.
RESULTS: QUALITATIVE RESEARCH
DBL Thesis_Keshia Mohamed-Padayachee Student Number 71364684 Page 226 of 351
The second question posed was: Respondents scored learning and development
opportunities high, even higher than pay. Would you agree with that?
The youths agreed with the statement that learning and development opportunities are
more important that pay.
HR practitioners’ responses
The question posed to the HRGs and specialists was: Do you receive many
requests for training and development opportunities?
Two (67%) of the three HRGs confirmed that their companies offered a formal bursary
programme, which contributed to the retention of their staff. According to one HRG,
her company recognised the importance of offering bursary opportunities.
The response from the recruitment manager was that, if companies do not pay for
studies, they lose employees who value education. Another specialist noted: “We do
offer bursaries, and employees ask about bursaries a lot.”
One OD specialist said that she received many requests for training and development
opportunities, and that her company spent a lot of money on training. The company
also provided bursaries, and she felt that employees appreciate the opportunity to
study further.
5.3.2.6. Work‒life
The codes within this category were: Flexible work arrangements and CSR. The code
Travel/Location emerged during the quantitative phase. Combined, these codes were
mentioned 47 times.
Youths’ responses
The question asked was: What is your view on work‒life, and how do you define
this concept?
RESULTS: QUALITATIVE RESEARCH
DBL Thesis_Keshia Mohamed-Padayachee Student Number 71364684 Page 227 of 351
The view of the 80% of the youths was that work‒life is very important. This was not
very important for one participant, who worked a set number of hours per day and was
only occasionally required to work extended hours.
HR practitioners’ responses
The question asked was: What are employees asking for with respect to work‒
life?
None of the companies of the HRGs and specialists had a policy on or approach to
work‒life.
5.3.2.6.1. Formal coaching or mentoring programmes
Youths’ responses
The question posed to the youths was: Did having a coach or mentor influence
your decision to join or stay with your organisation?
One (20%) of the five youths had had a coach, to which she attributed her tenure with
and success at the organisation. She felt that she really fit in well with the organisation,
and had no intention of leaving.
Two (40%) of the five youths had left their previous organisations because of the work
that they were doing and being ‘thrown in at the deep end’, without any support.
HR practitioners’ responses
The question asked was: Based on your experience, do coaching and mentoring
programmes influence young employees’ decisions to join or stay with your
organisation?
The HRG expressed the view that mentoring programmes work well and assists with
retention.
The above views were supported by one of the recruitment specialists, who felt that it
is important that employees who are joining the organisation for the first time should
have a mentor. He also noted that there is a growing awareness of this need.
RESULTS: QUALITATIVE RESEARCH
DBL Thesis_Keshia Mohamed-Padayachee Student Number 71364684 Page 228 of 351
5.3.2.6.2. Flexible work arrangements
Youths’ responses
The question posed to the youths was: How important would you say flexible work
arrangements would be if you had to consider leaving or joining an
organisation?
Flexible work arrangements were considered important by the youths, with the
exception of one participant, who worked a set number of hours daily and was only
occasionally required to work extended hours. Four (80%) of the five youths indicated
that they value and would be attracted to flexible work arrangements. Two (40%) of
the five participants felt that flexible work arrangements were more important than pay.
HR practitioners’ responses
The question posed to the HR practitioners was: Do you have any flexible work
arrangement policies?
None of the HRGs’ companies provided flexible work arrangements, but they noted
that there was the realisation in companies that this will become a need in the future,
which, at this stage, is linked to commuting to and from work. This need, however, is
very difficult to accommodate for front-end staff.
The response from the recruitment manager was that employees do not enquire about
flexible policies, such as working from home, during the recruitment process; they only
enquire once they have been appointed.
The OD manager responded that they had identified that there is a need for such
flexibility in order to retain staff.
RESULTS: QUALITATIVE RESEARCH
DBL Thesis_Keshia Mohamed-Padayachee Student Number 71364684 Page 229 of 351
5.3.2.6.3. Corporate social responsibility
Youths’ responses
The question posed to the youths was: There is a high degree of awareness of
social responsibility. Respondents viewed this as important when considering
joining an organisation. What is your view?
Of the five youths, three (60%) did not see CSR as an important consideration. The
remaining two (40%) felt that CSR indicate the culture of the organisation, but that it
is not an important factor when deciding to join or stay with an organisation.
HR practitioners’ responses
The question posed was: There is a high degree of awareness of social
responsibility. Respondents viewed this as important when considering joining
an organisation. What has you experience been in this regard?
Overall, the HRGs’ views were that CSR are rated highly by employees, and that
employees are excited by these initiatives.
The recruitment manager’s view was that CSR is not an important factor for the youth
when they consider joining a company.
The OD specialists agreed with the finding that CSR is highly rated by the youth as
both an attractor and a retainer.
5.3.2.6.4. Travel and location
Travel and location had emerged as a code during the quantitative phase of the study,
and it is for this reason that there was no formal question linked to it. This code was
mentioned ten times.
Youths’ responses
Two (40%) of the five youths’ view was that they would not easily accept positions that
required extensive commuting, and that they would turn down an offer because of the
organisation’s location.
RESULTS: QUALITATIVE RESEARCH
DBL Thesis_Keshia Mohamed-Padayachee Student Number 71364684 Page 230 of 351
HR practitioners’ responses
One HRG had not found that employees were turning down offers of employment due
to the company’s location.
One recruitment specialist had found that employees were turning down offers due to
location, but that employees would relocate for an attractive salary.
The remuneration specialist’s view was: “Location is important for employees, and an
area that they can improve on, which requires attention.”
International travel opportunities
International travel opportunities emerged as a code from the results of Phase I.
Youths’ responses
The question posed to the youths was: Would you be interested in international
travel opportunities?
Youths’ responses
The youth would be attracted to international travel opportunities, and this would aid
their retention.
5.3.2.7. Safety/Security
In this category, the researcher addressed the codes Longer-term job security and
Safe and secure work environment, including interviewees’ expectations. The code
that had emerged was Company reputation. Combined, these codes were mentioned
20 times.
5.3.2.7.1. Longer-term job security (> 12 months)
The question posed to the youths was: How important is longer-term job security
to you?
Youths’ responses
This proved to be very important to four (80%) of the five participants. They all noted
the importance of having secure employment. One (20%) interviewee would consider
RESULTS: QUALITATIVE RESEARCH
DBL Thesis_Keshia Mohamed-Padayachee Student Number 71364684 Page 231 of 351
a two-year contract without the security of permanent employment, if the pay and
environment were attractive.
HR practitioners’ responses
The question posed was: Are you finding that youth employees are seeking
longer-term job security?
The opinion of the HRGs was that youth employees are seeking job security.
Employees feel insecure when companies go through restructures, and leave as a
result.
The next question was: Do you find employees are asking, when you interview
them, if you are going to restructure?
The recruitment specialist responded, “They do not at interview stage, because they
assume that we are okay. But it is those inside, and then the new ones, because
they’re worried that they will apply last-in-first-out, so, they do.”
However, the remuneration specialist’s view was that future employees will not work
longer than ten years for a company.
The OD specialists were of the view that long-term job security is important to most
people.
5.3.2.8. Social support
This category included Supportive management, Supportive environment, and
Resources. Additional codes emerged from the findings of Phase I of the research,
specifically the responses to the open-ended questions, which the researcher
clustered in this category, due to association. These were: Working conditions,
Environment, and Leadership. Combined, these codes were mentioned 37 times;
these are discussed below.
RESULTS: QUALITATIVE RESEARCH
DBL Thesis_Keshia Mohamed-Padayachee Student Number 71364684 Page 232 of 351
5.3.2.8.1. Supportive management and environment
Supportive management and Supportive environment were grouped together,
because they were interlinked during the interviews.
The question posed to the youths was: Supportive management scored higher than
Supportive work environment. What are your views in this respect?
Youths’ responses
The five youths were in agreement that supportive management is more important
than a supportive environment, but that both are required. They felt that leadership is
very important, because leaders create the environment, and employees generally
follow their lead. Work environment proved to be an important consideration for the
youths.
HR practitioners’ responses
The question posed to the HRGs and specialists was: Supportive management was
scored higher than Supportive work environment by the respondents,
illustrating the importance of leadership. What are your views in this respect?
One HRG noted that supportive management and a supportive environment are very
important; she viewed these as one of the reasons why employees thrive, and the
reason for leaving where they do not exist.
The recruitment manager’s view was that supportive management is more important
than a supportive environment.
The OD specialists, in their engagement surveys, found that managers determine the
success or failure of teams. The culture of an organisation is also determined by
management.
5.3.2.9. Resources
The theme that emerged from the quantitative phase was Allowances.
RESULTS: QUALITATIVE RESEARCH
DBL Thesis_Keshia Mohamed-Padayachee Student Number 71364684 Page 233 of 351
The question the researcher posed to the youths was: How important are resources
that enable you to do your work to you?
The five youths were in agreement that resources are very important to them.
HR practitioners’ responses
The question the researcher posed was: What importance do employees place on
the resources they are provided with to do their jobs?
The HRG and recruitment specialist agreed that resources are very important to the
youth, and that a lot of value is placed on the technology and other resources provided.
The remuneration specialist’s view was that resources are important to the youth, and
one of the first things they enquire about when they join.
5.3.2.10. Rankings
In this section, the interviewer validated the participant’s views on the rankings
obtained from the last section of the research questionnaire, as illustrated in Table 40
in Chapter 4.
Overall, the participants agreed with the rankings. One recruitment specialist indicated
that she would have swapped Performance recognition with Work‒life. The group
agreed with the Number 1 ranking for Career development opportunities.
5.4. Attraction and Retention
One of the objectives of the research was to understand what attracts and retains
youth employees. This section summarises what attracts and retains the youth, as
determined from the interviews with youths, HRGs, and HR specialists. These
elements were mentioned 11 times.
RESULTS: QUALITATIVE RESEARCH
DBL Thesis_Keshia Mohamed-Padayachee Student Number 71364684 Page 234 of 351
Attraction:
HRG: “When we’re recruiting and in discussions with senior management, it’s career
growth and opportunity … dominates the conversation. Relevant and current brands.
…branding, the reputation of the company in the external environment.”
OD specialist: “Offering competitive salaries and paying market-related salaries.”
Recruitment specialist: “The younger generation was loud and clear that you need
to start looking at the total reward in terms of us repackaging our salaries.”
Retention:
Youth: “What incentivises me? Time off work, incentives, i.e. performance pay and
activities, team-buildings. Very motivating. A nice incentive as a team or as a work
group or colleagues. You go out and you interact on a social level, so it becomes a
little draining when you’re constantly interacting with people. But, in the work
environment only, you’re not allowed to be yourself. You’re not allowed to laugh and
make jokes. So, people don't know that side of you, because, when you’re at work,
you’re professional.”
HRG: In this HRG’s experience, senior-level employees were citing a lack of career
development as their reason for leaving. “These are the managers who feel
overlooked for promotions, and would therefore go elsewhere.”
HRG: “Employees … do not just want branded merchandise when being recognised.
They want much more, and they started to give overseas trips, and people loved that,
and this improved turnover.”
HRG: This interviewee was of the opinion that employees are motivated by the
possibility of earning more money; the more rewards they receive, the harder they
work, and the more excited they become. According to this HRG, total reward
elements need to be all-inclusive. Generation Y employees want choice, and
companies should consider implementing the cafeteria model in order to give them
choices regarding their rewards.
RESULTS: QUALITATIVE RESEARCH
DBL Thesis_Keshia Mohamed-Padayachee Student Number 71364684 Page 235 of 351
HRG: This HRG’s company used a long-term incentive to support its retention
strategy: “Its lucrative and a very good incentive to stay.”
HRG: According to this HRG, young employees are easily bored, and they leave their
employment without having secured another job. They need to feel that they ‘fit in,’
and want to be spoken to in a particular way. It is important to understand this new
generation.
OD specialist: “Culture and environment is what makes employees stay.”
Recruitment specialist: This interviewee indicated that the youth are retained
through higher salaries, career development opportunities, flexible work
arrangements, and attractive benefits. “They want more money. They leave their
permanent positions for contract positions, because they want to earn more money.
They take their careers into their own hands. They want work‒life balance, money,
medical aid, and a retirement fund.”
Recruitment specialist: According to this interviewee, team-building initiatives are
very important to the youth, along with attractive incentive bonuses.
To determine if what would retain youth employees differs from what retained previous
generations, the interviewer asked the interviewee who had been with one
organisation for 35 years what had made him stay. His response was: “I am
passionate about this company. This company has given me opportunities to develop
myself. Without that, I would not have been registered and been a global remuneration
professional. I've had all those opportunities. I've had opportunities to go to university
and growth in my working environment.
5.5. Frequency and statistical analysis
The frequency analysis of the codes is shown in Table 57, highlighting Salary/Pay and
13th cheque as the codes most frequently mentioned by the youths and the HR
practitioners.
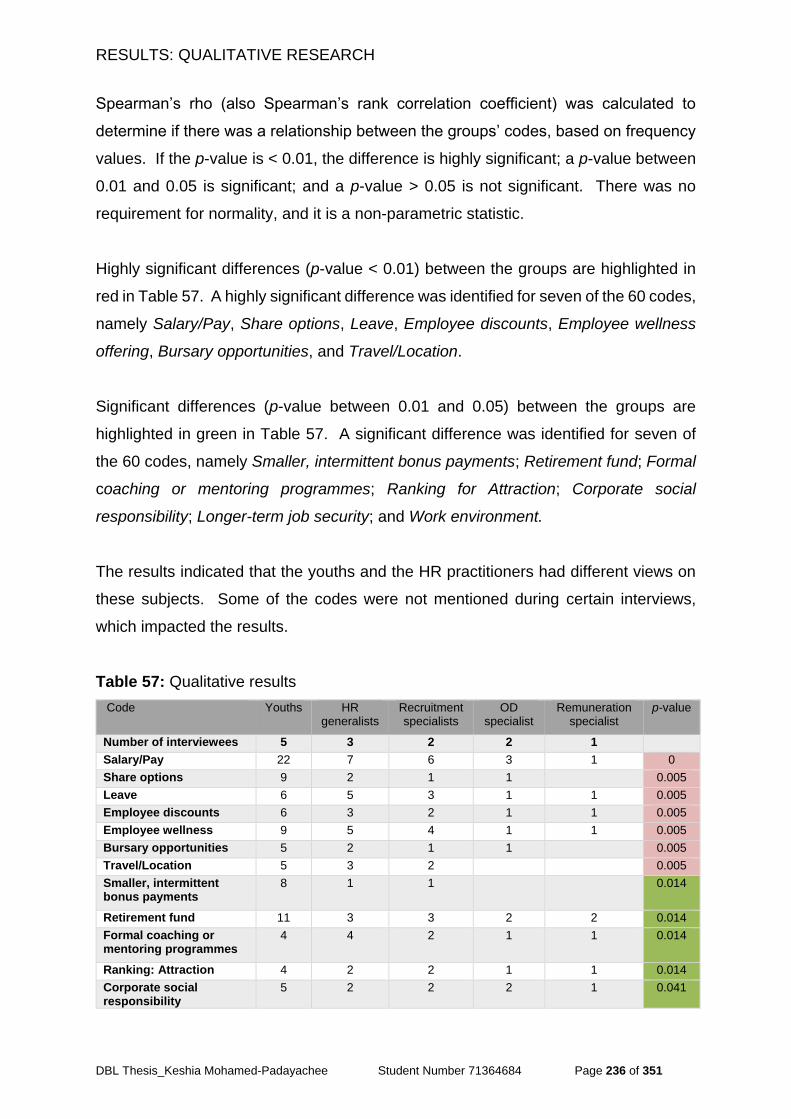
RESULTS: QUALITATIVE RESEARCH
DBL Thesis_Keshia Mohamed-Padayachee Student Number 71364684 Page 236 of 351
Spearman’s rho (also Spearman’s rank correlation coefficient) was calculated to
determine if there was a relationship between the groups’ codes, based on frequency
values. If the p-value is < 0.01, the difference is highly significant; a p-value between
0.01 and 0.05 is significant; and a p-value > 0.05 is not significant. There was no
requirement for normality, and it is a non-parametric statistic.
Highly significant differences (p-value < 0.01) between the groups are highlighted in
red in Table 57. A highly significant difference was identified for seven of the 60 codes,
namely Salary/Pay, Share options, Leave, Employee discounts, Employee wellness
offering, Bursary opportunities, and Travel/Location.
Significant differences (p-value between 0.01 and 0.05) between the groups are
highlighted in green in Table 57. A significant difference was identified for seven of
the 60 codes, namely Smaller, intermittent bonus payments; Retirement fund; Formal
coaching or mentoring programmes; Ranking for Attraction; Corporate social
responsibility; Longer-term job security; and Work environment.
The results indicated that the youths and the HR practitioners had different views on
these subjects. Some of the codes were not mentioned during certain interviews,
which impacted the results.
Table 57: Qualitative results
Code Youths HR generalists
Recruitment specialists
OD specialist
Remuneration specialist
p-value
Number of interviewees 5 3 2 2 1
Salary/Pay 22 7 6 3 1 0
Share options 9 2 1 1 0.005
Leave 6 5 3 1 1 0.005
Employee discounts 6 3 2 1 1 0.005
Employee wellness 9 5 4 1 1 0.005
Bursary opportunities 5 2 1 1 0.005
Travel/Location 5 3 2 0.005
Smaller, intermittent bonus payments
8 1 1 0.014
Retirement fund 11 3 3 2 2 0.014
Formal coaching or mentoring programmes
4 4 2 1 1 0.014
Ranking: Attraction 4 2 2 1 1 0.014
Corporate social responsibility
5 2 2 2 1 0.041
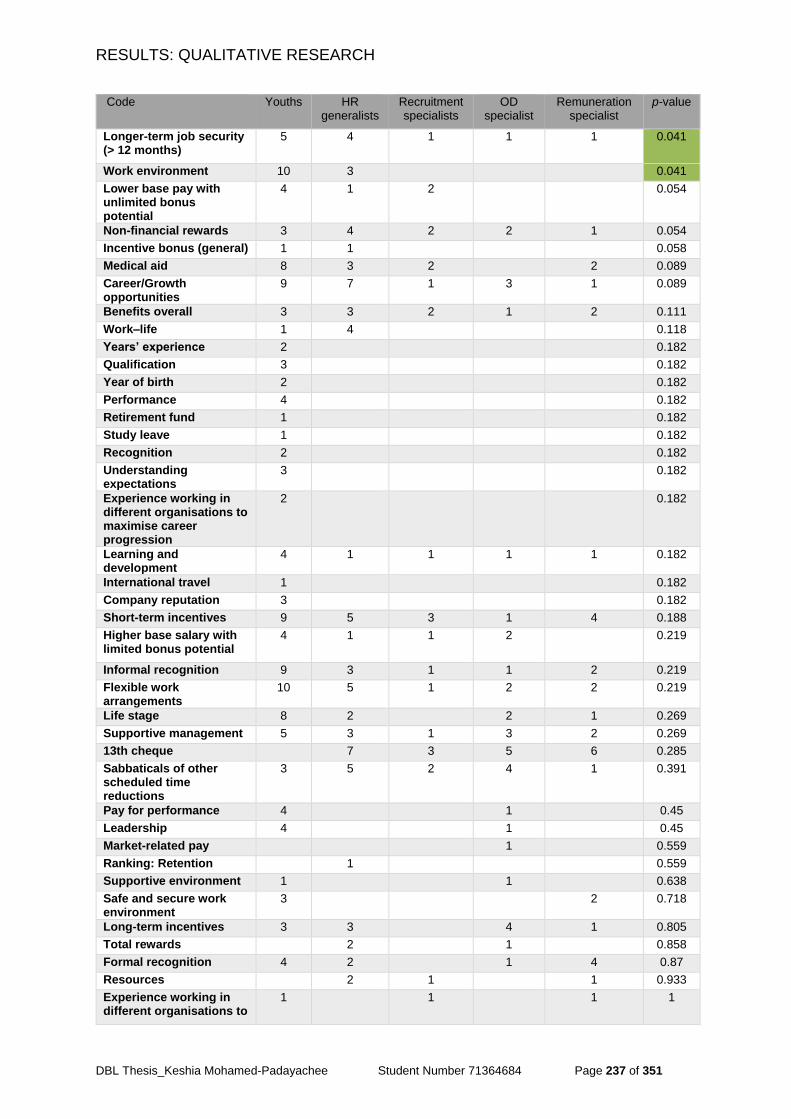
RESULTS: QUALITATIVE RESEARCH
DBL Thesis_Keshia Mohamed-Padayachee Student Number 71364684 Page 237 of 351
Code Youths HR generalists
Recruitment specialists
OD specialist
Remuneration specialist
p-value
Longer-term job security (> 12 months)
5 4 1 1 1 0.041
Work environment 10 3 0.041
Lower base pay with unlimited bonus potential
4 1 2 0.054
Non-financial rewards 3 4 2 2 1 0.054
Incentive bonus (general) 1 1 0.058
Medical aid 8 3 2 2 0.089
Career/Growth opportunities
9 7 1 3 1 0.089
Benefits overall 3 3 2 1 2 0.111
Work‒life 1 4 0.118
Years’ experience 2 0.182
Qualification 3 0.182
Year of birth 2 0.182
Performance 4 0.182
Retirement fund 1 0.182
Study leave 1 0.182
Recognition 2 0.182
Understanding expectations
3 0.182
Experience working in different organisations to maximise career progression
2 0.182
Learning and development
4 1 1 1 1 0.182
International travel 1 0.182
Company reputation 3 0.182
Short-term incentives 9 5 3 1 4 0.188
Higher base salary with limited bonus potential
4 1 1 2 0.219
Informal recognition 9 3 1 1 2 0.219
Flexible work arrangements
10 5 1 2 2 0.219
Life stage 8 2 2 1 0.269
Supportive management 5 3 1 3 2 0.269
13th cheque 7 3 5 6 0.285
Sabbaticals of other scheduled time reductions
3 5 2 4 1 0.391
Pay for performance 4 1 0.45
Leadership 4 1 0.45
Market-related pay 1 0.559
Ranking: Retention 1 0.559
Supportive environment 1 1 0.638
Safe and secure work environment
3 2 0.718
Long-term incentives 3 3 4 1 0.805
Total rewards 2 1 0.858
Formal recognition 4 2 1 4 0.87
Resources 2 1 1 0.933
Experience working in different organisations to
1 1 1 1
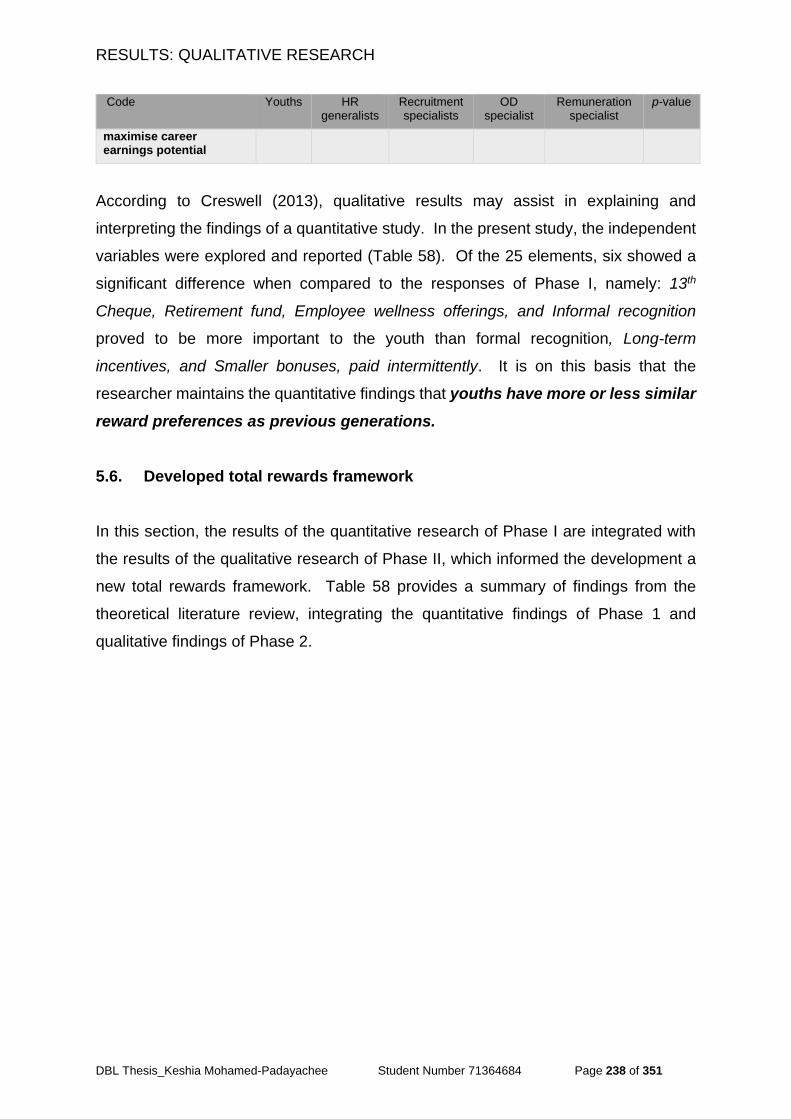
RESULTS: QUALITATIVE RESEARCH
DBL Thesis_Keshia Mohamed-Padayachee Student Number 71364684 Page 238 of 351
Code Youths HR generalists
Recruitment specialists
OD specialist
Remuneration specialist
p-value
maximise career earnings potential
According to Creswell (2013), qualitative results may assist in explaining and
interpreting the findings of a quantitative study. In the present study, the independent
variables were explored and reported (Table 58). Of the 25 elements, six showed a
significant difference when compared to the responses of Phase I, namely: 13th
Cheque, Retirement fund, Employee wellness offerings, and Informal recognition
proved to be more important to the youth than formal recognition, Long-term
incentives, and Smaller bonuses, paid intermittently. It is on this basis that the
researcher maintains the quantitative findings that youths have more or less similar
reward preferences as previous generations.
5.6. Developed total rewards framework
In this section, the results of the quantitative research of Phase I are integrated with
the results of the qualitative research of Phase II, which informed the development a
new total rewards framework. Table 58 provides a summary of findings from the
theoretical literature review, integrating the quantitative findings of Phase 1 and
qualitative findings of Phase 2.
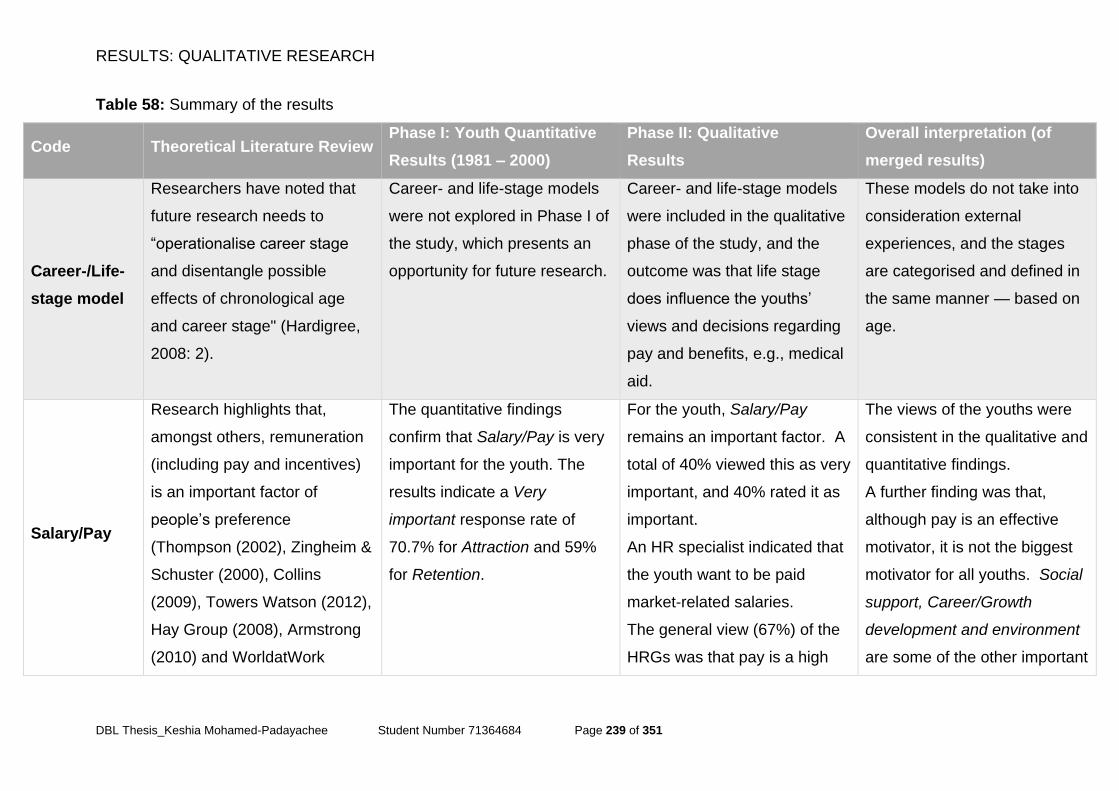
RESULTS: QUALITATIVE RESEARCH
DBL Thesis_Keshia Mohamed-Padayachee Student Number 71364684 Page 239 of 351
Table 58: Summary of the results
Code Theoretical Literature Review Phase I: Youth Quantitative
Results (1981 – 2000)
Phase II: Qualitative
Results
Overall interpretation (of
merged results)
Career-/Life-
stage model
Researchers have noted that
future research needs to
“operationalise career stage
and disentangle possible
effects of chronological age
and career stage" (Hardigree,
2008: 2).
Career- and life-stage models
were not explored in Phase I of
the study, which presents an
opportunity for future research.
Career- and life-stage models
were included in the qualitative
phase of the study, and the
outcome was that life stage
does influence the youths’
views and decisions regarding
pay and benefits, e.g., medical
aid.
These models do not take into
consideration external
experiences, and the stages
are categorised and defined in
the same manner — based on
age.
Salary/Pay
Research highlights that,
amongst others, remuneration
(including pay and incentives)
is an important factor of
people’s preference
(Thompson (2002), Zingheim &
Schuster (2000), Collins
(2009), Towers Watson (2012),
Hay Group (2008), Armstrong
(2010) and WorldatWork
The quantitative findings
confirm that Salary/Pay is very
important for the youth. The
results indicate a Very
important response rate of
70.7% for Attraction and 59%
for Retention.
For the youth, Salary/Pay
remains an important factor. A
total of 40% viewed this as very
important, and 40% rated it as
important.
An HR specialist indicated that
the youth want to be paid
market-related salaries.
The general view (67%) of the
HRGs was that pay is a high
The views of the youths were
consistent in the qualitative and
quantitative findings.
A further finding was that,
although pay is an effective
motivator, it is not the biggest
motivator for all youths. Social
support, Career/Growth
development and environment
are some of the other important
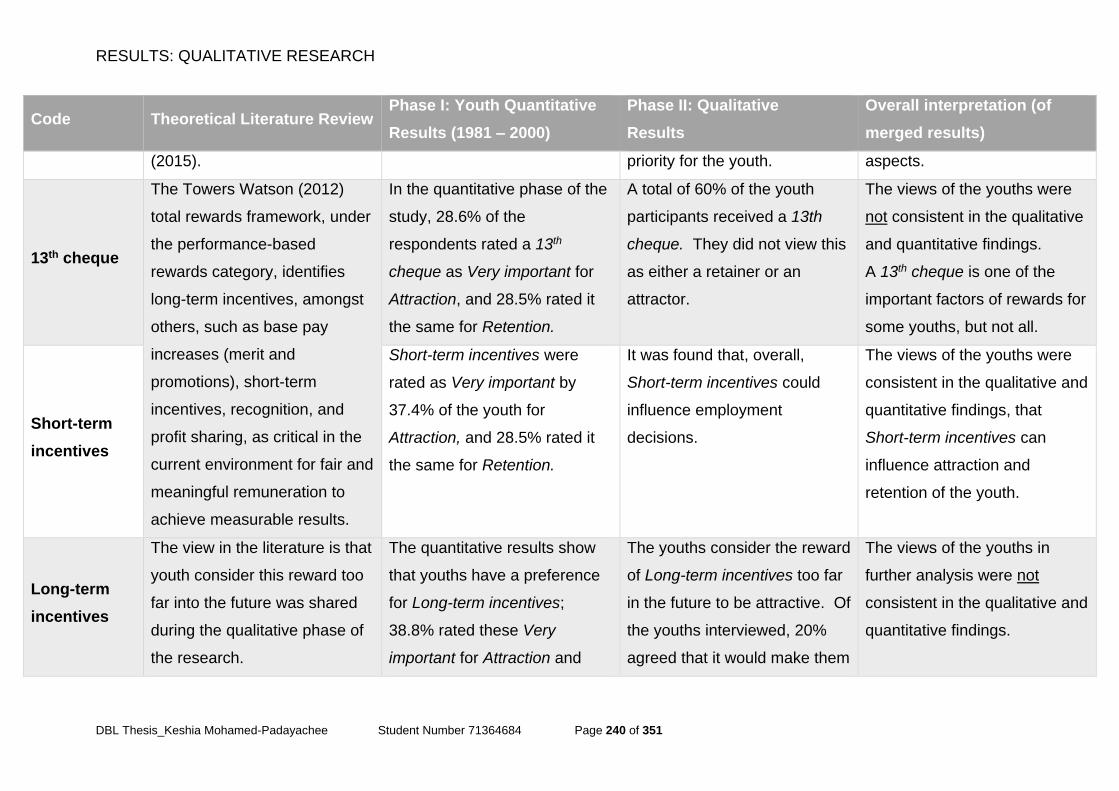
RESULTS: QUALITATIVE RESEARCH
DBL Thesis_Keshia Mohamed-Padayachee Student Number 71364684 Page 240 of 351
Code Theoretical Literature Review Phase I: Youth Quantitative
Results (1981 – 2000)
Phase II: Qualitative
Results
Overall interpretation (of
merged results)
(2015). priority for the youth. aspects.
13th cheque
The Towers Watson (2012)
total rewards framework, under
the performance-based
rewards category, identifies
long-term incentives, amongst
others, such as base pay
increases (merit and
promotions), short-term
incentives, recognition, and
profit sharing, as critical in the
current environment for fair and
meaningful remuneration to
achieve measurable results.
In the quantitative phase of the
study, 28.6% of the
respondents rated a 13th
cheque as Very important for
Attraction, and 28.5% rated it
the same for Retention.
A total of 60% of the youth
participants received a 13th
cheque. They did not view this
as either a retainer or an
attractor.
The views of the youths were
not consistent in the qualitative
and quantitative findings.
A 13th cheque is one of the
important factors of rewards for
some youths, but not all.
Short-term
incentives
Short-term incentives were
rated as Very important by
37.4% of the youth for
Attraction, and 28.5% rated it
the same for Retention.
It was found that, overall,
Short-term incentives could
influence employment
decisions.
The views of the youths were
consistent in the qualitative and
quantitative findings, that
Short-term incentives can
influence attraction and
retention of the youth.
Long-term
incentives
The view in the literature is that
youth consider this reward too
far into the future was shared
during the qualitative phase of
the research.
The quantitative results show
that youths have a preference
for Long-term incentives;
38.8% rated these Very
important for Attraction and
The youths consider the reward
of Long-term incentives too far
in the future to be attractive. Of
the youths interviewed, 20%
agreed that it would make them
The views of the youths in
further analysis were not
consistent in the qualitative and
quantitative findings.

RESULTS: QUALITATIVE RESEARCH
DBL Thesis_Keshia Mohamed-Padayachee Student Number 71364684 Page 241 of 351
Code Theoretical Literature Review Phase I: Youth Quantitative
Results (1981 – 2000)
Phase II: Qualitative
Results
Overall interpretation (of
merged results)
The WorldatWork (2015) and
the Hay Group (2008), highlight
long-term incentives as
important for attraction and
retention. Zingheim and
Schuster (2000), emphasis that
it is not a one-size-fits-all
proposition, and some
companies may emphasize
one component over the
others, and that the best
companies offer some of each
component.
41% rated it the same for
Retention.
stay with a company, while
80% of the interviewees felt
that it would not.
Share
options
The Towers Perrin model
suggests that tangible rewards
such as shares are a significant
factor for Generation Y
(Armstrong, 2010).
Share options were rated by
32.7% as Very important for
Attraction, and 36.1% rated it
the same for Retention.
A total of 40% of the youths
agreed that they would be
interested in receiving shares,
but that they did not see it as a
motivator, while 40% of the
youths indicated that shares
Based on the description
provided in the qualitative
phase of the study, the views of
the youths were consistent with
the quantitative findings. Share
options do not play a major role
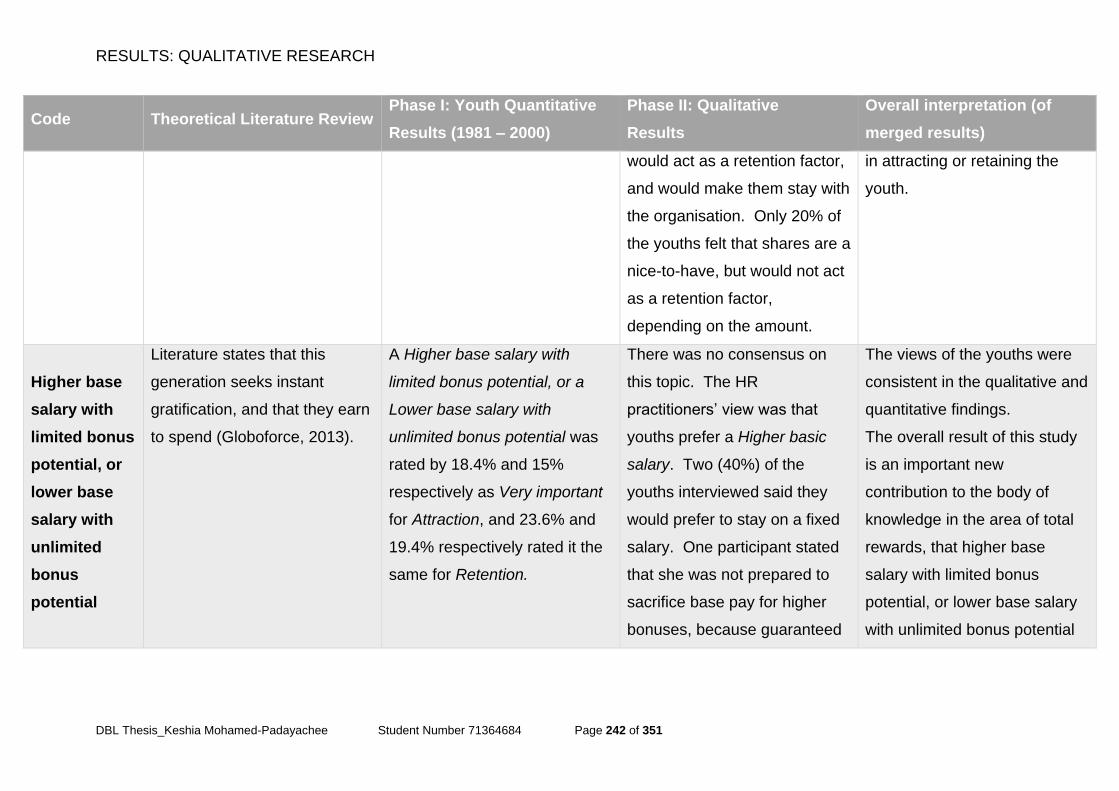
RESULTS: QUALITATIVE RESEARCH
DBL Thesis_Keshia Mohamed-Padayachee Student Number 71364684 Page 242 of 351
Code Theoretical Literature Review Phase I: Youth Quantitative
Results (1981 – 2000)
Phase II: Qualitative
Results
Overall interpretation (of
merged results)
would act as a retention factor,
and would make them stay with
the organisation. Only 20% of
the youths felt that shares are a
nice-to-have, but would not act
as a retention factor,
depending on the amount.
in attracting or retaining the
youth.
Higher base
salary with
limited bonus
potential, or
lower base
salary with
unlimited
bonus
potential
Literature states that this
generation seeks instant
gratification, and that they earn
to spend (Globoforce, 2013).
A Higher base salary with
limited bonus potential, or a
Lower base salary with
unlimited bonus potential was
rated by 18.4% and 15%
respectively as Very important
for Attraction, and 23.6% and
19.4% respectively rated it the
same for Retention.
There was no consensus on
this topic. The HR
practitioners’ view was that
youths prefer a Higher basic
salary. Two (40%) of the
youths interviewed said they
would prefer to stay on a fixed
salary. One participant stated
that she was not prepared to
sacrifice base pay for higher
bonuses, because guaranteed
The views of the youths were
consistent in the qualitative and
quantitative findings.
The overall result of this study
is an important new
contribution to the body of
knowledge in the area of total
rewards, that higher base
salary with limited bonus
potential, or lower base salary
with unlimited bonus potential
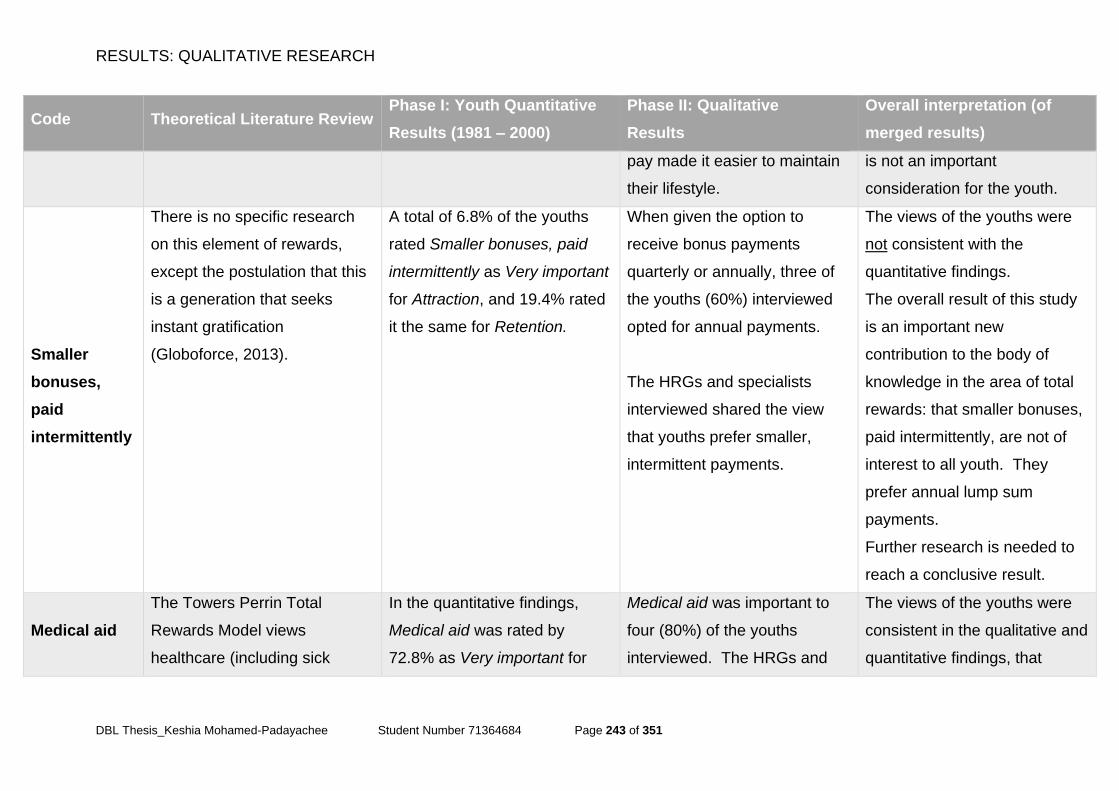
RESULTS: QUALITATIVE RESEARCH
DBL Thesis_Keshia Mohamed-Padayachee Student Number 71364684 Page 243 of 351
Code Theoretical Literature Review Phase I: Youth Quantitative
Results (1981 – 2000)
Phase II: Qualitative
Results
Overall interpretation (of
merged results)
pay made it easier to maintain
their lifestyle.
is not an important
consideration for the youth.
Smaller
bonuses,
paid
intermittently
There is no specific research
on this element of rewards,
except the postulation that this
is a generation that seeks
instant gratification
(Globoforce, 2013).
A total of 6.8% of the youths
rated Smaller bonuses, paid
intermittently as Very important
for Attraction, and 19.4% rated
it the same for Retention.
When given the option to
receive bonus payments
quarterly or annually, three of
the youths (60%) interviewed
opted for annual payments.
The HRGs and specialists
interviewed shared the view
that youths prefer smaller,
intermittent payments.
The views of the youths were
not consistent with the
quantitative findings.
The overall result of this study
is an important new
contribution to the body of
knowledge in the area of total
rewards: that smaller bonuses,
paid intermittently, are not of
interest to all youth. They
prefer annual lump sum
payments.
Further research is needed to
reach a conclusive result.
Medical aid
The Towers Perrin Total
Rewards Model views
healthcare (including sick
In the quantitative findings,
Medical aid was rated by
72.8% as Very important for
Medical aid was important to
four (80%) of the youths
interviewed. The HRGs and
The views of the youths were
consistent in the qualitative and
quantitative findings, that
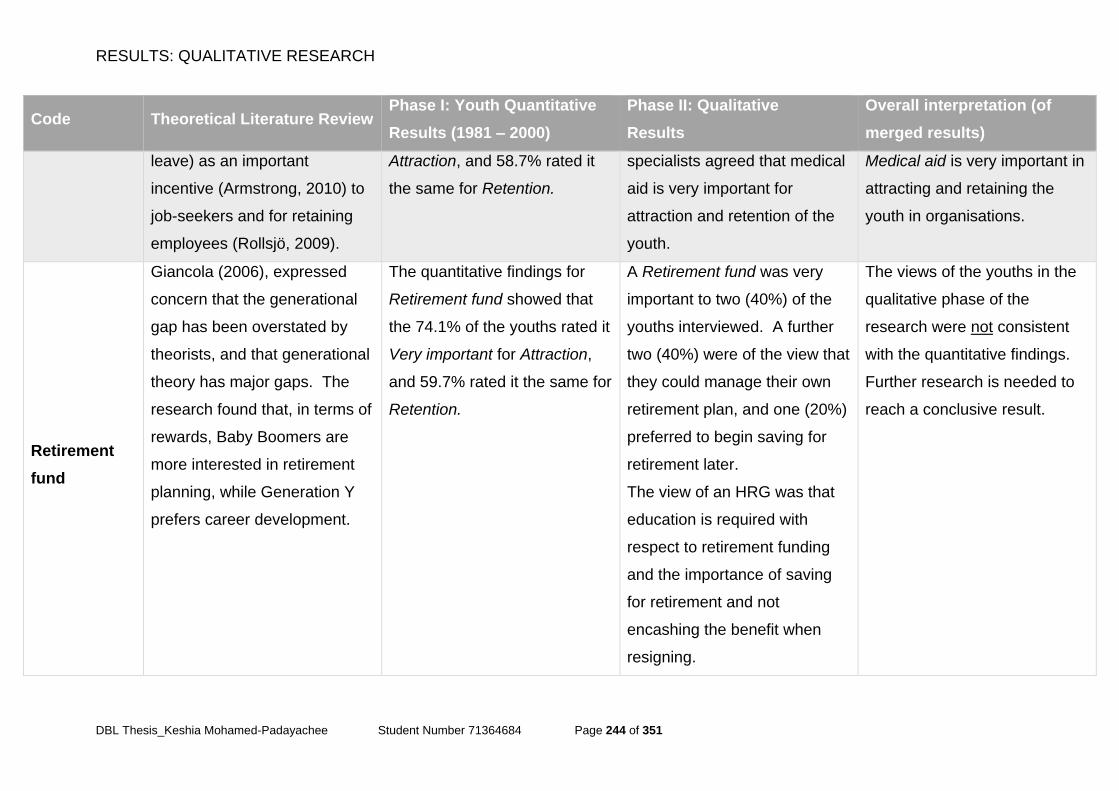
RESULTS: QUALITATIVE RESEARCH
DBL Thesis_Keshia Mohamed-Padayachee Student Number 71364684 Page 244 of 351
Code Theoretical Literature Review Phase I: Youth Quantitative
Results (1981 – 2000)
Phase II: Qualitative
Results
Overall interpretation (of
merged results)
leave) as an important
incentive (Armstrong, 2010) to
job-seekers and for retaining
employees (Rollsjö, 2009).
Attraction, and 58.7% rated it
the same for Retention.
specialists agreed that medical
aid is very important for
attraction and retention of the
youth.
Medical aid is very important in
attracting and retaining the
youth in organisations.
Retirement
fund
Giancola (2006), expressed
concern that the generational
gap has been overstated by
theorists, and that generational
theory has major gaps. The
research found that, in terms of
rewards, Baby Boomers are
more interested in retirement
planning, while Generation Y
prefers career development.
The quantitative findings for
Retirement fund showed that
the 74.1% of the youths rated it
Very important for Attraction,
and 59.7% rated it the same for
Retention.
A Retirement fund was very
important to two (40%) of the
youths interviewed. A further
two (40%) were of the view that
they could manage their own
retirement plan, and one (20%)
preferred to begin saving for
retirement later.
The view of an HRG was that
education is required with
respect to retirement funding
and the importance of saving
for retirement and not
encashing the benefit when
resigning.
The views of the youths in the
qualitative phase of the
research were not consistent
with the quantitative findings.
Further research is needed to
reach a conclusive result.
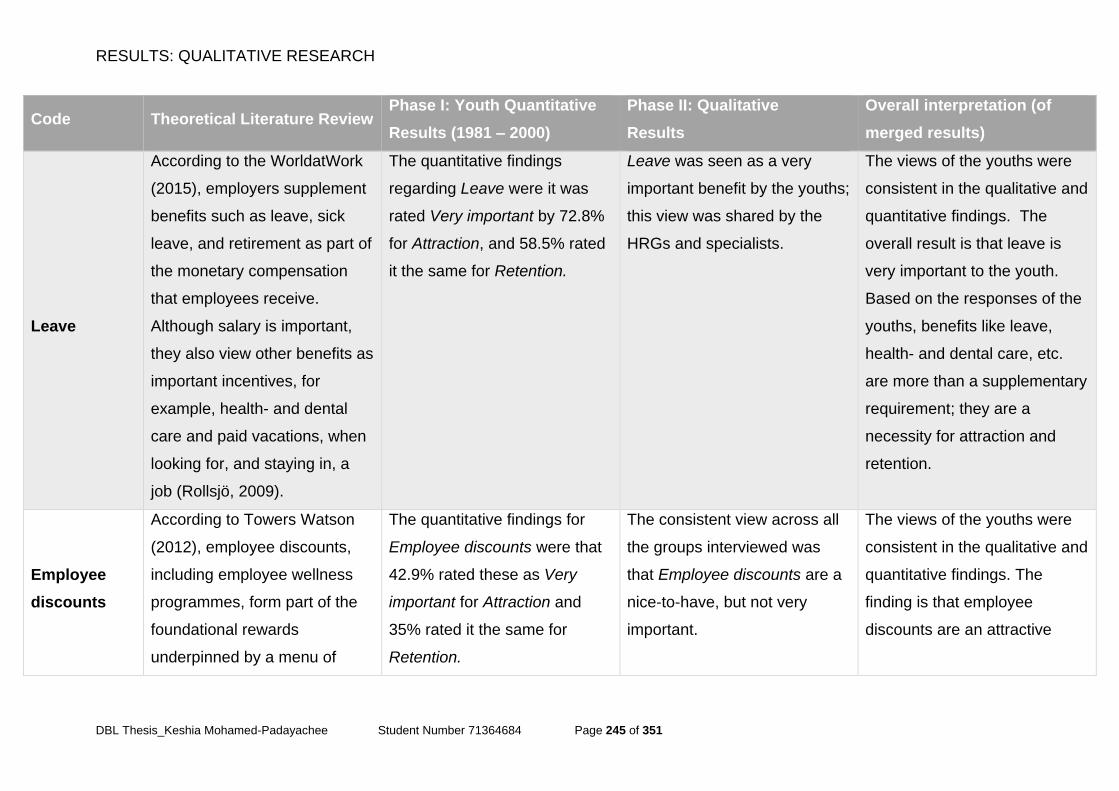
RESULTS: QUALITATIVE RESEARCH
DBL Thesis_Keshia Mohamed-Padayachee Student Number 71364684 Page 245 of 351
Code Theoretical Literature Review Phase I: Youth Quantitative
Results (1981 – 2000)
Phase II: Qualitative
Results
Overall interpretation (of
merged results)
Leave
According to the WorldatWork
(2015), employers supplement
benefits such as leave, sick
leave, and retirement as part of
the monetary compensation
that employees receive.
Although salary is important,
they also view other benefits as
important incentives, for
example, health- and dental
care and paid vacations, when
looking for, and staying in, a
job (Rollsjö, 2009).
The quantitative findings
regarding Leave were it was
rated Very important by 72.8%
for Attraction, and 58.5% rated
it the same for Retention.
Leave was seen as a very
important benefit by the youths;
this view was shared by the
HRGs and specialists.
The views of the youths were
consistent in the qualitative and
quantitative findings. The
overall result is that leave is
very important to the youth.
Based on the responses of the
youths, benefits like leave,
health- and dental care, etc.
are more than a supplementary
requirement; they are a
necessity for attraction and
retention.
Employee
discounts
According to Towers Watson
(2012), employee discounts,
including employee wellness
programmes, form part of the
foundational rewards
underpinned by a menu of
The quantitative findings for
Employee discounts were that
42.9% rated these as Very
important for Attraction and
35% rated it the same for
Retention.
The consistent view across all
the groups interviewed was
that Employee discounts are a
nice-to-have, but not very
important.
The views of the youths were
consistent in the qualitative and
quantitative findings. The
finding is that employee
discounts are an attractive
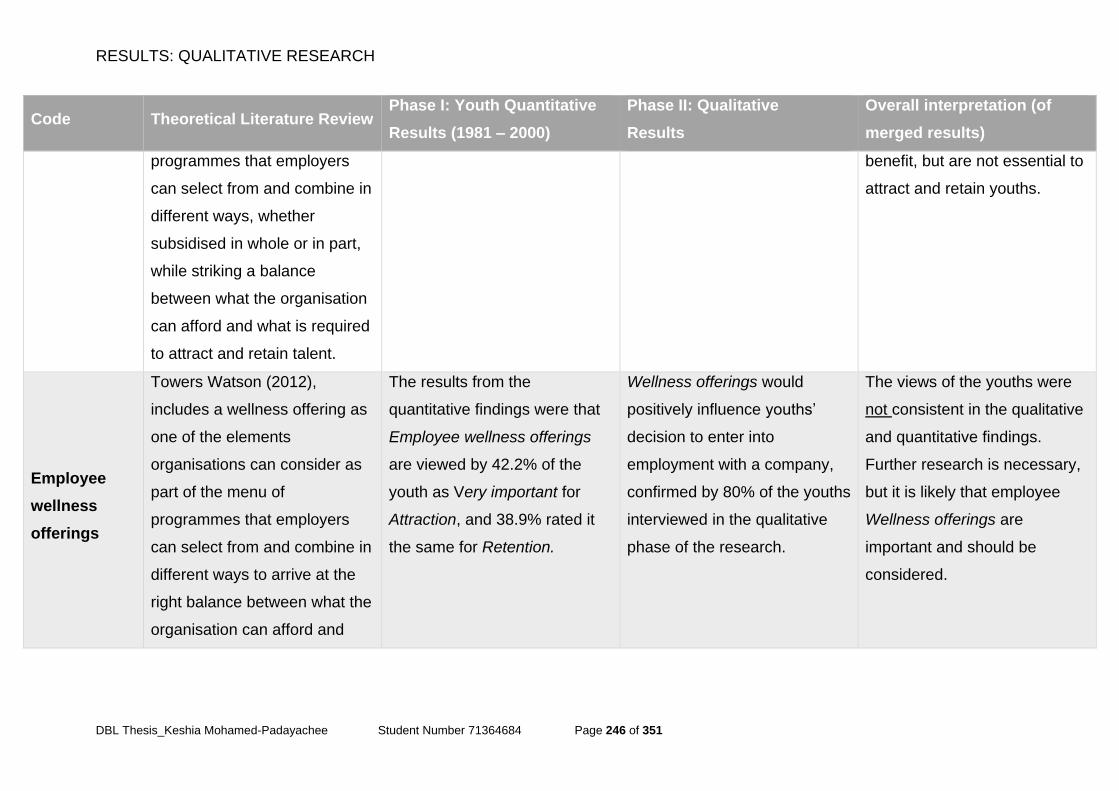
RESULTS: QUALITATIVE RESEARCH
DBL Thesis_Keshia Mohamed-Padayachee Student Number 71364684 Page 246 of 351
Code Theoretical Literature Review Phase I: Youth Quantitative
Results (1981 – 2000)
Phase II: Qualitative
Results
Overall interpretation (of
merged results)
programmes that employers
can select from and combine in
different ways, whether
subsidised in whole or in part,
while striking a balance
between what the organisation
can afford and what is required
to attract and retain talent.
benefit, but are not essential to
attract and retain youths.
Employee
wellness
offerings
Towers Watson (2012),
includes a wellness offering as
one of the elements
organisations can consider as
part of the menu of
programmes that employers
can select from and combine in
different ways to arrive at the
right balance between what the
organisation can afford and
The results from the
quantitative findings were that
Employee wellness offerings
are viewed by 42.2% of the
youth as Very important for
Attraction, and 38.9% rated it
the same for Retention.
Wellness offerings would
positively influence youths’
decision to enter into
employment with a company,
confirmed by 80% of the youths
interviewed in the qualitative
phase of the research.
The views of the youths were
not consistent in the qualitative
and quantitative findings.
Further research is necessary,
but it is likely that employee
Wellness offerings are
important and should be
considered.
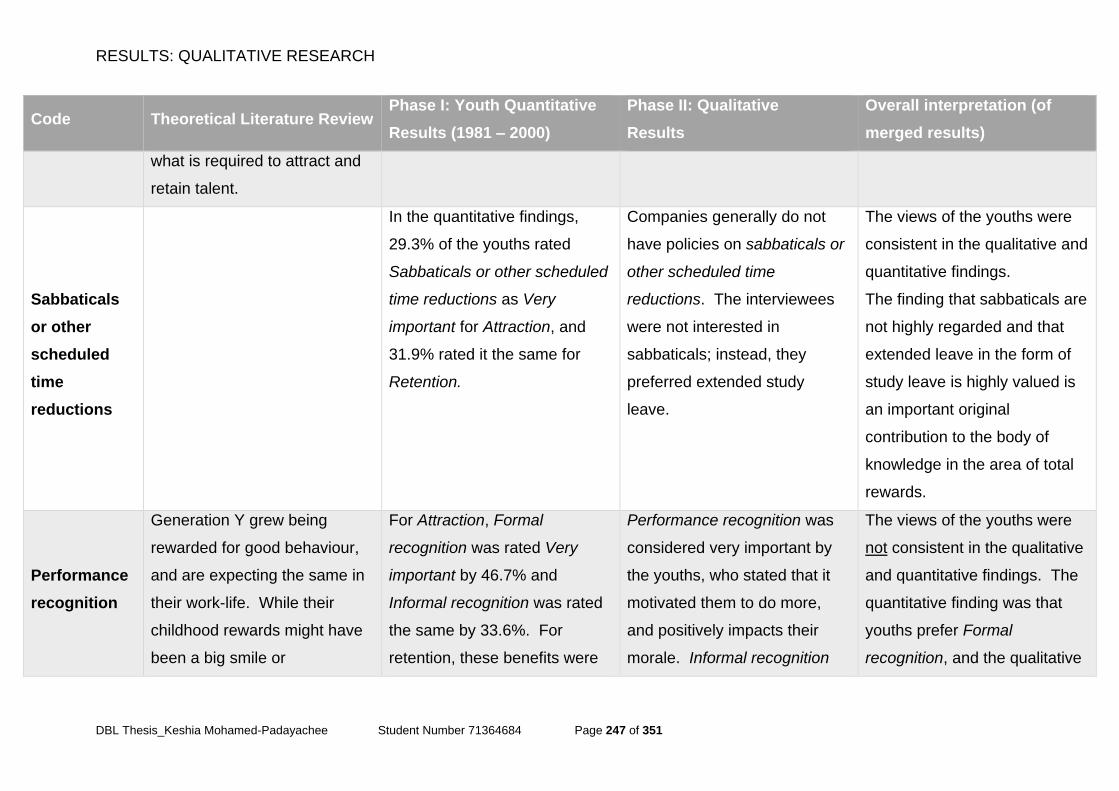
RESULTS: QUALITATIVE RESEARCH
DBL Thesis_Keshia Mohamed-Padayachee Student Number 71364684 Page 247 of 351
Code Theoretical Literature Review Phase I: Youth Quantitative
Results (1981 – 2000)
Phase II: Qualitative
Results
Overall interpretation (of
merged results)
what is required to attract and
retain talent.
Sabbaticals
or other
scheduled
time
reductions
In the quantitative findings,
29.3% of the youths rated
Sabbaticals or other scheduled
time reductions as Very
important for Attraction, and
31.9% rated it the same for
Retention.
Companies generally do not
have policies on sabbaticals or
other scheduled time
reductions. The interviewees
were not interested in
sabbaticals; instead, they
preferred extended study
leave.
The views of the youths were
consistent in the qualitative and
quantitative findings.
The finding that sabbaticals are
not highly regarded and that
extended leave in the form of
study leave is highly valued is
an important original
contribution to the body of
knowledge in the area of total
rewards.
Performance
recognition
Generation Y grew being
rewarded for good behaviour,
and are expecting the same in
their work-life. While their
childhood rewards might have
been a big smile or
For Attraction, Formal
recognition was rated Very
important by 46.7% and
Informal recognition was rated
the same by 33.6%. For
retention, these benefits were
Performance recognition was
considered very important by
the youths, who stated that it
motivated them to do more,
and positively impacts their
morale. Informal recognition
The views of the youths were
not consistent in the qualitative
and quantitative findings. The
quantitative finding was that
youths prefer Formal
recognition, and the qualitative
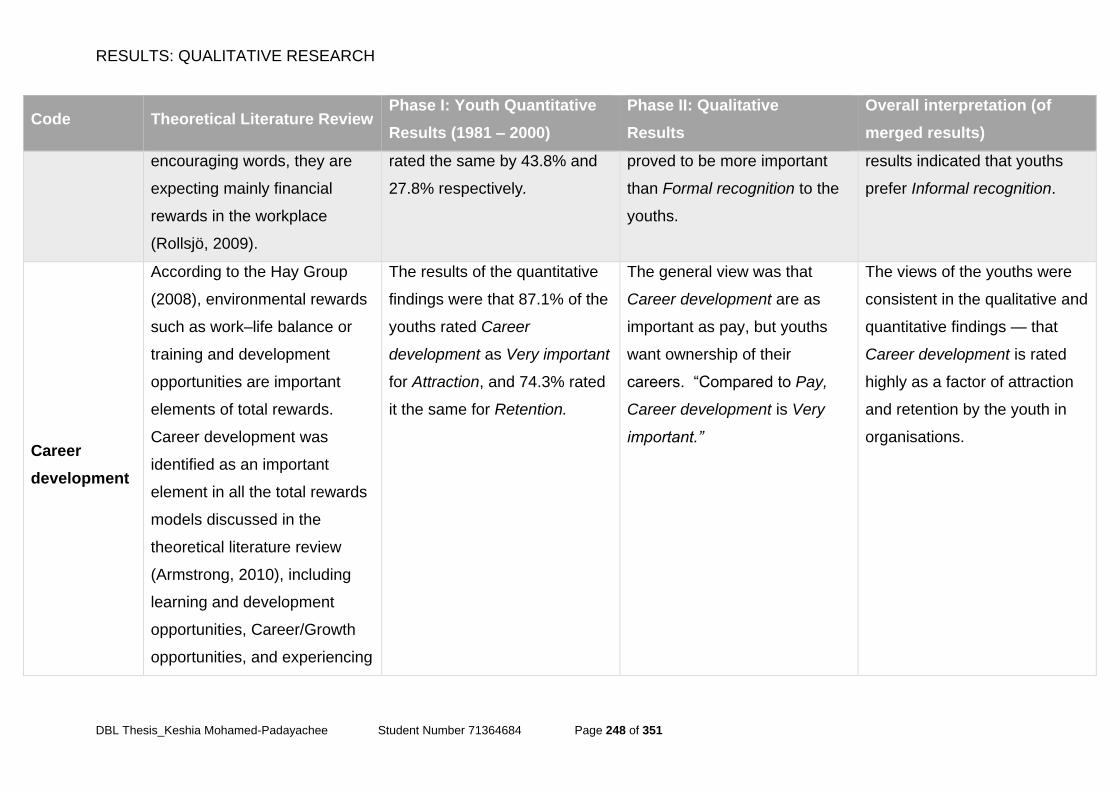
RESULTS: QUALITATIVE RESEARCH
DBL Thesis_Keshia Mohamed-Padayachee Student Number 71364684 Page 248 of 351
Code Theoretical Literature Review Phase I: Youth Quantitative
Results (1981 – 2000)
Phase II: Qualitative
Results
Overall interpretation (of
merged results)
encouraging words, they are
expecting mainly financial
rewards in the workplace
(Rollsjö, 2009).
rated the same by 43.8% and
27.8% respectively.
proved to be more important
than Formal recognition to the
youths.
results indicated that youths
prefer Informal recognition.
Career
development
According to the Hay Group
(2008), environmental rewards
such as work‒life balance or
training and development
opportunities are important
elements of total rewards.
Career development was
identified as an important
element in all the total rewards
models discussed in the
theoretical literature review
(Armstrong, 2010), including
learning and development
opportunities, Career/Growth
opportunities, and experiencing
The results of the quantitative
findings were that 87.1% of the
youths rated Career
development as Very important
for Attraction, and 74.3% rated
it the same for Retention.
The general view was that
Career development are as
important as pay, but youths
want ownership of their
careers. “Compared to Pay,
Career development is Very
important.”
The views of the youths were
consistent in the qualitative and
quantitative findings — that
Career development is rated
highly as a factor of attraction
and retention by the youth in
organisations.
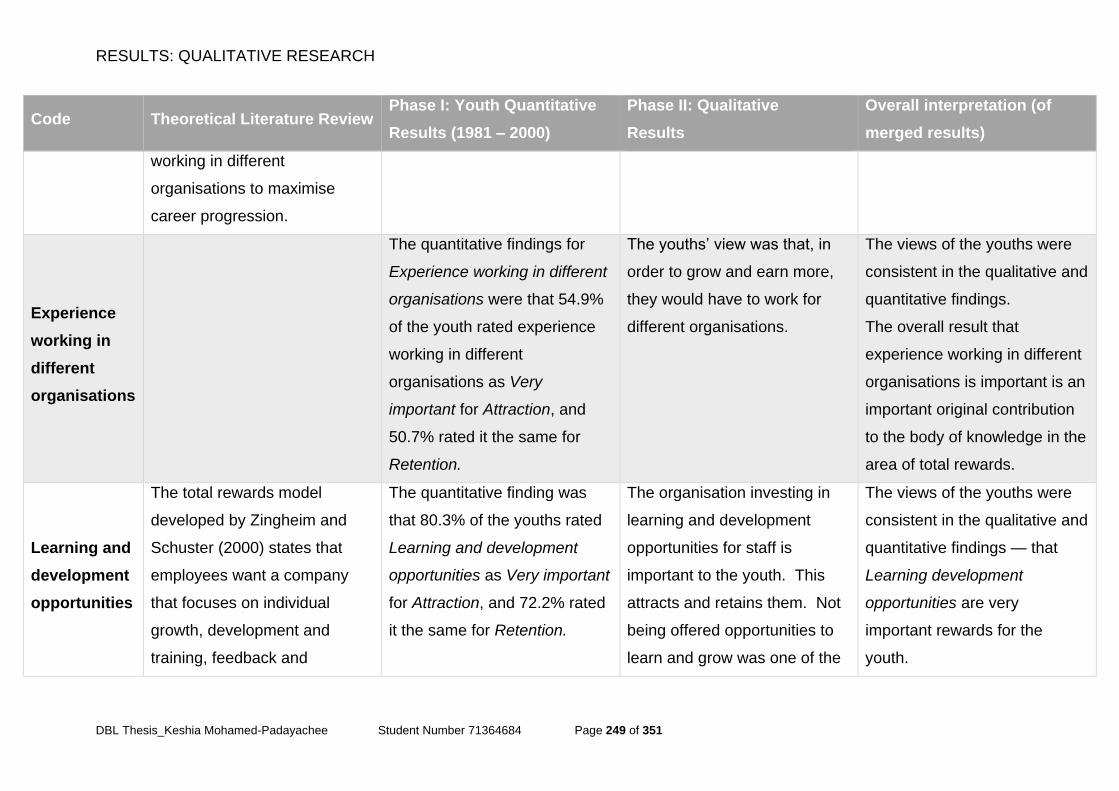
RESULTS: QUALITATIVE RESEARCH
DBL Thesis_Keshia Mohamed-Padayachee Student Number 71364684 Page 249 of 351
Code Theoretical Literature Review Phase I: Youth Quantitative
Results (1981 – 2000)
Phase II: Qualitative
Results
Overall interpretation (of
merged results)
working in different
organisations to maximise
career progression.
Experience
working in
different
organisations
The quantitative findings for
Experience working in different
organisations were that 54.9%
of the youth rated experience
working in different
organisations as Very
important for Attraction, and
50.7% rated it the same for
Retention.
The youths’ view was that, in
order to grow and earn more,
they would have to work for
different organisations.
The views of the youths were
consistent in the qualitative and
quantitative findings.
The overall result that
experience working in different
organisations is important is an
important original contribution
to the body of knowledge in the
area of total rewards.
Learning and
development
opportunities
The total rewards model
developed by Zingheim and
Schuster (2000) states that
employees want a company
that focuses on individual
growth, development and
training, feedback and
The quantitative finding was
that 80.3% of the youths rated
Learning and development
opportunities as Very important
for Attraction, and 72.2% rated
it the same for Retention.
The organisation investing in
learning and development
opportunities for staff is
important to the youth. This
attracts and retains them. Not
being offered opportunities to
learn and grow was one of the
The views of the youths were
consistent in the qualitative and
quantitative findings — that
Learning development
opportunities are very
important rewards for the
youth.

RESULTS: QUALITATIVE RESEARCH
DBL Thesis_Keshia Mohamed-Padayachee Student Number 71364684 Page 250 of 351
Code Theoretical Literature Review Phase I: Youth Quantitative
Results (1981 – 2000)
Phase II: Qualitative
Results
Overall interpretation (of
merged results)
coaching, and opportunities to
grow and learn to add value
over time.
reasons why they had left
companies in the past.
Formal
coaching or
mentoring
programmes
According to research by
Eisner (2005), the group born
1965–1980 values developing
skills and keeping up to date,
and respond well to a coaching
management style that
provides prompt feedback and
credit for positive results. This
may be the same for youth
born 1981–2000.
The quantitative findings were
that 46.3% of the youths rated
Formal coaching or mentoring
programmes as Very important
for Attraction, and 53.5% rated
it the same for Retention.
The youths were in agreement
that Formal coaching or
mentoring programmes are
very important.
The views of the youths were
consistent in the qualitative and
quantitative findings. The
overall finding is that Formal
coaching or mentoring
programmes are very important
factors of rewards.
Work‒life,
Flexible work
arrangements
The literature indicates that
many employees have
developed a work-to-live rather
than live-to-work mind-set that
spills over into valuing the
quality of the work environment
The quantitative findings were
that 61.6% of the youths rated
Work‒life, Flexible work
arrangements as Very
important for Attraction, and
Differing views between the
youths and the HR group were
found in this regard.
The youths viewed a Work‒life
as very important, and added
that they would also be
The views of the youths were
consistent in the qualitative and
quantitative findings.
The overall results are that
Work‒life and Flexible work
arrangements are very
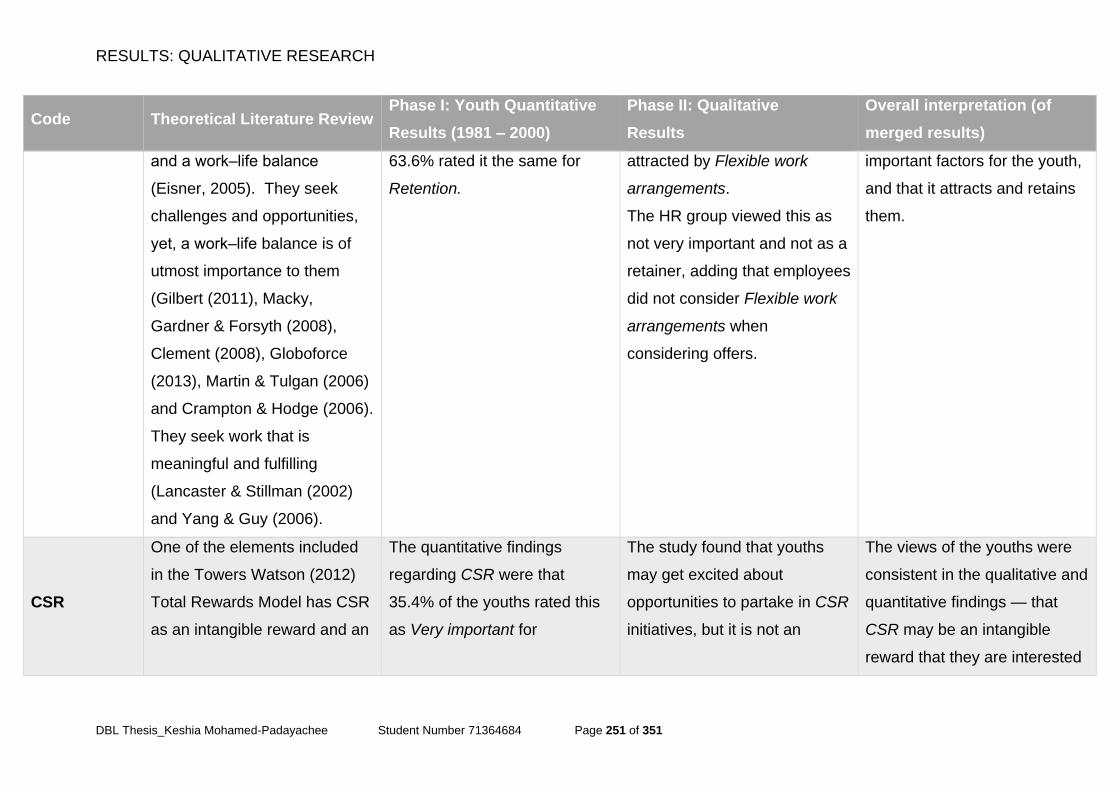
RESULTS: QUALITATIVE RESEARCH
DBL Thesis_Keshia Mohamed-Padayachee Student Number 71364684 Page 251 of 351
Code Theoretical Literature Review Phase I: Youth Quantitative
Results (1981 – 2000)
Phase II: Qualitative
Results
Overall interpretation (of
merged results)
and a work‒life balance
(Eisner, 2005). They seek
challenges and opportunities,
yet, a work‒life balance is of
utmost importance to them
(Gilbert (2011), Macky,
Gardner & Forsyth (2008),
Clement (2008), Globoforce
(2013), Martin & Tulgan (2006)
and Crampton & Hodge (2006).
They seek work that is
meaningful and fulfilling
(Lancaster & Stillman (2002)
and Yang & Guy (2006).
63.6% rated it the same for
Retention.
attracted by Flexible work
arrangements.
The HR group viewed this as
not very important and not as a
retainer, adding that employees
did not consider Flexible work
arrangements when
considering offers.
important factors for the youth,
and that it attracts and retains
them.
CSR
One of the elements included
in the Towers Watson (2012)
Total Rewards Model has CSR
as an intangible reward and an
The quantitative findings
regarding CSR were that
35.4% of the youths rated this
as Very important for
The study found that youths
may get excited about
opportunities to partake in CSR
initiatives, but it is not an
The views of the youths were
consistent in the qualitative and
quantitative findings — that
CSR may be an intangible
reward that they are interested
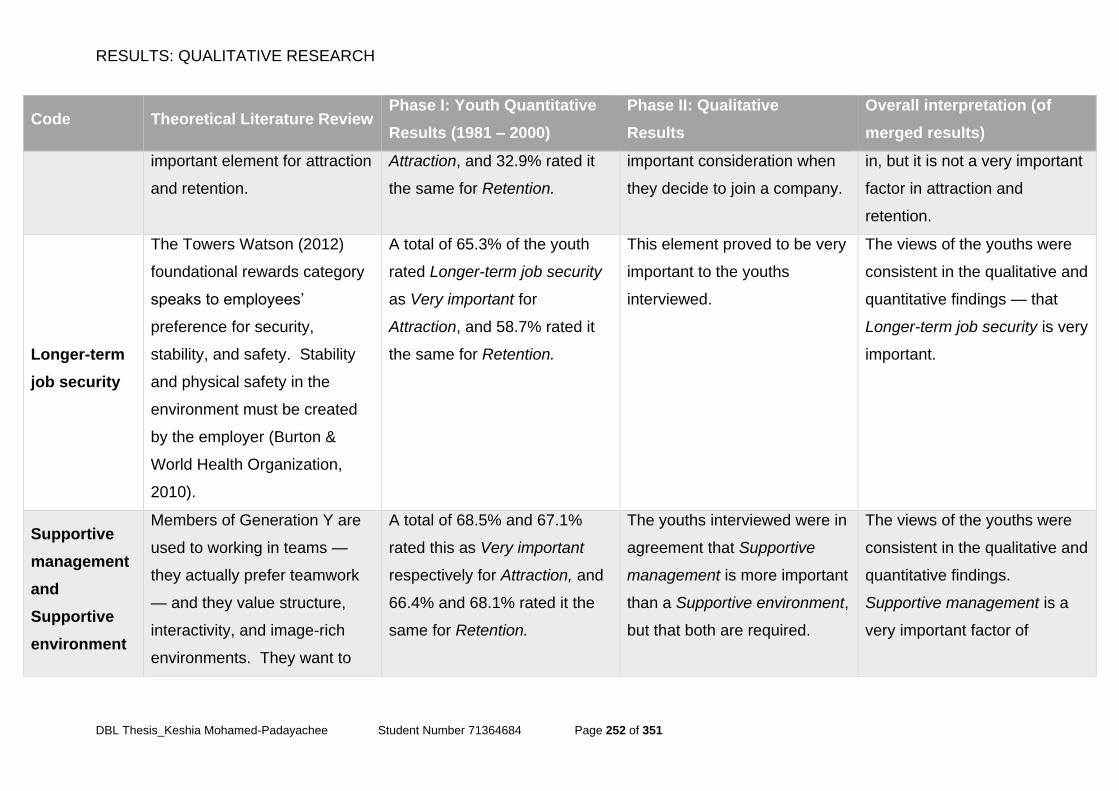
RESULTS: QUALITATIVE RESEARCH
DBL Thesis_Keshia Mohamed-Padayachee Student Number 71364684 Page 252 of 351
Code Theoretical Literature Review Phase I: Youth Quantitative
Results (1981 – 2000)
Phase II: Qualitative
Results
Overall interpretation (of
merged results)
important element for attraction
and retention.
Attraction, and 32.9% rated it
the same for Retention.
important consideration when
they decide to join a company.
in, but it is not a very important
factor in attraction and
retention.
Longer-term
job security
The Towers Watson (2012)
foundational rewards category
speaks to employees’
preference for security,
stability, and safety. Stability
and physical safety in the
environment must be created
by the employer (Burton &
World Health Organization,
2010).
A total of 65.3% of the youth
rated Longer-term job security
as Very important for
Attraction, and 58.7% rated it
the same for Retention.
This element proved to be very
important to the youths
interviewed.
The views of the youths were
consistent in the qualitative and
quantitative findings — that
Longer-term job security is very
important.
Supportive
management
and
Supportive
environment
Members of Generation Y are
used to working in teams —
they actually prefer teamwork
— and they value structure,
interactivity, and image-rich
environments. They want to
A total of 68.5% and 67.1%
rated this as Very important
respectively for Attraction, and
66.4% and 68.1% rated it the
same for Retention.
The youths interviewed were in
agreement that Supportive
management is more important
than a Supportive environment,
but that both are required.
The views of the youths were
consistent in the qualitative and
quantitative findings.
Supportive management is a
very important factor of
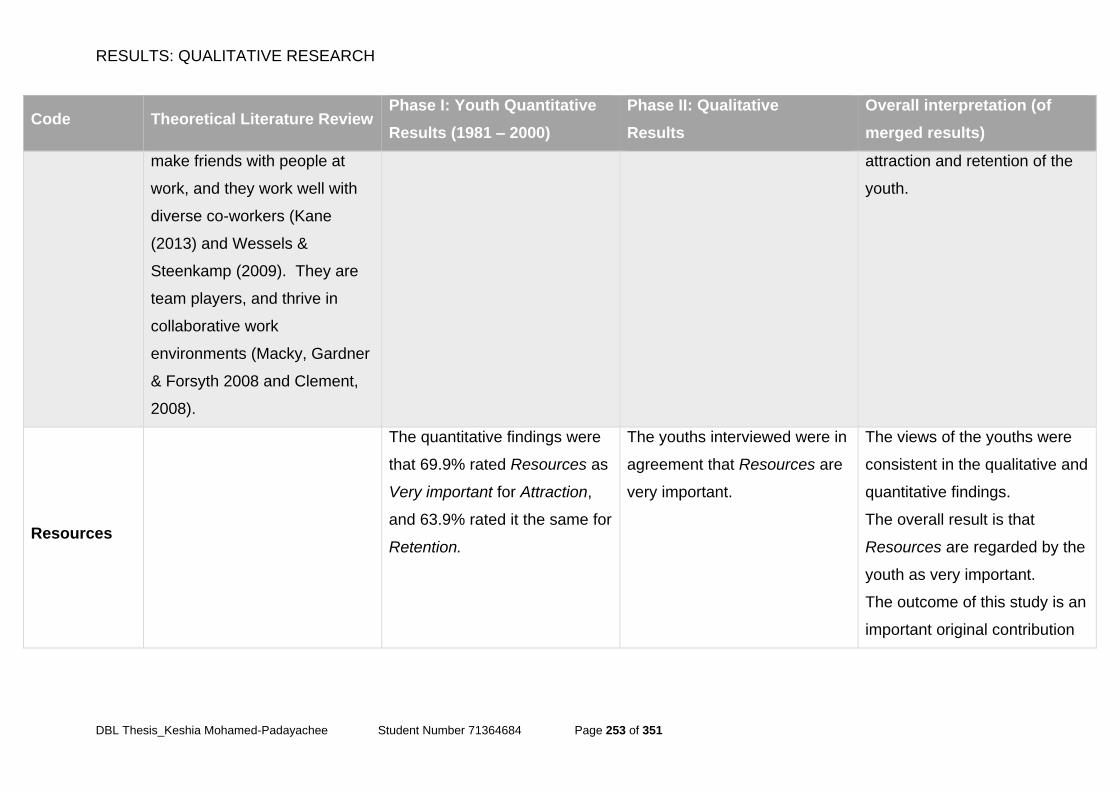
RESULTS: QUALITATIVE RESEARCH
DBL Thesis_Keshia Mohamed-Padayachee Student Number 71364684 Page 253 of 351
Code Theoretical Literature Review Phase I: Youth Quantitative
Results (1981 – 2000)
Phase II: Qualitative
Results
Overall interpretation (of
merged results)
make friends with people at
work, and they work well with
diverse co-workers (Kane
(2013) and Wessels &
Steenkamp (2009). They are
team players, and thrive in
collaborative work
environments (Macky, Gardner
& Forsyth 2008 and Clement,
2008).
attraction and retention of the
youth.
Resources
The quantitative findings were
that 69.9% rated Resources as
Very important for Attraction,
and 63.9% rated it the same for
Retention.
The youths interviewed were in
agreement that Resources are
very important.
The views of the youths were
consistent in the qualitative and
quantitative findings.
The overall result is that
Resources are regarded by the
youth as very important.
The outcome of this study is an
important original contribution
RESULTS: QUALITATIVE RESEARCH
DBL Thesis_Keshia Mohamed-Padayachee Student Number 71364684 Page 254 of 351
Code Theoretical Literature Review Phase I: Youth Quantitative
Results (1981 – 2000)
Phase II: Qualitative
Results
Overall interpretation (of
merged results)
to the body of knowledge in the
area of total rewards.
Sources: Hardigree (2008), Thompson (2002), Zingheim & Schuster (2000), Collins (2009), Towers Watson (2012), Hay Group
(2008), Armstrong (2010), WorldatWork (2015), Globoforce (2013), Rollsjö (2009), Eisner (2005), Gilbert (2011), Macky, Gardner &
Forsyth (2008), Clement (2008), Martin & Tulgan (2006), Crampton & Hodge (2006), Lancaster & Stillman (2002), Yang & Guy
(2006), Burton & World Health Organization (2010), Kane (2013), Wessels & Steenkamp (2009), Macky, Gardner & Forsyth (2008),
and Clement (2008)
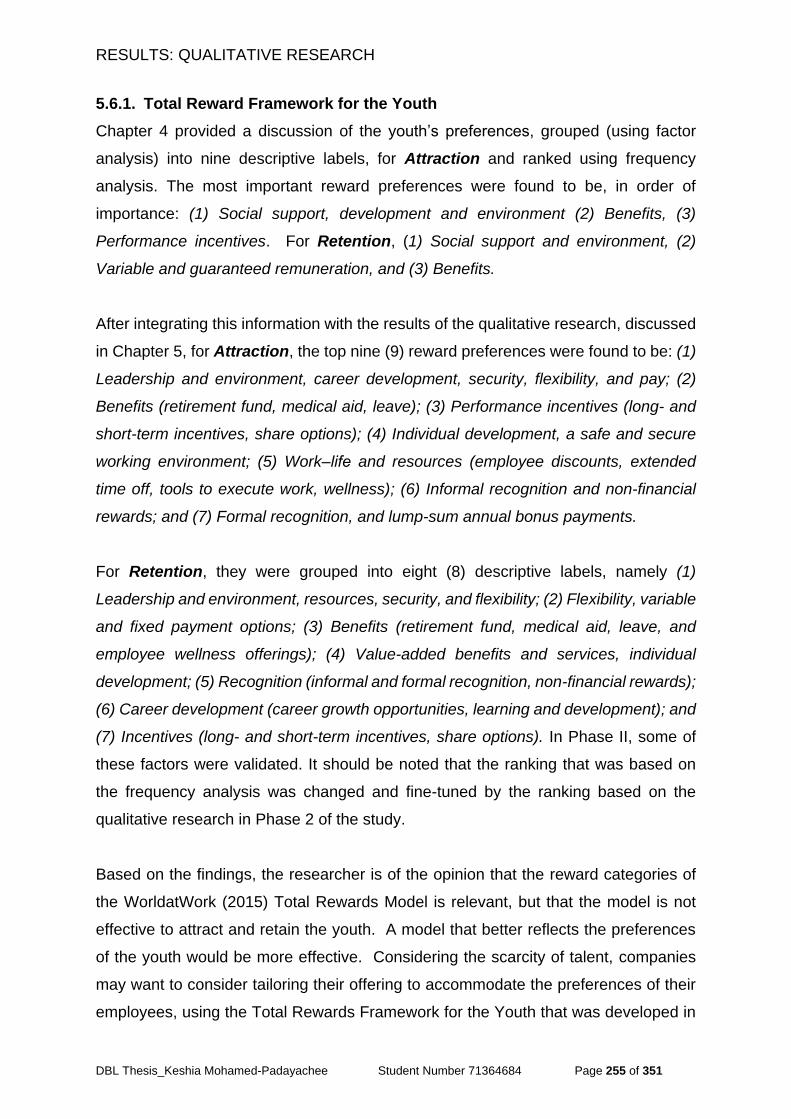
RESULTS: QUALITATIVE RESEARCH
DBL Thesis_Keshia Mohamed-Padayachee Student Number 71364684 Page 255 of 351
5.6.1. Total Reward Framework for the Youth
Chapter 4 provided a discussion of the youth’s preferences, grouped (using factor
analysis) into nine descriptive labels, for Attraction and ranked using frequency
analysis. The most important reward preferences were found to be, in order of
importance: (1) Social support, development and environment (2) Benefits, (3)
Performance incentives. For Retention, (1) Social support and environment, (2)
Variable and guaranteed remuneration, and (3) Benefits.
After integrating this information with the results of the qualitative research, discussed
in Chapter 5, for Attraction, the top nine (9) reward preferences were found to be: (1)
Leadership and environment, career development, security, flexibility, and pay; (2)
Benefits (retirement fund, medical aid, leave); (3) Performance incentives (long- and
short-term incentives, share options); (4) Individual development, a safe and secure
working environment; (5) Work‒life and resources (employee discounts, extended
time off, tools to execute work, wellness); (6) Informal recognition and non-financial
rewards; and (7) Formal recognition, and lump-sum annual bonus payments.
For Retention, they were grouped into eight (8) descriptive labels, namely (1)
Leadership and environment, resources, security, and flexibility; (2) Flexibility, variable
and fixed payment options; (3) Benefits (retirement fund, medical aid, leave, and
employee wellness offerings); (4) Value-added benefits and services, individual
development; (5) Recognition (informal and formal recognition, non-financial rewards);
(6) Career development (career growth opportunities, learning and development); and
(7) Incentives (long- and short-term incentives, share options). In Phase II, some of
these factors were validated. It should be noted that the ranking that was based on
the frequency analysis was changed and fine-tuned by the ranking based on the
qualitative research in Phase 2 of the study.
Based on the findings, the researcher is of the opinion that the reward categories of
the WorldatWork (2015) Total Rewards Model is relevant, but that the model is not
effective to attract and retain the youth. A model that better reflects the preferences
of the youth would be more effective. Considering the scarcity of talent, companies
may want to consider tailoring their offering to accommodate the preferences of their
employees, using the Total Rewards Framework for the Youth that was developed in
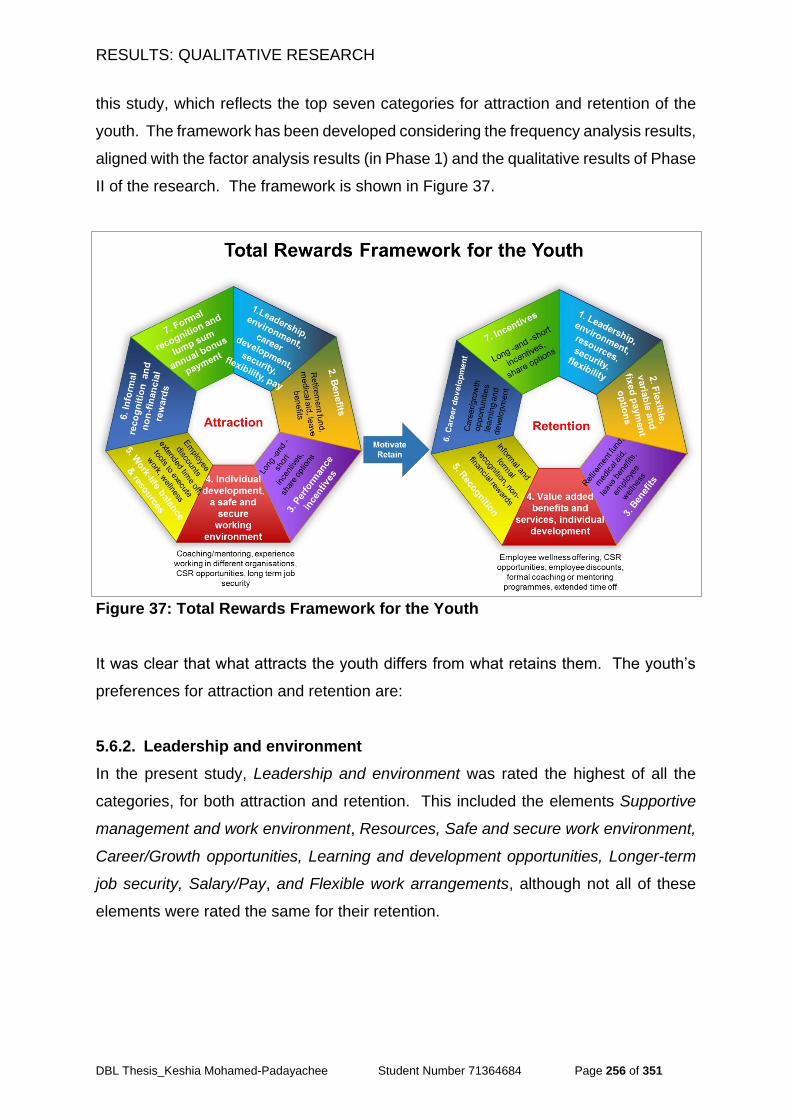
RESULTS: QUALITATIVE RESEARCH
DBL Thesis_Keshia Mohamed-Padayachee Student Number 71364684 Page 256 of 351
this study, which reflects the top seven categories for attraction and retention of the
youth. The framework has been developed considering the frequency analysis results,
aligned with the factor analysis results (in Phase 1) and the qualitative results of Phase
II of the research. The framework is shown in Figure 37.
Figure 37: Total Rewards Framework for the Youth
It was clear that what attracts the youth differs from what retains them. The youth’s
preferences for attraction and retention are:
5.6.2. Leadership and environment
In the present study, Leadership and environment was rated the highest of all the
categories, for both attraction and retention. This included the elements Supportive
management and work environment, Resources, Safe and secure work environment,
Career/Growth opportunities, Learning and development opportunities, Longer-term
job security, Salary/Pay, and Flexible work arrangements, although not all of these
elements were rated the same for their retention.
RESULTS: QUALITATIVE RESEARCH
DBL Thesis_Keshia Mohamed-Padayachee Student Number 71364684 Page 257 of 351
5.6.2.1. Supportive management and work environment
It is clear from the results that organisations that focus on leadership and developing
talent will be in a stronger position to retain key employees as the war for talent
intensifies (Boxall & Purcell, 2011). Youths expect that promises will be kept.
Supportive and understanding leaders attract and retain them. They appreciate
managers who have an open-door policy and are available to listen to their concerns.
They want leaders who are focused on their development, create growth opportunities,
value a work‒life, and are able to create a supportive environment.
The themes Culture and Work environment emerged during Phase I of the study,
which the researcher grouped with Supportive work environment. This was validated
during Phase II, when the youths and the OD specialist indicated that the culture of an
organisation is very important for both the attraction and retention of the youth.
5.6.2.2. Resources
Youths value tools and devices, to the point that they would use their own in the
workplace. The devices and tools given to them to perform their work were rated very
important in both the qualitative and quantitative phases of the research.
5.6.2.3. Safe/Secure work environment
The elements that formed part of this category for both attraction and retention were
Long-term job security and Safe/secure work environment. Long-term job security and
a safe and secure work environment are important to the youth.
5.6.2.4. Longer-term job security
Longer-term job security (> 12 months) was ranked very important in Phase I of the
research for both attraction and retention, and, in Phase II, was important for some of
the youth interviewed, but not all. In order to enhance retention, youths need to feel
that their position is secure. However, they consider pay more important than job
security; they are prepared to sacrifice security for more money. They will also
sacrifice security for job satisfaction and opportunities to grow and learn. They are not
afraid of risks, but take calculated risks, as purported by Howe and Strauss (2007).
RESULTS: QUALITATIVE RESEARCH
DBL Thesis_Keshia Mohamed-Padayachee Student Number 71364684 Page 258 of 351
5.6.2.5. Career/Growth and learning and development opportunities
These elements represent opportunities designed to enhance employees’ applied
skills and competencies. As described by WorldatWork (2015) in their Total Rewards
Model, development encourages employees to perform better and enables leaders to
advance their people strategies. This aspect includes a plan for employees to
advance their own career goals, and may include advancement to a more responsible
position in an organisation. The organisation supports career advancement internally,
so that talented employees are deployed in positions that enable them to deliver their
greatest value to the organisation (WorldatWork, 2015).
5.6.2.6. Salary/Pay
The respondents rated an attractive Salary/Pay as important. Phase II of the present
study indicated that companies need to pay market-related salaries in order to attract
and retain the youth. Salary and other monetary benefits are a significant
consideration for the youth, as it was, and still is, for previous generations. This finding
supports those of Martin and Tulgan (2006) and Rollsjö (2009). Phase II of the
research illustrated that youths are not unrealistic about their earning potential, but
they do want to be paid market-related salaries. They are also aware that their
qualifications and years’ experience impact their earning potential. This result
contradicts the literature stating that promotion is very important to members of
Generation Y, but that they want this with minimal effort, perhaps reflecting a sense of
entitlement that is the product of a pampered upbringing (Ng et al., 2010, CLC, 2005
and Nelson & Twenge, 2005). This generation ‘wants it all and wants it now’ in terms
of better pay and benefits, rapid advancement, work‒life balance, interesting and
challenging work, and making a contribution to society (Ng et al., 2010: 282). The
reason for this was not investigated in the present study.
5.6.3. Benefits
Benefits ranked second in importance for attraction and third for retention. The study
found that the most important benefits, in rank order are Retirement fund, Medical aid,
and Leave. A benefit that youths find important that emerged from the quantitative
phase of the present study was study leave. They want a work‒life, and therefore do
not want to take annual leave when their study leave becomes depleted. Youth find
RESULTS: QUALITATIVE RESEARCH
DBL Thesis_Keshia Mohamed-Padayachee Student Number 71364684 Page 259 of 351
the current allocation of study leave insufficient. Sabbaticals or other scheduled time
reductions were ranked fifth and fourth in importance respectively for attraction and
retention of the youth.
5.6.4. Flexible, variable, and fixed pay options
This factor ranked second-highest for retention. The elements included in this factor
were: Lower base salary with unlimited bonus potential, Smaller bonus payments
intermittently, Higher base salary with limited bonus potential, Lump-sum annual
bonus payment, 13th cheque, Salary/Pay, and Share options. Ranking third for
attraction was Long-term incentives, Share options, and Short-term incentives (which
were ranked similarly for retention).
5.6.5. Career- and individual development
Raking fourth for attraction and sixth for retention, career- and individual development,
this factor includes Formal coaching or mentoring programmes, Experience working
in different organisations to maximise career progression, Experience working in
different organisations to maximise career earnings potential, CSR, and 13th cheque.
For retention, the elements include Flexible work arrangements, Career/Growth
opportunities, Learning and development opportunities, and Formal coaching or
mentoring programmes.
5.6.6. Work‒life
Ranking fifth for Attraction and for Retention, this factor included Employee discounts,
Sabbaticals or other scheduled time reductions, Employee wellness offering, and
Flexible work arrangements. Analysis of the responses to the open-ended questions
in both the quantitative and qualitative phases highlighted the importance of a work‒
life to the youth.
5.6.7. Recognition
Recognition ranked fifth for Retention and sixth for Attraction. The elements included
in this factor are Formal recognition, Informal recognition, and Non-financial rewards.
Being recognised and rewarded is a need of the youth. This research found that both
Formal and Informal recognition motivate them, but not in equal measure. Formal
RESULTS: QUALITATIVE RESEARCH
DBL Thesis_Keshia Mohamed-Padayachee Student Number 71364684 Page 260 of 351
recognition was rated higher than informal recognition in the questionnaire section of
the study and informal rated higher during the interviews.
5.6.7.1. Formal recognition
This research found that Formal recognition drives and encourages the youth. This
finding supports that of Rollsjö (2009). Youths grew up receiving rewards for good
behaviour, and are expecting the same in their work-life.
5.6.7.2. Informal recognition
This was ranked Very important by youth respondents and interviewees, as well as
the HR practitioners interviewed. Youths prefer on-the-spot recognition and thanks
from management in recognition of their contributions. Recognition motivates them to
display even more of the same behaviour. The majority (60%) of the interviewed
youths preferred informal to formal recognition. This should be of great interest to
companies that may not always have the budget to host formal recognition events.
It was found that both Formal and Informal recognition are motivational. Spontaneity
and fun in the work environment appealed to 60% of the youth interviewees. One of
the themes that emerged during the interviews was the need of young employees to
receive feedback. When they do not receive this feedback, they will source it from
their managers.
5.6.7.3. Non-financial rewards
These can be part of either formal or informal recognition, and may have a monetary
value. This study found that youths do value non-financial rewards. This presents an
opportunity for future research to confirm what exactly youths value in terms of non-
financial rewards. “People were saying they did not just want branded merchandise,
they wanted much more, and they started to give overseas trips, and people loved that
...”
The researcher considered the results of both Phases I and II, and reviewed the
literature, to develop an accurate and defendable set of rewards for the youth, which
rewards were investigated empirically.
RESULTS: QUALITATIVE RESEARCH
DBL Thesis_Keshia Mohamed-Padayachee Student Number 71364684 Page 261 of 351
5.7 Conclusion
This chapter described the findings obtained in Phase II of the research. It provided
a summary of each of the groups’ responses by category and code, aligned with the
framework of the research. It concluded with presenting the newly developed Total
Rewards Framework for the Youth. The framework was developed from the items that
were investigated using frequency analysis and categorised using factor analysis
reported in Chapter 4, the results of which were validated in Phase II.
The next chapter presents the empirical findings from the research, summarising the
researcher’s interpretation of the findings obtained through the questionnaire and the
semi-structured interviews, linking these to the theories discussed in Chapter 2.
CHAPTER 6
DBL Thesis_Keshia Mohamed-Padayachee Student Number 71364684 Page 262 of 351
CHAPTER 6
DISCUSSION, CONCLUSIONS, AND RECOMMENDATIONS
6.1. Introduction
This study set out to evaluate the effectiveness of the reward categories of the
WorldatWork (2012) total rewards model and other existing total rewards models for
attraction and retention, with specific emphasis on the youth. The aim was to identify
the factors of attraction and retention of the youth and, subsequently, to develop a
more relevant total rewards framework for the youth. To ensure rigour and enhance
the credibility of the study, the researcher assessed whether career- and life-stage
models, as an alternative to generational theories, could be applied as predictors of
what will attract and retain the youth. The study further sought to link selected theories
of motivation regarding reward, to determine the intrinsic and extrinsic motivators
linked to rewards that drive youth employees’ behaviour. This would help to create a
deeper appreciation and understanding of the driving forces behind the attraction and
retention of youth employees. The study utilised the reward categories of the
WorldatWork (2015) Total Rewards Model, customised with elements from other
existing reward frameworks.
This is the last chapter of the thesis. It begins with a detailed discussion of the study
results, in accordance with the structure of Chapters 4 and 5, and in the context of the
theoretical literature review presented in Chapter 2. This is done in Section 6.2., which
presents a discussion of the results and the youth’s work preferences. Section 6.3.
describes how the specific objectives of the study were achieved, where after an
evaluation of the limitations of the study are presented in Section 6.5. The contribution
of this study to the body of knowledge in this field is presented in Section 6.6, followed
by Section 6.7, where recommendations and policy implications are given, and future
research is suggested.
DISCUSSION, CONCLUSIONS, AND RECOMMENDATIONS
DBL Thesis_Keshia Mohamed-Padayachee Student Number 71364684 Page 263 of 351
6.2. Discussion of results
Through a survey using a sample of 276 respondents and 11 semi-structured
interviews, the researcher compared total reward preferences for attraction and
retention across various total reward models, with specific reference to the
WorldatWork (2015) Total Rewards Model. Identified categories and elements from
these models were applied in several ways, to assess the rewards prioritisation, using
frequency distribution, the chi-square test, the Kruskal-Wallis test and factor analysis.
Three top variables emerged as most significant in terms of their effect on the
attraction and retention of the youth. For Attraction, these were: (1) Leadership and
environment, career development, security, flexibility, and pay; (2) Benefits (retirement
fund, medical aid, leave); (3) Performance incentives, and, for Retention, (1)
Leadership and environment, resources, security, and flexibility; (2) Flexibility, variable
and fixed payment options; (3) Benefits (retirement fund, medical aid, leave, and
employee wellness offerings). Additionally, several individual components of rewards
were significantly linked to rewards prioritisation. These bivariate and multivariate
findings are discussed in this section of the report.
In this section, the results presented in Chapters 4 and 5 are discussed, to refine the
conclusions and recommendations, in the following order: generational theory,
theories of motivation, and total reward categories and elements for attraction and
retention.
6.2.1. Generational theory
The findings based on the similarity of the responses in the quantitative and qualitative
phases of the research support the literature and the similarities between generations
posited by Howe and Strauss (1991; 2007), who developed similar collective
personae.
The research highlights that each generation has distinct characteristics that affect
how the war for talent is waged (Twenge, 2010), and will therefore require a different
approach for their attraction and retention.
DISCUSSION, CONCLUSIONS, AND RECOMMENDATIONS
DBL Thesis_Keshia Mohamed-Padayachee Student Number 71364684 Page 264 of 351
6.2.2. Theories of motivation
As attraction and retention remain of strategic importance to organisational success,
offering the desired blend of rewards is imperative. The following is a discussion of
the findings, aligned with theories and the literature presented in Chapter 2, of what
motivators influence and drive the youth’s decision-making about employment. By
understanding these theories of motivation, a deeper appreciation of the driving forces
behind the attraction and retention of the youth was gained.
These theories were assessed in both phases of the present study by the responses
provided by youth respondents and participants. The theories are discussed
individually below.
6.2.2.1. Incentive theory of motivation
Based on the results of this research, youths are motivated by both monetary and non-
monetary rewards and incentives. These rewards, in order of importance for their
attraction are: (1) Leadership and environment, career development, security,
flexibility, and pay; (2) Benefits (retirement fund, medical aid, leave); (3) Performance
incentives (long- and short-term incentives, share options). For their retention, the
rewards are: (1) Leadership and environment, resources, security, and flexibility; (2)
Flexible, variable, and fixed payment options; and (3) Benefits (retirement fund,
medical aid, leave and employee wellness).
The research found that these top three rewards enhance the attraction and retention
of the youth, and should be provided, to motivate them in their work. The findings of
this study support this theory and its applicability in the workplace.
6.2.2.2. Maslow’s hierarchy of needs
For the youth, Leadership and environment is the most important for attraction and
retention. The findings are not completely aligned with Maslow’s hierarchy of needs,
according to which social needs are more important than the psychological need of
Salary/Pay. Pay is very important, as it fulfils their need to buy a house and a car, and
to maintain a certain lifestyle, as stated in interviews in the qualitative phase of the
research. The need for Safety/Security in their jobs ranks the same as safety needs
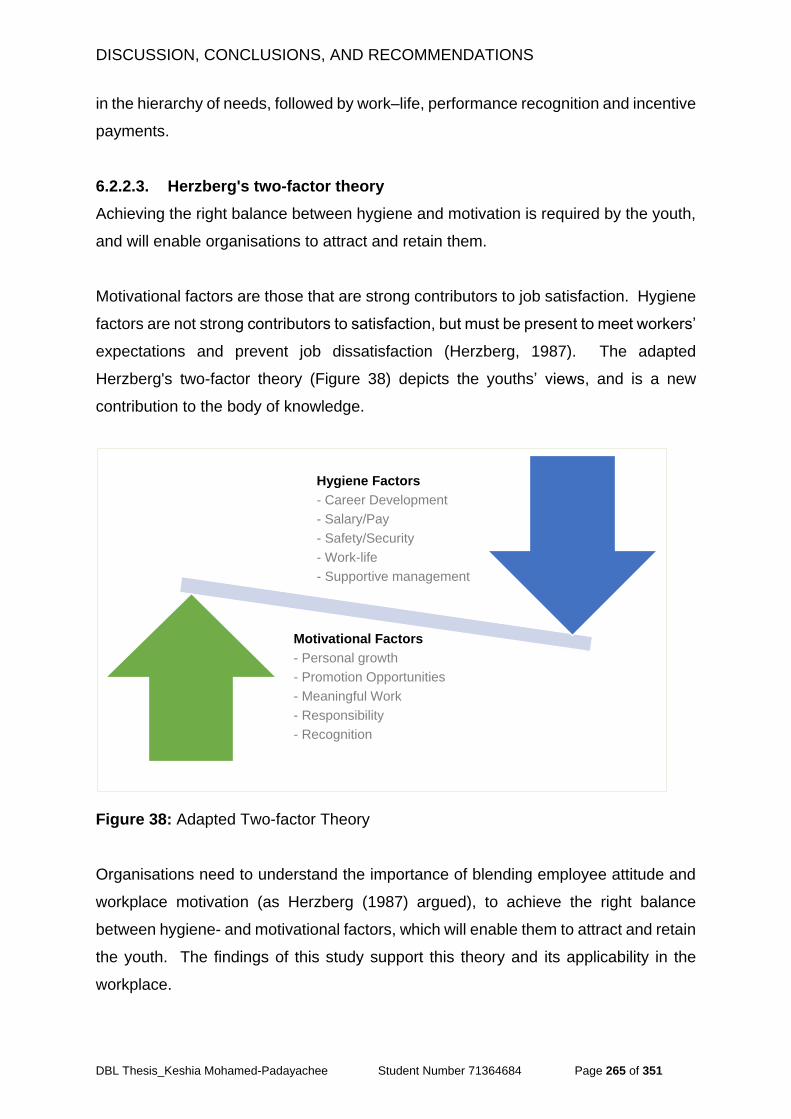
DISCUSSION, CONCLUSIONS, AND RECOMMENDATIONS
DBL Thesis_Keshia Mohamed-Padayachee Student Number 71364684 Page 265 of 351
in the hierarchy of needs, followed by work‒life, performance recognition and incentive
payments.
6.2.2.3. Herzberg's two-factor theory
Achieving the right balance between hygiene and motivation is required by the youth,
and will enable organisations to attract and retain them.
Motivational factors are those that are strong contributors to job satisfaction. Hygiene
factors are not strong contributors to satisfaction, but must be present to meet workers’
expectations and prevent job dissatisfaction (Herzberg, 1987). The adapted
Herzberg's two-factor theory (Figure 38) depicts the youths’ views, and is a new
contribution to the body of knowledge.
Figure 38: Adapted Two-factor Theory
Organisations need to understand the importance of blending employee attitude and
workplace motivation (as Herzberg (1987) argued), to achieve the right balance
between hygiene- and motivational factors, which will enable them to attract and retain
the youth. The findings of this study support this theory and its applicability in the
workplace.
Hygiene Factors
- Career Development
- Salary/Pay
- Safety/Security
- Work-life
- Supportive management
Motivational Factors
- Personal growth
- Promotion Opportunities
- Meaningful Work
- Responsibility
- Recognition
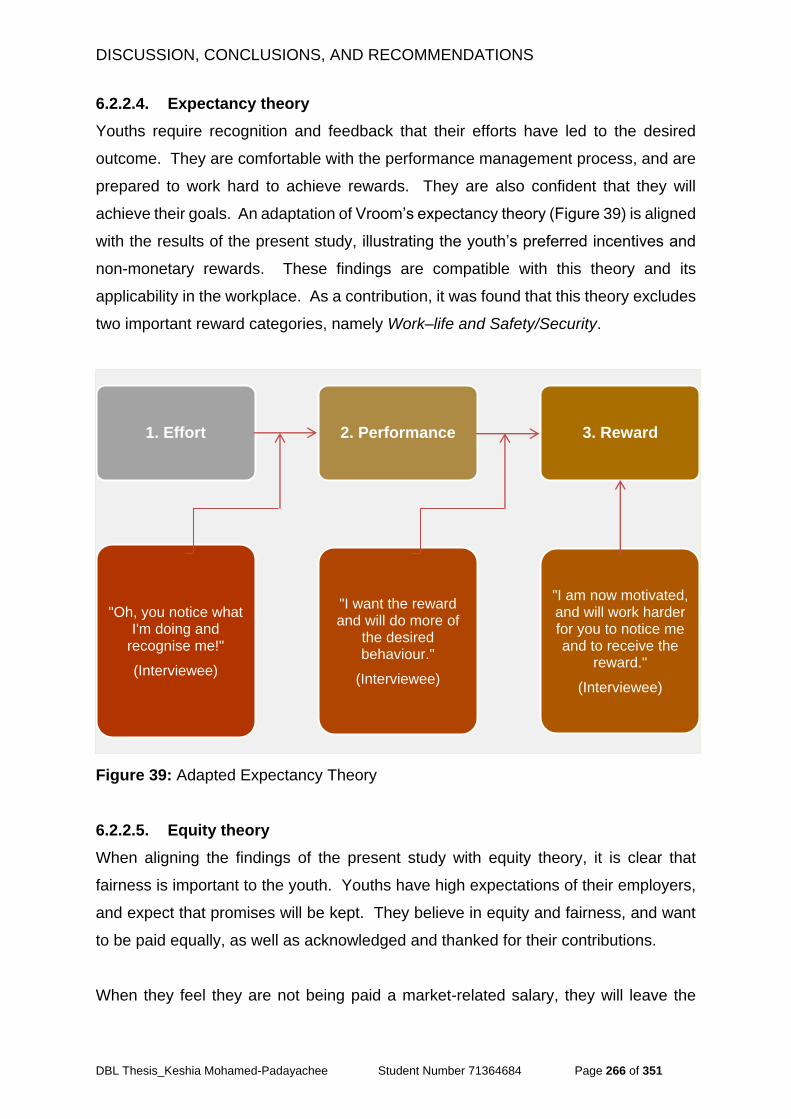
DISCUSSION, CONCLUSIONS, AND RECOMMENDATIONS
DBL Thesis_Keshia Mohamed-Padayachee Student Number 71364684 Page 266 of 351
6.2.2.4. Expectancy theory
Youths require recognition and feedback that their efforts have led to the desired
outcome. They are comfortable with the performance management process, and are
prepared to work hard to achieve rewards. They are also confident that they will
achieve their goals. An adaptation of Vroom’s expectancy theory (Figure 39) is aligned
with the results of the present study, illustrating the youth’s preferred incentives and
non-monetary rewards. These findings are compatible with this theory and its
applicability in the workplace. As a contribution, it was found that this theory excludes
two important reward categories, namely Work‒life and Safety/Security.
Figure 39: Adapted Expectancy Theory
6.2.2.5. Equity theory
When aligning the findings of the present study with equity theory, it is clear that
fairness is important to the youth. Youths have high expectations of their employers,
and expect that promises will be kept. They believe in equity and fairness, and want
to be paid equally, as well as acknowledged and thanked for their contributions.
When they feel they are not being paid a market-related salary, they will leave the
1. Effort 2. Performance 3. Reward
"I am now motivated, and will work harder for you to notice me and to receive the
reward."
(Interviewee)
"I want the reward and will do more of
the desired behaviour."
(Interviewee)
"Oh, you notice what I'm doing and
recognise me!"
(Interviewee)
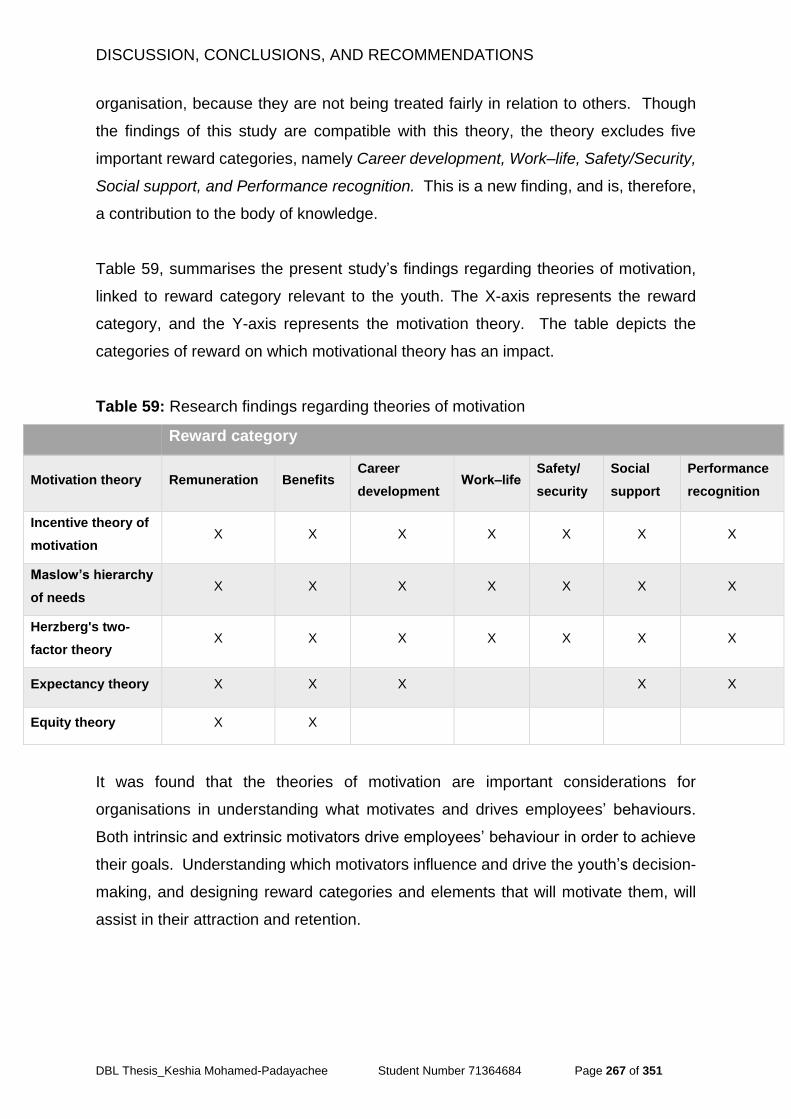
DISCUSSION, CONCLUSIONS, AND RECOMMENDATIONS
DBL Thesis_Keshia Mohamed-Padayachee Student Number 71364684 Page 267 of 351
organisation, because they are not being treated fairly in relation to others. Though
the findings of this study are compatible with this theory, the theory excludes five
important reward categories, namely Career development, Work‒life, Safety/Security,
Social support, and Performance recognition. This is a new finding, and is, therefore,
a contribution to the body of knowledge.
Table 59, summarises the present study’s findings regarding theories of motivation,
linked to reward category relevant to the youth. The X-axis represents the reward
category, and the Y-axis represents the motivation theory. The table depicts the
categories of reward on which motivational theory has an impact.
Table 59: Research findings regarding theories of motivation
Reward category
Motivation theory Remuneration Benefits Career
development Work‒life
Safety/
security
Social
support
Performance
recognition
Incentive theory of
motivation X X X X X X X
Maslow’s hierarchy
of needs X X X X X X X
Herzberg's two-
factor theory X X X X X X X
Expectancy theory X X X X X
Equity theory X X
It was found that the theories of motivation are important considerations for
organisations in understanding what motivates and drives employees’ behaviours.
Both intrinsic and extrinsic motivators drive employees’ behaviour in order to achieve
their goals. Understanding which motivators influence and drive the youth’s decision-
making, and designing reward categories and elements that will motivate them, will
assist in their attraction and retention.
DISCUSSION, CONCLUSIONS, AND RECOMMENDATIONS
DBL Thesis_Keshia Mohamed-Padayachee Student Number 71364684 Page 268 of 351
6.2.3 Total reward options
A total rewards system encompasses the reward framework for an organisation and
the strategy to attract and retain talent. The following sub-section discusses the
results with regard to the total rewards framework for attraction and retention of the
youth.
6.2.3.1 Demographic differences in reward preferences
The demographic data provided the researcher with an overview of the profile of those
who participated in the study. The results of Phase I (quantitative) were obtained using
Pearson’s correlational analysis (Table 42). The majority of the results proved to be
invalid, with more than 20% of the cells having an expected cell count of less than 5
or a minimum expected cell count of less than 1, or both. Some interesting
associations between reward preferences and demographic characteristics were
found; Share options, Smaller bonus payments intermittently, Experience working in
different organisations to maximise career progression, CSR, Safe and secure work
environment, and supportive management varied according to Gender.
A 13th cheque, Short-term incentives, Share options, Medical aid, Retirement fund,
Employee discounts, Employee wellness offering, Formal recognition, Informal
recognition, Learning and development opportunities, Experience working in different
organisations to maximise career progression, Formal coaching or mentoring
programmes, Safe and secure work environment, and Resources varied according to
Race.
Lower base salary with unlimited bonus potential, Non-financial rewards, and Formal
recognition relationship status varied according to Relationship status.
It was also found that, for Attraction, the youths value Leave, Employee discounts,
Long-term job security, and a safe work environment more than the previous
generations; and, for Retention, the youths value Employee discounts. The youth
have rewards preferences more or less similar to those of previous generations.
In considering the demographic data in Phase II (qualitative), the results indicated that
there are no differences in reward preferences between races and genders. Further
DISCUSSION, CONCLUSIONS, AND RECOMMENDATIONS
DBL Thesis_Keshia Mohamed-Padayachee Student Number 71364684 Page 269 of 351
to this, no differences were identified with regard to level of education and field of
study. Differences were, however, noted related to years of experience and
relationship status. Youths with more years of experience had a greater need for a
work‒life than those with fewer years’ experience. This is compatible with the
generation theory discussed in Chapter 2. The same applies to relationship status
and flexible work arrangements (i.e. for married couples with children). Respondents
who had children felt that they would benefit from flexible work arrangements, and that
this would attract and retain them. This is an interesting insight for organisations, and
presents an opportunity for further research.
6.2.3.2 Total reward categories and elements for attraction and retention of
the youth
The findings regarding total reward categories and elements for attraction of the youth
in the context of the theoretical literature presented in Chapter 2 are as follows:
1. Tangible (extrinsic) rewards include Remuneration and Benefits.
2. Intangible (intrinsic) rewards include Work‒life, Performance recognition, and -
Career development opportunities.
3. The WorldatWork (2015) model excludes: Safety/Security, Social support, and
Coaching and mentoring.
4. The null hypothesis, that there is no association between the rewards
categories (e.g., remuneration, benefits, performance recognition, etc.) that
attract people to organisations and the generation to which they belong was
rejected. The reward elements, Leave, Employee discounts, Career/Growth
opportunities, Experience working in different opportunities, and Longer-term
job security proved to be more important to the youth than to previous
generations. This implies that these are the total reward elements that would
attract and retain the youth.
5. Leave, Employee discounts, Career/Growth opportunities, Experience working
in different opportunities, and Longer-term job security are important reward
preferences of the youth, compared to members of previous generations.
For retention, the null hypotheses were rejected with reference to smaller bonuses
paid intermittently and employee discounts.
DISCUSSION, CONCLUSIONS, AND RECOMMENDATIONS
DBL Thesis_Keshia Mohamed-Padayachee Student Number 71364684 Page 270 of 351
The present study used the reward categories of the WorldatWork (2015) Total
Rewards Model and other popular total rewards models to create an increased
understanding of the attraction and retention of youth employees, based on their
reward preferences. None of total reward models described in the literature review
includes the options of a higher base salary with limited bonus potential vs. a lower
base salary with unlimited bonus potential, smaller bonuses paid intermittently, or
resources. This is an important new contribution to the body of knowledge in the area
of total rewards.
6.2.4 The youths work preferences
With an increasingly diverse workforce, no single reward element should be regarded
as a value driver. Job enrichment, flexibility, and career development should be
valued above job security and stability. There should be increased emphasis on the
EVP for individual workers. The traditional career path is outdated — organisations
should provide many opportunities for workers, as found by Kelley, Moore, and
Holloway (2007).
Youths are generally well-educated and self-confident, and they are confident about
their future (Gilbert, 2011). They take control of their careers and growth, and want to
work for an employer who will pay for this. They are very cost-conscious, and
organisations supporting their studies, enhances their loyalty, as it shows that the
organisation cares about their future. They are a mature generation with clear goals,
and they know how they will go about achieving these. They desire supportive
management, mentoring, and coaching. They will benefit greatly from mentors who
can help guide and develop their young careers, as postulated by Kane (2013).
Youths prefer to plan ahead, which is why they want guaranteed pay options. They
understand variable pay, and are prepared to work for this, but they will not sacrifice
guaranteed pay.
They prefer to work in teams, because they are able to interact and, through team
interaction, learn faster, whilst at the same time reducing their risk of failure, using
collective decision-making and engagement. They enjoy team-building, as it provides
them with the opportunity to interact and make friends with people at work.

DISCUSSION, CONCLUSIONS, AND RECOMMENDATIONS
DBL Thesis_Keshia Mohamed-Padayachee Student Number 71364684 Page 271 of 351
The culture and environment of an organisation are very important to the youth, and
they want to work for an organisation that cares about its employees. Coaches should
be used in organisations to create an environment that bespeaks care and
understanding through communicating in the form of storytelling about the history and
culture of the organisation, as suggested by Viljoen (2016), whilst, at the same time,
communicating the organisation’s expectations.
Work‒life balance is very important to the youth, and they are prepared to trade pay
for what is important to them in their lives. They work to live (Kane 2013). They dislike
working long hours, and they value family time.
Youths have high expectations of their employers, and expect that promises will be
kept. They believe in equity and fairness, and want to be paid equally, and also to be
acknowledged and thanked for their contributions.
Youths want to be noticed. They seek feedback — they want to know how they are
doing, and want to be consulted and kept updated. This generation values inclusivity,
as found by Viljoen (2016).
This generation is unafraid to take risks, but these risks have to be calculated. They
stand up for what they believe in, and are not afraid to speak up. They are not passive
bystanders. They demand respect. They are very motivated, and focus their efforts
on achieving their goals.
The implication of all this is that reward professionals, HR practitioners, and managers
who understand the youth’s preferences in rewards are able to design a more relevant
and meaningful total rewards package, thereby increasing their ability to attract skilled
resources, retain employees, and reduce turnover and the associated replacement
costs.
DISCUSSION, CONCLUSIONS, AND RECOMMENDATIONS
DBL Thesis_Keshia Mohamed-Padayachee Student Number 71364684 Page 272 of 351
6.3 Research objectives
In this sub-section, the research objectives are revisited, to indicate how they were
achieved.
Objective 1: To evaluate the effectiveness of the reward categories of the
WorldatWork Total Rewards Model
In Table 12, Chapter 3, it was indicated that this objective was dealt with by applying
both the quantitative and qualitative methodologies. A survey questionnaire was used
to collect quantitative data, which were analysed to investigate and identify the reward
factors that affect the attraction and retention of the youth. The chi-square test and
Kruskal-Wallis test were used to determine whether the identified rewards categories
that are important to the youth and to other generations are different. These tests
were used to evaluate the reward categories of the WorldatWork (2015) Total Rewards
Model. The results were presented in Chapter 4 and discussed in Section 6.2 of the
present chapter.
Qualitative data were collected in the second phase of the study, to assist with the
explanation and interpretation of the results obtained from the quantitative data, by
answering questions regarding why and how significant relationships occurred the way
they did. The results were then compared and contrasted with what the model
prescribes. In Sub-section 6.2.3.2., it was indicated that the WorldatWork (2015)
model excludes: Safety/Security, Resources, Supportive management and
environment, and Coaching and mentoring, and that Career/Growth opportunities,
Employee benefits, Experience working in different opportunities, Longer-term job
Safety/Security are important reward preferences of the youth, compared to members
of previous generations. Also, the factor analysis in Phase I of the study revealed that
all the factors contained in the WorldatWork (2015) model are important for the youth’s
attraction and retention, but that the model lacks two important reward categories,
namely (1) Resources and (2) Safety/Security
Objective 2: To identify the factors that attract the youth to organisations
DISCUSSION, CONCLUSIONS, AND RECOMMENDATIONS
DBL Thesis_Keshia Mohamed-Padayachee Student Number 71364684 Page 273 of 351
Table 12 also showed that the survey design and quantitative methodology were used
to collect data to identify the factors affecting the attraction of the youth. In Chapter 4,
seven reward categories were found to affect the youth’s attraction to organisations.
These, in order of importance, are:
1. Leadership and environment — supportive management and work environment;
2. Benefits — retirement fund, medical aid, and leave;
3. Performance incentives — long- and short-term incentives and share options;
4. Individual development, a safe/secure working environment —
coaching/mentoring, working in different organisations to maximise career growth,
CSR, and long-term job security;
5. Work‒life and resources — extended employee benefits and tools to execute
one’s work;
6. Informal recognition — informal recognition and non-financial rewards; and
7. Formal recognition — formal recognition and lump sum annual bonus payment.
Objective 3: To identify the factors that retain the youth in organisations
Table 12 showed that a survey (a quantitative methodology) was used to collect data
to identify the factors affecting the retention of the youth to organisations. According
to the results, reported in Chapter 4, seven reward categories were found. These, in
order of importance, are:
1. Leadership and environment — supportive management and environment;
2. Flexible and variable payment options — flexible payment options and
Salary/Pay;
3. Benefits — retirement fund, medical aid, and leave;
4. Value-added benefits and services and individual development — employee
wellness, CSR, employee discounts, formal coaching or mentoring, and extended
time off;
5. Recognition — informal and formal recognition, non-financial rewards;
6. Career development — Career/Growth opportunities and learning and
development; and
7. Incentives — long- and short-term incentives and share options.
DISCUSSION, CONCLUSIONS, AND RECOMMENDATIONS
DBL Thesis_Keshia Mohamed-Padayachee Student Number 71364684 Page 274 of 351
Objective 4: To determine what changes need to be made to the WorldatWork
(2015) Total Rewards Model to make it more effective
The changes to be made to the WorldatWork (2015) Total Rewards Model to make it
more effective were derived from the achievement of Objective 1. The required
changes are:
1. a better reflection of the reward preferences of the youth; and
2. inclusion of Safety/Security, Resources, Supportive management and
environment, Flexible payment options, and Coaching and mentoring in the
model, as these are important reward preferences of the youth, compared to
members of previous generations.
The factor analysis in Phase I of the study revealed that all the reward categories in
the WorldatWork (2015) model are important to the youth, and are therefore suitable
to be used in a total rewards framework; however, not all the important factors are
included in the current model. Categories to be added are: Leadership and
environment, Flexible remuneration options, Safety/Security, extended leave
opportunities and resources. In order for organisations to have a more effective
reward strategy for the youth, their total rewards must include the aforementioned
components.
Objective 5: To develop an effective total rewards framework for attracting and
retaining the youth
After addressing the first four objectives, the researcher was able to develop a more
effective total rewards framework for the youth and answer the research question:
How can a total rewards framework for the youth be conceptualised best?
An organisation’s ability to attract, motivate, and retain the youth is a major predictor
of fiscal performance and survival. To that end, given the diverse workforce,
organisations must offer a varied set of rewards as they try to access the best and
brightest employees. For a diverse, global workforce, no single reward element is a
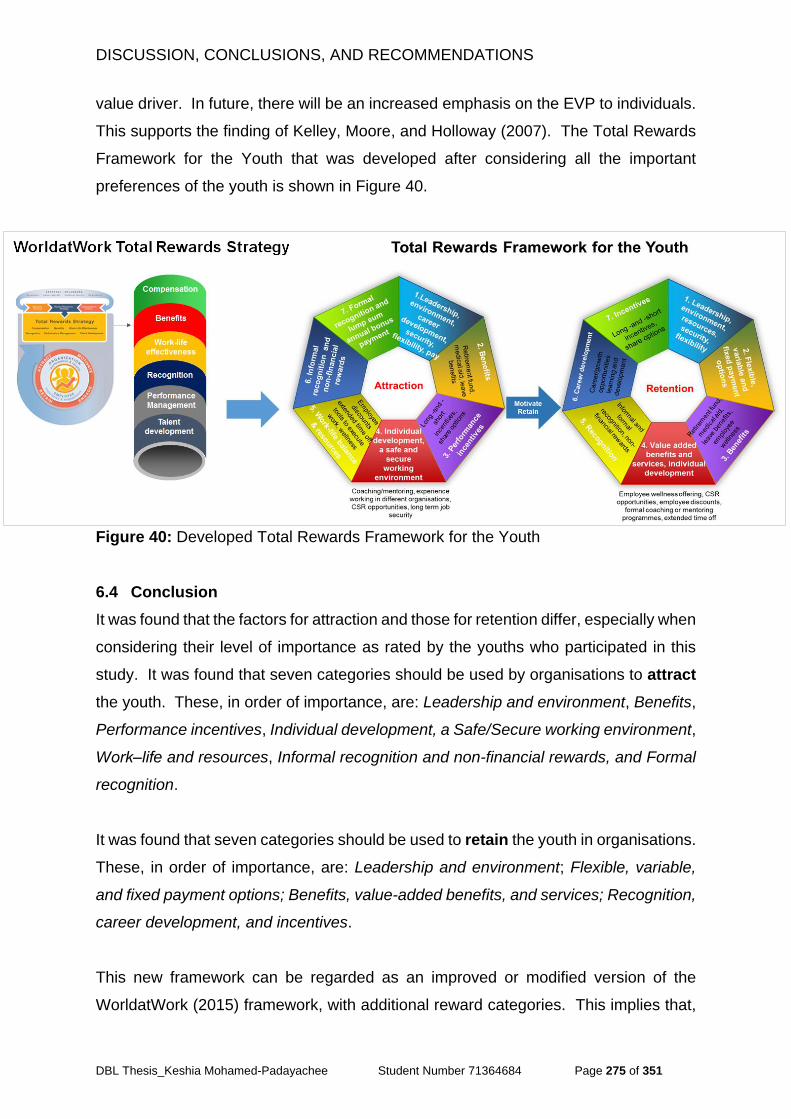
DISCUSSION, CONCLUSIONS, AND RECOMMENDATIONS
DBL Thesis_Keshia Mohamed-Padayachee Student Number 71364684 Page 275 of 351
value driver. In future, there will be an increased emphasis on the EVP to individuals.
This supports the finding of Kelley, Moore, and Holloway (2007). The Total Rewards
Framework for the Youth that was developed after considering all the important
preferences of the youth is shown in Figure 40.
Figure 40: Developed Total Rewards Framework for the Youth
6.4 Conclusion
It was found that the factors for attraction and those for retention differ, especially when
considering their level of importance as rated by the youths who participated in this
study. It was found that seven categories should be used by organisations to attract
the youth. These, in order of importance, are: Leadership and environment, Benefits,
Performance incentives, Individual development, a Safe/Secure working environment,
Work‒life and resources, Informal recognition and non-financial rewards, and Formal
recognition.
It was found that seven categories should be used to retain the youth in organisations.
These, in order of importance, are: Leadership and environment; Flexible, variable,
and fixed payment options; Benefits, value-added benefits, and services; Recognition,
career development, and incentives.
This new framework can be regarded as an improved or modified version of the
WorldatWork (2015) framework, with additional reward categories. This implies that,
DISCUSSION, CONCLUSIONS, AND RECOMMENDATIONS
DBL Thesis_Keshia Mohamed-Padayachee Student Number 71364684 Page 276 of 351
if the framework is applied in an organisation, the organisation will be able to attract
and retain the youth more effectively, because it includes all the preferences of the
youth. The framework was informed by a scientific study, in which the data that were
collected were objectively analysed.
6.5 Evaluation and limitations of the study
The present study’s sample consisted of skilled labour, which might have impacted
negatively on the generalisability of the findings to other groups. The sample of tertiary
students might have had a negative impact on the credibility of this study, due to the
sample being homogeneous and therefore lacking a wide range of perspectives.
Furthermore, the racial composition of the sample (49.62% black African, 29.62%
white, 10.38% Coloured and 10.38% Indian lacked representation in terms of the racial
composition of South Africa’s population.
The limitations of the sampling method (purposive) were mitigated, to an extent, by
the researcher ensuring wide demographic representation in the quantitative phase of
the study and by the in-depth interviewing in the qualitative phase of the study. The
respondents and participants represented both the public and private sectors. The
transferability of the study is sound, and the research can be replicated using other
classes of employees, in and outside of the country.
6.6 Original contribution of the study
No empirical study exists that authenticates the existing total rewards models and
Generation-Y theory. As employers strive to attract and retain high-value young
employees, it is more important than ever that employers understand the expectations
that young people bring to the labour market (Ng et al., 2010). The present study
makes an original theoretical contribution to the body of knowledge by identifying the
most important reward preferences of the youth, and consequently developing a new,
more effective total rewards framework for the youth.
This research makes an original contribution to the body of knowledge on the youths’
preferences and those of the other age groups included in the study. HR practitioners
and remuneration specialists should be able to apply the findings in their
DISCUSSION, CONCLUSIONS, AND RECOMMENDATIONS
DBL Thesis_Keshia Mohamed-Padayachee Student Number 71364684 Page 277 of 351
organisations. To reiterate, theoretically, the research contributes to the reward
models or frameworks in terms of reward preferences and attraction and retention
strategies.
6.7 Recommendations and policy implications
The preceding sections summarised the research findings. This section offers
recommendations based on the study findings, and makes recommendations for
future research.
The findings of the present study support those of the CLC (2004), that customised
reward frameworks positively impact engagement levels, leading to greater levels of
productivity and improved organisational performance. A different approach is
required for the attraction and retention of the youth, and the one-size-fits-all approach
of the past will not be sufficient in the future. For organisations to survive in the long
term, they need to offer customised solutions for attracting and retaining the youth.
6.8 Future research opportunities
Future research opportunities were indicated throughout the report, and are
summarised in this section. These research opportunities include a study of unskilled
labour and inclusion of employee discounts, retirement fund considerations,
allowances, and sabbaticals/extended leave opportunities in total rewards offerings.
The focus of this research was on the rewards preferences of skilled, young
employees. Although the research used quantitative data for non-graduates, non-
graduates were not included in the qualitative phase of the research. Future studies
could include interviews with non-graduates.
Retirement funding is a concern for South African organisations, and, generally, their
perception is that youths are not interested in saving towards their retirement, which
was disproved in this study. Focused research is required to understand this
phenomenon better, and to develop options for consideration by the youth, which
could be linked to the Life-stage Model.
DISCUSSION, CONCLUSIONS, AND RECOMMENDATIONS
DBL Thesis_Keshia Mohamed-Padayachee Student Number 71364684 Page 278 of 351
This study highlighted that youths value employee discounts more than previous
generations did. From the interviews conducted, it would appear that not all benefits
attract and retain them, but if the benefits have perceived value, they retain
employees. Further studies are required in this regard to understand what benefits
youths value and will therefore act as attractors and enhance their retention in
organisations.
It also appears that the need for sabbaticals is industry-dependent, and may be
applicable to specific fields, such as medicine and academia. Youths value personal
development and a work‒life. Few organisations offer sabbaticals, which presents the
opportunity to study the role of sabbaticals in retention.
Housing, car, food, and many other allowances are fast becoming obsolete reward
elements (Bond, Galinsky & Swanberg, 1997). Many of these allowances have been
discontinued due to tax concerns and the administrative burden placed on
organisations. The youths’ responses to the open-ended questions posed in the
quantitative phase of the research indicated that car- and food allowances are
attractors. This also presents an opportunity for future research.
LIST OF REFERENCES
DBL Thesis_Keshia Mohamed-Padayachee Student Number 71364684 Page 279 of 351
LIST OF REFERENCES
Alderfer, C.P., 1969. An empirical test of a new theory of human needs. Organizational
behavior and human performance, 4(2), pp.142-175.
Anderson, C., 2010. Presenting and evaluating qualitative research. American journal
of pharmaceutical education, 74(8), p.141.
Appelbaum, S.H., Serena, M. and Shapiro, B.T., 2005. Generation “X” and the boomers:
an analysis of realities and myths. Management Research News, 28(1), pp.1-33.
Armstrong, M., 2010. Armstrong's handbook of reward management practice:
Improving performance through reward. London: Kogan Page Publishers.
Arsalidou, D., 2015. Rethinking Corporate Governance in Financial Institutions.
Canada: Routledge.
Babbie, E.R., 2015. The Practice of Social Research. Cengage Learning. 7/e. Belmont,
California: Wadsworth Publication.
Bell, N.S. and Narz, M., 2007. Meeting the challenges of age diversity in the workplace.
The CPA Journal, 77(2), p.56.
Black, I., 2006. The presentation of interpretivist research. Qualitative Market Research:
An International Journal, 9(4), pp.319-324.
Bond, J.T., Galinsky, E. and Swanberg, J.E., 1997. The National Study of the Changing
Workforce, 1997. No. 2. Families and Work Institute, 330 Seventh Avenue, New
York, NY 10001.
Borngraber-Berthelsen, M.A., 2008. Recruiting and retaining generation Y: A new
workforce (Doctoral dissertation, M. Sc. Thesis, Aalborg University, Denmark).
Boxall, P. and Purcell, J., 2011. Strategy and human resource management. UK:
Palgrave Macmillan.
Brewerton, P.M. and Millward, L.J., 2001. Organizational research methods: A guide for
students and researchers. Great Britain: Sage Publication.
Bryman, A. and Bell, E., 2015. Business research methods. USA: Oxford University
Press.
Burnard, P., Gill, P., Stewart, K., Treasure, E. and Chadwick, B., 2008. Analysing and
presenting qualitative data. British dental journal, 204(8), pp.429-432.
Burns, N. and Grove, S.K., 1993. The practice of nursing research. Conduct, critique &
utilization, 4. 5/e. Philadelphia: W.B. Saunders Company Publisher.
LIST OF REFERENCES
DBL Thesis_Keshia Mohamed-Padayachee Student Number 71364684 Page 280 of 351
Burton, J. and World Health Organization, 2010. WHO Healthy workplace framework
and model: Background and supporting literature and practices.
Bussin, M., 2011. The remuneration handbook for Africa: A practical and informative
handbook for managing and recognition in Africa. Randburg: Knowres
Publishing.
Bussin, M., 2014. Remuneration and Talent Management: Strategic compensation
approaches for attracting, retaining and engaging talent. Randburg: Knowres
Publishing.
Bussin, M. and Toerien, W.C., 2015. Influence of reward preferences in attracting,
retaining, and motivating knowledge workers in South African information
technology companies. Acta Commercii, 15(1), pp.1-13.
Calmeyer, T., De Kok, C., Hardy, J., Rogers, J.A. and Taljaard, L., 2011. How to
succeed in your master's and doctoral studies: A South African guide and
resource book, Johann Mouton: book review. New Voices in Psychology, 7(2),
pp.148-152.
Carson, D., Gilmore, A., Perry, C. and Gronhaug, K., 2001. Qualitative marketing
research. London: Sage Publication.
Cattell, R.B., 1966. The scree test for the number of factors. Multivariate behavioral
research, 1(2), pp.245-276.
Cherry, Kendra., 2013. Theories of Motivation: A closer look at some important theories
of motivation. [online] Available at: <https://essaysketch.org/behaviour-
management-theories-essay>. [Accessed 21 January 2014].
Child, D., 1990. The essentials of factor analysis. Cassell Educational. New York:
Continuum.
Child, D., 2006. The essentials of factor analysis. A&C Black. New York: Continuum,
c2006.
Christopherson, J. and King, B., 2006. Total Rewards Concept and Model. [online]
Available at :< http://www.worldatwork.org>. [Accessed 24 June 2014].
Clement, D., 2008. Why businesses need Generation Y. Weekend Herald, February, 2,
p.F7.
Codrington, G.T. and Grant-Marshall, S., 2008. Mind the gap. Rosebank: Penguin
Books.
Cole, M., 2006. Qualitative research: a challenging paradigm for infection control. British
Journal of Infection Control, 7(6), pp.25-29.
LIST OF REFERENCES
DBL Thesis_Keshia Mohamed-Padayachee Student Number 71364684 Page 281 of 351
Collins, K. 2009. Exploring Business. Flat World Knowledge, Incorporated. [online].
Available from: <http://catalog.flatworldknowledge.com/bookhub/reader>.
[Accessed on: 16 January 2014].
Collis, J. and Hussey, R., 2009. Business Research: A Practical Guide for
Undergraduate and Postgraduate Students. 3/e. UK: Palgrave Macmillan.
Comrey, A.L., 1978. Common methodological problems in factor analytic studies.
Journal of consulting and clinical psychology, 46(4), p.648.
Connelly, L.M., 2008. Pilot studies. Medsurg Nursing, 17(6), pp.411-413.
Cooper, D.R. and Schindler, P.S., 1998. The research proposal. Business research
methods, 6, pp.86-103.
Costello, A.B. and Osborne, J.W., 2011. Best practices in exploratory factor analysis:
four recommendations for getting the most from your analysis. Pract Assess Res
Eval 2005; 10. URL http://pareonline. net/getvn. asp, 10(7).
Corporate Leadership Council., 2004. Generation X and Y employees. Washington,
DC: Corporate Executive Board.
Corporate Leadership Council., 2005. HR considerations for engaging Generation Y
employees. Washington, DC: Corporate Executive Board.
Crampton, S.M. and Hodge, J.W., 2006, July. The supervisor and generational
differences. In Allied Academies International Conference. Academy of
Organizational Culture, Communications and Conflict. Proceedings (Vol. 11, No.
2, p. 19). Jordan Whitney Enterprises, Inc.
Creswell, J.W. and Clark, V.L.P., 2007. Designing and conducting mixed methods
research. Thousand Oaks, CA: Sage Publication.
Creswell, J.W., 2012. Qualitative inquiry and research design: Choosing among five
approaches. 3/e. Los Angeles: Sage Publications.
Creswell, J.W., 2013. Research design: Qualitative, quantitative, and mixed methods
approaches. LA: Sage Publications.
Crotty, M., 1998. The foundations of social research: Meaning and perspective in the
research process. London: Sage Publications.
Dalton, G.W., Thompson, P.H. and Price, R.L., 1977. The four stages of professional
careers—A new look at performance by professionals. Organizational Dynamics,
6(1), pp.19-42.
Datta, P., 2012. An applied organizational rewards distribution system. Management
Decision, 50(3), pp.479-501.
LIST OF REFERENCES
DBL Thesis_Keshia Mohamed-Padayachee Student Number 71364684 Page 282 of 351
DeCoster, J., 1998. Overview of factor analysis. [online]. Available from:
<http://www.stat-help.com/notes.html>. [Accessed on: 29 January 2015].
Demo, G., Neiva, E.R., Nunes, I. and Rozzett, K., 2012. Human resources management
policies and practices scale (HRMPPS): Exploratory and confirmatory factor
analysis. BAR-Brazilian Administration Review, 9(4), pp.395-420.
De Vaus, D.A. and de Vaus, D., 2001. Research design in social research. UK: Sage
Publication.
De Vos, A.D., Strydom, H., Fouché, C.B. and Delport, C.S.L., 2005. Research at grass
roots. For the social sciences and human service professions. Pretoria: Van
Schaik Publishers.
Diamantopoulos, A. and Schlegelmilch, B.B., 2000. Taking the fear out of data analysis:
a step-by-step approach (No. 118). Cengage Learning EMEA. 2/e. Singapore:
Thomson Learning.
Easterby-Smith, M., Thorpe, R. and Lowe, A., A., 1991. Management Research-An
Introduction: Business research methods. London: Sage Publications.
Eisner, S.P., 2005. Managing generation Y. SAM Advanced Management Journal,
70(4), p.4.
Engelman, E., 2009. Generation Y vs. Baby Boomers: how workplace commitment
levels affect recruitment and retention of Generation Y within corporate America
(Doctoral dissertation, Capella University).
Eyerman, R. and Turner, B.S., 1998. Outline of a theory of generations. European
Journal of Social Theory, 1(1), pp.91-106.
Field, A., 2009. Discovering statistics using SPSS. London: Sage Publications.
George, J.M., Jones, G.R. and Sharbrough, W.C., 1996. Understanding and managing
organizational behavior. 6/e. Reading, MA: Addison-Wesley. England: Pearson.
Giancola, F., 2006. The generation gap: More myth than reality. People and strategy,
29(4), p.32.
Giancola, F., 2008. Should generation profiles influence rewards strategy. Employee
Relations Law Journal, 34(1), pp.56-68.
Gibbs, G.R., 2008. Analysing qualitative data. England: Sage Publications.
Gilbert, J., 2011. The Millennials: A new generation of employees, a new set of
engagement policies. Ivey Business Journal, 75(5), pp.26-28.
LIST OF REFERENCES
DBL Thesis_Keshia Mohamed-Padayachee Student Number 71364684 Page 283 of 351
Globoforce., 2013. Employee Recognition Programs. Globoforce Limited: SHRM.
Globoforce. [online]. Available at: <http://www.globoforce.com> [Accessed 24
March 2015].
Green, S.B., Lissitz, R.W. and Mulaik, S.A., 1977. Limitations of coefficient alpha as an
index of test unidimensionality1. Educational and Psychological Measurement,
37(4), pp.827-838.
Guba, E.G., 1990. The Alternative Paradigm Dialog. In. EG Guba (ed.) The Paradigm
Dialogue (pp17-27).
Guttman, L., 1982. Facet theory, smallest space analysis, and factor analysis.
Perceptual and Motor Skills, 54(2), pp.491-493.
Halcomb, E.J. and Andrew, S., 2005. Triangulation as a method for contemporary
nursing research: The complex nature of phenomena investigated by nurses
demands the use of a multifaceted approach to develop nursing knowledge.
Nurse researcher, 13(2), pp.71-82.
Hardigree, A.E., 2008. Work generativity from a life cycle, career stage model, and
gender-role perspective: An examination of individual differences and
moderating factors that influence work generativity in managers (Doctoral
dissertation, Rice University).
Hay Group., 2008. The Hay Group Total Reward Framework. [online]. Available at:
<http://haygroup.com> [Accessed 20 June 2014].
Heger, B.K., 2007. Linking the employment value proposition (EVP) to employee
engagement and business outcomes: Preliminary findings from a linkage
research pilot study. Organization Development Journal, 25(2), p. P121.
Heneman, R.L., 2002. Merit pay. Strategic reward management: Design,
Implementation, and Evaluation. Connecticut: Information Age Publishing.
Herzberg, F., 1987. One more time: how do you motivate employees?. Harvard
business review, 65(5), pp.109.
Herzberg, F., 2005. Motivation-hygiene theory. Organizational behavior one: Essential
theories of motivation and leadership, eds JB Miner, ME Sharpe Inc, New York,
pp.61-74.
Hewitt, A., 2012. Total rewards survey: Transforming potential into value. Aon
Corporation. [online]. Available at: <http://aon.com> [Accessed 24 April 2014].
Hewitt, A., 2016. Employee Benefit Brief, One Size No Longer Fits All. Aon Corporation.
[online]. Available at: <http://aon.about.com> [Accessed 23 April 2016].
LIST OF REFERENCES
DBL Thesis_Keshia Mohamed-Padayachee Student Number 71364684 Page 284 of 351
Hill, R., 1998. What sample size is “enough” in internet survey research. Interpersonal
Computing and Technology: An electronic journal for the 21st century, 6(3-4),
pp.1-12.
Hirschheim, R., Klein, H.K. and Lyytinen, K., 1995. Information systems development
and data modeling: conceptual and philosophical foundations. New York:
Cambridge University Press.
Holland, P., Sheehan, C. and De Cieri, H., 2007. Attracting and retaining talent:
Exploring human resources development trends in Australia. Human Resource
Development International, 10(3), pp.247-262.
Howe, N. and Strauss, W., 1997. The fourth turning: An American prophecy. Portland:
Broadway Books.
Howe, N. and Strauss, W., 2007. The next 20 years: how customer and workforce
attitudes will evolve. Harvard Business Review, 85(7-8), pp.41 - 52.
Hudson, L.A. and Ozanne, J.L., 1988. Alternative ways of seeking knowledge in
consumer research. Journal of consumer research, 14(4), pp.508-521.
Johnson, D.E., 1998. Applied multivariate methods for data analysts. Duxbury
Resource Center. New York: Cambridge University Press.
Julious, S.A., 2005. Sample size of 12 per group rule of thumb for a pilot study.
Pharmaceutical Stat, 4(4), pp.287-291.
Jupp, V., 2006. The Sage dictionary of social research methods. 1/e. London: Sage
Publication.
Kane, S. 2013. The multigenerational workforce: Getting along with all generations.
[online]. Available at: <http://legalcareers.about.com> [Accessed 18 March
2014].
Kane, S. 2012. Generation X. [online]. Available at: <http://legalcareers.about.com>
[Accessed 18 March 2014].
Kapoor, C. and Solomon, N., 2011. Understanding and managing generational
differences in the workplace. Worldwide Hospitality and Tourism Themes, 3(4),
pp.308-318.
Kelley, K., Moore, B. and Holloway, S., 2007. The Future of Attraction, Motivation, and
Retention: A Literature Review. WorldatWork. [online]. Available at: <http://www.
worldatwork.org/waw/adimLink>. [Accessed 05 May 2014]
Kline, P., 2014. An easy guide to factor analysis. Canada: Routledge.
LIST OF REFERENCES
DBL Thesis_Keshia Mohamed-Padayachee Student Number 71364684 Page 285 of 351
Labour Guide., 2017. Your guide to labour law in South Africa. [online]. Available at:
<http://www.labourguide.co.za>. [Accessed 18 May 2017].
Lancaster, L.C. and Stillman, D., 2002. When generations collide: how to solve the
generational puzzle at work. New York: Harper Collins.
Langley, A., 1999. Strategies for theorizing from process data. Academy of
Management review, 24(4), pp.691-710.
Lawler, E.E., 2003. Treat people right! How organizations and individuals can propel
each other into a virtuous spiral of success. San Francisco: Jossey-Bass
Publishers.
Lawrence, B.S., Arthur, M.B. and Hall, D.T. eds., 1995. Handbook of career theory. New
York: Cambridge University Press.
Lee, T.W., 1999. Using qualitative methods in organizational research. London: Sage
Publication.
Levinson, D.J., 1986. A conception of adult development. American psychologist, 41(1),
pp.3-13.
Likert, R. (1932). A technique for the measurement of attitudes. Archives of Psychology,
22 (140), pp. 55.
Lowe, D., Levitt, K.J. and Wilson, T., 2008. Solutions for retaining Generation Y
employees in the workplace. Business Renaissance Quarterly, 3(3), pp.43-57.
Macky, K., Gardner, D. and Forsyth, S., 2008. Generational differences at work:
Introduction and overview. Journal of Managerial Psychology, 23(8), pp.857-861.
Mannheim, K., 1936. Ideology and Utopia: An Introduction to Sociology of Knowledge,
trans. Louis Wirth and Edward Shils. New York: A Harvest Book, Harcourt, and
World.
Mantel, N., 1963. Chi-square tests with one degree of freedom; extensions of the
Mantel-Haenszel procedure. Journal of the American Statistical Association,
58(303), pp.690-700.
Marsh, H.W., Muthén, B., Asparouhov, T., Lüdtke, O., Robitzsch, A., Morin, A.J. and
Trautwein, U., 2009. Exploratory structural equation modeling, integrating CFA
and EFA: Application to students' evaluations of university teaching. Structural
Equation Modeling: A Multidisciplinary Journal, 16(3), pp.439-476.
Martin, C.A. and Tulgan, B., 2006. Managing the generation mix: From urgency to
opportunity. Human Resource Development. 2/e. Amherst, Mass. McClelland:
HRD Press.
LIST OF REFERENCES
DBL Thesis_Keshia Mohamed-Padayachee Student Number 71364684 Page 286 of 351
Maslow, A.H., 1943. A theory of human motivation. Psychological review, 50(4), p.370.
McNamara, C., 2009. General guidelines for conducting interviews. [Online]. Available
at: http: <http://managementhelp.org/evaluatn/intrview.htm> Accessed January,
19, 2015].
Menefee, J.A. and Murphy, R.O., 2004. Rewarding and retaining the best:
Compensation strategies for top performers. Benefits Quarterly, 20(3), p.13.
Merriam, S.B., 1998. Qualitative Research and Case Study Applications in Education.
Revised and Expanded from "Case Study Research in Education". San
Francisco: Jossey-Bass Publishers.
MetLife., 2013. Annual Study of Employee Benefits Trends. [online]. Available from:
<https://benefittrends.metlife.com>. Accessed 26 January 2015].
Mtayi, F., 1997. Retirement-Fund Matters. Juta's Bus. L., 5, p.39.
Mulaik, S.A., 1990. Blurring the distinctions between component analysis and common
factor analysis. Multivariate Behavioral Research, 25(1), pp.53-59.
Mundfrom, D.J., Shaw, D.G. and Ke, T.L., 2005. Minimum sample size
recommendations for conducting factor analyses. International Journal of
Testing, 5(2), pp.159-168.
Murlis, H. and Schubert, P., 2002. Engage employees and boost performance. Hay
Group, pp.1-22.
Myers, V.L. and Dreachslin, J.L., 2007. Recruitment and retention of a diverse
workforce: Challenges and opportunities. Journal of Healthcare Management,
52(5), p.290.
Naris, N.S. and Ukpere, I.W., 2010. Developing a retention strategy for qualified staff at
the Polytechnic of Namibia. African Journal of Business Management, 4(6),
p.1078-1084.
Nelson, B., 1999. Incentives for all generations. Bob Nelson's Rewarding Employees
newsletter. Feb 1, 1999.
Nelson, C. and Twenge, J.M., 2005. Generation Me: Why Today's Young Americans
Are More Confident, Assertive, Entitled—and More Miserable Than Ever Before.
New York: Free Press.
Ng, E.S., Schweitzer, L. and Lyons, S.T., 2010. New generation, great expectations: A
field study of the millennial generation. Journal of Business and Psychology,
25(2), pp.281-292.
LIST OF REFERENCES
DBL Thesis_Keshia Mohamed-Padayachee Student Number 71364684 Page 287 of 351
Nienaber, R., 2008. The Relationship between Personality Types and Reward
Preferences. (Doctoral dissertation, Department of Industrial Psychology and
People Management, University of Johannesburg).
Nissen, H.E., Klein, H.K. and Hirschheim, R., 1991. Information systems research:
contemporary approaches and emergent traditions. North-Holland: Elsevier
Incorporated.
Nordstokke, D.W. and Zumbo, B.D., 2010. A new nonparametric Levene test for equal
variances. Psicologica: International Journal of Methodology and Experimental
Psychology, 31(2), pp.401-430.
Norusis, M.J., 2010. PASW statistics 18 guide to data analysis. USA: Prentice Hall
Press.
Norusis, M.J., 2009. Statistical Packages for Social Sciences (SPSS), SPSS Inc.
SPSS/PC+ for Windows, base and advanced statistics user’s guide, Version, 17.
Norušis, M.J., 1998. Guide to data analysis. Upper Saddle River, NJ: Prentice
Nunnally, J., 1978. Psychometric methods. New York: McGraw-Hill.
Nutbeam, D., 1998. Health promotion glossary. Health promotion international, 13(4),
pp.349-364.
O'Bannon, G., 2001. Managing our future: The generation X factor. Public Personnel
Management, 30(1), pp.95-110.
O'Leary, Z., 2004. The essential guide to doing research. London: Thousand Oaks.
Sage Publication.
Pilcher, J., 1994. Mannheim's sociology of generations: an undervalued legacy. British
Journal of Sociology, 1(9), pp.481-495.
Polit, B. and Beck, C.T., 2001. The Importance of Pilot Studies. Social Research update,
16(4), pp.33-6.
Provalis Research, 2014. Data Miner: QDA Miner. [online]. Available at: <http://www.
QDAminer.co.za>. [Accessed 18 March 2014].
PricewaterhouseCoopers., 2013. A global generational study Millennial Workers Want
Greater Flexibility, Work/Life Balance, Global Opportunities. PwC, NextGen.
[online]. Available at: <http://www.pwc.co.za>. [Accessed 09 June 2014].
Remenyi, D. and Williams, B., 1998. Doing research in business and management: an
introduction to process and method. London: Sage Publication.
Rennekamp, R.A. and Nall, M., 1993. Professional growth: A guide for professional
development. Lexington: University of Kentucky Cooperative Extension Service.
LIST OF REFERENCES
DBL Thesis_Keshia Mohamed-Padayachee Student Number 71364684 Page 288 of 351
Reynolds, M. and Holwell, S., 2010. Systems approaches to managing change: a
practical guide. London: Springer.
Richards, L. and Morse, J.M., 2012. Readme first for a user's guide to qualitative
methods. London: Sage Publication.
Ritter, L.A. and Sue, V.M., 2007. Conducting online surveys. Los Angeles: Sage
Publications.
Robbins, S.P. and Judge, T.A., 2010. Organisational Behavior. Upper Saddle River,
New Jersey: Prentice Hall.
Rollsjö, Å., 2009. Attraction and Retention of Generation Y Employees. Baltic Business
School, University of Kalmar.
Roucek, J.S. and Coser, L.A., 1978. Masters of Sociological Thought: Ideas in Historical
and Social Context. New York: Harcourt Brace Jovanovich.
SAICA. 2016. Employment Equity Act. [online]. Available from:
<https://www.saica.co.za>. [Accessed 29 March 2016].
Saldana, J., 2009. An introduction to codes and coding. The coding manual for
qualitative researchers. 2/e. New York: Sage Publication Ltd.
Saunders, M., Lewis, P. and Thornhill, A., 2009. Research methods for business
students. 5/e. England: Prentice Hall.
Schurink, E., 2009. Qualitative research design as tool for trustworthy research. Journal
of Public Administration, 44 (Special issue 2), pp.803-823.
Seale, C., 1999. Quality in qualitative research. Qualitative inquiry, 5(4), pp.465-478.
Serumaga-Zake, P., 2014. Research Methodology: Guidelines for Master’s and
Doctoral Students (Unpublished).
Sieberhagen, C., Pienaar, J. and Els, C., 2011. Management of employee wellness in
South Africa: Employer, service provider and union perspectives. SA Journal of
Human Resource Management, 9(1), p.1.
Silverman, M. and Reilly, P.A., 2003. How Flexible is Total Reward?. Institute for
Employment Studies. [online]. Available at: <http://www.employment-
studies.co.uk/resource/how-flexible-total-reward>. [Accessed 21 January 2014].
Silverman, M., 2004. Non-financial recognition: The most effective of rewards. Institute
for Employment Studies Research Network. [online]. Available at:
<http://www.employment-studies.co.uk/resource/how-flexible-total-reward>.
[Accessed 21 January 2014].
LIST OF REFERENCES
DBL Thesis_Keshia Mohamed-Padayachee Student Number 71364684 Page 289 of 351
Simonsen, P., 1986. Concepts of career development. Training & Development Journal,
23(5): 70-74.
South Africa, Central Statistic Services., 2013. Statistical release. P0211.4.2. Pretoria:
Central Statistical Services.
South Africa, Department of Labour., 2005. Labour Relations Act. South Africa:
Department of Labour, Section 213. Johannesburg: Department of Labour.
South Africa, National Youth Policy., 2009. ASSA Projections in Budlender.
Strauss, W. and Howe, N., 1991. Generations: The history of America’s future, 1584 to
2069. New York: William Morrow & Company.
Sullivan, S.E., 1999. The changing nature of careers: A review and research agenda.
Journal of management, 25(3), pp.457-484.
Super, D.E., 1957. The psychology of careers; an introduction to vocational
development.1/e. New York: Harper & Brothers.
Tabachnick, B.G. and Fidell, L.S., 2007. Multivariate analysis of variance and
covariance. Using multivariate statistics, 3, pp.402-407.
Taylor, B. and Francis, K., 2013. Qualitative research in the health sciences:
Methodologies, methods and processes. New York: Routledge.
Theron, N., 2014. Research proposal on employability of tourism graduates: A three-
way relationship. University of Johannesburg Aucklandpark. Unpublished.
Thompson, S.K., 2002. On sampling and experiments. Environmetrics, 13(5‐6), pp.429-
436.
Tongco, M.D.C., 2007. Purposive Sampling as a Tool for Informant Selection.
Ethnobotany Research and Applications, 5, pp.147-158.
Towers, Watson., 2012. Total rewards strategies for the 21st century. Towers Watson.
[online]. Available at: <http//www.towerswatson.com>. [Accessed 20 October
2014].
Trochim, W.M., 2006. Reliability & Validity. [online]. Available at:
<http//www.socialscienceresearchmethods.net>. [Accessed 24 January 2014].
Tsede, O.A. and Kutin, E., 2013. Total reward concept: a key motivational tool for
corporate Ghana. Business and Economic Research, 3(2), p.173.
Twenge, J.M., 2010. A review of the empirical evidence on generational differences in
work attitudes. Journal of Business and Psychology, 25(2), pp.201-210.
Van Belle, G., 2011. Statistical rules of thumb. New York: John Wiley & Sons.
LIST OF REFERENCES
DBL Thesis_Keshia Mohamed-Padayachee Student Number 71364684 Page 290 of 351
Viljoen, R., 2016. Inclusive Organizational Transformation: An African Perspective on
Human Niches and Diversity of Thought. Routledge. England: Gower Publishing
Limited.
Vroom, V.H., 1964. Work and motivation. NY: John Wiley & Sons.
Walder, A.G., 1994. The decline of communist power: Elements of a theory of
institutional change. Theory and society, 23(2), pp.297-323.
Wang, W., 2012. The Way We Work: Past, Present, and Future. In Virtual Work and
Human Interaction Research. USA: IGI Global.
Weaver, K. and Olson, J.K., 2006. Understanding paradigms used for nursing research.
Journal of advanced nursing, 53(4), pp.459-469.
Welman, C., Kruger, F. and Mitchell, B., 2005. Research methodology (pp. 35-40). 3/e.
Cape Town: Oxford University Press.
Wessels, P.L. and Steenkamp, L.P., 2009. Generation Y students: Appropriate learning
styles and teaching approaches in the economic and management sciences
faculty. South African Journal of Higher Education, 23(5), pp.1039-1058.
Wiley, C., 1997. What motivates employees according to over 40 years of motivation
surveys. International Journal of Manpower, 18(3), pp.263-280.
Wilson, J., 2010. Essentials of Business Research: A Guide to Doing Your Research
Project. London Sage Publications.
WorldatWork., 2015. Total Rewards Concept and Model. Rewards. [online]. Available
at: <http//www.worldatwork.org>. [Accessed 24 June 2016].
WorldatWork., 2015. Total rewards articles: A special collection from WorldatWork.
Scottsdale: USA: WorldatWork.
Yang, S.B. and Guy, M.E., 2006. GenXers versus boomers: Work motivators and
management implications. Public Performance & Management Review, 29(3),
pp.267-284.
Yong, A.G. and Pearce, S., 2013. A beginner’s guide to factor analysis: Focusing on
exploratory factor analysis. Tutorials in Quantitative Methods for Psychology,
9(2), pp.79-94.
Zingheim, P.K. and Schuster, J.R., 2000. Pay people right!: Breakthrough reward
strategies to create great companies. San Francisco: Jossey-Bass Publishers.
APPENDIXES
DBL Thesis_Keshia Mohamed-Padayachee Student Number 71364684 Page 291 of 351
APPENDIXES
Appendix A: Research questionnaire
Informed consent for participation in an academic research project
A Total Rewards Framework for the Attraction and Retention of the Youth
Dear Respondent
You are herewith invited to participate in an academic research study conducted by
Keshia Mohamed-Padayachee, a student in the Doctoral of Business Leadership at
UNISA’s Graduate School of Business Leadership (SBL).
The purpose of the study is to investigate what rewards are important to attract and
retain employees to organisations. Rewards are defined as everything an employee
perceives to be of value resulting from the employment relationship.
All your answers will be treated as confidential, and you will not be identified in any of
the research reports emanating from this research.
Your participation in this study is very important to us. You may, however, choose not
to participate, and you may also withdraw from the study at any time, without any
negative consequences.
Please answer the questions in the attached questionnaire as completely and honestly
as possible. This should not take more than 10-15 minutes of your time, and consists
of two parts, Part A: Demographic Data and Part B: Survey Questions.
The results of the study will be used for academic purposes only, and may be
published in an academic journal. We will provide you with a summary of our findings
on request.
APPENDIXES
DBL Thesis_Keshia Mohamed-Padayachee Student Number 71364684 Page 292 of 351
Please contact my supervisor, Dr. Mark Bussin ([email protected]) if you have
any questions or comments regarding the study. Please sign below to indicate your
willingness to participate in the study.
Yours sincerely
Keshia Mohamed-Padayachee
I, herewith give my consent to participate in the study. I have read the letter and
understand my rights with regard to participating in the research.
___________________________ ____________________
Respondents signature Date
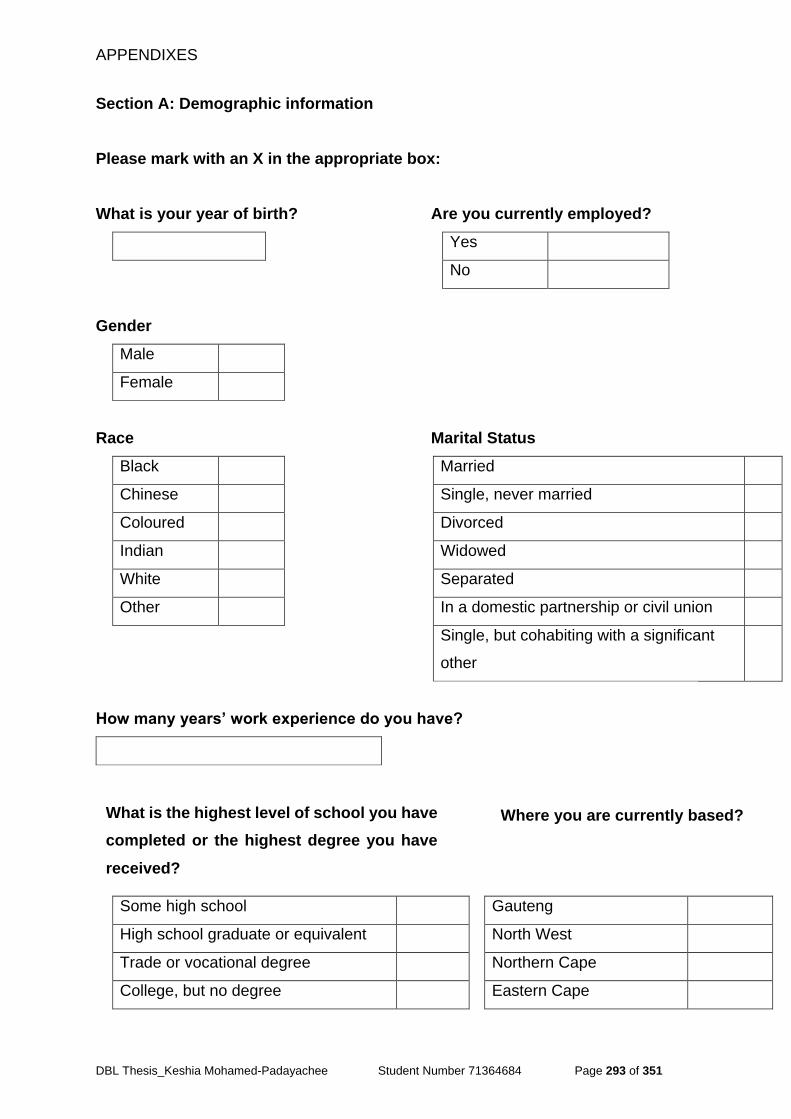
APPENDIXES
DBL Thesis_Keshia Mohamed-Padayachee Student Number 71364684 Page 293 of 351
Section A: Demographic information
Please mark with an X in the appropriate box:
What is your year of birth? Are you currently employed?
Yes
No
Gender
Male
Female
Race Marital Status
Black Married
Chinese Single, never married
Coloured Divorced
Indian Widowed
White Separated
Other In a domestic partnership or civil union
Single, but cohabiting with a significant
other
How many years’ work experience do you have?
Some high school Gauteng
High school graduate or equivalent North West
Trade or vocational degree Northern Cape
College, but no degree Eastern Cape
Where you are currently based? What is the highest level of school you have
completed or the highest degree you have
received?
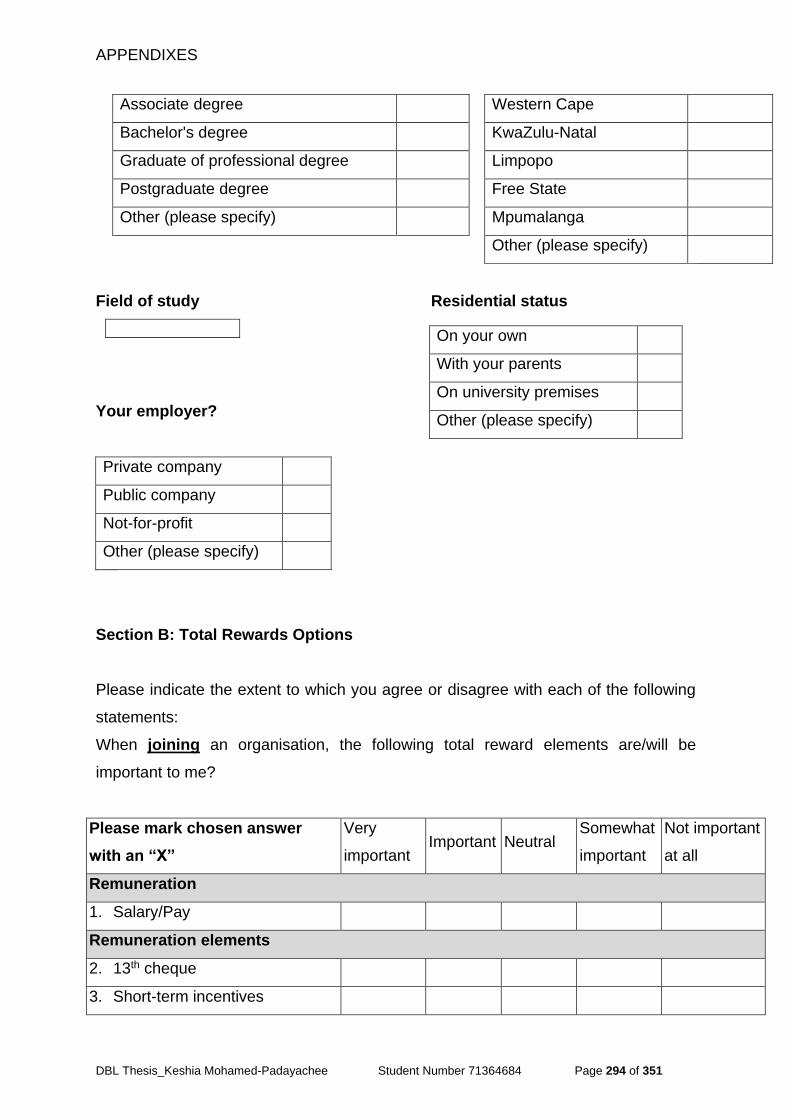
APPENDIXES
DBL Thesis_Keshia Mohamed-Padayachee Student Number 71364684 Page 294 of 351
Associate degree Western Cape
Bachelor's degree KwaZulu-Natal
Graduate of professional degree Limpopo
Postgraduate degree Free State
Other (please specify) Mpumalanga
Other (please specify)
Field of study Residential status
Your employer?
Private company
Public company
Not-for-profit
Other (please specify)
Section B: Total Rewards Options
Please indicate the extent to which you agree or disagree with each of the following
statements:
When joining an organisation, the following total reward elements are/will be
important to me?
Please mark chosen answer
with an “X”
Very
important Important Neutral
Somewhat
important
Not important
at all
Remuneration
1. Salary/Pay
Remuneration elements
2. 13th cheque
3. Short-term incentives
On your own
With your parents
On university premises
Other (please specify)
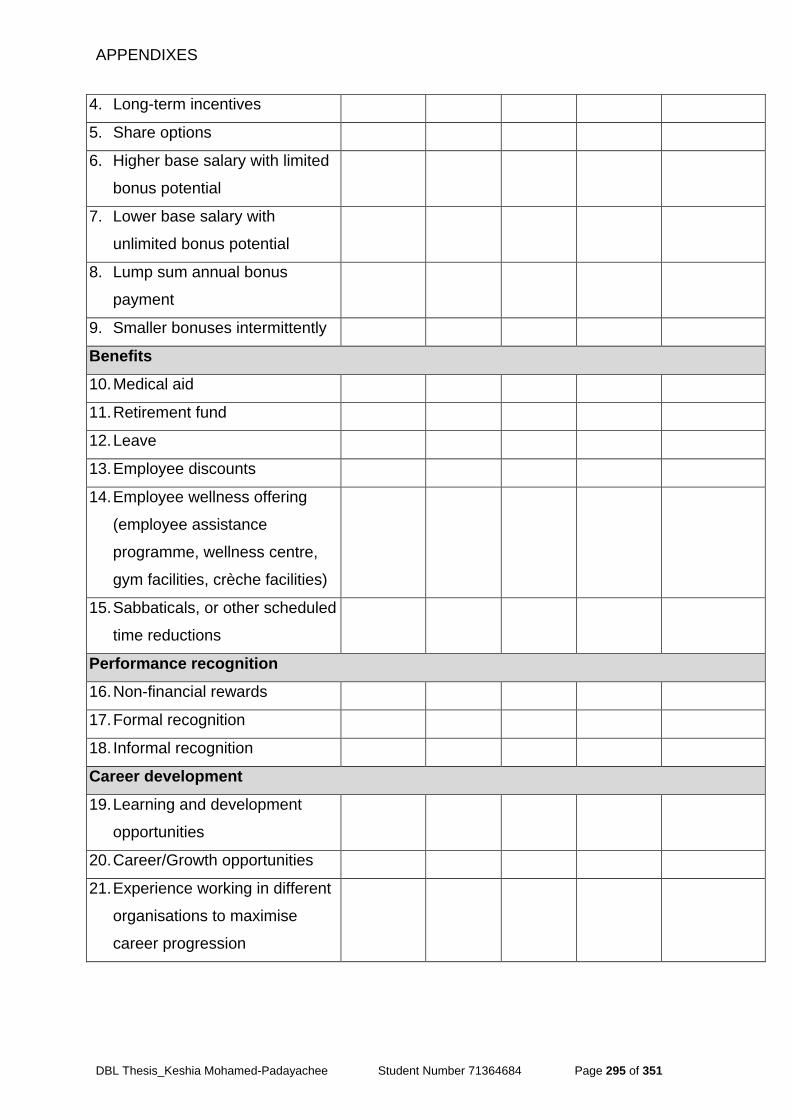
APPENDIXES
DBL Thesis_Keshia Mohamed-Padayachee Student Number 71364684 Page 295 of 351
4. Long-term incentives
5. Share options
6. Higher base salary with limited
bonus potential
7. Lower base salary with
unlimited bonus potential
8. Lump sum annual bonus
payment
9. Smaller bonuses intermittently
Benefits
10. Medical aid
11. Retirement fund
12. Leave
13. Employee discounts
14. Employee wellness offering
(employee assistance
programme, wellness centre,
gym facilities, crèche facilities)
15. Sabbaticals, or other scheduled
time reductions
Performance recognition
16. Non-financial rewards
17. Formal recognition
18. Informal recognition
Career development
19. Learning and development
opportunities
20. Career/Growth opportunities
21. Experience working in different
organisations to maximise
career progression
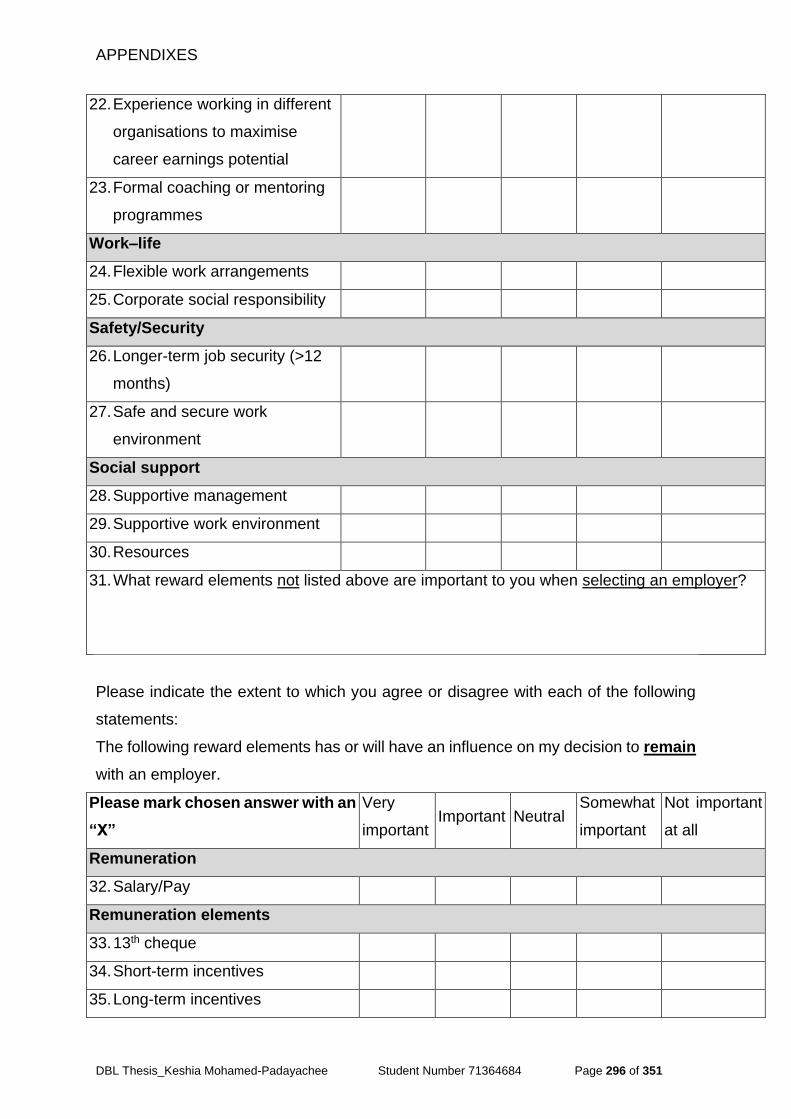
APPENDIXES
DBL Thesis_Keshia Mohamed-Padayachee Student Number 71364684 Page 296 of 351
22. Experience working in different
organisations to maximise
career earnings potential
23. Formal coaching or mentoring
programmes
Work‒life
24. Flexible work arrangements
25. Corporate social responsibility
Safety/Security
26. Longer-term job security (>12
months)
27. Safe and secure work
environment
Social support
28. Supportive management
29. Supportive work environment
30. Resources
31. What reward elements not listed above are important to you when selecting an employer?
Please indicate the extent to which you agree or disagree with each of the following
statements:
The following reward elements has or will have an influence on my decision to remain
with an employer.
Please mark chosen answer with an
“X”
Very
important Important Neutral
Somewhat
important
Not important
at all
Remuneration
32. Salary/Pay
Remuneration elements
33. 13th cheque
34. Short-term incentives
35. Long-term incentives
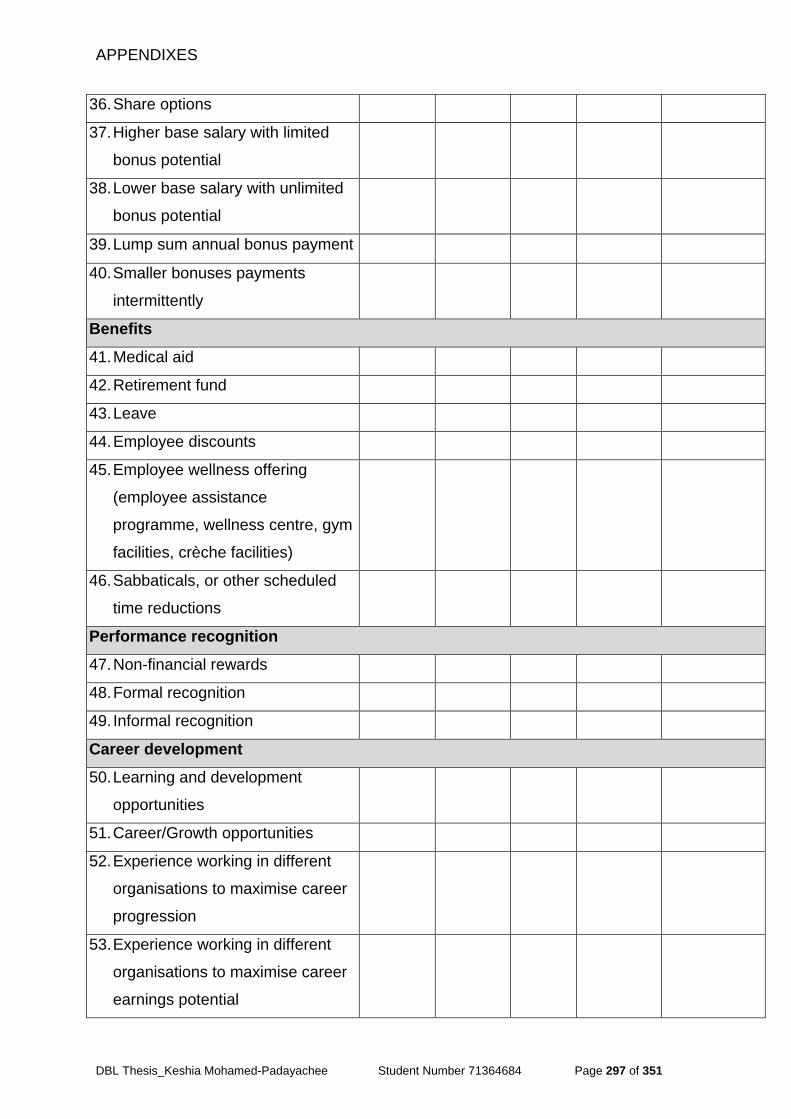
APPENDIXES
DBL Thesis_Keshia Mohamed-Padayachee Student Number 71364684 Page 297 of 351
36. Share options
37. Higher base salary with limited
bonus potential
38. Lower base salary with unlimited
bonus potential
39. Lump sum annual bonus payment
40. Smaller bonuses payments
intermittently
Benefits
41. Medical aid
42. Retirement fund
43. Leave
44. Employee discounts
45. Employee wellness offering
(employee assistance
programme, wellness centre, gym
facilities, crèche facilities)
46. Sabbaticals, or other scheduled
time reductions
Performance recognition
47. Non-financial rewards
48. Formal recognition
49. Informal recognition
Career development
50. Learning and development
opportunities
51. Career/Growth opportunities
52. Experience working in different
organisations to maximise career
progression
53. Experience working in different
organisations to maximise career
earnings potential
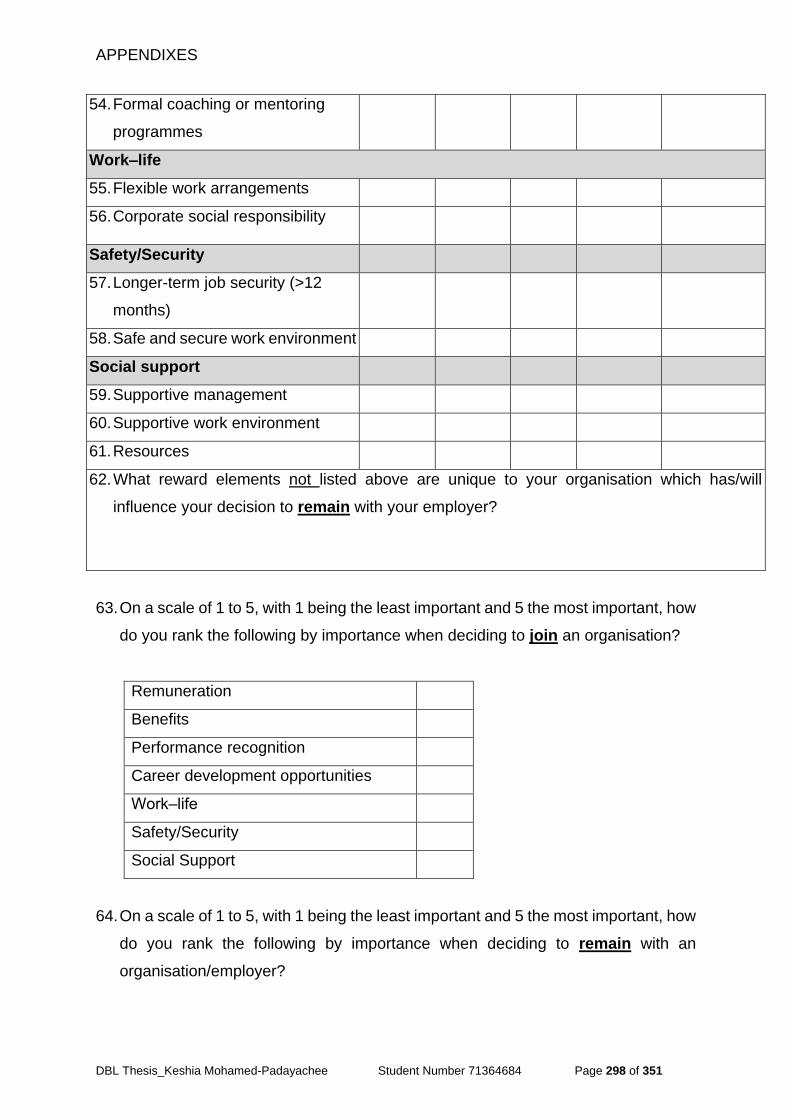
APPENDIXES
DBL Thesis_Keshia Mohamed-Padayachee Student Number 71364684 Page 298 of 351
54. Formal coaching or mentoring
programmes
Work‒life
55. Flexible work arrangements
56. Corporate social responsibility
Safety/Security
57. Longer-term job security (>12
months)
58. Safe and secure work environment
Social support
59. Supportive management
60. Supportive work environment
61. Resources
62. What reward elements not listed above are unique to your organisation which has/will
influence your decision to remain with your employer?
63. On a scale of 1 to 5, with 1 being the least important and 5 the most important, how
do you rank the following by importance when deciding to join an organisation?
Remuneration
Benefits
Performance recognition
Career development opportunities
Work‒life
Safety/Security
Social Support
64. On a scale of 1 to 5, with 1 being the least important and 5 the most important, how
do you rank the following by importance when deciding to remain with an
organisation/employer?
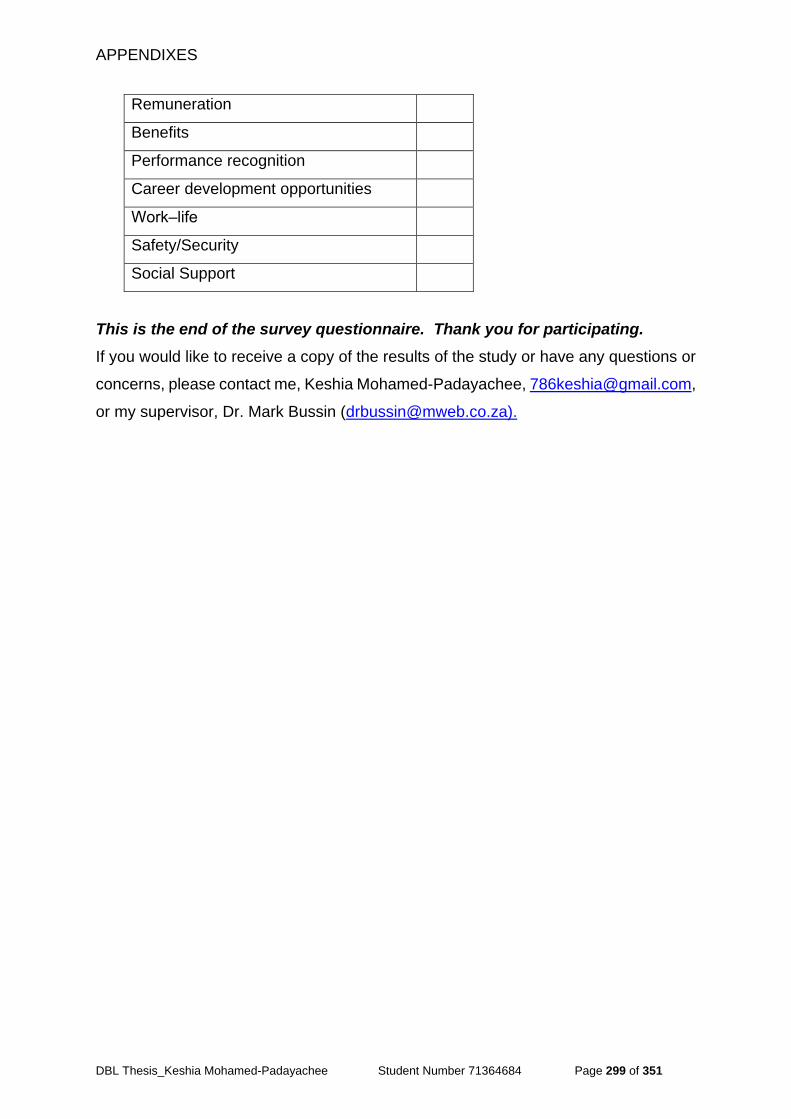
APPENDIXES
DBL Thesis_Keshia Mohamed-Padayachee Student Number 71364684 Page 299 of 351
Remuneration
Benefits
Performance recognition
Career development opportunities
Work‒life
Safety/Security
Social Support
This is the end of the survey questionnaire. Thank you for participating.
If you would like to receive a copy of the results of the study or have any questions or
concerns, please contact me, Keshia Mohamed-Padayachee, [email protected],
or my supervisor, Dr. Mark Bussin ([email protected]).
APPENDIXES
DBL Thesis_Keshia Mohamed-Padayachee Student Number 71364684 Page 300 of 351
Appendix B: Research interview guide
Informed consent for participation in an academic research project
A Total Rewards Framework for the Attraction and Retention of the Youth
Dear __________
Thank you for your time and agreeing to assist me in my academic research study
conducted as part of my Doctoral studies with UNISA’s Graduate School of Business
Leadership (SBL).
Purpose
The purpose of the study is to investigate what rewards are important to attract and
retain employees to organisations. Rewards are defined as everything an employee
perceives to be of value resulting from the employment relationship. The aim of the
interviews is to test the preliminary results from the quantitative part of the research.
Furthermore, I wish to gain further meaning, experiences, and views that may differ
from the results of the quantitative analysis that I am able to generalise and compare.
Confidentiality
All your responses will be treated as confidential, and you will not be identified in any
of the research reports emanating from this research. I will use verbatim quotations
in the analysis of the research to demonstrate, inform, or support findings. Your
participation in this study is very important to me, and I appreciate you making time to
meet with me. You may, however, choose not to participate, and you may also
withdraw from the interview at any time, without any negative consequences.
Format of the interview
This interview should not take more than 30 minutes of your time, and will be led by
questions from me. The interview will be recorded for record and transcription
purposes, to ensure that I capture your responses correctly in the final analysis of my
research.
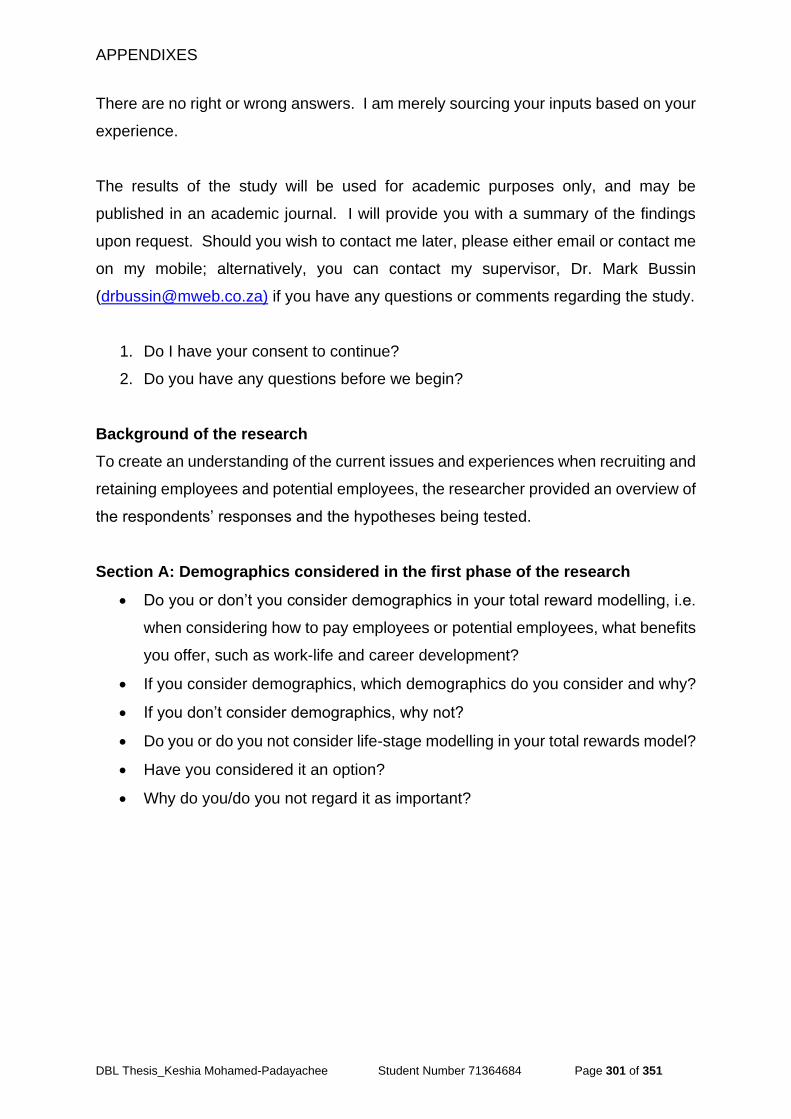
APPENDIXES
DBL Thesis_Keshia Mohamed-Padayachee Student Number 71364684 Page 301 of 351
There are no right or wrong answers. I am merely sourcing your inputs based on your
experience.
The results of the study will be used for academic purposes only, and may be
published in an academic journal. I will provide you with a summary of the findings
upon request. Should you wish to contact me later, please either email or contact me
on my mobile; alternatively, you can contact my supervisor, Dr. Mark Bussin
([email protected]) if you have any questions or comments regarding the study.
1. Do I have your consent to continue?
2. Do you have any questions before we begin?
Background of the research
To create an understanding of the current issues and experiences when recruiting and
retaining employees and potential employees, the researcher provided an overview of
the respondents’ responses and the hypotheses being tested.
Section A: Demographics considered in the first phase of the research
Do you or don’t you consider demographics in your total reward modelling, i.e.
when considering how to pay employees or potential employees, what benefits
you offer, such as work-life and career development?
If you consider demographics, which demographics do you consider and why?
If you don’t consider demographics, why not?
Do you or do you not consider life-stage modelling in your total rewards model?
Have you considered it an option?
Why do you/do you not regard it as important?
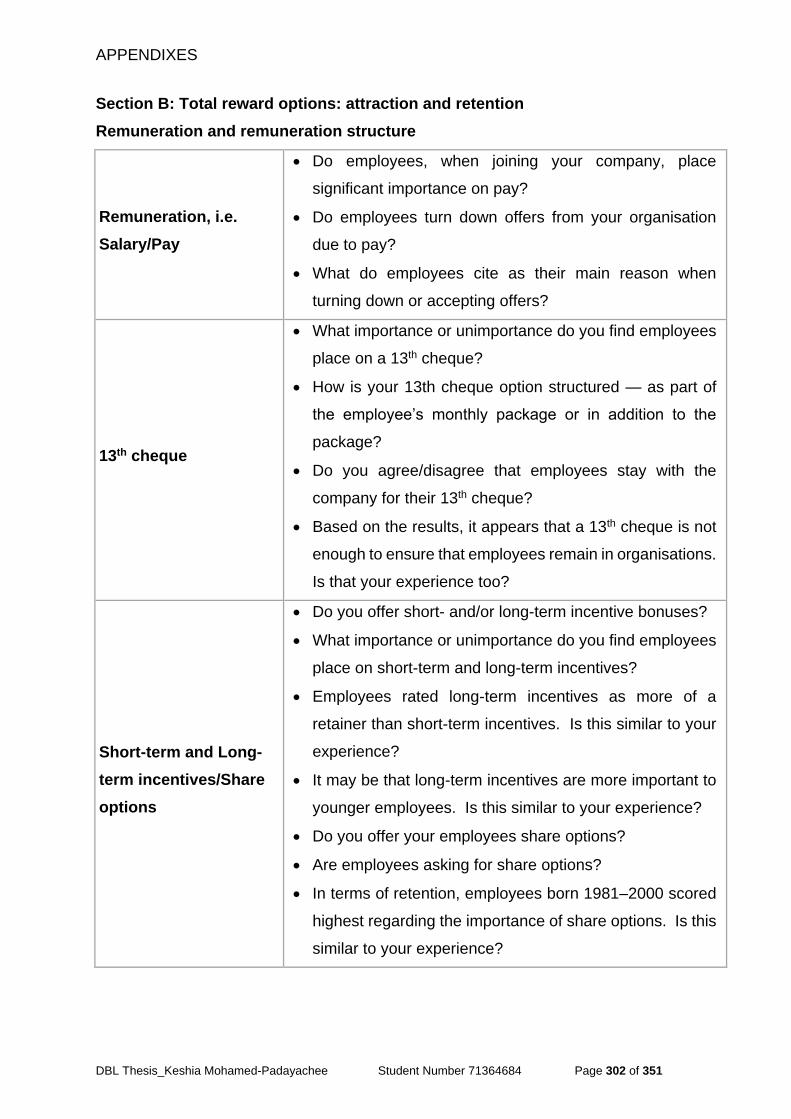
APPENDIXES
DBL Thesis_Keshia Mohamed-Padayachee Student Number 71364684 Page 302 of 351
Section B: Total reward options: attraction and retention
Remuneration and remuneration structure
Remuneration, i.e.
Salary/Pay
Do employees, when joining your company, place
significant importance on pay?
Do employees turn down offers from your organisation
due to pay?
What do employees cite as their main reason when
turning down or accepting offers?
13th cheque
What importance or unimportance do you find employees
place on a 13th cheque?
How is your 13th cheque option structured — as part of
the employee’s monthly package or in addition to the
package?
Do you agree/disagree that employees stay with the
company for their 13th cheque?
Based on the results, it appears that a 13th cheque is not
enough to ensure that employees remain in organisations.
Is that your experience too?
Short-term and Long-
term incentives/Share
options
Do you offer short- and/or long-term incentive bonuses?
What importance or unimportance do you find employees
place on short-term and long-term incentives?
Employees rated long-term incentives as more of a
retainer than short-term incentives. Is this similar to your
experience?
It may be that long-term incentives are more important to
younger employees. Is this similar to your experience?
Do you offer your employees share options?
Are employees asking for share options?
In terms of retention, employees born 1981–2000 scored
highest regarding the importance of share options. Is this
similar to your experience?
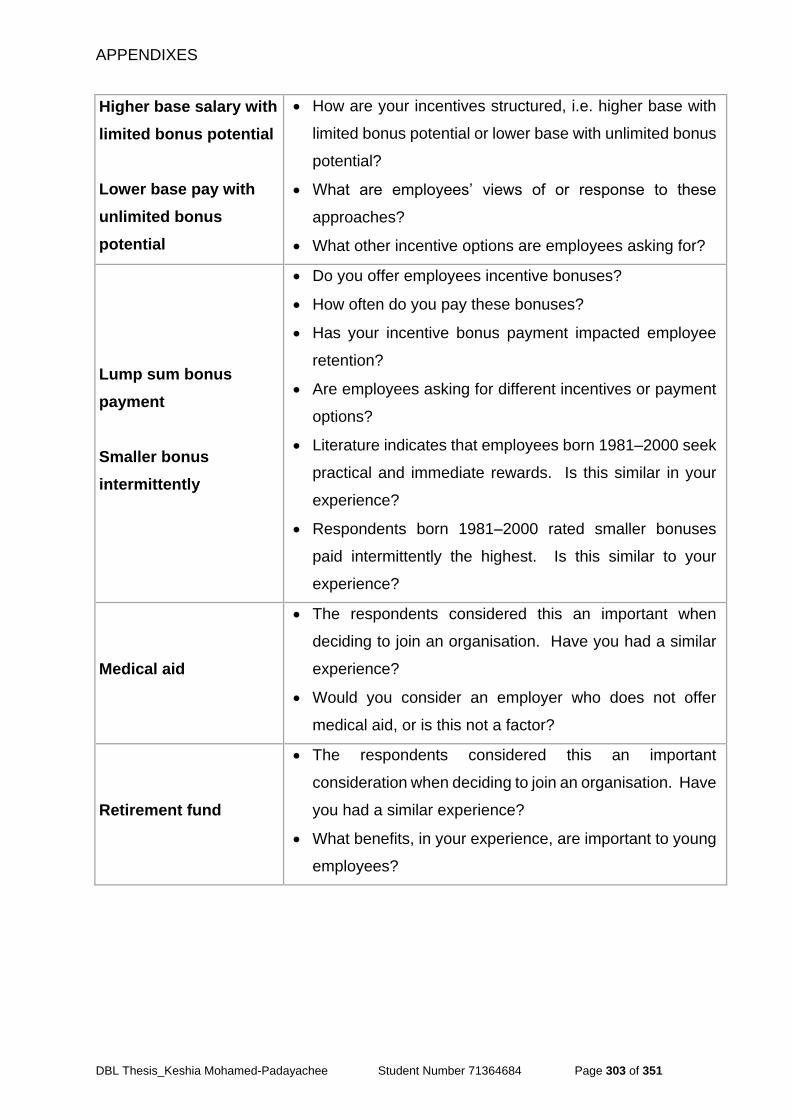
APPENDIXES
DBL Thesis_Keshia Mohamed-Padayachee Student Number 71364684 Page 303 of 351
Higher base salary with
limited bonus potential
Lower base pay with
unlimited bonus
potential
How are your incentives structured, i.e. higher base with
limited bonus potential or lower base with unlimited bonus
potential?
What are employees’ views of or response to these
approaches?
What other incentive options are employees asking for?
Lump sum bonus
payment
Smaller bonus
intermittently
Do you offer employees incentive bonuses?
How often do you pay these bonuses?
Has your incentive bonus payment impacted employee
retention?
Are employees asking for different incentives or payment
options?
Literature indicates that employees born 1981–2000 seek
practical and immediate rewards. Is this similar in your
experience?
Respondents born 1981–2000 rated smaller bonuses
paid intermittently the highest. Is this similar to your
experience?
Medical aid
The respondents considered this an important when
deciding to join an organisation. Have you had a similar
experience?
Would you consider an employer who does not offer
medical aid, or is this not a factor?
Retirement fund
The respondents considered this an important
consideration when deciding to join an organisation. Have
you had a similar experience?
What benefits, in your experience, are important to young
employees?
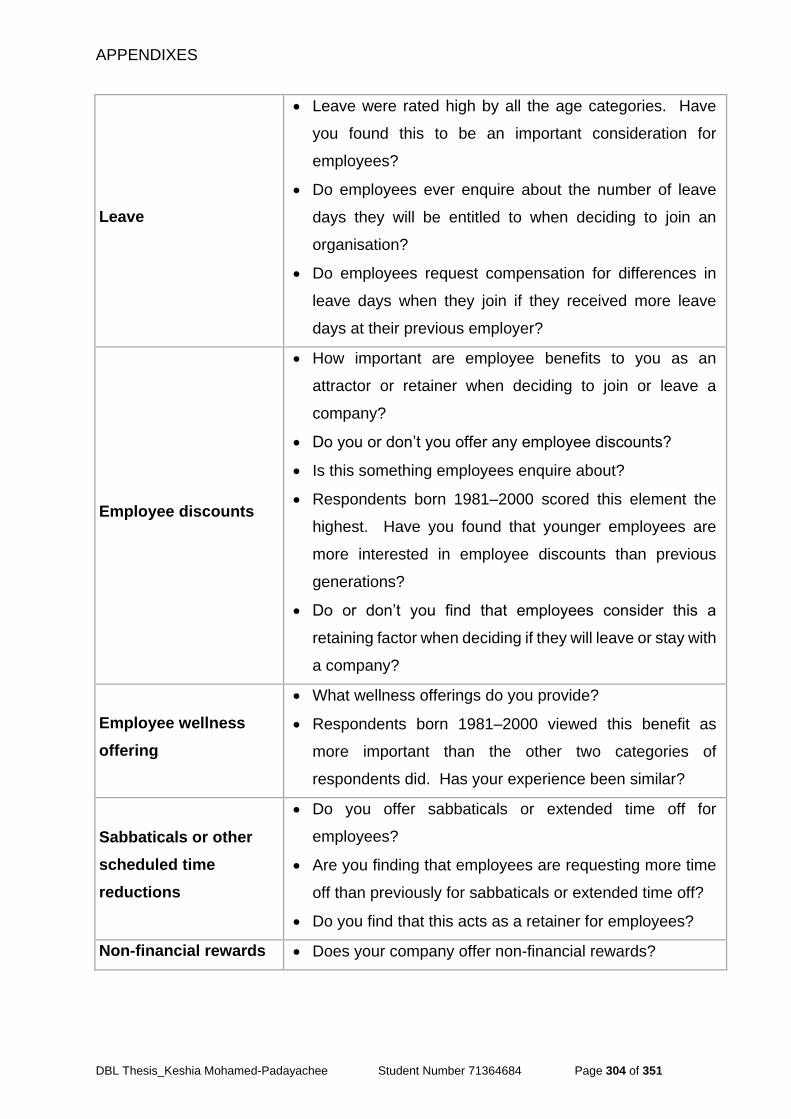
APPENDIXES
DBL Thesis_Keshia Mohamed-Padayachee Student Number 71364684 Page 304 of 351
Leave
Leave were rated high by all the age categories. Have
you found this to be an important consideration for
employees?
Do employees ever enquire about the number of leave
days they will be entitled to when deciding to join an
organisation?
Do employees request compensation for differences in
leave days when they join if they received more leave
days at their previous employer?
Employee discounts
How important are employee benefits to you as an
attractor or retainer when deciding to join or leave a
company?
Do you or don’t you offer any employee discounts?
Is this something employees enquire about?
Respondents born 1981–2000 scored this element the
highest. Have you found that younger employees are
more interested in employee discounts than previous
generations?
Do or don’t you find that employees consider this a
retaining factor when deciding if they will leave or stay with
a company?
Employee wellness
offering
What wellness offerings do you provide?
Respondents born 1981–2000 viewed this benefit as
more important than the other two categories of
respondents did. Has your experience been similar?
Sabbaticals or other
scheduled time
reductions
Do you offer sabbaticals or extended time off for
employees?
Are you finding that employees are requesting more time
off than previously for sabbaticals or extended time off?
Do you find that this acts as a retainer for employees?
Non-financial rewards Does your company offer non-financial rewards?
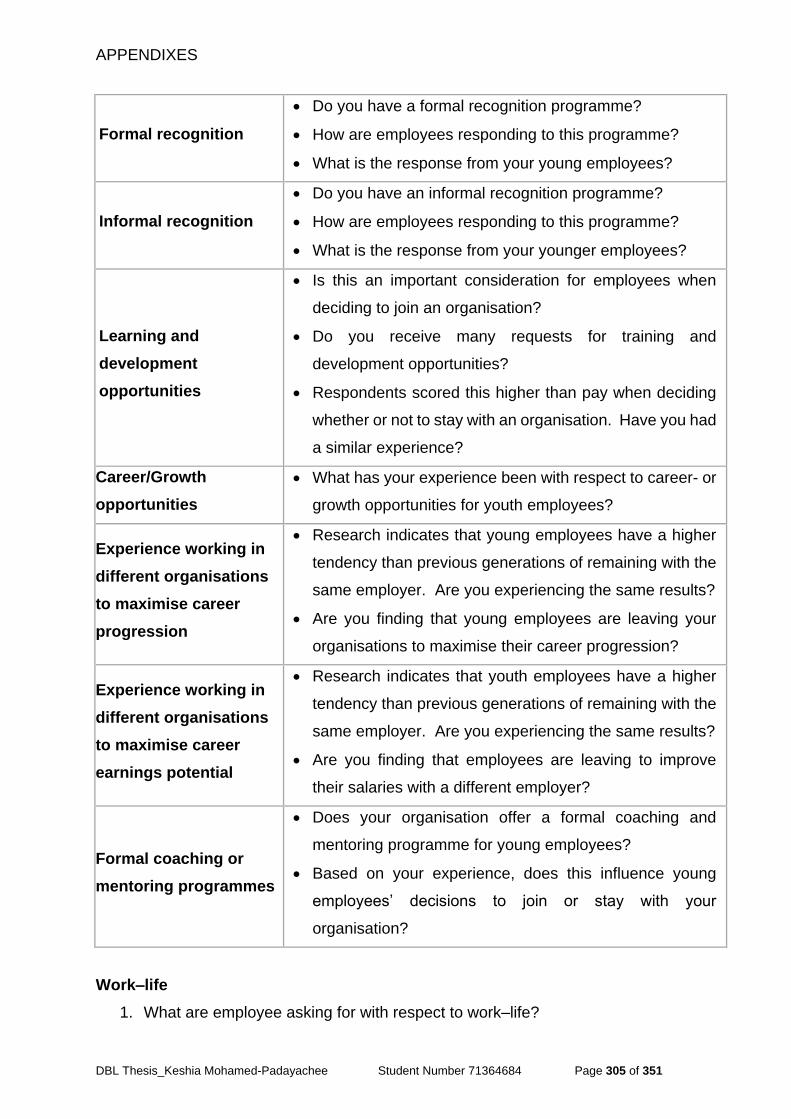
APPENDIXES
DBL Thesis_Keshia Mohamed-Padayachee Student Number 71364684 Page 305 of 351
Formal recognition
Do you have a formal recognition programme?
How are employees responding to this programme?
What is the response from your young employees?
Informal recognition
Do you have an informal recognition programme?
How are employees responding to this programme?
What is the response from your younger employees?
Learning and
development
opportunities
Is this an important consideration for employees when
deciding to join an organisation?
Do you receive many requests for training and
development opportunities?
Respondents scored this higher than pay when deciding
whether or not to stay with an organisation. Have you had
a similar experience?
Career/Growth
opportunities
What has your experience been with respect to career- or
growth opportunities for youth employees?
Experience working in
different organisations
to maximise career
progression
Research indicates that young employees have a higher
tendency than previous generations of remaining with the
same employer. Are you experiencing the same results?
Are you finding that young employees are leaving your
organisations to maximise their career progression?
Experience working in
different organisations
to maximise career
earnings potential
Research indicates that youth employees have a higher
tendency than previous generations of remaining with the
same employer. Are you experiencing the same results?
Are you finding that employees are leaving to improve
their salaries with a different employer?
Formal coaching or
mentoring programmes
Does your organisation offer a formal coaching and
mentoring programme for young employees?
Based on your experience, does this influence young
employees’ decisions to join or stay with your
organisation?
Work‒life
1. What are employee asking for with respect to work‒life?

APPENDIXES
DBL Thesis_Keshia Mohamed-Padayachee Student Number 71364684 Page 306 of 351
2. Do you have policies on work‒life?
3. Do work‒life options influence potential employees to join your organisation?
4. Do your work‒life options/policies influence employees’ decision to remain with
your organisation?
Flexible work
arrangements
Do you have any flexible work arrangement policies?
Has this been requested by employees?
Corporate social
responsibility
opportunities
Respondents viewed this as important when
considering joining an organisation. Has this been your
experience?
Longer-term job security
(>12 months)
Are you finding that youth employees are seeking
longer-term job security more than previous
generations?
Safe and secure work
environment
Are you finding that employees are turning down job
offers due to location?
Does your location influence your turnover?
Supportive management
Supportive management scored higher than a
supportive work environment, illustrating the continued
importance of leadership. What are your views in this
respect?
Supportive work
environment
How important do you think a supportive work
environment is?
Resources How important do you think resources are to the youth?
Top-ranked options for attraction and retention
Do the results reflect or not reflect what you have experienced in your organisation?
This is the end of the interview. Thank you for participating.
If you would like to receive a copy of the results of the study or have any questions or
concerns, please contact me ([email protected]) or my supervisor, Dr. Mark
Bussin, ([email protected]).
APPENDIXES
DBL Thesis_Keshia Mohamed-Padayachee Student Number 71364684 Page 307 of 351
Appendix C: Chapter 5 interview responses
This section presents direct quotations from the interviews by code grouped by total
rewards category, element and group (Youths, and HR practitioners). The narrative
presents the participant responses beginning with the researcher specifying the
category and codes classified under each category, wherein emerging codes were
also noted. The researcher provides relevant selected portions of the participants’
responses, to corroborate the findings from Chapter 5, Section 5.3.2.
The responses were required by the researcher to validate the findings presented in
Chapter 5. Appendix D, provides a further table with the transcripts by category and
code.
1. Life- and career stage models
As described in Chapter 5, codes, which emerged in this category, included
Qualification and Years’ experience.
Youths’ responses
The researcher asked the youths: In your view, should organisations consider life
stages when designing total reward options?
One of the participants’ response to this question was: “Now, everything has changed,
because now my responsibilities are bigger. I had my baby, and it would definitely be
remuneration, and I would not just leave, because there are still things I need to
achieve here, and I’m fairly new — just over a year — so the only thing that would
cause me to move is a good salary”. This response validated the findings that life
stages does influence the importance the youth places on reward options.
Availability to travel was also linked to life stages, one participant’s response was,
“…before this, I travelled, and it was not a problem, but now that I have a baby, my
priorities have changed.”
Another interviewee responded, “…now, I won't go. Before, I’d do it, but now I won’t
do it.”
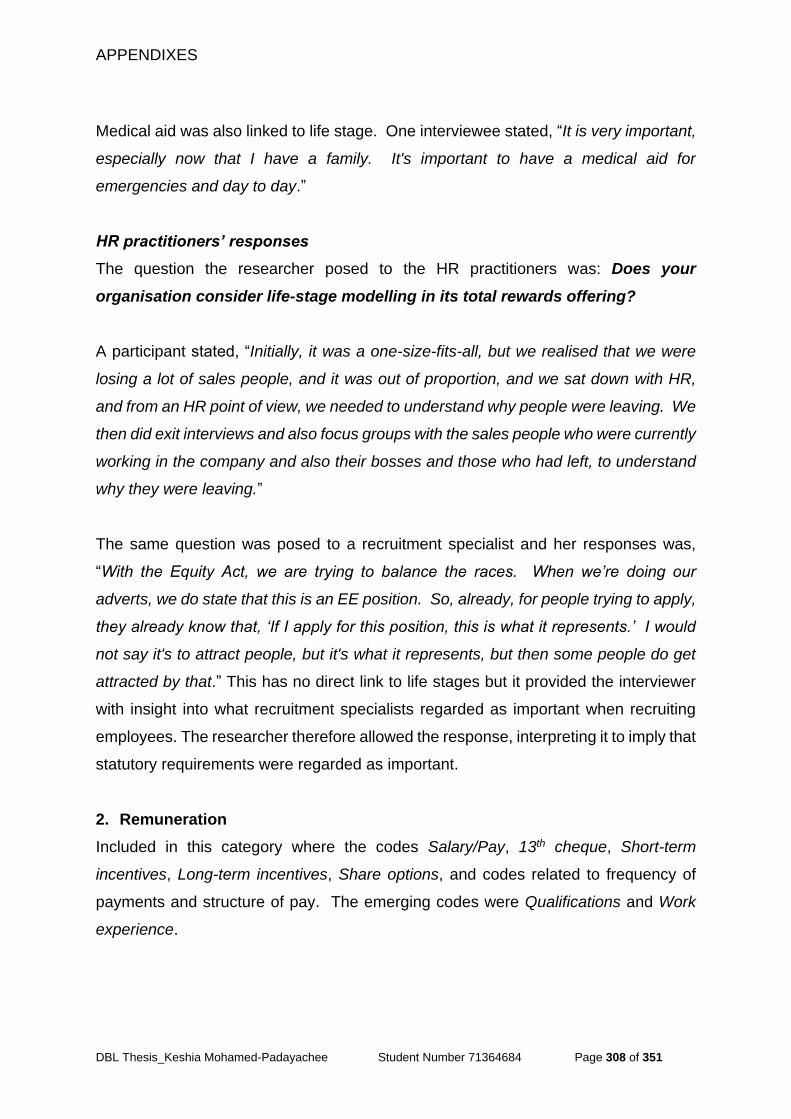
APPENDIXES
DBL Thesis_Keshia Mohamed-Padayachee Student Number 71364684 Page 308 of 351
Medical aid was also linked to life stage. One interviewee stated, “It is very important,
especially now that I have a family. It's important to have a medical aid for
emergencies and day to day.”
HR practitioners’ responses
The question the researcher posed to the HR practitioners was: Does your
organisation consider life-stage modelling in its total rewards offering?
A participant stated, “Initially, it was a one-size-fits-all, but we realised that we were
losing a lot of sales people, and it was out of proportion, and we sat down with HR,
and from an HR point of view, we needed to understand why people were leaving. We
then did exit interviews and also focus groups with the sales people who were currently
working in the company and also their bosses and those who had left, to understand
why they were leaving.”
The same question was posed to a recruitment specialist and her responses was,
“With the Equity Act, we are trying to balance the races. When we’re doing our
adverts, we do state that this is an EE position. So, already, for people trying to apply,
they already know that, ‘If I apply for this position, this is what it represents.’ I would
not say it's to attract people, but it's what it represents, but then some people do get
attracted by that.” This has no direct link to life stages but it provided the interviewer
with insight into what recruitment specialists regarded as important when recruiting
employees. The researcher therefore allowed the response, interpreting it to imply that
statutory requirements were regarded as important.
2. Remuneration
Included in this category where the codes Salary/Pay, 13th cheque, Short-term
incentives, Long-term incentives, Share options, and codes related to frequency of
payments and structure of pay. The emerging codes were Qualifications and Work
experience.
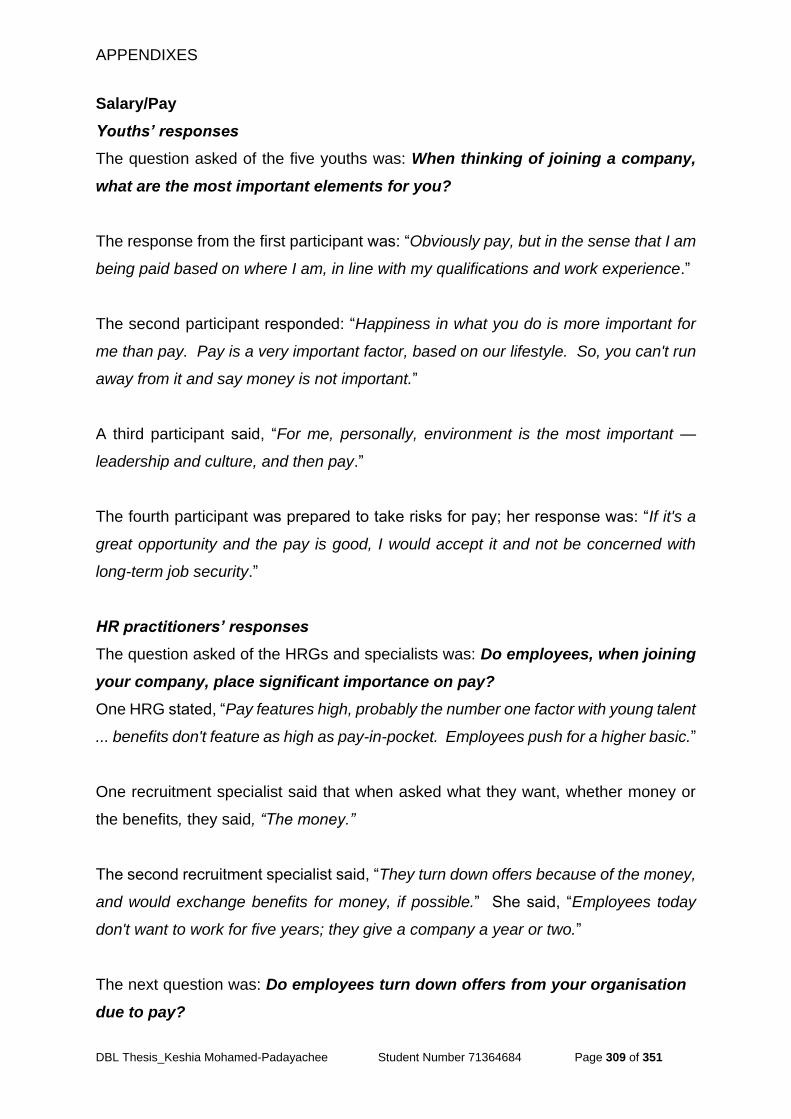
APPENDIXES
DBL Thesis_Keshia Mohamed-Padayachee Student Number 71364684 Page 309 of 351
Salary/Pay
Youths’ responses
The question asked of the five youths was: When thinking of joining a company,
what are the most important elements for you?
The response from the first participant was: “Obviously pay, but in the sense that I am
being paid based on where I am, in line with my qualifications and work experience.”
The second participant responded: “Happiness in what you do is more important for
me than pay. Pay is a very important factor, based on our lifestyle. So, you can't run
away from it and say money is not important.”
A third participant said, “For me, personally, environment is the most important —
leadership and culture, and then pay.”
The fourth participant was prepared to take risks for pay; her response was: “If it's a
great opportunity and the pay is good, I would accept it and not be concerned with
long-term job security.”
HR practitioners’ responses
The question asked of the HRGs and specialists was: Do employees, when joining
your company, place significant importance on pay?
One HRG stated, “Pay features high, probably the number one factor with young talent
... benefits don't feature as high as pay-in-pocket. Employees push for a higher basic.”
One recruitment specialist said that when asked what they want, whether money or
the benefits, they said, “The money.”
The second recruitment specialist said, “They turn down offers because of the money,
and would exchange benefits for money, if possible.” She said, “Employees today
don't want to work for five years; they give a company a year or two.”
The next question was: Do employees turn down offers from your organisation
due to pay?
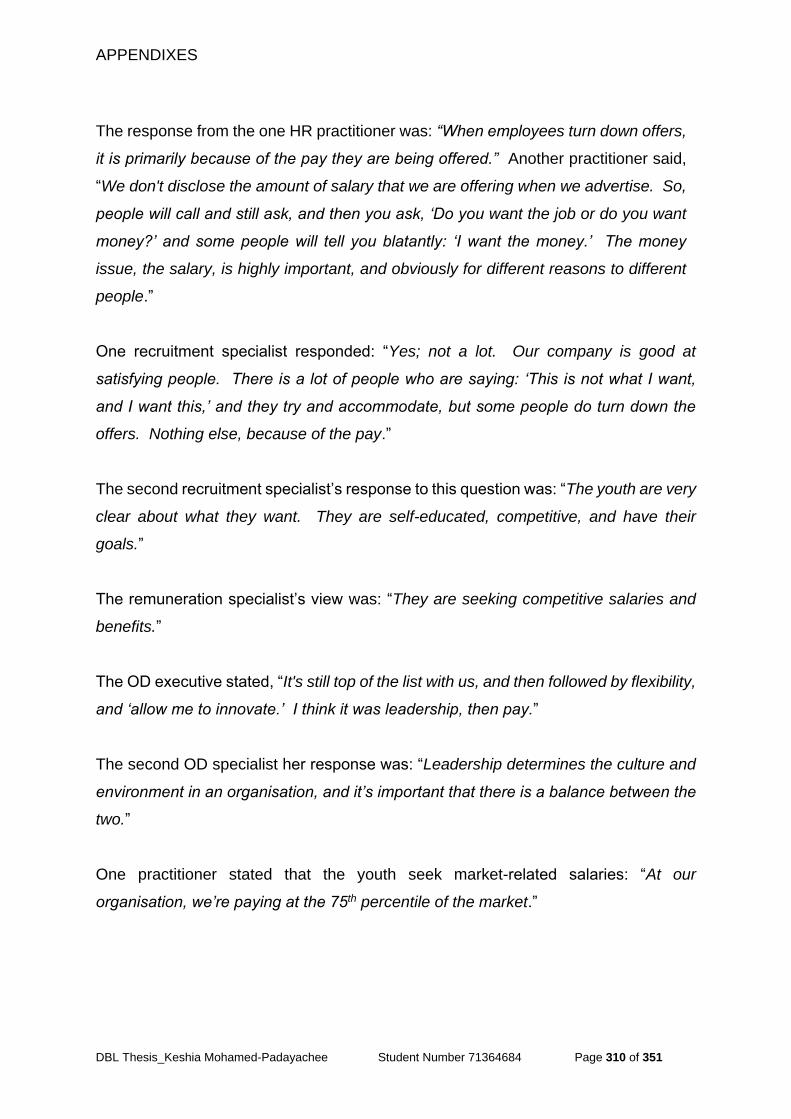
APPENDIXES
DBL Thesis_Keshia Mohamed-Padayachee Student Number 71364684 Page 310 of 351
The response from the one HR practitioner was: “When employees turn down offers,
it is primarily because of the pay they are being offered.” Another practitioner said,
“We don't disclose the amount of salary that we are offering when we advertise. So,
people will call and still ask, and then you ask, ‘Do you want the job or do you want
money?’ and some people will tell you blatantly: ‘I want the money.’ The money
issue, the salary, is highly important, and obviously for different reasons to different
people.”
One recruitment specialist responded: “Yes; not a lot. Our company is good at
satisfying people. There is a lot of people who are saying: ‘This is not what I want,
and I want this,’ and they try and accommodate, but some people do turn down the
offers. Nothing else, because of the pay.”
The second recruitment specialist’s response to this question was: “The youth are very
clear about what they want. They are self-educated, competitive, and have their
goals.”
The remuneration specialist’s view was: “They are seeking competitive salaries and
benefits.”
The OD executive stated, “It's still top of the list with us, and then followed by flexibility,
and ‘allow me to innovate.’ I think it was leadership, then pay.”
The second OD specialist her response was: “Leadership determines the culture and
environment in an organisation, and it’s important that there is a balance between the
two.”
One practitioner stated that the youth seek market-related salaries: “At our
organisation, we’re paying at the 75th percentile of the market.”

APPENDIXES
DBL Thesis_Keshia Mohamed-Padayachee Student Number 71364684 Page 311 of 351
13th cheque
Youths’ responses
The question asked was of the youths was: If you had to receive an employment
offer today and the company did not offer you a 13th cheque, would that prevent
you from leaving your employer?
One youth replied: “It wouldn't really.”
For the second youth it did not matter: “Look, it depends what the other benefits are,
so I would weigh my options. If the overall total package is good and you can just put
aside an amount, I can just compromise on that.”
The fifth youth stated, “I do get a 13th cheque, and opted for this option to be structured
in my package, because I know that I am really bad with saving and would ordinarily
not save for December.”
HR practitioners’ responses
The question posed was: What importance or unimportance do you find
employees place on a 13th cheque?
One HRG believe was: “…because employees believe they must live for now.”
The remuneration specialist responded “…yes, very important… It is, however, not
seen as an attraction or retention factor. The short-term incentives serve that purpose.
Employees receive a 13th cheque, short-term incentives, and gain shares, and that's
quarterly. So, this is just part of the offering, and contributes to our low turnover rates.”
One OD specialist’s experience was “…so, 13th cheque, they look at it as part of the
salary, because they structure it like that, so the performance bonus is more important
to them.”
Short-term incentives
Pay for performance, Performance-based pay, Performance-based incentives, and
Short-term planning also emerged from the data.
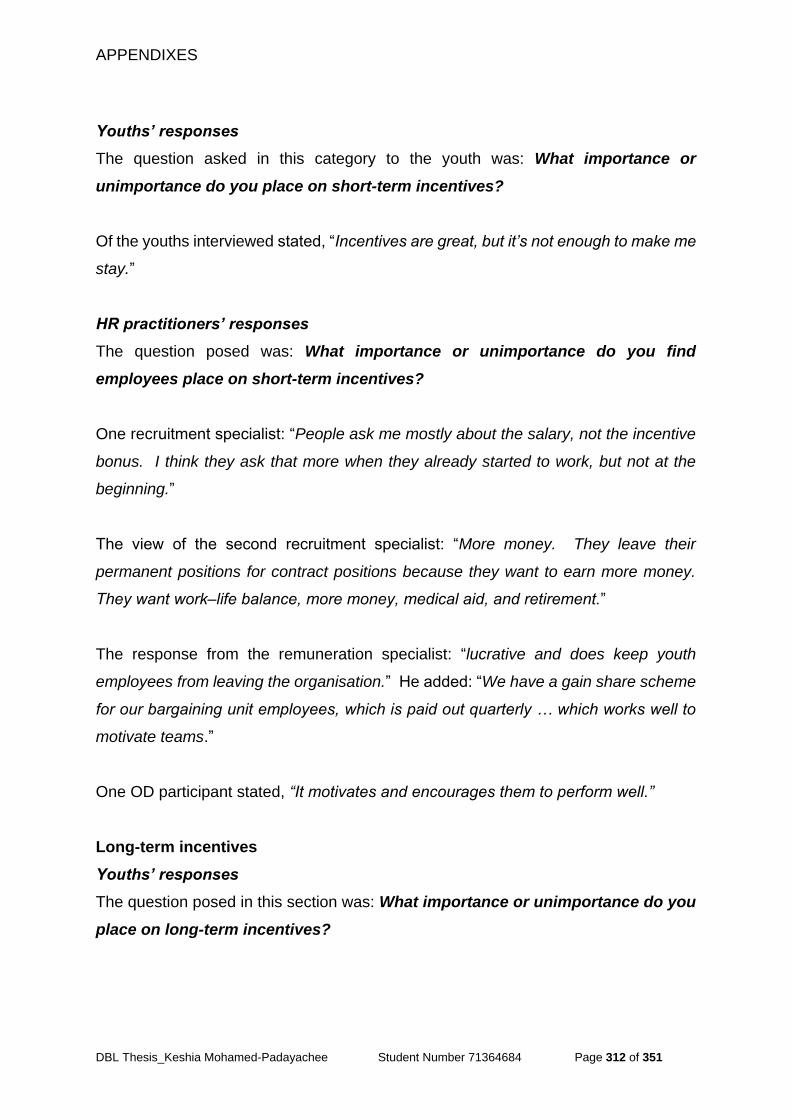
APPENDIXES
DBL Thesis_Keshia Mohamed-Padayachee Student Number 71364684 Page 312 of 351
Youths’ responses
The question asked in this category to the youth was: What importance or
unimportance do you place on short-term incentives?
Of the youths interviewed stated, “Incentives are great, but it’s not enough to make me
stay.”
HR practitioners’ responses
The question posed was: What importance or unimportance do you find
employees place on short-term incentives?
One recruitment specialist: “People ask me mostly about the salary, not the incentive
bonus. I think they ask that more when they already started to work, but not at the
beginning.”
The view of the second recruitment specialist: “More money. They leave their
permanent positions for contract positions because they want to earn more money.
They want work‒life balance, more money, medical aid, and retirement.”
The response from the remuneration specialist: “lucrative and does keep youth
employees from leaving the organisation.” He added: “We have a gain share scheme
for our bargaining unit employees, which is paid out quarterly … which works well to
motivate teams.”
One OD participant stated, “It motivates and encourages them to perform well.”
Long-term incentives
Youths’ responses
The question posed in this section was: What importance or unimportance do you
place on long-term incentives?
APPENDIXES
DBL Thesis_Keshia Mohamed-Padayachee Student Number 71364684 Page 313 of 351
One interviewee responded: “Not for me. I would not want a long-term bonus. It would
not retain me or motivate me. It's too long to wait; at some point, I might forget that
it’s coming.”
HR practitioners’ responses
The question posed in this section was: What importance or unimportance do you
find employees place on long-term incentives?
One HRG said, “The youth are not for long-term incentives or short-term incentives...
If they were given an option, they would not want a retirement fund.”
Of the OD specialists: “That's true. Right now, we’re doing the talent assessments.
People know that the talent assessments outcome gives them the opportunity for long-
term incentives, so you will see that people are on their toes. So, I think that it is
important, and people who do not qualify want to know why. But it’s only at leadership
levels, and a selected few would qualify.”
The second OD specialist stated, “Long-term incentives support the company’s
retention strategies, because it's lucrative and paid once, and you invest part and the
other 50% vests after three years without a work-back clause, but it is linked to
performance … you need to maintain your performance and talent cluster.”
Share options
Youths’ responses
Participants were asked: In terms of retention, employees born 1981 to 2000
scored highest regarding the importance of share options. What is your opinion
on this?
One of the youths expressed the following view: “Shares won't motivate me to stay.
You have to pay for it … but if someone gives me a better offer on my current salary,
then I'll take it. It won't make me stay. Over and above, you’re waiting for that lump
sum of money and, in-between, you’re living. I would not stay, but it is a motivating
factor.”
APPENDIXES
DBL Thesis_Keshia Mohamed-Padayachee Student Number 71364684 Page 314 of 351
The following was a response from one of the participants: “I was interested in being
part of this company, and so, now, if I own shares, I know that I am here to stay. I'm
really part of the company. You know, if you’re part of something, if you own shares
here, you would not do anything destructive, because you are actually hurting yourself
directly now. It will be a motivator. ‘Let me perform, let me push those targets.’ I have
a hand in it. I have a slice of [the] cake, and I am also part of the company. I actually
own a little bit.”
HR practitioners’ responses
The question posed to the HR practitioners was: What importance or unimportance
do you find employees place on shares? The second question asked was: Do you
offer your employees share options? The final question was: Are employees
asking for share options?
The HR practitioners stated that their companies did not offer shares and could
therefore not comment. The recruitment specialist stated that prospective employees
do not ask about share options. The remuneration specialist’s experience that the
gain shares offered to employees retained them.
Higher base salary, and lower base salary
The interviewer assessed the interest in a higher base salary with limited bonus or a
lower base salary with unlimited bonus.
Youths’ responses
The question posed to the youths was: If you could choose between a higher base
salary with limited bonus potential and a lower base salary with unlimited bonus
potential, what would you choose, or would you prefer to keep receiving a fixed
salary?
One of the participants stated, “Bonus is based on performance, and it would be a risk
to the company to change this, because the results are not guaranteed.”
APPENDIXES
DBL Thesis_Keshia Mohamed-Padayachee Student Number 71364684 Page 315 of 351
HR practitioners’ responses
The question posed to the participants was: If employees had the choice, what do
you think they would opt for: a higher base salary with limited bonus potential
or a lower base salary with unlimited bonus potential, or do you think they would
prefer to keep receiving a set salary?
A participant responded: “Sales people receive a low basic salary with higher variable
pay.”
One OD specialist responded: “If pay was number one, why would I want to go with a
lower base?”
Smaller bonuses, paid intermittently
Youths’ responses
The interviewees were asked to indicate whether they agreed with the statement:
People seek immediate rewards. They don't want rewards once a year, but
prefer to have these divided into payments made quarterly.
Of the youths one said, “Partially, I do. Actually, I agree with that one hundred percent.
I don't believe that you should wait for something. Not only your pay, but promotion,
stuff like that. So, I know there is a structure, and you can't just push people to the top
if they haven't worked, but I believe if something is there and the reward needs to be
given, give the reward. I don't believe you have to wait a certain time.”
The second youth responded: “It would, definitely. Throughout the year, you find,
halfway through, you become demotivated and you start slacking, and that contributes
to your final. So, if you know every three months …, you don't get a chance to start
slacking, because you know, ‘I must push, because it’s incentive time.’ It's also a
motivating factor, a constant motivating factor.”
The third youth responded: “I totally agree, because, sometimes, saying ‘Thank you
for doing your work’ is not enough. Sometimes I need a little… When you’re working
and you know you’re going to be earning something, it's not the same as volunteering
to do it. If I do A, B, C, and I do it well, I am guaranteed some money. That is
APPENDIXES
DBL Thesis_Keshia Mohamed-Padayachee Student Number 71364684 Page 316 of 351
motivation enough, and the younger generation, we’re more interested in money. I
would not say money is the only thing, but it's the sweet to the child. It's the driver for
us. It's easy to attract us with money. So, now you also need to know if you’re
performing well. Sometimes I need to be reminded, ‘Yes, you’re performing well. Here
is your bonus.’”
Of the youths who preferred an annual bonus, the first said, “I would not be interested
in intermittent payments. I would prefer an annual lump sum, which would be larger
than the interim payments.”
The second youth said, “The way it works now is fine for me — to get it once a year
— if it's the same amount. In fact, I would not want it differently, in quarters.”
HR practitioners’ responses
The interviewees were asked to indicate whether they agreed with the statement:
People seek immediate rewards. They don't want rewards once a year, but
prefer to have these divided into payments made quarterly.
The view of the HRG executive: “requires a very high-performance culture.”
The recruitment specialist: “The contract employees receive quarterly increases,
which they love! Every quarter, they would receive an increase in their salary, which
really motivated and retained them.”
3. Benefits
The codes classified under this category included Medical aid, Retirement fund,
Leave, Employee discounts, Employee wellness offering, and Sabbaticals or other
scheduled time reductions. The code that emerged under this category was Study
leave, and was grouped under Sabbaticals or other scheduled time reductions.
Medical aid
Youths’ responses
The question posed to the youths was: Would you consider an employer who does
not offer medical aid, or is this not a factor?
APPENDIXES
DBL Thesis_Keshia Mohamed-Padayachee Student Number 71364684 Page 317 of 351
One participant who saw it as a very important benefit said: “It is very important,
especially now that I have a family. It's important to have a medical aid for
emergencies and day to day.”
Another youth stated, “It would, because it would mean I would still have to have
medical aid and obviously find a way of working it into my package. So, yes. If they
don't offer it, the package must be good, but I would try and negotiate, and we’re
speaking about subsidising the medical aid.”
One youth who did not think medical aid was important stated this as the reason: “I
don't believe that you must have a low salary because you have medical aid and a
retirement fund. I can take out my own medical aid, because companies have limited
options. You should choose for yourself what cover you have and how it should be
structured.”
HR practitioners’ responses
The question posed to the HR practitioners was: The respondents considered this
an important consideration when deciding to join an organisation. Have you
had a similar experience?
One HRG said, “You find that the low-earning employees sometimes feel it is
expensive … but what we have done is give them education and examples of people
who did not have medical aid, and when they became sick and had to be boarded.”
For the recruitment specialist her experience was that, “Where there is no medical aid,
they pay for their own medical aid and retirement fund.”
The recruitment specialists agreed that medical aid is important: “They do worry about
medical aid benefits.”
The view of the remuneration specialist: “Although not everyone, but more than 60%
of them are members of the medical aid.” He further agreed with the findings from
APPENDIXES
DBL Thesis_Keshia Mohamed-Padayachee Student Number 71364684 Page 318 of 351
Phase I, stating: “People are looking for ways for companies to subsidise medical aid.
We subsidise R1 100, which is paid like an allowance.”
The OD specialist view that medical aid is not important for the youth stated: “They
are satisfying their immediate need and not being responsible.”
Retirement fund
Youths’ responses
The questioned posed to the youths was: If an employer did not offer a retirement
fund, would you consider that offer of employment?
One of the participant’s responses was: “If they did not offer [a retirement fund], I would
probably do my own thing, but it would not be a deal-breaker.”
A third youth’s opinion was: “The thing is, the youth of today, we don't want to work
until we’re 60. You want to work hard whilst you’re still young, and retire early, and
then do your thing.” This interviewee articulated that she would like the option to begin
saving towards retirement later in her career, and use the first few years’ income to
buy a house and a car. She said, “If I don't want to contribute to pension until I am
thirty, allow me to do that.”
For the fifth youth: “I would say, more than pay. If I could save more now towards my
retirement, that would be beneficial for me, because I would rather live average now,
and then, when I retire, I know I'm totally comfortable.”
HR practitioners’ responses
The question posed was: The respondents considered this an important
consideration when deciding to join an organisation. Have you had a similar
experience?
Another HRG agreed that a retirement fund is important to employees, but voiced a
concern: “Employees contribute towards a retirement fund, but when they leave they
do not transfer the money saved to a preservation fund or retirement annuity — they
encash it.”
APPENDIXES
DBL Thesis_Keshia Mohamed-Padayachee Student Number 71364684 Page 319 of 351
The third HRG said, “Retirement fund is compulsory, and they have no choice but to
join, but there is a peculiar thing about a retirement fund. When people leave, when
they are in financial difficulty, they want to cash the retirement fund.” For this
executive, there was “no understanding of the value of the retirement fund; they want
to cash it and pay off their house or pay off their debts, in other words, they are using
long-term investment for short-term debt.”
The OD specialist reported: “The youth want flexibility and the option to begin saving
towards a retirement fund later, which will allow them the opportunity to buy a house
and car when they begin working.
The second OD participant shared a similar sentiment: “A retirement fund was not
favoured very highly, because they’re saying, ‘I want to buy a car and it takes a huge
portion of my salary. Rather put a restriction on age.’”
Leave
The emerging codes in this category included Study leave, which was clustered under
Sabbaticals and other scheduled time reductions. The youths considered study leave
part of Sabbaticals and other scheduled time reductions, while the HR specialists
considered it part of Leave.
Youths’ responses
The question posed to the youths was: This is a generation who ‘works to live,’
which is different from previous generations, who ‘lived to work.’ Do you agree
with that statement? How important is leave to you?
One participant responded: “Leave is very important, because, and I only realised it
last year … you learn why the leave is there and how to take it. You need a break
from everything, so leave days is what I encourage staff to do... So, you’re taking two
weeks off, you’re almost off for a month. So, you get time to rest and you get a time
break away from the work environment. You don’t think about it, because physically,
emotionally, and spiritually it’s draining to constantly be in a work environment, or,
when you off, you’re thinking about work, you’re worried about work and you wanting
APPENDIXES
DBL Thesis_Keshia Mohamed-Padayachee Student Number 71364684 Page 320 of 351
to phone in. So, I always encourage them: ‘When you’re on leave, you’re on leave.
Forget about work. When there is a crisis, we'll deal with it.’ It’s very, very, very
important for me, and I don’t have children, so I can only imagine how much more
important it is for them and how they could do with more leave days.”
For a second youth, stated, “I do think about it, and it has been different everywhere,
but it would not be a deal-breaker. I’m not one to take a lot of leave, and my family
comes first, and that is my priority. I will take leave if required for my family, but, other
than that, I’m not opportunistic, and it’s not my priority. I will look at it, but it’s not the
most important thing.”
For a third participant her response was: “It would all depend on the package they’re
offering me. I believe that, with certain things, you have to sacrifice other things in
order to benefit in other areas. It just depends what's more important to me at the
time. Leave, for them, would not be a deal-breaker, and there are other benefits, and
they would find a way to work around it. Leave is important, but not critical, when
deciding on a company and choosing between pay.”
HRGs’ and specialists’ responses
The question posed to the HRG and specialist participants was: Leave was rated
high in all the categories. In your experience, is this an important consideration
for employees?
The HRG agreed: “Leave is always going to feature high, and I just had an employee
who was negotiating his leave because he was getting 32 days at his previous
employer. Leave is contentious, and people want more leave all the time.”
The follow-up question posed was: Do employees request compensation for
differences in leave days when they join, if they received more leave days at
their previous employer?
“I recently had someone that was negotiating because they were joining one of the
companies who had 15 days’ leave, and they were negotiating for two or three more
leave days.”
APPENDIXES
DBL Thesis_Keshia Mohamed-Padayachee Student Number 71364684 Page 321 of 351
The second HRG’s view was: “The dynamics have changed, because, before, you
could encash your leave, and now the only time you get your leave is when you resign
or are retrenched.” In her experience, employees value their leave and do not want
to work long hours: “I see that a lot of young people, even females, are … saying they
don't want to come and work on a public holiday…, ‘So, don't put me in the roster,
because I want to be with my family.’”
One recruitment specialist stated: “Most employees are studying, and request
information on study leave and sick leave. Family responsibility leave are other
categories enquired over.”
Employee discounts
Youth’s responses
The question posed to the youths was: How important are employee benefits to
you as an attractor or retainer when deciding to join or leave a company?
One participants’ response summed up the responses of the other interviewees:
“…this is an important consideration, but would not influence my decision to stay or
join the company.”
HR practitioners’ responses
The question posed to the HRGs and specialists was: Do or don’t you find that
employees consider employee benefits a retainer when deciding if they will
leave or stay with a company?
One HRG said, “Employee discount is a nice-to-have, but not an essential for them.”
The second view was: “This does not act as a retainer, and is also not an important
factor for employees when they join.”
One recruitment specialist commented: “This is not an important factor, and, at times,
they don’t even know about discounts until they are there a few months.” The second
said, “They’re not too phased with that, and, again, it depends on the industry.” She
APPENDIXES
DBL Thesis_Keshia Mohamed-Padayachee Student Number 71364684 Page 322 of 351
added, “If employers do offer discounts, it must be discounts that they see as relevant
and able to use in their everyday lives.”
Employee wellness offering
Youths’ responses
The statement posed to youths was: Respondents born 1981 to 2000 viewed this
benefit as more important than the other two categories of respondents in the
quantitative phase of the study. Do you agree or disagree with this result?
A youth was concerned that his company had a wellness offering, but the youth were
not taking this up: “My generation is not interested in wellness that much. Only if a
person puts on weight a little, then they worry. Normal stuff. It's not as big and as
active as it should have been.”
Another participant stated, “Wellness is important, and the company currently has a
good wellness programme in place. This is an important consideration when deciding
on a company.”
The response from a third participant was: “Not really. I'm finding that people are not
really worried about their health, and it's a bit worrying. There is a lot of people who
have joined the gym, but they don't go. They just like the fact that, ‘I have joined the
gym,’ but the wellness people are not 100%. Medical aid, that is the only thing that
interests them in the wellness department.”
The four interviewees who felt that wellness is important said they would be attracted
to organisations who offered wellness programmes. One of these interviewees said,
participant said: “Yes, it would be, and would make my life so much easier. Yes, it
would definitely attract me to a job one day.”
The fifth interviewee said, “That's important. It shows that the organisation takes care
of their people.” She added that it would attract her to an organisation: “At least, if
they do have some form of employee assistance programme, it attracts me, because
it means that they do prioritise their people, and that is important. It says something
APPENDIXES
DBL Thesis_Keshia Mohamed-Padayachee Student Number 71364684 Page 323 of 351
about the culture. So, when I heard about the wellness at my current company, I was
actually drawn to it. I appreciate it if it's there.”
HR practitioners’ responses
The statement posed was: Respondents born 1981 to 2000 viewed this benefit as
more important than the other two categories of respondents in the quantitative
phase of the study. Has your experience been similar?
The HRGs disagreed on the importance of an organisation offering a wellness
programme of which one stated, “Manufacturing Standard has that benefit, so there
are wellness centres that every plant has in terms of the Occupational Health and
Safety Act, and from a corporate wellness perspective, there has been no requests.
Wellness Day is met with resistance at head office, because people don't see the
value.”
The company of the second participant saw wellness offerings as important: “The
youth at this organisation has scored high for wellness.”
The third interviewee’s company supported factory workers’ welfare through primary
healthcare, as they did not have medical aid, and, for them, this was an important
benefit.
One recruitment specialist, in her experience, found that employees are not concerned
about their health, and do not enquire about wellness offerings during the recruitment
process.
The second found that preferences in this regard differ from industry to industry; e.g.,
employees within the financial services sector are very interested in wellness offerings.
In her experience, it also depended on leadership; where there was a service provider
managing wellness, employees were very enthusiastic about it. Her view was that the
youth wants gymnasiums and counselling.
At the remuneration specialist’s company, the wellness programme had been
communicated extensively, and was used by employees.
APPENDIXES
DBL Thesis_Keshia Mohamed-Padayachee Student Number 71364684 Page 324 of 351
Sabbaticals or other scheduled time reductions
Youths’ responses
The question asked in this category was: Are you interested in sabbaticals or
extended time off?
“It could be something that I would be interested in, because you can't, with the current
study leave that we have, do much…. You have to tap into your own personal time
on weekends, so that would help.”
HR practitioners’ responses
The question asked in this category was: Are you finding that employees are
requesting more time off than previously for sabbaticals or extended time off?
One HR executive noted that: “Sometimes, they do try and take a chance, but they
know that we don’t have. Even study leave — if they want to take ten days to attend
study school, they need to take it from their annual leave if they have exceeded their
study leave”, he said.
According to the OD executive, “Not a lot of people have used this. When we initially
introduced the policy, many employees were interested, until they were advised that it
would be unpaid time off. This does not act as a retainer for employees.”
Performance recognition
This category included the codes Non-financial rewards, Formal recognition, and
Informal recognition. The emerging code was Years of service.
Youths’ responses
The youths were asked: How do you feel about the recognition and programme?
A youth participant responded: “For the formal recognition, we send the nominees and
we motivate, and other people decide. So, because it's not an internal decision that's
made on the winner … they don't question, and just take whatever comes.”
APPENDIXES
DBL Thesis_Keshia Mohamed-Padayachee Student Number 71364684 Page 325 of 351
Another youth participant commented: “It provides the platform to recognise my
contribution and fulfil my need to be recognised and rewarded.”
One participant felt that recognition would not incentivise her to do more, stating that
“I've had too many of those, so it’s okay. I'm not motivated by that. I set my own
standards, and I try and achieve my goals and work at those standards, and I don’t
need a pat on the back all the time. I'm doing my job. I should be doing this. You
don't need to say ‘Thank you, thank you,’ all the time. I'm not going to leave my job
because you don’t say thank you, and I’m not going to cry over it.”
One of the participants who viewed it as important stated: “Employee of the Year and
Supervisor of the Year — that's what I would work towards — the formal part of it, and
not the informal part of it”, the interviewee said.
For informal recognition a participant noted, “It’s like they just recharged our batteries.
‘Oh, you do see us running around! Oh, you do see us leaving here after hours! Oh,
you do see us working throughout lunch…’ Even an email — you will be surprised
what that will do to you. It makes me want to work even harder; it makes me want to
impress you even harder … keep working hard so that my manager can say, ‘Well
done.’ For example, our executive manager is always saying ‘Well done. I see you’re
doing well.’ So, every time when she walks past, if you’re on your phone, you drop it;
you want to show her that you’re working, because of the feedback she constantly
gives us. She is not aware of what she does, but that feedback pushes me, it makes
me want to do even more for the company, even more for my managers.”
A second interviewee’s view was: “I'd be happy, definitely. I'd be over the moon, but I
don't think it would have that much of an effect on me. I'd be like, ‘Thank you,’ and
that's it.”
HR practitioners’ responses
The question posed to the HRGs and specialists was: How do youths respond to
formal recognition programmes?
APPENDIXES
DBL Thesis_Keshia Mohamed-Padayachee Student Number 71364684 Page 326 of 351
An HRG noted: “People were saying they did not just want branded merchandise, they
wanted much more, and we started to give overseas trips, and people loved that …
improving turnover. Now we’re no longer worried about losing people, we’re
attracting.”
The remuneration specialist’s response was that employees are very motivated by
non-financial rewards, and his organisation has both formal and informal recognition
programmes.
The second HRG said: “Employees are very interested in the awards. When it started,
not everyone was interested, and then the second and this year’s nominations had
significantly increased, and employees were actively participating.” The second HRG
stated, “Employees love the awards and gifts that are given.”
The HRG executive’s response was: “The focus is on teams, and not always the
individual, which works well. Recognition works like magic. Employees who do not
have cars will make sure that they attend the recognition function. They love it, and
some of the areas do team building and everyone wants to attend. Interestingly
enough, senior people love recognition too.”
Another HRG’s experience was that: “Formal recognition is a celebration in front of
people and the announcements on e-mail, with runner-up,” which she found greatly
motivated employees.
The OD executive held the view that: “Recognition incentivises employees, particularly
the youth, and they love it and what we do … if you’re nominated, your spouse also
benefits. We go out of our way to make sure it’s the best of the best, and we make
them feel special.”
The second OD specialist stated: “I think, the informal one; the response is better.
You find people taking their selfies and writing about the fact that they got an informal
recognition. I find, people want to be spoken to more than anything. They know that
they will get their salary, but people want to be told they are doing well. Lunch with an
APPENDIXES
DBL Thesis_Keshia Mohamed-Padayachee Student Number 71364684 Page 327 of 351
executive is very important, lunch at an exclusive venue is very important, branded
material, for some people, is very important.”
The view of the recruitment specialist was that: “Employees prefer both formal and
informal recognition, but it is important that it must not be an event. They prefer on-
the-spot recognition. It’s more of a process if you do it on a more regular basis, as
opposed to the once-a-year event. They frown upon that.” The OD specialist
commented: “When recruiting, employees do not ask about the recognition
programmes. Perhaps during induction, they will ask.”
4. Career development
The codes that formed part of this category were Career/Growth opportunities,
Learning and development opportunities, Experience working in different
organisations to maximise career progression, Experience working in different
organisations to maximise career earnings potential, and Formal coaching or
mentoring programmes. Furthermore, Bursary opportunities had emerged as a code
from Phase I of the study.
Career/Growth opportunities
Youths’ responses
The question posed was: The results of the quantitative phase of my study
indicate that career growth opportunities are seen as more important than pay.
Do you agree or disagree with this statement?
The youth participant’s response was: “Career growth is one of the most important
things. I think, our generation, we are more educated. When I say educated, I mean
overall. So, we’re exposed to everything, and we have access to all kinds of
information all the time. So, I think, today's generation, me and my friends, my age
group, we know the importance of not going in a job and being a potato. So, I think,
the fear of my age group is going into a job … and you can’t get out.”
The second youth’s response was: “We move around, because, what you find with our
company, they don’t provide bursaries, studies, courses; they don’t provide any of that.
So, you apply for another job, because you want to study. …you need a better job
APPENDIXES
DBL Thesis_Keshia Mohamed-Padayachee Student Number 71364684 Page 328 of 351
with better pay. So, career growth would also link to your studying. The more you’re
studying, the more opportunities you have. Where I am staying in one company all
the time, you don't grow…; you know the company, and that’s it. There is no growth.
So, currently, where I am, if I need to stay there for another five years or two or three
years, whatever, it may be I’m stuck, because the structure of our company is:
someone literally has to leave and not be there in order for you to qualify for a better
position.”
The third participant related: “We … used to go to school and varsity and then work.
We are so used to climbing a ladder. You need to be able to move from one place to
another. Career development is very important, it’s super important.”
One participant commented: “I think it’s a balance of importance. You can keep going
up, but also have pay.”
Another said, “I think, to remain positive and keep wanting to go, I would have to be
compensated. So, I think, if I don't get enough pay, then I'm probably not going to
want to grow in that organisation, and want to go somewhere else.”
HR practitioners’ responses
The question posed was: The results of the quantitative phase of this study
showed that career growth is seen as more important than pay. What has your
experience been with respect to career or growth opportunities for young
employees?
One HRG’s response was: “In 2015, career development was cited as the number one
reason for people leaving.” The second HRG commented: “Young individuals have
indicated that they don't see opportunity here, and that is because people don't leave,
so they left. Where they’re going, they either got a promotion or better opportunity or
more opportunity for growth.”
The third HRG said, “…it’s more at senior level. People who have been waiting for
promotion and feel overlooked would go elsewhere. You will get one person per year
who does that. There are people who don't want to move, because they are making
APPENDIXES
DBL Thesis_Keshia Mohamed-Padayachee Student Number 71364684 Page 329 of 351
so much money and are content to stay in their positions.” This interviewee further
said, “Career development is also very important for people when they join, although
there is room for improvement, because the leaders who are there have always been
there, and there is no room for a lateral move. We have spoken about rotation of skills,
and we’re beginning to see that, but people are looking for hard-earned cash.”
Another HRG noted: “Career development — this is in the top three for why employees
leave.”
The recruitment specialist said, “The youth in general are very interested in their career
growth.”
The OD executive: “It's a very important as part of recognition that employees want to
be part of the top development programme. It’s prestigious, and the learning and
development opportunities of it. The bursaries and non-formal short programmes are
viewed as very important.” As part of the career development plans, this interviewee’s
company gave bursaries. In this regard, she stated, “Employees are now saying, ‘You
have given me the opportunity to go and study, and now that I have studied and I have
the qualifications, I am not given the opportunity to move and grow.”
In her experience, youths are also saying “‘…when you attract us, please do
communicate the career and learning paths available.’ So, that does become
important from a development point of view — what opportunities are available.
Career pathing was one of the highest scores. Our turnover is very low, and the people
that will leave will really have been struggling for career growth.”
Maximise career progression
Youths’ responses
The question posed to the youth was: Has the need for the experience of working
in different organisations to maximise your career progression been a reason
you have left a previous employer? Is it important for you to work in different
organisations?
APPENDIXES
DBL Thesis_Keshia Mohamed-Padayachee Student Number 71364684 Page 330 of 351
One youth said that, this was one of the reasons why she left her previous
organisations. “I think that's one of the things, maybe at both companies. One of the
reasons why I left was that I needed to develop and learn more. I need to be
challenged and exposed to new things”, she said.
The second participants view was: “The worst thing is going to work, coming home,
going to work, coming home. There is nothing that you look forward to … and you’re
not networking.”
A third participants view was: “The more experience I can gain, the quicker I can climb
the ladder, and that will also change in time, because not all people can move.”
HR practitioners’ responses
The question posed was: Research indicates that young employees have a
higher tendency than previous generations to remain with the same employer.
Are you experiencing the same, or are you finding that young employees are
leaving your organisations to maximise their career progression?
The response from the recruitment specialist was that, “The youth do move around a
lot, and this generation of youth employee has many entrepreneurs, and some refuse
to work for a boss. They prefer contracts over permanent positions in certain industries
and believe in taking their careers into their own hands.”
Maximise career earnings potential
The question posed was: Has the need for experience working in different
organisations to maximise your earning potential been a reason you have left a
previous employer?
Youths’ responses
One of the youth participants said, “People say, ‘I’m going to leave, get more money
and a higher position, and come back here, and they will place me in a more senior
position.”
APPENDIXES
DBL Thesis_Keshia Mohamed-Padayachee Student Number 71364684 Page 331 of 351
Bursary opportunities
Bursary opportunities emerged as a code in Phase I of the study.
The question posed was: If your company offered you a bursary, would that act
as an attractor or retainer for you?
Youths’ responses
The first participant responded: “Definitely. Fees are very expensive, and if my
company is offering to pay for my fees, why should I go anywhere else? And how can
I repay them? Let me work. Let me give it back. That’s the only way I know how.”
Another interviewee’s view was: “Yes, definitely. I want to do my Master’s, and I think
it would be great if a firm would pay for that. I'm not sure what I would like to do my
Master’s in, so, if we can sit down and decide together and they pay for that, that would
be great.”
Youths see bursary opportunities as an investment in their future, and are prepared to
stay with an employer who pays towards their studies. As one said, “…investing in
my future … definitely would buy my loyalty.”
Learning and development opportunities
Youths’ responses
The question posed to the youths was: How important are learning and
development opportunities to you?
One interviewee responded: “Pay is important, but development more so.”
The second question posed was: Respondents scored learning and development
opportunities high, even higher than pay. Would you agree with that?
One interviewee’s response was: “One hundred percent, because I was even willing
to settle with the salary if they… could expose me to more organisational development
stuff.”
APPENDIXES
DBL Thesis_Keshia Mohamed-Padayachee Student Number 71364684 Page 332 of 351
HR practitioners’ responses
The question posed to the HRGs and specialists was: Do you receive many
requests for training and development opportunities?
One HRG responded in the affirmative, and stated that this is because such
opportunities are linked to performance and career growth. The second HRG
responded that his organisation received many requests for bursaries and study loans
for employees' children, which are offered by the organisation and act as a retainer.
Two (67%) of the three HRGs confirmed that their companies offered a formal bursary
programme, which contributed to the retention of their staff. These organisations also
offered study loans. HRG response: “You pay for your studies and, when you pass,
you claim the money that you have paid back from the company. So, it's a bursary
that pushes you to study and pass, and then you’re going to get it back.”
Another specialist noted: “We do offer bursaries, and employees ask about bursaries
a lot.”
Formal coaching or mentoring programmes
Youths’ responses
The question posed to the youths was: Did having a coach or mentor influence
your decision to join or stay with your organisation?
The one participants view was that, “Coaches are very important. I started a
supervisor role … it’s trial and error. So, a lot of the times, it can’t always be trial and
error, especially when you’re dealing with a team. So, I personally feel like I was
thrown in with the whales and sharks.”
HR practitioners’ responses
The question asked was: Based on your experience, do coaching and mentoring
programmes influence young employees’ decisions to join or stay with your
organisation?
APPENDIXES
DBL Thesis_Keshia Mohamed-Padayachee Student Number 71364684 Page 333 of 351
The HR executive expressed the view that mentoring programmes work well and
assists with retention. In her experience, employees who have been in a coaching or
mentoring programme do stay longer with the organisation. following view: “Working
in corporate is not an easy place to work, so creating a buddy system could assist with
retention. I have been a mentor, and the feedback has always been good.”
The second HRG stated, “Mentoring that we’re doing would be for top talent, who
would go on a programme and be allocated mentors. Where they have allocated
mentors, that worked well, and some of the people are still with the business. This
improves retention and shows the seriousness around a particular programme.”
The third HRG responded: “Employees who are linked to a coach stay longer in the
business.”
Work‒life
The codes within this category were: Flexible work arrangements and CSR. The code
Travel/Location emerged during the quantitative phase.
Youths’ responses
The question asked was: What is your view on work‒life, and how do you define
this concept?
The view of one youth was: “For me, it means you cannot dedicate your entire life to
a company, unless you own the company. It is knowing that, ‘Now I’m at work, I need
to work, I need to push, I need to be productive, this is my knock-off time, I need to go
home, I have my personal things I need to do.’ So, everyone has a life, and you need
to understand that, as much as you’re working hard, you need to have your time with
your family. You need to have your personal time, just your time, on your own, doing
your things — a balance between your personal life and work. Sometimes, the one
will overlap the other, so, sometimes, you have too many personal commitments, so
you have to manage it, and vice versa. I don't believe that your work should be your
life. A lot of people do it because they are workaholics.”
APPENDIXES
DBL Thesis_Keshia Mohamed-Padayachee Student Number 71364684 Page 334 of 351
HR practitioners’ responses
The question asked was: What are employees asking for with respect to work‒
life?
None of the companies of the HRGs and specialists had a policy on or approach to
work‒life.
Flexible work arrangements
Youths’ responses
The question posed to the youths was: How important would you say flexible work
arrangements would be if you had to consider leaving or joining an
organisation?
The first participant said, “Flexible hours would be great and would be important. They
do not have a policy. It’s set working hours, and they’re not very flexible, but both jobs
before this had that, and I loved it. I was responsible, so you don’t take advantage of
it, but I could work from home, and I would work and probably be more productive.
That would be nice.”
The second participant’s response was: “Of all the things that you've asked me, this is
probably the most important. So, the others are probably nice to have, and I would
probably here or there change my mind, but if you had to tell me I could work flexible
hours, I would grab that opportunity…”
The third participant said, “Flexible work arrangements are very important, more
important than pay. I would be prepared to sacrifice salary to have more flexibility.
This is very appealing. Managing my own time, perfect. It gives you a sense of
responsibility and a sense of entitlement.”
The fouth responded: “I believe I can manage my own time… I don’t believe a clock
or someone should manage this for me. The structure can be there for us to follow,
but to say, ‘That is the only way, there is no other way’ is a little bit unreasonable.”
APPENDIXES
DBL Thesis_Keshia Mohamed-Padayachee Student Number 71364684 Page 335 of 351
The second participant added: “I might negotiate around this and that, but it would
definitely attract me…”
The third participant said, “I would value that, especially with my daughter being small.
Now, I spend time in traffic to drop her off and in traffic getting back. I spend two hours
on the road. Flexible hours would really help.”
HR practitioners’ responses
The question posed to the HR practitioners was: Do you have any flexible work
arrangement policies?
The HR executive said, “At best, they can consider flexible working hours whilst
ensuring that the core teams are available during business hours” … “With the traffic
in Johannesburg, companies are going to seriously have to look at this option.
Companies will also need to assist employees with setting up offices at home.”
The third HRG responded, “The company is very flexible and understanding when it
comes to that, but it becomes very difficult for front-end staff.”
One HRG added: “Qualified employees or employees completing their MBA require
this, because there are a number of days that they are not in the office. Definitely an
important factor for career advancement. Moms with kids are looking for more
flexibility …”
The response from the recruitment manager was: “When they’re looking for work, they
don't ask, ‘Do you have flexitime?’ They want to be accepted. It's when they’re inside
that they ask. That's what I have found.”
The OD manager responded: ‘Work-life balance and flexible work arrangements and
CSR — I think they want it, but what I have observed is that we lost two people who
left because they felt they were just too busy and they didn’t have time for themselves,
which has made us stop and say, “What is it that we’re not doing right there, because
our beliefs are, if you busy, that means you’re more valued.” Sometimes people think
APPENDIXES
DBL Thesis_Keshia Mohamed-Padayachee Student Number 71364684 Page 336 of 351
like that. ‘Give me flexibility to do what I need to do, and I may be at home delivering.’
The culture change — we’re not there yet.”
Corporate social responsibility
Youths’ responses
The question posed to youths was: There is a high degree of awareness of social
responsibility. Respondents viewed this as important when considering joining
an organisation. What is your view?
The participant responded: “… I'm goal-driven, so I would not focus on it.” The third
interviewee stated, “I'm not too concerned. I do a lot of community work. If the
company does not do it, it’s okay, and it’s not make-or-break. If they do it, it's not
necessarily going to attract me.”
Another participant felt that, “It is important, and illustrates whether the company is a
caring organisation creating happier people. CSR is indicative of the culture at the
organisation.”
HR practitioners’ responses
The question posed was: There is a high degree of awareness of social
responsibility. Respondents viewed this as important when considering joining
an organisation. What has you experience been in this regard?
One interviewee responded: “Employees are in awe of the initiatives, and it excites
them. The business is in support and encouraged by the initiatives...”
The recruitment manager’s view was: “Employees do not ask about CSR during the
recruitment process...”
The OD executive’s view was that: “CSR is important because it illustrates whether
the company is a caring organisation.”
Travel and location
APPENDIXES
DBL Thesis_Keshia Mohamed-Padayachee Student Number 71364684 Page 337 of 351
Travel and location had emerged as a code during the quantitative phase of the study,
and it is for this reason that there was no formal question linked to it.
Youths’ responses
A participant indicated: “I've lived in Gauteng all my life; I don't see myself outside of
Gauteng, unless they make me such a good offer that I can't say no.”
HR practitioners’ responses
One HRG her response was: “Location is important, but does not influence turnover.
Employees have gotten so used to traveling in traffic in Johannesburg.”
The second participant’s response was: “Location initially does play a role in
employees’ decision, until you explain to them that it's not that far. Employees would
relocate or travel if it was a career advancement opportunity.”
One recruitment specialist her response was: “Some people come here, and, after a
few months, they say that they want a transfer, citing their family, or something
happens to the family. But location does play a big role.”
The second recruitment specialist’s response was: “I have had a few people who have
turned down offers for travel. For some cultures, what's very important … its family,
and they’re going to be starting a family, they’re going to get married. If you’re not
going to support them with that, and they’re not going to get their leave, they are not
interested. So, that work‒life balance is important.”
The remuneration specialist’s view was: “Location is important for employees, and an
area that they can improve on, which requires attention. There are, however, not that
many cases.”
International travel opportunities
International travel opportunities emerged as a code from the questionnaire in Phase
I.
APPENDIXES
DBL Thesis_Keshia Mohamed-Padayachee Student Number 71364684 Page 338 of 351
Youths’ responses
The question posed to the youths was: Would you be interested in an international
travel opportunity?
Youths’ responses
The response from one of the participants was: “Definitely. An experienced person
can go and come back and give the information, but, I think, you can get a lot more
from a younger employee. They limit your growth when it comes to those kinds of
things, because they believe only certain people can do it.”
A second participant responded: “That is very important. …I think every employee
needs to have the opportunity to travel. It opens your mind to bigger-picture thinking.
You’re meeting with people. You’re interacting with different people. So, for me, that
is essential.”
Safety/Security
In this category, the researcher addressed the codes Longer-term job security and
Safe and secure work environment, including interviewees’ expectations. The code
that had emerged was Company reputation.
Longer-term job security (> 12 months)
The question posed to the youths was: How important is longer-term job security
to you?
Youths’ responses
This proved to be very important to the participants. It meant something different to
each, and each had a different perspective on the matter and they all noted the
importance of having secure employment.
HR practitioners’ responses
The question posed was: Are you finding that youth employees are seeking
longer-term job security more than previous generations?
The opinion of the HRGs was: “There has been restructures based on operational
requirements, because the business has changed in those companies. They've got
APPENDIXES
DBL Thesis_Keshia Mohamed-Padayachee Student Number 71364684 Page 339 of 351
insecure employees like you can't believe. We've had people resign because they
feel they don't have job security. I think it's a major thing." Another HRG confirmed
this statement, saying: “Employees are seeking longer-term job security.”
The next question was: Do you find employees are asking, when you interview
them, if you’re going to restructure?
The recruitment specialist responded: “They do not at interview stage, because they
assume that we are okay. But it is those inside, and then the new ones, because
they’re worried that they will apply last-in-first-out, so, they do.”
Social support
This category included Supportive management, Supportive environment, and
Resources. Additional codes emerged from the findings of Phase I of the research,
specifically the responses to the open-ended questions, which the researcher
clustered in this category, due to association. These were: Working conditions,
Environment, and Leadership.
Supportive management and environment
The question posed to the youth was: Supportive management scored higher than
Supportive work environment. What are your views in this respect?
Youths’ responses
This was illustrated by one interviewee’s apportionment of “Leadership 60% and 40%
environment.”
Work environment proved to be an important one of the participants stated: “If the
environment is great, I would even accept the position if it was only for two years.”
Another interviewee commented: “For me personally, environment is the most
important, leadership and culture, and then pay.” A third interviewee stated, “Another
thing that will make me turn down an offer at a company is working conditions.”
APPENDIXES
DBL Thesis_Keshia Mohamed-Padayachee Student Number 71364684 Page 340 of 351
HR practitioners’ responses
The question posed to the HRGs and specialists was: Supportive management was
scored higher than Supportive work environment by the respondents,
illustrating the importance of leadership. What are your views in this respect?
One HRG executive responded: “We do an annual poll, called the Employee
Satisfaction Index, and you can see the correlation between performance, general
happiness, and mood in the environment and leadership. Where you have strong
leaders, the scores are up there, and the comments even go to the extent of saying
‘That executive is the best; my company is the best company to work for.’ …of course,
the work environment, because people are engaged, and they know that they are
taken care of. So, leadership is key. In areas where the leader is autocratic and does
not care so much, we have seen scores go down. Employees need to be taken care
of.”
The second HRG responded, “Supportive management and supportive environment
is very important and viewed as one of the areas or reasons why employees thrive,
and the reason for leaving where they don’t.”
The recruitment manager’s view was that supportive management is more important
than a supportive environment, stating: “It is important to have supportive
management.”
The OD specialists stated: “Leadership is much more important than pay. Leadership
determines the culture and creates the environment in an organisation, and it’s
important that there is a balance between the two. I think it was leadership, then pay”,
the specialist said.
Resources
The question the researcher posed to the youth was: How important are resources
that enable you to do your work to you?
The youth were in agreement that resources are very important to them.
APPENDIXES
DBL Thesis_Keshia Mohamed-Padayachee Student Number 71364684 Page 341 of 351
HR practitioners’ responses
The question the researcher posed was: What importance do employees place on
the resources they are provided with to do their jobs?
One HRG responded: “The device that you give them to work from is important, and
will, in the future, become an issue.” Another HRG commented: “Skilled employees
are more interested in this, and ask the question if they will receive a laptop or desktop;
even graduate employees. Resources do create a sense of status.”
The remuneration specialist’s responded: “Especially with today's youngsters; first
thing they ask is, ‘When I can get my laptop and my cell phone’ and all of that.”
Appendix C, described the main findings from obtained in Phase II of the research. It
provided a summary of each of the groups’ responses by category and code, aligned
with the framework of the research.
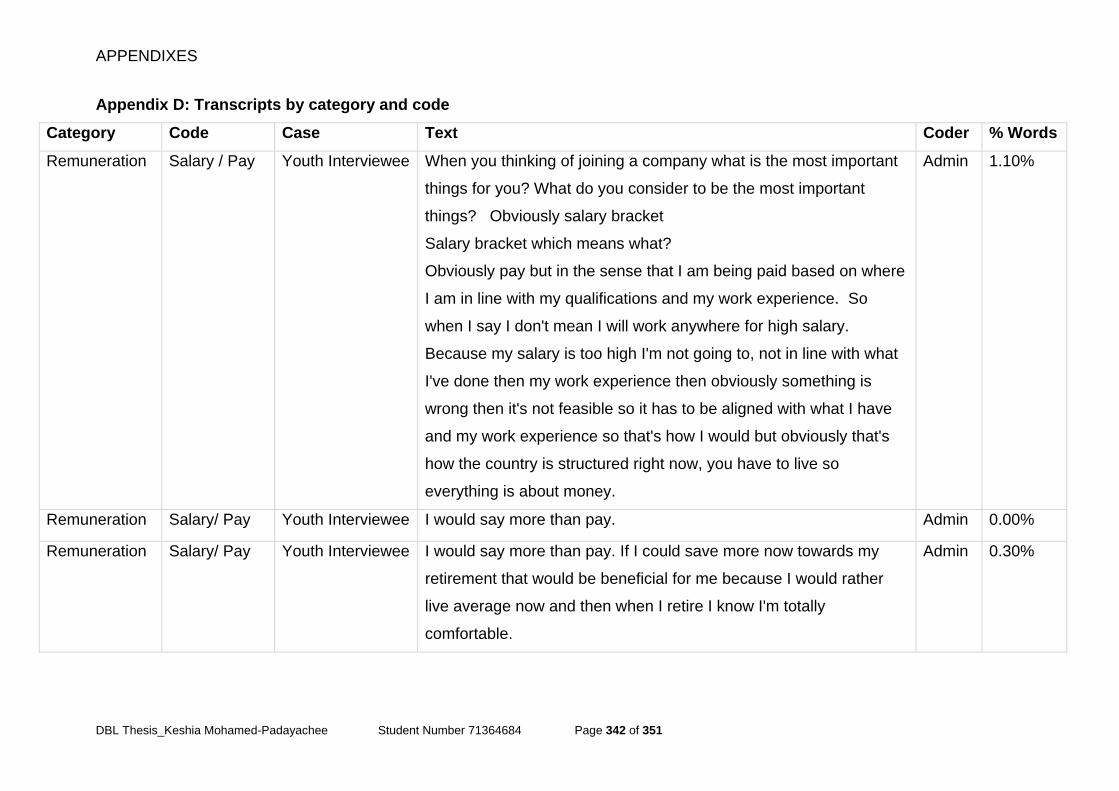
APPENDIXES
DBL Thesis_Keshia Mohamed-Padayachee Student Number 71364684 Page 342 of 351
Appendix D: Transcripts by category and code
Category Code Case Text Coder % Words
Remuneration Salary / Pay Youth Interviewee When you thinking of joining a company what is the most important
things for you? What do you consider to be the most important
things? Obviously salary bracket
Salary bracket which means what?
Obviously pay but in the sense that I am being paid based on where
I am in line with my qualifications and my work experience. So
when I say I don't mean I will work anywhere for high salary.
Because my salary is too high I'm not going to, not in line with what
I've done then my work experience then obviously something is
wrong then it's not feasible so it has to be aligned with what I have
and my work experience so that's how I would but obviously that's
how the country is structured right now, you have to live so
everything is about money.
Admin 1.10%
Remuneration Salary/ Pay Youth Interviewee I would say more than pay. Admin 0.00%
Remuneration Salary/ Pay Youth Interviewee I would say more than pay. If I could save more now towards my
retirement that would be beneficial for me because I would rather
live average now and then when I retire I know I'm totally
comfortable.
Admin 0.30%
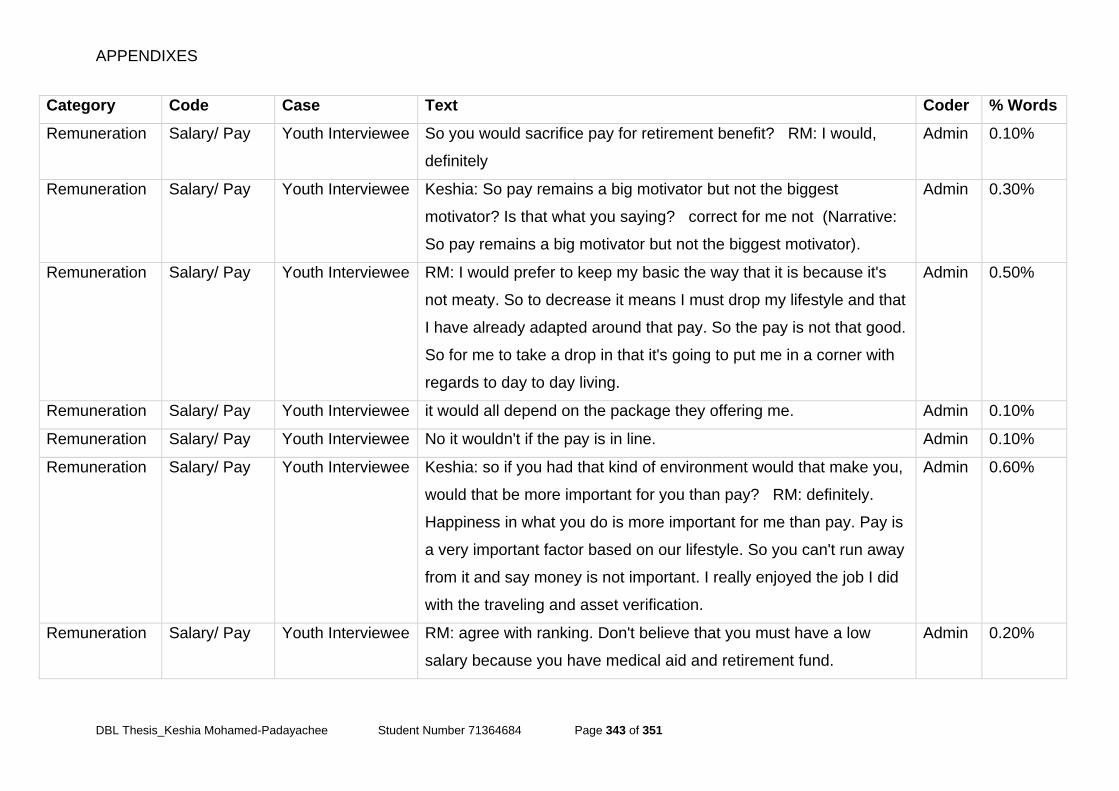
APPENDIXES
DBL Thesis_Keshia Mohamed-Padayachee Student Number 71364684 Page 343 of 351
Category Code Case Text Coder % Words
Remuneration Salary/ Pay Youth Interviewee So you would sacrifice pay for retirement benefit? RM: I would,
definitely
Admin 0.10%
Remuneration Salary/ Pay Youth Interviewee Keshia: So pay remains a big motivator but not the biggest
motivator? Is that what you saying? correct for me not (Narrative:
So pay remains a big motivator but not the biggest motivator).
Admin 0.30%
Remuneration Salary/ Pay Youth Interviewee RM: I would prefer to keep my basic the way that it is because it's
not meaty. So to decrease it means I must drop my lifestyle and that
I have already adapted around that pay. So the pay is not that good.
So for me to take a drop in that it's going to put me in a corner with
regards to day to day living.
Admin 0.50%
Remuneration Salary/ Pay Youth Interviewee it would all depend on the package they offering me. Admin 0.10%
Remuneration Salary/ Pay Youth Interviewee No it wouldn't if the pay is in line. Admin 0.10%
Remuneration Salary/ Pay Youth Interviewee Keshia: so if you had that kind of environment would that make you,
would that be more important for you than pay? RM: definitely.
Happiness in what you do is more important for me than pay. Pay is
a very important factor based on our lifestyle. So you can't run away
from it and say money is not important. I really enjoyed the job I did
with the traveling and asset verification.
Admin 0.60%
Remuneration Salary/ Pay Youth Interviewee RM: agree with ranking. Don't believe that you must have a low
salary because you have medical aid and retirement fund.
Admin 0.20%
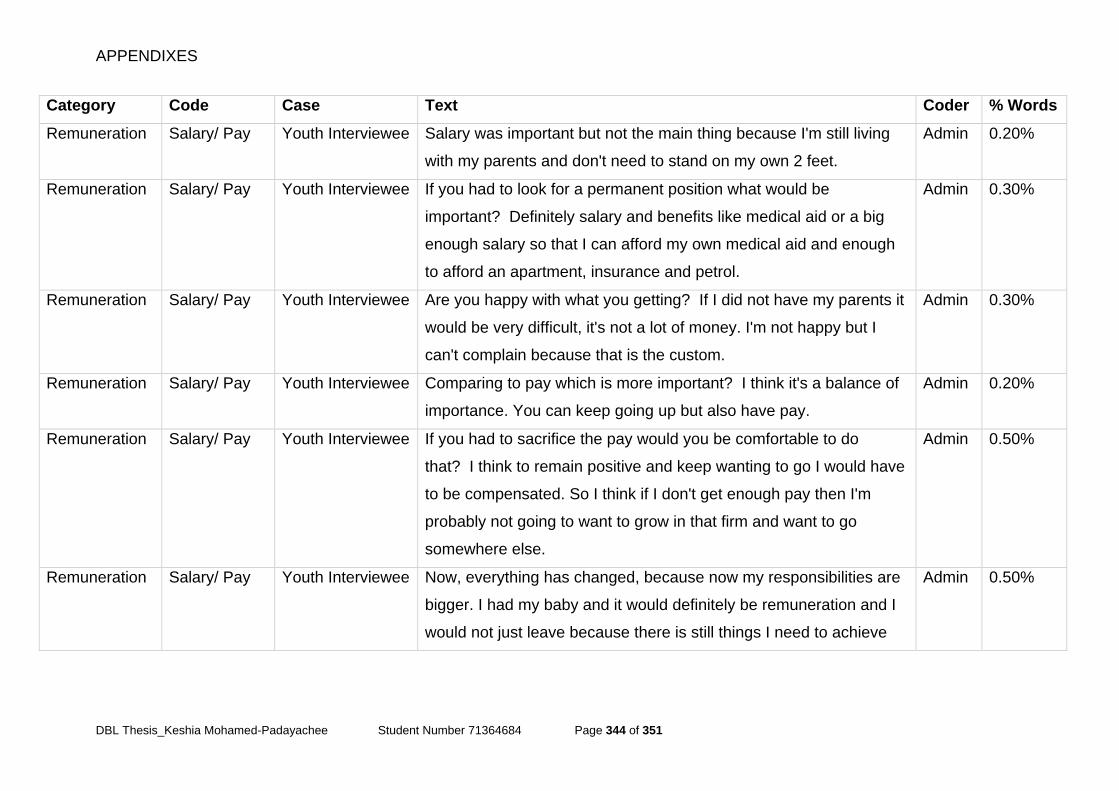
APPENDIXES
DBL Thesis_Keshia Mohamed-Padayachee Student Number 71364684 Page 344 of 351
Category Code Case Text Coder % Words
Remuneration Salary/ Pay Youth Interviewee Salary was important but not the main thing because I'm still living
with my parents and don't need to stand on my own 2 feet.
Admin 0.20%
Remuneration Salary/ Pay Youth Interviewee If you had to look for a permanent position what would be
important? Definitely salary and benefits like medical aid or a big
enough salary so that I can afford my own medical aid and enough
to afford an apartment, insurance and petrol.
Admin 0.30%
Remuneration Salary/ Pay Youth Interviewee Are you happy with what you getting? If I did not have my parents it
would be very difficult, it's not a lot of money. I'm not happy but I
can't complain because that is the custom.
Admin 0.30%
Remuneration Salary/ Pay Youth Interviewee Comparing to pay which is more important? I think it's a balance of
importance. You can keep going up but also have pay.
Admin 0.20%
Remuneration Salary/ Pay Youth Interviewee If you had to sacrifice the pay would you be comfortable to do
that? I think to remain positive and keep wanting to go I would have
to be compensated. So I think if I don't get enough pay then I'm
probably not going to want to grow in that firm and want to go
somewhere else.
Admin 0.50%
Remuneration Salary/ Pay Youth Interviewee Now, everything has changed, because now my responsibilities are
bigger. I had my baby and it would definitely be remuneration and I
would not just leave because there is still things I need to achieve
Admin 0.50%
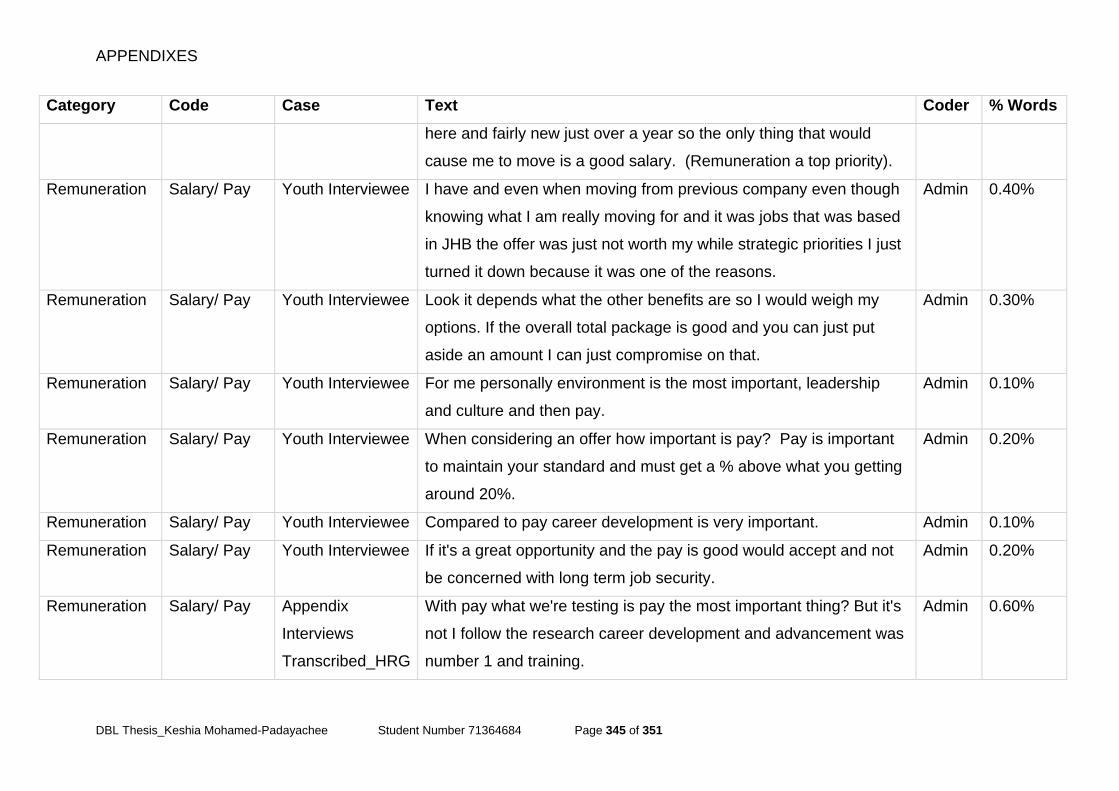
APPENDIXES
DBL Thesis_Keshia Mohamed-Padayachee Student Number 71364684 Page 345 of 351
Category Code Case Text Coder % Words
here and fairly new just over a year so the only thing that would
cause me to move is a good salary. (Remuneration a top priority).
Remuneration Salary/ Pay Youth Interviewee I have and even when moving from previous company even though
knowing what I am really moving for and it was jobs that was based
in JHB the offer was just not worth my while strategic priorities I just
turned it down because it was one of the reasons.
Admin 0.40%
Remuneration Salary/ Pay Youth Interviewee Look it depends what the other benefits are so I would weigh my
options. If the overall total package is good and you can just put
aside an amount I can just compromise on that.
Admin 0.30%
Remuneration Salary/ Pay Youth Interviewee For me personally environment is the most important, leadership
and culture and then pay.
Admin 0.10%
Remuneration Salary/ Pay Youth Interviewee When considering an offer how important is pay? Pay is important
to maintain your standard and must get a % above what you getting
around 20%.
Admin 0.20%
Remuneration Salary/ Pay Youth Interviewee Compared to pay career development is very important. Admin 0.10%
Remuneration Salary/ Pay Youth Interviewee If it's a great opportunity and the pay is good would accept and not
be concerned with long term job security.
Admin 0.20%
Remuneration Salary/ Pay Appendix
Interviews
Transcribed_HRG
With pay what we're testing is pay the most important thing? But it's
not I follow the research career development and advancement was
number 1 and training.
Admin 0.60%
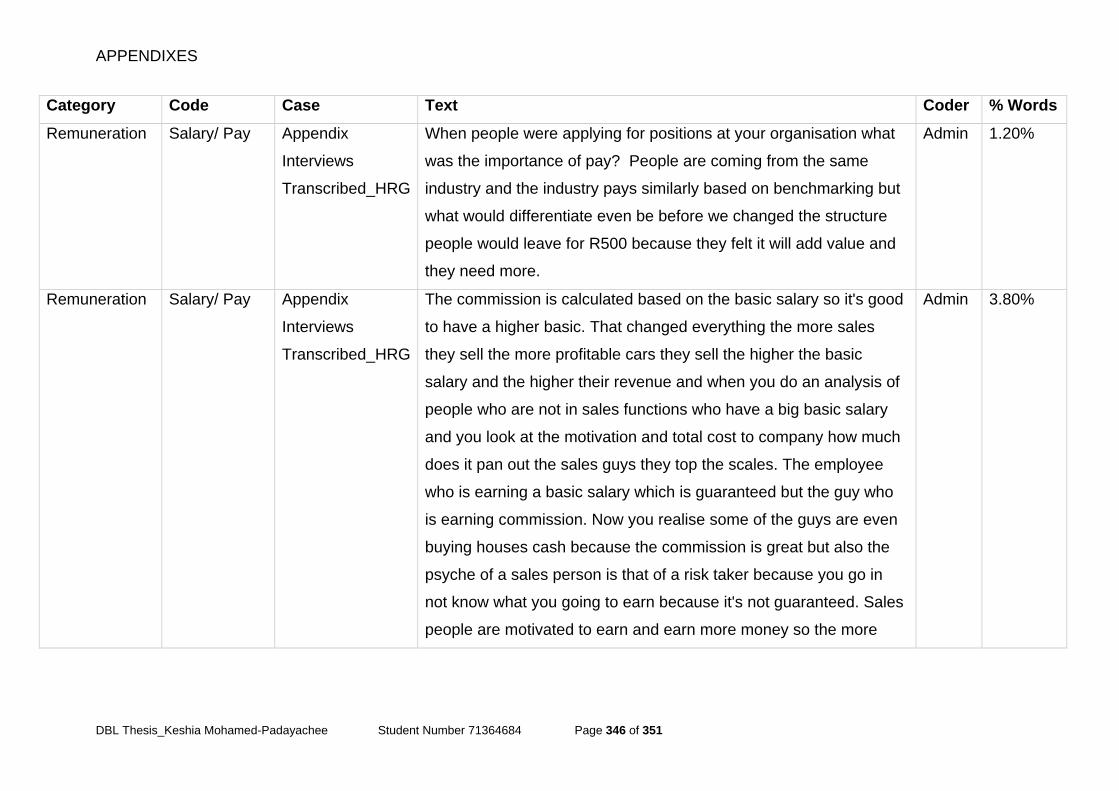
APPENDIXES
DBL Thesis_Keshia Mohamed-Padayachee Student Number 71364684 Page 346 of 351
Category Code Case Text Coder % Words
Remuneration Salary/ Pay Appendix
Interviews
Transcribed_HRG
When people were applying for positions at your organisation what
was the importance of pay? People are coming from the same
industry and the industry pays similarly based on benchmarking but
what would differentiate even be before we changed the structure
people would leave for R500 because they felt it will add value and
they need more.
Admin 1.20%
Remuneration Salary/ Pay Appendix
Interviews
Transcribed_HRG
The commission is calculated based on the basic salary so it's good
to have a higher basic. That changed everything the more sales
they sell the more profitable cars they sell the higher the basic
salary and the higher their revenue and when you do an analysis of
people who are not in sales functions who have a big basic salary
and you look at the motivation and total cost to company how much
does it pan out the sales guys they top the scales. The employee
who is earning a basic salary which is guaranteed but the guy who
is earning commission. Now you realise some of the guys are even
buying houses cash because the commission is great but also the
psyche of a sales person is that of a risk taker because you go in
not know what you going to earn because it's not guaranteed. Sales
people are motivated to earn and earn more money so the more
Admin 3.80%
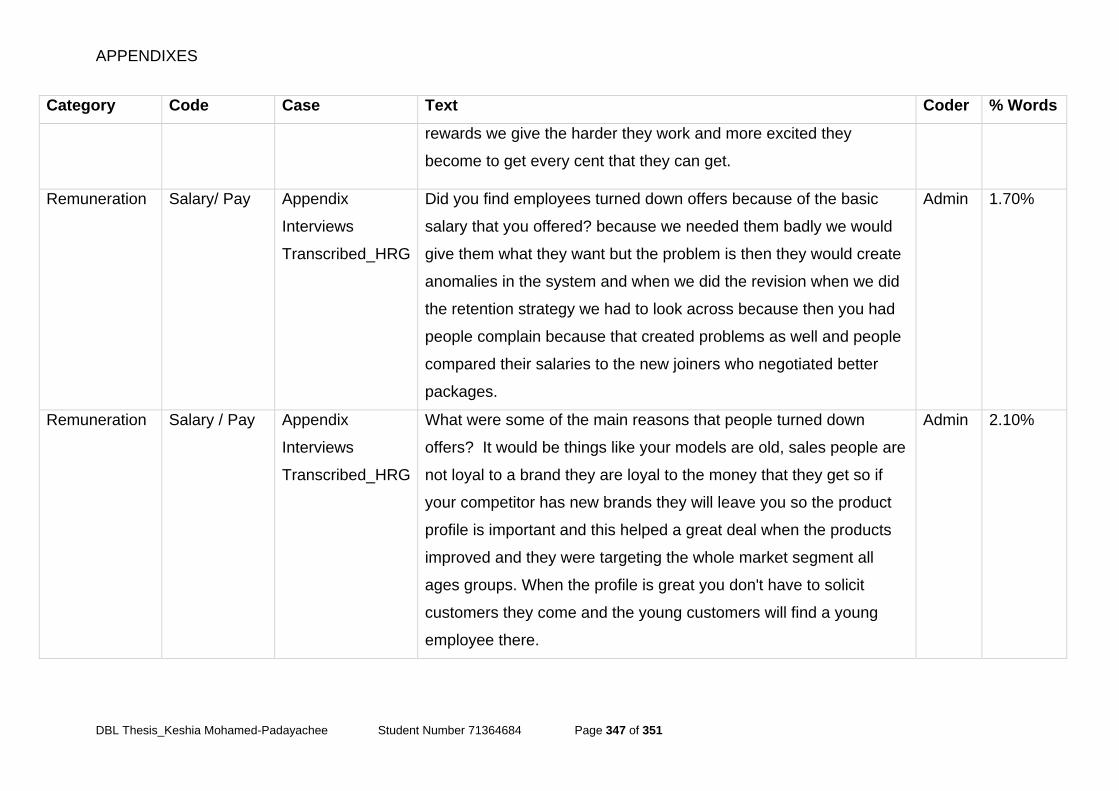
APPENDIXES
DBL Thesis_Keshia Mohamed-Padayachee Student Number 71364684 Page 347 of 351
Category Code Case Text Coder % Words
rewards we give the harder they work and more excited they
become to get every cent that they can get.
Remuneration Salary/ Pay Appendix
Interviews
Transcribed_HRG
Did you find employees turned down offers because of the basic
salary that you offered? because we needed them badly we would
give them what they want but the problem is then they would create
anomalies in the system and when we did the revision when we did
the retention strategy we had to look across because then you had
people complain because that created problems as well and people
compared their salaries to the new joiners who negotiated better
packages.
Admin 1.70%
Remuneration Salary / Pay Appendix
Interviews
Transcribed_HRG
What were some of the main reasons that people turned down
offers? It would be things like your models are old, sales people are
not loyal to a brand they are loyal to the money that they get so if
your competitor has new brands they will leave you so the product
profile is important and this helped a great deal when the products
improved and they were targeting the whole market segment all
ages groups. When the profile is great you don't have to solicit
customers they come and the young customers will find a young
employee there.
Admin 2.10%
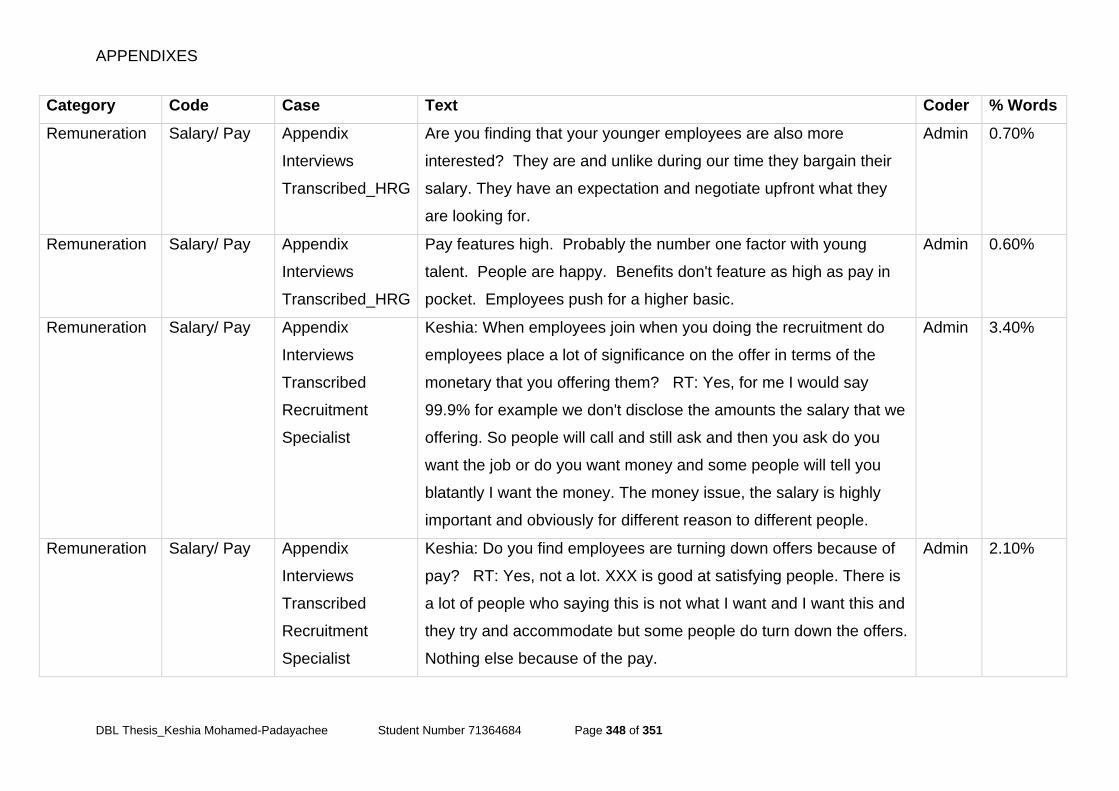
APPENDIXES
DBL Thesis_Keshia Mohamed-Padayachee Student Number 71364684 Page 348 of 351
Category Code Case Text Coder % Words
Remuneration Salary/ Pay Appendix
Interviews
Transcribed_HRG
Are you finding that your younger employees are also more
interested? They are and unlike during our time they bargain their
salary. They have an expectation and negotiate upfront what they
are looking for.
Admin 0.70%
Remuneration Salary/ Pay Appendix
Interviews
Transcribed_HRG
Pay features high. Probably the number one factor with young
talent. People are happy. Benefits don't feature as high as pay in
pocket. Employees push for a higher basic.
Admin 0.60%
Remuneration Salary/ Pay Appendix
Interviews
Transcribed
Recruitment
Specialist
Keshia: When employees join when you doing the recruitment do
employees place a lot of significance on the offer in terms of the
monetary that you offering them? RT: Yes, for me I would say
99.9% for example we don't disclose the amounts the salary that we
offering. So people will call and still ask and then you ask do you
want the job or do you want money and some people will tell you
blatantly I want the money. The money issue, the salary is highly
important and obviously for different reason to different people.
Admin 3.40%
Remuneration Salary/ Pay Appendix
Interviews
Transcribed
Recruitment
Specialist
Keshia: Do you find employees are turning down offers because of
pay? RT: Yes, not a lot. XXX is good at satisfying people. There is
a lot of people who saying this is not what I want and I want this and
they try and accommodate but some people do turn down the offers.
Nothing else because of the pay.
Admin 2.10%
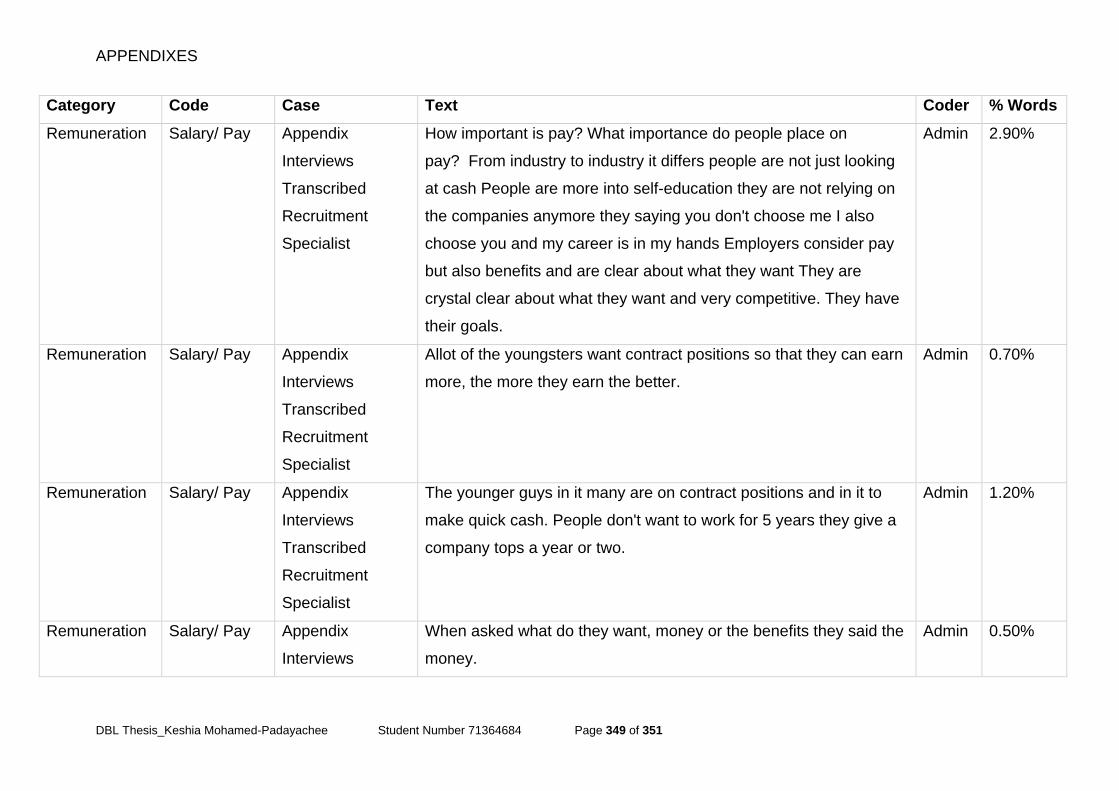
APPENDIXES
DBL Thesis_Keshia Mohamed-Padayachee Student Number 71364684 Page 349 of 351
Category Code Case Text Coder % Words
Remuneration Salary/ Pay Appendix
Interviews
Transcribed
Recruitment
Specialist
How important is pay? What importance do people place on
pay? From industry to industry it differs people are not just looking
at cash People are more into self-education they are not relying on
the companies anymore they saying you don't choose me I also
choose you and my career is in my hands Employers consider pay
but also benefits and are clear about what they want They are
crystal clear about what they want and very competitive. They have
their goals.
Admin 2.90%
Remuneration Salary/ Pay Appendix
Interviews
Transcribed
Recruitment
Specialist
Allot of the youngsters want contract positions so that they can earn
more, the more they earn the better.
Admin 0.70%
Remuneration Salary/ Pay Appendix
Interviews
Transcribed
Recruitment
Specialist
The younger guys in it many are on contract positions and in it to
make quick cash. People don't want to work for 5 years they give a
company tops a year or two.
Admin 1.20%
Remuneration Salary/ Pay Appendix
Interviews
When asked what do they want, money or the benefits they said the
money.
Admin 0.50%
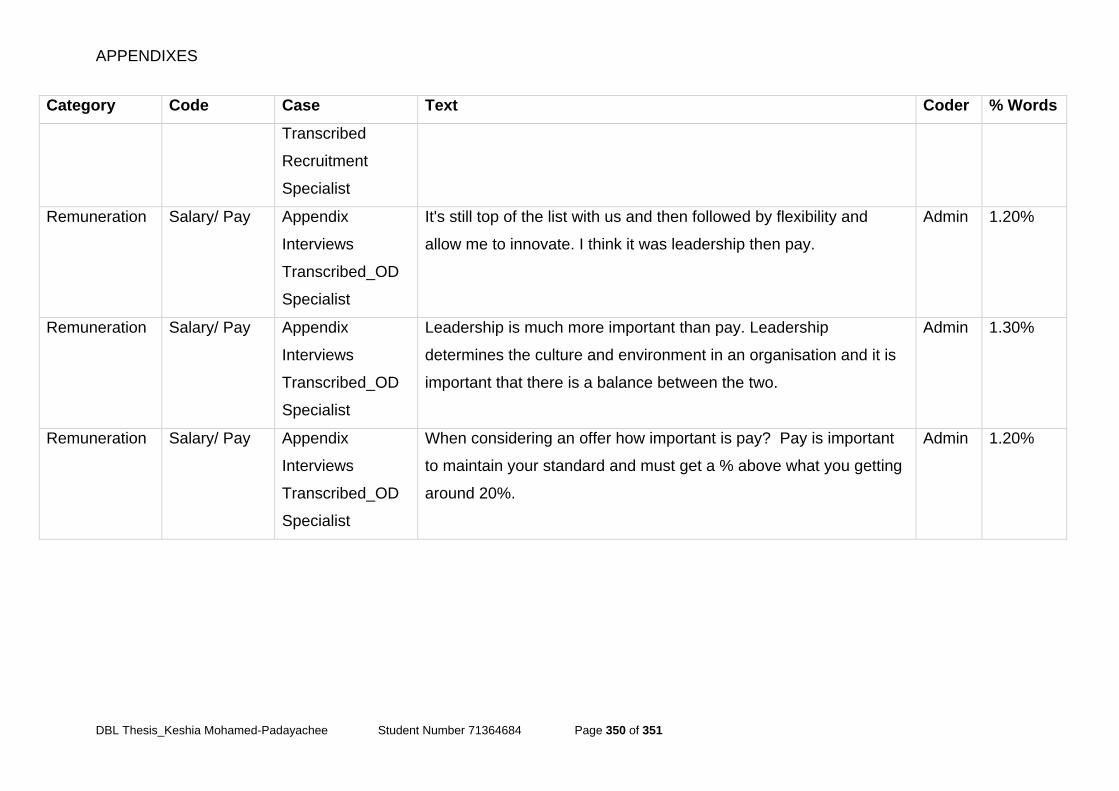
APPENDIXES
DBL Thesis_Keshia Mohamed-Padayachee Student Number 71364684 Page 350 of 351
Category Code Case Text Coder % Words
Transcribed
Recruitment
Specialist
Remuneration Salary/ Pay Appendix
Interviews
Transcribed_OD
Specialist
It's still top of the list with us and then followed by flexibility and
allow me to innovate. I think it was leadership then pay.
Admin 1.20%
Remuneration Salary/ Pay Appendix
Interviews
Transcribed_OD
Specialist
Leadership is much more important than pay. Leadership
determines the culture and environment in an organisation and it is
important that there is a balance between the two.
Admin 1.30%
Remuneration Salary/ Pay Appendix
Interviews
Transcribed_OD
Specialist
When considering an offer how important is pay? Pay is important
to maintain your standard and must get a % above what you getting
around 20%.
Admin 1.20%
APPENDIXES
DBL Thesis_Keshia Mohamed-Padayachee Student Number 71364684 Page 351 of 351
Appendix E: Editing certificate
Teresa Kapp Language Services
082 789 7878
This serves to certify that the document
A Total Rewards Framework for the Attraction and Retention of the
Youth
by
Keshia Mohamed-Padayachee
was duly edited by me.
I am an accredited editor with the University of Johannesburg, and my clients include
Absa, FNB, Takelaot, and many universities in South Africa and Namibia.
Please note that all editing is done in Track Changes, and I therefore have no
control over what is accepted or rejected by the author.
Should there be any queries, please contact me on the number provided above.
Teresa Kapp